Archive for milk check risk management

$51,000 a Day in Silence: AMPI’s Paynesville Plant Went Dark, and Nobody Told You

AMPI’s Paynesville plant is dark. Its biggest member sells milk to five other processors. You sell to one. Same co-op. Guess who has a backup plan.

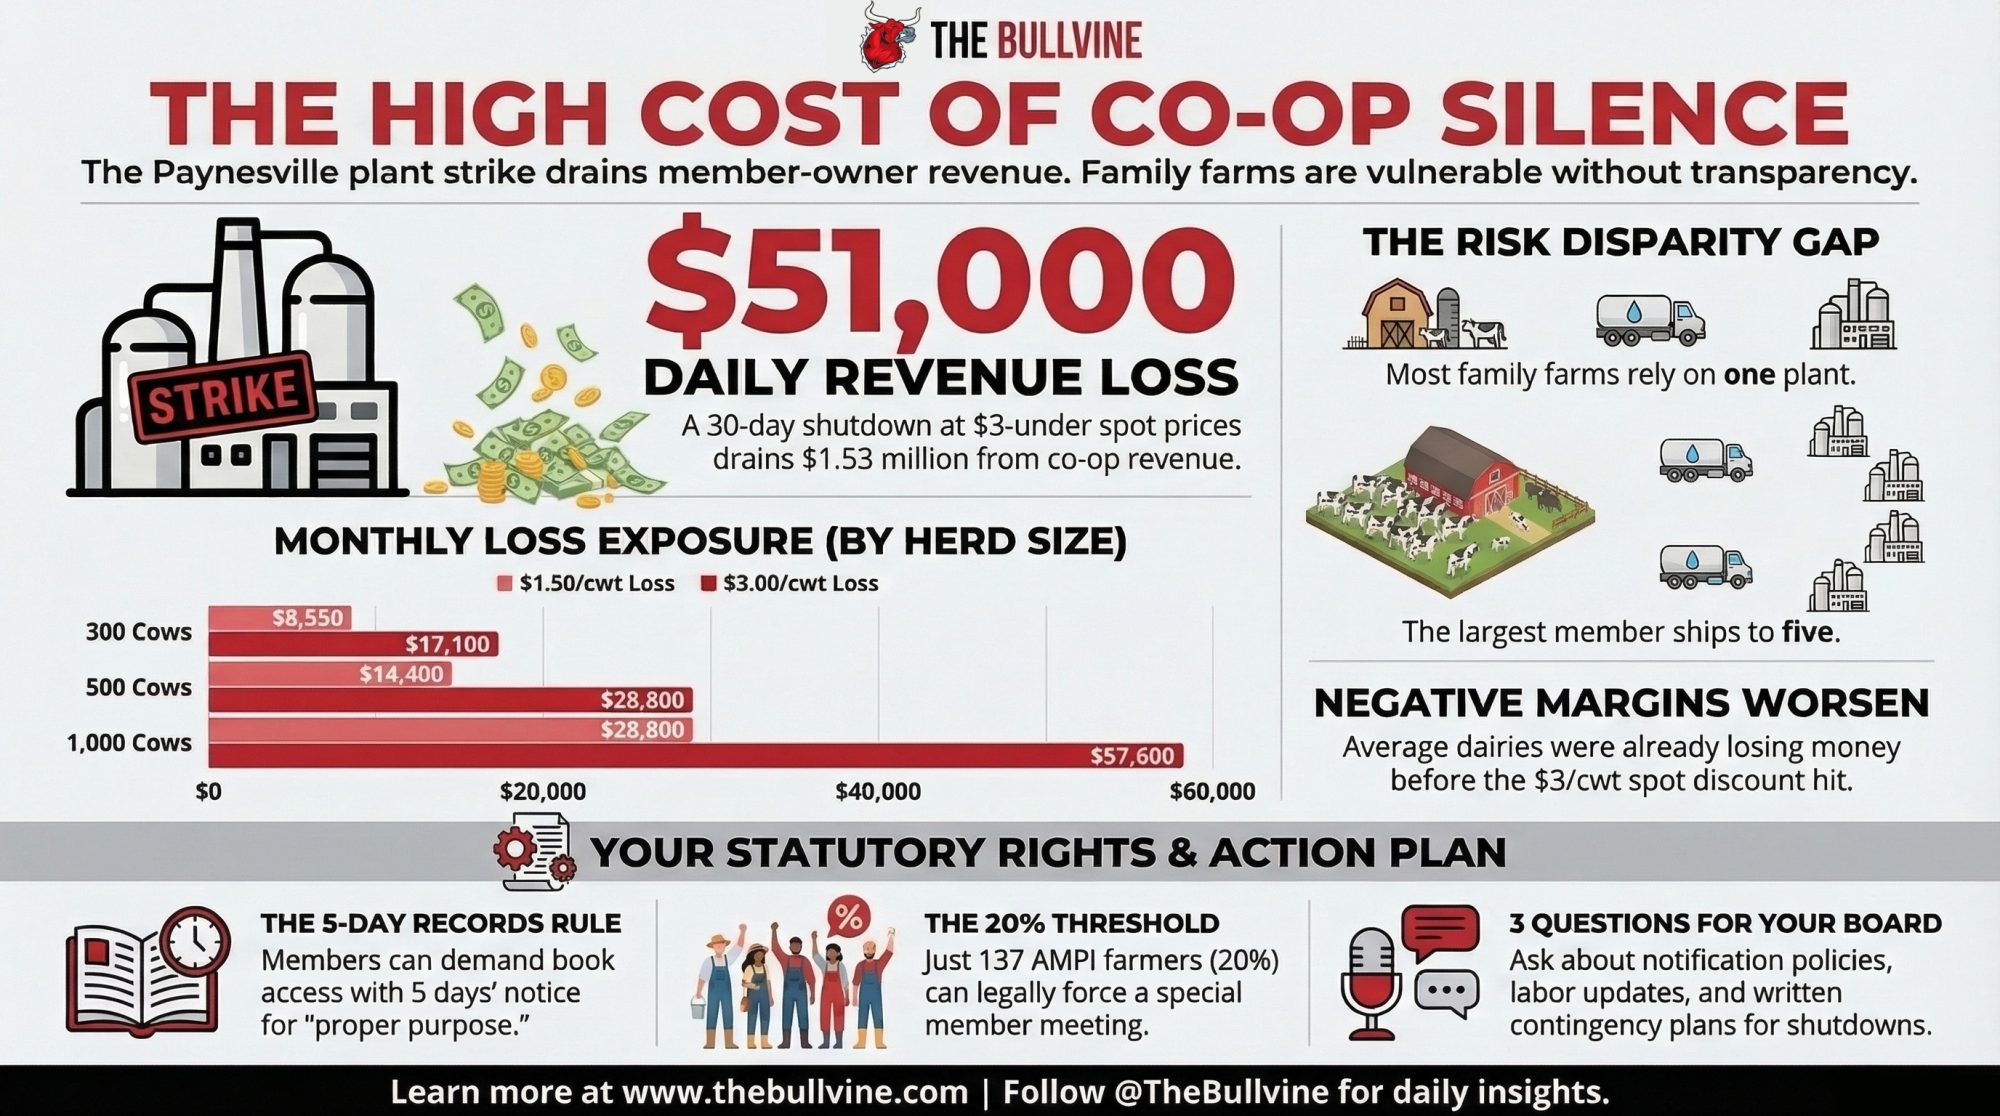
Executive Summary: At 10 a.m. Saturday, 18-year AMPI lab tech Heidi Barg walked out of the Paynesville, Minnesota cheese plant — and a $51,000-a-day clock started ticking for 685 farmer-owners who got zero warning. Teamsters Local 471 declared a formal Unfair Labor Practice strike after nearly a year of rejected demands for better wages, health-care flexibility, and a guarantee that jobs survive if AMPI sells the plant. With the facility processing 1.7 million pounds of milk daily and Midwest spot running $3-under, a 30-day shutdown burns through $1.53 million in co-op revenue — on top of margins that were already negative before a single picket sign went up. AMPI’s largest member, Riverview LLP, ships to five processors and is building its own 4-million-lb/day powder plant 90 miles away; most family-scale members ship to one plant and have no backup. Under Minnesota cooperative law, the board may have no legal obligation to warn you — a governance blind spot that seven Ontario farmers cracked open in 2020, when a single public letter forced province-wide reform. Below: the per-herd loss math, the statutory rights most co-op members don’t know they have, and the one action you can take before your next district meeting.

AMPI dairy strike

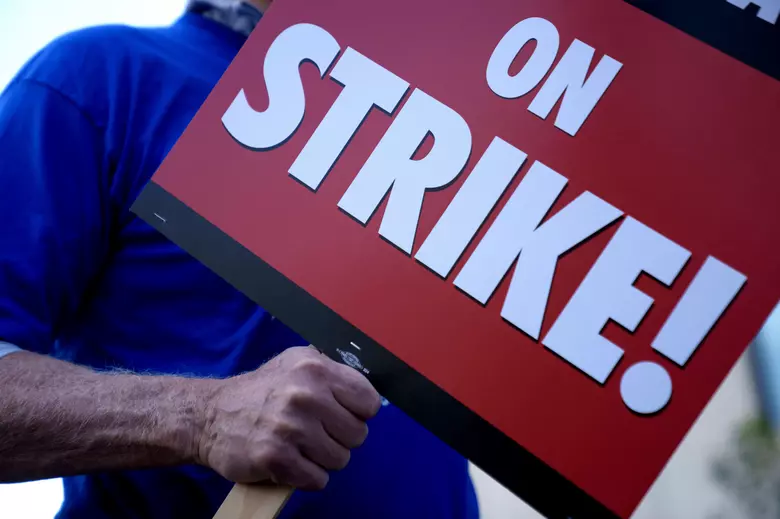
Just before 10 a.m. on Saturday, March 21, Heidi Barg hung up her lab coat at the AMPI cheese plant on West Railroad Street in Paynesville, Minnesota, and walked out to the picket line. She’s spent 18 years in that lab, testing the milk that 685 farm families ship into the cooperative every day. A few minutes later, the rest of her co-workers in Teamsters Local 471 — more than 60 employees in all — followed her out, and AMPI’s highest-capacity cheese plant went dark. 

While the lab coats hit the pavement, the clock started ticking — $51,000 a day in lost milk value at the March 19 spot floor, and up to $1.53 million if $3-under conditions persist for a month. That’s a hole your milk check is expected to fill.

“When I started at AMPI 18 years ago, this was a place where people built successful careers in a small town to support their families,” Barg said. “Too many now see it as just a job, and that has been tough for me to watch”. 

Eighteen years of institutional knowledge about milk quality, cheese yields, and production standards — gone from the plant floor in a single morning. And there’s no sign that any of AMPI’s 685 farmer-owners received a real warning that their plant was one step from going dark.

How Did a 12-Month Standoff Turn Into a Surprise Shutdown?

This didn’t start with a one-day blow-up. It started in April 2025, when Paynesville workers — who’d spent 50 years under an independent union — voted 71 to 1 to affiliate with Teamsters Local 471. They believed the Teamsters would give them “the leverage, resources, and collective power necessary to bargain the best contract possible”. 

Since then, it’s been a long, slow grind. Workers came to the table asking for a meaningful wage increase after more than a year without a raise, more flexibility in health care coverage, and a guarantee that, if AMPI sells the plant, their jobs and union contract will go with it. AMPI said no on all three. 

“AMPI has had more than enough time to do right by these workers, but instead they’ve dragged their feet,” said Lyndon Johnson, Secretary-Treasurer of Local 471. “Our members are united in demanding the wages, health care, and job protections they deserve. We’re prepared to stay out as long as it takes”. 

Local 471 has called this a formal Unfair Labor Practice strike — meaning they believe they can prove AMPI hasn’t been bargaining in good faith. That’s a legal accusation that builds over months of bargaining records, not one bad meeting. And the dairy labor crisis driving these negotiations isn’t unique to Paynesville

Three Facilities, One Pattern

FacilityProductWhat HappenedWorkers AffectedTimelineMember Impact
Paynesville, MNCheeseULP strike — plant went dark60+ Teamsters Local 471March 21, 2026685 farmer-owners lose outlet for 1.7M+ lb/day
Blair, WICheddar → Cottage CheeseConversion retool — temporary layoffs86 employeesLayoffs start March 31, 2026; reopen early 2027Milk rerouted during 9–12 month gap
New Ulm, MNButterSold to Grassland Dairy Products185 employees transferredLate 2025AMPI exits butter; “focuses on core business = cheese”

Paynesville isn’t AMPI’s only moving piece. In Blair, Wisconsin, AMPI is converting its cheddar plant into a cottage cheese facility — temporarily laying off 86 workers starting March 31, with a reopening planned for early 2027. In New Ulm, Minnesota, AMPI sold its butter plant to Grassland Dairy Products in late 2025. AMPI Marketing VP Sarah Schmidt confirmed that 185 employees had transferred, saying the sale would allow AMPI “focus on its core business, which is cheese.”

If you’re a Paynesville worker watching AMPI shut one plant and retool another, you’re going to ask for a guarantee that your facility won’t be sold next. Workers asked for exactly that. Management refused.

AMPI did not respond to a request for comment regarding the strike.

What Does It Actually Cost When Your Co-op Plant Goes Dark?

When a plant shuts down, your cows don’t. Milk has to move. And in late March 2026, it’s moving into one of the ugliest spot markets in recent memory.

USDA’s Agricultural Marketing Service reported Midwest Class III spot milk trading at $ 3 under to flat the week of March 19. One week earlier, the Central region spot was $ 5 under to flat, and cheesemakers were “unable to take on additional volumes of milk, as they are already running full schedules.” A March 17 snowstorm across the Upper Midwest made hauling even messier.

Teamsters say the plant was running about 1.7 million pounds of milk per day — roughly 17,000 cwt. AMPI’s own 2025 summer tour materials claim Paynesville can process up to 4 million pounds daily — though the plant’s last publicly documented capacity upgrade, reported by Farm Progress in January 2023, put the figure at 3 million pounds. However you measure it, a lot of milk just got orphaned.

At the co-op level: 17,000 cwt/day × $3.00 spot discount = $51,000 per day in lost value. Thirty days at $3-under is $1.53 million in cooperative revenue that isn’t coming back.

Herd SizeDaily Milk (cwt)Monthly Loss ($1.50/cwt)Monthly Loss ($3.00/cwt)
300 Cows190$8,550$17,100
500 Cows320$14,400$28,800
1,000 Cows640$28,800$57,600

Note: Spot discount losses only. Additional hauling costs (estimated at 20¢/cwt for diversions over 200 miles) would add roughly $1,100–$3,800/month, depending on herd size.

Why the Timing Couldn’t Be Worse

Those dollars land on a base market that’s already bleeding. February’s WASDE put the 2026 all-milk price at $18.95/cwt. ERS estimates the average total cost of production at $19.14/cwt — meaning the average dairy started 2026 losing money before the first truck left the yard. January’s actual Class III came in at $14.59/cwt, the lowest since July 2023. FarmDoc Daily’s December 2025 analysis projected that “economic costs are projected to be above total returns in 2026.”

You’re already underwater. Stack a $3-under spot discount on top of that, and this stops being an academic conversation.

The Member Who Doesn’t Have to Worry — And Why That Should Worry You

Now ask a harder question: who in this cooperative can actually ride out a plant shutdown?

MetricSmall/Mid Family DairyRiverview LLP
Approximate herd size280–1,000 cows135,000+ cows (16 MN feedlots)
Milk processors used15
Own processing capacityNone4M lb/day powder plant under construction (Morris, MN; startup Nov 2027)
Strike/shutdown backup planNone — diverts to spot market at $3-underRoutes volume to 4 other buyers same day
Est. 30-day loss if Paynesville dark$17,100–$57,600 (spot discount only)Near zero — volume absorbed elsewhere
Hauling cost exposure+$1,100–$3,800/month at $0.20/cwtNegligible — contracts with multiple plants
Co-op governance influenceAttends district meetingAMPI featured Riverview on summer tour brochure
Long-term co-op dependencyHigh — one plant, one checkDeclining — exit ramp under construction

Riverview LLP, based in Morris, Minnesota, is the state’s largest milk producer — and it’s not close. According to state feedlot records cited by the Star Tribune on March 16, 2026, Riverview now owns 16 permitted dairy feedlots in Minnesota, housing more than 135,000 cows. The company is also permitted for two North Dakota mega-dairies currently under international environmental review after Manitoba flagged potential nutrient impacts on the Red River watershed.

Riverview is an AMPI member. In 2025, AMPI’s own “Future Focused” summer tour bused visitors to the Paynesville cheese plant, then to Louriston Dairy, a 9,500-cow Riverview operation near Murdock. The co-op literally put Riverview on the brochure.

But Riverview doesn’t need AMPI. As of a late-2024 Red River Farm Network tour, Riverview was selling milk to five different cheese processors. If Paynesville goes dark for a month, Riverview shifts volume to four other buyers before your truck has figured out where to go. And in July 2025, Riverview broke ground on the Stevens Milk Plant — a 148,000-square-foot powder facility in Morris that will process 4 million pounds of milk per day. Startup: November 2027. That’s at or above what AMPI says Paynesville can handle.

Nobody’s saying Riverview shouldn’t build its own plant — they’re managing their own risk, same as you should be managing yours. The question is what it means for the members who can’t. You’re subsidizing the overhead on a plant that Riverview is building an exit ramp from. We broke down the full math on what Riverview’s expansion means for Upper Midwest pricing last week — and this strike makes that analysis hit different.

Two realities under the same “farmer-owned” banner:

  • A 280-cow Stearns County family dairy with one truck, one plant, one milk check.
  • A 135,000-cow-plus member with milk going to five processors and its own powder plant under construction.

Same co-op. Wildly different risk universe. And the consolidation dynamics reshaping cooperative processing aren’t slowing down.

Why Your Co-op Board May Be Legally Required to Keep You in the Dark

AMPI runs a three-tier governance system. You go to district meetings. District reps go to division meetings. Division reps elect a 15-member corporate board on three-year terms. The board oversees management. Management negotiates labor contracts.

There’s no standing labor relations committee you elect. No bylaw trigger that says “if a negotiation drags past 180 days, members get notified.” Nothing.

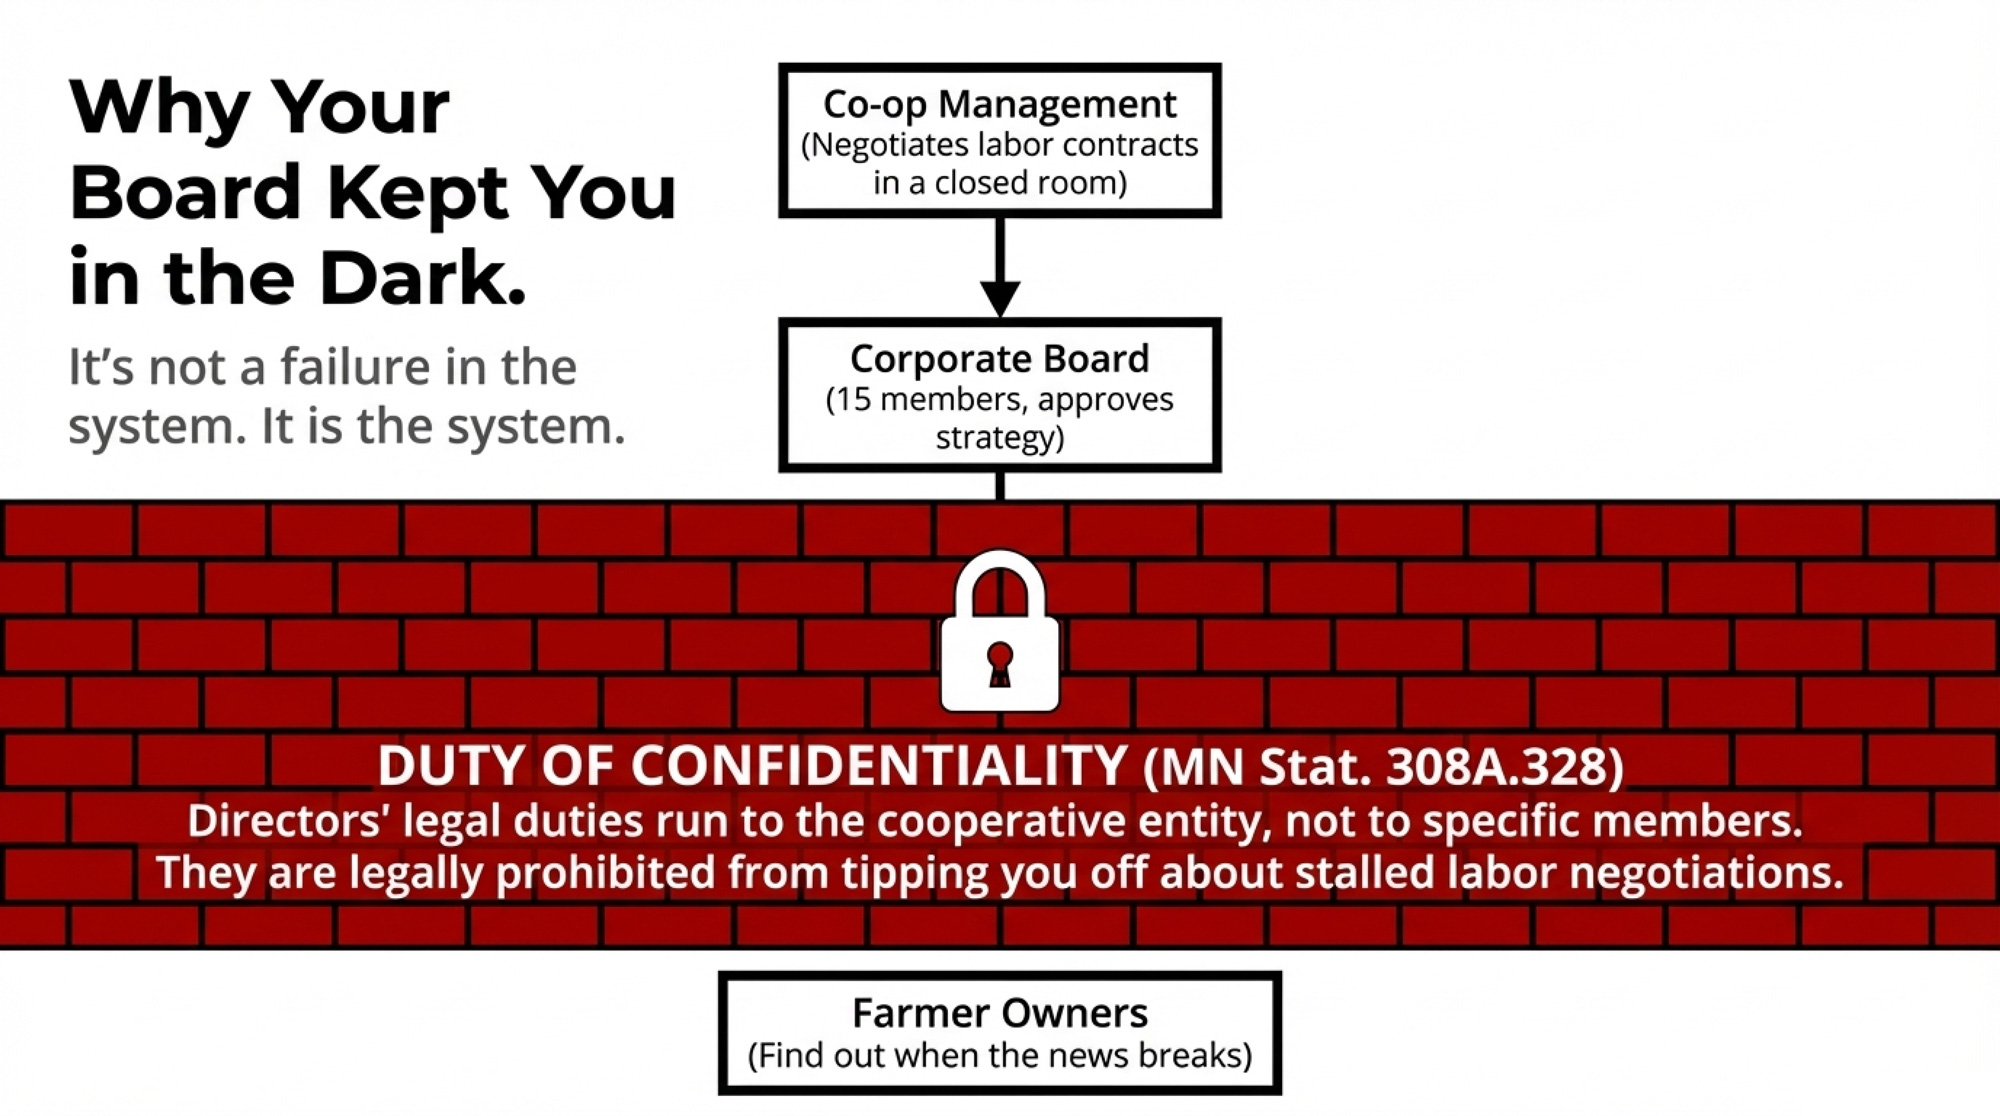
Minnesota Statute 308A.328 says directors must act “in good faith, in a manner the director reasonably believes to be in the best interests of the cooperative.” Those duties run to the cooperative as a legal entity — not to specific members. Directors can rely on management reports they “reasonably believe to be reliable and competent.” On top of that, directors carry a duty of confidentiality on labor and legal strategy that may actually prohibit them from tipping you off at a district meeting.

Management runs it. The board approves it in a closed room. You find out when the news breaks. That’s not a failure in the system. That’s the system.

What Happened When Seven Ontario Farmers Said “Enough”?

In January 2020, all seven dairy farmers on the Glengarry County milk producer committee in eastern Ontario resigned at once. Their target: Dairy Farmers of Ontario, which had unilaterally switched to third-party verification for its proAction quality program without consulting any of the province’s 48 local committees.

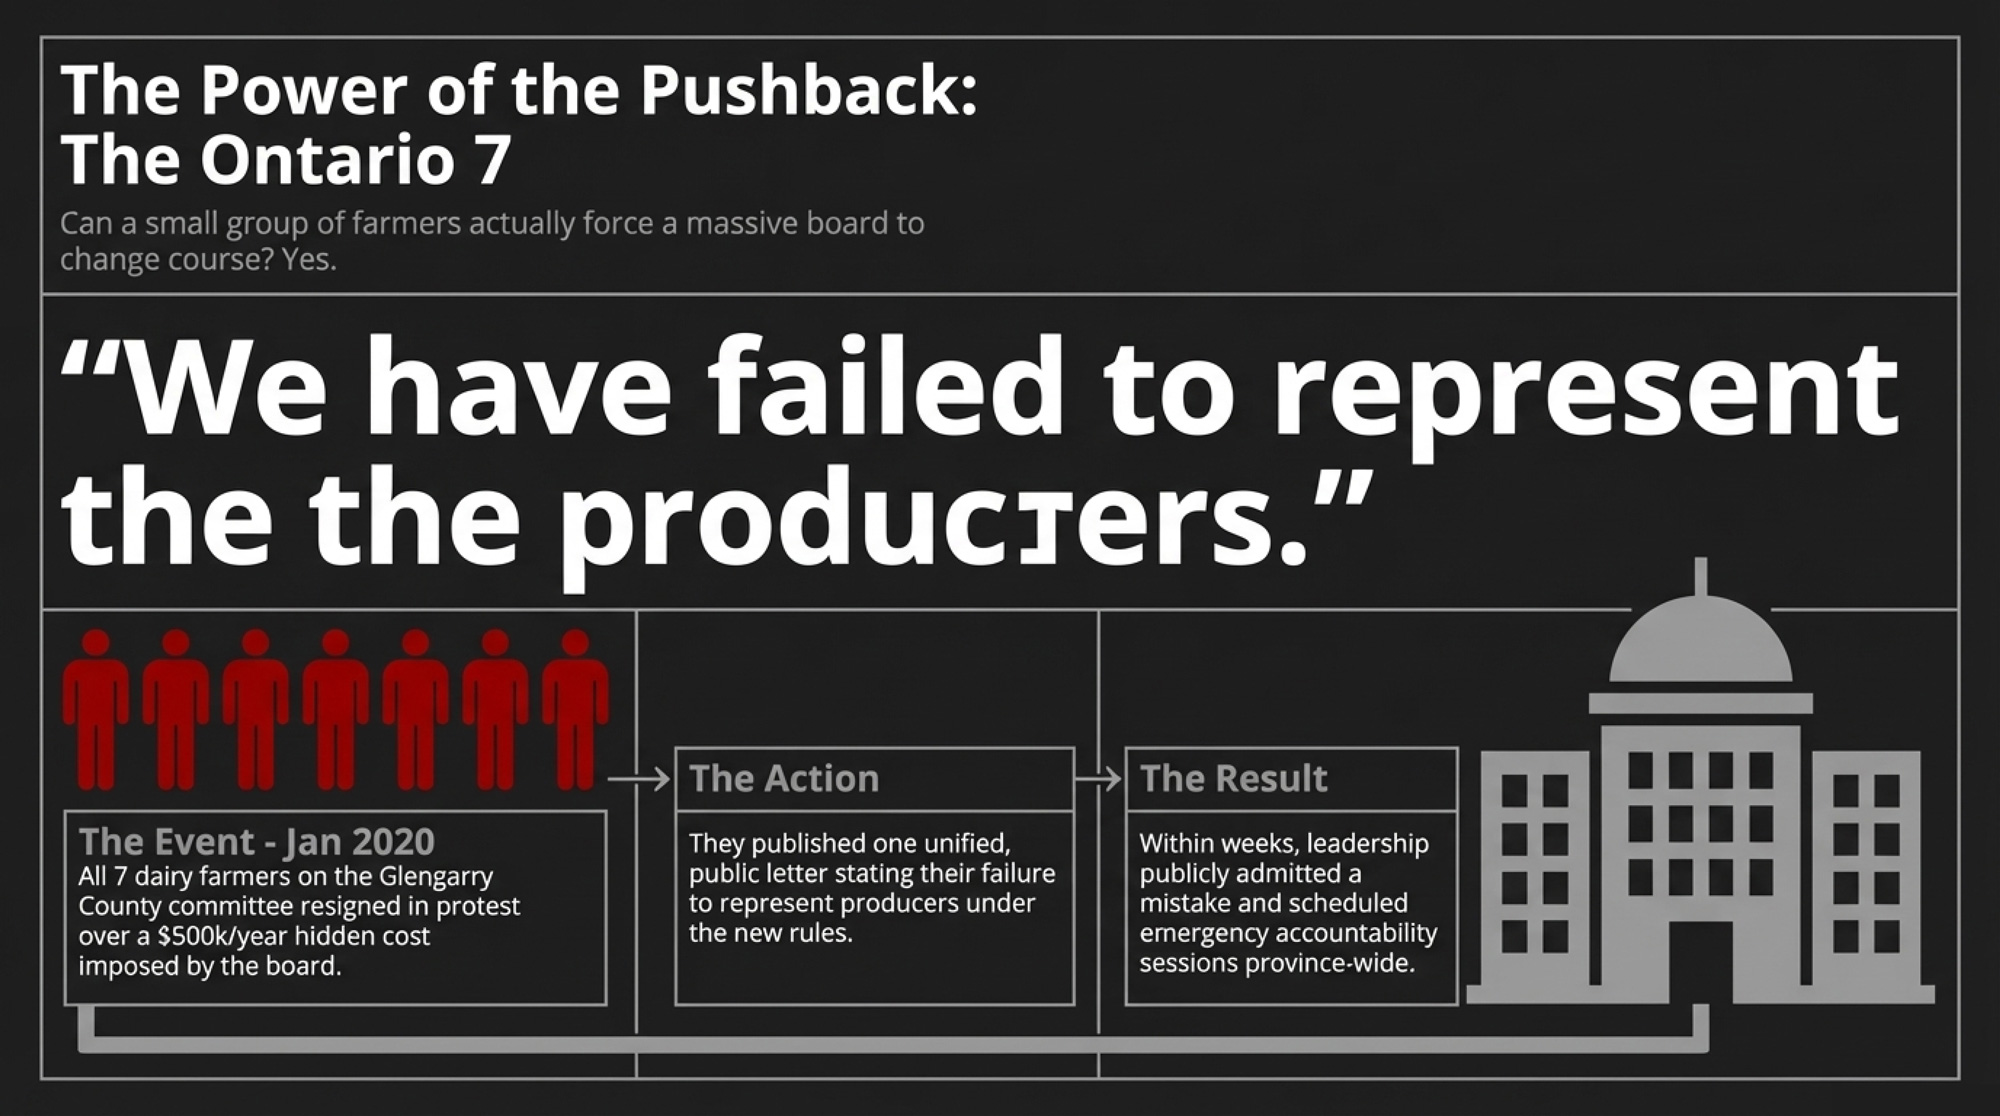
Their letter didn’t mince words: “We have failed as a committee to represent the producers that have elected us.” They estimated the switch would cost Ontario producers at least $500,000 a year on top of what they called “millions and millions” already spent, with absolutely zero to show for it.

Seven farmers. One public letter. Within weeks, DFO board member Bart Rijke told the farm press, “Maybe we made a mistake.” Leadership reached out to committee chair Melanie Trottier. DFO scheduled emergency sessions with all 48 committees. Trottier and six neighbors changed the conversation province-wide. You don’t have to resign from anything. But Glengarry proves that coordinated, specific pushback from a small number of members can move organizations that usually feel untouchable. And when cooperative accountability actually works, it changes what’s possible for the whole community

Does Your Co-op Have the Same Blind Spot?

In Minnesota, your leverage is written into law. Most members just haven’t read the statute.
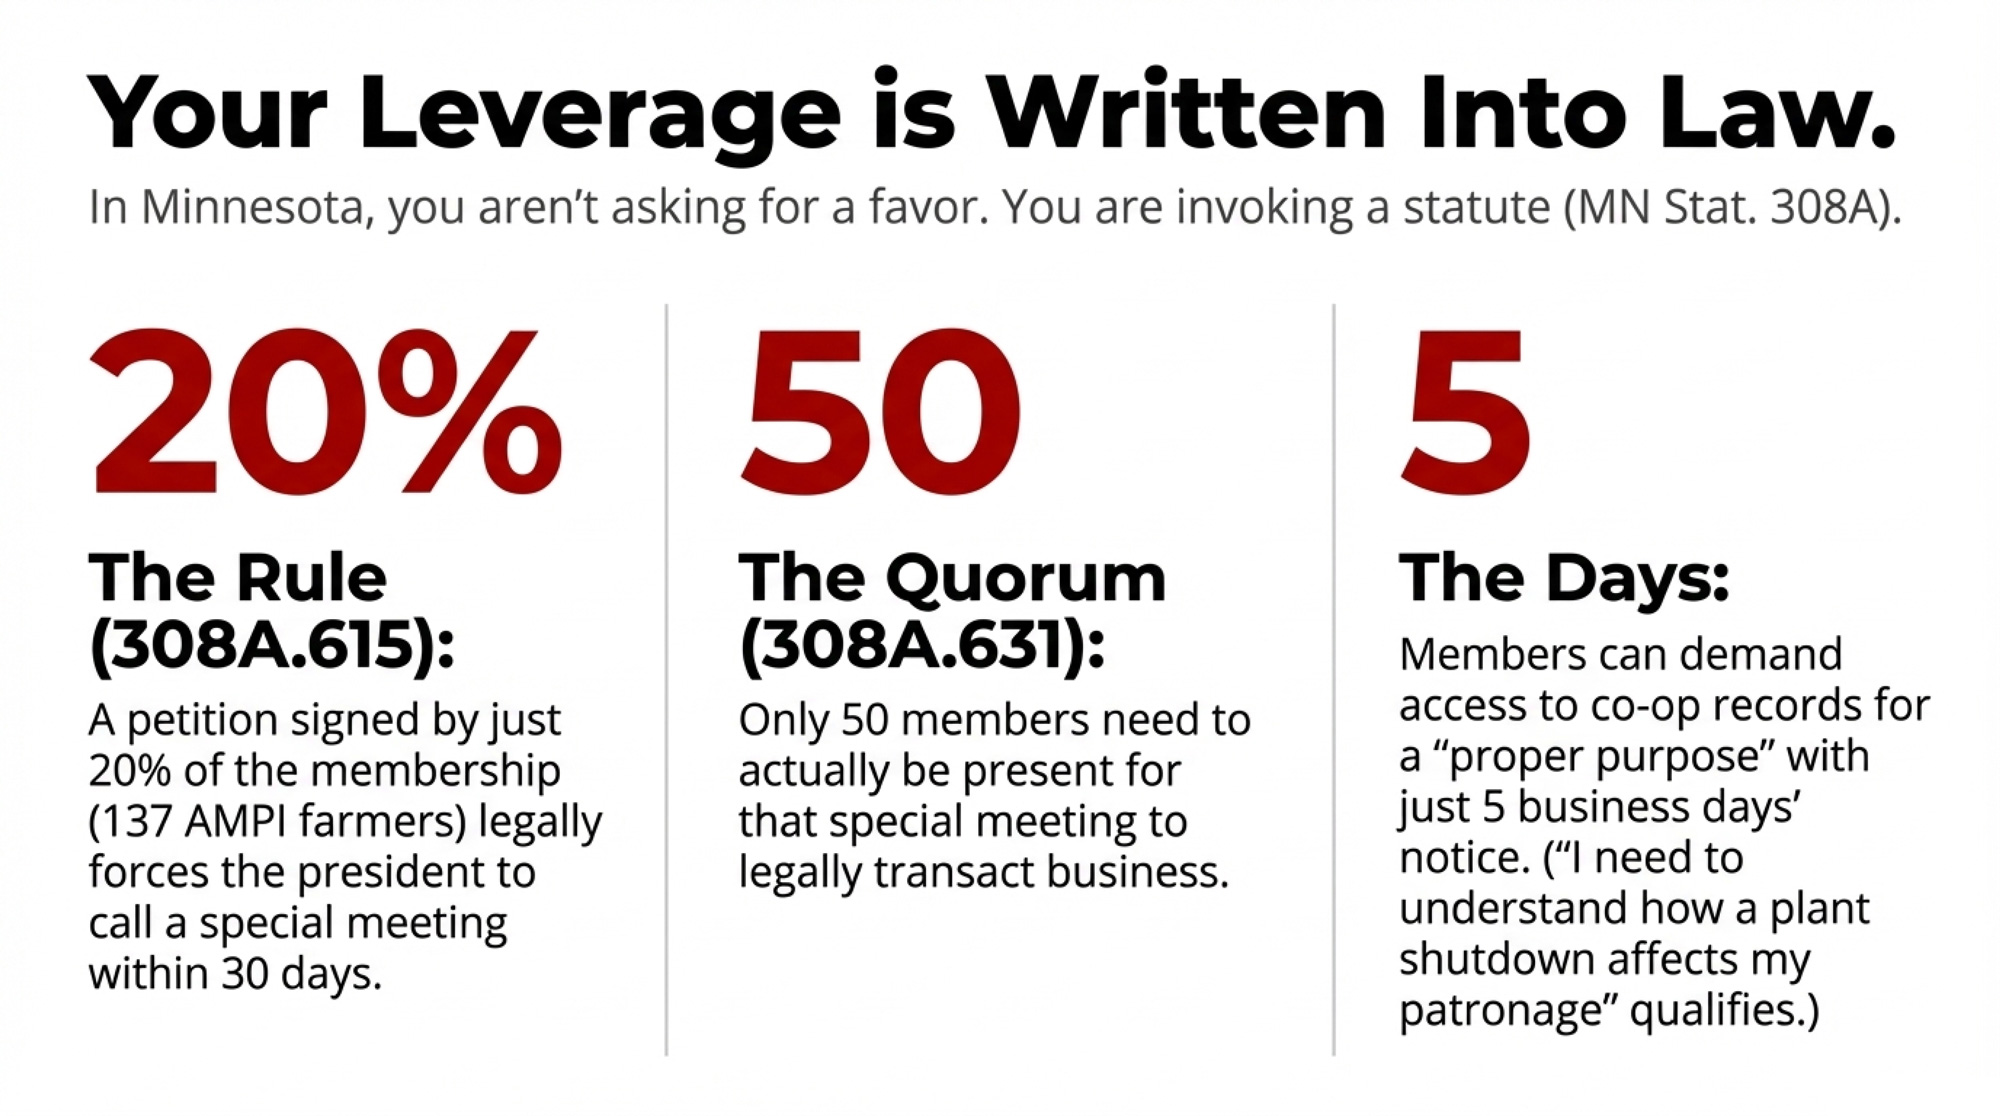
ToolStatuteThresholdTimelineWhat It Forces
Records InspectionMN 308A (records access)Any single member, written request5 business days after certified noticeBoard must disclose financials relevant to your “proper purpose” — e.g., patronage impact of plant downtime
Special Member MeetingMN 308A.61520% of membership = 137 AMPI farmersBoard must call meeting within 30 daysForces full membership discussion of any governance issue, including labor crisis transparency
Quorum to Transact BusinessMN 308A.63150 members presentAt any duly called meetingMeeting can vote on resolutions, bylaw amendments, or formal demands — 50 farmers is enough
Bylaw AmendmentStandard co-op governanceMajority vote at qualified meetingVariable — next district or special meetingCan add mandatory notification trigger (e.g., “board alerts members if labor talks exceed 180 days unresolved”)

The 20% Rule: Under 308A.615, a petition signed by 20% of the membership — that’s 137 AMPI farmers — forces the president to call a special meeting within 30 days.

The Quorum Factor: Under 308A.631, only 50 members need to be present for the meeting to transact business.

The 5-Day Rule: Members may demand access to the cooperative’s books and records for a “proper purpose” with 5 business days’ written notice. “I need to understand how a plant shutdown is affecting my patronage allocation” is about as proper as it gets.

You’re not asking for a favor. You’re invoking a statute.

What’s Your Actual Monthly Exposure If Your Plant Goes Down?

Plug your own herd into the formula:

Your daily cwt × spot discount ($/cwt) × days offline + extra hauling cost = your monthly strike exposure.

At 500 cows shipping 320 cwt/day with spot $2-under and 20¢ in extra hauling: (320 × $2.00) + (320 × $0.20) = $704/day. Over 30 days: $21,120. That’s why the question for AMPI members isn’t just “Are workers being treated fairly?” It’s “How much is this costing my farm, and did anyone tell me we were getting close to this?”

Even if you’re nowhere near Paynesville, at your next meeting, ask three questions:

  • Does our cooperative have any policy requiring member notification when a contract negotiation drags past a set point?
  • When was the last time the board gave members a plain-English update on labor relations at each plant?
  • What’s our written contingency plan — and member cost estimate — if any plant goes offline for 30, 60, or 90 days?

If nobody has answers, you’ve found the blind spot.

Options and Trade-Offs for Farmers

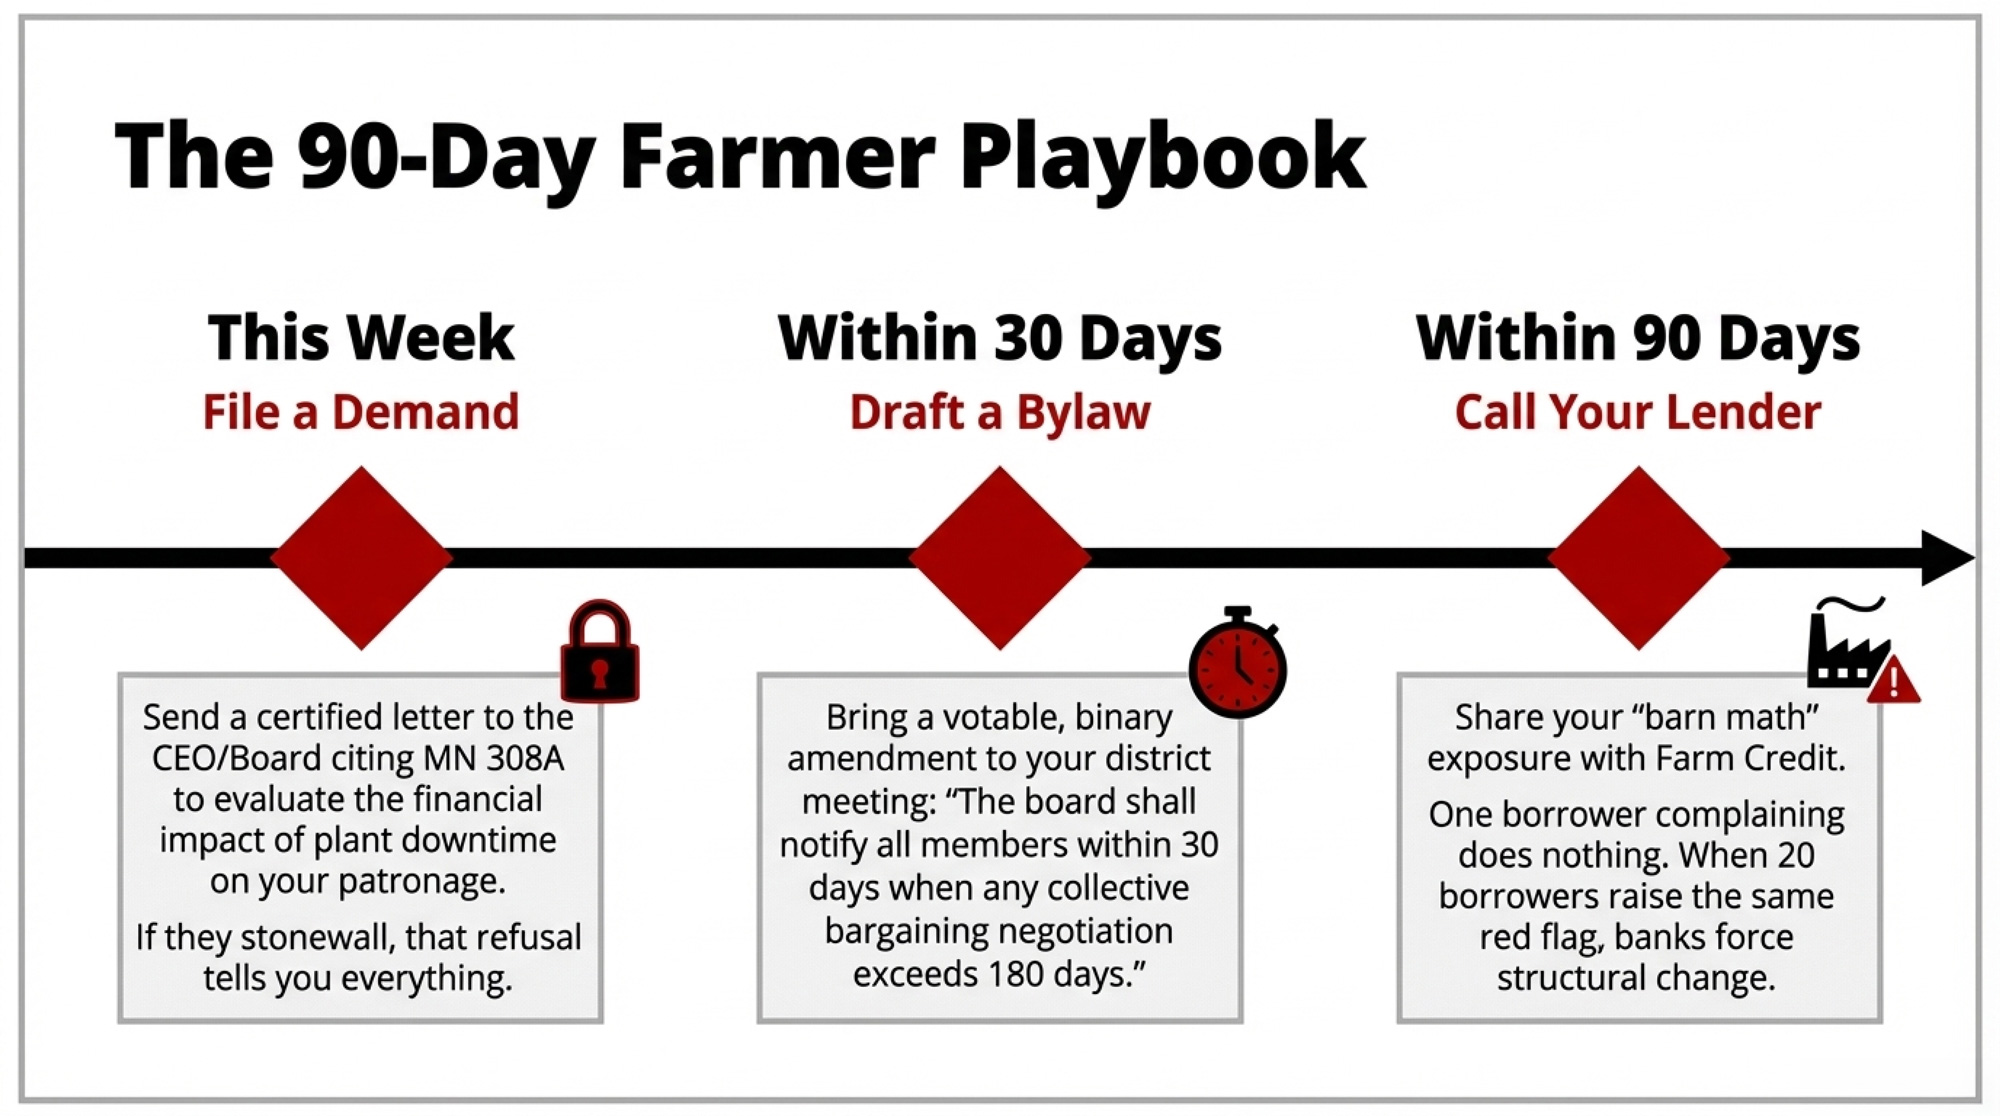
This Week: File a Records Inspection Demand

Write a short letter stating your proper purpose — evaluating the financial impact of plant downtime on your patronage — and cite Minnesota 308A. Send it certified mail to the CEO and board secretary. They have five business days. If they comply, you learn what the board knew and when it knew it. If they stonewall, that refusal tells you everything. Total cost: postage.

Within 30 Days: Draft a Bylaw Amendment

Something binary and votable. Example: “The board shall notify all members within 30 days when any collective bargaining negotiation at a cooperative facility exceeds 180 days without resolution.” Bring it to your district meeting, on the record. Management will argue disclosure hurts negotiating leverage — and they’re not entirely wrong. But the question isn’t whether to live-stream bargaining on Facebook. It’s whether member-owners deserve a heads-up before their plant goes dark.

Within 90 Days: Bring Your Lender Into the Conversation

Share your barn-math exposure with Farm Credit or your bank. Ask how they evaluate processor concentration riskwhen they underwrite your operation. One borrower raising the flag does nothing. 20 borrowers raising it with the same lender start to move things.

Within 12 Months: Decide If the Needle Moved

Did the board start reporting on labor status? Did they respond to your records demand? Remember: 137 members force a meeting. Fifty make it legal.

Key Takeaways

  • If your plant could go dark, run your own diversion math this week. Your daily cwt × spot discount × 30 days, plus hauling. For a 300-cow herd at $3-under, spot losses alone hit $17,100 over a month — add hauling, and you’re near $18,200.
  • If your co-op has no notification trigger for stalled labor talks, the gap isn’t the strike — it’s the silence.Ask, on the record.
  • If you don’t know your statutory rights, learn them before you need them. Minnesota: five days for records, 20% for a special meeting, 50 for a quorum.
  • If your largest member is building its own plant, pay attention. When they no longer need the co-op, you’re the one paying for the empty capacity.

The Bottom Line

Heidi Barg walked out of that Paynesville lab Saturday morning after 18 years of testing your milk and your neighbors’ milk. Melanie Trottier and six Ontario farmers proved that names on a letter can force a marketing board to sit down and listen. The tools exist. The statutes are on the books. The barn math is real.

The Paynesville strike isn’t just a labor dispute. It’s a transparency stress test. AMPI just failed. Is your co-op next?

Complete references and supporting documentation are available upon request by contacting the editorial team at editor@thebullvine.com.

Learn More

The Sunday Read Dairy Professionals Don’t Skip.

Every week, thousands of producers, breeders, and industry insiders open Bullvine Weekly for genetics insights, market shifts, and profit strategies they won’t find anywhere else. One email. Five minutes. Smarter decisions all week.

NewsSubscribe
First
Last
Consent

Same Cows, $15,000 Apart: Class III Milk Price, DRP, and Your Spring 2026 Risk Plan

Same cows, same milk, $15,000 apart. This spring, Class III won’t decide your future—your DRP and risk plan will.

Executive Summary: Class III and Class IV price swings are quietly putting five‑figure gaps between herds that look almost identical on paper. Using current USDA class prices and the latest 2026 milk production forecast, this piece shows how the same 500‑cow herd can end up roughly $10,000–$15,000 apart in a month, just on pooling and price exposure.It then sorts risk management into three simple lanes—defensive, balanced, and aggressive—with practical DRP and Class III options ideas, suggested coverage ranges, and clear cheese/Class III triggers for when to act. The article also walks through five numbers you’ll want on paper before you call your DRP agent: production, components, basis, utilization mix, and break‑even. If you’re planning for Spring 2026, it’s built to help you move from watching Class III to running a risk plan that actually fits your herd.

You know that feeling when Class III is up on the screen, but your milk check sure doesn’t look like it got the memo? You’re not alone. A lot of 400–800 cow herds are finding that when the Class III/Class IV spread opens up, two 500‑cow dairies with very similar cows, butterfat levels, and fresh cow management can still end up thousands of dollars apart each month, just because their milk is pooled and used differently.

What I want to walk through here is a simple, practical playbook for Spring 2026: three risk “lanes,” five numbers you need in front of you, and some Dairy Revenue Protection (DRP) timing and price triggers that actually help you decide, not just worry.

How the Class III/Class IV Spread Quietly Moves Your Milk Check

Let’s start with what the numbers really look like. USDA’s own class price reports make it pretty clear the spread between Class III and Class IV moves around more than most of us would like. For example, in February 2025, the USDA reported Class III and Class IV milk prices of 20.18 and 19.90 dollars per hundredweight, respectively. So in that month, Class III had a small edge. 

By October 2025, those class prices had shifted again. USDA’s Announcement of Class and Component Prices shows a Class III price of 16.02 dollars per hundredweight and a Class IV price of 14.30 dollars per hundredweight, giving Class III about a 1.72‑dollar advantage. So the story isn’t “Class IV always wins” or “Class III always wins.” The point is that the relationship between the two can change within a year, and your pay price rides on how your milk is used. 

Here’s an easy way to picture it. Say you’ve got a 500‑cow Holstein herd averaging about 60 pounds per cow per day. That’s roughly:

  • 500 cows × 60 lb = 30,000 lb per day
  • 30,000 lb × 30 days ≈ 900,000 lb per month
  • 900,000 lb ÷ 100 = 9,000 cwt per month

Now imagine two different pools:

  • One is effectively 70% cheese (Class III) and 30% butter‑powder (Class IV).
  • The other is closer to 25% Class III and 75% Class IV.

If Class III is a couple of dollars higher than Class IV for a stretch, that cheese‑heavy pool is going to capture a lot more of that value. A 2‑dollar spread on 9,000 cwt is 18,000 dollars on paper. Even if only part of that makes it into your final mailbox price because of pooling and adjustments, you can see why it’s realistic for two similar 500‑cow herds, sitting in two different utilization situations, to be ten‑plus thousand dollars apart in some months. The cows don’t know it, but the blend sure does.

Uniform prices tell the same story in a different way. USDA’s 2025 uniform milk price tables show that the monthly uniform price at 3.5% butterfat can differ by more than a dollar per hundredweight between some Federal Orders, depending on class utilization and the month. Industry coverage of those uniform prices in late 2025 noted that when class prices fell together, all 11 orders saw lower uniform prices, but the actual level on the milk check still varied by order and utilization mix. On 9,000 cwt, a 1‑dollar uniform price gap is 9,000 dollars before you even talk about premiums or penalties. 

And here’s something that’s easy to miss: the FMMO numbers are useful, but they’re still averages. Your co‑op’s monthly statement will often show how your specific pool and plant mix are behaving, and that’s the document you really want to study alongside the federal reports.

The bottom line: you don’t control the spread. You don’t control how your co‑op pools. But you do control how much of your business is exposed to that spread, and that’s where this risk “lane” idea comes in.

Three Risk Lanes: Which One Looks Most Like You?

What I’ve found, sitting at kitchen tables in Wisconsin and the Northeast, is that most herds don’t need a PhD in futures. They need an honest look at their balance sheet and a simple way to decide how much downside they can live with. When you do that, most 400–1,000 cow dairies fall into one of three lanes:

  • Defensive: “We really can’t afford a bad quarter.”
  • Balanced: “Let’s protect the downside, but don’t cap all the upside.”
  • Aggressive: “Feed’s lined up, equity’s good, we’ll ride more risk.”

Here’s an illustrative snapshot for that 500‑cow, 2.7‑million‑lb‑per‑quarter herd:

StrategyProduction CoveredPremium Commitment*Floor StrengthUpside ExposureBest Fits
Defensive65–70%HigherNear sustainable break‑even~30–35%Tight cash, higher leverage
Balanced40–50%ModerateGood, but not maximum~50–55%Moderate leverage, modest reserves
Aggressive20–25%LowDisaster‑only~75–80%Strong equity, feed locked, higher risk

*Premium commitment here is total premiums over several months as a rough share of gross milk revenue, not a quote.

A quick way to check your lane:

  • Defensive herds have less than 6 months of cash cushion, debt-to-asset ratios around 50–60%, and a genuinely scary outlook if one quarter goes badly.
  • Balanced herds have six to twelve months of operating cushion, manageable debt, and enough breathing room to absorb a tough quarter without the banker reaching for the restructuring file.
  • Aggressive herds have strong equity, feed covered through the next harvest at tolerable prices, and enough cash flow to ride out a bad quarter or two without forced cow sales.

What’s interesting is that no lane is “right” or “wrong.” They just come with different trade‑offs. More coverage buys stability but trims upside. Less coverage keeps upside but magnifies the swings. In many cases, producers I work with aim to keep at least 15–20% of production covered with something—DRP, deep out‑of‑the‑money puts, or a mix—just as catastrophic protection. It’s the rest of the milk where the lane really shows up.

If You’re Defensive: “We Can’t Afford a Bad Quarter”

Let’s talk about the herd that’s built new facilities, maybe added robots, and is carrying more debt than they’re comfortable with. If one really bad quarter would have your lender asking hard questions, you’re in the defensive lane, whether you feel like a risk‑taker or not.

You probably recognize yourself if:

  • Your cash cushion is under six months of expenses.
  • Debt‑to‑asset is 50–60% or more.
  • Your sustainable break‑even is at least in the mid‑15‑dollar range, once you account for all costs.
  • A quarter of low prices isn’t just “tight,” it’s a survival issue.

In this lane, it generally makes sense to cover about 65–70% of your projected production. For that 500‑cow herd producing about 2.7 million pounds a quarter, that’s roughly 1.8–1.9 million pounds insured in some way.

A practical defensive toolkit often includes:

  • DRP at around 90% coverage using Class Pricing that leans toward Class III if your plant is largely cheese‑focused. 
  • At‑the‑money or slightly out‑of‑the‑money Class III put options on part of that same milk to pull your effective floor closer to your sustainable break‑even once you factor in basis and component premiums.

The catch with going defensive:

  • DRP coverage is more expensive, net, at higher coverage levels because subsidy percentages are smaller.
  • You’re deliberately giving up some upside in exchange for a tighter floor.
  • You’ll feel the premium cost in a good year—but you’ll sleep better in a bad one.

What DRP materials and risk‑management guides consistently show is that premium subsidies are relatively larger at lower coverage levels and smaller at higher coverage levels, so an 80% policy usually has a larger subsidy share than a 95% policy. That’s why your out‑of‑pocket cost per insured hundredweight rises as you push coverage closer to 95%. 

What I’ve seen in many Wisconsin and Minnesota operations is that herds who accept the premium cost and stick to a consistent DRP and options plan tend to have calmer conversations at the bank when cheese and class prices fall than those who keep riding everything on the cash market. The year might still be tough, but the floor does its job.

If that sounds like you, here’s what this means in practical terms:

  • Your main question isn’t, “Where’s Class III going?” It’s, “What’s the lowest mailbox price we can live with and still pay the bills and keep the lender comfortable?”
  • If your sustainable break‑even is around 16 dollars per hundredweight and a quarter, and a 14‑dollar Class III would put you in real trouble, then your structures need to focus on keeping realized prices above that danger zone, not chasing every rally.
  • Once Q2 Class III futures sit 1.50–2.00 dollars above your sustainable break‑even for a while, you can justify easing off new coverage on part of your milk and letting some upside run. Until then, your priority is staying in business, not maximizing upside.

If You’re Balanced: “Protect the Downside, Don’t Miss the Rally”

A lot of progressive herds fall into this middle lane. You’ve tightened costs, you know your numbers, and your debt and cash position give you room, but you’re not interested in gambling.

You’re probably here if:

  • You’ve got six to twelve months of operating cushion.
  • Debt service fits comfortably into your cash flow most years.
  • You accept that you won’t call the top or the bottom.
  • You want real downside protection, but also want to participate when Class III runs.

In this lane, covering about 40–50% of your projected production often makes sense. For that same 500‑cow example, that’s roughly 1.1–1.4 million pounds hedged, with 1.3–1.6 million pounds left open.

The balanced toolkit usually has two pieces:

  • Slightly out‑of‑the‑money Class III puts—say, in the mid‑15 to low‑16‑dollar range if Q2 futures are in the mid‑16s—on around one‑third to two‑fifths of your milk. That way, a 1.50–2.00‑dollar slide in Class III starts to trigger protection, but you still fully enjoy a strong rally.
  • DRP at 80–85% coverage on another slice of milk as a safety net. Because DRP subsidies are generally more generous at these coverage levels than at 90–95%, the net cost per hundredweight on that insured volume is more manageable. 

In this setup, the options tend to do the heavy lifting for routine price swings, while DRP is there for the really ugly quarters.

For your herd, this lane means:

  • You’re trading moderate premiums for a decent floor and lots of upside.
  • A bad quarter still hurts, but it doesn’t put the whole operation at risk.
  • It helps to define a couple of simple triggers, so you’re not guessing in the heat of the moment:
    • If CME block cheddar sits under roughly 1.30–1.35 dollars per pound for several trading sessions, that’s usually a sign the cheese market is under real stress. In that situation, many balanced or aggressive herds add another 15–25% coverage via DRP or puts. 
    • If front‑month Class III slips under about 15.00 dollars per hundredweight, that’s a reasonable point to shift your posture a little more defensive and protect more of your production.

If You’re Aggressive: “Feed’s Locked, We’ll Ride It”

Then there are the herds that have built equity and efficiency over time and are in a position to withstand more volatility. In these dairies, feed is often locked at a decent price, the cows are producing well, and the balance sheet can take a punch without panic.

You’re in this camp if:

  • Your equity position is strong, and leverage is modest.
  • Feed costs are locked in through the next crop year at levels that still leave a margin.
  • You can live through a bad quarter or two without emergency financing, forced cow sales, or putting off critical maintenance.
  • You genuinely think the current weakness in cheese and Class III is overdone and want more upside exposure.

In this lane, you’re often only covering about 20–25% of projected production, leaving 75–80% to float with the market. For our 500‑cow example, that’s around 500,000–700,000 pounds covered and 2 million pounds uncovered.

The typical aggressive toolkit:

  • A modest DRP policy at 80% coverage on a slice of milk as “disaster insurance.” Because this is the lowest coverage level, it tends to carry a smaller net premium per hundredweight and still gives you something if prices collapse. 
  • Deep out‑of‑the‑money Class III puts—maybe around 14.50–15.00 dollars per hundredweight—that don’t cost much and only kick in if we get a serious wreck.

The trade‑off is pretty straightforward. You’re spending less on premiums, you’ve got maximum upside, but you’re also accepting that a routine 1‑dollar slide in Class III will hit you harder. That only works if your equity, cash flow, and feed position can legitimately handle that risk.

So it’s worth being blunt here: if your balance sheet isn’t genuinely strong, this lane isn’t a badge of honor, it’s just unnecessary risk. Plenty of good operators have gotten hurt by trying to be aggressive when the books said they should’ve been balanced or defensive.

If you are in a position to ride in this lane, it really pays to write down your “I’m wrong” lines:

  • Maybe you decide that if block cheese breaks 1.35 dollars per pound and stays below there for a week, you immediately add 20–25% more coverage.
  • Or you say that if front‑month Class III trades under 15.00 dollars per hundredweight, you’ll move yourself back toward a balanced posture and start building floors.

What’s encouraging is that when aggressive herds set those lines in advance and stick to them, they’re not just guessing. They’re managing risk, even if it’s a higher‑octane version.

DRP and Class III Options: Different Tools, Same Job

It’s easy to get stuck in debates about DRP versus futures and options, almost like it’s a philosophical choice. In practice, they’re just two tools in the same box. The real question is which mix fits your risk lane and your comfort level.

Dairy Revenue Protection is a USDA‑backed insurance program that lets you insure quarterly milk revenue. You pick a coverage level—anywhere from 80% to 95%—and choose between Class Pricing and Component Pricing. Under Class Pricing, your guarantee is based on a mix of Class III and Class IV futures, as you choose. Under Component Pricing, it’s based on futures‑derived butterfat and protein values and your declared component levels. 

Those guarantees are settled against published quarterly revenue indexes specific to your state or region. And because DRP is a federal program, premiums are partially subsidized. The key thing the program documents and industry overviews agree on is that subsidy percentages are higher at lower coverage levels and smaller at higher coverage levels, which is why an 80% policy usually has a lower net cost per insured hundredweight than a 95% policy. 

Class III put options are different. When you buy a put, you’re buying the right (but not the obligation) to sell Class III futures at your chosen strike. There’s no subsidy, and you need a futures/options account, plus some discipline around margin and position management. But the flexibility is hard to beat: you pick the strike, you pick the months, and on that hedged milk you keep all the upside above your floor.

So in many Midwestern dairies, the practical split looks like this:

  • Use DRP—particularly at 80–85% coverage—as relatively simple, subsidized, disaster‑style coverage on at least part of your milk.
  • Layer in Class III puts for the portion where you want a clear floor but don’t want to give up upside, especially in the balanced and aggressive lanes.

Five Numbers You Really Want in Front of You

Here’s something you probably know already from dealing with lenders and nutritionists: the better your numbers, the better the advice you get. Risk management’s no different. Before you call your DRP agent or broker, having these five numbers written down changes the conversation.

1. Projected Quarterly Production

Look back at the last three to six milk checks and average your monthly pounds shipped. Multiply by three to get a starting point for the next quarter. Then adjust for what’s actually happening on your farm:

  • Are you freshening more heifers?
  • Did you change your transition period management?
  • Are you switching to or from a dry lot system?
  • Is a new robotic box coming online?

You don’t need to be exact, but you do need an honest estimate.

2. Butterfat and Protein Averages

Pull your last several milk checks or DHIA tests and take the average butterfat and protein levels. If you’re considering DRP Component Pricing, those declared component levels should reflect the milk you actually ship. DRP resources make it clear that indemnities under Component Pricing are based on futures‑derived component values and your declared quantities, so over‑declaring components can come back to bite you if you don’t hit those numbers in the tank. 

High‑component herds that consistently run above the regional average often like Component Pricing because it lets them insure the value they’re producing. Herds with more variable components often lean toward Class Pricing because they’re not betting on precise tests every quarter.

3. Basis to Class III or Class IV

Basis is one of those words that makes people’s eyes glaze over, but it’s just the difference between the futures‑based price (Class III or IV) and your mailbox price.

For each of the last few months:

  • Take your net milk pay and divide by pounds shipped, then divide by 100 to get your mailbox price per hundredweight.
  • Look up the USDA Class III and Class IV prices for that month. 
  • Subtract Class III (or IV) from your mailbox price.

If your mailbox price has been running, say, about 0.30 dollars per hundredweight over Class III, and you buy puts with a 16.00‑dollar strike, your “real” floor before premiums and fees is closer to 16.30 dollars. That basis number helps you judge whether the protection you’re buying lines up with your actual risk.

4. Class III/Class IV Utilization Mix

This one’s easy to overlook, but it matters. In the U.S. marketing orders, different plants and co‑ops have different utilization mixes—some are heavily cheese‑weighted, others lean more toward butter‑powder. Federal Order documents and policy briefs on current and proposed marketing order reforms spell out just how different those mixes can be between areas. 

A simple call to your co‑op or plant rep with a question like, “Roughly what percentage of our pooled milk ends up in Class III products versus Class IV?” can give you a ballpark figure. And just as important, take a good look at your co‑op’s own monthly statement; that’s often the clearest picture of how your actual milk is being used and paid for, beyond the FMMO averages.

If your herd is effectively 65% Class III‑driven and you structure DRP as if you were a 50/50 Class III/Class IV herd, the policy won’t track your milk check as well as it could.

5. Break‑Even Milk Price

Finally, you need at least a rough survival break‑even and a sustainable break‑even.

  • Survival break‑even covers feed, power, essential repairs, and the minimum debt service to keep the doors open.
  • Sustainable break‑even adds in full debt service, family living, and enough capital replacement that the operation can keep going long term.
Herd ScenarioSustainable Break-Even ($/cwt)$1.00/cwt Drop = Monthly Loss$2.00/cwt Drop = Monthly Loss$3.00/cwt Drop = Monthly Loss
300-cow herd, 36 lbs/cow/day$16.25 (RED)$16,200/month$32,400/month (RED)$48,600/month
500-cow herd, 60 lbs/cow/day$15.75 (RED)$27,000/month$54,000/month (RED)$81,000/month
800-cow herd, 68 lbs/cow/day$15.00$36,480/month$72,960/month$109,440/month
Industry Median Break-Even (2024 USDA ERS)$15.50$25,920/month$51,840/month$77,760/month

A quick back‑of‑the‑envelope calculation is to total your annual cash costs and divide by your annual production (in cwt). It’s not perfect, but if it shows your sustainable break‑even is around 16 dollars per hundredweight, you now know that a 14‑dollar Class III “floor” isn’t really protection. It’s just a more predictable way to lose money.

In DRP and risk management meetings across the Midwest, it’s common to hear agents say that the producers who walk in with these five numbers tend to walk out with coverage structures that fit their lane. The ones who don’t bring numbers usually end up talking about feelings, not risk.

Timing and Triggers: Managing Spring 2026 Without Staring at the Screen All Day

If there’s one thing many of us have learned the hard way, it’s that risk management is as much about timing as it is about tools. You don’t have to watch the market all day. But you do want a few dates and signals written down so you can act on your plan, not your emotions.

How DRP Sales Windows Actually Work

DRP isn’t like corn insurance, where you have one big sales closing date. According to the 2026 DRP Basic Provisions, coverage is sold during specific “sales periods,” and sales are suspended on days when major USDA reports, such as Milk Production and Cold Storage, are released. That means you can buy coverage at multiple points, but not every single day. 

Practically speaking:

  • Q2 2026 endorsements (April–June milk) will mostly be written in the late‑January to March window, outside of those report days. 
  • Q3 2026 endorsements (July–September milk) will mostly be written in the April–June window, again avoiding report days.

So instead of waiting for a single “deadline,” you’re better off deciding in January and April what your lane is, how much milk you want covered, and what coverage levels make sense. Then it’s just a matter of working with your agent during an open sales period.

Watching USDA Production and Stocks

It’s worth noting that USDA’s January 2026 WASDE forecast bumped expected 2026 U.S. milk production up to about 234.3 billion pounds, roughly 3.2 billion pounds more than 2025, which works out to about 1.4% growth. On paper, that doesn’t sound huge, but as many of us have seen, an extra 1–2% milk floating around in a flat demand environment can put real pressure on prices. 

When you pair that with the monthly Milk Production report and the Cold Storage report—especially for cheese and butter inventories—you get a reasonable sense of whether the market is starting to back up or tighten. That can help you decide when to be more defensive and when you can afford to lighten up.

Simple Price Triggers That Help You Act

Most of the herds I talk to don’t want a complicated market model. They just want a few lines in the sand that tell them when it’s time to add coverage or lock in more upside. Here are three that can work as a starting point:

Signal / TriggerLevel (Approx.)Market ConditionDEFENSIVE Lane ActionBALANCED / AGGRESSIVE Lane Action
CME Block Cheddar< $1.30–$1.35/lb for 3+ sessionsCheese market in real stressADD 15–25% coverage immediately via DRP or Class III puts. Do not wait.Monitor closely; consider 10–15% extra coverage if sustained below $1.33/lb.
Front-Month Class III Futures< $15.00/cwtCash market under heavy pressureSHIFT POSTURE DEFENSIVE on 20–30% of unprotected milk.Add DRP or puts without delay.Tighten stops; add 15–25% coverage. This is your warning line.
Front-Month Class III Futures> $18.00/cwt for 2+ weeksRally is real and sustainedMonitor for profit-taking. Keep current coverage. Let upside run.Lock in a slice of gains; protect half your upside with tight stops or modest puts. Consider locking 10–15% at high prices.
USDA Milk Production Forecast1.5%+ YoY growth; cheese stocks risingOversupply buildingAssume downside risk increases Q2–Q3; add 20–30% coverage now while prices near seasonal highs.Add 10–15% defensive coverage on forward Q3 milk. Plan for lower Q3 prices.

These aren’t magic numbers. They’re practical guardrails. The real key is writing down, ahead of time, what each of those triggers will mean for you so you’re not trying to invent a plan on a bad Monday morning.

So What Does This Actually Mean for Your Dairy?

USDA’s current outlook, as summarized in late‑January 2026, is a year with a bit more milk and lower average prices than 2025. At the same time, the official class price series shows that the Class III/Class IV relationship can swing enough within a year to move your milk check by meaningful amounts, especially if your herd is tied heavily to cheese or butter‑powder. 

You don’t get to choose whether that spread exists. But you do get to choose how much of your herd’s future you leave riding on it.

If you’re in the defensive lane, your job this spring is to:

  • Get those five numbers—production, components, basis, utilization mix, and break‑even—on paper.
  • Work with your DRP agent to price 85–90% coverage on 60–70% of your Q2 milk, using Class Pricing that matches your actual exposure.
  • Layer in near‑the‑money Class III puts on part of that volume, so your effective floor comes closer to your sustainable break‑even.

If you’re in the balanced lane, your focus is to:

  • Use DRP at 80–85% coverage on 20–25% of your production as disaster coverage.
  • Use slightly out‑of‑the‑money Class III puts on another 20–30%, so you’ve got a reasonable floor with upside.
  • Put your cheese and Class III price triggers in writing and decide, ahead of time, how much extra coverage you’ll add when those lines get crossed.

If you’re in the aggressive lane and your numbers truly support it, you can:

  • Keep coverage lighter—say 20–25% of production with DRP at 80% or deep out‑of‑the‑money puts—to guard against a real crash.
  • Be honest about your “I’m wrong” lines on cheese and Class III and commit—with your family or business partners—to changing lanes if those lines are crossed.
  • And just as important, make sure your balance sheet is strong enough that you’re not turning your livelihood into a bet you can’t afford to lose.

And there’s one more step that’s worth taking this week, no matter which lane you’re in:

  • Pull your last six months of milk checks and calculate your basic basis and break‑even.
  • Put a ten‑minute weekly price check (cheese, Class III, Class IV) on your calendar.
  • Talk through your lane with whoever else has a stake in the dairy—family, partners, key employees—so everyone understands the plan.

In a 2025–26 world where USDA expects higher milk production and lower prices, and where the Class III/Class IV spread can change direction more than once a year, hoping the market behaves isn’t a strategy. Your balance sheet—not your opinion of cheese—is what should pick your lane. 

The goal isn’t to guess exactly where Class III will be in June. It’s to decide what you can live with now, set your floors accordingly, and make sure the market doesn’t get the final say on whether your dairy makes it through the next year.

Key Takeaways

  • Same cows, big gap: Class III/IV spread and pooling differences alone can put two similar 500‑cow herds $10,000–$15,000 apart in a single month.
  • Pick your lane: defensive herds should cover 65–70% of production, balanced herds 40–50%, and aggressive herds 20–25%—based on cash, leverage, and risk tolerance, not feelings.
  • DRP at 80–85% coverage offers the best subsidy‑to‑protection trade‑off for most operations; add Class III puts when you want a tighter floor with upside intact.
  • Know your numbers: projected production, component averages, basis, utilization mix, and break‑even should be on paper before you call your DRP agent.
  • Set triggers, not hopes: decide now what cheese price and Class III levels will make you add protection—so you’re acting on a plan, not reacting to a bad Monday.

Complete references and supporting documentation are available upon request by contacting the editorial team at editor@thebullvine.com.

Learn More

The Sunday Read Dairy Professionals Don’t Skip.

Every week, thousands of producers, breeders, and industry insiders open Bullvine Weekly for genetics insights, market shifts, and profit strategies they won’t find anywhere else. One email. Five minutes. Smarter decisions all week.

NewsSubscribe
First
Last
Consent
Send this to a friend