










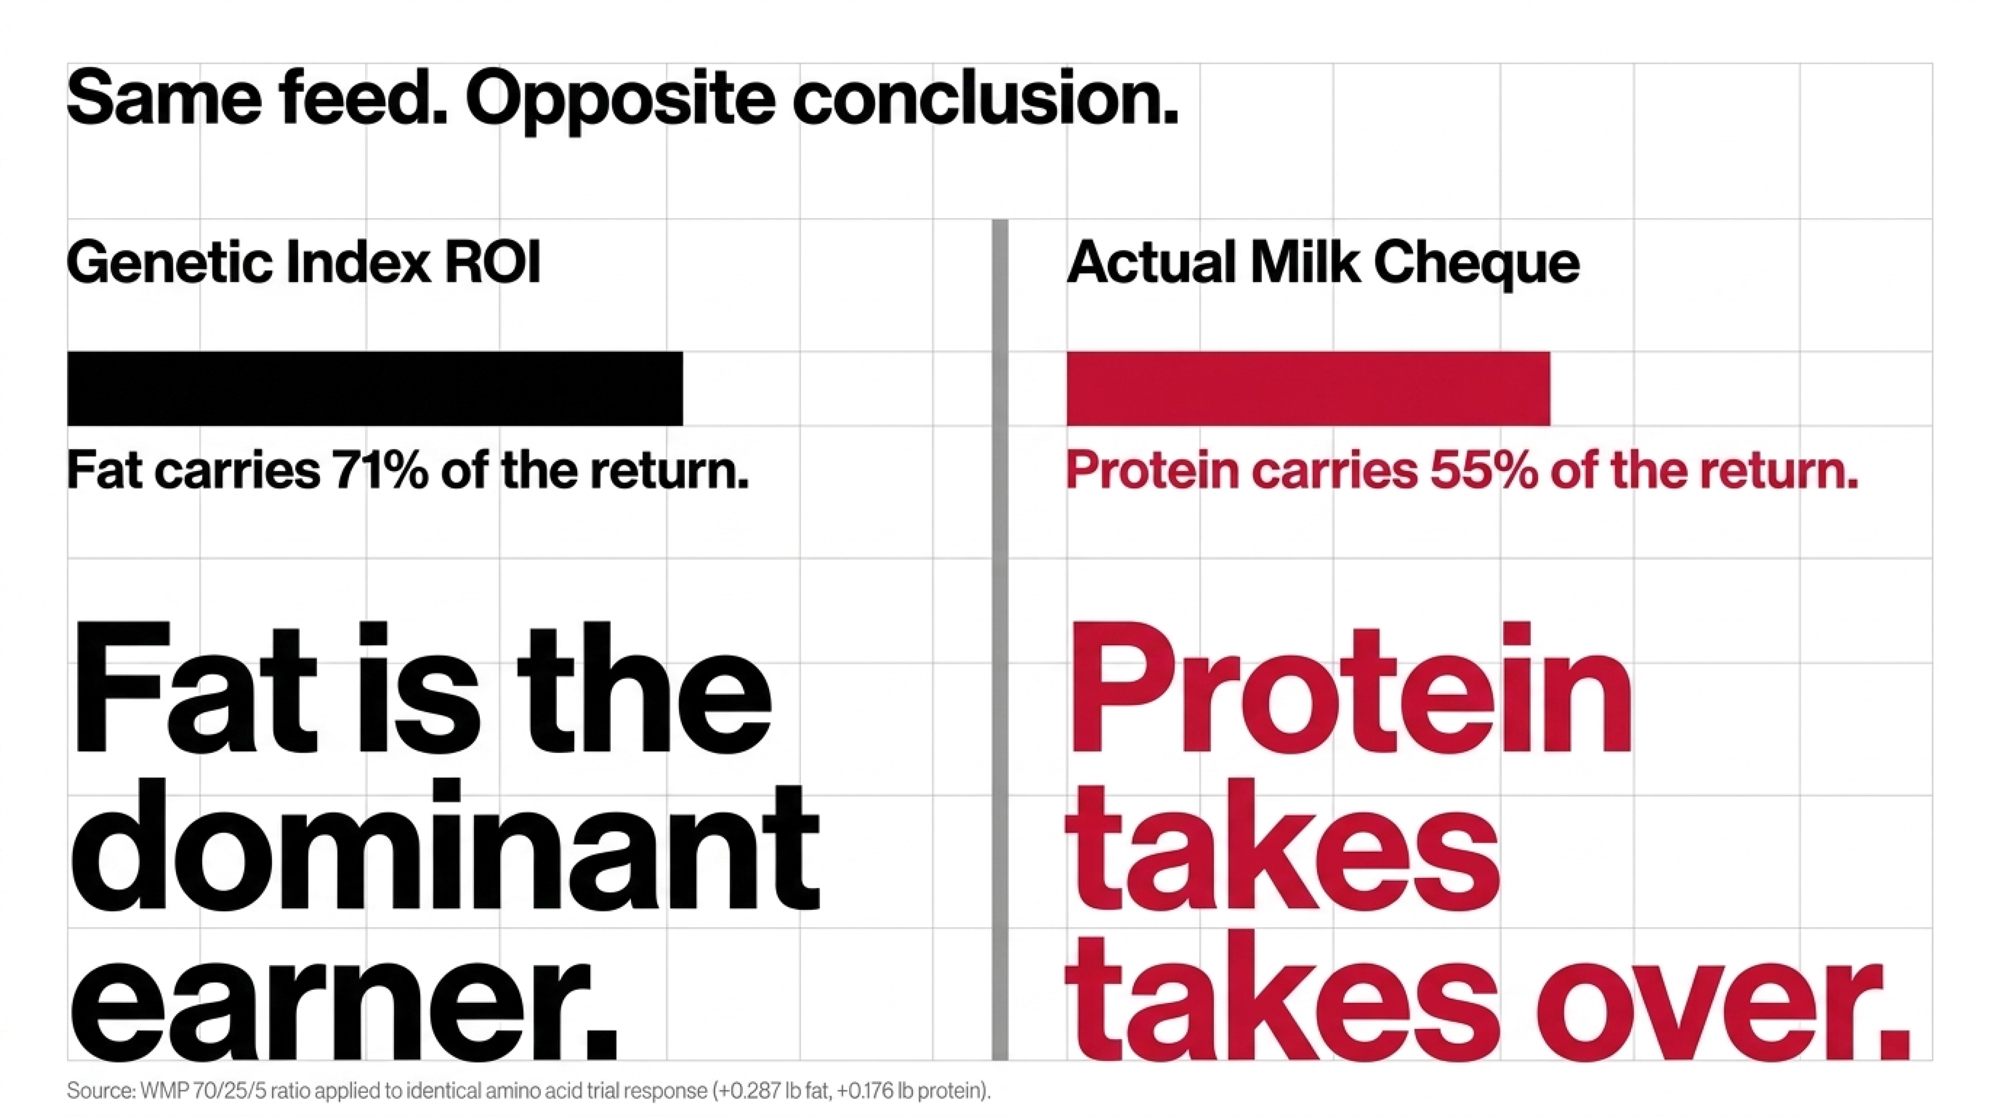
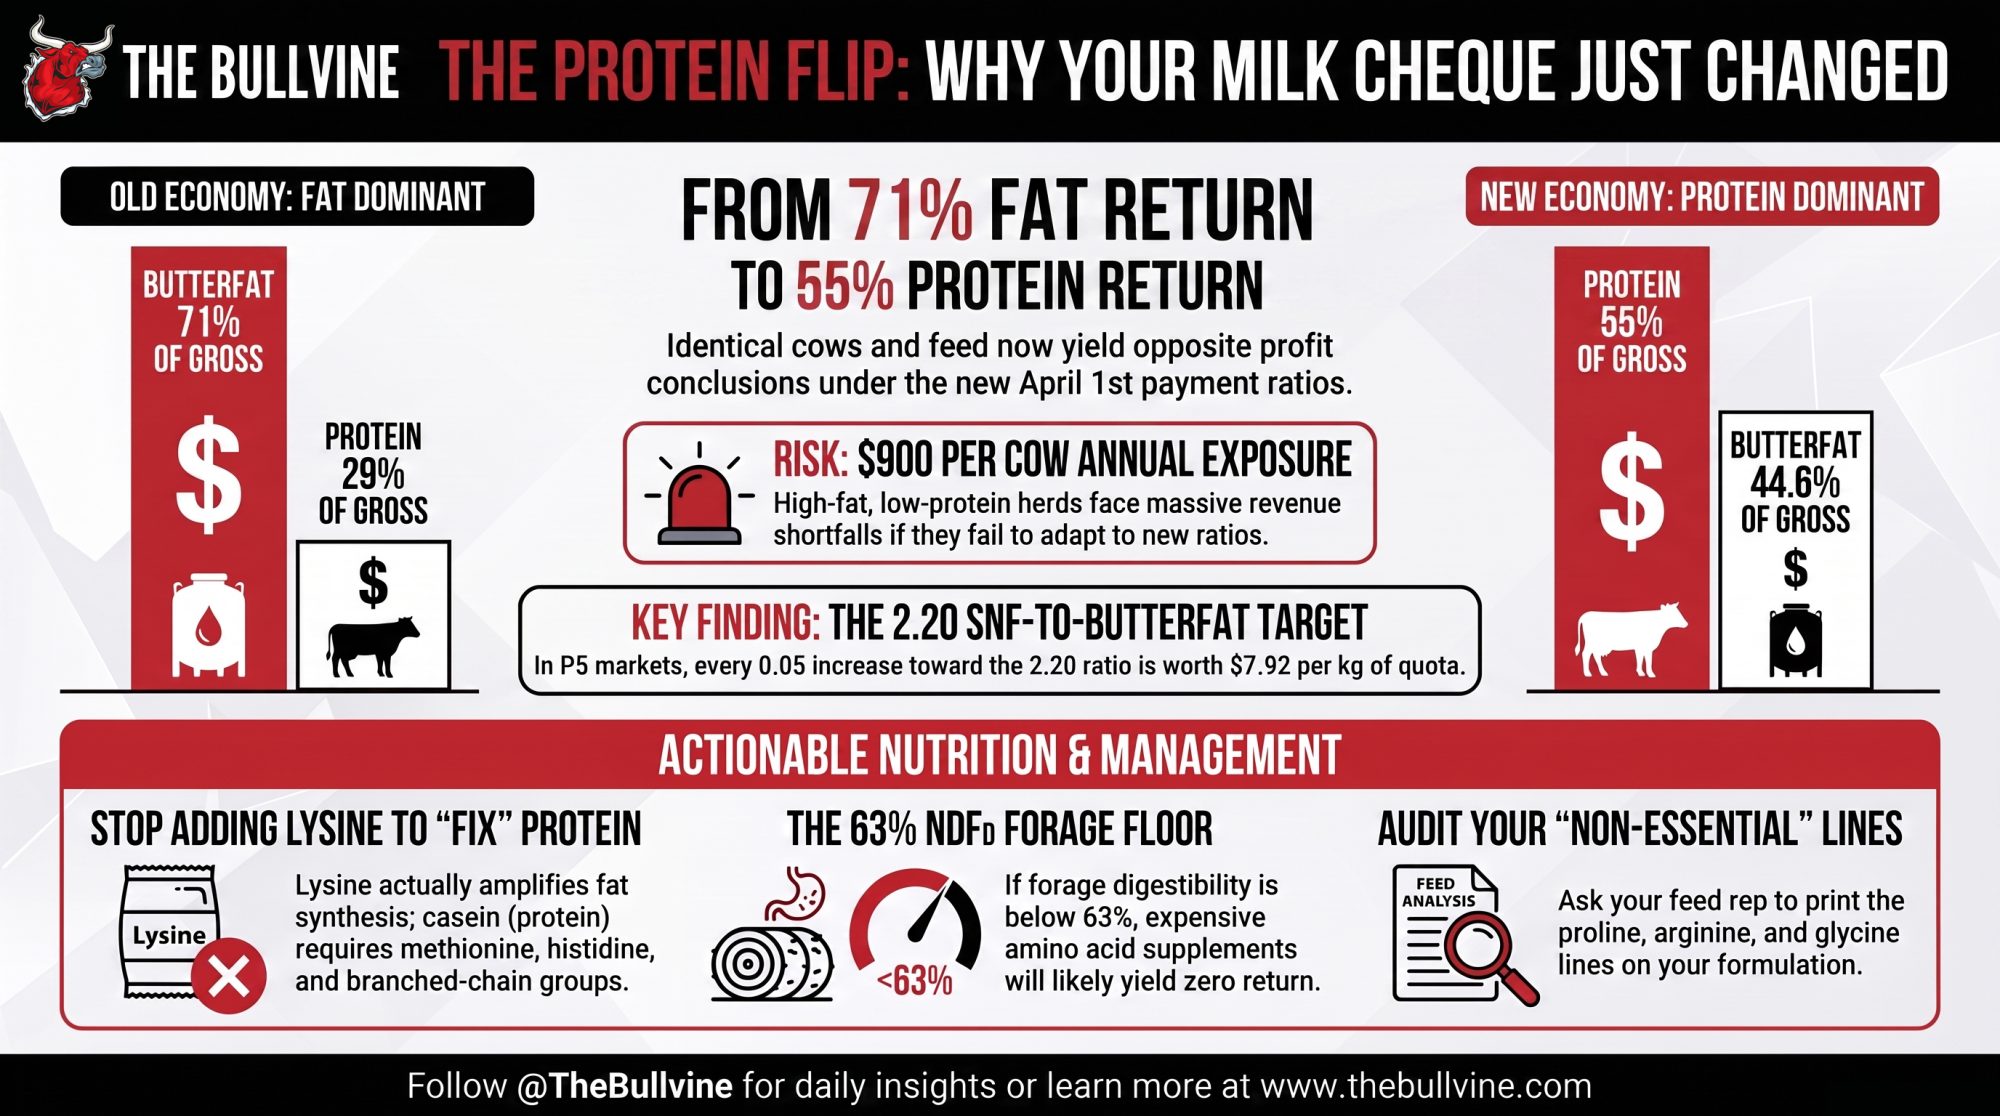
Same trial. Same +0.287 lb fat, +0.176 lb protein. On index weights, fat carries 71% of the return. On Western Canada’s April 1 ratio, protein carries 55%.
EXECUTIVE SUMMARY: The same amino acid trial response is worth 71% fat and 29% protein on genetic index weights — and 45% fat, 55% protein on the Western Milk Pool’s new 70/25/5 ratio, which took effect April 1. That’s a 26-point swing on identical cows eating identical feed, which means the ROI sheet you were handed probably priced one component and charged you for both. WMP shippers running high fat against low protein face up to $900 per cow per year in exposure; P5 producers should be measuring SNF-to-butterfat against 2.20, not 2.14, because every 0.05 up to the market ratio is worth roughly $7.92 per kilogram of quota per month. The nutrition side is real but bounded: balancing rumen nitrogen plus all essential amino acids against metabolizable energy moved 2.9 kg/d of ECM, with fat and protein rising together (+0.13 kg / +0.287 lb fat, +0.08 kg / +0.176 lb protein), worth $1.82 to $2.45 per cow per day against 20¢ of protected product. Three cited trials added protected amino acids and got nothing, and none of it works below 63% 30-hour NDFd — so fix forage before you buy product. Lysine is the trap: it’s already working the fat side, and casein needs methionine, histidine, the branched-chain group, and the proline precursors delivered together. Two things to do this week — ask your feed rep to print the non-essential amino acid line on your current formulation, and re-run every component ROI number on the pool that actually issues your cheque.
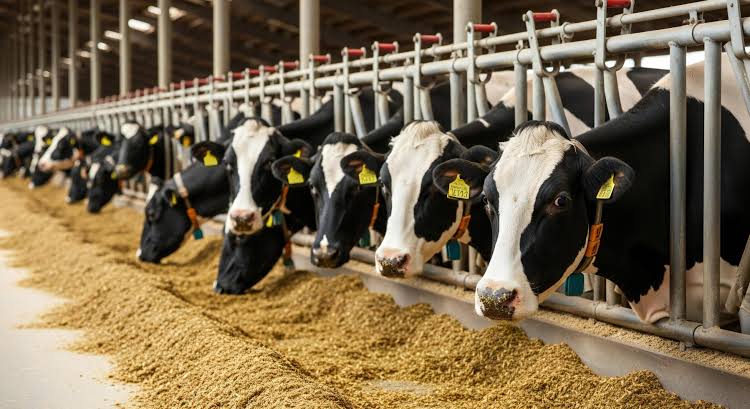
If your bulk tank sheet reads the same three test days running — butterfat strong, protein parked and stubborn — while the ration sheet says lysine is at target and the protected-product invoice says you’re paying for it, you’ve got a substrate problem, not a dosing problem. And if you ship in Western Canada, the payment ratio that took effect April 1 just changed which component that problem is costing you.
What follows comes from published feeding trials and model documentation, not one farm’s records. Worth saying plainly, because every number below needs testing against your own pay sheet.
The Fat Side Got Solved. Almost by Accident.
The first fix was subtractive. Cut the polyunsaturated load. A review of milk fat synthesis regulation published in Physiological Genomics summarizes it this way: unsaturated long-chain fatty acids mostly suppress mammary fat synthesis; saturated ones support it. Which is how too much unsaturated fat and linoleic acid quietly capped milkfat across whole regions of the US herd. Dial that back, balance palmitic, stearic, and oleic properly, and fat tests had room to climb.
Genomics stacked on top. Genomic selection cut the sire-of-bull generation interval from roughly 6.8 years to about 2.4 and roughly doubled annual genetic gain for milk, fat, and protein against the progeny-test era. According to CDCB’s published base-change record, the genetic base moved on April 1, 2025, from cows born in 2015 to cows born in 2020. Holsteins led every breed with a 45-pound butterfat rollback — an 87.5% shift from the 24-pound rollback in 2020. Ohio State Extension data puts the longer arc at 3.65% to 4.30% milkfat over 25 years.
That’s the win. Nobody’s giving it back.
But the recent fat responses didn’t come from feeding more fat. They came from amino acids — methionine, lysine, and histidine balanced together against metabolizable energy rather than tuned individually against metabolizable protein. Cell-culture work in bovine mammary epithelial cells, published in the Journal of Agricultural and Food Chemistry, shows lysine amplifying fatty-acid-driven milk fat synthesis through GPRC6A-PI3K-FABP5 signaling. One route by which amino acid supply lifts fat, not only protein.
A 2026 meta-analysis of rumen-protected amino acids in Holsteins split it cleanly: rumen-protected methionine raised milk yield and fat percentage, while rumen-protected lysine primarily raised yield.
Read that split again.
Why Doesn’t Protein Respond the Same Way?
Lysine is feeding the fat side. It isn’t, on its own, building casein.
Casein needs a longer list delivered at once. Leucine, isoleucine, and valine. Proline — which usually means more arginine, since the mammary gland converts arginine and ornithine to proline. Glycine. Then threonine and phenylalanine. Miss one and the pathway stalls, no matter how much lysine sits in the metabolizable protein pool.
Independent research lines converge here. Methionine, lysine, and histidine are the primary limiting amino acids in US dairy diets, with leucine, isoleucine, and threonine as secondary constraints depending on the base ration.
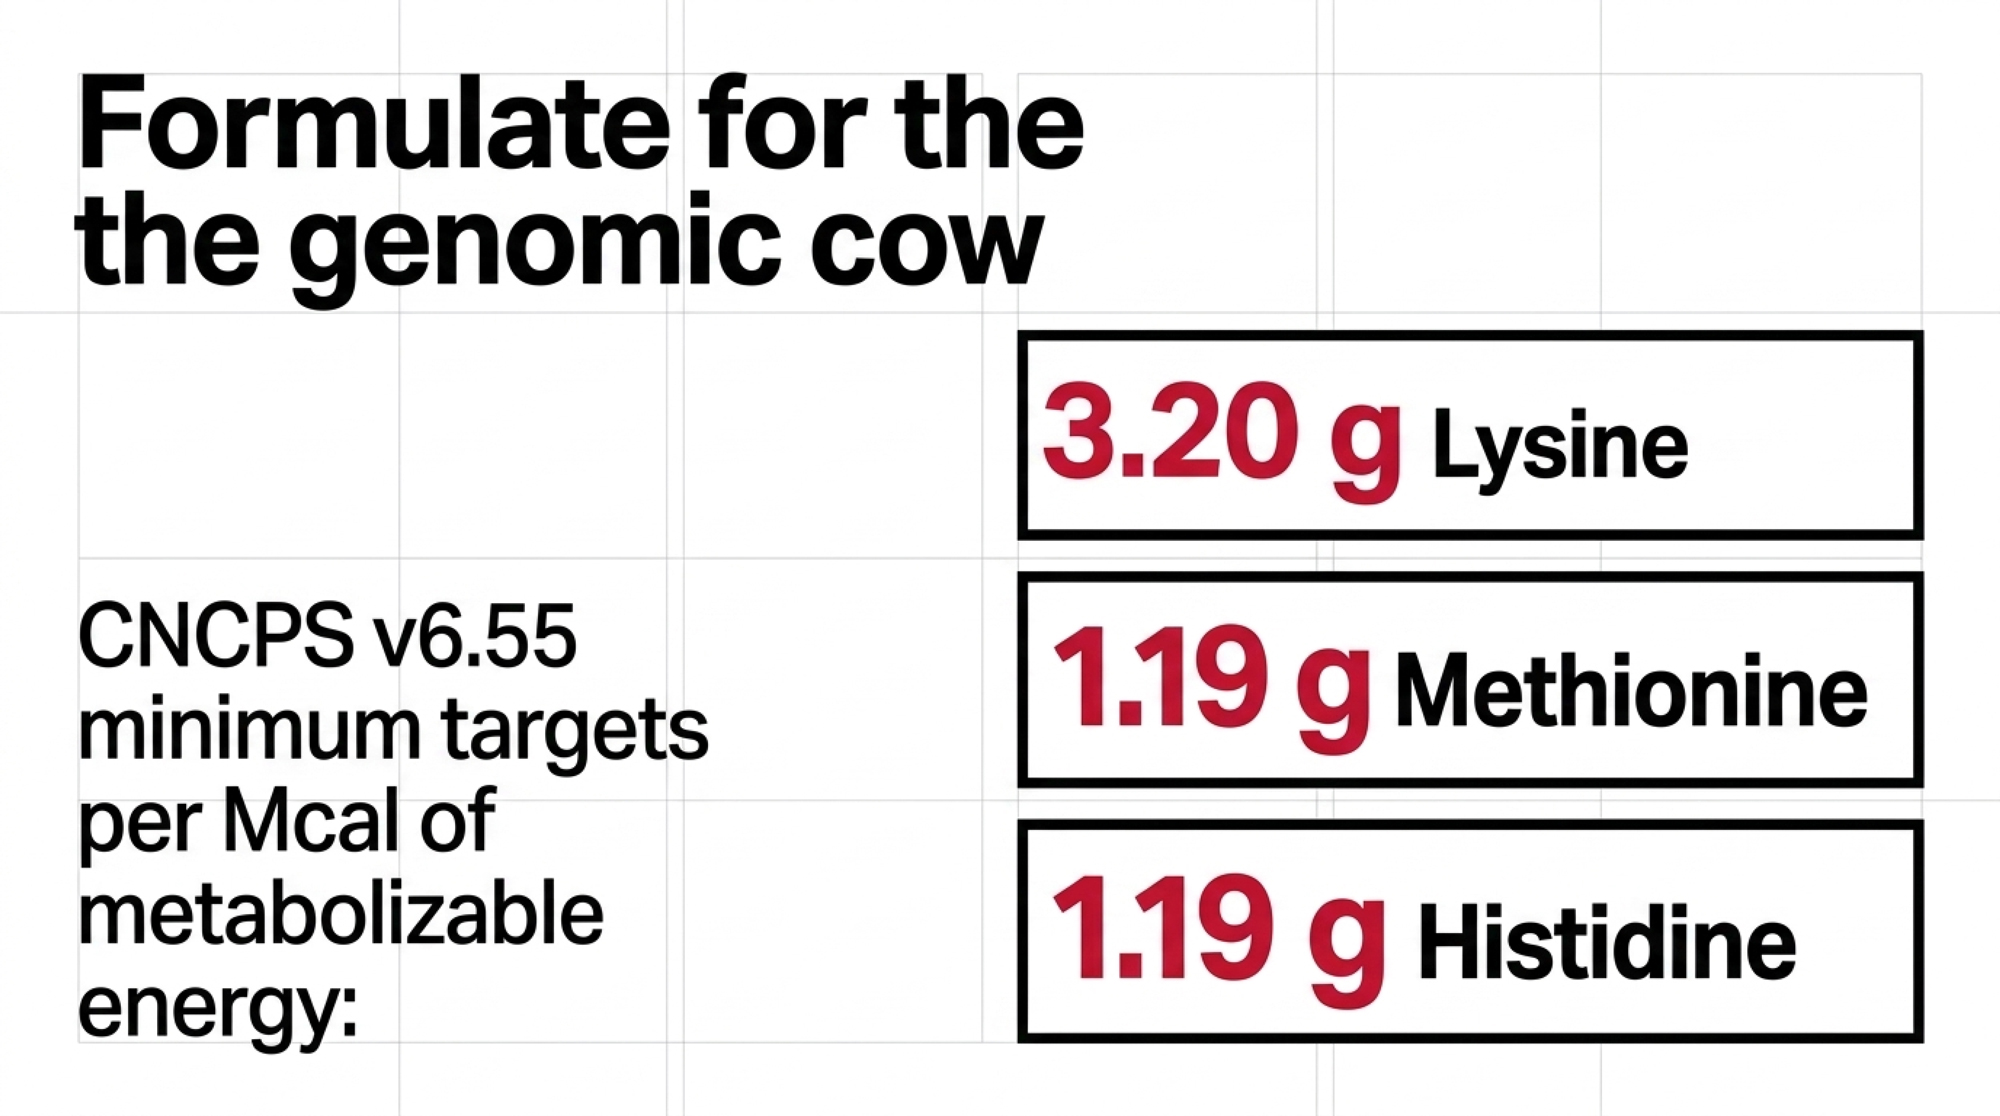
The Cornell Net Carbohydrate and Protein System reference points are worth writing on the wall of the feed office: roughly 1.19 g histidine per Mcal ME, 1.19 g methionine per Mcal ME, and about 3.20 g lysine per Mcal ME — lysine at roughly 2.7 times methionine, as modeled in CNCPS v6.55 and v6.56. Push methionine from 0.86 to 1.19 g/Mcal ME in that work, and ECM rose along with milk fat and true protein content.
That’s the ratio single-product programs miss. Lysine gets fed to target. Methionine and histidine get whatever the software’s default requirement says. And the tables underneath that software were derived for a different cow.
The Non-Essential Amino Acid Your Model Probably Doesn’t Print
Which brings us to the one thing on this list you can act on before lunch — without waiting for another trial, another proof run, or another product.
The science on non-essential amino acid feeding is genuinely emerging. Thin, in places. But auditing what your ration software reports is not a research question. It’s a question you can ask your feed rep today, and the answer tells you whether your program has been formulating casein synthesis with half the substrate list visible.
Start with proline, because it catches people sideways.
It’s classified as non-essential — the cow synthesizes it, mostly from arginine and ornithine. Infusion work published in the Journal of Dairy Science in 1990 found mammary proline uptake running low relative to proline output in milk, with that conversion covering the shortfall. At the casein output levels genomic cows now hit, conversion capacity plausibly becomes the bottleneck.
Straight talk on the evidence: this is thinner than the methionine and lysine work by a wide margin. One 1990 infusion study and an active conversation in casein-composition research circles — not a body of published feeding trials. Treat it as a question worth asking, not settled guidance.
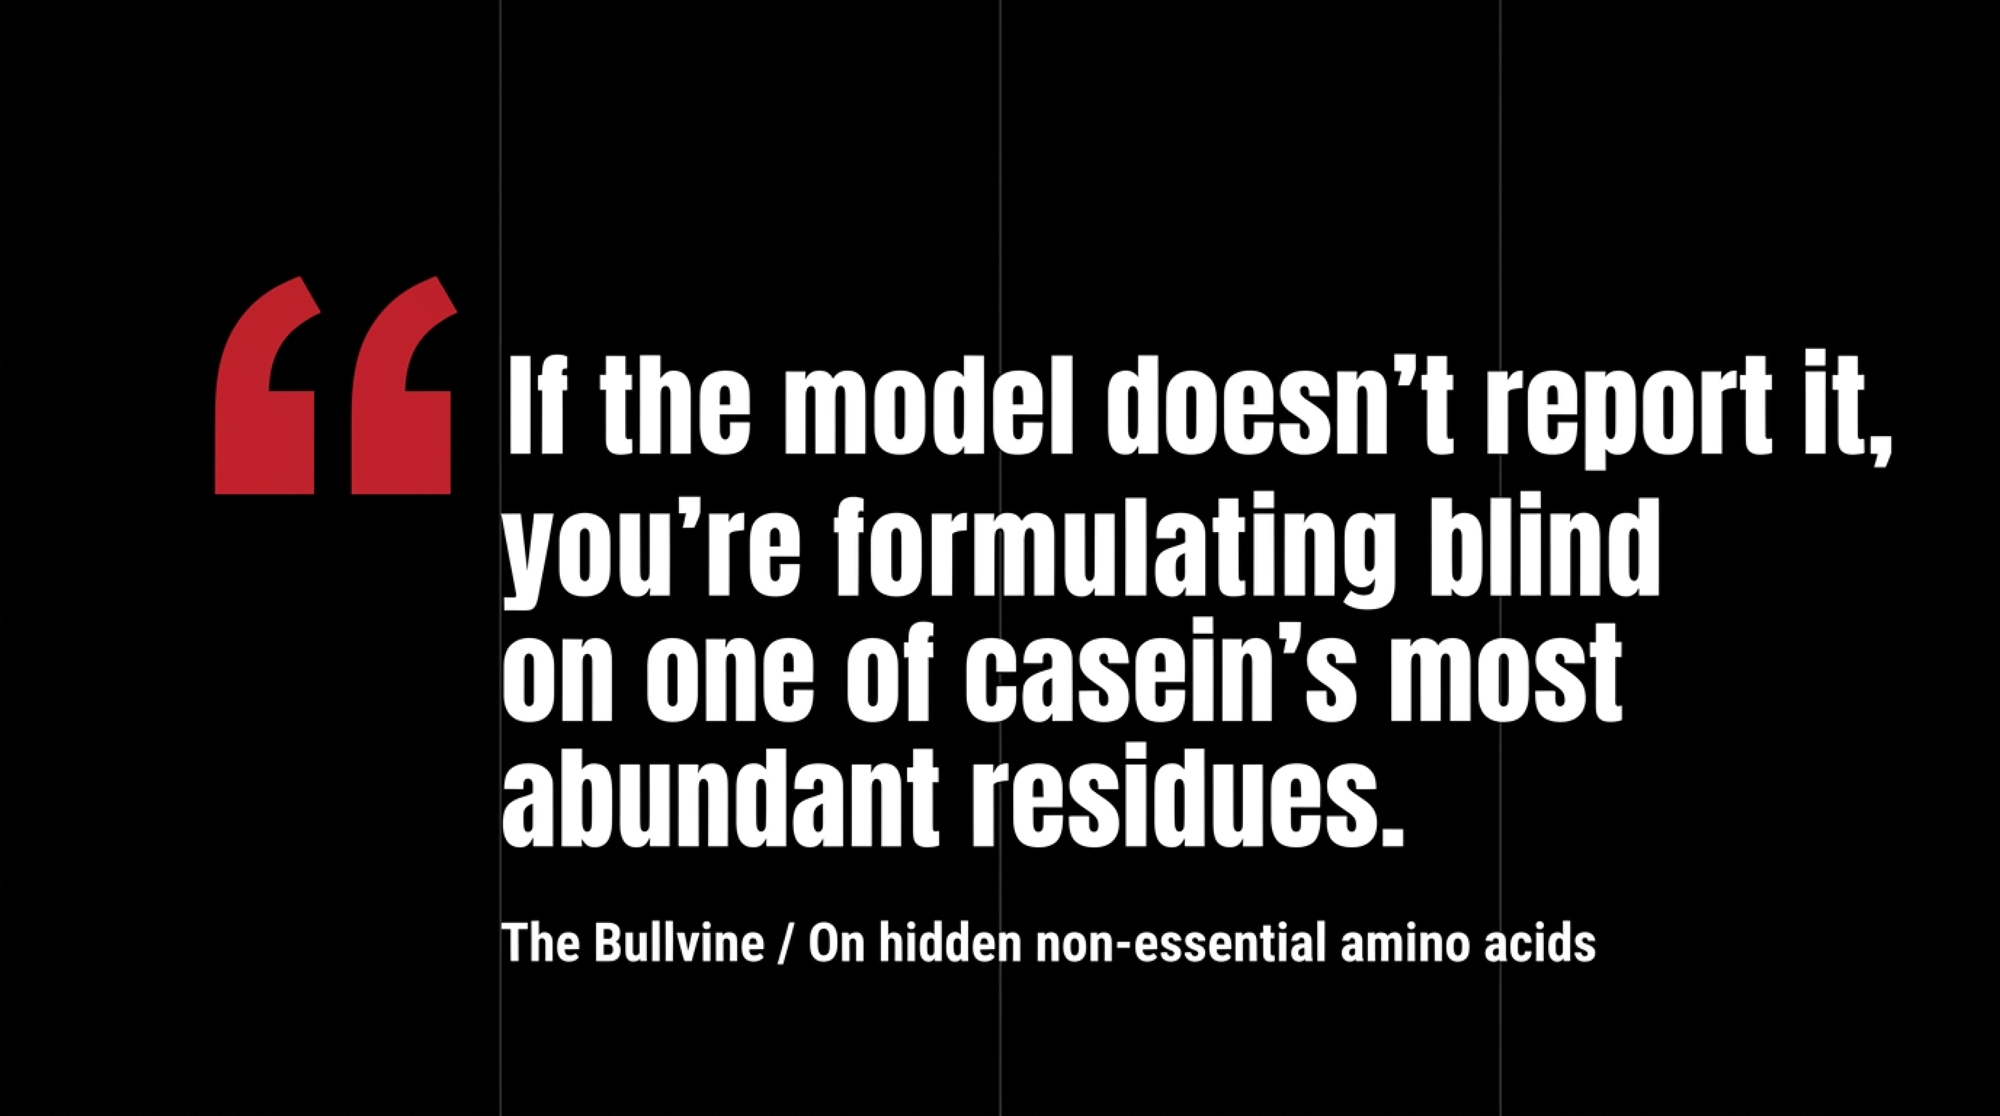
The operational gap, though, is simpler than the biochemistry, and it isn’t waiting on data. “Non-essential” gets read as “don’t worry about it,” so most on-farm ration reviews never print a proline number at all. Ask your nutritionist or feed rep to show you the non-essential amino acid supply line on your current formulation. If the model doesn’t report it, you’re formulating blind on one of casein’s most abundant residues — and you now know that before your next ration change rather than after. Same goes for arginine and glycine: not glamorous, not on the invoice, still load-bearing.
Stop Formulating for Net Requirements
The net-requirement model calculates how much lysine or methionine builds X pounds of casein, full stop. But the enzyme systems running the synthesis carry their own metabolic requirement on top of the net nitrogen cost. Genomics handed cows more synthetic capacity. Feeding programs kept formulating against the older ceiling.
CNCPS has been correcting for it. Versions 6.5 and 6.55 rebuilt amino acid efficiencies on a metabolizable-energy-allowable basis rather than fixed net values, and the formulation goal for digestible methionine as a percentage of MP now sits at 2.6% — roughly 11% above v6.0, and genuinely hard to hit without rumen-protected product. When researchers balanced diets for rumen nitrogen plus all essential amino acids relative to metabolizable energy, ECM rose 2.9 kg/d, fat 0.13 kg/d, and true protein 0.08 kg/d against the negative control.
One working hypothesis — still argued over inside the groups building these models — is that rather than amino acids competing for a fixed pool, the mammary gland prioritizes whichever synthesis route is most energetically efficient at the time. If that holds, lysine, butyrate, acetate, and glucose availability interact instead of behaving as separate silos, and programs built on isolated single-nutrient targets are fighting how the cow actually partitions.
The Forage Baseline Check
This is the part the supplement literature underplays, and the part that protects your money.
Amino acid balancing won’t rescue a weak forage program. The herds running 4.8% fat and 3.5% protein — shipping better than a ton of components annually — get there on three legs: high levels of highly digestible forage, properly balanced dietary fatty acids, and full amino acid balancing. Those are individual high-management herds, not regional averages.
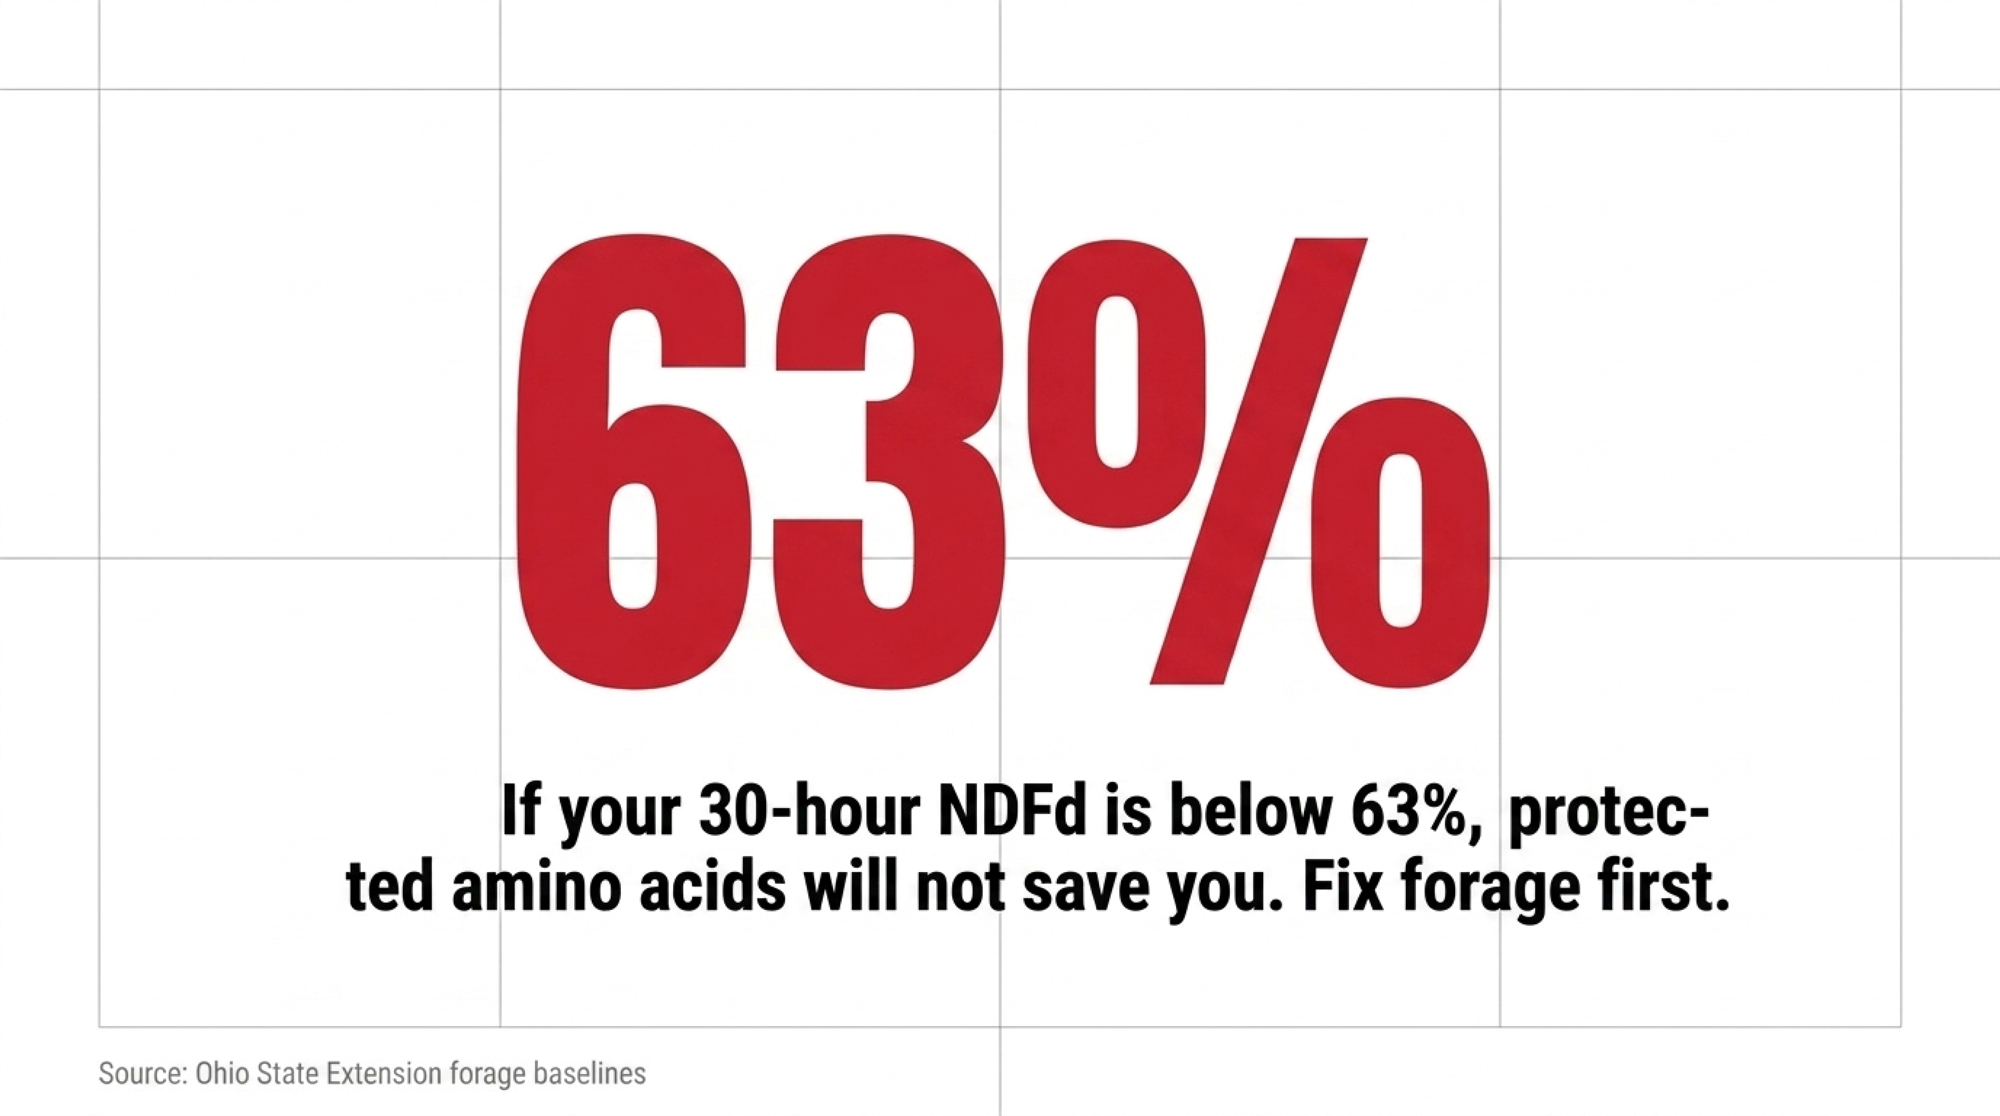
The four numbers that gate everything downstream. Ohio State Extension data defines quality corn silage as 30-hour NDFd above 63%, uNDF240 below 9%, kernel processing above 78%, and 7-hour starch digestion over 70%. Miss those, and protected amino acids are an expensive way to feel productive.
The null results matter as much as the wins. A branched-chain trial at roughly 45.8 g metabolizable leucine, 33.2 g isoleucine, and 31.8 g valine per day found no effect on dry matter intake, milk yield, or milk protein. An N-acetyl-L-methionine study found no change in milk, ECM, or component yields, though feed efficiency improved. A CNCPS analysis across a large dataset found histidine, leucine, tryptophan, threonine, and methionine limiting or co-limiting — while lysine results did not support it as limiting at the inclusion rates tested.
The pitch is almost always simpler than the biology: add the protected amino acid. But three of the trials above added it and got nothing. Find out what’s actually short first.
The Math: Pricing Yield, Not Test Percent
Here’s where most on-farm amino acid arithmetic goes wrong, and it isn’t the multiplication.
The trial reports yield responses — kilos per day of fat and protein — not test percentages. Those are different currencies. A diet that lifts ECM 2.9 kg/d is producing more component pounds partly through concentration and partly through volume, and you can’t split the two without the trial’s baseline yield and baseline tests in front of you. Convert those kg/d figures into percentage points, and the answer swings from about +0.29 to +0.41 points of fat depending on which baseline you assume. That’s not precision. That’s a guess wearing a decimal point.
So price the yield response directly. Both unit systems, because the milk cheques don’t agree on one: +0.13 kg / +0.287 lb of fat and +0.08 kg / +0.176 lb of true protein per cow per day, at a fat-to-protein response ratio of roughly 1.6:1. US Federal Order component prices run in dollars per pound; Canadian Dairy Commission class schedules and provincial pool payments run in dollars per kilogram. Whichever column your pay sheet uses, the response is the same milk — just measured twice.
Now the part most ROI sheets get quietly wrong. The figures below start from genetic index economic values — $5.01/lb fat and $3.33/lb protein — because they’re published and dated. These are not pay prices. An economic value is what an index uses to weight a PTA pound when ranking sires. Your cheque runs on something else: US Federal Order component prices are formula-derived from wholesale product prices minus make allowances, and January 2026 Class III came in at $14.59/cwt. Canadian producers price off Canadian Dairy Commission class schedules — Class 3(d) butterfat at $11.6208/kg and protein at $10.1476/kg effective February 1, 2026, per the Commission’s published component pricing tables.
On the index weights, working in pounds, the same response prices out like this — and if you want the real math on running these numbers against your own operation rather than a trial average, that’s a different exercise:
- Fat: 0.287 lb × $5.01 = $1.44/cow/day
- Protein: 0.176 lb × $3.33 = $0.59/cow/day
- Gross: $2.02/cow/day
- Less protected methionine and lysine at 20 cents — roughly $7,300/year on 100 cows
- Net: $1.82/cow/day, about $5,470/month on 100 cows
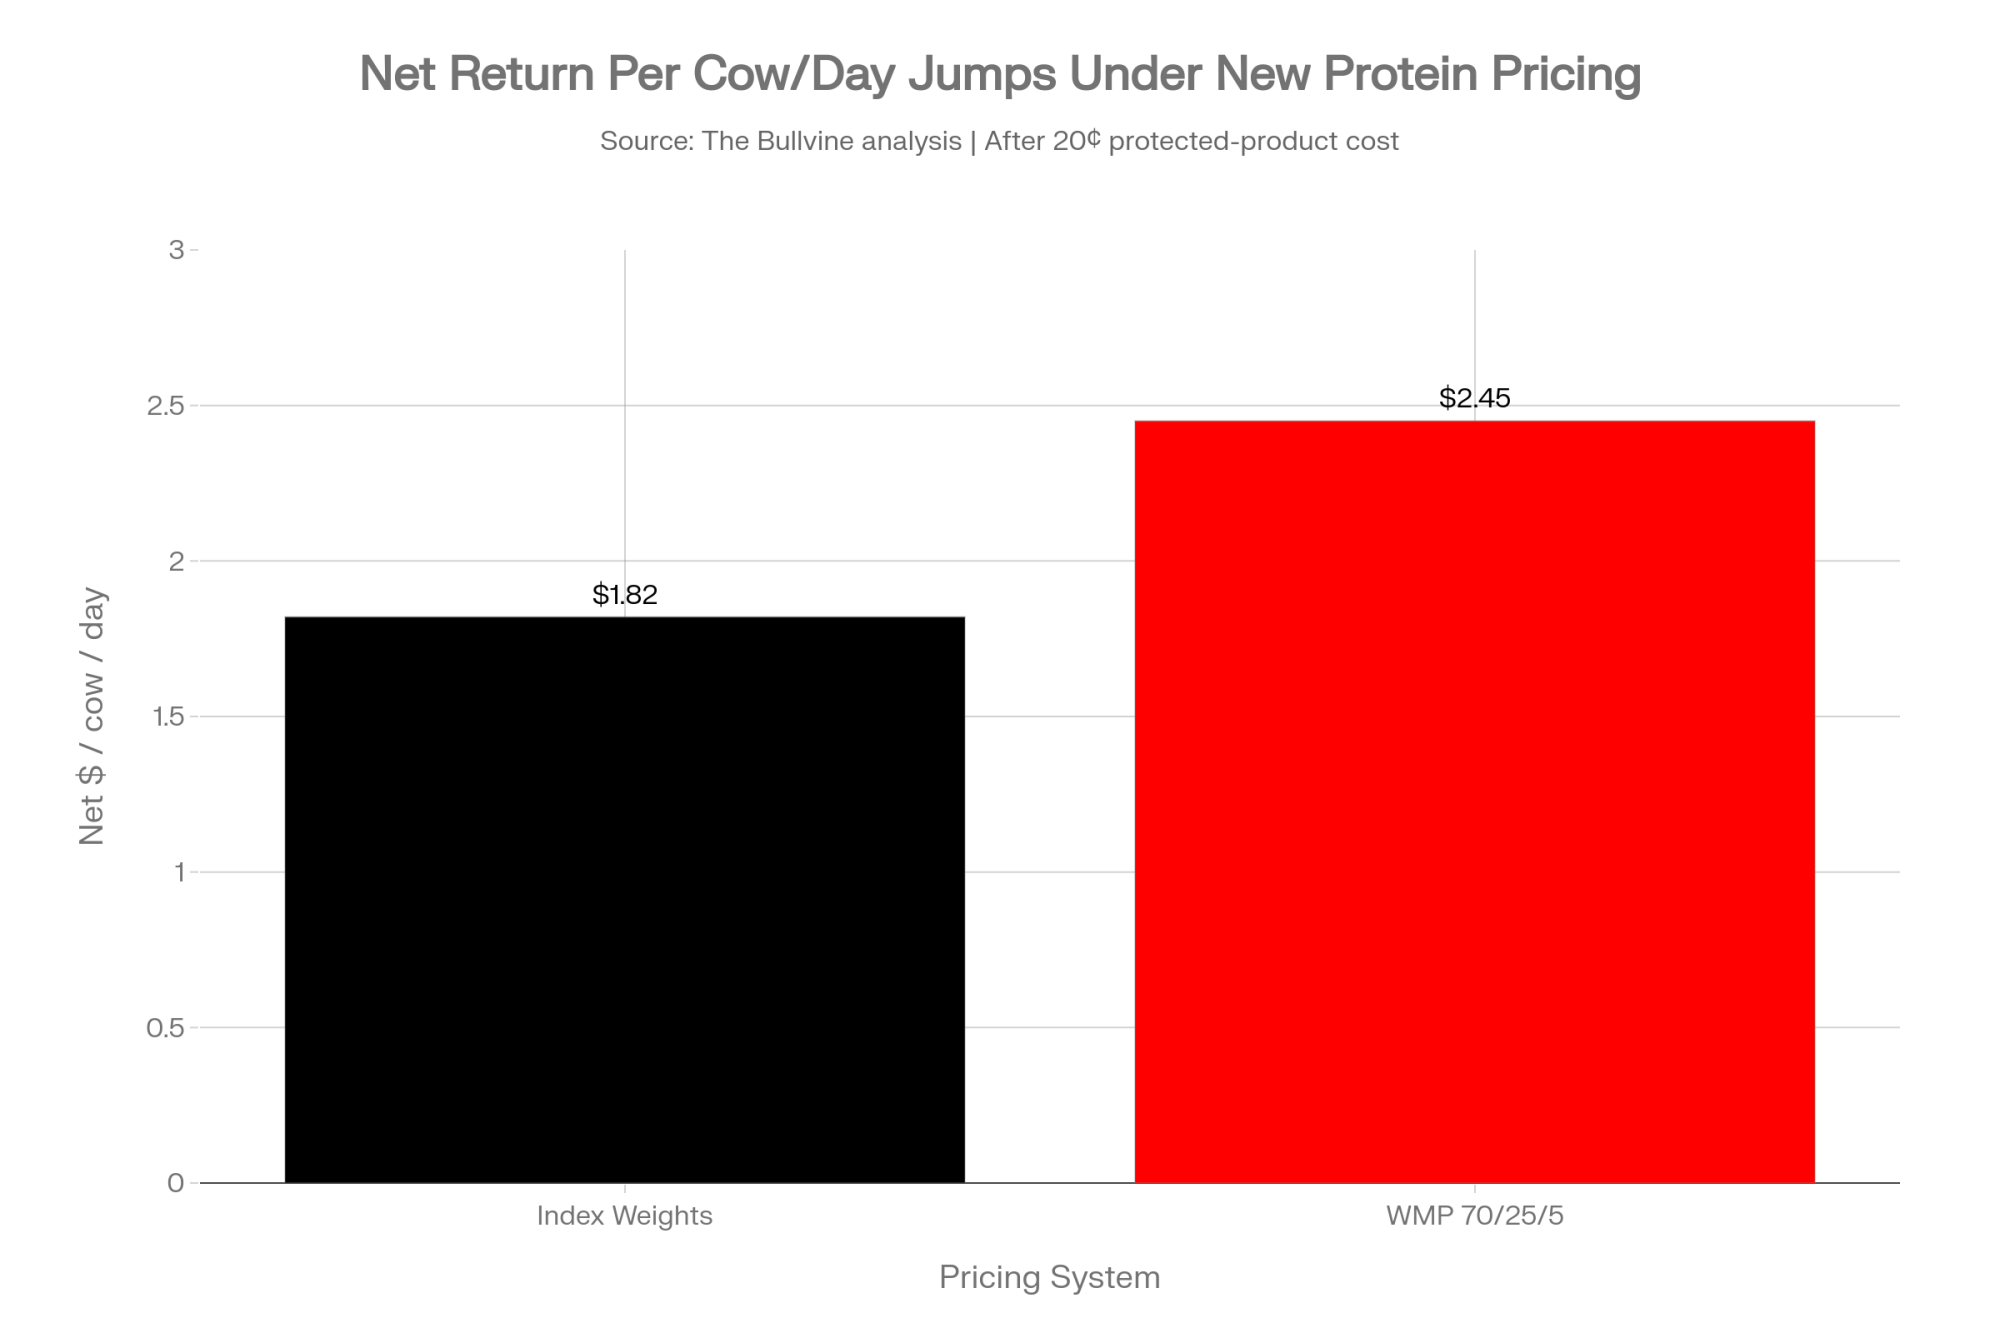
Treat that as a directional ceiling, not a budget line. It’s one trial on one base ration, and the three trials cited above returned no component response at all.
Same Response, Two Ratios, Opposite Conclusion
Now run the same trial response against the Western Milk Pool’s new ratio and watch what happens to the story.
The WMP boards moved from 85% butterfat / 10% protein / 5% other solids to 70/25/5 effective April 1, 2026, as reported by Farm Tario and confirmed in The Bullvine’s own coverage of the change. At provincial average composition, that’s roughly a 17.6% cut to butterfat’s per-kilogram value and a 150% increase to protein’s. Apply that directional shift to the identical +0.13 kg / +0.287 lb fat and +0.08 kg / +0.176 lb protein:
| Index economic weights | WMP 70/25/5 ratio applied | |
| Fat return | $1.44/cow/day | $1.18/cow/day |
| Protein return | $0.59/cow/day | $1.47/cow/day |
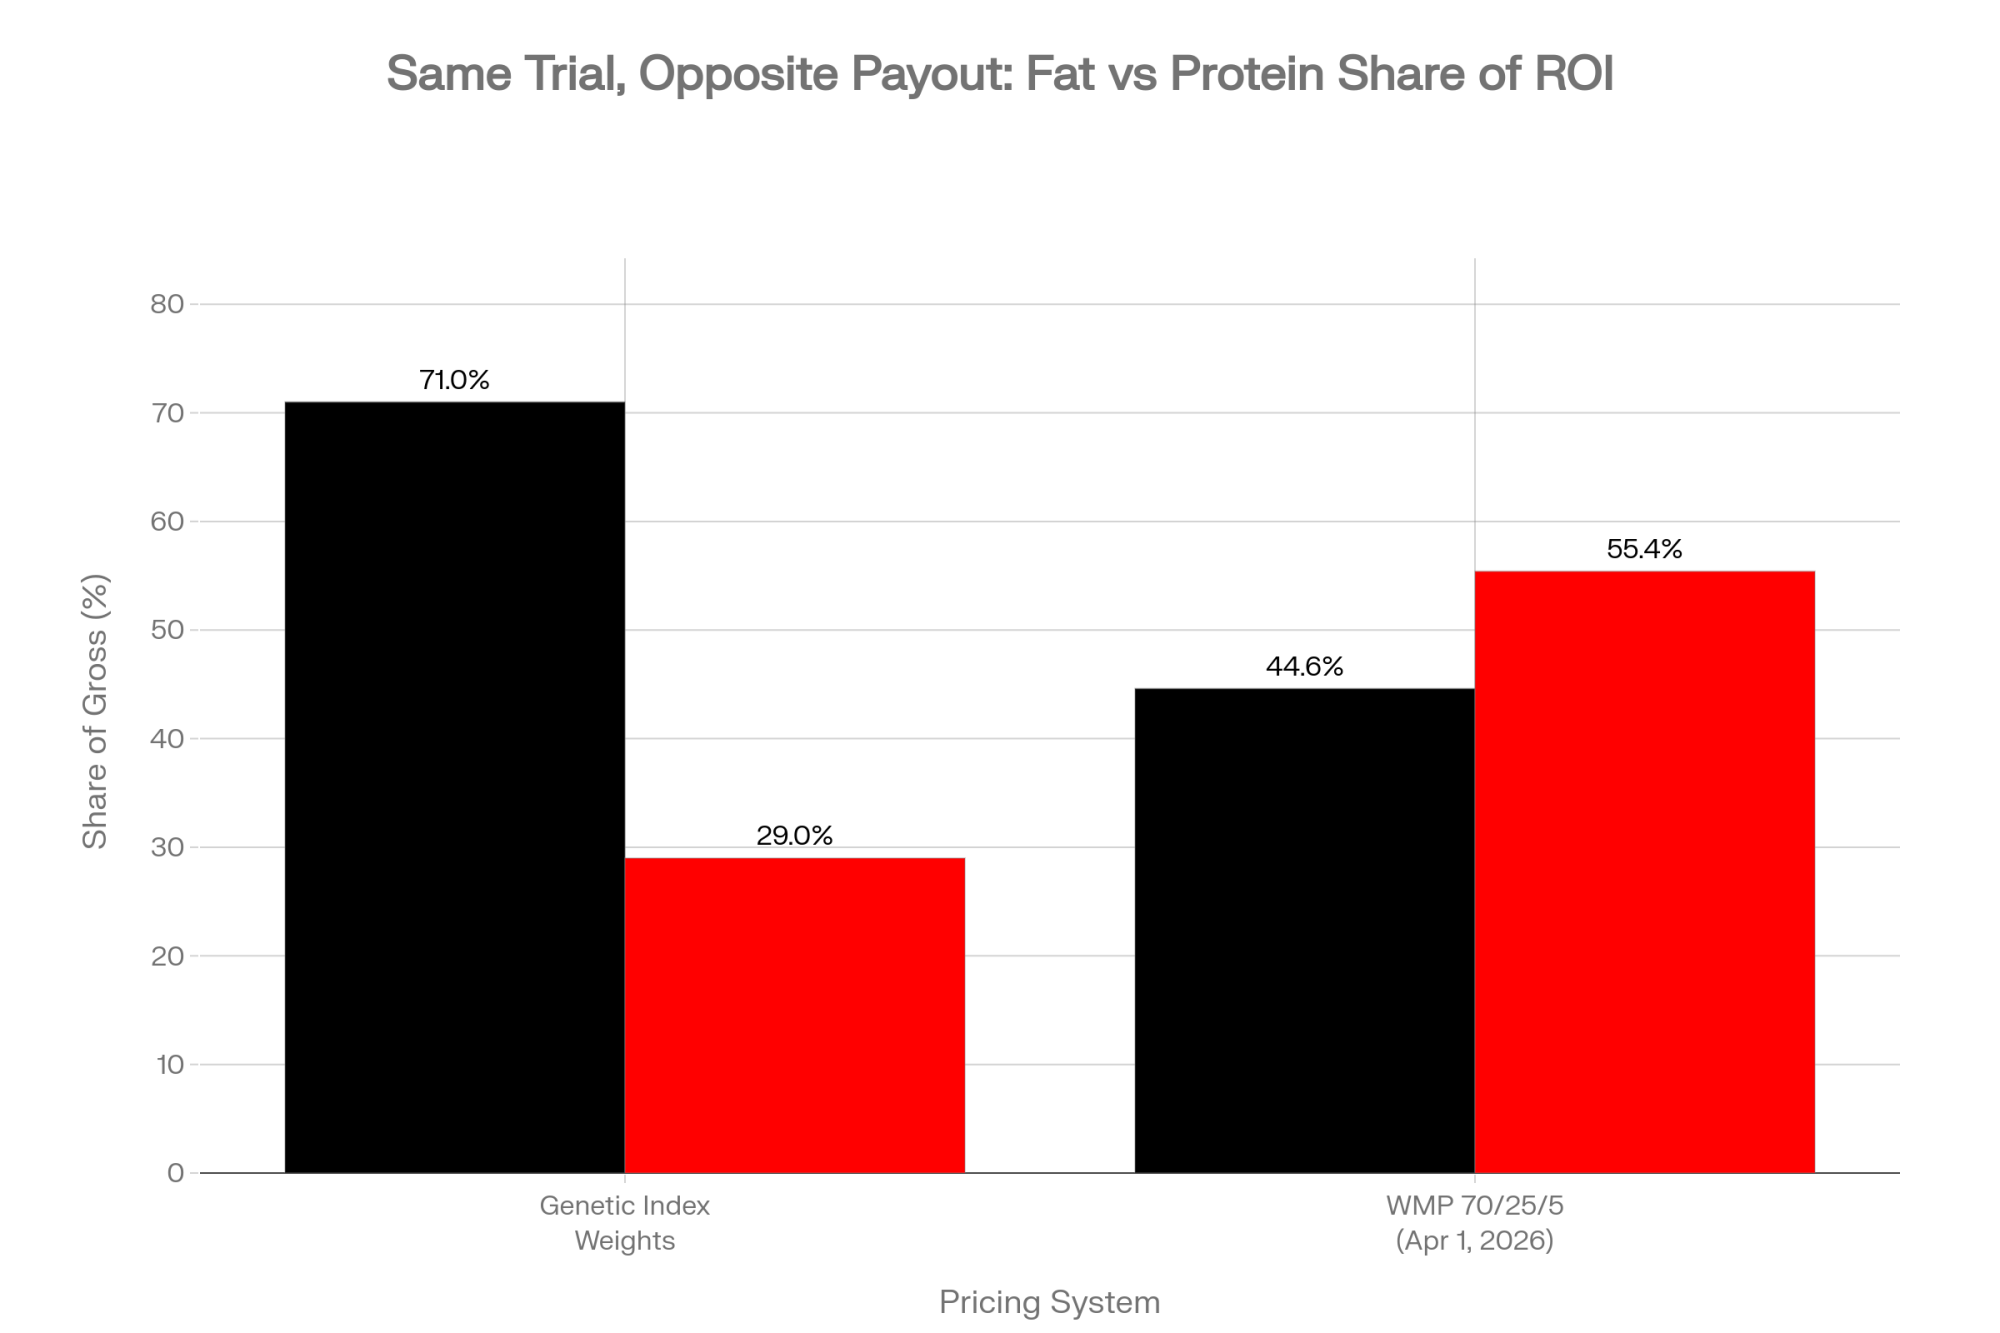
| Fat’s share of gross | 71.0% | 44.6% |
| Protein’s share | 29.0% | 55.4% |
| Dominant component | Fat | Protein |
| Net after 20¢ product | $1.82/cow/day | $2.45/cow/day |
Directional illustration in US dollars per pound. The WMP column applies the published ratio change to index weights to show how the same feed response reprices — it is not a WMP pay-price calculation. Canadian producers should re-run it on their own pool’s per-kilogram component values.
Fat’s share of the return drops 26 percentage points, and protein takes over as the majority earner, reflecting the revenue reallocation the Western boards approved for April 1. Same cows. Same feed. Same trial. Opposite conclusion about which component you just bought.
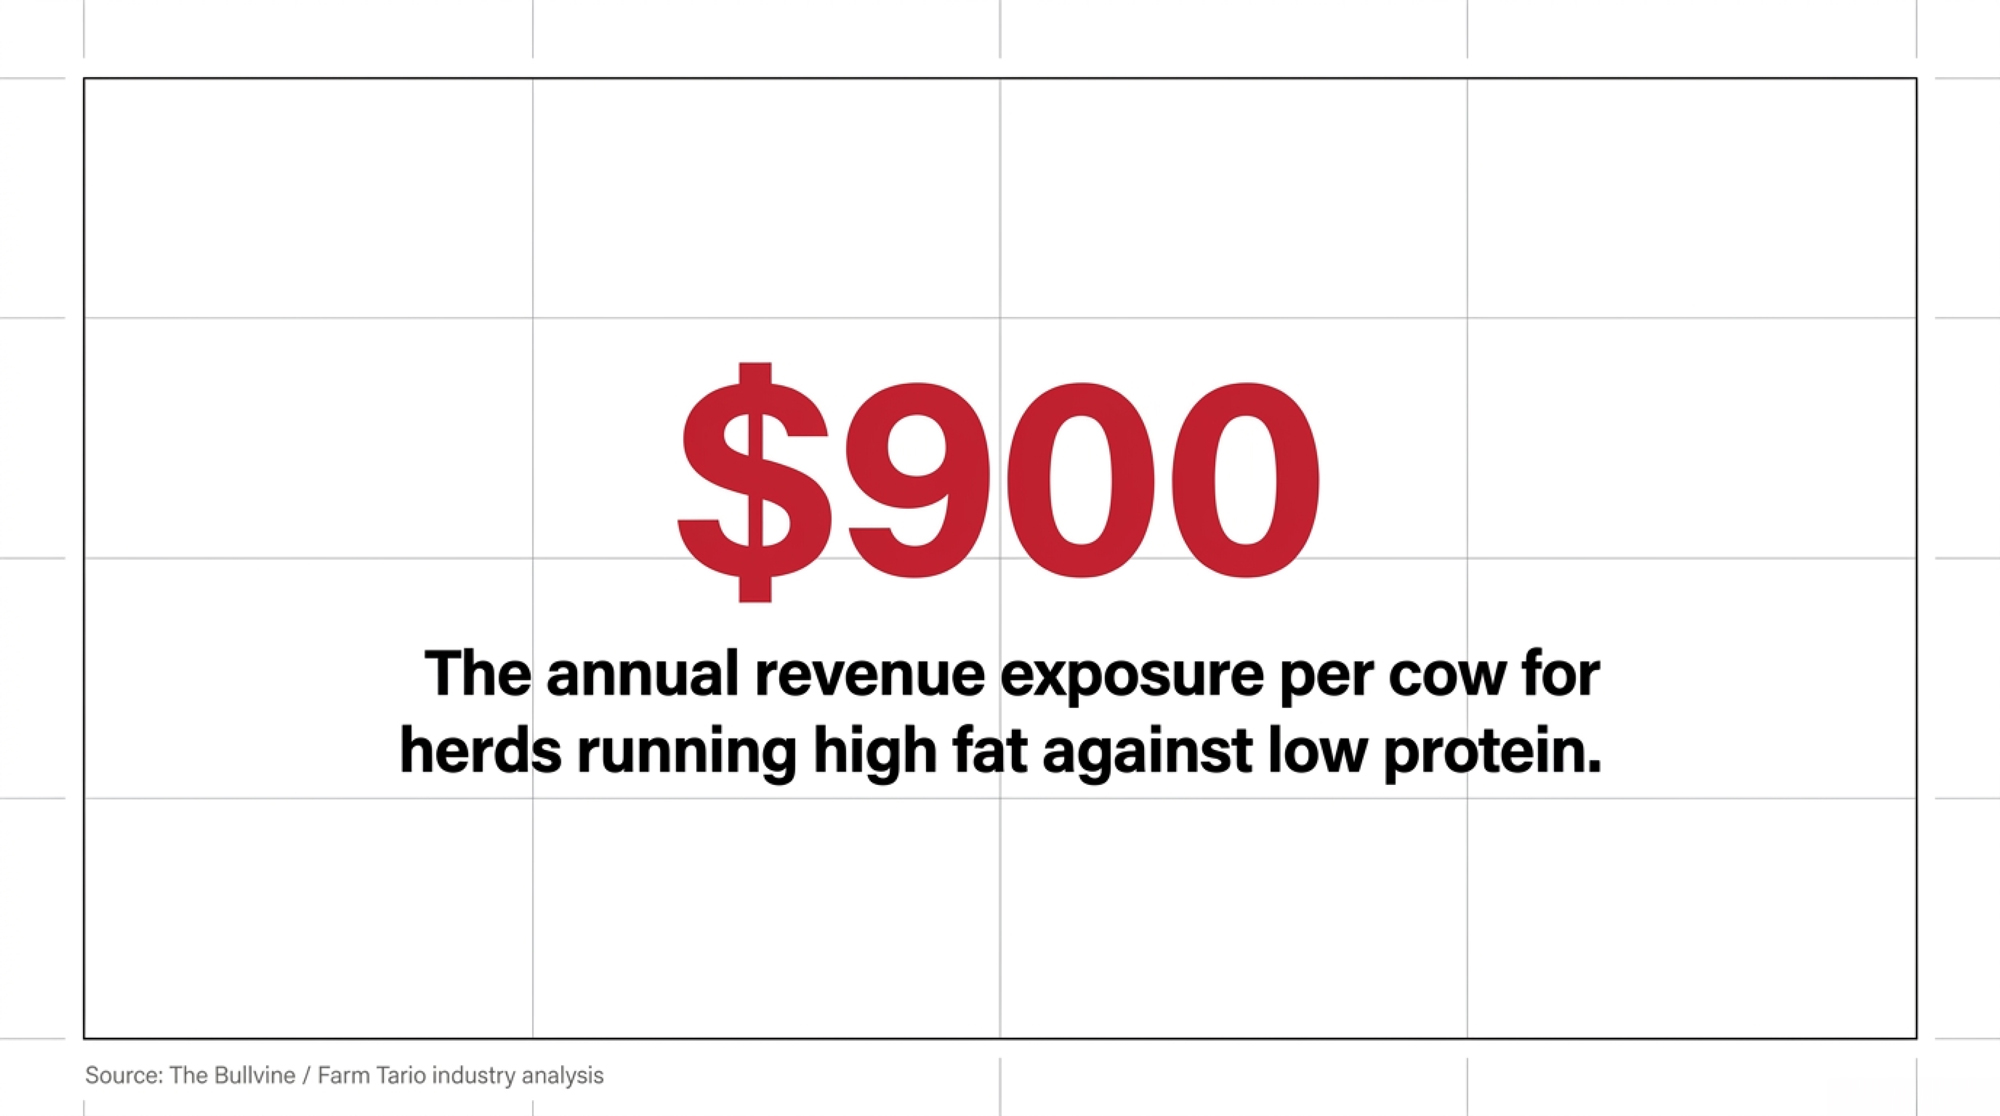
And the exposure runs the other direction too. High-fat, low-protein herds that don’t adapt to the new ratio could face annual revenue shortfalls of up to $900 per cow — a profile a decade of butterfat selection produced on purpose. Set that beside the $1.82 to $2.45 per cow per day a balanced amino acid program might return, and the arithmetic gets uncomfortable: nutrition can recover a meaningful slice of that gap this year, but it can’t close it alone.
So when someone hands you a nutrition ROI sheet, the first question isn’t about the response size. It’s which system’s values they used — and which unit.
Three Repricings, Two Mechanisms, Four Months
Component pricing moved under the industry’s feet this year, and the changes don’t all work the same way.
| System | Change | Effective Date | Producer Impact |
|---|---|---|---|
| Western Milk Pool | 85/10/5 → 70/25/5 (fat/protein/other solids) | April 1, 2026 | Fat share of ROI drops from 71% to 44.6%; high-fat/low-protein herds face up to $900/cow/year exposure |
| P5 (Ontario/Quebec etc.) | Market ratio raised to 2.20, no-pay ratio to 2.30; SNF residual now 100% to Tier 1 protein | April 1, 2026 | Tier 1 protein up ~$2.00/kg; butterfat down ~$1.80/kg; each 0.05 step to 2.20 worth ~$7.92/kg quota/month |
| Lactanet LPI Production subindex | Holstein weighting: 60F:40P → 40F:60P | April 2026 | Genetic (not milk-cheque) shift — changes sire selection targets, takes 3–5 years to show in the herd |
Why the pools moved at all. Canada spent years managing a protein surplus. That situation reversed — Farm Credit Canada’s 2026 dairy outlook describes a sector now “staring down a protein deficit rather than a protein surplus,” driven by significant 2025 growth in higher-protein products like yogurt and cheese. Cottage cheese is the sharpest example: Statistics Canada production data shows a 20% jump between December 2023 and December 2024, with retail demand reportedly up as much as 30% and shortages on shelves through spring 2026. Decades of butterfat-first payment ratios had produced exactly the milk the market no longer wanted most.
Western Canada repriced the cheque. The WMP boards went to 70/25/5 on April 1. Protein didn’t get slightly louder on a Western cheque. It got roughly 2.5 times louder.
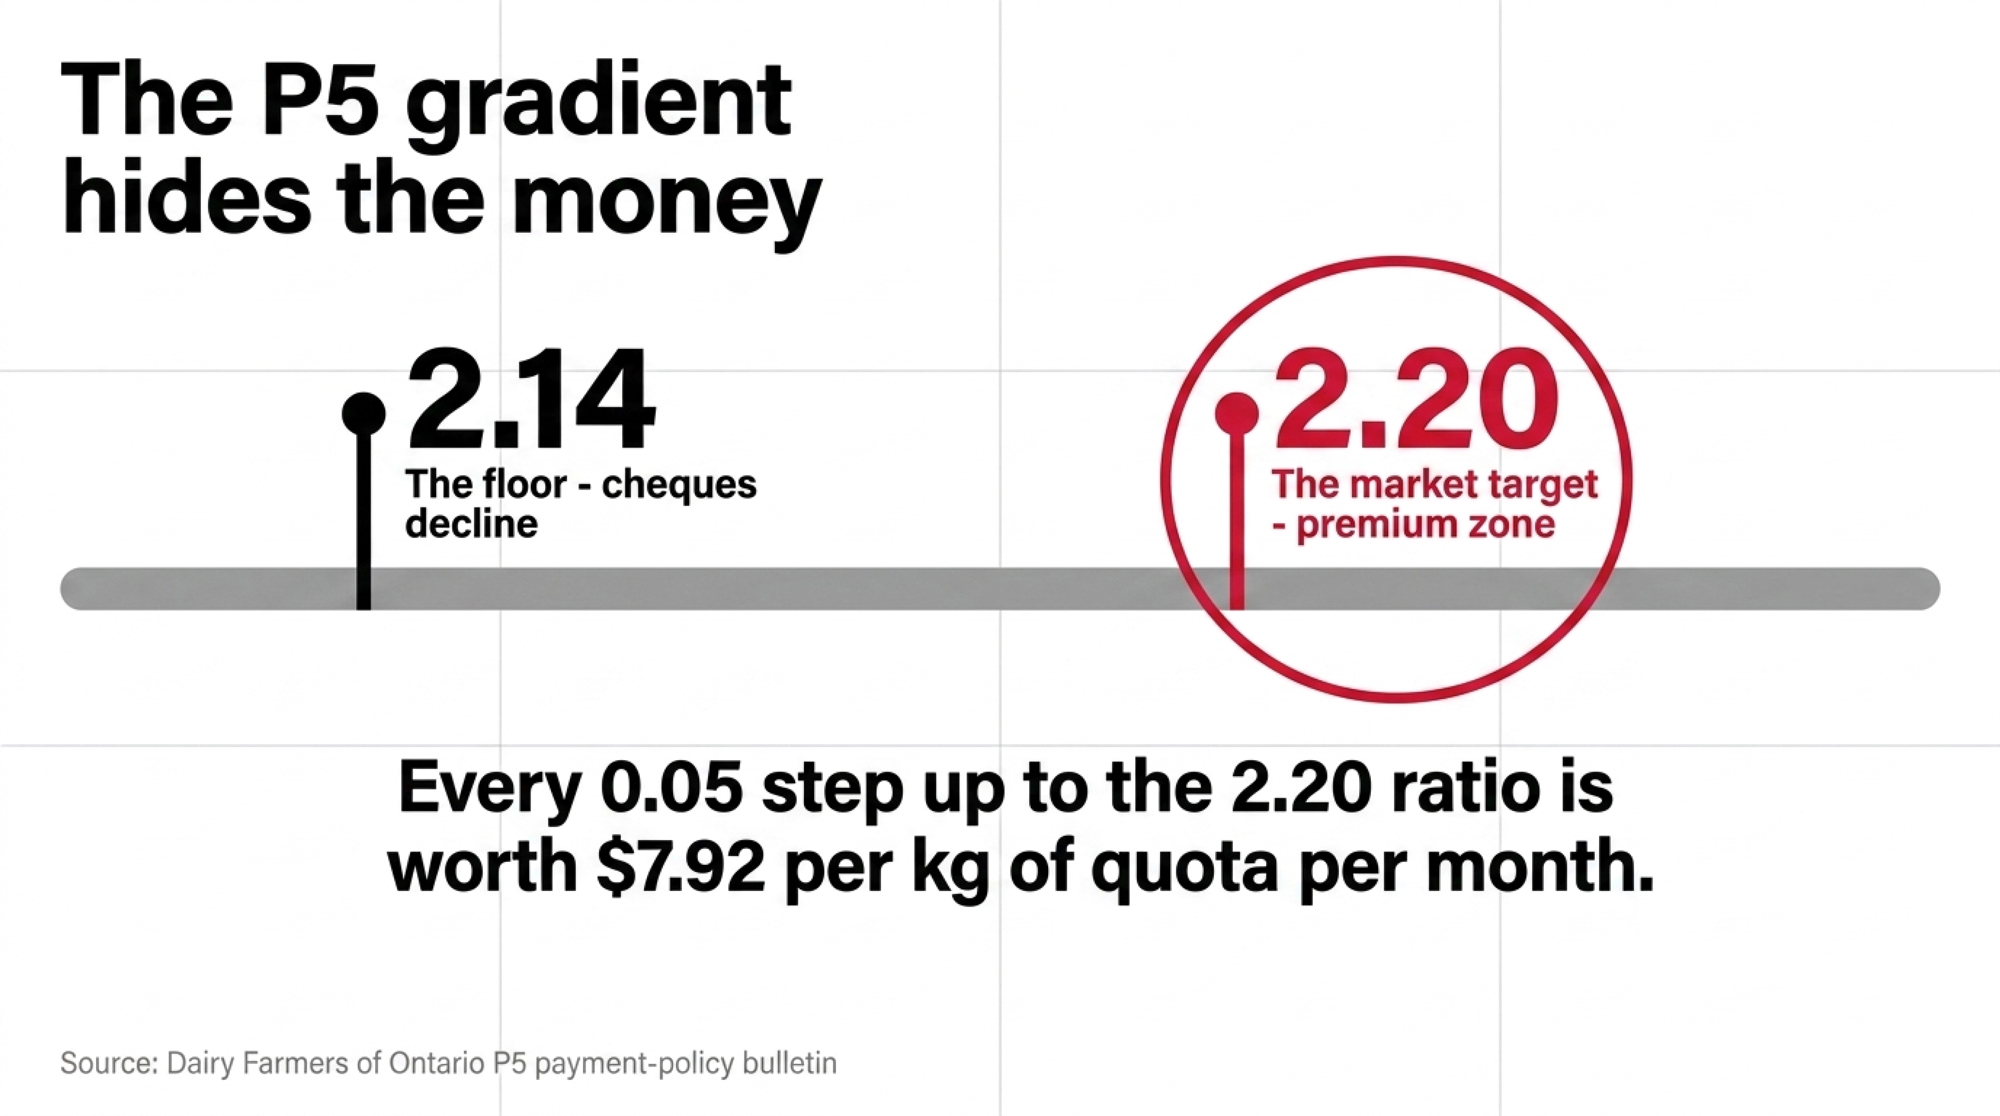
P5 repriced it with a gradient, not a switch. Dairy Farmers of Ontario’s P5 payment-policy bulletin sets out the change: the market ratio rises to 2.20, the no-pay ratio to 2.30, both effective April 1, with the residual revenue distribution from other solids shifted so 100% flows to Tier 1 protein instead of splitting 30/70 with butterfat. Net effect: Tier 1 protein up about $2.00/kg, butterfat down about $1.80/kg. Tier 2 protein sits at the 4(a) price plus $3.00/kg.
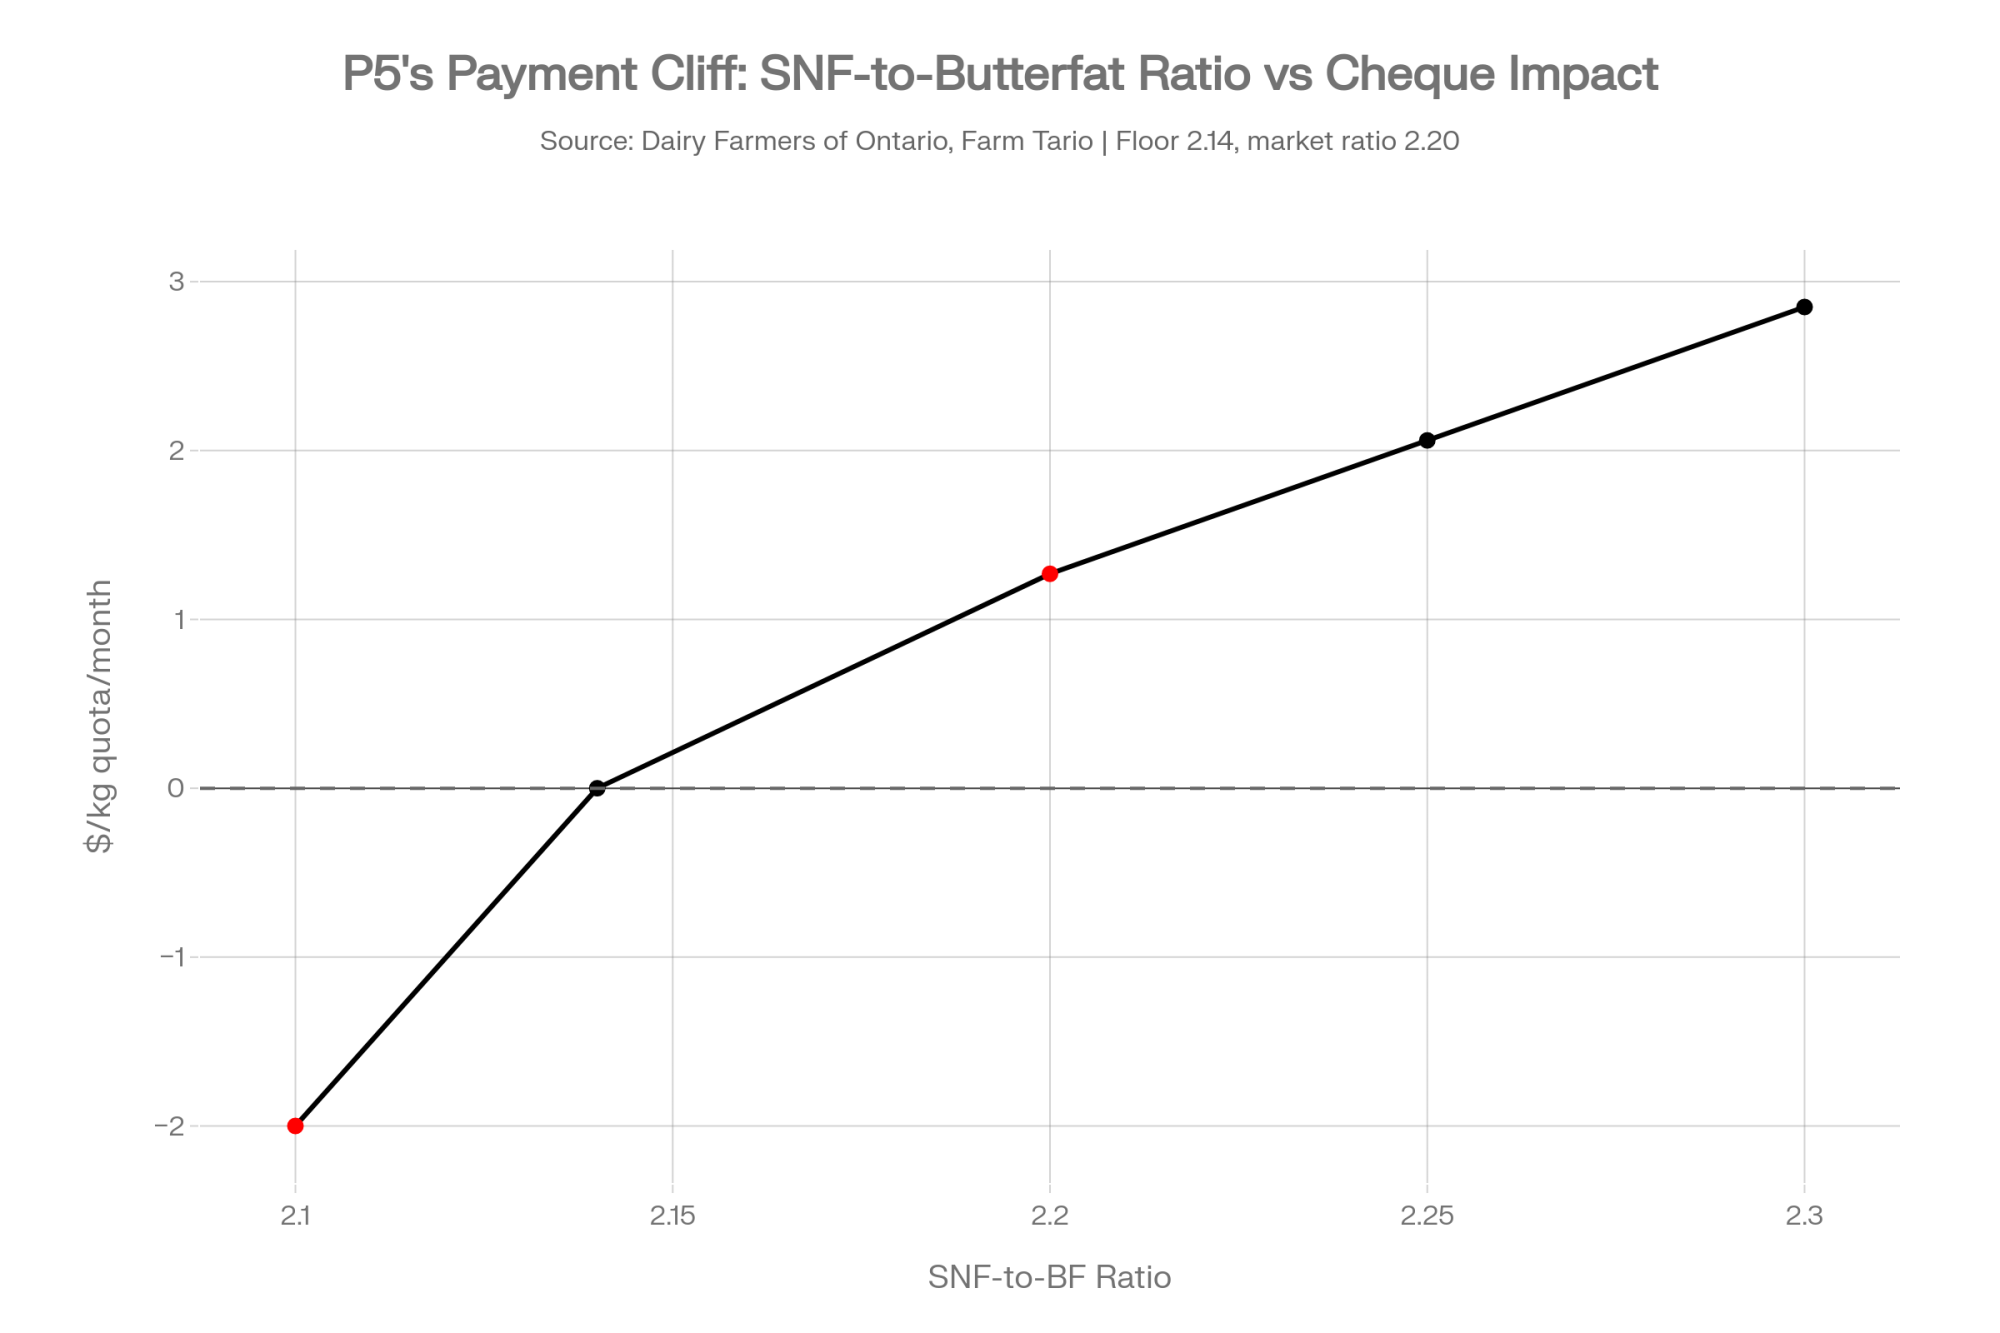
The P5 gradient is where the money hides. Farm Tario’s analysis of the change puts it plainly: Holstein producers below a 2.14 SNF-to-butterfat ratio will see cheques start to decline — but 2.14 is the floor, not the target. The market ratio is 2.20, and every 0.05 increase in SNF up to 2.20 is worth roughly $7.92 per kilogram of quota owned per month. Above 2.30, extra protein stops being paid. A farm sitting at 2.1 that makes no management changes will receive about $2 less per kilogram of quota owned.
Lactanet repriced the breeding decision. The April 2026 revision to the LPI Production subindex moved Holstein weighting from 60% fat / 40% protein to 40% fat / 60% protein, Jersey to 33F:67P, and Ayrshire to 50F:50P. That one’s a genetic index change — it alters what your sire selection optimizes toward, not what your milk earns this month.
Meanwhile, the US national protein-to-fat ratio has slid to roughly 0.77. What ratio do plants want? Sources disagree — one puts it at 0.80 and up, another at 0.85–0.90 depending on the plant. Either way, 0.77 sits below the floor.
So the herd that won the butterfat race now has a ratio problem, whichever system it ships into. Genetics takes three to five years to correct — heifers bred this fall calve in 2027 and finish a first lactation into 2028. Nutrition is the lever that moves this year.
One caution before you chase SNF. AgProud’s SNF strategy analysis makes the point that in a quota system the old rule still holds: fill quota with butterfat first, optimize SNF second. Sacrificing total kilograms of butterfat shipped to chase SNF, at the expense of filling owned quota, costs more total revenue than the protein premium returns.
| Lever | What It Actually Does | Common Mistake |
| Lysine | Amplifies fatty-acid-driven milkfat synthesis via GPRC6A-PI3K signaling | Assuming it builds casein on its own |
| Methionine + Histidine | Raises protein and fat when balanced against ME, not MP alone | Feeding solo methionine and expecting full protein response |
| Proline, Arginine, Glycine | Non-essential, but potentially rate-limiting for high-output casein synthesis | Ignored because models omit non-essential lines |
| ECM-Basis Balancing | Matches nutrient partitioning in modern genomic cows | Formulating against outdated fixed net-nitrogen tables |
| Forage NDFd (>63%) | Baseline rumen capacity requirement for AA response | Adding expensive bypass AA to patch poor forage quality |
Action Steps for Your Next Ration Review
- Ask your feed rep to print the non-essential amino acid supply line this week. It’s a report request, not a research project — and if the model doesn’t produce one, that’s your answer about what your program can and can’t see.
- If an ROI sheet doesn’t say which values it used, send it back. Index economic weights make fat 71% of this response. WMP’s April ratio makes protein 55%. Same trial, 26-point swing.
- If you’re in P5, calculate your SNF-to-butterfat ratio against 2.20, not 2.14. The floor where cheques start declining is 2.14; the market ratio is 2.20, and each 0.05 step up to it is worth about $7.92 per kg of quota per month.
- If you’re testing high fat against low protein in the WMP, price the exposure before you price the fix. That profile carries up to $900 per cow per year in revenue shortfall if it doesn’t adapt.
- If your 30-hour NDFd is below 63%, fix forage before buying a bag of protected amino acid. The 4.8/3.5 herds got there on digestible forage first.
- If your program balances lysine to target but sets methionine and histidine by default, you’re feeding one leg of a three-legged requirement. CNCPS v6.55 reference points: roughly 3.20 g lysine, 1.19 g methionine, 1.19 g histidine per Mcal ME.
- If chasing SNF would cost you butterfat kilograms against owned quota, don’t. Fill quota first, optimize SNF second.
Key Takeaways
- Within the next 30 days: request a full amino acid readout — essential and non-essential — calculated on an energy-corrected milk basis rather than net nitrogen, and get 30-hour NDFd on this year’s forage before committing to any protected product. Both are one phone call.
- If protein is flat while fat is strong, stop adding lysine. Lysine is working the fat side. The casein constraint sits with methionine, histidine, the branched-chain group, and the proline precursors.
- Run every component response twice — once on the values you were quoted, once on the values that pay you. The same +0.13 kg / +0.287 lb fat and +0.08 kg / +0.176 lb protein swings from 71% fat-driven to 55% protein-driven depending on the system.
- Nutrition narrows the gap; it doesn’t close it. A high-fat, low-protein herd faces up to $900 per cow per year of exposure against a nutrition response worth $1.82 to $2.45 per cow per day.
- Three repricings, two mechanisms, one direction. WMP’s 70/25/5 and P5’s 2.20 market ratio changed what milk earns; Lactanet’s 40F:60P changed what breeding chases. Nutrition is the only one you can act on this month.

Every herd that chased butterfat did what the indexes and the milk cheque asked. Right call at the time, and the gain is banked. The question now is narrower and more awkward: when your nutritionist says the ration is balanced, balanced against what — the tables, or the cheque you actually cash? Ask which year those tables were built. Then ask which pool’s values are in the spreadsheet, and in which unit.
Complete references and supporting documentation are available upon request by contacting the editorial team at editor@thebullvine.com.
Learn More
- The State of the Dairy Industry 2026: Policy, Markets & Change — Arms you with a blueprint for surviving shifting component payment grids, quantifying the $900-per-cow exposure facing herds that fail to realign fat and protein yields.
- Are You Breeding for Yesterday’s Milk Cheque? Why the Next Five Years Demand a New Plan — Exposes why selecting exclusively for butterfat creates long-term structural deficits under updated pricing ratios, mapping out multi-year sire selection targets to rebuild herd protein output.
- From Feed Bunk to Bulk Tank: The Precision Tech Reshaping Dairy Nutrition — Breaks down real-time rationing technologies and dynamic amino acid modeling software, showing how automated metabolic tracking prevents expensive over-supplementation of bypass proteins.
The Sunday Read Dairy Professionals Don’t Skip.

Every week, thousands of producers, breeders, and industry insiders open Bullvine Weekly for genetics insights, market shifts, and profit strategies they won’t find anywhere else. One email. Five minutes. Smarter decisions all week.
