Archive for Farm Economics & Management – Page 2

Gay Lea Says $450 Million. BNN’s Host Said $250 Million. Nobody’s Reconciled It.

Two numbers, $200M apart, for the same program. Meanwhile, $1.00/hL of retention runs $5,243 a year on an average Ontario farm — and nobody outside the co-op can tell you which way it’s moving.
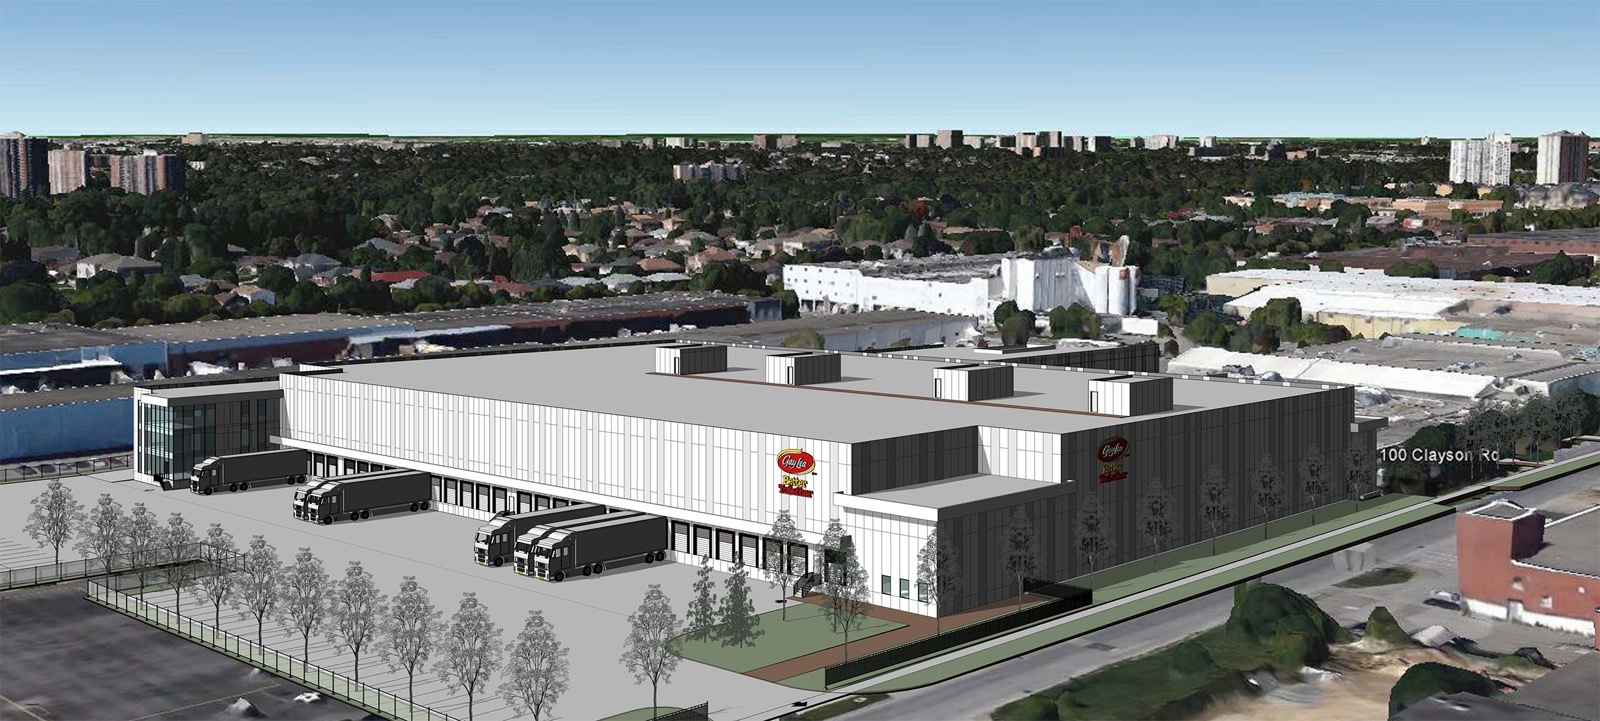
Gay Lea Network for Growth

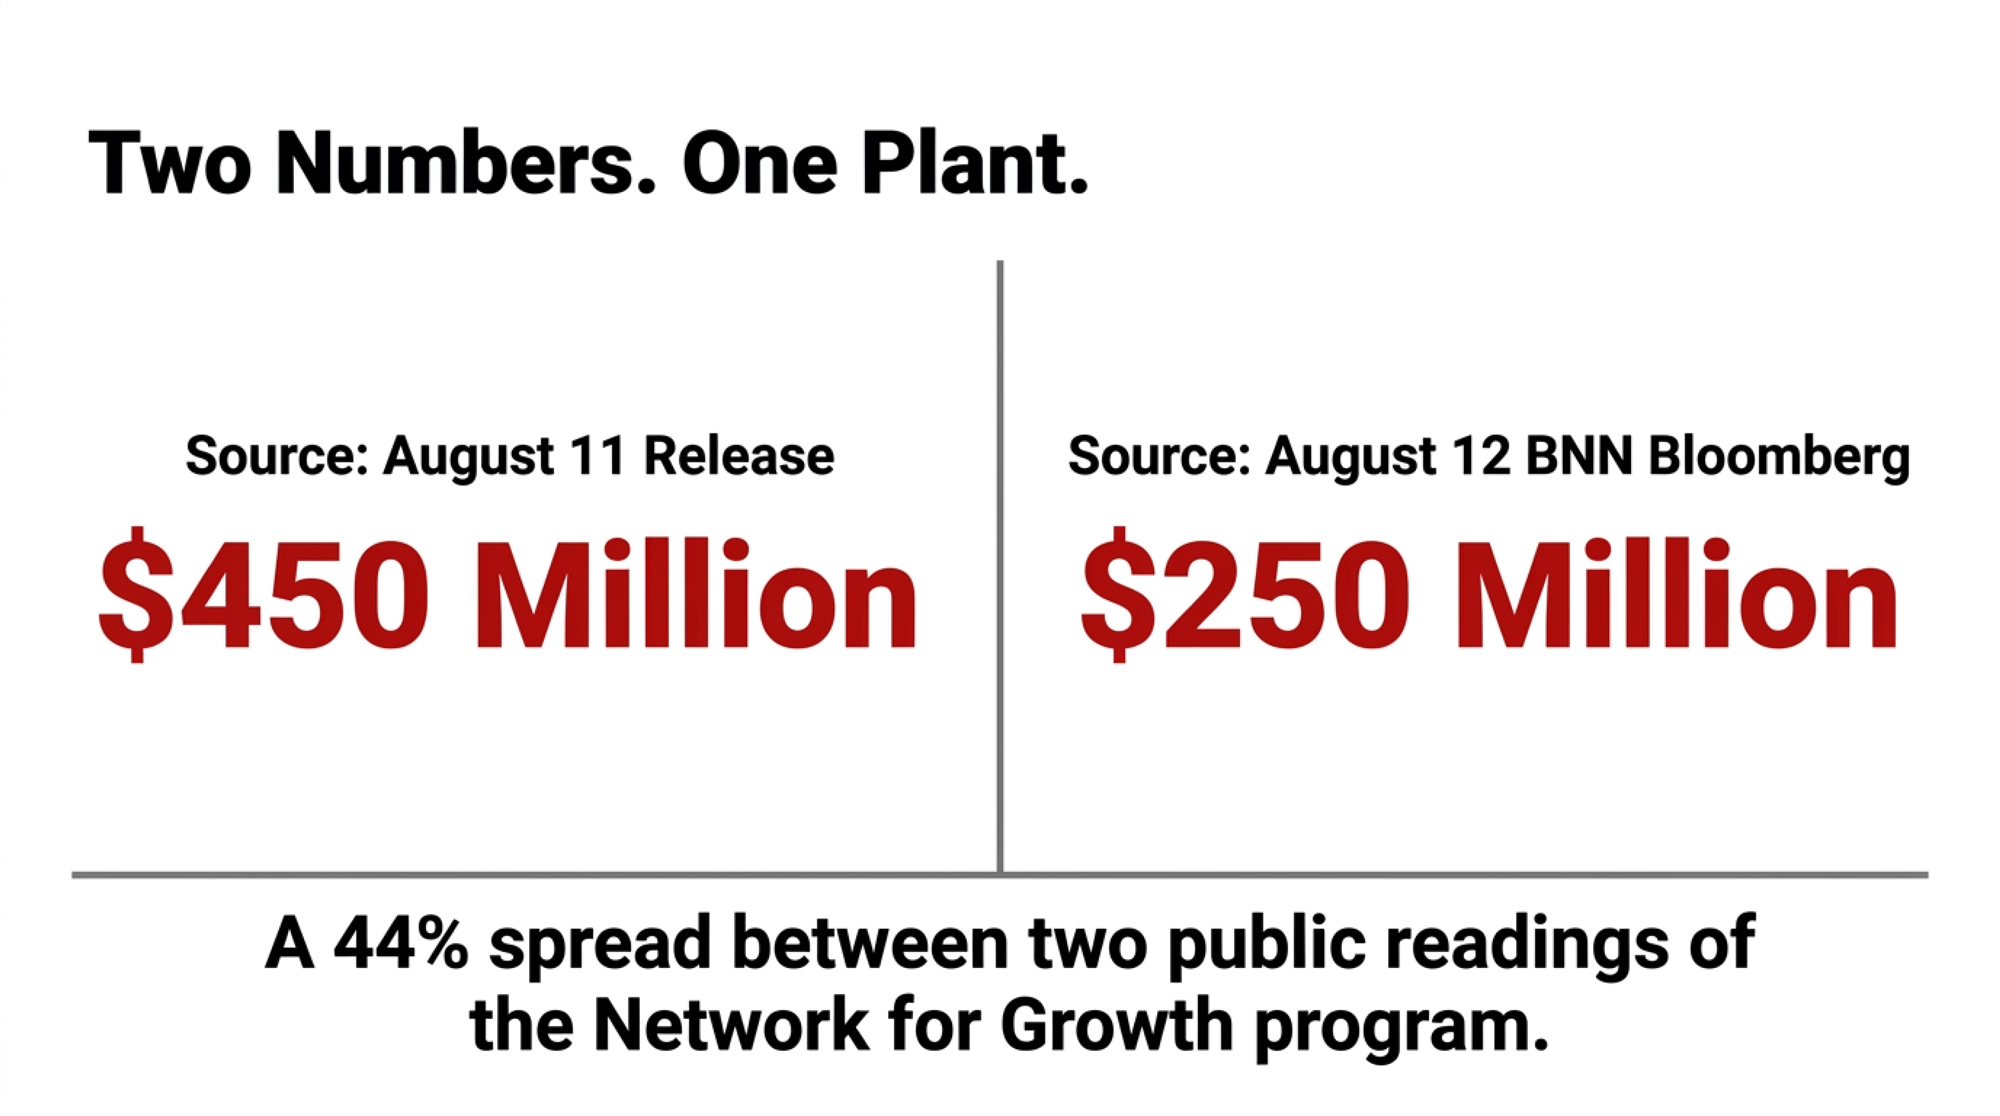
Gay Lea’s own release calls it an approximately $450 million program. Two days later, on BNN Bloomberg, the number was $250 million — and neither figure has been reconciled.

SourceDateFigure CitedContext
Gay Lea press releaseAug 11, 2026$450 millionDescribed as approximate program total, Network for Growth
BNN Bloomberg (host, on air)Aug 12, 2026$250 millionStated live, uncommented and unreconciled
Public record reconciliationAs of Aug 13, 2026Not reconciledNo public source clarifies which figure is operative
Confirmed first trancheAug 11, 2026$200 million+The only figure both sources agree exceeds this floor

The co-op committed more than $200 million on August 11, 2026 to expand its Clayson Road plant in Toronto, described as the first milestone in a multi-year program named Network for Growth. About 1,200 farmer-members across Ontario and Manitoba own the business making that commitment. Co-op capital of that size comes off the balance sheet somewhere, and no public source breaks out how much comes from retained patronage, how much from debt, and how much from government.
The Category Bet Underneath the Capital

Three straight years of accelerating volume
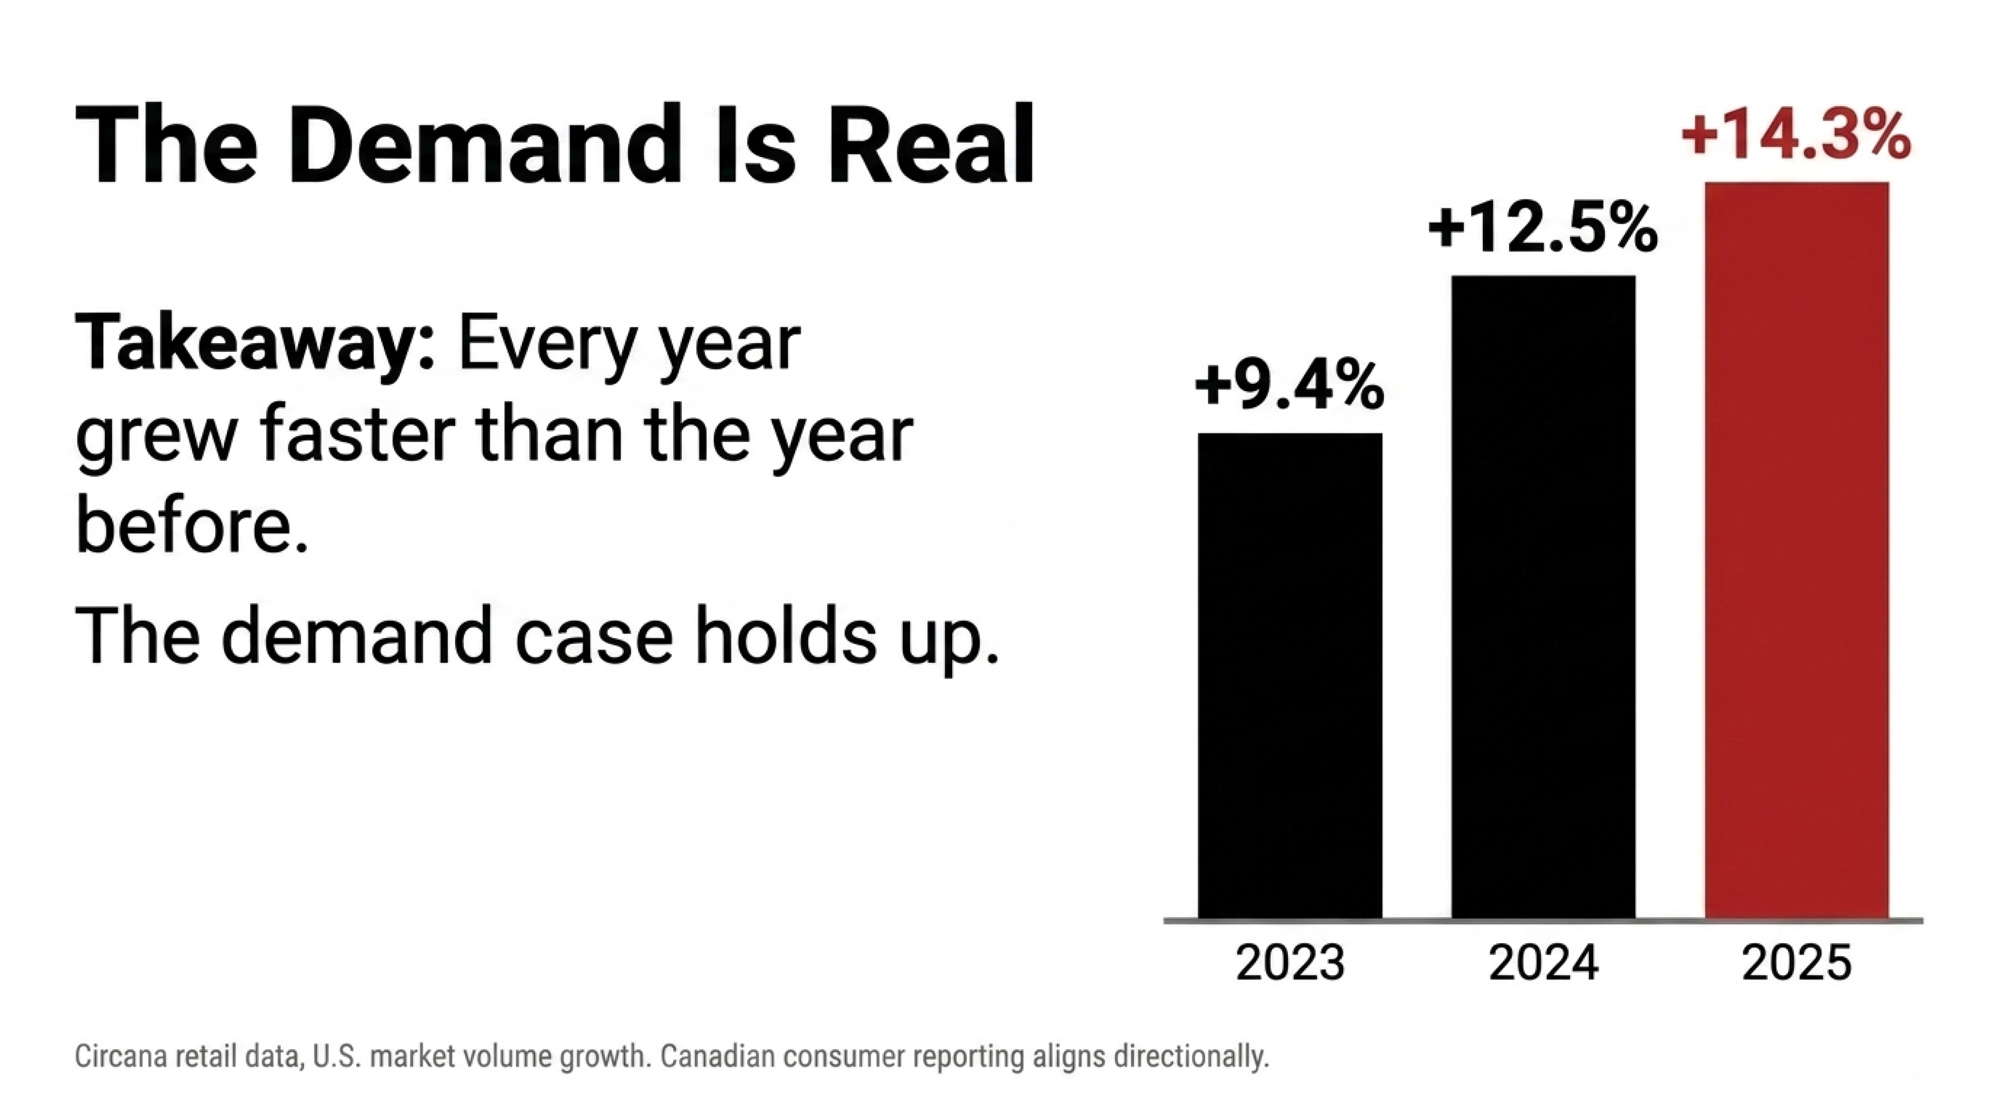
Circana retail data shows U.S. cottage cheese bottoming out in 2022 at 534.6 million pints, then climbing:

  • 2023: +9.4%
  • 2024: +12.5%
  • 2025: +14.3%, reaching 746.6 million pints

Each year faster than the one before. U.S. retail sales cleared $2 billion in 2025, up 19.2% in dollars and 13.9% in volume, following roughly 17% dollar growth in the 52 weeks ending December 1, 2024.

Canada moved harder

Gay Lea’s own read matches the U.S. trajectory. President and CEO Suzanna Dalrymple, speaking to BNN Bloomberg on August 12, 2026, put category growth in “double digits over the last several years” and described Canadians “incorporating cottage cheese into their breakfast, lunch, dinner, and snacks.”

Canadian consumer reporting from Chatelaine (April 2026) and CBC News Windsor (May 2026) puts the increase near 30% year over year, with empty shelves in major markets. Both cite retail and industry commentary rather than a StatCan or Nielsen Canada series — directional, not precise.

The demand case holds up. That was never the part a patron needed clarified.

Where Co-op Capital Actually Comes From

The mechanism

Cooperatives fund processing investment primarily through retained patronage refunds and preferred stock, per USDA Rural Development’s guidance on patronage refunds. The co-op calculates what it earned on your milk, keeps a share to build with, and credits it to your equity account for redemption on the co-op’s timetable.

The trade-off, on the record

The U.S. Government Accountability Office stated it plainly in its 2019 report on dairy cooperative consolidation:
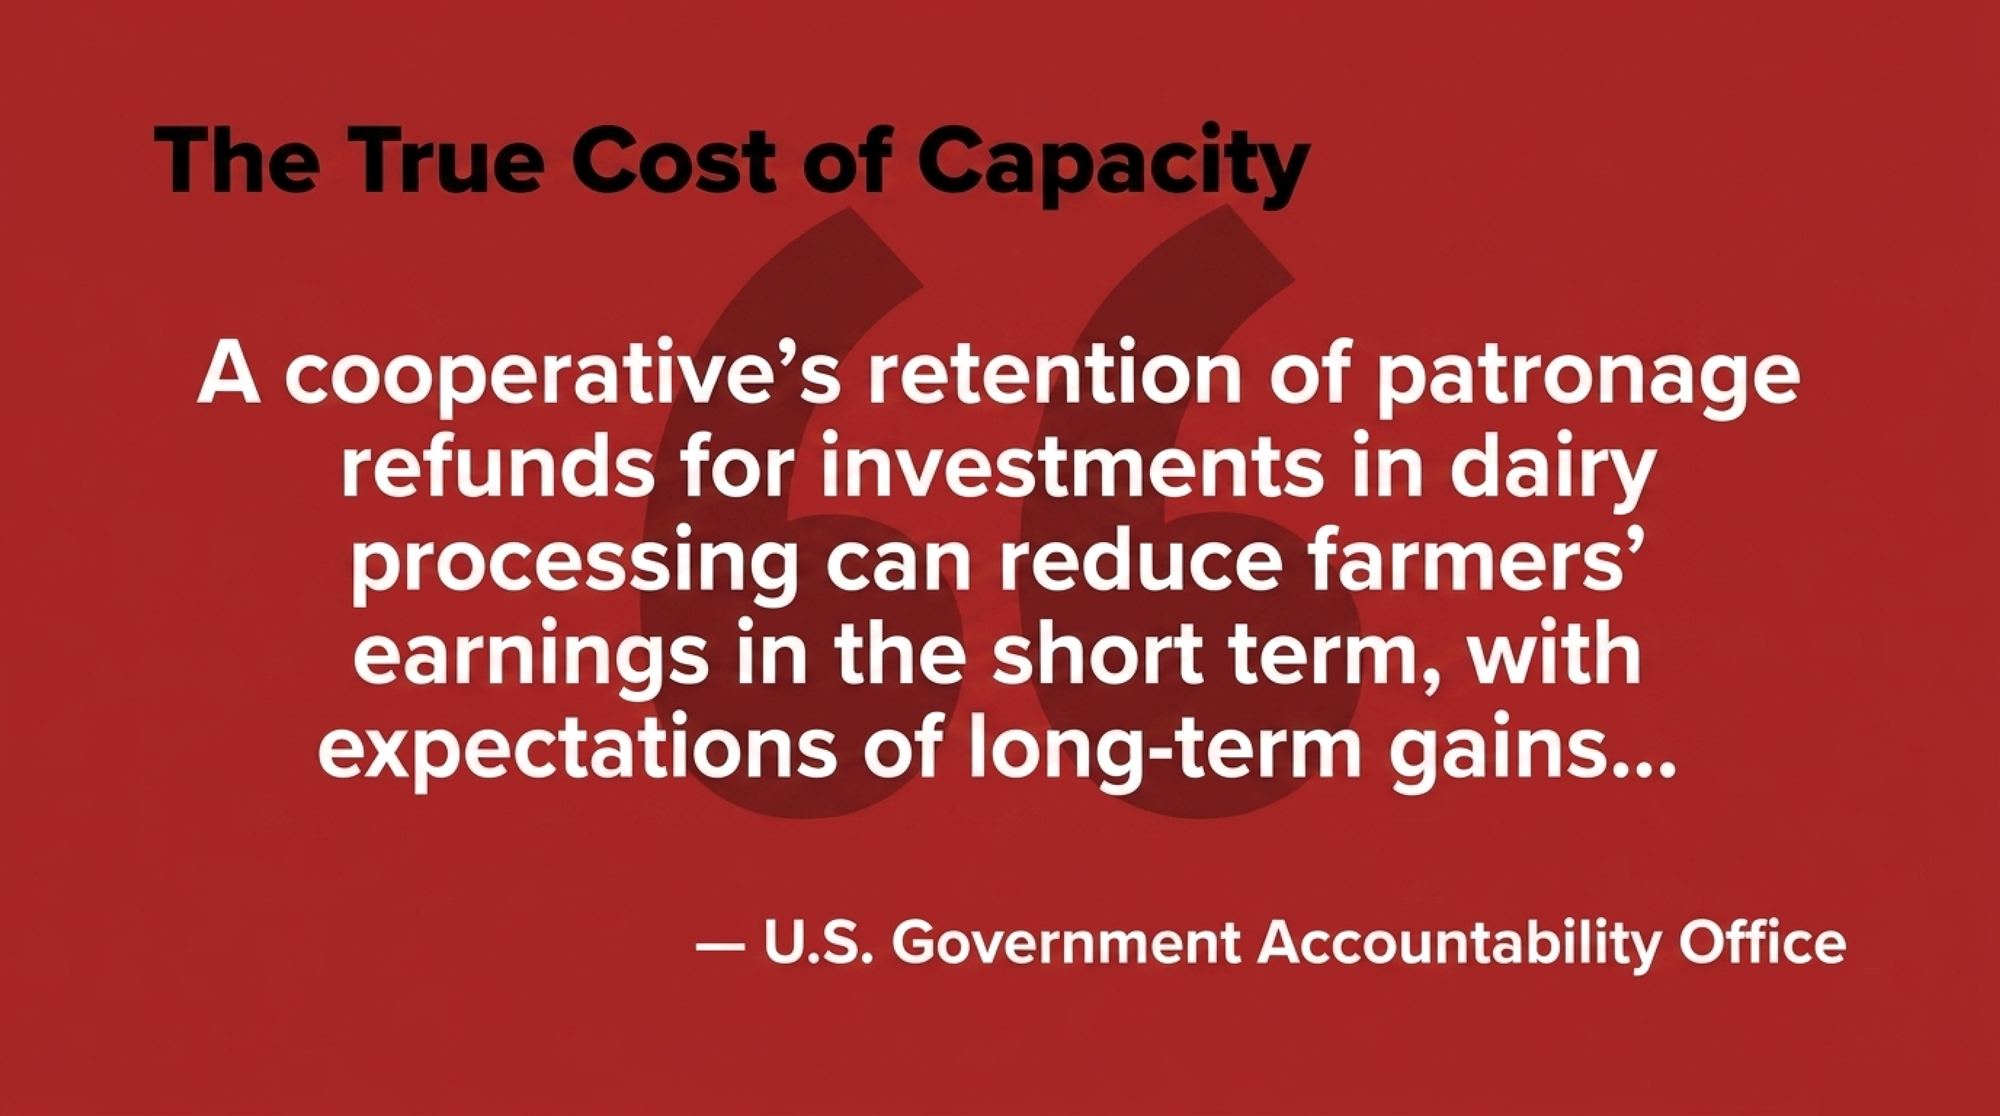
“A cooperative’s retention of patronage refunds for investments in dairy processing can reduce farmers’ earnings in the short term, with expectations of long-term gains when the cooperative undertakes investments that may increase earnings.”

Both sources are American and describe an accounting mechanism common to co-ops on either side of the border. Canadian retention rules differ in ways that may be material rather than technical — some Canadian frameworks permit retaining a substantially higher share of declared refunds than typical U.S. practice, and Gay Lea’s own bylaw provisions aren’t public. Treat the mechanism as portable and the percentages as not.

Where your milk lands in Ontario’s class system also shapes what a retention point costs you. Pull your own component detail before modelling off any provincial average.

Running the Numbers

The program figure has appeared two ways — and it changes the math

Gay Lea’s August 11 release and the trade coverage that followed put Network for Growth at approximately $450 million. In the August 12 BNN Bloomberg interview, the host referred to the program as $250 million; the figure went uncommented on air. Both readings sit on the public record.

That’s not a rounding issue. Run both:
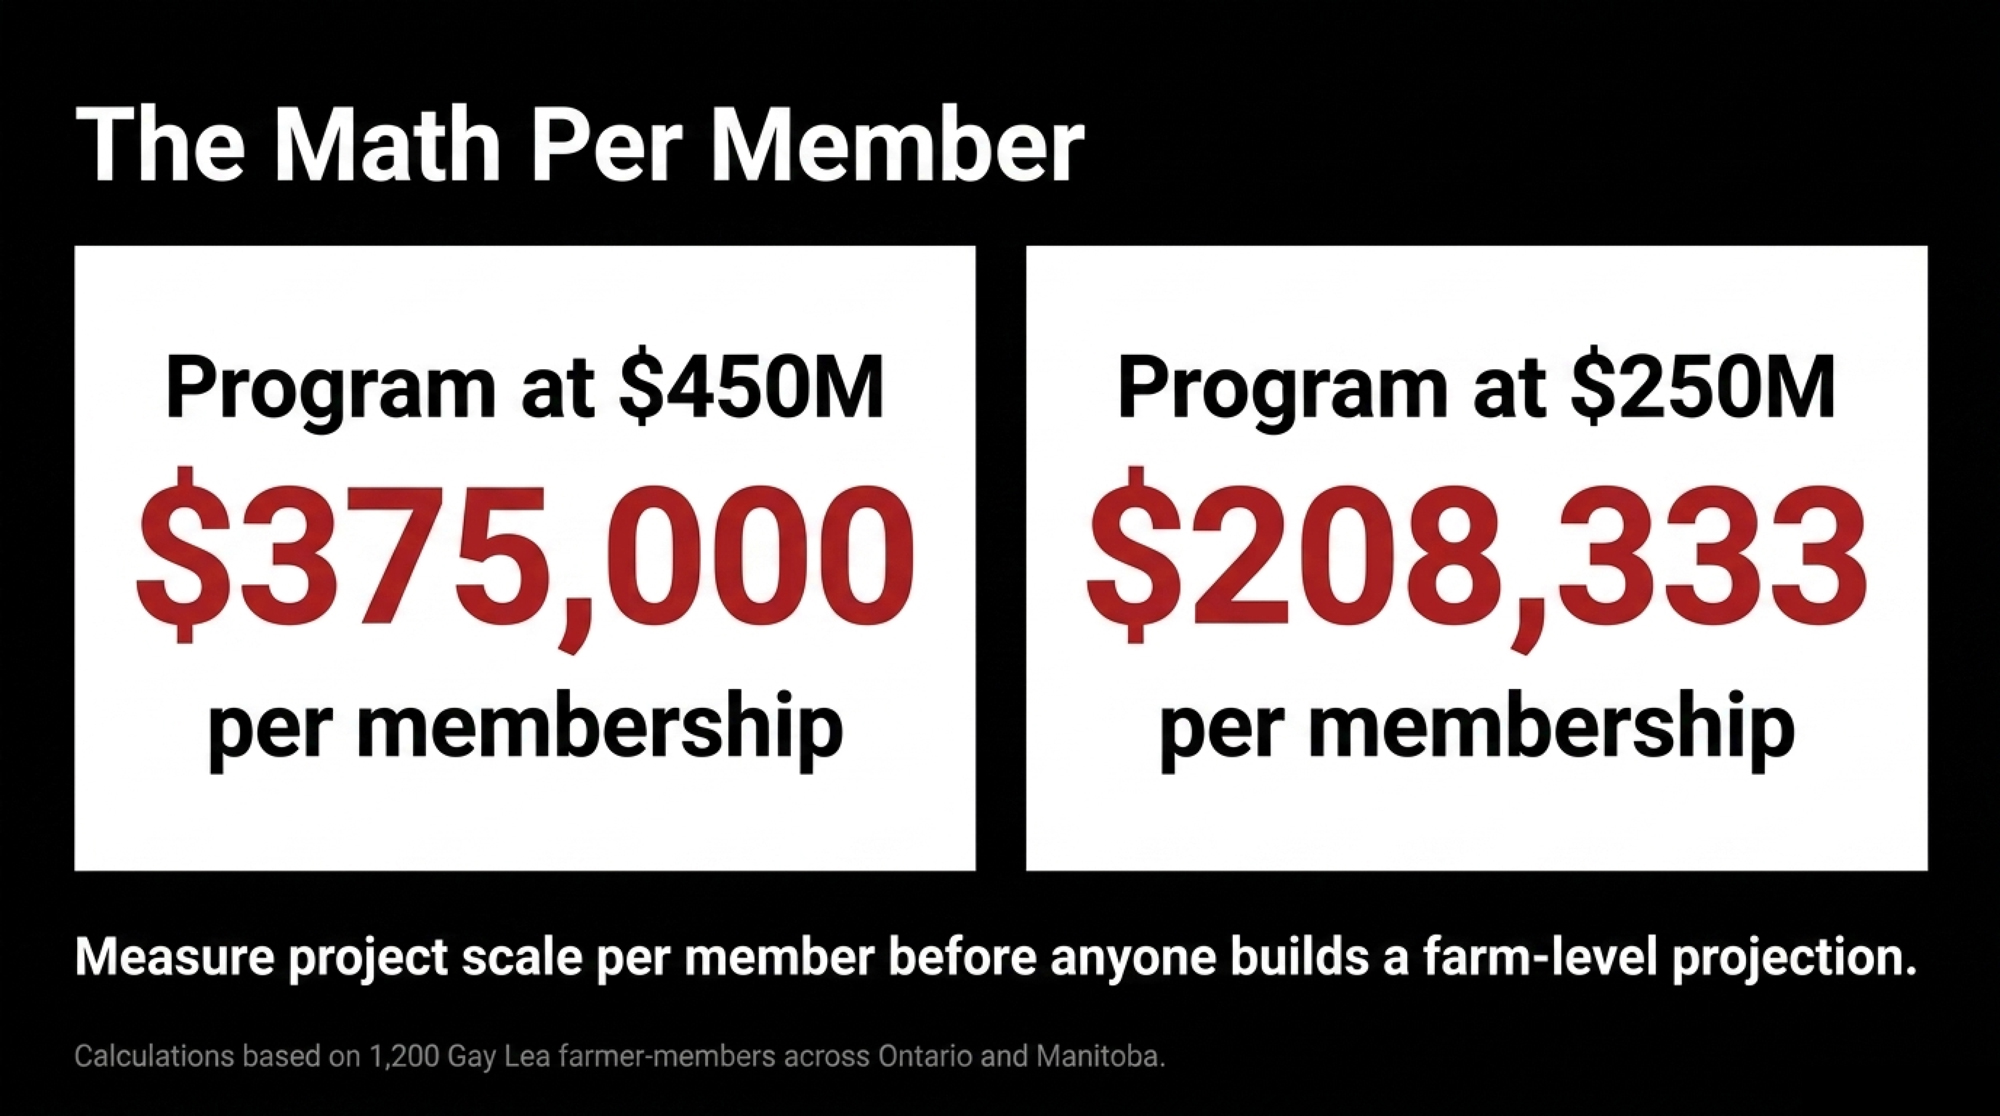
ScenarioProgram total÷ 1,200 membersPer membership
First tranche only$200M+$200,000,000 ÷ 1,200$166,667
Program at $450M$450M$450,000,000 ÷ 1,200$375,000
Program at $250M$250M$250,000,000 ÷ 1,200$208,333

A 44% spread between the two program readings. Before anyone builds a projection off either figure, confirm which one the co-op is working from.

Read all three correctly. They measure project scale per member — not retained equity, not a deduction, not an exposure estimate. Retained patronage depends on what the co-op earns on your milk, not on what a project costs. A build financed 60% by debt produces nowhere near $375,000 per member in retention.

What a retention shift costs, by volume

Assumptions: Ontario average milk sold per farm of 524,341 litres (~5,243 hL) from the Ontario Dairy Farm Accounting Project’s 2022 annual report, and producer returns of $89.48/hL at Ontario average composition from Dairy Farmers of Ontario’s 2022 annual report. Both boards publish annually — pull the current year before you plan on these. Larger-volume rows scale the provincial per-farm average proportionally.

Annual volumeGross milk revenue+$1.00/hL+$2.00/hLOne month of gross
5,243 hL (provincial avg)~$469,000$5,243$10,486~$39,100
15,000 hL~$1.34M$15,000$30,000~$111,900
25,000 hL~$2.24M$25,000$50,000~$186,400

Run your own hL against your own $/hL. The arithmetic is one line, and your numbers beat any provincial average.

The number that’s actually yours

  1. Pull your last three patronage statements.
  2. Record the retained-versus-cash split on each — in dollars and as a percentage.
  3. Line the three years up side by side.

That trend is your real signal. Rising retention across two consecutive years while cash patronage falls is a cash-flow planning item. Rising retention in a strong earnings year may mean nothing at all, which is why you read absolute dollars alongside the percentage.

Leverage changes the calculus too. A farm carrying heavy term debt feels a retention shift in its operating line immediately. A debt-free operation absorbs the same shift as deferred equity.

What Producers Outside the Co-op Should Take From This

The GAO flagged a second effect in the same report, and non-patrons should read it as a shipping decision rather than a policy note. Increased market access from a co-op’s processing investment, the report found, “may result in higher earnings for farmers in the cooperative while potentially reducing market access for farmers outside of the cooperative.”

Dalrymple told BNN Bloomberg the Toronto facilities take milk “every day… from the dairy farmers of Ontario.” A patron is funding capacity that will absorb their protein. A non-patron watches a competitor’s outlet grow while carrying none of the build cost — and gaining none of the access.

You take on equity exposure and market access together, or you decline both. Neither side of that trade is obviously the winner.

Is There Public Money in This Build?

What DIIF allows

Canada’s Dairy Innovation and Investment Fund was built to co-fund this class of expansion. Per the Canadian Dairy Commission’s applicant guide:

  • Non-repayable contributions up to 33% of eligible costs
  • 25% for construction specifically
  • Capped at $75 million per project
  • Ontario allocated $127 million of the $333 million national pool

No public record indicates Gay Lea has applied for or received DIIF funding for Clayson Road.

The precedent at this exact site

The Government of Canada’s Grants and Contributions database carries agreement 062-2020-2021-Q1-00441: a $10 million FedDev Ontario Business Scale-Up contribution, running June 12, 2018 to September 30, 2020, for equipment acquisition and building expansion across four facilities — Teeswater, Guelph, Hamilton, and Clayson. That agreement closed nearly six years before this announcement.

It sat inside a larger package announced jointly by the co-op and the federal government at Teeswater on July 24, 2019, with then-Agriculture Minister Marie-Claude Bibeau present:

  • $10 million — FedDev Ontario, processing equipment
  • $6.9 million — AAFC Dairy Processing Investment Fund, waste-reduction work
  • $16.9 million total, with roughly 13 skilled positions created and 50 maintained

The FedDev component in the grants database is the same $10 million inside that $16.9 million package — one program, publicly announced, and separately logged in Ottawa’s statutory disclosure database, which publishes contribution records regardless of what recipients announce.

Gay Lea has form on multi-year capital programs, too. In November 2016, the co-op announced $140 million over four years for a nutraceutical-grade dairy ingredients business, with a $60 million first phase at Teeswater starting in early 2017.

Financing SourcePublicly Confirmed?Amount / StatusNote
Retained patronage refundsMechanism confirmed, amount not disclosedUnknown splitStandard co-op practice per USDA guidance
DebtNot disclosedUnknownNo public breakdown of leverage on this build
DIIF (federal co-funding)No application on record$0 confirmedProgram allows up to 33% of eligible costs, capped at $75M
FedDev Ontario (2018 precedent, same site)Confirmed, closed$10 millionAgreement ran 2018–2020, unrelated to current build
AAFC Dairy Processing Investment Fund (2019 precedent)Confirmed, closed$6.9 millionPart of a separate $16.9M package announced jointly with Ottawa

The pattern worth noting: when federal money has been part of a Gay Lea plant project, it came with a joint announcement and a dollar figure attached. On the current program, no equivalent announcement has appeared.

It’s early in a build that runs to 2028. Terms may not be final. Public co-investment may not be part of this one at all. Each of those stops being a question the moment somebody asks.

Is Fixed-Price or Cost-Plus the Question Nobody Asked?

On a nine-figure build, that single contract distinction sets whether member equity exposure has a ceiling or floats with the project. Fixed-price caps it. Cost-plus doesn’t.

Asked on BNN Bloomberg whether anything could affect the 2028 timeline, Dalrymple said: “Nothing that would be different from any other construction build, but we’ve got a great team working on it, and we expect it to be on time and on budget.”

That’s a confidence statement about outcomes, not a disclosure of contract structure — and they aren’t the same thing. On budget against a fixed price means the price holds. On budget against cost-plus means the estimate held, which is a different promise with a different owner of the overrun risk.

No public source states which structure governs Clayson Road, and capital projects routinely don’t publish contract terms. Members hold the equity here, though, and whether a co-op discloses those terms is governed by its own bylaws and by Ontario co-operative law. Check your membership agreement rather than assuming either way.

Ask it while the build is still in front of you. Once the plant is running, the terms are settled.

Is Your Shipping Decision Now a Category Decision?

One 60-day window shows where dairy capital thinks the margin lives:

CompanyCommitmentRead
Lactalis Canada$900M+ across 19 sitesMulti-category, investor-owned
Gay Lea$200M+Cottage cheese
Bongards’ Creameries$135MProcess cheese
Dairy Farmers of AmericaSt. Albans, VT idled Aug 17Fluid milk exit

Bongards adds 180 million pounds of annual capacity, with construction starting Q4 2026 and commercial operations expected in early 2028. DFA’s idling costs roughly 80 jobs — and the hauling bill lands on the farms around it, not on the processor. Lactalis Canada’s program includes $42 million at Winchester, Ontario, with a $16.4 million milk receiving bay.

Three co-op or co-op-adjacent entities. Three category-specific calls. One quarter. And Lactalis — investor-owned, no member equity in play — reading the same categories the same way.

If you’ve never pressed your processor on what your milk actually becomes, that’s the gap Same Milk, Different Payday was built to close. For the American version of the same squeeze, the $11 billion gap runs those numbers.

The 30/90/365-Day Playbook

30 Days — Urgent Checks

1. Chart your retention split across three years

  • Do: Pull three years of patronage statements; record the retained-versus-cash split in dollars and percentages.
  • Requires: Statements, twenty minutes
  • Trigger: Retained share up in each of the last two years while cash patronage fell
  • Watch for: Retention climbs in strong earnings years too — read absolute dollars before concluding anything

2. Submit three financing questions in writing

  • Do: Email your board asking for the patronage/debt/government split, the contract structure, and whether a member-approved cost cap exists.
  • Requires: An email
  • Trigger: None — do it regardless
  • Watch for: “Not finalized” is legitimate this early in a build. Asking now sets the expectation that it gets answered later.

3. Ask which program figure is operative

  • Do: Request written confirmation of the Network for Growth total
  • Requires: One line in the same email as #2
  • Trigger: The $200M spread between the public readings
  • Watch for: Both figures may be accurate under different definitions — one could be net of a component the other includes. Ask what’s in and out, not just the number

90 Days — Structural Adjustments

4. Model exposure against your actual volume

  • Do: Work your real hL through the retention scenarios with your accountant, not the even-split figures
  • Requires: Three years of statements, your hL shipped, your CPA, about an hour
  • Threshold: Projected retention exceeding one month of gross milk revenue belongs in operating-line planning — roughly $39,100 at 5,243 hL, $111,900 at 15,000 hL
  • Watch for: You’re modelling against an undisclosed financing mix and an unreconciled program total. Build a range; revisit when the co-op discloses

5. Read your supply agreement’s term before you model anything

  • Do: Check whether you’re on a multi-year supply commitment or shipping year-to-year
  • Requires: Your membership and supply documents
  • Threshold: A patron locked into a multi-year agreement through 2028 carries retention exposure across the full build; a year-to-year shipper has an exit that a long-term commitment doesn’t
  • Watch for: Exit optionality isn’t free — leaving a co-op mid-build can trigger equity redemption on the co-op’s timetable, not yours

6. Get the equity redemption schedule in writing

  • Do: Request the revolving period from your board or corporate secretary
  • Requires: Persistence
  • Threshold: Know the period in years, not in “eventually”
  • Watch for: Boards can revise redemption schedules under financial pressure. A stated schedule isn’t a contract

365 Days — Strategic Positioning

7. Track the competitive response

  • Do: Monitor Saputo, and Lactalis for cottage-cheese capacity announcements
  • Opportunity signal: A competitor move within twelve months means companies with zero member equity at risk are independently confirming the demand read
  • Current status: Nothing announced as of mid-August 2026
  • Watch for: Silence has three readings — the category is too small for their portfolios, they’re already at capacity, or something unannounced is in motion. The public record doesn’t distinguish among them

8. Watch the supply-management file alongside the capital file

  • Do: Track whether Ottawa concedes on supply management in U.S. trade talks. Dalrymple’s public position is that Gay Lea is “focused on what we can control,” describing trade disruption to date as minimal because the Canadian system is built around domestic supply
  • Trigger: A concrete concession affecting Class allocations changes the demand assumptions under any protein-category build
  • Watch for: Trade rumours aren’t announced policy. Wait for the latter

9. Stress-test the demand curve

  • Do: Build your long-range plan on a range, not a point estimate
  • The data: Three consecutive Circana years at 9.4%, 12.5%, 14.3%. No defensible ceiling estimate exists
  • Watch for: Commercial forecasters put long-range U.S. growth anywhere from 3.5% to 6.2% annually into the early 2030s, and their absolute market-size estimates disagree by orders of magnitude

What This Means for Your Operation

If you’re a Gay Lea patron: you’re on the short-term-cost side of the GAO’s trade-off until Clayson Road commissions in 2028. That’s the structure working as designed. The open question is whether you can see the terms while you’re inside them.

If you’re a non-patron Ontario producer: the GAO’s market-access finding says this build shifts your competitive position without asking for your permission or your capital. Watch the capacity announcements as pricing intelligence.

If you’re a U.S. producer: Bongards committed $135 million to process cheese in the same week DFA idled a fluid plant. The disclosure question travels. Ask your board what share of the last capital project came from retained patronage versus debt versus a state or federal program, then watch whether anyone can answer without checking.

The Question Worth Putting in Writing

Short-term equity for long-term position is a legitimate trade. It built most of the processing capacity your milk already moves through, and Gay Lea’s demand read is well-supported by three years of Circana volume data and by what its own CEO is saying publicly.

But a $200 million spread between two public statements of the same program’s size gets resolved in a sentence, once somebody asks for it.

So pull the statements. What did your co-op retain from your cheque in each of the last three years, and can anyone at your next annual meeting tell you what it bought?

Key Takeaways

  • Two public figures for the same program, $200M apart, swing project scale per member from $208,333 to $375,000 — ask which number your board is working from before this year’s retention rate gets set.
  • Retained patronage funds this build before anyone sees a return. At $1.00/hL, that’s $5,243 a year on 5,243 hL, $15,000 on 15,000 hL, and you can’t estimate it from outside because the financing mix isn’t public.
  • Pull three years of patronage statements and chart the retained-versus-cash split. Rising retention two years running while cash drops is a cash-flow item; rising retention in a strong earnings year might be nothing.
  • Fixed-price or cost-plus decides whether your exposure has a ceiling. On a build that runs to 2028, the answer is worth having in writing now rather than reconstructing later.

Based on public documents, trade coverage, and broadcast interviews available as of August 13, 2026.
Learn More

The Sunday Read Dairy Professionals Don’t Skip.

Every week, thousands of producers, breeders, and industry insiders open Bullvine Weekly for genetics insights, market shifts, and profit strategies they won’t find anywhere else. One email. Five minutes. Smarter decisions all week.

NewsSubscribe
First
Last
Consent

$34.4 Million Later, the Rule That Hid Your Pay Price Is Still on the Books

Private processors must itemize your deductions. Co-ops don’t have to — and the exemption is one line of federal code. Two co-ops just paid $34.4M. The rule didn’t budge.

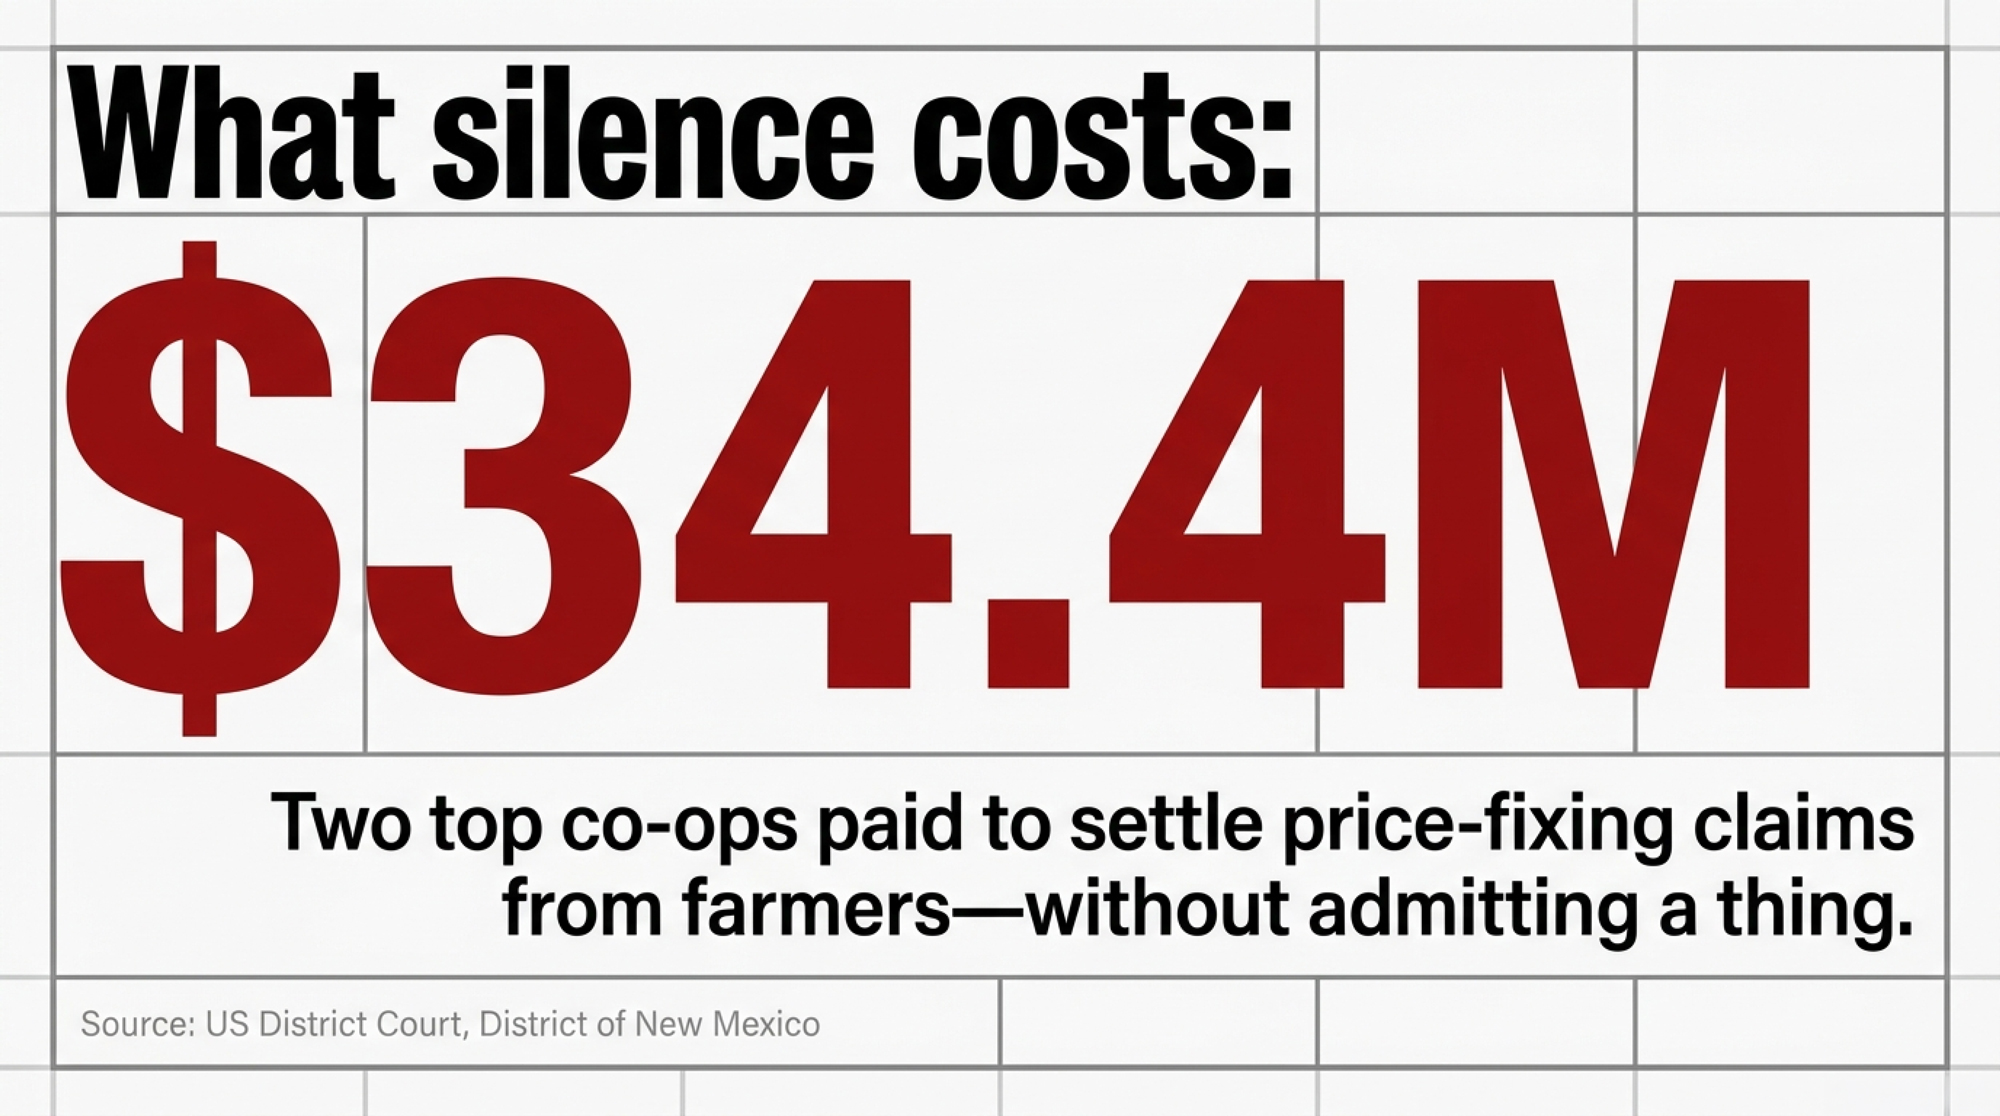
The short version: Two of the biggest co-ops in the country paid $34.4 million to settle price-fixing claims from a handful of New Mexico dairies, and part of the deal was agreeing to stop sharing member pay-price data — DFA at $24.5 million, Select Milk Producers at $9.9 million, neither admitting a thing. The farmers who filed said they couldn’t prove what they suspected from their own paperwork, and the reason is a carve-out in the federal milk marketing orders: the itemization rule that forces private handlers to break down your deductions applies to every producer except one whose milk came through a cooperative association handler. That exemption sits in the .73(f) provision of every federal order — the section number changes with your region, the exemption doesn’t — which means your co-op can provide a detailed statement, but no federal rule says it has to. History says don’t count on the recovery either: the last Northeast case put roughly $4,000 into the average farm’s hands, about $20 a cow on a 200-cow herd, after seven years of litigation and $16.7 million in attorney fees. The judge who approved it wrote that $4,000 “could reasonably be perceived as a modest recovery.” The practical move costs you an afternoon: pull twelve months of pay statements, line them against your state’s Mailbox Milk Price from AMS, and flag any month your check moved in lockstep with a competing buyer’s announced price. One month is noise. Twelve is a document — and if you can’t reconcile a deduction, asking your co-op in writing for the calculation method is a courtesy request, not an entitlement.

milk check transparency

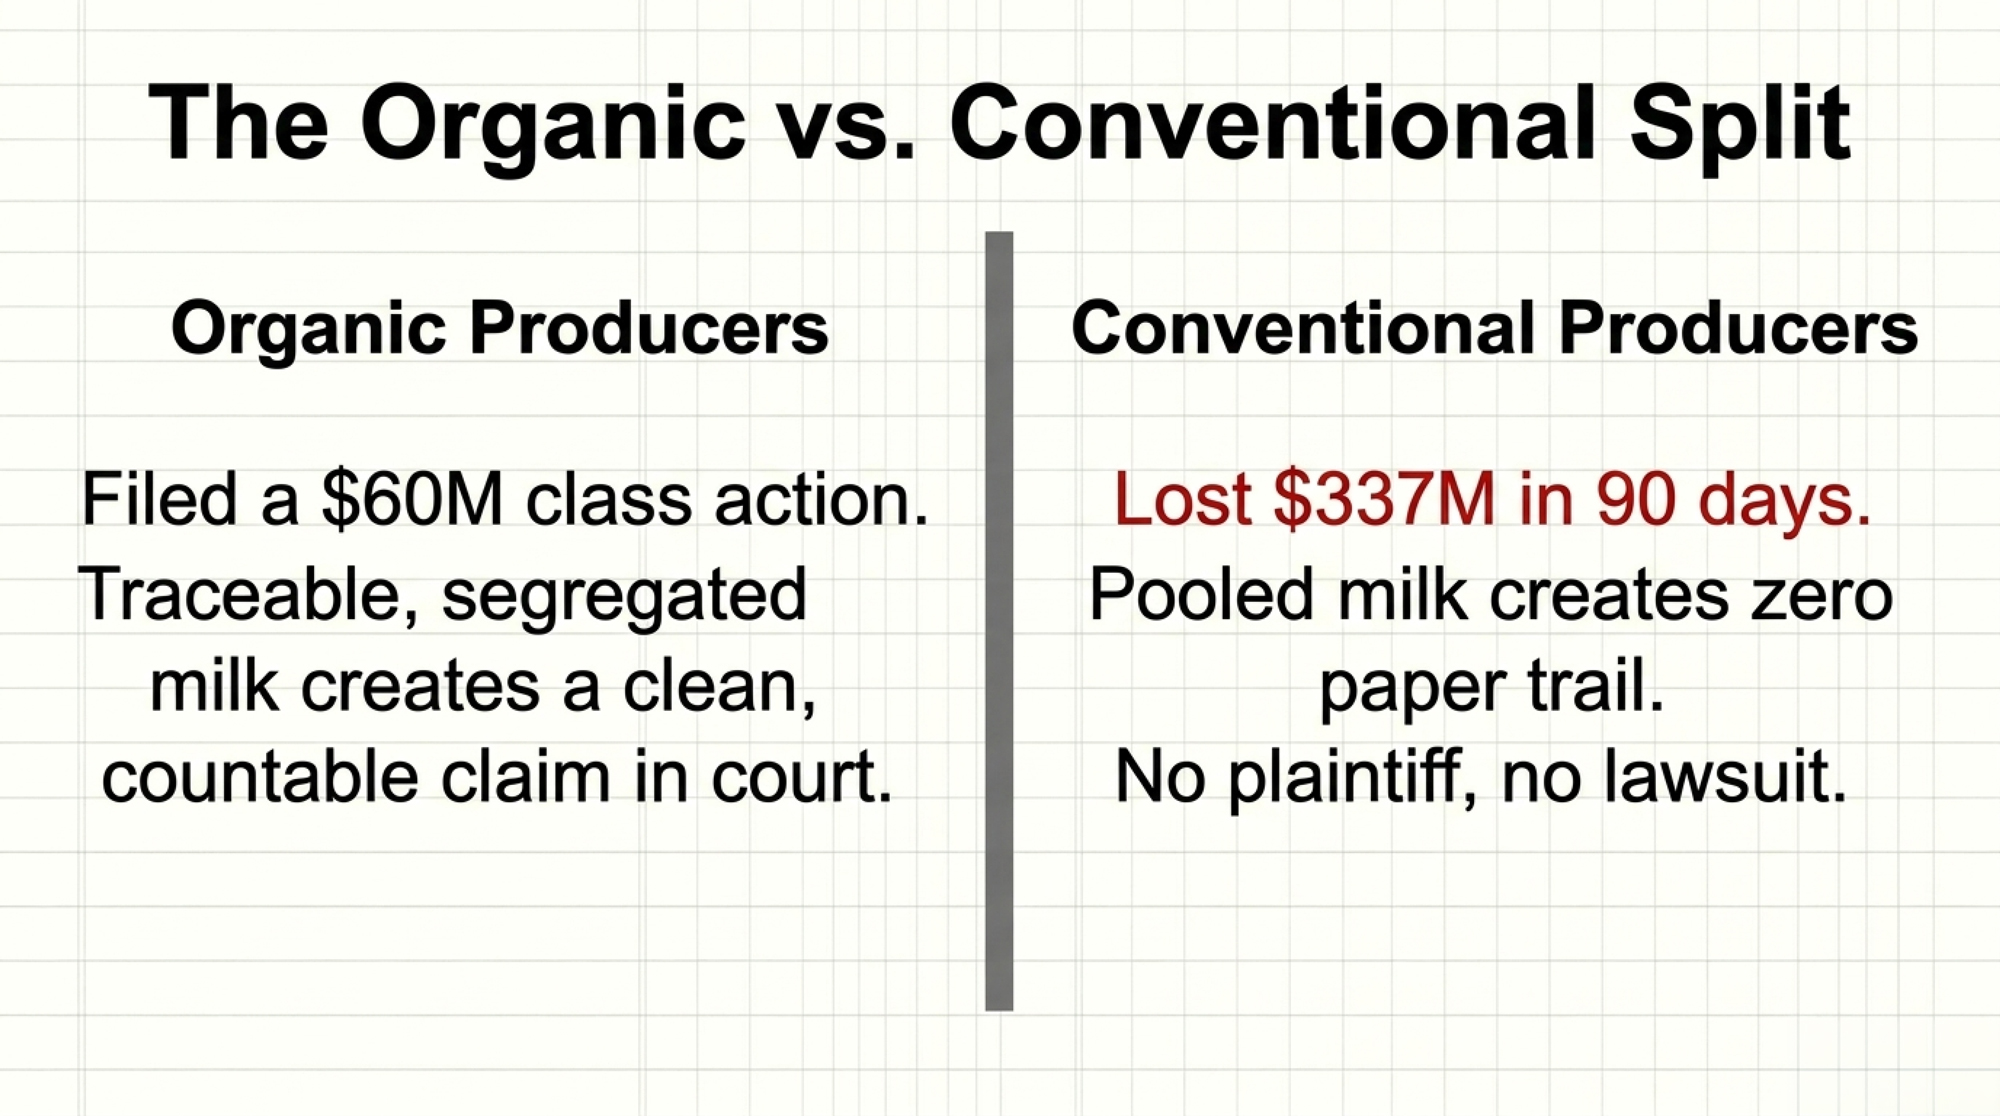
A group of New Mexico dairies said their milk checks were being held down, and they couldn’t prove it from their own paperwork. Four years later, two of the biggest co-ops in the country paid $34.4 million to make the case go away — and agreed to stop sharing member pay-price data with each other. Neither admitted a thing. 

Here’s the part that should stop you: the reason those farmers couldn’t check their own statements isn’t an oversight. It’s a carve-out in the federal milk marketing order rules, and if you ship through a co-op, it covers you too.

In March 2024, Judge Margaret Strickland of the U.S. District Court for the District of New Mexico summarized what those farmers were alleging. Her ruling puts their complaint this way: “The price paid to a member-farmer need not match the FMMO or the Mailbox Milk Price, nor does the algorithm to calculate actual payment need to be disclosed.” That’s an allegation, not a judicial finding about the industry. But it describes the rulebook accurately. 

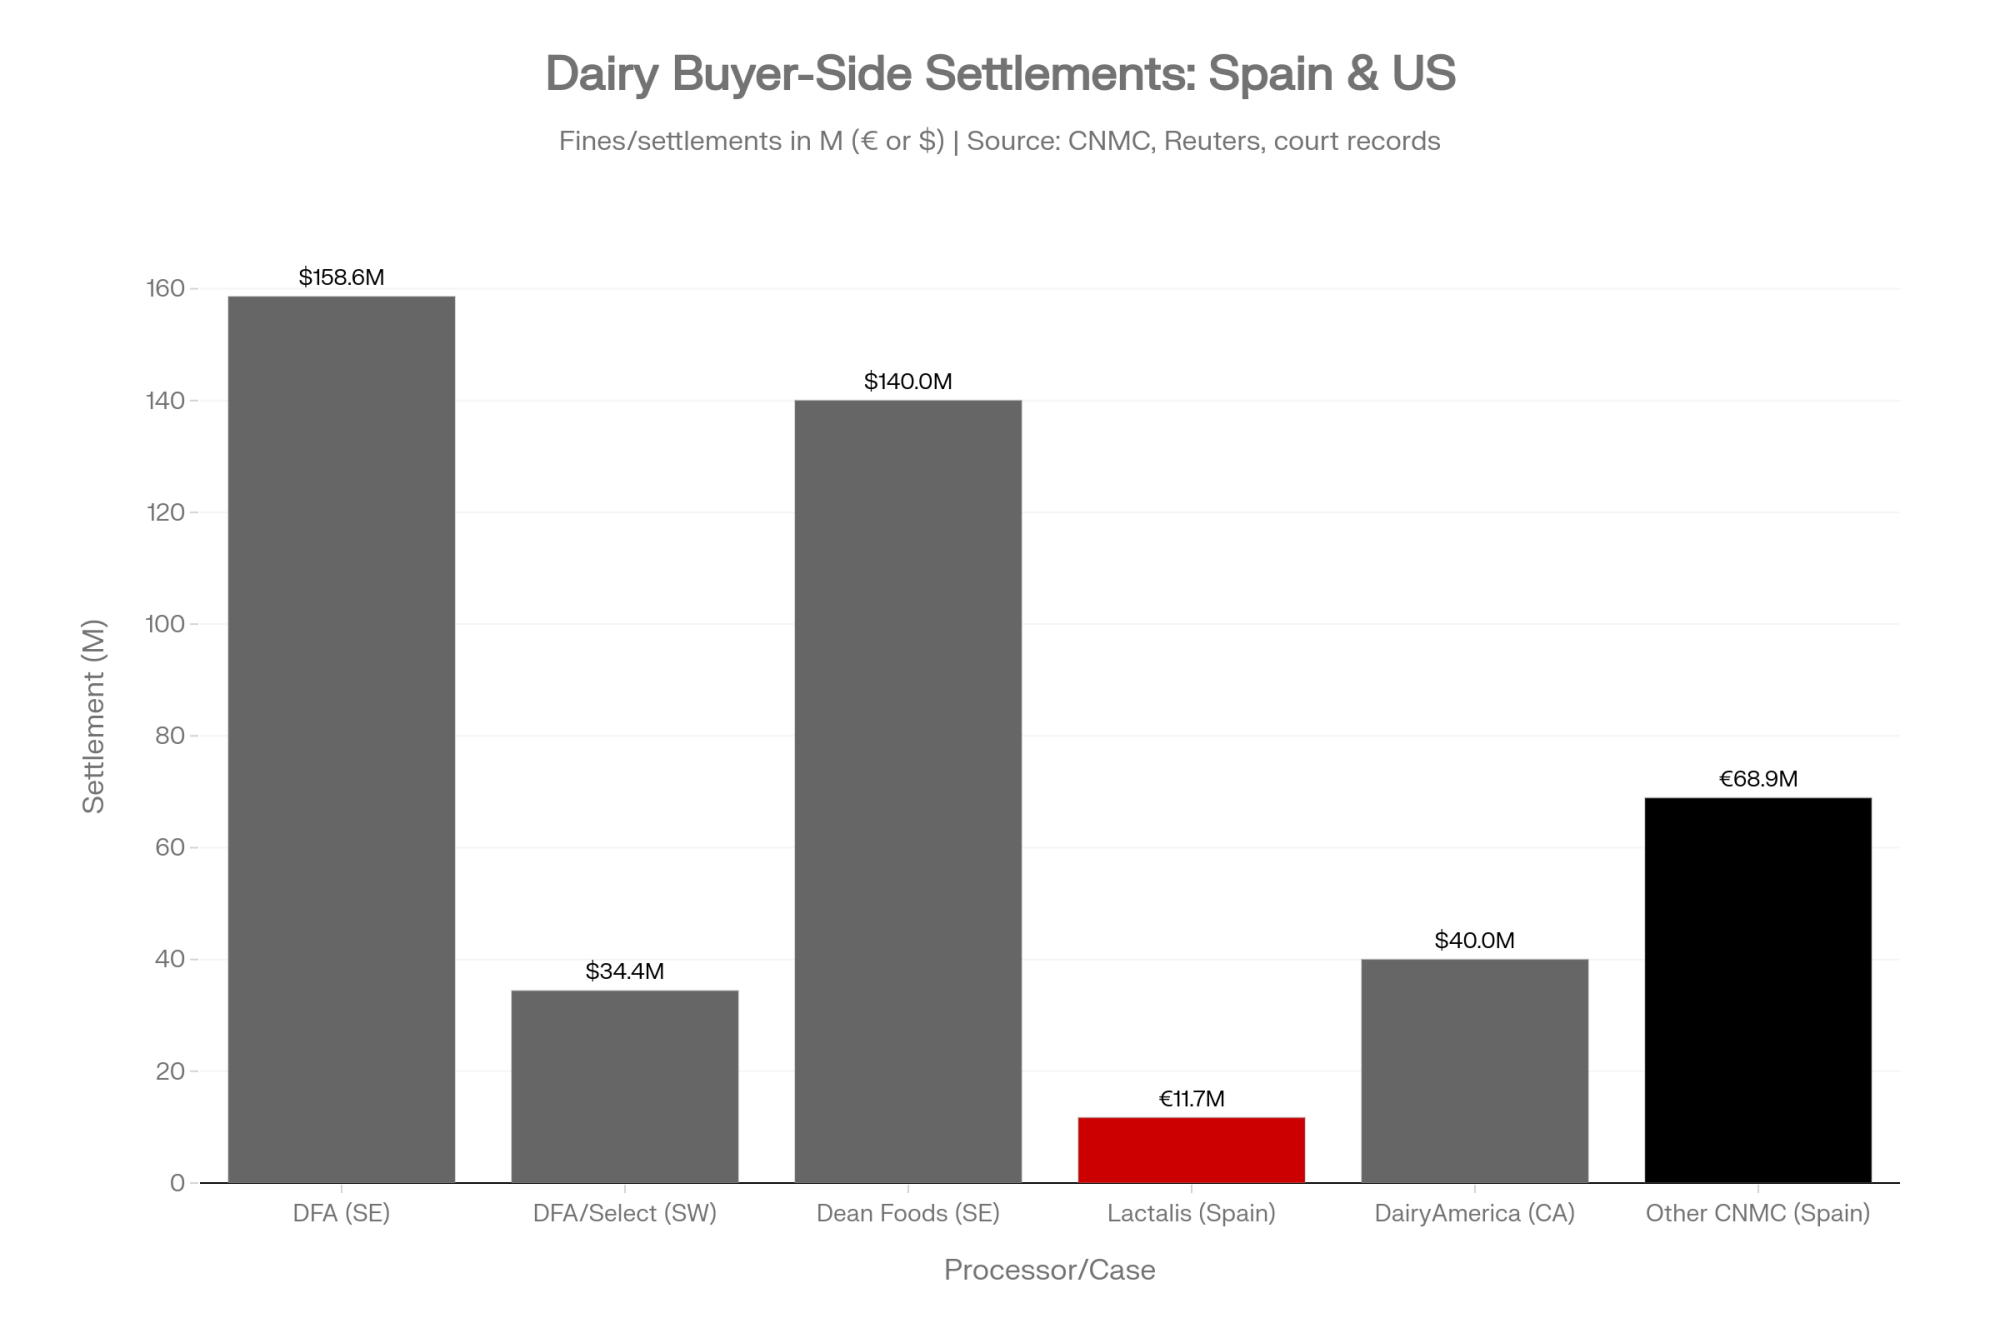
The plaintiffs included Othart Dairy Farms in Belen, Pareo Farm in Socorro County, Desertland Dairy in Vado, Del Oro Dairy in Anthony, and Bright Star Dairy and Sunset Dairy, both in Mesquite. They alleged DFA and Select Milk Producers coordinated to suppress Southwest Grade A milk pay. Strickland let the case proceed. On December 8, 2025, the court granted final approval of the settlement — $24.5 million from DFA and $9.9 million from Select. Payments started going out June 2, 2026. 

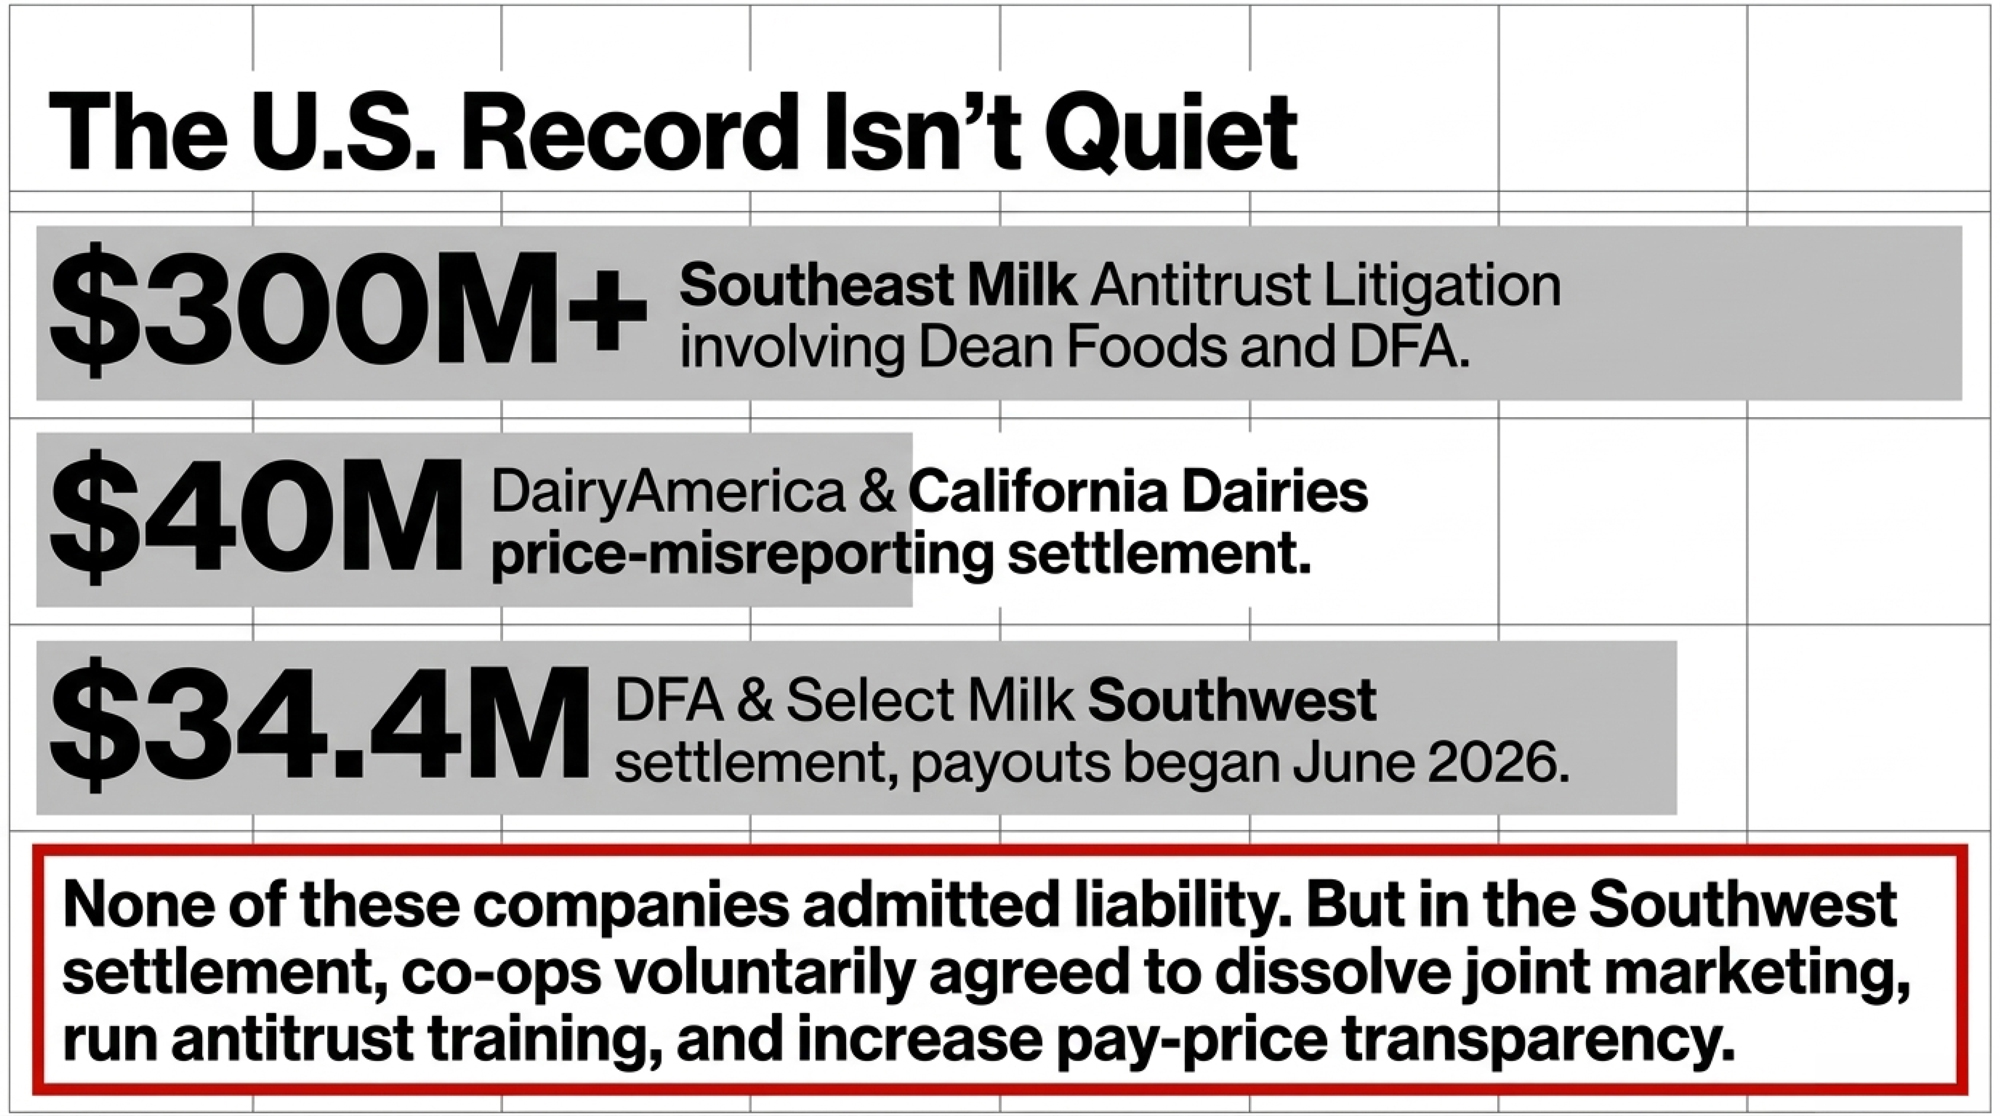
The non-monetary terms are worth reading. Both co-ops agreed to dissolve their jointly-owned marketing agency, run antitrust training for marketing staff, and provide better pay transparency and milk check education for members. Neither accepted that any of the alleged conduct occurred, and settlements like this routinely include forward-looking terms without any finding that the practice took place. Still, it’s fair to ask why those particular terms — and not others — were the ones on the table. 

The European Warning: What Real Price-Fixing Actually Costs a Herd

Here’s why this article takes you to Spain. American dairy antitrust cases settle. They settle with no admission of wrongdoing, no finding of fact, and no number attached to what the conduct actually cost a farm. You get a fund size and a denial. That’s it.

Spain doesn’t work that way. Its competition regulator ran the investigation to conclusion, named the companies, named the behaviors, and its courts are now putting euro figures on the damage — farm by farm, in public rulings you can read. If you want to know what hidden pay-price coordination costs a dairy, Europe is the only place that has shown its arithmetic.

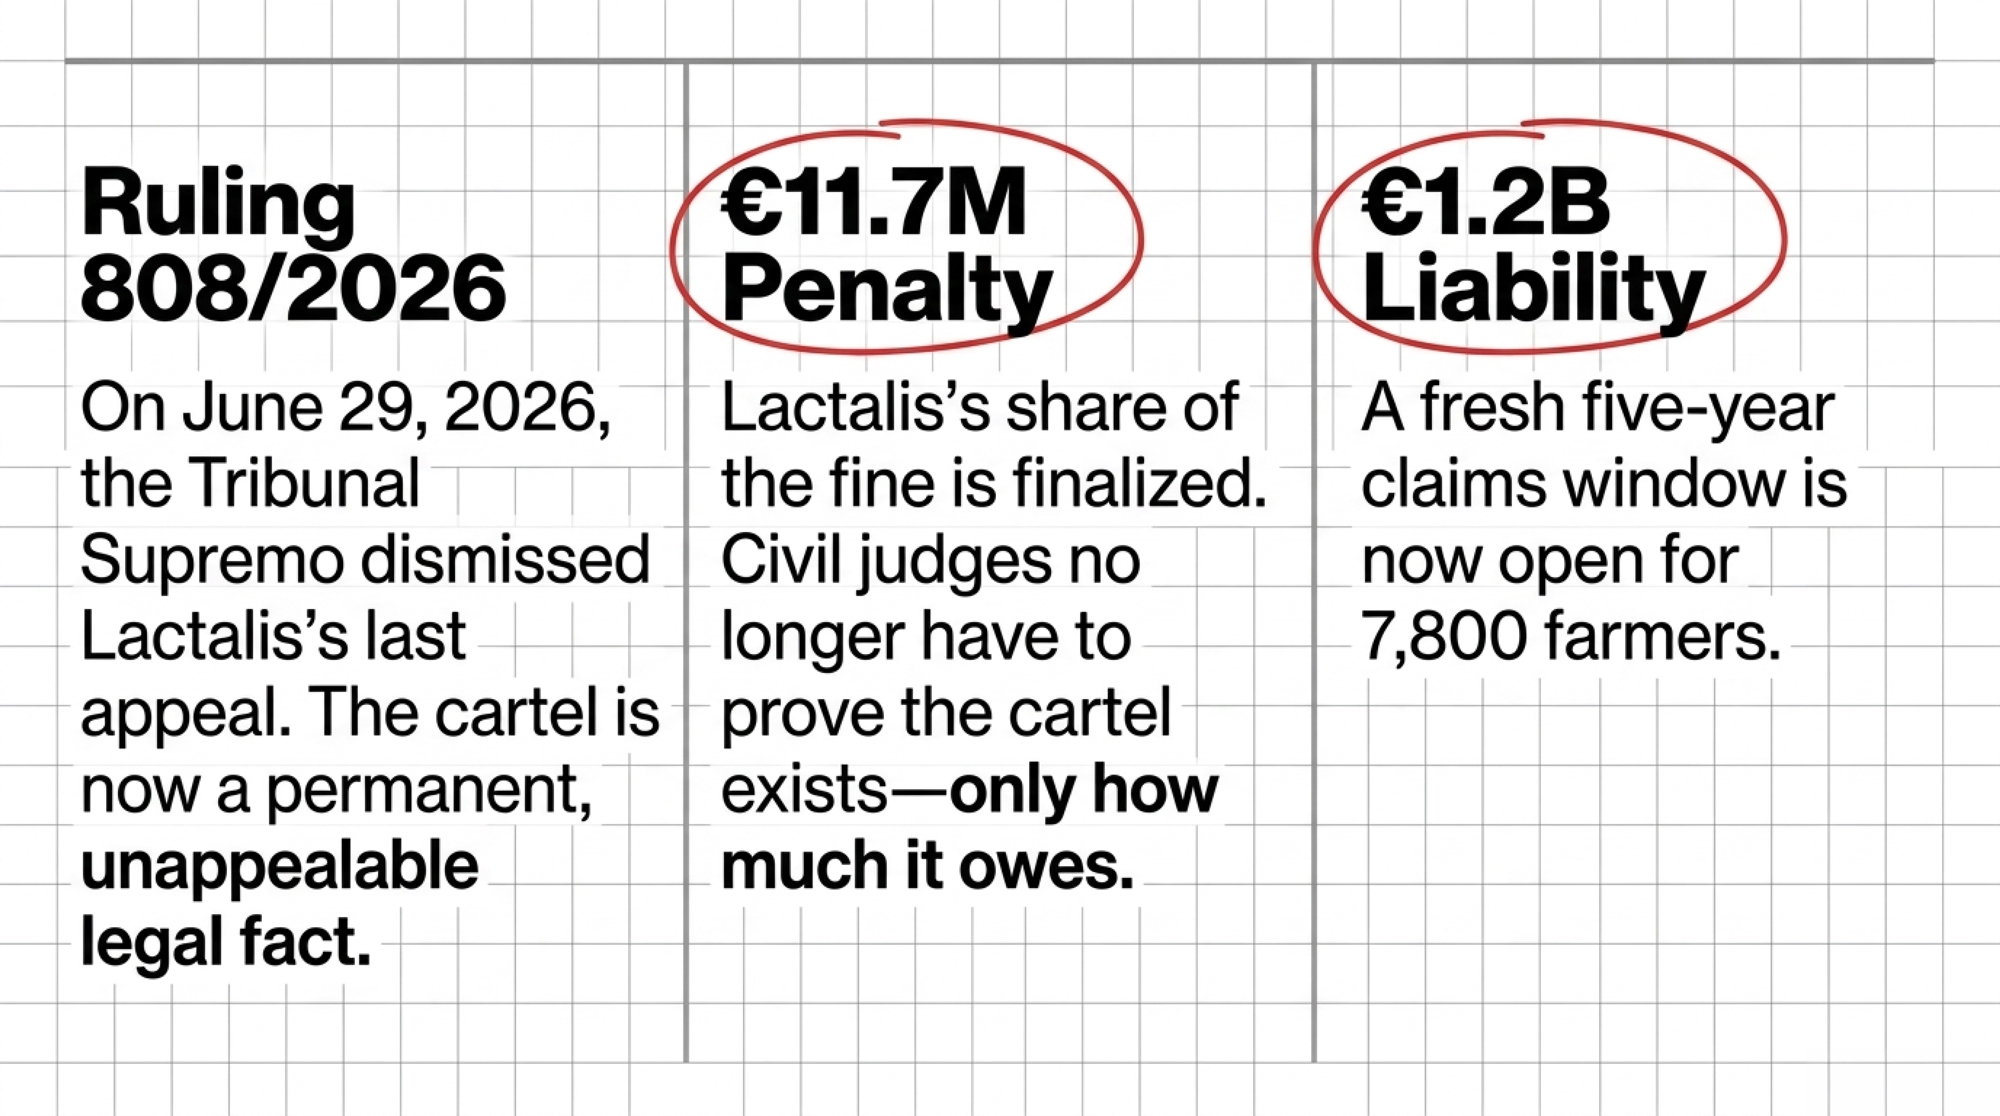
The CNMC found that eight dairy companies and two trade associations ran a single continuous infringement from 2000 to 2013 — thirteen years — and fined them a combined €80.66 million in July 2019. Lactalis Iberia’s share was €11,692,998. On June 29, 2026, Spain’s Tribunal Supremo dismissed Lactalis’s final appeal in ruling 808/2026. Reporting at the time noted that Lactalis could still explore an appeal to the EU Court of Justice, but that path wouldn’t reopen the Spanish factual record. 

Keep the three cases in this article straight as you read. One company was found liable. Two paid and admitted nothing. One man pleaded guilty. Those are not the same thing, and the difference decides what a producer can do with any of it.

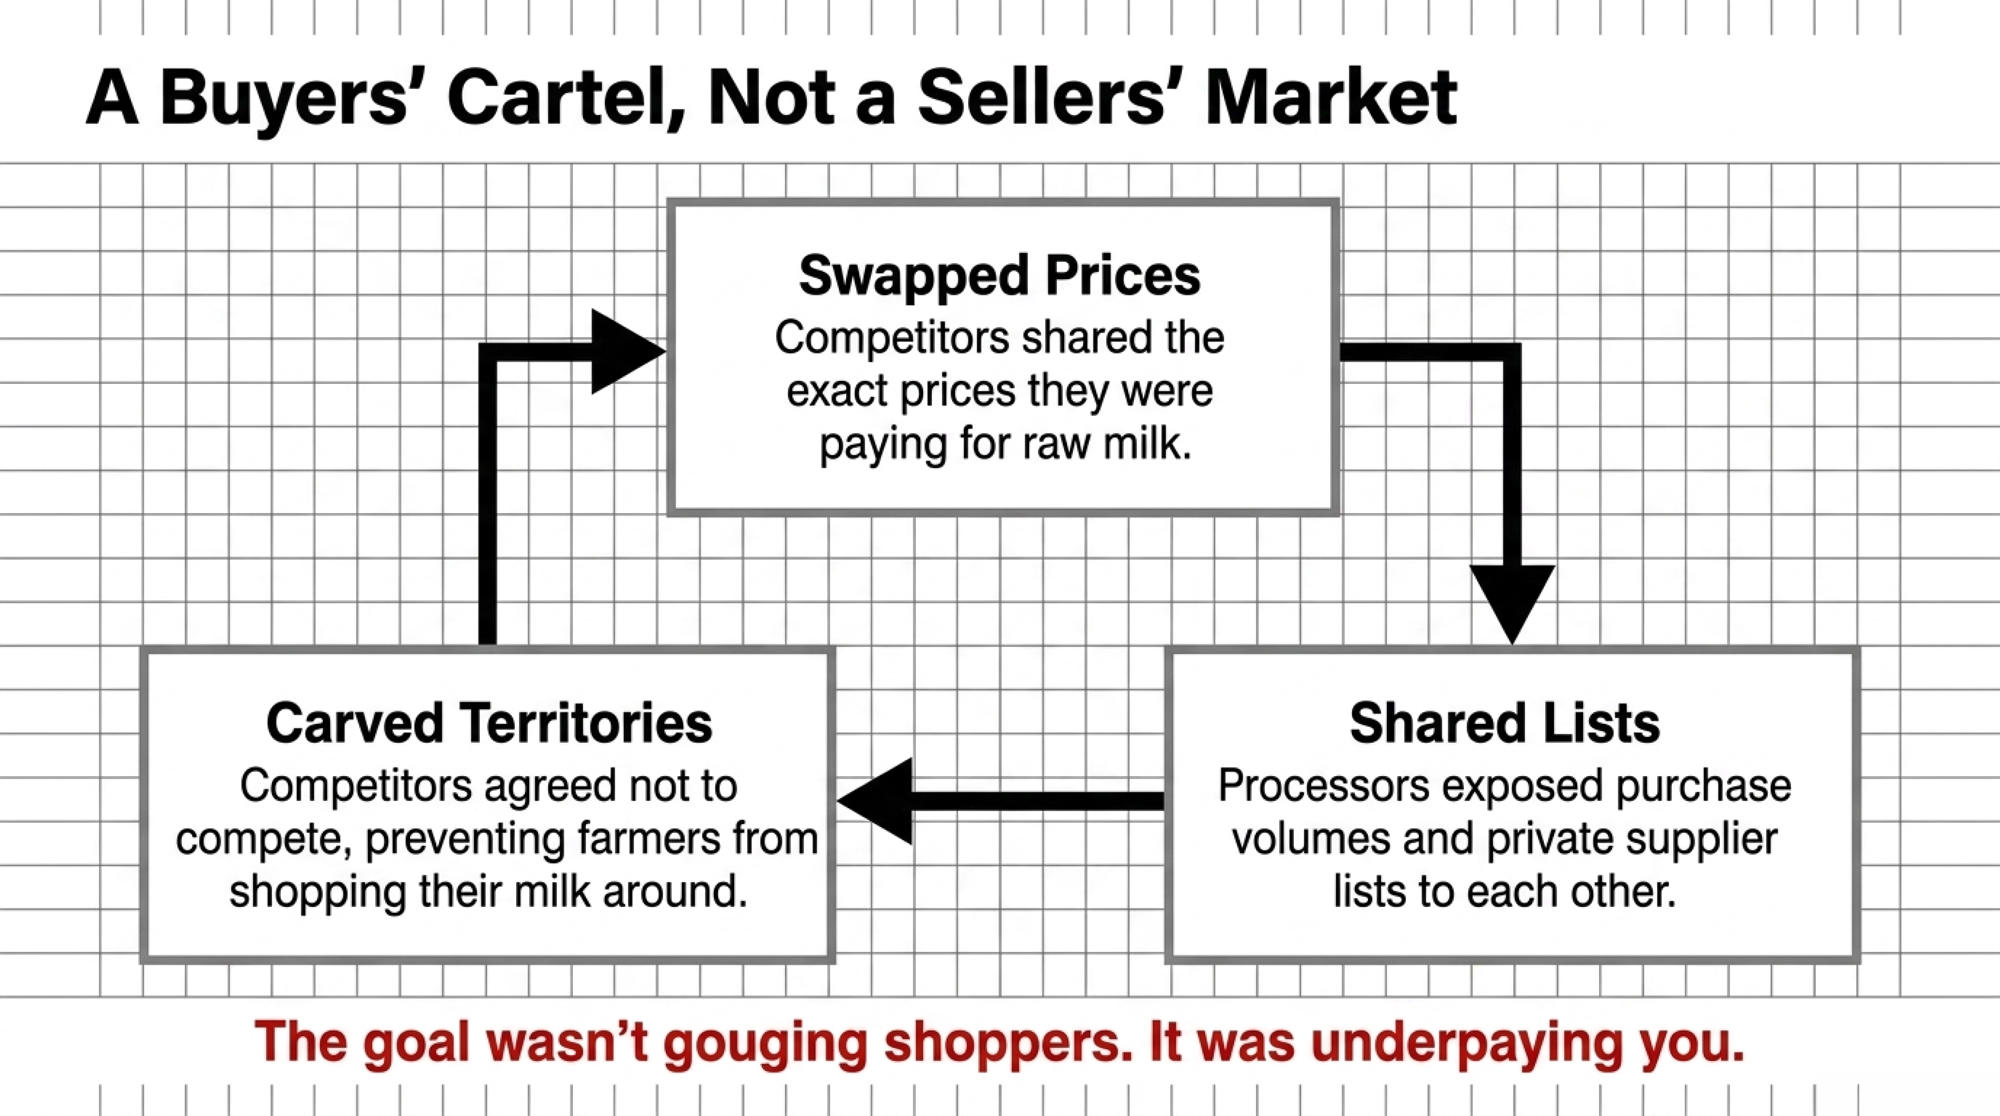
CNMC didn’t issue a vague finding of unfairness. It named four behaviors: buyers exchanging current and future raw milk purchase prices, sharing purchase volumes and supplier lists, agreeing on coordinated price reductions, and effectively allocating which farmers belonged to which buyer. 

That fourth one is the one that stings. Where buyers divide up the supply base, a farmer doesn’t have a market. He has an assignment.

The €313,000 Question: How Much Money Are We Actually Talking About?

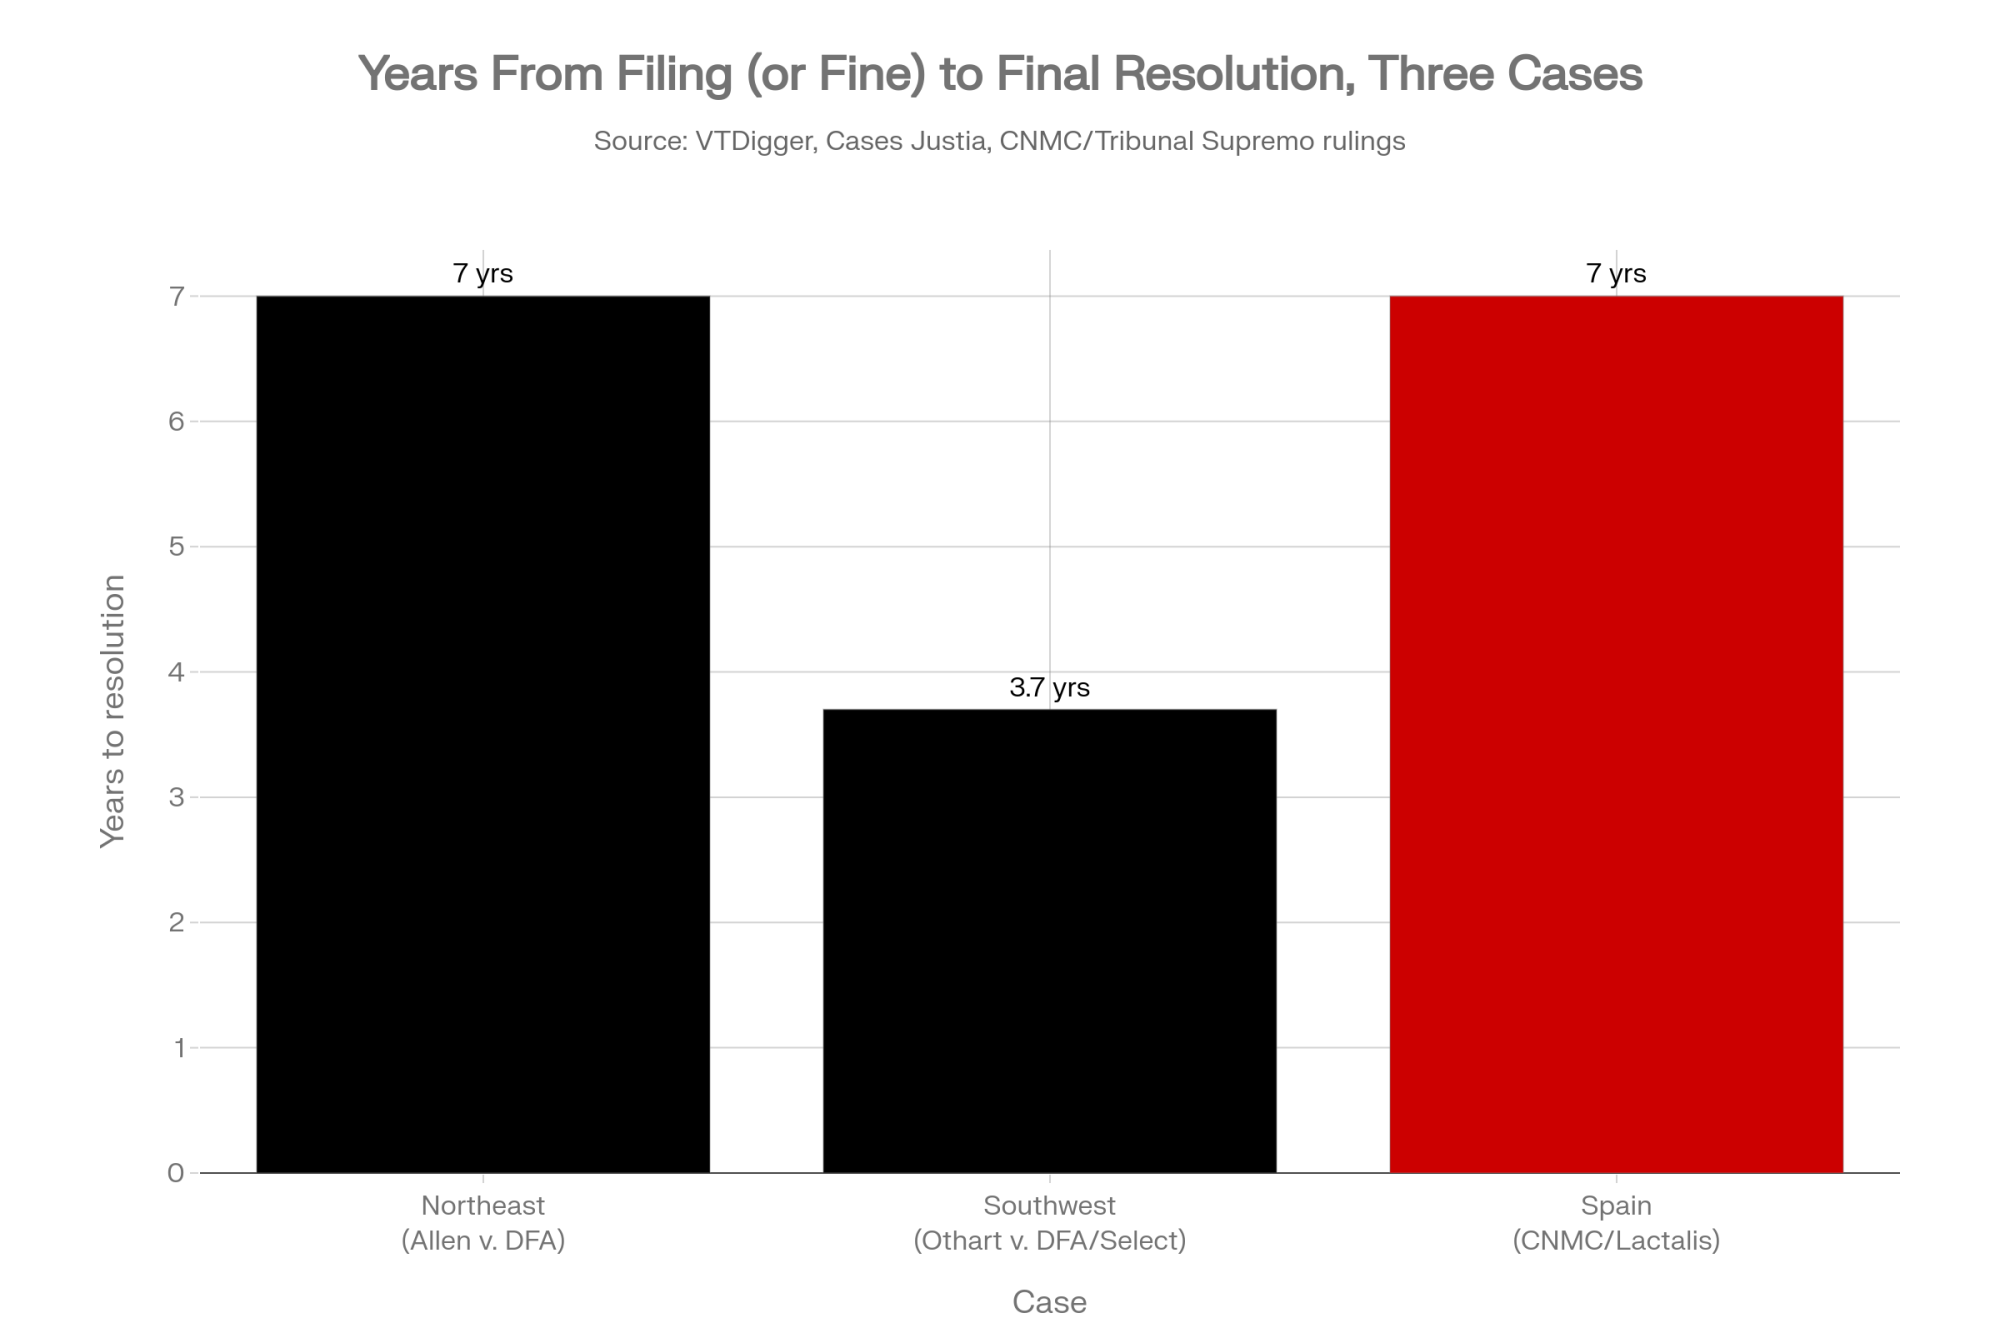
Start with the American number, because it’s the one you can hold against your own operation. In Allen v. Dairy Farmers of America, roughly 9,000 Northeast farms split a $50 million settlement — an average of about $4,000 per farm. On 200 cows, that’s $20 a head. Once, after seven years of litigation. 

Now the Spanish side, where the numbers run larger, and the courts can’t agree on how large. CNMC estimated the cartel held farmgate prices down by more than 10 percent. Spanish civil courts are now deciding what that’s worth in cash, and they’ve split into two camps. 

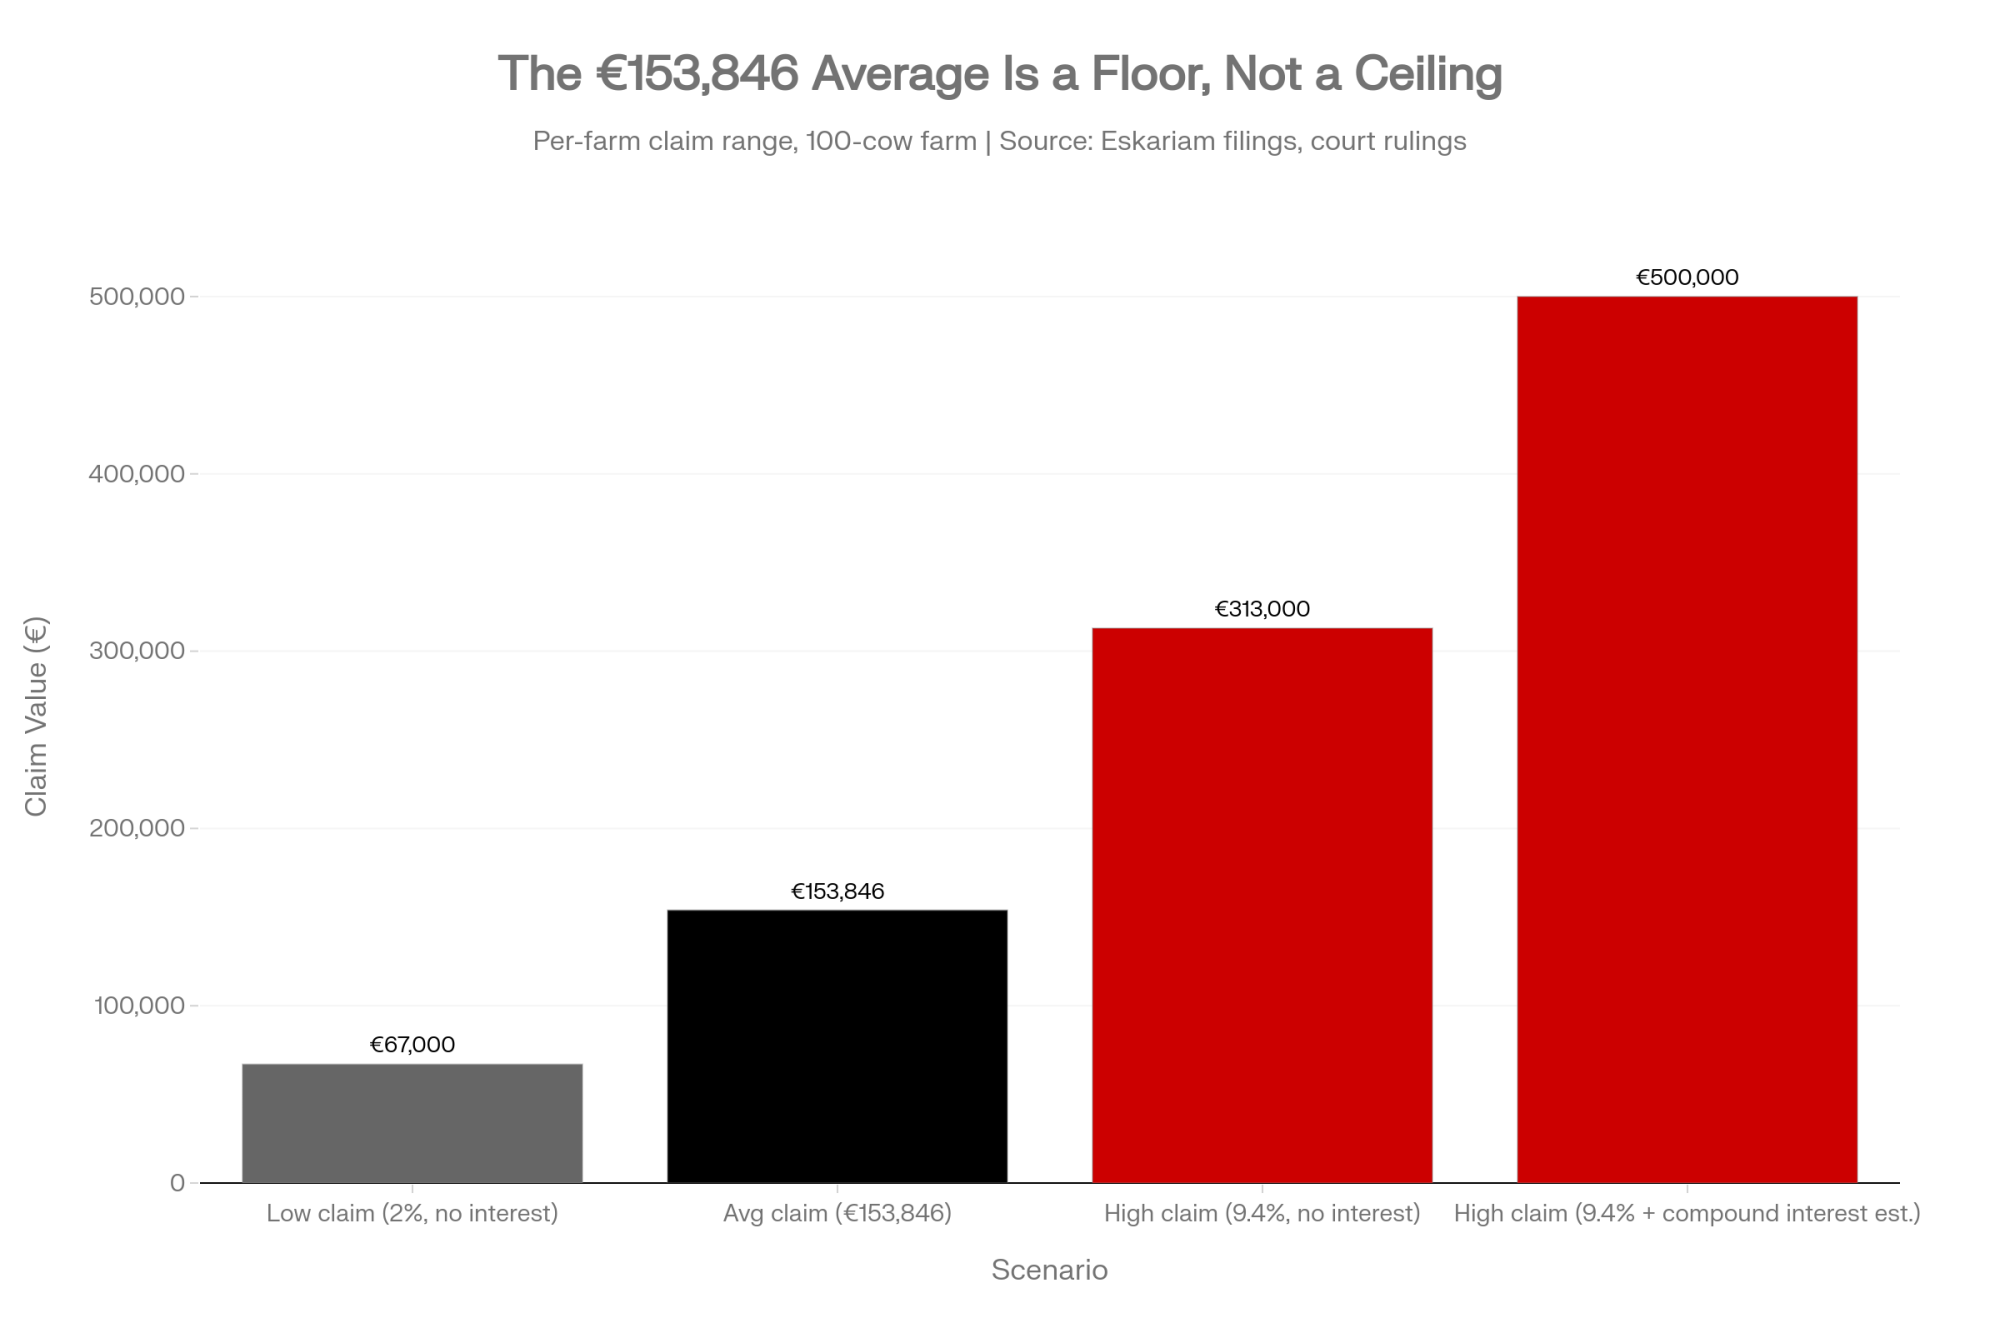
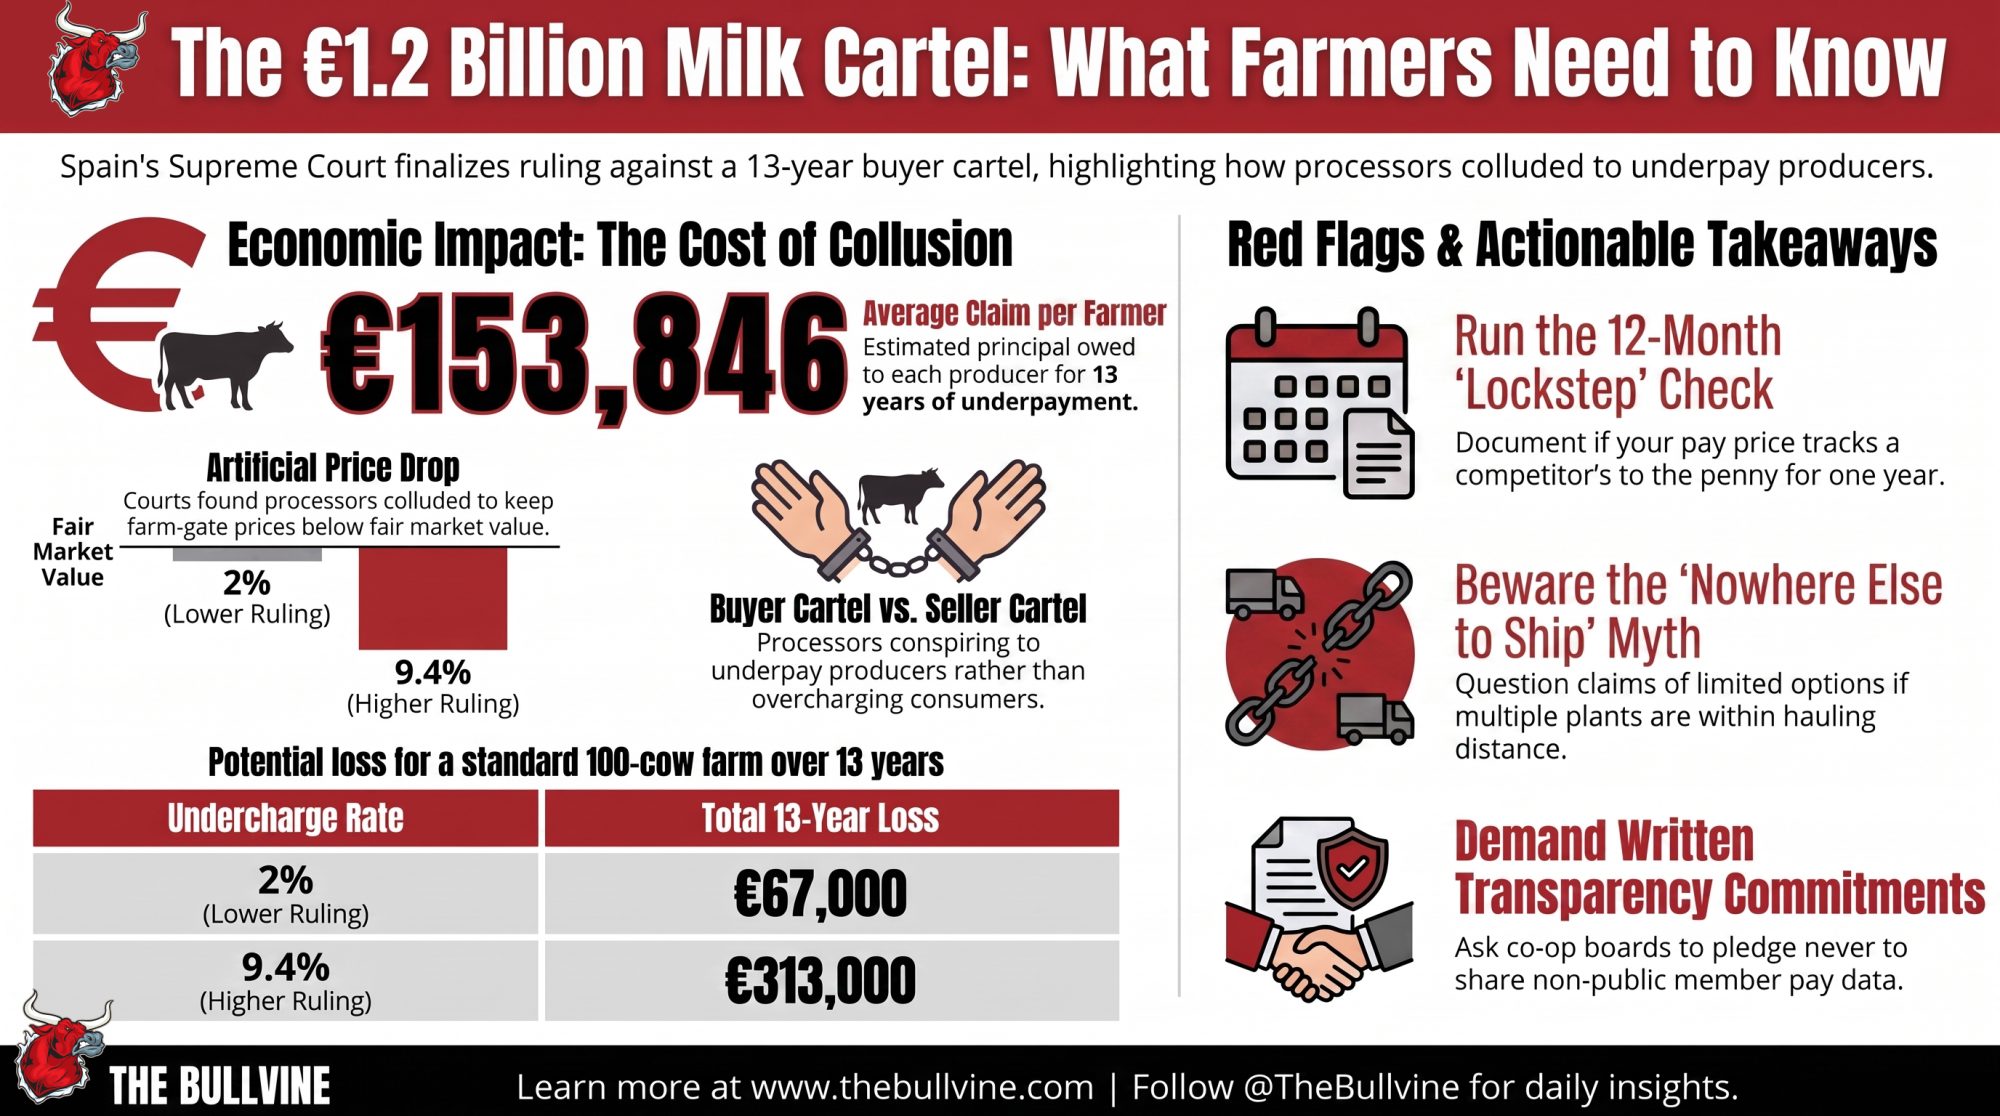
Madrid’s Commercial Court No. 14, in its October 16, 2025 ruling, accepted a 9.4 percent undercharge on the price farmers actually received, working from an economic report by Compass Lexecon and rejecting the defendants’ alternative methodology as not solid enough. Three Ávila-area dairies brought that case against Lactalis Iberia and Industrias Lácteas de Granada (Puleva). Their combined award came to roughly €500,000

Barcelona’s Provincial Court, Section 15, went a different way. Rather than building from an economic model, it worked from price reductions documented in CNMC’s own administrative file — generally one to three pesetas per liter, which the court reasoned represented somewhere between 2 and 6 percent of the milk price. It settled on the low end and fixed the undercharge at 2 percent of affected sales value. That reasoning appears in Sentencia 1437/2025 (December 15, 2025) and again in Sentencia 140/2026. In March 2026, the same section applied it against Lactalis, Nestlé and Pascual in a claim brought by nearly a hundred Galician farmers, co-ops and agrarian societies. 

Both of those courts compound the interest. Madrid’s Court No. 14 and Toledo’s Commercial Court No. 1 each ordered the undercharge updated at compound interest, following the Supreme Court’s approach in Spain’s earlier Envelope Cartel damages cases. 

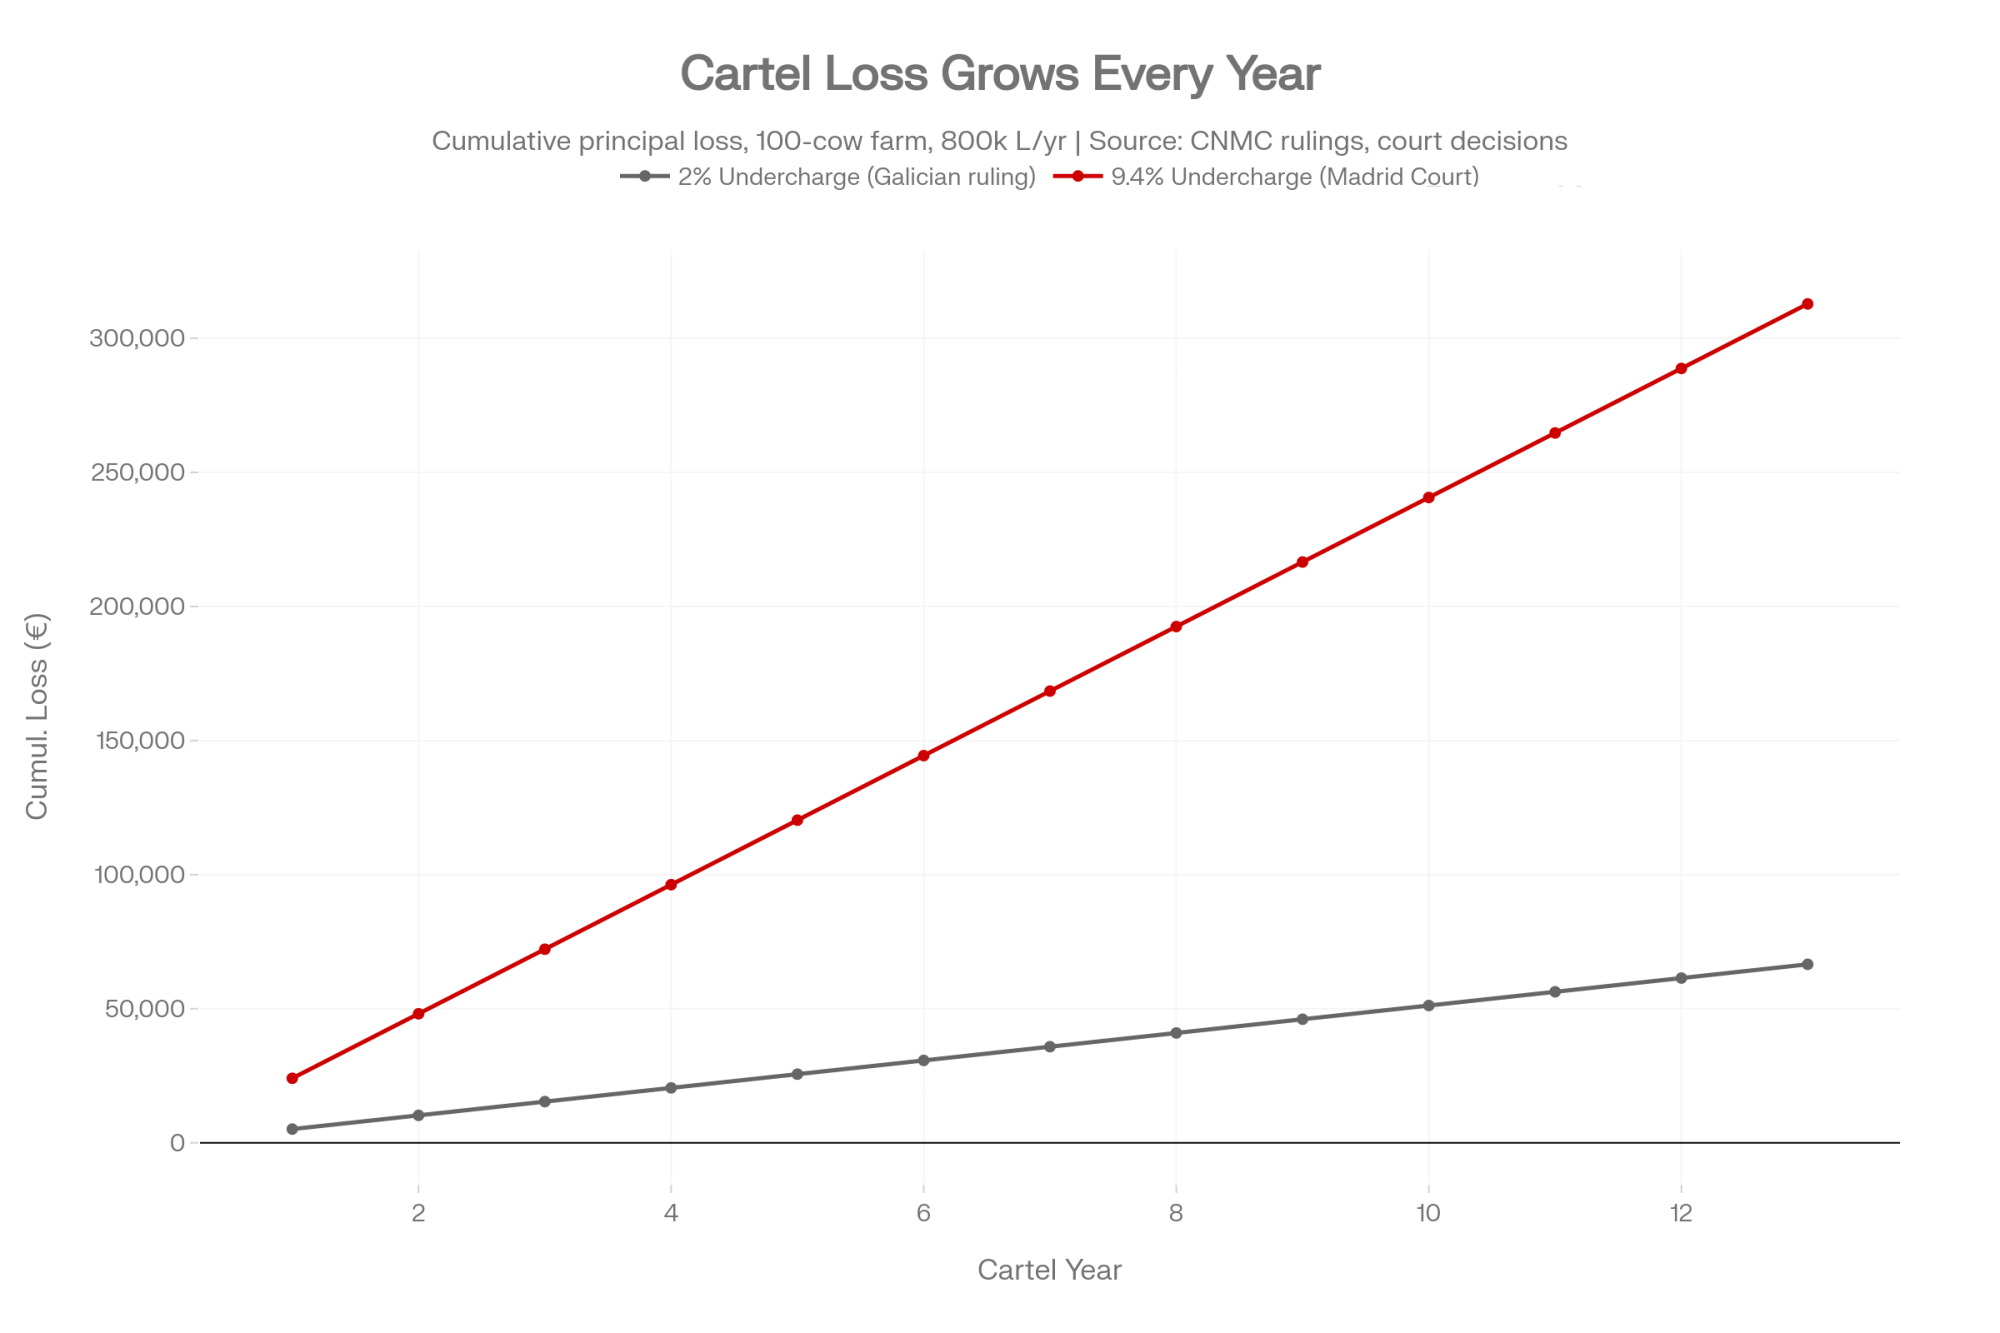
Run it through a barn. Take a 100-cow herd shipping roughly 800,000 liters a year at about €0.32/L — call it €256,000 in annual milk revenue. At Barcelona’s 2 percent, that’s about €5,120 a year, or roughly €67,000 across the 13-year window before interest. At Madrid’s 9.4 percent, it’s about €24,064 a year. Roughly €313,000 in principal. A quarter-million-euro gap on one mid-size farm, decided by which court you land in and whose economist the judge finds more persuasive.

CaseHerd Size UsedTime in Litigation/AppealsRecovery
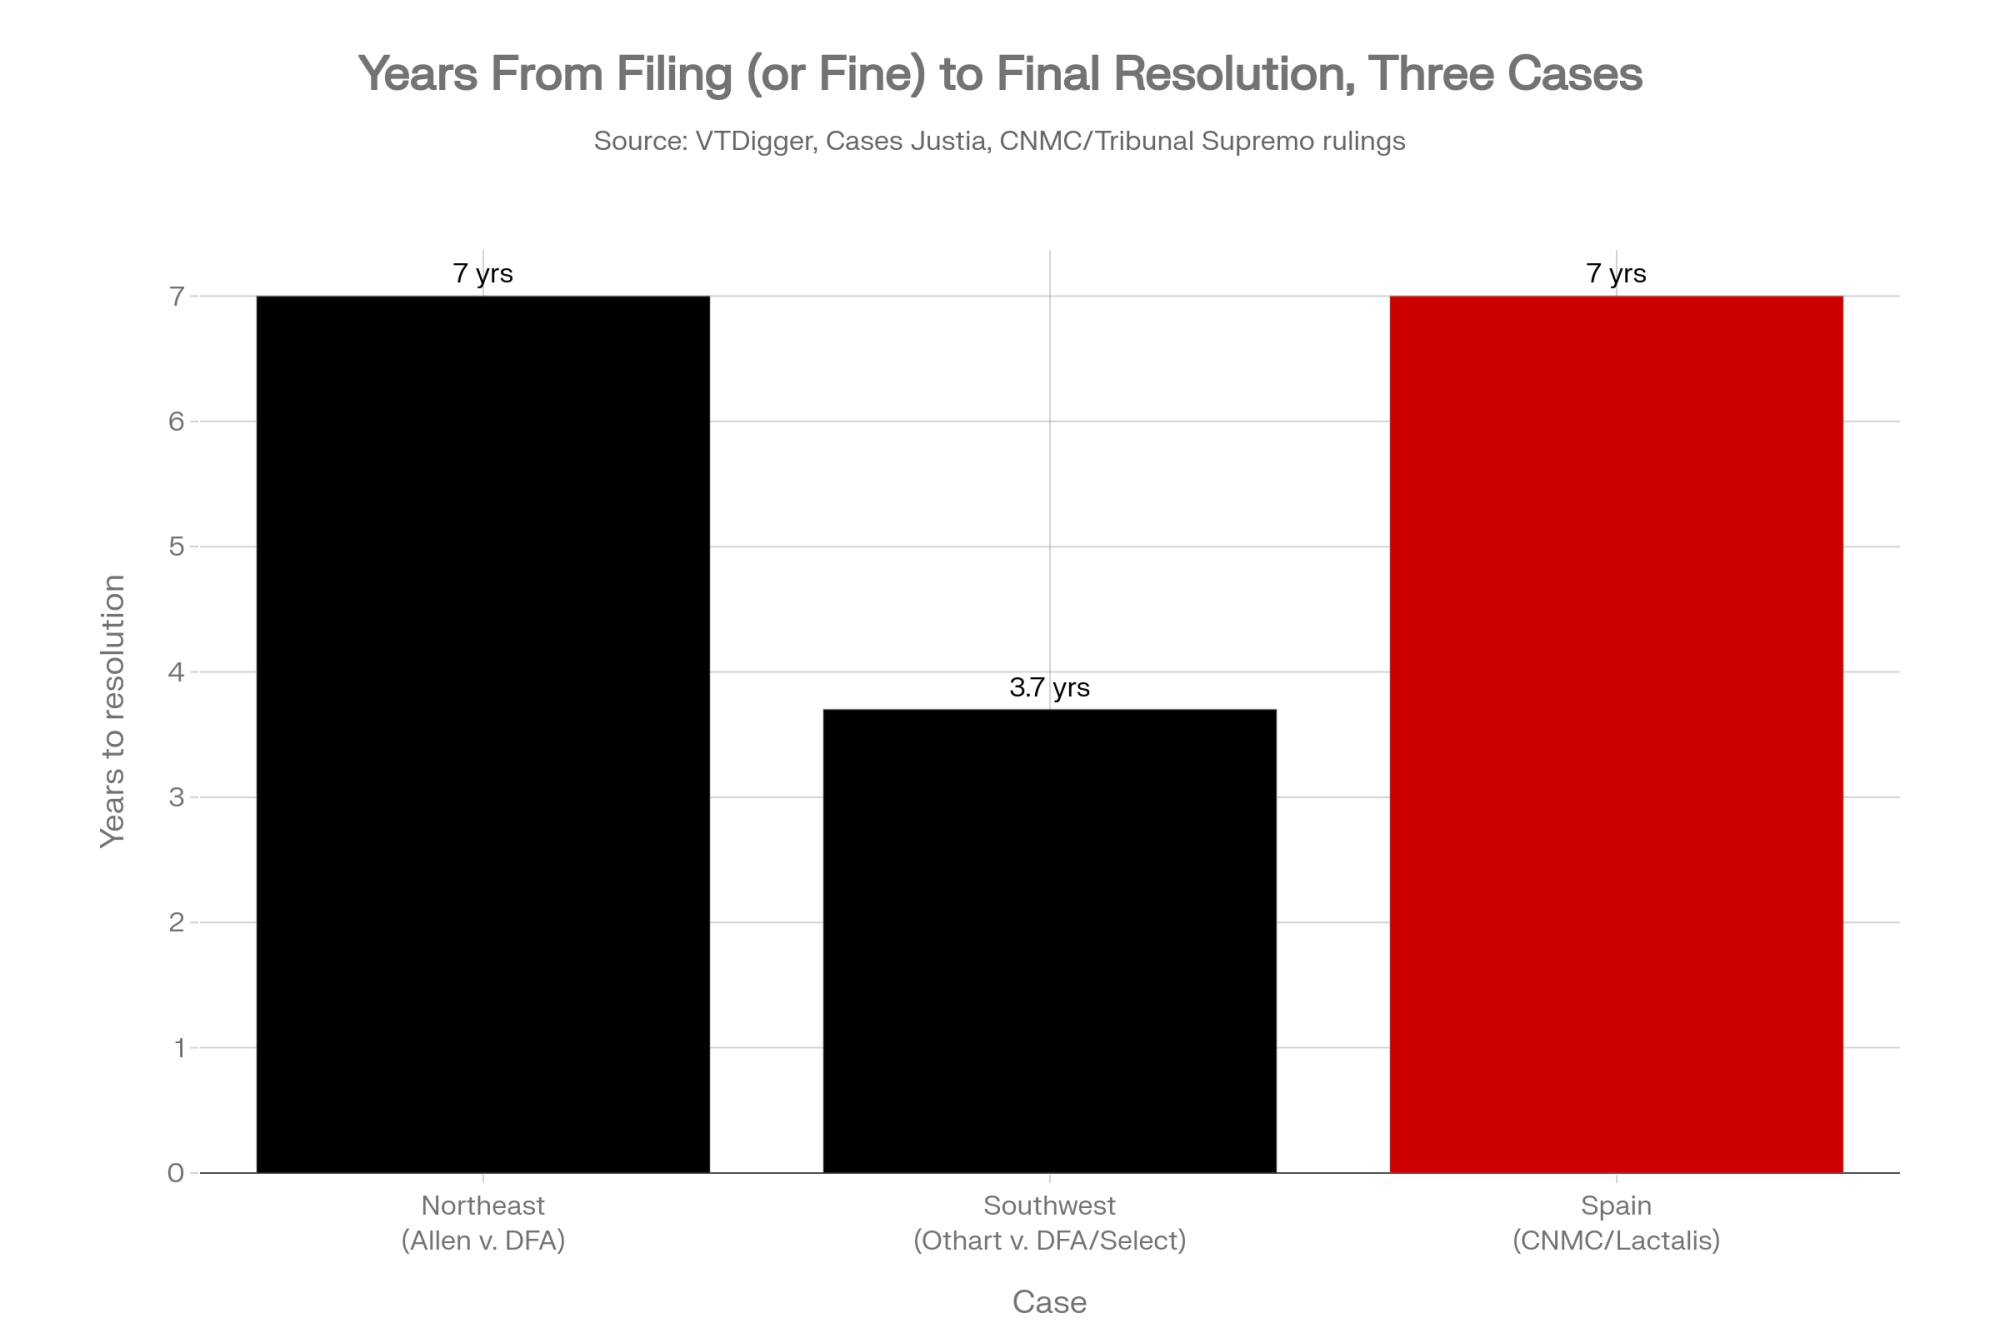
Northeast (Allen v. DFA)200 cows7 years$4,000/farm (~$20/head) — called “modest” by the judge
Southwest (Othart v. DFA/Select)Class-wide, all herd sizes~3.7 years (filed 2022–approved Dec 2025)$34.4M fund; per-farm share not yet public
Spain — Barcelona standard100 cows13 yrs conduct + 7 yrs appeals~€67,000 principal (2% undercharge)
Spain — Madrid standard100 cows13 yrs conduct + 7 yrs appeals~€313,000 principal (9.4% undercharge)

One caveat on those totals: applying a single flat price across thirteen years smooths out real variation in Spanish farmgate prices, so treat the figures as illustrative scale rather than a claim calculation.

Madrid firm Eskariam represents more than 7,800 Spanish farmers with claims topping €1.2 billion — roughly €153,846 per claimant on average. Treat that average as arithmetic, not an entitlement. Individual recoveries will swing hard on herd size, which court hears the claim, and how many of the thirteen years a farm actually shipped. 

Eskariam CEO David Fernández, whose firm represents claimants in those proceedings, put it this way after the ruling: “This ruling puts an end to years of appeals and definitively closes any avenue for Lactalis to reverse the facts of the cartel. The sanction is final, the facts are unassailable, and no appeal remains.” If you want the per-farmer arithmetic laid out claim by claim, we broke that down in the full per-farmer breakdown of the Spanish ruling

CNMC-Documented BehaviorVisible in Your Pay Records?What a Farmer Would Actually See
Buyers exchanging pay pricesPartiallyYour price tracking a neighbor’s, different buyer, same month
Coordinated price reductionsPartiallyMultiple processors cutting the same amount, same window
Sharing volume/supplier dataNoNothing — surfaced only via CNMC’s own file review
Allocating farmers between buyersNoCan document being told there’s nowhere else to ship, not intent

What Spain Proved That US Courts Settled

Back to that $4,000. Chief Judge Christina Reiss of the U.S. District Court for Vermont approved the Allen settlement on June 7, 2016, after seven years of antitrust litigation. Attorneys were awarded $16.7 million of the fund. The settlement came on top of a separate $30 million Dean Foods paid in 2011 to settle out. And DFA admitted no wrongdoing. 

Reiss approved it as not inadequate or unreasonable on its face. She also wrote that “the receipt of approximately $4,000 per dairy farm could reasonably be perceived as a modest recovery.” 

Now scale the Southwest case against what was at stake. Plaintiffs’ counsel put the Southwest Grade A raw milk market at more than $3.5 billion annually and alleged DFA paid member-farmers $46 million over the class period. Those figures measure different things — total market value versus payments to one co-op’s members — and DFA disputes the characterization. But the order-of-magnitude difference is why plaintiffs argued a $34.4 million fund was worth taking rather than litigating further. 

The class covered farmers selling to DFA and Select across all of New Mexico, most of Texas, eastern Arizona, the Oklahoma panhandle and southwestern Kansas, from January 1, 2015 through June 30, 2025 — ten and a half years. The pattern holds across both continents: recovery arrives years late and lands thin against the length of the conduct. 

Why Your Co-op Milk Check Leaves You in the Dark

Here’s the regulatory answer, and it’s sitting in the Code of Federal Regulations. FMMO rules require handlers to give each producer a supporting statement itemizing pounds received, butterfat, protein, and other solids, the minimum rate or rates of payment, and deductions. Then comes the carve-out.

THE CARVE-OUT

The FMMO itemization requirement applies to “each producer, except a producer whose milk was received from a cooperative association handler.” 

What it means: Ship through a co-op and the federal rule requiring a detailed pay statement doesn’t reach you. Your co-op may provide one anyway. It isn’t federally required to.

Source: 7 CFR § [order number].73(f), “Producer payment record” — parallel provisions across all Federal Milk Marketing Orders. Upper Midwest is § 1030.73(f); Northeast is § 1001.73(f); California is § 1051.73(f).

RequirementPrivate Processor HandlerCooperative Association Handler
Itemized pay statement required by federal ruleYesNo — exempt under .73(f)
Must disclose deduction breakdown (hauling, dues, etc.)YesVoluntary only
Must match FMMO/Mailbox Milk PriceNot required either wayNot required
Reports payroll data to market administratorYesYes (to regulator, not to farmer)
2026 enforcement cost of hidden pay-price coordination$34.4M (DFA $24.5M + Select $9.9M)

The provision appears in every federal order. The section number changes with your region. The exemption doesn’t.

The Four Things Nobody Has to Explain to You

Ask anyone who reads these statements for a living, and you get the same list of problems. A milk-check reading guide published by Jacoby — a dairy brokerage and consulting firm, so read it with that in mind — names four specific ones: producer prices shown on the check don’t match prices announced by the Federal Order; deductions for co-op operations or hauling get spread vaguely across multiple lines, potentially masking their full impact; statements don’t clearly say whether deductions apply monthly or bi-weekly as part of advance payments; and some reductions in farmer pay never appear in the “deductions” section at all. Its advice for producers who can’t reconcile the numbers is blunt: start by asking questions. 

The problem isn’t going away either. The new FMMO pricing rules make milk pricing more complicated, and milk checks less transparent, and co-ops are not required to pay pooled members the FMMO minimum blend; they may re-blend with deductions. Higher make allowances get subtracted from the four commodity prices that feed the class formulas — they never show up as a line item on your statement at all. 

Handlers do have to report producer payroll to the market administrator, including “the amount and nature of any deductions and the disbursement of money so deducted.” But that’s a filing to a regulator in an office somewhere. Not a statement to you. If you want the governance side of this, how co-op voting power shapes what shows up on your statement covers who sets those rules.

Layer on how the FMMO functions. It sets a minimum price handlers must pay — a floor, not a target. USDA doesn’t set what a cooperative pays its own members, and real prices can and do land above or below that minimum. The Mailbox Milk Price, published monthly by USDA AMS, is a weighted state average of what farmers actually received net of costs. Useful as a benchmark. Not a promise about your account. 

What Your Records Can Prove — And What They Can’t

The Southwest case never reached trial, so nothing was proven. But it survived a motion to dismiss in full, and Strickland’s reasoning is the part worth your time. She found the plaintiffs “plausibly allege[d] a continuing conspiracy to violate the antitrust laws,” “sufficiently plead[ed] each part of their horizontal price-fixing claim,” and alleged “parallel conduct alongside other factors that when taken together ‘tend to exclude the possibility of independent action.'” 

That last phrase is the legal test, and it tells you exactly what your own records can and can’t do. Parallel pricing by itself won’t clear it — courts understand that feed, fuel, and freight move for everybody at the same time. What pushed this case past dismissal was parallel conduct plus structure: the co-owned Greater Southwest Agency, joint processing ventures, and allegations of selective non-pooling of milk. Your pay statements are the parallel-conduct half. You can’t supply the structural half from your farm office. 

Now line CNMC’s four behaviors against what you can actually document.

CNMC behaviorShows up on your records?What you’d be looking for
Buyers exchanging pay pricesYes — partiallyYour price and a neighbor’s, different buyers, matching month after month. Southwest plaintiffs alleged DFA and Select paid “nearly identical rates”
Coordinated price reductionsYes — partiallyMultiple processors cutting the same amount in the same window, repeatedly, with no shared cost story
Sharing your volume and supplier dataNoNothing. In Spain, this surfaced through CNMC’s own investigation of company records — not through anything a farmer could see
Allocating farmers between buyersNoYou can document being told there’s nowhere else to ship. You can’t distinguish an agreement from ordinary hauling logistics

Barcelona’s Section 15 shows what the structural half looks like when it surfaces. That court built its 2 percent figure from price reductions documented in CNMC’s administrative file — one to three pesetas per liter — rather than from an economic model. Those records came out of a regulator’s investigation. Not anyone’s milk check.

So set your expectations accordingly. A farmer can build a pattern. Building a case has taken regulatory or court powers every time — CNMC’s investigation in Spain, discovery in Othart.

4 Actionable Steps to Audit Your Own Milk Check Today

Step 1: Know where your legal protection ends, because it sets the boundary for everything else. Capper-Volstead gives agricultural cooperatives limited antitrust immunity to market their members’ output collectively. Courts have held that immunity doesn’t stretch to cover conspiracies with non-cooperative entities, predatory conduct, or price enhancement beyond legitimate marketing. It was written in 1922 to protect farmers pricing together. Not two co-ops coordinating in ways that touch their own members’ pay. Knowing where the protection ends tells you which questions are fair to put to your board — and co-op liability isn’t theoretical if you need the reminder. 

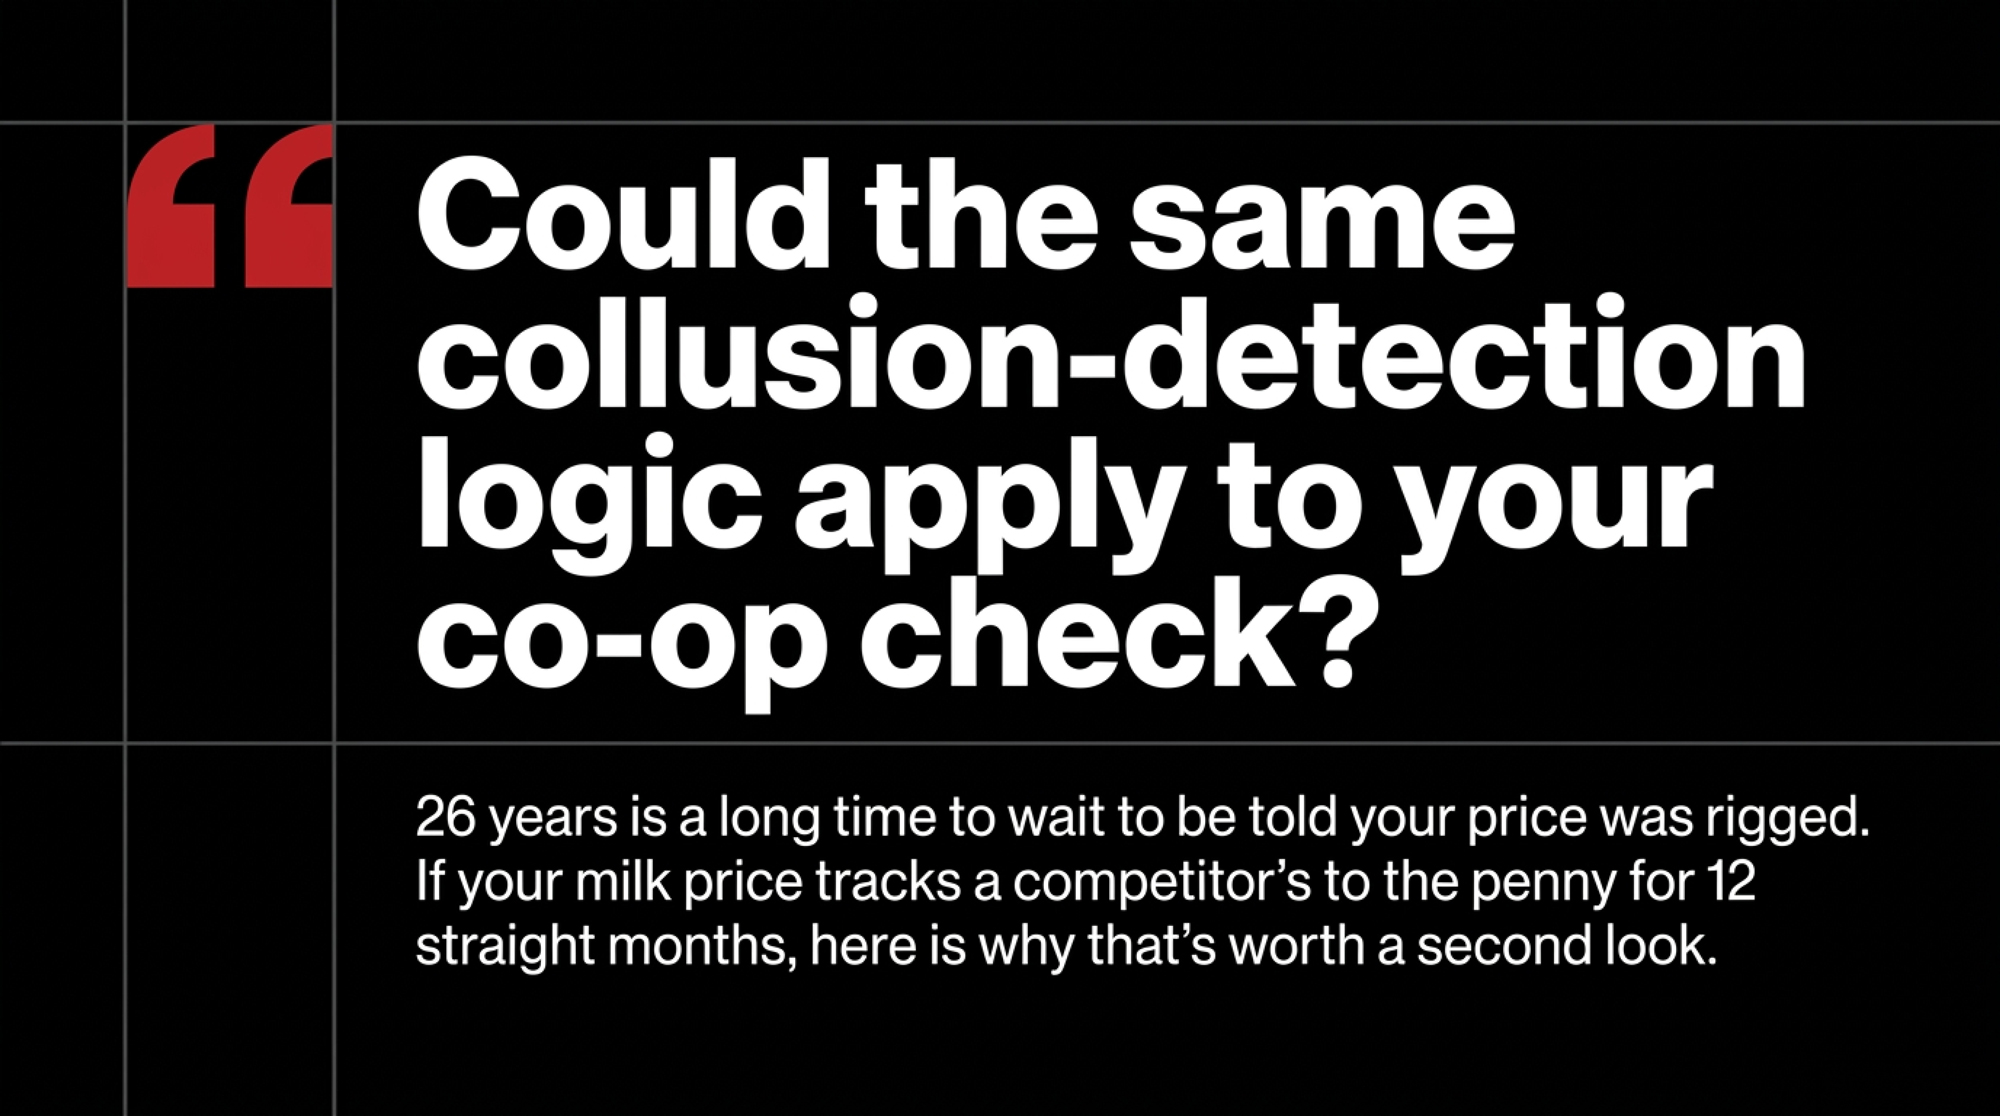
Step 2: Run the 12-month convergence check — do this within 30 days. Pull your last 12 months of pay statements and line them against your state’s Mailbox Milk Price from USDA AMS. Flag any month where your check moved in near-lockstep with a competing buyer’s announced price. One month is noise. Twelve is a document. Costs you an afternoon and needs nothing but paper you already have. The limit worth naming: you may find a perfectly boring explanation, and that’s a good outcome.

Step 3: Document before you escalate. If a pattern holds up, keep the records and talk to an antitrust attorney before you raise it with your processor. Going direct first means a hard conversation with your only buyer. Worth knowing on timing: DOJ’s antitrust whistleblower rewards program pays individual informants 15 to 30 percent of resulting criminal fines or recoveries of $1 million or more, and it only took effect in July 2025. 

Step 4: Push the governance lever at your co-op. Ask your board to commit in writing to never sharing non-public member pay-price data with any entity that also buys your milk, and to provide the payment calculation method on request. Not a radical ask — the Allen settlement required DFA and DMS to disclose certain financial information, fund an independent advisory council for four years, and seat a farmer ombudsperson for five. It requires board appetite you may not have, and one member rarely moves a board alone. Works better as a signed resolution with names behind it, which is the governance lever most members never pull.

It’s Not Just Raw Milk — DOJ Guns for AI Genetics

Everything above is civil litigation. Spain’s case and the Southwest settlement both ran on a preponderance of evidence, resolved with money, and on the American side, no admission of liability. Civil cases end in checks. 

Criminal cases end differently — and cattle purchasing is now in scope.

On August 6, 2026, Herbert D. Lutz, 56, of Chester, South Carolina, pleaded guilty in U.S. District Court in Columbus, Ohio, to conspiring to rig bids in violation of Section 1 of the Sherman Act. The conduct ran from at least October 2018 to at least May 2024. DOJ described the mechanics plainly: “In advance of cattle auctions, Lutz and his co-conspirators agreed which company would win the bid. During the sales, the agreed-upon losing firm would either not bid or would submit an intentionally-losing bid before bowing out to permit the agreed-upon winner to prevail.” His employer picked up cattle worth over $1.6 million through those rigged sales. 

Court filings identify Lutz as the Jersey development manager for “Company A,” bidding against an unnamed “Company B.” Neither company has been publicly named, and other corporations and individuals appear as co-conspirators without being charged. Individuals face up to 10 years in prison and a $1 million fine; corporations face up to $100 million, or twice the gain or twice the loss, whichever is greater. The Antitrust Division’s Chicago Office is prosecuting, with help from the USDA Office of Inspector General. 

DOJ called Lutz “the first defendant to be charged and to plead guilty in the ongoing investigation into bid rigging in the bovine artificial insemination industry.” First, and ongoing. Put that next to the milk pricing cases and a question worth asking emerges: from genetics purchasing to raw milk procurement, who’s talking to whom before the price gets set? No source connects these investigations. But the enforcement attention is landing in more than one place at once. We covered the full breakdown of the Columbus plea when it landed. 

Key Takeaways

  • If your pay price has tracked a competing buyer’s within pennies for 12 straight months, pull the statements and benchmark them against your state’s Mailbox Milk Price before you do anything else.
  • If your statement’s producer price doesn’t match the Federal Order announcement, or hauling and co-op deductions are spread across multiple lines you can’t reconcile, ask in writing for the calculation method. The federal itemization rule exempts co-op members, so this is a courtesy, not an entitlement.
  • If you find a pattern, call an antitrust attorney before you call your field rep. Order of operations matters when your buyer is also your only market.
  • Ask your board two direct questions: does the co-op share non-public member pay-price data with any other milk buyer, and does it participate in a marketing agency in common with one?
  • If you shipped to DFA or Select in the Southwest region between January 1, 2015 and June 30, 2025, check your claim status. Payments started June 2, 2026.
  • If you’re pursuing a Spanish claim, ask your counsel which court and which precedent they’re arguing from. Madrid’s 9.4 percent and Barcelona’s 2 percent are a 4.7-fold difference on identical conduct.
  • If you buy cattle through a bovine AI company, understand that DOJ has named its first defendant in an investigation it describes as ongoing.

So here’s the question. A decade of alleged pay-price coordination in the Southwest took a federal class action to surface. Thirteen years of it in Spain took a national regulator, then another seven years of appeals to make final — and Judge Reiss called $4,000 a farm a modest recovery back in 2016. What would it take for you to spot the same pattern in your own region, working only from what lands in your mailbox each month?

That’s a records question, not a rhetorical one. And for most producers, the honest answer is they’d notice something and have nowhere to take it — which is exactly why the paperwork matters more than the outcome of any single case.

We’re building the full per-hundredweight claim model next: how the 2-versus-9.4-percent split maps across herd sizes and shipping histories, with a Mailbox Price benchmarking worksheet you can run against your own statements. That’s going out in an upcoming Bullvine Weekly. If you want the math instead of the headline, that’s where it’ll be.

This article is based on court records, regulatory filings, and Department of Justice releases available as of August 14, 2026.

Run Your Numbers

Dairy Farm Corridor Score Calculator — The exemption hides what’s coming out of your cheque. This one puts a number on it: your state’s structural position, your hauling cost per cwt, and the FMMO make-allowance drag, expressed as a share of gross milk revenue. Run it before your next co-op meeting.

Learn More

The Sunday Read Dairy Professionals Don’t Skip.

Every week, thousands of producers, breeders, and industry insiders open Bullvine Weekly for genetics insights, market shifts, and profit strategies they won’t find anywhere else. One email. Five minutes. Smarter decisions all week.
NewsSubscribe
First
Last
Consent

87% Can’t Point to the Agreement. 92% Never Got Paid. October 2 Is the Deadline.

657 producers, one survey, and a comment window that shuts October 2. The data you hand over every year is priced in Europe. Here, it isn’t priced at all.

EXECUTIVE SUMMARY: Eighty-seven percent of 657 dairy producers surveyed by the American Dairy Coalition couldn’t say they’d signed a data-sharing agreement covering the sustainability information they hand over every year — and 92% have never been paid a cent for it. That data doesn’t sit in a filing cabinet. Feed rations, manure management, energy use and herd numbers move from your FARM Environmental Stewardship evaluation through co-op aggregation into corporate Scope 3 disclosures and, from there, into loan pricing. In the Netherlands, that same information is worth roughly $1.06/cwt net through FrieslandCampina’s Foqus planet program — about $58,000 a year on a 200-cow herd shipping 75 pounds. In the U.S., there’s no index, no exchange, and no rate at all, and Nebraska’s LB525 — the only state law making producers the default owner of farm data — specifically carves out the aggregated form your numbers take by the time anyone monetizes them. The FARM Version 2028 comment window closes October 2, and while Environmental Stewardship runs on the same cycle as Animal Care, the publicized proposed changes and review bodies are animal-care governance, so where consent terms actually get reviewed is an open question. Two things worth doing before the window shuts: ask your co-op in writing for the agreement, and if it doesn’t exist, put that in your comment.

farm data ownership

Sit through a FARM Environmental Stewardship evaluation, and you’ll hand over some version of the same inventory: feed rations, manure management, energy use, herd numbers. You know where it comes from. The question is whether you know where it goes — and whether you ever signed anything saying it could.

The American Dairy Coalition put that question to 657 dairy producers between February 24 and March 14, 2026. Eighty-seven percent said they did not believe they’d signed a data-sharing agreement. The other 13% weren’t sure one existed. In the end, the survey turned up: “Farm data has value, and that value is being captured.”

Whether that’s true isn’t really the argument. The question is who’s holding the pen when the value gets assigned — and whether you can put your hands on your own agreement before October 2, when the National Dairy FARM Program’s Version 2028 comment window closes. James “Cricket” Jacquier, an Agri-Mark member involved in the program’s committee process, made the case for using it when the window opened July 8: “Farmer involvement is critical to ensuring program standards are practical and achievable.” He’s right. It’s a fair standard to hold the program to.

What the Survey Actually Found

Three numbers came back stacked. Seventy-seven percent said the data request felt more forced than voluntary. Ninety-two percent reported no compensation for providing it. And 100% said producers should own the data they generate.

Read those carefully, because they’re three different kinds of claim. The 77% is a perception of pressure. The 92% is a factual report about payment. And the 100% is a preference — what farmers think should be true, not a description of what their contracts currently say. Blur those together, and you’ll lose the argument with your co-op in about ninety seconds.

One caution on scope. This was a self-selected, voluntary-response sample, not a randomized national census, and ADC hasn’t published a methodology summary. It tells you something real about what the producers who answered are experiencing. It doesn’t license projecting a precise farm count across the 26,000-plus operations enrolled in FARM.

Where Your Data Goes After It Leaves the Barn

The chain isn’t secret, and nobody’s breaking a rule. It’s contractual, and it runs one direction.

Step 1 — Your barn. Feed rations, manure management, energy use, and herd inventory are collected through a FARM ES evaluation, a co-op sustainability program, or a buyer questionnaire. The FARM Program reports more than 6,000 ES evaluations completed since 2017.

Step 2 — Co-op or processor aggregation. The FARM Program’s own materials describe Environmental Stewardship as unifying “industry response to customer requests for sustainability data,” with data aggregated by cooperatives and processors. That’s not a hidden purpose. It’s the stated design.

Step 3 — Corporate Scope 3 accounting. Processors use those aggregated metrics to calculate supply-chain emissions. Nestlé reports that dairy and livestock ingredients represent roughly 30% of the company’s total greenhouse gas footprint.

Step 4 — The public climate claim. Nestlé’s first dairy-specific disclosure, published in 2026, reports a 26% net emissions reduction since 2018, built substantially on farm-level intervention data gathered through supplier programs. Trade coverage in DairyReporter called it strong on headline disclosure but light on the farm-level breakdown that would let outside readers trace how the figure was built.

Step 5 — Financing terms. Sustainability-linked loans typically adjust a borrower’s interest margin by roughly 5 to 25 basis points depending on whether emissions targets get hit, according to sustainable-finance analyses from Inrate and law firm Cassels. That range is cross-sector, not dairy-specific. But the mechanism is real: data you supply for free becomes an input into somebody’s cost of capital.

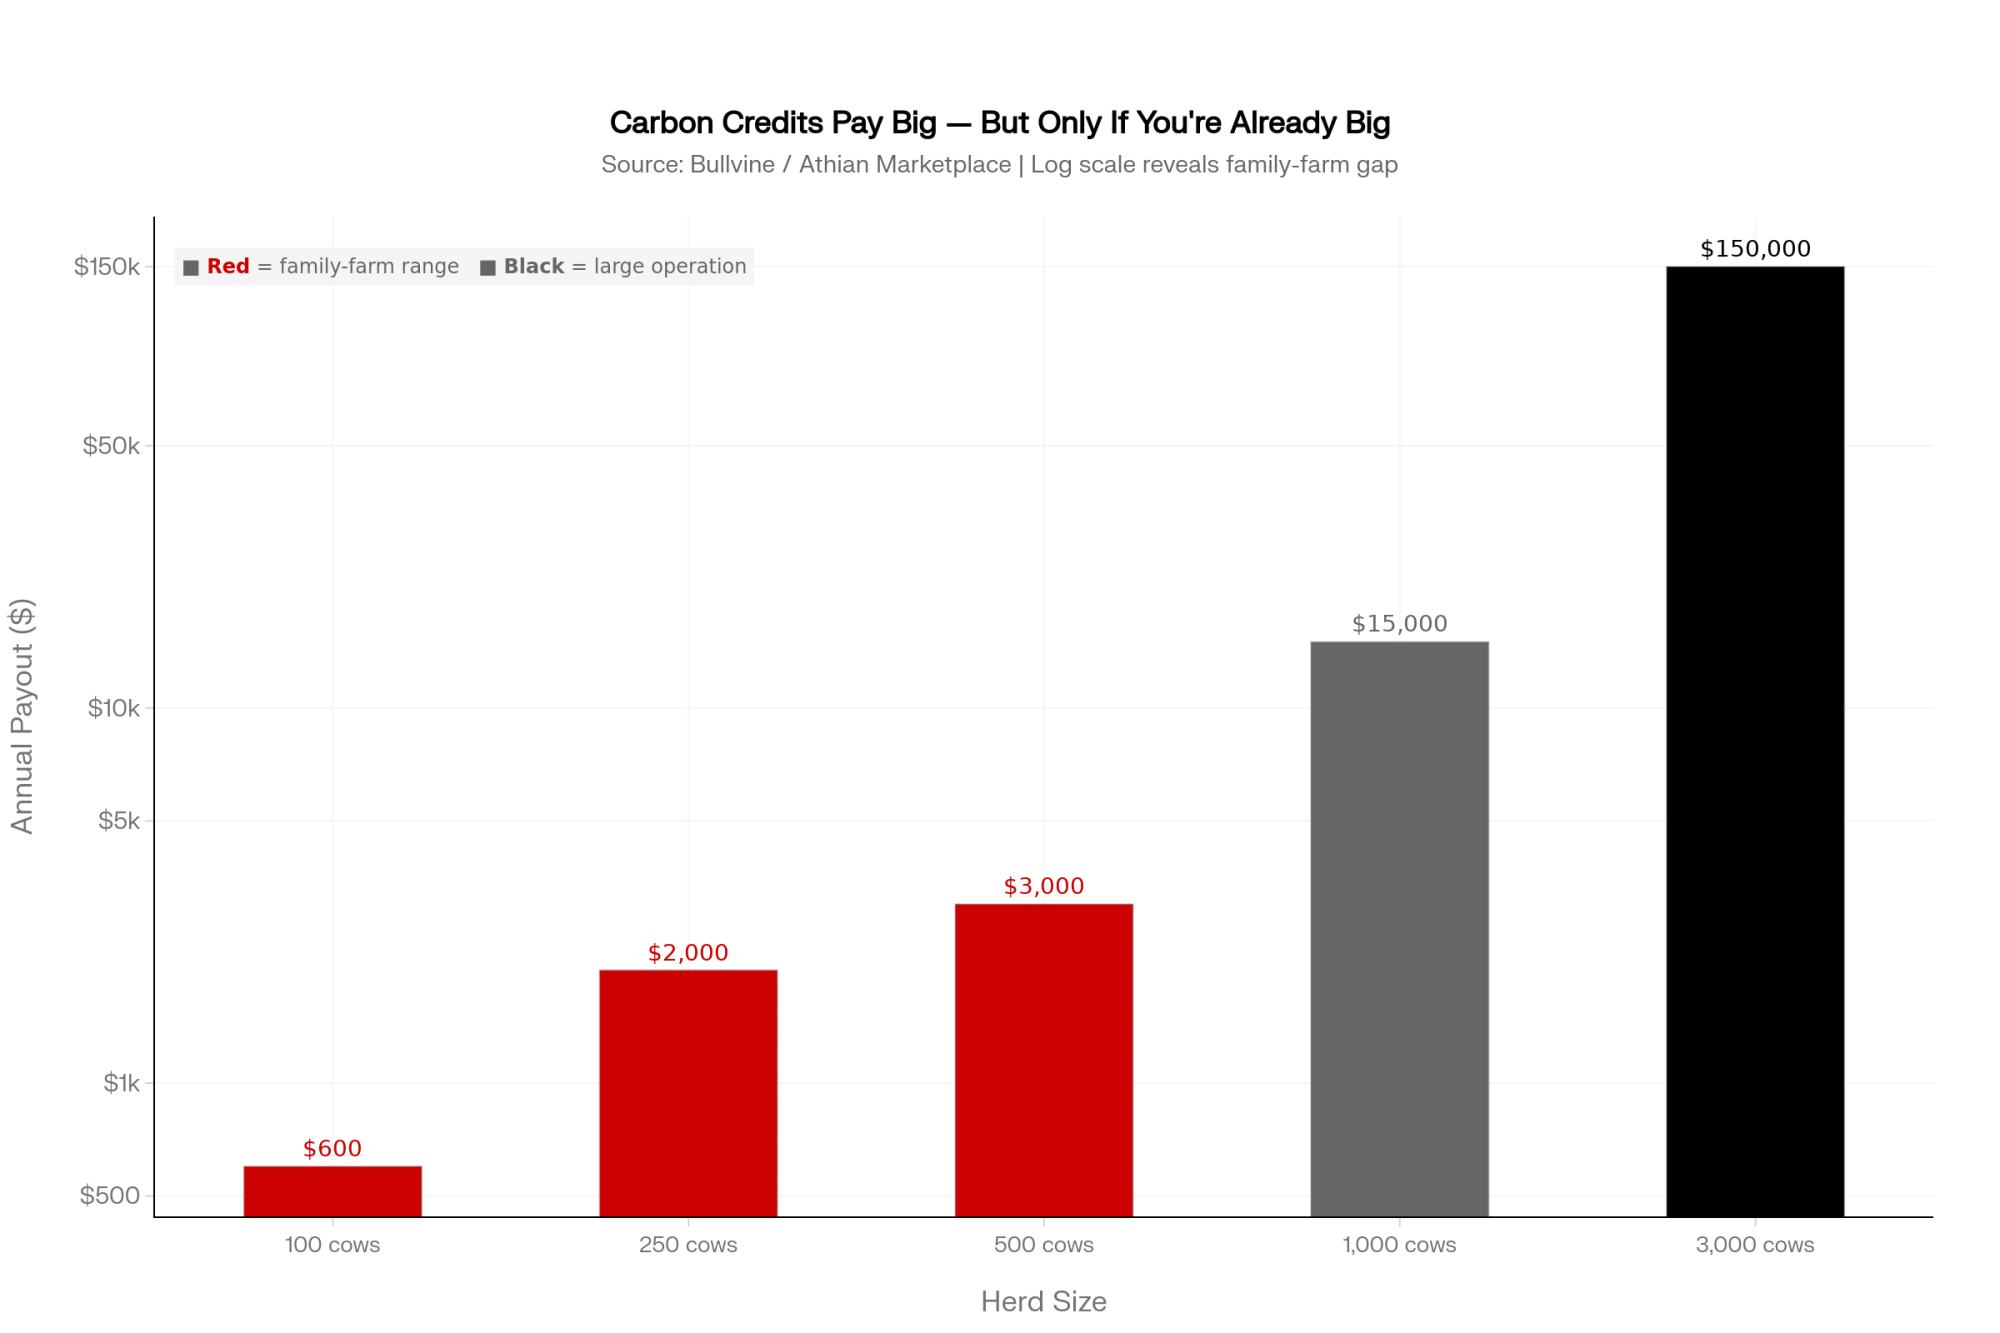
Five steps. Your name is on step one. Scale changes what that’s worth to you, and not in the direction most people assume — we broke that down in why carbon credit payouts vary so widely by herd size.

What Is Sustainability Data Worth — and Who’s Setting That Price?

In the U.S., honest answer: nobody knows, because no market prices it. There’s no index, no exchange, no third-party valuation methodology for farm-level sustainability data the way there is for milk or cheese. That’s a genuine structural barrier, not a dodge.

MetricUnited StatesNetherlands (FrieslandCampina)
Pricing mechanismNone — no index, exchange, or rateFoqus planet program, published annually
Gross rate per cwtNot applicable$1.37/cwt (€2.63/100kg, 2023 payout)
Net rate per cwt (after member deposit)Not applicable$1.06/cwt
Producer default ownership lawNebraska LB525 only, excludes aggregated dataNot a separate legal category — priced contractually
Annual value, 200-cow herd at 75 lbs/day$0$58,000 net

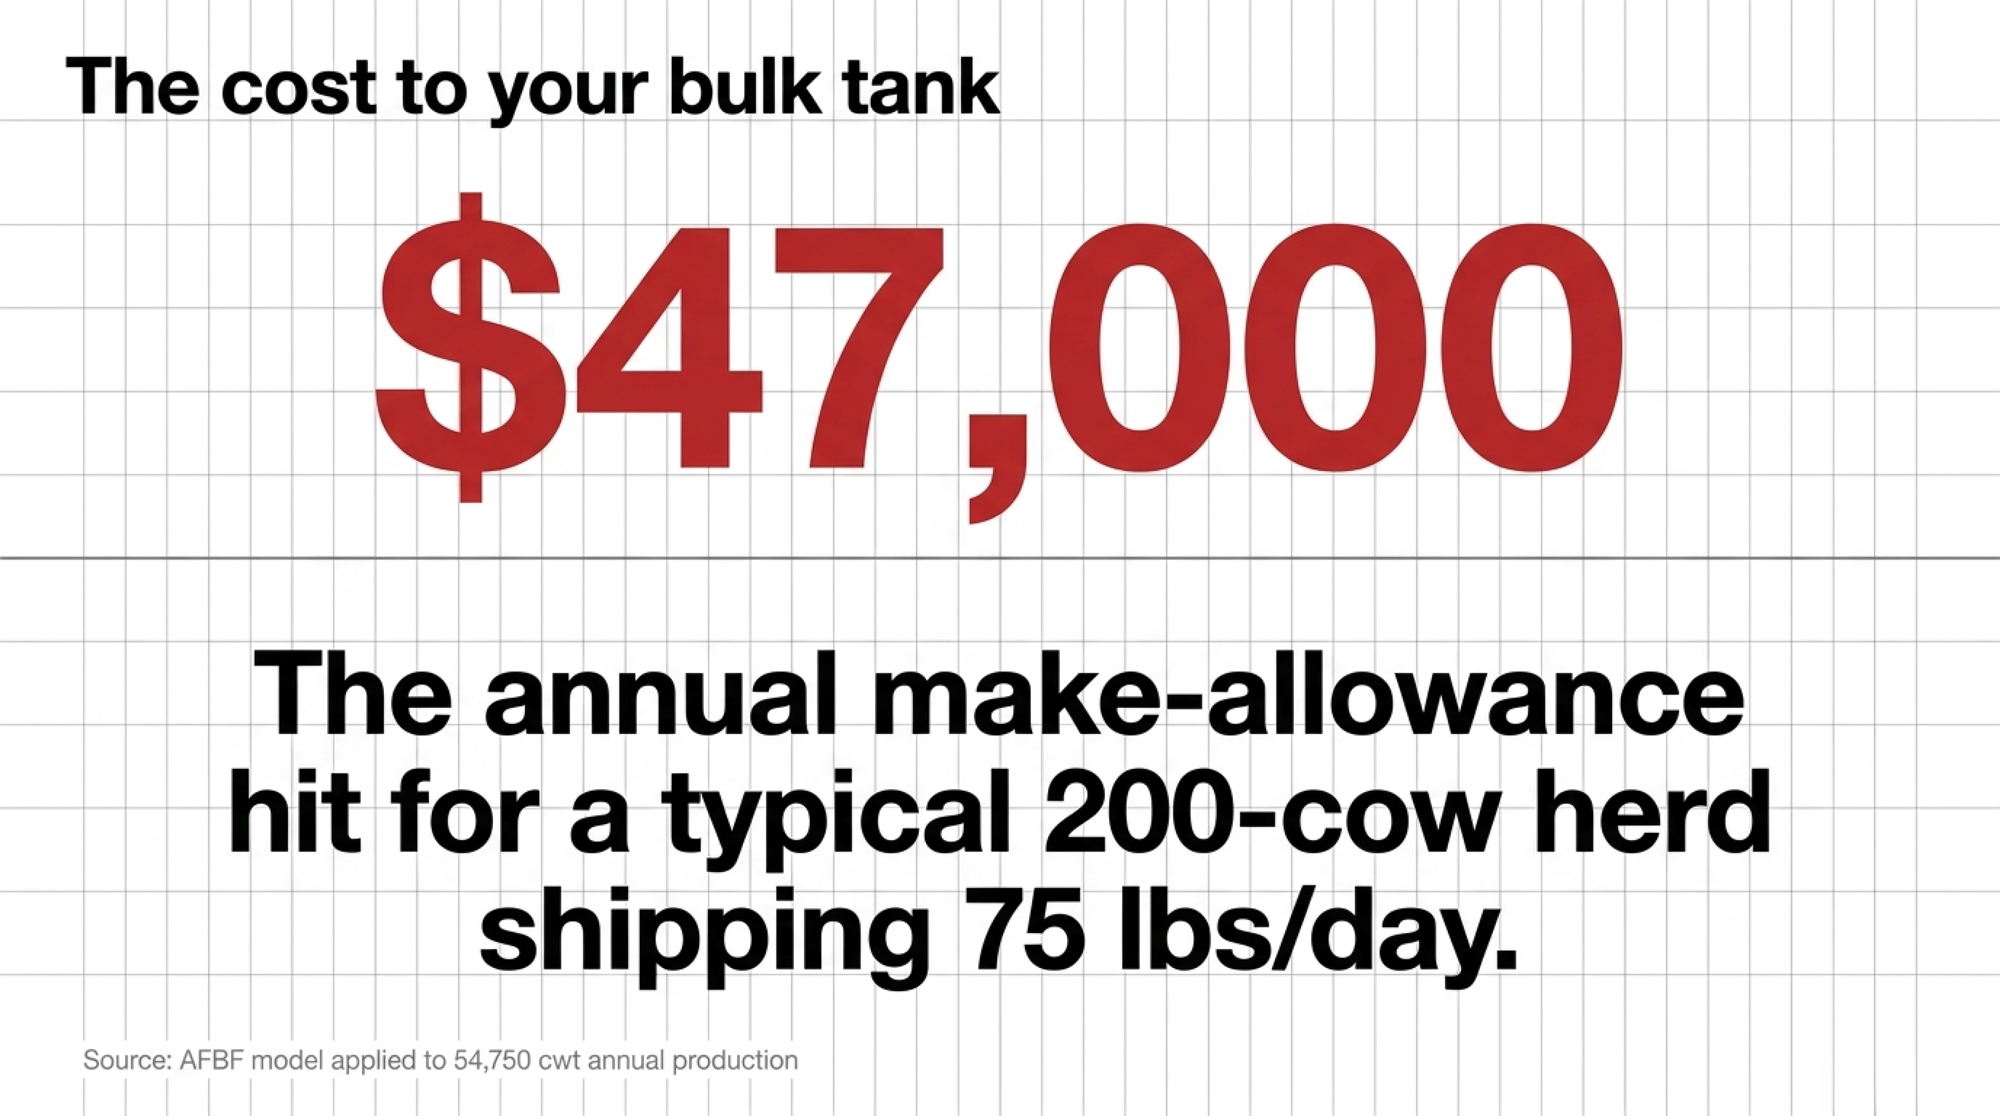
One place a real number exists is Europe. FrieslandCampina, the Dutch cooperative, paid member farms an average of €2.63 per 100 kg in sustainability premiums for the 2023 performance year under its Foqus planet program — €245 million total, published June 2024. Convert it, and that’s €1.19 per hundredweight, about $1.37/cwt at the August 10, 2026 rate of 1.15. On a 200-cow herd shipping 75 lbs per cow per day — 150 cwt daily, 54,750 cwt over twelve months — the gross lands near $75,100.

Now subtract the part the farmers fund themselves. Foqus planet is paid for by the company, by customers, and by members through a cooperative deposit of €0.60 per 100 kg. Net that out and you’re at €2.03 per 100 kg, roughly $1.06/cwt — closer to $58,000 on the same herd. Still real money. Just not a gift, and about 23% below the headline figure. The euro’s moved since we covered this premium last year at roughly $1.25/cwt — which tells you something about building a farm plan around a foreign-currency benchmark.

Run it against your own bulk tank for a second. At $1.06/cwt net, a 120-cow herd shipping 70 lbs would see somewhere near $32,500 a year; a 600-cow operation at 80 lbs, closer to $186,000. Nobody in the U.S. is offering you that. It’s a scale marker for what a functioning mechanism looks like elsewhere, not a number to take to your field rep.

Here’s the part that matters most. Foqus planet pays for outcomes across nine sustainability indicators, with the GHG indicator alone worth up to €1.50 per 100 kg and the whole program capped near €3.50. It is not a payment for data submission. That’s a different ask than compensation for the data itself — and you’ll need to decide which one you’re actually arguing for before you file anything.

The Ownership Stack: Four Questions, Four Different Answers

Here’s where the conversation usually goes sideways. “Ownership” gets used as though it’s one thing. It’s four, and they resolve differently.

LayerThe QuestionWhere It Stands Today
TitleWho legally owns the raw data?Unsettled in most states. No federal ag-data ownership law exists. Nebraska’s LB525 — signed April 14, 2026, effective July 17 — is the first state statute making the producer the default owner of farm-originated data, including a defined “Sustainability Data” category covering GHG emissions and water-quality impact.
AccessWho can see and pull it?Co-ops, processors, and FARM evaluators, through program participation and milk supply contracts.
Use rightsWho can process, aggregate, and republish it?Already granted, mostly implicitly, through co-op membership terms and milk contracts most producers never reviewed for a data clause.
Value captureWho monetizes the downstream output?Processors and CPG buyers, via Scope 3 disclosures, financing terms, and net-zero marketing.

Nebraska’s law looks like a win, and in the title layer it is. But LB525 explicitly excludes aggregated and derived data from producer ownership and grants technology providers a nonexclusive right of control for service delivery — legal analyses from the National Agricultural Law Center and the firm ArentFox Schiff both confirm the carve-out. Aggregated and derived data is exactly what your numbers become by the time they reach a Scope 3 report. The statute protects the input and carves out the output.

That’s not a Nebraska drafting quirk. Ag Data Transparent — founded in 2014 after the American Farm Bureau Federation started hearing the same complaints from members — reviews company contracts against eleven published questions, with a third-party administrator checking whether the answers match the contract language. Two of those eleven go straight at aggregation: whether a user can opt out of anonymized and aggregated datasets, and whether signing up gives the company the right to sell aggregated data to third parties without further consent. Useful questions. But ADT can only report what a contract says — it can’t reach the value created after the data is pooled.

Can You Put Your Hands on Your Agreement Today?

Try it this week. Call your co-op or field rep and ask for the signed document specifying what sustainability data gets collected, who receives it, and what they’re permitted to do with it.

Based on the survey, there’s a strong chance no such document is on file for your operation. That’s not somebody hiding the ball. It’s just how membership agreements tend to get written — broad language, signed once, filed away, and most of them signed well before Scope 3 reporting was anyone’s concern. But the practical result is that a decision about your data got made on your behalf, possibly years ago, for reasons that had nothing to do with sustainability reporting.

If you want the wider context on how these questions have been landing across the industry, our ongoing coverage of farm data ownership tracks it.

The Case for Doing It This Way

FARM and NMPF have a real argument, and it deserves airing before anyone answers it. A single standardized metric lets the industry make one credible claim to retailers and CPG buyers instead of a patchwork of unverifiable farm-by-farm assertions. That protects market access for operations that will never have their own sustainability staff. Dr. Meggan Hain, speaking to Brownfield Ag News about the Version 2028 updates, named the design tradeoff directly: the program has to find “that best fit for our farmers, which is not going to be perfect for every farm, but it’s the best fit for the overall industry.”

Give them this too. FARM opened Version 2028 development in July with a stakeholder survey that drew more than 800 responses. NMPF says results go to the Animal Health & Wellbeing Committee, the Animal Care Task Force, and the Farmer Advisory Council this fall, with a summary report to be published on the FARM website. That’s a more open process than the program has run before, and the published-report commitment is the part worth holding them to.

Where the argument runs short is compensation. Collective bargaining power over a resource has never required paying the people who generate it nothing. But FARM is a standards and evaluation body — its task forces report to NMPF’s Executive Committee and Board — not a negotiating one with any mandate over milk pricing. On our read, there’s no obvious place in the current structure to put a compensation mechanism.

What’s Under Comment — and What Isn’t

Version 2028 launches January 2028, and the name itself signals a change: FARM now identifies cycles by launch year instead of successive version numbers, on a three-year rhythm. Environmental Stewardship and Workforce Development run on the same cycle as Animal Care. So ES isn’t excluded from the version process.

What’s less clear is the comment mechanics. The proposed-changes documents FARM has publicized for this window cover Animal Care and Workforce Development. The named review bodies — Animal Health & Wellbeing Committee, Animal Care Task Force, Farmer Advisory Council — are animal-care governance. Whether ES data-sharing consent language is itself under revision in this cycle, and through which body, isn’t something the public materials answer.

That’s the gap worth writing into your comment. Not “you left ES out” — that isn’t accurate. Rather: if ES is on this cycle, where do consent and data-use terms get reviewed, and will that review be published the way the Animal Care survey summary will be?

Four Paths, and What Each One Costs You

▸ Request your agreement in writing — do this within 30 days. Costs a phone call and creates a record either way. If the document exists, you finally know your terms. If it doesn’t, that absence is worth documenting before October 2. Limit: your co-op isn’t obligated to produce anything on your schedule, and pushing hard can strain a relationship you need.

▸ File a Version 2028 comment before October 2. Jacquier’s point about farmer involvement cuts both ways — a process only reflects what gets submitted to it. Ask specifically where ES data-sharing consent terms get reviewed in this cycle and whether that review will be published. It’s a governance question, not an accusation, and it’s answerable. Limit: the publicized task forces are animal-care bodies, so say plainly in your submission that the comment concerns ES.

▸ Push your co-op toward Ag Data Transparent certification. The eleven-question review forces contract-level disclosure of what a company does with farm data, checked by a third-party administrator and renewed annually. Cooperatives are already an eligible membership category. Limit: you can’t self-certify — your co-op has to agree to submit its contracts, which makes it a member-meeting ask.

▸ Watch your statehouse. If your state drafts ag-data legislation modeled on Nebraska, the aggregated-and-derived carve-out is the clause to flag early, before it gets copied forward by default. Limit: multi-year path, no near-term return, worth your energy only if you’re already engaged with your Farm Bureau chapter.

Key Takeaways

▸ If you can’t produce a signed agreement within 30 days of asking — treat that absence as the finding, and reference it directly in your Version 2028 comment.

▸ If you’re enrolled in FARM ES through a co-op requirement rather than a direct choice — “voluntary” may describe your co-op’s enrollment decision rather than your consent to specific data uses.

▸ If you’re arguing for compensation — decide first whether you want payment for outcomes, the FrieslandCampina model where the GHG indicator alone runs up to €1.50 per 100 kg, or payment for the data itself. Different asks, different mechanisms.

▸ If your co-op hasn’t pursued Ag Data Transparent certification — raise it at your next member meeting, and point at the two aggregation questions specifically. Those are the ones that reach your problem.

▸ If your state introduces ag-data legislation this session — check whether it copies Nebraska’s aggregated-data exclusion before your organization endorses it.

▸ If someone quotes you a per-cwt value for sustainability data in the U.S. — ask what market set that price. As of now, none has.

Before October 2

Put the question to your neighbors at the next co-op meeting: how many of them can produce their agreement? If the answer around that table looks anything like the survey — and there’s no particular reason it wouldn’t — then the useful conversation isn’t whether FARM should change. It’s how many of you file something before the window closes, and whether the consent question ends up in that published summary report or gets left out of it.

Which leaves the harder question underneath all of this. Nebraska drew its line at the farm gate and left everything past it alone, and no U.S. market prices the aggregated layer at all. Somebody has to build that mechanism before anyone can argue about the rate — and we’re working through who that would actually be, what the legal machinery looks like, and why the valuation problem has stalled every attempt so far. That’s next in Bullvine Weekly.

Survey figures come from the American Dairy Coalition’s producer poll conducted February 24–March 14, 2026. ADC has not published a methodology summary or sample breakdown. FrieslandCampina premium figures are from the company’s June 11, 2024 announcement of 2023 sustainability payments. Currency conversion at the August 10, 2026 EUR/USD rate of 1.15.

Learn More

The Sunday Read Dairy Professionals Don’t Skip.

Every week, thousands of producers, breeders, and industry insiders open Bullvine Weekly for genetics insights, market shifts, and profit strategies they won’t find anywhere else. One email. Five minutes. Smarter decisions all week.
NewsSubscribe
First
Last
Consent

$11 Billion Went Into New Dairy Plants. New England Got Zero.

DFA idles St. Albans August 17. New York’s building $2.8B in new capacity one state over. Three lines on your milk check can move — and only two are published anywhere.

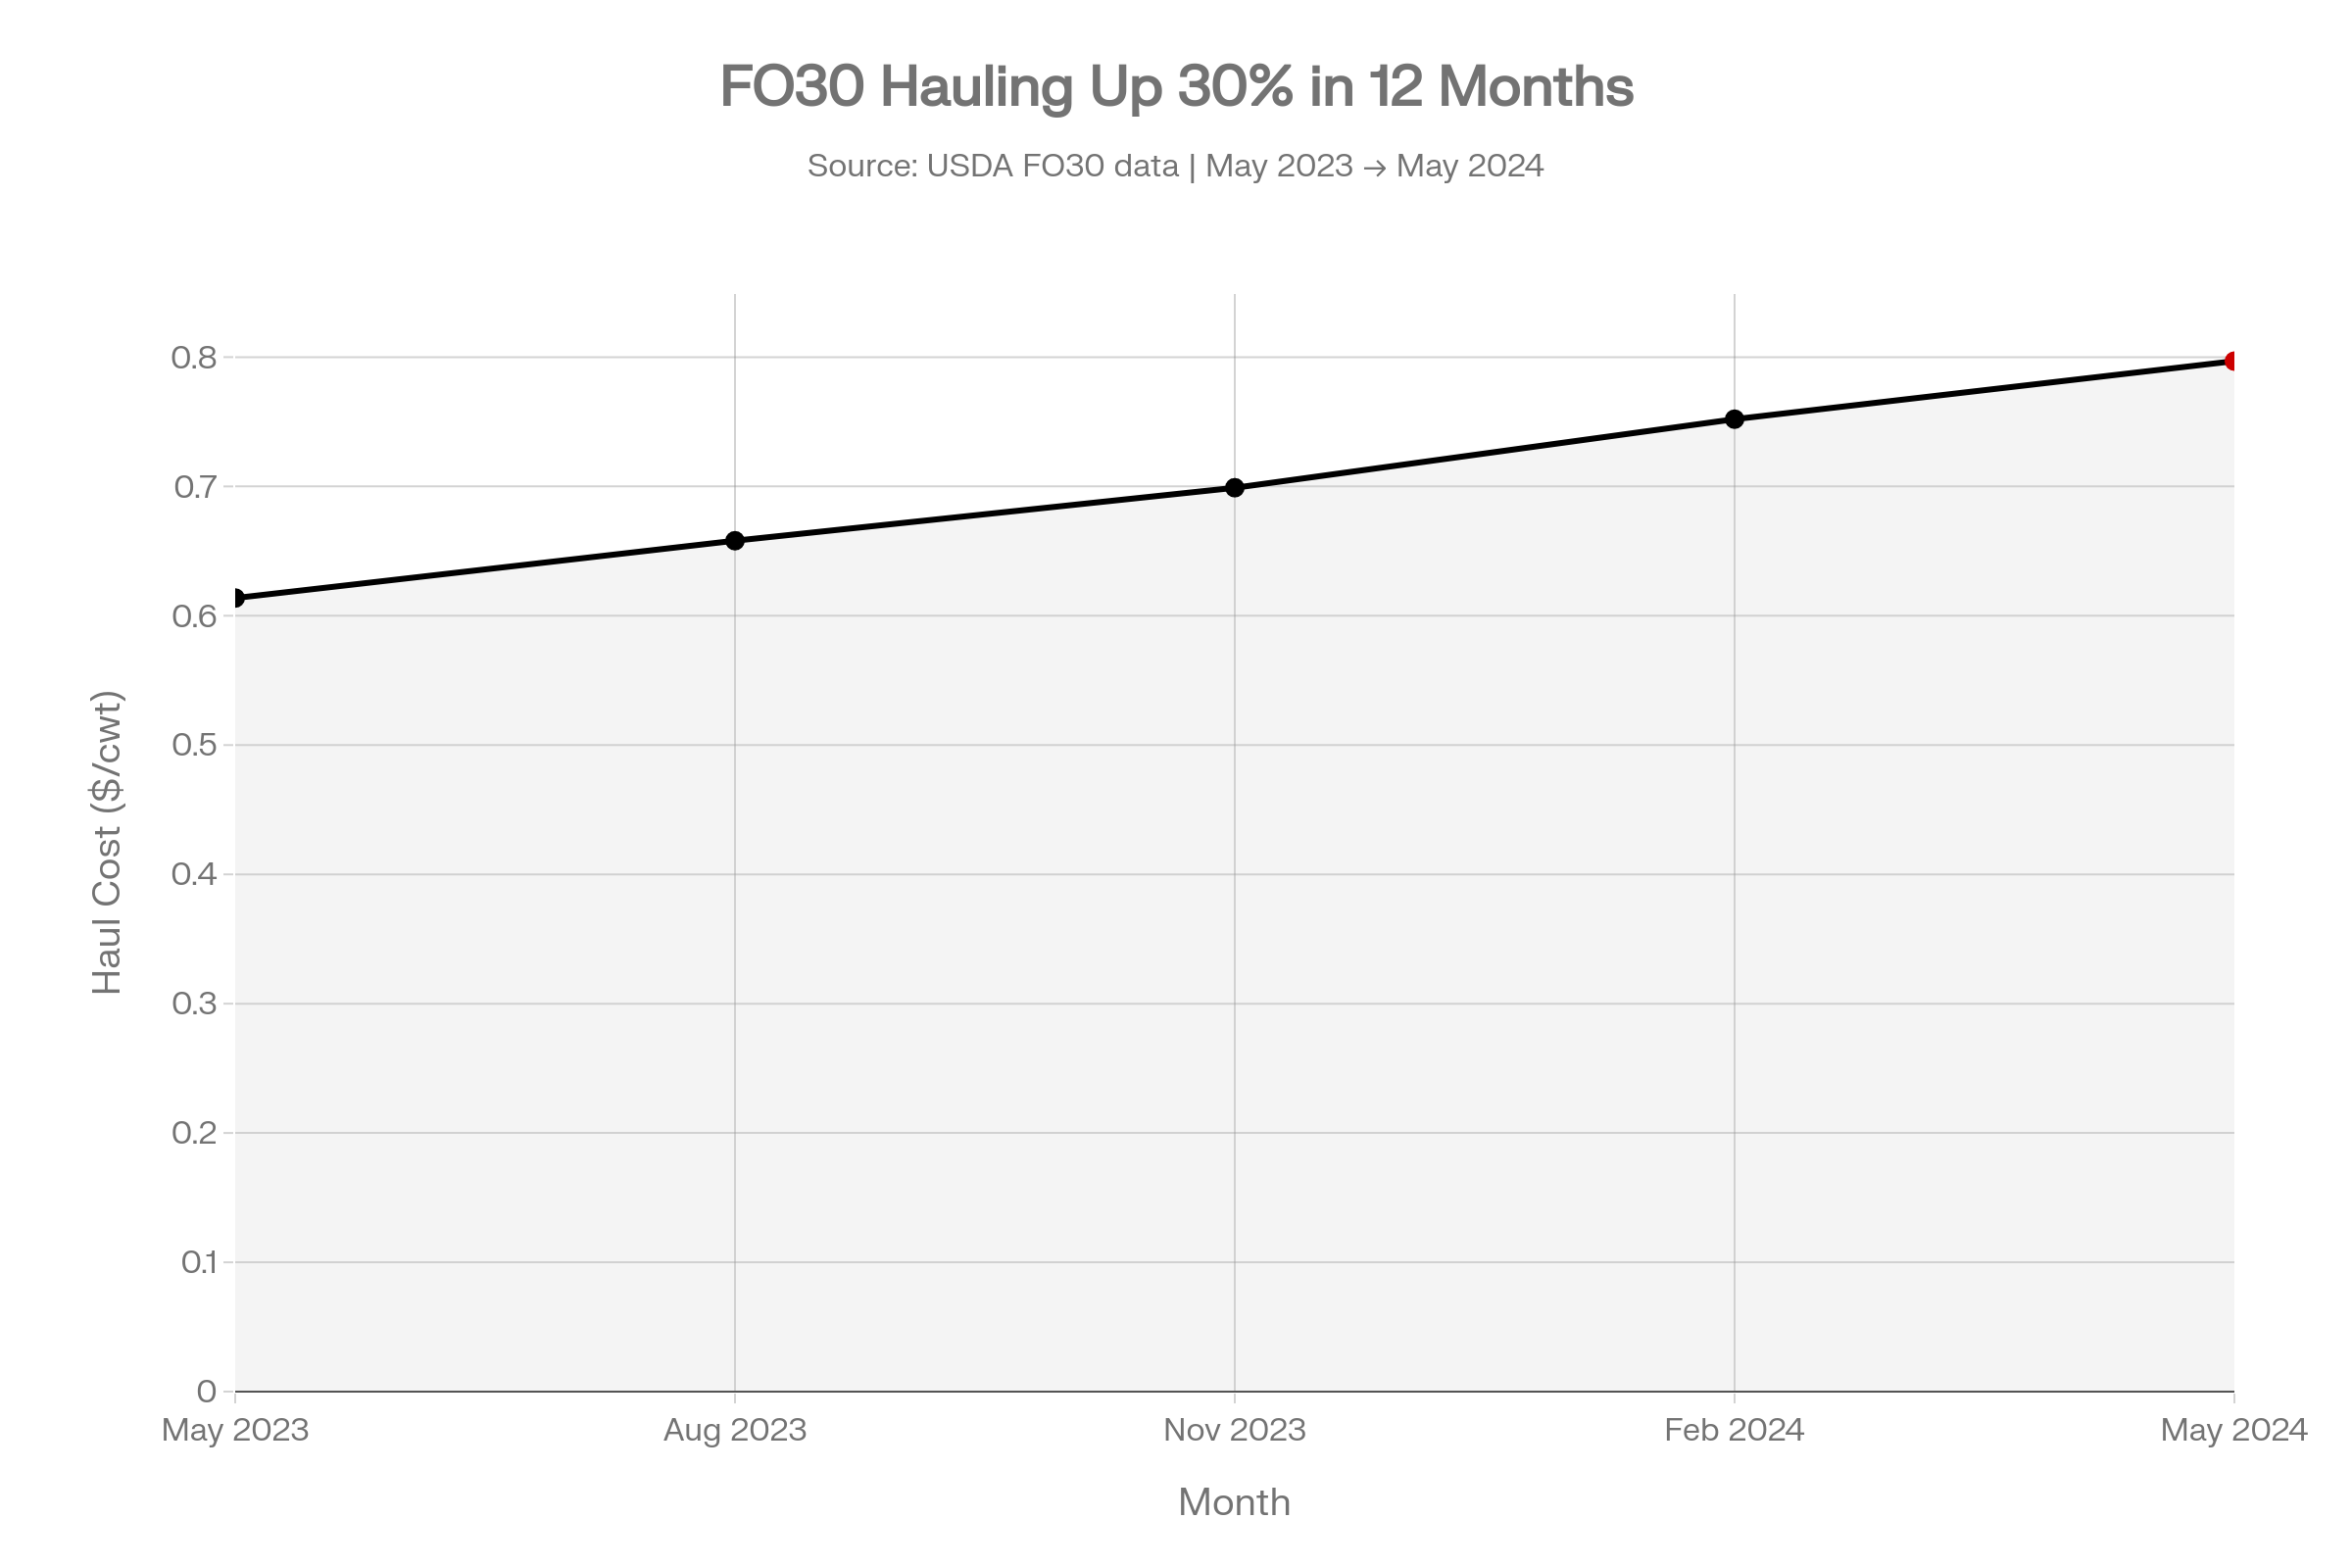
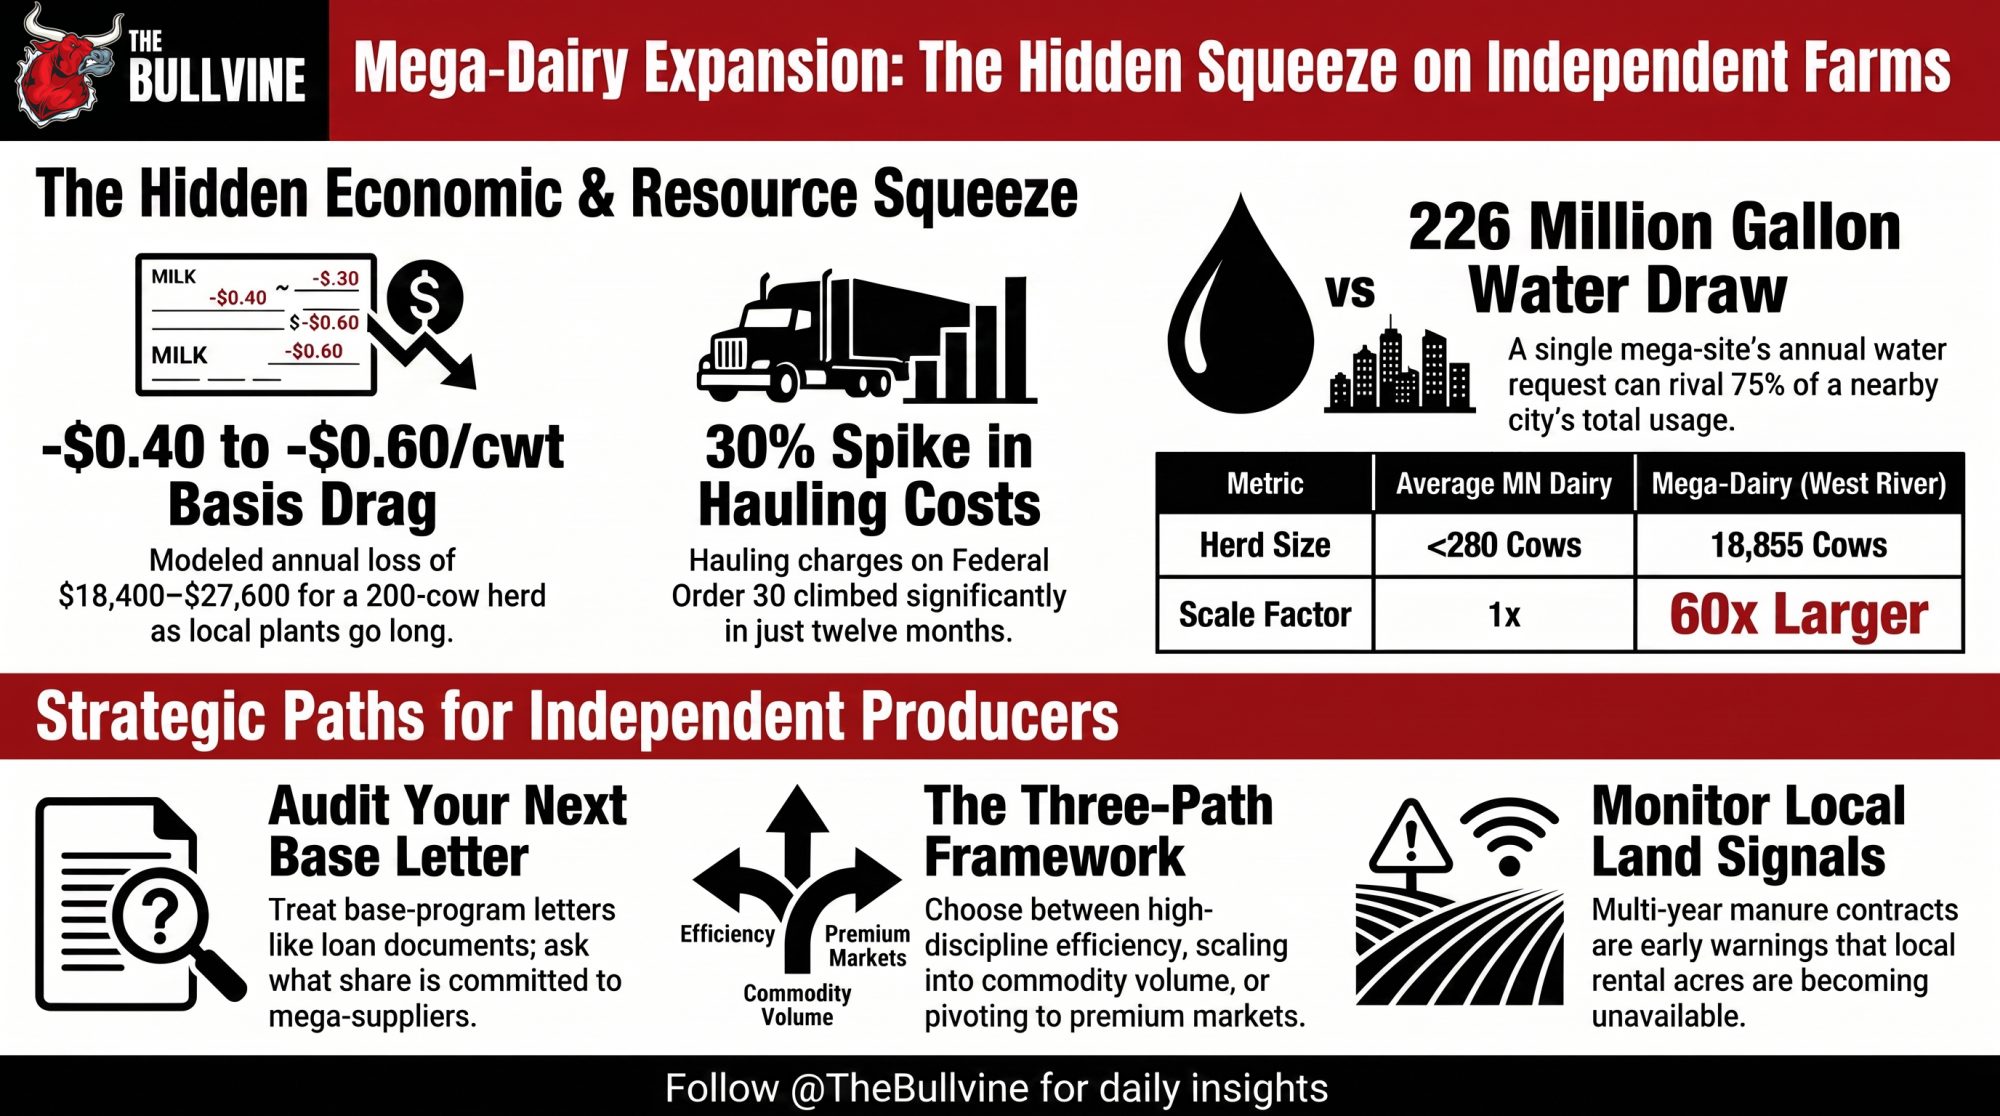
Executive Summary: More than $11 billion is going into 50-plus new or expanded dairy plants across 19 states through 2028, per IDFA — and none of the 66 facilities is in New England. Vermont loses its fourth plant of the year when DFA idles St. Albans on August 17, three of the four in Franklin County. For rerouted shippers, the hauling deduct is the one moving check line with no federal formula behind it — a 19-cent shift runs $27,740 a year on a 500-cow herd.

dairy plant closures

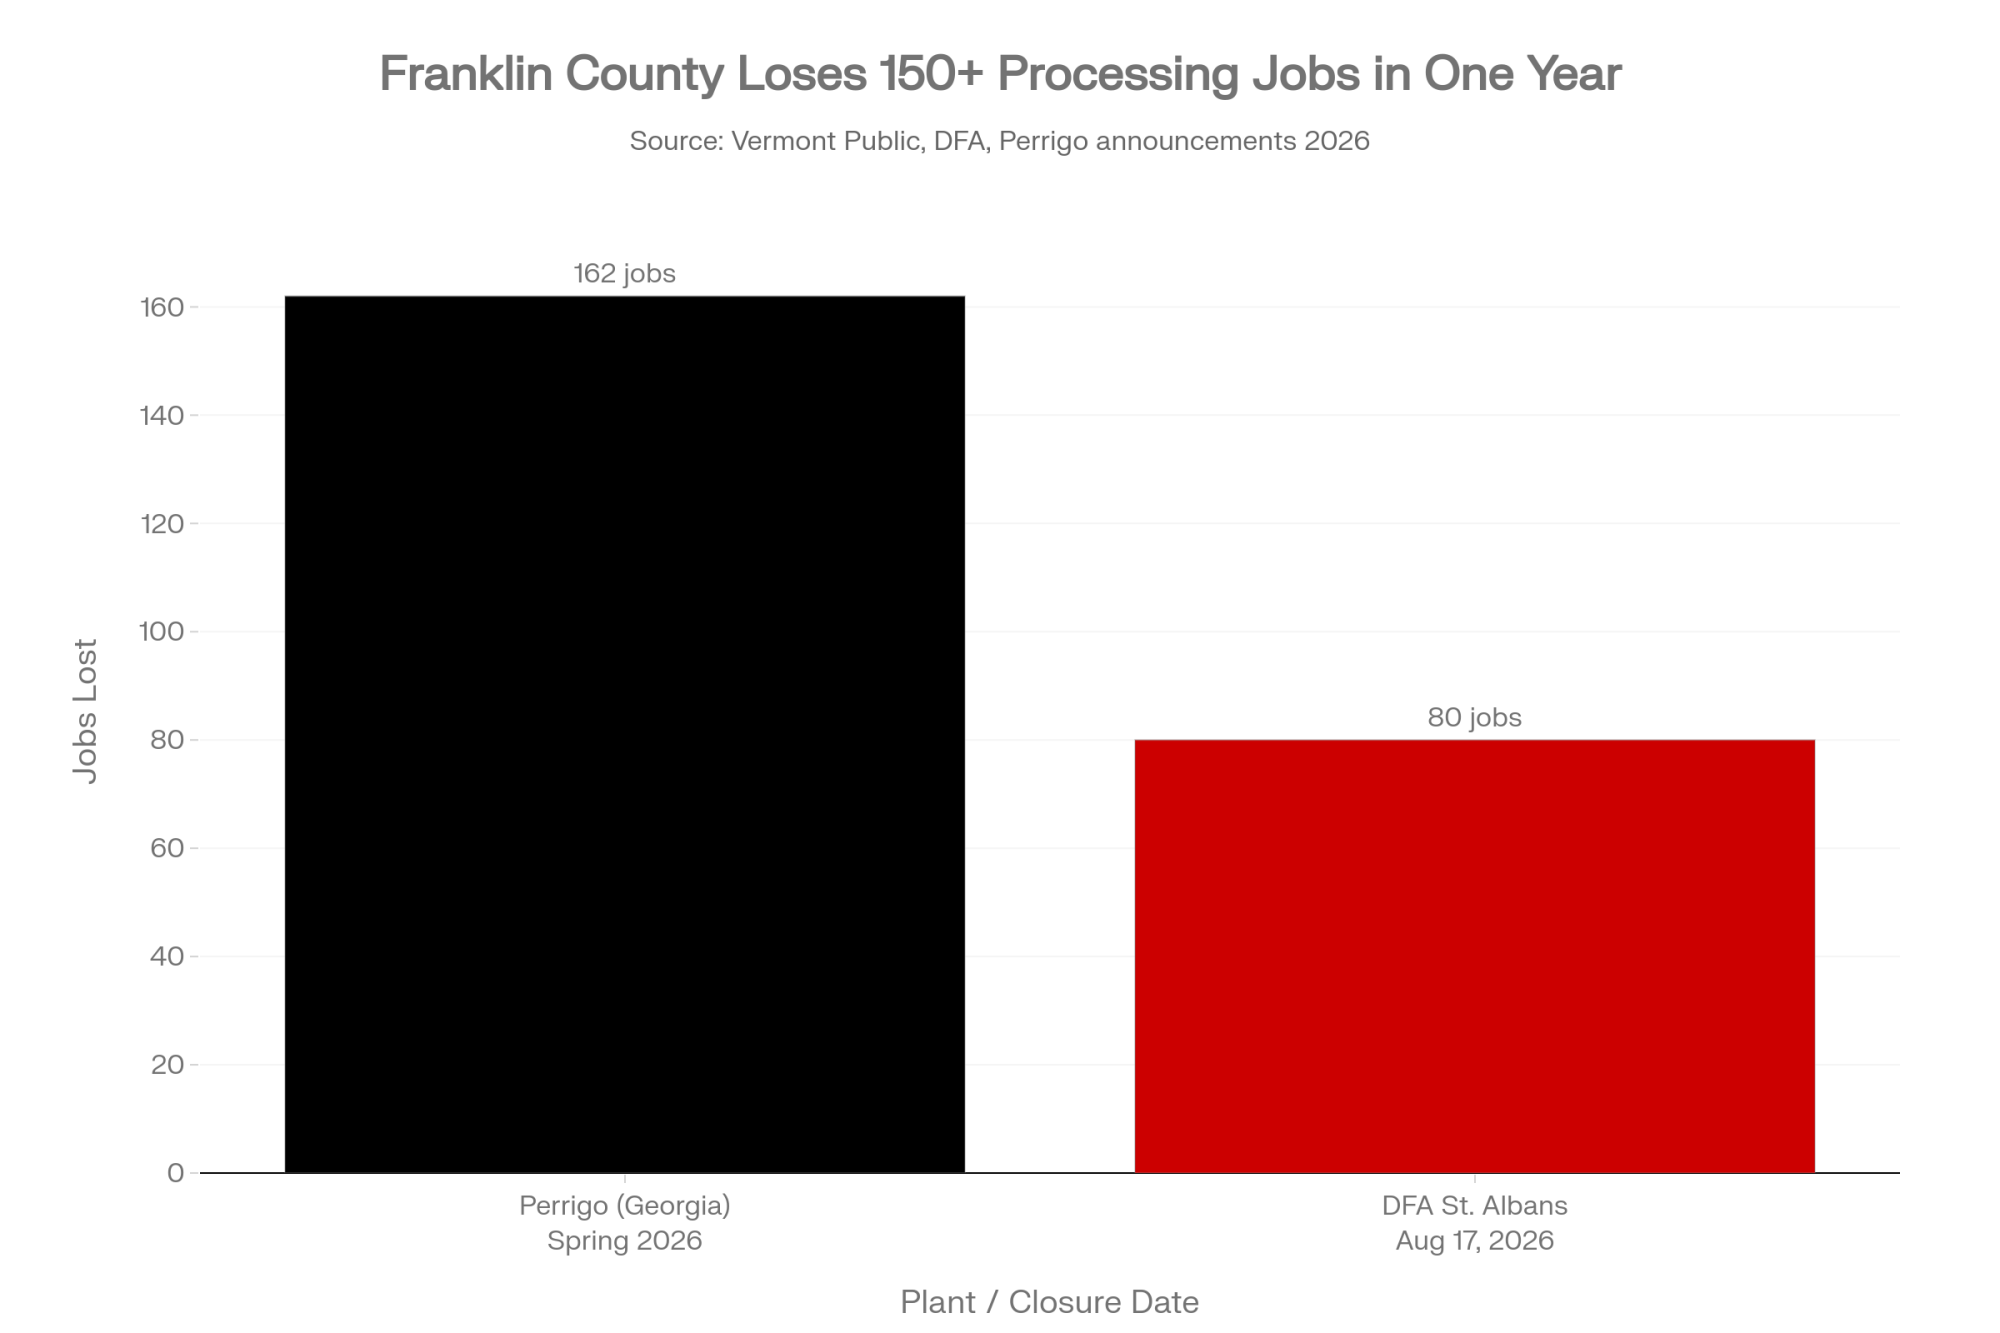
Curtis Clough, a plant worker, told VTDigger in June that employees “feel like they have supported DFA through the hard times, like Covid, and DFA is turning around and abandoning them.” He was talking about roughly 80 jobs going away when Dairy Farmers of America idles its St. Albans, Vermont facility on August 17. He’s one of about 390 people in Vermont who got that kind of news this year, and that number deserves saying on its own terms before anyone starts doing math about milk checks.

But this closure isn’t the usual consolidation story. American dairy processors are in the middle of a building boom — more than $11 billion committed to over 50 new or expanded plants across 19 states between 2025 and 2028, according to the International Dairy Foods Association’s October 2, 2025 announcement. New York alone is getting $2.8 billion of it, the largest share in the country. Texas is getting $1.5 billion, Wisconsin $1.1 billion, Idaho $720 million, Iowa $701 million.

Of the 66 new plants underway or recently opened under that investment, VTDigger reported on July 12, 2026, that none are in New England. The money went to the state next door and kept going.

Four Plants, One Year, Three in One County

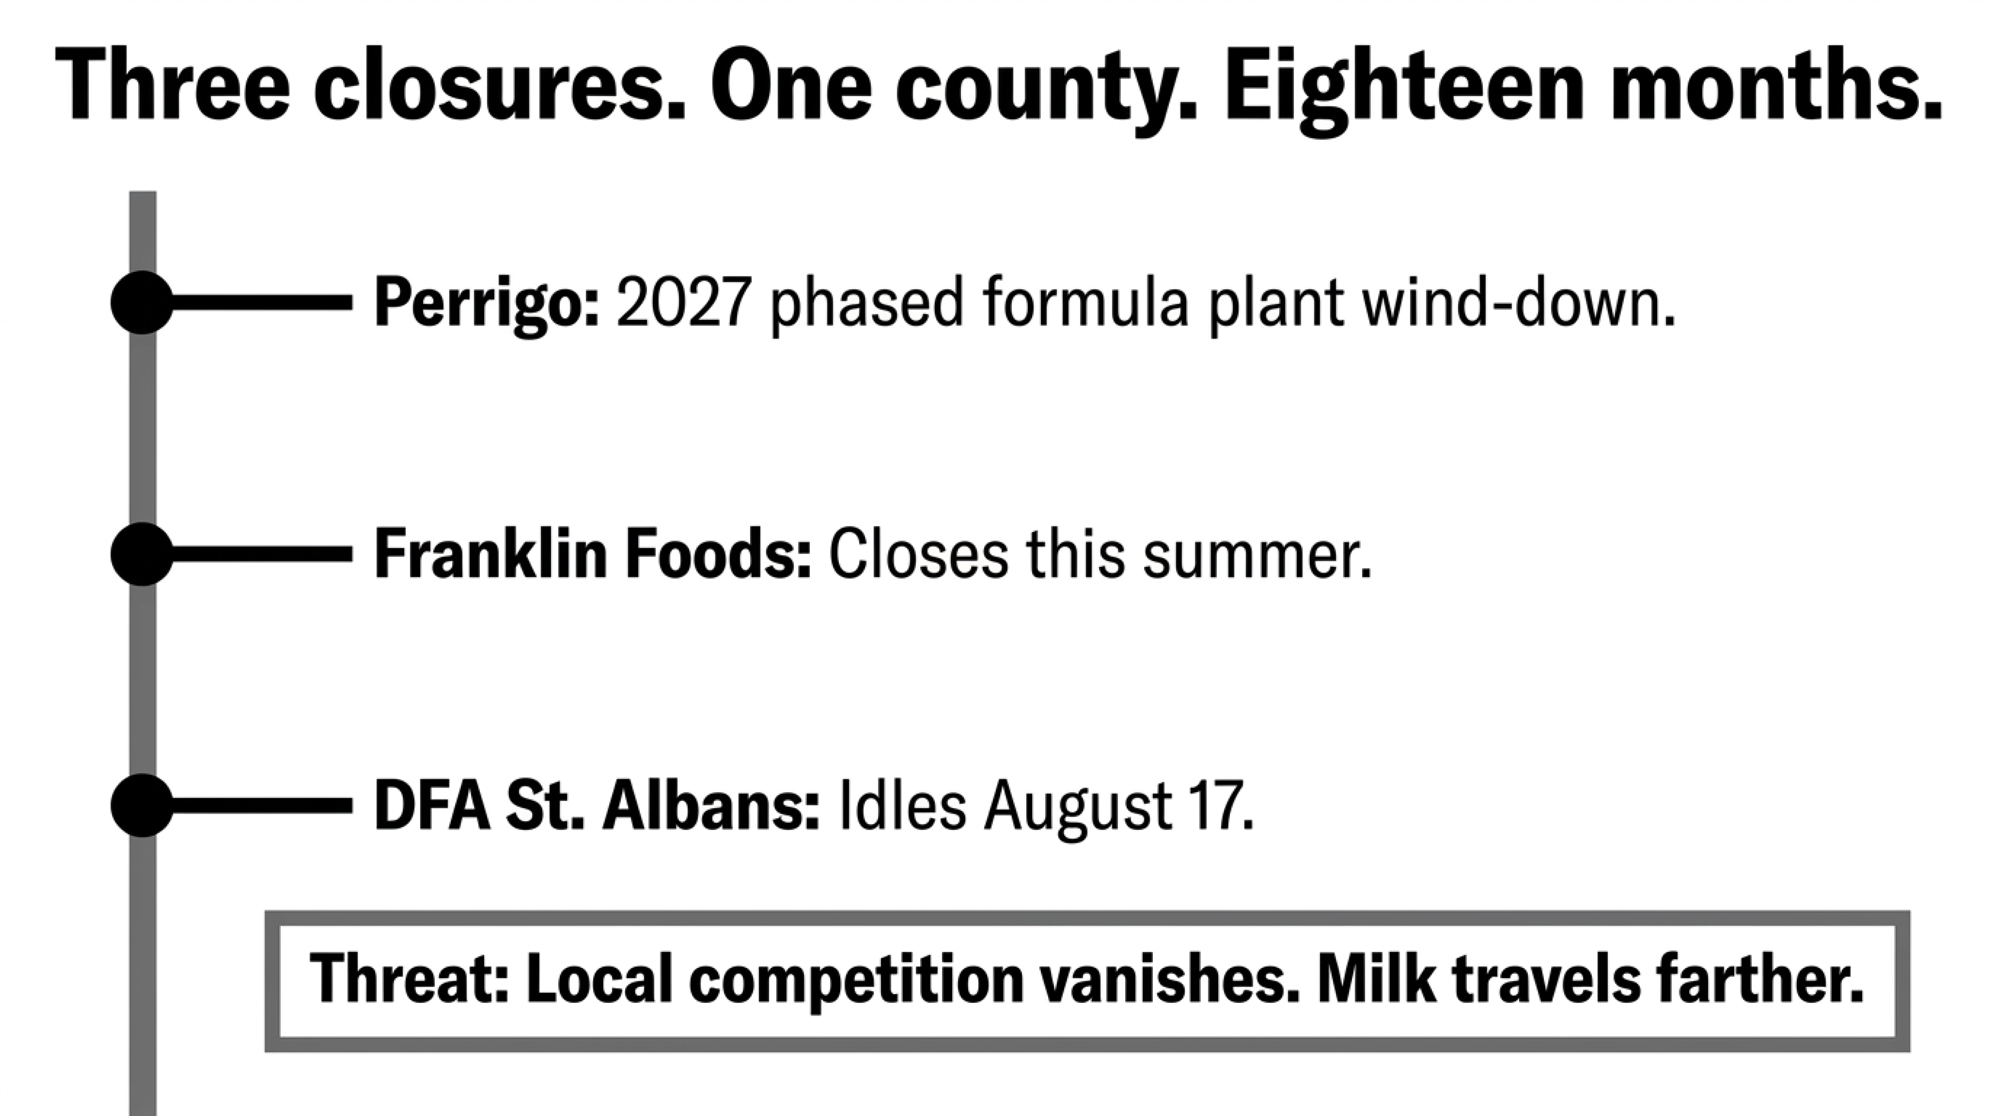
Vermont isn’t losing one plant. It’s losing four in 2026, and the Vermont Farm Bureau tallied the damage on July 16: roughly 4 million pounds of daily processing capacity and about 390 jobs, gone inside a single year. Three of the four sit in Franklin County.

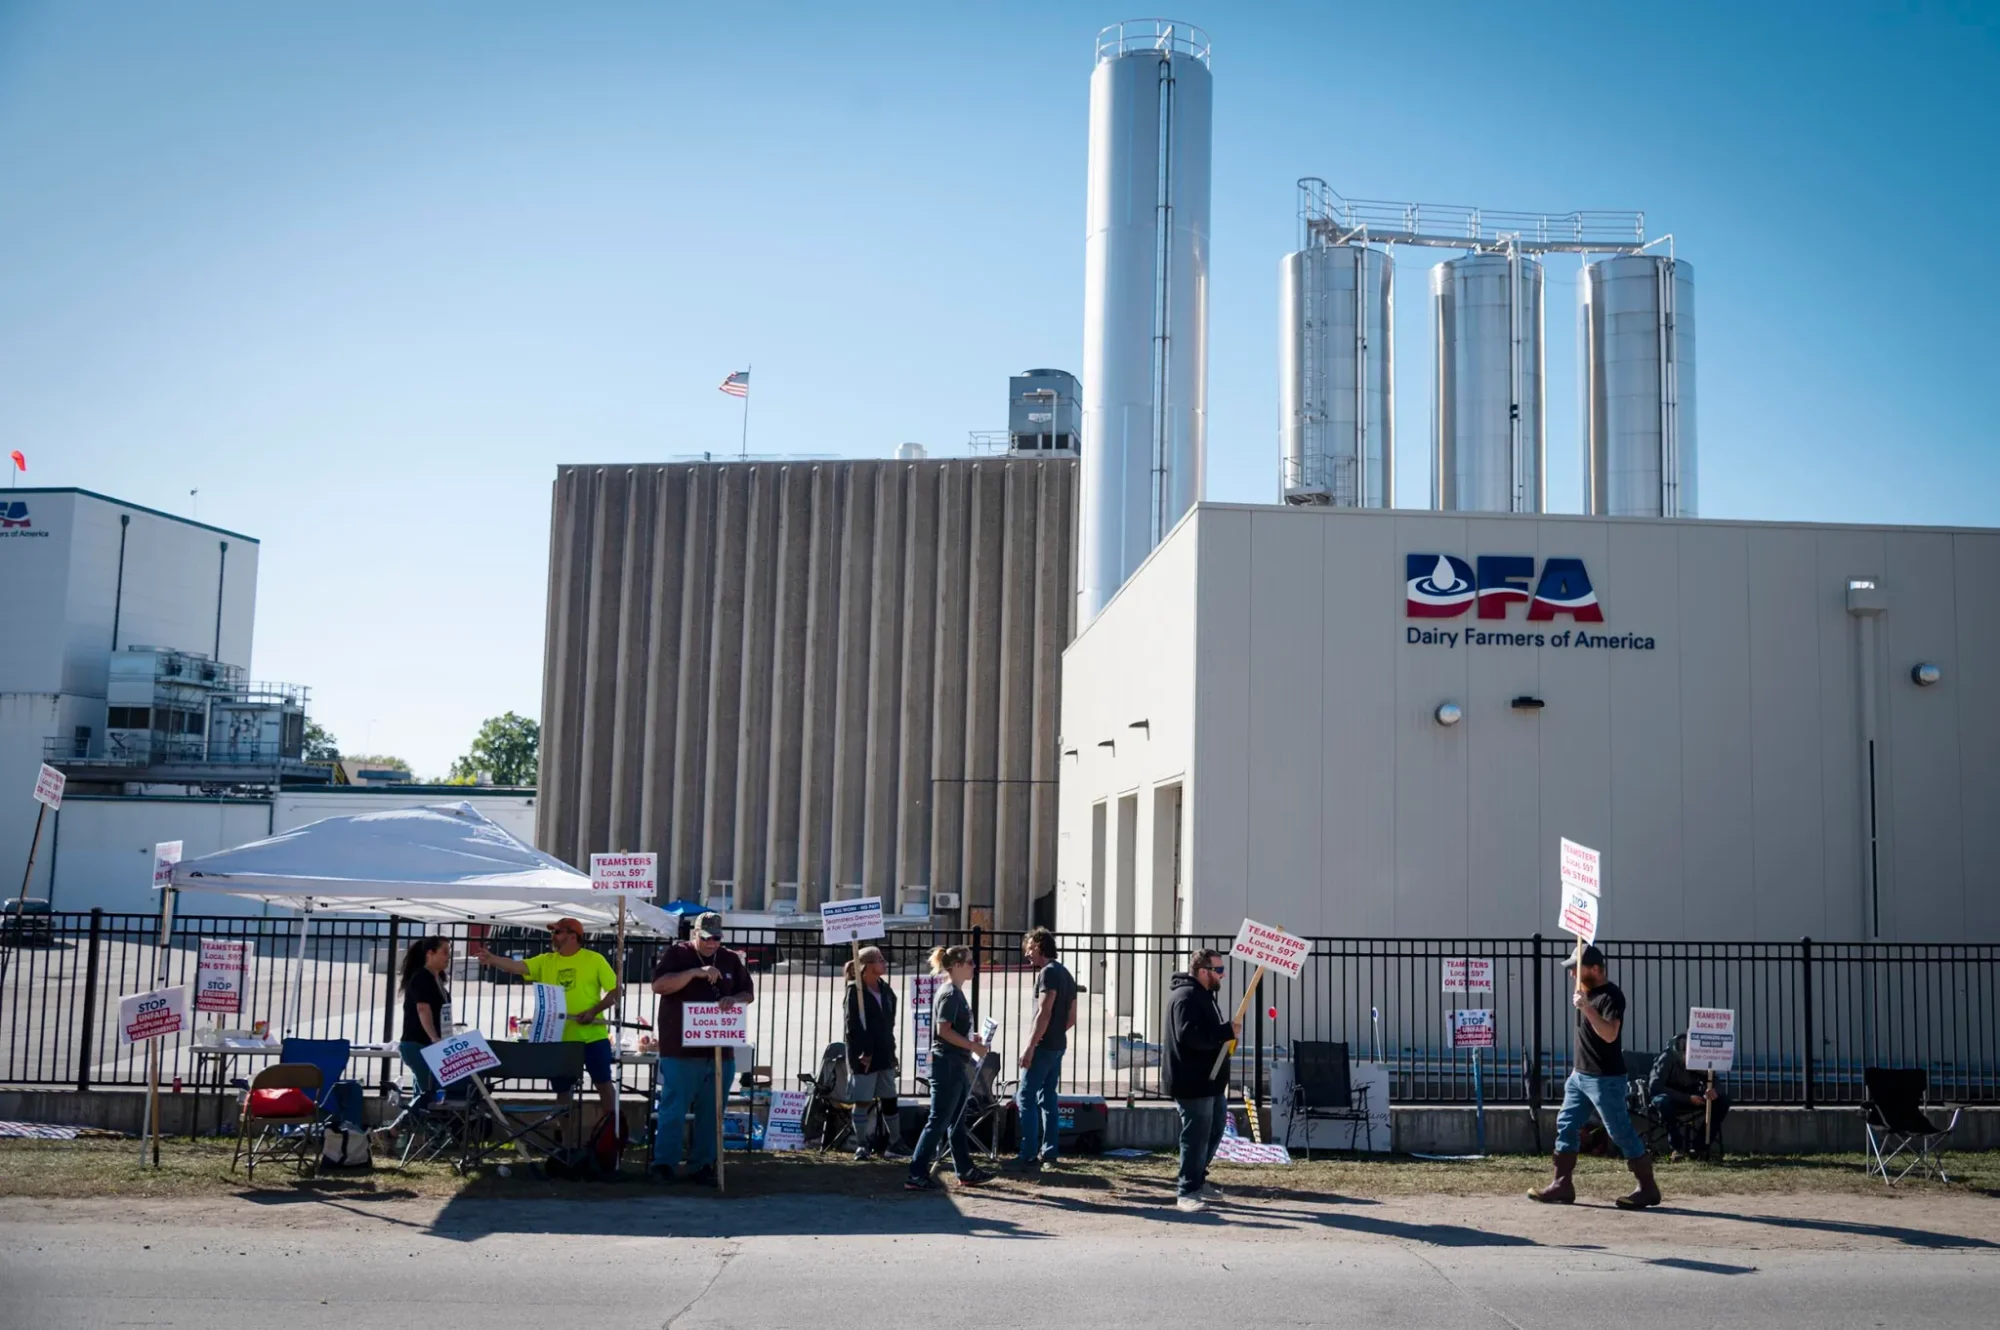
Hood’s Booth Bros. facility in Barre took its last milk delivery in late March and closed April 1, after nearly 80 years — the plant opened in 1946, Hood bought it in 1997, and it was Vermont’s last commercial fluid bottler at more than 500,000 pounds a day. Perrigo ended production at its Georgia, Vermont infant formula plant on June 30, laying off 161 in phase one of a closure that ultimately affects about 420 people. Franklin Foods closed its Enosburg Falls plant July 31 after 125 years, cutting roughly 100 jobs. And St. Albans, the biggest of the four at over 3 million pounds a day, goes dark August 17 — a balancing plant, the facility that absorbs surplus milk when fluid demand dips, closing six years after a $30 million upgrade completed in 2020.

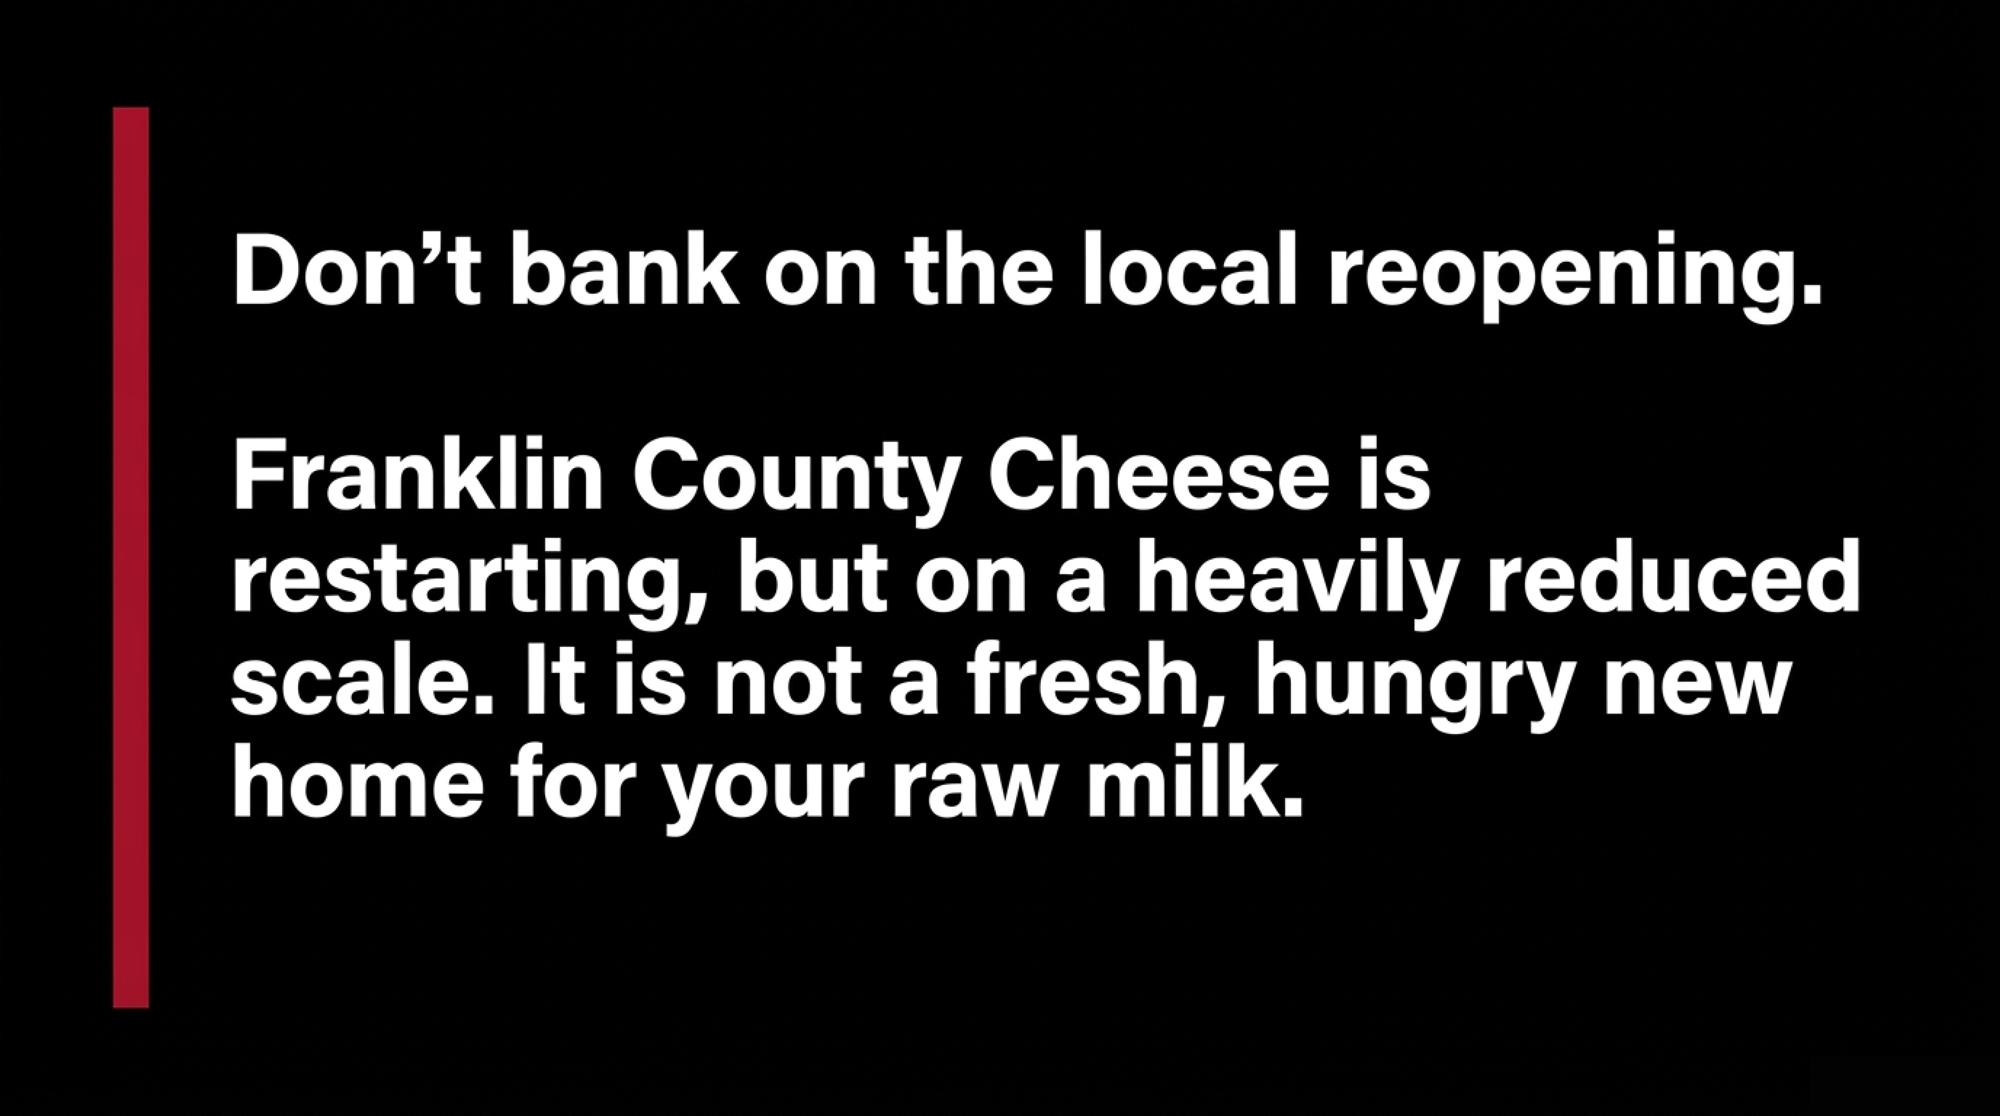
One of those four has a second act. The Enosburg Falls facility was sold and reopens September 1 as Franklin County Cheese, a new Vermont-based business, per Franklin Foods’ own June 16 announcement. Worth noting, because the trend line isn’t uniformly one direction and this piece shouldn’t pretend it is.

Watch what happened to the Booth Bros. milk, though, because that’s the tell. That volume now hauls to HP Hood in Concord, New Hampshire — and according to the Vermont Farm Bureau’s July 16, 2026 analysis, the added transportation cost landed on farm producers. The plant closes, the milk keeps flowing, and the freight bill changes hands.

DFA closed a Connecticut plant in May and opened a Michigan plant making whey protein powder, per Washington Post reporting on July 13, 2026. Read those two decisions together, and you get the same signal the investment map sends: capital isn’t leaving dairy, it’s following the milk — the same pattern as the last time a plant went dark without much warning.

Why the Money Skipped the Region

Claire Kelloway, food systems program manager at Open Markets, put it plainly on Vermont Public’s Vermont Editionon July 7, 2026. Consolidation has run for decades, she said, “and there’s a case to be made that the Northeast has been affected particularly acutely compared to other regions of the country.”

The underlying economics back her up, and they’re rough. VTDigger’s July 12, 2026 analysis of USDA data compared dairy production costs against milk sales across 19 states and found Vermont’s costs exceeded sales by the widest margin of any of them — an average loss of $8.65 per hundredweight. California farmers, by contrast, cleared $2.49 in profit on the same measure. One Vermont farmer told VTDigger overhead runs as high as $72,000 a month.

State/RegionNew Plant Investment (2025-2028)Cost vs. Sales per cwt
New York$2.8 billion
Texas$1.5 billion
Wisconsin$1.1 billion
California+$2.49 profit/cwt
Vermont$0-$8.65/cwt (widest loss margin in US)

The farm count tracks the same curve. Vermont had 838 cow dairy farms in 2016. University of Vermont Extension’s February 2026 Dairy Update counts 427 locations producing milk, with the series running 636 in 2020, 583 in 2021, 550 in 2022, 503 in 2023, and 434 in 2024. Vermont Farm Bureau projects another 50 gone by year’s end and fewer than 200 by 2036 — which is roughly where the farm-count math is heading nationally, not just here.

Processors build where milk is cheap, plentiful, and growing. That’s the whole calculation, and it isn’t personal. New England is none of those three right now, and the $11 billion investment map is what that judgment looks like poured in concrete.

What Changes on Your Milk Check After a Plant Closure?

Kevin Kouri chairs the Vermont Dairy Producers Alliance and works as director of nutrition and sales at Phoenix Feeds & Nutrition — so he watches this from both sides of the fence. In the VDPA’s June 19 statement on the St. Albans closure, he said the loss “will directly increase processing and transportation costs.” A month later, he told VTDigger the worry runs past any one plant: “We potentially may continue to see an exodus of dairies from the state. And the trickle-down effect that that has not only to local communities and what these dairies bring in terms of employment opportunities in rural Vermont, but also the infrastructure and the allied businesses like mine.”

DFA says milk received at St. Albans “will continue to be processed,” ensuring “a market for regional dairy farmers and continued service to customers without disruption,” with volume rerouting to plants in Maine, Massachusetts, and New York. What the statement doesn’t say is what that costs. VTDigger put it plainly in July: farmers now pay to move milk out of Vermont to DFA facilities in nearby states, “adding an unknown sum of money to members’ hauling fees.” Unknown is the operative word, and it matters more than it sounds — for reasons that show up on the next statement.

Three lines can move when your milk gets rerouted. Two of them USDA publishes. The third one your cooperative sets — and that distinction runs opposite to what most people assume.

Milk Check LineWho Sets ItPublished?Farmer Can Verify Independently?
Location differentialUSDA (Federal Milk Marketing Order)Yes — public zone mapYes
Producer price differential (PPD)Northeast Market AdministratorYes — monthlyPartially (pool-wide, not closure-specific)
Hauling deductCooperative (no federal formula)No — must askNo — must request in writing

Hauling deduct. Your co-op sets this. No federal formula, no publication requirement. University of Wisconsin Extension’s May 2026 walkthrough of milk check line items treats hauling as a market-determined adjustment, sitting alongside check-off and cooperative charges rather than among the regulated ones. The arithmetic is easy once you have the rate. Getting the rate is the work.

Location differential. Public — and it already moved for reasons that have nothing to do with St. Albans. The June 2025 changes to the Federal Milk Marketing Orders, the USDA system that sets minimum class prices, raised Boston’s Class I differential from $3.25 to $5.10 per cwt. That’s a $1.85 jump, the highest in the Northeast order. Boston is the base zone, and nearly every other Northeast county prices below it, so most producers now carry a larger negativelocation adjustment than a year ago. One detail matters more than the rest: the adjustment keys off where your milk is received and priced, not where your barn sits.

Producer price differential. The PPD is the pool-wide adjustment that reconciles your blend price against the class values, and the Northeast Market Administrator publishes it monthly. You can look it up any time. What you can’t do is isolate how much of a given month’s figure reflects this closure versus everything else moving through the pool.

The Barn Math You Can Run Today

Skip the mileage guessing. The calculation that matters is simpler: new hauling rate, minus old hauling rate, times your annual hundredweight.

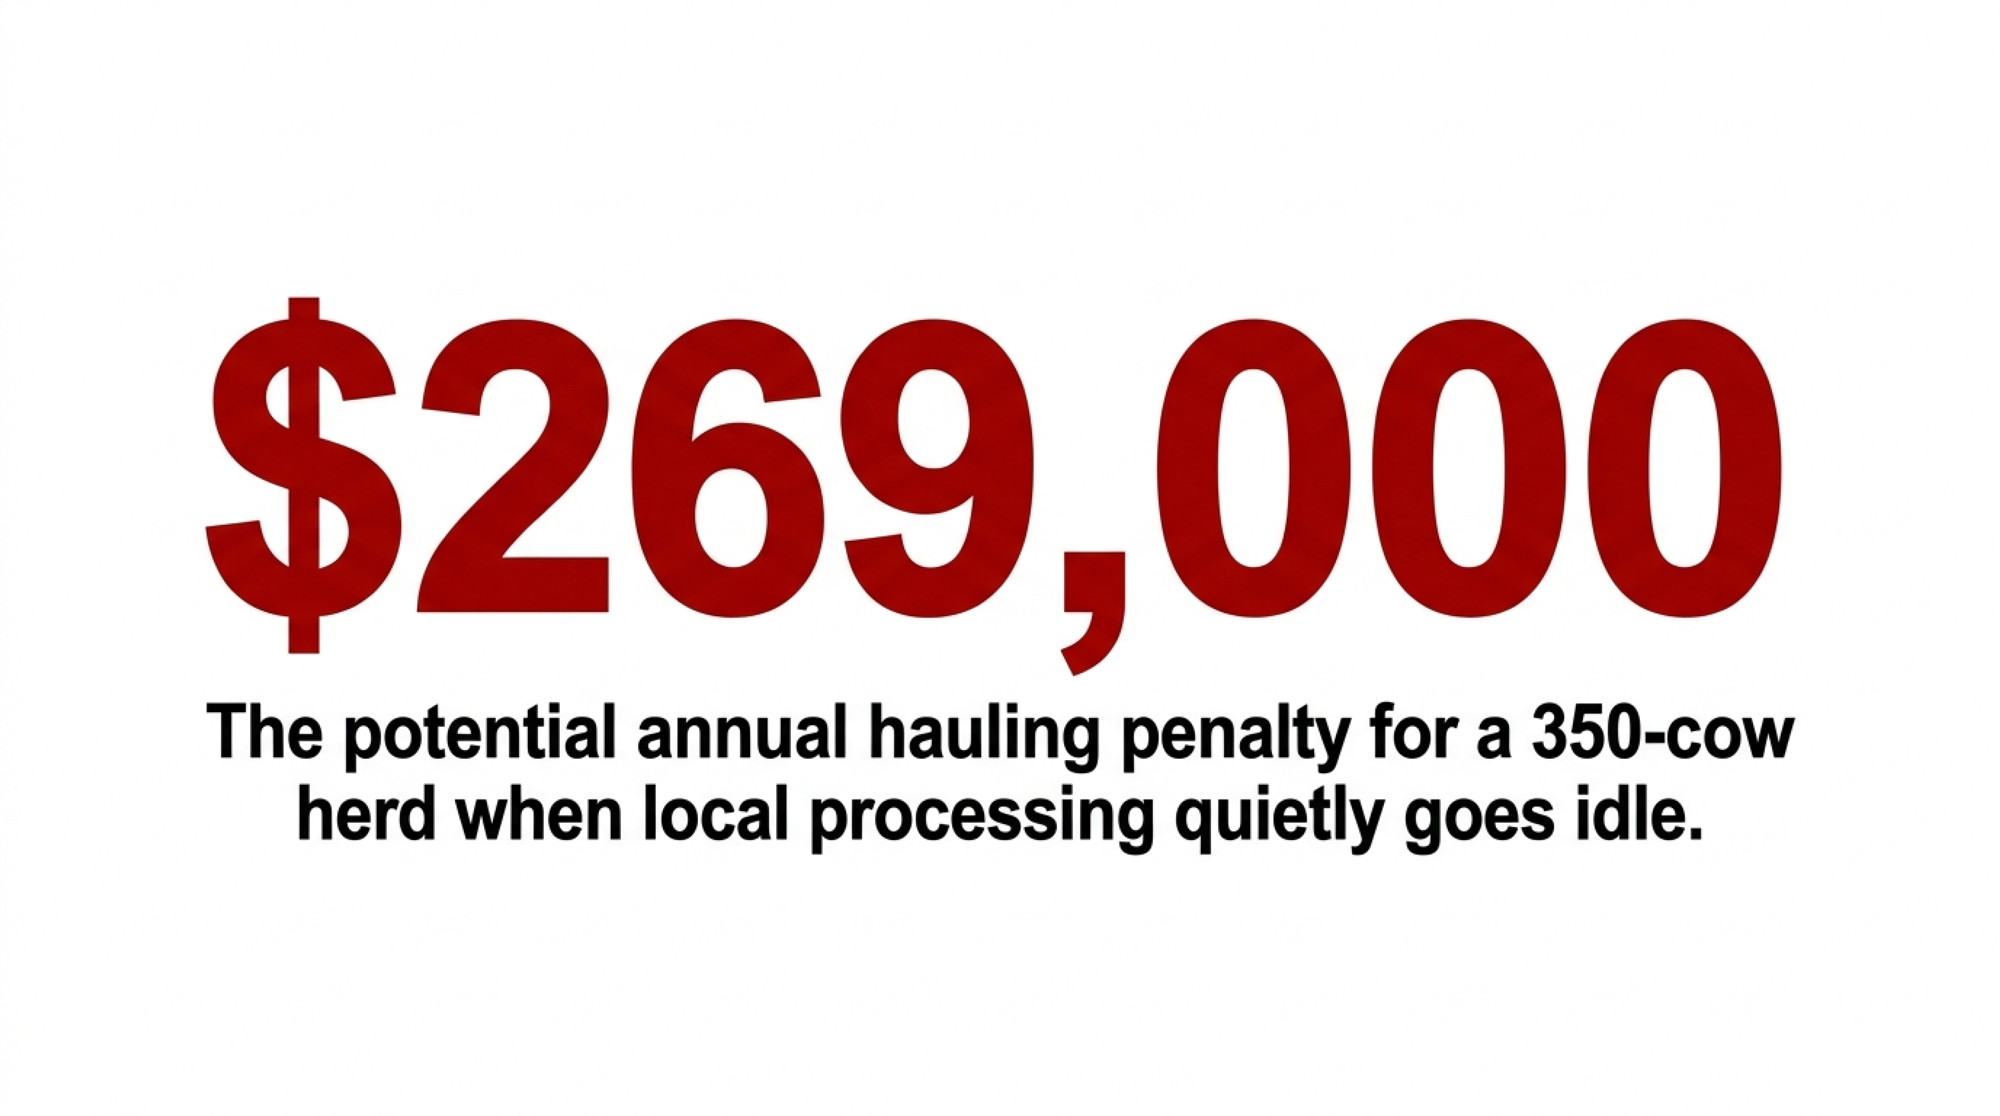
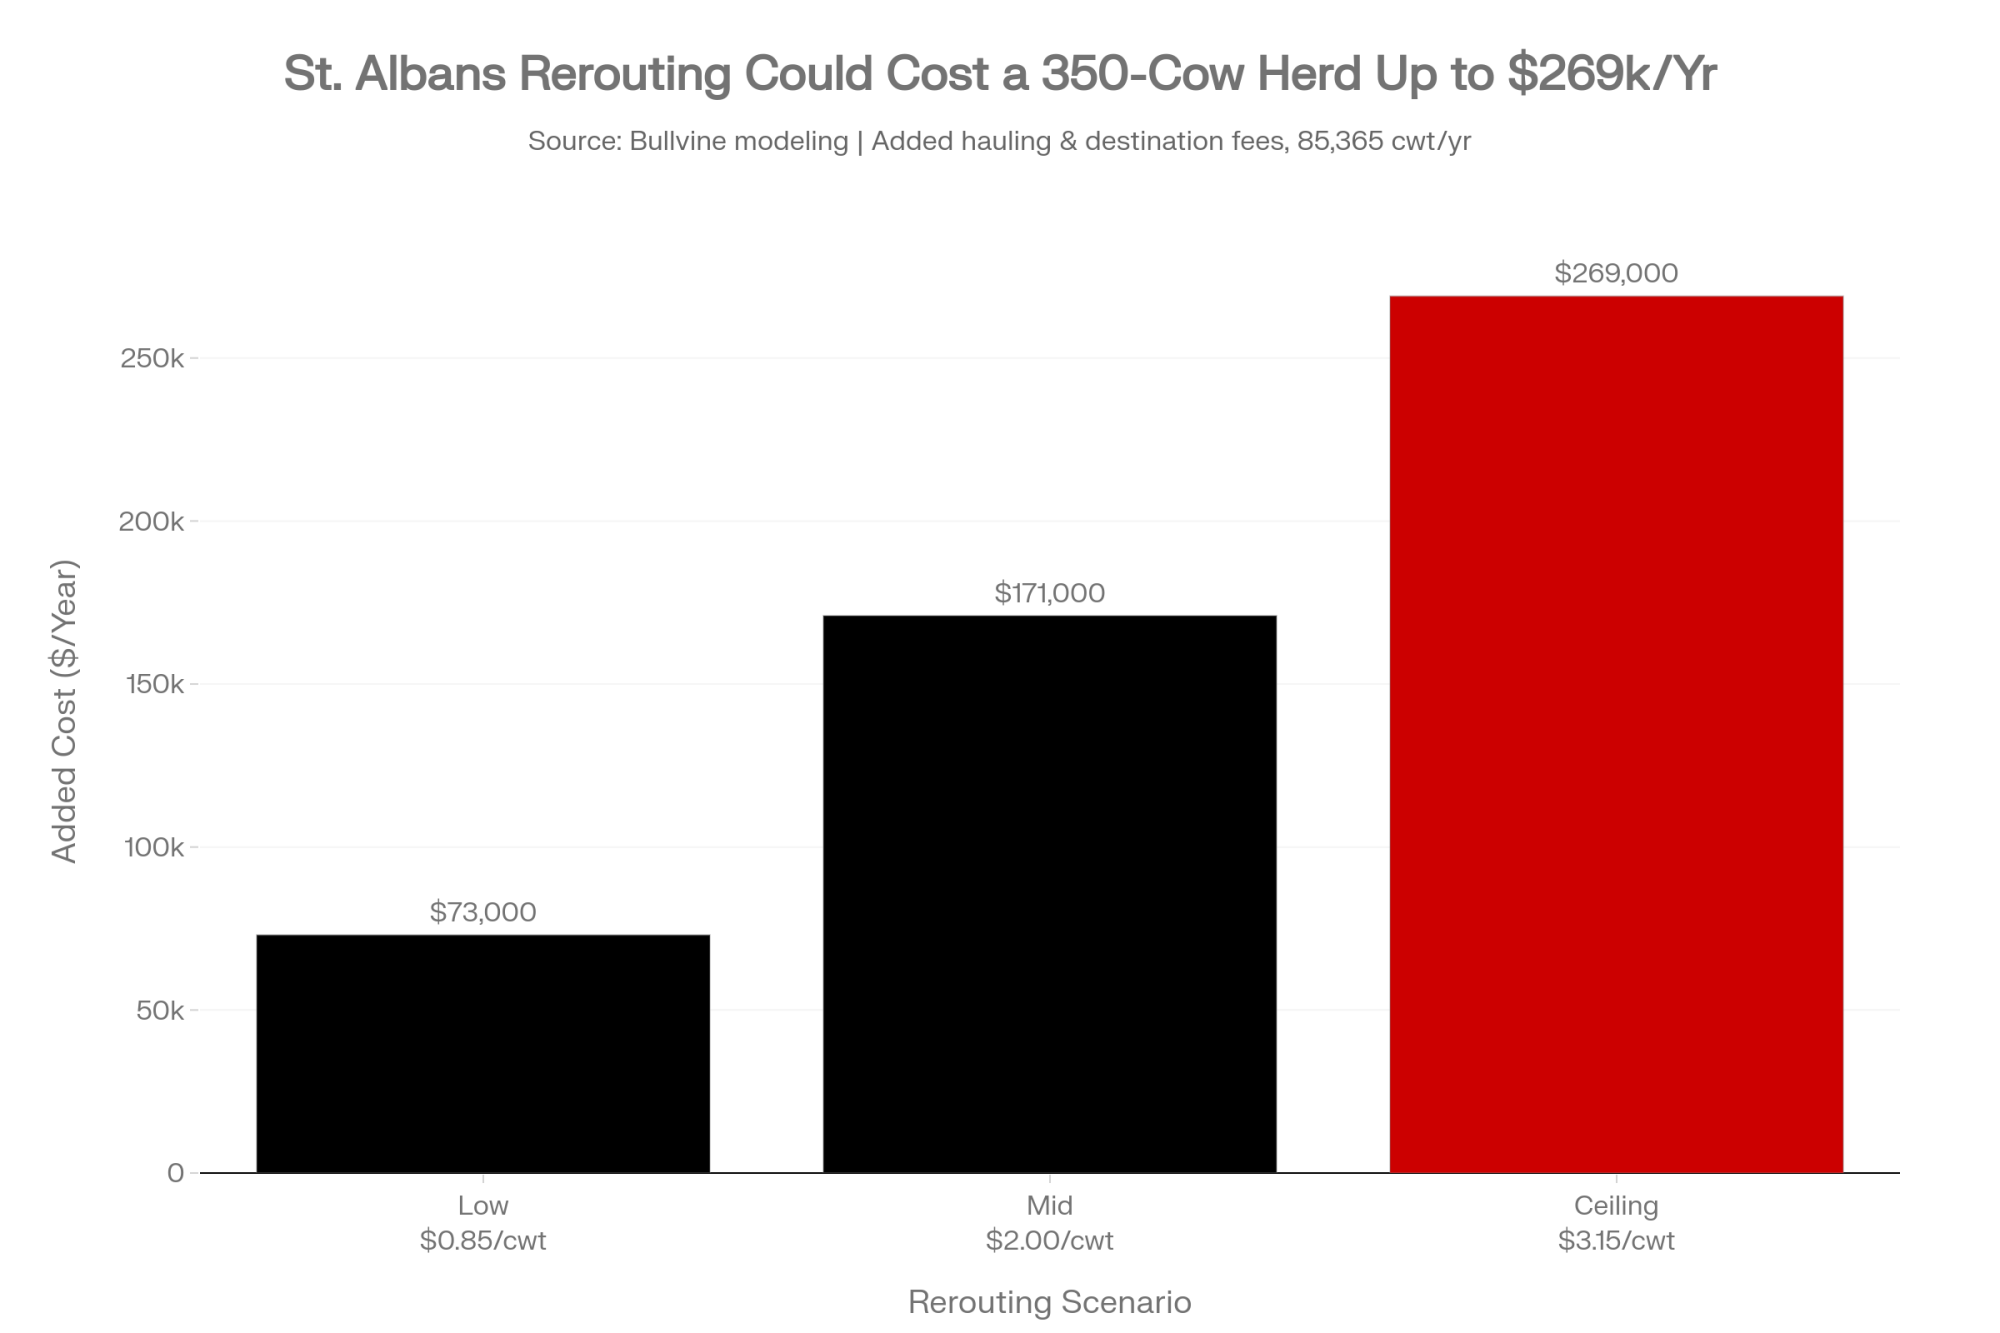
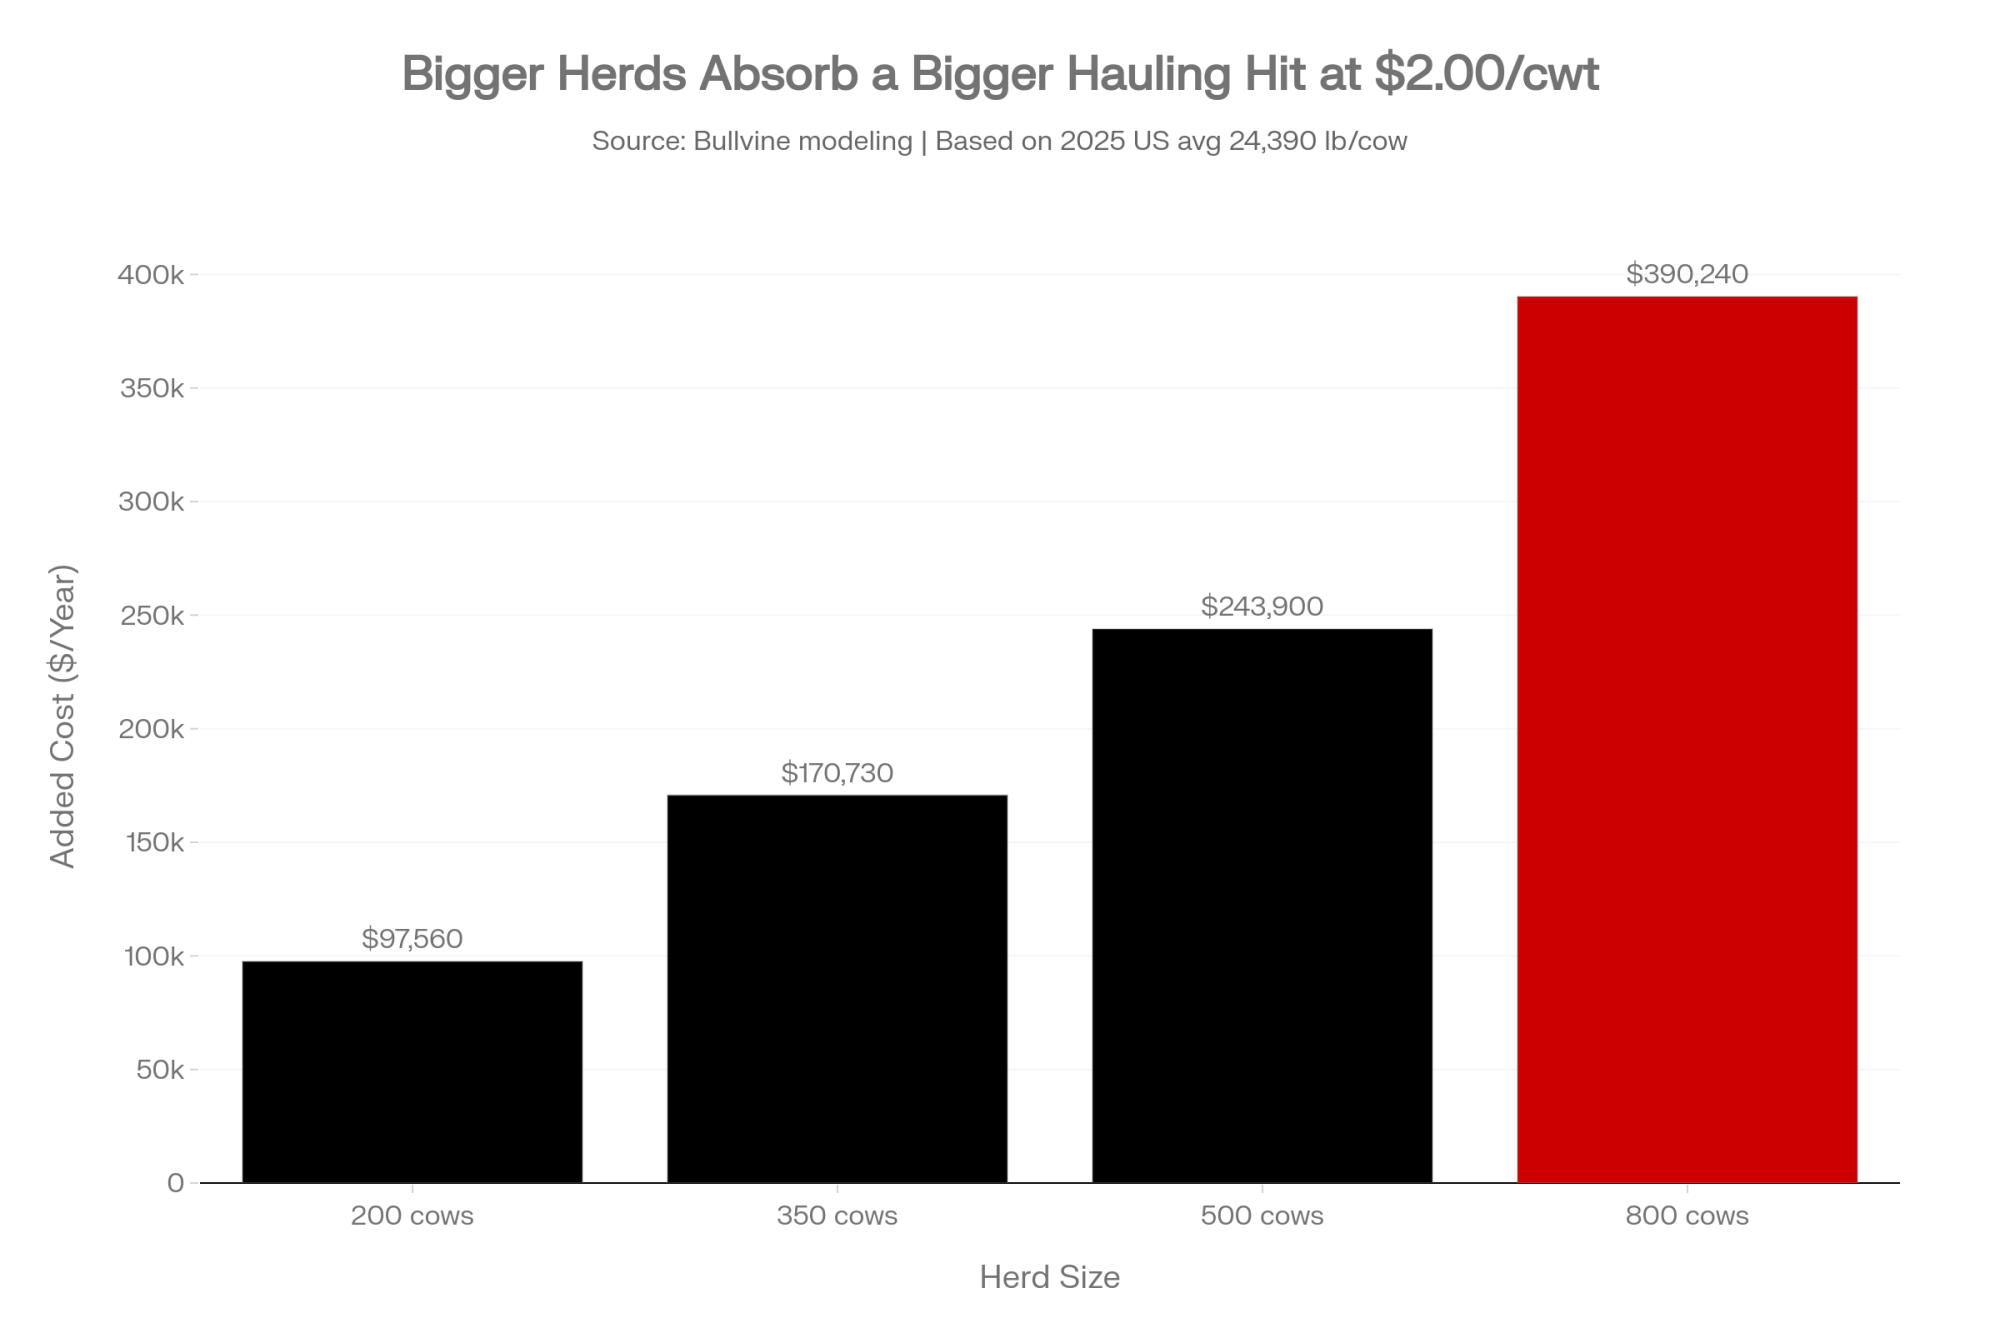
Take a 500-cow herd shipping 80 pounds per cow per day — about 146,000 cwt a year. Check that against your own figure, because it’s an above-average assumption. USDA NASS put 2025 national production at 24,390 pounds per cow, roughly 67 pounds a day. At 146,000 cwt, a dime of added hauling costs $14,600 a year. A quarter costs $36,500.

Is a quarter plausible? DFA’s Western Area Council moved its hauling charge from 6 cents to 25 cents per cwt inside a single year in 2008, per reporting on cooperative base-excess programs — a different region under different program rules, but the same cooperative. A 19-cent swing isn’t a thought experiment.

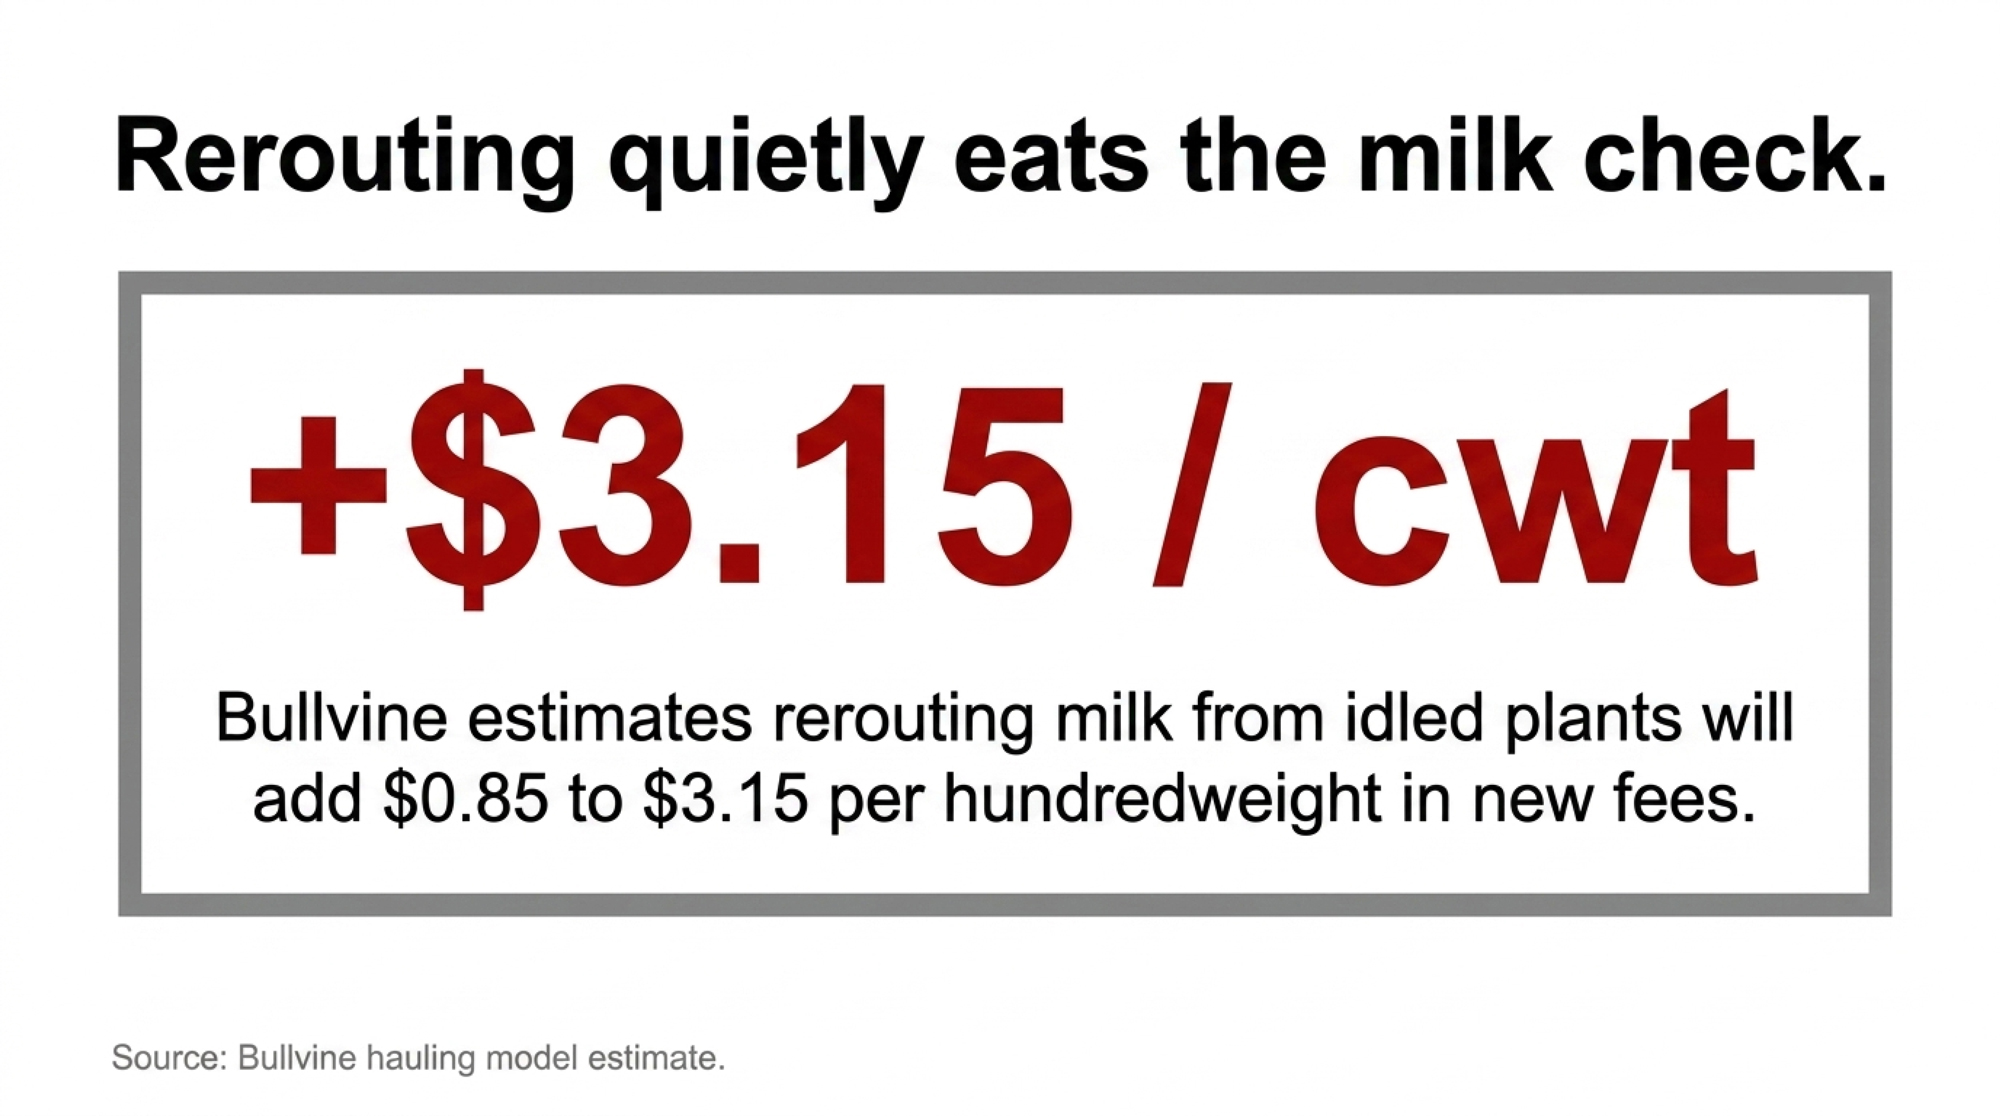
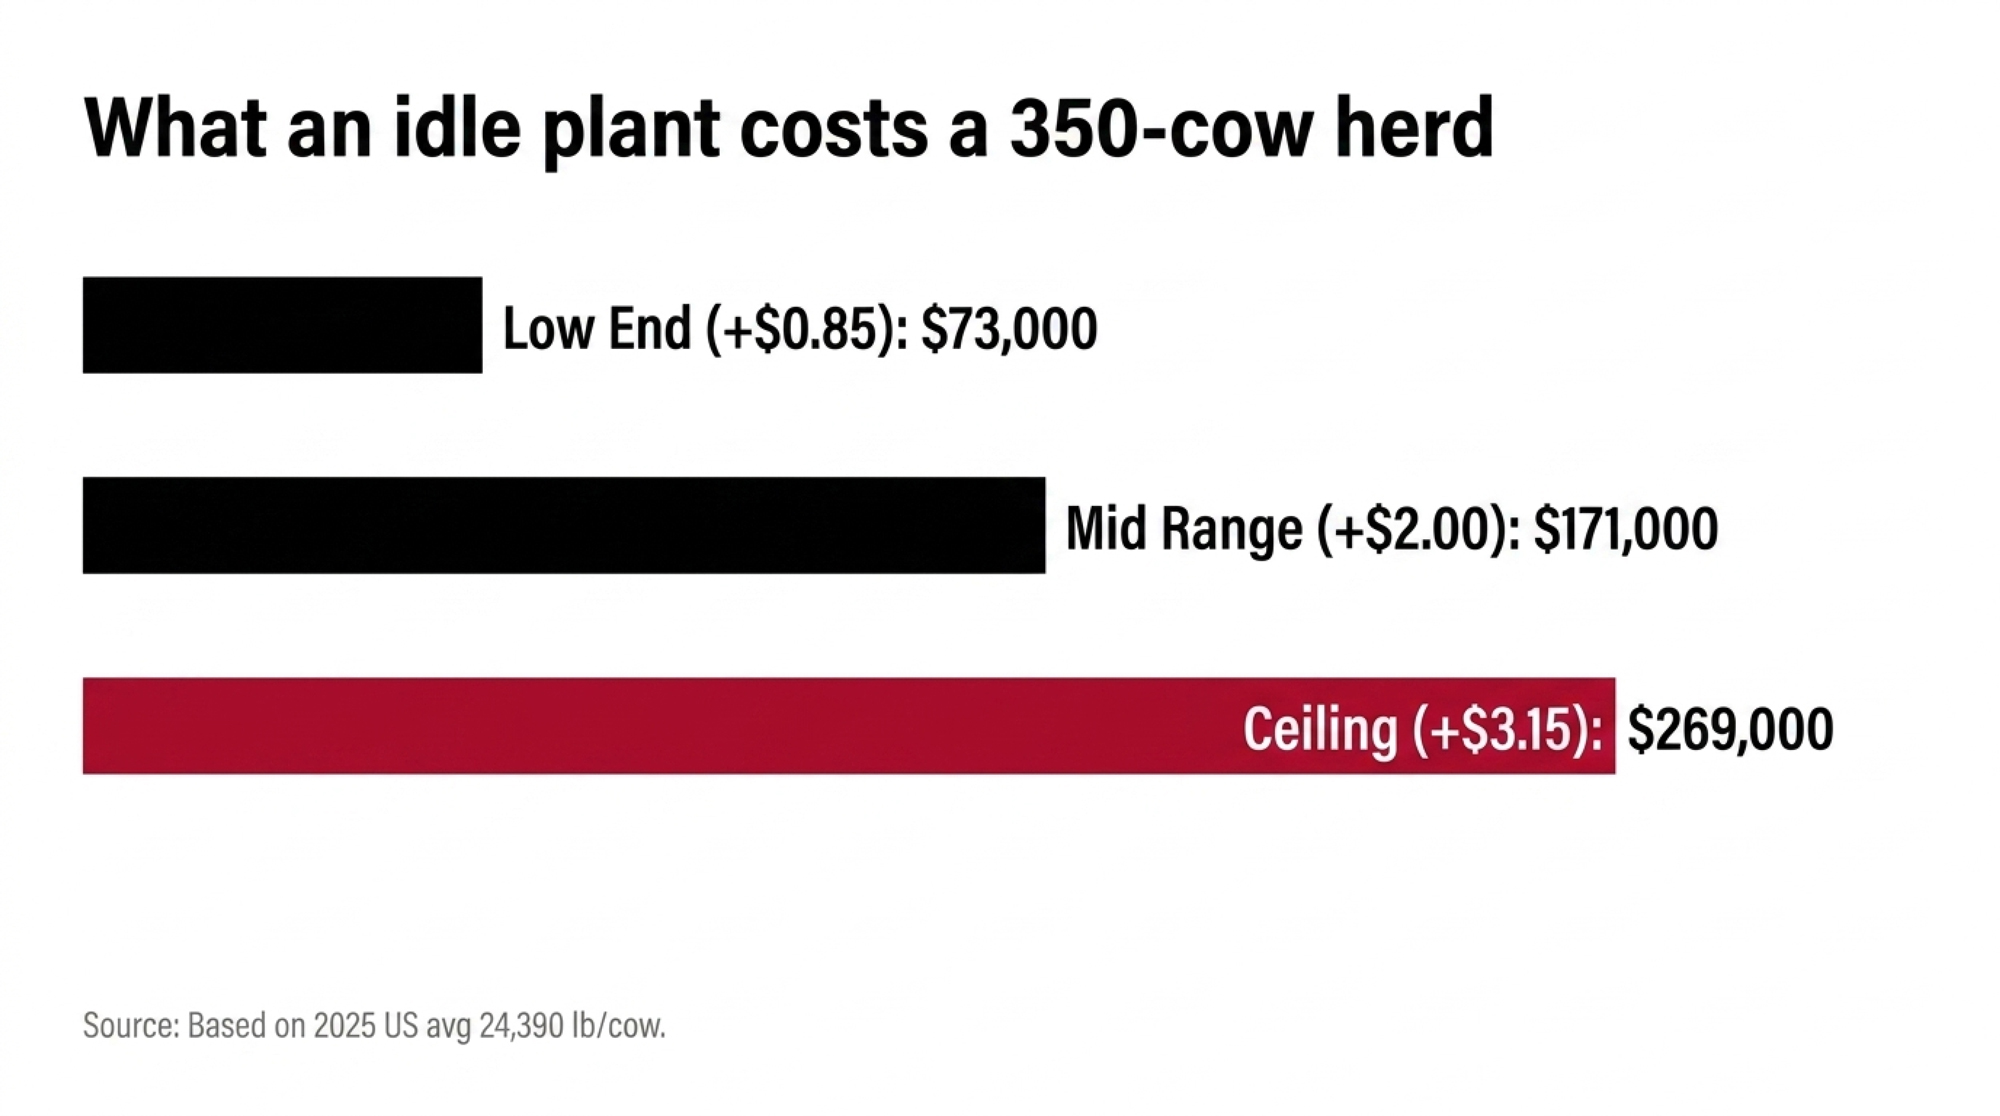
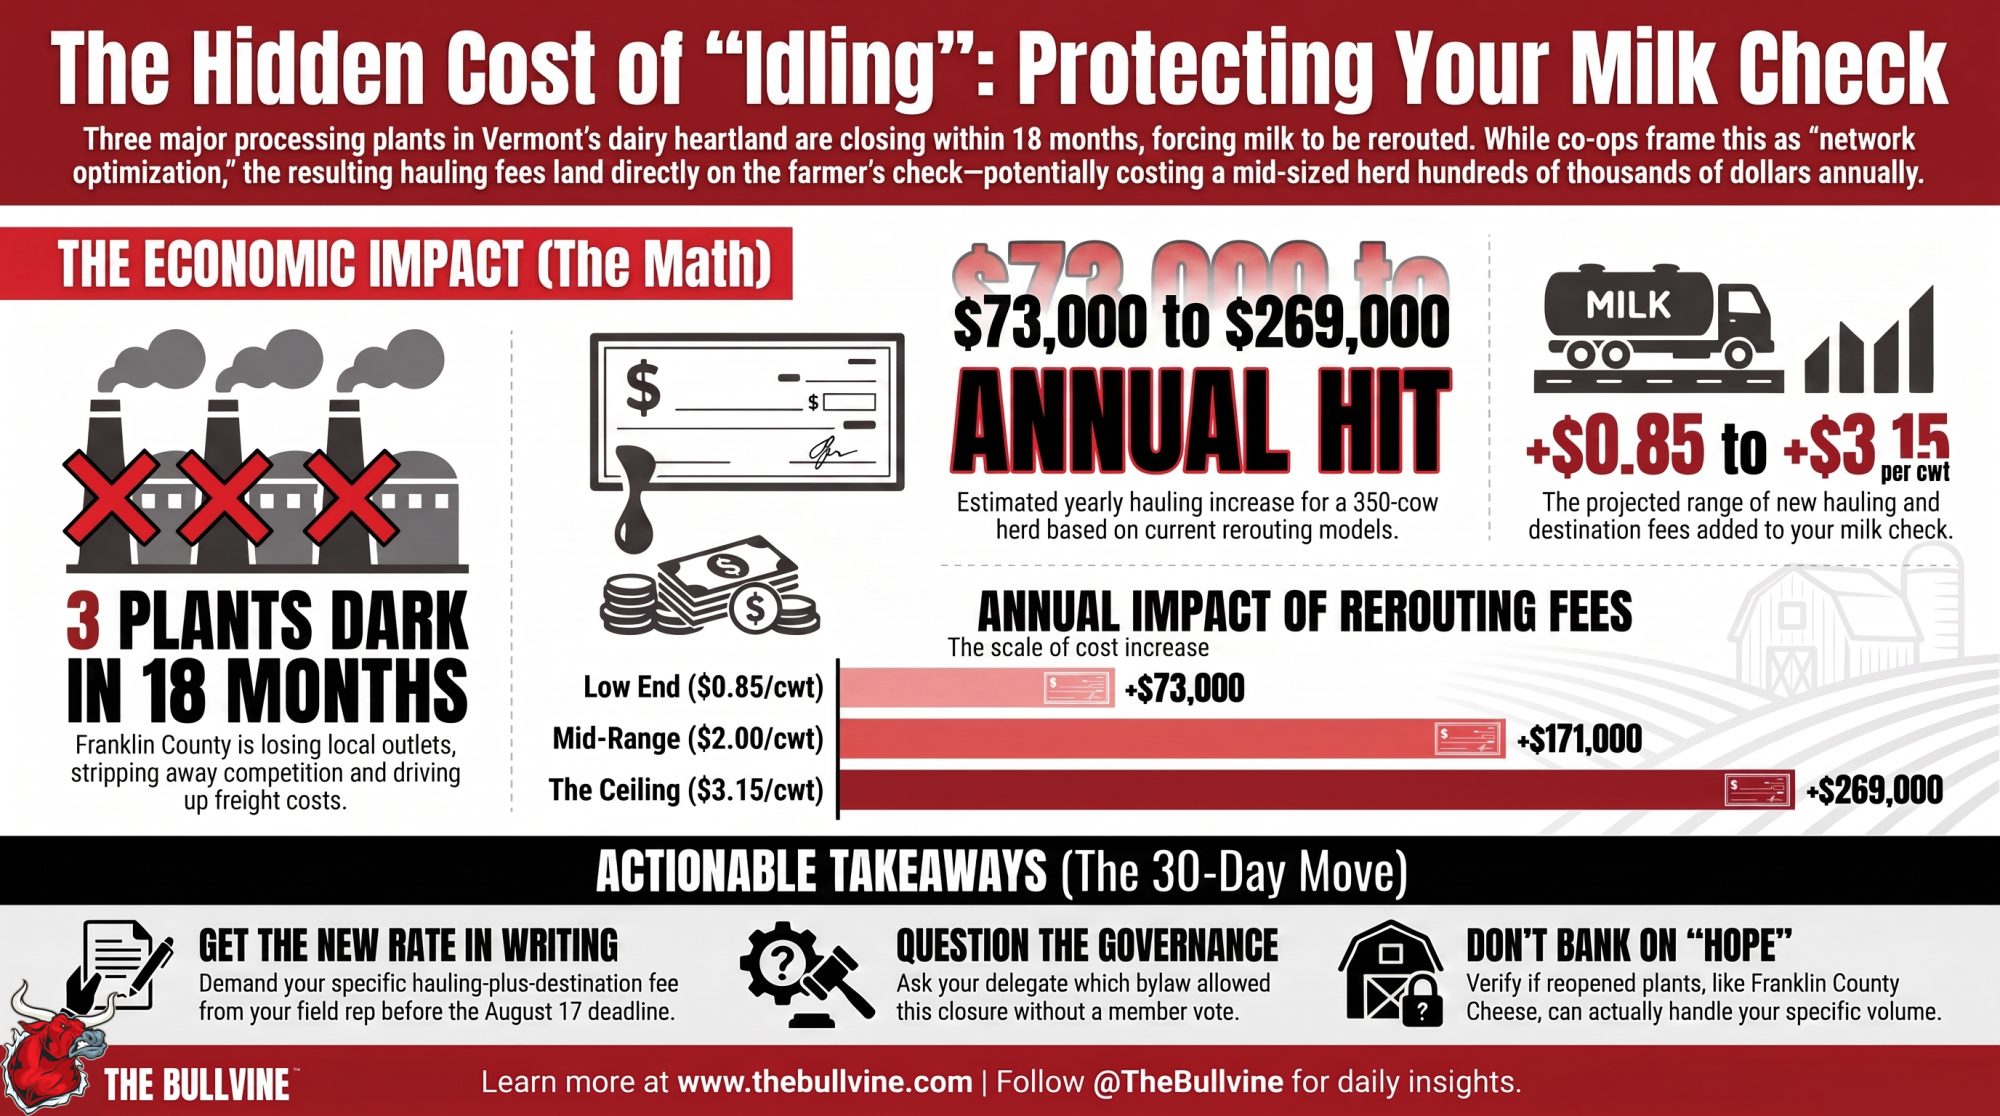
A note on method: our June estimate on this closure used a wider basis — total reroute impact of $0.85 to $3.15/cwt depending on destination. The calculator above isolates just the hauling line, which is the piece you can actually check against a rate somebody gives you.

Now hold that against what membership is worth on price. Research by Munch, Schmit and Severson, published through the NCERA-210 proceedings in 2020, found dairy farmers willing to accept about 2.3% lower compensation — roughly 45 cents per cwt — for the security of belonging to a co-op. But once every pricing component got counted, the same work found the net milk price advantage came to about 20 cents per cwt, roughly 1%. The authors noted the real value of membership likely comes from things other than price.

Twenty cents of measured price advantage, against a hauling line that has historically moved nineteen. That’s not an argument for leaving your co-op. It’s an honest read on how thin the cushion is.

Who Sets Your Hauling Rate, and How Do You Get It in Writing?

Your cooperative sets it, and you get it by asking. Four questions, one call. Which plant is my milk going to? What’s the new one-way mileage? What’s the per-cwt hauling rate, and when does it take effect? Can I have that in writing?

The plant name is the one people skip, and it’s the one that unlocks everything else. Without it, you can’t use the Northeast Order’s zone differential map, which means the location line stays a mystery. With it, you can pull the map from fmmone.com and the monthly PPD from the Market Administrator and reconcile two of the three yourself, at the kitchen table, in an evening.

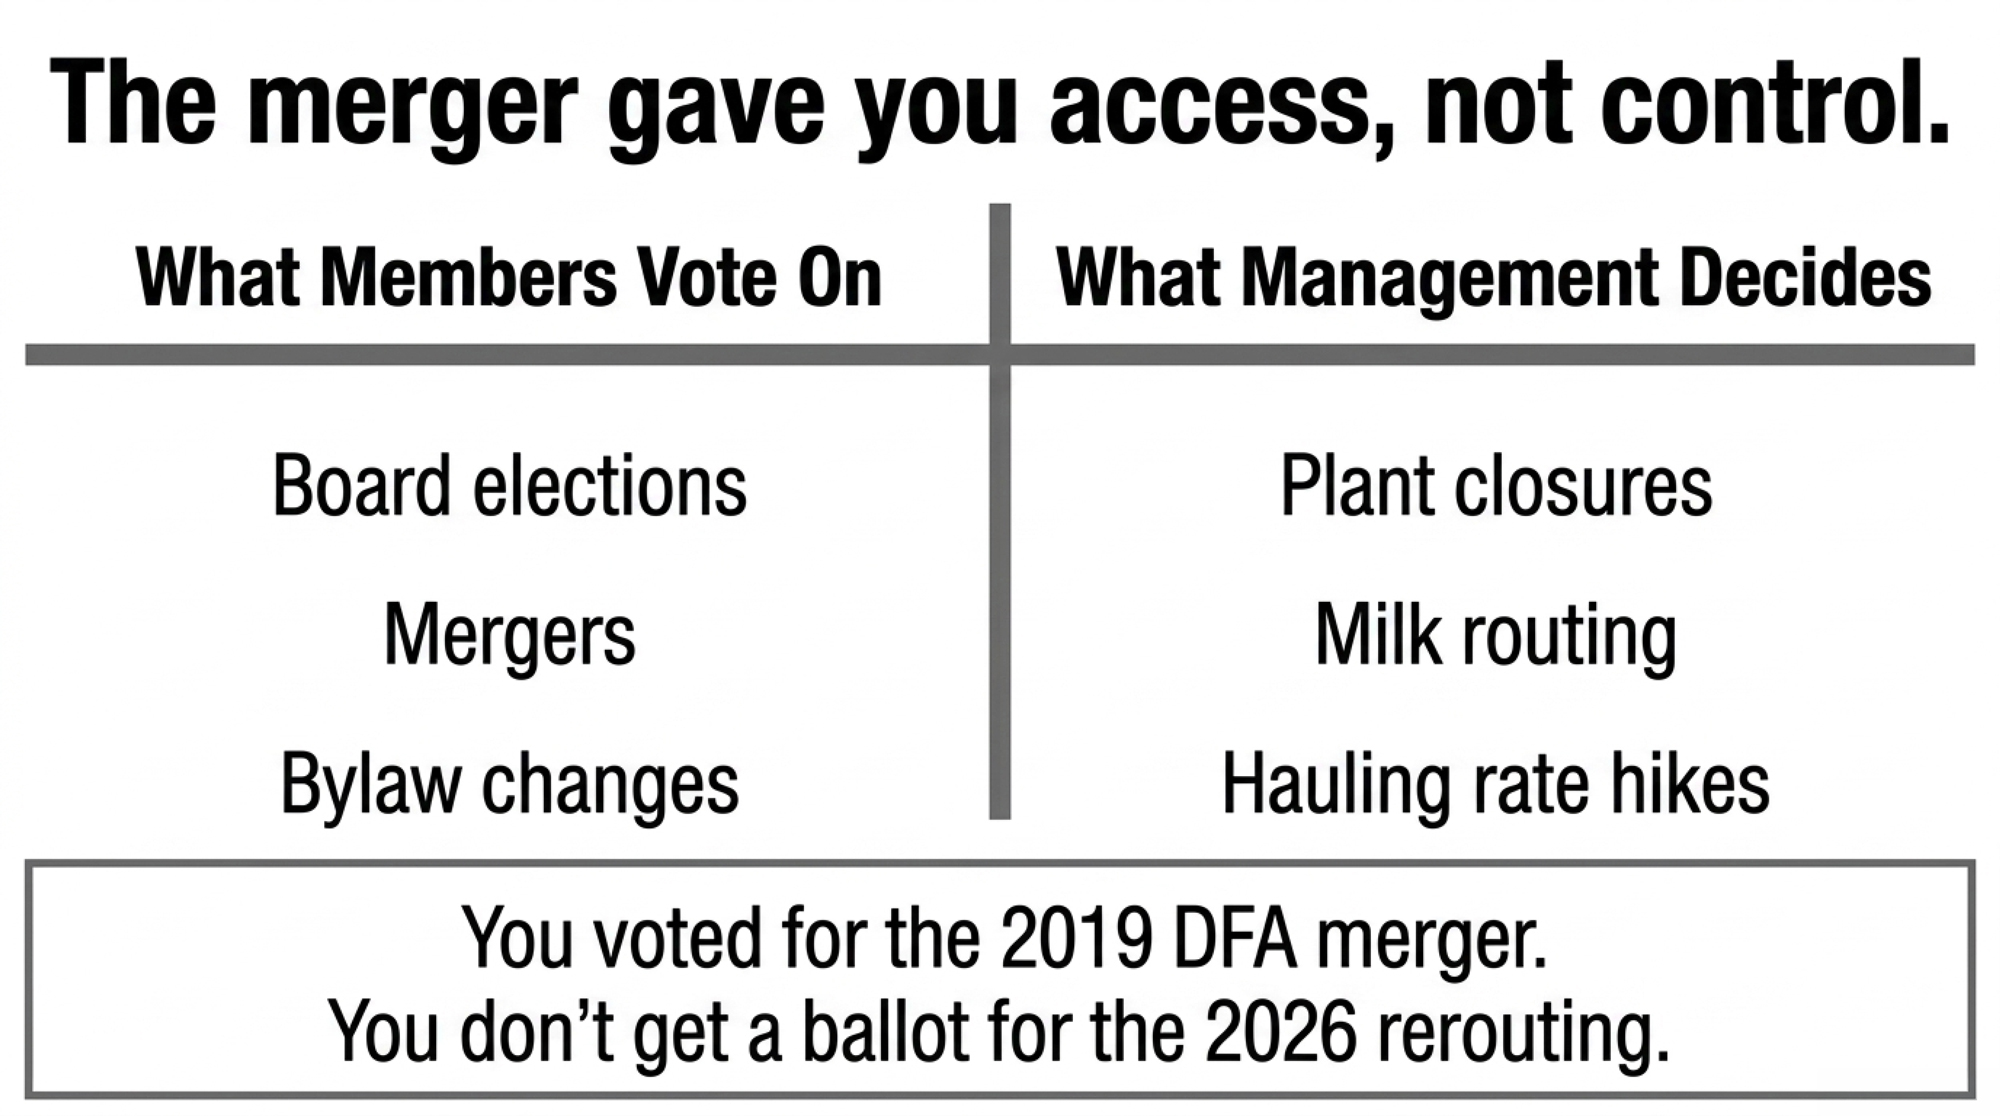
If the answers come back specific and documented, say so out loud to your neighbors — clean execution deserves reporting as clean execution. If they come back vague, that’s not evidence anybody’s hiding anything. Field reps answer this stuff daily. It’s evidence that hauling sits outside the federally regulated part of your check — no federal provision we could locate requires advance written notice before a rate change lands. That gap in what gets published is its own kind of governance question, and it’s the same one that surfaces when 0.8% of members vote on a bylaw rewrite.

Options and Trade-Offs for Farmers

Path 1 — Get your rate in writing. Do this within 30 days. Plant name, mileage, per-cwt rate, effective date. When it makes sense: always, and urgently before the first post-closure statement. What it requires: one call and an email follow-up. Risk: none. Even a non-answer is information. This is the only route to the hauling number, since there’s no published fallback.

Path 2 — Reconcile the two lines you can source. Pull the monthly PPD and the zone differential map and check both against your stub. It takes about an hour a month once you’ve set it up the first time — the same kind of accounting discipline that shows up in the real math on where your hours and dollars actually go. Worth doing if margins are tight enough that you need the variance explained rather than just absorbed. The catch is that you’re verifying formula math on only two lines. The third still depends on a rate somebody has to hand you.

Path 3 — Review your Dairy Margin Coverage election. USDA’s Economic Research Service forecast $122.9 million in DMC payments for 2026 in its May 18, 2026 farm sector income forecast, a $176.3 million swing from 2025 when net activity ran negative. It’s worth a look as baseline protection on Tier I production, but understand what it won’t do. DMC triggers on a national margin, so it can’t see a hauling deduct or a location differential specific to your reroute. Different problem, different tool.

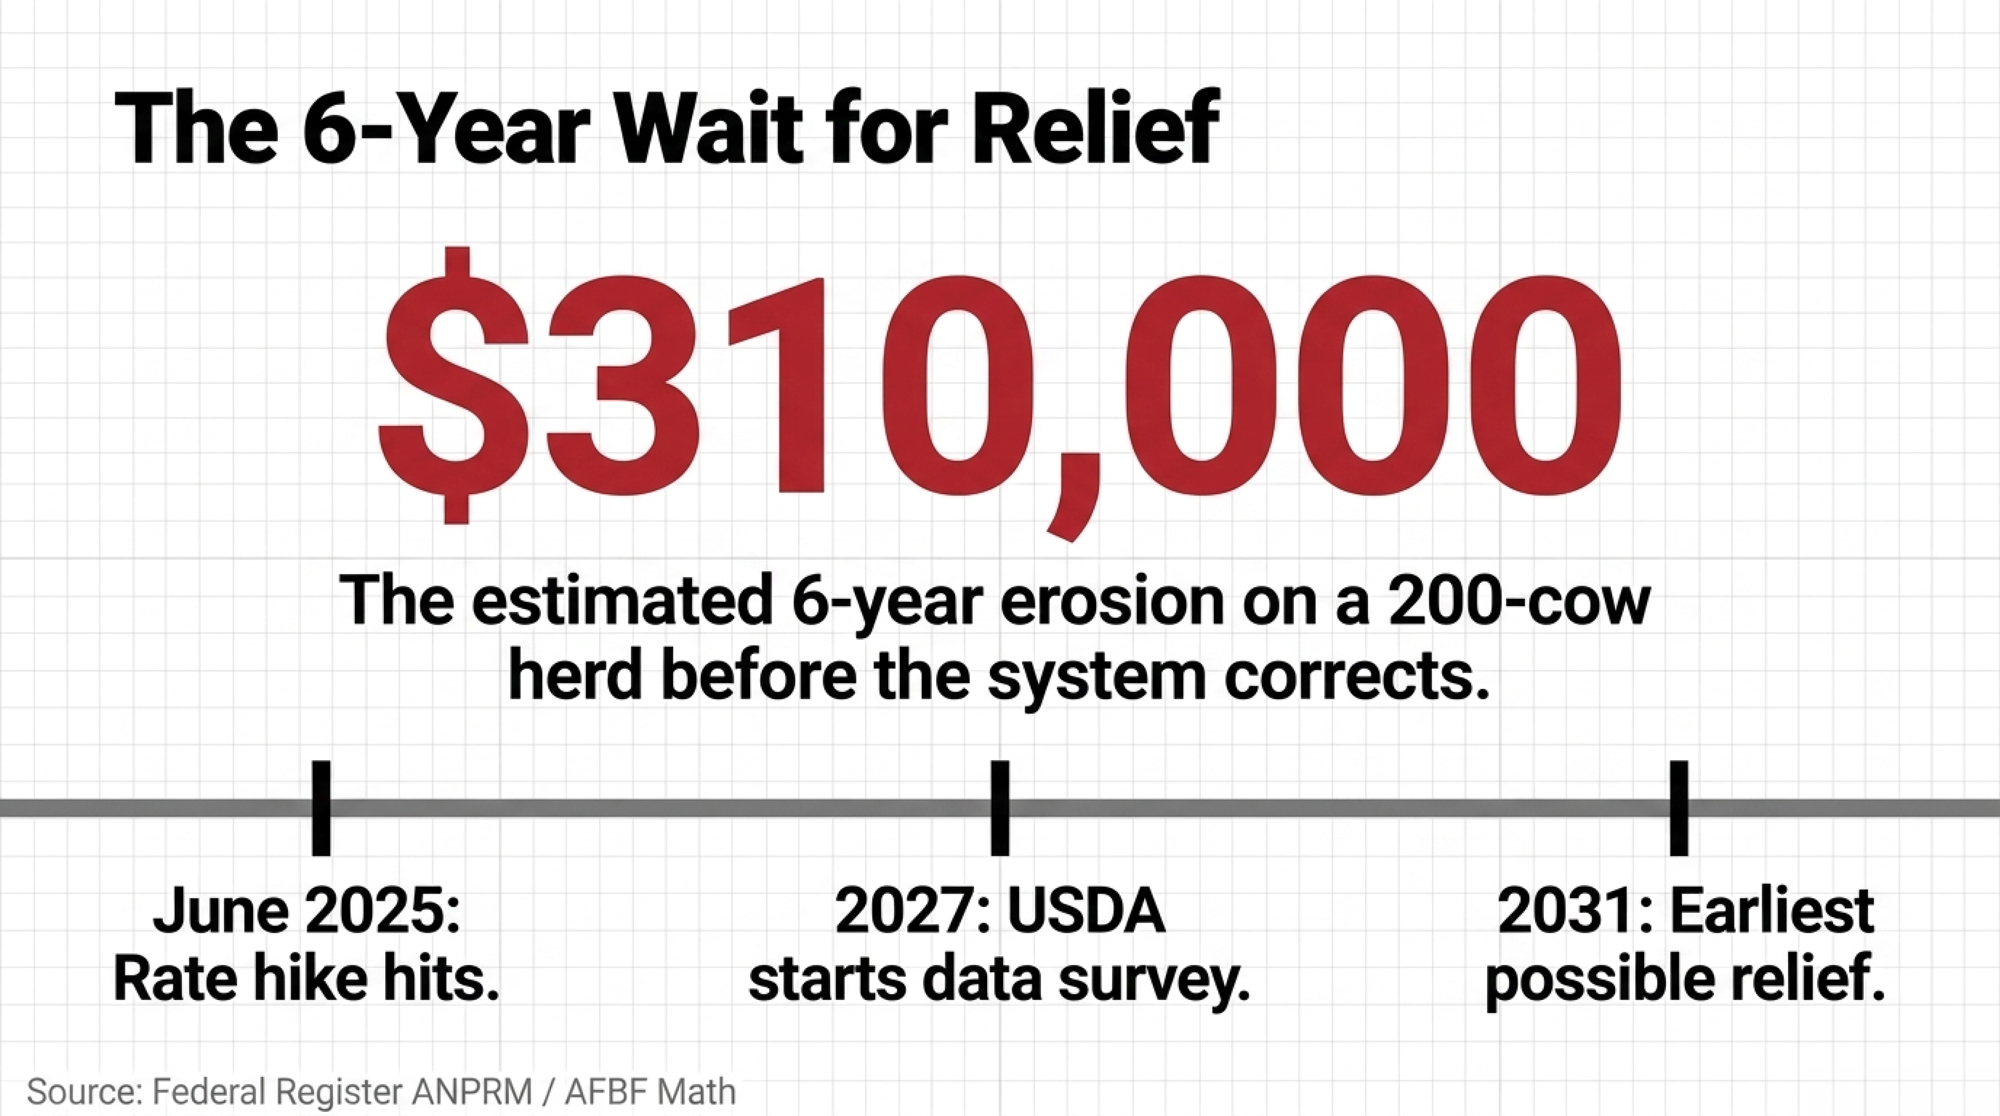
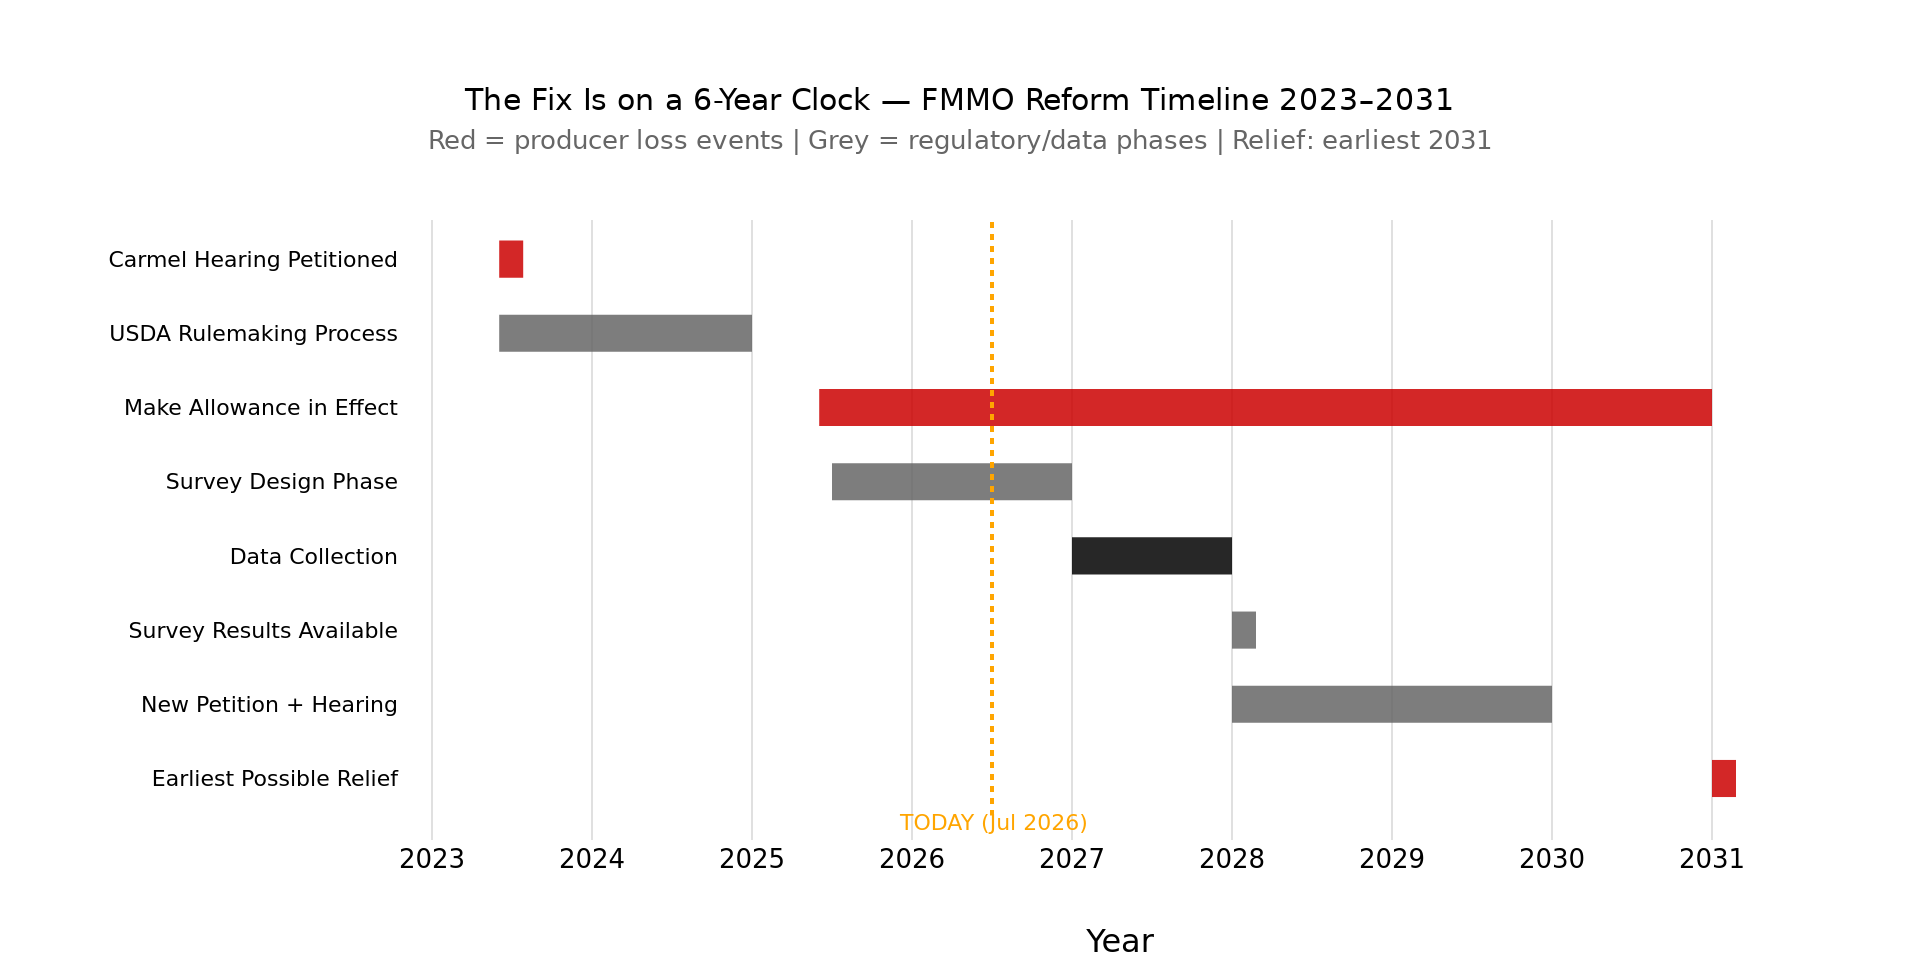
Path 4 — Track Section 1006, don’t budget around it. The House passed the Farm, Food, and National Security Act of 2026 on April 30 by a 224-200 vote, and the Senate Agriculture Committee released its own draft text in late June. Both versions carry mandatory biennial dairy processing cost surveys. But Munch has been clear that new data doesn’t automatically adjust anything — it still takes a full FMMO hearing, initiated by stakeholders, to change a make allowance. His floor is 2028. A realistic read lands closer to 2031. File comments, stay engaged with your state Farm Bureau, and treat passage as a clock starting rather than stopping.

Key Takeaways

  • If you can’t get a written per-cwt hauling rate from your field rep, that’s your finding. Log the ask and the date.
  • If you don’t know which plant your milk goes to, you can’t check your location differential — the published zone map is keyed to the receiving plant, not your barn. That’s the first call, not the last.
  • If your hauling deduct rises more than 19 cents/cwt — the size of DFA’s 2008 Western adjustment — run the full-year number against your annual cwt before assuming you can carry it.
  • If your location differential got worse sometime after June 2025, check the Boston base-zone change before blaming the reroute. Two separate events.
  • If your operation sits within 20 to 45 cents per cwt of breakeven, the measured co-op price advantage is inside your margin of error. Know that before you renew anything.
  • If your PPD line diverges from the published Order 1 figure without explanation, ask — the number is public, so the question is answerable.
  • If all three lines come back clean and fully documented, tell your neighbors. That’s data too.

Barre. Georgia. Enosburg Falls. St. Albans. Four Vermont towns that had a plant in January and won’t have one by fall — though Enosburg Falls gets a new tenant on September 1, which is more than the other three can say. Somewhere in New York, meanwhile, a plant is going up in a town most Vermont farmers couldn’t find on a map. That’s what an $11 billion forecast looks like when people with capital at risk write it down.

So the real question for any Northeast operation isn’t whether this reroute costs you $14,600 or $36,500. It’s whether there’s still a buyer within trucking distance of your bulk tank in five years — and when you last checked instead of assumed. We’re building the plant-by-plant location differential breakdown for Order 1 once the first post-closure statements land in September, paired with the New England capacity map set against that investment list. That’s the one to have in front of you before your fall lender meeting.

Complete references and supporting documentation are available upon request by contacting the editorial team at editor@thebullvine.com.

Learn More

The Sunday Read Dairy Professionals Don’t Skip.

Every week, thousands of producers, breeders, and industry insiders open Bullvine Weekly for genetics insights, market shifts, and profit strategies they won’t find anywhere else. One email. Five minutes. Smarter decisions all week.
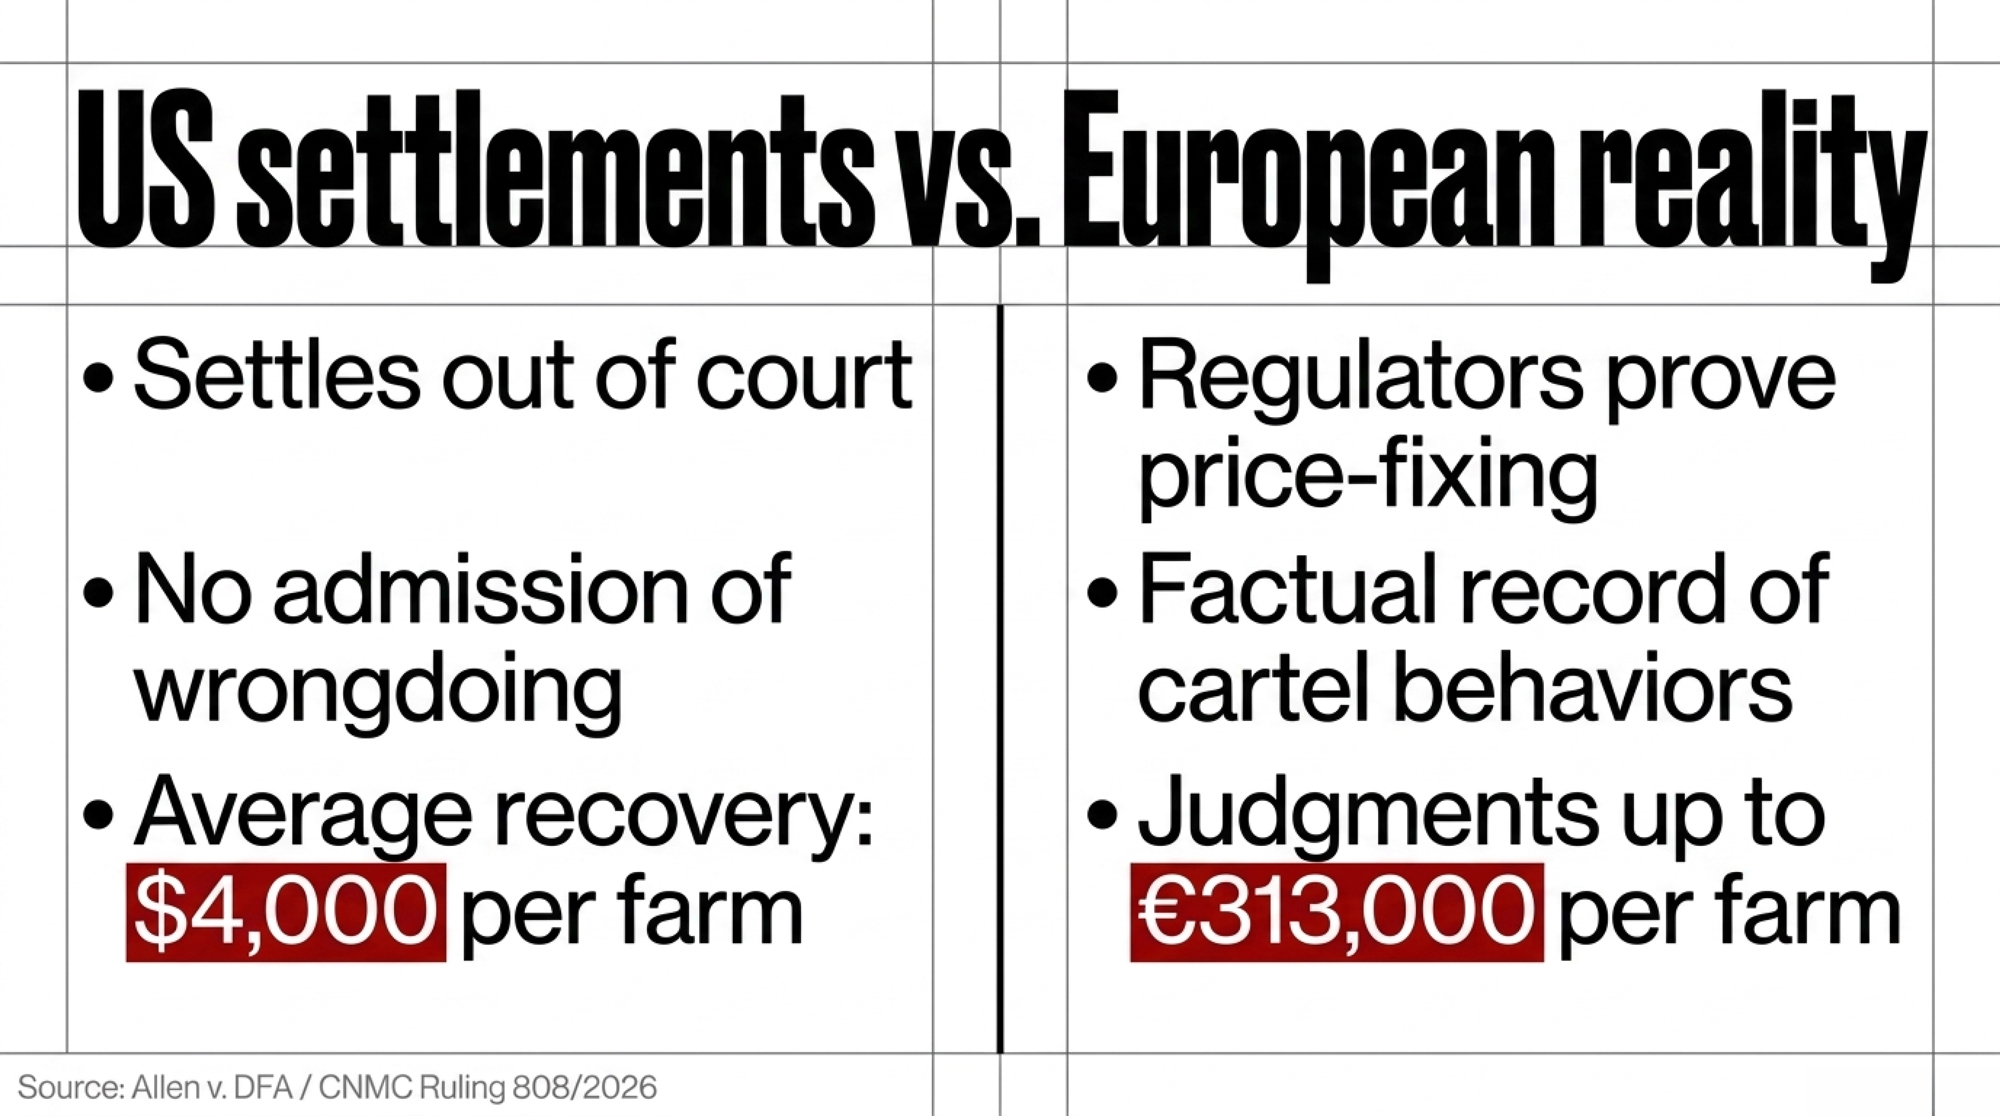
NewsSubscribe
First
Last
Consent

At $3,010 a Heifer, Your Worst Cow Just Got a Reprieve

Five cows on the cull list this morning. Run the retention math at $3,010 a springer, and three of them are worth more in the stall than any heifer you could buy.

Executive Summary: At $3,010 a head — USDA’s July 2025 average, with top springers past $4,000 — the cheapest cow on most operations is the one already standing in the stall. Run Overton’s net replacement cost formula, and a heifer moving from $1,500 to $3,500 pushes your cost from about $1.37 a day to $6.85 on the same animal in the same slot, because the denominator never changed; that extra $5.48 a day is what a marginal cow now has to beat before she earns a trip to the plant. CoBank’s June 2026 numbers explain why this isn’t a one-year problem: 796,000 head drained from the pipeline across 2025-2026, against a rebuild of just 360,200 by 2028. Here’s the part that stings — retention pay-off models accurately rank damaged cows, and with 30% of cows hit by clinical disease inside 21 DIM (Carvalho et al., via UW-Madison Extension), a lot of your “obvious culls” were made in the fresh pen, not born that way. Cows with one clinical event drop 750 to 800 pounds over the lactation; dry-period heat stress costs another 5 kg/day through the next one (Tao et al., 2011). Fix the transition inputs before you trust any cull ranking, and the four moves that matter most — fresh-cow ketone checks, RPO-ranked cull lists, a lower replacement-rate target, dry-pen cooling — need labor and attention, not capital. The counterweight: Swiss data across 29 farms shows over-retention costs about three times more than culling early, roughly 161 CHF per farm per month, so this isn’t permission to keep passengers.

replacement heifer cost

Picture a manager standing at the head of the fresh pen with a list of five second-lactation cows he’s ready to sell. Annoying cows. Cows he’s tired of looking at. Then, for the first time, he runs them through a retention pay-off calculator — and three of the five come back worth more in place than any heifer he could realistically buy.

That’s the moment the math changes. Not in a boardroom, not in a journal — at chore time, with a $3,500 replacement price tag turning a gut-feel call into something expensive to get wrong. This is a story about a number that used to be background noise and is now the loudest figure on the balance sheet. And about producers learning, sometimes reluctantly, that on the economics, the most profitable cow in the barn often isn’t the biggest milk check on the board.

What’s Really at Stake

Replacement heifers used to be the cheapest fix on the farm, and now they’re one of the most expensive decisions you’ll make all year. For years, keep-or-replace was easy because it was cheap. A springer ran around $1,200, so culling the bottom of the herd and slotting in a fresh face barely moved the needle. You didn’t need a model. You needed a cull truck and a phone number.

That world is gone. U.S. dairy replacement heifer inventory has fallen to its lowest level since 1978, and CoBank’s June 2026 Knowledge Exchange report projects supplies will keep shrinking — a combined 796,000 head drained from the pipeline across 2025 and 2026 — before a slow rebuild of about 360,200 head begins in 2027 and 2028. That rebuild is real but thin: roughly 3.75% of the herd against what the pipeline just lost. Average replacement prices hit $3,010 per head in USDA’s July 2025 Agricultural Prices data, and top springers in California and Minnesota auction barns have cleared $4,000.

Here’s why that reshuffles the whole decision. When a heifer was cheap, a marginal cow’s flaws were the only thing on the scale. Now there’s a $3,000-plus weight sitting on the other side. If you’re running 500 cows at a 35-38% replacement rate, this is your story whether you like it or not — that’s 175 to 190 head a year you’re either buying or growing, at a cost that’s tripled. The “just buy another heifer” reflex now carries a price that forces a harder question, one the best dairy systems in the world have been asking for years.

Why Dutch Herds Measure Value Per Cow Per Day

The Netherlands ranks its most profitable farms on value generated per cow per day of productive life — not peak milk, not herd average, but what she returns for every day she occupies a stall. It’s a deceptively simple metric, and it changes what “a good cow” means.

Look at what those top Dutch farms actually show. CRV’s milk-recording statistics for the 2022-2023 year put Dutch culled cows at an average of 2,255 days of age — just over six years — and 38,327 kilograms of lifetime milk. CRV has gone further and put a euro figure on it: extending lifespan by two years could mean 1,800 to 3,000 euros in additional lifetime margin per cow, depending on milk margin.

Now compare that to high-producing systems generally, where average productive lifespan still sits at roughly three to four years — a figure that’s barely budged despite decades of longevity research. The gap isn’t mostly genetic, though genetics carries its own quiet bill: rising Holstein inbreeding is already draining real money per cow, and two herds found different ways to stop that leak. The bigger gap is how the question gets asked. Dutch top farms ask, “How many euros does this cow deliver per day she stands in that stall?” Plenty of North American herds are still asking, “What’s my cull rate?”

It’s the difference between managing a percentage and managing a pipeline. One is a habit you inherited. The other is a strategy you choose. And the herds that chose it years ago are the ones least exposed to a $3,500 springer right now.

Inside the RPO Math: What Actually Moves the Needle

Retention pay-off math answers one question: does keeping this cow in this stall for another year beat replacing her? Crack open the calculation and it’s less intimidating than it sounds. It’s one question with receipts — do I make more from her, or from the heifer whose bill I’d be paying?

The concept traces to economic modeling by Dr. Victor Cabrera at the University of Wisconsin-Madison and Dr. Albert De Vries at the University of Florida. De Vries’s replacement-economics work framed the goal plainly: maximize the net return each stall — each “slot” — generates per year, not the milk any single cow gives today. The model’s job is to fill that slot with the cow that returns the most over time, not the one that looks best this Tuesday.

So what moves the needle? A handful of inputs do most of the work. The cow’s parity and where she sits on the lactation curve. Her pregnancy status — an open cow with three failed inseminations scores nothing like a confirmed pregnant one. Her current and expected milk yield. Then the price side: milk price, feed cost, cull cow value, and the big lever, replacement cost.

Most of us have seen this formula and never actually run it. Dr. Mike Overton, in his University of Guelph heifer-inventory work, boils net replacement cost down to one line you can write on a notepad:

Read that denominator again. When a heifer jumps from $1,500 to $3,500, it doesn’t change — she still takes the same number of days to grow up and produce. The numerator climbs hard. That single shift is what flips RPO from “always cull the bottom 30%” to “wait, this annoying second-calver might be the cheaper option.”

What That Looks Like in Dollars

Run Overton’s formula on a marginal cow. Say she’ll give you roughly 305 lactating days plus a 60-day dry period before her next decision point — call it 365 days in the slot. That denominator holds steady no matter what heifers cost.

InputAt $1,500 HeiferAt $3,500 Heifer
Replacement heifer cost$1,500$3,500
Net salvage value (cull cow)$1,000$1,000
Days in slot (denominator)365365
Net replacement cost/day$1.37$6.85
Marginal cow must earn/day to justify cullingLow bar$5.48 more

Now plug in real numbers. Take a net salvage value of around $1,000 for a cull cow.* At a $1,500 replacement, your net replacement cost runs about $1.37 per day. Push the heifer to $3,500 and the same cow in the same stall jumps to roughly $6.85 per day — about a fivefold increase. Nothing about the cow changed. The cost of getting rid of her did. That extra $5.48 a day is what a low-end cow now has to beat before she earns a one-way trip, and plenty of cows you’d have culled on reflex two years ago clear that bar easily.

And here’s the twist record cull prices add: USDA pegged combined cull cow values at $162/cwt in October 2025, so a heavy cull can now salvage $2,000 or more. When the cull check climbs that high, the salvage side of the formula gets large enough that selling a productive older cow later — instead of dumping her early into a soft decision — can pencil out even harder in her favor. The cull check is real money, but it’s a one-time event. Her future margin compounds every day she’s in the stall.

That’s the whole game in one line. A cow’s value to you isn’t fixed — it’s relative to what it costs to replace her. And right now, that cost is the highest it’s been in two generations. If you’ve ever watched what happens when a family actually runs the real math on their own operation, you know the number on the page usually isn’t the number in your head.

*Net of hauling and commission, and conservative against today’s market; run your own cull weight × current $/cwt to re-pencil for your barn.

The Blind Spot That Survives the Spreadsheet

Now the uncomfortable part. RPO is only as honest as the cow you hand it. And on most farms, that cow’s “true potential” got quietly shaved off months earlier — in the transition pen.

The transition period runs 60 days before calving through 30 days after, and University of Minnesota Extension is blunt about it: cows are at their greatest risk of disease and involuntary culling during this window. In a retrospective study of more than 5,000 cows by Carvalho et al., summarized by University of Wisconsin-Madison Extension, nearly 50% of cows experienced at least one clinical disease by 305 days in milk — 40% by 60 days, and 30% by just 21 days. Cows with one clinical disease lost roughly 750 to 800 pounds of milk over the lactation. Cows with multiple diseases lost about 1,550 pounds.

Subclinical ketosis tells the same story in miniature. A Canadian study (Duffield et al., Journal of Dairy Science) pegged the cost of an SCK case at about CAD $289, with prevalence of 15-30% common in many herds and roughly double the risk of early removal. University of Florida research (Tao et al., 2011) measured cows heat-stressed across the entire dry period producing about 5 kilograms per day less milk through the next lactation than cooled cows — milk you can’t claw back once she’s calved.

So here’s the line that stops people: RPO will happily tell you a cow is a bad bet — it just won’t tell you that you made her a bad bet at calving. Feed a damaged performance profile into the model and it calmly recommends replacing a cow who, managed properly, might have been one of your most profitable four-lactation animals. The math is complex. The fix is boring.

The Fix Is Boring. That’s the Point.

If half your fresh pen takes a transition hit, then half your RPO inputs are already corrupted. The model isn’t wrong — it’s ranking damaged cows accurately. It just can’t show you the cows you could have had. Which means the place to start fixing your cull list isn’t the cull list. It’s the feedbunk.

None of the Monday-morning moves require new capital. Check fresh cows for ketones in the first 7-14 days using a hand-held blood meter, treat the positives, and adjust the transition ration around body condition instead of habit. Don’t overstock the close-up and fresh pens — aim to keep cows lying 12 to 14 hours a day and out of the pen no more than three to three-and-a-half hours for milking and handling, because Miner Institute work ties each lost hour of lying time to 2 to 3.5 pounds of lost milk and more lameness. And hang fans and soakers in the dry pen, not just the milking string, because the heat stress you ignore in July shows up as lost milk and open cows next spring.

It doesn’t look like a longevity strategy. It looks like chores. But it’s the difference between an RPO score that reflects a cow’s real potential and one that reflects how badly she got managed in her first three weeks. At today’s heifer prices, that difference is no longer a rounding error — it’s the cost of a $3,500 springer you didn’t actually need to buy.

Four Paths That Don’t Need a Checkbook

None of these needs new capital. All of them need you to reorder what you pay attention to.

FixBest ForRisk If Done Wrong
Clean up transition inputsHerds with fresh-cow disease above 20% in first 21 DIMOne-time audit instead of daily routine
Make RPO the default cull list300+ cow herds with solid recordsData corrupted by untracked transition damage
Lower target replacement rate (39% → 35%)Herds rethinking beef-on-dairy/sexed-semen mixCutting heifer numbers before longevity actually improves
Hard-wire dry-pen heat abatementAny herd in a warm climateBackfires only through inaction — easiest to skip, easiest to regret

1. Clean Up the Transition Inputs

  • Best for: Herds where fresh-cow disease runs above the 20% benchmark in the first 21 days.
  • The action: Pull fresh-cow records this month; run daily fresh-cow checks and ketone testing.
  • The risk: Backfires if you treat it as a one-time audit instead of a hard-wired daily routine.

2. Make RPO the Default Cull List

  • Best for: 300-plus cow herds with decent records.
  • The action: Stop picking “the bottom 32%.” Rank cows by expected future margin and start at the bottom — with a bias to delay replacing low-value cows whose problem you’re actively fixing.
  • The risk: Backfires if the data feeding it is already corrupted by untracked transition damage.

3. Lower the Target Replacement Rate

  • Best for: Operations rethinking their sexed-semen and beef-on-dairy mix.
  • The action: Overton’s work shows dropping replacement rate from 39% to 35% keeps the average market cow about 100 days longer — build a multi-year youngstock plan to match.
  • The risk: Backfires if you cut heifer numbers before your longevity actually improves and you get caught short.

4. Hard-Wire Heat Abatement Into the Dry Pen

  • Best for: Any herd in a warm climate.
  • The action: Put fans and soakers in the close-up and fresh pens, not just the milking string — dry-period cooling protects the next lactation.
  • The risk: Backfires only through inaction; it’s the easiest investment to skip and the easiest to regret.

The forward signal worth watching: CoBank’s own numbers show the rebuild adding back just 360,200 head over 2027-2028 against 796,000 drained. The operations that come through intact won’t be the ones scrambling to source replacements. They’ll be the ones who don’t need as many — and in a decade where the honest question is who’s still milking at all, that distinction matters more than any single year’s cull rate.

Key Takeaways

  • If a heifer now costs $3,500 instead of $1,500, your net replacement cost per day roughly five-folds on the same animal in the same stall — which means cows you’d have culled on reflex two years ago may now pencil out as keepers.
  • If your fresh-cow disease rate is above 20% in the first 21 days, fix the transition pen before you trust any RPO ranking — you’re scoring damaged cows, not their real potential.
  • If you’re still managing to a cull percentage instead of value per cow per day, you’re using the metric many of the world’s most profitable herds have already moved past.
  • If you’re cooling only the milking string, you’re paying for dry-period heat stress next spring in lost milk and open cows — and you won’t see it coming on the spreadsheet.

Here’s the trap waiting for the producers who do everything right. You fix the math. You clean up the fresh pen. You rebuild the policy. And then you overcorrect — you start keeping cows for the wrong reasons, just with better vocabulary. The Swiss research warns about exactly this from the other direction: in a study of replacement decisions across 29 farms, losses from retaining unprofitable cows ran about three times higher than losses from culling too early, averaging 161 Swiss francs per farm per month. Sentiment is expensive. So the question isn’t whether you can keep cows longer — it’s whether you’ll know the difference between a cow that’s earning her stall and a passenger you’re keeping out of habit.

Which one is standing in your fresh pen right now?

Run Your Numbers

Bullvine Pipeline Index Calculator — Six numbers off your herd software scores your replacement pipeline 0-100 and flags whether it’s green, yellow, or already red. It weighs heifer supply, your actual replacement cost, cull rate, and sexed-versus-beef semen mix, then plots you against the national trend and CoBank’s 2027-2028 rebuild.

Complete references and supporting documentation are available upon request by contacting the editorial team at editor@thebullvine.com.

Learn More

The Sunday Read Dairy Professionals Don’t Skip.

Every week, thousands of producers, breeders, and industry insiders open Bullvine Weekly for genetics insights, market shifts, and profit strategies they won’t find anywhere else. One email. Five minutes. Smarter decisions all week.
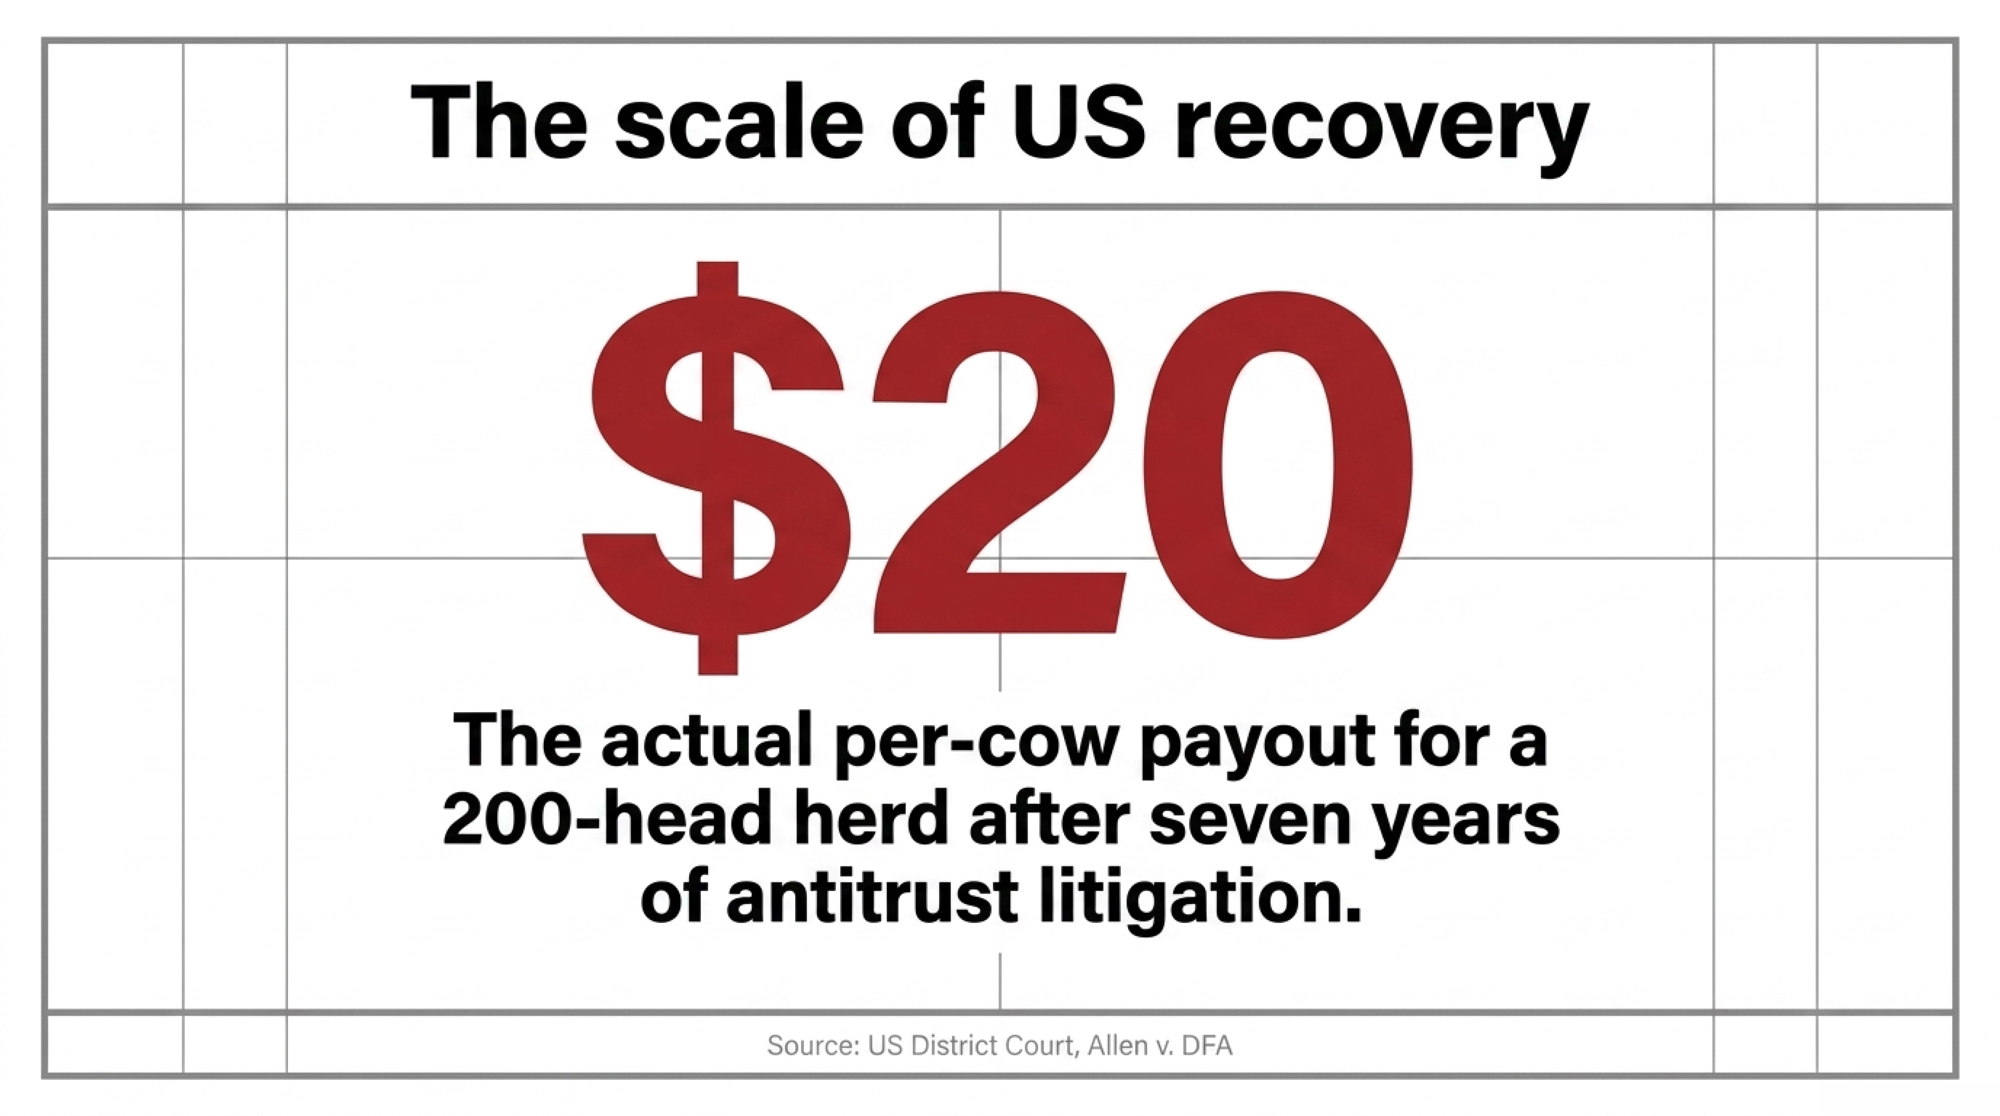
NewsSubscribe
First
Last
Consent

Parity Beats Your Ration 52-to-1, and Nothing You Buy Changes a Cow’s Age

Three companies, four levers, four failure points. The €16,950 figure your rep quotes was published by a company selling one of them. Seven things to measure before you buy.

Executive Summary: The €16,950 milk fever cost figure your nutritionist quotes was published in February 2021 by Phibro Animal Health’s Business Manager Europe — a company that sells anionic minerals for the problem the model prices. That’s not a reason to discard it, because the per-case costs underneath it trace to Guard (1996) and Oetzel (2011), and Oetzel’s own worked example holds up cleanly: a 2,000-cow dairy loses about $12,000 a year to clinical cases it treats and roughly $48,750 to subclinical cases it never sees. Four approaches are on the table and every one has a real failure point. Before any of them, three measurements cost almost nothing and decide which lever could even work on your farm — read on if your transition numbers have been stuck for three years and you can’t say for certain whether the last thing you changed actually worked.

milk fever prevention

Sabrina Caron doesn’t soften what her Quebec herd went through. “For a long time we had a lot of problems with calvings and with cows not having a good start to the lactation. It was a horror,” she in a recent interview. She’d tried plenty. The one that stuck was X-Zelit, and she credits it with lifting her herd average from 40 to 48kg per cow per day inside a year.

Caron and Danny Giguère run 105 Holstein milking cows at Ferme Roland Caron in Laurierville, Quebec — third-generation ground, and named Agropur’s 2024 Grand Champion for animal welfare. Her account is a real producer describing a real result. Whether it’s a result you can copy is a different question, and the research on transition failure explains why.

A 2017 Journal of Dairy Science study of Costa Rican grazing herds found parity dominated every other risk factor for milk fever, at an odds ratio of 52.59 for cows in their sixth lactation or later. That figure comes from the study’s base model; the same paper’s full model, which adjusts for more herd-level variables, puts the same group at OR 12.84. Both models found parity was by far the largest factor. We quote the base-model figure because it’s the one the literature circulates — which is exactly the kind of choice this article is about. A producer weighing it should know the range, and know these were grazing herds in Costa Rica, not confinement herds in Wisconsin or Ontario.

Either way, nothing you buy changes a cow’s parity. And here’s the inversion that reframes the economics. Oetzel’s 2012 worked example put it plainly: a 2,000-cow dairy with 2% clinical incidence at $300 a case loses about $12,000 a year, while the same herd with 30% subclinical incidence among second- and later-lactation cows at $125 a case loses about $48,750. Four times more, from cases nobody treats.

Three Things to Measure Before You Buy Anything

The full decision guide is further down, but if you read nothing else: pull urine pH on your close-up cows, test your dry cow forage potassium, and tally your clinical cases by lactation group. All three cost almost nothing. All three change which of the four approaches below could plausibly work on your farm. None of them require a sales call.

What’s Actually Changed in Transition Prep

Transition prep used to be one conversation. Get dietary cation-anion difference right in the final three weeks, check urine pH, hope. That’s still the backbone: University of Wisconsin–Madison Extension puts the research-based DCAD target at -100 to -200 mEq/kg DM, with -100 often preferred because pushing toward -200 risks too severe a metabolic acidosis response. NASEM’s 2021 requirements land in the same place, recommending -100 mEq/kg DM inside the final 21 days. Target urine pH for Holsteins runs 6.2 to 6.8.

What’s new is that the field now has genuinely different biochemical routes to the same endpoint — with independent research confirming they aren’t the same thing wearing different labels. A 2024 Journal of Dairy Science trial from Wisconsin compared synthetic zeolite A head-to-head against negative DCAD and found both improve postpartum calcium metabolism, but “they appear to work through different mechanisms.” That’s a controlled comparison saying the physiology diverges, not a marketing claim.

Dry-Off Isn’t the End of Anything

The third route steps outside feeding altogether, and it starts earlier than most protocols do. Julien Redor, Ruminant Technical Manager at the French company Natual, frames it this way: drying off “should no longer be seen as the end of milk production, but rather as a phase of immunological preparation” directly after the last milking, with active metabolic preparation across the final three weeks before calving.

That framing has independent research behind it. A 2025 Journal of Dairy Science review approaches the dry-to-lactation window through immunometabolism — metabolic and immune function wired together rather than stacked in sequence. A heavily cited 2017 review put the interdependence bluntly: metabolic diseases like milk fever and ketosis raise a cow’s risk of infectious disease, and infectious disease raises her metabolic risk right back.

Here’s what it looks like as a protocol rather than a concept. On a French farm running roughly 250 Holsteins with a stated goal of cutting antibiotic use at dry-off, the sequence is specific: no over-milking at the last milking, minimal teat stimulation afterward, Natual’s Taribol bolus administered systematically within two hours, then straight into a separate dry group on a high-fiber, low-energy ration — physically separated from the milking herd so nothing re-stimulates production. Metrabol follows post-calving, aimed at uterine involution and getting the cycle restarted.

Read that list again and notice how much of it costs nothing. The over-milking, the teat handling, the physical separation, the ration split — those are protocol decisions, not purchases. Whatever you conclude about the boluses, the handling sequence around them is available to any herd that decides to run it.

The Farms Where Everything Looks Right and It Still Goes Wrong

Ask a nutritionist about their problem farms and you’ll often hear the same profile: textbook rations, sporadic milk fever anyway. Dr. Norbert Göres has spent years on that list. He’s a veterinarian with a TiHo Hannover doctorate on cattle feeding and, since 2021, Director of Business Development for the EU market on Sano’s SmartDairyNutrition program.

“There are farms where everything seems to be right — low potassium dry cow rations, optimal mineral supplementation and a perfectly mixed ration, but they continue to be confronted with cases of milk fever here and there,” Göres said in a European trade interview on transition management. “These types of cases made us rethink existing concepts and further develop them.”

Sano’s answer is Mipro Close-Up 700 — acidification held across the full dry period instead of the close-up phase alone, paired with rumen-protected methionine and choline for liver support. The company reports clinical milk fever effectively eliminated on client farms and fresh cows averaging 7.9kg more milk per day, with the biggest gains in older cows. Those are company-reported field results from Sano’s own advisory work. We could not locate the underlying trial data in the published literature, which doesn’t mean the results aren’t real — field results rather than published trials are common practice across on-farm nutrition advisory programs — but it does mean you’re weighing a vendor’s client outcomes rather than an independent trial.

Zeolite’s trail is more traceable, and it doesn’t rest on one trial. Kerwin and colleagues, publishing in the Journal of Dairy Science in 2019, found synthetic zeolite A fed prepartum produced markedly improved serum calcium around calving in a housed Cornell herd — and DairyNZ’s scale-up work is the most recent large-scale confirmation. DairyNZ — funded by New Zealand dairy farmers through the levy and by the Ministry for Business, Innovation and Employment — ran its Zeolite Scale-Up Trial across roughly 1,000 cows in three Waikato herds in 2019/20 and another 1,500 cows across three herds the following season. Half of each herd got 500g/day of synthetic zeolite for three weeks pre-calving. Clinical milk fever fell from 4.4% in controls to 1.2% in treated cows.

Worth noting where the commercial interest sits on this one too. Vilofoss, which markets X-Zelit, calls the product “a definitive solution for the control of hypocalcemia” and “a significant and disruptive advance” in its own 2026 conference material. Strong independent evidence and strong marketing aren’t mutually exclusive. They’re just different things, and only one went through peer review.

Four Levers, Four Failure Points

ApproachMechanismBest fitWhere it fails
Close-up negative DCADAcidosis activates TRPV5/TRPV6 calcium channels; mechanism still debatedConfinement herds, controlled and testable rationsNo benefit below pH 6.0 or -100 mEq/kg DM; failed entirely at dietary Ca above 1.6% in a 1992 trial
Extended acidification — Sano Mipro Close-Up 700, full dry period plus methionine and cholineSame acidification route held longer, with liver supportPersistent cases despite textbook close-up formulationNeeds precise DCAD calculation, mineral balancing, cow comfort, routine urine pH. Results are company-reported, not independently published
Synthetic zeolite — Vilofoss X-Zelit, 500g/day for 2–3 weeks, stop at calvingBinds calcium and minerals in the rumen; large pre-calving blood phosphate drop documentedGrazing and high-K forage systems where DCAD is hard to hitNot on fodder beet or low-P diets; not mined natural zeolite; magnesium needs active management; cuts prepartum intake ~13% versus negative DCAD
Dry-off bolus support — Natual Taribol within 2 hours of last milking, Metrabol post-calvingAnti-inflammatory and immune support at dry-off, layered on any feeding programHerds targeting antibiotic reduction at dry-offNo peer-reviewed trial located on either product as of publication; the 85-minute lying-time study used a different bolus type

Running the Barn Math, and Naming Who Built It

ConditionCost per caseIncidenceAnnual cost, 200-cow herd
Clinical milk fever$285 per multiparous case (Liang et al. 2017, JDS)1.2–4.4% in DairyNZ trial herdsRoughly $685 to $2,510
Subclinical hypocalcemia$125 per affected cow (Oetzel, 2012 worked example)40.7% measured across 1,380 German cows at a 2.0 mmol/L thresholdRoughly $10,175

Incidence figures pair DairyNZ’s pasture-trial herds with US per-case costs and a German prevalence survey. Oetzel applied his $125 to second-and-greater-lactation cows; Venjakob’s 40.7% covers all parities, so the herd figure runs slightly high. Directional, not transferable — run your own incidence.

The direction holds across both currencies and both continents: the subclinical column is always the bigger number. The multiple doesn’t hold. It runs about 3.6:1 in Phibro’s model, 4.1:1 in Oetzel’s own example, and closer to 6:1 using the figures above. Which tells you the incidence assumption is doing most of the work — and that it’s the number worth arguing about.

Cost figurePublished byCompany sellsUnderlying sourceYear
€16,950/yr subclinical modelPhibro Animal Health (Arnout Dekker)Anionic minerals (Animate)Oetzel (2011) per-case cost2021
€312 clinical caseGuard et al.— (academic)Original 1996 study1996 — 30 yrs old
“Definitive solution” languageVilofossSynthetic zeolite (X-Zelit)Company conference material2026
7.9kg/day milk gain, milk fever “eliminated”SanoMipro Close-Up 700Company-reported, no published trialOngoing
Clinical milk fever 4.4%→1.2%DairyNZ (farmer levy-funded)Nothing — independentZeolite Scale-Up Trial2019–21

So here’s the model most often quoted at producers. That 250-cow European breakdown — clinical at €312 a case and 6% incidence giving €4,680 a year, subclinical at €113 and 60% giving €16,950 — was published in February 2021 by Arnout Dekker, Business Manager Europe for Phibro Animal Health. Phibro markets Animate, an anionic mineral used in negative-DCAD programs.

The per-case costs underneath the table aren’t Phibro’s own: €312 traces to Guard et al. (1996), €113 to Oetzel (2011). The 6% and 60% incidence figures are the model’s. Don’t convert between the euro model and the US numbers — different cost assumptions, different years, different decades in the case of Guard.

If you want to see what a single fresh-cow line item does at scale, our reporting on Steve Jaeger’s $511 fresh cow problem tracks a $111-per-cow fix across 4,495 cows.

Different Doors, Same Room

Negative DCAD acidifies the cow, so her own calcium regulation switches on before she needs it. It’s a systemic metabolic intervention, and it only works if she eats the ration you formulated.

Zeolite goes through a different door, and the sources disagree about which door. DairyNZ describes synthetic zeolite binding dietary calcium and other minerals in the rumen, stimulating increased intestinal absorption — while also documenting a large pre-calving phosphate drop as part of the mechanism. Martín-Tereso’s 2011 review reports the original calcium-binding hypothesis has been challenged by a hypophosphatemia-driven explanation, where lower blood phosphorus reduces FGF23 signaling and triggers bone mobilization. A 2025 review adds that zeolite likely acts on several systems at once, including the ruminal environment and immune modulation.

Here’s the trade-off you should expect, and it’s substantial. Frizzarini and colleagues, in that 2024 Wisconsin trial, measured prepartum dry matter intake at 11.7 kg/day on zeolite against 13.5 on negative DCAD and 13.9 on the control — a 13% drop versus DCAD and 15.7% versus control. Rumination fell too: 487 minutes a day against 527 and 531. Both differences were significant at P<0.01.

That’s not a small dip, and any nutritionist will flag it. What the same trial found, though, is that blood BHB didn’t change, body fat mobilization postpartum didn’t increase, and rumination came back to parity after calving. The authors concluded zeolite “does not affect energy metabolism” despite the intake reduction, and reported higher colostral IgG plus the most milk from third-lactation-and-older cows on zeolite. So the prepartum intake loss appears to be a cost the cow absorbs without metabolic consequence — but you should know it’s there before a rep tells you the product is free of downsides.

The Mechanic Nobody Sells Against

Delivery. Urine pH testing exists precisely because correctly formulated DCAD rations fail in practice. Cows running out of feed and slug feeding, under- or over-mixing, and unexpected shifts in forage mineral levels all change what the cow receives versus what’s on the spec sheet. A ration is a plan. Urine pH is the only thing that tells you whether she actually got the memo.

Why One Farm’s Number Can’t Settle It

Savaron’s recent history is a matter of public record: fire destroyed a barn at the Laurierville farm in March 2020, a new facility came into operation in December 2021, and the herd is milked robotically. Caron has spoken publicly about the rebuild.

Nothing in this section reflects on Caron’s management or on her herd’s performance. Ferme Roland Caron holds a national animal-welfare award, which is not something a poorly run operation collects. The confounders here are structural, and they would apply identically to any farm that rebuilt and automated across the same seasons — including, most likely, yours.

That’s the point. When a facility change, a new milking system, and a transition protocol all land inside a few seasons, nobody can cleanly separate afterward what moved the tank. X-Zelit has independent trial evidence of its own; none of it rests on Savaron. But if you can’t tell which of your own changes moved the needle, you can’t repeat it, scale it, or stop paying for the part that didn’t matter.

Your Dry Pen Decision Guide

Work down in order. Each step is a gate, not a suggestion.

IF you haven’t measured urine pH on close-up cows in 60 days ➔ don’t spend another dollar on additives until you do. Target 6.2 to 6.8. Mixer accuracy and slug feeding are the documented failure points, and no product fixes a delivery problem.

IF your dry cow forage K is above 1.5% of DM ➔ you’re into anionic-salt territory. Above 2.5% ➔ salts won’t rescue it. Published guidance sets the dry cow forage target under 1.5% K, treats 2–2.5% as the range where anionic salts become necessary, and calls above 2.5% almost impossible to correct with salts alone. Cornell puts the grass target under 2% K for a workable anionic diet. Past 2.5%, low-K forage or zeolite is the answer, not more salt.

IF your clinical cases cluster in fourth-lactation-and-older cows ➔ split your dry cow ration by parity. Venjakob’s survey of 1,380 cows across 115 German farms found clinical milk fever at zero in first lactation, then 1.4%, 5.7% and 16.1% in second, third and fourth-plus. Subclinical prevalence at a 2.0 mmol/L threshold ran 5.7%, 29.0%, 49.4% and 60.4% across the same four groups. One group ration treats two different risk populations identically.

IF lameness in your dry pen is unmeasured ➔ score it before you buy anything. In Neves and colleagues’ 2017 work, cows that were lame but normocalcemic at calving were 3.2 times more likely to be subclinically hypocalcemic by two days in milk than non-lame normocalcemic cows — the paper’s abstract renders the same comparison as 3.4. Either way, that’s a facility problem wearing a mineral problem’s clothes.

IF more than 15% of first-week fresh cows show BHB above 1.2 mmol/L ➔ calcium isn’t your bottleneck. That threshold signals significant herd-level disease risk and real production loss. Steeneveld’s 2020 analysis put clinical ketosis at €709 a case and subclinical at €150, running €3,613 a year on a default 130-cow Dutch farm and €7,371 on a high-risk one. For comparison, the clinical milk fever figure in Phibro’s model above is €312 a case, sourced to Guard et al. (1996) — a different study, a different decade, and not Steeneveld’s number.

IF you’re changing two things at once ➔ stagger them. A product alongside a facility upgrade, a robot startup, or a grouping change means you won’t know which one worked.

IF a vendor shows you a testimonial ➔ ask three questions. Is there an independent, peer-reviewed trial on this specific product, or only on the ingredient class? Who funded it? Who co-authored it? Kerwin’s 2019 Cornell zeolite trial lists co-authors from outside the university alongside the Cornell team — standard and disclosed in applied nutrition research, and worth factoring in.

Sørensen and colleagues said the underlying thing plainly back in 2002: the most suitable milk fever control strategy for any herd depends on herd-specific circumstances — the farmer’s skills, the production system, and the economics of that particular choice. Two decades on, nothing has displaced it. DairyNZ’s own scale-up data points the same way, noting that herds with a milk fever history benefit most from zeolite.

Run Your Own Numbers Before You Run a Trial

If your transition numbers have been stuck for three years, the honest question isn’t which of these approaches to buy. It’s whether you’ve got enough measurement in place to know whether the last thing you changed actually worked.

The European Food Safety Authority requires a minimum of three independent in vivo studies showing significant effects before an efficacy claim is supported for a feed additive. Our own view is that the design details matter as much as the count — control groups, randomization, blinding, enough animals to rule out chance — but that’s editorial framing, not EFSA’s wording. Either way, three independent studies is a workable bar to hold in mind when a rep shows you one farm’s numbers. It’s a fair bar to hold yourself to, too.

Start with your own figures: The Bullvine’s Ketosis Cost Calculator will put your fresh-cow BHB rate against Steeneveld’s per-case costs, and the Health ROI Calculator will tell you whether the input you’re weighing clears its own price. We’re publishing the seven gates as a printable one-pager for the office wall — watch for it in this week’s Bullvine Weekly.

Key Takeaways

  • Before you buy anything, pull urine pH on close-up cows and check you’re inside 6.2 to 6.8, and get a forage K test. If K is above 1.5% of DM, you’re into anionic-salt territory; past 2.5% salts won’t rescue it, and you need low-K forage or zeolite.
  • Zeolite cut DairyNZ’s clinical milk fever from 4.4% to 1.2%, but it also drops prepartum dry matter intake around 13% and needs magnesium watched. Extended acidification rests on company-reported field results, and there’s no published trial on the dry-off boluses specifically.
  • On 200 cows, the clinical bill runs roughly $685 to $2,510 a year while subclinical sits near $10,175. Tally your cases by lactation group — subclinical prevalence goes from 5.7% in first-lactation cows to 60.4% in fourth-plus, so one dry ration is treating two different herds.
  • When someone hands you a cost-per-case model, check who published it before you check the number. The €16,950 figure came from a company selling anionic minerals — the academic work under it is sound, but the incidence assumptions are theirs.

Research and product claims reflect published literature and company statements available as of publication. Sano, Natual and Vilofoss were not asked for comment before publication; this article will be updated if any party provides trial data or a response.

Learn More

The Sunday Read Dairy Professionals Don’t Skip.

Every week, thousands of producers, breeders, and industry insiders open Bullvine Weekly for genetics insights, market shifts, and profit strategies they won’t find anywhere else. One email. Five minutes. Smarter decisions all week.
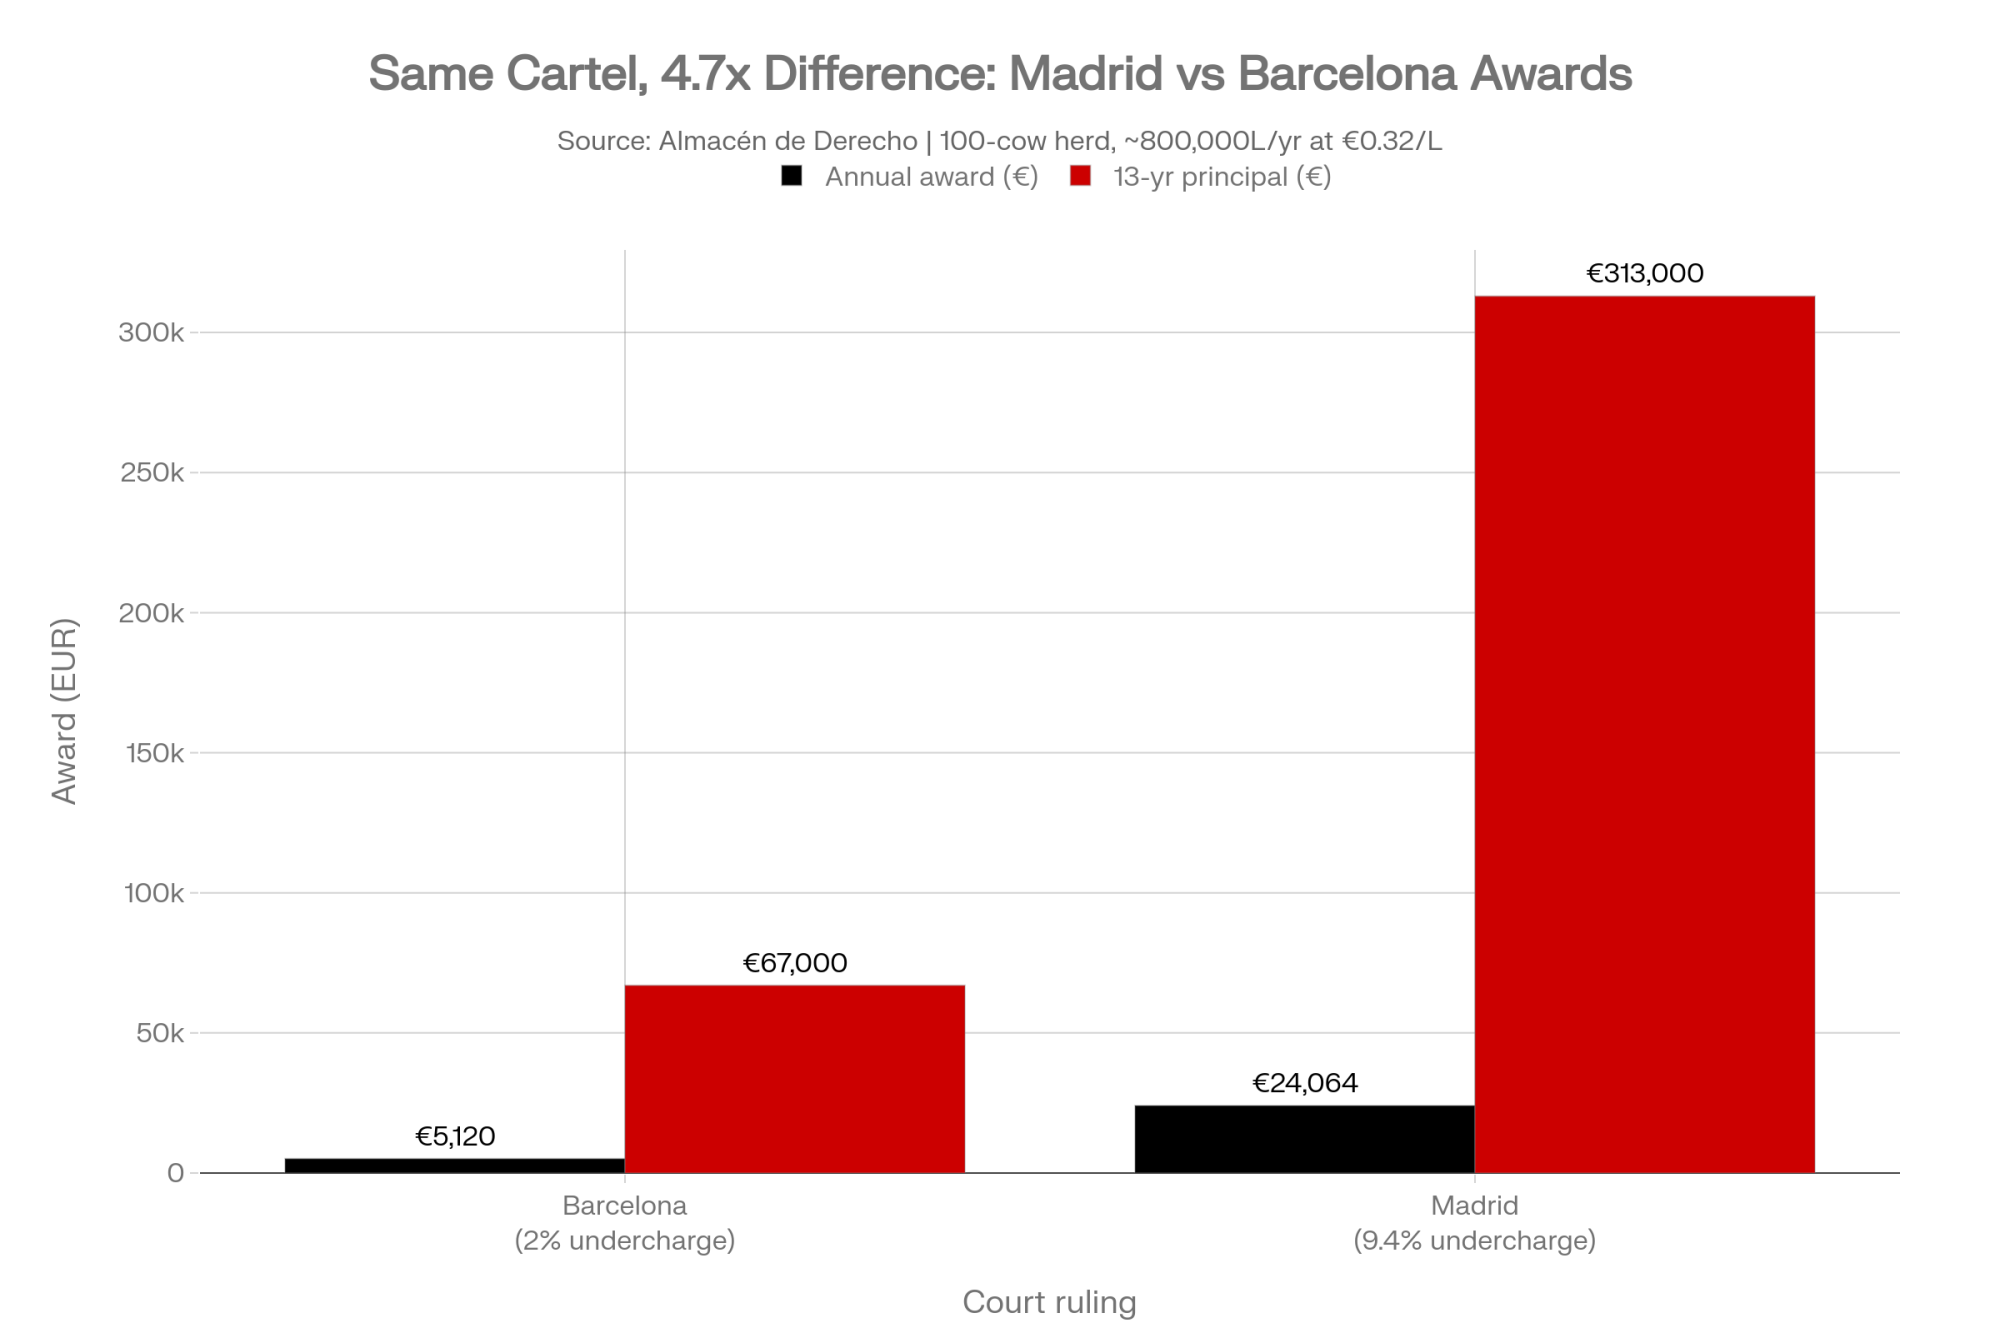
NewsSubscribe
First
Last
Consent

$4.17 a Straw for Polled. The A2A2 Premium Isn’t Reaching You.

Purdue put the homozygous polled ceiling at $4.17 a straw — 2017 dollars, so call it $5.70 today. Meanwhile, only 15% of A2 converters say anyone is paying a premium. Your semen invoice is in the office; this analysis takes four minutes.

Joel Hendrickson started converting his herd to A2 genetics at Ten Finns Creamery in Menahga, Minnesota, back in 2014. Roughly three years to reach 100%. Then in 2019 he built an on-farm creamery, inspected by the Minnesota Department of Agriculture, to bottle and sell his own milk — because that turned out to be the way to get paid for what he’d bred.

Ask him why, and the answer isn’t a spreadsheet. “I am convinced that if all the cows in the United States were A2, humans would be healthier,” he told AURI in an August 2024 interview. He milks 140 cows now, 40–50% of production going direct to institutions and retail, the rest to his local co-op. He also supplies 10 Minnesota school districts at no premium at all, because state-funded schools don’t have the budget to pay more for A2 than for conventional. 

That’s the honest shape of the A2 opportunity. It exists. Capturing it meant becoming a processor.

Polled genetics sit somewhere different. There’s a peer-reviewed number attached to that trait, published in dollars per straw, and you can check it against the invoice on your desk this afternoon.

Two Traits Moving in Opposite Directions

A2A2 used to be scarce. Not anymore. Chuck Sattler, vice president of genetic programs at Select Sires, laid out the trajectory in a CentralStar Cooperative webinar: 33% of Holstein bulls in the Select Sires program were A2A2 in 2015, 56% by 2020, 70% by 2023. A November 2024 review of STgenetics’ directory found 317 of 421 Holstein sires — 75% — were A2A2, along with 62 of 72 Jerseys and all five Guernseys. Sattler’s read is that producers can now select A2A2 sires with minimal sacrifice of other traits. Worth noting he works for one of the studs selling them. 

That 70% figure is nearly three years old, so today’s number is almost certainly higher. When three-quarters of the lineup carries a trait, you’re not buying an edge. You’re noticing something that came in the box.

Polled went the other direction. A heterozygous polled bull on a horned cow gives you roughly a coin flip — half polled calves, half horned. A homozygous PP bull gives you 100% polled offspring no matter what the dam carries. That guarantee still comes from a limited pool of sires, and while the merit gap against horned contemporaries has narrowed sharply, it hasn’t closed. Some polled sires still give up real production or type, and you should assume you’re choosing from a shorter list.

What Can You Pay for Polled and Still Break Even?

Here’s the number, and it’s Purdue’s, not ours. Nathanael M. Thompson, Nicole Olynk Widmar and Michael M. Schutz at Purdue, working with John B. Cole of USDA-ARS and Christopher A. Wolf, published stochastic budgets across dehorning and polled scenarios in the Journal of Dairy Science in June 2017 — volume 100, issue 6, pages 4941–4952. 

Their dehorning finding: expected cost across four traditional methods ran US$6 to $25 per head, averaging $12 to $13 in 2017 dollars. Hot-iron disbudding without pain relief came in cheapest at $11.90/head — which, as Thompson told in an interview, “is consistent with what most producers are currently doing.” 

Then the part that lands at the order desk. Their published conclusion, verbatim: producers could spend up to $5.95/head and $11.90/head more for heterozygous and homozygous polled genetics, respectively, compared with horned genetics — “or $2.08 and $4.17/straw of semen at an assumed average conception rate of 35%.” 

So the per-straw figure isn’t a Bullvine conversion. It’s in the paper.

The 2017 Dollar Problem

Here’s what nobody quoting that $4.17 mentions: it’s a 2017 number, and you’re holding a 2026 invoice.

BLS puts CPI-U at 245.120 for 2017 and 335.123 for 2026 — a factor of 1.367, or 36.7% cumulative inflation. Run the published figures through it:

Thompson et al. figureAs published (2017 USD)Bullvine CPI adjustment (2026 USD)
Homozygous PP break-even$4.17/straw≈$5.70/straw
Heterozygous P break-even$2.08/straw≈$2.84/straw
Cheapest dehorning method$11.90/head≈$16.27/head
Study’s average cost range$12–$13/head≈$16.41–$17.77/head

Arithmetic: $4.17 × 1.367 = $5.70. Audit it yourself. These adjusted figures are The Bullvine’s calculation, not the authors’ — Thompson’s team published nominal 2017 dollars and never claimed otherwise.

Two caveats on that column. Semen prices have risen since 2017 too, so the adjusted threshold is a directional correction, not a precise 2026 break-even. And dehorning cost is mostly labor, which has outrun general CPI over the same stretch — so $16.27/head is probably the conservative end.

One more, and it comes from the authors. Thompson’s team noted that sensitivity to individual farm semen and dehorning costs is likely to swamp the differences between their modeled scenarios. That’s not a weakness in their work. It’s precisely why the instruction here is check your own invoice rather than here’s the industry answer. The people who built the model said farm-specific costs dominate. 

Where your herd sits on conception changes it too. Herd-level reproduction benchmarking shows only 16% of herds hit both a 40%-plus conception rate and a 50%-plus insemination rate, while 29% fall short on both. Irish figures run higher — ICBF’s analysis of 1.83 million dairy inseminations from 2018–2022 put conventional AI pregnancy rates at 64% and sexed at 59% — but that’s a seasonal grazing system on a different measurement basis, and it shouldn’t be read straight across to a North American freestall.

Better conception means fewer straws per pregnancy, which pushes the premium you can justify up, not down.

Where the Barn Math Actually Lands

Run the numbers off USDA NASS’s January 2026 Cattle report, and the U.S. dairy replacement pipeline is tighter than most rules of thumb assume: 2.50 million dairy replacement heifers expected to calve during 2026, against 9.57 million milk cows. That’s 26.1 heifers per 100 cows — down from 26.7 a year earlier, while the milking herd itself grew 2%. More cows, fewer replacements coming behind them.

So a 200-cow herd at that national ratio is bringing in about 52 replacements a year, not the 60-plus an older 30% rule would suggest. Both dollar frames:

  • 52 replacements: ≈$619/year at the published $11.90/head — or ≈$846/year at the CPI-adjusted $16.27
  • 60 replacements (30% rate): ≈$714/year published — or ≈$976/year adjusted

Your number moves with your cull rate, your heifer retention, and whether you’re buying replacements instead of raising them.

Not dramatic money either way. But it recurs annually with no further decision required, and homozygous polled eliminates the line rather than halving it. And these are gross figures. Pay the full break-even premium, and you land at zero by definition — the saving only becomes margin when your actual premium comes in under the threshold.

A second simulation brackets the same ground. A Penn State paper we haven’t been able to obtain directly, written up by C. Jones ran 10,000 iterations and put expected dehorning cost at $5.84–$22.89 (average $11.79) against polled genetics at $0.47–$22.50 (average $10.73), concluding farms could spend an additional $7.50 for polled and break even. That $7.50 comes out of the full model, not the gap between the two averages — treatment costs and complication rates do most of the work. Same 2017-era dollar caveat applies.

The model skipped a few things worth money, too: reduced calf stress, the merit difference between polled and horned sires, public perception, and the plain value of not doing an unpleasant job. The authors flagged this themselves — the value of avoiding dehorning “may be larger for the industry, and perhaps some individual farms, than initially suggested if additional value is put on calf comfort and possible worker aversion to dehorning.” So the real case for polled probably sits better than either set of arithmetic shows.

Which bulls clear the threshold is a longer conversation than this article can hold. That’s a separate piece — and it starts with the fact that you can’t compare a German RZG to a Canadian LPI without getting the answer wrong.

Why Did So Few Converters Cite the Premium?

AURI’s survey ran mid-August to mid-September 2024, drew 75 completed responses from 36 Minnesota counties — roughly 4% of the state’s dairy farms — and 92% of respondents ship to processing cooperatives. Among them, 35% were converting to A2 genetics, 9% had finished, 48% hadn’t started, and 8% didn’t know what A2 milk was. 

Then AURI asked the converters why, from a preset list of eight options. 82% cited perceived consumer interest. 75% cited market opportunities. 64% said A2 is trending. 42% believed A2 milk is better than conventional. And two options tied at the bottom: 15% said their buyers were asking for A2, and 15% cited a higher selling price.

AURI’s conclusion is blunt: producers see A2 as a trending market opportunity “despite not receiving a premium price for A2 milk,” and higher prices “appear to have a limited impact on farmers’ decisions to convert their herd.” The survey also found Minnesota processors weren’t driving A2 interest at all.

Among farms not interested in converting, 60% said market opportunities don’t exist, and 50% pointed to conversion cost. One respondent: “Currently, I do not know of a market for A2 milk. I don’t see the need to switch without market or premium prices.” Another, more wistful: “I would love to make some extra income from A2, but I don’t think our co-op wants to sell A2 milk.”

Scope caveat, stated plainly — Minnesota, 75 farms, one survey window, and AURI cautions the sample may not represent the true statewide conversion rate. Whether your region reads differently is exactly what the processor call below is for.

Retail explains the disconnect, and the two figures that look contradictory aren’t. A2 dairy hit 1.3% of the total dairy category in the North Central U.S. in 2024 — milk, yogurt and ice cream combined, from SPINS scanner data across 13,000 stores — up from 0.5% in 2022, with sales growing 161%. Measured against fluid milk alone, a much narrower base, retailers told AURI A2 sits under 1%, at a 60–70% shelf premium. Different denominators, not different findings. A half gallon of A2 fluid milk averaged US$6.10 in 2024 against $5.11 in 2022. 

But four brands — The A2 Milk Company, Alexandre Family Farm, Zeal Creamery and Origin — control more than 90% of the A2 fluid market. Ten Finns is among the small local brands filling the remainder. So unless you ship to one of the big four, that shelf price is describing somebody else’s brand. Same trap that catches most premium market specialization in genetics: the trait is the easy part, the buyer isn’t.

The Index Numbers Behind Both Decisions

Two things get misread constantly, and either one can cost you.

Start with what the indexes actually measure. TPI, by Holstein Association USA’s own description, applies a constant that “adjusts for our periodic base change, allowing TPI values to be comparable across time.” It’s a ranking tool. Net Merit comes from USDA-ARS and CDCB, built from 12 individual traits plus 5 composite subindexes to estimate lifetime profit in dollars, per VanRaden, Toghiani, Basiel, and Cole’s 2025 revision. Selecting hard on one doesn’t optimize the other.

SireEvaluation system & runIndex 1Index 2Reliability / note
Aurora GS Woodford-ET (#1 TPI)Holstein USA / CDCB, Apr 2026 genomicTPI +3565Net Merit +$1,29665–75% genomic reliability
Welcome Gustavsson-ET (#10 TPI)Holstein USA / CDCB, Apr 2026 genomicTPI +3528Net Merit +$997Spread across top 10: 37 TPI points = $299 Net Merit
Stantons Remover PPLactanet, Dec 2025 → Apr 2026LPI +42 ↑Pro-Dollars −$299 ↓Same bull, same run window, opposite directions
Siemers Renegade Rozline-ETLactanet, Dec 2025 → Apr 2026Lost #1 → to ParfectPro-Dollars −$626Reranking event driven by 40/60 fat/protein flip

Source: Holstein Association USA / CDCB April 2026 genomic evaluation run. Genomic-only reliability, typically 65–75%

Thirty-seven TPI points. Two hundred ninety-nine dollars in Net Merit. Ranking order and profit order aren’t the same list.

So what’s the table not telling you? Those are genomic bulls at 65–75% reliability. A daughter-proven figure isn’t the same animal — a young genomic sire can re-rank hard at the next run. And when a handful of young sires get used heavily across the breed before their proofs mature, the concentration compounds: that’s how a single backup bull ended up behind seven percent of every Holstein alive.

Even a proven bull moves, and not always in one direction. Stantons Remover PP gained 42 LPI points between Lactanet’s December 2025 and April 2026 runs — while losing 299 on Pro-Dollars, dropping from #4 to #8 on that list. Same bull, same run, two indexes pointing opposite ways. Check both before you commit volume.

Canadian and U.S. indexes don’t share a scale either. LPI comes from Lactanet on Canada’s genetic base. TPI is Holstein Association USA on a U.S. base. Different trait weightings, different base populations, different base-change years — reading a Canadian daughter-proven result off an American genomic ruler isn’t a gap, it’s a category error. Never rank them side by side.

Both systems just moved. Holstein USA raised TPI’s protein weighting from 19 to 24 and cut fat from 19 to 14 — a 24:14 split inside the production slice, about 1.7 to 1 in favor of protein, which is a bigger shift than “raised protein” suggests. ABS Global put the resulting drop at roughly 35 TPI points on average. It also brings TPI’s protein weighting problem into play. Lactanet flipped Holstein LPI’s production subindex to 40% fat / 60% protein in the same window. Siemers Renegade Rozline-ET lost 626 Pro-Dollars points between those two Lactanet runs and gave up #1 to Parfect. Pin down the run date and the exact list before you quote anyone’s ranking.

Does the Robot Barn Argument Hold Up?

Polled gets marketed hard to automated milking herds. The mechanism underneath is real — but be precise about what’s proven and what isn’t.

A peer-reviewed study of 21 horned dairy herds in loose housing measured blood-in-milk incidence from horn-related udder injury at monthly rates of 0.3% to 7.8%, averaging 2.2% ± 1.9% of the herd, with visible udder damage in 38% of cases. Risk ran significantly higher during confined barn season than with pasture access — odds ratio 2.39. Pack cows indoors, and horn injuries climb.

That maps onto AMS barns structurally. Rodenburg’s 2017 Journal of Dairy Science review of robotic milking design notes AMS layouts need adequate open space near milking stations plus escape routes to enable low-stress, voluntary access. The design literature already assumes cows need room to dodge each other around the robot. In a parlor, a person handles her. In a free-traffic robot barn at 2 a.m., nobody does — one more line item for anyone still running the numbers on the robotic milking bet.

What doesn’t exist is any study measuring horned-versus-polled injury rates at a robot entry point. The mechanism is peer-reviewed; the AMS-specific measurement isn’t. Treat it as reasoned extrapolation rather than a statistic — particularly in front of a lender.

And say this plainly: nothing in the research connects A2A2 status to any AMS operational benefit. It doesn’t change milking speed, robot visits, or teat placement.

Actionable Strategies: 4 Paths Forward

Path 1: Benchmark Your Polled Premium

  • Action: Check your semen invoices. If the homozygous polled premium is under $4.17/straw as published — roughly $5.70 in 2026 dollars — dehorning savings cover the cost. 
  • Works best if: You’re raising your own replacements and dehorning in-house. If you buy springers, this math doesn’t apply to you.
  • A2 trait strategy: With 70–75% of Holstein lineups already A2A2, treat it as a tiebreaker between otherwise-equal sires rather than sacrificing total merit rank to chase it.
  • The limit: Polled means a shorter list. Check each bull’s trait profile against your herd’s actual needs instead of assuming index rank covers it.

Path 2: Commit to Homozygous (PP) or Skip It

  • Action: Avoid heterozygous (P) sires if your sole goal is eliminating dehorning. They only cut dehorning in half while capping your break-even at $2.08/straw published, roughly $2.84 in 2026 dollars. 
  • Works best if: You’re breeding a predominantly horned herd and want the line item gone rather than halved.
  • The risk: Sire availability at your merit target. Most PP bulls still on offer are genomic-only at 65–81% reliability — that’s reliability risk stacked on top of the polled decision.

Path 3: Make the Processor Call First (do this within 30 days)

  • Action: Call your milk buyer before ordering your next tank of semen. Three questions:
    • Do you currently run an A2 segregation program?
    • What is the minimum daily volume required?
    • What is the actual premium paid per cwt?
  • Why it matters: AURI found Minnesota processors weren’t driving A2 interest at all, and only 15% of converters said their buyers were asking for it. If yours says no, that closes the question before you breed toward a market that isn’t there. A phone call, not a project.

Path 4: Build the Channel (If Pursuing A2)

  • Action: If you’re pursuing A2 without a co-op premium, factor on-farm processing or direct-to-consumer and institutional contracts into your business plan.
  • Works best if: You already have retail or institutional relationships, or the appetite to build them. Not a fit for a farm that wants to ship and be done.
  • The precedent: Hendrickson took about three years to convert, then built the creamery in 2019. Holstein Canada estimates an intense breeding strategy can reach 100% conversion in three to four years. He’s now pursuing A2 butter and exploring ice cream — the value-added categories AURI found growing fastest.
  • The trade-off: He names his own frictions — product identity, the time cost of direct-to-institution relationships, and margin improvement that needs packaging automation he hasn’t yet capitalized on. You’re adding a business, not a trait.

On testing: A beta-casein-only milk protein test ran about US$25 per animal as of 2021 reporting. Writing in NODPA News that same year, Penn State dairy cattle genetics specialist Chad Dechow argued for genomic testing instead — modestly more expensive, but it returns production and fertility information alongside beta-casein status. Genomic testing ran $35–$45 per animal in 2026.

One More Reranking Event Is Already Here

CDCB’s August 2026 evaluations introduce three new traits: Resistance to Diarrhea (DIA), Resistance to Respiratory Problems (RSP), and First Service to Conception (FSC). The two calf health traits are the first national selection traits aimed at calfhood disease, built from more than 768,000 respiratory records and over 260,000 diarrhea records across breeds. At launch, they cover Holsteins and Jerseys, with DIA reliability at 43% for Holstein genomic sires and 48% for progeny-tested sires, and RSP at 45% and 53%.

Nothing in that work connects polled status to calf health — don’t let anyone tell you otherwise. The relevance is narrower: new traits entering the evaluation system mean another reranking event, on top of April’s TPI and LPI weighting changes. If you’re building a mating plan off a sire list, check which run it came from before you commit volume.

Key Takeaways

  • If your homozygous polled premium runs under $4.17/straw as published — roughly $5.70 in 2026 dollars — Purdue’s break-even says dehorning savings cover it. Above that, you’re buying something other than the dehorning savings.
  • If you’re using heterozygous polled sires, your break-even is $2.08/straw published, about $2.84 adjusted — not $4.17 — because you’re still dehorning about half your calves.
  • Every Thompson et al. figure is in 2017 dollars, and dehorning is labor-heavy, so treat the CPI adjustment as directional and probably conservative. The authors themselves said farm-specific costs likely swamp the scenario differences — your invoice beats any published average.
  • If your conception rate beats 35%, recalculate. Fewer straws per pregnancy raises the premium you can justify.
  • Before weighting A2A2 in any mating decision, call your processor. Only 15% of surveyed Minnesota converters cited a higher selling price, and another 15% said their buyers were asking for it.
  • If you’re shown a TPI gap and told what it costs per cow, ask for the Net Merit figure on the same bull, then check both indexes before committing. Remover PP gained 42 LPI and lost 299 Pro-Dollars in the same April 2026 run.
  • If the PP bull on your shortlist is genomic-only, check reliability first — 65–81% is not daughter-proven, and a bull at 70% can move hard at the next run.
  • If you’re working from a ranking published before April 2026, pull the current run — and never compare a Canadian LPI, a German RZG and a U.S. TPI figure as though they share a scale.
  • Running an AMS barn? The horn-injury case rests on real housing-density data, but no AMS-specific study exists — frame it honestly with your banker.

So Which Trait Would You Still Pay For?

Polled has a peer-reviewed break-even published in dollars per straw. A2A2 has a shelf premium four brands mostly keep, and a Minnesota survey full of farmers who bred for it because they believed consumers wanted it — not because anyone was paying more.

Find the polled line on your last semen invoice. Under $4.17 a straw as published — call it $5.70 once you adjust for nine years of inflation — and the Purdue math says you’re already ahead, before you count calf welfare, labor, or what a horn does in a robot barn at two in the morning. Then make the processor call.

Decision dimensionPolled (PP / P)A2A2
Peer-reviewed break-even$4.17/straw published, ~$5.70 CPI-adjusted (Thompson et al., J. Dairy Sci. 100(6):4941–4952, 2017)None published
Supply in Holstein lineupLimited — still a shorter shortlist~70–75% of Holstein sires already A2A2 (Sattler / CentralStar; STgenetics directory Nov 2024)
Return mechanismLine-item removed from replacement cost every yearRequires a paying buyer downstream
Buyer confirmation neededNo — dehorning savings are captured in-houseYes — only 15% of MN converters report a premium (AURI A2 Milk Market Assessment, 2024)
Break-even sensitivityConception rate, semen premium, labor costRetail brand concentration — 4 brands hold >90% of A2 fluid (SPINS via AURI)
Verifiable this afternoon?Yes — check the invoiceNo — starts with a processor phone call

Know Which Transaction You’re Making

Polled genetics carry a measurable return calculated right down to the straw. A2 genetics need a buyer before they yield a dime. Hendrickson found one by building it himself. One of those you can verify on an invoice this afternoon. The other starts with a phone call you haven’t made yet.

We’re building the full Net Merit-by-herd-size comparison for the polled segment in an upcoming Bullvine Weekly — that’s where the genetic-merit side of this decision gets settled properly.

Methodology Note: Dehorning and polled break-even figures come from Thompson, Widmar, Schutz, Cole and Wolf, Journal of Dairy Science 100(6):4941–4952, June 2017 (DOI 10.3168/jds.2016-12099) — a stochastic budget model, not survey data, assuming a 35% conception rate, expressed in nominal 2017 U.S. dollars. CPI-adjusted equivalents are The Bullvine’s calculation using BLS CPI-U annual averages of 245.120 (2017) and 335.123 (2026), a factor of 1.367; they are directional, not a substitute for the published figures, and general CPI likely understates labor-driven dehorning inflation. The secondary simulation is a Penn State model, which we have not obtained directly. Replacement-heifer figures are calculated from USDA NASS Cattle, released January 30, 2026: 2.50 million dairy replacement heifers expected to calve during 2026 against 9.57 million milk cows, U.S. national. A2 supply, conversion, retail, and case-study data come from the Agricultural Utilization Research Institute’s A2 Milk Market Assessment (December 2024 / January 2025): a Qualtrics survey of 75 Minnesota farms across 36 counties conducted mid-August to mid-September 2024, retailer interviews, SPINS scanner data across 13,000 North Central stores, and an August 2024 interview with Joel Hendrickson of Ten Finns Creamery. AURI cautions the survey sample may not represent the true statewide conversion rate. Genetic evaluations reference Lactanet’s December 2025 and April 2026 Holstein runs (Canada, LPI and Pro-Dollars) and the Holstein Association USA / CDCB April 2026 genomic run (U.S., TPI and Net Merit). These systems are not directly comparable. Dollar figures are USD unless noted. National averages may not reflect your region, herd size, replacement rate, or management system. If your numbers differ, send them — we’d rather publish your math than our estimate. Underlying AURI report: reports@auri.org. Corrections to this article: contact us through thebullvine.com.

Learn More

The Sunday Read Dairy Professionals Don’t Skip.

Every week, thousands of producers, breeders, and industry insiders open Bullvine Weekly for genetics insights, market shifts, and profit strategies they won’t find anywhere else. One email. Five minutes. Smarter decisions all week.
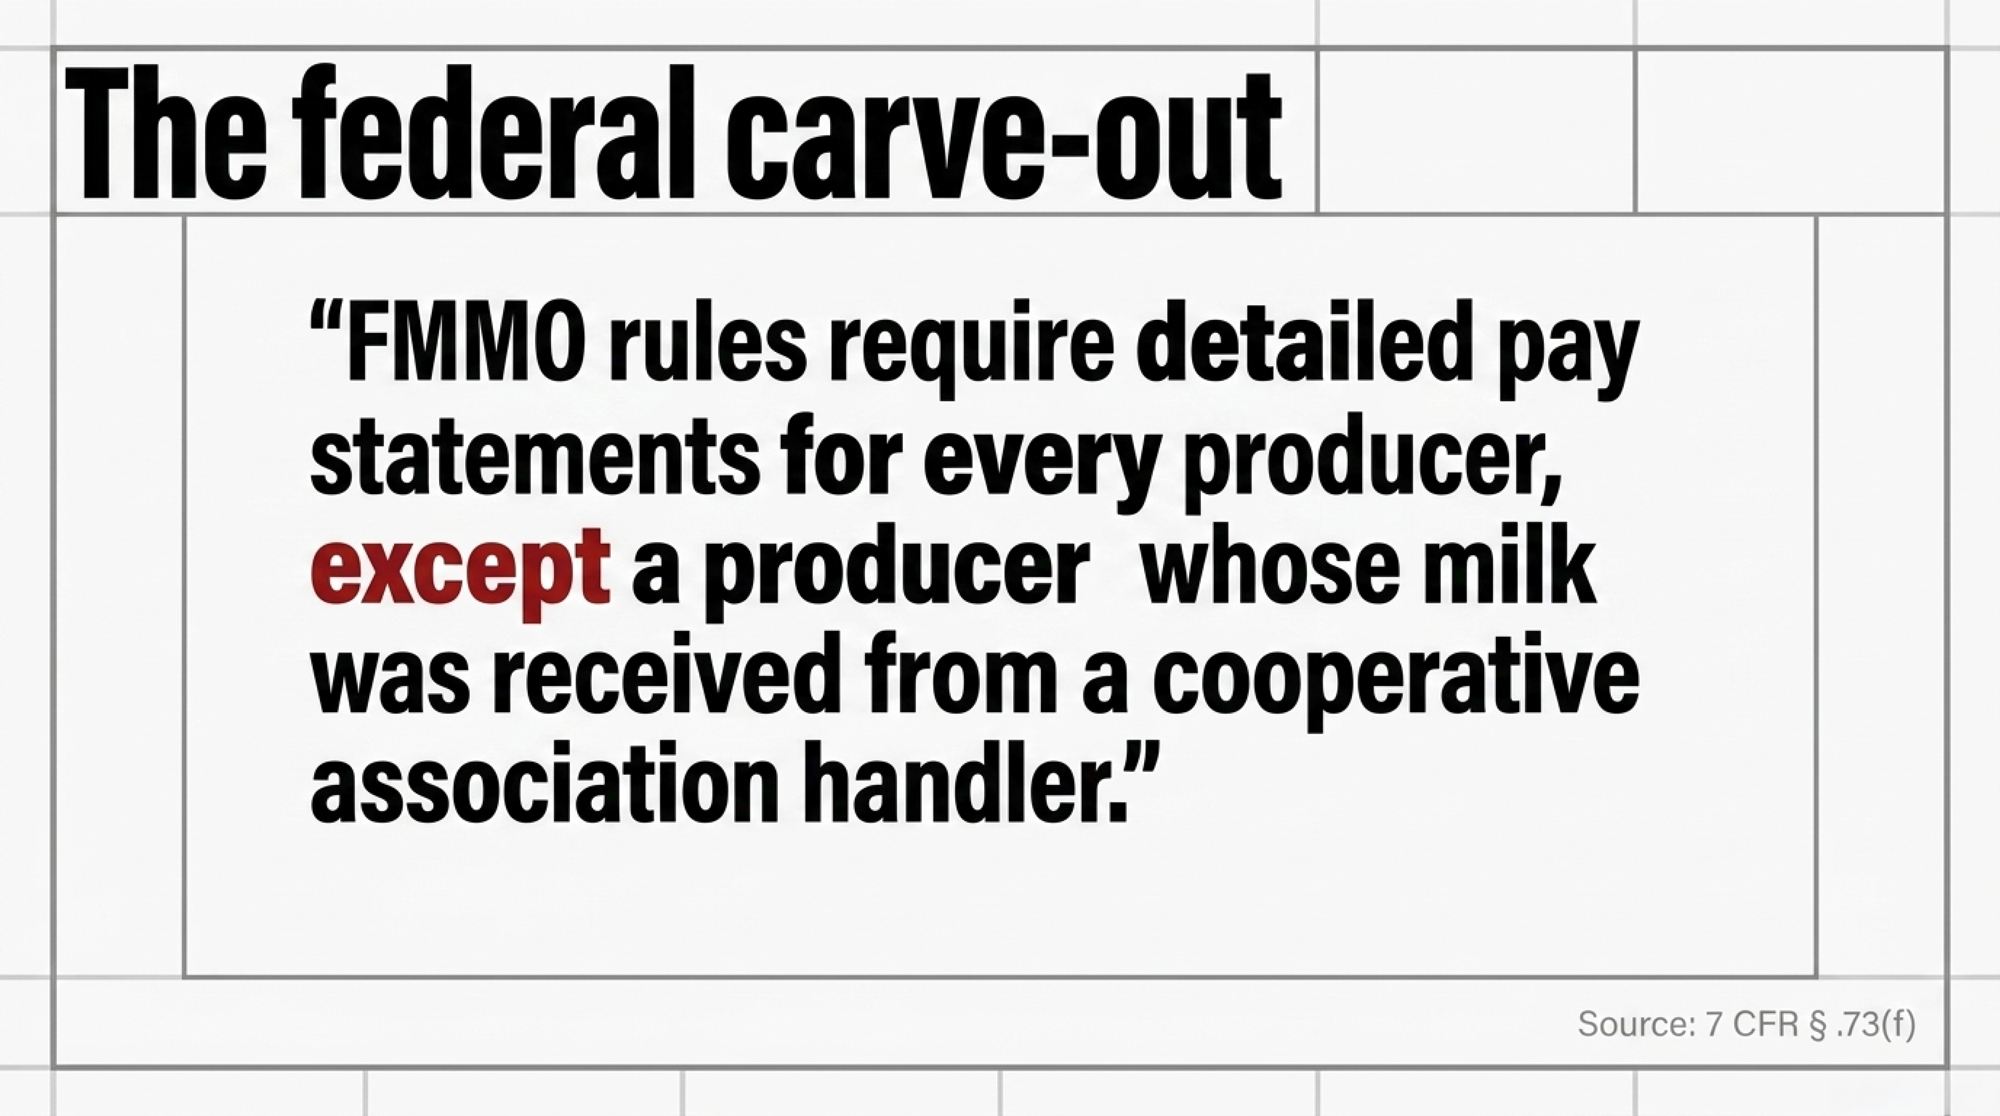
NewsSubscribe
First
Last
Consent

The Fairlife Hackers Didn’t Need a Password. Anubis Leaked 1TB Anyway.

Coca-Cola refused to pay. Anubis published a terabyte anyway on July 27 — nine days after four US plants went dark. Your DairyComp goes down Monday, and 20 heats are gone by Wednesday.

EXECUTIVE SUMMARY: Anubis leaked a claimed 1TB of Fairlife data on July 27 after Coca-Cola refused to pay — the same day it finished recovering four US plants that had been down since July 16, which tells you backups fix downtime and nothing else. Security reporting points to CVE-2025-5777, “CitrixBleed 2,” a flaw that leaks live session tokens out of a Citrix appliance’s memory, so an attacker walks in as an already-logged-in user with no password to crack and no MFA prompt to answer. Nobody on the payroll had to click a thing, and the patch was free. Your DairyComp or PC-DART database, DelPro Remote, Lely T4C, and your daily co-op upload all live behind that same category of hardware — no vendor has disclosed a comparable flaw, but the connection type is identical. Price it on a 500-cow herd: 72 hours dark runs roughly $918–$982 in missed heats and re-keying using a deliberately low $1.50 per extra day open — below almost every published estimate — and $1,660–$2,590 once you load culling, with tighter repro herds losing more because more cows sit in the window. Dole booked $10.5M in direct costs in 2023 and JBS paid $11M in 2021, so the sector precedent is real even though Coca-Cola’s ransom figure was never disclosed. Two things before your next herd-check: turn on MFA anywhere an off-farm login runs on a password alone, and unplug one backup copy — then actually pull a file off it.

 Fairlife ransomware Anubis

Fairlife’s four US plants stopped running on July 16. Coca-Cola disclosed unauthorized third-party access to a portion of its systems, including production, and confirmed a ransomware event. Fairlife’s Canadian operations weren’t affected. The Anubis ransomware group listed Fairlife on its dark-web leak site on July 20, claiming it had locked servers and taken 1TB of confidential data, and gave the company a week. The deadline passed July 27 without payment. Anubis published the dataset.

One terabyte, now public. That volume is still the gang’s own claim — Coca-Cola hasn’t confirmed the amount or the contents, and Anubis never posted proof it was behind the breach.

Here’s the part worth your attention. Neither entry method researchers associate with this group requires an employee to click anything. The reported way in was a box on a rack. And boxes on racks are how your nutritionist pulls a ration, how your vet reviews a repro list from the truck, and how your herd data reaches your co-op.

The Reported Vector Is a Patching Story

Security reporting attributes the intrusion to CVE-2025-5777 — nicknamed “CitrixBleed 2,” a memory-read flaw in Citrix NetScaler ADC and Gateway appliances — and says Anubis went on to encrypt Fairlife’s Nutanix infrastructure. Coca-Cola hasn’t confirmed the vector publicly. Its own statement said the full scope, nature, and impacts were unknown.

The plain version of the flaw: an attacker sends a deliberately malformed request to a vulnerable box, and the box leaks live session tokens sitting in its memory. Those tokens are a hall pass belonging to somebody who already logged in properly. Replay the token, and you’re inside as a trusted user — no password to crack, no login screen, no second-factor prompt, because you never triggered the login.

Arctic Wolf’s research names two standard entry methods for this group: stolen VPN credentials, or CitrixBleed 2. Both are remote-access stories. Neither requires anybody on the payroll to do a single thing wrong.

And the fix for that particular flaw is free. Patch the appliance. Roger Grimes — the security veteran whose MFA numbers appear later in this piece — estimates better patching stops 20 to 40% of cybercrime, which is more than he credits MFA with. Every dollar figure below buys you something different: a smaller blast radius once somebody’s already inside. 

Why “Just Restore From Backup” May Not Save You

Anubis runs as ransomware-as-a-service. The core crew builds the tooling and rents it to affiliates who carry out the attacks — publicly active since roughly December 2024, rebranded from an earlier strain called Sphinx.

Double extortion is their baseline: encrypt the files, then publish whether or not anyone pays. Fairlife is now the textbook demonstration. The group offered to restore systems “within hours” if Coca-Cola paid — a sales pitch, not evidence. Coca-Cola declined, recovered production through its own procedures, and the data went out anyway.

But the feature that should change how you think about the external drive on your office shelf is an optional switch called /WIPEMODE. It permanently destroys file contents on top of encrypting them. Paying guarantees nothing. And a backup still plugged into your network when the attack runs can be destroyed alongside the original.

KPMG’s threat advisory documents the signature: files renamed with a .anubis extension, Volume Shadow Copies deleted through vssadmin before the ransom note ever appears. Prior confirmed victims span healthcare, construction, engineering, and hospitality across Australia, Canada, Peru, France, and the US. Fairlife is the most prominent victim publicly attributed to the group so far.

What Has a Food-Sector Attack Actually Cost?

While Anubis’s exact ransom figure remains undisclosed by either side, confirmed precedents demonstrate the scale involved when food supply chains freeze:

CompanyYearSectorDisclosed cost
Dole2023Produce/food processing$10.5 million in direct costs, including $4.8 million tied to continuing operations, after roughly half its legacy servers were hit
JBS2021Beef processing$11 million ransom paid in Bitcoin, even though most plants kept running

Neither figure predicts what Fairlife will report. Coca-Cola’s stated position in late July was that it doesn’t expect a material financial impact. The company reports quarterly, so any restated figure surfaces on its normal reporting calendar rather than in a press release. What was actually in that terabyte — customer records, employee files, supplier contracts, production specs — Coca-Cola still hasn’t said.

What Would Three Days Without Your Herd Software Cost You?

Here’s where a processor story becomes a barn story. Run it on a 500-cow herd: your DairyComp or PC-DART database goes unreachable Monday morning and stays down through Wednesday.

Semen is the cheap part. The expensive part is what a missed heat does downstream — those cows sit another 21 days before the next shot at them.

Now, what’s a day open actually worth? The published estimates don’t agree, and anyone who tells you there’s one number hasn’t read the literature. Plaizier’s review spanned −$0.29 to $2.60 per extra day open, with his own estimate landing near $3.36; French and Nebel modeled $0.42 at 100 days open climbing to $4.95 at 175 days open. De Vries’s separate work on pregnancy economics puts the average value of a new pregnancy at $278 and the average cost of a pregnancy loss at $555. 

We’re running $1.50 below. That sits under almost every published estimate on purpose — a conservative number you can’t argue with beats an aggressive one you can.

📊 Financial Breakdown: The 72-Hour Blackout on a 500-Cow Herd

Assumptions: 200 cows past voluntary waiting period (VWP) · 70% baseline detection rate, the floor for well-managed herds per AHDB and NADIS benchmarking · $1.50 per extra day open — our deliberately low anchor, below the published range, culling costs excluded · Assumes detection drops to zero without the due-list, so a crew catching heats visually will do better · 72 hours is under one full cycle, so no cow gets missed twice

  • Cows cycling in the window: 200 cows past VWP ÷ 21-day cycle × 3 days = ~28.6 cows
  • Missed heat loss: 28.6 × 70% detection = 20 heats you’d normally catch. Assume the database going down drops detection to zero on those cows: 20 × 21 extra days open × $1.50/day = $630. If your crew still catches a third of them on paper, it’s closer to $315.
  • Reconstruction labor: two days of somebody’s time (~16 hours, author estimate) @ $18–22/hr Cornell priced farm labor = $288–$352
  • Conservative total outage cost: $918–$982
  • Culling-inclusive model (NZ analysis, $3.19–$5.41/day open): $1,660–$2,590

The NZ figure uses a different currency and production system — directional only. Run $3.36 or $4.95 through the same arithmetic and the number climbs fast. Swap your own inputs through the days-open calculator.

What this model leaves out: delayed treatment calls, missed dry-off dates, and the milk-check reconciliation you can’t run against your own figures. It prices lost heats and re-keying. Nothing else.

Push the day-open cost into that culling-inclusive range and the same outage runs $1,660 to $2,590. Note what the spread tells you: a herd running a tight 21-day pregnancy rate loses more than a herd already carrying a long calving interval. That’s not a rounding difference. That’s the whole point of running it yourself.

Which of Your Systems Sit on That Same Kind of Connection?

Before the table: this is not a list of vulnerable products. No herd-software vendor — not VAS, not Lely, not DeLaval — has disclosed a flaw comparable to CitrixBleed 2, and no herd-management platform has been named as breached in this incident or any other. What follows maps where off-farm connections exist on a typical operation. Appearing on it reflects normal connected-system design, not a known weakness in any product.

SystemWhat it touchesWhere the off-farm connection lives
DairyComp 305 (VAS)Herd database, repro, production recordsRemote access and mobile sync create an external door by design
Lely T4CAstronaut robots, feeders, one shared networkLely publishes its own cybersecurity guidance precisely because the platform is network-connected
DeLaval DelPro / DelPro RemoteMilking data, off-farm accessDeLaval describes DelPro Remote as preconfigured network equipment with a built-in security package — a vendor-managed appliance sitting between your network and the outside world, the general category where the Fairlife flaw was found
PC-DART / BoviSyncDHI records, breeding decisionsSyncs outward to processors and DHIA
Milk-processor uploadsDaily production and component data pushed to your co-opA direct pipeline between farm and processor systems — the connection type that made Fairlife a supply-chain event
Sensor arraysRFID, activity monitors, parlor controlsOften bridged onto the office LAN unless somebody deliberately separated them — worth checking rather than assuming either way

Not a vulnerability list. No vendor named above has disclosed a flaw comparable to CitrixBleed 2.

The honest wrinkle: a vendor-managed remote-access box may well get patched faster than one you maintain yourself. Nobody outside your operation can tell you which situation you’re in. That’s why the last path below is a phone call, not a purchase.

Options and Trade-Offs for Farmers

Path 1: Enforce Multi-Factor Authentication (MFA)

  • Goal: Complete within 30 days.
  • Scope: Email, VPN, DelPro Remote, herd-management accounts, co-op portals.
  • A correction we owe you: In Part 1 we passed along CISA’s claim that MFA makes you 99% less likely to get hacked. That number doesn’t hold up, and we shouldn’t have repeated it without checking. 
  • The reality check: Roger A. Grimes, a 38-year security veteran and CISO advisor at KnowBe4, told Cybersecurity Ventures in February 2023 that MFA stops 30–50% of credential attacks — and that the 99% figure “is not true and never will be”. Grimes has also noted that 90–95% of MFA implementations can be bypassed with a well-built phishing email. Turn it on anyway. A third to a half of credential attacks is still the cheapest risk reduction available to you. 
  • What it won’t do: Stop a CitrixBleed 2 session-token replay. A stolen token skips the login entirely. This eliminates the low-hanging fruit, not the exploit that hit Fairlife.
  • Cost: $0 on systems you already pay for, up to $3–$15 per user per month for a paid tool plus a few hours of setup.
  • The friction: One hour of work, and complaints from whoever now types a code.

Path 2: Air-Gap One Backup (3-2-1 Rule)

  • Goal: Complete this month.
  • Action: 3 copies of your data, 2 different media types, 1 fully unplugged from any network.
  • Why it matters: Direct defense against Anubis’s /WIPEMODE switch, which permanently destroys file contents rather than just encrypting them.
  • Crucial step: Run a test restore onto a secondary laptop. An unverified backup is a hope with a schedule attached.
  • The limit: It protects your data, not your uptime — and nothing about a leak. Coca-Cola recovered production through its own procedures and still had files published.

Path 3: Segment Parlor Networks from Office Computers

  • Goal: Quarantine IT from OT (operational technology).
  • Action: Make sure the office laptop checking email cannot speak to your robotic milkers, feeders, or activity collars on a flat network.
  • What it won’t do: Stop a token-replay exploit. Patching would have, for free — and on Grimes’s own numbers, patching outperforms MFA. Segmentation buys containment, not prevention. 
  • Estimated investment: $2,000–$4,000 for a robotics or automated-feeding setup, from our earlier cybersecurity reporting drawn from composite accounts across multiple operations. Treat it as a benchmark, not a quote.
  • The basics, from the people who publish them: Penn State Extension’s farm cybersecurity guidance covers employee training, password management, timely software updates, phishing awareness, and regular backups. The 72-hour continuity plan and the 30–45 days of cash or credit for feed and payroll come from our own earlier reporting rather than from Extension directly — flagging that so you know which is which.
  • When to skip it: Two computers and a wall-mounted tablet don’t need segmentation.

Path 4: Ask Your Vendor Who Patches the Box

  • Goal: One phone call, no purchase.
  • The question: Who applies security patches to our connected gateway, on what schedule, and how would we find out if it were compromised?
  • Why this is the same fight: Deere spent years insisting owners didn’t hold rights to the software running their machines. It took an FTC settlement in July 2026 — plus 10 years of compliance oversight — to force diagnostic tools out to independent shops. Same argument as the tractor in your yard.
  • The signal to watch: Whether any herd-software vendor issues a security advisory in the wake of Fairlife. None has. If one does, this stopped being a processor story.
DefenseCostTimelineStops CitrixBleed-style token replay?
Enable MFA$0–$15/user/month30 daysNo — token replay skips login entirely
Air-gap one backup (3-2-1 rule)Minimal (existing drive)This monthNo — protects data, not disclosure
Segment parlor/office networks$2,000–$4,000Varies by setupNo — containment only, not prevention
Ask vendor who patches the box$0 (one phone call)ImmediateYes, if patch cadence is confirmed fast

Key Takeaways

  • If any account on your farm can be reached from off-farm with a password alone, turn on MFA before your next herd-check. It’s 30–50%, not 99% — and it still costs nothing on most systems you already pay for. 
  • If your appliance patching is behind, fix that first. Grimes puts patching at 20–40% of cybercrime stopped, ahead of MFA, and the CitrixBleed 2 patch was free. 
  • If you can’t remember your last successful restore test, treat that backup as unverified until you’ve pulled an actual file off it.
  • If you think good backups make you leak-proof, look again at Fairlife. Coca-Cola restored production, and the terabyte went public anyway. Backups fix downtime, not disclosure.
  • If your repro program is tight — service rate above 55%, conception above 32% — your outage cost runs higher than a herd carrying a long interval, because more cows sit in the window to lose.
  • If you want a number you can defend at the kitchen table, don’t use ours. The published cost of a day open runs from under a dollar to nearly $5 depending on days open and milk price. Ours is deliberately low. 
  • If your AMS, milk meters, and office computer share one flat network, get a segmentation quote and judge it against three days of lost records, not against the quote in isolation.
  • If a vendor manages your remote-access hardware, you don’t set the patch schedule. Find out who does and how fast they move.
  • If you’ve never written down what you’d do in the first 72 hours of an outage, that’s the cheapest gap on this list to close — University of Maryland Extension publishes a free farm business continuity template covering prevention, response, and recovery, and there’s a farm-specific cyber continuity guide that does the same. 
  • If somebody tells you paying fixes it, weigh Coca-Cola’s refusal against the $11 million JBS paid in 2021 while most of its plants kept running anyway. Neither is clean, and a /WIPEMODE victim who pays may get nothing back.

Coca-Cola has a security team, a legal department, and an incident-response retainer on standby. It still stopped production at four plants over a flaw in a piece of network hardware — and the patch for that flaw was free. So the question isn’t whether your operation is worth attacking. It’s whether you could name, right now, every device on your farm that something outside your fenceline can reach. Most producers get to three and go quiet. Where do you land?

Still unresolved: the ransom figure, what specifically was in the published dataset, how long production was actually down, and whether the National Milk Producers Federation or Cornell PRO-DAIRY will say anything on the record. Nobody has yet. The full outage model — sensitivity-tested across detection rates, days open, and herd size so you can run your own numbers instead of ours — is what we’re building next for the Bullvine Weekly.

📝 The 10-Minute Security Audit Checklist

  • [ ] Audit user access: Delete retired employees, former herd managers, or equipment reps granted access years ago.
  • [ ] Verify restore ability: Extract a single file from last week’s backup onto an offline machine. Did it work, or did the job just run?
  • [ ] Isolate remote login: Check whether any off-farm login relies solely on a single shared password — especially one also used for email.
  • [ ] Confirm appliance patching: Call your hardware or software vendor and ask: “Who applies security patches to our connected gateway, and how are we notified of vulnerabilities?”

Bullvine Tool: 72-Hour Outage Risk Calculator

Estimate what 3 days without your herd database or parlor network costs your operation.

Estimated 72-Hour Outage Impact

Cows Cycling in 3-Day Window: 28.6 cows
Missed Heat Financial Drag: $630.00
Reconstruction Labor Cost (16 hrs): $320.00

Total Direct Outage Cost: $950.00

*Calculations based on 21-day heat cycles, 16 hours of whiteboard reconstruction labor, and selected day-open economic benchmarks.

This article reflects public reporting and disclosures available as of July 30, 2026. Coca-Cola has not publicly confirmed the attack vector, the volume of data taken, its contents, or the duration of production downtime. Fairlife, Coca-Cola, and DeLaval had not issued public comment beyond the disclosures cited here as of publication. Correction: an earlier version of our July 18 coverage repeated CISA’s claim that MFA makes users 99% less likely to be hacked; that figure is disputed and has been corrected here.

Learn More

The Sunday Read Dairy Professionals Don’t Skip.

Every week, thousands of producers, breeders, and industry insiders open Bullvine Weekly for genetics insights, market shifts, and profit strategies they won’t find anywhere else. One email. Five minutes. Smarter decisions all week.
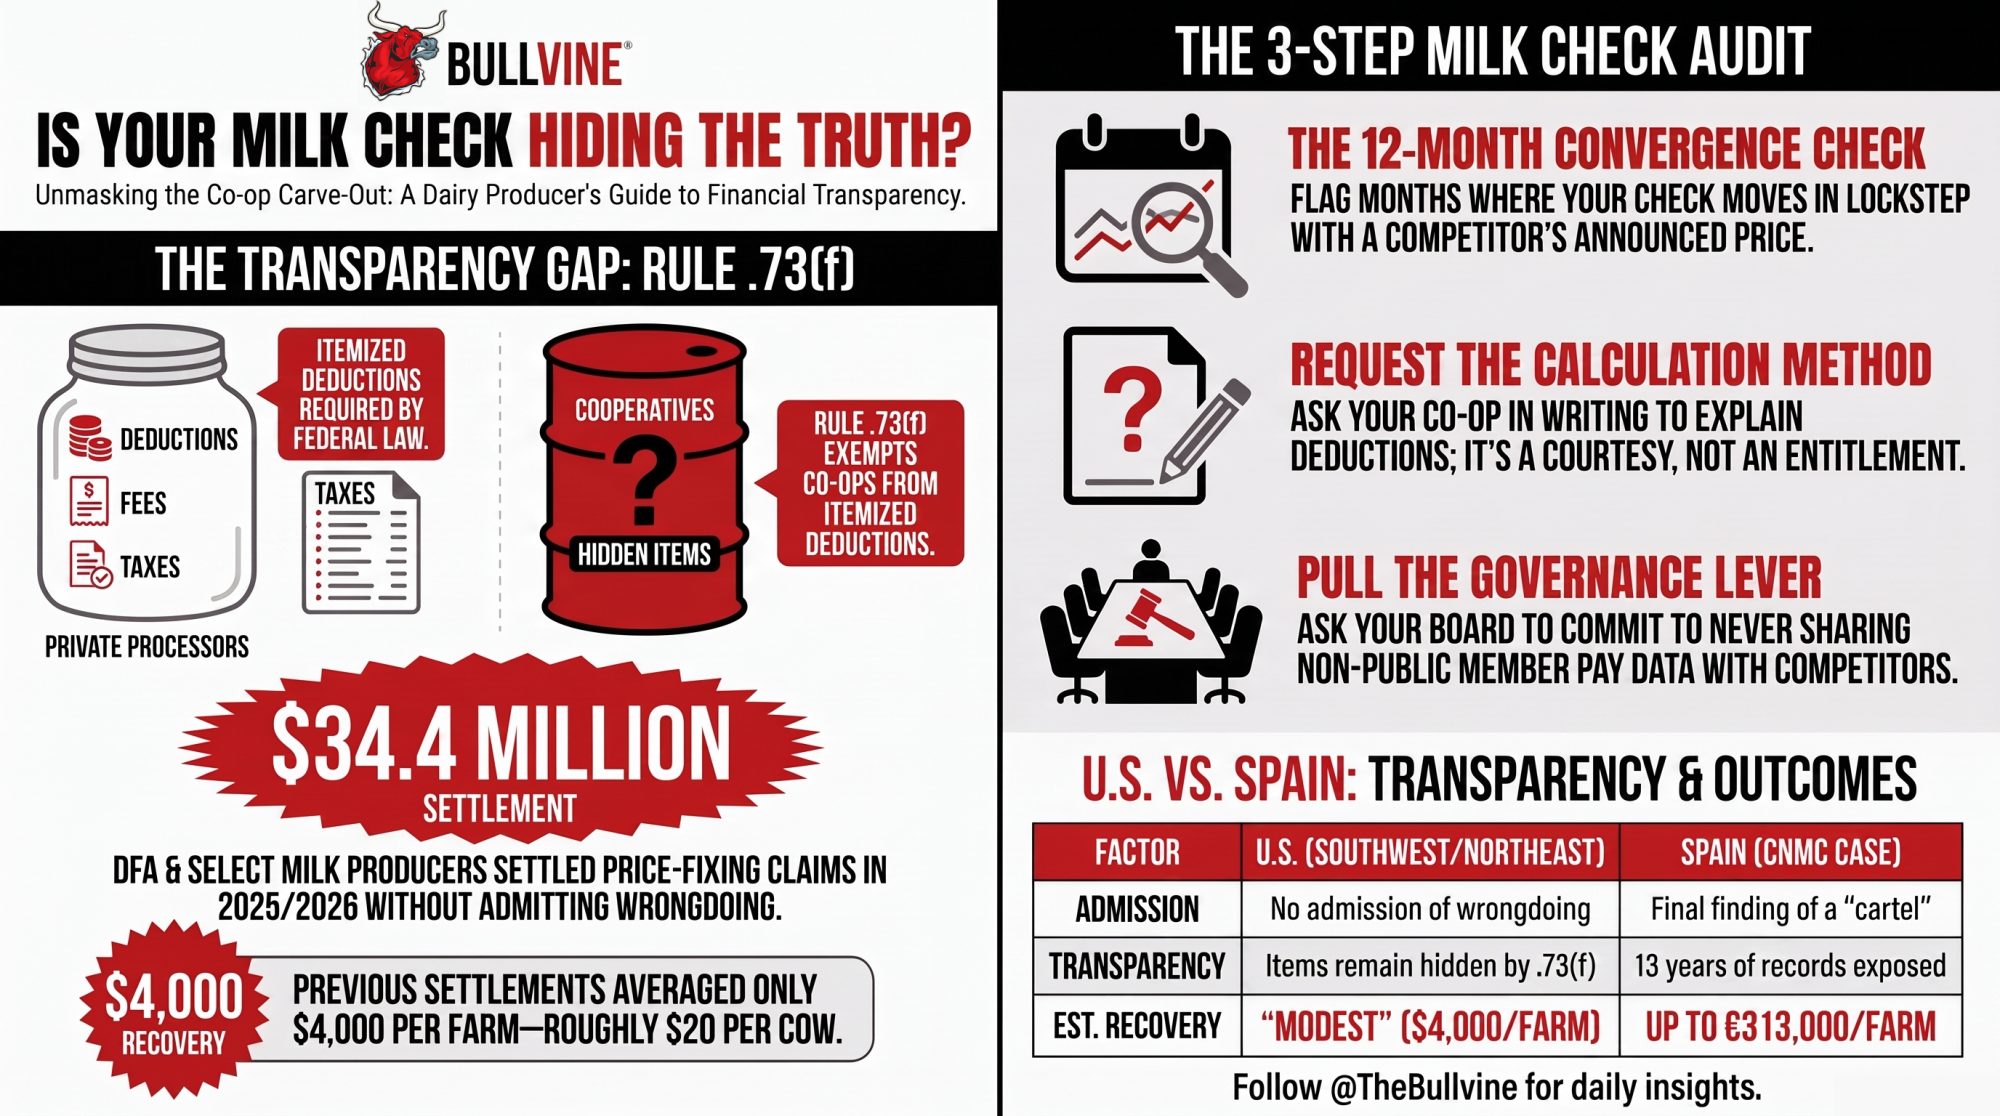
NewsSubscribe
First
Last
Consent

$20.11 Under Water on Every Hundredweight – Before the Bad Month

This isn’t the bad year. $42.71/cwt to make it, $22.60 to sell it — and that gap quietly moves $6,000 to $12,500 off your balance sheet every month you wait.

Picture a kitchen table in western Wisconsin at 11 p.m. No single family here — this is the version thousands of small operations are living right now. The accountant’s printout is still sitting there: interest, feed, the quote for the new manure pit. The 40-cow tie-stall out the window is lit up like always, bulk tank humming like it plans to outlive everybody. And the family already knows the number in the bottom corner doesn’t work. They’ve known for a while. They just can’t say it out loud yet.

That’s the real story behind dairy’s disappearing barns. Not a market crash — a slow squeeze that plays out one delayed decision at a time. The U.S. shed about 63% of its licensed dairy herds between 2004 and 2024, from 66,825 to 24,811, even as total milk output continued climbing, per the USDA’s Economic Research Service. More milk. Fewer barns. And a lot of families deciding whether tonight’s the night they finally run the numbers for real.

What’s Actually Squeezing the 40-Cow Barn

The cost curve turned against small herds, and it isn’t turning back. ERS, using 2021 ARMS data updated in August 2024, lays the scale penalty out plainly:

Herd Size ClassTotal Economic Cost (per cwt)The Reality Check
Under 50 cows$42.71Heavily penalized by fixed capital overhead
2,000+ cows$19.14Fixed costs distributed across volume
U.S. all-milk avg (2024)$22.60Leaves sub-50 herds with a roughly –$20.11/cwt structural deficit

Read that bottom row twice. A sub-50-cow herd is underwater by $20.11 on every hundredweight before anyone talks about a bad month. The American Farm Bureau’s read of ERS data shows even the average U.S. dairy ran total costs near $23.65/cwt against that $22.60 all-milk price in 2024 — a real margin around –$1.05. Big herds felt it. Small ones felt it worse.

This isn’t a bad year. It’s structural. The farms getting squeezed hardest are the 40- to 120-cow operations, especially those with older facilities and upcoming capital bills. Big herds spread their fixed costs over far more milk. A tie-stall can’t. And there’s no policy cavalry coming — you cannot have cheap, abundant retail milk and keep the same number of 40-cow tie-stalls. Eventually the structural math wins.

How This Plays Out at the Kitchen Table

Here’s the pattern University of Wisconsin–Madison Extension warns about: a farm loses equity for several years, everyone hopes prices turn, and hanging on can become a continual drain on the equity that’s left. The lender usually sees it first — monthly financials instead of annuals, an operating line that won’t clear. The family sees it last.

Run the barn math. Our own breakdown of the exit-timing problem found roughly an 18-month window between the first consistent inability to pay bills on time and a forced sale — and a swing of about $380,000 in preserved equity between exiting strategically around month eight to ten and getting liquidated at month 18. Depending on asset mix and land position, we’ve seen that strategic-exit figure run as high as $480,000. We laid out the full month-by-month countdown separately. Your number will be your own — but its direction won’t surprise your lender.

So why do families who can do that math sign up for another year anyway? Because they’re not optimizing the same thing the spreadsheet is. The spreadsheet counts dollars. You’re counting your back, your marriage, your kids’ options, and whether you’re still “the dairy farm” on Monday morning. And the load is measurable: CDC’s most recent occupational data, published in MMWR in December 2023 using 2021 death records from 49 states, put men working in agriculture, forestry, fishing, and hunting at 47.9 suicides per 100,000 against 32.0 for all working-age men — about 50% higher. A 2026 cross-sectional survey in the Journal of Dairy Science found roughly 16% of dairy farmers screening above the clinical cutoff for anxiety. Under that kind of load, people reach for immediate relief rather than long-term ROI. Delaying isn’t stupid. It’s grief with a payment schedule.

And if that weight is landing hard tonight, you’re not the only one. The 988 Suicide & Crisis Lifeline is free and staffed around the clock, anywhere in the U.S. — call or text 988. Farm Aid’s hotline connects farm families to financial and legal help at 1-800-FARM-AID. And if you’re in Arizona, Colorado, Connecticut, Missouri, Montana, Oregon, Pennsylvania, Texas, Virginia, Washington, or Wyoming, the AgriStress Helpline is answered by people trained specifically in ag stress — call or text 833-897-2474.

How Much Does Waiting 30 Days Actually Cost?

More than it feels like at the time. Bullvine’s review of mid-size operations put the annual “wait and see” cost at $75,000 to $150,000 in eroded equity — about $6,000 to $12,500 a month sliding off your balance sheet while you decide. It’s not a dramatic number on any single Tuesday. That’s exactly what makes it dangerous — it never trips an alarm loud enough to force the call.

So the honest question isn’t “can we make it another year?” It’s “what is this specific year costing us in net worth, and are we choosing that price on purpose?” If you can’t answer that tonight, that’s your 30-day job: pull your last 12 months of financials and put a real number on the drain. Then sit with your lender and an extension farm-management adviser before the bank sets the timeline for you. That one meeting is the whole difference between a strategic exit and a forced one.

The Mechanics Nobody Puts on the Whiteboard

The trap is that too much of a small barn’s cost is fixed per farm instead of variable per cow. The roof, the pipeline, the bulk tank, the manure storage — you need all of it whether you’re milking 40 cows or 140. Regulators expect those systems to hit modern standards no matter your output. So the per-cow capital bill on a small herd stays brutal, and there’s no volume underneath it to soften the blow.

So the obvious move is to automate your way out of the labor. That’s where most of these families are looking right now, and it deserves a hard number instead of a brochure. University of Minnesota Extension’s Jim Salfer found robot herds cut labor cost per hundredweight to about $1.40–$1.50, versus $2.34 for conventional herds — real savings. But the whole question is what your labor was costing you in the first place, and that number moves the answer more than anything a dealer will show you.

What’s Your Break-Even Wage?

This is the number that decides the robot question, and almost nobody knows theirs. It’s the effective hourly cost of the robot doing the milking. UW-Madison’s rule of thumb is blunt: if your actual labor cost is higher than your break-even, the transition is profitable. If it’s lower — or you’re paying family labor nothing on paper — the robot doesn’t pay for itself on margin, whatever else it does for you.

First, the capital you’re committing:

  • The base cost: $200,000 to $250,000 per box, uninstalled.
  • The true cost: $350,000+ once you pour concrete, update the wiring, and retrofit an older barn.
  • The debt load: financing a $400,000 project can add $2.60 to $3.99/cwt in fixed debt service. If you’re only saving $1.50/cwt in manual labor, you’ve just dug a deeper margin hole to solve a lifestyle problem.
  • The capacity math: each box handles roughly 55–65 cows. Fall short of filling it, and that same debt spreads over less milk — the per-cow bill climbs fast on a small herd.

Now the break-even. The published numbers span a wide range, and that range is the actual lesson:

ScenarioBreak-even labor wageWhat drives it
Salfer, Journal of Dairy Science — robots vs. a well-run parlor~$27/hourA genuinely efficient parlor is a hard benchmark to beat
UW-Madison’s 120-cow case study — 2 robots, 12 hrs/day milking, 5% yield lift$14.77/hourHeavy labor hours displaced, plus a production response

Both are right. In UW’s case, the farm was already paying $20.00/hour against a $14.77 break-even — the robot was the cheaper worker, so the investment penciled. Run that same farm at $12/hour hired labor and the machine becomes the expensive option overnight. Nothing about the robot changed. The wage did.

That’s why you cannot borrow somebody else’s break-even number — and why guessing is how families end up signing the wrong note.

UW-Madison’s Dairy Management program built the tool that calculates yours. The AMS Transition Budgeter, developed by Dr. Victor Cabrera and released in February 2026, is free and web-based. It doesn’t recalculate your whole farm — it looks only at what changes. You enter herd size, your real labor cost, your quoted robot price and financing, and it runs a 15-year simulation: labor saved and yield gained on one side, loan payments, maintenance, electricity, and pellet cost on the other. It returns your break-even wage on a gauge, tells you what year cash flow turns positive, and stress-tests the whole thing against a milk-yield miss or a rate increase.

Run it before a dealer runs their version. And note what UW’s own sensitivity analysis found: milk yield and labor rate swing the outcome hardest. In their case study, a farm that fails to deliver the assumed 5% production lift watches a $20,000 annual gain disappear. Robots don’t manage cows for you. They just milk them more often, and only if the cows cooperate.

Is a Robot a Business Decision or a Life Raft?

Both can be legitimate. But they’re not the same decision, and pretending they are is exactly where families get hurt. Iowa State economist Larry Tranel ran the real amortization on a two-robot setup. Here’s what the cash flow looks like in the early years:

Line itemAmount (annual)What it means
System financed$400,000 at 5.50% over 7 yearsThe starting hole
Ownership cost~$62,000/yrDepreciation, interest, repairs
Loan payment~$69,000/yrCash out the door
Net financial benefit~$1,400/yr (early years)What the robot gives back at first
Net cash-flow gap–$8,776/yrThe red-ink years before payoff

Note: ownership and loan costs share interest, so these rows don’t sum to the net — the –$8,776 is Tranel’s reported net cash-flow figure, not the sum of the lines above.

USDA’s January 2026 ERR-356 report finds that robots lift net returns by about 13% on average — but Tranel’s cash-flow work is a reminder that the average arrives after the 7-year robot cash-flow hole. Tranel and UW-Madison reach different answers because they assume different things. Which is the whole argument for running your own numbers instead of adopting somebody’s headline.

Extension will tell you this part straight. UW’s own guidance says that if you’re relying on cheap family labor, robots may not pay off financially — though they may still pay off in quality of life, and that’s a value the tool deliberately leaves for you to decide. Read that again, because it’s the honest version of the sales pitch. If the answer is “we’ll always be 60 cows” and your break-even lands above what you’re actually paying, the robot is a lifestyle purchase with a known annual price tag. It might still be worth every dollar to save your back and keep your family in the barn. Just call it what it is. The mistake isn’t buying the robot — it’s signing a six-figure note to buy time when the business underneath it is already underwater.

That debt isn’t capex anymore. For a family that’s exhausted and can’t find help, it’s emergency medicine.

Options and Trade-Offs

Most 40-to-80-cow families aren’t picking from a long menu. They’re choosing between a few hard doors.

PathCapital RequiredWhere It FailsEquity Outcome
Stay small and leanNear zeroOne shock — a knee, a tractor, a price dipSlow bleed at $42.71/cwt cost
Go weird on purpose$50k–$250kSecond business; 143-hr weeks reported+$2–$4/gal, burnout risk
Scale into viability$1M–$5M+Rates and cycles get meaner with leverage$1–2/cwt miss = 5 figures/yr on 300 cows
Exit on your terms nowZeroEmotionally hardest door in the barn+$380k–$480k preserved vs. month-18 sale
  • Stay small and lean. Works if your debt’s low, you genuinely want this life, and family labor is healthy and willing. Requires brutal honesty about your full cost of production — unpaid labor and depreciation included. Where it fails: one shock, a blown knee or a dead tractor or a price dip, turns “barely working” into a slow equity bleed.
  • Go weird on purpose. On-farm processing, direct sales, high-component or niche milk. It can lift your farmgate return meaningfully — University of Wisconsin extension figures cited by Bullvine put the bump from bottling your own at $2 to $4 a gallon. But it’s not a guaranteed escape hatch. Clark Farms ran an on-farm creamery for six years, serving dozens of accounts, then shut it down and kept milking. As Bullvine reported, the operation was running a 143-hour work week — the labor load, not the product, was the sticking point. Where it fails: it’s a second business — food and hospitality with cows attached — and the burnout is real. Line up committed buyers before you spend a dollar on infrastructure.
  • Scale into viability. Triple or quadruple the herd so fixed costs spread. It’s a capital commitment that commonly runs into the millions, and it takes a real appetite for risk — a $1–2/cwt miss on a 300-cow herd runs into five figures a year, real money on a herd carrying that much debt. Where it fails: rates and price cycles get a lot meaner with that much leverage.
  • Exit on your own terms — this month. If you’ve run negative on a full-cost basis for a couple years, book the lender-plus-adviser meeting now. This is the 30-day move, and it’s the one that preserves the most equity. Your state extension service will connect you with a transition specialist, confidentially and usually free of charge.

Three Questions to Answer Before the Week Is Out

Skip the recap. Sit down with these three, and be honest about the answers:

  1. Do I actually know my full cost per hundredweight right now — unpaid family labor and depreciation counted — and how close is it to that $42.71 small-herd ceiling? If you can’t answer this by Friday, that’s the whole problem in one sentence. UW-Madison’s Dairy Enterprise Budget spreadsheet will get you there in an evening.
  2. Do I know my own break-even labor wage, or am I working off a number I read somewhere? The AMS Transition Budgeter will answer it with your own numbers in one sitting. Anything less than your real number, and you’re negotiating a six-figure note on a guess.
  3. Who at my kitchen table is quietly funding the barn — and do they know it’s a decision, not an accident? If a spouse’s town job is the reason the milk check still clears, that’s a conversation to have on purpose.

One note for Canadian readers: the cost figures above are U.S. math, and you’re not paid on a $/cwt all-milk price. Supply management gives you a softer landing — predictable pricing and real quota equity you can actually sell. But the shape of the curve still looks uncomfortably familiar. Canada went from 12,007 dairy farms in 2014 to 9,256 in 2024 while the national herd barely moved. Quota protects farm income, not farm numbers. Same direction, gentler slope.

The Last Light in the Barn

The milk trucks will keep rolling down these roads. In five years, they’ll have fewer lanes. The question in front of your family isn’t whether the squeeze is coming — the ERS cost tables settled that one. It’s whether you make your next move on purpose, eyes open and equity intact, or let a banker make it for you eighteen months from now.

So pull that printout back out. Put a real number on what this year is costing you — not in stress, in dollars — and then decide which door your balance sheet can actually carry. We’re breaking down the full cost-per-cwt model by herd size, plus the exit timeline that preserves the most equity, in next week’s Bullvine Weekly. That’s where the real numbers live.

Should You Expand, Hold, or Exit?

5 questions. 60 seconds. Get your signal.

Learn More

The Sunday Read Dairy Professionals Don’t Skip.

Every week, thousands of producers, breeders, and industry insiders open Bullvine Weekly for genetics insights, market shifts, and profit strategies they won’t find anywhere else. One email. Five minutes. Smarter decisions all week.
NewsSubscribe
First
Last
Consent

The $65-a-Day Habit Draining Your Bulk Tank — and 83% of Us Do It

Same cow, same bug — one farm pays $120, another $330. The gap isn’t the infection. It’s the extra “just to be safe” days, at about $65 apiece in dumped milk.

Executive Summary: Michigan State’s Pam Ruegg tracked 37 commercial dairies and found the same mastitis case costing anywhere from $120 to $330 to treat — and the gap wasn’t the bug, it was how long crews kept tubing. Every extra treatment day past label minimum runs about $65, almost all of it dumped milk: on an 80-lb cow at $18/cwt, that’s $14.40 a day gone, roughly $43 over three needless days. It’s not a fringe habit either — Canadian data (Aghamohammadi 2018) show that 83% of producers treat longer than the label calls for, chasing milk that “looks clean” even as clinical cure already lags biological cure by 24–48 hours. Scale it, and a 500-cow herd bleeds around $6,500 a year in unnecessary discard alone, before you touch subclinical and culling losses. Culture-guided treatment cuts antibiotic use roughly in half with no hit to cure rates, and a $2,500–3,000 quad-plate setup typically pays back in 60–90 days — but only if your sampling’s clean and your crew trusts the plate over the reflex. Before you buy any “alternative,” the practicality test one Australian mastitis researcher lives by still holds: if it can’t save time, pencil out, and fit your routine, it won’t survive the barn no matter how good the trial looks. The 30-day move is free — pull your treatment records, sort clinical cases by duration, and that column past label minimum is your habit’s price tag in ink.

mastitis overtreatment cost

The Numbers at a Glance

MetricFigureWhat it means
Same-case cost spread$120 vs. $330Nearly triple, driven by habit — not biology
Cost per extra treatment day~$65Mostly dumped milk, not the drug
Daily milk value, 80-lb cow @ $18/cwt$14.40~$43 lost over three needless days
Producers treating past label83%~2 extra days on average (Canadian data)
Biological vs. clinical cure lag24–48 hrsYou’re often treating inflammation, not infection
Wasted discard, 500-cow herd~$6,500/yrBefore subclinical and culling losses
Culture-guided antibiotic cut~50%No hit to cure rates
Quad-plate culture setup / payback$2,500–3,000 / 60–90 daysIf sampling’s clean and the crew trusts it

It’s 5 a.m. and a cow flags in the parlor. Flakes in the milk, maybe a firm quarter. You know the drill, because your hands know it before your brain does: grab a tube, start treating, keep going until the milk runs clean. It feels responsible. It feels like insurance.

Here’s the number that should stop that reflex cold. Michigan State University research led by Dr. Pam Ruegg — tracking 37 commercial dairies averaging around 1,300 cows each — found that out-of-pocket costs for essentially identical mastitis cases ran anywhere from $120 to $330 per farm. Same antibiotics. Same case severity. Nearly triple the cost. And the difference wasn’t biology. It was habit.

Same Cow, Same Bug, Triple the Cost — Why?

The reason the spread is so wide comes down to one thing most of us never think of as a decision at all: how long you keep treating.

Ruegg’s team put a price on it. Each additional treatment day beyond label minimum costs roughly $65 in discarded milk and extended withdrawal, and milk discard — not the drug — is the bulk of what you’re paying for. Here’s the math on your own cows: an 80-pound cow at $18/cwt makes about $14.40 in daily milk value. Stretch treatment three days past what the case actually needed, and that’s roughly $43 in dumped milk per cow, before you count the antibiotic and the labor. It adds up faster than most of us realize.

Ruegg is blunt about why farms keep waiting. Producers treat until the milk looks normal — but, as she explains, the abnormal appearance stems from inflammation and isn’t predictive of whether bacteria are still present. Clinical cure lags biological cure by 24 to 48 hours. So those extra days are often spent treating a cow whose infection already cleared. You’re medicating inflammation. And paying dumped milk for the privilege.

The 83% Problem

If this were a fringe habit, it’d be a footnote. It isn’t.

The Canadian Bovine Mastitis Research Network study (Aghamohammadi et al., 2018) found that among producers using a single protocol for mild or moderate cases, 83% treated longer than the labeled regimen — averaging about two extra days. Only 17% followed the label exactly. And the classic decision-tree work from Pinzon-Sanchez and Ruegg, published in the Journal of Dairy Science in 2011, laid out why that habit costs money: for mild and moderate cases, the economically optimal play is a two-day course for gram-positive infections and no antibiotics at all for gram-negative or no-growth cases.

The extended five- and eight-day regimens? They consistently produced the worst economic outcomes in that model, because a small bump in bacteriological cure couldn’t cover the milk you dumped chasing it. As Ruegg put it flatly in Veterinary Clinics of North America in 2018, “using antibiotics to treat many cases of nonsevere clinical mastitis does not result in improved bacteriologic or clinical outcomes.” The tube you grabbed for peace of mind, in a lot of cases, bought you nothing the cow wasn’t going to do herself.

The Barn Math on a 500-Cow Herd

Put real numbers to it. For a 500-cow herd, The Bullvine’s analysis of the MSU work pegs treating past label minimum at roughly $6,500 a year in unnecessary discard alone — money that vanishes purely because the decision runs on reflex rather than results. That’s before you touch the bigger hidden buckets the same analysis flags: subclinical losses and culling each account for close to half of total mastitis cost in the Canadian data.

Cost BucketApprox. Share of Total Mastitis CostDriven By
Subclinical lossesClose to 50%Reduced milk yield, undetected without SCC testing
CullingClose to 50% (combined w/ subclinical)Chronic/repeat cases, treatment failures
Unnecessary discard (over-treatment)~$6,500/yr on 500 cowsTreating past label minimum, habit not biology
Drug and labor costSmaller shareAntibiotic units, treatment time per case

Treat the $6,500 as a starting illustration, not gospel — it moves with your milk price, your incidence, and your pathogen mix. But the direction is never in doubt. Farms that culture before they treat consistently report around 50% reductions in antibiotic use while holding or improving cure rates, with a quad-plate culture setup running $2,500–3,000 and typical payback in 60–90 days.

None of this needs a new gadget or a bigger drug budget. It needs the decision slowed down just long enough to ask what you’re actually treating.

What “Sample First, Treat Later” Really Costs to Run

The fix isn’t new, and the evidence for it is solid. A multi-state clinical trial in the Journal of Dairy Science found that using on-farm culture to guide clinical mastitis treatment reduced intramammary antibiotic use by about half and trimmed roughly a day off milk withholding — with no significant difference in clinical cure, bacteriological cure, recurrence, or culling compared with treating everything. Dairy Farmers of Canada’s 2024 stewardship guidance now formally recommends selective treatment of non-severe cases based on rapid diagnostics within 24 hours.

MetricTreat Everything (status quo)Culture-Guided Treatment
Intramammary antibiotic useBaseline (100%)~50% lower
Milk withholding timeLonger, ~1 day more~1 day shorter
Clinical/bacteriological cureNo significant differenceNo significant difference
Recurrence and culling ratesNo significant differenceNo significant difference
Setup cost$0 (no new equipment)$2,500–3,000 quad-plate
Payback periodN/A60–90 days
Failure modeReflex over-treatment, hidden costContaminated samples erode crew trust

So why doesn’t every barn run it? Because on a big dairy with lean labor, “sample first” is a systems change, not a tweak. It means aseptic sampling at the parlor, a small on-farm culture setup or a disciplined send-out, and — this is the part that breaks — a protocol short enough that a weekend relief milker follows it at 4 a.m. without guessing.

The predictable failure point isn’t the science. It’s the crisis of faith around Day 3, when the milk still looks abnormal, and the crew wants to keep treating. Herds that have made the switch consistently describe that first month as the hard part: staff need to see, firsthand, that milk clears on its own after a short course before they’ll trust the protocol. Contaminated samples and SOPs nobody follows are the other two killers. The protocol that lives in a binder instead of on the wall is the one that quietly reverts to “just grab a tube.”

Can a Machine Do What the Tube Can’t?

Here’s where the conversation gets genuinely tricky. Once you accept that reflex-tubing is expensive, the door opens to non-antibiotic tools — and the market is happy to sell you a lot of them. Most aren’t ready. A few are.

Of the non-antibiotic options, Acoustic Pulse Therapy (APT) has the strongest peer-reviewed evidence published to date. A 2024 PLoS One retrospective across four Israeli commercial herds (Merin et al.) reported 65.8% subclinical udder recovery at 90 days versus 11.5% in untreated controls, and mastitis culling of 1.35% versus 16.7%. The paper estimates a benefit of $15,106 per 100 cows per year against roughly $1,440 in APT cost. Striking numbers. Read the fine print, though: the study’s authors disclose that the device’s maker was involved in the work, and it’s a retrospective across four Israeli herds with subclinical cases defined by SCC over one million — promising evidence worth testing on your own cows, not a closed case.

The rest of the “natural” toolbox — probiotics, botanicals, immune modulators — isn’t there yet. A 2018 critical appraisal concluded that treating clinical infections with lactic acid bacteria “cannot be recommended” in current practice. Interesting science, the whole category — but the independent evidence hasn’t caught up to the marketing yet. If a product’s best support lives in a brochure, your milk cheque shouldn’t depend on it.

The Test That Kills Good Products: Will a Farmer Actually Use It?

Tiana Sherry, a genetics-and-law-trained PhD researcher in Australia working on non-antibiotic mastitis therapies, makes a point that should reframe how you read every “next big thing” pitched at your parlor. A treatment can’t just work in a lab — it has to survive the barn.

“There’s just no point in creating a different research direction or trying to implement a new practice on farm,” Sherry told the Dairy Black Belt podcast, “if farmers were never going to go for it in the first place.” She runs producer surveys alongside her lab work precisely because the graveyard of dairy innovation is full of compounds that were effective and completely impractical. Her own read on the antibiotic treadmill is blunt: churning out new antibiotic derivatives teaches bacteria to beat the next one, “so I believe the antibiotic journey should be stopping, and we should be looking for alternatives.”

Distill her logic into a filter you can use tomorrow: does the treatment save time, does it pencil out, and does it fit the way your barn already runs? A product that demands twice-a-day dosing — something Sherry flags as a real barrier in large systems — is a non-starter no matter how clean the trial data looks. Her own candidate compounds are years from a barn; she puts commercialization on the familiar six-to-eight-year horizon. The takeaway isn’t “wait for the miracle.” It’s that the same three questions are the ones you should run on anything a rep sets on your office desk today.

The 30-Day Mastitis Audit & Decision Framework

The hard part was never the bug. It’s that the most expensive input on most dairies — the reflex to reach for a tube — never shows up as a line item. It hides in dumped milk and vague vet bills, which is exactly why it survives. Here’s how to drag it into the light and decide what, if anything, to change. Work it in order.

  1. Pull and sort your records (this week, free). Export your last 12 months of clinical mastitis cases and sort by treatment duration. Count how many ran past label minimum. At roughly $65 a day in dumped milk, that column is your number — the cost of habit, in ink.
  2. Write the rule down. Do you have a written rule for which cases wait for culture and which get treated immediately, or does it live in one person’s head? If it isn’t on the parlor wall, a 4 a.m. relief milker can’t follow it — and it reverts to “just grab a tube.”
  3. Carve out the sick cows first. Flag severe cases (fever, off-feed, systemic signs) for immediate treatment, so “sample first” never delays a genuinely sick cow. This is the guardrail that makes selective treatment safe.
  4. Decide if culture-guided treatment fits your herd. Best for mid-to-large herds with the labor to sample cleanly and the case volume to justify the $2,500–3,000 setup, paying back in 60–90 days at ~50% less antibiotic use. It backfires when sampling is sloppy — contaminated plates are worse than no plates, because the crew stops trusting results. And if you culture, actually act on gram-negative and no-growth results by withholding the tube.
  5. Check whether selective dry cow therapy is on the table. Fits herds with reliable SCC records, lower bulk tank counts, and internal teat sealant on hand; AABP’s 2024 guidelines set the readiness criteria, with roughly a 50% antibiotic cut and about $5.37/cow in savings at equivalent udder health. Weak records or poor hygiene? Stay blanket until the basics are fixed rather than under-treat blind.
  6. Run the practicality test on anything a rep is selling. Before you buy any non-antibiotic tool — APT included — ask the three questions: does it save time, does it pencil out, does it fit your routine (or demand twice-a-day dosing your crew can’t sustain)? And does its best evidence live in an independent trial or a vendor’s slide deck? For APT specifically, run your own numbers against the manufacturer-linked Israeli-herd data before committing a full budget.

Bottom Line Takeaways

  • If you’ve never audited your treatment durations, assume you’re in the 83% — and that the fix is a records pull, not a purchase.
  • Milk that “looks clean” isn’t the finish line. When a mild or moderate case comes back gram-negative or no-growth, the decision-tree math says the tube likely earns you nothing.
  • A culture setup that pays back in 60–90 days isn’t an affordability question — it’s whether your case volume justifies it. Below a certain scale, discipline on treatment duration matters more than the plates.
  • No trial result survives a barn it doesn’t fit. If a therapy can’t clear time, cost, and routine fit, how good the data looks is beside the point.

You already run the numbers on a ration before you feed it and a bull before you breed to him. So next time you’re standing in the parlor on Day 3, staring at milk that still looks off — what’s your treatment log actually telling you about the peace of mind you’ve been buying?

Run Your Numbers

Health ROI Calculator — This article puts $65 a day on the overtreatment habit. The Health ROI Calculator turns that into your number: run your mastitis case load, milk-withdrawal losses, and cull pressure to see whether tightening treatment durations or moving to culture-guided protocols actually pays on your herd.

Complete references and supporting documentation are available upon request by contacting the editorial team at editor@thebullvine.com.

Learn More

The Sunday Read Dairy Professionals Don’t Skip.

Every week, thousands of producers, breeders, and industry insiders open Bullvine Weekly for genetics insights, market shifts, and profit strategies they won’t find anywhere else. One email. Five minutes. Smarter decisions all week.

NewsSubscribe
First
Last
Consent

USDA Forecasts 236.6 Billion Pounds of Milk. 5.8 Million SNAP Customers Are Gone. Do You Know What That Does to Your Milk Check?

USDA’s bringing 236.6 billion pounds of milk to market while more than 5.8 million of your best dairy customers disappear from SNAP — and almost nobody is running that math.

Executive Summary: USDA’s forecasting a record 236.6 billion pounds of milk in 2026 — right as more than 5.8 million people have dropped off SNAP since January 2025, gutting one of the biggest buyers of basic dairy in the country. That matters because SNAP households over-index on fluid milk and make up roughly a third of U.S. grocery sales, so when their benefits get cut, the demand hit lands squarely in the low-margin, high-volume staples you ship. Washington’s calling it a fraud crackdown, but the math doesn’t hold — 41,476 fraud disqualifications can’t explain 5.8 million people gone, which means this is structural demand loss, not housekeeping. Hoard’s pegged a 28% SNAP cut at roughly a 0.8% dairy-demand hit — sounds like a rounding error until it stacks on record supply and $20.00/cwt all-milk. On a 500-cow herd, even a 50¢/cwt demand-driven softening runs about $73,000 off the top in a year, and the exposure isn’t even — Arizona shed 43% of its caseload and Florida lost nearly 300,000 recipients, so Sunbelt fluid shippers are standing closest to the fire. If you’re budgeting 2027–2028 on a stable domestic floor, this is your cue to price a DRP quarter now and ask your co-op exactly where your milk lands.

SNAP cuts dairy demand

Editor’s note: The 500-cow Phoenix-corridor operation described below is a composite scenario modeled from multiple Sunbelt fluid-market dairies, not a single named farm. Every market, policy, and financial figure in this article is real and sourced.

Picture a composite 500-cow dairy shipping into the Phoenix retail corridor — a stand-in for the Sunbelt fluid-market operations facing this squeeze. Nothing’s changed in the barn — same cows, same components, same trucks rolling out at dawn. But in the stores that move that milk, something’s shifting under the surface. Arizona’s SNAP caseload fell 43% in a single year — the steepest state-level drop in the country after the new federal rules took hold — and the corner grocers in lower-income ZIP codes felt it first. That kind of operation won’t ever see a line item called “SNAP” on its milk check. It’ll just see a domestic floor that isn’t holding the way it used to — and by the time it does, the price path is already set.

That’s the story dairy hasn’t been telling itself. SNAP — the program most of us still call food stamps — has quietly been one of the biggest buyers of basic dairy in the country. And right now it’s contracting hard, at the exact moment USDA is forecasting a wall of milk. Record supply. Softening prices. A demand floor with a crack in it. Three arrows, all pointing the same way.

What’s Changing and Why

Start with the supply side, because that part isn’t in dispute. USDA’s Economic Research Service pegs 2026 U.S. milk production at 236.6 billion pounds, climbing to 238.1 billion in 2027. More cows, more milk per cow, low cull rates — this is a deliberate expansion, not an accident. And more milk means softer prices. As of its July 2026 outlook, ERS put the 2026 all-milk forecast at $20.00/cwt — 70 cents below its prior estimate — with cheese expected to “overhang the market this year and next.”

Now the part almost nobody in dairy has priced in. SNAP participation dropped from roughly 42.8 million people in January 2025 to 37,011,096 by April 2026 — a fall of more than 5.8 million people. Most of that came after July 2025, when the reconciliation law (H.R. 1, the “One Big Beautiful Bill Act”) kicked in. The Center on Budget and Policy Priorities found March 2026 participation already sitting 4.7 million below the fiscal 2025 average — bigger than the Congressional Budget Office’s own forecast.

Here’s why that lands on dairy in particular. SNAP households make up about a third of U.S. retail grocery sales, and roughly 70% of SNAP dollars go to food and beverages. They spend 23–26% more per year on packaged food and drink than non-SNAP households, and USDA data show they buy more fluid milk — partly because they’ve got more kids at the table. Milk sits dead center in the SNAP staple basket. When that basket shrinks, dairy’s standing in the blast radius.

How This Plays Out on Real Farms

The uncomfortable part is that this arrow doesn’t hit like a bad futures print. It hits slow. First, a retail partner mentions SNAP weeks are running flatter. Then private-label picks up more of the shelf. Then the independent grocer who used to move a pallet of gallons a week moves half — and nobody sends you a memo about it. By the time it reaches your milk check, it’s already baked into the price for months.

So how big is the hit, honestly? Nobody has a cleanly measured number yet, and you should be wary of anyone who claims they do. But Hoard’s Dairyman ran the math back in June 2025: using SNAP’s share of at-home food spending, they estimated a 28% cut in benefits would trim total U.S. dairy demand by about 0.8%. Sounds like a rounding error. It isn’t — not when it lands on top of record supply.

💡 Barn-Math Box 500-cow herd × ~80 lbs/cow/day ≈ 14.6 million lbs/year. A demand-driven softening of even 50¢/cwt on that volume ≈ $73,000 off the top in a single year. Treat it as an illustration, not a forecast — it’s the swing a weak domestic floor helps cause, stacked on top of the $250K-plus risk The Bullvine already flagged for mid-size herds running their 2026 numbers.

Is the “Fraud” Story Costing You More Than You Think?

Here’s where a lot of producers get talked out of paying attention. The official line from USDA Secretary Brooke Rollins is that SNAP is shrinking because of fraud reduction and a stronger economy — nearly 4.3 million people cleaned off the rolls. It’s a tidy story. And if it’s mostly fraud, there’s nothing structural to plan around — the whole thing becomes housekeeping.

The numbers don’t back that up. You don’t need an economics degree to see the gap:

41,476 people disqualified from SNAP for fraud (USDA, FY2023) — under 1% of the 42 million on the program.

5,800,000+ people gone from the program since January 2025.

As the AP’s fact-check put it: fraud “is insufficient to explain such a drastic reduction in participation.”

USDA also points to tighter work requirements and a stronger labor market — not fraud alone — as reasons for the decline. And that’s exactly the point for your operation. Whether it’s work rules, paperwork friction, or the benefit-formula changes in H.R. 1 — which CBO scored as cutting participation by 2.4 million people a month on average through 2034 — the people leaving are the same either way. FRAC calls it “a deliberate policy design”. Those aren’t fraudsters walking out of the dairy aisle. They’re customers — families who lost food help, which is exactly why the demand they represented was real.

The Mechanics Behind the Outcome

Strip away the politics and the mechanism is simple. Fewer people on SNAP means fewer dollars flowing into the exact staple categories — fluid milk, basic cheese, yogurt — where dairy has the least room to raise price and the most volume to move. It’s not a demand shock you can hedge with a single futures contract. It’s a slow leak in the floor everyone assumed was solid. Fluid milk was already sliding before any of this — see the longer arc in where domestic dairy demand is really heading, and the deeper policy backstory in SNAP Cuts Target $267 Billion: Here’s What Dairy Farmers Aren’t Being Told.

And the geography matters as much as the total. The cuts aren’t spread evenly — they’re concentrated in specific states and specific counties. Florida lost nearly 300,000 recipients, with the sharpest declines in Monroe and Collier counties. Arizona shed 43% of its caseload in a year. If your milk moves through a Sunbelt fluid market, your exposure looks very different from a herd shipping into a cheese plant in the Upper Midwest. Same national number, wildly different farm-level consequence.

Exposure FactorSunbelt Fluid Shipper (AZ/FL corridor)Upper Midwest Cheese Shipper
SNAP caseload decline43% (AZ), ~18% (FL) image.jpg~8% (regional est.)
Primary productFluid milk (staple basket)Cheese / value-added
SNAP demand sensitivityHigh — over-indexes on fluidLower — export & VAP buffer
Pricing power on volumeThin (low-margin staple)Moderate (differentiated)
Near-term tailwindLimited domestic floorExports growing through 2027 Bullvine Four-Row Tier-Mix Template v1.md

What Can You Actually Do About It This Month?

You can’t lobby your way out of this one — that ship has largely sailed. But you can stop treating domestic demand as a fixed given and start managing it like the variable it’s become. A few paths producers and co-ops are weighing right now:

FeatureDairy Revenue Protection (DRP)Dairy Margin Coverage (DMC)
2026 availabilityOpen — rolling quarterlyClosed Feb 26, 2026
ProtectsMilk revenueMargin over feed
Next action windowThis month (July)Re-enroll ~Jan 2027
Tier 1 ceilingN/AExpanded 5M → 6M lbs
Best forFlooring a specific exposed quarterSmaller volumes, $9.50 tier
  • Price a Dairy Revenue Protection quarter — this is the 30-day move. DRP sells through USDA’s Risk Management Agency and your crop insurance agent on a rolling quarterly basis, so, unlike DMC, it’s a tool you can actually act on in July, not just in the January window. When it makes sense: if you want to floor a specific quarter’s milk revenue against a softening domestic market. What it takes: a call to a livestock insurance agent and a look at the current quarterly endorsements. The catch: it protects revenue, not margin over feed, and premiums move with the market — so run the quarter you’re most exposed on first.
  • Mark the 2027 DMC window and re-run your numbers now. The 2026 Dairy Margin Coverage enrollment closed February 26, 2026, so you can’t sign for this year — but coverage runs through 2031, the Tier 1 production ceiling expanded from 5 to 6 million pounds, and the $9.50 tier triggered payments early in 2026. When it makes sense: almost always, for smaller volumes. What to do now: pull your 2021–2023 marketings and price the $9.50 tier so you’re ready the day the next window opens, typically in January.
  • Engage co-op leadership on channel risk. Push your co-op or processor to tell you where your milk actually lands — how much moves through the small independent grocers most exposed to benefit cuts versus value-added and export-ready channels. When it makes sense: on a 2–3 year horizon, and it starts with a single conversation. What it takes: raising channel-level SNAP exposure at your next board or patron meeting and asking for the data in writing. The trade-off: shifting toward more resilient channels can cost you flexibility and near-term price — but exports are projected to keep growing through 2027, which is the tailwind here. It’s a co-op-scale decision, not a solo one, which is exactly why leadership has to own it.

Key Takeaways

The question isn’t whether record milk and shrinking food aid are converging. The data says they already are. It’s whether your operation’s demand assumptions can survive being honest about it. So here’s the one worth sitting with tonight: if you pulled last year’s milk check and asked “how much of this leaned on customers who are no longer on SNAP,” would you even know where to start looking?

Run Your Numbers

Dairy Profit Projector — Take that 50¢/cwt demand-softening scenario and put it against your own herd. The Projector turns milk price, feed cost, and ration assumptions into IOFC, breakeven milk price, and 12-month whole-herd margin — so you find out where your floor really sits before the market tests it.

Complete references and supporting documentation are available upon request by contacting the editorial team at editor@thebullvine.com.

Learn More

The Sunday Read Dairy Professionals Don’t Skip.

Every week, thousands of producers, breeders, and industry insiders open Bullvine Weekly for genetics insights, market shifts, and profit strategies they won’t find anywhere else. One email. Five minutes. Smarter decisions all week.
NewsSubscribe
First
Last
Consent

Your Oldest Cow Isn’t a Cull — She’s a $3,000 Heifer You Don’t Have to Buy 

She’s in her 7th lactation, still breeds back, still sound — and you’ve got her penciled for the cull truck. At $3,010 a heifer, that’s a $3,000 check you don’t have to write.

Gillette Emperor Smurf EX-91 grazing at La Ferme Gillette near Embrun, Ontario. She milked to 18, completed 11 lactations, and set a Guinness world record at 478,163 lb — better than four times the 2.7-lactation national average. At $3,010 a replacement heifer, that kind of longevity isn’t just a welfare story anymore. It’s deferred capital.

Back in 2012, when the animal-rights conversation around Gillette Emperor Smurf EX-91 was loudest, The Bullvine pushed back on PETA’s read of how dairy cattle actually live. The critics wanted the record-setting Holstein retired to a sanctuary, off the milk line for good. Eric Patenaude, who’d milked her for years at La Ferme Gillette near Embrun, Ontario, didn’t argue the point. He flipped it:

“They want to put her in an animal sanctuary, but I think at this point she is in an animal sanctuary.” — Eric Patenaude, La Ferme Gillette

At the time, that read like a good comeback. Read it today, with a replacement heifer costing you $3,010 a head, and it sounds like herd strategy.

Smurf lived to 18 and left behind a Guinness-certified lifetime record of 478,163 lb (216,891 kg) of milk — the most any dairy cow has ever produced. Every extra lactation a cow like her stays sound is a heifer you didn’t have to buy. Her longevity was a welfare story once. Now it’s a hedge against the exact cost squeeze wringing out mid-size dairies.

What’s Changing and Why

CoBank economist Corey Geiger has the trajectory on record: replacement heifers ran $1,140 in April 2019, $2,660 by January 2025, then a record $3,010 in July 2025 — a 164% climb that rewrote the keep-or-cull math. Top California and Minnesota auction barns have been clearing north of $4,000 a head by mid-2025, per the same analysis. And raising your own is no bargain either, running somewhere around $2,900 to $3,300 by the time she calves.

That price tag rewrites an old habit. For years, freshening an aging cow out the door and dropping in a heifer was just routine herd turnover. But that heifer is now one of the priciest line items you’ll book all year. The cow who breeds back clean at seven lactations and stays on her feet isn’t a soft-hearted keeper anymore — she’s postponing a $3,000-plus purchase.

Who feels it worst? Mid-size operations. They don’t have the scale to shrug off a replacement-market shock, and they often can’t raise heifers as cheaply as the big outfits do. But the equation lands on everybody the same way. USDA counted just 3.914 million dairy replacement heifers on January 1, 2025 — the lowest since 1978, so the longer a healthy cow keeps producing, the less exposed you are to a market that won’t loosen up until 2027 at the earliest.

How This Plays Out in the Barn

Longevity is the one thing you can’t fake, and that’s exactly why it matters. According to Guinness World Records, Smurf averaged 83 lb (37.7 kg) of milk a day across her life and lived in what Eric called a “cow palace” — her own stall, deep straw, a mattress, fresh feed pushed up regularly.

To stay in the herd that long, she had to clear the transition period over and over — those three weeks on either side of calving when milk fever, ketosis, and fresh-cow infections do their worst. Every single time, her feet, her udder, and her reproductive tract all had to hold.

Gillette Emperor Smurf EX-91 with her eleventh calf on deep straw at La Ferme Gillette. Each calving reset the clock on milk fever, ketosis, and fresh-cow infection — the transition gauntlet that ends most cows’ careers before parity three. Smurf cleared it eleven times. That’s not luck. That’s the management behind every heifer she saved you from buying.

Most cows never get close. USDA’s own inventory work pegs the national average around 2.7 lactations, with fertility problems, mastitis, and lameness pushing most cows out the door well before their bodies are done. Smurf reached parity 11 — better than four times the average — because the things that end most cows’ careers never caught up with her.

Here’s the barn math, and it’s worth running all the way out:

A 200-cow herd averaging 2.7 lactations turns over about 37% a year — roughly 74 replacements at $3,010, or nearly $223,000 in replacement capital annually. Push that average to 3.7 lactations and turnover drops to 27%: about 54 heifers, or $163,000. That one-lactation gain is 20 fewer heifers — right around $60,000 back in your pocket every year. Even half a lactation is worth roughly $35,000.

You don’t erase the cost. You stretch the interval between checks you have to write. At $3,010 a head, that interval is money — and now you can see exactly how much.

The Four Things That Keep a Cow Around

So what actually kept Smurf milking that long? Four things, done right, day after day:

  • Transition nutrition — controlled pre-fresh energy and mineral balance to dodge milk fever and ketosis.
  • Udder health — a tight, consistent milking routine: pre-dip, pre-strip, a short wait for letdown, wipe, attach, auto-detach, post-dip.
  • Feet — regular trimming, because lameness drags down breeding and invites more disease.
  • A clean uterus — one that clears infection fast enough to settle cycle after cycle.

None of that is exotic. It’s the grind of good management, and there’s economic weight behind it. A 2023 study of Swedish dairy farms found that herd average cow longevity carries an overall positive, significant link to farm economic performance — though in an inverted-U shape, meaning the payoff climbs, then eventually flattens as cows age. That’s a very different production system than most US barns, but the direction held — and the direction is the point.

One honest caveat, because it protects the whole argument. “Long life equals good welfare” isn’t a settled equation, and the longevity literature warns against oversimplifying it. The defensible version is narrower: cows carrying chronic, unmanaged problems don’t reach high parity. Smurf’s cull-free 18 years say her care cleared a very high bar. That’s strong evidence — not proof of a formula.

How Much Does One More Lactation Actually Save You?

You’ve seen the herd-level number — roughly $60,000 a year on 200 cows for a full lactation of added productive life. Per cow, the logic is just as clean, though it rides on your cull rate and whether you buy or raise:

  • Buying: Replacements at $3,010, top genetics north of $4,000. Not needing a heifer this year has never been worth more.
  • Raising: Roughly $2,900 to $3,300 — cheaper than buying at the peak, sure, but still real money tied up for two years before she gives you a drop.

So the question is simple. Where does your herd’s average productive life sit right now, and what’s it worth to move it by even half a lactation? Run it against your own replacement number before you make the next cull call. If you want the buy-versus-raise side worked all the way through, our breakdown of why raising your own heifers turned profitable again in 2025 lays out the full comparison — raising now runs up to 54% cheaper than buying at these prices.

Is Your Best Old Cow a Liability or an Asset?

Most barns have a Smurf-in-miniature standing in a back pen — a 6th- or 7th-lactation cow, still breeding back, still sound. Old habits say cull her and freshen a heifer. The 2025 math says look twice before you do.

So ask the harder question: what is she actually costing you to keep, versus what she saves you by not calling the heifer dealer? On one side, she’s proof your transition, feet, and udder programs work over the long haul. On the other, she’s a $3,000-plus purchase you get to put off for another year.

Eric Patenaude with Gillette Emperor Smurf EX-91 and her Guinness World Record certificate. The plaque in one hand, the cow’s muzzle against his cheek in the other — that’s the whole argument in one frame. The affection and the balance sheet were never at odds. The cow good management keeps around long enough to love is the same cow that saves you a $3,010 heifer check.

Cull her on age alone and you throw out both. Keep her because her health earns it — the way Ferme Gillette did with Smurf — and welfare and economics finally point the same direction. As one Bullvine analysis put it, at $3,000–$4,000 a head producers are right to “stop culling anything that still stands in a stall” — provided she’s genuinely earning her place.

Options and Trade-Offs for Farmers

If you want to turn longevity into a real hedge against $3,000-plus heifers, here’s what producers are actually doing.

Option 1: Audit Transition Management Immediately

  • When it makes sense: Every herd. Start this month.
  • What it requires: A hard look at dry-off nutrition, calving hygiene, and the first-30-day health check — attention more than capital.
  • The risk: Easy to launch, just as easy to let slide the first week labor gets tight.

Option 2: Re-Evaluate Age-Based Cull Policies

  • When it makes sense: Highest payoff where replacement costs bite hardest.
  • What it requires: Honest health and production records, and a per-cow call — never a blanket policy. A useful this-month check: pull your herd’s weighted-average Productive Life (PL) breeding value. If your PL sire stack averages below +3.0, you’re not making the longevity bet.
  • The risk: Cuts both ways. Holding a cow past her real value costs you too. The Swedish work is the guardrail — the payoff runs an inverted U, so “older” isn’t automatically “better.”

Option 3: Target Cow Comfort Investments

  • When it makes sense: Herds bleeding cows to lameness and mastitis.
  • What it requires: Real capital — bigger stalls, better flooring, cleaner bedding.
  • The risk: Run the payback against your own heifer bill before you pour concrete. The return shows up as fewer forced culls, not overnight.

Option 4: Document Your Fresh-Cow Protocol on Camera — Once This Quarter

  • When it makes sense: Any operation whose practice would survive a close look — and that’s most of you.
  • What it requires: One phone, one fresh-cow round filmed start to finish. Consumer-trust research consistently finds transparency moves attitudes where slogans don’t; a real barn video is the cheapest social-license asset you own.
  • The risk: If the footage embarrasses you, that’s not a PR problem — it’s a management signal. Fix the practice first, then film it.

Key Takeaways

  • If your involuntary cull rate is climbing on fertility, mastitis, or lameness, audit your transition protocol before you touch anything else — that’s where longevity is won or lost.
  • With replacements at $3,010 and top heifers north of $4,000, put a dollar figure on every avoidable cull before you make it. A sound old cow is deferred capital — on a 200-cow herd, a single added lactation is worth about $60,000 a year.
  • If your cows average fewer than 2.7 lactations, you’re replacing faster than the national herd — and paying $3,010-plus each time to do it.
  • Watch the top end too. Longevity’s payoff runs an inverted U — keep a cow because her health and production earn it, not out of habit.
  • If you’d flinch at a camera in your barn during fresh-cow chores, fix the practice before you worry about the PR.

So walk your own barn tonight and pick her out. Which cow is your Smurf — and are you managing her like deferred capital, or writing her off on age while heifer prices sit near record highs?

The industry spent a decade letting its loudest critics decide what a dairy cow’s life looks like, and the quiet, well-run majority rarely becomes the story. You don’t have to make that same trade on your own balance sheet.

Whether longevity actually pays at your scale comes down to three numbers — your cull rate, your heifer cost, and your herd’s average productive life — and we’re running the full breakdown by herd size in an upcoming Bullvine deep-dive, so it’s worth watching for.

So here’s the real question for the comments: which cow in your barn is worth more standing than she’d bring on the cull truck — and how do you know?

Run Your Numbers

Bullvine Pipeline Index Calculator — This article makes the case for keeping sound old cows. The Pipeline Index puts your herd on the scale: feed in your cull rate, heifer inventory, and replacement cost, and it flags whether your pipeline is green, yellow, or already replacing faster than you’re rebuilding. See where you stand before the next cull call.

Complete references and supporting documentation are available upon request by contacting the editorial team at editor@thebullvine.com.

Learn More

The Sunday Read Dairy Professionals Don’t Skip.

Every week, thousands of producers, breeders, and industry insiders open Bullvine Weekly for genetics insights, market shifts, and profit strategies they won’t find anywhere else. One email. Five minutes. Smarter decisions all week.
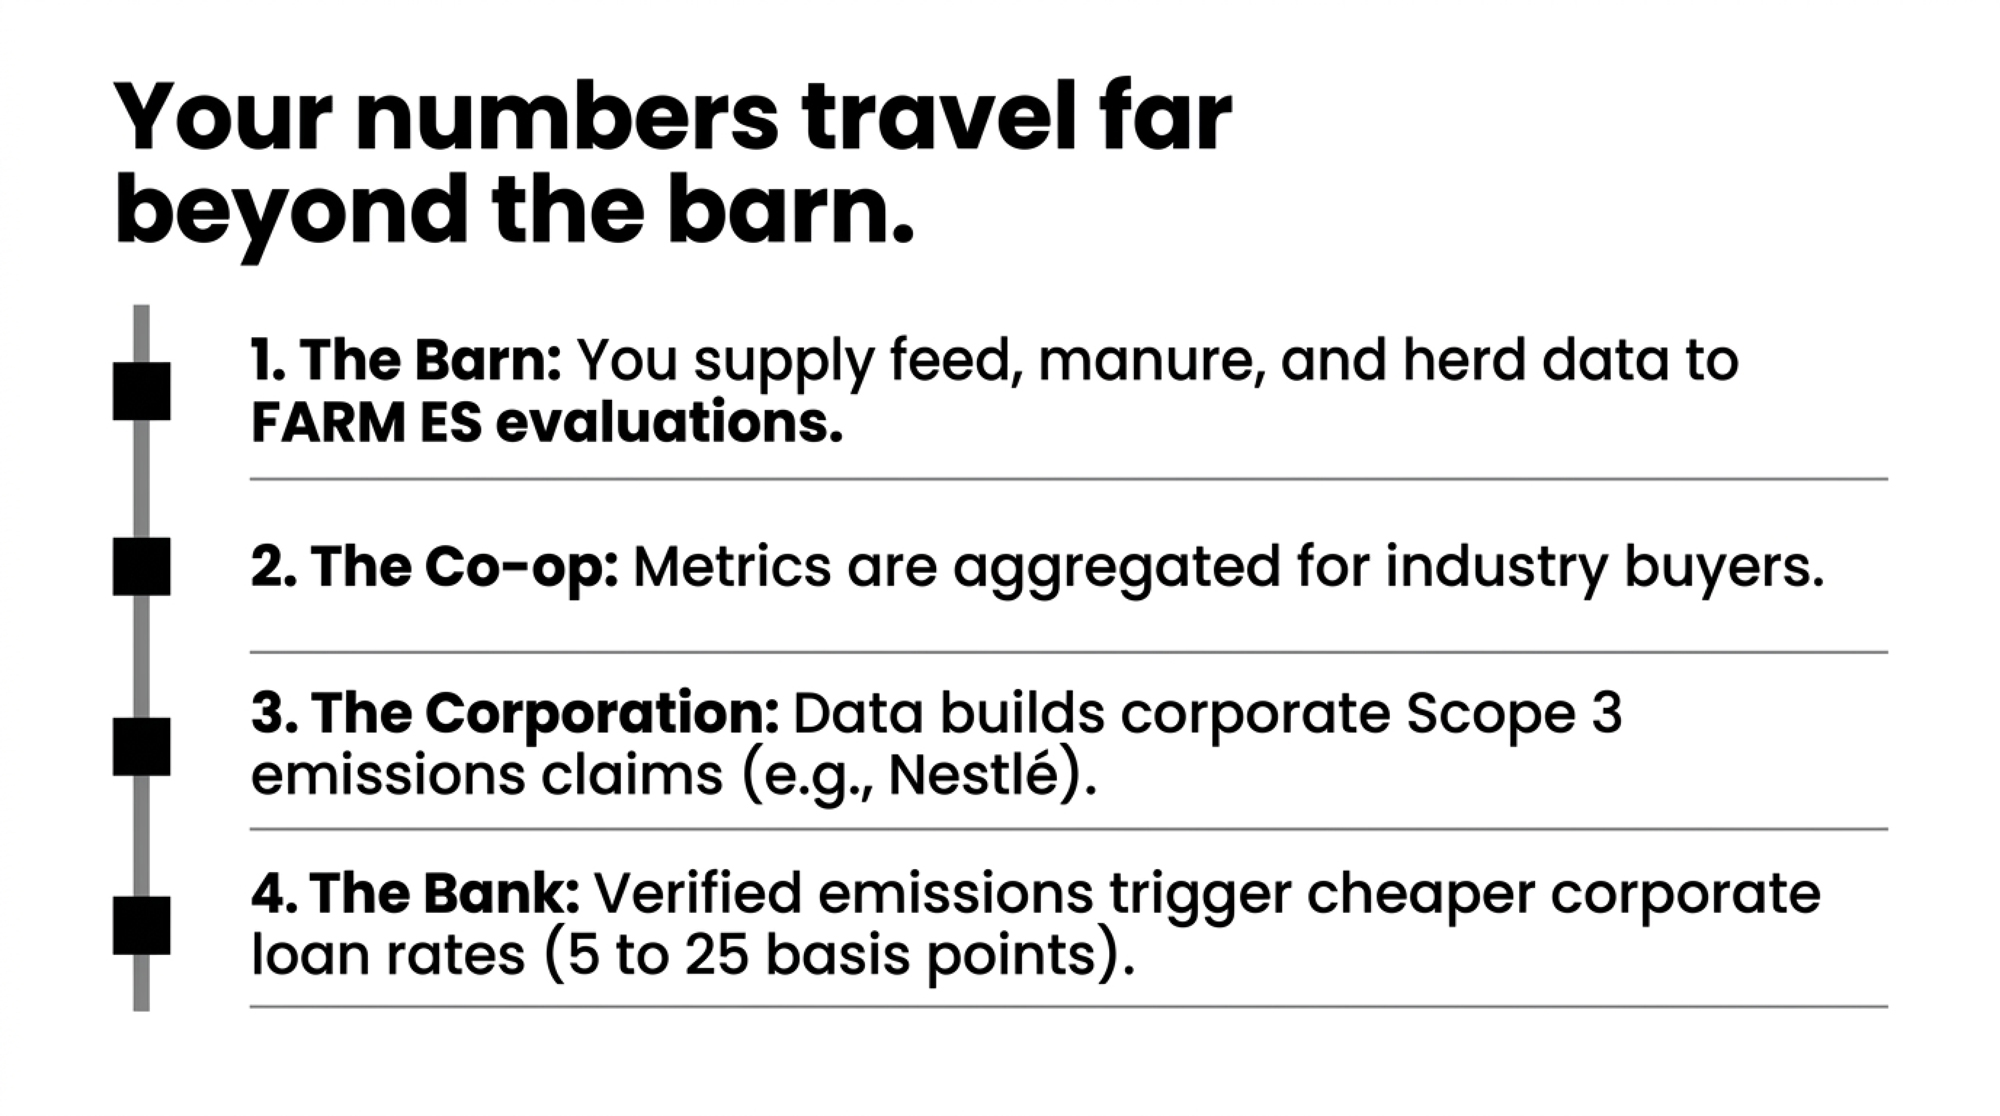
NewsSubscribe
First
Last
Consent

Riverview: 25,000 Cows, 1.5 Miles from the River Four Cities Drink From

25,000 cows are going up a mile and a half from the Red River — the drinking water for four cities. The state says “no discharge.” A judge just took the fight under advisement.

Executive Summary: A courtroom in Traill County is now deciding whether “no discharge” on a permit actually means “no risk” — and the answer could reshape how every expanding operation gets permitted near water. The Dakota Resource Council is asking a judge to rescind Riverview’s state permit for its 25,000-cow Herberg Dairy and force a federal Clean Water Act review DEQ chose to skip. The numbers behind the fight are big: 204.8 million gallons of manure and wastewater a year spread across roughly 12,643 acres — about 16,200 gallons per acre — into a basin whose phosphorus load already runs 69% over target, 2,366 tonnes against a 1,400-tonne limit. Add Riverview’s 12,500-cow Abercrombie Dairy and the two barns would more than quadruple North Dakota’s entire milking herd, which sat near 8,700 cows in 2025. If the court rules DEQ needed a federal NPDES permit, the “no discharge” shortcut gets harder for anyone expanding near surface water — and your own nutrient plan becomes the next thing under the microscope. Judge Bailey took it under advisement without ruling, so nothing’s settled yet.

Dairy cows ride the rotary parlor at Riverview’s Campbell Dairy in Wilkin County, Minnesota, on July 10, 2025 — the same scale of operation now testing whether “no discharge” permits can really protect a river four cities drink from. (Photo by Jeff Beach/North Dakota Monitor)

Based on court filings, agency records, and reporting available as of July 21, 2026, the appeal remains under advisement.

Scott Skokos keeps coming back to one number: $16,000 a day. That’s what Des Moines spends treating upstream farm nitrate out of its drinking water, the Dakota Resource Council’s executive director told the court — “yet in spite of spending an extra $16,000 dollars/day for treatment, water restrictions were in place for much of last summer.” His point lands because the same river system is in play up north. “The Red River is part of the drinking water supply to Fargo, West Fargo, Moorhead and Grand Forks,” Skokos said when his group sued the state. That’s the worst case he wants North Dakota to avoid — and it’s why a permit for one dairy near Hillsboro has turned into a fight over a whole river.

MetricValueContext
Herd size25,000 cowsNearly 3x ND’s entire existing herd of 8,700
Annual manure/wastewater volume204,800,000 gallonsSpread across ~12,643 acres
Average application rate~16,200 gal/acre/yearCorridor-wide average, not a spread rate
Distance to Red River1.5 milesRiver supplies drinking water to 4 cities
Residential wells within 2 miles27 wellsPotable water source unconfirmed for the dairy itself
Basin phosphorus overage69% over target2,366 tonnes vs. 1,400-tonne limit

The dairy is Riverview LLP’s Herberg operation — 25,000 cows, going up just a mile and a half west of the Red River, with 27 residential wells inside two miles of the site. On July 13, 2026, Judge Susan Bailey heard the challenge and drew a line: “It’s not for me to judge the science,” she said, then took the case under advisement without ruling. She wasn’t there to referee the manure chemistry. She was there to decide whether the state did its homework before it signed off.

That should matter to you even if you’ll never milk more than 200 cows — because the question underneath this case isn’t really about one Minnesota company building big in North Dakota. It’s whether a permit that promises “no discharge” actually means “no risk” — and who’s watching the whole river when every regulator only ever signs off on one farm at a time.

What’s Actually Being Fought Over

North Dakota’s Department of Environmental Quality issued Herberg’s state feeding-operation permit on September 24, 2025, after a lengthy technical review. The agency’s conclusion: the dairy doesn’t require a federal Clean Water Act discharge permit, because it isn’t a point source that discharges pollutants. That single call is the hinge the entire lawsuit swings on.

Skokos’s group — represented by Food & Water Watch and the Wild & Scenic Law Center — appealed, calling the review “deeply flawed.” Their argument is procedural, not emotional. They say the state skipped a federal permit it was legally required to demand, and that the manure plan doesn’t pin down enough about when, where, and how more than 200 million gallons of manure and wastewater a year get spread across fields within roughly a 15-mile radius of the barn — much of it, the appeal says, stored in clay-lined ponds located partially within a floodplain.

Riverview, for its part, has said its North Dakota dairies were approved after careful, science-based review by state regulators, and its attorney told the court DEQ followed a “rational process.” So this isn’t a case of a company dodging scrutiny — it’s a fight over whether the scrutiny that happened was the right kind.

And this isn’t a one-off barn. Herberg’s 25,000 cows plus Riverview’s 12,500-cow Abercrombie Dairy near Wahpeton would together more than quadruple North Dakota’s entire milking herd, which deputy ag commissioner Tom Bodine pegged at roughly 8,700 cows across 23 permitted farms in 2025. The rulebook being stress-tested here wasn’t built for that. As Minnesota Farmers Union vice president Anne Schwagerl put it about Riverview’s separate expansion near Morris — a push toward nearly 19,000 cows — “When we established our current regulatory framework for feedlots in the late 1990s, no one contemplated a nearly 19,000-cow dairy operation. That is more than 60 times the average size dairy herd in our state.”

How This Plays Out on Real Farms

The whole fight hinges on two words: “no discharge.” Under the Clean Water Act, a big dairy dodges a federal NPDES permit only if the runoff from its land-applied manure counts as “agricultural stormwater” — and that only holds if the manure went down according to a proper nutrient management plan. DEQ’s position in court was flat: it has no authority to require a federal permit unless there’s a discharge, and there won’t be one.

But a “no discharge” finding is a prediction about how a system will perform — not a reading off a meter. That’s the distinction the opponents are pressing. And it’s not just the advocacy groups. Todd Leake, a Grand Forks County farmer who buys his water from the East Central Water District, has pressed since 2024 on whether the state is even equipped to enforce what it permits, and on where a 25,000-cow herd’s potable water will come from in the first place. When a farmer downstream is asking the same question as the lawyers, that’s worth noticing.

Nobody has sampled a tile line at Herberg yet because the cows aren’t there. What we do know is the volume — the appeal filing puts it at 204.8 million gallons of manure and wastewater a year, headed for roughly 12,643 acres of cropland inside that spread radius, much of it tile-drained. Tile moves water off a field fast, and extension work in the region has flagged how sharply it changes where nutrients end up.

Here’s the barn math, and you can map it to your own ground. Spread 204.8 million gallons across the 12,643 acres cited in the appeal and you land at roughly 16,200 gallons per acre per year on average. That’s a corridor-wide average, not a spread rate — real applications swing hard by field, crop, and season, and you know that better than any permit does. Now shrink it to your scale: on 400 acres, one bad application window before a heavy rain isn’t a headline — it’s a fine, a fish kill, and a neighbor with a phone. The margin for error doesn’t grow with the herd. It just gets more expensive to miss.

The Mechanics Nobody Argues About

Two quiet mechanics drive this, and neither one makes headlines on its own. The first is self-monitoring. Under standard large-dairy permitting, the operator conducts inspections, pulls manure and soil samples, logs application rates and field conditions, and maintains the records — while the regulator reviews the paperwork and retains the right to inspect. That’s not a Riverview quirk. It’s how the system works on every permitted operation in the country. The wrinkle is simple: the party with the most to lose from a discharge finding is also the one mainly responsible for spotting and reporting it.

Oversight MechanicWho Does the WorkWho Reviews ItRisk to Watch
Manure/soil samplingOperator (Riverview)State regulator (paperwork only)Self-reported data, no routine third-party verification
Application rate logsOperator (Riverview)State regulator (paperwork only)Records controlled by party with most to lose
Discharge inspectionsState regulator (right to inspect)N/AInspections are episodic, not continuous
Cross-border river accountingNo single regulatorIJC Red River Watershed Board (advisory only)North Dakota and Minnesota each approve their own piece; no one owns the whole river

The second mechanic is that no single regulator owns the whole river. North Dakota reviews the North Dakota permit. Minnesota reviews the Minnesota expansion. Each call looks defensible on its own page. But the Red River carries about 68% of the total phosphorus load reaching Lake Winnipeg, according to Manitoba’s own nutrient accounting. And the river is already over the line: the International Joint Commission’s Red River Watershed Board logged a five-year average phosphorus load of 2,366 tonnes a year through 2021 — running roughly 69% above its own 1,400-tonne target. That gap explains the most telling move in this whole story, and it came from the wrong side of the border. On October 8, 2025, Manitoba welcomed the IJC’s decision to direct its Red River Watershed Board to review the North Dakota permits — before any U.S. court had ruled. A downstream government started counting tonnes while the domestic process was still counting pages.

How Much Does “We Got the Permit” Actually Protect You?

Less than the paperwork suggests. A permit certifies your plan meets the rules as written. It does not certify that your watershed can actually absorb the nutrients, and it won’t shield you from a discharge finding if someone’s monitoring later catches one. In a basin already running 69% over its phosphorus target, “compliant” and “safe” have quietly stopped being the same word.

So treat the permit as your starting line, not your finish line. That’s not a knock on anyone who’s followed the rules — it’s a read on where the risk is actually moving. The rules were written for a scale of farming that barely exists in that valley anymore, and they’re now being tested by the scale that does.

Is Your Manure Plan Built for Your Drainage, or Just Your Acres?

This is the operational question Herberg is forcing into the daylight. Most nutrient management plans are built around acres and agronomic rates — pounds of N per acre, setback distances, storage days. Fewer of them wrestle honestly with what tile drainage does to the speed and path of water leaving the field. If you’ve added tile in the last ten years, like a lot of the Red River Valley has, your runoff behavior may not match the assumptions your plan was first written on.

That’s worth a conversation with your agronomist before it’s ever worth one with a regulator. Pull the plan. Find the drainage map. See if they were built to talk to each other.

Options and Trade-Offs for Farmers

You’re probably not building a mega-dairy. But how this case lands shapes the permitting weather for anyone thinking about growth, so it’s worth knowing where the paths lead.

  • Treat compliance as the floor. Makes sense if you’re anywhere near surface water, tile drains, or a nutrient-sensitive watershed. Requires knowing your own nutrient plan cold — windows, buffers, drainage layout. The catch: it costs time and some agronomic flexibility, and a clean permit still won’t save your reputation if a neighbor films a runoff event.
  • Get ahead of monitoring instead of waiting for it. Makes sense if you’re expanding or already under a microscope. Requires independent record-keeping and ideally some third-party water sampling you control. The catch: you’re paying to prove a negative — but that’s cheaper than becoming the case study an advocacy group builds its next lawsuit around.
  • Watch the whole corridor, not just your county. Makes sense anywhere consolidation is stacking cows into one basin. The forward signal here is real: the IJC’s Red River review is advisory, not binding under the Boundary Waters Treaty, but it points toward basin-level nutrient accounting becoming a live permitting factor. Requires paying attention to cumulative-load talk before it hardens into rules.

Here’s the one to do this month: pull your nutrient management plan and check whether it actually accounts for your tile drainage, not just your application acres. That’s a 30-day job, not a five-year strategy.

Key Takeaways

  • If your operation sits within a mile or two of surface water, pull your nutrient plan this month and confirm it accounts for tile drainage — not just acres.
  • If you’re planning to expand, assume “compliant” won’t mean “uncontested,” and budget for independent monitoring you control before anyone asks for it.
  • If you farm in a watershed with a published nutrient target — like the Red River’s 1,400-tonne phosphorus goal — find out where current loads actually sit before you assume there’s headroom.
  • If a permit says “no discharge,” treat that as the minimum bar, then ask what a downstream regulator or a neighbor with a phone could document.
  • If the Herberg ruling ends up requiring a federal NPDES permit, expect the “no discharge” shortcut to get harder for large operations everywhere — watch for the decision.

The two Riverview dairies are still under construction, and as of mid-July 2026, Judge Bailey had taken the appeal under advisement without ruling. So nothing’s settled. Todd Leake will keep drawing his household water from the East Central district while the barns go up a short drive away.

Complete references and supporting documentation are available upon request by contacting the editorial team at editor@thebullvine.com.

Learn More

The Sunday Read Dairy Professionals Don’t Skip.

Every week, thousands of producers, breeders, and industry insiders open Bullvine Weekly for genetics insights, market shifts, and profit strategies they won’t find anywhere else. One email. Five minutes. Smarter decisions all week.
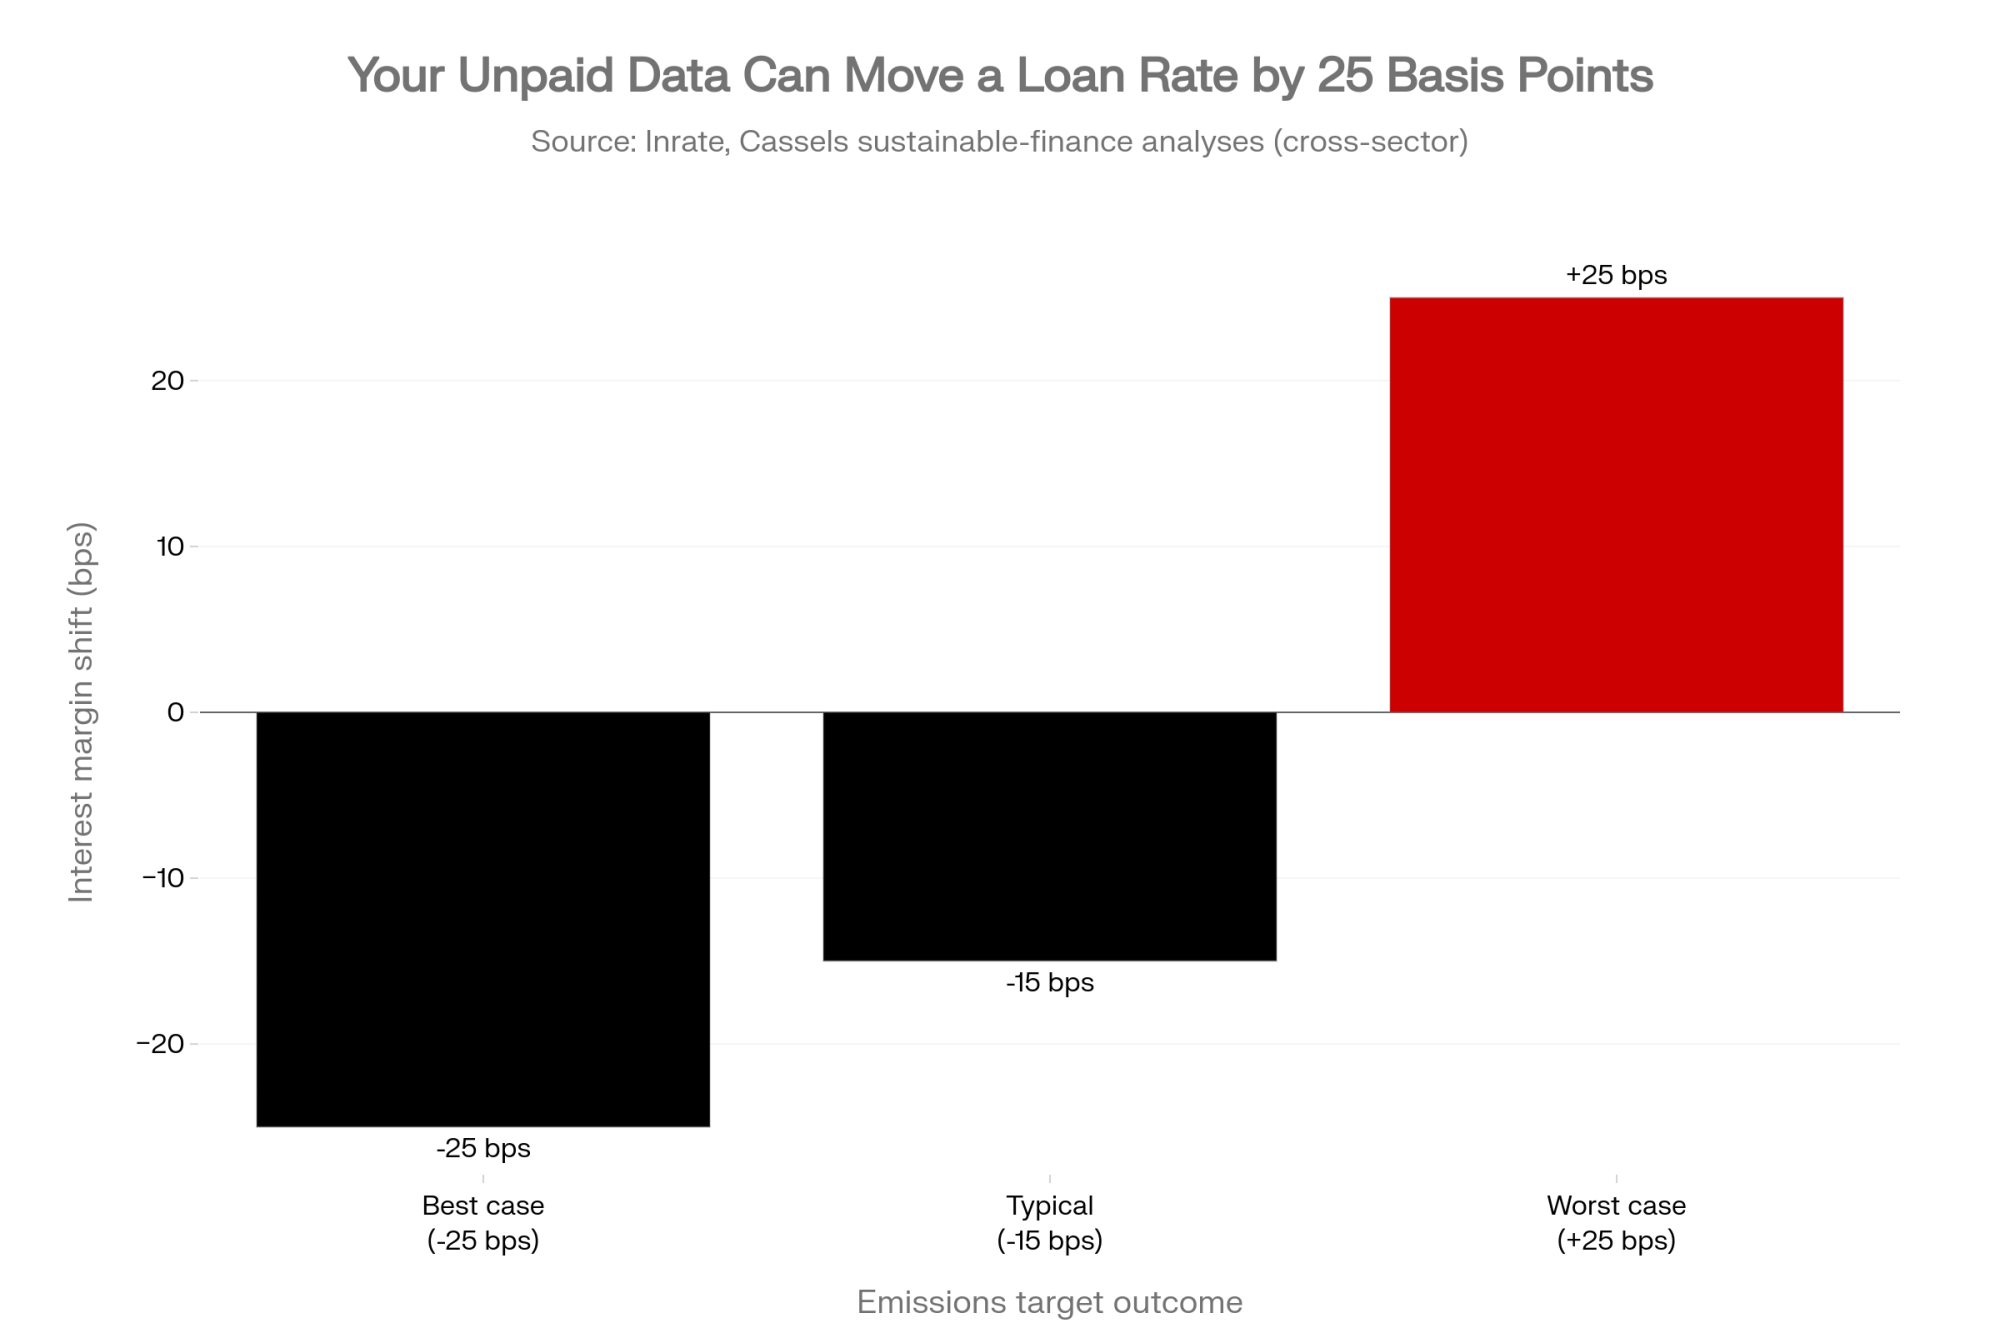
NewsSubscribe
First
Last
Consent

Ten Hot Days, $8,600 Gone: The Heat Bill Hiding in Your Milk Cheque

Ten days of 90°F and THI in the 70s can quietly strip $8,600–$14,000 from a 400-cow herd — unless your fans and dry cows are actually set up to fight back.

Executive Summary: Ten days of 90°F-plus with THI in the mid-70s can quietly pull $8,600 to $14,000 off a 400-cow herd — roughly $1.80 to $2.92 per cow per day in lost milk, heat-stress ration adds, and cooling power, or about $0.30 to $0.55/cwt off your July margin. Most of it never shows up labeled “heat”; it lands as an “off” bulk tank, a fatter feed bill, and soft fall preg checks nobody walks back to July. The single highest-leverage fix costs almost nothing: set your fans and soakers on a controller to trip at THI 68, not “when it feels hot” — fertility starts eroding at THI 65, a full seven points before milk visibly drops. Dry cows are the most-skipped, highest-ROI target, since full dry-period cooling lifts the next lactation for up to 30 weeks and protects the developing heifer calf’s mammary and ovarian growth. DRP and DMC cover the price side of a bad summer, but nothing in those tools rewards the cooling that protects your herd — that gap is yours to close, one barn at a time. If your July milk per cow runs 5–10 lbs light every hot stretch, this piece hands you the barn math and the three moves worth making before the next dome builds.

heat stress dairy costs

When One French Farm Melts, Every Barn Should Pay Attention

In late June, western France baked under a heatwave that’s already going into the record books. Reporting from the region described milk shipments down 15 to 20% from some herds as cows backed away from the bunk and spent their days crowding water troughs. The same coverage documented tens of thousands of broiler chickens dead in a matter of days and vegetable yields slashed as harvest crews worked around heat alerts. 

Those French barns are a long way from your lane. But they’re living the physics you’re feeling more quietly this summer. Across the Midwest, climatologists have been warning about a string of heat domes landing right as corn and soy slide into critical growth stages. The weather stories talk about pollination risk and futures rallies. You see the same thing as cows eating less, fans that can’t quite keep up, and a July bulk tank that feels “off” without any obvious disaster. 

That “off” tank isn’t just a bad week. It’s the first line item in a heat bill that includes extra ration cost, more hydro, softer conception, and calves that never quite hit the ceiling they should. You don’t get that bill labeled “heat.” It just shows up as thin margins and “rough July” in the notes column.

THE ONE SETTING THAT DOES THE MOST WORK: THI 68

Put your fans and soakers on a controller and set them to kick on at a temperature-humidity index (THI) of 68 — not “when it feels hot” and not at the old THI 72 rule of thumb. Fertility starts eroding around THI 65 and visible milk loss kicks in past 72. If you wait until you feel uncomfortable, the cows have already done most of the damage. 

The Summer 2026 Heat Story — Corn, Cows, and Timing

In the northern and central Midwest, this summer’s heat hasn’t just been hot; it’s been badly timed. Iowa’s climatologist, Justin Glisan, has warned about “two heat domes” sitting over the region with 90°F-plus highs and high dewpoints stretching over 7–10 days as corn entered pollination. Purdue’s Dan Quinn has been flagging the same concern for Indiana’s crop — accelerated growth under stress, pollination happening under heat advisories, and fields that were already rough coming out of wet conditions. 

AccuWeather meteorologist Chad Merrill, speaking on Farm Futures, has been blunt: mid-90s at pollination will likely shave 5–6% off expected corn yields across parts of the belt, with soy more vulnerable later in July. Traders have noticed. Corn and soy futures pushed more than 3% higher in early July as heat-damage risk in Europe and North America began to show up on screens. That’s where your ration costs start to move. 

Globally, the FAO–WMO “Extreme Heat & Agriculture” report released in April laid out what this kind of weather means at scale. It warned that over a billion people whose livelihoods are tied to agrifood systems are now exposed to increasing heat risk, with yields and herd productivity dropping sharply once common thresholds are crossed. For crops, losses ramp up once mean daily temperatures climb much above 30°C; for livestock, heat stress starts showing up around 25°C and becomes severe at 30–35°C depending on humidity. Dairy cattle are right in the cross-hairs. 

What Heat Actually Does Inside the Barn

The number that ties all this together is THI — the temperature-humidity index. It blends heat and humidity into a single score that tracks how hard your cows are working to stay cool. Several JDS and subtropical-environment studies put the comfort band for most lactating cows under about THI 68–72. Above that, things change fast. 

A 2023 meta-analysis in the Journal of Dairy Science pulled data from dozens of trials and found that under sustained heat stress, dry matter intake (DMI) dropped by roughly 19% and energy-corrected milk (ECM) fell about 18% compared with thermoneutral conditions. Feed efficiency and milk components shifted, and the longer cows stayed hot, the worse the numbers got. In Girolando cows — ¾ Holstein, ¼ Gir — heat stress reduced milk yield by around 7% compared with cooled controls. 

Here’s the part most herds miss: reproduction cracks first. Reproduction studies now point to fertility starting to erode around THI 65, a good seven points below where you see obvious milk loss. Conception rates slide, early embryo loss ticks up, and days open stretch out. You feel July again when the vet reads off your fall preg checks, and you rarely line those numbers back up against the one hot spell that kicked it off. 

There’s also a group of cows almost nobody budgets for in their heat plan: dry cows. Work by Laporta, Davidson, and others has shown that cooling cows throughout the entire dry period — with shade, fans, and soakers — lifts milk yield for up to 30 weeks into the following lactation compared with cows left under heat stress. Even splitting cooling into “early dry” and “late dry” partially helps, but full-period cooling gave the best results. The trials also showed that in-utero heat stress hits the calf she’s carrying: mammary and ovarian development are compromised, setting a lower ceiling on that heifer’s future production. 

You’re not just losing July milk when a dry pen cooks. You’re writing down the next three years of that family line.

How Much Does Ten Hot Days Actually Cost You?

Let’s put real barn math to a very common situation. Picture a 400-cow Holstein herd in the eastern Corn Belt. This is a disclosed composite — not a single real farm, but a scenario built from several mid-size operations in the region — and every number under it comes from published data.

On a normal July day:

  • Cows ship about 85 lbs/head/day.
  • Ration cost runs around $9.00/cow/day, right in the middle of current lactation feed budgets, which range from $8.16 to $9.39. 
  • Fans run in the freestalls and over the parlor return lane, with a simple soaker line at the bunk.

Now ten to twelve days of 90°F-plus roll in, with THI pushing into the mid-70s by early afternoon and flirting with 80. Under that kind of sustained moderate heat, JDS data support an 8–12% drop in milk yield if cooling is partial — so think of that herd sliding from 85 lbs down into the 75–78 lb range. 

USDA’s May 2026 Livestock, Dairy and Poultry Outlook pegs the annual all-milk price forecast around $18.95 to $21.25/cwt depending on scenario. Using the higher $21.25 number to make the math simple, that 8–12% hit works out to about $1.45 to $2.17 per cow per day in lost milk revenue

You don’t stand still on feed. Most herds bump electrolytes, buffers, and energy density to fight the intake drop, which adds somewhere around $0.30 to $0.60 per cow per day in ration costs. Fans and soakers running longer and harder will add perhaps $0.05 to $0.15 per cow per day in power, depending on how efficient your setup is. 

Put that together:

Financial Impact Summary — 400-Cow Composite, 12 Hot Days

Line itemApprox. cost per cow per dayBasis
Lost milk (85→75–78 lbs @ $21.25/cwt)$1.45 – $2.17JDS meta-analysis on yield loss; USDA 2026 all-milk forecast 
Heat-stress ration add$0.30 – $0.60Modeled from DMI and ECM drops under heat stress 
Extra cooling power$0.05 – $0.15Fans/soakers energy estimates; full-period cooling trials 
Total per cow per day$1.80 – $2.92
Herd total, 400 cows × 12 days≈$8,600 – $14,000Computed from the lines above
Approximate margin hit~$0.30 – $0.55 per cwtDerived from daily total vs shipped milk

That’s a heat bill. And it lands even when milk price and feed markets look decent on paper.

You can plug your own numbers into that table. If you’re shipping 70 lbs instead of 85, and your ration is cheaper because you’re closer to corn, the ranges shift. But the shape doesn’t.

How Does This Map to Your Herd?

A few quick back-of-the-envelope checks you can run on your own books:

  • Take your average July milk per cow and ask what happens if you lose 8–12% of it for 10–15 days at your actual mailbox price — not the futures screen. That’s your top line.
  • Add what you spent on buffers, electrolytes, and extra energy those weeks — and be honest about whether you’d have bought those products in a cool summer.
  • Look at your power bill for the month and split out what’s cooling vs everything else — even a rough estimate will do.
  • Finally, mark your July and August breedings and walk them forward to your fall preg checks. If conception drops right after those hot spells, that’s the invisible part of the bill.

Most producers have never stacked those four lines together under the heading “heat.” When you do, July starts looking different.

Why Dry Cows Are Your Highest-Return Heat Investment

Dry pens are often the simplest part of a barn: shade, water, and not much else. That’s fine on a mild day. Under extreme heat, it’s a margin leak.

Trials in which cows were given full cooling — shade, fans, and soakers — throughout the entire dry period showed higher subsequent milk yield for up to 30 weeks into the next lactation compared with cows that had only shade. Cooled cows ate more, calved in better shape, and carried less heat stress into early lactation. 

Economic feasibility work has gone a step further. Ferreira and colleagues modeled dry-cow cooling in hot climates and found that even at lower milk prices, cooling dry cows paid for itself once herds faced around 100 heat-stress days a year. That’s not a fancy robot. It’s fans and water over cows that aren’t even milking. 

And then there’s the calf. In-utero heat stress has been shown to affect mammary and ovarian development in the heifer calf. Heifers gestated under heat in late pregnancy produced less milk later in life and showed altered reproductive performance. You can’t see that in this year’s milk cheque. You feel it years from now when daughters of those summers never quite hit the top of the family line. 

If your dry pen has shade and no fans, this is probably the highest-return heat move you can make in the next month.

Are Margin Tools Designed for This Kind of Risk?

Heat doesn’t just move milk. It moves feed and policy.

On the feed side, early-summer heat and dryness in Europe and parts of North America pushed corn and soy futures up more than 3%, with traders explicitly citing stress on pollinating corn and shrinking maize projections in France. French analysts have talked openly about the country’s maize crop potentially falling by as much as a third this year — which would make it the smallest in 35 years if current estimates hold. Those moves ripple straight into your TMR. 

On the risk-management side, Dairy Revenue Protection (DRP) and Dairy Margin Coverage (DMC) are built around milk-feed margin and price swings — not around ten days of THI 78 shaving 10 lbs off every cow while feed cost and hydro inch higher. They help on the price side of a bad year. They don’t directly reward the operator who spends on cooling that protects the herd. 

France has started treating cooling as infrastructure. Coverage of the 2026 heatwaves there has highlighted emergency measures to fund building ventilation, misting, and water-spraying systems, along with fast-tracked support for livestock losses. In North America, similar support mostly appears as EQIP cost-share for barn projects filed under environmental or animal-welfare headings, rather than as a targeted heat-risk program. The FAO–WMO report is blunt: without adaptation, extreme heat will push agrifood systems toward systemic risk — but it also notes practical measures, from shade and cooling to early warning systems, that cut the damage. 

You’re expected to manage that risk one barn at a time.

Question 1: Where Does Heat Start to Break Your Margin?

This is the economics question.

If your herd routinely sees more than 50–60 days a year with THI above the high-60s, you’re already in the band where the DMI and ECM drops from the JDS meta-analysis apply more than just a week or two. USDA and academic modeling points to average annual heat-stress milk losses on the order of 1% of total yield for many U.S. dairies, with higher losses in small herds and hotter regions — and those losses are projected to climb as summers warm. 

The practical check is simple:

  • If your July and August milk per cow are consistently 5–10 lbs below where they “should be” based on genetics, feed, and health history, and those months line up with spelled-out heat events, you’re paying a recurring heat tax.
  • If your annual shipped milk sits noticeably below what your repro, culling, and genetics should support — and you’ve ruled out disease and nutrition — heat is one of the quiet culprits.

The threshold where cooling moves from “nice to have” to “margin tool” is lower than most barn budgets have assumed.

Question 2: Is Your Cooling System Actually Doing the Job You Think It Is?

This is the management question.

Most barns have fans. Fewer have the airflow and water they think they have.

The practical steps:

  • Grab a cheap anemometer and walk your barn. If you’re seeing much under 200 feet per minute at cow levelin stalls and at the bunk, those fans are décor more than cooling. Adding or repositioning fans to hit that band is a very different upgrade than buying one more box fan for the alley. thedairylandinitiative.vetmed.wisc
  • Look closely at your soaker lines. You want a coarse droplet that wets the cow’s skin, not a fine mist that cools the air, raises humidity, and wets bedding. The FAO–WMO report and several extension pieces emphasize that water on the cow, not just in the air, drives evaporative cooling. 
  • Check where your controller is actually set. If fans and soakers only kick in at THI 72 or at some guessed temperature (“about 80°F”), you’ve left fertility and a chunk of milk exposed. Reset to THI 68 and watch how often you’re in that band. 
THI ThresholdWhat’s Already FailingRecommended ActionRisk Level
65Fertility begins eroding, embryo loss ticks upFans/soakers should already be activeEarly warning
68Cooling still masks most damage if triggered hereSet controller to trip here — not laterOptimal trigger
72Milk yield visibly drops; old “rule of thumb” settingToo late — fertility already compromisedHigh
78–80DMI down ~19%, ECM down ~18%Full-period dry cow cooling now urgentSevere

Most operations that go through that three-step audit find they were cooling “some” cows “some” of the time — and leaving dry cows and youngstock almost entirely out of the plan.

Options and Trade-Offs for Your Barn

You can’t do everything this month. Here’s a realistic sequence.

Path 1: Dry Cow Cooling First (30-Day Action) When it makes sense: Herds in regions that regularly see THI above 68 for weeks at a time — much of the southern U.S., parts of the Midwest, and hotter pockets elsewhere. What it requires: Shade plus fans and a soaker line over the dry pen, tied to a THI controller set at 68. Modest capital, some wiring, and a slight uptick in water and power use. Risks/limits: Payback shows up in next lactation and in daughters’ performance, not in this month’s pay. It’s easy to bump down the priority list when cash is tight. But the trials and economic modeling are clear that in hot climates, this is one of the highest-ROI heat moves you can make. Forward-looking signal: If your area is on track for 80–100 heat-stress days a year, treat this as infrastructure, not a luxury. 

Path 2: Fix Air and Water at the Bunk When it makes sense: Herds already seeing milk slips under heat even with “lots of fans.” What it requires: A barn walk with anemometer, adding or re-aiming fans to hit 200 ft/min, and swapping or re-nozzling soakers to a coarse droplet pattern. Risks/limits: Easy to do halfway and assume you’re covered. If stalls stay at 120–150 ft/min and soakers mist the air more than cows, you won’t see the full benefit. Forward-looking signal: As summers trend hotter, this gap only gets more expensive. It’s the fix you make once and benefit from for years. 

Path 3: Ration Tweaks as a Guardrail When it makes sense: Herds already running decent cooling but still seeing DMI dips in hot spells. What it requires: Pre-emptive changes — more electrolytes and buffer, tighter feeding windows, and energy-dense ingredients where appropriate. Risks/limits: This is a cost to lose less, not a cure. You’re paying for products that mostly blunt the damage, and the gains are smaller if airflow and water aren’t there. Forward-looking signal: Works best as part of a package — ration + cooling + reproductive timing — not as the only move. 

Path 4: Heat-Tolerance Genetics as a Tie-Breaker When it makes sense: Herds already selecting aggressively on TPI, Net Merit, or similar indexes and running proper cooling. What it requires: Asking your genetics rep for heat-tolerance EBVs, particularly Milk_THI breeding values. JDS work on U.S. Holsteins and Jerseys shows cows can differ by roughly −1.27 to +1.07 kg of milk per THI unit, meaning some cows give up a kilo of milk for every point the heat index climbs, while others hold much closer. Risks/limits: If you chase heat tolerance at the expense of production, type, or health, you’ll give up margin in cool seasons. And genetics cannot replace fans — no cow sweats her way out of dead air. Forward-looking signal: Treat heat tolerance like a health trait tie-breaker among bulls you already like. That way, your 2030 herd is better built for the summers you’ll actually face, without bleeding today’s income. 

Key Takeaways

  • If your controller still kicks fans and soakers on at “when it feels hot,” change it to THI 68. Fertility starts eroding around THI 65, and milk loss shows up past 72; the 68 trigger is where you protect both the cheque and the pregnancy. 
  • Walk your barn with an anemometer and a sharp eye on dry cows. If you’re under 200 ft/min at cow level or your dry pen has shade and no fans, your cooling system is decoration, not protection, and dry cows are likely your highest-ROI fix. 
  • Line up your fall preg checks against your July THI history. If conception softens after heat spells, stop treating that as bad luck. That’s the invisible part of your heat bill, and it can be bigger than the milk drop. 
  • Separate price risk from heat risk on paper. DRP and DMC help on the price side; only cooling, ration changes, and genetics touch the heat side. If you don’t see those moves in your plan, the gap belongs to you. 
  • Use heat-tolerance genetics to break ties, not as a magic bullet. Bulls and cows differ in how much milk they lose per THI unit, but no breeding program fixes a barn with poor airflow and no water on backs. 

So here’s the question to sit with before the next dome shows up on your forecast. If you added up the milk you lost this July, the extra feed and hydro you paid, and the repro softness you’ll see in a few months — then stacked that against what a cool July should have returned — how big is that hole on your own farm?

If the number makes you uncomfortable, that’s useful. It’s telling you exactly how much room you have to justify a fan controller, a dry-cow cooling line, or a re-aimed bunk. And if you want the deeper math — the full cost-per-cwt models by herd size, the dry-cow cooling ROI, and where heat-tolerance genetics genuinely pencil out — watch for the follow-up Bullvine economics piece. That’s where we’ll run the full numbers.

Run Your Numbers

Dairy Profit Projector — Plug in your herd size, ration, and corn-price scenario to see what a hotter summer does to your IOFC, breakeven milk price, and margin per cwt before the next heat dome lands. Stress-test a feed-cost spike against your milk check and find out where the number actually breaks.

Complete references and supporting documentation are available upon request by contacting the editorial team at editor@thebullvine.com.

Learn More

The Sunday Read Dairy Professionals Don’t Skip.

Every week, thousands of producers, breeders, and industry insiders open Bullvine Weekly for genetics insights, market shifts, and profit strategies they won’t find anywhere else. One email. Five minutes. Smarter decisions all week.
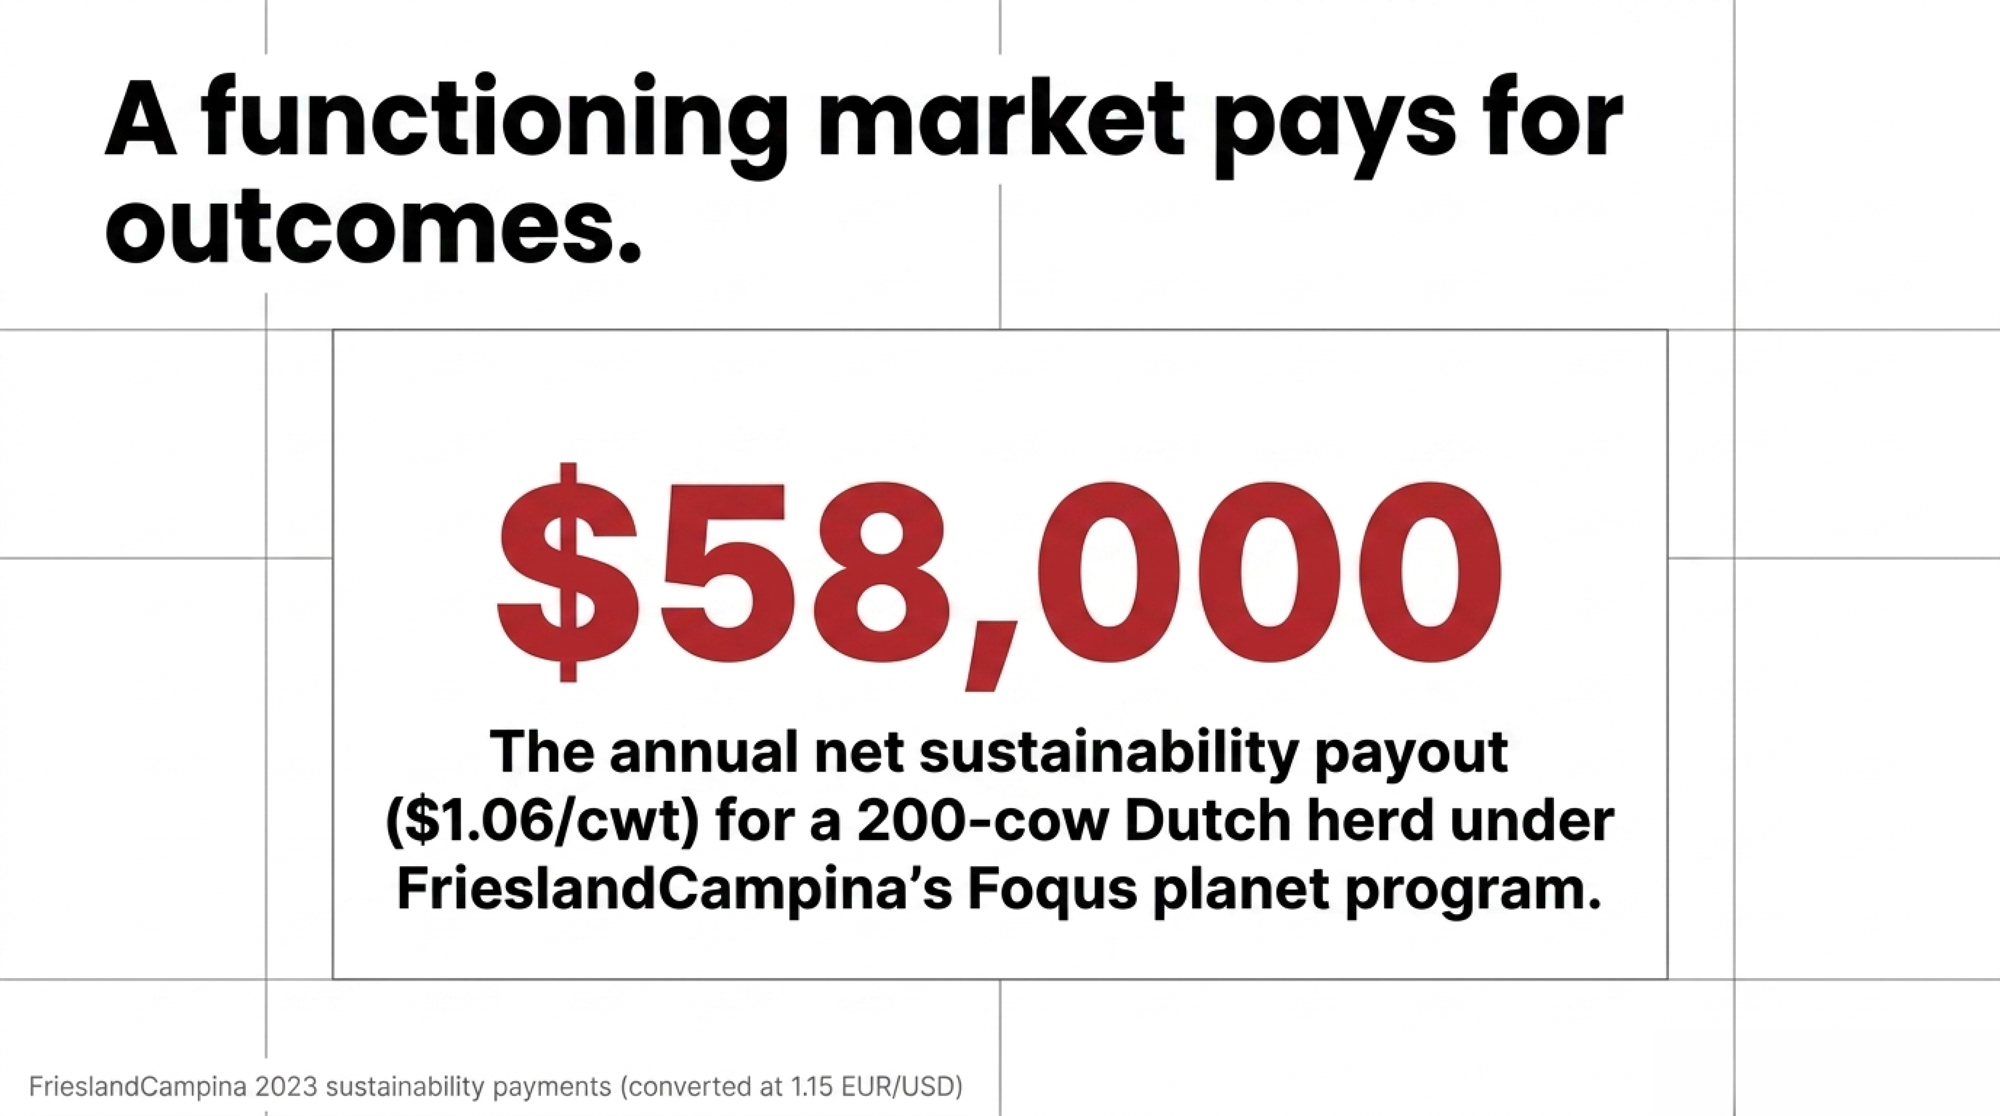
NewsSubscribe
First
Last
Consent

Agri-Mark Printed the Suicide Hotline on the Milk Cheque. The Fix Isn’t Grit — It’s 25 Hours a Week.

A New England co-op started mailing crisis lines with the pay stub in 2018. The data says the real lever isn’t tougher farmers — it’s a workload almost nobody redesigns.

⚠️ Need help right now? Canada: National Farmer Crisis Line — 1-866-FARMS01 (1-866-327-6701), 24/7 · Talk Suicide Canada — 1-833-456-4566 · Ontario Farmer Wellness Initiative — 1-866-267-6255 United States: Call or text 988 · AgriStress Helpline — 833-897-2474 · Farm Aid — 1-800-FARM-AID In an emergency, call 911.

In February 2018, a New England dairy farmer opened his twice-monthly cheque from Agri-Mark and found something new tucked inside. Not a premium notice. Not a hauling change. A list of suicide-prevention hotlines, mailed to all of the co-op’s roughly 1,000 members alongside a price forecast sitting near $17 per hundredweight, well under break-even. Spokesman Doug DiMento told Vermont Public the idea came from the co-op’s own board, which is made up of farmers, after they lost a member to suicide.

Sit with that for a second. The crisis number didn’t go on a poster in the milk house or a slide at a winter meeting. It went on the cheque. The one piece of paper every farmer opens. When a board of farmers decides that’s where the number belongs, they’re saying the quiet part out loud: the way this business is built is dangerous to the people running it. 

And here’s the part that should stop you. The fixes we reach for don’t always help. Robots get sold as the great labor saver, yet in one Finnish study, 71.5% of the farmers running them reported stress from alarms going off in the dark. Trade the 5 a.m. grind for a 2 a.m. alert. This is a workload story before it’s a feelings story, and that’s exactly why it’s fixable. 

What’s Actually Driving the Distress

For a decade, farmer mental health got treated as an awareness problem. Talk more, stigma less, hang up the helpline poster. But the research keeps landing somewhere harder to fix. A 2016 Finnish study of dairy farmers found 42% under significant stress and 9% in severe burnout, with “amount of work” among the strongest drivers. A follow-up using the Job Demands-Resources model went further — workload and loneliness tracked straight to ill health, even after the researchers accounted for burnout itself. 

The Canadian numbers sharpen the point. University of Guelph surveys led by Dr. Andria Jones-Bitton found 76% of farmers reporting moderate or high stress, and roughly one in four saying they’d recently felt life wasn’t worth living. Across her team’s 1,132-farmer study, stress, anxiety, and depression all ran higher than normative data — and resilience ran lower, not higher. These aren’t people short on grit. They’re people running on a buffer that’s already spent. 

Now the twist. When researchers isolated dairy on its own — a 2026 Journal of Dairy Science survey of 115 dairy farmers in Western Canada and Ontario — producers reported lower stress and anxiety and higher resilience than the broader Canadian farming population. But the same study found workload and financial pressures were the stressors most strongly tied to increased stress, anxiety, and depressive symptoms. Even the tougher, more resilient group points straight at the hours. 

Is the “3.5x Farmer Suicide Rate” Even Real?

You’ve heard the stat. Farmers die by suicide “3.5 times more than the general population” — it shows up in co-op newsletters, keynotes, awareness campaigns. But pull the thread and it frays. That figure descends from an older 2016 CDC occupational study that reported a startling 84.5 per 100,000 for “farming, fishing, and forestry,” a number CDC corrected in 2018 after admitting it had misclassified farmers into the wrong occupational group. As The Counter put it, the claim “that farmers have the highest suicide rate in the country — is not supported by the study’s underlying data.” Even the National Rural Health Association’s own brief lands at 43.2 per 100,000 for male farmers, not a clean 3.5-times multiple. 

So what’s real? The most recent CDC data — published in MMWR in December 2023, using 2021 death records from 49 states — put male workers in agriculture, forestry, fishing, and hunting at 47.9 suicides per 100,000, against 32.0 for all working-age men. That’s roughly 50% higher, not 3.5x. The honest version: farmers face meaningfully elevated risk, and a clean dairy-specific multiple doesn’t exist yet. You don’t need the inflated number to take this seriously. 

Why does the messier stat actually make the case stronger? Because if resilience already runs below average and dairy farmers are still more distressed than the general public, resilience isn’t a tank you keep topping up. It’s mostly gone. Look at the hours alone: an Irish study of 313 spring-calving farms found the best-run quarter averaged 58.6 hours a week with 16.6 days off, while the worst-run quarter ran 82.6 hours on just 5.1 days off. Same job. A 24-hour-a-week gap, driven by how the work is built, not by how tough the farmer is. 

The Mechanics: Where the Hours Actually Hide

Milking is the anchor tenant. UK CAFRE benchmarking found it eats 30–50% of total working time on dairy farms. Total labor demand runs anywhere from about 22 to 80 hours per cow per year depending on the system — a 3.5x spread for what’s essentially the same job. That range is where wellbeing lives or dies. 

And the spread isn’t about herd size. It’s about how the work is built. Bullvine’s own labor analysis found the most efficient operators worked 51.2 hours a week running 112 cows, while the least efficient put in 70 hours on a virtually identical herd. Same cows, same milk, nearly 19 hours a week apart. That’s a full extra work day, every week — one farm spends it, the other reclaims it, purely on system design. The difference between a Sunday off and a Sunday in the parlor. 

Then there’s the input nobody costs: unpaid family labor. Wisconsin and Minnesota organic dairy data pegged it at 25–31 hours per cow per year, and the better-run farms sometimes leaned on it more, not less. Meanwhile USDA’s Dairy Margin Coverage protects feed and milk margins but largely ignores labor and replacement-heifer costs — quietly treating a small farm’s 70-hour week as a free input. It’s the same math that makes a cash-basis farm look fine right up until the day you try to pay yourself. 

So here’s the uncomfortable core. In a system where nobody wants to absorb the cost, someone already is. It shows up as long weeks, worn-out backs, and grief that lands in farmhouses — never on anyone’s balance sheet.

How Much Is a 70-Hour Week Really Costing You?

Start with what money is supposed to buy: your time and your health. If you’re logging 60–70 hours a week across milking, calves, cropping, and paperwork, the research drops you square in the zone where workload predicts ill health directly. So run it in dollars. One full-time hire at roughly $18–$20/hour CAD/USD over a 2,500-hour year lands near $45,000–$50,000 in wages alone — before benefits, housing, or payroll costs, which typically add another 15–30%. 

Here’s the barn-math version, so you can map it to your own place. Say that hire takes 20 hours a week off your back — a conservative number for one good employee. Over a year that’s about 1,040 hours you’re not doing. Put your own time at that same $18–$20 CAD/USD, and you’ve effectively bought back $18,700–$20,800 worth of your own labor while the wage bill runs $45–50K. The gap is what the extra cows, fewer mistakes, and a full night’s sleep have to cover. Where does that pencil out on your herd? That’s the real question — and it moves with scale.

Which Fix Fits Your Operation?

Four structural moves keep surfacing in the research. Each one shifts the stress somewhere. None of them erases it — so pick the trade you can actually live with. Here’s how each one moves a 150-cow solo operator’s week before you stack them.

📊 Hours reclaimed per week — 150-cow solo operator Baseline: 55–65 hrs/week (70+ in peak season).

  • Robots → ~30–35 hrs off the pit → week toward 35–45 hrs
  • Beef-on-dairy → ~4–6 hrs off calf chores → 50–58 hrs
  • Outsource cropping → kills the 70–80 hr peaks → 45–52 hrs
  • Add one FTE / share-milk → down toward 35–40 hrs Stacked, not additive. Full week-by-week schedule in the deep dive below.

The paths pull different levers. Robots are capital-heavy and buy back the most raw hours, but they hand you a new kind of stress. Beef-on-dairy costs almost nothing and quietly shrinks the chore list. Outsourcing cropping kills the peak-season spikes fast. Adding labor hits the hours hardest — but only if the arrangement itself is built right. Here’s the side-by-side.

FixPrimary LeverCapital / CostWhat it Buys BackThe Catch
Milking RobotsCapital-for-laborHigh: 7-yr negative cash flow ~75% of milking labor (6.5 → 1.5 hrs/day); +13% net returns (USDA ERR-356)71.5% of robot farmers report stress from nightly alarms 
Beef-on-DairyFewer replacement animalsVery Low: incremental semen cost 18–24 months of daily chores per heifer not raised; +$22–$65/cow margin Beef-sired stillbirths run 5% vs 2% — sire selection is critical 
Outsource CroppingShed peak-season spikesLow–Medium: per-acre custom rate (operating cost, not capital) The 70–80 hr peak weeks tied hardest to burnoutWeather turns, and you’re on the custom operator’s schedule, not yours
Add Labor / Share-MilkMore handsMedium/High: ~$45K–$50K CAD/USD per FTE/yr Owner’s week from 60-plus down toward 40 hrsPoor contract design just relocates the burnout onto whoever signs it 

One bright spot worth pulling out of the robot row. Guelph found farmers who added automated feeding alongside robots reported lower stress, anxiety, and depression. The tech isn’t the enemy. Selling it as a standalone fix is. 

The share-milking line deserves a plain warning, because it’s the one people get wrong. A New Zealand survey found 73% of contract milkers hit financial or mental-health strain and 43% reported abusive behavior on the job. Hand off the tasks the wrong way and you reproduce the same burnout on someone else’s back. The contract terms — hours, holidays, downside protection — decide whether it’s healthy for anyone. 

Where does your break-even sit? Rule of thumb, not gospel: a solo operator north of about 120 cows usually hits the added-labor tipping point first, because the hours already run past what one person can safely carry. Under 80 cows milking alone, beef-on-dairy and outsourced cropping tend to move the needle faster and cheaper than a full wage. Run your own numbers before you treat either line as settled.

The 30-day move: don’t buy anything yet. Price one outsourced task. Call two custom operators this month, get a real per-acre number, and stack it against your own hours in planting or harvest. That’s a decision you can make before next calving, with no capital and no contract.

Is This Your Problem to Fix — Or the Industry’s?

Both, and it’s worth being straight about the split. You own the hours you tolerate and the fixes you install. But co-ops, processors, and policymakers own the structures that make a 70-hour week feel normal. The EU’s 2025 SafeHabitus policy brief named “excessive working hours” as a target for actual policy — not just individual coping. Agri-Mark’s own letter said it plainly: “Farm families are incredibly resilient, but…” people still need help. That “but” is the whole argument. The resilience is maxed. The design is the next lever. 

Key Takeaways

  • If you’re logging more than 60 hours a week across milking, calves, and cropping, treat that as an operational risk metric — not a badge. The data ties that range straight to burnout. 
  • If you’re quoting the “3.5x” number, stop. It was corrected down — say “meaningfully higher risk” instead. It’s the honest and defensible version. 
  • If you’re solo past roughly 120 cows, run the added-labor numbers first. If you’re under 80 and milking alone, start with beef-on-dairy and custom cropping — they usually pay back faster.
  • If you’re eyeing robots, budget for the alarm stress and the seven-year cash-flow valley — and pair them with automated feeding, which the data links to better wellbeing. 
  • If you’re breeding your bottom third to dairy out of habit, switch to beef. Fewer replacements means fewer 10 p.m. February chores and $22–$65 CAD/USD more margin per cow. 
  • If share-milking is on the table, cap the hours in the contract — or you’ll just move the burnout to whoever signs it. 

So here’s the number worth running this week: which single task on your place eats the most hours for the least joy — and what would it actually cost to hand it off before next calving? Do that math with your accountant at the table, not in your head at 2 a.m. And tell us in the comments which of the four fixes you’d pull first, and why — we read every reply, and the sharpest ones shape what we dig into next.

⚠️ You don’t have to run these numbers alone. Canada: National Farmer Crisis Line — 1-866-FARMS01 (1-866-327-6701), 24/7 · Talk Suicide Canada — 1-833-456-4566 · Ontario Farmer Wellness Initiative — 1-866-267-6255United States: Call or text 988 · AgriStress Helpline — 833-897-2474 · Farm Aid — 1-800-FARM-AID In an emergency, call 911.

Run Your Numbers

Farm Benchmark Snap Check — This piece names four levers; the Snap Check pressure-tests three of them in under a minute. Plug in 3–5 numbers and see, in dollars per cow, whether your margin exposure, heifer pipeline, and robot payback land in the Strong, Watch, or Risk band — then decide which hour to buy back first.

Complete references and supporting documentation are available upon request by contacting the editorial team at editor@thebullvine.com.

Learn More

The Sunday Read Dairy Professionals Don’t Skip.

Every week, thousands of producers, breeders, and industry insiders open Bullvine Weekly for genetics insights, market shifts, and profit strategies they won’t find anywhere else. One email. Five minutes. Smarter decisions all week.
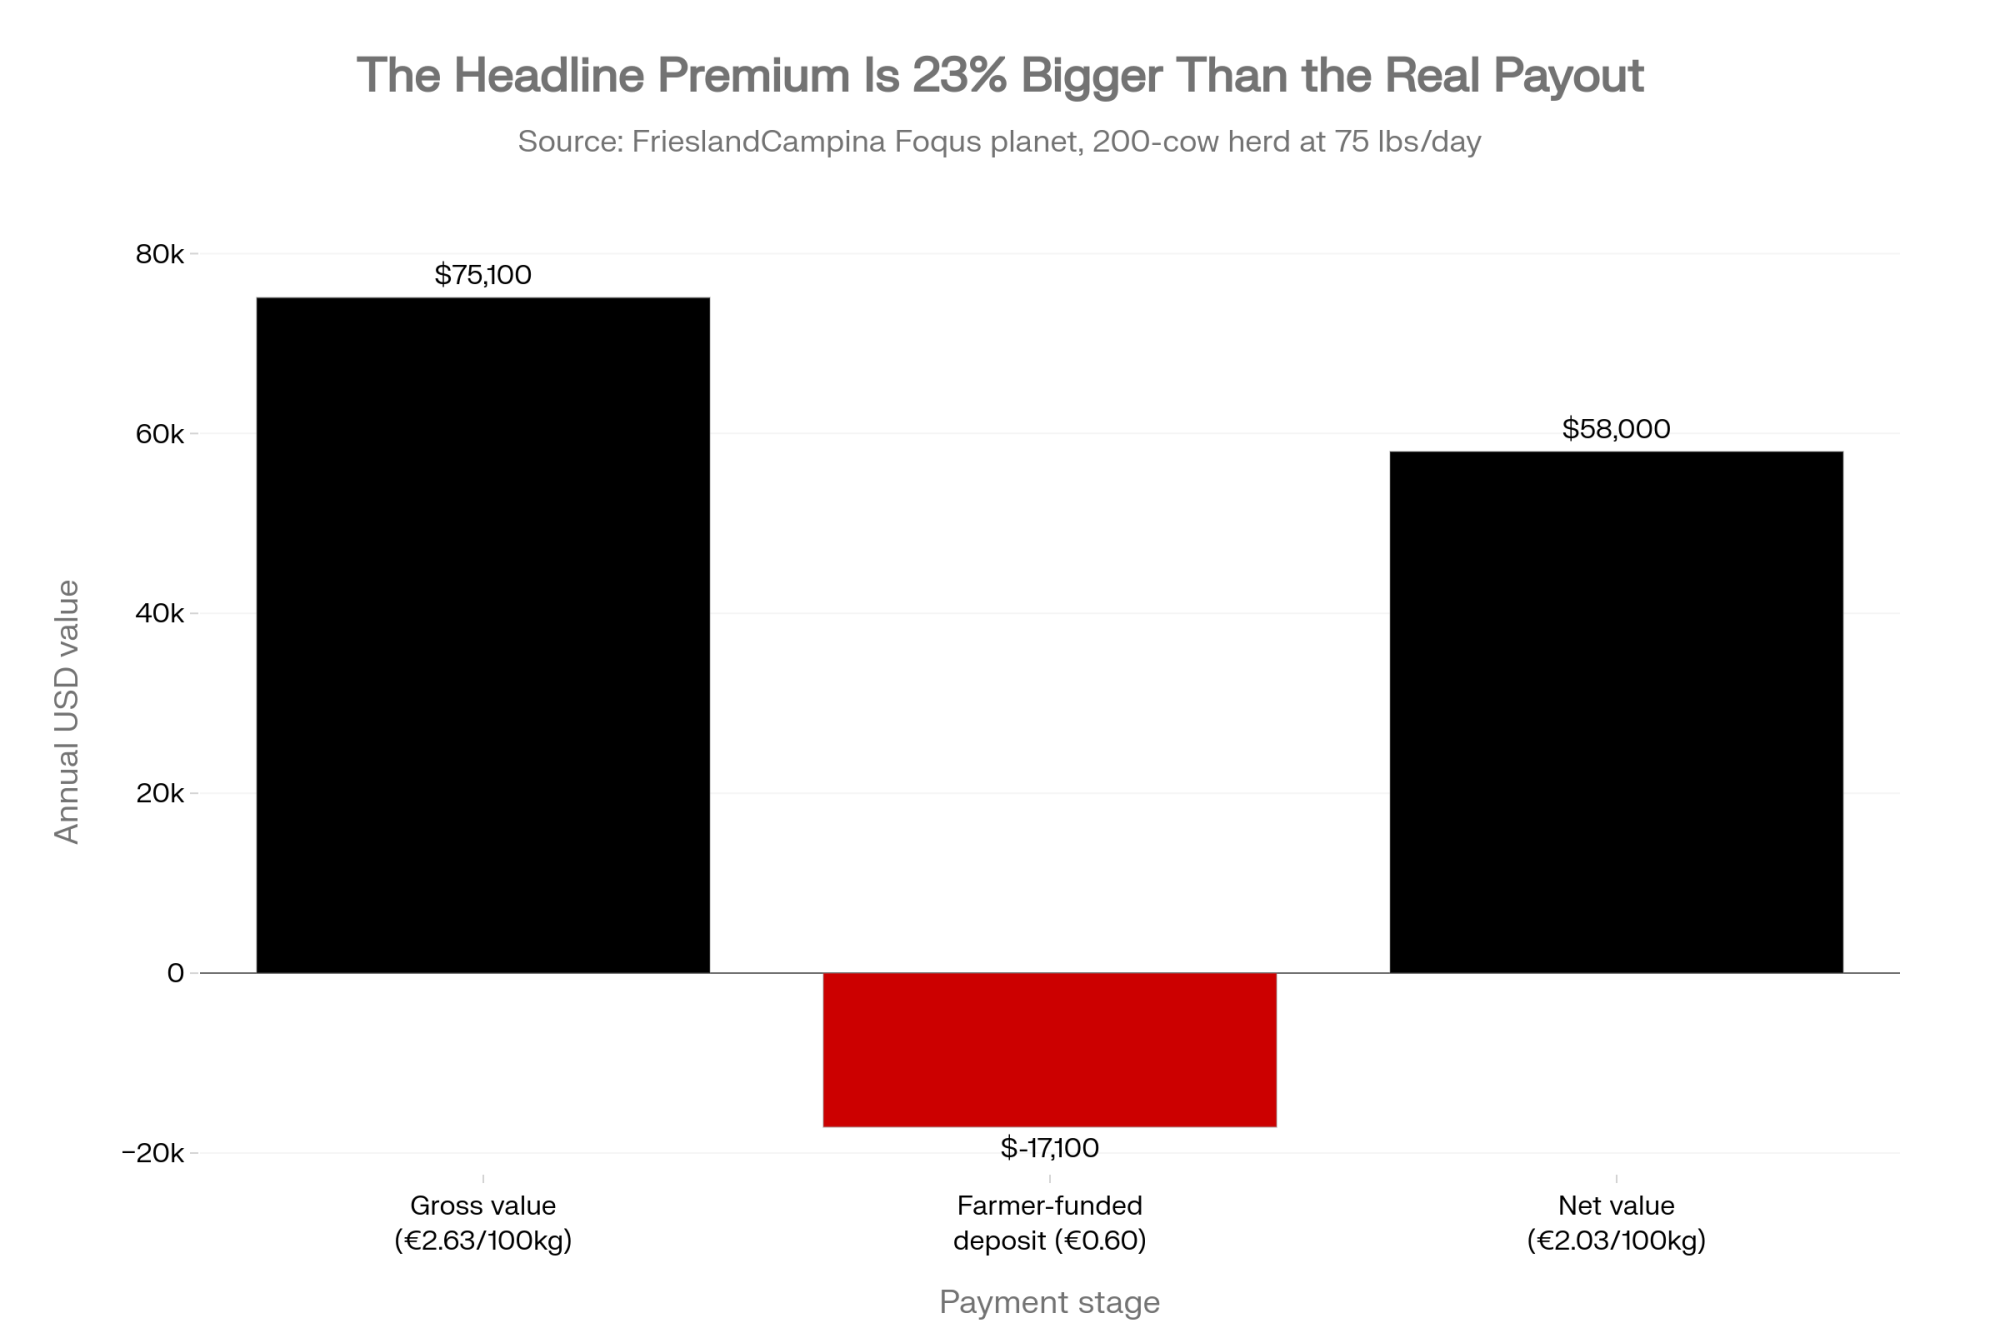
NewsSubscribe
First
Last
Consent

The Bank Stopped Asking If You Paid. Now It Asks How Long You’d Last at $17.

It’s renewal season. Your banker already ran your cows at $17 milk and watched the working capital run dry on a screen you’ve never seen. Have you run that number yet?

Executive Summary: Your lender has already run your herd at $17 milk for 2026–2028 — the question is whether you’ve run the same number, because the test just quietly switched from “have you always paid?” to “how many months do you last before the working capital’s gone.” That shift hits 200- to 1,000-cow operators hardest: ERS pegs 2026 all-milk near $20.70/cwt against a full economic cost close to $23.50, so a 400-cow herd is bleeding roughly $2.80/cwt — call it $300,000 a year — through equity and borrowing before basis drag even lands. Cornell’s 2023 PRO-DAIRY summary put the average farm’s debt-service coverage near 0.29, meaning a lot of dairies couldn’t fully cover payments in a decent income year, let alone at the $17 your banker is stress-testing. Sit on your hands for 18 months, and that gap runs $300K–$500K in lost margin and equity; Chapter 12 filings already jumped 46% in 2025, and Kooser Farms filed twice in six years. The FMMO make-allowance change stacks on top — 85–93¢/cwt off class prices, $337 million pulled from producer pools in 90 days — and it now pays component pounds shipped, not test percentage, so three cycles bred for high fat and low volume can quietly become a liability. The fix isn’t complicated: run your own DSCR at $17 before renewal season, check working capital per cow against the $450 line, and walk into the bank first with your numbers instead of last with a tax return and a story. If your breakeven at $17 is a number you can’t say out loud right now, that’s the thirty-minute job that changes every decision after it.

Editor’s note: The 400-cow figures below are a composite scenario, modeled from multiple mid-size U.S. dairy financials and Cornell PRO-DAIRY benchmark data — built from real numbers, not one real farm. The named farms and counselor session referenced are real and sourced. Price and cost figures reflect USDA and industry data as of June 2026.

Earlier this year, a 550-cow Wisconsin dairy sat down with a farm financial counselor and ran the same numbers their lender was about to run. Same cows, same parlor, same management that had always made the payment. What changed wasn’t the farm — it was the test the farm was being judged against. That’s the quiet shift reshaping mid-size dairy in 2026: your lender relationship stopped running on payment history and started running on a forward stress test.

Here’s the short version. Your banker isn’t really asking “have they always paid?” anymore. They’re asking how many months this business survives $17 milk before the working capital runs dry. Two very different questions. And the gap between them is exactly where 200- to 1,000-cow operators are getting caught.

What’s Actually Changing

For years, ag lenders ran a trailing 12-month debt service coverage ratio. Did you cover your payments last year — yes or no? That’s not the test anymore. Lenders now model forward DSCR at lower milk prices and higher interest rates, stress-testing your cash flow against that scenario rather than the rear-view mirror. The same three-scenario drill banks run on their own books — most likely, downside, worst-case — they’re now running on your file.

DSCR is just the cash you’ve got to service debt divided by your total debt payments. Farm Credit Canada calls 1.5x healthy, 1.0–1.25x tight but manageable, and anything under 1.0x a flashing red light — the farm can’t cover payments from operations alone. Now the uncomfortable part. Cornell’s PRO-DAIRY Dairy Farm Business Summary for the 2023 business year — 127 New York farms — put the all-farm average DSCR near 0.29, with the lowest-profit group around 0.34. Many dairies couldn’t fully cover debt payments even in a decent income year.

Who’s most exposed? The middle. USDA’s Economic Research Service reports licensed U.S. dairy herds fell 63% — from 66,825 in 2004 to 24,811 in 2024 — while average herd size more than doubled. The 200- to 1,000-cow herd lands in a hard spot on the cost curve: too big to run on sentiment, too small to claim the lowest cost structure. ERS’s cost-of-production data makes the gap concrete:

Cost to make 100 lbs of milk, by herd size

Herd sizeCost per cwt
Under 50 cows$42.70/cwt
200–499 cows~18–21% above the largest herds
2,000+ cows$19.14/cwt

The middle pays more per cwt than the big herds — and ships less volume to spread it over. (2021 ERS; latest full national breakdown available.)

How It Plays Out on Real Farms

Run that Wisconsin operation forward on one clean baseline. ERS’s June 2026 forecast puts 2026 all-milk at $20.70/cwt — revised down 55 cents from the month before — while full economic cost of production sits close to $23.50/cwt. That’s the number that matters: a gap of roughly $2.80/cwt between what it costs to make the milk and what the milk pays back.

Now the barn math. A 400-cow herd at about 75 lbs/cow/day moves roughly 300 cwt a day — call it 110,000 cwt a year. Multiply that $2.80 gap across the year, and you’re absorbing better than $300,000 through equity and borrowing, unless something changes. Stretch it across 18 months of doing nothing, layer in the basis drag below, and you’re looking at $300,000 to $500,000 in lost margin and equity. Here’s how the rest of the price picture stacks up around that baseline:

The numbers your lender is working with

LinePrice
ERS 2026 all-milk forecast$20.70/cwt
Lender stress-test price$17.00/cwt
USDA 2026 all-milk (Feb WASDE)$18.95/cwt
Full economic cost of production$23.50/cwt

Your milk check moves with the top three. Your survival is judged against the $17 line.

Then it stacks. As regional milk volume grows, basis and premiums can tighten — Bullvine’s regional milk-price analysis associates this with net price differences of 40 to 60 cents/cwt in some regions.¹ On a 9,000-cwt monthly check, that’s $3,600 to $5,400 a month, or roughly $43,000 to $65,000 a year, gone before you touch a single thing on your own farm. None of it lands as one dramatic blow. Ninety cents here, fifty thousand there.

And you usually find out late. Bullvine’s reporting describes the tells — quarterly financial requests where you used to send them once a year, a new credit analyst in the room, an off-cycle appraisal, an operating line that stops expanding. The shift from partner to decision-maker happens inside the committee before anyone says it out loud in your barn. The proof it’s already happening: U.S. Chapter 12 farm bankruptcy filings hit 315 in 2025 — a 46% jump — and some operations are filing twice. Kooser Farms of Pennsylvania filed Chapter 12 in October 2025, six years after its first filing in 2019; a federal judge confirmed its second restructuring plan in February 2026.

What’s on the Committee’s Screen

So what are they actually looking at? More than character and collateral. They run your DSCR at base and stress prices — current cash flow at $18.95 milk, then at $17, sometimes $16 — plus a rate bump on any variable debt, watching for where you cross below 1.25x and 1.0x. They check working capital per cow — Compeer flags a management goal above $450/cow — as well as your operating expense ratio and debt repayment per cwt. And they read the trend lines: is equity eroding? Is liquidity shrinking year over year?

MetricHealthyWarning zoneRed flag
DSCR1.5x+1.0–1.25xBelow 1.0x
Working capital/cow$450+$300–$450Below $300
Debt-to-asset ratioUnder 55%55–70%Above 80%
Operating line drawnUnder 50%50–80%Above 80%

The rate side matters more than it used to. Farm Credit Services of America projects Class III to average around $17.25/cwt in the second half of 2026, stress-tested against operating-loan rates that are well above where they were a few years ago. So a herd that penciled fine at the cheap money and $20 milk of three years back can fail the same committee’s test at today’s rates and $17 milk, with not one cow sold and not one ration changed. That’s the trap. The farm didn’t get worse. The test got harder.

None of these formulas are secret. Compeer publishes them. Farm Credit Canada explains them. Your local extension office hands them out for free. So the gap isn’t access. It’s time, identity, and a little bit of dread. You’re running a multi-million-dollar business and a hands-on farm at once, and most operators were raised to think of themselves as dairy farmers first, never the CFO. Purdue Extension has made the point that producers under financial stress tend to bury themselves in chores and put off the long-term decisions.

There’s a real cost to opening that file, too. Researchers define financial stress as the psychological strain that comes from worrying about money — for farm households it’s a measurable, front-and-center part of the work, not a footnote. The first time you run DSCR at $17 and see a number below 1.0, the story flips from “we’re tight but okay” to “this has to change.” That moment stings. It’s also the only place real decisions start. If the math feels heavier than the spreadsheet, you’re not the only one — in the U.S., the 988 Suicide & Crisis Lifeline and the Farm Aid hotline (1-800-FARM-AID) are there for exactly that pressure; in Canada, Do More Ag connects producers to the same kind of help.

How Much Does Standing Still Actually Cost?

Scenario (400-cow herd)Annual cost gap18-month cumulative cost
Cost-of-production gap ($2.80/cwt × 110,000 cwt)~$300,000~$300,000–$500,000
Regional basis drag (40–60¢/cwt)~$43,000–$65,000Stacks on top of above
Cornell PRO-DAIRY avg. DSCR (2023)0.29Can’t fully cover payments in a good year

Freezing isn’t passive. It’s a decision to accept the status quo — and in 2026 the status quo carries a price tag. For a 400-cow herd carrying that economic-cost gap plus basis drag, doing nothing for 18 months runs comfortably into the $300,000 to $500,000 range in lost margin and equity, before you count the heifer-replacement squeeze coming down the pipe. When a producer says “we’ll ride it out,” the math usually hears “we’ll give up a quarter-million and hope the market bails us out before the lender’s spreadsheet does.”

The outlook doesn’t reward waiting, either. The University of Georgia’s 2026 outlook cited a USDA all-milk projection near $18.75/cwt, with prices expected to stay soft through much of the year. Class III futures have priced milk near $17/cwt through the third quarter of 2026. Riding it out is a bet on a bounce the current data doesn’t promise.

Is Your Breeding Strategy Already Behind the Pay Formula?

Here’s where it gets interesting for herds that chased butterfat for a decade. The FMMO make-allowance changes that took effect June 1, 2025, cut class prices roughly 85 to 93 cents/cwt and, per American Farm Bureau Federation analysis, pulled about $337 million out of producer pool values in the first 90 days. The change was adopted to reflect processors’ rising plant costs, but the skim-composition update that would have partly offset the producer side didn’t take effect until December 31, 2025 — so you absorbed the full hit before any relief showed up. Butterfat’s component value, meanwhile, slid from around $2.95/lb in January 2025 to roughly $1.45/lb a year later.

The deeper shift is in the formula logic: Net Merit $ now rewards component pounds shipped, not just test percentage. Bullvine modeled two 500-cow Upper Midwest herds on NM$ planning prices — same cow count, opposite breeding philosophy — and the spread is the part worth screenshotting:

Two 500-cow herds · same count · opposite strategy (modeled)

HerdButterfatMilk/cowComponent value
A — “High Test”4.25%72 lbsbaseline
B — “High Volume”4.05%82 lbs~$210,000 more per year

Lower test, higher volume — and the pay formula now rewards exactly that. The modeled edge ranges from roughly $55,000 (fluid-heavy order) to $95,000 (manufacturing order) on a comparable component improvement.

Three breeding cycles built for high test, low volume can quietly turn into a structural disadvantage after a single formula change. There’s a fuller breakdown in our look at [what butterfat’s crash reveals about breeding into a moving market][LINK-1] — worth reading before your next sire decision.

Options and Trade-Offs

There’s no single right move. But there are a few clear paths producers are taking, each with real trade-offs.

  • Run your own stress test and get to the lender first — within 30 days. Pull your last 12 months of financials and calculate DSCR and full breakeven at $17–$18 milk, including unpaid family labor and depreciation at replacement cost. Then book the meeting before renewal season books it for you. Bullvine’s reporting and Ag Proud’s stress-test guidance both find that operators who walk in with their own rolling cost-per-cwt and downside scenarios get more flexibility on terms than those who show up with a tax return and a story. The requirement is honesty. The only real risk is emotional — you have to be willing to see the number.
  • Restructure debt, but only if you fix the underlying problem. Re-amortizing carry-over debt or refinancing can ease the monthly squeeze. The catch: restructuring without closing the cost gap delays your position on the curve, as Bullvine’s analysis puts it. Wisconsin Extension makes the same point a blunter way — paying down dead-weight debt and rebuilding working capital often beats the more exciting capital upgrade. It buys time, not a fix.
  • Add non-correlated revenue. Lenders like income that isn’t chained to the Class III/IV roller coaster, and beef-on-dairy calves sell into the fed-cattle market, not the milk market. But lean too hard on it, and you drain a pipeline you’ll need later — replacement heifers hit a record $3,010/head in July 2025, a 164% jump, and have topped $4,000 at some auctions.
  • Plan a controlled exit with equity intact. For some operators, the right call is selling on your own timeline rather than the bank’s — or filing a strategic Chapter 12 while equity remains, which works best when debt-to-asset is in the 55–70% range, and the operation can pencil after restructuring. It’s the hardest path emotionally and the cleanest one financially when DSCR is structurally broken.

What’s Stopping You From Running the Numbers Today?

If the formulas are free and the stakes are six figures, why is the 400-cow operator so often the last person to run them on themselves? Usually it isn’t ignorance. It’s that the day-to-day grind eats the hours, and there’s a quiet fear that the real cost-per-cwt sits three dollars higher than the story you’ve been telling yourself. Heavier to face than a balky parlor.

But here’s the reframe. Once you’ve seen your own math in the same light your lender is using, every other decision — breeding, expansion, exit, even who you ship to — stops being a guess and becomes a choice. That Wisconsin dairy didn’t walk out of the counselor session with better cows. It walked out knowing which months of the year actually broke even and which ones bled — the same numbers the bank was already holding. 

Your 30-Day CFO Checklist

Work these in order. Each step has a trigger — a number that tells you whether to move on or stop and act. Print it, screenshot it, tape it to the office wall.

1. Run the core number. Calculate DSCR at $17 milk using this year’s feed bill and current rates. → Trigger: below 1.20x at $18.95 milk is your warning line — stop here and make it a 30-day priority. Kansas City Fed surveys already show that 60% of district lenders report lower farm income and loan repayment rates at their weakest since 2020, so the squeeze is real even as overall stress is still building.

2. Check your liquidity cushion. Pull working capital per cow and your operating-line draw. → Trigger: line more than 80% drawn, or working capital well under $450/cow? Those are the exact trend lines your committee is watching.

3. Read your leverage. Find your debt-to-asset ratio. → Trigger: past 60%, restructuring talks should already be happening; past 80%, call an ag attorney this week.

4. Re-test against the rate environment. If any debt is on variable rates, re-run the test at today’s money and $17 milk. → Trigger: the same cows fail a test that penciled three years ago? The rates moved, not the herd.

5. Audit your component strategy. Model fat and protein pounds — not test percentage — against the post-June 2025 pay formula. → Trigger: three breeding cycles of high-test, low-volume genetics? Reweigh it before your next sire pick.

6. Pressure-test your side revenue. If beef-on-dairy is propping up margin, check what it’s doing to your replacement pipeline. → Trigger: heifers north of $3,010/head mean you may be selling tomorrow’s herd to fund today’s cash flow.

So here’s the real question — not whether your lender has run these numbers, but whether you’ve seen the same spreadsheet they’re working from. Where does your breakeven actually sit at $17 milk, and how many months of it can your balance sheet absorb before something gives? The 550-cow Wisconsin dairy found out by choosing to look. Most won’t, until the committee looks for them.

Key Takeaways

  • Your lender’s already stress-testing you at $17 milk against a full cost near $23.50/cwt — run your own DSCR at $17 before renewal season, because on 400 cows that gap is roughly $300K a year through equity.
  • If your DSCR comes in under 1.0 or working capital’s below $450/cow, that’s not a wait-and-see number — get to the bank first with your own math instead of last with a tax return and a story.
  • The FMMO change now pays component pounds shipped, not test percentage; if you’ve bred three cycles for high fat and low volume, reweigh that before your next sire pick.
  • Sitting still for 18 months runs $300K–$500K in lost margin and equity, and Chapter 12 filings jumped 46% in 2025 — riding it out is a bet on a bounce the current numbers don’t promise.

Run Your Numbers

Dairy Profit Projector — Before renewal season, run your herd at $17 milk and see your own breakeven price, IOFC per cow per day, and 12-month margin — the same math the committee’s already holding. Walk in with the number, not a tax return and a story.

Complete references and supporting documentation are available upon request by contacting the editorial team at editor@thebullvine.com.

Learn More

The Sunday Read Dairy Professionals Don’t Skip.

Every week, thousands of producers, breeders, and industry insiders open Bullvine Weekly for genetics insights, market shifts, and profit strategies they won’t find anywhere else. One email. Five minutes. Smarter decisions all week.
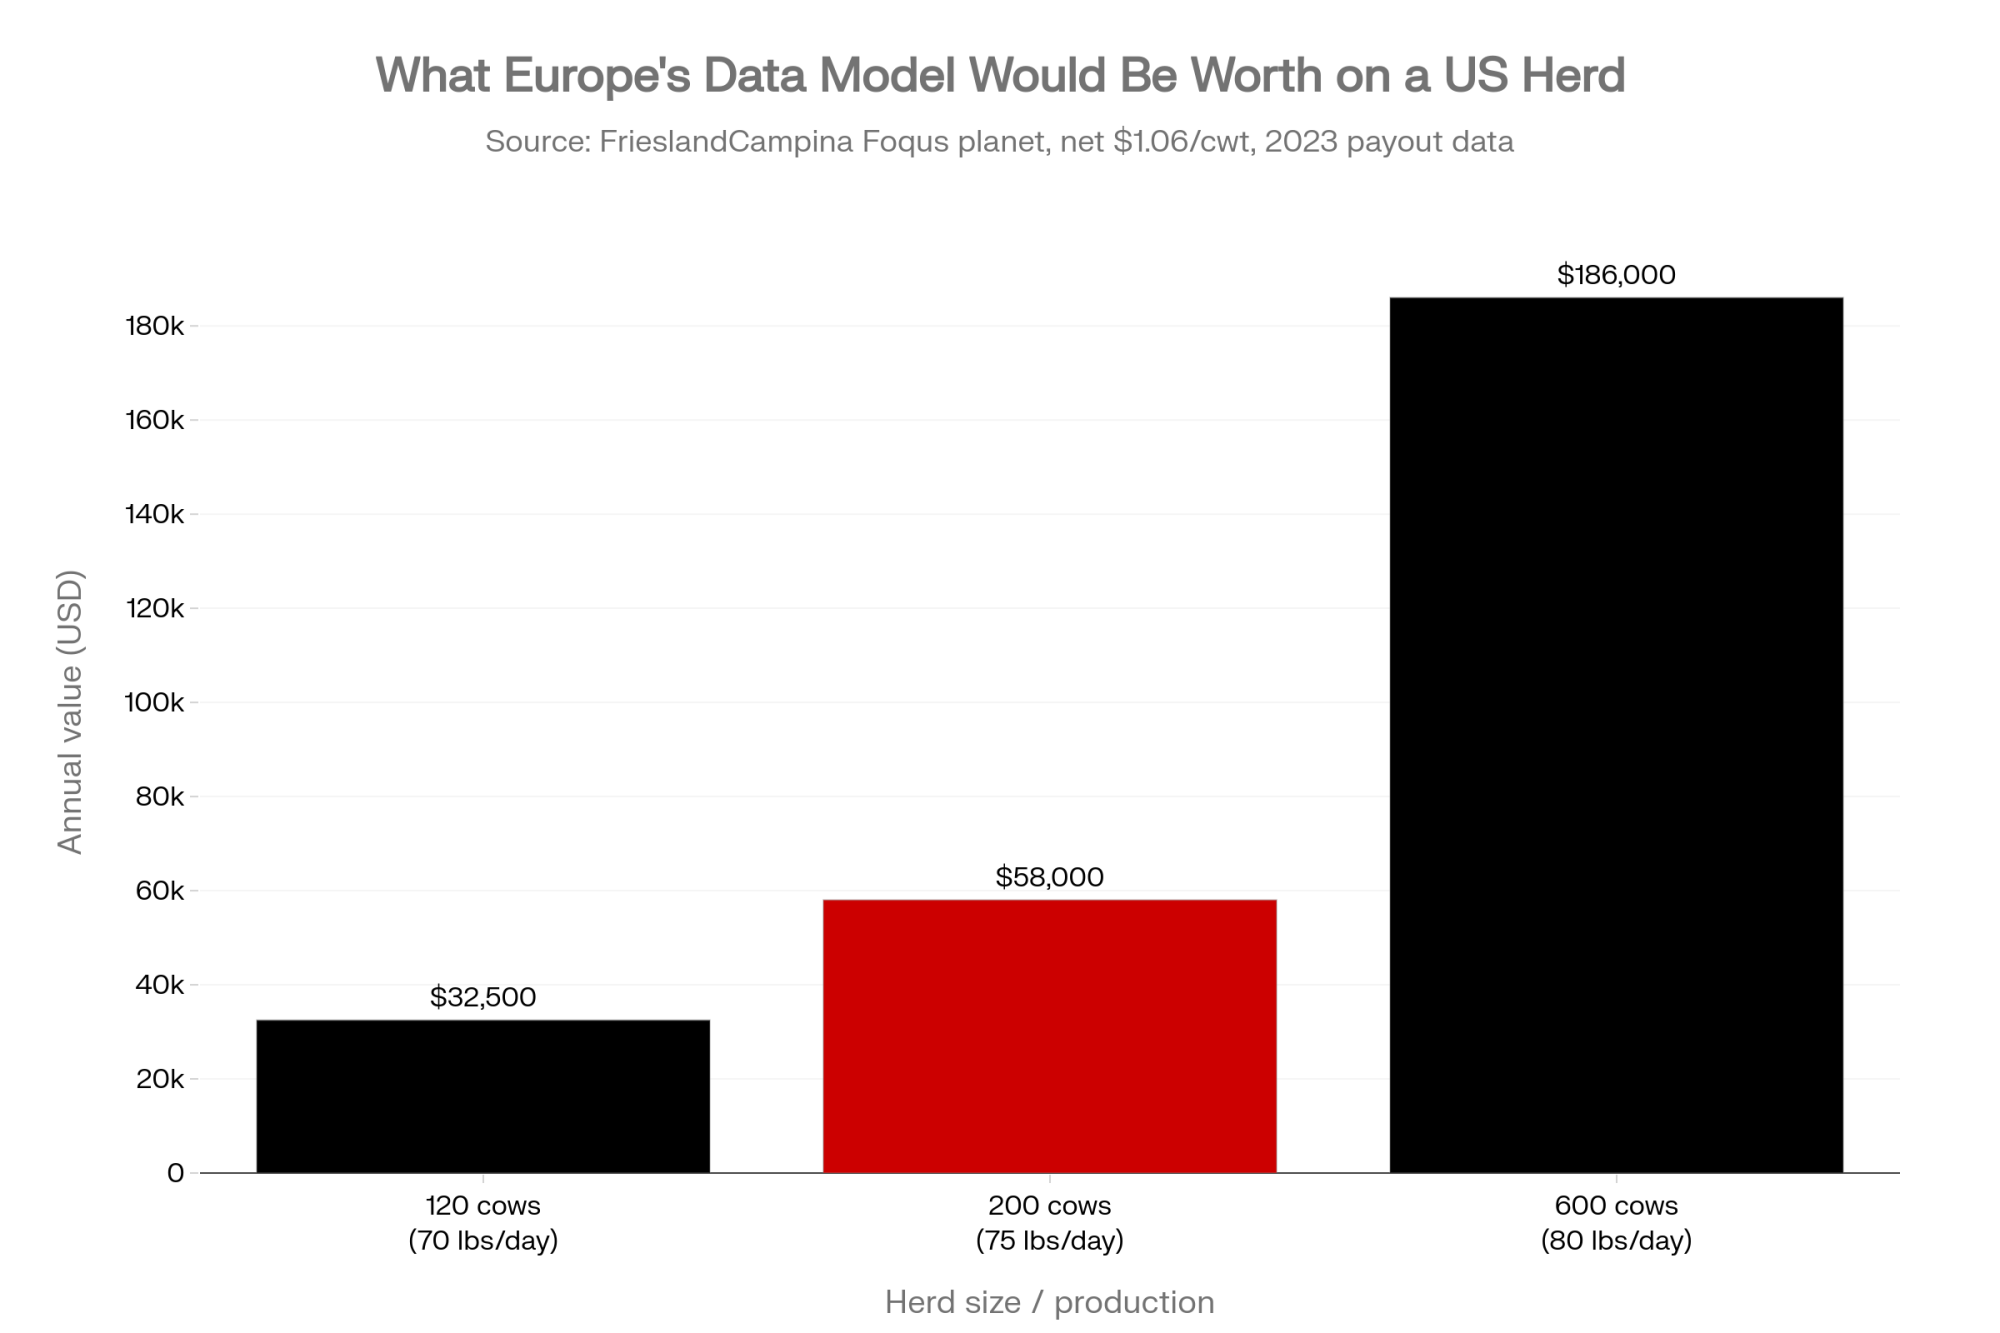
NewsSubscribe
First
Last
Consent

 82% of Colostrum Samples Failed the Bacteria Test. The Cow Wasn’t the Problem.

It’s 2 a.m., week six of calving. That colostrum’s been in the bucket for hours, the refractometer’s in the vet box, and the calf looks fine. In a benchmark study, 82% of samples were over the bacteria limit — and the cow was never the problem.

Executive Summary: A calf can hit 4 L of ≥22% Brix colostrum, on time, and still fail passive transfer — because high bacterial load physically blocks IgG absorption at the gut wall, so the number looks right while the immunity isn’t there. In a benchmark study, 82% of colostrum samples tested over the 100,000 CFU/mL bacteria limit by the time they reached the calf, and the failure lived in the two-to-six-hour handling window, not in the cow. Calves with failed passive transfer carry 2.46× the odds of dying and cost about €60 a head up front — and on a 200-cow herd at Ontario’s 37% FPT rate, that’s roughly 67 calves and C$6,450 leaking out before you count the first-lactation milk those heifers never make. It hits hardest on compact-calving herds, where the SOP written wide-awake gets handed to someone running on six hours of sleep in week six. The fixes are cheap and closeable: move the tools to the pen, run a laminated four-check card, pasteurize at 60°C/60 min (not 63, where you lose 34% of your IgG), and blood-sample calves at the start and end of the block to catch the drift. Miss it, and the bill doesn’t show up now — it lands three years out on a DHIA sheet, and nobody connects it back to a 2 a.m. bucket. Worth the full read if you’re calving in a tight window and have never actually measured what your calves absorbed.

colostrum bacteria contamination

It’s 2 a.m. in week six of a compact spring calving. Your best calf person — the one you’d trust with anything — has been awake since before yesterday’s afternoon milking. Three calves hit the ground in the last two hours. The refractometer is in the vet box across the yard. The tube feeder is somewhere. And the colostrum from that first heifer has been sitting in a bucket at barn temperature for longer than anybody’s tracking.

Nobody’s writing down a timestamp. Nobody’s culturing that bucket. And the calf standing in front of everyone looks absolutely fine. That’s the trap. Whether that calf got real immunity or just a warm meal is being decided right now, in the dark, by a tired human — and you won’t find out which for three years, when a first-lactation heifer quietly underperforms, and nobody connects it back to this night.

The Failure Nobody Can See Coming

Here’s the reframe that changes how you run the whole block: the colostrum leaving the cow is usually fine. Westhoff’s invited review in the Journal of Dairy Science (2024) makes the point plainly — colostrum IgG concentrations from first-, second-, and later-lactation dams often aren’t significantly different, and udder quality is frequently adequate. Shivley’s US preweaned heifer study (JDS, 2018) lands in the same place: failure of passive transfer traces back to how colostrum gets harvested, handled, and delivered — not to inherently bad cows.

So the weak link isn’t bovine. It’s the two- to six-hour window when people, protocols, and equipment decide the calf’s fate. And that’s oddly hopeful, because it means the failure is almost entirely inside your control.

One upstream lever does sit at the cow, and it’s worth naming: quality at the udder is usually fine, but if you’re chasing a genuine quality problem at the source, look at dry-period length and close-up protein before you blame the cow. Short dry periods and thin close-up rations cut the IgG mass a cow packs into that first milking. That’s the exception, though — not the rule. For most herds, the leak is downstream.

But it’s invisible in the moment. Beam’s foundational US work (JDS, 2009) tied failure of passive transfer to higher neonatal death and lower first- and second-lactation milk. And the Raboisson meta-analysis put hard odds on what that failure costs a calf.

WHAT FAILURE OF PASSIVE TRANSFER DOES TO A CALF Raboisson et al. meta-analysis, Veterinary Medicine International, 2016; mortality odds ratio confirmed in Abdallah et al., JDS, 2022

  • 2.46× the odds of dying (Raboisson 2016; confirmed Abdallah 2022)
  • Roughly 2× the odds of being treated for disease
  • Elevated overall preweaning morbidity
  • €60 average added cost per dairy calf (prediction interval €10–€109)

You can’t see any of that by looking at a calf on day one. You can’t see passive transfer with your eyes.

Where Does a Compact Block Actually Break First?

Ask where compact calving breaks, and the honest answer — pulled from the labor studies, not a gut feeling — is that it breaks on people and calves long before it breaks on the milk cheque.

Hogan’s labor time-use study of spring-calving Irish farms (JDS, 2022) found average labor input of about 2,200 hours per farm, with milking the single most time-consuming task at 31% and calf care second at 14%. The daily load climbs hard into the calving months. Beecher’s Irish work (2023) underlines who carries it: the farmer and farm family account for roughly 77.5% of the annual labor requirement — exactly the people who can’t clock out when calving peaks.

Then there’s sleep. Hall’s study of block-calving workers in New Zealand (JDS, November 2024) clocked average sleep during peak calving at six hours and 15 minutes a night — below the 7-to-9 hours needed for sound cognitive function — and it dropped further as the season wore on. That’s the setup for failure. Tired people making hundreds of micro-decisions on short sleep don’t skip the big visible jobs — milking still happens, calves still get fed. What slips are the small, time-sensitive, hygiene-heavy steps: the rinse, the Brix test, the timing.

Palczynski’s stakeholder interviews in England (Animals, 2021) found farmers and vets repeatedly describing calf outcomes as hinging on small, easily-skipped tasks — the first casualties when the barn’s on fire. Mulkerrins’ qualitative analysis of compact calving (JDS, 2022) identified the trade-off directly: pushing the six-week calving rate delivered more days in milk and better cash flow, but it also brought a heavier workload and the challenge of managing a large number of calves born in a condensed window. Northern Ireland’s DAERA advisory (2022) put it plainer still, cautioning that a poorly managed compact block can drive inefficiency or burnout among family and paid labor.

None of that argues against compact calving. The grass efficiency is real. The cash-flow gain from a tight block is real. The friction lands somewhere the pasture budget doesn’t track.

The fault line runs through the people who don’t sleep in April — and the calves who look fine tonight. That’s the part the spreadsheet never shows.

Design the Protocol for the Tired Person, Not the Fresh One

Most colostrum SOPs get written by someone wide awake at a whiteboard. Then they get handed to someone running on six hours of sleep in week six. That’s the design gap. And you can’t train your way out of it.

The National Dairy FARM Safety Manual (2021) makes the case that people are vulnerable to error and fatigue, and that ergonomic design is needed to cut performance error. The fix, borrowed from human-factors work in healthcare and aviation, is to stop relying on memory and vigilance and start building the trigger into the physical environment. Ontario’s OABP veterinary SOP guidance (2017) recommends numbered bullet-point steps, short sentences, fewer than 10 steps for a simple task, and — critically — keeping the SOP physically accessible at the point of use rather than filed in the office.

Put it simply. If the refractometer lives in the vet box, it gets used when things are calm. If it lives on a hook at the maternity pen, it gets used at 2 a.m. Location is protocol design.

Ontario’s OMAFA colostrum factsheet (August 2024) boils the whole decision down to four pass/fail checks — no judgment call, no decision tree. Print it. Laminate it. Hang it on the pen.

🐄 THE 4-Q COLOSTRUM CARD — HANG IT ON THE PEN Four yes/no checks. Any “NO” = fix it before the calf drinks. Source: OMAFA, “Colostrum for the Dairy Calf,” Aug 2024

#CHECKTHE STANDARD☐ YES / ☐ NO
1QUANTITY4 L (about 1 gallon), or 8.5–10% of birth weight, at first feeding
2QUICKNESSFed within 1–2 hours of birth (no later than 6)
3QUALITY≥22% on the Brix refractometer
4CLEANLINESSClean udder prep + clean equipment

All four YES → feed it. Any NO → don’t guess. Fix the gap first.

Four yes-or-no questions a tired person can answer without thinking. And benchmarking is what actually shifts behavior. Sumner’s UBC work (JDS, 2018) found that “benchmarking encouraged farmers to make changes in their calf management by identifying areas needing attention” — not through shame, but by giving them evidence of how their own calves were really performing.

The Bacteria Count That Makes the Decision for You

There’s a failure mode beyond timing and fatigue: sometimes the colostrum itself is the source of contamination. This is where the tired old “natural versus processed” debate ends.

The accepted thresholds, per Godden’s work at the University of Minnesota, are a total plate count under 100,000 CFU/mL and coliforms under 10,000 CFU/mL for good-quality colostrum. The uncomfortable number: in the benchmark work behind Godden and McMartin’s heat-treatment studies (JDS, 2006) — and in Stewart’s critical-control-point study (JDS, 2005) — 82% of sampled colostrum exceeded that 100,000 CFU/mL ceiling, plenty of it with perfectly acceptable IgG. Later commercial-farm work found the same pattern, with 82–92% of samples over the limit (Donahue et al., JDS, 2012). High bacterial load doesn’t just ride along. It competes with immunoglobulins at the gut wall, physically blocking absorption during the narrow window before gut closure. Feed that, and you’re not feeding colostrum anymore. You’re feeding a bacterial slurry with some IgG dissolved in it.

Where does the contamination come from? Not the udder, mostly. Šlosárková’s study of Czech farms (JDS, 2021) isolated E. coli from 9.0% of harvested colostrum samples and found high overall microbial contamination — pointing squarely at hygiene and sanitation around collection, not the cow. Coliforms multiply fast when colostrum sits warm; the longer it’s in a bucket, the worse the count. Pooling makes it worse again — one dirty sample compromises the whole batch, and a 2023 review in Antibiotics (Miranda et al.) flagged raw and pooled raw colostrum as a route for spreading antibiotic-resistant pathogens.

Once your own culture results keep coming back dirty, pasteurization stops being a luxury add-on and becomes arithmetic. Heating colostrum to 60°C for 60 minutes (140°F) — the “60/60” protocol validated in Godden’s on-farm trials — reduces bacterial and coliform counts well below the threshold while preserving IgG and fluidity. Godden’s randomized trial across six dairies in Minnesota and Wisconsin (JDS, 2012) showed that heat treatment reduced microbial counts and calf morbidity while maintaining IgG concentration. The old trials that scared people off pasteurization ran hotter: McMartin’s batch study (JDS, 2006) found a 34% loss of IgG and a jump in viscosity at 63°C. Sixty and sixty works. Sixty-three doesn’t.

What It Actually Costs — A Barn-Math Walk-Through

Run the numbers on a herd you can picture. A 200-cow operation calving 180 live calves through a compact block. Published FPT prevalence runs wide — Trotz-Williams found 37% on Ontario farms, against 19% on US farms (Beam, JDS, 2009), and dairy-calf reviews put the range anywhere from roughly 13% to 44% depending on test and cutoff (Male Here et al., 2025). Take the high, honest end — 25% to 37% — and see where the leak sits.

THE FPT LEAK — 200-COW HERD, 180 LIVE CALVES / BLOCK

MetricLow end (25% FPT)High end (37% FPT, Ontario)
Calves starting life immunologically short45 calves67 calves
Direct cost @ €60/calf (Raboisson 2016, EU basis)€2,700€4,000
≈ Canadian dollars (mid-2026 rate, ~1.61 EUR→CAD)C$4,350C$6,450
≈ US dollars (mid-2026 rate, ~1.17 EUR→USD)US$3,150US$4,650

Direct cost only — treatment + mortality per Raboisson 2016. Excludes the deferred first-lactation milk loss and early culls, which are the bigger bill.

That’s before you count a drop of the first-lactation milk those heifers won’t make, or the ones culled early.

The direct bill is the small part. The deferred bill — the one that lands on a DHIA sheet three years out — is the part nobody budgets for.

This isn’t a scare tactic. It’s a range built from peer-reviewed cost and prevalence figures, and your own number depends on your calf crop and your actual FPT rate. Which is exactly why it matters: you can’t manage what you’ve never measured.

Options and Trade-Offs for Your Operation

The story points to a few real paths, depending on where your herd sits.

  • Move the tools, not the people (start here). Relocate the refractometer, tube feeder, and a laminated 4-Q card to the maternity pen. When it makes sense: every operation, right now. What it demands: almost nothing but the decision. Where it backfires: a card nobody helped design gets ignored — so build it with the person who actually works nights.
  • Benchmark before you invest. Blood-sample at least 12–14 calves aged 1–7 days, once at the start of the block and again near the end. When it makes sense: before spending on equipment. What it demands: modest vet coordination. Where it backfires: if you sample once and stop, the value lies in the start-versus-finish comparison that exposes fatigue-driven drift.
  • Pasteurize when the cultures say so. When it makes sense: when your own plate counts sit above threshold, and hygiene fixes haven’t moved them. What it demands: real capital — an Iowa State producer survey (2009, in 2009 dollars, so budget higher today) pegged pasteurizers at an average of $8,329 plus about $3,370 in added equipment — plus disciplined time-temperature and cleaning routines. Where it backfires: too-hot or too-long protocols cost you IgG; run 60/60, not 63.
  • This month: blood-sample a batch of calves against the current passive-transfer standard. The 2021 categories put Excellent at serum total protein above 6.2 g/dL (IgG ≥25 g/L) and Poor below 5.1 g/dL (IgG <10 g/L), with a herd goal of more than 40% of calves in the Excellent band and under 10% in Poor (Lombard, 2021; Michigan State Extension, 2023). Fall short of that split, and you’ve found a process failure — not bad luck — and now you know where to aim.

What This Means for Your Operation

  • The single most important shift: assume the colostrum leaving the cow is fine, and treat everything that happens to it in the next six hours as your system’s responsibility.
  • Where does your refractometer actually live — the vet box, or a hook at the maternity pen?
  • Do you know your own colostrum plate counts, or are you assuming clean because you can’t see dirty?
  • If you blood-sampled calves at the start and end of the block, would the numbers hold — or drift as your crew ran down?
  • Is your colostrum SOP written for the person who wrote it, or the person working the 2 a.m. shift in week six?
  • At your herd’s FPT rate, how much future milk are you quietly converting into current stress?

Key Takeaways

  • If a benchmark study found 82% of commercial colostrum over the bacteria threshold, then assume yours could be too until a culture proves otherwise — measure before you trust it.
  • If your plate counts keep coming back dirty after hygiene fixes, then pasteurize at 60°C for 60 minutes (140°F). Just don’t run it hotter — 63°C cost McMartin’s samples 34% of their IgG.
  • If your SOP needs a rested brain to run, it’ll fail in week six — redesign it for the tired person, with the tools at the pen and the decision cut to four yes/no checks.
  • If fewer than 40% of your sampled calves hit the Excellent band, or more than 10% land in Poor, you’ve got a process problem — and only a start-and-end-of-block audit will show you where it cracked.

The block will compress. The workload will spike. Your best calf person will drift toward six hours of sleep whether you plan for it or not. So the real question to carry back to your own barn isn’t whether your cows make good colostrum — they probably do. It’s whether your system can protect that colostrum at 2 a.m. on the fortieth day, when nobody’s writing down the timestamp. What are you going to change before the next block starts?

Run Your Numbers

Calf Feed ROI Tool — Colostrum failure shows up as sick calves and dead heifers you paid to raise. This tool turns better early-life calf investment into a per-calf number, weighing added growth, survival, and treatment savings so you can see whether tightening your program actually pays before the bill lands three years out.

Complete references and supporting documentation are available upon request by contacting the editorial team at editor@thebullvine.com.

Learn More

  • 4 Golden Rules for Optimal Colostrum Feeding — Arms you with an objective, pass-fail blueprint to eliminate 2 a.m. maternity pen guesswork. This breakdown details the specific collection windows and sanitizing practices required to consistently hit the 50 mg/mL immunoglobulin target.
  • $3010 Per Heifer. 800000 Short. Your Beef-on-Dairy Bill Is Due. — Exposes the hidden long-term financial risk of cannibalizing your replacement pipeline for immediate crossbred premiums. Learn to recalculate your breeding spreadsheet before a shrinking heifer crop forces a six-figure capital deficit on your operation.
  • Top 5 Must-Have Tools for Effective Calf Health and Performance — Delivers a concrete diagnostic checklist to transition your calf barn from reactive treatments to automated data tracking. You will leverage precision tools, including serum refractometers and ammonia monitors, to protect calf lungs and boost preweaning daily gains.

The Sunday Read Dairy Professionals Don’t Skip.

Every week, thousands of producers, breeders, and industry insiders open Bullvine Weekly for genetics insights, market shifts, and profit strategies they won’t find anywhere else. One email. Five minutes. Smarter decisions all week.
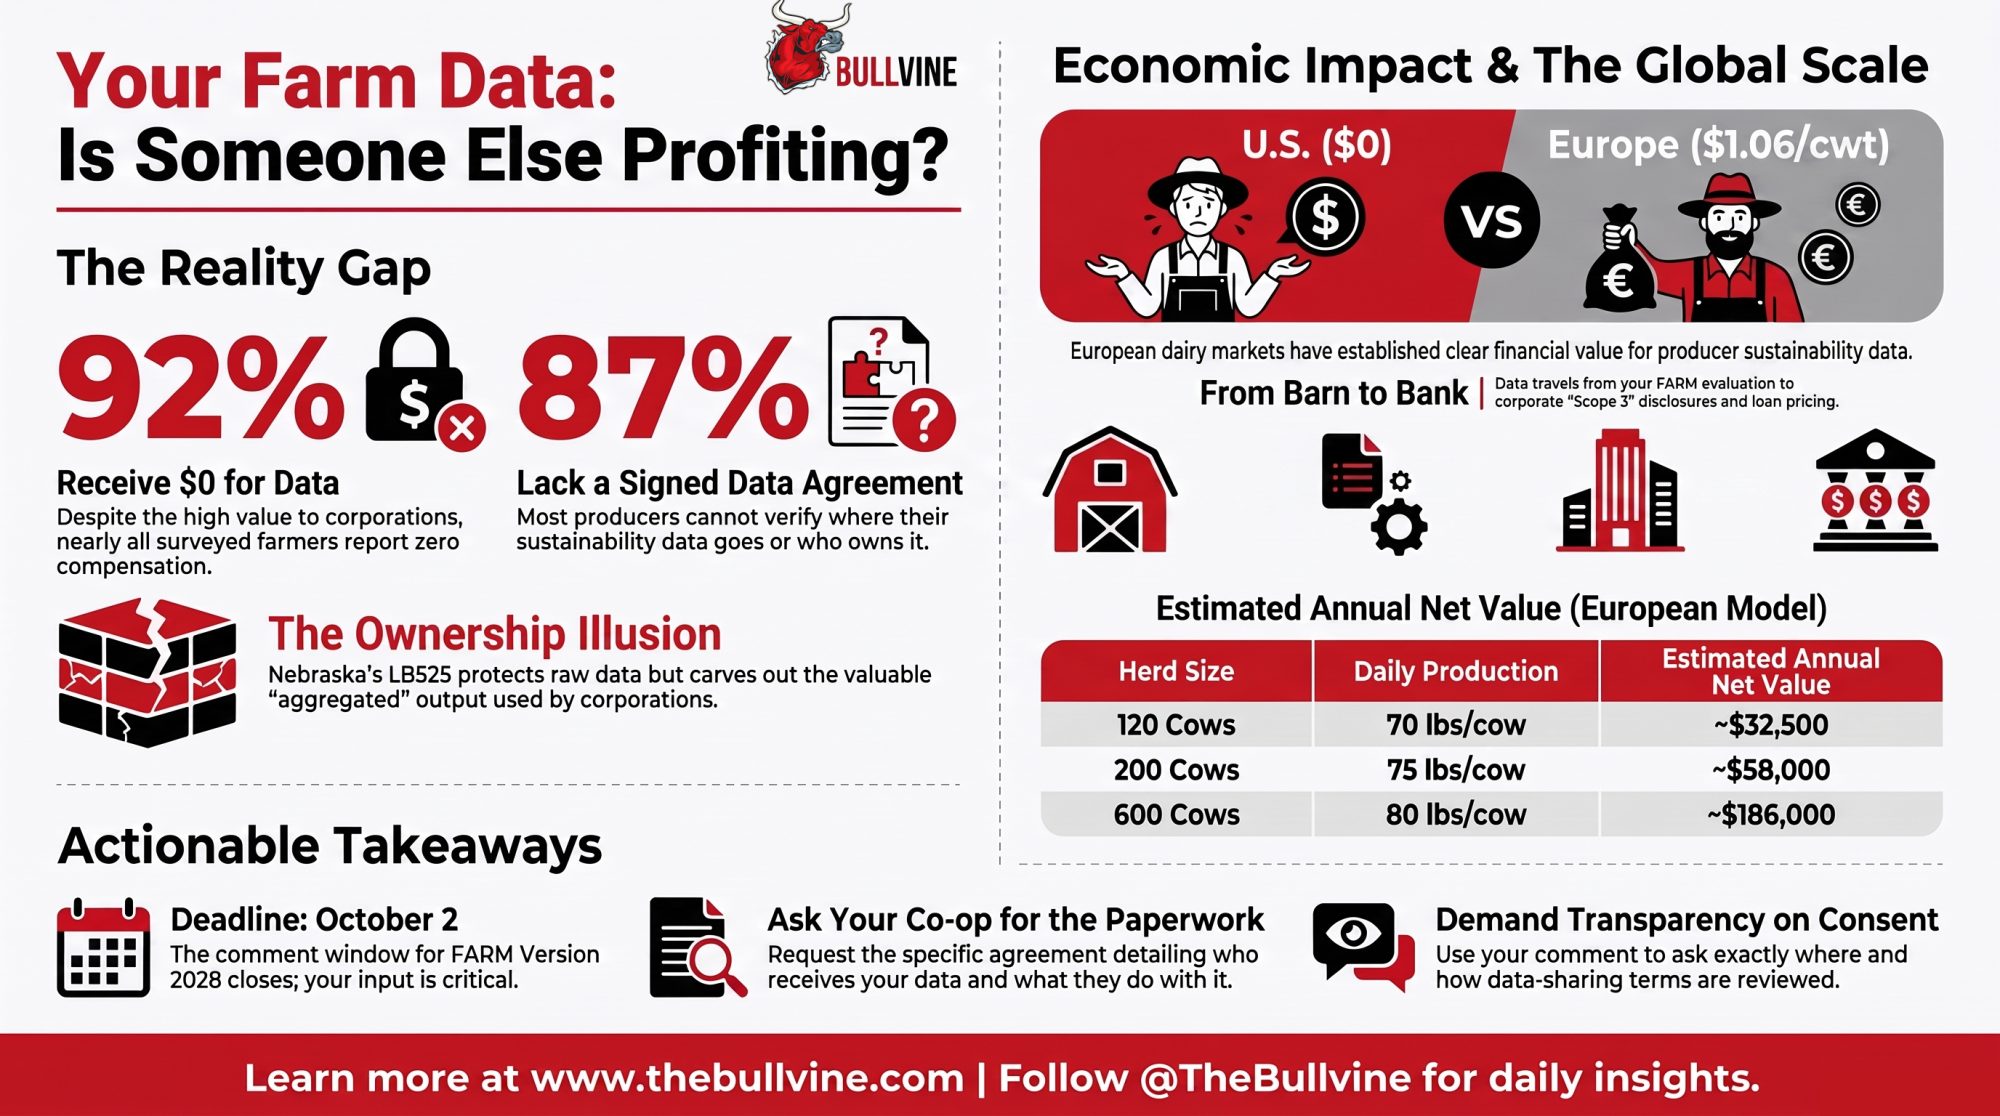
NewsSubscribe
First
Last
Consent

The $1.01/cwt You’re Blaming on the Market Is Actually the Formula

Your check says soft market. Hold June’s cheese, butter, powder, and whey flat, run both formulas, and $1.01/cwt is pure reform — permanent, and it doesn’t leave when cheese comes back.

Executive Summary: At June 2026’s confirmed USDA prices, the June 2025 make-allowance reform is costing Class III $1.01/cwt — and that dollar is pure formula, not market. Hold the month’s butter, cheese, powder and whey flat, run them through the pre-June-2025 formula and the current one, and Class III comes out $16.99 the old way versus $15.98 today; the gap is the reform, isolated from every price swing you’ve been blaming. On a 500-cow herd shipping Class III, that’s about $258/cow and roughly $129,000 a year — permanent, and it doesn’t disappear when cheese recovers, because higher cheese raises the number the allowance gets subtracted from. If your blended price is down and you can’t fully explain it with Class III/IV and butter moves, run the 20-minute audit inside — anything unexplained north of 50¢/cwt is structural, and it belongs on its own line in front of your lender.

make allowance Class III

At the Wisconsin Farmers Union delegate session this March, WFU president Darin Von Ruden described a neighbor running 300 cows who watched roughly $50,000 disappear from his milk checks — same herd, same plant, same management (Brownfield Ag News, “Delegate session highlights dairy farmer losses under new Federal Milk Marketing Order,” March 9, 2026). “It’s hard for dairy farmers to recover from that,” Von Ruden said (Brownfield Ag News, March 9, 2026). His cows didn’t slip. The 2025 FMMO make-allowance change moved under him, and his milk check never spelled it out.

Here’s the number that explains that quarter. June 2026 Class III milk settled at $15.98/cwt (USDA AMS, Announcement of Class and Component Prices, CLS-0626, July 1, 2026). Hold that month’s exact butter, cheese, powder, and whey prices constant, then run them through the pricing formula as it stood on May 31, 2025 — the day before reform took effect. Class III comes out at $16.99. That $16.99 is the same June commodity prices run through the pre-June-2025 make allowances instead of the current ones; the component-by-component reconstruction is in our companion breakdown, The USDA Formula Change No Milk Check Explains (July 1, 2026). Same milk, same commodity prices, two formulas. The gap is $1.01/cwt.

That dollar isn’t market noise. It’s policy, and it’s permanent until Washington changes it again.

One boundary before the math: this is a U.S. Federal Milk Marketing Order mechanism. Canadian producers under supply management price milk a completely different way — read this as a look at your export competitors’ cost base, not your own check.

What Actually Changed on June 1, 2025

On June 1, 2025, USDA updated the make allowances inside the FMMO formulas for the first time since 2008 (Farm Credit Services of America, “New Federal Milk Marketing Order Rules Now Effective,” June 9, 2025). A make allowance is USDA’s assumed cost for a processor to turn your raw milk into cheese, butter, powder, or whey — subtracted before your component prices are set. Bigger subtraction, smaller check.

All four jumped at once: cheese to $0.2519/lb, butter to $0.2272, nonfat dry milk to $0.2393, dry whey to $0.2668 (USDA AMS Final Decision, Nov. 11, 2024; effective June 1, 2025). Dry whey took the steepest jump of the four — up 34%, from $0.1991 to $0.2668/lb (USDA AMS Final Decision, 2024). That single number is why this isn’t a cheese-shipper problem: whey feeds the other-solids price that touches every Class III check in the country.

The American Farm Bureau Federation ran the first published scoring. Over the reform’s first three months, the higher allowances cut Class III by 92¢/cwt and Class IV by 85¢/cwt — a gross hit of about $337 million to pool revenues in 90 days, with the deepest bites in the Upper Midwest, the Northeast, and California (AFBF Market Intel, “Three Months In,” Daniel Munch, Sept. 21, 2025). Net the reform’s offsetting pieces — higher Class I differentials and the return to the higher-of mover — and the number lands closer to $231.9 million on The Bullvine’s accounting of AFBF’s figures. Keep those two straight. The gross is the make-allowance damage; the net is what producers lost after the give-backs. Anyone quoting $337 million as the bottom line is skipping a step.

To be fair about it: USDA and processors argued the old allowances were nearly two decades stale, that real plant costs had climbed, and that updating them keeps processing capacity alive — the plants that buy your milk (Farm Credit Services of America, June 9, 2025). IDFA testified that the make allowance covers the costs manufacturers incur in turning raw milk into finished dairy products, and needed to reflect what those costs had actually become (IDFA testimony to USDA AMS, FMMO hearing record). That’s a real position. The fight isn’t whether costs rose. It’s how big the number should be, whether anyone checked it, and who’s carrying it.

Why Can’t You See This on Your Milk Check?

Here’s the trap. You get your check, see a smaller number, and hear the same line everybody hears: cheese was soft, the market was down. Both can be true at once. Class III did run well below its early-2025 levels — USDA’s February 2026 Class III component value worked out to about $15.46/cwt, down from $21.55 a year earlier, a $6.09/cwt drop (USDA AMS February 2026 component prices, at 3.8% fat / 3.2% protein / 5.7% other solids). That part is real market movement. But underneath the noise, a fixed piece keeps working. And it doesn’t leave when cheese comes back.

Everyone assumed a cheese rebound would wash the pain out. It won’t. Higher cheese prices don’t shrink the make-allowance subtraction — they raise the number it’s subtracted from. The dollar stays.

The 2026 Reality Check: The make allowance isn’t a line item on your statement. It’s subtracted inside the formula, before your check is ever calculated — so you never watch the dollar leave, because it was never on the page to begin with.

That’s how Von Ruden’s neighbor lost that money without a single line naming the cause. It’s the difference between riding out a normal price cycle and paying a fixed toll on every hundredweight, in good months and bad. For the human side of that gut punch, read Von Ruden’s full account of the 300-cow hit.

Running the Numbers: What $1.01/cwt Does to a 500-Cow Herd

The math is simpler than the formula that produces it. Here’s the drag on an illustrative 500-cow dairy — then plug in your own herd.

The 500-Cow Herd Impact (At a Glance)

MetricBaseline FigureAnnual Impact
Herd Size500 milking cows
Daily Production~70 lbs / cow / day
Total Annual Milk127,750 cwt
Formula Reform Drag$1.01 / cwt–$129,027 / year
Per-Cow Toll–$258 / cow / year

Illustrative Class III herd only. Production assumption based on USDA NASS Milk Production (Jan. 2026, major states): 2,082 lbs/cow/month, roughly 68–69 lbs/day, so 70 is a fair working figure.

Adjust the pieces for your operation. A herd averaging 80 lbs/cow/day pushes the drag to about $147,000. Weight your utilization toward Class IV and the per-cwt hit eases toward 85¢. The exact figure isn’t the point. The point is that this is a five- to six-figure annual number for a mid-size dairy, hiding inside a price you’ve been calling “the market.”

Set that toll next to the safety net, and it stings worse. A Bullvine breakdown put a 200-cow dairy’s Dairy Margin Coverage payout at about $1,800 in a year against roughly $42,240 lost to make allowances — a 23-to-1 gap. The support program is real. It’s also a rounding error against the formula change.

👉 Companion Analysis: See the full safety-net math in GT Thompson’s 2026 Farm Bill Math: DMC Pays Your 200-Cow Dairy $1,800, Make Allowances Cut $42,240 (Feb. 17, 2026).

Will the Mandatory Cost Survey Actually Lower Your Make Allowance?

This is where the story turns on the people waiting for Washington to fix it. Producers assumed the reform’s cost data would eventually get audited, corrected, and walked back. The first part is happening. The second might go the wrong way.

The 2026 Reality Check: The permanent, nationwide formula that did five figures in damage to mid-sized herds was built on voluntary processor cost surveys that USDA never independently audited before locking them in.

AFBF’s Munch called the increase “very disappointing because it’s based on voluntary processor cost-of-production surveys and doesn’t necessarily reflect the true cost of production” (Brownfield Ag News, July 8, 2024). A number doing that kind of damage was set without independent verification.

Congress agreed that wasn’t good enough. The One Big Beautiful Bill Act, signed on July 4, 2025, mandates biennial, audited processor cost surveys and allocates $9 million for them. USDA is moving — AMS issued an Advanced Notice of Proposed Rulemaking on Feb. 27, 2026, and released an updated 2021 processing-cost study covering 61 plants (USDA AMS; Federal Register, Feb. 27, 2026). As of July 12, 2026, the mandatory-survey rule wasn’t finalized.

Read the study before you cheer. It suggests costs have climbed enough that allowances on cheese, whey, and NFDM could go higher, not lower — only butter looks like it drops (AFBF Market Intel, Feb. 13, 2026). And on Munch’s read, any change is unlikely to reach milk checks before 2028, with the full hearing track pointing closer to 2031–2032. The audit is coming. It might raise your drag, and it won’t arrive fast. Plan around that, not around a rescue.

How Do You Size Your Own Loss in 20 Minutes?

You don’t need the full component math. Take your annual Class III cwt and multiply by roughly 90¢–$1.01 — that’s your working estimate of the yearly formula drag. Then check it against reality. Pull your blended $/cwt from April–May 2025 (before reform) and set it alongside July–September 2025. Strip out the known Class III/IV and butter moves. Whatever gap is left over and unexplained above about 50¢/cwt, treat as structural drag, not a bad month.

If the leftover is 50¢ or more, you’ve found the formula in your own statement. For most mid-size herds, this ranges from $80,000 to $130,000 per year. That’s expansion-decision money, not coffee-shop-gripe money.

Herd SizeDaily Production (lbs/cow)Annual Class III cwtAnnual Formula Drag @ $1.01/cwt
200 cows7051,100 cwt$51,611
400 cows70102,200 cwt$103,222
500 cows70127,750 cwt$129,027
500 cows (80 lbs/day)80146,000 cwt$147,460

Size Your Loss —
Pencil It In Line A — Your annual Class III milk: __________ cwt 
Line B — Your drag estimate: $0.90 to $1.01 per cwt 
Line C — Estimated annual formula drag: Line A × Line B = $__________ 
Gut check: Your blended $/cwt (Apr–May 2025) minus (Jul–Sep 2025), less known Class III/IV and butter moves = your unexplained gap. Over 50¢? That’s structural, not a bad month.

The 30/90/365-Day Playbook for Herds Like the Von Ruden Neighbor’s

30-Day Window — Urgent Checks

Pull your statements. Run the 20-minute audit above, comparing April–May 2025 to your recent 2026 checks.

  • The trigger: any unexplained gap over 50¢/cwt is your structural formula drag.
  • The danger: subtract genuine market and component moves first, or you’ll overstate it.

Isolate the cash flow. Put the drag on its own line in your ledger, separate from feed, DRP, or DMC.

  • The trigger: if your debt-service coverage has been below 1.2 for three straight months using your lender’s or CPA’s method, treat this as an operational emergency, not an academic one.
  • The danger: a lender who sees the number buried inside “market” can’t help you plan around it.

90-Day Window — Structural Adjustments

Take the number to the table. Bring your documented $/cwt drag into your next operating-loan and co-op conversation, in writing, with herd size and order attached.

  • The trigger: schedule it before your next renewal, not after.
  • The danger: a round guess instead of your real number kills your credibility fast.

Stress-test your mix. Review your class breakdown and whether component or manufacturing shifts change your exposure.

  • The trigger: if you’re heavily Class III in the Upper Midwest or Northeast, you’re carrying the top of the 85¢–$1.01 range.
  • The danger: don’t chase a class mix that wrecks your milk market or hauling economics to dodge a formula.

365-Day Window — Strategic Positioning

Get on the record. The mandatory-survey rulemaking is live now — comment with your herd size, order, and real drag.

  • The opportunity: this is a rare window in which a documented farm-level number carries weight. Anonymous aggregate losses don’t move USDA. Named math does.
  • The danger: comment periods close. Miss it, and you’re arguing after the number is locked.

Budget for no rescue. Plan your multi-year path as if relief doesn’t reach checks before 2028 — and could tilt against you if cheese, whey, and NFDM allowances rise.

  • The opportunity: if your margin over feed holds while your structural drag is fully accounted for, you’ve got room to make cull, expansion, or refinancing calls on real numbers instead of hope.
  • The danger: expanding on the assumption the audit walks the drag back. It may not.

👉 Companion Analysis: For the line-by-line version of that first check, see Surviving the $0.94/cwt Dairy Make Allowance Hit (April 19, 2026) — how a 400-cow dairy separates formula effects from component and market moves.

Is This a Temporary Dip or a Permanent Shift?

Not close. The loss is structural, and it stays until the allowances change through regulation — a process that, on Munch’s read, likely won’t affect your check before 2028 and could be pushed to 2031–2032. Every year you call this “a bad year” is a year you didn’t name the real problem. Name it, size it, build it into your plan. That’s the difference between Von Ruden’s neighbor knowing where his money went and just absorbing it.

Von Ruden has argued for years that U.S. producers need a more stable domestic price rather than chasing export volume (Wisconsin Public Radio, Jan. 9, 2024). You can agree or disagree with his fix. But the trade-off at the heart of this one is blunt. Processors got cost recovery; they say they needed it to keep plants running. You got a permanent per-cwt reduction built on cost figures nobody independently audited before they took effect. Both can be true — and only one of them shows up on your statement.

So before you accept anyone’s tidy explanation of why your check got smaller, run your own gap. Then ask the question that actually matters at your kitchen table: what’s your real margin over feed per cwt this month versus a year ago — and how much of that difference is the market, and how much is a formula you never got a vote on?

Key Takeaways

  • At June 2026 prices, the make-allowance reform is pulling $1.01/cwt out of Class III — about $258/cow and roughly $129,000 a year on a 500-cow herd. That’s formula, not market, and it’s permanent.
  • A cheese rebound won’t save you. Higher cheese raises the number the allowance gets subtracted from, so the dollar stays whether prices are up or down.
  • Run the 20-minute check: compare your blended $/cwt from April–May 2025 to recent 2026, back out the known Class III/IV and butter moves, and anything unexplained over 50¢/cwt is structural drag. Put it on its own line in front of your lender.
  • Don’t budget for a rescue. The audited cost survey won’t touch checks before 2028, maybe 2032, and could push cheese, whey, and NFDM allowances higher, not lower.

Run Your Numbers

Dairy Farm Corridor Score Calculator — This article gives you the $1.01/cwt make-allowance drag. The Corridor Score puts it in dollars for your operation, layers in your hauling cost, and flags whether your location is quietly turning that formula hit into a red-zone milk-check risk.

Complete references and supporting documentation are available upon request by contacting the editorial team at editor@thebullvine.com.

Learn More

The Sunday Read Dairy Professionals Don’t Skip.

Every week, thousands of producers, breeders, and industry insiders open Bullvine Weekly for genetics insights, market shifts, and profit strategies they won’t find anywhere else. One email. Five minutes. Smarter decisions all week.
NewsSubscribe
First
Last
Consent

Did Your Co-op Just “Idle” a Plant? Here’s the $73,000–$269,000 Hauling Math They Didn’t Put on the Ballot

Three Franklin County plants are going dark in 18 months, and the rerouting bill lands on farmers who never got a vote.

Executive Summary: Three plants in one Vermont county — DFA’s St. Albans, Franklin Foods in Enosburg Falls, and Perrigo’s Georgia formula plant — are shutting or winding down inside an 18-month window, stripping out local competition and pushing more milk out of state. Once DFA reroutes St. Albans milk after its August 17 idle, a 350-cow herd could absorb an estimated $73,000–$269,000 a year in extra hauling: an added $0.85–$3.15/cwt, where even a $1.00/cwt bump runs about $85,000 on 24,390 lb/cow. The 2019 co-op merger vote gave those farmers market access but no direct say on this closure — and DFA hasn’t detailed how milk gets rerouted or whether the decision went to a member vote. Inside, there’s a barn-math example you can plug your own cwt into, plus three moves to make within 30 days: get your new rate in writing, ask your delegate who voted and under which bylaw, and confirm whether “ray of hope” plants like Franklin County Cheese will actually take your milk. If your hauling line is creeping up or your co-op is talking about “optimizing the network,” this shows you in dollars per year what that means for your check. Before the next plant on your route quietly goes “idle.”

Members of the Teamsters local 597 union picket outside the Dairy Farmers of America plant in St. Albans in Sept. 2025. File photo by Glenn Russell/VTDigger

John Ovitt has walked into the same Enosburg Falls cream cheese plant for 37 years — a Franklin Foods operation that’s been making cheese in that town for 125 years — until its German owner, Hochland, decided to shut it down this summer. On September 1, Ovitt plans to take it over and reopen it as Franklin County Cheese, a rare bright spot in a county bleeding processing jobs. But here’s the part that should stop every dairy farmer around him cold: Ovitt himself has said he’ll restart the plant on a reduced scale, running some of the old product lines but not at the volume that came before. It is not a fresh, hungry new home for your raw milk.

That’s the gap that matters right now. Because about 19 miles away, DFA said on June 17 it had “made the difficult decision to idle” its St. Albans plant effective August 17, telling farmers the milk received there would keep being processed for now “to ensure a market for regional dairy farmers.” For a 350-cow dairy, that quiet word “idle” could still translate into $73,000 to $269,000 a year in new hauling costs once the milk gets rerouted, based on Bullvine’s modeling. Same cows. Same barn. A very different milk check.

ScenarioAdded Rate ($/cwt)Annual Cost (350-cow herd, 85,365 cwt)Risk Level
Low End$0.85$73,000Likely floor
Mid Range$2.00$171,000Most probable outcome
Ceiling$3.15$269,000Worst case — plan for it, don’t bank on it

Three Plants, One County, One Year

Franklin County is Vermont’s dairy heartland, and in about 18 months it’s watched its processing capacity walk out the door. St. Albans goes idle August 17, with roughly 80 jobs gone and DFA keeping the building but winding down production. Franklin Foods closes this summer before Ovitt’s reopening — and even that reopening comes back at reduced capacity, not full throttle. Between St. Albans and Enosburg Falls alone, Franklin County stands to lose more than 150 jobs.

PlantStatus & DateJobs AffectedTakes Your Raw Milk?
DFA St. AlbansIdles Aug 17, 2026~80 jobsYes — but rerouted, plant unnamed
Franklin Foods (Enosburg Falls)Closes summer 2026; reopens Sept 1 as Franklin County CheeseNot disclosedReduced scale only — not full volume
Perrigo (Georgia, infant formula)Mfg ended June 2026; full wind-down through 2027162 laid off (of ~420 total)No — never processed raw milk

Then there’s Perrigo. Its infant formula plant in the town of Georgia laid off 162 workers this spring and ended manufacturing at the end of June, the first phase of a full wind-down of the roughly 420-person site that runs through 2027 — another anchor employer gone, even if it never took your milk.

Here’s what makes this different from the usual closure story: it’s the clustering. Three plants, one county, one narrow window — which means farmers lose every local outlet at roughly the same time, with no nearby competitor left to bid for their milk or hold hauling rates honest. When plants close, milk doesn’t disappear — it has to travel farther to find a buyer, and in dairy, the farmer usually eats that freight. Vermont Public framed the core worry plainly in its reporting: whether the closure will ultimately raise the transportation costs Vermont farmers have to shoulder.

The answer is almost always yes. More milk moving out of state means longer hauls, and those costs show up as a deduction on your monthly check.

How This Lands on a Real Farm

Let’s put a number on it. Bullvine’s analysis of the St. Albans closure estimates rerouting could add $0.85 to $3.15 per cwt in hauling and destination fees, depending on which plant DFA sends your milk to — and DFA hasn’t named one yet. Take a 350-cow herd running at the 2025 US average of 24,390 pounds per cow. That’s roughly 85,365 cwt going out the driveway each year.

The Cost Breakdown (350-Cow Herd) Based on an added $0.85 to $3.15 per cwt in rerouting fees:

  • The Low End — $0.85/cwt: +$73,000 / year
  • The Mid Range — $2.00/cwt: +$171,000 / year
  • The Ceiling — $3.15/cwt: +$269,000 / year

That ceiling is the worst case, not the likely one. Most reroutes will land somewhere in the middle, and that’s before basis, shrink, and fuel adjustment even enter the picture. Run it on your own herd’s real production and your number will shift — that’s the point.

Now picture Ovitt’s neighbors, the ones who fed St. Albans for years. The farmer who never pulls those numbers finds out six months from now, when the statement looks different, and nobody’s around to explain why. The one who lays three milk stubs on the kitchen table and does the arithmetic walks into that conversation holding something the first one doesn’t — a figure.

Who Actually Decided This?

Here’s where it stings. St. Albans farmers voted 99-9 in 2019 to merge into DFA — but only 108 of roughly 307 members showed up to cast a ballot, about a third of the membership. That wasn’t naivety. Those were smart people making a rational call under real price pressure — they needed a buyer, and DFA was the truck that showed up.

What the vote gave them was market access. What it didn’t give them was a seat at the table when the 2026 routing decision got made. DFA framed the closure as a decision it “has made,” attributing it to broader operational changes, and has not publicly detailed how affected farms’ milk will be rerouted long term or whether the decision went to a member vote.

That’s not necessarily a communication failure. It’s how the authority is split. According to the University of Wisconsin Center for Cooperatives, members control the co-op mainly by electing a board of directors and by voting on bylaw changes, mergers, or dissolution — not on operational calls like which plant runs. Which plant runs, and where your milk gets trucked? That sits with the board and management, not with a member ballot. So to a farmer facing the hauling bill, “network optimization” can feel like a cost shift with a nicer name — and unless you turn it into a number tied to your farm, it stays abstract.

How Much Does Waiting 30 Days Actually Cost?

Do the arithmetic before August 17 comes and goes. If you’re milking 350 cows and rerouting adds even $1.00/cwt, that’s roughly $85,000 a year you never budgeted for. Every month you don’t confirm the real number is a month you absorb it blind.

The cost of waiting isn’t the deduction itself — it’s the difference between negotiating from preparation versus negotiating from surprise. And a farmer who shows up at a board meeting with a hauling-drag figure and a bylaw question is a completely different meeting than one who shows up with a grievance. One is easy to manage. The other puts a number on the table.

Is Your Location Quietly Becoming a Milk-Check Risk?

Some farms sit in a corridor where milk is cheap to move and easy to sell. Others don’t — and the drag from hauling, basis, and thinning processing options can quietly eat a slice of every check. Bullvine’s own hauling work found that past about 25 extra miles, the freight line stops being background noise, and a 500-cow herd can start losing 1% of gross before feed or labor. Franklin County, with three closures in a single year, is close to a textbook case of that risk rising fast.

You don’t need a fancy calculator to start reading the signal. Pull your last three milk stubs. Find the hauling and destination lines. Then watch what they do after August. That trend line is your early warning system, and it costs you nothing but ten minutes at the table.

Options and Trade-Offs

There’s a 30- to 90-day window after a closure notice when the useful moves actually happen. Here’s what farmers are doing with it.

Action 1: Make the Three Calls This Week

  • Best For: Anyone shipping to St. Albans.
  • The Goal: Call your DFA field rep or milk accounting to get the specifics in writing — which plant your milk goes to once rerouting starts, the new hauling-plus-destination fee per cwt, the effective date, and whether it’s temporary or permanent.
  • What It Takes: Your recent milk stubs in hand first.
  • The Catch: You may not get a clean answer on the first try — be persistent, and ask for it in writing.

Action 2: Ask the Governance Question

  • Best For: Regaining long-term leverage before the next plant closes, not just answers after this one.
  • The Goal: Contact your board delegate. Ask whether the board formally voted on the closure and rerouting, and request the bylaw provision covering plant and routing decisions.
  • What It Takes: Knowing who your delegate is.
  • The Catch: You’re asking about authority and process, not confidential minutes — keep it specific.

Action 3: Don’t Count the Reopening as Your Outlet

  • Best For: Any farm tempted to assume the local plant solves the problem.
  • The Goal: Call Franklin County Cheese directly and confirm what — and how much — it’ll actually buy. Ovitt’s operation is real and welcome, but he’s said it comes back on a reduced scale, running some of the former product lines at lower volume.
  • What It Takes: A direct call before you bank on it.
  • The Catch: A “ray of hope” headline isn’t a milk contract.

Action 4: Compare Notes With Your Neighbors

  • Best For: The long game — months, not this week.
  • The Goal: Put your numbers side by side with other affected farms. When 200-plus Irish farmers gathered outside Dairygold’s Mitchelstown offices last September — each able to name a roughly €2,290-a-month gap against what neighboring Carbery suppliers were paid — insulated management suddenly had to answer for it.
  • What It Takes: Neighbors willing to lay their figures on the table alongside yours.
  • The Catch: Sustained collective action is the hardest thing to organize — but organized members change bylaws and boards, and isolated ones absorb decisions.

Key Takeaways

  • If you ship to St. Albans, call your field rep this week and get your new hauling-plus-destination rate per cwt in writing before August 17.
  • Multiply your own annual cwt by a $0.85–$3.15 range to see your realistic added-cost band before you assume the impact is small.
  • If you can’t name who voted on this closure, ask your delegate — and request the bylaw section covering routing and plant decisions.
  • Watch the hauling and destination lines on your next three checks; a rising trend is your corridor-risk signal, no software required.
  • Before you treat the reopened Enosburg Falls plant as an option, confirm it’ll buy raw milk at your volume — the operator has already said he’s restarting at reduced scale.
  • If several neighbors see the same drag, put your numbers together now, while you still have a window to act on them.

So where does your hauling line sit right now — and do you actually know who decided it? That’s the question worth carrying into the next board meeting, not as a complaint, but as a figure nobody can wave away. The plants are closing whether anyone runs the math or not. The only variable left is whether you’re the farmer who ran it first.

Run Your Numbers

Dairy Farm Corridor Score Calculator — Plug in your state, herd size, and hauling cost per cwt to see whether your location is quietly becoming a milk-check risk. It turns “network optimization” into a Red, Yellow, or Green read on your own corridor — before the next plant on your route goes idle.

Methodology: Barn-math figures use the 2025 US average of 24,390 lb/cow (USDA NASS, released February 2026) as a national benchmark; your own herd’s production will change the result. The $0.85–$3.15/cwt hauling range is a Bullvine modeled estimate for an as-yet-unnamed receiving plant, not a published DFA rate; actual impact will vary by route, basis, shrink, and fuel adjustment.

Complete references and supporting documentation are available upon request by contacting the editorial team at editor@thebullvine.com.

Learn More

  • 25 extra miles is where your milk check starts bleeding — Arms you with a 30-day auditing plan to calculate exact hauling-mileage exposure on your own stub. It reveals the explicit point where a longer haul stops being background noise and drains four to seven percent of your gross margin.
  • A CA$686M Co-op Just Sent Maritime Farmers the Hauling Bill — Delivers critical long-term warning signs by tracing how profitable co-ops leverage pooling rules to hide regional freight shifts. Learn to defend your five-year catchment strategy before localized plant shutdowns silently slice $32,000 from your annual bottom line.
  • $337 Million Left Conventional Milk Checks in 90 Days — No Bill, No Plaintiff — Exposes the quiet regulatory shift behind updated USDA make allowances that shaved nearly $0.92/cwt off regulated minimum pricing formulas. This analysis shows you where manufacturing-class revenue is leaking and how to stress-test your risk portfolio against it.

The Sunday Read Dairy Professionals Don’t Skip.

Every week, thousands of producers, breeders, and industry insiders open Bullvine Weekly for genetics insights, market shifts, and profit strategies they won’t find anywhere else. One email. Five minutes. Smarter decisions all week.
NewsSubscribe
First
Last
Consent

The Collar Says Breed Her. Your Gut Says Wait. In a $3,010-Heifer Market, Who Wins?

It’s 6 a.m. The list says breed pen 4. Your best cow-man says two aren’t ready. Someone’s wrong—and on a $3,010-heifer market, being wrong twice a week adds up fast.

Executive Summary: The U.S. replacement dairy heifer hit $3,010 a head in July 2025 and pushed past $3,100 by October (USDA Agricultural Prices) — and that number is quietly eating the beef-on-dairy premium most herds think they’re banking. Switch 35% of the herd to beef semen and you might net ~$370 more per cross calf than a Holstein (Bullvine modeling), but if you’re short a replacement two years later, that calf cheque is just prepaying a $900-plus hole on the heifer you now have to buy. Nobody puts those two numbers on the same line, which is exactly the problem. The same blind spot shows up inside the barn: on data-heavy dairies, the leak isn’t the collars or the robots — it’s the handoff, the morning the breeding list says “breed her,” and the fifteen-year gut says “wait,” and nobody’s decided in advance who wins. Tighten conception timing enough to pull just 20 cows out of stale 250-plus-DIM territory in a 200-cow herd, and the IOFC math runs ~$45–$75 per cow a year, money that sits right alongside the beef premium once you spread it across the herd. The piece hands you a four-step, 90-day playbook — surface one buried signal, write one breeding rule (over 390 days and 55% of your own mature body weight), name one owner, and price the replacement cost on every semen decision. Read it before your next beef-vs-dairy semen order, because the calf cheque isn’t the win it looks like until the second line’s on the page.

beef-on-dairy replacement cost

Picture a breeding tech in the heifer pen, phone in hand — a scene that plays out on data-equipped dairies every morning. The screen says breed her. His gut says she’s not ready yet. He pockets the phone and walks past, the way he’s done for fifteen years, reading frame at fifty feet.

That small moment, repeated across a herd, is where most dairies quietly leak money. Not in the sensors. Not in the software. In the handoff between what the data says and what the experienced person does next. And on a data-driven dairy, the bill almost never shows up the day the decision gets made.

The trap that shows up first and pays you later

Here’s the pattern that connects nearly every expensive miss on a modern dairy: the first-order number is loud and immediate, and the second-order consequence is invisible until it’s a bill.

Beef-on-dairy is the cleanest example anyone’s living through right now. The calf cheque shows up on sale day. The replacement problem shows up two years later, when there’s no heifer in the pipeline to take that cow’s place.

If you run a tech-heavy operation — collars, milk meters, genomic tests on every heifer calf, three pieces of software that don’t talk to each other — you’ll recognize yourself in this. You’re not data-poor. You’re insight-poor. The signals are everywhere. The bridge between signal and action is what’s missing.

The cockpit where every warning light is on

Walk into a lot of dairies and the data is everywhere and changing nothing. There’s a difference between recording what happened and deciding what to do next.

The 2026 Journal of Dairy Science invited review Milking the Data for Value-Driven Dairy Farming makes the point directly: the bottleneck isn’t sensor capability anymore — it’s the human capacity to interpret, prioritize, and act on multiple data streams in real time. The sensors did their job. The system around them didn’t.

European work on precision livestock farming (Hostiou et al., 2017; EU dairies) found the same thing from the farmers’ side: managing the flood of alarm warnings is itself a source of stress, and the researchers argue it’s essential to set priorities for which alerts actually require action. That’s alert fatigue — the tax you pay for collecting data without a decision architecture behind it. The alarm goes off enough times without meaning anything, and eventually nobody looks up.

On a bad day, a precision dairy looks like a cockpit where every warning light is on — and the pilot is still flying by habit.

Three ways the handoff actually breaks

The failure isn’t the sensor being wrong. It’s the moment between the data and the human who’s supposed to act on it. It shows up in three predictable places.

1. Heat detection

  • Data said: Collars flag cows 17, 34, 112 for breeding, ~a day ahead (Penn State Extension, 2023).
  • What happened: Nobody checks the list before morning. Cows get bred off chalk and visual signs, conception rate doesn’t move — and the collars take the blame.

2. Mastitis/health

  • Data said: Robot logs a yield drop and conductivity spike on one quarter; flags likely mastitis (Univ. of Waterloo case study, ~2023, Canada).
  • What happened: No one owns the weekend dashboard. The cow’s caught when she’s visibly sick days later — higher treatment cost, higher cull risk.

3. Feeding

  • Data said: Precision-feeding software flags overfeeding in late-lactation pens; IOFC could improve by trimming offered dry matter.
  • What happened: Ration still set by habit and a look at the bunk. The margin sits on the table.

Notice the common thread. In every case, the tech was right. The system around it — who checks, who acts, what the rule is — wasn’t built.

SystemWhat the Data SaidWhere the Handoff BrokeCost of the Gap
Heat detection (collars)Flags cows ~1 day ahead of estrusList unchecked each morning; bred off chalk/visual signs insteadConception rate stagnant, collars wrongly blamed
Mastitis / robot healthYield drop + conductivity spike flags likely mastitisNo owner on weekend dashboard shiftsHigher treatment cost + higher cull risk
Precision feedingFlags overfeeding in late-lactation pensRation still set by habit, not by dashboardMargin left on the table (IOFC erosion)

What “crossing over” actually looks like

On farms where it works, the day doesn’t start with “what’s wrong with my herd?” It starts with “which ten cows does the system want me to look at today?”

Penn State Extension’s precision-technology purchasing guidance (2023–2024) frames the whole thing around assigned ownership: a named person has to be responsible for managing alerts, the system needs a written protocol for who acts and when, and the farm needs an actionable plan to turn that data into better herd performance — or the system never pays for itself. The sensor is the easy part. The protocol and the person are the job.

Michigan State Extension (2021) describes the labor shift the same way — precision tools are meant to move skilled people off routine pen-watching and onto the cows and decisions that actually need judgment. The University of Waterloo’s dairy robotics case study found the same pattern on robot herds: less manual labor, more time interpreting reports and managing exceptions, plus a new skill demand that’s “not always intuitive” for traditional managers.

And the people doing the work mostly buy in. A 2024 study of dairy employees and precision technology (Borchers et al.) found 95.6% comfortable with the tech they use and 91.8% saying they understand it — but that same work flags real friction, from language barriers to cold-weather and lighting limits in the barn. The difference between a data hoarder and a system designer is simple: the hoarder checks everything; the designer checks a few lists that already have a next step attached.

The cost nobody prices: becoming needed differently

But here’s the part the vendor demos skip. That transition costs a person something real, and it isn’t the software learning curve.

The operator who can read a cow at fifty feet built an identity around being the one who knows. The system doesn’t just ask them to learn a tool. It asks them to become someone who’s needed differently — to give up being the hero who walks into the barn and sees everything, and become the architect who builds a system where they’re not the only one who can.

The PLF research backs this up sideways. Hostiou’s farmers pushed back on the idea that a farm can run itself on precision tech alone — the know-how still matters; it just moves. The ones who cross over treat their own know-how as something to be coded and shared, not guarded. They’d rather build a system ten people can run than be the genius everyone’s waiting on. The ones who can’t make that trade fight the screen forever.

Turning gut feel into a rule the software can enforce

The heifer-breeding decision is the cleanest place to watch that happen. What used to live in one person’s gut becomes a rule the system can run.

The biology isn’t new. USDA APHIS, citing the 2001 Dairy NRC, recommends heifers be “pregnant by 55% of mature size and calve at 82% of mature size” — and the 2021 NASEM Dairy NRC carries the same target-bodyweight framework forward. University of Wisconsin Dairy Extension takes it further: define weight-based breeding eligibilityon weight relative to mature body weight and structural growth, and you can hit age-at-first-calving targets without short-changing the heifer. Their guidance is direct — “heifers reach 55% of mature body weight and 90% of mature structural growth… by the time you breed them.” Ontario’s ag ministry puts the same number in plain terms: a heifer’s ready at 55% of mature body weight, “which for most animals occurs by 14 months of age.”

Here’s the build. Weigh a group of mature cows to set the herd’s mature body weight. Then, as BoviSync’s documentation describes it, define each heifer’s waiting period as “the greater of 390 days of age or date of achieving 55% of mature body weight,” with pen moves triggered 15–22 days ahead. Every weight you capture — weaning, six months, a vaccination day — updates her individual curve. The system stops asking “how old is she?” and starts asking “is she over 390 days and over 55% of mature weight?” Everything else is math.

Trigger ConditionThresholdSourceAction
Minimum ageOver 390 daysBoviSync breeding protocolEligible only if weight also cleared
Minimum weightOver 55% of herd’s mature body weightUSDA APHIS / NASEM Dairy NRC 2021Eligible only if age also cleared
Pen move lead time15–22 days ahead of eligibilityBoviSync documentationTriggers physical pen transition
Herd-specific mature weight benchmark~771 kg avg (Canadian Holsteins, 43-herd study)Lactanet 2022 — do not borrow this number, set your ownRecalibrate rule per herd

Where it breaks isn’t the algorithm. It breaks when the scale is wrong or the weight is never entered. It breaks when the rule was never tuned for that herd — Lactanet (2022, Canada), drawing on 43 Holstein herds, found average mature weights well above older references, around 771 kg, and stresses that every herd should set its own target rather than borrow a benchmark. And it breaks at the handoff, when the list gets ignored and frame-reading takes over again.

When the list and the gut disagree, who wins?

So when the screen says breed her and the experienced tech says she’s not ready — who should win?

If the rule is built on NRC targets and your own validated outcomes, it’s earned the right to be innocent until proven guilty. In a tie, the list should usually beat the gut. But the moment you say “the list always wins,” you’ve left science and entered religion. The PLF research warns that placing total confidence in the tech, without critical human oversight, can make decisions worse, not better.

The real fix isn’t picking a winner. It’s a tiebreaker you agree on in advance. When the list and the experienced tech disagree, it should be a lab experiment, not a power struggle — you either just learned the rule is wrong, or you just learned the human bias is. Low-risk disagreement? Follow the list and log the outcome. Clear red flag — sick, mis-ID’d, scale error? The human overrides, and writes down why. Those overrides become the audit trail that improves the rule.

Can a tool own that role? Honestly, not yet

That conflict-resolution job — the person who reads the overrides, asks why, and decides whether the rule or the habit needs to change — doesn’t exist on most farms. So can an LLM fill it?

Help with it, yes. Own it, no. University of Wisconsin Extension (2025) is explicit that large language models don’t replace the need for human expertise; their review treats multi-modal models as a tool to support better decisions, not make them. The UW-Madison Dairy Brain project is building a “real-time, data-integrated, data-driven, continuous decision-making engine” — but the language is decision support, not decision maker. For more on where AI actually earns its keep in the barn, the line between support and autopilot is the whole game.

The reason for caution comes from higher-stakes fields. Recent assurance research on medical AI has found large language models still vulnerable to confidently stated but false outputs — so-called hallucinations — and that prompt-based guardrails reduce the problem without coming close to eliminating it. The dairy use case is lower-stakes, but the lesson carries: AI can be your lab assistant in that conflict, not your judge. If a pitch — from any vendor — is that the AI will decide for you, that’s not innovation; it’s abdication.

The math that proves the trap

Now run the beef-on-dairy numbers all the way through, because this is where the invisible second line gets expensive.

Purina’s 2024 Beef-on-Dairy Industry Report (U.S. survey) found most dairy farmers “realizing a premium approaching $200 a head, with some netting double or triple that advantage.” Bullvine’s August 2025 analysis of the real cost of the beef-on-dairy boom put a sharper number on the upside: switching about 35% of the herd to beef semen netted roughly $480 a head on cross calves — nearly $370 more than Holsteins in that scenario. That’s a modeled herd example, not a national average. Loud, immediate, real.

Now the second line. The U.S. replacement dairy heifer averaged $3,010 per head in July 2025 (USDA Agricultural Prices) — and climbed past $3,100 by that October — up sharply from a few years earlier, with top California heifers pushing $4,000+. Against an old baseline near $1,800–$2,200, that’s an $810–$1,210 swing per replacement. So in a lot of herds, the extra few hundred dollars on a beef calf is paying for the extra ~$900 on the replacement you now have to buy. You never see the two numbers on the same line.

MetricOld Baseline2025 RealityNet Swing
Beef-on-dairy premium per calf~$110/head~$480/head (35% herd switch, Bullvine model)+$370/head
Replacement heifer cost$1,800–$2,200$3,010 (Jul 2025), $3,100+ (Oct 2025)+$810–$1,210/head
Top-market heifers (California)~$2,500$4,000++$1,500/head
Net position if short one replacementBreak-even to positiveOften net negative-$430 to -$840/head

Here’s the IOFC piece in plain barn math. Overton notes income over feed cost “generally represents half or more of a dairy’s total profitability,” and Penn State’s 2023 example herds run around $8.31–$9.03/cow/day. Late-lactation cows typically sit below fresh and mid-lactation cows on that line. So take a 200-cow herd and shift just 20 cows — 10% — out of stale, 250-plus-DIM territory by tightening conception timing. At a modeled $1.25/cow/day IOFC gap, that’s 20 × $1.25 × 365 = about $9,100 a year, or roughly $45 per cow across the herd. Assume a wider $2.00/day gap, which some herds see between fresh and stale cows, and you’re closer to $75 per cow.

These are modeled figures, not a single herd’s audited result — the point is the order of magnitude. Run your own IOFC-by-DIM split before you trust the number; the gap between your fresh and stale pens is the figure that makes or breaks the comparison. Either way, that money sits right alongside, or above, the marginal beef premium once you spread it across every cow and subtract the replacement hole.

If this second-order math still lives in one consultant’s head and not in your breeding rules, you’re not running a management system — you’re running a series of bets.

Your move: a four-step roadmap for the next 90 days

Don’t try to fix the whole farm. Work the handoff in order — each step earns the right to the next.

Step 1 — This month: surface one buried signal. Pull the records you collect and never use — retained placentas, weights, heat-day data — and pick the single one that should be triggering a decision and isn’t. Decision check: Is there a record sitting in a file that, if acted on, would change an outcome? Start there.

Step 2 — Write one rule and name one owner. Turn that signal into a written rule — heifer breeding eligibility is the cleanest place to start (over 390 days and over 55% of your own mature body weight). Assign one person to own the daily list. Backfires when: the weights feeding the rule are sloppy — the curve is only as good as the scale behind it.

Step 3 — Set the tiebreaker before you need it. Decide now who wins when the list and the experienced hand disagree: follow the list on low-risk calls and log the result; let the human override on a clear red flag and write down why. Decision check: Are your overrides becoming an audit trail that improves the rule, or vanishing into habit?

Step 4 — Price the second line on every breeding call. Before the next beef-vs-dairy semen decision, put the calf premium and the current replacement-heifer cost on the same page, then layer in your own IOFC-by-DIM split. Threshold: if the beef premium is quietly funding a $900-plus replacement hole and a stale-cow margin drag, the calf cheque isn’t the win it appears to be.

And one rule that sits above all four: if a pitch — from any vendor — promises the AI will decide for you, read that as a warning label, not a feature. AI is your lab assistant in these calls, not your judge.

The breeding tech in that heifer pen isn’t wrong to trust his eye — he’s right more often than the sales pitch suggests. The question isn’t whether to replace his judgment. It’s whether your farm has built a place for the disagreement to teach you something, instead of disappearing every morning when the phone goes back in the pocket and the list goes unread. So which one runs your barn right now — the rule, or the habit?

Key Takeaways

  • The beef calf premium and the replacement heifer aren’t separate lines — with heifers at $3,010-plus, that extra ~$370 per cross calf is often just prepaying a $900 hole two years out. Price both together before your next semen order.
  • On a tech-heavy dairy, the leak isn’t the collars or the robot. It’s the handoff — decide now who wins when the breeding list says “breed her” and your best cow-man says “wait,” and log every override so the rule actually gets smarter.
  • Build one written breeding rule you can defend: over 390 days and over 55% of your own herd’s mature body weight, not a borrowed benchmark. The math only holds if the scale’s right and the weights get entered.
  • Pulling 20 cows out of stale 250-plus-DIM territory in a 200-cow herd pencils near $45–$75 per cow a year in IOFC. Run your own IOFC-by-DIM split before you trust it — the gap between your fresh and stale pens is what makes or breaks the call.

Run Your Numbers

Bullvine Pipeline Index Calculator — Before your next beef-vs-dairy semen order, run your herd through the Pipeline Index. It scores heifer supply, replacement cost, culling pressure, and beef-on-dairy diversion into one number, and flags whether your pipeline is green, yellow, or already running dry.

Complete references and supporting documentation are available upon request by contacting the editorial team at editor@thebullvine.com.

Learn More

  • $585 a Straw: What That ‘Free’ Beef Calf Really Costs — Identifies the exact $585 opportunity gap handed over per service when trading away future replacements for immediate calf revenue. This guide details how to calculate your herd’s specific pipeline ratio and rolling pregnancy rate thresholds before placing your next semen order.
  • $3010 Per Heifer. 800000 Short. Your Beef-on-Dairy Bill Is Due. — Exposes the long-term structural reality of the nation’s 48-year low heifer inventory against surging processor demand. Learn how to navigate four concrete strategic paths to control herd turnover, manage somatic cell risks, and protect contract delivery terms.
  • AI and Precision Tech: What’s Actually Changing the Game for Dairy Farms in 2025? — Delivers concrete financial baselines for automated systems, tracking how AI surveillance achieves 85% lameness accuracy and saves up to $500 per cow. This data-driven analysis maps out real investment payback timelines for precision feeding, virtual fencing, and automated health platforms.

The Sunday Read Dairy Professionals Don’t Skip.

Every week, thousands of producers, breeders, and industry insiders open Bullvine Weekly for genetics insights, market shifts, and profit strategies they won’t find anywhere else. One email. Five minutes. Smarter decisions all week.
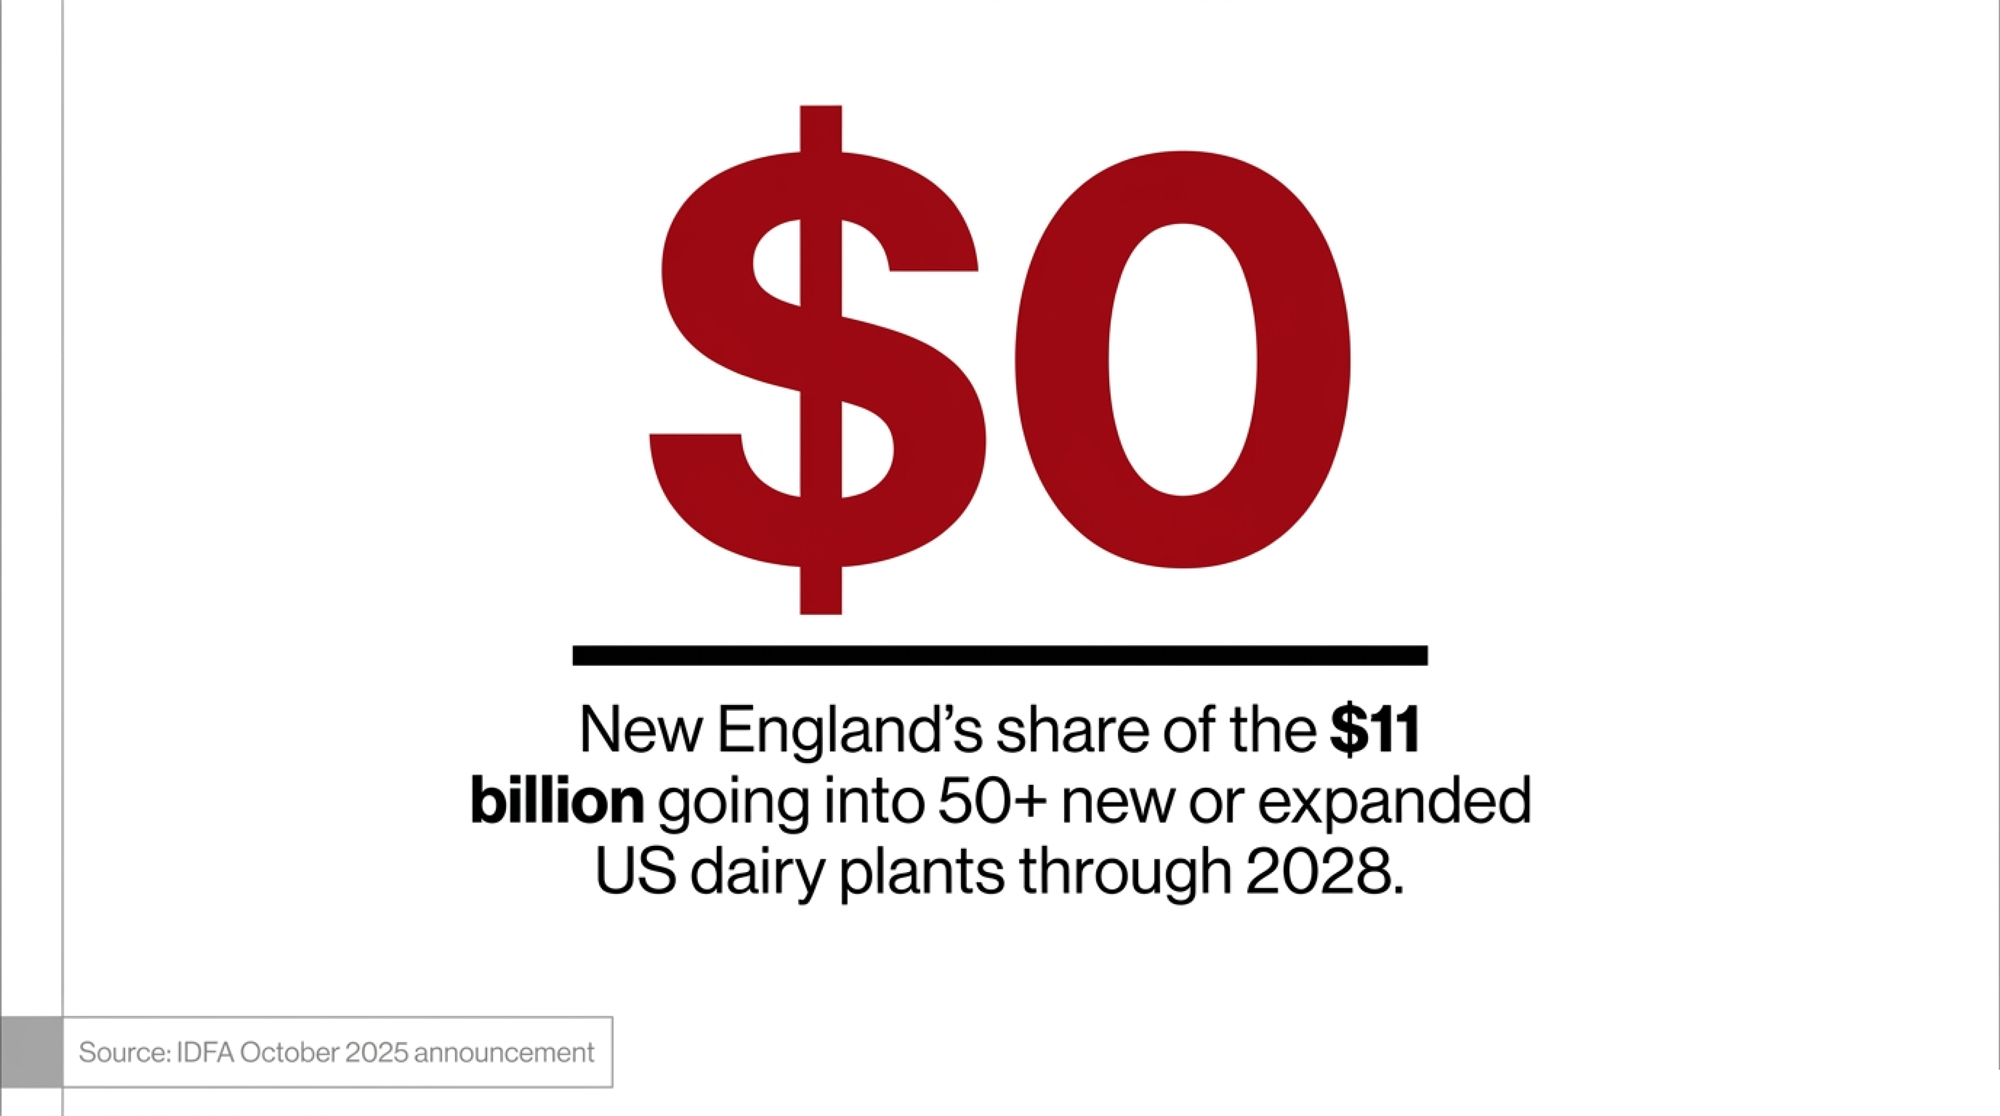
NewsSubscribe
First
Last
Consent

When Fairlife Went Dark: The $4 Billion Ransomware Hit That Should Have Every Dairy Checking Its Backups

A locked server at Fairlife froze a $4B dairy on July 16. On a 200-cow herd, one month’s milk is ~$70,000 — and a delayed check hits before the hacker ever does.

Executive Summary: Coca-Cola’s Fairlife just had every U.S. plant knocked offline by ransomware on July 16 — Canada kept running; the American operations didn’t. If a $4 billion processor with real IT budget can get locked out of its own systems, your parlor full of networked robots, feeders, and RFID readers is squarely in range. This isn’t a one-off: Dairy Farmers of America got hit in 2025 and left producers waiting up to 17 days for milk checks, an Ontario dairy ate a $9,999,000 ransom demand after attackers sat in its network for three years, and a Swiss farmer lost a cow and calf when his milking robot data got locked. Here’s the part that should worry you more than the hacker: nearly two-thirds of U.S. dairies carry under two weeks of operating capital, so on a 200-cow herd shipping 75 lbs at roughly $15.74/cwt Class III, a delayed check strands better than half of a $70,000 month while feed and payroll keep marching. The fixes that actually move the needle cost a Saturday afternoon, not a fortune — separate your office network from the parlor, keep one backup fully unplugged and tested, and turn on MFA everywhere (CISA says it makes you 99% less likely to get hacked). Processors are already starting to treat NIST cyber benchmarks the way they treat SCC and quality premiums, which means “are your systems secure” is about to become a condition of shipping, not a suggestion. Read on for the three-tier defense playbook — DIY, managed detection, and the co-op pooling model — plus the four questions to put on your next board agenda.

Fairlife ransomware attack

A milking robot and a corporate server run on the same kind of network — and share the same kind of vulnerability. Fairlife found that out on July 16, 2026, when Coca-Cola told the SEC that ransomware had frozen its dairy subsidiary’s production systems. The plants didn’t slow down. They stopped.

So if a roughly $4 billion operation — with U.S. plants in Goodyear, Arizona; Dexter, New Mexico; Coopersville, Michigan; and Fair Oaks, Indiana, plus the new $650 million Webster, New York, facility — can get locked out of its own systems, the question isn’t whether smaller operations are exposed. It’s whether you’d even see it coming.

What Actually Happened in Atlanta

Coca-Cola’s SEC filing said fairlife LLC identified “unauthorized access by a third party to a portion of its systems,”including production-related systems, “in connection with a ransomware event.” Strip out the legal language, and it means someone got inside, locked things down, and the plants went quiet. Canadian production kept running without a hitch — the disruption was U.S.-only.

The company did the right things fast. It activated its incident response and business continuity protocols, brought in outside cybersecurity experts, and looped in law enforcement. Product already on shelves is safe, they say.

But watch what Coca-Cola hasn’t said. No ransomware group has claimed the hit, and the company hasn’t attributed it to anyone — the filing describes the intruder only as an unauthorized third party. Nobody’s confirmed whether data walked out the door, and there’s no extortion figure on the record. The filing admits the full impact is still being evaluated and that it’s uncertain whether the incident will materially affect the company. Translation: they’re still counting the damage, same as the rest of us.

Why do hackers keep targeting dairy farms?

Because the thing that makes your barn efficient is the same thing that makes it a target. Robotic milkers, automated feeders, RFID herd software, environmental controls — all of it sits on a network. And on a lot of farms, that network never got separated from the laptop checking email in the office. If you’ve never mapped how your automated systems connect, that audit is worth ten minutes before you read further.

Attackers know the math. Cows can’t wait. Feed schedules can’t slip for long. A lockout that would be a headache at a widget factory turns into an animal-welfare emergency in a dairy barn within hours. FBI Special Agent Gene Kowel has pointed to that exact combination — operations that can’t pause, security budgets that stay thin — as the reason criminals and even state-linked actors keep circling farm and food infrastructure.

There’s a second angle that gets less attention. Cybersecurity researcher Ali Dehghantanha has flagged rising activist attacks in which the goal isn’t a payout at all — it’s footage or data to fuel campaigns against how you farm. Different motive. Same broken lock.

This Wasn’t the First Warning Shot

Fairlife is just the biggest name on a list that’s been growing for two years. Dairy Farmers of America — the largest co-op in the country — got hit by the Play ransomware gang in mid-2025 across multiple plants. The fallout landed on producers, not just IT departments: milk pickups were disrupted and payments delayed up to 17 days, against a system built for a 3-to-5-day turnaround. HP Hood and Schreiber Foods have both experienced plant shutdowns, and Hood’s disruption reportedly rippled all the way into the New England school milk carton supply. The DFA case is the clearest processor-level warning yet.

It gets more personal at the farm gate. Dehghantanha documented an Ontario dairy hit three separate times — attackers sat undetected in the network for three years before the final strike encrypted the RFID reader, the robotic milkers, and the backups all at once, with a $9,999,000 ransom demand attached. In Switzerland, farmer Vital Bircher refused a $10,000 demand after his milking robot’s data got locked in 2023. During the outage, with Bircher cut off from the robot’s data while his herd needed it, a cow and her calf died.

Who Got HitYearWhat Locked UpWhat It Cost Them
Fairlife (Coca-Cola)2026U.S. production systemsAll U.S. production halted; Canada spared.
Dairy Farmers of America2025Multiple plantsPickups disrupted; payments delayed up to 17 days.
Ontario Dairy Farm2022–2024RFID reader, robots, backups$9,999,000 ransom demand after 3 years of silent intrusion.
Swiss Dairy (Vital Bircher)2023Milking robot data$10,000 demand refused; a cow and calf died during outage.
Lactanet2025Credentials stolen, MDR caught itBarely a scratch — active monitoring flagged it early.

Food and ag ransomware climbed 27% in 2024, to 212 recorded incidents from 167 the year before, and the FBI now ranks agriculture among its most-targeted sectors. This isn’t a rare-event story anymore. It’s a weather pattern.

Could your operation survive two weeks offline?

Here’s the number that should stop you cold. Penn State Extension data shows nearly two-thirds of U.S. dairy farms carry less than two weeks of operating capital. So when a system goes down and the milk check gets delayed — as DFA’s producers waited up to 17 days — the problem isn’t the software. It’s the feed bill, the payroll, and the herd health decisions stacking up while you wait.

Run the barn math on it. Say you’re milking 200 cows at 75 lbs a day. That’s 15,000 lbs of milk daily, or about 4,500 hundredweight over a 30-day cycle. With the July 2026 Class III benchmark near $15.74/cwt — the component price, not what actually lands in your mailbox — that’s roughly $70,000 of milk value riding on a single month’s production. A payment held even 17 days locks up better than half of that while your fixed costs keep marching. Most operations don’t have that kind of cushion sitting idle. That’s the real exposure — not the hacker, the cash gap the hacker creates.

The Things Worth Doing Before Monday

Skip the generic password lecture. Researchers and extension folks keep landing on the same short list, and the top of it costs you almost nothing.

1. Air-Gap Your Networks (Keep the Office Out of the Parlor). Your business side — email, accounting, the office computer — should not sit on the same network as your milking robots, feeders, and controls. When those two are wired together, a phishing click in the office can reach the parlor. CISA’s own guidance is blunt about this: keep operational networks, such as production, segmented from business networks.

2. Enforce the 3-2-1 Backup Rule (And Pull the Plug). Three copies, two types of media, one copy fully disconnected from the network. That last part is exactly the failure Dehghantanha described in the Ontario case — network-connected backups that got encrypted right alongside the live systems. And a backup you’ve never tested restoring isn’t a backup. It’s a hope.

3. Turn On Multi-Factor Authentication Everywhere. Farm software, email, remote access — all of it. CISA says MFA makes you 99% less likely to get hacked. It takes an afternoon. Do it this week.

4. Write Down an Incident Response Plan Before You Need One. Who do you call, in what order, when the parlor software won’t boot at 4 a.m.? Most farms have no answer, and that’s the single biggest reason a recovery drags into weeks instead of days.

One more habit, and it’s free: train everyone on the payroll — family included — to spot a phishing email, because that’s still one of the most common ways in.

Options and Trade-Offs

The DIY route — do it yourself, this month. Network separation, offline backups, and MFA are within reach for almost any operation and cost more in a Saturday afternoon than in dollars. This is the 30-day action: pick those three, knock them out before month’s end. The limit is that DIY covers the basics, not active monitoring. You’re hardening the doors, not watching them.

Managed detection — pay someone to watch. This is the Lactanet model, and it’s worth studying. Two years before attackers hit them, the organization brought in KPMG for risk assessments and hired a 24/7 managed detection and response team, even running mock phishing drills on staff. When the breach came — stolen credentials, real network access — they caught it fast and contained it. Compare that to DFA, where producers waited up to 17 days for their milk checks after the 2025 attack. The catch: a full MDR contract runs real money that most single farms can’t justify on their own.

The co-op path — pool the cost. Here’s where scale solves what a single farm can’t. Rural electric cooperatives have already built a shared cybersecurity monitoring system that cut member outage time nearly in half and trimmed technology costs by about 40% compared with going it alone. USDA rural development offices and state councils are reportedly considering adapting that model to food and dairy. Dairy already pools equipment, testing labs, and marketing — pooling cyber defense is the same muscle. The friction is organizational, not technical: someone has to lead it.

ApproachCostWhat It CoversKey Limitation
DIY (network split, offline backup, MFA)A Saturday afternoon, near-$0Hardens the doorsNo active monitoring — you’re not watching, just locking
Managed Detection (Lactanet model)Real ongoing contract cost24/7 monitoring, mock phishing drills, fast containmentOut of reach for most single farms financially
Co-op pooled model (electric co-op precedent)Shared cost across membersCut outage time ~50%, trimmed tech costs ~40%Organizational friction — someone has to lead it

One more signal worth reading. Some national processors are starting to push suppliers toward NIST Cybersecurity Framework benchmarks — treating cyber readiness the way they’ve long treated milk quality and traceability. If that spreads, “are your systems secure” stops being optional and becomes a condition of shipping. The farms that get ahead of it now won’t be scrambling when the buyer’s letter arrives.

Key Takeaways

  • If your milking robots and your office email share one network, treat that as your top exposure — segment them before you do anything else.
  • If your backups are connected to the network, they’re not backups — get one copy fully offline and test a restore this month.
  • If you carry less than two weeks of operating capital — like most U.S. dairies — build a written 72-hour continuity plan, because a payment delay will hurt you before the hacker does.
  • If you’re on a co-op board, put four questions on the next agenda: how quickly can payments recover, when was the last tested backup restore, does insurance cover producer payment delays or only hardware, and who vets your outside vendors’ security?
Board QuestionWhy It MattersRed Flag Answer
How quickly can producer payments recover after an outage?DFA producers waited 17 days in 2025“We don’t have a documented recovery timeline”
When was the last tested backup restore?Untested backups are “a hope,” not a plan“We’ve never actually tried restoring it”
Does insurance cover payment delays, or only hardware?Payment delays hit cash flow before hardware costs do“Insurance only covers equipment/data loss”
Who vets outside vendors’ security?Ontario dairy attackers sat undetected for 3 years“No one — we trust the vendor’s word”

Before You Close the Laptop

The hard truth is that a payment freeze hurts your cash flow long before a hacker ever touches your hardware. In next week’s Bullvine Weekly, we’ll break down the exact math on pricing cyber insurance against a two-week Class III freeze. Until then, ask yourself before you close the laptop tonight: where are your backups right now, and when did you last prove they actually work?

Run Your Numbers

Farm Benchmark Snap Check — This story hinges on one question: could your cash cushion absorb a delayed milk check? The DVI Risk Check plugs your working capital, debt load, and feed share into three numbers and tells you — Strong, Watch, or Risk — whether you’re built to ride out a shock or scrambling when it lands.

Complete references and supporting documentation are available upon request by contacting the editorial team at editor@thebullvine.com.

Learn More

The Sunday Read Dairy Professionals Don’t Skip.

Every week, thousands of producers, breeders, and industry insiders open Bullvine Weekly for genetics insights, market shifts, and profit strategies they won’t find anywhere else. One email. Five minutes. Smarter decisions all week.
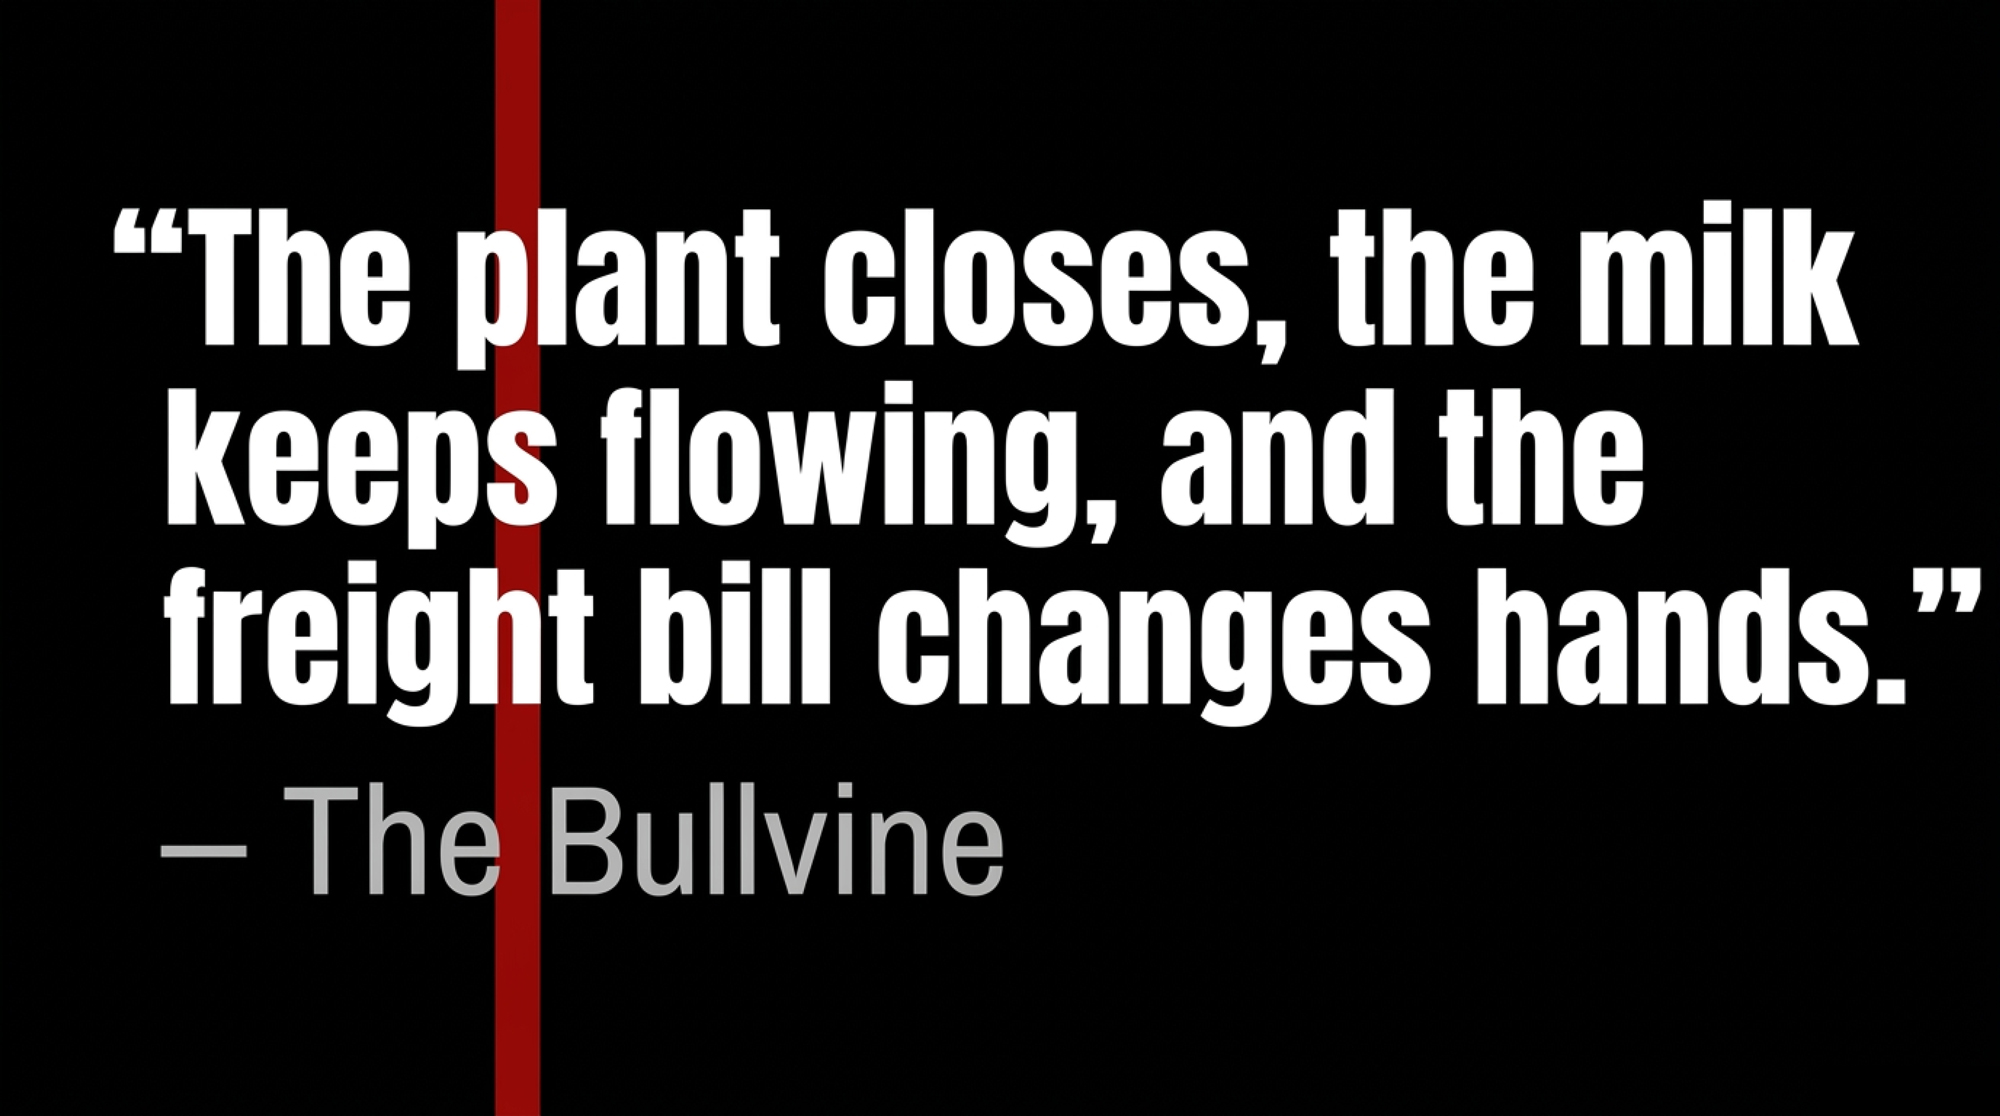
NewsSubscribe
First
Last
Consent

The 18% Trap: One Pregnancy Rate, Two Completely Different Diseases

Two herds. Same 18% pregnancy rate. One’s missing heats, the other’s missing pregnancies — and the manager watching conception rate can’t tell which. The fix for one is the wrong move for the other.

Picture two herd managers at the same repro meeting, both staring at a 21-day pregnancy rate of 18%. Same number, same screen, same shrug. One of them is missing heats. The other is missing pregnancies. And neither one can see it, because they’re both watching conception rate instead.

That’s the trap. It quietly costs herds real money while the actual problem hides one column over — and the fix for one manager is the exact wrong move for the other.

The Number Everyone Quotes, and Few Actively Manage

Ask a herd manager for their conception rate, and you’ll get an answer before you finish the question. Ask for their 21-day pregnancy rate and watch them reach for the software. That gap tells you how the industry got trained.

Conception rate is a fine number. It’s just answering the wrong question. It tells you how well a breeding worked — nothing about how many cows were even in the room when the breeding happened. Paul Fricke’s framing at the 1999 Western Canadian Dairy Seminar laid this out decades ago: pregnancy rate is the product of two levers — service rate (the share of eligible cows bred in a 21-day window) and conception rate (the share of those breedings that hold).

So the math is simple and unforgiving. Breed 40% of your eligible cows, get 50% of them pregnant, and your 21-day PR is 20%. Conception rate is a lever. Pregnancy rate is the scoreboard.

Here’s the piece worth sitting with. The whole ecosystem was built to celebrate the outcome of a single breeding, not the flow of cows from open to pregnant. The U.S. Council on Dairy Cattle Breeding’s Cow Conception Rate PTA is defined per-insemination. Extension bulletins teach it cow-by-cow — “two pregnant out of four bred, that’s 50%.” Even the ultrasound hands you a verdict on one animal at a time. It’s no surprise many managers think in cows, not in cycles.

Two Herds, One Number, Two Different Diseases

This is where the diagnostic gets clean once you know to look. Take those two 18% herds.

MetricHerd A (The Detection Battle)Herd B (The Fertility Battle)
21-Day Preg Rate18%18%
Service Rate45% (low)65% (strong)
Conception Rate40% (strong)28% (low)
The real diseaseMissing heats (detection / rebreeding)Missing pregnancies (transition / health)
The wrong moveSpending on Double-OvsynchDoubling down on heat detection

Multiply the two levers and both herds land at 18%. Identical from the outside. Completely different problems underneath.

Herd A has a heat-detection problem — cows aren’t getting bred often enough. Herd B has a fertility problem — cows are getting bred plenty, but too few pregnancies stick.

The 18% is just the symptom. The two levers tell you where the disease actually lives.

Schefers and colleagues (Journal of Dairy Science, 2010) put real ranges around this across 200 U.S. Holstein herds. Conception rates ran from 20% to 44%, averaging 32.2%. Service rates ranged from 39% to 76%, with an average of 55.6%. They also found that herds rebreeding quickly after a non-pregnant diagnosis pushed their service rate up — proof that one of these levers is a management decision, not a biological ceiling.

So when a repro report lands in front of you, split the PR back into its two parts and check each against those ranges. Service rate low, conception fine? You’ve got a detection and rebreeding problem. Service rate fine, conception low? Now you’re looking at transition health, body condition, and protocol design — a different barn, a different budget, a different conversation.

LeverSchefers Range (200 US Holstein herds)Target ThresholdIf You’re Below → The Real Fight
Service Rate39% – 76% (avg 55.6%)Above ~55%Under 50%: heat detection, rebreeding intervals, detection discipline
Conception Rate20% – 44% (avg 32.2%)Above ~32%Under 30%: transition health, bunk, body condition 2.75–3.0
21-Day Preg Rate~14% (2000s) → 21%+ today20%+ (60% of DRMS herds now clear it)Split into the two levers above before spending a dollar
Value of +1 point PR$3–$6/cow/yr (conventional)Six-point gain ≈ $18–$36/cow/yrDoing nothing is the expensive choice

Where Do You Actually Pull These Numbers?

This is the part the textbooks skip. The diagnostic only works if you can get the two levers from your herd software, and the definitions have to be clean, or the whole thing lies to you.

In DairyComp 305, the workhorse command is BREDSUM\E — it runs the 21-day pregnancy rate and insemination (service) rate broken out by heat interval, with conception rate pulled from the same breeding analysis. In PCDART, it’s Standard Report 126, the Pregnancy Rate Summary, which calculates PR over 21-day intervals. Either way, use the rolling figure, not last week’s snapshot. A single 21-day cycle is too noisy to act on — a heat wave, a bad semen-tank week, one tech on vacation, and your PR bounces. Pull the trailing year and the signal steadies.

The trap is the eligibility definition. Service rate depends entirely on which cows the software counts as “eligible” in each 21-day window. If your voluntary waiting period is set incorrectly, or do-not-breed cows aren’t flagged, the service rate will read high or low for reasons unrelated to your heat detection. Before you trust either lever, confirm the VWP, the breeding cutoff, and the do-not-breed list are current.

The Cycle Most Managers Never See

Here’s the piece that runs underneath everything. Fixing pregnancy rate doesn’t just improve one lactation. It rewires the herd’s biology going forward.

Fricke calls it the high fertility cycle, and his 2023 JDS Communications mini-review defines it precisely. Cows that establish pregnancy by 130 days in milk have shorter calving intervals, gain less body condition during the lactation, and dry off and calve at a lower body condition score — 2.75 to 3.0. After calving, those cows lose less condition, hit fewer health problems, breed back with greater fertility, and lose fewer early pregnancies, which lets them get pregnant again by 130 DIM. 

That’s the loop. And it’s self-reinforcing in a way that makes it genuinely hard to break into from the outside. Middleton and colleagues (Journal of Dairy Science, 2019) tracked body condition change from a week before calving to 30 days after in 851 Holstein cows in a single herd, and the cows that held or gained condition bred back better with lower pregnancy loss.

Once a herd is inside that cycle, the cows are doing half the repro work for you. Good energy balance produces better embryos and fewer losses, resulting in more timely pregnancies and preventing cows from getting too fat at the tail end of lactation. The herds stuck outside it are fighting the reverse: long days open, over-conditioned cows, transition wrecks, poor fertility, more long days open.

The scale of the shift is real. Fricke’s UW-Madison Extension work on the high fertility cycle (updated August 2025) reports that the U.S. average 21-day pregnancy rate now exceeds 21%, with more than 60% of DRMS Holstein herds above 20% — a long way from the roughly 14% average of two decades ago, when 20% was a stretch goal few herds hit.

When Does Double-Ovsynch Actually Earn Its Keep?

This is where the protocol conversation gets sharp, because it’s really a sequencing problem. Too many farms reach for the most sophisticated tool first, before they’ve earned the right to use it.

The evidence for Double-Ovsynch is genuinely strong in the right herd. Nowicki’s 2017 review in the Journal of Veterinary Research reported final pregnancy rates of 49.7% for Double-Ovsynch versus 41.7% for Presynch-Ovsynch across the summarized trials, crediting the edge to better handling of anovular and inactive-ovary cows. A 2024 Frontiers in Veterinary Science study (Z. Li et al.) in high-producing cows found Double-Ovsynch cut follicular cysts to 0.8% (from 2.8%) and inactive ovaries to 0.2% (from 1.7%), with a numerically — though not statistically — higher pregnancy rate, 48.2% versus 41.8%.

The most striking recent result comes from Berean and colleagues (Animals, 2025), who compared four protocols in 216 multiparous Holstein cows at a single 1,800-cow farm in Alba County, Romania, between October 2023 and May 2024. Double-Ovsynch with a single timed AI hit a 64.8% pregnancy rate — well ahead of standard Ovsynch with one AI at 42.6% — at the lowest cost per confirmed pregnancy, €89.51 (roughly $97 at the 2024 average euro-dollar rate). Adding a second insemination didn’t help. Double-Ovsynch with two AIs came in slightly lower at 61.1% and pushed cost per pregnancy up to €127.65 (about $138). One healthy-cow, single-herd result in one country. Read it as directional, not a promise for your barn.

The economics back it up where fertility is the true bottleneck. Ricci and colleagues (Journal of Dairy Science, 2020) modeled seven programs and found Double-Ovsynch+PGF more profitable than Presynch-Ovsynch — earning about $42 more profit per cow per year than one Presynch-Ovsynch variant — and calculated that U.S. hormone costs would need to run 5 to 14 times higher (2 to 6 times higher in the European market) before any Presynch program overtook it. Borchardt and colleagues (Journal of Dairy Science, 2021) pooled data from 9,735 cows across 11 studies and found that adding a second PGF dose during Ovsynch increased pregnancy per AI by 5.6 percentage points and was profitable in 95% of their scenarios.

The Seasonal Caveat: Why Those Returns Move With the Calendar

None of those economics hold still through the year. Heat stress hammers conception — cows in summer show weaker heats, more silent ovulations, and lower fertility to detected estrus. UW-Madison’s own DairyComp heat-stress work shows the pattern in hard numbers: one herd holding a 36% 21-day pregnancy rate in the cooler months dropped to 27.5% across June, July, and August.

That’s part of why the timed-AI advantage widens in hot months. When cows aren’t expressing strong heats, a program that breeds every eligible cow on schedule protects your service rate in the exact window when estrus detection falls apart. The Z. Li 2024 work pointing to fewer cysts and inactive ovaries under Double-Ovsynch matters most in the herds and seasons where ovarian function is already under strain. A protocol that looks like overkill in October can look like insurance in July.

But none of that rescues a broken foundation. Double-Ovsynch is a scalpel, not a magic wand. If your service rate is stuck at 45% because heat detection is broken, more hormones won’t fix cows that never get bred. If your transition pens are throwing metritis and ketosis, and cows are dropping a full point in body condition, the protocol is decorating a problem that lives in the close-up pen. The honest sequence: fix body condition and transition, tighten detection and rebreeding, then reach for the scalpel.

The Barn Math That Stops the Shrug

At some point, a manager sitting at 22% PR decides that’s fine. Here’s the number that tends to change the conversation — a line item with a herd size attached, not a simulation.

Lauber and colleagues (Journal of Dairy Science, 2026) modeled net return per one-percentage-point gain in 21-day PR: $3 to $6 per cow per year for conventional-semen herds, $2 to $7 for sexed-plus-beef scenarios, depending on the starting point. An earlier Lauber stochastic evaluation (Canadian Journal of Animal Science, 2015) pegged the gain from moving PR from 10% to 30% at roughly US$75 per cow per year, driven mostly by fewer days open and fewer reproductive culls.

Run it on your own herd. A move from 22% to 28% PR — six points — lands somewhere near $18 to $36 per cow per year in Lauber’s 2026 framework. In a 500-cow herd, that’s roughly $9,000 to $18,000 a year. In a 1,000-cow herd, double it. And Cabrera’s reproductive economics work (Animal, 2014) puts the value of a single pregnancy in high-yielding confined herds at roughly $128 to $232 — so a few points of PR across hundreds of eligible cows is dozens of pregnancies you didn’t have before. 

The sharp part isn’t the cost of doing something wrong. It’s the cost of doing nothing differently.

Your 30-Day Repro Audit Checklist

▢ Check the software setup first. Before running any numbers, confirm your voluntary waiting period (VWP), breeding cutoffs, and do-not-breed flags are accurate in DairyComp or PCDART — so your service-rate calculation isn’t lying to you.

▢ Pull the trailing 12-month average. Run BREDSUM\E or Report 126. Don’t act on a single 21-day cycle snapshot — it’s too noisy. 

▢ Isolate your bottleneck. Compare your service and conception rates against the Schefers benchmarks (targets: service rate above ~55%, conception rate above ~32%).

▢ Align your checkbook with your bottleneck. If service rate is under 50%, fix heat detection, rebreeding intervals, and detection discipline (tail paint, activity monitors, whatever your barn runs) before buying more hormones. If the conception rate is under 30%, focus on fresh-cow transition, bunk management, and body condition (aim for 2.75 to 3.0 at calving) before implementing a complex timed AI protocol.

▢ Do the barn math. A six-point PR gain — say 22% up to 28% — is worth roughly $18 to $36 per cow per year on Lauber’s 2026 conventional-semen range. Multiply the low end by your herd size for a conservative budget — 500 cows × $18 = $9,000 a year just off the floor of the range — then use that figure to size your next protocol change.

When your next repro report lands, you’ll face a quiet choice most managers never notice they’re making: read the number the tech hands you, or read the two numbers your milk cheque is actually keeping score with. One of them tells you the herd is stuck. The other tells you where to dig. Which one are you going to manage to this breeding season?

Key Takeaways

  • Conception rate tells you how well a breeding worked, not how many cows got bred. Split your 18% into service rate and conception rate before you spend a dollar — the number alone hides which problem you actually have.
  • If service rate is under 50%, fix heat detection and rebreeding first; more hormones won’t get open cows bred. If conception rate is under 30%, the fight is in the close-up pen — transition, bunk, and body condition at 2.75–3.0.
  • Double-Ovsynch earns its keep when fertility is the real bottleneck, especially through summer heat stress. It’s a scalpel, not a rescue for a barn that never gets cows bred.
  • Pull your trailing 12-month BREDSUM\E or PCDART Report 126 this month, check both levers against the Schefers ranges, and a six-point PR gain is worth roughly $18–36 per cow a year on Lauber’s 2026 numbers.

Complete references and supporting documentation are available upon request by contacting the editorial team at editor@thebullvine.com.

Learn More

The Sunday Read Dairy Professionals Don’t Skip.

Every week, thousands of producers, breeders, and industry insiders open Bullvine Weekly for genetics insights, market shifts, and profit strategies they won’t find anywhere else. One email. Five minutes. Smarter decisions all week.
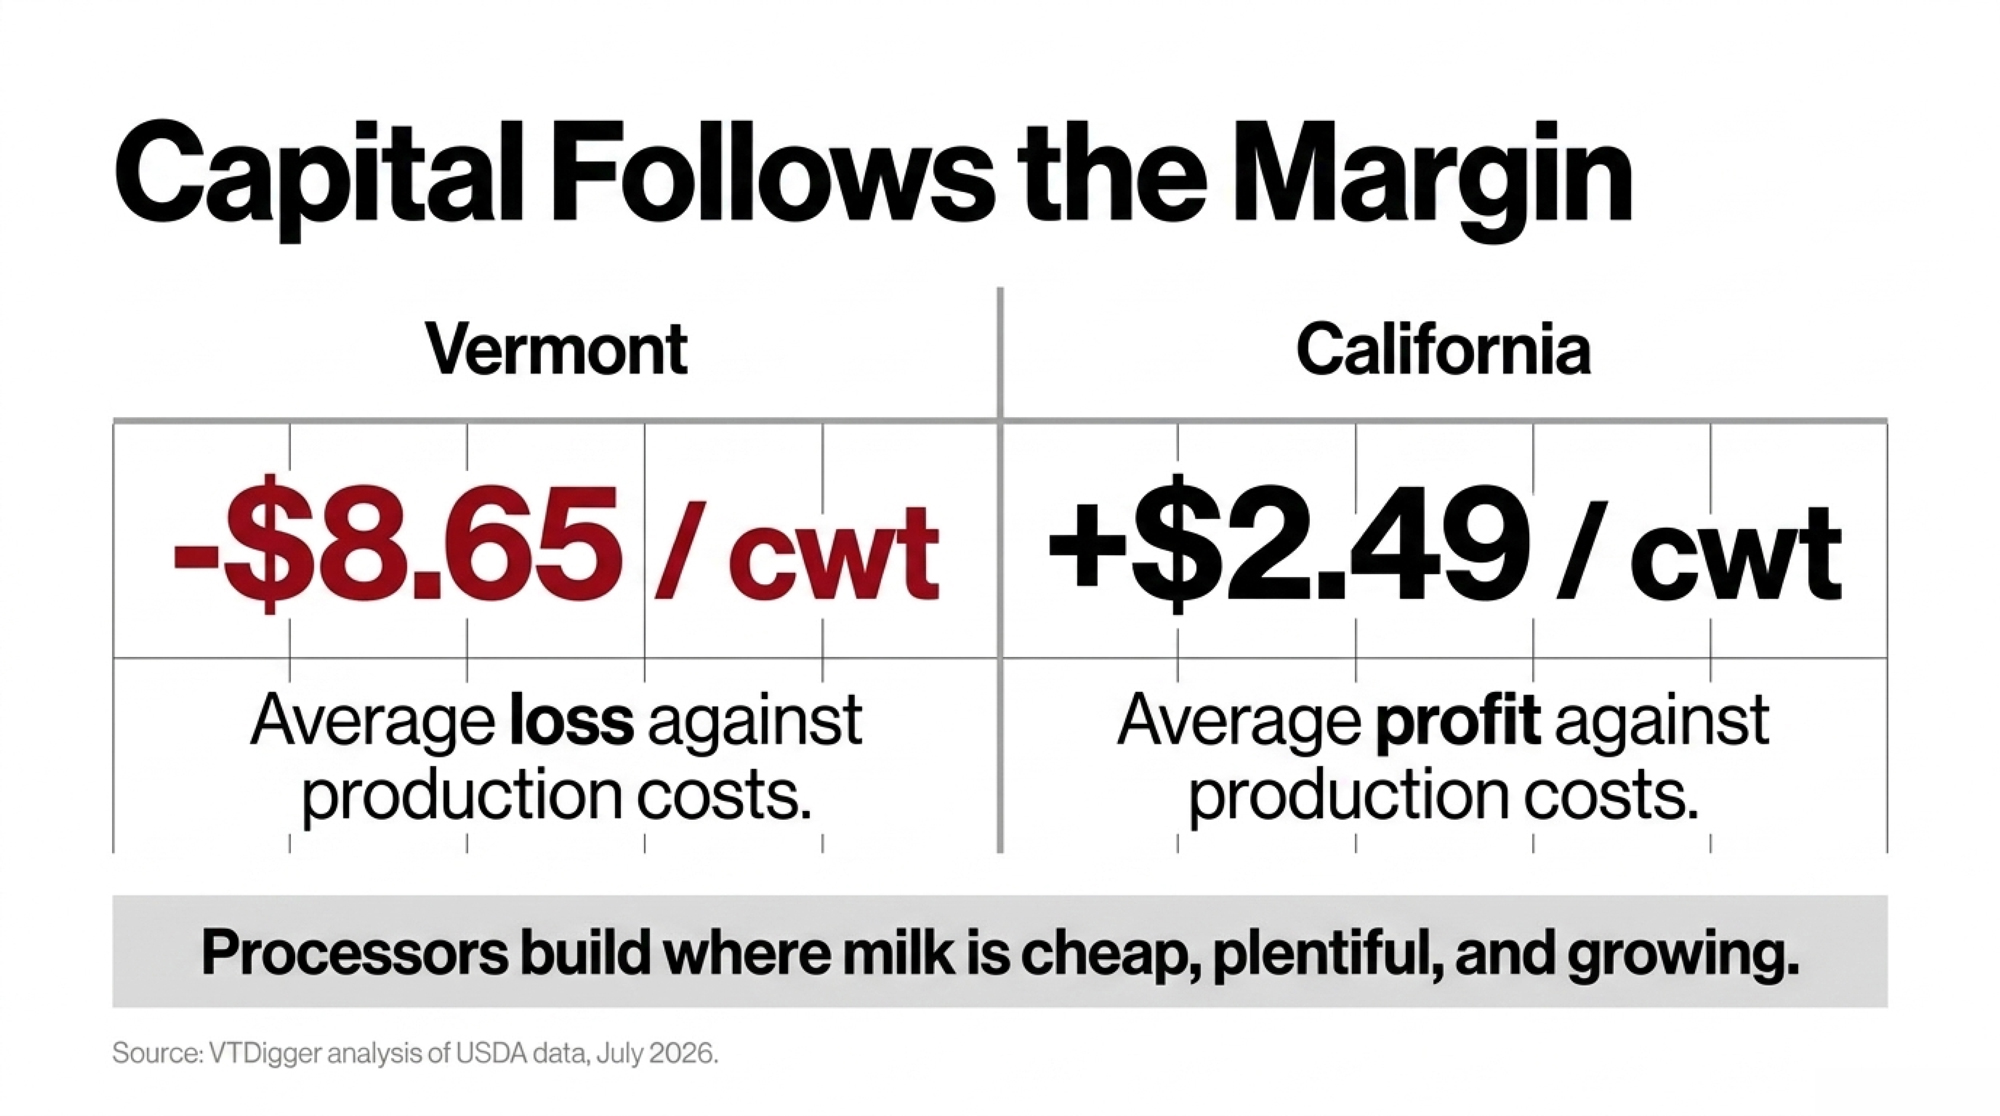
NewsSubscribe
First
Last
Consent

A 3-Day Silage-Window Breakdown Costs $2,400 – Here’s the Deere Settlement That Aims to End It

It’s day two of silage, the crop’s at perfect moisture, and your chopper drops into limp mode — and you can’t clear the code. That lockout is what Deere just got ordered to end. Mostly.

Executive Summary: On July 8, 2026, the FTC and five state AGs (Illinois, Arizona, Michigan, Minnesota, Wisconsin) locked Deere into a 10-year order to hand owners and independent shops the same repair tools its dealers get — fault-code clearing, ECU reprogramming, and the limp-mode restart that used to strand a machine cold until a tech showed up. The everyday tools are covered now; the deeper diagnostics (Machine Health Insights, DTAC, offline mode, full PIP access) don’t have to land until December 31, 2026, so that’s your real go-live date, not July 8. Here’s why it matters to a dairy: a self-propelled harvester down three days in your silage window runs roughly $2,400 in downtime alone at $800/day — before the service call. And that’s likely a floor once you count the fermentation hit and a winter of feeding compromised forage. Two catches keep this from being a clean win. “Fair and reasonable terms” is a seven-factor legal test, not a price cap, and Deere still hasn’t posted what owner-tier access will cost — so nobody can say yet whether DIY actually beats the dealer. And a slice of fault codes runs on third-party software Deere only has to make “reasonable best efforts” to unlock, with no deadline, meaning your most breakdown-prone system could stay dealer-locked indefinitely. Before December, pull two seasons of repair records, tag every failure as software or mechanical, and flag which software faults are recurring and which sit behind that carve-out — that’s the difference between a subscription that pays for itself and one that changes nothing. (The separate $99M class-action settlement for 2018–2026 repairs is a different track, with an Oct. 29 fairness hearing — don’t confuse the two.)

Deere right to repair
Moree, Australia – November 25, 2010: A farmer performs a maintenance routine on his John Deere combine harvester in Moree a major agricultural area in New South Wales, Australia.

It’s day two of corn silage, the crop’s sitting at exactly the moisture you’ve been chasing all season, and your self-propelled forage harvester throws an ECU fault and drops into limp mode. The nearest Deere tech can’t roll out for days. You can’t clear the code yourself — the software’s locked to the dealer — so the chopper sits while your window closes. That’s the scenario a July 8 federal settlement is supposed to end, and for a dairy it’s the difference between good fermentation and a bunk face that heats and molds all winter.

Farmer Jason Wilson knows the lockout firsthand. He and hundreds of other plaintiffs argued in a separate class-action suit that Deere’s dealer-only software renders most independent repairs “nearly unfeasible,” as NBC News reported in April 2025. It’s the same argument that ran straight through the FTC’s case — the one the agency just spent 18 months winning.

On July 8, 2026, the Federal Trade Commission and five state attorneys general — Illinois, Arizona, Michigan, Minnesota, and Wisconsin — filed a stipulated order in the U.S. District Court for the Northern District of Illinois, settling the monopolization case they’d brought against Deere & Company back in January 2025. Deere agreed to the terms without admitting any violation of the law. Every outlet ran the “10-year win” headline. Hardly any ran the barn math, flagged the deadline that actually matters, or warned you about the loophole that could keep your machine dealer-locked anyway.

That last part determines whether this cracks your lock or rattles it. One scope note before you get excited: this is a U.S. federal order — Canadian producers don’t get anything directly from it, though it shifts what’s technically possible on the same machines running in barns on both sides of the border.

What a Silage-Window Breakdown Really Costs a Dairy

Here’s why this lands harder on a dairy than a row-crop operation. When an SPFH goes down mid-harvest, the loss isn’t just a delayed field. You blow past the ideal chop-moisture window, and everything downstream follows.

Corn chopped too dry packs poorly and traps oxygen, which means unstable fermentation and a bunk face that heats and molds all winter. Chop it too wet waiting on a fix, and you get clostridial fermentation, effluent losses, and lower intakes. Either way, you’re feeding compromised forage for months — the kind that quietly pulls down butterfat and protein tests, drives up feed shrink at the bunk, and forces you to buy your way back with more purchased protein or a rebalanced ration. One missed window doesn’t cost you a day. It costs you a feeding season.

That’s the real stake behind a fault code your dealer used to control. And it’s the number the national coverage never put in dairy terms.

What Deere Actually Has to Hand Over Now

The heart of the order is plain enough. Deere has to give owners and independent repair shops the same repair resources it gives its own dealers, on “fair and reasonable terms” — on a license, subscription, or purchase basis, software tools included. Most of it covers the everyday jobs that used to require a dealer: reading, clearing, and resetting electronic fault codes, reprogramming and pairing new electronic parts, and the “limp mode” restart after an emissions shutdown. That last one’s the function that used to strand a machine cold until a tech showed up.

There’s also a forward-looking trigger worth knowing. Any future repair resource Deere rolls out has to reach farmers and independent shops too — once Deere makes it available to more than 50% of its U.S. authorized dealer network. So the door doesn’t just open once. It’s supposed to stay open as the tools evolve.

But “covered by the order” doesn’t mean “live on day one.” A specific batch of tools carries a hard December 31, 2026 deadline written into the filed order: Deere Machine Health Insights, DTAC Solutions, fluid sampling, and offline-mode diagnostics and reprogramming, plus the full suite of Product Improvement Programs. So if you’re building next season’s repair plan around this, that’s your real go-live date for the deeper tools. Not July 8. The order runs 10 years and can be extended if Deere violates its terms. Deere also agreed to pay the five states a combined $1 million — not $1 million each — to cover their legal costs.

Why Doesn’t “Fair and Reasonable” Mean Cheap?

Here’s where the celebrating gets ahead of the facts. “Fair and reasonable terms” isn’t a price cap. Per the filed order, it’s a seven-factor test — what dealers pay for the same tools, what it costs Deere to prepare and distribute them, what rival makers charge for comparable software, your ability to pay, how the tool’s distributed, how much it gets used, and inflation. Legal analysts reading the order note that affordability is only one of several factors.

That’s a wide fairway for Deere to set a number in. And as of the July 8 filing, Deere reaffirmed its commitment to the tools but hadn’t posted what owner-tier access will actually cost. Anyone telling you the DIY route is automatically cheaper is guessing. The tools are coming. The price tag isn’t nailed down yet.

The Loophole Nobody Put in the Headline

Now the part that got buried. Some ECU functions run on software Deere licenses from a third party — a company that isn’t named in the order and never sat at the table. For those functions, according to the filed order and independent legal reads of it, Deere only has to use “reasonable best efforts” to win that third party’s approval before it opens them up. No deadline attached.

Read that twice, because your budget hangs on it. A slice of your machine’s fault codes could stay dealer-only indefinitely — not because Deere’s dragging its feet, but because the settlement couldn’t bind a company that was never a party to the case. Before you tear up a dealer service agreement, you’d better know whether your most breakdown-prone system falls inside that carve-out.

Where Does the Break-Even Actually Sit?

This is the math nobody ran, so let’s run it. Say that harvester’s down three days in the silage window — the kind of “key times” delay farmers described waiting on a dealer. A 2023 PIRG survey of 53 farmers put reported downtime losses in a credible band of $100 to $1,500 per day — the range researchers kept after trimming the outliers on both ends.

Take a figure inside that band. Three days at $800 a day is $2,400 in downtime on one breakdown — before you’ve paid a nickel of the service call, the labor, or the parts markup. That’s a modeled example, not a real farm’s invoice, so plug in your own daily figure: your feed shrink, your milk-check hit, your custom-hire backup rate. For a dairy staring down lost silage quality, $800 a day may run low, not high — the 2023 PIRG band leaned on row-crop responses, and a spoiled harvest window hits your ration for months, not a single delayed pass.

For the full break-even by herd size once Deere posts a price, run the same logic you’d use on any capital tool — the way we break down robot payback.

FactorAll-Dealer PathDIY / Independent Path (Post-Settlement)Carve-Out Risk
Diagnostic accessWait for dealer dispatch; vulnerable during peak seasonImmediate code reading/clearing (if in scope)No deadline if fault runs on third-party ECU software
Direct cost/seasonService call + hourly labor + parts markupAnnual subscription (price pending) + laborUnknown — Deere hasn’t posted owner-tier pricing
Downtime impact$100–$1,500/day lost momentumNear-zero for in-scope faultsUnchanged for carve-out faults
Go-live dateN/A (dealer-controlled today)Everyday tools: live now; deep diagnostics: Dec 31, 2026Indefinite for carve-out software

The decision rule is straightforward. Take your real downtime days per season, multiply them by your honest daily loss, and stack that against Deere’s annual tool price once it’s public — then check whether your recurring faults fall within the settlement or behind the carve-out. Lose a day maybe once a year at the low end of that band, and a dealer relationship might still win. Bleed multiple days per breakdown in a two-week window, and the math tips toward owning the tool in a hurry.

For scale, the same 2023 PIRG/National Farmers Union survey pegged the average farm’s yearly loss from downtime and repair restrictions at $3,348, part of an industry-wide estimate of near $3 billion in downtime and $1.2 billion in excess repair costs. Those numbers lean toward row crops, not dairy, and they’re two years old. A downed harvester in your silage window is its own beast — treat $3,348 as a floor, not your number. It stacks straight onto your real cost of production per cwt.

Is This the Same Thing as the $99 Million Deere Payout?

No. And don’t let anyone tell you it is. Deere agreed in April 2026 to a separate $99 million private class-action settlement — the same suit Wilson and more than 200,000 other farmers were part of — resolving claims that its repair restrictions inflated what farmers paid for large-equipment repairs from January 10, 2018 through the date of preliminary approval. That’s money tied to past repair costs. A federal court granted preliminary approval in May 2026, and producers have until Sept. 14, 2026 to object ahead of a final fairness hearing set for Oct. 29, 2026. Those windows are effectively closing as this settlement takes hold.

DetailFTC/State AG Order (Jul 8, 2026)Class-Action Settlement
What it coversFuture repair tool accessPast repair overcharges, Jan 2018–2026
ValueNo cash payment (tools access)$99 million payout
Term10-year orderOne-time settlement fund
Key dateDeep diagnostics live Dec 31, 2026Objection deadline Sep 14, 2026; fairness hearing Oct 29, 2026
Applies toRepair tool access going forwardFarmers who paid for repairs 2018–2026

The July 8 FTC order is on an entirely different track. It’s about the tools you get going forward — not a check for the past. Same defendant, two different pockets. Keep them straight when you read the coverage, because plenty of it conflates the two.

Options and Trade-Offs for Your Operation

Stay all-dealer. Makes sense if breakdowns are rare, your dealer’s quick, and your machines lean hard on carve-out software. You give up nothing you were counting on and dodge a new subscription. The risk: you’re still exposed to those service gaps “during key times” when everyone’s cutting at once.

Buy the owner-tier tools when they post. This is the play if you already run your own repairs and lose real days to dispatch delays. It takes a tech-comfortable hand on staff and a subscription cost that isn’t public yet. Watch the pricing announcement before you commit — “fair and reasonable” hands Deere plenty of latitude.

Lean on an independent shop. Best fit for a mid-size operator who doesn’t want to run diagnostics but wants out of the dealer bottleneck. The order tells Deere’s dealers to promote these resources and not to retaliate against customers who use independent repair — but that shop still hits the same carve-out wall you would.

Your 30-Day Move

Before December 31, give yourself one afternoon of homework:

  • Pull your last two seasons of repair records. Every service call, every code.
  • Tag each failure — ECU/software or mechanical. Only the software faults are in play here.
  • Flag which software faults are recurring. Those are the ones a subscription would actually pay to fix.
  • Cross-check them against the carve-out. If your worst offender runs on third-party software, budget as if nothing changed.

Do that, and you’ll walk into the pricing announcement with a number in hand instead of a guess. It’s the same discipline behind counting what a breakdown really costs beyond the repair line.

Key Takeaways

  • If your recurring faults are ECU/software-based, then the everyday tools (fault codes, reprogramming, limp-mode restart) are covered now, but the deeper diagnostics land by December 31, 2026 — plan around that date.
  • If a downed machine costs you more than roughly $800 a day in your window, then even a modest subscription likely pays for itself on a single multi-day breakdown.
  • If your worst failures run on carve-out third-party software, then budget as if nothing changed — that access has no deadline.
  • If you’re weighing DIY against the dealer, then wait for Deere’s posted pricing before you decide; “fair and reasonable” is a legal test, not a bargain.
  • If you paid Deere for repairs between January 2018 and 2026, then that’s the $99M class action — a separate track from this order, with the objection window closing Sept. 14 and a fairness hearing Oct. 29.
  • If you farm in Canada, then treat this as a signal, not a right — the order stops at the U.S. border even when the machine doesn’t.

So where does your repair bill actually sit? Pull the records this month, tag the software faults, and you’ll know before the price is even public whether this settlement changes your barn or changes the sales pitch you get. When Deere posts the real subscription number, we’ll run the full break-even against dairy-specific downtime — that deeper math lands in The Bullvine Weekly, so you can drop in your own herd’s figures before you sign or cancel a thing.

Complete references and supporting documentation are available upon request by contacting the editorial team at editor@thebullvine.com.

Learn More

The Sunday Read Dairy Professionals Don’t Skip.

Every week, thousands of producers, breeders, and industry insiders open Bullvine Weekly for genetics insights, market shifts, and profit strategies they won’t find anywhere else. One email. Five minutes. Smarter decisions all week.
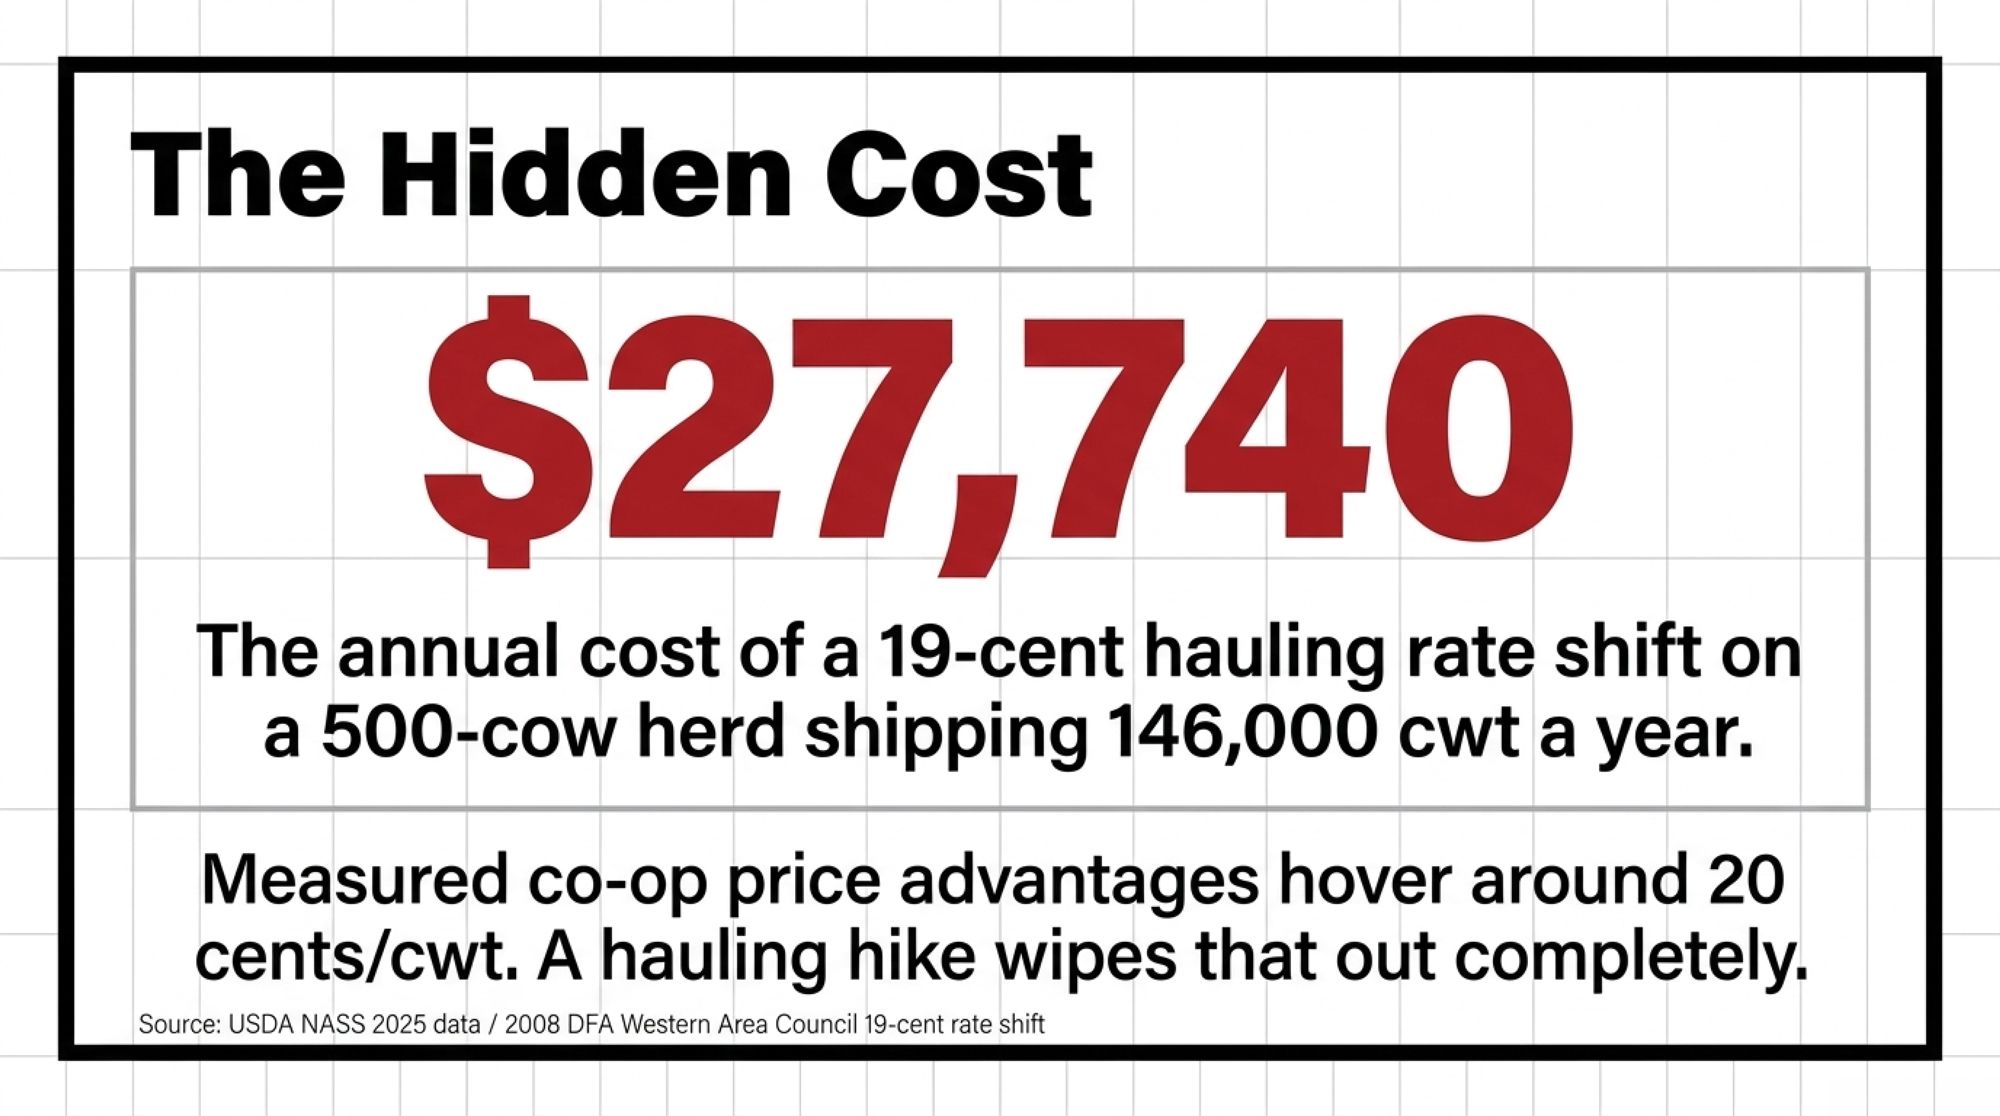
NewsSubscribe
First
Last
Consent

One Permit Could Draw 700,000 Gallons a Day – Equal to 125 Barns Your Size

Riverview’s Hillsboro dairy isn’t built yet, but it’s already spoken for 700,000 gallons a day — about 125 barns your size. Here’s the water math to run before the co-op does.

Executive Summary: Riverview ND’s Herberg Dairy near Hillsboro is permitted for 25,000 head — about 2.5 times North Dakota’s entire remaining dairy herd on one site — and it’s still stuck in court after Judge Susan Bailey took the Dakota Resource Council’s appeal under advisement on July 13. At Riverview’s own 20–30 gal/cow/day, that barn draws roughly 700,000 gallons daily, on the order of 125 times what a 200-cow neighbor pulls from the same aquifer or rural co-op. DEQ signed off on a “sufficient cropland” manure plan in a 641-page decision, which means the spreading ground within hauling distance is about to either gain value as free fertilizer for your grain neighbors or get locked into contracts you’re not part of. If you milk within 30–50 miles of Hillsboro, this reaches your well, your rented acres, and your milk route whether or not you ever ship a load to Riverview — and North Dakota’s already down from 1,810 dairies in 1987 to about 18 Grade A operations today. Three moves this month: call your water provider about capacity and rate exposure, audit how many spreading acres you actually own versus rent, and ask your hauler what a 25,000-cow anchor does to your pickup window. Watch Bailey’s ruling — uphold means lock your contracts now; remand means tighter basin-wide nutrient caps are coming for your barn too.

North Dakota largest dairy permit

Based on regulatory filings and court proceedings as of July 16, 2026. Judge Susan Bailey had not ruled at publication. Riverview ND, LLP’s public statements on the project are included below.

The Holle family has already run out of easy options. Their Northern Lights Dairy, a 1,000-cow Holstein herd about 12 miles south of Mandan, has been forced to find a new milk buyer twice in 30 months, and now hauls to a Bongards plant in Perham, Minnesota — about five hours one way. “We don’t know what we are going to do,” the family told The Bullvine in early 2026. Now, three hours east of them, a project is taking shape that would make Northern Lights look small — and reset the water, land, and hauling math for every small barn around it. 

That project is Herberg Dairy near Hillsboro. It isn’t built yet. But the neighbors are already doing the water math, and you should too.

What’s Actually Been Approved Near Hillsboro?

Riverview ND, LLP — the Morris, Minnesota company behind several Upper Midwest mega-dairies — holds a state permit to build a 25,000-head dairy in Traill County, about seven miles east of Interstate 29 near the Red River. Roughly 21,250 of those animals would be milking cows, and the site would fill about 22 tanker loads a day — more than 170,000 gallons of milk, by Riverview’s own estimate — making Herberg the largest dairy in North Dakota history by a wide margin. 

The paperwork is already dense. In a 641-page final decision dated September 24, 2025, the North Dakota Department of Environmental Quality (DEQ) approved a Concentrated Animal Feeding Operation permit after a 45-day comment period and a public hearing at Hillsboro High School the previous spring. That permit covers manure handling, storage, and land application. It does not cover water rights — Riverview still needs a separate water-supply permit and a rural water contract before the first slab gets poured. 

So the cows aren’t here. The obligations already are.

How Much Water Does a 25,000-Cow Dairy Actually Pull?

This is where a 200-cow operator should grab a pen. Riverview’s own filing estimates Herberg will use 20 to 30 gallons of water per cow, per day. At 25,000 head, that’s roughly 500,000 to 750,000 gallons per day, with DEQ using a figure of about 700,000 gallons per day. 

Now hold the water use per cow the same on both sides and stack the two operations against each other:

Metric (at 20–30 gal/cow/day)Your 200-cow barnHerberg (25,000 head)Scale difference
Head count20025,000125x larger
Daily water draw~4,000–6,000 gal~700,000 gal~115–175x
Milking cows~170~21,250~125x
Tanker loads shipped/day<1~22 (170,000+ gal milk)dozens x

Both figures use Riverview’s own 20–30 gal/cow/day estimate, so the comparison is apples-to-apples.

That’s a scale comparison, not a claim that your well runs dry tomorrow. We’ve watched this single-site scale play out before — it’s the same story as Riverview’s 18,855-cow West River permit that cleared with no full review, where a single permit reset the local math overnight.

And the water question isn’t hypothetical for this company. In January 2026, Arizona’s Attorney General announced a settlement requiring Riverview to fallow 2,000 acres in the Willcox basin and fund $11 million in relief for residents whose wells were hit by over-pumping — the kind of after-the-fact accountability that only arrives once the wells are already stressed. The lesson for North Dakota is about timing: the leverage to set terms sits with the neighbors and the co-op before a water contract is signed, not after. If Riverview taps your rural water system or the same aquifer, you stop being the customer the network was sized around. You become the exception in a system built for someone else’s demand.

The Manure Problem Behind “Sufficient Cropland”

DEQ’s approval leans hard on Riverview’s manure plan. The agency says the company identified enough cropland acreage to spread manure as fertilizer, and it kept fields inside the 100-year floodplain off the application list pending further review. Riverview, for its part, says its dairies are built to safeguard surface waters and prevent any manure discharge — with waste stored in a synthetic-lined lagoon before it’s incorporated into the soil as organic fertilizer. 

But “sufficient cropland” is where the small-farm fight actually lives. Court filings by the opposition, drawing on the permit, tie a facility this size to enormous volumes of nitrogen-, phosphorus-, and bacteria-laden waste — a characterization DEQ addressed by concluding that the approved nutrient-management plan meets state water-quality standards and requires no federal discharge permit. All of that manure has to land on real fields — owned, rented, or contracted — somewhere in your neighborhood. 

Here’s the double-edged part. For a cash-grain neighbor, a manure contract with a big dairy can read as free fertilizer — nitrogen and phosphorus they’d otherwise buy, delivered and spread. Where local crop farmers actively want those nutrients, Herberg’s manure could actually ease competition for spreading ground because both the dairy and the grain grower win. But that same demand cuts against you if your nutrient plan leans on rented acres. A landowner who used to rent you 80 or 100 acres for spreading now has a counterparty willing to pay in fertilizer value, which could reshape what that ground is worth. There’s no public data yet showing per-acre rent shifts tied to Herberg — that’s an honest gap. It rhymes with the land-base squeeze we tracked in Wisconsin, where data-center money pushed farmland toward $21,946 an acre: once a deep-pocketed buyer enters a fixed-acre market, price discovery stops working in the small operator’s favor.

Who’s Fighting the Permit, and Why It’s Really About Review Scope

The opposition isn’t a handful of anonymous complainers. It’s named groups with lawyers on retainer. The Dakota Resource Council, backed by Food & Water Watch, filed suit and appealed in October 2025, arguing DEQ’s review was inadequate and that a dairy this size should require a federal permit under the Clean Water Act. 

Their argument is straightforward: opponents contend a facility generating that much waste near the Red River watershed poses a discharge risk deserving federal oversight, and they warn it threatens the river and, downstream, Lake Winnipeg in Canada. DEQ’s counter is just as plain — in its 641-page decision, it held that under state law a federal NPDES permit is only required if there’s an actual discharge, and it found Herberg’s design and nutrient plan are built to prevent one. 

On July 13, 2026, that clash came before Judge Susan Bailey. As of mid-July, she’d taken it under advisement with no ruling. The permit still stands. Construction is still conceptually greenlit. But the legal risk is live, and every lender and processor watching the region is quietly pricing it in — a shift in regulatory risk we continue to track closely as permit fights rewrite local lending standards. 

There’s a cross-border wrinkle too. Manitoba groups, including the Manitoba Eco-Network and the Save Lake Winnipeg Project, pushed for scrutiny of cumulative nutrient loading — and the International Joint Commission has directed its International Red River Watershed Board to review the North Dakota dairy projects. That’s not directly about your barn. But if international boards start pressing for tighter nutrient caps on the basin, small operators can end up bound by limits triggered entirely by someone else’s scale. 

One State’s Whole Dairy Sector, Rebuilt Around Two Sites

To feel the weight of this, layer it on North Dakota’s collapse. The state had around 1,810 dairy farms in 1987. By the 2022 Census of Agriculture, it was down to just 24 — and by early 2026, the Holle family counted the number of Grade A dairies even lower, at around 18. Total cows left in the state run somewhere between 8,700 and 10,000, per USDA NASS and state reporting. 

Herberg alone would run about 2.5 times the entire current state herd on a single site. Pair it with Riverview’s second permitted project — a dairy near Abercrombie in Richland County licensed for 10,625 milking cows plus 1,875 dry cows — and the two facilities would add nearly four times the state’s current cow count, pushing the total to roughly five times what’s milked in North Dakota today. An NDSU Extension analysis from December 2025 estimated that the two dairies would require about $270 million in initial investment and generate gross annual revenue between $122 million and $227 million, depending on milk prices. That collapse from 1,810 dairies to two dozen is a story in its own right — the kind of long arc that explains why a single applicant now carries this much weight in a state that used to spread its milk across a thousand barns. 

Read that plainly. The state’s dairy sector shifts from a scattered mix of 20-some herds to a two-anchor system with a handful of satellites. When that happens, the “state average” producer stat you get benchmarked against — by USDA, by your lender, by input surveys — is basically describing two facilities that aren’t you.

What Does This Mean for a 200-Cow Dairy Down the Road?

Get out of the courtroom and into your barn office. Say you milk 200 cows within 30 to 50 miles of Hillsboro. Here’s how Herberg’s numbers reach you even if you never trade a single load with Riverview.

On water: their 700,000 gallons a day is on the order of 125 times your daily draw at the same per-cow rate. You’re not going to lose your well tomorrow. But any future change in co-op capacity, pressure, or rate structure will get designed around their profile first, and yours second. 

On land: DEQ already blessed a “sufficient cropland” plan for a 25,000-cow manure load. Translation — the spreading ground within hauling distance is either about to gain value as free fertilizer for your grain neighbors, or get locked up in contracts you’re not part of. Either way, if your manure plan leans on rented acres, your negotiating position just changed. 

How Do You Protect Your Operation Before the Concrete Trucks Roll?

Start with three checks you can knock out this month.

Call your water provider within the next 30 days. Ask your rural water co-op or well-permitting office one direct question: would Herberg’s application trigger new capacity limits, infrastructure upgrades, or a new rate tier that would hit you? Get the answer before you finalize any parlor or herd-expansion assumptions. Build a water-cost buffer into those plans now, not after the fact.

Audit your manure land base. Figure out exactly how many of your spreading acres are owned versus rented. If rented acres are load-bearing for your nutrient plan, open the conversation on term length and pricing early. Long-term contracts are cheap insurance against a much larger operation entering the same market.

Map your milk route and your backup plant. North Dakota’s processing side is already brittle. Prairie Farms closed its Bismarck plant in September 2023, DFA shut its Pollock, South Dakota plant effective August 30, 2024, and that leaves Cass-Clay’s Fargo facility as the last milk plant standing in-state. When Pollock closed, one producer northwest of Bismarck saw milk rerouted 151 miles at a $0.55 per hundredweight freight surcharge. Haulers build routes around anchors, and a 25,000-cow site is the biggest anchor the region has ever seen. Ask your hauler, straight up, what that could mean for your pickup window — not for a quote, just for an honest read. 

Options and Trade-Offs

There’s no single right move here, and the right one depends on where your barn sits and how leveraged you are.

MoveBest fitUpfront costMain risk
Lock in now (contracts + acres)Rely on rented ground/shared water, milking 5+ yrsSmall premium for longer termsOverpay if permit gets tossed
Wait and watchCash-tight, water and land fully ownedNoneGood acres/capacity gone when you move
Reposition entirelyNeighborhood economics already shiftingHighest — consolidate or relocateHighest friction; only if both sites clear
Watch Bailey’s rulingEveryone within 30–50 miNoneUphold = lock now; remand = tighter caps coming

Lock in now — contracts and acres. Makes sense if you rely on rented spreading ground or shared water and you plan to keep milking five-plus years. It requires having the conversations early and maybe paying a small premium for a longer term. The risk: you commit to costs before the court rules, and if the permit gets tossed, you overpaid for security you didn’t need. Watch Judge Bailey’s ruling as your signal — if she upholds the permit, the market pressure is real and near-term. 

Wait and watch. Makes sense if you’re cash-tight and your water and land are fully owned. It costs you nothing upfront. The risk is obvious — you’re betting the good acres and the co-op capacity are still there when you finally move. If the ruling favors DEQ and construction accelerates, this path narrows fast.

Reposition entirely. For some operators near a project this size, the honest read is that the neighborhood economics are shifting under them, and the move is to consolidate, relocate spreading ground, or rethink the milking enterprise. It’s the highest-cost, highest-friction path. But it’s the one to model if the ruling clears the way for both Riverview sites and for a third or fourth project to follow — the same cumulative-scale scrutiny Manitoba regulators are already pushing toward international review. 

Key Takeaways

  • If your water comes from a shared co-op or aquifer near Hillsboro, call the provider within 30 days — before Herberg, not after, is when you have leverage to ask about capacity and rate protection.
  • If more than half your manure acres are rented, treat contract renewal as urgent, not routine — a 25,000-cow neighbor changes the bidding pool, and whether that helps or hurts you depends on how badly your grain neighbors want the nutrients.
  • If Judge Bailey upholds the permit, read that as your signal to lock contracts; if she orders deeper review, expect tighter basin-wide nutrient rules that will eventually reach your barn too. 
  • If you’re benchmarking against “North Dakota average” milk or cost numbers, stop — once two mega-sites dominate, the state average describes them, not a 200-cow herd.

Here’s the real question to sit with tonight: can your operation survive in a landscape where a single permit sets the baseline for water, manure, and haul logistics across your whole county? North Dakota went from 1,810 dairies to two dozen in one lifetime, and the Holles are hauling five hours one way to prove what’s left of the map. The next chapter is being written in a Traill County courtroom right now, and it won’t wait for you to catch up. 

Run your own numbers against Herberg’s. Then, if you want the full consolidation model — the per-acre rent scenarios, the water-competition math, and the cost curves behind the collapse — that’s exactly what we dig into in The Bullvine Weekly and our deeper economics coverage.

Run Your Numbers

Dairy Farm Corridor Score Calculator — Herberg reshapes the water, land, and hauling map around your barn. Feed in your state, herd size, and hauling cost per cwt to see whether your location is quietly turning into a red-zone milk-check risk before the concrete trucks roll.

Complete references and supporting documentation are available upon request by contacting the editorial team at editor@thebullvine.com.

Learn More

The Sunday Read Dairy Professionals Don’t Skip.

Every week, thousands of producers, breeders, and industry insiders open Bullvine Weekly for genetics insights, market shifts, and profit strategies they won’t find anywhere else. One email. Five minutes. Smarter decisions all week.
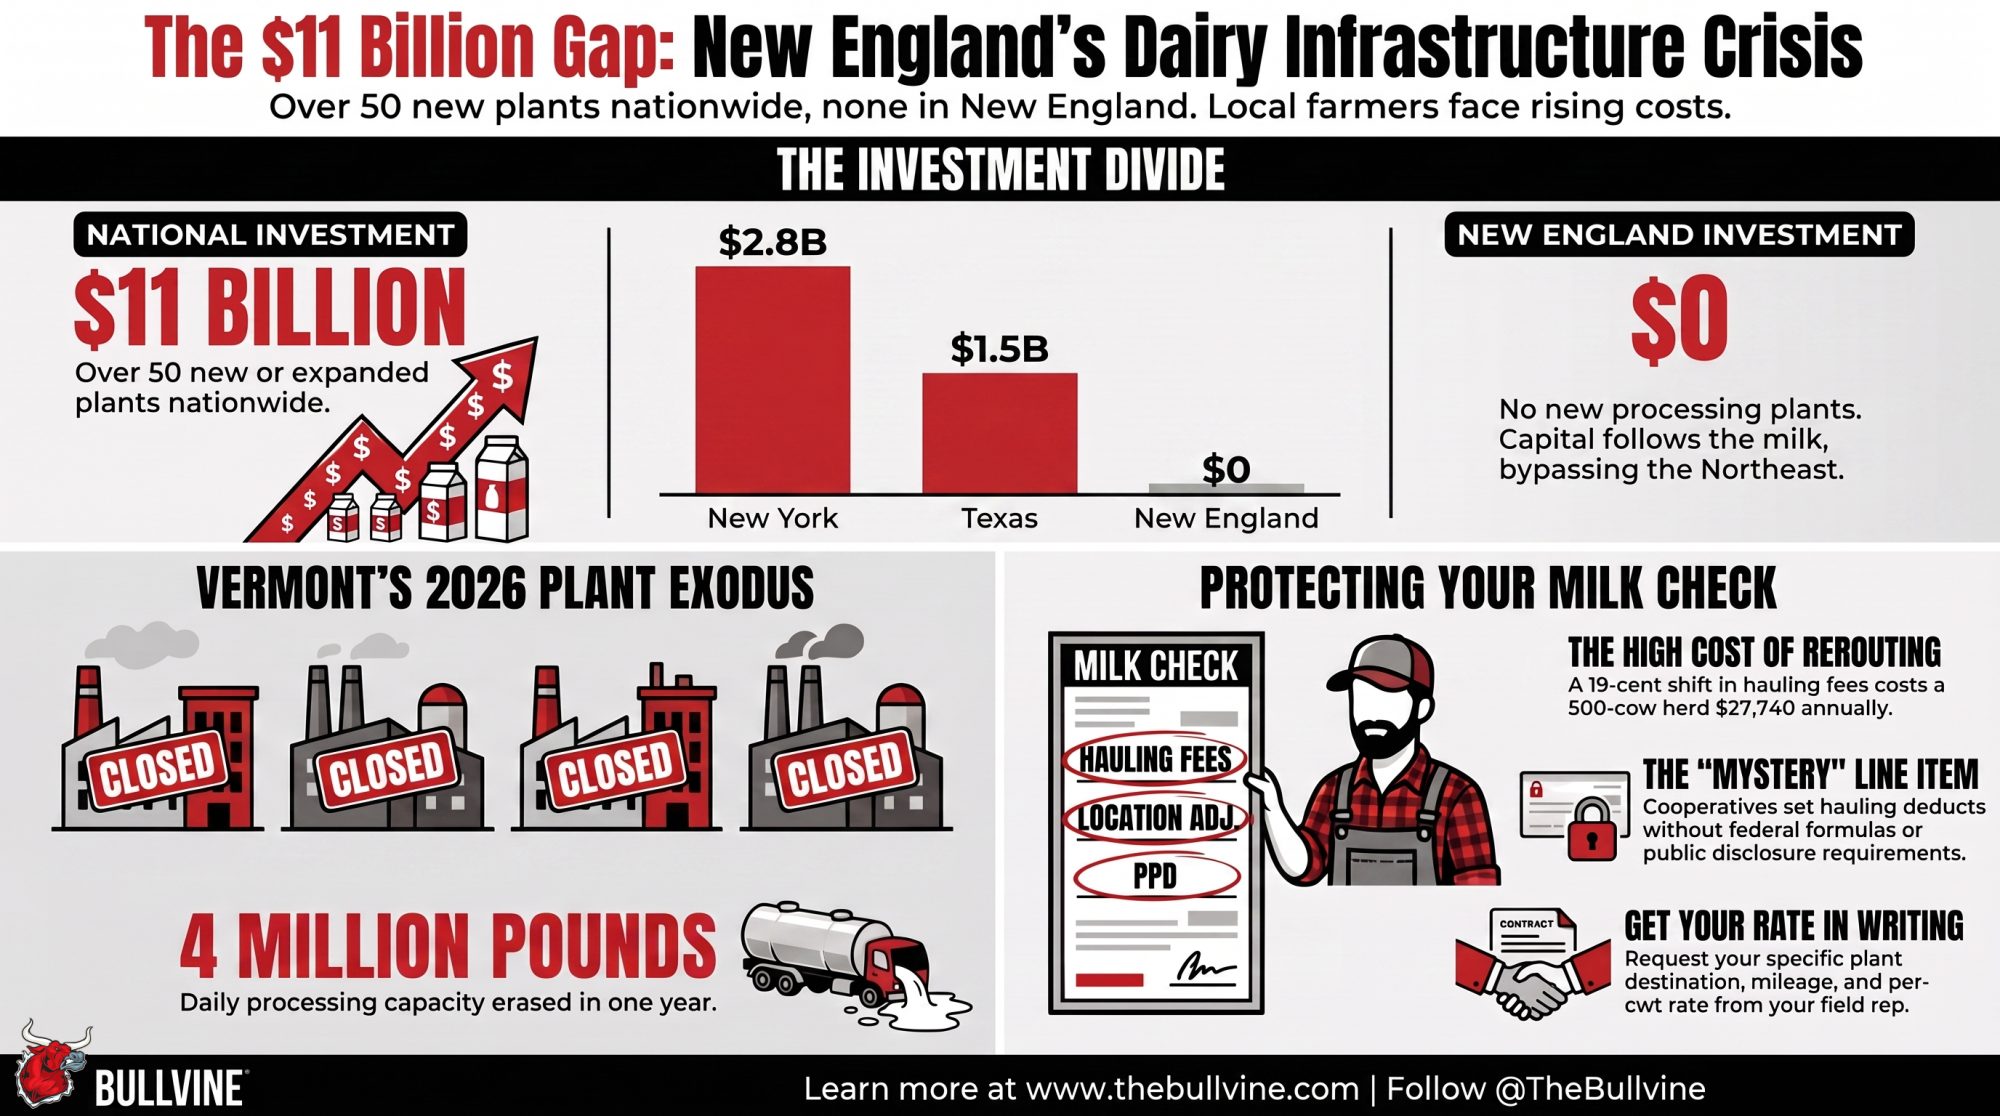
NewsSubscribe
First
Last
Consent

$87 a Cow, $2,460 a Barn: The Heat Loss You Never Book

$87 a cow. About $2,460 across a 30-head dry group. And you’ll never see it — because the loss lands on next year’s tank, not this month’s, and nobody charges it to the dry pen.

Executive Summary: An uncooled dry cow gives back about 447 kg of milk in her next lactation — roughly $87 a head, or around $2,460 across a 30-head dry group — and almost nobody books it, because the loss shows up on next year’s tank, not this month’s. UF/IFAS pegged the trigger at THI 68, not the old 80°F rule of thumb, so you’re bleeding milk on a muggy 27°C afternoon in Wisconsin or Ontario long before the barn feels hot. The damage is structural: heat during the dry period means the udder rebuilds fewer alveoli, and no amount of fans after calving puts those cells back. It doesn’t stop at her, either — Laporta’s 2020 JDS work found heat-stressed dams throw daughters that milk 2.2 to 6.5 kg/day less across their first three lactations, so you can cook a high-genomic heifer’s expression before she’s born. Retrofits can pay back inside a season at as few as ~6 heat days a year; new cooled dry housing pencils around 5.7 years in humid regions — but “average” is the wrong number, and your own THI count is the one that decides it. The 30-day move: hang a logger in the dry pen and get your real heat-day count before the next capital request. Read the full piece if you cool your milking string but still leave the dry cows in the shade to sweat.

dry cow cooling

Walk through almost any dairy on a hot July afternoon, and you’ll see the priorities written in aluminum and water. Fans humming over the milking string. Soakers cycling in the holding pen. And off to the side, in the shade, the dry cows — standing under a roof with not a fan in sight.

That split-screen is the whole story. Because the research says the cows getting ignored in that far pen are the ones quietly costing you the most next year. About 447 kg of milk per cow in the next lactation. Roughly $87 a head. And nobody writes it down.

The Number That’s Been Sitting There Since 2016

The figure isn’t new, and it isn’t soft. Ferreira, Gennari, Dahl and De Vries published it in the Journal of Dairy Sciencein 2016: leave the average U.S. dry cow uncooled through her hot days, and she gives back about 447 kg of milk in her next lactation. Multiply across the herd, and it’s roughly $87 a cow. Ferreira’s 2016 model puts the national tab near $810 million a year in milk that never gets made.

So the math has been done for the better part of a decade. The behavior hasn’t moved. That gap — between what’s proven and what actually happens in the barn — is the part worth chewing on.

Albert De Vries, the University of Florida dairy management professor behind that paper, put the diagnosis plainly in the UF/IFAS release: “many farmers often ignore cooling dry cows, not realizing that dry cows under heat stress produce less milk later.” Read that twice. It’s not about effort or intelligence. It’s a loss engineered to stay invisible.

Why $87 Doesn’t Change Anybody’s Mind

Here’s the trap. A lactating cow in heat stress shows you the bill in real time — she pants, she drops feed, the tank dips this week. You see it, you act. A dry cow in the same heat looks exactly like she did yesterday, and nothing happens today.

The cost shows up months later, as a slightly flatter peak on a lactation curve nobody thinks to connect back to a hot afternoon in the dry pen. No alarm. No event. Just a number that arrives late and untraceable.

That’s why waving the $87 around doesn’t work. Farmers respond to numbers — that’s never been the problem. The problem is this one shows up in the wrong format, in the wrong pen, at the wrong time to do a thing about it.

The Dry Pen Isn’t a Parking Lot

The deeper issue is a filing error. In most managers’ heads, the dry pen is a holding area — animals waiting to matter again. So when someone floats spending money on fans and soakers out there, it feels like robbing the cows that are paying the bills today.

But that pen isn’t downtime. It’s the construction phase. During the dry period, the udder tears down old tissue and rebuilds the alveoli that’ll make next lactation’s milk. It’s the one window where the factory gets rebuilt for the year ahead.

Cook that process while it’s happening, and you don’t get a temporary dip you can cool your way out of after calving. You get a permanently smaller factory. Studies on the mechanism show heat-stressed dry cows redevelop fewer alveoli and more connective tissue, and the carry-over lands as a 3 to 7.5 kg per day drop in the next lactation — a loss postpartum cooling doesn’t rescue. You cooked it during the build. Fans in September don’t put the missing cells back.

So the honest label for the dry pen isn’t “waiting.” It’s “actively building next year’s milk cheque.” Fix that category, and the $87 finally has somewhere to land. It’s the same logic behind the cooling you’re already paying for on the milking string — you’re just applying it to the pen where it pays off latest.

The Thread That Actually Moves People

If the dollar figure alone won’t do it, what does? The multi-generation thread.

Jacobo Laporta and colleagues (Journal of Dairy Science, 2020) followed the daughters of heat-stressed dams and found the damage doesn’t stop with the dam’s next lactation — it reaches into her calves. Those daughters milked less in each of their first three lactations: 2.2 kg/day lower in the first, 2.3 kg/day lower in the second, and 6.5 kg/day lower in the third, compared with daughters of cooled dams. Their conclusion was blunt: late-gestation heat stress “exerts carryover effects on at least 2 generations.”

This is the ultimate frustration for a progressive breeder. You buy the best genetics, you mate for high genomic merit — and then you choke that heifer’s genetic expression before she’s even born, because her dam spent July panting in a dry pen. You didn’t lose the genetic lottery. You cooked the epigenetic switch. Nobody connects those dots without help, which is exactly why the loss survives — and it’s worth remembering when the daughter proof lands under the catalog number and comes up light.

Where the Clock Actually Starts

Before the barn math, reset one thing: the trigger. The old rule of thumb — cows are fine until it’s about 80°F — is wrong for modern high-producers.

UF/IFAS defines a heat-stress day at an average Temperature-Humidity Index of 68 or higher. That’s a mark you cross on a muggy 27°C afternoon in Wisconsin, New York or Ontario, long before the barn feels dangerously hot. Wait for “hot” by human standards before you worry about the dry pen, and you’ve already been bleeding milk for weeks. If you want the full picture on the trigger, here’s why THI 68 is the number that matters now.

StandardTrigger PointReal-World ExampleRisk If Ignored
Old rule of thumb80°F ambientClear, dry 80°F dayUnderestimates humid-day risk
THI 68 (UF/IFAS)~27°C with humidityMuggy 80°F afternoon, WI/NY/ONLosses start weeks earlier than assumed
Practical takeawayHang a logger, don’t guessFarm-specific THI count“Average” data misses your real exposure

Run It for Your Own Barn

UF/IFAS extension (publication AN342, 2018) turned the research into numbers you can actually use. Each dry-period heat-stress day costs about 10.3 lb (4.66 kg) of next-lactation milk. UF/IFAS values that at roughly $0.91 per cow per day, using their full model, with $14.90/cwt milk income over feed cost — note that’s their discounted per-day figure, not a simple milk-price multiplication of that day’s kilos.

Plug in the U.S. average, and you land right back home: about 96 heat days a year, and a full-model loss near 447 kg and $87 a cow. But “average” is the wrong number for any single farm. The 2016 study modeled New York, California and Wisconsin climate data specifically, and the spread runs wide — Wisconsin sits near 349 kg and $68 a cow, while Florida, at 257 heat days, hits roughly 1,197 kg and $234. Treat all of these as modeled estimates, not guaranteed returns. Wisconsin and Florida bracket the range; the by-state chart with this article lays out where the rest fall in between.

Here’s the micro barn-math, and reset it to your own milk price, because UF’s rides on that $14.90/cwt assumption. Take a 200-cow herd, 15% dry at any time (30 head), through 90 heat-stress days:

  • Per cow: 90 days × $0.91 ≈ $82 in lost next-lactation milk (about 925 lb).
  • Across 30 dry cows: roughly $2,460 — and that’s the hit to next lactation, not a line item you’ll ever see on this year’s expense sheet before you count a thing on the calf side.
MetricUncooled Dry CowCooled Dry CowStandout Impact
Next-lactation milk loss (kg)4470-447 kg/cow
Annual dollar loss per cow$87$0-$87/cow
Loss across 30-head dry group$2,460$0-$2,460/group
National annual milk value lost$810 millionIndustry-wide blind spot

Lower your milk price, and the per-day loss shrinks; raise it, and it grows. The point isn’t a magic dollar figure. It’s that even at conservative prices, the leak is real money, and it scales fast from 100 cows to 1,000.

Retrofit, Build New, or Start Measuring

The research points to genuinely different calls depending on your facilities and your climate. Here’s how the three paths stack up:

StrategyBest ForPayback / ThresholdKey Risk / Failure Point
1. Retrofit Existing BarnYou already have the structure; moderate-to-hot summers~6 heat-stress days/year; payback often within one seasonPoorly angled fans or undersized water lines that never drop core body temperature
2. Build New With CoolingExpanding or replacing dry housing in humid regions~55 heat-stress days/year; ~5.7-year paybackOver-building for the national average instead of your local climate — or your milk price
3. Measure Before SpendingEvaluating real risk before committing capitalLow cost, ~30 days: hang a temperature-humidity logger, spot-check respirationsLetting “average” regional data dictate a decision your own micro-climate should make

Thresholds and payback figures are from Ferreira et al., J. Dairy Sci. 2016, under its default assumptions ($14.90/cwt milk income over feed cost). Your own capital and utility costs will move them.

The direction of travel is clear: extension groups increasingly frame dry-cow cooling as roughly as important as cooling the milking string, even in moderate northern climates. The “only the hot states need to worry” assumption is aging badly — and it ties straight into how dry-pen cooling fits the transition-cow picture.

📋 The Dry-Pen Audit: 4 Questions for Your Next Team Meeting

  • How do we file “dry cows” in our budget? Is that pen “downtime” — or “the construction phase of next year’s milk”? Your honest answer probably predicts your cooling budget.
  • Are we tracking the grand-offspring? When a heifer underperforms relative to her genomic projection, do our records allow us to check whether her dam was heat-stressed in late gestation?
  • What is our actual THI-68 count? Instead of guessing off the local forecast, have we hung a logger in the dry pen to get our own barn-level number before the next capital request?
  • Are we doing half the job? If we cool the milking string but leave the dry cows to sweat, we’re actively cooking the factory before it opens — and no amount of post-calving cooling puts those cells back.

The uncomfortable part was never the money. It’s that the dry pen is the one place on the farm where you place a bet you won’t see settled for six months — and whose full cost might not surface until a daughter milks light two years out. Most barns aren’t built to remember that long. So the real question isn’t whether $87 a cow is worth chasing. It’s whether you’re willing to treat “was this cow cooled while she was dry” as a number worth writing down, the same way you already track milk, SCC and genomics. Until you do, the loss stays exactly where it’s always been — out in the far pen, in the shade, where nobody’s looking.

Key Takeaways

  • Cooling stops at the milking string on most farms, but the dry pen is where next year’s tank gets built — leave it uncooled and you’re out about 447 kg and $87 a cow, money you’ll never trace back to the pen that cost it.
  • The clock starts at THI 68, not 80°F, so hang a logger in the dry pen and get your real heat-day count before the next capital request — that number, not the national average, decides whether cooling pencils on your farm.
  • Retrofits can pay back in a season with as few as ~6 heat days a year; new cooled-dry housing runs closer to a 5.7-year payback, so match the spend to your climate and milk price, not somebody else’s.
  • Heat stress a dry cow and the loss doesn’t stop with her — her daughters milk 2.2 to 6.5 kg/day less, so you can choke a high-genomic heifer’s expression before she’s ever born.

Run Your Numbers

Dairy Profit Projector — This piece runs on UF’s $14.90/cwt milk-income-over-feed assumption. Swap in your own milk price, feed cost, and IOFC to see what that lost next-lactation milk is actually worth against your margin — and whether cooling the dry pen pencils before the next capital request.

Complete references and supporting documentation are available upon request by contacting the editorial team at editor@thebullvine.com.

Learn More

  • Concrete, Air, and Shade: The Real Drivers Behind Milk Yield — Reclaims $1,100 to $2,300 in monthly revenue leaks by executing low-cost, 90-day payback stall modifications. This blueprint breaks down the exact dimensions, airflow settings, and bedding targets needed to force immediate lying-time production responses.
  • Fans Won’t Fix It – Heat-Stressed Cows Go Leaky in 3 Days — Exposes the metabolic reality that fan cooling only recovers 60% of summer milk losses. This analysis delivers the gut-health and DCAD nutrition strategies required to stop the remaining 40% from leaking through a compromised digestive tract.
  • How Epigenetic Factors Influence the Next Generation of Dairy Cows — Dismantles the assumption that genetics are locked at conception by revealing how maternal environment flips cellular switches. It arms you with the management keys to translate nutritional and environmental comfort into permanent, multi-generational genetic performance.

The Sunday Read Dairy Professionals Don’t Skip.

Every week, thousands of producers, breeders, and industry insiders open Bullvine Weekly for genetics insights, market shifts, and profit strategies they won’t find anywhere else. One email. Five minutes. Smarter decisions all week.
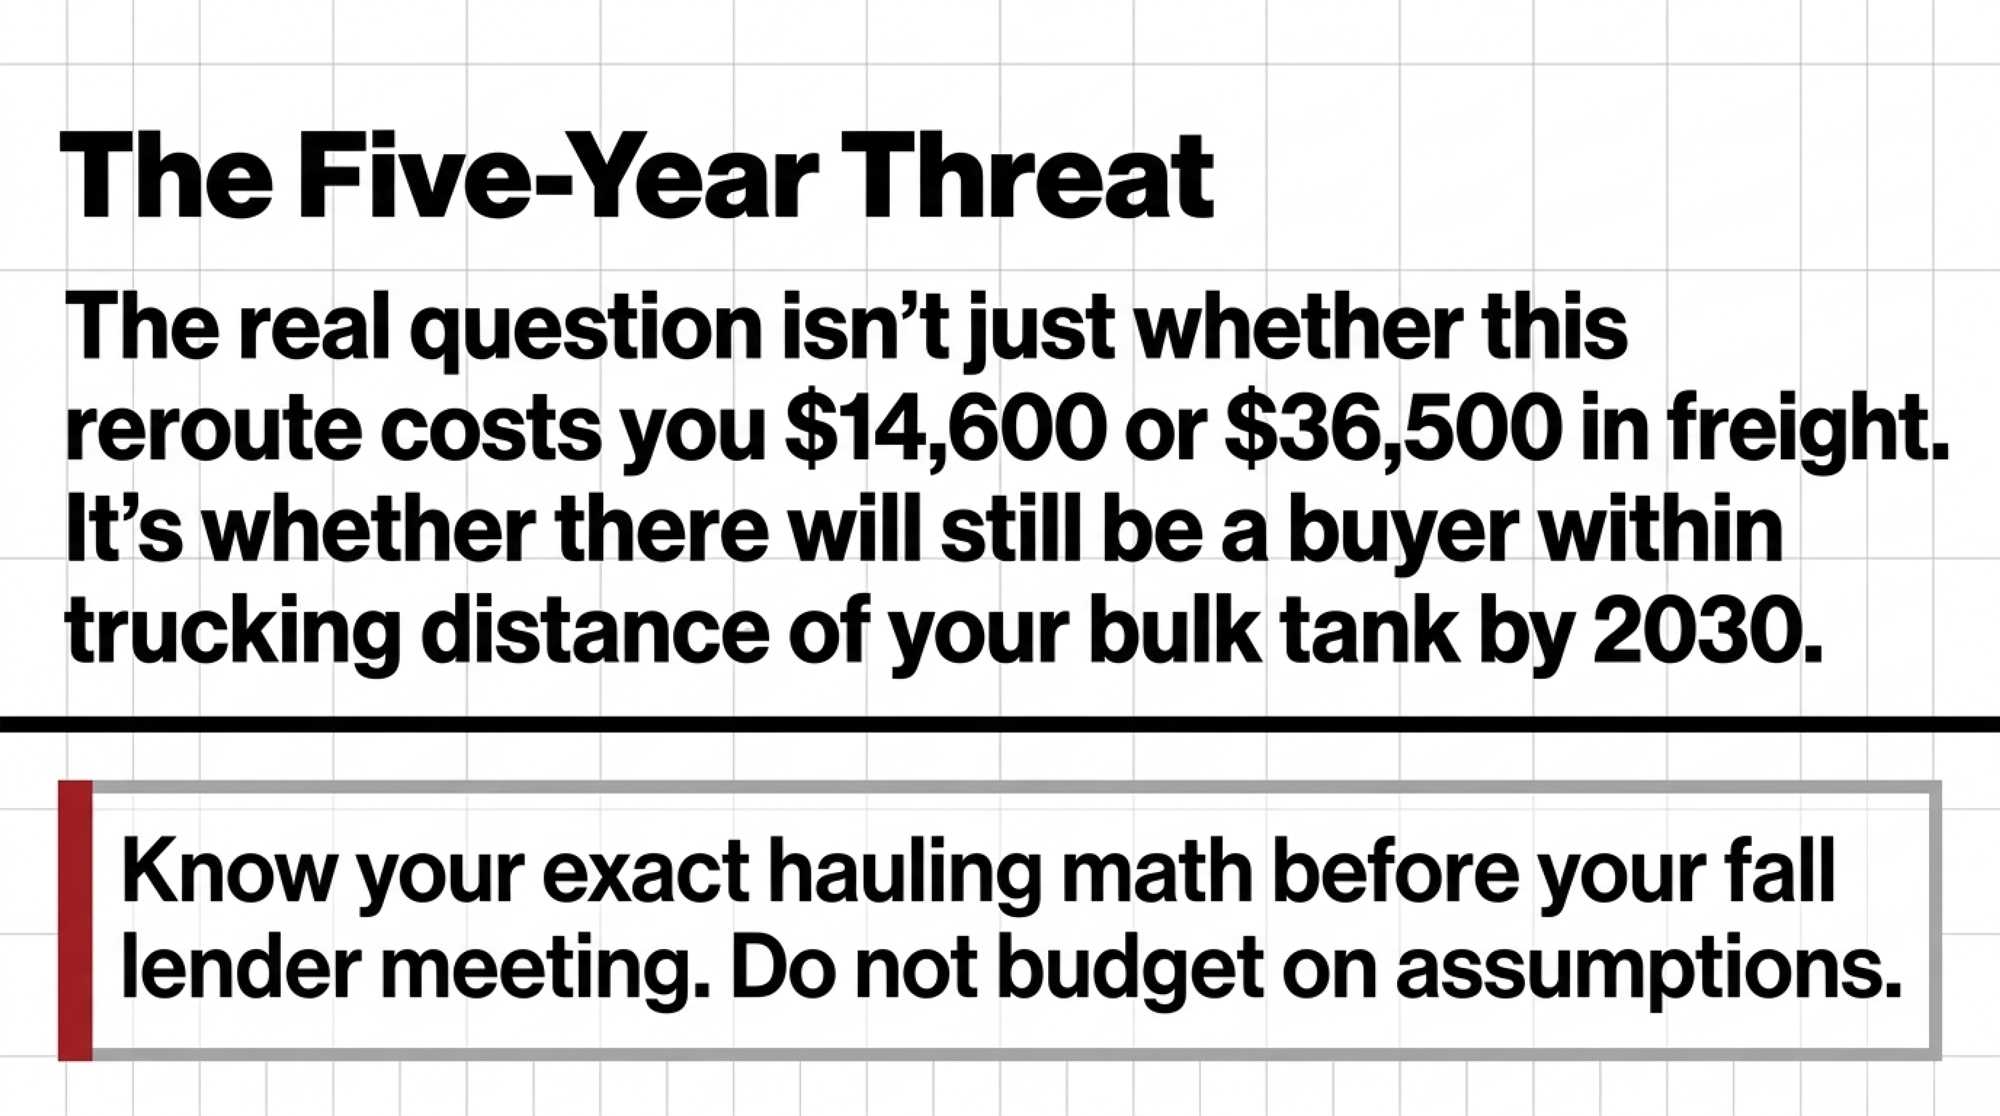
NewsSubscribe
First
Last
Consent

The 5¢ TRQ Fight vs. a $96,000 Hole in Your Milk Check

That border fight is worth about 5¢/cwt. The $96,000 hole already in your milk check is the one that decides if you’re still milking in 2030.

North Dakota once counted 1,810 dairy farms. By March 2025, Deputy Agriculture Commissioner Tom Bodine told state lawmakers just 23 permitted operations were left — one of them not even milking — running about 8,700 cows between them (North Dakota Monitor). That’s not a rough market cycle. That’s a state’s dairy industry going quiet, one processing plant and one lender conversation at a time.

Here’s the part that should stop you cold. While farms like those disappeared, the loudest fight in dairy policy has been about Canadian tariff quotas — a dispute that, run through the actual numbers, lands on your milk check as a nickel per hundredweight (USDA milk production data). The border fight has a flag and a villain. The thing pulling barns under has a spreadsheet and a month-end accounting entry. And it’s winning.

Do the Math on the $200 Million and It Shrinks to a Nickel

U.S. dairy groups say Canada owes them roughly $200 million a year in market access under CUSMA. Real money — until you spread it across the 232 billion pounds of milk this country produced in 2025. Divide the full $200 million across that production and you get about 8.6 cents per hundredweight. Because only 42% of the access actually gets used, though, roughly $116 million goes unfilled each year — and spread across production, that’s about a nickel per cwt.¹ (The Bullvine: North American dairy trade)

Economists Keith Head and Werner Antweiler said it plainly in a 2024 working paper: any remedy to the TRQ dispute “would likely result in only modest economic gains to the United States.” On a 150-cow dairy shipping around 24,000 pounds per cow, that nickel is worth roughly $1,800 a year (Head & Antweiler, SSRN 2024). That’s the fight burning political capital in Washington and Ottawa through the 2026 review.

DimensionThe Political Fight (CUSMA TRQ)The Real-World Margin Pressure
Value per cwt~$0.05/cwtClass III drop to $14.59/cwt (Jan 2026)
Annual impact, 150-cow herd~$1,800/yr
Annual impact, 400-cow herd$96,000 lost on a $1/cwt shortfall
What it actually decidesBurns political capital in DC & OttawaWhether the bank pulls your credit line

Now hold that nickel next to what’s happening inside your own milk check.

Fewer Farms, More Milk — and No Column for the Ones That Vanish

From the outside, dairy looks healthy. U.S. exports hit a record $9.51 billion in 2025, up 15% over the year before, and production set its own record (IDFA). Zoom in and the story flips.

USDA’s Economic Research Service reports the number of licensed U.S. dairy herds fell 63% — from 66,825 in 2004 to 24,811 in 2024 — even as output climbed. The 2022 Census of Agriculture put the drop at 39% in just five years, with farms selling milk falling from about 39,000 in 2017 to 24,000 in 2022. Every herd size shrank except operations with 2,500 cows or more (USDA ERS). The dashboards driving dairy policy measure production, exports, and cost per unit — not how many families stay in business. ERS frames it as efficiency, and the numbers back that framing: in 2021, producing 100 pounds of milk cost $42.71 on herds under 50 cows versus $19.14 on farms with 2,000-plus. By that math, fewer, larger farms making more milk is a win. There’s just no line on the spreadsheet for North Dakota’s missing 1,787 dairies — where the consolidation curve is heading by 2035.

How This Plays Out on a Real Farm

A DSCR breach isn’t a number. It’s a sequence that lands on a real family over months.

What DSCR means: Your debt service coverage ratio is the cash your operation throws off measured against the loan payments you owe. At 1.0×, every dollar of margin goes straight back to the bank — you’re running the parlor to break even with the lender, nothing left over. Below 1.0×, the milk check no longer covers the debt, and you’re pulling from equity to make the payment. (FCC)

North Dakota shows the squeeze in real time. As local processing capacity thinned out, the January 2026 Class III price had already dropped to $14.59 per hundredweight — the lowest since April 2021 — leaving farms with fewer places to send milk at a workable price. It got tight enough that Dawson Holle, whose family runs the 1,000-cow Northern Lights Dairy near Mandan, told a House committee they’d researched building their own processing — after being forced to switch milk markets twice (North Dakota Monitor). That’s the trap: it isn’t always low prices alone. Sometimes it’s the buyer disappearing and stranding your milk.

Run the barn math on a herd that size. On a 400-cow dairy shipping roughly 96,000 hundredweight a year — that’s about 24,000 pounds per cow — a $1/cwt shortfall against your breakeven is about $96,000 gone in twelve months. Stack that against the nickel the TRQ fight might return. One of those numbers decides whether you re-amortize the parlor note. The other you’ll never feel — how North Dakota’s processing collapse played out.

The $4.98 Spread Most Producers Never See Coming

Here’s the mechanism almost nobody in the trade conversation talks about: depooling. It’s a legal, disclosed feature of how voluntary pooling works — and it’s where the structural pressure quietly builds, in plain sight.

Under Federal Milk Marketing Orders, fluid milk has to be pooled, but manufacturing milk — Classes II, III, and IV — is pooled voluntarily. When a manufacturing-class price climbs well above the order’s blend price, a handler can simply choose not to pool it. As Ohio State’s dairy economists put it, “A Class II, III, or IV price which exceeds the Uniform price signals reduced pooling of that class.” The call gets made at month’s end, once every price is known. (Ohio State Extension)

Watch what happens when the spread blows out. In June 2026, USDA announced Class III at $15.98/cwt and Class IV at $20.96/cwt — a spread of $4.98 (USDA AMS class prices). That gap is a green light for handlers to pull their higher-value Class IV milk out of the Order pool. And when that milk walks out the door, the money it would have contributed to the blend walks with it — so the fluid producers left in the pool get handed a thinner blend price and choppier basis they never voted on. The decision is lawful and routine. But it’s made quietly at month-end, and the first place you notice it is your own check — how depooling thins your blend price.

How Much Does the TRQ Fight Actually Change Your Bottom Line?

The answer is a hard no. Line up that political nickel against a real-world cost structure — Illinois FBFM pegged total economic cost, unpaid family labor and equity included, at $23.56/cwt for 2024, against a net milk price of $21.63, a loss of $409 per cow — with an all-milk price USDA now forecasts at $20.70/cwt for 2026 (American Ag Network). That gap is measured in dollars, not cents.

So if both sides “win” their version of the CUSMA review — full enforcement for the U.S., intact supply management for Canada — it doesn’t fix either farmer’s structural problem. It just decides who bleeds a little slower. Chasing the border fight while your own cost of production runs $3 over your milk price is a losing trade. Where does your breakeven actually sit right now?

Is Your Lender Already Seeing Trouble You Haven’t Named Yet?

Probably. Farm financial research shows lenders often see the strain building well before producers are ready to name it — they’re running rolling DSCR and margin models most farms aren’t (The Bullvine: The 18-Month Window). In that gap, the story a farmer tells himself is simple: we’ve milked through worse, we’ll milk through this. The bank’s spreadsheet already knows a multi-dollar structural gap doesn’t close with more hours in the parlor.

MetricHealthy PositionWatch ZoneDistress / Act Now
DSCR (Cornell DFBS 2024)2.95× (top group)~1.0× breakeven0.36× (lowest-profit group)
What the milk check coversDebt + margin left overDebt only, nothing leftPulling from equity to pay
Total economic cost (IL FBFM 2024)Below milk price$23.56/cwt vs. $21.63 net–$409 per cow
Lender responseRestructuring roomStress test at $16 milkGets the letter, not the plan

Cornell’s Dairy Farm Business Summary shows how thin the bottom end runs. In the 2024 DFBS, the lowest-profit group averaged about 0.36× debt coverage — roughly a third of what a healthy loan needs — while the top group ran 2.95×. The farms that get restructuring room walk into the bank with a stress test at $16 milk and a real plan. The ones that get letters walk in saying “it’ll turn around.” Hope and identity run on a different clock than DSCR — and that gap is exactly where the equity bleeds out. Run your DSCR before your lender does.

Your Four-Step Survival Blueprint

Nobody’s hopeless here. But the farms that get flexibility show up with numbers, not hope. Work these in order.

1. Run a rolling DSCR stress-test — within 30 days. Calculate your honest 12-month cost per cwt, then re-run your last twelve milk checks against $20.70, $18.00, and $16.00 milk (USDA ERS dairy outlook). Pay close attention if you’ve recently repriced operating or term debt into 7–8% money. The number might rattle you — that’s the point. On a leveraged herd, acting now instead of six months from now can preserve well into six figures of equity, per Bullvine’s exit-timing analysis.

2. Audit your handler’s utilization reports — monthly. Ask your cooperative or independent handler exactly where your milk pools each month. Watch whether Class IV depooling is shaving your basis when the Class III–IV spread stretches past normal — it hit $4.98 in June (USDA AMS). You may not have leverage to change it, but you can’t manage what you can’t see.

3. Layer secondary margin protection — quarterly. Basic Dairy Margin Coverage offsets just 67–74% of total costs for many operations, leaving a quarter or more of your real economic cost exposed (Farm Bureau). Stack Dairy Revenue Protection or LGM underneath DMC to floor the balance during sustained down-cycles. Premiums cost money up front, and no TRQ win rescues a negative-margin farm — survival still comes down to cost control.

4. Set a hard balance-sheet threshold — strategic horizon. Not everyone should stay, and the worst exit is the one the bank times for you. Identify the exact equity floor where a structured, 12-to-24-month orderly exit preserves family wealth. If your models show DSCR sliding past 0.86× with no processing relief in sight, transition early rather than letting a forced liquidation dictate terms (The Bullvine: 18-month countdown).

Key Takeaways

  • If you haven’t run your DSCR at $20.70, $18.00, and $16.00 milk in the last 90 days, do it this week — that’s the number your lender is already watching. 
  • If your blend price or basis has gotten erratic, ask your handler where your milk pools before you blame the market — the June III–IV spread hit $4.98. 
  • If DMC is your only coverage, check whether it’s leaving a quarter of your costs uncovered, and whether DRP fills the gap. 
  • If your stress test drops below 1.0× DSCR, treat it as urgent, not strategic — acting at month 8 instead of month 14 can save well into six figures of equity on a leveraged herd. 
  • If you’re tracking CUSMA headlines closer than your own cost of production, you’re guarding the nickel and ignoring the $3/cwt hole. 

Where’s Your Breakeven — Really?

North Dakota didn’t lose 1,787 dairies to a trade dispute. It lost them to processing that dried up, prices that ran under cost, and lenders who saw the math before the families were ready to name it. Even the Holles — a 1,000-cow operation with a legislator in the family and a state grant program on the books — looked at the cost of building their own plant and told The Bullvine, “We don’t know what we are going to do” (The Bullvine: From 1,810 Dairy Farms to 18). The 2026 review will keep making headlines. Your DSCR won’t make a single one.

A note on the count: North Dakota’s dairy tally varies by definition — Bodine’s March 2025 testimony cited 23 permitted operations, the Holles reported 18 Grade A farms in early 2026, and Dairy Star put the figure at 25 in mid-2025. All three describe the same collapse from a peak of 1,810. (North Dakota Monitor)

¹ Nickel math: $200M ÷ 232B lb = $200M ÷ 2.32B cwt ≈ $0.086/cwt. At 42% TRQ utilization, ~$116M goes unfilled, so the realized gap is roughly $0.05/cwt.

Learn More

The Sunday Read Dairy Professionals Don’t Skip.

Every week, thousands of producers, breeders, and industry insiders open Bullvine Weekly for genetics insights, market shifts, and profit strategies they won’t find anywhere else. One email. Five minutes. Smarter decisions all week.
NewsSubscribe
First
Last
Consent

The Math Behind Raw Farm’s $1.5M Recall: 5% for Them, $100K for You

That $1.5M recall was 5% of Raw Farm’s revenue — a parking ticket. On a 400-cow herd, the same 5% is a $100K hole. Same event, very different day. Here’s the math.

Executive Summary: America’s largest raw-milk brand just took its eighth documented outbreak since 2006 — nine sick, three hospitalized, mostly kids under five — and walked away with no mandatory recall, no warning letter, no injunction. Raw Farm’s Mark McAfee recalled about $1.5 million in cheddar “under protest,” clawed most of it back within weeks, and the FDA closed the file April 30 without pulling a single lever it had. Here’s why it lands on your milk check: that $1.5M was roughly 5% of Raw Farm’s ~$30M in revenue — a parking ticket. Run the same 5% against a 400-cow herd grossing ~$2M at USDA’s 2025 numbers and you’re staring at a $100K hole — the difference between a good year and a call to the lender. The government still holds a live 2023 consent decree over the operation, so the enforcement door’s open; nobody’s walked through it. The real lesson isn’t about raw milk — it’s the recall-liability clause buried in your own supply agreement, and whether you know who writes the check if a recall ever traces back to your tank. Your 30-day move: pull that contract and find out before you need to.

Raw Farm FDA action

Mark McAfee called it a “big win.” On April 30, 2026, the CDC closed the E. coli outbreak tied to his Fresno-based Raw Farm — nine people sick across three states, three hospitalized, one with hemolytic uremic syndrome, and over half the illnesses in children under five, according to the CDC and a Congressional Research Service report. The federal response to all of it? No mandatory recall. No warning letter. No injunction. The file just closed, and the FDA’s advisory said it would only reopen “if additional information becomes available.”

Within weeks, McAfee retracted his own recall and put raw cheddar back into national distribution through distributor KeHE. The CRS calls Raw Farm the largest raw-milk operation in the country; ProPublica put its revenue at roughly $30 million a year. And he just proved something every dairy operator should sit with for a minute: the whole episode cost him a recall he mostly clawed back, and not one federal penalty on top.

You don’t sell raw milk. So why should a Fresno dairy’s parking-ticket recall land anywhere near your milk check? The number is the whole story.

What actually happened between March and April?

Here’s the timeline, and it moves fast. On March 15, the FDA recommended Raw Farm pull its cheese; the farm declined. Two days later, LA County Public Health told people not to eat it. By March 18, state and federal officials had named the operation the likely source while Raw Farm insisted its products tested negative for pathogens.

Then Congress got loud. On March 22, Rep. Rosa DeLauro and the Congressional Food Safety Caucus publicly pressed the FDA to force the product off shelves, per Food Safety Magazine. The FDA inspected the plant on March 26. Raw Farm finally recalled its cheddar on April 2 — the CRS reports the farm said the recall hit about $1.5 million of its product — and stamped it “under protest,” stating it “disputes being the cause of this outbreak.” By April 7, it dropped the “protest” language while holding the denial. On April 30, the outbreak was declared over. No enforcement followed, and the cheese returned to shelves.

This sequence exposes a wide gap between the regulatory power on the books and the regulatory action taken.

The FDA had the tools. Why didn’t it use them?

Most wire coverage skipped this piece. Under the Food Safety Modernization Act, the FDA can force a mandatory recall when there’s a “reasonable probability” a food is adulterated and could seriously hurt or kill someone. Raw Farm sat on the FDA’s recall request for 18 days while kids were sick. That’s the textbook case for using the authority.

The agency didn’t. It has used mandatory recall power exactly once — a 2018 order for Salmonella-tainted pet treats. Food Safety Magazine asked the question flat out after the case closed: why never here? Bill Marler, the food-safety attorney who’s litigated against this farm since 2006, laid out the backdrop in June — by his account, the FDA shed nearly 3,900 staff in 2025 and was already running fewer than one inspector per 80 food facilities before those cuts, while CDC’s FoodNet narrowed from tracking eight pathogens down to two.

ProPublica reported two developments some critics have linked. In January 2025, the DOJ dropped a pending enforcement action tied to the 2024 outbreak. And McAfee has said publicly he applied for an FDA advisory role at the urging of HHS Secretary Robert F. Kennedy Jr., a raw-milk booster. ProPublica did not establish a connection between the two, and neither the DOJ nor McAfee has said one exists. Set them side by side, note the calendar, and draw your own conclusions — carefully.

An outbreak record that isn’t in dispute

McAfee’s denials aside, the government’s own case files tell the story on their own.

Since 2006, federal and state regulators have tied Raw Farm (formerly Organic Pastures) to at least eight documented outbreaks — more than any other U.S. raw-dairy operation on the public record — sickening at least 227 people and hospitalizing dozens. That’s almost certainly low, because most people who get sick on raw milk ride it out at home and never get tested. We laid out the full case-by-case history in our earlier coverage of the Raw Farm outbreak record.

YearPathogenConfirmed CasesHospitalizationsCritical Outcome / Impact
2006E. coli O157:H76MultipleFirst on record; a child left with permanent kidney damage
2012Campylobacter10MultiplePatients aged nine months to 38 years
2023–24Salmonella165 (4 states)~20 (CA state data)Mostly children; among the largest U.S. raw-dairy outbreaks
2024E. coli O157:H7115 (2 with HUS)Refused, then recalled, then retracted
2025–26E. coli O157:H793 (1 with HUS)Closed with no enforcement

The 2023–24 Salmonella outbreak alone — 165 people across four states, most of them children, per the CDC’s July 2025 report — ranks among the largest documented U.S. raw-dairy outbreaks in recent years. This isn’t a farm that had one bad tank. It’s a two-decade pattern with a paper trail.

The court leash nobody’s pulling

Here’s what genuinely matters for what comes next. Raw Farm isn’t running free and clear. The federal government first sued the operation and McAfee by name in California’s Eastern District back in 2008 — United States v. Organic Pastures Dairy Company, LLC, Case No. 1:08-cv-01786 — over shipping raw milk across state lines through a pet-food labeling loophole the government said endangered public health. That case ran 15 years. In July 2023, U.S. District Judge Jennifer L. Thurston signed a consent decree, agreed to by McAfee and the DOJ, that keeps the court’s oversight live, with Raw Farm able to petition the FDA for relief only after 60 months.

So the government doesn’t have to build a case from scratch. The door’s already open. The court already has jurisdiction, an admitted history, and an audit mechanism on file — the kind of standing that, if inspectors document a fresh violation, hands the DOJ a path without filing anew. The legal footing exists. What’s missing is the will to walk through it.

What would the next enforcement move actually cost?

No new action was announced as of mid-July — nothing in the table below has happened. This is a decision-rule model built only on sourced figures, with the assumptions in plain sight.

The inputs we know: ProPublica’s roughly $30 million a year works out to about $2.5 million a month, call it $577,000 a week. The April recall pulled about $1.5 million in product, per the CRS report. The rule here is simple — scale the exposure to the scope of the action and how fast product restocks.

Enforcement scenarioSales interruptionRevenue exposureBite vs. the April “parking ticket”
Warning letter, no halt0–2 weeks$0–$1.2MSame ballpark
Mandatory recall, cheese only3–6 weeks$1.5M–$3.0M1–2×
Injunction, all products halted4–12 weeks$2.3M–$6.9MUp to ~5×
Full suspension, all channels8–16 weeks$4.6M–$9.2MUp to ~6×

Ranges are illustrative, built on ProPublica’s public revenue figure, and exclude legal fees, settlements, and lost shelf space — all of which land on top. The full-halt row assumes about $2.5M/month at 100%.

Now run the same hit against your own operation. That $1.5 million recall was almost exactly 5% of Raw Farm’s ~$30 million in annual revenue — the “parking ticket.” Take a 400-cow commercial herd. At the 2025 U.S. average — 24,390 pounds per cow and a $21.19/cwt producer return, per USDA — that herd grosses right around $2 million a year. A 5% hit there runs closer to $100,000. Run it at your own mailbox price if you want it exact, but the order of magnitude holds.

Sit with the gap. Same 5% event. For the raw giant, it’s a reversible recall and a press release. For a family dairy, it’s a six-figure hole — often the difference between a profitable year and a call to the lender. What reads as a nuisance on a $30 million operation reads as a bankruptcy risk on a family farm, and that’s the double standard worth chewing on. If you want the full margin-versus-outbreak model, we ran the deeper version in what one outbreak really costs a herd.

Now flip the lens from the big event to the everyday dock you already watch. Say a quality or safety flag costs you a 12¢/cwt penalty. On 400 cows at a strong 80 lb/day, that’s 320 cwt a day, or about $38 daily — roughly $14,000 over a year on one standing dock. It’s the kind of hit you absorb without blinking, nowhere near the six-figure version above. And that’s exactly the trap: when the consequence is cheap enough to shrug off, nobody changes anything, which is precisely how a farm reaches outbreak number eight.

Why does a raw-milk farm land on your milk check?

Because enforcement asymmetry is contagious. When the operation with the longest documented outbreak record in raw dairy absorbs eight events over 20 years and the worst consequence is a recall it reverses within weeks, that tells every regulator, retailer, and plaintiff’s lawyer where the floor sits. It also hands the anti-dairy crowd a loaded headline. “Milk made kids sick in California” gets stapled to the whole category, and the average shopper never learns the difference between raw and pasteurized. You eat that reputation risk for free.

There’s one lever that doesn’t need Washington’s permission: the retailer. Several stores voluntarily pulled the product during the outbreak. If this brand ever gets delisted for good, that call happens at the shelf, not the courthouse — and it happens fast. Watch that, because it’s the mechanism most likely to actually move.

For its part, Raw Farm has consistently maintained that its products are safe, that its testing found no pathogens in the recalled cheese, and that it disputes being the source of the outbreak.

Options and Trade-Offs for Farmers

You can’t enforce federal food-safety law from your parlor. But you’re not a bystander to how this plays out, either. A few real paths:

Watch the retail signal, not the FDA. Makes sense if you sell direct, run a farm store, or move product through natural-grocery channels. It requires knowing which of your buyers carry raw or minimally processed dairy and how they’d react to a category scare. The risk: retail delisting moves faster than any recall and doesn’t wait for proof — so the likeliest next domino here is a retailer pullback, not an FDA letter.

Audit your own recall exposure this month. Makes sense for any operation shipping to a processor with a recall-cost clause. It requires pulling your supply agreement and finding the language that says who pays if a downstream recall traces to raw material. Plenty of producers have never read it. The risk: you learn the answer during a recall instead of before one — which is the whole lesson of the Raw Farm sequence. We break down where that clause hides and what to ask your field rep in who pays when a recall traces to your tank.

Separate your brand from the raw-milk fight, deliberately. Makes sense if you market farm identity, A2, grass-fed, or any premium consumer story. It requires clear language distinguishing your practices and testing from raw-milk risk. The trade-off: it costs marketing effort now, but the alternative is letting a Fresno headline define your product for you.

Your 30-day move: In the next 30 days, pull your milk supply agreement and read the recall-liability and quality-dock language. Find the line that says who pays if a downstream recall traces back to your milk. If you can’t tell from the contract who’d write that check — that’s your answer, and it’s your next call to your field rep.

Key Takeaways

  • If your buyer’s recall clause doesn’t spell out who pays for a downstream event, treat it as an open liability and get it clarified within 30 days — don’t discover it mid-recall.
  • If you sell into raw, direct, or natural-grocery channels, assume a retailer pullback is a faster and likelier threat than any FDA action, and know your buyers’ triggers now.
  • If you market a premium consumer story, build the language that separates your testing and practices from raw-milk risk before the next California headline does it for you.
  • If you’re pricing a food-safety event as unlikely, price it instead as survivable-but-recurring — the Raw Farm record shows the real risk is a cheap consequence that never changes behavior.

Raw Farm just proved an outbreak can cost as little as a reversible recall and a press release. The government’s case against this operation ran 15 years and ended in a consent decree that’s still live — yet so far, nobody’s used it. So here’s the question worth carrying into your own operation: if a downstream recall traced back to your tank next month, do you actually know who’d write the check — and how many weeks of shipments you’d lose before it cleared?

For the full enforcement-cost model — every scenario and assumption spelled out — that’s where our deeper coverage lives. Start with the two pieces linked above, then hold your own contract up against the numbers.

Run Your Numbers

Farm Benchmark Snap Check — This story turns on one question: could your operation absorb a five-figure hit the way Raw Farm shrugged off its $1.5M recall? Run the DVI Risk Check to see whether your margin, debt load, and working capital land you in the Strong, Watch, or Risk band before a recall or dock ever tests it.

This article is based on public records and reporting available as of July 15, 2026, including CDC (E. coli outbreak declared over April 30, 2026; MMWR July 24, 2025 on the 2023–24 Salmonella outbreak), FDA outbreak investigation updates (most recent June 17, 2026), the Congressional Research Service, Food Safety Magazine, ProPublica, and federal court records in Case No. 1:08-cv-01786 (E.D. Cal.). Raw Farm was contacted for comment; its published statements are reflected above.

Complete references and supporting documentation are available upon request by contacting the editorial team at editor@thebullvine.com.

Learn More

The Sunday Read Dairy Professionals Don’t Skip.

Every week, thousands of producers, breeders, and industry insiders open Bullvine Weekly for genetics insights, market shifts, and profit strategies they won’t find anywhere else. One email. Five minutes. Smarter decisions all week.
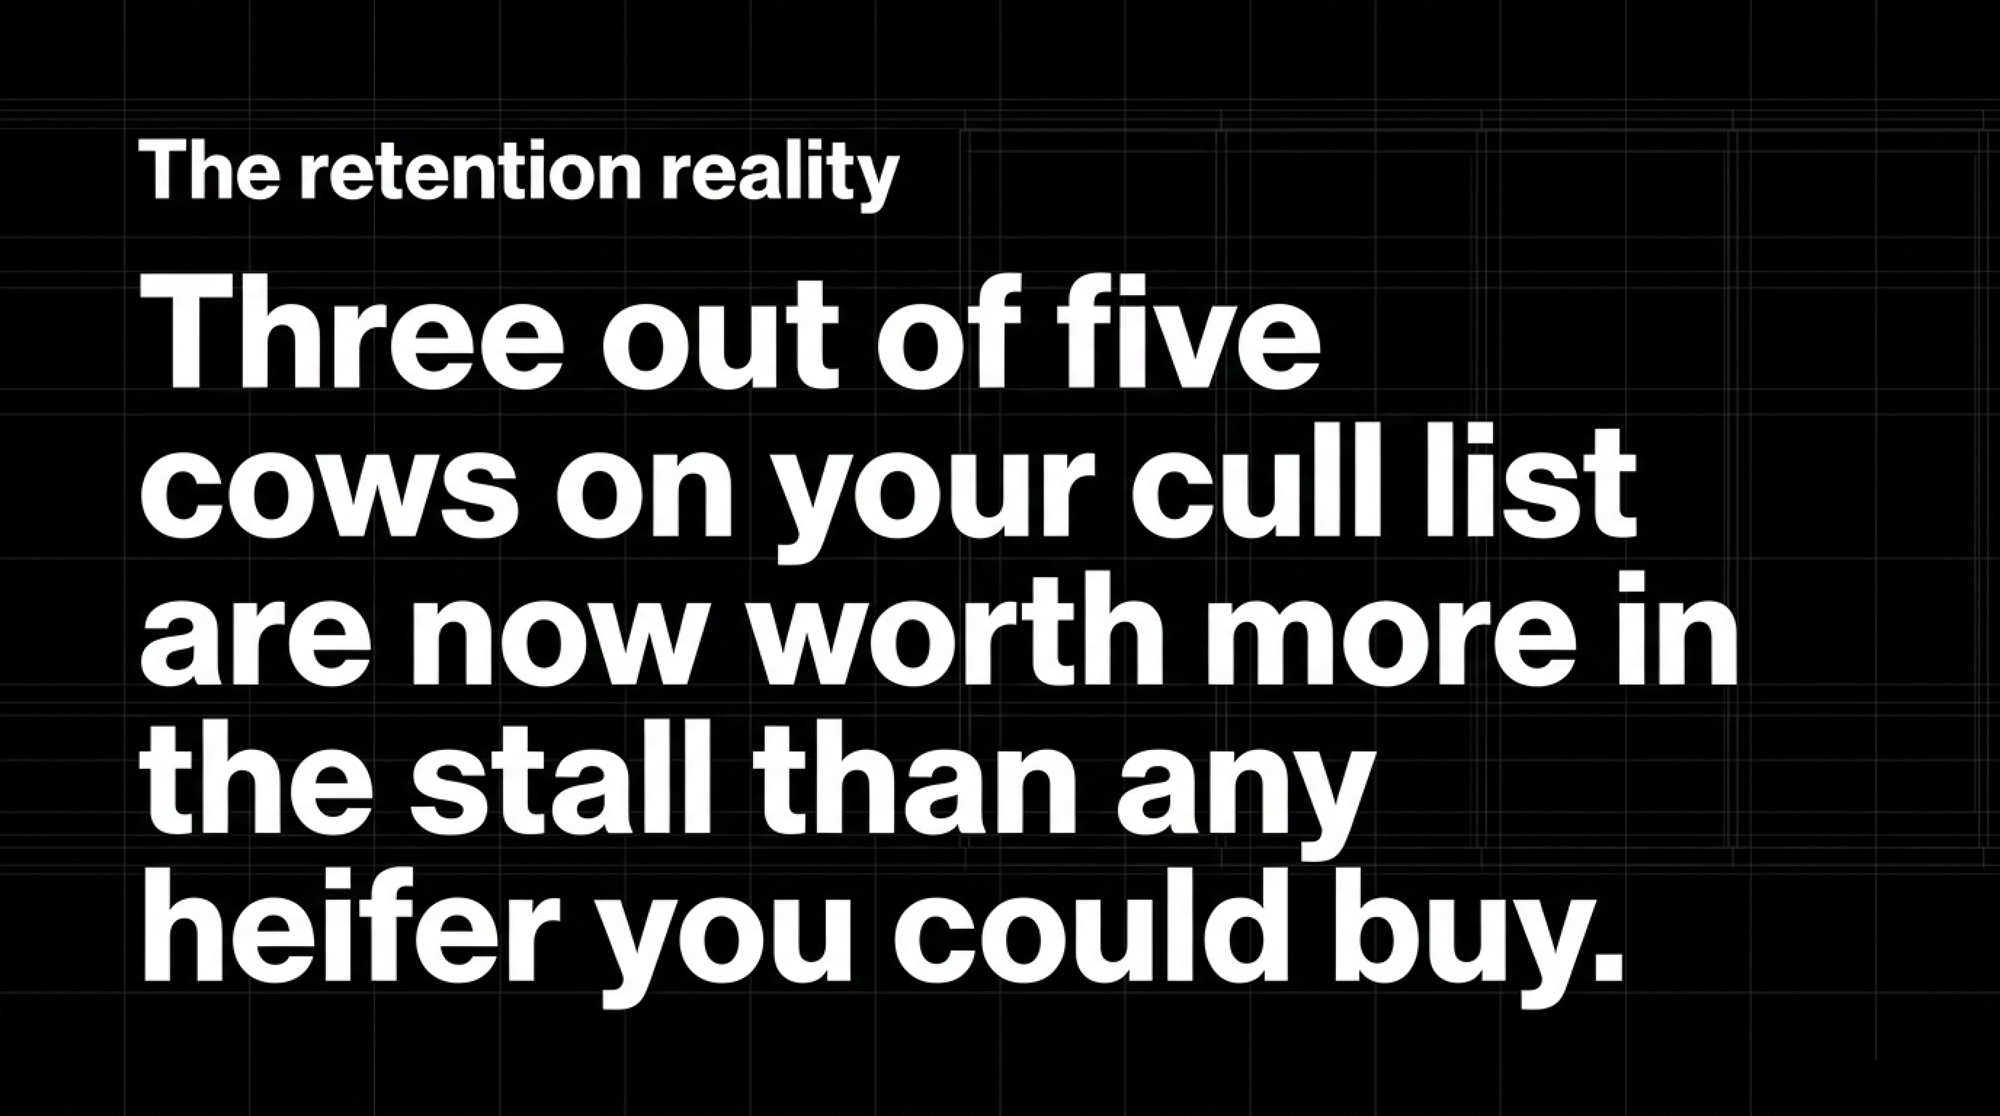
NewsSubscribe
First
Last
Consent

$20 Milk, $19.14 Costs, 15.9¢ of the Food Dollar: Should You Chase Thunder CoffeeMilk-Style Value-Added?

At roughly $20/cwt milk against $19.14 in full costs and just 15.9¢ of the food dollar, Thunder’s $40–50K months show both what’s possible — and how fast value-added can blow a hole in your cash flow.

Executive Summary: Two Florida dairy farmers built Thunder CoffeeMilk into $40,000–$50,000 a month — starting in a kitchen, driving 15 hours to a Michigan lab, and watching their first shelf-stable batch come out as a solid brick. The reason it matters to you has nothing to do with coffee: you get just 15.9¢ of every food dollar, and the dairy farm share has slid from 52¢ in 1980 to 25¢ today. At an all-milk price around $20/cwt against $19.14 in full costs, a lot of herds are running on fumes, and value-added looks like the way into the other 84¢. But the math is brutal — Thunder ran negative cash flow for two to three years, and if you’re bankrolling a brand off the same balance sheet that feeds your cows, a $1/cwt price dip is another $125,000 to absorb on a 500-cow herd. The piece lays out four real paths past 15.9¢ — branded CPG, on-farm processing, commodity optimization, and carbon/data monetization — and exactly where each one breaks. Read it if you’ve ever wondered whether your operation is built to capture value or just produce it. The 30-day move is the cheapest one: spend half a day auditing your hauling and co-op product mix before you fantasize about cans.

value-added dairy

Dave Temple grew up on a dairy farm in Queensland, Australia, where milk-brewed iced coffee is the drink you grab without thinking about it. He moved to Florida, started his own farm, and went looking for that coffee on American shelves. It wasn’t there. So he and fellow multigenerational dairy farmer Ed Henderson decided to build it themselves, starting eight years ago in Ed’s kitchen (Entrepreneur, June 15, 2026).

Their brand, Thunder CoffeeMilk, now moves $40,000 to $50,000 a month and rolled out across more than 400 select 7-Eleven stores in Florida when it launched. The numbers sound impressive until you stack them against what USDA says you get from the average food dollar. In 2023, U.S. farmers captured just 15.9 cents of every dollar consumers spent on domestically produced food (USDA ERS Food Dollar Series, 2023 data). That ceiling is the backdrop for what Temple and Henderson built — a value-added product that captures more of the retail dollar than raw milk ever will, one 11-ounce can at a time.

What’s Actually Squeezing the Farm Share

The old playbook was simple. Milk more cows, milk them cheaper, ship to the co-op, and pray the mailbox price covered your cost of production. In 2026, that math is harder to make work. USDA’s latest WASDE outlook has 2026 all-milk hovering around the $20/cwt mark, with 2027 pegged lower. ERS cost figures put average large-herd cost near $19.14/cwt, and the smallest herds run far higher — which is why plenty of dairies start the year structurally tight even when the price looks decent (The Bullvine, “$18.95 Milk, $19.14 Costs,” Feb 10, 2026).

The farm’s slice of the dairy retail dollar has been eroding for two generations. It sat near 52 cents in 1980. USDA’s most recent price-spread data puts it around 25 cents today — the full decline from 52¢ to 25¢ is roughly a 52% drop over that span (The Bullvine, Dec 30, 2025, citing USDA ERS Price Spreads). Same cows. Same barn. A much thinner cut of the same gallon.

That’s the pressure pushing more farmers to look past the tank. Bullvine’s own analysis puts value-added dairy growth near 12% a year while commodity fluid milk stays roughly flat (Nov 24, 2025). And ready-to-drink coffee is one of the hottest rooms in that house — Mordor Intelligence pegs the U.S. RTD coffee market at about $8.3 billion in 2026, and Future Market Insights has milk-based drinks leading the category at 38% (May 2026). Temple and Henderson didn’t chase a fad. They walked into a growing category and noticed most canned coffee is brewed in water, with milk added as an afterthought. Their whole thesis was to flip that — brew the coffee in real milk from the start.

The Solid Block: What It Costs to Cross the Fence

Picture it: two dairy farmers, fifteen hours from home, standing in a food-processing lab at Michigan State University’s Food Processing Innovation Center, watching their first shelf-stable run come out of the machine. Except it didn’t pour. It thudded. The whole batch had seized into a solid block — not a drink, a brick (Entrepreneur, June 15, 2026). That brick is the whole story of value-added dairy in one image.

They spent two days on-site reworking the recipe before they could move forward. And here’s the honest part they’ll tell you themselves: neither had a background in sales, marketing, or distribution. Just decades of farming and a willingness to keep asking questions until they found the right people.

That solid block is worth more than a laugh. It’s the tuition receipt for crossing from commodity supplier to manufacturer. Inside the fence, these two can diagnose a sick cow or a broken ration in seconds. Step outside it into protein chemistry and shelf-life validation, and none of that instinct transfers. You’re back at square one. The failure wasn’t a fluke — it’s what the leap actually feels like. A 2024 Tarleton State University review names limited business and technical expertise, plus thin access to processing infrastructure, as core barriers stopping small U.S. dairy farms from making exactly this kind of move (Tarleton State University, Dec 22, 2024).

How This Plays Out on a Real Balance Sheet

The line from Dave that should stop any producer cold is about retail, not chemistry. “For us to get our toe in the door, it has cost a large amount of money to effectively buy space to get our product in stores,” he told Entrepreneur. “This means negative cash flow for what seems like forever.” That’s not a Silicon Valley runway story with venture money padding the fall. That’s an operating line feeding cows and buying shelf space at the same time.

Put real numbers on the milk side first, because that’s the floor this whole bet stands on. Take a 500-cow herd averaging around 25,000 lb per cow — call it 125,000 cwt a year. A $1.00/cwt swing in your mailbox price — well within the range USDA has moved its 2026 forecast this year alone (from $18.95 in February toward the low $20s by mid-year) — is $125,000 in cash flow, up or down, across twelve months. Run lighter cows at 22,000 lb, and you’re closer to $110,000, but the point holds either way. That’s the sensitivity before you add a thing — then you stack a second business on top, one you’re deliberately running at a loss to hold a cooler slot.

Herd SizeAvg Production (lbs/cow)Annual CWT ProducedImpact of $1/cwt SwingImpact of $2/cwt SwingMargin Note
100 cows25,000 lbs25,000 cwt$25,000$50,000Modest swing — still can’t absorb brand losses
250 cows25,000 lbs62,500 cwt$62,500$125,000One bad year = value-added runway gone
500 cows25,000 lbs125,000 cwt🔴 $125,000$250,000Article benchmark — two ventures, one balance sheet
750 cows25,000 lbs187,500 cwt$187,500$375,000Enough scale to potentially isolate ventures
1,000 cows25,000 lbs250,000 cwt$250,000$500,000Scale helps but concentrated risk remains high
1,500 cows22,000 lbs330,000 cwt$330,000$660,000🔴 Large exposure — separate entity structure essential

Here’s the retail side in plain barn terms. For example, say you sell a can wholesale for around a dollar and it costs you 70 cents to make and ship — that’s 30 cents of gross margin per can. Slotting fees, demos, and marketing to hold shelf space in a category run by recognized brands can eat into five figures per chain, per year. At 30 cents per can, you’re moving tens of thousands of units just to cover the cost of being on the shelf — before you clear a dime. That’s the arithmetic hiding inside “negative cash flow for what seems like forever,” and it’s why it took Thunder two to three years to reach consistent monthly revenue. (Those per-can figures are illustrative; Thunder hasn’t published its unit economics.)

Why Is the Farm’s Slice So Thin to Begin With?

Most of the value in food gets built after the product leaves the farm gate. USDA’s Food Dollar data assigns more than 88 cents of every consumer food dollar to the “marketing bill” — processing, packaging, transportation, retail, and food service. A farmer selling raw milk into that system is, by design, holding the smallest slice on the table. In 2024, the all-food farm share slipped to 11.8 cents, with only about 5.8 cents representing true farm-level value added (American Farm Bureau, citing USDA ERS, 2024).

Ed Henderson framed the real barrier better than any economist could. Marketing, he said, is “a feeling. I’m not a feeling kind of guy.” That’s the whole problem in one sentence. Deep expertise inside the fence can turn into a blind spot outside it — you don’t know what you can’t see.

But that same trap cut in their favor once. Not knowing the “proper” RTD formulation rulebook, they built the simplest version that survived the science: cold brew, real milk, a short ingredient list, no artificial sweeteners. Their one stated regret is not bringing a food scientist in earlier. Yet that clean label — the thing shoppers now reward — may exist precisely because two farmers didn’t over-engineer a product they were still learning to make.

Which Path Actually Fits Your Balance Sheet?

Thunder isn’t a template you can photocopy. It’s proof the staircase exists. There are four real paths producers are using to reach past 15.9 cents — and each one breaks in a different, predictable place. Find yours before you commit a dollar.

Strategy PathCapital RiskTime to Positive Cash FlowPrimary Skill GapPrimary Failure PointBest Fit Herd Size
Branded CPG(Thunder path)🔴 High — multi-year negative cash flow2–3 yearsMarketing, slotting, CPG brokersRunning out of capital before shelf velocity covers feesAny — if balance sheet is isolated from farm
On-Farm Processing(cheese/bottled)🔴 High — infrastructure upfront3–5 yearsRegulatory compliance, local salesUnderestimating health/safety compliance cost100–500 cows with local market access
Commodity Optimization(hauling/co-op audit)✅ Low — no new entity30–90 daysInternal ops, premium program knowledgeLow ceiling; optimizing a small sliceAll herd sizes — start here
Carbon/Data Monetization🟡 Low–Medium — verification cost1–2 yearsDisciplined record-keeping🔴 Scale dependency: 500-cow farm ≈ $3,000/yr vs 3,000-cow ≈ $150,000/yr1,000+ cows to make verification overhead worthwhile

¹ Entrepreneur, June 15, 2026 · ² Nuffield Scholar report, 2016 · ³ The Bullvine, “You Only Get 15.9¢ of the Food Dollar” · ⁴ The Bullvine, “Data That Pays”

The branded-product path — Thunder’s — makes sense when you’ve got capital tolerance, a genuine market gap, and someone willing to learn the outside-the-fence game. And retail is no safe harbor: 7-Eleven’s parent, Seven & i, disclosed in its Q4 earnings documents that it expects to close or convert roughly 645 North American stores in fiscal 2026, per cstoredive (April 12, 2026) — even the shelf you fought to reach can move under you.

On-farm processing is the more traveled road, the one most research treats as the default value-added move (Nuffield Scholar report, 2016, Ireland/EU). The limit shows up early: regulatory complexity and capital cost stop most farms before they start. Only a small fraction of Irish farms are formally diversified, per Nuffield’s data — a useful signal for how steep the on-ramp is.

Then there’s the move you can actually start this month, no new company required. Capture more inside the commodity system — audit your hauling routes, question your co-op’s product mix, and press on component and premium programs, the cents-per-cwt kind of work that doesn’t require you to build a thing (The Bullvine, Jan 21, 2026). The ceiling is lower, but the risk is low and the payback is fast.

The fourth path is younger and worth watching: monetizing data and verified sustainability. Bullvine’s reporting found the Athian Marketplace has paid between $15 and $35 per metric ton of CO₂ equivalent for certified U.S. livestock emission reductions (The Bullvine, “Data That Pays,” Oct 22, 2025). It requires verification infrastructure and disciplined record-keeping. The catch is scale — payouts skew hard toward large operations, with 3,000-cow dairies capturing around $150,000 a year while family farms see closer to $3,000 (The Bullvine, Nov 23, 2025).

How Much Does “Buying Your Way In” Really Cost?

More than the slotting fees, honestly. The real cost is concentrated risk. When one family balance sheet backs both the farm and the new venture, a milk-price dip or a feed-cost spike hits both businesses on the same day. Bullvine’s robotic-milking case study describes the same shape of pain — Iowa State’s Larry Tranel found a typical two-robot install can run roughly $8,776 a year in the red for seven years before the payoff arrives (The Bullvine, “Robotic Milking Labor Math,” Apr 10, 2026). If your 500-cow herd hits a $1/cwt price drop in the middle of that valley, that’s another $125,000 you have to absorb. Thunder lived a beverage version of the same thing: two to three years before steady revenue, shelf space bought on borrowed patience. Before you chase any value-added play, the real question isn’t “can I make the product.” It’s “can my balance sheet survive the years before it pays.”

Is Your Operation Built to Capture Value, or to Produce It?

This is the shift worth sitting with, and it has nothing to do with coffee. Most dairies are built — financially and mentally — as commodity producers: fill the tank, ship the milk, take whatever price the system hands back. Temple and Henderson took the other route — a producer-owned brand that signs its own co-packer contracts and holds a piece of the story beyond the farm gate. You don’t need to launch canned coffee to make that shift. But it does mean asking, honestly, whether your operation is set up only to produce milk — or to capture some of what your milk becomes. Australian value-adding scholar Fiona Aveyard put it plainly in her 2023 Nuffield report: farmers “often have more control over their product than they realise” (Nuffield Australia, “Beyond the Farm Gate,” Aug 13, 2025).

Key Takeaways

  • If your net runs below full economic cost — check your real number against the ERS large-herd benchmark near $19.14/cwt against an all-milk forecast around $20/cwt — you’re in the same squeeze pushing farmers toward value-added plays. Nail down your breakeven before you consider one.
  • Before launching any branded product, model a two-to-three-year negative cash-flow window and stress-test whether your balance sheet absorbs it while milk prices swing.
  • Too big a leap? This month, set aside half a day to audit hauling costs and your co-op’s product mix for the cents-per-cwt you’re leaving on the table.
  • Name your outside-the-fence skills gap out loud. If you can’t spot what’s broken in marketing the way you can in the parlor, budget for the expertise you don’t have.
  • Don’t over-engineer the product. Thunder’s clean, short-ingredient label came from building the simplest version that worked.
  • Treat data and sustainability programs as a real but young value stream — and check where a herd your size actually lands, since a 3,000-cow dairy can bank roughly $150,000 while a 500-cow family farm might see around $3,000.

Where does your operation sit on that staircase right now — still shipping into the 15.9 cents, or reaching for a piece of the other 84? You don’t have to answer with a product launch. You do have to answer with your own numbers, because at an all-milk forecast around $20/cwt against $19.14 costs, ERS math says a lot of herds are running on a razor-thin full-cost margin.

Run Your Numbers

Dairy Profit Projector — Before you chase the other 84¢, find out if your core business even pencils. Drop in your herd size, milk price, and ration to see your breakeven milk price, IOFC, and 12-month margin — then stress-test what a $1/cwt swing does to your bottom line before you bet a second business on it.

Complete references and supporting documentation are available upon request by contacting the editorial team at editor@thebullvine.com.

Learn More

The Sunday Read Dairy Professionals Don’t Skip.

Every week, thousands of producers, breeders, and industry insiders open Bullvine Weekly for genetics insights, market shifts, and profit strategies they won’t find anywhere else. One email. Five minutes. Smarter decisions all week.
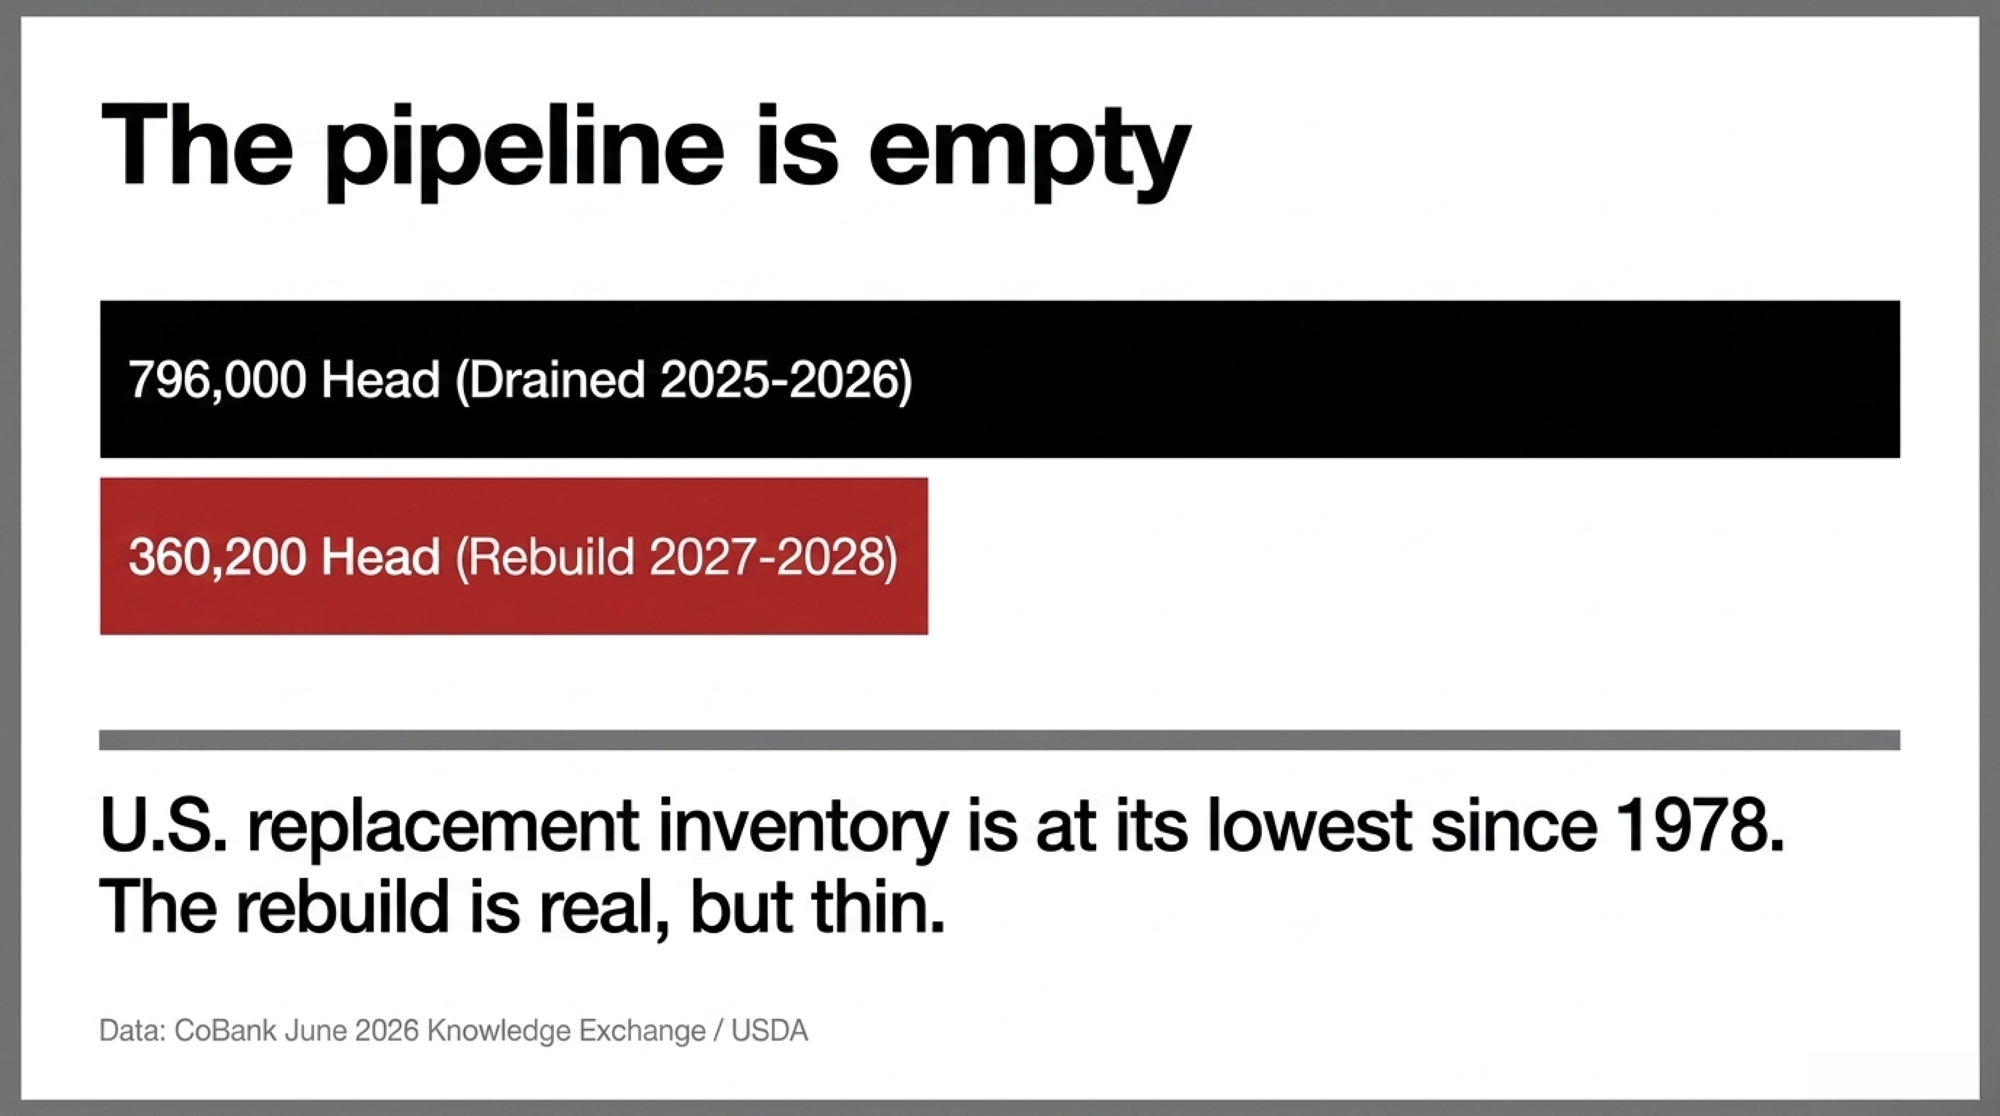
NewsSubscribe
First
Last
Consent

$585 a Straw: What That “Free” Beef Calf Really Costs

$585. That’s what one beef straw really costs once you count the $3,000 replacement you didn’t breed — with heifers at a 48-year low, that calf check isn’t free money. It’s borrowed.

Executive Summary: With U.S. replacements at 3.91 million head — the lowest since 1978 — a single beef straw carries a hidden $585 cost: the $3,000 replacement heifer you didn’t breed and will buy back in 2027. Run 200 beef services on a 500-cow herd, and you’re looking at roughly $117,000 in foregone replacement value the calf check quietly hides. Whether that’s a smart play or a slow leak comes down to two numbers most herds never pull before the semen order: your pipeline ratio (bred heifers plus springers ÷ annual replacement need — you want ≥1.0) and your honest rolling 12-month 21-day pregnancy rate (≥20%). Below either line, UW–Madison’s modeling says there’s no aggressive beef strategy that pencils once you’ve covered replacements — you’re drawing down the herd you’ll need when milk tightens and everyone’s bidding on the same scarce heifer. Clear both gates and the leak moves to the bull: carcass-trait selection, not hide colour, is where the grid premium actually lives. Before your next order goes in, pull those two numbers and decide if your beef percentage is earning its place — or costing you a herd you’ll rebuy at $3,000 a head.

beef-on-dairy cost

Editor’s note: The breeding-meeting scene and the two herd scenarios below are composites, modeled from multiple U.S. dairy operations to illustrate how the math plays out at different pipeline and reproduction levels. The cow numbers, replacement rates, ratios, and pregnancy rates in those examples are illustrative. Every market figure, study result, and economist quote is real and sourced as cited.

The breeding meeting starts the same way on a lot of farms right now. Someone slides the calf-sale receipts across the table — beef-cross calves cashing $1,200, $1,400, even $1,700 a head — and asks the obvious question. Why aren’t we breeding more cows to beef? The calf buyer wants more. The semen rep has a black bull he loves. And the milk check, forecast under $19/cwt for 2026, isn’t doing anyone any favors.

Here’s the tension nobody at that table is pricing in. Every one of those beef calves is a dairy heifer that doesn’t exist. With U.S. replacement heifers now at a 48-year low, that missing heifer isn’t free — you’ll buy her back in 2027, at roughly $3,000 a head. On many farms, the beef-on-dairy premium is no longer a bonus. It’s become load-bearing. And that’s exactly when it gets dangerous.

What’s Really at Stake When You Order Semen

The calf premium is real. University of Tennessee economist Charley Martinez, summarizing USDA data, pegged the typical 2020–2024 beef-cross premium at $130–$200 per head, climbing to a $450–$470 peak in 2025. Nobody’s arguing beef-cross calves don’t pay better than Holstein bulls. They do.

But the calf check is one side of a two-sided ledger, and the other side is getting expensive fast. USDA’s January 30, 2026 Cattle Inventory pegged dairy replacement heifers at roughly 3.91 million head — the lowest since 1978 and about 18% below the 2018 peak. The American Farm Bureau’s read on that same report was blunt: milk cow numbers are at their highest since 1993, even as the replacement pipeline thinned to a 48-year low, a divergence the Farm Bureau tied to short-term herd management decisions rather than true expansion. Translation: a lot of those missing heifers got bred to beef.

CoBank’s lead dairy economist Corey Geiger put it plainly on Iowa PBS in May 2026: “This year we’re going to have 438,000 fewer dairy replacements becoming milk cows compared to last year. And this won’t rebound until 2027, when we see an improvement of 285,000.” So the real Monday-morning question isn’t “what will the calf pay?” It’s “what will the heifer cost me?” That reframe is the whole story.

The $585 That Stops the Room

Most operators know what a beef-cross calf is worth, and what a straw costs. What they haven’t done is multiply two numbers they each accept on their own.

Walk it through, one step at a time. A sexed-semen service on a replacement-eligible cow produces — in typical field and modeling terms — somewhere around 0.33 to 0.35 heifers, once you account for conception and calf losses. Multiply that by a replacement value of roughly $3,000 to $3,300 — USDA’s January 2026 inventory put the range right there — and you’ve got roughly $1,000 to $1,150 of future heifer riding on that single service. That’s the most expensive heifer market in a generation: USDA Agricultural Prices data put the 2025 replacement average in the $2,860–$3,110 range, more than double where it sat five years earlier. This isn’t a soft number.

Now net it against the beef calf. Take the midpoint of that foregone value — call it about $1,085 — and subtract a calf advantage of roughly $500, which sits at the top of the premium range Martinez tracked in 2025. You land near a $585-per-service true cost on every beef straw you put into a cow that could have made a replacement. Run 200 of those services on a 500-cow herd, and you’re looking at roughly $117,000 in foregone replacement value. Use a fatter premium and the cost shrinks; use today’s $3,000-plus heifer, and it grows. Either way, it’s real money the calf check hides.

The calf clears in three weeks. The heifer would’ve milked for years. That’s the multiplication most breeding meetings never finish — the pieces get accepted one at a time, so the total never has to land. (Run your own numbers in The Bullvine’s Pipeline Index Calculator.)

“I Can’t Afford to Stop” — Is That a Reason, or a Trap?

When the $585 finally lands, the pushback usually isn’t “your math is wrong.” It’s “I can’t afford to stop.” That line tells you everything. The calf premium has stopped being gravy and become structural — it’s covering feed bills and loan payments, not buying anyone a new pickup.

And that’s the real bind. It’s hard to buy breeding strategy for 2028 when you’re trying to make next Tuesday’s payment. A $1,400 calf check that keeps the line of credit off its limit is a powerful argument, and pretending otherwise insults anyone who’s actually run a barn through a sub-$19 milk year. The trap isn’t choosing the calf check. The trap is choosing it without ever pricing the heifer you gave up to get it.

A few defenses come up again and again, and each holds a kernel of truth. The calves are paying the bills — fair, and HighGround Dairy projected beef income above $4.50/cwt over a twelve-month window in its October 2025 analysis. I’ll buy heifers back if I need them — except you’d be buying into a structurally short market, with CoBank’s modeling pointing to a combined 796,000 fewer replacements entering the milking herd across 2025 and 2026. The university says beef-on-dairy is a win — but UW–Madison’s Cabrera model built its $51/cow/year advantage on $570 calves and $2,355 heifers, not the $1,500 calves and $3,000-plus heifers we’re actually breeding into today.

Input ParameterUW–Madison Cabrera Model Assumption2025–2026 Actual MarketDirection of Risk
Beef-cross calf value$570/head$1,400–$1,700/head↑ Favorable
Replacement heifer value$2,355/head$3,000–$3,300/head 🔴↑ Hugely unfavorable
Foregone heifer per beef service~$800~$1,050–$1,150 🔴↑ Cost overstated
Net advantage per cow/year$51/cowRecalculated lower 🔴↓ Shrinks significantly
Replacement heifer availabilityAmple market48-year low — 3.91M 🔴↑ Supply risk
Milk price assumption~$20–22/cwt<$19/cwt forecast 2026🔴↓ Margin pressure
Heifer completion rate assumed~90%79% actual (Overton, 85 herds) 🔴↓ Pipeline cushion smaller

None of those is a dumb argument. They don’t erase the foregone heifer. They postpone the moment you have to look at it. The honest read: beef-on-dairy can be a smart play or a slow leak, and the difference comes down to two numbers most herds aren’t checking before they pick up the phone.

Have You Actually Earned the Right to Run Beef?

That’s the question that reframes everything. Plenty of producers treat beef-on-dairy like a right. The math says it’s a privilege you qualify for — and you qualify with two numbers, pulled before the semen rep answers.

The first is the pipeline ratio: bred heifers plus springers on hand, divided by annual replacement need. Take a 500-cow herd at a 27% replacement rate. That’s 135 heifers needed a year. If you’ve got 120 bred heifers and springers on the ground, your ratio is about 0.89 — already underwater. The Bullvine’s April 2026 thresholds are blunt: at or above 1.0, you’re covering your need; below 1.0, you’re already short; below 0.8, you’re mathematically short by 2027 in every scenario, including the optimistic one. (How chasing beef premiums broke the replacement pipeline.)

The second is your rolling 12-month 21-day pregnancy rate — the real number off your DHI or herd-management software, not the target you’d like to hit. As The Bullvine framed it in December 2025, the figure that matters is your actual rolling 12-month 21-day pregnancy rate, not your target — that single number largely determines which strategies fit your operation. A lot of producers think they’re sitting at 25–30%. Pull the report, and a fair share are actually living in the 18–22% range — wrong in the direction that flatters them. (Check the dollars with the Pregnancy Rate Economics Calculator.)

Two Herds, Same Calf Market, Opposite Calls

Numbers in the abstract don’t change behavior. Two herds reading the same January inventory do. The two operations below are illustrative composites, built to show how the same calf market drives opposite right answers.

Picture a 250-cow herd running a 25% replacement rate — 63 heifers needed a year — with 75 bred heifers and springers in the yard. That’s a pipeline ratio near 1.19, and a verified 21-day PR around 24%. This herd has earned its program. It can run beef on 45–50% of the herd, push sexed dairy onto its best cows, and bank the calf check without bleeding future replacements. The $585 math still applies to each straw, but the herd is generating heifers faster than it needs them, so the foregone-heifer cost is cushioned by surplus.

Now picture a 600-cow herd at a 30% replacement rate — 180 heifers needed — sitting on 130 bred heifers and springers. Ratio: about 0.72. Its 21-day PR, pulled honestly off the software, comes back at 19%, not the 26% the manager assumed. Same calf buyer, same black bulls, same tempting receipts. But this herd is already short, and at a sub-20% pregnancy rate, the UW–Madison modeling says there’s no aggressive beef strategy that pencils once replacements are covered. The right call here is to choke beef back to 25–30%, lock sexed dairy onto the top end, and rebuild the pipeline before chasing the calf premium. Two herds, one market, two completely different right answers — and the difference is two numbers, not the calf check.

MetricHerd A: Pipeline-HealthyHerd B: Pipeline-Broken
Herd size500 cows600 cows
Replacement rate25%30%
Annual heifer need~63 head~180 head
Bred heifers & springers75 head130 head
Pipeline ratio1.19 ✅0.72 🔴
Verified 21-day PR24% ✅19% 🔴
Max defensible beef %45–50%25–30% max
$585 cost absorbed by surplus?Yes — generating ahead of needNo — deepening the hole
Recommended actionRun full program, upgrade bull teamChoke beef back, fix repro first

What the Numbers Say You Can Run

UW–Madison’s modeling, translated into herd-level terms by The Bullvine, sketches the tiers clearly. Herds at 30%+ 21-day PR can see roughly $6,215/month in net calf income from a sexed-plus-beef strategy. Herds near 20% drop to about $2,001/month. And below 20%, the research found no economically viable beef semen strategy once replacement needs were covered. The repro rate isn’t a footnote. It’s the gate.

The replacement side sets the other gate. Bullvine’s modeling, working from a 35% beef-cap framework, describes herds walking into breeding meetings with a pipeline ratio sitting at 0.70–0.75 — and the call is to choke beef back to 25–30% until the ratio recovers, with sexed dairy locked onto the top cows. Pair the two numbers, and you get a working rule of thumb:

  • Pipeline ratio under 0.8, or 21-day PR under 18–20%: Pull beef back hard. Order more sexed and conventional dairy on cows you’d want daughters from. Beef goes only on clear bottom-end and late-lactation cows.
  • Ratio near 1.0, 21-day PR around 20–22%: Hold beef where it is — often the 25–35% range — and revisit in six to twelve months once repro or heifer retention improves.
  • Ratio at or above 1.0–1.1, 21-day PR 22–25%+: You’ve earned a real program at 40–50% beef. Now the job shifts to picking the right bulls.

There’s a reality check buried in those replacement numbers, too. Overton’s 85-herd beef-on-dairy study found an average heifer completion rate — liveborn heifer calf to first calving — of just 79%, not the 90% a lot of breeding plans quietly assume. If only four of every five heifer calves actually make it into the milking string, your pipeline math needs more cushion than you think, not less.

Does the Border Change the Math?

The framework travels; the inputs don’t. The $585 figure and the USDA inventory numbers above are U.S. data — American replacement values, an American calf market, FMMO milk pricing. The logic underneath is just arithmetic: foregone heifer value minus calf premium. That holds anywhere.

North of the border, the inputs shift significantly. Canadian replacement heifers trade strong — The Bullvine’s own September 2025 market coverage put dairy replacements averaging north of $3,000 with the best animals topping $4,000 at major auctions — and quota asset values reward a highly predictable milk volume, so the penalty for a hollowed-out pipeline is arguably even steeper than in the U.S. The calf-premium side differs too, dictated by local packer grids rather than U.S. frameworks. The takeaway for a Canadian reader isn’t to dismiss the math — it’s to plug local numbers into the same two gates. Same gates, different dollar signs.

The Sire Gap: Paying First-Class, Flying Coach

Say you’ve cleared both gates. You’ve earned a real program. Here’s the last leak — and it’s a quiet one.

A 2021 UW–Madison Extension survey of 40 Wisconsin dairy farms found producers ranked beef sire selection on the “three C’s”: conception rate, calving ease, and cost per unit. Carcass traits lagged. USDA ARS’s summary of the same work was blunter — relatively few farms weighted carcass traits such as muscling, marbling, or terminal indexes, traits ARS describes as critical to lifting dairy-beef carcass value. The selection is still dairy-centric, built to protect the cow and the semen invoice. The money, meanwhile, has moved to the packer grid.

Work the grid for a second, because this is where the leak shows up in dollars. SDSU Extension warned back in 2020 that picking beef sires to throw a black-hided calf creates cattle that lack the muscling and ribeye improvements needed to merit any premium over straight Holstein beef. Take a finished beef-on-dairy carcass near 900 pounds — in the range trial data has reported for these cattle — and the grid premiums stack up fast, scaling with whatever your own carcasses actually weigh. On a 900-pound carcass, a $12/cwt Choice/Select spread is worth about $108 a head; clearing the bar for a $4/cwt CAB premium adds roughly $36; hitting Prime at a $15/cwt premium is another $135 on top. The bull either gets your calf into those tiers or it doesn’t. Bullvine’s June 2026 modeling put the gap between a high-marbling sire at +0.65 Marbling EPD and a bargain bull near +0.30 at $50 to $100 per head. Premier Select Sires’ April 2024 ProfitSOURCE brochure reported program carcasses — sired by its TD Beef genetics — bringing roughly $190 to $210 more per head than the comparison cattle on a grid basis. That’s the company’s own data, not an independent study, and the major AI studs all run competing carcass-value programs — but it points the same direction as the grid math: carcass-trait selection, not hide colour, is where the premium lives. (How sire selection sets your grid cheque.)

That’s the picture in one line. You take all the replacement risk, all the repro risk, and then hand the grid upside to the packer because the bull didn’t clear the spec. First-class ticket, coach seat.

The Two-Gate Breeding Protocol

Before the next semen order goes in, run these three steps in order. The first two decide whether you’ve earned a beef program at all; the third decides whether it pays once you have.

1. Check the pipeline ratio — target ≥ 1.0. Divide your total bred heifers and springers by your annual replacement need. If you’re below 1.0, stop. You don’t have surplus heifers; you’re actively drawing down your future herd asset, and every beef straw deepens the hole.

2. Verify the 21-day pregnancy rate — target ≥ 20%. Pull the hard 12-month rolling average from your management software, not the target in your head. If your actual PR is under 18–20%, choke beef semen back to 25% or less. Aggressive beef-on-dairy needs elite reproductive efficiency to avoid a pipeline crash.

3. Select for the packer grid — target real market premiums. If you clear both gates, stop buying beef straws on cost and conception alone. Target carcass traits, marbling EPDs, and a defined dairy-beef index so the calf actually lands in the Choice, CAB, and Prime tiers you’re paying genetics for.

What This Means for Your Operation

  • Run the pipeline ratio before you run anything else. Bred heifers plus springers, divided by annual need. Under 1.0 and the calf market doesn’t get a vote — you’re drawing down a herd asset you’ll rebuy at $3,000-plus.
  • Pull the real 21-day pregnancy rate, not the one in your head. If your honest rolling 12-month number is under 18–20%, fix reproduction before you expand beef. The economics don’t close below that line.
  • Treat each beef straw on a replacement-eligible cow as a ~$585 decision, not a free calf check. Decide whether your pipeline has the surplus to absorb that cost.
  • If you’ve cleared both gates, the leak moves to the bull. Ask whether your current beef sires actually clear your buyer’s marbling and ribeye spec, or just throw a black calf.
  • If you farm under quota, re-run both gates with your own numbers. The penalty for a hollow pipeline is steeper north of the border, not softer.
  • Ask whether you could defend your current beef percentage to your lender using your pipeline ratio and 21-day PR — not the national average.

Key Takeaways

  • If your pipeline ratio is under 1.0, order more sexed dairy before you add a single beef straw — every beef straw below that line is borrowed against a heifer you’ll buy back at $3,000-plus.
  • If your verified 21-day PR is below 18–20%, fix reproduction before you expand beef; the economics don’t close below that line.
  • If you’ve earned a real program, a small, disciplined bull team that clears your buyer’s specs beats a tank full of cheap black straws.
  • If two herds can read the same calf market and land on opposite right answers, the calf check was never the deciding number — your pipeline and your repro rate are.
  • This month: pull your rolling 12-month 21-day pregnancy rate and count your bred heifers and springers against your annual need. Two numbers, written down, before the next order goes in.

The national semen mix on dairy cows ran about 43% sexed, 24% conventional, and 33% beef in NAAB’s 2025 year-end report. But that one-third beef figure is an average sitting on top of a herd base with only 3.91 million replacements behind it. So the question at your next breeding meeting isn’t whether you belong in that third — it’s whether your own numbers earned the spot, or whether you’re about to pay $3,000 a head to join it late. Which number is setting your breeding strategy right now: your pipeline, or last week’s calf check?

Run Your Numbers

Bullvine Pipeline Index Calculator — Feed in your herd size, heifer inventory, cull rate, replacement cost, and sexed-vs-beef mix, and the Index scores your replacement pipeline green, yellow, or red. It turns the pipeline-ratio question into one number: are you replacing faster than you’re rebuilding, or bleeding heifers to that beef check?

Complete references and supporting documentation are available upon request by contacting the editorial team at editor@thebullvine.com.

Learn More

The Sunday Read Dairy Professionals Don’t Skip.

Every week, thousands of producers, breeders, and industry insiders open Bullvine Weekly for genetics insights, market shifts, and profit strategies they won’t find anywhere else. One email. Five minutes. Smarter decisions all week.
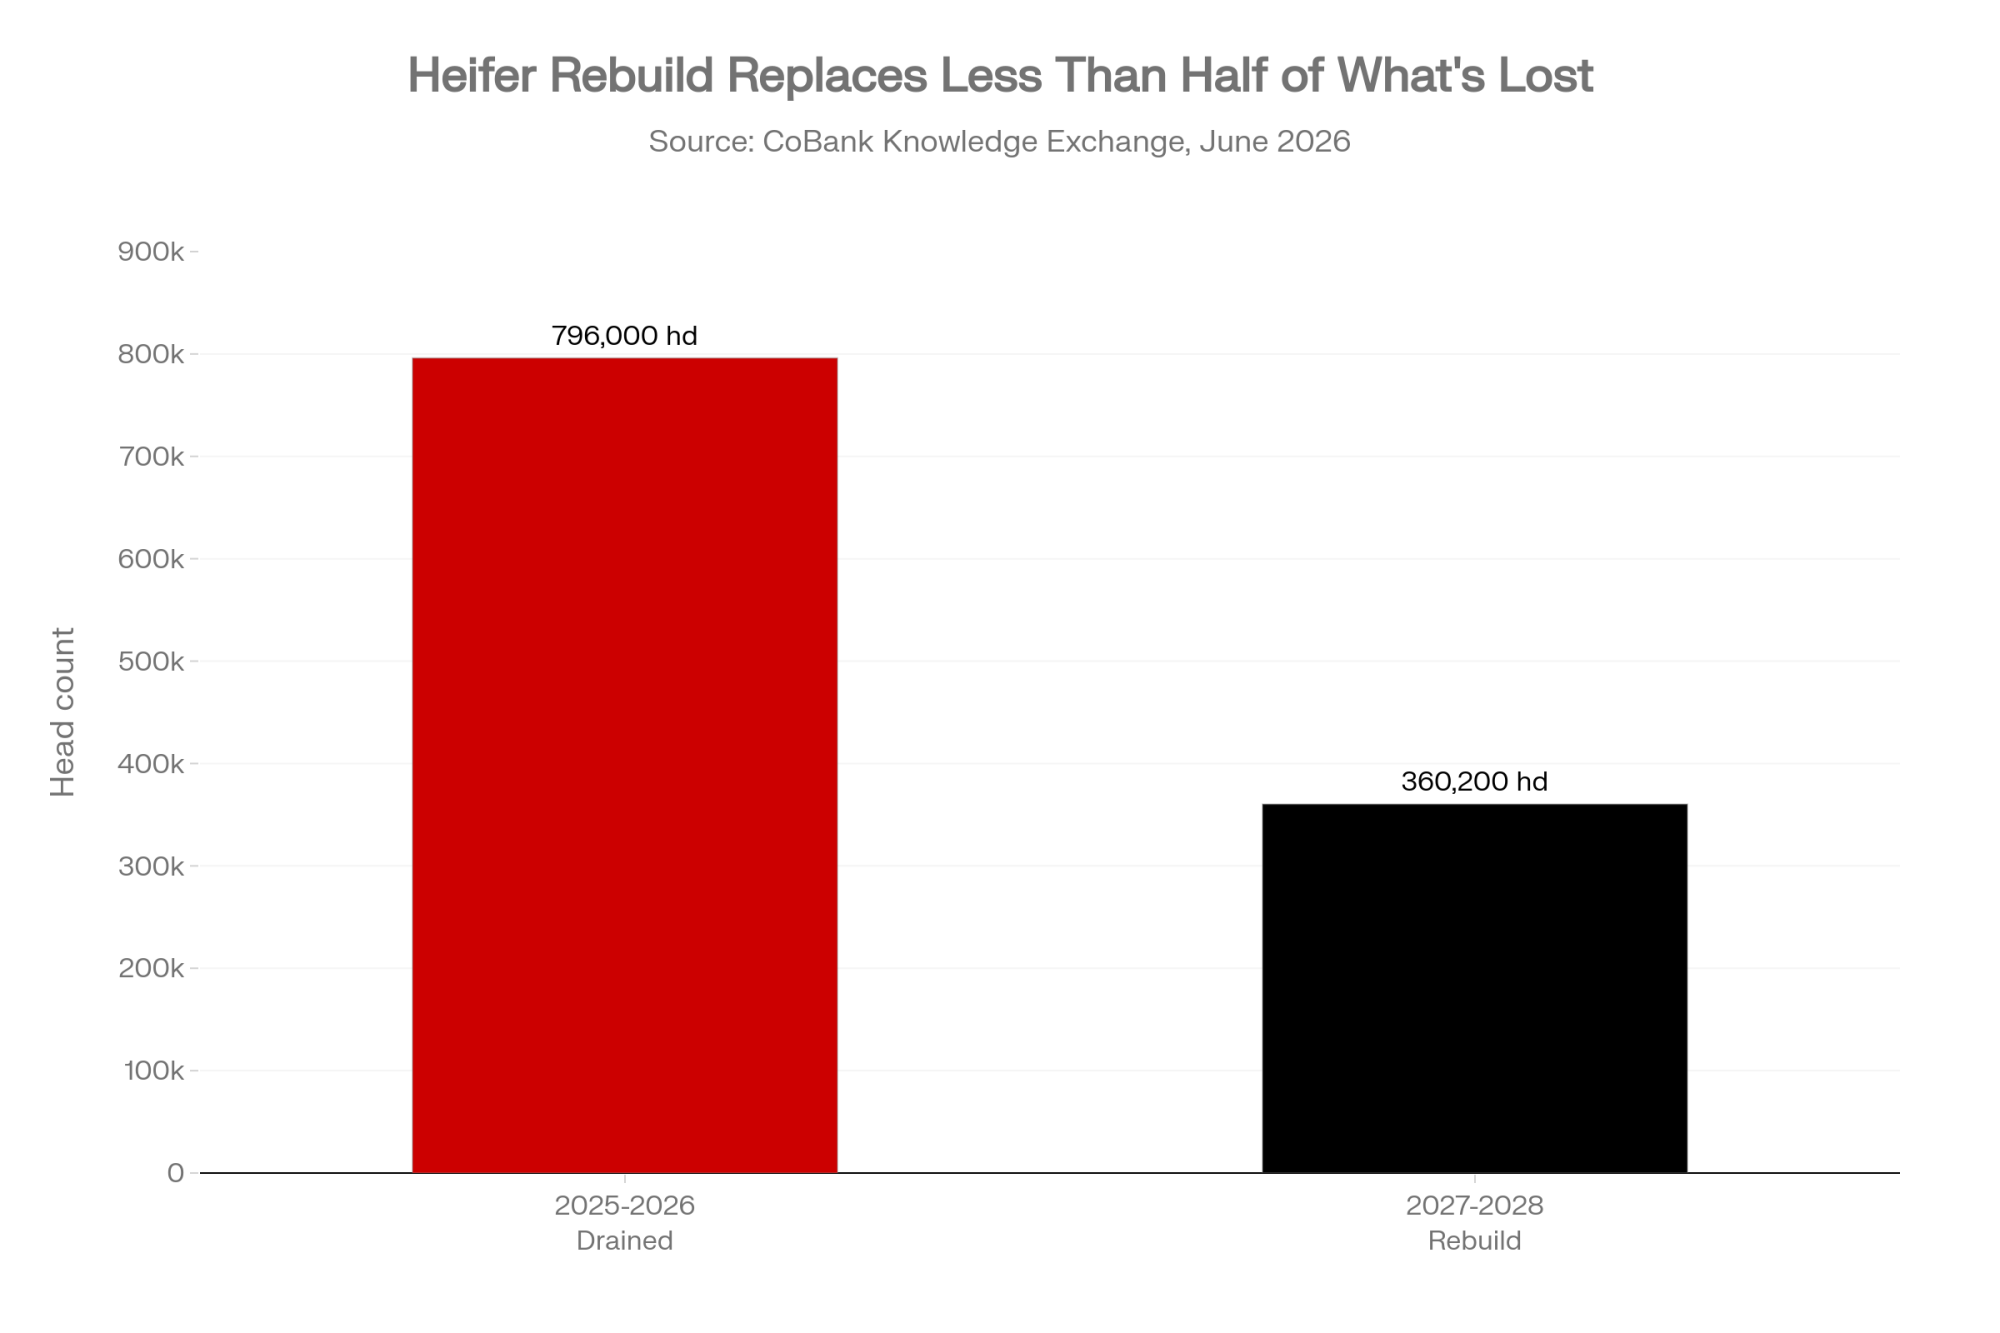
NewsSubscribe
First
Last
Consent

The $134,000 Hole You Can’t See: Why “We Paid Our Bills” Is the Most Expensive Sentence in Dairy

Cows healthy, tank full, bills paid — and a 70-cow dairy still lost about $237,000 last year. At $16.92 per cwt for milk against Cornell’s $31/cwt, here’s the bill your milk check never shows you.

The dairy farmers in this scene aren’t real, but every number behind them is. Picture a family that’s milked 70 cows in the same tie-stall barn for 25 years, sitting across the kitchen table from an advisor who’s just run their numbers. They’re good farmers. Cows are healthy, the bulk tank’s full, the bills got paid last year. Then the spreadsheet says they lost money — real money — and the look on their faces is the whole problem with small commodity dairy in 2026.

They didn’t lie when they said “We paid our bills.” They did. But paying the bills and turning a profit are two different questions, and the gap between them is where small commodity dairies quietly bleed equity. At 60 to 150 cows shipping to a co-op with no premium, that gap can run well past $130,000 a year — and you can lose it without ever feeling the hit. This is the cost of production math nobody wants to run. It’s also the only math that tells you which of three paths you’re actually on.

What’s Changing and Why

The structural numbers don’t leave much room for argument. USDA’s Economic Research Service reported in February 2026 that licensed U.S. dairy herds fell from 66,825 in 2004 to 24,811 in 2024 — a 63% drop — while total milk production climbed from 170.8 to 225.9 billion pounds over the same stretch. Fewer farms. More milk. And the herds that disappeared were overwhelmingly the small ones.

Look closer at which farms vanished and the pattern sharpens. Farmdoc’s read of the 2022 Census of Agriculture found the 20–49 cow class declined the most on a percentage basis, with 50–99 cow herds right behind — the exact bracket our 70-cow family sits in. In total, 39% fewer U.S. farms sold milk in 2022 than two decades earlier. The milk didn’t disappear with them. It moved to bigger barns.

The cost gap is why. ERS data from its 2021 ARMS survey put the total cost to produce 100 pounds of milk at $42.71 per cwt for herds under 50 cows, against $19.14 for herds with 2,000 or more. That’s not a rough patch you outwork. It’s a roughly $23/cwt structural disadvantage built into scale itself, and it doesn’t care how hard you hustle in the parlor.

Our 70-cow family sits right in the teeth of it. So does anyone running 50 to maybe 500 cows, shipping bulk milk with no value-added product and no direct premium. You’re competing on cost against operations that make milk for less than half what you spend, then selling into the same market at the same price.

How a Profitable-Looking Farm Loses Six Figures

Here’s the part that blindsides families. On a cash basis, a small dairy can look fine — the milk check covers feed, the vet, the loan payment, and there’s something left to live on. But the cash basis leaves out two enormous costs: the family’s own labor and honest depreciation on barns and equipment bought decades ago. According to Illinois Farm Business Farm Management data released in December 2024, even farms with positive cash returns posted negative economic returns averaging –$686 per cow over five years, including –$758 per cow in 2023.

So run the barn math on that 70-cow family. At roughly 24,000 lbs per cow, they ship about 16,800 cwt a year. Anchor it to a real price: USDA’s Agricultural Marketing Service reported Class III milk closed May 2026 at $16.92/cwt — the number a cheese-market commodity shipper actually lives on, even as USDA’s headline all-milk forecast sat higher at $20.70. At $16.92, that’s about $284,000 in revenue. For full economic cost, use a real benchmark instead of a guess: Cornell’s Dairy Farm Business Summary puts the 100–199 cow class at $31–33/cwt once labor and capital are counted, and a 60–150 cow operation sits at or above the top of that band. Take the low end — $31/cwt — and this herd’s cost runs about $521,000. The hole is roughly $237,000 a year. Even at the rosier $20.70 forecast, you’re still down more than $170,000.

The number that trips up commodity operators: $20.70 is the forecast. $16.92 is the check. Now, all-milk and Class III aren’t a clean apples-to-apples subtraction — all-milk blends every class and folds in premiums. But the gut-check holds: if you budget your year on the price you actually get paid, not the forecast headline, you’re planning around roughly $3.78/cwt you may never see. On 16,800 cwt, that’s about $63,000 between the plan and the mailbox.

So why don’t they feel the loss? Nobody writes the family a paycheck at $18–22 an hour, and the barn’s still on the books at 1990s prices instead of today’s rebuild cost. The signs show up before the spreadsheet does. Deferred vet calls. Peeling paint on the milkhouse. A spouse’s town job quietly covering the feed bill some months.

That last one is the clearest diagnostic there is. Farm Credit Canada’s BeefResearch.ca team flagged the gut-check back in September 2022: if off-farm income has covered farm operating losses in three or more of the last five years, you’re looking at a structural problem, not a tight stretch — the farm isn’t paying its own way. The benchmark is Canadian, but the logic crosses the border intact. A farm leaning on a town paycheck to cover operating losses, not just household groceries, isn’t carrying itself. That doesn’t make it worthless. Plenty of families decide, eyes open, to subsidize a life they love, and that’s a legitimate call when you make it on purpose. The trouble starts when the subsidy is invisible — when a farm runs a decade on borrowed equity while everyone at the table calls it “tight but okay.” Name it out loud, and the question shifts from “are we failing?” to “what do we actually want this to be?” That’s a far better question to answer while you’ve still got options on the board.

What Does the Same Barn Look Like at 40 Cows and a Cheese Vat?

Now flip the model. Take a 40-cow herd that never sees a co-op truck — every drop goes direct-to-consumer, into a cheese vat, or onto a farm-store shelf. Fewer cows, radically different math. At 24,000 lbs/cow, that’s 9,600 cwt a year, against the 70-cow herd’s 16,800. On commodity terms it’d be a rounding error. The point is that this farm isn’t selling a commodity.

Here’s where the numbers diverge hard. NODPA reported organic and grass-fed pay prices running $38–60/cwt this spring — more than double the $16.92 a conventional cheese shipper saw. Say half this herd’s milk — 4,800 cwt — moves as branded fluid or direct sales at an organic-grade $45/cwt: that’s about $216,000. Turn the other 4,800 cwt into farmstead cheese, and the leverage compounds, because roughly 10 lbs of milk makes 1 lb of cheese. That’s about 48,000 lbs of cheese; even at a conservative farm-store $12/lb, you’re looking at another $576,000 in gross sales off the same volume that would’ve fetched maybe $81,000 as bulk milk. (These 40-cow figures are illustrative, built on conservative assumptions — a 50/50 fluid-to-cheese split, mid-range NODPA organic pay price of $45/cwt, and $12/lb farm-store cheese — not a single sourced operation.)

But before anyone trades the parlor for a make-room, read the trade-off honestly. That cheese revenue isn’t margin — it’s gross, and the costs behind it are brutal. A Journal of Dairy Science study pegged artisan cheese plant startup at $267,248 to $623,874, and that’s a 2013 figure, so budget higher today. Then add the labor: aging, packaging, food-safety compliance, farmers’-market booths, and the website that drives the whole thing. You’re not adding a revenue stream. You’re bolting a second business — manufacturing and retail — onto a dairy farm, and plenty of operators discover they like cows a lot more than they like invoicing. The upside is real. So is the failure rate.

The Mechanics Behind the Outcomes

So why is the deck stacked this way for the commodity shipper? Part of it is plain scale economics. Bigger farms spread fixed costs across more cows and buy feed, semen, and supplies cheaper per unit. RaboResearch puts that edge at roughly $10/cwt for 2,000-plus-cow farms over 100–199 cow herds. But part of it is the pricing system itself, which shifted again in 2025 — and most farmers never saw it move.

The Federal Milk Marketing Order changes that took effect June 1, 2025, raised the “make allowances” — the manufacturing-cost credits processors keep before paying for your milk’s components. The American Farm Bureau Federation calculated the change lowered Class III prices by 92¢/cwt in the first three months and pulled roughly $337 million out of producer pool revenues nationwide, per economist Daniel Munch’s September 2025 Market Intel analysis. On our 70-cow family’s 16,800 cwt, 92¢ is about $15,500 a year — gone, off a check that was already underwater.

Here’s why that 92¢ stings a small herd worse than a big one. The cut comes off everyone’s component price the same way — but large operations have buffers small shippers don’t. The Bullvine’s own market reporting notes smaller farms take disproportionate hits, and scattered producers routinely pay higher per-cwt hauling charges than the big routes. Volume herds negotiate over-order and quality premiums that claw back some of the loss; many small bulk shippers don’t have that leverage. And hedging tools like Class III futures or Dairy Revenue Protection can offset a price drop — but as risk-management firms like CIH lay out, they take a broker relationship, a written margin-management policy, and enough volume to make the contracts worthwhile. A 70-cow herd rarely has all three. So the same 92¢ that a mega-dairy partly absorbs or hedges away lands full-force on the small commodity shipper’s mailbox check.

And it arrived almost invisibly. The change came inside dense formula language and a single up-or-down producer vote on the whole order — so on most farms it showed up simply as a lower milk price, not as a line item anyone flagged. There’s no entry on a milk check that reads “this is the day margin moved from your bulk tank toward the plant.” The system keeps your eye on the gross price while the real action happens three layers down in the formula.

How Much Does Waiting Actually Cost?

More than most families expect — and the meter runs whether you look at it or not. Cornell’s Dyson School research, as reported by The Bullvine in December 2025, found that well-planned transitions preserve $400,000 to $680,000 more wealth than distressed sales, and that delaying an exit by three years can destroy roughly $450,000 in family equity. Forced sales make it worse. When assets sell on a lender’s timeline instead of yours, Calder Capital’s March 2025 distressed-sale analysis pegs auction recovery at just 23–51% of fair market value, versus far more in an orderly going-concern sale.

There’s a quieter cost too. Farm advisors note that producers who have an exit plan — even one they never pull the trigger on — make calmer, sharper daily decisions, because the desperation’s gone. The plan isn’t a white flag. It’s a steering wheel you keep in your own hands instead of handing to the bank.

Staring at numbers like these and feeling the weight of them? You’re not the only one, and you don’t have to sort it out alone. Farm Aid (1-800-FARM-AID) and Do More Ag connect farm families with both financial and mental-health support.

So Which Path Are You Actually On?

There are three real paths here — not a fourth one where milk prices ride in and rescue a small commodity herd. Each one works for some operations and quietly destroys others. The honest part is matching the path to who you actually are. Read the prerequisite first: if it doesn’t describe you, that’s not your path.

PathBest forPrerequisite to even startWhat it requiresThe risk
1. Go big & efficient (commodity)Operators who want to compete on cost at scaleA balance sheet that pencils well below the $20.70 forecast — extension economists advise stress-testing expansion against milk as low as $16/cwt500–1,000+ cows, strong equity, low cost per cwtYou stop being a “small dairy” entirely, and the debt is real the day milk drops
2. Go radically niche (high margin, low cow count)Operators near affluent/health-minded buyers who genuinely like marketing$267,248–$623,874 in processing capital for modest artisan cheese volumes — and that’s a 2013 figure, so budget higher today (Journal of Dairy Science, 2013)Brand work, regulatory know-how, and patience through years of thin returnsPremium transitions often lose money for years before they turn; the upside is real — organic and grass-fed ran $38–$60/cwt this spring per NODPA, against that $16.92 check
3. Exit while you still have equityFarms with no successor and a breakeven stuck above marketAn honest valuation and a timeline you control, before the lender sets one for youA real tax conversation and lead timeNone, if done early — strategic exits have preserved $400,000–$680,000 more than forced liquidations (Bullvine, March 2026)

Our 70-cow family at the kitchen table? On these numbers, with no off-farm buyer lined up and no appetite for building a brand, they’re a Path 3 candidate — unless someone’s willing to pay a premium for the story behind that milk, which moves them toward the 40-cow value-added model and Path 2. What they can’t be is Path 0: a commodity tie-stall that pays all the bills at $16.92. That option left the table years ago.

And the choice isn’t only about this year’s check. Each path carries a different forward bet. Path 1 is a bet that you can keep driving cost per cwt down faster than milk prices fall — RaboResearch’s $10/cwt scale gap says the big farms will keep pressing that advantage. Path 2 is a bet that the organic and direct-to-consumer premium holds; NODPA’s $38–60/cwt spread is real today, but it rides on consumer demand you don’t control. Path 3 is the only one that locks in what you’ve already built before the next down-cycle takes another bite. Pick the bet you can live with.

The 30-day move that fits all three: Calculate your true cost of production. Price your own labor at $18–22 an hour, depreciate the barn at replacement cost, and stack the result against the price you actually get paid — not the forecast headline. Cornell Cooperative Extension recommends a full production-and-financial analysis plus a sit-down with your lender as the first moves for farms under pressure. You can’t pick a path until you know which side of the line you’re standing on.

Key Takeaways

  • If you can’t state your cost per cwt with your own labor priced in and depreciation at replacement cost, that’s your first 30-day project — Cornell pegs the 100–199 cow class at $31–33/cwt, so if your number is lower, prove it before you bank on it.
  • If you’re budgeting off USDA’s $20.70 all-milk forecast instead of the Class III strip your check actually tracks ($16.92 in May 2026), rebuild the plan on the lower number before you commit a dollar.
  • If off-farm income has covered farm operating losses in three or more of the last five years, treat it as a structural signal and run the full economic analysis, not just the cash flow.
  • If niche is the dream, price the second business honestly — $267K-plus in processing capital plus the marketing and food-safety load — before you fall for the $38–60/cwt headline.
  • If there’s no successor and equity’s sliding, get a valuation now — a planned exit can hold six figures that a forced sale at 23–51% of value won’t.
  • If you’re staying commodity, book the lender conversation with real numbers before a covenant breach books it for you.

So where does your breakeven actually sit right now — not the cash version, the real one with your wage and your depreciation in it? That single number tells you whether you’re running a business, subsidizing a way of life, or slowly handing your equity to someone further up the chain. None of those three is wrong. But you ought to know which one you’ve chosen, instead of finding out when the bank does.

Complete references and supporting documentation are available upon request by contacting the editorial team at editor@thebullvine.com.

Learn More

The Sunday Read Dairy Professionals Don’t Skip.

Every week, thousands of producers, breeders, and industry insiders open Bullvine Weekly for genetics insights, market shifts, and profit strategies they won’t find anywhere else. One email. Five minutes. Smarter decisions all week.
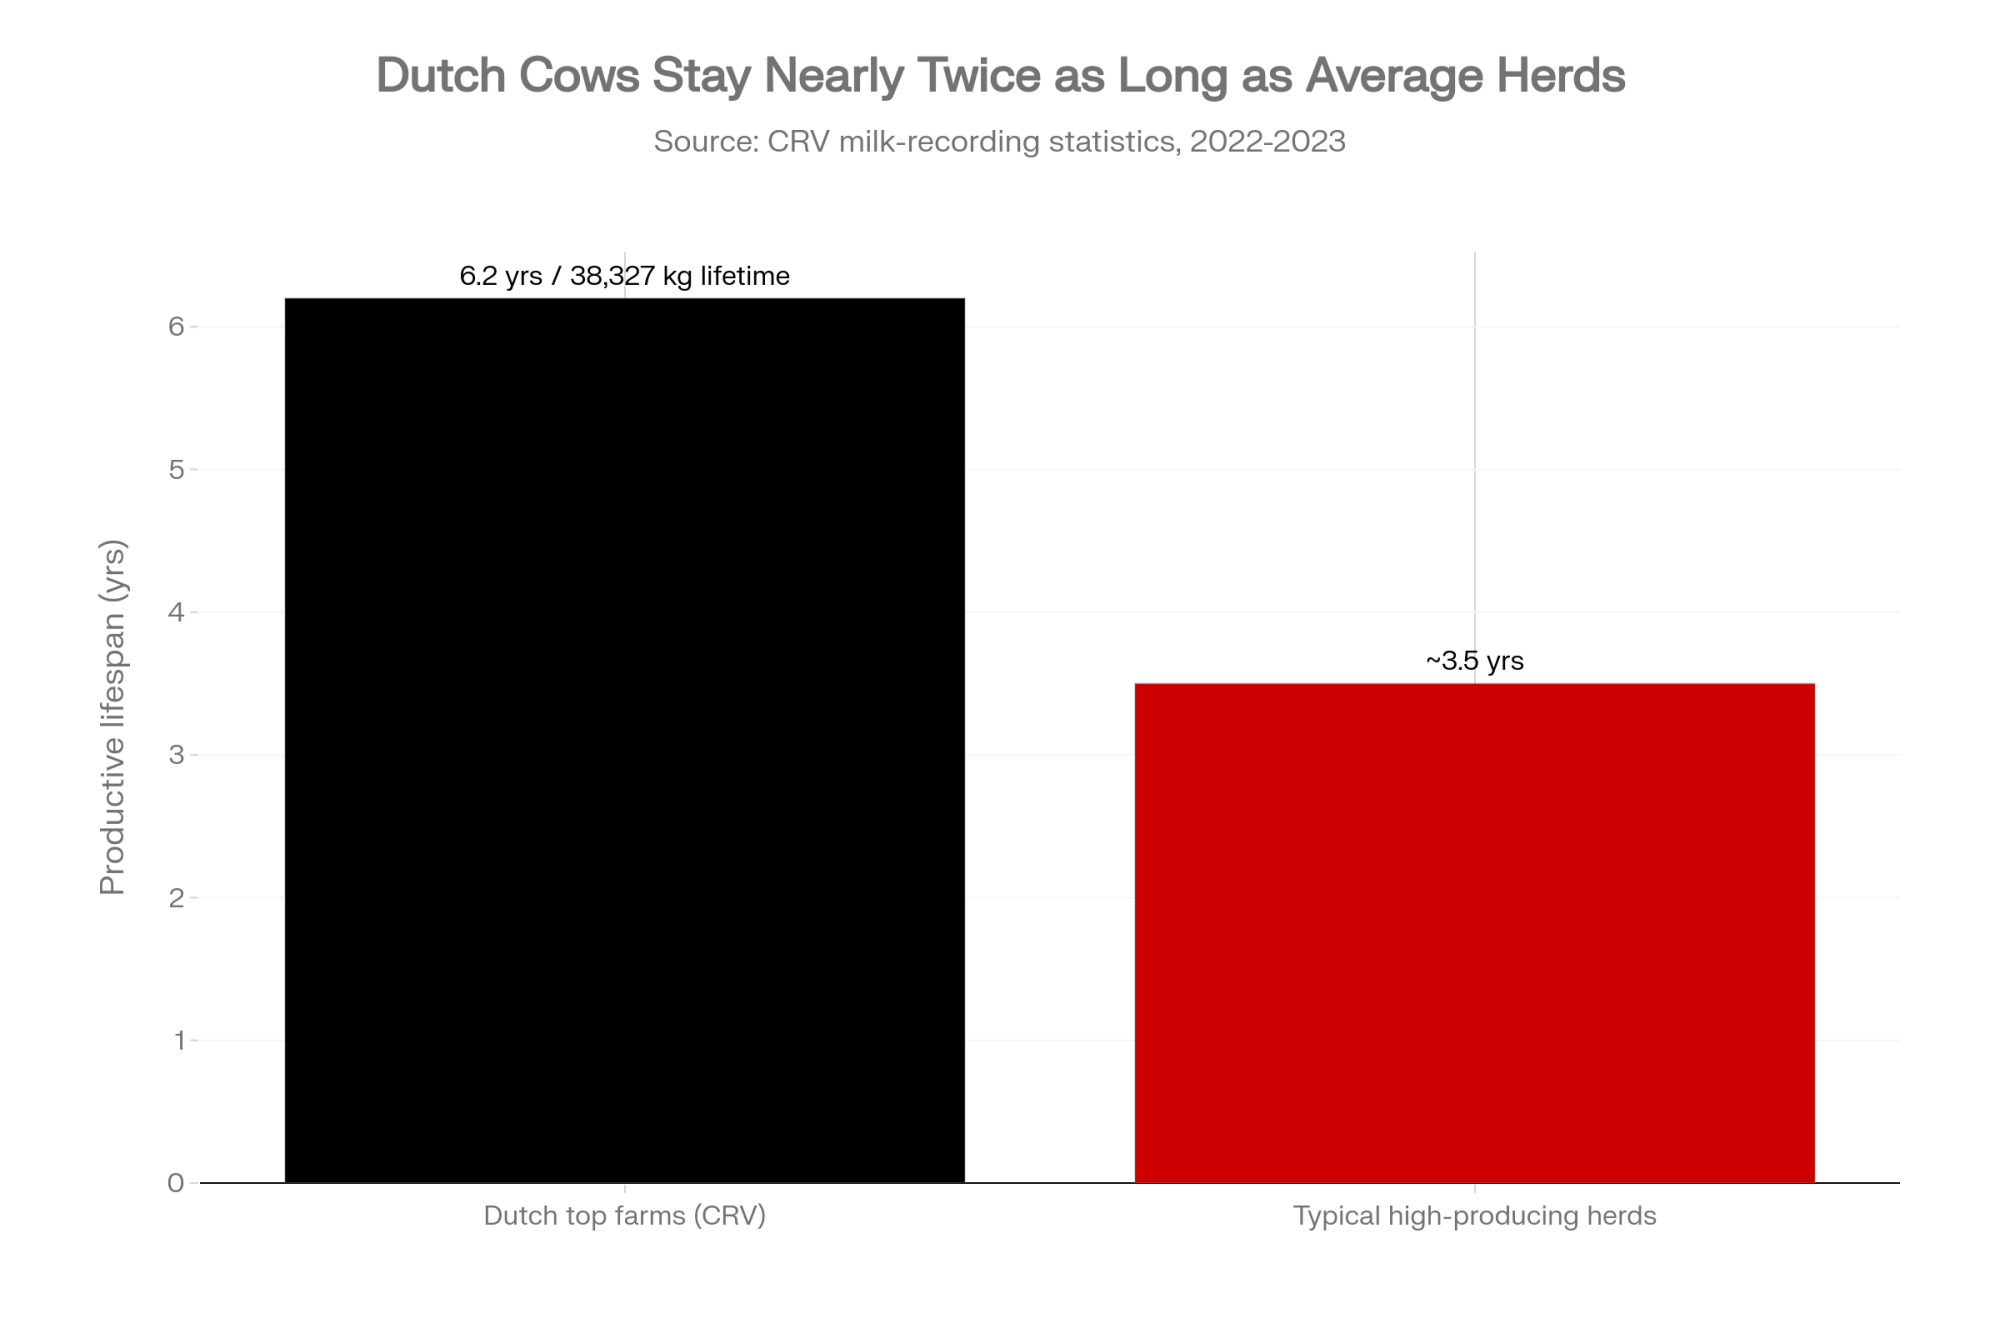
NewsSubscribe
First
Last
Consent

Cornell Heat Stress: Your Fans Do 60% of the Job — the Gut Does the Rest by Day 3

Cornell’s chamber cows sprang a gut leak by day 3 — before the tank flinched. Fans handle about 60% of the loss; the other 40% needs a THI-68 trigger, not more airflow.

Executive Summary: Your fans are only doing about 60% of the job — Cornell’s chamber trial showed the cow’s gut goes permeable by day 3 of heat, dumping milk that no amount of airflow gets back. The bigger surprise sits in your milk check: a 10-point THI jump cuts yield 1.2% but revenue 2.8%, because fat and protein slide before volume does, so you’re bleeding component money on days that don’t even feel hot enough to hurt. The science isn’t fully settled — Cornell found the leak, Virginia Tech didn’t, and pinned 66% of its yield loss on lower intake alone — which is exactly why you should demand real trial data before you buy any “gut” additive. Most cooling controllers still fire at THI 72; Cornell and Ohio State both put the real start at 68 for cows milking 77 lbs or more, so if you wait for 75–80°F you’ve already programmed a loss. Recovering a conservative 2 kg/cow/day over a 120-day summer is worth roughly $54,800 on 500 cows at $20.70 milk — but net the additive cost and only pull the trigger if it still clears at $16. And don’t forget the dry pen: heat there costs 8–10 lbs/day across the whole next lactation, and cooling it pays back fast when the barn already exists. Reset your trigger to 68, cool the dry cows, and make any additive earn its spot on the wagon. 

Cornell heat stress dairy

It’s mid-July. The fans are screaming, the soakers are firing, and the tank keeps sliding anyway. If you’re a nutritionist or herd manager staring at that gap, here’s the uncomfortable news from Cornell on dairy heat stress: your cooling system is probably doing only about 60% of the job — the pair-fed chamber work shows intake alone can’t explain the milk you’re losing. The other 40% is happening inside the cow’s gut — and in the Cornell trial, the leak showed up within three days of the heat coming on, well before the tank told anybody anything was wrong. 

Here’s what changed, what didn’t, and what to walk out and check tomorrow morning.

The 46-Cow Trial That Broke the “She’s Just Eating Less” Excuse

Joseph McFadden’s group at Cornell put 46 Holsteins through a climate chamber and published the results in the Journal of Dairy Science in September 2022. The design is what makes it stick. Cows kept cool at THI 68 during the covariate period, then split into cool controls, heat-stressed controls, cool cows pair-fed the reduced ration the hot cows chose to eat, and heat-stressed cows on a gut-support additive. 

That pair-fed group is the whole argument. Cool cows, eating like heat-stressed cows. If the lost milk were purely a feed-intake story, they’d have milked like the hot group. They didn’t — they out-milked them. The gap that intake couldn’t explain is what pointed Cornell at the gut. 

That somewhere is the gut wall. Total-tract gut permeability measured at day 3 was higher in the heat-stressed cows than in either the cool controls or the pair-fed cool cows — the loss was independent of how much they ate. Blood gets pulled to the skin for cooling, the intestinal lining loosens, bacterial endotoxin slips across, and the immune system lights up. An activated immune system is a glutton, and the glucose it burns is glucose that was supposed to leave the barn as milk. It’s the same leaky-gut mechanism we broke down in why your fans can’t fix half of heat stress. 

The additive was a microencapsulated organic-acid and pure-botanical blend, wrapped to slip past the rumen and release in the small intestine. It restored about 3 kg of milk per day and pulled gut permeability and nitrogen efficiency back toward the cool-cow group — the study calls it partial restoration, not a full fix.

Worth noting how this one got validated: the work ties to a commercial additive, which is standard when a product goes through independent university trial work. What matters is that the pair-fed design stands on its own — and it does.

What Changed: A Second Study Says “Not So Fast”

Good editors don’t cherry-pick the study they like. In 2024, a Virginia Tech team ran its own chamber trial, published it in the same journal, and did not find increased gut permeability. 

Same broad question, tighter design, different answer. They used 16 multiparous Holsteins against a pair-fed thermoneutral control, and dosed both Cr-EDTA and sucralose to track gut leak. Heat stress cut feed intake 35%, and that intake drop accounted for 66% of the milk-yield loss — leaving 34% to heat acting independently of feed. But neither permeability marker moved, and lipopolysaccharide-binding protein didn’t budge. Their conclusion was blunt: under their conditions, gut-derived endotoxin wasn’t behind the milk drop. 

So who’s right? Both, probably. Same species, overlapping conditions — yet the leak showed in Cornell’s 46-cow chamber and not in Virginia Tech’s 16. That points to a mechanism that’s real but conditional. It depends on how hard, how long, and on which cows the heat lands — not a switch that flips in every barn. 

ParameterCornell (McFadden et al., JDS 2022)Virginia Tech (2024)
Sample size46 multiparous Holsteins16 multiparous Holsteins
Study designCool controls + heat-stressed + pair-fed + additive groupHeat-stressed + pair-fed thermoneutral control
Permeability markersTotal-tract gut permeability measuredCr-EDTA + sucralose dual-marker dosing
Gut leak detected?✅ Yes — elevated by Day 3❌ No — neither marker moved
LPS-binding protein change?Elevated (immune activation signal)No change
Feed intake dropReduced (heat group ate less)35% reduction
% yield loss from intake aloneIntake couldn’t explain full loss66% attributed to intake
Residual loss beyond intake~40% — pointed at gut mechanism34% — heat acting independently
Additive tested?Yes — microencapsulated organic acid/botanicalNo
Additive restored milk?~3 kg/cow/day (partial)N/A
Bottom lineGut leak is real, conditional, and fastGut endotoxin not behind milk drop in this trial

Which means anybody selling you a “gut” additive as a guaranteed universal fix is ignoring a peer-reviewed study showing the mechanism doesn’t fire every time. Ask for the trial data before you believe the pitch.

What didn’t change: both studies agree heat steals milk beyond what feed intake explains — Virginia Tech itself put that share at 34%. Fans and soakers alone don’t close that gap either way. 

“Double the Damage”: The Number You’re Not Even Counting Yet

On June 17, 2026, Cornell put a price on a loss most barns never track. A study by Jeisson Prieto, Ariel Ortiz-Bobea, and colleagues — published online May 29 and announced June 17 in Environmental Research Letters — found that a 10-point rise on the temperature-humidity index cuts milk yield 1.2% but cuts revenue 2.8%. More than double. 

Why? Heat doesn’t just thin the tank; it thins the milk. Fat and protein fall, and you get paid on components — so the revenue hit runs ahead of the volume hit. The researchers framed it plainly: the losses from lower fat and protein match the well-established losses from lower yield. Translation for your barn: if you set your “heat-on” trigger by the bulk tank, you’re already late. The component meter starts running earlier. 

That’s on top of the broader bill. Modeling in the Canadian Journal of Animal Science pegged U.S. heat-stress losses above $1.2 billion a year — roughly $800 million tied to lactating cows and $595 million to dry-cow and in-utero effects. 

Why the Dry Pen Is Where Next Year’s Milk Already Lives

Everything above is your milking string. The bigger, quieter bill sits in the dry pen.

Geoffrey Dahl’s group at the University of Florida has shown for years that a cow heat-stressed during the dry period milks 8 to 10 lbs/day less through the entire next lactation — not for a rough week, for the whole thing. Partial cooling doesn’t rescue it. Any heat stress in the dry period does the damage, and those cows tend to come in with more fresh-cow trouble. 

Jimena Laporta’s group at the University of Wisconsin–Madison followed it down the family tree. In a Florida Holstein dataset, daughters of heat-stressed dry cows lost about 4.9 months of productive life and were culled more often before first calving; the effect reached into the granddaughters, too. UF/IFAS work estimated that failing to cool dry cows could cost the U.S. industry roughly $810 million a year once the dam’s own next-lactation loss is counted. 

FactorMilking String Heat StressDry Pen Heat Stress
Immediate yield loss1.2%+ per 10-pt THI jump0 (cow is dry)
Revenue loss timelineStarts within hours of THI riseHidden until next lactation
Lactation impactCurrent lactation only8–10 lbs/day across entire next lactation
MechanismGut leak + intake suppression + immune activationBlunted mammary redevelopment (structural)
Reversible mid-season?Partially — respond to gut/cooling interventionsNo — baked in before first fresh day
Multigenerational effect?No direct evidenceYes — daughters lose ~4.9 months productive life (UW–Madison)
Effect on granddaughters?NoYes — extends to F2 generation (Laporta et al.)
US industry annual cost estimate~$800M (lactating cows)~$810M (dry cow + next-lactation)
Cooling infrastructure neededFans + soakers (existing)Fans AND soakers — fans alone insufficient
Payback speedImmediate if barn existsFast — when barn already exists

The mechanism is structural. Heat during the dry period blunts mammary redevelopment, so the cow builds fewer milk-making cells. You can’t cool your way out of that in August. It’s baked in months earlier.

Is THI 72 Costing You Money Before You Even Notice?

Short answer: yes. The number a lot of cooling controllers still run on — THI 72 — is a fossil. Cornell’s Dairy Environmental Systems Program puts the start of heat stress for a moderate-to-high producer (77 lbs/day or more) at THI 68, not 72. Ohio State extension lands in the same place: milk starts slipping at THI 68. And the component data pulls the real trigger lower still, because fat and protein fade before volume does. 

FactorOld Standard (THI 72)Cornell / OSU Recommendation (THI 68)
Trigger temperature (approx.)~75–80°F with humidity~72–74°F with humidity
When cooling activatesAfter stress is measurableBefore measurable milk loss begins
Gut permeability clockHeat has already started Day 1–2Cooling active before gut clock fires at Day 3
Component revenue bleedingFat/protein already falling before trigger firesCooling covers fat/protein window
Cows covered at 77+ lbs/dayHeat stress underway for hrs–daysCovered at biological threshold
Dry cow triggerOften set at 72 or higher — or ignoredSame 68 threshold required (or lower)
Estimated lag cost (500 cows)2+ kg/cow/day loss during lag windowRecoverable if trigger reset this month
SourceLegacy industry defaultCornell Dairy Environmental Systems / OSU Extension

We made the same case in the $74-per-cow number was never finished — the newer data just moved the number down again. 

Here’s the reference chart to tape inside the office door — Cornell’s own THI zones, with the real 68 trigger marked against the old 72 setting: If your fans don’t kick on until 75–80°F, you’ve programmed a loss into the system.

The Barn Math: What 2 kg/Cow/Day Is Actually Worth

Cornell’s chamber restored about 3 kg of milk per day with gut support. Be conservative on your own farm — call it 2 kg/cow/day over a 120-day heat season, at USDA ERS’s 2026 all-milk forecast of $20.70/cwt (June 17 revision). Canadian producers, swap in your own farmgate rate — the Canadian Dairy Commission raised the farm-gate price 2.3255% effective February 1, 2026. 

🐄 HerdECM recoveredMilk (cwt)💵 Gross at $20.70
250 cows60,000 kg / 132,300 lb1,323~$27,380
500 cows120,000 kg / 264,550 lb2,646~$54,760
750 cows180,000 kg / 396,830 lb3,968~$82,140
1,000 cows240,000 kg / 529,110 lb5,291~$109,520

That’s the gross prize, before product cost. The decision rule: get a real quote on whatever you’re feeding, subtract it, and only pull the trigger if the net still clears at $16/cwt. If it only works at $20 milk, it’s not a protocol — it’s a bet on a strong year.

Dry-cow cooling runs the other direction — cheaper, surer. UF/IFAS built a feasibility spreadsheet for exactly this call, and the payback is fast when the barn already exists. The sequencing is straightforward: cooling first, always. You don’t feed your way out of a broken fan. The nutritional layer only earns its keep after physical cooling is maxed and a long, hot stretch is still bleeding milk. 

The THI Action Guide: Set Your Trigger by the Number, Not the Calendar

THI🚦 LevelDo this
65–68🟡 YellowPre-season done: fans clean, soakers aimed, water flowing. Nutritional module ready to switch on. 
68–72🟠 AmberCooling active for every group — lactating, dry, bred heifers. Shift feed push-up to cool hours.
72–76🔴 RedFull cooling. Holding-pen priority. Gut-support module on if a long stretch is coming. Check stocking density. 
76+⛔ EmergencyMax cooling. Fresh and high groups first. Minimize midday movement. 

Walk the Barn: The 7-Point Cooling Audit

Run this sequence today, in order — each step is a pass/fail you can fix on the spot:

  1. Fans — blades clean, belts tight? Dirty fans quietly lose a big chunk of airflow.
  2. Soakers — hitting skin, not fogging, with overlapping coverage?
  3. Air speed — roughly 3–5 mph at cow level where they rest and eat?
  4. Holding pen — cooled, and cows out of it in under about 3.5 hours a day total?
  5. Dry pen — fans and soakers, not just fans? 
  6. Water — 3+ inches of clean trough space per cow, good flow?
  7. Close-up DCAD — audited separately from the lactating ration, holding a negative target (most programs run roughly −100 to −150 mEq/kg DM)? See how to audit your close-up DCAD. 

Two more levers worth knowing. Betaine acts as an osmolyte, helping cells hold water when a cow’s losing fluid through sweat and breath. Live yeast (Saccharomyces cerevisiae) steadies rumen pH, which slides when a hot cow slug-feeds at night, and JDS trial work under heat has generally leaned positive on intake and metabolic profile. Both are worth a look, neither is a substitute for airflow and water on skin. 

What This Means for Your Operation

  • Your trigger is probably set too high. If controllers fire at 75–80°F, you’re paying for the lag — Cornell and OSU both put the real start at THI 68 for 77+ lb/day cows, not 72. Decision: reprogram fresh, high, and dry groups first, this month. 
  • You’re measuring the wrong loss. Volume is the tail, not the dog — a 10-point THI jump costs 1.2% yield but 2.8% revenue. Check: lay your test-day fat and protein over local THI and find the days you bled without noticing. 
  • The dry pen is the cheapest fix you’re skipping. Dry-period heat costs 8–10 lbs/day for the whole next lactation, and cooling it pays back fast when the barn already exists. Decision: does your dry pen have soakers, or just fans? 
  • Treat the additive as conditional, not automatic. Cornell found a gut leak by day 3; Virginia Tech found none, and pinned 66% of its yield loss on intake alone. Threshold: only feed it after physical cooling is maxed, and only if the net clears at $16 milk. 

Key Takeaways

  • If your controllers still trigger at THI 72, reset them to 68 in the next month — cooling handles maybe 60% of your summer milk loss, and the rest starts before the tank shows it. Fresh and dry groups first. 
  • The gut-additive science is split: Cornell saw a leak by day 3, Virginia Tech saw none. Demand a lactating-Holstein heat-stress trial with a real milk or permeability endpoint, then net the cost and only feed it if it still pays at $16 milk. 
  • Your biggest quiet loss is the dry pen — heat there costs 8–10 lbs/day across the whole next lactation, and cooling it pays back fast when the barn already exists. Fans and soakers before feed additives, every time. 

The science didn’t fire your fans — you still need them, and they’re doing most of the physical work. What it moved is the timing, the trigger, and the accounting. In the Cornell chamber, the gut clock ran at three days. The component meter runs before the tank. And the dry pen decides next year’s milk months before the first hot morning. So the real question isn’t whether you’re cooling. It’s whether you’re cooling early enough, in the right pen, and counting what it costs when you don’t. What would your last two summers of test-day data say if you finally laid them over the THI chart? 

Run Your Numbers

Component Value Tracker — This piece says heat thins your fat and protein before it thins the tank. This calculator turns that into dollars: it shows what 0.1 point of butterfat or protein is worth in your herd, flags your P:F ratio, and pressure-tests whether a summer additive clears its break-even before you buy.

Learn More

The Sunday Read Dairy Professionals Don’t Skip.

Every week, thousands of producers, breeders, and industry insiders open Bullvine Weekly for genetics insights, market shifts, and profit strategies they won’t find anywhere else. One email. Five minutes. Smarter decisions all week.

NewsSubscribe
First
Last
Consent

AI Balanced His Ration in 30 Seconds. The $38,340 Bill Came Six Weeks Later.

A vendor’s AI balanced a ration in 30 seconds flat. The nutritionist said no. Six weeks later, SARA was quietly costing a 500-cow herd $38,340 a year — and nobody traced it back.

Executive Summary: An AI can balance a dairy ration in 30 seconds — and dairy’s leading nutritionists just drew a hard line: not for the biology, not yet. The split matters because “AI” is being sold as one thing when it’s really two — large language models that pattern-match on text and mechanistic models like NASEM 2021 and CNCPS that actually calculate rumen function. Get that distinction wrong, and an LLM can hand you a ration that lowballs peNDF and walks cows into subacute ruminal acidosis, which shows up as sliding butterfat and mystery lameness three to six months later, long after anyone would blame the ration. Run the barn math: push 20% of a 500-cow herd into SARA at a 5-lb daily milk loss, and at a US all-milk price of $21.30/cwt (USDA NASS, May 2026), that’s $106.50 a day — $38,340 a year gone before you count a single cull or open cow. The fix isn’t shutting AI out; it’s putting it in the analysis layer, where AI heat and health detection have posted real wins (~20% better heat detection, ~10% fewer days open in reported industry research), and keeping it off the formulation math until the vendor can name the biological engine underneath. Before you sign anything, three questions sort a real ration tool from a language model in a lab coat — which model runs the nutrition math, how it calculates peNDF, and what its error range is on metabolizable protein. If your butterfat’s already soft, that’s the number any AI tool will be measured against six weeks from now.

AI dairy ration

Picture the kitchen table. A vendor flips open a laptop, types in your herd size, your milk price, your forage tests — and 30 seconds later the screen hands back a finished ration. Ingredient weights. Nutrient projections. Income over feed cost, right down to the penny. It looks clean. It looks smart. And a seasoned nutritionist — the kind who’s balanced rations for decades — is exactly the person telling producers to slow down.

It’s not fear of the technology. It’s about protecting the biology. That’s the tension playing out on farms right now, because AI in dairy nutrition has split into two camps moving at very different speeds. The AgTech companies are selling ration tools hard. The people who actually understand rumen function are saying: not for the biology, not yet. And the gap between those two positions is exactly where your feed dollars — and your cows’ rumen health — are sitting this month.

What’s Actually Being Sold to You

Here’s the confusion the sales pitch runs on. “AI” gets slapped on two completely different things, and only one of them belongs anywhere near your feed bunk.

The first is a large language model — think ChatGPT. It’s a pattern engine trained on mountains of text, and its whole job is predicting the next word in a sentence. It’s genuinely good at summarizing research, explaining a concept, drafting a report. What it does not do is simulate a rumen.

The second is a mechanistic model — NASEM 2021, CNCPS, NDS Professional. These don’t look up an answer. They calculate one. NASEM 2021 works out methane energy loss from the actual fatty acid content and digestible fiber in that specific diet, and the whole energy cascade recalculates the moment you swap an ingredient (National Academies of Sciences, Engineering, and Medicine, Nutrient Requirements of Dairy Cattle, 8th ed., 2021). Change the canola for soy hulls, and the math moves.

The core difference: A language model has read about how fiber holds up rumen pH. A mechanistic model actually models it. Reading and modeling aren’t the same job — and your cows only care about the second one.

Dr. Alex Bach, writing in Animal Frontiers (Vol. 16, 2026), makes the point cleanly: machine learning can predict outcomes well, but the mechanistic models are far better at explaining why performance changed. When milk fat drops in your tank, “why” is the only thing that helps you.

How the Damage Hides for Six Weeks

This isn’t a theory problem. It’s a disorder called subacute ruminal acidosis (SARA), and it’s the cleanest example of how a wrong ration buries its damage where nobody thinks to look.

SARA sets in when rumen pH drops below roughly 5.6 for three to five hours a day (Plaizier et al. threshold, cited in Journal of Dairy Science, 2021). There’s no dead cow the next morning. No alarm. The pH dips, the fiber-digesting bugs slow down, and butterfat starts sliding. Ontario’s OMAFRA notes the real fallout — laminitis, weight loss on cows that should be gaining, mystery abscesses — shows up three to six months after the episode (OMAFRA, “Sub-acute Ruminal Acidosis in Dairy Cows,” 2020). By then the ration that caused it is ancient history.

And this isn’t rare. Field studies put SARA at 19% to 26% of cows in early and peak lactation (University of Manitoba diagnosis study, citing multiple field trials), with some individual farms running as high as 40% (Journal of Dairy Science critical review, 2025). Affected cows give roughly 5 to 6 pounds less milk a day than their healthy penmates (Progressive Dairy, “From the lab to the barn,” 2022).

So run the math on your own barn. Say a tool lowballs physically effective fiber and quietly pushes 20% of a 500-cow herd into SARA. Here’s what that costs, step by step:

Metric (500-cow herd example)Impact / Cost
SARA prevalence (20% of herd)100 affected cows
Daily milk loss per cow5 lbs (0.05 cwt)
Total daily milk loss500 lbs (5 cwt)
Financial loss at $21.30/cwt (US all-milk, USDA NASS, May 2026) $106.50 / day
Monthly drain$3,195 / month
Annual bottom-line hit$38,340 / year

Annualized on 360 milking days, with SARA held at 20% prevalence. Milk value uses the US all-milk price — run your own pool or blend price here, since a Canadian, EU, or NZ check will land somewhere different.

And that’s before you count a single lame cow, open cow, or early cull. Scale the same 20% hit to a 2,000-cow operation and you’re into four figures a day. The bigger the herd, the less you can afford to guess on fiber.

The tool saved you a consulting fee on Wednesday. The bill shows up in week six, and it doesn’t come with a label that says “wrong ration tool.”

Why Can’t the AI Catch This Itself?

Because the number that predicts SARA — physically effective NDF, or peNDF — isn’t sitting in a database somewhere. It depends on your chop length, your forage dry matter, and how your mixer ran that morning. It’s a live calculation, not a lookup.

Mechanistic models handle that. They model the tug-of-war between fermentable starch and effective fiber to predict daily rumen pH (Journal of Dairy Science, “Models to predict the risk of subacute ruminal acidosis,” 2021). A language model can describe that tug-of-war beautifully and still spit out a ration that walks your cows straight into acidosis. Describing a thing and calculating it are entirely different acts.

Then there’s the novel-ingredient trap. Feed a mechanistic model a new byproduct — some off-spec bakery meal, a distiller’s product you got a deal on — and it demands lab characterization before it’ll use it. Feed the same ingredient to a language model and it quietly pattern-matches to the closest thing it saw in training. No warning. No flag. That’s the hallucination problem, except it’s in your feed bunk now. Not a wild, obvious error. A confident, reasonable-looking wrong answer — which is the more dangerous kind.

What Three Questions Should You Ask Before You Sign Anything?

There’s no certification standard here. No disclosure requirement. The FDA regulates AI mainly as software in medical and veterinary device contexts, and the USDA runs its own internal AI strategy, but neither one is vetting the ration platform a rep sets on your table (FDA AI regulatory guidance, 2026; USDA FY2025–2026 AI Strategy). Your own questions are the only guardrail you’ve got. Three of them do the sorting:

  • “Which biological model runs the nutrition math — and can you show me the validation data?” A real answer names NASEM or CNCPS and points to published validation. The red flag sounds like “our AI learned from thousands of rations.” That’s pattern-matching describing itself. It isn’t biology.
  • “How does the system calculate peNDF, and where’s that input coming from?” You want particle-size data feeding a real rumen-pH equation. If all they can tell you is total NDF percentage, the tool will miss acidosis risk in finely chopped or over-processed forage — exactly where it bites.
  • “What’s your error range on metabolizable protein, and what happens when I feed an ingredient it’s never seen?” Every honest model has a known error range. A vendor who can’t give you one doesn’t know theirs — and neither will you until the tank tells you.

Plenty of vendors are upfront about which engine sits underneath. The ones that won’t tell you are the problem. Ask all three questions, then watch whether the rep answers with a named model and a number, or slides back to the demo. The pivot tells you everything.

Is Your Farm’s Data Even Ready for This?

Short answer: probably not. And the people building these tools say so out loud, which is the part the sales deck skips.

John Goeser, Ph.D. — director of nutritional research at Rock River Laboratory and an adjunct at the University of Wisconsin–Madison — put the gap between AI’s promise and dairy’s actual data this way:

“Picture the size of the Grand Canyon — that would be an anecdote to the gap.” — John Goeser, Rock River Laboratory (Progressive Dairy, Nov. 2024)

His example is almost boring, and that’s the point. One dairy logs a metabolic event as “ketosis.” The next logs the same thing as “BHBA.” Same disease, two labels — and no model can learn from that mess.

Goeser has argued the industry needs to aggregate and structure its data before AI can deliver on its potential (Progressive Dairy, Nov. 2024). The vendor pitch assumes your feed software, herd software, parlor data, and forage labs all talk to each other in clean, matched terms. On most farms, they don’t. Dr. Victor Cabrera’s Dairy Brain project at UW–Madison is building exactly that plumbing — pulling genetics, milking, feed, and DHI records into one real-time stream — but it’s still largely a university research effort, not something you can buy off a shelf. The infrastructure has to come first. It mostly hasn’t.

Options and Trade-Offs for Your Operation

None of this means you shut the barn door on AI. It means you put it in the layer where it earns its keep, and keep it out of the one where it doesn’t. Here’s what producers are actually doing.

Option 1: Keep the biology mechanistic, let AI handle detection.

  • The Play: Run NASEM or CNCPS — through a real platform like AMTS (Agricultural Modeling & Training Systems) or NDS Professional — as your formulation engine, and let AI-driven sensors do the watching.
  • The Payback: The validated stack. Works almost always, as long as a nutritionist who knows the model’s limits stays in the loop.
  • The Risk: Very little. This is the safe default, not a gamble. If you want the deeper version of this, our rumen-health and SARA coverage walks through the warning signs before the milk check shows them.

Option 2: Put AI health and heat detection to work this month.

  • The Play: Your 30-day move. Pilot AI heat and health detection on your fresh pen and measure it against your current program.
  • The Payback: Farms running AI heat-detection systems have reported roughly a 20% jump in heat detection and about a 10% cut in days open — figures circulated in industry research rather than a single named peer-reviewed trial, so treat them as directional. Every open day you claw back is money that stops leaking from your repro program.
  • The Risk: Payback runs longer on smaller herds, and activity monitors still miss a meaningful share of cows in heat — depending on system and management, missed-heat rates commonly land in the 20–30% range (Farm Progress, 2024) — so you need a timed-AI backup plan.

Option 3: Use precision feeding to fine-tune income over feed cost.

  • The Play: Optimization after formulation. It dials in delivery rather than rewriting the biology.
  • The Payback: Idaho producers have reported 15% to 25% feed-efficiency gains (The Bullvine feed analysis, Sept. 2025 — producer-reported, not trial data). Eliminating just a 0.5% protein overfeed has been reported to save $15 to $25 per cow/month — $3,000 to $5,000 a month on a 200-cow herd (The Bullvine, “Lifetime Efficiency,” July 2025).
  • The Risk: It’s an optimizer, not a formulator. It sharpens a good ration; it won’t build one. The full precision-feeding margin breakdown is worth a read before you price a system.

Option 4: Watch LLM-only ration formulation, but keep your checkbook closed.

  • The Play: The direction worth betting on long-term — a language model as a front end that routes your question to a mechanistic model and explains the answer back in plain English, not as the thing generating the diet. The first published prototype of exactly this appeared in the Journal of Dairy Science in September 2025 (“Agents are all you need: Pioneering the use of agentic artificial intelligence to embrace large language models into dairy science”). 
  • The Payback: Worth a look when the vendor can name the biological engine underneath the interface.
  • The Risk: If there’s no engine under the interface, you’re paying for a confidence machine.

Key Takeaways

  • Treat any tool that can’t name its biological model as analysis-only. If it won’t tell you whether NASEM or CNCPS runs the math, it doesn’t formulate rations — it describes them.
  • Check for SARA before you blame the weather. If your Holsteins’ butterfat is sliding below 3.0% — a practical field trigger, not a hard clinical cutoff — run a rumen-health check first.
  • Separate “formulate” from “optimize” before you buy. Those are two different products carrying two completely different levels of risk.
  • Demand an error range on metabolizable protein. If a vendor can’t give you one, assume they don’t have it — and price that uncertainty into your decision.
  • Make health and heat detection your first AI purchase, not ration balancing. It’s the fastest, lowest-risk win — with a timed-AI plan for the cows the monitors miss. Pilot it on one pen this month.
  • Fix your data plumbing before you buy the AI. If your feed, herd, and forage-lab software still can’t share data in matched terms, that’s your real bottleneck.

So What Happens the Next Time a Rep Opens a Laptop at Your Table?

The better question isn’t whether AI belongs in your nutrition program. It clearly does — in the analysis layer, where it’s already paying for itself. It’s whether the specific tool in front of you knows the difference between reading about a rumen and modeling one. Ask the three questions. Watch for the pivot. And before you let anything touch your ration, ask yourself where your butterfat and your fresh-cow health actually sit right now — because that’s the number any tool will be measured against six weeks from now.

The pushback from experienced nutritionists isn’t a rejection of the future. It’s about guarding the biology while the tools catch up to it. We’re breaking down the full SARA cost model by herd size — and the sensor-ROI math by operation scale — in next week’s Bullvine Weekly. That’s where the real numbers live.

Run Your Numbers

Dairy Profit Projector — That $38,340 SARA hit is really an IOFC problem. Drop in your herd size, milk, and ration assumptions, and the Projector shows what a lost 5 lbs per cow does to your IOFC per cow per day, breakeven milk price, and 12-month margin — before you let any AI tool touch the ration.

Complete references and supporting documentation are available upon request by contacting the editorial team at editor@thebullvine.com.

Learn More

The Sunday Read Dairy Professionals Don’t Skip.

Every week, thousands of producers, breeders, and industry insiders open Bullvine Weekly for genetics insights, market shifts, and profit strategies they won’t find anywhere else. One email. Five minutes. Smarter decisions all week.
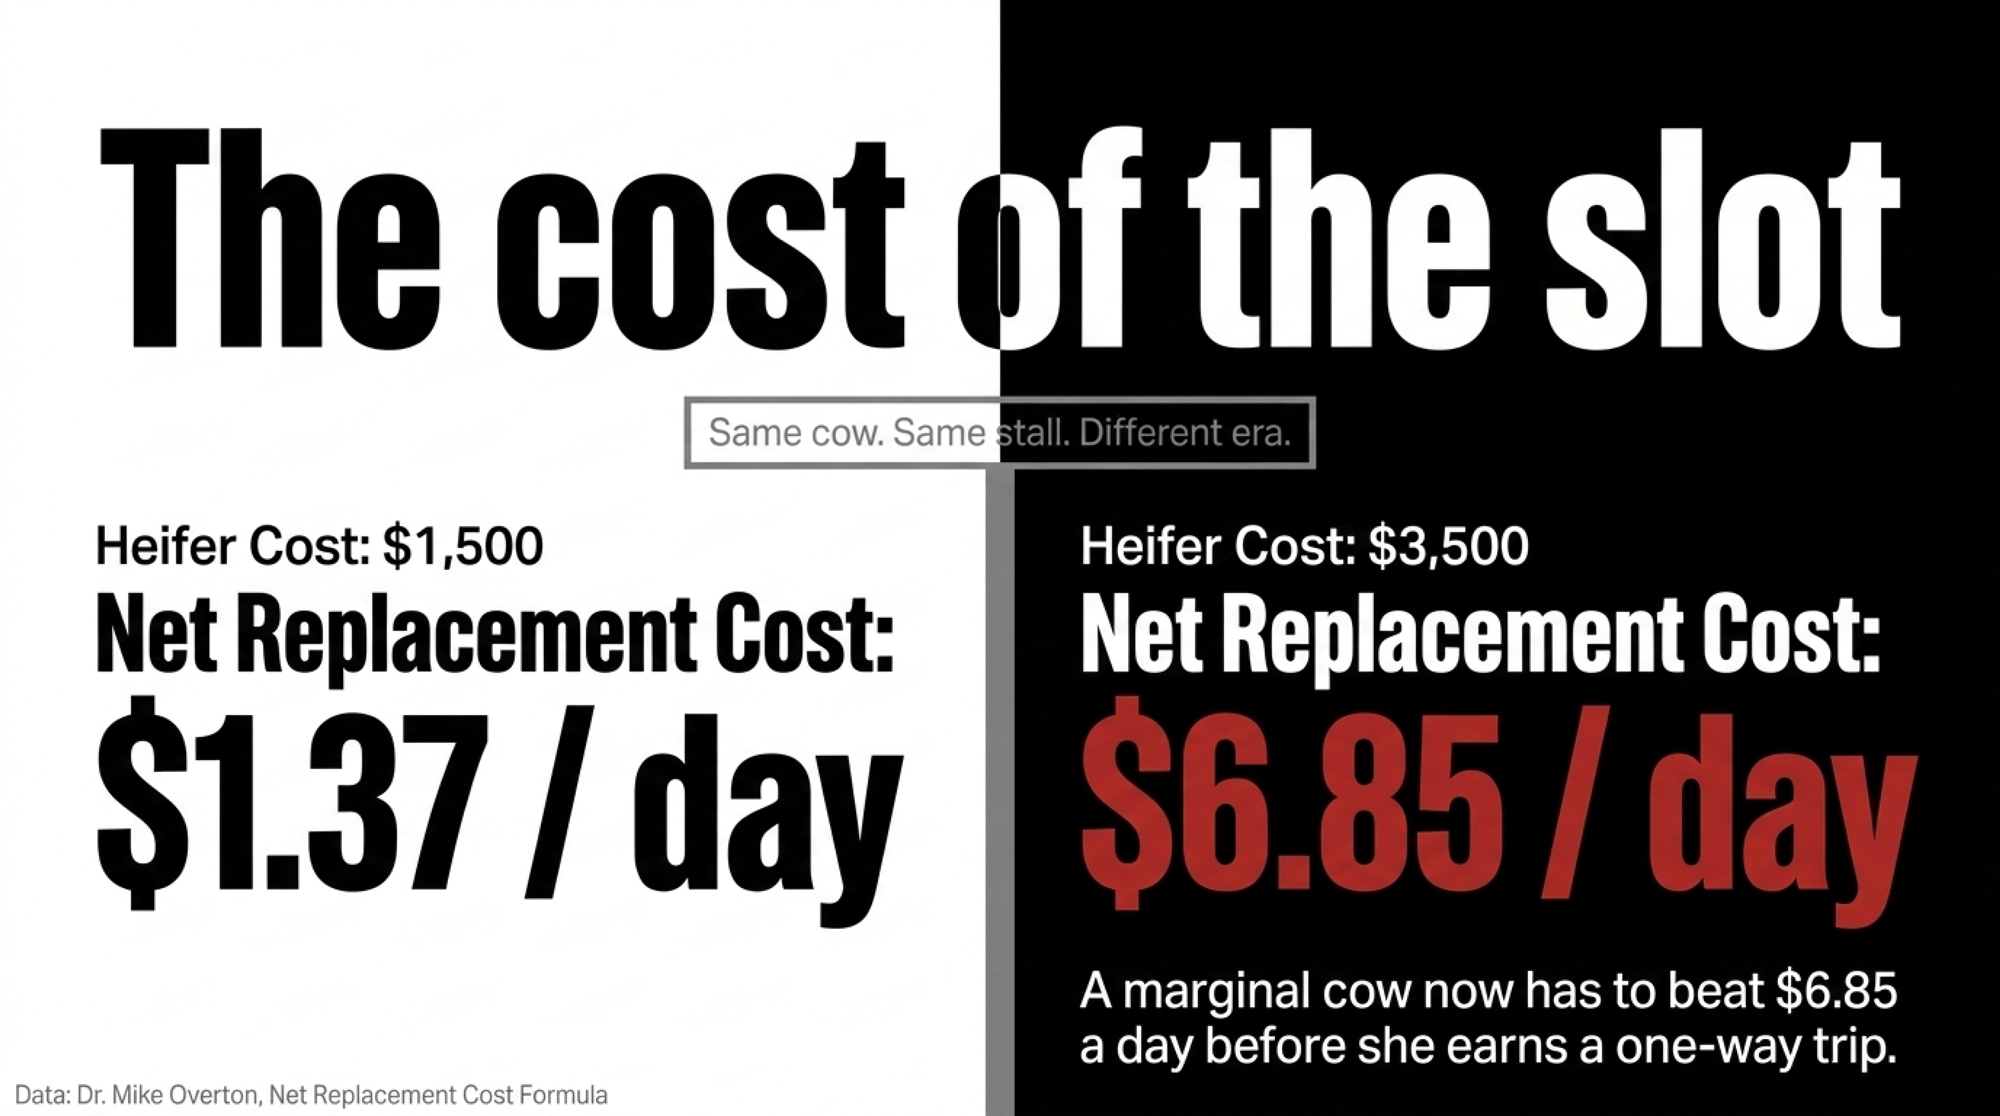
NewsSubscribe
First
Last
Consent

$337 Million Left Conventional Milk Checks in 90 Days — No Bill, No Plaintiff

$337 million left conventional milk checks between June and August 2025. No lawsuit, no plaintiff, no line item — it was gone before your cheque cleared. Can you name your number?

Executive Summary: USDA’s June 2025 make-allowance hike quietly pulled about $0.92/cwt off your Class III check — and roughly $337 million out of producer pools in its first three months, per AFBF’s September 2025 numbers. It never showed up as a line item. On a 200-cow herd shipping 5.6 million pounds, that’s about $56,000 gone over 13 months; scale to 1,000 cows and you’re near $279,000, with six years of erosion running past $310,000 before any fix can land. Seven Organic Valley farmers, led by Abby Swan of Westfield, Wisconsin, sued over their share and can name a dollar figure — conventional producers lost far more and have no plaintiff, no courtroom, and nowhere obvious to point. The catch: the federal cost survey meant to check the math won’t collect data until 2027, and a fresh hearing could push real relief to 2031. Anyone shipping Class III or IV is exposed, and if your co-op also owns processing plants, the increase touched both sides of its books while only one side hit your cheque. Two moves this month — pull your co-op’s 2024 and 2025 audited financials, and price a floor with the 2026 all-milk forecast cut to $20.70/cwt — decide whether you’re looking at a market problem or a governance one.

make allowance milk check

Abby Swan, a dairy farmer from Westfield, Wisconsin, is the lead plaintiff on a federal lawsuit that says the milk-pricing system is quietly bleeding organic farmers. She and six other Organic Valley farmer-members filed a class-action takings claim — one of four organic dairy suits filed April 28 under the Coalition for Organic Dairy Exemption. Their argument: the Federal Milk Marketing Order forces organic producers to pay into a national pool for milk they never sell as commodity, and the class action seeks at least $60 million in compensation. 

Here’s the part that should stop every conventional producer cold. That same pricing formula pulled an estimated $337 million out of producer pools between June and August 2025 — its first three months, according to the American Farm Bureau Federation’s September 2025 analysis. That money came off conventional milk cheques. And unlike the organic side, nobody filed anything — no lawsuit, no plaintiff, no headline with your name on it. It was gone before your cheque cleared.

What Changed on June 1, 2025

USDA updated the “make allowances” baked into all 11 Federal Milk Marketing Orders — the fixed deductions in the pricing formula that stand in for what it costs a processor to turn your raw milk into cheese, butter, or powder. They hadn’t been touched since 2008. In the January 2025 final rule, they climbed across the board: cheese to $0.2519 a pound, butter to $0.2272, nonfat dry milk to $0.2393, and dry whey to $0.2668, all effective June 1. 

Make-Allowance CategoryPre-June 2025 Rate ($/lb)Post-June 2025 Rate ($/lb)Change ($/lb)Net Impact on Producer
Cheese$0.2003$0.2519+$0.0516Largest Class III hit
Butter$0.1715$0.2272+$0.0557Class IV exposure
Nonfat Dry Milk$0.1678$0.2393+$0.0715Class IV + protein pools
Dry Whey$0.1991$0.2668+$0.0677Class III whey component
Combined Class III Effect~-$0.92/cwtOff your regulated minimum
First-Quarter Pool Damage-$337MAcross all 11 FMMOs
Last Rate Update Before This200817-year gapNo inflation adjustment

The mechanic is simple, and it doesn’t work in your favor. The make allowance gets subtracted from the product price before your milk gets priced. Bigger deduction, smaller regulated minimum. AFBF’s math put the Class III hit at about $0.92/cwt — money that now stays on the processor’s side of the ledger instead of flowing into the pool that pays you. 

Who’s most exposed? Anyone shipping into Class III and IV, the manufacturing classes — which is most of the country. AFBF tallied the first-quarter damage at $64 million in the Upper Midwest, $62 million in the Northeast, and $55 million in California. (The Bullvine: the full $337 million breakdown by region) And here’s the tell: farm-level prices fell 11.4% between August 2024 and August 2025, but retail cheese prices didn’t follow. Whatever the lower regulated minimum saved on the processing side, it doesn’t appear to have reached the dairy case. 

Where the First $337 Million Went Missing (June–August 2025)

RegionFirst-Quarter Estimated Losses
Upper Midwest$64 million
Northeast$62 million
California$55 million

Source: American Farm Bureau Federation Market Intel, September 21, 2025. Figures cover the first three months under the amended make allowances.

How This Lands on a Real Farm

The $0.92 doesn’t knock on the door. It won’t show up on your statement as a line labeled “make allowance increase.” It’s just a slightly smaller number where a bigger one used to sit. That’s the whole trap — you can’t rally around a loss you can’t see.

Wisconsin farmer and Farmers Union leader Darin Von Ruden already put a face on that math. He ran the numbers on his own 300-cow operation and found the make-allowance change was pulling tens of thousands of dollars a year off his milk check — a hit he says arrived with no line item explaining it. He’s not an outlier. He’s just one of the few who bothered to calculate it.

So run it on your own tank. Take a 200-cow herd shipping about 5.6 million pounds a year — that’s 56,000 hundredweight, or roughly 28,000 pounds a cow, so dial it to your own rolling herd average. At $0.92/cwt, that’s $51,520 a year, or about $56,000 across the 13 months since the change took effect. Neither number arrived as a bill. It arrived as absence, which is exactly why it’s gone unfought.

Now look at the contrast. The organic coalition can name its number: the class action puts a dollar figure on the harm and asks the court for at least $60 million back. The organic side has a figure, plaintiffs, and a courtroom. The conventional side has a lighter cheque and nowhere obvious to point.

DimensionOrganic Producers (Organic Valley Plaintiffs)Conventional Producers
Estimated Loss (first 3 months)Portion of $60M+ claimed$337M total [all FMMO regions]
Loss VisibilityTraceable — segregated milk poolInvisible — absorbed into co-op pooling math
Legal Action✅ Class-action filed Apr 28, 2025❌ No plaintiff, no filing
Dollar Figure Named≥ $60M in federal complaintNone on record
Pay Statement TransparencyDeductions itemized per organic programOften catch-all “market adjustment” terms
Co-op Conflict of Interest RiskLower — OV is producer-owned, no processing assetsHigher — largest co-ops own processing plants
Path to RecoveryFederal court ruling (timeline TBD)2031 at earliest via new FMMO hearing
Action Required NowLawsuit proceeds; plaintiffs waitPull co-op financials; price a risk floor

The Mechanics Behind the Split

Why aren’t the biggest conventional players fighting this the way the organic coalition did? Part of the answer is structural — some of them sit on both sides of the counter.

Organic producers like Swan and her co-plaintiffs can trace a defined block of segregated milk into the pool and calculate exactly what comes back — a clean, countable claim. A conventional producer never sees that math. Your cooperative handles the pooling, so the money never materializes on your side. And the paperwork doesn’t help you find it. The Bullvine’s reporting, citing a 2024 University of Wisconsin Extension analysis, found that many cooperative pay statements don’t fully explain deductions over $0.25/cwt — they lean on catch-all terms like “market adjustment” and leave it there. (The Bullvine: who speaks for your milk check?

Here’s the structural wrinkle worth naming plainly. Several of the largest cooperatives also own processing assets, which means the make-allowance mechanic can cut in two directions inside one balance sheet. Dairy Farmers of America is the biggest example: net sales of $24.5 billion in 2022, a BBB credit rating, and 44 former Dean Foods plants absorbed out of bankruptcy in 2020. That dual role — cooperative and processor — has drawn scrutiny before. In a separate 2022 antitrust case in Vermont unrelated to make allowances, plaintiffs alleged a conflict between members’ interest in the highest milk price and a processor’s interest in the lowest; DFA spokesperson Kristen Coady called those allegations “baseless and completely without merit,” and no court has upheld them. Nothing in the public record connects DFA to the 2025 make-allowance decision. The point isn’t any one co-op’s conduct — it’s that the structure lets a single organization sit on both sides of the same price. 

How Much Does Waiting on the “Fix” Actually Cost You?

Congress already passed the fix everyone points to. It’s slower than it sounds. The Carmel hearing that produced these increases was petitioned in May 2023 and took effect June 1, 2025 — 25 months from ask to paycheck. The mandatory processor cost survey meant to check that math was funded in July 2025, is still in the design stage as of the February 2026 rulemaking notice, and USDA doesn’t plan to begin collecting data until 2027. 

Stack the intervals from the last hearing on top of that, and relief lands no sooner than 2031 — six years after the cut started biting. For that same 200-cow herd, six years at today’s rate and volume runs to roughly $310,000 of erosion before the system can even theoretically correct. The increase arrived in 25 months. The audit on it takes six years. That gap isn’t a rumor. It’s arithmetic. 

There’s a catch inside the catch, too. AFBF economist Danny Munch told Brownfield the survey changes nothing on its own: “You would still have to go through an FMMO hearing to change them.” New data doesn’t reset make allowances. It just gives somebody grounds to petition for another hearing — and start the 25-month clock over. 

Is Your Own Cooperative’s Math Working For You or Around You?

This is the question the whole story lands on, and you don’t need a lawyer to answer it. If your cooperative owns processing assets, the make-allowance increase touched both sides of its books — and only one of those sides shows up on your milk cheque. You’re entitled to understand how it played out.

The goal here isn’t to hunt a villain in your co-op boardroom. Plenty of cooperatives passed the value through as cleanly as the formula allowed, and said so. But most producers can’t tell the difference right now — because they’ve never pulled the one document that would show them. Reading it turns a vague sense that something shifted into a number you can actually work with.

Options and Trade-Offs

The fix is on a six-year clock. Here’s where you actually have room to move before then.

Pull your cooperative’s audited financials this month. As a member, you have the right to your co-op’s audited annual financials — the exact terms are set out in your co-op’s bylaws and your state’s cooperative law, so check yours before you ask. Either way, requesting them costs you an afternoon. Set 2024 and 2025 side by side and watch a single thing: did processing revenue climb while member milk payments, as a share of total revenue, slipped? The statements won’t isolate the make-allowance effect for you — you’ll have to read them against the $0.92 yourself — but they’re the closest thing you’ve got to a receipt.

Don’t wait on the federal survey to bail you out. The One Big Beautiful Bill Act (H.R. 1, signed July 4, 2025) funded a mandatory, audited cost survey covering all reporting plants, replacing the old 61-plant voluntary sample — genuinely better data. But better data isn’t relief. There’s nothing before 2028, no automatic adjustment when it lands, and a hearing timeline that could push any actual change toward 2031. Treat it as a reason to stay engaged on policy, not a rescue you can budget around. 

Lock a floor under the price you can still reach — this is the move that pays this year. With the 2026 all-milk forecast cut to $20.70/cwt in USDA’s June estimate and Class III soft, a lower regulated minimum is exactly when a risk floor earns its keep. If your breakeven sits anywhere near current prices, ask your advisor whether Dairy Revenue Protection (DRP), Class III futures, or Dairy Margin Coverage fits your class mix before the next contract window. Yes, coverage costs money and can cap your upside. You’re buying back the certainty the formula just took away — and right now that’s cheap insurance. 

Back the groups building the paper trail. Edge Dairy Farmer Cooperative organized around exactly this governance-transparency gap, and if your own financials raise real questions, that’s where collective weight starts to matter. Fair warning: this one runs on the six-year clock, not the 30-day one. 

Key Takeaways — Your Make-Allowance Checklist

✔ Run the $0.92. If you ship Class III or IV, assume roughly $0.92/cwt has come off your regulated price since June 2025. Multiply it by your annual hundredweight before you write it off as “just the market.” 

✔ Pull the financials. If your cooperative owns plants, request the 2024 and 2025 audited statements this month. If processing revenue rose while your milk-payment share fell, that’s your question for the next meeting. 

✔ Don’t bank on the survey. No data before 2028, no automatic adjustment, relief possibly not until 2031. It’s oversight, not a rescue. 

✔ Price a floor if you’re close to breakeven. If your breakeven is within a dollar or two of $20.70/cwt, talk to your advisor about DRP or Class III coverage now — don’t wait on a regulated price to recover. 

✔ Question vague deductions. If your pay statement carries deductions over $0.25/cwt with no line-item explanation, ask your co-op to itemize them. 

The Question Worth Your Coffee Monday

Abby Swan knew her number well enough to put it in a federal complaint. Darin Von Ruden knew his well enough to run it on 300 cows and go public. So here’s the one to sit with: do you know yours? Not the regional estimate. Not the co-op average. Your operation’s actual exposure to a formula change that’s been quietly running for more than a year.

Pull the statements, run the $0.92 against your tank, and you’ll know whether you’re looking at a market problem or a governance problem — because those two need very different answers. We’re breaking down the full cost-per-cwt model by herd size, region, and class utilization in next week’s Bullvine Weekly. That’s where the real numbers live.

Run Your Numbers

Dairy Farm Corridor Score Calculator — This tool puts a dollar figure on the same drag this article tracks, folding FMMO make-allowance impact, hauling burden, and structural pressure into your milk revenue by state. Run your farm through it to see whether that $0.92/cwt is a market problem or a location problem you’re stuck paying.

Complete references and supporting documentation are available upon request by contacting the editorial team at editor@thebullvine.com.

Learn More

The Sunday Read Dairy Professionals Don’t Skip.

Every week, thousands of producers, breeders, and industry insiders open Bullvine Weekly for genetics insights, market shifts, and profit strategies they won’t find anywhere else. One email. Five minutes. Smarter decisions all week.
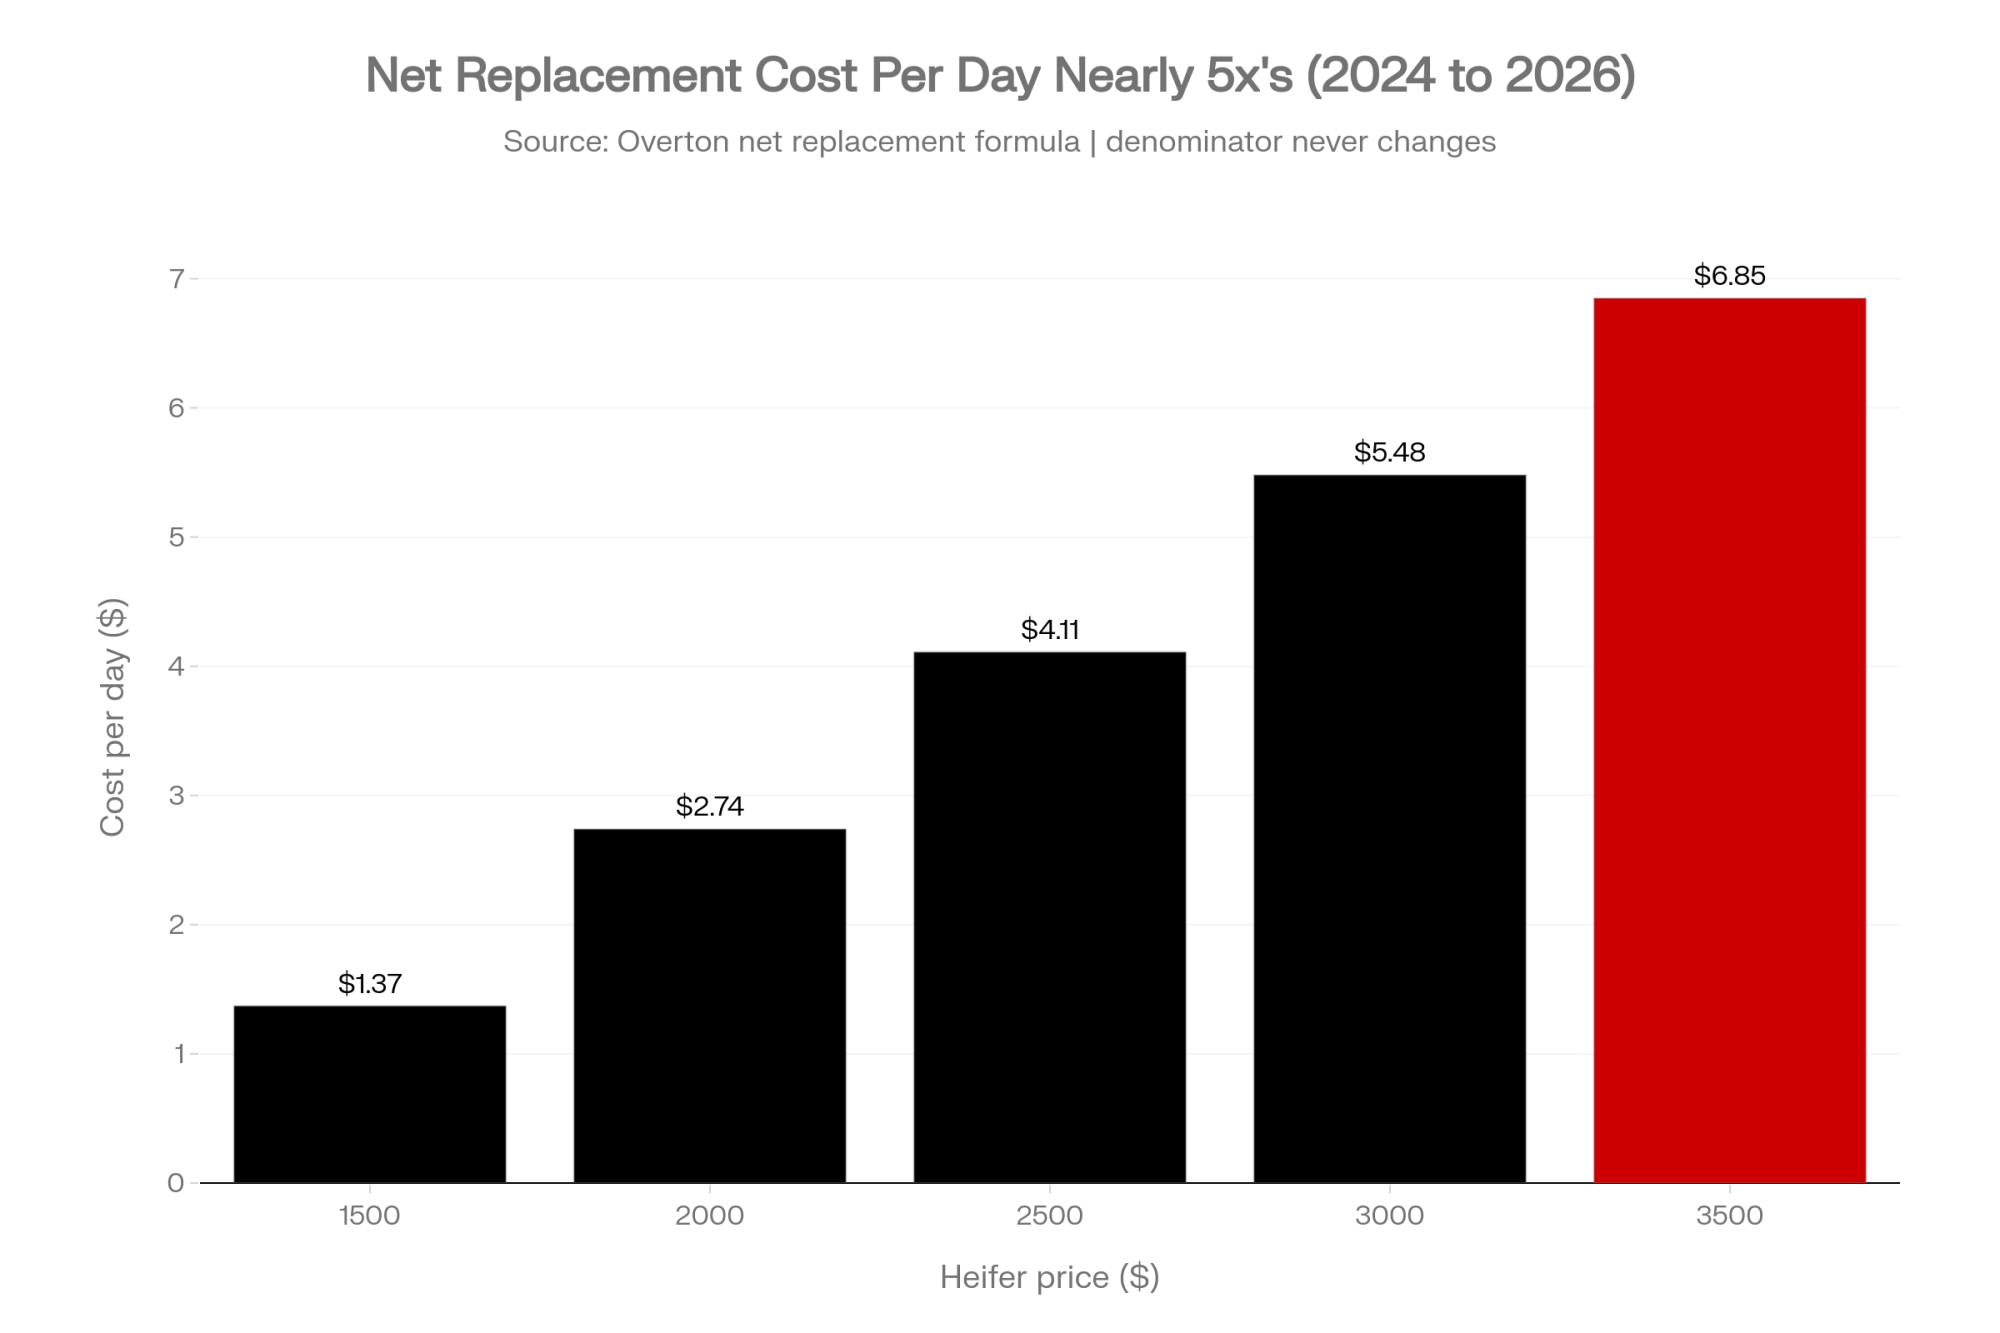
NewsSubscribe
First
Last
Consent

Organic Valley Sued USDA Over $50M a Year — and Your Blend Price Is In It

Organic Valley says it’s forced to pay ~$50M a year into a pool for milk it can’t sell. The same June 2025 rule cut your check too. Here’s the pooling math.

Executive Summary

  • What happened: On April 28, three of the biggest organic dairies in the country — Organic Valley/CROPP, Aurora, and Horizon — filed four federal lawsuits arguing that Federal Milk Marketing Order pooling is unconstitutional as applied to organic. CROPP alone claims more than $60 million for roughly 1,350 farms and pegs the ongoing drain near $50 million a year.
  • The mechanism: Organic processors are almost all Class I, so they pay into the pool at the top, then get back a blend average dragged down by cheaper cheese and butter milk — money that lands with the manufacturing handlers.
  • The trigger: The same June 2025 AMS rule that cut Class III by about 92¢/cwt and pulled $337 million out of producer checks raised organic’s pool-in payments while shrinking what the pool pays back.
  • The legal reality: CODE’s lead claim leans on Horne v. USDA, but Horne involved a physical taking of raisins. Proving a regulatory cash pool is a “taking” is a real legal stretch, and USDA hadn’t responded as of July 9.
  • Why it’s not just an organic story: A win shrinks the pool conventional blend prices lean on, and it bites hardest in fluid-heavy Southern orders like Florida (Order 6, $24.04/cwt in April) and the Southeast — not the Upper Midwest, where January’s PPD was $0.46/cwt.
  • The caveat: The dollar figures above $50M are CODE’s own math, not audited findings. Read the arrow, not the number.
  • Your move: Before the late-August answer deadline, know which order you’re in and how exposed your blend price is if the biggest premium producers walk out of the pool.
organic dairy lawsuit FMMO

Here’s the number that put USDA in front of three federal judges: about $50 million a year — what the country’s biggest organic dairies say they’re forced to pay into a Federal Milk Marketing Order pool for milk they legally can’t even sell. On the hook are Organic Valley/CROPP, Aurora Organic Dairy, Horizon Organic, and seven named CROPP farmer-members — people like Elvin Ranck in Pennsylvania and Remington Perkins, who, by CODE’s account, runs West Virginia’s first certified organic dairy, filing for roughly 1,350 farms. The trap they’re fighting is the same June 2025 rule change that cut your milk check — and if they win it, the pool your blend price leans on gets smaller. 

While framed as an organic dispute, this is an FMMO fight that could fundamentally alter blend prices for conventional fluid milk shippers. The ruling lands on them whether they’ve shipped an organic pound or not.

Who’s Suing, What They Claim, and How Much

On April 28, 2026, three companies filed four separate suits in three federal courts. They call themselves CODE — the Coalition for Organic Dairy Exemption — a descriptive name, not a separately incorporated entity. USDA hadn’t publicly answered any of the four as of July 9, 2026, and docket numbers weren’t confirmable in public PACER records at press time. 

PlaintiffCourtCore claimDollar figureSource status
CROPP/Organic Valley (7 farmer-members)Court of Federal Claims (D.C.)Fifth Amendment Takings, class action>$60M for ~1,350 farms Filing
CROPP/Organic ValleyW.D. WisconsinDue process, non-delegation, APA ~$50M/yr ongoing Plaintiff estimate
Aurora Organic DairyD. ColoradoTakings, due process Part of >$400M since 2006 Plaintiff estimate
Horizon OrganicD. ColoradoTakings, due process Part of >$400M since 2006 Plaintiff estimate

While the headline numbers are massive — reaching up to $400 million since 2006 — it’s critical to note these are the plaintiffs’ internal accounting figures, not audited court findings. Only the $60 million class-action claim traces directly to a filing. 

Why Should a Conventional Producer Care About an Organic Lawsuit?

It isn’t an organic lawsuit. Strip the label, and it’s one question: can a pricing law written in 1937 force a legally distinct product to bankroll a pool it can’t draw from — and does that break the Fifth Amendment? The organic-versus-conventional framing is the distraction. The real fight is small-and-differentiated against the industrial pool, argued based on pooling math and constitutional law. (Related: The Bullvine’s July 2, 2026 make-allowance analysis, “$337 Million Disappeared from Milk Checks. Cheese Prices Never Dropped.”) 

How the Producer Settlement Fund Actually Moves the Money

Skip the textbook. Every hundredweight in an FMMO gets priced by what it becomes — fluid drinking milk (Class I) pays the most, cheese (Class III) and butter/powder (Class IV) less. The market administrator blends all that value into one uniform price, the minimum every handler pays. Handlers whose milk went to a high-value class pay the difference into the Producer Settlement Fund. Handlers whose milk went cheap draw out of it. The key thing to remember: it’s the handlers who settle with the pool, not the individual farmer. 

Now watch where organic gets stuck. Organic processors are almost all Class I. They pay in at the top, then get back the blend average, dragged down by all that cheaper cheese and butter milk. The gap doesn’t evaporate — it lands with the handlers who ran the cheap manufacturing milk. 

Pay in at the top. Get back the average. Subsidize the cheese plant. Every month.

Adam Warthesen, Organic Valley’s VP of Government and Industry Affairs, pegs the transfer at more than $400 million out of organic since 2006 — about $50 million a year now. Both figures are CODE’s own math. No neutral party — not USDA, not a land-grant economist, not Farm Bureau — has independently run them in any source found for this piece. Believe the arrow. Don’t yet bank the number. 

The June 2025 Rule Change That Lit the Fuse

You felt this one. The USDA AMS final rule, published January 17, 2025 and effective June 1, did five things. 

  • Raised make allowances — the processing-cost credits in Class III/IV. Cheese went from $0.2003 to $0.2519/lb; butter, from $0.1715 to $0.2272/lb; nonfat dry milk, from $0.1678 to $0.2393/lb; dry whey, from $0.1991 to $0.2668/lb. 
  • Restored the “higher-of” Class I mover, scrapping the 2019 average-of-plus-74-cents formula.
  • Raised Class I location differentials.
  • Dropped the 500-lb barrel cheddar from the Class III formula.
  • Updated skim composition factors, effective December 1, 2025.

That make-allowance change cut roughly 92¢/cwt from the Class III price and pulled about $337 million from producer milk checks — money that now stays with processors, even though cheese prices never dropped to match. Across all classes, the reform netted a $231.9 million decline in pool revenue in its first three months. 

Here’s the piece aimed at organic. Under the restored higher-of, the base Class I skim price each month equals the higher of the advanced Class III and Class IV skims. For July 2026, USDA’s advanced price sheet put the base Class I price at $21.33/cwt, down $0.85 from June. Organic processors are Class I handlers. Higher Class I means a bigger check into the pool, and fatter make allowances shrank what the pool hands back in the blend. Organic pays more in, pulls less out — both levers yanked the same way on June 1, 2025. 

Running the Numbers: What the Pool Costs, Organic vs. Conventional

The 300-Cow Organic Herd

Organic cows milk well below conventional — regional organic data runs roughly 10,000 to 19,000 lb/cow/year depending on grain and pasture rules, so call it 16,000 lb/cow (160 cwt) as a working middle. For a 300-cow herd, that’s about 48,000 cwt a year. 

Now the drag per cwt, and here’s where you have to be careful, because CODE’s own numbers point two directions. Spread the $50 million-a-year claim across the roughly 1,350 farms and their volume, and the annual burden lands near $0.35/cwt. Take instead the $60 million class-action claim — a cumulative compensation ask, not an annual flow — and the implied per-cwt figure runs higher. They aren’t the same measurement, and stacking one on the other double-counts. Use the annual figure for a yearly comparison.

  • Pool drag (CODE-implied annual): roughly $0.35/cwt.
  • Annual PSF transfer for a 300-cow organic herd: 48,000 cwt × $0.35 = about $16,800 per year, leaving that herd’s pool position for the conventional system.

That’s not lost revenue — these farms still clear $35–$45/cwt in organic pay. It’s the cash walking out the pool door. Warthesen claims that June 2025 lifted organic’s pool burden by about 60%; the direction holds, but the exact percentage is CODE’s estimate and varies with the order, volume, and butter-cheese spread each month. 

The Conventional Herd, Same Rule Change

Conventional cows milk far harder — figure roughly 24,000 lb/cow (240 cwt), so a 300-cow herd runs near 72,000 cwt. That’s why the cwt totals differ between these two boxes even at the same cow count. Apply the verified 92¢/cwt Class III make-allowance cut:

  • 300 cows (~72,000 cwt): 72,000 × $0.92 = about $66,240 a year, gone.
  • 500 cows (~120,000 cwt): 120,000 × $0.92 = about $110,400 a year.

Same rule change. Two producers. The conventional herd’s dollar hit is bigger — it’s a measured make-allowance loss straight off USDA’s own class-price math, not a contested pool estimate — and yet it’s the organic side that went to court. Plug in your own herd’s rolling average and the arithmetic doesn’t change.

Metric300-Cow Organic300-Cow Conventional500-Cow Conventional
Est. milk yield/cow16,000 lb (160 cwt)24,000 lb (240 cwt)24,000 lb (240 cwt)
Annual herd volume~48,000 cwt~72,000 cwt~120,000 cwt
Per-cwt impact~$0.35/cwt pool drag$0.92/cwt make-allow. cut$0.92/cwt make-allow. cut
Annual dollar hit~$16,800~$66,240~$110,400
Organic pay base$35–$45/cwt~$18–22/cwt blend~$18–22/cwt blend
Source qualityCODE estimate — unauditedUSDA-verified class price mathUSDA-verified class price math

The 11-Year Paper Trail Before Anyone Filed

CODE didn’t skip the line. In 2015, the Organic Trade Association asked USDA to exempt organic fluid handlers from PSF payments above a threshold. NMPF, DFA, Agri-Mark, Land O’Lakes, and ten co-ops lined up against it; OTA withdrew by January 2017 with no hearing held. The 2023–24 national FMMO hearing in Carmel, Indiana, ran 49 days and accepted 21 proposals — organic’s weren’t among them. USDA’s Final Decision landed November 2024 with organic’s submissions unaddressed. CODE filed formal Section 15A petitions in May 2025; they’re still pending. Then, on April 28, four lawsuits were filed. 

Eleven years. Two hearing cycles. Three administrations. Same answer every time.

What’s the Constitutional Argument — and Is It Real?

CODE makes four claims. Every one is a plaintiff allegation; none adjudicated; USDA hasn’t answered. 

Legal ClaimWhat CODE ArguesKey PrecedentUSDA’s Likely CounterRelative Strength
Fifth Amendment TakingsMandatory PSF payments = taking of private property without just compensationHorne v. USDA(2015) — raisin physical takingRegulatory cash pool ≠ physical seizure; courts give regulators more latitude over money than goodsMedium — Horne is real but the fit is a stretch
Due ProcessOrganic gets no usable benefit from a pool it can’t draw commodity supply fromGeneral 14th/5th Amendment doctrineOrganic processors voluntarily entered a regulated market knowing pooling was mandatoryWeak-to-medium — voluntary entry undermines this
Non-DelegationPrivate industry groups (NMPF, DFA) effectively blocked organic’s proposals from reaching a hearingAPA structural limits on delegationHearing process followed statutory AMAA procedures; all proposals subject to the same rulesWeak — hardest to win at district level
APA (Arbitrary & Capricious)USDA ignored organic’s FMMO reform submissions in its 2024 Final DecisionMotor Vehicle Mfrs. v. State Farm(1983)USDA considered and implicitly rejected organic’s submissions through the public recordMedium — strongest if organic can document procedural gaps

The Fifth Amendment Takings claim is the heavyweight: mandatory PSF payments take private property without just compensation. The precedent is Horne v. USDA (2015), in which the Supreme Court ruled 8-1 that a marketing order requiring raisin growers to physically surrender part of their crop to a government reserve was a per se taking. 

Here’s the catch, and it’s a real one. In Horne, the government physically took raisins — tangible property it hauled off. In CODE’s case, USDA isn’t seizing milk; it’s telling a handler what to do with their money through a regulatory pool. CODE’s hurdle is proving that a regulatory cash-balancing mechanism constitutes a physical or categorical “taking” of private property, not just an economic regulation that handlers dislike. Courts have long given regulators more room on money than on physical goods. That gap is exactly where USDA will push back.

The other three claims round it out: due process (organic gets no benefit from a pool it can’t draw supply from), non-delegation (CODE alleges private industry groups effectively pick which proposals reach a hearing and blocked organic’s), and an APA claim (ignoring organic’s submissions was arbitrary and capricious). Horne is real and decided. Whether a cash cross-subsidy fits inside it is the live question — and it’s not frivolous. 

The Case for the Other Side — Without the Hedging

USDA hasn’t filed its answer. The conventional defense is real, so put it on the table straight.

The strongest card isn’t legal; it’s arithmetic. Organic lost a vote it was always going to lose, then went to court. The 2025 changes were approved by a two-thirds supermajority of pooled producers in separate referenda under the Agricultural Marketing Agreement Act of 1937. Organic accounts for about 3% of the pool volume. The system is built to let 97% outvote 3% — that’s the design, and it’s held up for 90 years. 

Second card: voluntary entry. Organic processors entered a regulated market knowing that participation was mandatory. Courts don’t love a plaintiff who signs up for the game, then calls the rulebook unconstitutional when the score turns.

Third, NMPF’s genuine point is that the pool isn’t pure extraction. It sets a floor nobody can lowball under and keeps marketing orderly — the whole Depression-era reason it exists. The counter is just as sharp. None of that answers Horne. “You benefit from stability” didn’t save the raisin reserve, and “you knew the rules” gets weaker when the rules changed under organic in 2025 by a vote it couldn’t win. Two real arguments. That’s why this won’t settle on a napkin. 

Does a CODE Win Actually Shrink Your Pool?

Yes — but smaller and more targeted than the headline suggests, and not where most people assume.

Everyone pictures the Northeast as fluid country. It isn’t anymore. Order 1’s Class I utilization has run in the high-20s to low-30s percent in recent months, and sat near 20% in 2024. The truly Class I-heavy orders are the Southeast (Order 7) and Florida (Order 6), which run on skim-fat pricing and post the highest uniform blend prices in the country — Florida’s statistical uniform price hit $24.04/cwt this past April against far lower manufacturing-order prices. That’s where an organic exit from the pool actually bites a conventional blend price. In Upper Midwest cheese-and-butter country, a multiple-component-pricing order where January 2026’s PPD was just $0.46/cwt, you’d barely feel it. 

Organic accounts for about 3% of total U.S. milk and a larger share of Class I fluid. Pull it out, and the net payers shrink; the Class III and IV plants that currently receive PSF money get a little less. Spread CODE’s ~$50M/year across the affected orders and the per-cwt hit is real but small. 

Here’s the bigger question, the one that should keep co-op boards up at night. CODE isn’t only asking for an organic carve-out. They’re arguing the FMMO was never built for a differentiated market — that a 1937 commodity machine structurally punishes any product that’s legally distinct, sells at a premium, and can’t swap commodity milk into its supply chain. Win on that, and grass-fed, A2, and high-protein specialty milk all get the same argument, ready-made. That’s not a certainty. It’s a door — and CODE just showed everybody where it is. (See also The Bullvine’s coverage of building-component premiums and differentiated-milk market position.) 

The 30/90/365-Day Playbook for Herds Like Ranck’s

In the next 30 days — run the urgent checks.

  • Know your order and how it prices. If you ship into Florida (Order 6) or the Southeast (Order 7), you’re in a skim-fat order that pays a single uniform blend price directly — that blend value is your exposure, and it’s among the highest in the country. If you’re in a component-pricing order like the Upper Midwest, your check reflects fat, protein, and other solids plus a PPD, and your exposure to an organic exit is far smaller. 
  • Map your blend-price exposure, not a “pool draw.” Individual farmers don’t settle with the Producer Settlement Fund — handlers do. What matters for you is how much of your order’s blend value rides on Class I utilization that a premium-milk exit could thin out.

In the next 90 days — make the structural moves.

  • Calendar USDA’s answer deadline and read what USDA files. Under Federal Rule of Civil Procedure 12(a)(2), the government gets 60 days from service, putting the window into roughly late August 2026 depending on the actual service date. A motion to dismiss on standing means USDA is dodging the merits; a head-on Horneargument means a durable fight. 
  • If you sit on a co-op board in a high-Class-I order, ask your GM one question: if organic exits the pool, what happens to our blend price — and who’s next in line behind them? Just don’t overreact to a lawsuit that’s 12–24 months from any ruling.

Over the next 365 days — position for the outcome.

  • Model your blend price under a scenario where premium milk leaves the pool. If you’re manufacturing-heavy and your handlers draw from the PSF, a shrinking pool of net-payer handlers is a slow structural risk worth pricing into your next contract cycle.
  • Track the parallel fight — USDA still hasn’t ruled on CODE’s Section 15A petitions, filed back in May 2025. Sitting on them can itself become an APA issue and reshape the timeline. 

Realistic ruling horizon: 12–24 months minimum. Don’t expect a district decision before late 2027. But August tells you which movie you’re watching. (Background: The Bullvine’s ongoing coverage of the Class III/IV price squeeze on family-scale operations.) 

What This Means for Your Operation

The FMMO was built in 1937 for a market where milk was milk. The market it’s policing in 2026 has organic, grass-fed, A2, and specialty premiums the law never imagined and can’t substitute. CODE isn’t trying to burn the pool down — they’re asking three federal courts one question: can a Depression-era commodity system force a legally distinct product to pay for a pool it doesn’t use?

Lose, and nothing changes. Win small, and a couple of fluid-heavy Southern orders lose a little blend value. Win big — on the theory, not just the exemption — and the wall around your pool has a door in it. You gain nothing by waiting until the ruling to run your own numbers.

So here’s the contract check that matters more than the headline: know your order, know how it prices, and know how much of your blend value rides on Class I milk staying in the pool. What does your check look like if the biggest premium producers in the country win the right to walk out?

Key Takeaways

  • This isn’t an organic fight — a CODE win shrinks the pool your blend price leans on, and it bites hardest in fluid-heavy Southern orders like Florida (Order 6) and the Southeast, not the Upper Midwest.
  • The $50M/year, $60M class, and $400M-since-2006 figures are CODE’s own math, not audited findings. Read the arrow, not the number, until USDA answers.
  • The lawsuit leans on Horne v. USDA, but Horne was a physical taking of raisins. Proving a regulatory cash pool is a “taking” is a real stretch, so don’t assume this wins.
  • Before the late-August answer deadline, know your order and how it prices — Florida and the Southeast pay a uniform blend directly, so your whole blend value is what’s exposed.

FMMO Revenue Pool Exposure Calculator

Evaluate your localized make-allowance impact and Class I premium pool exposure.

Estimated Annual Production: 7,200 cwt
Direct Make-Allowance Formula Loss: -$66,240 / yr
EXTREME STRUCTURAL EXPOSURE

Loading assessment…

Legal claims attributed to CODE and its members throughout; USDA had not publicly responded as of July 9, 2026. Docket numbers for the April 28 filings couldn’t be found in public PACER records at press time. The $50M/year, $60M class, $400M since 2006, and ~60% pool-burden-increase figures originate with CODE/Organic Valley and have not been independently verified. FMMO class prices, make allowances, uniform prices, and PPDs are sourced from USDA AMS and Federal Order market administrator sources. The ~$0.35/cwt annual organic pool-drag figure and the 16,000 lb/cow organic and 24,000 lb/cow conventional yields are labeled estimates. The Bullvine editorial team will source party and expert commentary separately.

Complete references and supporting documentation are available upon request by contacting the editorial team at editor@thebullvine.com.

Learn More

The Sunday Read Dairy Professionals Don’t Skip.

Every week, thousands of producers, breeders, and industry insiders open Bullvine Weekly for genetics insights, market shifts, and profit strategies they won’t find anywhere else. One email. Five minutes. Smarter decisions all week.
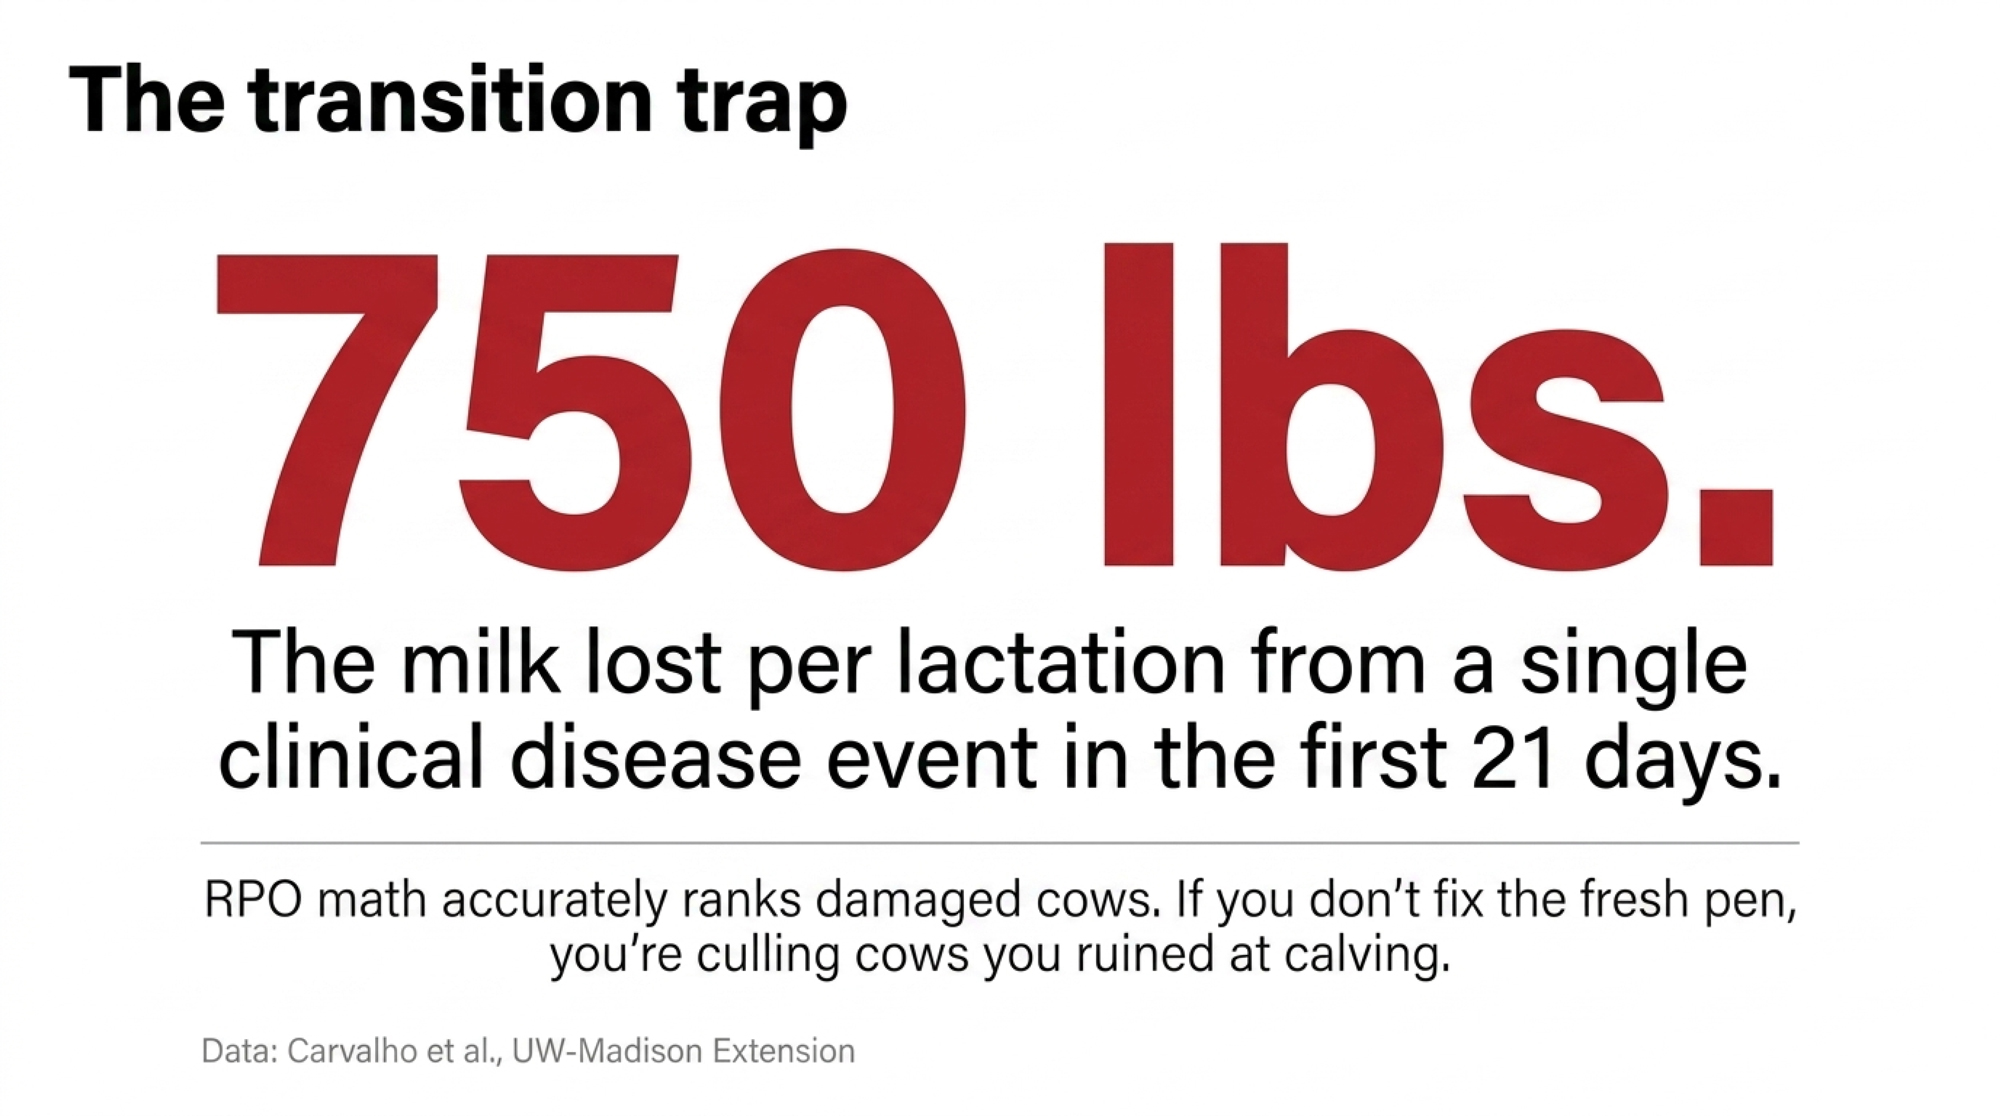
NewsSubscribe
First
Last
Consent

1.38 vs 0.90: The Calf Number That Predicts Your Worst Heifers 

Same barn, same week: the poorest calves on one program held 1.38 lb/day. On the other, 0.90. That floor — not your average — is what shows up in the heifer pen two years later.

Picture the calf every feeder loves. Four weeks old, slick-haired, bright-eyed, draining the bottle and bawling for more. Nobody worries about her. She gets weaned around six weeks, moved to a group pen, and forgotten — because she never got sick and never gave anyone trouble.

Then somebody puts a scale under the group, and the calves split into two stories. That’s the shape of what one Midwestern dairy found when it ran a 39-calf comparison of two commercial calf programs, tracked on average daily gain (ADG). It was one farm’s report, not a controlled multi-herd trial — so read the size of the gap as directional, not gospel. But the point at which calves separate is the part of any calf-weaning program that almost nobody measures: right around week six.

The three numbers that tell the story. Overall ADG: 1.73 vs 1.39 lb/day (+0.34). Late pre-weaning phase: 2.07 vs 1.31 lb/day. Poorest calves in each group: 1.38 vs 0.90 lb/day (Program A vs. Program B; single Midwestern farm, 39 calves).

What the Report Showed — and How to Read It

Across the full pre-weaning period, the calves on Program A gained 1.73 pounds per day, compared with 1.39 pounds per day for Program B — a 0.34-lb/day edge. Over a 56-day pre-weaning window, that’s about 19 extra pounds of calf, built during the weeks that matter most.

The more telling number is when the gap opened. Early on, the groups ran close. In the late pre-weaning phase — the week-six window — the Program A calves surged to 2.07 lb/day, while Program B stalled at 1.31 lb/day. One group accelerated into weaning; the other flattened. Same barn, same week, opposite direction.

And look at the bottom of each group, because that’s where a program is really judged. The poorest-performing calves on Program A still gained 1.38 lb/day. The poorest on Program B dropped to 0.90. Your worst calves tell you whether a program protects the whole group or flatters the average — and a floor of 1.38 versus 0.90 is the difference between a slow calf and a stalled one.

The Program A calves also grew differently in frame — about 0.084 inches a day of height versus 0.061 — finishing taller and leaner rather than just heavier. One caveat worth saying out loud: this was a single farm, 39 calves. It’s a real result, not a guarantee your barn will see the same spread, and it isn’t repeatable trial data.

The Calf That Looks Fine and Still Falls Behind

The trap is that pre-weaning ADG doesn’t announce itself. A dead calf gets noticed. A calf gaining 1.31 pounds a day instead of 2.07 looks completely normal in the pen — she’s just a little smaller, and “small for her age” rarely earns a phone call.

That’s why the week-six stall survives on so many farms. Most herds answered a decade of calf research by feeding more milk; feeding 3 quarts twice a day is common now, where two quarts twice a day used to be the rule. Fewer changed how, or when, they wean. So the front half of the program improved, and the back half didn’t — and the seam between them is exactly where calves stall. The report didn’t just show a winner. It showed where and when the second program lost the calves.

The Stall Starts Before You Think — Day One, Actually

Here’s the part that catches good managers off guard: the week-six stall often gets set in motion in the first 24 hours of a calf’s life. Get colostrum wrong, and you’ve handicapped the calf before she’s ever offered a handful of starter.

The target is well established, and it scales to the calf. Most extension programs feed colostrum at roughly 10% of body weight in the first feeding — so a 90 lb Holstein calf takes about a gallon, while a 70 lb calf needs closer to 3 quarts, not four. What matters is clean, high-quality colostrum testing above 22% on a Brix refractometer, fed within the first 2 hours, with passive transfer confirmed in the first few days. Calves that miss that window absorb fewer antibodies, get sicker more often, and — critically — eat less starter feed in weeks two and three. Less starter means a slower-developing rumen heading straight into weaning. The first feeding and the week-six gain are the same story, just told 40 days apart.

The day-one rule that shows up at week six: feed colostrum at about 10% of body weight (≈3 quarts for a 70 lb calf, a gallon for a 90 lb calf), testing above 22% Brix, in the first 2 hours. Then feed transition milk (milkings 2–6) for two to three days before switching to milk or replacer.

StepTargetTimingWhy it drives week-6 gain
Colostrum volume~10% of body weight (≈3 qt for a 70 lb calf; 1 gal for 90 lb)First feeding, within first 2 hoursAntibody absorption window closes fast; miss it and starter intake drops in weeks 2–3
Colostrum qualityAbove 22% BrixrefractometerFirst feedingBelow-22% colostrum = weaker passive transfer, more sickness, slower rumen
Transition milk (milkings 2–6)Feed 2–3 days before switchingDays 2–4 of lifeRicher in fat, protein, growth factors; most farms dump this down the drain
Passive transfer checkConfirmed adequateFirst few daysFailed transfer = sicker calf, lower early intake, stalled rumen into weaning

Transition milk — the second through sixth milkings after calving — is the bridge most farms still pour down the drain. It’s richer in fat, protein, and bioactive growth factors than the milk or replacer that follows, and feeding it for two or three days after colostrum has been associated with improved early gut development and higher early intakes. You’re not buying anything new. You’re just not throwing away something the cow already made.

Why Starter Beats Milk for Building Week-6 Calves

Two things run underneath all of this, and neither cares how your barn is laid out.

First, calves are born with a rumen that barely works. The papillae — the projections that absorb energy from fermented grain — only grow when there’s grain in the rumen producing volatile fatty acids. So starter intake, not milk, is what builds the rumen heading into weaning. Penn State Extension puts it bluntly: no matter how much milk you feed or what age you wean, calves whose rumens aren’t ready will struggle afterward. That’s the mechanism behind a 0.90 lb/day floor.

Second, that same window appears to shape the udder. Reviews from UF/IFAS and others suggest that nutrition and stress during the first six to eight weeks influence mammary development. You’re not just building a bigger calf — you may be shaping how much milk-making machinery she carries as a cow. That’s the working theory behind why early gain tracks with later milk.

There’s a tension here worth naming, because it bites a lot of well-meaning farms. The same heavy milk feeding that drives those gorgeous four-week calves can suppress starter intake if you’re not careful — a calf full of milk doesn’t go looking for grain. That’s why the step-down matters so much. Pull the milk too fast, and the rumen isn’t ready; leave it high too long, and the calf never learns to eat. The herds that thread that needle are the ones whose calves don’t stall.

Now stack management on top. Wean by age and pen space, not starter intake. Cut milk over two or three days instead of stepping it down. Move, mix, and disbud in the same week. Push calves onto a forage-heavy grower ration before the rumen can handle it. Do enough of that at once, and you get the stall: rumens that never got enough grain, intake dropping just as the milk goes away. The calf survives. The growth curve flattens right when it counts.

Why That 0.34 Pounds Is a Lever You Actually Control

The skeptic’s question is fair: Does a third of a pound a day in the calf barn really show up in the tank two years later? The research says it’s linked — and it’s been quantified.

In the foundational Cornell work (Soberon and Van Amburgh, Journal of Dairy Science, 2012), every additional kilogram of pre-weaning ADG was associated with about 1,113 kilograms more milk in first lactation in the commercial herd, and across both herds studied, pre-weaning gain explained 22% of the variation in first-lactation yield. That slope works out to roughly 1,100 pounds of first-lactation milk per additional pound of daily gain at the high end; more conservative pooled analyses land lower, bracketing a working range of about 600 to 1,300 pounds per pound of gain (roughly 60–130 lb for every 0.10 lb/day).

Run the report’s edge through that range. A 0.34 lb/day advantage projects to roughly 205 to 440 pounds of additional first-lactation milk per heifer, depending on which published slope you use. Raise 100 replacements a year on that better curve, and you’re looking at 20,000 to 44,000 pounds of milk — somewhere around $4,300 to $9,200 a year at $21/cwt, with no new barn and no new genetics.

One honest line on that number: the report measured calf growth, not these calves’ actual milk records. The milk figure is a projection from outside research, not something this farm has weighed in the tank. That’s still the right argument — genetics, transition, and breeding decisions all come later and cost more to move. Pre-weaning gain is one of the few levers you can pull before the heifer is even bred.

How Much Does the Week-6 Stall Actually Cost You?

Run the report’s spread through your own herd, and it stops being abstract. A 250-cow dairy raising 60 heifers a year, with a 0.34 lb/day gap, is projecting roughly 12,000 to 26,000 pounds of first-lactation milk left behind per cohort. A 600-cow herd raising 140 heifers? Roughly 29,000 to 64,000 pounds.

Then there’s the rearing bill. Iowa State Extension pegged the cost of raising a heifer in 2024 at about $2.65 a day for a good genetic heifer, or $3.15 with labor, and heifer raising is the second-largest expense on most U.S. dairies, behind only the milking herd’s feed. A stalled calf doesn’t just milk lighter; she tends to breed and calve late, stacking more of those $2.65-to-$3.15 days onto a heifer that isn’t earning yet. So the week-six stall bills you twice — once in a softer first lactation, once in the extra rearing days before she enters the parlor.

Herd sizeHeifers raised / yrProjected first-lactation milk left behind / cohortRearing cost exposure ($2.65–$3.15/day)
250 cows6012,000 – 26,000 lbStalled calves breed & calve late, stacking extra $2.65–$3.15 days
600 cows14029,000 – 64,000 lbHeifer raising = 2nd-largest dairy expense (Iowa State, 2024)
100 replacements10020,000 – 44,000 lb (≈ $4,300 – $9,200/yr at $21/cwt)No new barn, no new genetics — pure management lever
Per heifer1205 – 440 lbLate calving adds unearned rearing days on top

What the Report Doesn’t Tell You — and Why That Matters

Be honest about the limits of a single-farm comparison, because your own numbers will carry the same caveats. This report tracked growth — ADG and frame — not health events, not feed cost per pound of gain, not what these specific calves eventually milked. A program can post a great ADG and still cost more per pound, or run into a scours break the numbers don’t show.

It also can’t separate the feed from everything around it. Same barn, same crew, same season — but we don’t know how the two groups were split, whether one got slightly better hutches, or how the weather hit the trial window. Thirty-nine calves are enough to see a clear pattern and not enough to rule out luck. Treat the size of the gap as directional and the shape of it — a stall versus a surge right at week six — as the part worth trusting.

None of that sinks the story. It sharpens what you should take from it: not “switch feed and gain 0.34 pounds,” but “find out whether your own calves stall at week six, and if they do, fix the handoff.” The report is a prompt to measure your barn, not a promise about it.

Is Your Weaning Plan Ready for the Milk You’re Feeding?

You don’t need to recite papillae biology to answer this. You need four blunt answers about your own barn.

When do calves start eating starter, and are they really eating it before week three? How many days have they been on grain before you pull the milk? Are you weaning on age because that’s when the pen needs to turn — or do starter intake and ADG get a vote? And what else hits those calves that same week: disbudding, regrouping, a move somewhere colder?

Stack all of that around an unfinished rumen, and you’ve built a stall, not a handoff. The herds pulling ahead aren’t the ones with the fanciest sensors. They’re the ones where somebody can tell you, without opening a laptop, what their ADG to weaning is, what happens the week after, and what they changed last time the curve went flat.

How Do You Measure Starter Intake Without Losing Your Mind?

This is where most programs quit, because “measure intake” sounds like a research trial. It doesn’t have to be. You’re chasing a trend and a trigger, not a number to three decimals.

Pick a representative pen or a set of individual calves. Weigh the starter you put out, weigh back what’s left and wasted, and you’ve got daily intake per calf close enough to act on. Watch for the moment a calf reliably eats 2 to 3 pounds a day for three straight days — the practical green light that the rumen is doing real work. Pair that with a weigh tape or scale at a few fixed points, and you see both halves: is she eating, and is she growing? The herds that do this well don’t measure every calf every day. They sample, chart the trend, and let intake and ADG — not the calendar — decide when milk comes off.

Sponsored Post

Three Changes That Help Calves Power Through Week 6

You can close most of this gap without rebuilding the calf barn. But you have to decide what becomes a non-negotiable habit.

Earn the right to wean. Switch the trigger from age alone to starter intake plus age. Don’t fully wean before calves eat 2 to 3 pounds of starter a day for three straight days, and step milk down over 7 to 10 days rather than yanking it. USDA APHIS data on preweaned Holstein heifers show that higher planes of liquid feeding support the kind of gains — pushing toward 1.8 to 2 pounds a day — that Program A landed in. The trade-off is real: intake-based weaning disrupts tight pen-move schedules, and someone actually has to monitor intake.

Unstack the week-six pile-up. Keep dehorning, big group changes, and major pen moves out of the week before and after milk withdrawal. Hold calves on a starter-heavy diet for a week or two post-weaning before loading in forage. Headed to group housing? Move them before the step-down so they’re already eating well in the new pen. The limit is logistics — spreading jobs out feels inefficient until you price in the lost gain and the vet calls.

Make one person the owner of the curve. Name one person to record weights, review ADG by group monthly, and flag the slumps — then give that person a real slot in the herd meeting, next to somatic cell count and repro. The risk: with no backup, the whole system rides on one person and dies fast if leadership never acts on the numbers.

What This Means for Your Operation

  • If you can’t state your herd’s pre-weaning ADG off the top of your head, you don’t have a calf program — you have a calf routine. Measuring is the first decision.
  • If your late pre-weaning gain looks more like 1.31 than 2.07, the week-six handoff — not the calf — is probably the problem.
  • If you’re weaning strictly by calendar age, check starter intake first: under 2 to 3 pounds per day for three days likely means the rumen isn’t ready.
  • If you’re dumping transition milk, you’re throwing away the cheapest gut-development tool you’ve got — feed milkings two through six for a couple of days before you change anything else.
  • If you want to know whether a program protects every calf, look at your bottom tier, not your average — 1.38 versus 0.90 is the whole ballgame.
  • If a chunk of your heifers calve late, trace them back and ask whether they were the calves that stalled at six weeks — because at $2.65 to $3.15 a day, those extra rearing days aren’t free.

Key Takeaways

  • If you only change one thing this month, weigh 10 heifers at weaning and again a week later, calculate ADG, and find your week-six slope before you touch anything else.
  • If your colostrum isn’t testing above 22% Brix and going in within two hours — at about 10% of the calf’s body weight — fix the first feeding before you fuss over the weaning end. The stall often starts on day one.
  • If your bottom-tier calves gain under 1.0 lb/day, that floor — not the group average — is your real target, and it’s a feed-and-weaning problem before it’s a genetics problem.
  • If your weaning is age-triggered, switch to intake-plus-age: 2 to 3 pounds of starter for three straight days before milk comes off.
  • If you’re carrying heifers past 24 months at first calving, the calf barn is a likelier culprit than the breeding pen — start there.

The Midwestern dairy in that report didn’t find a magic calf. It found a 0.34-pound-a-day fork in the road, most of it opening in a single week — and it could see the fork only because it put a number on the part of the program everyone else eyeballs. So here’s the question worth chewing on at your next herd meeting: do you actually know what your calves gain between week four and week six, or are you trusting that the slick-haired ones are telling you the truth?

Complete references and supporting documentation are available upon request by contacting the editorial team at editor@thebullvine.com.

Learn More

The Sunday Read Dairy Professionals Don’t Skip.

Every week, thousands of producers, breeders, and industry insiders open Bullvine Weekly for genetics insights, market shifts, and profit strategies they won’t find anywhere else. One email. Five minutes. Smarter decisions all week.
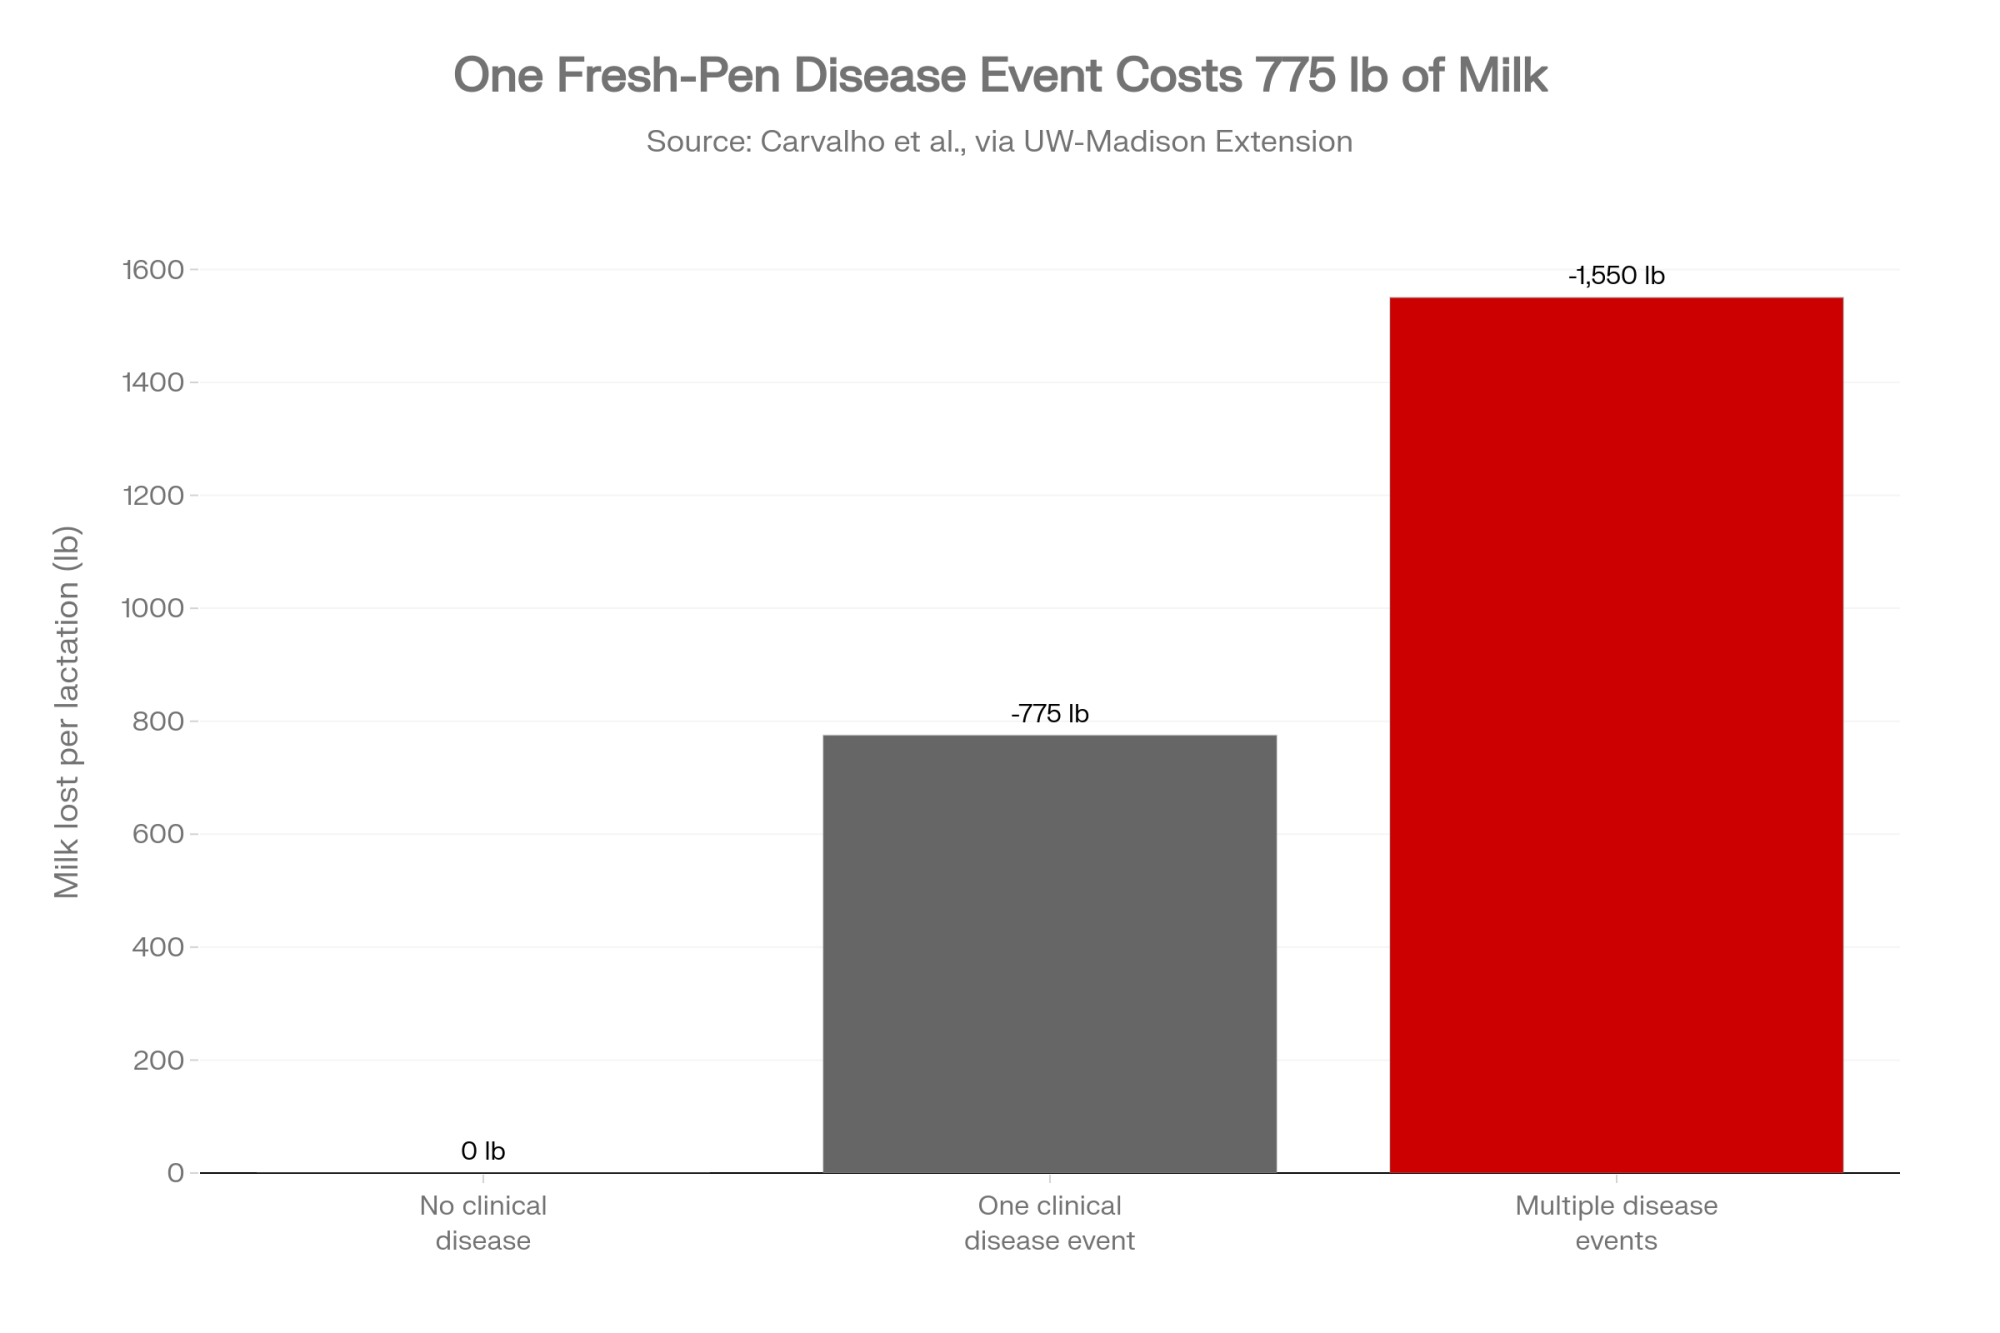
NewsSubscribe
First
Last
Consent

One Barn, 18,855 Cows, No Full Review: What Riverview’s West River Permit Means for the 200-Cow Dairy Down the Road

Minnesota just cleared a single site near Morris to nearly double its herd without an environmental impact statement — and the costs could first fall on independents you’d never associate with that decision.

Executive Summary: Minnesota just cleared Riverview LLP’s West River Dairy near Morris to increase from 7,855 cows to 18,855 — without a full environmental impact statement. That single site would become the state’s largest feedlot, and Riverview already runs 16 Minnesota feedlots holding more than 135,000 cows, roughly a third of the state herd. The risk doesn’t stop at the property line: The Bullvine’s modeling puts a $0.40–$0.60/cwt basis drag on nearby independents as plants go long on milk, which on a 200-cow herd shipping ~46,000 cwt a year is $18,400 to $27,600 off the bottom line — before hauling, which on FO30 climbed about 30% in twelve months. Water’s the other pressure point: Riverview’s seeking up to 226 million gallons a year, near 75% of Morris’s municipal draw, and Arizona’s Willcox basin shows where reactive rules lead — a decade of falling water tables before a January 2026 settlement forced 2,000 fallowed acres and $11M in relief. If you’re a 300- to 800-cow operation shipping to the same plants or renting from the same landlords, this is your early-warning story, not a distant one. The piece lays out three honest paths — stay disciplined, scale into commodity volume, or pivot — plus a 30-day move: read your next base-program letter like a loan document and ask your fieldman what share of plant intake is already committed to its biggest suppliers. Read the full article if you want the barn math mapped to your own herd size, along with the leading indicators to watch before the squeeze reaches your milk check.

The week of June 22, 2026, the Minnesota Pollution Control Agency told Riverview LLP it could expand its West River Dairy near Morris from 7,855 cows to 18,855 — without a full environmental impact statement. If you milk 200 cows in Stevens County, that decision didn’t make your phone ring. But the kind of pressure that follows a build this size tends to show up on your milk check, your hauling bill, and your land lease — and our modeling suggests it will, long before anyone in St. Paul connects those dots back to one barn outside Morris.

Here’s the part worth sitting with. MPCA’s job, by law, is to police manure, water, and runoff — not your milk price, and not whether a family-scale dairy can survive next door to a site running 26,397 animal units. So the question isn’t whether the agency did its job. It’s what happens to everyone the system was never built to count.

What’s Changing and Why

Riverview isn’t just another big dairy. According to state feedlot records cited by the Star Tribune in March 2026, the company owns 16 permitted dairy feedlots across Minnesota housing more than 135,000 cows — about a third of the state’s entire dairy herd. For scale, USDA’s NASS pegged Minnesota at 440,000 milk cows entering 2025, down 10,000 head in a single year. West River’s jump to 18,855 cows would make it the largest single feedlot in the state — more than 60 times the size of the average Minnesota dairy, which ran fewer than 280 cows in 2025.

The national backdrop makes this less of an anomaly than a pattern. USDA’s Economic Research Service reported in February 2026 that licensed U.S. dairy herds fell 63% — from 66,825 in 2004 to 24,811 in 2024 — even as total milk output kept climbing. Fewer farms, more milk. That math only works if the remaining volume keeps concentrating into bigger operations.

The farms most exposed here aren’t the 2,000-cow operations that can match a mega-site on efficiency. By the structural data, it’s the mid-size tier — roughly the 300-to-800-cow herds The Bullvine’s survival-crisis reporting calls the danger zone, plus the smaller independents still shipping into the same plants and renting from the same landlords as a neighbor adding 11,000 cows in one move.

The argument isn’t one-sided. In a May 28, 2026 Star Tribune column, longtime Minnesota dairy voices framed Riverview’s scale as the next chapter of a transformation that started decades ago — noting, as the column put it, that the state has lost about 75% of its dairy farmers over the past two decades, long before this permit. On the other side, Sean Carroll, policy director for the Land Stewardship Project, has tracked CAFO permitting across western Minnesota for years. In LSP’s April 2026 white paper, the group estimates roughly 7,395 independent dairy farms were lost in Minnesota over 20 years, even as cow numbers held steady — a consolidation trend LSP argues is accelerated by operators like Riverview, now about a third of the state’s herd.

In fairness to Riverview, the company points to its own safeguards. It says it’s about 75% employee-owned, expects the project to add 40-plus permanent jobs, and has voluntarily cut the well’s permitted draw from 452 to 226 million gallons a year — running West River under an individual NPDES permit, one of Minnesota’s stricter feedlot categories.

“The MPCA’s job, by law, is to police manure, water, and runoff — not your milk price. The question isn’t whether the agency did its job. It’s what happens to everyone the system was never built to count.”

How This Plays Out on Real Farms — The Hidden Line Items

The trap doesn’t announce itself. There’s no foreclosure notice. It shows up as boring line items — a slightly worse basis, a new “market adjustment” charge, a hauling bill creeping up faster than your mailbox price, and landlords quietly signing longer deals with the big operator. By the time you spot the pattern, the structure’s already built.

Run the barn math on just the milk-check piece. Take a 200-cow herd at a conservative 230 cwt per cow per year — a bit under the 24,390-lb (about 244 cwt) national average USDA logged for 2025 — and you’re shipping roughly 46,000 cwt annually. The Bullvine’s earlier analysis of West River modeled a realistic $0.40–$0.60/cwt drag on nearby independents as plants go long on milk and trim premiums. On those assumptions, that’s $18,400 to $27,600 off your bottom line every year — for a decision you had no vote in. And that’s before hauling. Federal Order 30 hauling charges jumped from $0.6137 to $0.7969/cwt in a single year, May 2023 to May 2024 — about a 30% climb.

Then there’s the land. Riverview’s own filing says West River will market about 10,000 acres of locally grown crops and spread manure on roughly 7,700 acres a year; LSP’s white paper puts the full manure land base near 13,200 acres. So when a landlord mentions a five-year manure contract with West River, that’s not just their security. It’s your signal that the acres you were counting on may already be spoken for.

The Mechanics Behind the Outcomes — Three Systems That Don’t Count You

Why does one barn ripple this far? Because three systems — permitting, milk pricing, and land — all treat scale as efficiency by default. None of them treats “how many independents survive” as an output worth tracking.

Start with water. Minnesota’s DNR uses flow-based triggers that cut a permit holder’s pumping only after streamflows in places like the Pomme de Terre River drop below set thresholds. That’s reactive by design — it responds to damage already underway. Riverview is seeking up to 226 million gallons of groundwater a year for West River, which The Bullvine’s own reporting puts at roughly 75% of the city of Morris’s municipal water volume.

Arizona shows where reactive rules lead. In the Willcox basin, where Riverview runs a large dairy, groundwater dropped 2–4 feet a year from 2010 to 2015, and 3–5 feet a year since. It took more than a decade of falling water tables and dry residential wells before the state moved. In January 2026, Arizona’s Attorney General announced a settlement requiring Riverview to fallow or convert 2,000 acres and fund $11 million in relief for affected residents. Riverview agreed to the terms, and the state didn’t find it broke the law. But the lesson for Minnesota is hard to miss: the fix arrived late, came through negotiation, and kept the biggest user operating under new rules. While Minnesota is far from an arid desert, the lesson is about localized aquifer depletion: when a single site draws a municipal-sized volume of water, nearby shallow residential and agricultural wells — and flow-sensitive streams like the Pomme de Terre — are the first to feel the drop, regardless of state lines.

DimensionArizona — Willcox Basin (Past)Minnesota — Morris / Pomme de Terre (Present)
OperatorRiverview LLPRiverview LLP
Trigger eventLarge-scale dairy expansion approvedWest River permit: 7,855 → 18,855 cows approved June 2026
Annual water draw~100M+ gallons/year (multiple sites)Up to 226M gallons/year (single permit)
Regulatory frameworkReactive: cuts only triggered after flow/level dropReactive: DNR flow-based triggers on Pomme de Terre River
Aquifer decline rate2–4 ft/yr (2010–15); 3–5 ft/yr afterUnknown — Stevens County Geologic Atlas incomplete
Years before action~10+ years of declining water tablesYear 0 — permit just issued
ResolutionJan 2026 settlement: 2,000 fallowed acres + $11M reliefNo settlement framework yet; no EIS completed
Operator outcomeContinued operating under new rules; no law brokenPermit approved; individual NPDES; voluntary cut to 226M gal
Resident/farm impactDry wells, fallowed cropland, litigationTBD — leading indicators not yet tracked publicly
Key lessonFix arrived late, through negotiation, kept big user runningSame structure, earlier in the timeline

How Much Does Sitting Still Actually Cost You?

More than the milk check alone shows. Stack the pieces a 200-cow dairy near Morris could face — the modeled $0.40–$0.60/cwt basis drag, FO30 hauling up about 30% in a year, and the 2025 federal make-allowance change that pulled value out of pool prices nationwide — and the combined hit, on the assumptions in The Bullvine’s model, runs well into the tens of thousands of dollars annually. Here’s the cleaner way to think about it: on 46,000 cwt, every extra $1.00/cwt of total pressure is $46,000. You don’t need our model to feel that.

So don’t borrow our number — build your own. Where your figure lands depends on your plant, your hauler, and your contracts. But if you haven’t run those line items against your breakeven lately, you’re guessing at the one thing on this list you can actually measure.

What Should You Be Watching Before the Squeeze Tightens?

Three things, and they’re all leading indicators if you catch them early. First, your milk check — specifically whether “market adjustment” lines start growing faster than your base price. Second, your hauling terms — new minimum volumes, route changes, or per-cwt charges climbing while milk prices flatten. Third, the land conversations around you. When neighbors and landlords start mentioning multi-year contracts with a large operator, the open acres near you are shrinking.

The deeper signal nobody’s handing you is a basin-level picture: how much of your local water, cropland, and plant capacity is already effectively claimed. That data exists — in permit PDFs, hydrology reports, co-op filings — it’s just never on one page where a farmer can act on it. Stevens County doesn’t even have a completed County Geologic Atlas yet, which means key aquifer information isn’t available to guide these decisions in the first place.

Options and Trade-Offs for Farmers

There’s no single right answer here. It depends on your debt, your age, your land base, and what your family actually wants out of the next 20 years. But the honest framing for a 200-cow operation comes down to three paths.

FactorPath 1: Stay DisciplinedPath 2: Scale Into VolumePath 3: Pivot Deliberately
Best fit forSolid footing, low debt, secure land & waterStrong equity, proven management depthDebt-heavy, seeking premium lane or exit
Core requirementCash cushion to absorb $0.40–$0.60/cwt drag for yearsPer-cow capital + locked contracts for base, haul, landNew skills; separating identity from cow count
Annual pressure absorbed$18,400–$40,200+ (basis + haul)Same pressure, but at higher volume to dilute itPotentially insulated via premium pricing or exit
Key risk / The TrapDoing nothing, calling it “staying the course”Racing a 19,000-cow competitor in its own laneUnderestimating skill/capital required to pivot
Land exposureMedium — monitor multi-year manure contracts nearbyHigh — scaling needs more acres in same contested basinLower — reduced land dependency if pivoting off commodity
Water riskMediumHigh — expansion increases aquifer draw competitionLower
Time horizon3–5 years before pressure builds2–3 years to lock structure or abort1–3 years to execute before equity erodes

Path 1 — Stay with discipline. This is the play if your footing is solid.

  • When it makes sense: your cost of production is genuinely competitive, your debt load is manageable, and your land and water position is secure — the footing The Bullvine’s survival-crisis analysis says separates viable mid-size herds from the danger zone.
  • What it requires: a cash cushion deep enough to ride out a $0.40–$0.60/cwt drag and rising hauling for years without flinching.
  • The trap: doing nothing while every lever moves against you, then calling it “staying the course.”

Path 2 — Scale into more commodity volume. Tempting, and sometimes right — but go in clear-eyed.

  • When it makes sense: you have the equity and management depth to compete on cost per hundredweight.
  • What it requires: real per-cow capital and a lot more leverage at a time when replacement heifers are historically expensive and inventories historically tight — plus iron-clad commitments on base, hauling, and land in writing.
  • The trap: you’re racing a 19,000-cow neighbor in the exact lane it dominates.

Path 3 — Pivot deliberately. Maybe the smartest move isn’t more cows at all.

  • When it makes sense: you can shift toward premium positioning — organic, specialty, A2 — or lean into custom work and off-farm income, or build a controlled exit you time on your terms instead of the bank’s.
  • What it requires: new skills, and the harder thing — separating the family’s identity from cow numbers.
  • The signal: ERS’s “fewer farms, more milk” curve says the mid-size herds that last tend to either grow big or get different — and getting different is often how three-generation farms stay on the land.

The 30-day action that fits any of these paths: read your next co-op base-program letter like it’s a loan document, and ask your fieldman directly what share of your plant’s intake is already committed to its largest suppliers over the next three years. If he won’t answer, that’s an answer too.

Key Takeaways

  • If your “market adjustment” or hauling lines grew over the last six months while your base price didn’t, run those exact changes against your annual cwt before you do anything else — that’s your real number.
  • If a single operator within 50 miles is permitted to add the equivalent of 50-plus herds your size (11,000 cows ÷ 200 ≈ 55), assume your co-op’s base rules could tighten within a year or two, and read the next base letter accordingly.
  • Before you bank on rented acres for the next decade, find out which nearby parcels are already under multi-year manure or crop contracts.
  • If you’re weighing expansion, ask whether you’re scaling into a commodity lane a mega-site already owns — and what makes your milk worth a premium it can’t match.
  • Track DNR water-appropriation permits across your whole basin, not just your own well — watch for one name showing up on multiple high-volume permits.
  • If two of your three levers — water, base rules, land — are tilting toward the big operator, stop waiting. Pick a path on purpose: partner, differentiate, or plan a controlled exit.

The real question isn’t whether consolidation is coming to your township. For most of Minnesota, it’s already parked down the road. It’s whether your margins can absorb a $20,000-plus annual drag at today’s feed costs — and which of those three paths actually fits your balance sheet and your kitchen-table conversations. So before the next permit clears or the next base letter lands, where does your breakeven really sit?

Run Your Numbers

Dairy Farm Corridor Score Calculator — Plug in your state, herd size, and hauling rate to see whether your corridor scores red, yellow, or green. It isolates FO30 hauling drag and the 2025 make-allowance hit as a share of your milk revenue, so you can size the structural squeeze before it reaches your mailbox.

Complete references and supporting documentation are available upon request by contacting the editorial team at editor@thebullvine.com.

Learn More

The Sunday Read Dairy Professionals Don’t Skip.

Every week, thousands of producers, breeders, and industry insiders open Bullvine Weekly for genetics insights, market shifts, and profit strategies they won’t find anywhere else. One email. Five minutes. Smarter decisions all week.
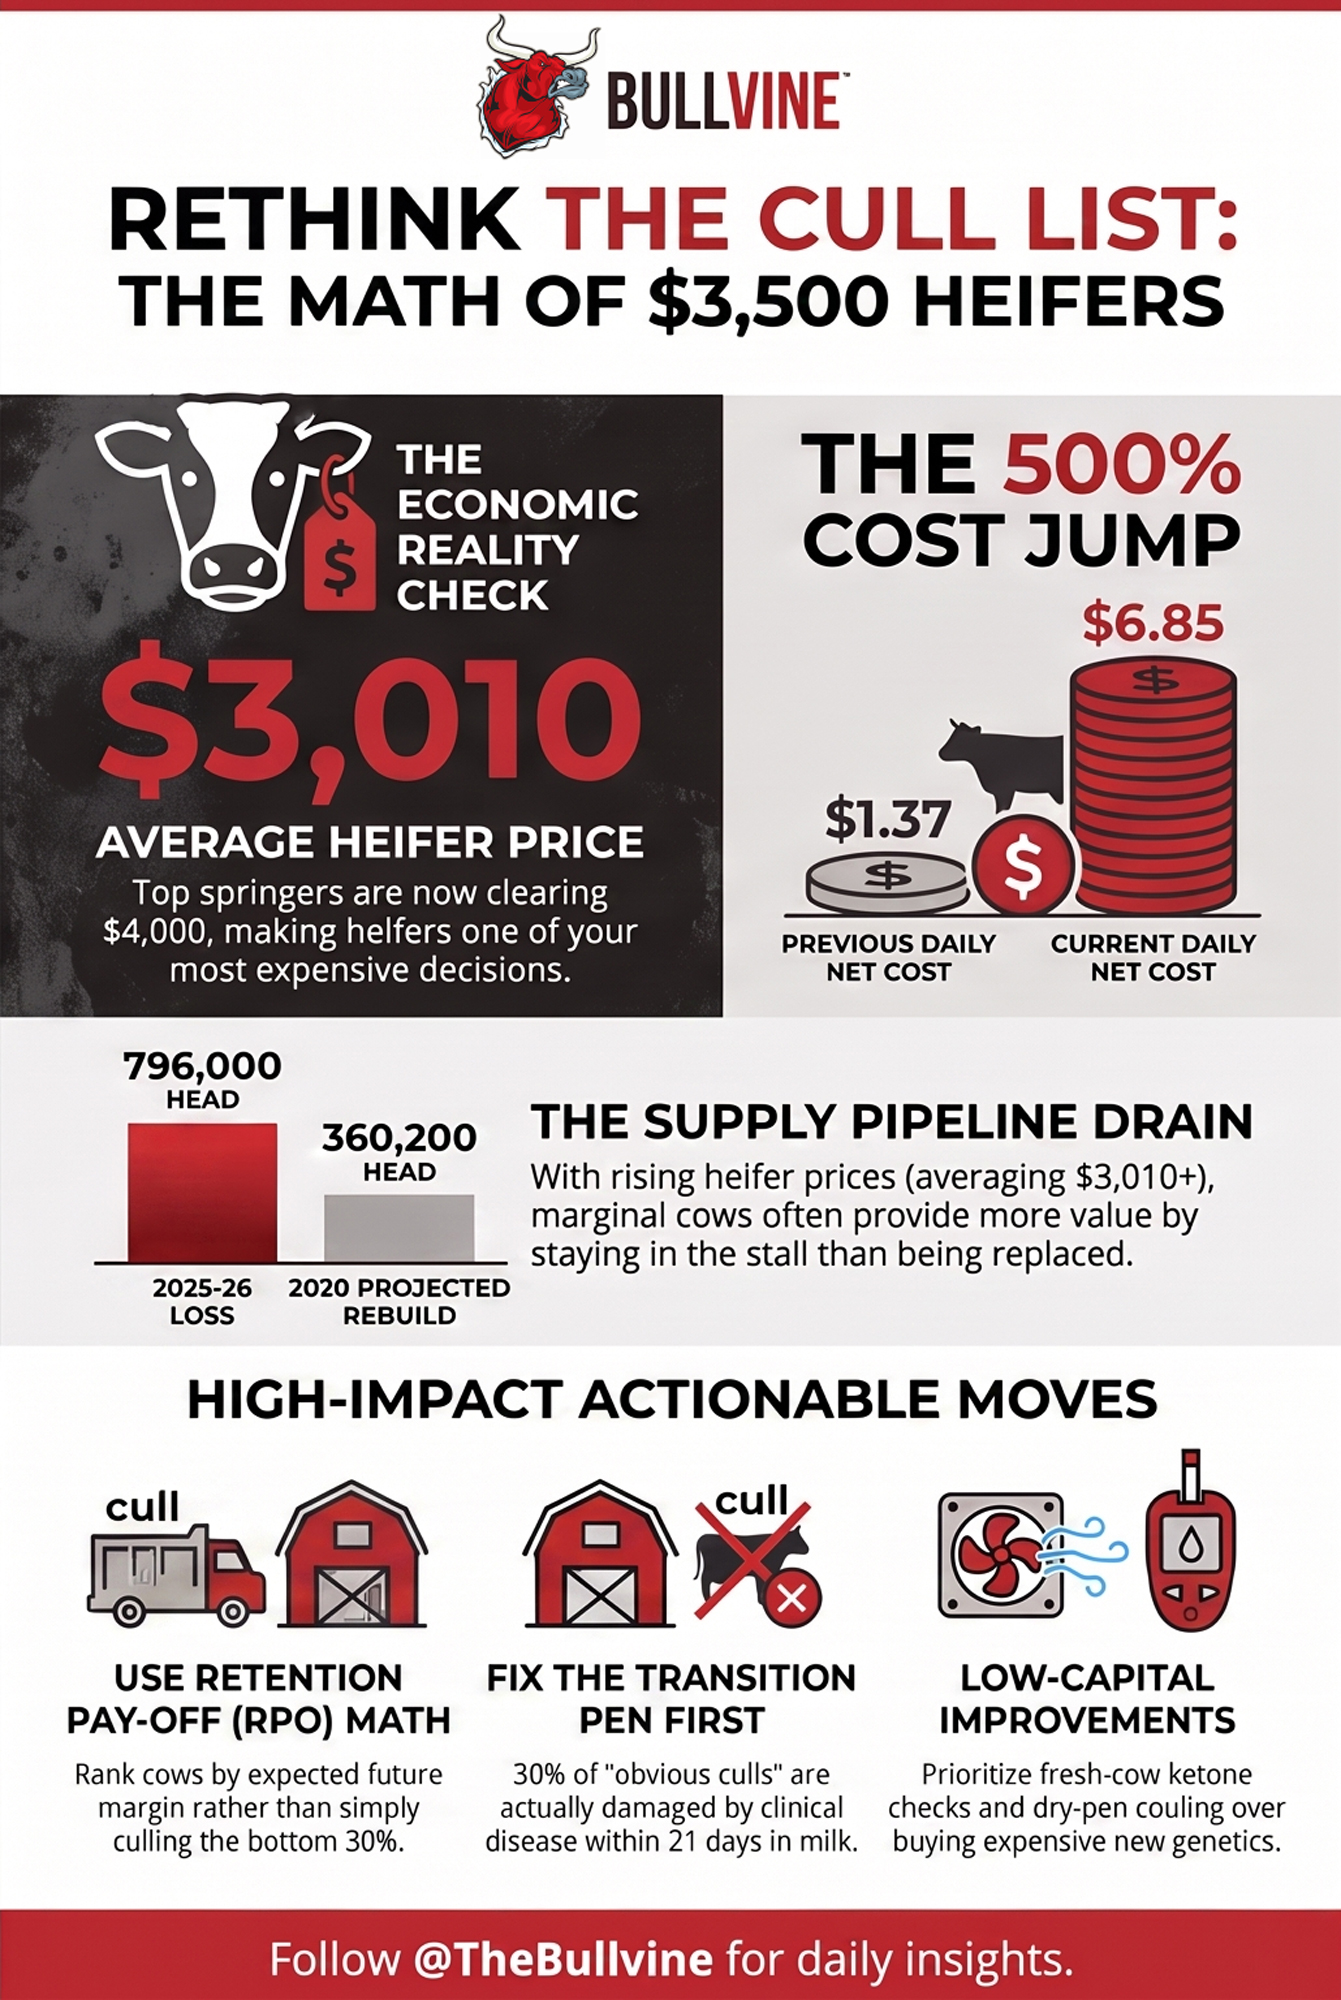
NewsSubscribe
First
Last
Consent

You Bred for Butterfat. Make Allowances Took $337M – and Retailers Took the Provenance Premium.

Your herd hit 4.24% butterfat. The system changed the rules, skimmed 90¢/cwt and $337M, then let retailers cash the story your milk never tells.

Executive Summary: Make allowances pulled $337 million out of producer pool revenues in 90 days, while your herd’s butterfat climbed to record levels and your milk check went the wrong way. Higher fat test (4.24% U.S. average in 2024) and record butter use didn’t translate into a stronger butterfat premium because FMMO formulas skimmed roughly 85–92¢/cwt, and most co-ops still dump fat into anonymous “Grade AA” or private-label butter, where retailers keep the provenance money. On a 200‑cow herd shipping about 75 lbs/day, that policy shift alone pencils out to roughly $47,000–$50,000/year, before you even count the second leak — the branded premium your practices could earn but that never shows up on the package. Meanwhile, younger buyers and the Journal of Dairy Science data say they’ll pay more for butter tied to “no added hormones,” pasture-raised claims, and a real local story, and processors like Kerrygold are already cashing in with named family farms while your co-op treats identity as optional. The move is blunt: document your herd’s attributes, push your processor or co-op to recognize where your fat actually goes, and use barn math plus a 30‑day checklist to decide whether certification, a branded buyer, or a carefully scoped creamery pulls more of that premium back into your own milk check.

butterfat premium

In late 2018, a Pennsylvania dairyman named Nelson Troutman grabbed a paintbrush and wrote “Drink Local Whole Milk 97% fat free” across a plastic-wrapped round bale, then dropped it at the edge of his property. No agency. No trade-association budget. Just paint and a message people could repeat in one breath. That bale grew into 97 Milk, a farmer-run nonprofit, and it helped drag whole milk back into school cafeterias — a fight that ended when President Trump signed the Whole Milk for Healthy Kids Act into law on January 14, 2026.

Your herd is cranking out record butterfat, Gen Z is actively paying more for dairy with a real origin story, and the butterfat premium that should follow all that fat is barely reaching your bulk tank. You’ve got the power to tell your story and capture that value.

The Record You Set — And the Cheque That Didn’t Follow

You bred for fat. You won. The U.S. average fat test hit 4.24% in 2024, up from 3.74% a decade earlier, per USDA figures compiled by Select Sires — and on a pounds-of-fat-per-cow basis, that’s roughly a 15% climb over the stretch. Butter consumption backed it up, hitting a record of 6.8 pounds per person in 2024, per IDFA and USDA’s Economic Research Service. On paper, the trait everybody chased is finally paying off.

Then the reward structure moved. When USDA raised the make allowances baked into all 11 Federal Milk Marketing Orders on June 1, 2025, the American Farm Bureau Federation ran the damage. Economist Danny Munch’s Market Intel report, published September 2025, found the change cut class prices by 85 to 93 cents per hundredweight and pulled $337 million out of producer pool revenues in the first three months. That’s AFBF’s model built on USDA data — not a USDA headline number — and it’s worth saying plainly so nobody mistakes whose math it is. If you want the full $337 million make-allowance breakdown, it’s worth the read before your next contract talk.

So you’ve got a paradox in the tank. Record components, and margins that went the wrong way. AFBF’s read of USDA cost data put the average U.S. dairy near –$1.05/cwt in 2024 — roughly $23.65/cwt in costs against a $22.60 all-milk price. Champion fat, negative margin. That’s the squeeze this whole piece is about.

What Winning With Gen Z Actually Looks Like

Look one shelf up from the commodity case. Kerrygold’s 2026 “Make It Gold” campaign doesn’t argue saturated fat — it leads with Irish grass-fed cows, gold foil, and the idea that ordinary food glows when you upgrade it. Behind the mood sits a concrete supply story: roughly 14,000 Irish farm families in a grass-based system. The origin is the product. When they flew creators to Ireland to walk the pastures, they weren’t selling fat percentages — they were selling something a 25-year-old wants to put on the counter and post.

Now come home. One Vermont farm working with a local creamery has reported cultured butter around $24 a poundat farmers’ markets, from cream near 40% butterfat, cultured overnight. That’s one reported example, not a typical price. But it’s the same fat that goes anonymously into a commodity block somewhere else — wildly different payday. The difference isn’t the milk. It’s whether anyone bothered to attach a name and a place to it.

Younger buyers back this with their wallets. They shop by mood and values, not by aisle, and Ipsos research summary found brand values that match a shopper’s own rank among the top three purchase drivers across every generation. They’ll pay for a story. Commodity butter doesn’t have one to tell.

How Much Is Anonymous Butter Costing Your Herd?

You’re bleeding from two different wounds, and it pays to know which is which — because they don’t come from the same place. Leak one is the make-allowance hit, and it’s already quantified. Take a 200-cow herd shipping 75 lbs/day — call it 54,750 cwt of milk over a year. That 85–92¢/cwt skim works out to roughly $47,000 to $50,000 over twelve months, and it lands on every hundredweight you ship, not just your fat. Run your own herd size through it; it scales fast.

Leak two is a different animal, and nobody sends you a statement for it. It’s the branded premium you never chase in the first place. Private label keeps taking share — U.S. store-brand sales hit a record $282.8 billion in 2025, up 3.3% and growing roughly triple the pace of national brands, per PLMA and Circana. When your co-op ships an anonymous pound into one of those store brands, the provenance premium a named product would earn doesn’t vanish — it lands in the retailer’s ledger, not yours. That’s the quiet transfer: you make the branded value, and someone with a logo prices it.

The honest caveat: there’s no clean public number for exactly how many cents per pound a story adds to butter at the co-op level. The direction of that transfer, though, isn’t in doubt.

Why Your Co-op Isn’t Dumb — The System Pays It to Stay Quiet

None of this happens because co-op leaders can’t picture a brand. It happens because anonymity is the rational move given how the system was built. USDA describes dairy co-ops as farmer-owned businesses that market member milk, balance supply, and pay back by volume — a structure engineered to make a pound from one plant swap cleanly for a pound from another. Interchangeable is efficient. It’s also the exact opposite of what sells to a generation that wants to know who made the thing.

Stack consolidation on top. GAO’s 2019 review found that as co-ops grow and buy into processing, “competing interests may make farmers feel that they have lost control over the cooperative’s priorities” — the plant wants cheap milk, you want more for it. And here’s the wrinkle most producers never see: because of how bloc voting works in FMMO referenda, your co-op can cast your ballot for you, so you may never have personally voted on the rule that cut your pay. So many co-ops default to low-risk private-label and bulk butter contracts — even as a few have started building branded lines — which caps how much identity premium they capture. The Cornucopia Institute has made the consumer side plain: private-label products are anonymous by design, even as shoppers increasingly want to know where their food comes from.

And the research is already done. A 2024 Journal of Dairy Science study found the label claims that actually moved buyers were “produced without added hormones,” “made with milk from our pasture-raised cows,” and “made locally” — all beating generic “family farm” language. A companion study found people define “local” by region or state and attach real emotional weight to it. The signal’s been sitting there. Most co-op butter just never puts it on the front of the pack.

Label ClaimTypical Co-op Private LabelTypical National BrandMoves Buyer (JDS 2024 Data)Provenance Premium Potential
“Produced without added hormones”RarelySometimesYes — top driverHigh
“Pasture-raised cows”RarelyOccasionallyYes — top driverHigh
“Made locally / regional origin”NoNoYes — emotional weightHigh
“Family farm” (generic)SometimesCommonWeak — below specificsLow–Medium
Grade AA / USDA shieldStandardStandardNo purchase liftNone
Named farm / individual storyNoKerrygold, some brandsYes — Gen Z driverHighest

Is Your Best Trait Quietly Working Against You?

Watch this twist, because a lot of high-fat herds haven’t clocked it. Butterfat has grown at roughly twice the pace of protein. The national protein-to-fat ratio has slid to about 0.77, down from the 0.82–0.84 range that held steady for years — and below the 0.85–0.90 window a lot of cheese plants want. You can be a butterfat champion and still be misaligned with where your processor actually makes money.

Bullvine reporting has documented at least one processor group trimming premiums on high-fat milk in late 2025. CoBank’s Corey Geiger has argued that protein is poised to overtake fat on milk checks, simply because processors need more of it. The decade you spent breeding up fat is only an asset if the product it feeds carries an identity worth paying for. Pull your last 24 months of DHIA records and run your own protein-to-fat math — if you’re drifting under 0.80 and shipping to a cheese plant, treat that as your own warning line and run the numbers.

Options and Trade-Offs for Farmers

No single fix here, and the right move depends on where you sit. Four real paths:

PathWorks Best WhenCapital RequiredKey Risk (RED = Critical)Time to First $
Branded processor contractHerd already has real attributes (pasture, cert, region)Low — records + cert feePremium captured by brand margin, not your contract3–6 months
Farmstead / creameryNear a provenance-paying market; labor bandwidth existsHigh — equipment + processing hoursComplexity swamps the dairy (Kyle Clark case)12–24 months
Third-party certificationPractices already solid; volume supports audit costMedium — cert fees + auditLow volume makes ROI negative6–12 months
Push co-op to brandOn co-op board; willing to make it a governance priorityNone from producerCo-op defaults to bulk/private-label without board pressure24–36 months
  • Take your story to a branded processor — start this month. If your herd already carries a genuine attribute (pasture access, a welfare cert, high test, a distinct region), document it and put it in front of the buyer you ship to. Works when you’re on a component grid but your practices are invisible in the pay formula. Requires records and maybe a certification. Fails when the premium gets written into the brand’s margin instead of your contract — so get it in writing.
  • Go value-added or farmstead — but walk in with your eyes open. Kyle Clark ran the creamery at Clark Farms, his family’s fifth-generation dairy in Delhi, New York, for six years before pausing production in January 2026 while keeping nearly 300 cows milking. He didn’t fail on demand — he told AllOtsego he stopped because “it became too much to manage to his standards,” and filed the closure as a temporary status with the state, hoping to try again. He was running 120,000–150,000 lbs of milk a month through five 16-hour days a week with a crew he says should’ve been 10 people. Works when you’re near a market that pays for provenance, and you’ve got the labor bandwidth. Requires serious capital plus the processing and delivery hours stacked on top of a full dairy workload. Fails when the complexity swamps you, even with the accounts coming in.
  • Use certification as a credibility shortcut. Only about 14% of consumers strongly trust dairy labels, but an “excellent”-rated welfare certification drove a $2.63 per half-gallon premium in one documented Bullvine caseWorks when your practices are already solid and need third-party proof. Fails when volume’s too low to cover the audit costs.
  • Push your co-op to own the story. The forward signal is real: cultured and European-style formats keep pulling away from commodity, with new products like Lifeway’s Probiotic Kefir Butter hitting shelves in early 2026. A co-op that treats story as a governance decision — not a marketing afterthought — is the only player with the scale to build a regional butter brand you’d actually see reflected in your cheque. It’s the path Kyle Clark couldn’t carry alone at Clark Farms, but a co-op has the balance sheet an individual creamery doesn’t.

Your 30-Day Checklist

Skip the strategy deck. Here’s what to actually do:

  • Call your processor. Ask which product your fat goes into — commodity block or a branded line — and whether your grid reflects the difference.
  • Graph your protein-to-fat ratio. Last 24 months of DHIA. Drifting under 0.80 and shipping to a cheese plant? That’s your self-check trigger.
  • Document your attribute. Pasture, welfare cert, region — get it on paper this month. The label claims that move buyers are specific; undocumented earns you nothing at the pay window.
  • Price the full creamery load before you build one. Capital plus labor, not just demand — the wall Kyle Clark hit.
  • Run the certification math. A $2.63/half-gallon lift only pencils out at real volume.
  • If you’re on a co-op board: put “who owns the story” on the agenda as strategy, not marketing.

Key Takeaways

  • If your herd’s shipping around 200 cows and 75 lbs/day, plan on roughly $47K–$50K/year gone from make allowances alone — that’s not optional math to ignore.
  • If your protein-to-fat ratio is sliding under ~0.80 into a cheese plant, you’ve bred for a trait the current grid doesn’t fully value; pull your DHIA and run that check this month.
  • If your milk goes into anonymous butter or private label, assume the provenance premium is landing in someone else’s ledger; document your pasture, welfare, and local story before you ask for more money.
  • If you’re serious about pulling the butterfat premium back into your own milk check, treat “who owns the story” as a board-level decision — processor, co-op, cert, or creamery — rather than just a marketing line.

So sit with this one. When a 25-year-old picks up a pound of your co-op’s butter, is there a single reason on that package to feel anything at all? Troutman moved a whole industry with a paintbrush and a hay bale — nobody’s really picked up that brush for butter the way he did for whole milk. If your package gives that shopper no reason to care, that’s not a problem TikTok fixes. It’s an identity problem, and someone downstream is already cashing the story you didn’t tell.

Run Your Numbers

Component Value Tracker — Plug in your herd’s real fat, protein, and P:F ratio to see what one-tenth of a point is actually worth on your check, where your ratio sits against the 0.75 compression line, and how much component revenue you’re leaving on the table at national averages. Print the lender-ready summary before your next contract talk.

Complete references and supporting documentation are available upon request by contacting the editorial team at editor@thebullvine.com.

Learn More

The Sunday Read Dairy Professionals Don’t Skip.

Every week, thousands of producers, breeders, and industry insiders open Bullvine Weekly for genetics insights, market shifts, and profit strategies they won’t find anywhere else. One email. Five minutes. Smarter decisions all week.
NewsSubscribe
First
Last
Consent

The Best Dairy Business School Isn’t a School — It’s the Judging Ring

Eight minutes, four strange cows, no notes, and a stranger who’ll push back on every word. That’s not a nightmare — it’s the best manager-training dairy has, and we’re defunding it.

Somewhere in a university barn this fall, a nervous 19-year-old is going to open her mouth and defend — out loud, on the spot, in front of a stranger who knows more than she does — a decision she made in eight minutes about four cows she’d never seen before. She doesn’t know it yet. But that two-minute speech is worth more to her career than anything she’ll do in a lecture hall this semester.

There’s a workforce problem sitting at the heart of dairy right now, and it has nothing to do with genomics, robots, or milk price. It’s about people. Specifically, it’s about building confident individuals who can walk into any barn, any boardroom, any hard conversation, and hold their ground.

Clipboards out, four cows in the ring, and a wall of students working the class: more than 100 schools contested the FFA Dairy Cattle Judging Contest at World Dairy Expo in 2025. This is the crowd the industry keeps saying it can’t find — the communicators and decision-makers, still showing up coast to coast. 

Dairy cattle judging has been quietly building exactly those people for over a century. The 104th National Intercollegiate Dairy Cattle Judging Contest ran at World Dairy Expo in September 2025, with 16 university teams competing for the title. But who won is almost beside the point. The story worth telling is where the participants end up — and once you follow that thread, you start to wonder why an industry this starved for talent treats its best development pipeline like an afterthought.

Suits, laptops, notes in hand, and the Madison skyline behind them: collegiate competitors work the room at World Dairy Expo, 2025. This is the part no ribbon photo shows — where you stand up and defend the call you just made. Call it the best business school in dairy.

This Has Never Just Been About Cows

Ask serious dairy professionals how they got their start, and a remarkable share point back to a 4-H barn, an FFA chapter, or a college judging team. Breed association executives. AI company reps. Geneticists. Farm lenders. Classification managers. Extension educators. Veterinarians. The talent pipeline runs straight through the ring.

Sixteen university teams contested the 104th National Intercollegiate Dairy Cattle Judging Contest at World Dairy Expo in September 2025 — the University of Minnesota won for the third straight year. (Source: World Dairy Expo)

It’s not a coincidence you’ll find judging-team alums scattered across ABS, Select Sires, Farm Credit, Zoetis, and the breed associations — the same systematic evaluation process they drilled in the ring becomes a template for the complex decisions they make for the rest of their careers. Ask a university coach, and you’ll hear the same thing: judging-team alums are highly sought after by employers and graduate schools, and they land in leadership roles across the industry.

Three people who’ve spent their lives in and around the ring — longtime coaches Brian Kelly and Bonnie Ayars, and former competitor-turned-professor Madison Dyment — laid out exactly why on a recent Dairyvoice Podcast about dairy cattle judging. Their firsthand accounts anchor what the data underneath already shows.

Take Kelly. He’s coached the University of Wisconsin–Madison dairy judging team since 2010, but the ring built his own career first — eight years as a Holstein Association classifier, then Select Sires, and now a dairy production specialist role at Zoetis.

“Dairy judging, dairy shows, dairy cattle evaluation — you get to meet a lot of great people and see a lot of great cows. A lot of life lessons come with it.” — Brian Kelly, UW–Madison judging coach since 2010

Coach Brian Kelly (far right) with his University of Wisconsin–Madison squad after taking High Team Overall at the Southwest Dairy Judging Contest, Fort Worth Stock Show & Rodeo, 2023. Kelly — a former Holstein classifier now with Zoetis — is exactly the kind of hiring manager who scans a résumé for judging: “That’s the line I always look at.” 

The reason it works is structural, not sentimental. Judging forces a set of skills most career-prep programs never touch head-on — and it forces them young, under pressure, with something on the line.

What a Set of Oral Reasons Actually Teaches You

Here’s the mechanic that makes it work — and if you want the full technical version, The Bullvine has already mapped the systematic “assess, prioritize, decide, and explain” process elite judges run every time. The short version: you walk into the class. You get eight to ten minutes — a hard clock — to evaluate four animals you’ve never seen, rank them best to worst against a specific, learnable set of criteria, and get ready to defend that ranking to an official who will push on every claim you make. No notes when you deliver. No hedging. You pick a position, plant your feet, and make your case in under two minutes.

Kelly puts the value of that exercise bluntly. “Reasons are such a powerful impact, and one of the biggest life lessons you’ll get from dairy judging,” he says. “You’re always going to have to tell someone why you’re doing something, or defend your thought process throughout life.”

Watch what the drill actually builds:

Decision-making under a hard clock. You don’t get a week to deliberate. You gather what you can see, form a view, commit, and move. Bonnie Ayars, who’s held a staff appointment at Ohio State for 20 years, likes to point out just how little time the ring gives you. “You only get 12 to 15 minutes to make a choice on four cows,” she says — then, half-joking, compares it to picking a spouse. The point stands: it’s a system that teaches you to explain and justify a decision in a very limited timeframe.

“You only get 12 to 15 minutes to make a choice on four cows.” — Bonnie Ayars, The Ohio State University

Bonnie Ayars, center, received the American Dairy Science Association's Hoard's Dairyman Youth Development Award in 2015, recognizing more than 40 years spent pulling kids into the dairy industry — the exact work this article is about. Hoard's Dairyman's Amanda Smith and Corey Geiger made the presentation. (Photo: Journal of Dairy Science)

Bonnie Ayars, center, received the American Dairy Science Association’s Hoard’s Dairyman Youth Development Award in 2015, recognizing more than 40 years spent pulling kids into the dairy industry — the exact work this article is about. Hoard’s Dairyman’s Amanda Smith and Corey Geiger made the presentation. (Photo: Journal of Dairy Science)

Persuasion, unrehearsed. You’re not reading a script. You’re building a case live, in a room where the listener has the authority to disagree and the knowledge to smell a bluff. That’s a job interview. That’s a sales call. That’s every high-stakes conversation that actually moves a career. “You have to be able to communicate,” Ayars says. “And if you don’t think you need communication, don’t become a parent — because eventually they become teenagers.”

Using discomfort instead of freezing under it. The unofficial reasons score — the one no ribbon reflects — is the moment you stand in front of someone who knows more than you do, say your piece, and hold your ground when they push. For most young people, it’s genuinely terrifying. Ayars has watched it turn kids around one set at a time, describing students who arrived convinced they couldn’t give reasons at all, went to the contest, delivered several sets, and came back changed by having done the thing they feared. Her measure of success isn’t the placing — the goal, as she frames it, is blue-ribbon kids more than blue ribbons.

Defending a position without going defensive. There’s a precise line in oral reasons between confident and combative — and learning to walk it is the whole game.

A good set of reasons grants the opponent’s real strengths honestly, then explains why the placing still holds. The grant earns trust. The pivot wins the argument. Now run that exact structure through a hard performance review, a lender meeting, or a disagreement with a herdsman who doesn’t want to hear it. Same move.

It’s the same discipline the best show judges preach: say what you see, keep it positive, three reasons not ten.

A 1997 Journal of Dairy Science paper said it flat out: dairy judging teaches critical life skills that carry across industries. Nearly three decades on, that hasn’t aged out — and the more recent research on youth livestock programs backs it, tracing durable leadership and communication gains straight to the structured stress of competition. It’s also why oral reasons carry roughly half the score in a modern contest — the industry figured out long ago that the talking isthe skill.

Ask the People Who Lived It

Bryce Windecker was named high individual at the 2021 National Intercollegiate Dairy Cattle Judging Contest — the best cow evaluator in the country that year. Ask him what it prepared him for, and he doesn’t talk about cattle. He talks about the bad days.

“You have good and bad days, and you have to take the bad days and learn from them. We all make mistakes, but you have to be able to take constructive criticism.” — Bryce Windecker, 2021 national high individual, now at ever.ag

He now works at ever.ag, a commodity brokerage and risk-management firm — a job that has nothing to do with picking the sharper udder and everything to do with the skills the ring drilled into him. “Talking and interacting with people, working with others, being a part of a team, having a boss or coach, working toward a common goal and getting a job done,” he told Progressive Dairy. “These skills are all developed in dairy judging.”

That’s the whole argument in one alum. The cattle were the hook. The transferable skills were the point.

The Team Dimension Nobody Fully Accounts For

Judging gets talked about as an individual skill. That misses half the value.

At the college level, teams run three to four deep and scores combine. Which means the result rides on everyone, not just the star. Somebody carries a rough day so the rest can score. Somebody watches a teammate post a personal best on the same class where they placed second — and celebrates it anyway.

“When we think about where we’re at right now, we’re in that team environment throughout the dairy industry — a lot of organizations are pushing that team environment,” Kelly says. “When you think about a judging team, there are relationships within that team. Combine that, and it’s just such a nice life lesson.” That dynamic — individual performance measured inside a shared result, week after week — is rare in structured training. Every dairy runs on it. So does every sire company, every co-op board, every management team. The judging contest is just the controlled environment where a kid rehearses it before the stakes get real.

The Networking Effect Is Bigger Than It Looks

For Madison Dyment, the ring wasn’t mainly about placings. It was about people.

Madison Dyment competed for the University of Kentucky — a judging win there put her on Bonnie Ayars’ radar and set up the mentorship that led to grad school and, today, a professorship at New Mexico State. The ring built the network.

Dyment grew up in Burgessville, Ontario — “you can throw a stone in either direction and you’re probably going to hit a dairy farm” — competed for the University of Kentucky, and is now an assistant professor of agricultural communications at New Mexico State University. Her whole career traces back to a network the contests built. “One of the greatest things that I gained was access and networking with a lot of different people from all over the place,” she says. “You’re meeting kids from Illinois, from Ohio, from Wisconsin, California — for someone from Ontario, that was mind-blowing. These were people I wasn’t going to run across in my day-to-day life.” (Read more: From Calf to Classroom: Madison Dyment’s Journey to Impact Agricultural Communications in Canada)

That web of relationships is the part alums rank highest, and it compounds. “I can chalk up so many different opportunities to Bonnie alone — keeping me plugged in, mentioning me, encouraging me to go after things,” Dyment says of Ayars, who sought her out after she won at Kentucky and steered her toward grad school at Ohio State. “Ultimately, whenever I look at whatever success I’ve had, I am who I am because of the people who shaped me.”

Kelly draws the same line from the other side of the desk — as the guy doing the hiring. “I’ve hired some of them, I’ve managed some of them, I’ve worked with some of them,” he says of his former judging-team students. “When I’m looking at resumes, dairy judging is something I always look at, because I think they’re going to have those skill sets.” His advice to young people is disarmingly simple: ask questions. “If you can find someone that’s been successful and you want to follow that path, don’t be afraid to go up to them and start asking questions. You might develop a lifelong friendship.”

Ayars frames the payoff in language every operator should recognize.

“It’s not just like going to the bank and making a deposit. Dairy judging is an investment. It permeates every step of your life.” — Bonnie Ayars

The return horizon on that investment runs 10 to 30 years — compounding through every negotiation, every hard conversation, every hire a judging alum handles better than they otherwise would have.

The Barn Math on Not Building This

Now flip it. What does it cost the industry to not build this pipeline? That number isn’t theoretical.

The average U.S. dairy runs turnover of 38.8% a year, according to the FARM Program’s Nationwide Dairy Labor Survey on Workforce Development — nearly four of every ten positions refilled annually. Cornell Extension’s cost framework puts each departed worker at $15,000 to $25,000 once you count recruiting, training, lost productivity, equipment damage, and quality slips. On a farm with 10 employees, that’s about four departures a year — $60,000 to $100,000 walking down the driveway, annually, a lot of it because people were hired without the communication skills, decision habits, and team instincts the job actually demands.

This is a leaking bucket. You can pour wages, benefits, and signing perks in the top, but if four of every ten hires walk out the bottom every year, you’re not staffing a dairy — you’re refilling a hole. And you plug that hole from the intake side: hiring and building people who can communicate, decide, and stick.

Here’s the ROI in one line: on that same farm, developing or hiring one judging-trained employee who sticks and leads well can offset an entire $15,000–$25,000 turnover event by itself. One retained hire pays for a lot of contest entry fees.

The cost of the gapFigureSource
Average annual dairy worker turnover38.8%FARM Workforce Development survey
Cost per departed worker$15,000–$25,000Cornell Extension framework
Annual turnover cost, 10-employee farm$60,000–$100,000Turnover rate × cost per worker
U.S. licensed herds, 2004 → 202466,825 → 24,811 (−63%)USDA ERS

Meanwhile the structural squeeze keeps tightening. U.S. licensed dairy herds fell 63% between 2004 and 2024 — from 66,825 to 24,811 — even as milk output climbed, according to the USDA Economic Research Service. Fewer, bigger operations mean each one runs more like a mid-size business and less like a family chore chart. Those businesses need managers who can lead people, defend a decision to a lender, and communicate under pressure.

That’s the exact skill set a judging kid spends years drilling. The industry is paying, right now, in six-figure turnover bills and thin management benches, for a talent shortage it has a proven, century-old answer to — and it’s under-investing in that answer anyway. Cheap now, expensive later. The bill shows up on a different line than you’d expect.

The Honest Catch

Here’s the part the cheerleaders skip: the pipeline is under strain at exactly the moment dairy needs it most. As ag colleges consolidate departments and squeeze budgets, funding a judging team — coaching stipends, travel, cattle access, entry fees — is increasingly treated as a discretionary line rather than a core one, and some smaller programs have quietly scaled back or dropped teams entirely. That’s the argument, not against it. If the machine that reliably produces communicators and decision-makers is being defunded while the workforce gap widens, the case for operators, breed associations, and alums to step in with sponsorship and access isn’t sentimental. It’s self-interested.

Seeing the Whole Industry Before Your Career Starts

Here’s something rarely said about judging contests: for a lot of participants, the first plane they ever board is for a judging trip.

Teams compete coast to coast — the All American in Harrisburg, Expo in Madison, Louisville, Fort Worth. The geographic reach isn’t incidental. It’s formative. A student who’s only ever seen big freestall Holsteins walks into a New England tiestall barn and starts to grasp that the industry is a spectrum, not a type. Dyment lived exactly that arc — Ontario, then Kentucky, now New Mexico, a state she was surprised to learn is one of the national leaders in cheese production. “People who are invested and passionate about dairy are everywhere,” she says, “even in the most unexpected places.”

She’s found a specific kind of talent in the places without award-winning herds down the road. “These folks have so much grit — a raw passion and determination, and they want to prove themselves,” she says of New Mexico’s dairy youth. “When I’m looking at kids I want to work with, I want the ones who are in it for the love of the game, not just because it was a family legacy expected of them.” Multiple farms, multiple breeds, multiple regions seen young — that compresses years of field exposure into a few contest seasons, and the graduate starts their career already fluent in an industry most people take a decade to see fully.

What the Canadian Model Gets Right

Ontario and Quebec youth programs are unusually strong feeders into elite judging and industry careers, and Dyment is a walking case study for why.

“I am so incredibly blessed to have been a byproduct of all of that youth programming,” she says. “You don’t really realize it until you’re gone from it, because it was just normal — it was what I did as a kid growing up. Once I was removed from it, you really come to appreciate how much investment is put in our dairy youth.” The Canadian model does two things better than most: it starts early, and it builds continuity across age cohorts instead of treating each year’s team as a blank slate. Holstein Canada’s Young Leaders program alone runs roughly 100 youth aged 12 to 21 through competitive judging, showmanship, and clipping every year, on top of 4-H programming that begins in childhood.

By the time a Canadian kid reaches the intercollegiate level, the reps are already banked — thousands of cows seen, hundreds of reasons given, contests lost and won and coached back from both times. That depth is why Canadian competitors routinely show up at U.S. contests and perform outside their home context. It isn’t talent alone. It’s a system that never lets a promising kid coast — the same 4-H leadership crucible The Bullvine has documented at events like the TD Canadian 4-H Dairy Classic, where the real lesson was never about the cattle.

The Coaching That Happens After the Contest

Experienced coaches will tell you, nearly to a person, that what happens after the contest matters more than the prep before it. The academic work agrees: youth livestock programs deliver their most durable benefits from the structured reflection and accountability that follow the competition, not from the competition itself.

A kid who won needs a different conversation than a kid who bombed. Both need a coach playing the long game — and both need someone willing to talk them out of their own fear first. “Most courage develops in fear,” Ayars says. “Nobody’s just courageous on their own.” She frames coaching as providing enough comfort for a scared kid to step out of a comfort zone — and describes education itself as a productive struggle, arguing that shielding students from that struggle robs them of its rewards.

Holding a group together through uneven outcomes, then pushing the scared kid out of the comfort zone anyway — that’s a leadership skill with a name in management research. In judging, it happens organically, repeatedly, under stakes that feel real to the kids living them, which is exactly why it sticks. A coach who does that well isn’t just producing judges. They’re producing managers, and the industry gets both.

The Ring That Builds Careers Is Still Open

There’s a skill gap in dairy that quietly worries serious people — not a gap in genomics knowledge or milking technology, but in the human pipeline. Fewer, larger operations need more managers who can communicate, decide under pressure, and lead a team, and the supply isn’t keeping pace.

Dairy cattle judging has been solving part of that problem for more than a hundred years. It’s proven. It’s everywhere. And measured against what it produces, it’s badly under-invested in by an industry that should know the difference between a deposit and a compounding return better than anyone.

The ring is open every fall. The only question is whether we fill it.

Your Next Move

  • If you own or manage an operation: weigh dairy judging on the résumés that cross your desk — it’s the line coaches like Kelly scan for, and it predicts communication, decision-making, and the steadiness of someone who’s been wrong in public and recovered. Then go further: call the nearest university or 4-H program and offer what they’re short on — cattle access, a practice venue, travel sponsorship, or a paid summer role for a team member. Strong communication is one of the cheapest retention upgrades a dairy can make; hiring someone who already has it is cheaper still.
  • If you have kids — or know one — curious about dairy: get them to the ring. FFA runs dairy judging in all 50 states, and the 2026 FFA Dairy Cattle Judging Contest at World Dairy Expo is set for Tuesday, September 29, with team registration open through September 11. The 4-H national contest runs the same week. It doesn’t matter whether they grew up on a farm — the non-farm kids with something to prove often go the furthest.
  • If you coach or teach: keep hunting for the kid who won’t self-select in. As Kelly’s own roster proves, the payoff shows up in unlikely places — he once coached a business major who’d barely judged since her 4-H days into an All-American finish; she now works finance in downtown Chicago. Both the farm-raised and the newcomers have something to prove. That mix is why the programs work — Ayars, by her own account, recruits promising judges “from under a rock.”

The 2026 National 4-H and Intercollegiate Dairy Cattle Judging Contests run during World Dairy Expo in Madison, Wisconsin, September 26–29, 2026.

Key Takeaways

  • Judging isn’t about ribbons — it builds the communication, fast decision-making, and defend-your-position skills that later show up in every lender meeting, sales call, and hard barn-aisle conversation.
  • With turnover averaging 38.8% at $15,000–$25,000 a head, one judging-trained hire who sticks and leads can pay back a full turnover event by itself. Weight it on resumes.
  • The pipeline that produces those people is getting defunded as colleges cut teams. If you run cattle, offer a program what it’s short on — access, a practice venue, or travel money.
  • Get a kid to the ring this fall, farm-raised or not. FFA runs judging in all 50 states, and the non-farm kids with something to prove often go the furthest.

Related reading on The Bullvine: The Judge’s Eye: Mastering the Art & Science of Dairy Cattle Evaluation · Judge With Confidence: The Ultimate Playbook for Dairy Cattle Judging · Words That Win: How Elite Dairy Judges Master Oral Reasons

The Sunday Read Dairy Professionals Don’t Skip.

Every week, thousands of producers, breeders, and industry insiders open Bullvine Weekly for genetics insights, market shifts, and profit strategies they won’t find anywhere else. One email. Five minutes. Smarter decisions all week.
NewsSubscribe
First
Last
Consent

13 Grams of Choline Buys Milk – Not a Lower Ketosis Rate

The meta-analysis is blunt: 13–14 grams of rumen-protected choline reliably increases milk production but does nothing for your ketosis or DA rate. Buy it for the right reason — or don’t buy it.

Executive Summary: Rumen-protected choline reliably buys you milk — about 1.3 to 1.6 kg a day at the sweet-spot dose of 13–14 grams — but the biggest meta-analysis we’ve got (21 trials, 1,313 cows) found it does nothing for your ketosis, DA, or milk fever rate. That’s the whole spending decision in one line: buy it for the milk, not as fresh-cow-disease insurance the research won’t underwrite. One 2023 dose study even saw BHB go up in supplemented cows, so your ketone meter won’t tell you whether the program’s working. The honest return is 2:1 to 3:1 gross over product cost on your own numbers — real money, but a long way from the 11:1 that gets quoted. And none of it rescues a close-up pen that’s overstocked, short on bunk space, or drifting positive on DCAD; stack choline on a broken transition and your response collapses to zero while the bag still costs $14.70 a cow. Fix the pen first, then decide if 13–14 grams of a truly rumen-protected product — one with a peer-reviewed trial behind its coating, not just a label claim — earns a spot in your ration.

rumen-protected choline

The 13-gram decision, at a glance: 13–14 g/day choline chloride · +1.3–1.6 kg milk/day (meta-analysis average) · realistic 2:1–3:1 gross return on your own numbers · the window that matters runs −21 to +21 days around calving.

You know the conversation. A producer’s standing in the feed alley with a nutritionist who just said the words “rumen-protected choline.” The pen behind them is overstocked, the close-up DCAD is drifting positive, and bunk space is tight. The pitch sounds good — meta-analysis numbers, an 11:1 ROI, more milk.

But here’s the question nobody in that alley asks first: is choline the best next dollar this farm can spend? Or is it about to get blamed for problems it was never built to solve — a positive-DCAD close-up pen, tight bunk space, cows that were already behind before the additive showed up?

What’s Really at Stake

“Can I afford choline?” is the wrong place to start. The sharper question is whether your herd actually looks like the herds where rumen-protected choline is delivered — and whether you’re buying it for the thing it actually does.

The evidence base is solid, but it’s specific. A 2020 Journal of Dairy Science meta-analysis by Arshad and colleagues pooled 21 trials and 1,313 parous cows, and found that feeding rumen-protected choline at a median 12.9 grams of choline ion per day — from roughly 21 days before calving through early lactation — raised milk yield by about 1.6 kg/day and energy-corrected milk by 1.7 kg/day, and lowered the risk of retained placenta and mastitis. A separate 2025 dose-response meta-analysis in the same journal landed the sweet spot at 13 to 14 grams per day of choline chloride, with milk peaking at +1.29 kg/day (95% CI: 0.17–2.41) and dry matter intake up 0.48 kg/day at that dose. 

The catch: those numbers came from controlled research herds. Reasonable bunk space. Sensible grouping. Rations that broadly met requirements. That’s the part the best-case math tends to skip.

This story is for the producer who’s already past the basics — and for the one who isn’t yet, but thinks an additive can paper over the gap.

The Claim That Doesn’t Hold: Choline as a Ketosis Cure

This is where a lot of choline pitches quietly overreach, and it’s worth getting straight before you spend. The sales logic goes like this: choline cleans fat out of the liver, so it must cut your ketosis and displaced-abomasum rates. Intuitive story. The strongest data doesn’t back it.

That same Arshad meta-analysis — 21 trials, the most authoritative pool we’ve got — found no significant effect of rumen-protected choline on the incidence of ketosis, displaced abomasum, or milk fever, and no significant change in postpartum liver triacylglycerol. The milk response was real and repeatable. The “fewer sick fresh cows” response, on the metrics that matter most, wasn’t. So if your fresh pen is lighting up with clinical and subclinical ketosis, choline is not the fix. That’s a transition-management problem — energy density, intake, grouping, body condition — and an additive layered on top won’t rescue it. Buy choline for the milk. Don’t buy it as ketosis insurance the research won’t underwrite.

Why the Liver Still Matters — and Where Choline Fits

The liver story is real; it’s just narrower than the pitch. In late gestation, the cow’s dry matter intake falls while her energy demand climbs. She mobilizes body fat, and it lands in the liver as non-esterified fatty acids. The liver repackages that fat into very-low-density lipoproteins — VLDL — and ships it back out for energy and milk. University of Georgia extension reviewed the same mechanism in March 2026: choline supports the phosphatidylcholine the liver needs to build those VLDL particles and move fat out. 

The dairy cow is genuinely poor at exporting VLDL compared to other species, so that pathway is a real bottleneck. Choline helps open it. What the meta-analysis tells us is that opening it reliably produces more milk — but doesn’t reliably show up as lower measured liver fat or fewer ketosis cases across trials. The mechanism is sound. The downstream disease claims just outran the data. 

Read it straight: choline buys you milk and a smoother metabolic transition. It does not buy you a guaranteed drop in your ketosis or DA rate. If a rep promises the second thing, ask for the trial.

The BHB Surprise: It Can Go Up, Not Down

Here’s the finding that should retire the “choline lowers your BHB” talking point for good. A 2023 Journal of Dairy Science dose study from Bradford’s group didn’t just fail to lower blood ketones — supplemented cows showed higher plasma BHB in a pre-challenge window, and the authors concluded the milk benefit was metabolic and “unlikely to be related to resolution of inflammation”.

Sit with that. The nutrient marketed in part as a liver-and-ketone helper raised the very number some folks expect it to lower, in at least one careful dose study. That doesn’t make choline a bad buy. It makes the simple “choline = lower BHB” story wrong, and it means you can’t use your BHB meter to tell whether your choline program is “working.”

The inflammation and immune-function angle reads the same way: mixed. Some work suggests choline modulates inflammatory and immune markers around calving; the most directly on-point dose study points instead to a metabolic mechanism and away from inflammation resolution. Bet on choline for an anti-inflammatory effect, and you’re betting ahead of the evidence. 

The Methionine Question Almost Nobody Asks

Producers get tripped up here before they even reach the product shelf. If you’re already feeding rumen-protected methionine, you’ve got a different choline math problem than your neighbor who isn’t.

Methionine and choline aren’t the same lever. Choline works mainly as a lipotropic nutrient — it supports the phosphatidylcholine the liver needs to package fat into VLDL and ship it out. Methionine does different work: it drives milk protein yield and feeds the cow’s antioxidant and methylation systems. Complements, not substitutes. (For the wider methionine and one-carbon picture, see The Bullvine’s transition nutrition coverage.)

But the Arshad meta-analysis found something a methionine herd needs to hear. The choline milk response trended smaller at higher dietary methionine concentrations. Still positive — just smaller. The honest framing: choline still earns its keep on top of methionine in most herds, but the incremental pounds shrink, and the only way to know your number is to run it on your own ration — not borrow your neighbor’s. 

Don’t Buy a Label, Buy a Delivery System

Say the producer decides choline pencils out. Now they’re staring at bags that all claim roughly the same thing. This is where it gets murky fast.

Choline gets destroyed in the rumen unless it’s protected — that’s the whole point of the “rumen-protected” label. And here’s the loophole worth understanding. AAFCO does define “rumen protected” — a nutrient “that does not result in a change in rumen fermentation parameters yet is available to the animal in the intestine”. But the definition attaches no minimum rumen-escape percentage, as The Bullvine has reported. A product can call itself “rumen-protected” whether it delivers 70% of its choline past the rumen or a fraction of that. There’s no floor to clear and no requirement to print the one number that decides whether the cow ever sees the dose on the tag. 

The label tells you what’s in the bag. It tells you nothing about what reaches the liver. Two products at the same declared dose can deliver very different amounts of choline to the cow.

A 2025 study in the Italian Journal of Animal Science (Sáinz de la Maza-Escolà and colleagues) put that gap to the test with 24 multiparous Holsteins, comparing two commercial products — one microencapsulated at 25% choline chloride, one fluidized-bed coated at 60% — both formulated to deliver 15 grams per day of choline chloride from 21 days pre- to 35 days post-calving. Same label dose. The researchers reported no overall difference in milk yield or ECM, with a treatment-by-time interaction suggesting the two sources differed in feed efficiency and production patterns. With only 24 cows and no overall effect, they frame it as a signal, not a ranking — and both products are commercially used with their own data behind them. The practical point holds: identical label doses don’t guarantee identical results in the cow. 

Product attributeProduct A (microencapsulated)Product B (fluidized-bed coated)What it means for the cow
Choline chloride concentration in product25%60%Higher % lets you feed less product for the same label dose
Label dose to deliver 15 g/day choline chloride60 g/head/day25 g/head/daySame target on paper — very different bag draw
Rumen-escape rate disclosed on labelNot disclosedNot disclosedAAFCO sets no minimum floor — “rumen-protected” is a claim, not a number
Peer-reviewed trial on this coating technologyRequired — ask supplierRequired — ask supplierIf they can’t produce one, you’re buying marketing, not liver protection
Observed milk-yield difference at 15 g/day (Sáinz de la Maza-Escolà 2025, n=24)No overall difference reportedNo overall difference reportedSignal, not a ranking — but identical label doses don’t guarantee identical results
Practical grams choline reaching the intestineUnknown without trial dataUnknown without trial dataThe one number that decides whether the cow ever sees the dose

The walk-away signal is simple. If a supplier can only show you generic “choline works” literature with no named, peer-reviewed trial on their coating technology, at a dose and window resembling your herd, you’re relying on a marketing claim, not a tested result. (For the full breakdown of how coating technology changes what reaches the liver, see The Bullvine’s Rumen-protected choline: the delivery number suppliers hide.)

More Isn’t Better — Unless You’re Paid on Components

If 13 grams is good, is 20 better? Mostly no — and that’s a useful guardrail when a rep starts talking about loading the ration.

The 2023 dose study from Bradford’s group found no milk-yield bump from pushing rumen-protected choline above standard feeding rates. The cow appears to use choline up to the point where her VLDL-export and methyl-donor systems are satisfied, and past that, extra grams mostly cost money for milk volume. But there’s a nuance worth knowing. Dellait’s December 2025 analysis notes that while milk yield peaks at 13–14 g/day, fat-corrected milk kept climbing at 15–21 g/day — over 2 kg/day more FCM — with fat yield improving up to about 24 g/day. 

So the dose answer depends on your milk check. If you’re paid heavily on components, a higher dose might pencil. For fluid volume, 13–14 grams is the sweet spot. Either way, the target isn’t “as much as the budget allows” — it’s “enough to clear the bottleneck, in a form that actually reaches the liver, across the whole window,” set against how your milk gets paid. 

The 11:1 ROI Is a Best-Case Thought Experiment

That 11:1 number gets thrown around like a law of physics. It isn’t. It’s a model, and it breaks the moment you change one input.

The Bullvine’s own 2024 example assumed about $14.70 per cow for a 42-day program and up to $142 per cow in extra milk revenue — which only works if you stack a roughly 4 lb/day response across about 25 weeks at around $20/cwt (USD, U.S. component pricing). Run the arithmetic and even that pencils closer to 10:1 — a reminder of how loosely the headline ratio gets quoted. Dellait’s December 2025 analysis in Feed & Additive Magazine is more conservative: at 13–14 g/day, cows ate about 0.5 kg more dry matter and gave about 1.3 kg (2.9 lb) more milk per day. 

Here’s the barn math, run off the meta-analysis average rather than a best-case projection. Take 1.6 kg ≈ 3.5 lb/day of extra milk. At about $0.20/lb milk and roughly $0.25–$0.35/day in product, that’s $0.70/day in revenue — a gross return in the 2:1 to 3:1 range over product cost, before you net out the extra half-kilo of intake. Real money. But a long way from 11:1.

Run It On One Pen, Start to Finish

Generic ratios don’t pay bills, so walk a single group through the whole window. The numbers below are an illustrative worked example, not a specific farm’s results — but every input is anchored to the sourced figures above, so you can drop in your own and see where you land.

Say you feed choline across the 42-day transition — 21 days before, 21 after — to the cows freshening this month. At roughly $0.25 to $0.35 a day, that’s about $10.50 to $14.70 per cow in product before she ever hits the parlor with the supplement on board. 

Now the return side, kept deliberately conservative. Use the meta-analysis midpoint of about 1.3 to 1.6 kg — call it 3 lb of extra milk a day. Hold it for just the first 100 days, ignore any carryover past that, and price milk at $0.20/lb. That’s $0.60/day, or roughly $60 over 100 days, against your $10.50 to $14.70 cost. Net her out and you’re near $45 to $50 a cow, this lactation, on the cautious end.

Push it across 30 cows freshening in a month, and you’re spending roughly $315 to $440 to generate about $1,800 in extra gross milk revenue over those cows’ first 100 days — call it $1,400 net of product. That’s the case for trying it. The case for caution sits right beside it: that whole calculation assumes you actually capture the meta-analysis response. Stack it on a heat-stressed, overstocked close-up pen and your real-world number can collapse to zero — while the bag still costs full price.

The Window You Can’t Make Up Later

Timing is where a lot of choline money gets wasted. The response in the literature comes from feeding across the transition — roughly 21 days pre-fresh through 21 to 35 days in milk. Dellait’s review makes the point bluntly: feeding choline before calving alone didn’t change intake — it’s the consistent feeding through early lactation that pays off. Start late, after she’s already calved, and you’ve missed the priming. Stop early, the day she leaves the fresh pen, and you cut off the tail of the response. 

This is the practical trap on farms running a single close-up group with constant turnover. A cow that lands in the pen 10 days before calving instead of 21 gets barely half the priming dose, and nobody notices because she’s in the “choline pen” on paper. If your grouping or pen moves can’t reliably deliver three weeks of pre-fresh supplementation, you’re paying for a 42-day program and feeding something shorter. Fix the pen flow before you blame the additive.

The Colostrum Angle — Promising, but Don’t Overcount It

There’s one more output people rarely put in the spreadsheet: colostrum. Some research has reported meaningful colostrum-yield increases from prepartum choline — more volume at the same quality means more passive immunity to transfer to the calf. A genuine second dividend, if it holds on your farm.

But hold it loosely. A 2026 study evaluating rumen-protected choline from 21 days pre-calving through 28 days postpartum found the lactation and metabolic effects without a clear, consistent boost to colostrum IgG or calf growth. So the colostrum and calf-side benefits are plausible and worth watching — not a number to bank in your ROI math yet. Want to know if it’s real in your barn? Measure colostrum volume and Brix on a treated group before you credit it. 

What This Means for Your Operation

Choline is a scalpel, not a bulldozer. Before you spend a dollar, find your herd in one of these groups — then follow the integrity rule no matter which one you land in.

Herd profileBuy choline now?Target doseNext 30-day actionRealistic return
Fundamentals-first — close-up pen >100% stocked, bunk <30 in/cow, DCAD drifting positive, subclinical ketosis >15% of fresh cowsNo — fix pen firstN/A until management fixedPull fresh-cow BHB logs; identify real subclinical ketosis rate≈$0/cow — response collapses on broken transition
Fine-tuning — stocking, bunk space, DCAD, and methionine dialed inYes — with verified coating13–14 g/day (or 15–21 g if paid on components)Request peer-reviewed trial on the supplier’s specific coating technology$45–$50/cow net over first 100 DIM
Progressive evaluator — can track discrete fresh pens and run trialsYes — split-group trial13–14 g/day across −21 to +21 windowRun a phased trial; measure milk to 60 DIM, weigh and Brix colostrum on treated groupFarm-specific — judge on milk yield, not BHB
Any of the above using a product with no named coating trialNo — that’s marketing, not liver protectionN/AAsk the supplier for the peer-reviewed dose study on their coatingUnknown — you’re buying a label, not a delivered dose

The Fundamentals-First Herd (high transition turbulence). If your close-up pen runs over 100% stocked, bunk space is under 30 inches per cow, or DCAD is drifting positive, don’t buy choline yet. Pull your fresh-cow BHB logs this month and find your real subclinical ketosis rate — if more than about 15% of your fresh cows test above 1.2 mmol/L in the first two weeks, you’ve got a transition problem an additive can’t touch. The Bullvine’s reporting on subclinical ketosis hiding in “good” herds shows how far guesses drift from the meter. And remember: choline won’t pull that number down — the meta-analysis found no ketosis effect. Fix the management first. 

The Fine-Tuning Herd (dialed-in management). If stocking, bunk space, and methionine are already handled, layering 13–14 grams of true rumen-protected choline across the window is your next logical step — bought for the milk, 2:1 to 3:1 gross over product cost, with the response shrinking the more methionine you already feed. Paid hard on components? Talk to your nutritionist about whether 15–21 g pencils for fat-corrected milk. (For the wider margin picture, see The Bullvine’s transition cow economics coverage.)

The Progressive Evaluator (split-group testing). For operations that can track discrete fresh pens: run a phased trial across the exact 42-day window (−21 to +21). Watch early-lactation milk out to 60 DIM, and if you’re curious about the colostrum angle, weigh and Brix-test it on the treated group. Judge it on milk, not on BHB — that gauge can move the wrong way. 

The integrity rule for all three: if a supplier can’t show a named, peer-reviewed study on their specific coating technology at a 13–14 gram dose across the transition window, you’re buying a marketing story, not a liver-protection strategy.

Key Takeaways

  • If you’re buying choline to cut your ketosis or DA rate, stop — the strongest meta-analysis found no effect on either; buy it for the milk. 
  • If you use BHB to judge whether choline is “working,” switch metrics — one dose study found supplemented cows ran higher BHB, not lower. Judge it on milk yield. 
  • If your close-up pen is over 100% stocked or under 30 inches of bunk, fix that before you spend — an additive can’t out-run social stress and sorting. 
  • If you already feed rumen-protected methionine, model choline on your own ration — the response is real but shrinks as methionine rises. 
  • If you’re paid heavily on components, ask about 15–21 g — milk volume peaks at 13–14 g, but fat-corrected milk kept climbing higher. 
  • If a product can’t show a peer-reviewed trial on its own coating technology at 13–14 g, treat the label as marketing — “rumen-protected” carries no legal escape-rate floor. 
  • In the next 30 days, pull your fresh-cow BHB logs and find your real subclinical ketosis rate — then decide whether choline, or better transition management, is your best next dollar.

Walk back to that feed alley. The pitch hasn’t changed, but your approach should. Rumen-protected choline reliably buys more milk for parous cows in a sound system — and just as reliably won’t rescue a pen that’s failing for other reasons. So the real question isn’t “can I afford choline?” It’s whether you’ll treat those six transition weeks as the capital project they are, and buy the additive for what it actually does — not what the brochure wishes it did.

Pour the concrete first. Then reach for the precision tools.

Run Your Numbers

Health ROI Calculator — This article says choline won’t cut your ketosis or DA rate, so fix the transition problem first. Run your culling rate, mastitis incidence, and replacement cost through the Health ROI Calculator to see whether the management fix — not the additive — is where your real fresh-cow money is hiding.

Complete references and supporting documentation are available upon request by contacting the editorial team at editor@thebullvine.com.

Learn More

The Sunday Read Dairy Professionals Don’t Skip.

Every week, thousands of producers, breeders, and industry insiders open Bullvine Weekly for genetics insights, market shifts, and profit strategies they won’t find anywhere else. One email. Five minutes. Smarter decisions all week.
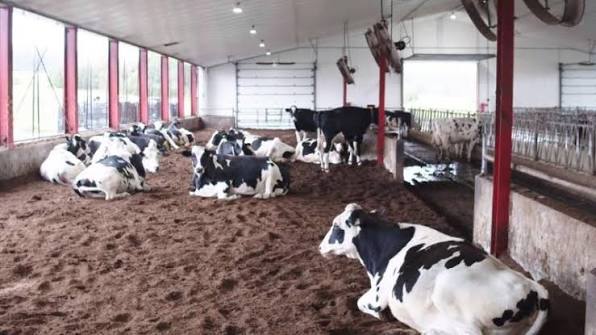
NewsSubscribe
First
Last
Consent

€153,846 Per Farmer: The Real Price of Spain’s 13-Year Milk Cartel

€11.7M was just the fine. The real number is €153,846 — the average claim per farmer now that Spain’s top court made the milk cartel final and unappealable. Here’s the barn math.

Executive Summary: Spain’s Tribunal Supremo just made the milk cartel a permanent, unappealable fact — ruling 808/2026 slammed the door on Lactalis’s last appeal on June 29, 2026, confirming a €11.7M fine and clearing the way for 7,800 farmers to pursue civil claims worth more than €1.2 billion. That pencils out to roughly €153,846 per farmer before interest, and it’s for the kind of cartel that gets ignored: buyers colluding to underpay producers between 2000 and 2013, not sellers gouging shoppers. Courts have already put the farm-gate undercharge somewhere between 2% and 9.4% — on an illustrative 100-cow farm shipping 800,000 liters, that’s a spread of about €67,000 to €313,000 in principal over 13 years, before a cent of compound interest. The cartel finding is now settled, so civil judges only decide how much and for whom, and a fresh five-year claims window is open. The obvious question for North American suppliers: could the same collusion-detection logic apply to your co-op check, given the $300M-plus Southeast settlements and last year’s $34.4M DFA/Select deal, which started paying farmers on June 2, 2026? None of those admitted liability — but the transparency terms they agreed to mean a supplier should ask what their own co-op shares are and with whom. If your milk price tracks a competitor’s price to the penny for 12 straight months, this story explains why that’s worth a second look.

Based on court records, regulatory filings, and settlements available as of July 2026.

In March, Galician farmers dumped 15,000 liters of milk in the street to protest what they get paid for it — the raw nerve of a fight that’s run for a generation. For nearly 15 years, those farmers said their milk cheques were rigged. Regulators finally proved them right — and as the Basque farmer union ENBA put it after the rulings landed, what they “denounced almost 15 years ago as illegal practices by the dairy industry has now been fully demonstrated.” Two dairy farms in Ávila already have court orders in hand telling Lactalis to pay up. 

That’s not a grievance anymore. It’s a number. On June 29, 2026, Spain’s Tribunal Supremo issued ruling 808/2026, thereby making a milk price-fixing cartel a final, unappealable legal fact. The fine on Lactalis is €11.7M. The farmer claims that just got their green light run north of €1.2 billion. 

What Did the Supreme Court Actually Decide?

The Contentious-Administrative Chamber dismissed Grupo Lactalis Iberia’s cassation appeal in full and confirmed both the CNMC’s July 11, 2019 sanction and the National Court’s February 12, 2024 judgment. Confilegal called the decision definitiva e inapelable — final and un-appealable. The facts about Lactalis’s role in the cartel are now settled and beyond challenge.

The Court only agreed to hear one narrow question: whether the CNMC had to spell out the exact fine in its draft resolution. It ruled no — defense rights don’t require that, as long as the criteria are explained. This means Lactalis’s attempt to challenge the process failed, and the core facts about the cartel — the collusion, the 13 years, the harm to farmers — are now beyond challenge in Spain. 

Lactalis has floated a trip to the EU Court of Justice in Luxembourg. But that’s not a normal appeal, and it doesn’t reopen the Spanish facts. For the farmers, those facts are the whole ballgame. 

The Cartel: Buyers, Not Sellers

Here’s what makes this case different. This wasn’t companies conspiring to overcharge supermarkets. It was companies conspiring to underpay farmers — a buyers’ cartel. 

The CNMC’s 2019 resolution, S/0425/12, laid out how it worked between 2000 and 2013. Companies swapped the prices they were paying for raw milk. They shared purchase volumes and supplier lists. They agreed on when to push prices down. And they carved up farmers between them so that a producer couldn’t shop his milk to a competitor. 

David Fernández, CEO of the Madrid class-action firm Eskariam that’s led these claims, has described it as an illegal agreement among the big processors to buy raw milk cheaply — one that kept farmers from negotiating their own price. 

The names on the CNMC’s list aren’t small. Danone. Nestlé España. Calidad Pascual. CAPSA/Central Lechera Asturiana. Puleva. Schreiber. Celega. Two industry associations. And Grupo Lactalis Iberia. Total fines: €80.6M. Lactalis’s share: €11.7M. Keep one thing straight, though: Lactalis’s liability is now final, while appeals by other sanctioned firms are still working through the courts — for them, this remains a sanction under challenge, not a closed book. 

How Much Did It Cost a Farm?

CNMC didn’t just yell “cartel” and walk off. It put a number on the damage: an artificial price decrease of more than 10%, and it said each farmer could claim at least 10% of turnover during the cartel years plus interest. 

Then the courts started sharpening it — and they haven’t settled on a single figure. Two rulings have set very different underprice marks, and your claim size swings hard depending on which one a court applies:

Court / rulingUndercharge appliedInterestLoss on the illustrative 100-cow farm*
Madrid Commercial Court No. 14 (Oct 16, 2025) 9.4%Compound, from harm date~€24,064/yr → ~€313,000 over 13 yrs
Galician ruling ~2%Per ruling~€5,120/yr → ~€67,000 over 13 yrs

*Illustration only — a 100-cow Galician-style farm shipping 800,000 liters a year at roughly €0.32/L (about €256,000 in annual milk revenue). During the cartel period, Spanish and EU farmgate prices generally ranged from €0.28 to €0.35/L. 

FactorMadrid Commercial Court No. 14Galician Ruling
Undercharge rate applied9.4%~2%
Interest typeCompound (from harm date)Per ruling terms
Annual loss — 100-cow farm, 800k L~€24,064~€5,120
13-year principal~€313,000~€67,000
Est. with compound interest€500,000+~€80,000–90,000
StatusPrecedent-setting; basis for Eskariam floorLower bound; applied in some provincial courts
Key risk for farmersMay not be universally adopted by civil courtsSignificantly undervalues the cartel harm

So the principal alone ranges from roughly €67,000 to €313,000 over 13 years — before a cent of interest. Add compound interest from every underpaid cheque, and the top of that range climbs fast — potentially past €500,000 on the 9.4% path, depending on the rate a court applies. 

Two honest caveats. That €0.32/L is a period average for illustration — actual prices swung year-to-year. And which percentage sticks is still being fought farm by farm. This is barn math to show the size of the hole, not a cheque anyone’s cashed.

Does the €1.2 Billion Number Hold Up?

Divide Eskariam’s aggregate claim by its client count, and you get a blunt average: €1.2 billion ÷ 7,800 farmers ≈ €153,846 per farmer in principal, before interest. Individual amounts will vary with each farmer’s milk volume and how many of the 13 years they shipped. 

Now the reconciliation, because at first glance the numbers seem too big. Run all 7,800 farmers at 800,000 liters × 13 full years × 9.4% × €0.32/L, and you’d clear €2 billion. So why is the claim “only” €1.2B? Because that back-of-the-envelope math assumes every farm was large and caught for the full stretch. Most weren’t — many are smaller, and plenty didn’t ship all 13 years. Some courts are also applying the lower 2% figure, which pulls the average down. The €1.2B reads as a disciplined floor for one firm’s cohort, not a ceiling — and an earlier estimate put the universe of affected farmers near 50,000, with sector-wide harm of €1 billion or more. 

Why the Ruling Changes Everything for These Farmers

The Supreme Court didn’t discover the cartel. CNMC did that in 2019; the National Court confirmed it in 2024. What June 29 did was clear the last roadblocks between those findings and farmers’ bank accounts. 

Three things flipped. The facts are now permanent for Lactalis — no relitigating. The statute-of-limitations clock, which under recent EU case law doesn’t start until the decision is final, gives farmers a fresh five-year window from here rather than a closed door. And civil judges no longer have to prove the cartel from scratch. They decide how much, and for whom. 

That’s 26 years from the cartel’s start in 2000 to this ruling in 2026. A long time to wait to be told your price was rigged.

Could the Same Thing Happen to Your Co-op Check?

Careful here — there’s no Spanish-style final ruling that any North American processor ran a 13-year buyer cartel, and nothing below should be read as saying one did. But the U.S. record isn’t exactly quiet.

The Southeast Milk Antitrust Litigation alone brought the dairy farmers there more than $300 million — Dean Foods settled for $140M and DFA for $158.6M, both without admitting wrongdoing. In a separate case, DairyAmerica and California Dairies settled a nonfat-dry-milk price-misreporting suit for $40M, finally approved in 2019 for roughly 26,000 farmers; the companies denied wrongdoing, and the court made no finding of liability. And just last year, DFA and Select Milk settled a Southwest case covering Texas, New Mexico, Arizona, Oklahoma, and Kansas, in which farmers alleged the co-ops “stabilized and depressed” Grade A pay through shared pricing data — $34.4 million total, DFA $24.5M and Select $9.9M, agreed without admitting liability. That Southwest settlement received final court approval on December 8, 2025, and payouts to farmers began on June 2, 2026. 

The detail worth your attention? As part of it, DFA and Select agreed to dissolve their joint marketing arm, run antitrust training, and give members better pay-price transparency. Both admitted no liability. But in our view, co-ops voluntarily agreeing to those terms is at least worth a supplier asking what their own co-op shares, and with whom. reuters

What Should a Supplier Actually Watch For?

Farmers in Spain didn’t get a memo. They saw symptoms, and regulators turned symptoms into findings. The same signals travel.

Watch for suspiciously identical prices across supposed competitors — multiple processors moving the same amount on the same schedule, all sitting below what the formula suggests. The bigger tell is an information-sharing structure like a joint venture that quietly becomes a pricing channel, the kind of arrangement farmers challenged in the DFA/Select case. Then there’s the oldest one in the book: being told there’s nowhere else to ship while two plants sit within hauling distance. That’s the soft version of Spain’s farmer-allocation game. 

One more thing worth knowing. Capper-Volstead — the 1922 law giving U.S. agricultural co-ops a limited antitrust exemption to market their members’ milk collectively — does give co-ops real cover. But courts have said that cover doesn’t protect conduct aimed at suppressing what members get paid. That’s the exact line Spain spent 13 years crossing. 

Red FlagHow It Appeared in SpainNorth American ParallelRisk Level
Price lockstepMultiple processors moved farm-gate price same amount, same date, 2000–2013Co-op pay price tracks competitor to the penny for 12+ months🔴 HIGH
Information sharingProcessors swapped purchase volumes & supplier lists via CNMC-documented exchangesJoint marketing arms sharing non-public member pricing data (DFA/Select cited)🔴 HIGH
Farmer allocationProducers told they couldn’t switch — cartel carved up supply catchment areasTold “there’s nowhere else to ship” while 2+ plants sit within hauling distance🟡 MODERATE
Formula vs. actual gapFarm-gate ran 2%–9.4% below competitive price for 13 yearsMonthly pay below FMMO blend price with no published explanation🟡 MODERATE
Settlement termsCNMC €80.6M total fines; Lactalis €11.7M confirmed finalDFA/Select $34.4M + transparency mandates, no liability admission🔴 NOTE
Transparency commitmentPost-ruling: civil judges mandate disclosure of pricing methodologyPost-settlement: DFA/Select agreed to member pay-price transparency✅ WATCH

Options and Trade-Offs for Farmers

Run the 30-day check. Pull your last 12 months of pay statements and lay them side by side with the announced FMMO blend price. Flag any month your co-op moved in near-perfect lockstep with a competitor. This costs you an evening and tells you whether you’ve got a pattern worth watching. The limit: one month of alignment is noise, not evidence — you’re hunting a persistent trend, not a single coincidence.

Document before you escalate. If a 12-month pattern emerges, keep the records and talk to an antitrust attorney before speaking with anyone else. That makes sense when the gap is consistent and unexplained. The risk: pattern isn’t proof, and a lawyer will tell you fast whether you’ve got smoke or fire — which beats torching a processor relationship on a hunch.

Push your co-op on the data. Ask your board to commit, in writing, to never sharing non-public member pay prices with anyone who also buys your milk — the same kind of transparency term the DFA/Select settlement put in place. Works best with allies on the floor. The trade-off: it’s a governance fight, and you spend some goodwill to gain transparency. 

The forward signal to watch: Spain’s other sanctioned firms still have appeals in play. If those fall the way Lactalis’s did, the €1.2B claim widens, and the precedent for buyer-side cartels hardens across the EU. That’s the case North American regulators will be reading. 

Key Takeaways

  • If your co-op’s monthly pay price tracks a competitor’s to the penny for 12 straight months, that’s a pattern to document — not a coincidence to shrug off. 
  • If a court in Spain can put the undercharge somewhere between 2% and 9.4%, assume your own gap versus the FMMO blend is knowable too — so measure it before you assume the market’s fair. 
  • If you’re told “there’s nowhere else to ship” while multiple plants sit within hauling range, treat that as a red flag worth a second opinion, not a fact. 
  • If you sit on a co-op board, a written pay-price-transparency commitment is cheap insurance — Spain shows what 13 years of the alternative costs. 

So — Where Does Your Price Actually Sit?

Spanish farmers waited 26 years for a court to confirm what their gut told them in 2000. You don’t have to wait for a courtroom to check your own numbers this month. Pull the statements. Run the comparison. See if your price tells a clean story.

If you want the full model — the per-farm loss math, the 2%-vs-9.4% methodology fight, and how the FMMO blend comparison actually works on your herd size — that’s the deeper dive we’re building next, and it’ll land in Bullvine Weekly before Spain’s remaining appeals are decided.

Complete references and supporting documentation are available upon request by contacting the editorial team at editor@thebullvine.com.

Learn More

The Sunday Read Dairy Professionals Don’t Skip.

Every week, thousands of producers, breeders, and industry insiders open Bullvine Weekly for genetics insights, market shifts, and profit strategies they won’t find anywhere else. One email. Five minutes. Smarter decisions all week.
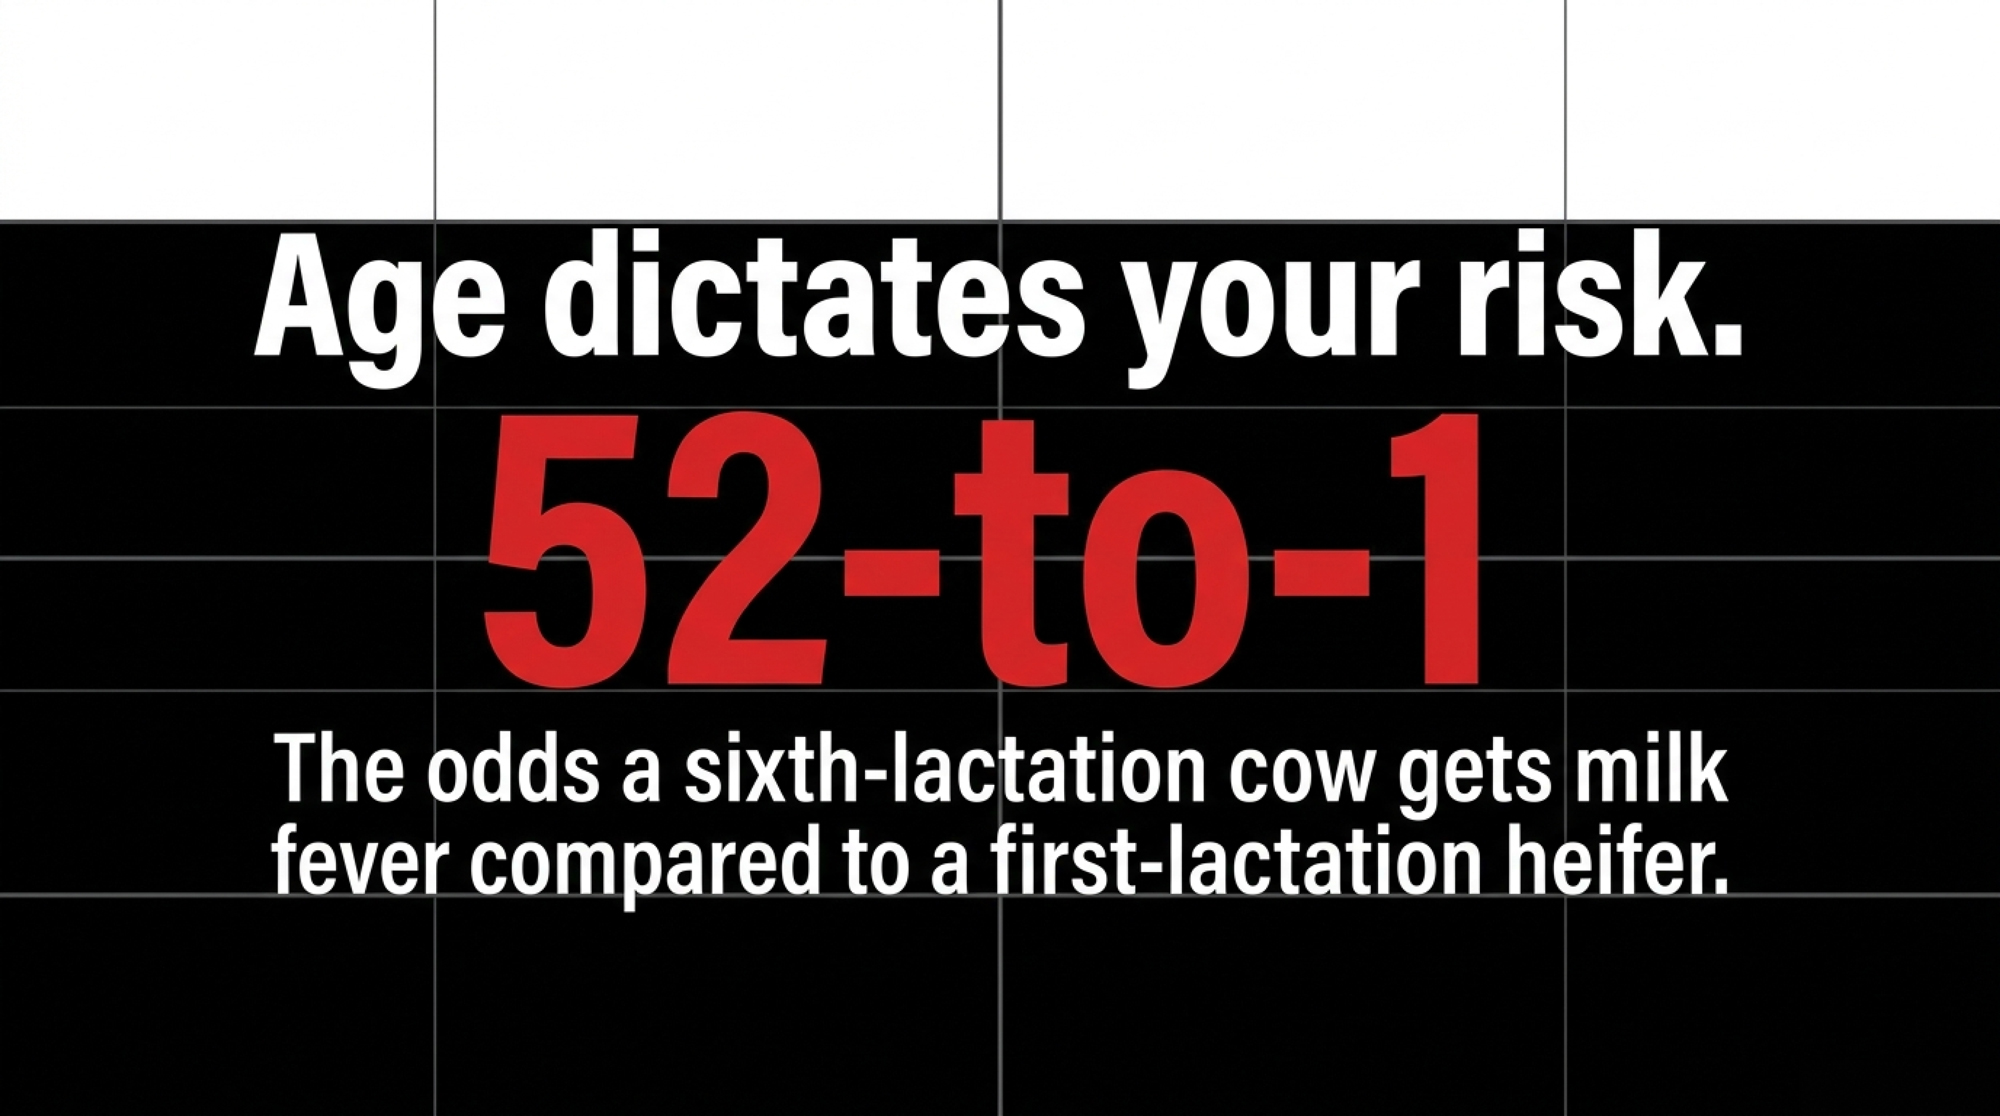
NewsSubscribe
First
Last
Consent
Send this to a friend