



Archive for transition cow protocol

JDS Study: Fresh Cows Ate 4.3 kg Less Before Their Calcium Split

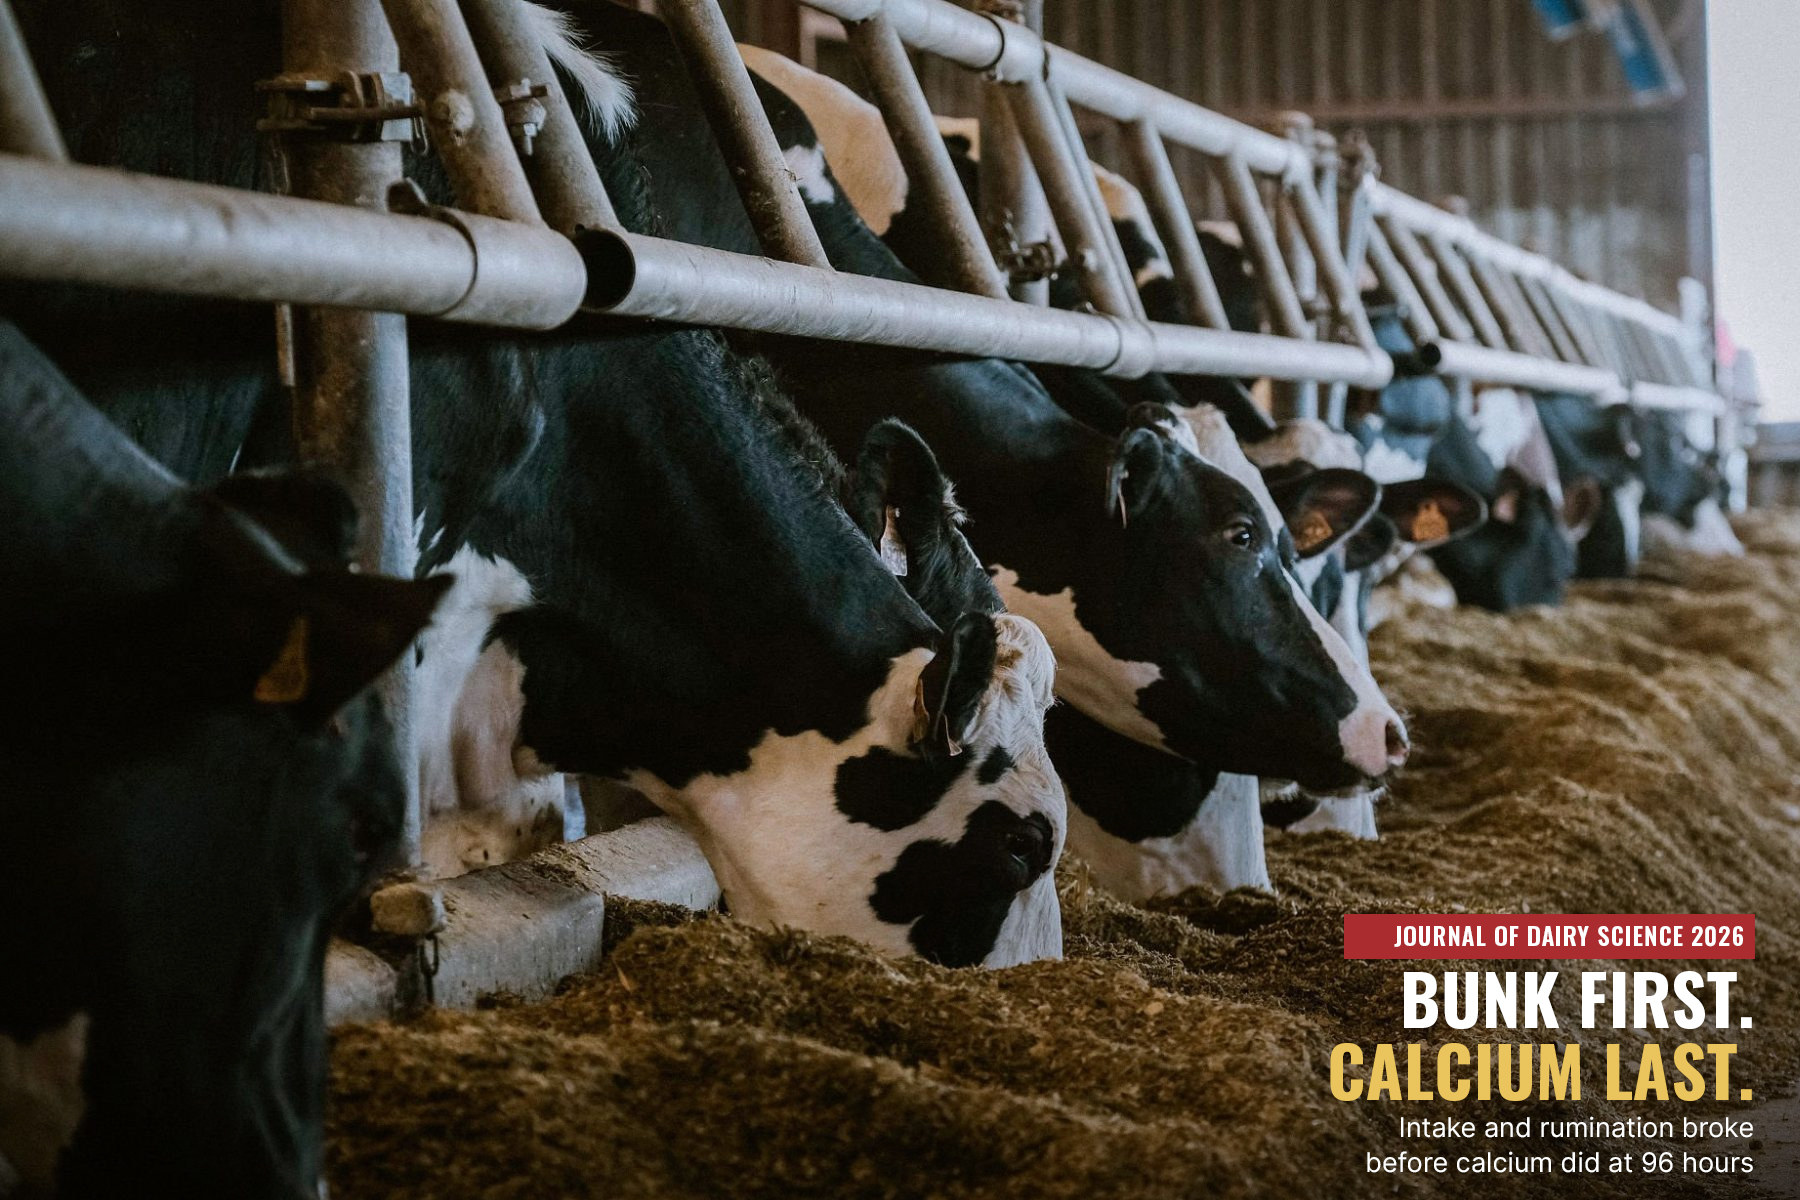
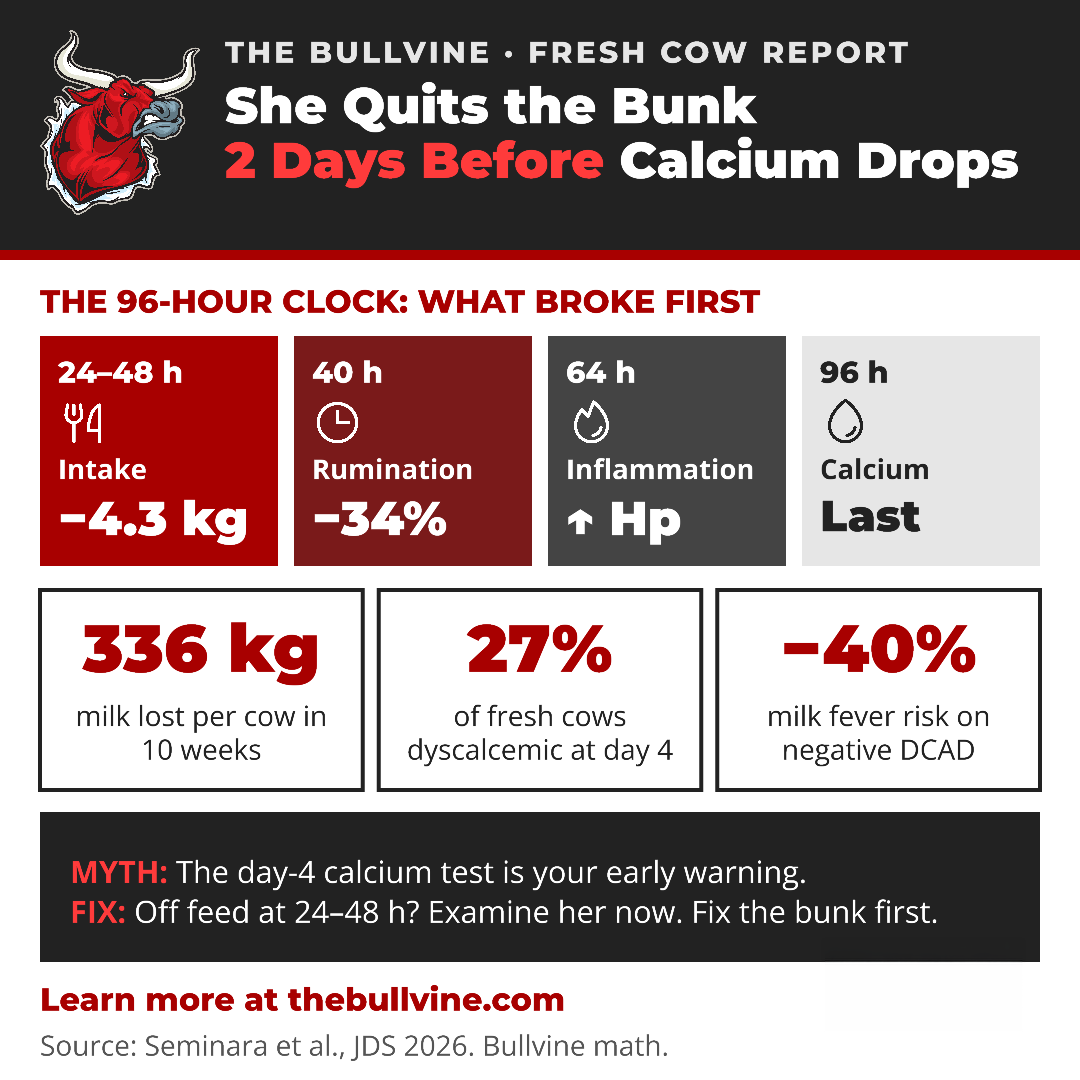
Cows headed for dyscalcemia backed off feed 24 to 48 hours after calving. Their blood calcium didn’t separate until 96 hours, so a day-four test confirms a problem that started two days earlier.
 fresh cow dyscalcemia

The fresh cow that tests low for calcium at four days in milk may not have started with a calcium problem.

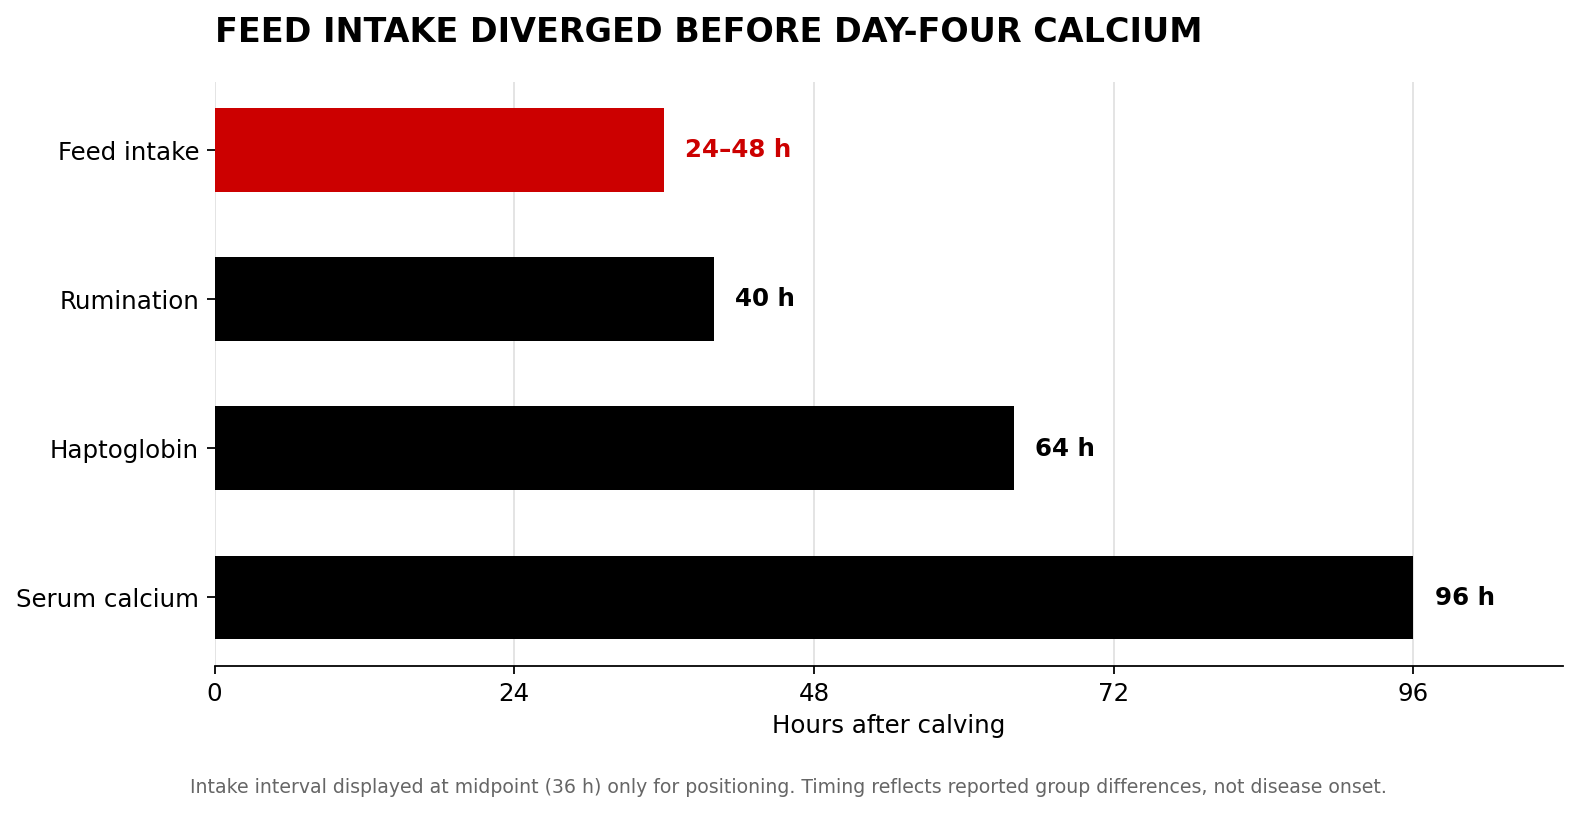
A 2026 Journal of Dairy Science study followed 45 multiparous Holsteins. The first measurable split between cows that kept normal calcium regulation and cows that became dyscalcemic was feed intake, between 24 and 48 hours after calving. Rumination split next, then an inflammatory marker. Blood calcium was the last of the four to break.
That changes the job in the fresh pen. Calcium prevention still matters. But the earliest warning you can act on may be the cow backing off the bunk two days before a blood test says anything.

The 96-Hour Clock
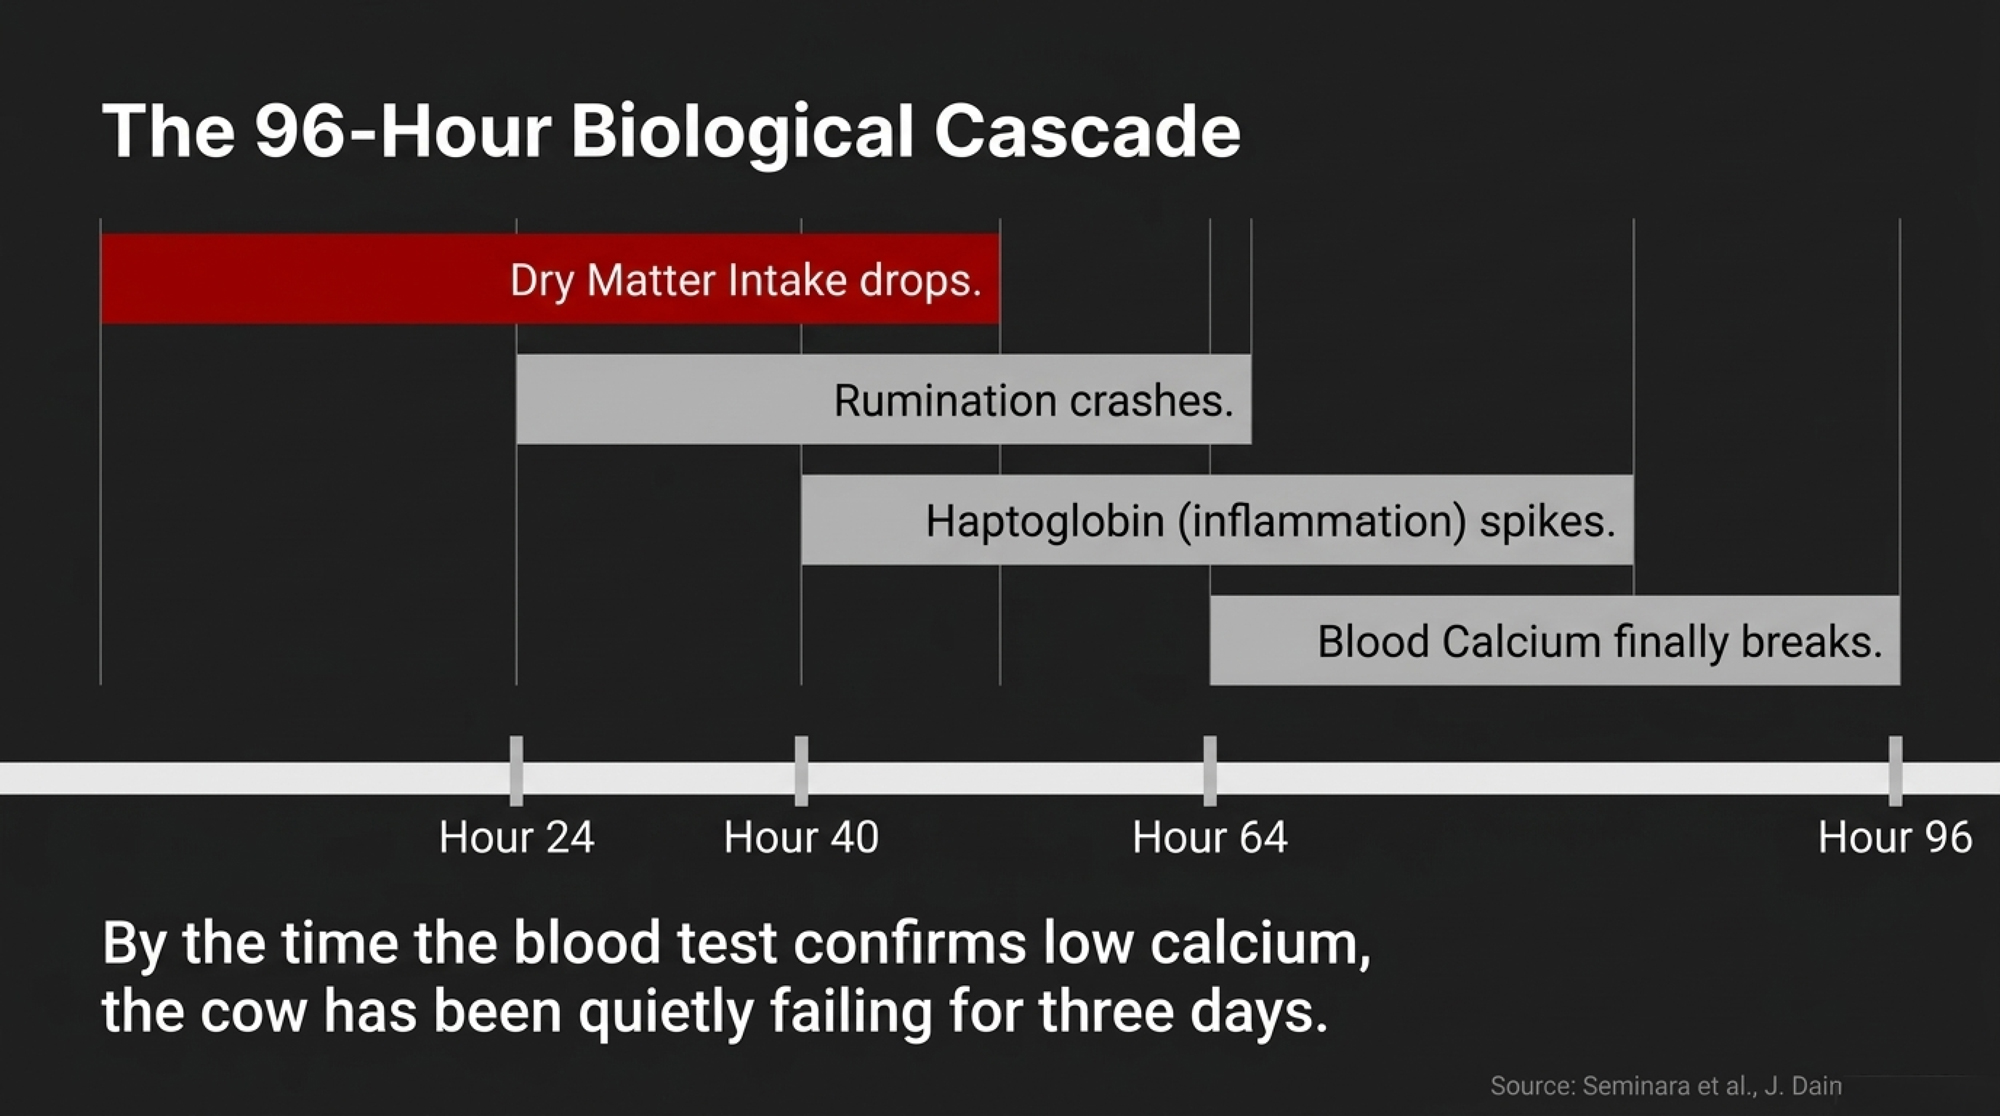
Researchers followed the cows from 14 days before calving through 14 days in milk. They recorded intake and rumination daily and drew blood every eight hours from calving through 96 hours.

Twelve cows were dyscalcemic, meaning serum total calcium at or below 2.2 mmol/L at 96 hours (about 8.8 mg/dL, Bullvine conversion). The other 33 were eucalcemic.

First differenceMeasurementDyscalcemic (n=12)Eucalcemic (n=33)Difference
24–48 hoursDry matter intake, kg/day16.320.6−4.3
40 hoursRumination, min/hour2538−13
64 hoursHaptoglobin, g/L0.690.39+0.30
96 hoursSerum calcium, mmol/L2.112.36−0.25

Source: Seminara et al., J. Dairy Sci., 2026. Group means.
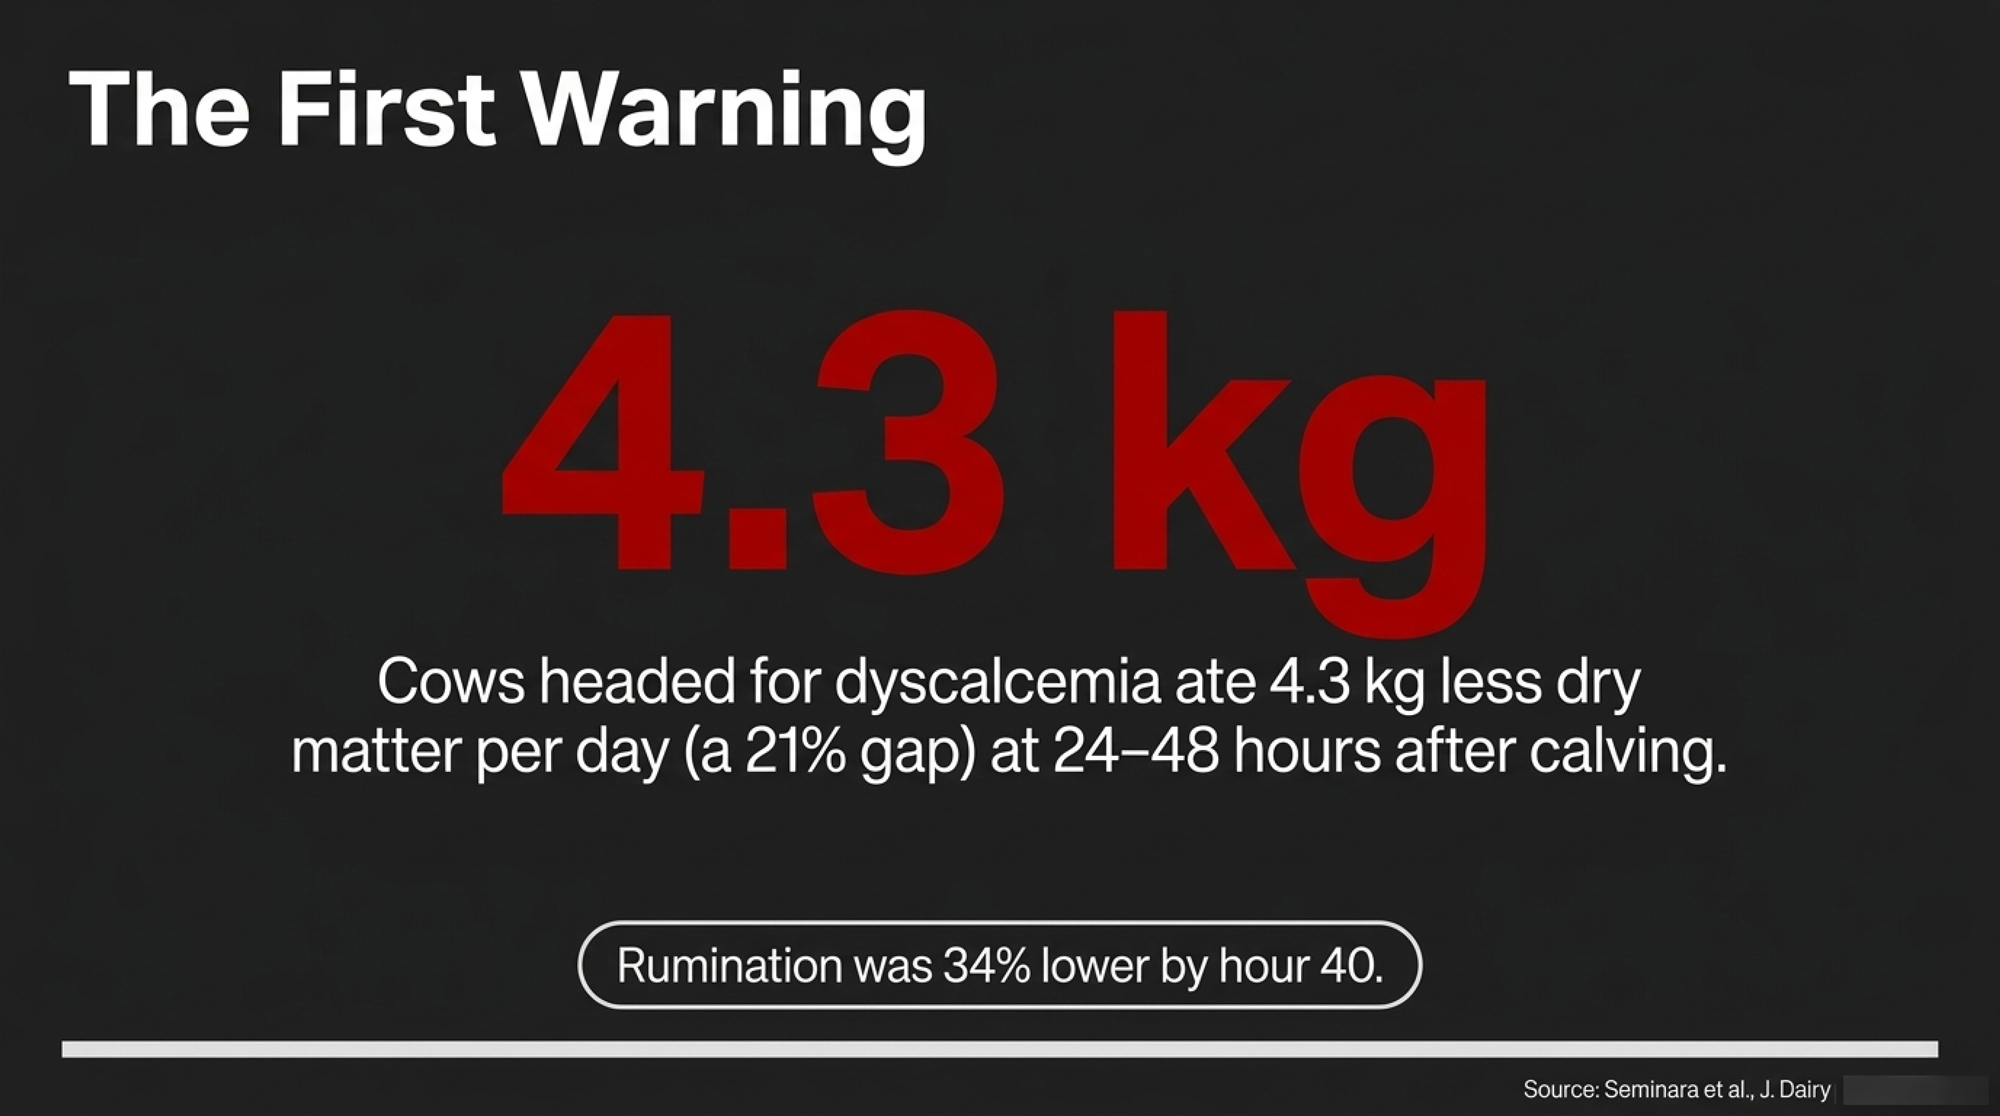
By Bullvine calculation, the cows headed for dyscalcemia ate 4.3 kg less dry matter a day before their calcium split. That’s a 21% gap. Their rumination was 34% lower by hour 40. None of the measures taken before calving told the two groups apart.

The milk loss didn’t stay in the fresh pen. Dyscalcemic cows gave 1.4 kg less per milking through 14 days in milk, and 4.8 kg/day less on average through 10 weeks.

The authors flag the limits themselves: one farm, one season. What the study does establish is order: intake, rumination, inflammation, then calcium. Proving cause in either direction was beyond its design.

Most of the herd data here comes from US Holstein research in New York, Wisconsin and Minnesota. Grazing systems, other breeds and different calving seasons may not follow the same pattern.

What 4.8 kg a Day Adds Up To
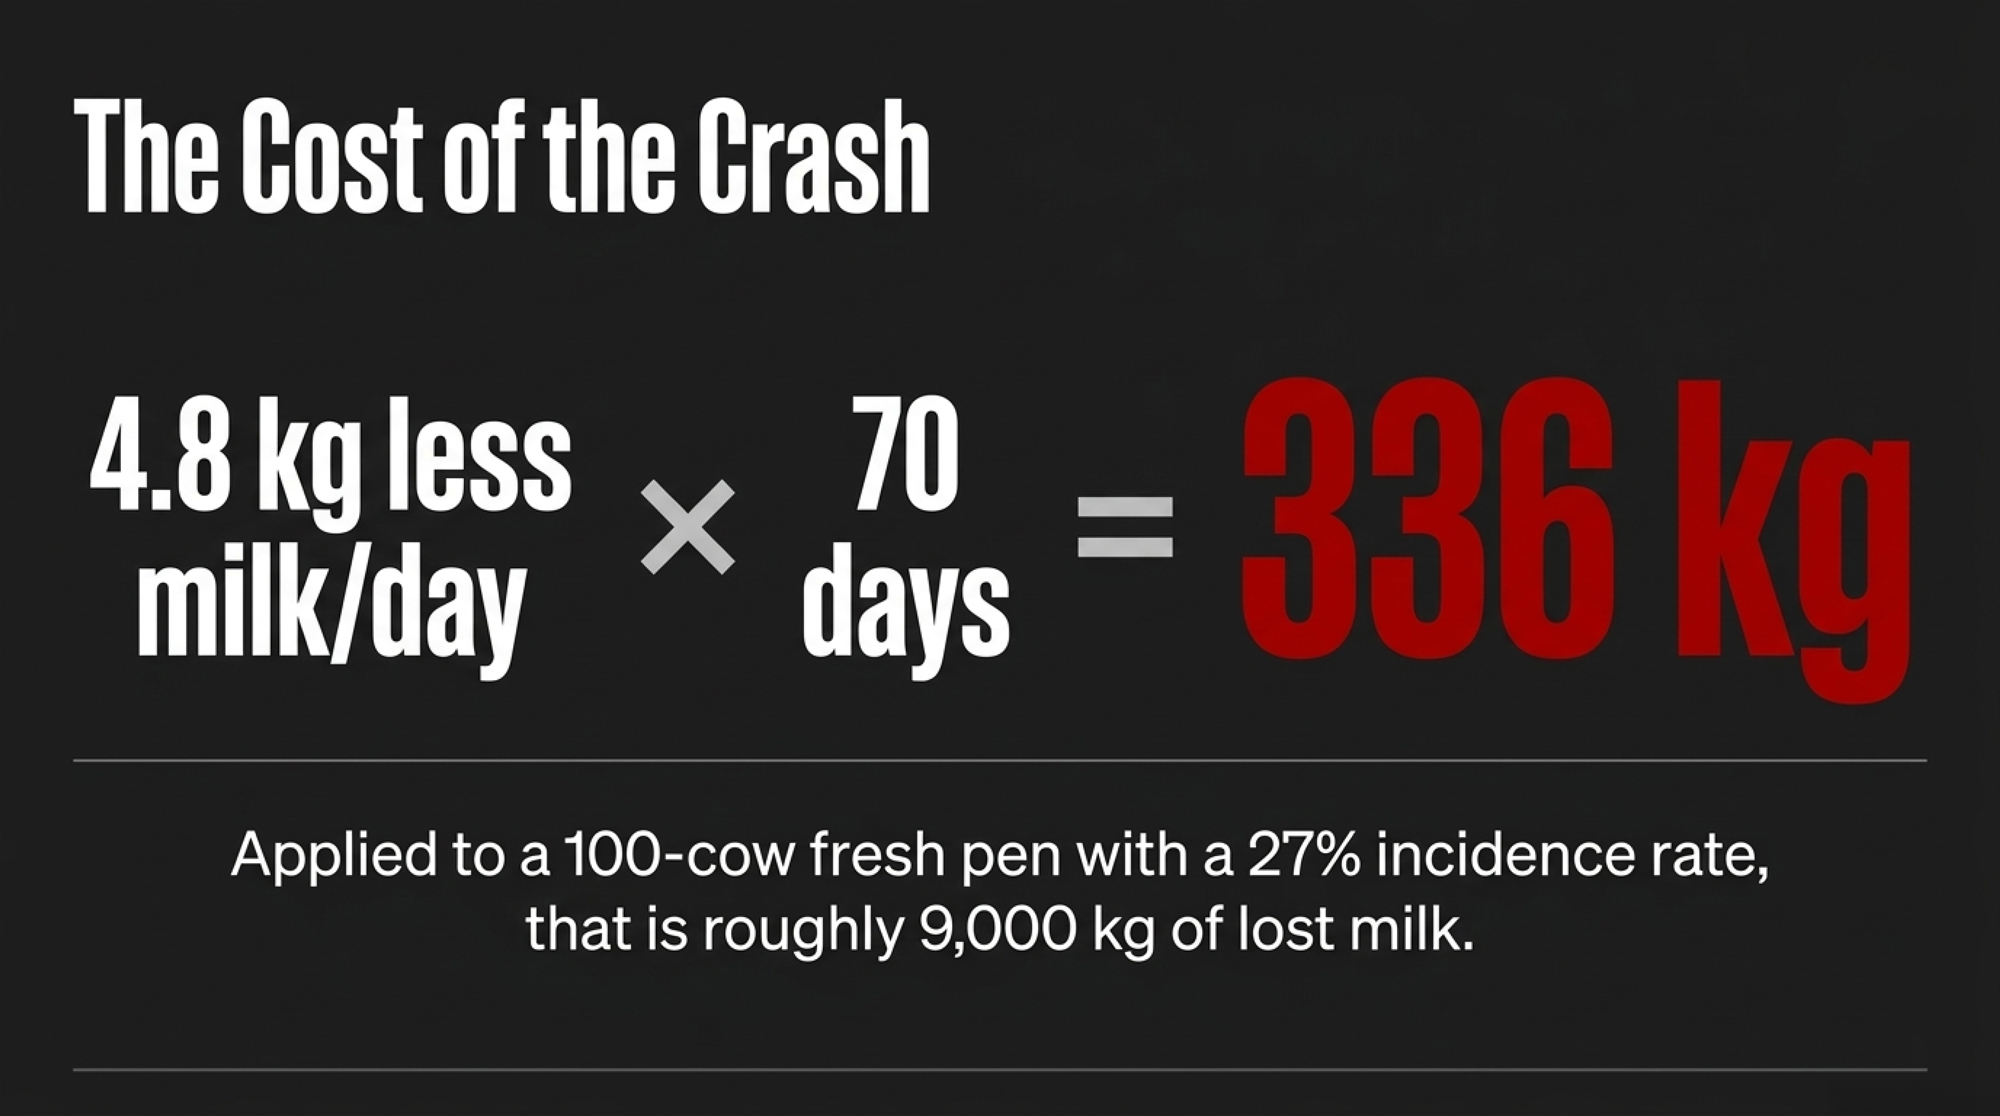
This is Bullvine math, not the study’s, and it uses only the study’s own figures:

  • Per dyscalcemic cow: 4.8 kg/day × 70 days = 336 kg of milk over 10 weeks. Using the study’s 95% confidence interval (2.3 to 7.4 kg/day), the range is 161 to 518 kg.
  • At the study herd’s rate: 12 of 45 cows, or 27%. Applied to 100 multiparous fresh cows, that’s about 27 cows and roughly 9,000 kg of milk (range about 4,300 to 14,000 kg).
  • For your herd: multiply your day-four dyscalcemic count by 336 kg, then by your net milk price per kg.

Read that as the cost that comes with the problem. It’s a group-mean gap from one herd, and an observational study can’t say how much of it prevention would win back.

Transient Hypocalcemia vs. Dyscalcemia: Day Four Decides
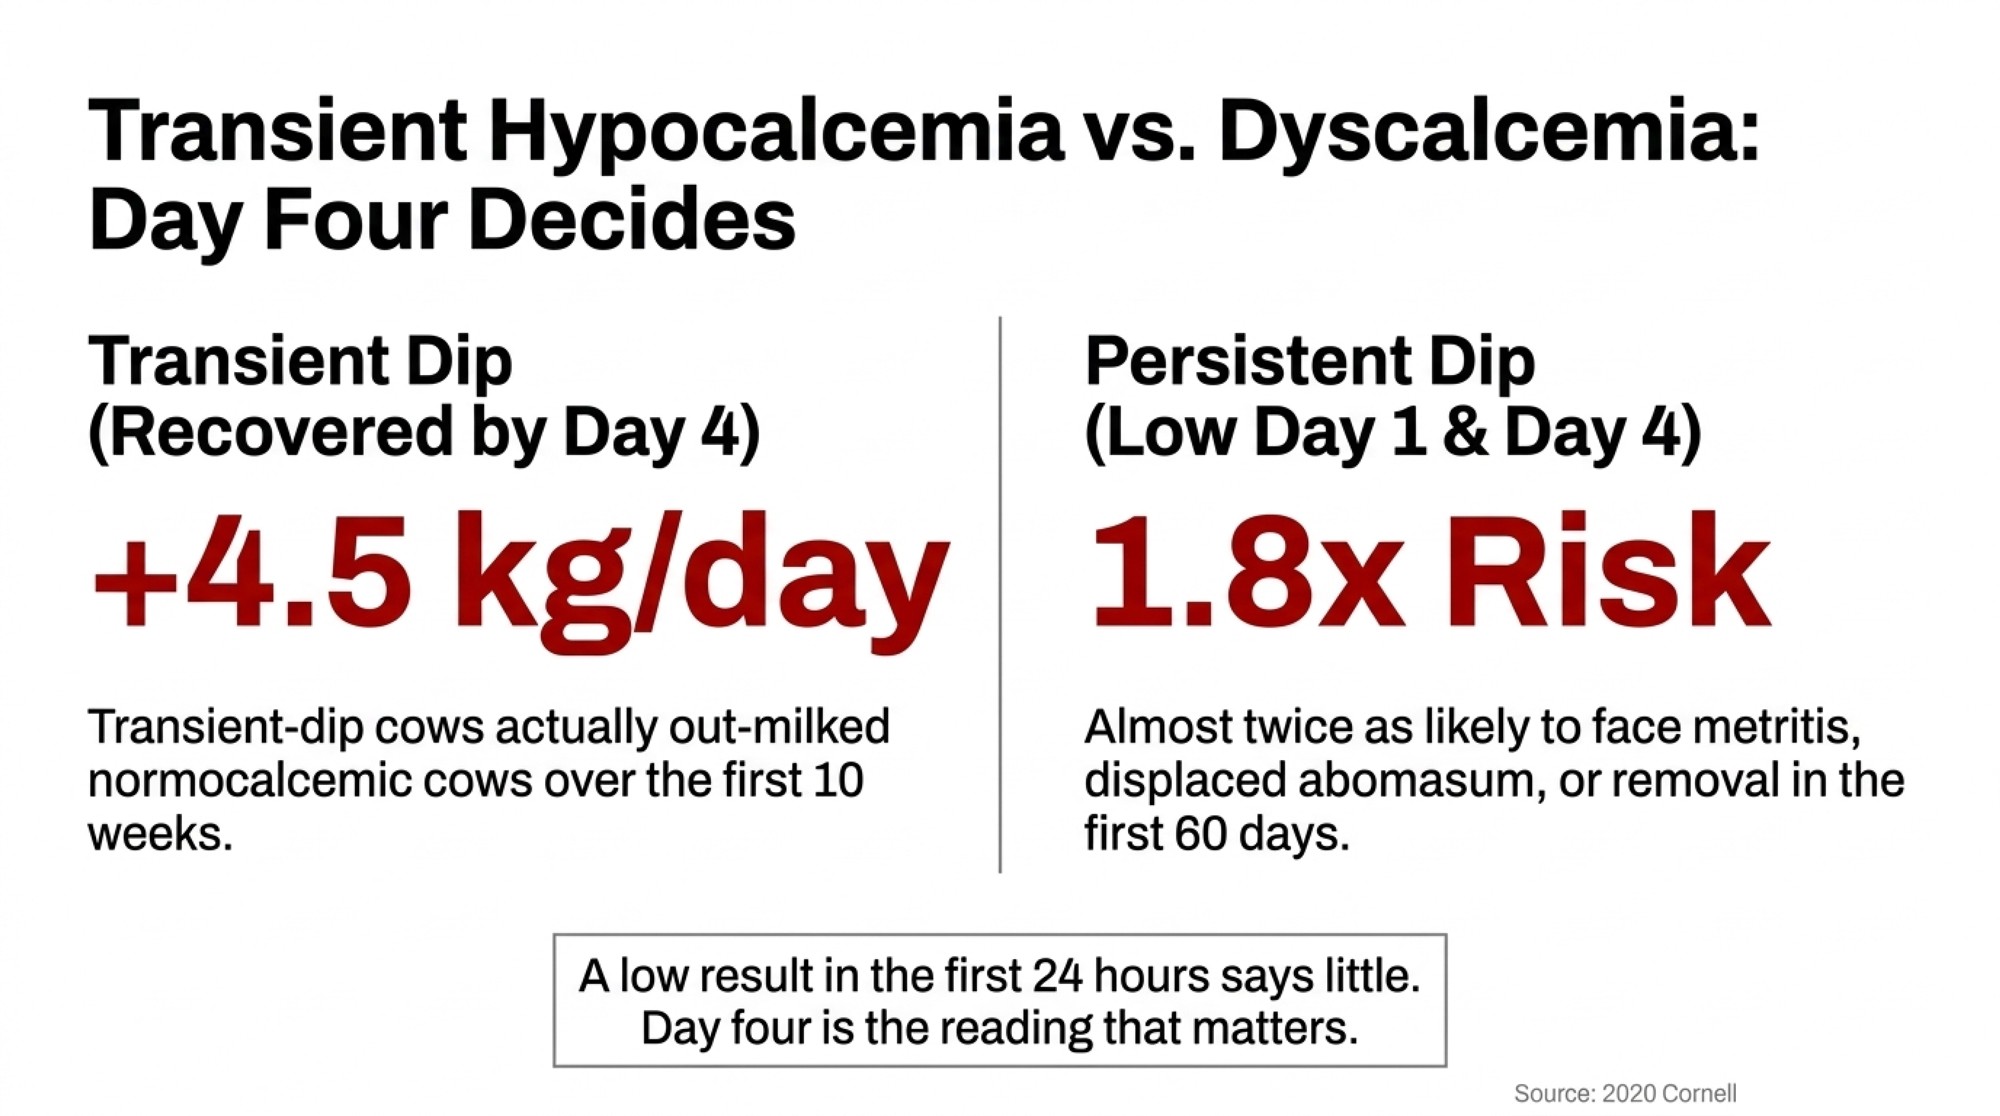
For years, any calcium dip after calving was something to wipe out. The data have moved past that, because how long the dip lasts matters more than whether it happens.

A 2020 Cornell study of 407 Holsteins in two New York herds sorted multiparous cows by their calcium on days one and four. It then averaged their milk across the first 10 weeks:

Multiparous calcium patternMilk, kg/day (first 10 weeks)
Transient dip (low day 1, recovered by day 4)49.1
Normocalcemic (above study cutoffs, days 1 and 4)44.6
Persistent (low day 1 and day 4)46.4
Delayed (normal day 1, low day 4)41.4

By Bullvine’s read, transient-dip cows out-milked normocalcemic cows by 4.5 kg/day and delayed cows by 7.7 kg/day.

Persistent and delayed multiparous cows were also 1.8 and 1.9 times more likely than normocalcemic cows to have an adverse event in the first 60 days. That covers hyperketonemia, metritis, displaced abomasum or removal from the herd.

So the reading that matters comes at day four: has the cow recovered? A low result in the first 24 hours says little about the transition program on its own.

That’s a problem for blanket supplementation, in our reading of the evidence. If a short dip comes with more milk, treating every subclinical cow isn’t obviously helping. And the 2020 study didn’t test a treatment protocol for the cows that stay low.

Clinical milk fever is still a veterinary emergency. A cow that’s down isn’t the place to argue about adaptation. Standing, healthy-looking cows belong on a written, risk-based protocol, and that protocol decides which cows get calcium.

Treating standing cows can even backfire: in a University of Guelph trial across two Ontario herds, cows given two oral calcium boluses post-calving actually ended up with lower serum calcium by day two (2.18 vs. 2.27 mmol/L) than untreated herdmates.

Negative DCAD and Urine pH: What the Meta-Analyses Show

Negative dietary cation-anion difference (DCAD) programs hold up fine under this evidence.

A 2019 meta-analysis pooled 42 experiments, 134 treatment means and 1,803 cows. Its models predicted that dropping prepartum DCAD from +200 to −100 mEq/kg would:

  • Raise blood calcium on calving day from 1.86 to 2.04 mmol/L.
  • Add 1.0 kg/day of postpartum dry matter intake.

Lower DCAD also cut prepartum intake in both parity groups, while improving intake after calving.

Heifers are where the case weakens. In the five nulliparous experiments (151 animals), lowering DCAD either didn’t change milk and protein yield or cut fat and fat-corrected milk.

A second 2019 meta-analysis found lower-DCAD diets cut disease risk. Converted to plain English (Bullvine math):

OutcomeReportedWhat it means
Clinical hypocalcemiaRisk ratio 0.6040% lower risk
Retained placentaRisk ratio 0.5941% lower risk
MetritisOdds ratio 0.4654% lower odds

The DCAD number on the ration sheet is what you planned. Urine pH tells you what the cows actually got.

Synthetic Zeolite A: Calcium Through Phosphorus Binding

Negative DCAD isn’t the only prepartum tool that works. Synthetic zeolite A gets at calcium another way, by tying up phosphorus.

The 2024 University of Wisconsin trial ran at the university’s Emmons Blaine Dairy Research Center in Arlington, Wis., from November 2019 to April 2020. It put 121 multiparous Holsteins on one of three close-up diets:

  • A control at +190 mEq/kg.
  • A negative-DCAD diet at −65 mEq/kg.
  • A +278 mEq/kg diet with synthetic zeolite A at 3.3% of dry matter, targeting 500 g/day.

Zeolite cows had lower blood and saliva phosphorus, more water-extractable phosphate in their manure, and the highest blood calcium before and after calving. The authors conclude zeolite improved calcium metabolism largely through binding phosphorus and excreting it in the feces.

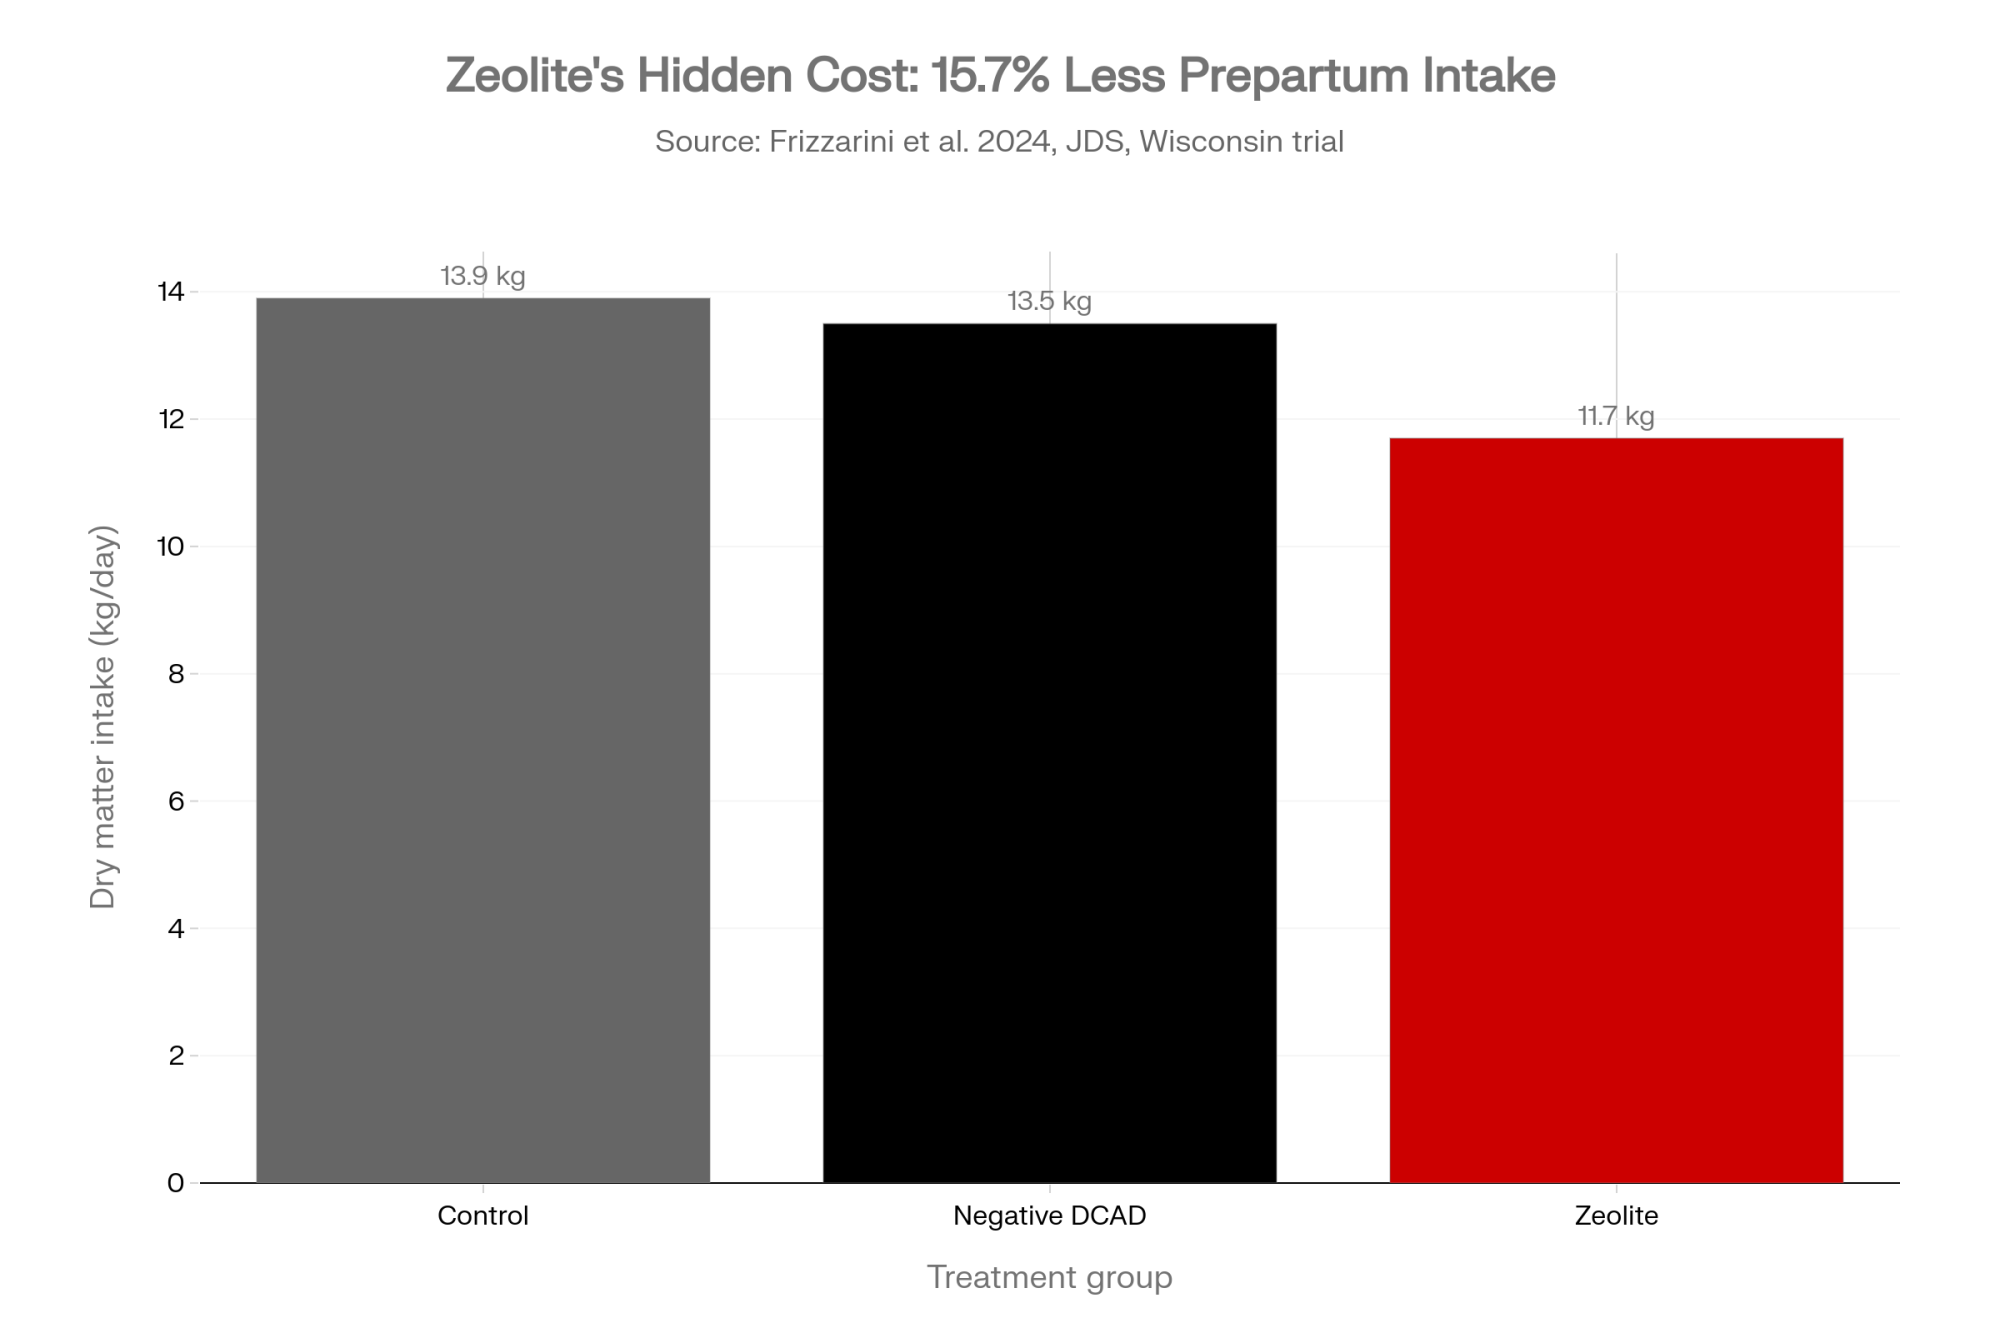
It costs intake. In the companion paper, prepartum dry matter intake averaged 11.70 kg/day on zeolite, against 13.88 on the control and 13.45 on negative DCAD. Rumination averaged 487 minutes a day on zeolite, against 531 and 527.

Blood glucose and BHB didn’t differ by diet. Average milk over the first seven weeks didn’t either.
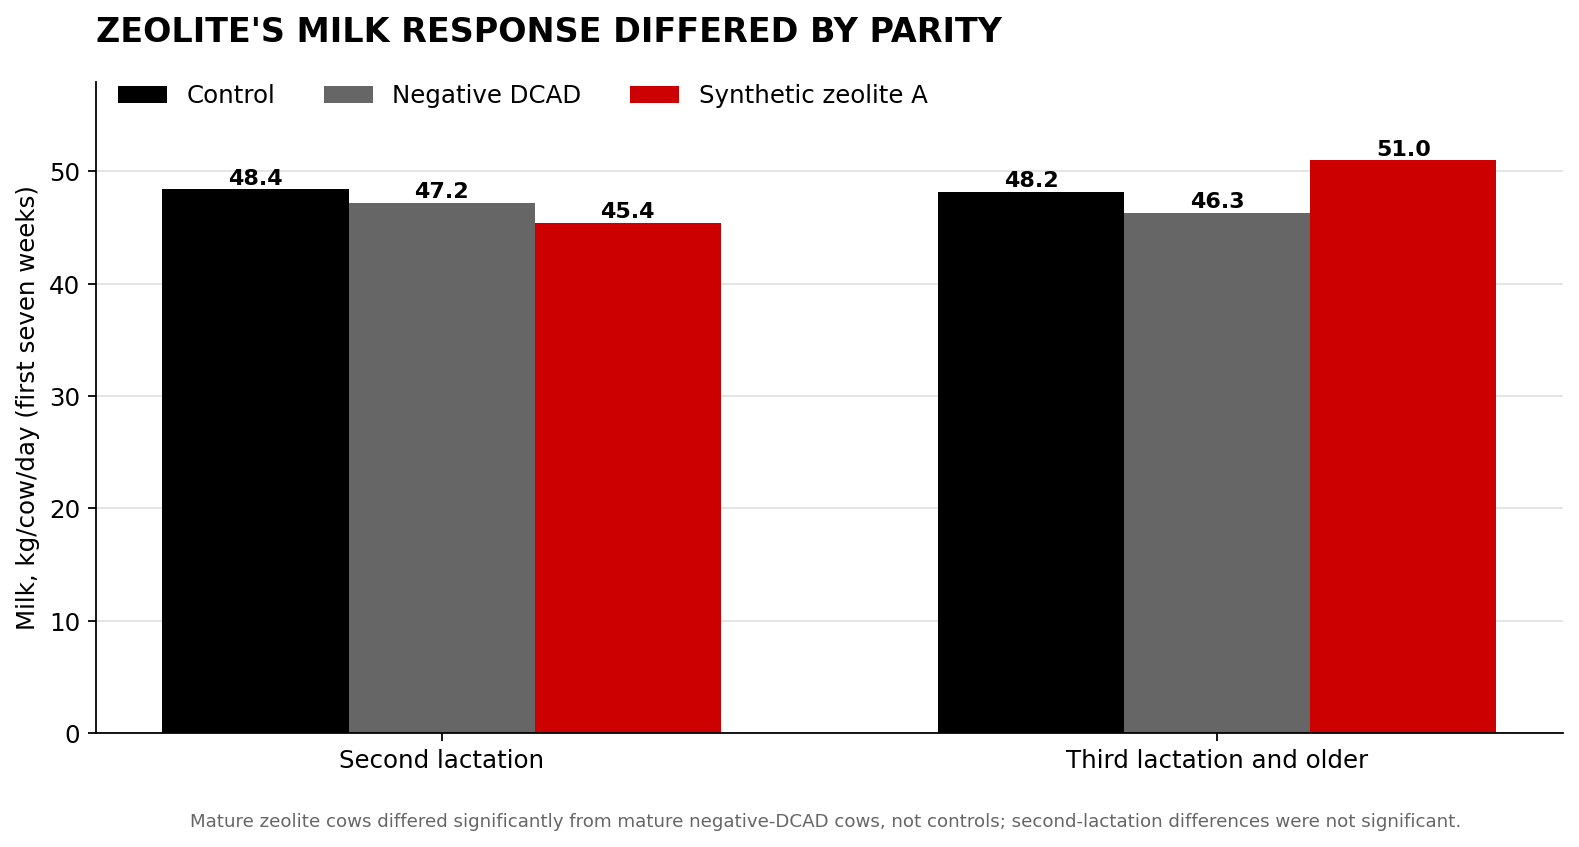
Parity is where the cows split:

  • Third lactation and older: zeolite cows gave 51.0 kg/day. That was significantly more than mature negative-DCAD cows (46.3 kg) but not different from mature controls (48.2 kg).
  • Second lactation: zeolite cows gave the least milk, 45.4 kg/day.

The companion paper lists USDA-Hatch funding and acknowledges funding support from VitaPlus Corporation and Vilofoss-Protekta. Their products, Ultra Chlor and X-Zelit, were the tested negative-DCAD supplement and zeolite. The authors stated no conflicts of interest.

Treat synthetic zeolite as a ration ingredient your nutritionist formulates and doses. Restricting phosphorus is the whole mechanism, and it can go too far. A 2026 npj Biofilms and Microbiomes study used it to induce hypophosphatemia on purpose, feeding 300 g/day of synthetic zeolite from 21 days before calving to three days after.

The First 48 Hours

The window that matters falls between calving and the usual day-four calcium test, and a second data set supports the timing.

A Cornell case-control study in the Journal of Dairy Science looked at 48 multiparous Holsteins on two commercial farms in central New York. Both farms fed negative DCAD before calving and didn’t give fresh cows blanket calcium.

Cows later diagnosed dyscalcemic already had higher haptoglobin, an inflammatory marker, at two days in milk: 1.11 g/L, against 0.39 g/L in eucalcemic herdmates. The authors write that “the causal structure of this relationship remains unknown.”

Put the two studies side by side and the inflammation signal shows up before the day-four calcium call in both:

  • The Cornell case-control study (sampled daily): the signal was there by day two.
  • The 2026 study (sampled every eight hours): it appeared at 64 hours, and intake had already dropped before that.

The herds, sampling schedules and calcium cutoffs differ, so this is a pattern across two studies.
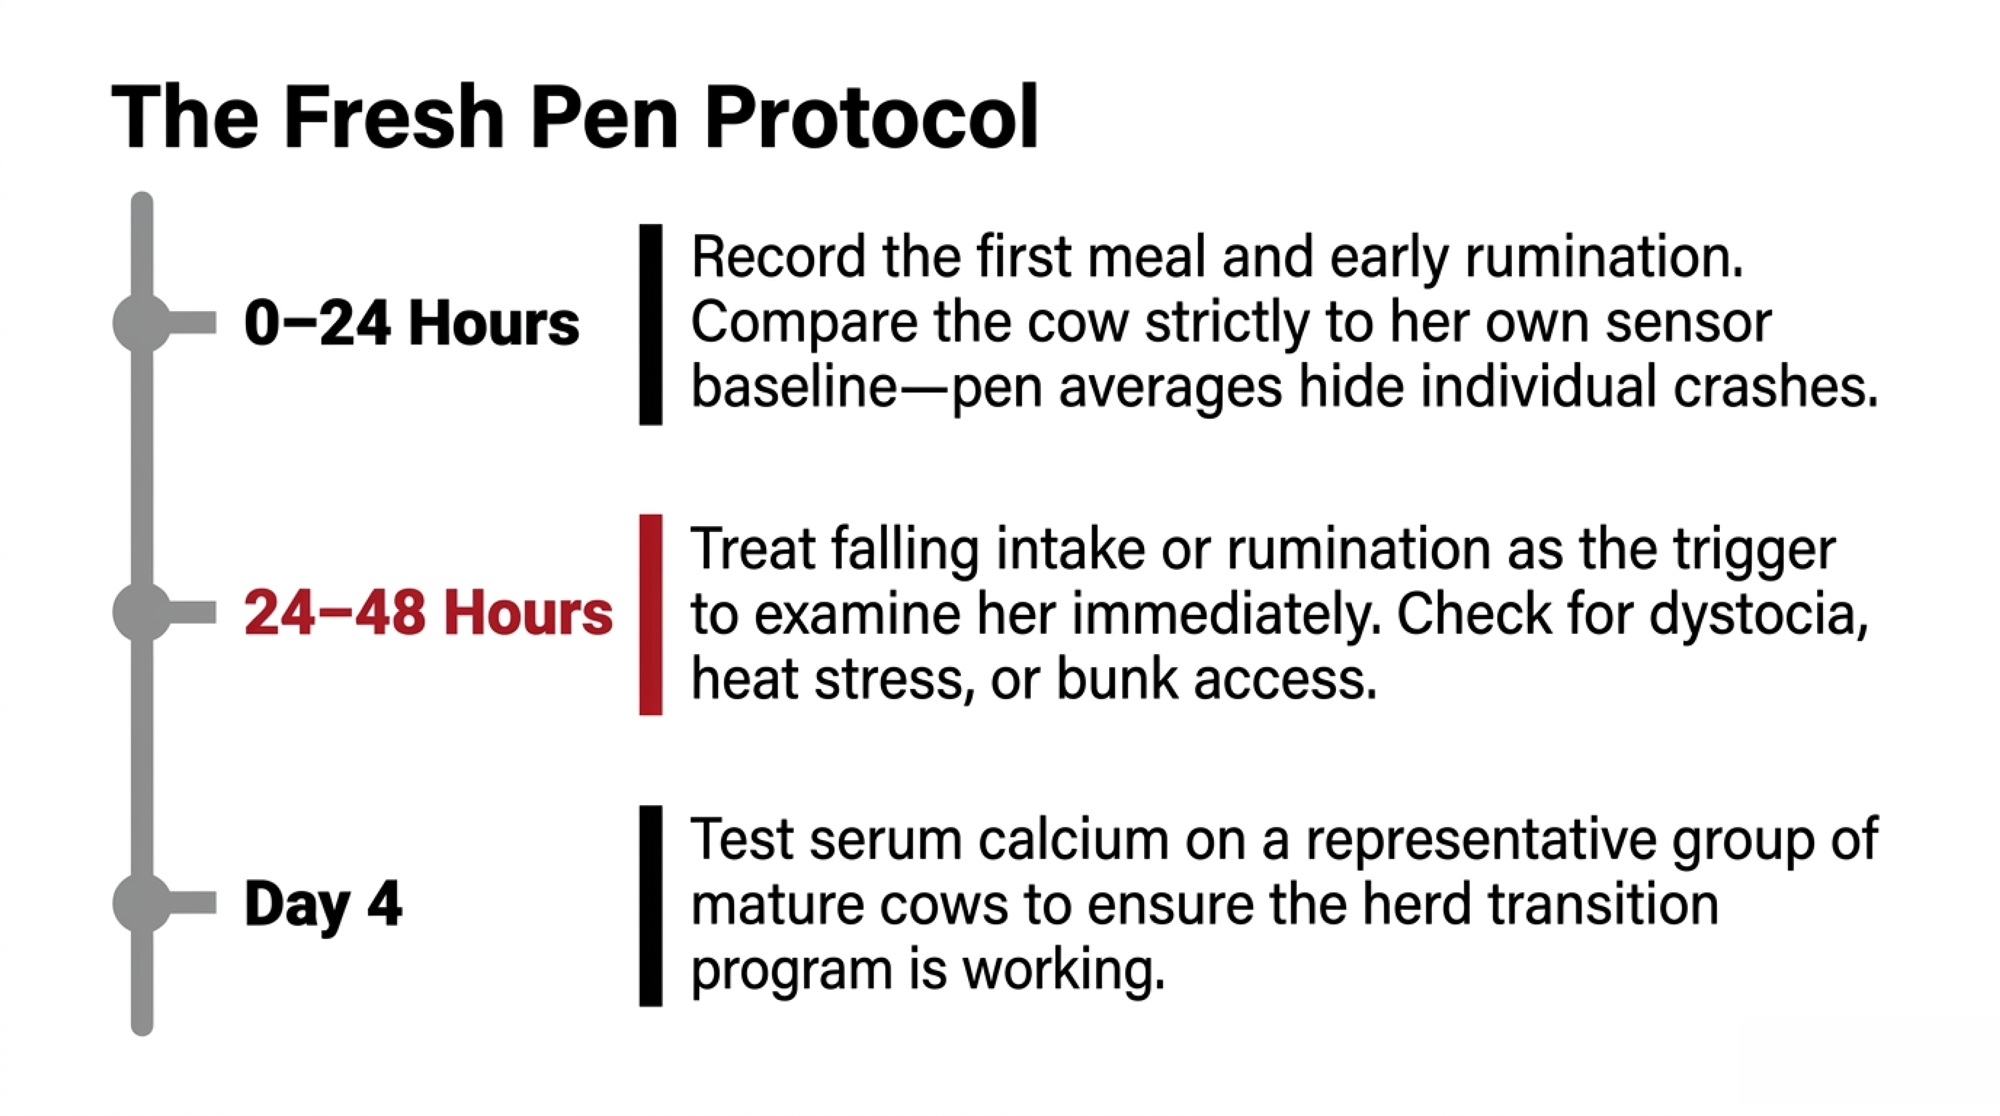
What that means for the fresh-pen routine:

  • 0–24 hours: record calving difficulty, the first meal, water access and early rumination. Compare each cow with her own sensor baseline, because a pen average hides the mature cow whose activity has crashed.
  • 24–48 hours: treat falling intake or rumination as the trigger to examine her, then check her surroundings. Dystocia, uterine disease, mastitis, lameness, respiratory disease, digestive upset, heat stress or simply not getting to feed can all produce the same pattern.
  • 48–72 hours: if she’s still off feed or behind her rumination curve, bring in the vet and nutritionist together.
  • Day four: test serum calcium on a representative group of second-lactation-and-older cows to see whether the herd is recovering.

The 2026 study reported group means and didn’t test them as an alert threshold for individual cows. Let the sensor put a cow on the work list, and let the exam decide what happens next.

Fix the Bunk First
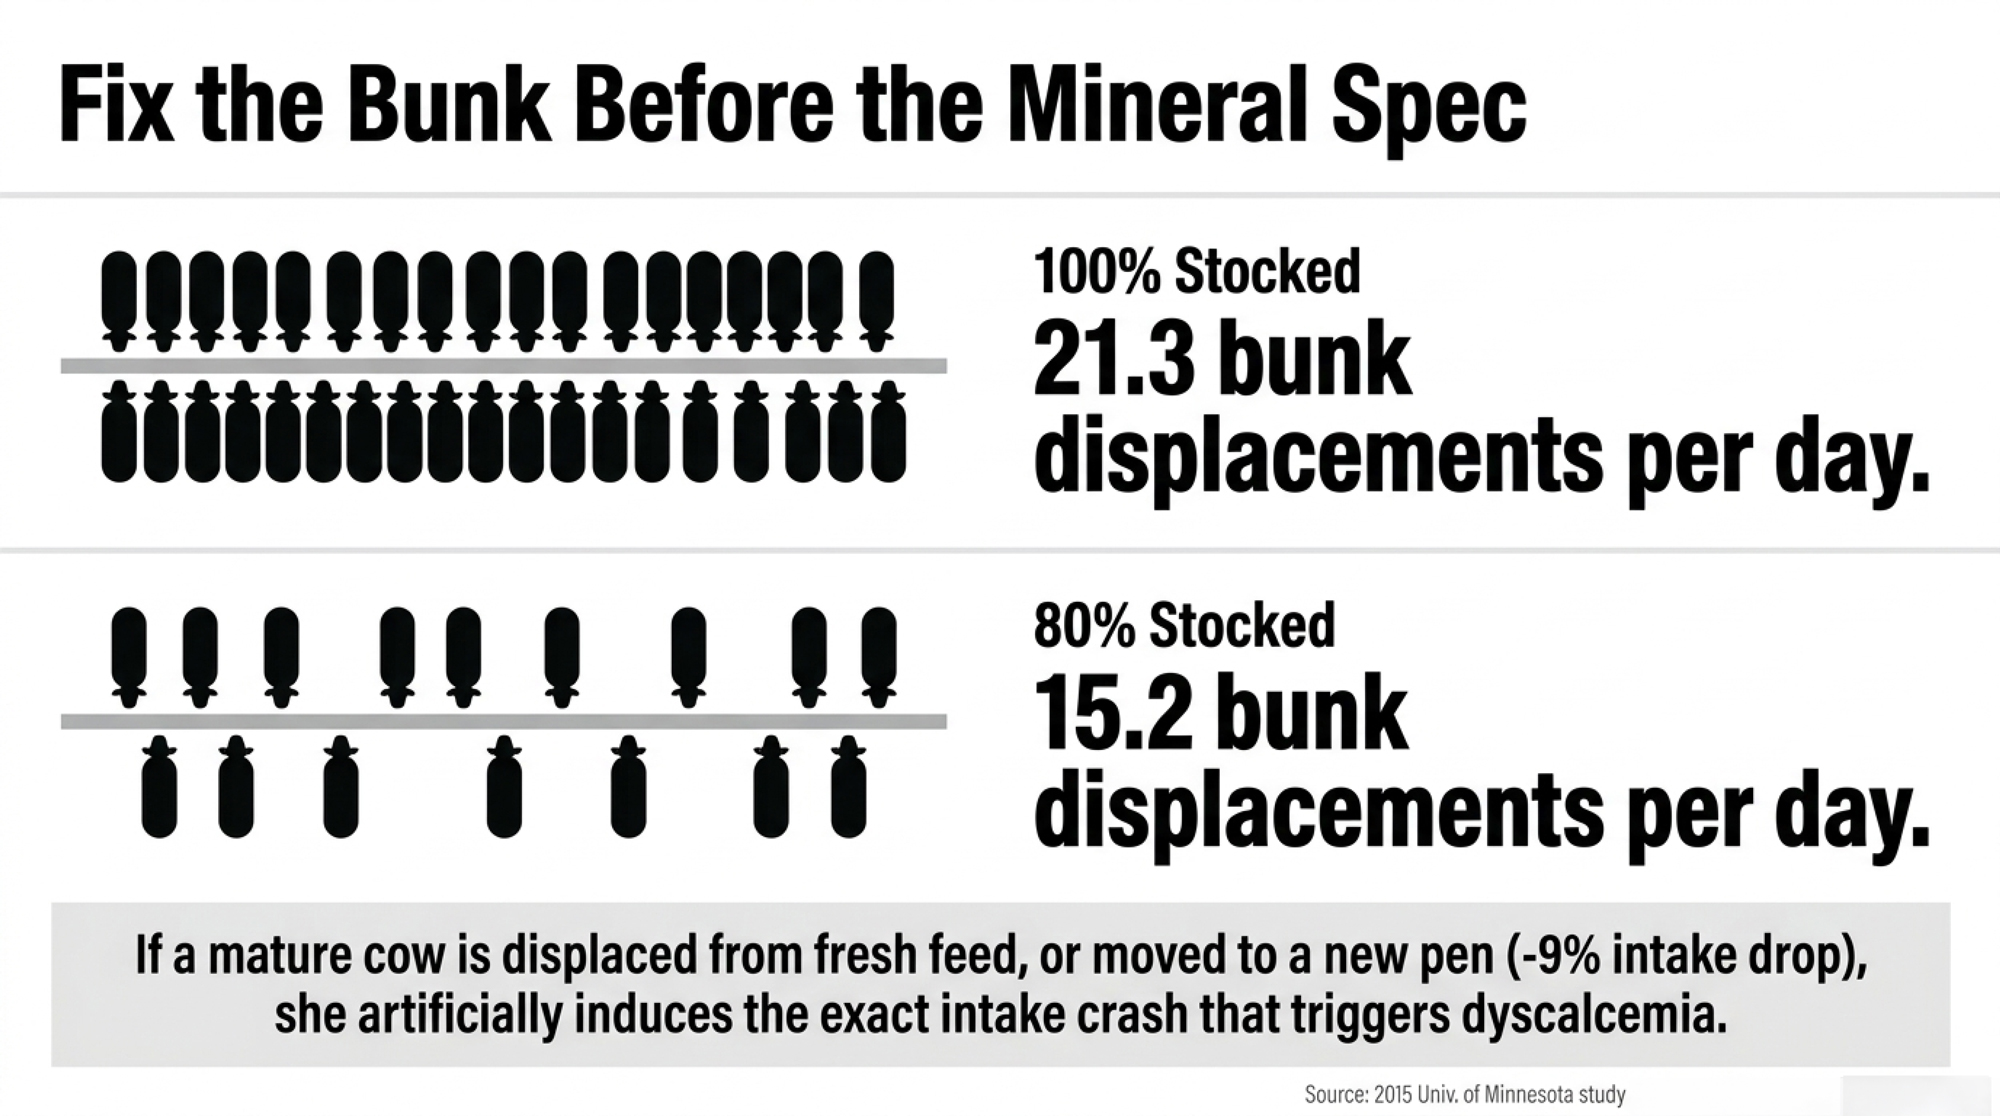
If cows can’t get to the ration, changing the mineral spec won’t fix it. Two Journal of Dairy Science studies show how competition and pen moves shape access to feed.

  • Stocking density: a 2015 University of Minnesota study enrolled 756 Jersey animals at a 6,400-cow commercial dairy in south-central Minnesota. Pens had 48 headlocks and 44 stalls, stocked at either 80% (38 animals) or 100% (48 animals). The 80% pens had 15.2 feed-bunk displacements per day, against 21.3 at 100%, counted over the three hours after fresh feed. The authors called the behaviour changes small, said more stocking density couldn’t be recommended, and flagged the need for work in other breeds.
  • Pen moves: in a 2011 University of British Columbia study of 48 dry Holsteins at Agassiz, B.C., cows were regrouped about 40 days before calving. Cows moved to a new pen cut dry matter intake by about 9% on the day they moved. Cows that stayed in their home pen while newcomers arrived showed no significant drop. Rumination fell about 9% in both groups.

A fresh-cow review worth doing asks:

  • Did every mature cow have uninterrupted access when fresh feed arrived?
  • Was the ration delivered and pushed up on schedule?
  • Did the actual mix match the formulated ration?
  • Was sorting visible in the refusals?
  • Were waterers clean, accessible and fast enough for peak demand?
  • Were first-lactation cows losing bunk access to older cows?
  • Did pen moves, calving difficulty or heat load cut intake?
  • Which cows failed to recover rumination by the second day?

Change the Scorecard
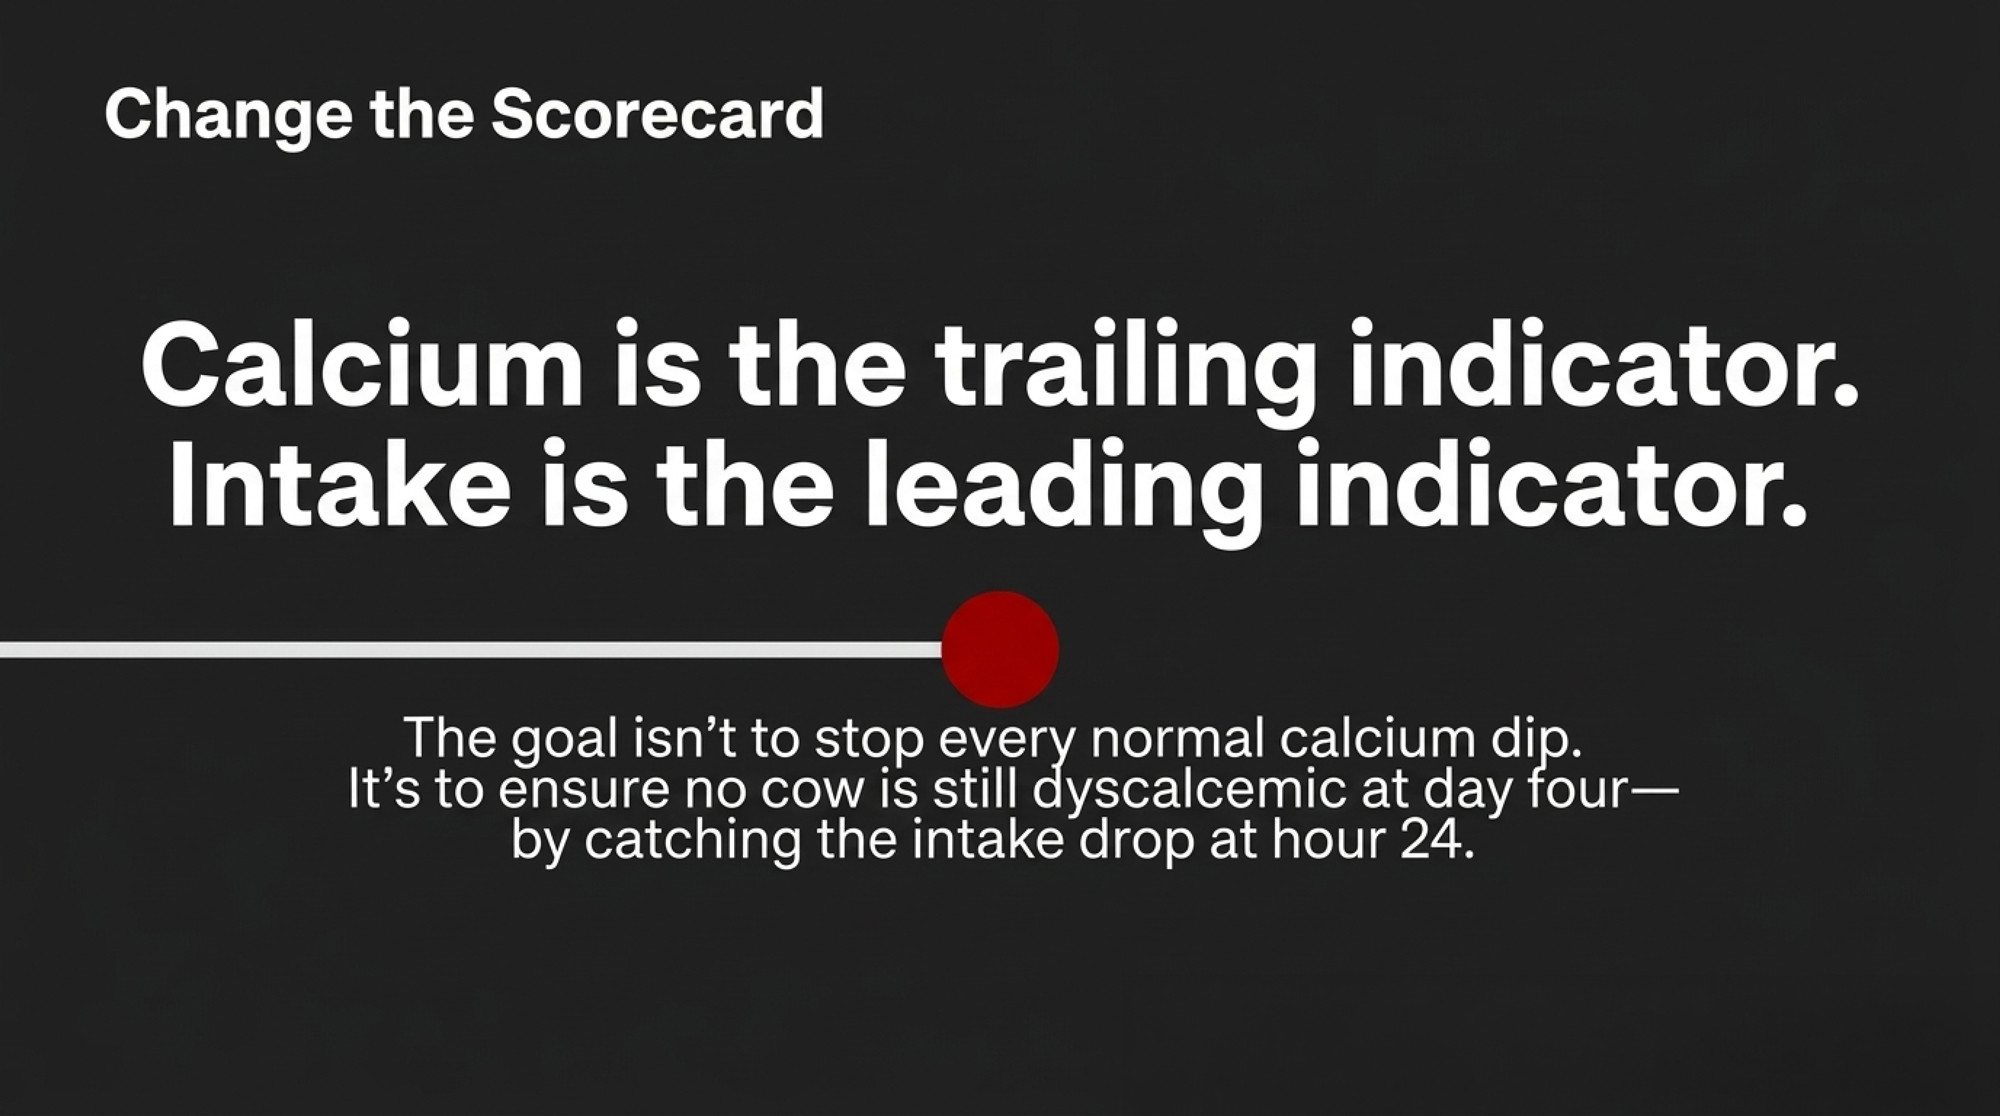
Counting clinical milk fever is a poor way to grade a transition program. It catches the most visible failure and misses the cows that stay on their feet while losing intake, rumination and milk.

A better herd dashboard tracks five things:

  • Close-up dry matter intake and ration consistency.
  • Each cow’s rumination recovery over the first 48 hours.
  • Day-four dyscalcemia prevalence in multiparous cows.
  • Metritis, displaced abomasum, hyperketonemia and early removals.
  • Milk through the first 10 weeks, priced with the per-cow math above.

Break each one out by parity, season and pen. A herd average can look fine while fourth-lactation cows, crowded groups or hot fresh pens quietly take most of the damage.

The goal isn’t to stop every normal calcium dip after calving. It’s to make sure no cow is still dyscalcemic at day four.

By the time that test comes back, the earliest warning is already two days old.
Complete references and supporting documentation are available upon request by contacting the editorial team at editor@thebullvine.com.

Learn More

The Sunday Read Dairy Professionals Don’t Skip.

Every week, thousands of producers, breeders, and industry insiders open Bullvine Weekly for genetics insights, market shifts, and profit strategies they won’t find anywhere else. One email. Five minutes. Smarter decisions all week.
NewsSubscribe
First
Last
Consent

Parity Beats Your Ration 52-to-1, and Nothing You Buy Changes a Cow’s Age

Three companies, four levers, four failure points. The €16,950 figure your rep quotes was published by a company selling one of them. Seven things to measure before you buy.

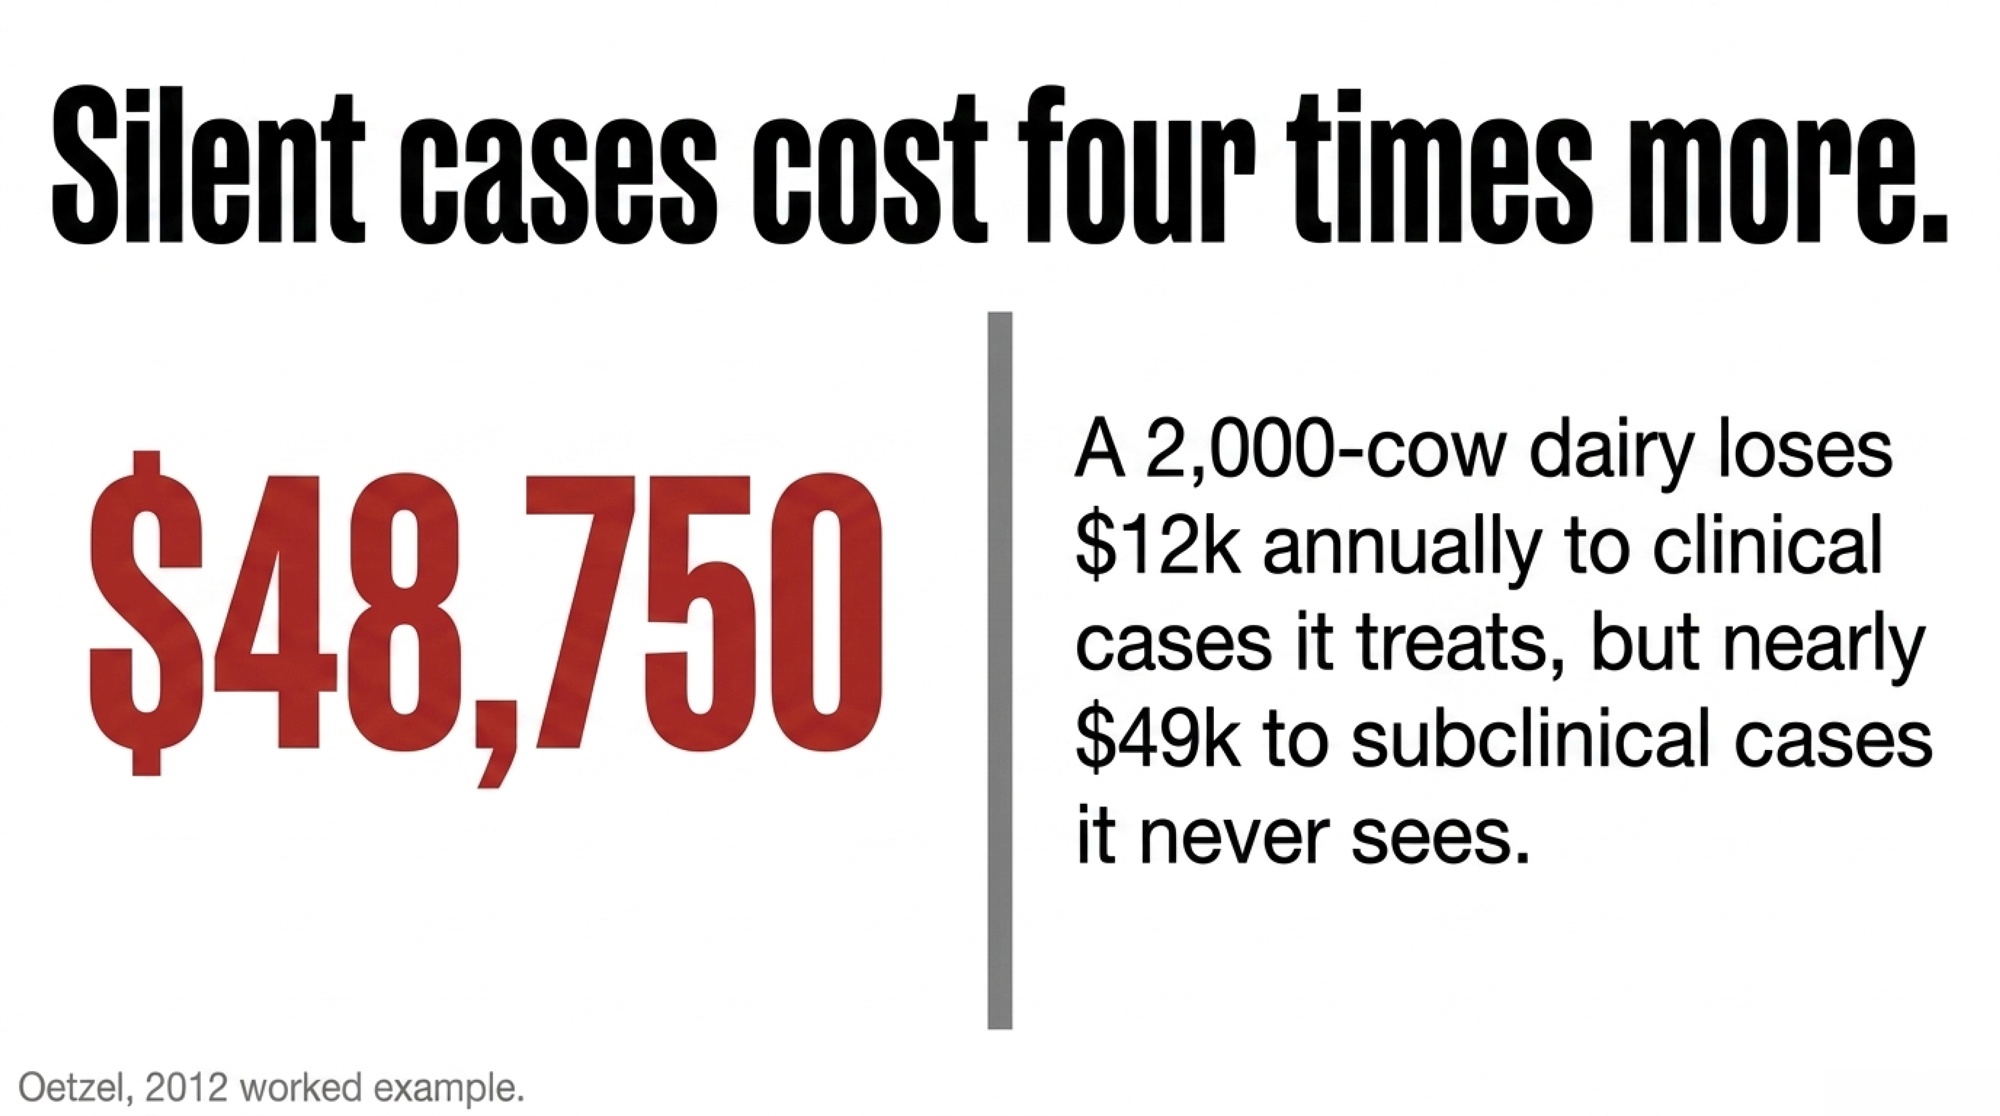
Executive Summary: The €16,950 milk fever cost figure your nutritionist quotes was published in February 2021 by Phibro Animal Health’s Business Manager Europe — a company that sells anionic minerals for the problem the model prices. That’s not a reason to discard it, because the per-case costs underneath it trace to Guard (1996) and Oetzel (2011), and Oetzel’s own worked example holds up cleanly: a 2,000-cow dairy loses about $12,000 a year to clinical cases it treats and roughly $48,750 to subclinical cases it never sees. Four approaches are on the table and every one has a real failure point. Before any of them, three measurements cost almost nothing and decide which lever could even work on your farm — read on if your transition numbers have been stuck for three years and you can’t say for certain whether the last thing you changed actually worked.

milk fever prevention

Sabrina Caron doesn’t soften what her Quebec herd went through. “For a long time we had a lot of problems with calvings and with cows not having a good start to the lactation. It was a horror,” she in a recent interview. She’d tried plenty. The one that stuck was X-Zelit, and she credits it with lifting her herd average from 40 to 48kg per cow per day inside a year.

Caron and Danny Giguère run 105 Holstein milking cows at Ferme Roland Caron in Laurierville, Quebec — third-generation ground, and named Agropur’s 2024 Grand Champion for animal welfare. Her account is a real producer describing a real result. Whether it’s a result you can copy is a different question, and the research on transition failure explains why.

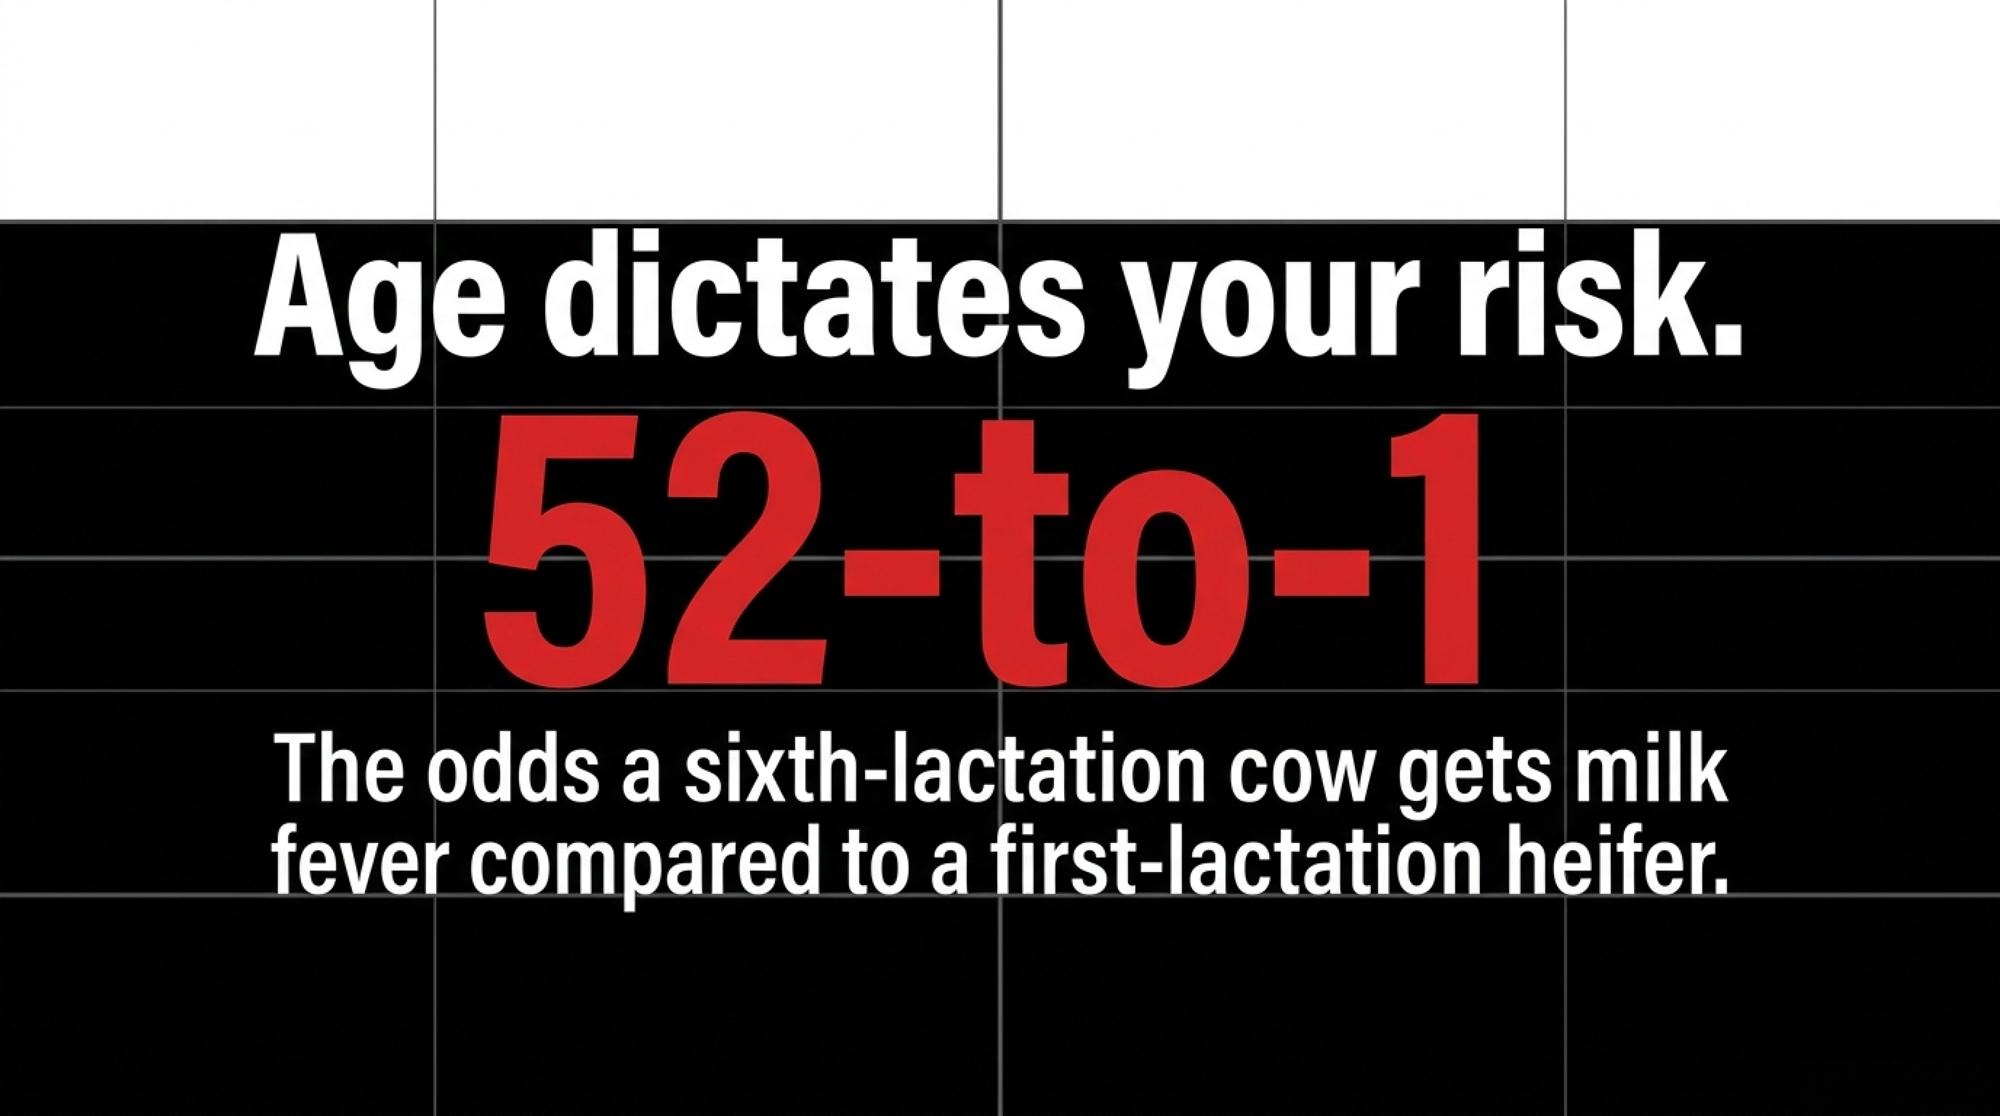
A 2017 Journal of Dairy Science study of Costa Rican grazing herds found parity dominated every other risk factor for milk fever, at an odds ratio of 52.59 for cows in their sixth lactation or later. That figure comes from the study’s base model; the same paper’s full model, which adjusts for more herd-level variables, puts the same group at OR 12.84. Both models found parity was by far the largest factor. We quote the base-model figure because it’s the one the literature circulates — which is exactly the kind of choice this article is about. A producer weighing it should know the range, and know these were grazing herds in Costa Rica, not confinement herds in Wisconsin or Ontario.

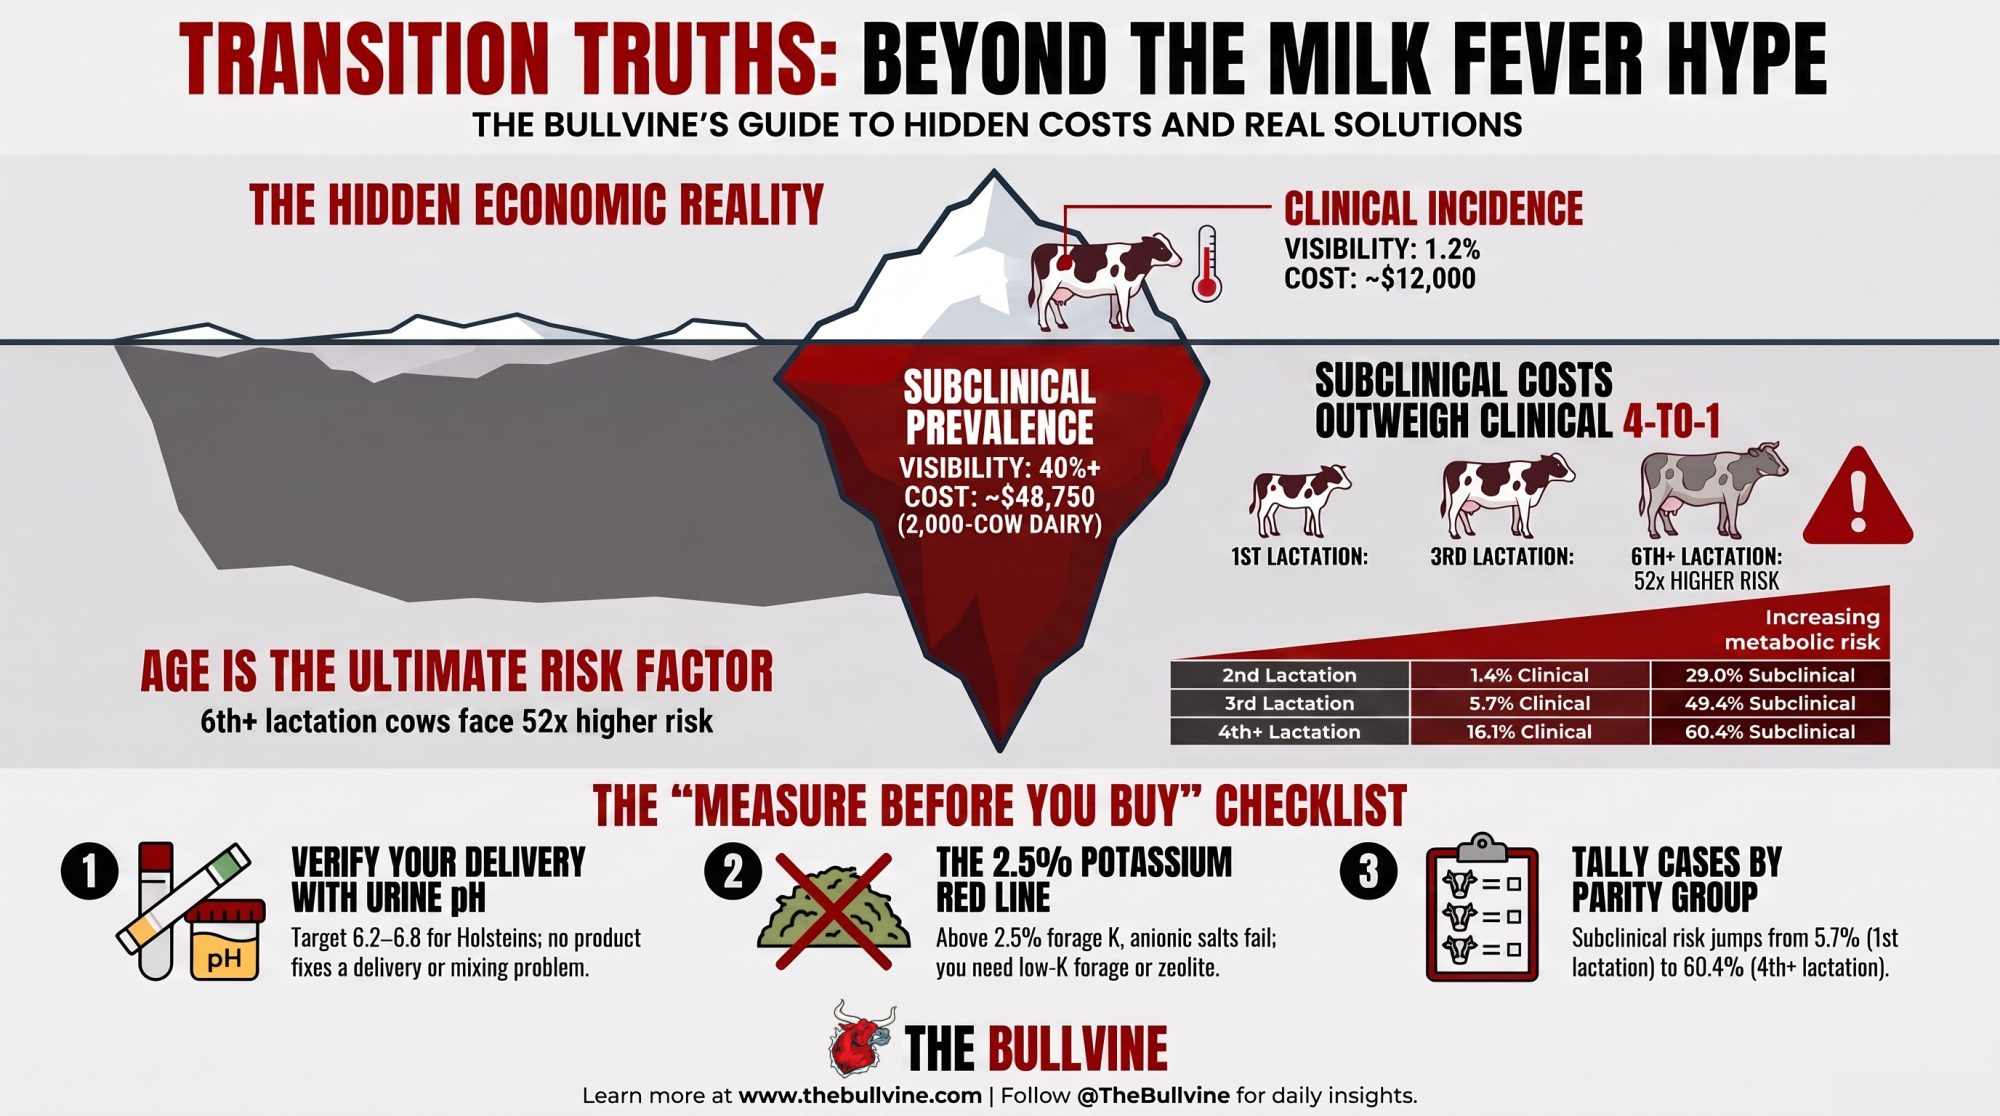
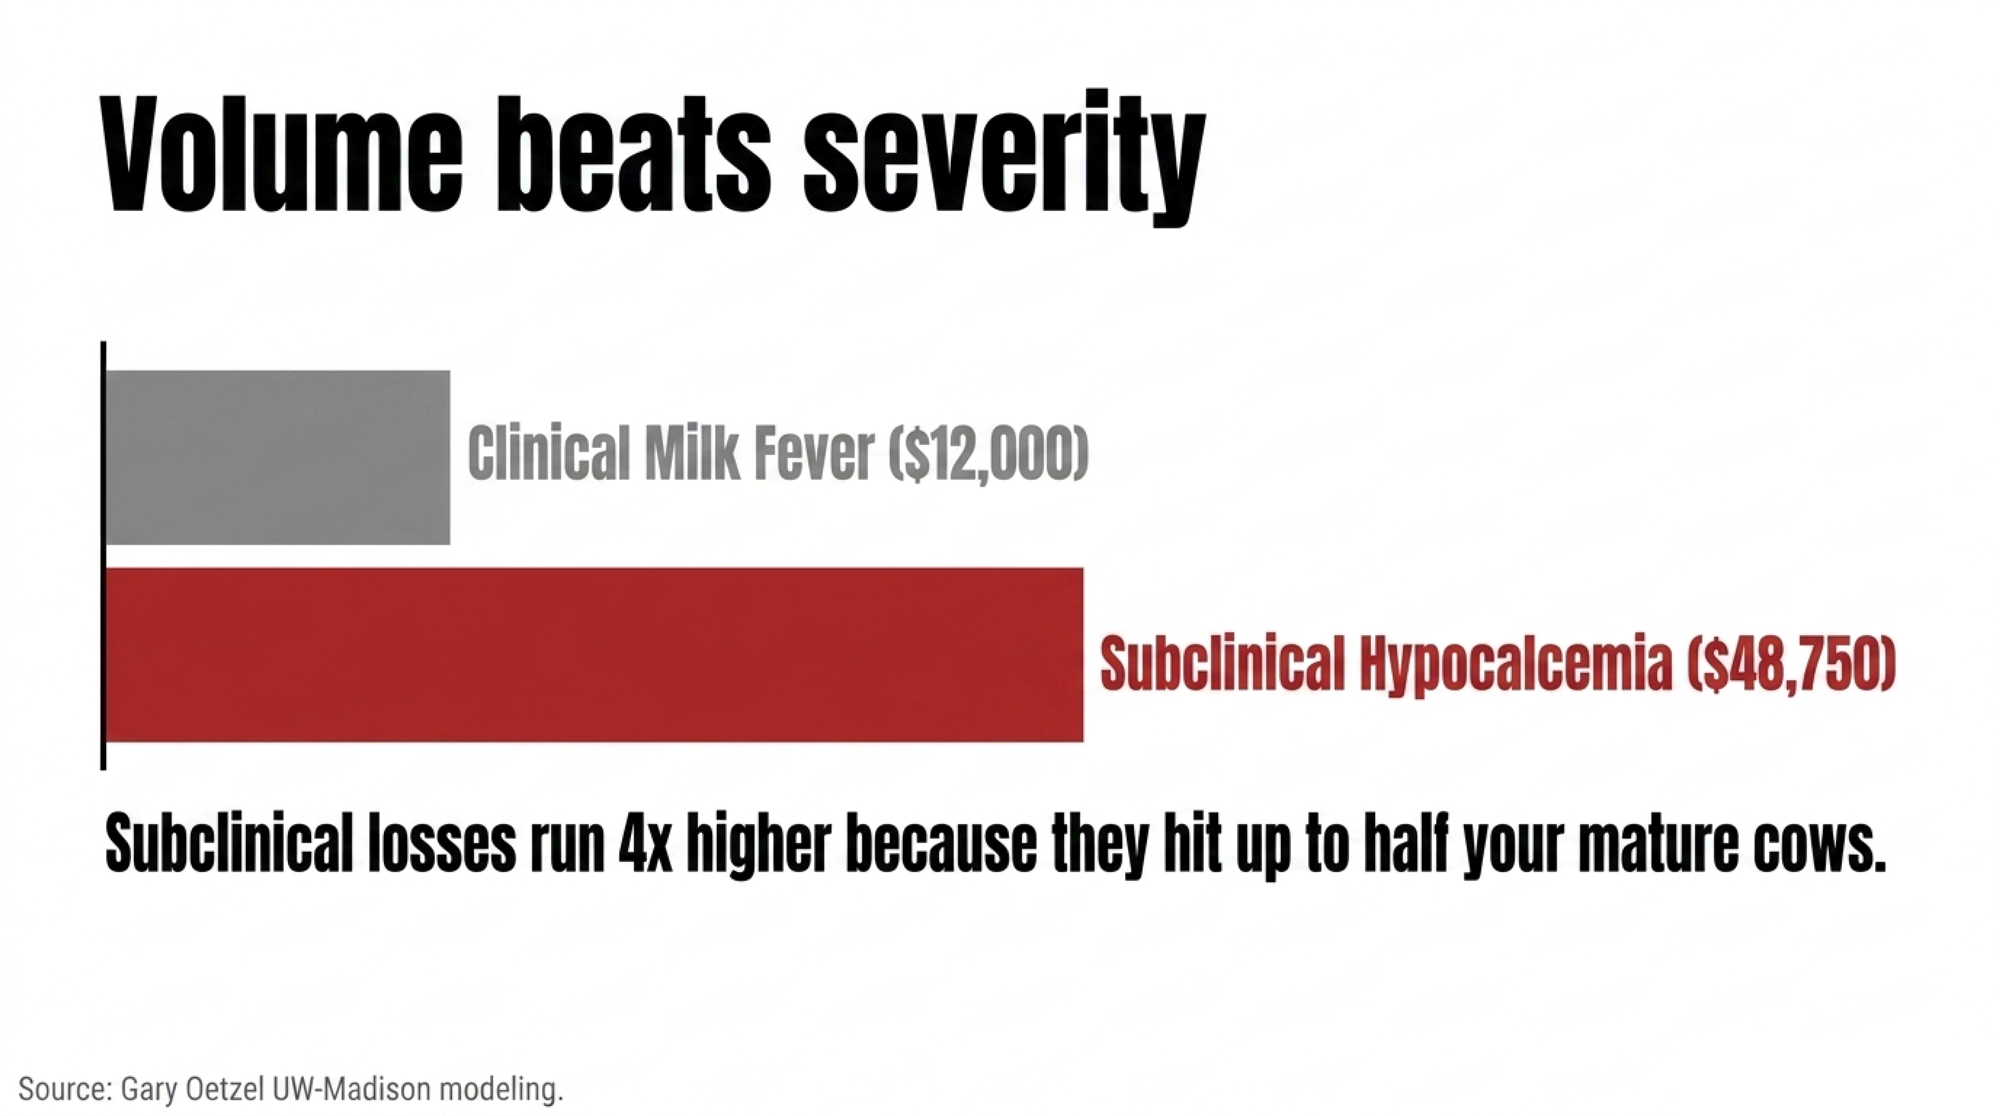
Either way, nothing you buy changes a cow’s parity. And here’s the inversion that reframes the economics. Oetzel’s 2012 worked example put it plainly: a 2,000-cow dairy with 2% clinical incidence at $300 a case loses about $12,000 a year, while the same herd with 30% subclinical incidence among second- and later-lactation cows at $125 a case loses about $48,750. Four times more, from cases nobody treats.

Three Things to Measure Before You Buy Anything

The full decision guide is further down, but if you read nothing else: pull urine pH on your close-up cows, test your dry cow forage potassium, and tally your clinical cases by lactation group. All three cost almost nothing. All three change which of the four approaches below could plausibly work on your farm. None of them require a sales call.

What’s Actually Changed in Transition Prep

Transition prep used to be one conversation. Get dietary cation-anion difference right in the final three weeks, check urine pH, hope. That’s still the backbone: University of Wisconsin–Madison Extension puts the research-based DCAD target at -100 to -200 mEq/kg DM, with -100 often preferred because pushing toward -200 risks too severe a metabolic acidosis response. NASEM’s 2021 requirements land in the same place, recommending -100 mEq/kg DM inside the final 21 days. Target urine pH for Holsteins runs 6.2 to 6.8.

What’s new is that the field now has genuinely different biochemical routes to the same endpoint — with independent research confirming they aren’t the same thing wearing different labels. A 2024 Journal of Dairy Science trial from Wisconsin compared synthetic zeolite A head-to-head against negative DCAD and found both improve postpartum calcium metabolism, but “they appear to work through different mechanisms.” That’s a controlled comparison saying the physiology diverges, not a marketing claim.

Dry-Off Isn’t the End of Anything

The third route steps outside feeding altogether, and it starts earlier than most protocols do. Julien Redor, Ruminant Technical Manager at the French company Natual, frames it this way: drying off “should no longer be seen as the end of milk production, but rather as a phase of immunological preparation” directly after the last milking, with active metabolic preparation across the final three weeks before calving.

That framing has independent research behind it. A 2025 Journal of Dairy Science review approaches the dry-to-lactation window through immunometabolism — metabolic and immune function wired together rather than stacked in sequence. A heavily cited 2017 review put the interdependence bluntly: metabolic diseases like milk fever and ketosis raise a cow’s risk of infectious disease, and infectious disease raises her metabolic risk right back.

Here’s what it looks like as a protocol rather than a concept. On a French farm running roughly 250 Holsteins with a stated goal of cutting antibiotic use at dry-off, the sequence is specific: no over-milking at the last milking, minimal teat stimulation afterward, Natual’s Taribol bolus administered systematically within two hours, then straight into a separate dry group on a high-fiber, low-energy ration — physically separated from the milking herd so nothing re-stimulates production. Metrabol follows post-calving, aimed at uterine involution and getting the cycle restarted.

Read that list again and notice how much of it costs nothing. The over-milking, the teat handling, the physical separation, the ration split — those are protocol decisions, not purchases. Whatever you conclude about the boluses, the handling sequence around them is available to any herd that decides to run it.

The Farms Where Everything Looks Right and It Still Goes Wrong

Ask a nutritionist about their problem farms and you’ll often hear the same profile: textbook rations, sporadic milk fever anyway. Dr. Norbert Göres has spent years on that list. He’s a veterinarian with a TiHo Hannover doctorate on cattle feeding and, since 2021, Director of Business Development for the EU market on Sano’s SmartDairyNutrition program.

“There are farms where everything seems to be right — low potassium dry cow rations, optimal mineral supplementation and a perfectly mixed ration, but they continue to be confronted with cases of milk fever here and there,” Göres said in a European trade interview on transition management. “These types of cases made us rethink existing concepts and further develop them.”

Sano’s answer is Mipro Close-Up 700 — acidification held across the full dry period instead of the close-up phase alone, paired with rumen-protected methionine and choline for liver support. The company reports clinical milk fever effectively eliminated on client farms and fresh cows averaging 7.9kg more milk per day, with the biggest gains in older cows. Those are company-reported field results from Sano’s own advisory work. We could not locate the underlying trial data in the published literature, which doesn’t mean the results aren’t real — field results rather than published trials are common practice across on-farm nutrition advisory programs — but it does mean you’re weighing a vendor’s client outcomes rather than an independent trial.

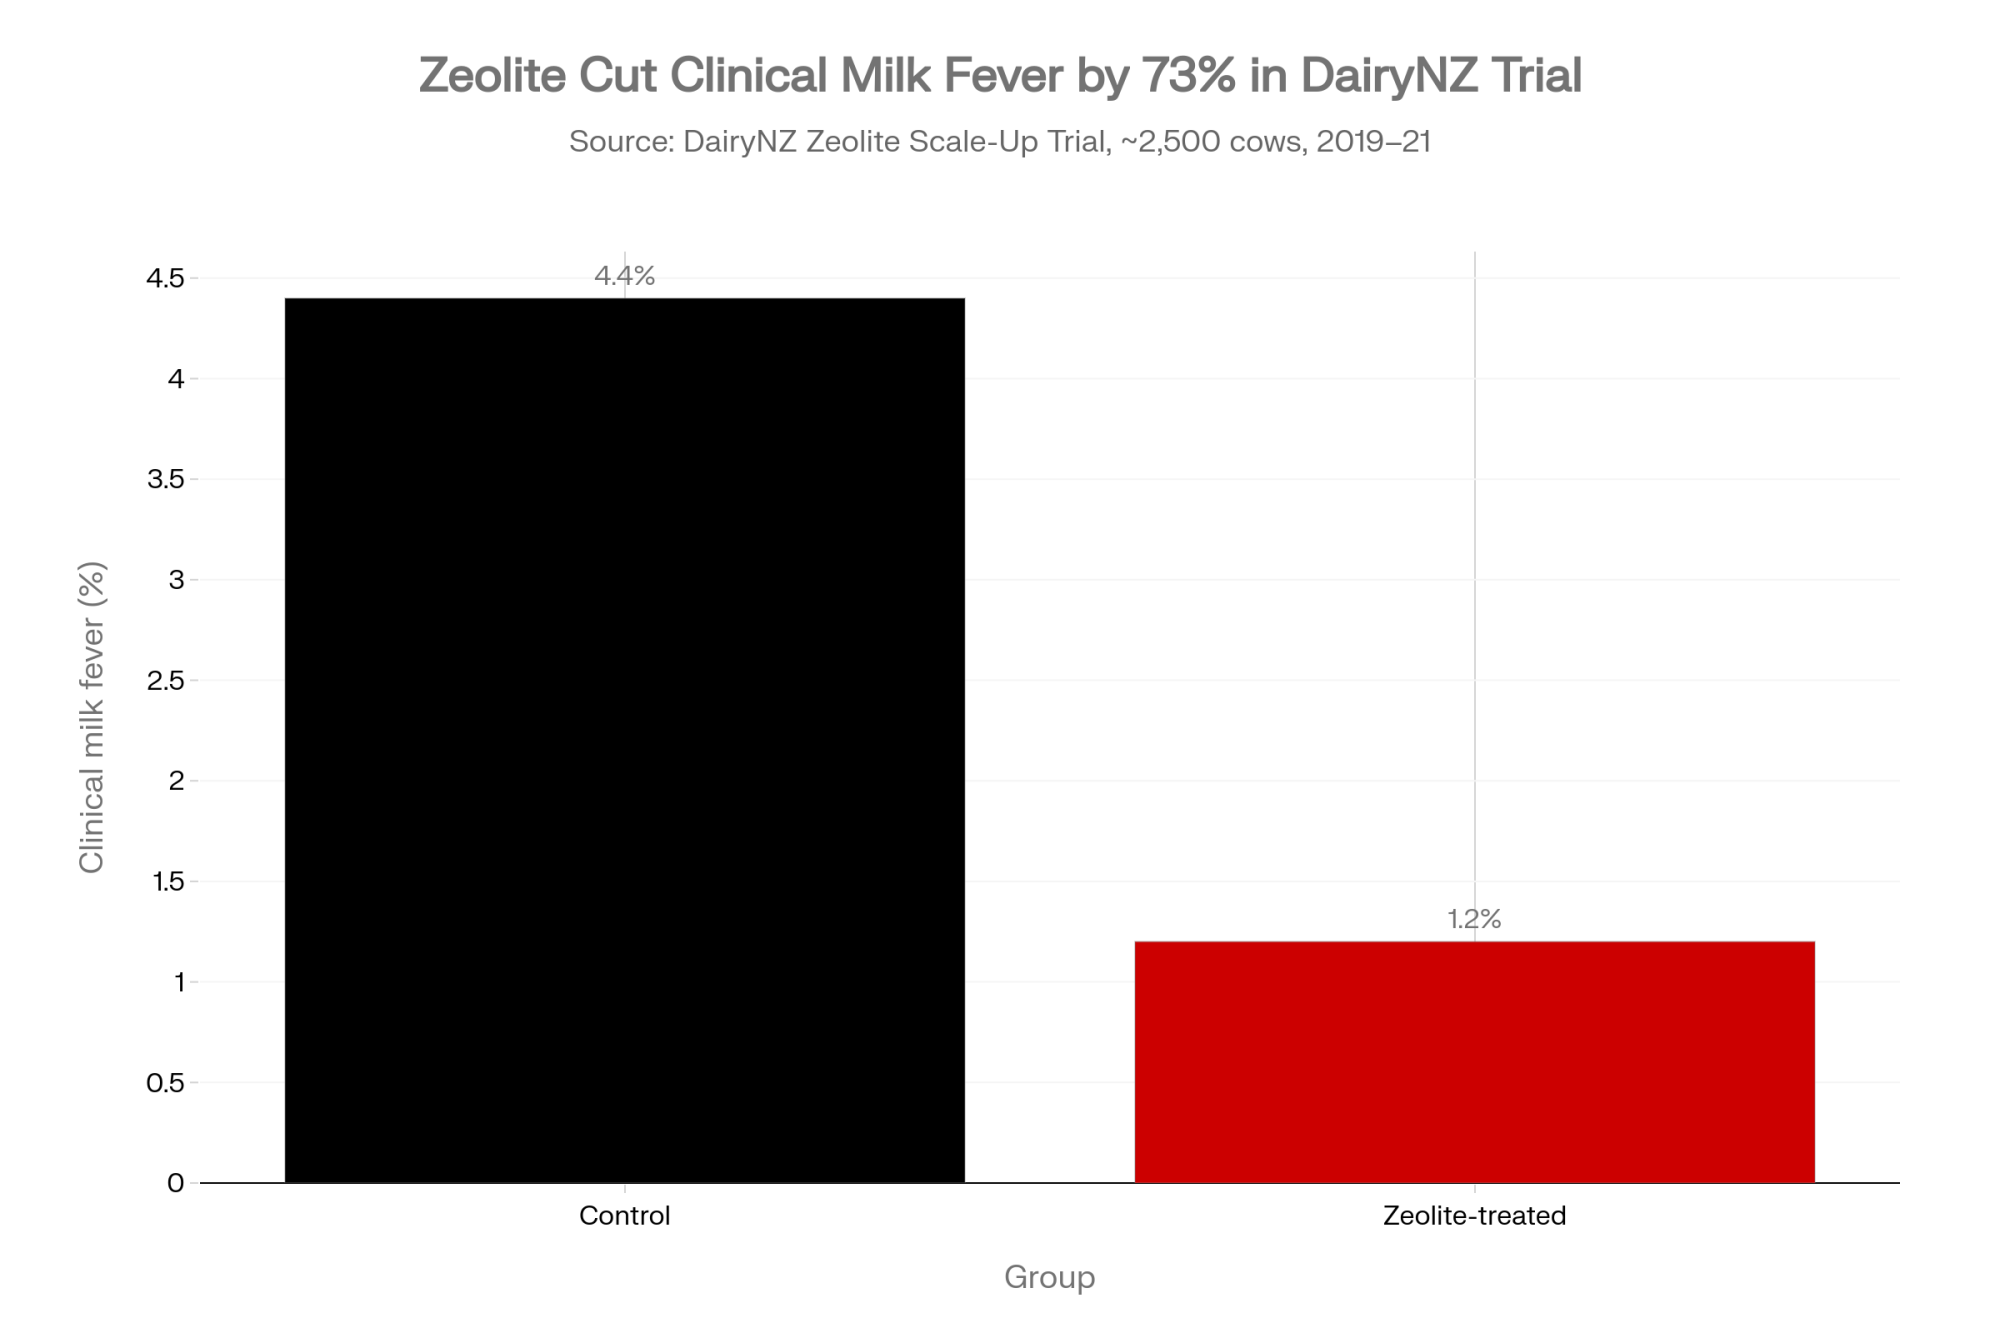
Zeolite’s trail is more traceable, and it doesn’t rest on one trial. Kerwin and colleagues, publishing in the Journal of Dairy Science in 2019, found synthetic zeolite A fed prepartum produced markedly improved serum calcium around calving in a housed Cornell herd — and DairyNZ’s scale-up work is the most recent large-scale confirmation. DairyNZ — funded by New Zealand dairy farmers through the levy and by the Ministry for Business, Innovation and Employment — ran its Zeolite Scale-Up Trial across roughly 1,000 cows in three Waikato herds in 2019/20 and another 1,500 cows across three herds the following season. Half of each herd got 500g/day of synthetic zeolite for three weeks pre-calving. Clinical milk fever fell from 4.4% in controls to 1.2% in treated cows.

Worth noting where the commercial interest sits on this one too. Vilofoss, which markets X-Zelit, calls the product “a definitive solution for the control of hypocalcemia” and “a significant and disruptive advance” in its own 2026 conference material. Strong independent evidence and strong marketing aren’t mutually exclusive. They’re just different things, and only one went through peer review.

Four Levers, Four Failure Points

ApproachMechanismBest fitWhere it fails
Close-up negative DCADAcidosis activates TRPV5/TRPV6 calcium channels; mechanism still debatedConfinement herds, controlled and testable rationsNo benefit below pH 6.0 or -100 mEq/kg DM; failed entirely at dietary Ca above 1.6% in a 1992 trial
Extended acidification — Sano Mipro Close-Up 700, full dry period plus methionine and cholineSame acidification route held longer, with liver supportPersistent cases despite textbook close-up formulationNeeds precise DCAD calculation, mineral balancing, cow comfort, routine urine pH. Results are company-reported, not independently published
Synthetic zeolite — Vilofoss X-Zelit, 500g/day for 2–3 weeks, stop at calvingBinds calcium and minerals in the rumen; large pre-calving blood phosphate drop documentedGrazing and high-K forage systems where DCAD is hard to hitNot on fodder beet or low-P diets; not mined natural zeolite; magnesium needs active management; cuts prepartum intake ~13% versus negative DCAD
Dry-off bolus support — Natual Taribol within 2 hours of last milking, Metrabol post-calvingAnti-inflammatory and immune support at dry-off, layered on any feeding programHerds targeting antibiotic reduction at dry-offNo peer-reviewed trial located on either product as of publication; the 85-minute lying-time study used a different bolus type

Running the Barn Math, and Naming Who Built It

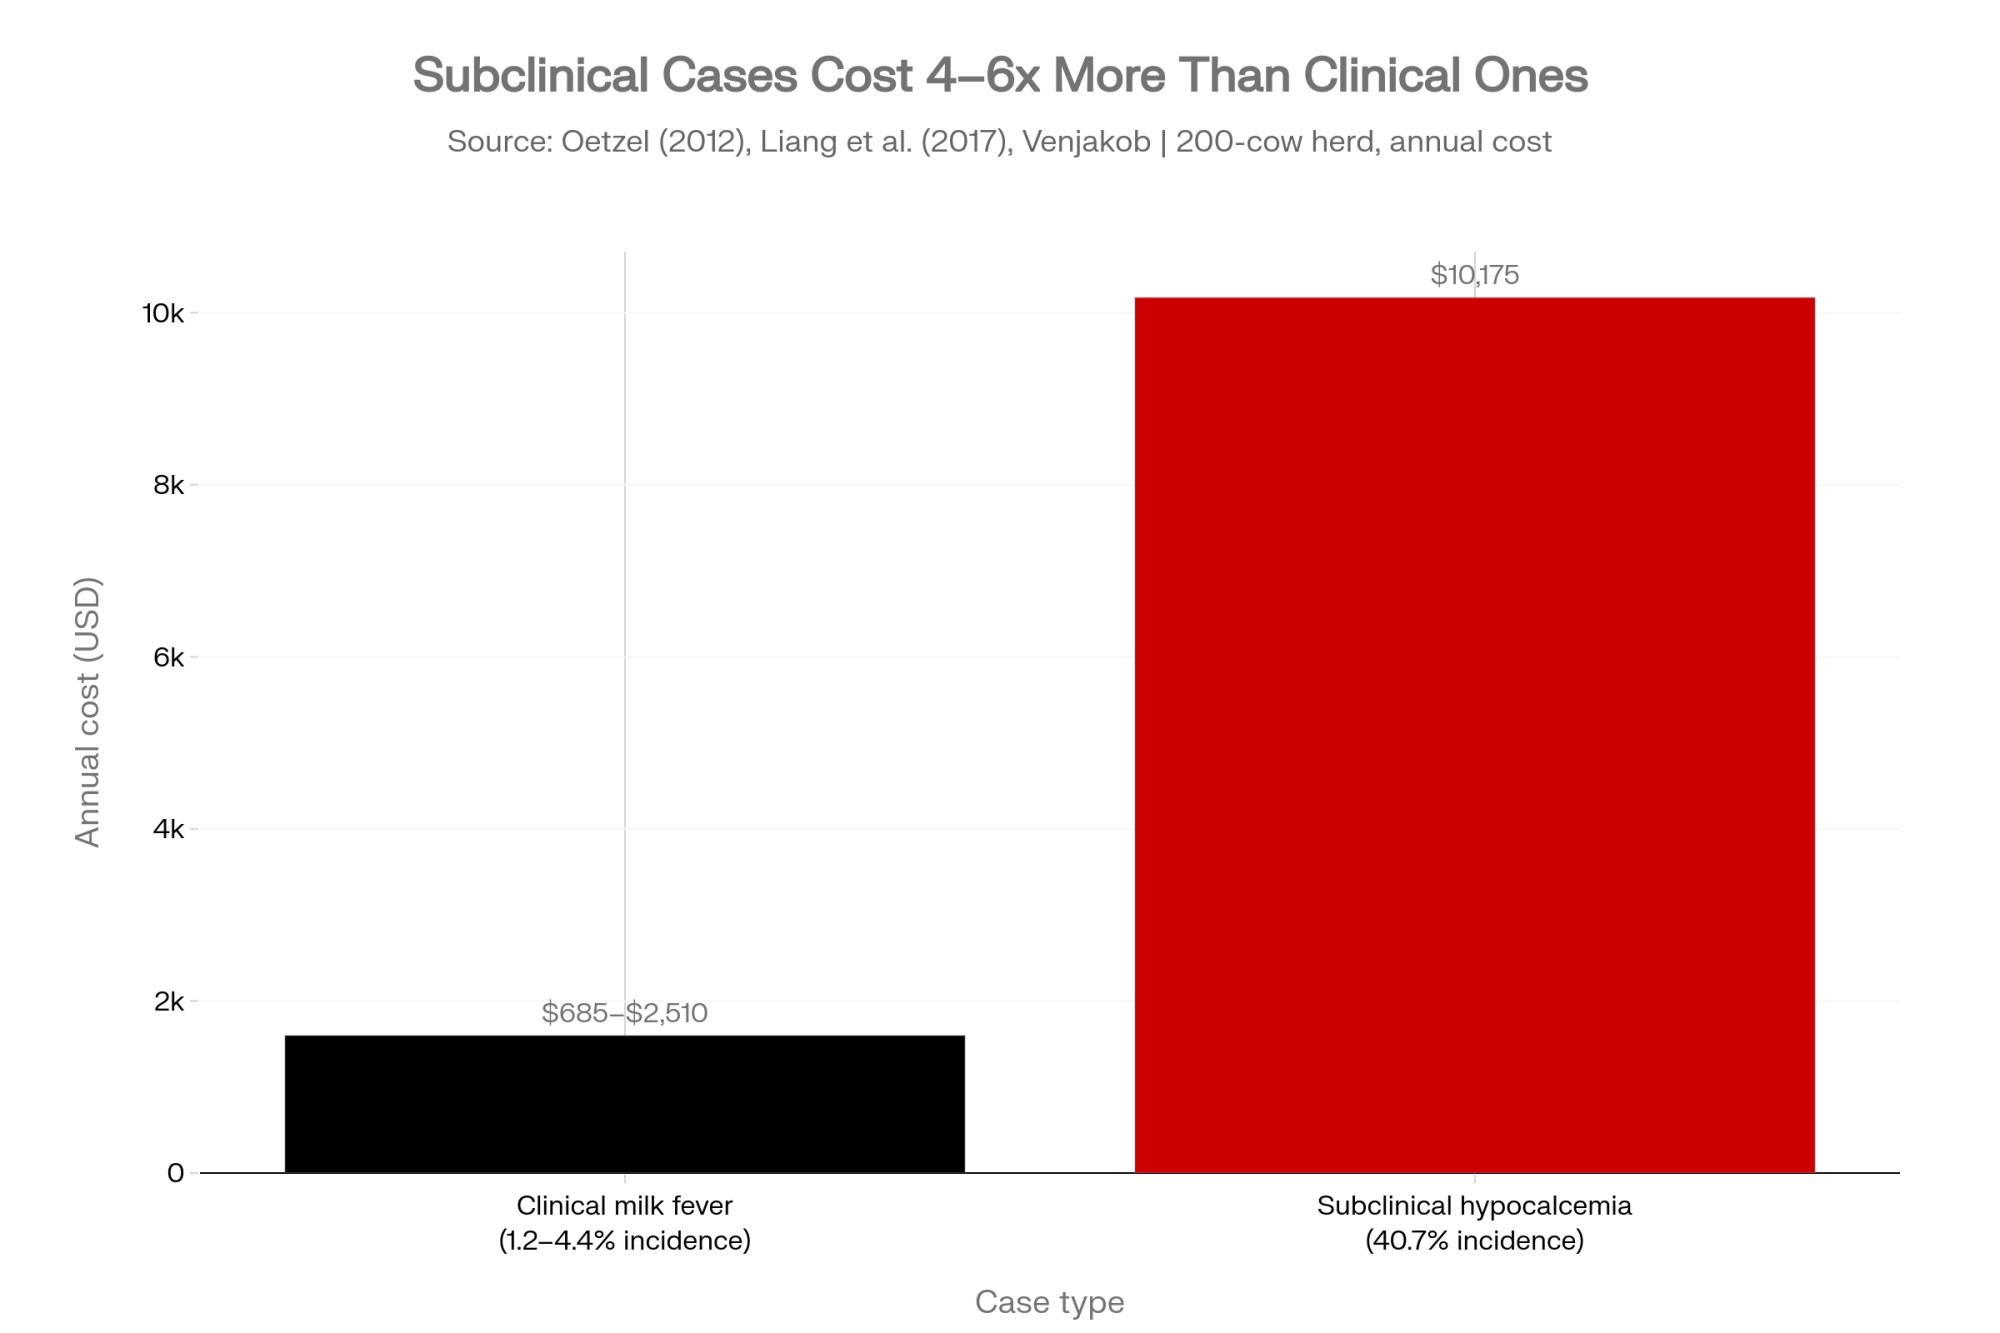
ConditionCost per caseIncidenceAnnual cost, 200-cow herd
Clinical milk fever$285 per multiparous case (Liang et al. 2017, JDS)1.2–4.4% in DairyNZ trial herdsRoughly $685 to $2,510
Subclinical hypocalcemia$125 per affected cow (Oetzel, 2012 worked example)40.7% measured across 1,380 German cows at a 2.0 mmol/L thresholdRoughly $10,175

Incidence figures pair DairyNZ’s pasture-trial herds with US per-case costs and a German prevalence survey. Oetzel applied his $125 to second-and-greater-lactation cows; Venjakob’s 40.7% covers all parities, so the herd figure runs slightly high. Directional, not transferable — run your own incidence.

The direction holds across both currencies and both continents: the subclinical column is always the bigger number. The multiple doesn’t hold. It runs about 3.6:1 in Phibro’s model, 4.1:1 in Oetzel’s own example, and closer to 6:1 using the figures above. Which tells you the incidence assumption is doing most of the work — and that it’s the number worth arguing about.

Cost figurePublished byCompany sellsUnderlying sourceYear
€16,950/yr subclinical modelPhibro Animal Health (Arnout Dekker)Anionic minerals (Animate)Oetzel (2011) per-case cost2021
€312 clinical caseGuard et al.— (academic)Original 1996 study1996 — 30 yrs old
“Definitive solution” languageVilofossSynthetic zeolite (X-Zelit)Company conference material2026
7.9kg/day milk gain, milk fever “eliminated”SanoMipro Close-Up 700Company-reported, no published trialOngoing
Clinical milk fever 4.4%→1.2%DairyNZ (farmer levy-funded)Nothing — independentZeolite Scale-Up Trial2019–21

So here’s the model most often quoted at producers. That 250-cow European breakdown — clinical at €312 a case and 6% incidence giving €4,680 a year, subclinical at €113 and 60% giving €16,950 — was published in February 2021 by Arnout Dekker, Business Manager Europe for Phibro Animal Health. Phibro markets Animate, an anionic mineral used in negative-DCAD programs.

The per-case costs underneath the table aren’t Phibro’s own: €312 traces to Guard et al. (1996), €113 to Oetzel (2011). The 6% and 60% incidence figures are the model’s. Don’t convert between the euro model and the US numbers — different cost assumptions, different years, different decades in the case of Guard.

If you want to see what a single fresh-cow line item does at scale, our reporting on Steve Jaeger’s $511 fresh cow problem tracks a $111-per-cow fix across 4,495 cows.

Different Doors, Same Room

Negative DCAD acidifies the cow, so her own calcium regulation switches on before she needs it. It’s a systemic metabolic intervention, and it only works if she eats the ration you formulated.

Zeolite goes through a different door, and the sources disagree about which door. DairyNZ describes synthetic zeolite binding dietary calcium and other minerals in the rumen, stimulating increased intestinal absorption — while also documenting a large pre-calving phosphate drop as part of the mechanism. Martín-Tereso’s 2011 review reports the original calcium-binding hypothesis has been challenged by a hypophosphatemia-driven explanation, where lower blood phosphorus reduces FGF23 signaling and triggers bone mobilization. A 2025 review adds that zeolite likely acts on several systems at once, including the ruminal environment and immune modulation.

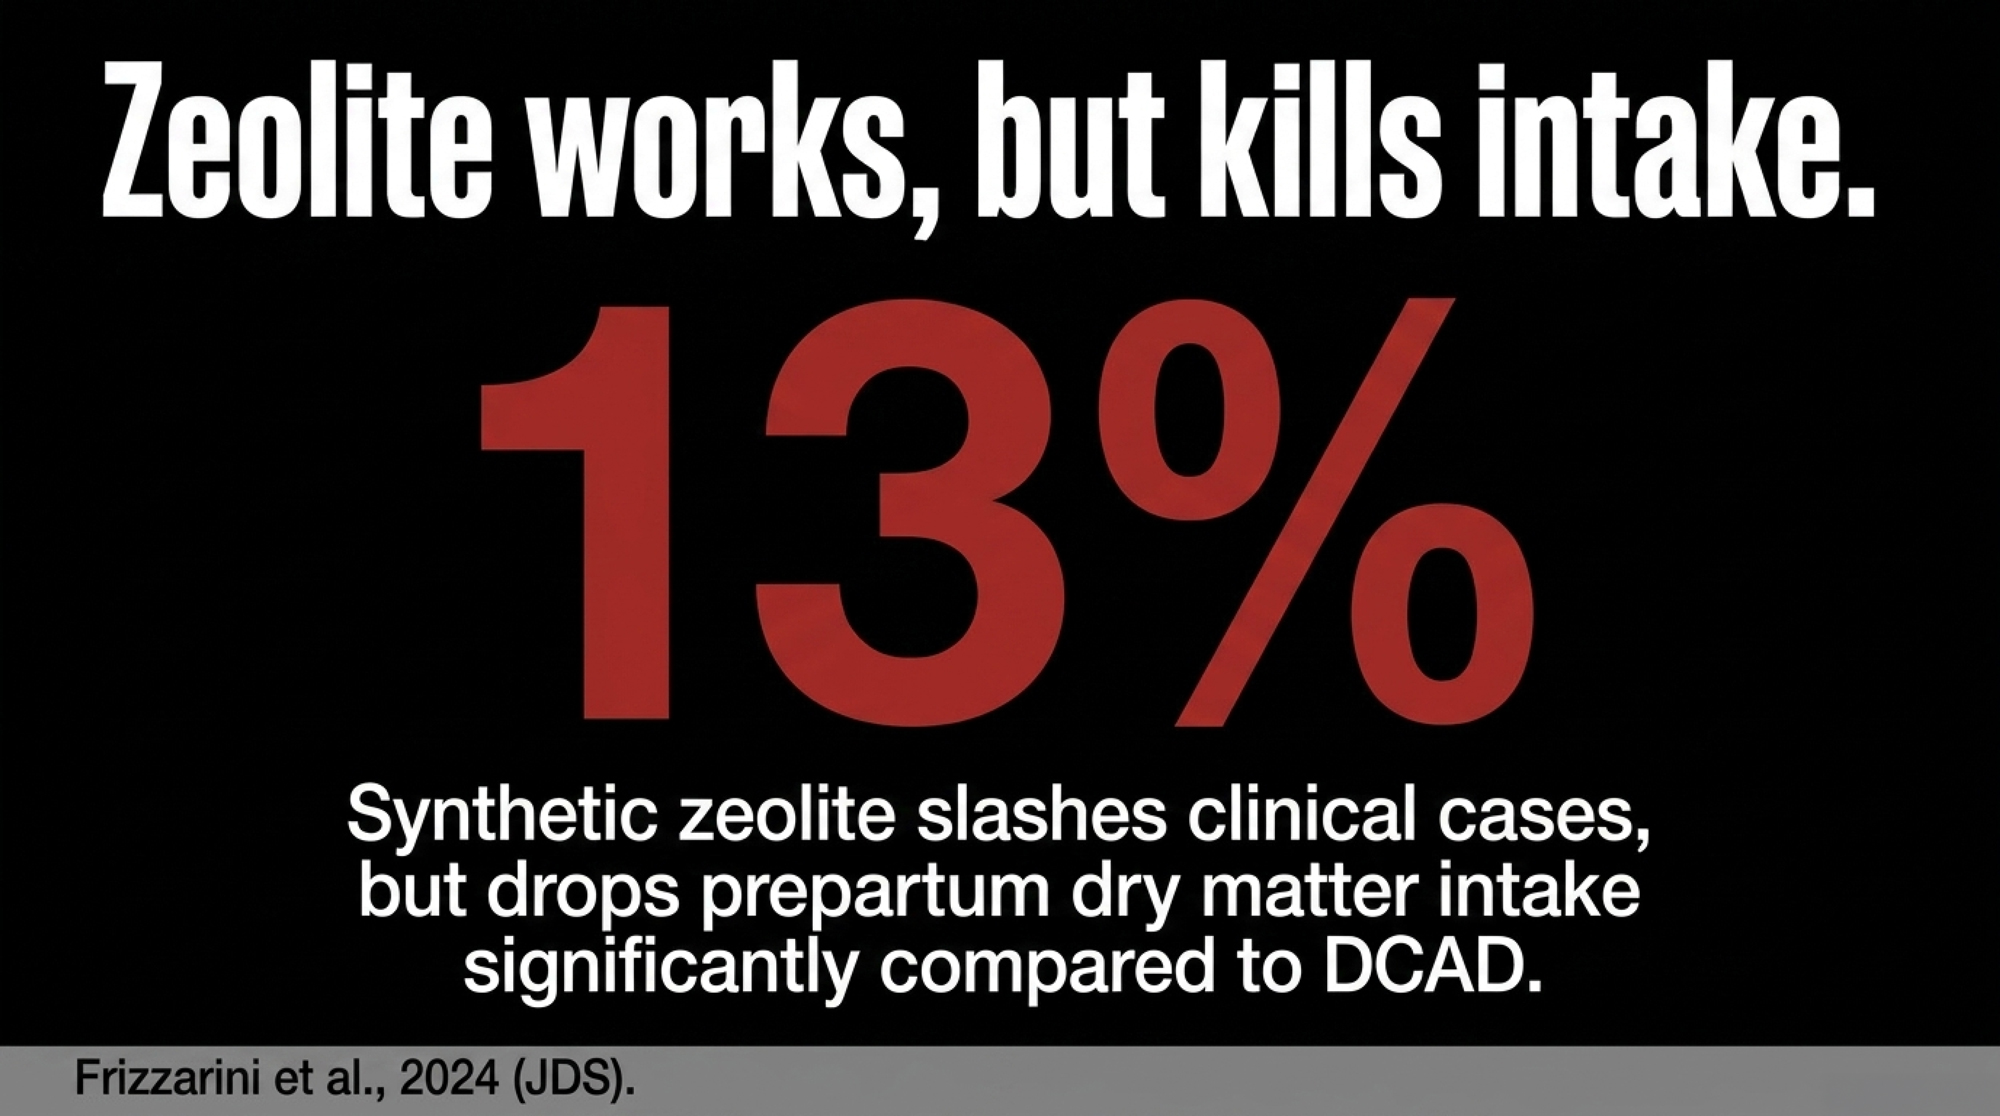
Here’s the trade-off you should expect, and it’s substantial. Frizzarini and colleagues, in that 2024 Wisconsin trial, measured prepartum dry matter intake at 11.7 kg/day on zeolite against 13.5 on negative DCAD and 13.9 on the control — a 13% drop versus DCAD and 15.7% versus control. Rumination fell too: 487 minutes a day against 527 and 531. Both differences were significant at P<0.01.

That’s not a small dip, and any nutritionist will flag it. What the same trial found, though, is that blood BHB didn’t change, body fat mobilization postpartum didn’t increase, and rumination came back to parity after calving. The authors concluded zeolite “does not affect energy metabolism” despite the intake reduction, and reported higher colostral IgG plus the most milk from third-lactation-and-older cows on zeolite. So the prepartum intake loss appears to be a cost the cow absorbs without metabolic consequence — but you should know it’s there before a rep tells you the product is free of downsides.

The Mechanic Nobody Sells Against

Delivery. Urine pH testing exists precisely because correctly formulated DCAD rations fail in practice. Cows running out of feed and slug feeding, under- or over-mixing, and unexpected shifts in forage mineral levels all change what the cow receives versus what’s on the spec sheet. A ration is a plan. Urine pH is the only thing that tells you whether she actually got the memo.

Why One Farm’s Number Can’t Settle It

Savaron’s recent history is a matter of public record: fire destroyed a barn at the Laurierville farm in March 2020, a new facility came into operation in December 2021, and the herd is milked robotically. Caron has spoken publicly about the rebuild.

Nothing in this section reflects on Caron’s management or on her herd’s performance. Ferme Roland Caron holds a national animal-welfare award, which is not something a poorly run operation collects. The confounders here are structural, and they would apply identically to any farm that rebuilt and automated across the same seasons — including, most likely, yours.

That’s the point. When a facility change, a new milking system, and a transition protocol all land inside a few seasons, nobody can cleanly separate afterward what moved the tank. X-Zelit has independent trial evidence of its own; none of it rests on Savaron. But if you can’t tell which of your own changes moved the needle, you can’t repeat it, scale it, or stop paying for the part that didn’t matter.

Your Dry Pen Decision Guide

Work down in order. Each step is a gate, not a suggestion.

IF you haven’t measured urine pH on close-up cows in 60 days ➔ don’t spend another dollar on additives until you do. Target 6.2 to 6.8. Mixer accuracy and slug feeding are the documented failure points, and no product fixes a delivery problem.

IF your dry cow forage K is above 1.5% of DM ➔ you’re into anionic-salt territory. Above 2.5% ➔ salts won’t rescue it. Published guidance sets the dry cow forage target under 1.5% K, treats 2–2.5% as the range where anionic salts become necessary, and calls above 2.5% almost impossible to correct with salts alone. Cornell puts the grass target under 2% K for a workable anionic diet. Past 2.5%, low-K forage or zeolite is the answer, not more salt.

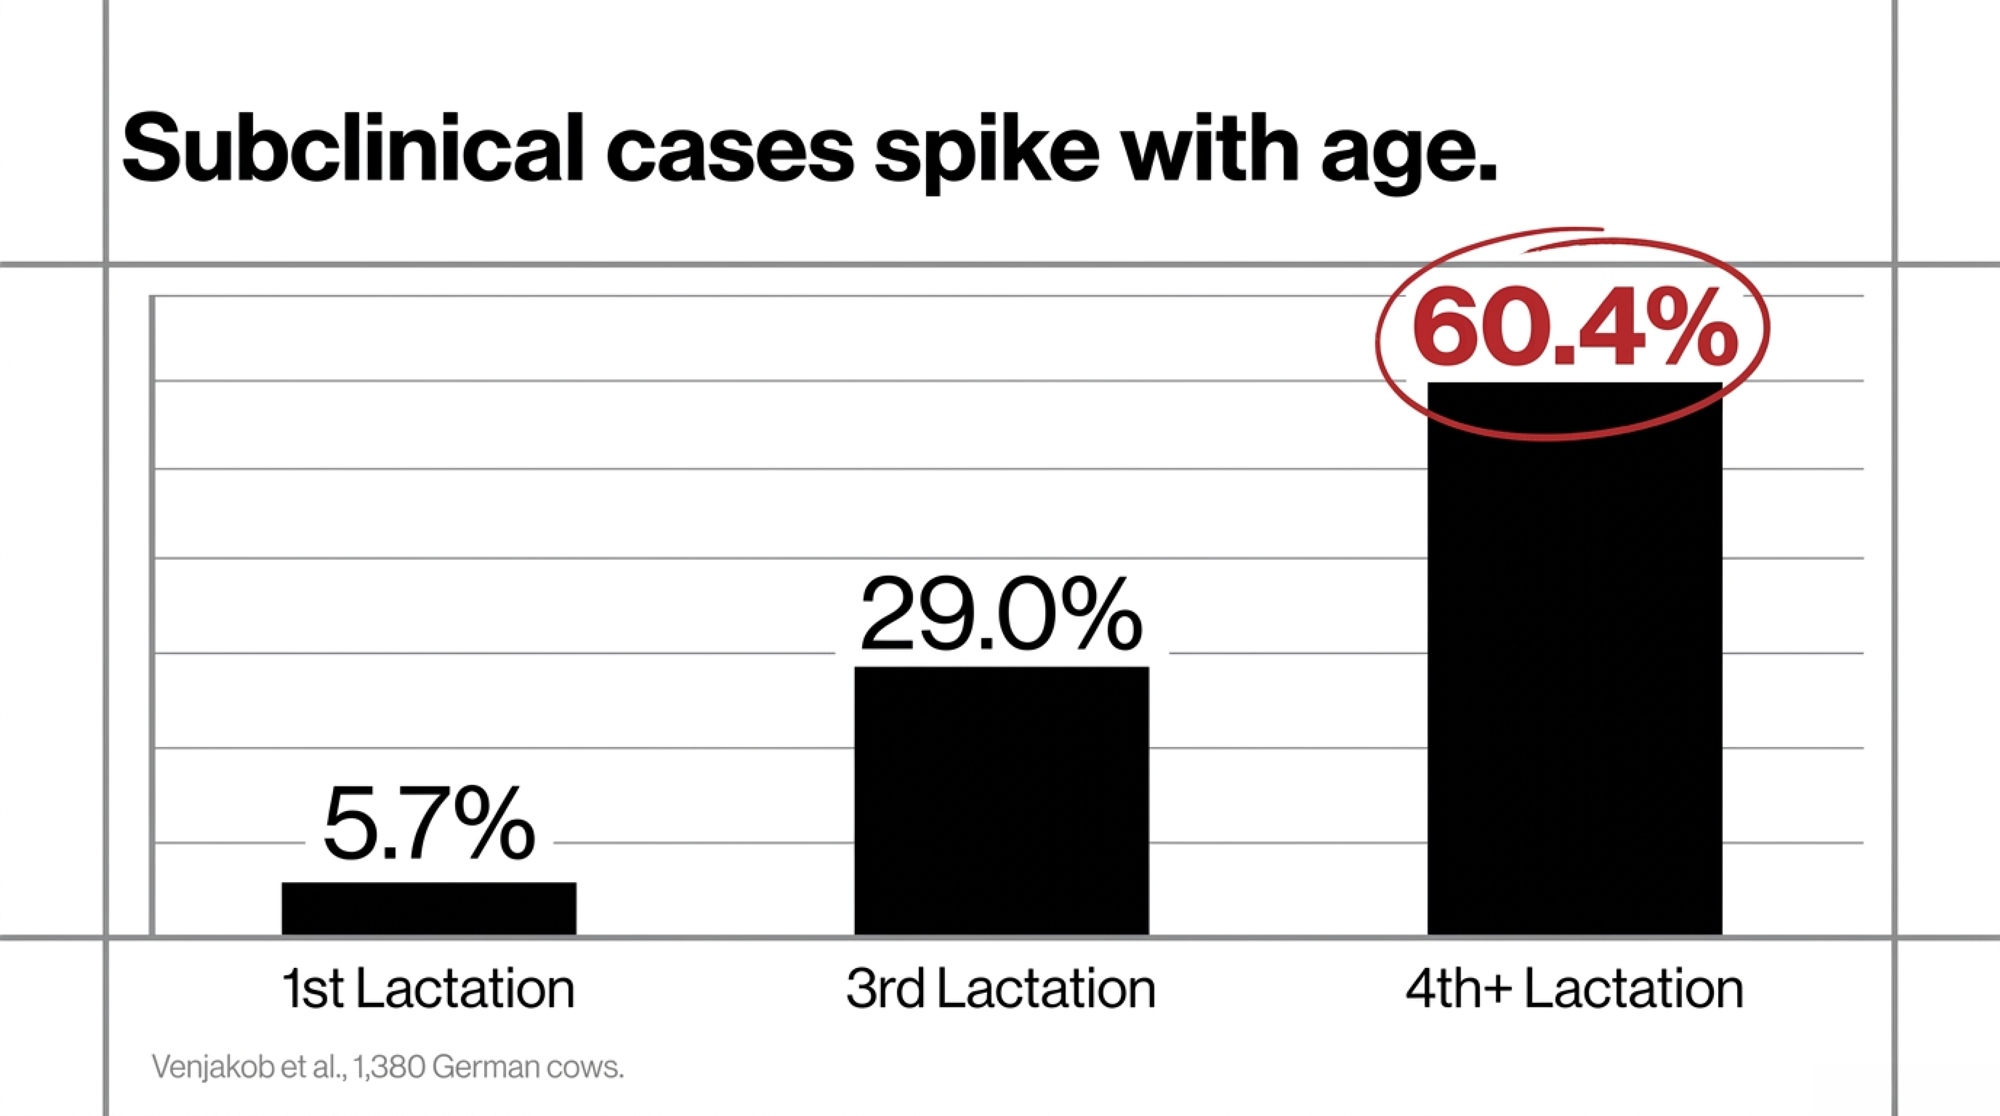
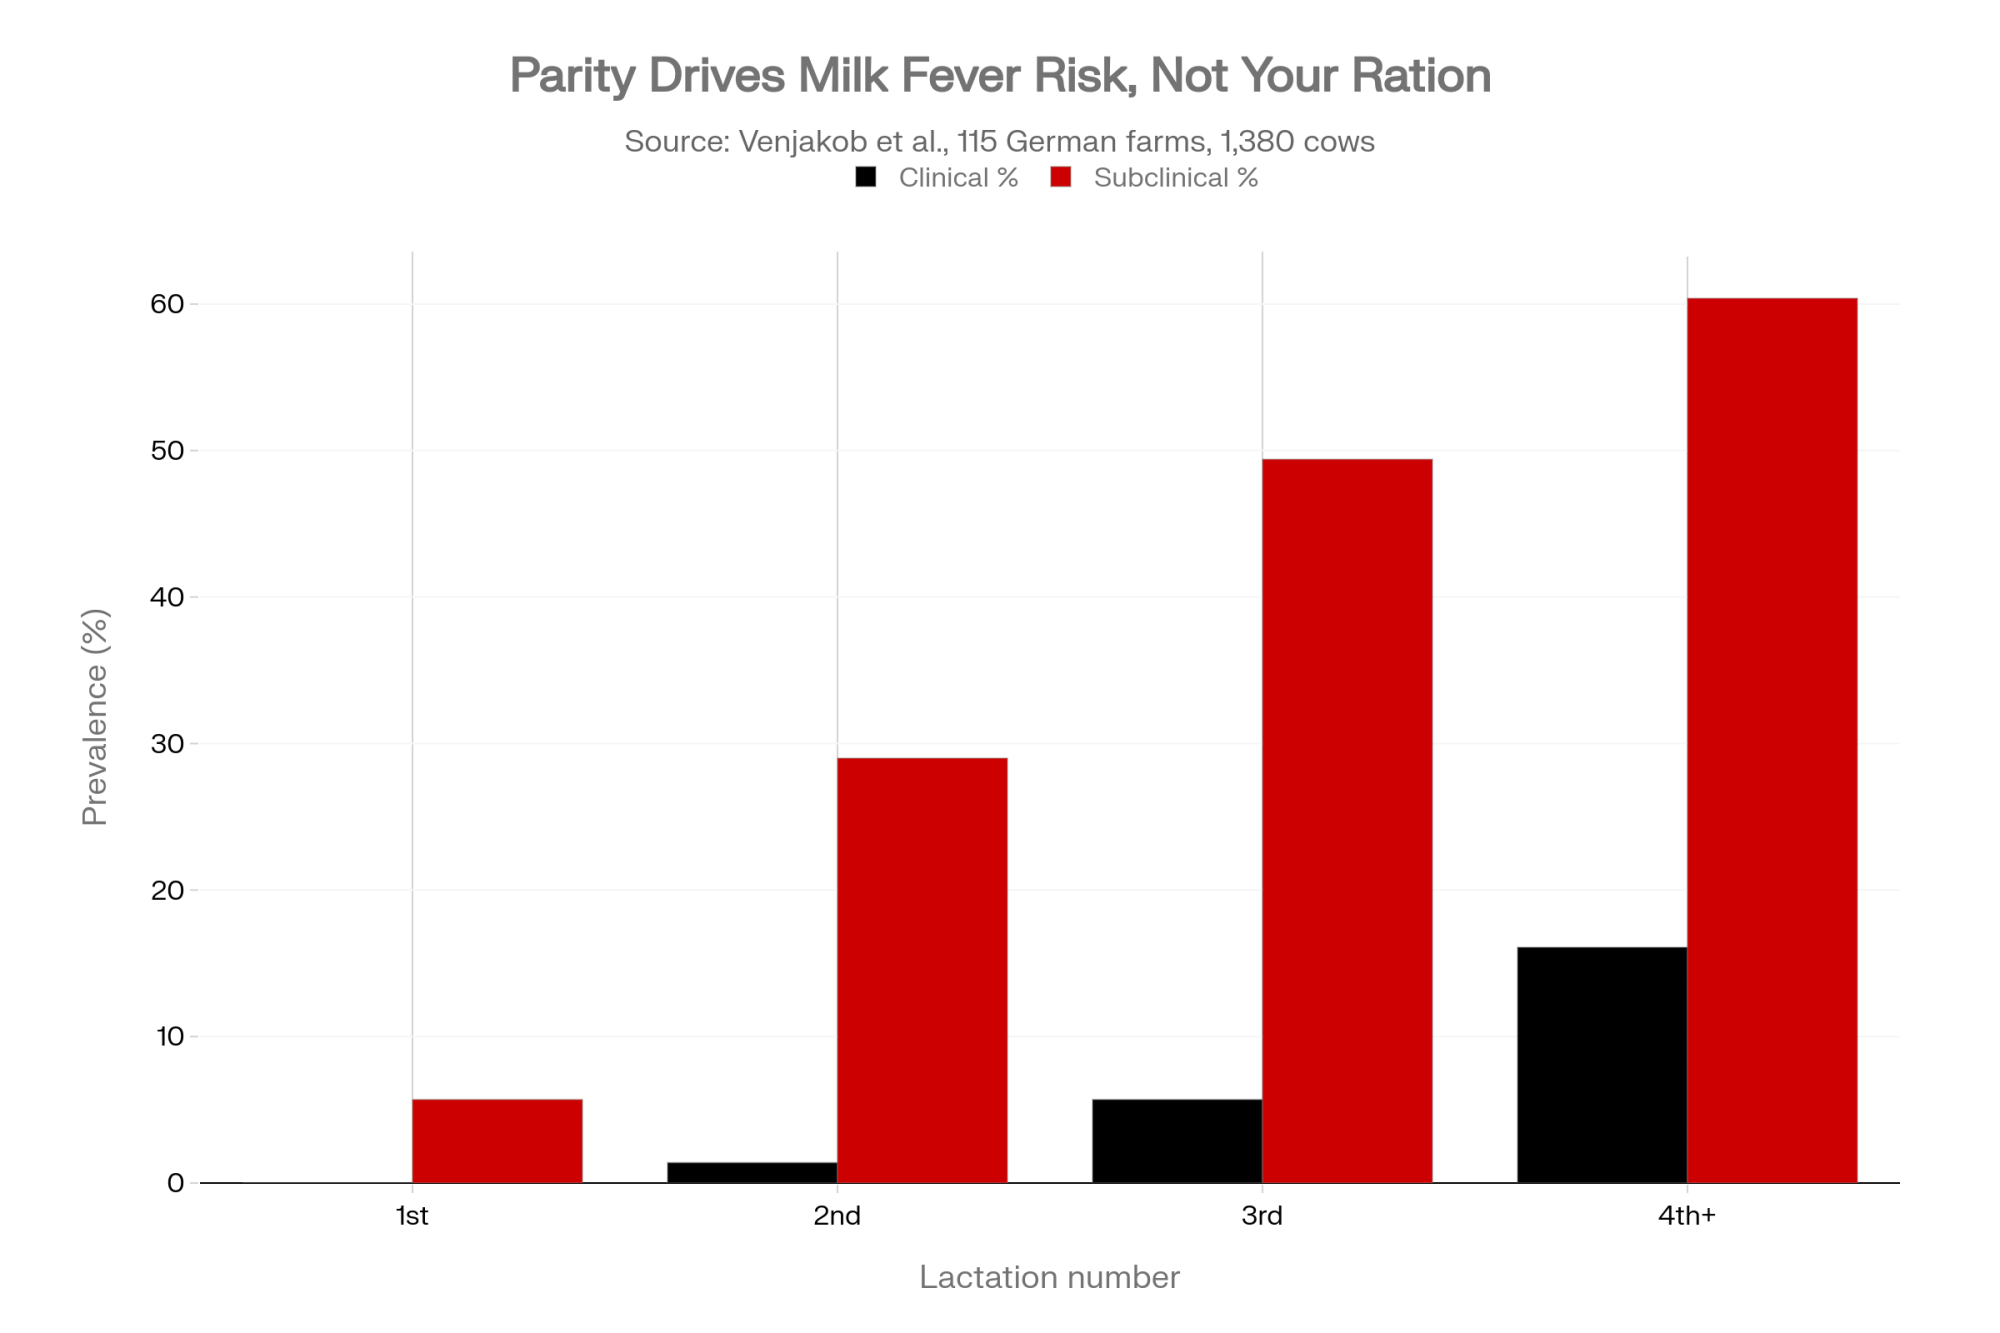
IF your clinical cases cluster in fourth-lactation-and-older cows ➔ split your dry cow ration by parity. Venjakob’s survey of 1,380 cows across 115 German farms found clinical milk fever at zero in first lactation, then 1.4%, 5.7% and 16.1% in second, third and fourth-plus. Subclinical prevalence at a 2.0 mmol/L threshold ran 5.7%, 29.0%, 49.4% and 60.4% across the same four groups. One group ration treats two different risk populations identically.

IF lameness in your dry pen is unmeasured ➔ score it before you buy anything. In Neves and colleagues’ 2017 work, cows that were lame but normocalcemic at calving were 3.2 times more likely to be subclinically hypocalcemic by two days in milk than non-lame normocalcemic cows — the paper’s abstract renders the same comparison as 3.4. Either way, that’s a facility problem wearing a mineral problem’s clothes.

IF more than 15% of first-week fresh cows show BHB above 1.2 mmol/L ➔ calcium isn’t your bottleneck. That threshold signals significant herd-level disease risk and real production loss. Steeneveld’s 2020 analysis put clinical ketosis at €709 a case and subclinical at €150, running €3,613 a year on a default 130-cow Dutch farm and €7,371 on a high-risk one. For comparison, the clinical milk fever figure in Phibro’s model above is €312 a case, sourced to Guard et al. (1996) — a different study, a different decade, and not Steeneveld’s number.

IF you’re changing two things at once ➔ stagger them. A product alongside a facility upgrade, a robot startup, or a grouping change means you won’t know which one worked.

IF a vendor shows you a testimonial ➔ ask three questions. Is there an independent, peer-reviewed trial on this specific product, or only on the ingredient class? Who funded it? Who co-authored it? Kerwin’s 2019 Cornell zeolite trial lists co-authors from outside the university alongside the Cornell team — standard and disclosed in applied nutrition research, and worth factoring in.

Sørensen and colleagues said the underlying thing plainly back in 2002: the most suitable milk fever control strategy for any herd depends on herd-specific circumstances — the farmer’s skills, the production system, and the economics of that particular choice. Two decades on, nothing has displaced it. DairyNZ’s own scale-up data points the same way, noting that herds with a milk fever history benefit most from zeolite.

Run Your Own Numbers Before You Run a Trial

If your transition numbers have been stuck for three years, the honest question isn’t which of these approaches to buy. It’s whether you’ve got enough measurement in place to know whether the last thing you changed actually worked.

The European Food Safety Authority requires a minimum of three independent in vivo studies showing significant effects before an efficacy claim is supported for a feed additive. Our own view is that the design details matter as much as the count — control groups, randomization, blinding, enough animals to rule out chance — but that’s editorial framing, not EFSA’s wording. Either way, three independent studies is a workable bar to hold in mind when a rep shows you one farm’s numbers. It’s a fair bar to hold yourself to, too.

Start with your own figures: The Bullvine’s Ketosis Cost Calculator will put your fresh-cow BHB rate against Steeneveld’s per-case costs, and the Health ROI Calculator will tell you whether the input you’re weighing clears its own price. We’re publishing the seven gates as a printable one-pager for the office wall — watch for it in this week’s Bullvine Weekly.

Key Takeaways

  • Before you buy anything, pull urine pH on close-up cows and check you’re inside 6.2 to 6.8, and get a forage K test. If K is above 1.5% of DM, you’re into anionic-salt territory; past 2.5% salts won’t rescue it, and you need low-K forage or zeolite.
  • Zeolite cut DairyNZ’s clinical milk fever from 4.4% to 1.2%, but it also drops prepartum dry matter intake around 13% and needs magnesium watched. Extended acidification rests on company-reported field results, and there’s no published trial on the dry-off boluses specifically.
  • On 200 cows, the clinical bill runs roughly $685 to $2,510 a year while subclinical sits near $10,175. Tally your cases by lactation group — subclinical prevalence goes from 5.7% in first-lactation cows to 60.4% in fourth-plus, so one dry ration is treating two different herds.
  • When someone hands you a cost-per-case model, check who published it before you check the number. The €16,950 figure came from a company selling anionic minerals — the academic work under it is sound, but the incidence assumptions are theirs.

Research and product claims reflect published literature and company statements available as of publication. Sano, Natual and Vilofoss were not asked for comment before publication; this article will be updated if any party provides trial data or a response.

Learn More

The Sunday Read Dairy Professionals Don’t Skip.

Every week, thousands of producers, breeders, and industry insiders open Bullvine Weekly for genetics insights, market shifts, and profit strategies they won’t find anywhere else. One email. Five minutes. Smarter decisions all week.
NewsSubscribe
First
Last
Consent

The $48,750 Hypocalcemia Blind Spot: What Day-4 Calcium Really Costs Your Herd

Your milk fever rate looks great. The $48,750 you’re losing on day-4 calcium never shows on that board — and it’s riding on cows that never went down.

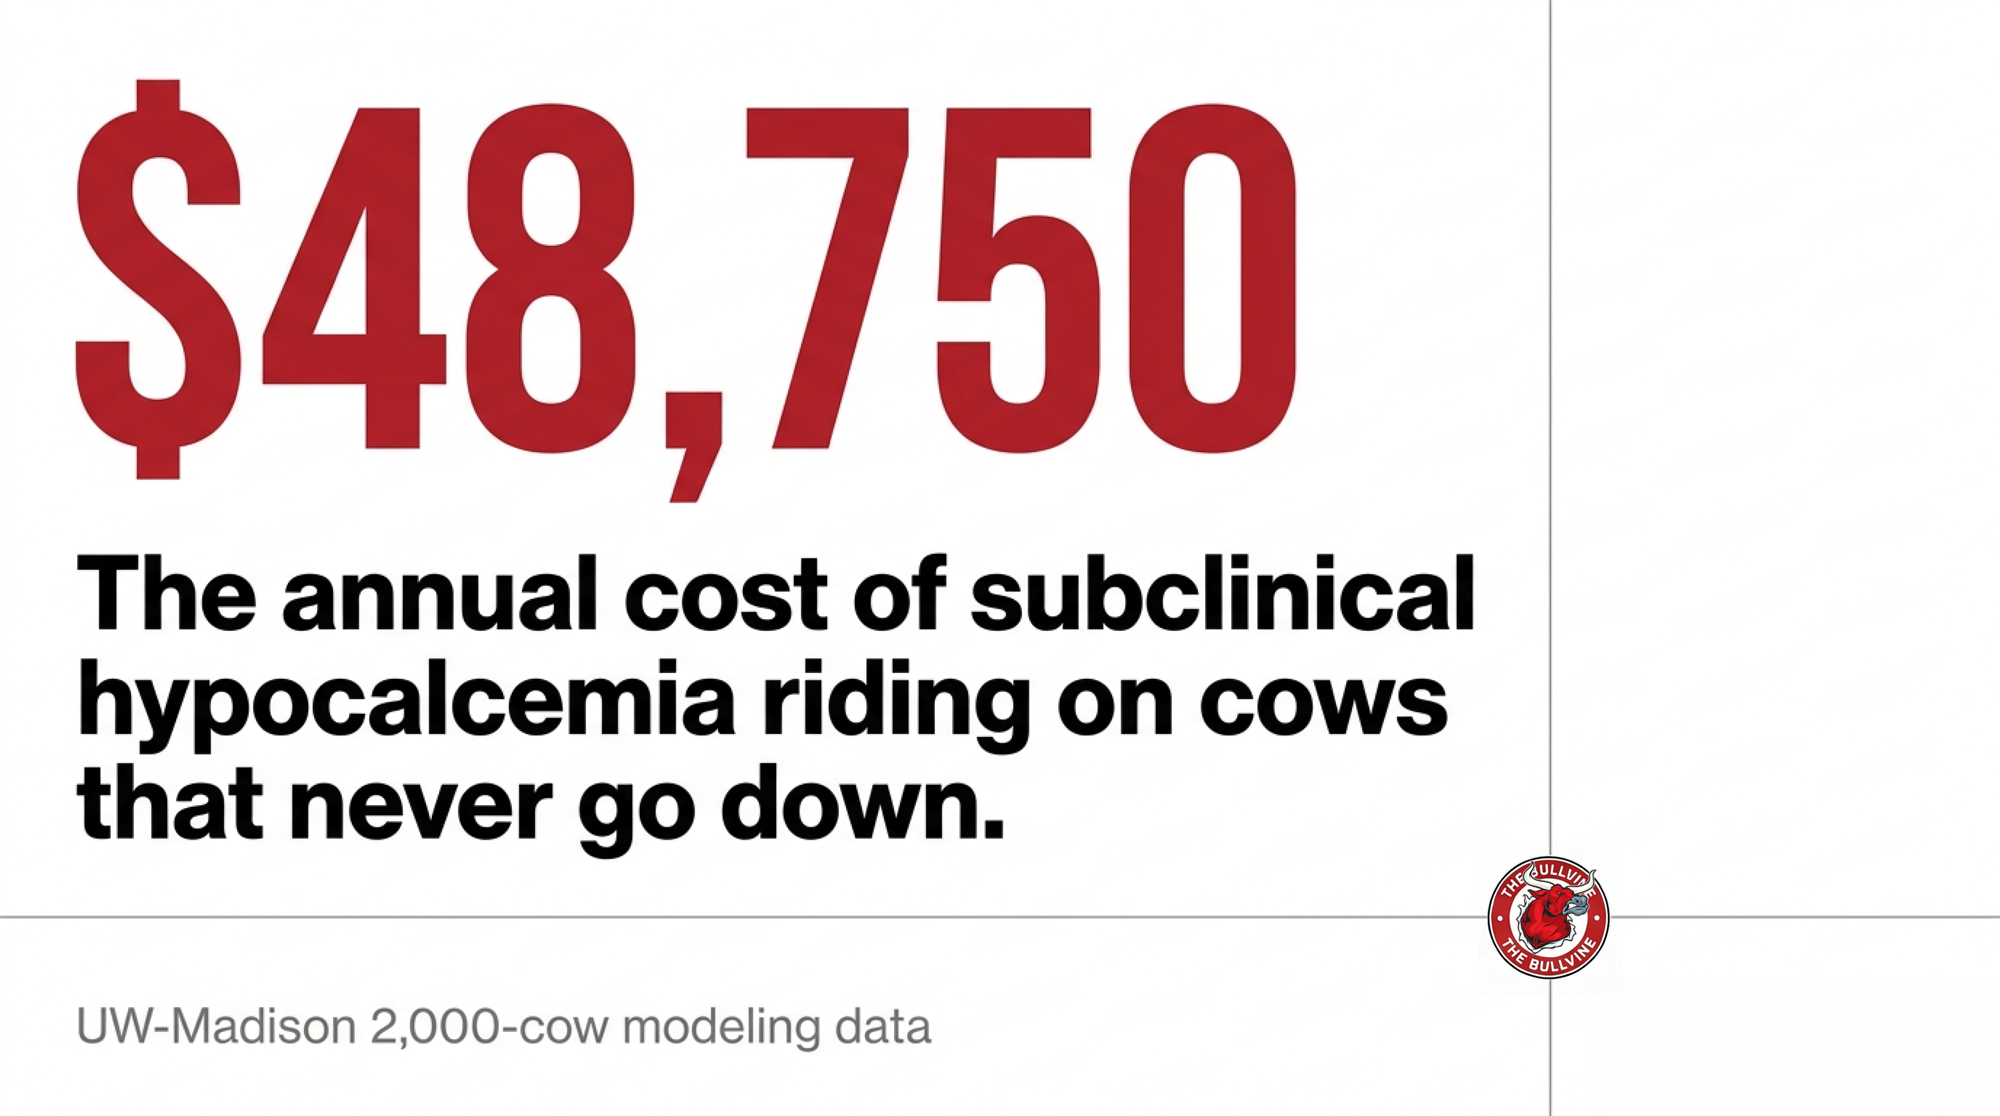
Executive Summary: About half of your mature fresh cows dip into subclinical hypocalcemia, and the modeled herd-level losses hit about four times what you’re spending on clinical milk fever. Those cows never show up on the milk-fever board, but they carry a higher risk of metritis, slower reproduction, and earlier culling — adding roughly $50 to 60 per cow in six‑month costs on top of the obvious cases. The article makes one blunt case: the number that matters isn’t your milk fever rate, it’s how many older cows are still under 8.5 mg/dL (2.12 mmol/L) on day 3–4, and whether you’re wasting bolus money on heifers that physiology says rarely need it. Using current Oetzel-style economics, blanket two‑bolus protocols in a 1,000‑cow herd can run around $15,000 a year, while targeting roughly 65% of higher‑risk calvings drops that spend to about $9,750 with better health payback. If you’re proud of a low milk fever rate but have nagging fresh‑cow disease and repro issues, this piece shows you exactly how to run a 30‑day day‑4 blood‑draw check, re‑aim calcium at high‑risk cows, and confirm whether your DCAD program is actually working.

subclinical hypocalcemia fresh cows

Picture two third-lactation cows that calved overnight. Both got up fine. Both walked to the fresh pen. Neither one will ever land on your milk fever board — and one of them is quietly costing you more than the downer cow you’ve spent your whole career dreading.

That’s the uncomfortable math at the center of transition-cow management right now. The cow on the ground gets the IV bottle, the attention, and the protocol. The cow standing next to her, blood calcium sitting just under the line for three days running, gets nothing. Because nobody’s looking, and the research keeps landing in the same place: she’s the one bleeding margin out of your fresh pen — not as a scare-line, but as a number you can actively address and improve.

What’s Really at Stake

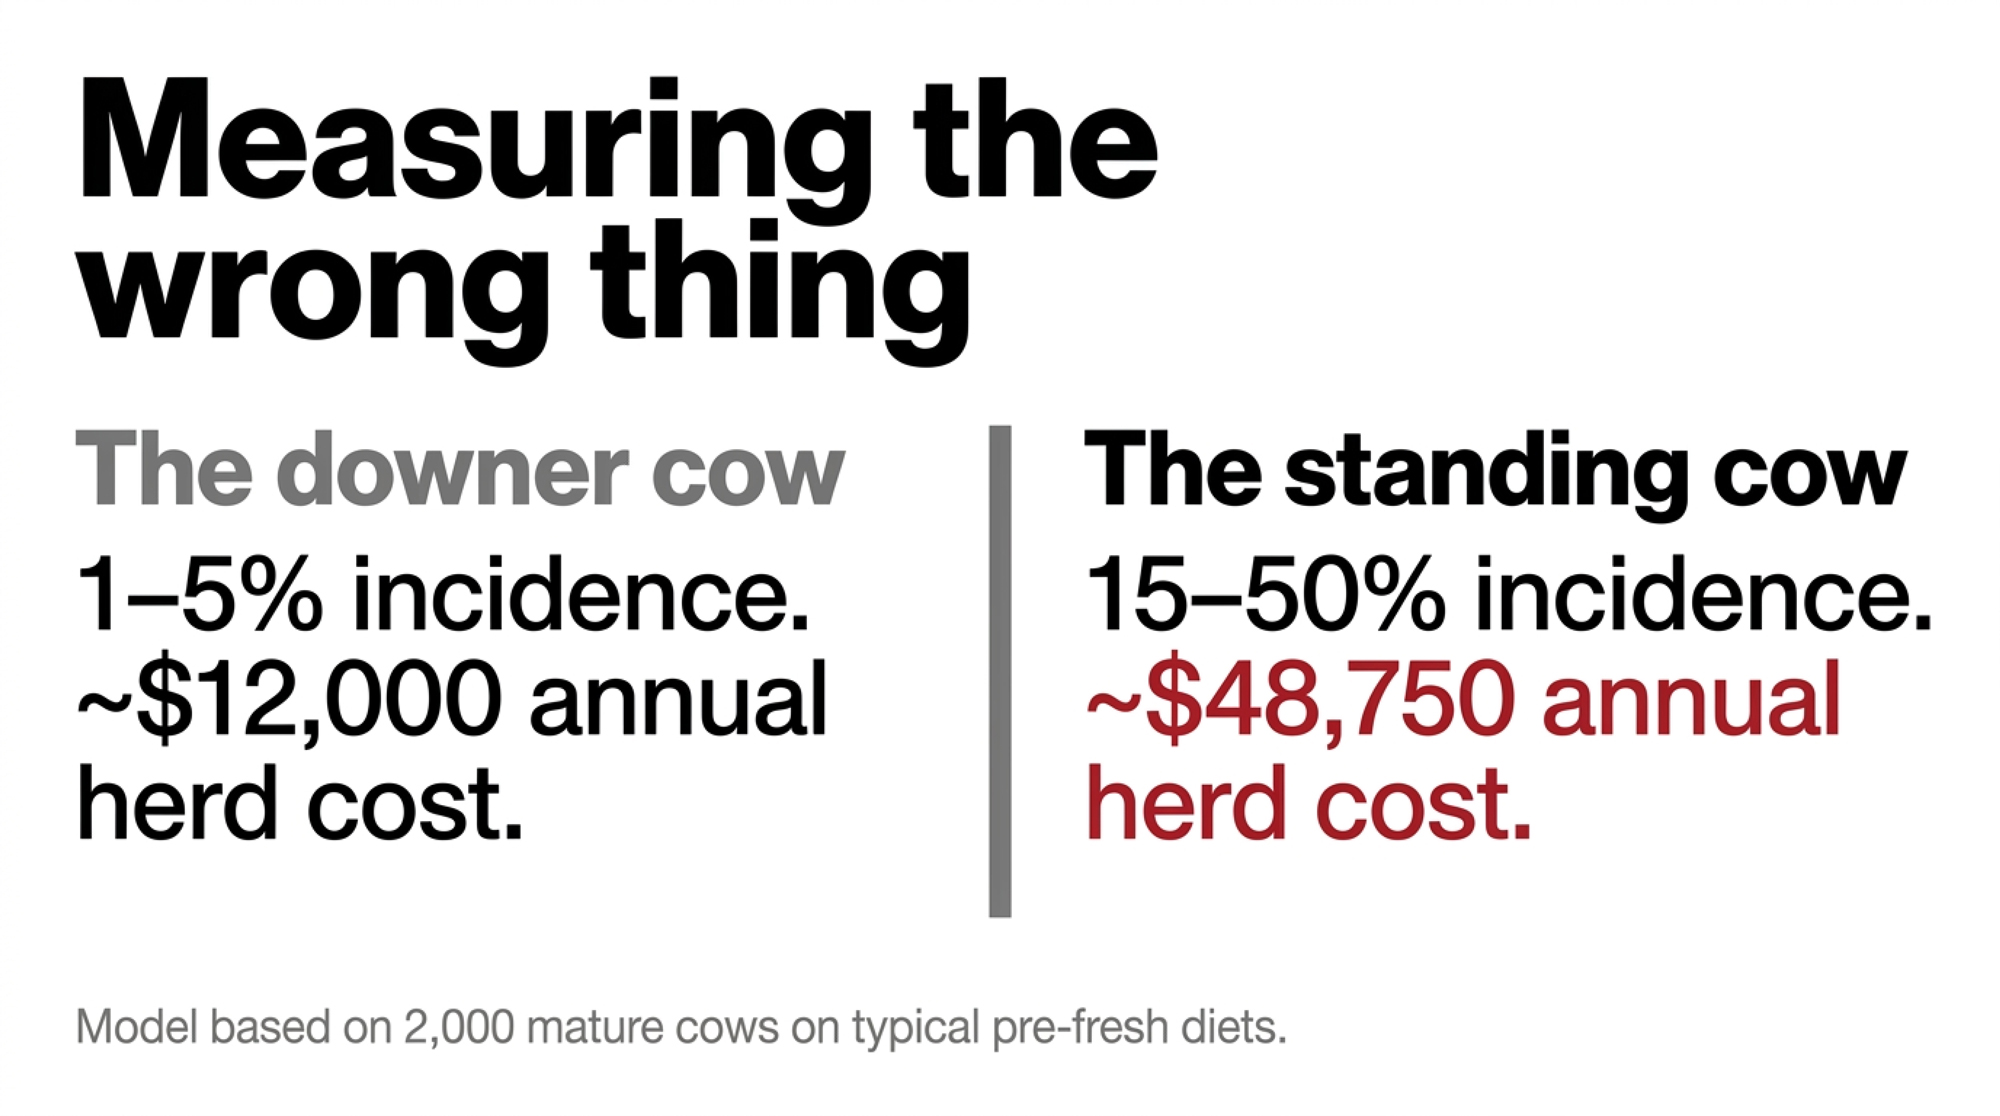
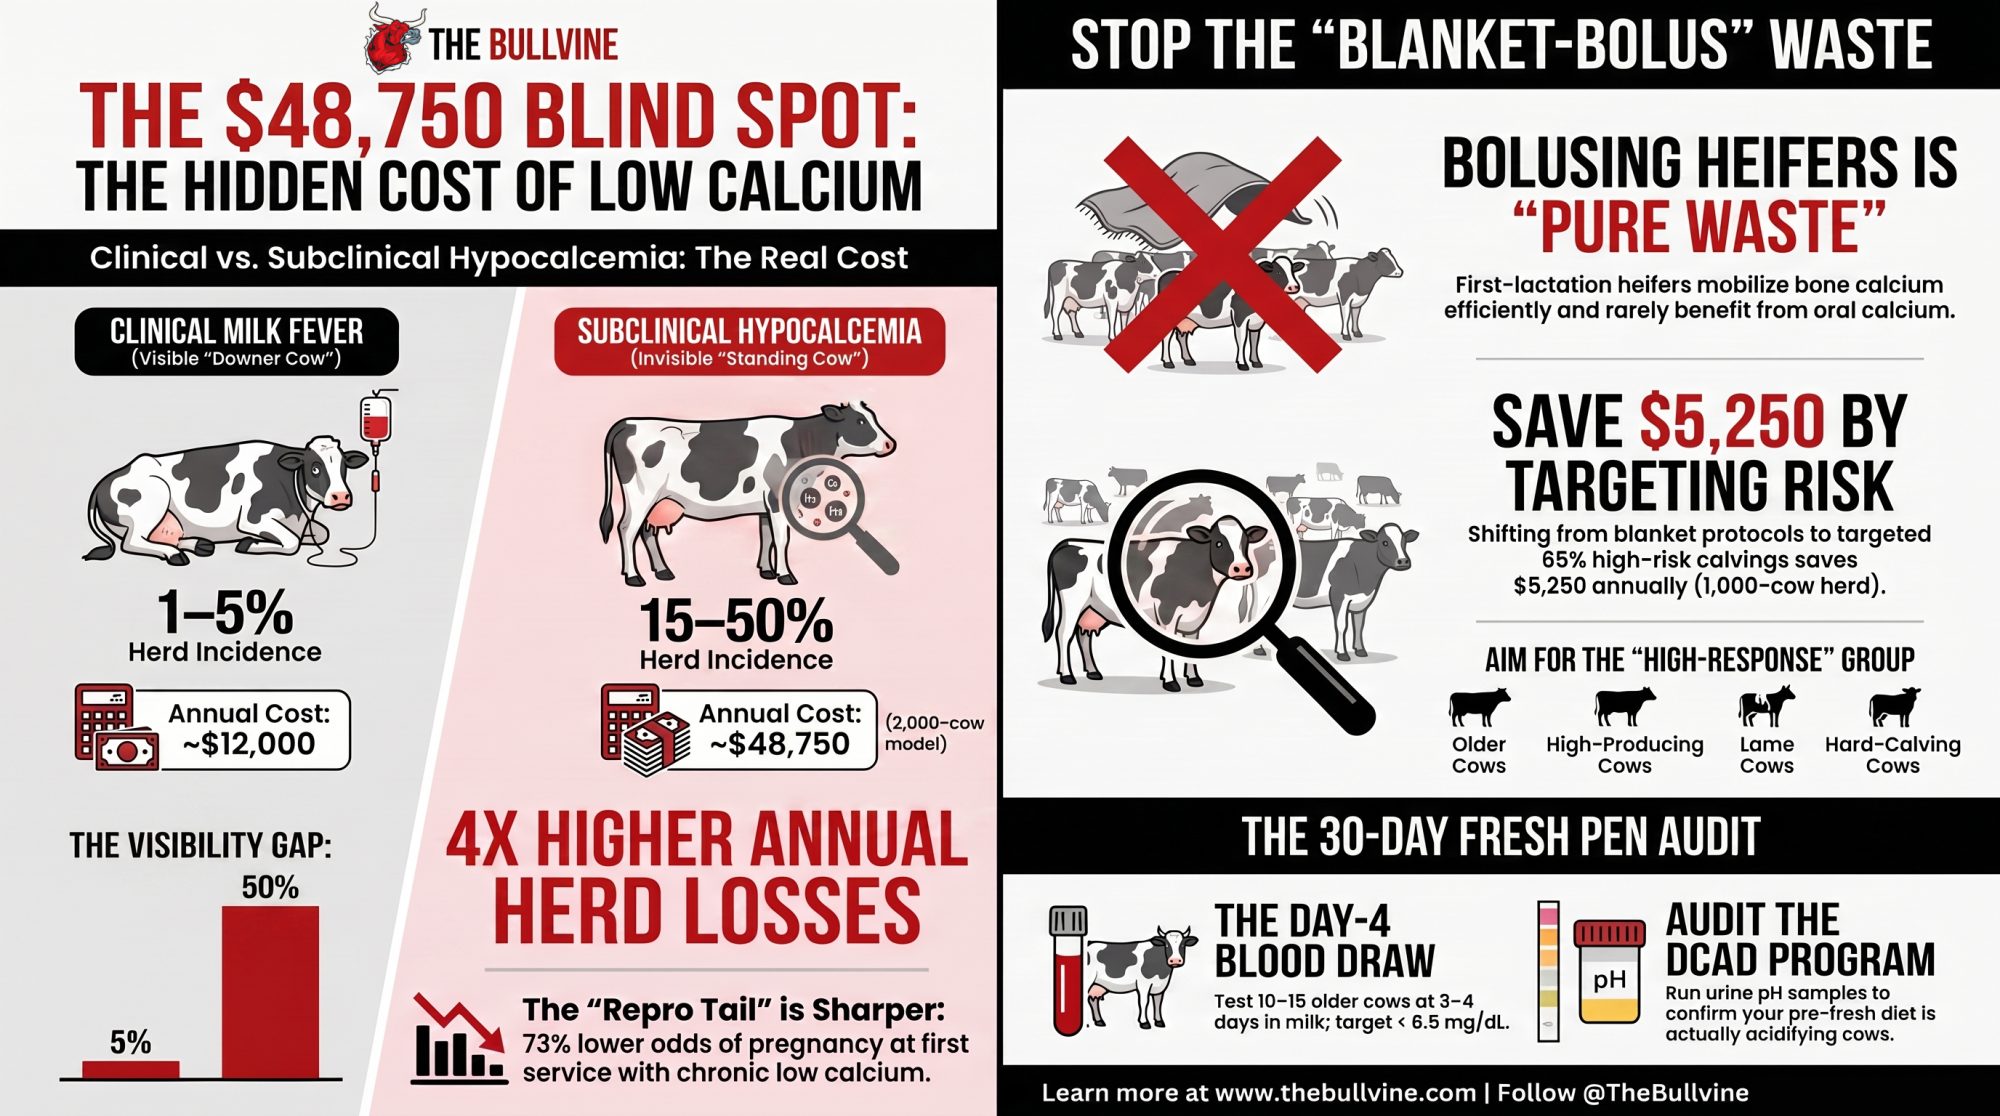
Most of us measure the wrong thing, and we were trained to do so. Clinical milk fever shows up in roughly 1–5% of cows in well-managed herds, according to the University of Wisconsin–Madison Extension and multiple veterinary summaries. It’s dramatic, it’s visible, and it’s the disaster everyone learned to fear. 

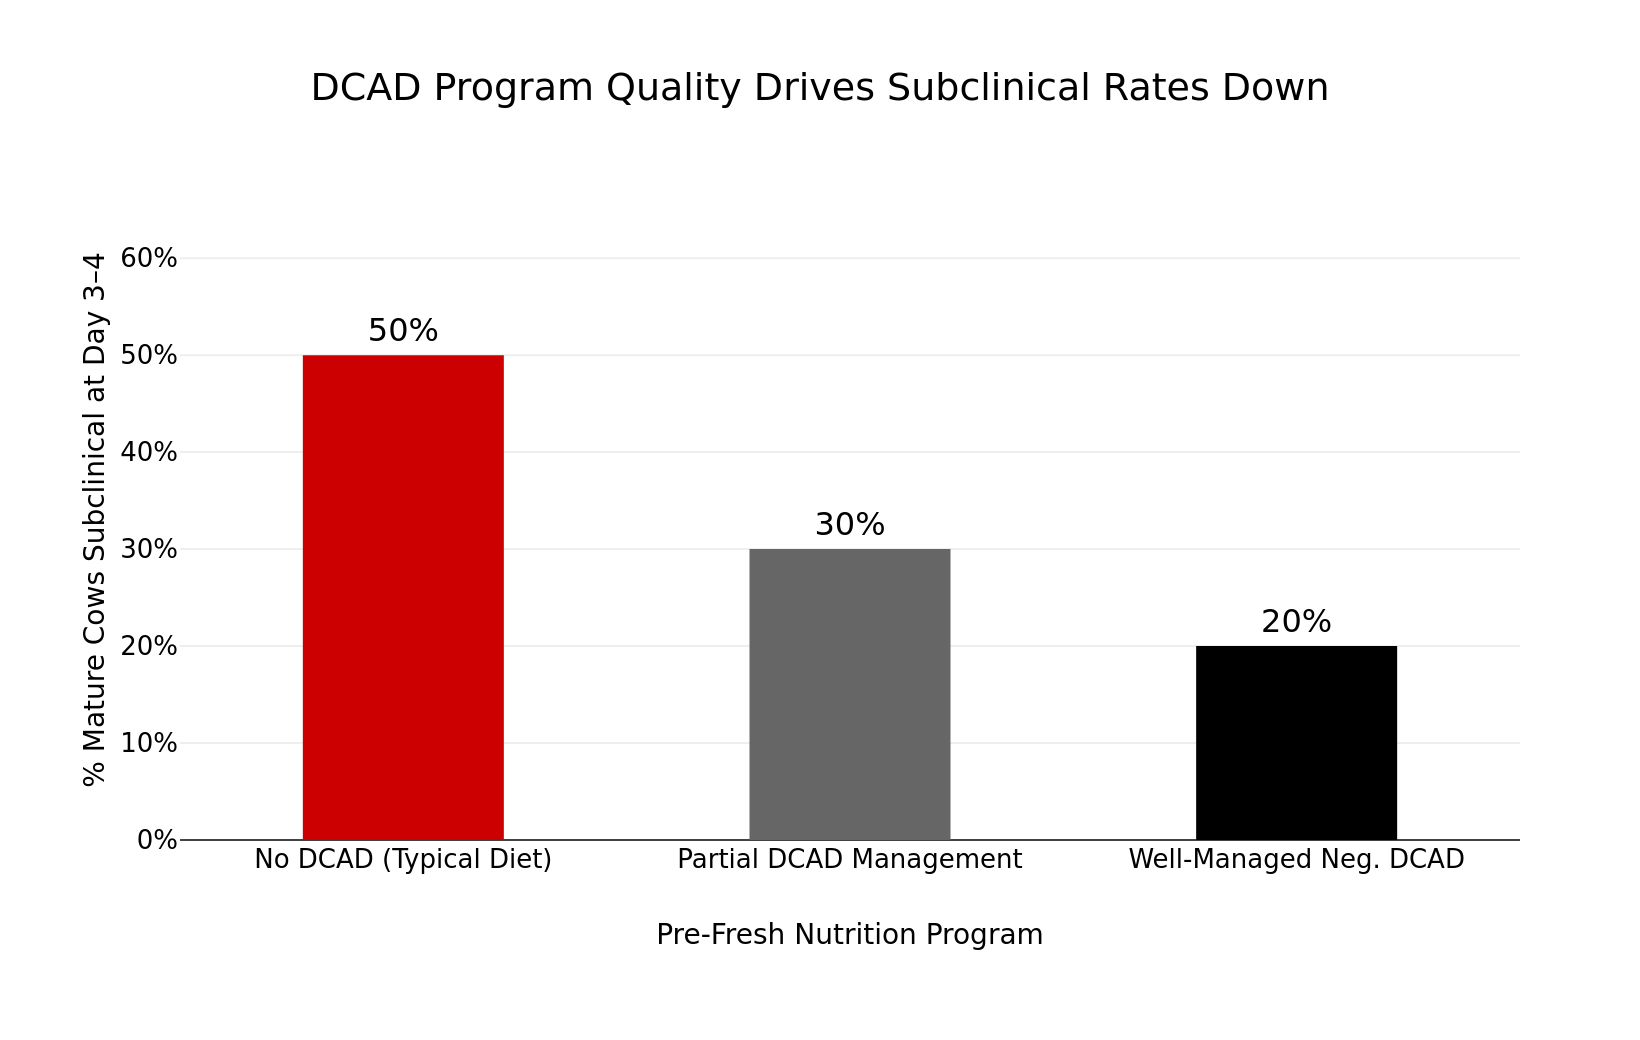
Subclinical hypocalcemia — low blood calcium with no outward signs — is a different animal. Michigan State Extension data indicate about 50% of second-lactation-and-older cows dip into it on typical pre-fresh diets, dropping to roughly 15–25% under well-managed negative DCAD programs. Here’s how the two stack up: 

MetricClinical Milk FeverSubclinical Hypocalcemia
Incidence in mature cows1–5%15–50%
Visibility in fresh penHigh — cow goes downInvisible — cow stands
Cost per case (USD, Oetzel modeling)~$300~$117
Est. annual cost, 2,000-cow herd~$12,000$48,750
Metritis risk vs. normocalcemicModerate66–88% higher
First-service conception oddsNormalOR = 0.27 (73% lower)
Responds to bolus protocolYesHigh-risk cows only
Heifer risk levelLow-moderateVery low — bolus wasteful
DCAD impact on incidenceMinimal (late-stage)Drops to 15–25%

*~50% on typical pre-fresh diets; 15–25% under well-managed negative DCAD. Per-case costs from Gary Oetzel’s UW–Madison modeling (2011–2013); herd-cost figures from his modeled 2,000-cow US scenario.

Now do the multiplication. The reason subclinical losses run roughly four times the clinical ones isn’t that each case is worse — it’s that it hits so many more cows. And remember, those per-case figures are in early-2010s US dollars; in today’s input and milk-price environment, the real gap is almost certainly wider, not narrower. European field data summarized by industry technical sources put the added cost of postpartum subclinical hypocalcemia at roughly €50–60 per cow over six months — treatment, lost milk, and reproduction — versus normocalcemic herdmates. Different currency, different continent, same direction. 

If you run mostly mature cows and you’ve been quietly proud of a low milk fever rate, this is the story that should make you a little uncomfortable in a good way.

The Cow That Got Up but Never Recovered

Here’s the reframe that changes how you watch the fresh pen. The question isn’t “how many went down?” It’s “how long did calcium stay low?” Recognizing and addressing this early can make a real difference in herd outcomes and profitability.

Calcium drops around calving, bottoms out somewhere between 12 and 24 hours, and in a healthy cow starts climbing back. That recovery curve is the whole game. A Holstein cohort study, summarized by Dellait, sorted cows by the dynamics of their hypocalcemia — transient, prolonged, or delayed — and the pattern was hard to miss. Cows with only a short, transient dip adapted well and stayed relatively healthy. The cows that stayed low — prolonged or delayed — carried a higher risk of early-lactation disease, removal, and lower milk. 

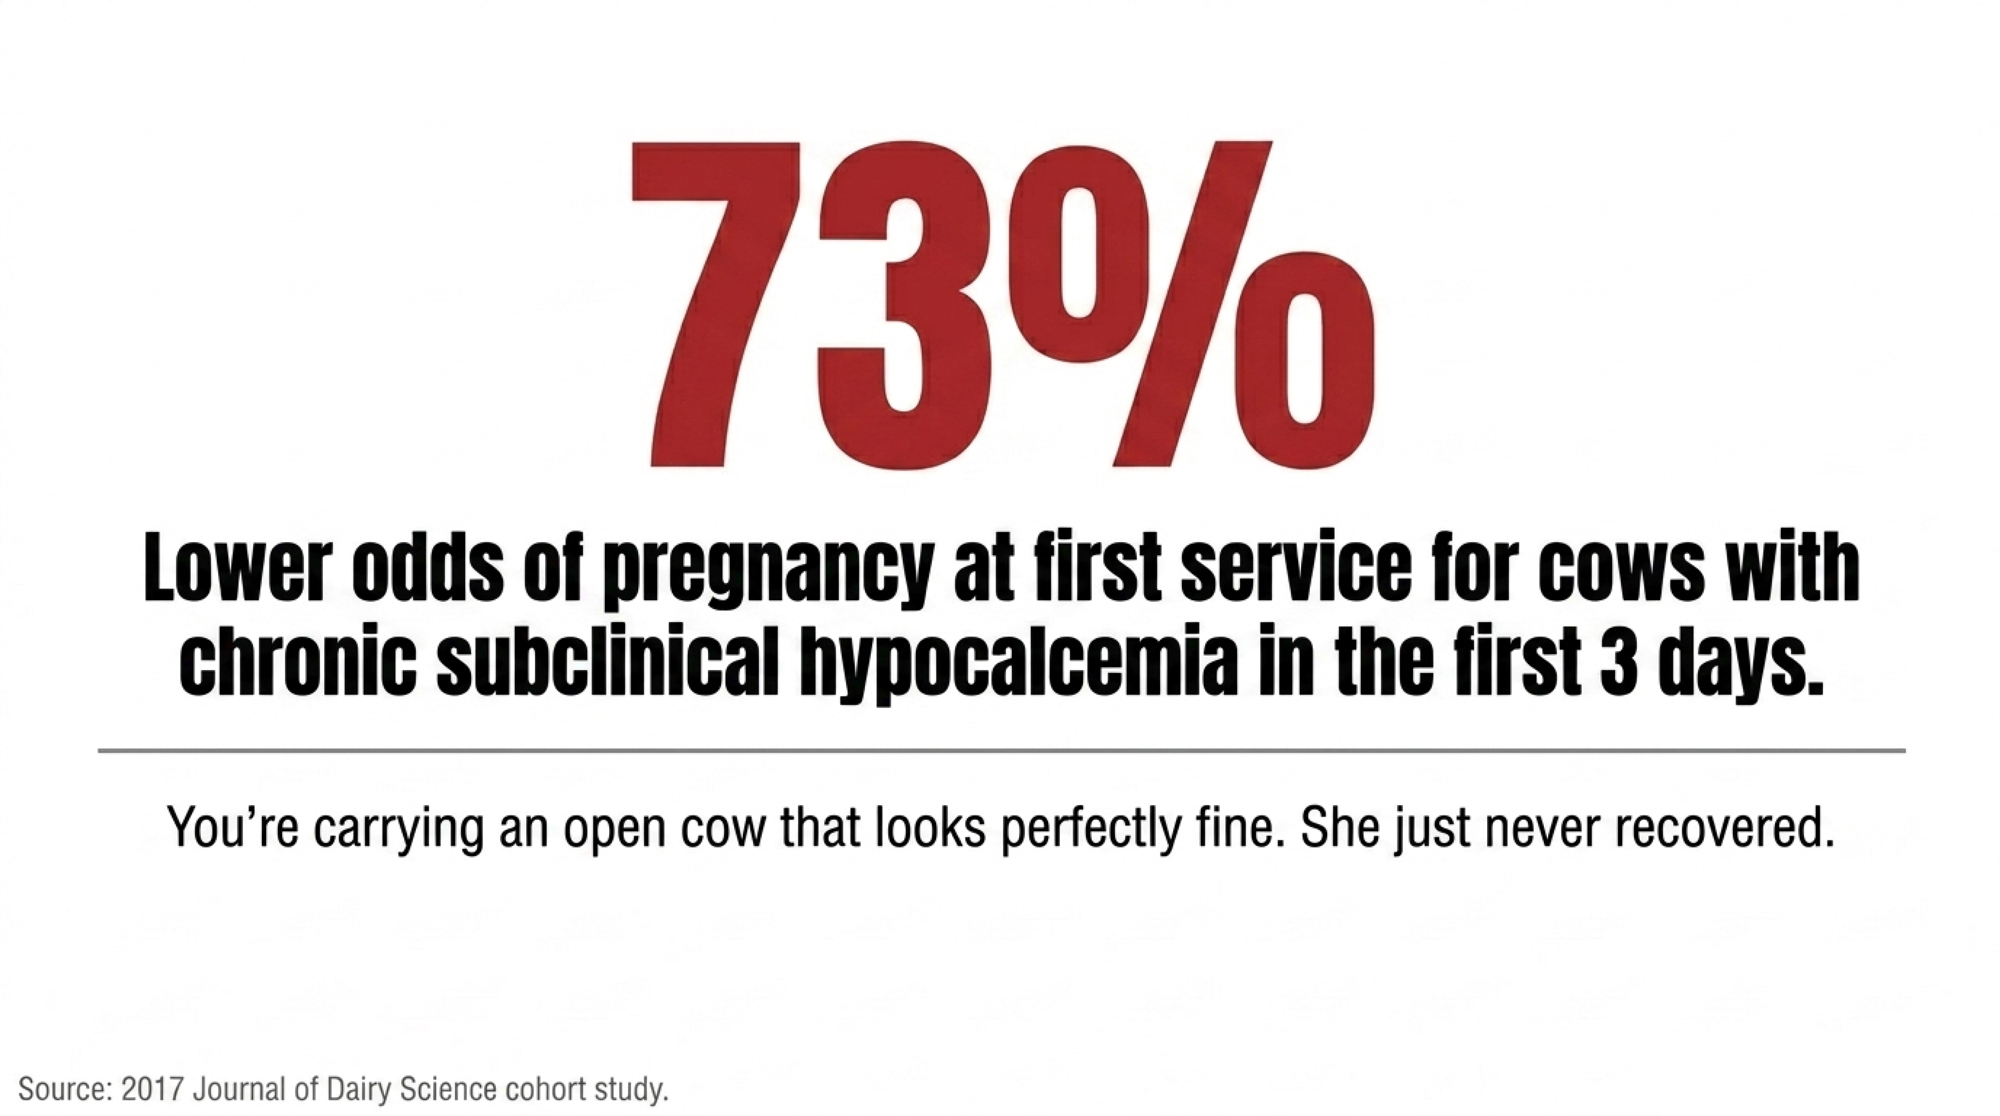
The reproductive tail is sharper still. A 2017 Journal of Dairy Science prospective cohort found cows with chronic subclinical hypocalcemia in the first three days postpartum took longer to resume ovarian activity and had about 73% lower odds of pregnancy at first service — an odds ratio of 0.27 — compared with cows that had normal calcium. That’s not a rounding error. That’s a cow you’re carrying open while she looks perfectly fine. 

So you’ve got an animal that got up, walked away, and showed no signs. And she’s the slow breeder, the metritis case, the eventual cull. She just never got off the mat. You couldn’t see it because you were watching for the wrong thing.

Why Is Low Calcium Both a Cause and a Symptom?

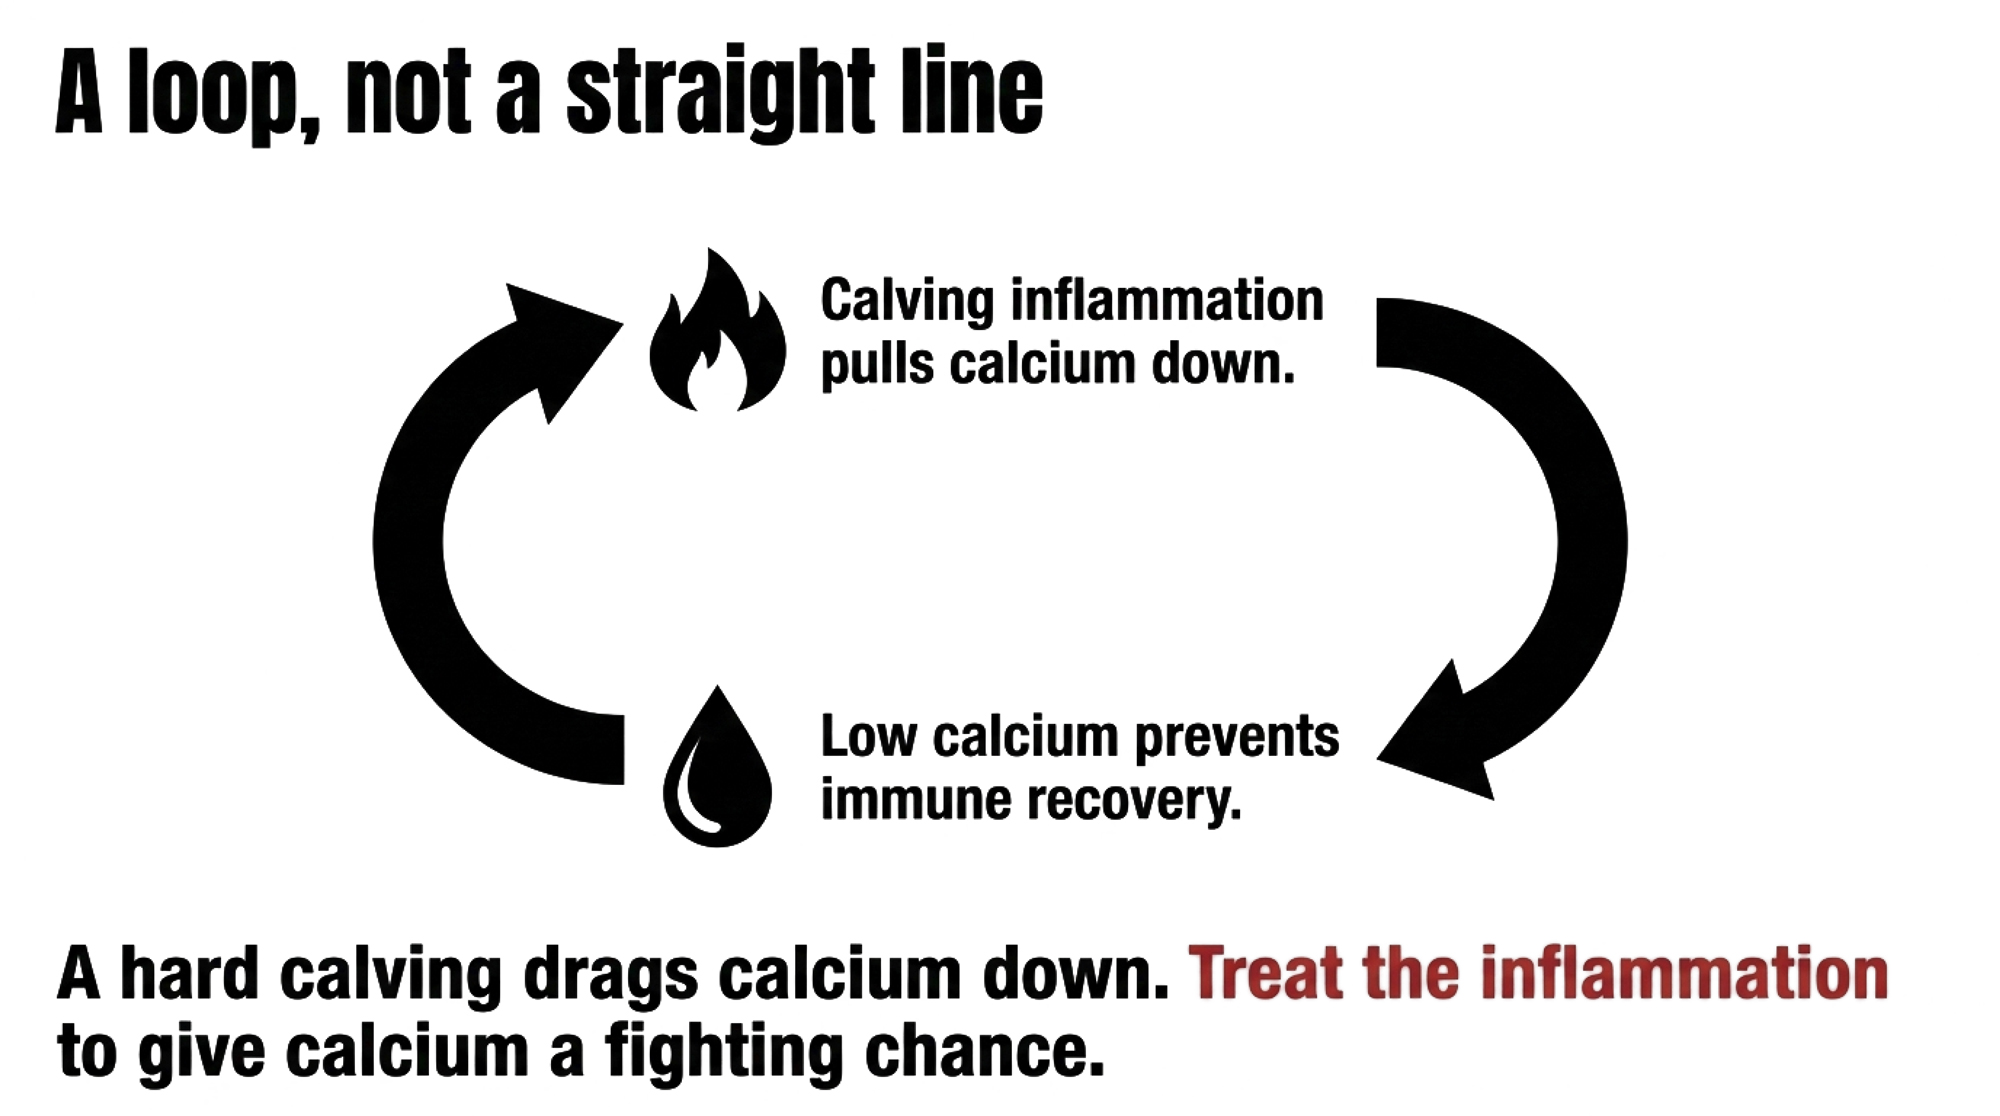
It’s tempting to read this as a straight line: low calcium causes disease. It isn’t. It’s a loop — and that two-way street is the part that often gets lost between the lab result and the fresh-pen conversation.

Think of it like a smoke alarm wired to a breaker panel. Calving lights up the immune system. That inflammatory surge pulls calcium down. And if the cow can’t reset the breaker, she stays stuck — low calcium and high inflammation feed each other. Penn State and other transition-cow researchers frame hypocalcemia and systemic inflammation as part of the cow’s normal physiology, with inflammatory markers climbing from around 14 days pre-calving, peaking at calving, then easing over the following week or two. The trouble starts when that response runs hot and long. 

Recent reviews on calcium dynamics and inflammatory responses conclude that systemic inflammation is consistently associated with reduced blood calcium, and some researchers now propose immune activation itself as a root cause of subclinical hypocalcemia. A Dellait-summarized 2019 study of European commercial herds found that cows sitting at 2.5 mmol/L (about 10.0 mg/dL — the healthy end of the range) calcium on day 3 had a 66–88% lower chance of metritis than cows down at 1.5 mmol/L (about 6.0 mg/dL), depending on parity. 

A hard calving, a dirty uterus, a coliform mastitis case — each one drags calcium down and makes recovery harder. That’s exactly why the fresh-cow problem list is the first place to look. Metritis cows and low-calcium cows tend to be the same cows. 

The Blanket-Bolus Trap

So a producer runs a few blood draws, sees 30, 40, maybe 50% of his older cows under 8.5 mg/dL (2.12 mmol/L) — a cut-off drawn largely from Martinez’s University of Florida work, though some studies use 8.0 mg/dL (2.0 mmol/L) — and asks the obvious question: what do I do Monday? This is where a lot of farms get sold the easy answer. Bolus every cow, every calving, done. 

The economics don’t back it up. A recent meta-analysis of prophylactic oral calcium found little evidence that blanket postpartum bolusing improves milk yield across the trials reviewed. A 2016 stochastic model and subsequent extension summaries showed the return lives in the high-risk cows — older, high-producing, lame — while spreading boluses across the whole herd dilutes the benefit until it disappears. A 2023 Guelph DHMCP hypocalcemia update concluded that blanket therapy isn’t beneficial, pointing instead to the cows where oral calcium earns its keep: high-producing cows, older cows, lame cows, and cows with difficult calvings. 

The ROI lives in the risk profile, not in the product.

Cow GroupEst. % of CalvingsSubclinical RiskBolus ROIAnnual Waste in 1,000-Cow Blanket Protocol
1st-lactation heifers~35%Very LowNear Zero~$5,250/yr
2nd-lactation cows~25%ModerateModerate~$1,500/yr if well-managed
3rd+ lactation cows~25%HighStrong— (keep targeting)
Lame cows (any parity)~5–10%HighStrong— (keep targeting)
Hard calvings / twins~5%HighStrong— (keep targeting)

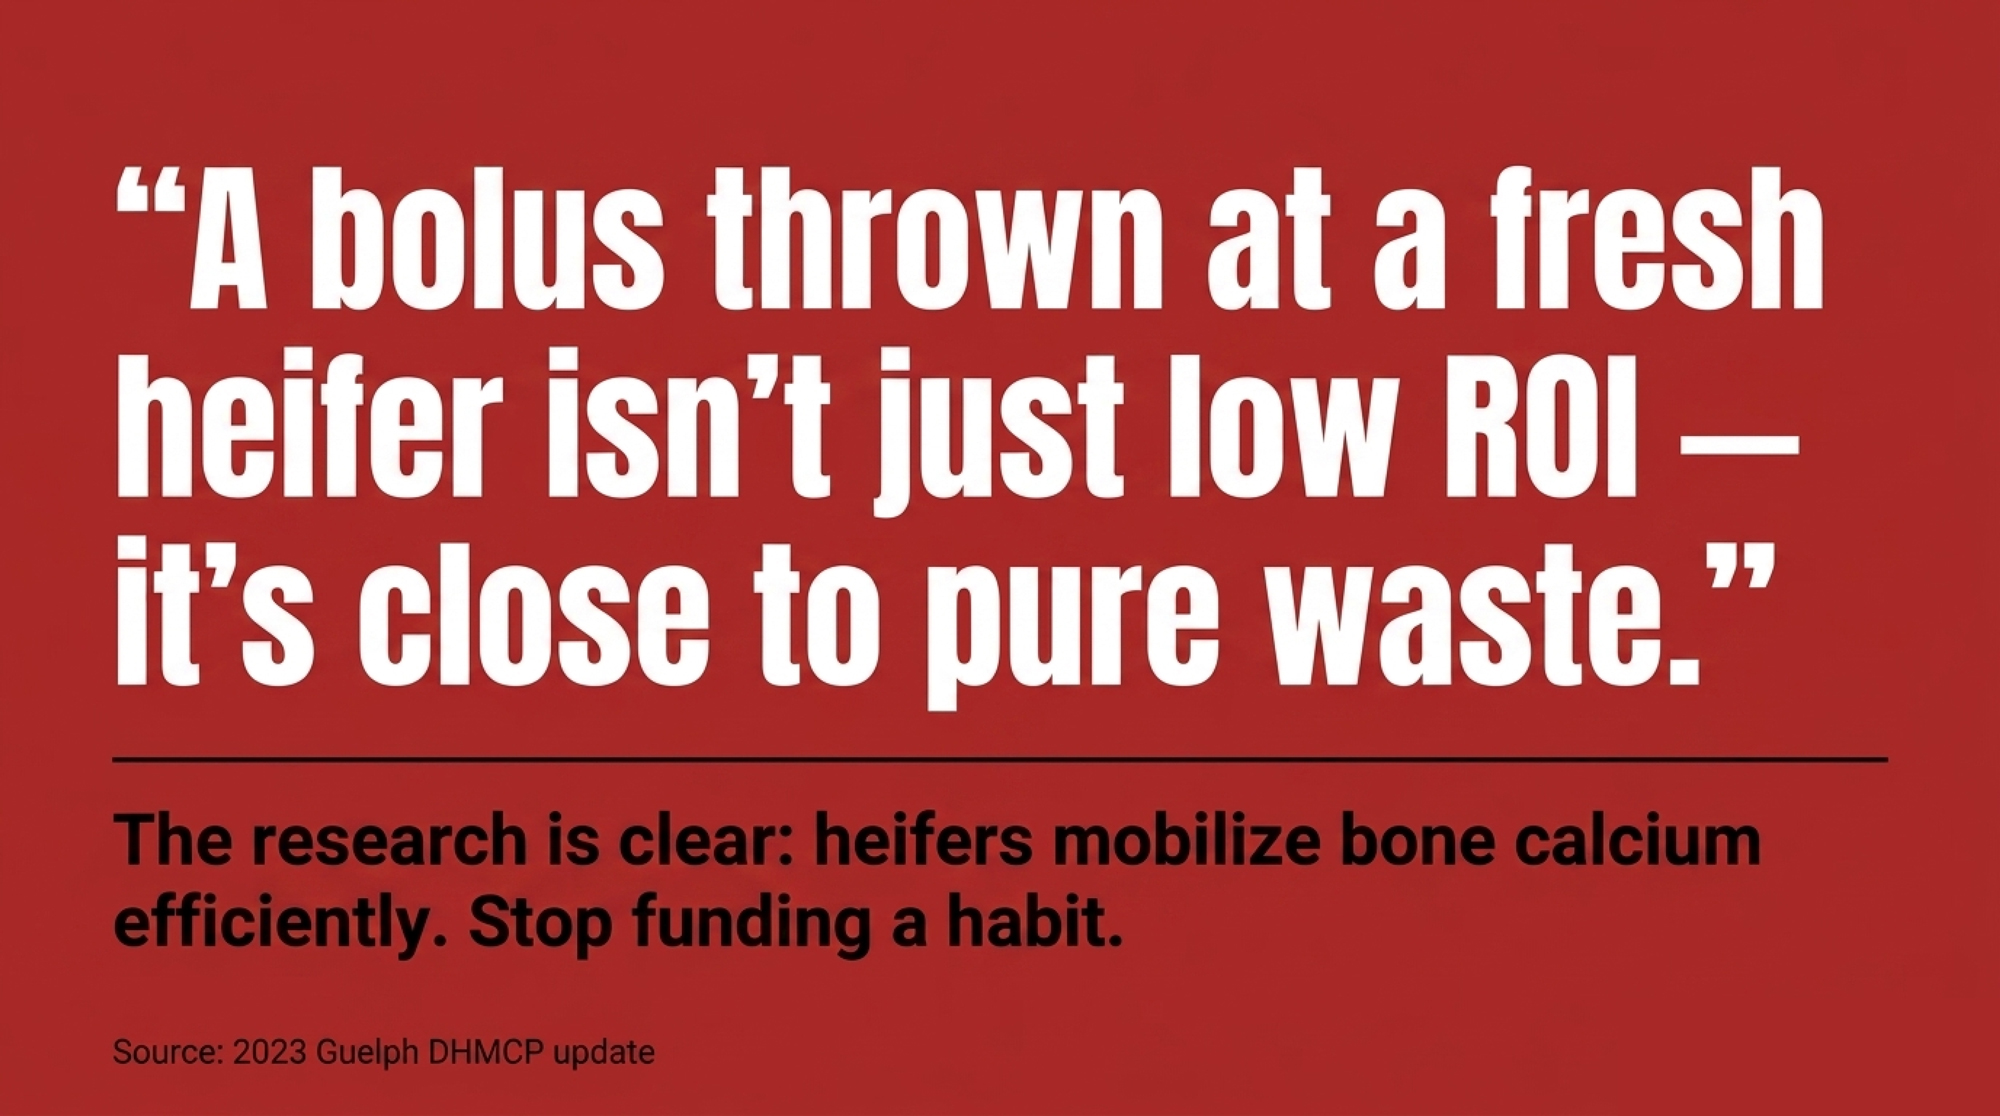
And here’s the part that should sting: first-lactation heifers are the worst possible target for a blanket protocol. They mobilize bone calcium efficiently and have a much lower risk of meaningful subclinical hypocalcemia than mature cows. So a bolus thrown at a fresh heifer isn’t just low ROI — it’s close to pure waste. You’re paying full price for a protocol most first-lactation cows never needed and won’t measurably benefit from. Multiply that by every heifer in a blanket program, and you’re funding a habit, not an outcome. 

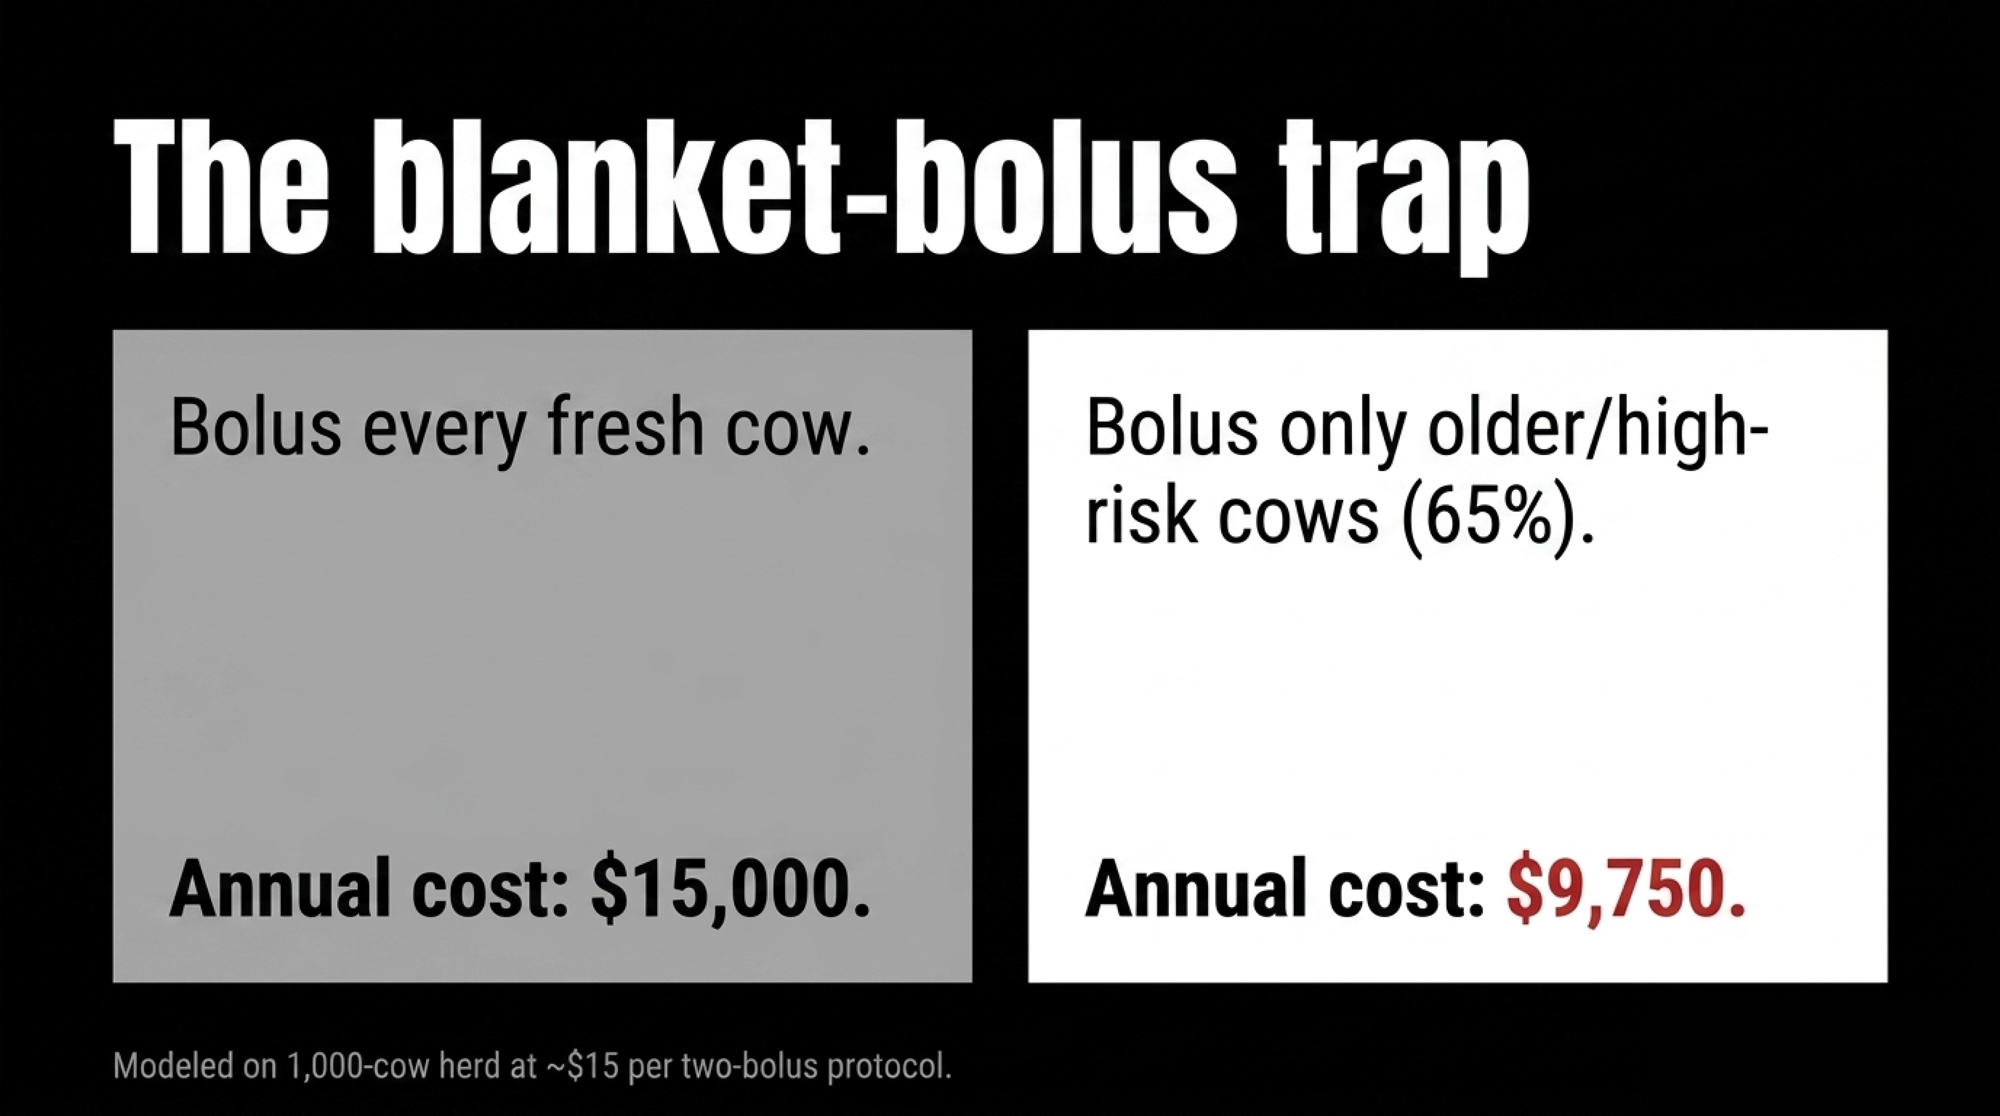
Here’s the barn math, and the point holds at whatever your boluses actually cost. Take your delivered price for a two-bolus protocol and run it two ways. Bolus every fresh cow in a 1,000-cow herd and you pay for roughly 1,000 protocols a year — a big share of them going to heifers and low-risk cows where the research shows little measurable benefit. Aim the same protocol only at your mature, higher-risk cows — say about 65% of calvings — and you’ve cut that product bill by roughly a third, with most of the remaining spend now landing where the data says it works. To put real numbers on it: at a delivered cost in the ballpark of $15 per cow for two boluses, that’s roughly $15,000 a year blanket versus around $9,750 targeted — same product, very different return, depending entirely on where you point it. Plug in your own price, and the gap moves, but the direction never does. 

In lower-risk cows, the research suggests that spending buys reassurance more than results — money out the door for the feeling of having done something. Honest caveat: in herds with high subclinical rates and no DCAD program, some of Oetzel’s modeling does show blanket treatment of mature cows paying off. So the accurate line isn’t “blanket is always wrong.” It’s “blanket rarely pays in low-risk cows, or in herds already managing calcium well.” 

Options and Trade-Offs for Your Operation

The story here isn’t “bolus more” or “bolus less.” It’s “measure first, then aim.” A few paths, depending on where your herd sits:

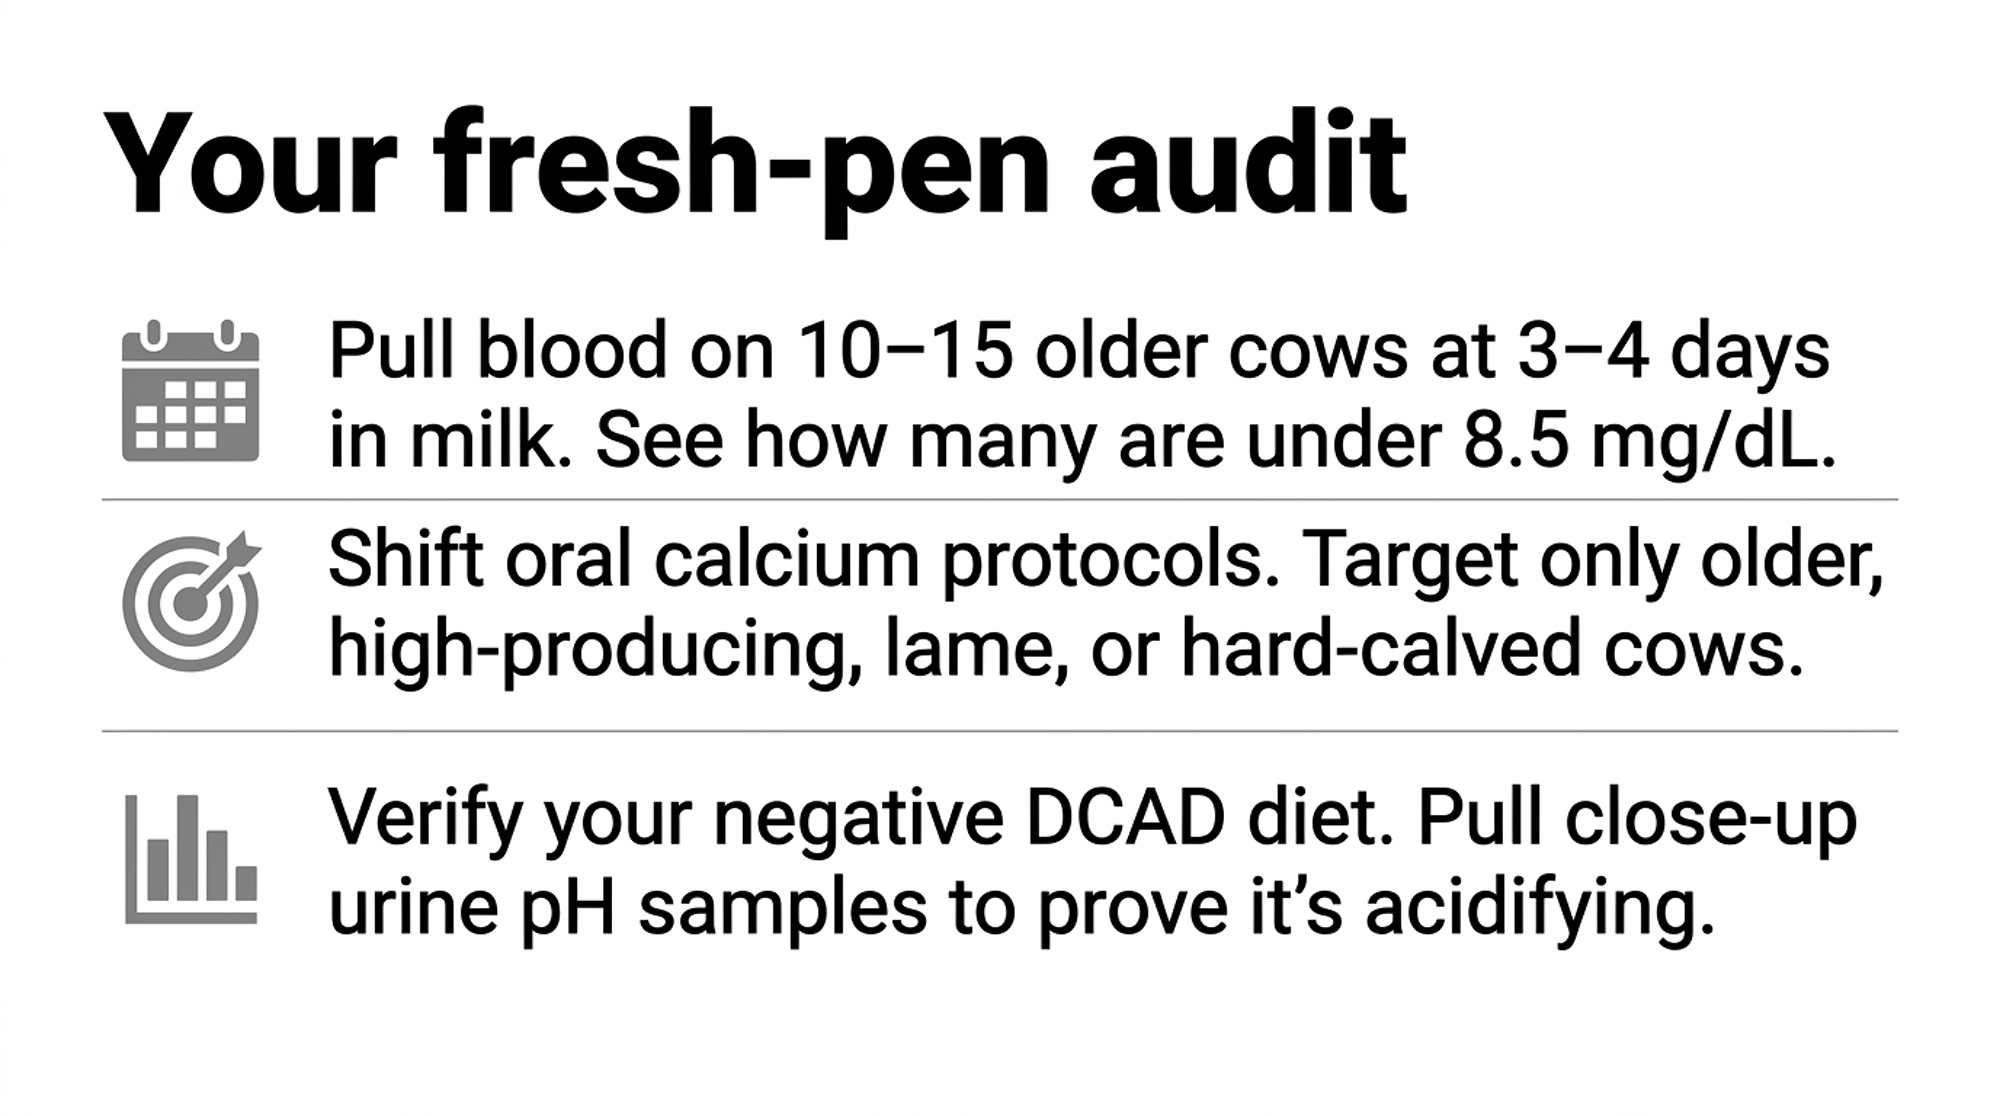
  • Start with a weekly day-3-to-4 calcium check — the 30-day move. This month, work with your vet to pull blood on 10–15 second-lactation-and-older cows at 3–4 days in milk, and track the percentage still under 8.5 mg/dL (2.12 mmol/L). It’s cheap, it’s simple, and it tells you whether your current program works before you spend a dollar changing it. Where it backfires: sample sloppily or skip the repeat, and one bad week looks like a crisis. 
  • Target oral calcium to the high-risk groups. Older cows, high producers, lame cows, hard calvings — a bolus at calving and a second 12–24 hours later. Best fit for herds with many mature cows. The risk: drifting back toward blanket habits, because targeting takes a discipline the shotgun approach doesn’t. 
  • Tighten the pre-fresh program instead of treating downstream. A well-run negative DCAD diet shrinks the low-calcium group at the source. It demands forage testing, mixing accuracy, and urine pH monitoring — a real management load. Where it backfires: a half-built DCAD program can crater intakes without ever fixing calcium. 
  • Manage the inflammation, not just the mineral. Cleaner calving pens, fewer hard pulls, faster response to metritis and severe mastitis. Lower the inflammatory load, and you give the cow’s own calcium recovery a fighting chance. The catch: it’s a whole-team habit change, not a line item you can buy. 

Your Fresh-Pen Audit Protocol

Don’t nod along — run these checks against your own barn. Each one is a decision, not a takeaway:

  • Find your real number. What percentage of your mature fresh cows are still under 8.5 mg/dL (2.12 mmol/L) at day 3–4? If the honest answer is “no idea,” that’s the gap — and the weekly blood draw on 10–15 older cows is how you close it. You’re tracking the wrong 5% until you do. 
  • Map your problem list to age. Pull last month’s fresh-cow cases — metritis, DAs, slow breeders. Do they cluster in your older animals? That overlap is your calcium map. And treat any hard calving, twins, or metritis case as a calcium-recovery risk, not just an infection to clear. 
  • Audit the spend before you buy another pail. If you’re blanket-bolusing, what’s the annual bill, and how much is landing on heifers — the one group that rarely needs it? That’s not low ROI; it’s close to pure waste. 
  • Confirm your DCAD actually works. If your negative DCAD program has never been urine-pH checked, you don’t yet know whether it’s acidifying cows or just looking good on the ration sheet. A handful of close-up urine pH samples settles it in a week. 
  • Know your high-response group. Older, high-producing, lame, hard-calved cows — are they getting targeted support today, or are they buried in a one-size-fits-all protocol? 

Key Takeaways

  • Subclinical hypocalcemia hits far more cows than clinical milk fever, so if you’re only watching the downers, you’re missing most of the cost.
  • Day‑3/4 blood calcium on mature cows is the real fresh‑pen number; if you don’t know how many are under 8.5 mg/dL, that’s your first 30‑day job.
  • Blanket bolusing burns money on heifers and low‑risk cows; aim calcium support at older, high‑producing, lame, and hard‑calved animals instead.
  • A negative DCAD diet and cleaner calving management cut the low‑calcium herd at the source — but only if you’re checking urine pH to prove it’s working.

The shift here is really about a different kind of attention. For decades, the job in the fresh pen was watching for the cow that goes down. The harder, more valuable job is spotting the cow that got up and never really recovered. That’s a quieter signal, and it won’t announce itself.

So here’s the question worth carrying out to the barn Monday morning:

If you drew blood on your next fifteen older fresh cows at day four, how many do you honestly think would still be under the line — and are you ready to find out?

Run Your Numbers

Herd Health ROI Calculator — This article says undermanaged calcium quietly drives culling, metritis, and lost milk. Plug in your herd size, culling rate, and replacement cost to see what those fresh-cow losses are actually costing you—and whether tightening transition health pays before you spend another dollar on boluses.

Complete references and supporting documentation are available upon request by contacting the editorial team at editor@thebullvine.com.

Learn More

The Sunday Read Dairy Professionals Don’t Skip.

Every week, thousands of producers, breeders, and industry insiders open Bullvine Weekly for genetics insights, market shifts, and profit strategies they won’t find anywhere else. One email. Five minutes. Smarter decisions all week.
NewsSubscribe
First
Last
Consent
Send this to a friend