Archive for negative DCAD diet

The $48,750 Hypocalcemia Blind Spot: What Day-4 Calcium Really Costs Your Herd

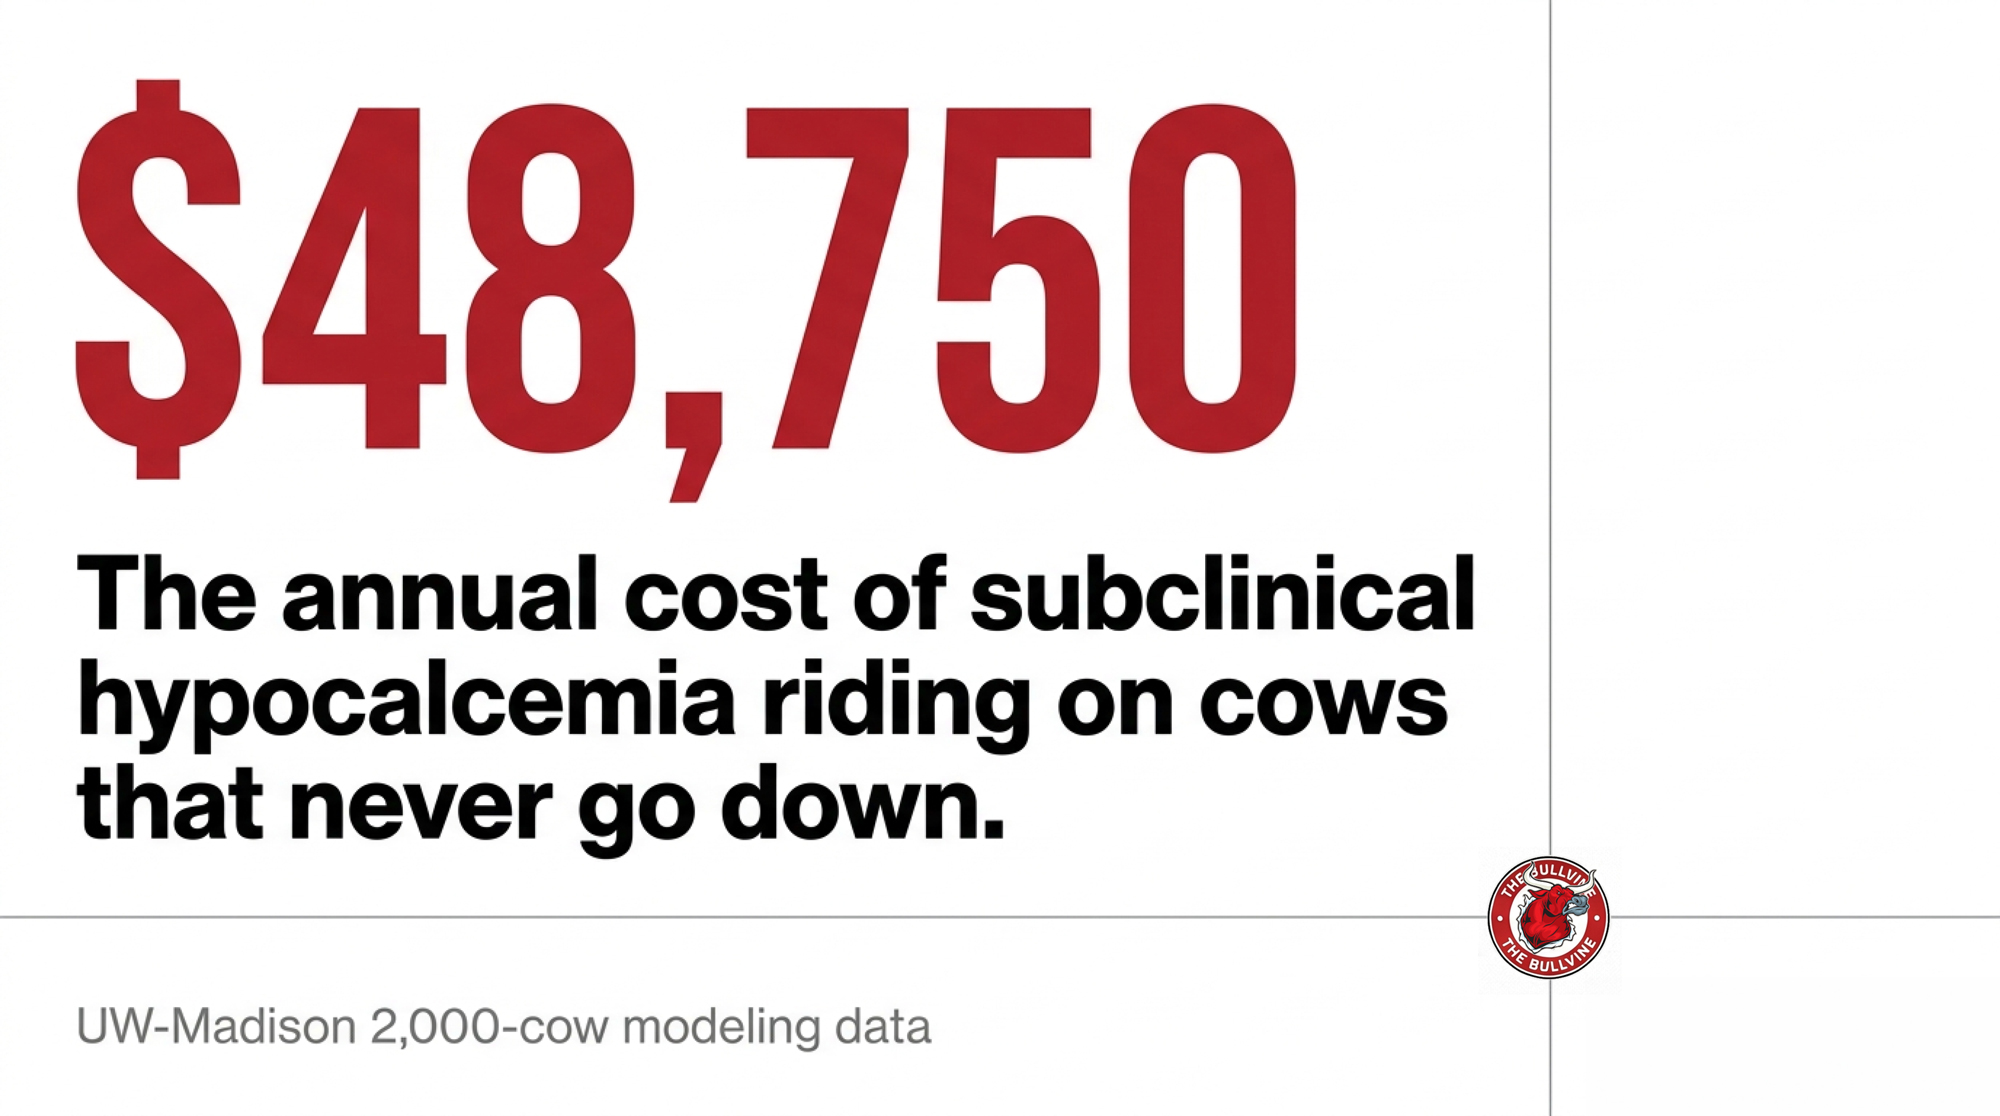
Your milk fever rate looks great. The $48,750 you’re losing on day-4 calcium never shows on that board — and it’s riding on cows that never went down.

Executive Summary: About half of your mature fresh cows dip into subclinical hypocalcemia, and the modeled herd-level losses hit about four times what you’re spending on clinical milk fever. Those cows never show up on the milk-fever board, but they carry a higher risk of metritis, slower reproduction, and earlier culling — adding roughly $50 to 60 per cow in six‑month costs on top of the obvious cases. The article makes one blunt case: the number that matters isn’t your milk fever rate, it’s how many older cows are still under 8.5 mg/dL (2.12 mmol/L) on day 3–4, and whether you’re wasting bolus money on heifers that physiology says rarely need it. Using current Oetzel-style economics, blanket two‑bolus protocols in a 1,000‑cow herd can run around $15,000 a year, while targeting roughly 65% of higher‑risk calvings drops that spend to about $9,750 with better health payback. If you’re proud of a low milk fever rate but have nagging fresh‑cow disease and repro issues, this piece shows you exactly how to run a 30‑day day‑4 blood‑draw check, re‑aim calcium at high‑risk cows, and confirm whether your DCAD program is actually working.
subclinical hypocalcemia fresh cows

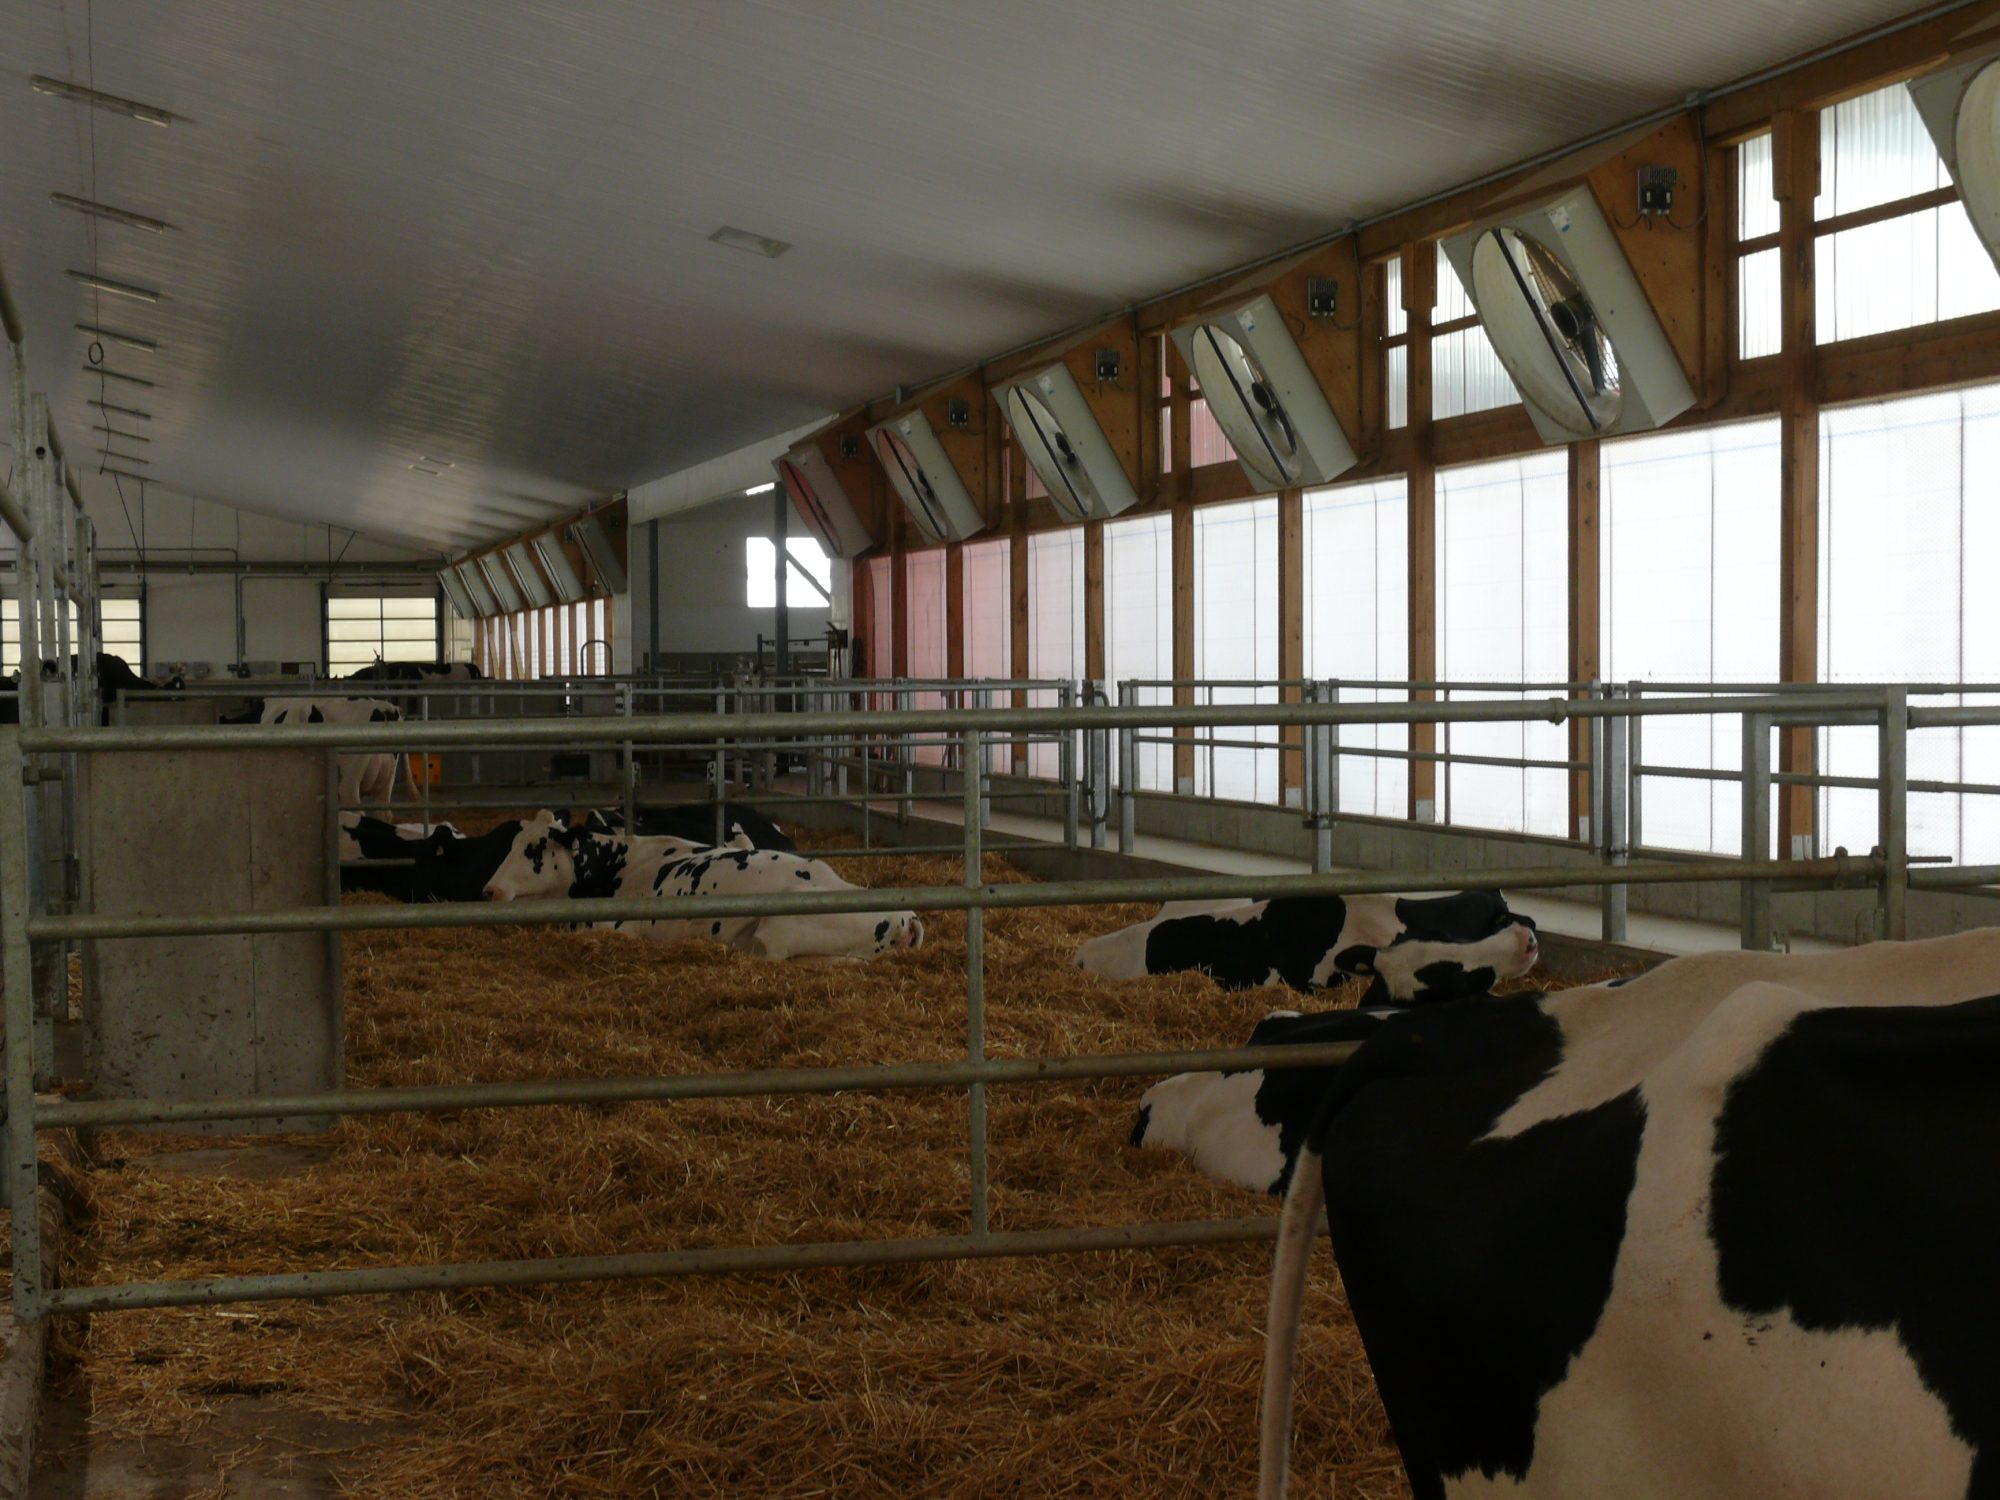
Picture two third-lactation cows that calved overnight. Both got up fine. Both walked to the fresh pen. Neither one will ever land on your milk fever board — and one of them is quietly costing you more than the downer cow you’ve spent your whole career dreading.

That’s the uncomfortable math at the center of transition-cow management right now. The cow on the ground gets the IV bottle, the attention, and the protocol. The cow standing next to her, blood calcium sitting just under the line for three days running, gets nothing. Because nobody’s looking, and the research keeps landing in the same place: she’s the one bleeding margin out of your fresh pen — not as a scare-line, but as a number you can actively address and improve.

What’s Really at Stake
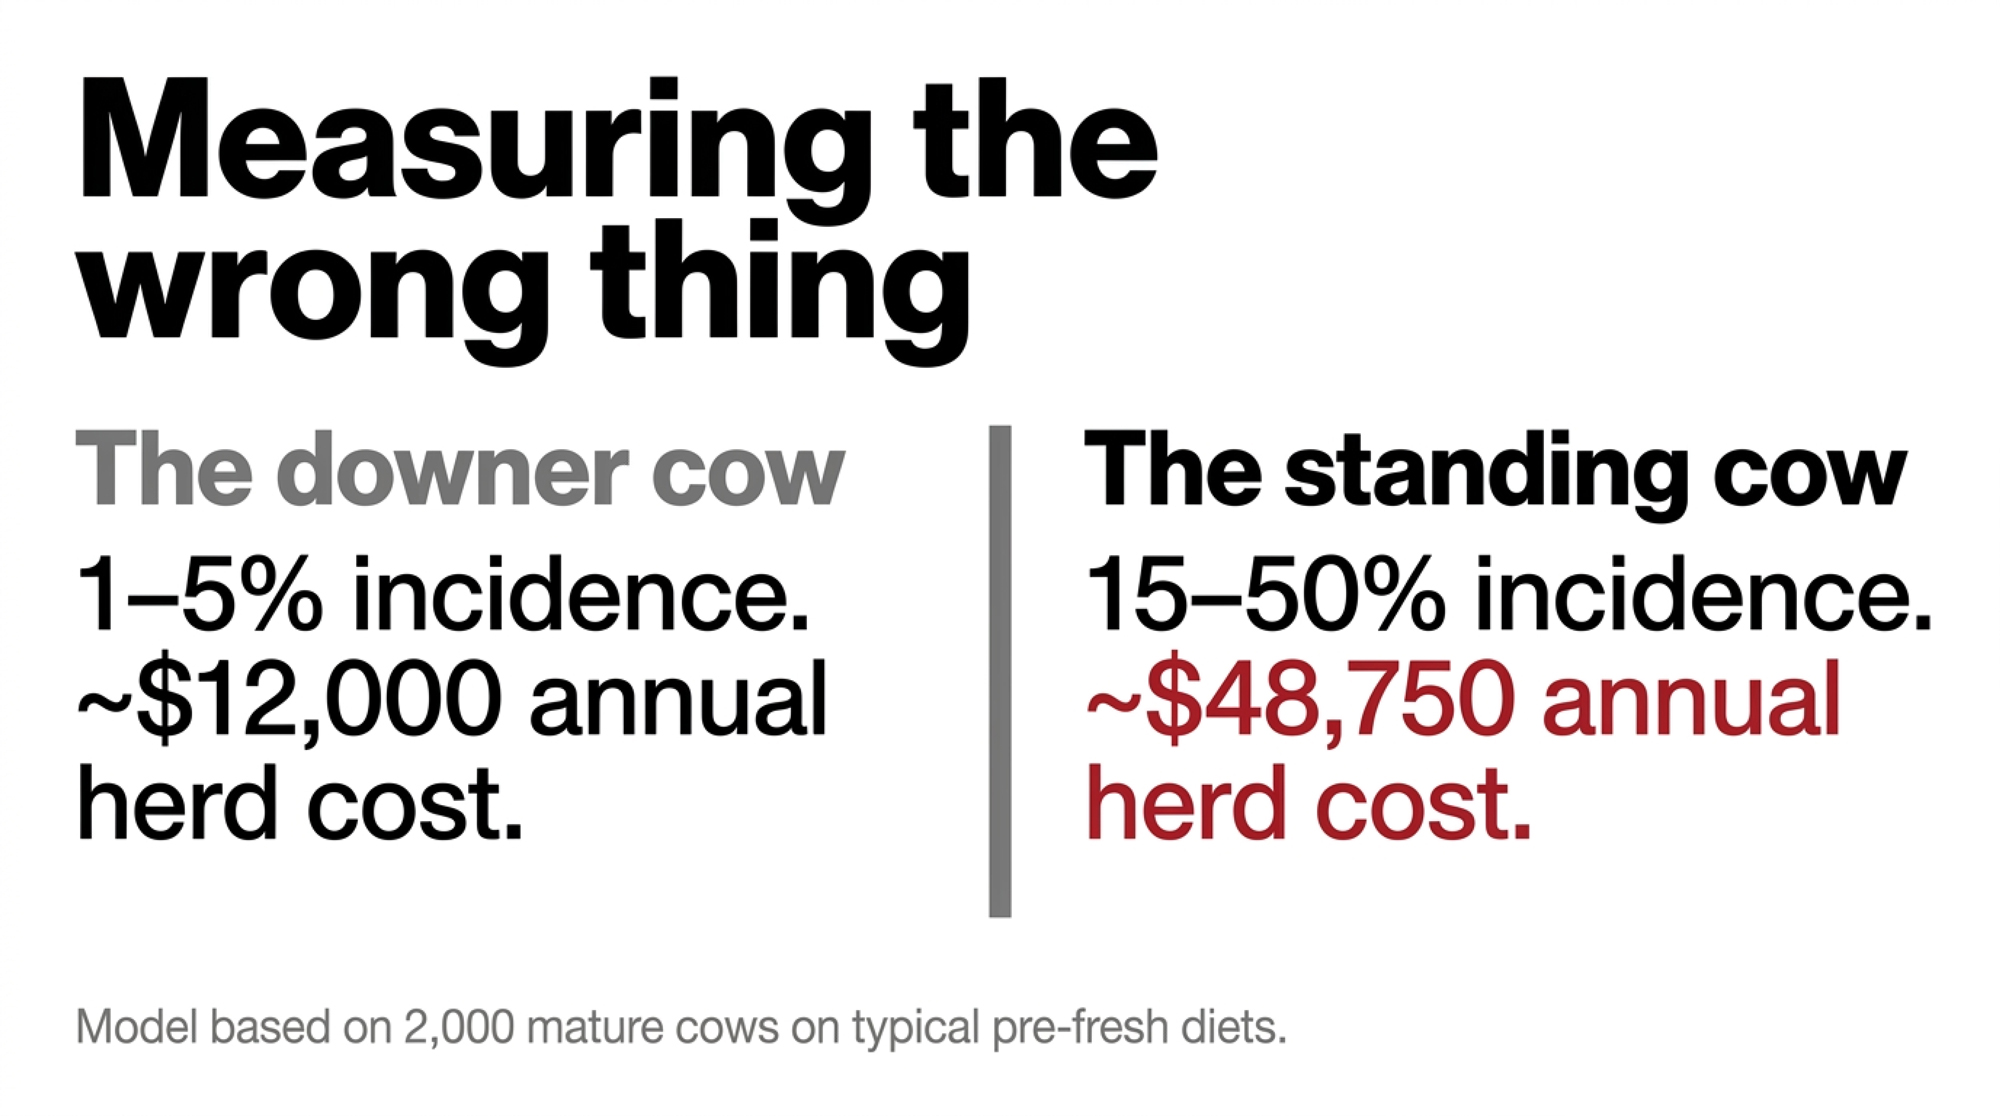
Most of us measure the wrong thing, and we were trained to do so. Clinical milk fever shows up in roughly 1–5% of cows in well-managed herds, according to the University of Wisconsin–Madison Extension and multiple veterinary summaries. It’s dramatic, it’s visible, and it’s the disaster everyone learned to fear. 

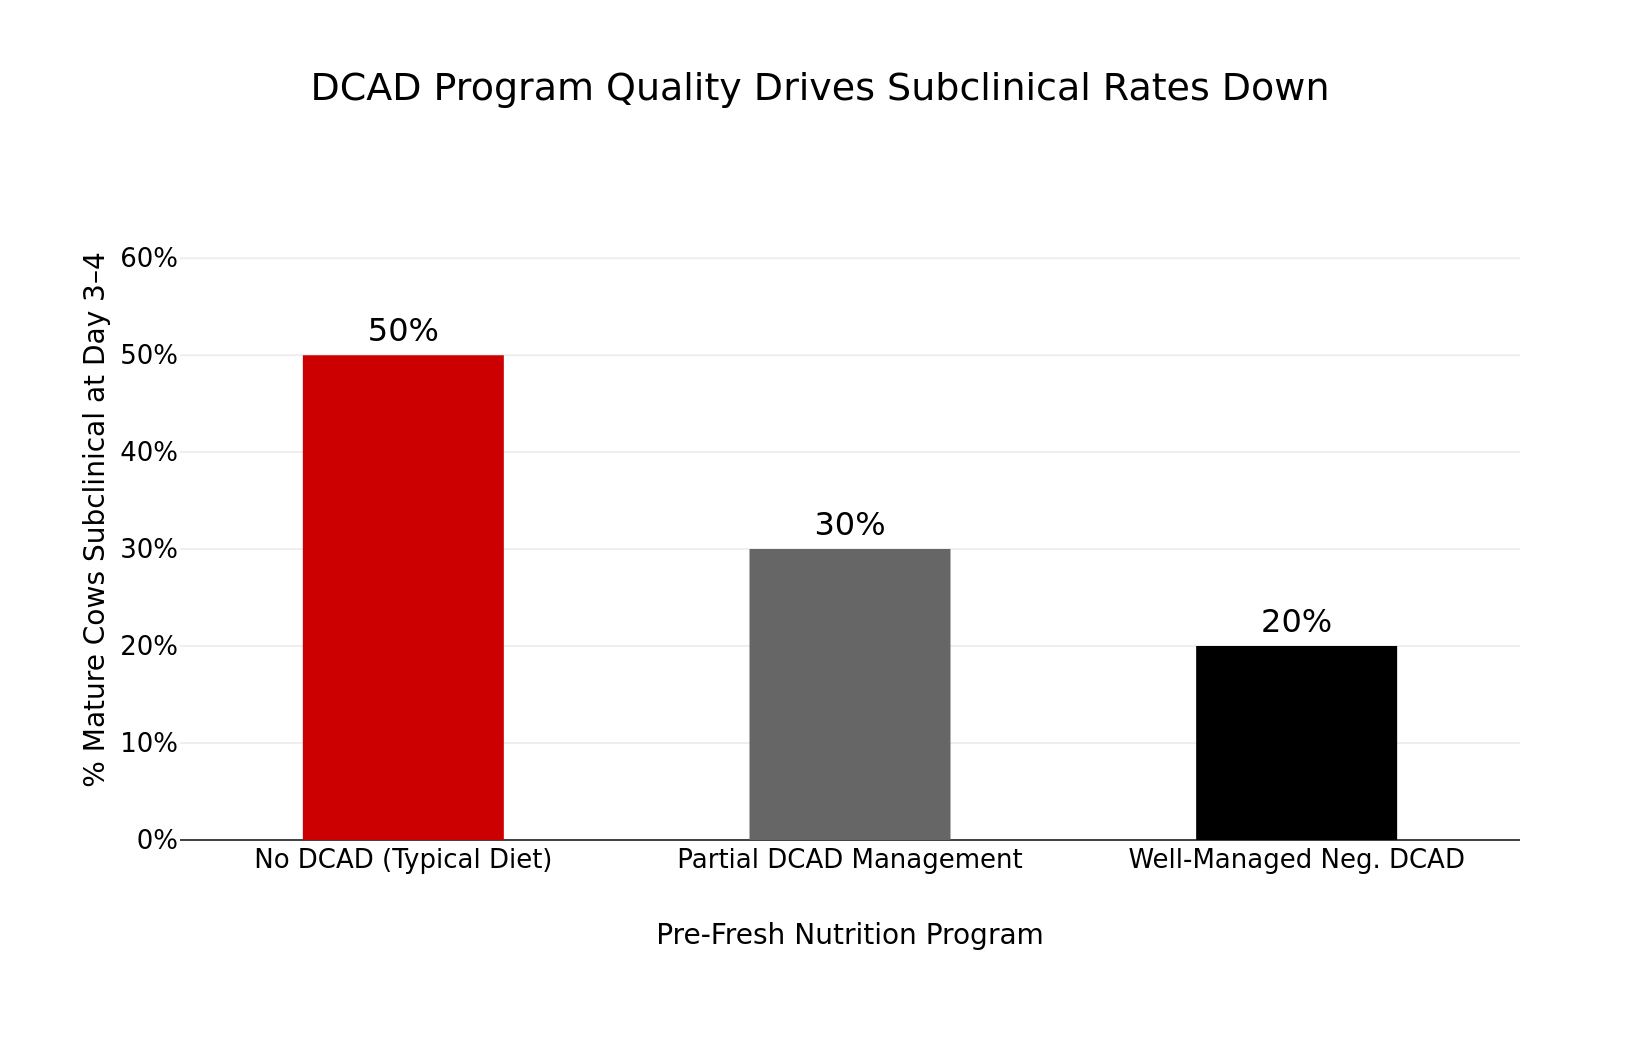
Subclinical hypocalcemia — low blood calcium with no outward signs — is a different animal. Michigan State Extension data indicate about 50% of second-lactation-and-older cows dip into it on typical pre-fresh diets, dropping to roughly 15–25% under well-managed negative DCAD programs. Here’s how the two stack up: 
MetricClinical Milk FeverSubclinical Hypocalcemia
Incidence in mature cows1–5%15–50%
Visibility in fresh penHigh — cow goes downInvisible — cow stands
Cost per case (USD, Oetzel modeling)~$300~$117
Est. annual cost, 2,000-cow herd~$12,000$48,750
Metritis risk vs. normocalcemicModerate66–88% higher
First-service conception oddsNormalOR = 0.27 (73% lower)
Responds to bolus protocolYesHigh-risk cows only
Heifer risk levelLow-moderateVery low — bolus wasteful
DCAD impact on incidenceMinimal (late-stage)Drops to 15–25%

*~50% on typical pre-fresh diets; 15–25% under well-managed negative DCAD. Per-case costs from Gary Oetzel’s UW–Madison modeling (2011–2013); herd-cost figures from his modeled 2,000-cow US scenario.
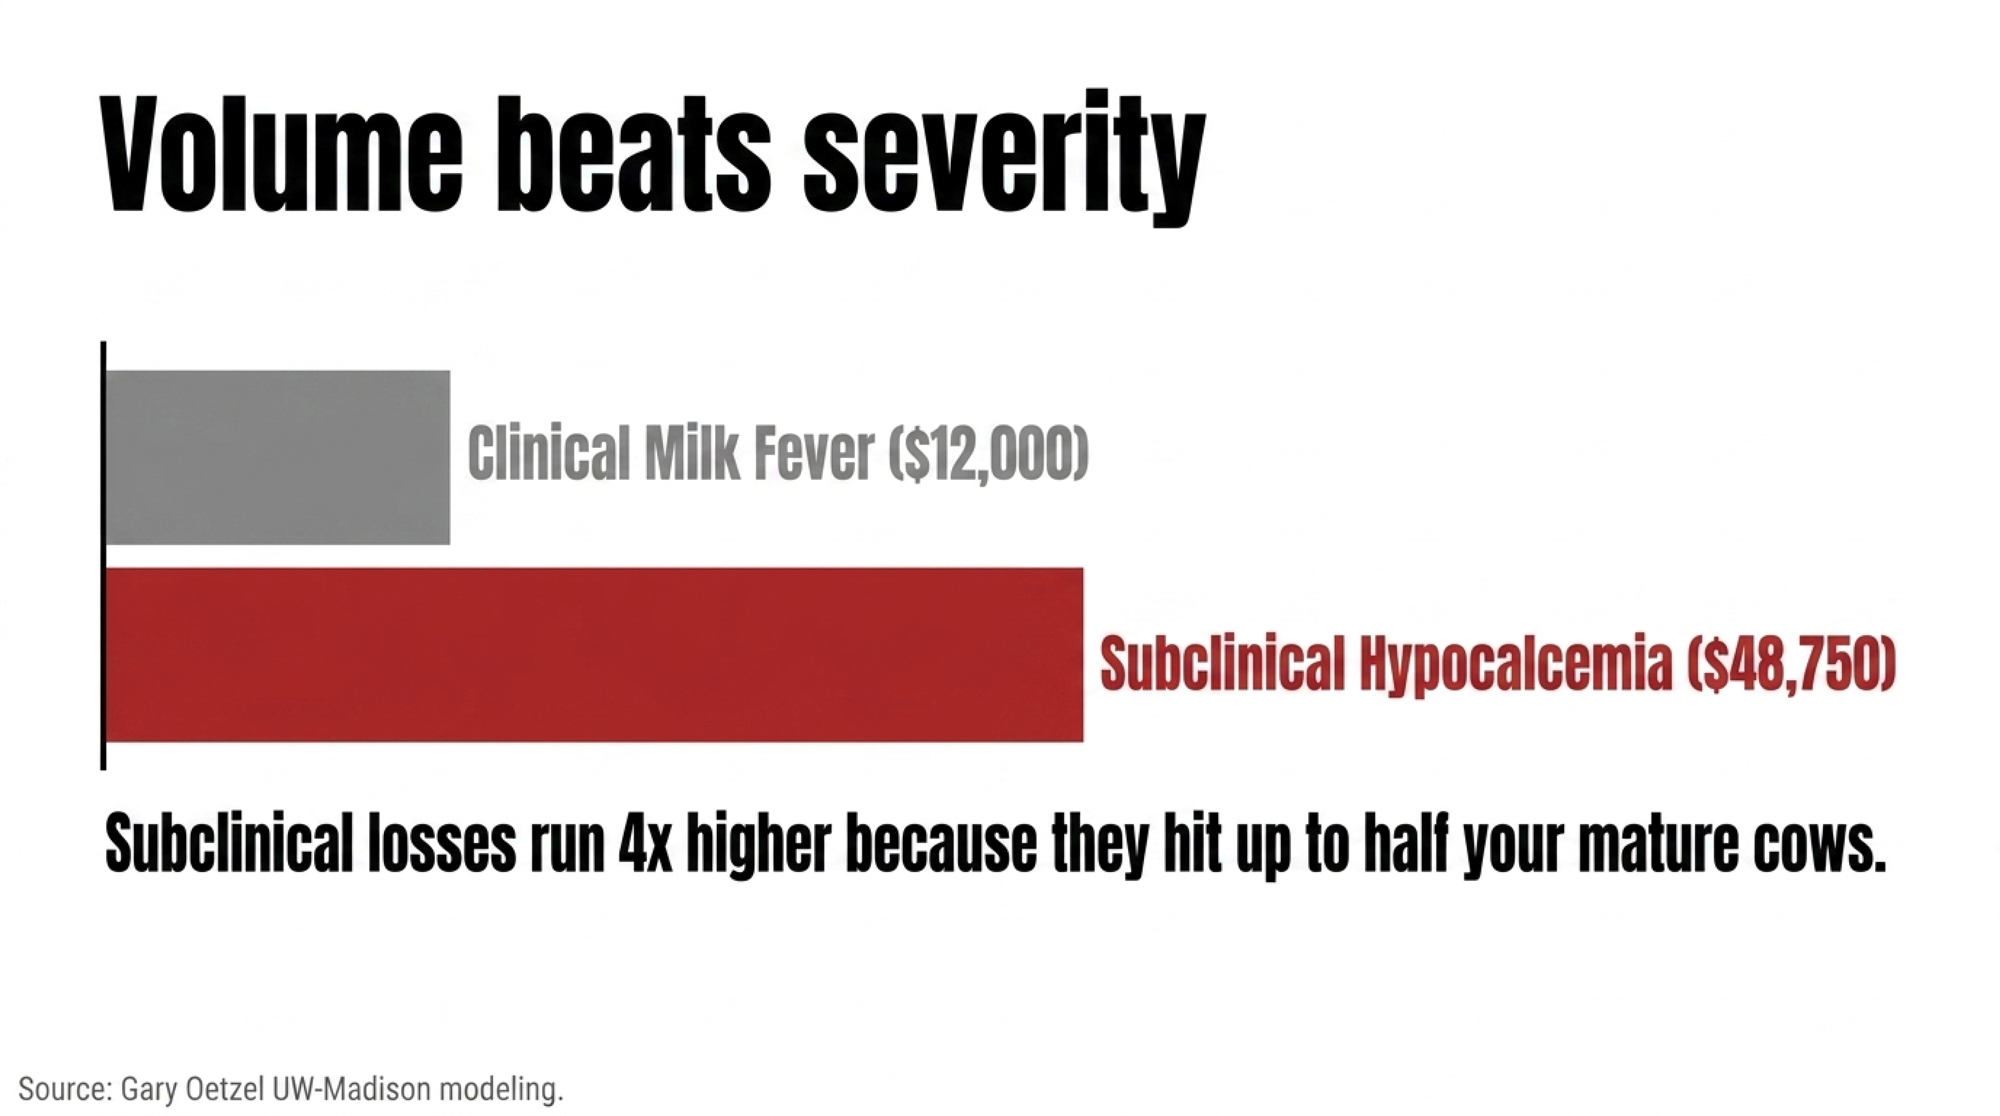
Now do the multiplication. The reason subclinical losses run roughly four times the clinical ones isn’t that each case is worse — it’s that it hits so many more cows. And remember, those per-case figures are in early-2010s US dollars; in today’s input and milk-price environment, the real gap is almost certainly wider, not narrower. European field data summarized by industry technical sources put the added cost of postpartum subclinical hypocalcemia at roughly €50–60 per cow over six months — treatment, lost milk, and reproduction — versus normocalcemic herdmates. Different currency, different continent, same direction. 

If you run mostly mature cows and you’ve been quietly proud of a low milk fever rate, this is the story that should make you a little uncomfortable in a good way.

The Cow That Got Up but Never Recovered

Here’s the reframe that changes how you watch the fresh pen. The question isn’t “how many went down?” It’s “how long did calcium stay low?” Recognizing and addressing this early can make a real difference in herd outcomes and profitability.

Calcium drops around calving, bottoms out somewhere between 12 and 24 hours, and in a healthy cow starts climbing back. That recovery curve is the whole game. A Holstein cohort study, summarized by Dellait, sorted cows by the dynamics of their hypocalcemia — transient, prolonged, or delayed — and the pattern was hard to miss. Cows with only a short, transient dip adapted well and stayed relatively healthy. The cows that stayed low — prolonged or delayed — carried a higher risk of early-lactation disease, removal, and lower milk. 
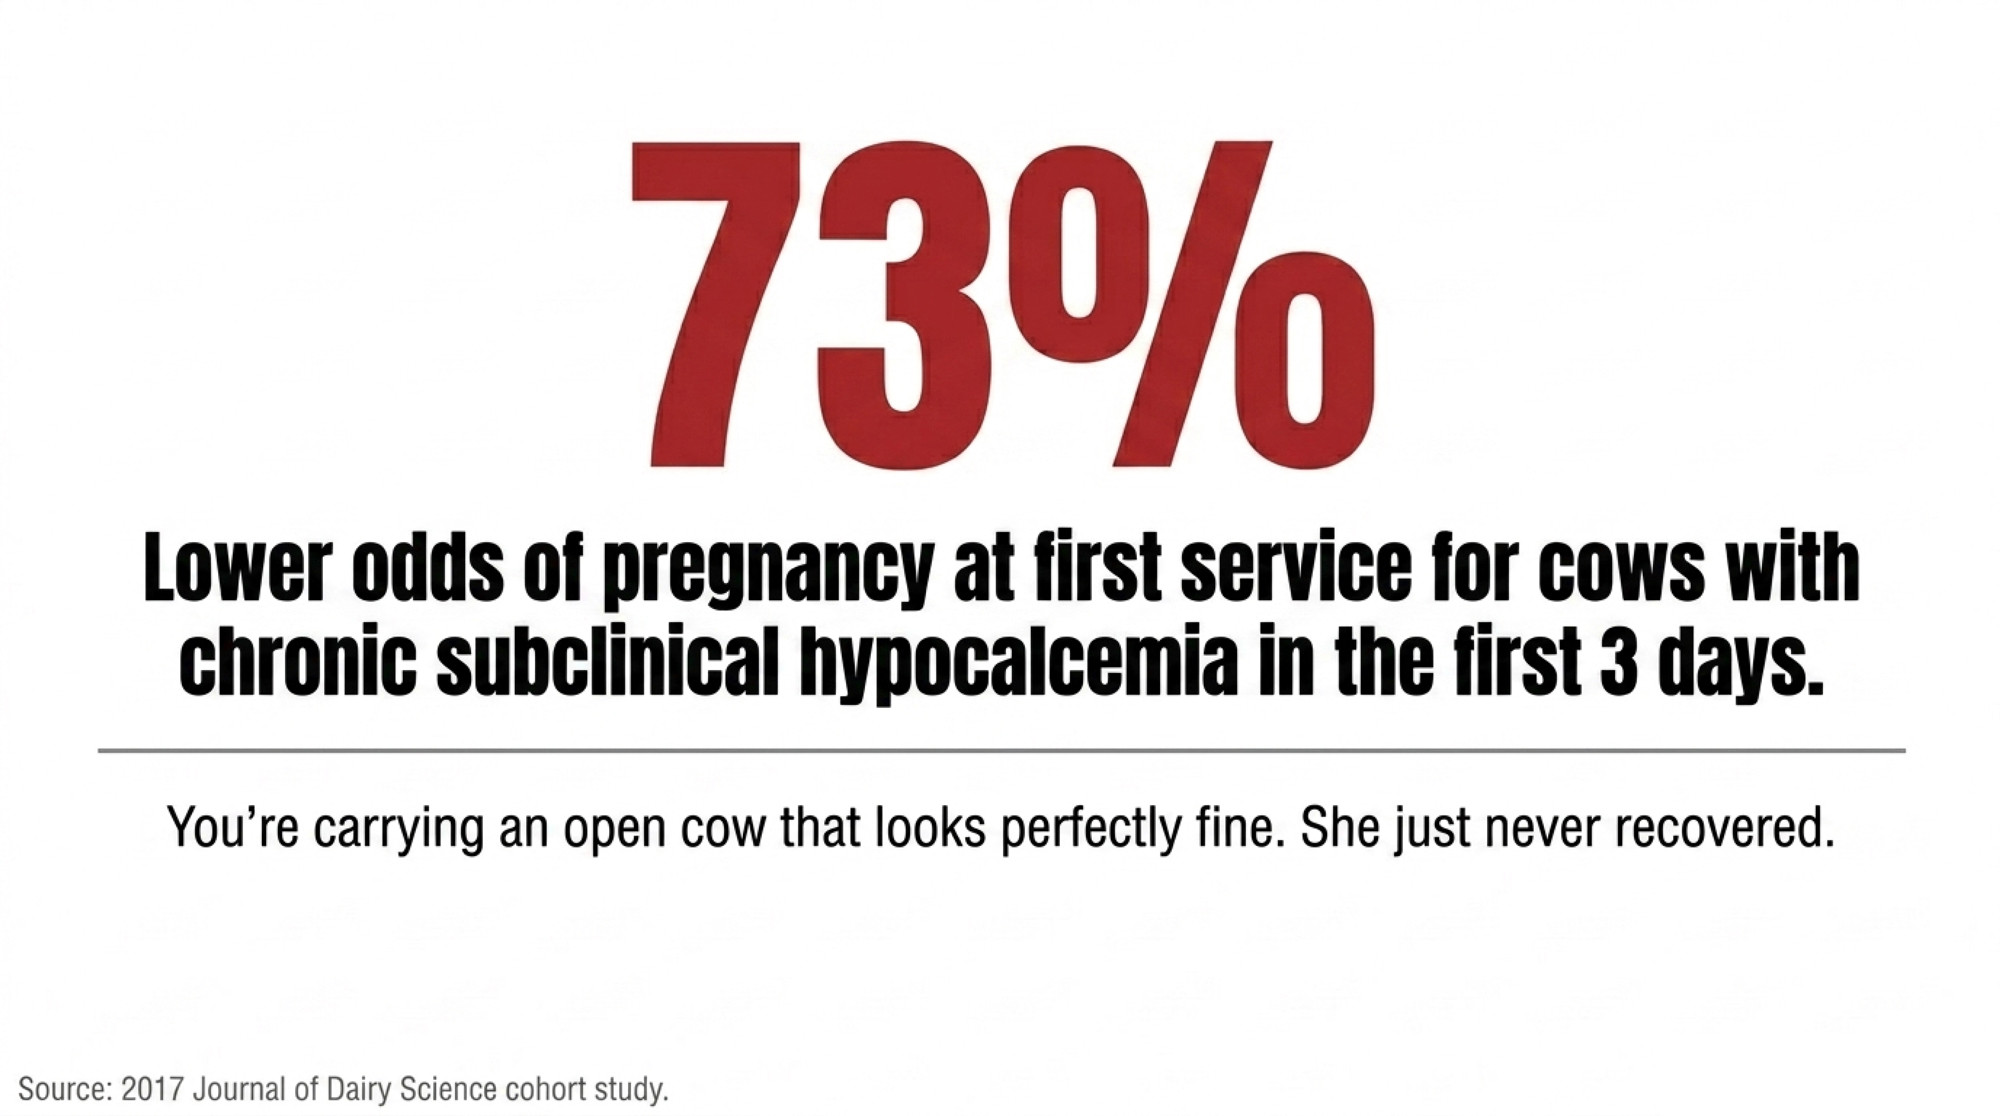
The reproductive tail is sharper still. A 2017 Journal of Dairy Science prospective cohort found cows with chronic subclinical hypocalcemia in the first three days postpartum took longer to resume ovarian activity and had about 73% lower odds of pregnancy at first service — an odds ratio of 0.27 — compared with cows that had normal calcium. That’s not a rounding error. That’s a cow you’re carrying open while she looks perfectly fine. 

So you’ve got an animal that got up, walked away, and showed no signs. And she’s the slow breeder, the metritis case, the eventual cull. She just never got off the mat. You couldn’t see it because you were watching for the wrong thing.

Why Is Low Calcium Both a Cause and a Symptom?
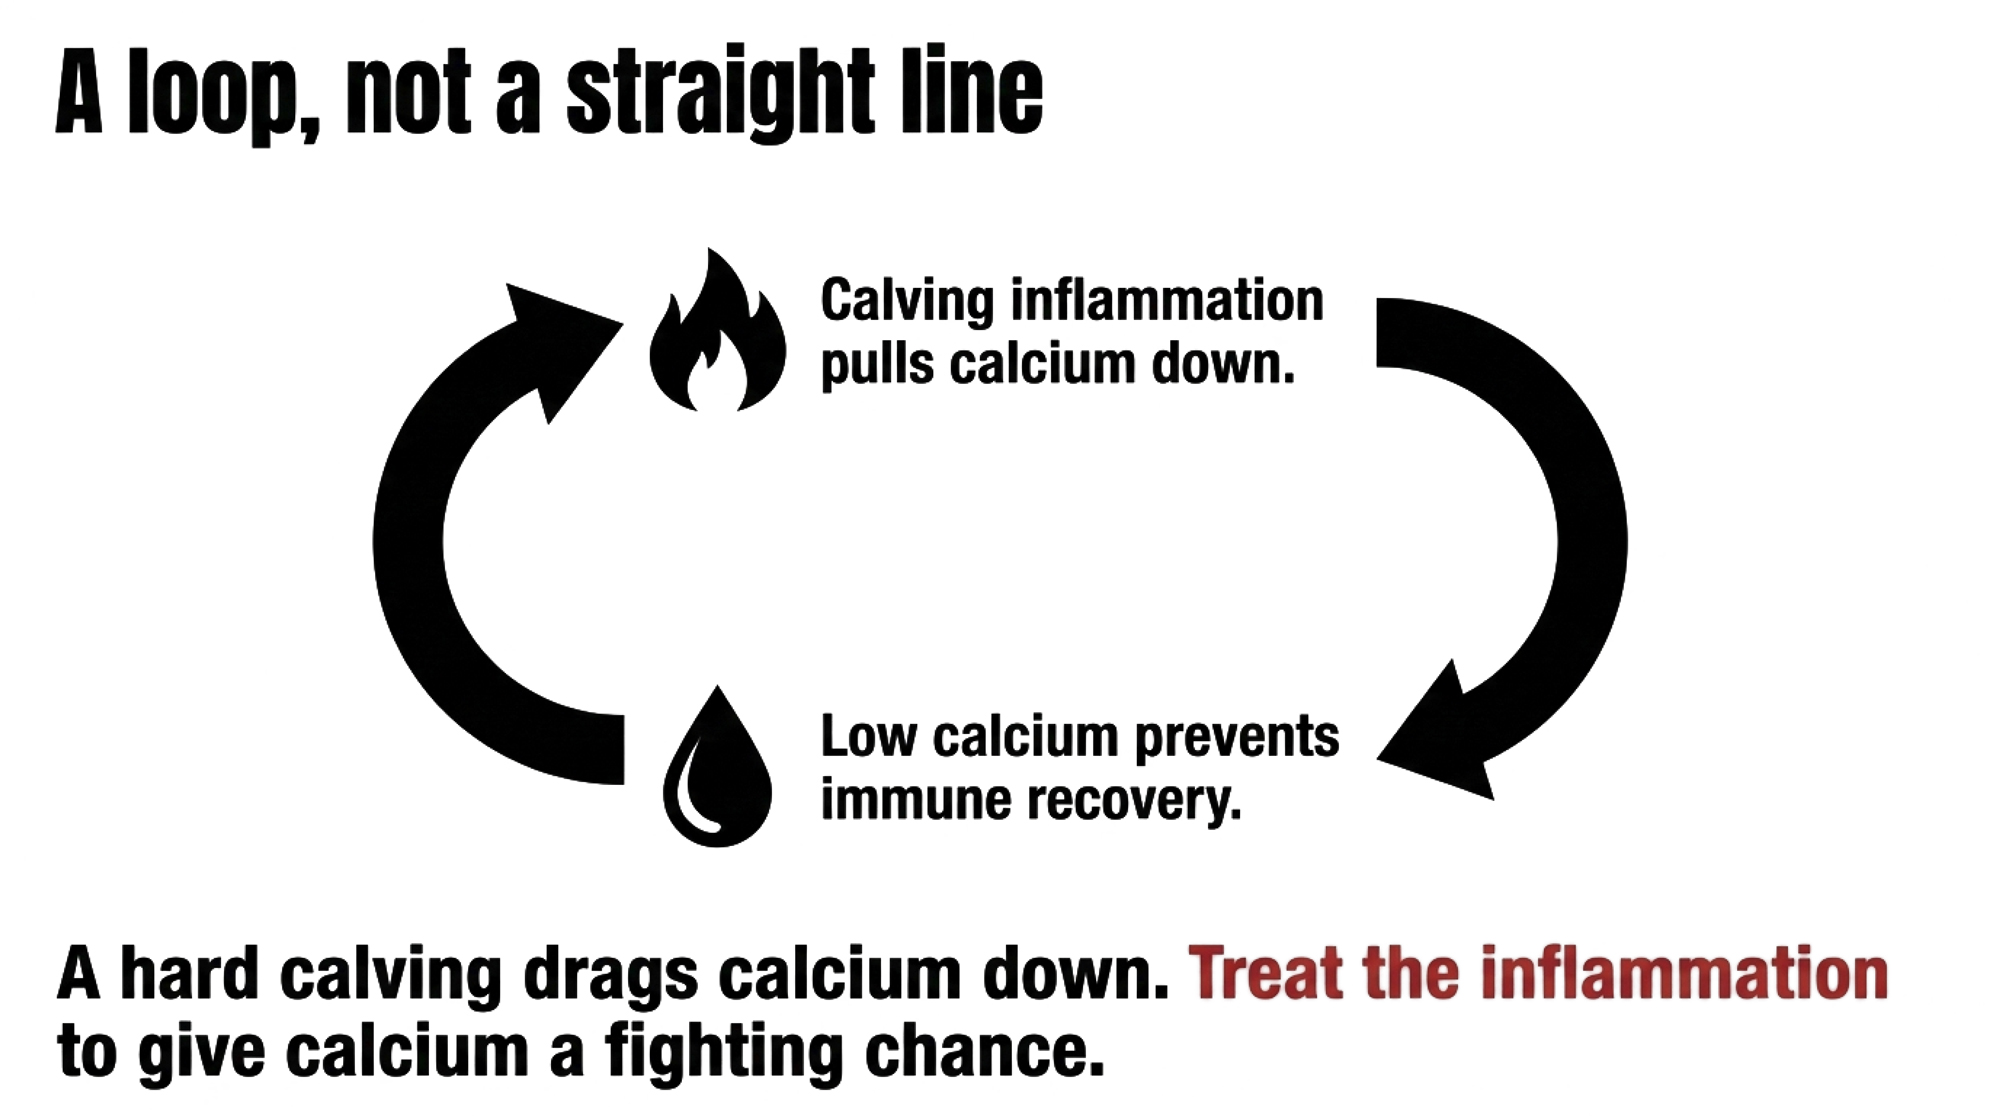
It’s tempting to read this as a straight line: low calcium causes disease. It isn’t. It’s a loop — and that two-way street is the part that often gets lost between the lab result and the fresh-pen conversation.

Think of it like a smoke alarm wired to a breaker panel. Calving lights up the immune system. That inflammatory surge pulls calcium down. And if the cow can’t reset the breaker, she stays stuck — low calcium and high inflammation feed each other. Penn State and other transition-cow researchers frame hypocalcemia and systemic inflammation as part of the cow’s normal physiology, with inflammatory markers climbing from around 14 days pre-calving, peaking at calving, then easing over the following week or two. The trouble starts when that response runs hot and long. 

Recent reviews on calcium dynamics and inflammatory responses conclude that systemic inflammation is consistently associated with reduced blood calcium, and some researchers now propose immune activation itself as a root cause of subclinical hypocalcemia. A Dellait-summarized 2019 study of European commercial herds found that cows sitting at 2.5 mmol/L (about 10.0 mg/dL — the healthy end of the range) calcium on day 3 had a 66–88% lower chance of metritis than cows down at 1.5 mmol/L (about 6.0 mg/dL), depending on parity. 

A hard calving, a dirty uterus, a coliform mastitis case — each one drags calcium down and makes recovery harder. That’s exactly why the fresh-cow problem list is the first place to look. Metritis cows and low-calcium cows tend to be the same cows. 

The Blanket-Bolus Trap

So a producer runs a few blood draws, sees 30, 40, maybe 50% of his older cows under 8.5 mg/dL (2.12 mmol/L) — a cut-off drawn largely from Martinez’s University of Florida work, though some studies use 8.0 mg/dL (2.0 mmol/L) — and asks the obvious question: what do I do Monday? This is where a lot of farms get sold the easy answer. Bolus every cow, every calving, done. 

The economics don’t back it up. A recent meta-analysis of prophylactic oral calcium found little evidence that blanket postpartum bolusing improves milk yield across the trials reviewed. A 2016 stochastic model and subsequent extension summaries showed the return lives in the high-risk cows — older, high-producing, lame — while spreading boluses across the whole herd dilutes the benefit until it disappears. A 2023 Guelph DHMCP hypocalcemia update concluded that blanket therapy isn’t beneficial, pointing instead to the cows where oral calcium earns its keep: high-producing cows, older cows, lame cows, and cows with difficult calvings. 

The ROI lives in the risk profile, not in the product.

Cow GroupEst. % of CalvingsSubclinical RiskBolus ROIAnnual Waste in 1,000-Cow Blanket Protocol
1st-lactation heifers~35%Very LowNear Zero~$5,250/yr
2nd-lactation cows~25%ModerateModerate~$1,500/yr if well-managed
3rd+ lactation cows~25%HighStrong— (keep targeting)
Lame cows (any parity)~5–10%HighStrong— (keep targeting)
Hard calvings / twins~5%HighStrong— (keep targeting)

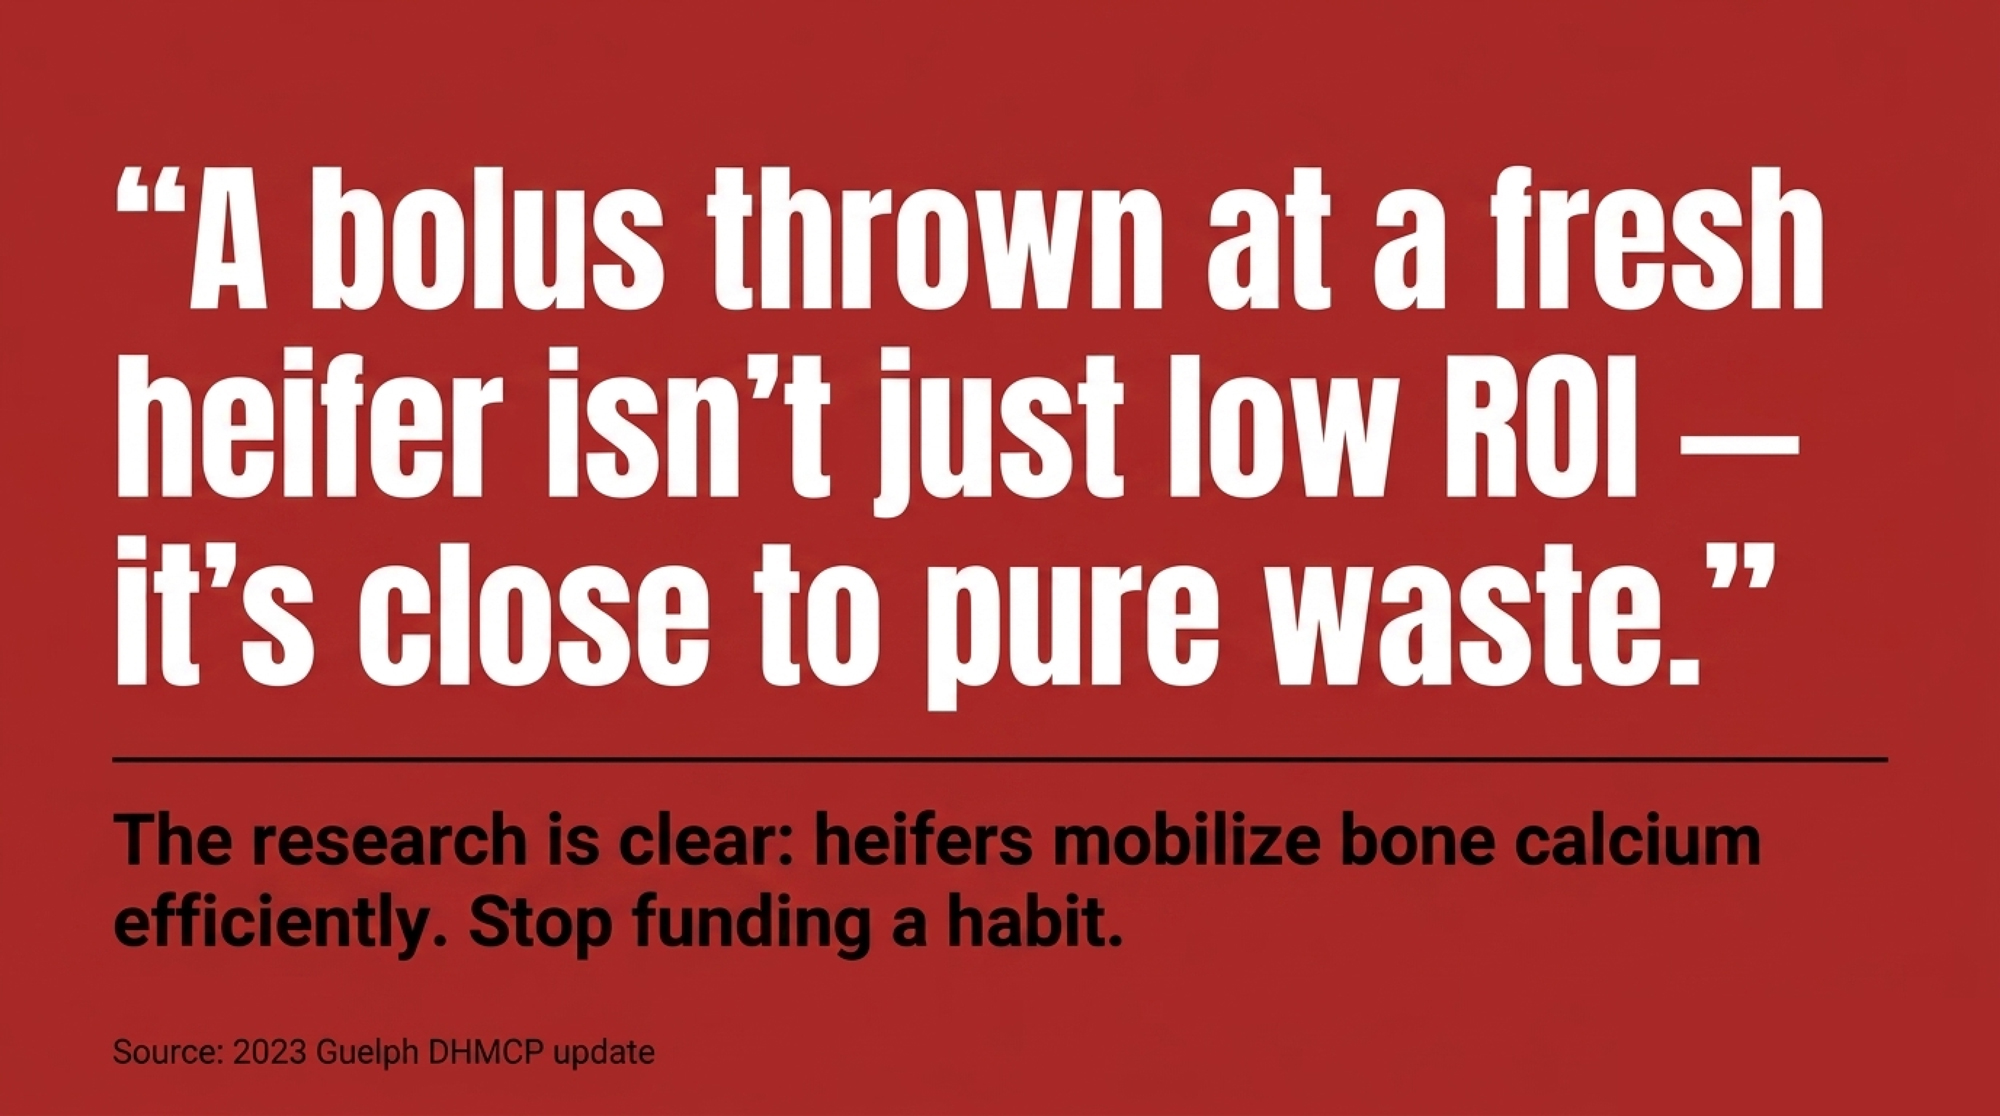
And here’s the part that should sting: first-lactation heifers are the worst possible target for a blanket protocol. They mobilize bone calcium efficiently and have a much lower risk of meaningful subclinical hypocalcemia than mature cows. So a bolus thrown at a fresh heifer isn’t just low ROI — it’s close to pure waste. You’re paying full price for a protocol most first-lactation cows never needed and won’t measurably benefit from. Multiply that by every heifer in a blanket program, and you’re funding a habit, not an outcome. 
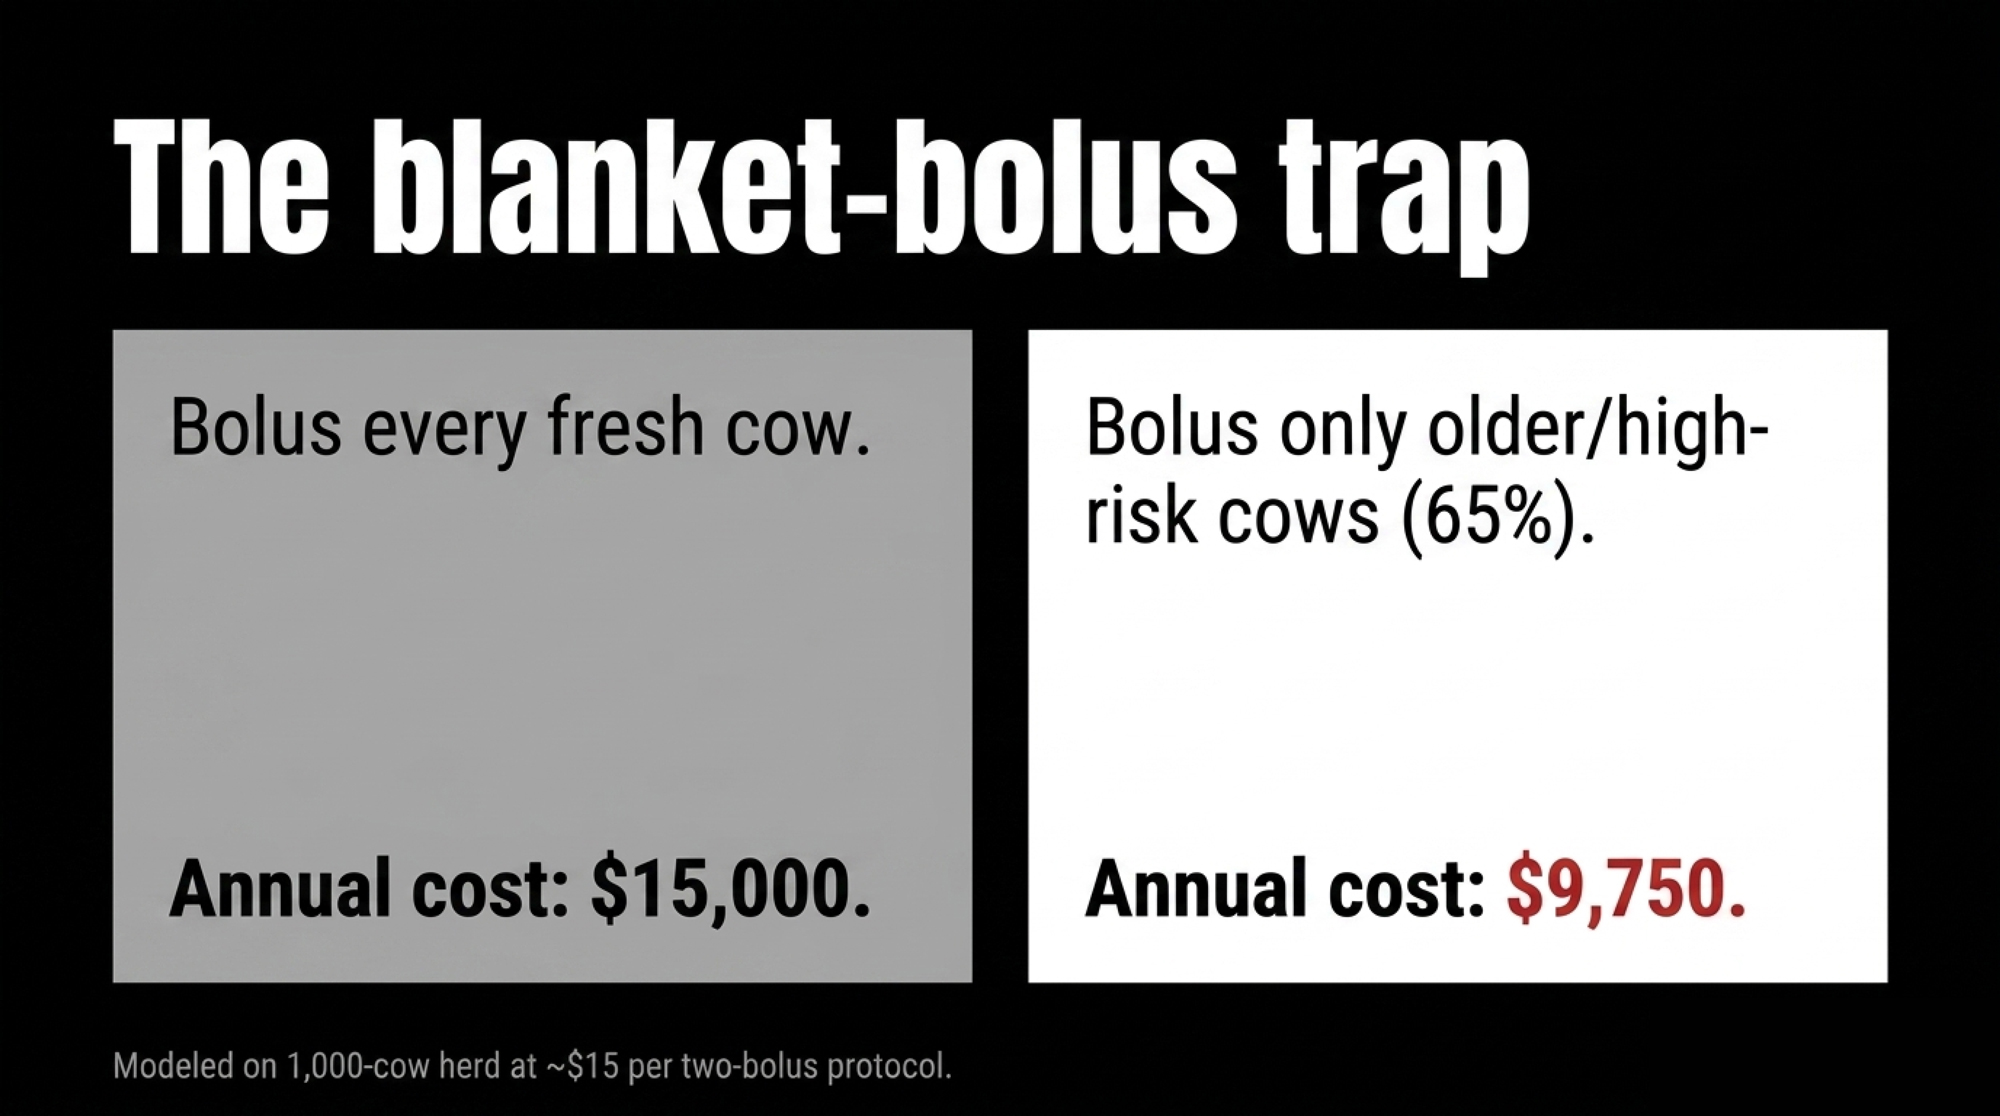
Here’s the barn math, and the point holds at whatever your boluses actually cost. Take your delivered price for a two-bolus protocol and run it two ways. Bolus every fresh cow in a 1,000-cow herd and you pay for roughly 1,000 protocols a year — a big share of them going to heifers and low-risk cows where the research shows little measurable benefit. Aim the same protocol only at your mature, higher-risk cows — say about 65% of calvings — and you’ve cut that product bill by roughly a third, with most of the remaining spend now landing where the data says it works. To put real numbers on it: at a delivered cost in the ballpark of $15 per cow for two boluses, that’s roughly $15,000 a year blanket versus around $9,750 targeted — same product, very different return, depending entirely on where you point it. Plug in your own price, and the gap moves, but the direction never does. 

In lower-risk cows, the research suggests that spending buys reassurance more than results — money out the door for the feeling of having done something. Honest caveat: in herds with high subclinical rates and no DCAD program, some of Oetzel’s modeling does show blanket treatment of mature cows paying off. So the accurate line isn’t “blanket is always wrong.” It’s “blanket rarely pays in low-risk cows, or in herds already managing calcium well.” 

Options and Trade-Offs for Your Operation

The story here isn’t “bolus more” or “bolus less.” It’s “measure first, then aim.” A few paths, depending on where your herd sits:

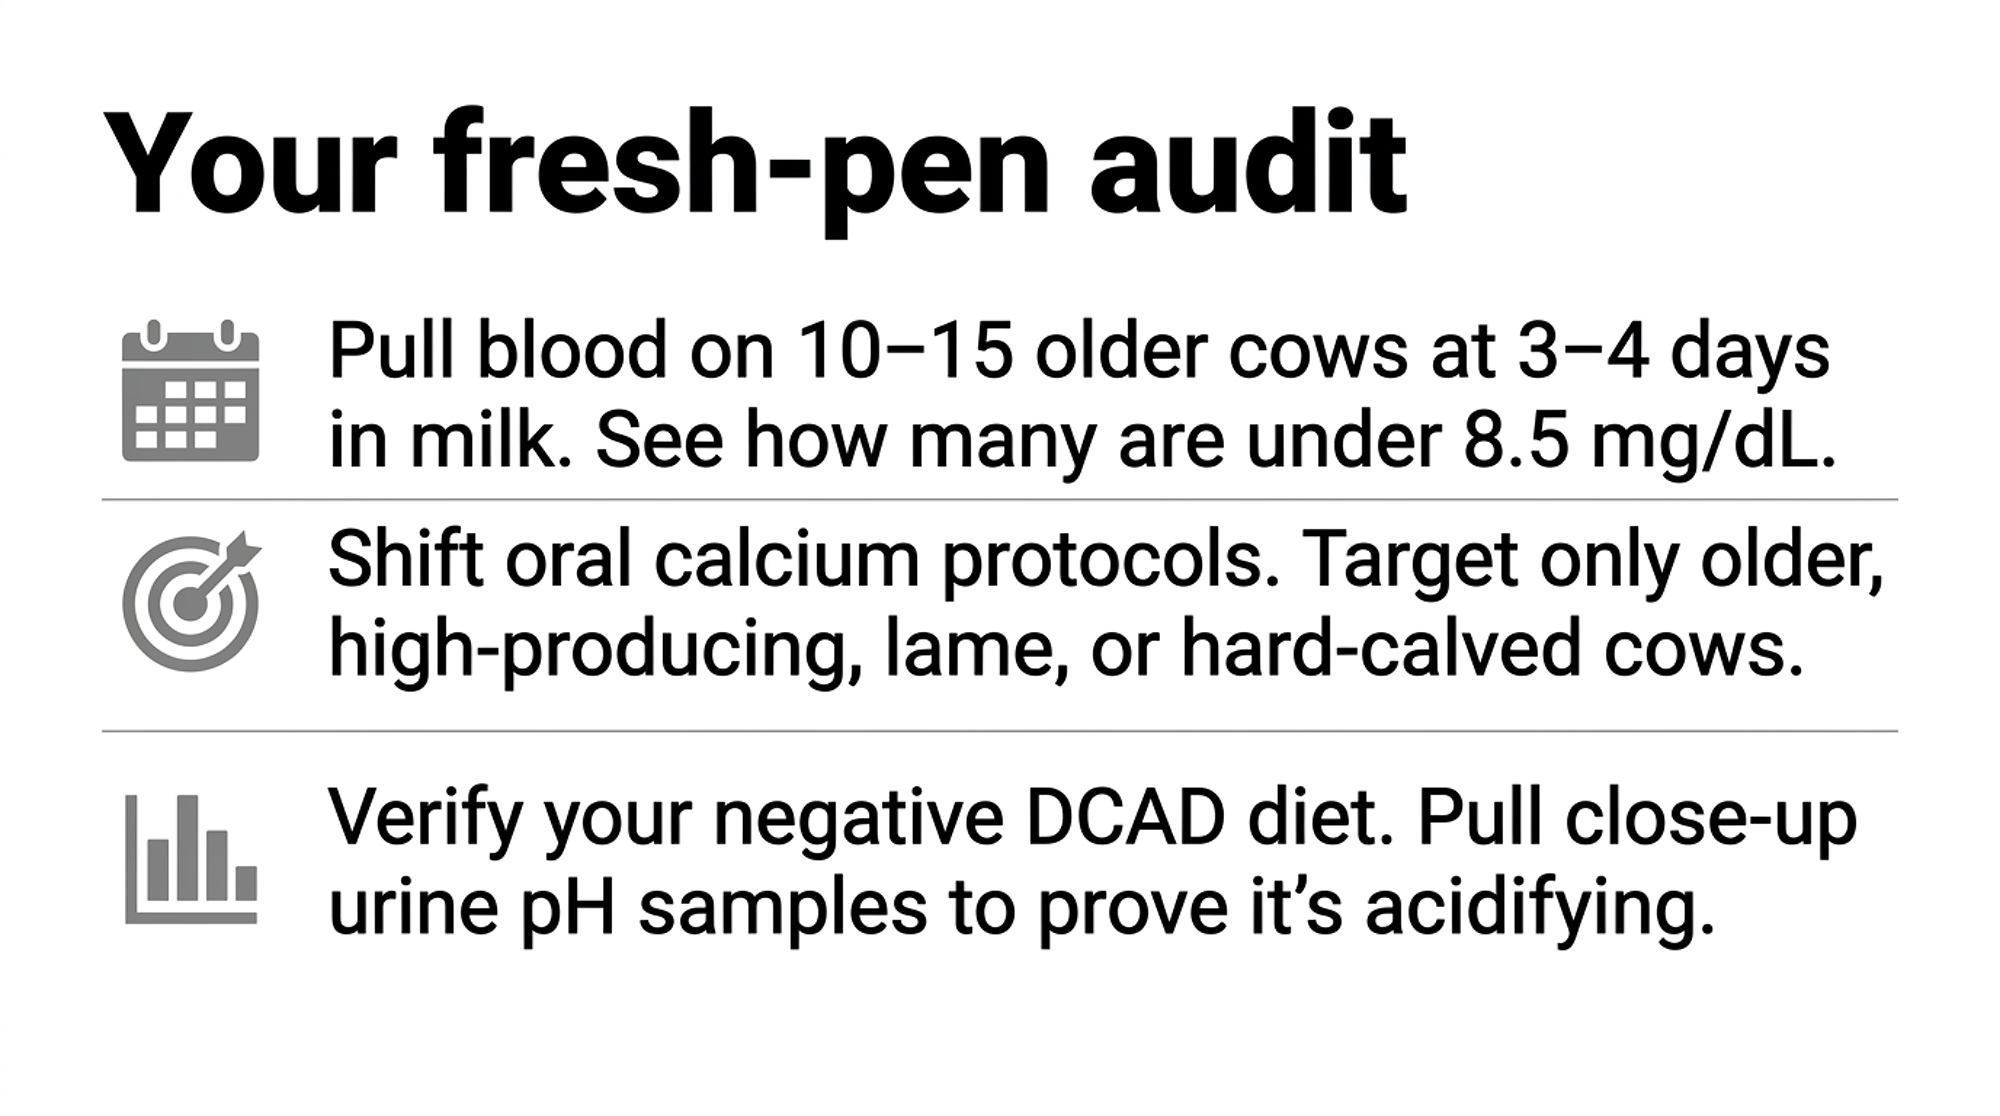
  • Start with a weekly day-3-to-4 calcium check — the 30-day move. This month, work with your vet to pull blood on 10–15 second-lactation-and-older cows at 3–4 days in milk, and track the percentage still under 8.5 mg/dL (2.12 mmol/L). It’s cheap, it’s simple, and it tells you whether your current program works before you spend a dollar changing it. Where it backfires: sample sloppily or skip the repeat, and one bad week looks like a crisis. 
  • Target oral calcium to the high-risk groups. Older cows, high producers, lame cows, hard calvings — a bolus at calving and a second 12–24 hours later. Best fit for herds with many mature cows. The risk: drifting back toward blanket habits, because targeting takes a discipline the shotgun approach doesn’t. 
  • Tighten the pre-fresh program instead of treating downstream. A well-run negative DCAD diet shrinks the low-calcium group at the source. It demands forage testing, mixing accuracy, and urine pH monitoring — a real management load. Where it backfires: a half-built DCAD program can crater intakes without ever fixing calcium. 
  • Manage the inflammation, not just the mineral. Cleaner calving pens, fewer hard pulls, faster response to metritis and severe mastitis. Lower the inflammatory load, and you give the cow’s own calcium recovery a fighting chance. The catch: it’s a whole-team habit change, not a line item you can buy. 
Your Fresh-Pen Audit Protocol
Don’t nod along — run these checks against your own barn. Each one is a decision, not a takeaway:

  • Find your real number. What percentage of your mature fresh cows are still under 8.5 mg/dL (2.12 mmol/L) at day 3–4? If the honest answer is “no idea,” that’s the gap — and the weekly blood draw on 10–15 older cows is how you close it. You’re tracking the wrong 5% until you do. 
  • Map your problem list to age. Pull last month’s fresh-cow cases — metritis, DAs, slow breeders. Do they cluster in your older animals? That overlap is your calcium map. And treat any hard calving, twins, or metritis case as a calcium-recovery risk, not just an infection to clear. 
  • Audit the spend before you buy another pail. If you’re blanket-bolusing, what’s the annual bill, and how much is landing on heifers — the one group that rarely needs it? That’s not low ROI; it’s close to pure waste. 
  • Confirm your DCAD actually works. If your negative DCAD program has never been urine-pH checked, you don’t yet know whether it’s acidifying cows or just looking good on the ration sheet. A handful of close-up urine pH samples settles it in a week. 
  • Know your high-response group. Older, high-producing, lame, hard-calved cows — are they getting targeted support today, or are they buried in a one-size-fits-all protocol? 
Key Takeaways

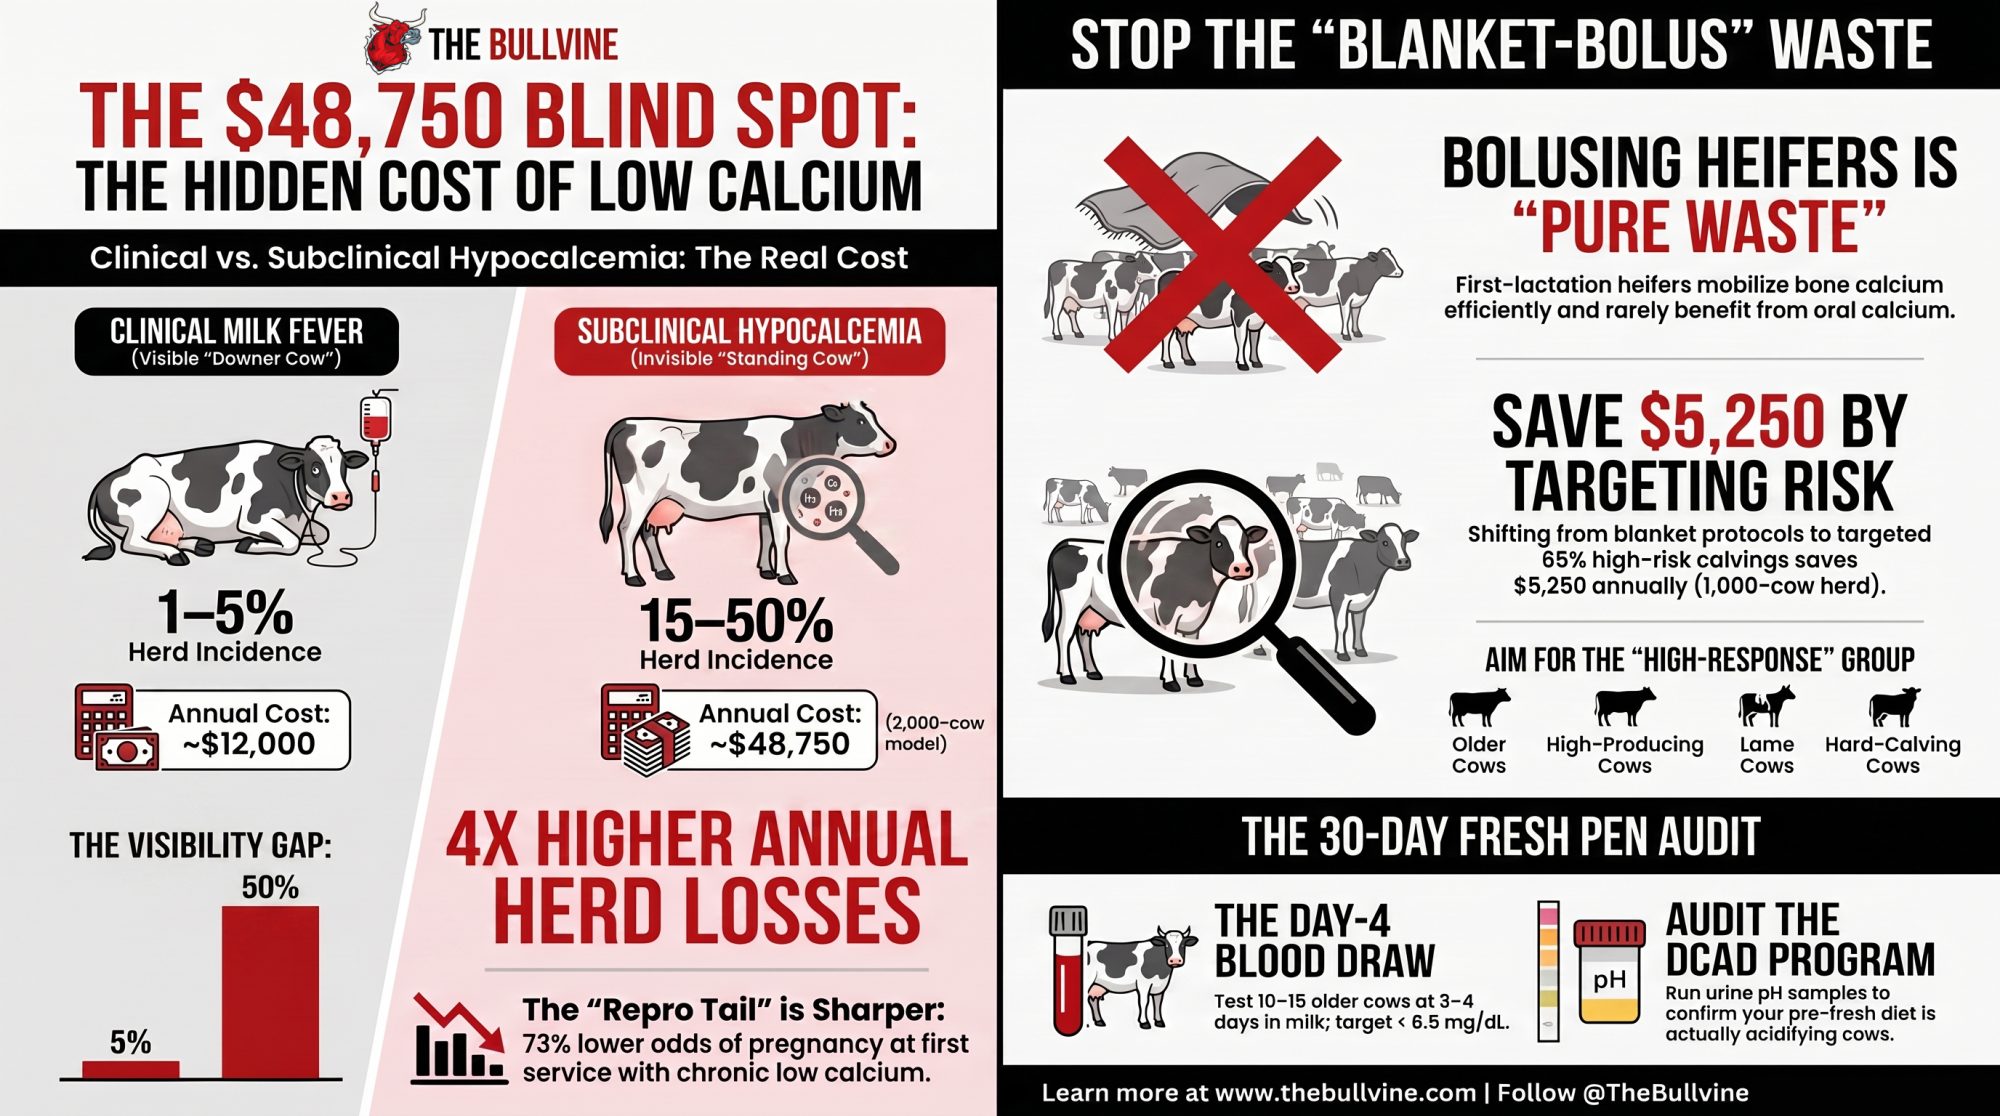
  • Subclinical hypocalcemia hits far more cows than clinical milk fever, so if you’re only watching the downers, you’re missing most of the cost.
  • Day‑3/4 blood calcium on mature cows is the real fresh‑pen number; if you don’t know how many are under 8.5 mg/dL, that’s your first 30‑day job.
  • Blanket bolusing burns money on heifers and low‑risk cows; aim calcium support at older, high‑producing, lame, and hard‑calved animals instead.
  • A negative DCAD diet and cleaner calving management cut the low‑calcium herd at the source — but only if you’re checking urine pH to prove it’s working.

The shift here is really about a different kind of attention. For decades, the job in the fresh pen was watching for the cow that goes down. The harder, more valuable job is spotting the cow that got up and never really recovered. That’s a quieter signal, and it won’t announce itself.

So here’s the question worth carrying out to the barn Monday morning:

If you drew blood on your next fifteen older fresh cows at day four, how many do you honestly think would still be under the line — and are you ready to find out?

Run Your Numbers

Herd Health ROI Calculator — This article says undermanaged calcium quietly drives culling, metritis, and lost milk. Plug in your herd size, culling rate, and replacement cost to see what those fresh-cow losses are actually costing you—and whether tightening transition health pays before you spend another dollar on boluses.

Complete references and supporting documentation are available upon request by contacting the editorial team at editor@thebullvine.com.

Learn More

The Sunday Read Dairy Professionals Don’t Skip.

Every week, thousands of producers, breeders, and industry insiders open Bullvine Weekly for genetics insights, market shifts, and profit strategies they won’t find anywhere else. One email. Five minutes. Smarter decisions all week.

NewsSubscribe
First
Last
Consent

Your Fresh Cow Problems Started 6 Weeks Ago: The $70K Dry Period Fix

Metritis Day 5 = Dry pen Day -45. Elite dairies know this. Average dairies pay $70K/year, learning it the hard way. Which are you?

Executive Summary: That fresh cow disease you’re treating today started 6 weeks ago in your dry pen. Research from Barry Bradford at Michigan State and Jessica McArt at Cornell confirms that immune suppression begins around Day -35 and hits bottom at calving—by the time metritis appears on Day 5, the conditions were established on Day -45. This timing gap costs average 400-cow dairies $50,000-$70,000 annually in treatment, lost milk, and reproductive failure. Elite operations running disease rates below 10% have figured this out: instead of reacting to fresh cow problems, they invest upstream in negative DCAD diets (-100 to -150 mEq/kg), dry pen density management, and teat sealants that cut infection rates by 52-70%. Farms making this shift typically see disease rates drop from 35-40% to under 20% within a year. The dry period isn’t downtime between lactations—it’s where your transition success or failure gets decided.

The farms with the best fresh-cow outcomes aren’t doing more in the fresh pen—they’re obsessing over the dry pen.

I know that feels backwards. We pour so much energy into treating ketosis, monitoring for metritis, and dealing with fresh-cow problems after they show up. But here’s what the research keeps telling us: by the time you see disease in the fresh pen, the damage was done 4-6 weeks earlier. That metritis case on Day 5? It started around Day -45.

Work from Cornell and other land-grant universities puts the cost of preventable fresh-cow disease at $50,000 to $70,000 annually for a 400-cow dairy. Elite operations running disease rates below 10% capture that value. Average operations? They’re paying what amounts to a “mediocrity tax” every single year.

So what are the top performers actually doing differently? That’s what we’re digging into.

Disease Rate CategoryFresh Cow Disease RateAnnual Cases (400 cows)Cost per CaseTotal Annual Loss
Elite Performance10%40$450$18,000
High Performance15%60$450$27,000
Industry Average35%140$450$63,000
Poor Performance40%160$450$72,000

The Real Cost—It’s Bigger Than You Think

Garrett Oetzel at Wisconsin has documented how transition costs cascade, and the numbers are worth understanding. Treatment for metritis, mastitis, and clinical ketosis runs $80-$150 per case. But that’s just the visible part.

Lost milk hits harder. Jessica McArt’s research team at Cornell found that subclinical ketosis (BHBA ≥1.2 mmol/L) decreased milk production by 0.5 kg/day during the first 30 days of lactation. And here’s what caught my attention: each 0.1 mmol/L increase in BHBA also raised the risk of displaced abomasum and early culling. That’s not a sick cow for a week—that’s damage following her through the entire lactation.

Reproduction takes a hit, too. Research from Overton’s group at Cornell showed cows with elevated NEFA or BHBA had 13-19% lower pregnancy probability within 70 days of the voluntary waiting period. At roughly $4 per day open, you can see how the math compounds pretty quickly.

Mortality clusters early. Industry data consistently shows dairy cow deaths are disproportionately concentrated in the early lactation period, with transition complications as a leading cause.

When you add it all up, the total cost per case of transition disease ranges from $300 to $700, depending on severity and what else goes wrong downstream.

Here’s a quick way to see what this might mean for your operation:

Herd size × disease rate × $450 = annual transition losses

400 cows at 38% disease rate: 400 × 0.38 × $450 = $68,400/year

400 cows at 15% disease rate: 400 × 0.15 × $450 = $27,000/year

The difference: over $41,000 in recoverable value—not theoretical savings.

The $115 treatment you see vs the $385 in damage you don’t.

“Most producers don’t calculate these costs because they’re scattered across multiple categories,” Tom Overton at Cornell has observed. “The treatment expense is visible. The lost milk shows up gradually. The impact of reproduction doesn’t surface for months. But when you put it all together, transition disease is often the single largest controllable cost on the dairy.

That’s worth sitting with for a minute.

The Biology: What’s Actually Happening

Here’s where things get interesting—and where the conventional approach starts to look incomplete.

Barry Bradford (now at Michigan State) and Lorraine Sordillo have mapped the immune trajectory around calving in considerable detail. The timeline matters more than most of us realized.

The Immune Suppression Timeline

TimeframeWhat’s Happening
Day -35 to -21Inflammatory responses triggered by rapid fetal growth begin suppressing immune function
Day -21 to -7Metabolic stress intensifies as the cow shifts into negative energy balance; feed changes disrupt rumen microbiota
Day -7 to calvingEnvironmental stressors peak—overcrowding, pen moves, and heat stress all compound the immune suppression
Day 0 to +3Immune function hits its lowest point—this is when infections take hold
Day +5 to +14Clinical disease appears—but the conditions were set weeks earlier

As Bradford explains it: “The inflammatory cascade that compromises immune function starts with fetal cortisol release and metabolic changes that happen well before we see clinical signs. By the time a cow develops metritis on Day 7, the conditions that allowed that infection were established three to four weeks earlier.

By the time you’re treating disease, immune collapse happened 10 days ago.

The implication is pretty clear: you can’t fix fresh-cow disease in the fresh pen. You prevent it in the dry pen.

From what I’ve observed across Midwest and Northeast operations, average farms dedicate 60-70% of transition attention to fresh cows and maybe 25-35% to dry cows. The elite performers? They often flip that ratio entirely.

What High Performers Actually Do

When you talk to veterinarians, nutritionists, and managers at farms achieving consistently strong transition outcomes, certain patterns keep showing up.

Measurement Discipline

The biggest difference between average and elite isn’t fancy technology—it’s measurement.

Top farms track fresh-cow disease weekly by condition. They compare the first DHI test against genetic expectations. They run BHBA blood tests to catch subclinical ketosis before it becomes clinical. They review days open monthly with their vet team.

Average farms? Most can’t tell you their actual disease rate. They’re estimating. And you probably know this already, but without measurement, it’s nearly impossible to know if you’re improving—or to identify which interventions are actually working.

“The farms that turn this around always start the same way,” Jessica McArt has observed. “They commit to measuring outcomes systematically before they change anything else. You need that baseline, or you’re just guessing.

Written Protocols

This sounds almost too simple, but elite operations develop written disease definitions and treatment protocols with their veterinarians. Exact criteria for each condition. Standardized treatments. Clear escalation triggers.

Why does this matter so much? Consistency. It doesn’t depend on who’s working that day. It’s a repeatable process that survives staff turnover—and staff always turns over eventually.

Dedicated Monitoring Time

Here’s where commitment becomes tangible. High-performing farms dedicate 1.5-2 hours daily specifically to fresh-cow monitoring. Structured screening with documented results—not casual observation while doing other tasks.

The daily routine typically includes appetite assessment, attitude evaluation, discharge observation, udder examination, and locomotion scoring. Results get to the manager each morning for same-day decisions.

Catching subclinical ketosis on Day 3 rather than clinical ketosis on Day 7 changes outcomes dramatically. But you can’t catch what you’re not systematically looking for.

Dry-Period Investments That Pay Forward

Farms achieving elite transition outcomes share common approaches to dry-period management. This is where the real leverage exists—and where I often see the widest gap between what farms think they’re accomplishing and what’s actually happening.

Nutrition Fundamentals

Negative DCAD diets for close-up cows—most commonly targeting -100 to -150 mEq/kg—keep calcium metabolism on track through calving. Jose Santos’ 2019 meta-analysis of 42 experiments in the Journal of Dairy Science found that negative DCAD significantly reduces hypocalcemia, retained placenta, and metritis while improving postpartum feed intake and milk yield in multiparous cows.

DCAD Program ElementTarget RangeMonitoring MethodFrequencyOut-of-Spec Consequence
Dietary DCAD-100 to -150 mEq/kgRation analysisMonthlyInadequate calcium mobilization
Urine pH (Holstein)5.5 to 6.0pH strips or meterWeekly (10-12 cows)Program not working – adjust immediately
Urine pH (Jersey)5.8 to 6.2pH strips or meterWeekly (10-12 cows)Higher target than Holsteins – breed difference
Vitamin E2,000-3,000 IU/daySupplement auditWeeklyImmune function compromised
Selenium0.5-1.0 mg/daySupplement audit + blood testWeekly audit / Quarterly bloodRetained placenta risk increases 35%

Some operations target more aggressive levels (-150 to -200 mEq/kg), particularly in higher-risk multiparous cows. The key is monitoring urine pH weekly to verify cows are responding appropriately—target urine pH of 5.5-6.0 for Holsteins indicates the program is working. Assumptions about ration performance tend to drift from reality over time.

Vitamin E and selenium supplementation (2,000-3,000 IU vitamin E daily; 0.5-1.0 mg selenium) supports immune function heading into calving. Cost: $2- $5 per cow, monthly.

“The mineral piece is where I see the biggest gap between what farms think they’re doing and what’s actually happening,” Bill Weiss at Ohio State has noted. “Testing forage mineral content and adjusting supplementation—it sounds basic, but most farms don’t do it consistently.

Density Management

Overcrowding during the dry period—exceeding 100-110% of bunk space and lying area—creates chronic stress that suppresses immune function. Research from Rick Grant at the Miner Institute shows cows in overcrowded dry pens eat less, have elevated cortisol, and reduced lying times.

Regional considerations matter here. Heat stress complicates close-up management significantly in the Southeast, where summer humidity compounds the metabolic burden. Large Western operations face different scale challenges around pen design and monitoring logistics. Upper Midwest farms deal with seasonal extremes in both housing and nutrition.

The fundamentals stay consistent, but the application requires regional adaptation.

Teat Sealants at Dry-Off

One of the highest-ROI interventions that’s still underutilized on many farms.

Meta-analyses in Animal Health Research Reviews show that internal teat sealants reduce new intramammary infections during the dry period by 52-70% when used with proper technique. Simon Dufour’s 2019 analysis showed a 52% reduction in risk compared with untreated controls.

The math: $10-$20 per cow prevents infections costing $300-$500 to treat post-calving.

A Wisconsin producer managing about 1,200 cows shared a story I’ve heard many times: “We fought teat sealants for years because we’d tried them early and had problems. Turned out we were just rushing through, not being careful enough about prep. Once we committed to proper technique and gave people enough time, our fresh cow mastitis dropped by half within a year.

That pattern—initial frustration followed by success after protocol refinement—repeatedly shows up in conversations with producers who eventually embraced the practice.

💡 PRO TIP: How Cohort Grouping Changes the Math

Instead of continuous cow flow through transition pens (animals entering and leaving daily), consider moving to weekly cohort systems. All cows due within a 7-14 day window group together and move as a unit.

Why this works:

  • Reduces social disruption from constant pen changes
  • Allows thorough cleaning between groups
  • Matches capacity to actual weekly calving numbers rather than random peaks

Example: A farm averaging 20 calvings weekly but peaking at 28 needs capacity for 28 under continuous flow. With cohort grouping, the same pen accommodates 20 at near-full utilization, then empties and refills. You often end up with better per-cow space during actual occupancy.

Some farms discover that adjusting herd size to match facility capacity actually improves profitability. A 350-cow dairy at 15% fresh-cow disease may generate better returns than a 400-cow operation struggling with 40% disease in undersized facilities. That’s not always comfortable math to confront, but it’s worth examining honestly.

When Other Priorities Make Sense

I should acknowledge something important here: not every operation is positioned to make transition management their primary focus right now. Farms managing heavy debt, facing generational transitions, or operating in severely compressed markets may reasonably direct capital elsewhere.

A California producer I spoke with recently put it plainly: “We know transition matters, but right now we’re dealing with water costs that threaten our whole operation. First things first.”

That’s a legitimate constraint that deserves respect rather than dismissal.

The question isn’t whether transition management matters—it clearly does—but whether it’s the highest-return use of limited capital for your operation at this specific moment. That’s a calculation each farm needs to make, honestly.

But don’t assume you’re in that category by default. Many farms have more room to improve without major capital investment than they initially think. The first steps—measuring baseline disease rates, writing down protocols, restructuring time allocation—require commitment more than cash.

Realistic Timelines

For producers ready to pursue meaningful improvement, understanding realistic timelines helps maintain momentum when progress feels slow.

Months 1-3: Foundation Baseline measurements, written protocols, daily screening, BHBA testing, and close-up nutrition review. Realistic outcome: Disease drops from 35-40% to 25-30%. Investment: Approximately $5,000-$8,000.

Months 4-12: Optimization Protocol refinement based on emerging data, facility adjustments, and staff training for consistency. Realistic outcome: Disease reaches 18-24%.

Year 2+: Building Culture Transition metrics integrated into regular management review. Genetic selection for health traits. Facility improvements where economically justified. Best performers: 10-15% disease. Most committed: Single digits—but that typically takes 3-5 years of sustained focus.

PhaseTimelineManagement ActionsInvestment RequiredExpected Disease Rate
BaselineWeek 1Measure current disease rate by condition – this is non-negotiable$500 (records + BHBA testing)35-40% (typical average)
FoundationMonths 1-3Written protocols, daily screening, DCAD nutrition review, teat sealants$5,000-$8,00028-32% (visible progress)
OptimizationMonths 4-12Protocol refinement, facility adjustments, staff training for consistency$8,000-$15,00018-24% (the slow middle)
Culture BuildYear 2+Transition metrics in regular mgmt review, genetic selection, dedicated monitoring labor$35,000-$45,000/year (labor)10-15% (high performance)
EliteYear 3-5System becomes self-sustaining, continuous improvement mindset embeddedOngoing operational cost<10% (elite – single digits)

The Labor Reality

Here’s something that deserves honest discussion: sustainable transition improvement requires dedicated labor.Farms that try adding monitoring to already-full staff schedules typically see the effort erode within a few months.

A dedicated fresh-cow monitoring position runs approximately $35,000-$42,000 annually, including benefits. That’s substantial, particularly for smaller operations.

But consider the math differently. Prevented disease losses of $30,000-$50,000 annually often justify the expense within the first year. Add better reproduction and longer productive life, and the investment calculation shifts considerably.

Farms that can’t make this commitment may still achieve meaningful improvement through protocol discipline alone—perhaps reaching 25-28% disease incidence rather than 35-40%. Understanding those realistic ceilings helps set appropriate goals for your situation.

“I tell producers to think about it as an investment decision, not an expense decision,” Tom Overton suggests. “Would you spend $40,000 to capture $50,000 in value? Most would say yes. But when it’s framed as ‘hiring another person,’ suddenly it feels impossible.”

That reframing is worth considering.

Quick Self-Assessment

Before wrapping up, it might be useful to reflect on a few questions:

  • Do you know your actual fresh-cow disease rate by condition? Or are you estimating?
  • What percentage of your transition attention goes to the dry period versus the fresh period?
  • Are treatment protocols written down—or do they depend on who’s working that day?
  • When did you last verify your DCAD program with urine pH testing?
  • If you use teat sealants, are you giving staff adequate time for proper technique?

There’s no judgment in these questions—just an invitation to consider where opportunities might exist.

The Bottom Line

The transition period is where money is made or lost. Farms that measure outcomes, implement protocols, invest appropriately in monitoring, and recognize that the dry period determines fresh-cow success are capturing $30,000-$50,000 in value that average operations leave on the table every year.

The top performers stopped seeing fresh-cow disease as an inevitable form of bad luck. They started seeing it as a management outcome they can actually influence.

The dry period isn’t a holding pattern between lactations. It’s the foundation for everything that follows.

You’re leaving money in the dry pen. Run the numbers this week—or keep paying the “average dairy” tax.

The choice is yours.

Key Takeaways:

  • The timing is backwards: That metritis case on Day 5 started on Day -45. Fresh cow disease begins in the dry pen—not the fresh pen.
  • The cost is massive: Average 400-cow dairies lose $50,000-$70,000 annually to preventable transition disease. Elite herds running <10% disease rates capture that value instead.
  • The solution is upstream: Negative DCAD diets (-100 to -150 mEq/kg), dry pen stocking under 110%, and teat sealants that cut new infections by 52-70%.
  • The results are proven: Disease rates typically drop from 35-40% to under 20% within Year 1. Top performers reach single digits by Year 3—with first-year investments of $5,000-$8,000 returning $30,000-$50,000 in prevented losses.

Complete references and supporting documentation are available upon request by contacting the editorial team at editor@thebullvine.com.

Learn More:

The Sunday Read Dairy Professionals Don’t Skip.

Every week, thousands of producers, breeders, and industry insiders open Bullvine Weekly for genetics insights, market shifts, and profit strategies they won’t find anywhere else. One email. Five minutes. Smarter decisions all week.

NewsSubscribe
First
Last
Consent
Send this to a friend