












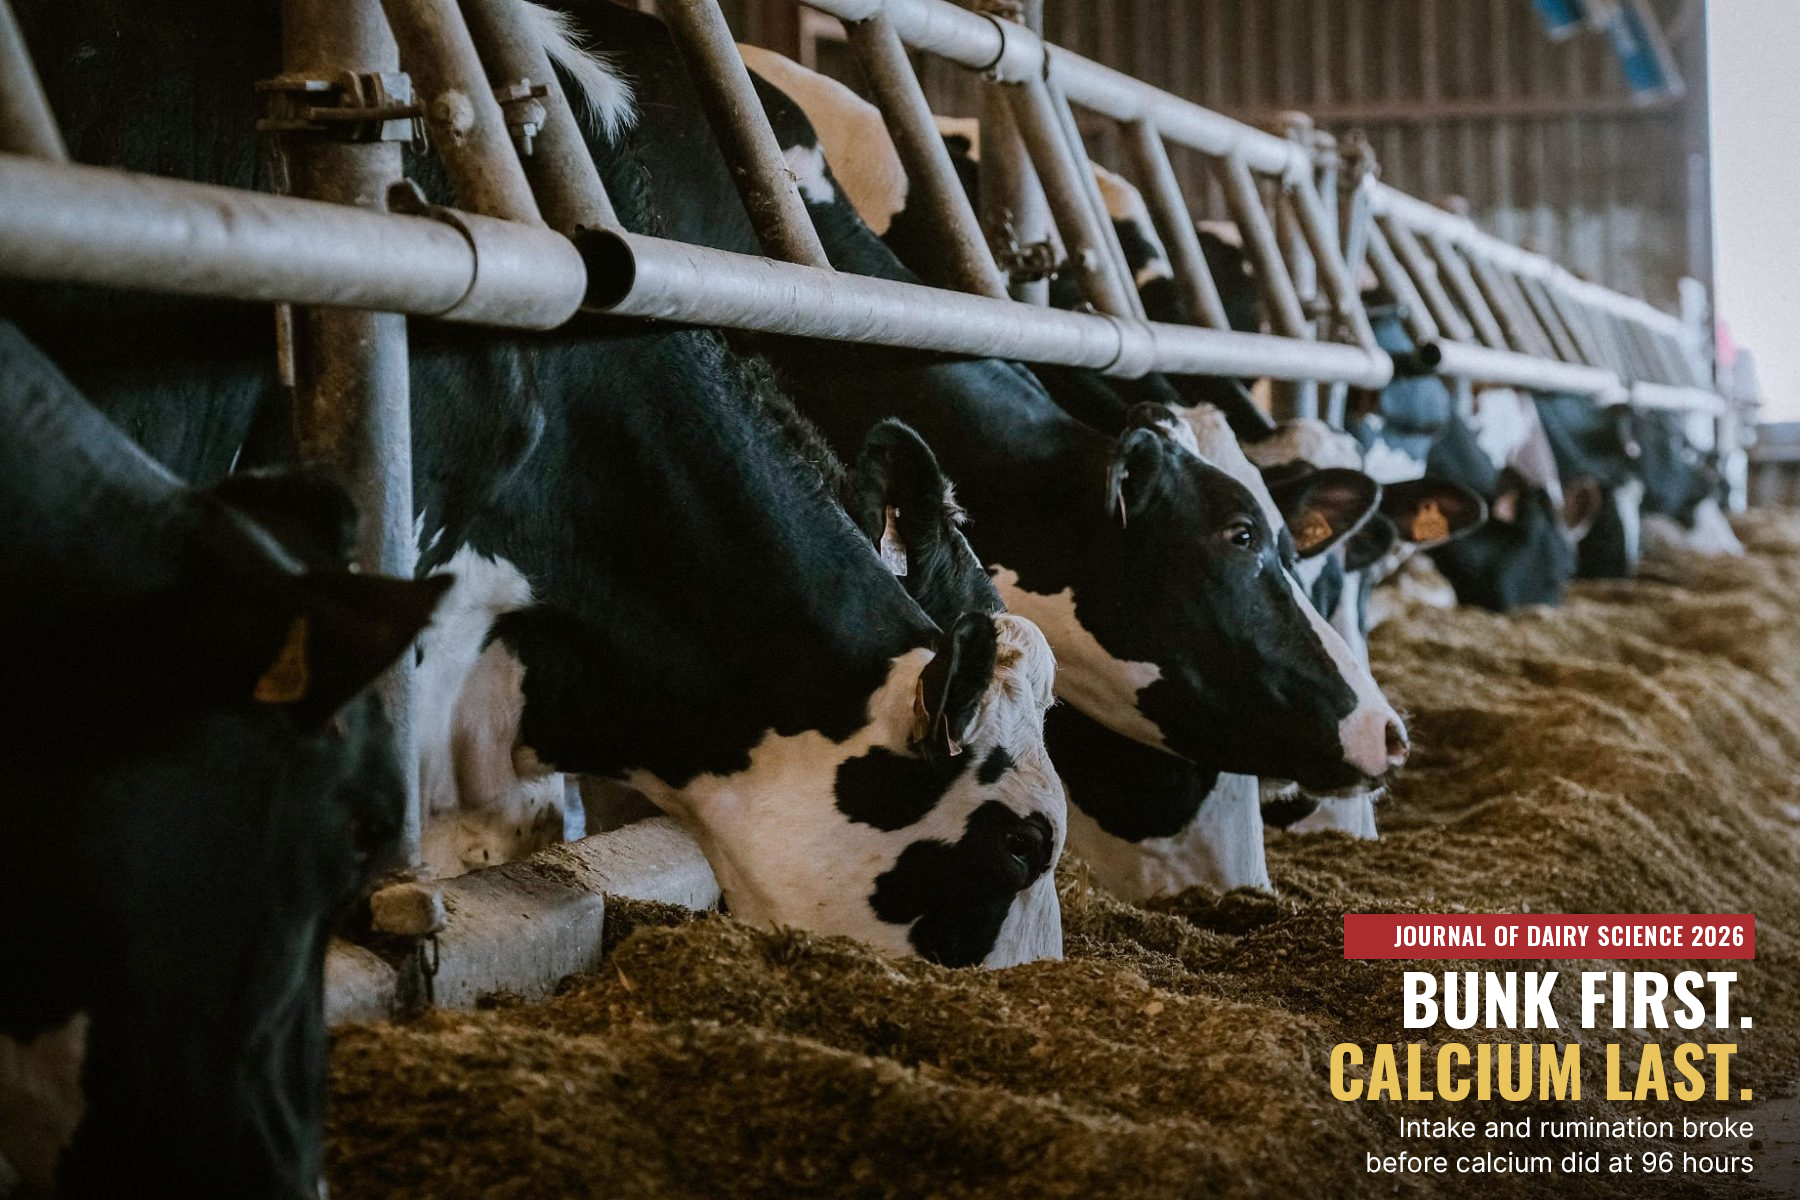
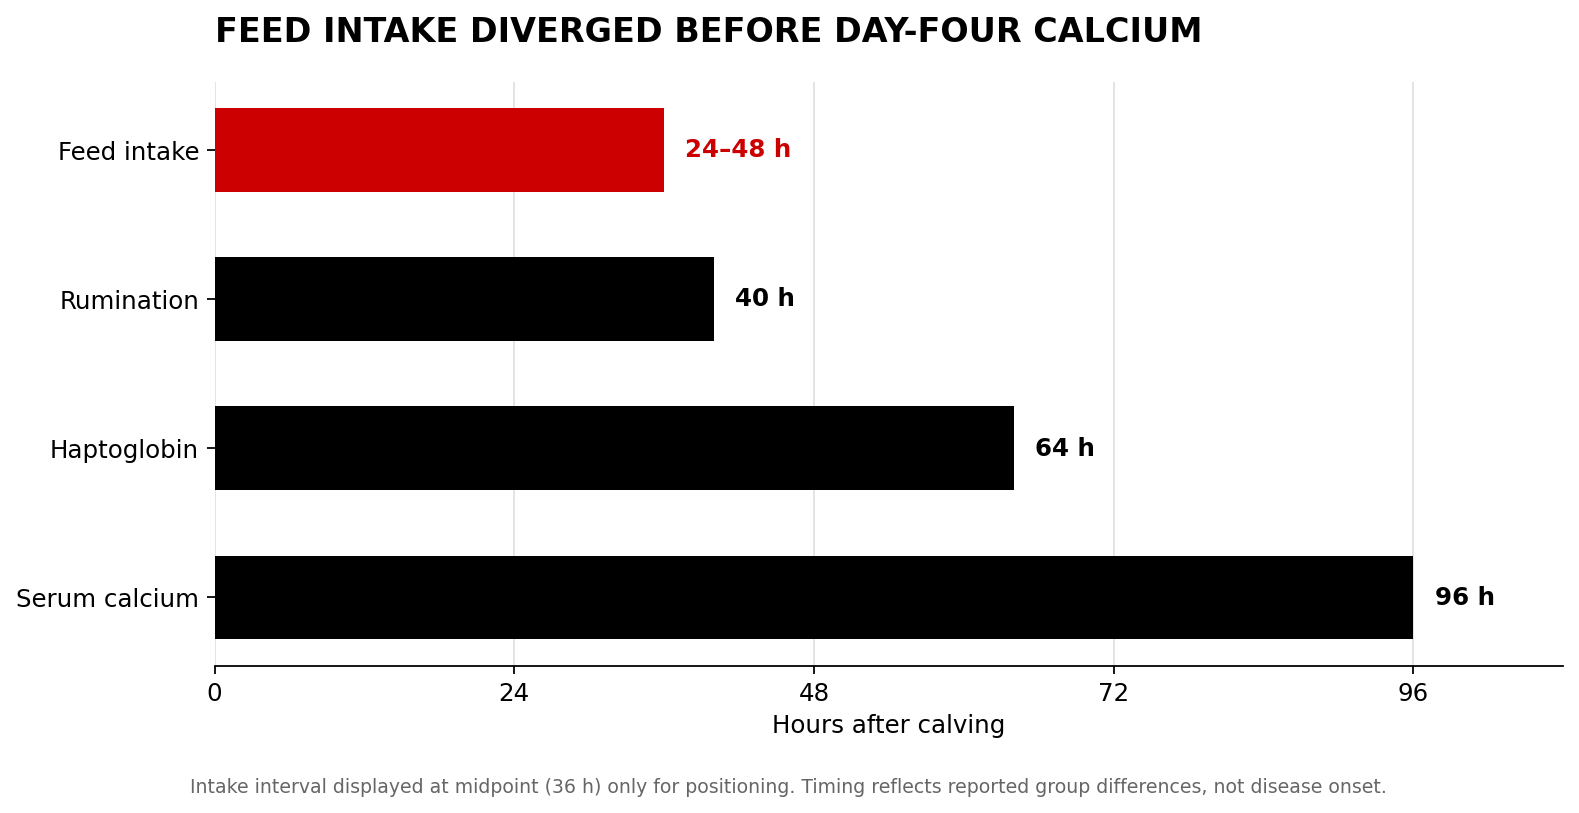
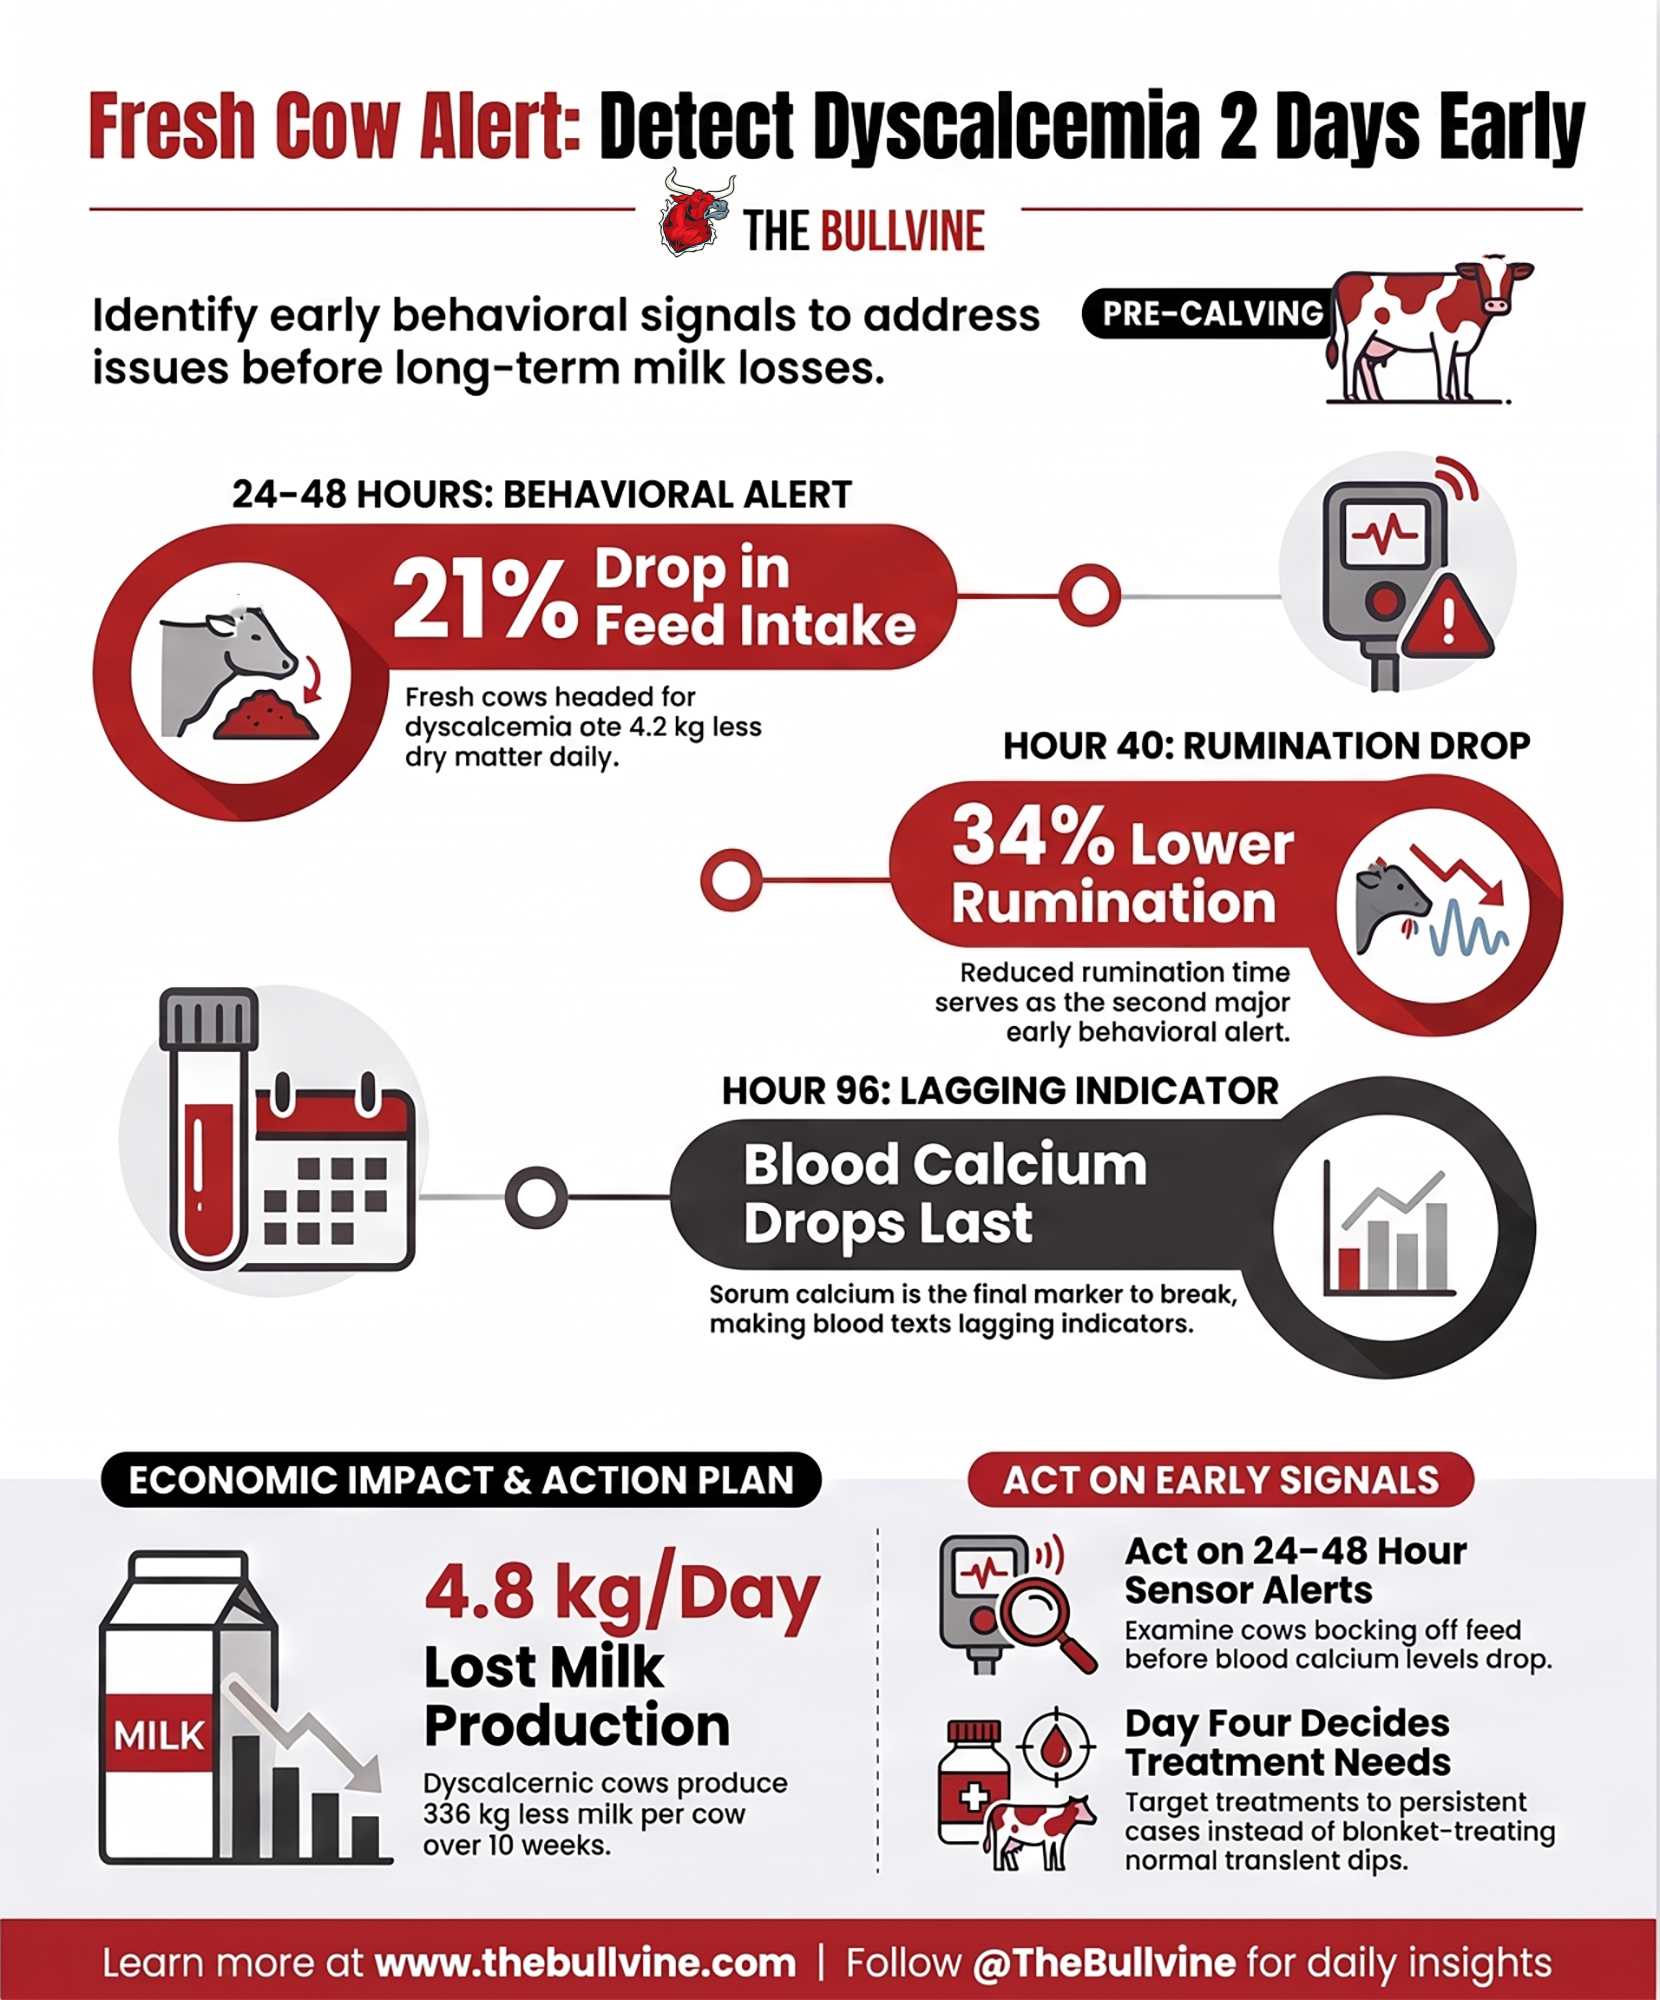
Cows headed for dyscalcemia backed off feed 24 to 48 hours after calving. Their blood calcium didn’t separate until 96 hours, so a day-four test confirms a problem that started two days earlier.
The fresh cow that tests low for calcium at four days in milk may not have started with a calcium problem.
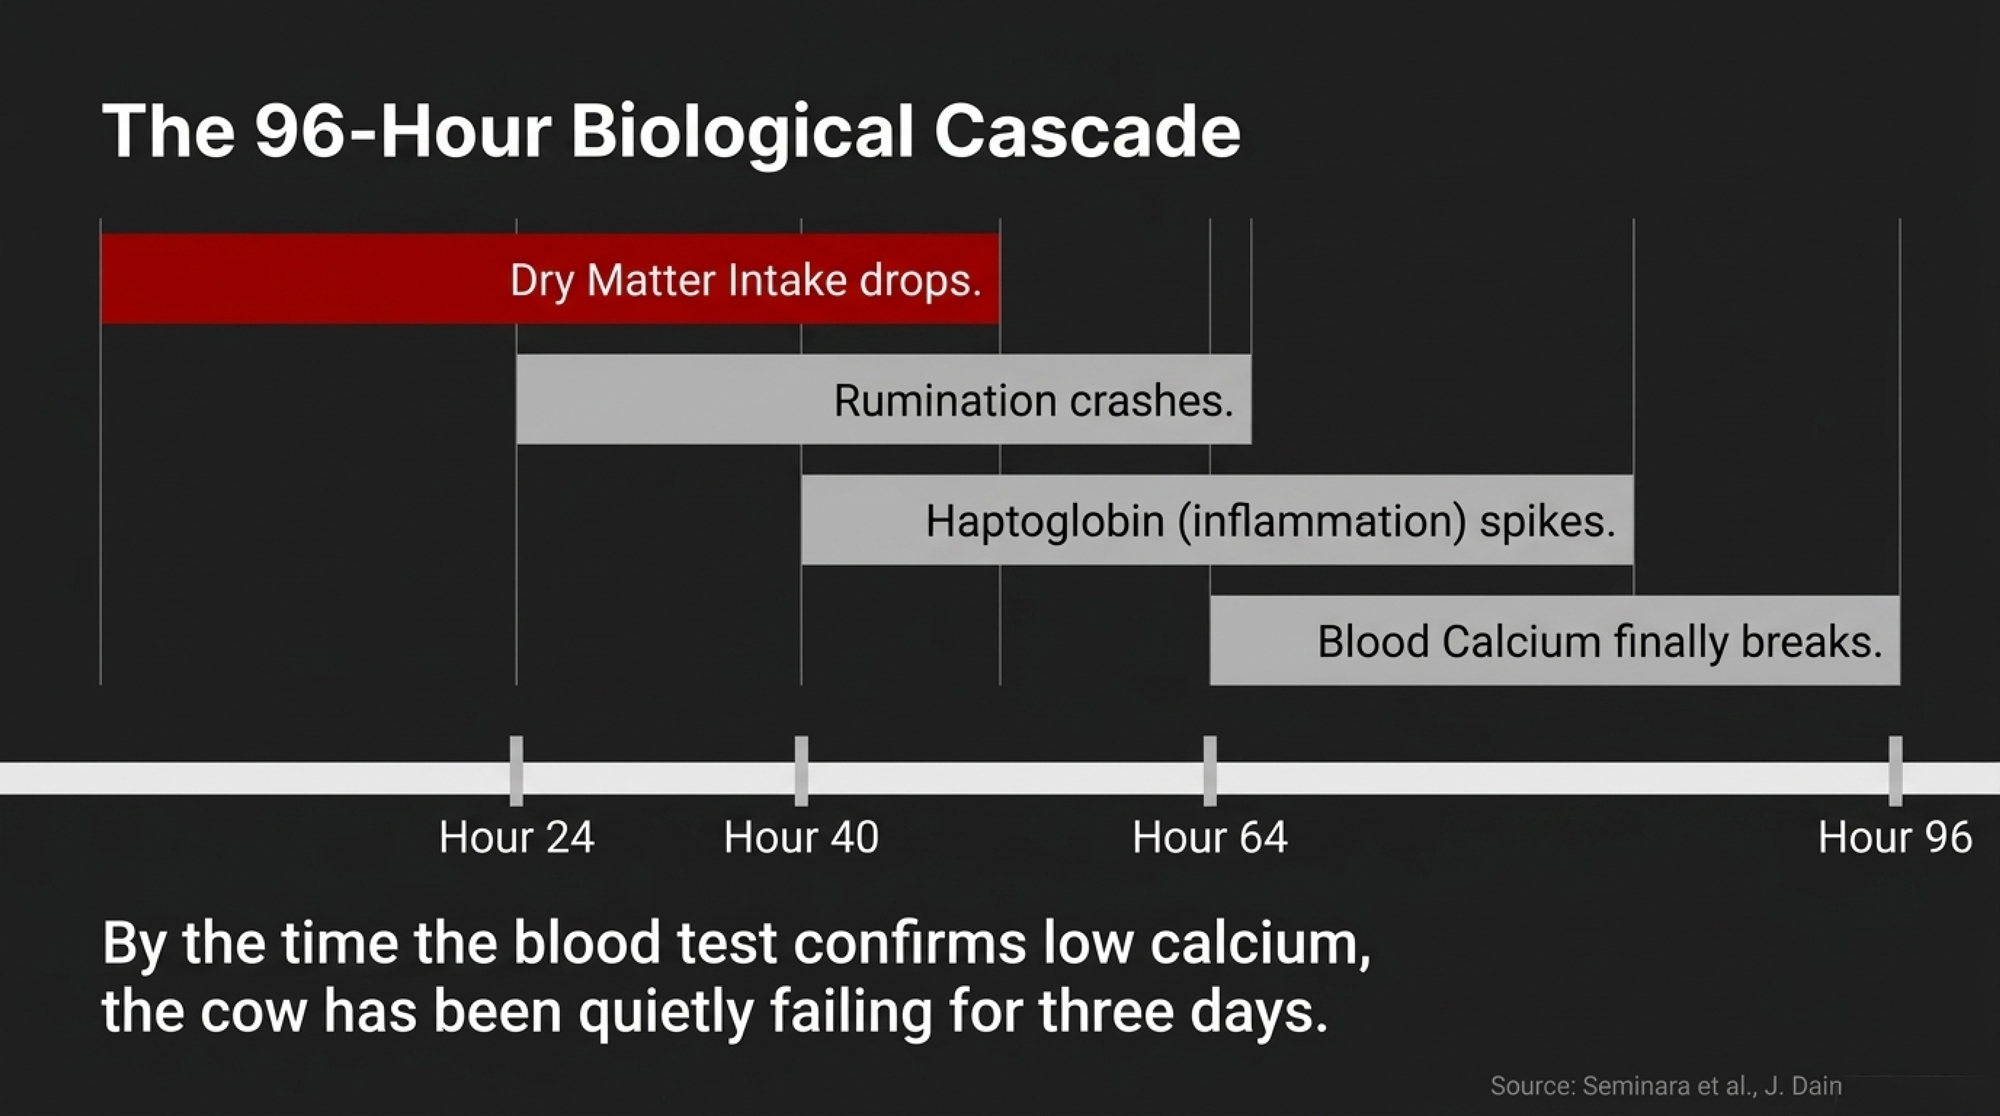
A 2026 Journal of Dairy Science study followed 45 multiparous Holsteins. The first measurable split between cows that kept normal calcium regulation and cows that became dyscalcemic was feed intake, between 24 and 48 hours after calving. Rumination split next, then an inflammatory marker. Blood calcium was the last of the four to break.
That changes the job in the fresh pen. Calcium prevention still matters. But the earliest warning you can act on may be the cow backing off the bunk two days before a blood test says anything.
The 96-Hour Clock
Researchers followed the cows from 14 days before calving through 14 days in milk. They recorded intake and rumination daily and drew blood every eight hours from calving through 96 hours.
Twelve cows were dyscalcemic, meaning serum total calcium at or below 2.2 mmol/L at 96 hours (about 8.8 mg/dL, Bullvine conversion). The other 33 were eucalcemic.
| First difference | Measurement | Dyscalcemic (n=12) | Eucalcemic (n=33) | Difference |
|---|---|---|---|---|
| 24–48 hours | Dry matter intake, kg/day | 16.3 | 20.6 | −4.3 |
| 40 hours | Rumination, min/hour | 25 | 38 | −13 |
| 64 hours | Haptoglobin, g/L | 0.69 | 0.39 | +0.30 |
| 96 hours | Serum calcium, mmol/L | 2.11 | 2.36 | −0.25 |
Source: Seminara et al., J. Dairy Sci., 2026. Group means.
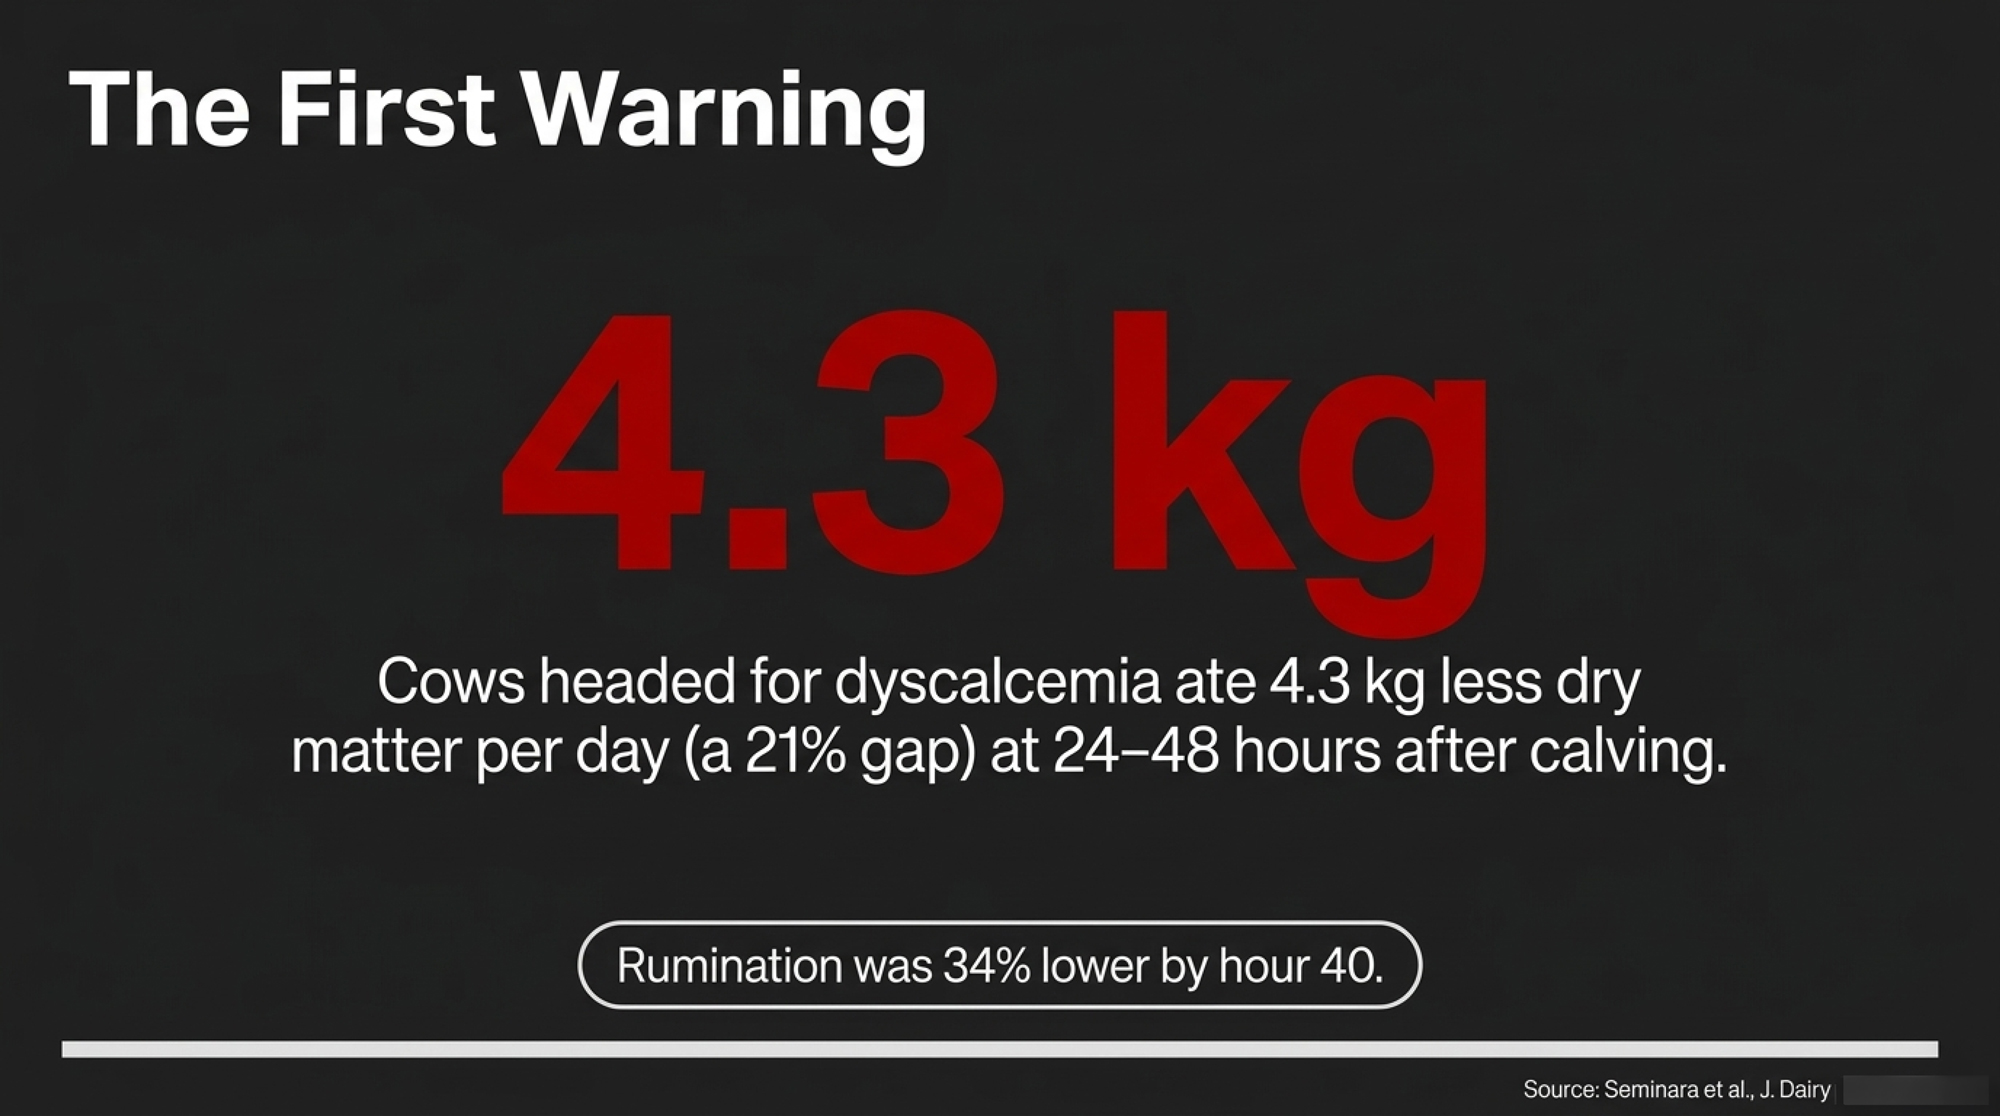
By Bullvine calculation, the cows headed for dyscalcemia ate 4.3 kg less dry matter a day before their calcium split. That’s a 21% gap. Their rumination was 34% lower by hour 40. None of the measures taken before calving told the two groups apart.
The milk loss didn’t stay in the fresh pen. Dyscalcemic cows gave 1.4 kg less per milking through 14 days in milk, and 4.8 kg/day less on average through 10 weeks.
The authors flag the limits themselves: one farm, one season. What the study does establish is order: intake, rumination, inflammation, then calcium. Proving cause in either direction was beyond its design.
Most of the herd data here comes from US Holstein research in New York, Wisconsin and Minnesota. Grazing systems, other breeds and different calving seasons may not follow the same pattern.
What 4.8 kg a Day Adds Up To
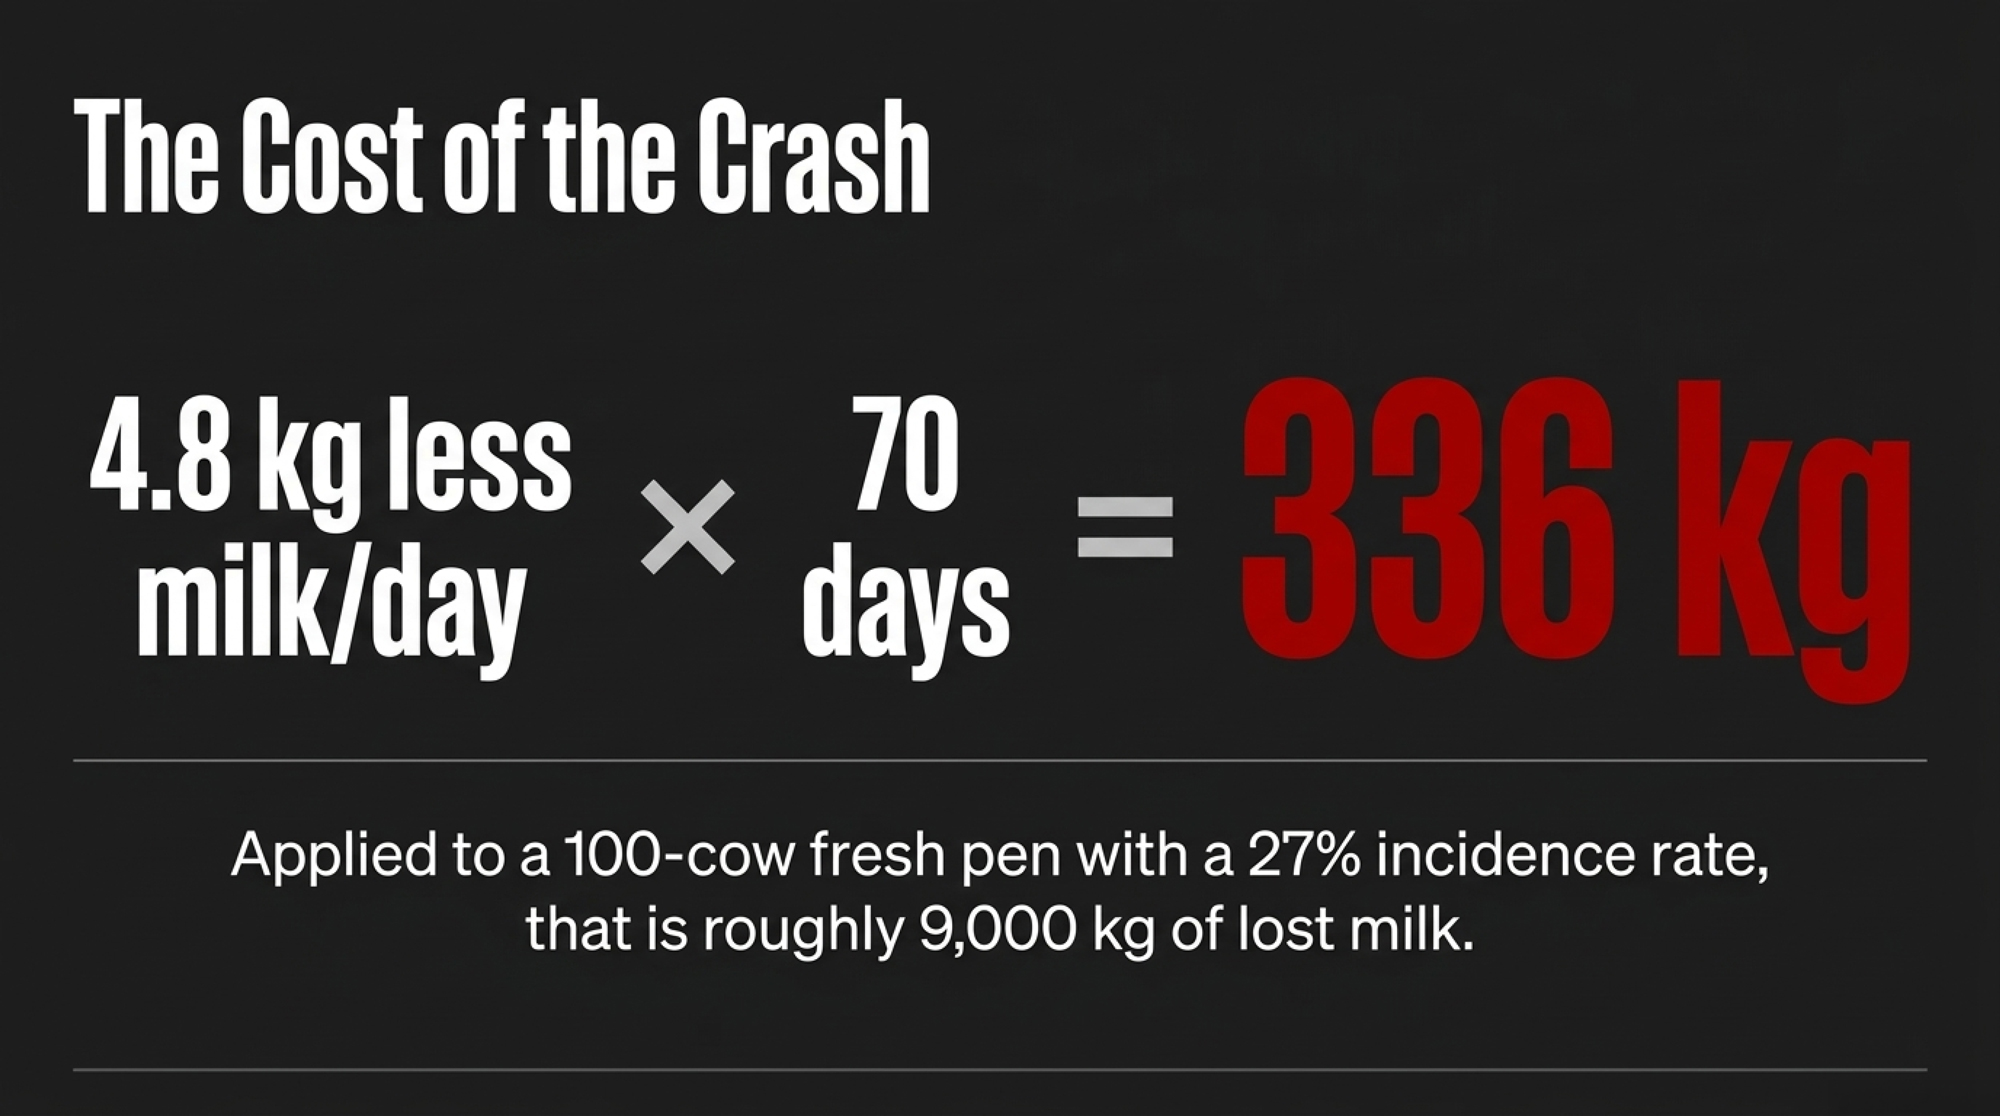
This is Bullvine math, not the study’s, and it uses only the study’s own figures:
- Per dyscalcemic cow: 4.8 kg/day × 70 days = 336 kg of milk over 10 weeks. Using the study’s 95% confidence interval (2.3 to 7.4 kg/day), the range is 161 to 518 kg.
- At the study herd’s rate: 12 of 45 cows, or 27%. Applied to 100 multiparous fresh cows, that’s about 27 cows and roughly 9,000 kg of milk (range about 4,300 to 14,000 kg).
- For your herd: multiply your day-four dyscalcemic count by 336 kg, then by your net milk price per kg.
Read that as the cost that comes with the problem. It’s a group-mean gap from one herd, and an observational study can’t say how much of it prevention would win back.
Transient Hypocalcemia vs. Dyscalcemia: Day Four Decides
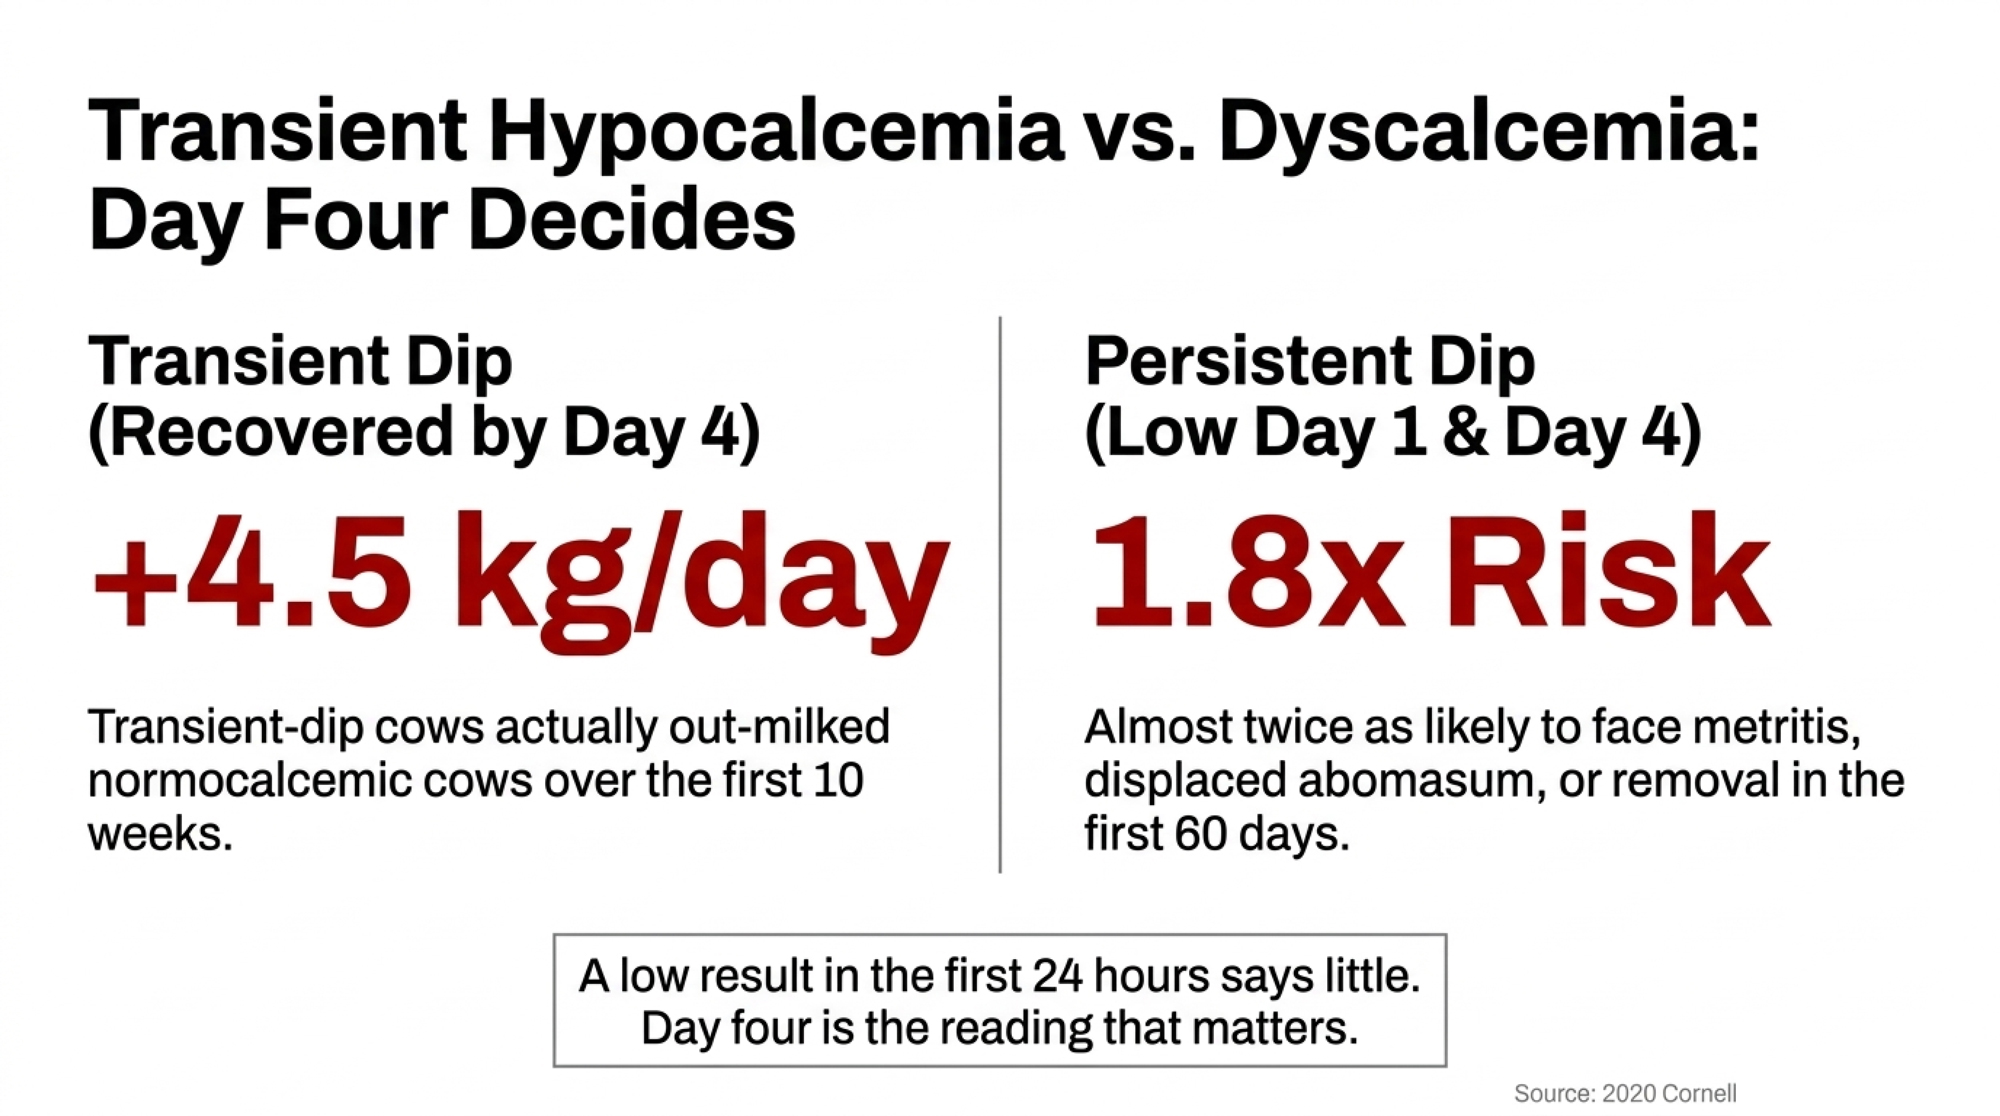
For years, any calcium dip after calving was something to wipe out. The data have moved past that, because how long the dip lasts matters more than whether it happens.
A 2020 Cornell study of 407 Holsteins in two New York herds sorted multiparous cows by their calcium on days one and four. It then averaged their milk across the first 10 weeks:
| Multiparous calcium pattern | Milk, kg/day (first 10 weeks) |
| Transient dip (low day 1, recovered by day 4) | 49.1 |
| Normocalcemic (above study cutoffs, days 1 and 4) | 44.6 |
| Persistent (low day 1 and day 4) | 46.4 |
| Delayed (normal day 1, low day 4) | 41.4 |
By Bullvine’s read, transient-dip cows out-milked normocalcemic cows by 4.5 kg/day and delayed cows by 7.7 kg/day.
Persistent and delayed multiparous cows were also 1.8 and 1.9 times more likely than normocalcemic cows to have an adverse event in the first 60 days. That covers hyperketonemia, metritis, displaced abomasum or removal from the herd.
So the reading that matters comes at day four: has the cow recovered? A low result in the first 24 hours says little about the transition program on its own.
That’s a problem for blanket supplementation, in our reading of the evidence. If a short dip comes with more milk, treating every subclinical cow isn’t obviously helping. And the 2020 study didn’t test a treatment protocol for the cows that stay low.
Clinical milk fever is still a veterinary emergency. A cow that’s down isn’t the place to argue about adaptation. Standing, healthy-looking cows belong on a written, risk-based protocol, and that protocol decides which cows get calcium.
Treating standing cows can even backfire: in a University of Guelph trial across two Ontario herds, cows given two oral calcium boluses post-calving actually ended up with lower serum calcium by day two (2.18 vs. 2.27 mmol/L) than untreated herdmates.
Negative DCAD and Urine pH: What the Meta-Analyses Show
Negative dietary cation-anion difference (DCAD) programs hold up fine under this evidence.
A 2019 meta-analysis pooled 42 experiments, 134 treatment means and 1,803 cows. Its models predicted that dropping prepartum DCAD from +200 to −100 mEq/kg would:
- Raise blood calcium on calving day from 1.86 to 2.04 mmol/L.
- Add 1.0 kg/day of postpartum dry matter intake.
Lower DCAD also cut prepartum intake in both parity groups, while improving intake after calving.
Heifers are where the case weakens. In the five nulliparous experiments (151 animals), lowering DCAD either didn’t change milk and protein yield or cut fat and fat-corrected milk.
A second 2019 meta-analysis found lower-DCAD diets cut disease risk. Converted to plain English (Bullvine math):
| Outcome | Reported | What it means |
| Clinical hypocalcemia | Risk ratio 0.60 | 40% lower risk |
| Retained placenta | Risk ratio 0.59 | 41% lower risk |
| Metritis | Odds ratio 0.46 | 54% lower odds |
The DCAD number on the ration sheet is what you planned. Urine pH tells you what the cows actually got.

Synthetic Zeolite A: Calcium Through Phosphorus Binding
Negative DCAD isn’t the only prepartum tool that works. Synthetic zeolite A gets at calcium another way, by tying up phosphorus.
The 2024 University of Wisconsin trial ran at the university’s Emmons Blaine Dairy Research Center in Arlington, Wis., from November 2019 to April 2020. It put 121 multiparous Holsteins on one of three close-up diets:
- A control at +190 mEq/kg.
- A negative-DCAD diet at −65 mEq/kg.
- A +278 mEq/kg diet with synthetic zeolite A at 3.3% of dry matter, targeting 500 g/day.
Zeolite cows had lower blood and saliva phosphorus, more water-extractable phosphate in their manure, and the highest blood calcium before and after calving. The authors conclude zeolite improved calcium metabolism largely through binding phosphorus and excreting it in the feces.
It costs intake. In the companion paper, prepartum dry matter intake averaged 11.70 kg/day on zeolite, against 13.88 on the control and 13.45 on negative DCAD. Rumination averaged 487 minutes a day on zeolite, against 531 and 527.
Blood glucose and BHB didn’t differ by diet. Average milk over the first seven weeks didn’t either.
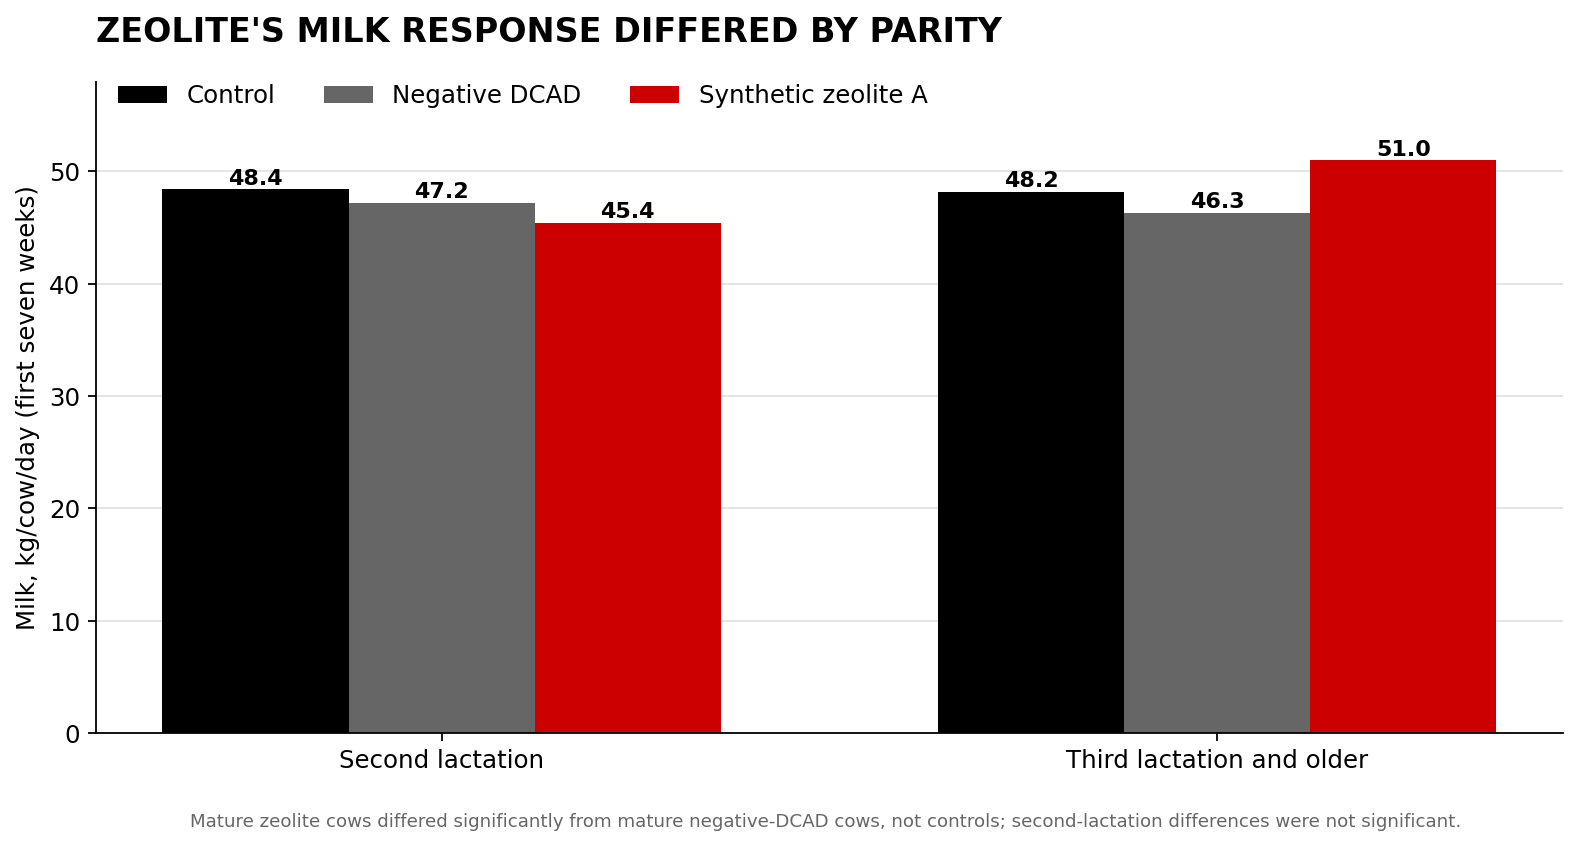
Parity is where the cows split:
- Third lactation and older: zeolite cows gave 51.0 kg/day. That was significantly more than mature negative-DCAD cows (46.3 kg) but not different from mature controls (48.2 kg).
- Second lactation: zeolite cows gave the least milk, 45.4 kg/day.
The companion paper lists USDA-Hatch funding and acknowledges funding support from VitaPlus Corporation and Vilofoss-Protekta. Their products, Ultra Chlor and X-Zelit, were the tested negative-DCAD supplement and zeolite. The authors stated no conflicts of interest.
Treat synthetic zeolite as a ration ingredient your nutritionist formulates and doses. Restricting phosphorus is the whole mechanism, and it can go too far. A 2026 npj Biofilms and Microbiomes study used it to induce hypophosphatemia on purpose, feeding 300 g/day of synthetic zeolite from 21 days before calving to three days after.
The First 48 Hours
The window that matters falls between calving and the usual day-four calcium test, and a second data set supports the timing.
A Cornell case-control study in the Journal of Dairy Science looked at 48 multiparous Holsteins on two commercial farms in central New York. Both farms fed negative DCAD before calving and didn’t give fresh cows blanket calcium.
Cows later diagnosed dyscalcemic already had higher haptoglobin, an inflammatory marker, at two days in milk: 1.11 g/L, against 0.39 g/L in eucalcemic herdmates. The authors write that “the causal structure of this relationship remains unknown.”
Put the two studies side by side and the inflammation signal shows up before the day-four calcium call in both:
- The Cornell case-control study (sampled daily): the signal was there by day two.
- The 2026 study (sampled every eight hours): it appeared at 64 hours, and intake had already dropped before that.
The herds, sampling schedules and calcium cutoffs differ, so this is a pattern across two studies.
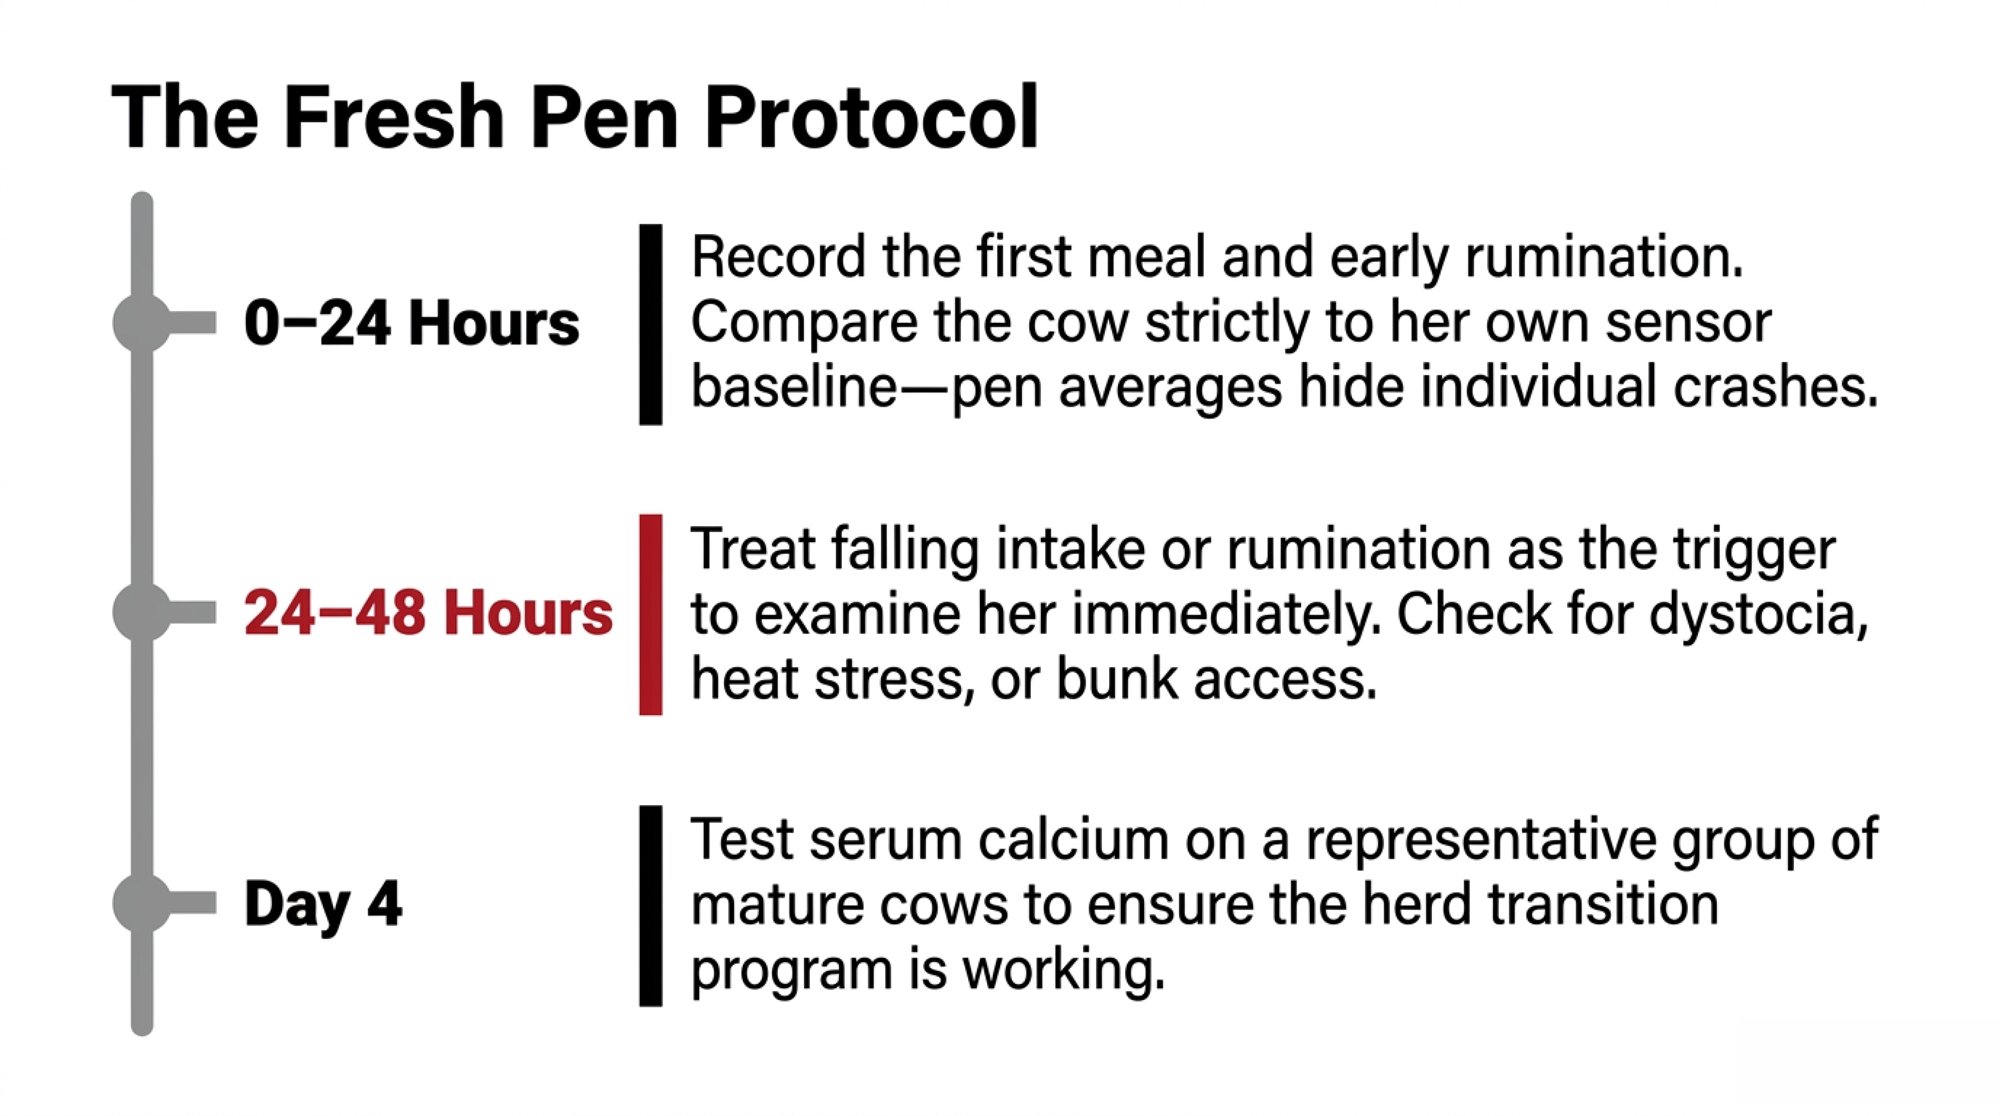
What that means for the fresh-pen routine:
- 0–24 hours: record calving difficulty, the first meal, water access and early rumination. Compare each cow with her own sensor baseline, because a pen average hides the mature cow whose activity has crashed.
- 24–48 hours: treat falling intake or rumination as the trigger to examine her, then check her surroundings. Dystocia, uterine disease, mastitis, lameness, respiratory disease, digestive upset, heat stress or simply not getting to feed can all produce the same pattern.
- 48–72 hours: if she’s still off feed or behind her rumination curve, bring in the vet and nutritionist together.
- Day four: test serum calcium on a representative group of second-lactation-and-older cows to see whether the herd is recovering.
The 2026 study reported group means and didn’t test them as an alert threshold for individual cows. Let the sensor put a cow on the work list, and let the exam decide what happens next.
Fix the Bunk First
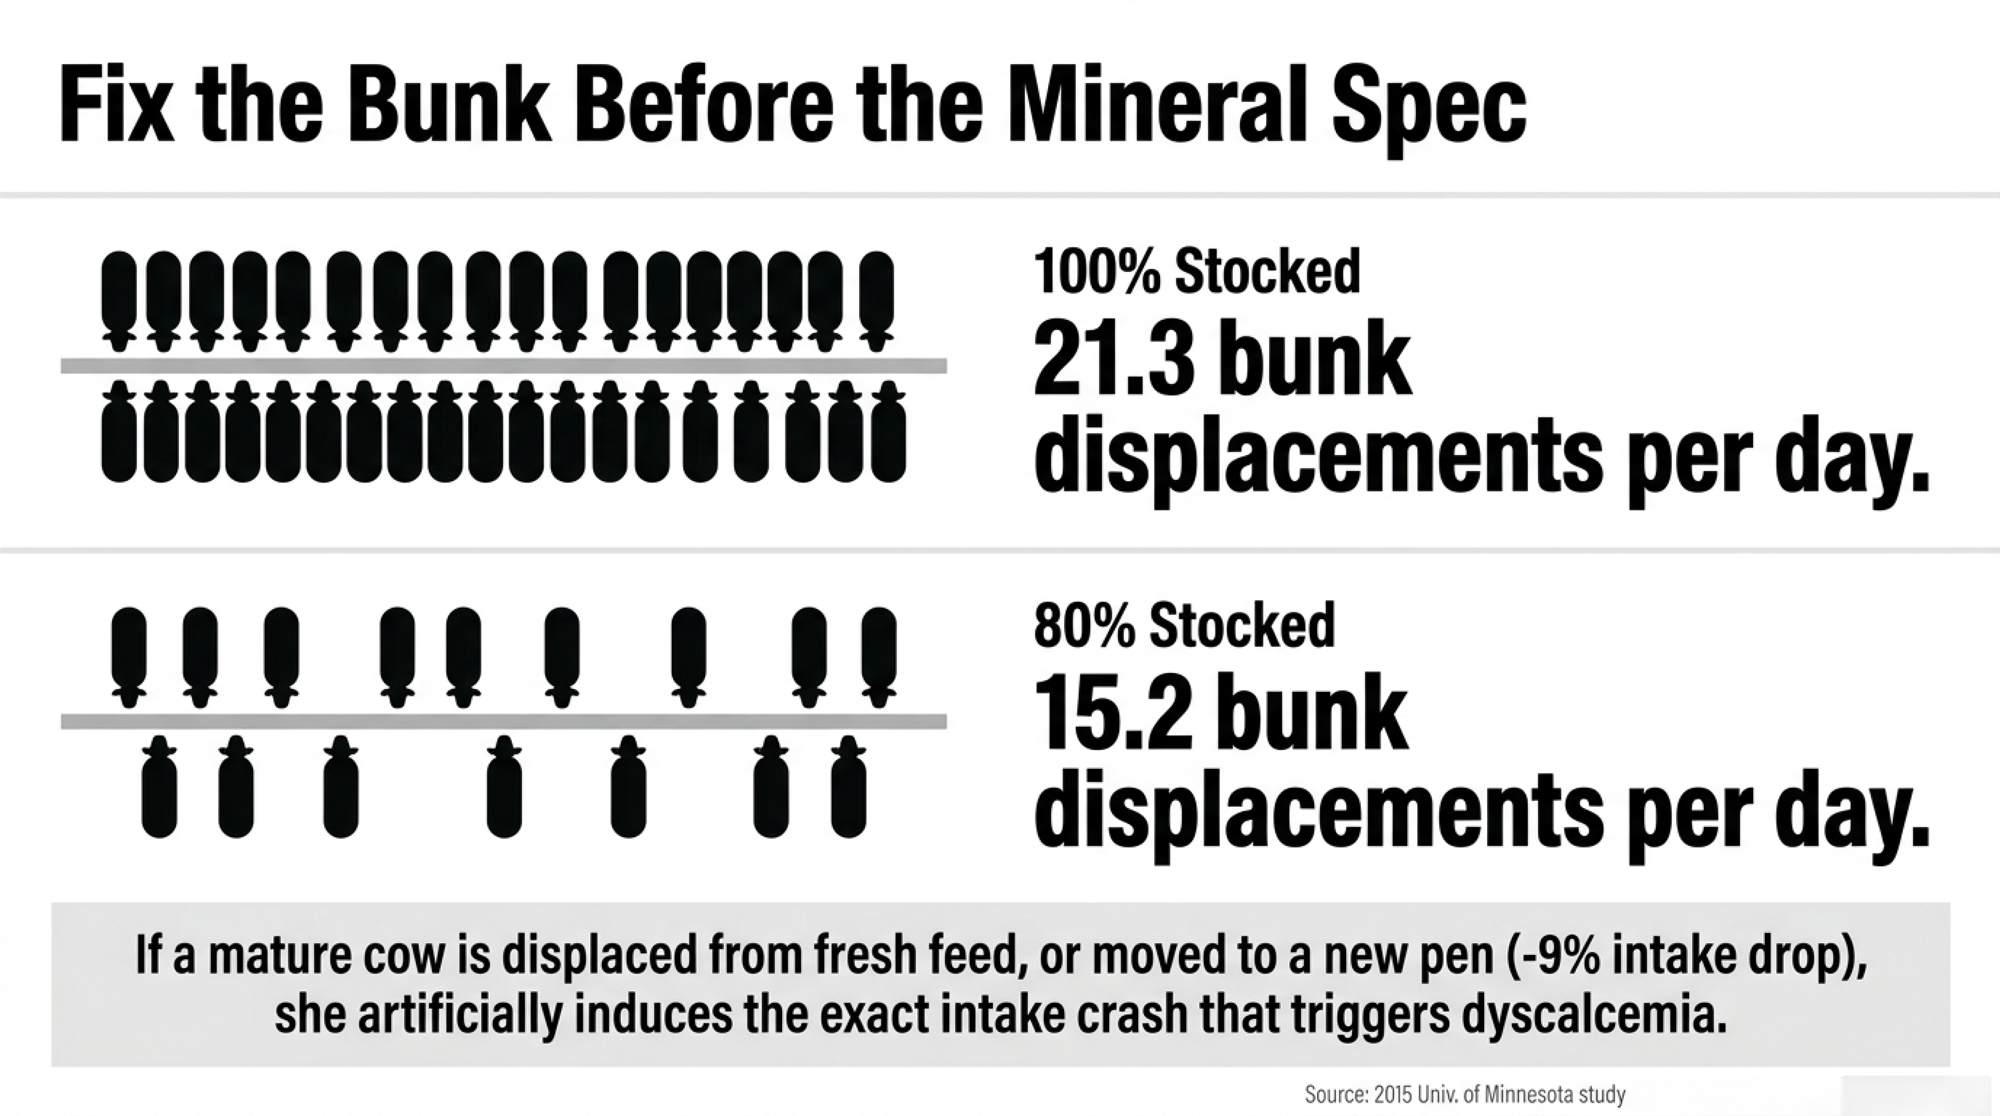
If cows can’t get to the ration, changing the mineral spec won’t fix it. Two Journal of Dairy Science studies show how competition and pen moves shape access to feed.
- Stocking density: a 2015 University of Minnesota study enrolled 756 Jersey animals at a 6,400-cow commercial dairy in south-central Minnesota. Pens had 48 headlocks and 44 stalls, stocked at either 80% (38 animals) or 100% (48 animals). The 80% pens had 15.2 feed-bunk displacements per day, against 21.3 at 100%, counted over the three hours after fresh feed. The authors called the behaviour changes small, said more stocking density couldn’t be recommended, and flagged the need for work in other breeds.
- Pen moves: in a 2011 University of British Columbia study of 48 dry Holsteins at Agassiz, B.C., cows were regrouped about 40 days before calving. Cows moved to a new pen cut dry matter intake by about 9% on the day they moved. Cows that stayed in their home pen while newcomers arrived showed no significant drop. Rumination fell about 9% in both groups.
A fresh-cow review worth doing asks:
- Did every mature cow have uninterrupted access when fresh feed arrived?
- Was the ration delivered and pushed up on schedule?
- Did the actual mix match the formulated ration?
- Was sorting visible in the refusals?
- Were waterers clean, accessible and fast enough for peak demand?
- Were first-lactation cows losing bunk access to older cows?
- Did pen moves, calving difficulty or heat load cut intake?
- Which cows failed to recover rumination by the second day?
Change the Scorecard
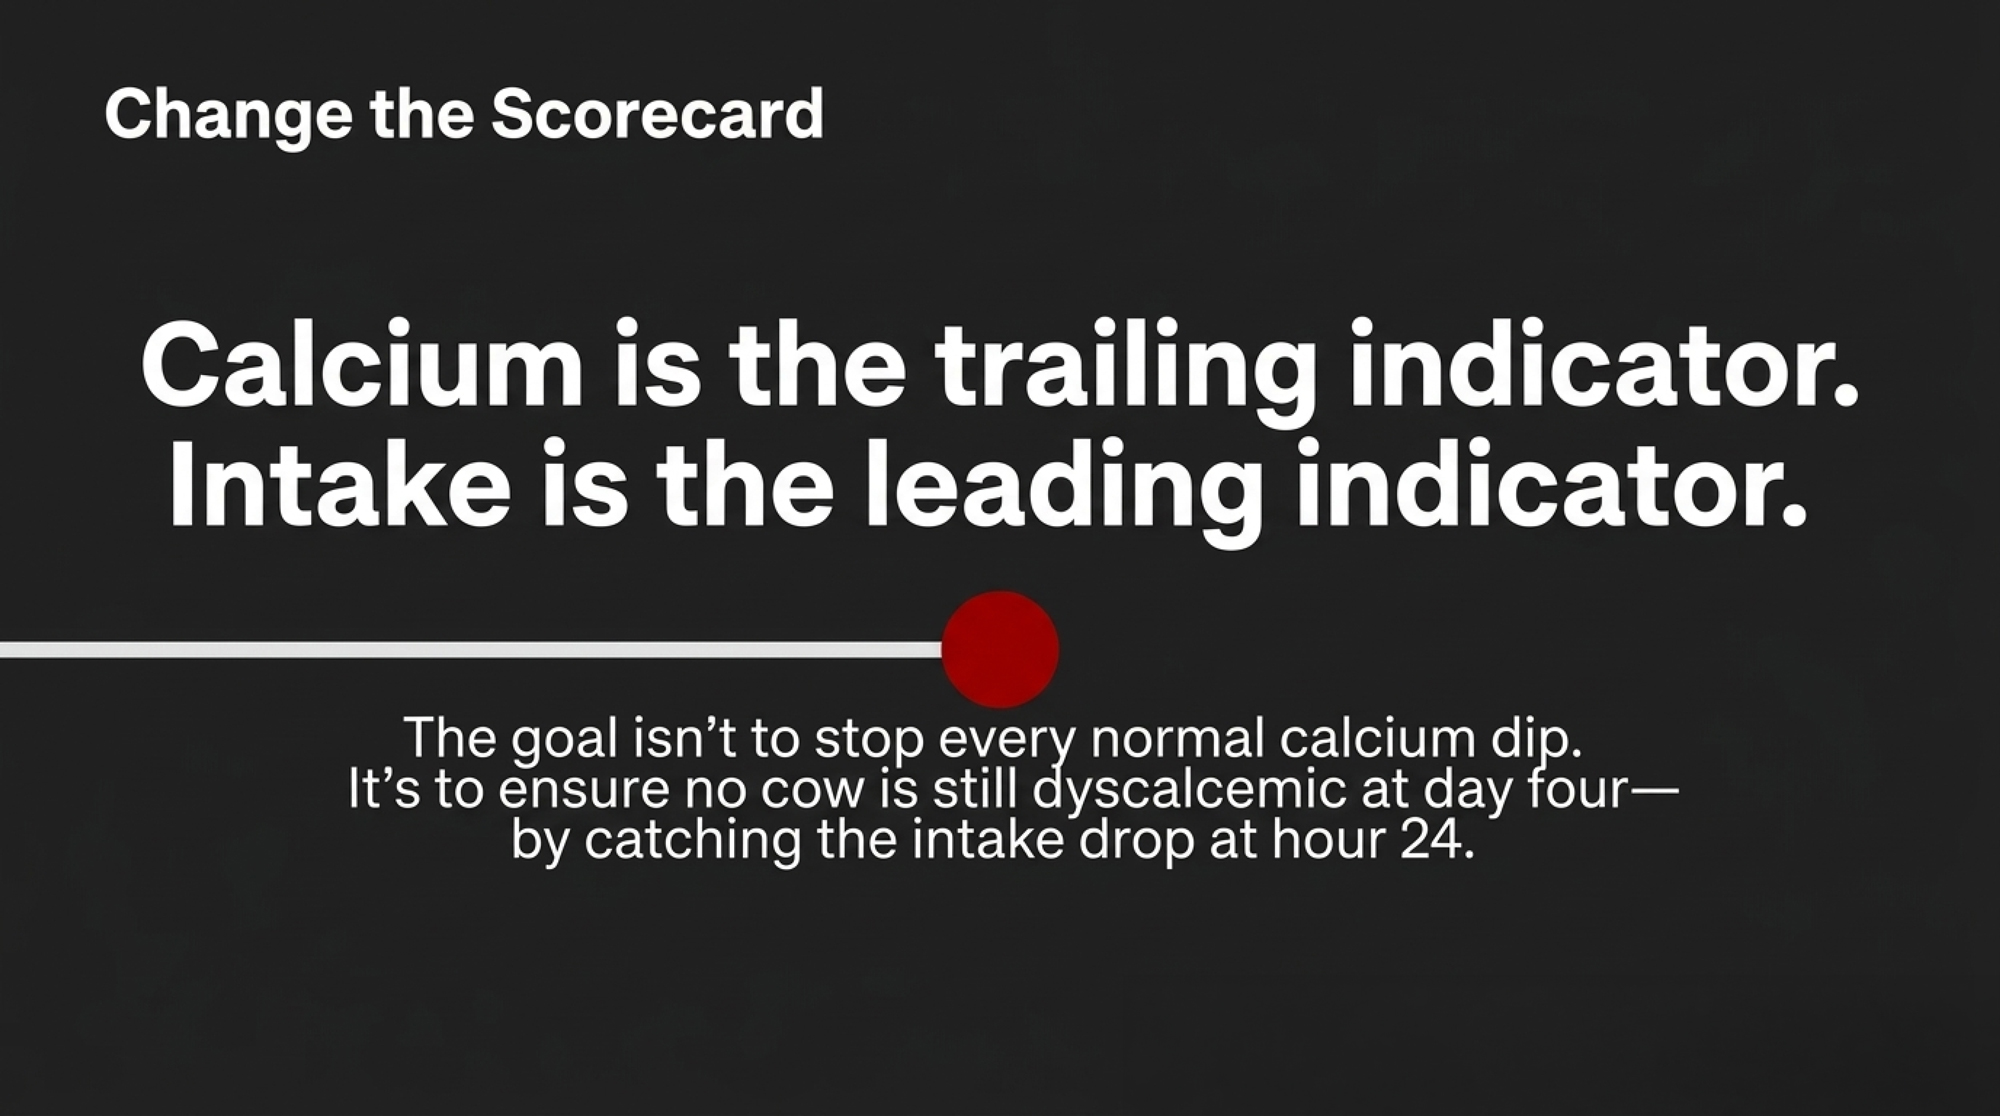
Counting clinical milk fever is a poor way to grade a transition program. It catches the most visible failure and misses the cows that stay on their feet while losing intake, rumination and milk.
A better herd dashboard tracks five things:
- Close-up dry matter intake and ration consistency.
- Each cow’s rumination recovery over the first 48 hours.
- Day-four dyscalcemia prevalence in multiparous cows.
- Metritis, displaced abomasum, hyperketonemia and early removals.
- Milk through the first 10 weeks, priced with the per-cow math above.
Break each one out by parity, season and pen. A herd average can look fine while fourth-lactation cows, crowded groups or hot fresh pens quietly take most of the damage.
The goal isn’t to stop every normal calcium dip after calving. It’s to make sure no cow is still dyscalcemic at day four.
By the time that test comes back, the earliest warning is already two days old.
Complete references and supporting documentation are available upon request by contacting the editorial team at editor@thebullvine.com.
Learn More
- A Wisconsin Herd’s DCAD Said −120. A 50‑Cent Urine Strip Said Otherwise.: Pull 10 urine strips before you blame the mineral. One herd’s ration was formulated at −100 to −160 mEq/kg, yet its cows still averaged pH 7.2 because 15.2 inches of bunk space let them sort. Your ration sheet won’t show that.
- Overstock the Close-Up Pen, Pay $500 a Cow in the Fresh Pen: Follows the money from a crowded close-up pen to a $500-a-cow fresh-pen bill 30 to 40 days later. Penn State puts the heifer penalty at 1.6 lb/day for every 10 points over 80% stocking, and the fix is smoothing your calving calendar.
- Revolutionize Dry Cow Economics: How $200 Sensors Predict Fresh Cow Problems Days Earlier: Earlier warning than 24 hours fresh. Michigan State found hyperketonemia cows ruminating 24 to 26 minutes less five to six days before dry-off, and Cornell collars flagged metritis 1.5 days ahead of skilled staff. Treat vendor ROI figures skeptically.
 The Sunday Read Dairy Professionals Don’t Skip.
 The Sunday Read Dairy Professionals Don’t Skip.
Every week, thousands of producers, breeders, and industry insiders open Bullvine Weekly for genetics insights, market shifts, and profit strategies they won’t find anywhere else. One email. Five minutes. Smarter decisions all week.
