Archive for Farm Economics & Management – Page 3

$15,613 vs. $4,800: The Injury You Buy When You Skip the Day Off

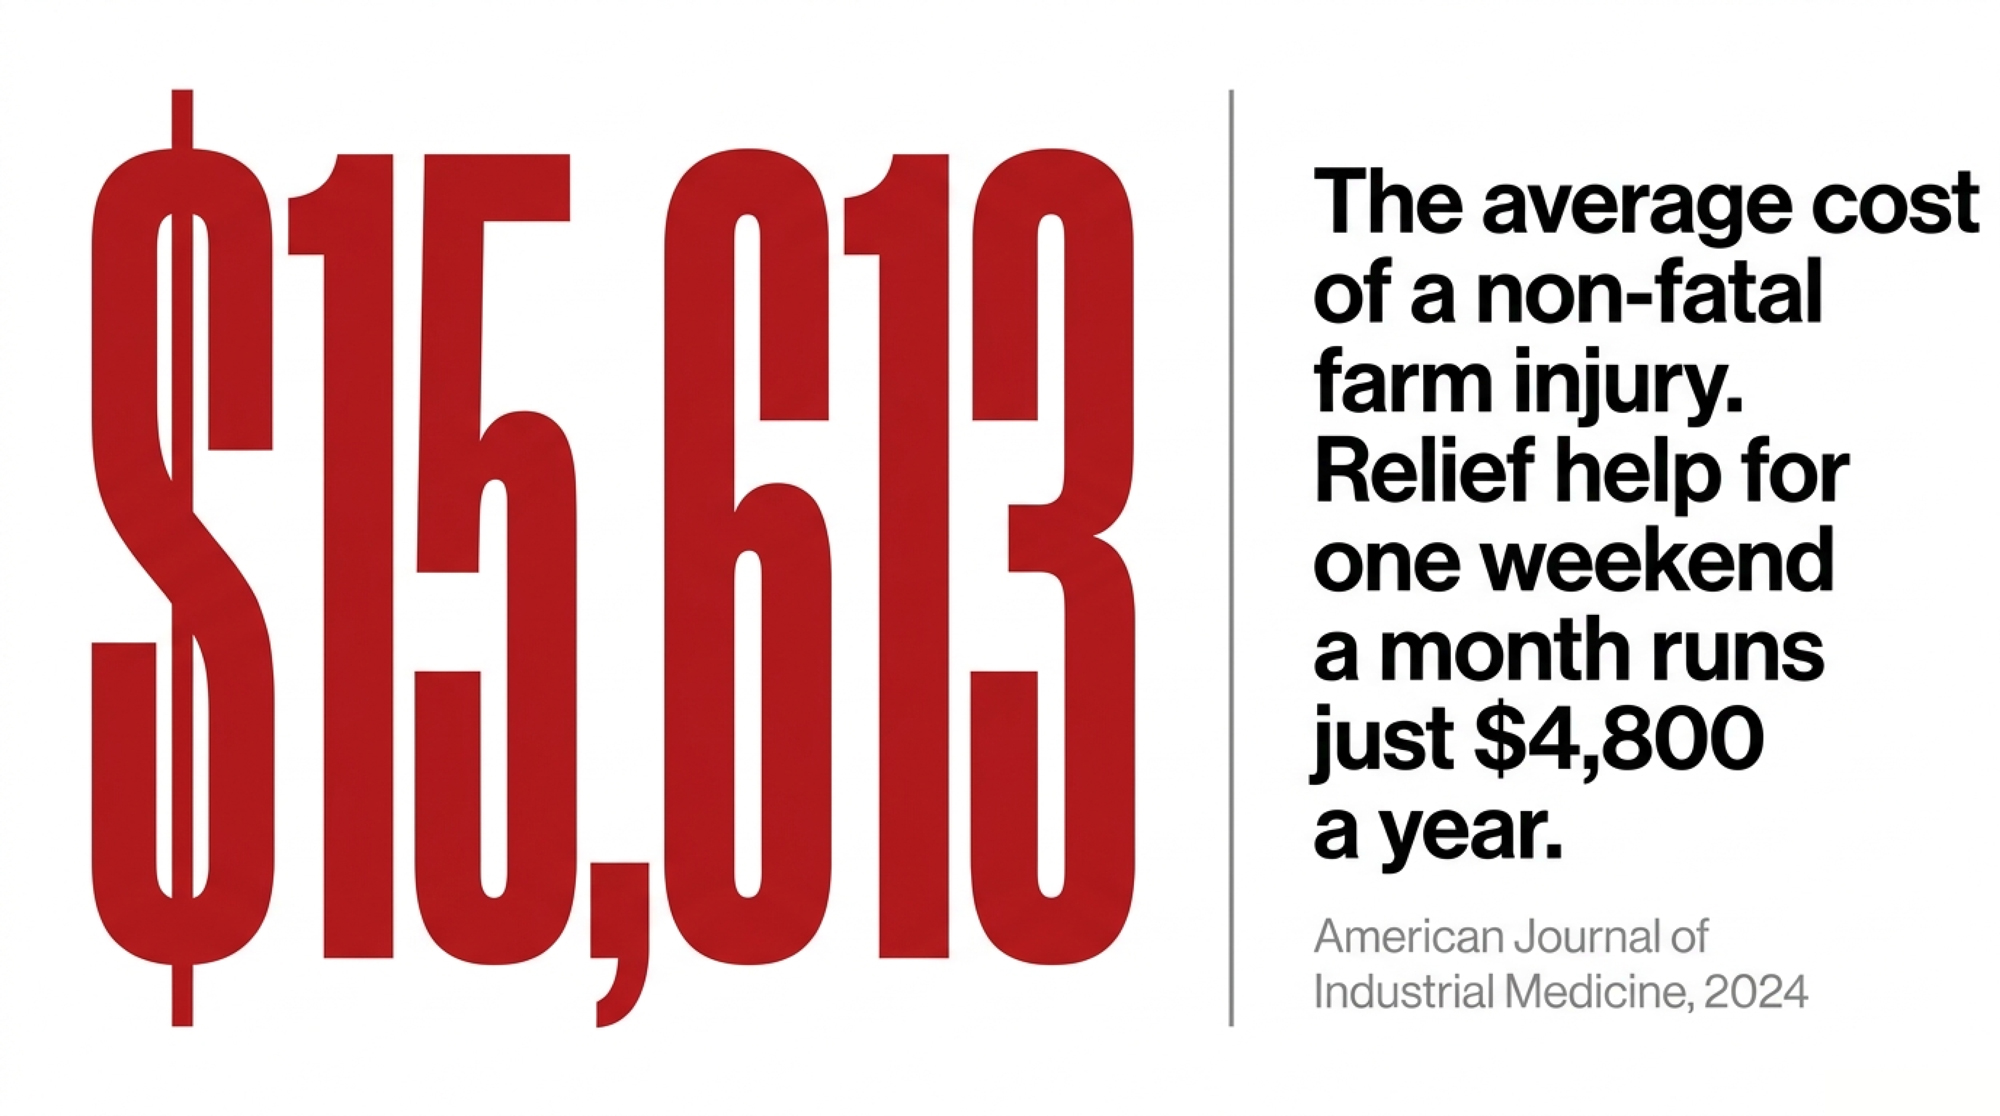
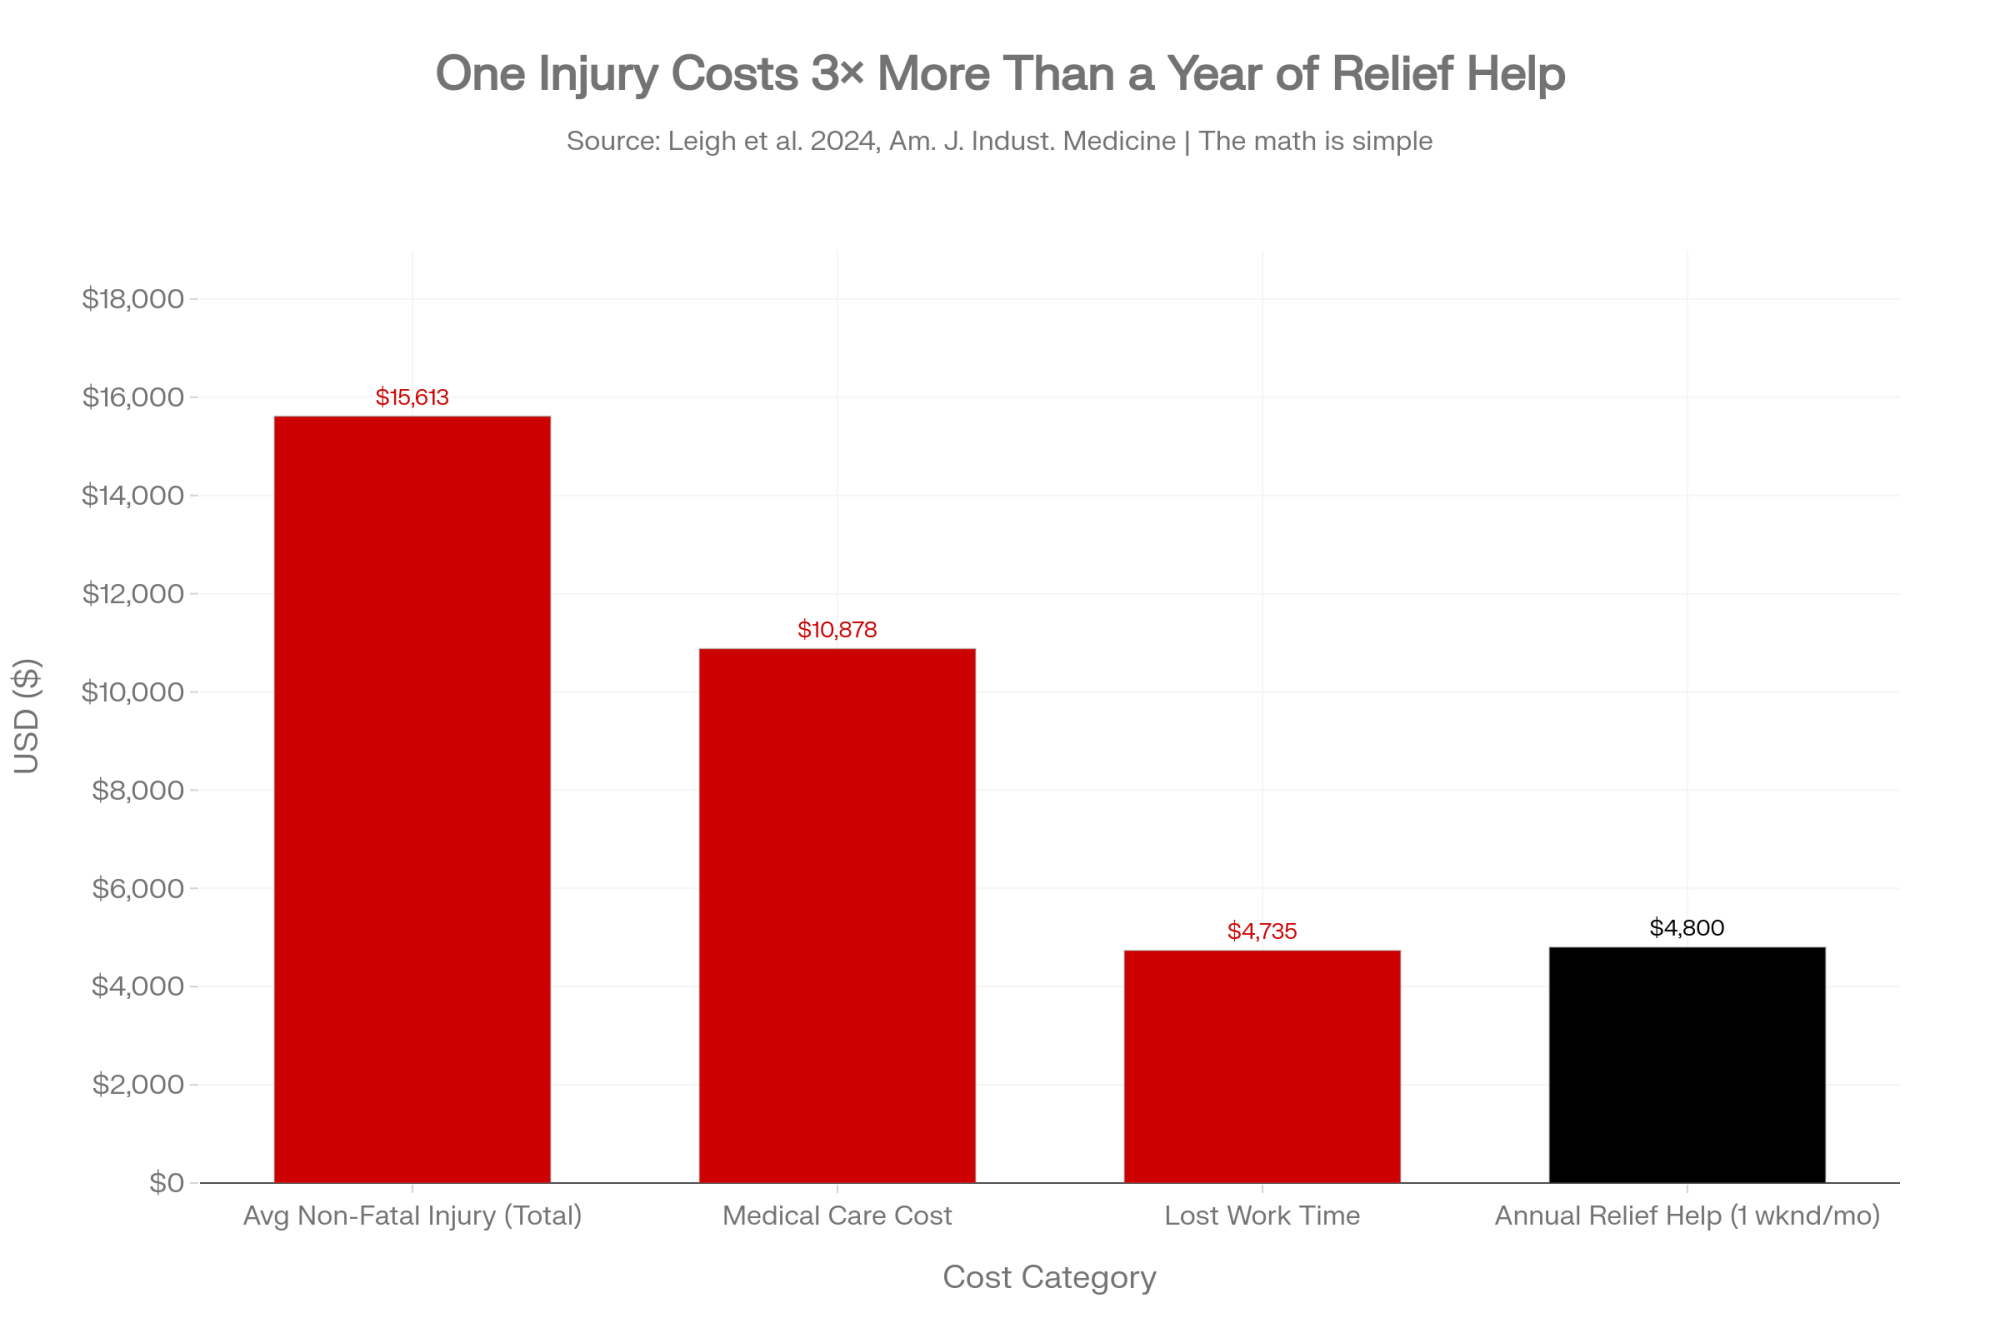
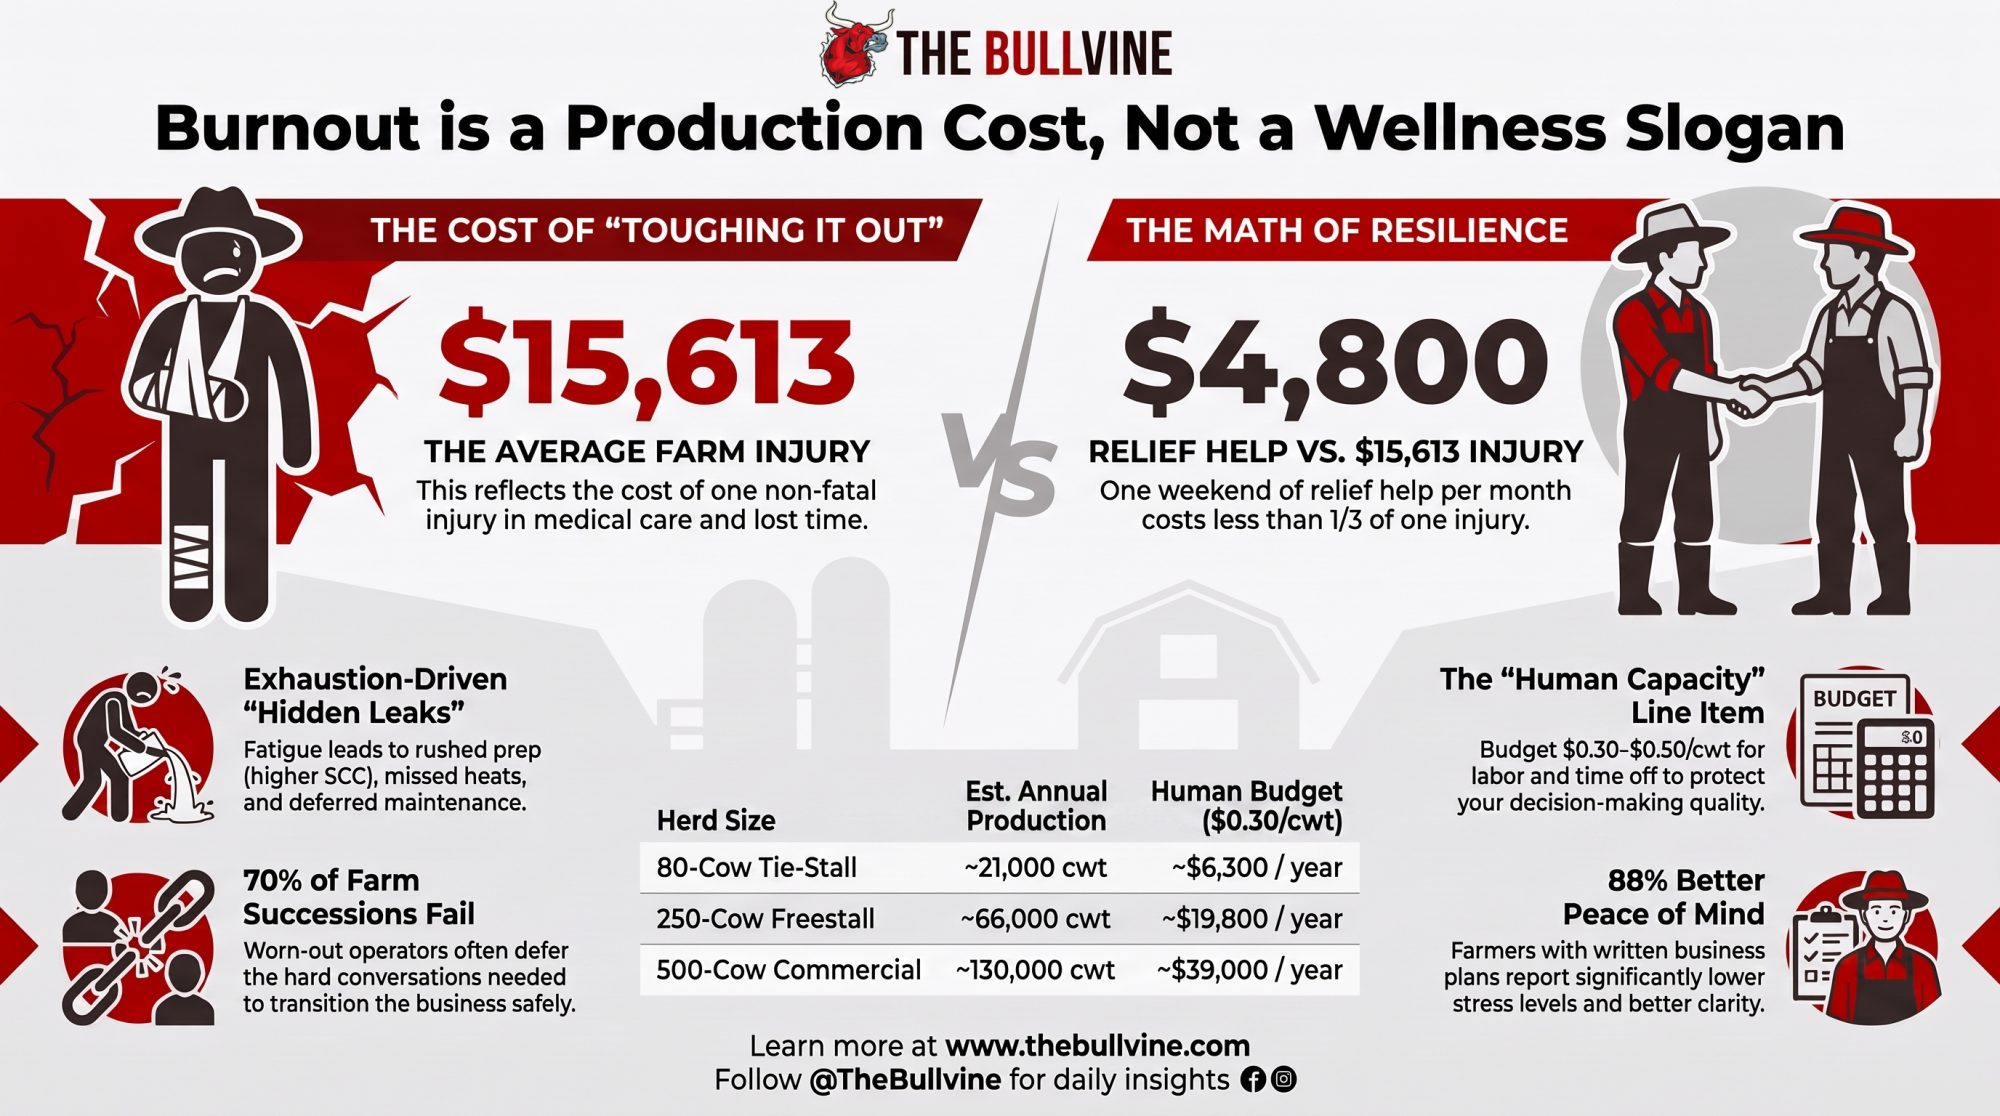
$15,613 is the average non-fatal farm injury. Relief help runs $4,800 a year. The tired 10:30 call to run the failing pump one more week is exactly how you buy the first.

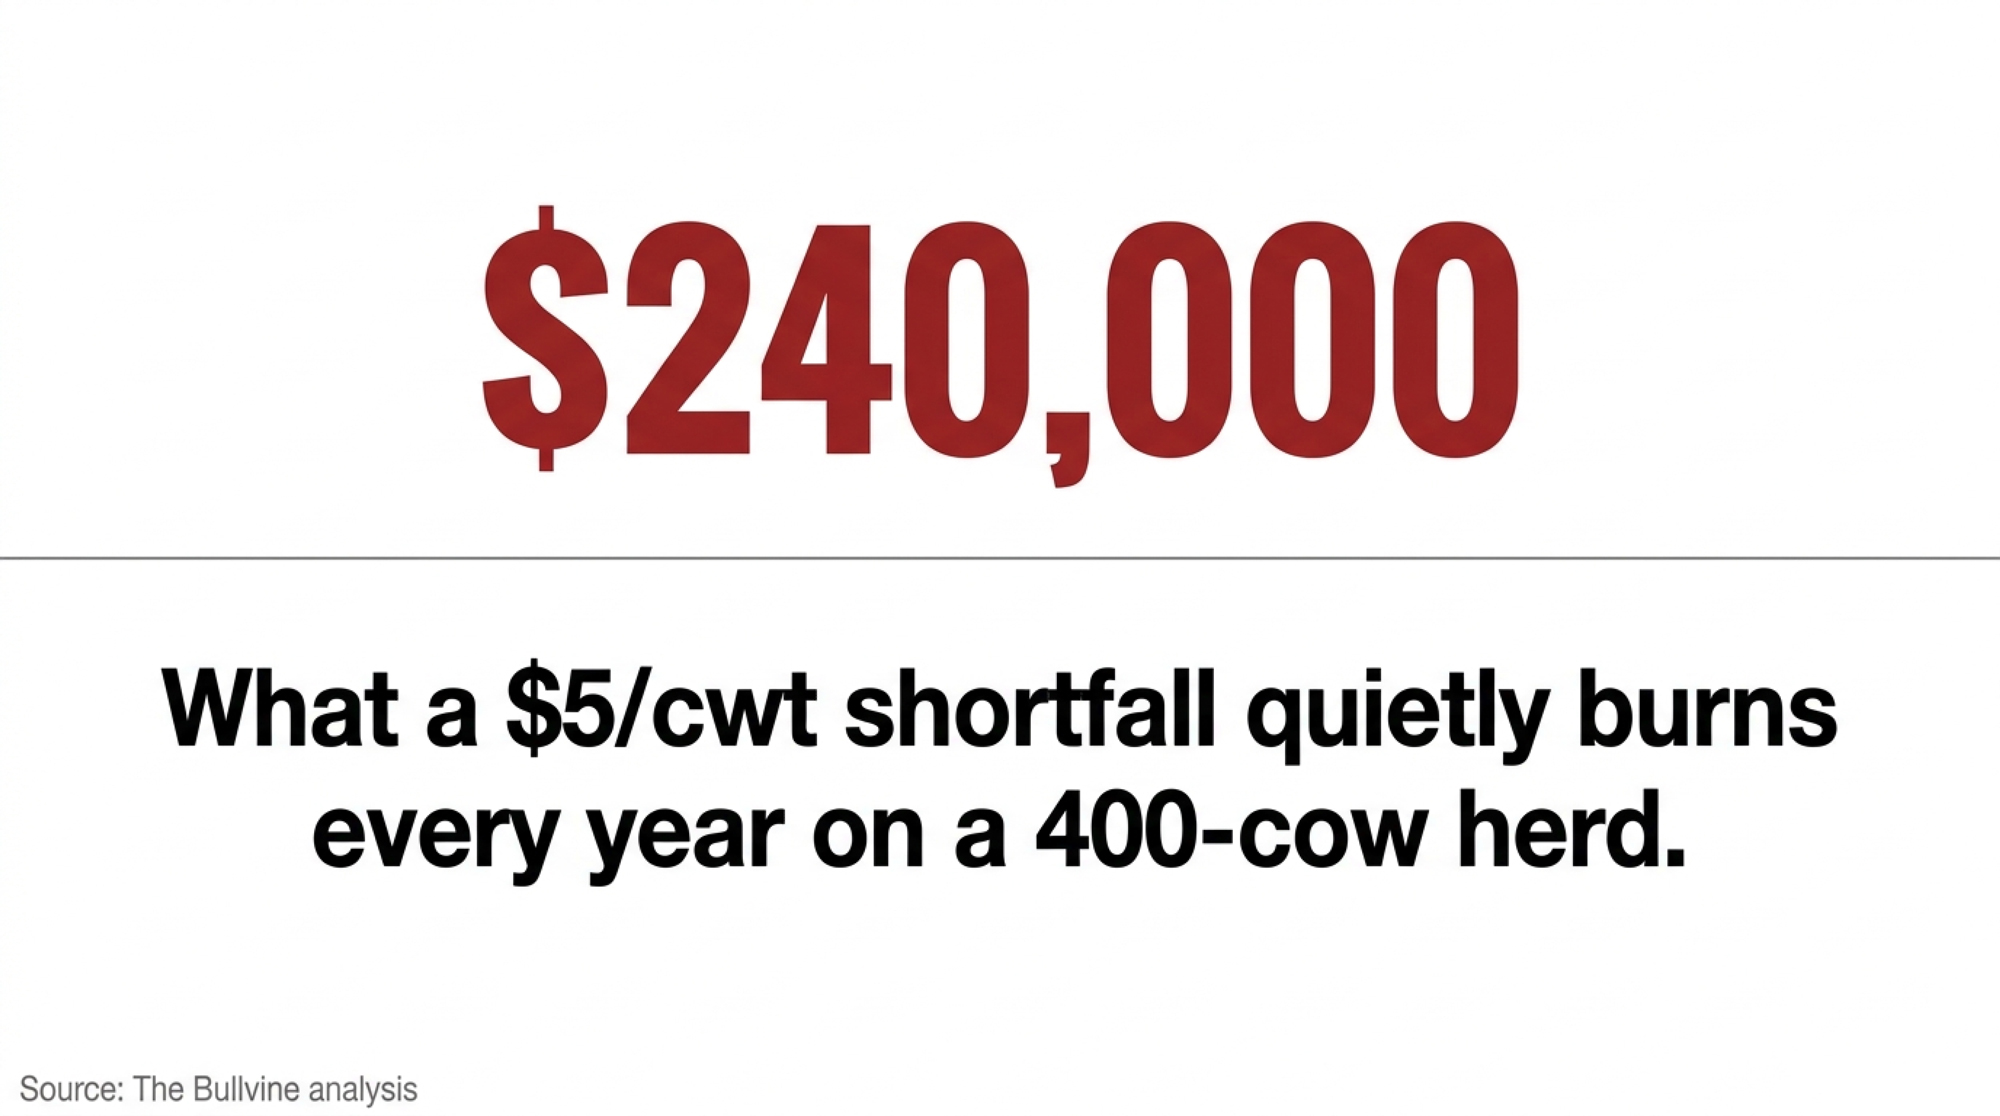
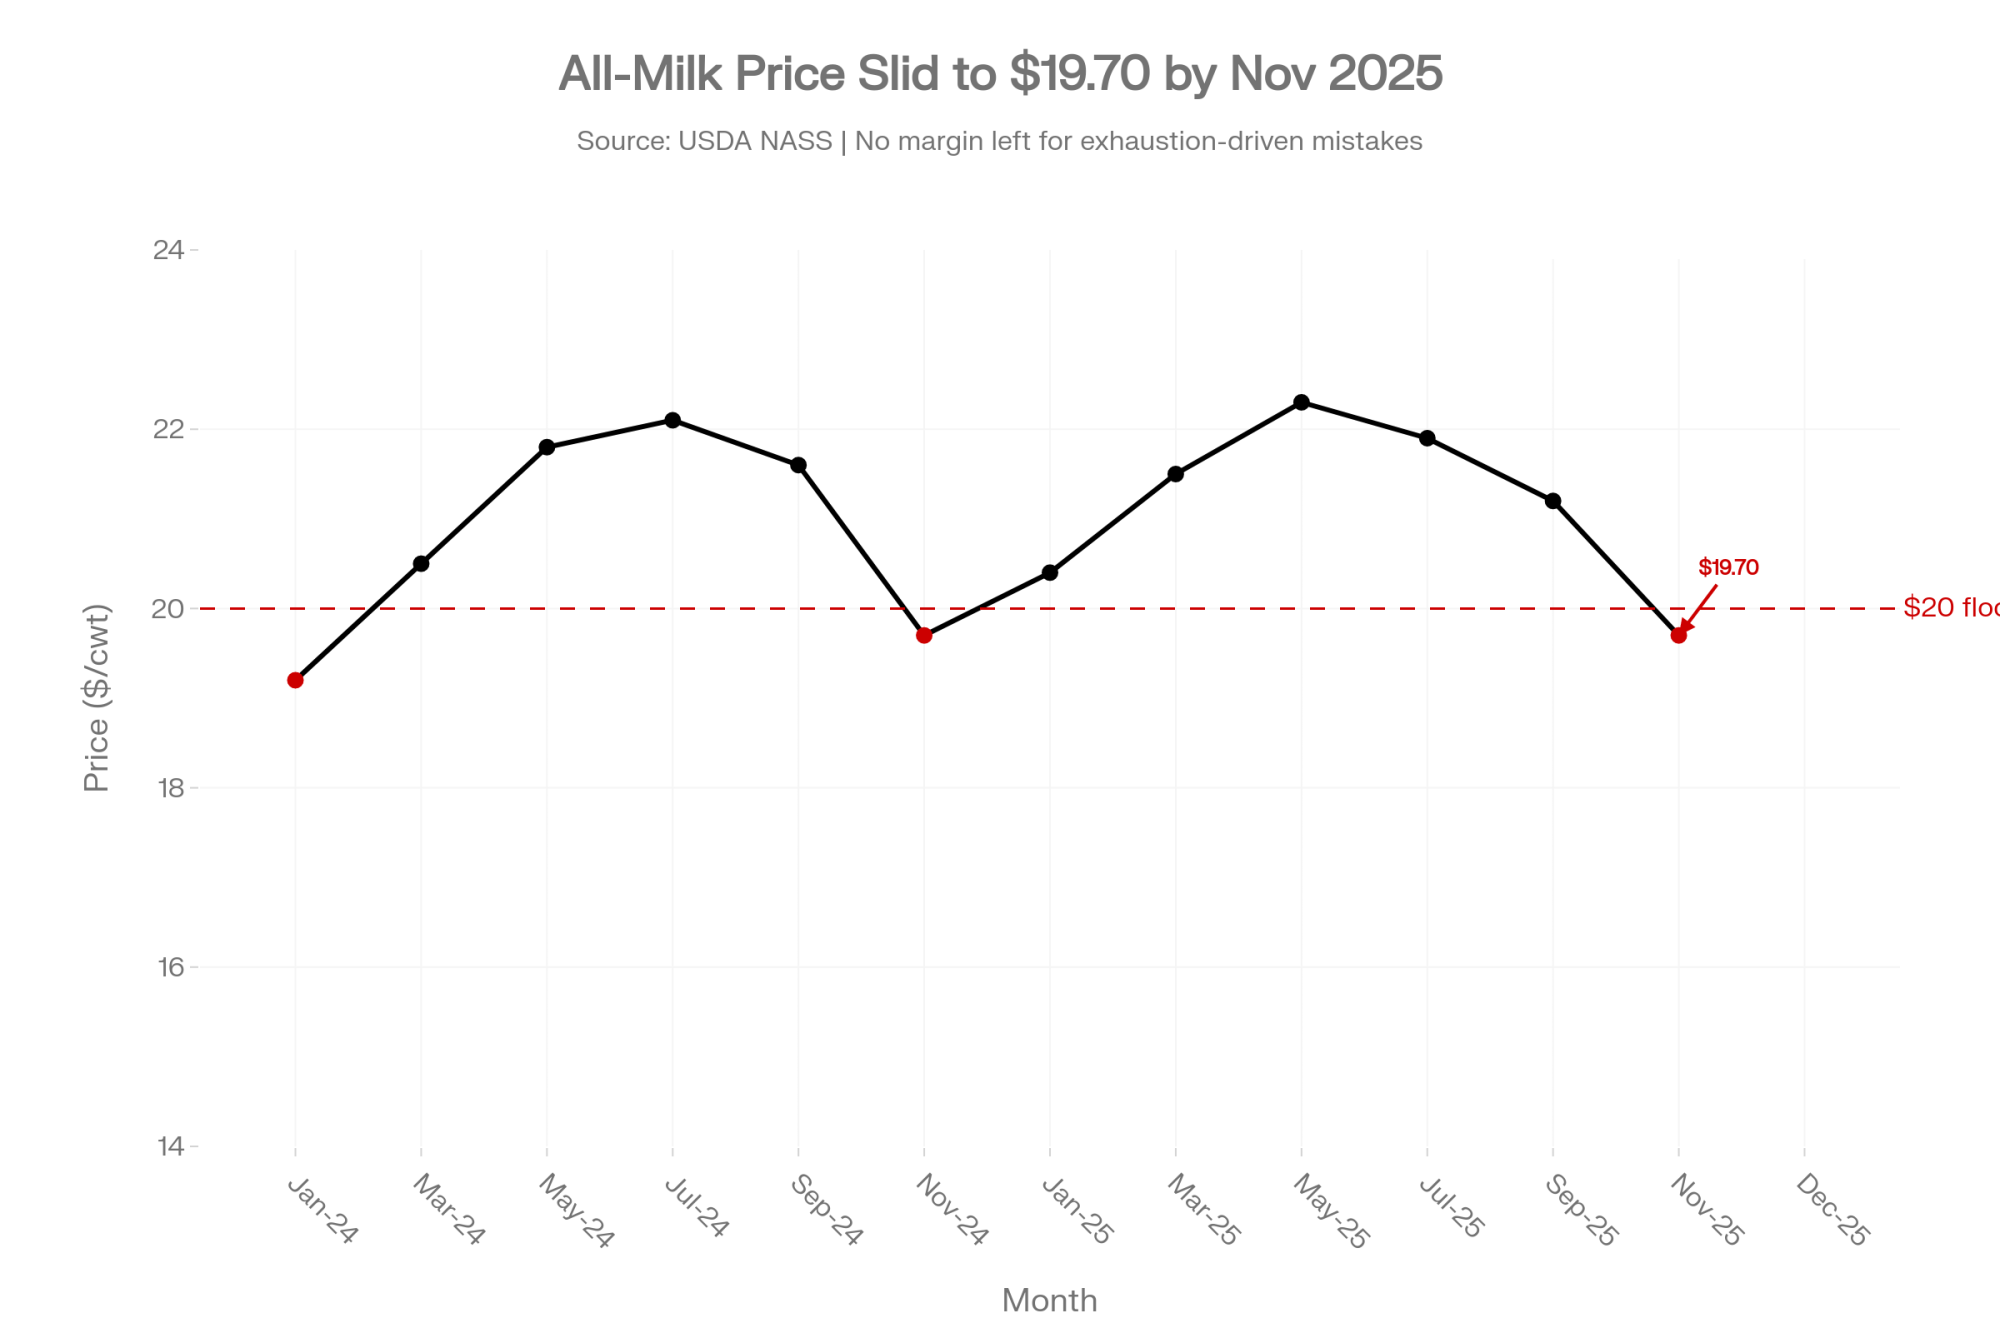
Executive Summary: The average non-fatal farm injury runs $15,613 — and the tired 10:30 PM call to run the failing pump one more week is exactly how you buy one. That makes farmer burnout an unbudgeted line item sitting right next to feed and bedding, not a wellness slogan. It hits small and mid-size operations hardest: U.S. licensed herds are down 63% since 2004, and with November 2025 all-milk at $19.70/cwt, there’s no margin left to absorb an exhaustion-driven mistake — the skipped cull, the rushed prep that lifts your SCC, the contract nobody had capacity to read. The fix is a “human capacity” line at $0.30–$0.50/cwt; on a 250-cow herd that’s $20,000–$33,000 a year, and one weekend a month of relief help runs just $4,800–$5,800 — less than a third of one injury. The deeper bill is succession: only about 16.5% of family businesses reach a third generation, and a worn-out operator is the one who never has the hard conversation in time. If you can’t name the last full day off your primary operator took, that’s your signal to run these numbers against your own RHA — and read the full piece.
farmer burnout cost

Editor’s note: The opening scene is a composite, modeled from documented patterns of stress and deferred maintenance on dairy farms, not a single real operation. Every figure and named source that follows is real and verified.

It’s 10:30 at night. The vacuum pump’s been whining for two weeks, the dealer quoted four to six grand to rebuild it, and you’re three weeks into 18-hour days because you’re a milker short. You look at the quote. You look at the calendar. You make the call: “We’ll run it one more week.” Three days later it fails mid-milking on a Saturday — you’re dumping milk, paying weekend call-out rates, and your hired hand nearly goes down in the heat trying to keep cows moving.
That wasn’t a strategy. That was exhaustion making the call. And it’s the clearest reason farmer mental health belongs on your cost-of-production sheet — not as a feel-good wellness slogan, but as a hard line item sitting next to feed, bedding, and power. Whether you’re shipping to a co-op in Wisconsin or operating under supply management in Ontario, the economic math of exhaustion is identical. The average non-fatal farm injury in the U.S. runs $15,613, and male farmers, ranchers, and ag managers carry a suicide rate of 43.2 per 100,000 (National Rural Health Association; CDC) — roughly two to three-and-a-half times the general population, depending on the study. Burnout isn’t soft spending. It’s expensive, and right now most operations price it at zero.

Why Farmer Mental Health Is a Cost of Production, Not a Wellness Slogan

For years the message was “it’s okay to not be okay.” True. But it bounces off a culture built on toughing it out. The sharper argument treats stress and exhaustion as production costs with dollar figures attached — the same way you’d treat a rising cell count or a feed-efficiency slip.
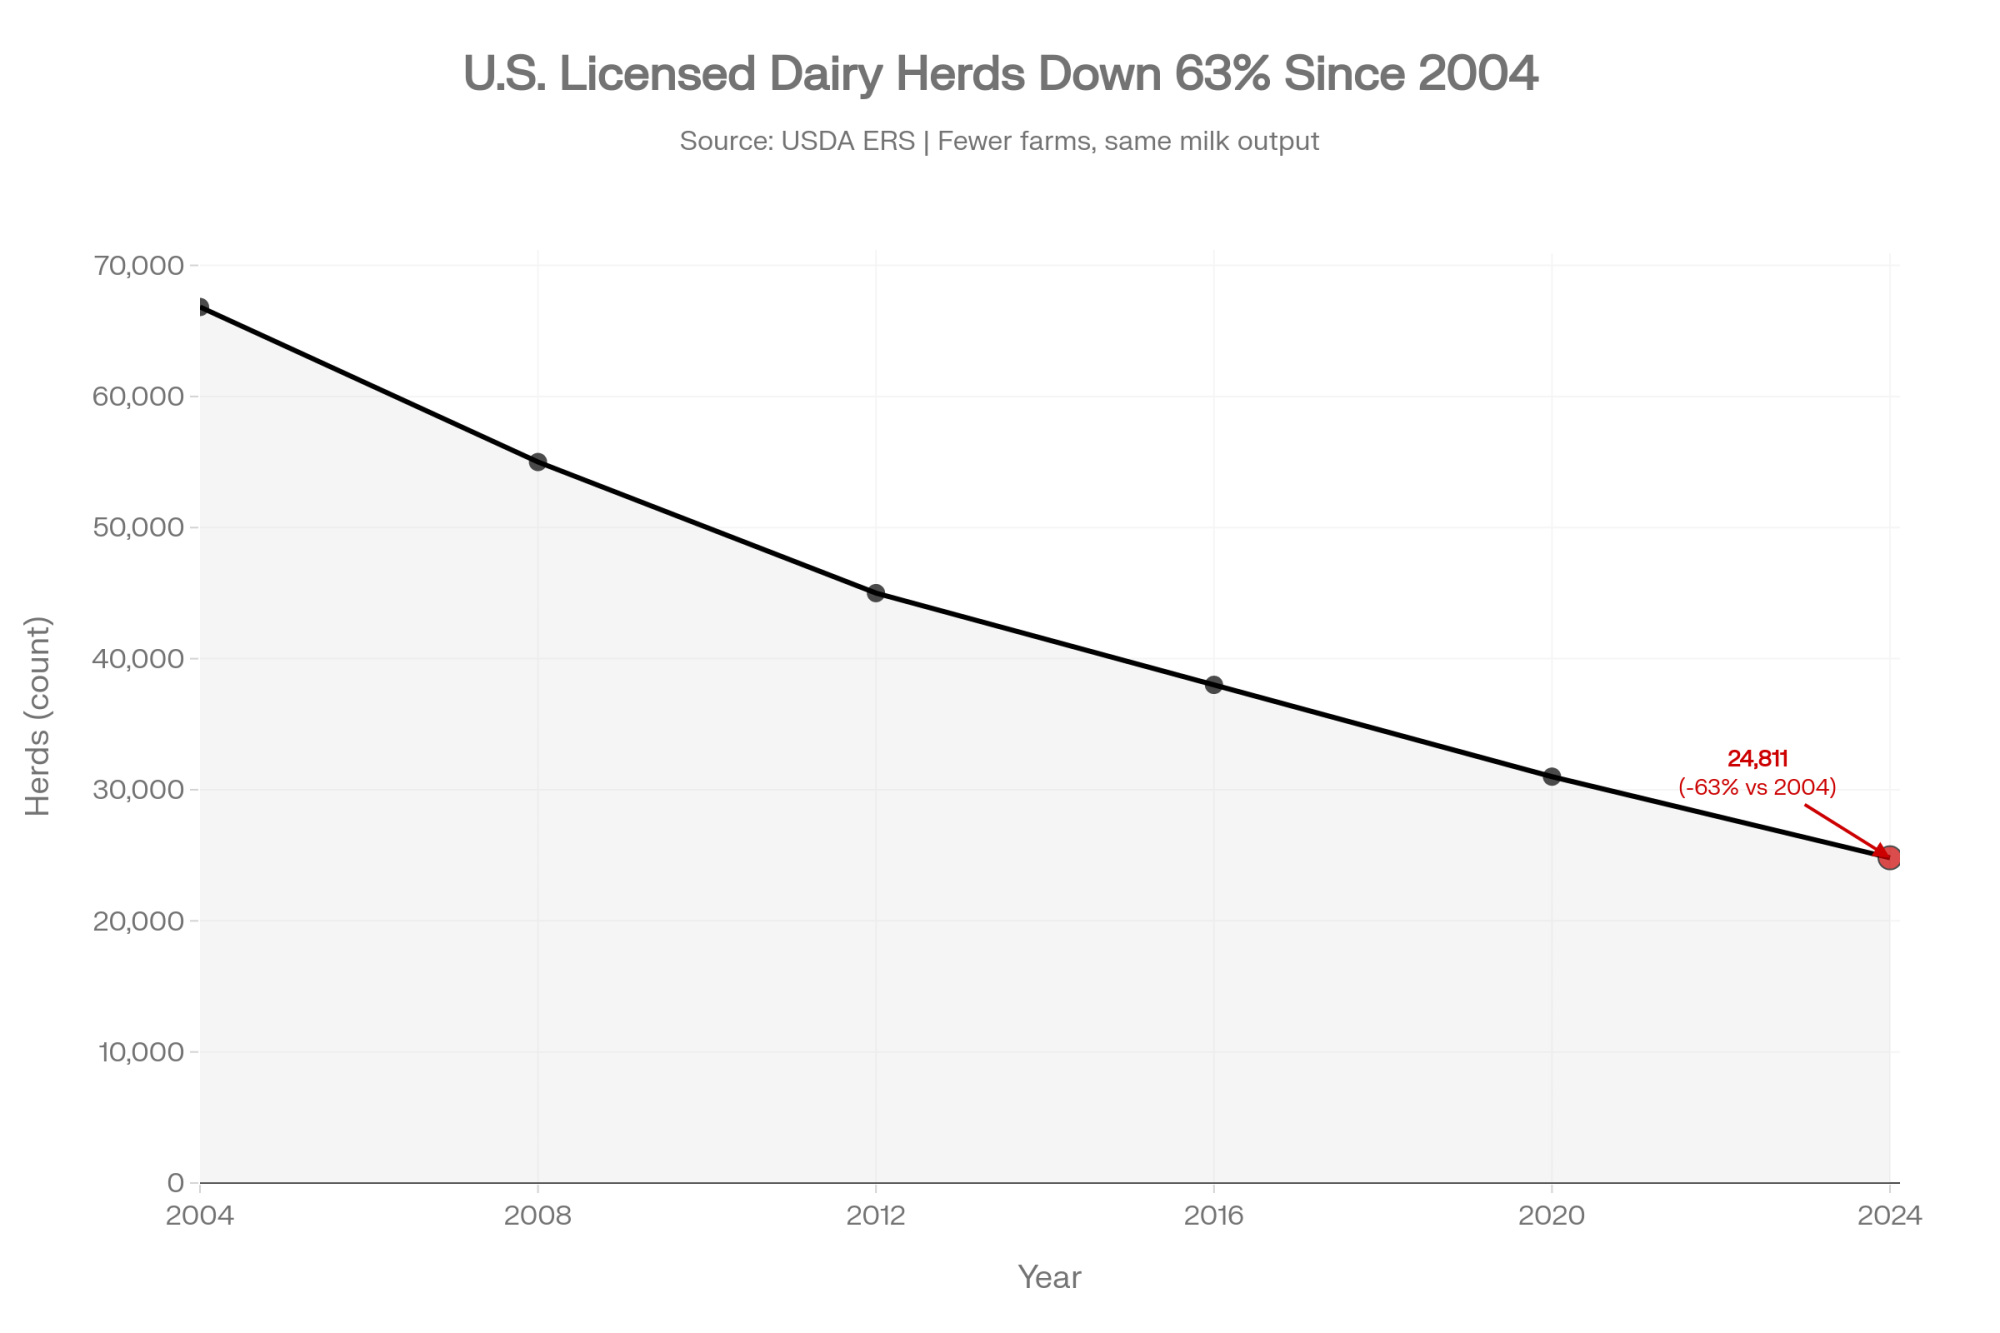
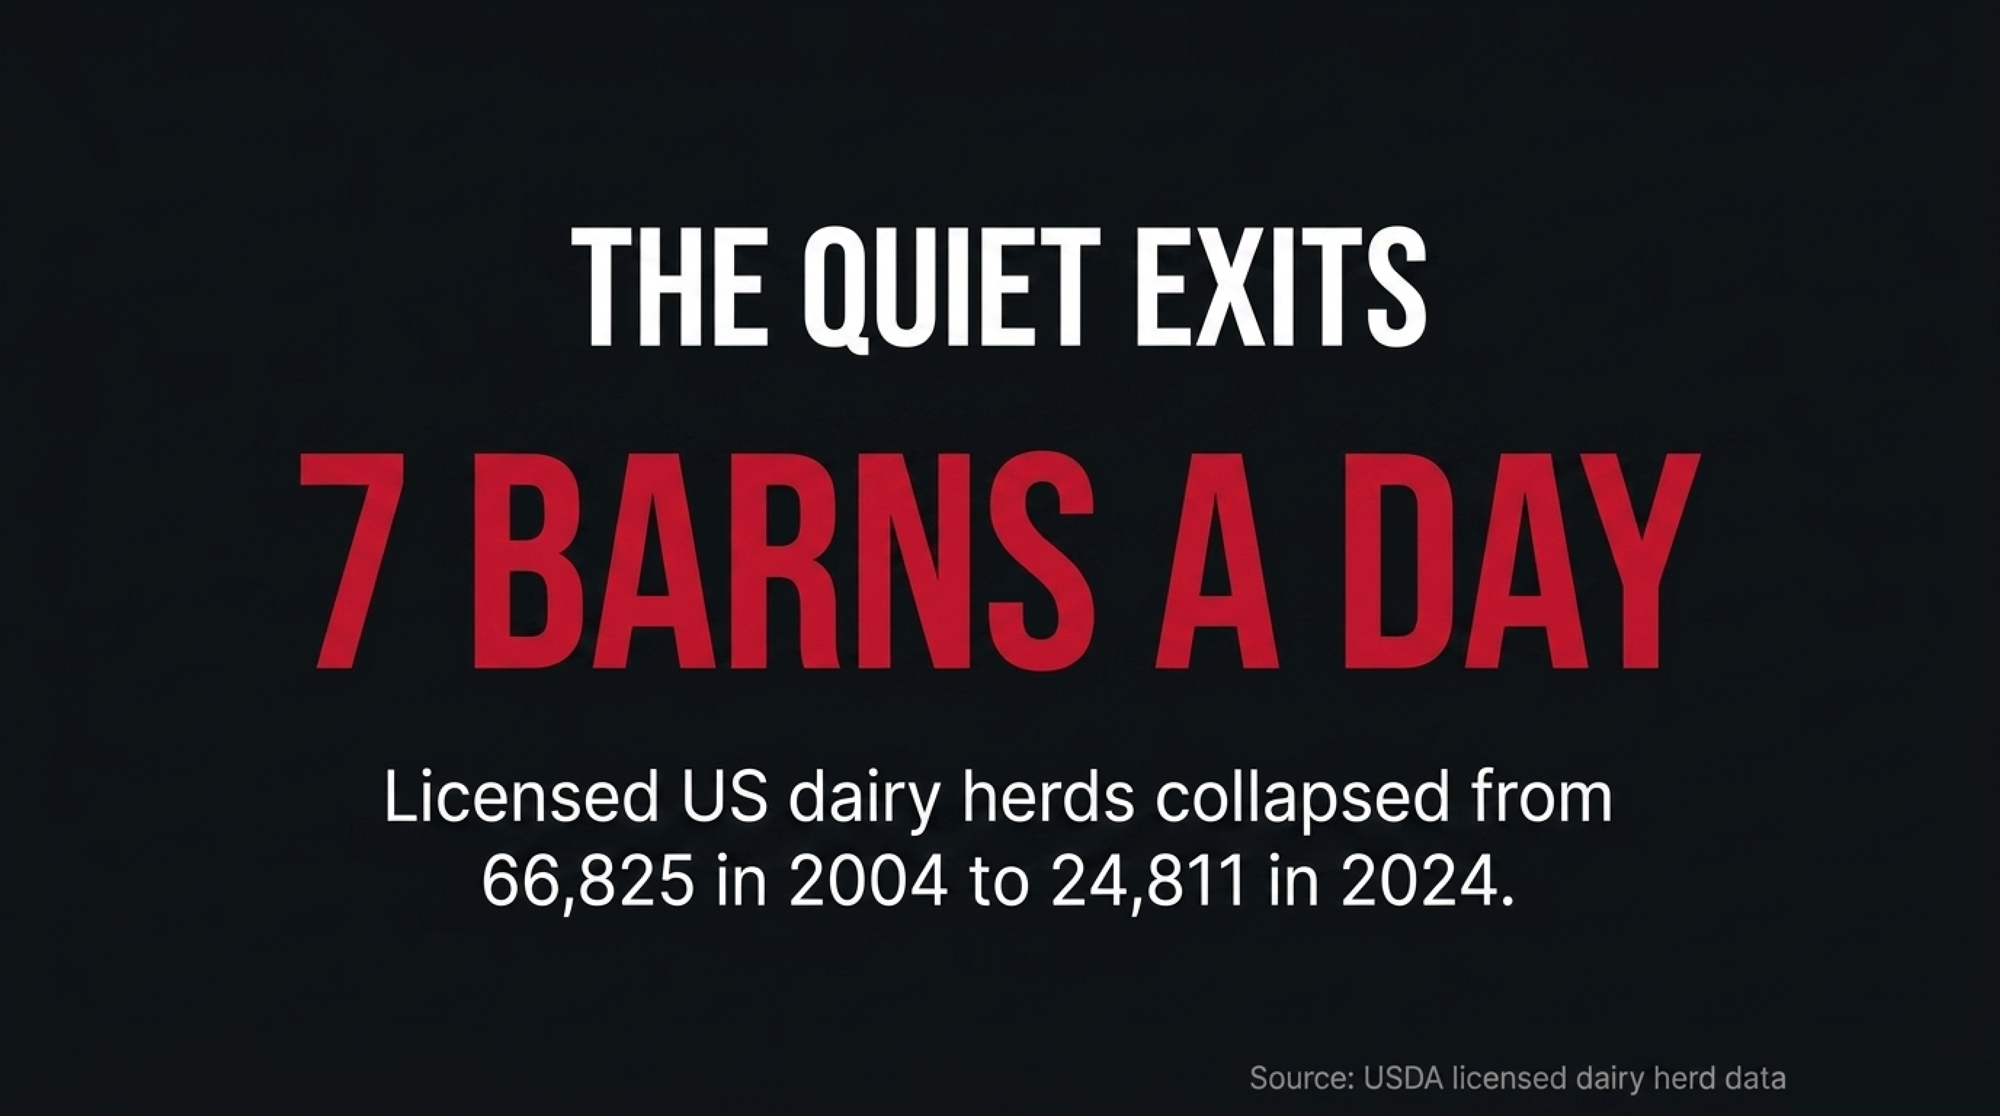
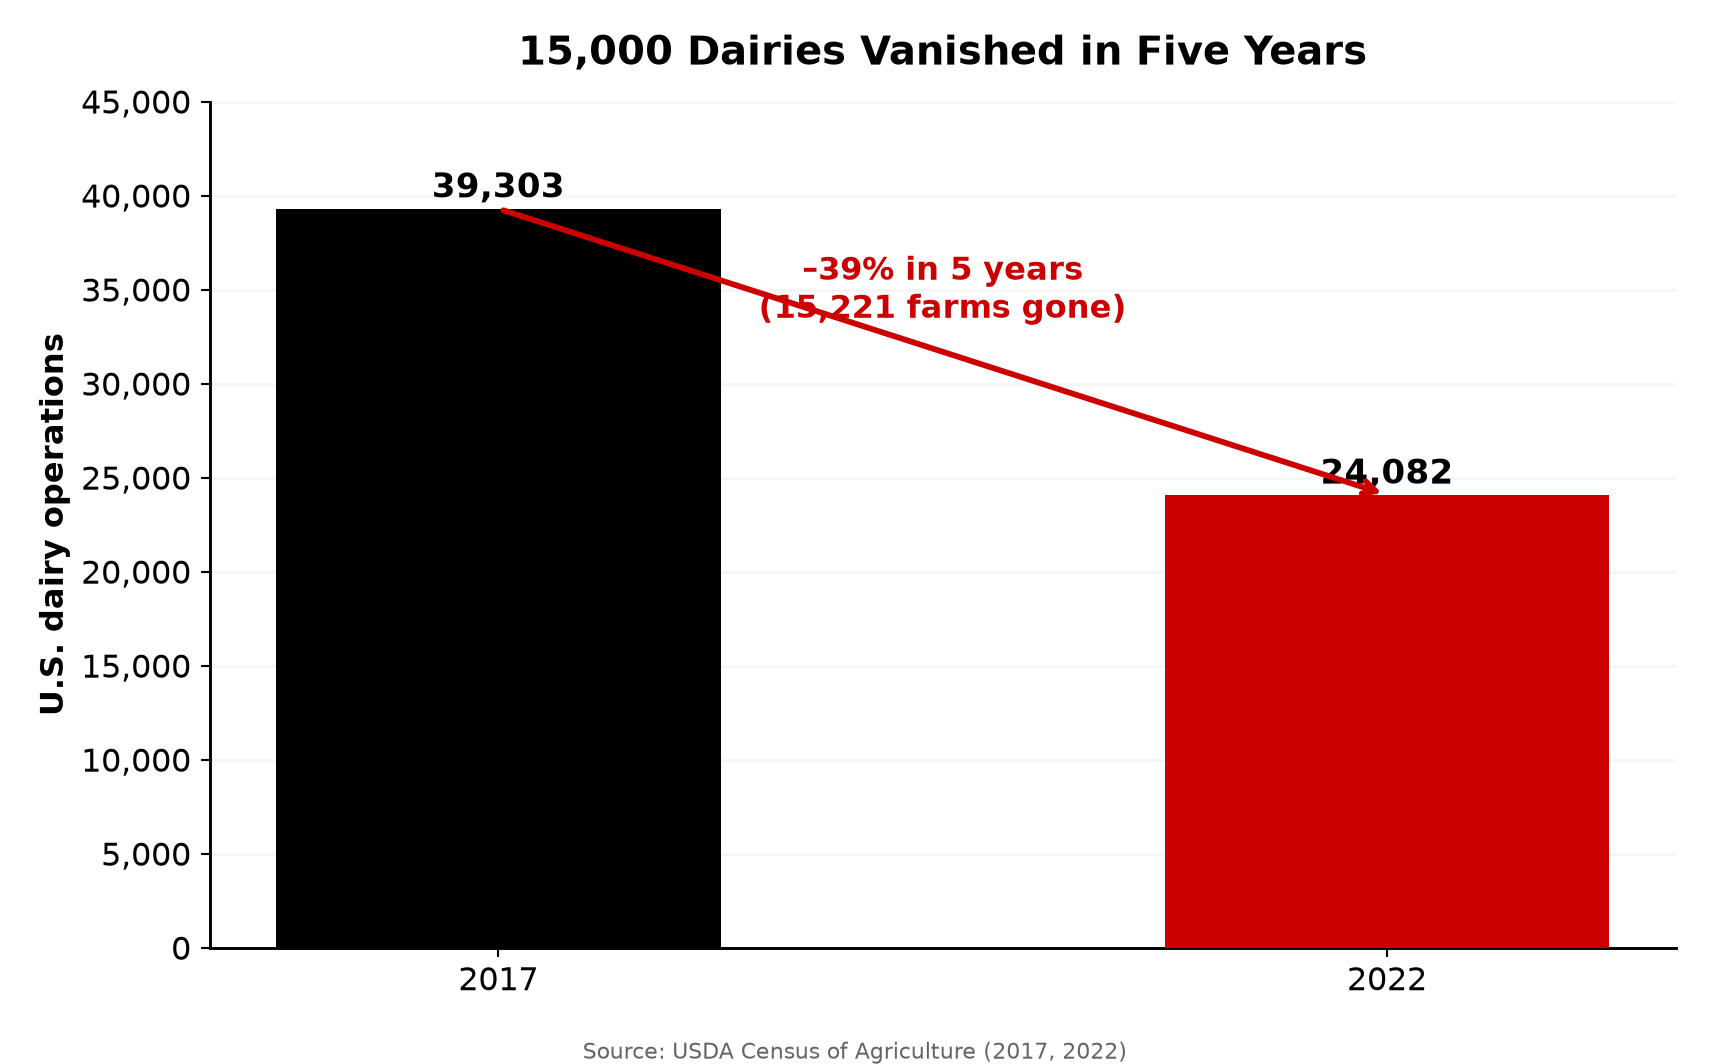
The pressure behind it is structural, not personal. U.S. licensed dairy herds fell 63% — from 66,825 in 2004 to 24,811 in 2024 — even as total milk output kept climbing (USDA ERS, “Fewer Farms, More Milk,” February 2026). And the cushion is gone. The all-milk price slid to $19.70/cwt in November 2025 — the lowest of the year and the first time under $20 since January 2024 — before Class III collapsed to $15.86 in December, down from $18.89 a year earlier (USDA NASS; Dairy Star, January 2026). The 2025 all-milk average landed near $21.00/cwt, but the back-half slide is what operators actually lived through. Fewer families are carrying more cows, more debt, and more fixed cost per person — the same grind we dug into in the real cost of 70-hour weeks.
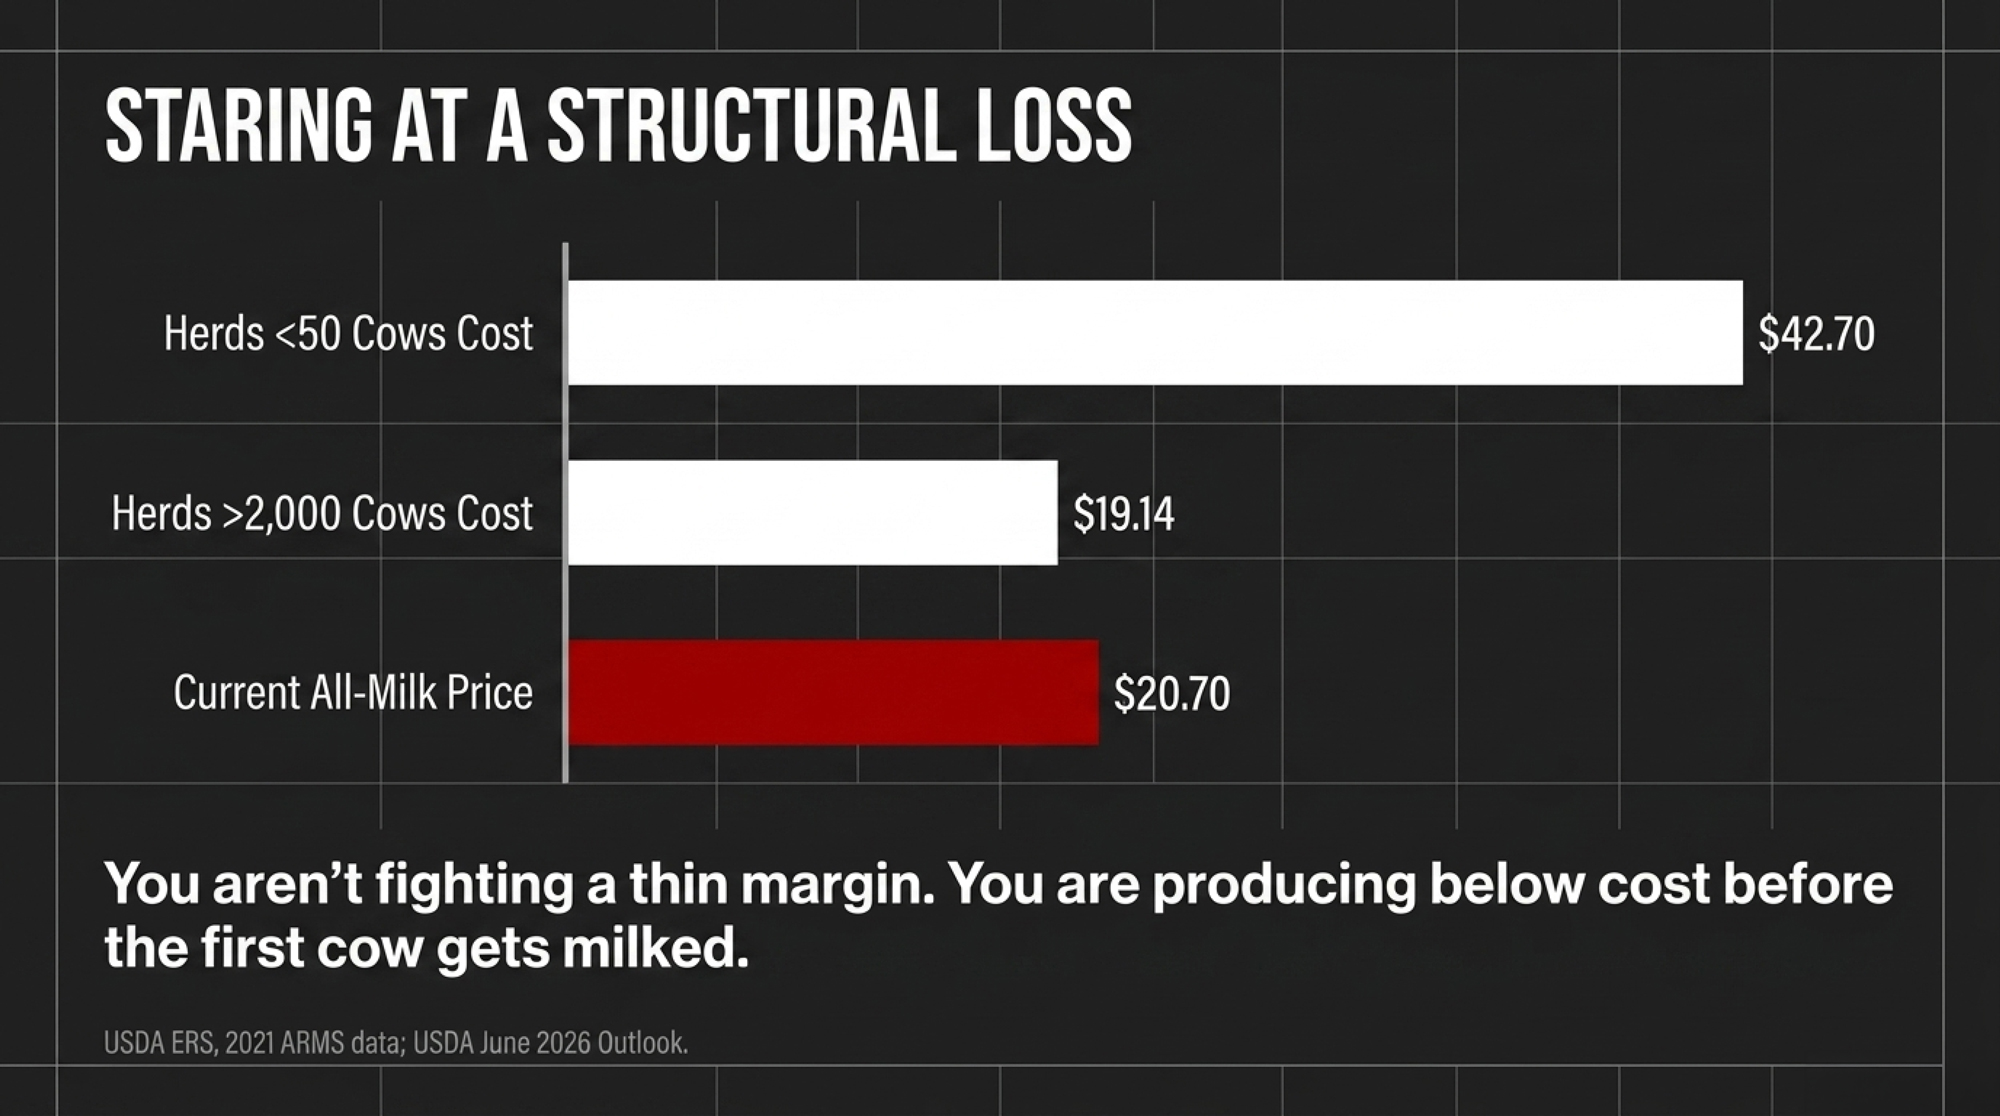
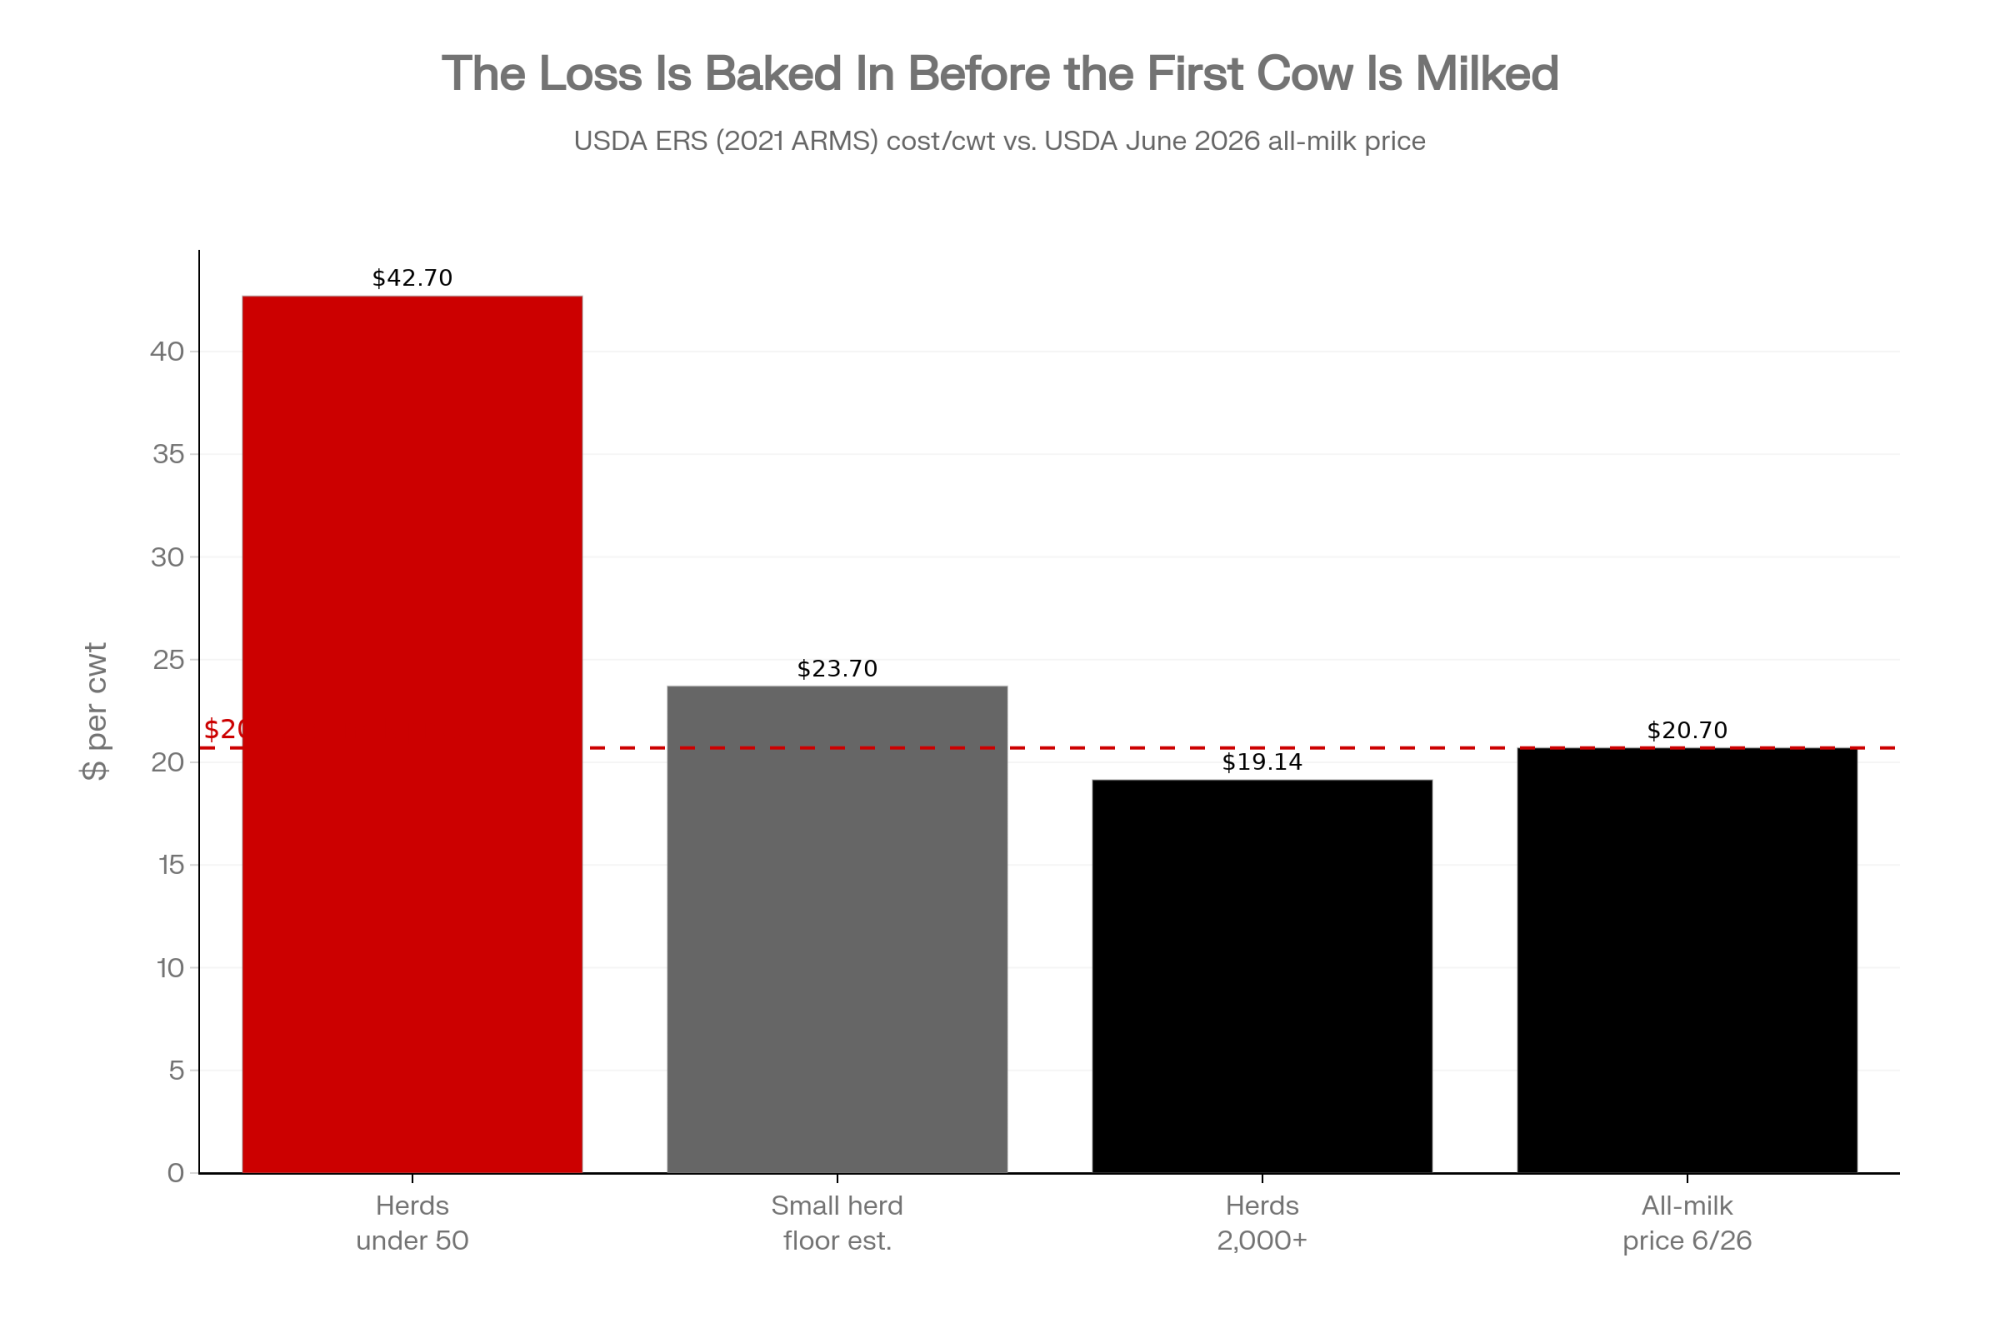
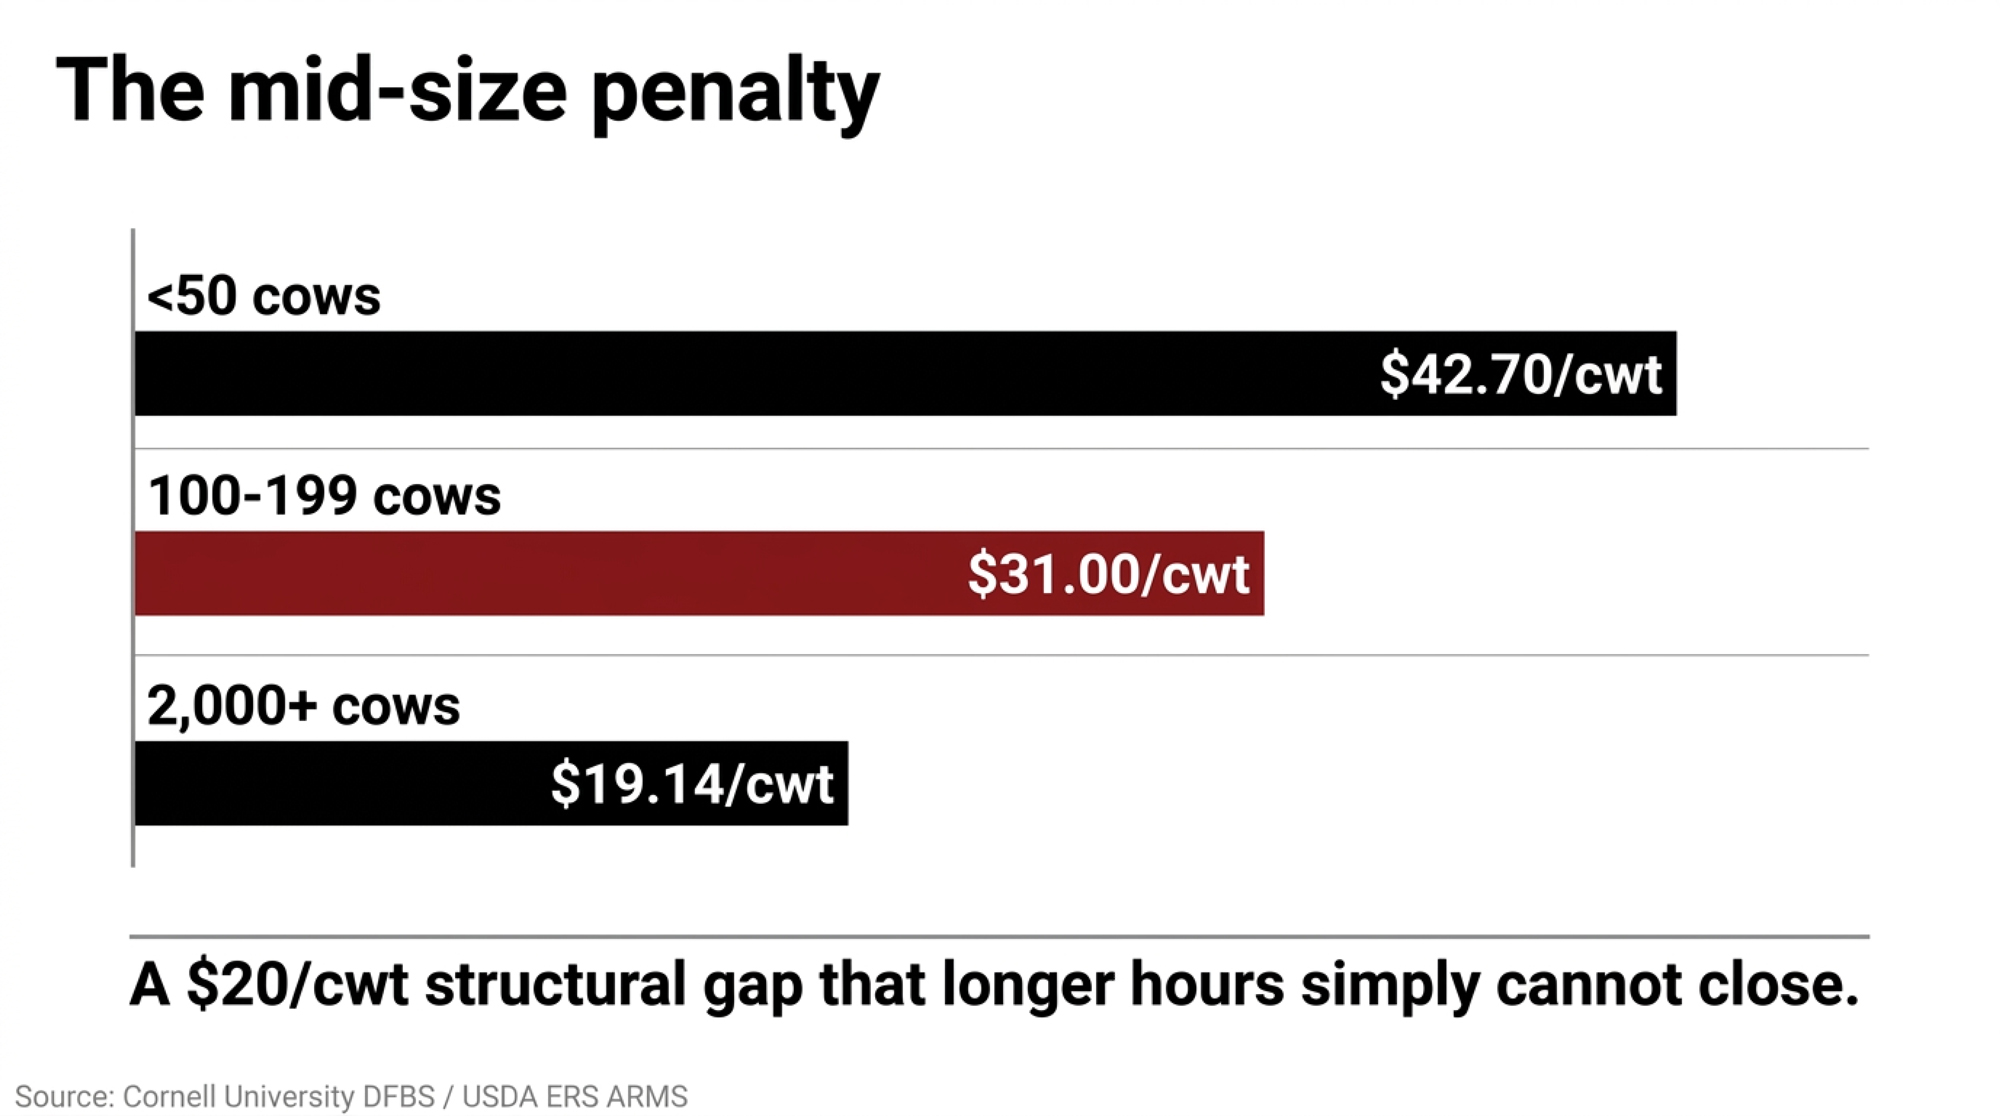
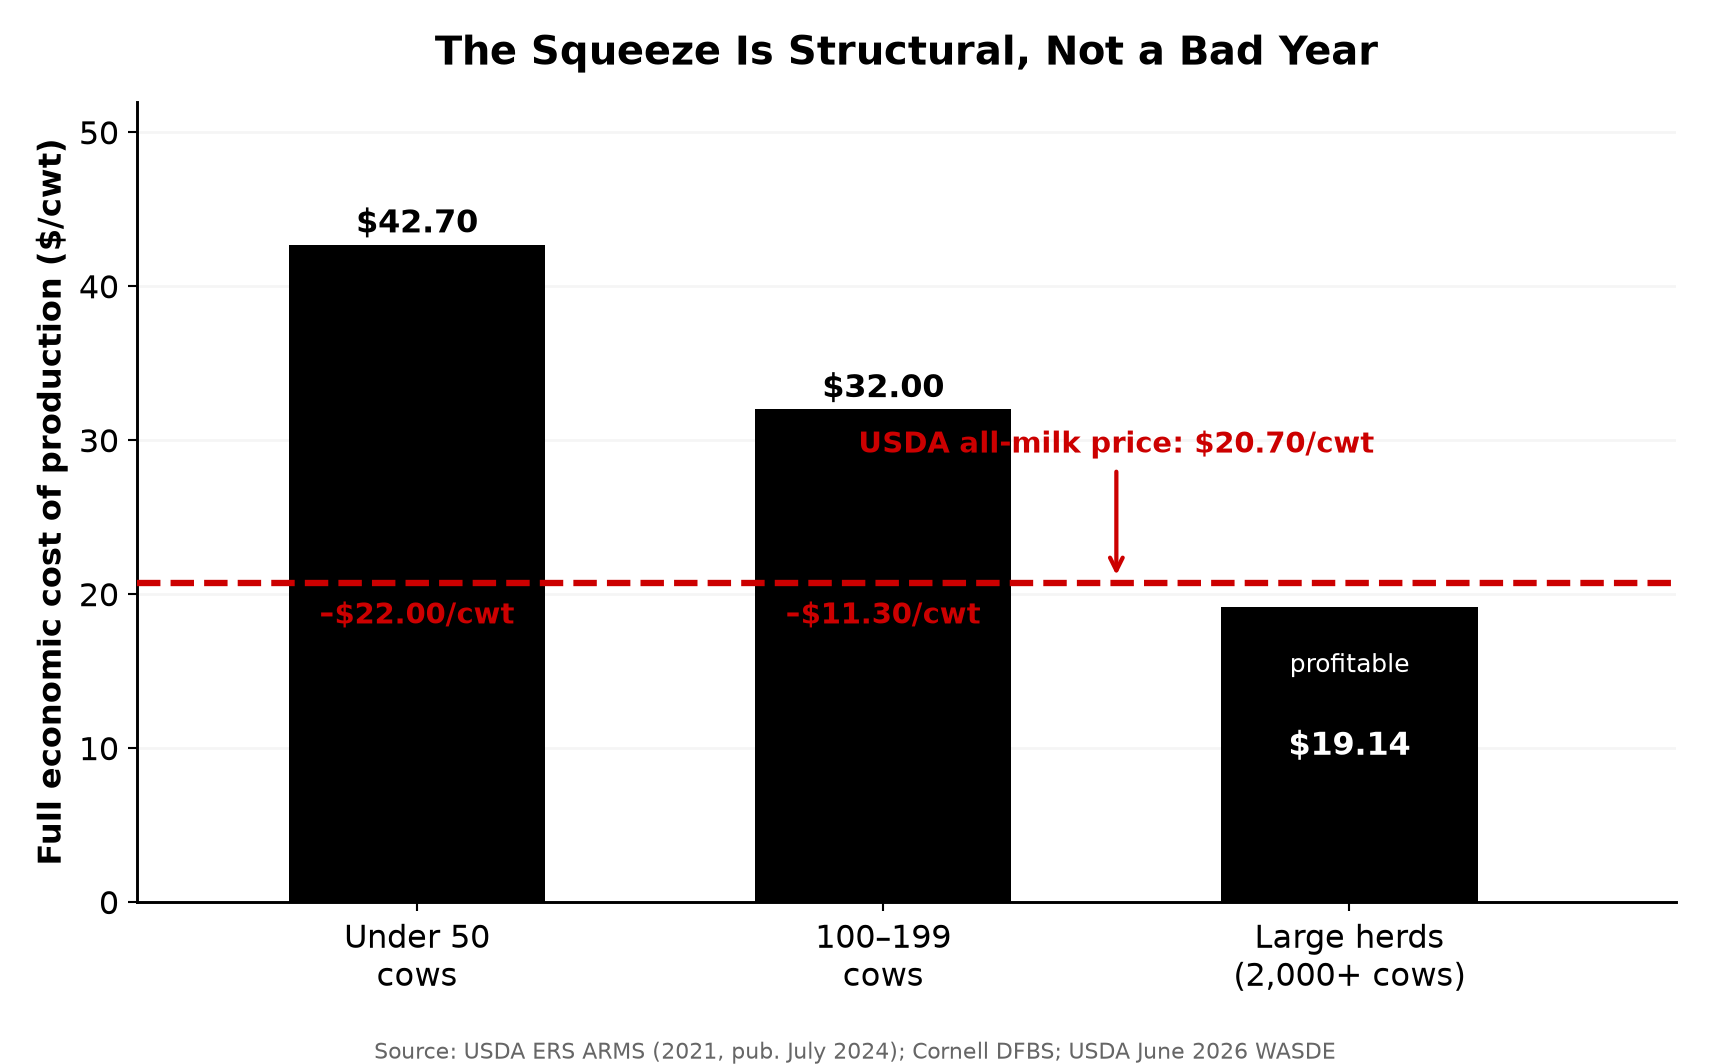
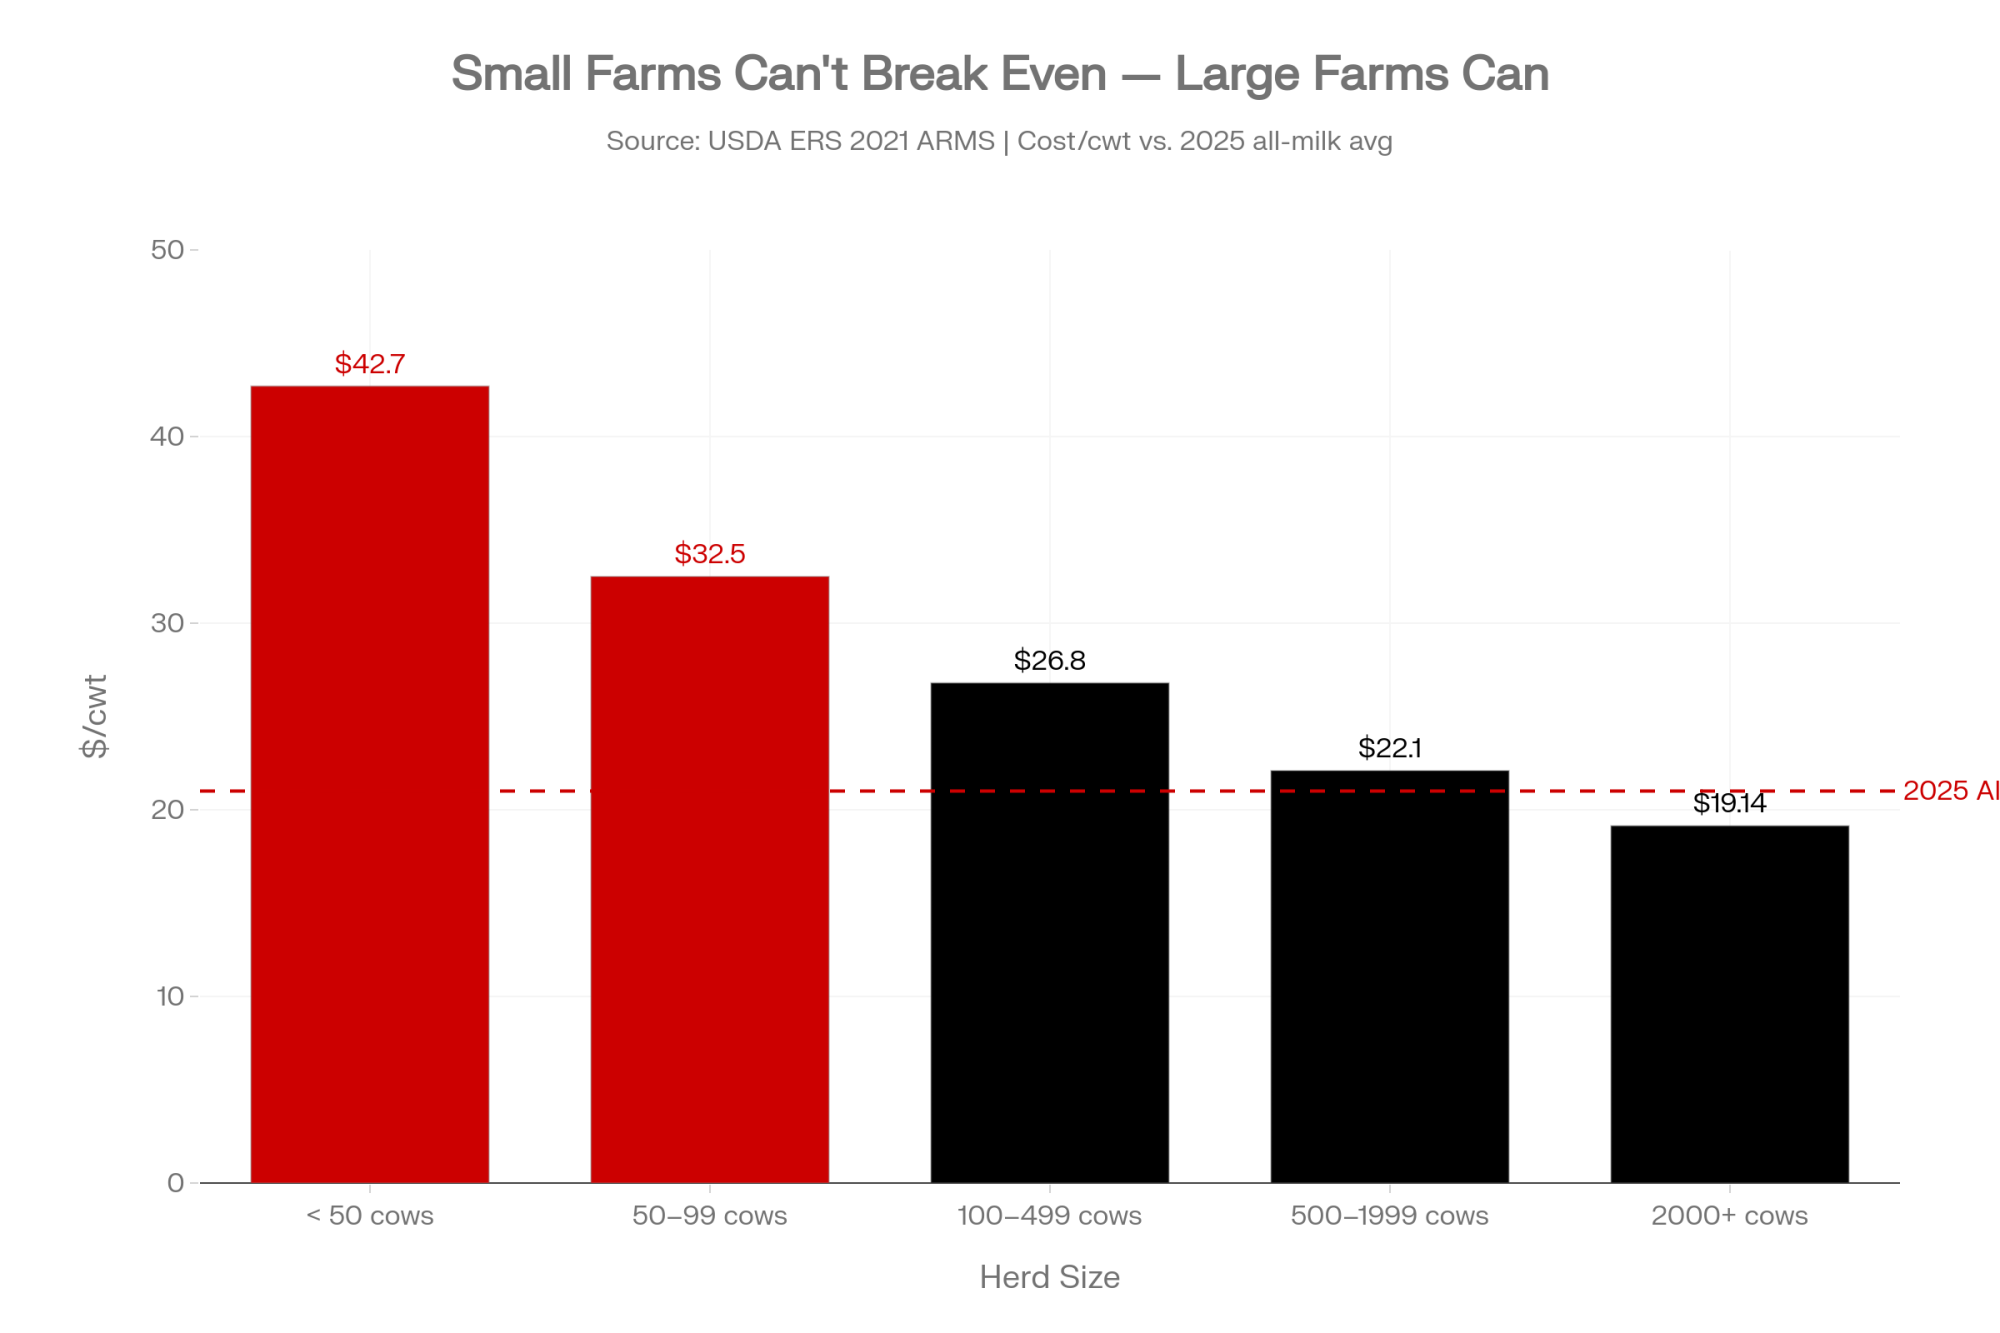
The Canadian data tells the same story from the human side. A 2020 national study from Farm Management Canada, Healthy Minds, Healthy Farms, found 75% of Canadian farmers reported being moderately to highly stressed, with the top drivers being the sector’s unpredictability, workload, and financial pressure (Heather Watson, executive director, Farm Management Canada). Who’s most exposed on either side of the border? Small and mid-size operations. USDA ERS data (2021 ARMS) put total U.S. cost per hundredweight near $42.70 for herds under 50 cows, against $19.14 for operations of 2,000-plus cows — small farms pull more revenue per cwt but can’t out-earn that gap. When your margin is that thin, one exhaustion-driven mistake — or a forced exit — becomes the most expensive thing on the place.
How This Plays Out on Real Farms

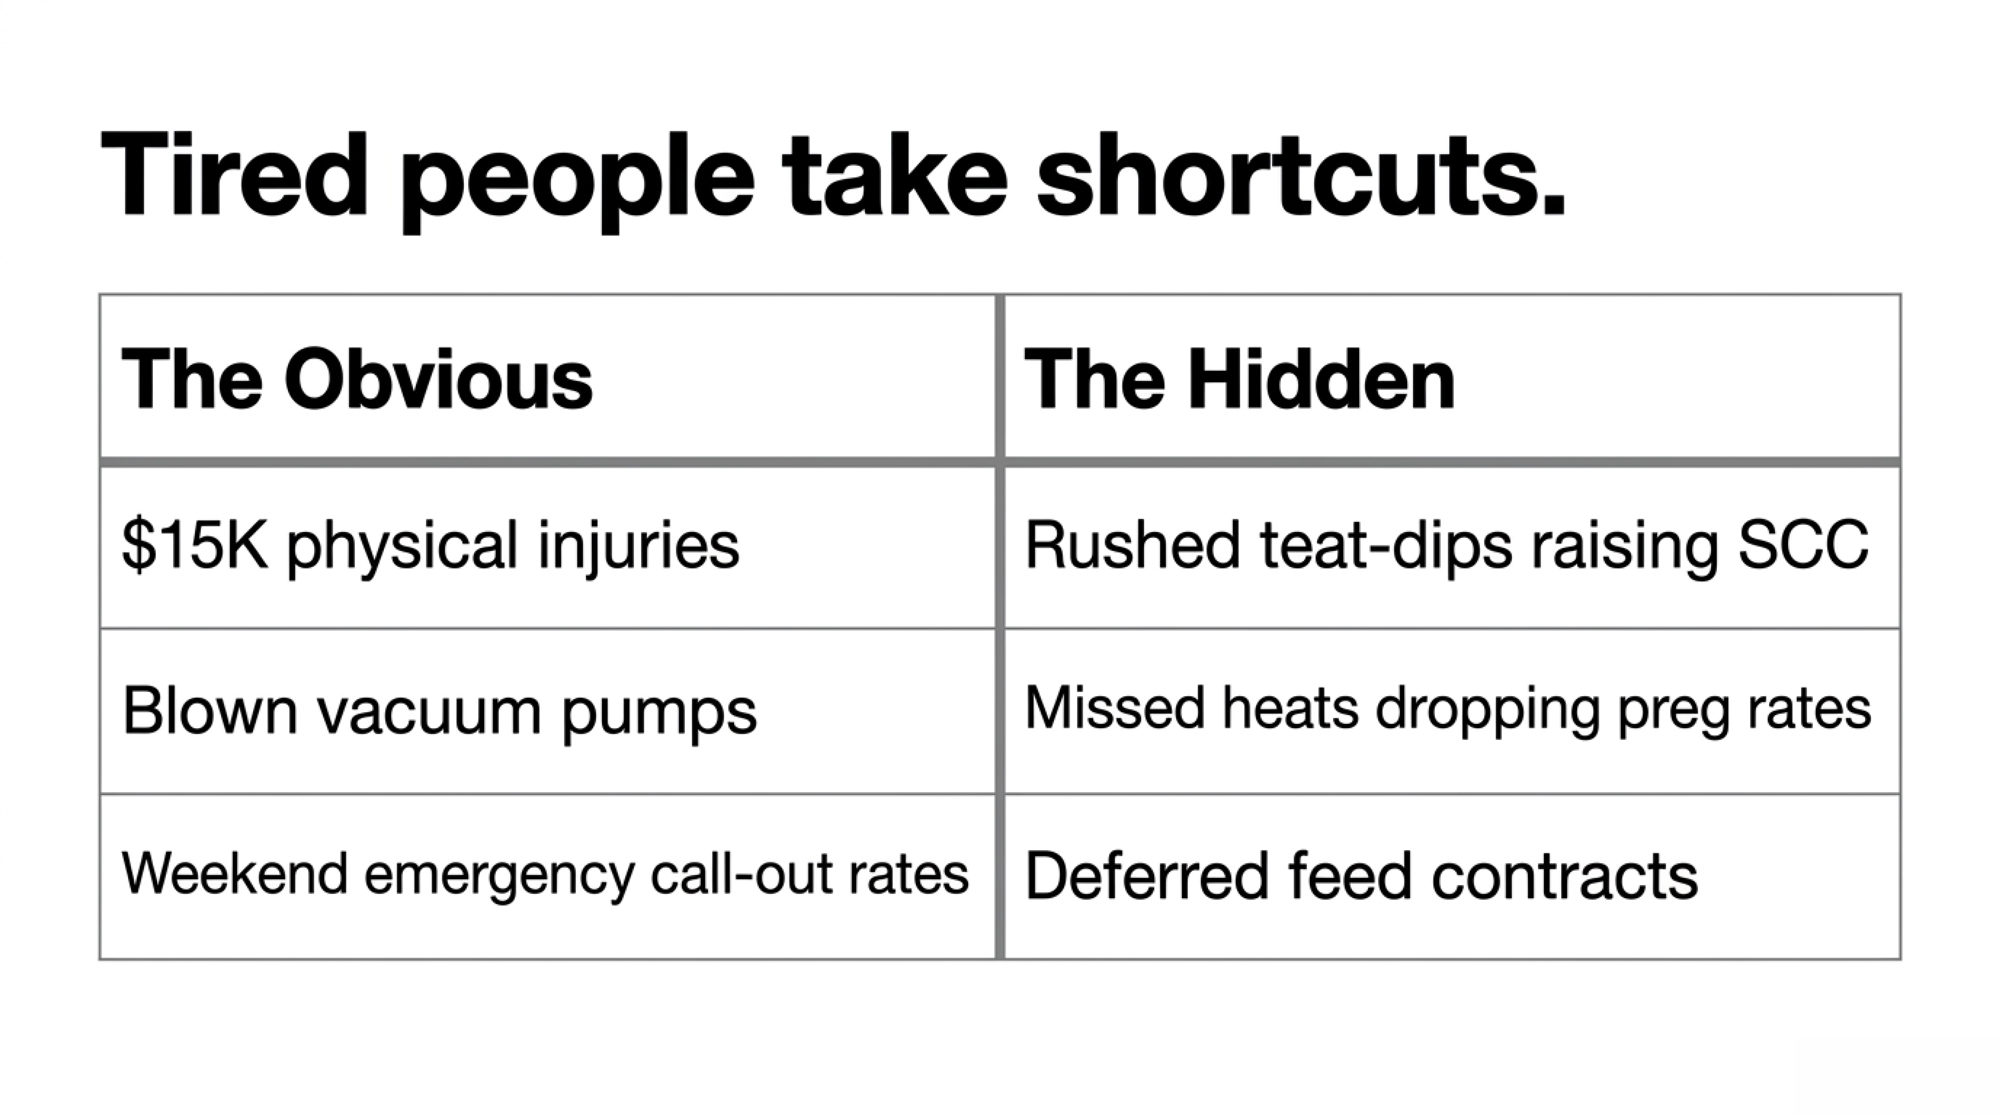
The pump scene is a composite, but the mechanism behind it is well documented. University of Wisconsin Extension’s farm-stress guidance is direct: heavy, sustained stress narrows your ability to weigh alternatives and work through complex problems — exactly the judgment a tired operator needs most. A 2024 study in Safety and Health at Workfound that farmers under high stress reported trouble making decisions and a tendency to make poor ones — rushing jobs, deferring maintenance, skipping the safety step. Tired people take shortcuts. Shortcuts cost money, and sometimes a lot more than money.

Here’s the barn math, laid out so you can find your own row:

Herd SizeEst. Annual ProductionHuman Budget @ $0.30/cwtHuman Budget @ $0.50/cwtRisk It Offsets
80-cow tie-stall~21,000 cwt$6,300/yr$10,500/yr≈ 1 minor injury
250-cow freestall~66,000 cwt$19,800/yr$33,000/yr1 serious injury + relief year
500-cow commercial~130,000 cwt$39,000/yr$65,000/yrFraction of 1 blown succession
1,000-cow operation~260,000 cwt$78,000/yr$130,000/yr2–3 average injuries + overhead
2,000+ cow large~520,000 cwt$156,000/yr$260,000/yrFull labor redundancy budget

Table assumes a rolling herd average near 26,000 lbs per cow; lower output shifts the dollars down proportionally — run it on your own RHA.

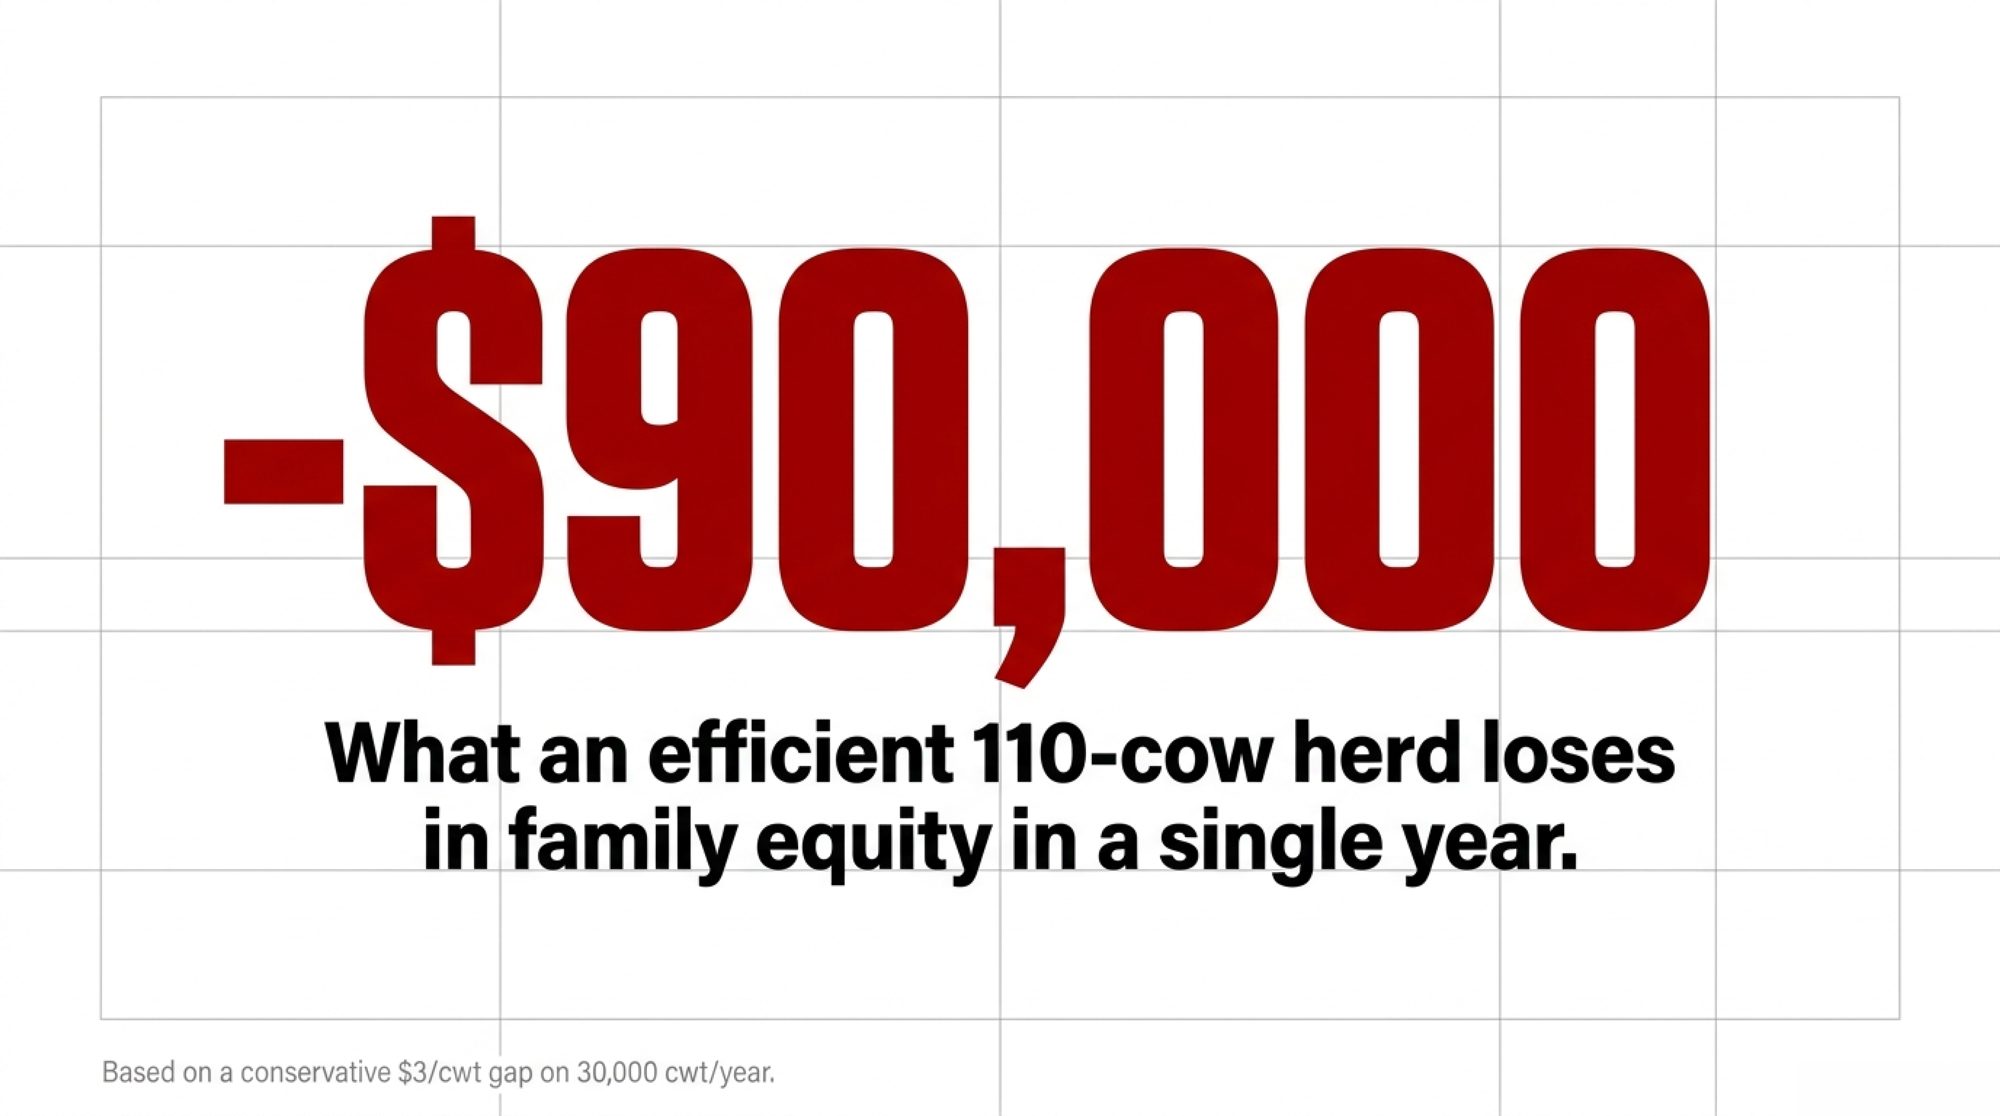
Set those numbers against the hard figure: the $15,613 average non-fatal injury cost from Leigh et al.’s 2024 estimate in the American Journal of Industrial Medicine — $10,878 in medical care and $4,735 in lost work time. Relief help for one weekend a month runs roughly $4,800 to $5,800 a year on its own (two 8-hour shifts a month at $25–30/hour, before payroll). Nationally, the same study pegs total U.S. agricultural injury cost at $11.31 billion a year — 2.1% of gross farm income and 13.4% of net farm income in 2019. You won’t see that as a tidy line on your books. But one bad day already outruns the relief help you told yourself you couldn’t afford.
Where Else the Money Leaks Out

The accident is the obvious cost. The quieter ones do just as much damage. When you’re running on fumes, the routines slip first — and the bills show up later, scattered across the operation where they’re harder to trace back to the cause.

Think about where a tired operator actually cuts corners. You shave the prep routine — less wipe time, a rushed teat-dip — and your SCC creeps up two weeks later; we broke down exactly how a rushed prep routine shows up in your tank. You’re too fried to watch the activity monitors, so heat windows slide by and pregnancy rate softens. You mix the TMR in a hurry to be done before 9:00 PM, and the ration that leaves the mixer isn’t the one you formulated. None of these show up as a “burnout” line. They show up as a higher cell count, a longer calving interval, and a feed-efficiency number you can’t quite explain.

Burnout BehaviorWhat It TriggersMeasurable IndicatorEstimated Cost Impact
Rushed milking prepElevated SCC, mastitisBulk tank SCC >200,000$0.50–$1.50/cwt penalty
Skipped heat detectionMissed cycles, lower pregnancy rateCalving interval >13.5 months$150–$250/cow/yr
Hurried TMR mixingRation inconsistency, sortingFeed efficiency > 1.55 lb ECM/lb DM$75–$150/cow/yr
Deferred cull decisionsCarrying non-productive cowsCull rate below optimum 25–35%$200–$500/cow kept too long
Skipped vet/hoof checksLameness, mastitis spikesLameness prevalence >15%$300–$500/lame cow event
No succession planningFarm sale or forced exit70% fail at 1st transitionEntire asset base at risk

Vet and cull costs creep up as routine care gets skipped, too. Business management thins out — the Farm Management Canada study (2020) found that following a written business plan improved peace of mind for 88% of farmers, yet stressed producers are the least likely to keep those plans current. And the market doesn’t wait: a contract decision deferred because nobody had the capacity to look at it is a margin you don’t get back. Succession is the biggest leak of all, because the hard conversations need an operator who isn’t worn to the nub.

The cow connection. A University of Guelph exploratory study on robotic-milking farms found associations between better farmer well-being and better herd-health numbers like lameness and mastitis. It’s an association, not proof of cause — but it runs in a direction every herd manager recognizes. Your headspace shows up in your cows, and your cows show up in your milk cheque.

How Much Does Saying “I’m Fine” Actually Cost You?

This is where the economics get personal. Stigma is still real — a 2022 American Farm Bureau Federation poll found 63% of U.S. farmers still perceived stigma around mental health in the ag community. That silence carries a price tag.

When you minimize the warning signs — “I’m just tired” — you defer the same way you defer that pump repair. The deferral feels free. It isn’t. Dr. Andria Jones-Bitton’s University of Guelph national survey (released 2021–2022) found suicidal ideation was twice as high among farmers as in the general population, and that one in four farmers surveyed reported, in the past year, that their life wasn’t worth living or that they’d thought about death or self-harm. That’s not an industry statistic. That’s a number that lives at kitchen tables — the strongest argument going that “toughing it out” is a costly habit the whole industry rewarded, not a virtue, and not something any one operator should carry alone.

If you or someone on your operation is struggling, you don’t have to wait for a crisis to reach out. In the U.S., call or text 988 (Suicide & Crisis Lifeline) or Farm Aid at 1-800-FARM-AID. In Canada, the Do More Ag Foundation lists provincial crisis lines and farmer-specific supports, and Crisis Services Canada is at 1-833-456-4566.

Would Your Kids Actually Sign Up for the Life You’re Modeling?
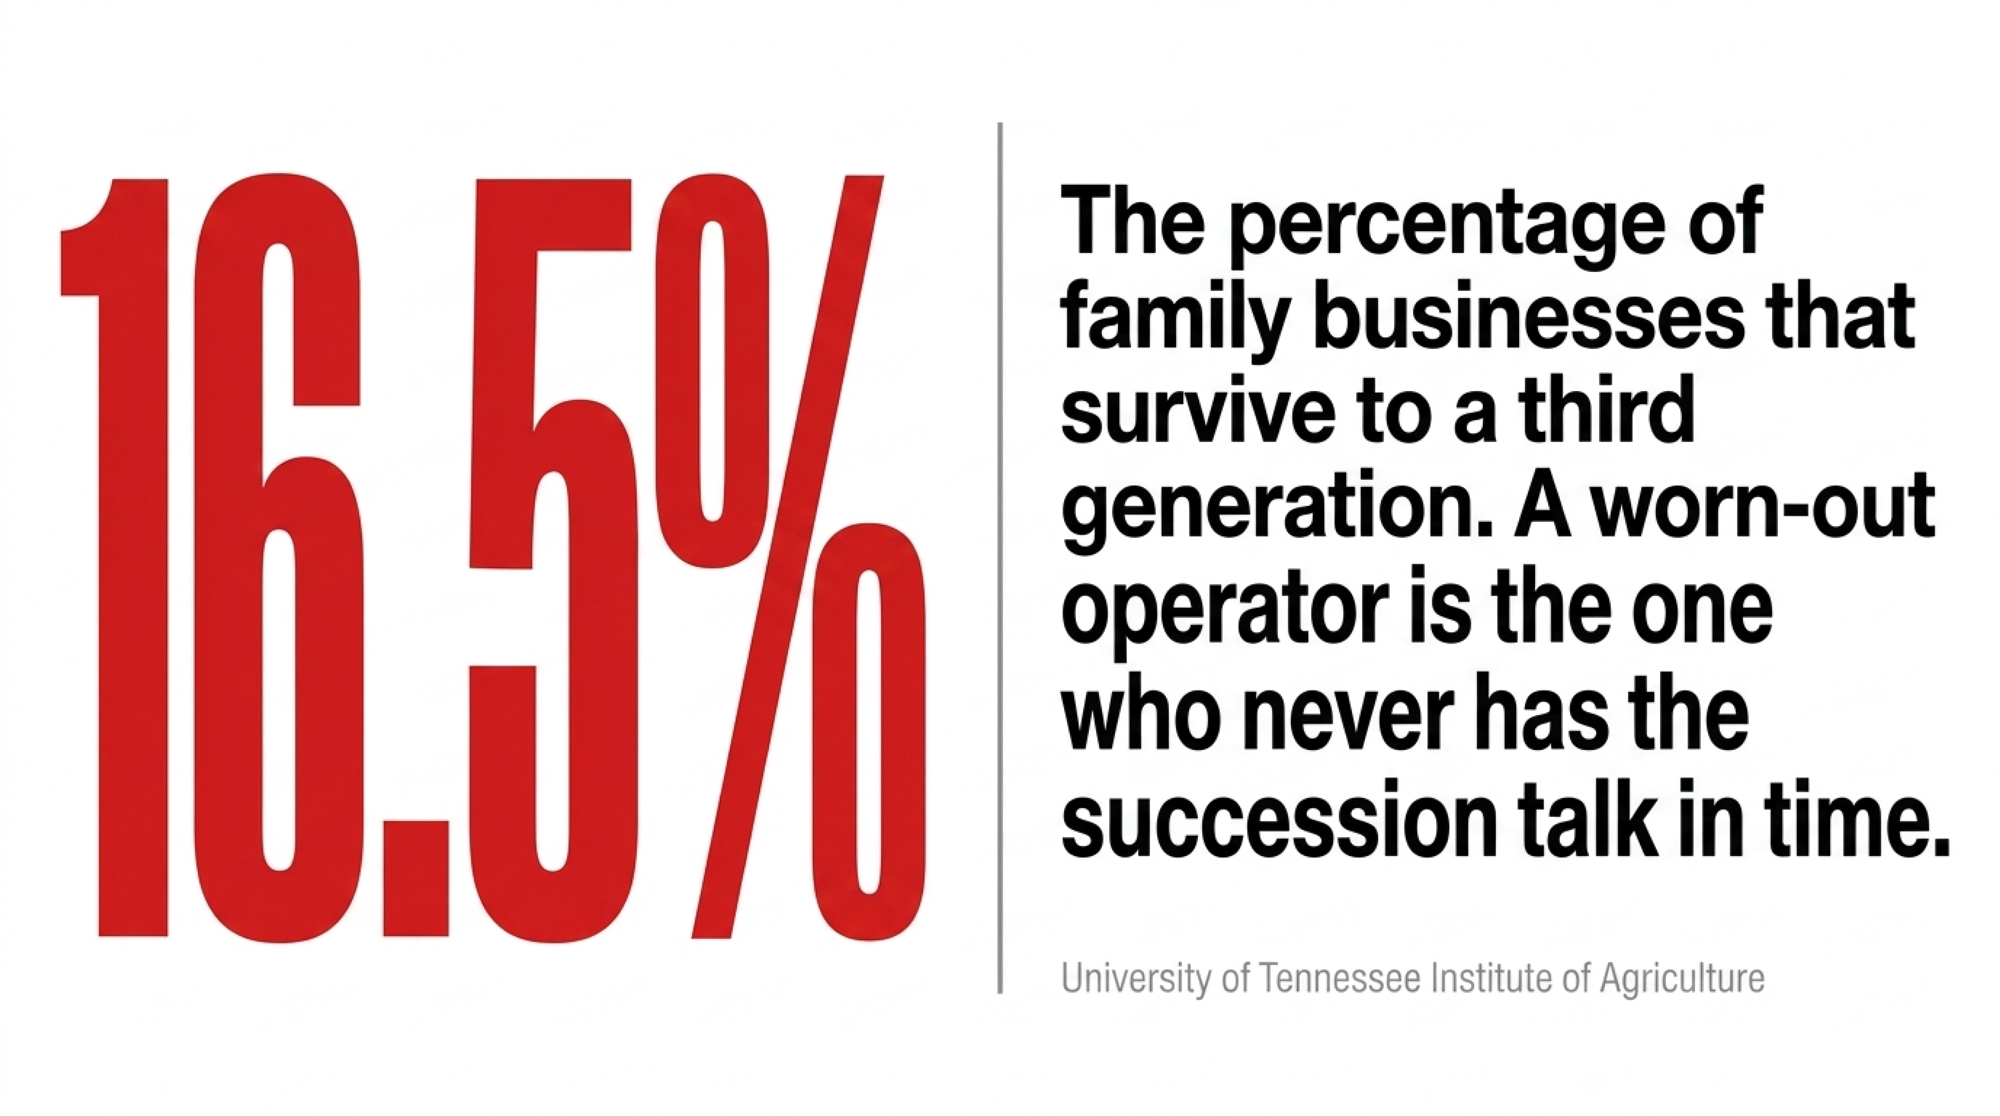
The succession math is sobering. Only about 16.5% of family businesses survive to a third generation of ownership — a general business statistic widely cited in farm-transition extension materials, including from the University of Tennessee Institute of Agriculture. Roughly 70% fail at the first transition, driven mostly by poor communication, family conflict, and inadequate successor development, not just economics. And an Iowa State University study found 71% of retiring farmers had not identified a successor at all — meaning the most common “plan” is no plan. It’s the same wall we walk through in why most dairy farms never make it past Dad.

Farm family coach Elaine Froese has made the point in her writing and talks that the next generation won’t put in the hours their parents and grandparents did — they want a real life beyond the farm by 30, not an open-ended grind. So if your kids only ever see you exhausted, your spouse resentful, and every decision a crisis, they’re not rejecting agriculture. They’re rejecting the only business model you’ve shown them. A farm worth inheriting needs sane-ish hours, a visible path to ownership, and a family culture where the hard talks happen before the auction signs go up.

Options and Trade-Offs for Farmers

No single fix here. But producers are already using a handful of practical paths — and the honest part is the catch on each one.

  • Budget a “human capacity” line at $0.30–$0.50/cwt. On a 250-cow herd, that’s $20,000–$33,000 a year for relief labor, time off, or coaching. The catch: it’s a management benchmark, not a rigid standard. If $0.50 makes you choke, start at $0.15 and buy six weekends off instead of twelve. Run your own number tonight — multiply $0.30 by your annual cwt, then ask whether one injury, breakdown, or bad call in the last five years cost more than that.
  • Schedule guaranteed time off — and do this within 30 days. Block one weekend a month where the primary decision-maker is genuinely off chores, and line up the relief person now, not in July. That coverage runs roughly $4,800–$5,800 a year — less than a third of one average injury. The catch: finding and trusting relief labor is the real barrier, not the cost. The going rate and the training lead time both run ahead of what most operators budget, so start the search this week.
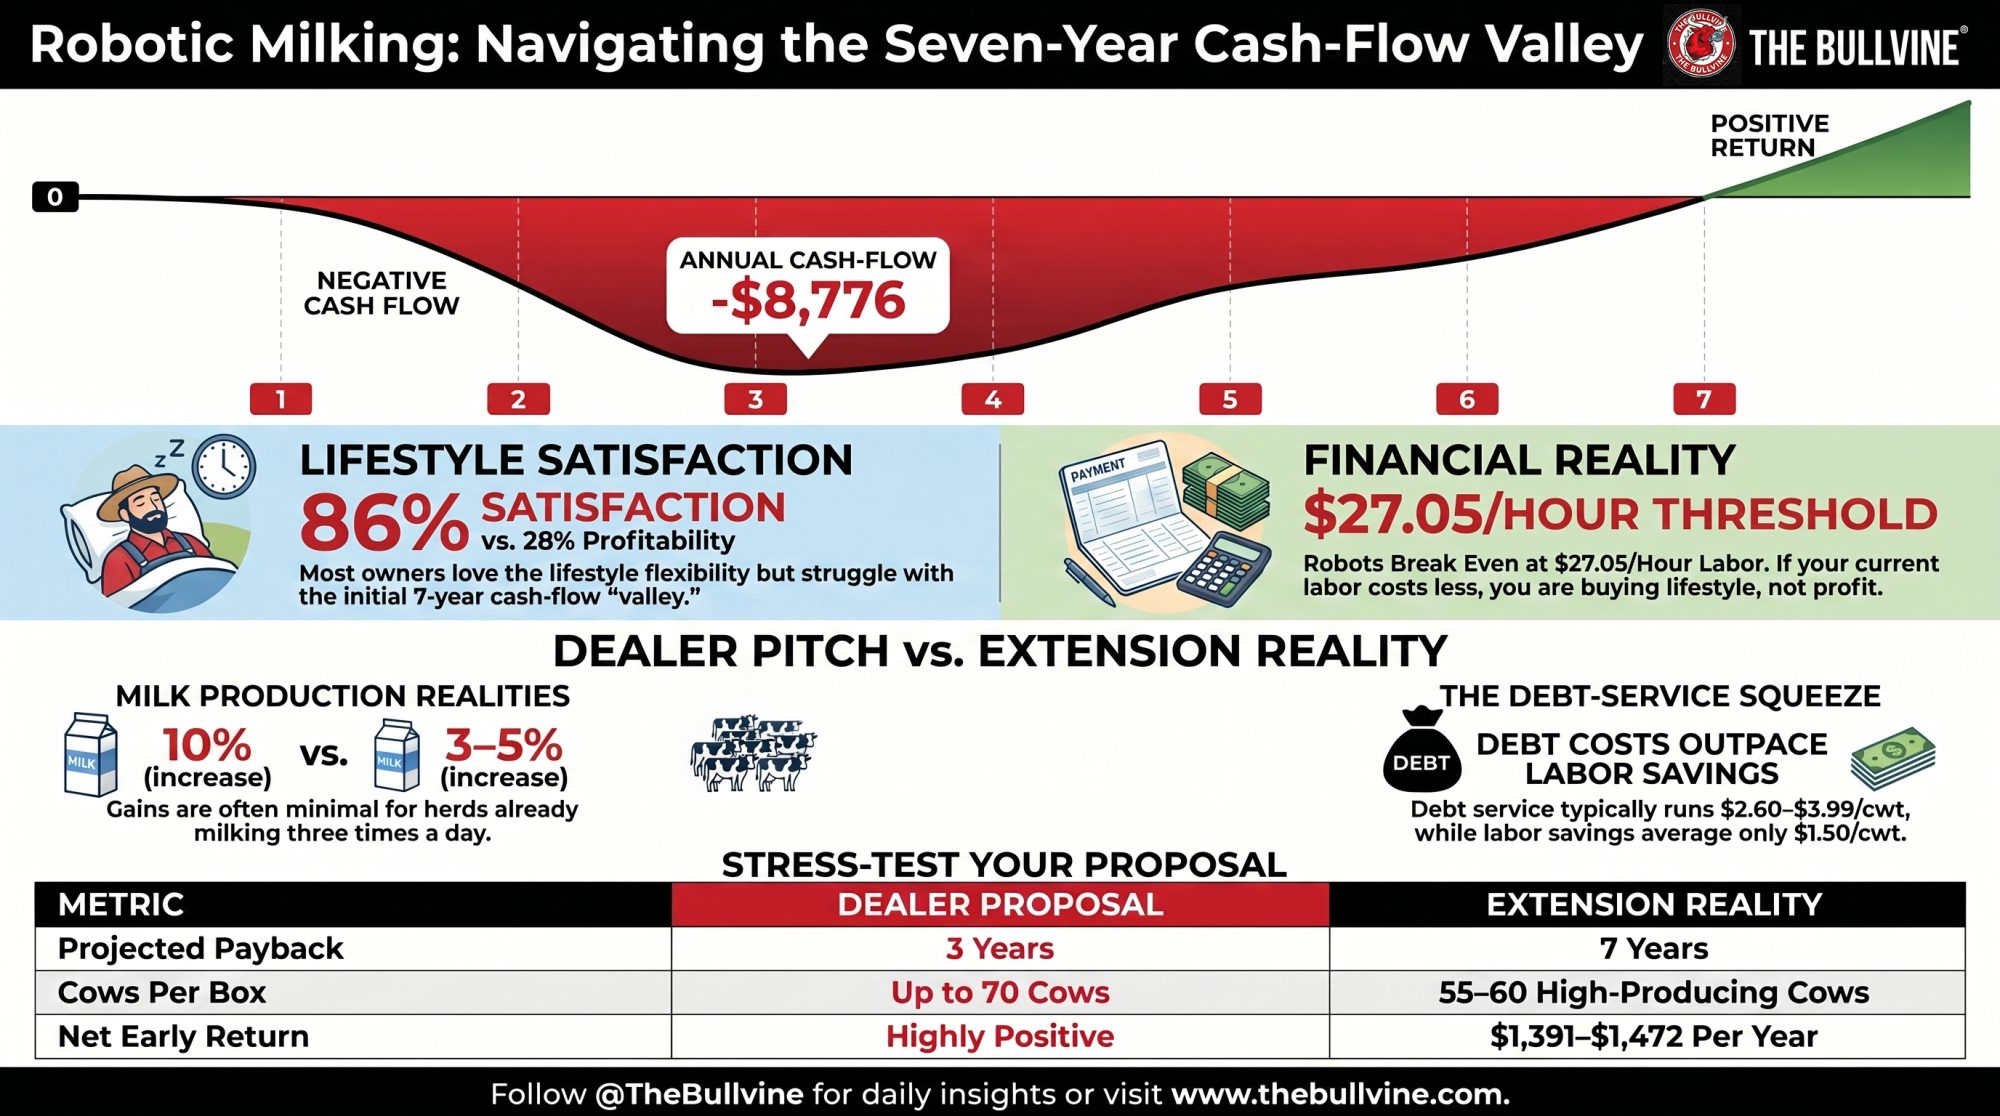
  • Automate or cut in your highest-stress zone. A feed pusher, an alley scraper, hired bookkeeping — pull load off the operator where it bites hardest. The catch: capital cost and payback swing widely by herd size and barn layout, so run your own numbers before you sign anything — the kind of math we lay out for the mid-size dairy squeeze.
  • Formalize roles and start succession early. Put a wage on invisible spousal work and map a real ownership path for the next generation. The catch: these talks are emotionally loaded, and most families stall until a crisis forces the issue — the worst possible time to have them. If a successor is even a possibility, start the conversation now, and ask honestly whether the daily life on your farm is something a sane 25-year-old would choose.
One more read on your own numbers. If your SCC, pregnancy rate, or feed efficiency has drifted with no obvious barn-level cause, ask whether the operator running on empty is the variable you haven’t measured. And if you’ve deferred a maintenance, cull, or vet decision because you were “too slammed to deal with it,” treat that as a stress signal, not just a scheduling one — because margin pressure pushing you toward longer hours is exactly when decision quality matters most and is most at risk.
So sit with this one. If you traced every “we’ll deal with it later” call you made last year back to how tired you were when you made it, what would that column add up to? Not in feelings — in dollars, dumped milk, deferred culls, and the conversations you never got around to having. Pretending your brain is a free, bottomless input is the most expensive false economy on the farm. We kept the math simple here on purpose — but if you want the full cost-per-cwt model, broken down by herd-size scenarios you can run against your own numbers, it’s in next week’s Bullvine Weekly. That’s where we go straight into the ledgers.

Run Your Numbers

Farm Benchmark Snap Check — Before you decide that relief help “doesn’t pencil,” plug in three numbers and see whether your margin, debt, and feed share leave any room to absorb one $15,613 mistake — or whether you’re already in the risk band, one tired call from trouble.

Complete references and supporting documentation are available upon request by contacting the editorial team at editor@thebullvine.com.

Learn More

The Sunday Read Dairy Professionals Don’t Skip.

Every week, thousands of producers, breeders, and industry insiders open Bullvine Weekly for genetics insights, market shifts, and profit strategies they won’t find anywhere else. One email. Five minutes. Smarter decisions all week.
NewsSubscribe
First
Last
Consent

USDA Confirmed “Systemic Failures” at Alexandre. Then Made It Its Regenerative Poster Child.

A FOIA request pried loose USDA’s own file on Alexandre — ‘systemic failures’ the farm denied for years. The farm had recently dropped its ROC regenerative certification but held a separate one; USDA put it on stage anyway.

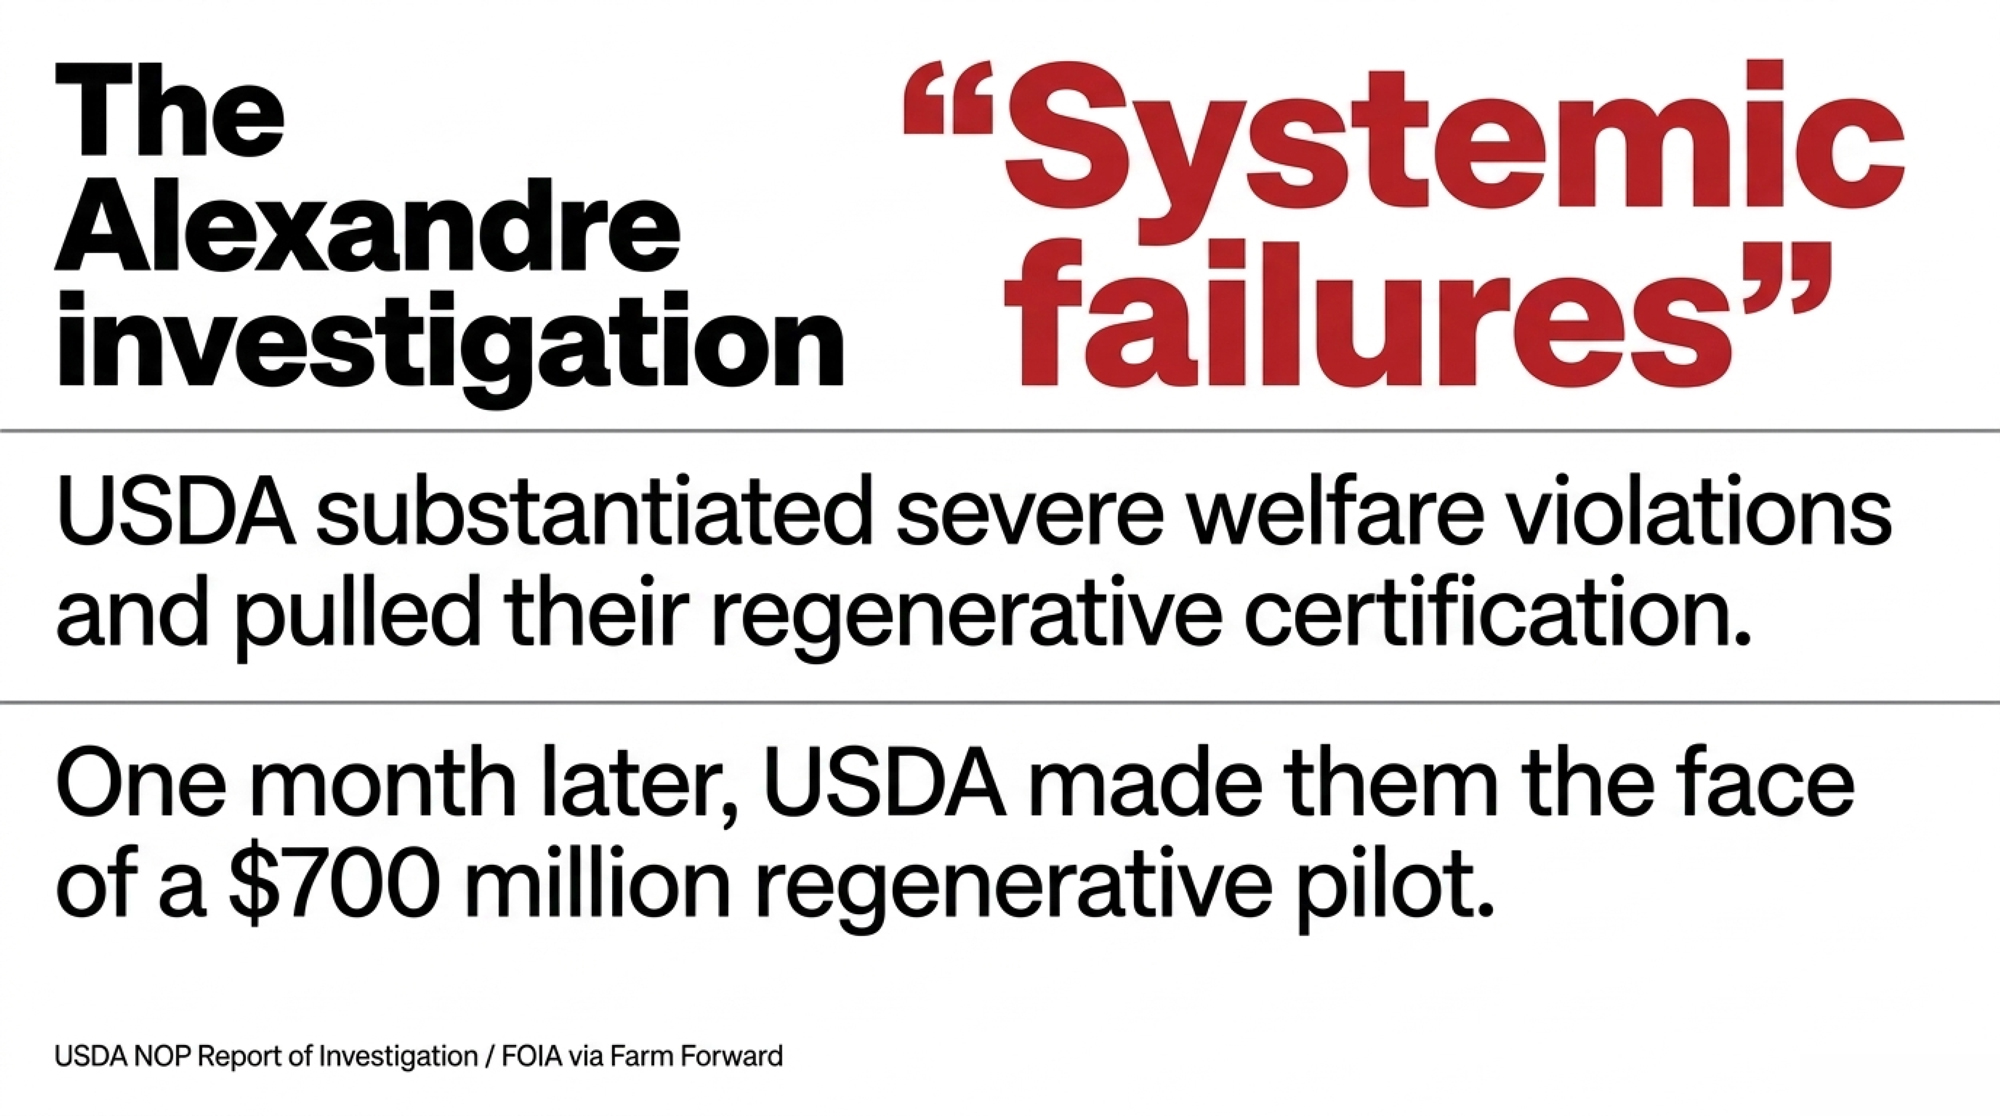
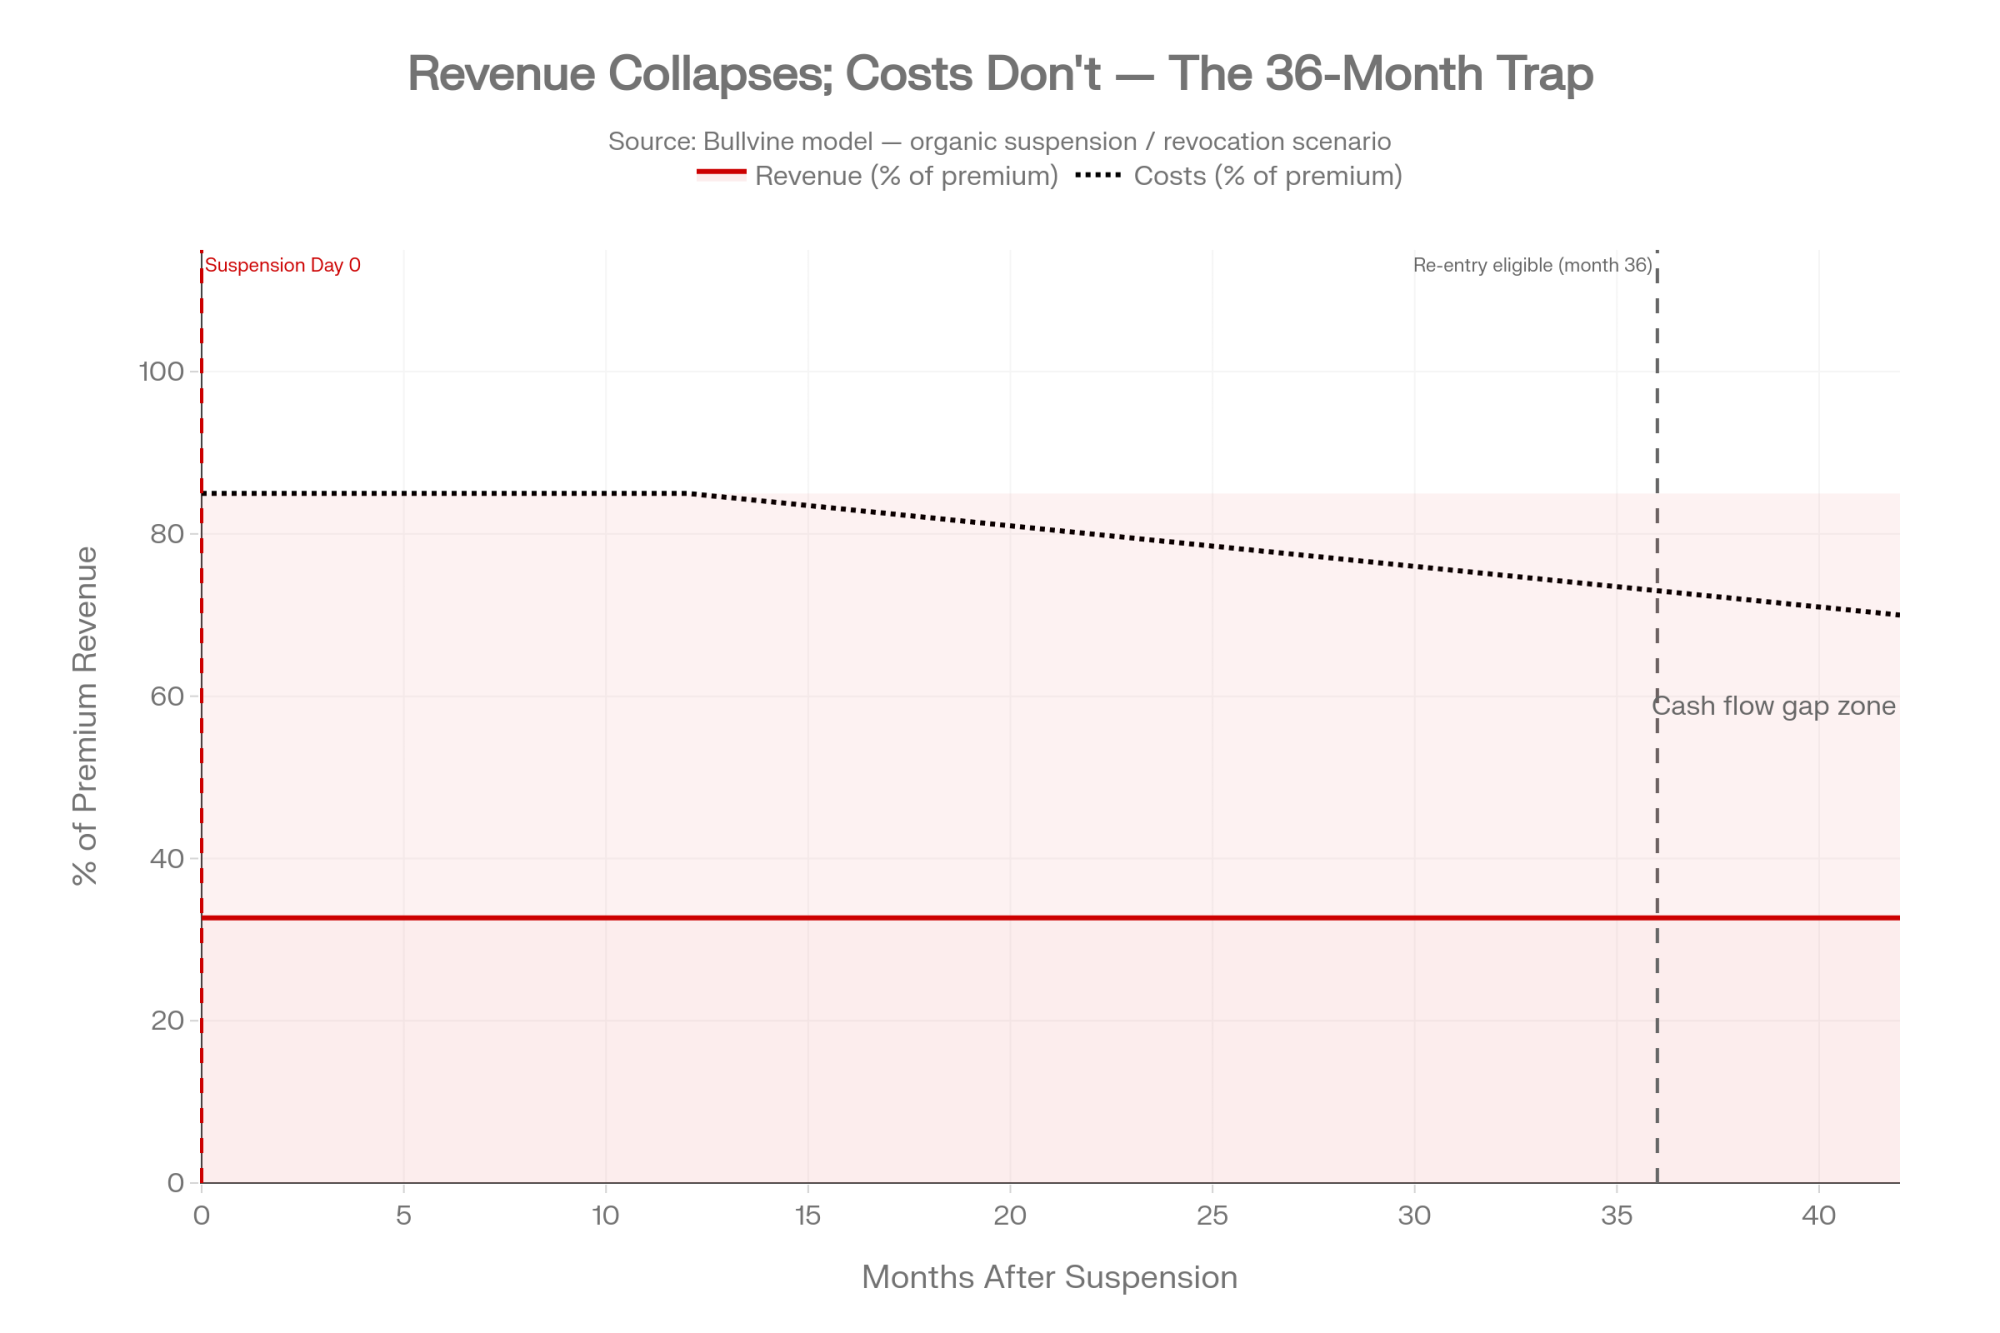
Executive Summary: A FOIA request pried loose USDA’s own investigation file on Alexandre Family Farm — the Crescent City, California operation that built a premium on regenerative and A2/A2 milk — and it confirmed “systemic failures” the farm had denied for years. The violations Alexandre admitted to include dragging cows with hip clamps, horn-tipping without pain relief, and cutting the teat off a mastitic cow; the National Organic Program logged them between 2019 and 2023. Then USDA put owner Blake Alexandre on a December 2025 podium to launch a $700 million regenerative pilot — even though the farm had recently let its ROC regenerative certification lapse while keeping a separate one, Land to Market, active (see correction). Here’s why it lands on your operation and not just his: welfare and organic milk have been paying $40–$50/cwt against a Class I base near $14.70, so a 400-cow organic herd is carrying roughly $2 million a year on certifications a single inspection report can suspend overnight (Bullvine certification reporting, February 2026). Lose them, and your costs stay organic-level while your check gets cut by more than half — and a revocation means a 36-month re-entry with no organic premium the whole way. A federal class action and a Humboldt County cruelty suit are both still live, neither decided. The move this month: pull your own certifier file and your five worst animal-care cases and read them cold, before someone with a FOIA request or a subpoena does it for you.

Alexandre Family Farm

In December 2025, Agriculture Secretary Brooke Rollins put dairy farmer Blake Alexandre on a USDA podium to announce a $700 million regenerative farming pilot, alongside RFK Jr. and Dr. Oz. Alexandre told the room his Crescent City, California operation was the first U.S. dairy certified regenerative organic, and that regenerative farming meant “farming in harmony with nature, with the way that God intended”.

What nobody on that stage mentioned: a USDA investigation had already substantiated animal-welfare violations at his farm and found “systemic failures”.

The Label Claimed…The Federal File Found…TimelineStatus (as of July 2026)
“Certified Humane” practicesHip-clamping to drag cows; horn-tipping without pain relief2019–2023Federal class action live, not decided
“Regenerative Organic Certified”NOP logged systemic welfare failures; ROC status ended in 2025″Pre-Dec 2025ROC ended 2025 — Farm Forward: suspended; farm: non-renewal. Land to Market cert retained (Nov 2025–Nov 2026)
“First U.S. dairy certified regenerative organic”CCOF proposed suspension; 2-year heightened oversight settlementFeb 2024Settlement in place; new welfare concerns flagged June 2024
USDA podium endorsement (Dec 2025)USDA’s own NOP file documented “systemic failures”2024 ROIFOIA’d by Farm Forward; now public
Farm committed to “upholding organic standards”OrganicEye filed fresh NOP + OIG complaintsOct 2025Unresolved; allegations not yet substantiated

That gap — between the milk carton and the federal file — is the whole story. And it’s a warning for any dairy whose premium rides on a label.

Blake and Stephanie Alexandre built the kind of operation most people only sketch on a napkin. A fifth-generation family running grass-based organic dairies on California’s North Coast, with A2/A2 and Certified Humane milk on Whole Foods shelves. From the outside, that stack of premium labels looked unbreakable.

Then Farm Forward filed a Freedom of Information Act request. And USDA’s own file told a different story than the one on the carton.

What’s Changing and Why

The National Organic Program investigated alleged welfare problems between 2019 and 2023, substantiated several, and laid out “systemic failures” in a 2024 Report of Investigation. None of it was public until the FOIA documents surfaced. The secret wasn’t the barn. It was the paper trail nobody outside the certifier had ever seen.

The Alexandre case isn’t really about one farm making bad calls. It’s about how a premium built on labels turns into a liability the moment your records can’t back it up.

If you sell organic, grass-fed, A2, regenerative, or welfare-certified milk, you’re making a claim a federal program can test — and document forever. Under USDA rules (7 CFR §205.662), your certifier puts every noncompliance in writing, and a proposed suspension stays on your record as an adverse action even after you fix the problem. Passing your next inspection doesn’t erase it.

Groups like Cornucopia and OrganicEye — and plaintiffs’ lawyers — can pull that record years later and quote your worst day without ever mentioning your best one. So who’s most exposed? Not the operation cutting corners on purpose. It’s the producer who genuinely believes in the model, stacks two or three labels, and never thought to stress-test the paperwork behind them.

How the Labels Fell — Faster Than the Milk Stopped Moving

The certifications didn’t all collapse at once. They peeled off one at a time while the milk kept shipping.

It started with the CCOF settlement on February 16, 2024. Facing a Combined Notice of Noncompliance and Proposed Suspension, Alexandre signed on to two years of heightened oversight — one unannounced inspection a year, plus regular healthcare-treatment and culling records handed to the certifier. An outright suspension was on the table. The settlement pulled it back.

In October 2025, the Cornucopia Institute downgraded Alexandre on its Organic Dairy Scorecard, flagging both product lines as “under increased scrutiny”. That same month, OrganicEye filed fresh complaints with the NOP and USDA’s Office of Inspector General, including alleged conflicts of interest involving the certifier. Cornucopia notes those OrganicEye allegations “have not been substantiated”.

Then the most visible label changed. The farm’s Regenerative Organic Certified (ROC) status for the dairy ended in 2025 — Farm Forward’s timeline describes it as a suspension after an audit report; the farm says it chose not to renew. Either way, the ROC seal that anchored the brand was on its way off the carton. The farm retained a separate regenerative certification, Land to Market — Bullvine has reviewed the certificate, valid November 2025 through November 2026 — and says it has been continuously certified regenerative throughout.

And the timing turned sharp. The specific label most associated with Alexandre’s national profile — ROC — was already lapsing by the December stage, whether by suspension or non-renewal. The farm was not without a regenerative certification, though: it held Land to Market throughout. Farm Forward’s Andrew deCoriolis called the USDA’s choice of poster child “disappointing,” warning it signals “it’s fine if you violate organic and animal welfare rules. You’ll be rewarded with a national spotlight”.

You don’t have to take a side here to see the gap between the public story and the record.

What’s a Premium Milk Check Actually Worth?

Start with what the premium is actually worth, because that’s the number that moves this from a compliance headache to a balance-sheet problem.

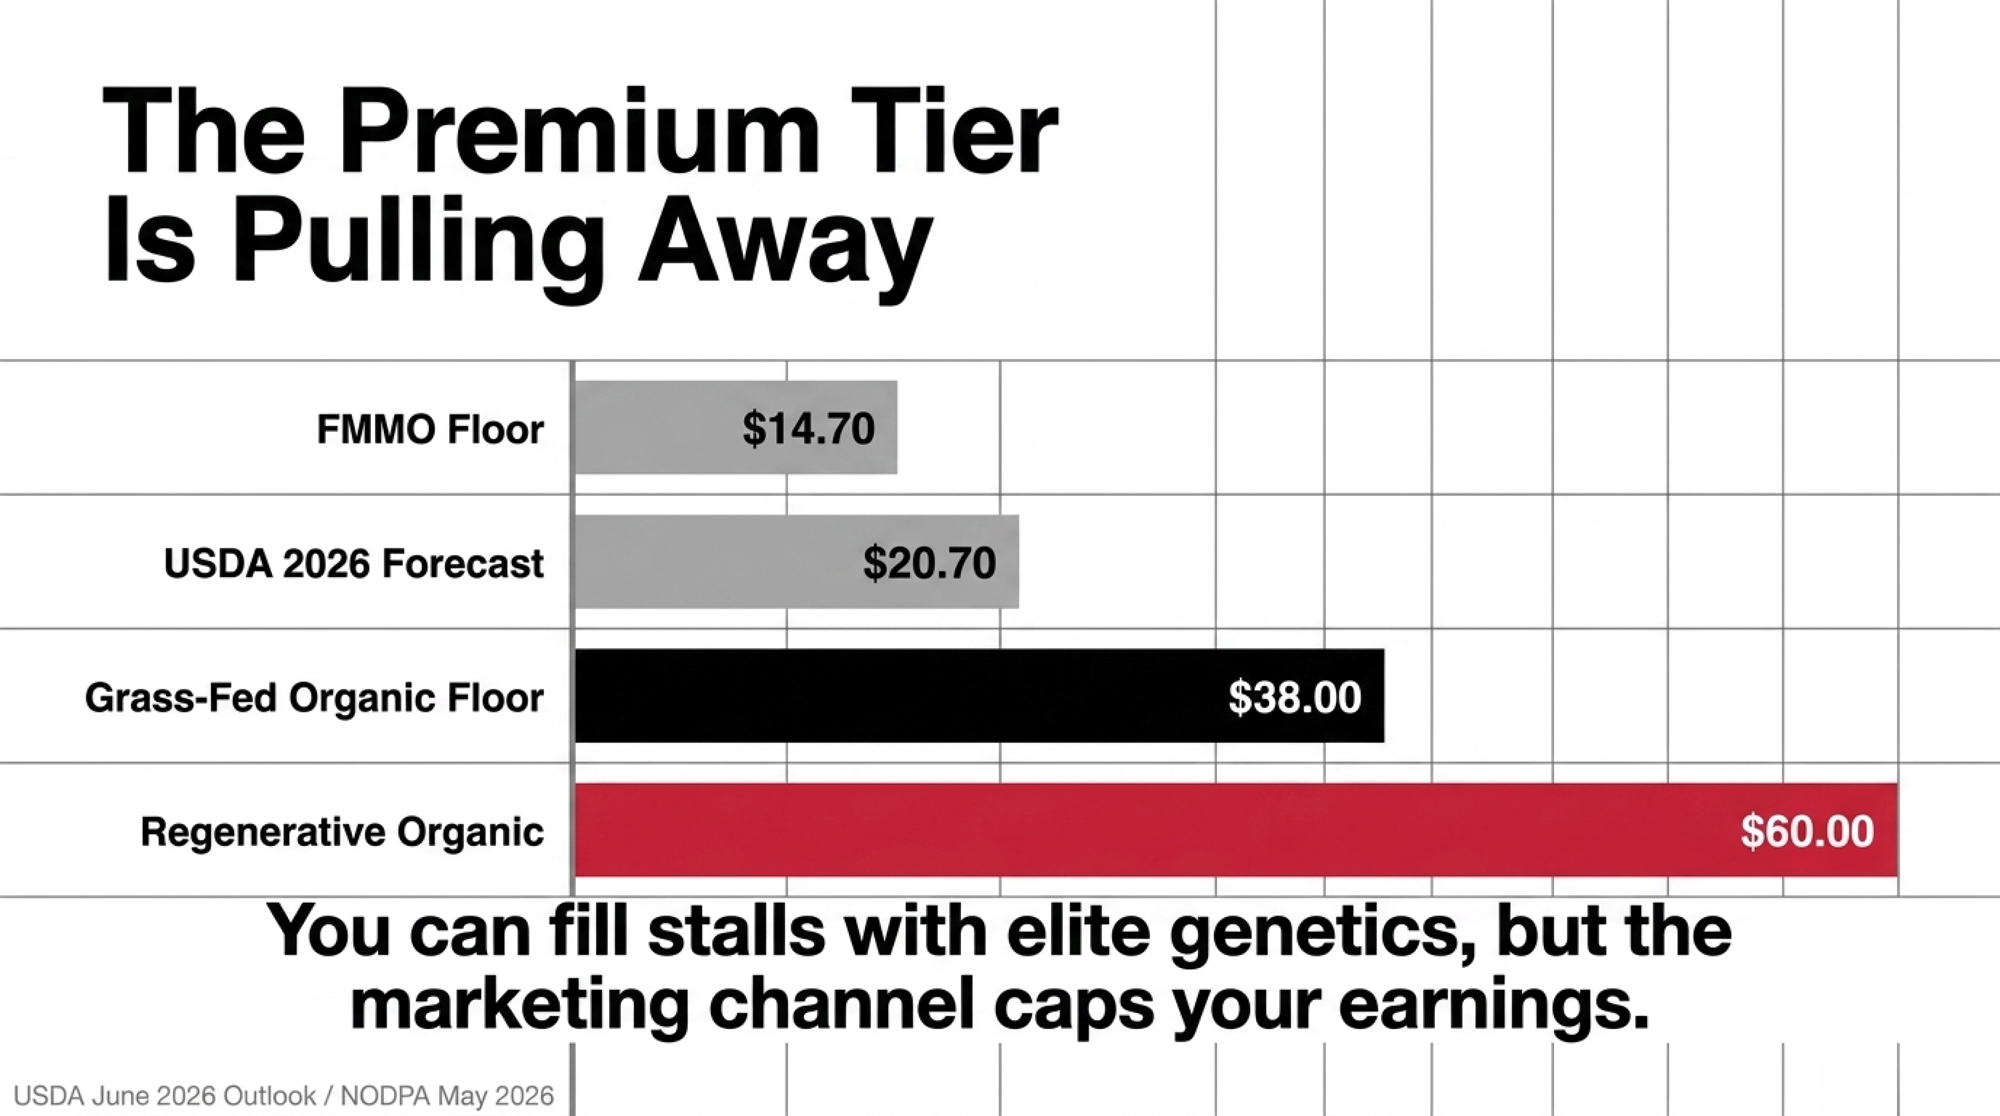
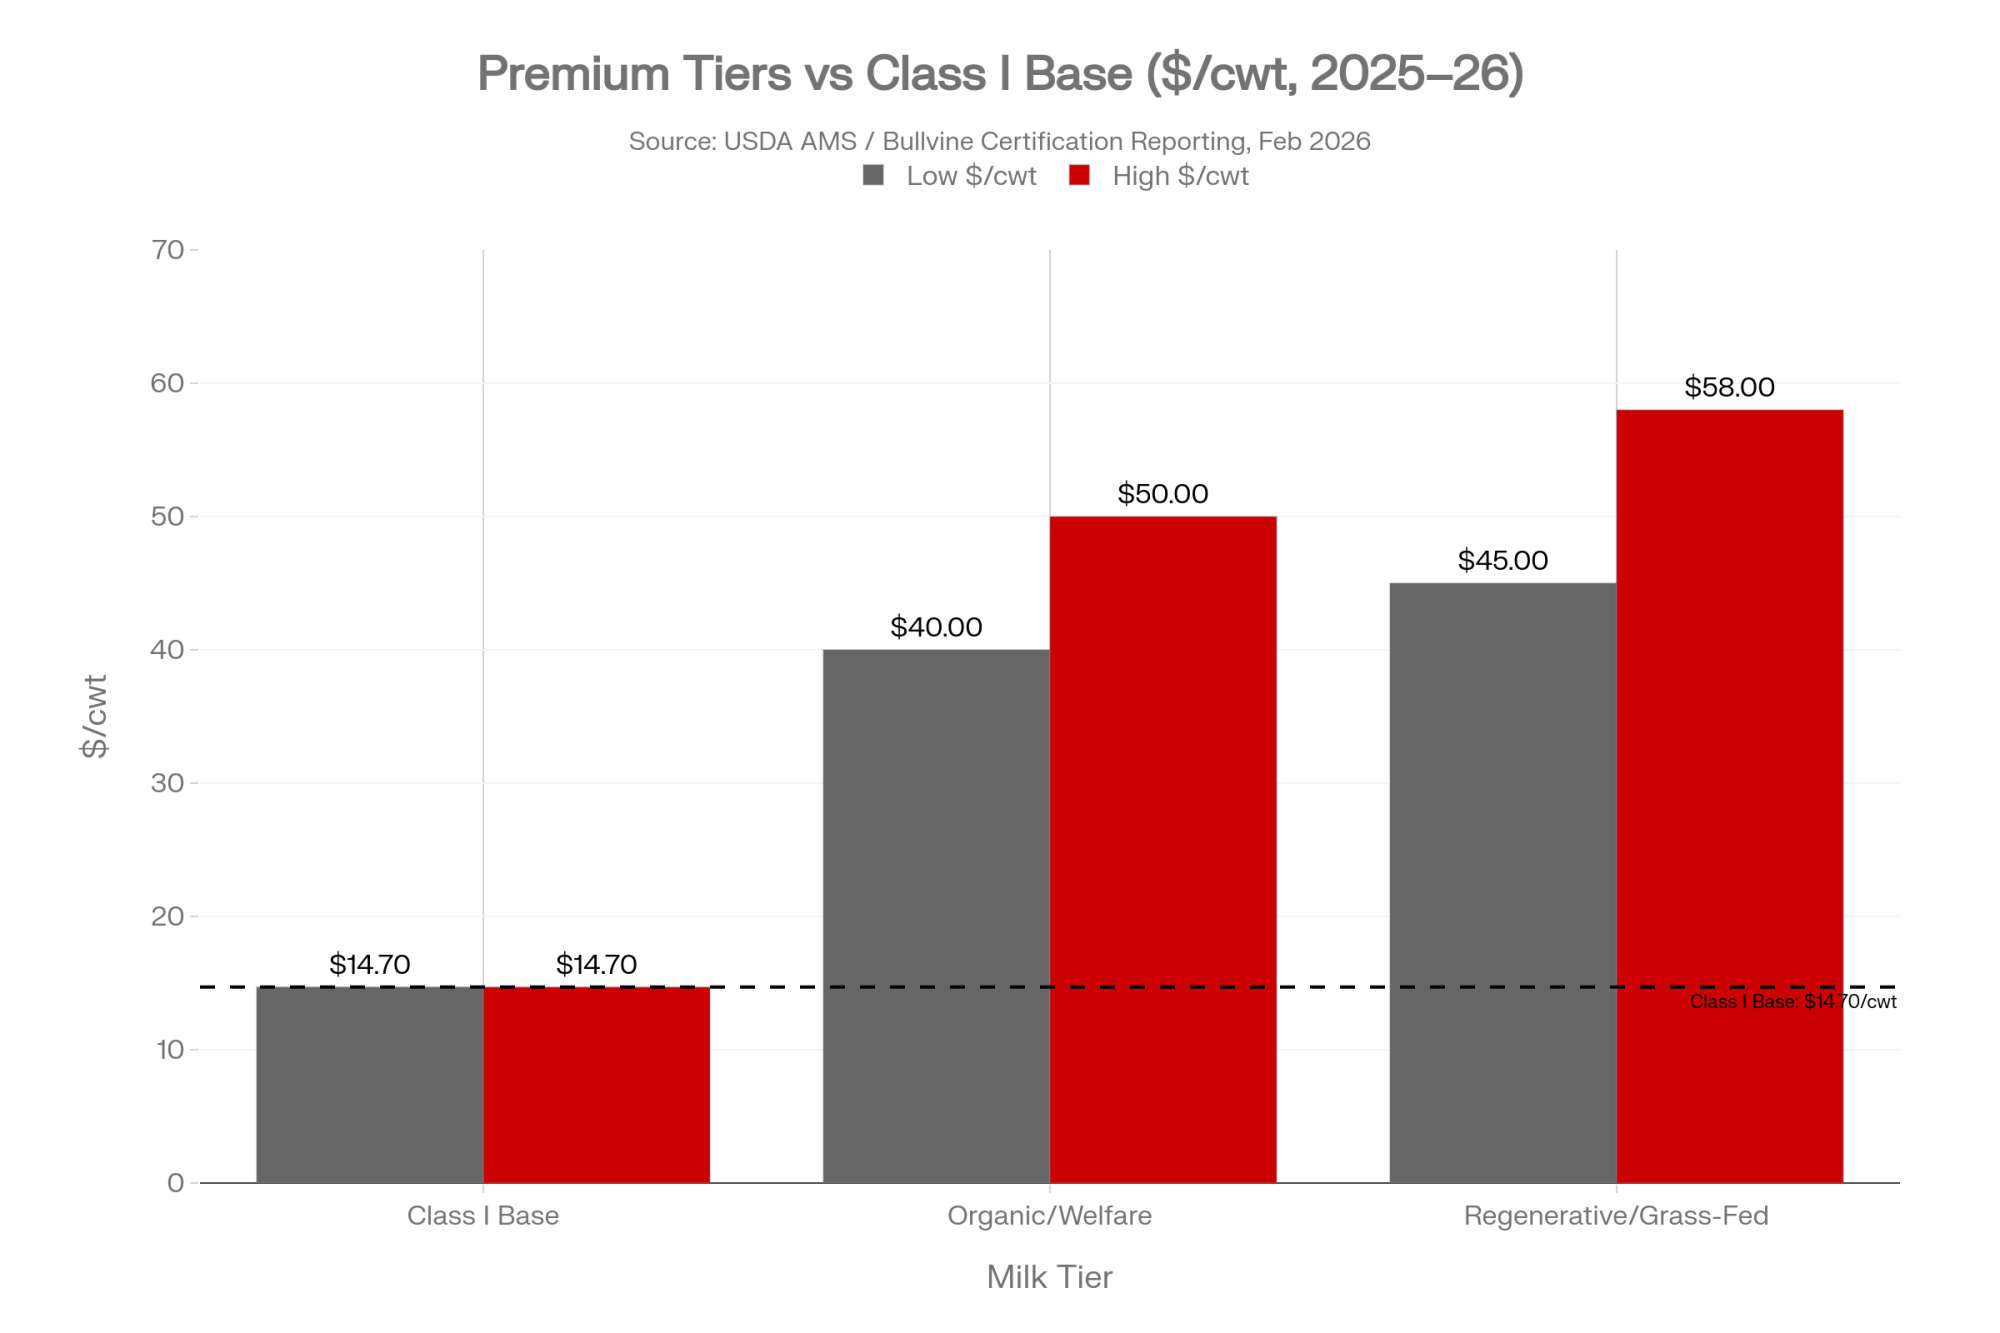
According to Bullvine certification reporting (February 2026), welfare-backed and organic brands — Jasper Hill, Maple Hill, Alexandre, AGW-certified herds — have been seeing farm-gate pay in the $40–$50/cwt range against a Class I base near $14.70, plus a retail premium around $2.63 per half gallon. Regenerative and grass-fed contracts can sit at the top of that band.

So the spread between a stacked premium and the base price often runs $25 to $35 a hundredweight. Sometimes more.

The barn math, one herd at a time

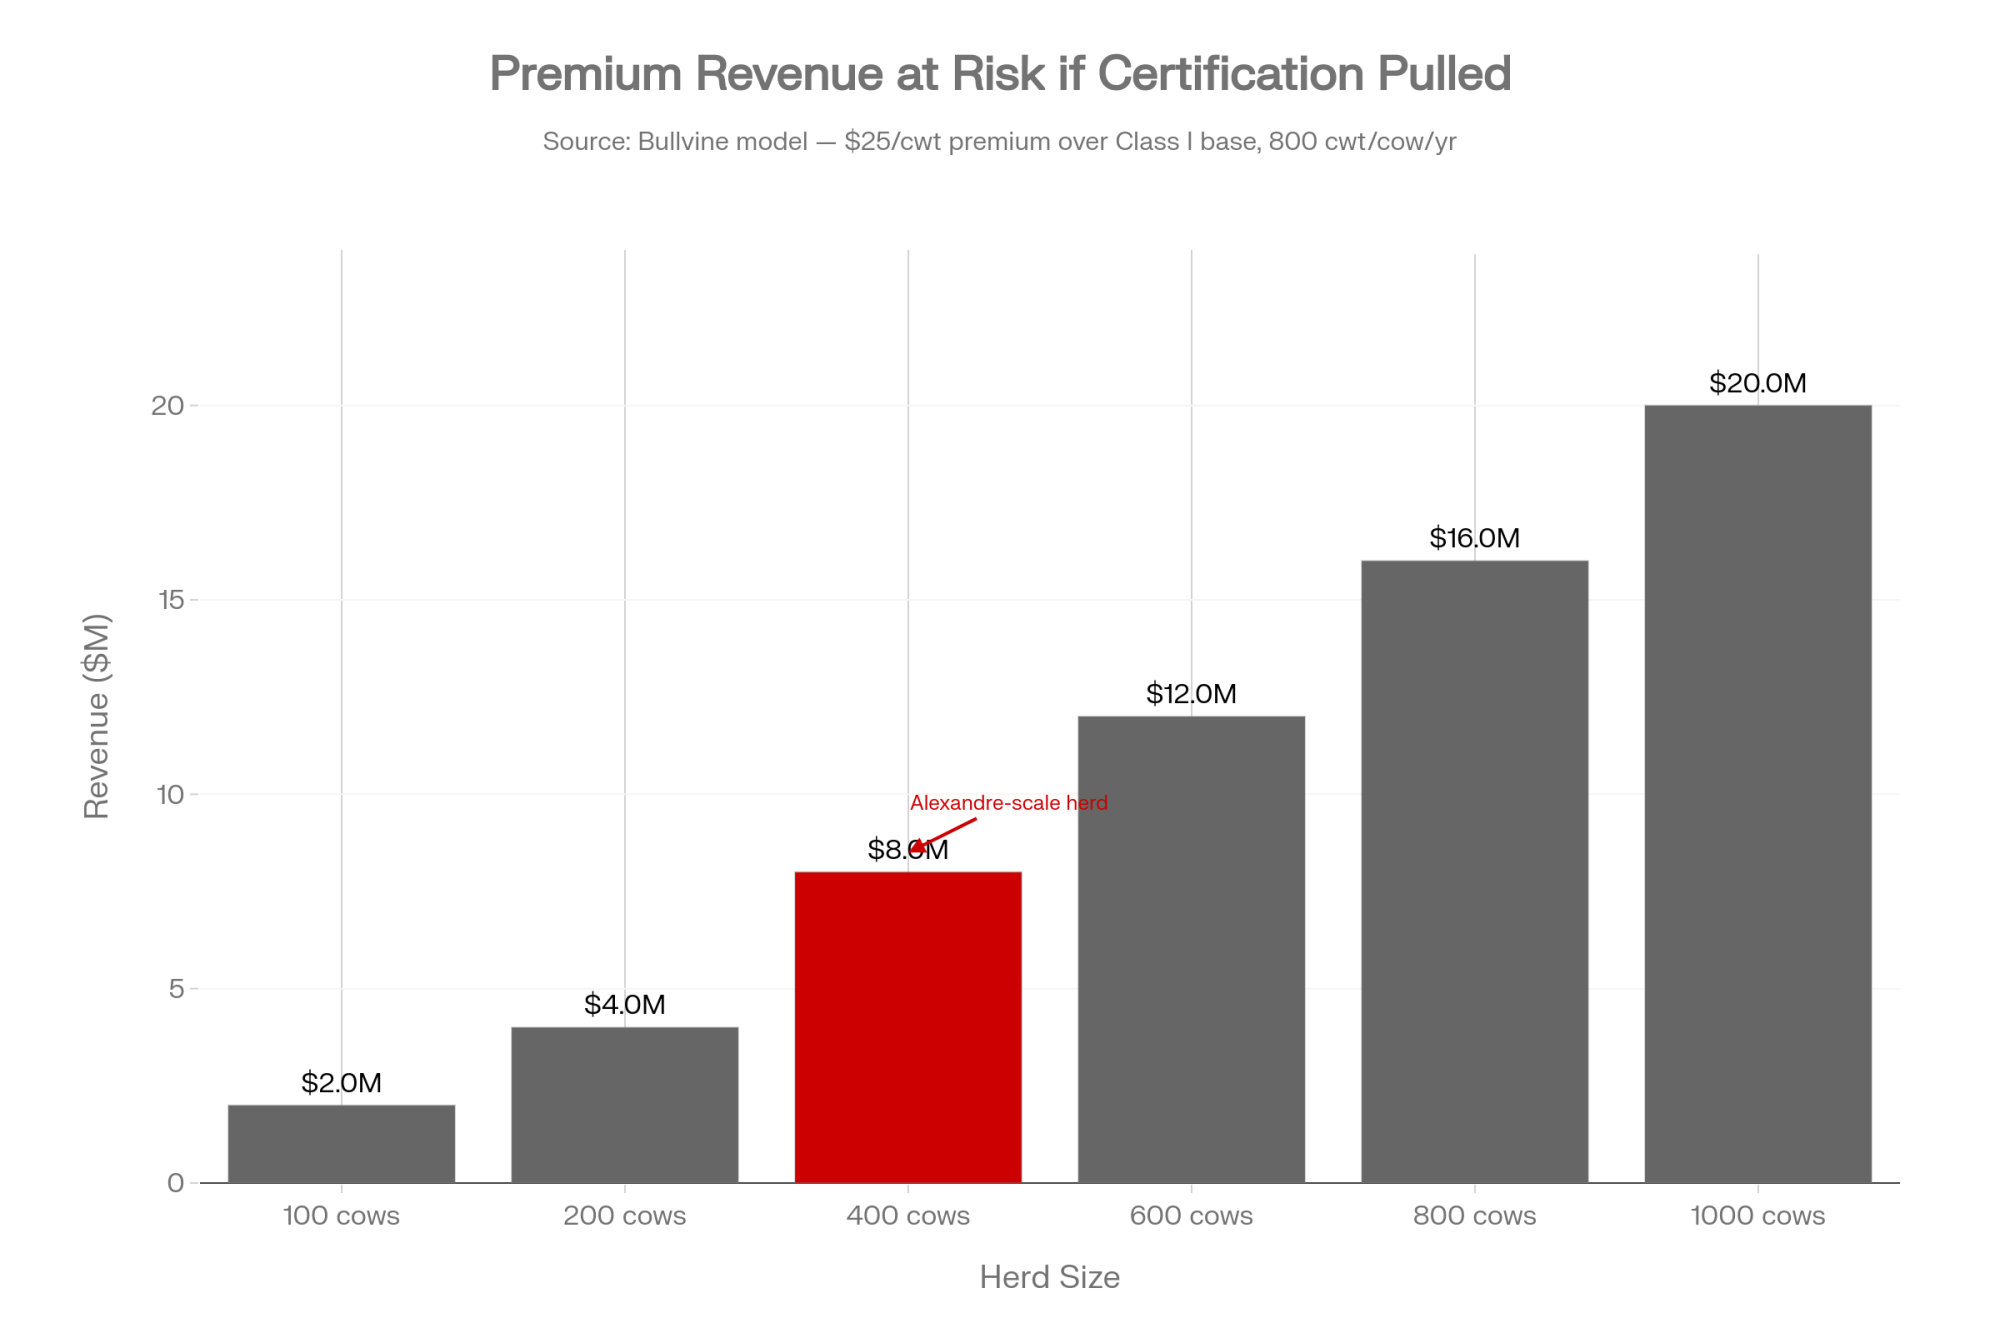
Take a 400-cow organic herd shipping roughly 80,000 cwt a year — about 55 lb/cow/day across the herd. Put the premium at a conservative $25/cwt over the Class I base. That’s $2 million a year riding on certifications a single inspection report can pull. Every year.

Lose them overnight, drop back toward base, and your costs are still organic-level while your milk check just got cut by more than half. The cost side can’t shrink anywhere near as fast as the revenue disappears.

And suspension isn’t even the worst case. If a certification gets revoked and you have to re-enter organic, you’re looking at a 36-month transition — three years of organic-level costs without the organic check while the land re-qualifies. That tail is where the real damage lives.

What the farm admitted — and where the cases stand

Here’s the part that’s already settled, not alleged. According to the USDA report, the violations Alexandre admitted to include dragging cows with hip-clamping machinery, horn-tipping without pain relief, cutting the teat off a cow with mastitis, spraying a diesel mixture on animals to ward off flies, animals going without feed, and animals dying from trampling. The farm admitted multiple violations of organic standards.

The farm also did real corrective work. Per the NOP Report of Investigation, it trained staff, hired an animal-welfare consultant, and corrected the existing noncompliances. A June 2024 unannounced CCOF inspection confirmed those corrections — though it also flagged a few new welfare concerns, including improper horn trimming on an unknown timeline.

Two lawsuits are still moving. A federal consumer class action in the Southern District of California accuses Alexandre and the Certified Humane program of “humane-washing,” seeking more than $5 million for conduct from at least 2019 through summer 2024. A separate animal-cruelty suit from Legal Impact for Chickens, filed in Humboldt County in September 2024, survived Alexandre’s writ challenge when the Court of Appeal denied it on September 11, 2025; the parties are now in discovery. Neither case has been decided.

In a statement, the farm said its “commitment to upholding organic and regenerative standards and bringing healthy food to our customers is unwavering”.

Both things are true at once. The farm improved and kept defending its product — and the record of what came before is permanent. Reached after publication through the reputation firm The Next Solutions Group, and in a statement the farm’s co-owner confirmed for attribution, Alexandre Family Farm disputed that its regenerative certification was ‘pulled.’ The farm said it ‘chose not to seek renewal’ of its ROC certification for the dairy and ‘elected to maintain’ a separate Land to Market regenerative certification, adding that it ‘continued to have a valid regenerative certification at the time of the news conference… and we continue to be certified regenerative to this day.’ Bullvine reviewed the Land to Market certificate, effective November 19, 2025 through November 19, 2026.

The Mechanics Behind the Outcomes

So how does a farm that genuinely cares end up with “systemic failures” in a federal file? Three forces stack up. Scale outruns oversight. Audits tend to check paperwork more than they check the worst corner of the barn. And every treatment decision doubles as a revenue decision.

There’s also a coverage gap most people miss. Modern Farmer reported that while Alexandre marketed whole-farm values, only a fraction of the milking herd actually met certain label criteria at any given time. That’s how the marketing and the barn drift apart even when some acres are genuinely managed to the highest standard.

The label becomes the identity. The barn becomes the thing you manage around the label. You file the paperwork, you pass the inspection, you assume it’s working. But the file your inspector sends to NOP reads more like a prosecutor’s memo than a thank-you note. Few of us ever read what NOP enforcement actually looks like cold.

How Much Premium Is Actually Riding on Your Certification?

Run the number before someone else does. Multiply your annual hundredweight by your premium over base, and that’s your exposure if a label gets pulled.

For a 400-cow herd at a $25/cwt premium, that’s about $2 million a year. That’s not a marketing risk. That’s your main business line.

Then add what the milk-check math leaves out: a retailer delisting your brand after a bad headline, cull buyers tightening up on who they’ll take, and a lender who modeled your debt service on that premium and now wants to re-run your covenants. If that premium vanishes for even a few months, the conversation with your banker changes overnight — which is exactly how a values-based premium quietly becomes a liability when the records don’t hold.

Can You Reconstruct Your Worst Five Animal-Care Cases From the Records Alone?

This is where Alexandre actually got hurt — not only in what happened, but in what the file could prove.

Pick the five worst animal-health events on your place in the last two years. The downer cow. The calving wreck. The calf-care mistake you still feel in your gut. Now pull the paper trail first, before you go ask anyone what happened.

Can you show, inside 24 hours, the animal ID, the treatment-or-euthanasia decision and the reasoning, who signed off, and where that cull went and when? If your honest answer is “not consistently,” that’s your weak spot — even if you’ve never done anything close to what’s in that file. NOP rules require written euthanasia plans and prompt treatment. The gap usually isn’t your intentions. It’s your documentation.

Remember, Alexandre’s settlement specifically required handing healthcare-treatment and culling records to its certifier on a regular basis. That connects straight to the dollars: certified welfare and organic claims can sit well above base price, which is precisely why the records behind them have to hold.

Options and Trade-Offs for Farmers

There’s no single right answer here. There’s the one that fits your market, your team, and your tolerance for risk. Jump to the path that matches your operation.

CertificationEst. Premium Over Base ($/cwt)Re-Entry Period if RevokedKey Audit RiskWho Can Pull the File
USDA Organic$25–3536 monthsTreatment records, feed logsNOP / any FOIA requester
Certified Humane$3–8Case-by-caseAnimal handling events, euthanasia planAuditor + civil plaintiffs
Regenerative Organic Certified$8–15Immediate suspension possibleWelfare pillar + grazing practicesROC auditor + Farm Forward
A2/A2$2–5None (genetics-based)Sire verification, herd testing recordsBuyer / co-op audit
Grass-Fed (AGA/PCO)$5–1212–24 monthsGrazing logs, TMR documentationCertifier + FTC complaint

Path 1 — Double down on fewer, higher-value labels

  • When it makes sense: Your premium is real and durable, and your team keeps clean records.
  • What it requires: Tighter SOPs, real staff training, consolidated files.
  • The risk: You gain margin but lose flexibility. One bad inspection or one ugly video hits harder than it used to.

Path 2 — Stay organic, skip the extra badges

  • When it makes sense: Organic already does the heavy lifting and your processor doesn’t reliably pay more for welfare or regenerative claims.
  • What it requires: An honest talk with your buyer about what actually shows up on the pay stub.
  • The risk: You lose some shelf story to farms stacking more labels — at least until one of those stories goes sideways, the way Alexandre’s did.

Path 3 — Run premium practices quietly, without the logo

  • When it makes sense: In regions where premiums are thin or volatile.
  • What it requires: Keeping the welfare and grazing benefits without carrying the certification exposure.
  • The risk: Lost revenue upside, and you can still get cross-wise with buyers if you talk premium without backing it.

Path 4 — Audit your own file in the next 30 days (start here)

  • When it makes sense: Always, and now.
  • What it requires: Pull your certifier file and your five worst animal-health cases and read them cold — the way Cornucopia or a plaintiff’s lawyer would. Hunt for vague timelines, missing treatment records, and any noncompliance language you forgot was in there.
  • The signal to watch: How retailers handle cases like Alexandre over the next year or two. Quieter delistings and fewer single-farm promotions would tell you the market is already pricing in label risk.

Key Takeaways

  • If your premium runs more than $15/cwt over base, treat it as exposure, not a bonus — for a 400-cow organic herd that’s roughly $2 million a year riding on a label a single inspection report can pull.
  • A suspension cuts your check while your costs stay organic-level, and a revocation means a 36-month re-entry with no premium the whole way — the revenue drops overnight, the cost side can’t.
  • USDA’s findings on Alexandre only surfaced because Farm Forward filed a FOIA request; proposed suspensions and noncompliances stay on your record even after you fix them.
  • This month, pull your certifier file and your five worst animal-care cases and read them cold — animal ID, treatment-or-euthanasia call, sign-off, and cull destination — the way a plaintiff’s lawyer or Cornucopia would.

The Gut Check Worth Sitting With

Strip it down and it’s one question with a dollar sign on it. If your premium runs more than $15/cwt above base, that’s not a bonus — it’s exposure, and a suspension is a seven-figure event even for a mid-size herd. If you can’t reconstruct your five worst animal-care cases from records alone, inside 24 hours, your real risk isn’t the barn — it’s what you can’t prove.

So read your certifier file end to end this month, and read it cold — the way Cornucopia or a plaintiff’s lawyer would. Assume every word could go public, because Alexandre’s did, via FOIA. If your labels vanished tomorrow, would what’s in your files and your barn still stand up — and could your business survive the milk-check hit while it did?

If you’re not sure, that uncertainty is the point, and this is the window to close it before someone tests it for you. We’re breaking down the full premium-exposure model in an upcoming Bullvine Weekly — what a suspension costs by herd size and label stack, the 36-month transition tail, and the FOIA-grade record checklist that keeps you out of the file.

Correction, July 9, 2026: An earlier version stated that Alexandre Family Farm’s regenerative certification had been ‘pulled’ and that the farm had lost ‘two’ premium labels. The farm says it chose not to renew its Regenerative Organic Certified (ROC) certification for its dairy and maintained a separate Land to Market regenerative certification, which Bullvine has reviewed (valid Nov. 2025–Nov. 2026). The article has been updated to correct the characterization and to add the farm’s response. The USDA Report of Investigation findings and litigation status are separately sourced and unchanged.

📊 Interactive Premium Risk Simulator

Calculate your operation’s financial exposure if certifications or labels are suspended or revoked.

The difference between your stacked premium price and Class I base.

Annual Volume Shipped
80,000 cwt
Annual Revenue At Immediate Risk
$2,000,000

Losing your label cuts this cash flow instantly while operational overhead remains flat.

36-Month Transition Tail Liability
$3,600,000

Estimated regulatory cost if revoked. Requires 3 years of organic-level input costs while receiving only conventional base pay checks.

Diagnostic baseline assumes an organic maintenance drag of $15.00/cwt during a standard 36-month transition phase.

This article is based on USDA’s 2024 NOP Report of Investigation (obtained via FOIA by Farm Forward), Cornucopia Institute records, court filings, and published reports available as of July 4, 2026.

Learn More

The Sunday Read Dairy Professionals Don’t Skip.

Every week, thousands of producers, breeders, and industry insiders open Bullvine Weekly for genetics insights, market shifts, and profit strategies they won’t find anywhere else. One email. Five minutes. Smarter decisions all week.
NewsSubscribe
First
Last
Consent

1 in 5 IVF Embryos Never Had a Shot and It’s Draining Your Genetics Budget

About 1 in 5 embryos you transfer may already be dead on arrival — and your microscope can’t see it. That’s not bad luck. That’s a leak.

Executive Summary: About 1 in 5 of the IVF embryos you transfer may already be dead or dying on transfer day, and your microscope can’t tell you which ones. That’s the claim from EmGenisys founder Dr. Cara Wells, and even if her exact 20% is still hers to prove, the biology behind it is well documented — lab-grown embryos run pregnancy rates 10 to 40% lower than flushed ones, and field IVP outcomes sit around 42% fresh and 38% frozen. Run 100 IVF transfers on your top donors, and roughly 20 duds burn $1,660 to $2,160 in synch and transfer fees alone — before you count the pregnancy and the $3,000-to-$4,200 replacement heifer you’ll never raise in a market short 800,000 head. Wells’s fix is a $50,000 machine’s job done with software: mount a phone to the scope you already own, shoot a 30-second video, and get a 0-to-100 viability score independent of the old Grade 1-to-4 call. The catch is honest — no independent study has yet replicated her number across multiple herds, and her company sells the tool. If your fresh IVF rate has sat well under 50% for three rounds straight, the piece hands you a 30-day audit to run before you blame another recipient. And with IVF now producing roughly 80% of the world’s bovine embryos, a leak this size isn’t just your problem — it’s a brake on how quickly the whole industry moves its best genetics.

IVF embryo viability

Dr. Cara Wells estimates that about one in five of the IVF embryos going into cows on transfer day are already dead or dying, with virtually no chance of making a pregnancy. Wells is a reproductive physiologist and the founder of EmGenisys, and she didn’t land on that number in a boardroom. She got there watching which embryos actually settled into pregnancies at the 35-to-60-day check — and noticing that the tool everyone trusts, the visual quality grade, couldn’t reliably tell the live ones from the dying ones. If you’re running IVF on your best donors, that’s not a lab curiosity. That’s your genetics budget leaking from the middle. 

Here’s why it matters now. IVF isn’t a boutique tool anymore — it’s how the industry makes embryos. So a failure rate that hits your elite matings hardest isn’t a rounding error. It’s real money; it’s slower genetic progress; and most operations blame the recipient when the problem may already have walked in the door dead.

The IVF Takeover: Where Is the Money Leaking?

In-vitro production has taken over the embryo business. The International Embryo Technology Society counted 2,468,877 embryos collected or produced in farm animals worldwide in its 2024 report, up 2.4% over the prior year. Over a million of those were cattle embryos, and roughly 80% of all bovine embryos produced globally are now in-vitro-produced rather than flushed the old way. Most of that volume runs through a handful of labs — Trans Ova in the US, Boviteq in Canada, and a growing bench of regional providers — and that’s where your pricing and your options get set. Flushing shrinks. IVF grows. That’s the whole trend in four words. 

But IVF embryos don’t get pregnant as reliably as flushed ones, and both the labs and the producers planning around them have priced that in. Trans Ova puts well-managed fresh IVF pregnancy rates at around 45–50%, with frozen a little lower. Canada’s Boviteq advertises a direct-transfer frozen pregnancy rate of 55 to 60% using its own culture-media system — so the ceiling has moved, but even the good numbers still leave many embryos that don’t take. 

The field study numbers are blunter. One published morphokinetic trial pegged IVP pregnancy outcomes at 42% for fresh transfers and 38% for frozen — well below what flushed embryos deliver. Your lab won’t hit those figures to that decimal place. But the headwind is real, and every IVF program is pushing into it.


For years, the fix was assumed to live downstream. Bad recipient. Thin body condition. A sync protocol that slipped a day. All real problems. But Wells flipped the question: nobody was checking whether the embryo itself was alive and developing normally when it went in.

Why Can a Grade 1 Embryo Still Be Dead on Arrival?

Morphology grading is a snapshot. You look under the scope once, count the cells, assess the shape, and call it a Grade 1 or 2. What it can’t tell you is whether that “pretty” embryo is actually still developing — or already shutting down.

That’s not just Wells’s opinion. Fieldwork on bovine morphokinetics found that IVP embryos rated top grade still had pregnancy outcomes in the low 40s and high 30s. The prettiest embryo under the microscope isn’t reliably the one that sticks. That’s why a Grade 1 can still be dead on arrival. 

Her method records a short video and measures morphokinetics — the timing and pattern of the embryo’s cellular movement — and scores it against a model built on real pregnancy outcomes. “My research and the literature show that about 20% of all transferred embryos are actually dead or dying at the time of transfer,” Wells told RealAgriculture in September 2025. “Just by identifying that 20% and eliminating those, pregnancy outcomes improve by about 20%.” The score runs 0 to 100, so you set the bar — not the microscope. 

Now, fair is fair: labs and embryologists who rely on morphology grading would push back on the size of that number. Grading remains the field’s proven, everyday standard, and no independent study has yet replicated the 20% figure across multiple herds. But the biology underneath Wells’s argument is well documented. A 2019 review of the post-transfer consequences of IVP embryos found pregnancy rates 10 to 40% lower for cattle carrying lab-produced embryos than for those carrying flushed ones. Every IVF embryo grows in artificial culture media, and that dish stresses an embryo in ways the oviduct never does. So a meaningful fraction arriving damaged isn’t a sales angle — it’s baked into how IVF works, industry-wide. 

Here’s the one caveat worth saying out loud: the specific 20% figure is Wells’s own read of her research and the literature, not an independently replicated industry number, and her company sells the fix. The direction is well supported. The exact size of it is hers to prove at scale. 

How a TED Talk and a Kitchen Table Started This

Cara Wells didn’t set out to build software. She’s a reproductive physiologist, and the whole thing turned on a video she happened to watch — a TED Talk on MIT’s Video Motion Magnification, a tool that reveals hidden movement in ordinary footage. Wells’s leap was simple. An embryo is a rapidly dividing organism whose cellular activity you can’t see in real time, even under the best microscope — so what if video could mine out those hidden signatures of life? 

Then COVID shut everything down, and the work moved to her kitchen table. Wells sat there, measuring embryo diameters every five seconds and quantifying how each embryo’s shape shifted over time. She worked with Texas Panhandle ET veterinarian Dr. Russell Killingsworth, tracking which embryos actually made pregnancies at the 35- to 60-day checks. A pattern came out of the noise: embryos that make pregnancies show moderate, middle-of-the-curve activity, while the ones at the fast and slow extremes mostly don’t. 

Six years on, that kitchen-table method is a machine-learning platform. One published study alone drew on 6,900 thirty-second smartphone videos of bovine embryos recorded during routine ET. That’s not a lab demo — that’s barn reality. 

And here’s what it isn’t: a $50,000 machine. It’s software. An embryologist mounts a phone to the microscope they already own, records a roughly 30-second video, and uploads it through a web app. The system returns a viability score from 0 to 100 plus a sex prediction, both generated independently of that 1-to-4 morphology grade. It isn’t judging how the embryo looks. It’s measuring what it’s doing. 

Running Your Own Numbers: 100 Transfers on a 400-Cow Herd

Say you milk 400 cows and put 100 IVF embryos on the ground this year, all from your top donor matings. Apply Wells’s estimate, and roughly 20 of them were never viable.

Start with the direct burn on those 20. Recipient synchronization runs about $18 to $28 a cow, and the transfer fee another $65 to $80 per recipient, per The Bullvine’s own ET cost work. At the low end, 20 × ($18 + $65) = $1,660. At the high end, 20 × ($28 + $80) = $2,160. That’s synch and transfer alone — before the recipient cow herself, her open days, or the drugs. Plug in your own embryo count and per-cow costs, and it scales straight up. And if you’ve ever watched an ET calf sell for less than it cost to make, you know the setup bill is the least of it — we ran that math in the $4,917 breakeven on ET Holstein calves.

But the setup cost is the small line. University of Florida economist Albert De Vries famously pegged the value of a dairy pregnancy at $278 in 2006. Two decades later, in a market starved for replacements, that number vastly underestimates the opportunity cost. With springing heifers fetching $3,000 to $4,200 and the pipeline short an estimated 800,000 head across 2025–26, a dead embryo isn’t just a lost sync fee — it’s a forfeited option on a premium future asset, in the exact market where that option is worth the most in living memory. Want a hard per-embryo number? You’d need your own calf survival rate, heifer ratio, and rearing cost to discount that $3,000 to present value. That’s worth an afternoon with your own records. 

Genetic Progress vs. Multiplied Mistakes

IVF isn’t about making embryos. It’s about multiplying your best donors — more calves a year from the cows you rate highest, carried by lower-merit recipients. Trans Ova cites one donor that failed in conventional flushing, then made 80 pregnancies in five months through IVF; another breeder aspirated 10 heifers five times each and pulled 103 female pregnancies. That multiplier is the entire point. And it only pays if the pregnancies stick. 

So a dead embryo from a top donor isn’t a random miss. It’s a branch that never grows on the pedigree tree — the same slow drain we mapped in when your elite genetics start costing you real money, except here it hits before the calf is even conceived. And when your whole program leans on a handful of donors, a run of dead embryos narrows your genetic base fast — the trap we broke down in your top heifers all trace to three cow families. Multiply that across the million-plus IVF cattle embryos made every year, pulled disproportionately from the top of the pyramid, and a farm-level nuisance starts looking like a brake on how fast the whole industry moves its best genetics forward. 

Options and Trade-Offs for Your Operation

ScenarioFresh IVF RateRounds of DataRecommended ActionRisk Flag
Rate well above 50%>52%3+ roundsMaintain current protocol; monitor donor-by-donorDon’t fix what isn’t broken
Rate sitting near 50%45–52%3+ roundsAudit recipient management; rule out sync issues firstSample size may hide embryo problem
Rate stuck below 45%<45%3+ roundsPull fresh vs. frozen split; pressure your lab on embryo QCRed flag — recipient isn’t the only variable
High-value seedstock, any rateAny1–2 roundsRun scored vs. unscored pilot; one elite calf covers trial costPilot must be large enough to be meaningful
Occasional IVF userAny<3 roundsWait for multi-herd peer-reviewed dataGiving up potential early gains — accept that trade

There’s no single right answer here — there’s a right answer for your herd. Here’s how the paths break down.

Audit before you buy anything (do this in the next 30 days). Pull your last three IVF transfer rounds and calculate your real pregnancy rate, split fresh versus frozen and, if your records allow, donor by donor. If your fresh IVF rate sits well under the roughly 50% Trans Ova reference after three rounds, that’s your flag. The risk: small samples lie, so don’t blame the embryo until you’ve logged enough transfers to mean something and ruled out recipient factors. Block off one afternoon this month and do it. 

Run a controlled pilot before committing to screening tech. Score one block of transfers, leave another block unscored, and compare pregnancy rates. This makes sense for high-value seedstock operations where one elite calf pays for the trial many times over, especially at today’s $3,000-plus replacement values. The risk: run it too small, and you’ll read noise as proof. 

Tighten donor and recipient management in parallel. Recipient age and quality move conception on their own — one Iowa State dataset put virgin-heifer recipients at 73% pregnant versus 56% for two-year-olds — and IVP embryos start at a hardiness disadvantage. This always makes sense, whatever screening you adopt. The trap: treating management as the only lever — which is the exact blind spot this story is about. 

Wait and watch, if you’re an occasional user. The signal to move from watching to piloting is multi-herd, peer-reviewed, embryo-level data confirming both the non-viable fraction and the pregnancy uplift. For smaller operations that do occasional IVF, letting the evidence mature is the cheaper, more defensible play. The trade-off is honest: wait, and you get proof, but you give up a year of possible gains if the tech proves out.

Key Takeaways

  • If your fresh IVF pregnancy rate has sat well below ~50% for three straight rounds, stop assuming it’s the recipient and start asking your provider what they measure about the embryo itself. 
  • If a provider quotes you a pregnancy-improvement number, ask whether it’s backed by multi-herd data you can see — or a single-source estimate. Wells’s own 20% figure is the latter until it’s independently replicated. 
  • If you run high-value seedstock, a scored-versus-unscored pilot may pay for itself on a single elite calf in a $3,000-plus replacement market — but only if it’s big enough to mean something.
  • If you’re an occasional IVF user, waiting for peer-reviewed, embryo-level pregnancy data is the defensible call, not a cop-out.

The next time a preg check comes back light, don’t reach straight for the recipient. Ask the harder question first: are you sure that embryo ever had a chance — or have you been solving for the wrong variable and calling it management? Pull your last three transfer rounds this week and run the fresh-versus-frozen split. What does your provider actually know about whether those embryos were alive when they went in — and what’s that answer worth against a heifer you’ll never get to raise?

IVF Embryo Budget Leak Calculator

Find out how much dead or dying embryos are costing your operation.

Your Operation Inputs

Your Dynamic Impact Report

Based on Dr. Wells’s 20% estimated non-viable rate at transfer.

Estimated Non-Viable Embryos: 20 embryos
Immediate Sunk Fees Wasted: $2,000
Forfeited Future Heifers (50% Female Ratio): 10 head
TOTAL HIDDEN BUDGET LEAK: $34,000

Complete references and supporting documentation are available upon request by contacting the editorial team at editor@thebullvine.com.

Learn More

The Sunday Read Dairy Professionals Don’t Skip.

Every week, thousands of producers, breeders, and industry insiders open Bullvine Weekly for genetics insights, market shifts, and profit strategies they won’t find anywhere else. One email. Five minutes. Smarter decisions all week.
NewsSubscribe
First
Last
Consent

$110.5M to “Reputation”: Why 3 Farmers Are Suing USDA

DMI’s own 2024 books show $110.5M — 43.4% of your checkoff — ran through “Reputation,” not milk ads. Three Wisconsin farmers just sued USDA to shut off the tap.

Executive Summary: DMI’s own 2024 audited books show that $110.5 million (43.4% of the checkoff budget) was routed through a category it labels “Reputation,” not ads that move product. A new federal lawsuit by three Wisconsin producers aims to block this pipeline.

Here’s what every dairy farmer needs to know before their next co-op meeting:

  • The Lawsuit: Filed June 9, 2026, against USDA, arguing that mandatory checkoff funds are being illegally used to build a “Net Zero” infrastructure the 1983 law never authorized.
  • The Real Cost: This isn’t just about the 15¢/cwt deduction (roughly $18,000/year on a 500-cow dairy). The real threat is the commercial squeeze — pressure to adopt sustainability practices like Bovaer, which in most current contracts carries an unfunded $60–$85 per-cow deficit.
  • The Legal Shift: Unlike 40 years of failed checkoff challenges, this suit leans on the Supreme Court’s 2024 Loper Bright ruling, meaning judges no longer have to defer to USDA’s interpretation of the law.
dairy checkoff lawsuit

Every farm shipping milk in America pays the same 15 cents per hundredweight. Nobody gets to opt out. And three Wisconsin producers now say a chunk of that mandatory money is being used for purposes they never signed up for — and they’ve taken USDA to federal court to prove it.

In February, Westfield, Wisconsin, dairy farmer Abby Swan told Fox Baltimore that her milk plant had sent a letter asking for a year’s records — natural gas, diesel, propane, electricity — to calculate her farm’s carbon footprint. The program was billed as “voluntary.” But as Swan tells it, participation didn’t feel optional when she believed her milk pickup was on the line. The processor’s side isn’t reflected in that account.

That tension — voluntary on paper, pressured in practice — is the whole fight, folded into one envelope.

On June 9, 2026, Swan put her name on a federal lawsuit against USDA and the National Dairy Promotion and Research Board. So did Adam Faust of Chilton and Christopher Baird of Ferryville. Their claim: the mandatory 15-cent-per-hundredweight dairy checkoff every U.S. producer pays is being used for environmental and sustainability programs the plaintiffs allege fall outside what the 1983 law authorizes (WILL, June 9, 2026).

Dimension1983 Dairy Production Stabilization Act LanguageCurrent DMI SpendingPlaintiffs’ Argument
Authorized purpose“Promotion of the sale and use of dairy products”43.4% ($110.5M) to “Reputation” categorySustainability story ≠ product promotion
Secondary purpose“Research and nutrition education”$57.9M to “Innovation” (Net Zero, FARM ES)Net-zero infrastructure not authorized by law
Core promotionConsumer advertising and market development~$53.7M to consumer promoThis is the only spend plaintiffs consider legal
Oversight mechanismUSDA oversight under AMS Promotion OrderFarmer-elected board; no mandatory public auditOFF Act would add USDA Inspector General audits
Legal doctrine (pre-2024)Chevron deference — courts defer to USDA interpretationUSDA defined scope broadly over 40+ yearsChallengers consistently lost under deference
Legal doctrine (post-2024)Loper Bright — judges read statute independentlyUntested on checkoff programsOpens statutory challenge courts couldn’t take before

What’s Changing and Why

The checkoff isn’t new. Congress built it under the Dairy Production Stabilization Act of 1983, which says the funds “shall be used” for “advertisement and promotion of the sale and use of dairy products,” plus related research and nutrition education (7 U.S.C. ch. 76; Public Law 98-180). The 15-cent rate hasn’t moved in over 40 years. What’s moved, the plaintiffs argue, is the mission.

The lawsuit aims at the Innovation Center for U.S. Dairy — a forum initiated in 2008 by dairy farmers and run by Dairy Management Inc. (DMI) — and three programs under it: the U.S. Dairy Net Zero Initiative, Pathways to Dairy Net Zero, and FARM Environmental Stewardship (FARM ES). The funding link isn’t in dispute. The Innovation Center has said dairy farmers and importers have primarily funded its work through DMI and the national checkoff since its inception (Innovation Center for U.S. Dairy). What’s in dispute is whether building a sustainability story counts as “promotion of the sale and use” of dairy. The suit doesn’t try to kill the checkoff — it asks the court to block checkoff funding of the Innovation Center specifically.

The dollars are real, and they’re big. The checkoff collects more than $350 million annually from producers and importers, per USDA figures cited in the June 2026 complaint. DMI’s 2024 audited financials show $254.6 million in total expenditures once state and regional pass-throughs are counted — and of that, $110.5 million, or 43.4% of the entire budget, ran through a category DMI itself labels “Reputation,” with another $57.9 million booked to “Innovation” (DMI 2024 Annual Report; The Bullvine, May 27, 2026). That’s not advertising milk. That’s work measured partly by whether the public believes dairy farmers are good for the environment.

To be fair to DMI, the organization sees that spending differently. Its position is that reputation and trust work protects long-term demand — that a consumer who trusts dairy’s environmental record keeps buying milk, cheese, and butter for decades. The plaintiffs argue spending in that category drifts from the checkoff’s promotional purpose. That’s the exact disagreement now headed to a federal judge.

How This Plays Out on Real Farms

For Swan, the friction started with that data request. She told Fox Baltimore the letter wanted “herd data, nutrition data, energy data, total terms of natural gas, total gallons of diesel” — “mind you, this is for a whole year,” she said — and that participation didn’t feel optional when she believed her pickup was on the line (Fox Baltimore, Feb. 19, 2026). USDA Secretary Brooke Rollins said publicly she’d investigate the new requirements. As of late June, there’s no public record of what that review turned up — a gap worth watching as the case moves.

Faust isn’t a first-time litigant. He’s the Chilton farmer who, with the Wisconsin Institute for Law & Liberty (WILL), beat the agency in a separate discrimination case in roughly 11 months. Same legal shop. Same farmer. Now pointed at the checkoff. We tracked how that first win came together, and it’s the reason this filing reads differently from the usual coffee-shop grumbling — WILL deputy counsel Daniel Lennington told Brownfield Ag News on May 27, 2026, that the checkoff is “an unconstitutional” use of mandatory funds.

Baird, the third name on the filing, farms near Ferryville in the southwest corner of the state. The complaint describes all three as Wisconsin producers “subject to and harmed by” the mandatory assessment (Cheese Reporter, June 11, 2026) — not activists who went looking for a fight, but farmers who pay the levy every month and want to know what it’s being used for. That’s the thread worth holding onto: this isn’t a fringe case. It’s three working dairies questioning a deduction that automatically hits all of them.

Here’s where it gets concrete. The 15 cents scales straight with volume, so the bigger you milk, the bigger the bill. Run the numbers on a herd averaging about 24,000 lbs per cow per year — adjust up or down for your own rolling herd average — and the assessment lands like this:

Herd sizeApprox. milk shipped/yrAnnual checkoff at 15¢/cwt
200 cows~48,000 cwt~$7,200
500 cows~120,000 cwt~$18,000
1,000 cows~240,000 cwt~$36,000

(Figures assume a 24,000-lb rolling herd average; recalculate against your own production.)

And that’s before the second layer: the practices these sustainability programs are starting to expect.

The Real Cost Isn’t Just the Deduction

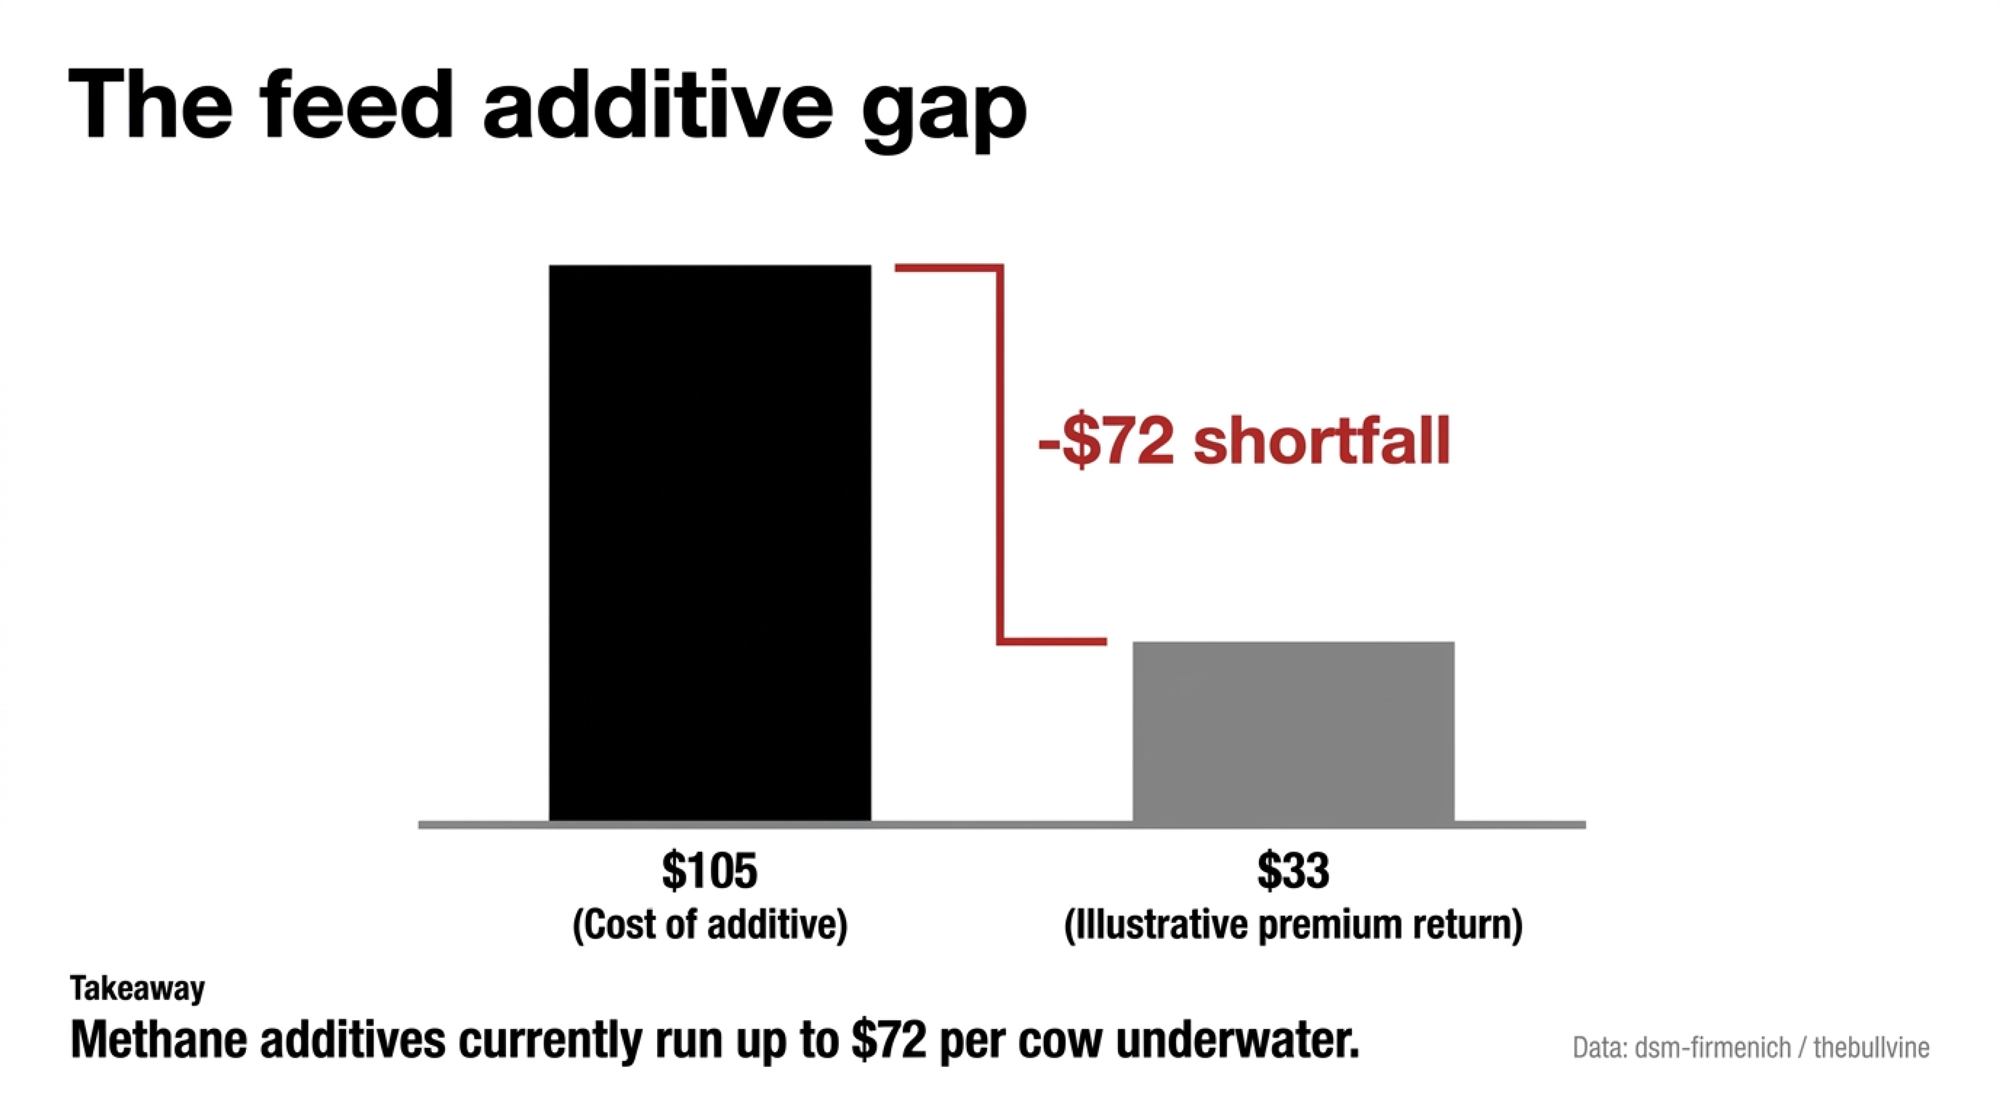
Take Bovaer, the methane-reducing feed additive moving through sustainability channels. Start with the cost. DSM-Firmenich pegs it at roughly $93–$105 per cow per year on a lactating-cow basis — call it about a quarter to thirty cents a head a day (DSM-Firmenich; The Bullvine, June 23, 2026). That’s the bill, and it’s fixed.

Now the return, run at its most optimistic. Elanco has estimated an annual return of $20 or more per lactating cow from feeding Bovaer, drawn from voluntary carbon markets, conservation-program funds, and processor incentives (Elanco, via Dairy Herd Management, Nov. 2024 — note this estimate is over a year old and may have shifted). Add an assumed 12¢/cwt sustainability premium on a cow milking 75 lbs a day and you’d claw back about $33. Even that’s generous, since most documented sustainability and component premiums today run higher per cwt but rarely attach to methane reduction specifically (The Bullvine, Oct. 2025). Call the total documented return $20–$33 per cow — and that’s the friendly read.

So line them up. Cost of $93–$105 against a return of $20–$33 leaves a $60–$85 per-cow gap the system doesn’t close. On a 300-cow herd, that’s an unfunded $18,000 to $25,500 a year. The climate story and the cash-flow story aren’t the same story. We ran the full methane-efficiency-breeding-versus-Bovaer comparison separately — worth a look before you sign anything.

The Mechanics Behind the Outcomes

Most producers treat the 15 cents and the data letter as two separate headaches. They’re not. They’re two ends of one pipe.

Checkoff dollars fund the Innovation Center and the Net Zero infrastructure. That infrastructure builds the measurement standards — FARM ES uses the Ruminant Farm Systems model to estimate a farm’s greenhouse gas footprint (National Dairy FARM Program, June 2025). Here’s how that turns into a letter in your mailbox:

The Leverage Pipeline — how “voluntary” becomes a condition of the sale

1. Your checkoff funds the Innovation Center and its Net Zero / FARM ES measurement standards. 2. Those standardsbecome the yardstick for a farm’s carbon footprint. 3. Your processor or co-op pools your farm-level data to show buyers the supply chain is cleaning up. 4. A buyer like Nestlé or Danone writes sustainability reporting into its purchase contracts. 5. To keep that account, your processor needs your numbers — so a “voluntary” program quietly becomes a practical condition of getting your milk hauled.

No regulation cited in the letter. No law forcing your hand. Just leverage running down the contract chain.

That reach is already wide, and it’s growing. By 2025, 39 cooperatives and processors representing about 77% of U.S. fluid milk had signed the U.S. Dairy Stewardship Commitment — up from 35 companies and 75% in 2022 (Innovation Center for U.S. Dairy, 2025, via Choices magazine). And the people approving how the checkoff spends? It’s a farmer-led board, funded by more than 23,000 dairy farmers plus importers (DMI 2024 Annual Report; Agri-Marketing, April 2026). As of its 2021 report, the board consisted of 41 dairy farmers, 12 importer representatives, and 2 non-voting cooperative seats, and it’s chaired by Pennsylvania dairy farmer Marilyn Hershey, re-elected to lead the checkoff for 2026 (Dairy Checkoff, April 27, 2026). Farmer-controlled on paper. If you want the full picture of where those dollars actually go, we broke down Hershey’s $121 million checkoff bet — and why 76% of it chases cheese and exports. The plaintiffs argue the spending has drifted beyond what farmers signed up for in 1983.

Why This Lawsuit Is Different From the Last 40 Years of Checkoff Fights

If you’ve tuned out every prior checkoff challenge — and there’s been a parade of them — here’s the one reason to look up this time.

Back in 2004, a federal appeals court struck down the dairy checkoff in Cochran v. Veneman, calling it unconstitutional compelled private speech. The win didn’t hold. In 2005, the Supreme Court upheld the beef checkoff in Johanns v. Livestock Marketing Association, ruling that checkoff advertising is “government speech” and therefore shielded from First Amendment attack (Cornell Law School case summary). That doctrine has protected the dairy program ever since. Every speech-based challenge since has run straight into the same wall.

But this case isn’t only a speech case. In June 2024, the Supreme Court decided Loper Bright Enterprises v. Raimondoand overruled the 40-year-old Chevron doctrine (U.S. Supreme Court, 603 U.S. 369, 2024). Here’s the tractor-cab version: judges no longer have to take USDA’s word for what a statute means. They read it themselves. So a court can now look at the 1983 law’s actual language — “promotion of the sale and use of dairy products” — and ask whether funding net-zero infrastructure honestly fits, without deferring to the agency running the program. That’s a statutory question, not a speech question. It sidesteps the wall that stopped everyone before. No court has tested it on a checkoff yet. It’s an opening, not a verdict.

The Global Playbook: What U.S. Farmers Can Learn from Canada and the EU

DimensionUnited StatesCanadaEuropean Union
Funding mechanismMandatory 15¢/cwt federal checkoff (USDA order)Provincial levies via supply management marketing boardsEU Common Agricultural Policy (taxpayer-funded co-financing)
2024/25 budget~$350M+ collected annually (USDA, per complaint)DFC-administered; $7.5M+ federal top-up in 2023€160M co-financing for 2026 promotion budget
Sustainability commitmentNet Zero by 2050 — Innovation Center / FARM ESNet Zero by 2050 — “We’re In” campaignClimate-linked CAP payment conditions for farmers
GovernanceFarmer-elected board; 41 farmers + 12 importers (as of 2021)Producers hold direct provincial board seatsEuropean Commission approval; NGO/parliamentary pressure
Active legal challengeSwan v. Rollins — June 9, 2026 (Eastern District, Wisconsin)None equivalentNone equivalent; pressure runs opposite direction
Key legal leverLoper Bright (2024): courts read statute independentlySupply management consent structure differsRegulatory, not judicial
“Voluntary” pressure dynamicProcessor data requests tied to pickup contractsLess documented at farm levelNGOs and buyers push for more strings on CAP payments

To see where this “reputation-first” pipeline eventually leads, American producers only have to look across the border and over the Atlantic. Two mature systems, two very different answers on who controls the money — and both are instructive for what’s coming down the U.S. contract chain.

Canadian producers fund promotion too, but the structure is different enough that the same fight hasn’t erupted north of the border. Dairy Farmers of Canada (DFC) runs producer-funded promotion and has committed the Canadian sector to net-zero greenhouse gas emissions by 2050, backed by its “We’re In” sustainability campaign featuring real farmers (Dairy Farmers of Canada, 2023). Ottawa has chipped in too — over $7.5 million to DFC for sustainable dairy development in 2023 (Government of Canada, July 2023). (Canada-specific figures — don’t read these across to U.S. operations.)

The difference is governance. DFC’s levies flow through provincial marketing boards under supply management, where producers hold direct seats and the money is collected at the provincial level rather than through a single federally mandated USDA-style order. That’s why you haven’t seen a Canadian compelled-funds lawsuit mirroring Swan v. Rollins — the consent-and-control mechanics differ, even though the sustainability-spending direction looks strikingly similar.

Europe is almost the mirror image. The EU’s 2026 farm-promotion budget — €160 million in co-financing — isn’t a mandatory producer levy at all; it’s largely Common Agricultural Policy money, meaning taxpayers, not a milk-check deduction (European Commission call for proposals, Jan. 2026). And the pressure there comes from NGOs and parliamentarians who want more climate strings attached to the money, not from farmers suing to keep climate spending out. Mirror image of Wisconsin. Same global sustainability current, three very different fights over who controls the cash (European Commission, 2026; Regulation 1144/2014).

How Much Is This Really Costing Your Balance Sheet?

Start with what you can see. The 15-cent assessment is fixed and printed on every milk statement. What’s harder to see is the second layer — the practices and reporting the sustainability programs increasingly expect, with Bovaer just the most-quoted example. More buyer requirements are coming, and they don’t show up as line items until they’re already conditions of the sale.

The deeper problem is that the accountability runs one direction. The money is mandatory. Transparency is optional — you can request DMI’s budget breakdown, but no one pushes it to you (DMI Budget & Financials page). And there’s no rule anywhere requiring that a checkoff-funded obligation come with a documented, farm-level return that actually covers its cost. That’s the real gap. Not whether sustainability matters — but who’s on the hook when it costs more than your milk check can carry.

Is Your Co-op Routing Your Money Somewhere You Didn’t Choose?

Worth knowing, and most producers haven’t checked: of your 15 cents, you can direct up to 10 to a qualified state or regional program where farmer-elected boards steer the spending. The remaining nickel flows to DMI nationally (per the USDA AMS Dairy Promotion and Research Order). Do you know which path your dime takes — directed by people you can call, or dropped into the national pool by default?

Put numbers on it. On a 500-cow dairy paying about $18,000 a year, the directable 10-cent share is roughly $12,000, with the national nickel running near $6,000. Scale that to 1,000 cows, and you’re looking at about $24,000 you could be steering locally versus $12,000 pooled nationally. One phone call to your milk handler settles where yours actually lands. That’s a this-month job, not a someday one.

Options and Trade-Offs for Farmers

There’s no single right move here. Some of this you can do this month with one phone call. Some of it is a longer game. Sort them that way.

Practice / ObligationAnnual Cost/CowDocumented Return/CowNet Gap/CowGap on 500-Cow HerdReturn Source Reliability
Bovaer (methane additive)$93–$105$20–$33$60–$85$30,000–$42,500Low — carbon markets volatile; premiums not broadly attached to methane reduction
FARM ES data collectionStaff time + audit cost (~$5–$15 est.)$0 documented farm-level premium~$5–$15~$2,500–$7,500None published at farm level
Annual checkoff assessment$18,000 (500 cows, 24k lb RHA)No direct farm-level return guaranteedFull amount$18,000Indirect only (market development)
Genetics for methane efficiency$0–$8/cow higher semen cost (est.)Compounding herd improvement; no direct premium yetNeutral to slight positiveNeutralEmerging — no contract premium attached as of 2026
Carbon footprint audit (1-yr records)~$500–$2,000 in time/records prep (est.)$0 guaranteed; possible future credit access$500–$2,000$250,000–$1,000,000Speculative; market access not guaranteed

Do this in the next 30 days:

  1. Verify your assessment routing. Pull your last three milk statements and ask your handler where your 10-cent state credit lands. Costs nothing, risks no relationship, takes one call. The limit: it tells you where the money goes, not what it buys.
  2. Request the budget breakdown. Ask your checkoff rep or co-op for the split between consumer promotion, “Reputation”/sustainability, and overhead. Makes sense if you want to judge ROI for your own herd type. The catch: the categories are self-reported, so read them with a skeptical eye.
  3. Make one policy call. The OFF Act (Opportunities for Fairness in Farming Act) would force USDA Inspector General audits and public budgets for the big checkoffs (Farm Action Fund). A call to your senator’s office costs nothing and spends zero co-op goodwill. The downside: it hasn’t passed, and Washington moves slowly.

Play the longer game:

  • Watch the lawsuit — and weigh involvement carefully. Swan et al. v. Rollins is filed in the U.S. District Court for the Eastern District of Wisconsin, and WILL has posted the full complaint publicly. Litigation like this realistically takes 18 to 30 months before any ruling changes how the program runs. Getting publicly involved means a visible disagreement with the organizations tied to your milk check. That’s a real cost, not a small one — and only you know your own relationships.

Key Takeaways

  • If you’ve never checked where your 10-cent state credit goes, call your milk handler this month — on a 500-cow herd that’s roughly $12,000 either steered locally or pooled nationally.
  • If a sustainability program asks for a year of farm data, ask straight out: is participation tied to whether my milk gets picked up, and who owns the data once I hand it over?
  • Before you adopt any checkoff-promoted practice, run the per-cow math first. If the cost (Bovaer’s ~$93–$105/cow) outruns the documented return (~$20–$33/cow), find out who’s covering the $60–$85 gap before you sign.
  • If you want the assessment’s spending audited, the OFF Act is the existing vehicle — a constituent call is the cheapest pressure you can apply.
  • Track the Swan v. Rollins timeline, but plan to keep paying the 15 cents regardless of how it lands for the next year and a half.

Abby Swan is still shipping milk. Still paying the 15 cents, same as you, while her name sits on a federal docket that won’t see a ruling for a year or more. So here’s the question worth carrying into your next co-op meeting: do you actually know what your mandatory 15 cents is buying — and whether the practices it’s nudging you toward still pencil out at the milk price you’re getting paid right now? Most producers have never run that number. Swan, Faust, and Baird did, didn’t like the answer, and handed it to a judge.

THE BULLVINE INTERACTIVE

Calculate Your Herd’s True Checkoff Cost & Sustainability Deficit

1. Enter Your Herd Metrics

2. Your Farm Financial Impact

Annual Checkoff Tax Total automatic 15¢/cwt deduction
$0
Funded to “Reputation” Your 43.4% non-advertising share
$0
Your Directable Local Dime Max up to 10¢ state/regional pool
$0
Unfunded Sustainability Deficit Bovaer gap ($60–$85/cow average)
$0

Calculations derived from DMI 2024 audited books & processor sustainability contract models.

Complete references and supporting documentation are available upon request by contacting the editorial team at editor@thebullvine.com.

Learn More

The Sunday Read Dairy Professionals Don’t Skip.

Every week, thousands of producers, breeders, and industry insiders open Bullvine Weekly for genetics insights, market shifts, and profit strategies they won’t find anywhere else. One email. Five minutes. Smarter decisions all week.
NewsSubscribe
First
Last
Consent

38 Workers Gone in Days: Why H-2A’s 350-Day Fix Falls 15 Days Short

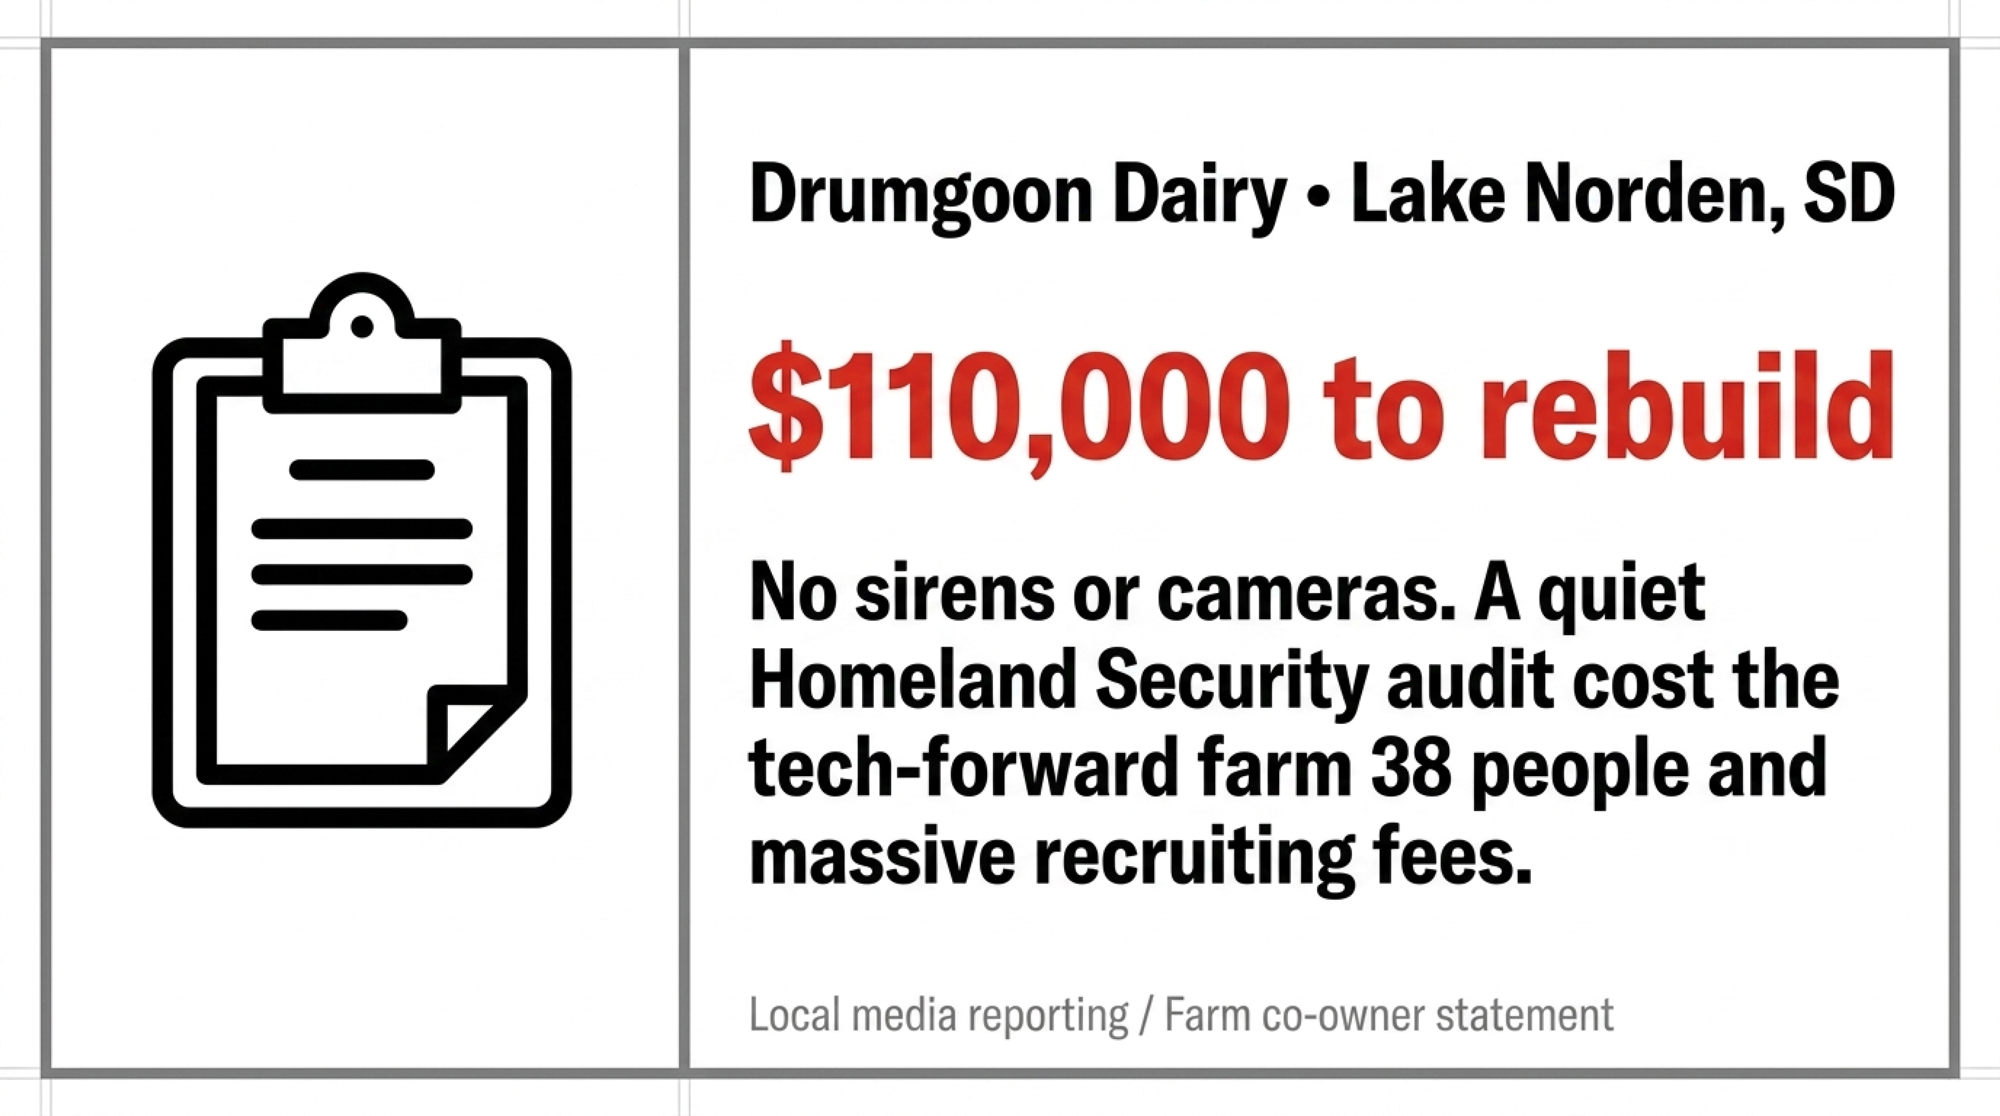
One I-9 audit took Drumgoon Dairy from 50-plus workers to 16. Washington just opened H-2A to dairy—but it caps at 350 days, and milking never stops. Where’s your breakeven on day four?

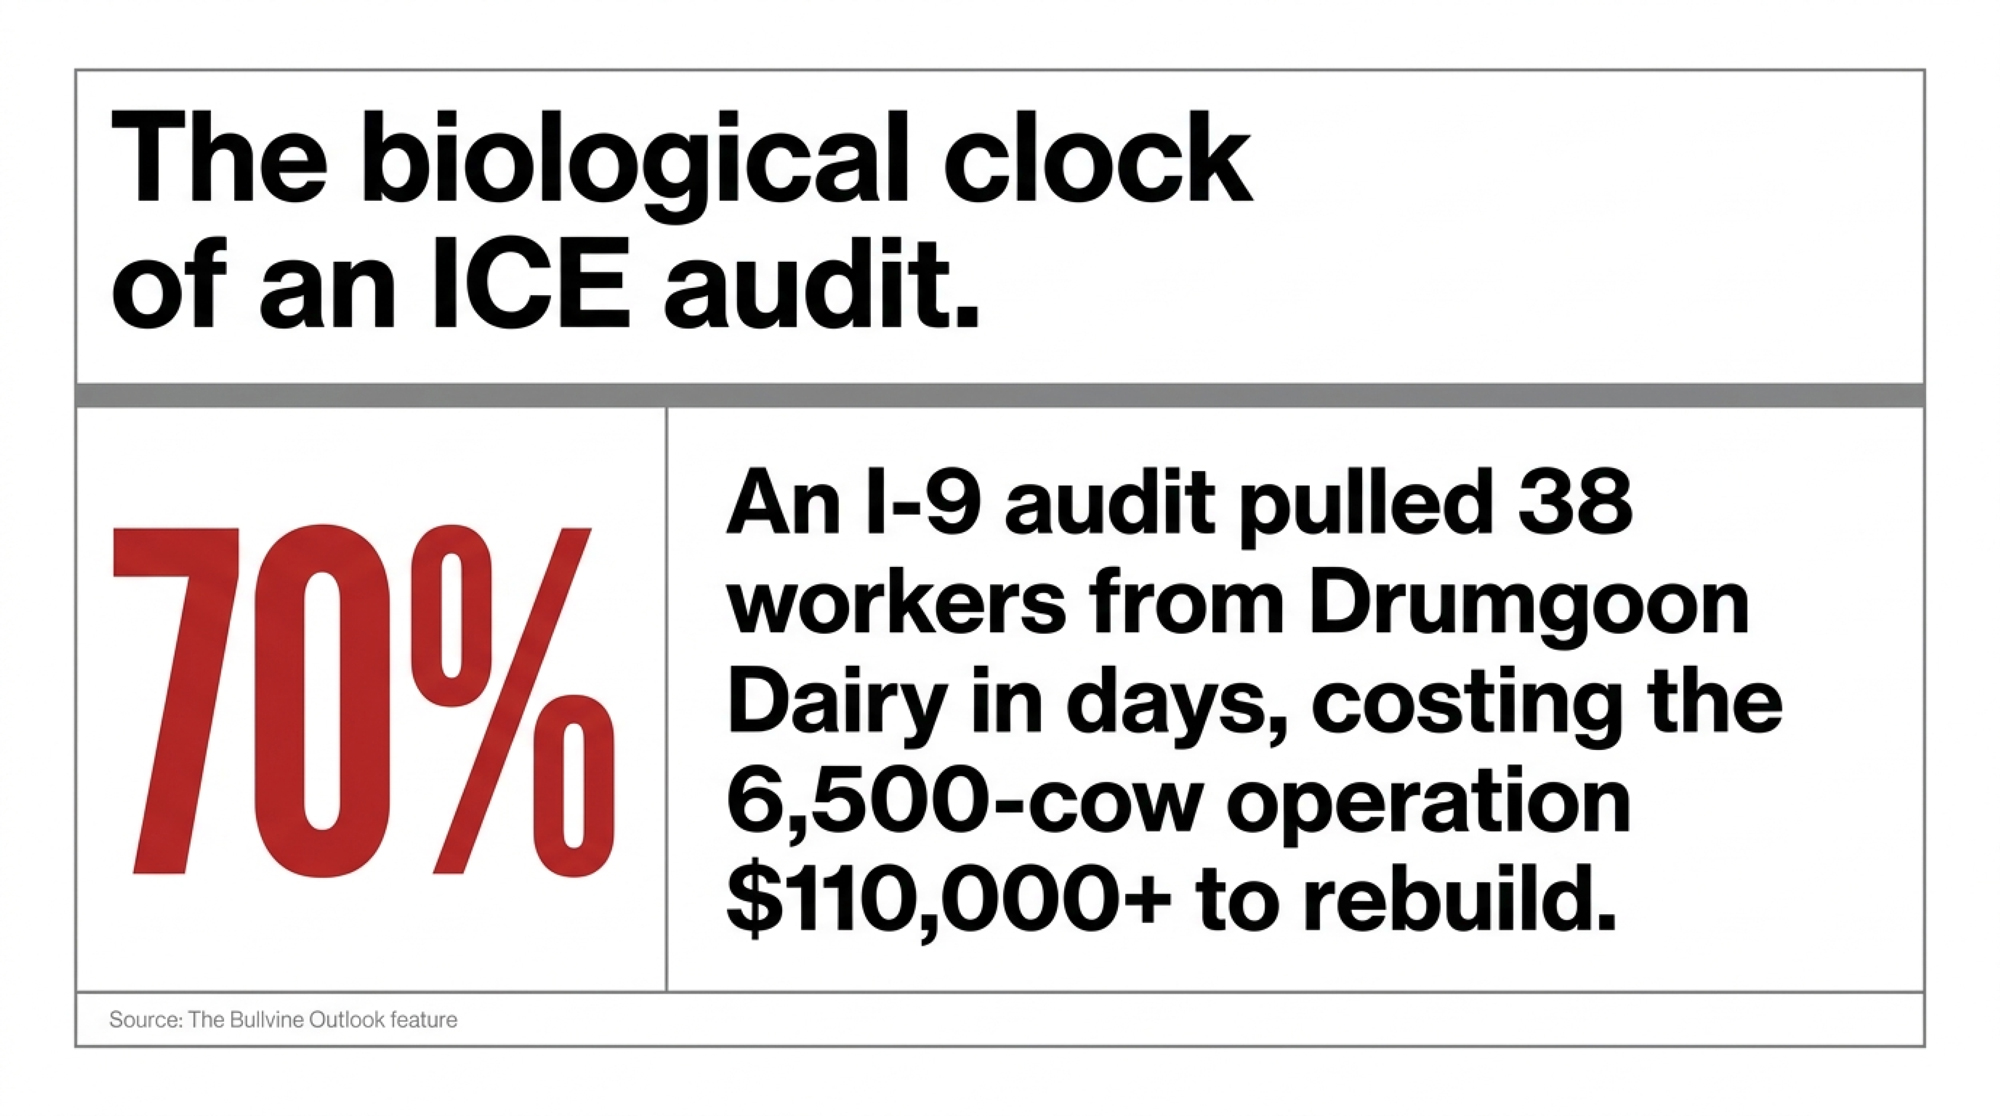
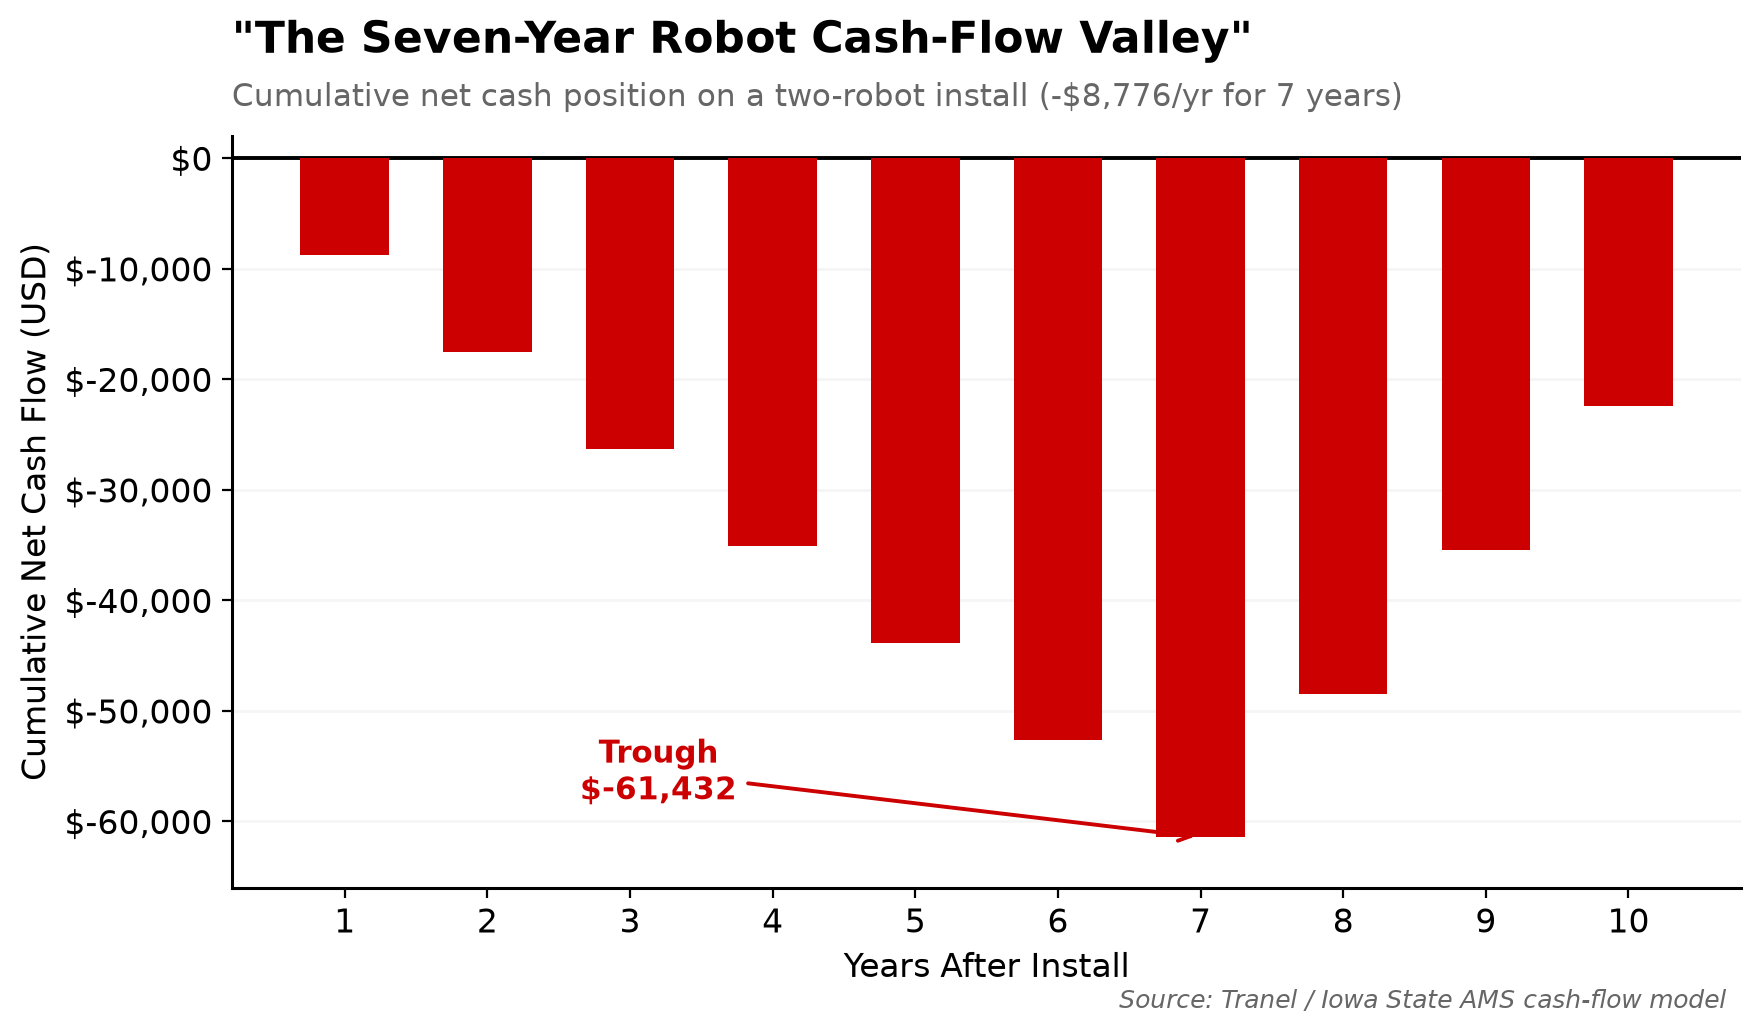
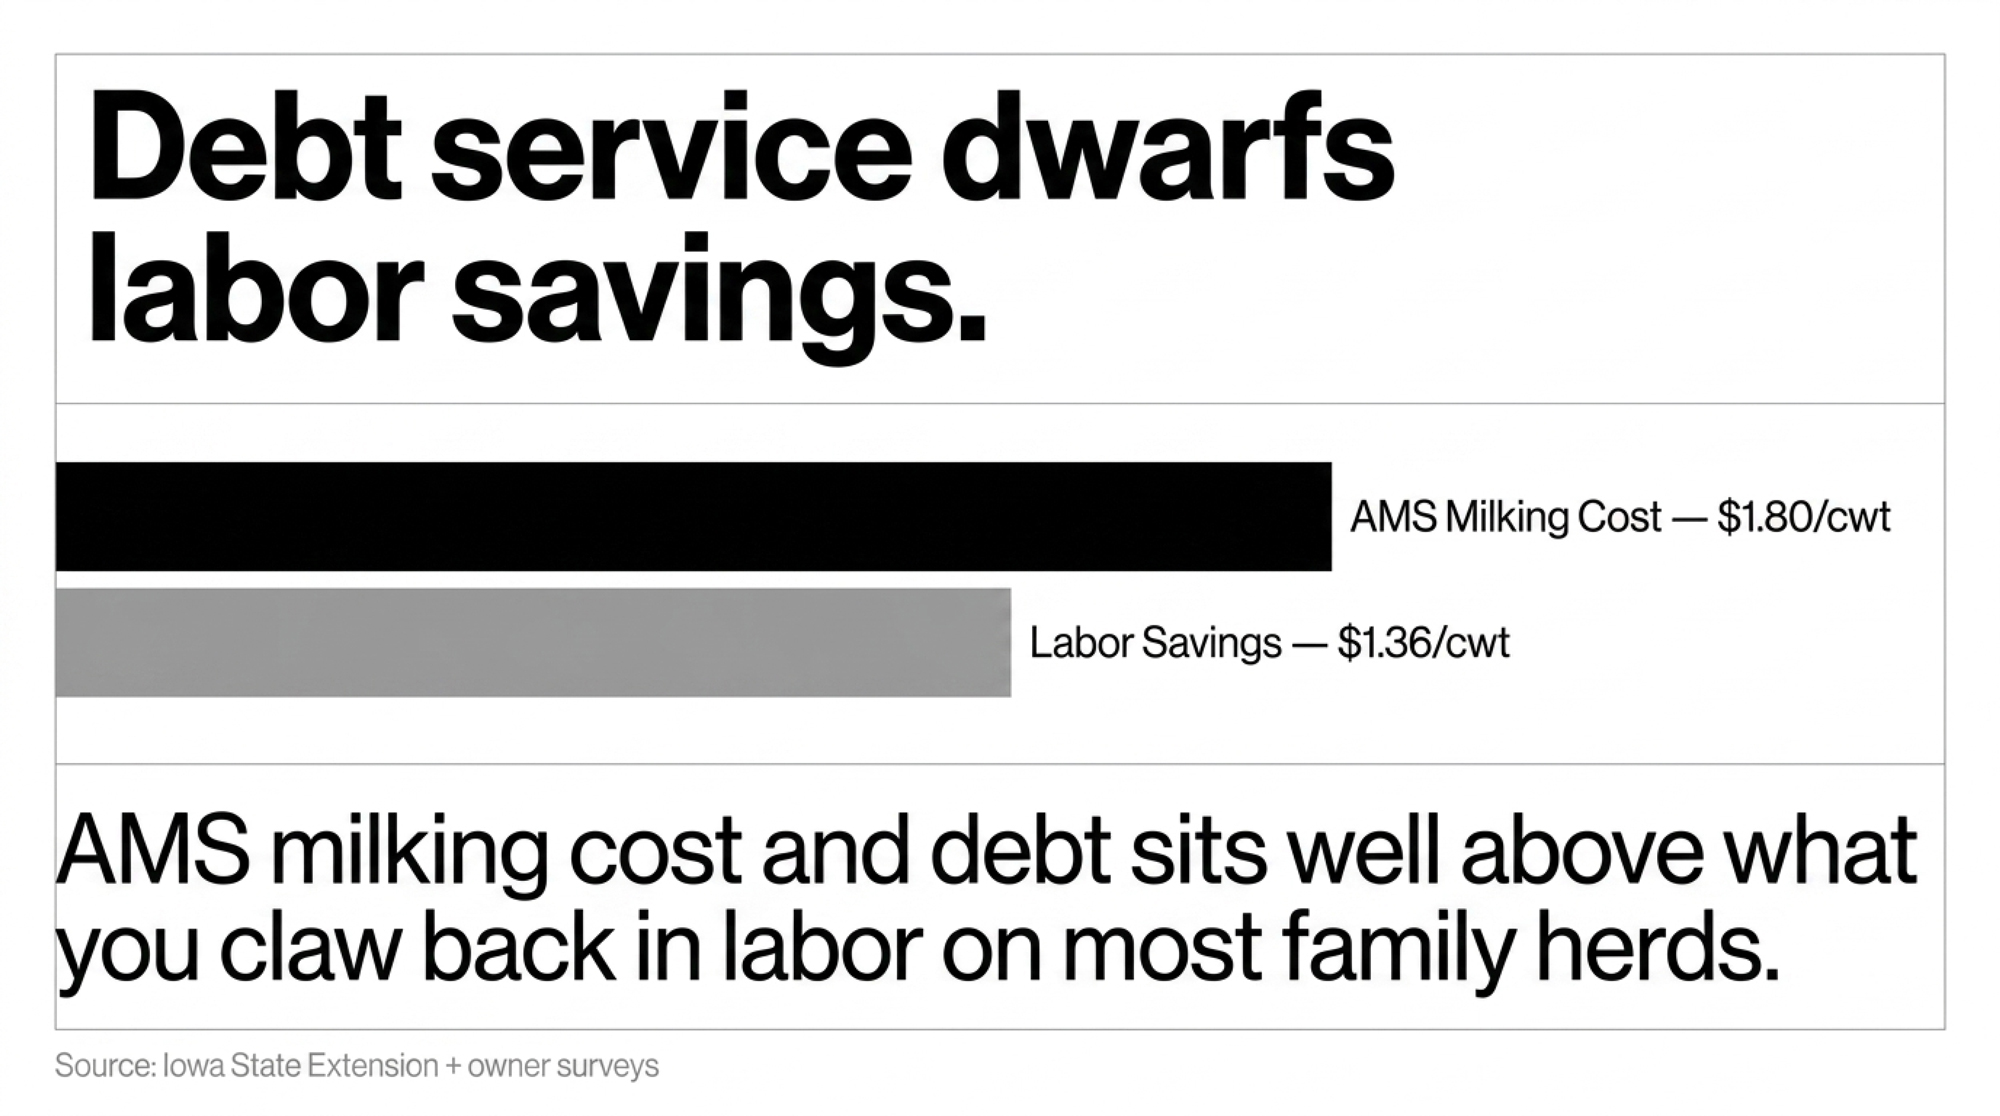
Executive Summary: One I-9 paperwork audit dropped South Dakota’s Drumgoon Dairy from 50-plus workers to 16 in a matter of days — 38 people gone, and a $110,000 bill to rebuild the crew. Washington’s answer landed June 17, 2026: USDA, DOL, and DHS jointly opened H-2A to dairy, and the SAWA bill would redefine “temporary” as a 350-day contract. But milking is a 365-day job with no off-season, so you’re 15 days short of the work by design, and H-2A still takes 75 to 120 days to land a replacement. This hits the operations that produce roughly 79% of U.S. milk on immigrant labor — mostly mid-size and smaller herds without the balance sheet to automate out of it. Run the barn math before Congress does: at the FARM Program’s 38.8% turnover average, a 20-person crew loses about eight people a year, which is why retention — not a temporary visa — is the cheapest labor lever you can pull this month. Robots aren’t the escape hatch either; USDA’s ERR-356 pegs the net-return gain at about 13%, but Larry Tranel’s models show roughly seven years of negative cash flow first, and Drumgoon’s 20 robots didn’t keep it whole. The real question isn’t whether H-2A helps at the edges — it’s how many days your parlor runs if you lose a third of your crew next Thursday.

H-2A for dairy

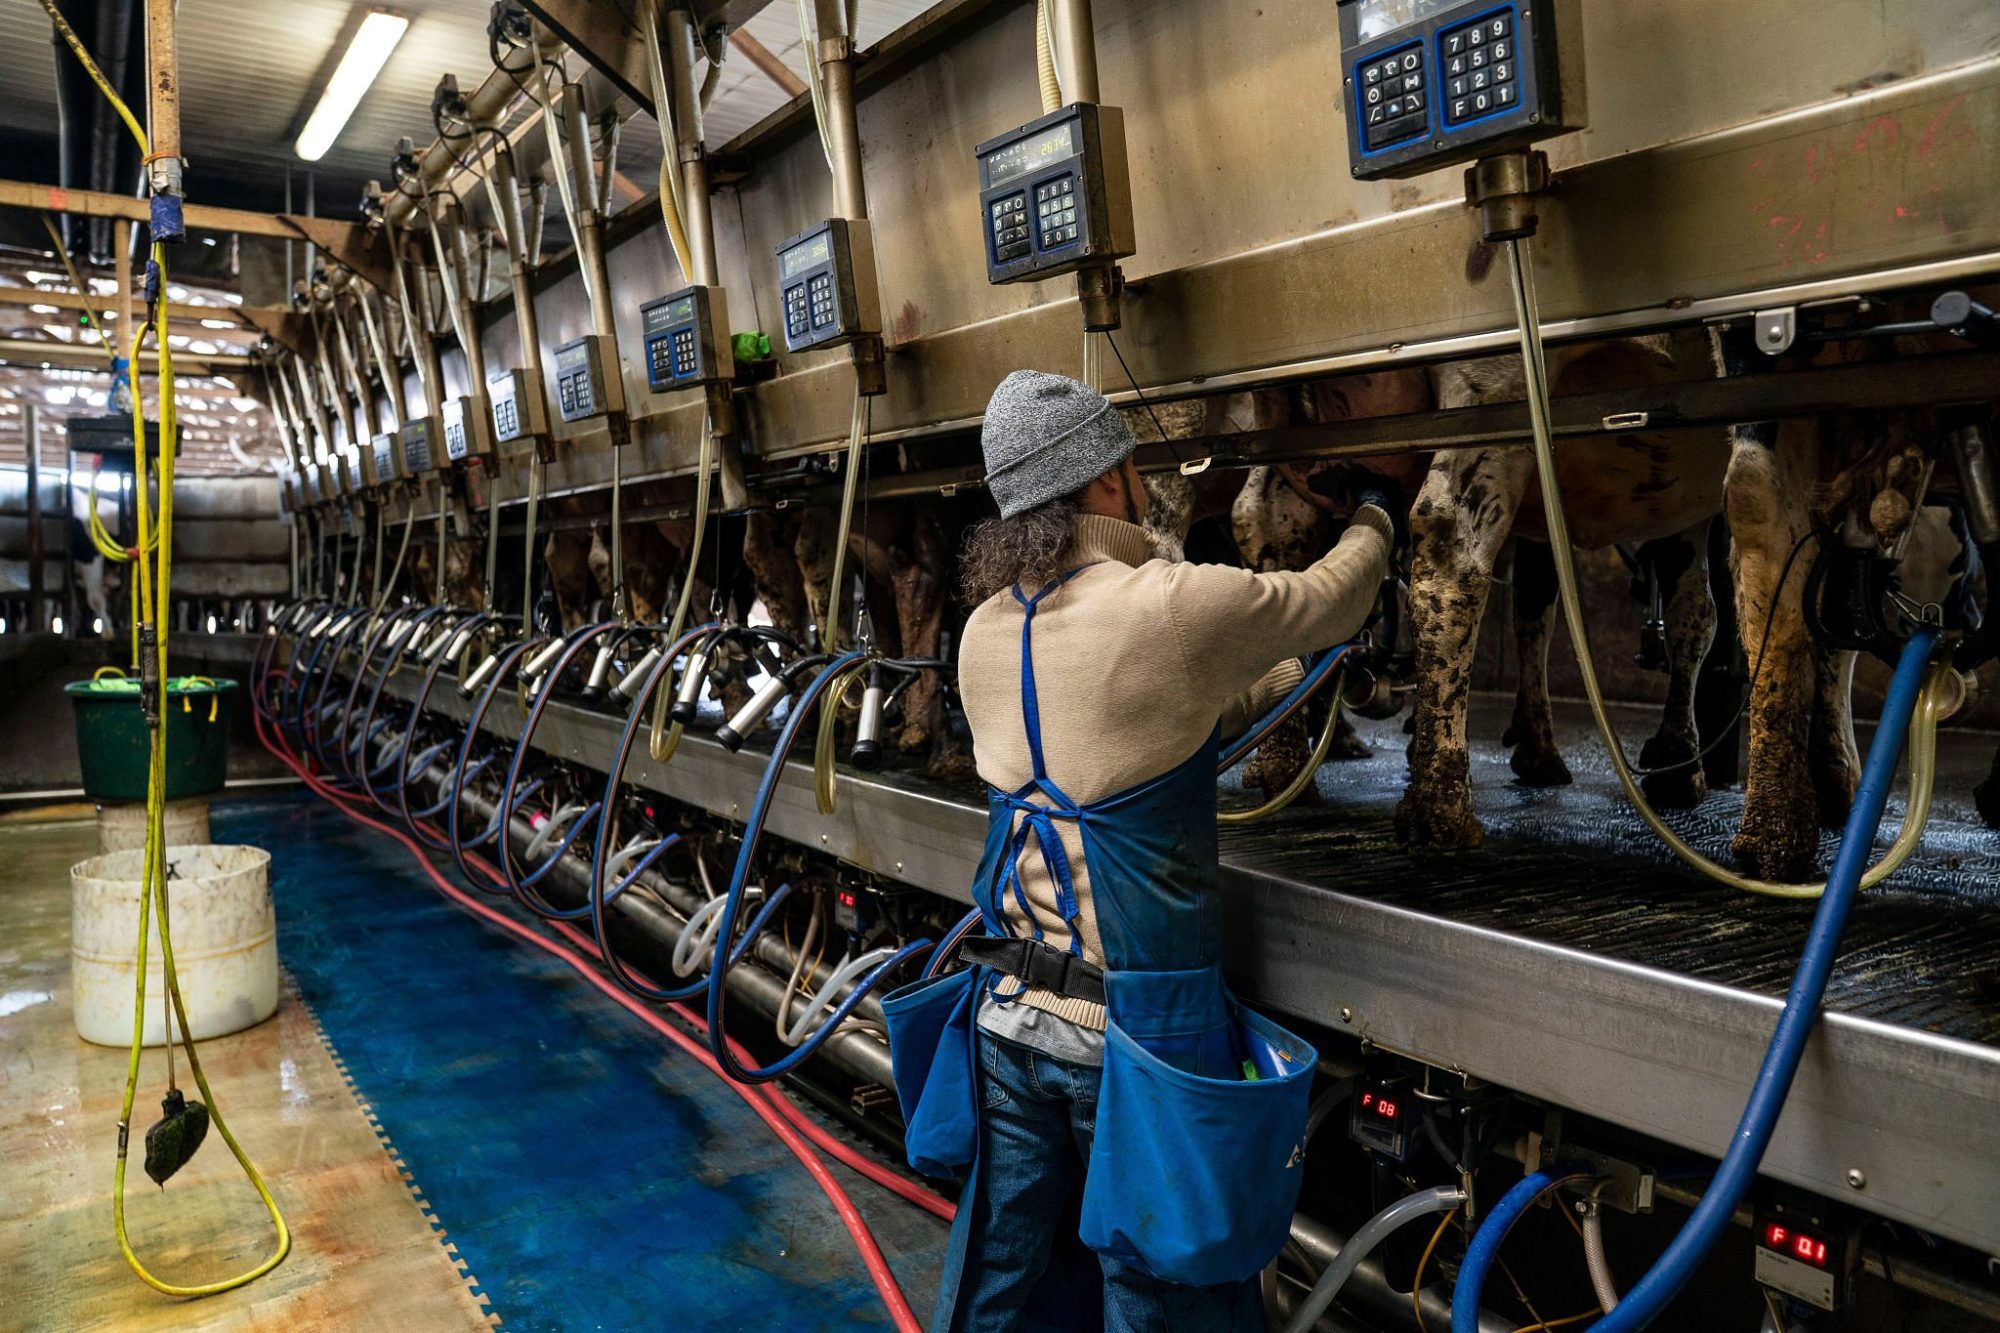
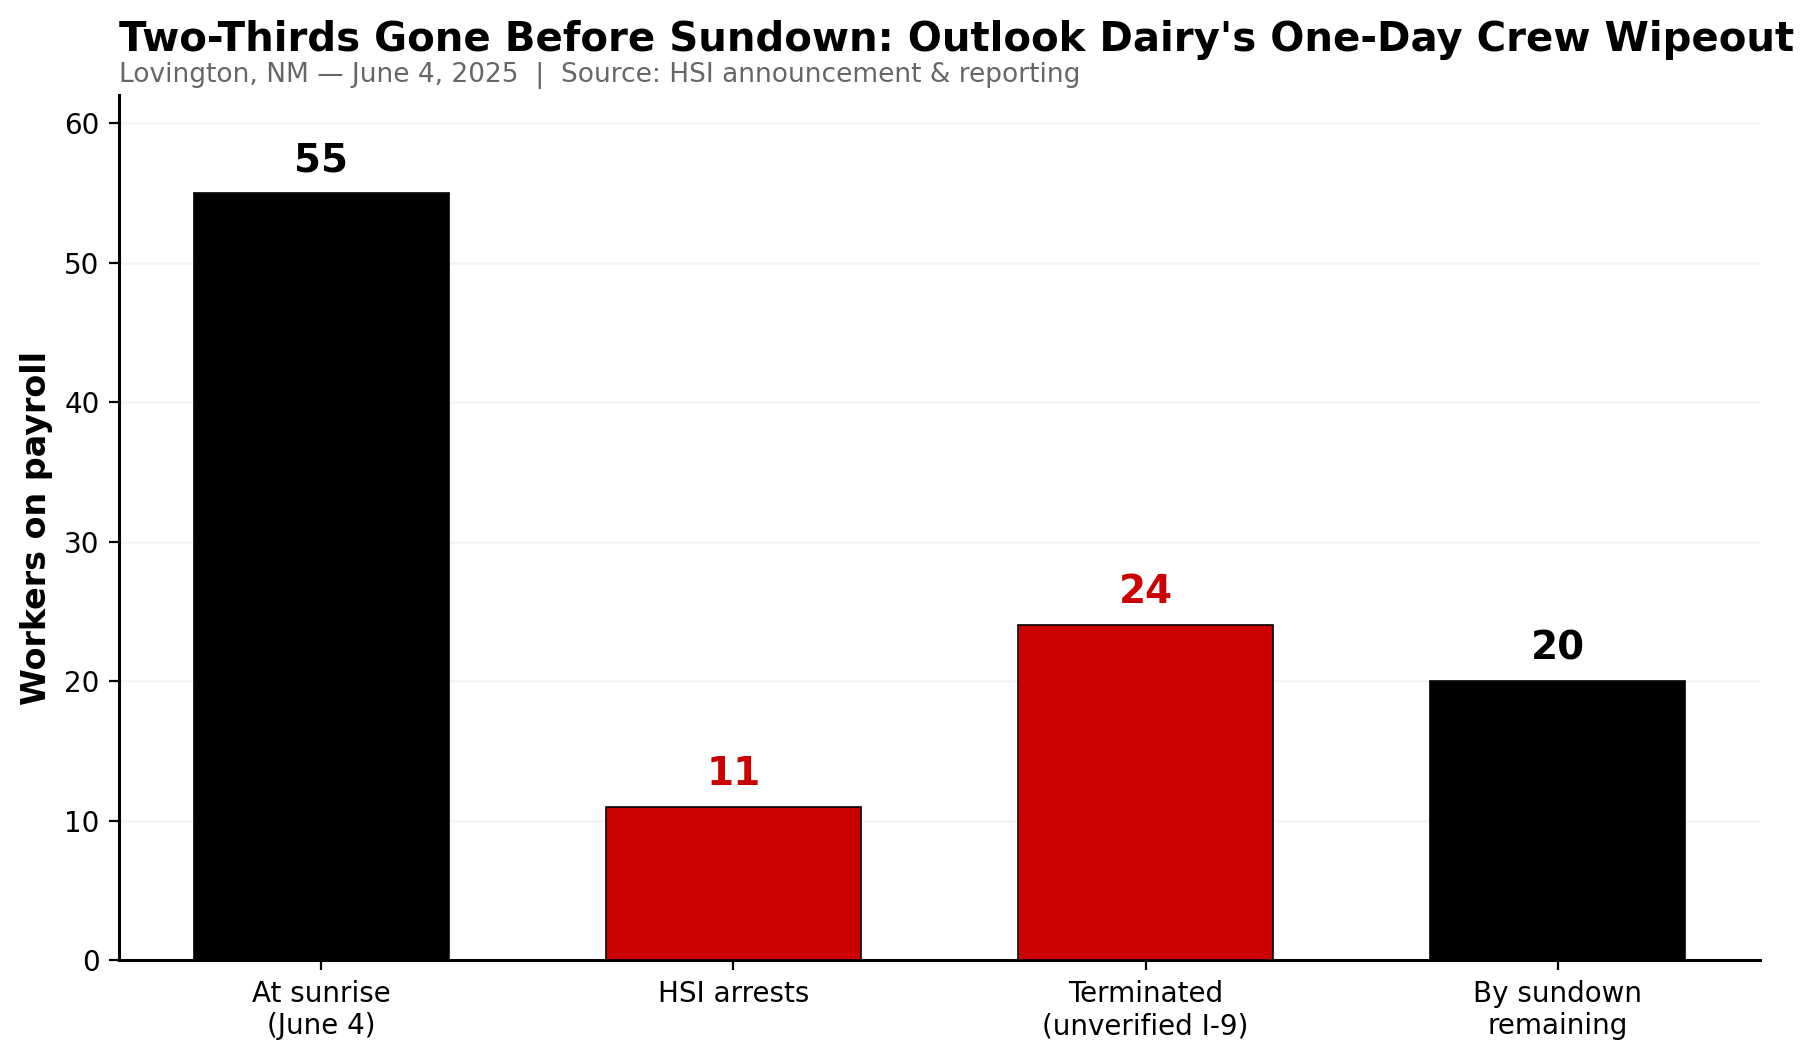
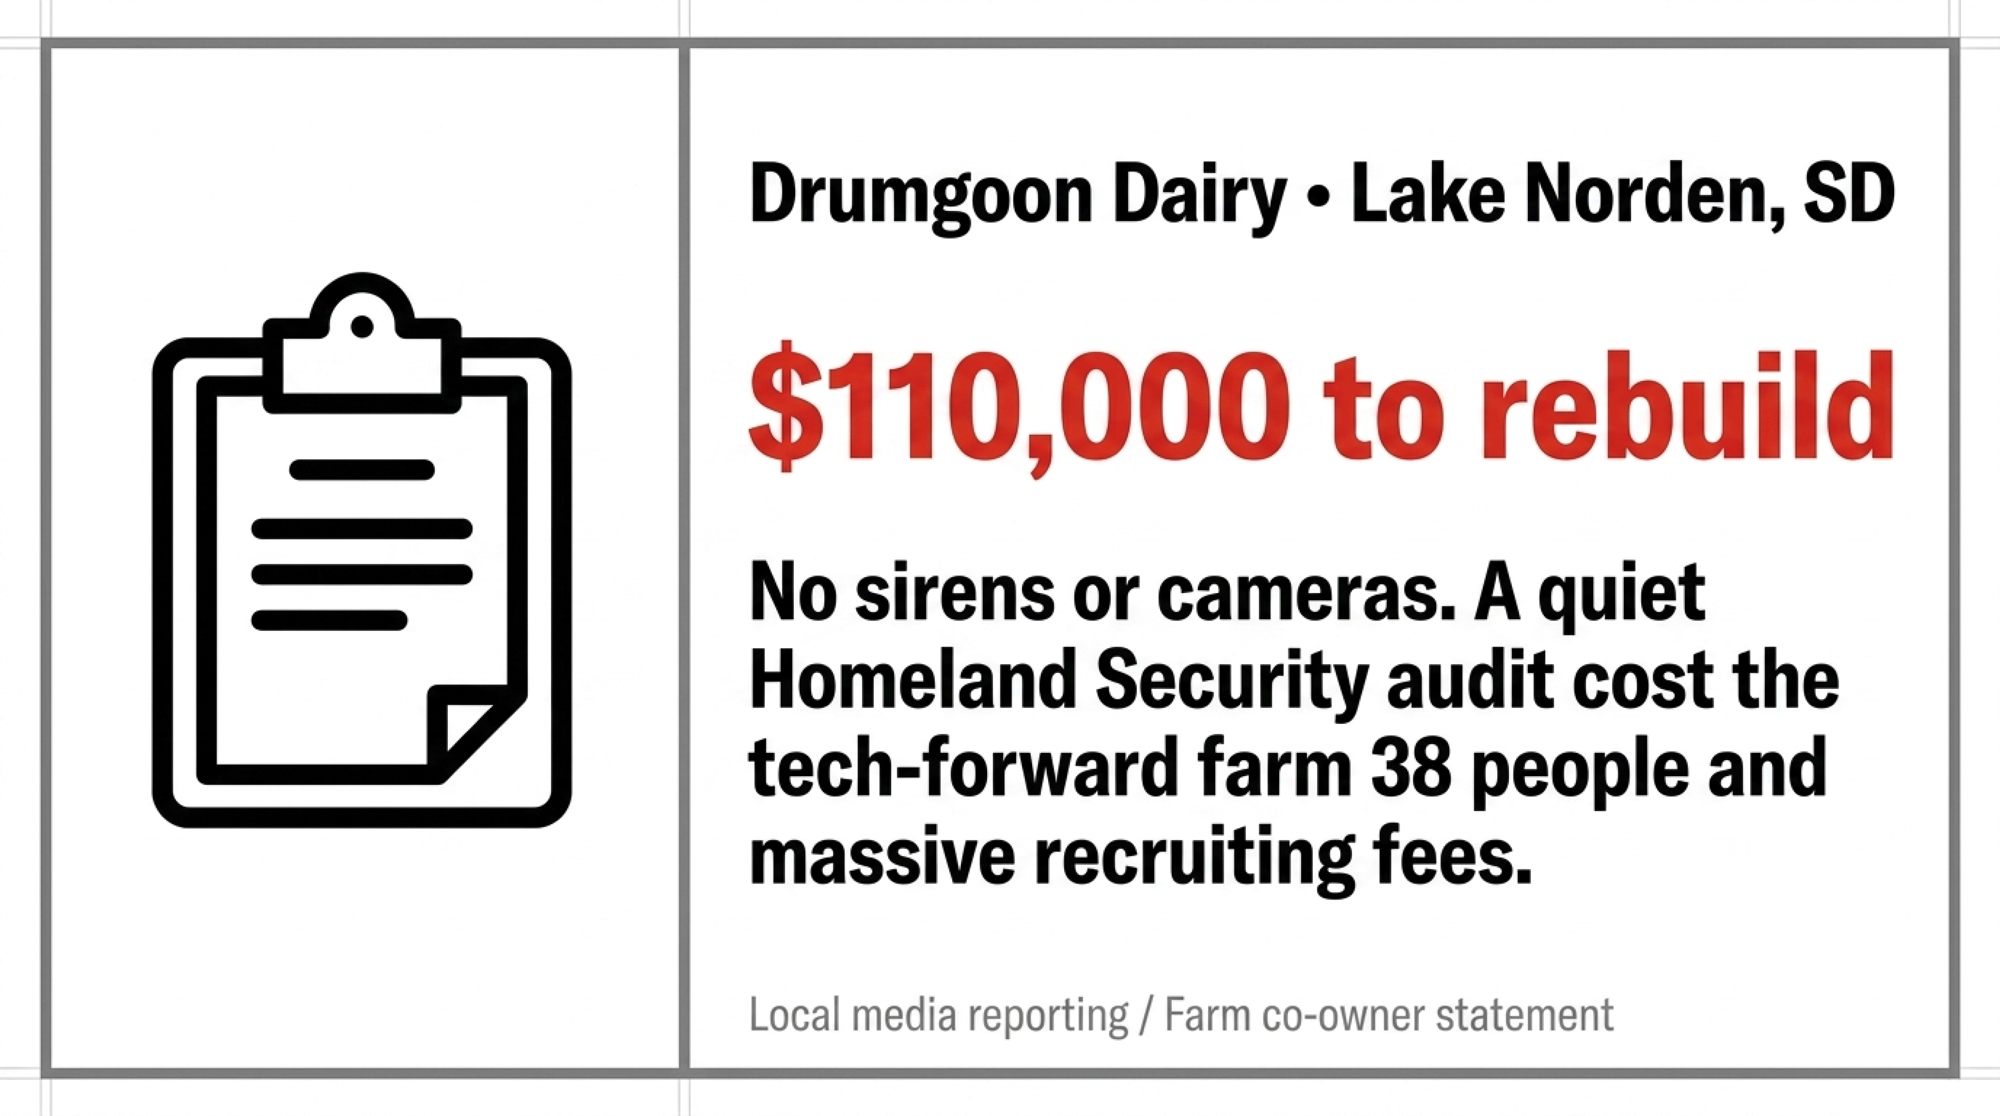
Rodney and Dorothy Elliott left a 140-cow farm in Northern Ireland nearly 20 years ago to build something bigger near Lake Norden, South Dakota. By 2026, Drumgoon Dairy was milking 6,500 cows with 20 robots and a crew of more than 50. Then a federal Homeland Security I-9 audit hit in late May 2025, and co-owner Dorothy Elliott told Northeast Radio SD that the farm let 38 employees go after the audit flagged their documents as “inaccurate, outdated, or incomplete proof of U.S. citizenship or permission to work.” Total staff fell from over 50 to just 16. No agents at the gate — just an envelope, a Notice of Inspection, and three business days to produce papers that didn’t hold up. 

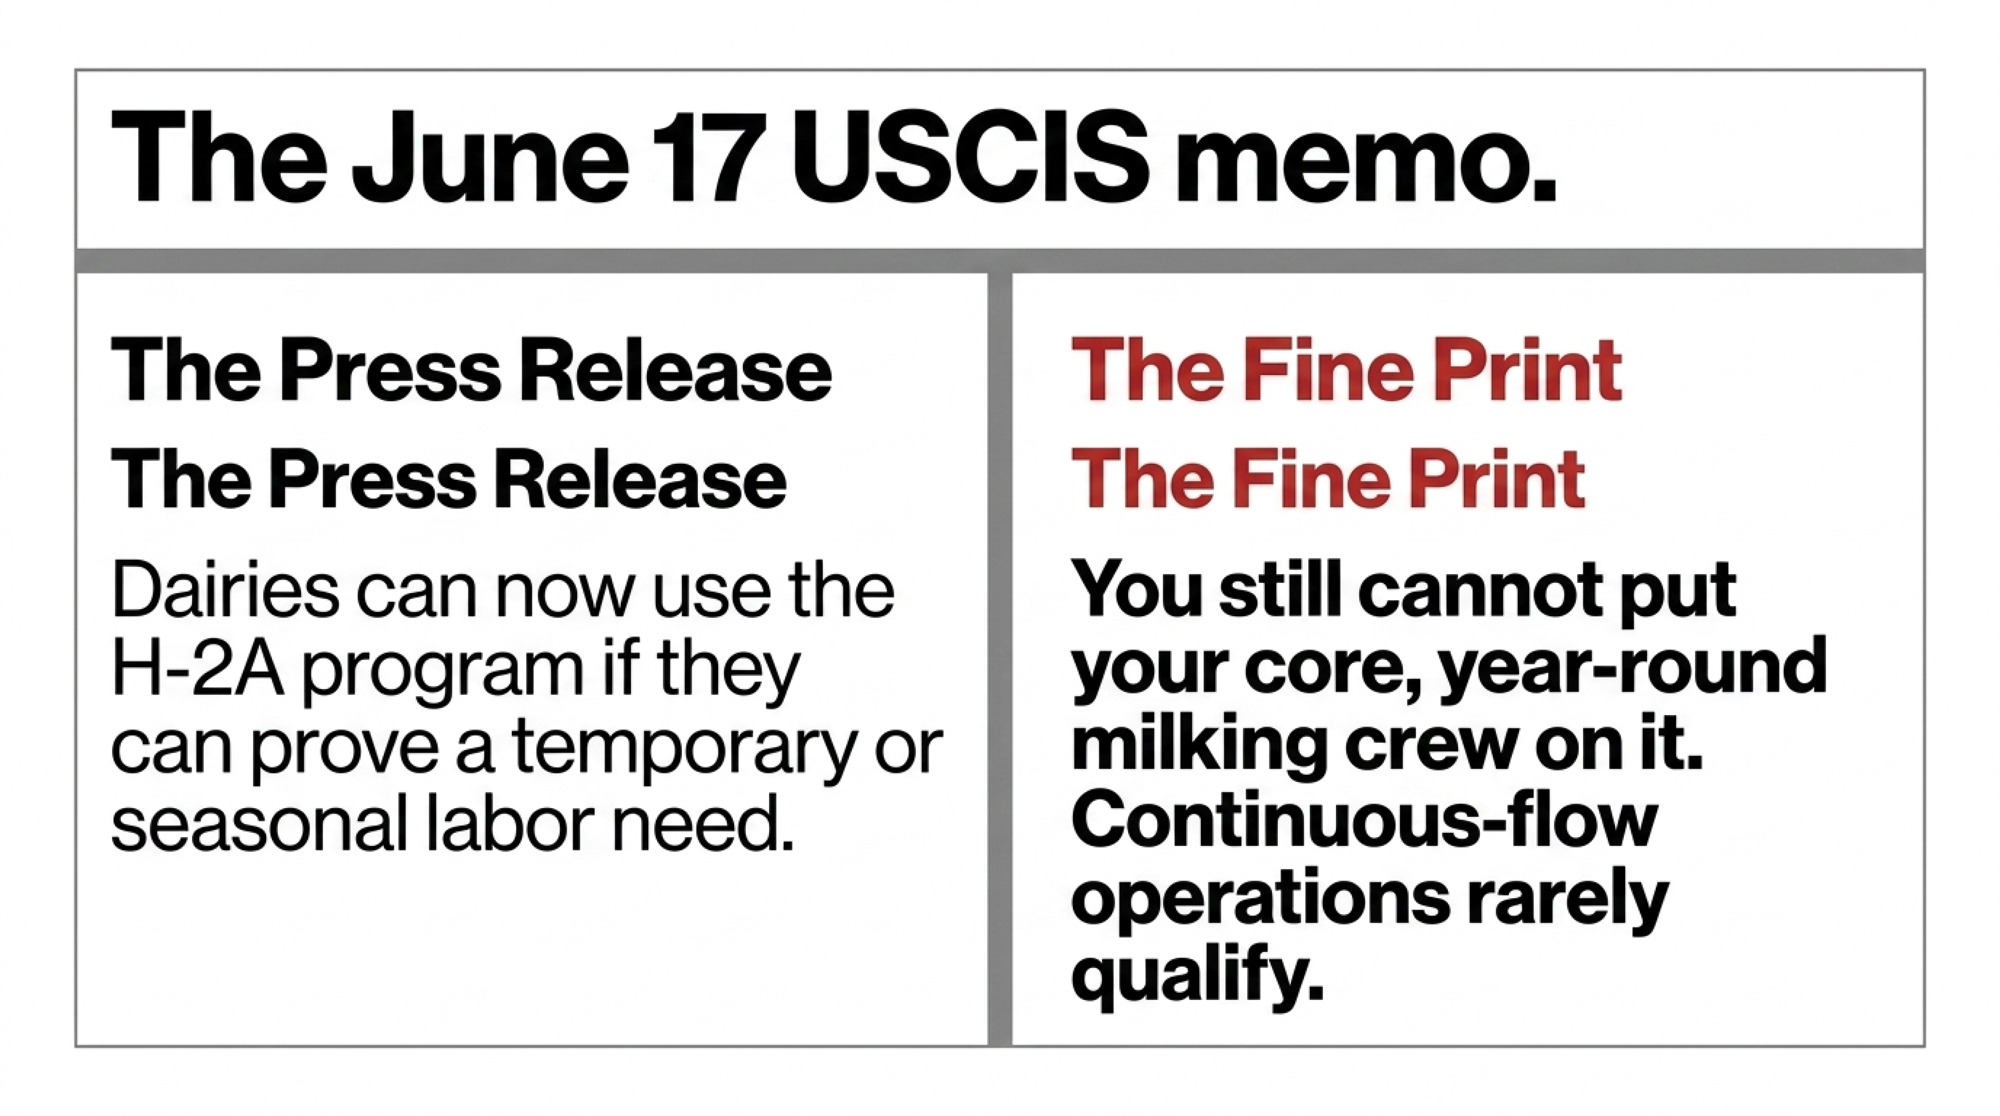
Worth being precise about what that was, because the next farm’s story in this piece is different. An I-9 audit isn’t an immigration raid — it’s a paperwork inspection, and the employer, not the workers, is the legal target. If you milk cows for a living, that scenario still sits in the back of your head every time another immigration headline scrolls past. And here’s why it matters this week: on June 17, 2026, USDA, the Department of Labor, and DHS jointly clarified that dairy farms can finally tap the H-2A guest worker program. Sounds like the cavalry showing up. But the fix is built on a contradiction nobody’s actually solved — H-2A is a temporary or seasonal program, and milking is the most year-round work there is. 

The short version: this helps at the edges. The longer version is worth your time.

What’s Changing and Why

For decades, dairy was effectively locked out of H-2A. By statute, the program is for work “of a seasonal or temporary nature,” and that language was written with crops in mind. A crew shows up for harvest, the harvest ends, the crew goes home. Dairy doesn’t work that way. Cows get milked Christmas morning the same as any Tuesday in April. 

The June 2026 guidance changed the interpretation, not the law. Dairy farms can now petition for H-2A workers if they can show a qualifying temporary or seasonal need, assessed on a case-by-case basis. The bigger swing is in Congress. The Securing Agriculture’s Workforce Act (SAWA), introduced by House Agriculture Committee Chairman Glenn “GT” Thompson, would drop the “seasonal” requirement outright and redefine “temporary” as a contract of 350 days or less. To be fair to its backers, the bill also caps how much wage rates can swing year to year and builds an online application portal — real administrative wins over today’s clunky system. What it won’t do is offer anyone a path to citizenship. 

So who’s most exposed here? Mid-size and smaller herds that lean on a handful of skilled, long-tenured people and don’t have the balance sheet to automate their way out. Immigrant workers make up about 51% of all hired dairy labor, and farms that employ them produce roughly 79% of U.S. milk. That’s not a niche corner of the industry. That’s the floor the whole thing stands on. 

MetricFigureWhy it matters
Immigrant share of hired dairy labor51%Half the workforce sits under this policy question
U.S. milk from farms using immigrant labor79%Not a niche—the industry’s floor
Est. milk production drop if that labor vanished~25%Worst-case bookend, not a forecast
Est. retail milk price rise in that scenario~90%Consumer-facing shock built on a labor gap
H-2A time to land a replacement worker75–120 daysNo futures contract hedges that hole

How This Plays Out on Real Farms

On the ground, “demonstrating temporary need” means slicing a year-round operation into pieces that look seasonal on paper. Attorneys are advising dairies to file H-2A petitions for fieldwork crews, silage harvest, manure hauling, surges in heifer raising, or to cover a worker out on extended leave. Cornell Agricultural Workforce Development put it plainly: dairy can participate “for temporary or seasonal jobs,” but “permanent or lengthy and consecutive jobs are not eligible.” 

You see the problem. A farm writes up a job description that says “forage crew” for someone who’s been in the parlor since February. The cows don’t read the petition, and neither does a DOL auditor. Stretch the description to fit the program, and you’ve handed an auditor a thread to pull — immigration attorneys warn that petitions which don’t match the actual work invite denial and added scrutiny. Honest operators get squeezed from both sides. Describe the job accurately, and you don’t qualify. Bend it toward “seasonal,” and you’ve taken on compliance risk you didn’t have before — which is exactly why so many operators are wrestling with the workers dairy can’t legally hire but can’t survive without

Now run the barn math on the staffing risk itself. The Texas A&M/NMPF modeling estimates that if the entire immigrant dairy workforce disappeared, U.S. milk production would drop about a quarter and retail milk prices could climb roughly 90% — a deliberate worst-case bookend, not a forecast. Bring that down to one farm. Drumgoon lost 38 of its 50-plus workers overnight, even with 20 robots already running — because robots don’t feed calves or catch a fresh cow. Rebuilding cost the Elliotts more than $110,000, and even then, H-2A takes 75 to 120 days to land replacement labor. No futures contract hedges a hole like that. 

The Mechanics Behind the Outcomes

The whole mess comes down to one definitional mismatch. H-2A defines “temporary” need as lasting no longer than a year except in extraordinary cases, and “seasonal” need as tied to an event that “requires labor levels far above those necessary for ongoing operations”. A 365-day milking job has no off-season and no spike. It’s just steady, every single day. SAWA’s 350-day contract gets closer to reality, but “closer to year-round” still isn’t year-round — you’re 15 days short of the actual job. 

Then there’s the math from the worker’s side, which is the part the policy debate keeps skipping. SAWA would allow some unauthorized workers to apply for H-2A status, but it’s temporary, tied to one employer, and leaves no path to staying. Picture someone who’s milked on your farm for a decade without papers. Stepping into this program means entering your name and address into federal systems in exchange for an expiring permission. And the track record isn’t reassuring — the Economic Policy Institute’s survey of H-2A workers found violations were near-universal in its sample, with every worker reporting at least one serious worker-protection violation and 94% reporting three or more. 

So put yourself in their boots. You’ve built a life, your kids are in the local school, and the offer on the table is “register now, get time-limited status, then leave when it ends.” For a lot of long-tenured workers — given a permit that expires and that violation record — the rational move is often to stay invisible. That’s not stubbornness. That’s just the math from where they’re standing, and it’s exactly why a “temporary” fix doesn’t reach the people actually holding your parlor together.

How Much Does “Demonstrating Temporary Need” Actually Cost You?

More than the filing fee, and that’s before you’ve hired anyone. H-2A carries real compliance weight: twice-monthly earnings statements, housing standards, precise hour records, and exposure to Wage and Hour Division audits that can result in fines or being barred from the program entirely. American Farm Bureau notes that the paperwork has become so complex that more farms are handing it off to farm labor contractors to keep up. 

That’s time and focus pulled straight off your herd. And the mental load of defending a “forage crew” job description for a year-round milker is its own quiet tax — one that lands hardest on the operators trying hardest to do it by the book. Before you file, price out the legal and administrative overhead against what you’d actually gain in labor. On a smaller dairy, that ratio may simply not pencil.

Is Your Operation One Audit Away From the Drumgoon Scenario?

Ask it straight. If a meaningful share of your crew has uncertain status — and across U.S. agriculture, FWD.us estimates roughly half of farmworkers are undocumented — then your single biggest operational risk isn’t the milk price, the feed market, or the weather. It’s an envelope from the federal government. And it doesn’t even take an audit to gut you: according to Bullvine’s earlier reporting, one Idaho dairy lost about a third of its crew over three weeks with no raid, no warrant, and no agents on the property — workers simply stopped showing up after enforcement hit a farm 50 miles away. 

So build the contingency plan before you need it. After Drumgoon’s audit, neighboring farms sent workers over in shifts to keep the place moving — but that kind of help only exists if you’ve built the relationships first. Know which neighbors or relief milkers you could call at 5 a.m., which tasks you could pause for a week, and how many days you could run short-handed before production falls off a cliff. The farms that ride out a labor shock are the ones that gamed it out in advance. Not the ones reading the audit notice cold, with no plan and no one to call. 

Options and Trade-Offs for Farmers

There’s no clean fix here. There are paths, and each one costs you something different. Here’s the at-a-glance before you read the detail:

Strategic PathBest Operational FitThe Major Catch / Risk
H-2A for Seasonal SlicesReal fieldwork, forage harvest, or project spikes.Won’t touch year-round milking; mismatched or “stretched” petitions invite heavy audit denial.
Retention FocusEvery operation, starting immediately.Doesn’t fix underlying legal status issues; requires intentional wage and cultural investments.
Robotic MilkingCapital-strong herds (typically 200–350 cows).Expect roughly 7 years of negative cash flow first; robots do not feed calves or catch fresh cows.
Revenue DiversificationHerds looking for an immediate volatility buffer.Adds zero hands to the parlor; cushions income but does not solve the physical labor deficit.

Start with H-2A only where the need is genuinely seasonal — fieldwork, forage, a project spike, covering extended leave. It takes documentation and probably legal counsel, and the job descriptions have to match what people actually do. Chain petitions for the same year-round role and you’re inviting denial and an audit, so this won’t plug your core milking gap. 

Let’s look more closely at that retention line, because it’s the one number in this piece most worth comparing against your own operation. The FARM Program’s Nationwide Labor Survey on Workforce Development puts the average annual dairy turnover rate at 38.8%. Replacing a worker typically costs about a third of that worker’s annual pay, once you factor in lost productivity, recruiting, and training. On a crew of 20, that 38.8% is roughly eight people walking out the door in a year. Picture rehiring and retraining eight positions annually — that’s a cost that never shows up as a tidy line item but bleeds out all the same. A worker who stays is one you’re not scrambling to replace mid-audit. It’s the cheapest labor strategy on the board, the only one that doesn’t wait on Congress, and the cost gap behind it is largely what’s driving the loss of 15,000 farms, since smaller herds can’t carry it. 

What about robots? Only if you can carry the runway. USDA ERS (ERR-356, January 2026) found that robotic milking lifts net returns by about 13% on average, with the biggest gains occurring in herds of roughly 200 to 350 cows. But Iowa State economist Larry Tranel’s models show roughly seven years of negative cash flow before that upside shows up — a $400,000 system carrying about $62,000 in annual ownership costs against only around $1,400 in net financial benefit in the early years. And Drumgoon proves automation isn’t a force field — 20 robots couldn’t keep the operation whole when the people disappeared. If your debt-service coverage can’t absorb seven lean years, the 13% is a number on a slide, not a lifeline. It pays to ask the hard questions that separate $50K wins from $200K mistakes before signing a capital lease. 

Diversifying revenue won’t put a hand in the parlor, but it buffers the shock. Beef-on-dairy calves, for instance, sell into the fed-cattle market instead of the milk market, so that income keeps flowing when milk doesn’t. It takes breeding and marketing changes — and it’s a cushion, not a cure. 

The forward signal worth weighing across all four is that the Farm Workforce Modernization Act cleared the House twice and died in the Senate both times. Don’t build your five-year plan on the assumption that SAWA breaks that pattern. Plan for the labor base you can actually control today. And remember, automation isn’t a clean exit from the labor question either — Bullvine’s own reporting lays out 5 hard truths about labor and the ROI of robotic milking for a dairy that’s short-handed and alone. 

Key Takeaways

  • If a large share of your crew has uncertain legal status, treat a labor shock — not milk price — as your top operational risk this quarter, and write a three-business-day staffing-loss plan before month’s end.
  • Build your neighbor network now, while things are calm. Drumgoon got relief milkers in shifts because the relationships already existed — that help doesn’t materialize after the audit lands. 
  • Before filing for H-2A, confirm you have a genuinely seasonal or project-based need. If the role is year-round milking, the program likely won’t fit, and a petition that doesn’t match the work invites denial. 
  • Price the full H-2A overhead — legal, housing, records, audit exposure — against the labor you’d actually gain. On a smaller herd, that math may not work. 
  • If robots are on your whiteboard, stress-test cash flow across a seven-year negative window, not just the 13% long-run return. And don’t assume automation insulates you from a labor shock — Drumgoon’s 20 robots didn’t. 
  • Run your real turnover number against the 38.8% average. If you’re at or above it, the retention math may beat the H-2A math — and it’s the one lever you can pull this month without waiting on Congress. 

So here’s the question to carry back to the kitchen table: if you lost 38 of your 50-plus workers next Thursday, how many days could you keep the parlor running — and what exactly happens on day four? Drumgoon spent more than $110,000 rebuilding its workforce, relied on neighboring farms for relief help, and still faced a months-long H-2A timeline for replacements, according to its owners and DairyHerd’s reporting. The June guidance opened a door. It didn’t change the fact that dairy is a 365-day business being handed a 350-day solution. 

If you want the numbers that fit your barn, that’s where we’re headed next. We’re breaking down the full labor-risk math — herd-size-by-herd-size contingency planning and the real cost per cwt of each staffing path — in next week’s Bullvine Weekly. That’s where the figures live, not the headlines.

Run Your Numbers

Robot ROI Reality Check — Before you treat automation as your labor exit, run the Robot ROI Reality Check with your own labor cost, milk price, financing, and installed cost. It stress-tests whether robots actually pencil against that seven-year cash-flow window — not the dealer’s payback slide.

Complete references and supporting documentation are available upon request by contacting the editorial team at editor@thebullvine.com.

Learn More

The Sunday Read Dairy Professionals Don’t Skip.

Every week, thousands of producers, breeders, and industry insiders open Bullvine Weekly for genetics insights, market shifts, and profit strategies they won’t find anywhere else. One email. Five minutes. Smarter decisions all week.
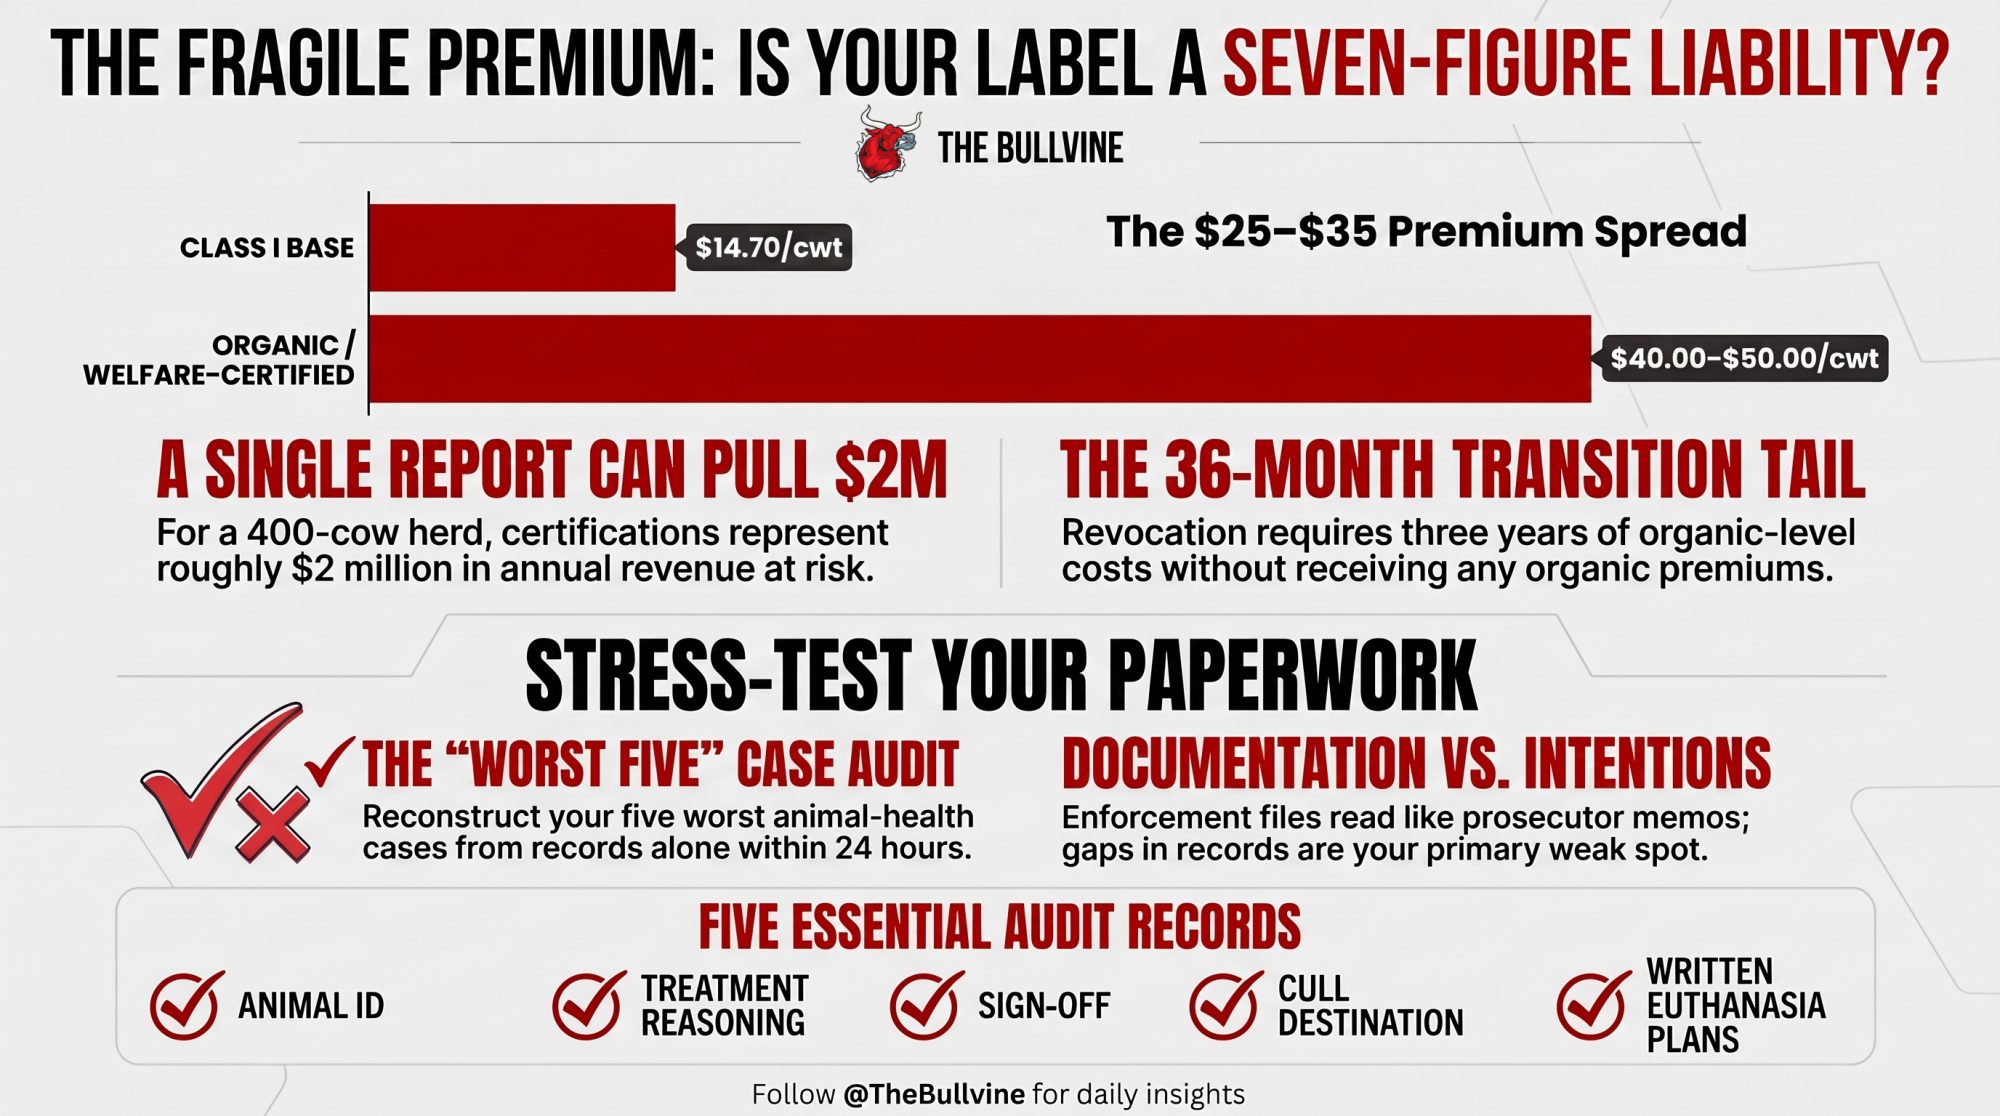
NewsSubscribe
First
Last
Consent

$262,000 a Year, Gone: The USDA Formula Change No Milk Check Explains

USDA reset make allowances June 1, 2025, and quietly pulled ~90¢/cwt from Class III/IV. On 1,000 cows, that’s about $262,000 a year — and no line on your check says so.

Executive Summary: On June 1, 2025, USDA reset FMMO make allowances for the first time since 2008, and that single formula change pulled roughly 90¢/cwt out of regulated Class III and IV prices — before global oversupply took a nickel. If your milk flows into cheese, butter, or powder across the Upper Midwest, Plains, or West, this hit you hardest, and nothing on your check spells it out. On a 1,000-cow herd shipping 80 lbs/day, that’s about $262,000 a year, gone; run your own pounds times 90¢, and the number scales straight up. AFBF’s Danny Munch clocked Class III down 86¢ and Class IV down 89¢ in the first three months, and here’s the part that stings: it’s structural, not cyclical, so it won’t bounce back when futures rally. Don’t count on shrinking global supply to bail you out either — Rabobank still has 2026 production up about 1%, and USDA has EU deliveries edging up 0.1%, not down. With 2026 all-milk forecast at $20.70, the real question is whether your operation can run 12 months at that number with 90¢ permanently baked into the floor. The move this month: run your DSCR without any DMC or Dairy-RP payments, and if it lands under 1.0x, that’s a lender conversation now — not at renewal.

make allowance milk price

Picture an Upper Midwest dairy milking 1,000 cows. Same parlor, same cows, same routine that penciled out fine in 2024.

Then the June 2025 milk check came back lighter. And it kept coming back lighter, month after month, with nothing new in the deductions column to point at. Nobody dried off the wrong cows. Nobody blew a ration. The math changed underneath them.

On June 1, 2025, a federal pricing formula quietly shifted. That one change pulled roughly $0.90/cwt out of regulated Class III and IV milk prices — before global supply moved a nickel.

That’s the make-allowance change. And it’s the part of the 2026 squeeze most producers felt in their gut but couldn’t name on paper.

What Actually Changed on June 1, 2025

A make allowance is the processing cost USDA subtracts from surveyed wholesale prices for cheese, butter, nonfat dry milk, and dry whey when it builds your Class III and IV milk prices. Raise that deduction, and the regulated milk price drops by the same amount — dollar for dollar, per pound of product.

It’s not a market force. It’s a formula input.

USDA’s final rule reset those allowances effective June 1, 2025: $0.2519/lb for cheese, $0.2272/lb for butter, $0.2393/lb for nonfat dry milk, and $0.2668/lb for dry whey. The old rates — frozen since October 2008 — were $0.2003 for cheese, $0.1715 for butter, $0.1678 for nonfat dry milk, and $0.1991 for dry whey, according to USDA Agricultural Marketing Service rulemaking.

Run the percentages and the jumps are steep: 25.8% on cheese, 32.5% on butter, 42.6% on nonfat dry milk, and 34.0% on dry whey. Those aren’t tweaks. The cheese number alone — a nickel a pound more carved out before the milk price is even set — is what does most of the damage to a III-heavy check, because cheese yield drives the Class III formula harder than anything else. The Bullvine has shown how thin the link already is between what your components are actually worth and what the formula pays you — and this rule widened that gap.

American Farm Bureau economist Danny Munch, tracking the first three months under the new rule, found average Class III prices fell about 86¢/cwt and Class IV about 89¢/cwt, with the make-allowance bump doing most of the damage, per American Farm Bureau Market Intel. The Bullvine’s own breakdown landed close by, at $0.94/cwt on Class III and $0.87 on Class IV.

The spread between those estimates comes down to method and which orders you weight — which is exactly why “roughly 90 cents” is the honest midpoint to plan around.

And who gets hit hardest? If your milk flows into cheese, butter, and powder — the Upper Midwest, the Plains, the West — your mailbox price leans on Class III and IV, so the haircut lands with full force. Fluid-heavy regions feel it less, because more of their value rides on Class I, which the same rule actually nudged higher in spots.

How This Plays Out in the Barn

Here’s what makes it so slippery: nothing on the check screams “USDA just took a dollar.” Class prices simply print lower.

So you blame exports, or China, or “the market” — and the formula change rides along invisible.

Run the math on that 1,000-cow herd. At about 80 lbs/cow/day — swap in your own average — you’re shipping roughly 292,000 cwt a year. A $0.90/cwt haircut works out to about $262,000 gone — every year — before a single cull cow leaves the yard or a futures contract moves.

The number scales cleanly with herd size, because it’s just pounds times 90 cents. Here’s the same math run across four herd sizes, all at 80 lbs/cow/day:

Herd sizeApprox. annual cwtAnnual hit at $0.90/cwt
200 cows58,400~$52,600
400 cows116,800~$105,100
1,000 cows292,000~$262,800
2,500 cows730,000~$657,000

The Bullvine ran a version of this on a 400-cow herd and got close to $105,000 a year vanishing into the formula. Plug in your own per-cow production — a 90-lb herd ships more pounds, so the bite is bigger.

And it didn’t land in a vacuum. The rule took effect just as global milk surged through mid-2025, so the cut and the oversupply hit the same checks at the same time — but only the oversupply made headlines. USDA’s June 2026 WASDE lowered the 2026 all-milk forecast by 55¢ to $20.70/cwt — below 2025 and below full economic cost for a lot of mid-size herds.

Stack the structural cut on top of a soft market, and that “$1.25/cwt even when you do everything right” feeling stops being a complaint. It’s arithmetic.

The Mechanics Nobody Walked You Through

Why didn’t this register clearly? Because USDA bundled the bad news with some good.

The same rule package returned Class I to the “higher of” mover and raised Class I differentials in parts of the East — both lift fluid skim values. And there was a genuine offset for high-component herds: updated skim milk composition factors — protein assumptions raised from 3.1% to 3.3%, other solids from 5.9% to 6.0%, nonfat solids from 9.0% to 9.3% — that lift the calculated value of skim milk.

But that piece didn’t take effect until December 1, 2025, a full six months after the make-allowance cut had already been pulling cash out of checks.

Rule ElementEffective DateWho It HelpsWho It Hurts$/cwt Impact
Make-allowance rate reset (cheese +25.8%, butter +32.5%, NDM +42.6%, whey +34.0%)June 1, 2025ProcessorsClass III/IV producers (Upper Midwest, Plains, West)−$0.86–0.94/cwt
Class I “higher of” mover restoredJune 1, 2025Fluid milk regions (East/Southeast)No direct impact on Class III/IV+Variable
Class I differentials increased (select Eastern orders)June 1, 2025Eastern fluid producers+Variable
Skim milk composition factors updated (protein 3.1%→3.3%; other solids 5.9%→6.0%; nonfat solids 9.0%→9.3%)December 1, 2025High-component herdsLow-component herds+Partial offset
DMC Tier 1 coverage raised to 6M lbs at $9.50 margin2026 Farm BillSmaller herds (≤6M lbs production)Large herds shipping 20M+ lbs — Tier 1 covers <25% of volumePartial floor only
Net structural impact on Class III/IV mailbox priceOngoingAll manufacturing-region producers~−$0.90/cwt permanent

That staggered timing is what muddied the water. The big-picture message could stay neutral-to-positive even while the specific message for cheese-and-powder country was brutal: your core class prices just dropped almost a dollar.

Farm groups didn’t speak with one voice, either. Processors had pushed for higher make allowances for years, arguing real costs — energy, labor, packaging — had outrun rates frozen since 2008. That argument isn’t crazy on its face; nobody’s processing milk in 2026 at 2008 cost. But “the rate was stale” and “the producer should eat the entire catch-up in one step” are two very different conclusions, and the rule landed on the second one. Some producer groups swallowed the higher allowances as the price of getting “higher of” back. So the clean “you’re losing 90 cents” line got lost in the trade.

The distinction that matters: this isn’t cyclical. It doesn’t reverse when futures rally. The Bullvine put it bluntly — “that money is now legally reallocated from the farm to the plant.” It’s welded into the floor now.

Won’t Slowing Global Milk Bail Out Prices?

Every few weeks a hopeful headline lands: the global wall of milk is finally cresting. And there’s truth to it — Rabobank’s Q2 2026 Global Dairy Quarterly, released in June, has Big-7 output growth peaking and milk supply turning negative by the fourth quarter, down an estimated 1.6% year-on-year.

But here’s the catch most of those headlines skip. Rabobank still pegs full-year 2026 global production up about 1%, following a 3.1% surge in 2025. The slowdown is a Q4 story, not a 2026 story. A herd budgeting on a calendar-year basis won’t feel a fourth-quarter dip until the back end of the year — long after the spring and summer checks are already spent.

So why doesn’t your check recover? Because the milk’s still coming. The U.S. is forecast to keep growing for the full year, and even Europe isn’t pulling back the way the “shrinking EU herd” story suggests — USDA’s Foreign Agricultural Service, in its June 2026 update, actually has EU cows’ milk deliveries edging up 0.1% in 2026 to about 148.6 million metric tons. That’s not a contraction. That’s flat-to-higher from the one region everyone keeps expecting to ride to the rescue.

The wall doesn’t come down until production actually contracts and stays there — and Rabobank doesn’t see that holding until late 2026 into 2027.

The Bullvine has laid out who actually blinks first in the global milk picture — worth a read if you’re tempted to bank on an overseas rescue.

How Much Does Doing Nothing Actually Cost You?

This is the question worth sitting with at the kitchen table. On a 1,000-cow herd shipping about 24,000–25,000 cwt a month, a $1.00/cwt shortfall against what you budgeted is roughly $25,000 a month — just under $300,000 a year.

The Bullvine’s risk math frames the smaller version cleanly: on 9,000 cwt, every $1.00/cwt gap is $9,000 a month.

Dairy Margin Coverage helps — but know exactly where it stops. Tier 1 coverage rose from 5 to 6 million lbs for 2026, with subsidized protection up to a $9.50 margin. That’s a genuine lifeline on your first 6 million pounds.

But a 1,000-cow herd ships around 29 million pounds, which leaves roughly 23 million pounds with no Tier 1 net under it. DMC puts a floor under part of your milk. It doesn’t fix a model that’s underwater before debt service.

If you want the coverage tables and lane-by-lane strategy, the full 2026 risk playbook breaks it down.

What This Means for Your Operation

Strip away the policy talk and it comes down to three things you can do something about. First, the make-allowance cut is now part of your structural cost of doing business, the same way a higher haul rate or a tighter component schedule would be — so it belongs in your budget as a permanent line, not a bad-luck footnote you expect to bounce back.

Second, the size of the hit scales directly with how many pounds you ship, which means your highest-production strings are also where the formula takes the most. That’s not a reason to pull production. It is a reason to make sure every one of those pounds is either hedged, contracted, or priced into a margin you can actually live with.

Third, the relief everyone’s waiting on — shrinking global supply — is a late-2026-into-2027 event at best, and Europe isn’t even cooperating with the story yet. Budget for the world you’re milking in now, not the one the optimistic headlines keep promising. If your 2026 cash-flow plan assumes a second-half price rally, stress-test it against milk staying near $20.70 and see whether the year still closes in the black.

Is Your Breakeven Number Written Down — or Just a Feeling?

Here’s the one risk-management question most operators aren’t asking out loud: What’s the lowest mailbox price and margin over full cost you can ride for 12 straight months before you’re forced to cut cows, change the model, or get out — and what protection actually kicks in at that line?

Most producers can rattle off their rolling herd average from memory but can’t name that floor. The Bullvine said it plainly: “Your main question isn’t, ‘Where’s Class III going?’ It’s, ‘What’s the lowest mailbox price we can live with and still pay the bills and keep the lender comfortable?'”

Write the number down. Then tie specific hedges, DMC coverage, and cull triggers to it.

If you can’t name it, you’re not managing risk — you’re hoping the wall of milk spares your yard.

Options and Trade-Offs

Producers are handling this squeeze a few different ways. None is a silver bullet, and each one costs you something. Here’s how they stack up — scan the bold, then dig into the one that fits your operation:

  • Layer DMC and Dairy-RP together: This remains a no-brainer for 2026, especially with the 6-million-pound Tier 1 bump. Just remember: DMC only protects your first slice; Dairy-RP has to handle the rest without capping your upside too heavily if the market rallies.
Protection ToolCoverage TriggerMax Covered VolumeApprox. Annual PremiumAddresses Structural Cut?Lender Comfort?
DMC Tier 1 (2026)Margin < $9.50/cwt6M lbs (~75 cows)~$800–$1,200 subsidizedNo — formula loss not a DMC triggerPartial — floor on first slice only
DMC Tier 2Margin < $9.50/cwtUnlimited (unsubsidized)Rises steeply above 6M lbsNoPartial
Dairy-RP (Class III/IV floor)Declared price < insured levelUp to ~100% of production$0.05–$0.15/cwt depending on coverage %Yes — if floor set below current pricesYes — quantifiable hedge
DMC + Dairy-RP layeredCombined triggersFull production volume$0.08–$0.20/cwt combinedBest availableStrongest lender case
No program$0NoDSCR risk: <1.0x on many 1,000-cow herds
Futures hedge onlyCBOT Class IIIVariableBasis risk + margin callsPartial — doesn’t recover formula lossDepends on structure
  • Run a “No-Program” DSCR Test within 30 days: Calculate your debt-service coverage ratio without any safety-net payments. If your herd sits below the 1.15x–1.25x benchmark your bank demands — The Bullvine’s 400-cow analysis found one at just 0.9x even after a $16,600 DMC “win” — you need a proactive conversation with your lender today, not at loan renewal.
  • Audit your basis and your buyer: This matters most in manufacturing regions, where plant closures or consolidation can widen basis $2–3/cwt. The risk you can’t hedge is the one to name out loud: a buyer that simply stops taking your extra milk.
  • Tighten breeding and replacement decisions before the cushions thin: Beef-on-dairy premiums and strong cull prices have been quietly masking the milk-margin problem — and both could face pressure by late 2026. The trade-off is real: more dairy replacements means giving up some beef-cross cash flow today.

Key Takeaways

  • If you ship to a Class III/IV-heavy order, treat roughly $0.90/cwt of your 2025–26 price drop as structural, not market — and build your cash flow as if it’s permanent.
  • Multiply your annual cwt by $0.90. If that number rattles you (a 1,000-cow herd: about $262,000; a 2,500-cow herd: north of $650,000), it belongs in your 2026 budget, not your blind spot.
  • Run your DSCR without program payments this month. If it’s under 1.0x, that’s a lender conversation now — not at renewal.
  • Don’t budget around a global supply rescue. Rabobank still has 2026 production up about 1%, and even the EU is edging up, not down — so the relief is a late-2026-into-2027 story at best.
  • Watch your cushions. If beef-on-dairy premiums or cull prices soften while milk stays flat, the margin you thought you had disappears fast.
  • Write down your 12-month floor — the lowest mailbox price you can survive — and attach a specific action to it before futures test that line.

So — Where Does Your Floor Actually Sit?

If milk holds near $20.70 and that make-allowance cut stays baked in, can your operation run 12 months at that number without leaning on the cushions? It’s not rhetorical. It’s the question your lender will ask at renewal, and the one your milk buyer is already modeling.

Pull last June’s milk check and this one, lay them side by side, and see how much of the gap you can actually explain. The part you can’t? Some of that is the formula.

Calculate Your Structural Make-Allowance Hit

Enter your herd size or annual milk volume to see the real impact of the USDA formula shift on your operation.

cows
lbs/day

Calculated Annual Shipped Vol. 292,000 cwt
Estimated Annual Margin Loss $262,800
Monthly Cash Flow Hit: $21,900 / mo

*Based on a baseline structural loss midpoint of $0.90/cwt across Class III and Class IV pricing formulas following the June 1, 2025 FMMO modifications.

Editor’s Note: The 1,000-cow operation described below is a composite scenario, modeled from typical Upper Midwest herds shipping to Class III and IV markets. It does not represent any single real farm. The dollar figures are drawn from USDA, the American Farm Bureau, and published Bullvine calculations, as cited throughout.

Learn More

The Sunday Read Dairy Professionals Don’t Skip.

Every week, thousands of producers, breeders, and industry insiders open Bullvine Weekly for genetics insights, market shifts, and profit strategies they won’t find anywhere else. One email. Five minutes. Smarter decisions all week.

NewsSubscribe
First
Last
Consent

Your 110-Cow Herd Loses $90,000 a Year at $20.70 Milk. Here’s Why You Don’t Quit

At $42.70 to make and $20.70 to sell, even a tight 110-cow herd erodes ~$90K a year. The chain above runs smoother when you don’t quit — here’s your move before the bank makes it.

Picture a 110-cow family herd in a county that used to support 35 licensed dairies and now has 9. Two owners, one hired hand, a high-school kid on the morning milking. They’ve run negative on a full-cost basis two years in a row, and the banker’s been warmer about expansion than about “we’ll just keep doing what we’re doing.” Nobody at that kitchen table has said the quiet part out loud: staying small on commodity milk without a plan is already a decision. It’s just the one with the worst odds.

A dairy farmer still captures about 51 cents of every retail dollar spent on fresh fluid milk, but only about 25 cents across the full basket of dairy products people actually buy — cheese, butter, yogurt, ice cream (USDA ERS Food Dollar / price-spread data, 2024 release, March 2026). They milk below the national herd-size average, and they stay in anyway, because “dairy farmer” isn’t a job to them. It’s who they are. And somewhere up the chain, the system runs smoother when you don’t quit.

What’s Changing and Why

The math on small herds turned hard, and it turned fast. USDA’s Economic Research Service reports the average U.S. dairy herd grew from 112 cows in 2000 to 283 by 2021 (USDA ERS, Amber Waves: Fewer Farms, More Milk, Feb. 2026). Progressive Dairy’s annual stats push it further — about 377 cows on average in 2024, around 402 in 2025 (U.S. Dairy Statistics). Licensed herds fell from roughly 45,000 in 2014 to 24,811 in 2024, then to 23,609 in 2025.

So if you’re milking 60 to 140 cows — like our composite family — you’re not behind the curve. You’re a statistical outlier. And the cost curve doesn’t love outliers: in 2021, ERS pegged the total cost to produce 100 pounds of milk at $42.70 for herds under 50 cows, versus $19.14 for herds of 2,000 or more (USDA ERS, Amber Waves, Feb. 2026, from 2021 ARMS survey data). Set that against USDA’s June 2026 outlook — a $20.70/cwt all-milk price, revised down 55 cents from the month before (USDA Livestock, Dairy, and Poultry Outlook, June 16, 2026) — and the smallest herds aren’t fighting a thin margin. They’re staring at a structural loss baked in before the first cow gets milked.

Who’s most exposed? Commodity producers under roughly 200 cows, especially anyone carrying land and equipment debt refinanced at 6.5–7% instead of the 3–4% that felt routine a decade ago. The farms in real danger aren’t the ones who can’t read a balance sheet. They’re the ones who never ran the full number — cash costs, unpaid family labor, depreciation, interest — until the lender ran it for them.

How This Plays Out on Real Farms

Here’s where it gets concrete. The Bullvine already ran the barn math on this once — the 143-hour week at Clark Farms laid out what “fixing” thin margins with an on-farm creamery actually costs in hours and equity. When full-cost breakeven sits above the all-milk price for two years running, that gap comes straight out of family equity, while the processing side continues to benefit from relatively cheap raw milk. Now shrink it back to that 110-cow kitchen table.

First, understand how the gap scales, because there’s a wide band between the headline number and what a well-run small herd actually lives. That $42.70 ERS figure is the structural ceiling — the absolute worst-case for an ultra-small or heavily indebted setup — and, against a $20.70 price, it implies a brutal ~$22/cwt hole. And since that cost figure is from 2021 while the price is current, the real-world gap today is more likely wider than narrower. Most small herds don’t sit at the ceiling. But here’s the uncomfortable floor: even a tight, efficient small operation, once you load in unpaid family labor, depreciation, and interest, is leaking at least $3/cwt on full economic cost. So $3 isn’t the likely number — it’s the best case, the smallest gap a sharp small-herd manager can expect once the real costs are counted.

Quick barn math, at that conservative floor. On a 110-cow herd shipping ~75 lbs/cow/day, you’re moving roughly 30,000 cwt a year. A $3/cwt gap amounts to about $90,000 per year from family equity. Now slide that number up the band — at $6/cwt it’s $180,000; nearer the ERS ceiling it’s a figure no family balance sheet survives for long. Either way, the best case is a second mortgage you never signed.

🛠️ Toolroom: Don’t guess your equity drain. Run your numbers through The Bullvine Dairy Profit Projector to calculate your IOFC, true breakeven milk price, and whole-herd margin in under three minutes.

Often the thing keeping that farm afloat isn’t the milk check at all. The Dairy Margin Coverage figure — milk price over feed cost — is projected to bottom out as low as $7.09/cwt in 2026, with the low point landing early in the year (Farm Credit East, Dairy Industry Snapshot, Feb. 2026). So the spouse’s town job quietly covers the loan payment, the health insurance, the shortfall. On paper that’s “household diversification.” In the barn, it’s the invisible subsidy that lets the identity keep running after the milk stopped paying for it.

The Mechanics Behind the Outcomes

Why does cheap milk keep flowing if so many small herds lose money on it? Because the rest of the chain works better when the milk shows up no matter what. After the Federal Milk Marketing Order amendments took effect June 1, 2025, increased processor make allowances immediately squeezed the farm gate, cutting average class prices across the first quarter by:

  • Class I: −$0.89/cwt
  • Class II: −$0.85/cwt
  • Class III: −$0.92/cwt
  • Class IV: −$0.85/cwt

That pulled $337 million out of producer pool revenues nationwide in just the first three months (American Farm Bureau Federation, Market Intel, Sept. 2025). And this isn’t the story of one co-op’s policy — it’s the architecture of a consolidated system doing what it’s built to do. In fiscal 2024, S&P Global Ratings reported that Dairy Farmers of America generated $485 million in free operating cash flow and cut net debt by $315 million. That’s the scale a member-owned co-op operates at; The Bullvine’s reporting puts DFA at roughly 30% of U.S. milk and 44 processing plants. Whether that scale is returning enough to the farm gate is the open question — DFA has publicly positioned itself as a single, connected cooperative built to return value to its member-owners (DFA public communications, 2024).

Here’s the uncomfortable read, offered as analysis rather than accusation: intentional or not, the structure rewards farmers who keep producing below cost. And inertia is just as costly as design when the bill lands on someone else’s kitchen table. The concentration is real and documented — University of Illinois researchers, working from the 2022 Census of Agriculture, found that the 2,013 farms running 1,000 or more cows accounted for 66% of all U.S. milk sales in 2022, up from 57% in 2017 (farmdoc daily, Feb. 2024). The fastest-growing tier sits even higher up: the number of dairies milking 2,500-plus head actually grew — from 714 to 834 between 2017 and 2022 — even as every smaller size class shrank, with herds of 20 to 99 cows declining the most (farmdoc daily, Feb. 2024). Roughly 23,000 smaller farms now split what’s left. That trajectory — 15,000 U.S. farms by 2035 and under 10,000 by 2050 — is already priced into the industry’s planning.

Retail categoryFarmer’s share of retail $What the rest of the chain keepsDirection
Fresh fluid milk51¢49¢Highest farm share
Full dairy basket (cheese, butter, yogurt, ice cream)~25¢~75¢Where most volume actually sells
All U.S. food (2024)11.8¢88.2¢Down from 12.1¢ in 2023
Net effect on 110-cow commodity herdPrice-taker, no pricing powerProcessor gains from cheap raw milkStructural, not cyclical

The food-dollar trend tells the rest without spin. Across all U.S. food, the farm share fell to just 11.8 cents in 2024, down from 12.1 cents the year before; for the broad dairy basket, the farm-value share sits near 25% (USDA ERS Food Dollar, 2024 data, March 2026). That’s not a bad year. That’s the shape of the gap.

How Much Is “Staying Small Without a Plan” Actually Costing You?

Run the real number, not the feed-bill-plus-vet version. Pull two years of records and add all of it: cash costs, family labor at a fair illustrative wage (say $18–22/hour), depreciation at replacement cost, a management return, and every dollar of interest and principal. Divide by hundredweights shipped. Then set that against the $20.70 all-milk outlook — if your full breakeven lands above it, you’re selling below cost, and the first problem isn’t efficiency. It’s the price you’re accepting.

There’s a faster version you can run this week — call it the 50¢ co-op check. It requires no complex spreadsheets — just two milk checks and a calculator.

The 50¢ Co-op Check

  1. Pull your January 2025 and January 2026 milk statements.
  2. Divide net pay by total hundredweights (cwt) shipped on each.
  3. Subtract the 2026 value from the 2025 value.
  4. If you find an unexplained gap of roughly 50¢/cwt or more — outside normal Class III, Class IV, and butter swings — a good chunk of it is likely the post-June 2025 FMMO make-allowance drag, not just a soft month.

Land underwater and didn’t know it? That’s not a character flaw — it’s the most common spot for herds your size. But it changes what your next move should be.

Is a Creamery Plan Actually a Succession Plan in Disguise?

A lot of families — our 110-cow couple included — reach for the creamery, the robots, or the expansion because it looks like one lever that fixes three problems at once: thin margin, dependence on one buyer, and a reason for the kids to come back. It’s not irrational. It’s a pretty elegant theory of the farm. The trouble is it usually solves the wrong constraint, because the hardest problem isn’t price. It’s whether anyone’s actually committed to running this thing in five years.

The succession numbers are sobering. Farm-transition research consistently finds that only about 30% of family farms survive into the second generation and roughly 12–16% into the third, that a large majority of farmers have no formal estate or transition plan, and that most family dairies never complete a successful transfer — usually because the real conversation never happened (widely reported farm-succession research; see The Bullvine succession coverage, 2025). The conversations that work start ugly and specific: “Are we trying to continue this farm, or cash it out well?” Then, one-on-one with each kid: “Do you actually want this — and on what terms?” A creamery plan isn’t a succession plan. It’s a succession proxy families grab when they’re scared to ask the question straight.

Options and Trade-Offs for Farmers

There’s no “back to 1985” lane. The credible analysis keeps landing on three live paths — scale, niche, or a planned exit. Each one is legitimate. Each one can fail. Here’s how they line up side by side:

PathCapital RequiredLabor / Time CommitmentThe Fatal Flaw / Primary Risk
1. Scale up (300–500+ cows)~$3,000–$3,500/stall before electrical and plumbing (Dairy Challenge / extension, 2022); one expansion budget ran $1.5–$2M for facilities plus $1.3M for cattle (The Bullvine, May 2025) — often refinanced at 6.5–7%Shifts from physical farming to managing a 4–8 person teamA sub-$20 milk year stacked on high interest can force a distressed sale — or leave you with a massive facility and a dropped milk contract
2. Go niche (on-farm / value-add)~$315K for equipment inside a ~$1.5M facility (UT Institute of Agriculture); or skip on-farm pasteurization ($30K–$50K+) and use a co-packer (The Bullvine, Dec. 2025)~70–90 extra hours/week for processing, bottling, delivery, and marketingRunning out of hours, not milk — failure lands in the bottling room, licensing office, and customer pipeline
3. Planned exit (protect equity)$0 — equity-preservation mode30 days to run true costs and start an intentional transitionWaiting too long, until the lender or processor forces the exit on their terms

A few things the table can’t carry. Scaling makes sense only when you can pencil a credible path toward that $19.14 ERS cost benchmark, and you’ve locked a milk home first — the same genetics-and-capital shakeout that’s reshaping herd values is the backdrop for that bet. Niche makes sense when you’re within driving distance of population and genuinely want to run a food business on top of a dairy. And the exit path — the one the industry rarely says to a farmer’s face — makes sense when you don’t see a committed successor or a route to competitive cost, and you’d rather protect equity, relationships, and your own health than grind another decade. It’s not hypothetical: five farmers walked away with $575,000 in preserved equity precisely because they left on their own terms.

Not sure which path your own numbers point to? Answer five questions in the Consolidation Clock, and it’ll tell you whether your farm’s signal reads expand, optimize, pivot, transition, or exit.

That third path isn’t failure. A planned exit belongs on the same whiteboard as a new parlor. And if the weight of that decision gets heavy, you’re not carrying it alone — the Farm Aid hotline (1-800-FARM-AID / 1-800-327-6243), the 988 Suicide & Crisis Lifeline, and most state extension programs offer free, confidential support.

Key Takeaways

  • If your true cost of production — family labor, depreciation, and interest included — lands above the $20.70 all-milk outlook, run the scale-vs-niche-vs-exit comparison now, not after the next refinance.
  • If your unexplained January-over-January milk-check gap runs around 50¢/cwt or more, treat a good chunk of it as make-allowance drag and bring those two statements to your next co-op meeting.
  • If a spouse’s town job is quietly covering loan payments or insurance, name it out loud and decide whether it’s a temporary bridge or a permanent subsidy.
  • Before you spend a dollar on a creamery, robots, or expansion, confirm in writing who’s committed to running the farm in five years. Capital should follow a succession decision, not stand in for one.
  • If you’re eyeing a niche, budget 70–90 extra hours a week before you budget for equipment — and check whether a real customer base is within reach before you pour concrete.
  • Have a one-on-one conversation with each family member, not just the group one, and treat “I don’t want in” as useful information rather than a betrayal.
  • Put a planned, dignified exit on the table as a valid outcome you’re allowed to design — not a failure you delay until someone forces it.

So — Which Future Do You Actually Belong In?

The honest answer isn’t pick-a-side. Staying, scaling, going niche, or leaving are all legitimate. The only wrong move is refusing to decide until the bank or the processor decides for you. The 2035 trajectory — fewer farms, bigger herds, co-op tables run by the operations shipping two-thirds of the milk — is already largely locked in. The open question is which side of it your operation lands on, and whether you chose it.

So where does your breakeven actually sit this morning? And if the DMC margin really does sink toward $7/cwt early next year, how many months of equity do you have before the choice gets made for you? Pull the two-year number first, then have the conversation you’ve been putting off.

Should You Expand, Hold, or Exit?

5 questions. 60 seconds. Get your signal.

Editor’s note: The 110-cow family in this story is a composite, modeled from multiple Upper Midwest and Northeast herds and the USDA cost-of-production data cited throughout. The numbers are real. The single farm is illustrative. Financial figures attributed to S&P Global Ratings and the American Farm Bureau Federation reflect those organizations’ reporting as of June and September 2025, respectively.

Learn More

The Sunday Read Dairy Professionals Don’t Skip.

Every week, thousands of producers, breeders, and industry insiders open Bullvine Weekly for genetics insights, market shifts, and profit strategies they won’t find anywhere else. One email. Five minutes. Smarter decisions all week.
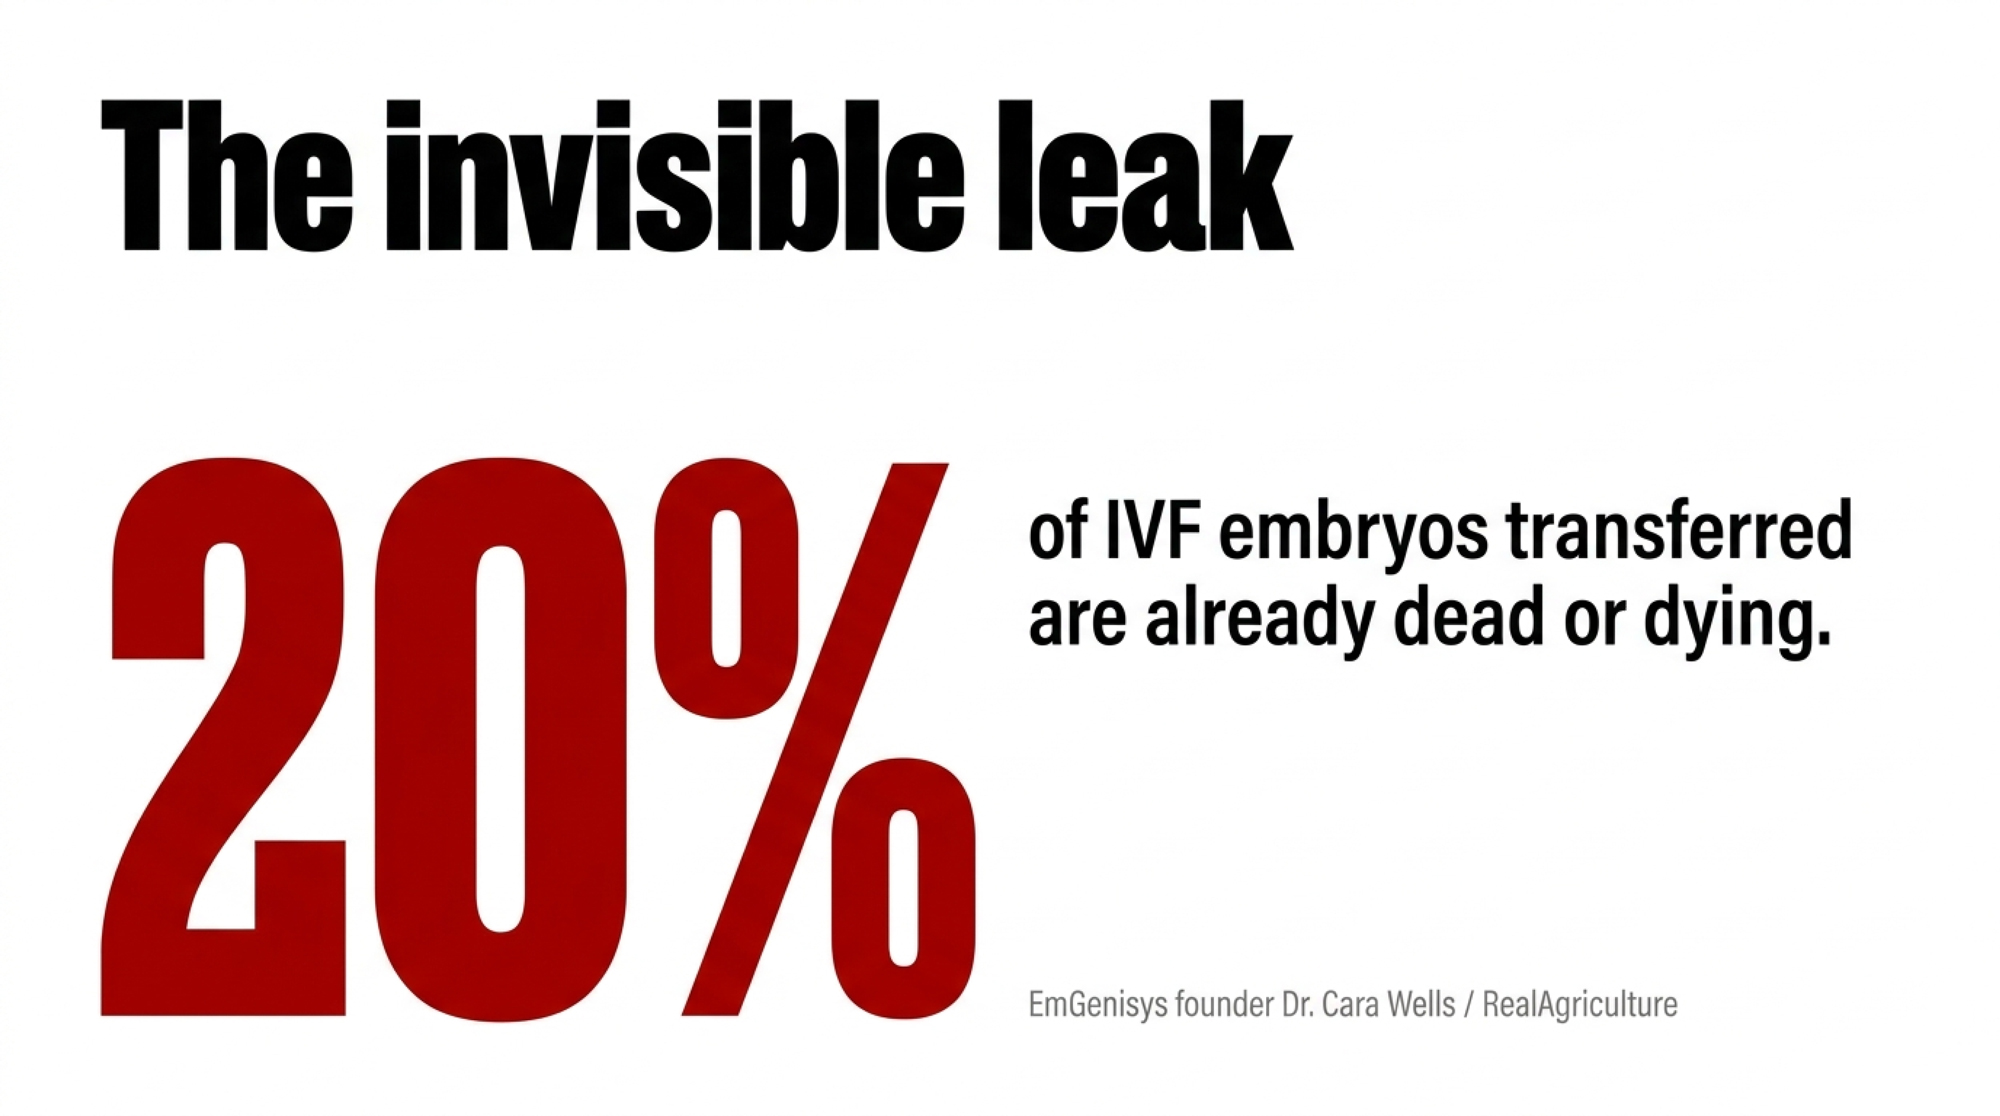
NewsSubscribe
First
Last
Consent

The Beef Check You Banked in 2023 Is the $3,010 Heifer You Can’t Afford in 2026

A day-old beef calf paid you a few hundred bucks in 2023. The dairy heifer it replaced now runs $3,010 — up 75% in 27 months. CoBank’s Corey Geiger says that spread decides who’s still milking in 2030.

Executive Summary: A springing dairy heifer went from $1,720 in April 2023 to $3,010 by July 2025 — a 75% jump in 27 months, per USDA’s Agricultural Prices series — and CoBank’s Corey Geiger reads that number as the signal for which mid-size herds still own their cows in 2030. The squeeze hits 250-to-600-cow operations hardest, because the replacement inventory sits at 3,914,300 head, the lowest since 1978, and there’s no cheap way to refill the pipeline. Here’s the trap: that beef-on-dairy check you banked was never free money — every beef service on a viable dam trades away roughly $585 in replacement value, and a beef calf has to clear $1,580 to match a sexed-dairy pregnancy on the same cow. Run it on a representative 500-cow Panhandle herd needing 135 replacements a year, and the price jump alone adds $174,150 to $307,800 annually — an extra $1.74 to $3.08/cwt on 100,000 cwt shipped, before you touch the interest on financing them. With Class III stuck at $14–$16/cwt through early 2026 against a mid-size breakeven near $21/cwt, that added replacement load is the difference between tight-but-surviving and your lender running the numbers before you do. The herds getting sorted out aren’t the smallest — they’re the ones running volume economics with value-farm overhead and no plan to hold DSCR above 1.0 into 2028. The full piece runs the barn math and a 30/90/365 playbook, including the $1,580 crossover that should govern every beef breeding you book this season.

dairy heifer prices

In April 2023, a springing dairy heifer ran $1,720 a head on USDA’s Agricultural Prices series. By July 2025, that same animal cost $3,010 on the same series — a 75% jump in 27 months — and premium springers were fetching $4,000 to $4,500-plus at California sale barns. CoBank dairy economist Corey Geiger’s reports keep returning to that move, because it’s the dairy heifer price in 2026 that decides which mid-size herds still own their cows in 2030 — and which ones quietly get sorted out. The beef-on-dairy math that looked smart in 2022 is sending the biology bill now, and it’s landing hardest on the 250-to-600-cow operations least able to absorb it.

This isn’t expansion. It’s a sort.

What’s Actually Behind the Record-Milk Headline

Start with the dashboard everyone’s reading off. According to the USDA NASS Milk Production report released in February 2026, U.S. milk production hit 232 billion pounds last year — a 2.6% climb over 2024. The milk-cow herd ran near 9.6 million head in early 2026, the largest in roughly three decades. Per-cow output keeps grinding higher. Every light on that row reads green.

Drop down one row. USDA’s Cattle inventory report, out at the end of January 2025, counted just 3,914,300 dairy replacement heifers — the fewest since 1978, and about 18% below the 4.77 million head on hand in 2018. Dairy cow slaughter totaled near 2.53 million head through 2025, a decade low, suggesting producers held onto older cows rather than culling them, per the American Farm Bureau’s January 2026 Market Intel analysis.

Then the milk check turned. USDA’s Class and Component prices put Class III at $14.59/cwt in January 2026, $14.94 in February, and $16.16 in March — a long way below the $19.70 all-milk average of late 2025 that Farm Bureau flagged. The green production light and the red margin light are on simultaneously. That’s the whole problem.

Geiger laid out the pipeline read in CoBank’s August 2025 report: the shortage moved replacement prices from $1,720 a head in April 2023 to $3,010 by July 2025 — that 75% climb — with the national herd at 3,914,300 head, 18% thinner than 2018.

Why does a sale-barn number matter this much to a dairy economist? Because it’s the price of staying in the cow business. At $1,700 to $2,000 a head, a 30% replacement rate stings but pencils for most family operations. At $3,000 to $4,000, the capital math changes who can afford to keep the pipeline full. That’s the lens Geiger’s using. Most of the trade conversation still isn’t.

The Assumption Was Free Money. The Math Says It Was a Cash Advance.

Rewind to when beef-on-dairy actually was the smart play. The spread was real, and it was big. By late 2024, a day-old beef-on-dairy cross calf was worth several hundred dollars more than a pure Holstein bull calf, and Farm Bureau’s Market Intel work showed the large majority of dairies capturing that premium.

University of Wisconsin dairy economist Victor Cabrera ran the break-evens early. As Progressive Dairy summarized his 2022 DairyMGT modeling in June 2023, the break-even on a beef-on-dairy calf sat near $69 a head for herds with exceptional fertility and climbed toward $300 a head for poor-fertility herds — and Northeast calf prices were clearing those break-evens with room to spare. The beef check kept growing. CoBank’s June 2026 follow-up notes beef sales now contribute roughly 12% to 15% of revenue on many dairy farms, approaching 20% per hundredweight on some.

So the industry assumption was simple: beef-on-dairy is free money on calves you didn’t want anyway.

The math says otherwise, and the framing in CoBank’s analysis is the line that belongs taped to every farm lender’s monitor. In essence: a beef-on-dairy cross calf is a one-time check today, while a dairy replacement is a two-year build. Read that again. It wasn’t free money. It was an instant cash advance taken against a two-year replacement obligation — and the obligation comes due whether you budgeted for it or not.

Our own Replacement Pipeline Tracker put a number on that trade. At a $3,010 replacement, every beef service on a viable dairy dam trades away roughly $585 in expected replacement value — and a beef calf has to clear $1,580 a head to match what a sexed-dairy pregnancy is worth on that same cow. Below that crossover, you’re not capturing a premium. You’re selling a future cow at a discount.

MetricBeef-on-Dairy CrossSexed Dairy Heifer Pregnancy
One-time calf revenue (avg.)~$400–$600$0 at birth
Replacement value foregone (per service)-$585$0
Crossover to match sexed-dairy valueMust clear $1,580$1,580 baseline
Time to revenue (heifer path)N/A — terminal24–26 months to first milk
Pipeline impact (2023–24 heavy beef)−796k heifers by end 2026Inventory preserved
DSCR risk by 2028HIGH if beef % > viable thresholdLower with balanced breeding
Best candidate cowsTrue terminal / low-indexTop 30–40% of herd
Worst use caseViable dairy dam, top geneticsN/A

The biology doesn’t negotiate. A replacement heifer takes about 24 to 26 months from conception to first milking. Heavy beef breeding in 2022 and 2023 showed up as missing dairy heifers in 2024 and 2025, and it rolls forward as tighter fresh-cow supply into 2026 and 2027. “This year we’re going to have 438,000 fewer dairy replacements becoming milk cows compared to last year, and this won’t rebound until 2027, when we see an improvement of 285,000,” Geiger told Iowa PBS’s Market to Market in May 2026. CoBank’s modeling puts the two-year hole at 357,490 fewer dairy heifers in 2025 and 438,844 fewer in 2026 — a combined shortfall near 796,000 head before any rebound. Enough of a rebuild ahead to stop the bleeding. Not enough to reverse the sort.

What Does the $1,720-to-$3,010 Heifer Jump Mean for a 500-Cow Herd in 2026?

This is where beef-on-dairy stops being a calf-check conversation and turns into a balance-sheet one. The heifer move isn’t just expensive. It’s selective. It separates the barns that can refill their pipeline from cash flow from the ones that have to borrow to do it — or stop doing it.

The cost bands frame the squeeze. Working from its most recent full ARMS cost series (2021 base year), USDA’s Economic Research Service puts total economic cost — cash expenses plus unpaid labor, depreciation, and opportunity cost — at $42.71/cwt for herds under 50 cows and under $20/cwt for herds with 2,000-plus cows. Herds in the 100-to-499-cow range interpolate into roughly the $19 to $21/cwt band. Set that against Class III sitting in the $14 to $16/cwt range through early 2026, and a mid-size herd carrying a true $21/cwt breakeven is deep underwater on the milk side alone.

The Canadian read is different, and worth saying plainly. Under supply management, Ontario and other provincial producers price milk through the quota system rather than through a volatile mailbox check, which softens the price-collapse risk that drives the U.S. sort. The heifer-supply squeeze and the beef-on-dairy breeding tradeoff still apply north of the border — the cash-flow timing hits differently.

That’s not hypothetical in the sense that matters. Our Replacement Pipeline Tracker ran the same trap on a representative 500-cow Panhandle dairy shipping to new Panhandle processing capacity: it needs 135 replacement heifers a year at a 27% turnover rate, and after running 35% beef through 2023–24, it’s trading away roughly $117,000 in expected replacement value annually on beef services that could’ve carried dairy pregnancies. That’s the barn where the theory stops being theory.

Editor’s disclosure: the Panhandle herd figures are modeled from the Bullvine Replacement Pipeline Tracker using representative Panhandle inputs — not a single named operation.

Now put the price move in a table you can read off in ten seconds.

Heifer Purchase PriceAnnual Cost (135 head)Capital Added vs. 2023 BaseCost per cwt (~100,000 cwt/yr)
$1,720 (USDA, April 2023)$232,200— (base year)$2.32/cwt*
$3,010 (USDA, July 2025)$406,350+$174,150+$1.74/cwt added
$4,000 (CA premium springers, 2026)$540,000+$307,800+$3.08/cwt added

*The $2.32/cwt is the total base replacement load, not an add-on. The $1.74 and $3.08 figures are what the price jump adds on top of that base — don’t stack them on the $2.32.

Running the Numbers — The 500-Cow Replacement Line

Take the Panhandle herd: 500 cows, 27% turnover, 135 replacements a year.

Same herd. Same cull rate. The price move from the 2023 base alone adds $174,150 to $307,800 a year in replacement capital — an extra $1.74 to $3.08/cwt on roughly 100,000 cwt shipped (≈ 200 cwt per cow; swap in your own rolling herd average).

Now finance them. Put 135 head at $3,010 on a note and the interest stacks on top of the purchase price — at 7% simple, that’s roughly $28,500 a year; at 9%, closer to $36,500. Run it at your own note rate and term, because a multi-year amortized loan spreads it differently than a one-year operating line.

Plug in your herd size, your cull rate, and the heifer price your local barn is printing this month.

That extra $1.74 to $3.08/cwt is the gap between tight-but-surviving and the bank running your numbers before you do. The trigger is mechanical. When replacement and interest drag push your debt service coverage ratio below 1.0 — the point where farm income no longer covers principal and interest without off-farm money or an equity draw — your options have already narrowed. Lenders generally want to see a DSCR near 1.5 and get nervous between 1.0 and 1.2.

Why the $3,000 Heifer Floor Punishes the Middle Tier

Here’s the turn. The reflex answer to a cost squeeze has always been scale — get big, spread overhead, grind out commodity milk. The $3,000-plus heifer floor breaks that reflex for the operations in the middle, and it does it through cash, not size.

For decades, a mid-size family farm could coast through a down cycle on paid-off equity. Cows die or leave, you replace them out of the herd or buy a few at a manageable price, and you ride out the low milk check on a clean balance sheet. That escape hatch is closing. When the asset you have to replace — the cow — costs $3,010 to $4,000 instead of $1,720, coasting isn’t an option. You’re forced to lay out serious cash to keep the same stalls full, and if you don’t have it sitting there, you borrow it.

Run it against the Panhandle box: 135 replacements at $3,010 is a $406,350 replacement line, versus $232,200 at the old price — and interest on the gap on top of that. A high-volume operation at sub-$20/cwt cost can absorb that. A value-model operation capturing more dollars per gallon can absorb it. The herd caught in between — running volume economics with value-farm overhead — can’t, and that’s the operation getting sorted out.

The split isn’t small-versus-large anymore. It’s disciplined-versus-not. Even some large herds bled in the last down cycle by running costs their scale couldn’t outrun. Big and undisciplined still bleeds.

As agricultural financial experts recently warned Northeast producers, the industry overall may survive, but many individual farms won’t — and producers don’t have the luxury of waiting for things to get better. They have to manage risk and make strategic calls now to stay among the survivors.

The question stopped being “how many cows?” It became “which business am I actually in — and do my numbers match it?”

What Are the 2030 Survivors Doing Now That Their Neighbors Aren’t?

The instinct in a squeeze is to do something dramatic. The data says the survivors are doing something almost boring. They measure more often than everyone else.

On the ground, that’s three disciplines. First, they pull the true cost of production every month — not the Dairy Margin Coverage proxy, which can sit well off real-world costs — counting unpaid family labor at local rates, depreciation at replacement cost, current interest, and heifers at their actual cost today. Second, they rebalanced breeding early, holding a meaningful share of matings on dairy semen and putting sexed dairy on their best cows instead of maxing the beef calf check. Third, they treat the beef check as revenue to hedge rather than a windfall.

Recent agricultural outlooks emphasize a critical shift for 2026: protect predictable cash flow rather than chasing high prices. Financial experts urge producers to maximize Dairy Margin Coverage and Dairy Revenue Protection for milk. Furthermore, as beef-on-dairy genetics become a staple revenue stream, utilizing Livestock Risk Protection to cover beef revenue is now just as essential as protecting milk margins.

You’ve seen this consolidation arc build before, and the human cost of it up close.

The 30/90/365-Day Playbook for Herds Like the Panhandle 500

This reads like a plan for a 300- to 1,500-cow operator or the advisor across the table, not a pep talk.

30-Day actions — urgent checks

  • Pull your last three milk checks and calculate your real margin over feed per cwt — same components, same hauling, every time. Requires: settlement sheets and feed invoices. Trigger: if your true breakeven sits above your rolling 12-month mailbox price, this goes to the top of the list. Watch for: omitting unpaid family labor and depreciation, which inflates the number.
  • Run your pipeline math. Pull 12 months of heifer-calf births, multiply by a realistic survival-to-first-calving rate for your herd (many well-managed herds run near 0.79; use your own if you track it), and compare to herd size × replacement rate. Trigger: if you’re short, that gap is baked into 2027–2028 regardless of where prices go. Watch for: counting beef-cross calves as replacements — they aren’t.
  • Run your DSCR using your lender’s or CPA’s method. Trigger: if it’s been under 1.2 for three straight months, this is your first call, not your last. Watch for: one-time income masking a structural cash shortfall.

90-Day actions — structural moves

  • Tier your herd and write it into your breeding SOPs: top genetics to sexed dairy, the middle tier a mix, true terminal cows only to beef. Requires: index and repro data. Backfire risk: letting beef creep back onto viable dams because the straw’s cheaper that day — that’s the $585 trade repeating itself.
  • Decide which game you’re in — volume engine or value model — and test your cost structure against it. Requires: a full ERS-style cost build and an honest read on your market access. Backfire risk: half-committing leaves you with value-farm overhead and commodity-milk revenue, the worst of both.
  • Layer revenue protection across both milk and beef. Requires: a conversation with your DRP and LRP provider before the coverage window closes. Watch for: sales-period deadlines that move; confirm the current date with your agent.

365-Day moves — strategic positioning

  • Align your herd plan to your plant. If you’re near new Panhandle processing capacity, decide whether you’re growing, holding, or shrinking, and match your pipeline, beef percentage, and culling to that call. Requires:refinancing conversations and a hard look at debt structure. Opportunity signal: if your margin over feed holds positive and your basis stays firm while neighbors exit, you may have room to add cows from someone else’s dispersal rather than buying $4,000-plus springers.
  • Set hard floors and ceilings: the minimum beef-calf price where beef services still make cash-flow sense, and the maximum share of breedings you’ll put to beef on viable dairy dams. Watch for: the $1,580 crossover — that’s your north star, not the calf buyer’s mood that week.

The Number That Forces the Question

The thing about that heifer price is it won’t let you headline your way out of the decision. Twenty-seven months took a springer from $1,720 to $3,010 on the USDA series, and that move is quietly naming who still owns dairy cows in 2030.

You gain cash today from every beef-cross calf you sell. You give up a future cow you’ll have to buy back at replacement-market prices — roughly $585 of her per service, at today’s spread. That’s the trade at the center of this whole story.

So pull your beef-on-dairy plan for this breeding season and set it next to your replacement inventory by age group. Does the calf check you’re banking this year leave you enough dairy heifers to hold your DSCR above 1.0 in 2028 — or are you taking another cash advance on cows you won’t have?

From $1,720 to $3,010 a head in 27 months — CoBank’s data says that heifer price isn’t a feed-yard story; it’s a signal about who still owns dairy cows in 2030. Which side of the sort do your replacement numbers put you on?

Key Takeaways

  • Every beef service on a viable dairy dam trades away about $585 in replacement value, and a beef calf has to clear $1,580 to match a sexed-dairy pregnancy on that same cow — that crossover, not the calf buyer’s mood, should govern your breeding plan.
  • At $3,010 a head, a 500-cow herd needing 135 replacements is carrying an extra $174,150 to $307,800 a year versus 2023 — roughly $1.74 to $3.08/cwt — before you touch the interest on financing them.
  • With Class III stuck at $14–$16/cwt against a mid-size breakeven near $21/cwt, the herds getting sorted out aren’t the smallest — they’re the ones running volume economics with value-farm overhead and no plan to hold DSCR above 1.0 into 2028.
  • In the next 30 days, run your real margin over feed, check your heifer pipeline against your cull rate, and pull your DSCR — if it’s been under 1.2 for three straight months, that’s your first call, not your last.

Complete references and supporting documentation are available upon request by contacting the editorial team at editor@thebullvine.com.

Learn More

The Sunday Read Dairy Professionals Don’t Skip.

Every week, thousands of producers, breeders, and industry insiders open Bullvine Weekly for genetics insights, market shifts, and profit strategies they won’t find anywhere else. One email. Five minutes. Smarter decisions all week.
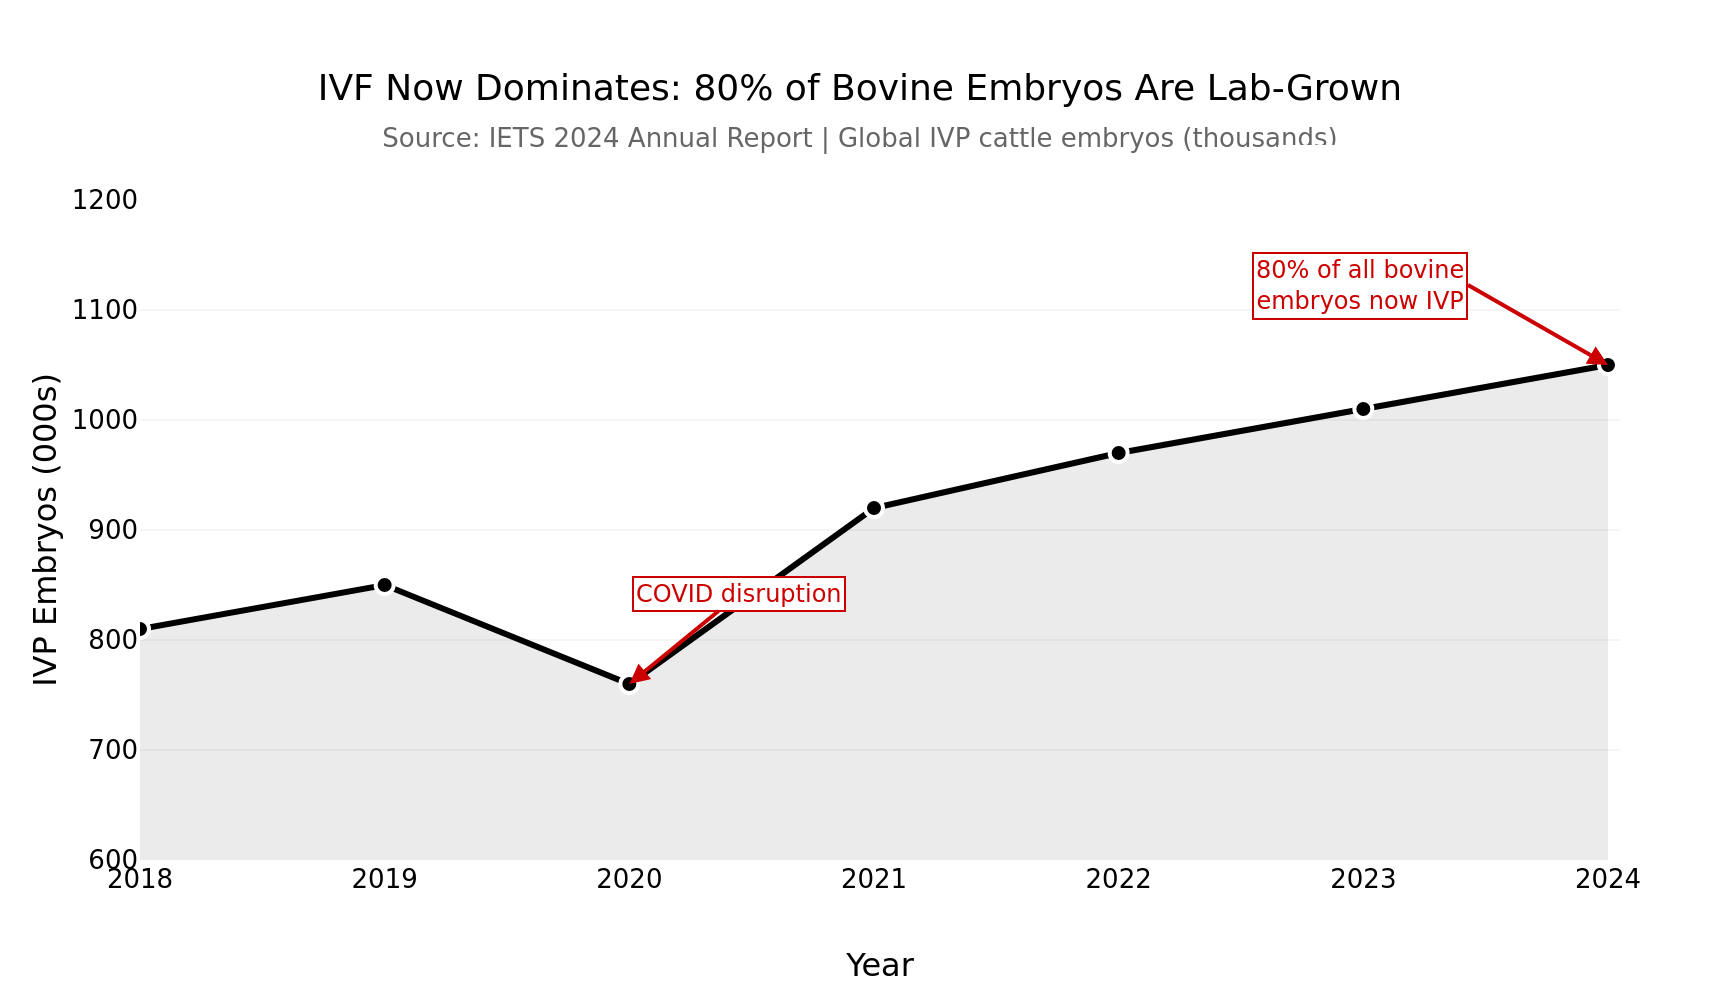
NewsSubscribe
First
Last
Consent

Canada vs. USA: The Dairy Border War Where One Side’s Fighting Over a Nickel and the Other’s Ignoring $3 Million

The CUSMA review lit the fuse on July 1, 2026 — but the fight that decides which farms survive isn’t at the border. It’s a nickel per cwt versus a 15% quota drop that quietly turns a bankable 55% balance sheet into 60.4% — and wipes out CA$300K in equity.

Picture two farms — composites, but built from real numbers. A 150-cow operation in Wisconsin, watching Washington rail against Canada “stealing billions” in dairy trade, thinking: finally, somebody’s fighting for us. And a 100-cow farm in Ontario, watching Ottawa hold the line with a brand-new law protecting supply management, thinking: our system won. Both proud. Both patriotic. Both watching the wrong battle while the real risk sits quietly on their own asset line.

Neither farm is a single real operation — they stand in for thousands on each side of the line. But the numbers behind them are real, and they’re the numbers the July 1 CUSMA review dragged into the open. Not a border war over milk. A question about which system leaves its farmers more exposed when the fighting drags on. So let’s put both flags on the table and settle it. Who’s actually winning? And who’s lying to themselves harder?

The “Cliff” That Wasn’t

First, kill the headline that had everyone reaching for the fireworks and the pitchforks. CUSMA didn’t die July 1. The deal runs a 16-year term to July 1, 2036, and July 1, 2026 was a scheduled joint review under Article 34.7 — a checkpoint, not a guillotine. Canada’s chief trade negotiator Janice Charette has framed the review the same way — a checkpoint rather than a cliff. The Bank of Canada’s April 2026 report flagged the review as a significant risk but maintained its base case that the core of the agreement will remain in effect. 

But here’s what should worry both camps. If the three countries don’t sign a full extension, CUSMA slips into annual joint reviews — potentially every single year until 2036. Farm Credit Canada’s read: the grievances won’t be settled come July, so tariffs and uncertainty drag on through 2026 and into 2027. 

So this isn’t one battle. It’s a ten-year war of attrition. Which makes the only question that matters this: who’s actually exposed when the clock keeps resetting?

Team USA’s Case — And the Gut-Punch Underneath It

Fly the stars and stripes for a minute, because the American producer has a real grievance. USMCA promised US dairy roughly US$200 million a year in new tariff-free access to Canada. Canadian fill rates have run near 42%, meaning more than half of the promised access goes unused — an estimated US$116 million a year left on the table. And in 2024, a CUSMA dispute panel again took up how Canada allocates its dairy import quotas — the core of a years-long fight over whether Ottawa is honoring the deal it signed. That’s not nothing. That’s a deal Canada signed and then, in the US view, quietly boxed shut. 

Now the gut-punch. Spread that whole fight across US milk production, and it works out to about five cents per hundredweight. On a 150-cow herd shipping roughly 24,000 lb per cow a year — call it 36,000 cwt — that’s around US$1,800. Real money, sure. Call it a month of feed. But it won’t move the needle on a farm that’s bleeding from somewhere else. 

And somewhere else is where American farms actually bleed. US milk prices swing hard — Class III ran near US$24/cwt in mid-2022 and slid to around US$16 by 2023. That’s a US$8 swing per hundredweight, dozens of times larger than the entire border fight — a different order of risk entirely. 

Licensed US dairy herds have collapsed from 66,825 in 2004 to 24,811 in 2024 — roughly 2,500 to 2,800 exits a year lately. About seven barns a day. 

The border fight is the loud war. The price cycle is the quiet one that actually closes those barns — and no panel ruling in Geneva fixes a debt-service coverage ratio that breaks at US$18 milk.

What Does the Border Fight Actually Change on a US Milk Cheque?

Not much — and that’s the whole point. Say the US wins the TRQ fight outright and Canada fills every basket tomorrow. The most credible estimates put the upside at five to fifteen cents per hundredweight spread across US production. On that same 150-cow farm — the same 36,000 cwt, just at 15¢ instead of a nickel — the top of the range is roughly US$5,400 a year. A nice cheque. Not a strategy. 

Line that up against what the price cycle already does to the same farm. A US$8/cwt swing on that milk is the difference between a comfortable year and a call to the lender. So if you’re American, the honest question isn’t whether Ottawa plays fair. It’s whether your operation clears its debt service when Class III drops back toward US$16 — the number that’s actually been closing seven barns a day. The border is the fight you can watch. Your DSCR is the fight you can win. 

Why Aren’t More US Farms Using the Tools Built for Exactly This?

Here’s the frustrating part. The federal programs designed to blunt that US$8 swing already exist — and plenty of farms leave them on the shelf. Dairy Margin Coverage pays out when the national milk-feed margin falls below the coverage level you buy, and Dairy Revenue Protection lets you lock a floor under your quarterly milk revenue. Neither is a handout, and neither is complicated once you’ve run it once. 

The catch producers cite is cost and paperwork — premiums due when margins look fine, forms that feel like busywork in a good year. That’s exactly the wrong time to judge them. And the program’s most affordable coverage tier is built for the family-scale operation — it applies to a base slice of your production history, which, for a herd the size of that 150-cow Wisconsin farm, covers all of its milk at essentially the cheapest rate. If that’s your farm and you’re not enrolled, you’re leaving your best-fit risk tool on the shelf while arguing about a nickel at the border. 

Team Canada’s Case — And Its Own Gut-Punch

Now raise the Maple Leaf. The Canadian producer’s pitch is stability, and the numbers back it. Supply management delivers a steadier milk cheque, and Ottawa just made it law that nobody can trade it away. Bill C-202 received Royal Assent on June 26, 2025, replacing an earlier version that died when Parliament was prorogued. The trade minister now legally can’t raise import quotas or cut over-quota tariffs on dairy, poultry, or eggs. That’s settled law now, not a proposal — which is what makes the “off the table” framing real. Fortress sealed. Flag planted. 

Here’s the gut-punch for Team Canada. That protected system runs on quota — and quota is where the real exposure hides. Farm Credit Canada’s 2026 report pegs mid-size quota holdings near CA$2.5 million, at CA$24,000 to CA$27,000 per kilogram of butterfat. Our 100-cow Ontario example runs a bit higher — about CA$3 million in quota — which is where the barn math below starts. Either way, it’s the biggest asset on the balance sheet. And it’s not a commodity price you can hedge — it’s a value that exists only because the political system says it does. 

That system’s already been chipped away three times.

CETA, CPTPP, and CUSMA combined opened access equal to about 8.4% of national milk production. Ottawa’s answer each time: up to CA$4.8 billion in compensation to producers, plus CA$497.5 million to processors. 

Concede a slice, pay the compensation, declare the fortress intact. The new law even hints at the fear underneath it. If quota value were truly bulletproof, you wouldn’t need a statute swearing you’ll never trade it away.

Could Quota Values Actually Re-Rate — Or Is That Fear Talking?

Fair question. Nobody’s predicting a crash, and no lender or ag-economics body has published a model calling for one. But you don’t need a crash to feel it — you need a slow squeeze, and the pieces for one are already on the board. Three trade deals have opened access equal to about 8.4% of production, and C-202 has removed dairy as a bargaining chip for the next round. Each concession moves more foreign product inside the fence; the guarantee behind your quota gets a little thinner each time. 

Here’s why that matters for the price of a kilogram of butterfat. Quota holds its CA$24,000-to-CA$27,000/kg value because the system guarantees you a buyer at a set return. Weaken that guarantee — more import share, a thinner effective utilization rate — and the asset starts to look less bulletproof to the next buyer, and to your lender. Provincial boards cap how fast quota prices can move, which slows any re-rate but doesn’t put a floor under the underlying value. And with Ottawa’s only remaining tool being the compensation cheque, the political durability of quota value sits dead center of the next decade. The data on exactly how past concessions moved quota values is thin — but the direction of the pressure isn’t in dispute. 

How Much Would a 15% Quota Drop Actually Cost Your Equity?

Here’s the barn math that should make a Canadian producer put down the flag and pick up a calculator. Take that 100-cow Ontario farm: CA$5.0 million in assets, CA$3 million of it quota, CA$2.75 million in debt, CA$2.25 million in equity. Debt sits at about 55% of assets — comfortable, bankable, nothing a lender blinks at. 

Now knock 15% off the quota. CA$3.0 million becomes CA$2.55 million. Same cows. Same milk. Same components. But equity drops to CA$1.80 million, and debt climbs to roughly 60.4% of assets — the kind of shift that moves a farm from a routine renewal to a sit-down with the bank. A 10-to-20% haircut on that CA$3 million is a CA$300,000 to CA$600,000 hit to your equity, with zero warning on the milk cheque. 

And here’s the part that makes it personal: that same cut lands differently depending on where your leverage sits. A farm that paid its quota down over the years absorbs the hit and stays comfortably bankable. A farm that expanded recently at peak quota prices — far more debt against the same asset — can get pushed from a routine renewal into a hard conversation with the lender. Same milk cheque. Same haircut. Wildly different phone call. The question isn’t whether quota drops. It’s where your leverage sits when it does — which is exactly what the 30-day stress-test below is built to tell you.

So Who’s Actually Winning the Border War?

Depends on which risk scares you more. Here’s the honest scoreboard, side by side.

Risk Dimension🇺🇸 Team USA (150-cow Wisconsin)🇨🇦 Team Canada (100-cow Ontario)
Milk Price StabilityVolatile — US$8/cwt swings in a single yearRegulated, formula-based — predictable
The Trade Fight’s Real Value~5–15¢/cwt upside if US wins outright8.4% of production already conceded
Annual Impact on 150/100-cow Farm~US$1,800–$5,400/year max gainQuota re-rate risk: CA$300K–$600K equity
Debt-to-Asset at RiskDependent on milk price / DSCR55% → 60.4% on a 15% quota drop
Biggest Structural ThreatPrice cycle + ~2,500–2,800 farm exits/yrQuota value linked to political system
Freedom to Grow / ExportHigh — open market, export upsideCapped — C-202 seals dairy as non-tradeable
Government Risk BackstopDMC, DRP — voluntary, no price floorCA$4.8B in compensation paid to date
What Producers Are WatchingOttawa’s TRQ fill ratesWashington’s tariff threats
What They Should Be WatchingTheir DSCR at US$18 milkTheir D/A ratio after a quota haircut

Read it straight, and nobody sweeps. On price stability, Canada wins — no argument. On scale, export upside, and freedom to grow, the US wins. But on the risk each side refuses to look at? It’s a tie in the worst way. The American’s chasing a rounding error at the border while the price cycle eats his neighbors. The Canadian’s sleeping on a six-figure asset he’s never once stress-tested. Both flags flying. Both fighting the wrong battle.

Is Your Farm Watching the Wrong Border?

The instinct on both sides is to watch the other country. Americans watch Ottawa’s “unfair” quota walls. Canadians watch Washington’s “400% tariff” soundbites and Trump’s threats. But for the US producer, the milk cheque barely moves either way — the real war is a debt-service coverage ratio nobody’s tested against the next price dip. And for the Canadian producer, Washington’s mood is a sideshow. The variable that could reset your net worth is whether quota values hold through ten years of annual reviews. Everyone’s watching the border. The risk is in the barn.

Options and Trade-Offs: Your Move by Border

Panic isn’t the point. Nobody can put a probability on a quota re-rate, and no lender or ag-economics body has published a formal model predicting one. Most farms on both sides have rehearsed the wrong risk. Here’s the playlist — Canadian balance-sheet homework first, then the American risk-management moves.

If you farm in Canada:

Farm SizeQuota Value (Baseline)Equity (Baseline)D/A (Baseline)–10% Quota Drop–15% Quota Drop–20% Quota Drop
60-cow (Starter)CA$1.8MCA$1.0M~55%–CA$180K → 58.9%–CA$270K → 61.3%–CA$360K → 63.8%
100-cow (Mid-size)CA$3.0MCA$2.25M~55%–CA$300K → 58.2%–CA$450K → 60.4%–CA$600K → 62.5%
200-cow (Large)CA$6.0MCA$4.5M~55%–CA$600K → 57.8%–CA$900K → 59.7%–CA$1.2M → 61.6%
  1. Run the haircut stress-test yourself — within 30 days. Take your current quota value, cut it 10%, 15%, and 20%, and recalculate your debt-to-asset ratio and loan-to-value.
    1. When it makes sense: any farm carrying quota as major collateral.
    1. What it takes: an afternoon and your last balance sheet.
    1. The risk of skipping it: you learn where your covenants sit from your lender, not from yourself.
  2. Ask your lender their own haircut assumptions. Your bank or FCC may already discount the quota internally when sizing up your position.
    1. When it makes sense: before your next operating-line renewal.
    1. What it takes: one direct conversation.
    1. The payoff: you find out if the bank already values your equity lower than you do.

If you farm in the US:

  • Treat the TRQ fight as gravy, not a plan. Even a fully “fixed” quota system moves you five to fifteen cents per cwt. 
    • The real levers: your DSCR, and whether you’re actually enrolled in DMC and DRP.
    • The limit: no ruling in Geneva saves a balance sheet that breaks at US$18 milk. 
  • Check your risk-management coverage before the next sign-up window. DMC and DRP are built to blunt exactly the price swings that close barns, and the most affordable coverage favors family-scale herds. 
    • When it makes sense: any herd exposed to margin collapse — which is all of them.
    • What it takes: a sign-up window and premiums paid even when margins look fine.
    • The trade-off: small guaranteed cost now versus an uncovered margin collapse later.

For both sides:

  • Grow margin before volume. For Canadians, C-202 walls off big export-driven growth, so the edge is cost per litre and better components. For Americans, chasing volume into a price trough is how good herds go under.
    • The Canadian catch: financed quota at around 6% interest already bleeds cash on a negative carry, so buying more into a possible re-rate stacks the risk. 

Key Takeaways

  • If quota is your largest asset and a 15% cut pushes your debt-to-asset ratio past your lender’s comfort zone, you’ve found your real exposure — not the one on the news.
  • If you bought quota recently at peak values with high leverage, you’ve got the thinnest equity cushion to absorb a re-rate. Model it before your next renewal.
  • If you’re American and your DSCR can’t survive a US$18 milk year, fix that before you spend one more minute on a TRQ fight worth about 5¢/cwt. 
  • If you’re not enrolled in DMC or DRP, you’re leaving the tools built for exactly these price swings unused — check your coverage before the next sign-up window. 
  • If you see dairy compensation getting reframed as “temporary” or “transitional” in Canada, or risk-tool cuts moving through a US Farm Bill, that’s your signal the ground is shifting under your system.

The border war makes for great fireworks on both sides. But the fight that decides whether your farm will still be standing in ten years isn’t happening in Washington or Ottawa. It’s happening on your own balance sheet — and most operations on both sides of the line have never run the numbers.

So pick your battle, but pick the right one. If you’re American, would your farm survive the next price crash without a single Canadian container crossing the border? And if you’re Canadian, if your quota value dropped 15% tomorrow, would your lender notice before you did? We’re breaking down the full head-to-head — the quota-haircut model by herd size beside the US risk-tool playbook — in an upcoming Bullvine deep-dive. That’s where the real numbers live, for both flags.

The Bullvine Balance Sheet Stress-Tester

Stop watching the news. Run your actual numbers below.

Learn More

The Sunday Read Dairy Professionals Don’t Skip.

Every week, thousands of producers, breeders, and industry insiders open Bullvine Weekly for genetics insights, market shifts, and profit strategies they won’t find anywhere else. One email. Five minutes. Smarter decisions all week.
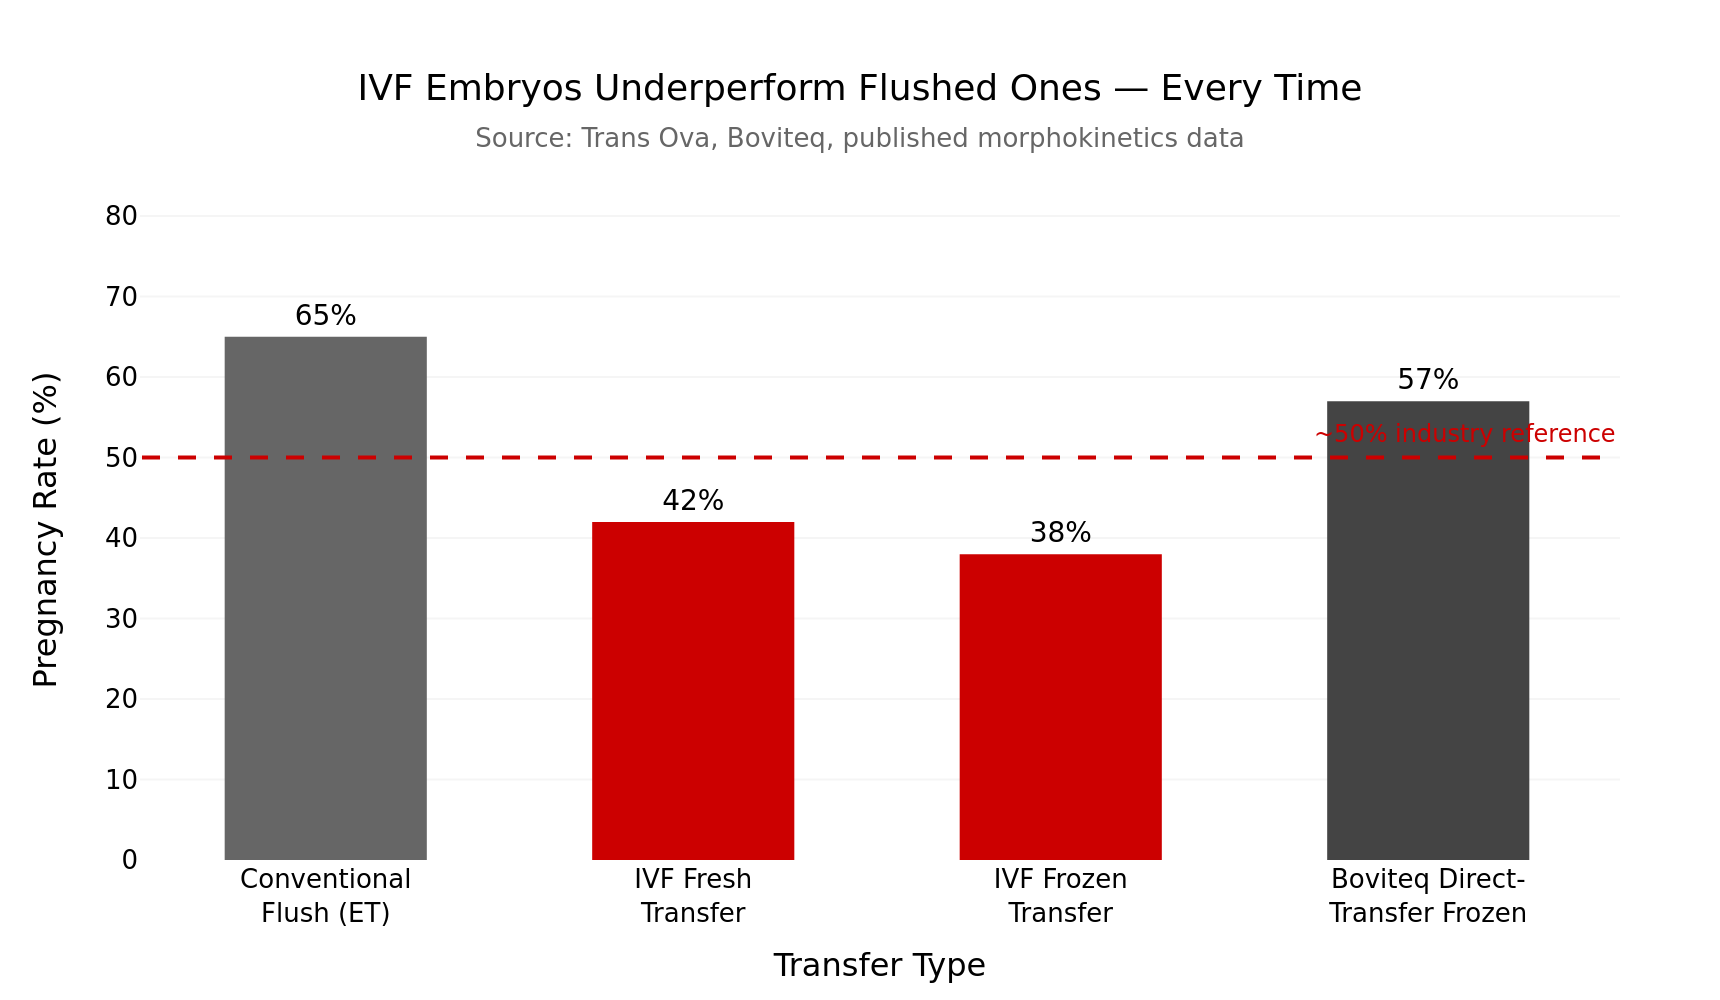
NewsSubscribe
First
Last
Consent

Dairy Got the Visa Win. Its Workers Got a $2 Billion Pay Cut

Dairy spent years lobbying for H-2A access and finally got it on June 17. Same stretch, a Fresno court let a $2B wage cut stand — and the undocumented crew already milking your cows got nothing.

Executive Summary: On June 17, 2026, USCIS opened the H-2A guest worker program to dairies that can prove a “temporary or seasonal” labor need — the industry’s biggest immigration win in decades, and one corn, soybeans, and poultry couldn’t pull off, because farms staffed by immigrant labor produce 79% of U.S. milk. But read the fine print: you still can’t put your year-round milking crew on H-2A, eligibility is judged farm by farm, and the all-in cost runs roughly $877/cow — often right on top of what you’re already paying. The same stretch handed agriculture a DOL wage rule, now in effect after a Fresno court denied the UFW’s injunction on May 13, that cuts guest-worker pay by $2 billion (26–32%), with new AEWR rates taking effect July 1. None of it helps the undocumented workers already in your parlor, who got zero new protection. And the real exposure hasn’t moved: Drumgoon Dairy lost 38 of about 50 workers — 70% of the crew — in one I-9 audit and spent $110,000+ rebuilding, while a labor gap costing just 8 lbs/cow/day on a 400-cow herd bleeds about $662 a day before a single SCC penalty. If you lean on immigrant labor, the 30-day move isn’t filing H-2A paperwork — it’s running an I-9 self-audit, so you know your exposure before someone else finds it.

H-2A dairy visa

The Elliott family moved from a 140-cow farm in Northern Ireland and built Drumgoon Dairy near Lake Norden, South Dakota, into a 6,500-cow operation running 20 robots over nearly two decades. Then a Homeland Security I-9 audit pulled 38 of about 50 workers — roughly 70% of the crew — in a matter of days, and Nicole Elliott was running the place when it had to spend more than $110,000 rebuilding afterward. One paperwork check, and an operation that took 20 years to build suddenly faced the question every short-staffed dairy does: who’s milking tonight?

That’s the version of dairy’s labor crisis that never makes the press release. And it’s the pressure that pushed the industry to its biggest immigration win in decades. On June 17, 2026, U.S. Citizenship and Immigration Services issued Policy Memorandum PM-602-0200, opening the H-2A guest worker program to dairy operations that can show a “temporary or seasonal” labor need. If you run cows, this matters — just not in the clean, solved-problem way the celebration suggests.

The short version: dairy got a legal door it never had. The longer version is worth your time, because of what that door does and doesn’t open.

What Actually Changed on June 17

For decades, dairy was effectively locked out of H-2A. The program was built for seasonal work — fruit, vegetables, nursery crops that need a crew for a few months and then send them home. Cows don’t work that way. They need milking 365 days a year, so dairy never fit the “seasonal” box, and specialty crop growers used the program while dairy farmers watched from the sidelines.

The new memo doesn’t create a new visa. It reinterprets the old rule, telling adjudicators that dairying can involve a temporary or seasonal need and must be judged on a case-by-case basis, like any other H-2A petition. USDA welcomed it. The Green Bay–based Edge Dairy Farmer Cooperative called it a meaningful step for an industry that’s been asking for exactly this clarification for years.

Here’s why dairy had the leverage to get this when corn, soybeans, and poultry couldn’t. A 2015 Texas A&M AgriLife study for the National Milk Producers Federation found:

  • 51% of all dairy workers are immigrant labor.
  • Farms employing immigrant labor produce 79% of the U.S. milk supply.
  • Pulling those workers out would push retail milk toward $6.40 a gallon and hit the broader economy by $32.1 billion.

Those figures are now a decade old, but the dependency hasn’t eased. That’s not a labor-rights pitch. It’s a grocery-shelf pitch — and it lands in rooms where immigration arguments stall out.

Why Was Dairy’s Argument the One That Worked?

Every ag sector says it’s essential. Corn says it. Poultry says it. They all have lobbyists making the same case. So why did dairy walk out with a memo nobody else got?

Because dairy’s ask was narrow and legal, not broad and political. The industry didn’t ask Washington to invent a new “dairy visa.” It pointed at the statute and said the law already lists dairying as eligible agricultural labor — your interpretation of “seasonal” is what’s broken. The Farm Bureau framed it the same way: flexibility, not amnesty. That’s a correction USCIS could make in a nine-page memo without waiting on Congress. One is a political ask. The other is a legal fix. And legal fixes are a lot harder to say no to.

But the same thing that made the ask winnable also caps what it delivers:

  • Eligibility still hinges on proving a temporary or seasonal need, judged on a farm-by-farm basis.
  • Immigration firm másLabor says very few dairies can actually satisfy that standard under the current framework.
  • You can’t file H-2A for your year-round milking crew. You’d have to carve out something genuinely time-bound — a calving-season role — and prove you don’t need that same job the rest of the year.

That’s where most dairies hit the wall. A continuous-flow operation can’t easily claim a “season” when cows freshen every week of the year. The farms most likely to qualify are the ones with a concentrated calving block or a seasonal feed-and-forage push — not the bulk of confinement dairies. So read the memo for what it is: a real crack in a door that was fully shut, not the door swinging open.

Labor DimensionBefore June 17, 2026After June 17, 2026Bottom Line
H-2A access for dairyEffectively locked out — no seasonal frameworkLegal pathway exists; case-by-case eligibilityReal crack in a shut door
Year-round milking crew eligibilityIneligibleStill ineligible⚠️ Nothing changed
AEWR guest-worker wages$15–$20/hr range (many states)$8–$17/hr (26–32% cut, effective Jul 1)Workers paid for the win
Undocumented workers in barnNo legal status, no pathwayNo legal status, no pathway⚠️ Zero new protection
Farm-by-farm compliance riskHigh (I-9 audit exposure)Still high — memo doesn’t affect enforcementAudit risk unchanged
FWMA / legalization trackStalled in SenateStill stalled⚠️ No movement
2,000-cow operation calculusH-2A unusable for core laborH-2A usable for seasonal/forage rolesMarginal improvement
400-cow operation calculusH-2A unusableH-2A theoretically available; rarely qualifiesPaper win; cash reality bites

How This Plays Out in a Real Barn

Drumgoon wasn’t a one-off. In June 2026, an ICE raid hit Outlook Dairy in New Mexico, where owner Bos had 55 workers on payroll at sunrise and 20 by sundown — 35 gone in a single action, and milk production effectively stopped overnight. When the crew vanishes, the clock that matters isn’t political. It’s biological.

Miss milkings and cows pay for it fast. DairyNZ’s guidance notes that a quarter of cows not milked for seven days developed mastitis, with somatic cell counts spiking above 400,000 cells/mL and taking days to return to normal. The WH Miner Institute reports that even mild mastitis costs 11 to 18 pounds of milk per cow per day — and sometimes production never fully returns.

Here’s the barn math you can map straight to your own operation:

  • A labor disruption costing a conservative 8 lbs/cow/day on a 400-cow herd = 3,200 lbs/day.
  • At USDA’s 2026 all-milk forecast of $20.70/cwt, that’s about $662 a day walking out the door — before SCC penalties, dumped milk, or vet bills.
  • Run that for a week while you wait on emergency labor, and you’re past $4,600.

The cows don’t pause for paperwork.

And the lost milk is only the part you can see on the bulk-tank ticket. A short-handed crew cuts corners on heat detection, fresh-cow checks, and footbaths — the quiet jobs that show up three weeks later as open cows and lame cows. Iowa State Extension’s 2024–26 cost work estimates that the change in reproduction value is about $6 per cowwhen performance slips, with a missed breeding pushing the calving interval out by roughly 21 days. That’s the second wave of a labor shock, landing after the headlines move on. When neighboring farms sent workers to Drumgoon after its audit, that’s the wave they were trying to head off.

The Same Memo on a 2,000-Cow Operation

Scale changes the math, but not the constraint. On a large Western or Midwest dairy, the fixed costs of H-2A amortize better — a housing build or legal bill spread across 20 workers stings less per head on 2,000 cows than on 400. Bigger operations often already have bunk-style housing and HR staff, which makes the program’s housing, transport, and record-keeping rules more realistic. Wisconsin Public Radio reported that at least 14% of Wisconsin farms approved for visas this year already have dairy herds — mostly using H-2A for non-milking field and forage work.

But even at 2,000 cows, the wall is the same:

  • You still can’t put your core milking crew — the ones on that 72-hour clock — on H-2A year-round under this guidance.
  • You’re still bound by the one-year contract maximum and three-year cap, with workers required to return home.
  • A continuous-milking operation with cows freshening evenly has less obvious seasonality to point to than a smaller herd with a tight calving window.

The memo hands big dairies a scalpel for specific seasonal jobs. It’s not a blanket over the year-round labor gap that keeps the lights on in the parlor.

What Does the “Win” Actually Pay Your Operation?

Less than the headlines suggest — and here’s the part the press releases skip. The same stretch of 2026 that handed dairy its H-2A door also brought a Department of Labor interim rule, effective October 2025, that rewrote how H-2A wages get set. The Economic Policy Institute estimates:

  • Over 350,000 H-2A farmworkers will see pay cut by $2 billion or more in 2026.
  • That’s a 26% to 32% reduction in their wages.
  • In some states, H-2A pay drops from the $15–$20/hour range toward $8–$17.

So the employer side of agriculture got two things at once: dairy got access, and the whole sector got cheaper guest labor. That changes your per-cow math if you use the program. But say it plainly — those savings come straight out of worker paychecks. The United Farm Workers sued to block the rule, and on May 13, 2026, a federal judge in Fresno denied their request for an injunction, so the wage cut is in effect while the lawsuit grinds on toward a ruling on the merits. DOL is set to publish new wage rates under it effective July 1, 2026. The rule could still be struck down later — so don’t treat those lower numbers as permanent in a long-term budget.

Run the program cost honestly before you celebrate. H-2A requires you to pay the Adverse Effect Wage Rate, provide free housing, cover travel both ways, and hit a “three-fourths guarantee” on contract hours. Non-wage costs land around $10,000 per worker, with federal fees adding well over $1,000 a head.

The number to run before you celebrate: The Bullvine’s own modeling pegs all-in H-2A dairy labor at roughly $877 per cow per year — often right on top of, or above, what you’re already paying.

How that lands depends entirely on your size, because the fixed costs spread differently across the herd:

Herd sizeH-2A fixed cost spread (housing, fees, travel, legal)All-in labor lens
400 cowsHeaviest per-cow burden; small crew can’t dilute fixed costsLikely above current labor cost for most
1,000 cowsModerate dilution; depends on existing housingRoughly break-even vs. current, case-by-case
2,000+ cowsBest dilution; existing housing/HR helpsClosest to penciling, still capped by seasonality rule

The table isn’t a verdict — it’s a reminder that the same memo pays out very differently on a 400-cow tie-stall than on a 2,000-cow freestall. Run your own number before you decide the win is yours.

What Happens to the Crew Already in Your Barn?

Nothing changed for them on June 17. The memo helps future hiring. It offers no legal status, no protection, and no pathway for the undocumented workers already milking your cows — the people who rode out every audit and every enforcement wave. They woke up on June 18 in the same position as June 16. Years of essential work, and still no door to legal status.

That’s the hard truth under the celebration. A large share of dairy’s immigrant workforce is undocumented — in some studied regions like the Northeast, estimates run as high as 90%, though that’s a regional figure, not a national census. Fixing that would take something this memo isn’t:

  • A true year-round ag visa, or
  • legalization track tied to work history.

The Farm Workforce Modernization Act was the best-known attempt at the latter. It passed the House twice with bipartisan support but stalled in the Senate, and the Center for Migration Studies estimated it would have legalized about 235,600 undocumented agricultural workers and their families. It never became law. Until something like this does, your most experienced people remain essential and exposed.

Options and Trade-Offs for Farmers

There’s no single right move here. There are paths, and each one has a real cost.

OptionBest FitUpfront CostTimeline to ImpactKey RiskCore Limitation
H-2A for seasonal rolesDefined calving block; large herds (1,000+)$10,000+/worker (housing, travel, legal)75–120 days lead time⚠️ Rates resting on live court fightYear-round milking crew still ineligible
I-9 self-auditEvery operation, right nowMinimal (staff hours)This monthFinding problems you’d rather not seeFixes exposure; doesn’t fix status
72-hour contingency planAny herd relying on immigrant laborStaff time onlyThis weekNeighbors-helping-neighbors isn’t a planLabor shortage still materializes
Robotics / automationChronic labor gaps; capital-strong ops$200,000–$500,000+ per milking unitMulti-year payback⚠️ Doesn’t prevent an I-9 auditNo 72-hour fix; debt risk
Legalization track (FWMA)All dairy ops employing undocumented crewLobbying/advocacy onlyStalled — no timelineCongress required; Senate blocked twiceNo active pathway exists
  • Use H-2A for genuinely seasonal roles. Works for larger operations with defined calving or breeding seasons, or time-bound forage work. Requires housing, legal help, 75-to-120-day lead times, and compliance systems. The risk: most core milking jobs still won’t qualify, and you front every dollar before a cow gets milked. The October 2025 wage rule makes the cost side look better than it did in 2024 — but those rates rest on a court fight that’s still live, so don’t build a decade-long plan on them.
  • Run an I-9 self-audit this month. Works for every operation, regardless of size — this is the 30-day move. Requires a few hours and an honest look at your paperwork. The risk: you find problems you’d rather not see. But Drumgoon let 38 workers go after exactly this kind of DHS check. Knowing your exposure beats discovering it during a raid.
  • Build a written 72-hour contingency plan. Works for any herd leaning on immigrant labor — statistically, most of them. Requires mapping who does what, lining up backup labor, and deciding now which pens you’d triage first. Drumgoon leaned on neighbors sending workers over — but that’s a favor, not a plan. The cows line up whether you’re ready or not.
  • Look hard at automation. Works for operations facing chronic labor gaps that can carry the debt. Requiresserious capital; robots are a multi-year bet, not a 72-hour fix. The catch: Drumgoon’s 20 robots still didn’t insulate it from a DHS audit.

Key Takeaways

These are decisions to make, not points to remember.

  • If you run defined calving or breeding seasons, ask your immigration attorney whether one specific, time-bound role could qualify for H-2A — but don’t assume your milking crew does.
  • Before you budget H-2A, run the per-cow number. At roughly $877/cow all-in, check whether it beats your current labor cost or matches it — and remember a 400-cow herd dilutes fixed costs far worse than a 2,000-cow one.
  • Do an I-9 self-audit this month. If one DHS check pulled 70% of Drumgoon’s crew and cost $110,000+ to rebuild from, the question isn’t whether you’d survive it — it’s whether you know your exposure before someone else finds it.
  • If you lost 40% of your crew tomorrow, can you name who milks, which pens get triaged, and where your backup labor comes from? If not, that’s this week’s job.
  • If you rely on long-term undocumented workers, factor in that the memo gives them zero new protection. Build that risk into your staffing plan, not your press clippings.

So Where Does Your Operation Actually Stand?

Picture an audit hitting you next Tuesday. How many of your people are still standing in the parlor Wednesday morning — and do you actually know, or are you guessing? That’s not a political question. It’s a milk-check question, and the answer is sitting in your I-9 folder right now.

The June 17 memo handed dairy a tool. Whether it fits your herd comes down to your size, your seasons, and your balance sheet. We’re breaking down the full H-2A cost-per-cow model by herd size — where it pencils, where it doesn’t, and how the July 1 wage rates change the math — in next week’s Bullvine Weekly. That’s where the real numbers live.

Run Your Numbers

Dairy Profit Projector — Drop that $877/cow H-2A figure into your own herd size, milk price, and ration and see what it does to your 12-month whole-herd margin, IOFC per cow per day, and breakeven milk price — before you decide the visa win actually pencils on your farm.

Complete references and supporting documentation are available upon request by contacting the editorial team at editor@thebullvine.com.

Learn More

The Sunday Read Dairy Professionals Don’t Skip.

Every week, thousands of producers, breeders, and industry insiders open Bullvine Weekly for genetics insights, market shifts, and profit strategies they won’t find anywhere else. One email. Five minutes. Smarter decisions all week.
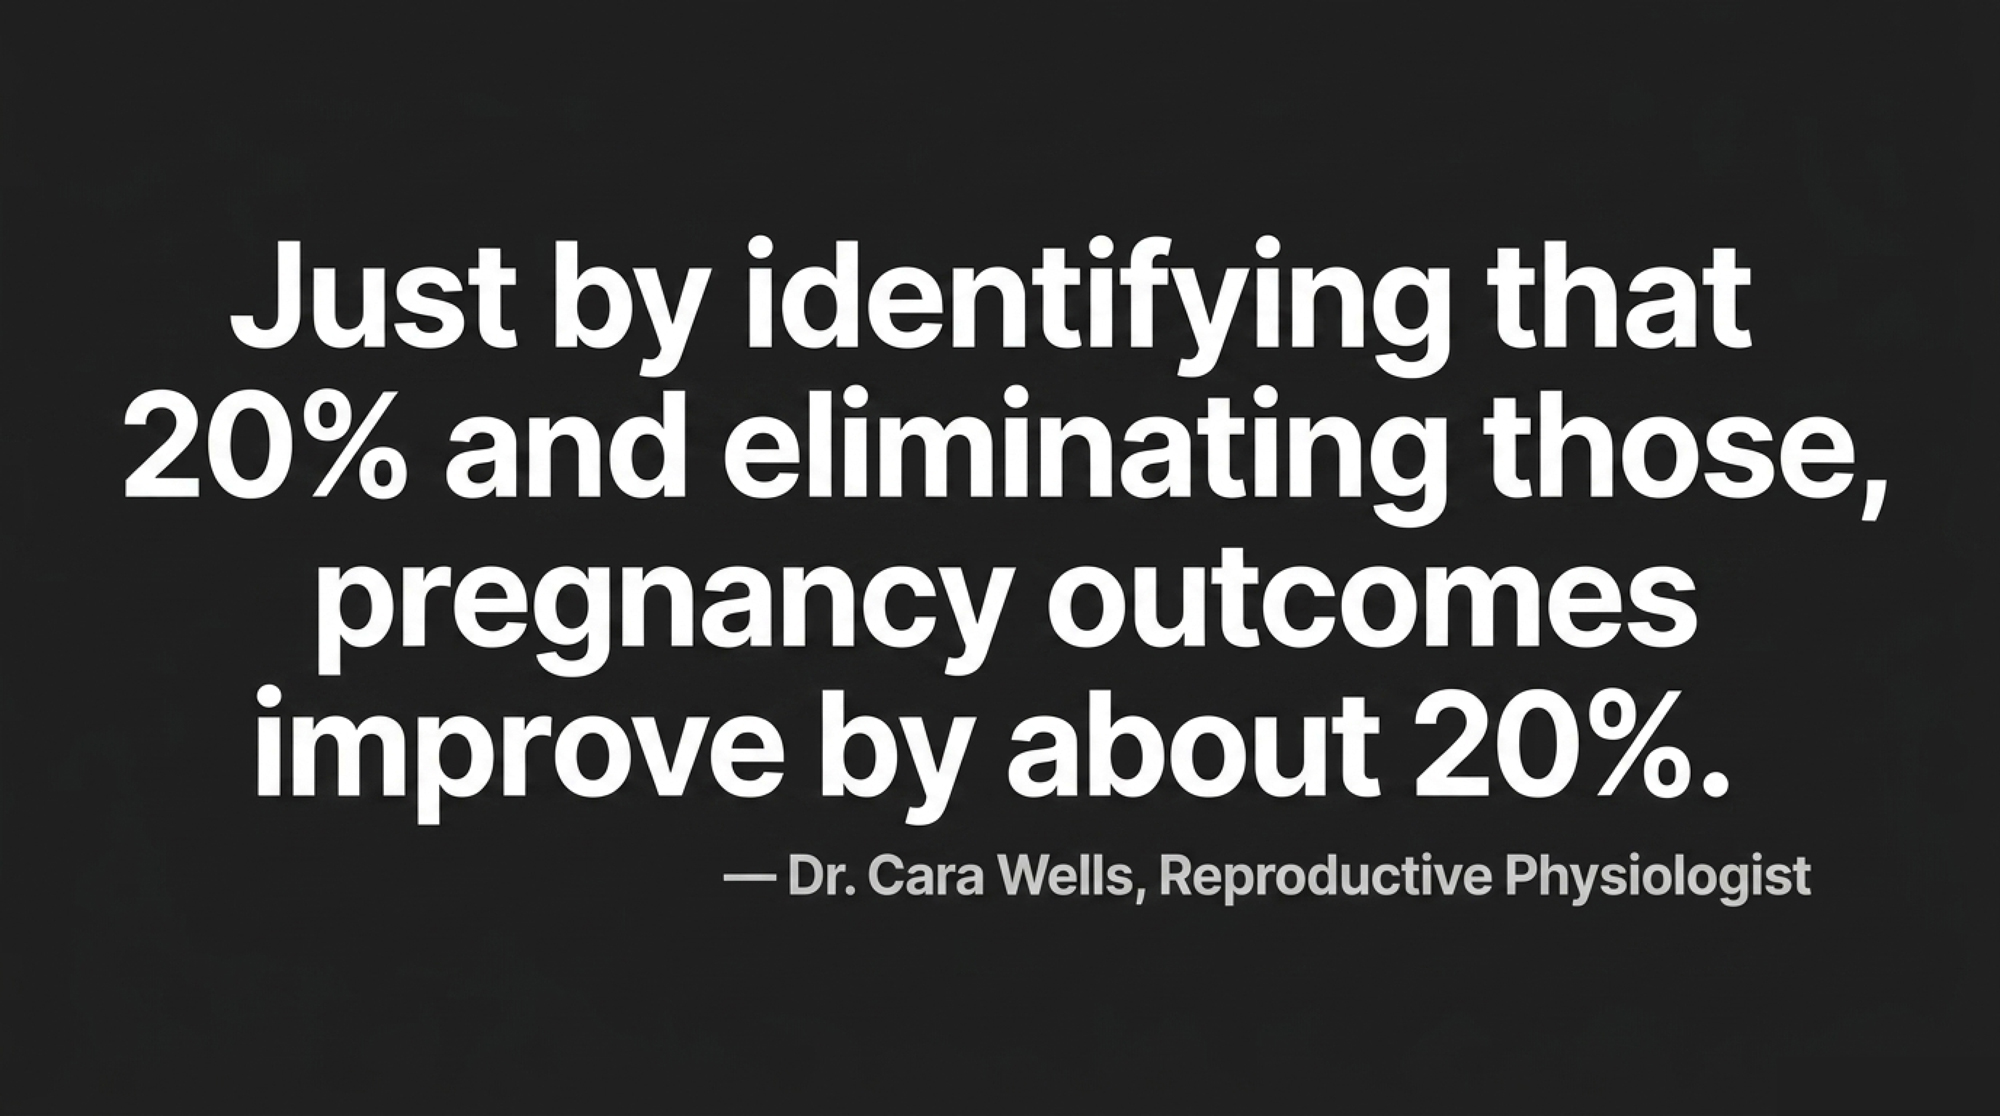
NewsSubscribe
First
Last
Consent

Steve Jaeger’s $511 Fresh Cow Problem – And the Hidden $111‑Per‑Cow Fix 4,495 Cows Just Proved

An 8‑farm, 4,495‑cow trial shows how changing fresh‑cow and dry‑off protocols can turn metritis costs and withdrawal milk into about $111 of margin per cow — without adding a single stall.

Steve Jaeger used to joke that United Vision Dairy was “always cutting the check, not collecting it.” After he put every fresh cow on a proactive protocol and switched dry-off to StopLac, the 1,000-cow Wisconsin herd sold 70 animals at premium prices in six months — and the dry barn finally went quiet.

When a 1,000‑cow Wisconsin dairy stopped dumping fresh‑cow milk to withdrawal and changed how cows were dried off, pregnancy rates climbed to 61–62%, the barn went quiet, and the herd started collecting premium checks instead of just writing cull checks.

You track SCC. You watch the preg rate. You probably know your days open and death loss. But do you actually know how many dollars in withdrawal milk your fresh‑cow protocol quietly takes out of your tank every month — and what would change if you didn’t?

At United Vision Dairy in Wisconsin, herd manager Steve Jaeger used to joke that they were “always the ones cutting the check, not collecting it.” It’s a 1,000‑cow herd, well‑run and shipping good milk. But every freshening brought the same routine: treat the sick ones with antibiotics, pull their milk, listen to a noisy dry barn for a couple of days, and sign off on cull checks that felt too frequent. That started changing when Jaeger put every fresh cow — twins, triplets, all of them — on AHV’s proactive fresh‑cow protocol and switched his dry cows to StopLac. His first‑service conception rate climbed to about 61–62%, and in six months, they sold 70 dairy animals at premium prices instead of shipping them on a cull truck. After their first StopLac dry‑off day, the barn that used to be full of bawling cows just…stayed quiet.

Jaeger’s story fits a bigger pattern. In Oostburg, Wisconsin, herd manager Karl Gabrielse at Quonset Farms (1,350 cows) describes the change the same way: fewer fresh‑cow issues, less antibiotic use, calmer dry‑off, and a six‑point jump in first‑service conception, from 47% to 53%. And when eight Western U.S. dairies — 4,495 cows total — ran a controlled trial on their fresh cows, the numbers behind those barn stories became hard to ignore.

The Fresh Pen Math You’re Probably Not Doing

Metritis doesn’t look like a margin line when you’re treating one cow in one pen. But it is. Pérez‑Báez and colleagues estimated the average economic cost of metritis at $511 per affected cow, with a range of $240 to $884 when accounting for treatment, discarded milk, reproductive delays, and culling risk (11,733 cows across 16 U.S. farms). Depending on how you define and track postpartum uterine disease, up to 40% of cows can end up with metritis or endometritis in early lactation.

That’s just the obvious cost. The number almost nobody sees is the milk that never leaves the hospital list. Every time you treat a fresh cow with antibiotics, you pull her milk. On a 1,000‑cow operation freshening close to 1,000 cows a year, even a modest metritis and retained‑placenta rate means a lot of milk quietly going down a separate line. And because most herds don’t track withdrawal milk as its own line item, it never shows up on your P&L as “lost revenue.” It just hides inside the lower ship weight.

What’s different now is that the evidence for a different way to handle that fresh pen — a proactive, zero‑withdrawal approach built around quorum sensing inhibition (QSI) instead of blanket antibiotics — isn’t just a nice theory or a tie‑stall study anymore. In 2024, AHV USA ran an eight‑farm, 4,495‑cow commercial trial in the Western U.S. using a simple odd‑week/even‑week design. It’s company‑run data, not yet independently peer‑reviewed, but it’s one of the largest controlled looks at proactive fresh‑cow protocols in real freestall herds we’ve seen.

On top of that, a USDA SARE‑funded project (OS24‑178) is underway with Texas A&M at a certified organic dairy, measuring bacteriology, PCR, SCC, and economics around similar compounds. Results are expected by March 2026, so the independent check is coming.

What 4,495 Cows on Eight Dairies Actually Showed About Fresh Cow Protocol ROI

The 8‑farm design is one you could copy without hiring a statistician. Cows calving in odd‑numbered weeks went on a zero‑withdrawal oral protocol: AHV Metri Bolus, Aspi Bolus, and Fresh Start (Milk Start) Paste. Even‑week calvings stayed on each farm’s existing fresh‑cow program. Eight dairies, all in the Western U.S., ranging from 1,000‑cow herds up to 20,000; the average herd size was around 5,700 cows, with about 45,000 cows total behind the gate.

Here’s what they saw across 4,495 fresh cows (2,240 AHV, 2,255 control):

8‑Farm Trial Results at a Glance

MetricControl GroupAHV ProtocolImprovement
Metritis incidence7.0%4.6%–34% (P<0.001)
Retained placenta1.4%0.4%–71% (P<0.001)
Milk yield, first 100 DIM8,083 lb8,751 lb+668 lb (+6.7 lb/day)
1st‑service conception47.5%48.4%+1.9 points (P=0.70, NS)
Net gain (all 4,495 cows)+$111.17 per cow

The 1.9‑point lift in first‑service conception didn’t reach statistical significance (P=0.70), so you shouldn’t treat this dataset as proof that conception will jump on every herd. In well‑run herds, even a couple of points can matter — which lines up with the six‑point gain Gabrielse reports at Quonset — but the strongest signals here are health and production: metritis, retained placenta, and early milk yield.

On the 2,240 protocol cows, AHV’s modeled 100‑day results looked like this:

  • $566,370 in additional milk value
  • $86,903 in retained‑placenta savings
  • $8,258 in metritis treatment savings
  • $22,475 in conception‑related gains

Total gross gain: $684,006. Subtract $184,295 for protocol cost, and the net comes to $499,712. Spread across all 4,495 cows in the trial — both protocol and control — that’s where the $111.17 per cow figure comes from.

Now plug that into your own barn. On a dairy freshening 1,000 cows a year — roughly the size of United Vision Dairy — the trial’s average net gain of $111 per cow works out to about $111,000 in annual margin without adding a single stall. Using USDA’s February 2026 WASDE forecast of $18.95/cwt for all‑milk and ERS cost‑of‑production estimates around $19.14/cwt for large herds, that extra $111,000 is the difference between red and black for a lot of U.S. operations this year.

Why This Matters More Now Than It Did 5 Years Ago

The economics around replacement heifers have changed the stakes on fresh‑cow survival and longevity.

USDA’s January 2025 Cattle Inventory report puts dairy replacement heifers at 3.914 million head — the lowest level since the late 1970s. In 2025, replacement heifers were selling for well over $2,900 per head in many U.S. regions, roughly double what many producers were paying in 2020. Most analysts expect the pipeline to stay tight, with hundreds of thousands fewer heifers available than historical norms.

That means every cow you keep alive and milking past her payback point is a cow you don’t have to replace at $3,000–$4,000 — and in some regions, even more. A 70% reduction in 60‑day death loss on a 1,000‑cow herd with 3–5% fresh‑cow mortality translates to 21–35 fewer dead cows per year. At today’s replacement prices, that’s not a rounding error. It’s a six‑figure capital line over a few years.

What the Survival Data Said About Keeping Fresh Cows Alive

The 8‑farm trial looked at metritis, retained placenta, and early milk. A separate AHV trial across California, Idaho, and Wisconsin focused on the first 60 days after calving.

That study tracked 2,703 cows. Of those, 1,134 received at least one AHV Extra Bolus in the first 14 days after calving; the remaining 1,569 cows were managed under each farm’s normal protocol.

Compared with controls, cows that received at least one Extra Bolus showed:

  • 70% lower mortality in the first 60 DIM (P<0.001)
  • 41% fewer cows sold in the first 60 DIM (P=0.006)
  • 14% fewer udder‑health issues in the first 60 DIM (P<0.001)

On a 1,000‑cow herd, if your current 60‑day death loss is 3%, that’s 30 cows. A 70% reduction would bring that down to about 9 deaths, saving 21 cows in that window. At 5% mortality (50 cows) dropping to around 15, you’re saving 35 cows. Multiply that by even a conservative replacement value, and you’re quickly into tens of thousands of dollars — before you count milk and genetic potential.

When Bird Flu Turned into a Protocol Stress Test

You don’t get to schedule a perfect stress test. Sometimes it shows up as a virus you never asked for.

In late 2024, California dairyman Joe Soares watched both of his herds be hit by H5N1 avian influenza: about 2,500 cows at Turlock and 5,500 at Chowchilla. Same owner. Same management. Similar genetics. Very different treatment protocols.

  • Turlock was on AHV protocols: one Booster Bolus and two Aspi Boluses per cow — no drenching, single‑day application with a multi‑bolus gun. Cost: about $54.02 per cow.
  • Chowchilla ran a traditional approach: electrolytes, NSAIDs, and a vitamin B12 injection given via drench over two days. Cost: about $26.71 per cow.

The cheaper protocol looked cheaper on paper until the numbers came back.

Turlock’s cows recovered milk production within days. SCR collar data showed improvement the day after treatment and full recovery by day three. Chowchilla saw months of up‑and‑down production.

Over the nine months after the outbreak:

  • Milk yield: Turlock Holsteins averaged about 88 lb/cow/day vs. Chowchilla’s 77 lb/cow/day — an 11 lb/day gap.
  • Culling: Turlock averaged 55 cows sold per month vs. Chowchilla’s 120.
  • Deaths: Turlock averaged 12 deaths per month vs. Chowchilla’s 25.

Using conservative U.S. replacement economics, AHV’s analysis estimates that the Turlock dairy saved roughly $1.5 million in reduced culling costs and about $350,000 in reduced death losses compared to the Chowchilla protocol over that period. And that’s before you add the milk revenue from 11 extra pounds per cow per day, which AHV’s breakdown pegs at about $670,000 per 1,000 Holsteins at a 20¢/lb milk price.

“We were able to bounce back quickly,” Soares says. “The cows didn’t suffer much, and we didn’t lose nearly the amount of milk that a lot of other facilities did.”

It’s not a randomized university trial. But it is two large dairies under the same management, hit by the same virus at the same time, running two different protocols. And the direction of the difference is hard to argue with.

How a Plant-Based Product Can Disrupt an Infection

If you’re skeptical that a bolus based on plant compounds can compete with injectable antibiotics, you’re not alone. Most of us were raised on the idea that you kill bacteria with drugs, or they kill the cow.

Here’s what AHV is actually doing instead.

Bacteria talk to each other. They use chemical signals — quorum sensing — to coordinate when to build biofilms, when to stick to tissue, and when to ramp up toxin production. Individually, they’re not that dangerous. In a coordinated biofilm, they’re hard to treat and hard for the cow’s immune system to clear. That’s why chronic infections feel like they sit there no matter how many times you hit them.

AHV’s QSI (quorum sensing inhibition) products don’t kill the bacteria outright. They use a purified allium‑derived extract to block those communication signals. Independent lab work, including external testing, has shown that AHV’s QSI molecules disrupt virulence in both gram‑positive and gram‑negative bacteria without killing them or creating antimicrobial resistance.

Dr. Geoff Ackaert, AHV’s technical director and global head of ruminants, puts it this way: “If you have a group of nasty people, you blindfold them and make them deaf. They can’t communicate anymore, so they’re immediately harmless. That’s what we do with these little nasty microorganisms — they can’t work as a group anymore.”

Once you’ve broken the communication, the cow’s own immune system — with a little help from supportive products like Aspi — can clean things up. Because the QSI products are classified as specialty feed additives, there’s no milk or meat withdrawal.

The core QSI technology is covered by several patents and has been validated in AHV’s in‑house microbiology, cell culture, and analytical labs, with external collaborations at places like Leiden University and Utrecht University. In the field, it showed up in that longevity study by Herrema and colleagues: 2,161 cows across 22 Dutch farms treated with the AHV concept had 8,653 kg higher lifetime production, a 19.8‑point lower replacement rate, and an estimated 11.1:1 ROI, with revenue per day of life up from €5.87 to €6.37.

Is This Really About Using Fewer Antibiotics?

No fresh‑cow article is honest if it pretends you can toss all your antibiotics. You can’t, and you shouldn’t.

In the 8‑farm trial, plenty of cows still needed intervention. And in a real fresh pen, you’ll always have a handful of train‑wreck cows that need a vet, a bottle, and sometimes a cull truck.

Here’s the honest middle ground the data supports:

  • The metritis and retained‑placenta improvements came from treating every fresh cow proactively — not just reacting to the obviously sick ones.
  • Antibiotics still had a role for true clinical cases.
  • The real economic win wasn’t “never use antibiotics.” It was using fewer of them on fewer cows, and dumping a lot less milk to withdrawal.

AHV’s CEO Jan de Rooy says it this way in internal presentations: antibiotics remain an important tool, but they should be reserved for severe cases; the company’s goal is to keep its use to an absolute minimum. That’s a very different message from “antibiotics are bad.”

Meanwhile, regulators are watching. FDA data show that U.S. sales of medically important antibiotics for food‑producing animals jumped 16% in 2024 after several years of decline, with tetracyclines accounting for 69% of those sales and increasing by 20% year‑over‑year. That’s exactly the kind of chart that gets people in Washington and Brussels asking hard questions.

So this isn’t a moral argument against antibiotics. It’s an economic and regulatory argument for saving them for the cows that actually need them.

What Happens to Your Margin If You Don’t Count Withdrawal Milk?

You’d never sign a milk contract and ignore the component schedule. But a lot of herds effectively do something similar with withdrawal milk. They accept the hospital list, they dump the milk, and they never look at the line where that volume would’ve hit their pay stub.

If your fresh‑cow metritis rate is running north of 5%, your dry‑off program is still built around tubes, and you’re treating a decent chunk of fresh cows with systemic antibiotics, withdrawal milk is one of your biggest invisible cost centers. That’s true whether you’re milking 250 cows or 2,500.

The 8‑farm trial’s $111/cow net and the survival trial’s 70% mortality reduction are company numbers, not independent university trials — yet. But even if you cut those numbers in half, they still point in the same direction: for a lot of commercial herds, fresh‑cow and dry‑off protocols are now a six‑figure annual decision, not a footnote in the vet bill.

What Actually Changes in Your Dry-Off and Fresh Cow Routine?

On paper, protocols can sound like more work. Jaeger thought that at first. Then he realized what was going away.

At United Vision Dairy, StopLac replaced dry tubes. Instead of orchestrating a whole team around a tube routine and then listening to cows bawl and kick for days, his crew gives a single oral dose. Utrecht University and AHV’s broader StopLac data show about a 56% reduction in milk yield within 24 hours in treated cows, with no spike in leaks or mastitis when the dry period is managed sensibly; in one Utrecht study, 47 cows dried off with StopLac dropped milk quickly and then returned to normal production with no long‑term udder damage. On Jaeger’s farm, that translated into something you can hear: no more noisy dry barns, no more post‑dry‑off “ballering” and discomfort.

In the field, StopLac has now been used on more than 52,700 cows across 14 countries, with U.S. and German data showing 62–70% reductions in milk leakage and fewer new intramammary infections at calving. Across two U.S. farms (404 cows), abrupt dry‑off with StopLac cut 60‑day death loss almost in half and reduced milk leakage, while maintaining next‑lactation yield with a 3 kg/day advantage over controls.

On the fresh‑cow side, both Jaeger and Gabrielse describe a similar practical shift. Instead of waiting for sick cows and then reacting, every fresh cow gets a bolus protocol at calving. That doesn’t remove all problems — you still have twins that go sideways and the occasional disaster — but it changes your default from “treat the sick ones” to “protect all of them.”

What’s the Smartest Way to Test a New Fresh Cow Protocol on Your Farm?

You don’t have to swallow the entire protocol story in one gulp. If you’re interested but skeptical, the most honest thing you can do is run a clean, on‑farm trial.

The odd‑week/even‑week design from the 8‑farm trial is simple enough for most record systems. Pick a start date and agree that cows calving in odd weeks get the proactive protocol, while even‑week calvings stay on your current program. Then track four things for at least 60–100 days: metritis, retained placentas, antibiotic treatments, and milk per cow at 100 DIM. You can add survival and culling in the first 60 DIM if you want to push it.

Within 30 days, you can at least see if protocol cows are showing up on the sick‑cow list less often and whether you’re dumping fewer pounds of withdrawal milk. By 60–100 days, you can compare milk and repro with enough cows to see whether the pattern lines up with the trial data or not.

How Much Should You Change at Dry-Off Before You Fix the Fresh Pen?

For some herds, dry‑off is the biggest pain point — labor, cow comfort, animal welfare pressure, or tube management — even more than metritis or mastitis. In that case, it can make sense to start there.

If you’re used to tubes, switching to a bolus that drops milk 50‑plus percent in one day feels like a big leap. That’s why many herds start by running StopLac alongside tubes for a few weeks, monitoring for leaks and mastitis, then phasing tubes out as they get comfortable with the results. You still need sound transition nutrition and stocking density in your dry pens; StopLac isn’t a fix for bad diets or overcrowding. But if you can get to quiet dry barns, fewer leaks, and no spike in mastitis, you’ve taken a lot of stress off your cows and your crew.

Sponsored Post

Options and Trade-Offs for Farmers

You don’t have to do everything at once. Here are four realistic paths — and what each one asks of you.

Path 1: Run a controlled on-farm trial this month.

  • When it makes sense: You’re interested but skeptical, or your vet is. You want data from your own cows, not just somebody else’s case study.
  • What it requires: Pick a start date and follow the odd‑week/even‑week design. Odd‑week calvings follow the AHV fresh‑cow protocol; even‑week calvings stay on your current program. Track metritis and RP within 21 DIM, antibiotic use, milk per cow at 100 DIM, and, if you can, culls and deaths in the first 60 DIM.
  • Risks/limits: You need clean records and discipline to avoid “contaminating” the control group. And it takes 60–100 days to see meaningful trends.
  • 30‑day action: Commit to a start date, set up the treatment codes in your software, and agree with your vet on what counts as “metritis,” “retained placenta,” and “fresh‑cow problem” before you start.

Path 2: Start at dry-off and work forward.

  • When it makes sense: Your biggest pain is dry‑off — labor, cow comfort, animal welfare pressure, or tube management — more than metritis or mastitis.
  • What it requires: Replace tubes with StopLac where your vet is comfortable, and monitor cows closely for the first 5–7 days post‑dry‑off. Make sure your transition nutrition and stocking density are in good shape first.
  • Risks/limits: StopLac handles the milk drop; it doesn’t fix a bad transition diet or overcrowded dry pens. You still need to watch for metabolic issues and leaks as you dial it in.
  • Forward signal: If you see quieter barns, fewer leaks, and no uptick in mastitis through the dry period, you’ve earned the right to look harder at fresh‑cow protocols next.

Path 3: Fix your tracking before you change anything.

  • When it makes sense: You can’t easily answer “What’s my metritis rate?” or “How many pounds of milk do I dump to withdrawal every month?” from your current records.
  • What it requires: Build three simple reports: metritis cases within 21 DIM, average hospital days per fresh cow, and total pounds (or liters) of milk tagged as “do not ship” per month.
  • Risks/limits: You’ll probably uncover some uncomfortable numbers. But without them, you’re guessing.
  • Forward signal: Once you know those three numbers, you can run any protocol comparison — AHV or otherwise — like a grown‑up business experiment.

Path 4: Keep your current program — but make it an explicit choice.

  • When it makes sense: Your metritis rate is under 5%, fresh‑cow mortality is under 2%, and your withdrawal milk losses are already tracked and modest.
  • What it requires: Verify those numbers, ideally for the last 12 months, and stress‑test them with your vet or adviser.
  • Risks/limits: The main danger is complacency. If heifer prices keep rising and antibiotic rules tighten, the cost of sticking with “what’s always worked” could change fast.
  • Forward signal: Re‑run your numbers annually. If you see metritis or early culls creeping up, or if your heifer pipeline tightens, revisit the other three paths.

Key Takeaways

  • If your fresh‑cow metritis rate is above 5% and you don’t know how much milk you’re dumping to withdrawal, you’re guessing on one of your biggest controllable cost centers. Pull those numbers over the next 30 days and treat them like components.
  • If you’re paying $2,900–$4,100 for replacement heifers, any protocol that cuts 60‑day mortality by even half of the 70% shown in the 2,703‑cow survival trial will pay for itself in avoided replacements alone. Don’t shrug off death loss at those prices.
  • If your main concern is the strength of the evidence, treat AHV’s 8‑farm trial and survival study as what they are: large company‑run datasets pointing in a clear direction, backed by a peer‑reviewed longevity paper and an ongoing SARE/Texas A&M project. Then run your own odd‑week/even‑week trial to see if your herd lines up.
  • If you’re not ready to switch protocols across the board, start where your pain is loudest — dry‑off stress, fresh‑pen chaos, or the hospital list — and use that as your test area. You don’t have to do everything at once to learn something real.

Steve Jaeger didn’t tackle any of this with a whiteboard full of equations. He started with a barn full of cows that calved and cleaned on their own, a dry barn that went from loud to quiet, and a mailbox that started seeing more premium checks than cull checks. The eight‑farm trial and the survival and bird‑flu numbers say his experience isn’t a fluke.

Complete references and supporting documentation are available upon request by contacting the editorial team at editor@thebullvine.com.

Learn More

The Sunday Read Dairy Professionals Don’t Skip.

Every week, thousands of producers, breeders, and industry insiders open Bullvine Weekly for genetics insights, market shifts, and profit strategies they won’t find anywhere else. One email. Five minutes. Smarter decisions all week.
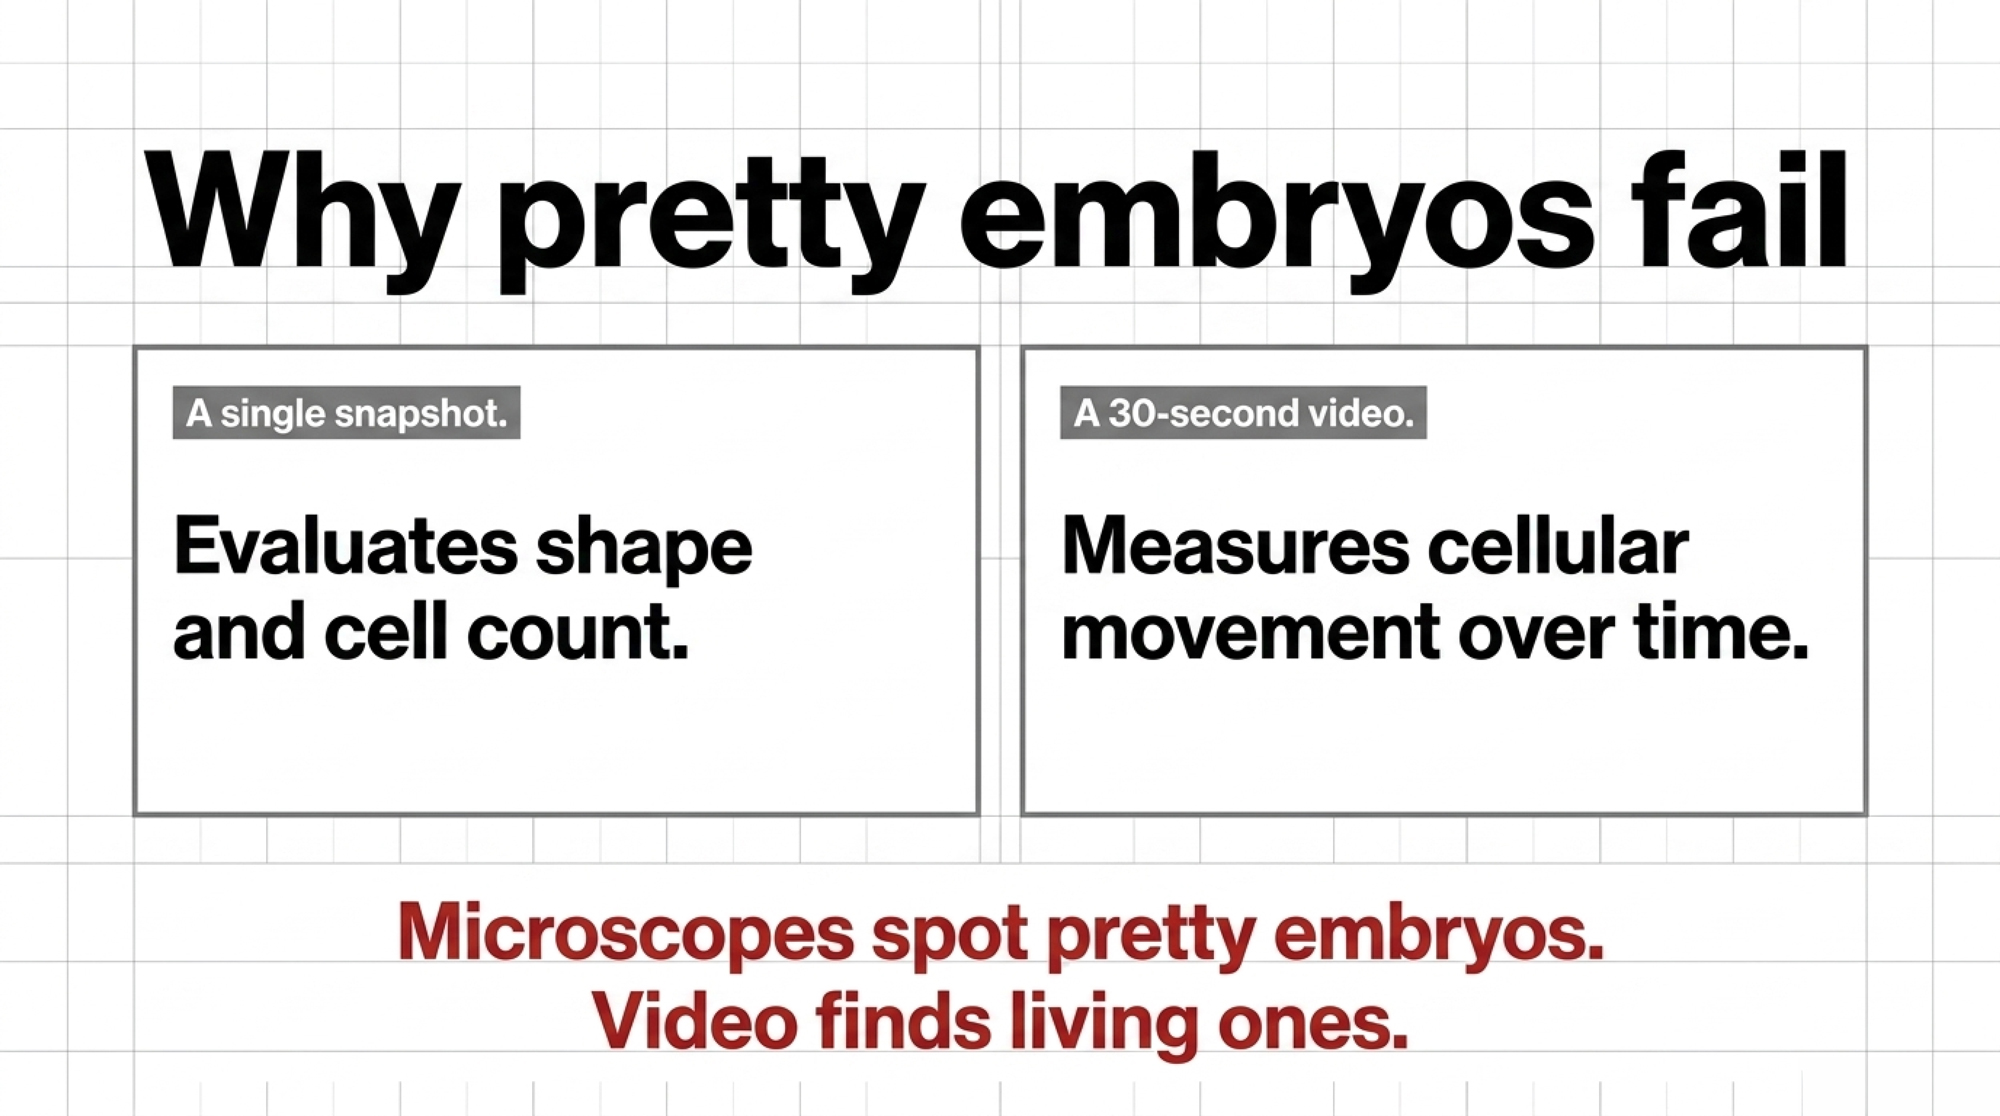
NewsSubscribe
First
Last
Consent

Your Calf Raiser’s Audit Protects the Brand, Not Your Milk Check

A drone caught what the audit didn’t — and Double D’s milk was suspended before the correction even cleared. The seal protected the brand. Your contract’s the only thing that protects you.

Executive Summary: A drone caught calf abuse at California’s Agresti Calf Ranch that an American Humane audit hadn’t — and Clover Sonoma suspended the connected supplier, Double D Dairy, before a correction even cleared the milk-supply link. That’s the part every producer who outsources calves should sit with: the suspension came first, the facts came later, and the contract — not the audit seal — was the only thing standing between the dairy and a stopped milk check. American Humane can certify a farm at 85% of the criteria, and the “isolated incident” finding rested on one terminated worker, not on any unannounced observation of daily handling when no supervisor’s in the barn. Run your own exposure: a 500-cow herd ships about 375 cwt a day, and distressed spot milk hit $7/cwt under Class III in the spring 2025 flush — that’s roughly $2,625 a day gone before you’ve sorted out hauling or reinstatement. The fix isn’t outrage; it’s three contract clauses — a named welfare standard, an unconditional right to inspect, and a vet-written disbudding protocol with treatment logs — plus one email to your processor asking exactly what triggers a suspension and what ends it. FARM 5.0 already makes disbudding pain control mandatory as of July 2024, so the standard’s set; the open question is whether your custom-raising paperwork actually names it. If a camera showed up tomorrow at every facility touching your animals, your contract’s either your proof or your problem.

Temple Grandin watched the Agresti Calf Ranch footage and didn’t reach for soft language. The Colorado State University livestock-welfare expert, reviewing the video for the Los Angeles Times, said the kicking, punching, and use of pliers on calves amounted to abuse — and that one calf’s violent thrashing and collapse during hot-iron disbudding indicated no pain mitigation had been used. 

That’s the first shock. The second is the one producers should sit with longer: the welfare-audit system didn’t catch what the video showed. A drone did.

The footage was recorded in late February 2026 at the Ceres, California, facility by investigators with the activist group Direct Action Everywhere and was then reported by the Los Angeles Times on May 12, 2026. It shows a worker booting a calf in the face three times while its head was locked in a stanchion, another worker yanking a calf by the tail, a worker using pliers to drag a calf by its nose, and hot-iron disbudding performed without visible anesthesia. One worker filmed in the video was terminated; as of late June 2026, no charges have been publicly reported, though the Stanislaus County Sheriff and District Attorney received a cruelty referral on February 27, 2026.

Here’s the part that matters before you read another word. The Los Angeles Times issued a correction on May 14, 2026, clarifying that Agresti Calf Ranch opened in 2025 and that no animals reared there had ever supplied milk for Clover Sonoma. But Agresti and Double D Dairy aren’t strangers — the calf ranch is owned and operated by the principals of Double D Dairy, which has supplied raw milk to Clover Sonoma since 2016. The contract questions in this piece apply to any producer using any off-site calf raiser. The lesson isn’t about Agresti. It’s that any off-site agreement is only as strong as what’s written into it. 

The Bullvine NOTE: In a branded supply chain, reputational risk moves faster than a fact pattern. Even after the correction cleared Clover’s milk supply, the brand had already suspended Double D and commissioned an audit. The phone call came before the facts settled. 

The Footage Was Hard to Watch. The Audit Was the Bigger Warning

The conduct in the footage is hard to defend, and an expert didn’t try to defend it. But the sharper lesson for producers isn’t about one facility. It’s that a paper-based audit process cleared the supplier within weeks — based on what the records showed, not on what the daily work culture looked like when no supervisor was present. That gap is exactly why unannounced inspection matters more than a clean file. 

Disbudding hurts — that isn’t in dispute among the people who actually do it. The FARM Animal Care program, which covers most U.S. milk, elevated pain management for all disbudding from a Continuous Improvement Plan to a Mandatory Corrective Action Plan under Version 5.0, effective July 1, 2024. This isn’t a guideline anymore. For producers shipping to major processors, it’s a condition of market access. 

The science behind that rule is settled. University of Wisconsin guidance recommends a cornual nerve block with 2% lidocaine before hot-iron disbudding, plus an NSAID such as meloxicam for longer-lasting relief. Published research on co-administering lidocaine and meloxicam reports clear benefits in cutting pain and inflammation. Dairy Farmers of Canada landed in the same place: a local anesthetic plus an NSAID beats either one alone. 

So when an expert called the footage abuse, the industry didn’t need a vocabulary lesson. It needed to answer a harder question. If the standard is mandatory and the science is settled, why did the accountability structure miss what a drone caught?

After Clover Sonoma suspended Double D Dairy’s shipments, American Humane — the body behind Clover’s welfare label — conducted a specialized audit and concluded the filmed events were an isolated failure of individual protocol rather than systemic practice, which cleared the dairy to resume shipments. That sequence is verified through public corporate actions and advocacy records, but the complete internal audit report remains proprietary to American Humane and Clover Sonoma. So read “isolated” carefully. It’s the audit’s conclusion — not a set of findings anyone outside the process can inspect. 

That distinction matters for producers. A private audit may close the loop for a brand. It won’t necessarily protect the farm whose milk stopped moving while that loop closed.

The Bullvine has walked through how thin paperwork and the wrong contract leave producers exposed when a crisis hits — the weak spots tend to be the same ones every time.

Picture the Producer Two Steps Down the Chain

Forget the named parties for a second and picture a producer we’ll call the kind you already know — a 500-cow operation that ships to a branded processor and sends its bull and dairy calves to an off-site ranch 40 minutes up the road. Good handshake relationship. Twelve years running. No complaints.

Now a drone films something ugly at that ranch, and the story doesn’t stop to check whose calves were in frame. The processor’s brand team sees the footage, sees the connection to animals from that producer’s herd, and makes a call to protect the label first. That’s the scenario that should keep you reading — not because it’s likely tomorrow, but because the cost of being unprepared for it is asymmetric. Cheap to prevent. Expensive to survive.

That producer’s exposure isn’t the abuse. It’s the contract that never said what happens next. Hold onto that 500-cow operation — we’ll walk it through the actual decision a few sections down, because the math and the renewal conversation are where this stops being a news story and starts being your Tuesday.

What Changed Isn’t Welfare. It’s Visibility.

Animal welfare didn’t suddenly become important in 2026. Every serious producer already knows calf care matters — morally, operationally, and financially. What changed is who can document a failure. In the Agresti case, the drone footage came first, and the supply-chain response came after. That sequence should make every producer with a custom-raising agreement open the file drawer. 

The old model was episodic. Annual audit, scheduled in advance with management. Written protocol. Training log. Corrective action if something slipped. Under standard American Humane protocols, audits review written herd-health plans, employee training logs, and a physical inspection of housing, bedding, and animal health. 

None of that is useless. Paper matters. Training matters. Corrective action matters. But a pre-announced audit doesn’t show what happens when a tired employee is handling calves at 2:30 on a July afternoon with no supervisor in the barn. It doesn’t tell you whether the person holding the iron waited long enough after the lidocaine block. And it can’t tell you whether a treatment log reflects real practice or just tidy intent. The Agresti audit verified a written care policy and the worker’s termination — but it did not include unannounced, continuous, or off-peak observation of employee behavior. 

Consumer Reports flags exactly this gap: a farm can be certified if it meets 85 percent of the criteria at the time of inspection, “but the consumer has no way of knowing which criteria were met”. That doesn’t prove what happened at any one facility. It does explain why a pass/fail welfare seal can feel a lot stronger at the grocery shelf than it looks when you’re the producer holding the risk. 

What Does One Day Without a Milk Home Actually Cost You?

Start with milk flow, because the cows don’t care what the press release says. Distressed milk doesn’t sell at list price — and your exposure swings hard with the calendar. USDA AMS Dairy Market News reported Midwest spot milk trading as much as $7.00 under Class III during the spring 2025 flush. By the June 4, 2026 DMN report, spot trades had tightened to a range of $1-under to $2-over Class. 

Scenario$/cwt DiscountDaily Loss (375 cwt)Weekly Loss (7 days)30-Day Loss
Tight market — low end$1.00 under$375$2,625$11,250
Tight market — high end$2.00 under$750$5,250$22,500
Spring flush extreme$7.00 under$2,625$18,375$78,750
Full suspension / reroute cost$15–$20 est.$5,625–$7,500$39,375–$52,500$168,750–$225,000
Complete milk rejection (no pickup)Full check lost100% daily revenue100% × 7 days100% × 30 days

Take that same 500-cow operation shipping 75 lbs per cow per day — and run your own numbers in the right-hand column:

Market Scenario500-Cow Farm Impact (375 cwt/day)Your Farm’s Exposure
Daily milk volume37,500 lbs (375 cwt)________ cwt
Tight market discount ($1–$2 under Class)$375–$750 / day$________ / day
Spring flush discount ($7 under Class III)$2,625 / day$________ / day
Total rejection / dumped milk (full value)Full milk check + disposal100% of daily revenue

The $7 figure is a spring-flush extreme, not a typical week — but it’s the number that shows up exactly when you can least afford a rerouted truck. Plug in your own pounds and your own mailbox price; the gap is the number that should worry you. Don’t start with a dramatic loss figure. Start with your pounds, your cwt, and the discount your processor agreement actually puts on you when the truck reroutes.

The higher cost may not even be day one. It’s the uncertainty. If pickup gets suspended “pending review,” who pays for emergency hauling? Who approves alternate placement? What documentation triggers reinstatement? Does your processor owe you a timeline — or just a decision whenever they’re ready to make one?

Most supply agreements were built around milk quality, delivery, pricing, and termination. Welfare-liability language tends to sit in a softer corner, leaning on phrases like “humane treatment” or “industry standards.” Those words sound reassuring right up until a processor’s legal team decides whether your milk moves tomorrow morning. The Bullvine has reported on how thin milk-contract language quietly decides who absorbs a supply-chain shock — the welfare clause is the same blind spot wearing a different hat.

Does an “Isolated Incident” Verdict Actually Protect You?

Here’s where the language gets slippery. An incident can be called “isolated” if one employee was let go, written protocols exist, and the facility files corrective action. In the Agresti case, the “isolated” finding rested specifically on the strikes and unanesthetized disbudding being attributed to a single employee who has since been terminated. That doesn’t mean the animal’s experience was isolated. And it doesn’t mean the daily work culture got observed across shifts, weather, staffing gaps, and procedure days. 

A welfare audit is a snapshot. A calf-raising operation is a movie. There’s also a structural reality worth naming plainly. A buyer-commissioned audit is built to answer the buyer’s question — is this supplier compliant? Clover Sonoma was the first commercial dairy brand in the U.S. to secure American Humane certification, and it leveraged that designation to secure premium shelf space and build consumer trust. That’s a different question from the one our 500-cow producer two steps down the chain needs answered: if something goes wrong here, am I protected? Same audit. Different stakes. 

So here’s the line. A certification audit isn’t worthless. But an audit whose findings you can’t see, whose trigger you don’t control, and whose reinstatement criteria aren’t written into your contract isn’t your safety net. It’s built for somebody else’s question. We’ve made the same argument about show-ring judging — big banners, real prestige, and accountability standards that never kept pace.

Protection DimensionWelfare Audit Seal (e.g., American Humane)Producer’s Signed Contract with Calf Raiser
Who it primarily protectsBrand / retailerThe producing farm
Inspection typePre-announced, scheduledUnconditional right to appear unannounced (if written in)
Pass threshold85% of criteria met at time of visit100% of named clauses enforceable at any time
Findings public?No — audit report proprietaryYes — contract terms visible to both parties
Pain management standardMay reference “industry standards”Should name FARM 5.0, specific drug/dose/timing
Covers all calf types?Depends on scope of certificationOnly if contract explicitly includes beef/bull calves
Suspension trigger defined?Processor decides unilaterallyCan be written into contract with reinstatement criteria
Protects milk check if footage emerges?NoYes — if clauses are in place and exercised

Can You Inspect the Calf Raiser Before the Drone Does?

This is the operational question that belongs on the kitchen table within 30 days.

If your calves are raised off-site, do you have the right to show up unannounced? Not “with reasonable notice.” Not “by mutual agreement.” A real right-to-inspect clause lets you or your designated herd veterinarian walk in during active operations, review treatment logs, watch handling, and document what you saw. Penn State Extension’s heifer-contracting guidance already treats monitoring, reporting, and animal-identification terms as standard contract elements — the welfare-specific access right is the natural extension nobody’s adding yet.

That clause isn’t a trust issue. It’s an ownership issue.

Picture our 500-cow producer walking into that renewal meeting. Twelve years of handshake history sits between them and the calf raiser, and asking for a written inspection right feels like an accusation. A good calf raiser may bristle the first time it comes up. That’s human — nobody wants to turn a working partnership into a legal seminar.

But the conversation shifts when you frame it in terms of shared exposure. Our producer doesn’t say, “I don’t trust you.” They say, “If a video from your facility hits my milk market, both of us need written proof we agreed to a standard and followed it.” That framing gives a good operator room to say yes. And it tells you something if the answer is no.

The Human Part Is the Hardest

Dominic Assali, co-owner of Double D Dairy, told the Turlock Journal that the dairy held a zero-tolerance policy for animal mistreatment. That reflects what most producers and operators would say — and mean — when confronted with footage like this. 

Most calf raisers aren’t hunting for a loophole to mistreat animals. The investigative record itself notes that the vast majority of U.S. custom calf-raisers operate with high professional standards and trained staff who understand low-stress handling. They’re trying to feed calves, keep crews trained, hit health targets, and make thin margins work in a labor market that hasn’t gotten any easier since 2020. Producers know that. It’s exactly why these conversations are uncomfortable. 

The problem is that a long relationship is no longer enough of an answer.

Fifteen years of trust tells you something about character. It doesn’t define a pain-management protocol. It doesn’t create a treatment log. And it won’t force a processor to keep picking up your milk while a brand reviews an allegation. The relationship still matters. It just can’t be the only document in the file.

There’s a respectful way to do this. Tell your raiser the truth: your processor can suspend your milk over what happens at any facility connected to your animals, so if something ever goes wrong and it’s on camera, the contract is what proves you both took the standard seriously before the footage existed. That keeps the relationship intact while moving the risk into writing.

A Wrinkle Worth Naming: Dairy Calf or Beef Calf?

One detail the public record never settled: whether the calves in the footage were dairy replacement heifers or beef-on-dairy and bull calves headed to feedlots. Agresti functions as a heifer-raising arm for Double D, but commercial dairies also generate male and crossbred calves that route into the beef chain. 

It matters for your contract for one reason: custom operations that raise both dairy and beef calves have to apply one welfare standard across the whole barn — because a camera doesn’t sort calves by destination, and neither does a brand’s crisis team. If your agreement only names “replacement heifers,” it may say nothing about the bull calves leaving the same property under your operation’s name.

Three Clauses That Move the Risk Into Writing

Contract ClauseWhat It DoesWhat It Doesn’t DoUrgency
Named welfare standard (FARM 5.0)Sets enforceable floor; drug/dose/timing legally specifiedDoesn’t enforce itself — requires inspection to verifyAdd at next renewal
Unconditional right to inspectYou or your vet can walk in unannounced during operationsWorthless if you never exercise itAdd this month
Vet-written disbudding protocol + treatment logsCreates paper trail; proves intent before footage existsLog proves intent, not every actAdd this month
Suspension/reinstatement terms in writingDefines what triggers stoppage and what ends itProcessor may still act first; writing limits liabilityEmail processor now
Coverage of beef/bull calves explicitly namedCloses the gap when calves of mixed destination are on-siteRequires separate clause — “replacement heifers” doesn’t cover itReview current contract

The fix isn’t complicated, and it isn’t a lawyer’s retainer. It’s three pieces of language most custom-raising agreements are missing, plus one phone call. Here’s what each one does and where it falls short:

  • A named welfare standard, not a vibe. Write FARM Animal Care Version 5.0 — including mandatory disbudding pain control — directly into the agreement as the floor. When it makes sense: always. The limit:naming a standard doesn’t enforce it, which is why it only works paired with the next clause. 
  • An unconditional right to inspect. You or your herd vet can show up during active operations, unannounced, and review logs. When it makes sense: any off-site arrangement. The limit: it depends on you actually using it — an unexercised right protects no one.
  • A vet-written disbudding protocol with treatment logs. Specific drugs, doses, timing, and a log that gets reviewed. When it makes sense: any operation disbudding your calves. The limit: a log proves intent, not every act — which is exactly why the inspection right backs it up.

Key Takeaways

  • If your calves are raised off-site and your contract says “humane treatment” or “industry standards” without naming FARM 5.0, you have a welfare clause that won’t survive a processor’s legal review — fix the language at your next renewal.
  • If you can’t legally show up at your calf raiser’s facility unannounced, you don’t have oversight — you have hope. Add an inspection right this month.
  • Run the one-day number before you need it: your daily cwt times the worst spot discount your processor agreement allows. That’s your floor exposure if the truck reroutes.
  • A welfare seal on the retail carton answers the buyer’s question, not yours. Ask your processor in writing what triggers a milk suspension and what ends it.
  • If your agreement only names replacement heifers, confirm it also covers every bull and beef-cross calf leaving the property under your name.
  • A long handshake relationship isn’t a document. Character doesn’t write a treatment log — get the protocol on paper without blowing up the partnership.

The One Email to Send This Week

Here’s the move that costs you ten minutes: email your processor field rep and ask, in writing, exactly what would trigger a suspension of your milk pickup over a welfare allegation at a facility connected to your animals — and exactly what documentation gets you reinstated. Save the answer. If they can’t give you one, that silence is itself the answer, and it’s worth more to you than any seal on the carton.

So where does your breakeven sit if the truck doesn’t come Thursday — and is the proof that protects you sitting in a signed contract, or in twelve years of goodwill that a thirty-second video can override? We’re breaking down the full calf-raising contract language — clause by clause, with the FARM 5.0 and inspection-right wording you can hand your raiser — in next week’s Bullvine Weekly. That’s where the real paperwork lives.

Run Your Numbers

Farm Benchmark Snap Check — Before you assume a suspended milk check won’t happen to you, run your daily cwt and spot-discount exposure through Farm Benchmark Snap Check. It turns “what could a rerouted truck cost me” into a number, and flags whether your margin sits strong, worth watching, or already in the risk zone.

Methodology note: This piece draws on the Los Angeles Times’ May 12, 2026 reporting and its May 14 correction, the Turlock Journal, Consumer Reports’ assessment of the American Humane Certified seal, USDA AMS Dairy Market News, National Dairy FARM Program Version 5.0 documentation, and University of Wisconsin and Dairy Farmers of Canada disbudding guidance.

Limitations: The full American Humane audit report is not public; the “isolated” characterization is the audit’s conclusion, not independently verifiable findings. The dairy-versus-beef destination of the filmed calves was never settled in the public record. As of June 29, 2026, no charges have been publicly reported.

Corrections: editor@thebullvine.com. Conflict-of-interest disclosure: The Bullvine has no commercial relationship with any entity named in this piece.

Learn More

The Sunday Read Dairy Professionals Don’t Skip.

Every week, thousands of producers, breeders, and industry insiders open Bullvine Weekly for genetics insights, market shifts, and profit strategies they won’t find anywhere else. One email. Five minutes. Smarter decisions all week.
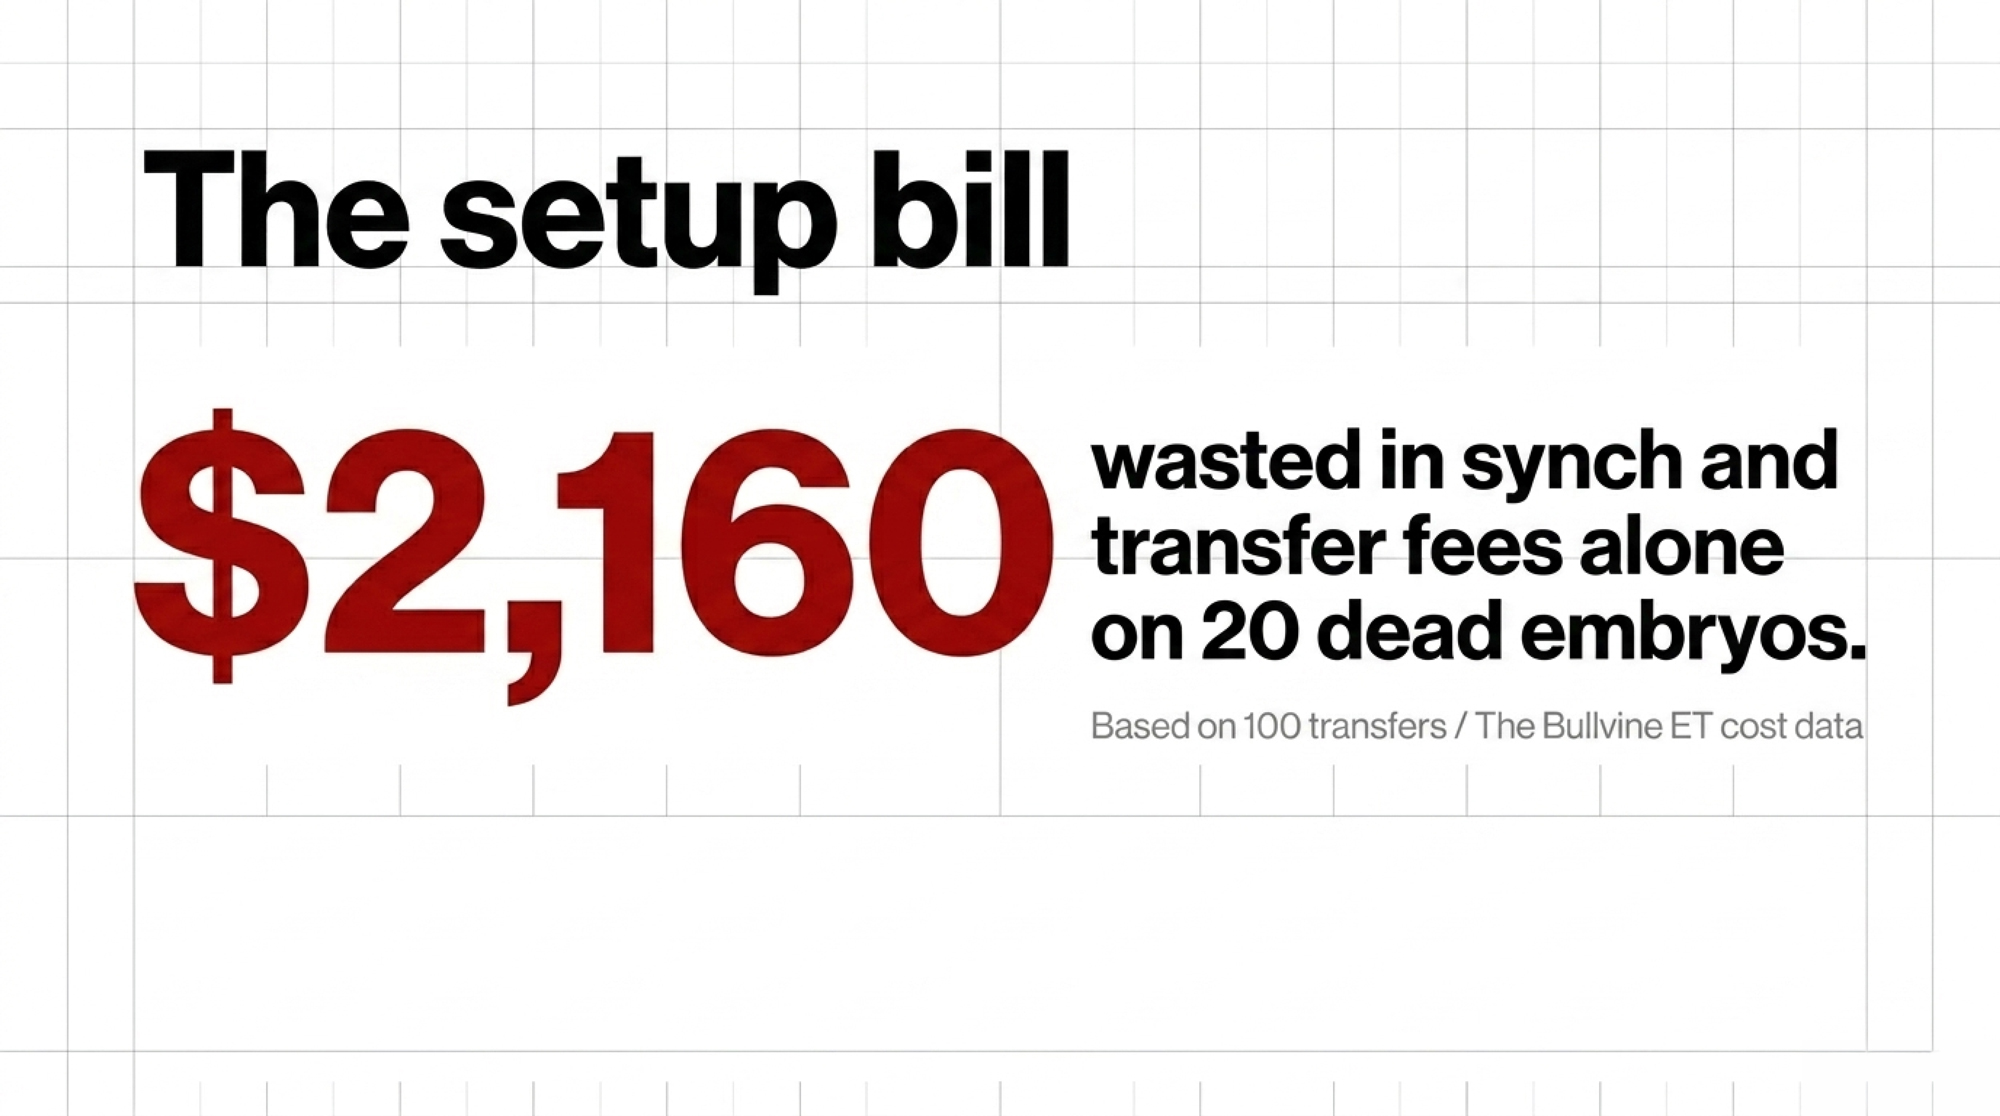
NewsSubscribe
First
Last
Consent

The Carbon Rule Everyone Misread: Britain Didn’t Vote a Cull, But Your Herd Is Still in the Crosshairs

MPs did vote on Britain’s carbon budget. The panic headline was wrong—but the 27% herd cut it quietly assumes can still land on your milk cheque.

Executive Summary: Britain’s new carbon budget quietly assumes a 27% cut in cattle and sheep by 2040, and MPs just voted to legislate it, even though nobody voted to “cull 40% of cows.” That framework is already pushing toward North American barns through processor demands for farm‑level carbon footprints, not through tariffs first. On the feed side, chasing methane reduction with Bovaer currently runs about $93–$105/cow/year against an illustrative 12¢/cwt premium worth only ~$33/cow, leaving you roughly $60–$72/cow underwater unless someone else pays the difference. At the same time, genetic tools like Lactanet’s Environmental Impact Index and CDCB’s Net Merit revision now weight Feed Efficiency, Methane Efficiency, and Feed Saved heavily — a zero‑cost premium if you actually use those traits when you pick bulls. The opportunity is to lock in your own whole‑farm footprint number within the next 30 days using Holos, FARM ES/RuFaS, or COMET-Farm, and start shifting sire selection toward efficiency so you can argue for performance rather than headcount as buyers and regulators tighten rules. The risk is signing methane‑credit or additive contracts that look green on paper but quietly shave tens of dollars per cow off your margin every year while policymakers find it cheaper to cap animals than reward efficient milk.

dairy carbon footprint

Editor’s Note: The producer described in this article is a composite scenario modeled from typical mid-size Ontario and Upper-Midwest dairy operations, not a single named individual. All policy, economic, and genetic figures are real and sourced.

Picture a 250-cow operator somewhere between Listowel and Fond du Lac, sitting down this spring to book semen. The milk’s been shipping fine. Then the processor’s field rep asks a question that wasn’t on last year’s list: what’s the carbon footprint of your milk? No number ready. And no clear idea why the question suddenly matters. That’s the moment this story is really about — because the reason that question is landing in North American barns traces straight back to a document most producers have never read.

A screenshot circulated in the farm group chats claiming that UK MPs had voted to legislate a 40% cut in cattle by 2040. It traveled fast — that kind of number always does. Here’s the twist: MPs did vote on the carbon plan in late June, but nothing in it culls a cow. The “40% cull” part is invented. 

That document is the UK Climate Change Committee’s Seventh Carbon Budget — and what it actually says matters more to your milk cheque than any screenshot.

What the Document Actually Says

The Climate Change Committee — the CCC — is the UK government’s statutory climate advisor. Its Seventh Carbon Budget covers 2038 to 2042, and for the first time, it includes livestock reductions in the plan as a named tool, not a side effect.

The modeling assumes a 27% cut in cattle and sheep numbers between 2023 and 2040, which the CCC’s own math indicates would account for a 32% reduction in agricultural emissions. On the land side, the plan aims for 16% of the UK to be under woodland by 2040 and 12% of grassland to be released for other uses. Nobody’s culling a herd. The CCC handed government a spreadsheet, and the internet turned it into a herd-cull headline. 

The vote itself was real, though. In late June 2026, MPs moved to legislate the budget level — a 535 MtCO₂e cap for 2038–2042, about an 87% cut on 1990 levels — ahead of the statutory June 30 deadline. That’s almost certainly the event that got garbled into “they voted to cull.” The delivery plan, which spells out how the cuts happen, comes next. 

So where did “40% by 2040” come from? The CCC’s pathway also assumes a 20% drop in dairy consumption by 2035 sustainweb and a broader red-meat-and-dairy shift of roughly 260 grams per person per week — and in the retelling, those got mashed together and welded onto the 2040 date. Several different numbers, one scary headline. 

Why a British Spreadsheet Lands in a North American Barn

Britain is a first mover here, not an outlier. Once a G7 climate plan treats “fewer cattle” as legitimate policy and bolts a percentage to it, the idea stops being fringe and starts being precedent.

It’s already spreading in the UK before it crosses the ocean. Scotland’s climate plans target a 26% cut in livestock by 2035; Northern Ireland’s, 31% by 2040. Same logic, three jurisdictions. When the framework replicates that fast at home, betting it stops at the water’s edge is a bet, not a plan. 

Will This Reach You as a Tariff or as a Phone Call From Your Processor?

Probably the phone call — the same one our composite operator just got. And that’s the part most coverage misses.

Here’s the formal mechanism first. Britain launches a Carbon Border Adjustment Mechanism (CBAM), a levy on imports priced according to their embedded carbon, on January 1, 2027. Right now it covers aluminum, cement, fertilizers, hydrogen, and steel. Dairy isn’t in scope. But the government has said CBAM’s scope will remain under review beyond 2027, and the Country Land & Business Association has already floated a food CBAM in its response to Carbon Budget 7. So the door isn’t open. It’s just unlocked. 

The quieter mechanism is the one that bites first. As British farmers absorb herd cuts and tighter standards, British retailers and processors are starting to treat carbon-verified milk as the floor, not the bonus. Anything above their intensity benchmark becomes a commercial liability. An Ontario processor shipping cheese or milk powder into that market wouldn’t get hit with a tariff — it’d get asked for farm-level emissions numbers, and lose the contract if it couldn’t produce a credible one. The market-access problem shows up on a spec sheet long before it shows up in a law.

What Does This Cost at the Feed Bunk Today?

The cleanest dollar math you can run right now isn’t on the trade side. It’s at the bunk — and it tells you exactly what a carbon-scored world rewards and what it doesn’t.

Take a methane-reducing feed additive like Bovaer. The math comes out lopsided fast:

LinePer cow/yearSource
Bovaer cost (lactating-cow basis)$93–$105dsm-firmenich 
12¢/cwt premium (illustrative)~$33thebullvine
Net gap (what you eat)–$60 to –$72

Two things to flag before you map that to your own barn. The 12¢/cwt premium is illustrative — real sustainability premiums vary by processor and aren’t a published standard yet. And that $33 return is the same per cow whether you milk 200 or 2,000, because the premium scales with milk shipped, not with herd size. At 75 lbs/day, every cow earns back about $33 and costs you up to $105 in additive. You’re roughly $60 to $72 a head underwater before moving a single carbon-verified load. The tools exist. The premium doesn’t cover them yet. 

Bovaer’s other wrinkles, quickly:

  • Cost may fall. A new dsm-firmenich plant in Dalry, Scotland, is projected to pull the price toward $58–$64/cow/year — shrinks the gap, doesn’t close it. 
  • Safety is under review. After Denmark’s late-2025 mandate, the Danish Dairy Farmers’ Association reported farms experiencing yield declines and digestive issues, and EFSA opened a fresh review in 2026 that remains ongoing. 
  • The maker disagrees. dsm-firmenich and the U.S. FDA maintain the additive is safe and effective. 

The takeaway isn’t “Bovaer is bad.” It’s that if a methane-credit contract you’re eyeing requires it, watch how that review lands before you sign.

Two Roads: Do They Count Your Efficiency or Just Your Cows?

Underneath all of it sits one fork, and it decides everything. Climate policy splits into two roads, and which one your regulators walk decides whether an efficient farm keeps its herd or shrinks it.

Performance-based policy asks one question: how many kilos of CO₂-equivalent come off your farm per kilo of milk? Drive that number down with genetics, feed efficiency, and manure management, and your cows stay on the landscape. California’s SB 1383 goes this way — a 40% cut in dairy methane by 2030, pursued through digesters, manure management, and efficiency rather than mandated herd reductions. A UC Davis CLEAR Center and California Dairy Research Foundation analysis projects that the state’s dairies will hit that target and reach climate neutrality around 2030, as long as voluntary, incentive-based adoption holds. 

Headcount-Based PolicyPerformance-Based Policy
Core question askedHow many animals do you have?How many kg CO₂e per kg milk?
Best-known exampleNetherlands farm buyouts (€1.81B / 723 farms)California SB 1383 (40% methane cut by 2030)
UK Carbon Budget 7 alignment✅ 27% cattle & sheep cut assumed by 2040❌ Not the primary lever in CB7
Impact on efficient farmsYour best cow still gets cutEfficiency is the competitive moat
Policy cost tool usedHerd cap / buyoutDigester incentives, genetics, feed management
Risk to North American exportersBlanket intensity benchmarks on imported milkMust demonstrate verified farm-level footprint
Your counter-argumentHard to make — you’re just a numberStrong — if you have the verified data ready

Headcount-based policy skips the efficiency question entirely. It just says: fewer animals. The Netherlands is the hard version — the Dutch agriculture ministry spent €1.81 billion to buy out 723 farms, in which herd size, not emissions per liter, was the lever that mattered. Carbon Budget 7 leans the same direction. In a headcount world, your best cow still gets caught in a blanket cut. 

Here’s the irony that ought to sting. North American dairy already has the receipts to win the performance argument. Lactanet’s published figure puts the carbon footprint of Canadian milk at 0.92 kg CO₂-equivalent per kilogram at the farm gate — a 2016 analysis, down about 25% since 1990, with the whole sector under 1.3% of national emissions. That’s a Canadian number, though, built on a different life-cycle modeling approach than the U.S. uses — so don’t hand a U.S. buyer the Canadian stat and call it yours. The data’s sitting in PDFs while other people write the rules. 

Is the Performance Argument Actually Winnable?

On paper, yes. The Canadian footprint numbers, California’s methane trajectory, and the evidence on breeding efficiency give the sector a genuinely strong, data-backed case that efficient milk belongs on the land. 

But here’s the honest part. It’s only winnable if the industry shows up before the headcount framework hardens into law somewhere that matters to your exports. A 2024 Navius analysis for Canada found that capping emissions is the cheapest, most efficient way to cut farm climate impact, with a livestock cap as the next-cheapest option. Read that twice. The blunt instruments are already sitting on policymakers’ desks, scored as the cheap option. Receipts don’t argue for themselves. Somebody has to put them on the table. 

Is Your Bull Team Already Behind on Methane?

This is where the fork stops being a policy debate and lands in your sire selection — the exact decision our composite operator was sitting down to make. Lactanet’s modernized LPI now includes an Environmental Impact Index based on Feed Efficiency, Methane Efficiency, and Body Maintenance, initially released for Holsteins. And it’s not just a Canadian play: CDCB’s April 2025 Net Merit revision lifted Feed Saved to 17.8% of the index — up from 12% — while cutting Body Weight Composite, a shift The Bullvine has called a $57-per-point “weight tax” on big Holsteins. Both systems are actively refining these traits — Lactanet can now predict methane from milk spectral data at low cost across many cows. 

Here’s the part that should land with anyone staring at that $60–72/cow Bovaer gap: selecting for high-efficiency genetics carries a zero-cost premium. You’re already buying semen. Weighting Feed Saved and Methane Efficiency in your index costs nothing extra per straw, while the additive runs you up to $105 a cow every year it’s in the ration. One’s a recurring input cost. The other’s a free lever you’re either pulling or leaving on the floor. It won’t move your footprint this lactation — but the herd you breed this summer is the number you’ll hand a buyer in 2035.

Bovaer / Feed AdditiveGenetic Selection (Feed Saved / Methane Efficiency)
Annual cost per cow$93–$105 (current); ~$61 (future Dalry plant)$0 incremental over base semen cost
Index toolN/A — contract-basedLactanet EII, CDCB Net Merit (Feed Saved = 17.8%)
When benefit showsImmediately (current ration year)2030+ herd profile
ReversibilityEasy — stop the contractPermanent genetic change in herd
Regulatory statusEFSA review open (2026); Danish concerns on yield/healthNo regulatory risk; standard breeding practice
Stacks with each other?Yes — but gap must close firstYes — foundation layer regardless
Bottom lineOnly pencils if premium covers $60–72 gapFree lever — pull it now regardless of premium

Options and Trade-Offs for Your Operation

There’s no single right move here. A few clear paths, and which one fits depends on how exposed your milk is to export markets and tightening rules.

Get your own footprint number — start this month. Run a credible whole-farm emissions-intensity figure on a peer-reviewed tool, and pick the one built for your side of the border. In Canada, Agriculture and Agri-Food Canada’s Holosis a free whole-farm model that estimates your emissions and lets you test “what if I change feed or tillage” scenarios before you spend a dollar. In the U.S., the dairy-specific FARM Environmental Stewardship program — now running on the updated Ruminant Farm Systems model — gives a cradle-to-farmgate estimate that processors and co-ops already aggregate up the supply chain. For broader cropping and soil-carbon accounting, the USDA-backed COMET-Farm is the other free U.S. option. It costs you data you mostly already keep — milk records, ration, manure, energy — and the number is only as good as what you feed it. Do this one now; everything else sits on top of it. 

ToolGeographyWhat It CoversWho Uses ItCost
HolosCanadaWhole-farm: livestock, feed, manure, tillageSupply chain reporting, processor auditsFree (AAFC)
FARM ES / RuFaSU.S.Cradle-to-farmgate dairy; co-op aggregatedFARM-participating co-ops and processorsFree (NMPF)
COMET-FarmU.S.Soil carbon, cropping, some livestockMixed operations with significant row crop acresFree (USDA)
COMET-PlannerU.S.Conservation practice scenario modelingProducers evaluating cover crops, tillage changesFree (USDA)
⚠️ Cross-border warningCanadian 0.92 kg CO₂e stat uses different LCA methodology than U.S. toolsDo NOT use Canadian Lactanet figure for U.S. buyer claims

Breed for the efficiency traits — your slowest lever, so start early. Weight Feed Efficiency and Methane Efficiency in your sire selection this season. It fits every herd, carries no per-straw cost, and won’t dent production if you balance the index. The catch is time: you’re breeding for 2030 and beyond, not this year’s tank, so the longer you wait, the more ground you give up. 

Feed additives — a bet, not a margin play, until the premium moves. This one only pencils if a processor is actually paying enough to close that $60–72/cow gap, or a buyer’s spec sheet starts demanding it. You’d want the premium in writing — and, given the Danish reports and the open EFSA review, a hard look before you commit. Move early, and you’re wagering on where prices and premiums go, not banking a return today. 

The forward signal to watch sits on these paths, not in a crystal ball: if a food CBAM moves into “under review” with a date attached, or a major processor publishes an intensity benchmark with a number on it, the footprint path stops being optional and the additive path stops being a bet. 

Key Takeaways

  • If your milk touches an export market — directly or through your processor — get a credible whole-farm footprint number this quarter, because the first ask will be for data, not a tariff payment.
  • If you’re booking semen this season, weight Feed Efficiency and Methane Efficiency now; it’s a zero-cost lever, and the herd you breed today is the number you hand a buyer in 2035. 
  • If a processor offers you a sustainability premium, run it against the $60–72/cow gap before you sign — at an illustrative 12¢/cwt, the additive math still runs underwater. 
  • If you’re weighing a Bovaer-based methane-credit contract, watch how EFSA’s open 2026 review lands before committing; Danish farmer groups have raised yield and health concerns, while the maker and the FDA say it’s safe. 
  • If you operate in Canada, you’re sitting on a strong footprint number — 0.92 kg CO₂e/kg milk — but it only counts if the sector puts it on the table before the headcount framework hardens. 

Back to that semen order and the processor’s question nobody had a number for. Where does your own emissions-intensity figure sit right now — and could you produce it tomorrow if a buyer asked? Most operations couldn’t, and that’s the real exposure, not a viral screenshot about a vote that never happened the way the post claimed.

We ran the simple version of the barn math here. If you want the full model — additive cost curves, premium break-even by herd size, and what a food CBAM would actually do to Canadian and U.S. export margins — that’s the deeper Tier 3 economics piece, and the running numbers land in The Bullvine Weekly newsletter as Carbon Budget 7 moves from vote to delivery plan. 

Run Your Numbers

Component Value Tracker — Before you sign a sustainability premium against that $60–72/cow Bovaer gap, run the Component Value Tracker. Its nutrition break-even module pressure-tests whether an additive clears your real component prices, and the sire module prices fat and protein per daughter so your breeding lever earns its keep.

Complete references and supporting documentation are available upon request by contacting the editorial team at editor@thebullvine.com.

Learn More

The Sunday Read Dairy Professionals Don’t Skip.

Every week, thousands of producers, breeders, and industry insiders open Bullvine Weekly for genetics insights, market shifts, and profit strategies they won’t find anywhere else. One email. Five minutes. Smarter decisions all week.
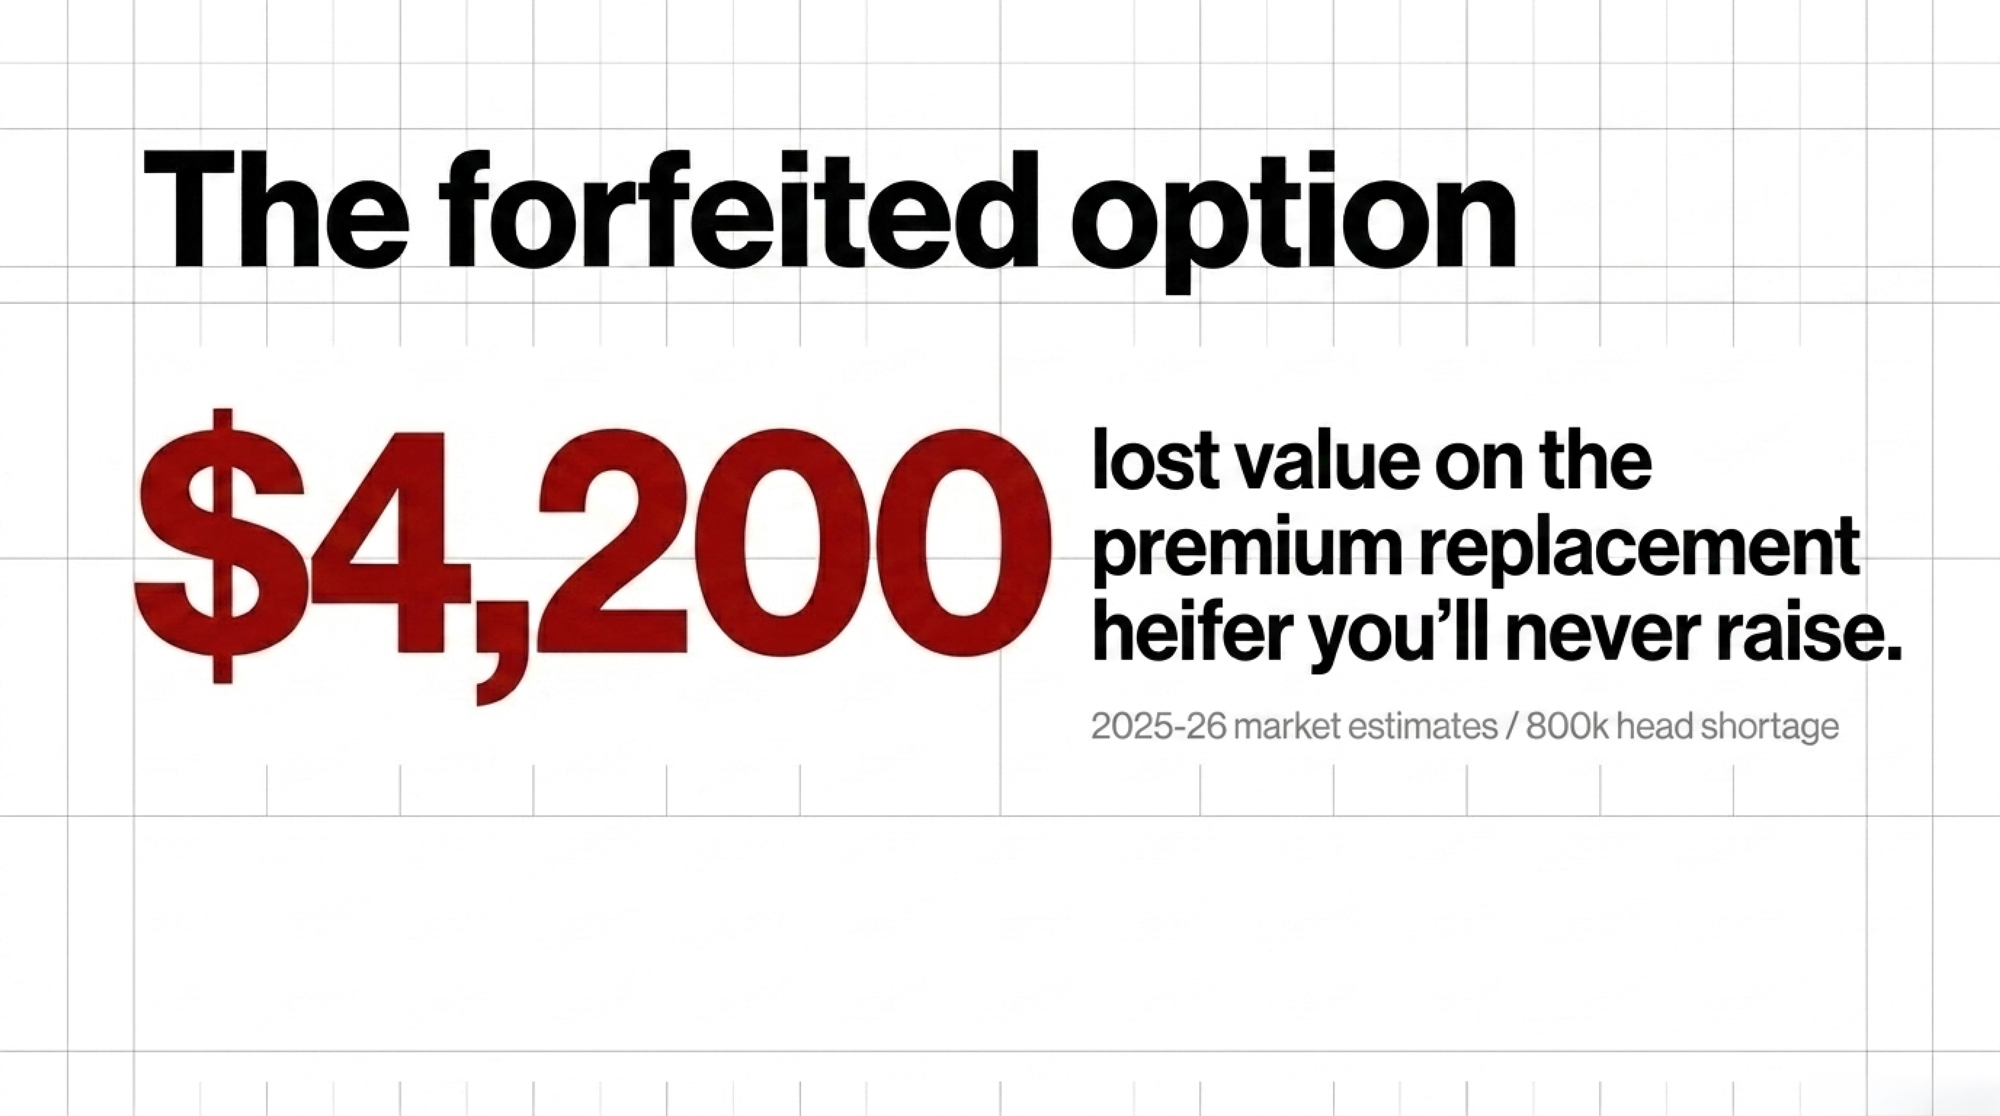
NewsSubscribe
First
Last
Consent

−$8,776 a Year for Seven Years: The Real Cash-Flow Curve Behind Your Dairy’s Robot Note

On a 140-cow herd, that −$8,776/year robot valley isn’t theory — it’s seven milk checks’ worth of red ink before the dealer’s “payback” ever shows up.

Editor’s note: The farmer and his daughter described below are a composite scenario modeled from typical 120–160-cow Midwest and Ontario family operations, not a single real individual. All farm cases drawn from named, published sources are identified as such.

Picture a 58-year-old farmer at the kitchen table on a 140-cow operation, a robot dealer’s proposal sitting between the coffee cups. Two boxes, a tidy three-year payback, and that line everybody’s heard: “the labor savings pay the payment.” His daughter’s leaning in the doorway, half-deciding whether there’s a future here worth coming home to. That’s where robotic milking actually gets decided. Not in a spreadsheet — at a table, with a payment book on one side and a balance sheet on the other.

Here’s the number that should be sitting there too. Across Iowa State surveys and Bullvine’s own analysis, 86% of robot owners are satisfied — but only 28% find it profitable. That gap is the reason you can love your robot and still be patching cash-flow with off-farm income.

What’s Changing — and Why the Gap Is So Wide

Robotic milking has gone mainstream fast, and the appeal is real: fewer 4 a.m. shifts, more flexibility, a barn that runs while you sleep. A 2021 University of Guelph study of 28 Ontario robotic-milking farms, published in Animal Welfare, found that farmers who paired robots with automated feeding reported lower stress, anxiety, and depression — and that better farmer well-being tracked with healthier, less-lame cows. That’s the kind of thing the 86% satisfaction number is really capturing. Quality of life. And on that score, robots usually deliver exactly what they promised.

Profitability is a different ledger. In January 2026, USDA’s Economic Research Service published ERR-356 — the first nationally representative study of its kind — and found that box robots increase dairy net returns by 13% — about $3.15 per cwt — relative to nonadopters. But that’s an average built on average assumptions. What your farm actually sees rides on your herd size, your capital cost, and how well you run the barn.

One number is about your life — your sleep schedule and who’s in the barn at 4 a.m. The other is about your loan — the payment book on the fridge. You need to be clear which ledger you’re really buying in before you sign.

How This Plays Out on Real Farms

Iowa State dairy economist Larry Tranel has been running AMS economics for years, and his cash-flow model tells the part of the story the payback chart skips. A typical two-robot install — about $400,000 all-in — carries roughly $62,000 a year in ownership costs plus $69,000 in loan payments, against only a slim net financial benefit in those early years: about $1,391 a year in the partial-budget run this article follows, and $1,472 in Iowa State’s published 2018 example, depending on herd size and inputs. Run Tranel’s full model — ownership, payments, labor savings, and production gains all netted together — and you land on a cash-flow gap of about $8,776 a year for seven years before the math turns positive. That $8,776 isn’t payments minus benefit; it’s the net annual shortfall after every offset is counted.

Stack it up and that $8,776 hole runs to roughly $60,000 before the valley ends. You don’t need a consultant to tell you what that would feel like on your own balance sheet. Tranel’s modeling shows robot cash flow running sharply negative for roughly the first seven years before turning positive, and he’s clear that the swing depends heavily on lifetime repair costs across the whole life of the machine.

Run it on your own herd. Average AMS labor savings come in around $1.50/cwt across surveyed herds — but debt service on the robots runs $2.60 to $3.99/cwt. On a 140-cow herd shipping roughly 8 million pounds a year, that $1.50/cwt of labor savings is about $120,000. Real money. But if your robot debt service lands at $3.00/cwt, that’s $240,000 going the other way. The production bump and the management value have to cover the difference. Sometimes they do. Often they don’t.

The Dealer Pitch vs. Extension Reality

Put the brochure side by side with the university numbers and the gap stops being abstract. Here’s where the two stories diverge on the figures that actually drive your payment book:

Financial MetricDealer Proposal PitchUniversity Extension Reality
Projected payback3 years7 years — the cash-flow valley
Milk yield bump5% to 10% increase3% to 5%; near zero if you’re already milking 3x
Cows per robot boxUp to 70 cows55 to 60 high-producing cows
Break-even labor wage“Pays for itself”Only balances if current labor costs $27.05/hr
Net early annual returnHighly positive$1,391 to $1,472/year net cash flow

None of the dealer’s numbers are lies, exactly. They’re best-case inputs presented as expected ones. The extension column is what the same machine does in an average barn with average cows and an average loan — which is the barn most of us actually farm.

What Does a Robot Actually Cost Per Cwt — and What Does It Really Save?

This is where the dealer math and the extension math part ways. Iowa State pegs the AMS milking cost at about $1.80/cwt, with a realistic range of $1.36 to $2.00 once you account for a leased two-robot setup at roughly $32,819 per unit per year. The labor savings that are supposed to offset it? Iowa State puts those at $1.06 to $1.36/cwt on a 120-cow herd — real, but thinner than the pitch implies. Line those bars up against debt service and the early-year squeeze stops being abstract.

Look at the gap and the lesson lands without anybody having to spell it out. The cost of running the robot plus the cost of financing it sits well above what you claw back in labor on most family-scale herds. That’s not an argument against robots. It’s an argument for knowing exactly where your own numbers fall inside those ranges before you treat the dealer’s single tidy figure as gospel. Pull your real labor hours and your real quoted payment, drop them onto this chart, and see whether your bars cross.

📖 Go deeper: Want the cash-flow valley walked through one year at a time? See our companion breakdown, Robotic Milking Pays 13% More — After 7 Years of Red Ink.

The Mechanics Behind the Outcomes

The most fragile number on a typical robot ROI proposal is the assumed milk-yield bump. Proposals routinely pencil in a 5 to 10% production increase. Tranel and the extension data put the realistic gain at 3 to 5% for herds coming off twice-daily milking — and for herds already on 3x, that per-cow response can run lower still. If you’re milking 3x in a good parlor today, that gap can shrink toward zero. And every other line on the spreadsheet is riding on it.

Tranel points to a cleaner predictor anyway: milk per robot box, not milk per cow. He’s blunt that milk per AMS unit is “very highly correlated” with profitability, more so than per-cow yield. Dealers rate the boxes for up to 70 cows. Extension guidance from Iowa State, Wisconsin, and Lactanet pegs the realistic profit sweet spot closer to 55 to 60 high-producing cows per robot. Push past that to make the numbers sing, and box time climbs, fetch lists grow, and the system quietly bleeds.

Then there’s the labor assumption holding the whole thing up. University of Minnesota Extension’s Jim Salfer found robots and a well-run parlor only break even when you’re paying milkers $27.05 an hour — or gaining about 3 pounds per cow per day more milk than your current 3x system. For you, if you’re not paying $27 an hour for milking labor, robots are first a lifestyle call. That’s a fair reason to buy one. It’s just not the same as a profit upgrade, and it’s worth being honest with yourself about which one you’re signing for.

Does the Math Change North of the Border?

It does, and not in the direction most people assume. Under Canada’s quota system, the constraint isn’t selling more milk — it’s making more fat per kilogram of quota you already own. That flips the robot equation from “milk more cows” to “push more fat through each box.” A Lactanet-profiled farm in Lambton County, Ontario, shows what that looks like in practice: they grew from 90 cows producing 130 kg of fat a day to 120 cows on 175 kg of quota, lifting output per robot from 65 to 87 kg of fat a day. Same hardware, far better economics — because they optimized fat per box, not headcount.

But quota cuts the other way on the debt side. Lactanet has warned that with $20,000 of debt per kilogram of quota, a 2% interest-rate bump can add $225 per kilogram per year, and for a 100-cow farm with 113 kg of quota that’s an extra $2,000 to $3,500 a month before you’ve bought a single robot. Stack a $400,000 AMS loan on top of an already quota-leveraged balance sheet and the seven-year valley gets steeper, not shallower. If you farm under quota, you need to run the robot decision as a fat-per-box question and a debt-stacking question at the same time — not as the volume play the US extension models describe.

Options and Trade-Offs for Your Operation

There’s no single right answer here. There’s a right answer for your barn, your labor market, and your balance sheet. Four paths producers are actually walking:

PathWhen It FitsCapital / PaybackThe Risk (flagged)
Buy the robotsLabor scarce, wages mid-$20s, purpose-built barn~$400,000, 2 boxesRetrofit + cheap labor = financing the problem
Go hybrid (parlor + tech)Herds under 180 cowsMonitors: 7–14 mo paybackManages a shortage; doesn’t solve a true one
Fix the herd firstLameness or poor cow flowNear-zero (audit only)Skip it and the 7-yr valley gets deeper, fast
Wait & stress-testTight financesModel at $18 milk$18 milk pushed one pitch from $2.03 to $4.07/cwt
  • Buy the robots — when labor is scarce and expensive. Makes sense when you genuinely can’t hire or keep milkers, wages are pushing into the mid-$20s, and you’ve got a purpose-built barn with good cow flow and low lameness. Needs a strong start: a manager who likes living in the data, sand-bedded freestalls, tight box utilization. The risk — in a retrofit barn with cheap labor, you’re financing your problems, not fixing them.
  • Go hybrid — parlor plus targeted tech. For herds under the 180-cow threshold where activity monitors and precision feeding consistently out-return robots, you can capture much of the benefit at a fraction of the capital. The Bullvine’s 2025 tech-ROI analysis puts the automation sweet spot squarely between 180 and 400 cows — below it, monitors with a 7- to 14-month payback usually win. The risk — it manages around a labor shortage; it doesn’t solve a true one.
  • Fix the herd first — and start this month. Before you sign anything, run a real milking-routine and lameness check. Tranel’s seven-year valley gets deeper fast if cows won’t walk to the box. This is the cheapest move on the list, and it tells you whether your throughput problem is a robot problem or a management problem.
  • Wait and stress-test. If your finances are tight, model the proposal at $18 milk before you commit. A 240-cow Upper Midwest family ran their dealer’s four-robot pitch at $18 instead of the dealer’s $22 and watched the projected milking cost jump from $2.03 to $4.07/cwt. The risk cuts both ways — waiting costs you too if your labor situation is actively falling apart.

📖 Go deeper: If you’re milking under 500 cows and weighing robots against hired help, read Robots Won’t Save Your Dairy If You’re Alone: 5 Hard Truths About Labor and Robotic Milking ROI Under 500 Cows.

How Much Does That Seven-Year Valley Actually Cost a Family?

Year three is where it gets real. The robot has kept its promise on lifestyle — the early mornings are gone, the data’s slick, the barn looks modern enough that the neighbors slow down to look. But the bank’s promise on profitability is still on layaway. The monthly reality is $8,000-plus in annual red ink getting patched with off-farm income, a deferred repair, or a quiet draw on equity that nobody mentions at supper.

Try the debt-service coverage check your lender actually runs. DSCR is just your net farm income available for debt service divided by your total annual payments. Say you’ve got $260,000 available and $200,000 in existing payments — that’s a 1.30x ratio, comfortable. Add, say, an $80,000 robot payment and the same income now covers $280,000 of debt, dropping your DSCR to roughly 0.93x. Below 1.0x means the farm isn’t generating enough to cover its own payments, and that’s when a lender turns cautious. The University of Waterloo’s dairy-robotics case study put it bluntly: adopting AMS “may require a transition period of up to four years to achieve profitability.” That’s a polite description of the same valley.

Is Your Barn Already Telling You the Answer?

You can spot the fit before the decision’s even made — no hindsight required. The farm that should buy robots has high, hard-to-fill labor, a DSCR comfortably above 1.25x, sand-bedded stalls, clean feet, and cows already hitting strong milk per box. The infrastructure was doing the hard work. Robots just monetize it. Walk that barn and the cows are calm, the alleys flow, the fetch list is short.

The farm that shouldn’t is the tie-stall retrofit with cheap labor, a debt-service ratio already flirting with 1.0x, lameness in every alley, and a fetch list that’d make a robot tech wince. There’s a hard infrastructure truth underneath this, too: Bullvine’s 2025 tech-ROI work found 62% of automated-milking difficulties trace back to inadequate electrical and connectivity setup, not the purchase decision. Robots won’t fix lameness or a weak service panel. They’ll just put interest on it. Here’s what the glossy proposal tends to underplay: the robot is an amplifier, not a cure. Watch a milking, walk the alleys, look at the feet — your barn usually answers the question before the dealer does.

What About the Next Generation Standing in the Doorway?

Now put the daughter back in the picture. Only about 16.5% of dairy farms make it to the third generation — the other 83.5% don’t, and it’s usually planning and debt structure that sink them, not markets. Lenders generally want debt-to-EBITDA under 4:1 and term-debt coverage of at least 1.25x before they’ll bless new debt. So the question across that table isn’t really “robots or no robots.”

It’s whether you want to hand her a business with room to breathe — or a high-tech barn strapped to a payment schedule she’ll spend her thirties servicing. A clean balance sheet with good cows is a bigger inheritance than a laser arm. Robots can absolutely be part of a strong handoff. But only when they’re turning a real labor crisis into durable margin in a barn that already works — not when they’re bolting cutting-edge debt onto a structure that was already wobbling.

📖 Go deeper: Before you add a dime of debt, walk through Why 83% of Dairy Farms Will Disappear: How to Beat the Succession Odds Before It’s Too Late.

📋 The Kitchen-Table Checklist

Financial Guardrails

  • The DSCR target: If your debt-service coverage ratio sits below 1.15x before adding robot debt, treat it as a flashing yellow light — model the new payment against your income before you fall for the technology.
  • The stress test: Run the proposal at $18 milk, not $22 — then add one $10,000-to-$15,000 maintenance spike. If it still covers payments and family living, proceed. If it only works at $22, you’ve found your real answer.
  • The yield assumption: Make the dealer put the milk bump in writing. If it’s above 3 to 5% and you’re already milking 3x, demand retrofit-specific data before you sign.

Operational Realities

  • The break-even wage: Check your actual milking-labor wage. If you’re paying well under $27/hour, you’re buying a lifestyle upgrade, not a profit margin — fine, as long as you decide with that clear.
  • Box efficiency: Keep plans capped at 55 to 60 high-producing cows per box. Push past that and your fetch lists spike while box utilization tanks.
  • The quota flip (Canada): Judge the system on fat per box, not head count. Follow the Lambton County model — they hit 87 kg of fat per robot per day by optimizing that, not headcount.

Before You Sign

  • Infrastructure first: Have an electrician audit your service panel and connectivity. 62% of automated-milking failures trace back to poor electrical/connectivity setup, not the purchase.
  • The free option: Book a comprehensive milking-routine and lameness audit this month. If cows won’t walk to the box voluntarily, your cash-flow valley gets deep, fast — and it’s the cheapest check on this list.

The One Question to Put on the Table

So if you could ask just one thing across that kitchen table, make it this: If I plug my own last 12 months of milk checks, my real labor cost, and my actual barn into Tranel’s cash-flow model and Salfer’s breakeven wage, does this robot still make money — or am I just financing a lifestyle upgrade? It’s a fair question. It just forces the dealer’s averages to collide with your numbers — which is exactly the collision a glossy proposal is built to avoid.

So where does your breakeven really sit? Before you sign a $400,000 note, run your own numbers against the ones the brochure left out, and have that conversation with your lender and your kid in the same week. We’ve built the full cost-per-cwt model by herd size — plus the $18-milk stress test and the quota-side fat-per-box math — in this week’s Bullvine Weekly breakdown. That’s where the real numbers live, and it’s worth an evening before the dealer’s truck comes back down the lane.

Key Takeaways

  • If your DSCR is under roughly 1.15x before the robot note, treat that as a yellow light and run the $18 milk stress test before you sign.
  • Robots make the most sense where labor is truly scarce and expensive, cows are sound, and you can keep box use in the 55–60 high-producing cows range.
  • If you’re paying well under $27/hour for milking labor, be honest that you’re mostly financing lifestyle, not margin, and decide with that clear.
  • Before any AMS contract, do the cheap work first: a full milking-routine, lameness, and infrastructure audit in the next 30 days to see if you’re fixing management or just buying hardware.

Run Your Numbers

Before you accept any dealer’s three-year payback, drop your own installed cost, labor wage, milk price, interest rate, and downtime into the Robot ROI Reality Check. It turns the dealer’s averages into your breakeven and shows whether the seven-year valley is real on your balance sheet.

Learn More

The Sunday Read Dairy Professionals Don’t Skip.

Every week, thousands of producers, breeders, and industry insiders open Bullvine Weekly for genetics insights, market shifts, and profit strategies they won’t find anywhere else. One email. Five minutes. Smarter decisions all week.
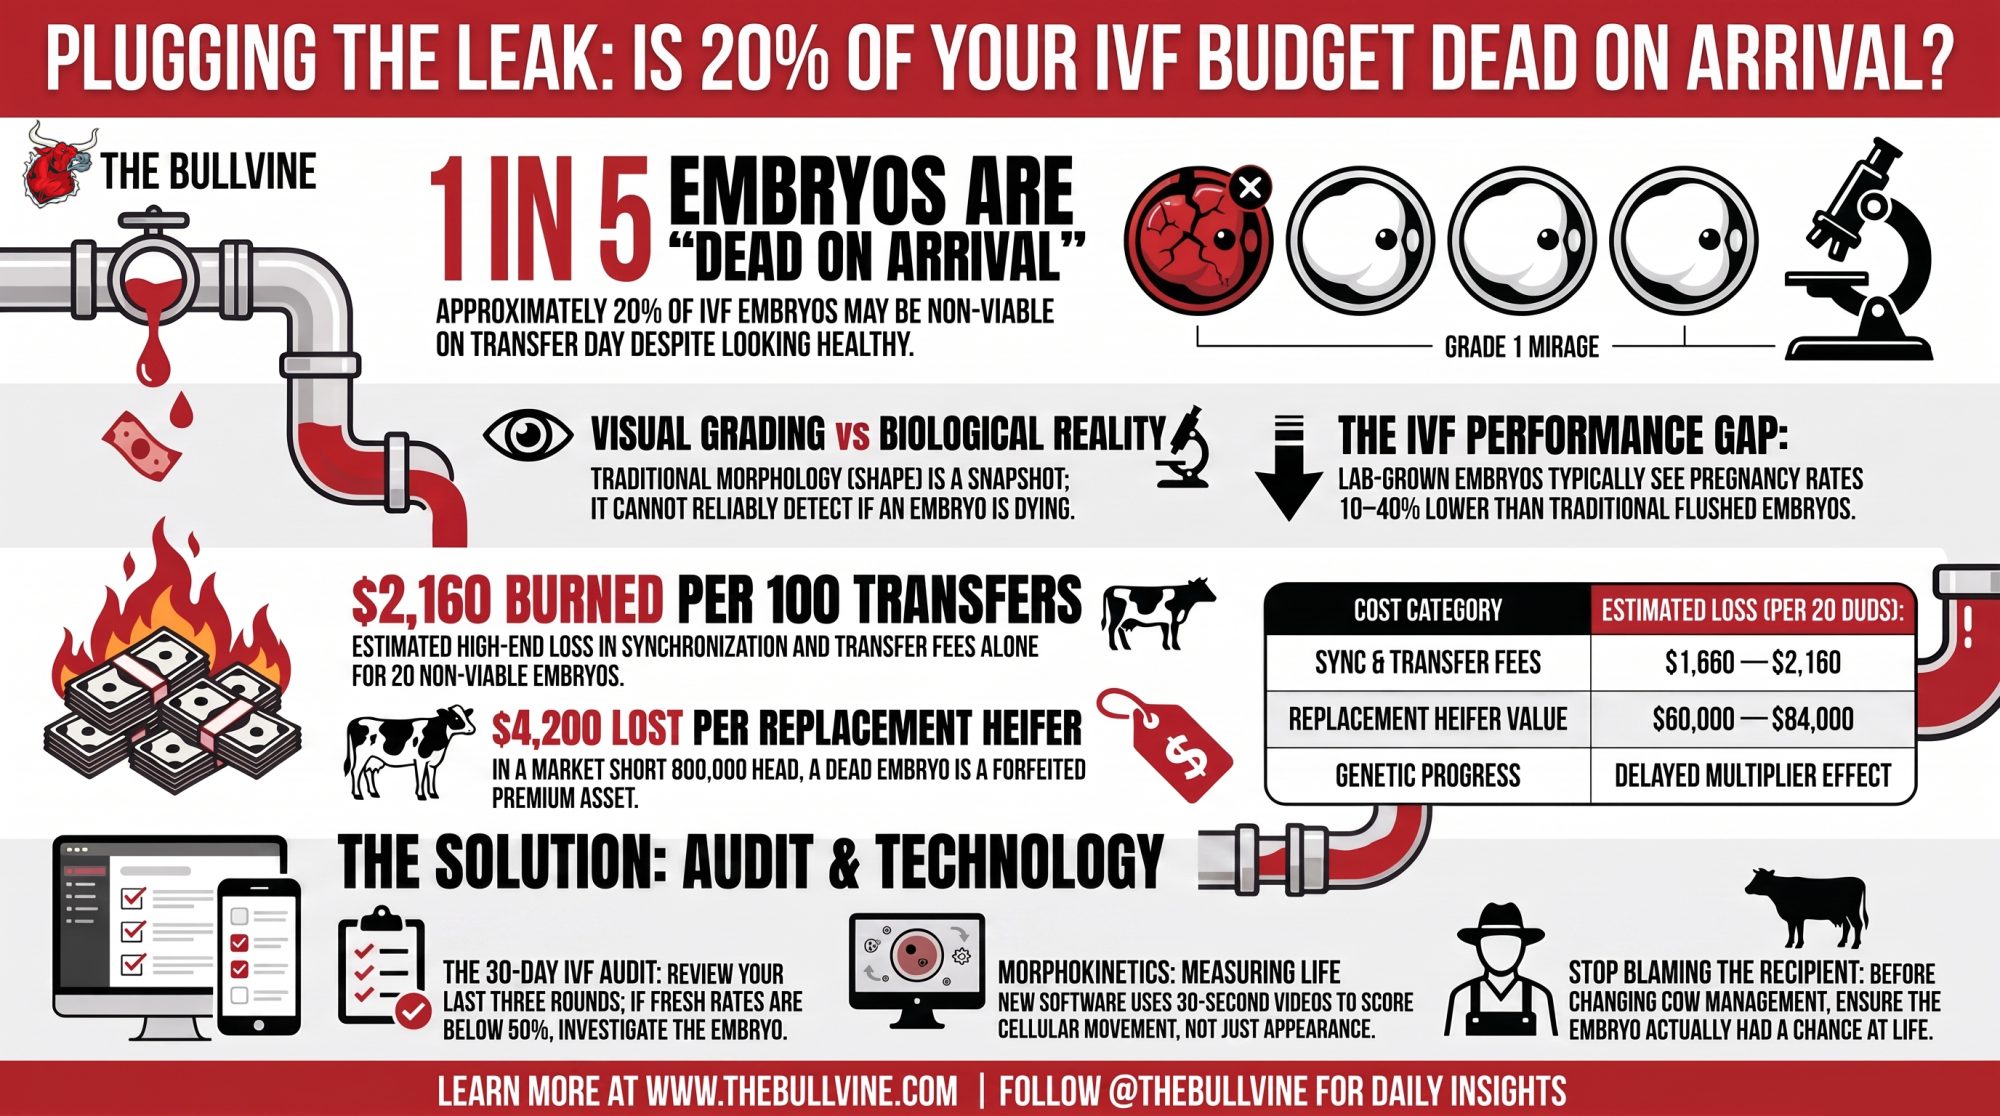
NewsSubscribe
First
Last
Consent

An $800 Permit vs. $50,000 a Day: The Raw-Milk Math Dairies Ignore

An $800 permit. Up to $50,000 per product per day in penalties. Jacy Vaughn’s West Texas dairy is finding out which number mattered — and the insurance angle is worse.

Executive Summary: A judge in Travis County has already ruled against Jacy Vaughn’s Like Wildflowers Homestead near Lamesa, and the next hearing in Texas DSHS v. Like Wildflowers (Cause No. D-1-GN-25-010854) is scheduled for June 29. Her mistake wasn’t the milk — it was skipping the $800, two-year Grade A Raw-for-Retail permit, a number that’s lunch money next to the 1,000-plus gallons she says she’s dumped since 2025 (call it $5,000–$12,000 at $5–$12 a gallon) and a statutory penalty ceiling of up to $50,000 a day per product. But the part that should grab any direct-sale operator is the insurance: as of June 2024, Verisk’s standard farm forms now carry an optional endorsement letting carriers exclude raw-milk liability outright — and that exclusion can reach the policy covering your cows, your parlor, and the note at the bank. That’s the real asymmetry here. A 30-cow homestead and a 400-cow dairy face the same legal theory, but the big operation is betting the whole shop on a sideline that might gross $15,000 a year. With Texas the #4 milk state in 2025 and the federal interstate ban still in force despite the deregulation noise, a ruling this size becomes the template neighboring regulators reach for. The June 29 hearing will signal where Texas is headed — so the move this week is simple: call your agent and get one answer in writing, does my policy cover raw-milk sales, or already exclude them?

Based on Travis County court records and public reporting available as of June 28, 2026. The case is ongoing; the June 29 hearing is the next step, not a final resolution.

Jacy Vaughn didn’t set out to become a test case. By her own account, she’s a first-generation farmer, a wife, and a mom of two who just wanted to sell raw milk off her micro-dairy near Lamesa, out on the West Texas plains, straight to the families who came looking for it. She’s argued — in her own posts and in her court filings — that a Private Membership Association kept those sales private, member-to-member, beyond the state’s reach. Texas didn’t buy it. The Department of State Health Services took Like Wildflowers Homestead to court for selling without a Grade A Raw-for-Retail permit; a judge already sided with the state once, and the next hearing is June 29.

Here’s the part that should stop you cold, even if you milk 400 cows and wouldn’t touch raw milk with a barn pole. The permit she skipped costs $800 for two years. She says the fight has already cost her more than 1,000 gallons of dumped milk since 2025, plus thousands in legal fees. So this isn’t really a raw-milk story. It’s a story about a risk that’s mispriced on many balance sheets — with a court date about to test it in some of the biggest dairy country in the nation. And the worst of it isn’t the fine or the poured-out tank. It’s the insurance.

What’s Actually on the Docket

Travis County civil records list the case as Texas DSHS v. Like Wildflowers Homestead, LLC, Cause No. D-1-GN-25-010854, in the 200th District Court. A temporary-injunction hearing ran on February 19, 2026, and by early April, the judge had ruled against the homestead, with the next court date set for June 29. What that April order actually demands — a full shutdown, a narrower injunction, penalties — isn’t fully public. As of the latest reporting, the complete text of the ruling hadn’t been released.

Vaughn has also said publicly that she believes a complaint set the state on her. DSHS files these enforcement actions in Travis County, regardless of where the complaint originated, and the agency hasn’t named any complainant in this case. Treat the competitor theory as her allegation, not a finding — because that’s exactly what it is.

Why a West Texas Micro-Dairy Matters to Everyone Else

Raw milk is having a political moment. HHS Secretary Robert F. Kennedy Jr. has signaled he might lift the FDA’s interstate ban and float voluntary federal standards, and in March 2026, Representatives Thomas Massie and Chellie Pingree introduced H.R. 7880, the Interstate Milk Freedom Act. The mood music says deregulation. The reality says wait.

As of late June 2026, the FDA’s interstate ban remains fully in force, and H.R. 7880 is pending in committee with no floor vote. State law is where raw milk lives or dies. And Texas is blunt about it: any Grade A raw milk sold direct to consumers has to come from a permitted Grade A Raw-for-Retail processor. A PMA membership card doesn’t change that in the state’s eyes.

Now the scale. Texas isn’t some bit player — it ran #3 nationally for milk production in 2024, then Idaho edged back ahead of it in 2025, knocking Texas to #4, with both states posting some of the fastest growth in the country (Idaho up 7.3%, Texas up 6.9% year over year). A ruling in a state that big doesn’t stay put. It becomes the thing regulators in other states point to when their own enforcement questions land on a desk.

And the dairies most exposed here aren’t the megaherds. They’re the small and mid-size operators eyeing direct sales to claw back a little margin — a much bigger crowd than the handful of true raw-milk believers.

How Much Does Skipping the Permit Actually Cost?

Start with the math nobody runs before they start. The Texas Grade A Raw-for-Retail license is $800 for two years, plus a monthly inspection fee of 4.5 cents per hundredweight processed. For a micro-dairy moving a few hundred gallons, that’s lunch money. The compliance underneath it — quarterly inspections, pathogen testing, temperature logs, posted results, record-keeping — costs time and some capital, but it’s a known, fixed number you can put in a budget.

Run that as an annual line. The license pencils to $400 a year. Say you process 250 hundredweight in a year off a small herd — that’s about $11.25 in inspection fees on top. Call it somewhere in the low hundreds of dollars a year to stay legal, before testing and your own labor. Hold that number.

Now run the other column. Vaughn’s account, carried by raw-milk advocacy site GetRawMilk.com, puts it at 1,000-plus gallons poured out since 2025 and thousands in legal fees. Raw milk sells direct for roughly $5 to $12 a gallon. So 1,000 dumped gallons conservatively amount to $5,000 to $12,000 in product hitting the drain — before a single lawyer’s invoice. On top of that, the Texas Food, Drug, and Cosmetic Act allows civil penalties of up to $50,000 per day for each food product in violation: a ceiling courts rarely reach for, but one that’s right there in the statute.

That’s the trade, side by side. A few hundred dollars a year, fixed and known. Against five figures of dumped product, legal fees, and a statutory penalty ceiling that most operators have never read.

The Two Lanes: What Each One Actually Costs

Metric✓ Permitted Lane✗ Unpermitted Lane
Up-front cost$800 (2-year license)$0 — until enforcement
Annual fees~$411/yr (4.5¢/cwt + inspections)$0 — until enforcement
Compliance burdenQuarterly inspections, pathogen testing, temp logsNone — until enforcement
Product loss risk$0 from compliance1,000+ gal dumped (~$5,000–$12,000)
Legal fee exposurePredictable & budgetableOpen-ended; $20,000+ documented
Statutory penalty ceilingN/AUp to $50,000/day per product
Insurance coverageStandard farm policy (verify in writing)Possible exclusion — Verisk endorsement active since June 2024
Public recordRoutine inspection fileNamed lawsuit on public docket
Risk to whole operationFixed & minimalOpen-ended ruin — herd, facility, note at bank
Verdict risk (Texas)No enforcement actionJudge already sided with DSHS at injunction stage

Most operators never lay it out like that. They ask, “Can I move ten more gallons a day at $10?” and let the legal machinery fade into the background — right up until a process server is standing in the driveway.

It’s only fair to put Vaughn’s argument on the table, because this is more than enforcement paperwork to her. Her position, in her filings and posts, is that the PMA made these private transactions between members, not retail sales the state can touch. That’s a legal argument, not a settled finding, and no final ruling on the PMA question had come down as of the latest reporting. The judge didn’t accept it at the injunction stage. June 29 is when it gets tested again.

The Part That Blindsides People: Insurance

It isn’t the fine that wrecks a dairy here. It’s the coverage you assumed you had.

⚠️ The Insurance Blindspot

As of June 2024, liability coverage for raw milk isn’t readily available through standard or surplus farm-insurance markets — and even a farm product-liability rider built for direct off-farm sales typically won’t cover it. It’s getting harder, not easier. In June 2024, Verisk — the insurance-industry data firm behind the standard ISO farm forms — described an optional endorsement that allows carriers to explicitly exclude liability coverage for the sale of unpasteurized “raw” milk. Sample exclusion forms are already circulating in the market.

The danger isn’t just being uninsured on the raw milk. It’s an exclusion that can reach the coverage protecting the rest of the operation — the cows, the parlor, the note at the bank. One producer’s account in a dairy group — which The Bullvine has not independently verified — described a policy being bought out, and the new carrier refusing to write raw-milk sales off the farm at all.

Before you sell a single jar, get your agent’s answer in writing: Does my policy cover raw-milk sales, or carry an exclusion?

Why does this stay invisible until it’s too late? Same blind spot dairies have with recall risk. The Bullvine’s own reporting found plants penciling a recall at $100,000 when the realistic hit runs closer to $800,000. People grab the upside number first and assume somebody downstream — an insurer, a lawyer, a waiver — is holding the tail risk. In a Like Wildflowers situation, nobody is. It bounces straight back to the farm gate.

And the legal exposure isn’t hypothetical, especially in Texas. Back in 2017, raw milk from K-Bar Dairy in Paradise, Texas, tested positive for Brucella RB51, according to CDC and Texas health officials — a case the CDC tracked across seven states, with a Texas woman hospitalized and confirmed infected, and officials working to reach more than 800 households that had bought the milk between June 1 and August 7. RB51 is resistant to first-line antibiotics and can turn chronic and lifelong, the agency warned. More recently, Rachel Maddox sued Keely Farms Dairy of New Smyrna Beach, Florida, alleging raw milk sickened her toddler and contributed to the loss of her unborn child, after a state agency report alleged a link between the farm and an outbreak that sickened 21 people, including six children, according to NBC News. None of these claims has been proven in court. But that’s exactly the kind of claim no waiver was ever written to survive.

The bet gets worse the bigger you are. A 30-cow homestead and a 400-cow commercial dairy face the same legal theory. But if a raw sideline drags an exclusion onto the policy covering 400 cows, the loss isn’t a few jars — it’s the herd, the facility, and the borrowing base behind them. The micro-dairy is risking a project. The commercial operator is risking the whole shop.

Factor30-Cow Homestead150-Cow Mid-Size400-Cow Commercial
Raw-milk sideline revenue (est.)~$5,200/yr~$10,400/yr~$15,600/yr
Compliance cost (permitted)~$500/yr~$750/yr~$1,200/yr
Net margin (permitted)~$4,700/yr~$9,650/yr~$14,400/yr
Insurance exclusion impactPolicy on small operationPolicy on mid-size herdPolicy covering 400 cows, parlor & debt
Tail liability (single claim est.)$50,000–$100,000$100,000–$300,000$300,000–$1M+
What’s at riskOne projectMargin & equipmentEntire operation + borrowing base
PMA/herd-share protection (TX)Unproven; judge rejected at injunctionUnproven; judge rejected at injunctionUnproven; same legal exposure
Recommended actionGet permit + written insurer answerGet permit + written insurer answerAudit insurance NOW before first sale

Is a Raw-Milk Sideline Worth It at Your Scale?

Here’s where it gets real for herds in the squeeze. Mid-size dairies — roughly 150 to 500 cows — are already running close to the line, where a small swing in milk price or feed cost flips them from black to red, per The Bullvine’s own margin work. These are the operations looking hardest at direct sales, because the regular milk check is so tight.

So picture a 300-cow herd testing a small raw line for extra income. Say it moves 30 gallons a week at $10 — that’s about $15,600 a year in topline, before bottling, labeling, and the time it eats. Now set that against the tail risk: one Brucella– or E. coli-type claim, like the ones reported against K-Bar or Keely Farms, landing on a policy that may now carry a raw-milk exclusion. The upside is a five-figure topline you can see. The downside is a six- or seven-figure claim you can’t see, sitting behind an exclusion you didn’t read. For a values-driven micro-dairy, raw milk is a lifestyle-and-mission call, and the operator usually walks in knowing the stakes. For a commercial dairy, it’s a fragile balance sheet sitting next to a risk the insurer may have already carved out — often without anyone in the office running that second column. Same milk. Very different math. A raw sideline can pencil out, but only inside the permit lane, with your insurer’s answer in writing.

What Should a Producer in a Neighboring State Read Into This?

If you’re milking in New Mexico, Oklahoma, or Louisiana, don’t file the Vaughn case under “Texas problem.” The specific rules don’t copy across the border — they’re all over the map. New Mexico allows retail sales of raw milk with a permit. Louisiana bans the sale of raw milk for human consumption outright. And Oklahoma just went the other way: Senate Bill 2028, signed in May 2026, raised the direct-sale cap from 100 gallons per month to 1,500 gallons per month. Three neighbors, three completely different answers.

What does travel is the enforcement posture. A ruling in a top-four production state is exactly the kind of thing a regulator next door cites when an enforcement question lands on their desk. The signal to watch isn’t the verdict alone — it’s whether DSHS treats the PMA-and-herd-share argument as a loophole to close hard, because that’s the argument operators everywhere are leaning on. If Texas slams that door on June 29, expect the language to show up in other states’ enforcement letters within a season or two. That’s how precedent travels in this business — not through statute, but through the example regulators reach for.

Options and Trade-Offs for Farmers

There’s no villain here, and raw milk isn’t the enemy. The real question is how you carry the risk if you go anywhere near direct sales. A few paths producers actually use:

  • Get the permit and run in the lane. Right call when raw or direct sales are a real revenue line, not a hobby. It takes the $800 license, inspection readiness, testing, and record-keeping — time and capital, but you keep your legal footing. The do-it-this-month move: before you sell a single jar, call DSHS and your insurance agent in the same week and get both answers in writing. One call confirms the permit path. The other tells you whether your farm policy still covers you after the first sale — or quietly excludes it.
  • Bottle through a licensed processor. Many states allow you to produce milk and sell it under your own brand through a licensed processor. Worth it when you want the premium and the brand without owning the full compliance burden — the same play we broke down in our deep dive on direct-sale margins. You give up some control and some cents per gallon — that’s the trade.
  • Sit out until the federal law actually changes. Makes sense if deregulation chatter is the only thing tempting you. It takes a clear read of reality: the interstate ban is still in force, and H.R. 7880 hasn’t moved out of committee. You leave a premium on the table while you wait. But you’re not betting the farm on a bill that may never pass.
  • Run the PMA or herd-share play anyway. This is what Like Wildflowers did. In Texas, it rarely makes sense, given the explicit permit requirement and the fact that a Travis County judge has already sided with DSHS at the injunction stage. The risk is the whole list above — dumped product, legal fees, an insurance exclusion, and a public court record. Texas does recognize true herd shares as distinct from sales when they operate with a bill of sale and divide milk proportionally, but that’s a question for your own attorney, not a workaround to assume on your own.

Key Takeaways

  • If you’re weighing raw or direct sales in Texas, get the $800 Grade A Raw-for-Retail permit in hand before you sell anything — running without it is exactly what put Like Wildflowers in court.
  • Call your agent this month and get one answer in writing: Does my policy cover raw-milk sales, or carry an exclusion? If it’s excluded, the rest of the decision just got easy.
  • If the only reason you’re tempted is the talk of deregulation, wait — the interstate ban is still federal law, and H.R. 7880 hasn’t passed.
  • If you run 150 cows or more, price the tail risk, not just the upside: what happens to the whole operation if a Brucella– or E. coli-type claim lands on an excluded policy?
  • Treat waivers, LLCs, and “donation” labels as untested cover against a product-liability claim — talk to your own attorney before you lean on any of them.
  • If a customer or a competitor files a complaint, assume the state files where the agency sits, not where you milk — DSHS brought this case in Travis County, hundreds of miles from Lamesa.

The honest question isn’t whether you believe in raw milk or in food freedom. It’s whether your operation could survive being wrong about the legal risk — the way Like Wildflowers is finding out, one dumped tank at a time. So before June 29 tells us where Texas is headed, run your own numbers: what’s your real exposure if a side revenue stream collided with an enforcement action tomorrow, and does your insurance agent already know the answer?

We’re tracking the June 29 ruling and will update this story as it progresses. If you want the full math on whether a raw line actually pencils, we ran the “$3 Million Gamble” Punch Test on raw-milk premiums — and the per-herd-size breakdown with the insurance-exclusion scenario built in runs in next week’s Bullvine Weekly, where the deeper numbers live.

Run Your Numbers

Farm Benchmark Snap Check — Before you bolt a raw or direct line onto the operation, run the DVI margin-risk check. It bands your hedge, debt, and feed exposure in dollars per cow and tells you whether you’re built to absorb a hit — or already too thin to be adding one.

Complete references and supporting documentation are available upon request by contacting the editorial team at editor@thebullvine.com.

Learn More

The Sunday Read Dairy Professionals Don’t Skip.

Every week, thousands of producers, breeders, and industry insiders open Bullvine Weekly for genetics insights, market shifts, and profit strategies they won’t find anywhere else. One email. Five minutes. Smarter decisions all week.
NewsSubscribe
First
Last
Consent

233 Sick, 40 in the Hospital, One Farm Still Selling: What Raw Farm’s Outbreak Streak Costs the Rest of You

A California raw-milk dairy weathered eight outbreaks in 18 years and kept its shelf space — and in 2026, the federal brakes came off. Here’s why that lands on your milk check, not just theirs.

EXECUTIVE SUMMARY: One California dairy — Raw Farm, run by raw-milk crusader Mark McAfee — has been linked to at least 233 illnesses and 40 hospitalizations across eight outbreaks since 2006, and it’s still shipping 5.48 million pounds a year into hundreds of stores. Half the kids in its latest E. coli outbreak were under five, yet the FDA closed its 2026 case with no enforcement, RFK Jr. now runs the agency’s parent department, and Massie’s Interstate Milk Freedom Act (H.R. 7880) would open a national raw-milk lane that’s never legally existed. Here’s why it’s your problem even if you’ve never sold a drop raw: consumer trust doesn’t sort by category, so when a parent reads “raw cheddar sent kids to the hospital,” they just hear “dairy made a kid sick.” Soften fluid demand after a national scare and you push milk out of Class I — your highest-value pool use — into manufacturing classes, and the blend price every pooled producer gets drifts down with it. For scale on how that lever moves money, USDA’s 2025 make-allowance tweak alone cut class prices 85–93¢/cwt and pulled $337 million out of producer pools — and that wasn’t even a demand event. The full piece runs the barn math on a 200-cow herd and hands you a 30-day message-discipline and liability checklist to protect your brand before the next headline hits. If you ship fluid or sit on a checkoff board, that 30 seconds of reading decides whether you’re ready or improvising on camera.

raw milk outbreaks

Mark McAfee doesn’t sound like a man on the ropes. The owner of Raw Farm in California’s Central Valley has called himself a pioneer — somebody “climbing a mountain they say you can’t climb,” in his own words to reporters. By April 2026, he was climbing it again, recalling cheddar “under protest” while federal and state investigators traced sick kids back to his product.

Here’s the number that should stop you. Across eight outbreaks since 2006, public health investigators have linked Raw Farm products to at least 233 illnesses and roughly 40 hospitalizations. Half the people sickened in the latest E. coli outbreak were children under five. And the farm is still selling — about 5.48 million pounds of raw milk a year by its own scale, into hundreds of stores. The raw-milk fight isn’t your fight. But the bill has a way of showing up at your door anyway.

How does one farm rack up eight outbreaks and keep its shelf space?

Start at the beginning, because the pattern is old. In 2006, an E. coli O157:H7 outbreak tied to the operation — then called Organic Pastures — sent two young children to the hospital, one with hemolytic uremic syndrome, and California’s health department concluded the farm’s unpasteurized products were the likely source. That’s kidney failure in a kid. From a glass of milk.

What followed was 18 years of the same movie on repeat. A 2007 Campylobacter outbreak and recall. A May 2012 Campylobacter outbreak that sickened ten people, from a nine-month-old to a 38-year-old. A 2010 interstate injunction, then a 2023 consent decree with independent audits. A 2023–24 Salmonella outbreak that sickened 171 people. Then two E. coli cheese outbreaks — one in early 2024, another that surfaced in March 2026.

The CDC declared the 2026 outbreak over on April 29, after nine confirmed illnesses across multiple states, with one case of HUS and no deaths. Raw Farm disputes the investigations. The company’s official recall notice states flatly that “no pathogens have been found in RAW FARM-brand cheese products” and that the recall was “performed under protest.” That’s its on-record position, and it belongs in the story. But the agencies named the farm anyway — the FDA and CDC had already identified it as the likely source of a similar 2024 outbreak, and California’s health department said it could not rule out the farm, given how many patients had consumed its products before getting sick.

Why did the federal brakes come off in 2026?

Because the people running the enforcement machine changed, and so did the politics. Robert F. Kennedy Jr. — a vocal raw-milk advocate — now runs Health and Human Services, the department that houses the FDA. The agency’s posture toward Raw Farm softened throughout 2025 and into 2026, and a consumer watchdog group put the question bluntly: Did the FDA go easy on a repeat offender with ties to RFK Jr.’s campaign?

Then Congress moved. In March 2026, Representatives Thomas Massie and Chellie Pingree introduced the Interstate Milk Freedom Act — H.R. 7880 — to strip federal restrictions on interstate raw-milk sales entirely. The bill would hand raw milk a national lane it has never legally had.

ActorWhat They GainWho Carries the Risk
Raw Farm / Mark McAfeeNational retail lane; no federal enforcement ceilingSick consumers; pooled producers via trust damage
RFK Jr. / HHSPolitical base consolidation; “food freedom” opticsFDA credibility; outbreak response capacity
H.R. 7880 co-sponsors (Massie/Pingree)Libertarian/food-movement crossover votesInterstate consumers with no state-level backstop
Raw-milk retailers (multi-state)Expanded SKU access without FMMO scrutinyBrand liability if product recalled post-sale
Pooled fluid-milk producersNothingBlend-price erosion from demand scare; no compensation mechanism

This is the part that matters for you, and it has nothing to do with whether raw milk is good or bad. The guardrail you’ve quietly relied on — federal enforcement keeping the worst actors penned in their own states — is being filed down. And the science on the underlying risk hasn’t moved an inch.

The risk math hasn’t changed, even if the politics did

The CDC’s own characterization is that raw milk causes illness far more often than pasteurized — dozens of times the per-unit risk, not a few percentage points. A peer-reviewed analysis cited in Canada’s communicable disease report put unpasteurized dairy at hundreds of times more illnesses and dozens of times more hospitalizations. A 2026 food-science study using different methods landed on roughly 29 times the illness risk and 75 times the hospitalization risk.

The exact multiplier moves with the method. The direction never does. Raw milk gets people sick at a rate pasteurized milk doesn’t, and the people who pay the hardest are the youngest.

That’s the science. Now the part nobody’s pricing.

What does someone else’s outbreak actually cost your operation?

Consumer trust isn’t filed by category. When a parent reads “raw cheddar sent kids to the hospital,” they don’t run a mental search-and-replace for “raw” versus “pasteurized.” They register one thing: dairy made a kid sick. The headline does the damage. The fine print never catches up.

Here’s the barn-math version, and you can map it to your own numbers. Run a 200-cow herd shipping 75 pounds a day, and you’re moving roughly 5.48 million pounds of milk a year — almost exactly the volume Raw Farm pushes. Now picture a fluid-demand wobble after a national raw-milk scare. Class I — fluid milk — is the highest-value use in the federal pool, and your blend price is a weighted average of how that pool’s milk gets used. Soften fluid demand, shift milk into lower-value manufacturing classes, and the uniform price every pooled producer receives drifts down — whether your milk ever touched a fluid bottle or not. You don’t sell raw milk. You’d still help pay for the headline.

How big is the drift? Use the system’s own arithmetic. The July 2026 base Class I price ran $21.33/cwt — well above Class III and IV manufacturing values most months. For perspective on how the formula moves real money: USDA’s 2025 make-allowance change alone permanently cut class prices by roughly 85 to 93 cents per hundredweight and pulled an estimated $337 million out of producer pools. That wasn’t even a demand event — just a formula tweak. A genuine, sustained dip in fluid demand pushes the same lever in the same direction. The exact cents-per-hundredweight depends on the depth and length of any scare, and pinning that figure needs a full pool model — which is exactly what the Tier 3 follow-up runs. The mechanism is settled. The magnitude is the open question.

Price EventTriggerClass Price ImpactEst. Producer Pool Impact
2025 USDA make-allowance adjustmentFormula change (USDA rulemaking)–85 to –93¢/cwt–$337M from producer pools
Hypothetical raw-milk demand scareConsumer trust erosion; Class I fluid shiftTBD — depends on scare durationDirectionally same lever, formula already set
July 2026 Class I base priceUSDA advance pricing$21.33/cwtHighest-value pool position — most to lose
2024 bird flu / avian influenza dairy scareDisease outbreak; consumer concernModest Class I softeningLocalized; recovered within quarters
PatternAny event softening fluid demandPushes milk to lower manufacturing classesEvery pooled producer pays; raw or not

Options and Trade-Offs for Your Operation

You can’t control RFK Jr., you can’t control H.R. 7880, and you sure can’t control McAfee. You can control how your operation and your message are positioned when the next headline hits. Three paths, depending on where you sit.

ActionWho It’s ForCost to ActCost to Skip
Publish clear “we’re pasteurized” message across all channelsEvery fluid producer, farmers’ market sellerOne afternoon; near $0Improvising on camera when a reporter calls
Pull product-liability policy; ask about category-contamination coverageProcessors, large consumer-facing operations1 hour + possible premium reviewDiscovering coverage gap mid-recall
Put raw-milk bill status on monthly review calendarAnyone in a state with active raw-milk legislation15 min/monthBlindsided by overnight competitive shift
Brief co-op board or checkoff committee on category-trust riskBoard members, checkoff directorsOne agenda itemNo institutional response plan when headlines hit
Run your own blend-price sensitivity: what does –$0.50/cwt do to your operation?Any pooled producerSpreadsheet hourTreating a structural risk as background noise
Review recall plan; confirm chain-of-custody documentationAnyone with consumer-facing brandQuarterly ops reviewRecall conversation you’re having for the first time during a recall

Tighten your own message discipline — start this month. Within the next 30 days, sit down with whoever speaks for your farm — on social, at the co-op, at the farmers’ market — and draw the line in plain language: your milk is pasteurized, your safety record is separate, and you don’t get lumped in with raw. This works for everyone and costs almost nothing but an afternoon. The limit: messaging can’t fix a problem you actually have, so it only helps if your own house is in order first.

Pressure-test your liability and recall posture. This fits processors and larger operations carrying real consumer-facing exposure. Pull your product-liability coverage and your recall plan, and ask your insurer the direct question: are we covered if a category-wide raw-milk scare drags our brand into a recall conversation we didn’t cause? It requires an honest hour with your agent and maybe a premium conversation. The risk of skipping it is finding the gap during the crisis instead of before it.

Watch your state’s raw-milk rules like a hawk. This is for anyone in a state where raw-milk law is in play — and with H.R. 7880 live, that list could grow fast. If your state opens an interstate lane, the competitive and reputational math in your region shifts. The forward signal to watch isn’t a poll. It’s your statehouse calendar and the bill’s committee progress.

Key Takeaways — Decisions, Not a Recap

  • If you sell anything fluid and consumer-facing, lock in your “we’re pasteurized, we’re separate” message within 30 days — before a scare forces you to improvise it on camera.
  • If you carry brand or processing exposure, call your insurer this quarter and get the category-contamination question answered in writing, not assumed.
  • If your state has a live raw-milk bill, track its committee progress monthly — treat the statehouse calendar as a competitive-intelligence feed, not background noise.
  • If you sit on a checkoff or promotion board, the question to put on the table is whether your consumer messaging can survive being lumped in with a raw-milk outbreak — and if it can’t, that’s the gap to close now.

Raw Farm has weathered eight outbreaks and kept selling. The open question isn’t whether McAfee can keep climbing his mountain — he’s made clear he intends to. It’s whether the rest of the dairy case gets billed for the trust he spends on the way up. So pull your own numbers. Where does your brand sit if the next “raw milk sent kids to the hospital” headline runs on a Tuesday, and a customer can’t tell your bottle from his?

Run Your Numbers

Dairy Profit Projector — A raw-milk scare you didn’t cause can still soften fluid demand and drag your blend price down. Run your herd through the Projector to pressure-test what a milk-price dip does to your next 12 months of IOFC, breakeven, and whole-herd margin — before the headline hits.

Complete references and supporting documentation are available upon request by contacting the editorial team at editor@thebullvine.com.

Learn More

The Sunday Read Dairy Professionals Don’t Skip.

Every week, thousands of producers, breeders, and industry insiders open Bullvine Weekly for genetics insights, market shifts, and profit strategies they won’t find anywhere else. One email. Five minutes. Smarter decisions all week.
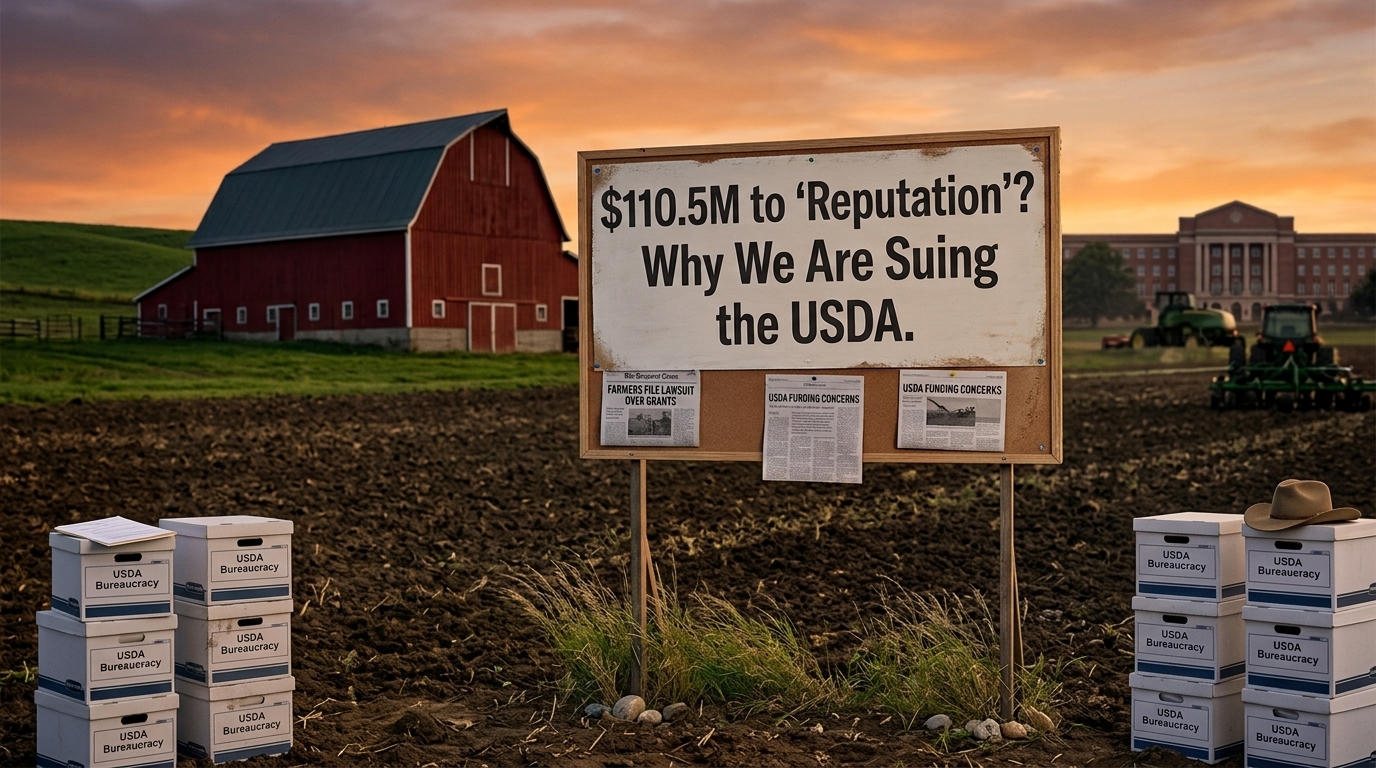
NewsSubscribe
First
Last
Consent

Overstock the Close-Up Pen, Pay $500 a Cow in the Fresh Pen

One crowded close-up pen, 40 heifers, and you’re leaking roughly 192 lb of milk a day before a single vet bill — and the DA that lands 40 days later clears $500 a cow. Count yours this afternoon.

Executive Summary: Overstock your close-up pen at 110%, and you’re not saving a stall — you’re booking a $500-a-cow bill that lands 30 to 40 days later in the fresh pen as a DA, a retained placenta, or a heifer who never hits her peak. The damage hides because the decision and the consequence are five weeks apart, so good operators end up blaming the cow while the pen stays exactly the way it was. The barn math is brutal: every 10% over the 80% target costs first-lactation heifers about 1.6 lb/day in the next lactation, so 40 crowded heifers leak roughly 192 lb/day — call it $32 to $40 a day before a single vet bill, depending on whether you run Class III or the all-milk forecast. Crowding pulls nearly two hours of lying time at 1.5 cows per stall, drives pre-fresh NEFA and post-calving BHB the wrong way, and stacks the whole disease cluster at once — which is why a DA rate over the 6% alarm line is really a flag for the metritis and ketosis riding behind it. The fix costs zero capital and ten minutes: count your last 30 days of fresh cows against the achievable-versus-alarm benchmarks, then pull your actual close-up density against both the stall ratio and the 30-inch bunk-space target, not the barn average. If they’re clustering, the pen made that call — and you can take it back this week.

transition cow stocking density

The close-up pen fills up. Nobody pulls cows out. The transition group runs at 110% because that’s just what the barn does when calvings bunch up — and three weeks later, a fresh cow flips a displaced abomasum, and everybody chalks it up to bad luck.

That’s the trap. Transition cow stocking density is a textbook pay-now, pay-later decision: cheap today, brutal in 40 days. The empty stall you avoid is real money saved right now. The DA, the retained placenta, the heifer who never quite peaks — those show up a month later, and not one of them arrives with a note saying where it came from. So they get written off as one of those things. The market won’t show you the second price until it’s too late to change your mind. But the research will, and once you see the mechanism, you can’t unsee it: a default nobody consciously chose is one of the most expensive line items on the farm — and the fix doesn’t cost a dime of capital. It costs something harder. Admitting the pen was a choice all along.

The Decision That Doesn’t Feel Like a Decision

Overstocking a transition pen rarely feels like a call you made. It feels like the weather. The barn’s tight; the calvings stacked up. You’ll sort it out next month. Except next month looks the same, and so does the one after.

The cows don’t help you catch it. They look fine. Up at the bunk, cudding, the pen busy and functional. That’s the whole problem. The University of Wisconsin’s Dairyland Initiative puts it flatly in its stocking-density guidance: the negative effects of overstocking “creep up over months to years,” which is exactly why nobody connects the cause to the effect.

Read that twice, because it’s the entire game. The decision happens in the close-up pen. The bill lands in the fresh pen 30 to 40 days later. By the time it shows up, it no longer looks like a stocking problem. It looks like a cow problem. So you treat the cow, cull the cow, blame the cow — and leave the pen exactly the way it was.

Be precise about which pen we mean, because “stocking density” gets thrown around loosely. The lactating barn has its own arguments. The close-up and fresh groups are a different animal. These are cows whose intake is already declining in the final days before calving and whose immune systems are running at a discount throughout the periparturient window. Crowd that pen, and you’re not shaving comfort off a healthy cow. You’re pulling rest and feed away from the one animal in the barn that can least afford the loss.

Here’s the part that makes this pen worth obsessing over. A cow spends maybe three weeks in the close-up group. Three weeks. But the decisions her body makes in that window — how much she eats, how much she lies down, how hard her immune system is working when the calf hits the straw — set the ceiling on a 305-day lactation. You’re not managing three weeks of comfort. You’re managing the down payment on ten months of milk.

What Actually Happens to a Cow in That Pen

Walk it forward, step by step. In an overstocked close-up pen, the losers are predictable: the timid cows and the first-lactation heifers. They get crowded off the bunk. They eat fewer, bigger meals at the wrong times of day. They stand more and lie less. Fregonesi and the UBC team showed back in 2007 that as freestall access tightened, cows didn’t loiter in the stalls — they got displaced into the alley, and total lying time fell as stocking density climbed. The subordinate cows took the worst of it. In a close-up pen, the subordinate cows are your heifers.

How much rest disappears? The Dairyland Initiative’s figure is blunt: at 1.5 cows per stall, cows lose roughly 15% of their lying time, dropping from an optimal 12 hours toward the low end of what they need. For a dry cow whose whole job in those three weeks is to eat and rest, nearly two hours off her feet is not a rounding error.

Here’s the part you can’t read from the alley. The metabolic damage doesn’t require the cow to eat dramatically less. It just requires her to work harder and rest less for the same feed.

Lost lying time and disrupted intake push cows deeper into negative energy balance. As intake slides in the last days before calving, she mobilizes body fat to cover the gap, and blood NEFA — the marker of fat breakdown — climbs. After calving, the liver turns some of that fat into BHB, the ketone that defines subclinical ketosis. These aren’t abstractions. Pre-fresh NEFA above 0.4 mmol/L in the final 7 to 10 days predicts poor performance — doubling the risk of retained placenta and culling in the first 60 days in milk. A crowded pen pushes that number the wrong way before the cow ever calves.

BiomarkerNormal / TargetAlarm Cut-PointWhat It MeansPen-Level CauseDownstream Risk
Pre-fresh NEFA<0.3 mmol/L≥0.4 mmol/L(7–10 days pre-calving)Excessive fat mobilization before calvingReduced DMI from crowding, slug feeding, social stress2× retained placenta risk; 2× cull risk in first 60 DIM
Post-calving BHB<1.0 mmol/L≥1.2 mmol/L(subclinical ketosis)Liver overloaded converting NEFA to ketonesNegative energy balance compounded by pre-fresh crowding3–8× DA risk; 3× metritis risk
Clinical ketosis (BHB)<1.2 mmol/L≥2.9 mmol/L(clinical threshold)Overt ketosis — productivity loss guaranteedSame root causes; represents a more severe NEB spiralReproductive failure, peak suppression, early cull
Milk fever risk (Ca)Serum Ca ≥2.0 mmol/L<1.75 mmol/L at calvingHypocalcemia — muscle/nerve function impairedDCAD failure + overcrowding stress compounding Ca metabolismCascades into DA, metritis, downer cow
DA alarm (herd rate)<3% incidence>6% incidenceSystemic transition failure signalCrowded close-up pen is primary upstream driverMetritis and ketosis almost certainly co-occurring

Then the immune hit, which the barn-level conversation usually underrates. Subclinical ketosis — blood BHB above 1.2 mmol/L — carries a 3-to-8-times higher risk of a displaced abomasum and triples the risk of metritis. The same cortisol response that accompanies crowding and competition blunts the cow’s ability to clear the bacteria behind metritis and mastitis, right when her uterus is open and her udder is filling. Work summarized at the Western Canadian Dairy Seminar (King, 2023) notes drops in milk yield and rumination showing up one to ten days before a cow is ever diagnosed. She’s telling you she’s in trouble before the clinical sign lands. An overstocked pen guarantees more cows reach that point at once.

Then she calves, and the receipt comes due — as a DA, a retained placenta, a case of metritis, or a peak that never shows up. Drawing on Ken Nordlund’s University of Wisconsin work, Penn State Extension puts a hard number on the heifer side: first-lactation cows housed with mature cows in an overstocked close-up pen produce 1.6 lb/day less milk for every 10% increase in stocking density above the recommended 80% during the next lactation (Penn State Extension, 2023). In transition work comparing 80% versus 120% stocking, the crowded heifers gave roughly 6.5 lb/day less early in lactation — a cumulative deficit near 548 lb over the first 85 days in milk, gone, before you’d ever trace it back to the pen.

Read more: Unlocking Cow Comfort

Why “80 Percent” Isn’t a Nice-to-Have

Plenty of producers hear “stock the transition pen at 80%” and file it under research-station advice — the kind that works when you’ve got empty stalls to burn. It isn’t that.

Michigan State University Extension is direct about why this one pen is different: the transition cow pen should be only 80% stocked, because close-up dry and fresh cows are “already predisposed to have decreased dry matter intake and decreased rest” (MSU Extension, 2022). Penn State pairs the stall number with the half of the rule most barns forget — 30 inches of bunk space per cow, because subordinate cows get displaced at the feed face long before they get displaced from a stall. You can hit your stall ratio and still starve your heifers at the bunk.

That bunk-space number deserves a second look, because it’s where a lot of “we’re not overstocked” arguments fall apart. A barn can run one cow per stall and still be badly overstocked at the feed face if the headlocks were spaced for 24-inch cows. When the bunk gets tight, the boss cows eat first and longest, and the timid cows and heifers wait — then bolt their feed in fewer, larger meals once a spot opens. Slug-feeding like that drops rumen pH and feeds the exact metabolic mess the close-up pen is supposed to prevent. Penn State’s more recent guidance is tighter for headlocks: with a headlock feed barrier, stocking should be at 85% or less so every cow can eat at once (Penn State Extension, 2025).

Canada’s Lactanet lands in the same place from a different angle. Its housing guidance for dry and transition cows recommends 120 to 160 square feet of resting area per Holstein, minimizing regrouping, and — where herd size allows — keeping heifers in a separate pen from mature cows to cut social-hierarchy stress (Lactanet, 2024). Same biology, two countries, one conclusion: this is the pen where you give cows room, not where you hunt for efficiencies.

The regrouping point hides a cost most barns never count. Every time you move a cow into a new pen, she spends days re-fighting the pecking order instead of eating and resting — and in a transition group, those are the exact days she can’t spare. Mix fresh heifers into an established mature-cow group, and you stack two stressors at once: a strange social order and a size mismatch she loses every time. That’s why Lactanet’s “separate the heifers where you can” isn’t soft advice. It’s a direct shot at the cows paying the highest price for the crowding.

Be honest about the gray zone, though. Not every study shows a cliff at 80% — at least one freestall trial found varying stocking density had no measurable effect on lying time or milk yield (Krawczel et al., 2012), which is exactly why bunk space and pen design matter as much as the stall ratio itself. Krawczel’s later work points at the real culprit: the most consistent response to bunk overstocking isn’t fewer stalls used — it’s more aggression at the feed face. The clear, repeatable damage shows up when herds push past 100% on both stalls and bunk space, and when first-calf heifers get mixed in with mature cows and lose every standoff. That’s the danger combination. That’s the one worth hunting for in your own barn.

The Diagnostic You Can Run This Week — No Vet, No Lab

You don’t need a consultant or a blood machine to find out whether you have a transition problem hiding in plain sight. You need a clipboard and ten minutes in the fresh pen.

Count the cows that calved in the last 30 days. Then count how many carry a tag for any of the big ones: DA, retained placenta, metritis, milk fever, clinical ketosis. One or two is noise. When they start clustering, you’re not looking at bad luck. You’re looking at a system.

The transition benchmarks below are the standard achievable-versus-alarm rates used in North American transition-cow monitoring, with per-case costs to match:

Health MetricAchievable RateAlarm RateCost / Indirect Driver
Displaced Abomasum (DA)3%6%Often exceeds $500 per case
Clinical Milk Fever2%5%~$334 in direct + indirect losses
Metritis5%10%Drives downstream DA + culling risk
Subclinical Ketosis (BHB ≥1.2 mmol/L)15%25%3–8× DA risk, 3× metritis risk
Pre-fresh NEFA (≥0.4 mmol/L)herd-level audit2× retained placenta + cull risk

Achievable and alarm rates reflect standard North American transition-cow monitoring thresholds; subclinical ketosis and NEFA cut points follow widely used blood-BHB (≥1.2 mmol/L) and pre-fresh NEFA (≥0.4 mmol/L) benchmarks. Per-case cost figures are industry estimates combining treatment, discarded and lost milk, labor, and culling or death risk; individual-farm costs vary with milk price and culling decisions. Canadian (Lactanet) housing figures cited elsewhere in this article are kept separate from these benchmarks.

The logic worth stealing is the read-across: a DA rate over 6% is the flag that metritis and ketosis are almost certainly riding along behind it. The DA isn’t the only problem. It’s just the one wearing a surgical scar — the visible tip of a list you can finally measure.

Want the next level up from a clipboard? The tool already exists. The University of Wisconsin’s Transition Cow Index (TCI) pulls 14 factors from each cow’s DHIA history to project her expected first-test milk, then measures how far she actually landed from it. A herd-wide negative TCI is the statistical fingerprint of a transition program leaking milk — and a crowded close-up pen is one of the first places to look when the number turns red.

The Barn Math: What One Crowded Pen Is Really Worth

Show the math, because a number nobody can see is a number nobody fixes. Put a pencil to a single overstocked close-up group. Say you cycle 40 first-calf heifers through that pen at 110% instead of 80%. Penn State’s figure pegs that at roughly 4.8 lb/day less milk per heifer in the next lactation — 1.6 lb for every 10 points above 80%. Across 40 head, that’s 192 lb/day. At the May 2026 Class III price of $16.92/cwt (USDA AMS, announced June 3, 2026), that’s about $32 a day walking out the door before a single vet bill — and closer to $40 a day against USDA’s June 2026 all-milk forecast of $20.70/cwt (WASDE, June 11, 2026). Use whichever number matches your mailbox check. Either way, it’s real money leaving on milk you never see.

Then layer in the disease, because the lost milk and the health bill ride together. A DA often exceeds $500 per case once surgery, lost milk, and culling risk are factored in, and a clinical milk fever case incurs an estimated $334 in direct and indirect losses. None of those are one-and-done bills — they’re the disorders most likely to drag a cow into a second problem.

And these don’t occur in isolation. They breed each other. A ketotic cow is more likely to flip a DA. A cow that retains her placenta is more likely to develop metritis. The displaced abomasum traces straight back to negative energy balance, stress, and concurrent disease — the exact conditions a crowded pre-fresh pen manufactures. So the crowded pen doesn’t raise just one disease rate. It raises the whole interlocking cluster at once, which is precisely why a high DA number is a flag to look for metritis and ketosis hiding behind it.

Stack one hard-hit heifer’s lost milk on top of her share of a DA, and the all-in cost on a single affected cow clears $500 a cow. A herd sitting above the 6% DA alarm line with a chronically full close-up pen pays a slice of that every freshening — and never sees the line item, because it never had a name.

That’s the uncomfortable arithmetic, and it’s the same shape as every pay-now, pay-later trap in this business. The empty stall you’re avoiding is visible today. The milk and the health you’d recover are delayed and invisible. Human nature picks the visible loss every single time, which is exactly why this keeps happening on good farms run by careful, hardworking people.

Read more: The $500 Transition Gap

What This Means for Your Operation

No single right answer, but a few honest paths depending on where your barn actually sits. Before you pick one, run two free checks this week: walk the fresh pen and count the last 30 days of disease cases against the table above, and pull your actual close-up density — cows divided by usable stalls and against the 30-inch, 80% bunk-space target, not the barn average.

Barn SituationBest MoveWhat It TakesWhere It BackfiresExpected Payback Window
Chronically >100%, nowhere to put cowsCull/ship 5–10 lower-priority cows nowIdentify late-lact. or problem cows to movePushes crowding to adjacent penImmediate; 30-day disease rate improvement
Running 100–110%, flexible pen layoutDrop one notch (→85–95%) for 60-day trialDiscipline on cow movement; log every DA/metritisNone if tracked properly60–90 days; compare disease cluster
Mixing heifers with mature cowsSeparate heifer close-up penEnough heifers to justify a pen (≥8–10)Impractical for small herds or low heifer numbers1–2 lactations; peak improvement
Stall ratio “fine” but feed face crowdedCount headlocks — enforce 85% headlock ruleWalk the pen at fresh feed push; count cows at bunkNone — lowest-cost fix on this listImmediate rumen pH and intake improvement
Seasonal overstocking (e.g., Feb. slam)Smooth breeding calendar 12 months upstreamBreeding record review + synchronization timingTakes a full year to show; pair with short-term fix12–18 months for calving distribution
DA rate >6%, everything else “looks fine”Pull TCI from DHIA; map disease cluster backwardDHIA enrollment + records provider queryNoneIdentifies hidden pen problem within 1 report
  • Pull cows out of the close-up pen this month. When it fits: you’re chronically over 100%, and you’ve got somewhere to put lower-priority animals. What it takes: finding 5–10 cows you can move or ship — late-lactation cows you can dry off into a separate group, or problem cows already on the cull list. Where it backfires: shove the crowding into the next pen over, and you’ve relocated the problem, not fixed it.
  • Run the 30-day experiment. Drop that pen one full notch — 110% toward 95%, or 100% toward 85% — and hold it 60 to 90 days. Log every fresh-cow disease event by calving date and parity, then compare the next quarter against the last. You’re not rebuilding the barn. You’re choosing who gets the transition real estate and finding out what it’s worth.
  • Protect the heifers specifically. When it fits: you’re mixing first-calvers with mature cows in the close-up group. The Nordlund and Penn State data are sharpest here — heifers are the ones bullied off the bunk, paying for it at peak. What it takes: a separate heifer group, which Lactanet flags as the cleanest fix where herd size allows. Where it backfires: thin heifer numbers can make a separate pen impractical, so weigh it against your calving pattern.
  • Fix the bunk before you fix the stalls. When it fits: you’ve got headlocks and a density argument running in your head. Penn State’s 85%-or-less headlock rule means the feed face, not the stall count, may be your binding constraint. What it takes: counting headlocks against cows, not just stalls against cows. Where it backfires: nowhere — the cheapest check on the list, and the one most barns skip.
  • Smooth the calving curve, not just the pen. When it fits: your overstocking is seasonal — the pen’s fine in summer and jammed every February. What it takes: looking upstream at the breeding calendar so calvings don’t all stack into one window. Where it backfires: it’s a 12-month fix, so pair it with one of the moves above for the cows already in the pen.
  • Map your DA rate, then watch for the cluster. Over the 6% alarm line? Assume metritis and ketosis are riding behind it. On DHIA? Ask your records provider whether you can pull a Transition Cow Index — a negative TCI is the cleanest single signal that the pen is leaking milk.

Key Takeaways

  • If your fresh-cow cases are clustering toward the alarm rates — DA at 6%, metritis at 10%, milk fever at 5% — stop blaming individual cows and start auditing the close-up pen. The cluster is the diagnosis, not the coincidence.
  • If you’re mixing heifers with mature cows at stocking levels above 100%, expect to pay at peak — roughly 1.6 lb/day per heifer for every 10 points over 80%, per Penn State’s read of the Nordlund data.
  • If you run headlocks, your binding number is 85%, not 100% — count headlocks against cows before you argue you’re not overstocked.
  • If your DA rate is climbing, assume ketosis and negative energy balance are in the room, too. The fix is upstream — in the pen, the ration, and your DCAD/anionic-salt program — not on the surgery table.
  • If you can only move from 130% to 105% this season, do it anyway. One notch closer to 80% is a real gain, not an all-or-nothing purity test.
  • If the pen looks fine but your DA rate is over 6%, trust the number over the eye test — a high DA number is itself the warning that fresh-cow trouble runs deeper than what you’ve tagged.

The hardest thing to change here was never the barn. It’s the belief that the barn is just the way it is. So the real question isn’t whether you care about your cows — you clearly do, or you’d have quit reading paragraphs ago. It’s whether you’re willing to find out what one under-stocked pen is actually worth to you, before another lactation slips quietly through it. What would your last 90 days of fresh cows look like on that clipboard right now?

Run Your Numbers

Herd Health ROI Calculator — Plug in your culling rate, mastitis incidence, replacement cost, and milk price to put a real dollar figure on what fresh-cow disease is costing you now. The “Cost of Inaction” view turns that crowded close-up pen into the number you’ve been missing.

Complete references and supporting documentation are available upon request by contacting the editorial team at editor@thebullvine.com.

Learn More

The Sunday Read Dairy Professionals Don’t Skip.

Every week, thousands of producers, breeders, and industry insiders open Bullvine Weekly for genetics insights, market shifts, and profit strategies they won’t find anywhere else. One email. Five minutes. Smarter decisions all week.
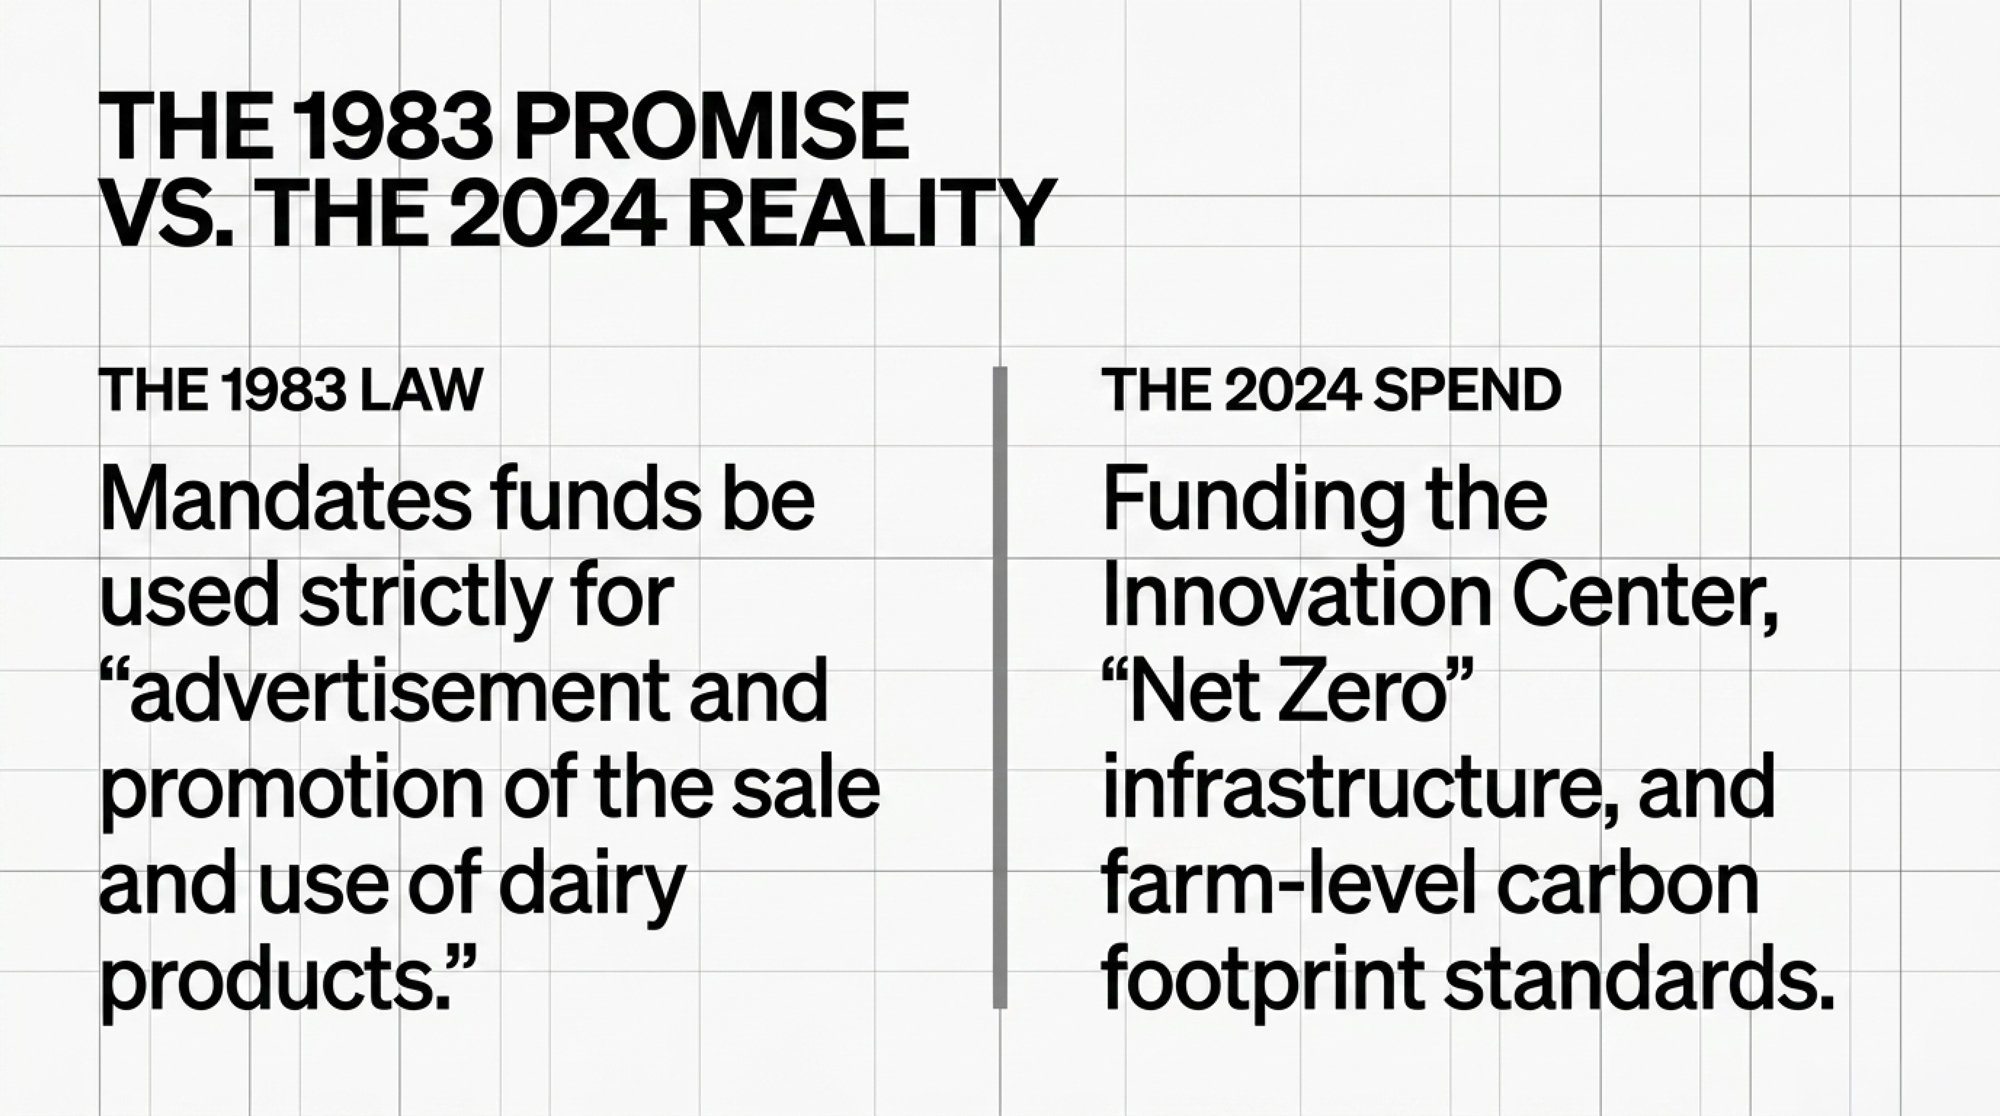
NewsSubscribe
First
Last
Consent

At Hornstead Dairy, the Land Costs $22,000 an Acre — and the Cows Can’t Pay

She farms ground homesteaded in 1863. Today it’d cost $22,000 per acre — and at $20.70 per cwt of milk, the cows can’t cover a sixth of that payment. So who’s really bidding?

Executive Summary: A 207-acre farm near Madison sold this April for $21,946 an acre, and at $20.70/cwt milk, the cows can’t cover a sixth of the payment that price demands. That’s the wall facing operators like Amber Horn-Leiterman at Hornstead Dairy in Brillion, Wisconsin: land has jumped 70.5% since 2020, while milk has done nothing close, and now data-center capital paying $10–12 million per megawatt is bidding on the same acres, water, and power you are. Run the math, and it’s brutal — University of Illinois farmdoc pegs 2025 cost of production near $5,499 a cow against roughly $5,090 in returns, so you’re underwater before a single dollar goes toward land. Finance an acre at $22,000, and the payment runs about $1,580; even at $10,000, it doesn’t pencil because the starting margin is already negative. The real damage shows up in your appraisal file and your kid’s buyout number, whether or not a server farm ever lands on your road. The decision rule is blunt: if you’re not generating a clear positive margin per cow, no land buy works on milk at any price — you’re making an equity bet and financing it yourself. What’s left to decide is which acres are part of your dairy’s future, and which are only worth their price because AI might someday sit where your alfalfa grows.

Amber Horn-Leiterman is the sixth generation to farm the ground her family first homesteaded near Brillion, Wisconsin, in 1863 — 40 acres claimed under a Lincoln-era homestead grant that became Hornstead Dairy. Today, she helps manage an operation running 2,400 milking and dry cows plus 1,600 youngstock in Calumet County, the kind of herd that lives or dies on the spread between the milk check and the cost of making it. And in that corner of the state, the value of dirt has climbed to a number that has nothing to do with what a cow can pay back.

This isn’t just a local spike. It’s a structural shift playing out across the country — the same shift that led an 82-year-old Kentucky woman to turn down $60,000 an acre for her ground this spring rather than watch it become a server farm. More on her shortly. The point for now: when this kind of capital starts pricing farmland, the bid stops having anything to do with what the land can grow.

A decade ago, good dairy land near Brillion changed hands well under five figures an acre. By late 2024, the Growers Edge Farmland Value Index pegged Calumet County at about $13,030 an acre, with neighboring Outagamie at $14,502. Then this April, a 207-acre farm in Dane County — about 15 miles south of Madison — sold in five tracts for roughly $4.55 million, an average of $21,946 per acre, with the top tract at $22,000 per acre. Here’s the kicker: the winning bidder was reported to be a local dairy farmer, not an outside fund. Dairy land is already trading at prices milk can’t justify — and now a new bidder is showing up who doesn’t even need a milk check.

What’s Changing, and Why It’s Happening Now

For years, rising land was a slow grind. Wisconsin’s statewide average ag-land sale price ran around $4,025 an acre in 2017. In 2025, it hit $7,238 — a 70.5% jump just since 2020, with one in five sales now clearing $10,000 an acre, according to UW–Madison Extension. Prime Wisconsin ground is already topping $21,500 an acre in spots. That alone outran milk. But it was still a farm-to-farm market: neighbors, grain guys, the occasional outside investor.

What’s new is a buyer playing a completely different game. Goldman Sachs projects U.S. data-center power demandwill climb from 31 gigawatts in 2025 to 66 GW by 2027 — more than doubling in two years, driven mostly by AI. To build that capacity, operators are paying $10–$12 million per megawatt for standard sites and more than $20 million per megawatt for AI-heavy ones. When you’re cutting a $2.5–$5 billion check for a single 250-MW campus, the difference between $12,000 and $35,000 an acre barely registers on the spreadsheet.

The farms most exposed sit in dairy-dense counties with good power, flat ground, and water. That describes a lot of eastern and southern Wisconsin. And this isn’t a southeast-corner problem anymore — Outagamie County is rewriting its 1989 zoning code, with supervisors openly debating whether to keep data centers out of certain towns. Shawano County advanced a temporary moratorium to its full board in June. Counties don’t pick those fights unless real projects are already knocking.

This Is Already Wisconsin’s Reality, Not a Forecast

The footprint is on the ground now. Wisconsin has four operating data centers totaling 424 MW, with ten more planned that would add another 2,320 MW of capacity — a nearly sixfold jump if they’re all built. Microsoft’s Mount Pleasant campus, billed as the world’s most powerful AI data center, is slated to come online in early 2026, carrying a dedicated 250 MW solar project in Portage with it. Together, Mount Pleasant and the Vantage center in Port Washington are projected to draw a combined 3.9 gigawatts — more power than every home in Wisconsin uses combined, per Clean Wisconsin.

And the land hunger is moving inland from Lake Michigan. A $1 billion, 520-acre data center surfaced in tiny Beaver Dam, roughly an hour from Brillion, before most locals knew it was coming. These projects don’t sip land — they buy it in blocks, at prices set by power and proximity to a substation. Every one of those deals becomes a comp. That’s the mechanism that drags the number on your own ground higher, whether or not a server hall ever lands on your road.

How This Lands on a Real Farm

Here’s where it gets concrete for a herd at your scale. Take a well-run operation shipping around 25,000 lbs per cow a year — call it 250 cwt. At $20.70/cwt all-milk, the figure the USDA set in its June 2026 outlook, that’s about $5,175 in milk revenue per cow. Sounds like real money. Now put it against the cost of making that milk.

The University of Illinois farmdoc team pegs the 2025 total cost of producing milk at roughly $5,499 per cow, compared with total milk-and-cull returns of near $5,090. Read that again. The model herd is already running a small negative economic margin before a single dollar goes toward land. There’s nothing left over to service an acre payment, because there’s nothing left over, period. (Those are Illinois figures used as a Midwest benchmark; plug in your own numbers and the shape won’t change much.)

So here’s the wall. Finance an acre at $22,000 with 80% debt at 7.5% over 25 years, and the annual payment runs about $1,580 per acre — close to $1,740 a cow, assuming roughly an acre of ground per cow once you spread it across the herd. Stack that on a cost of production that already tops income, and total cost runs past $7,200 a cow against roughly $5,100 coming in. Milk doesn’t cover a sixth of that land payment. It covers none of it — equity, off-farm income, or appreciation has to carry the whole thing. Even at $10,000 per acre, with the payment dropping to nearly $718, the math doesn’t improve because the starting margin is still underwater. The data-center money didn’t break the equation. It just makes the gap impossible to look away from.

At What Price Does Buying Stop Penciling?

The truth is harder than “data centers ruined it.” At $20.70 per cwt for milk and the University of Illinois farmdoc benchmark costs, there is no positive operating margin to allocate to a land payment. The question isn’t “What’s the magic price?” It’s “How big is the deficit at each price point?”

Land price / acreAnnual payment / acre (80% debt, 7.5%, 25 yr)Operating margin available from milkAnnual deficit per acre (covered by equity/off-farm)
$5,000~$359$0 (margin already negative)−$359
$10,000~$718$0−$718
$15,000~$1,077$0−$1,077
$22,000~$1,580$0−$1,580

Payment figures are illustrative and calculated based on the stated financing assumptions; the zero operating margin reflects the farmdoc 2025 cost-vs-returns gap. Figures assume an acre of owned or rented ground per cow — a tighter or looser land base shifts the per-cow number but not the direction. At the $22,000 row, that works out to a deficit north of $1,700 per cow per year that milk doesn’t fund. The hard decision rule: if your operation isn’t generating a clear, positive margin per cow after feed and overhead, no land purchase pencils on milk at any of these prices. You’re making an appreciation bet and financing it entirely with equity.

Why a Sale Three Counties Over Lands in Your File

The reason this feels different from a normal hot market is that it is, in fact, one. A neighbor bids up land based on what milk or corn can return — and even those bids already blow past what the cows justify. A data-center developer bids on megawatts, cooling, and how close he can get to a substation, none of which has anything to do with your component check. When that buyer sets the price at the margin, the whole comp set moves with him.

And here’s the part that’s easy to miss. You don’t need a server hall on your fence line to feel this. One high sale three counties over shows up in your appraisal file, in your assessor’s model, and eventually in the number your kid has to finance to buy out a sibling. Appraisers work off comps. Lenders work off appraisals. Siblings work off whatever they saw on their phone. None of those people is waiting for your opinion.

Water tightens the screw. A large data center can pull hundreds of thousands of gallons a day, and the National Wildlife Federation has flagged that these centers are becoming major water users, often in already water-stressed regions, drawing from the same municipal and groundwater that farm country depends on. So the same capital is bidding against you for land, power, and water all at once.

How Much Does “Waiting and Seeing” Actually Cost You?

More than most families want to admit — because sitting still isn’t neutral here. While you wait, the comps keep printing, the appraisals keep climbing, and your assessed value rises whether or not you ever sell a single acre. UW Extension’s data show land values up 70.5% in five years, while milk did nothing close to that. Every year you put off the conversation, the gap between what the land is “worth” on paper and what your dairy can actually service gets wider, and the buyout your successor faces gets steeper.

The bank, the assessor, and a site selector are all running their numbers on your ground right now. The only real question is whether you’re running yours, too. And if you’re not near a substation — up in Shawano or out toward Marinette, figuring this is somebody else’s headache — that comfort is exactly the trap. The pressure doesn’t spread by proximity. It spreads through comps, appraisals, and rezoning votes that hop county lines long before a developer turns down your road.

Is Your Succession Plan Already Negotiating Against a Phone Screen?

This is where it gets personal. Only about 16.5% of dairy farms reach a third generation, by The Bullvine’s own reckoning of family-business and dairy data — and that was true before AI money ever entered the picture. Now picture the one kid who wants to milk sitting across the Thanksgiving table from siblings who’ve never run a parlor but have a $22,000 comp pulled up on their phones.

There’s no version in which the farming heir borrows enough to pay everyone the full development value and still have a dairy that pencils. The families who survive this stop pretending the buyout can track the top appraisal — they discount the transfer price, carve off non-core acres to fund the rest, or use share structures so non-farming siblings hold real value without forcing a cash-out at AI prices. The ones who don’t aren’t doing succession planning anymore. They’re negotiating a liquidation, and they usually don’t see it until the bank does the math for them.

That’s the math. The choice is what you do over the next 30 days — and it follows a specific order.

Your 30-Day Action Sequence

No move lets milk outbid a $5 billion build. But you control how much of this you carry, how it’s structured, and who captures the upside if an offer ever lands. Work it in sequence.

1. Calculate your baseline margin — Days 1–10. Pull your last 12 months of financials. Figure your exact cost of production per cwt and benchmark it against the farmdoc averages, which are near $5,499/cow. If your margin is negative before land, pause all capital expansion plans immediately. The trade-off is real: holding pat can feel like falling behind, but buying into a negative margin funds the gap with equity you can’t replace.

2. Audit your land mix — own vs. rent — Days 11–20. Wisconsin non-irrigated cropland cash rent averaged $161 per acre in 2025; compare that to a $1,580-per-acre ownership payment. Rent you can shed in a bad year — a land note at 7.5% you can’t. Identify your “edge acres,” the parcels you could sell to clear high-interest debt without crippling your core forage base. The risk to watch: a landlord can sell rented ground into a development offer and pull it on short notice, so know which acres you truly can’t replace.

Land Price/AcreAnnual Ownership Payment/AcreWI Cash Rent/Acre (2025)Rent Savings vs. BuyBreak-Even Milk Price to Fund PaymentVerdict
$5,000~$359$161$198~$21.90/cwt⚠️ Marginal
$10,000~$718$161$557~$23.50/cwt🔴 Red — milk at $20.70 falls short
$15,000~$1,077$161$916~$25.20/cwt🔴 Red — deeply negative
$22,000~$1,580$161$1,419~$27.10/cwt🔴 Red — unfundable on milk alone

3. Insulate your succession plan — Days 21–30. Sit down with a transition planner. If non-farming heirs are eyeing local data-center comps, build share structures or discounted transfer agreements so they hold real value without forcing a cash-out at speculative AI valuations. Don’t make the farming successor buy out siblings at development pricing — that’s the move that turns a transfer into a liquidation.

And know your line before anyone calls. In Mason County, Kentucky, 82-year-old Ida Huddleston was offered $60,000 an acre for her 71 acres, and her daughter Delsia Bare turned down $48,000 an acre for her 463 — together more than $26 million from a Fortune-50 AI company, roughly ten times the going rate. They said no. The county rezoned 2,080 acres across 28 properties around them anyway, and a citizens’ group, We Are Mason County, sued to block it — with a court hearing set for June 26, 2026. A development-priced sale of non-core ground can fund a succession that otherwise can’t close — but once it’s a server farm, that ground never grows feed again. Decide which acres you’d refuse at any price, and which you’d let go.

Key Takeaways

  • If your margin per cow is at or below the farmdoc benchmark — roughly break-even to negative for 2025 — treat any land purchase above $10,000 an acre as an equity bet, not a milk-funded one. The cows aren’t paying for it.
  • If you can rent solid ground for $160–$200, run the comparison before you buy. Rent you can shed in a bad year; a $1,500-plus land payment you can’t.
  • If you’re carrying land debt, stress-test it at a milk price two dollars below today’s price this month, and see whether the payment still clears.
  • If you own edge parcels with obvious non-farm value, decide now which acres you’d refuse at any price and which you’d sell — before a sibling, lender, or developer decides for you.
  • If there’s a successor in the picture, put a date on the calendar within 30 days and bring three things: your real cost of production, a net-worth snapshot, and a color-coded land map. Bring numbers, not feelings.

The honest question for the next 24 months isn’t whether data centers reshape farm country — they already are. It’s narrower, and it sits at your kitchen table: which acres on your place are part of your dairy’s future, and which are only worth their price because a server farm might someday sit where your alfalfa grows now? Ida Huddleston answered it at 82. Where do you land?

Run Your Numbers

Dairy Profit Projector — Before you bid on another acre, run your herd through the Dairy Profit Projector and find your real breakeven milk price and IOFC per cow. It shows whether you’ve got any margin left to service land — or whether, like the math here, the cows can’t cover the payment at all.

Land values and prices cited reflect public auction results, USDA, University of Illinois farmdoc, University Extension, Clean Wisconsin, Cleanview, LEX 18, WCPO, and other published data as of June 2026.

Complete references and supporting documentation are available upon request by contacting the editorial team at editor@thebullvine.com.

Learn More

  • Why 70% of Dairy Farms Never Make It Past Dad – The Psychology, Math, and Monday Morning Fix — Arms you with a tactical framework to overcome the psychological friction of succession planning. Learn how to draft a written sweat equity ledger and create a structured timeline that prevents local land speculation from turning an internal family buyout into an involuntary liquidation.
  • Dairy Farm Economics 2026: Milk Pricing, Margins & Risk Playbook — Delivers a complete financial blueprint to insulate your operation against a projected negative net economic return of −$4.71/cwt. Explores specific mathematical math models to optimize your existing herd size, evaluate robotic milking payback windows, and deploy aggressive risk management strategies before interest rate exposure strips your equity base.
  • Data Centers, Water Rights, and Your Dairy’s Future: The 18-Month Window That Changes Everything — Exposes the hidden structural costs that digital infrastructure infrastructure imposes on neighboring producers, including a $0.25/cwt hit to milk production via surging utility grid rates. Reveals how aggressive tech industry competition for regional water tables threatens multi-generational wells while creating temporary, unprecedented 400% land exit premiums.

The Sunday Read Dairy Professionals Don’t Skip.

Every week, thousands of producers, breeders, and industry insiders open Bullvine Weekly for genetics insights, market shifts, and profit strategies they won’t find anywhere else. One email. Five minutes. Smarter decisions all week.
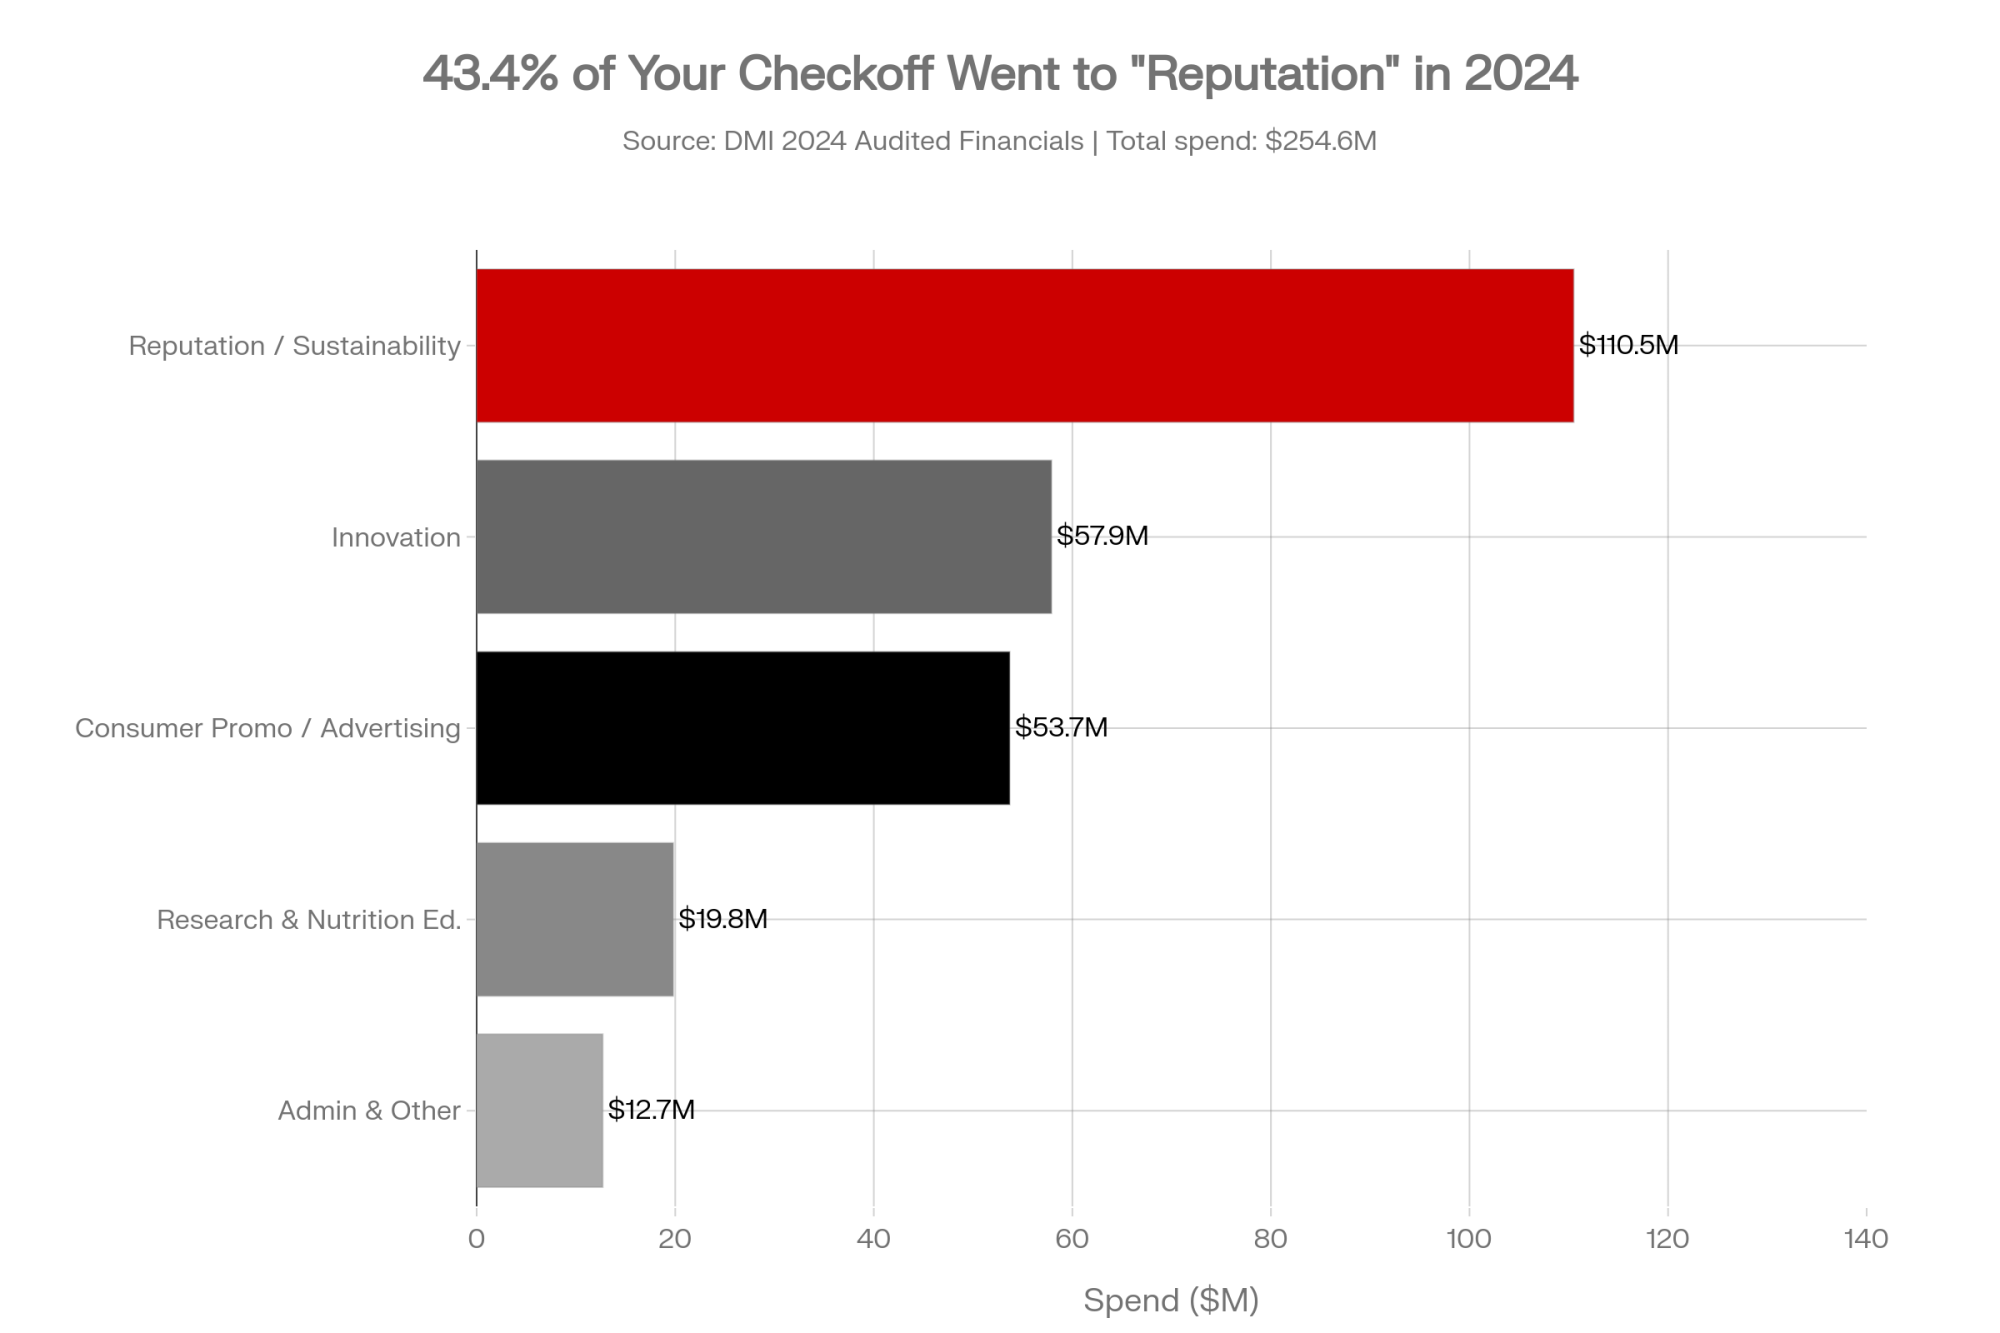
NewsSubscribe
First
Last
Consent

25 Extra Miles Is Where Your Milk Check Starts Bleeding

At about 25 extra miles, the haul line stops being noise. Past that, a 500-cow herd starts losing 1% of gross before feed or labor. Where’s your nearest plant now that four are gone?

Franklin County is Vermont’s dairy capital, and in roughly 18 months, Vermont has watched four processing plants go dark or announce closures — three of them in Franklin County alone. The cows didn’t leave. The plants did. And when local processing disappears, but the milk keeps coming, that milk has to travel — at a per-cwt cost that lands on the farmer, not the co-op press release. The jobs make the headlines. The hauling math is what keeps costing money long after the cameras pack up. If you ship milk anywhere in the Northeast, the mechanics of what’s happening here are worth your attention this month, not next year. 

What’s Changing and Why

Start with the scale of what’s gone. In about a year and a half, the corner of Vermont that runs more dairy farms than anywhere else in the state has lost or is losing four plants. Booth Brothers in Barre — operated by HP Hood, in Washington County, not Franklin — closed in April 2026 after roughly 80 years, becoming the state’s last commercial fluid bottler. Franklin Foods in Enosburg Falls, a 125-year-old cream cheese maker, is closing this summer. DFA’s St. Albans plant idles on August 17 with about 80 jobs lost, and Perrigo’s infant formula plant rounds out the four. 

Each closure has its own story, and they aren’t the same story. Booth Brothers was fluid milk — the bottling end. Franklin Foods and DFA St. Albans were further down the value chain, turning raw milk into cream cheese and other products that travel and store. Lose the bottler, and you lose a fluid outlet; lose the cheese and Class III homes, and you lose the plants that soak up volume when fluid demand dips. Four plants, one stretch of the map, eighteen months — and a county that suddenly has far fewer doors for its milk to walk through. Three of the four sit in Franklin County; Booth Brothers was a county over. But the milkshed doesn’t care about county lines — pull this much processing out of the region and the milk drives farther regardless.

Here’s the part that lands on your operation. Vermont still produces around 2.4 to 2.5 billion pounds of milk a year — roughly two-thirds of New England’s total. What’s vanishing is the local capacity to do something with it. Vermont Daily Chronicle estimates the four closures represent close to 4 million pounds a day of processing tied to the region, though those plant-level figures are the columnist’s estimates, not company-confirmed numbers, so treat them as scale, not gospel. 

When processing leaves but milk stays, the milk has to travel. DFA says milk from St. Albans will be handled at plants in New York, Massachusetts, or Maine, “ensuring a market for regional dairy farmers and continued service to customers without disruption.” DFA’s statement speaks to market access — that your milk will still have a buyer. It doesn’t address hauling cost or basis, and the company didn’t detail per-farm hauling impact in its public statements. That’s the part that lands on your check. Here’s the math.

How This Plays Out on Real Farms

Tim Smith has watched the whole run from the front row. As executive director of the Franklin County Industrial Development Corporation, he’s spent years recruiting and keeping employers in the county. “We’ve had years of good news, and now we’re riding a wave of bad news, for sure,” he told Vermont Public. That wave is the backdrop. The hauling math is the bill. 

Milk hauling under Federal Order 1 comes straight out of your check and scales with distance. USDA’s Agricultural Marketing Service sets a mileage rate factor of $0.00824 per hundredweight per mile, effective March 2024. The National Milk Producers Federation pegs real-world hauling higher — roughly $0.92 to $1.00 per cwt per 100 miles — and says those costs have “almost tripled” since the original price differentials were set. The table below uses the USDA regulatory factor, which sits a notch below NMPF’s real-world figure. So if anything, these numbers are conservative — your actual hauler invoice may run higher. 

Run it on your own barn. Take a 500-cow herd shipping 70 pounds a cow — figure your own herd’s average, but this runs 350 cwt a day, about 127,750 cwt a year. If your milk now has to travel an extra 50 miles to reach the remaining plant, that’s roughly $52,600 a year in added hauling costs. Stretch it to 100 miles, and you’re near $105,300. Push to 180 miles — not far-fetched if loads head into New York or coastal New England — and you’re looking at close to $189,500.

Smaller operation? The number shrinks but doesn’t disappear. Here’s the same math across three herd sizes and four added distances so that you can find the line closest to your own:

Added One-Way MilesAdded Cost per cwt150-Cow Herd300-Cow Herd500-Cow Herd
+25 miles$0.21$7,900 / yr$15,800 / yr$26,300 / yr
+50 miles$0.41$15,800 / yr$31,600 / yr$52,600 / yr
+100 miles$0.82$31,600 / yr$63,200 / yr$105,300 / yr
+180 miles$1.48$56,800 / yr$113,700 / yr$189,500 / yr

Method: each herd at 70 lb/cow/day, 365 days, times the USDA AMS Federal Order 1 mileage rate factor of $0.00824/cwt/mile. Miles are added one-way to your nearest remaining plant. Swap in your own production, and you’ve got your number.

Notice what the table does and doesn’t say. It doesn’t claim every Franklin County farm faces $52,600 — that’s the 500-cow herd at 50 added miles, nothing more. A 150-cow operation 25 miles farther out is looking at closer to $7,900. The point isn’t the headline figure. It’s that you can run your own line in about two minutes, and the closer your remaining plant, the smaller the bite — but at current Northeast prices, even a 25-mile stretch starts showing up on the year-end statement.

For the full per-cwt breakdown on a single named closure, see our earlier hauling-cost analysis of the DFA St. Albans plant.

The Mechanics Behind the Outcomes

One reroute can hit your milk check twice. There’s the cost you see on the deduction line, and the cost you have to dig for in the differential tables.

The visible cost — hauling. This shows up on your stub as a per-cwt deduction that climbs with every mile. It’s the $0.00824/cwt/mile factor, the number in the table above, the line you can point to. 

The invisible cost — basis and location differentials. This one doesn’t announce itself. It’s baked into your base price through where your milk is pooled, and it usually only surfaces when a letter shows up. 

Here’s why a plant idling shifts the pricing map so hard. Under Federal Order 1, the location of the plant receiving your milk helps drive Class I differentials and is part of your basis. When a nearby plant idles, your milk doesn’t just drive farther — it gets pooled at a different point on the map, and that point carries its own location adjustment. So the closure quietly resets two inputs at once: the miles you pay for, and the price zone you’re paid from. 

Both moved in 2026, in opposite directions. The June 2025 FMMO reform raised Class I location differentials across the Northeast, thereby lifting the Class I price and the producer price differential for the order. But pulling the other way, recent FMMO make-allowance changes trimmed class prices by roughly $0.85 to $0.93 per cwt nationally in their first three months, pulling an estimated $337 million out of producer pools, according to American Farm Bureau analysis. Less money in the pool, more cost credited to the processor. You feel both ends — the longer haul and the thinner pool. For a plain-language walk-through, here’s how the new FMMO make-allowance math hits your check. 

Then there’s a piece of regional history worth keeping handy, because it’s the closest thing the Northeast has to a dress rehearsal for what tight processing does to a co-op’s rules. In October 2019, Agri-Mark told its members that, starting in January 2020, any milk shipped above each farm’s base would incur a $5/cwt penalty. The co-op tied it directly to what it called “significant losses on excess milk” — too much milk, not enough room to process it. Farms under 2 million pounds a year were exempt; bigger herds felt it. The lesson wasn’t that one co-op got tough. It was that when a region runs short on plants, the math eventually shows up in the rules members live by. 

DFA says it doesn’t cap how much milk a member can produce, and it hasn’t announced any base or penalty program tied to these closures. The Agri-Mark episode isn’t a prediction about DFA. It’s a reminder that across the Northeast, base programs have historically shown up when processing tightens — so it’s a fair question to put to your own co-op, whoever that is. 

How Many Extra Miles Before It Actually Hurts Your Milk Check?

Closer than you’d guess. On that same 500-cow herd, gross milk revenue at a blend forecast of $21.07 per cwt runs around $2.69 million a year. A 1% hit — the kind your lender notices on the year-end statement — is about $26,900. Plug in the FMMO mileage factor, and that threshold shows up at roughly 26 extra miles of haul. Run it against USDA’s lower 2026 all-milk forecast of $20.70, and the trigger barely moves — about 25 miles. 

ScenarioBlend price (USD/cwt)Gross revenue (USD/year)Extra miles (one-way)Hauling cost as % of gross
Baseline, no reroute21.072,691,00000.0%
“Pain line” threshold21.072,691,000261.0%
USDA all-milk forecast lower case20.702,643,000251.0%
Long-haul case (+100 miles, current price)21.072,691,0001004.5%

So the working rule is blunt. Once your milk is traveling more than about 25 miles farther than it used to, the hauling line stops being background noise and starts being a line item you manage. At 100 to 180 miles, you’re handing over roughly 4 to 7% of a year’s gross before you’ve touched feed, labor, or interest. And that’s haul alone — fold in a basis swing from the new plant’s location, and the real number sits higher. Where does your breakeven sit if hauling jumps 40 to 80 cents a cwt? If you can’t answer that fast, it’s the number to find this week.

What’s the One Question Almost Nobody Asks Their Co-op?

Most farmers will now ask where their milk is headed. Far fewer ask the harder one: how will you tell me when the route changes again?

That’s the dangerous gap. The first reroute, you’ll see coming — it’s in the news. It’s the second and third, the quiet ones, six or twelve months out, when shipping requirements shift and the milk gets moved again without much notice, that catch you behind the math. You want a written commitment on how and when you’ll be notified. Without it, you find out when the check arrives with a new hauling deduction, a different basis, and maybe a note explaining why you’re suddenly over base.

There’s a counter-story running underneath all this, and it’s worth holding onto. John Ovitt has walked into the same Enosburg Falls cream cheese plant for 37 years. When Hochland, the German company that owns Franklin Foods, decided to shut its U.S. operations this year, Ovitt didn’t just stay through the closure — he moved to buy the building himself. On September 1, he plans to reopen it as Franklin County Cheese with about 20 workers, down from the nearly 100 the plant employed before. “I have worked here for 37 years and been through all the changes and did not want to see it close,” he told VTDigger. His bet on a small local plant is, in its own way, a vote that nearby processing matters for more than jobs — it’s what keeps milk from having to drive three states to find a home. 

Options and Trade-Offs for Farmers

No path here is free. Each one trades one thing for another.

Stay with your co-op and demand better numbers. Makes sense if your co-op still gives you the best market access and the relationships are solid. What it requires: you treat hauling like a feed cost — tracked, questioned, and pinned down in writing. The risk is that co-ops don’t always move fast on transparency, and you might be the one asking uncomfortable questions. With milk prices projected to be $2.50 to $3.00 lower in 2026 than in 2025, there’s no slack to leave on the table. Squeaky beats silent. 

Shop for a different plant within your radius. Makes sense if there’s another processor within 75-100 miles. What it requires: the same barn math on the new option — basis, premiums, volume commitment, hauling. The catch is real, though. Vermont Daily Chronicle notes the Northeast conventional market is “essentially closed” as co-ops limit new members. Worth a phone call. Don’t assume the door’s open. 

Move a slice of volume into shorter, higher-value milk. Makes sense if you’re near schools, direct markets, or a small processor like Ovitt’s Franklin County Cheese. What it requires: a home for the rest of your milk and the appetite to manage two channels. It won’t replace a big contract. But shaving 10 to 15% off to go to closer, higher-value outlets can buy room when long-haul costs spike. 

The 30-day move: Before any of the above, sit down with your field rep and get a written, farm-specific routing and hauling profile for the next 12 months — what plant, how many miles, what rate per cwt, what location differential, and how you’ll be told when it changes. That single conversation exposes your real exposure before the next reroute, not after.

Key Takeaways

  • If your milk route lengthens by more than about 25 miles and your hauling line doesn’t change clearly to match, treat it as a flag and ask for the numbers in writing — that’s roughly where a 500-cow herd starts losing 1% of revenue to haul. 
  • If your co-op can’t name the specific plant taking your milk, you can’t run real hauling or basis math. “New York, Massachusetts, or Maine” isn’t an answer you can budget against. 
  • If your milk moves to a plant in a different Order 1 location, pull both Class I location adjustments and price the swing — the basis shift hides where the haul deduction doesn’t. 
  • If you don’t have a written routing-and-notification agreement for the next 12 months, that’s the single most important ask to put on the table this month.
  • If you ship above the base level, pull the Agri-Mark 2019 precedent ($5/cwt over base) and ask your co-op directly how it would handle excess milk if regional processing continues to tighten. 
  • If a large share of your volume rides with a single buyer, run your concentration risk now — before a closure forces the question for you.

A Franklin County farmer reads this tomorrow morning. The plants are closing, whether or not anyone runs the numbers — but the farmer who pulls three milk stubs, sketches what another 25, 50, or 100 miles does to his own herd, and walks into the co-op office with that math is sitting in a very different chair than the one who waits for the letter. John Ovitt looked at a shuttered plant and saw something worth saving. The question for the rest of us is quieter: when your milk starts driving farther, will you be the first to know, or the last?

Dairy Hauling & Basis Impact Calculator

Adjust the sliders to mirror your barn’s current metrics and evaluate your real financial exposure under the new regional processing footprint.

Annual Volume
0 cwt
Added Hauling Cost
$0
Basis Equity Loss
$0
Total Annual Hit
$0

Complete references and supporting documentation are available upon request by contacting the editorial team at editor@thebullvine.com.

Learn More

The Sunday Read Dairy Professionals Don’t Skip.

Every week, thousands of producers, breeders, and industry insiders open Bullvine Weekly for genetics insights, market shifts, and profit strategies they won’t find anywhere else. One email. Five minutes. Smarter decisions all week.
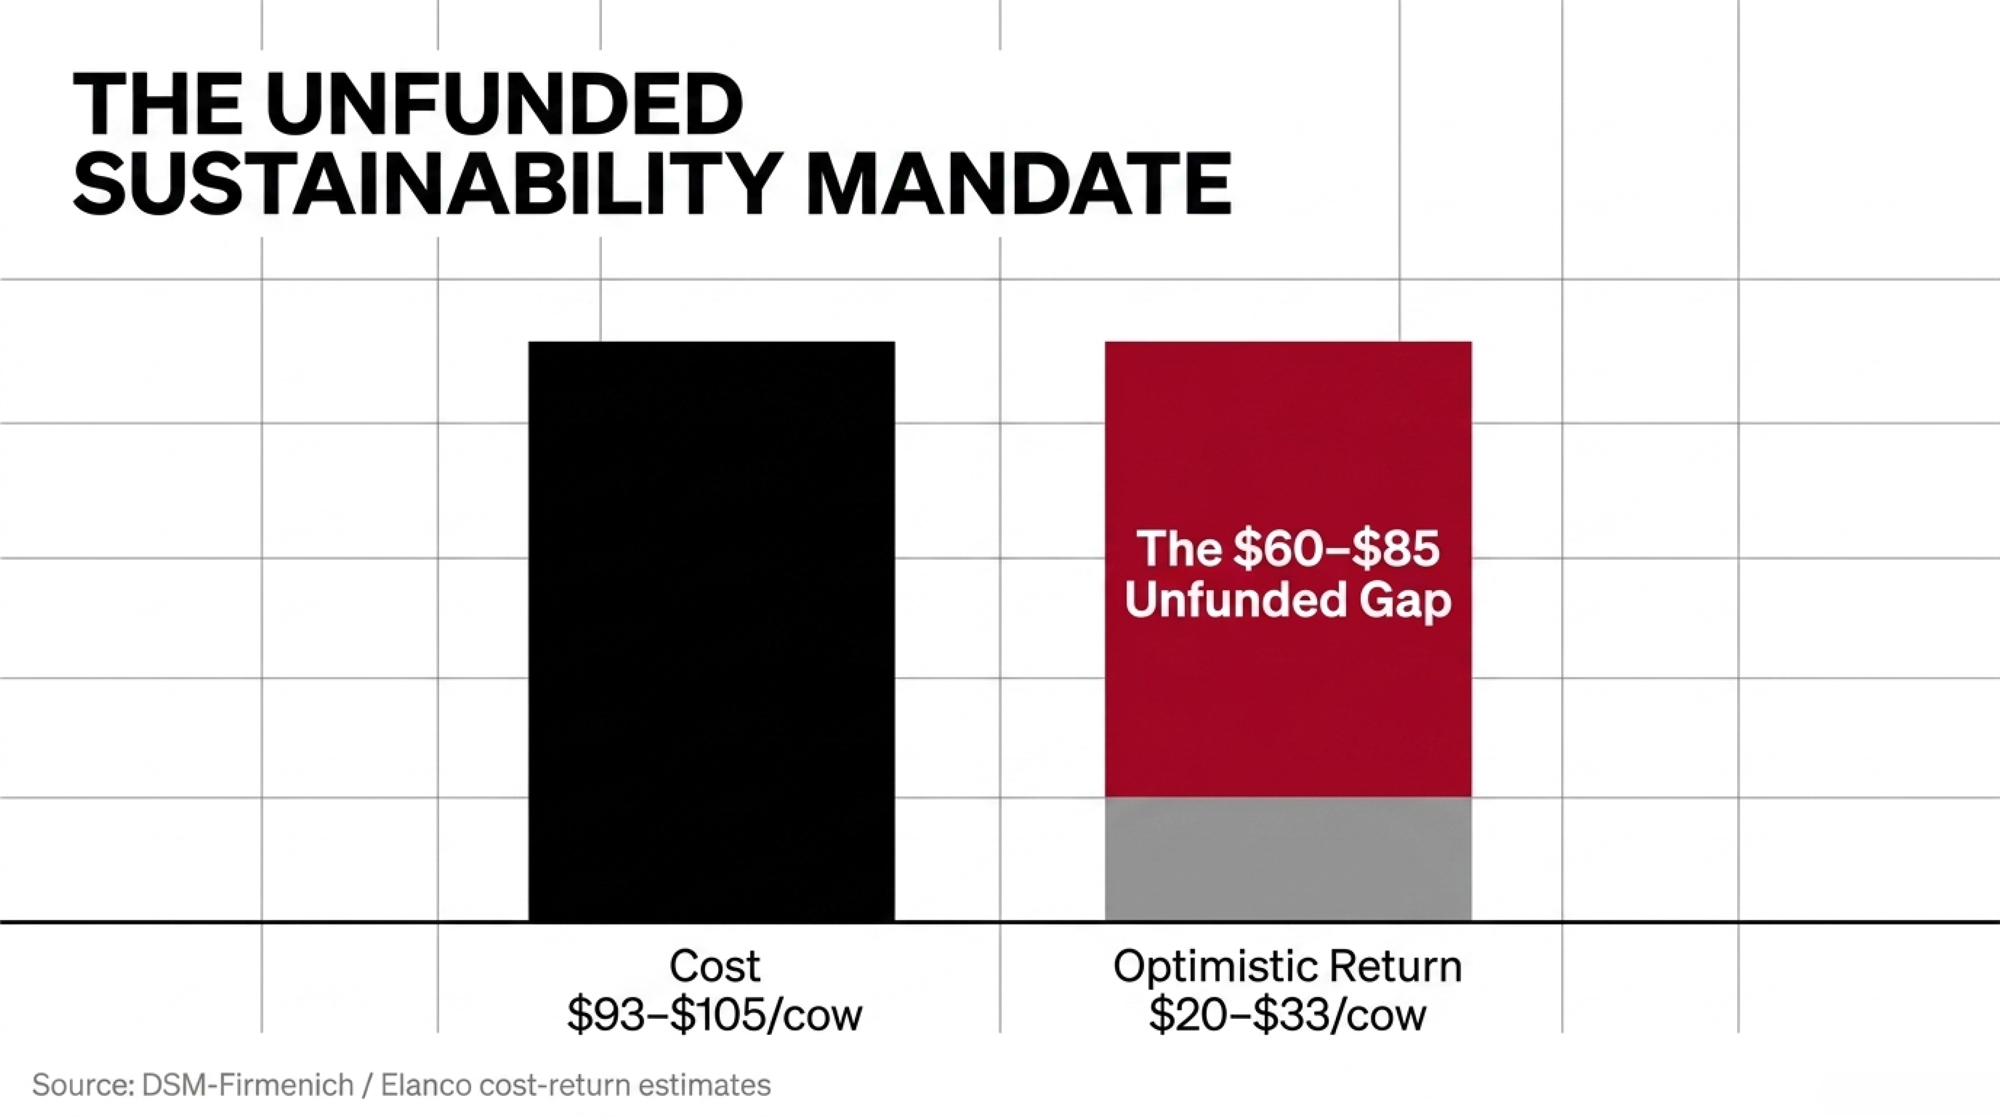
NewsSubscribe
First
Last
Consent

The $48,750 Hypocalcemia Blind Spot: What Day-4 Calcium Really Costs Your Herd

Your milk fever rate looks great. The $48,750 you’re losing on day-4 calcium never shows on that board — and it’s riding on cows that never went down.

Executive Summary: About half of your mature fresh cows dip into subclinical hypocalcemia, and the modeled herd-level losses hit about four times what you’re spending on clinical milk fever. Those cows never show up on the milk-fever board, but they carry a higher risk of metritis, slower reproduction, and earlier culling — adding roughly $50 to 60 per cow in six‑month costs on top of the obvious cases. The article makes one blunt case: the number that matters isn’t your milk fever rate, it’s how many older cows are still under 8.5 mg/dL (2.12 mmol/L) on day 3–4, and whether you’re wasting bolus money on heifers that physiology says rarely need it. Using current Oetzel-style economics, blanket two‑bolus protocols in a 1,000‑cow herd can run around $15,000 a year, while targeting roughly 65% of higher‑risk calvings drops that spend to about $9,750 with better health payback. If you’re proud of a low milk fever rate but have nagging fresh‑cow disease and repro issues, this piece shows you exactly how to run a 30‑day day‑4 blood‑draw check, re‑aim calcium at high‑risk cows, and confirm whether your DCAD program is actually working.

subclinical hypocalcemia fresh cows

Picture two third-lactation cows that calved overnight. Both got up fine. Both walked to the fresh pen. Neither one will ever land on your milk fever board — and one of them is quietly costing you more than the downer cow you’ve spent your whole career dreading.

That’s the uncomfortable math at the center of transition-cow management right now. The cow on the ground gets the IV bottle, the attention, and the protocol. The cow standing next to her, blood calcium sitting just under the line for three days running, gets nothing. Because nobody’s looking, and the research keeps landing in the same place: she’s the one bleeding margin out of your fresh pen — not as a scare-line, but as a number you can actively address and improve.

What’s Really at Stake

Most of us measure the wrong thing, and we were trained to do so. Clinical milk fever shows up in roughly 1–5% of cows in well-managed herds, according to the University of Wisconsin–Madison Extension and multiple veterinary summaries. It’s dramatic, it’s visible, and it’s the disaster everyone learned to fear. 

Subclinical hypocalcemia — low blood calcium with no outward signs — is a different animal. Michigan State Extension data indicate about 50% of second-lactation-and-older cows dip into it on typical pre-fresh diets, dropping to roughly 15–25% under well-managed negative DCAD programs. Here’s how the two stack up: 

MetricClinical Milk FeverSubclinical Hypocalcemia
Incidence in mature cows1–5%15–50%
Visibility in fresh penHigh — cow goes downInvisible — cow stands
Cost per case (USD, Oetzel modeling)~$300~$117
Est. annual cost, 2,000-cow herd~$12,000$48,750
Metritis risk vs. normocalcemicModerate66–88% higher
First-service conception oddsNormalOR = 0.27 (73% lower)
Responds to bolus protocolYesHigh-risk cows only
Heifer risk levelLow-moderateVery low — bolus wasteful
DCAD impact on incidenceMinimal (late-stage)Drops to 15–25%

*~50% on typical pre-fresh diets; 15–25% under well-managed negative DCAD. Per-case costs from Gary Oetzel’s UW–Madison modeling (2011–2013); herd-cost figures from his modeled 2,000-cow US scenario.

Now do the multiplication. The reason subclinical losses run roughly four times the clinical ones isn’t that each case is worse — it’s that it hits so many more cows. And remember, those per-case figures are in early-2010s US dollars; in today’s input and milk-price environment, the real gap is almost certainly wider, not narrower. European field data summarized by industry technical sources put the added cost of postpartum subclinical hypocalcemia at roughly €50–60 per cow over six months — treatment, lost milk, and reproduction — versus normocalcemic herdmates. Different currency, different continent, same direction. 

If you run mostly mature cows and you’ve been quietly proud of a low milk fever rate, this is the story that should make you a little uncomfortable in a good way.

The Cow That Got Up but Never Recovered

Here’s the reframe that changes how you watch the fresh pen. The question isn’t “how many went down?” It’s “how long did calcium stay low?” Recognizing and addressing this early can make a real difference in herd outcomes and profitability.

Calcium drops around calving, bottoms out somewhere between 12 and 24 hours, and in a healthy cow starts climbing back. That recovery curve is the whole game. A Holstein cohort study, summarized by Dellait, sorted cows by the dynamics of their hypocalcemia — transient, prolonged, or delayed — and the pattern was hard to miss. Cows with only a short, transient dip adapted well and stayed relatively healthy. The cows that stayed low — prolonged or delayed — carried a higher risk of early-lactation disease, removal, and lower milk. 

The reproductive tail is sharper still. A 2017 Journal of Dairy Science prospective cohort found cows with chronic subclinical hypocalcemia in the first three days postpartum took longer to resume ovarian activity and had about 73% lower odds of pregnancy at first service — an odds ratio of 0.27 — compared with cows that had normal calcium. That’s not a rounding error. That’s a cow you’re carrying open while she looks perfectly fine. 

So you’ve got an animal that got up, walked away, and showed no signs. And she’s the slow breeder, the metritis case, the eventual cull. She just never got off the mat. You couldn’t see it because you were watching for the wrong thing.

Why Is Low Calcium Both a Cause and a Symptom?

It’s tempting to read this as a straight line: low calcium causes disease. It isn’t. It’s a loop — and that two-way street is the part that often gets lost between the lab result and the fresh-pen conversation.

Think of it like a smoke alarm wired to a breaker panel. Calving lights up the immune system. That inflammatory surge pulls calcium down. And if the cow can’t reset the breaker, she stays stuck — low calcium and high inflammation feed each other. Penn State and other transition-cow researchers frame hypocalcemia and systemic inflammation as part of the cow’s normal physiology, with inflammatory markers climbing from around 14 days pre-calving, peaking at calving, then easing over the following week or two. The trouble starts when that response runs hot and long. 

Recent reviews on calcium dynamics and inflammatory responses conclude that systemic inflammation is consistently associated with reduced blood calcium, and some researchers now propose immune activation itself as a root cause of subclinical hypocalcemia. A Dellait-summarized 2019 study of European commercial herds found that cows sitting at 2.5 mmol/L (about 10.0 mg/dL — the healthy end of the range) calcium on day 3 had a 66–88% lower chance of metritis than cows down at 1.5 mmol/L (about 6.0 mg/dL), depending on parity. 

A hard calving, a dirty uterus, a coliform mastitis case — each one drags calcium down and makes recovery harder. That’s exactly why the fresh-cow problem list is the first place to look. Metritis cows and low-calcium cows tend to be the same cows. 

The Blanket-Bolus Trap

So a producer runs a few blood draws, sees 30, 40, maybe 50% of his older cows under 8.5 mg/dL (2.12 mmol/L) — a cut-off drawn largely from Martinez’s University of Florida work, though some studies use 8.0 mg/dL (2.0 mmol/L) — and asks the obvious question: what do I do Monday? This is where a lot of farms get sold the easy answer. Bolus every cow, every calving, done. 

The economics don’t back it up. A recent meta-analysis of prophylactic oral calcium found little evidence that blanket postpartum bolusing improves milk yield across the trials reviewed. A 2016 stochastic model and subsequent extension summaries showed the return lives in the high-risk cows — older, high-producing, lame — while spreading boluses across the whole herd dilutes the benefit until it disappears. A 2023 Guelph DHMCP hypocalcemia update concluded that blanket therapy isn’t beneficial, pointing instead to the cows where oral calcium earns its keep: high-producing cows, older cows, lame cows, and cows with difficult calvings. 

The ROI lives in the risk profile, not in the product.

Cow GroupEst. % of CalvingsSubclinical RiskBolus ROIAnnual Waste in 1,000-Cow Blanket Protocol
1st-lactation heifers~35%Very LowNear Zero~$5,250/yr
2nd-lactation cows~25%ModerateModerate~$1,500/yr if well-managed
3rd+ lactation cows~25%HighStrong— (keep targeting)
Lame cows (any parity)~5–10%HighStrong— (keep targeting)
Hard calvings / twins~5%HighStrong— (keep targeting)

And here’s the part that should sting: first-lactation heifers are the worst possible target for a blanket protocol. They mobilize bone calcium efficiently and have a much lower risk of meaningful subclinical hypocalcemia than mature cows. So a bolus thrown at a fresh heifer isn’t just low ROI — it’s close to pure waste. You’re paying full price for a protocol most first-lactation cows never needed and won’t measurably benefit from. Multiply that by every heifer in a blanket program, and you’re funding a habit, not an outcome. 

Here’s the barn math, and the point holds at whatever your boluses actually cost. Take your delivered price for a two-bolus protocol and run it two ways. Bolus every fresh cow in a 1,000-cow herd and you pay for roughly 1,000 protocols a year — a big share of them going to heifers and low-risk cows where the research shows little measurable benefit. Aim the same protocol only at your mature, higher-risk cows — say about 65% of calvings — and you’ve cut that product bill by roughly a third, with most of the remaining spend now landing where the data says it works. To put real numbers on it: at a delivered cost in the ballpark of $15 per cow for two boluses, that’s roughly $15,000 a year blanket versus around $9,750 targeted — same product, very different return, depending entirely on where you point it. Plug in your own price, and the gap moves, but the direction never does. 

In lower-risk cows, the research suggests that spending buys reassurance more than results — money out the door for the feeling of having done something. Honest caveat: in herds with high subclinical rates and no DCAD program, some of Oetzel’s modeling does show blanket treatment of mature cows paying off. So the accurate line isn’t “blanket is always wrong.” It’s “blanket rarely pays in low-risk cows, or in herds already managing calcium well.” 

Options and Trade-Offs for Your Operation

The story here isn’t “bolus more” or “bolus less.” It’s “measure first, then aim.” A few paths, depending on where your herd sits:

  • Start with a weekly day-3-to-4 calcium check — the 30-day move. This month, work with your vet to pull blood on 10–15 second-lactation-and-older cows at 3–4 days in milk, and track the percentage still under 8.5 mg/dL (2.12 mmol/L). It’s cheap, it’s simple, and it tells you whether your current program works before you spend a dollar changing it. Where it backfires: sample sloppily or skip the repeat, and one bad week looks like a crisis. 
  • Target oral calcium to the high-risk groups. Older cows, high producers, lame cows, hard calvings — a bolus at calving and a second 12–24 hours later. Best fit for herds with many mature cows. The risk: drifting back toward blanket habits, because targeting takes a discipline the shotgun approach doesn’t. 
  • Tighten the pre-fresh program instead of treating downstream. A well-run negative DCAD diet shrinks the low-calcium group at the source. It demands forage testing, mixing accuracy, and urine pH monitoring — a real management load. Where it backfires: a half-built DCAD program can crater intakes without ever fixing calcium. 
  • Manage the inflammation, not just the mineral. Cleaner calving pens, fewer hard pulls, faster response to metritis and severe mastitis. Lower the inflammatory load, and you give the cow’s own calcium recovery a fighting chance. The catch: it’s a whole-team habit change, not a line item you can buy. 

Your Fresh-Pen Audit Protocol

Don’t nod along — run these checks against your own barn. Each one is a decision, not a takeaway:

  • Find your real number. What percentage of your mature fresh cows are still under 8.5 mg/dL (2.12 mmol/L) at day 3–4? If the honest answer is “no idea,” that’s the gap — and the weekly blood draw on 10–15 older cows is how you close it. You’re tracking the wrong 5% until you do. 
  • Map your problem list to age. Pull last month’s fresh-cow cases — metritis, DAs, slow breeders. Do they cluster in your older animals? That overlap is your calcium map. And treat any hard calving, twins, or metritis case as a calcium-recovery risk, not just an infection to clear. 
  • Audit the spend before you buy another pail. If you’re blanket-bolusing, what’s the annual bill, and how much is landing on heifers — the one group that rarely needs it? That’s not low ROI; it’s close to pure waste. 
  • Confirm your DCAD actually works. If your negative DCAD program has never been urine-pH checked, you don’t yet know whether it’s acidifying cows or just looking good on the ration sheet. A handful of close-up urine pH samples settles it in a week. 
  • Know your high-response group. Older, high-producing, lame, hard-calved cows — are they getting targeted support today, or are they buried in a one-size-fits-all protocol? 

Key Takeaways

  • Subclinical hypocalcemia hits far more cows than clinical milk fever, so if you’re only watching the downers, you’re missing most of the cost.
  • Day‑3/4 blood calcium on mature cows is the real fresh‑pen number; if you don’t know how many are under 8.5 mg/dL, that’s your first 30‑day job.
  • Blanket bolusing burns money on heifers and low‑risk cows; aim calcium support at older, high‑producing, lame, and hard‑calved animals instead.
  • A negative DCAD diet and cleaner calving management cut the low‑calcium herd at the source — but only if you’re checking urine pH to prove it’s working.

The shift here is really about a different kind of attention. For decades, the job in the fresh pen was watching for the cow that goes down. The harder, more valuable job is spotting the cow that got up and never really recovered. That’s a quieter signal, and it won’t announce itself.

So here’s the question worth carrying out to the barn Monday morning:

If you drew blood on your next fifteen older fresh cows at day four, how many do you honestly think would still be under the line — and are you ready to find out?

Run Your Numbers

Herd Health ROI Calculator — This article says undermanaged calcium quietly drives culling, metritis, and lost milk. Plug in your herd size, culling rate, and replacement cost to see what those fresh-cow losses are actually costing you—and whether tightening transition health pays before you spend another dollar on boluses.

Complete references and supporting documentation are available upon request by contacting the editorial team at editor@thebullvine.com.

Learn More

The Sunday Read Dairy Professionals Don’t Skip.

Every week, thousands of producers, breeders, and industry insiders open Bullvine Weekly for genetics insights, market shifts, and profit strategies they won’t find anywhere else. One email. Five minutes. Smarter decisions all week.
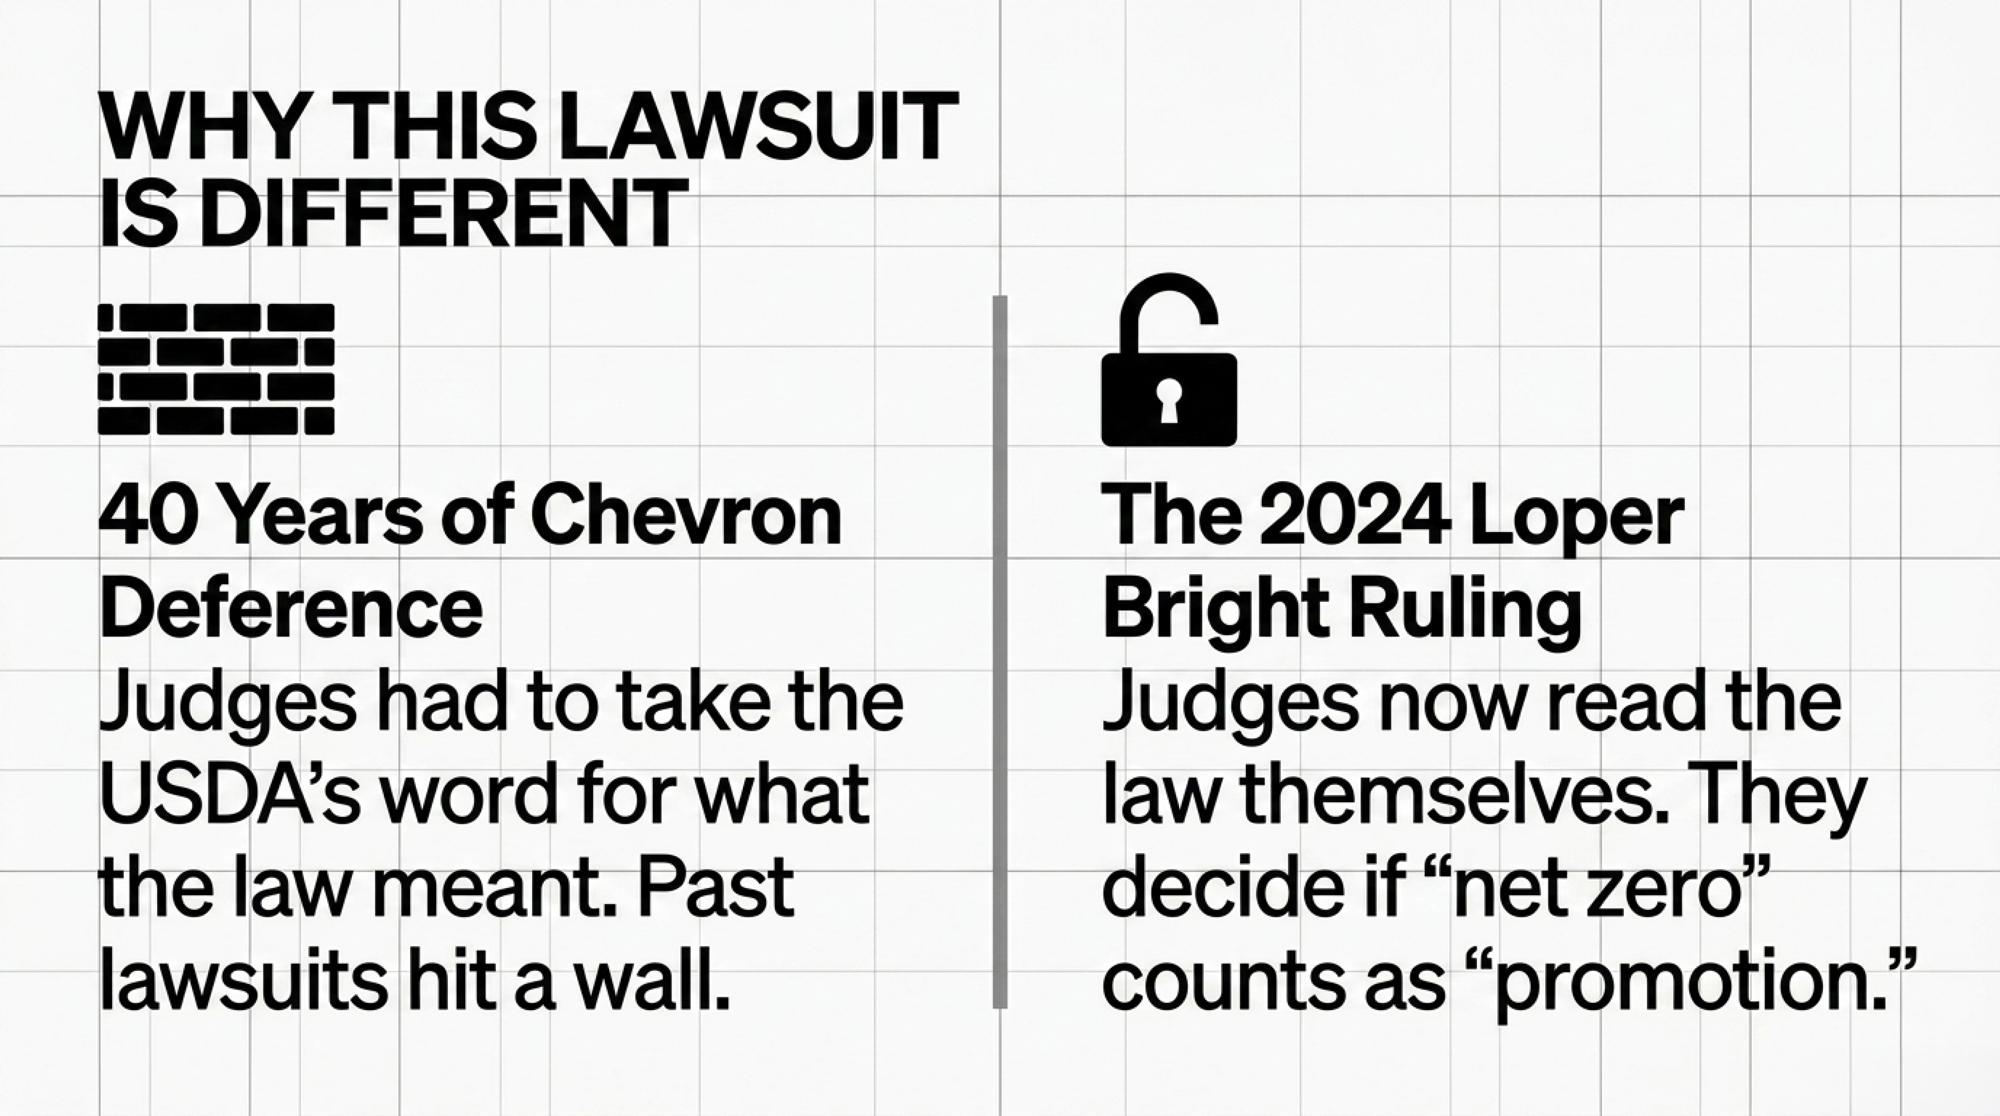
NewsSubscribe
First
Last
Consent

The Buyer, Not the Bull: How Forest Glen Cracked Costco’s A2 Lane

Forest Glen’s 2,200 Jerseys run 77.8% A2A2 by breed — but that’s not why Costco buys the milk. The genetics were the easy part. The buyer and the 3-year clock weren’t.

The people behind the milk: (from left) Kevin, Luis and Christina Castillo, Jamie Bansen, and Robert and Stewart Kircher, on the pasture at Forest Glen Jerseys near Dayton, Oregon — the registered, certified-organic Jersey herd whose A2 milk reaches Costco’s Kirkland line.

The quick numbers: ~2,200 registered Jerseys · organic since the mid-1990s · milk flows into Costco’s Kirkland Organic A2 line ($15.79–$22.99 per 4-pack) · Jerseys run ~77.8% A2A2 by breed · a 0.15% protein bump pencils to 25–40¢/cwt.

Robert Kircher was about 11 years old when he started working summers with the Jersey cows at Forest Glen, the Dayton, Oregon, operation he now co-owns and runs with his brother, Stewart, and owner Dan Bansen. Three decades and an Oregon State dairy science degree later, the two Forest Glen herds — Forest Glen Jerseys and Forest Glen Oaks — milk roughly 2,200 registered Jerseys, certified organic since the mid-1990s. And here’s where it gets interesting: “A lot of our milk goes to Nancy’s, to Costco for Costco Organic A2 milk,” Kircher said this June. 

That’s a premium lane most operations — especially Holstein herds — can’t access without years of work. The genetics that got Forest Glen there? Those were never the hard part.

What’s Actually Changing

A2 milk is fluid milk from cows that carry only the A2 form of beta-casein, a protein some consumers find easier to digest — though the human-health evidence remains thin and contested. The market doesn’t much care about the debate; it’s buying. A2 fluid milk carries a 25–50% premium in many markets. The broader A2 category was valued at about $2.44 billion in 2025 and is projected to hit $2.66 billion in 2026. Costco’s Kirkland Organic A2 whole milk ranges from $15.79 to $22.99 for a 4-pack of half-gallons, depending on the warehouse and date.

Organic is no longer niche, either. Organic fluid milk’s share of total US fluid sales more than doubled, from 3.3% in 2010 to 7.1% in 2024. Stack an A2 claim on an organic claim, and you’re selling into the part of the dairy case that’s actually growing while conventional fluid keeps shrinking. 

Genetics determine who can even play. Jersey cattle carry the A2A2 genotype at about 77.8% breed-wide — third-highest of any breed, behind Guernsey at 86.4% and Brown Swiss at 84.1%. A2A2-tested semen is readily available, but building a fully A2A2 herd takes years of selective breeding — there’s no shortcut, and understanding that timeline is crucial to planning your genetic strategy. 

The Genetics Didn’t Happen Overnight

Here’s the piece most “switch to Jerseys” pitches skip: Forest Glen isn’t just a big Jersey herd, it’s a deep one. Back in 2010, the AJCA-recorded lactation average across the herd was 16,529 lbs of milk, 737 lbs of fat, and 614 lbs of protein — serious component output for a grazing-organic Jersey operation. Dan Bansen was recognized with national Jersey awards for that breeding program. 

The herd has bred its own genomic sires, too. Forest Glen Visionary Marker (29JE3897) was released as a genomic young sire that ranked among the top Jersey bulls at the time, and the operation has historically carried multiple cows and heifers ranking in the top 1.5% of the breed on GJPI. Translation: the A2 and component story here rides on 30 years of registered-Jersey selection — not a quick semen swap.

That’s the honest gap between Forest Glen and a Holstein operator reading this. You can buy A2A2 Jersey semen tomorrow. You can’t buy 1996.

How This Plays Out on a Real Farm

The component math is tangible. As a breed reference, Jersey milk contains about 4.9% fat and 3.8% protein, compared with Holstein’s roughly 3.7% fat and 3.1% protein. The national all-breed average has itself climbed to about 4.30% fat and 3.28% protein in 2025, so your own gap depends on where your herd already sits. For a processor paying on protein concentration, that difference shows up on every load. 

Run a 300-cow herd at around 22,000 lbs a cow — about 66,000 cwt a year — through the numbers, and the two sides of the bet sharpen up fast.

Metric / ScenarioBaseline (Holstein)Shift Toward JerseyFinancial Impact
Component premium, 0.15% protein bump 66,000 cwt/yrIncreased concentration+$16,500 to +$26,000/yr
Volume-loss risk, full-Jersey transition66,000 cwt/yr−15% volume (−9,900 cwt)−$211,000/yr at $21.33/cwt Class I 
Volume effect, F1 Holstein × Jersey parental average+5.6% vs. breed averageSoftens the volume hit

The premium is real, but it’s small. The volume swing is the big one — and which way it cuts depends entirely on how far toward Jersey you go. One honest caveat on that −$211,000: it’s gross milk sales, before the lower feed and replacement costs a Jersey herd incurs, which claw back a chunk of it. Component premiums are also set region by region under federal milk marketing orders, so plug your own order, processor, and production into the same three rows before you trust anyone’s headline figure.

That’s the trap in “Jerseys give less milk.” Go full Jersey or pure-Jersey crossbred, and you’ll likely ship less; one Irish dataset put pure Jersey crossbreds about 625 kg per cow below Holsteins. But a first-cross Holstein × Jersey (F1) can actually beat the parental average — that peer-reviewed 5.6% bump. The premium shows up later; the volume change hits early. F1 crossbreeding is the lever that softens the gap you have to eat in between. 

What Would the Transition Actually Look Like, Year by Year?

Walk it forward on a real calendar, because the sequence is where operations get hurt. 

  • Year 1: You start breeding A2A2-tested Jersey or component semen onto your Holstein dams, and you begin the organic land and feed clock if you’re chasing the organic-A2 lane. No new revenue. Higher feed cost if you’ve gone organic.
  • Year 2: Your first crossbred heifers are growing but not milking; if you’ve pushed hard toward full Jersey, your earliest culling-and-replacement decisions start nicking volume. Still no premium cheque.
  • Year 3: Your first F1 or Jersey-influenced animals freshen, components climb, and — if you sequenced it right — your organic certification comes through, and a premium contract can finally activate. That’s the earliest a premium dollar realistically lands. So you carry two to three years of cost before the upside shows. Forest Glen absorbed that runway back in the 1990s. You’d be absorbing it against today’s feed and interest costs.

The Mechanics Behind It

There’s a quiet split underneath all this — between what the breeding index rewards and what the premium market pays. On April 1, 2025, the USDA’s Net Merit (NM$) index reduced protein’s weighting from 19.6% to 13.0% and increased fat’s weighting from 28.6% to 31.8%. CDCB has been straight about why: the change reflects recent component price trends in the commodity-and-cheese market most farms sell into.

So two things are true at once. The index is calibrated correctly for the market most producers are in. And it’s miscalibrated for the market Forest Glen is in. If you’re chasing a fluid A2 protein premium but still ranking bulls on NM$, you’re using a tool built for a different milk cheque.

CDCB already publishes a better-fit tool — Fluid Merit (FM$), one of the lifetime merit indices refreshed alongside NM$ in April 2025, built around the fluid market rather than cheese yield.

IndexOptimized ForProtein WeightFat WeightBest Fit Market
NM$ (post Apr 2025)Cheese/commodity13.0%31.8%FMMO cheese pools
NM$ (pre Apr 2025)Cheese/commodity19.6%28.6%FMMO cheese pools
FM$ (Fluid Merit)Fluid milk marketHigher protein emphasisBalancedFluid, bottling, A2 contracts
CM$ (Cheese Merit)Cheese yieldFat + protein yieldHighCheddar, mozzarella processors
GM$ (Grazing Merit)Pasture-based systemsModerateModerateOrganic, grass-based operations

How Much Does Waiting on the Buyer Actually Cost?

More than the feed bill — it can cost you the buyer. The organic whole-herd transition runs 12 months of documented organic management before milk qualifies, a one-time exception under the USDA rule. But the land underneath has to be clean for three full years first, so the real-world runway is closer to three years, not one. A2A2 herd conversion stacks on top of that. By the time you’re certified and qualified, the contract slots may already be filled. The Bullvine has reported that major processors locked much of their long-term supply in 2023–2024 while planning current expansions, often favoring larger, consistent-volume operations. 

And premium pay doesn’t erase costs. Forest Glen makes the organic-A2 model work, but Kircher is blunt about the squeeze: “It’s been pretty tough. We’re getting near to what we were seeing pricewise in 2014. But 10 years ago, all your costs were a lot lower.” Organic feed costs more, Oregon’s overtime rules apply the same as to any dairy, and the processor captures the bulk of the retail premium. The lesson isn’t speed — it’s sequence: get the market signal first, then start the clock you can’t reverse.

Is Your Genetic Strategy Pointed at the Wrong Cheque?

Pull your last twelve months of milk cheques and look hard at what they actually reward — protein concentration, fat, fluid, or volume. Then check whether your sire selection matches. If you’re selling into a fluid or A2 premium market but ranking bulls on NM$ — which now leans harder toward fat than it did — or chasing PTA Protein pounds instead of PTA Protein percent, your genetics may be drifting away from your own pay structure. 

It’s a thirty-minute job. Pull the cheque, pull your sire list, lay them side by side, and see if they tell the same story. Most operations have never done it.

The Strategic Playbook

Four moves, in the order they actually protect you. No single path fits every barn — but the sequence matters more than the breed.

  • Test what you’ve already got — start this month. A2 genotyping is available as a standalone test or as a genomic add-on through labs such as UC Davis VGL. Map your herd, then filter your next semen order for A2A2 status plus positive PTA Protein %. Low cost, low risk, and it tells you whether you’re already sitting on a qualifying pool. What it won’t tell you: whether a buyer exists. That’s the next move, not this one. 
  • Secure the buyer before you build. This is the discipline most transitions skip — and it’s the one that protects the other three. Forest Glen’s milk has a contracted home through Nancy’s Probiotic Foods, the Springfield Creamery family operation running since 1960, which gives the farm a stable outlet for organic Jersey milk. Get a letter of intent or a cooperative commitment before you spend Year 1 feed money. But treat an LOI as a maybe, not a yes: sequencing failure (no buyer at all) and counterparty failure (a soft commitment that evaporates) are different risks. Pin down volume and term in writing before the feed order changes. 
  • Crossbreed toward A2A2 and components — but mind how far you go. A first-cross Holstein × Jersey can hold or even gain volume while lifting components; a push to full Jersey trades volume for concentration. Works when a buyer conversation is already moving. Fails when you build the genetics before the market exists. The deeper you breed toward Jersey, the bigger the volume bet you’re making. 
  • Stack revenue beyond the milk cheque. Forest Glen runs a 370-kilowatt digester generating about 3.1 million kWh a year for Portland General Electric, sells registered Jersey genetics, and moves composted fiber to Willamette Valley vineyards. None of that is milk; all of it is margin. Works when you’ve got the scale and capital to build it — not a standing-start play in Year 1. 

The thread running through all four: check whether your genetics already match your pay structure before you spend a dollar changing either one. 

Key Takeaways

  • The genetics were the cheap part. Forest Glen’s edge is a contracted home through Nancy’s into Costco’s A2 line — line up your buyer before you breed or certify a single cow.
  • Run your own three rows before you trust the pitch: a 0.15% protein bump pencils to 25–40¢/cwt, but a full-Jersey shift can cost six figures in gross volume that lower feed and replacement costs only partly claw back.
  • If you sell into a fluid or A2 premium market, stop ranking bulls on NM$ alone — its protein weighting dropped to 13.0% in April 2025, and Fluid Merit (FM$) is built for the cheque you’re actually cashing.
  • The clock is the killer, not the breed. Organic land runs a three-year wait, and A2A2 conversion stacks on top, so the slots may be full by the time you qualify — which is why securing the contract comes first.

The Real Question for Your Operation

Forest Glen didn’t pivot into a premium lane. They were already most of what that lane required — a registered Jersey herd, organic since the mid-1990s, running high-A2A2 by breed and breeding its own top-1.5% genetics — before the A2 category took off. So the real question for your operation isn’t “should I run Jerseys.” It’s this: if a premium buyer in your region went looking for a reliable supply next year, would your genetics and your certifications already qualify you — or would you be three years and a contract short? 

Robert Kircher started learning these cows at 11 years old. The position he’s in now took thirty years to build, and even then, he’ll tell you it’s “been pretty tough.”

Run Your Numbers

Component Value Tracker — This whole story turns on what protein is worth in your check. Run the tracker to put a real dollar figure on that 0.15% bump in your herd, and see whether breeding for components pencils against the volume you’d trade away.

Complete references and supporting documentation are available upon request by contacting the editorial team at editor@thebullvine.com.

Learn More

The Sunday Read Dairy Professionals Don’t Skip.

Every week, thousands of producers, breeders, and industry insiders open Bullvine Weekly for genetics insights, market shifts, and profit strategies they won’t find anywhere else. One email. Five minutes. Smarter decisions all week.
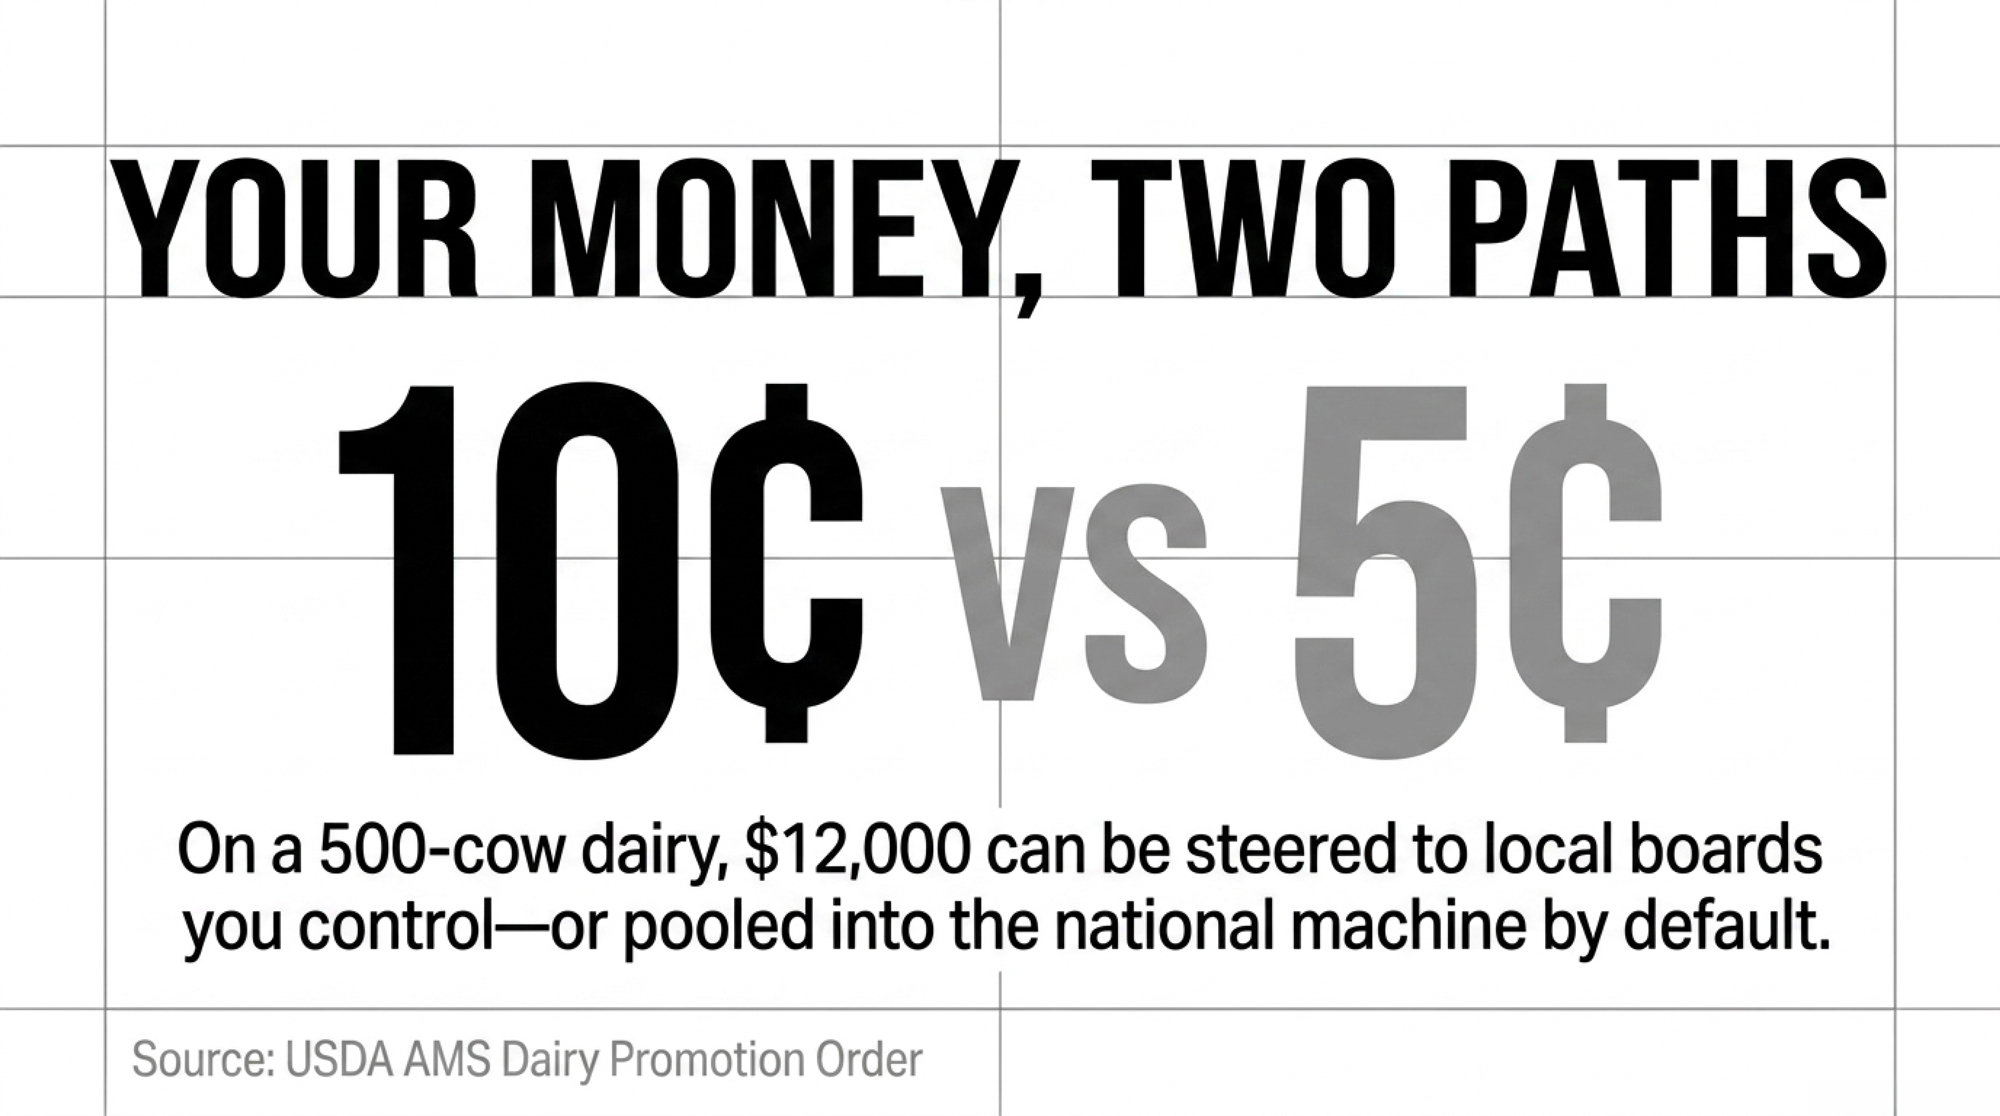
NewsSubscribe
First
Last
Consent

A Third of Retail Milk Tested Positive. The Map Said Under 0.1%.

One Ohio dairy lost $737,500 in 60 days to H5N1 — and in June 2026, fresh detections are landing in Texas, Idaho, and Utah just as federal testing gets pulled back. Here are the three questions to bring to your vet this week.

Figures reflect published research and federal data current as of June 25, 2026. The Ohio herd described below is the real, anonymized operation documented in Cornell University’s peer-reviewed July 15, 2025 Nature Communications study — not a composite.

In the spring of 2024, a roughly 3,900-cow Ohio dairy started seeing something its team couldn’t explain. Stubborn mastitis. Milk crashing across the string. About 20% of the herd clinically sick, and cows leaving the barn faster than anyone wanted to count. By the time the cause came back as H5N1, the damage ran to roughly $737,500 over 60 days— about $950 per affected cow (Cornell University, Nature Communications, July 15, 2025, U.S.). That farm did everything a good operation does. It still got hit.

Here’s the part that should stop you cold. While farms like that one were chasing “mystery mastitis,” federal scientists pulled 168 cartons of pasteurized milk off retail shelves and tested them. More than a third — 36.3% — came back positive for H5N1 RNA. The official outbreak map at that moment said fewer than one-tenth of one percent of U.S. herds were infected (CDC/USDA/FDA, Emerging Infectious Diseases, January 30, 2026, U.S. national). The virus wasn’t trailing the surveillance system. It was months out in front of it. Two years on, more than 1,000 herds across 19 states have been confirmed (Ontario Ministry advisory, May 5, 2026), and this isn’t past tense — Texas logged its first dairy-cattle case of the year in early June 2026, with 15 dairies across Texas and Idaho confirmed positive in a single 30-day window (CIDRAP, June 3, 2026).

Why Does H5N1 Hit the Udder and Not the Lungs?

H5N1 doesn’t act in cows the way it acts in anything else. In cats, foxes, and people, it’s a respiratory virus — it goes for the lungs. In dairy cows, it goes for the udder.

The Biological Blind Spot: H5N1 latches onto N-linked sialic acid receptors that are “virtually absent in cow airway tissue, but pervasive in udders” (University of Pittsburgh Health Sciences, lead researcher Suresh Kuchipudi, June 18, 2026). The lungs — the organ every flu surveillance protocol was built to watch — get skipped.

Think about what that does to detection. The mammary gland is the landing pad. So when a herd’s production tanks and cows go down with mastitis, nobody’s first call is the federal lab. It’s your vet, your mastitis protocol, your nutritionist.

That blind spot is how the virus traveled. Genomic work points to a single spillover from wild birds in late 2023, spreading quietly for months before anyone connected “bad mastitis” to “bird flu” (CDC/USDA/FDA, Emerging Infectious Diseases, January 30, 2026). The herds that got caught weren’t careless. They were doing ordinary things — sharing equipment, sharing labor, moving cattle down the road.

How This Plays Out on Real Farms

Go back to that Cornell-documented Ohio herd. The farm tried to isolate sick cows once it knew something was wrong. The virus still moved across the herd in 23 days (Cornell University, Nature Communications, July 15, 2025). Infected cows lost roughly 945 kg of milk apiece over about two months, with peak daily yield cratering close to 70% early on. And the production hole didn’t fully close — cows kept coming up short for months after they looked fine.

Run it against your own barn. Say you milk 200 cows and 20% get clinically hit — that’s 40 head.

The Barn Math: At about $950 per affected cow (a blended average), 40 sick cows runs roughly $38,000 before the leftover production drag. But cows that die or get culled cost more; cows that recover cost closer to $367 in lost milk alone (Cornell University, 2025). A 1,000-cow dairy at the same 20% morbidity? Around 200 affected cows — somewhere near $190,000.

So your real number swings on how many animals bounce back.

And the milk itself becomes the hazard. Infected cows shed virus at staggering concentrations — peaking above 10¹¹ TCID50 per milliliter in cows whose udders were experimentally infected (Ohio State University, May 2026). That’s exactly why retail sampling lit up at 36%. Pasteurization handles it; FDA testing has repeatedly confirmed the commercial supply is safe (FDA, 2025). Raw milk is a different story, and that’s a conversation for another day.

What Recovery Actually Looked Like on That Ohio Herd

The Cornell write-up doesn’t end when the cows stop looking sick — and that’s the part most producers underestimate. On that Ohio dairy, cows that survived the acute phase didn’t snap back to where they’d been. The milk they made after recovery stayed below their old curve, and the lost production stretched out past the eight-week window the headline loss number covers (Cornell University, Nature Communications, July 15, 2025).

That’s the trap in the $737,500 figure. It captures the 60-day crater, not the long tail. A cow that drops 945 kg over two months and then milks light for the rest of the lactation costs you twice — once on the spreadsheet you can see, and again on the one you won’t fully tally until cull time. When you price your own exposure, the recovery drag is the line item that quietly doubles the bill.

The Mechanics Behind the Outcomes

Strip it down and the failure has a clean shape.

The biology changed. The diagnostics didn’t. The outbreak lived in the gap between them.

Surveillance was tuned for respiratory disease and built on passive reporting — somebody notices something odd and sends a sample in. An udder-first virus throwing off “ordinary” mastitis walks right past that trigger.

Then there’s the messaging, and this is where it gets interesting for any size operation. The nuance is real at the top of the chain. The CDC says plainly that general-public risk is low, but that “people who have job-related or recreational exposure to infected birds or animals, including cows, are at greater risk” (CDC dairy-cow situation summary, July 22, 2025).

But watch what survives the trip from federal advisory to trade headline to your kitchen table. The split between public risk and worker risk gets flattened. The genotype detail drops out. What’s left is “mild cases, safe milk.” Not because anyone lied — the comfort clause is just shorter and cleaner. And you’re already triaging a dozen things that put people in the hospital every year, so a threat wrapped in “low risk” gets filed below the tractor, the manure pit, and next year’s feed bill.

How Much Does Reading “Mild” Wrong Actually Cost You?

“The dairy cases were mild” is true — for one genotype. As of June 2026, the CDC has confirmed 71 U.S. human A(H5) cases since February 2024, of which 41 are tied to dairy cattle exposure — almost all the B3.13 genotype, mostly conjunctivitis, with no known person-to-person spread (CDC, A(H5) Bird Flu Current Situation, accessed June 25, 2026). That’s the strain behind the reassuring headlines.

Here’s why the genotype label isn’t trivia. B3.13 is the strain that has actually circulated in dairy cattle, and the workers it infected mostly got red, weepy eyes and went home. So when somebody says “the dairy cases were mild,” what they’re really saying is “the B3.13 cases were mild.” That’s a statement about one virus on one set of farms — not a forecast about whatever shows up next.

CharacteristicB3.13D1.1
Primary host reservoirDairy cattle (U.S. herds)Wild/backyard birds
U.S. dairy-cattle detectionsDominant strain since Mar 2024Nevada, Arizona, early 2025
Human cases linked to dairy~41 confirmed (Feb 2024–Jun 2026)Dairy-linked exposures so far mild
Typical human illness severityMostly conjunctivitis; no deathsSerious illness; 1st U.S. H5N1 death (Louisiana, Jan 2025)
Human adaptation (lab evidence)Baseline reference“Better adapted to human nasal/airway organoids” (JID, Mar 2026)
Worker risk categoryModerate — PPE + monitoringElevated — same protocols, higher vigilance
Key message for operationsKnow your region’s strainDon’t assume “mild” applies to D1.1

But a second genotype, D1.1, turned up in dairy cattle starting in early 2025 — first Nevada, then Arizona (AVMA, September 15, 2025).

The Genotype Gap: D1.1 is the strain behind the most serious H5N1 illness in North America — including the Louisiana patient who became the first U.S. bird-flu death in January 2025 (CDC, January 6, 2025). That case was tied to backyard and wild birds, not dairy cattle, and it happened before D1.1 ever reached a milking parlor. A peer-reviewed study found D1.1 “better adapted to human nasal and airway organoids than genotype B3.13” (Journal of Infectious Diseases, March 16, 2026).

The dairy-linked D1.1 exposures so far have stayed mild — so this is a documented risk pathway, not a confirmed harm in cattle settings. But “mild” was never the whole story, and treating it as the whole story is the cheap-now move that carries an expensive-later tab. The honest read for your operation: which genotype is in your region changes how hard you lean on worker protection, and that’s a question with a real, knowable answer.

Is Your Detection Strategy Even Looking in the Right Place?

Ask yourself a plain question. If H5N1 walked into your herd next week, would your current testing find it before it spread? If your answer leans on watching for respiratory signs or assuming “we’d notice,” the Cornell case says otherwise — 23 days, herd-wide, despite isolation.

The Dose Bar Is Brutally Low: An Ohio State team led by Prof. Andrew Bowman found that just 10 infectious particles infused into a single udder quarter triggered severe clinical mastitis within three days — while a massive aerosolized dose to the nose produced no overt disease at all (Ohio State University, May 2026).

The udder isn’t just vulnerable — it’s the path of least resistance. That’s the trap. A cow can look fine, test clean on a nasal swab, and still be loading your bulk tank. Standard respiratory panels were built for the wrong organ. So the real question isn’t whether your herd looks healthy this morning — it’s whether you’re sampling the place the virus actually lives.

Detection MethodWhat It FindsWhat It MissesSpeedCost Signal
Nasal swab / respiratory panelRespiratory H5N1 shedUdder-first infection (cow looks fine)24–48 hrsLow sensitivity for dairy strain
Bacterial mastitis cultureStaph, Strep, KlebsiellaH5N1 (virus, not bacteria)48–72 hrsMisses virus entirely
Composite bulk-tank PCRPooled milk virus signalEarly-stage cows not yet milking into main tank24 hrsBest herd-level screen available
Individual cow milk PCRActive udder sheddersPre-clinical animals, dry cows24–48 hrsGold standard for case confirmation
Pre-movement testing (cattle)Infected cows before transportNo longer federally required in 41 “unaffected” states (WPR, May 2026)VariesResponsibility now on producer
USDA National Milk Testing (silo)Plant-level bulk detectionTime gaps between sampling roundsDays–weeksCatches herds, not individual cows

Questions to Ask Your Vet This Week

  • Which H5N1 genotype is circulating in our region right now — B3.13, D1.1, or both? (The answer changes how seriously to treat any worker exposure.)
  • How would we detect a udder-first infection here — are we set up for composite bulk-tank and milk PCR, not just nasal swabs and bacterial culture?
  • What’s our actual plan for people — PPE, 10-day monitoring after exposure, and antiviral access — if this shows up in our parlor?

Why Is Testing Being Cut Back Right as New Herds Light Up?

Here’s the development that should sharpen your attention this summer. In May 2026, USDA dropped the requirement that lactating cows be tested for H5N1 before crossing state lines — for any farm in the 41 states now classed as “unaffected” under the National Milk Testing Strategy (Wisconsin Public Radio, May 6, 2026). Cows moving in and out of those states no longer need a negative test. State vets asked for the change, citing a real drop in activity since 2024 and the cost and logistics of the testing burden (Dr. Darlene Konkle, Wisconsin State Veterinarian, WPR, May 6, 2026).

That’s a defensible call on the numbers — but listen to the people running the labs. Keith Poulsen, who directs the Wisconsin Veterinary Diagnostic Laboratory, says the threat from migratory birds and persistently infected farms isn’t going away, and that officials are “hedging everything on the success of the National Milk Testing Strategy” while more than 24,000 people have left USDA since the administration took office (WPR, May 6, 2026). His worry, in plain terms: the testing pullback may have more to do with thin staffing than with lower risk. So the net is loosening at the same moment Texas, Idaho, and Utah are posting fresh detections — Utah confirmed its first-ever dairy case on June 1, 2026 (The Bullvine, June 2026). That’s the 2024 mistake threatening to rhyme.

What Does the National Milk Testing Strategy Actually Ask of You?

Since USDA launched its National Milk Testing Strategy in December 2024, bulk-tank milk has become the front line of surveillance — silo samples and on-farm bulk tanks get pulled and screened to flag infected herds before clinical signs blow up (USDA, December 2024). For most producers that means your milk is already being sampled somewhere in the chain, whether you’ve thought about it or not.

What it doesn’t do is replace your own vigilance. A negative bulk-tank screen at the plant tells you about the day it was pulled, on the cows that were milking into that tank. With a 10-particle infection threshold and a virus that hides in early-stage cows, the gap between sampling rounds is exactly where an outbreak gets its head start. And with pre-movement testing now optional across 41 states, that gap just got wider. The strategy is a net, not a fence — useful, but not something to lean your whole biosecurity plan against.

Options and Trade-Offs for Farmers

No widely deployed cattle vaccine exists yet — none is approved for U.S. dairy cattle, though candidates are in development and field trials are underway (AVMA, September 15, 2025). Until that lands, your real levers are detection, separation, and people. Here’s how the three stack up.

Option 1 — Tighten milk-based detection (start this within 30 days)

  • Trigger: Any herd with unexplained mastitis clusters and milk crashes.
  • Action: Composite bulk-tank PCR and targeted milk sampling from suspect cows — what nasal swabs miss (Vet Clinics of North America, July 2025). Loop in your vet and USDA’s National Milk Testing Strategy.
  • The Catch: A clean bulk-tank test isn’t a permanent all-clear. It’s a snapshot — and with a 10-particle infection threshold, that snapshot can go stale fast.

Option 2 — Close the farm-to-farm doors (higher priority now that pre-movement testing is optional)

  • Trigger: Always, but especially if you swap equipment or staff with neighbors, or bring in cattle from another state.
  • Action: Cleaning protocols and your own pre-movement testing — no longer federally required for “unaffected” states, which means the responsibility has quietly shifted onto you (WPR, May 6, 2026). Federal reimbursement still helps: USDA offers up to $1,500 per farm toward a biosecurity plan and 90% of lost milk production on affected herds (USDA APHIS, 2025).
  • The Catch: It slows you down, and now nobody’s mandating it. That friction is the pay-now cost most farms will be tempted to skip precisely because the rule went away.

Option 3 — Build a worker plan before you ever need it

  • Trigger: Now — not after the first positive. This is the gap most operations haven’t closed, and it’s the cheapest insurance on the list.
  • Action: PPE, 10-day post-exposure monitoring, prompt antivirals for symptomatic exposed workers (CDC worker-safety page, June 23, 2025). The real work is the logistics — which clinic takes the case, which test they run, who calls public health.
  • The Catch: With two confirmed U.S. H5N1 deaths now on the books — the first being the Louisiana patient, killed by the same D1.1 genotype now circulating in cattle — and lab work showing that strain reads more human-adapted, “we’ll figure it out if it happens” isn’t a plan.

Key Takeaways

  • If you’ve had unexplained mastitis clusters paired with a sharp milk drop, ask your vet for milk-based H5N1 PCR — not just a bacterial culture and a nasal swab.
  • If you bring cattle in from another state, don’t assume the dropped federal testing rule means low risk — run your own pre-movement test, because the responsibility just shifted to you.
  • If you share vehicles, equipment, or labor with a neighboring operation, treat that as your single highest transmission risk and price out a cleaning protocol this month — USDA will still cover up to $1,500 of it.
  • If you’ve never walked through a worker-safety plan with your vet — PPE, monitoring, antivirals, who to call — close that gap before a case, not after.
  • If your region has confirmed cases, find out which genotype is circulating; B3.13 and D1.1 don’t carry the same human-risk profile.
  • If your state shows “unaffected” status, treat that as a reporting metric, not a biological guarantee — cows shed virus with no clinical signs and clean nasal swabs, and the testing net just got looser.

What’s Your Herd’s Real Risk Picture — Today?

So here’s the question worth sitting with over coffee tomorrow: if the official map ran three months behind the milk in 2024, and federal testing is being scaled back in 2026 while Texas, Idaho, and Utah post fresh cases, how confident are you that your own herd’s risk picture is current right now? Not the national number. Yours. For most operations the honest answer is “I’m not sure” — and that’s the right place to start, because it’s a question your vet can actually help you answer this week.

We’re breaking down the herd-by-herd detection-cost math below with a full model by herd size, including where your breakeven on testing actually sits now that the federal mandate is gone. That’s where the real numbers live.

H5N1 Financial Risk & Surveillance Calculator

Input your herd parameters to model your baseline exposure and find your testing breakeven threshold.

Cornell study documented a 20% clinical infection rate across the string.
Composite bulk-tank milk PCR screening.
Projected Outbreak Cost $0

Blended baseline losses including lost milk production, treatments, and culls.

Annual Testing Investment $0

Cost of proactive bulk-tank monitoring to catch the virus before clinical spread.

Complete references and supporting documentation are available upon request by contacting the editorial team at editor@thebullvine.com.

Learn More

The Sunday Read Dairy Professionals Don’t Skip.

Every week, thousands of producers, breeders, and industry insiders open Bullvine Weekly for genetics insights, market shifts, and profit strategies they won’t find anywhere else. One email. Five minutes. Smarter decisions all week.
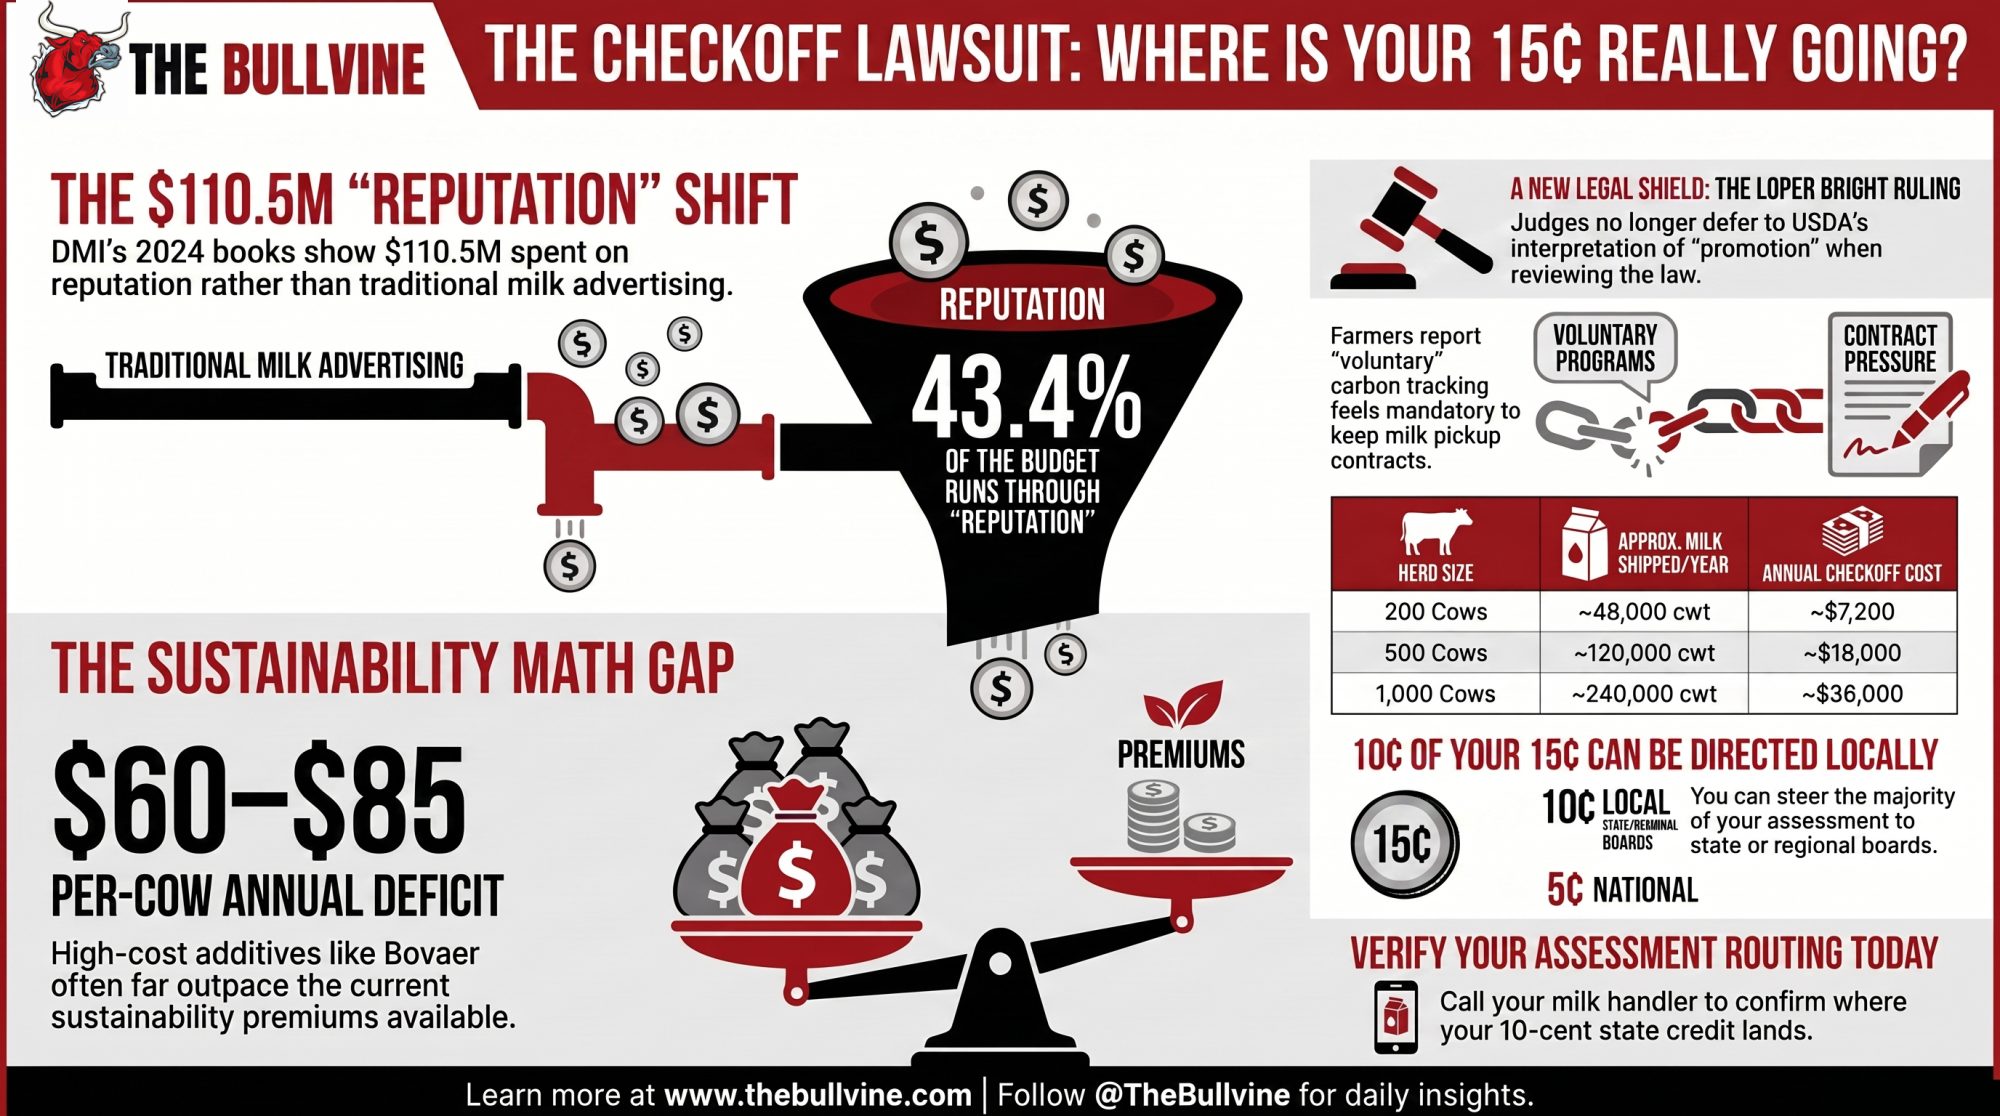
NewsSubscribe
First
Last
Consent

A Clean 140K Tank Can Hide Heifers Freshening at 200K

Pull the first-test SCC by lactation group tonight. If your heifers walk in at 200K while your mature cows hold the rolling average near 140K, your bulk tank’s been lying to you.

Executive Summary: The national DHI somatic cell average has stayed flat at 181,000 cells for two years running, and new University of Minnesota research suggests part of the reason may be hiding in your heifer pen, not your parlor. A study from Brad Heins’s WCROC program — presented at ADSA 2026 by Ph.D. researcher I. M. Rott — is testing whether a heifer’s residual feed intake during growth tracks with the somatic cell count she’ll carry into her first lactation, on the theory that more efficient animals have more energy left for immune development. The catch for most herds: a clean bulk tank reading 140K can mask first-lactation heifers walking in at 200K, because mature, lower-SCC cows drag the rolling average down and bury the problem. That matters because first-test SCC is largely a forecast, not a snapshot — a 2005 J. Dairy Science study associated heifers fresh at 50,000 cells with 119–155 kg more milk across the lactation than those at 1,000,000, and the damage doesn’t reset. Run the barn math: on a 300-cow herd at 24,000 lbs, the federal SCC adjustment for a 250K-to-150K move is lunch money (~$6,000/yr), but a $1.00/cwt over-order quality premium is worth ~$72,000 a year — roughly $216,000 over three years — riding on whether your replacements freshen clean. The genetics gap is real, too: CDCB’s Feed Saved index is built on lactating-cow data, so it isn’t yet capturing any heifer-period RFI-to-SCC link, and nobody’s published whether chasing efficiency hard helps or hurts SCS. The 30-second takeaway — pull your first-test SCC by lactation group; if your heifers run more than 50,000 cells above your rolling average, your tank’s been lying to you, and the fix is 18–24 months upstream.

heifer feed efficiency SCC

It’s 9 PM at the kitchen table. The DHI report is open on the laptop, the rolling bulk tank somatic cell count reads a comfortable 140,000 cells per milliliter, and by every number a producer usually checks, this herd has milk quality handled.

Then pull one more report — first-test SCC broken out by lactation group — and a different story shows up. The first-lactation heifers are walking in at 200,000 cells, while the second- and third-lactation cows quietly drag the average back down. The bulk tank isn’t lying. It’s just answering the wrong question. Read by lactation group, though, and the heifers tell on themselves.

That gap is the thread behind new research out of the University of Minnesota, presented this week at the 2026 ADSA Annual Meeting in Milwaukee. And it’s why a producer who’s sure he’s beaten his somatic cell problem might be one heifer group away from one he never saw coming.

Two Years Flat While Premiums Have Never Paid Better

Here’s the number that should bug anyone watching a milk check. The U.S. national DHI test-day average somatic cell count sat at 181,000 cells per milliliter — unchanged from 2023 to 2024, according to a CDCB/USDA summary report (reported via Agproud/Progressive Dairy, June 2025). Two years. No movement. And milk quality premiums have rarely paid more than they do right now.

The work prompting a rethink comes out of the University of Minnesota’s West Central Research and Outreach Center (WCROC) in Morris, where Dr. Brad Heins runs the dairy program. A study from that group — presented at ADSA 2026 by Ph.D. researcher I. M. Rott, with co-authors Isaac Salfer, Brad Heins, and Isaac Haagen — digs into the genetics of how efficiently young animals eat. The starting point sits roughly two years before a cow ever walks into the parlor — in the heifer barn, with something most producers have never tied to udder health at all: how efficiently she eats.

The producer who’ll see himself in this isn’t the one fighting a visible SCC crisis. It’s the one whose rolling average looks fine, who stopped sweating milk quality a while back, and who has no idea his replacement pipeline is quietly restocking a subclinical problem with every group that freshens.

And that’s the trap. A clean rolling average is a lagging indicator built mostly from cows who’ve already proven themselves. It tells you how your mature herd is milking today. It tells you almost nothing about the heifers about to replace them.

The Parlor Is a Warning Light. The DHI Report Is a Diagnostic.

Why is early SCC so hard to walk back? Because the damage doesn’t reset.

A 2005 study in the Journal of Dairy Science (88:938–947) tracked first-lactation heifers and found that those testing at 50,000 cells in early lactation were associated with an estimated 119 to 155 kg more milk over the lactation than heifers testing at 500,000 or 1,000,000 cells. The effect held across nearly the whole lactation, even when later test-day counts came back down. Once a subclinical infection sets up at freshening, you’re managing around it for the rest of that lactation, not erasing it.

That’s what makes a heifer’s first-test SCC the most predictive cell count she’ll ever post. It’s not a snapshot. It’s a forecast.

So the parlor protocol — the teat dips, the dry-cow therapy, the milking hygiene the industry has spent 30 years sharpening — is often cleaning up downstream of a problem that was already locked in. Put it this way: your bulk tank tells you something’s wrong. Your DHI report, read by lactation number, tells you where it came from.

Much of that infection never announces itself, either. Analysis of large-scale first-test data, summarized through Progressive Dairy in 2024, points to fresh-heifer mastitis — much of it subclinical, much of it established at or before calving — as a primary driver of first-lactation SCC. Subclinical infection at freshening commonly runs three to five times the clinical rate.

The Subclinical Iceberg: A herd showing a 6% clinical mastitis rate in fresh heifers is often sitting on an implied 18–30% subclinical infection rate that never lands in a single health record.

Think about what that means for a replacement strategy. You can buy the best fresh-cow protocol money can rent, and it still won’t touch the heifer who walked in already infected. The window to influence her closed months earlier, in a pen that most operations manage as a cost center and nothing more.

What Does Feed Efficiency Have to Do With a Clean Udder?

This is the connection nobody’s drawn yet, and it’s the heart of what the Minnesota group — Rott, Salfer, Heins, and Haagen in UMN’s Department of Animal Science — is working to characterize. The link runs through Residual Feed Intake, or RFI.

RFI strips out body size and growth rate and asks one clean question: is this heifer using her feed well, or burning extra to make the same gain as her pen-mates? A negative-RFI heifer is efficient. A positive one is eating more than her growth justifies.

The WCROC dairy measures this with precision automated feeders that capture individual dry matter intake — not pen averages. That distinction matters more than it sounds. Most heifer programs feed by pen, which means the efficient heifers and the wasteful ones eat the same ration, gain similar weight, and nobody can tell them apart until they freshen. By then, it’s two years too late to do anything about that group.

The efficiency signal itself is well documented. A 2024 study in the Journal of Animal Science found that low-RFI Holstein heifers ate 7.5% less feed per day than high-RFI herdmates, with no difference in body weight or average daily gain, and produced 7.7% less methane and gave off 5.6% less metabolic heat in the process. The Minnesota team’s ADSA 2026 abstract (Rott et al., “Genetic parameters for residual feed intake traits in Holstein calves”) takes the next step: pinning down how heritable that calf-stage efficiency is, and how it correlates with other traits.

What the early WCROC direction suggests — and what the full data set will test — is that the efficient, negative-RFI heifers tend to post lower first-test SCC. But here’s the honest line, and it stays in. The specific effect size — how strong the genetic correlation is between calf-stage RFI and somatic cell score, across how many animals — isn’t something this article should state until it’s read straight off the abstract or a published paper.

The Immune-Development Hypothesis — Why the Link Is Plausible

So why would feed efficiency and udder health travel together at all? The leading hypothesis is about where the energy goes.

A growing heifer partitions every megacalorie she eats — toward frame, toward fat, toward maintenance, toward immune-tissue development. An efficient animal, the thinking goes, wastes less on maintenance overhead and has more left to build the tissue that defends her, including the immune machinery around a developing mammary gland. An inefficient heifer burns more just to stand still, leaving less for everything else. Same ration. Different allocation.

There’s biological backing for the energy-partitioning piece. Research on heat production — including work showing that low-RFI heifers give off 5.6% less metabolic heat — indicates that efficient animals lose less energy to maintenance. The leap the Minnesota team is testing is whether the spared energy actually translates into better immune readiness at freshening, measured as lower first-test SCC.

This is where the discipline matters. Right now, this is a hypothesis with a plausible mechanism and early directional data — not a proven causal chain. The data suggest an association. They haven’t yet proven that feeding for efficiency causes a cleaner udder. A producer who treats it as settled science is getting ahead of the researchers themselves. But a producer who ignores it until it’s textbook-confirmed is leaving a two-year lead time on the table. The honest middle ground: it’s plausible enough to shape a mating list and a heifer-pen conversation, not yet strong enough to bet the farm on.

What’s not in doubt is the cost of getting udder health wrong. A 2018 Journal of Dairy Science analysis found that a cow at 250,000 cells produces about 1.6 kg less milk per day than one at 50,000, and converts feed less efficiently by roughly 0.04 kg of milk per kg of dry matter. She costs you milk and burns extra feed. That penalty is worth running barn math on even before the genetic correlation is nailed down.

The Barn Math, Built Step by Step

Here’s where the SCC story stops being academic and starts showing up on a milk check. Walk through it with clearly labeled assumptions so you can swap in your own.

Start with a 300-cow herd milking 24,000 lbs per cow per year — that’s 7.2 million lbs, or 72,000 cwt annually. Now the premium. The federal-order SCC adjustment itself is modest: at mid-2026 cheese prices, roughly $0.00083 per cwt for every 1,000 cells below the 350,000-cell benchmark. Moving a herd from 250K to 150K — a 100,000-cell improvement — is worth about $0.083/cwt on that mechanism alone. On 72,000 cwt, that’s roughly $5,976 a year — call it $18,000 over three years. Real, but not the headline.

The headline lives in the over-order and processor quality premiums, which are contract-specific and far larger than the federal adjustment. Many Upper Midwest and premium-tier processors pay tiered quality bonuses that can stack $0.50 to well over $1.00/cwt for consistently low-SCC milk. At a conservative $1.00/cwt spread between a threshold herd and a premium-tier herd, 72,000 cwt is $72,000 a year. Hold that for three years, and you’re looking at a $216,000 swing — most of it riding on whether your replacement heifers freshen clean or freshen at 200K.

The numbers tell the real story: the federal adjustment is lunch money, but the over-order tier is a down payment on a barn. That’s why the heifer pen is a milk-quality investment, not just a feed cost — and why the action step below is a phone call to find out which tier your milk actually qualifies for.

Does This Hold for Grazing and Organic Herds?

Most of the RFI research base — and the CDCB index built on it — comes from confinement Holsteins on a TMR. WCROC is a useful exception worth flagging, because it runs both a conventional and a certified-organic, pasture-based dairy at Morris, and Heins’s program has long worked in grazing and crossbred systems.

That matters for how you read this. On pasture, individual intake is harder to measure, and RFI rankings can shift because grazing animals express efficiency differently than animals at a feed bunk. The directional logic — efficient heifers may freshen cleaner — may travel across systems if the immune-development mechanism holds, though the Rott et al. calves were measured at WCROC and the specific system behind the data isn’t confirmed in the abstract title. The specific numbers almost certainly won’t transfer one-to-one from a confinement trial to a grazing herd regardless.

So a grass-based or organic producer reading this should treat the diagnostic — pull your first-test SCC by lactation group — as fully portable, and the genetic and ration specifics as “watch this space until the system-matched data lands.”

What Your Sire Lineup Isn’t Telling You

Here’s where the genetics catch up to the management — and where they don’t, yet.

CDCB publishes two feed-efficiency tools inside Net Merit: an RFI evaluation and Feed Saved, a composite of RFI and Body Weight Composite. The 2025 Net Merit revision lifted Feed Saved to 17.8% of the index while cutting Body Weight Composite to −11%, so efficiency now carries real weight in how bulls rank (CDCB Net Merit 2025; values current as of the April 2026 CDCB evaluation run). But by CDCB’s own published methodology, both tools are built from lactating-cow data — they aren’t designed to model a heifer-period RFI-to-SCC link. That’s not a knock on the index. It’s a question the research is only now asking, and the index reflects the data it was built on.

What’s solid: the genetic correlation between clinical mastitis and somatic cell score runs 60–80%. Selecting against SCS is already selecting against mastitis. The WCROC research is probing whether selecting for heifer-period feed efficiency yields an SCS dividend once the animal freshens. If the data confirm it, the index can fold it in over time. CDCB builds these connections deliberately, on the data, and that data is still being gathered.

There’s a real selection-pressure question buried here, too. With Feed Saved now at 17.8% of Net Merit and more producers chasing efficiency hard, nobody has published whether selecting aggressively for feed efficiency drags SCS in a favorable direction, a neutral one, or — the worst case — an antagonistic one. The honest answer today is that the correlation between heifer-period feed efficiency and adult SCC isn’t established in the public literature. That’s a question worth putting directly to a CDCB geneticist, and it’s one the WCROC work — the Rott et al. genetic-parameter estimates included — may help answer.

So the practical move sits with you, tonight, in the sire catalog. A bull strong on negative SCS and positive Feed Saved isn’t just an efficient cow that milks cleaner. He may be feeding immune development during the heifer period, which sets his daughters up for a cleaner first test. That’s the hypothesis the work is building toward. Not confirmed — but close enough to shape a mating list. 

Run the Diagnostic Before You Run the Math

Before you decide whether any of this is your problem, pull three reports you already generate. None of this needs new software or new data collection. It needs the data you’ve got, read through a different lens.

1. Pull First-Test SCC by Lactation Group — DHI / DairyComp 305. Isolate your last 12 months of freshening heifers and set their average first-test SCC next to your second- and third-lactation cows. If first-lactation runs higher, that’s a clear heifer-development signal — the older cows had a full lactation to clear infections, the heifers never did.

2. Apply the 50,000-Cell Rule — Herd math analysis. If your first-lactation first-test SCC runs more than 50,000 cells above your rolling herd average, you’ve got a hidden heifer problem being masked by older, cleaner cows. (On 300 cows — 100 heifers at 200K, 200 mature cows at 125K — a cow-weighted average lands near 150K, and your bulk tank sits close to it.)

3. Audit the Cohort Trend — Identify systemic issues. Look at your last three freshening groups. One bad group is an environmental event; three in a row above 150,000 cells points to a structural, system-wide problem in your heifer program.

One logistics note: not every DHI platform puts first-test SCC by parity on a standard report. DairyComp 305 pulls it readily; some cloud platforms need a request to tech support. Ask specifically for “first-test SCC by lactation number.”

MetricGroup A (Acceptable)Group B (Watch)Group C (Structural Problem)
First-test SCC — Heifers (cells/mL)<100,000100,000–150,000>150,000
Gap vs. mature cow first-test SCC<30,00030,000–50,000>50,000
Cohort trend (last 3 groups)All below 100KMixed / improving3 in a row above 150K
Implied subclinical mastitis rate~5–8%~10–15%18–30%+
Recommended actionMonitor quarterlyPrepartum CMT testingPrepartum CMT + heifer program audit + sire screen
3-year financial exposure at riskMinimal$50K–$100K$150K–$216K+

The 5-Step Kitchen Table Audit

Diagnosis is half the job. Here’s the full sequence — three reads and two moves — you can run from the same chair where you found the problem.

#StepWhat you’re deciding
1Read first-lactation vs. mature first-test SCC. If first-lactation runs higher than second-lactation, the fix isn’t in the parlor — it’s 18–24 months upstream in the heifer barn.Is your problem behind you or ahead of you?
2Apply the 50,000-cell rule. First-lactation first-test more than 50K above your rolling average means your mature cows are hiding a heifer problem.Is a clean bulk tank masking a dirty pipeline?
3Check the cohort trend. Three freshening groups in a row above 150K is structural, not bad luck.Bad luck, or bad program design?
4Run a dual sire screen. Sort your active AI lineup (April 2026 CDCB run) on SCS (negative better) and Feed Saved (positive better) at once. Bulls strong on both are your heifer-mating shortlist.Are you selecting on one trait and ignoring the other?
5Call your co-op fieldperson. Get your exact contract quality specs — what cell count triggers your next premium tier, and what missing it costs.Do you even know what your milk could qualify for?

For heifers already freshening above 150K, initiate a prepartum check before anything else. Teat-end scoring and California Mastitis Testing (CMT) on heifers two to four weeks pre-calving identifies infections established before they ever cross the parlor wood — labor and a vet conversation, not capital. The 30-day move that costs nothing is step 4; the move that protects every group coming behind it is the prepartum check.

The producer who runs this audit and finds his heifers freshening at 200K hasn’t failed. He’s just been asking his data the wrong question — and he caught it at his own kitchen table, before the bank or the co-op caught it for him. The number sitting in his heifer pen tonight is already two years old. The only real question left is whether his second-lactation string, three years from now, tells him a story he could have rewritten this week. So — when’s the last time you read your DHI report by lactation number rather than by bulk tank?

Run Your Numbers

Herd Health ROI Calculator — This article shows fresh-heifer mastitis costs you twice: lost milk and a missed SCC premium. Plug in your herd size, mastitis rate, cull rate, and replacement cost to put a real dollar value on cleaning up that pipeline — and see what inaction is costing you right now.

Complete references and supporting documentation are available upon request by contacting the editorial team at editor@thebullvine.com.

Learn More

The Sunday Read Dairy Professionals Don’t Skip.

Every week, thousands of producers, breeders, and industry insiders open Bullvine Weekly for genetics insights, market shifts, and profit strategies they won’t find anywhere else. One email. Five minutes. Smarter decisions all week.
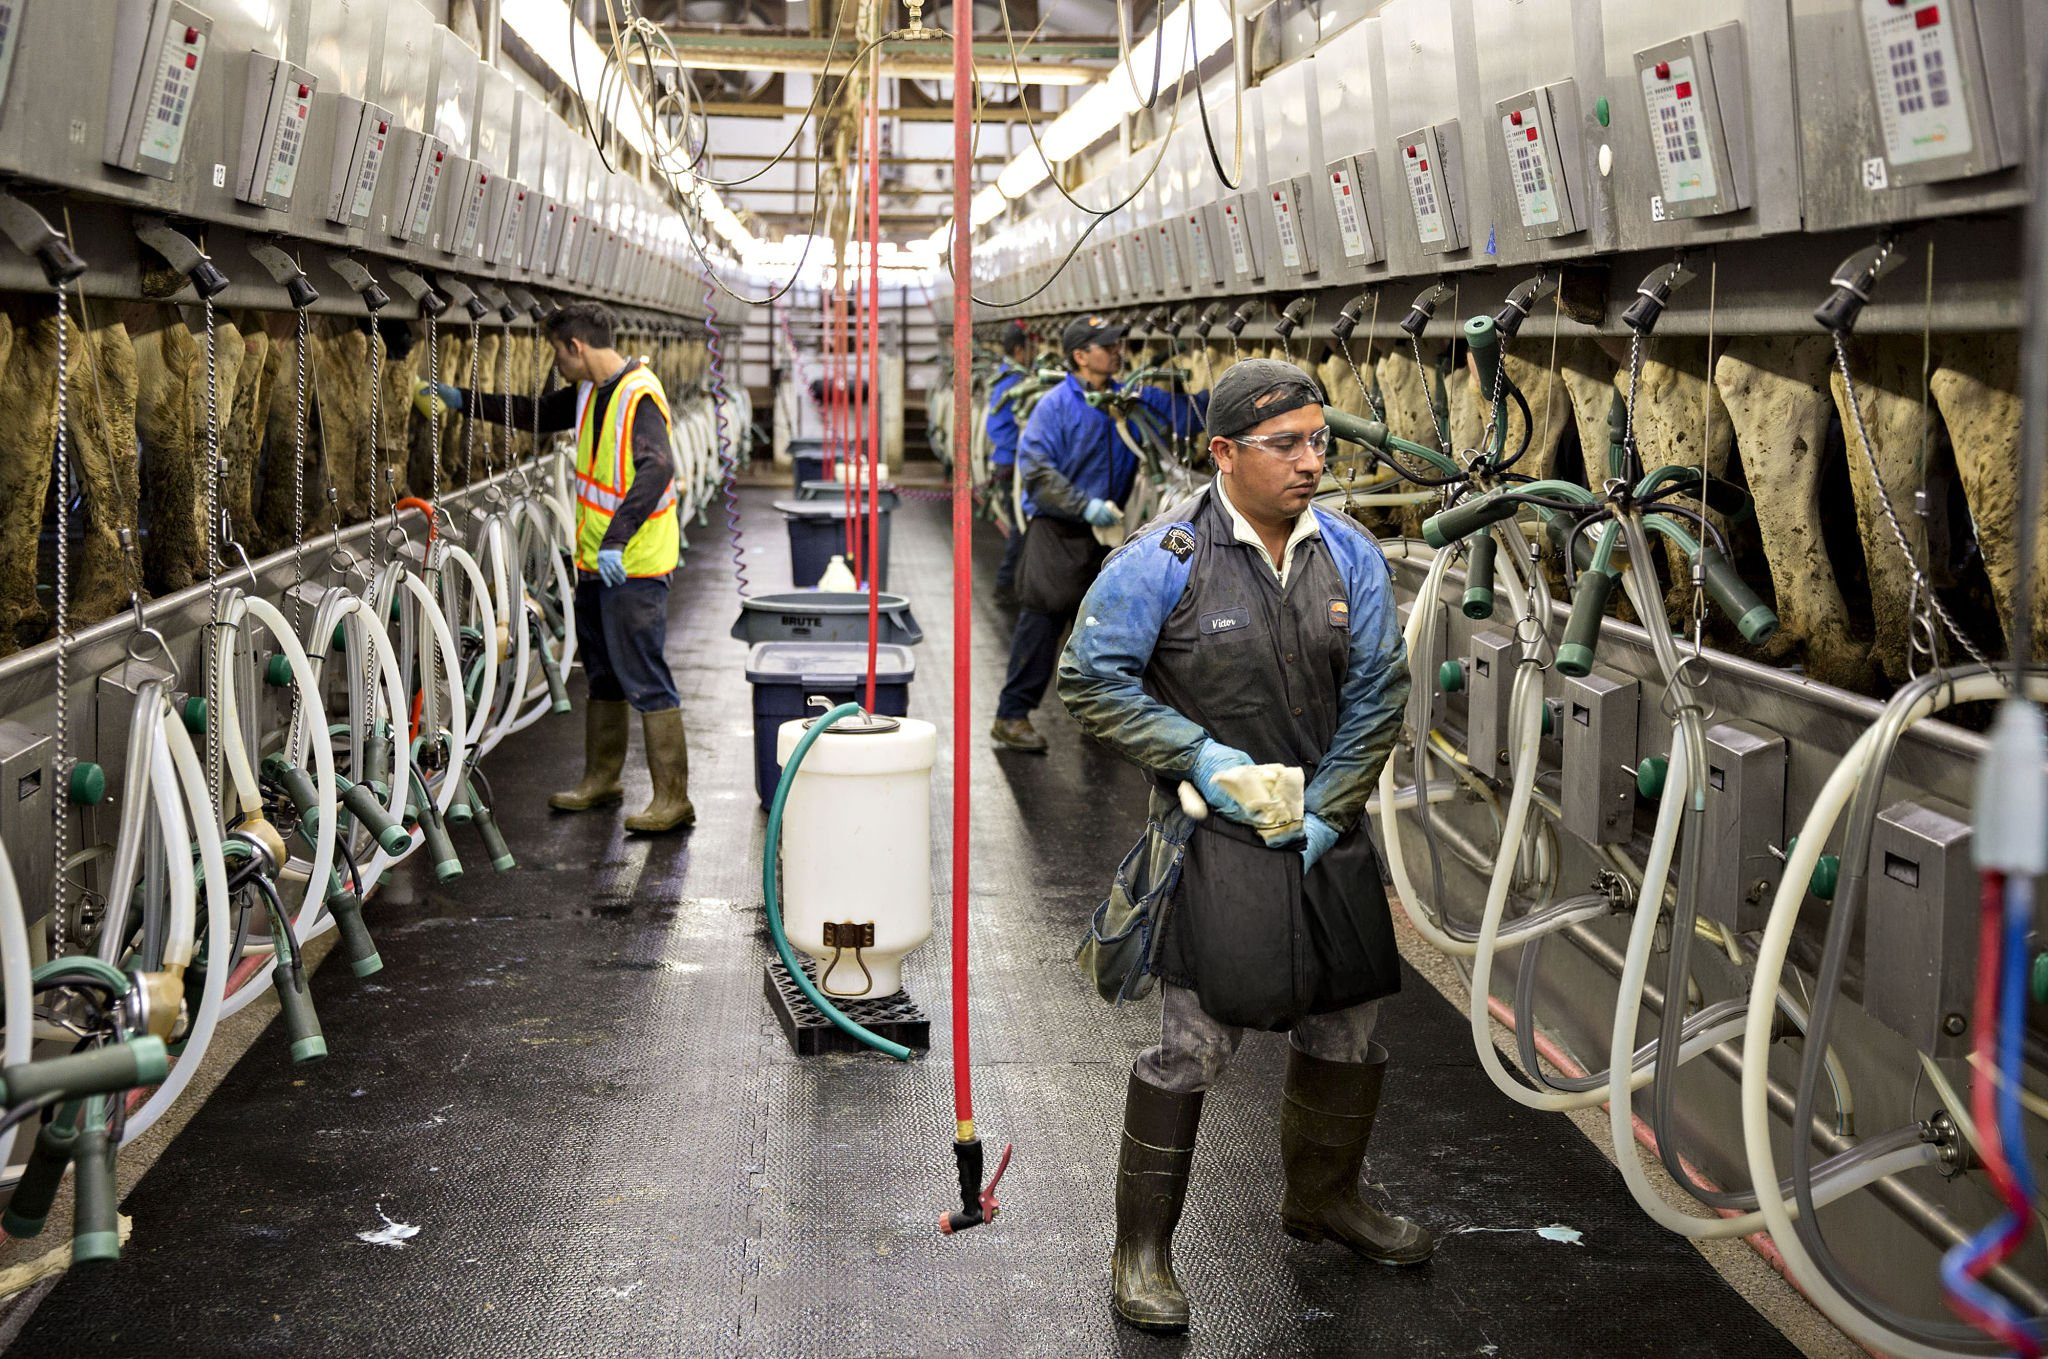
NewsSubscribe
First
Last
Consent

Too Small for the Tanker: A 50-Cow Herd’s £47,000 Fight to Keep Milking

Cut for volume, not quality, after 25 years. Now it’s £47,000 and an August 1 deadline against the tanker — and the barn math says 51 litres a day decides if the build pays for itself.

Executive Summary: A 50-cow Herefordshire organic herd, Wicton Farm’s Wild Cow Dairy, just lost a 25-year milk contract for one reason: it’s too small for the buyer’s tanker route — quality and welfare never came into it. The Howlett family now has until August 1 to raise £47,000 and build their own on-farm processing, or lose the only market they’ve got. Here’s the math the BBC and the trade wires skipped: at roughly 50 pence of extra margin per litre over wholesale, that build needs about 51 litres a day sold direct to pay for itself — under a tenth of the daily tank — so the capex isn’t the risk, the customer base is. And Wicton isn’t an outlier; GB lost around 160 dairy farms in six months while average output per farm climbed 7.6%, which is consolidation squeezing the bottom end out one route at a time. With UK farmgate at 33.99 ppl against 40–49 ppl production costs, any small or mid-size herd flagged on volume should run its own break-even now — daily direct litres times margin spread, minus annualised capex — before the letter arrives, not after. If the tanker stopped coming next spring, do you have a route to market, or just a tank and a problem?

organic milk contract loss

The news came three months ago. For the Howlett family behind Wild Cow Dairy at Wicton Farm, near Bromyard in Herefordshire, it landed like a gut punch dressed up as a logistics memo. “Three months ago, we received devastating news,” the farm wrote on its crowdfunding page. “After more than 25 years with the same milk buyer, our organic bulk milk contract was being terminated.” The reason given wasn’t quality or welfare. The farm was judged too small, its “values and farming methods no longer fitting [with] the industrial dairy model.” So now there’s a crowdfunder, a £47,000 target, and a deadline to hit it: August 1, 2026, with the build due to finish by Christmas. 

The BBC ran the story. So did FarmingUK and the trade wires. Every version stopped at the appeal. Nobody ran the barn math behind it — what cutting out the tanker actually costs, what it returns per litre, and the daily volume you’d need before any of it pays. That’s the part that matters, whether you milk 50 cows or 500. Because Wicton isn’t a freak accident, it’s the visible edge of a squeeze that’s been tightening on small UK herds for years, and the question it forces — go direct or go home — is sitting in a lot more inboxes than anyone’s admitting. 

What Actually Changed at Wicton — and Why It’s Not Personal

Strip the sentiment out, and the buyer’s logic is cold but rational. Processors build tanker routes around volume. A 50-cow herd at the end of a long collection run costs more per litre to pick up than a 500-cow herd on a main road. When margins tighten, the small accounts at the end of the route get cut first. Wicton didn’t fail an inspection. It failed a spreadsheet. The farm itself described the choice it was left with bluntly: either stop dairy farming or process and sell all its own milk. 

Here’s the macro picture in one view — and it tells you Wicton is a data point, not an outlier:

UK dairy reality (2026)FigureSource
GB dairy producers, April 20266,850, down from 7,040 a year earlierAHDB milk-buyer survey 
Farms lost Oct 2025–Apr 2026~160 in six monthsAHDB 
Average output per farm, year-on-year+7.6%AHDB 
UK average farm-gate price, April 202633.99 pence/litreDefra 
Cost of production (by system)40–49 pence/litreNFU / BBC, mid-2026 
Organic herd, two-year change48,000 → 46,000 cowsAHDB organic update, June 2026 

Fewer farms. More milk from each one. That’s consolidation written in two numbers, and it doesn’t reverse.

The processor squeeze isn’t theoretical either. On March 30, 2026, Müller issued 12-month termination notices to a cluster of farms across North Wales and Scotland — the company didn’t disclose how many, though over half were offered an ingredients-only contract as a fallback. Müller’s agricultural director, Richard Collins, told producers that the move followed “a recent adjustment in our contracted volumes” and “continued unprecedented levels of oversupply.” Read that next to Wicton’s “too small” letter and the pattern’s obvious. The volume threshold is moving, and it’s moving against the bottom end. 

And here’s the part that should make you angry, or at least curious: demand isn’t the problem. The organic herd is shrinking even as demand holds firm. People still want the milk. It’s the road to market that’s built against small herds — not the appetite at the other end. 

Does a Running Start Actually Change the Math?

Wicton has something most farms in its spot don’t. A running start. The farm runs 50 Holstein Friesians across 175 acres, already sells through 24/7 vending and a webshop, and pasteurises milk and makes cheese and yoghurt on-site — including a Cow-lloumi line. The Howletts have been building the direct-sales muscle for years. So this £47,000 isn’t a cold start from a standing position. It funds a dedicated processing and bottling space, raw and pasteurised bottling, an on-farm customer collection hub, and a winter cow-housing upgrade — scaling something that already turns a few coins. 

Now run it the way it should be run. Show the math, hold every number in pencil. The herd is milked once a day, calf-at-foot, 100% grass-fed — a low-input system that trades volume for a slower lifecycle, so saleable litres run lower than a conventional herd this size. The farm hasn’t published its daily volume, so the figures below are from a Bullvine model based on a 500-to-600-litre-a-day assumption — not the farm’s numbers. Treat them as a framework you’d plug your own figures into, not gospel.

Wholesale organic milk runs around 54 to 56 pence a litre through buyers like Arla right now. As of 2022 reporting, on-farm vending returned £1.20–£1.60 per litre. Strip out bottling, energy, and labour, and the extra margin over wholesale is around 40 to 70 pence per litre. That spread is the whole ballgame. 

Here’s the math you can map onto your own yard. Take a 50 pence per litre extra margin and spread £47,000 across five years — call it £9,400 a year to service the build. A farm would need to sell roughly 51 litres a day to cover it. On a 550-litre herd, that’s under a tenth of the daily tank. Push 30% of the milk direct, and that’s around £30,000 a year in extra gross margin; get to 50%, and you’re near £40,000 even after servicing the capex. The economics aren’t the hard part. The customers are. Always. 

The Mechanics Behind the Numbers

The gap driving all of this is brutal and simple. The UK average farm-gate price sat at 33.99 pence per litre in April 2026, while production costs ranged from 40 to 49 pence per litre, depending on the system. That’s money lost on every conventional litre leaving the yard — the BBC put the average loss at around 10 pence per litre in May 2026. Organic holds a premium in the mid-50s. But with costs climbing toward 50 pence, even the organic margin thins out fast. 

Direct sales flip that ratio because you keep the retail price instead of the wholesale one. The Milk Station Company told Farmers Weekly in 2022 that a typical vending-plus-pasteuriser setup runs “in the region of £30,000,” with payback often “within about 12 months” when the site sits right. Small pasteurisers handling 100 to 500 litres a day ran £6,000 to £15,000 at that time. 

But the spreadsheet only comes true if the demand shows up daily. The pasteuriser doesn’t care where your buyers are. You do. You need steady local demand soaking up your volume at a premium every day — not just on a sunny August Saturday when the farm-shop crowd is out. Without it, you’ve bought stainless steel and changed nothing about your margin.

How Much Does It Really Cost to Cut Out the Tanker?

Less than the headlines imply — if the customers are there. Servicing a £47,000 build over five years requires around 51 litres per day at a 50 pence extra margin. A vending-and-pasteuriser setup ran about £30,000 in 2022. Wicton’s plan goes further — adding bottling, a customer collection hub, and a winter housing upgrade — which is why the target sits higher.

The nasty surprises usually aren’t the equipment. University of Tennessee Extension found US producers consistently underbudget the building work and the cost of passing inspection — it’s the regulatory stack, not the stainless, that blows the number (US data, 2020; the structural warning travels). In England, the Class R permitted development right lets you convert an agricultural building to commercial processing use of up to 1,000 square metres without full planning permission, which can shave both costs and delays off the front end. That’s a real lever. Use it before you pour concrete. 

What Are Your Notice Rights If the Letter Ever Comes?

Here’s a question worth knowing the answer to before you ever need it. Since FDOM24 — the Fair Dealing Obligations (Milk) Regulations 2024 — a UK milk buyer must generally give a producer at least 12 months’ notice to end a contract that’s run longer than 12 months, unless the producer consents to less or has breached the agreement. Every existing contract had to comply by July 9, 2025. 

Wicton’s public statements describe being told “three months ago” but don’t say when its milk actually stops, and August 1 is consistently reported as the fundraising deadline, not a contract-termination date. So there’s no public basis to say the rule was or wasn’t followed here — the formal notice may have been given separately and earlier. The point for you is the rule itself. If a termination letter ever lands in your yard, FDOM24 sets the notice floor, and the Agricultural Supply Chain Adjudicator (ASCA) can investigate complaints and impose penalties of up to 1% of a processor’s turnover. Worth noting: in ASCA’s first year of operation, the adjudicator reported receiving confidential approaches from producers but no formal complaints had progressed to investigation (DEFRA/ASCA, 2025) — a rule you don’t use protects no one. Know in ink what your contract entitles you to before the call comes. 

Go deeper: The Bullvine on farm risk management and contract terms.

Is Your Customer Base Actually There — or Just the Crowdfunder Crowd?

This is the question that decides Wicton’s second act, and it’s the one the coverage skipped entirely. A crowdfunder gets you to August 1. An email list gets you to Christmas. A standing-order subscription base gets you to 2030. The novelty wave — the BBC clip, the viral appeal, the goodwill donations — has a shelf life. Then it’s just a farm trying to shift milk on a wet Tuesday in November.

Move 150 litres a day direct, and you need roughly 50 customer visits daily at a few litres each, or a tighter core of households locked into weekly orders. The farms that last past year one aren’t really selling milk. They’re selling a relationship with specific cows, a specific place, a specific story. Wicton’s farm presence, its calf-at-foot herd, and a team built around refugees, local apprentices with learning differences, and volunteers aren’t a sideline — they’re the story that drives retention. A customer who’s met the cows doesn’t bolt back to the supermarket the first cold week. That’s the moat. Build it before you need it. 

A Working Model: What Mossgiel Did

If you want proof that the pivot can hold, look north. Mossgiel Organic Dairy in Ayrshire — a roughly 45-cow operation — built a direct, batch-pasteurised, non-homogenised supply business and a delivery community around it. By spring 2026, it had gone further: taking on three organic farms in northern Scotland as direct supply partners, at least one of which had already lost its processor contract. That’s the model Wicton is reaching for. A small organic herd that stopped waiting for a tanker and built its own route to market. 

But don’t romanticise it. Mossgiel had years of community building, a recognisable brand, and a delivery network before it could absorb other farms’ milk. You can’t crowdfund your way to a customer base in eight weeks. The pivot works. The timeline is the trap.

FactorWild Cow Dairy (Wicton)Mossgiel Organic
Herd size~50 Holstein Friesians~45 cows
Acreage175 acres~200 acres
SystemCalf-at-foot, once-a-day, grass-fedPasture-based, batch pasteurised
ProcessingOn-farm vending + pasteuriser + cheese/yoghurtBatch pasteurised, non-homogenised
Direct sales infrastructureVending, webshop, 24/7 collectionDelivery community + local retail
Contract statusTerminated — Aug 2026 deadlineSelf-directed — no processor dependency
Years to build customer base~3 years (existing) + crisis forcing scale5–7 years before absorbing partner farms
Supplier expansionNot yetAdded 3 organic farms as supply partners (2026)
Crowdfunding target£47,000 by Aug 1, 2026None required at this stage
Key lessonCapex is the easy part; the 90-day customer clock is the hard partCommunity build time can’t be crowdfunded

Options and Trade-Offs for Farmers

If you’re watching this and wondering whether you’re one phone call away from Wicton’s position, there are a few real moves — each with a catch.

  • Add a vending or a small processing line. Makes sense when you’ve got footfall: a busy road, a market town inside 10 to 15 minutes, existing farm-shop traffic. A vending-plus-pasteuriser setup ran about £30,000 in 2022, plus roughly an hour a day of filling and cleaning, plus steady marketing forever. The risk: location is everything. No catchment, no payback. The forward signal here — with producer numbers down by ~160 in six months — is that more small herds will try this at once, and the best roadside sites will be claimed first. 
  • Partner with an existing direct brand. The Mossgiel route. Makes sense if there’s an established direct seller within haulage range who needs volume. Lower capex, faster to market, but you’re trading independence for someone else’s brand and terms. The signal: as more farms lose contracts, these partnerships fill up — the farm that calls first gets the slot.
  • Do the 30-day check before you do anything (start this week). Pull your last 12 months of milk cheques, your cost per litre, and a map of every town within a 15-minute drive. Calculate your real margin over cost and your plausible daily direct volume. That’s a weekend with your accountant, and it’s the difference between a decision made on your terms and one made under a deadline someone else set.
RouteUpfront CapexBreak-Even TimelineDaily Litres RequiredBiggest RiskMossgiel-Scale?
Wholesale Tanker (status quo)£0Immediate0Contract termination; loss ~10p/litreN/A
On-Farm Vending + Pasteuriser~£30,00012 months(right location)~37 litres @ 70p marginNo local catchment = zero paybackNo
Full Processing + Bottling Build (Wicton model)£47,000~5 years @ 50p margin51 litres/dayCustomer base, not equipmentStarting
Partner with Existing Direct Brand (Mossgiel model)Low / £0–£5k3–6 monthsNegotiated — based on partner termsDependent on partner capacity & termsYes
Farmhouse Cheese / Value-Added Processing£15,000–£50,0002–4 yearsVaries by product mixSkills gap; regulatory stack; spoilagePartial

Key Takeaways

  • If your contract margin is under 10 pence over cost or flagged on volume, model the direct pivot now — not after the letter arrives. 
  • If you can’t name 1,000-plus households within a 15-minute drive, fix demand before you buy stainless. The capex isn’t your risk. The catchment is.
  • If 10 to 15% of your daily litres can’t realistically sell direct in January — not just August — the vending math doesn’t close. 
  • If you ever receive a termination notice, check the FDOM24 12-month rule and the Adjudicator route before you accept the timeline you’re handed. 
  • If you don’t have an email list and a standing-order base, building one is a 90-day job you should start before you need it, not after.
MetricWhere to Find ItRed Flag ThresholdWhat to Do If You’re There
Farmgate price (ppl)Monthly milk statementBelow 38p (conventional); below 52p (organic)Model direct pivot immediately
Cost of production (ppl)Farm accounts / your nutritionistWithin 5p of your farmgate priceYou have less than one bad quarter of buffer
Margin over costAbove two combinedUnder 10p/litreRun break-even model — this week
Contract notice periodYour current milk contractUnder 12 monthsCheck FDOM24 entitlement in writing
Households within 15-min driveGoogle Maps + census dataUnder 1,000Fix demand before buying stainless
Direct litres sellable in JanuaryHonest conversation with yourselfUnder 10–15% of daily tankVending math doesn’t close in winter
Email/subscription list sizeYour current contactsUnder 200 householdsBuild this before you need it — 90-day job

So where does your breakeven actually sit right now — and if the tanker stopped coming next spring, do you have a route to market, or just a tank and a problem? Wicton had 25 years to build the customer relationships that will decide whether £47,000 is enough. Some of that groundwork was already done. Most farms don’t have that cushion, and the smart move is to build it while the milk cheque’s still arriving.

Run Your Numbers

The Bullvine Consolidation Clock — Wicton’s “go direct or go home” choice isn’t unique to Herefordshire. Answer five questions on herd size, cost position, and succession to see whether your signal reads Specialize & Pivot, Hold & Optimize, or something harder — before a processor makes the call for you.

Complete references and supporting documentation are available upon request by contacting the editorial team at editor@thebullvine.com.

Learn More

The Sunday Read Dairy Professionals Don’t Skip.

Every week, thousands of producers, breeders, and industry insiders open Bullvine Weekly for genetics insights, market shifts, and profit strategies they won’t find anywhere else. One email. Five minutes. Smarter decisions all week.
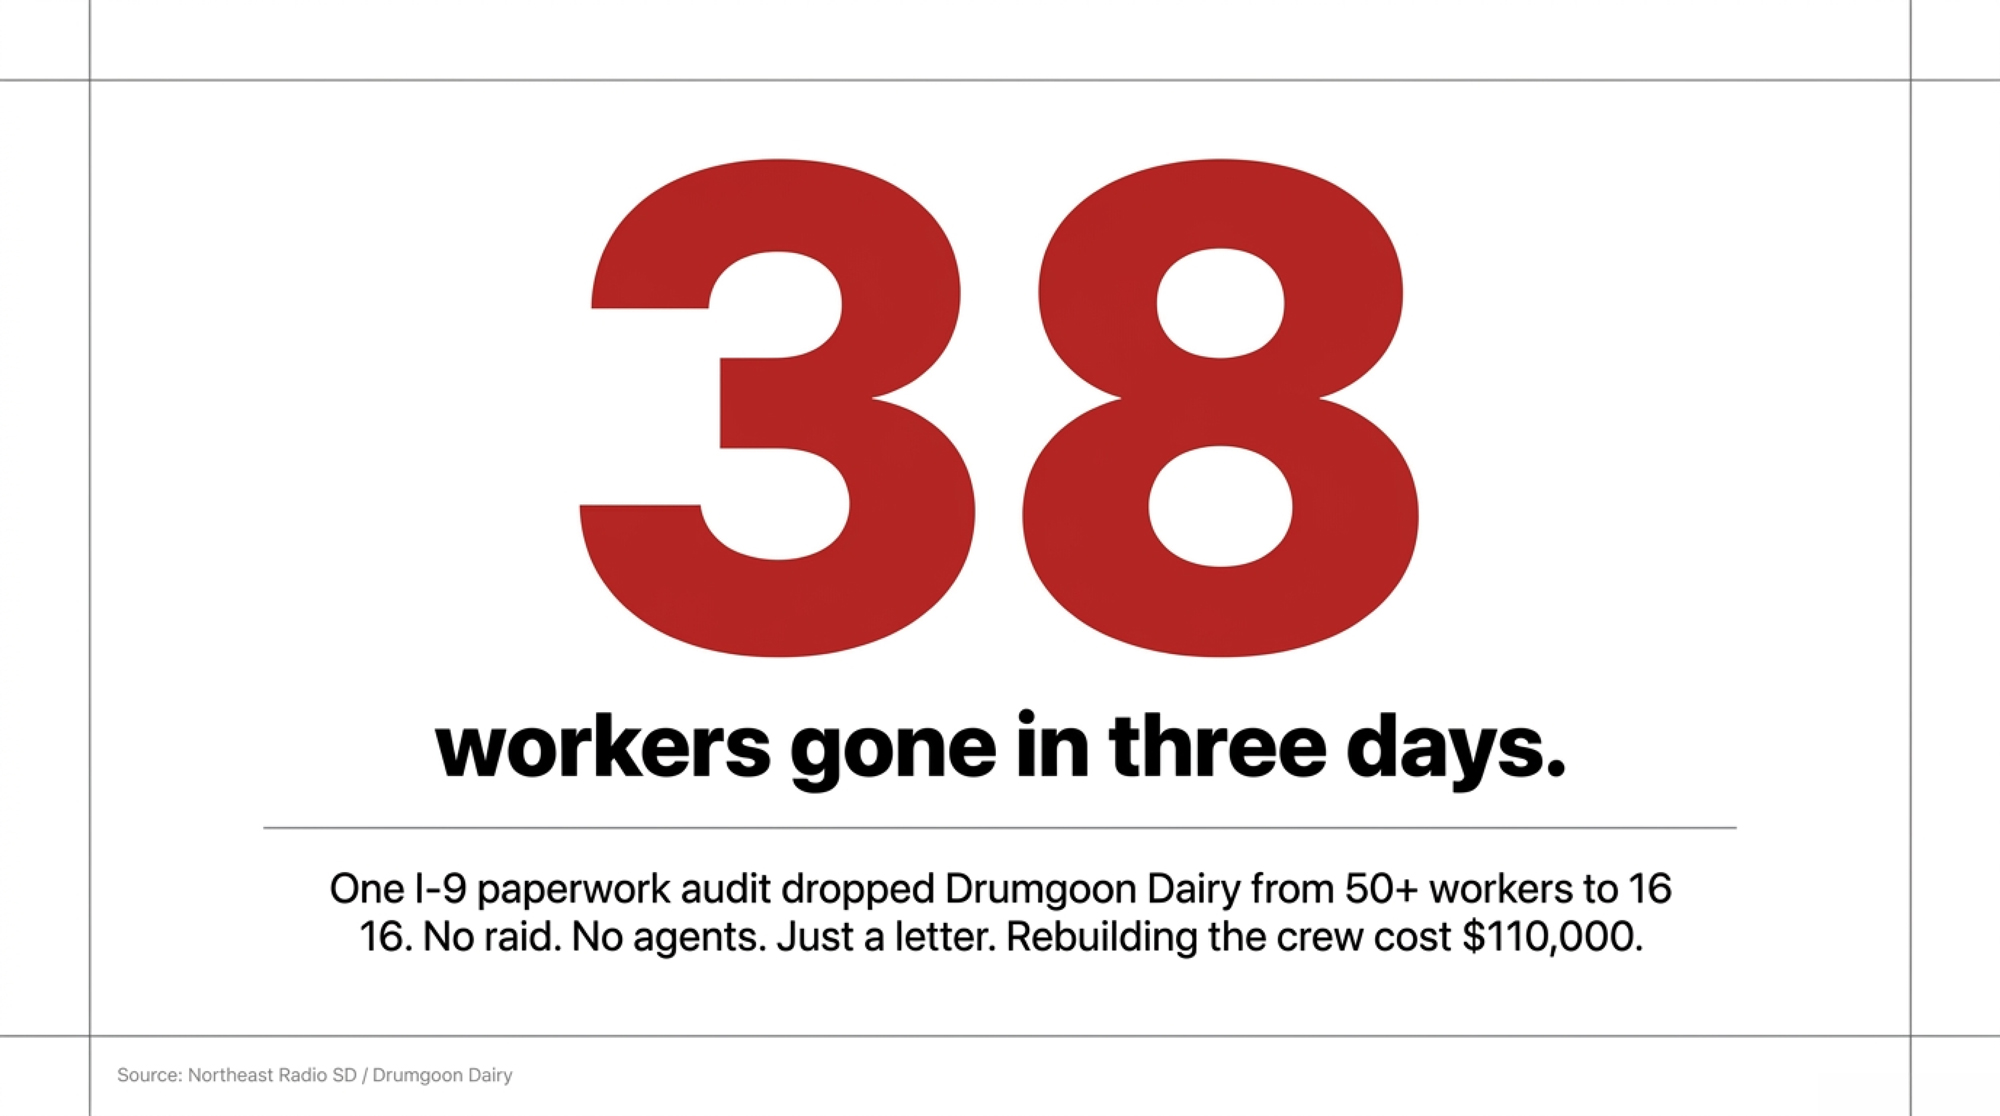
NewsSubscribe
First
Last
Consent

17 Genotyped Heifers and Cut Every Tag. The Dairy Network Got Them Back. The DNA Makes Sure They Can’t Disappear Clean.

Seventeen genotyped Holstein heifers. Gone from a Bliss Road calf barn between 1 and 3 a.m., every ear tag cut out before the trailer reached the highway. They were home within days — and here’s the part nobody expects: the DNA didn’t find them. The dairy network did, one phone call at a time. But the genetics? That’s the reason a thief can’t sell them, can’t register them, and can’t ever make them disappear clean. Ask the Ohio farm still missing 64 calves what that’s worth.

A dense community network got them back. A quiet genomic trap is why they were never going to disappear clean. The herds without either are the ones quietly paying for it.

Sometime between 1 and 3 a.m. on Sunday, May 24, 2026, 17 five-month-old Holstein heifers were hauled out of a pen at Lamb Farms in Oakfield, New York. Every one was genotyped. Every one was a registered replacement from Oakfield Corners Dairy’s elite herd. By the time the theft was discovered, they were already on their way to another state.

A neighbor’s camera on Lockport Road in Alabama, New York, caught it: a heavy-duty pickup pulling a cattle trailer around 1:21 a.m., a second vehicle following close behind. The Genesee County Sheriff’s Office put the loss at $41,000. And here’s the part that should stop you cold — three weeks earlier, a dairy near Coldwater, Ohio, lost 64 calves the same way. Oakfield got all 17 back within days. Ohio, as of early June, got nothing.

Same overnight method. Two completely different endings. The distance between them is the whole story.

MetricOakfield, NY (Lamb Farms)Coldwater, OH (Mercer County)
Date of theftMay 24, 2026May 2–3, 2026
Animals taken17 Holstein heifers64 Holstein steer calves
Reported value$41,000 (~$2,400/head)$128,000 (~$2,000/head)
Genotyped / registered✅ Yes — all 17❌ No (beef-cross feeders)
Tags removed by thieves16 of 17 cut outUnknown
Recovery✅ All 17, within 3 days🔴 None as of early June
Sale barn flagged✅ Lebanon Valley, PA🔴 None publicly reported
Arrests✅ 2 charged June 3, 2026🔴 No suspects named
Genomic trap active✅ DNA still on file🔴 No genomic record

Read more: Oakfield Corners Dairy Lost 17 Genotyped Heifers Overnight. The Dairy Community Brought Them Home

What Saved Oakfield Wasn’t Luck

Within hours of discovering the theft, Lamb Farms put out an alert. Not a vague “please share” post — a specific one that names the calves’ ages, weights, and the ID system in their ears, and asks anyone who’d seen cattle being moved to call it in.

That alert turned a regional theft into a multi-state watch. Sale barns, order buyers, haulers, and market staff from New York through Pennsylvania were suddenly looking for the same thing: a group of young Holsteins arriving without clean paperwork. On Wednesday, May 27, the calves were located at Lebanon Valley Livestock Market in Pennsylvania — a several-hour haul to the southeast — and were returned to Lamb Farms. The Genesee County Sheriff’s Office confirmed the recovery, kept the case open, and credited the ag community with the tips that moved it forward.

Think about how that actually worked. Stolen cattle have to go somewhere to become money, and for young Holsteins, that somewhere is a sale barn. The moment a detailed, specific alert reaches every market manager and buyer, that conversion point becomes a trap rather than an exit. The thieves needed the calves to look ordinary. The alert made them the most-watched animals in three states.

That tip network isn’t a feel-good footnote — it’s infrastructure, and it’s free. The same Facebook groups, breed pages, and text chains you use to chase a loose bull or find a used skid steer are the fastest recovery tool you’ve got. Oakfield’s alert worked because it was specific enough to act on and because the people who saw it actually picked up the phone. A vague post a day late doesn’t do that. A precise one within the hour does.

Torrence A. Schmitt, 25, and Kerisa J. Schmitt, 26, both of Lockport, NY. The Genesee County Sheriff’s Office arrested the pair on June 3 and charged them with third-degree burglary, grand larceny, tampering with evidence, and falsifying business records in connection with the Oakfield calf theft. The charges have not been tested in court. According to investigators, the tampering count relates to ear tags allegedly removed before the calves reached the sale barn — the visible ID that came off, while the DNA record that didn’t is the reason the case holds together. (Read more: BREAKING: 17 Genotyped Holstein Heifers Stolen from Oakfield Corners Dairy — Industry-Wide Alert Issued)

On June 3, deputies arrested Torrence A. Schmitt, 25, and Kerisa J. Schmitt, 26, both of Lockport, in Jamestown, New York, with help from Chautauqua County deputies. According to the Genesee County Sheriff’s Office, the charges are third-degree burglary, third-degree grand larceny, tampering with evidence, and falsifying business records. The Schmitts have been charged, not convicted; they’re due back in court at a later date, and the allegations haven’t been tested. But one detail in the case points straight at why this story should have your attention. Investigators say the tags on 16 of the calves had been removed before the animals reached the market — the very tags meant to make them traceable.

Cutting tags off 16 calves takes time and nerve. Nobody takes that risk for animals that aren’t worth it — and right now, replacement heifers are worth more than they’ve been in years. That’s the piece that turns a quiet calf pen into a target.

Why Your Heifers Are Worth Stealing Right Now

The timing isn’t random. The heifer side of the market has rarely been tighter, and that’s exactly what turns a calf pen into a target.

National average replacement prices hit $3,010 per head as of July 2025 — up 75% from $1,720 in April 2023, and near record highs, according to USDA Agricultural Prices data tracked by CoBank. When the pipeline gets that tight, stolen animals get that much harder to replace at any price. A pen of 17 registered, genotyped Holsteins stops looking like future milk and starts looking like a one-night payday.

There’s a wrinkle in the Oakfield numbers worth naming, though. The sheriff valued the 17 calves at $41,000 total — roughly $2,400 a head, the kind of figure that goes into a felony charge. The Bullvine’s own reporting on the herd’s genetics put elite registered heifers of this caliber at $3,500 to $5,000 per head. Both can be true. One is commodity replacement value; the other reflects genomic merit and cow-family pedigree. That gap will matter a lot when we get to insurance.

How One Night Plays Out on Two Different Farms

Now look at the Ohio case. A farm outside Coldwater in Mercer County was hit sometime between 10 p.m. Saturday, May 2, and the early hours of May 3. Sixty-four Holstein steer calves — about 13 weeks old, roughly 250 pounds each — gone in a single load-up from a converted calf barn on Coldwater Creek Road. Mercer County Sheriff Doug Timmerman called it “highly coordinated” and valued the group at up to $128,000. As of early June, the investigation was still active, with no recovery and no suspects publicly named.

Same playbook. Bigger haul. But no herd names the wider dairy world recognized from the colored shavings at World Dairy Expo, and no genotyping trap waiting downstream — these were beef-cross steers bound for feedlots, not registered Holsteins headed for a breed registry. Different animal, different escape route, different ending.

This isn’t a hypothetical for either farm — it’s two real losses, three weeks apart, with two very different checks at the end. Start with a real, sourced number before you model your own. Sheriff Timmerman put that Ohio group at up to $128,000 for 64 head — around $2,000 a calf at the top end, with no genetics premium attached. Call that the floor for what a stolen calf is worth. Now run it on your own barn, where the genetics premium is the whole point.

Take your 20 best heifers — the contract matings, the daughters of your best cows, the first calves out of a bull you’re excited about. Put a conservative $2,500 replacement value on each.

  • That’s $50,000 standing in one or two pens.
  • If your farm policy values them as generic replacements at $1,500 a head, your insurance check after a theft is $30,000.
  • You eat the $20,000 gap. Plus the genetic momentum you can’t buy back at any price.

On a 200-cow farm, $20,000 isn’t a rounding error. It’s roughly a year of activity collars for a herd that size. It’s the difference between riding out a soft milk price and booking a meeting with your lender. A large operation with reserves and a sharp policy absorbs that. The mid-size family dairy already squeezed on feed, labor, and loan payments might not. That’s how a theft story quietly becomes a consolidation story — the risk reads the same on paper, but the recovery odds don’t.

Farm ProfileTop 20 Heifers (Actual Value)Typical Policy PayoutUninsured GapMonths of Feed Cost LostRecovery Resilience
100-cow family dairy$50,000 @ $2,500/head$30,000 @ $1,500 cap🔴 $20,000~4–5 monthsVery low
250-cow mid-size$85,000 @ $4,250/head (registered)$30,000 @ $1,500 cap🔴 $55,000~6–8 monthsLow
600-cow regional$85,000 @ $4,250/head$60,000 (higher limits)$25,000~2–3 monthsModerate
1,500+ cow large operation$100,000+ @ elite genomics$85,000+ (scheduled policy)$15,000 or less<1 monthHigh

The Genomic Trap Most Producers Are Already Carrying

Lovhill Sidekick Kandy Cane, EX-97 — Oakfield Corners Dairy’s Grand Champion at the 2025 World Dairy Expo. This is the kind of genetics that turns a calf pen into a target. Steal the heifers, cut every tag, and you’ve still stolen nothing the registry can’t trace back. The tags come off. The DNA doesn’t. (Read more: International Holstein Show – World Dairy Expo 2025)

Here’s where the Oakfield ending gets interesting. When you genotype a calf, you pull a small tissue core from the ear, and that sample runs on a chip that reads tens of thousands of genetic markers — her SNP profile, her DNA fingerprint. Holstein Association USA stores that profile tied to her official ID and her parents, and lets you link the tissue-sample number to ID and test ordering through its Enlight system.

CapabilityBreeding Use (Current)Security/Theft Recovery Use (Untapped)
SNP profile stored✅ Used for EBV calculations✅ Proves ownership from one hair/tissue sample
Parent verification✅ Confirms sire/dam match✅ Flags stolen animal registered under fake parents
Registry linkage (HAUSA Enlight)✅ Ties sample ID to EID✅ Creates untamperable chain of custody for law enforcement
Ear tag dependency❌ Tag links sample to animal✅ Tag not needed — DNA survives tag removal
Sale barn utility❌ Not visible at point of sale✅ One swab at market = proof of origin
Active theft deterrence❌ No✅ Makes elite Holsteins near-impossible to launder
Cost per calf~$20–$35 (routine)$0 additional — already paid for

You probably did it for breeding. To sharpen selection, rank your heifers, make better mating calls. But that same record quietly became one of the strongest theft-proof systems livestock has ever had. Cut every ear tag, and the DNA still ties her back to your herd — one hair or tissue sample at any sale can prove who she is. Try to register stolen genetics under fake parents, and the profile generally won’t line up with the recorded sire and dam — when those parents are on file, the registry can flag the mismatch. And for known cow families, the genotype is effectively a biological brand; selling them with fresh tag holes and no papers is practically an invitation to get caught.

In the Oakfield case, the tags were allegedly cut from 16 calves, which, intentional or not, would have stripped the animals’ visible ID. The DNA didn’t move. That’s the quiet reason a load of stolen elite Holsteins is so hard to turn into cash through any legitimate channel — and it’s a tool sitting unused in the herd software of thousands of farms that genotype for breeding and never think of it as security.

Is Your Herd’s Security Still Just a Padlock and a Prayer?

Be honest about what you’d actually do if a truck backed up to your calf barn at 2 a.m. tonight.

Could someone reach your most valuable pen without a neighbor, a night feeder, or a camera ever clocking them? If you woke up to an empty pen, could you send photos and ID numbers to your sheriff and the regional sale barns within an hour? Most operations can’t, and that’s not a character flaw — nobody’s ever made them sit down and answer it. The Oakfield recovery worked because the pieces were already in place: everything genotyped, the alert clean and fast, and a network that trusted the tip and moved on it. None of that is automatic. It’s a string of choices, some made years ago, some made that morning.

How Much Would Waiting Cost You If It Happened Next Week?

The uncomfortable version of the question is about money, not security. Penn State Extension’s farm-insurance guidance is blunt about it: property coverage may include theft, but policies vary by company, limits cap what you can collect, and losses get valued at actual cash value, replacement cost, or functional replacement cost depending on the policy. If you’ve never asked your agent specifically how stolen registered heifers get valued, you don’t actually know what check is coming.

And there’s a sharper trap stacked on top. Penn State warns that animals being hauled in a truck or trailer often aren’t covered by the vehicle policy unless they’re specifically listed, so farms that move stock regularly need to confirm they’re covered under the farm owner’s policy. Until somebody connects the security value of your genomics to the actual numbers on your declarations page, you’re carrying a powerful recovery tool and a quiet underinsurance problem at the same time.

Options and Trade-Offs: Where to Start

You can’t stop every thief. But you can decide how exposed your genetics are if one shows up. Here are four paths, ordered from fastest to slowest — start at the top and work down as far as your operation needs to go.

Path 1 — Start here, within 30 days: build a packet on your top 20 to 50 heifers.

  • When it makes sense: if a handful of elite calves would genuinely hurt to lose.
  • What it takes: for each calf — a recent photo, the official ID, the visual tag number, the genotype sample ID, registration, dam and sire, birth date, and ownership docs — stored where your team can pull them at 2 a.m. Holstein USA lets you tie tissue-sample numbers to ID and ordering through Enlight, which takes some of the grind out of it.
  • The limit: it won’t stop a thief. It makes the animals far harder to launder and far easier to prove in court. The only real cost is an afternoon of admin, which is exactly why it keeps getting pushed to next month. Don’t.

Path 2 — This month or next: point your cameras at the exit.

  • When it makes sense: if you’ve had near-misses, or local thefts are showing up in your county.
  • What it takes: the footage that broke Oakfield open came from a road camera, not the front gate. Put your lenses where animals actually leave, add gates and load-out points that lock, and write a simple call list — who you phone, in what order, when a pen turns up empty.
  • The limit: cameras only help if someone reviews the footage before it overwrites.

Path 3 — The default you’re probably already on: genotyping for breeding only.

  • When it makes sense: if you’re testing for selection and mating and nothing else.
  • What it takes: nothing new — you’ve already done it.
  • The limit: you’ve built an ownership-proof system but aren’t using it. No current photos, no off-farm backup of IDs, no protocol for handing genomic data to law enforcement. The tool exists; nobody can find it at 2 a.m. Paths 1 and 2 are what close that gap.

Path 4 — The long game: push the registry and the sale barn to change.

  • When it makes sense: if you’re active in your breed association and your regional markets.
  • What it takes: tell your Holstein Association USA rep you want a simple consignment-integrity check for animals showing fresh tag holes. Tell your sale barn manager they won’t be hung out to dry for slowing a load down to make a call.
  • The forward signal: the more Oakfield-style recoveries pile up, the more examples there are to point to. And the cattle-rustling law is catching up — the Combating Organized Retail Crime Act (CORCA), the federal cattle-theft and cargo-crime bill, passed the U.S. House in May 2026 and, as of early June 2026, is pending in the Senate, where a coalition of nearly 200 groups is pushing for a vote. It targets organized cargo-theft networks, not barn-level rustlers, but it signals that moving stolen freight is getting harder to do quietly.

Key Takeaways

  • If you genotype for breeding but have no theft file, you’re carrying the tool, not the plan — build a digital packet for your top 20 heifers this month before you need it.
  • If you’ve never asked your agent how stolen registered heifers are valued, assume it’s at a commodity rate and run the gap yourself; Penn State warns that hauled animals often aren’t covered unless they’re scheduled on the farm policy.
  • If a stranger could back a trailer to your most valuable pen unseen, that’s the blind spot to fix first — one evening, drive in like a thief and look at where the cameras aren’t.
  • If a pen ever comes up empty, the first hour decides everything; have the alert — ages, weights, IDs, photos — ready to fire to your sheriff and regional sale barns before you need it, the way Oakfield did.
  • If your breed rep can’t tell you how your genomic records would help recover stolen animals, that’s feedback worth sending up the chain.
  • If animals come back with cut or altered tags, ask law enforcement and your vet how to document DNA samples without breaking the chain of custody — that’s what turns “looks like ours” into proof.

The real question isn’t whether thieves are getting bolder — the heifer shortage and the Mercer County haul already answered that. It’s whether the genetics you’re investing in this year would have a way home, or whether they’d disappear into someone else’s inventory, as 64 calves did in Ohio. One of those farms had a system. The other had a padlock.

Run Your Numbers

Bullvine Pipeline Index Calculator — Score how exposed your herd really is if a trailer backs up to your calf barn. The BPI tool puts a number on your replacement pipeline, heifer value, and cull pressure so you can see what a “17‑head night” would cost your operation and where to shore up the weak spots before someone else finds them.

Learn More

The Sunday Read Dairy Professionals Don’t Skip.

Every week, thousands of producers, breeders, and industry insiders open Bullvine Weekly for genetics insights, market shifts, and profit strategies they won’t find anywhere else. One email. Five minutes. Smarter decisions all week.
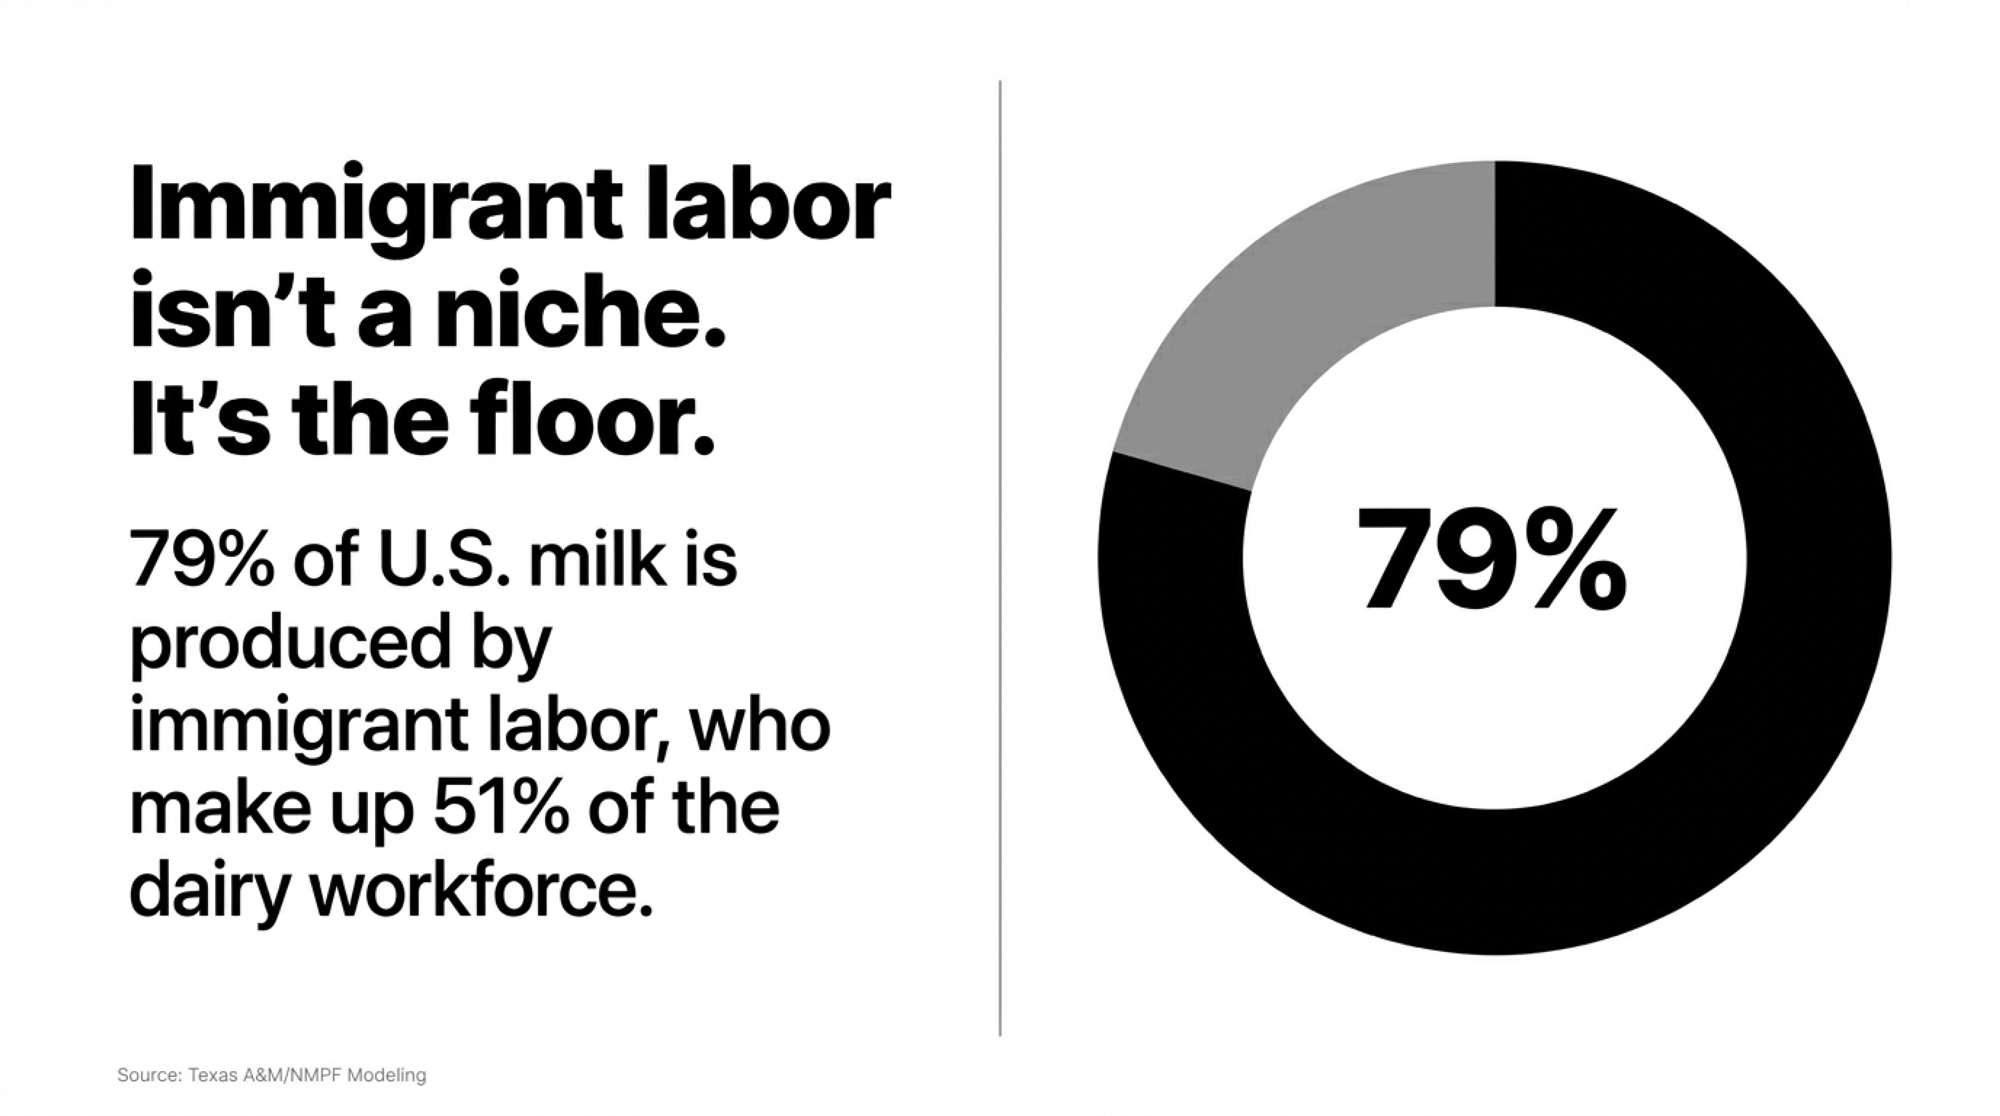
NewsSubscribe
First
Last
Consent

Fans Won’t Fix It – Heat-Stressed Cows Go Leaky in 3 Days

Cornell pinned the gut leak at three days. Fans recover about 60% of your summer milk — the other 40% is leaking from the inside out, and no single additive closes it.

Executive Summary: Cooling gets you back only about 60% of the milk heat stress steals — the other 40% leaks out through a gut that goes permeable inside three days, per a 2022 Cornell study in the Journal of Dairy Science, and reduced intake explains just 30–50% of the loss. The rest is inflammation burning energy that should’ve gone in the tank, which is why fans and soakers alone never close the gap. That’s why one more additive usually isn’t the fix: a 2003 University of Manitoba trial found Aspergillus oryzae did nothing for milk under heat, while yeast, betaine, and chromium each buy a different piece of the biology — rumen, gut hydration, energy metabolism — and don’t substitute for each other. There’s real money in it, too: recover even 2 kg/cow/day across 120 heat days on 500 cows and you’re looking at roughly $50,100 in gross milk, about $100 a head. The quiet trap is DCAD — push it positive for your milk cows in June and the same high-K forage drifts into the close-up pen, blunting calcium mobilization and setting up August’s retained placentas, metritis, and DAs. If you run one forage stream across pens, audit your close-up DCAD before you touch anything else. Read the full piece for the four-path self-audit that tells you which system’s actually failing before you spend a dollar.

dairy heat stress

It’s mid-July, and somewhere in the Midwest a producer is standing in the parlor running the same heat stress math he’s run for twenty summers. Fans going. Soakers firing. A ration he tweaked three weeks before the heat rolled in. And the tank still sliding.

He’s blaming himself again. He shouldn’t be. Heat stress is a multi-system failure, and the playbook he was handed only ever explained half of it.

What’s Really at Stake

For two decades, the message from extension and industry was clean and mostly true: heat makes cows eat less, so add energy density and hang more fans. Manitoba Agriculture’s guidance puts the intake drop at 10–12% or more in hot weather, with milk losses running 15–40%. That advice wasn’t wrong. It just wasn’t finished.

The cow this producer is fighting isn’t just eating less. A 2022 Cornell-led study in the Journal of Dairy Science found heat-stressed Holsteins develop “leaky gut” — increased gastrointestinal permeability — within three days of heat exposure. The kicker: lower feed intake explained only 30–50% of the milk loss. The rest came from inflammation, as bacterial endotoxin slipped across the weakened gut wall and the immune system started burning energy that should have gone into the tank.

Picture what’s actually happening inside her. Blood that should be feeding the udder gets shunted to the skin to dump heat. The gut lining — already running on less blood and less feed — loosens at the tight junctions between cells. Endotoxin crosses into circulation, the liver and immune system mount a response, and the cow starts spending energy on an inflammatory fire instead of milk. That’s why the loss outruns the lower feed bunk: she’s not just under-fueled, she’s under attack.

That same Cornell line of work found a combination of organic acids and botanicals helped restore milk under heat stress — not by cooling the cow, but by shoring up the gut barrier the heat had broken. Which tells you something the fans can’t: a lot of your summer milk leaks from the inside out.

This is the producer who’ll see himself here. The one who’s done everything the old way told him to and still can’t explain the gap between how hard he tries and what the milk check says. That gap is real, it’s measurable, and the research now maps it system by system — which is exactly where the fixable part starts.

The Additive That Looked Right — and Still Didn’t Work

To understand how to fix this biological breakdown, you first have to see how easy it is to spend money on the wrong fix — because the most expensive mistakes in heat stress aren’t reckless. They’re logical. Here’s a cautionary tale of how sound reasoning can still lead you off a cliff.

In a controlled study published in Animal Science in December 2003 (Vol. 77, pp. 485–490), researchers at the University of Manitoba fed the fungal culture Aspergillus oryzae to lactating cows under short-term heat stress. The reasoning was reasonable. It sat next to live yeast on the shelf, and rumen health helps cows cope with stress, so producers and nutritionists folded it into the same bucket.

The result? Nothing. After the five-day heat phase, milk yield still fell, and supplementation had “no effect on vaginal temperature, dry-matter intake, water intake, milk yield or milk components.” The authors concluded the fungal culture “did not ameliorate production losses associated with this type of heat stress.” Manitoba Agriculture’s own extension guidance still flags yeast and Aspergillus oryzae as having “variable results.”

Here’s the twist that makes it useful instead of just a dead end. A 2021 study found that a postbiotic derived from the same organism improved energy-corrected milk and lowered inflammatory markers under heat stress — by tamping down inflammation. Same organism. Different preparation. Opposite outcome. A 2026 meta-analysis in Animals later confirmed that live yeast (Saccharomyces cerevisiae) significantly raised both dry matter intake and milk yield in heat-stressed cows (P < 0.001), while the older fungal-culture trials never delivered that production response.

So the lesson isn’t “additives are snake oil.” It’s that the mechanism has to match what the cow is actually fighting. Bet on the shelf category instead of the biology, and the production response may just not show up — the way it didn’t in that Animal Science trial.

Same Cow, Three Different Heats

Here’s where the smart heat stress programs split from the copied ones. The biology is identical in Georgia, Arizona, and Wisconsin — gut still leaks at three days, immune system still overspends. What changes is the shape of the heat. And the program can’t be the same program.

FactorHot-Humid SoutheastArid SouthwestTemperate Midwest/Ontario
THI PatternChronic — above threshold for weeksExtreme peaks, big day-night swingEpisodic “ambush” spikes, 4–7 days
Night Recovery Window❌ None — stays sticky overnight✅ Strong — cool nights are a tool⚠️ Variable — sometimes yes, sometimes no
Primary Cooling ToolHigh-capacity ventilation + soakers (24/7)Evaporative cooling + shade geometrySwitchable fans/soakers with THI trigger
Forage StrategyMaximize energy density, limit fermentable starchTime high-DMI feeding to cool nightsPre-positioned “heat ration” variant ready to flip
Additive TimingAlways on — no off season in summerOn during peak months; use nights for intake recoveryDefined on/off trigger; OFF switch mandatory in fall
Biggest Hidden RiskDry cow heat stress → next-lactation loss ~1,000 lbSolar load on dry cows and bred heifersFeeding summer logic into October — stacking costs
Evaporative Cooling Efficacy🔴 Low — humid air can’t absorb moisture🟢 High — low humidity makes it the best tool🟡 Moderate — depends on humidity at event time
  • The Hot-Humid Southeast: The enemy is chronic. THI sits above the stress threshold for weeks, nights stay sticky, and cows never dump the load they built during the day. The biology here is unforgiving: with no overnight recovery window, body temperature ratchets up day over day, and a cow that can’t shed yesterday’s heat starts today already behind. You design for around-the-clock cooling and gut protection, and you treat dry cows and bred heifers as heat-stress animals too. The additive support is essentially always on.
  • The Arid Southwest: A different animal. Brutal afternoon peaks, fierce solar load, but low humidity and big day-night swings. That dryness is a tool — evaporative cooling actually works there, because the air can take the moisture, which is exactly why soakers and high-pressure misting earn their keep in the desert and disappoint in the swamp. In one Arizona study, shade over the feed bunk alone improved milk production by 7.5%. So you build like an engineer — shade geometry, airflow, evaporative cooling that exploits the dry air — and you use the genuinely cool nights to claw intake back.
  • The Temperate Midwest & Ontario: The trickiest version: ambush heat. Fewer brutal weeks, more surprise events, and a creeping climate trend toward more days over threshold each decade. The danger isn’t the severity, it’s the surprise — a barn built and managed for a temperate average gets caught flat by a four-day spike, and the cows pay before the ration ever catches up. The move that separates a nutritionist who understands the biology from one copying a Florida playbook is building a switchable program — one with a clear trigger and, just as important, an off switch. Because the costliest mistake here isn’t failing to turn it on. It’s forgetting to turn it off.

The Trap Hiding Inside the Switch

Can a smart heat program for your milk cows quietly wreck your dry cows? Yes — and it’s quiet enough that most farms don’t connect the dots until calvings go sideways in August.

ParameterLactating Cow (Heat Ration)Close-Up Dry Cow (Target)What Happens If Close-Up Gets the Heat Ration
DCAD Target+35 to +40 mEq/100g DM−23 to −68 mEq/lb DMDCAD pushed sharply positive — wrong direction
Potassium Level1.5% DM (Manitoba guidance)As low as possibleBlunts PTH response; impairs Ca mobilization
Sodium Level0.5% DMMinimalAdds to positive DCAD, worsening the problem
Blood pH EffectSlightly alkaline — desired under heatMildly acidic — required for Ca primingSubclinical alkalosis; Ca mobilization impaired
Calving Outcome RiskN/ASmooth Ca transitionSubclinical hypocalcemia → milk fever risk ↑
3-Week Post-Calving RiskN/AClean transitionRetained placentas, metritis, DAs elevated
Next-Lactation ImpactMaintainedFull potential~1,000 lb milk loss from heat-stressed dry cows
Audit ActionConfirm K% in each forage, by penTest close-up DCAD before touching lactation rationPull August fresh-cow disease logs — the damage is already there

In June, the nutritionist does the right thing for the high group: pushes dietary cation-anion difference (DCAD) up with extra potassium and sodium to replace what cows lose through sweat and panting. Manitoba Agriculture recommends heat-stress diets carry 1.5% potassium, 0.5% sodium and 0.35% magnesium; many heat rations push DCAD up toward +35 to +40 mEq/100g of dry matter. Research backs it — higher DCAD under heat stress improves blood acid-base balance and can lift milk fat. Good call for milk cows.

Then logistics take over. The same high-potassium forages feeding the milk cows are sitting in the bunkers the whole farm pulls from. Out of convenience, those forages keep flowing to the close-up pen. And now the dry cows are eating a near-lactation DCAD.

But the dry cow needs the exact opposite. In her last three weeks she needs a negative DCAD — standard close-up guidance puts the target in the range of roughly −23 to −68 mEq/lb of dry matter — to set up the mild metabolic acidosis that primes her to mobilize calcium at calving. The mechanism is straightforward once you see it: a slightly acidic blood pH makes her tissues more responsive to parathyroid hormone, so when calcium demand spikes at calving she pulls it from bone and gut on cue. Push DCAD positive and you blunt that response. She calves into subclinical hypocalcemia, and three weeks later you’ve got the retained placentas, the metritis, the DAs. Stack that on heat-stressed dry cows — which research links to roughly 1,000 lb less milk in the next lactation — and it’s a double hit. Nobody writes “we wrecked our close-ups with a lactation DCAD decision” on the whiteboard. It just feels like a rough summer.

Go deeper: Your Fans Can’t Fix Half of Heat Stress. Your Ration Can.

The Three-Line-Item Question

So a producer looks at stacking yeast, betaine, and chromium and sees three line items where he wants one. The skeptic’s version, and it’s a fair one: “Why pay for three when I could just pick the best one?”

The honest answer isn’t “more is better.” It’s that each tool buys a different piece of the biology. Take them one at a time, because the mechanisms don’t overlap the way the shelf placement suggests.

AdditivePrimary MechanismSystem TargetedKey EvidenceDMI ΔECM ΔUse If…
A. oryzae (fungal culture)Rumen fermentation modulationRumenManitoba 2003: zero effect on milk, DMI, temp under heat0 kg/d0 kg/d⚠️ Evaluate postbiotic form only (2021 data)
Live Yeast (S. cerevisiae)O₂ scavenging; stabilizes rumen pHRumenAnimals 2026 meta-analysis; P < 0.001+0.58 kg/d+1.10 kg/dSlug-feeding patterns; SARA risk elevated
BetaineOsmolyte — cellular water retentionGut barrier / hydrationJAS 2024 meta-analysis+0.58 kg/d+1.36 kg/dGut permeability is the primary failure mode
ChromiumInsulin sensitizer; glucose partitioningEnergy metabolismMultiple trials; est. effect+0.30 kg/d~+0.80 kg/dHigh-genetic cows burning glucose on heat maintenance
Combination StackAll three mechanisms simultaneouslyRumen + Gut + MetabolismAdditive (mechanisms don’t overlap)~+1.46 kg/d~+3.26 kg/dCooling & DCAD already handled; high-value herd

Yeast stabilizes the rumen. When a heat-stressed cow slug-feeds at night and the bunk pH crashes, live yeast helps scavenge oxygen and feed the bugs that keep fermentation steady — the front-line defense against the sub-acute ruminal acidosis that heat-driven feeding patterns invite. The 2026 Animals meta-analysis confirms it lifts both intake and yield specifically in heat-stressed cows.

Betaine works somewhere else entirely — as an osmolyte. It lets cells hold water under heat and osmotic stress, which supports gut-barrier integrity exactly where the three-day leak starts. A 2024 meta-analysis in the Journal of Animal Science found betaine raised dry matter intake by +0.58 kg/d and energy-corrected milk by +1.36 kg/d, with the effect on intake stronger in heat-stressed cows.

Chromium plays a third position. It improves insulin sensitivity and glucose uptake, so more of the energy you feed actually reaches the udder instead of getting burned just keeping the cow standing through the heat of the day. Pick one, and you’re really choosing which system failure to ignore: rumen, gut hydration, or energy metabolism. They overlap at the edges. They don’t substitute.

What’s Two Kilos of Milk Actually Worth?

Run the barn math, conservatively. Recovering even 2 kg of milk per cow per day across roughly 120 heat-stress days adds up faster than most producers expect.

THE BARN MATH 2 kg/cow/day × 120 heat-stress days × 500 cows = ~$50,100 in gross milk (at an assumed $18.95/cwt — about $100/cow over the heat season)

That’s the bucket you’re arguing inside. And it’s gross milk, before you net out additive cost — so the real decision is whether the stack captures enough of that to clear what it costs. The debate was never whether betaine runs you seven cents a cow or nine. It’s whether you want to leave most of that fifty grand sitting on the table to save a few pennies a day.

Your Heat-Stress Self-Audit: Four Paths, Four Questions

The lessons sort into four real paths, depending on where your operation sits today. Each one comes with a question to ask yourself before you spend a dollar.

  • Path 1 — Fix the free leaks first (any herd, this month). When it makes sense: Before a single additive, walk your water troughs, air speeds, shade lines, and stocking density. The audit question: Are your dry cows and bred heifers getting cooled like the high-value assets they are — or are they sweating out next lactation’s potential? And have you measured what heat costs your herd, or are you running on a national average? 30-day action: Pull last July and August milk curves, repro records, and fresh-cow disease logs. See what heat actually cost your herd, not a national average. If cows are at 130% stocking with only 18 inches of bunk space, moving cows beats any supplement you can buy.
  • Path 2 — Audit dry-cow DCAD before you touch the lactation ration (mixed-forage herds). When it makes sense:Any farm running one forage stream across pens. The audit question: Is your close-up DCAD actually negative right now — or is high-potassium forage quietly pushing it positive while you fix the milk cows? What it demands: A forage test and the discipline to keep high-potassium feed out of the close-up diet. Skip it, and you hand back your summer milk gains as August transition wrecks.
  • Path 3 — Build a switchable heat module (Midwest, Ontario, temperate herds). When it makes sense: Episodic, ambush heat. The audit question: Does your heat program have an off switch — or are you still feeding summer logic in October? What it demands: A defined “heat-on” ration variant and a trigger tied to forecast or THI. Leave it running into the fall and you’re feeding a summer ration in November.
  • Path 4 — Layer additives by mechanism, not by brochure (high-genetic, tight-ration herds). When it makes sense:Once cooling and DCAD are already handled. The audit question: When you weigh an additive, can you name the mechanism it’s buying — rumen, gut, or metabolism — or just the brand on the bag? And did you set the success metric before the trial started? What it demands: A structured 60-day trial with the success metric set before you start, plus the nerve to walk away if the response doesn’t show. Stack everything on day one with no benchmark group, and you’ll never know what paid and what didn’t.

One signal worth watching as you plan: combined-mode ingredients are arriving — chromium-yeast products that bundle rumen and metabolic pathways into a single bag. Call it version one of where this is heading, not the finished article.

Key Takeaways

  • If feed intake only explains a third to half of your summer milk loss, then fans alone were never going to get the rest — the gut and the immune system are.
  • If one forage stream feeds every pen, then a positive-DCAD heat move for your milk cows is probably leaking into your close-ups; audit it before you adjust anything else.
  • If you can’t name the mechanism an additive targets, you’re buying a category, not a result — and the Aspergillus oryzae story is what that costs.
  • If you’re going to stack, decide what success looks like in writing before the trial starts, or you’ll never know which line item earned its keep.

The producer in that July parlor isn’t failing. He’s been working off half a map. The other half — the three-day gut leak, the immune bill, the DCAD trap, the mechanism behind each additive — is now sitting on the table, measurable and fixable. So here’s the question worth carrying into the barn this week: before you reach for a product, can you point to the system that’s actually failing your cows when the THI sits over 70 for a week straight? Get that right, and everything after it is just the math you were always willing to do.

Run Your Numbers

Forage Quality Value Calculator — Punch in your lab numbers and milk price to see what each forage is worth per cow per day and exactly where it belongs — high group, heifers, or dry/far-off. The fastest way to catch high-K forage drifting into your close-up pen before it costs you next lactation.

Complete references and supporting documentation are available upon request by contacting the editorial team at editor@thebullvine.com.

Learn More

The Sunday Read Dairy Professionals Don’t Skip.

Every week, thousands of producers, breeders, and industry insiders open Bullvine Weekly for genetics insights, market shifts, and profit strategies they won’t find anywhere else. One email. Five minutes. Smarter decisions all week.
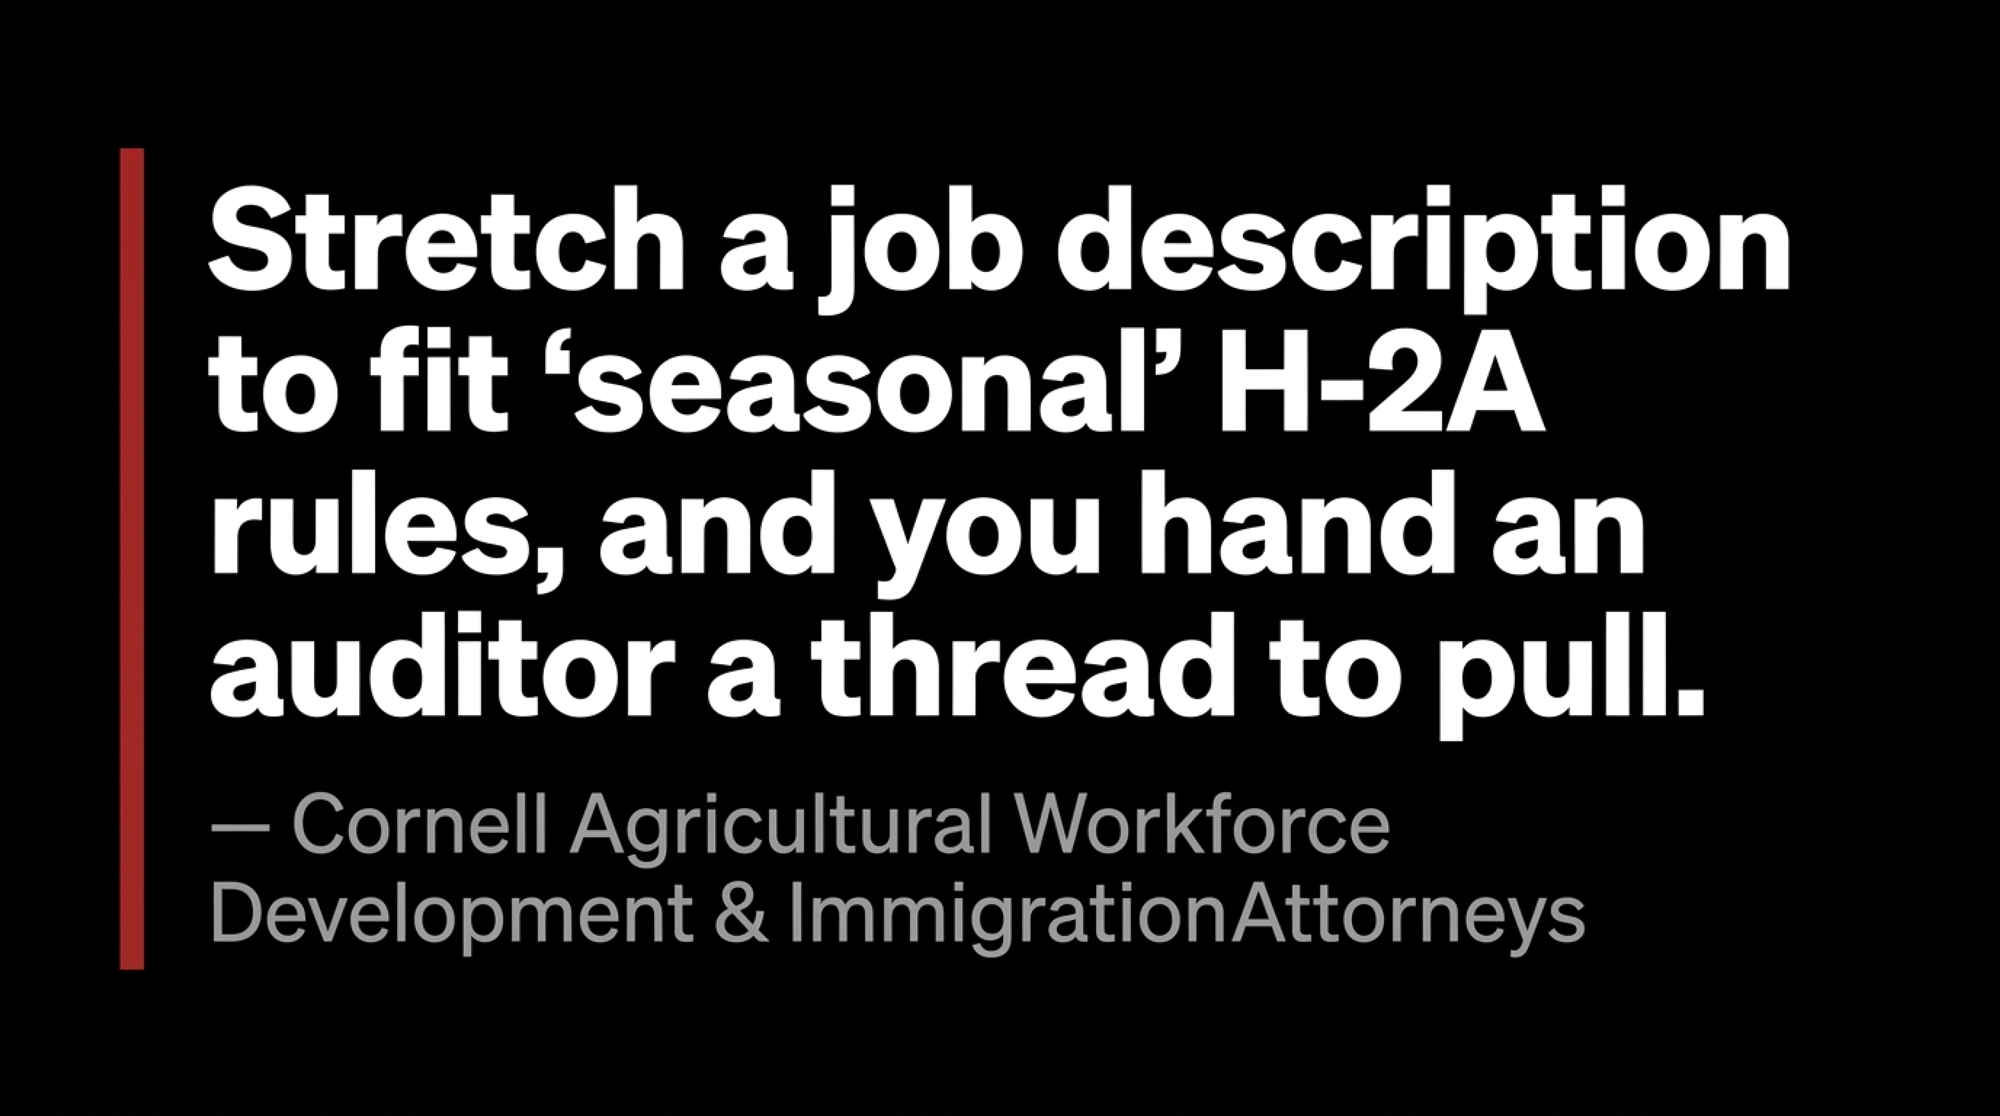
NewsSubscribe
First
Last
Consent

Dairy Finally Got Its H-2A Door. In Wisconsin, It Costs About $25 an Hour to Walk Through.

Trade media called the H-2A reinterpretation a win. Nobody ran the barn math: ~$877 a cow a year, about $25/hr all-in — right on top of the crew you’ve already got. Run your number first.

Executive Summary: After 40 years shut out, dairy can finally tap H-2A guest workers as of mid-June 2026 — but in Wisconsin the all-in cost lands near $25 an hour, about $877 per cow a year, right on top of what your current crew runs. This isn’t a new law; it’s a USCIS guidance memo reinterpreting “seasonal need,” which means the next administration can pull it as fast as it appeared, and it still won’t cover the year-round milking slots that make up most of the 51% immigrant share of the dairy workforce. Price your domestic crew honestly — wages plus the turnover hit at the 39% industry churn rate — and it runs about $26.83/hr, so H-2A isn’t a bargain or a blunder. It’s a wash. Which means the real decision was never cost; it’s stability versus compliance risk and a possible six-figure OSHA-spec bunkhouse you’ll still own if USCIS denies your petition. It pencils for higher-wage states with documentable seasonal spikes and existing housing — and stays a co-op conversation for the 240-cow herd milking the same five people all year. Pull your last 12 months of labor records before you call a recruiter, because the question isn’t whether the door’s open. It’s whether walking through pays for your herd.

 H-2A cost per cow

For four decades, the federal answer to dairy on H-2A was a near-automatic no. The program was built for harvest crews that come and go with the apples or the lettuce. Milking isn’t seasonal — cows don’t stop in December — so dairy never fit the box. That changed in mid-June 2026, when the government quietly reinterpreted the rules. The trade press ran it as a win. Nobody put a pencil to what walking through that door actually costs a working herd. So before you call a recruiter, here’s the math the headlines skipped.

What Actually Changed in June

U.S. Citizenship and Immigration Services issued new guidance directing its officers to stop reflexively rejecting dairy petitions and instead judge each one on whether the farm has a genuine temporary or seasonal need. Read that carefully. It’s a change in how existing rules get applied — not a new law, and not an expansion passed by Congress. 

The distinction matters more than the headlines let on. A law takes an act of Congress to pass and another to repeal. Guidance is a memo. It tells the agency’s adjudicators how to read existing rules, and the next administration can issue a different memo on a Tuesday. So when you hear “dairy got H-2A,” what dairy actually got is a more favorable reading of the same statute that’s been on the books for years — not a new, durable right.

The industry welcomed it, carefully. The National Milk Producers Federation framed it as a step toward opening the door. Edge Dairy Farmer Cooperative called it an early, positive step for year-round producers. Both groups are membership organizations whose job is to advance producer interests, so a positive read is expected, which makes the hedging in their own words (“toward,” “first step”) worth noting. Even the people cheering aren’t calling it the fix. 

Here’s the catch that didn’t lead the coverage. The guidance does not open H-2A to permanent, year-round milking. Cornell’s Ag Workforce Development team read it as covering temporary or seasonal jobs only — not permanent or back-to-back consecutive roles. File repeat petitions for the same milking slot with no real break, and USCIS will generally read that as proof of a permanent need — and deny you. 

Who This Helps — and Who It Doesn’t

This change helps a specific kind of operation. Larger herds with a documentable seasonal spike — a tight calving window, a defined expansion phase, and seasonal feed work. Farms in higher-wage states, where the gap between the H-2A wage floor and your current payroll is already thin. And operations that either own compliant worker housing or can afford to build it.

It does a lot less for everyone else. Milk 240 cows in a low-wage state with the same five people all year, and there’s no seasonal spike to point to — and the all-in cost can run higher than what you pay now once housing and fees land. For those herds, this was something to talk about at the co-op, not a new labor source. 

The biggest number in the room goes untouched. An NMPF-commissioned study put immigrant labor at roughly 51% of the dairy workforce, producing close to 79% of America’s milk — figures now about a decade old but still the standard reference. Most of those workers hold the year-round jobs this guidance doesn’t cover. So whatever H-2A becomes for dairy, it’s not a swap for the crew already in your parlor. 

Farm Profile FactorH-2A Likely Pencils ✓H-2A Likely Doesn’t Pencil ✗
Herd size500+ cows, multiple labor slots240 cows or fewer, same 5 people year-round
Seasonal needDefined calving window, expansion phaseYear-round milking with no documented spike
State wage floorHigher-wage states (WA, OR, NY, CA)Low-wage states where AEWR adds little vs. local labor
Housing statusOwn compliant OSHA-spec bunkhouse nowAging trailer, shared bath, no locks — renovation = six figures
Turnover rate39%+ churn — you’re already paying the H-2A rateLow churn, stable crew — domestic wins on simplicity
Risk toleranceCan absorb a denial after fees are sunkCannot carry sunk housing cost if petition is denied
Visa fee trajectoryLocked into a short-cycle contractMulti-year plan built on today’s $1,350 — fees keep climbing

Does H-2A Actually Pencil Out for a 500-Cow Dairy?

Everyone assumed “access to H-2A” meant cheaper labor. The barn math says otherwise. Here’s how the numbers stack up for a 500-cow Wisconsin dairy running 10 full-time equivalents on a 10-month contract, against a traditional domestic crew. That one-worker-per-50-cows ratio swings with parlor type and automation — some herds run 8, some run 12 — so set yours before you trust the rest. 

Running the Numbers: H-2A vs. Domestic Labor (Per Worker, Bullvine Model)

Cost CategoryH-2A Guest Worker (10-Mo. Contract)Domestic Crew (Honest Costing w/ Churn)
Base cash wages$30,300 (~1,733 hrs @ ~$17.50 effective) $40,560 (2,080 hrs @ $19.50, Midwest working assumption)
Taxes & benefitsIncluded in fees/overhead$7,440 (payroll taxes, modest perks)
Housing operating cost$11,000 (USDA seasonal average) $0 (assumes no farm-provided housing)
Visa & application fees$1,350 (up ~$600 in two years) $0
Inbound/outbound travel & subsistence$1,200 $0
Annualized turnover hit$0 (contract-guaranteed term)$7,800 (39% avg @ $20k replacement) 
Total cost per worker~$43,850~$55,800
All-in hourly rate~$25.29/hr (over ~1,733 contract hrs)~$26.83/hr (over 2,080 hrs)

Run that per-worker H-2A number against the cows it covers, and you get the figure the headlines never quote: one worker per 50 cows at ~$43,850 a year is about $877 per cow annually — your single biggest controllable cost after feed, and a number you can plug your own ratio straight into.

Two notes on reading that table honestly. The H-2A wage assumes a 40-hour week across the contract — real barn hours often run longer, so scale it to your own schedule. And the two hourly figures sit on different denominators (1,733 contract hours versus 2,080 full-time hours), so treat them as all-in cost-of-labor rates, not identical-hour comparisons.

The $43,850 isn’t a single-sourced figure — it’s a stack of USDA’s housing range, AFBF’s fee data, and published academic transport costs. Housing costs and fees vary by state and farm size, so confirm your state’s current AEWR off the DOL table and price your own housing before you lock in a decision.

One more thing the table can’t show: the fees move. AFBF flagged the per-worker application and visa costs climbing by roughly $600 over two years. Build a five-year labor plan on today’s $1,350, and you’re already behind, because the one input that’s pure paperwork is the one that keeps rising. 

The Turnover Line That Flips the Whole Comparison

Look at the table without the turnover row and domestic labor wins clean — about $48,000 against H-2A’s $43,850. Add the churn back, and the gap closes to almost nothing. That’s the entire argument in one line item:

  • H-2A, all-in: ~$25.29/hr — fixed by contract
  • Domestic, turnover excluded: ~$23.08/hr — what most herds think they pay
  • Domestic, turnover included: ~$26.83/hr — what they actually pay at the 39% industry average 

The number herds skip is the one that decides this. Price your crew honestly, and H-2A stops looking like a bargain or a mistake. It looks like a wash. And a wash on cost means the decision was never really about cost at all, which is where most of these conversations go wrong from the first phone call.

Why It Was Never a Wage Question

Once those two numbers sit side by side, the real question flips. It’s not “Is H-2A cheaper?” It’s “which system gives me more stability for roughly the same dollars — and can I survive a denial letter after I’ve poured concrete for a bunkhouse?”

That’s the trade the table doesn’t price. H-2A buys you a contract-locked crew that shows up for the season and can’t quit for the dairy down the road offering fifty cents more. You give up flexibility, and you take on compliance risk. A domestic crew gives you flexibility and no petition to lose — but you carry the turnover, the recruiting, and the 2 a.m. text that someone isn’t coming in. Same money, different risk. Pick the risk you can actually manage. That’s the revolving door at the parlor most operators are quietly trying to close. 

For a 500-cow herd, converting four genuinely seasonal positions to H-2A while keeping six domestic year-round might trim your labor line by a few cents to roughly $0.40/cwt — but only if you already own compliant housing and your petitions are approved. This is a marginal-savings figure from a partial conversion, not the same animal as the $877-per-cow all-in cost above — keep them separate. Here’s the arithmetic, with the production assumption stated: four H-2A at ~$43,850 plus six domestic at ~$55,800 runs about $510,000, against roughly $558,000 for an all-domestic crew priced for turnover. Spread the ~$48,000 gap across 120,000 cwt of annual production — that’s 500 cows at about 24,000 lb each — and you land near $0.40/cwt. Build housing from scratch, though, and you add maybe $1,500–$2,600 per worker per year in amortized cost — enough to erase that savings. 

Why Is “Free Housing” a Six-Figure Decision?

The reason H-2A isn’t cheap comes down to what the program legally demands. Pay the highest applicable wage. Provide free housing that meets federal safety standards. Cover travel in and out. And guarantee at least 75% of the contracted hours, whether or not the work shows up. That three-quarters guarantee is the clause nobody mentions — if your calving peak runs late, you still owe the hours. 

Compliant H-2A housing isn’t a spare farmhouse with a couple of mattresses and a space heater. Under OSHA’s temporary labor camp standard, you need at least 50 square feet of sleeping space per person, one toilet for every 15 workers, one shower for every 10, a stove per 10, a refrigerator for every 6, screened windows that open, working smoke detectors, and roughly 35 gallons of water per person per day. Build a bunkhouse for 10 to that spec, and you’re well into six figures. 

Housing RequirementOSHA H-2A StandardNY Dairy Survey FindingGap
Sleeping spaceMin. 50 sq ft per personNot measured directlyUnknown — likely underbuilt
Toilets1 per 15 workers48% of workers: no door locks on any bathroomNon-compliant baseline likely common
Showers1 per 10 workersNot separately measuredLikely insufficient in older housing
WindowsScreened, must open58% reported insect infestationsIndicates screened windows non-functional or absent
Structural integrityNo holes in walls/floors32% had holes in walls or floorsDirect structural non-compliance
Water supply~35 gal/person/dayNot measuredUnknown compliance rate
SecurityImplied by safety standards48% had no door locksDirect safety non-compliance
Estimated retrofit cost$80,000–$150,000+ for a 10-worker bunkhouse

A lot of existing dairy housing is nowhere close. A New York survey of dairy farmworker housing — general dairy housing, not H-2A-inspected units — found 58% of workers reported insect infestations, 48% had no door locks, and 32% had holes in their walls or floors. The point isn’t that H-2A housing is bad. It’s the gap. If your setup is an aging trailer with soft floors and one bathroom for eight guys, you’re not a coat of paint from compliance. You’re a renovation away. 

Here’s where the housing math turns on you. Spend six figures retrofitting a bunkhouse to OSHA spec, then file a petition that USCIS denies because your “seasonal” need looks year-round, and the concrete doesn’t disappear. You own the building and none of the workers. That’s the asymmetry: the housing cost is certain and up-front, the approval is not.

Is the Real Fix Even Coming From Washington?

Be careful betting your operation on it. This is policy guidance, not a law — a future administration could rewrite it without a single vote in Congress. It’s a door that can be closed the same way it opened. 

A real fix would need two hard things at once: legal status for the people already milking your cows, and a true year-round visa that admits cows don’t take winters off. The Farm Workforce Modernization Act proposed exactly that. It passed the House twice — in 2019 and 2021 — and died in the Senate both times. That’s the honest track record. Push for reform, by all means. But plan your next five to ten years as if it never arrives, and treat any progress as upside, not a rescue plan. 

This is the same squeeze behind the fact that 51% of the dairy workforce is immigrant labor — a structural dependence no temporary-visa memo was built to solve.

The 30/90/365-Day Playbook for Herds Weighing H-2A

TimeframeActionEstimated CostReversible?Red Flag Trigger
30 DaysPull turnover rate + true replacement costStaff time only — $0 out of pocketYesChurn near 39%? Your crew already costs ~$26.83/hr
30 DaysContractor housing walkthrough vs. OSHA checklist$500–$1,500 inspection feeYesOne bathroom for 8 workers = six-figure reno, not a paint job
90 DaysDocument seasonal need with legal help$2,000–$5,000 attorney feesPartialCan’t define a clear start-and-stop? Treat petition as a coin flip
90 DaysFile H-2A petition (DOL + USCIS)$1,350 visa & app fees per worker + legalNo — fees go to zero on denialFile late = approval lands after the work it was meant to cover
90 DaysInvest same money in housing as retention toolVaries — same housing, zero visa exposureYesPays back whether or not you ever file
365 DaysBuild/retrofit compliant bunkhouse$80,000–$150,000+ for 10 workersNo — concrete doesn’t disappear on denialAmortized cost erases $0.40/cwt savings if built from scratch
365 DaysModel labor assuming no Washington reformInternal planning cost onlyYesIf reform comes, treat it as upside — not a rescue plan

30-Day Actions (run the checks before you call anyone):

  • Pull your actual turnover rate and your true cost per worker, churn included. This is the one number that reframes every decision here. What to do: count departures over the last 12 months, multiply by the $15,000–$25,000 replacement range. Trigger: if your turnover is near the 39% average, your domestic crew may already cost what an H-2A worker would. Where it backfires: lowball your replacement cost, and you’ll talk yourself into a program you don’t need. 
  • Get a contractor’s housing quote before you get a wage quote. What it requires: a walkthrough against the OSHA checklist. Watch for: a “small renovation” that becomes a six-figure build once the inspector counts toilets and square footage. 

90-Day Actions (structural moves that need planning):

  • If you decide to pursue H-2A, document a genuinely seasonal need that survives USCIS scrutiny — a defined calving or expansion window, not a year-round milking slot. What it requires: legal help and clean records. Trigger: if you can’t draw a clear start-and-stop on the work, treat the petition as a coin flip. Backfire risk: a denial after you’ve sunk housing and fees. 
  • Or skip the visa and treat housing as a retention investment instead. Bullvine’s earlier reporting on Midwest dairies that invested in quality worker housing found turnover dropped as a result. The same housing pays back whether or not you ever file a petition. 
  • Time the petition to your start date. H-2A filings move through DOL and USCIS on a calendar, not on demand, so a crew you need for a spring calving push has to be filed months ahead. What it requires: a target start date locked now and a lead time confirmed with your ag-labor attorney. Backfire risk: file late, and the approval lands after the work it was meant to cover.

365-Day Moves (position for the next cycle):

  • Build your labor model assuming Washington delivers nothing. If reform comes, it’s upside. Opportunity signal: if you’re in a higher-wage state, already own compliant housing, and your turnover is punishing, that’s the narrow case where H-2A genuinely pencils — move deliberately, not on the recruiter’s timeline.
  • Watch the guidance’s legal footing. Because it’s policy guidance, not statute, build any multi-year housing investment so it pays off through retention even if H-2A access gets pulled. 
  • Stress-test your crew against a labor shock that empties your parlor. The herds that survive a sudden loss of workers are the ones that already know which jobs are seasonal, which are essential, and what each one really costs. 

Key Takeaways

  • If your annual turnover is near the 39% industry average, run your real replacement cost before you call a recruiter — your domestic crew may already cost what H-2A would. 
  • If you don’t already have compliant housing, get a contractor quote before a wage quote. You’re not comparing labor costs — you’re comparing labor plus a possible six-figure build. 
  • If you can’t document a genuinely seasonal need that survives USCIS scrutiny, treat the petition as a coin flip — the fees and housing go to zero the day a denial arrives. 
  • If you farm in a state with a wage floor under $16, check whether H-2A’s all-in cost actually beats your current payroll. It often won’t. 

So, Where Does Your Operation Actually Land?

H-2A is a narrow tool that pays for specific herds in specific states, and guidance that can be rewritten as fast as it was written. The trade-off at the heart of this isn’t cost versus savings. It’s stability versus paperwork-and-risk, for roughly the same dollars.

So pull your last 12 months of labor records this week. What’s your real cost per worker once you factor in turnover — and would an H-2A worker at about $25 an hour, roughly $877 per cow per year, actually beat it, or would you just be paying for more paperwork and a bunkhouse you’ll owe whether the guidance survives or not? The full cost-per-cwt model run line by line, for both a 500-cow and a 1,500-cow herd, is in the next Bullvine Weekly.

Is H-2A a Wash or a Win for Your Herd?

The math shifts the second you cross a state line or change your housing footprint. Use this interactive calculator to plug in your regional wage floor (AEWR), current domestic payroll, and real worker housing situation to see the true cost per hour side-by-side.

Dairy Labor Cost Calculator

Compare H-2A Guest Workers vs. Real Domestic Costs

1. H-2A Setup & Regional Rules

2. Your Current Domestic Crew

*Industry average is 39%. Replacing one worker safely costs $15,000–$25,000 in lost efficiency & recruitment.

3. True Side-By-Side Rate Analysis

All-In H-2A Cost
$25.29
per worker-hour across contract
Real Domestic Cost
$26.83
per hour once turnover is paid
Loading financial comparison scenario…

Complete references and supporting documentation are available upon request by contacting the editorial team at editor@thebullvine.com.

Learn More

The Sunday Read Dairy Professionals Don’t Skip.

Every week, thousands of producers, breeders, and industry insiders open Bullvine Weekly for genetics insights, market shifts, and profit strategies they won’t find anywhere else. One email. Five minutes. Smarter decisions all week.
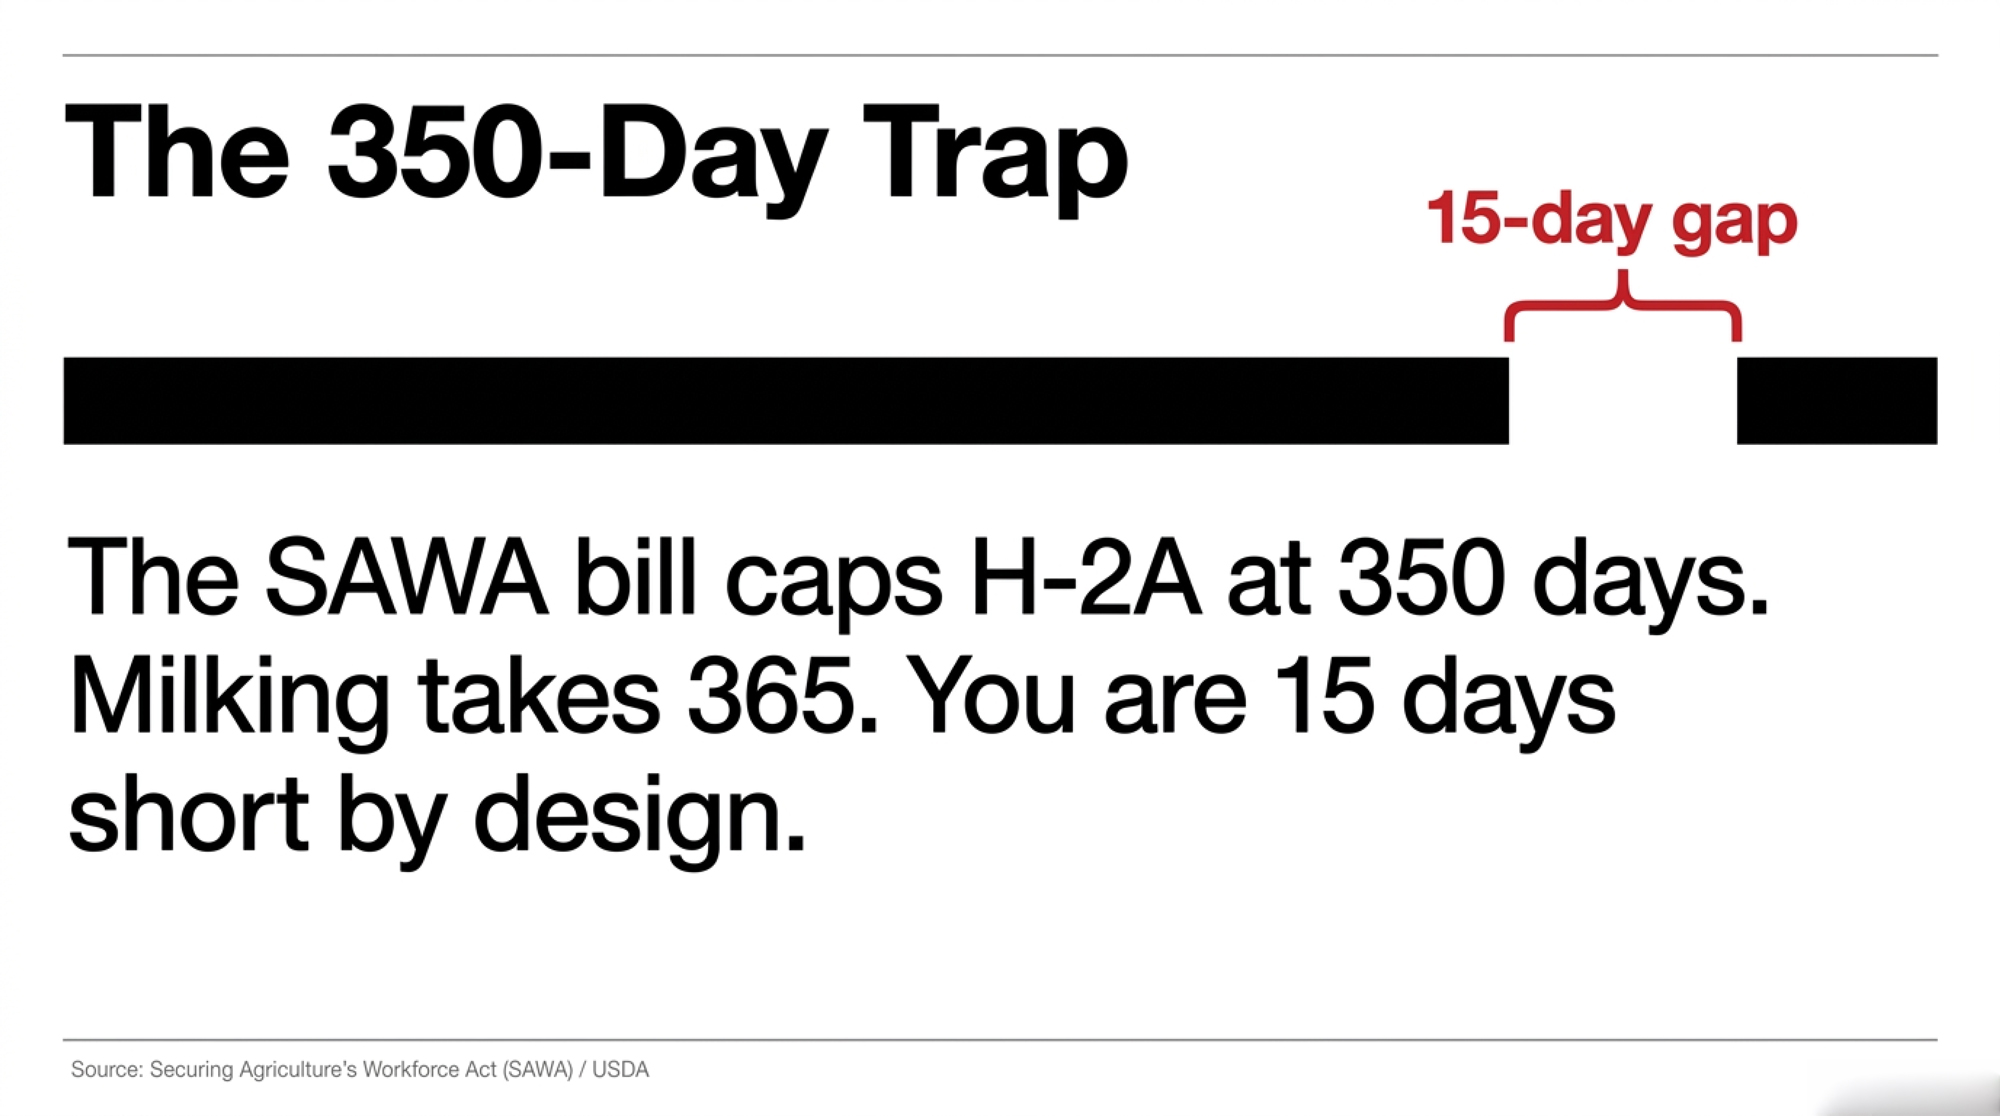
NewsSubscribe
First
Last
Consent

60 Frozen Days Can Lock $60K on a 500-Cow Dairy. Here’s the Screwworm Math.

USDA confirmed screwworm in six Texas counties. But the fly won’t gut your cash flow — the 60-day movement freeze will, locking culls, beef-cross calves, and dumped milk in place.

Executive Summary: Screwworm is back on U.S. soil for the first time since 1966, with USDA APHIS confirming cases across six Texas counties — and the real threat to your dairy isn’t the parasite, it’s the 20-km, 60-day movement freeze a single confirmed case triggers. That freeze locks your culls, beef-cross calves, and any treated cows in place: figure close to $60,000 stuck on a 500-cow herd and a quarter-million on a 2,000-cow operation, before a vet bill. The timing’s brutal — replacement heifers sit at 3.914 million head, the fewest since 1978, at roughly $3,010 apiece, so the animals you can’t move are worth more than they’ve been in a generation. Treat lactating cows and the milk math compounds: 19.5 days of dumped milk per cow on the Dectomax-CA1 injectable, 10 days on the F10 topical. Washington’s betting $105 million on sterile flies and drones, but none of that inspects the navel on the calf born in your barn at 3 a.m. Two moves matter now: run your own 60-day freeze number before a zone gets drawn around your county, and turn your wound-check habit into a written, checked protocol — because an untreated infestation can kill in seven days. If a case lands two counties over, the producer who already knows their number and has TAHC (1-800-550-8242) in the herd manager’s phone is the one who isn’t scrambling.

screwworm dairy quarantine

On a South Texas cow-calf operation near La Pryor, in Zavala County, a three-week-old calf became the first U.S. animal in 60 years to test positive for New World screwworm. USDA confirmed it on June 3, 2026, after finding larvae in the calf’s navel. And the cases didn’t stop there. Within days, USDA had confirmed detections spreading across six Texas counties, with one case reclassified into New Mexico — hitting cattle, a goat, and a dog.

The second Zavala case turned up in a one-month-old calf just 5.6 miles from the first. That’s the detail that should stop you cold. Six months earlier, the warning was already there — a 6-day-old calf in Llera, Tamaulipas, with screwworm in its navel, roughly 197 miles from the U.S. border.

Here’s the short version: the buffer zone you thought you had between Central America and your calves is gone. The longer version — what a confirmed case in your region does to your milk check and your farm’s stability — is worth fifteen minutes before the next milking.

U.S. screwworm detections (per USDA APHIS, as of June 12, 2026)
Texas counties with confirmed cases: Zavala, La Salle, Sutton, Tom Green, Edwards, Gillespie
New Mexico: 1 case (reclassified from an Andrews County, TX, dog)
Animals affected: cattle, a goat, a dog
Sources: USDA APHIS confirmed-detections tracker (updated Tuesdays/Thursdays); CAPCOG incident memo, June 15, 2026. Case counts are moving — check screwworm.gov for the current tally.

What’s Changing and Why

Screwworm isn’t a new bug. We beat it once, with sterile flies, and then mostly forgot it existed. What changed is the map. After escaping the long-standing containment barrier in Panama, the parasite worked north through Central America and into Mexico — closing to within about 52 miles of the border by late May 2026, then crossing onto U.S. soil within days.

The fly itself doesn’t roam far. USDA says adults generally stay within a couple of miles when there are animals to feed on. The long jumps north come from moving infested livestock, which makes this partly a trucking-and-logistics problem, not just a biology one. And logistics problems land squarely on working farms.

Who’s most exposed right now? Cow-calf and dairy operations in South Texas and southern New Mexico sit inside or beside the quarantine zones. But the real risk reaches any herd that produces wounds on a schedule — and every dairy does. Calving. Dehorning. Tagging. The odd surgery. Screwworm feeds on living tissue, and a barn manufactures fresh tissue every single day.

Worth saying plainly: this is an animal-health threat, not a food-safety one. USDA and the CDC have been clear that milk and dairy products remain safe, and that the risk to people stays low. The damage screwworm does to a dairy shows up in the barn and on the balance sheet — not in the bulk tank.

Why We Should Have Seen This Coming

We’ve done this dance before, and the history isn’t ancient. Through the 1960s, screwworm cost U.S. livestock producers more than $100 million a year in the Southwest alone, according to FAO records. The sterile-fly eradication program that finally cleared it by 1966 cost about $32 million — and APHIS later pegged the annual benefit to producers at roughly $796 million in 1996 dollars.

So this isn’t a hypothetical. It’s a re-run with the numbers attached. Texas A&M AgriLife now estimates a serious resurgence could cost Texas cattle producers $2.1 billion and do another $9 billion in wildlife-industry damage. Those are state-level figures, not your barn — but they tell you how hard the regulatory response will come down when a case shows up nearby. The bigger the projected statewide loss, the tighter the movement controls.

How This Plays Out on a Real Operation

When USDA confirms a case, it locks down animal movement in a 20-kilometer (12.4-mile) infested zone around the detection, stands up a unified command with the state animal-health agency, and layers on quarantines and inspection. Texas State Veterinarian Bud Dinges drew exactly that zone around much of Zavala County and a slice of neighboring Uvalde. That’s the part most producers haven’t put a pencil to. Not the fly. The freeze.

Trigger EventGeographic ScopeMovement RestrictionLead AgencyTimeline
Confirmed case20-km infested zoneFull animal movement freezeUSDA APHIS + State vetImmediate on confirmation
Larvae found / larvae suspectedCounty levelQuarantine + inspectionTexas Animal Health Commission (TAHC)Within 24–48 hrs
Case reclassified / spreads to adjacent stateMulti-state zoneInterstate movement controls layeredUSDA unified commandWithin days (NM precedent: June 2026)
Untreated wound detectedIndividual animalMandatory treatment; case reported within 24 hrsProducer + accredited vet7-day fatality window if untreated

Take a 500-cow dairy in a zone where animal movement stalls for 60 days. Three things hit at once. The cull cows you’d planned to ship can’t leave, so they keep eating while their value sits stuck. The beef-on-dairy calves you normally sell pile up in the hutches. And any treated animals carry milk withdrawals that pull product off your tank.

Cost Category200-Cow Dairy500-Cow Dairy2,000-Cow Dairy
Cull cows held (est. head)82080
Delayed cull revenue$12,000$30,000$120,000
Extra feed cost (60 days @ $6.50/hd/day)$3,120$7,800$31,200
Beef-cross calves held (est. head)2050200
Tied-up calf premium value$7,000$22,200>$100,000
Estimated total freeze exposure~$22,000~$60,000~$250,000+
Vet bill / treatment costsNot includedNot includedNot included
Zone-exit animal discountNot includedNot includedNot included

Run the rough math, using 2026 industry-standard estimates rather than a quote for your specific operation. Say 20 cull cows can’t move at $1,400–$1,600 a head — that’s around $30,000 in delayed revenue, plus roughly $7,800 to keep feeding cows you’d already decided to sell (figure about $6.50 a head a day across 60 days, near the low end of the $5.50–$8.50 lactating range most U.S. herds run). Add 50 beef-cross calves stuck on farm. Those crossbreds carry a documented $350–$700 premium over straight dairy bull calves, according to American Farm Bureau market data — so holding 50 of them ties up real money on top of their base value. Add up the delayed cull revenue, the extra feed, and the tied-up calf value, and one 500-cow operation is looking at close to $60,000 frozen in place. That’s before a vet bill. Before any discount on animals leaving a quarantine zone.

Smaller herd? Scale it down and the shape holds. A 200-cow dairy shipping a handful of culls and a dozen beef-cross calves a month still watches real money sit idle for two months — and on a tighter operation, two months of frozen cash flow is the part that keeps you up at night.

Now Run It on a 2,000-Cow Dairy

Scale up and the freeze doesn’t just get bigger — it changes character. A 2,000-cow operation typically moves cull cows weekly, not monthly, and ships beef-cross calves in a steady stream rather than in batches. Stall that for 60 days and the numbers stack fast.

Figure 80 cull cows held at the same $1,400–$1,600 — that’s roughly $120,000 in delayed revenue sitting in your pens. Feeding them runs about $31,200 over the 60 days at $6.50 a head a day. Pile on 200 beef-cross calves carrying that $350–$700 premium, and the held calf value alone climbs past six figures. All in, a large operation can watch a quarter-million dollars or more freeze in place — and unlike the cull check that’s merely delayed, some of that calf premium erodes if the animals grow past their optimal sale window while they’re stuck.

Here’s the part that scales worst: pen space. A 200-cow dairy can usually find somewhere to hold a few extra culls and a dozen calves for two months. A 2,000-cow dairy running at capacity can’t. Overcrowded pens mean more wounds, more stress, and — in a screwworm zone — more of exactly the conditions the parasite is looking for. The freeze that started as a cash-flow problem becomes an animal-health problem feeding right back into the thing that caused it.

The Replacement Squeeze That Makes the Timing Brutal

The reason this stings right now is timing. The U.S. dairy replacement pipeline is the tightest it’s been in nearly half a century — down to 3.914 million heifers as of January 1, 2025, the lowest count since 1978, according to USDA’s Cattle inventory report. So you’ve got fewer spare animals in the system than at almost any point in living memory.

Price tells the same story. Replacement heifers averaged around $3,010 a head nationally in USDA’s July 2025 Agricultural Prices data, with top animals at Texas and California auction barns bringing closer to $4,000 by midyear. That’s not just a number on a market report. It means the animals you can’t move during a freeze are worth more than they’ve been in a generation — and the ones you’d normally buy to backfill are priced out of reach.

Walk that chain forward and the freeze gets worse, not better. If a quarantine forces you to hold culls you’d planned to replace, you’re carrying low-value animals at the exact moment replacements cost the most. If the freeze coincides with your normal heifer-buying window, you either pay top dollar the moment the zone lifts — competing with every other operation in the same boat — or you milk on with a thinner string. Either way, the screwworm freeze doesn’t just dent one month’s cash flow. It can knock your replacement plan sideways for a year.

What About the Milk You Have to Dump?

The cull-and-calf math is the visible cost. The milk math is the one that catches people off guard. Any lactating cow treated for screwworm carries a milk-discard window, and that milk goes down the drain, not into the tank.

ProductTypeEUA DateMilk Discard WindowEst. Revenue Lost/CowUse Case
Dectomax-CA1 (doramectin)InjectableMay 19, 2026468 hrs (19.5 days)~$351Systemic treatment; lactating cows, dry cows, replacement heifers
F10 Antiseptic Wound SprayTopicalMay 202610 days~$180Wound-site treatment; lower discard, narrower indication

The numbers are now nailed down by FDA emergency-use authorizations. For Dectomax-CA1 (doramectin) — cleared for the milking string under the May 19, 2026 EUA — milk from treated lactating cows, dry cows, and replacement heifers must be discarded during treatment and for 468 hours (19.5 days) afterward, per the FDA and Zoetis. The F10 antiseptic wound spray EUA carries a shorter window: discard during treatment and for 10 days after. So your milk loss per treated cow depends entirely on which product your vet uses — roughly a week and a half of dumped production on the topical, nearly three weeks on the injectable.

Put that against the freeze and it compounds. Treat even ten lactating cows with the injectable and you’re discarding their milk for nearly three weeks each — and at a 2,000-cow scale, a wider outbreak turns “a few cows” into a tank-level number fast. There’s a harder version, too. If a regional quarantine ever interrupts hauling or processing — not because your milk is unsafe, but because trucks can’t move freely through a locked-down zone — a dairy can’t hold product the way a cow-calf outfit holds calves. You milk every day whether the truck comes or not. The Bullvine has walked through that interstate-hauling scenario before, and it’s the part of the screwworm story that hits dairy harder than beef.

The Federal Response, and Why It Doesn’t Walk Your Hutch Row

USDA’s New World Screwworm Grand Challenge put about $105 million into 40 projects — scaling sterile fly production, building better traps and lures, advancing treatments, and even testing AI drones to monitor wildlife. It’s a serious, well-funded effort. It’s also aimed at the ecosystem, not your individual barn.

Strip the labels off and the money buys long-term tools: detect faster, control faster, respond faster. None of it walks your hutch row tonight. USDA is already releasing about 4 million sterile flies twice a week over the South Texas zone, plus another 4 million pupae weekly — a regional eradication weapon, not a barn-level one. The drones watch deer and feral hogs across rangeland you don’t own. Both shrink the odds a quarantine lands on your county — and neither one inspects the navel on the calf born in your barn at three in the morning.

How Much Would a 60-Day Freeze Actually Cost You?

The honest answer: it depends on your herd size, your cull schedule, and how hard you’ve leaned into beef-on-dairy. But the pattern is consistent. The bigger your beef-cross program and the tighter your replacement situation, the more a movement freeze hurts — because the animals you can’t move are exactly the ones throwing off cash.

So plug in your own numbers. How many cull cows do you ship in a normal month? How many beef-cross calves leave the farm? Multiply each by 60 days of nothing, then add the feed to carry them and any withdrawal milk you’d lose to treatment. That figure — the one specific to your operation — is worth more than any headline about sterile flies. It’s also the number your lender will want to see if a case shows up two counties over, so it’s better to have it written down now than to scramble for it the week a zone gets drawn around you.

Is Your Wound Routine Actually What You Think It Is?

Here’s the uncomfortable part. Most dairies will tell you, honestly, that they dip every navel and check fresh cows daily. But spend a week shadowing the protocol on a typical farm and the gaps tend to show up — a missed dip on a busy calving night, a skipped follow-up when you’re short-handed, a dehorning site nobody’s looked at since the day it was made. It’s not a caring problem. It’s the gap between a habit and a written protocol — and screwworm lives in that gap.

Picture the conditions the parasite actually exploits. It’s the calf born at 2 a.m. that nobody logs until the morning shift. It’s the fly that finds a fresh navel before the dip cup does. It’s the back corner of a packed hutch row on a humid June afternoon, where a wound goes a day and a half without a second look. The Texas Animal Health Commission has put the whole defense in a single sentence: “Laying eyes on your animals is the best thing you can do,” the agency told producers on June 13, 2026, urging daily monitoring of livestock and immediate reporting of suspicious wounds. The parasite doesn’t need your official SOP. It lives in the space between what you believe your crew is doing and what actually happens when you’re not standing there.

APHIS has been specific about what to look for: draining or enlarging wounds, maggot or egg masses, animals acting uncomfortable, and lesions around body openings — nose, ears, genitalia, and the umbilicus. TAHC is just as blunt about the stakes: left untreated, an animal can die within one week of infestation. That’s a tight window. And it closes fastest on the wounds nobody’s watching.

Options and Trade-Offs for Farmers

No single move makes this disappear. But a few paths are open to you, and most cost nothing but attention.

Tighten surveillance now and treat it as your front line. This makes sense for every operation, in or out of a zone, because it’s free and it’s the only step that catches a case before it spreads. What it requires is honesty about your real protocol, not your intended one. The limit: surveillance buys early detection, not immunity — a sharp eye still can’t stop a fly that’s already in your county.

Build a freeze contingency before you need it. This is the move for any herd within a few counties of an active zone, or anyone whose operating line is already tight. It requires running your own 60-day number and walking it to your lender now, while it’s a hypothetical and not an emergency. The risk of skipping it: you find out your borrowing capacity the same week you find out you can’t move a single animal.

Lean on the sensors you already own. Activity, rumination, and temperature tags can flag an animal in distress before your eyes would — often a day or more ahead, depending on the condition. The Bullvine’s independent ROI work has favored modest sensor systems over big-ticket automation on return per dollar, and in an outbreak that lead time helps keep one case from becoming a whole-pen infestation. The catch: sensors flag distress, not screwworm specifically — they buy time, not a diagnosis.

Where’s this heading? If the sterile-fly program holds the line the way it did in 1966, most herds outside the immediate zones may never see a case — but the response posture, and the movement controls that come with it, are likely to stay in place across the South for the rest of the year. That’s the signal worth planning around: not whether your barn gets the parasite, but whether your county gets the quarantine. The contingency path above is the one that pays off either way.

Key Takeaways

  • If you ship culls or beef-cross calves on a regular schedule, calculate your exact 60-day freeze number this week — and if that frozen revenue would strain your operating line, take it to your lender before a zone is drawn, not after.
  • If you run at or near pen capacity, a freeze is an animal-health risk, not just a cash-flow one — build a holding plan now, because overcrowded pens in a screwworm zone create the exact wounds the parasite needs.
  • If your wound protocol is a habit rather than a written, checked routine, fix that within 30 days — walk the fresh pens and hutches yourself and verify every navel is actually dipped, because an untreated infestation can turn fatal in seven days.
  • If you’d be treating lactating cows, know your milk-discard math before you start — 19.5 days per cow on the Dectomax-CA1 injectable, 10 days on the F10 topical spray — and factor that dumped milk in when you run your number.
  • If you have activity or rumination tags, use the distress alerts as an early-warning layer — just remember they flag a sick animal, not screwworm, so a flag still means eyes and hands on the wound.
  • If you’re in Texas, put the TAHC Veterinarian on Call (1-800-550-8242) in every herd manager’s phone today — suspected cases are reportable within 24 hours, and you want the decision about who calls made before you need it.

The federal government just bet $105 million that it can push this parasite back out with sterile flies and smarter surveillance — and history says the bet can pay, since the same tool cleared screwworm in 1966 for about $32 million. But the screwworm that finds your herd won’t be stopped by a drone over a deer pasture. It’ll be stopped by whoever walks your calf hutches tomorrow morning.

So the real question isn’t whether USDA has a plan — it’s whether you know, to the dollar, what 60 frozen days would do to your operation, and whether your wound routine would survive a week of someone actually watching. If you want the deeper math, we’re building the full movement-freeze cost model by herd size — 200, 500, and 2,000 cows, with culls, beef-cross calves, and milk withdrawals broken out line by line — in an upcoming Bullvine Weekly. That’s where the real numbers live.

Run Your Numbers

Dairy Profit Projector — Before a zone gets drawn around your county, run the Dairy Profit Projector to see how 60 days of held culls, stuck beef-cross calves, and dumped milk hit your whole-herd margin, IOFC, and breakeven price. Turn the freeze from a guess into a number your lender will actually look at.

Complete references and supporting documentation are available upon request by contacting the editorial team at editor@thebullvine.com.

Learn More

The Sunday Read Dairy Professionals Don’t Skip.

Every week, thousands of producers, breeders, and industry insiders open Bullvine Weekly for genetics insights, market shifts, and profit strategies they won’t find anywhere else. One email. Five minutes. Smarter decisions all week.
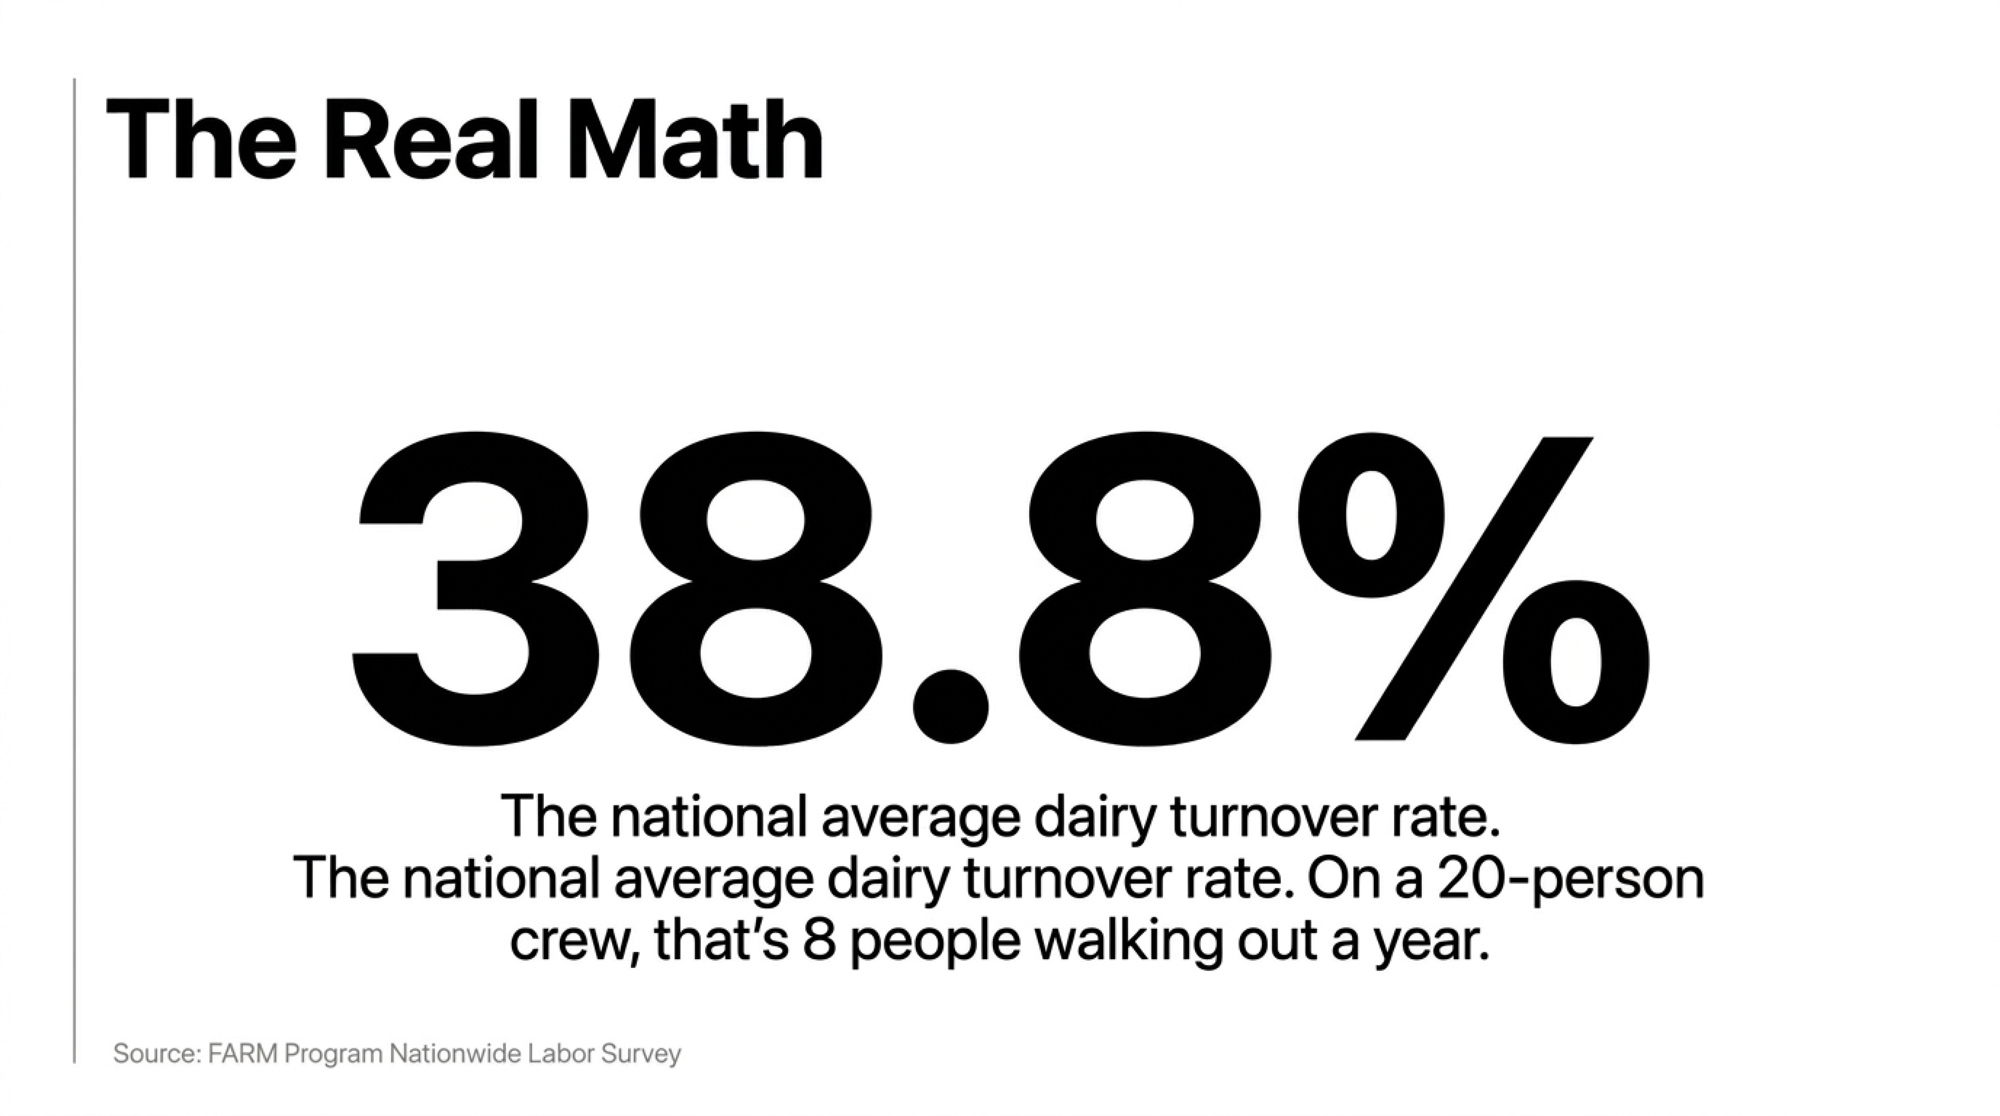
NewsSubscribe
First
Last
Consent

St. Albans Re-Route Could Add $3.15/cwt – and DFA Won’t Say Where

DFA idles St. Albans Aug 17 and sends the milk to “New York, Massachusetts, and Maine” — no plant named. That vagueness is worth up to $3.15/cwt on your check. Here’s the math.

Executive Summary: DFA idles its St. Albans, Vermont plant on August 17, and the wire’s “80 jobs lost” headline buried the part that hits your milk check: the milk still has to move, and DFA has named three states — New York, Massachusetts, and Maine — but not a single receiving plant. Until they name it, your added haul is a range, not a number, running +$0.85 to $3.15/cwt depending on where the milk lands. Here’s the trap: DFA owns the trucking company too, so whether those miles hit your deduction or get absorbed as network efficiency comes down to language in your producer agreement — not the press release. With Class I utilization in Order 1 at just 20.4%, this is manufacturing milk chasing the cheapest plant, not the closest one, and St. Albans lost that math. You’ve got about eight weeks to get a plant name, a per-cwt deduction, and a zone-adjustment answer out of your field rep in writing before the plant goes dark.

A 350-cow Franklin County dairy could be looking at between $40,000 and $200,000 a year in added hauling costs starting August 18, 2026 — and right now, producers are operating in a data vacuum because Dairy Farmers of America has named three states for the milk but not a single plant.

That’s the trap under the milk-hauling cost-per-hundredweight question every St. Albans patron is sitting with this summer. DFA confirmed on June 17, 2026, that it will “idle” its St. Albans, Vermont, plant effective Monday, August 17, in a decision the co-op said “reflects broader operational and network changes needed to best serve our farmer-owners and customers.” The wire ran the headline — roughly 80 jobs lost — and moved on. But the milk that fed that plant still exists on August 18. It has to go somewhere. And the farms that supplied it are about to learn what every extra mile costs, on their milk check, not DFA’s.

What DFA Said, and the Four Numbers It Skipped

Data point DFA skippedWhy it matters to your checkWhat you should ask forRisk if you never get it
Which farms ship to St. AlbansTells you how many neighbours share the route and leverageFull patron list or at least your route clusterYou negotiate alone while DFA optimizes the network
Daily pounds through the plantDetermines how much volume has to be re-routed and at what scaleAverage daily lbs shipped from St. AlbansYou can’t sanity-check DFA’s “network efficiency” story
One-way miles to new plantEvery extra mile feeds directly into $/cwt haul costExact plant name, town, and one-way miles from your farmYou price 2026 in the dark until the first milk check lands
Added haul cost per cwtThis is the number that moves breakeven and loan covenantsWritten $/cwt deduction and zone/location adjustmentHauling pass-through with no cap blows up margins overnight

“Idle” is a chosen word. A DFA spokesperson told VTDigger that idling means day-to-day production ends, but the co-op retains ownership of the facility and a “small team” on site — “Keeping the facility gives us flexibility as we evaluate what makes the most sense for the future.” Good for the real estate. It does nothing for the cow that was milked this morning.

Here’s what the announcement skipped: which farms ship to St. Albans, how many pounds move through it a day, the one-way mileage to wherever the milk lands, and what that re-route adds per hundredweight. Four questions, all of them on a balance sheet. None of them is in the statement.

The plant produced dairy for Vermont vendors, including Ben & Jerry’s and Cabot Creamery, and the adjoining St. Albans Creamery & Supply closes the same day after dropping its co-op grocery store last summer to go retail-only. This is manufacturing milk, not fluid milk chasing a Class I premium. And manufacturing milk follows the cheapest plant to run, not the closest one to the barn.

A Regional Read While the Patron Voices Stay Quiet

No Franklin County farm currently shipping to St. Albans has put its haul distance on the record yet. The voices that have surfaced come from the wider New England dairy community, and they’re already pointing at the survival math.

Matthew Staebner, a Connecticut dairy farmer whose family used to farm in Franklin County, told VTDigger the closure is “going to negatively affect all the dairy farmers in New England,” and argued it’s “time that a lot of the dairy farmers look to… marketing their own products.” That’s a producer telling other producers to stop assuming the co-op will always carry the milk to market. Hold that thought — it’s the whole tension in this story.

This story will be updated with named patron haul figures as St. Albans suppliers come forward. If you ship to St. Albans and are willing to talk numbers, the byline contact is at the foot of this page.

The Co-op That Voted Itself Into DFA

St. Albans wasn’t born a DFA plant. The St. Albans Cooperative Creamery ran farmer-owned before its members voted 99-9 to merge with DFA in 2019, folding the co-op, the store, and its trucking company into the national organization as wholly owned subsidiaries. The two sides had run a marketing partnership since 2003, and as local membership shrank, they moved toward combining.

Franklin County farmers told Seven Days in 2019 that the merger was the only way to compete amid low milk prices, deteriorating finances, and consolidation. That year, DFA pledged to invest $30 million in the St. Albans plant, plus another $5 million in its trucking company.

That structure is the whole point. The company deciding where your milk goes is the same company that owns the plant, the brand, the store, and the trucks. That splits the hauling-cost question into two very different answers — and you don’t get to pick which one lands on your check.

Where Does the Milk Actually Go on August 18?

DFA has named the states, not the plants. Milk currently received at St. Albans will be processed within DFA’s network at facilities across New York, Massachusetts, and Maine, the co-op told Seven Days. DFA said the move ensures “a market for regional dairy farmers and continued service to customers without disruption.”

Three states is a destination region, not an address.

That spread covers everything from a North Country New York plant an hour west to a Maine powder facility several hours east. The re-route mileage — and the cost — depends entirely on which plant DFA designates for your route. Until they put a name and a town on it, your added mileage is a range, not a number. So let’s bracket that range honestly, using published rates instead of a guess.

Running the Numbers: What Every Re-Routed Mile Costs

The arithmetic is simple. The honesty lives in the inputs, so here they are in the open — plug in your own.

The formula

ΔHauling cost per cwt=cwt per loadAdded one-way miles×Rate per loaded mile​

The inputs

  • Tanker load: about 350 cwt (~35,000 lbs) — standard industry assumption, not a St. Albans-specific figure.
  • Loaded-mile rate: $4.00–$5.50, anchored to USDA AMS agricultural refrigerated-truck spot-rate reporting for 2025 (2025 rates; 2026 may differ). A market band, not a DFA-disclosed figure.
  • Current one-way haul to St. Albans: 15–40 miles — representative Franklin County range.
  • Added one-way re-route distance: 75–200+ miles — scenario range across the NY/MA/ME footprint DFA named.

Added cost per cwt, by scenario (illustrative)

Added one-way miles$4.00/mile$5.00/mile$5.50/mile
+75 (close-in NY plant)+$0.86+$1.07+$1.18
+125 (mid-range)+$1.43+$1.79+$1.96
+150 (central NY / MA)+$1.71+$2.14+$2.36
+200 (western NY or ME)+$2.29+$2.86+$3.14

Working range: roughly +$0.85 to +$3.15/cwt. That spread isn’t sloppiness. It’s the honest width of three states and no named plant. Low end assumes a North Country New York facility; high end assumes a haul to western New York or Maine.

Run your own numbers: the interactive Hauling-Delta Calculator below takes your herd size, added miles, and rate, and returns your added cost per cwt and per year.

St. Albans Re-Route Cost Calculator

Estimate your farm’s custom hauling exposure based on potential NY/MA/ME re-routes.

230 cwt/year
125 miles
$5.00

Added Cost per Cwt +$1.79
Est. Annual Hit to Margin $143,750
*Assumes standard industry benchmark of 350 cwt (~35,000 lbs) per tanker load.

What Does That Range Do to a 350-Cow Herd?

Take a 350-cow Franklin County operation. Run it at roughly 230 cwt/cow/year — an illustrative production proxy, not a sourced herd figure — and you’re shipping about 80,500 cwt a year (rounded to 80,000 below).

Now stretch the delta across that volume:

Hauling deltaAnnual cost, 350-cow herd (~80,000 cwt)
+$1.00/cwt+$80,000
+$1.50/cwt+$120,000
+$2.00/cwt+$160,000
+$2.50/cwt+$200,000

A 175-cow herd at the same proxy ships about 40,000 cwt, so halve those — roughly $40,000 to $100,000 a year, depending on where the delta lands.

These are estimates, scoped to the assumptions above. Not a bill anyone has mailed yet. But here’s the uncomfortable part: you’re setting your 2026 cost of production right now, and one of your largest variable costs has no confirmed value. Your lender already understands that. The open question is whether you’ve run it yourself.

Will the Mileage Even Hit Your Milk Check?

This is the turn, and it’s the piece nobody at the announcement explained.

Because the hauling and the plant sit within the same cooperative — DFA owns the trucking company too — the added distance can land in two different places, depending on what your agreement allows. You’re in one of these worlds, and the contract decides which.

World one. DFA folds the extra miles into a bigger, consolidated network and absorbs most of the difference as route efficiency. Your deduction holds roughly flat. The tables above become a worst case you dodged.

World two. Your agreement allows pass-through, and the mileage shows up as a higher charge effective with your August or September settlement. The tables stop being a scenario. They’re your new breakeven.

ScenarioHow DFA handles extra milesWhat your milk check showsRed-flag clauses to look for
World One – network absorbsExtra miles blended into system routing and internal costHauling line stays roughly flat per cwtVague “network efficiency” language but no explicit pass-through
World Two – pass-through haulingMiles billed back to patrons on a per-cwt or per-stop basisSudden jump in hauling deduction after August settlement“Hauling charges may be adjusted to reflect actual transportation cost”
Zone / location changeMilk reclassified into a different Order 1 zoneUniform price shifts even if haul line looks similarLanguage letting handler reset zone or location adjustment unilaterally
Field / plant assessmentsNew or higher per-cwt assessments to fund “plant changes”New line item or higher per-cwt assessment appearsOpen-ended assessment authority tied to “operational changes”

Here’s exactly where to look on the statement. The mechanical levers that execute World Two are your hauling and stop-charge deductions, your zone or location adjustment, and any field-to-plant assessment line. A more distant receiving plant in a different location-adjustment zone under Federal Order 1 can move your uniform price calculation on its own, separate from the hauling deduction — two different lines, same root cause. Hauling assessments are commonly charged per hundredweight and can carry a monthly cap, depending on the handler. The language that decides which world you’re in is in your producer agreement, not on VTDigger. You get it out of your field rep — and the cleanest time to put the question on the record is now, while the plant’s still running.

The 30/90/365-Day Playbook for St. Albans Patrons

Roughly eight weeks separate today from the August 17 idle date. Don’t wait for the August check to answer the question for you.

30-Day Actions — get the number in writing

  • Call your DFA field rep and ask for the specific re-route destination: plant name, town, and one-way miles from your pickup point — not “New York, Massachusetts, and Maine.” Requires: one call and your farm location. Trigger: if they won’t name the plant, escalate in writing to your district rep.
  • Get your August hauling deduction in writing, per cwt, and ask directly whether your zone or location adjustment changes. Where it backfires: a verbal “shouldn’t change much” isn’t a contract term — get it in writing, or assume World Two.
  • Pull your last three milk checks and isolate your current hauling deduction and location adjustment per cwt, so you’ve got a clean baseline. Trigger: if you can’t find those line items, that’s your first phone call.

90-Day Actions — stress-test the structure

  • Have a farm lender or ag attorney read your producer agreement for a material-change clause tied to facility closure. Requires: the signed agreement and a couple of billable hours. Where it backfires: exit clauses carry notice windows and volume commitments — know the penalty before you reach for the door.
  • Re-run your breakeven at the high end of the range (+$2.00 to +$3.15/cwt) against your forward-contracted price and your operating-loan covenants. Trigger: if that breakeven crosses your forward price, you’ve got a margin problem, not a hauling annoyance.
  • Confirm whether your current carrier keeps your route or a new hauler takes over. Where it backfires: a carrier swap can quietly reset pickup timing and quality-premium logistics, not just price.

365-Day Moves — reposition before the next plant decision

  • Map your realistic secondary-market options by geography, and have a real conversation with a competing field rep — not feed-store rumor. Requires: time and a willingness to be told no. Where it backfires: in a consolidating region, “options” can be thinner than they look on paper.
  • Build a standing “haul exposure” line into your annual budget so the next consolidation move doesn’t catch you flat. Opportunity signal: if DFA designates a close-in New York plant and your delta lands near the +$0.85 low end while your margin over feed holds, you’re in a defensible spot — document it and stop losing sleep over the high-end rows.
  • Take Staebner’s point seriously and price out a direct-to-market or independent-processor option for at least part of your volume. Requires: real capital, label and food-safety work, and demand you can actually sell into. Where it backfires: self-marketing trades the co-op’s guaranteed home for margin you have to earn every month — flexibility you gain on price, risk you take on volume.

Why This Isn’t Just St. Albans’ Problem

For co-op directors and lenders reading from outside Vermont, the plant is a data point, not a one-off.

DFA’s antitrust record is public, and it cuts both ways. The co-op settled price-fixing and market-conduct cases in the Southeast ($140 million, 2013) and the Southwest ($34.4 million, 2025), both without admitting liability. A separate 2022 Northeast monopsony suit — alleging DFA suppressed raw milk prices and boxed out farmers’ ability to market milk independently — was dismissed when a federal judge sided with DFA in an October 2023 ruling. Settlements without admission, and a dismissal, don’t prove present-day conduct. But the structural friction those cases circled hasn’t gone anywhere.

The engine underneath is plainer than any filing. In Northeast Order 1, Class I fluid utilization averaged just 20.4% of pooled milk in 2024, per the FMMO Order 1 annual bulletin. Most of that milk is already manufacturing-class. Once milk lives there, network efficiency tends to beat local proximity. In our read, a plant like St. Albans competes on network economics — and on June 17, DFA came down on the side of the network, not the location. Every extra mile that decision adds shows up on your side of the ledger, not theirs.

Is This Retaliation for the 2025 Strike?

It’s the question everyone in Franklin County is asking, so let’s take it head-on. The plant’s unionized workers reached a contract with DFA in October 2025 after alleging “brutal” conditions, including mandatory overtime stretching shifts to 12-hour workdays. Eight months later, the plant is idled.

DFA said the closure is not a reflection of workers’ performance. Union organizer Curtis Clough — who helped lead the contract fight — told VTDigger he does not think the shuttering is tied to union activity, but that it “relates more to the fact that the dairy industry is in freefall in Vermont.” Clough still called the decision a surprise, citing the plant’s notable customers like Ben & Jerry’s.

The closure also lands in a brutal stretch for the county’s processing base. HP Hood confirmed its Barre plant closure in September 2025, affecting about 50 workers; Franklin Foods — in the county for more than a century — announced its closure earlier this month, laying off nearly 100; and Perrigo said in May it would lay off 161 as it moves to close its Georgia, Vermont facility. Every plant that goes dark thins the local labor pool, the municipal utility base, and your leverage at contract-renewal time. The people closest to the strike don’t read this as payback — and either way, the milk still has to move.

What to Watch, and the One Question That Decides It

The day DFA names the plant, this whole range collapses into a single number, and every supplying farm learns which world it’s living in. That’s the follow-up worth waiting for. Until then, you’re pricing 2026 in the dark, and the clock runs out on August 17.

You gain certainty by getting the destination and the deduction in writing now. You lose negotiating room once the plant goes dark and the call’s already made. So pull the agreement, make the phone call, and put the question on the record while the plant’s still running.

One question tells you whether the tables above are a scare or a forecast: what does your producer agreement actually say about who pays for the miles when the plant you ship to disappears — and have you read that clause since the co-op signed itself over in 2019?

Key Takeaways

  • DFA hasn’t named the receiving plant, so your added haul sits in a +$0.85 to $3.15/cwt range — about $40,000 to $200,000 a year on a 350-cow herd until you get a real number.
  • Because DFA owns the trucks too, whether those miles hit your deduction or get absorbed depends on your producer agreement — pull the contract and check the hauling, zone, and location-adjustment lines.
  • You’ve got until August 17 to get a plant name, a per-cwt deduction, and a zone answer out of your field rep in writing — don’t let the August milk check be the first time you find out.
  • With Class I utilization in Order 1 at 20.4%, this milk competes on network cost, not proximity — assume the next closure works the same way and budget a standing haul-exposure line now.

Ship milk to St. Albans? The Bullvine is tracking where the milk lands and what the re-route costs. Reach the reporter at the byline contact to share your haul miles for the follow-up.

Complete references and supporting documentation are available upon request by contacting the editorial team at editor@thebullvine.com.

Learn More

The Sunday Read Dairy Professionals Don’t Skip.

Every week, thousands of producers, breeders, and industry insiders open Bullvine Weekly for genetics insights, market shifts, and profit strategies they won’t find anywhere else. One email. Five minutes. Smarter decisions all week.
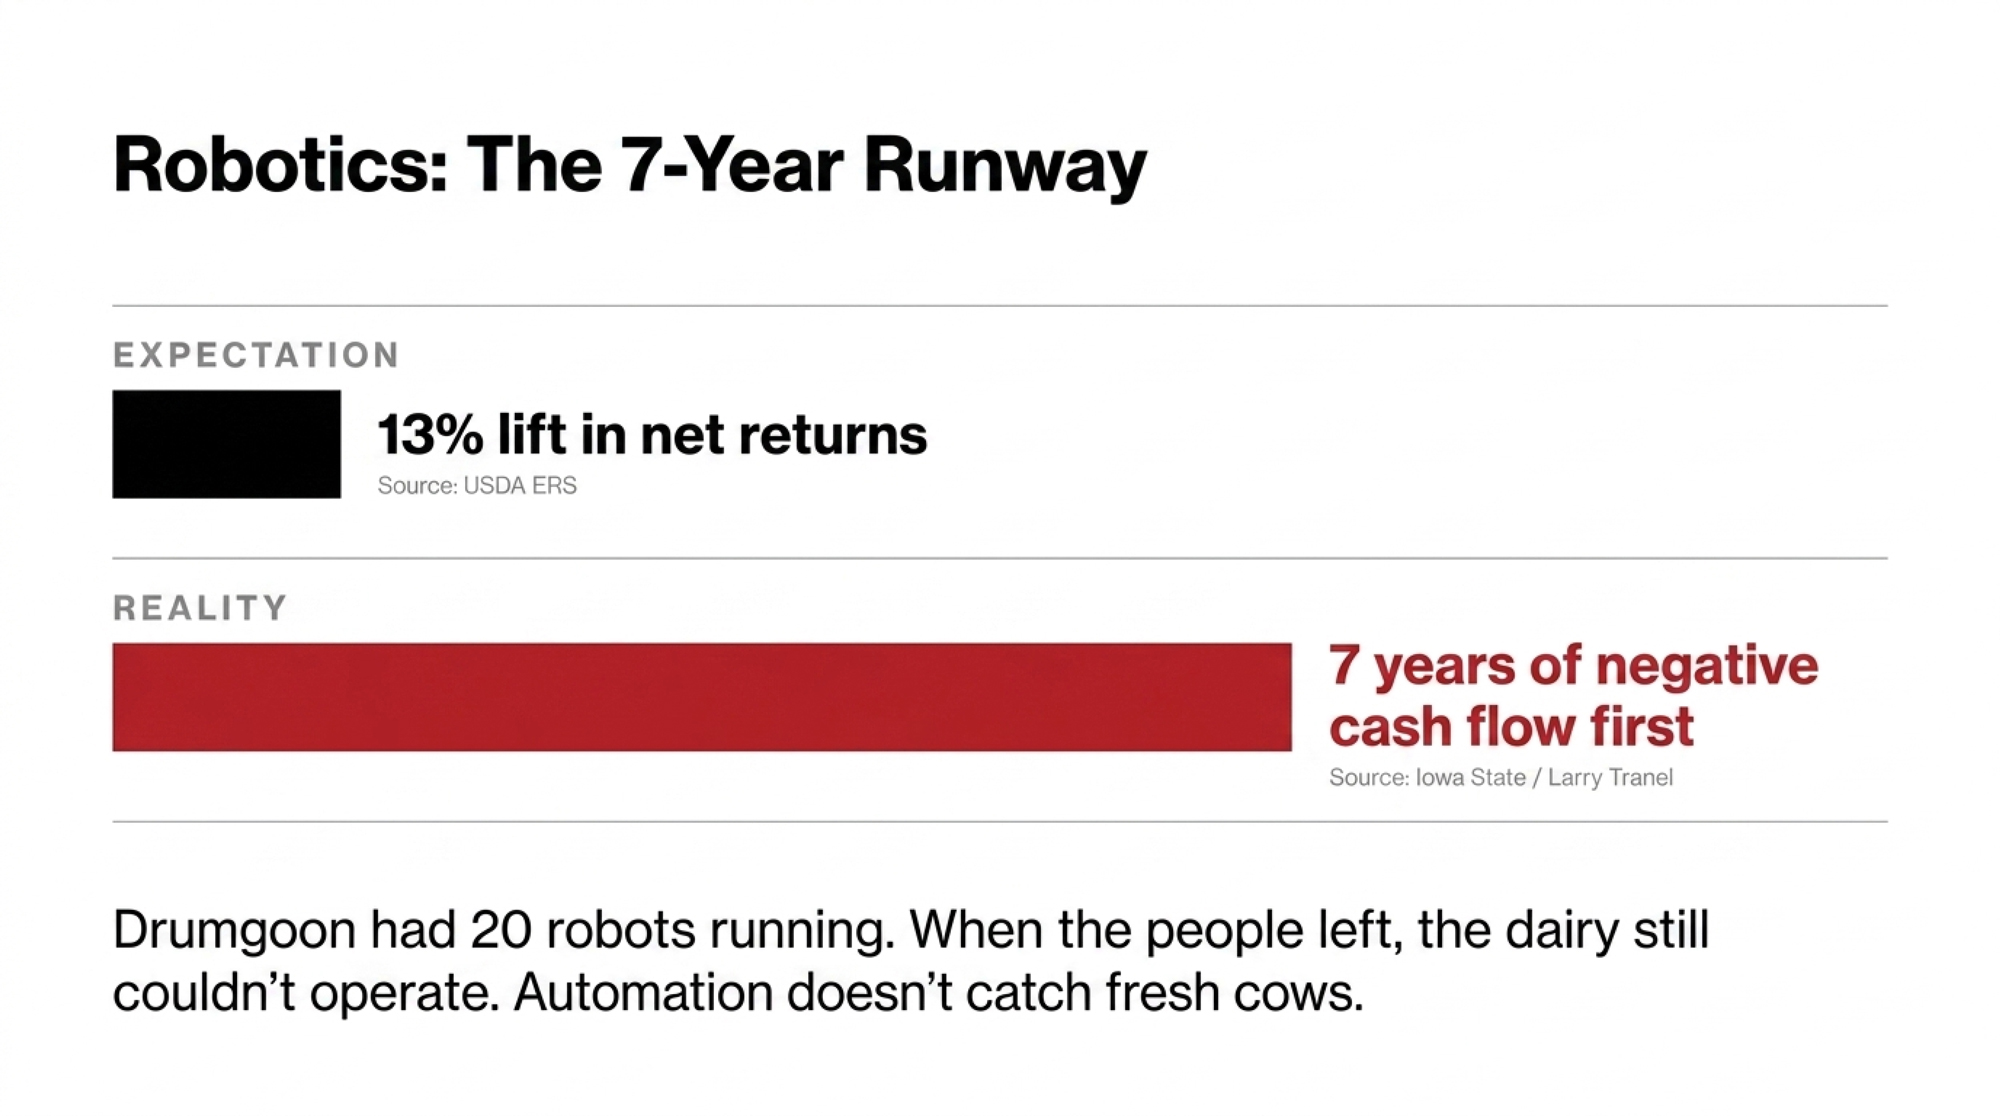
NewsSubscribe
First
Last
Consent

The Footbath Works. Your 5 a.m. Crew Doesn’t.

One Fond du Lac herd ran the exact same 5% copper bath as everyone else and cut lameness 24% to 14% for $3,100 a year. The fix wasn’t the chemical. It was who owned the job.

Executive Summary: Most confinement herds run around 22.8% lame (2023 JDS review) and genuinely can’t see it — in one German study, farmers caught as few as 24% of their own lame cows. A 600-cow Fond du Lac herd proved the fix is cheap: they cut lameness from a reported 24% to 14% for about $3,100 a year, no $45,000 cameras, no consultant. What changed wasn’t the chemical — it was putting one named employee on a fixed footbath schedule and checking pH and concentration instead of eyeballing them. At roughly $337 a case, that 10-point drop on a herd that size is near $20,000 in avoided loss against a rounding-error spend, and the subclinical cows are bleeding 3.3 lbs of milk a day before they ever limp. The catch worth weighing: a decade of copper sulfate loads your soil and forage — one UW-studied herd averaged 433 ppm liver copper — so if you’re running Jerseys, pull a forage test before you defend the status quo. Score your own 100–200 cows this month, set that number next to your gut estimate, and you’ll know in an afternoon whether this is your problem too.

footbath protocol

Editor’s note: The 5 a.m. scene below is a composite drawn from extension research and patterns common across many operations; it is not a single real morning at a single farm. The Fond du Lac herd, its cost and outcome figures, and all research data are real and sourced. Figures reflect studies and guidance available as of June 2026.

The footbath looks fine at 5 a.m. It’s full enough, the color’s about right, and the cows are filing through it on their way out of the parlor. So why is digital dermatitis still moving through the herd?

That’s the question that should keep more producers up at night. Because the honest answer usually isn’t the bottle. The copper sulfate works. The zinc works. What breaks is the human layer around it — the mixing, the changing, the consistency, and the simple question of who actually owns the job. Footbath management is one of the cleanest tells in the whole barn. Get a real look at how it runs at 5 a.m., and you’ve got a pretty good read on how the rest of the operation runs too.

What’s Really at Stake

Here’s the uncomfortable part. If you run a confinement herd and you’ve quietly accepted that some lameness is just the cost of doing business, this story is about you. Not in a finger-wagging way — in a “you genuinely might not be seeing what’s in front of you” way. And the research backs that up hard.

Most herds aren’t where they think they are. A 2023 systematic review in the Journal of Dairy Science reported a mean lameness prevalence of 22.8%, with a median of 22.0% and a between-study range of 5.1% to 45%, and within-herd numbers ranging from 0% to 88%. Merck’s 2024 epidemiology chapter frames the working reality as 8% in pasture-based systems versus 15–30% in confinement. Digital dermatitis is the engine behind most of it: UW–Madison Extension estimates DD is present in roughly 70% of U.S. dairies and 95% of large herds. That’s the global picture. The single-herd picture is often worse than the owner believes — and the footbath is frequently where the gap starts.

How It Falls Apart at 5 a.m.

Walk through a real morning. The bath isn’t quite full, so the concentration drifts. Nobody measures the product — it gets eyeballed, and even a small change in solution depth can move the working concentration enough to matter, according to industry hoof-care guidance. The solution doesn’t get changed when it should. And on a genuinely busy morning, the bath just doesn’t run at all.

None of those are catastrophic failures. That’s the trap. They’re small shortcuts that make the program invisible on good days and worthless on bad ones. A 2016 survey of 45 Wisconsin dairies found that while copper sulfate was used on 67% of farms, 27% of those farms ran it at a concentration of 12–30% — more than three times the recommended level. Only a third offered a footbath four or more times a week. These aren’t knowledge problems. They’re consistency problems.

What does “right” actually look like? Check these against your own barn wall:

ParameterTarget SpecDanger ZoneWhat Breaks When You Miss It
Bath length10–12 feet< 8 feetCows get fewer than 2 rear-foot dunks per pass
Solution depth4–6 inches< 3 inchesCoronary band and dewclaws don’t contact chemical
Change frequencyEvery 150–300 cow passes> 400 passes without changeSolution becomes diluted slurry — no bactericidal effect
pH range3.5–5.0> 5.5 or < 3.0Above 5.5: chemical inactive. Below 3.0: skin burns
Copper sulfate concentration2–5%> 8% or < 1.5%27% of WI farms ran 12–30% (triple recommended) — wastes product, increases soil load
Run frequency≥ 4×/week≤ 2×/weekFrequency beats formulation — 4× at spec beats “when we remember” every time
Named protocol owner1 dedicated employee“Whoever’s around”The Fond du Lac 24%→14% drop was entirely about accountability — not chemistry
  • Length: 10–12 feet — ensures at least two dunks per rear foot per pass
  • Depth: 4–6 inches — must cover the coronary band and dewclaws
  • Change frequency: every 150–300 cow passes, sooner when legs come in dirty
  • pH: 3.5–5.0 for copper or zinc sulfate — above 5.5 it stops working, below 3.5 it burns skin
  • Concentration: copper sulfate 2–5% (UW Dairyland Initiative); zinc sulfate 10–20%

Miss two or three of those at 5 a.m., and you haven’t run a footbath. You’ve run cows through an expensive puddle. As Progressive Dairy put it back in 2022, “Without a simple, well-defined footbath protocol, the only consistent result will be poor footbath management and poor hoof health.”

What One Wisconsin Herd Actually Did

Near Fond du Lac, Wisconsin, a 600-cow herd reported lameness around 24% — right in that “normal” confinement range nobody likes to look at too hard. Over 18 months, the operation pulled it down to 14%, a 42% reduction, on about $3,100 a year. No $45,000 detection cameras. No outside consultant. Just protocol.

What flipped the switch wasn’t a new product. It was deciding the bath wasn’t an afterthought anymore — assigning one employee to own it and running it like a milking shift. As the owner told The Bullvine: “We treat footbaths like milking — non-negotiable, same times, same concentrations, every single week. That consistency matters more than any camera could.” The protocol itself was almost boring on paper — 5% copper sulfate, changed every 200 cow passes, run four times weekly on a fixed Tuesday-Thursday-Saturday-Monday rotation, with pH checked rather than guessed.

That ownership piece is the part most herds skip. The chemistry on that farm wasn’t special. The schedule was, and so was the fact that one person’s name was attached to it. At an estimated $337 per lameness case, the herd’s math worked out to roughly $20,000 a year in avoided losses against that $3,100 spend — a payback measured in weeks, not years.

Which Chemistry — and What It Costs You

Before anyone argues copper versus zinc versus formalin, get one thing straight: the product matters far less than whether it’s mixed right and changed often enough. Iowa State’s Jan Shearer and UW’s Dörte Döpfer have both made the same point across years of work — frequency beats formulation. Four times a week with the cheap stuff beats “when we remember” with the premium product every time.

ChemicalWorking RateCost SignalCatch / Key Risk
Copper sulfate2–5%~$2–3/lb; most widely used workhorseDoesn’t break down — accumulates in manure, soil, and forage; decade-long programs average 433 ppm liver copper (UW, 2022)
Zinc sulfate10–20%Higher per-bath cost than copperLower environmental load; fewer large-herd efficacy trials vs. copper
Formaldehyde2–5%Cheapest per bathRegistered carcinogen — hard to justify for hand-mixing crews
Stannous fluoridePer labelPremium tier2024 JDS trial controlled DD at far lower copper loading — strongest environmental case for switching

The all-in cost is smaller than most producers assume. The Fond du Lac herd ran its full program — chemical plus labor — for about $3,100 a year. The chemical was never the expensive part. The lameness you don’t prevent is.

But copper has a cost that doesn’t show up on the invoice. It doesn’t break down — once it’s on your farm, it stays. Spent footbath solution usually gets washed into the manure storage and ends up back on the fields. A 2022 UW–Madison field study across 20 eastern Wisconsin dairies found that farms using copper sulfate footbaths had alfalfa copper levels nearly double a 2005 baseline, with third-cut forage “teetering on the boundary” of recommended TMR copper limits. Liver samples from one participating herd averaged 433 ppm copper, with a high of 740 ppm, well into the range UW flags as concerning (over 500 ppm) and approaching toxicity territory (850 ppm).

Warning for color-bred herds: Jersey cattle are significantly more sensitive to copper accumulation than Holsteins. If you’re running a mixed or pure Jersey herd, the downstream liver-toxicity limits in the UW study apply much sooner, and a forage or liver test moves from “good idea” to “do it this year.”

So the chemistry question isn’t only “does it work.” It’s “what’s it doing to my soil and my cows five years out.” That’s exactly why zinc sulfate, acidified copper at lower rates, and stannous-fluoride products are getting a serious look. None has clearly beaten copper on efficacy in well-run trials. The reason to switch is environmental, not performance.

The Tell: When the Bath Fails, So Does the Rest

A failing footbath is rarely an isolated problem. It’s a symptom.

When the bath is too short, mis-mixed, and run “when we remember,” you tend to find the same casualness elsewhere — overstocked pens, long standing times in the holding area, dirty alleys, and trimming that happens reactively instead of on a schedule. A 2022 Journal of Dairy Science study of automated-milking herds in Europe tied higher lameness to poor stall design, inadequate feed access, higher stocking density, and lower body condition. The herds running sand bedding and better feed access had lower lameness and better milk quality.

The paperwork tells the same story. An Irish survey found only 22% of farmers kept records of lame cows, just 15% had a written lameness herd-health plan, and 28% waited more than 48 hours to treat a cow they’d already spotted as lame. That’s not a knowledge gap. It’s a belief gap. These producers don’t think they’ve got a problem worth planning for.

Which is exactly why the “we’ve got it under control” conversation is so hard. They’re not bluffing you. They genuinely can’t see it.

Run Your Own Numbers

The Fond du Lac herd’s $3,100-for-$20,000 trade is convincing, but the number that moves a skeptic is their own. So here’s the tool, not another lecture on case costs.

Take your herd size, multiply by your honest prevalence, and multiply that by $337 — the per-case figure Robcis and colleagues landed on in a 2023 Journal of Dairy Science analysis (milk loss, reproduction, treatment, culling, and labor combined). A 350-cow herd at 20% is 70 cases, or about $23,590 a year. Regional labor costs shift the number — higher-wage regions land above the average, lower-wage regions below — and be skeptical of the $400–533 figures in equipment sales decks, which lean on inflated 30–40% prevalence assumptions that may not match your barn.

And the subclinical piece is where it gets quietly expensive. University of Wisconsin work led by Nigel Cook, as reported by The Bullvine, found that cows with subclinical hoof inflammation lose an average of 3.3 pounds of milk per day before they ever look lame, which is tied to as much as 17% of net farm profit in some herds. Read that as “in some operations,” not “in yours.” The point stands either way: the limp is the receipt, not the cost.

Why Did “10–20%” Ever Become Normal?

Somewhere along the way, an average became a standard. And, in our view, producers started defending a number that the industry shouldn’t be comfortable with.

Here’s where it came from. The literature kept reporting confinement herds in the low-20s. Merck repeated “15–30% in confinement.” Busy people shaved the top off that range in conversation until “10–20%” started to sound like a target rather than a symptom. Nobody ever published a paper calling that level acceptable. It just hardened into a norm through repetition.

The detection failure cemented it. A 2022 German study (Tillack and colleagues, Frontiers in Veterinary Science) had veterinarians score median lameness at 23.1%, 39.1%, and 23.2% across three regions, while the farmers in those same herds estimated 9.5%, 9.5%, and 7.1%. On average, those farmers were consciously aware of only 45.3%, 24.0%, and 30.0% of their lame cows. A 2014 New Zealand study (Fabian and colleagues) found nearly the same pattern: farmers recognized only about 27% of cows with reduced mobility.

So you get a region where every herd sits somewhere between 10% and 30%, everyone’s eyes are undercounting, and the lived experience becomes “my cows look like everyone else’s, so we’re fine.” That feeling is almost impossible to argue with — until a clipboard and a scoring chart make it visible.

The Window Most Herds Miss: Dry Cows and Heifers

If your footbath schedule only covers the milking string, you’re treating the symptom and ignoring the nursery. Digital dermatitis doesn’t wait for the first lactation. Heifers can carry lesions into the parlor on day one, and the dry-cow pen is where much of the infection quietly resets and reloads for the next lactation. Canada’s proAction footbath guidance is blunt about it: don’t forget the dry cows and the heifers.

The trim window matters as much as the bath here. University of Bristol research found that moving the functional trim to the dry period — before the metabolic and hormonal stress of calving lands — cut hoof lesions by 62%. But timing isn’t one-size-fits-all. Minnesota’s Gerard Cramer, whose 2025 randomized trial tested dry-off trimming methods, now argues trimming should be “targeted, not automatic” — his data showed the biggest payoff in first-lactation cows, where a modeling-focused trim at dry-off cut the odds of hoof-horn lesions by 76%, while blanket whole-herd trimming mostly burned chute time better spent on at-risk animals.

The economics back the targeted approach. A 2024 study found partial-herd trimming delivered a higher three-year net benefit than whole-herd trimming 100% of the time, and Bullvine-reported data pegs a well-timed mid-lactation trim (after 110 days in milk) at roughly $308 per cow per lactation in retained milk. So the practical move is to fold heifers and dry cows into the same hygiene discipline as the milk cows — footbath passes where the facility allows, clean dry housing, and a trim plan timed to dry-off and the right cows, rather than “whenever the trimmer’s already here.” The herds that reach single-digit lameness rarely do so by managing the milking string alone.

What “Good” Actually Looks Like

Set a real target, because “better than last year” isn’t one. The Fond du Lac herd’s 14% wasn’t even the ceiling — an Idaho operation cited by The Bullvine ran the full prevention bundle to 12%, then layered in cameras and held 8% consistently. The 8% you see quoted for pasture systems isn’t physics. It’s what consistent foot hygiene, low standing time, and timely trimming buy you, and some confinement herds get close.

The herds that live there share a short list of habits, and none of them are exotic. The footbath runs on a fixed schedule with one named owner. Concentration and pH checked, not guessed. Trim records reviewed quarterly, not pulled out only when a cow’s already three-legged. New lame cows treated within 48 hours, not parked until the next chute day. Locomotion scoring is done monthly by the same person, so the trend line means something.

Notice what’s not on that list: a more expensive chemical, a fancier bath, a bigger budget. The gap between a 24% herd and a 14% herd — the exact gap that Wisconsin farm closed — wasn’t money. It was about standards and whether anyone was actually accountable for upholding them.

What This Means for Your Operation

Walk your own barn against these. Each one pairs the question with a number that indicates whether your answer is good enough.

  • Are you counting, or guessing? Farmers in the German study were consciously aware of as few as 24% of their lame cows (Tillack 2022), while DD is present in 70–95% of U.S. herds (UW). Locomotion-score a random 100–200 cows this month and set that figure next to your gut estimate. If they’re far apart, you’ve found your problem.
  • Who owns the protocol? The Fond du Lac herd put one named employee on the bath and went from a reported 24% to 14%. If you can’t name the exact person responsible for mixing and monitoring, your program is running on luck.
  • Is your chemistry actually at spec? 27% of surveyed Wisconsin farms ran copper at triple the recommended rate. Check concentration and pH against a written spec — not by eye — this week.
  • Are the dry cows and heifers on the schedule? If only the milking string gets the bath, you’re reloading the infection every lactation. Fold them in, and time the dry-off trim to the cows that benefit most — Cramer’s trial showed a 76% cut in hoof-horn lesion odds in first-lactation cows.
  • Can you treat a new lame cow within 48 hours? The best herds don’t park her until the next chute day. If yours waits, that’s where chronic, expensive cases are born.
  • What’s your downstream copper footprint? If you’ve run copper sulfate for more than a decade, pull a third-cut alfalfa forage sample and test for accumulated loading — UW found farm forage copper near double its baseline and liver levels averaging 433 ppm.

Key Takeaways

  • If you can’t name the owner of your footbath, fix that first. The Wisconsin herd’s 24%-to-14% drop was driven by accountability, not equipment — one employee, a fixed four-day rotation, no skipping.
  • If your bath misses on length, depth, pH, or change frequency, the chemical doesn’t matter. Frequency beats formulation; 5% copper run four times a week on spec beats a premium product run “when we remember.”
  • If you’ve never measured prevalence, your gut is probably undercounting by half. Score 100–200 cows in the next 30 days — the cheapest, highest-value move on this list.
  • If you’ve been running copper for 10+ years, test your forage before switching products. The performance reason to change is thin; the soil-and-liver reason is real, and it shows up first in Jersey herds.

Most producers carry lameness as a bill they pay. The reframe that walks someone out to the alley with a clipboard is simpler and harder: lameness isn’t a bill, it’s a choice you make every day in how you measure, who you hold accountable, and what you’re willing to see. So which number are you defending — and would it survive a real score?

Run Your Numbers

Health ROI Calculator — That $337-a-case figure is an average, not your barn. Run your own herd size, prevalence, and protocol cost through the Health ROI Calculator to see whether tightening your footbath program actually pays back in lower culling, less milk loss, and fewer chronic cases — before you spend a dollar.

Complete references and supporting documentation are available upon request by contacting the editorial team at editor@thebullvine.com.

Learn More

The Sunday Read Dairy Professionals Don’t Skip.

Every week, thousands of producers, breeders, and industry insiders open Bullvine Weekly for genetics insights, market shifts, and profit strategies they won’t find anywhere else. One email. Five minutes. Smarter decisions all week.
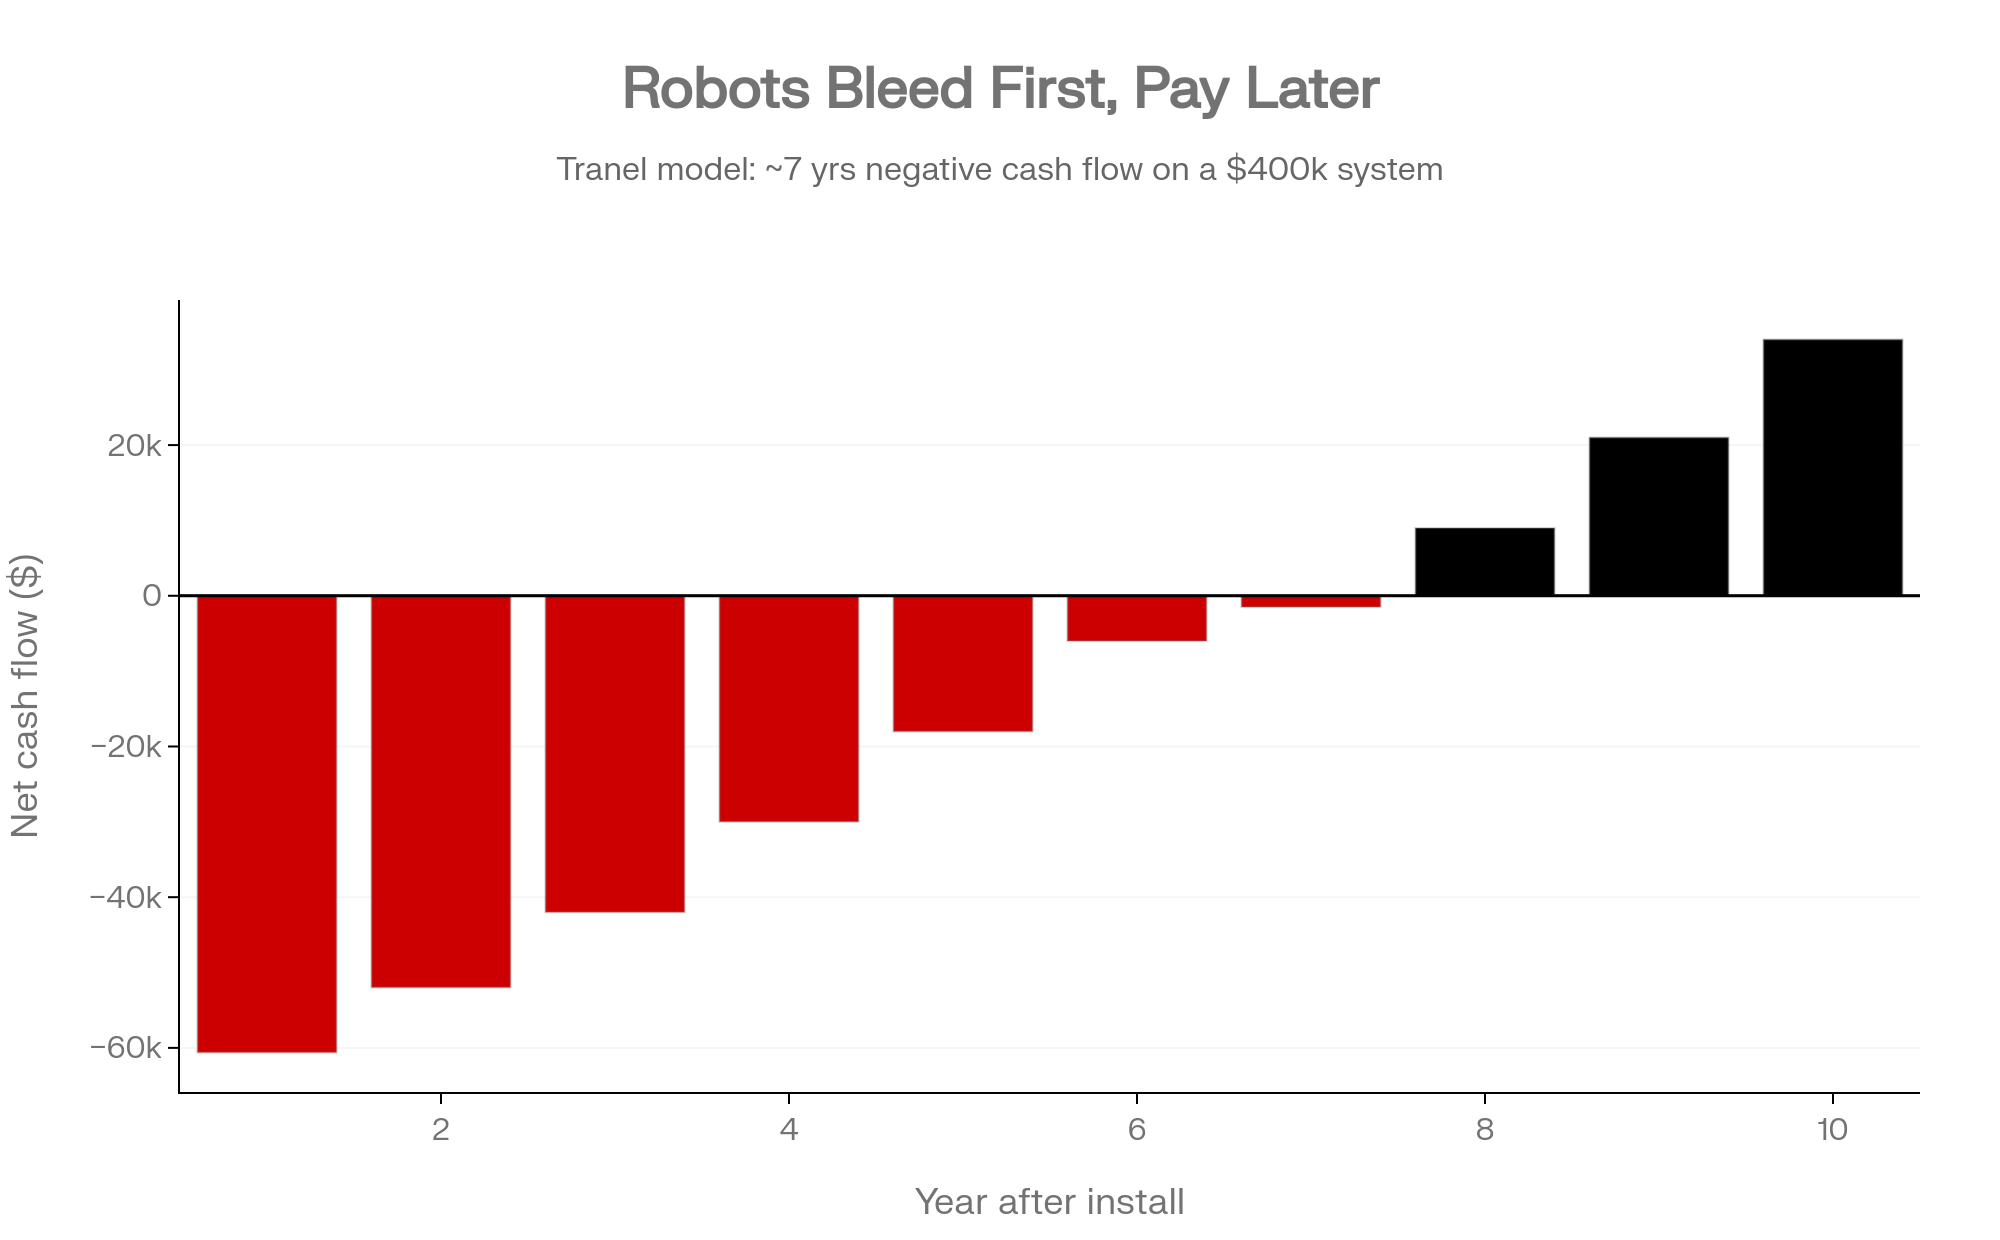
NewsSubscribe
First
Last
Consent

CoBank Says the Heifer Rebuild Starts in 2027. Run the Numbers, and It’s a 5.3-Point Crawl, Not a Comeback.

CoBank projects 360,200 more replacement heifers over 2027 and 2028 — just 3.75% of the national herd. Enough to stop the bleeding. Not enough to refill the pipeline. Here’s what it means for your breeding sheet this year.

Picture a 400-cow operation in central Wisconsin that’s been holding heifers like gold bars since 2024. The owner did everything CoBank’s models would applaud — genomic tested, sexed the top end, beef-bred the bottom. And he’s still staring at $3,100 replacement values and a pipeline that won’t feel “rebuilt” for years. If you’re milking cows anywhere in the U.S. right now, that’s your story, too.

The question isn’t whether replacements come back. It’s how little, how slow, and what you do about it in the meantime.

On June 18, 2026, CoBank’s Corey Geiger and Abbi Prins published their read on it: dairy replacements “should begin a slow rebuild in 2027 and 2028.” They’re right about the biology. They’re right about the timeline. But “rebuild” is a generous word for what the numbers actually deliver.

Disclosure: CoBank is a major agricultural lender to the U.S. dairy and livestock industries, so it has a commercial interest in how the dairy outlook is read. That’s a reason to check the numbers against independent data — not to assume bias. We did, and CoBank’s figures track USDA and NAAB reporting.

What CoBank Is Actually Saying

Give CoBank credit before you challenge them, because the framework is sound. Semen sales in a given year set replacement heifer availability roughly 30 months later — that biological lag doesn’t negotiate. Raising a dairy replacement from birth to maturity is a two-year investment, while a beef-on-dairy cross calf is “essentially an instant one-time revenue source,” as Geiger and Prins put it — and that timing gap is the whole story.

Their case rests on a few legs. The triple-play breeding shift — sexed dairy semen on elite cows, genomic testing to sort keepers, beef on the rest — has been reshaping the national mix since 2022. Retained dairy cows have plugged the gap, holding the milking herd above 9.6 million head, the highest in 30 years, even as replacement inventories fell to their lowest level since 1978. The beef pivot is what dug the hole, and it ran deep: beef-on-dairy semen sales grew 62% from 2020 to 2025, while gender-sorted dairy semen climbed 53.6% and conventional dairy semen collapsed 47.4% over the same window.

Here’s the headline number. Dairy replacements entering the milking herd shrink by a combined 796,000 head across 2025 and 2026, then rebuild by 360,200 head in 2027 and 2028. Call it 285,400 in 2027 and roughly 74,900 in 2028. CoBank’s read on geography holds up too — the wave of new dairy processing investment in New York, Texas, Wisconsin, Michigan, Idaho, and the I-29 corridor keeps replacement demand hotter in those zones than anywhere else.

The diagnosis is accurate. The fight is over what “rebuild” means once you run it forward — and over one thing CoBank’s own data quietly undercuts, which we’ll get to: beef isn’t going anywhere.

Where the Math Agrees With CoBank

Run CoBank’s numbers through The Bullvine’s BPI Index — the composite that scores a replacement pipeline on heifer supply, price signal, culling pressure, and semen mix momentum — and the early read matches CoBank almost exactly. The mid-2025 trough lines up with CoBank’s biology window. The beef-on-dairy surge of 2022–2023 locked in the 2025–2026 shortage before most producers felt it in their pens.

Price is where the agreement is tightest. CoBank’s own model puts dairy heifer replacement prices above $3,000 per head this year, driven by the ratio of dairy heifers expected to calve falling to 26.1% of the cow herd — down from above 30% as recently as 2022. And those USDA figures run conservative next to the auction barn: top-quality replacements cleared $3,400 to $4,400 in Minnesota and Wisconsin markets this spring. CoBank traces the whole arc — replacements ran $1,200 a head in 2019, when dairy heifers were worth more in a feedlot than a dairy barn, which is exactly what kicked off the beef-semen-on-dairy movement in the first place.

So the disagreement isn’t about today. It’s about what 360,200 head actually buys you.

Is CoBank’s “Rebuild” Big Enough to Move Your Replacement Costs?

Short answer: barely. Here’s the arithmetic, and you can map it to your own barn.

360,200 head ÷ 9.6 million cows = 3.75%. That’s the rebuild — two years of heifers entering the herd, measured against today’s 9.6-million-cow milking base. Now set it against the hole. The industry drained 796,000 replacements over 2025–2026. So the recovery gives back, over two years, less than half of what got pulled out in the prior two. You lost ground roughly twice as fast as you’re projected to win it back.

Zoom out, and it’s worse. CoBank pegs the inventory of dairy heifers 500 pounds and over as down 909,400 head — a 19% drop from 2016 to 2026. A 3.75% bump doesn’t undo a 19% slide. It dents it.

The BPI dial tells the same story. Plug CoBank’s 2028 assumptions into the national-average inputs, and the Index moves from 43.4 to 48.7 — a 5.3-point lift that never leaves the Yellow Zone. No scenario reaches Green. Here’s how the paths shake out:

ScenarioHeifer ratioCull %Heifer costSexed %BoD %BPIZone
National — today (mid-2026)0.4229%$3,10052%31%43.4Yellow
National — CoBank 2028 rebuild0.4532%$2,80055%32%48.7Yellow
Stress test — cull rate 33%0.4533%$2,80055%32%47.7Yellow
I-29 corridor — demand stays hot0.4532%$3,20055%32%42.0Yellow
Beef futures crash by late 20270.4534%$2,60058%22%52.5Yellow

The BPI is built around four levers, in order of weight: heifer supply carries the most, followed by culling pressure, then the price signal, then semen-mix momentum.

Here’s the part that should change how you read CoBank’s report. The rebuild is a quantity forecast — more heifers. But the price signal still moves the composite, and CoBank doesn’t forecast heifer prices at all. If demand stays hot in the processing-investment zones and prices hold near $3,100 instead of softening to the $2,800 CoBank’s math implies, the Index barely twitches — that’s the I-29 row sitting at 42.0. More water in the tank doesn’t help if the demand side keeps the price of that water high.

What Happens to the Math If Your Cull Rate Snaps Back?

This is the operational trap, and it’s already in motion. From August 2023 through August 2025, U.S. dairy farmers collectively retained more than 600,000 cows by sending fewer to slaughter — the pullback that pushed the national herd past 9.6 million head. Those retained cows are exactly what’s been holding the milking herd at a 30-year high.

But the drain is reopening. CoBank notes cull cow slaughter has risen in 35 of the last 38 weeks from mid-September through mid-June 2026 — a net 83,100 more dairy cows sent to slaughter, even if that’s still well off the 2022–2024 pace. Run it through the Index: take CoBank’s rebuilt 2028 heifer supply, then move the cull rate from today’s 29% retention mode back toward a more historical 33%, and the BPI drops a full point — 48.7 to 47.7. You’re filling the bathtub while someone reopens the drain. On your farm, the math runs the same direction, so want a faster read on where you sit?

Check your replacement-to-cull ratio with the RC Snapshot to see whether your heifer pipeline is short, tight, balanced, or long.

The Wild Card CoBank Doesn’t Model: Beef

The most interesting line in that table isn’t the rebuild. It’s the bottom row.

Live cattle futures hit a record $251 per cwt in May 2026, riding the smallest U.S. beef cattle herd in 75 years. As long as beef pays like that, dairy farmers keep beef-breeding the bottom of the herd — and the replacement pipeline stays starved. The beef check is now driving margins more than the milk check on many operations: five years ago, calf and cull sales accounted for about 5% of the dairy’s bottom line; today, they run 12–15%, with some operations near 20% on a per-hundredweight basis. No surprise the U.S. dairy herd has grown by 254,000 head since January 2025.

Metric5 years ago (~2021)Today (mid-2026)What it signals
Calf + cull share of dairy bottom line~5%12–15% (up to 20%)Beef now rivals milk as the margin driver
Live cattle futureswell below record$251/cwt (record, May 2026)Peak incentive to beef-breed the bottom
U.S. beef cattle herdlargersmallest in 75 yearsNo relief on cattle prices coming
Beef heifers retained for herd growth+1% vs. 2025Ranchers aren’t rebuilding — incentive holds
U.S. dairy herd vs. Jan 2025baseline+254,000 headRetained cows, not new heifers, fill the gap

But if beef rolls over before 2027, the whole incentive structure flips. Push beef-on-dairy down from 31% to 22% of matings, let sexed dairy climb to 58%, and the BPI jumps to 52.5 — the highest of any scenario here. Sit with that. The fastest path to a pipeline rebuild isn’t the patient triple play. It’s a beef market correction that drags farmers back into making dairy replacements.

Now here’s what makes CoBank’s own data so revealing. The beef herd isn’t rebuilding — heifers retained for beef cow replacement are up just 1% from 2025. Ranchers aren’t holding back females to grow the herd, which keeps cattle prices sky-high and keeps the beef-on-dairy incentive locked in. CoBank’s forecast quietly assumes those beef economics hold through 2028, and their own numbers say that’s the likely case, which means the slow rebuild, not the fast one, is the base case. But the report never models the flip side, and that flip is the single biggest swing factor in whether your heifer costs ease in 2028 or stay stuck.

Barn Math: A 400-Cow Midwest Herd

Run the same logic on the Wisconsin operation from the top of the page. It starts ahead of the national average — disciplined breeding, strong calf care — but watch where CoBank’s rebuild leaves it.

  • Today: 400 cows, replacement-to-cow ratio 0.70, 60% sexed, 30% cull rate, $3,100 heifer cost, 30% beef-on-dairy → BPI 61.8, Yellow Zone.
  • Apply CoBank’s 2028 rebuild: ratio rises 3.75% to about 0.73; heifer cost softens to $2,800; cull rate normalizes to 33%, sexed bumps to 62% → BPI 65.9, Yellow Zone.

Net move: +4.1 points. Zone change: none. Even the well-run herd that started above average doesn’t reach Green by 2028 on CoBank’s numbers. The rebuild is real. It just doesn’t close the gap. The other lever the well-run herd can still pull is sorting — deciding which heifers are worth the two-year carry in the first place.

That’s where the Genomic Testing ROI Calculator earns its keep: it weighs testing cost against avoided poor replacements and beef-on-dairy premiums.

Methodology note: the BPI uses a herd-level replacement-to-cow inventory ratio in the farm example (0.70), which is a different measure than the national heifer-availability ratio in the scenario table (0.42–0.45). The calculator reproduces the published mid-2025 national trough within roughly 3.7 points using national-average inputs; the directional findings hold.

Options and Trade-Offs for Your Operation

Three real paths, depending on where you farm and how you read beef.

If you’re inside the processing-investment corridor — New York, Texas, Wisconsin, Michigan, Idaho, or the I-29 stretch through western Iowa, Minnesota, and South Dakota — processor demand is locking in replacement demand through 2028 and probably past it. Heifer prices in those markets likely won’t soften to CoBank’s implied $2,800, which keeps your local BPI down near 42 even after the national rebuild. What it requires: holding heifers and not selling into the peak. CoBank’s Ben Laine framed the scale of the squeeze plainly at World Dairy Expo last October — “We haven’t seen heifer supplies this tight since 1978.” The risk: the next window to add quality genetics at a sane price may not open until late 2028 at the earliest. Score your herd now so you know which animals are worth holding.

If you’re outside those zones, the rebuild may show up as modest price relief — but later than you’d like, more like 2028 or 2029, and only if culling doesn’t normalize faster than the pipeline recovers. What it requires: budgeting honestly. Don’t pencil in $3,000 heifers unwinding fast. Treat $2,600–$2,800 as the optimistic case, not the base case. The margin for error is thin, and the BPI math says so.

For everyone, beef futures are the variable to watch — and this is the 30-day move. Pull up the live cattle board this week and write down your tipping point. With futures at that May 2026 record of $251/cwt and the beef herd showing only a 1% heifer-retention bump, the incentive to beef-breed isn’t fading on its own. But if futures drop 15% or more before the end of Q1 2027, shifting more breeding weight to sexed dairy stops being a nice-to-have and becomes the play — that’s the path to BPI 52.5, the fastest recovery modeled. Decide your number now, while the market’s calm, so you’re not reacting in a panic later.

Key Takeaways

  • If you farm in a processing-investment zone, don’t plan around softening heifer prices. Your local pipeline likely stays below BPI 45 through 2028 — hold heifers and score your herd this month.
  • If your cull rate sits near 29% because you’re retaining cows, know that normalizing to 33% costs you roughly a full BPI point of recovery. Make that call deliberately, not by drift.
  • If live cattle futures fall 15%+ from $251/cwt before Q1 2027, accelerate sexed-dairy matings. That single shift moves the pipeline faster than CoBank’s entire patient-rebuild scenario.
  • If beef-heifer retention stays near +1%, plan for the slow rebuild, not the fast one. The cattle herd isn’t growing, so the beef-on-dairy incentive holds — and so does your replacement cost.
  • If you’re budgeting replacements for 2027–2028, use $2,600–$2,800 as the optimistic case — not the number you bank on.

Where Does Your Pipeline Actually Sit?

CoBank’s biology is right and their timeline is probably right. But a 5.3-point BPI gain that keeps the national replacement pipeline in the Yellow Zone for another two-plus years isn’t a rebuild. It’s the end of the freefall — and honestly, that’s worth something. The freefall was the scary part.

So where does your barn land on that dial right now — green, yellow, or already flashing red? Run your herd through the BPI Index Calculator before you finalize a single 2027 breeding decision, because the national average is a story about everyone and nobody in particular.

If you want the backstory on how the pipeline got drained in the first place, the 800,000-Heifer Crisis pillar walks through the whole unwind. And for the full model behind these scenarios — the lever weights, the price-sensitivity curves, the regional adjustments — that’s where Bullvine Weekly digs in. Subscribe, and we’ll send the deeper math the week it drops.

Learn More

The Sunday Read Dairy Professionals Don’t Skip.

Every week, thousands of producers, breeders, and industry insiders open Bullvine Weekly for genetics insights, market shifts, and profit strategies they won’t find anywhere else. One email. Five minutes. Smarter decisions all week.
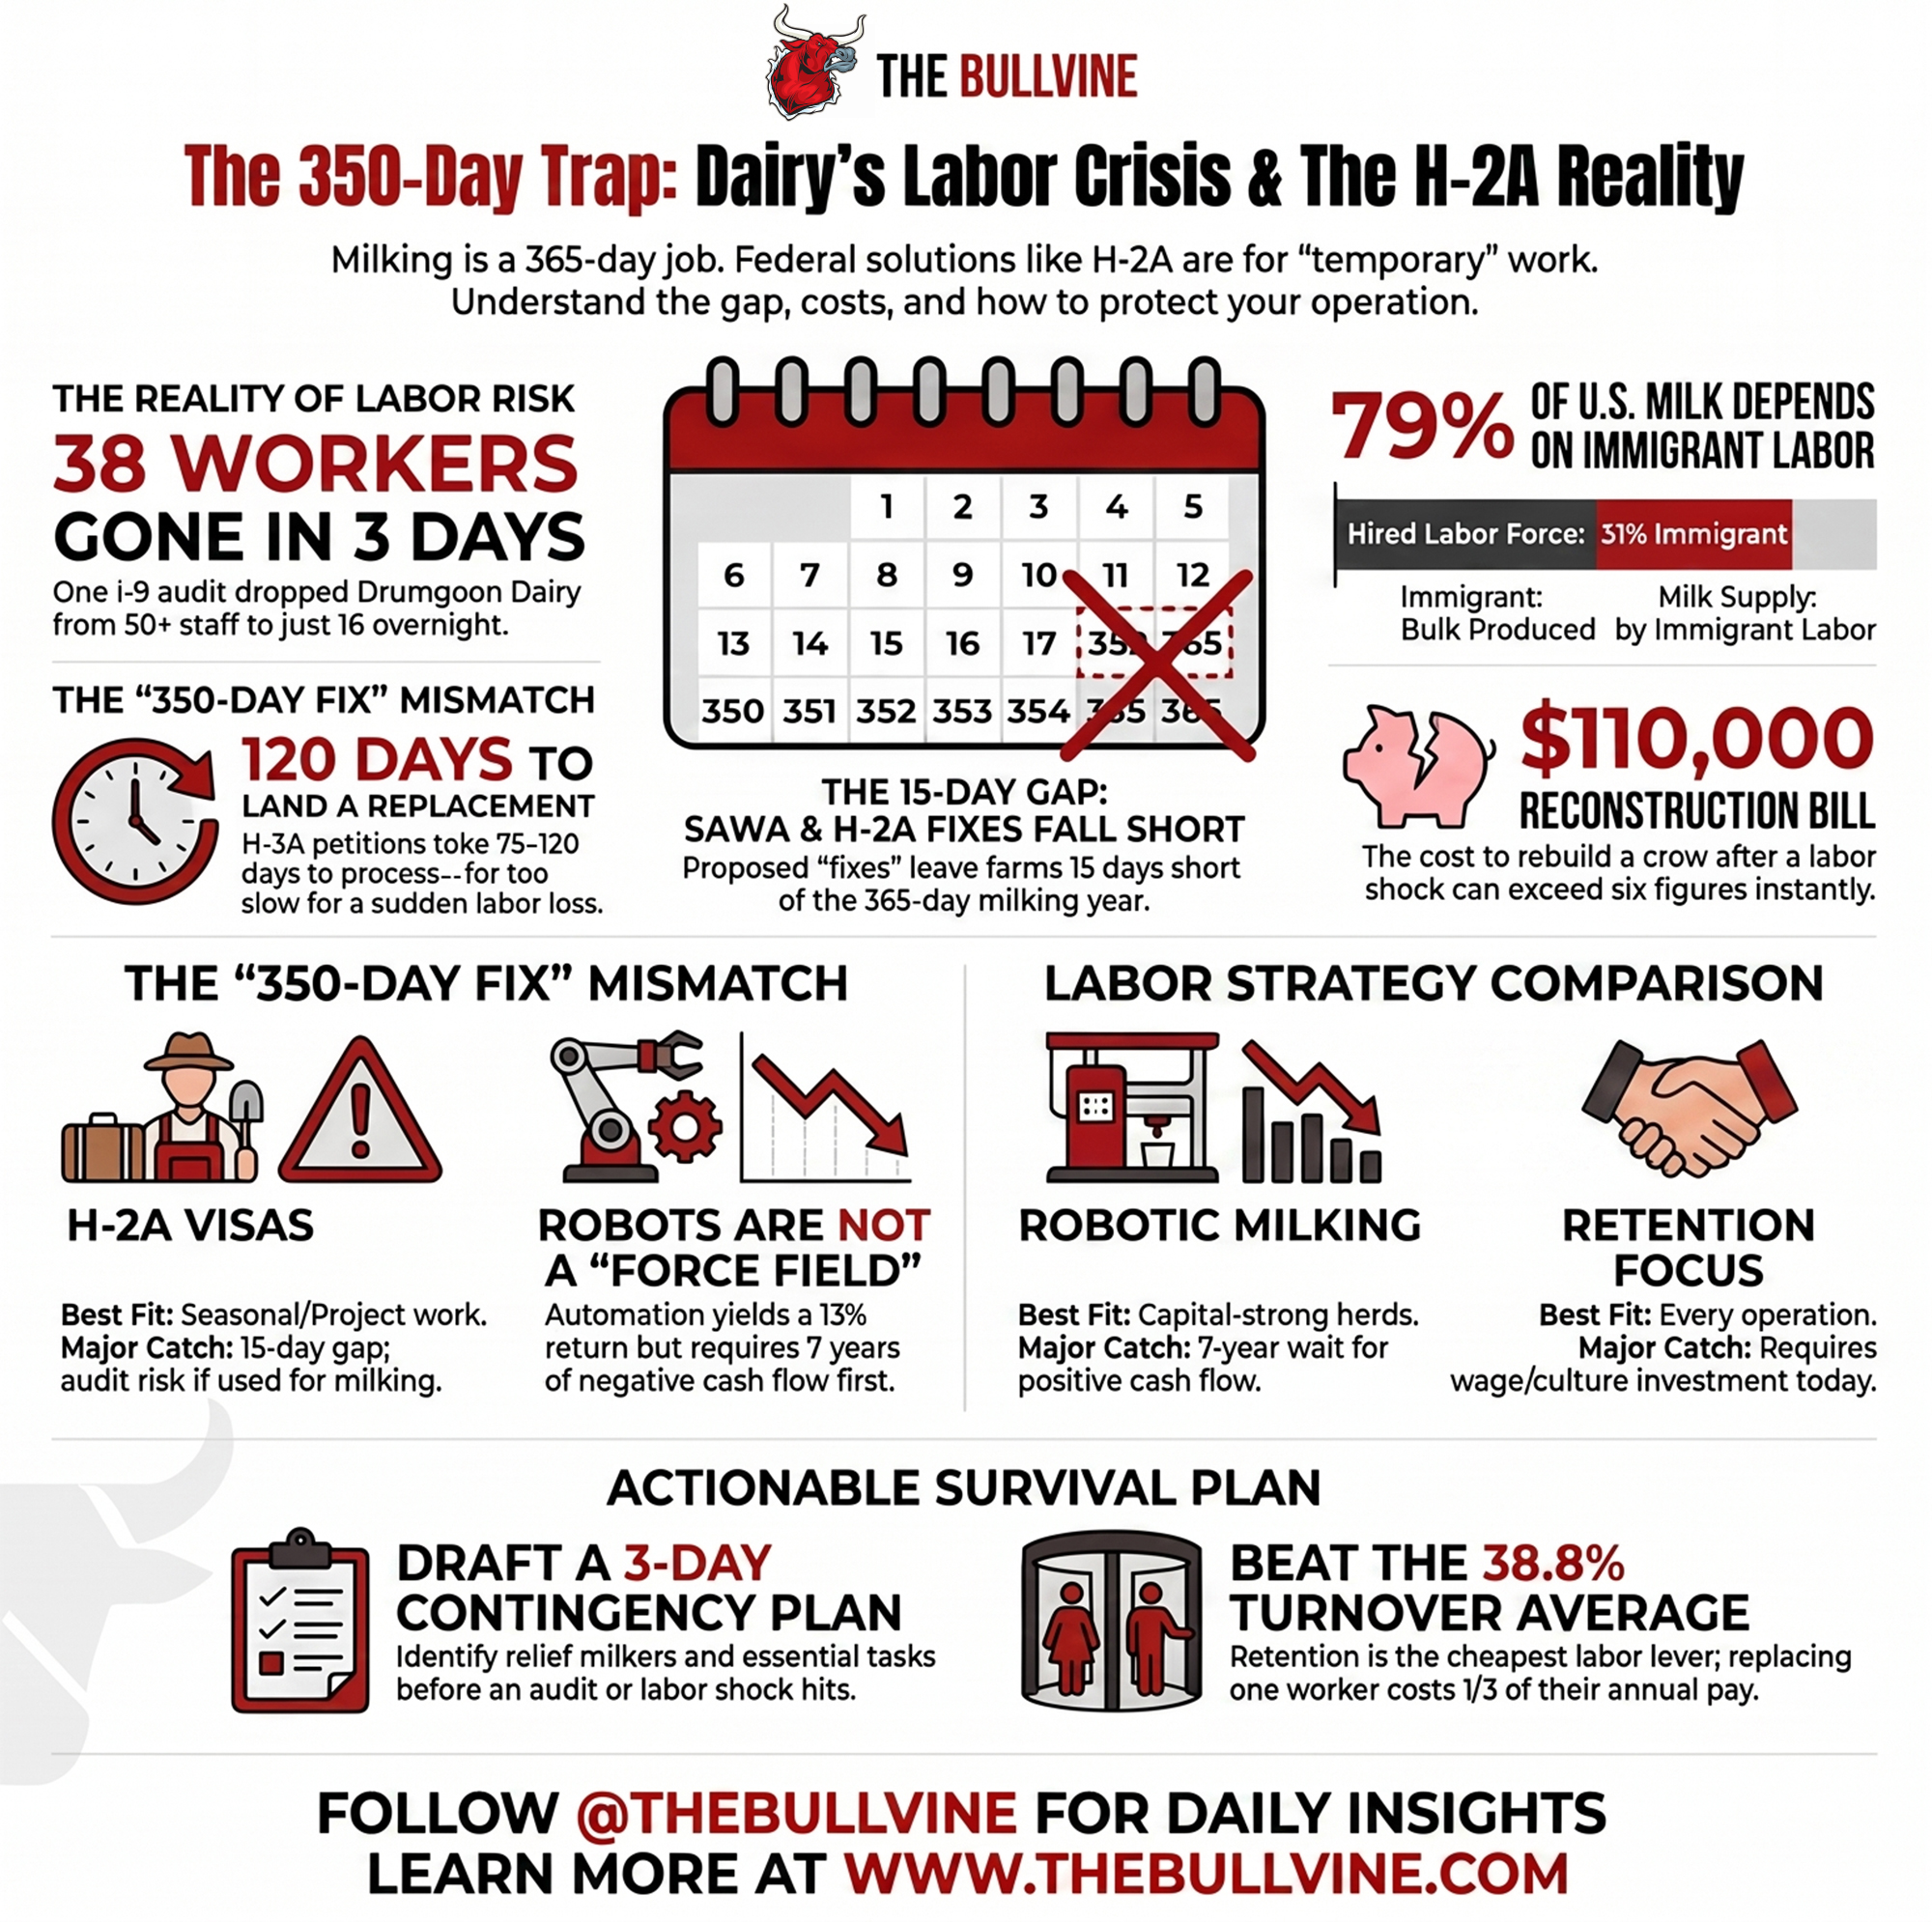
NewsSubscribe
First
Last
Consent

Pennsylvania Promised 50¢ a Cwt. Matt Espenshade Got 13. July 1, That’s Gone.

The state set the premium at 50¢/cwt. Espenshade’s March check showed 13. On July 1 even that vanishes — and most of your tank never qualified for it anyway. Go read your last statement.

Matt Espenshade, told the Milk Board his March milk check showed just 13¢ of the state’s 50¢ over-order premium — the gap at the heart of a program that sunsets July 1.

Matt Espenshade told the Pennsylvania Milk Board this June that his March milk statement showed an over-order premium of about 13 cents per hundredweight (cwt). The state had set that premium at 50 cents. So where did the other 37 cents go? 

Espenshade runs the Pennsylvania State Grange and ships to a DFA-affiliated co-op, and he put that number on the record in sworn testimony. That gap — 50 cents promised, 13 delivered — is the whole story of Pennsylvania’s over-order premium in one line. And on July 1, 2026, even that 13 cents disappears. The Milk Board deadlocked and, as of the June 12 special sunshine meeting, signaled there will be no over-order premium after June 30, ending a program that’s ridden on Pennsylvania fluid milk since the 1988 drought. If you ship Class I milk in this state, that’s money coming off your check in less than two weeks. 

What’s Changing and Why

The over-order premium — OOP, on your statement — is a state add-on that sits on top of the federal minimum for Class I milk: the drinking milk produced, processed, and sold inside Pennsylvania. That federal base ran $22.18/cwt for June 2026, up $2.03 from May; the state premium stacked on top. The program was born in 1988 to help farmers cover costs, and the Milk Board has renewed it by order every six months ever since. 

For most of that recent stretch, the number didn’t move. The Board held the premium at a flat $1.00/cwt through 2022, 2023, 2024, and all the way to the end of 2025 — order A-1015, A-1017, A-1019, A-1020, A-1021, each one essentially rubber-stamping the last. Then in December 2025, it broke the pattern. General Order A-1022, published December 17 after a December 3 hearing, split the decision in two: $1.00/cwt for January through March, then halved to $0.50/cwt for April through June — the first sub-dollar premium since 2021. One board member, James Van Blarcom, dissented and pushed for zero, calling the whole system flawed. He didn’t get zero in December. He’s effectively getting it now. 

Then June happened. The Board split at its hearing, no new order followed, and the program ran out of road. Lancaster Farming reported the premium is “likely to sunset July 1 because the Milk Board is deadlocked.” Farmshine’s Sherry Bunting put it flat after the June 12 meeting: “At this time, it appears there will be no over-order premium as of July 1, 2026. The farms on the hook are PA Class I shippers. But who actually felt that premium has always been a different question than who paid for it. 

How This Plays Out on Real Farms

Here’s the part that stings. Most Pennsylvania farmers were never getting the full premium to begin with — and the Board said so in writing. In General Order A-1019, dated June 2024, it found that “none of the three producers who testified at this hearing receive even a quarter of the over-order premium.” 

The June 2026 testimony backs that up with real checks. Espenshade reported about $0.13/cwt in over-order premium on his March statement against a 50-cent rate — roughly 26%. Paul Hartman, testifying for Farm Bureau off his Berks County operation shipping to Clover Farms Dairy, described the same gap between the stated premium and what actually reached his check. Same program, two farms, neither close to the headline. Larry Stoner, who runs Apple Valley Creamery, summed up the frustration in a January interview: “You never really know how much of the over-order premium you actually get.” 

Now the barn math, because that’s what your banker cares about. Using the Center for Dairy Excellence’s 2025 state average — 21,121 lbs per cow per year, or about 17.6 cwt per cow per month — here’s the hole on July 1. At the 13-cent capture most co-op members actually saw, a 200-cow herd loses roughly $458 a month — about $5,500 a year. A 400-cow herd, about $915 a month, call it $11,000 a year. Were you one of the rare farms capturing the full 50 cents? Quadruple it. Run your own number against the table below. 

Your July 1 Hole, By Herd Size

Herd sizeAt 13¢/cwt capture (typical co-op)At full 50¢/cwt (rare)
100 cows~$229/mo · ~$2,750/yr~$880/mo · ~$10,560/yr
200 cows~$458/mo · ~$5,500/yr~$1,760/mo · ~$21,120/yr
400 cows~$915/mo · ~$11,000/yr~$3,520/mo · ~$42,240/yr
800 cows~$1,830/mo · ~$22,000/yr~$7,040/mo · ~$84,480/yr

The math: cows × 17.6 cwt/month × your capture rate. Pull your own capture rate off your last three statements — don’t use 50 cents unless your check proves you earned it.

The Realities of Multi-State Pooling

So why the leak? Two reasons. First, only a slice of the state’s milk ever qualifies. A Pennsylvania legislative review found just 15–20% of all Pennsylvania-produced milk goes to Class I use, and the OOP only rides on milk produced, processed, and sold as fluid inside the state. For national context, Class I ran about 22.68% of all U.S. milk as of March 2025 — fluid is a shrinking slice everywhere, and PA’s qualifying share sits below even that. Most of your tank never triggers the premium. 

Second — and this is the one that surprises people — the co-op isn’t sitting on your money, it’s blending it. State law deems a cooperative a “producer,” so when a dealer pays the premium, it pays the co-op, which then settles with its members through the same pooling machinery that runs under the Federal Milk Marketing Orders. When DFA pools Pennsylvania Class I premium dollars across its entire Northeast Area — Federal Order 1 — those PA fluid dollars get spread across every hundredweight in the pool: Class II, III, and IV milk, and members in other states who never shipped a drop of PA Class I. DFA’s dairy economics manager Drew Frommelt acknowledged in the A-1019 hearing record that this pooling spreads the premium beyond the in-state fluid milk it was collected on.

That’s the mechanism, and it cuts both ways. Co-ops argue pooling spreads premium dollars and price risk evenly across a multi-state membership — your check is steadier because it isn’t riding on one state’s fluid utilization alone. Critics, including the dissent written into General Order A-1018, argue that every Pennsylvania consumer pays the premium at the dairy case while not every Pennsylvania farmer sees a direct benefit — which is how 50 cents on paper becomes 13 in the mailbox. Neither side is making it up. The dollars are real; they’re just diluted across a much bigger pool than the state line the premium was collected behind. 

There’s a wrinkle that explains why some farmers can read their leak and others can’t. When a milk dealer pays a producer — including a co-op — the law requires the premium shown as a line item. But when a cooperative then pays its own members, that disclosure historically wasn’t required, which is exactly the gap the Board’s Regulation 47-20 “Cooperative Over-Order Premium Line Item” rulemaking set out to close. That’s why Espenshade and Hartman could read theirs and testify to what landed — and why plenty of co-op members still can’t. 

None of this is a secret. Agriculture Secretary Russell Redding told the Board in December that replacement of the current over-order premium structure is overdue. Everybody named the leak years ago. Nobody plugged it before the program died. pa

What About the Fuel Adjuster Everybody Forgets?

Tucked alongside the headline premium is a second piece most coverage skips: the diesel fuel add-on. Under General Order A-999, in place since 2017, the adjuster sits at $0.00/cwt while average diesel stays below $2.70/gallon, then climbs $0.02/cwt for every 10-cent jump in the monthly average price — $0.02 in the $2.70–$2.799 bracket, $0.04 at $2.80, and up the ladder from there. That’s not trivial in a high-fuel year. Pennsylvania’s on-highway diesel was running around $5.59/gallon in mid-June 2026, which puts the adjuster near the top of its range — real cents stacked on the premium. Back in April 2023, with diesel elevated, the add-on ran $0.44/cwt on top of the $1.00 premium. 

Here’s the part that matters for July 1. The fuel adjuster has never been a standalone program — it’s renewed as part of the same over-order premium package and tied to the same dates. When Farm Bureau described the deal in 2023, it put the premium and the fuel adjuster in one breath, supporting “the existing over-order premium of $1.00 for the next six months, along with the fuel adjuster.” So if the base premium lapses at midnight June 30 with no successor order, the fuel add-on lapses with it — and at today’s diesel, that’s not pocket change you’re losing alongside the premium. Don’t bank on a quiet fuel line surviving the deadlock. Confirm it with your handler. 

Who Actually Dropped the Ball Here?

If you’re hunting for one villain, you’ll be disappointed. The gap exists because three parts of the system each chose to wait. The Board knew the premium leaked — it wrote a dissent saying exactly that into General Order A-1018 back in 2023 — and still rolled the premium forward six months at a time rather than force a redesign. When the reform question finally hit the table this June, the Board deadlocked and let the calendar make the call. 

The legislature had a fix in hand and parked it. Senators Elder Vogel and Judy Schwank introduced Senate Bill 689 in 2025 to let the state collect the premium at retail and distribute it directly to Pennsylvania producers — aimed squarely at the leak everyone keeps describing. It was laid on the table in June 2025 and never got a vote. And the co-ops operated within the FMMO pooling structure the law allows, where the per-farm share is set by co-op policy. Follow who could treat July 1 as an option instead of a deadline. The Board could. The legislature could. The co-ops could. The 400-cow family running on a $21 cost structure couldn’t. 

How Much Does the July 1 Cliff Actually Cost Your Herd?

Map it to your own tank. Take your cows, times 17.6 cwt a month, times whatever capture rate your statements actually show. A direct shipper capturing the full 50 cents loses nearly four times what a pooled co-op member at 13 cents does — same cows, same milk, different marketing arrangement. 

Here’s the honest framing, though. The Center for Dairy Excellence pegs net cost of production at $21.01/cwt for smaller PA herds and $20.87/cwt for larger ones — against an all-milk price USDA put near $21.60/cwt for 2025. That premium was never the thing making you profitable. It was a buffer. Losing it doesn’t kill a healthy farm. But for an operation already running on fumes, it’s the gust of wind that pushes a fire through the last fence line. 

Is the Premium’s End the Cause — or Just the Reveal?

Pennsylvania lost 490 dairy farms in 2025. That’s an 11.7% drop in a single year, and it accounts for 41% of every U.S. dairy exit. That collapse was rolling long before this hearing, and the PA milk price story in 2026 is bigger than any single line item. The OOP sunset won’t be the headline cause of the next round of exits — milk prices stuck near cost of production will be. 

But July 1 does something useful, in a hard way. It exposes which operations were quietly leaning on that buffer to make the loan payment. If your survival math depended on a premium where you captured 13 cents on the dollar, the real question isn’t aimed at the Milk Board. It’s whether the underlying business works without it.

Options and Trade-Offs

You can’t break the Board’s deadlock. You can control what you know about your own check before the cliff. Here’s what producers are doing.

  • Confirm your real capture rate — this week. Pull your last three statements and find the PMB over-order premium line. If you ship to a dealer it’s required to be there; if you ship through a co-op it may not be, so ask for it in writing. Know whether you got 13 cents, something higher, or something lower. Costs you 20 minutes, risks nothing, and it’s the only way to size your actual exposure. 
  • Call your handler or co-op before June 30. Ask straight: is the premium continuing past June 30, does the fuel adjuster survive, and when does my settlement change? You may not love the answer. You’ll like a surprise in your July check even less.
  • Rebuild your cash flow with the OOP line at zero. If your lender’s model assumed any premium income, update it now. For a leveraged operation sitting near a 1.0x debt-service coverage ratio, this is the difference between a planned conversation and a panicked one.
  • Push on reform — the long game. SB 689 is the vehicle that would’ve fixed the leak, but it’s parked, and reviving it is a 2027 fight at the earliest. Worth your voice if you believe a fixed, transparent premium beats no premium. Don’t count on it for next month’s cash flow. 

Key Takeaways

  • If any over-order premium showed on your last statement, call your handler or co-op before June 30 and confirm exactly when and how your check changes on July 1 — and whether the fuel adjuster goes with it.
  • If you haven’t checked your actual capture rate, do it this week — and if it came in under a quarter of the stated premium, you’re in the majority, losing less than the headline but losing it all the same.
  • If your 2026 cash flow assumed any OOP income, rerun it at zero. If that drops your debt-service coverage below 1.0x, talk to your lender before August, not after.
  • Use your own number: cows × 17.6 cwt/month × your capture rate. If you’re penciling in 50 cents without a statement to prove it, you’re budgeting on a premium you never got.
  • If you want a fixed premium back, SB 689 is the only live path — but treat it as a 2027 conversation, not a July fix.
PartyWhat they had in handWhat they didCould’ve treated July 1 as a choice?
PA Milk BoardIts own A-1018 dissent naming the leak (2023)Rolled premium forward 6 months at a time; deadlocked June 2026Yes
State legislatureSB 689 — collect at retail, pay producers directlyLaid on the table June 2025; never votedYes
Co-opsFMMO pooling discretion; per-farm share is policyBlended PA Class I dollars across the Northeast poolYes
The 400-cow family ($21 cost)A milk check and a loan paymentAbsorbs the loss with no lever to pullNo

The premium’s gone either way. The question your statement answers in about 20 minutes is the one that matters: how much of it were you ever actually getting — and can your operation carry that loss at today’s feed costs without flinching? Where does your breakeven sit right now if the buffer’s gone?

If you want the full model — every capture rate, every herd size, run against current mailbox prices and the fuel adjuster — that’s the next piece. Our Tier 3 breakdown walks the whole calculation by operation size and marketing arrangement, and it’s worth your time before you sit down with your banker.

Run Your Numbers

Learn More

The Sunday Read Dairy Professionals Don’t Skip.

Every week, thousands of producers, breeders, and industry insiders open Bullvine Weekly for genetics insights, market shifts, and profit strategies they won’t find anywhere else. One email. Five minutes. Smarter decisions all week.
NewsSubscribe
First
Last
Consent

A 16.4% TB Hotspot in Ireland Just Exposed the Trap Every Wildlife-Reservoir Dairy Farmer Faces

From Wicklow’s deer to Michigan’s whitetail, New Zealand’s possums, and England’s badgers — when TB lives in the wildlife, flat compensation caps quietly transfer the cost of a breakdown from the State onto your balance sheet. Here’s the real number, and three things to do about it this month.

Executive Summary: West Wicklow just posted 16.4% TB herd incidence — nearly triple the national 5.34% — and it’s exposing a trap that hits every farmer living over a wildlife reservoir, from Irish deer to Michigan whitetail to Kiwi possums. Here’s the gut-punch: Ireland’s OFMV compensation has been frozen at €3,000 per commercial reactor and €5,000 per pedigree cow since February 2023, while cattle prices ran away underneath it. The average top-up is just €1,540.61, so when a 12-reactor breakdown lands — like the Roundwood herd that got hammered this spring — you eat the gap. ifac pegged farmers’ total 2024 TB bill at €151.6 million, more than the State spent on the whole programme, and that’s before the ~30% odds you break down again. The cap punishes your best breeders hardest: the EBI valuation top-up got cut from €1.35 to €0.50 per unit, so the more genetic merit you’ve stacked into a cow, the bigger the share of her real worth the ceiling quietly erases. And it all lands in a year Teagasc expects average dairy income to drop toward €80,000 from €137,000. Run your own breakdown number before you need it — the full article’s calculator and the three things to do in the next 30 days will tell you exactly how exposed your herd is.

 bovine TB compensation

If you farm anywhere TB hides in the local wildlife, the valley of West Wicklow is your early-warning system. In June 2026, Wicklow County Council passed a unanimous motion demanding that the Department of Agriculture explain how it plans to tackle bovine TB, after councillor Gerry O’Neill warned that the disease is wiping out family farms across the county. Strip away the Irish politics and the lesson is universal: where a wildlife reservoir keeps reseeding the disease, breakdowns stop being rare accidents — and the compensation math was never built to cover what they actually cost you.

That’s not an Irish problem. It’s a Michigan problem, a New Zealand problem, a UK problem. New Zealand spends heavily through its OSPRI/TBfree programme chasing possums; England’s entire control framework revolves around the badger; Michigan’s lower peninsula has fought bovine TB in white-tailed deer for decades. Different animal, same trap. Wicklow happens to be where the numbers are loudest right now — so it’s the cleanest case study going.

RegionPrimary wildlife reservoirControl framework focusReader takeaway
West Wicklow, IrelandSika deer + badgersBadger-led, deer underweighted16.4% herd incidence — the blind spot has antlers Analytics-to-Action-Cheat-Grid-v1.2.md
Michigan, USAWhite-tailed deerDecades-long deer-focused fightLower peninsula reservoir never cleared Analytics-to-Action-Cheat-Grid-v1.2.md
New ZealandBrushtail possumsOSPRI/TBfree possum controlHeavy spend chasing the reservoir Analytics-to-Action-Cheat-Grid-v1.2.md
EnglandBadgersEntire framework built on badgerSingle-species model leaves gaps Analytics-to-Action-Cheat-Grid-v1.2.md

Run Your Own Number First

Cost componentCapped by OFMV?Figure (2024)Who eats it
Commercial reactor valueYes — €3,000 ceilingAvg top-up €1,540.61Farmer eats the gap Analytics-to-Action-Cheat-Grid-v1.2.md
Pedigree reactor valueYes — €5,000 ceilingPush to lift to €7,000Best breeders hit hardest Analytics-to-Action-Cheat-Grid-v1.2.md
Testing labour & disruptionNo€55m+ across farmsFarmer Analytics-to-Action-Cheat-Grid-v1.2.md
Total farmer TB billN/A€151.6mFarmers (exceeded State spend) Analytics-to-Action-Cheat-Grid-v1.2.md
Repeat breakdown riskNo~30% chanceFarmer, repeatedly Analytics-to-Action-Cheat-Grid-v1.2.md

Before the policy and the wildlife, start with your own balance sheet. The calculator below lets you toggle reactors, milk lost per cow, milk price, and your real cull-and-replace value, then shows the gap between your loss and the capped cheque. Tick the “pedigree” box and watch what the ceiling does to a high-merit cow.

Read it as a floor, not a ceiling. The tool counts only direct reactor losses — it leaves out the whole-herd output drag during a lock-up, disinfection, and the testing labour that ifac valued at over €55 million across Irish farms in 2024 alone. The per-cow milk-loss range it uses — 120 to 573 kg per lactation, per published Irish reactor-productivity data — comes from peer-reviewed work, not a round guess. Nationally, ifac put farmers’ total TB-related costs at €151.6 million in 2024 — more than the State spent on the entire programme that year.

What Wicklow Tells Every Reservoir Farmer

Here’s the blunt version. West Wicklow isn’t having a bad year. It’s living in a permanent TB landscape. According to the Comptroller and Auditor General’s 2024 audit, herd incidence ranged from just 2.4% of herds in Mayo to 16.4% in Wicklow West — among the highest county-level figures in the country, which the audit ties straight to high wild deer densities. The Irish Farmers Journal reported that nearly 20% of west Wicklow herds were locked up with TB in 2023, compared with a national rate near 6%.

That’s well over twice the national average. Year after year. When the same valley runs that hot for that long, breakdowns stop being lightning strikes and start being weather.

What makes a reservoir county different is the wildlife mix, and Wicklow’s is a textbook case. Most of Ireland’s control is built around badgers. But Teagasc’s own wildlife briefing specifically names Wicklow as a place where high densities of deer, cattle, and badgers overlap, allowing the same strains to circulate among all three. A Department survey back in 2015 found 16% of culled deer in the Calary area of Wicklow carried evidence of M. bovis, and Trinity College Dublin research has since flagged Sika deer as the chief wildlife concern in the county. A plan aimed mainly at badgers solves maybe two-thirds of the equation here — and the missing third has antlers. If your reservoir is possums or whitetail, the same blind spot applies.

The national picture, for context, has been moving the other way. Minister Martin Heydon says rolling 12-month herd incidence eased to 5.34% by May 31, 2026, and the Department points to that fall and its 2026 Action Plan as evidence that its approach is working. That’s the trouble with averages. They hide the valleys where the disease never left — and in 2024, Wicklow West was one of the deepest.

How This Plays Out on Real Farms

When a reactor turns up, the herd locks; no cattle move off-farm except to slaughter. You’re looking at a minimum 60-day restriction and two consecutive clear tests before you’re free — and under the 2026 rules, high-risk “relapse” herds can land on six-monthly testing for up to three years post-derestriction. The Department compensates you. Here’s where the math quietly stops working.

It’s not abstract in Wicklow. When a wave of previously clear herds went down in the county, one Roundwood farmer was reported among the hardest hit, with 12 reactors pulled in a single test. Twelve animals. One test. That’s the shape of a breakdown when you live in a blackspot — and the cheque that follows is capped before it ever reaches what those cows were worth.

The On-Farm Market Valuation scheme caps compensation at €3,000 per commercial reactor and €5,000 per pedigree cow, with stock bulls at €4,000 — ceilings set back in February 2023 and frozen since, even as cattle prices have climbed sharply beneath them. IFA animal-health chair TJ Maher calls the caps “unfair, arbitrary and out of date”. The DAFM-reported average top-up on the base payment is just €1,540.61. You lose your best cow, you eat the difference. The scheme doesn’t.

And the cash-flow timing couldn’t be worse. Teagasc forecasts average dairy farm income will fall to around €80,000 in 2026, down from an estimated €137,000 in 2025, with a milk price near 42.4 c/L. A breakdown lands hardest in exactly the year you can least absorb it.

Why the Cap Punishes Your Best Breeders Hardest

Here’s the part commodity coverage misses entirely. A flat ceiling doesn’t hit every farm equally — it hits the progressive breeder hardest, by design.

When the OFMV scheme values a €7,000 deep-pedigree cow at a €5,000 cap, the State isn’t compensating a loss. It’s balancing its own budget with your genetic equity — the flush histories, the high-conformation cow families, the years of genomic and sexed-semen work baked into that animal.

This isn’t a vibe; it’s in the scheme’s own machinery. The valuation formula carries an EBI “top-up” that’s meant to reward genetic merit — but that coefficient was cut from €1.35 to just €0.50 per unit of EBI. IFA says it secured a Department commitment to lift the coefficient again to offset a separate rescaling of the EBI index. Fair enough. But on valuation day, the practical effect is a formula that pays far more thinly for stacked breeding value than it once did — so the more merit you’ve built into a cow, the bigger the share of her real worth the cap quietly leaves on the table.

The €5,000 pedigree ceiling drives the point home. The Irish Farmers Journal flatly notes that the ceiling “would be considered low for some pedigree animals” in today’s market, which is why farm organisations are pushing to lift it to €7,000. If your breeding programme is the asset you’ve spent a decade building, the current cap treats your best work as average. That’s the genetic erasure nobody puts on the compensation form.

The Mechanics Behind the Outcomes

The cap isn’t the only mechanic. Repeat risk is the one that turns a single bad year into a structural drag. Teagasc data show herds that have had TB carry roughly a 30% chance of breaking down again. So, in a hotspot, the costs don’t land once and then clear. They stack — restriction after restriction, each one draining cash flow while the bank repayments and the tax bill keep their own calendar, indifferent to whether your gate is open.

And then there’s the part no spreadsheet tracks. A 2025 Farming Community Network report covering more than 450 TB-affected farmers found the dread of the next test letter often weighed heavier than the disease itself, driving anxiety, sleeplessness, and isolation. An NFU Cymru survey in Wales was blunter still: of 462 members who answered, 85% said bTB had hurt their own and their family’s mental health. That’s UK evidence, not Irish data — but the machinery is identical. The paperwork is mandatory. The support isn’t. If this is hitting close to home, the IFA points farmers to the Pieta 24-hour freephone crisis line, 1800 247 247.

Is Your Wildlife Risk a Badger Problem or a Deer Problem?

This is the question Wicklow forces on everyone, and most farms outside a hotspot never stop to ask it. If you’re in deer country — or possum or whitetail country — a badger-only mindset leaves a hole you can drive a jeep through. Teagasc and TCD both say plainly that deer have to be managed alongside badgers in places like Wicklow, not instead of them.

The practical lever is sitting right there and going underused. The Department offers free TB testing of deer carcasses culled through voluntary farmer-and-hunter groups in high-prevalence areas, which is how you actually find out whether the local herd is carrying it. Knowing which reservoir is driving your risk changes where you spend your money — there’s no sense pouring capital into badger-proofing if the infection’s walking in on four legs through your back fence.

How Do You Actually Harden the Yard? (A Step-by-Step)

Biosecurity against a wildlife reservoir isn’t one big project. It’s a sequence, cheapest and highest-impact first.

  1. Lock down feed and water. Raise troughs above badger reach, fence stored feed and silage faces, and don’t feed concentrates on the ground where badger saliva can contaminate leftovers — Teagasc flags all three as direct contact points. A PLoS ONE study found simple badger-exclusion measures were 100% effective at keeping badgers out of farm buildings when properly built and maintained.
  2. Seal the buildings. Sheet the bottoms of gates and doors so wildlife can’t slip into sheds and parlours overnight.
  3. Fence the setts and known crossings. Locate and notify the Department of badger setts, fence them and their latrines, and block the deer trails crossing your grazing ground.
  4. Find your reservoir. Book free deer carcass testing through your RVO or local hunter group so you’re spending on the right threat.
  5. Apply for the cost-share. Ireland’s 2026 Action Plan funds physical exclusion measures, backed by a TB budget of over €157 million for 2026 — ring your co-op or RVO before the window narrows.

Options and Trade-Offs for Farmers

No single move fixes TB. But producers in risk zones are choosing among a few clear paths, and the differences matter for your balance sheet.

  • Harden biosecurity now — the 30-day move. Run the sequence above. When it makes sense: always, especially in deer-and-badger country. What it costs: labour and modest capital. Where it falls short: it cuts yard contact but won’t stop exposure out on open grazing.
  • Tap the 2026 Action Plan cost-share. When it makes sense: if you’ve been putting off the capital spend anyway. What it requires: calling your co-op or RVO now. The risk: uptake depends on rollout — don’t assume it’s open next season.
  • Tighten buy-in toward a closed herd. New 2026 rules already require a 30-day pre-movement test for dairy cows entering breeding herds. Source only from low-incidence herds and cull previously inconclusive animals — Teagasc notes they’re 12 times more likely to become reactors, and prior bovine reactions are four times more likely. The trade-off: less flexibility when you suddenly need replacements.
  • Breed for resistance and protect your genetics on paper. There’s real genetic variation in TB susceptibility; Teagasc points farmers to bulls with a high health-traits sub-index EBI for TB resistance. Keep current pedigree, classification, and genomic documentation on every high-merit cow, so your OFMV valuation argument is airtight against the cap. The risk: none — it’s the difference between an arguable valuation and an automatic ceiling.

Key Takeaways

  • If your average productive cow is worth more than €3,000 — or your best ones top €5,000 — run them through the calculator and write that shortfall into your TB contingency plan before you ever need it.
  • If you breed pedigree or high-genomic stock, treat the thinned EBI top-up and the €5,000 ceiling as a constant drag on your best work, and keep valuation documentation up to date to fight for every euro.
  • If you’ve never had a breakdown, treat the ~30% repeat-risk figure as your reason to harden biosecurity this season, not after the first reactor.
  • If you farm in deer, possum, or whitetail country, identify your reservoir first — book free carcass testing before you spend a cent on the wrong fence.
  • If you’re carrying any animal that was inconclusive on a previous test, cull it by the end of this production cycle — it’s 12 times more likely to become a reactor.
  • If your cash flow can’t absorb a multi-month restriction in a year Teagasc already expects income to fall toward €80,000, that’s a conversation to have with your adviser now — not the week the gate locks.

So here’s the question worth sitting with this week. If a breakdown walked through your gate next month, do you actually know your number — the full cost, not just the cheque the Department would post you, and not just the milk but the breeding value the cap won’t touch?

West Wicklow is the warning, not the exception. Wherever TB lives in the wildlife — Irish deer, Kiwi possums, Michigan whitetail — the math runs the same way, just louder in some valleys than others. We’re building the full per-breakdown cost model, with the genetic-equity loss broken out by merit level, in a deeper Bullvine piece. That’s where the real numbers live.

Complete references and supporting documentation are available upon request by contacting the editorial team at editor@thebullvine.com.

Learn More

The Sunday Read Dairy Professionals Don’t Skip.

Every week, thousands of producers, breeders, and industry insiders open Bullvine Weekly for genetics insights, market shifts, and profit strategies they won’t find anywhere else. One email. Five minutes. Smarter decisions all week.
NewsSubscribe
First
Last
Consent

A $240,000 Warning: What a $5/cwt Gap Really Does to a 400-Cow Dairy

On a 400-cow herd, a $5/cwt shortfall quietly burns about $240,000 a year — and value-added only saves you if the math, the market, and your labor all line up.

On her 25th birthday — April 18, 2026 — Natalie Paino became licensed to make cheese curds from her family’s own milk. Getting there took six years: grant applications, a creamery built inside a shipping container, the full 423-page Pasteurized Milk Ordinance, and two kids born along the way. 

Paino runs Hightail Delivery near Plainfield, Iowa, selling ice cream and fresh cheese curds straight to consumers off the family’s dairy. She didn’t build it because direct sales are trendy. She built it because the commodity milk check stopped making sense — and that’s the same quiet conclusion many mid-size operators are reaching at their own kitchen tables right now. “Milk prices have been pretty poor over the last 40 years,” she told Iowa Food & Family in March 2026. “In fact, they’ve stayed about the same throughout that time, even adjusting for inflation.” That’s not a complaint. It’s a diagnosis — and the numbers back her up. 

Natalie Paino, packs a tub of ice cream to go at Hightail Delivery near Plainfield, Iowa — soft-serve machine humming behind her, the family dairy’s milk turned into something the commodity check never paid for.

Her work didn’t go unnoticed, either. Iowa State University Extension and Outreach named her a 2025 “Women Impacting Ag” honoree, and in 2026 she took a $10,000 Iowa Farm Bureau “Grow Your Future” award toward the operation. The recognition matters less than what it signals: a 25-year-old built a working dairy business out of a milk check that, by her own account, hasn’t paid in decades. 

What’s Changing and Why

Here’s the gap driving it all. For a 100-199-cow operation, Cornell University’s most recent Dairy Farm Business Summary puts the full cost of production at $31-33/cwt for that size class. USDA’s June 2026 WASDE projects this year’s all-milk price at $20.70/cwt — up from the $18.95 it forecast back in February, but still well short. Even big, efficient herds run $19.14/cwt in full economic cost, per USDA ERS’s 2021 ARMS survey published in July 2024. So the loss shows up before you count a single hour of family labor. 

And this isn’t a rough patch you wait out. That same USDA ERS ARMS data shows herds under 50 cows carry full economic costs near $42.70/cwt, while 2,000-plus-cow operations sit at $19.14/cwt — a structural gap of more than $20/cwt that longer hours can’t close. The mid-size disadvantage is baked into purchasing power, labor efficiency, and scale, not effort. A cycle ends. This one hasn’t ended for small- to mid-sized commodity dairy in over a generation. 

The squeeze lands hardest in the middle. Big enough to be a full-time business, too small to hit the cost efficiencies of a 2,000-cow operation. The 2022 USDA Census of Agriculture counted 24,082 dairy operations, down from 39,303 in 2017 — roughly a 39% drop in five years. The mid-size herd is standing right in its path. 

That exit rate isn’t spread evenly. The farms disappearing fastest are the ones too big to run as a hobby and too small to out-buy and out-scale a mega-dairy on feed, labor, and capital. Paino’s own read on the long arc — four decades of flat, inflation-adjusted prices — is exactly the math that’s been quietly thinning that middle for years. Where does your breakeven actually sit? If you haven’t run that number against $20.70 milk lately, that’s the first thing this piece should push you to do. 

How This Plays Out on Real Farms

Keegan Donovan works her Millbrook Beef and Dairy stand at a farmers market in Dutchess County, New York — coolers of product, a board of fresh cheese, and the first-generation bet that direct sales beat shipping commodity milk.

Paino isn’t a one-off. Keegan Donovan was 22 when she and her husband, Brian, launched Millbrook Beef and Dairy in Dutchess County, New York, in 2022 — first-generation farmers who quickly found that the cost of producing their milk outran what they were paid for it. Their answer was to stop shipping commodity milk entirely and sell beef, dairy, pork, and eggs directly off the farm. “You have to be able to bet on yourself,” Keegan told Main Street Magazine in 2024. For two people who started with no land base and no inherited herd, that bet was the whole business plan. 

Emily Mullen-Niccum takes a quiet minute with the farm dog in the tractor cab at her family’s Butler County, Ohio dairy — one of the two operations left in a county that once ran 88, now turning 4,000 pounds of milk a week into 35 flavors.

Then there’s Emily Mullen-Niccum, who came back to her family’s Butler County, Ohio, dairy knowing exactly how the commodity story ends there. Her county had gone from 88 dairies in 1970 down to two. She runs about 65 cows through a robotic milker and turns 4,000 pounds of milk a week into 35 product flavors. Her line to DTN/Progressive Farmer in January 2025 lands harder than any margin chart: “Average was over. Nothing bad about Dad or that generation of farmers… However, that generation has forgotten their worth.” 

What ties these three together isn’t age or geography. It’s the same calculation, run independently, ending the same way: the milk check alone doesn’t clear the cost of producing the milk, so they each found a buyer who’d pay for something more than a tanker pickup. None of them set out to be a movement. Each one just looked at the same spread between cost and check and decided the tanker wasn’t the only way off the farm.

Now the barn math — and watch what it does to the dream version. Take a slightly bigger herd than the one in the headline — 500 cows — and carve off 20% into a direct channel netting an extra $1.50 a gallon. At roughly 70 lbs of milk per cow, that slice is about 800 gallons a day (at 8.6 lbs per gallon), which throws off close to $1,200 a day.Sounds like the problem’s solved. It isn’t. You’re still shipping the other 80% into the same commodity market that’s bleeding money, and that premium only shows up if you actually sell every gallon you process. The direct channel doesn’t replace the milk check. It patches part of the hole the check leaves — and only when the selling works.

The Mechanics Behind the Outcomes

So the first thing to get straight: value-added is a wedge, not a replacement. A 300-cow herd makes around 21,000 lbs of milk a day — far more than a farmstead creamery typically moves. Most operations at this scale process only a fraction of their own volume through premium channels and ship the rest conventionally; UMass Extension warns producers outright that a value-added business may not turn a profit in its first five years. The co-op check doesn’t vanish. It shrinks while a higher-margin slice grows beside it. 

The capital math is humbling, too. A traditional on-farm creamery build runs $1.5-2.5 million, and the average USDA Dairy Business Innovation grant works out to roughly $112,600 per funded entity — about 4-7% of the bill. That’s the number that should stop people cold. Paino dodged it by going small on purpose. “Building a traditional creamery could easily cost millions of dollars,” she said. “So I started researching micro-dairies.” A shipping container isn’t a romantic origin story. It’s how you keep the entry cost from burying you before the first batch sells. 

Then there’s the cost nobody pencils in. A Bullvine analysis of a documented creamery operation found that on-farm processing added 70-90 hours per week to a full dairy workload. That’s not a side hustle. That’s a second business stapled to the first one — and somebody in the family has to run it, or you’re hiring it out and watching that $1.50 premium shrink. 

Paino’s six-year timeline tells you the rest. The grant applications, the 423-page PMO, the licensing that didn’t clear until her 25th birthday — that’s not slow execution, that’s the actual length of the on-ramp. Anyone who thinks value-added is a quick pivot out of a bad milk year has the timeline backwards. You start building before the crisis, or you’re building during it with no runway left. 

What Does This Mean for Your Co-op?

Here’s the angle that doesn’t get talked about enough. Every gallon a young member routes into ice cream or curds is a gallon that doesn’t ride the co-op tanker. And the members most likely to peel off are exactly the ones a co-op needs for the next 30 years — the under-35 crowd, who already make up just 9% of U.S. producers (USDA 2022 Census). When your youngest, most adaptable members start carving off volume, the erosion isn’t just this year’s pounds. It’s the future supply base. 

Run the co-op-side math, using that same 500-cow member from above. Shift 20% — roughly 7,000 lbs a day — out of the commodity pool and into their own creamery. Over a year, that’s about 2.5 million pounds of fluid milk leaving the co-op’s book from one farm (7,000 lbs × 365 days; illustrative, built on the herd assumptions above). One farm won’t move a regional co-op. But ten or twenty of them, clustered near the same metro markets where value-added actually works, start to thin the fluid pool on which a balance sheet was built.

The honest read for co-op supply managers: this isn’t a stampede, and there’s no clean public figure yet on how much volume direct channels are pulling out of co-op pools. But the direction is one-way. The members leaving the commodity pool aren’t the ones retiring out — they’re the ones who were supposed to be still shipping in 2050.

Is Value-Added Actually Right for Your Farm?

Before you price a single tank, run the operation through five honest filters. Each one has killed more creamery dreams than bad product ever has. Lay them out as a vertical checklist block — one card per filter, each with the question on top and the hard number underneath — so a reader has to slow down and answer each before scrolling on.

FilterThe QuestionHard NumberKill Signal
1 — Market AccessWithin reach of a metro market that’ll pay a premium?Needs a farmers-market track record, not a hunchNo market = no margin
2 — CapitalCan you fund the build without betting the dairy?Grant covers only 4–7% of a $1.5–2.5M buildFull-scale number sinks most first-timers
3 — LaborWho runs the second business?On-farm processing adds 70–90 hrs/week“We’ll figure it out” = unstaffed second business
4 — Regulatory LoadReady for the PMO, licensing, inspections?The PMO runs 423 pages; on-ramp ran 6 years for PainoTreating compliance as a footnote, not the job
5 — Margin BreakevenAt what volume/price does the premium clear costs?Budget for no profit in years 1–5 (UMass)Can’t write the number = a hope, not a plan
  • FILTER 1 — MARKET ACCESS Are you within reach of a metro market with buyers who’ll pay a premium — and can you prove it with a farmers-market track record, not a hunch? UMass Extension’s first question is blunt: are your locations convenient to the consumer? No market, no margin. 
  • FILTER 2 — CAPITAL Can you fund the build without betting the dairy? The grant covers 4-7%, not half. The rest is on you and your lender — a micro-build like Paino’s container creamery exists precisely because the full-scale number sinks most first-timers. 
  • FILTER 3 — LABOR Who’s running the second business — the processing, deliveries, licensing paperwork, and marketing? If the answer is “we’ll figure it out,” that’s 70-90 hours a week with no name attached to it. 
  • FILTER 4 — REGULATORY LOAD Are you ready for the Pasteurized Milk Ordinance, state licensing, and inspection cycles? Paino read all 423 pages of the PMO. That’s the job, not a footnote. 
  • FILTER 5 — MARGIN BREAKEVEN At what volume and price does the premium actually cover processing, labor, packaging, and spoilage? UMass tells producers straight: budget for no profit in the first five years. If you can’t write that number down, you don’t have a plan — you have a hope. 

Clear all five, and value-added is a real wedge against the squeeze. Miss two or more, and you’re building a money pit with a freezer attached.

How Much Does Waiting Actually Cost You?

This is where the clock matters. There’s no tidy figure for how long a struggling dairy drifts before it exits, but the pattern advisors describe is consistent: if off-farm income has bailed out farm operating losses in three or more of the last five years, that’s structural, not a tight stretch. Put real numbers on it. For a 400-cow herd shipping 120 cwt per cow, a $5/cwt full-cost shortfall amounts to about $240,000 a year — straight out of family equity, not the feed mill or the co-op. Every year you call that “a cycle,” that’s the bill. 

So the honest question isn’t “will prices come back?” It’s “what is this gray zone costing me every year I keep deciding not to decide?” Bullvine’s modeling puts the critical threshold at two consecutive years of full cost above the all-milk price — past that, you’re funding someone else’s business plan with your own balance sheet. The direction is one-way, and the value-added on-ramp that might offset it runs for years, not months. So the decision and the build can’t be the same conversation. 

Is Your Inheritance Plan Built on a Real Conversation?

Plenty of operators absorb losses on the quiet assumption that a son or daughter will take over. Be careful with that one. Only 9% of U.S. producers are under 35, and the average age of producers is 58.1 years (USDA 2022 Census). Iowa State research found a daughter’s odds of being the chosen successor climb from about 5.4% to 20.7% when she has real farm experience — though the experience and an explicit plan have to come first, and that figure is Iowa-specific, so treat it as directional rather than national. 

Here’s the sharper question underneath it. What are you actually trying to pass on — the land and the history, or this exact commodity business model? They’re not the same thing. Families hand down land and paid-off equipment all the time. Far fewer manage to hand down an unchanged model that’s losing money at today’s prices, and asking a 25-year-old to inherit a margin gap isn’t much of a gift. The young operators in this piece didn’t reject the family farm — they rejected the part of it that didn’t pay, and kept the cows.

Options and Trade-Offs for Farmers

When the commodity math breaks, four structural responses exist. Not all of them are open to every farm. Present these as four side-by-side path cards — each with the move, when it works, and the trap — so a reader can scan straight to the one that fits their balance sheet.

PathThe MoveWorks WhenThe Trap
Scale UpChase size efficiency — big herds run $19.14/cwt vs. $42.70 for the smallestYou’ve got equity and lending roomBorrowing toward efficiency you can’t service — millions of capital on an already-underwater sheet
Specialize (Value-Added)Capture the premium — diversified dairies report $25K–$300K/yr in non-commodity incomeYou’ve cleared all five filtersBuild the creamery before proving demand and you’ve bought a pricier way to lose money
Cut the Cost BaseAttack feed and labor — the two biggest cost linesYou need a bridge while you decideStalls as a standalone — most survivors already trimmed what they can; there’s a floor
Exit on Your TermsSell while land values holdNo viable successor, no capital for specializationWaiting until a lender forces the sale instead of choosing the timing
  • PATH 1 — SCALE UP The move: Chase the cost efficiency of size. The biggest herds run at $19.14/cwt full cost while the smallest sit near $42.70, and that gap is widening, not closing. Works when: You’ve got equity and lending room. The trap: Borrowing your way toward an efficiency you can’t service — reaching cost-competitive scale can mean millions in capital on a sheet that’s already underwater.
  • PATH 2 — SPECIALIZE (VALUE-ADDED / DIRECT) The move: Capture the premium. Diversified dairies have reported anywhere from $25,000 to $300,000 a year in non-commodity income, depending on scale and channel, while commodity producers fought for pennies at the milk check. The road Paino, the Donovans, and Mullen-Niccum each took. Works when: You’ve cleared all five filters above. The trap: Build the creamery before you’ve proven the demand and you’ve just bought a more expensive way to lose money.
  • PATH 3 — CUT THE COST BASE The move: Attack feed and labor — the two biggest lines in cost of production. Works when: You need a bridge while you decide. The trap: As a standalone strategy it stalls — most farms still running have already trimmed what they can, and there’s a floor under how lean you can get.
  • PATH 4 — EXIT ON YOUR TERMS The move: Sell while land values hold. Land has held or risen across most regions even as margins fell. Works when: There’s no viable successor and no capital for specialization. The trap: Waiting until a lender forces the sale instead of choosing the timing yourself.

The move that fits any of these — and you can start it this month: pull your last 12 months of milk checks, feed bills, debt service, and labor, and calculate your real cost per hundredweight, your own and your spouse’s labor included at $18-22/hour. Most operators in trouble are flying on feel instead of a current number. You can’t pick a path until you know which side of breakeven you’re actually standing on.

Run Your Own Number First

Dairy Profit Projector — This whole piece comes down to one question: would your farm make money at $20.70 milk? Run your herd through the Projector to pressure-test breakeven milk price, IOFC, and your next 12 months of margin before you pick a path — or decide value-added is worth the six-year build.

Key Takeaways

  • If you haven’t calculated full cost per cwt — family labor included at $18-22/hour — in the last 12 months, do it before month’s end. Every other decision waits on that number. 
  • If your full cost of production stays above the $20.70 all-milk projection for two consecutive years, the gap is coming out of family equity — treat that as the line, not a rough patch. 
  • If government payments (nearly 29% of net farm income nationally in 2026) are covering operating losses rather than topping up profit, read that as a signal, not a cushion. 
  • If you’re eyeing value-added, model it on a slice of your volume — not all of it — clear all five filters, and budget for no profit in years one through five. 
  • If a grant is what makes your creamery plan pencil, the plan doesn’t pencil. The average DBI grant covers about 4-7% of the build. 
  • If you’re starting a value-added build to escape a bad year, you’re already too late for that year — Paino’s on-ramp ran six years. Start before you need it. 
  • If you’re a co-op supply manager and your under-35 members are floating direct-channel ideas, treat retention of that group as a volume-planning issue now, not a problem for later.
  • If you’ve got no named, willing successor who’s actually seen the numbers, stop absorbing losses “for the next generation” until you’ve had that talk.

What’s Your Number?

So here’s what’s worth sitting with tonight. Strip out the off-farm paycheck and the government check — would this farm still make money at $20.70 milk? And if not, which of the four paths actually fits your balance sheet and your zip code? Most operators already know the answer in their gut. The numbers just make it sayable — and they tell you which door to walk through while you still get to choose. Natalie Paino ran her version of that math at 18 and spent six years acting on it. The question isn’t whether she’s unusual. It’s whether the math that pushed her is sitting on your kitchen table too.

If you want the deeper math — the full cost-per-cwt model broken out by herd size, plus the real capital and labor behind a value-added build before you sign anything — that’s where the next pieces pick up. Start with our breakdown of why the milk-check math stopped working, run the numbers in our honest creamery ROI piece, and if you’re a co-op member or manager, the milk-price coverage is where the supply-side story keeps developing.

Complete references and supporting documentation are available upon request by contacting the editorial team at editor@thebullvine.com.

Learn More

The Sunday Read Dairy Professionals Don’t Skip.

Every week, thousands of producers, breeders, and industry insiders open Bullvine Weekly for genetics insights, market shifts, and profit strategies they won’t find anywhere else. One email. Five minutes. Smarter decisions all week.
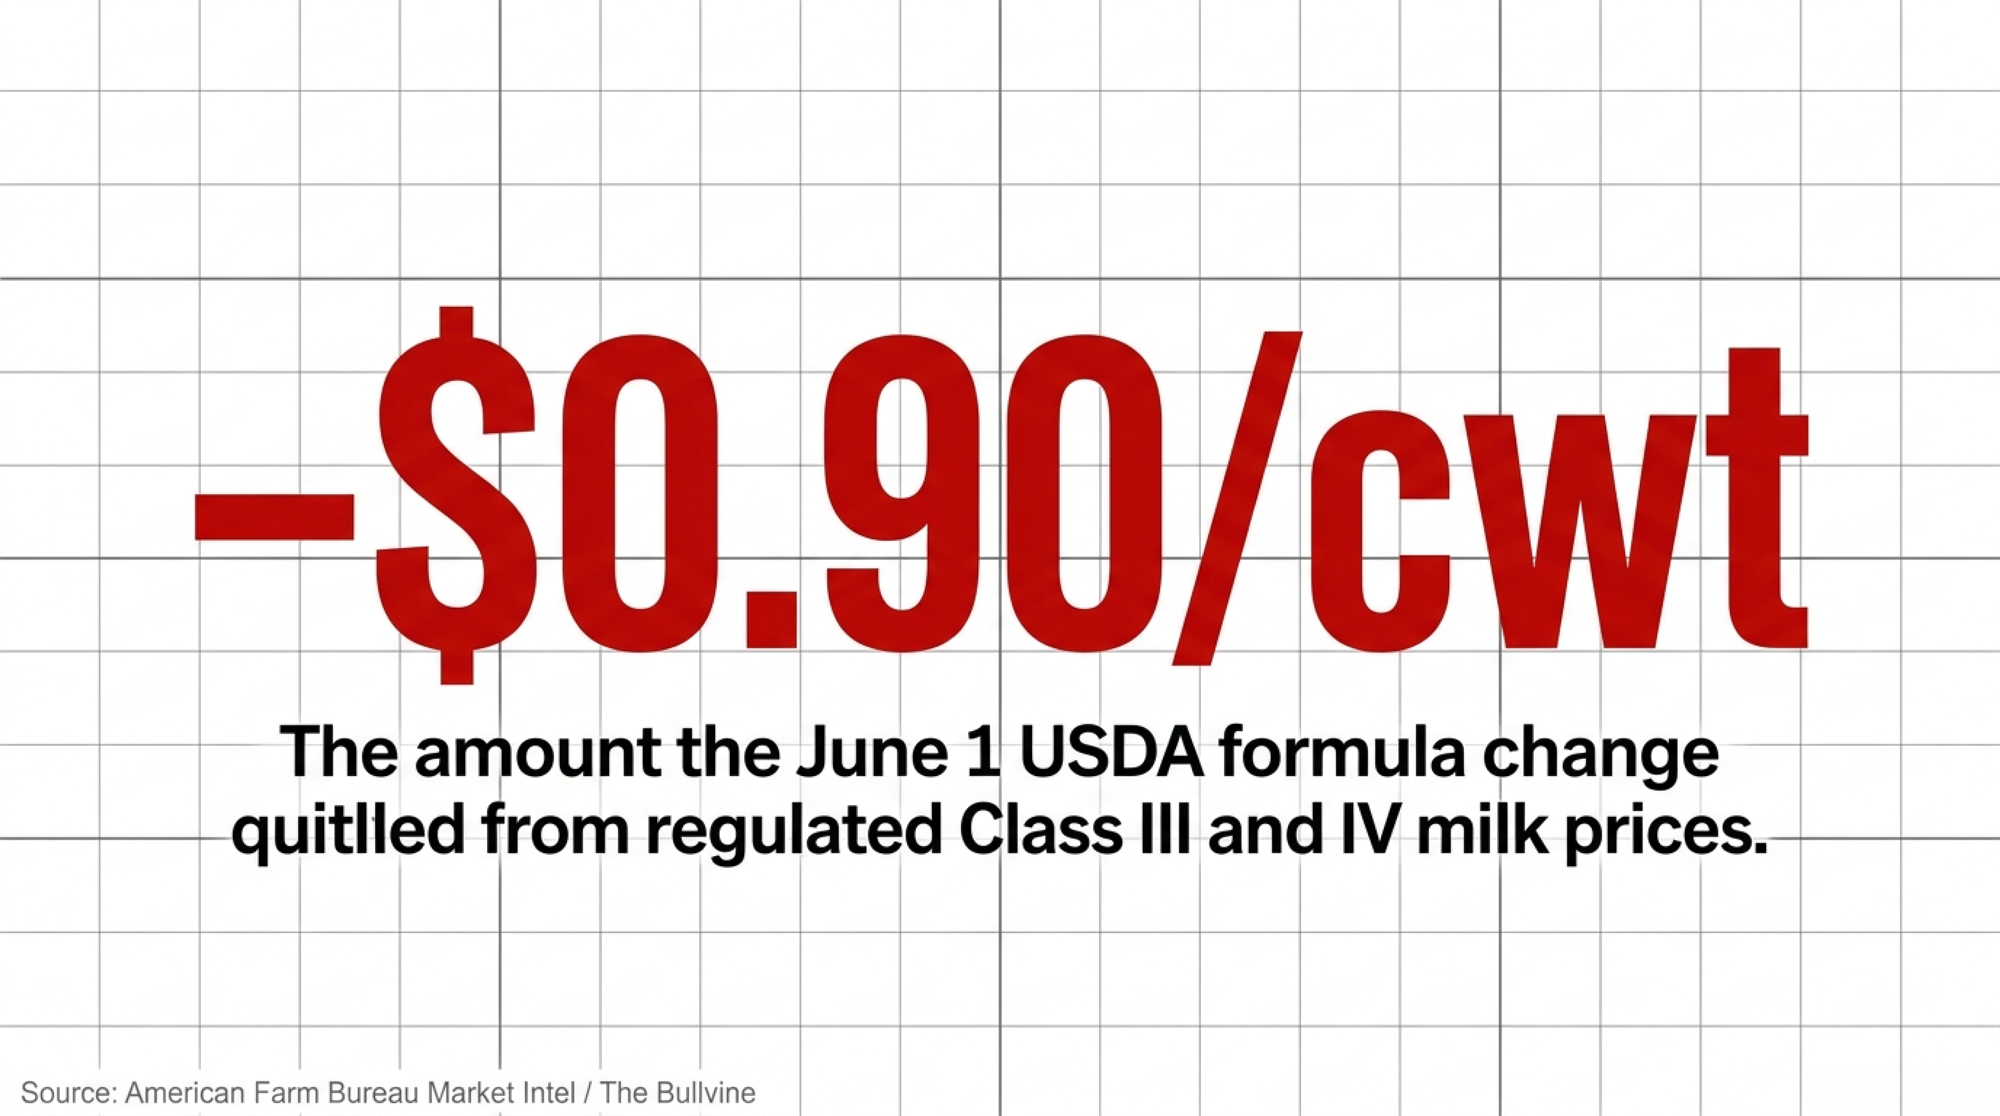
NewsSubscribe
First
Last
Consent

A $241M Verdict Hit a Dairy Co-op Because One Sentence Was Missing

A contract driver died hauling dry ice in 2016. The $241M bill just landed on 500 farm families who never voted on the call — and a one-line board rule could’ve capped it.

Eric Johnson didn’t know what was filling the cab of his vehicle.

Johnson, 64, was a courier hauling frozen strawberries packed in dry ice from St. Charles, Missouri, toward Fayetteville, Arkansas, for PFD Supply, a distribution subsidiary of Prairie Farms Dairy. About 90 minutes into the August 5, 2016, drive, he was found unconscious at the wheel after the dry ice sublimated into carbon dioxide inside the vehicle; he died in the hospital three days later. Dry ice does that. It turns into CO2 gas, pools in an enclosed space, and can cause loss of consciousness without warning. By his family’s account, relayed through their attorneys, he left behind his wife, Paula, and five children — two of them disabled and in his care.

On February 27, 2026, a Madison County, Illinois, jury decided that Prairie Farms and PFD owed his family $241 million — $49.5 million compensatory and $191.5 million punitive. Here’s the part that should stop every member-owner cold. Prairie Farms is a farmer-owned cooperative, founded in 1938, owned by the families who ship it milk. That verdict didn’t hit a faceless corporation. It hit them.

And the member-families didn’t make the call that led to Johnson’s death. Most of them likely never knew the lawsuit was building. That’s exactly what makes this a governance story, not just a courtroom one — and why the smart question for your own co-op isn’t “could this happen to us,” but “would we even know in time.”

$241 million = about 5.1% of Prairie Farms’ reported annual sales. That’s not a line-item. That’s a structural event landing on 500 farm families who never saw it coming.

What’s Changing and Why

Prairie Farms isn’t small. The co-op reports more than 500 farm families as member-owners, roughly 7,000 employees, 48 manufacturing plants, and over $4.69 billion in annual sales. Those are self-reported figures — the co-op doesn’t publish audited financials — but even at face value, the verdict equals about 5.1% of a year’s sales.

The legal theory was almost mundane. Federal OSHA’s Hazard Communication Standard (29 C.F.R. 1910.1200) requires employers to identify chemical hazards, train workers, and warn people about foreseeable exposures. Dry ice in a sealed vehicle is a textbook foreseeable exposure — one pound produces roughly 250 liters of CO2 gas, and in an enclosed cab, a dangerous concentration can build quickly, with OSHA and safety literature describing hazardous levels developing within minutes, depending on volume and ventilation. It’s a hazard OSHA has cited elsewhere in nearly identical terms — its own records describe a worker rendered unconscious by open boxes of dry ice in a walk-in freezer. At trial, the plaintiffs argued — and the jury agreed — that PFD Supply failed to warn or train Johnson about that hazard, against a backdrop of OSHA citations involving the standard both before and after his death.

And the size of the punitive number isn’t random. The jury settled on a punitive-to-compensatory ratio of 3.87-to-1($191.5M to $49.5M). That matters because the U.S. Supreme Court, in BMW of North America, Inc. v. Gore and State Farm Mutual Automobile Insurance Co. v. Campbell, has signaled that single-digit ratios are generally constitutional. Translation for a board: Prairie Farms’ best hope of slashing this on appeal — arguing the punitive award is grossly excessive — is weaker than you’d assume, because 3.87:1 sits comfortably inside the range courts have tolerated.

The co-op most exposed to a story like this isn’t the 80-cow operation down your road. It’s any cooperative big enough to own subsidiaries and distribution arms, where the loading dock sits a long way from the boardroom. 

Three Failures, One Group of Farm Families

This is more than a bad-luck verdict. Three separate fights are stacked on top of each other, and every one lands on the same 500 families. Here’s how the safety net is coming apart, layer by layer.

The FailureWhere It StandsWhat’s at Stake for Member-Owners
1. The verdictMadison County, IL Circuit Court, Case 2017 L 001562; PFD Supply found liable Feb. 27, 2026$241M judgment ($49.5M compensatory + $191.5M punitive) against the co-op
2. Alleged insurance failureU.S. District Court, S.D. Ill., Case 3:26-cv-00384 (Judge J. Phil Gilbert); alleges Travelers refused to settle within limits ~10 yrsCo-op loses its first line of protection if primary coverage is compromised
3. The coverage fightU.S. District Court, N.D. Ill., Case 1:2026-cv-02816; excess insurers argue they owe nothing on punitive award$191.5M punitive layer could drop straight onto the co-op’s balance sheet
Combined exposureAll three live and unresolved as of publicationA potential $191.5M uninsured punitive hit with the insurance tower collapsing underneath

Stack those three, and you get a co-op potentially holding a $191.5 million punitive judgment with the insurance tower collapsing underneath it. None of the farm families voted on PFD Supply’s safety program, the settlement strategy, or the policy language. They just own the balance sheet it all flows into. That’s the trap — and it’s structural, not unique to Prairie Farms. Prairie Farms has not issued a public statement on the verdict, and neither the company nor Travelers responded to requests for comment as of this writing; this story will be updated if either responds.

How This Plays Out on Real Farms

Here’s the uncomfortable part for member-owners. Your personal assets aren’t on the hook — cooperative structure limits a member’s liability to their investment. But “limited liability” isn’t the same as “no impact.” A nine-figure judgment flows straight into the things you actually feel: patronage payments, equity redemption schedules, and the co-op’s room to pay a competitive milk price.

When a major loss lands, a co-op reaches for blunt tools. It can draw down retained earnings, write down members’ allocated equity accounts, or — worst case — assess patrons directly. None of that shows up as a dramatic line on your milk cheque. It shows up as the equity redemption that arrives late, the revolving-fund payment that gets pushed a year, or the capital retain that doesn’t come back on schedule. For an older member counting on equity redemption as part of a retirement or exit plan, that timing isn’t an abstraction — it’s the difference between a clean handoff and a delayed one.

Put a number on it. The verdict equals about 5.1% of Prairie Farms’ reported annual sales — a hit larger than many processor cooperatives clear in net margin in a good year. As secondary context, CoBank’s Knowledge Exchange team, in a 2025 analysis, pegs co-op capital retains at $0.20 to $0.40 per cwt for large cooperatives. A 300-cow herd shipping around 90,000 cwt a year would have roughly $18,000 to $36,000 in retained equity riding on the co-op’s financial health. That’s the annual contribution — a member’s total equity on the co-op’s books builds up over the years, so the cumulative amount exposed to a catastrophic loss is larger. Real money, tied up in a balance sheet you don’t control.

The Mechanics: How a Loading-Dock Incident Becomes an Existential Threat

So how does a single lawsuit sit for nine years and grow into $241 million without the people who own the co-op ever hearing about it? That’s the real story — and it isn’t really about dry ice. Trace the climb:

  • 2016 — The incident. A contract courier dies of CO2 exposure hauling dry ice for a co-op subsidiary several steps removed from the parent’s safety review.
  • The years in between — The silent gap. The claim moves through litigation. The estate alleges that Travelers had repeated opportunities to settle within policy limits but didn’t, while Prairie Farms allegedly wanted to settle. No co-op governance rule requires that this exposure be reported up to the board at a set dollar threshold.
  • Feb. 27, 2026 — The verdict. The Madison County jury returns a $241 million verdict, including $191.5 million in punitive damages at a 3.87:1 ratio, which falls within the range courts have upheld.
  • March 31, 2026 — The bad-faith suit. Paula Johnson, now suing as Prairie Farms’ assignee, files in federal court, seeking more than $2 billion, alleging that Travelers’ decade of refusals exposed the co-op.
  • After the verdict — The coverage fight. Prairie Farms’ own excess insurers go to federal court, arguing they don’t cover the punitive award at all.

Here’s the mechanism most boards miss. Most cooperatives set a dollar threshold for capital spending — spend more than $X on a new dryer, and the board has to sign off. But almost no co-op governance document sets a parallel threshold for litigation exposure: a written rule that says, “If a claim against us could exceed $X, the board must be told, in writing, within Y days.” USDA’s Co-ops 101 and Kansas State’s co-op board guide both describe directors’ fiduciary duty to protect members’ equity from major loss, yet neither sets a concrete litigation-reporting trigger. No widely adopted co-op governance standard requires one, which is exactly the gap this case exposes.

That gap has a quiet consequence. OSHA’s entire enforcement model assumes that a citation reaches someone with the authority and motivation to fix the hazard. In a subsidiary structure with no upward-reporting requirement, that assumption fails silently — until a jury makes it loud.

How Much Does One Missing Sentence Actually Cost?

Potentially, the difference between a manageable insurance claim and an existential one. The Travelers bad-faith suit makes that concrete. Paula Johnson, suing as Prairie Farms’ assignee, alleges in federal court (S.D. Ill. 3:26-cv-00384) that Travelers had numerous opportunities over nearly a decade to settle within policy limits — and that Prairie Farms wanted to settle but was allegedly blocked from doing so by its insurer. The suit seeks more than $2 billion.

Those are unproven allegations from plaintiff’s counsel, an advocacy source — read them as claims, not findings, and ones Travelers has not answered in court. The plaintiffs go further, citing an email they say pegs the verdict’s true cost above $380 million once Illinois prejudgment interest and an appeal bond are factored in — again, their characterization, not an established figure. But the decision logic for a board is plain. A written notification rule wouldn’t have prevented the death, but it might have given the board years to push for an early settlement while it was still cheap. The missing sentence didn’t cause Johnson’s death. It removed a brake.

Now layer on the coverage fight. After the verdict, Prairie Farms’ own excess insurers — Berkeley National and an Endurance American (Sompo) unit — went to federal court in the Northern District of Illinois (Case No. 1:2026-cv-02816), arguing in their complaint that their policies don’t cover the $191.5 million punitive award, on the position that they insure only vicariously-assessed punitive damages, not a company’s own conduct. Illinois holds a strong public policy against insuring directly-assessed punitive damages. If those insurers win, that $191.5 million drops straight onto Prairie Farms’ balance sheet. No coverage, no offset — just the co-op and the judgment.

Is Your Co-op’s Loading Dock Outside the Boardroom’s Line of Sight?

Worth sitting with this one. Prairie Farms’ exposure didn’t come from a dairy barn — it came from PFD Supply, a food-service distribution subsidiary several steps removed from the parent’s safety review. That distance is common in large cooperatives, and it’s exactly where hazards slip through unnoticed.

The regulatory warning every board should read twice: OSHA’s Hazard Communication Standard (29 C.F.R. 1910.1200) covers foreseeable non-employee exposures — couriers, contract truckers, seasonal help — not just your own payroll. A written program that trains employees but stays silent on the contractor backing a trailer up to your dock is exactly the gap the jury found at PFD Supply.

The practical move is a one-page inventory: every subsidiary and distribution facility, the OSHA-regulated hazards at each (dry ice, ammonia refrigerant, CO2 in confined spaces), and which are actually covered by the parent co-op’s hazard-communication program. If management can’t produce that page, you’ve found a blind spot before a jury does. The Bullvine has watched this subsidiary-to-parent pattern before — the ByHeart infant-formula recall followed the same architecture: a plant-level failure with consequences that cascaded up the chain. 

Options and Trade-Offs for Farmers

You can’t fix OSHA from your kitchen table, and you can’t rewrite an insurer’s claim file. But there’s plenty a member-owner or director can actually do. Here are the paths producers and boards are weighing right now.

  • Demand a written litigation-notification threshold (do this within 30 days). Adopt a one-sentence amendment: any claim with potential exposure above a set dollar figure triggers mandatory written board notification within a defined window, with quarterly updates until it’s resolved. When it makes sense: always, and especially for co-ops with subsidiaries. What it requires: a board motion at the next meeting. Where it fails: if nobody verifies it’s actually followed instead of just filed.
  • Read the settlement-authority clause in your liability policy. Standard commercial policies hand settlement authority to the insurer. Most boards have never read that language. When it makes sense: before any large claim is pending — which means now. What it requires: pulling the policy and asking your CEO what happens if the co-op wants to settle and the insurer says no. Where it fails: you may not like the answer, but learning it now beats learning it at a verdict.
  • Retain independent coverage counsel for big claims. The insurer’s defense attorney works for the insurer. When interests diverge — exactly what Prairie Farms now alleges happened with Travelers — the co-op needs its own lawyer. When it makes sense: any claim where primary limits are in play. What it requires: a relationship with a coverage attorney, not a standing retainer. Where it fails: it costs money — trivial money next to a nine-figure exposure, but a line item somebody has to approve.
  • Audit hazard communication for third-party and contract workers. OSHA 1910.1200 covers foreseeable non-employee exposures — couriers, contract truckers, seasonal help. When it makes sense: any operation handling dry ice, ammonia, or confined-space hazards. What it requires: a written program that names those exposures, not just employee training. Where it fails: nowhere worth mentioning. This is the exact gap the jury found at PFD Supply.
The MoveBoard Action (holds the pen)Member Action (holds the questions)Where It Fails
Litigation-notification thresholdAdopt a 1-sentence amendment within 30 days: claims over $X trigger written board noticeAsk: “At what claim size are we guaranteed written notice?”If nobody verifies it’s followed, not just filed
Settlement authorityPull the policy; confirm in writing who controls settlement across the towerAsk: “Can we force a settlement if the insurer says no?”You may not like the answer — but learn it before a verdict
Independent coverage counselBuild a relationship with a coverage attorney for big claimsAsk: “Do we have counsel separate from the insurer’s defense lawyer?”Costs money — trivial next to nine-figure exposure
OSHA haz-comm auditDemand a 1-page subsidiary hazard inventory under 29 C.F.R. 1910.1200Ask: “Does our program cover contractors, not just employees?”The exact gap the jury found at PFD Supply
Equity-redemption stress testModel how a catastrophic judgment moves through patronage accountsAsk: “How would a big judgment change my redemption schedule?”$18K–$36K/yr riding on co-op stability for a 300-cow herd

The Board-Level Checklist

Take this into your next board or district meeting. If your leadership can’t answer all five on the spot, you’ve found your homework.

  • Settlement authority: In our insurance tower, who actually decides whether a claim settles — the co-op or the carrier? Is it in writing?
  • Notification threshold: At what dollar amount are directors guaranteed written notice of a lawsuit, and how often thereafter?
  • Excess-layer coordination: If our primary carrier refuses to tender limits, what triggers our excess layers — and who’s watching that handoff?
  • Coverage counsel: Do we have independent coverage counsel on retainer for large claims, separate from the insurer’s defense lawyer?
  • OSHA haz-comm self-audit: Does our written hazard-communication program (29 C.F.R. 1910.1200) name every asphyxiant and confined-space hazard across all subsidiaries — and does it cover contractors, not just employees?

Two Roles, Two Different Jobs

This story splits cleanly into two audiences, and the work isn’t the same for each.

If you sit on the board, you hold the pen. You can change the policy at the next meeting — nobody else can. Three moves are yours to make:

  • Move the one-sentence litigation-notification amendment at your next meeting and get it into the minutes.
  • Pull the liability policy and confirm in writing who controls settlement authority across the entire insurance tower.
  • Ask management for the one-page subsidiary hazard inventory under 29 C.F.R. 1910.1200 — and don’t accept “we’ll get to it.” 

If you’re a member-owner, you hold the questions. You don’t set policy, but you can stand up at the annual district meeting and put the right ones on the record:

  • “At what claim size are we guaranteed to hear about a lawsuit against our co-op — in writing?”
  • “Do we carry independent coverage counsel for big claims, separate from the insurer’s own defense lawyer?”
  • “How would a catastrophic judgment change our equity redemption schedule?”

If nobody on the board can answer those from the floor, you’ve just told 500 families where the blind spot is. That’s not a small thing to do with five minutes and a microphone.

Key Takeaways

  • If your co-op’s governance documents don’t set a dollar threshold for mandatory board notification of lawsuits, that’s the directors’ single highest-priority fix — bring the one-sentence amendment to the next board meeting.
  • If you’re a member-owner, ask at your next district meeting: “At what claim size are we guaranteed to hear about a lawsuit against our co-op, in writing?” If nobody can point to the page, you’ve found your job.
  • If your board has never read its own liability policy, pull it and confirm who controls settlement authority — and whether the co-op can force a settlement when the insurer won’t.
  • If your co-op leans on the insurer’s defense lawyer for big claims, ask whether it also retains independent coverage counsel. Those are not the same job.
  • If your operation or co-op handles dry ice, ammonia, or other asphyxiants, confirm your written hazard-comm program names third-party drivers and contractors — not just employees.
  • If you’re an older member counting on equity redemption, ask how a catastrophic judgment would affect the redemption schedule — because at $0.20-$0.40/cwt in retains, a mid-size herd can have $18,000 to $36,000 riding on co-op stability each year.

The Question to Carry In

Prairie Farms didn’t invent this governance gap. It just put a number on it — $241 million, and possibly more, depending on how three separate courtrooms land. The verdict isn’t final; post-trial motions and an appeal remain available, and the allegations against Travelers and the excess insurers are unproven.

So carry one question into your next board or district meeting. If a lawsuit started building against your cooperative tomorrow, how many years could it grow before the people who own the co-op found out? If you can’t answer that, you already know where to start.

We’re breaking down the full member-equity exposure model — how a catastrophic judgment actually moves through patronage accounts and equity redemption, sized by co-op — in next week’s Bullvine Weekly. That’s where the deeper numbers live.

Complete references and supporting documentation are available upon request by contacting the editorial team at editor@thebullvine.com.

Learn More

The Sunday Read Dairy Professionals Don’t Skip.

Every week, thousands of producers, breeders, and industry insiders open Bullvine Weekly for genetics insights, market shifts, and profit strategies they won’t find anywhere else. One email. Five minutes. Smarter decisions all week.
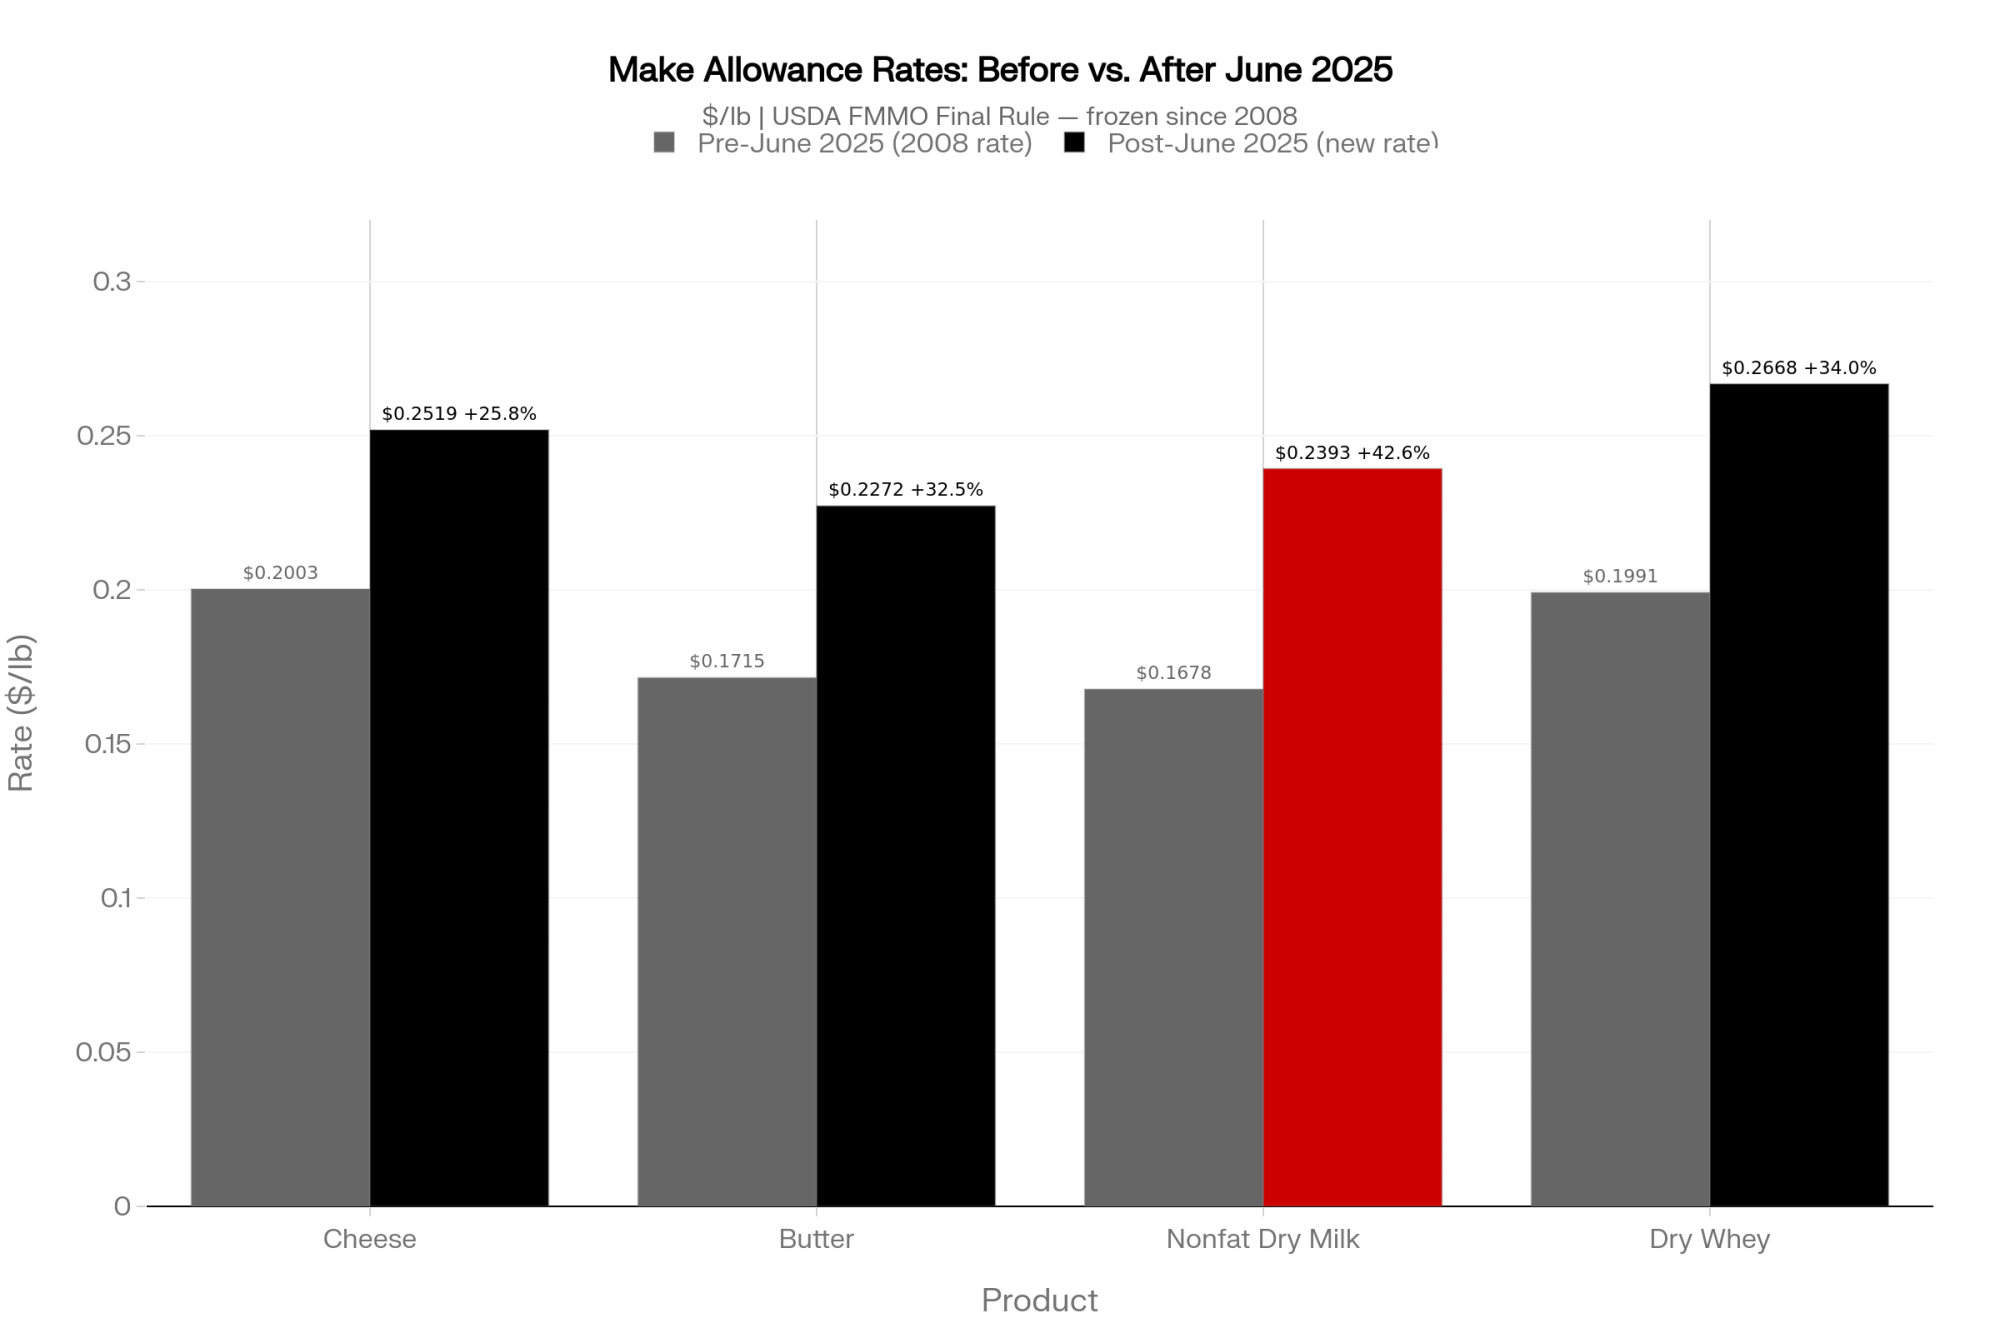
NewsSubscribe
First
Last
Consent

Only a Third of Your Summer Milk Loss Comes From the Bunk

Rhoads and Baumgard proved it: cut intake to match a heat-stressed cow, and you can explain only about a third of her milk drop. The rest leaks out through her gut.

Executive Summary: Only about a third of your summer milk loss traces back to reduced intake — the rest comes from a gut–immune cascade your fans can’t touch. When a cow shunts blood from her gut to dump heat, tight junctions loosen, LPS leaks into circulation, and the Warburg effect kicks in: her immune system burns more than a kilogram of glucose in twelve hours that the mammary gland needed for milk synthesis (Kvidera et al., Journal of Dairy Science, 2017). A University of Illinois analysis of 56 million production records found up to 8.2% of a day’s milk gone in the week after a single extreme-heat day — even in cooled barns (farmdoc, March 2025). Heat-stressed cows mount a stronger local inflammatory response to intramammary LPS than thermoneutral cows do (Tao et al., Journal of Dairy Science, 2023), which is why the same coliform that would’ve been a subclinical case in October becomes your July mastitis cluster. On a 400-cow herd, an 8-point climb in fresh-cow metritis incidence across a bad heat stretch runs 16,300 dollars or more in treatment costs before you count the milk curve those cows never recover. The fix isn’t another soaker line — it’s auditing where stressors stack: overstocked close-up pens running past 100%, multiple pen moves in the last three weeks pre-fresh, and weaning protocols that pile diet change, pen move, and dehorning into the same week all trigger the same leaky-gut circuit. Cooling is necessary; it’s just not sufficient.

heat stress milk loss

It’s mid-July. The fans are running, the soakers are firing, and you tweaked the ration three weeks before the heat rolled in. And your fresh pen is still throwing mastitis cases like it’s got a grudge.

You blame the bedding. You blame the milkers. You blame the flies. But a growing body of US dairy research points somewhere earlier in the chain — leaky gut. The idea is that those cows walked into the fight already worn down, their gut barriers leaking and their immune systems half spent, before a single pathogen ever reached the teat canal. That’s not a comfort story. It’s a milk-cheque story, and it changes which end of the problem you should be working on.

Why “They’re Just Not Eating” Stopped Holding Up

The industry spent decades treating summer milk loss as a simple intake problem. Cows get hot, they eat less, and they milk less. Add cooling, adjust the ration, move on.

Then researchers did the thing almost nobody bothers to do — they separated the heat from the feed. In the landmark pair-feeding study by Rhoads, Baumgard, and colleagues (Journal of Dairy Science, 2009), heat-stressed cows were compared with thermoneutral cows fed the same reduced intake. Reduced feed intake accounted for only about 35% of the drop in milk yield under heat stress. Later work from the same group, presented in extension talks, has put that figure closer to half — but either way, the headline holds: most of the loss isn’t about the bunk.

So where does it go? That’s the question that reframes the whole summer.

Most of this work comes out of US research herds — Iowa State, Cornell, and the University of Georgia, among them — so read the findings as US-condition science, not a Canadian or EU benchmark. And the money is real: a University of Illinois analysis of more than 56 million production records across nine Midwest states (farmdoc, March 2025) found herds lose about 1% of annual yield to heat stress every year, with up to 8.2% of a day’s milk gone in the week following a single extreme-heat day. If you run a herd of over 500 cows in a hot climate, that missing share of production is a line item you’ve probably never put on the books.

The Energy Balance That Doesn’t Add Up

Here’s the part that puzzled researchers early on. A heat-stressed cow should look like any other underfed cow — burning body fat to cover the energy she’s not eating. She doesn’t.

Rhoads and Baumgard’s metabolic work found that heat-stressed cows had higher circulating insulin levels and failed to mobilize body fat, unlike feed-restricted cows, even as milk production dropped. The cow was holding onto her reserves and still losing production. That doesn’t fit a simple intake story. It points to glucose being pulled elsewhere — and that somewhere else turned out to be the immune system, fed by a gut that had begun to leak.

The Wall That Does Two Jobs Until It Can’t

Picture a high-producing Holstein on a July afternoon, the kind giving 45 to 50 kilograms (100 to 110 pounds). For a cow at that level, heat stress isn’t a far-off threshold — high-yielding cows start feeling it at a temperature-humidity index around 68, which can hit as mild as 21 degrees Celsius at moderate humidity. To dump heat, she shunts blood away from her gut toward her skin and extremities. The cells lining her intestine — the ones sealing the gut contents off from her bloodstream — are now working on less oxygen while still handling a heavy load of feed, acid, and bacteria.

That gut wall is asking a lot of a single layer of cells. On one side sits a churning soup of feed, rumen acid, digestive enzymes, and a bacterial population that outnumbers every cell in the cow’s own body. On the other side sits her bloodstream. The only thing keeping the two apart is that sheet of intestinal cells and the protein “zippers” — tight junctions — that stitch them edge to edge. The wall has to be selective, not sealed: it intentionally pulls nutrients through while blocking everything else. That’s a hard job on a good day.

On a good day, that wall is well-caulked: nutrients move through in a controlled way, and almost nothing slips between. Under heat, the junctions loosen. That’s the leaky-gut moment.

Bacterial fragments cross first. Then, lipopolysaccharide endotoxins are shed by gram-negative bacteria. In the worst cases, whole bacteria get through. From the cow’s point of view, that reads as an invasion, and her immune system responds like one’s underway.

Here’s the expensive part. Activated immune cells switch fuel — they stop burning fat and amino acids and become glucose hogs through a process called the Warburg effect, first described by Otto Warburg back in the 1920s and now well documented in bovine immune cells. In LPS-challenge work from Baumgard’s group (Kvidera et al., Journal of Dairy Science, 2017), an acutely activated immune system burned through more than a kilogram of glucose in just twelve hours — and topping cows up with extra glucose to keep blood sugar normal still didn’t rescue milk synthesis. The immune system sits higher in the body’s priority list than the udder. Lactose needs glucose. Milk protein needs the same amino acids that the immune system is now grabbing. The mammary gland loses both at once.

All of this happens downstream of your fans. Cooling fights body temperature. It does nothing once LPS is in the bloodstream and the immune system has pulled the fire alarm. A 2025 analysis of heat-stress impacts found that even in high-tech, heavily cooled systems, fans and soakers offset at best about half the loss on moderately hot days — and less than 40% once it gets truly hot.

InterventionWhat It AddressesWhat It MissesEffectiveness Limit
Fans & SoakersReduces core body temperature riseLPS already in bloodstream, glucose drain underwayOffsets ~50% loss on moderate heat days; <40% on extreme days
Ration AdjustmentSupports DMI maintenance; reduces heat incrementGut–immune glucose burn; tight-junction looseningAddresses ~35–50% of the milk loss equation
Stocking Reduction (<100%)Lowers social stress; reduces cortisol spikesDoesn’t reverse LPS already in circulationRemoves a documented additive stressor from the stack
Eliminating Redundant Pen MovesReduces cortisol-driven gut permeability eventsDoesn’t fix inadequate cooling or overcrowding aloneEach move removed = one fewer trigger on the same stress circuit
Gut-Barrier Additives (Zn, live yeast, buffers)Supports tight-junction integrity; rumen pHCannot recover glucose already burned by immune activationSupport tool — third lever, not first
Pre-Fresh Ventilation UpgradeReduces thermal load on the highest-risk animalsDoesn’t reduce stocking or pen-move frequencyHighest ROI location if close-up THI routinely exceeds 68

Can One Hot Spell Really Set Off a Chain This Long?

It can, because the gut isn’t just a heat problem — it’s the place nearly every stressor lands.

Heat, overcrowding, a pen move, weaning, and a rough calving: the cow doesn’t run a separate system for each. She’s got one shared stress circuit. The brain reads “threat,” the stress axis fires, cortisol and adrenaline flood in, and digestion gets deprioritized. Blood leaves the gut. Stress hormones and inflammatory signals loosen those same tight junctions. The microbiome tilts toward more endotoxin-shedding bugs.

Different trigger, same sequence — LPS across the wall, immune system up, glucose gone. One way to put it: the costumes change, but the script doesn’t.

The gut ends up as the landing zone for two reasons. It’s the thinnest, most exposed barrier the cow has, in constant contact with feed, acid, and bacteria across an enormous surface. And it’s wired straight into the stress and immune systems, so those hormones don’t have far to travel.

When One Plus One Equals Three

So what happens when a cow takes two or three of these hits at once?

This is stressor stacking, and the framing comes from watching cows that should have shrugged off a problem fail badly once a second stressor landed. The cleanest proof is heat plus mastitis. A University of Georgia team (Tao and colleagues, with results published in the Journal of Dairy Science in 2023 and summarized by UGA Dairy Extension in May 2024) gave cows the same intramammary LPS challenge with and without evaporative cooling.

The non-cooled cows mounted a stronger local mammary inflammatory response, with a higher milk somatic cell count following the LPS infusion, at the same pathogen dose. Their systemic inflammatory markers didn’t spike the same way — suggesting the heat-stressed cow throws more of her fight into the udder itself. The researchers’ read: heat stress augments the mammary inflammatory response to LPS-induced mastitis — part of why summer SCC climbs.

In the barn, that’s your July cluster. The same coliform or strep that would’ve caused a contained case in cool October weather lands on a cow whose gut has been leaking for days and whose immune budget is already drawn down. You don’t get one mild case — you get several, with steeper milk losses and cows that never climb back to their old curve.

FactorOctober Case (Thermoneutral)July Case (Heat-Primed)Clinical Implication
Gut barrier statusIntact tight junctions; minimal LPS leakLoosened junctions; chronic low-level LPS in circulationJuly cow enters the fight immunologically pre-spent
Immune budgetFull glucose reserves available for immune responseWarburg effect already drawing >1 kg glucose in 12 hrsLess capacity to mount a contained, resolved response
Mammary inflammatory responseModerate local SCC elevationAugmented local response to same LPS dose (Tao et al., JDS 2023)Higher SCC spike; more severe tissue damage
Milk curve recoveryReturns to pre-case trajectory within 2–3 weeksFlatter recovery; cows often carry lower curve all lactationEach July mastitis case costs more than the treatment invoice shows
Metritis incidence context12% baseline on a well-managed herd20%+ with stressor stacking in July–August+$16,300+ in metritis costs alone on a 400-cow herd
Recommended intervention pointPathogen management (bedding, milking hygiene)Upstream: fix stocking, pen moves, and close-up THI beforesummer peaksTreating the bug misses two-thirds of the problem

With just heat, you’d have lost some milk. With just that pathogen pressure, you’d have had manageable cases. Stacked, you land in the “one plus one equals three” zone. The outbreak was never only about the bug. It was about cows walking into the fight already tired.

The Same Story Plays Out at the Hutch

If the gut is where every stressor lands, the youngstock side of the barn is the clearest place to watch it happen — because weaning loads several hits at once.

Pull a calf off milk, and you change her diet, her routine, and often her pen and pen-mates in the same window. Each is a stressor on its own; together they fire the same circuit that loosens the gut wall in a lactating cow. Research on weaning transitions has documented elevated cortisol, inflammatory markers, and signs of increased gut permeability in calves during that period — the same leaky-gut fingerprint, just in a 60-kilogram animal rather than a 650-kilogram one. That’s part of why post-weaning scours and slumps show up even in calves that looked bulletproof a week earlier.

The lesson reads straight across to the milking string: it isn’t the single event that breaks the calf, it’s the pile-up. Spread the diet change, the pen move, and the dehorning out across separate weeks, and you give the gut barrier time to recover between hits instead of asking it to absorb all three at once. Biology doesn’t care whether an animal is making milk or just trying to grow — the script is the same.

Where the Damage Concentrates: You Load the Gun, Then It Fires

Walk a 500-plus-cow herd with stressor-stacking glasses on, and you don’t start in the high group. You go where you’re about to ask the most.

Pen / StagePrimary Stressors PresentStacking Risk LevelMost Common Management ErrorsPriority Fix
Close-Up (3 wks pre-fresh)Late-gestation immune dip; metabolic shift; THI exposure🔴 HIGHEST— gun-loading zone>100% stocking; 2–3 pen moves in final 3 wks; inferior ventilation vs. main barnReduce to <100% stocking; limit moves to 1 max; match or exceed main-barn cooling
Fresh Pen (0–21 DIM)Calving inflammation; peak energy demand; ration transition🔴 HIGHEST— trigger zoneWorst-ventilated corner; aggressive ration switch; excess handlingBest stalls + bunk space on the farm; gradual ration transition; minimize exams
High GroupProduction pressure; summer SCC creep🟡 MODERATE— slow bleedTolerated as “normal” summer lossImprove cooling; monitor SCC trend; address after close-up/fresh fixed
Calves at WeaningDiet change + pen move + dehorning in same week🔴 HIGH — same leaky-gut scriptStacking all three events simultaneously for operational convenienceSpread events across separate weeks; one stressor per recovery window
Dry Cows (early dry)Lower metabolic demand; often under-resourced🟢 LOWER— relative priorityNeglected cooling (“they’re not milking”)Ensure THI <68 threshold met; don’t ignore as pre-cursor to close-up stress

The close-up pen is usually the worst offender — that’s where you load the gun. She’s late-gestation heavy, her immune system is in its normal transition dip, and her metabolism is shifting hard. Now, stack on what’s common on a lot of dairies: a pen pushed past 100% stocking, weaker fans than the main barn, and two or three pen moves in her last three weeks. None of those look like emergencies on their own.

The fresh group is where it fires. First 21 days in milk, climbing a vertical energy demand, still inflamed from calving, and too often parked in the worst-ventilated corner with extra handling and an aggressive ration switch. This is where ketosis, metritis, displaced abomasums, and mastitis cluster on the same animals. A fresh cow that misses peak doesn’t just cost you that week — she carries a lower curve for the whole lactation.

The high group pays too, but it’s a slow bleed — higher summer SCC, a couple of kilos off the top of the whole pen that don’t come back until fall. Real, but not the train wreck. If you’ve only got the political capital to fix stacking in two places, start with close-up, then fresh. The high group can wait its turn.

Run the Stacking Math on Your Own Fresh Pen

Here’s where the biology turns into a number you can put in front of a partner or a lender.

Bullvine’s own economic reporting pegs the average metritis case at around 511 dollars, with clinical ketosis at roughly 300 to 350 dollars a case before you count the lost milk. Run it on a 400-cow herd: push fresh-cow metritis from a manageable 12% up to a stacked-summer 20%, and that single disease alone walks out the door with more than 16,300 dollars in one bad stretch. Layer summer ketosis and a mastitis cluster on the same cows, and the bill compounds fast.

What it costsPer-case figureStacked-summer scenario (400-cow herd)
Metritis~511 dollars avg (median 398; most 240–884)12% → 20% incidence = +32 cases ≈ 16,300+
Clinical ketosis~300–350 dollars, before lost milkCompounds on the same fresh cows
Summer mastitis clusterSteeper milk loss; cows that don’t reboundLands on the same drawn-down immune systems

Sources: Bullvine economic reporting (June 2026) for per-case costs; the incidence shift is an illustrative scenario, not a single-herd result.

That’s the part the fan invoice never shows you. Cooling equipment is a capital line you can see; stacked-stressor disease is an operating leak you mostly can’t see until it surfaces as treatment costs, dumped milk, and cows that don’t breed back. The stacking math is the argument for fixing pen flow and stocking before you write the next equipment cheque.

Can You Feed the Gut Wall Back Together?

Short answer: you can support it, but you can’t supplement your way out of bad pen flow. The data on gut-barrier feed additives is real but still maturing, so read it as a support tool, not a fix.

The evidence is strongest where it’s been tested directly. Work on zinc amino acid complex showed improved intestinal architecture and lower leaky-gut biomarkers in heat-stressed cattle models (Journal of Dairy Science, 2020), and rumen-protected zinc-methionine has been shown to improve intestinal barrier function under heat stress (Frontiers in Veterinary Science, 2022). Live yeast (Saccharomyces cerevisiae) trials have improved energy-corrected milk and feed efficiency in heat-stressed cows. And buffering rumen acidosis matters in its own right, because sub-acute ruminal acidosis loosens the same junctions from the inside. But none of that recovers the glucose the immune system has already burned, and none of it substitutes for taking a stressor off the pile.

So treat additives as the third lever, not the first. Reduce the stressors, fix the pen flow, then ask whether a barrier-support product earns its place in the ration.

The Quiet Practice That Makes It All Worse

Here’s the one that stings, because it’s so defensible in the moment: routine regrouping of close-up and fresh cows to keep the numbers even.

Nobody’s being careless. They’re being organized. You move cows up when there’s space. You like the groups balanced. None of that sounds like abuse. But every pen move is a social-stress event — new hierarchy, more shoving, time off feed — and you’re firing the same stress circuit each time you do it. Stack that on late-gestation stress and July heat, and you’ve put three hits on the same cow in the same two- to three-week window.

One regrouping? She’d shrug it off. A warm barn? Uncomfortable, maybe a little milk. Transition alone? She’d adapt. Together, you get cows going off feed “for no reason” and a bump in fresh-cow disease that looks like bad luck and is really a policy decision.

What This Means for Your Operation

  • In the next month, pull your last two summers of fresh-cow disease records and sort them by season and pen. If your mastitis, metritis, and ketosis cases cluster in hot weather and in specific groups, that’s a stacking fingerprint — not a coincidence — and it tells you where to act first.
  • Walk your close-up pen this week and ask one question: is it getting the best stalls and bunk space on the farm, or the leftovers? If it runs over 100% stocking in summer, fix that before you buy another fan — you’re piling a documented immune stressor on top of the transition stress that’s already there.
  • Count how many separate things happen to a cow in her last 30 days pre-calving and first 10 days fresh — every pen move, exam, and ration change is a hit. If you regroup mainly for tidiness, stop: limit the moves, make them predictable, and don’t stack a social shake-up on top of heat and calving unless you have to.
  • Apply the same spacing rule at the hutch. Don’t pile the diet change, pen move, and dehorning into one week at weaning — spread them out so the calf’s gut wall recovers between hits.
  • Check the afternoon temperature and humidity in your holding pen and close-up, not the 6 a.m. number. The THI line for high cows sits around 68 — lower than most people guess — and that’s where the gut starts to leak.
  • When a summer mastitis case drags on longer and costs more milk than the same bug does in the fall, read it as a heat-primed immune system — not just a tougher pathogen. At about 511 dollars per metritis case and 300-plus per ketosis, eight points of extra incidence in a 400-cow herd is real money.
  • Before you spend on a barrier-support additive, take one real stressor off the pile first. Zinc, yeast, and buffers help at the margin, but they can’t outrun a bad transition layout — and fans manage thermal load, not a gut that’s already leaking.

Key Takeaways

  • If your fresh-cow disease and milk losses spike in July even with good cooling, assume a gut-driven stressor stack — not just “they’re not eating” — and start looking upstream.
  • If your close-up and fresh pens ever run over 100% stocking in the summer, that’s a bigger risk to your milk cheque than one more fan or soaker line.
  • If your weaning protocol stacks diet change, pen move, and dehorning into the same week, you’re teaching your calves the same leaky-gut script your cows are already paying for.
  • If you’re about to write a cheque for a gut-health additive, ask first which pen-move, stocking, or ration-switch stressor you could remove instead.

None of this shows up on a morning pen walk. Leaky gut, immune fatigue, the glucose drain — they stay invisible until they cash out as a cluster, a slow fresh cow, or a summer slump you can’t pin down. So the next time you walk the barn, don’t just ask whether they’re eating. Ask where you’re stacking stress on the same animals, and which one of those hits you could actually pull off the pile. You can’t cool your way out of a problem that started after the heat already got in. So what’s the one stressor you could take off your most fragile cows before this summer peaks?

Run Your Numbers

Health ROI Calculator — Before you write a cheque for another fan or a gut-health additive, run the Health ROI Calculator. It puts a dollar value on cutting fresh-cow mastitis, metritis, and culling losses, so you can see whether fixing stocking and pen flow pays harder than the equipment.

Complete references and supporting documentation are available upon request by contacting the editorial team at editor@thebullvine.com.

Learn More

The Sunday Read Dairy Professionals Don’t Skip.

Every week, thousands of producers, breeders, and industry insiders open Bullvine Weekly for genetics insights, market shifts, and profit strategies they won’t find anywhere else. One email. Five minutes. Smarter decisions all week.
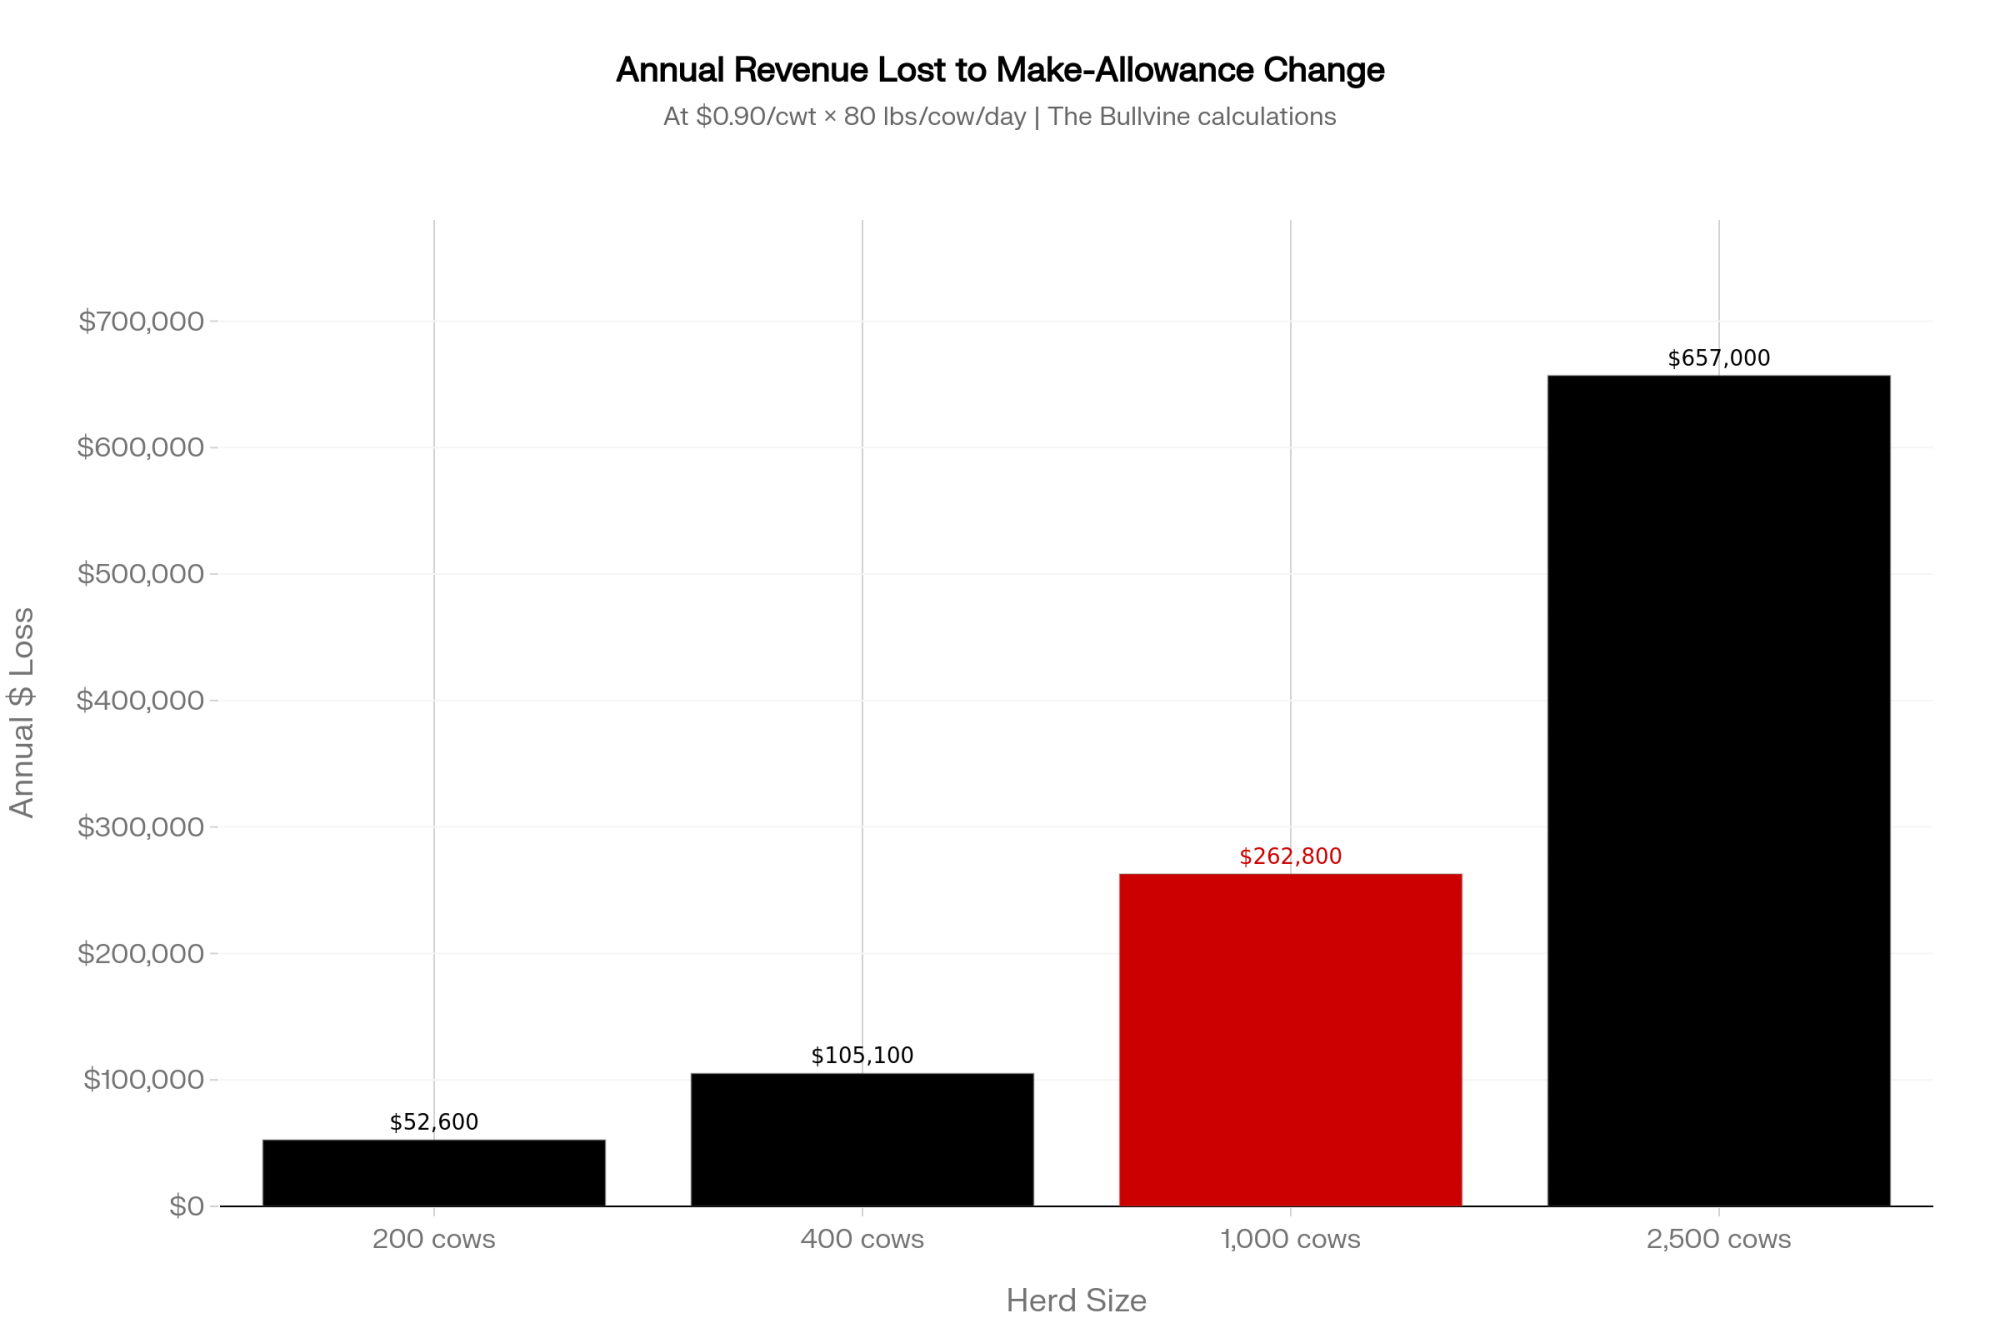
NewsSubscribe
First
Last
Consent

Your Cows Are Comfortable. The Milk Check Doesn’t Know It Yet.

A 100-cow pen short on rest leaks up to $2,300 a month at $14.70 milk — before the $38–$60/cwt some farms earn just for proving how their cows live.

At The Lands at Hillside Farms in Shavertown, Pennsylvania, the milking herd carries a credential most dairies don’t: Certified Animal Welfare Approved by AGW — the only U.S. animal-welfare label Consumer Reports rates “excellent.” Hillside is a 412-acre nonprofit educational dairy that bottles its own herd’s milk and sells it straight from the farm store, which means it pockets the value of that label instead of watching a processor capture it. That’s the whole argument in one barn. While USDA’s June 2026 outlook pegs the 2026 all-milk price at $20.70/cwt, NODPA’s May 2026 report had grass-fed organic-certified dairies earning $38 to $50-plus per cwt — and regenerative organic herds running $50 to $60 per cwt.

Same cows. Same chores. A pay gap wide enough to decide which barn is still milking in 2030. The difference isn’t the genetics standing in the stalls — it’s whether the operation can prove how its animals live, and sell that proof. You can fill those stalls with the best-bred cows in the country, but a broken comfort environment or a dead-end marketing channel caps what that genetic horsepower can ever earn. That’s the part most of the industry is still leaving on the table.

The Death of the Volume-Only Mindset

For decades, how you cared for your cows lived on the cost side of the ledger — overhead first, then compliance, then a line to shave when the milk cheque got thin. The Federal Milk Marketing Order, established in 1937, pays you on volume and components, not on welfare. There’s no column on the pay stub for a comfortable cow. So producers chased the only incentive the system actually rewarded: more milk, at a lower price. That’s not anybody’s villainy — it’s how the system was wired.

But the premium tier keeps paying, and the capital is following it. Horizon Family Brands — owned by Platinum Equity — acquired the grass-fed organic pioneer Maple Hill Creamery on December 1, 2025, according to the company’s announcement. Organic mailbox prices climbed $8 to $15/cwt year-over-year heading into 2026, AgProud reported in March 2026. When private equity buys grass-fed brands and pays prices that jump into double digits, the market’s telling you where it sees value heading.

That capital story isn’t all upside, and it’s worth saying so. Watchdog group OrganicEye filed an FTC complaint in January 2026, arguing the Horizon–Maple Hill deal could lessen competition in organic fluid milk — by OrganicEye’s account, Horizon already controls the largest organic share in the country. Consolidation can lift prices and concentrate buyer power simultaneously. The premium is real — so is the risk of fewer buyers holding the pen.

Here’s the harder part for anyone running the conventional treadmill. USDA’s June 2026 all-milk forecast of $20.70/cwt is a long way from the $38–$60 organic and grass-fed pay prices that NODPA tracked this spring. The gap between the two markets isn’t closing. If anything, the premium tier is pulling away while the commodity tier fights over fractions of a cent — and absorbs make-allowance hits the premium farms largely sidestep.

Welfare Pays in the Barn Before It Ever Hits a Label

Here’s the part that needs no certificate, no new buyer, no transition paperwork. Welfare pays inside the barn first. Work from Cornell, the University of Wisconsin’s Dairyland Initiative, and the Miner Institute shows that every extra hour a cow spends lying down returns roughly 1.7 to 3.5 lbs more milk per day. Comfortable cows make more milk. That’s physiology, not ideology.

This is also where your genetics either earn out or sit idle. You can chase a high-PTA-milk bull and still strand that potential in a crowded pen — the cow can’t express what the environment won’t let her. Put numbers on it. Take a 100-cow pen running a 1.5-hour daily rest deficit — cows standing in alleys, waiting on crowded stalls, fighting heat. At those lying-time rates, that’s roughly 255 to 525 lbs of milk a day left in the alley. We’ll run the dollars at the $14.70 Class I floor, not the $20.70 forecast, so the number’s conservative on purpose: you’re still looking at about $1,100 to $2,300 a month in gross revenue gone, on cows you already paid top dollar to breed. Use your own mailbox price, and it climbs.

And the rest deficit rarely travels alone. The same crowded pen that costs you lying time tends to push up lameness and somatic cell counts, drag down heat detection, and shorten productive life — every one of them a quiet drain on the same milk cheque. Cornell Pro-Dairy modeling pegs the payback on basic stall fixes — neck rails, bedding depth, airflow — inside a few months. None of it requires a label or a conversation with a buyer. It’s money already on your farm that better cow comfort lets you keep.

The retail spread is where the bigger money lives. NODPA reported organic half-gallon milk averaging $5.24 to $5.43 at retail through early 2026 — against conventional jugs that rarely clear $2. Spot fluid organic was reportedly running in the $60/cwt range this spring, with supply short across the Northeast and nationally. The premium isn’t hypothetical anymore. It’s sitting in the dairy case, and right now the market can’t make enough of it.

The Grocery Store Hypocrisy

Shoppers will tell a pollster they care about animal welfare and then reach for the cheapest jug on the shelf. A 2024 study in Food Quality and Preference — run across the UK, Sweden, Spain, the Czech Republic, and Switzerland by researchers including Agroscope and the University of Portsmouth — found consumers consistently ranked animal welfare among the top purchase drivers, ahead of food miles, carbon footprint, and organic production. And then plenty of those same shoppers grab the $1.90 jug anyway. Call it grocery store hypocrisy: what people say at the survey table and what they do at the cooler door are two different animals.

That gap is exactly why third-party validation isn’t optional — it’s the enforcement mechanism. A label like organic, certified grass-fed, AWA, or Regenerative Organic forces the issue: if a shopper wants the welfare claim, they have to pay the price attached to the certified product. No certificate, no premium, no way to make the hypocrisy pay you back. Economist Nicolas Treich, in his 2025 book Animal Economics (Cambridge University Press), frames the root cause in structural terms — welfare behaves like a public good, so voluntary markets chronically under-pay for it. You don’t need the theory to feel it at the dairy case, though. The behavior is the proof.

That’s the wall most producers hit. Only 14% of U.S. consumers fully trust grocery sustainability claims, according to RELEX Solutions’ 2025 survey. “We care about our animals” on a carton earns nothing without a third party standing behind it. Credible certification is the bridge between a welfare practice and a welfare premium. Without it, the practice is just an expense you can’t bill for.

There’s a warning shot buried in here, too. If markets structurally under-pay for welfare, the pressure to close that gap doesn’t vanish — it migrates to regulation. The EU has already moved that way on housing and transport, and a producer who builds a provable welfare system now is buying optionality: a premium today, and a head start if the floor rises tomorrow.

How Much Does Waiting Actually Cost You?

Run your own version of the barn-math before you write this off as somebody else’s strategy. If your cows are short on rest, the conventional milk you’re already shipping is worth less than it should be — revenue walking out the door today, at today’s price, no certification required. On a 100-cow pen at the top of that estimate, that’s roughly $2,300 a month at the $14.70 floor. Scale it to a 300-cow barn with the same deficit, and you’re somewhere between $3,400 and $7,000 a month, depending on where your lying-time loss actually sits. Twelve months of “we’ll get to it” isn’t neutral. It’s a number with your name on it.

The transition question is harder to time, and caution is fair. The University of Vermont’s grass-fed production guide is blunt about it: most farms see production costs rise and milk volume fall under grass-fed management. Organic also runs 36 months of organic-rule costs before organic pay arrives — a real cash-flow hole that’s sunk plenty of well-meaning transitions. The lower-risk sequence: bank the free in-barn gains first, then use that stronger cash flow to fund a slower, deliberate call on certification. You don’t have to bet the farm to start.

Is Your Welfare Story Provable, or Just Stated?

Here’s the gut-check. Walk your barn as a skeptical buyer — or a reporter — would, beside you. Can you show, not just say, how your animals live? Longevity, culling rates, lying time, clean housing, calf protocols, lameness scores? A provable welfare story is a marketable asset. A stated one is marketing copy nobody believes.

Worth knowing where the floor already sits. About 99% of U.S. milk production already participates in the National Dairy FARM program — more than 31,000 farms — and in Canada, proAction is mandatory on every licensed dairy. FARM and proAction are table stakes, not brand assets. They solve the floor, not the premium. The money lives in the layer you build on top — exactly what Hillside did when it stacked AGW certification onto a working dairy — and whether you can prove that layer to someone who walked in not believing you.

The proof has to be legible to an outsider, not just obvious to you. You know your cows are well cared for. The shopper at the dairy case doesn’t; the buyer signing a premium contract doesn’t, and, at 14% trust, neither assumes the best. A third-party audit is what turns “trust me” into “here’s the certificate” — and that’s the difference between a practice that costs you and one that pays you.

Four Strategic Paths: Where Does Your Barn Fit?

There’s no single right move. There’s a calculation that depends on your balance sheet, your buyer relationships, and your geography. Here’s what farms are actually doing.

Strategic PathPay PremiumUp-front Cost / Cash-flow RiskCertification HurdleBest Fit
Capture in-barn ROI firstNone directly; recovers lost milk revenueNear zero — payback in months (Cornell Pro-Dairy)NoneEvery barn, this month
Animal Welfare Approved (AGW)Premium only if a buyer/farm store paysFree to farmer — application, cert & annual audit (AGW)Pasture-based required; confinement won’t qualifyPasture herds w/ direct sales
Transition to organic / grass-fed$38–$50+/cwt (NODPA)36 months of organic costs first; volume typically drops (UVM)High; multi-yearStrong balance sheet + buyer lined up
Direct / regional channelFull retail spread captured ($5.24–$5.43/half-gal)Marketing + food-safety burden most farms lackSelf-managedOperators wanting pricing control
  • Capture the in-barn ROI first — start this month. Walk your stalls and pens this week. Measure lying time, check stocking density, look hard at neck rails and airflow. Almost no capital, no certification, payback in months per Cornell Pro-Dairy. Risk is near zero — and it’s the one path that unlocks the genetics you’ve already paid for. The only thing in the way is the half-day it takes to look honestly at your own barn.
  • Certify with Animal Welfare Approved. A Greener World’s AWA program is free to the farmer — the application, certification, and annual audit run at zero cost, per AGW — and it’s the label Consumer Reports rates highest. Hillside runs it on a working dairy herd and sells the milk directly. The hard limit: AWA requires pasture-based, high-welfare systems, so confinement operations won’t qualify, and the label only pays if a buyer — or your own farm store — turns it into a price.
  • Transition to organic or grass-fed. Biggest premium, biggest risk. NODPA had grass-fed organic certified pay at $38 to $50-plus this spring, but organic runs 36 months of organic costs first, and UVM warns that volume typically drops under grass-fed. Don’t start without a buyer relationship lined up — Maple Hill, for one, built its supply on roughly 140 small farms across upstate New York. And watch the consolidation: the OrganicEye FTC complaint is a reminder that fewer, bigger buyers can mean less leverage when your contract comes up for renewal.
  • Build a direct or regional channel. Farm-direct fluid, on-farm processing, and artisan cheese — exactly Hillside’s model — let you own more of the chain, so the premium is actually captured rather than absorbed by a processor or retailer. It demands marketing muscle and food-safety compliance that most farms don’t have in-house. But it’s the path with the most pricing control, and the one least exposed to a processor cutting your premium on 30 days’ notice.

Key Takeaways

  • If your pens are crowded or your cows are short on rest, run the lying-time math this month — at the $14.70 floor, a 100-cow pen with a 1.5-hour deficit may be leaking up to $2,300/month, and a 300-cow barn $3,400 to $7,000.
  • The best genetics you can buy are capped by the barn they live in and the channel you sell into — fix the environment before you blame the cow.
  • Treat stall comfort, airflow, and stocking density as a revenue decision, not a cost line — Cornell pegs the payback in months, not years.
  • Before chasing any premium, ask one question: Will a credible third party certify my claim? At 14% consumer trust, an unverified story earns zero.
  • If you’ve got pasture access, the AWA audit is free to the farmer — call A Greener World for an eligibility check before you assume it doesn’t fit your operation.
  • If you’re weighing organic or grass-fed, line up the buyer before you start the 36-month clock — budget for lower volume, not just a higher price, and factor in who’ll still be buying after the next acquisition.
  • Don’t assume FARM or proAction earns you a premium. They’re the floor. Name the differentiating layer you can actually prove on top — and make sure an outsider can read it.

A nonprofit dairy in Shavertown sells milk from a herd certified under the label Consumer Reports calls the best in the country, straight to the people who drink it. A buyer paying north of $50/cwt does it for milk it can vouch for. And the herd down the road ships into a $20.70 pool and never tells a soul how those animals live. The difference isn’t the genetics in the stalls — it’s whether the operation decided that the way it cares for its cows is worth proving and selling. So where does your operation sit on that line right now, and what would it take to move it ten feet?

Run Your Numbers

Dairy Profit Projector — This article runs the math at a $14.70 floor. Now run yours. Drop in your herd size, milk price, and ration to see your real breakeven, IOFC per cow per day, and 12-month margin — then stress-test what a premium contract would actually change.

If you want the deeper math — the full cost-per-cwt model by herd size, the 36-month transition cash-flow timeline, and which certifications actually pencil out at your scale — that’s what we’re building in the next Bullvine Weekly. That’s where the real numbers live.

The Sunday Read Dairy Professionals Don’t Skip.

Every week, thousands of producers, breeders, and industry insiders open Bullvine Weekly for genetics insights, market shifts, and profit strategies they won’t find anywhere else. One email. Five minutes. Smarter decisions all week.
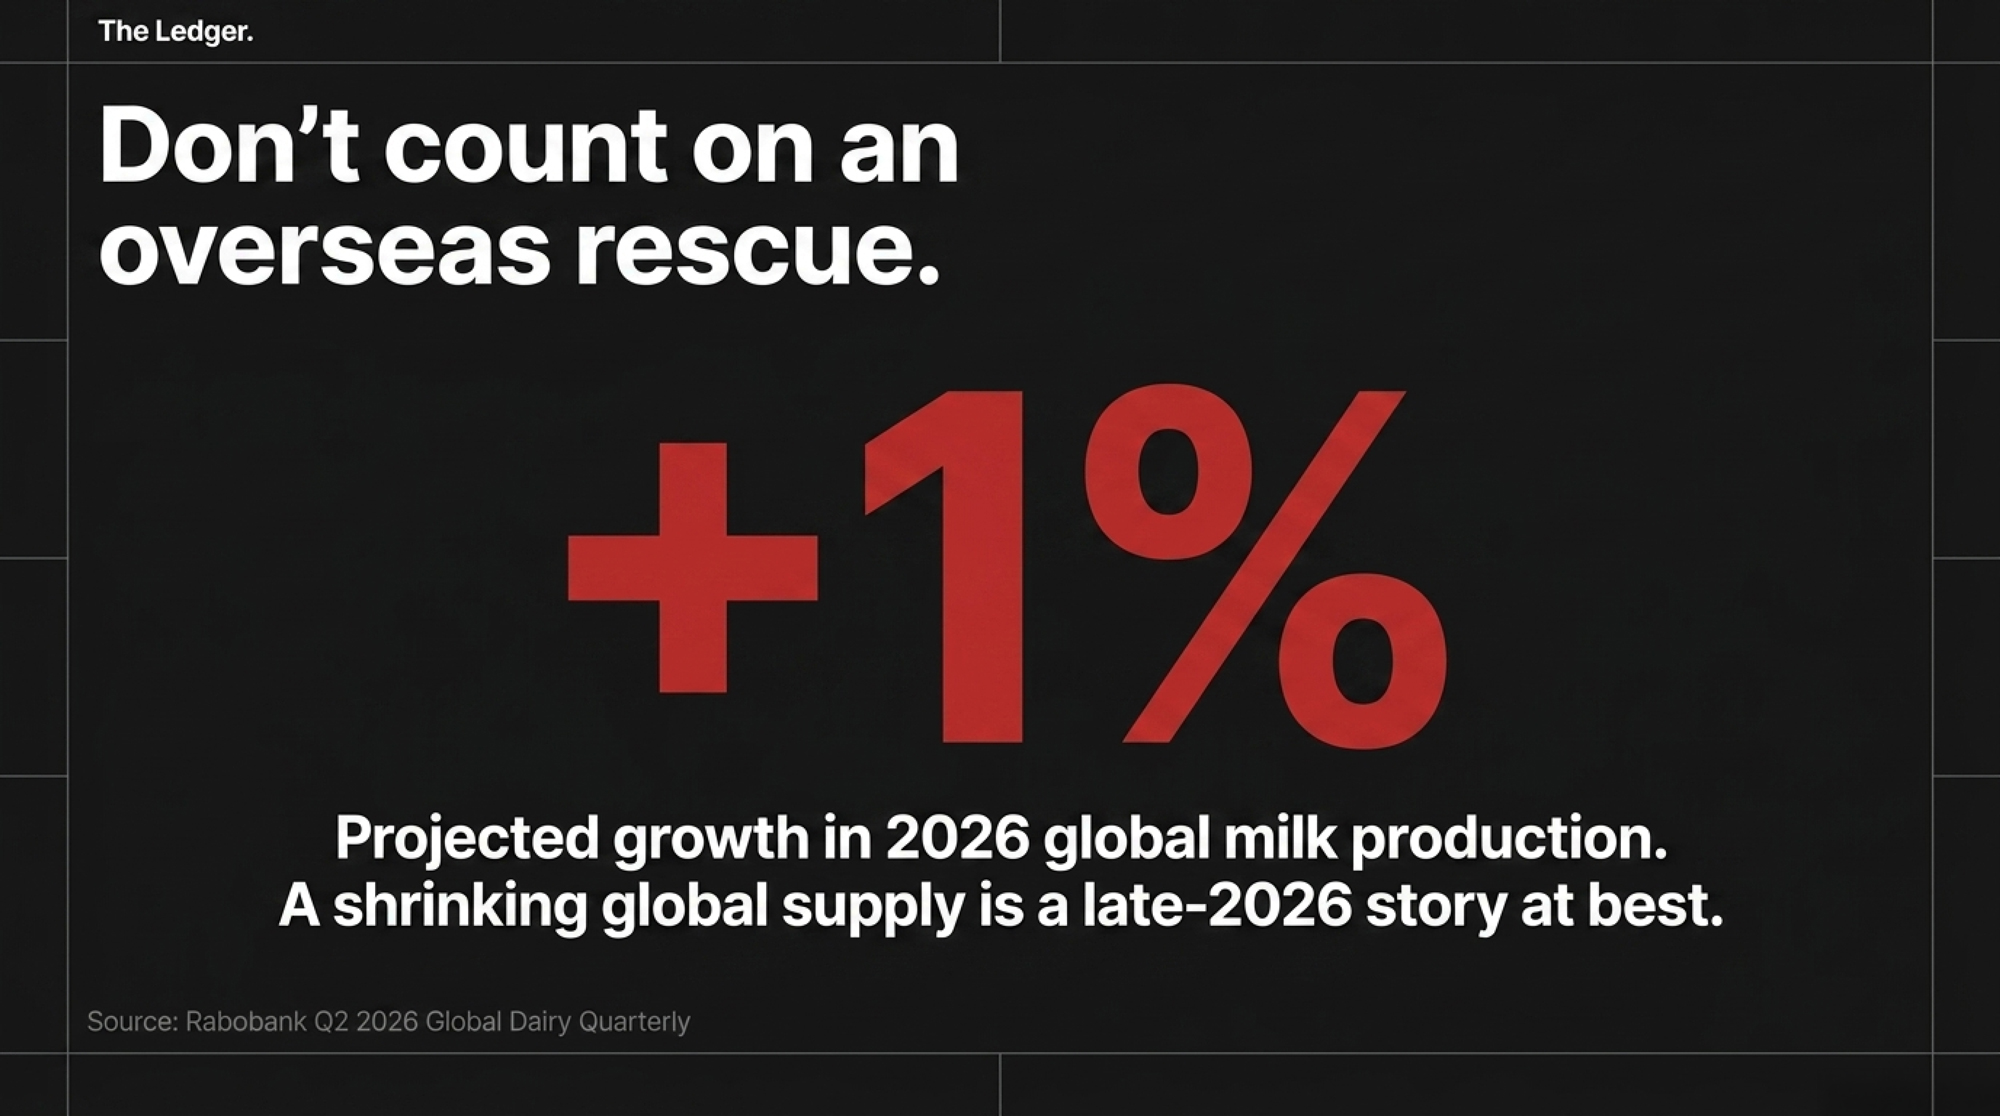
NewsSubscribe
First
Last
Consent

Learn More

Complete references and supporting documentation are available upon request by contacting the editorial team at editor@thebullvine.com.

Your Clean Whiteboard Won’t Win the Contract – or the $7.83

University of Minnesota proved selective dry-cow therapy saves $7.83 a cow and cuts antibiotics 55% — but it only pays if you kept the one record most farms wipe off by Friday.

Executive Summary: University of Minnesota research clocked algorithm-guided selective dry-cow therapy at a 55% cut in antibiotic use at dry-off and a net $7.83 a cow — that’s roughly $3,900 a year on 500 cows and close to $7,800 on 1,000, dropping straight to your bottom line with no measured hit to udder health, milk, or culling. The catch is the one most farms miss: it only works if you kept clean per-cow SCC and clinical-mastitis records, and Guelph found fewer than half of producers log every treatment. That whiteboard in your treatment pen — wiped by Friday — is the gap, and it’s the same gap a processor will eventually ask you to fill. As EU antimicrobial-use rules tighten toward a 50% cut by 2030 and premium buyers like Danone already lean on documented stewardship, the well-run farm with no record sits in the same hole as the careless one. The fix runs in three moves: log every treatment at the cow this month, sit down with your vet to read what it says about your protocols, then pilot SDCT if your bulk tank holds under 250,000 SCC. Start in 2026 and you’ll have four years of your own proof by 2030. Start later and you’re rebuilding it under a contract deadline.

selective dry-cow therapy

Aidan Connolly has spent his career at the intersection of animal agriculture and technology, and as president of AgriTech Capital, he watches where the money and the data are heading. This June, in a Forbes Tech Council column, he put his finger on a gap most of us stopped noticing: medication is still barely recorded on modern farms, and that hole quietly drags down learning, consistency, productivity, and welfare. The sensors around the cow keep getting smarter. The record of what we actually do to her hasn’t moved in decades.

Look at the whiteboard in your treatment pen right now. A tag number, a drug, a date in dry-erase marker. Gone by next week. Stack that up across every cow you treat this year, and you’re staring at the single biggest data gap on most dairies — and it’s costing you money, market access, and the one thing your vet has never had: proof of what actually works on your cows.

What’s Actually Breaking

We track nearly everything else to the decimal. Feed in, milk out, rumination, activity, heats — all digital, all crunched. The treatment itself? Marker on a board, or nothing at all. Connolly’s point is that medication shouldn’t be a one-and-done event you scribble down for compliance and forget. Catch it at the moment the needle goes in, tie it to that individual cow’s health and production, and it stops being a chore and becomes a number you can learn from.

And the clock’s running. The European Union has a legally binding target to cut antimicrobial sales for farmed animals 50% by 2030 under its Farm to Fork strategy. On this side of the Atlantic, two programs keep tightening their documentation rules with every revision: the U.S. FARM Antibiotic Stewardship program and, in Canada, proAction. Meanwhile, the precision livestock farming market is projected to grow from nearly $8 billion in 2025 to over $12 billion by 2030, according to MarketsandMarkets. That money isn’t flowing toward farms that are still undecided about data.

Here’s the part that stings. The most exposed operations aren’t the sloppy ones — they’re the clean farms running on a whiteboard. When a processor asks for antimicrobial use records as a condition of the contract, and the premium buyers are already drifting that way, the well-run dairy with no record sits in the same hole as the careless one. The proof that should have separated them was never written down.

How This Plays Out in the Barn

Take Mystic Valley Dairy in Sauk City, Wisconsin — about 450 registered Holsteins, bulk tank SCC running a tight 70,000 to 90,000 cells/mL. When The Bullvine profiled the farm’s move toward selective dry-cow therapy, owner Mitch Breunig didn’t lean on instinct. He leaned on records: three straight individual SCC tests under 200,000, no clinical mastitis during lactation, no flagged problem quarters before a cow ever qualified to skip a dry-cow tube. That’s the whole game in one farm. The decision is only as good as the per-cow history feeding it.

Most farms aren’t there yet, and the University of Guelph put numbers to why. A 2023 study of Ontario dairy farms found fewer than 25% of producers consistently recorded all calf illnesses, and fewer than half documented every antimicrobial treatment given to calves — a pattern researchers tied to the farm’s broader recording culture. These weren’t lazy operators. They had a feedback problem: when nothing useful came back from the records, the reason for keeping them fell off a cliff. The fix producers asked for most was simple — a system easy enough to use at the cow, in the barn, not back at the house.

Now look at the top end of the scale. McCarty Family Farms, the fourth-generation operation based in Rexford, Kansas, milks roughly 20,000 cows across several dairies and ships to Danone. “We have limited the potential milk residue antibiotics that we use on the farm to almost zero,” Ken McCarty told The Bullvine. “Those that we do use are tightly controlled, typically at one location that is not a milk-producing site — our dry cow and calving facility.” Mystic Valley runs 450 cows, McCarty runs 20,000, and the thing that lets both control antibiotics is identical: records clean enough to trust.

MetricMystic Valley Dairy (WI)McCarty Family Farms (KS)Undocumented Farm — Same Quality, No Record
Herd size~450 registered Holsteins~20,000 cows (multi-site)500–1,000 cows (typical)
Bulk tank SCC70,000–90,000 cells/mLNot published (Danone-certified)<200,000 (self-reported)
SDCT eligibility✅ Qualifies — 3 sub-200k SCC tests required per cow✅ Tightly controlled dry-cow protocols❌ No per-cow SCC history to qualify
AMU documentationPer-cow, per-lactationFacility-specific, near-zero residue policyWhiteboard — wiped by Friday
Processor relationshipDirect regional marketsDanone supply contractStandard commodity — no premium tier
Proof for processor AMU auditReadyReadyCannot produce
Market access risk (2026–2030)LowLow🔴 High — same hole as careless farm

What Does Logging at the Cow Actually Look Like?

Here’s where most record systems die: they ask the person holding the syringe to remember the treatment and enter it later, somewhere else. The Guelph data is blunt about why that fails — when producers logged treatments back at the house rather than in the barn, the records weren’t made. Time and memory both leak. A cow gets treated at 6 a.m.; by the time anyone sits at the office computer, the tag number’s fuzzy, and the dose is a guess.

Point-of-administration logging flips the order. The record gets made while the needle’s in the cow, on whatever’s already in the treatment person’s pocket. A phone or a rugged tablet at the headlock, a few taps: tag, drug, dose, route, days in milk. Some systems integrate directly with the herd-management software you already run, so the treatment is recorded on that cow’s individual record without anyone re-keying it. The behavioral fix matters as much as the tech — Guelph found the two things producers most wanted were a mobile app they could reach at the cow and a system simple enough that it didn’t slow the job down.

Think about who’s actually doing the treating on your farm. On a lot of operations, it’s not the owner — it’s a herdsperson, a relief milker, an employee whose first language might not be English. The record only survives staff turnover if it’s idiot-proof and lives in one place. Build it around the person with the syringe, not the person at the desk, and you get a treatment history you can actually trust six months later. Skip that, and you’re back to the whiteboard — and the whiteboard forgets.

Why Has Your Vet Been Flying Half-Blind?

The real prize here isn’t compliance. It’s the feedback loop your herd-health vet has never actually had.

Right now, your vet recommends a protocol, drives off, and finds out how it went six months later through bulk tank numbers. No per-cow signal comes back. Flip that. With treatments logged at the point of care — tag, drug, dose, days in milk — your vet walks in with a real question instead of a hunch. Research on veterinary herd-health management keeps running into the same wall: vets want to move from firefighting sick cows to proactive advising, but they lack compiled, analyzable farm data to anchor the conversation. Clean treatment records knock that wall down.

Picture a concrete one. You’ve been treating clinical mastitis with the same intramammary protocol for two years. With logged records, you and your vet can finally split the outcomes: cows treated before day 10 of the case versus after, this pathogen versus that one, first-lactation versus mature cows. Maybe your early-treatment cure rate is strong, and your late catches are dragging the average down — which isn’t a drug problem, it’s a detection problem, and the fix is cheaper monitoring, not a more expensive tube. You can’t see any of that on a whiteboard. The record is what turns “I think this works” into “here’s what works on our cows.”

The cows make the dollar case themselves. A single bout of metritis costs an estimated $329 to $386, and a 2021 peer-reviewed study put the median loss even higher — around $398 per case once you factor in milk losses, reproductive failure, and culling risk. That same research found treated metritis cows ran about 10 percentage points lower on pregnancy rates at 300 days in milk than healthy herdmates. And published clinical mastitis cure rates range from 25% to 98%, depending on the study. That spread is useless for making any decisions on your farm. The only way to know where your cows land is to build your own dataset, one treatment at a time. (For the management side, here’s how to assess your own SDCT readiness rather than relying on averages.)

What’s the Saving Actually Worth on Your Farm?

University of Minnesota research found that algorithm-guided selective dry-cow therapy cut antibiotic use at dry-off by 55%, with no impact on udder health, milk yield, or culling, and an average net benefit of $7.83 per cow. Run that against your own herd while it’s in front of you:

Herd sizeAnnual saving at $7.83/cow
250 cows~$1,960
500 cows~$3,915
1,000 cows~$7,800

Every dry-off cycle — plus a lower AMU number you can show a buyer. But mind the gate: that math holds for herds with fewer than 250,000 SCC and contagious mastitis under control. Above that line, blanket therapy may still be the smarter call. And the downside is real — in a separate Cornell New York project tracking 24 herds, 7 backed out of selective therapy once fresh-cow mastitis slipped. The saving is real. It just isn’t free of conditions.

Is Your Treatment Data an Asset or a Liability?

This is the honest tension, and nobody’s been straight about it. The principle’s clean: dairy data belongs to the producer. The practice is murkier. As Lactanet’s researchers put it: “Most farmers and non-farmers agree that the farmer owns the raw data produced on a farm, yet they don’t remember signing an agreement and don’t have control over how their data is used.” A 2025 commentary in Animals, drawn from a multidisciplinary group of U.S. dairy data stakeholders, makes the same point — ownership on paper isn’t the same as control in practice — and ties that concern directly to the sway large tech firms hold over how farm data is used.

Treatment records are sensitive in a way milk weights never will be. They’re a liability profile — your AMU history, your protocol calls, your disease rates. You’re right to ask who sees it and on what terms. The good news: newer systems let you share selectively, proving protocol compliance to a processor without handing over the whole herd-health picture. The honest catch: that infrastructure isn’t everywhere yet. So the answer isn’t to skip the record. It’s about building a system where you own what you generate — and pushing for clear governance terms before someone else writes them for you. (Worth reading before you sign anything: who really controls the data your farm produces.)

What Will Your Processor Actually Ask For?

This is the part that turns a nice-to-have into a contract term. The pattern’s already visible at the premium end. McCarty’s relationship with Danone isn’t a handshake — it’s a supply arrangement where tight stewardship and the records to prove it are part of how the milk earns its home. The “almost zero” residue position McCarty describes only means something to a buyer if it’s documented down to the cow and the facility.

The regulatory edge sharpens the same way. The EU’s antimicrobial rules already extend beyond Europe’s own farms: under Regulation 2023/905, imports of animal products must comply with restrictions on certain antimicrobials, with application phasing in from 2026. Once a brand sells into Europe or builds a premium “responsible antibiotic use” claim for North American shelves, that verification pressure runs back down the supply chain to the farm gate. Your buyer doesn’t have to wait for a law to be enacted in your state. They just have to want the claim.

So the real question isn’t whether AMU documentation is coming — it’s whether you’ll be building your record on your own terms now, or scrambling to reconstruct one under a contract deadline later. The farm with four years of clean treatment data walks into that conversation holding proof. Show up with a wiped whiteboard, and you’ve got nothing to put on the table.

Your 30-Day Execution Plan

Three moves, in order. You can start the first this week; the others follow once the data starts flowing.

Step 1 — Move the record into the barn (start within 30 days). Pick one logging tool and commit to it for a full month — every treatment, every cow, entered at the point of care. Before you choose, run it against this checklist:

  • Can the person holding the syringe enter it in the barn, one-handed?
  • Who owns the data — and can you export all of it if you switch systems?
  • Can you share selected records with a processor or vet without exposing everything?
  • Does it tie treatments to individual cow IDs and days in milk, not just a date?
Evaluation CriterionWhiteboard in Treatment PenEntry Back at the House (PC/Book)Point-of-Care Mobile AppIntegrated Herd Mgmt. System
Can be entered one-handed at the cow✅ Yes❌ No — requires separate trip✅ Yes✅ Depends on hardware
Survives staff turnover❌ No❌ No✅ If cloud-based✅ Yes
Tied to individual cow ID + DIM❌ Tag only, no historyVaries✅ Yes✅ Yes
Exportable / shareable selectively❌ NoLimited✅ Most platforms✅ Yes
Producer owns the data✅ Yes✅ Yes⚠️ Verify in contract⚠️ Verify in contract
Guelph: records actually get made?❌ <50% compliance❌ <50% compliance✅ Significant improvement✅ Significant improvement
Ready for processor AMU audit 2026+❌ No❌ No✅ Yes✅ Yes

Step 2 — Read the data with your vet, then pilot selective dry-cow therapy. After 30 days of clean logging, sit down with your vet and look at what it actually says about your protocols. If your bulk tank SCC sits under 250,000, that’s your green light to test SDCT on a small group — the same records-first discipline Mystic Valley used, with three straight sub-200,000 SCC tests before a cow qualified. Start small and watch the results before going protocol-wide; the next-lactation mastitis worry is legitimate.

Step 3 — Turn the record into a market-access asset. Ask your buyer now what AMU documentation they’ll want in two years. The EU’s 50% target lands in 2030, and supply-chain verification tends to cascade from there into any brand selling into those channels. Start logging in 2026, and you’ll have four years of your own evidence by then. Start in 2030, and you start from zero.

Key Takeaways

  • If your bulk tank SCC runs under 250,000 and contagious mastitis is controlled, selective dry-cow therapy is worth piloting at roughly $7.83 a cow — if it runs higher, stay with blanket therapy until you fix the SCC first.
  • If your treatments get logged anywhere but at the cow, assume they aren’t getting logged at all — Guelph’s data says recording away from the barn is where the record breaks down.
  • If a logging tool won’t let you export your own data or share it selectively, treat that as a liability, not a feature — your AMU history is a sensitive record, and you want to own it.
  • If you don’t know what AMU documentation your processor will want in the next few years, that’s a phone call to make this month, not a problem to meet at contract renewal.

So, Could You Answer the Question?

If your vet walked into the parlor tomorrow and asked which of your mastitis protocols has the highest cure rate on your cows — not in a journal, on your cows — could you tell them? Most of us couldn’t, not from carelessness, but because the record was never built to answer it. Mitch Breunig could, because he built one before he ever skipped a tube.

The farms that close this loop early stack a feedback advantage that compounds every year. The full per-herd math on selective dry cow therapy — and a closer look at what processor AMU requirements could actually demand by 2030 — is where we’re headed next in Bullvine Weekly. That’s where the real numbers live.

Run Your Numbers

Herd Health ROI Calculator — Plug in your herd size, mastitis incidence, culling rate, and replacement cost, and the tool puts a dollar value on your health and treatment spend — the same number your medication records exist to prove or disprove on your own cows.

Complete references and supporting documentation are available upon request by contacting the editorial team at editor@thebullvine.com.

Learn More

The Sunday Read Dairy Professionals Don’t Skip.

Every week, thousands of producers, breeders, and industry insiders open Bullvine Weekly for genetics insights, market shifts, and profit strategies they won’t find anywhere else. One email. Five minutes. Smarter decisions all week.
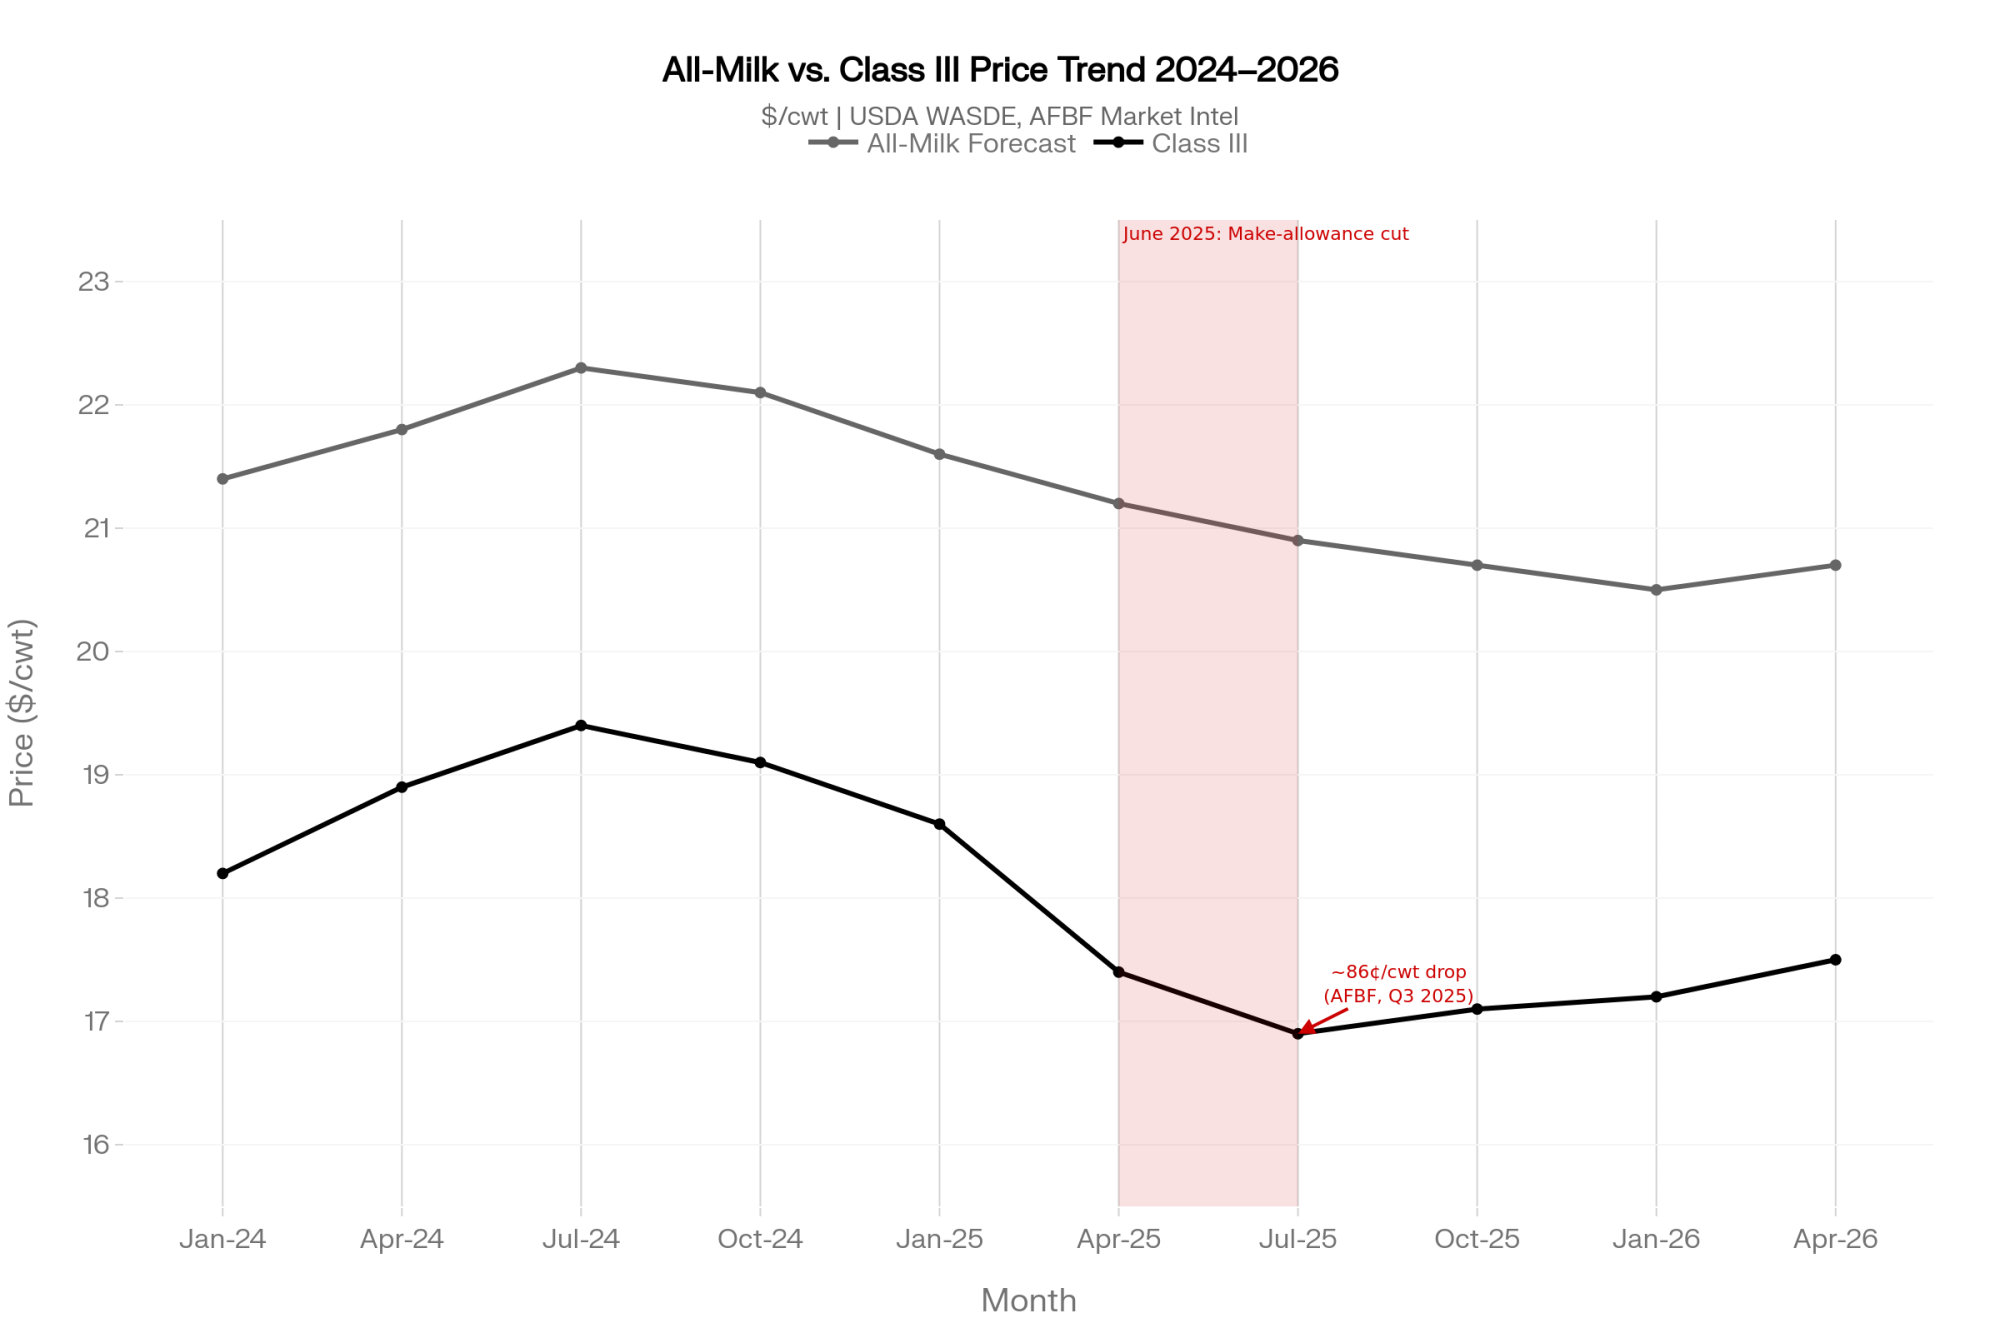
NewsSubscribe
First
Last
Consent

The Ration Was Perfect. The Cows Still Said No.

A working dairy consultant kept chasing a herd’s stuck income over feed cost with better rations. The fix wasn’t in the spreadsheet — it was riding shotgun in the feed mixer.

Executive Summary: A consultant spent months tweaking one herd’s “perfect” ration while income over feed cost stayed flat, until he finally rode a full feeding shift and found the leak sitting in the mixer cab. The written TMR and the real mix had drifted apart — loading order off, scale uncalibrated, silage moisture changed — thanks to a long‑tenured feeder freelancing for reasons that made sense from his side of the bunk. That gap between ration-on-paper and ration-in-wagon is quietly costing many herds more per cow per day than they’ll ever save by shaving a few dollars off wages or additives. The piece walks through a five-step sequence you can copy: ride the route, check three silent drift points, understand why the feeder freelances, rebuild the protocol with them, then run your own IOFC math on the slip. It also makes the uncomfortable case that treating feeders as interchangeable labor caps your margin just as hard as bad forage does, because every turnover resets the learning curve on your silage, mixer, and cows. If you’ve got respectable milk per cow but mediocre IOFC or feed efficiency, this is worth a read before you approve the next ration change or cut to the payroll.

income over feed cost

The ration checked out. Strong forages, sound genetics, facilities you’d photograph for a brochure. And the feed efficiency and income over feed cost still wouldn’t move off mediocre.

That’s the puzzle one dairy consultant kept circling on a particular herd — visit after visit, ration tweaks, regrouping, component rebalancing, all of it backed by the math. Nothing budged. The answer, when it finally surfaced, wasn’t in a spreadsheet. It was in the cab of a feed mixer, on a shift he finally rode start to finish. If you’ve ever stared at a herd that should be performing and isn’t, you already know the feeling.

What’s Really Going On Under the Numbers

Here’s the uncomfortable part about feed efficiency and income over feed cost: they’re outputs, not inputs. They’re the scoreboard reading of a system that’s mostly human — who mixes the feed, who sets the bunk targets, who trains the night crew, who checks whether the written protocol still matches what’s actually happening at the mixer.

Feed is the single largest operating cost on most dairies, which is why income over feed cost — milk income minus the feed cost to produce it, per cow per day — has become the go‑to profitability lens in extension and applied nutrition work. With feed and milk prices both swinging hard through 2024 into 2026, that margin per cow has been a moving target, and the herds protecting it best are the ones holding their feeding consistency steady while the markets don’t. 

Feed efficiency, energy‑corrected milk divided by dry matter intake, rides shotgun, because how consistently cows convert feed into solids is tightly linked to IOFC and profitability. A herd can post respectable milk per cow and still bleed margin if it’s buying that milk with too much feed, mixed too loosely. 

But most consultants don’t lead with the human system behind those numbers. They lead with the ration, the additives, the cost‑per‑cwt math. That’s the comfortable, controllable ground. Numbers have clean answers. People don’t.

When the Spreadsheet Stops Working

Early in his career, this consultant was exactly that guy. Show up, drop a sharp ration, present fresh benchmarks, suggest a couple of smart ingredient swaps to tighten cost and lift solids. On paper, it all worked.

Then nothing happened. Or worse — things got noisier. Fresh cows stayed inconsistent. Bunks looked good the day he visited, then went sideways three days later. The owner grumbled about employees “not doing what they’re told.” The feeders rolled their eyes at “another new idea.”

That tracks with what the labor and management work keeps finding: poor training and “protocol drift” are system failures that quietly erode performance and product quality — not individual moral failings. The ration on paper can be flawless while the ration in the wagon slowly drifts away from it. And drift is sneaky. It doesn’t announce itself with a blown mix or a sick pen. It shows up as a slow, steady gap between what the formulation software says the cows are eating and what they’re actually getting — a gap that never appears in the office. 

What He Found in the Cab

On the farm that finally broke the pattern, he did the thing he should’ve done from the start. He shut up and rode a full feeding shift.

What he saw wasn’t sabotage. It was drift. Loading order that almost matched the sheet. A scale nobody had recalibrated in months. Silage moisture that clearly moved while the inclusion rate never did. And, by the consultant’s account, a long‑tenured feeder who’d drifted toward his own routine — for reasons that, from the floor, made sense to him.

That picture lines up with what nutrition‑labor guidance has said for years — feeders are key professionals, and consistency in mixing and delivery is one of the biggest single drivers of feeding‑program performance. Mix order, mix time, load accuracy, push‑up frequency — none of it lives on the ration sheet, and all of it moves the result. What the consultant found wasn’t one bad employee. It was a common gap: a skilled feeder running a routine the written ration had quietly drifted away from. 

The way he frames it now, the ration was never his main tool on that farm. The people were. That realization didn’t come from a conference room. It came from the buddy seat.

“Honestly? A Cocktail of ‘Oh Shit’ and Embarrassment”

Ask the consultant what he felt watching the mix go wrong, and he doesn’t reach for the polished answer.

The first hit was how did I miss this. He’d been on that farm repeatedly, tweaked the ration, run the IOFC scenarios — and never once sat next to the person who touches every kilo of feed. Then came the embarrassment. From the feeder’s chair, he figured he probably looked like every consultant who breezes in with a new sheet and never sees how it plays out at the mixer.

The frustration flickered — why can’t you follow the sheet? — then turned inward. As the consultant tells it, the feeder had practical reasons: silage quality that hadn’t been addressed, past rations that hadn’t worked for fresh cows, and a scale no one had maintained. From where the feeder sat, freelancing the mix was the rational move. That read on the feeder’s thinking comes from the consultant, not the feeder himself — a limitation worth keeping in mind.

Underneath all of it sat something quieter. Relief. The disconnect finally made sense. Not bad cows, not tough markets — one human, fixable gap between what they thought was happening and what actually was. Plenty of consultants, faced with being wrong, double down and find another number to tweak. He sat with it instead.

From Cab to Fix: A Five‑Step Sequence

Here’s the move that came out of that ride, broken into the order the consultant now runs it. It’s the bridge between “I found drift” and “we fixed the margin” — and it’s deliberately boots‑first.

  1. Ride the shift before you touch the ration. Sit in the cab for a full feeding, start to finish. You’re not inspecting — you’re learning what actually happens between the sheet and the bunk.
  2. Check the three silent drift points. Does loading order match the sheet? When was the scale last calibrated? How often were key pens actually out of feed? None of these show up in the office. 
  3. Find out why the feeder freelances. Drift almost always has a reason — wet silage, a dead scale, a past ration that flopped on fresh cows. Until you know the reason, you can’t fix the system. 
  4. Rebuild the protocol with the feeder, not over them. Visual SOPs in their first language, “show‑me” training, and a real feedback loop. The decade‑long feeder knows things the software doesn’t. 
  5. Run the IOFC math on what you found. Put a believable number on the daily slip, multiply across the herd, and weigh it against the cost of training and keeping that person. That’s your business case. 
Drift PointHow It HidesIOFC Impact Est.Catch It ByRed Flag Threshold
Loading order deviationMix looks normal visually$0.20–$0.50/cow/dayCompare sheet vs. cab videoAny ingredient out of sequence
Uncalibrated scaleNumbers print, no one checks$0.30–$0.60/cow/dayScale cert. log; weigh-backs>90 days since last calibration
Silage moisture shiftInclusion unchanged despite wet face$0.40–$0.80/cow/dayWeekly moisture probe, ration re-run>3% swing from baseline
Mix time creep“Looks mixed enough”$0.15–$0.35/cow/dayTimer log on mixer>20% deviation from protocol
Bunk management gaps“Cows eat what’s there”$0.10–$0.30/cow/dayPush-up frequency log; slick bunk timeSlick bunks >2× daily or excessive refusals

The Math You Can Run on Your Own Herd

Here’s where the people story turns into a margin story — and where you do the arithmetic, not us.

Skip any scary headline number. Run your own. Take a realistic guess at how much energy‑corrected milk a freelanced, inconsistent mix is costing per cow per day on your dairy. Multiply by your milk price and your cow count. The point isn’t the exact figure — it’s that even a small, believable slip at the mixer, multiplied across the whole milking string every single day, usually dwarfs the cost of paying and training that feeder better. 

The reason this works is documented, not hypothetical. Lifting IOFC even modestly compounds fast, because it applies to every cow, every day — which is exactly why extension work treats feed efficiency and IOFC together as the profitability pair, rather than chasing milk per cow alone. A herd can post respectable milk per cow and still bleed margin if it’s buying that milk with too much feed, mixed too loosely. 

If you want a foundational walk‑through of that metric before you run your own numbers, start with a good IOFC explainer from extension or your nutritionist. 

Run Your Numbers

Dairy Profit Projector — This article argues your IOFC leak is at the mixer, not the spreadsheet. Run your herd through the Dairy Profit Projector to see what your feeding actually does to IOFC per cow per day, breakeven milk price, and your next 12 months of whole-herd margin before the market moves first.

Why “Labor as a Cost” Quietly Caps Your IOFC

Changing the feeder usually means changing the owner first.

On many dairies, owners still treat the feeder as a wage line to trim rather than a lever to pull. But farm‑business and labor work point the other way: strong culture and employee development correlate directly with better financial performance and lower risk, and high turnover carries a brutal price tag once you load in recruitment, onboarding, and the lost performance of a half‑trained replacement. Treating people as a disposable cost doesn’t just bruise morale — it undermines the efficiency and profitability you’re trying to protect. 

There’s a hidden compounding here, too. Every time a feeder leaves, the institutional knowledge of this farm’s silage faces, this mixer’s quirks, and this herd’s fresh‑cow patterns walks out with them. The replacement starts the learning curve from zero. The dairies that hold their feed people aren’t just saving on hiring — they’re protecting the one person whose daily consistency the whole ration depends on. 

So the reframe with an owner isn’t soft. It’s financial: You’ve already bought the mixer, the software, and the tracker. The cheapest way left to move your IOFC isn’t more steel — it’s getting the person who runs it all aligned with what you actually paid for. A growing line of farm‑business analysis argues that the competitive gap on many dairies now is workforce and execution as much as parlor size. 

If you want the deeper version of that argument, your own labor/culture playbook or a solid labor‑management resource is the next click. 

Turning a Feeder Into a Feed Manager

If the lever is the person, then the upgrade is in how you train and equip them — and most dairies do this badly, not from neglect, but from habit.

The default is the hand‑down: here’s the new sheet, do it this way. That produces compliance theater — the feeder nods, then goes back to the routine that’s kept the cows alive through three other consultants. What labor‑systems work actually recommends looks different. Visual SOPs in the worker’s first language. “Show‑me” training over “do‑you‑understand,” because nodding isn’t knowing. And a real feedback loop, so the feeder hears when the mix is right, not only when something breaks. 

The deeper move is co‑creation. The feeder who’s been on the farm a decade knows things the ration software doesn’t — which silage face is wetter, which group sorts hardest, when the scale started reading funny. Build the protocol withthat knowledge instead of on top of it, and you get two things at once: a more accurate mix and a feeder who owns the result. That’s the difference between a button‑pusher and a feed manager, and it’s mostly free. 

If you want a broader management playbook around this, look for good precision‑feeding and feed‑efficiency resources that tie bunker management, mixing, and IOFC together. 

DimensionFeeder (Button-Pusher)Feed ManagerIOFC Implication
Protocol ownershipFollows sheet (usually)Co-authored the protocolMix accuracy improves 10–20%
Scale & moisture checksWhen toldPart of daily routine$0.30–$0.60/cow/day saved
Training languageEnglish-only sheet handed overVisual SOP in worker’s languageError rate drops 30–50%
Feedback loopHears about problems onlyGets scorecard: right mix = recognitionTurnover drops from 45% → 15%
Silage face knowledge“It’s in the ration”“Face 3 is wet — I adjusted”Prevents $0.40–$0.80/cow/day drift
Annual turnover cost if lost$15,000–$25,000$8,000–$12,000 (lower; higher retention)Net positive after training invest

Options and Trade‑Offs for Your Operation

The five‑step sequence is the how. These are the strategic paths — pick the one that fits where your operation actually is.

  • Ride along before you re‑formulate. Best when the numbers say “should be performing” and the herd isn’t. Costs you a few hours in the cab and the humility to assume the office story is half the picture. Backfires if you treat it as an inspection — the feeder clams up and you learn nothing.
  • Turn “feeder” into “feed manager.” Best for herds large enough that the owner can’t watch every mix. Demands visual SOPs in the worker’s language, “show‑me” training, and a real feedback loop. Backfires if you hand down a finished protocol instead of building it together.
  • Fix the owner’s mindset first. Best when labor is still a cost line, not a lever. Demands framing wages and training as IOFC return. Backfires if you lead with feelings instead of the wallet — skeptics need the margin case before the morale case.

The forward signal lives in that first path. As sensors, cameras, and AI move from research into the barn, the bottleneck shifts from data to whether your people can act on it. The dashboards will flag the morning load running light on forage — but only a trained, trusted feed manager will fix it before the next one. More technology raises the ceiling on what a good feeding team can deliver. It does nothing for a farm whose feed manager is freelancing the mix. 

What This Means for Your Operation

Run this quick mental audit before your next ration meeting — three checks, honest answers:

  • The eyes check: Have you actually watched your highest‑impact feeding shift this quarter — or are you trusting the feed software’s version of events ? 
  • The status check: Does your best feeder carry the responsibility of a feed manager but the status of a button‑pusher? That mismatch is where IOFC leaks. 
  • The framing check: When a long‑tenured employee runs things “their way,” are you treating it as a discipline problem or a systems‑and‑training problem? The framing decides the outcome. 

Key Takeaways

  • If your IOFC and feed efficiency are stuck despite a clean ration on paper, ride the feed shift before you change a single ingredient.
  • If you can’t say when your mixer scale was last calibrated, you’ve got a measurement problem wearing a nutrition problem’s clothes.
  • If you treat labor as a cost to minimize rather than a lever to pull, you’ve quietly handed control of your margins to whoever answered your last job ad.
  • If a long‑tenured feeder is running “their way,” build the new protocol with them, not over them — co‑creation beats compliance every time.
  • The cheapest IOFC gain on most dairies isn’t more steel or a new additive — it’s aligning the people who already run the system you paid for.

The honest tension is this: ultimately, the owner owns the cows — the checkbook, the risk, the final call all sit with them. But an owner who keeps treating key people as interchangeable is making a decision, too, just not on purpose. So before your next ration meeting, ask the question worth sitting in the cab with — is the person mixing your feed a cost you’re trying to shrink, or the lever you haven’t pulled yet?

Some details of this account have been anonymized at the source’s request.

Complete references and supporting documentation are available upon request by contacting the editorial team at editor@thebullvine.com.

Learn More

The Sunday Read Dairy Professionals Don’t Skip.

Every week, thousands of producers, breeders, and industry insiders open Bullvine Weekly for genetics insights, market shifts, and profit strategies they won’t find anywhere else. One email. Five minutes. Smarter decisions all week.
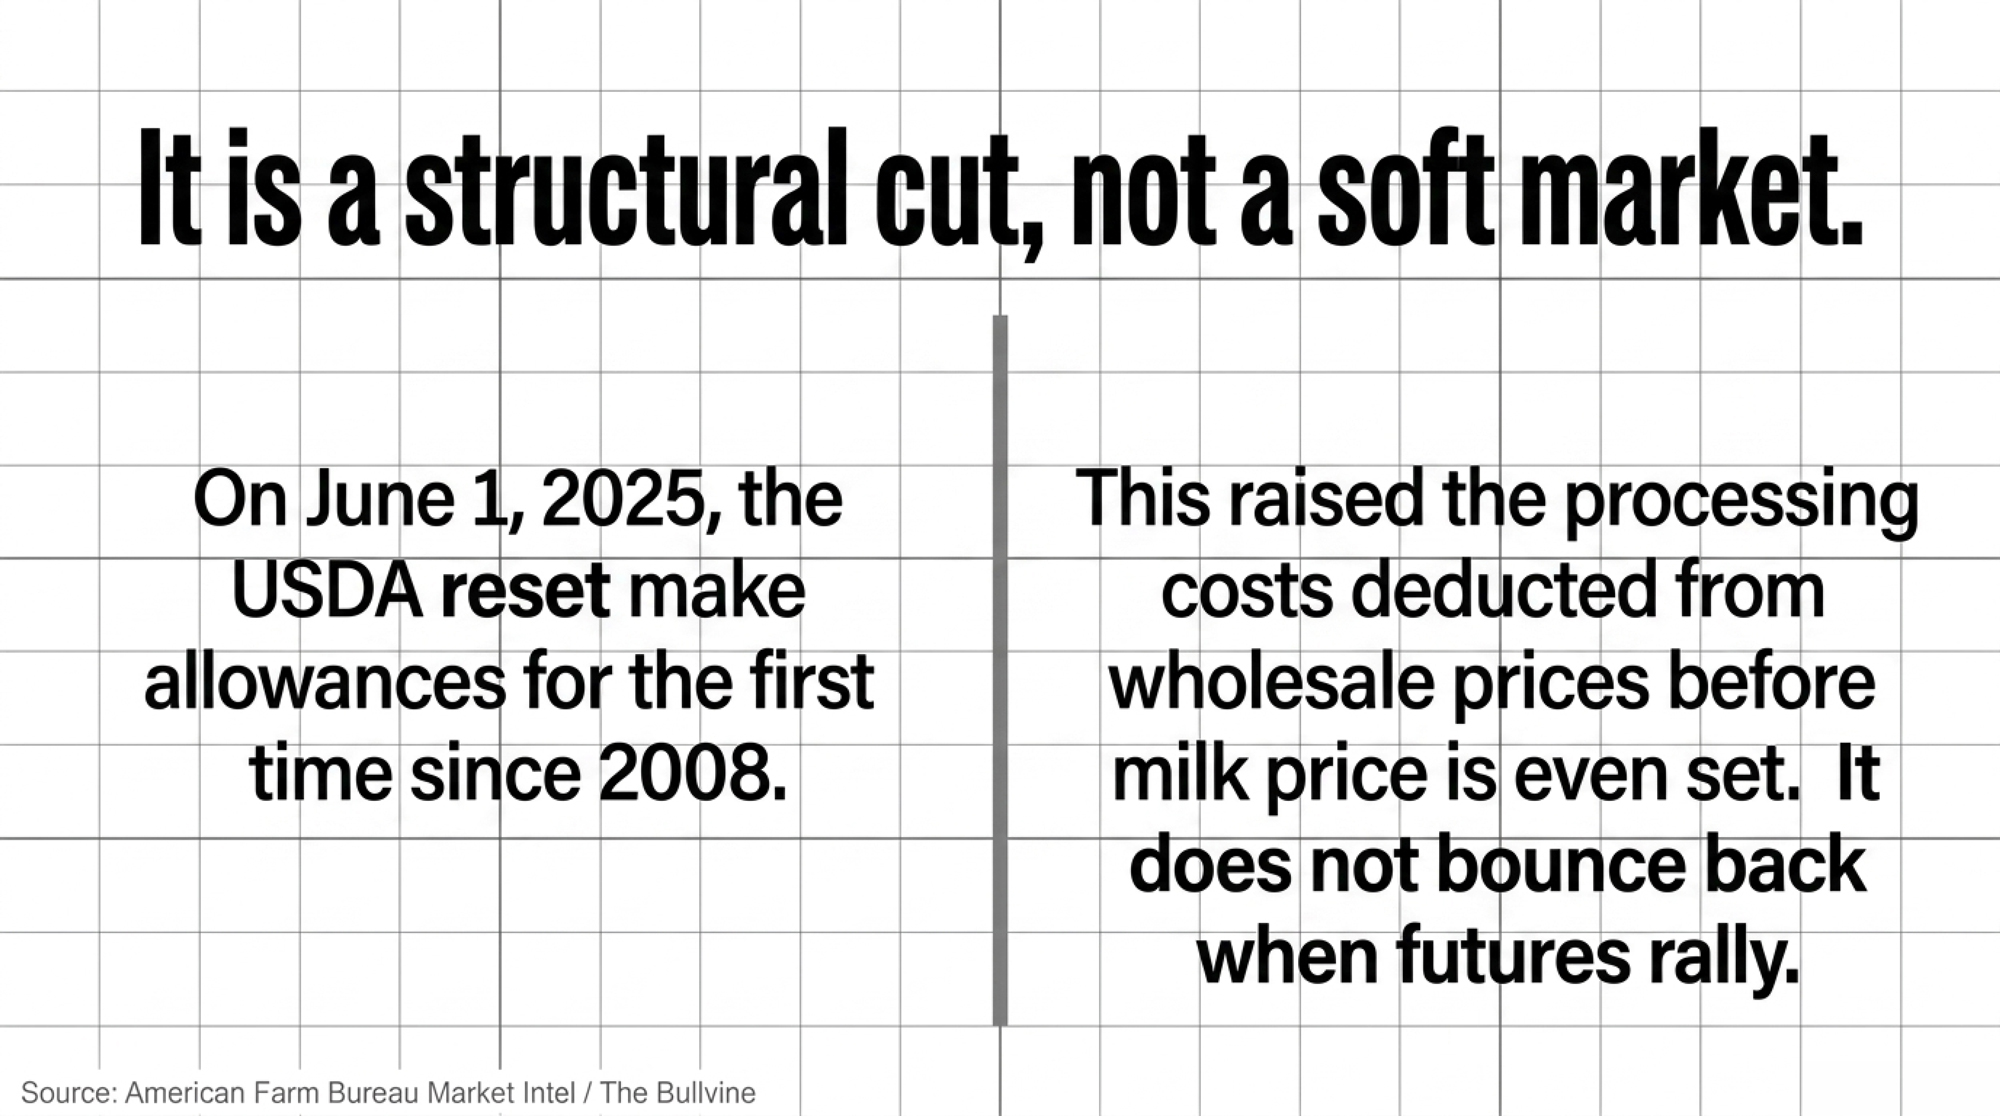
NewsSubscribe
First
Last
Consent

Outlook Dairy Lost 35 of 55 Workers Before Lunch. Then the Cows Lined Up. 

Outlook had 55 on payroll at sunrise and 20 by sundown. The parlor didn’t blink. If your crew vanished tomorrow, who runs the next six milkings — and what’s it cost by dark?

On June 4, 2025, Outlook Dairy outside Lovington, New Mexico, had 55 people on the payroll. By the time the dust settled, 35 of them were gone — Homeland Security Investigations agents arrested 11 workers while executing a search warrant, and the dairy terminated 24 more whose work-authorization documents could not be verified, according to the agency’s announcement and subsequent reporting. HSI said the arrested workers had used counterfeit documents to obtain work; as of this reporting, the public record does not indicate any charges against the dairy’s owners. Owner Isaak Bos didn’t soften the impact on the operation. Milk production, he told reporters, “didn’t just slow down, it effectively ceased.” 

That’s two-thirds of a workforce, gone before the day was out. Family, office staff, and local high school kids on summer break kept the cows alive in the days after. The parlor didn’t care that immigration enforcement had just gutted the crew. Cows still lined up. Calves still needed feeding. Somebody had to show up at 4 a.m. 

This is the sharp edge of a labor reality that touches nearly every hired-labor dairy in the country. About half of all hired dairy workers are immigrants, and the farms that employ them produce roughly 79% of the nation’s milk. When enforcement lands — or even when the rumor of it lands — your operation isn’t on a five-year labor trend anymore. It’s on a 72-hour clock. And most farms are only mentally prepared for half of what that clock measures. 

What’s Changing and Why

For years, immigration enforcement mostly skipped dairy barns. Raids hit meatpacking plants and construction sites. That assumption broke in June 2025.

This wasn’t one farm having a bad week. It was a wave. Within weeks it had touched four states. New Mexico on June 4. Then Nebraska and California the same week — ICE arrested more than 70 at an Omaha plant, with farm operations hit out West. South Dakota came last, after a quieter Homeland Security audit landed at Drumgoon. 

President Trump publicly acknowledged the bind: “We can’t take farmers and remove all their workers and send them back just because they might not have the necessary documentation,” he said on June 12. The directive paused, then reversed, inside a week. The cows didn’t. 

Drumgoon Dairy near Lake Norden, South Dakota, shows what the quieter version looks like. After a Homeland Security audit, the farm let 38 workers go — cutting staff from more than 50 down to 16, according to local reporting. Co-owner Dorothy Elliott told local media the farm spent more than $110,000 on recruiters and transportation trying to rebuild the crew. That’s a 6,500-cow operation with 20 robotic milking units already installed. Tech-forward, well-run, and still knocked sideways by a single paperwork action. 

Stack that on the structural math, and you see why this isn’t a New Mexico problem or a South Dakota problem:

  • A National Milk Producers Federation/Texas A&M study, published in 2015 and still the most-cited industry estimate on record, put immigrant workers at 51% of hired dairy labor on farms producing 79% of U.S. milk — and the industry still leans on those figures today. 
  • Dairy wages have climbed to roughly $19.52/hour, up about 30% since 2020, per USDA Farm Labor Survey data. 
  • ICE and Border Patrol are slated for a $170 billion funding increase through 2029, with workplace enforcement explicitly named as a priority. 

More pressure on the same workforce you already can’t easily replace. That’s the short version.

How This Plays Out on Real Farms

The Outlook and Drumgoon stories sound extreme because they are. But the mechanics showing up around them are quieter and more common.

In Idaho, one dairy reportedly lost about a third of its crew over three weeks. No raid. No warrant. No agents on the property. Workers stopped showing up after an enforcement action 50 miles away rattled the community, according to reporting on the incident. Fear became a labor event all by itself. 

Beverly Idsinga, who works with New Mexico dairy producers, put the whole problem in five words after the Lovington raid: “You can’t turn off cows.” That’s the line every owner-operator already knows in their gut. The biology doesn’t pause while you sort out the paperwork. 

Here’s the barn math that makes it real. Take a 500-cow herd:

  • At 24,000 lbs per cow per year, you’re shipping roughly 32,900 lbs a day.
  • At $18.95/cwt — USDA’s 2026 all-milk forecast — that’s about $6,230 in milk sales per day
  • Now say a chaotic milking, run by people who’ve never touched your parlor, spikes mastitis. A clinical case in early lactation runs in the $400–$450 range once you add treatment, dumped milk, and lost yield. A 10% spike on that herd is 50 cases — call it $20,000 to $22,500 at $400 to $450 a case — before you count somatic cell penalties on your next load. 

Don’t take our 500-cow example. Run your own herd size and milk price through the interactive calculator on this page and you’ll get your own daily exposure in about ten seconds.

And the production hit doesn’t bounce back the next morning. DairyNZ research found that roughly a quarter of cows not milked for seven days will develop mastitis, and the lost yield drags on through the lactation. You don’t get a do-over on a missed milking.

The Mechanics Behind the Outcomes

Two clocks start the moment enforcement touches your farm. The legal one is paperwork — an I-9 notice gives you 72 hours to produce documentation for every worker on the payroll, and ICE recently reclassified several I-9 error types as “substantive violations,” with fines running $288 to $2,861 per form (penalties current as of 2025; adjusted annually). The biological one is the parlor. It runs on schedule, or the cows pay for it — a few rough milkings push somatic cell counts high enough to trigger quality penalties or force you to dump milk you already paid to make. 

And if agents show up with a warrant instead of a notice? Your morning comes down to one question: is it a judicial warrant signed by a judge, or an administrative one? Without a judicial warrant, agents can’t compel entry into the non-public areas of your operation — and knowing that difference buys you the minutes to get an attorney on the phone. 

DimensionThe Legal Clock (paperwork)The Biological Clock (the parlor)
TriggerI-9 Notice of InspectionMissed or chaotic milking
Deadline72 hours to produce documentsNext milking, every ~8–12 hrs
Cost of failure$288–$2,861 per form~25% of unmilked cows develop mastitis in 7 days
Who controls itYour attorney + recordsNobody — “you can’t turn off cows”
Can automation help?NoPartial — robots don’t cover crisis pens

Here’s what most coverage misses: the raid isn’t the main event anymore. The audit is. In Texas, at least nine dairies received I-9 Notices of Inspection over a single weekend in 2025. Drumgoon’s audit arrived with no sirens and no TV cameras — just a notice that, per local reporting, cost the farm 38 people and more than $110,000. 

Automation helps, but don’t mistake it for armor. Robotic milking can cut milking labor hours by up to 75% and lift net returns on the right farms. Drumgoon had 20 robots running when the audit hit. They still couldn’t keep the operation whole, because robots don’t feed calves, catch every sick cow, or cover a fresh-cow pen during a crisis. 

How Much Does Waiting 30 Days Actually Cost?

This is the question most farms never run the numbers on.

Say you already know your I-9 system is messy. The files live in a drawer. You’re not sure every re-verification got done on time, and a couple of workers had documents that never quite matched on day one. You keep meaning to get counsel to review it. Something more urgent always wins — a forage test, a breakdown, a banker meeting.

Here’s the cost of waiting, built only on numbers we can source. If an audit forces out even five full-time workers at $19.52/hour — roughly $203,000 a year in labor capacity walking out the gate — that’s before recruiting costs, training time, or the elevated mastitis and injury risk that come with running thin. Drumgoon’s real-world rebuild topped $110,000 in recruiters and transport alone, by its co-owner’s account. Set that against the cost of a legal I-9 review now, and the “we’ll deal with it later” math stops looking cheap. 

ScenarioTriggerDirect CostSource basis
Proactive I-9 legal reviewYour choice, this monthAttorney review fee (modest)30-day move
5 full-time workers lostAudit forces exits~$203,000/yr labor capacity$19.52/hr × 5 FTE
Drumgoon crew rebuildPost-audit recruiting$110,000+Co-owner, local reporting
Per-form I-9 penalty“Substantive” violation$288–$2,861 eachICE, 2025

Is Your Parlor Ready for a 72-Hour Shock?

Labor isn’t a slow leak anymore. It’s a burst pipe. We’re trained to think of it as a slow grind — hard to hire, hard to keep, margins eroding over the years. Enforcement flips that into a same-day emergency. So ask three honest questions about your own parlor.

If you lost a quarter to a third of your crew tomorrow, who runs the next six milkings? Not who could in theory — names, shift by shift. Where does your I-9 paperwork live, and who could pull a complete, clean file set in under an hour? And if enforcement hit your county and workers 50 miles out started leaving, how many of your people would have enough reason to stay that they’d ride out the fear?

None of those questions asks you to take a side on national policy. They’re strictly operational. But the answers tell you exactly how exposed your herd really is.

Options and Trade-Offs for Farmers

There’s no single fix for a labor shock. But the farms that ride one out tend to have a few things in place before anything happens.

Cross-training and written SOPs. This works when you can lose 20–30% of your crew and still get cows milked without an immediate welfare problem. It takes written standard operating procedures for the critical jobs — milking, fresh-cow checks, treatment protocols — in language every employee can follow, plus enough rotation that more than one person can run each core task. The limit is honest: cross-training doesn’t create hours in the day. If your hit is Outlook-sized, you still need bodies. But it buys time and protects cow health while you find them. 

Mutual aid and relief-milker networks. Best for short disruptions — illness, a small audit, fear-driven absenteeism — where you need one or two extra people for a week or two. It requires relationships built before the crisis. After Drumgoon’s audit, neighboring farms sent workers over in shifts to keep things moving, according to reporting on the operation. In Vermont, NOFA maintains a list of trained relief milkers who step in during emergencies. The catch: in a regional enforcement surge, everyone’s short at once. 

A tightened I-9 and legal-response plan — this is your 30-day move. Don’t wait for a notice. In the next 30 days, pull a sample of your I-9s and have an immigration attorney review them. Designate one person to handle agents or auditors while everyone else stays with the cows, and post a simple protocol: where the warrant gets checked, who calls the lawyer, who documents what. It won’t fix a broad labor shortage, but it stops you from losing people over errors you could have caught. 

Automation as a partial hedge. Makes sense when milking labor is your biggest bottleneck and you’ve got the scale and capital. It demands real money up front and several years before the efficiency shows up in the bank, and you still need skilled people to run it. Useful — just not a shield, as Drumgoon proved. 

Key Takeaways

  • If your plan for a labor raid starts with “we’ll see what happens,” you don’t have a plan — you have a hope. Build the shift-by-shift coverage map this week.
  • If more than half your milk depends on immigrant labor, put that on paper. That’s not a political statement; it’s the starting line for any real contingency plan.
  • If you haven’t had an immigration attorney review your I-9s in the past 12 months, that’s overdue. Book it before the month is out — cleanup now almost always beats rebuilding after an audit.
  • If one person’s absence can shut down your parlor, that’s your highest-risk role. Cross-train it first, not eventually.
  • If you can’t name at least two neighboring operations that would pick up the phone at 5 a.m., your mutual-aid network isn’t built yet. Make those calls while things are calm.
  • If you’re pricing robots, price the people too. Automation cuts milking hours, but Drumgoon had 20 units and still got knocked down.

The Question Worth Sitting With

ICE and CBP have already touched agriculture, the funding to do more is on the books, and the fear effect doesn’t even require an agent in your driveway. So the question isn’t whether this reaches your county. It’s whether your operation can take the hit — an audit, a rumor, a Tuesday you didn’t see coming — and still get every cow milked on time without burning out the people who stay. 

Pull your own numbers this week. Count your single points of failure in the parlor, then ask the neighbor down the road how many milkings they could cover if you called at 5 a.m. We’re breaking down the full 72-hour play-by-play — the I-9 fine brackets, the legal-response steps, and labor-cost benchmarks by herd size — in an upcoming Bullvine deep dive. That’s where the spreadsheets live.

So here’s the one to chew on, and we genuinely want your answer in the comments: if HSI knocked on your door tomorrow morning, how many milkings could you cover before you’d have to call for help — and who’s the first name on that list?

Try It Yourself · Free Tool

Methodology note: This account is based on Homeland Security Investigations’ public statements, contemporaneous news reporting, and the operators’ own public comments, as of June 2025. Production and cost figures for the 500-cow example are illustrative barn-math estimates drawn from cited industry data, not figures from the named farms.

Learn More

The Sunday Read Dairy Professionals Don’t Skip.

Every week, thousands of producers, breeders, and industry insiders open Bullvine Weekly for genetics insights, market shifts, and profit strategies they won’t find anywhere else. One email. Five minutes. Smarter decisions all week.
NewsSubscribe
First
Last
Consent
Send this to a friend