



Archive for Class I milk price

USDA Raised Class I $1.84. Upper Midwest Gets 10 Cents, the Northeast 48.

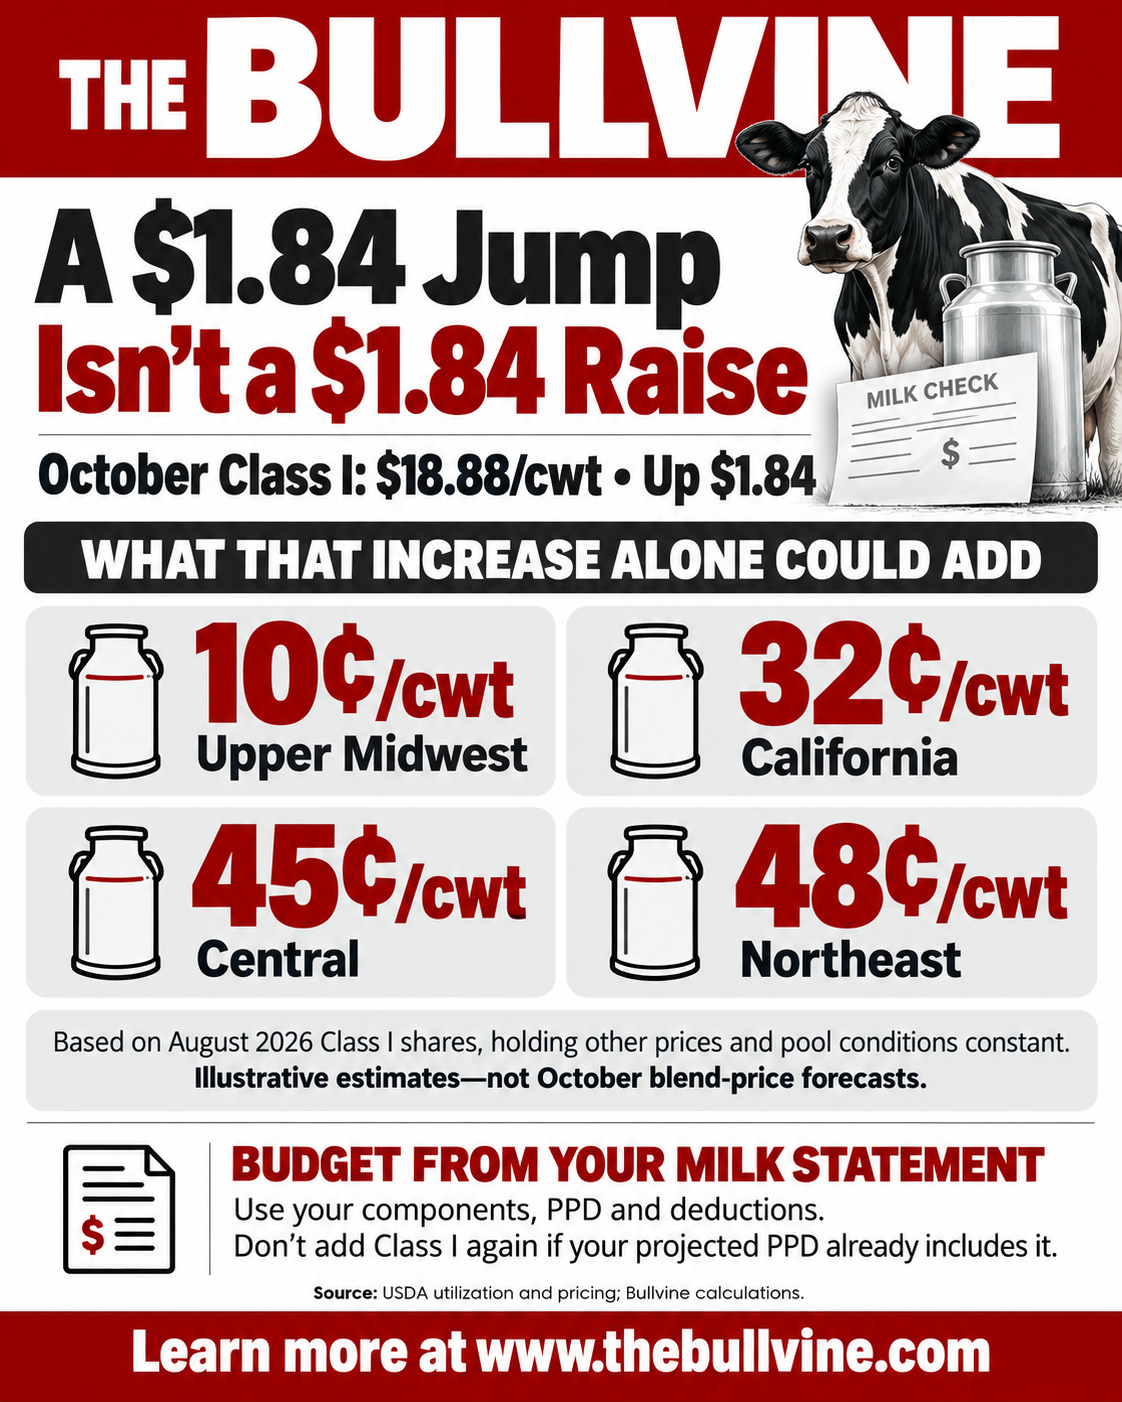
October’s base Class I hit $18.88. Run the $1.84 jump through August pool use and, on our math, an Upper Midwest blend picks up about a dime. The Northeast gets about 48 cents.
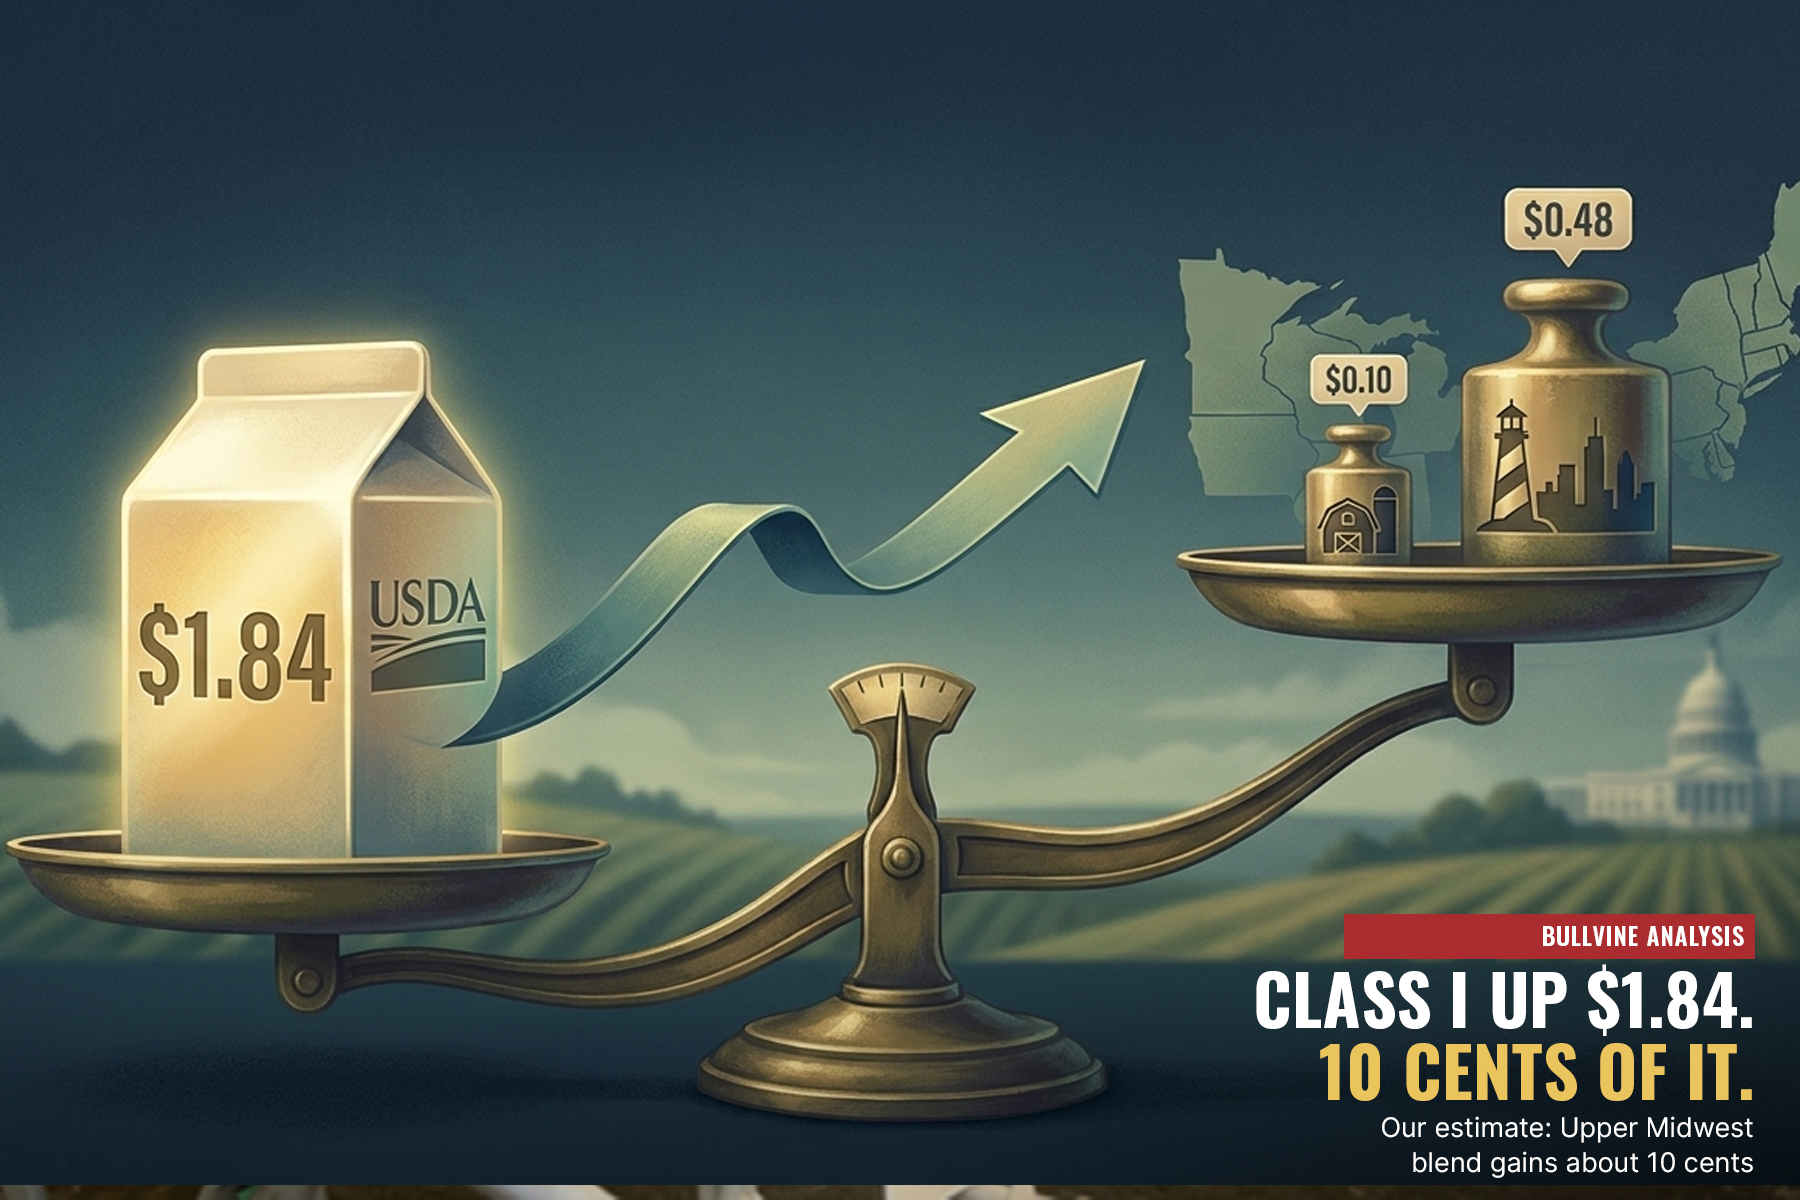
USDA set October’s base Class I milk price at $18.88/cwt. That’s $1.84 above September’s $17.04 and $2.53 above January’s $16.35. Run that $1.84 through actual August pool utilization and the first-pass blend effect is about 10 cents in the Upper Midwest, 32 cents in California, 45 cents in the Central Order and 48 cents in the Northeast.

All of those numbers are correct. None of them is $1.84.

The base Class I price is the minimum starting value for milk used in fluid products, before the location differential at the receiving plant. It isn’t the all-milk price or an order’s uniform price. It’s definitely not what’s left after components, the PPD, hauling, marketing charges and capital retains go through your statement.

Why October rose $1.84

USDA brought back the higher-of Class I mover on June 1, 2025. Updated Class I differentials and make allowances started the same day, and higher skim composition factors followed on December 1, 2025.

For October, the advanced Class IV skim value beat the Class III side. Nonfat dry milk carried the powder side, while weak butter capped the butterfat contribution. September’s final prices showed the same split: Class IV at $18.94 and Class III at $16.04.

That makes October a stronger price for fluid milk. It doesn’t mean every hundredweight in an order gained $1.84.

Utilization does the first cut

Bullvine math: simplified Class I pass-through

Blend change=Class I change×Class I utilization share

This leaves out moves in the other classes, components, location differentials, depooling and pool expenses. It’s not a forecast of the uniform price. It’s a way to keep a Class I headline in proportion.

USDA’s August 2026 utilization data, published September 24, gives each order a different multiplier:
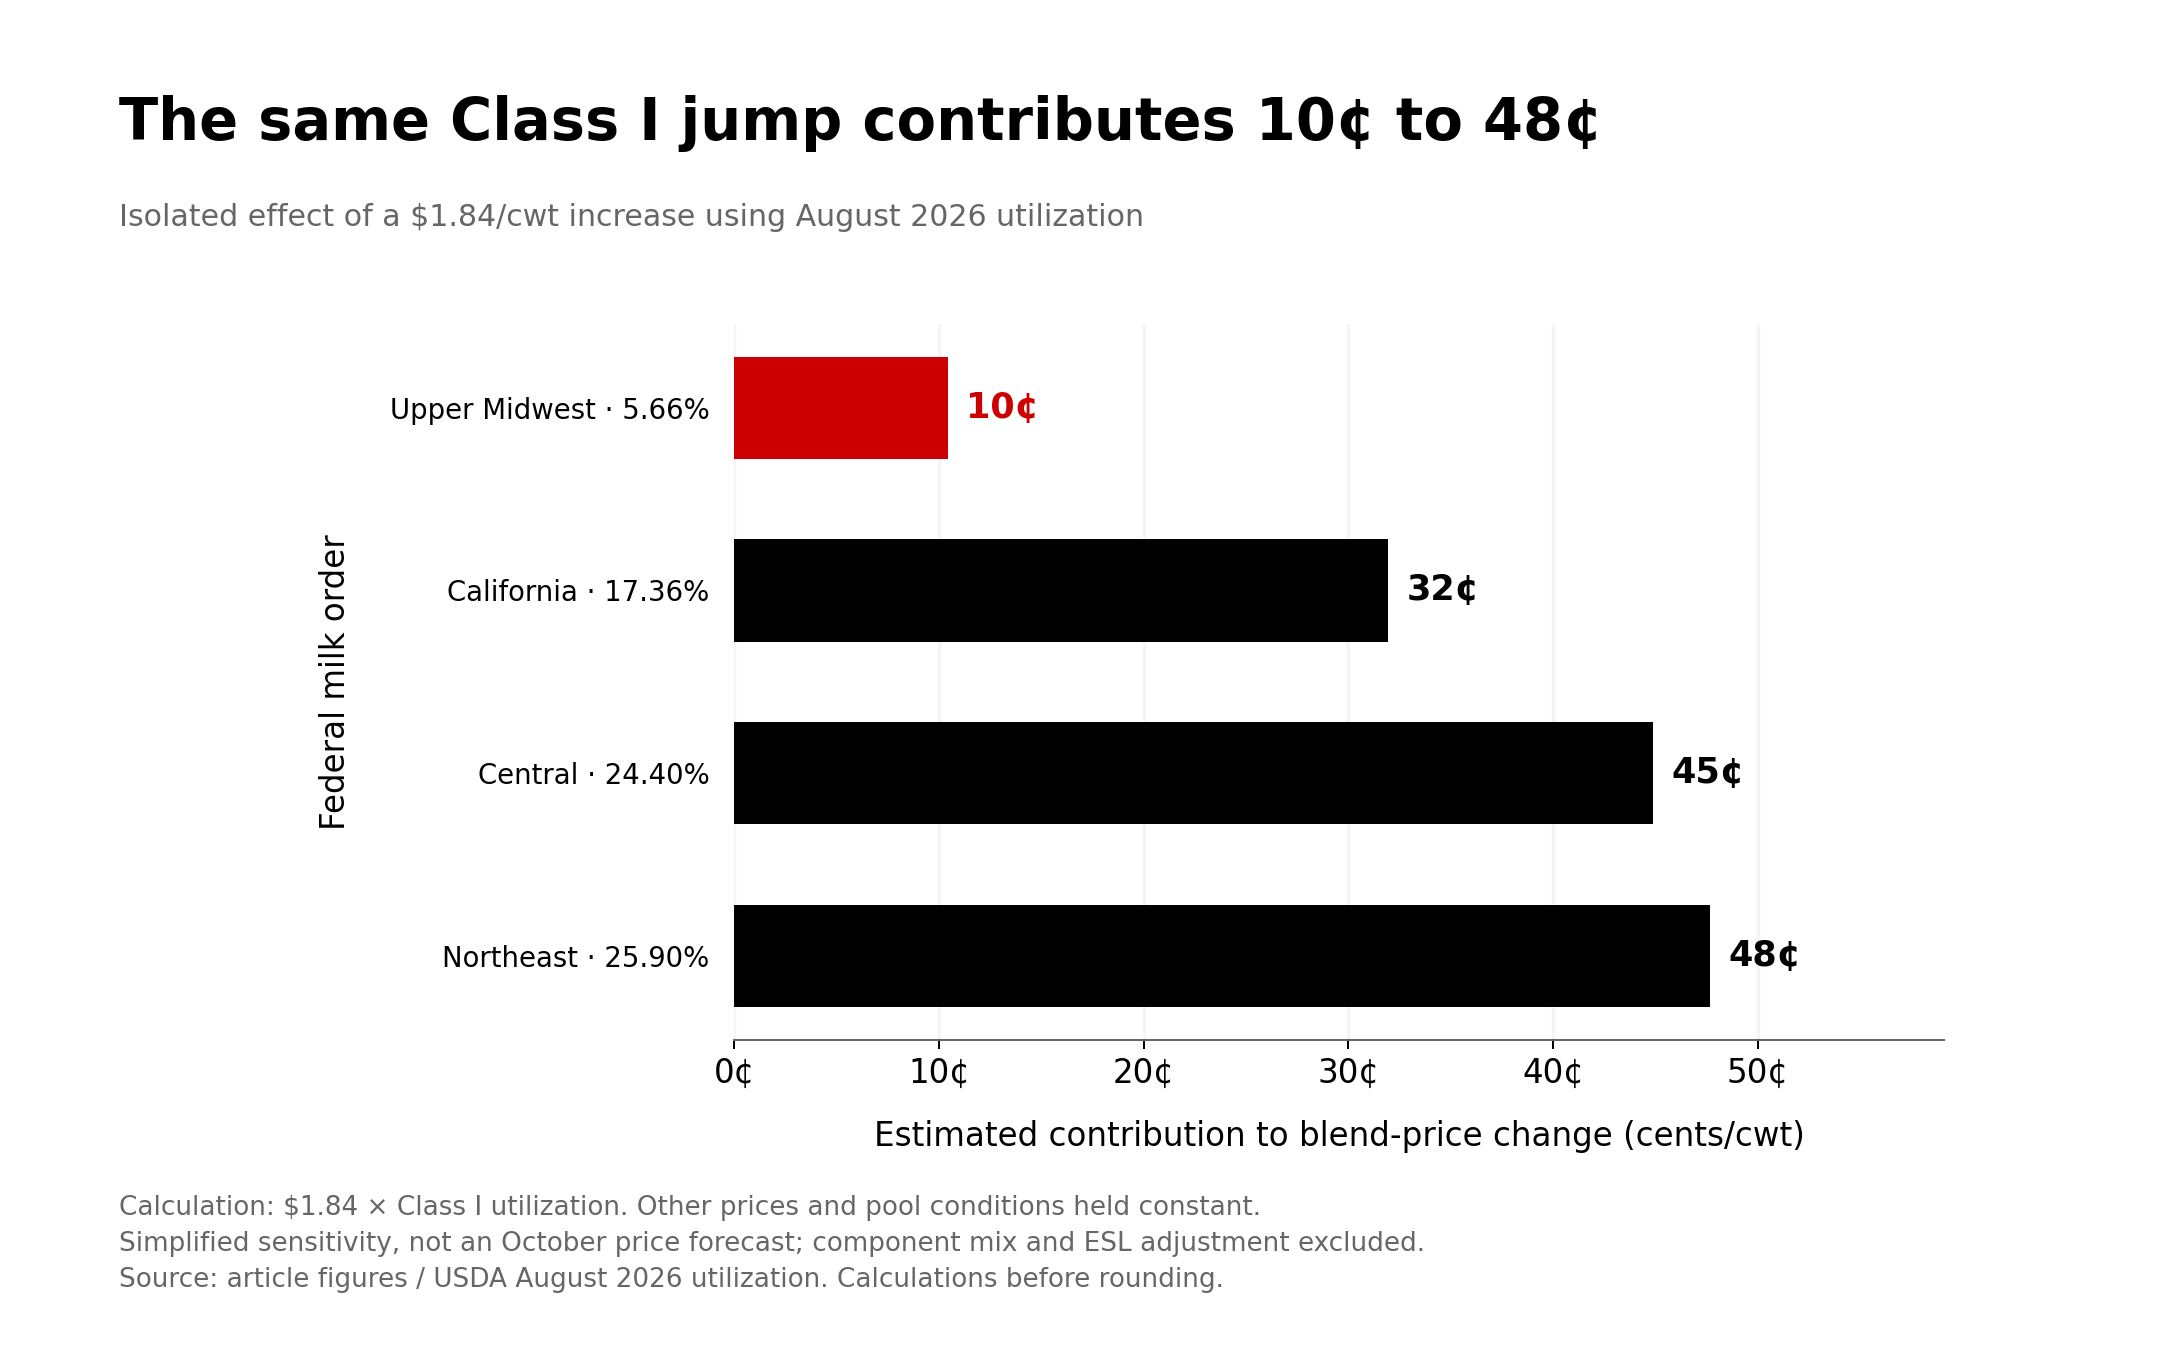
OrderAugust Class I utilization2026 range, Jan–AugBlend effect of October’s $1.84 (Bullvine math)
Upper Midwest, FMMO 305.66%5.66–12.25%about $0.10/cwt
California, FMMO 5117.36%17.36–23.13%about $0.32/cwt
Central, FMMO 3224.40%24.40–32.30%about $0.45/cwt
Northeast, FMMO 125.90%25.90–28.88%about $0.48/cwt

August is the conservative month for comparing the four orders. Order 30’s September report has since come out at 6.4% Class I, which would push its pass-through to about 12 cents. At January’s utilization, the same $1.84 would have added about 23 cents in Order 30 and 53 cents in Order 1.

The counterevidence holds up. Fluid-heavy orders get far more of a Class I move. Order 1 passes through about four and a half times what Order 30 does. Farmshine’s analysis put the combined PPD benefit from the updated differentials at about $0.71/cwt at the Northeast base zone over the first four months of 2026, with the amount depending on plant location.

Herd math

The herd blocks use 24,390 lb per cow per year, the 2025 U.S. average cited in CoBank’s recent component analysis. That’s 243.9 cwt per cow, or about 20,325 cwt a month on 1,000 cows. Production is assumed flat across months and the same at every herd size.
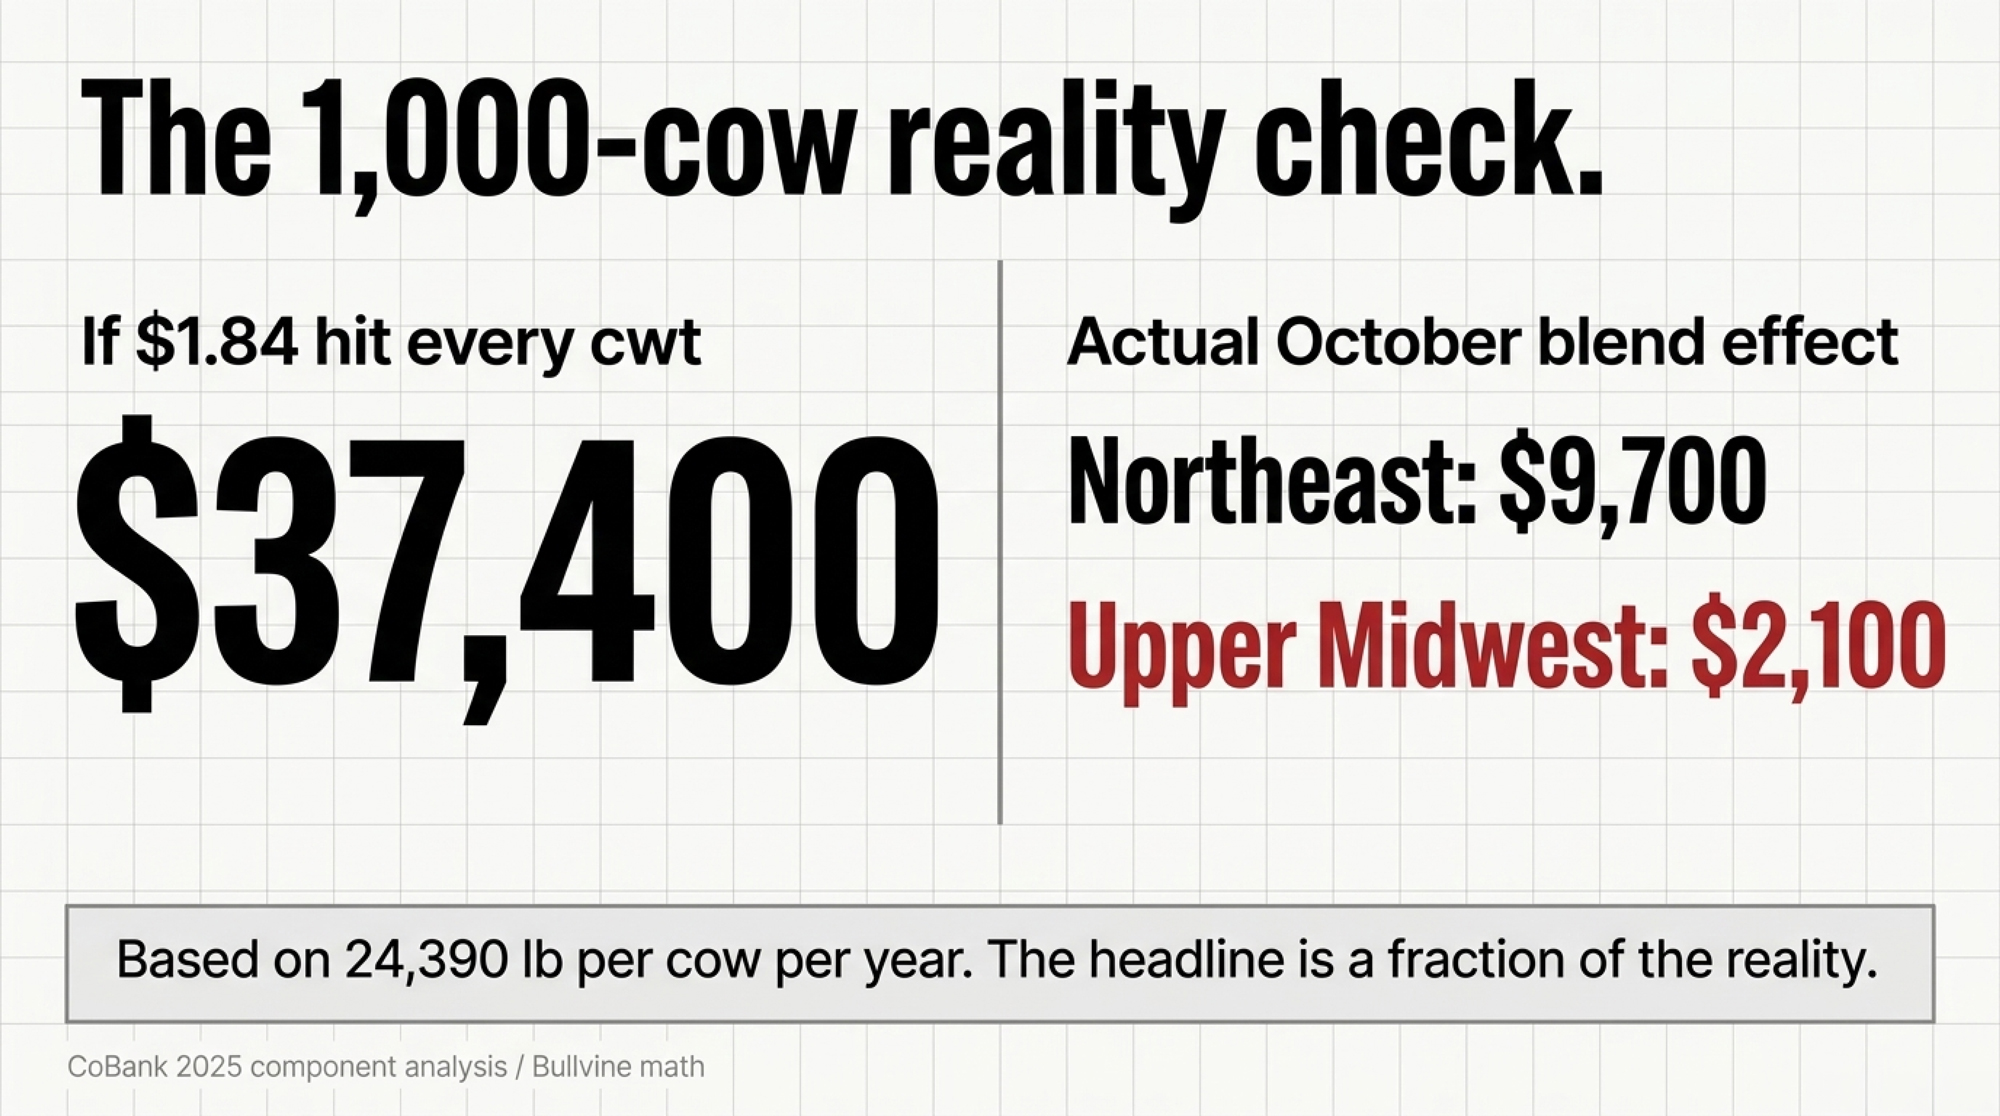
Bullvine math: October’s $1.84 Class I move, one month, 1,000 cows
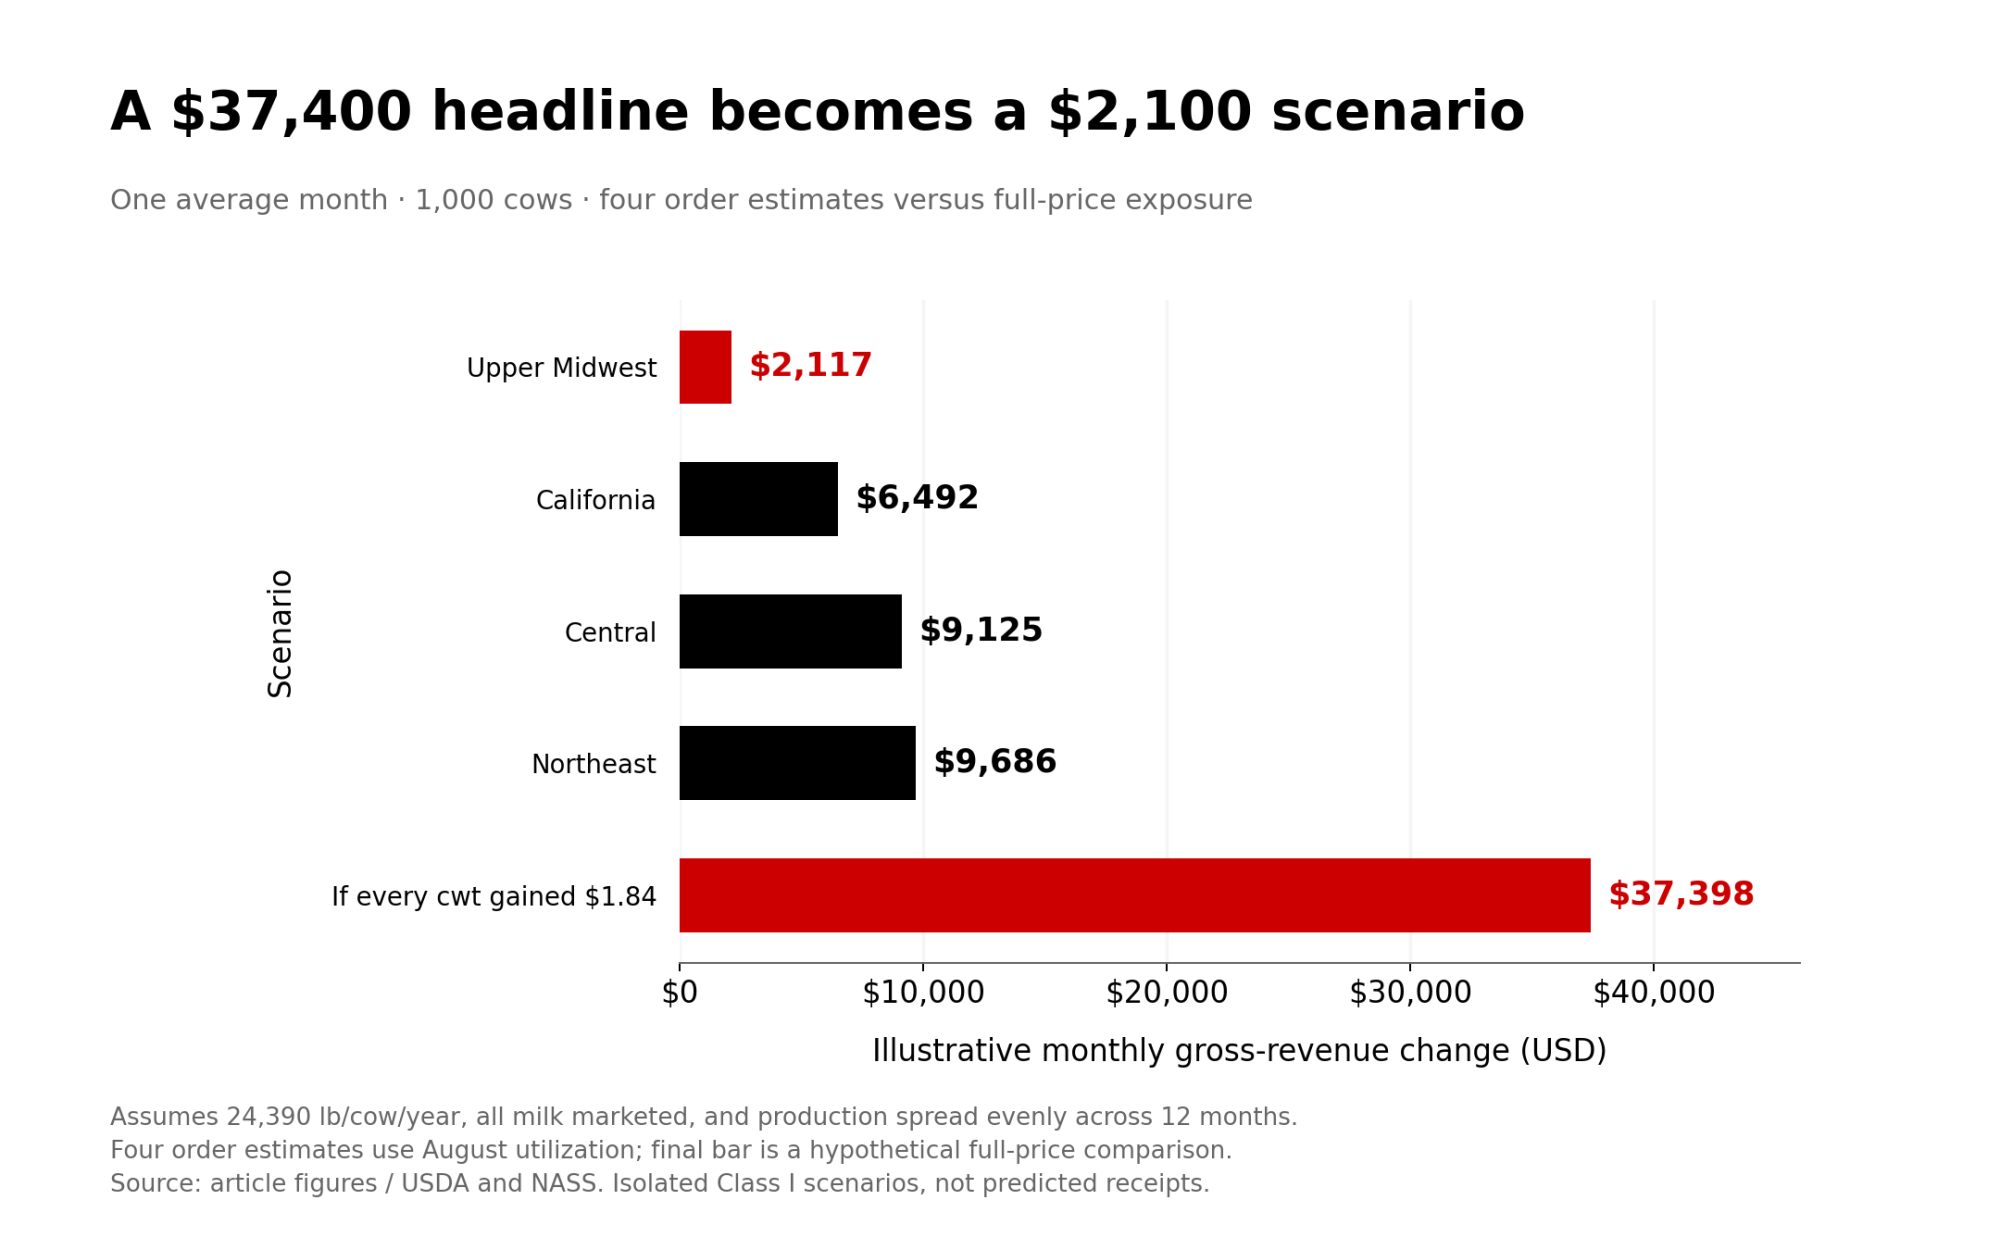
OrderApproximate blend effectOctober dollars
Upper Midwest$0.104about $2,100
California$0.319about $6,500
Central$0.449about $9,100
Northeast$0.477about $9,700
If the full $1.84 hit every cwt$1.84about $37,400

Bullvine math: annual effect of each lever, if it held for 12 months
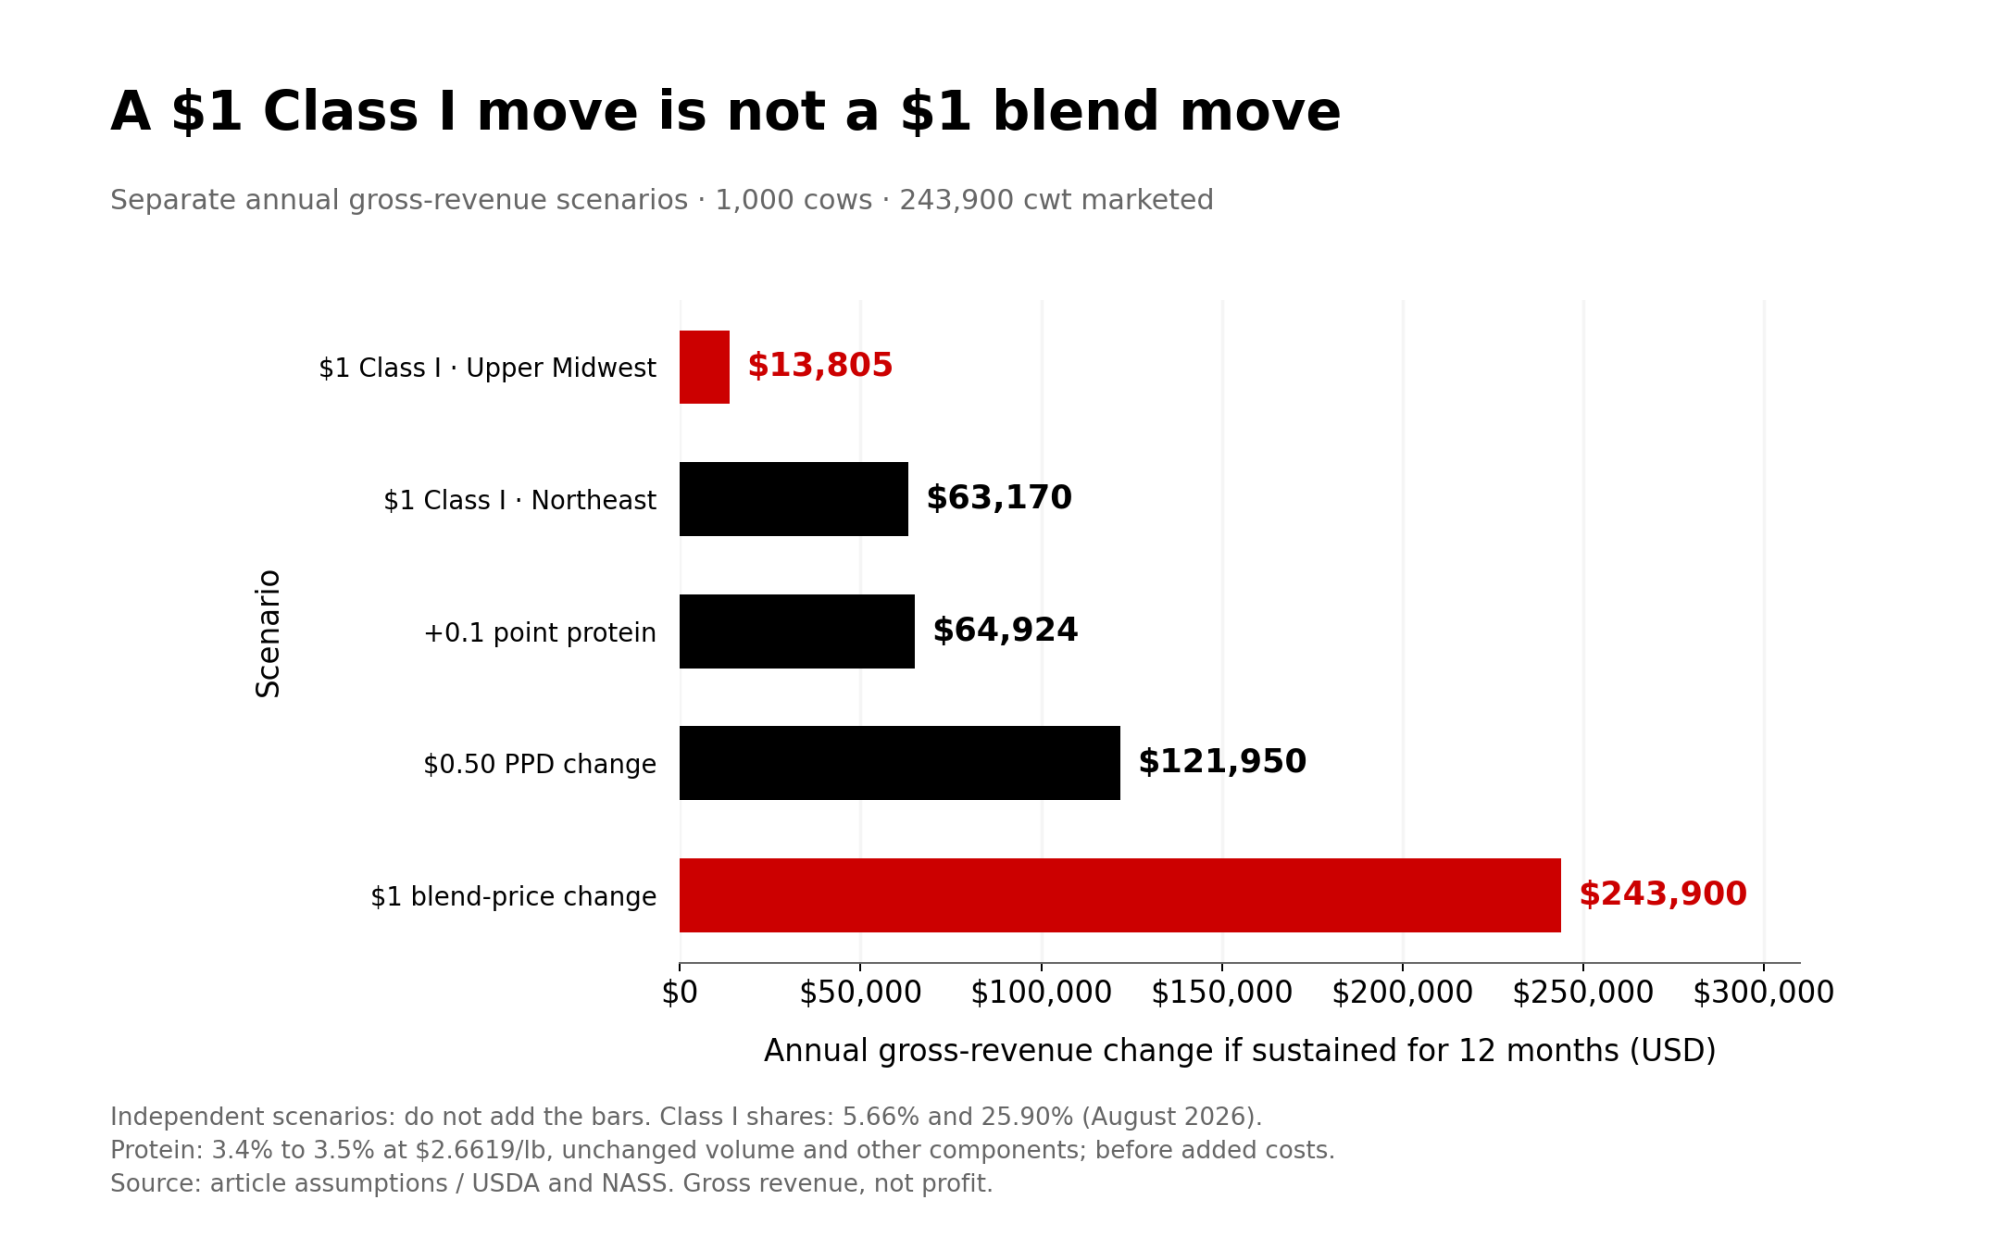
Lever300 cows (73,170 cwt)500 cows (121,950 cwt)1,000 cows (243,900 cwt)
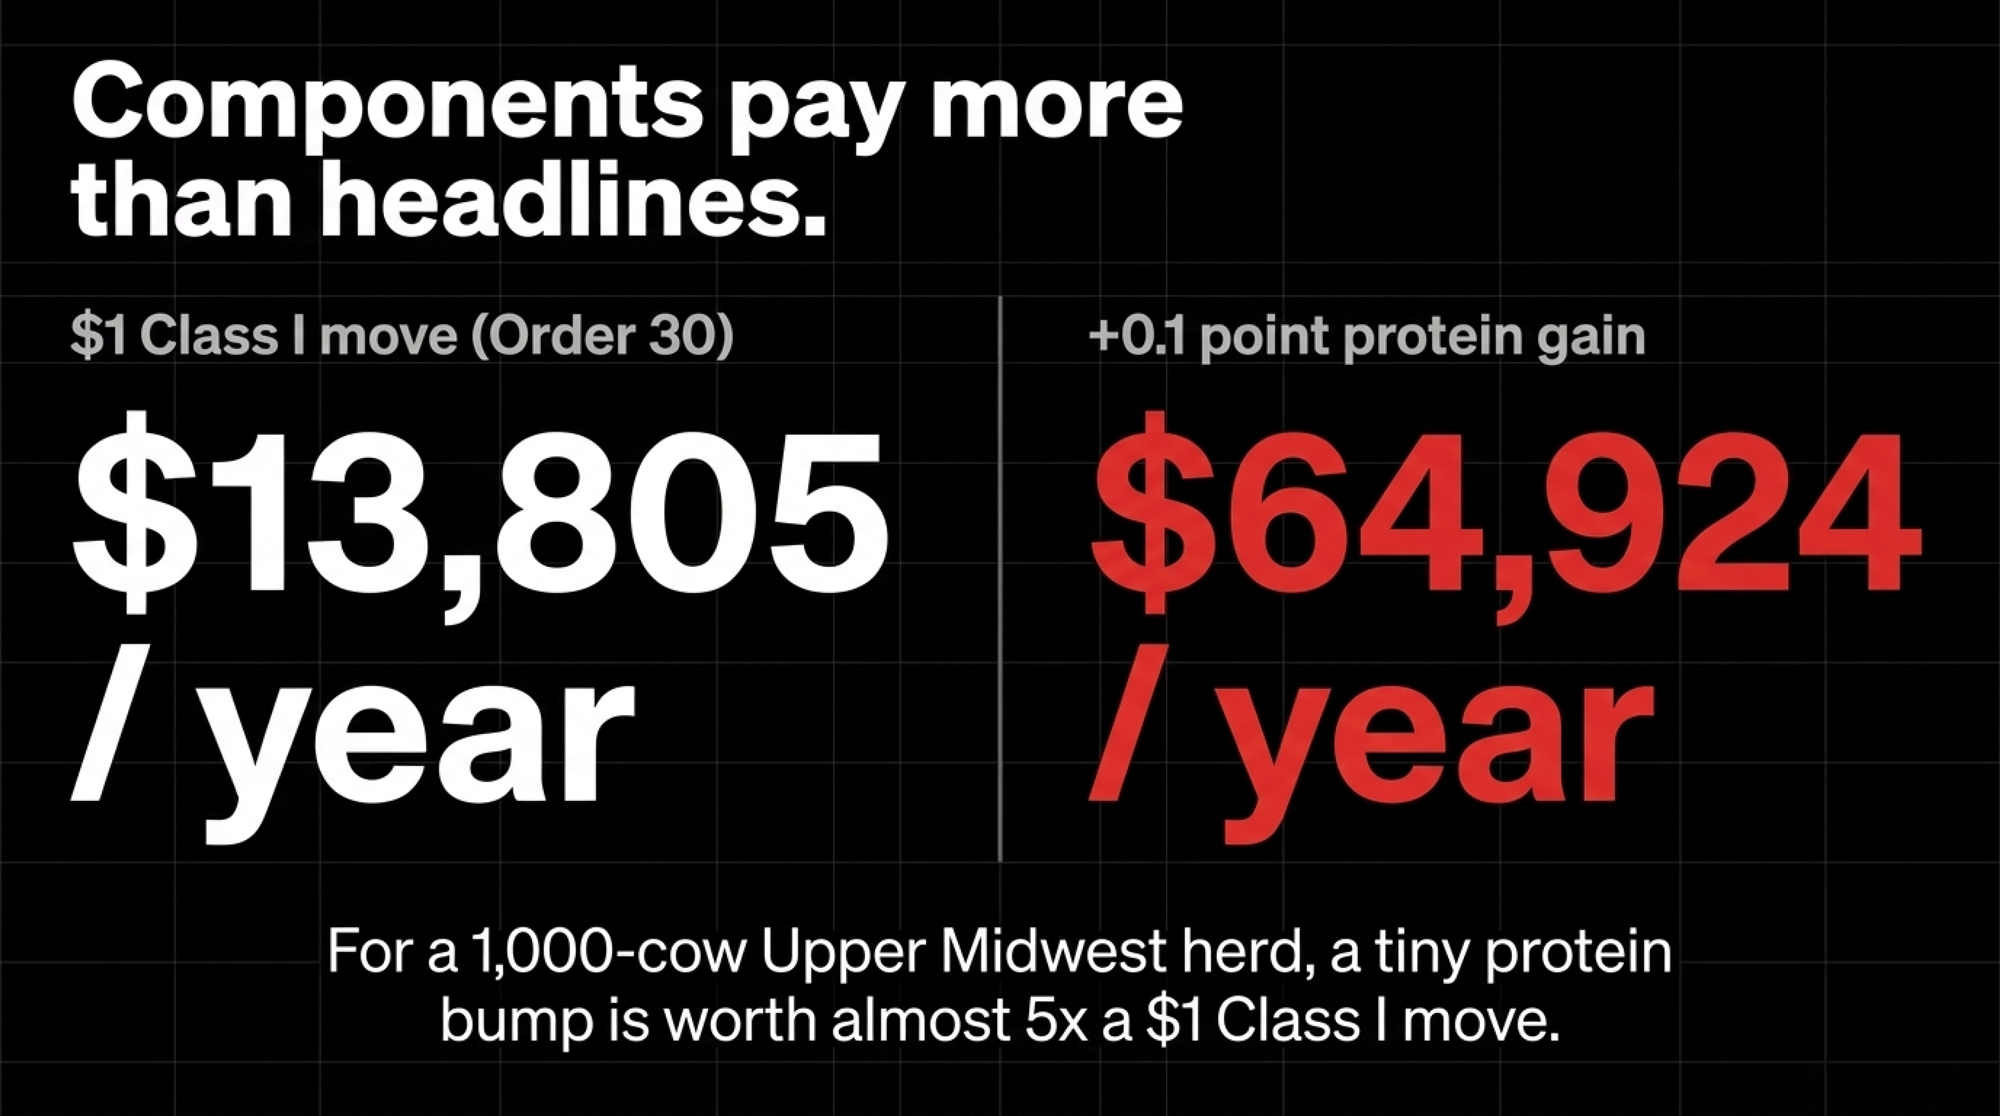
$1 Class I move, Order 30 (5.66%)$4,141$6,902$13,805
$1 Class I move, Order 1 (25.90%)$18,951$31,585$63,170
$1 blend move$73,170$121,950$243,900
$0.50 PPD swing$36,585$60,975$121,950
+0.1 point protein at $2.6619/lb (September price)$19,477$32,462$64,924

That’s the fix for the line that “$1/cwt equals $250,000 on 1,000 cows.” It’s roughly right for a $1 move in the blend, at this yield. For a $1 move in one class covering a fraction of the pool, it’s way off.

On a 1,000-cow Upper Midwest herd, a 0.1-point protein gain is worth almost five times a $1 Class I move, and a 50-cent PPD swing is worth more than that.

The PPD carries the rest

USDA announces a PPD in seven federal orders: Northeast, Upper Midwest, Central, Mideast, California, Pacific Northwest and Southwest. Those orders pay for butterfat, protein and other solids, plus the PPD, which is the uniform price minus the Class III price.

That makes the PPD sensitive to class spreads and to which manufacturing milk stays in the pool. Class I has to be pooled. Class II, III and IV milk can be left out when handlers meet the order’s rules. The incentive is strongest when a manufacturing class sits well above the uniform value.

That happened in 2026. Iowa State Extension reported Central Order pooled milk at about 1.35 billion lb in March, down from more than 1.50 billion a year earlier, with Class IV at only 12% of pooled milk. That pattern fits depooling while Class IV sat above Class III, but a drop in pooled volume alone doesn’t show which handler pulled which pounds.

Depooling is allowed under the order rules. The point isn’t that someone took farmers’ money. It’s that a high Class IV price can’t lift the blend if much of the high-value Class IV milk isn’t in the pool.

Walk one cheque

This is a constructed September example for an Upper Midwest Order 30 producer shipping at Order 30’s average tests. It’s not an actual producer statement. Every regulated line comes from USDA’s September Order 30 computation, released October 12. 

Step 1: Class I at the plant. USDA set September’s base Class I at $17.04. At a Cook County, Illinois plant, the $3.20 differential made it $20.24. That’s what fluid handlers owed the pool, not what the producer got paid.

Step 2: pool result. Class I was 6.4% of Order 30’s September producer milk and Class III was 91.6%. The statistical uniform price was $16.62 at 3.5% butterfat. 

Step 3: components at actual pool tests. Order 30 producer milk averaged 4.24% butterfat, 3.29% protein and 5.80% other solids in September. 

Bullvine math: component value

  • Butterfat: 4.24×1.4762=6.264.24×1.4762=6.26
  • Protein: 3.29×2.6619=8.763.29×2.6619=8.76
  • Other solids: 5.80×0.4147=2.415.80×0.4147=2.41
  • Component value: about $17.42/cwt

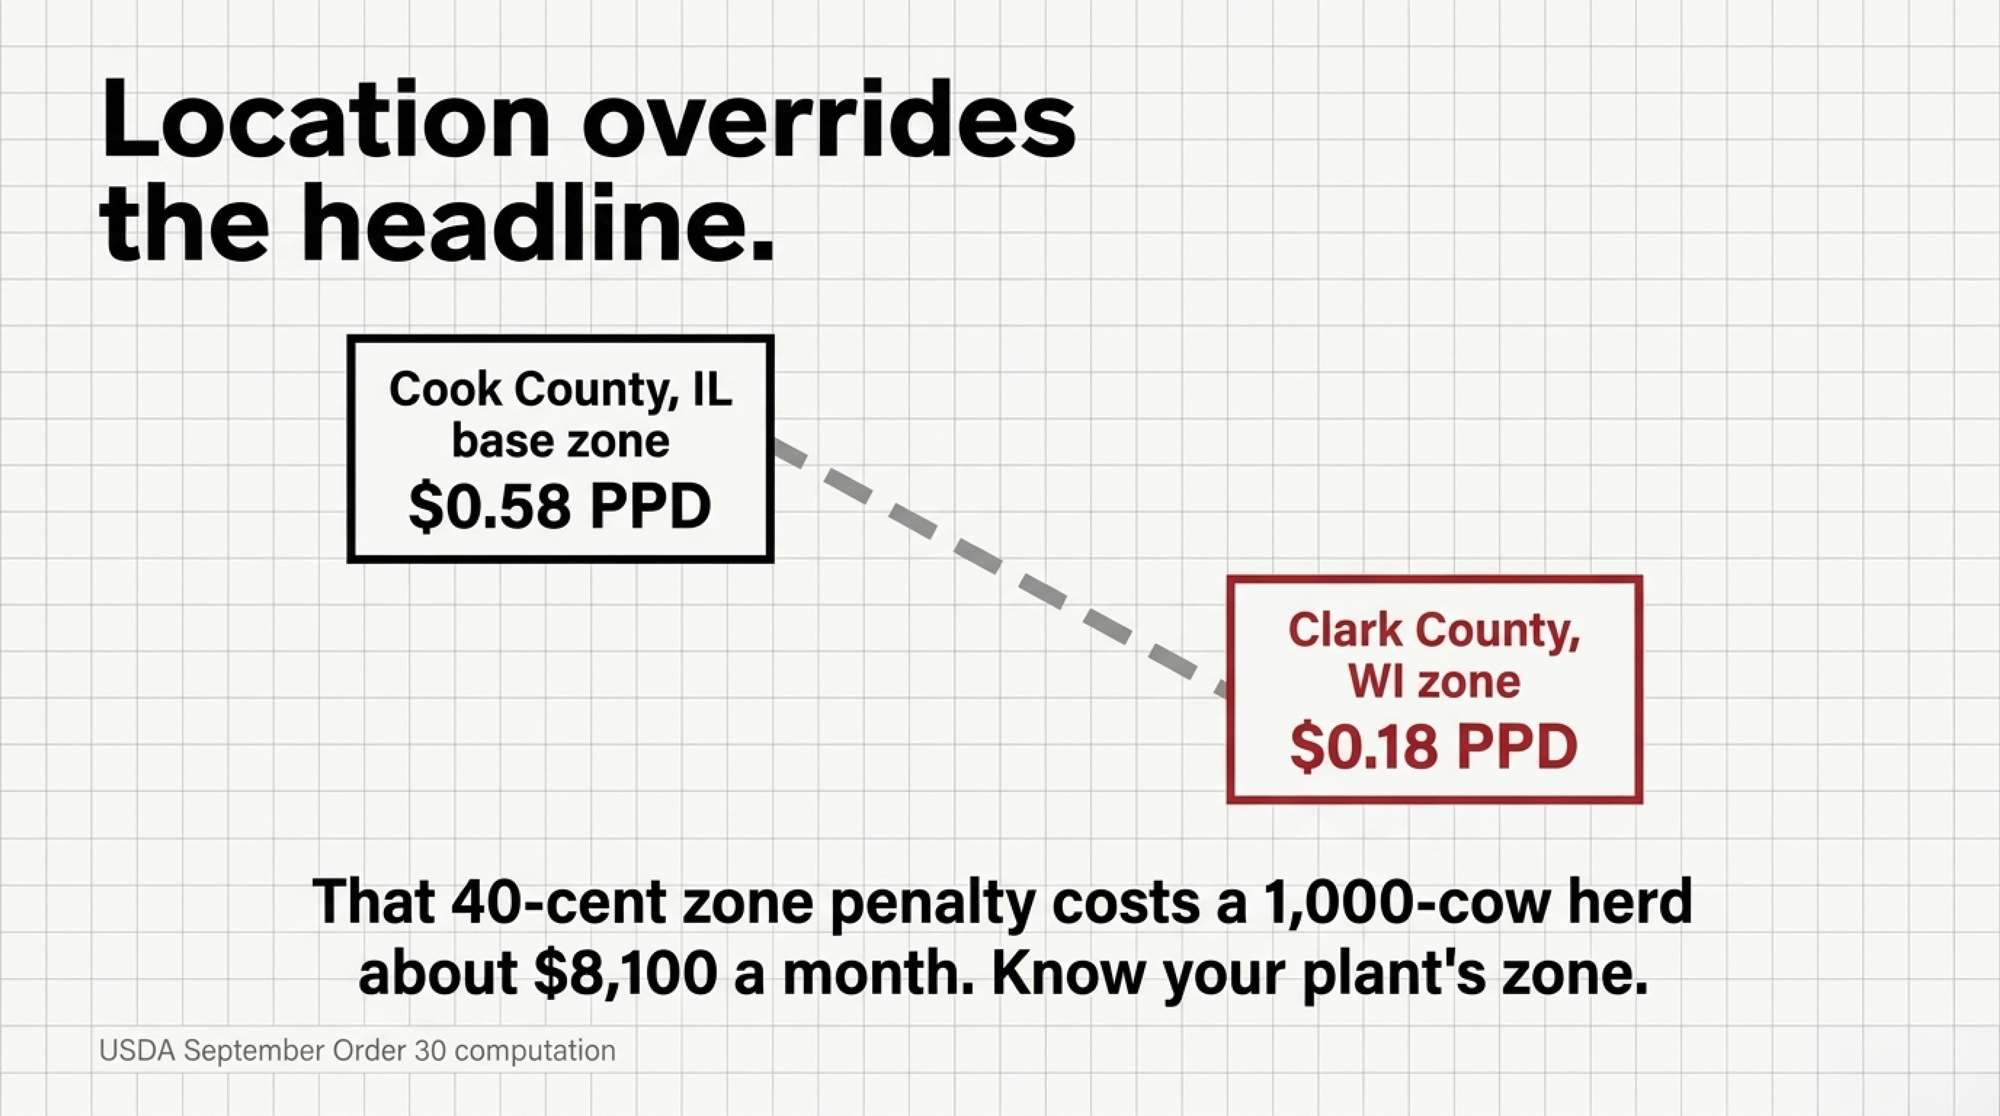
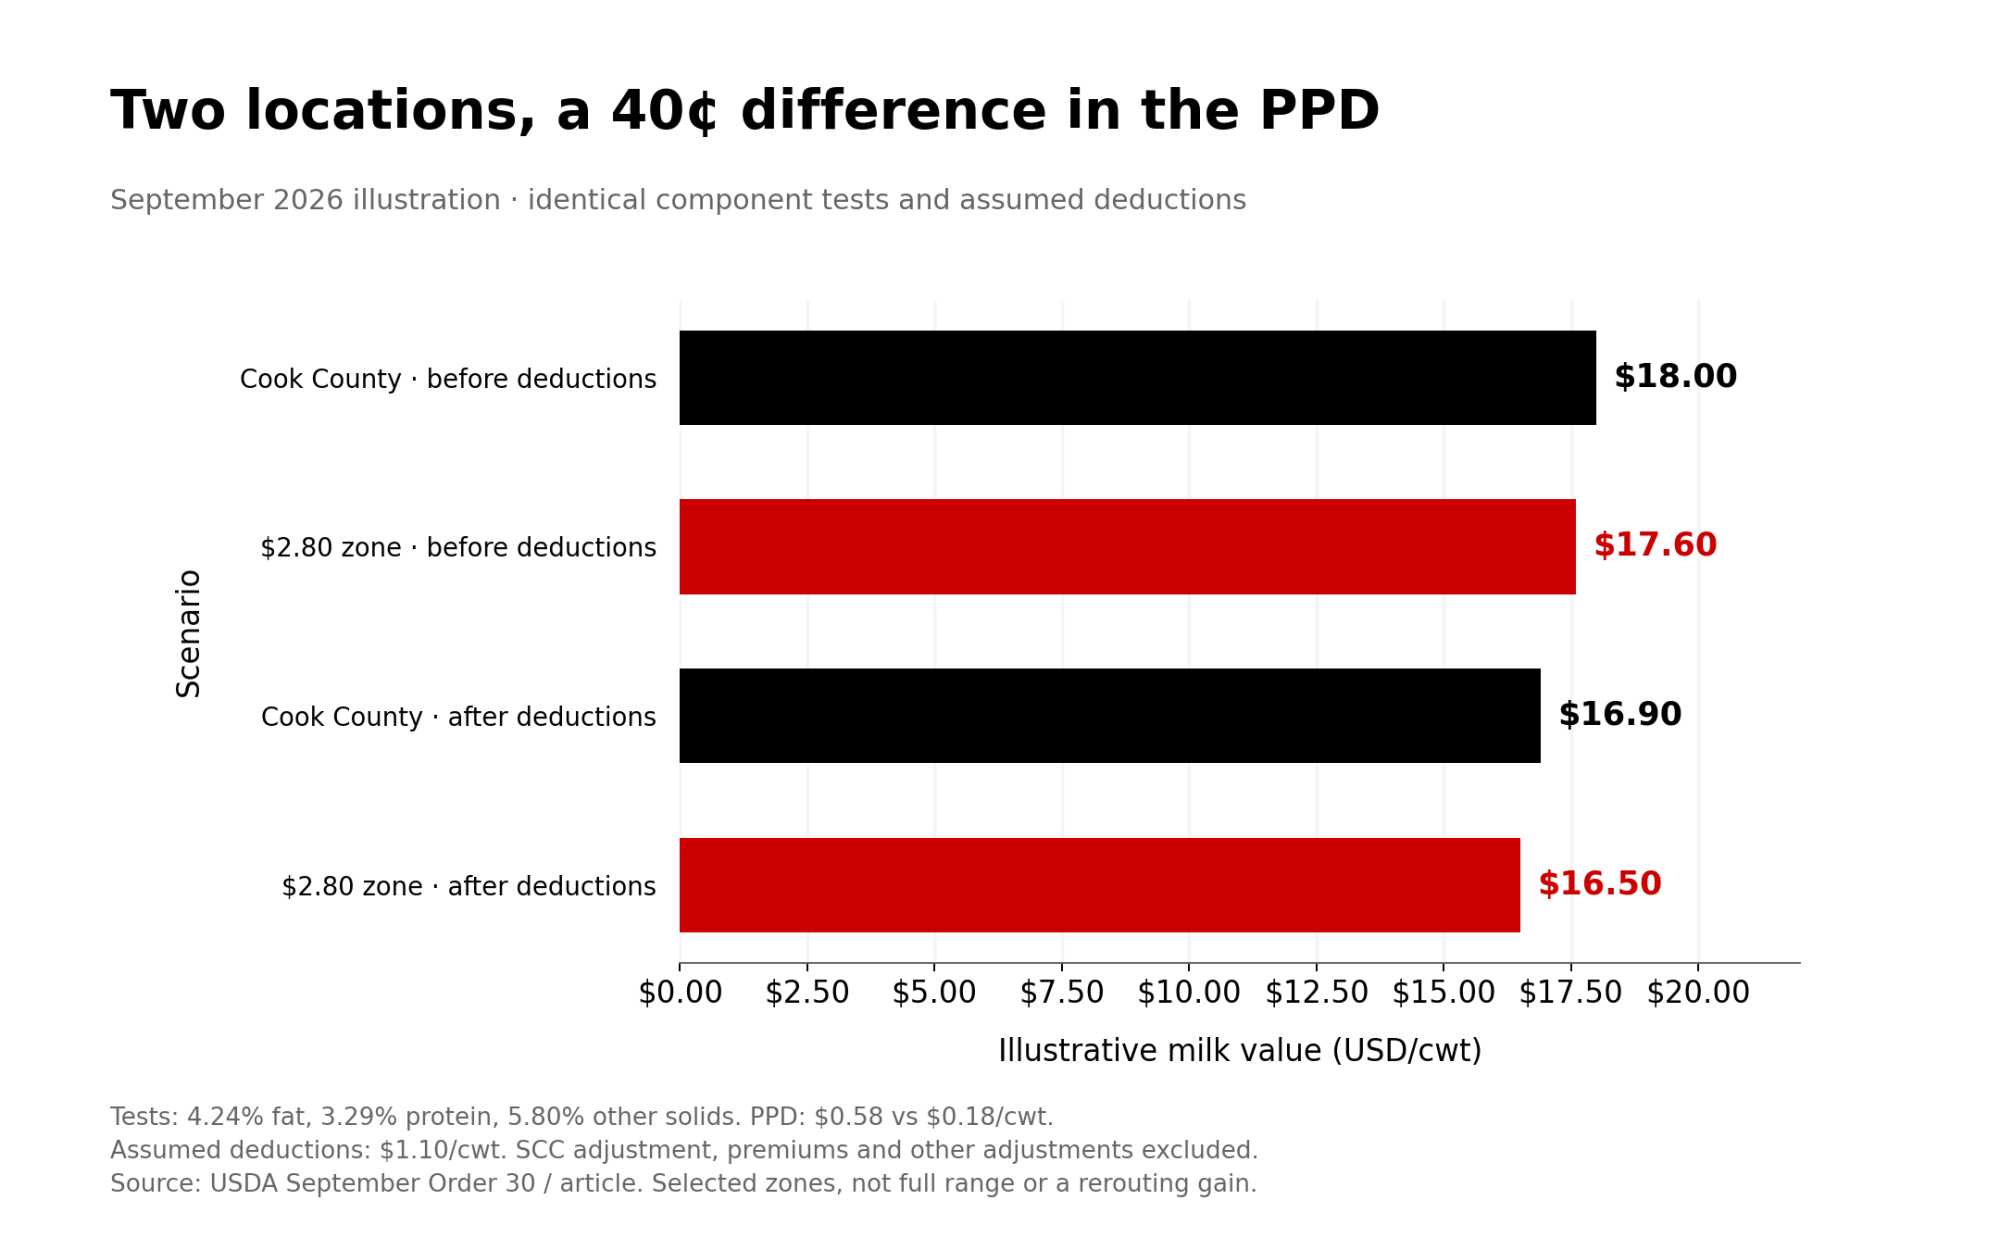
Step 4: PPD by zone. September’s PPD was $0.58 at the Cook County base zone. In the lower-differential zones it fell to $0.48, $0.28 and $0.18. Plants in Clark County, Wisconsin carried a $2.80 Class I rate, 40 cents under Cook County’s $3.20, which puts them in the $0.18 zone. 

Delivery pointPPDGross regulated value (Bullvine math)
Cook County, IL base zone$0.58about $18.00/cwt
$2.80 zone, e.g. Clark County, WI$0.18about $17.60/cwt

Step 5: co-op lines. These are assumptions, not reported figures:

  • Marketing charge: $0.15
  • Capital retain: $0.25
  • Hauling: $0.70
  • Constructed net: about $16.90/cwt at the base zone and $16.50 in the Clark County zone, before quality and volume premiums, assessments or other member-specific lines

The $20.24 Chicago Class I price never showed up on the cheque. It went into the pool at a 6.4% share. Then components and a PPD that depends on location set the regulated value. Notice too that this producer’s $18.00 gross beat the $16.62 uniform price, but only because the milk tested above the standard.

Location turned out bigger than the headline. Bullvine math: the 40-cent PPD gap between the base zone and the Clark County zone is about $8,100 for one month on 1,000 cows. Order 30’s entire October Class I pass-through is worth about $2,100 on the same herd.

No standardized public schedule of co-op hauling, marketing charges and retains turned up. Those three lines stay labelled as assumptions until a published schedule or a consented statement replaces them.
Mailbox data run behind

AMS mailbox prices are the better yardstick for what farms actually got. They’re net of hauling, co-op dues, assessments and capital retains, they include premiums, and they’re regional averages that come out well after the class prices.

That lag rules out a clean October comparison today. October’s Class I price is known before the milk is marketed. October components, uniform prices, PPDs and mailbox prices come later.

The board moved this week

On October 1, USDA’s table had November Class III at $15.96 and November Class IV at $20.65, a $4.69 spread. The October contracts showed $15.13 and $20.34.

Class III has rallied since then. November Class III closed at $16.87 on October 14, up 34 cents on the day. That’s $1.89 above the October 9 quote and 91 cents above October 1. 

The direction matters more than any one day. If Class IV holds near $20 while Class III climbs, the depooling incentive shrinks. If Class III gives the rally back, the March-style setup returns.

Market advisory firms that read this split for producers usually sell hedging and insurance services too. Weigh their recommendations with that in mind.

DMC and DRP measure different milk

USDA’s August DMC margin was $9.34/cwt: a $19.80 national all-milk price minus a $10.46 formula feed cost. Against $9.50 coverage, that’s a 16-cent shortfall before payment factors.

Put the same $19.80 milk price against a herd spending $12/cwt on feed. Its simple milk-over-feed margin is $7.80, not $9.34 (Bullvine scenario). DMC protects the national formula margin. It doesn’t know your mailbox price or your feed bill.

DRP protects quarterly revenue based on your elected Class III/IV weighting or component pricing, settled on announced USDA prices plus an area production adjustment. It doesn’t cover your mailbox price, your hauling bill or your zone PPD.
What this means for your operation

  • Budget from the statement, not the headline. Start with shipped cwt, actual tests and your plant’s zone. Add your zone’s PPD history and subtract your own deductions. Bring in the Class I price last, multiplied by your order’s utilization.
  • Know your multiplier. In August, a $1 Class I move was worth about 6 cents/cwt in Order 30 and 26 cents in Order 1. Check your market administrator’s latest monthly report before every budget run.
  • Know your zone. In September, the Order 30 PPD ran from $0.58 to $0.18 depending on location. Your statement’s PPD line should line up with your plant’s zone. If it doesn’t, ask why. 
  • Watch the Class III/IV spread. November’s spread was $4.69 on October 1, and Class III has gained 91 cents since. A narrowing spread eases depooling pressure on PPDs.
  • Price the protein. At September’s $2.6619/lb, 0.1 point of protein was worth about 27 cents/cwt. That beats a $1 Class I move in every order in the table.
  • October 21–22: USDA’s November advanced prices come out. Rerun the pass-through table.
  • December 18, 2026: 2027 DMC enrollment closes. Locked-in operations still have to file CCC-801 and pay the administrative fee. Tier 1 now covers the first 6 million lb.
  • Before buying DRP: check with your agent which quarters are still open. Then compare your elected basis against your last 12 statements.
The Bullvine: FMMO Reality Check Calculator

Stop budgeting on USDA headlines. Plug in your herd size to see exactly how much of a Class I price jump actually makes it to your uniform blend price.

The Headline Illusion (1 Month)
\$37,398
What the headline implies you’ll make
The Bullvine Reality (1 Month)
\$2,116
Your actual blend effect based on FMMO utilization

Copy this code to add this calculator to your own website:

Complete references and supporting documentation are available upon request by contacting the editorial team at editor@thebullvine.com.

Learn More

The Sunday Read Dairy Professionals Don’t Skip.

Every week, thousands of producers, breeders, and industry insiders open Bullvine Weekly for genetics insights, market shifts, and profit strategies they won’t find anywhere else. One email. Five minutes. Smarter decisions all week.
NewsSubscribe
First
Last
Consent

233 Sick, 40 in the Hospital, One Farm Still Selling: What Raw Farm’s Outbreak Streak Costs the Rest of You

A California raw-milk dairy weathered eight outbreaks in 18 years and kept its shelf space — and in 2026, the federal brakes came off. Here’s why that lands on your milk check, not just theirs.

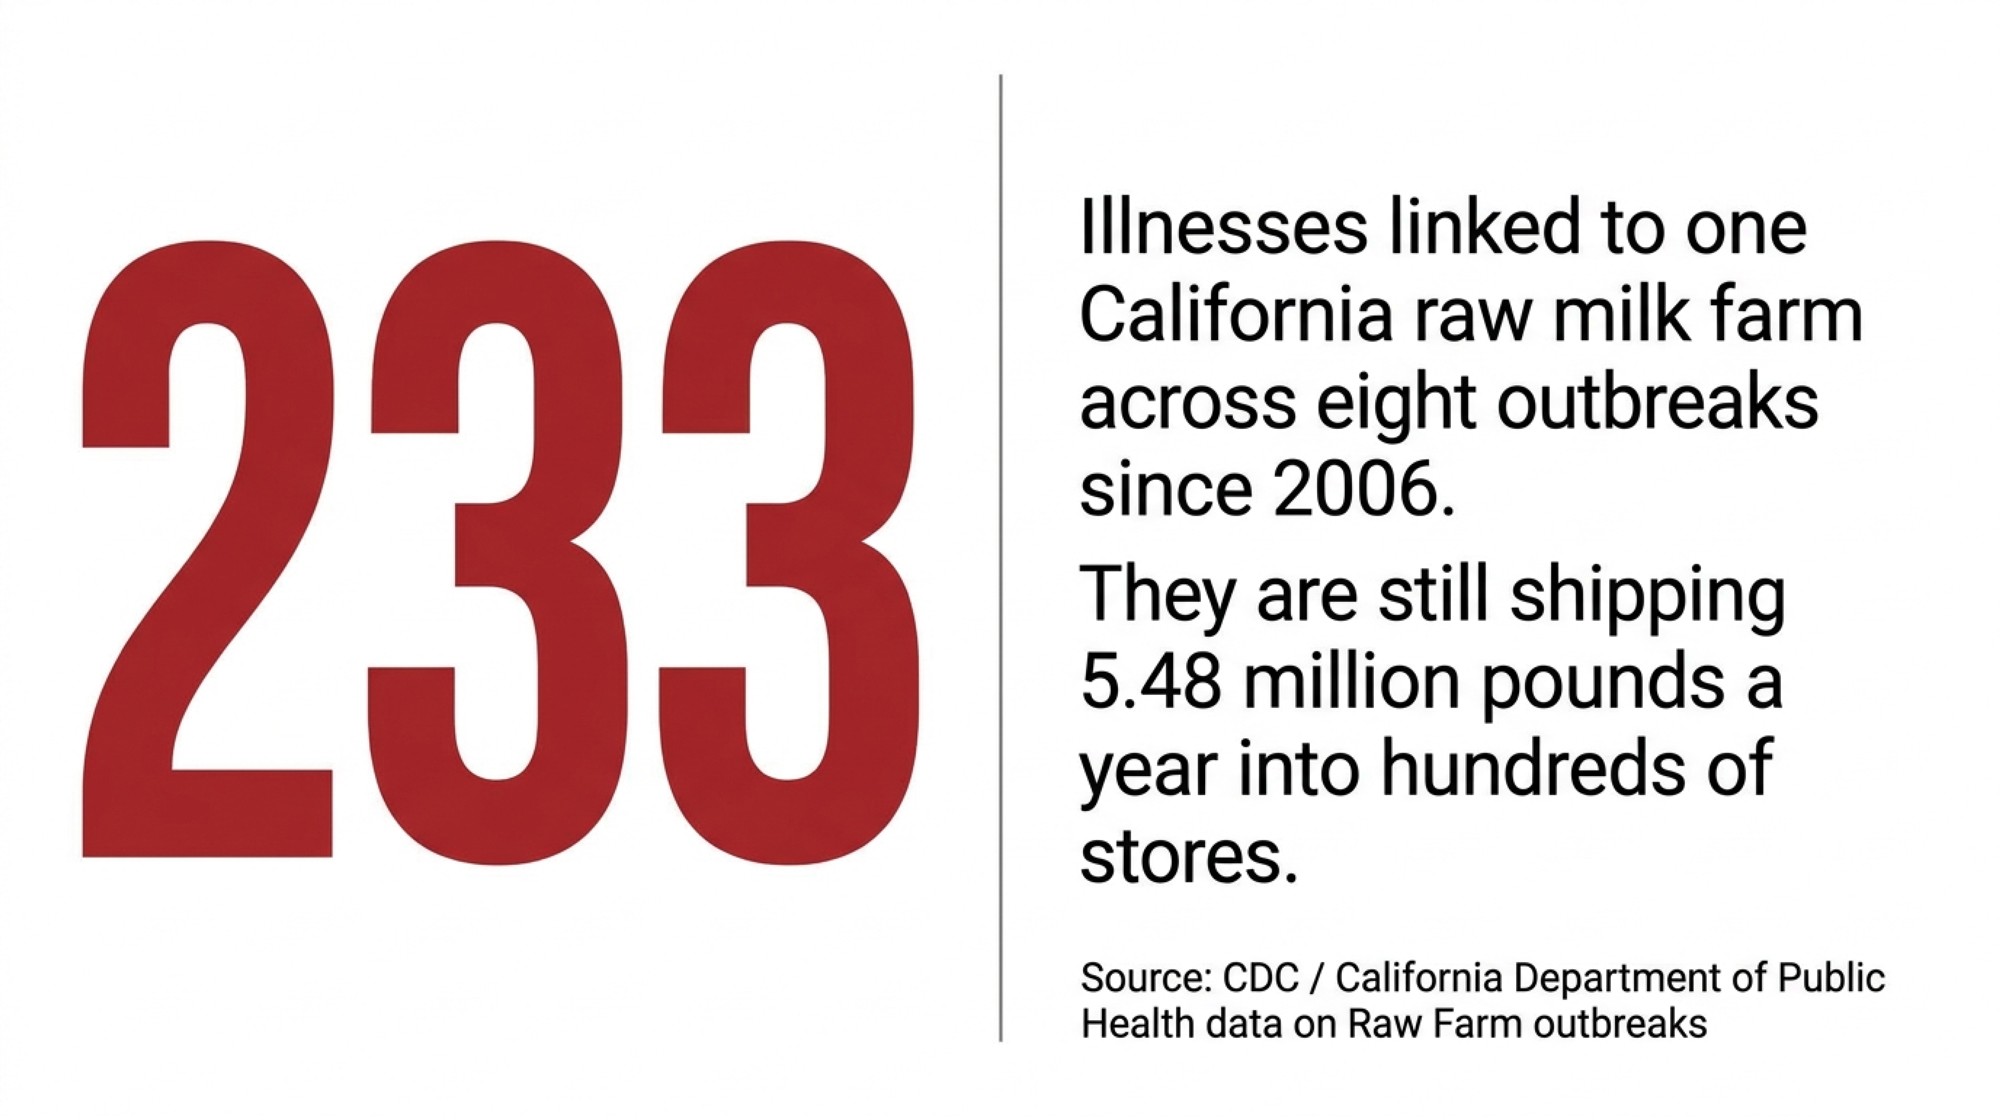
EXECUTIVE SUMMARY: One California dairy — Raw Farm, run by raw-milk crusader Mark McAfee — has been linked to at least 233 illnesses and 40 hospitalizations across eight outbreaks since 2006, and it’s still shipping 5.48 million pounds a year into hundreds of stores. Half the kids in its latest E. coli outbreak were under five, yet the FDA closed its 2026 case with no enforcement, RFK Jr. now runs the agency’s parent department, and Massie’s Interstate Milk Freedom Act (H.R. 7880) would open a national raw-milk lane that’s never legally existed. Here’s why it’s your problem even if you’ve never sold a drop raw: consumer trust doesn’t sort by category, so when a parent reads “raw cheddar sent kids to the hospital,” they just hear “dairy made a kid sick.” Soften fluid demand after a national scare and you push milk out of Class I — your highest-value pool use — into manufacturing classes, and the blend price every pooled producer gets drifts down with it. For scale on how that lever moves money, USDA’s 2025 make-allowance tweak alone cut class prices 85–93¢/cwt and pulled $337 million out of producer pools — and that wasn’t even a demand event. The full piece runs the barn math on a 200-cow herd and hands you a 30-day message-discipline and liability checklist to protect your brand before the next headline hits. If you ship fluid or sit on a checkoff board, that 30 seconds of reading decides whether you’re ready or improvising on camera.

raw milk outbreaks

Mark McAfee doesn’t sound like a man on the ropes. The owner of Raw Farm in California’s Central Valley has called himself a pioneer — somebody “climbing a mountain they say you can’t climb,” in his own words to reporters. By April 2026, he was climbing it again, recalling cheddar “under protest” while federal and state investigators traced sick kids back to his product.

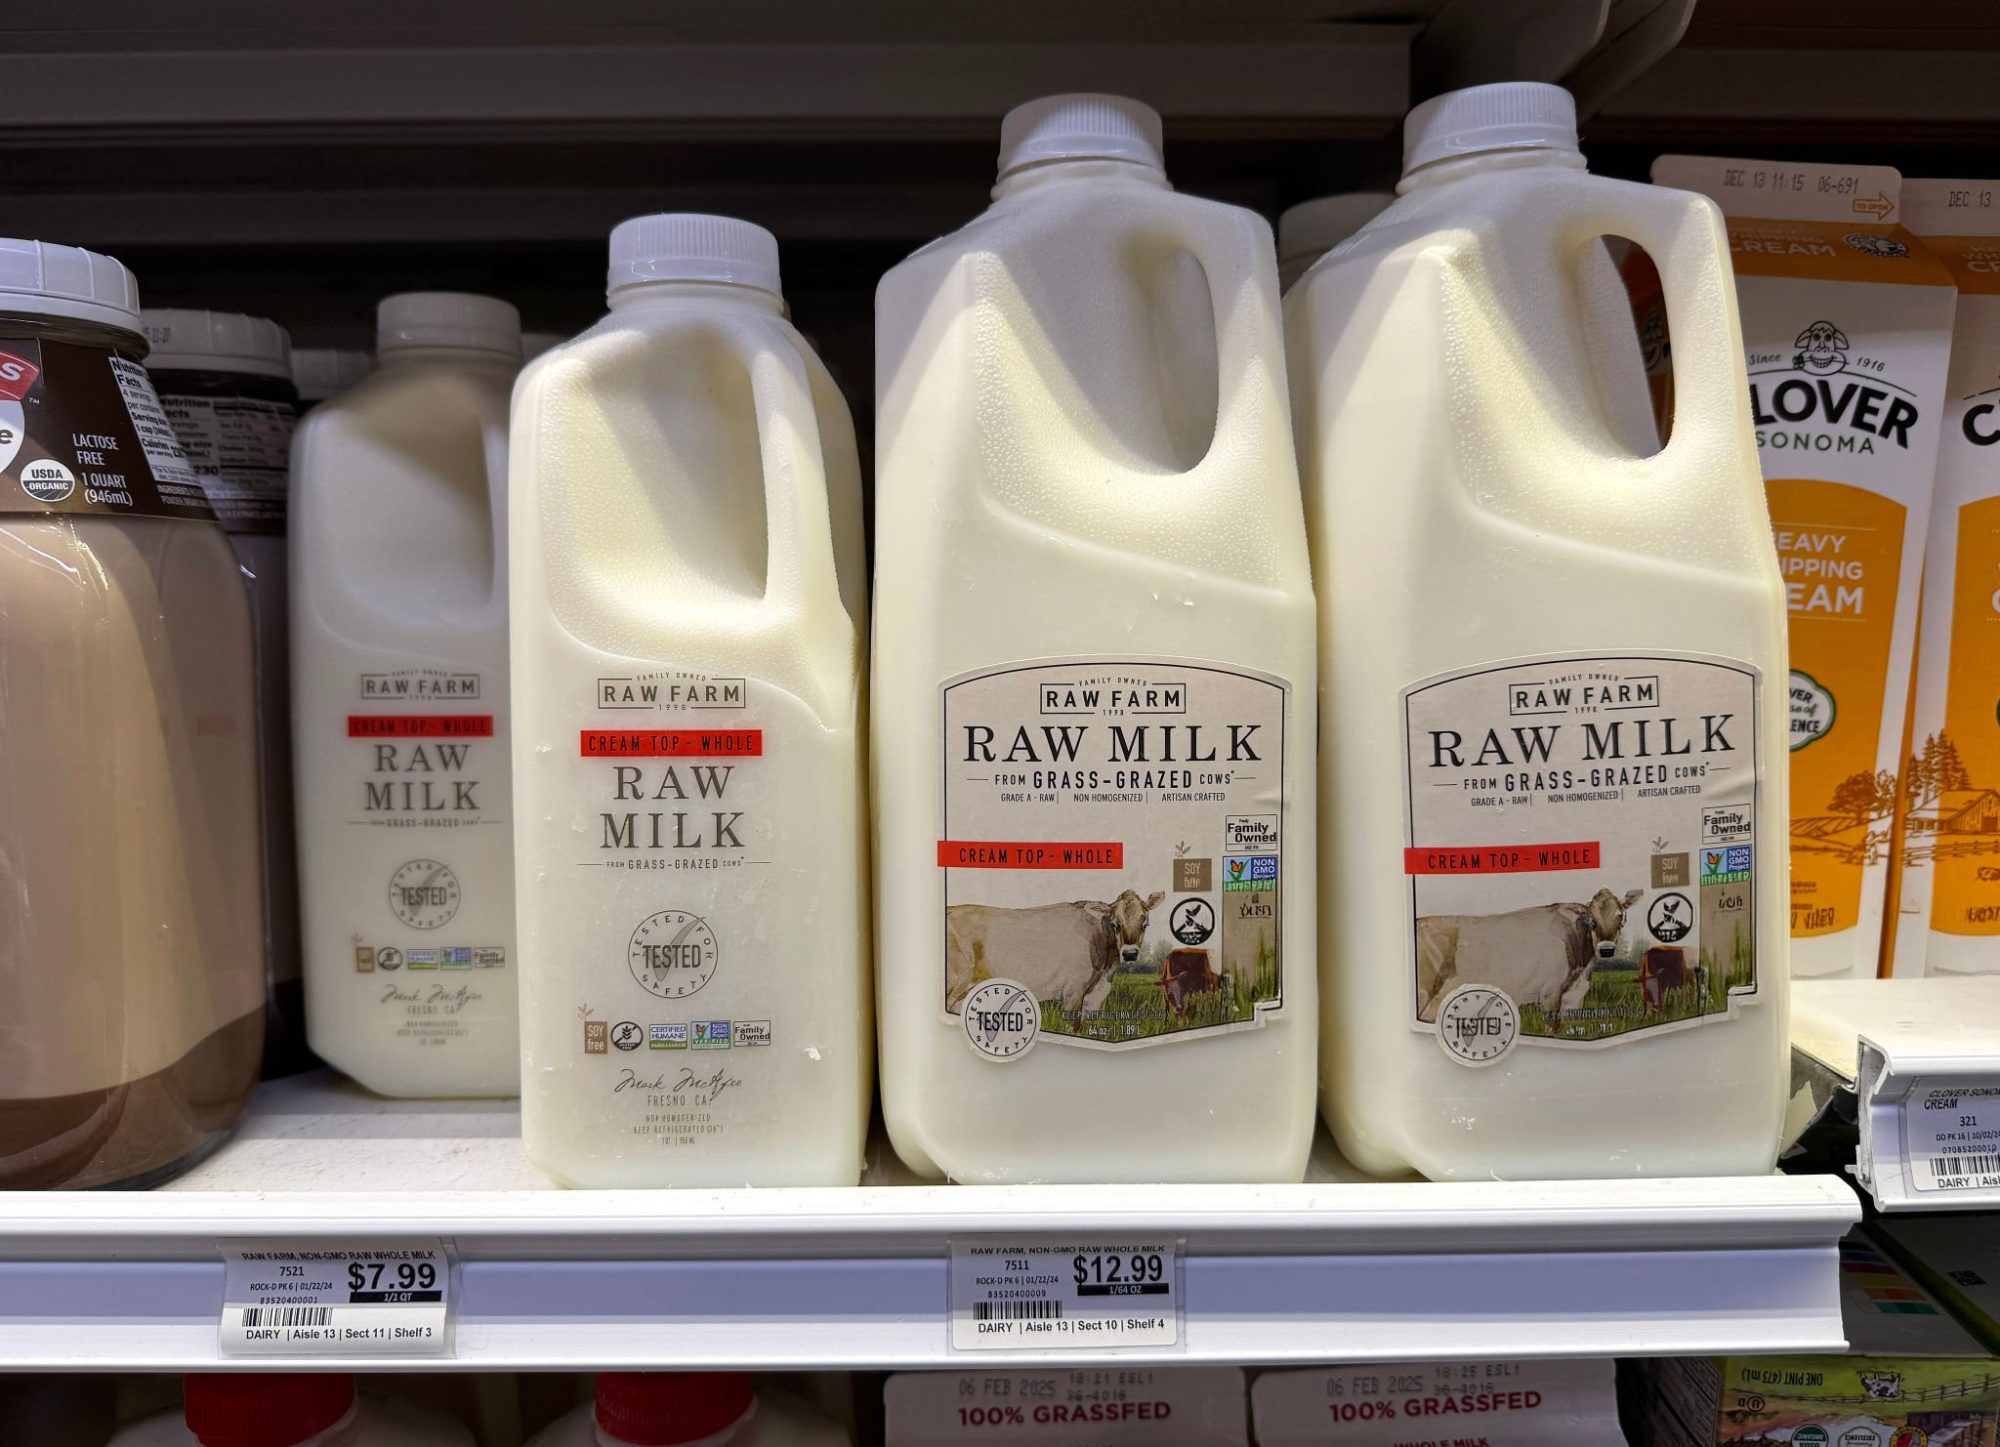
Here’s the number that should stop you. Across eight outbreaks since 2006, public health investigators have linked Raw Farm products to at least 233 illnesses and roughly 40 hospitalizations. Half the people sickened in the latest E. coli outbreak were children under five. And the farm is still selling — about 5.48 million pounds of raw milk a year by its own scale, into hundreds of stores. The raw-milk fight isn’t your fight. But the bill has a way of showing up at your door anyway.

How does one farm rack up eight outbreaks and keep its shelf space?

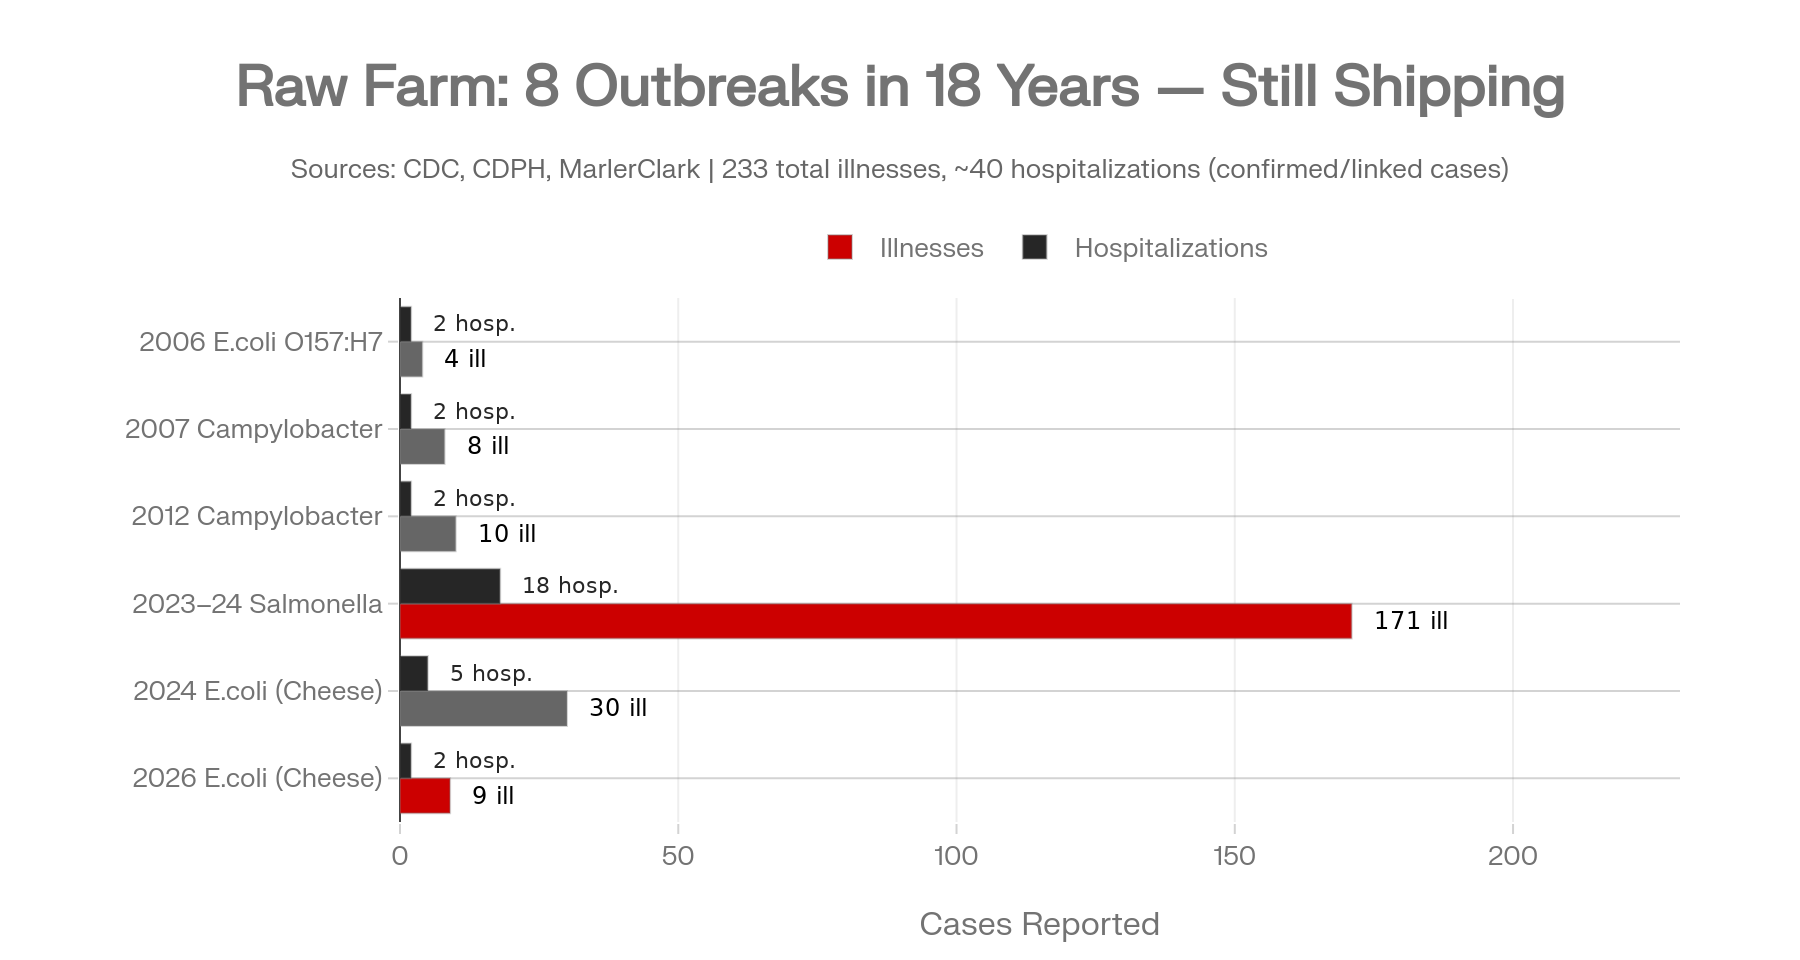
Start at the beginning, because the pattern is old. In 2006, an E. coli O157:H7 outbreak tied to the operation — then called Organic Pastures — sent two young children to the hospital, one with hemolytic uremic syndrome, and California’s health department concluded the farm’s unpasteurized products were the likely source. That’s kidney failure in a kid. From a glass of milk.

What followed was 18 years of the same movie on repeat. A 2007 Campylobacter outbreak and recall. A May 2012 Campylobacter outbreak that sickened ten people, from a nine-month-old to a 38-year-old. A 2010 interstate injunction, then a 2023 consent decree with independent audits. A 2023–24 Salmonella outbreak that sickened 171 people. Then two E. coli cheese outbreaks — one in early 2024, another that surfaced in March 2026.

The CDC declared the 2026 outbreak over on April 29, after nine confirmed illnesses across multiple states, with one case of HUS and no deaths. Raw Farm disputes the investigations. The company’s official recall notice states flatly that “no pathogens have been found in RAW FARM-brand cheese products” and that the recall was “performed under protest.” That’s its on-record position, and it belongs in the story. But the agencies named the farm anyway — the FDA and CDC had already identified it as the likely source of a similar 2024 outbreak, and California’s health department said it could not rule out the farm, given how many patients had consumed its products before getting sick.

Why did the federal brakes come off in 2026?

Because the people running the enforcement machine changed, and so did the politics. Robert F. Kennedy Jr. — a vocal raw-milk advocate — now runs Health and Human Services, the department that houses the FDA. The agency’s posture toward Raw Farm softened throughout 2025 and into 2026, and a consumer watchdog group put the question bluntly: Did the FDA go easy on a repeat offender with ties to RFK Jr.’s campaign?

Then Congress moved. In March 2026, Representatives Thomas Massie and Chellie Pingree introduced the Interstate Milk Freedom Act — H.R. 7880 — to strip federal restrictions on interstate raw-milk sales entirely. The bill would hand raw milk a national lane it has never legally had.

ActorWhat They GainWho Carries the Risk
Raw Farm / Mark McAfeeNational retail lane; no federal enforcement ceilingSick consumers; pooled producers via trust damage
RFK Jr. / HHSPolitical base consolidation; “food freedom” opticsFDA credibility; outbreak response capacity
H.R. 7880 co-sponsors (Massie/Pingree)Libertarian/food-movement crossover votesInterstate consumers with no state-level backstop
Raw-milk retailers (multi-state)Expanded SKU access without FMMO scrutinyBrand liability if product recalled post-sale
Pooled fluid-milk producersNothingBlend-price erosion from demand scare; no compensation mechanism

This is the part that matters for you, and it has nothing to do with whether raw milk is good or bad. The guardrail you’ve quietly relied on — federal enforcement keeping the worst actors penned in their own states — is being filed down. And the science on the underlying risk hasn’t moved an inch.

The risk math hasn’t changed, even if the politics did

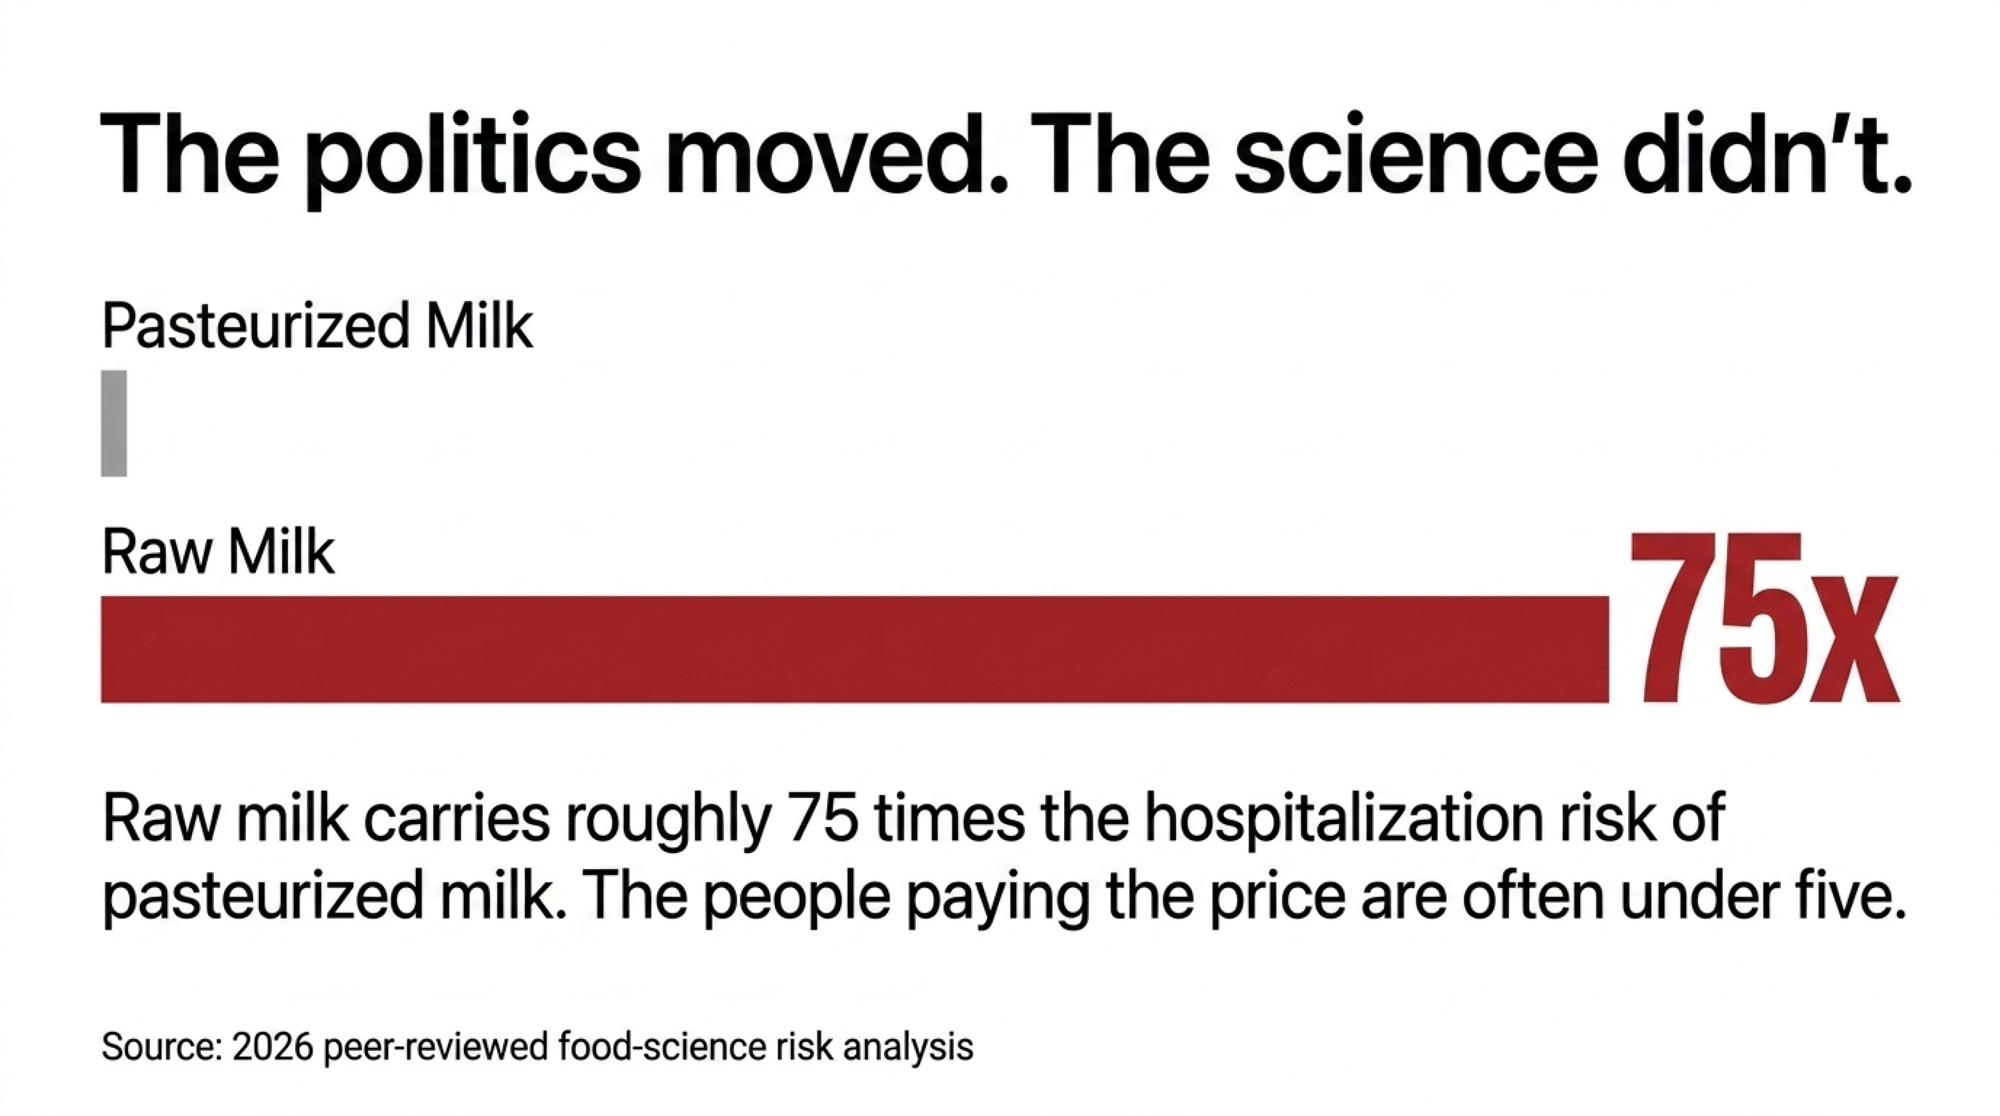
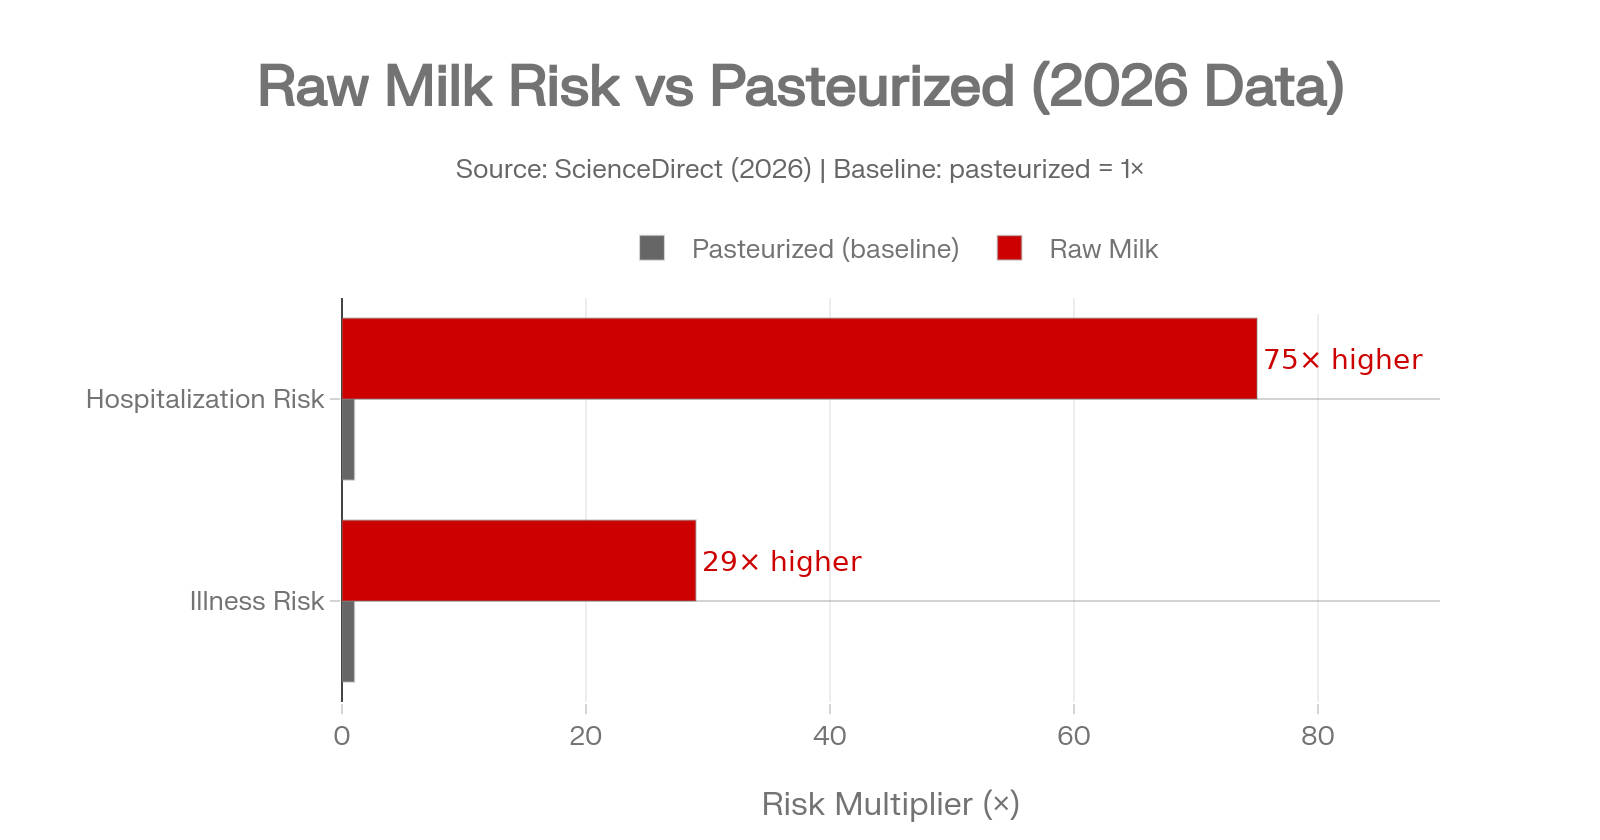
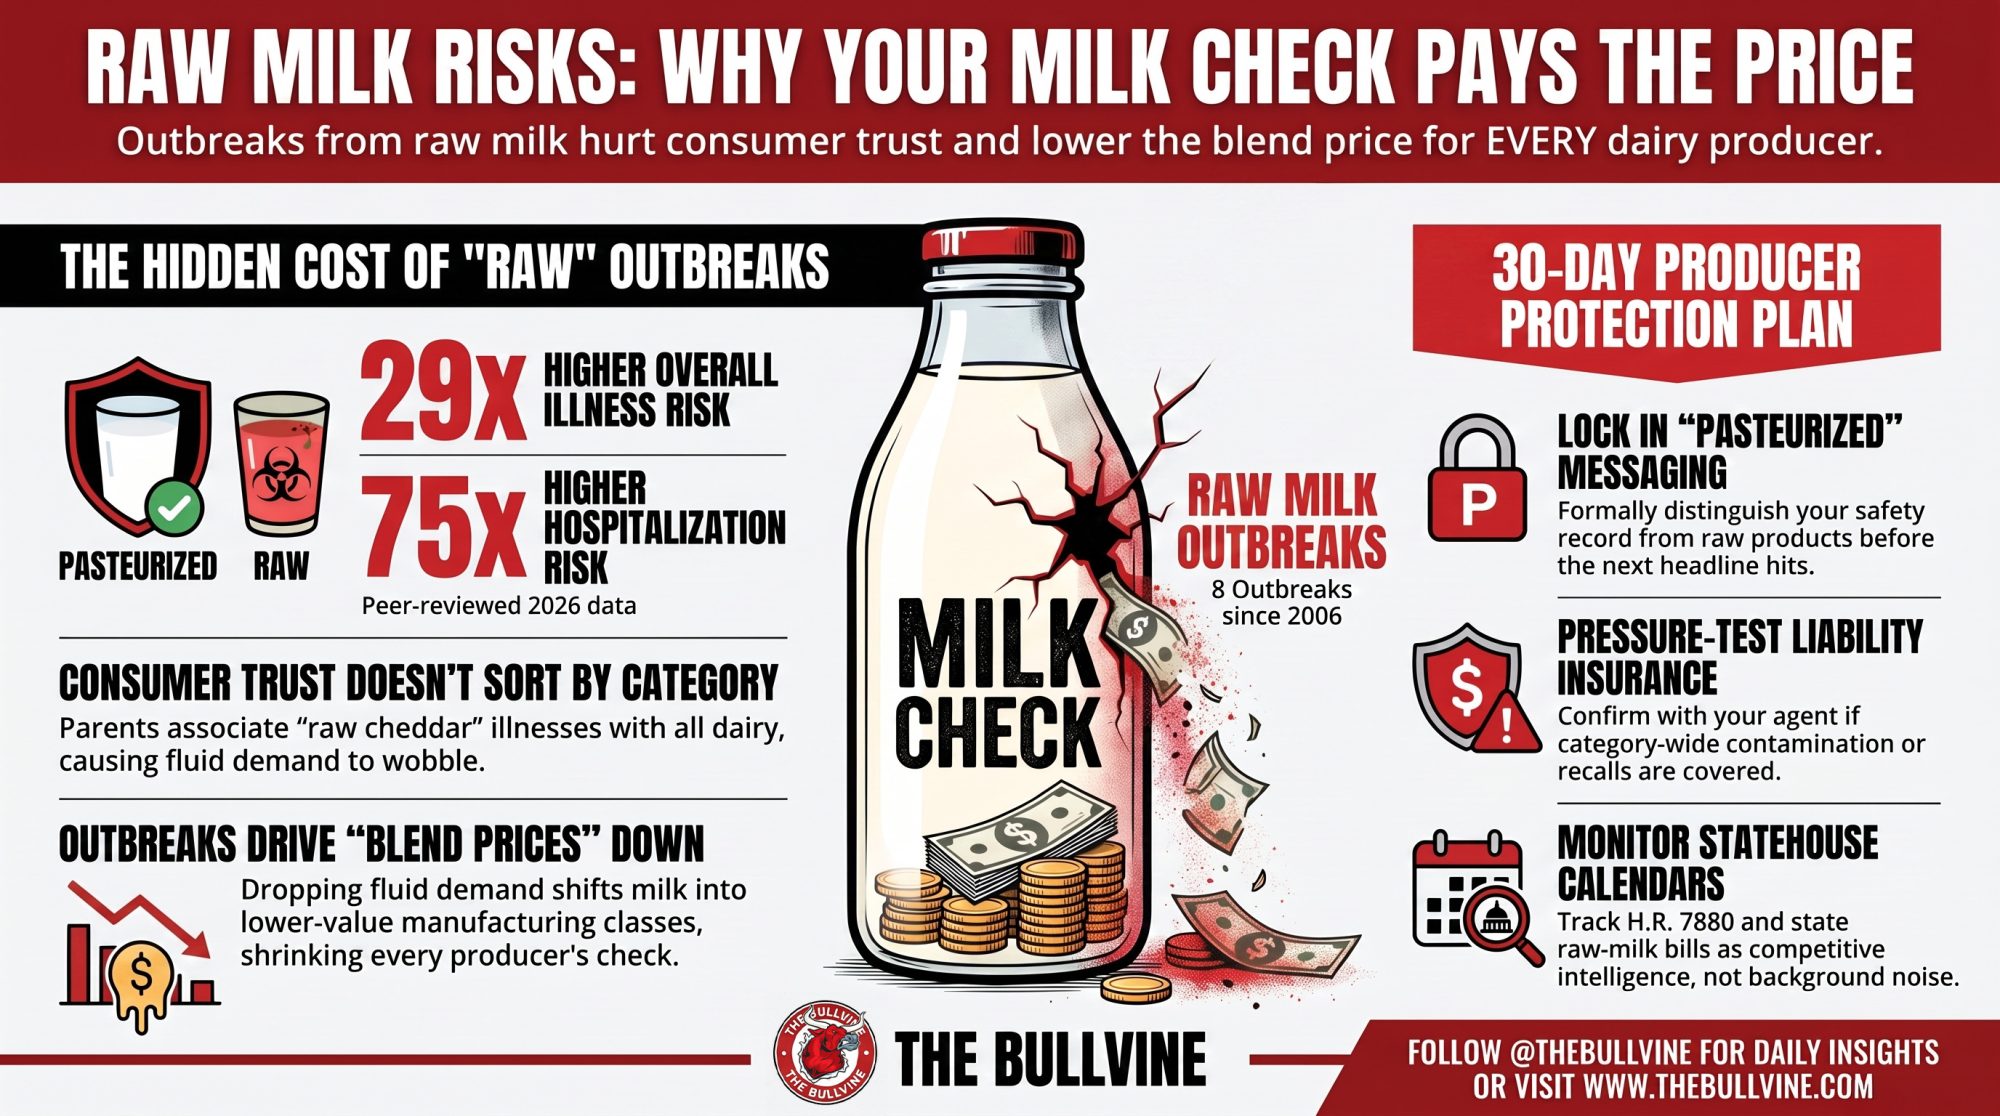
The CDC’s own characterization is that raw milk causes illness far more often than pasteurized — dozens of times the per-unit risk, not a few percentage points. A peer-reviewed analysis cited in Canada’s communicable disease report put unpasteurized dairy at hundreds of times more illnesses and dozens of times more hospitalizations. A 2026 food-science study using different methods landed on roughly 29 times the illness risk and 75 times the hospitalization risk.

The exact multiplier moves with the method. The direction never does. Raw milk gets people sick at a rate pasteurized milk doesn’t, and the people who pay the hardest are the youngest.

That’s the science. Now the part nobody’s pricing.

What does someone else’s outbreak actually cost your operation?

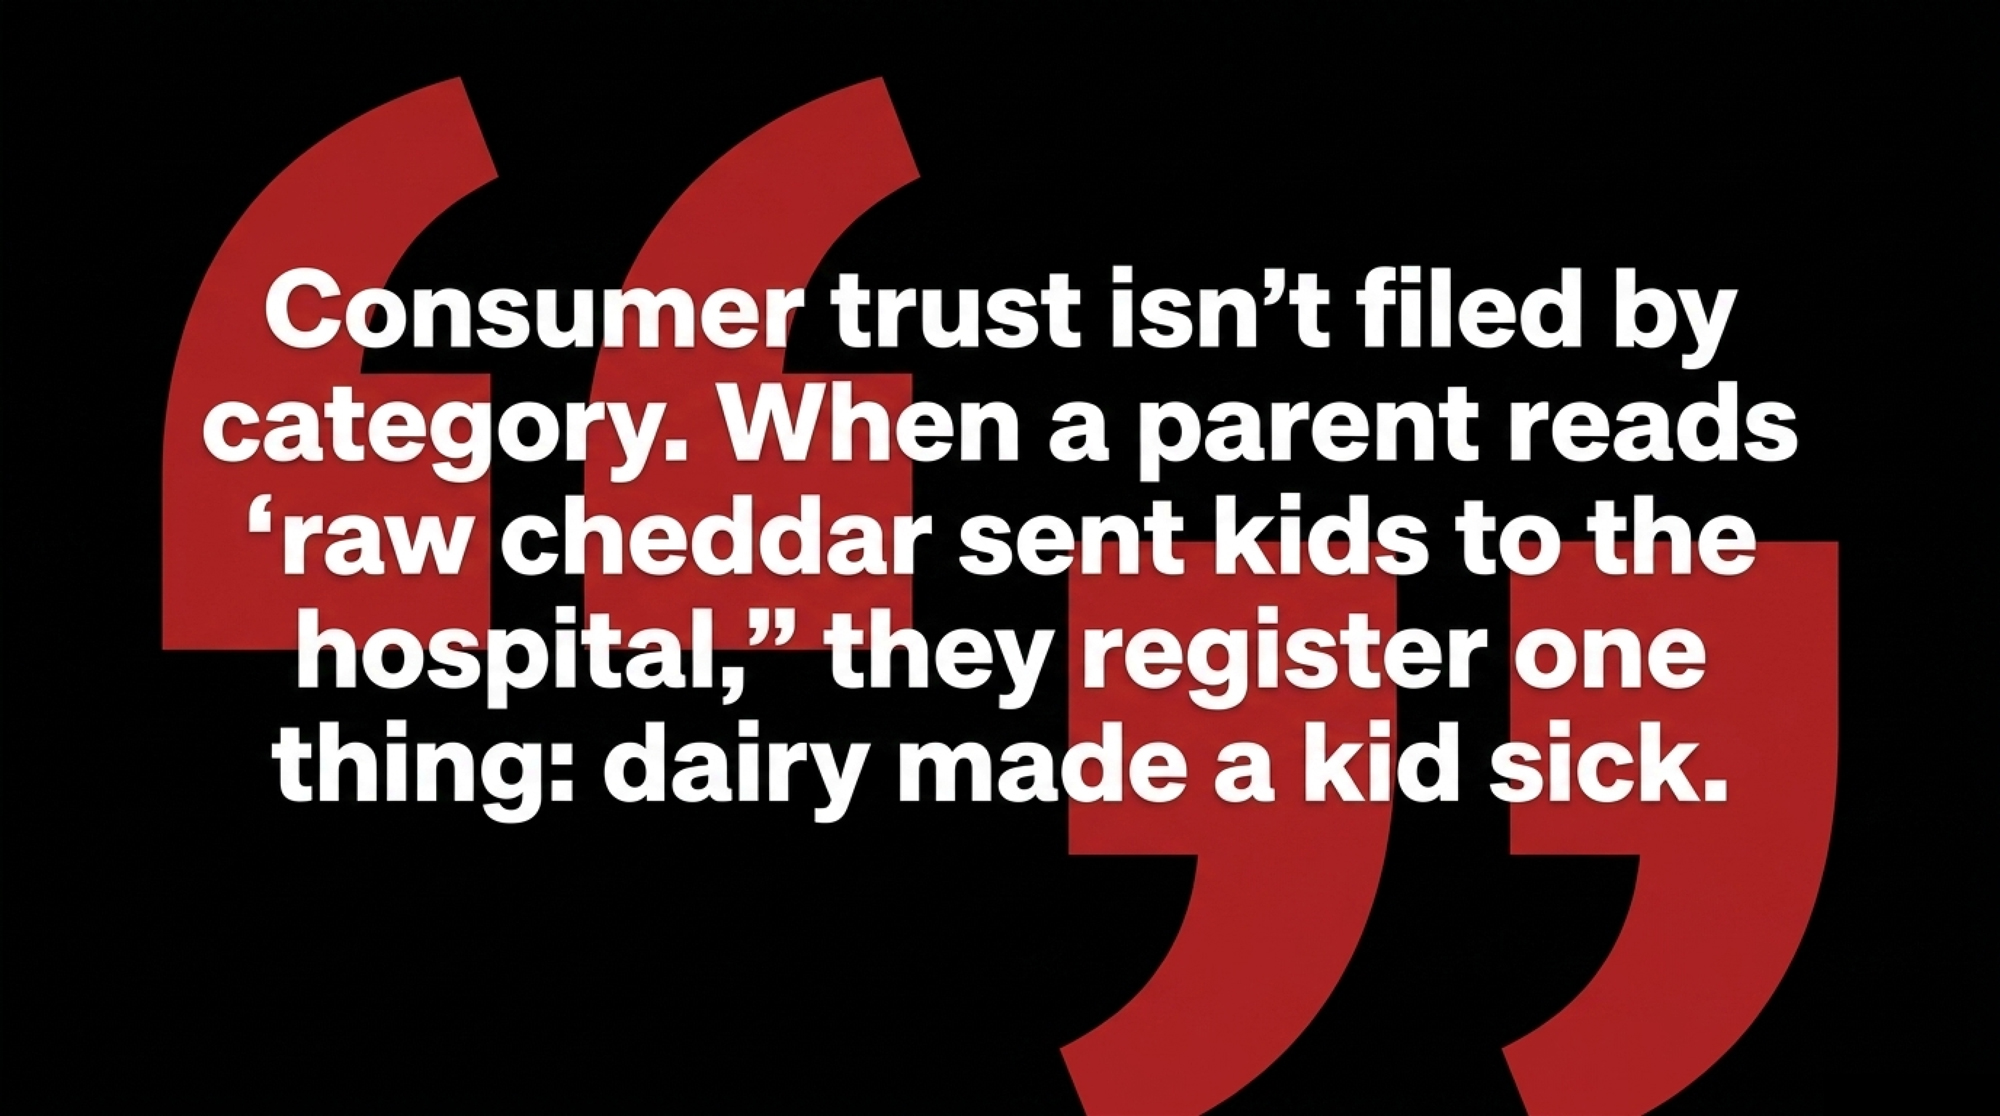
Consumer trust isn’t filed by category. When a parent reads “raw cheddar sent kids to the hospital,” they don’t run a mental search-and-replace for “raw” versus “pasteurized.” They register one thing: dairy made a kid sick. The headline does the damage. The fine print never catches up.

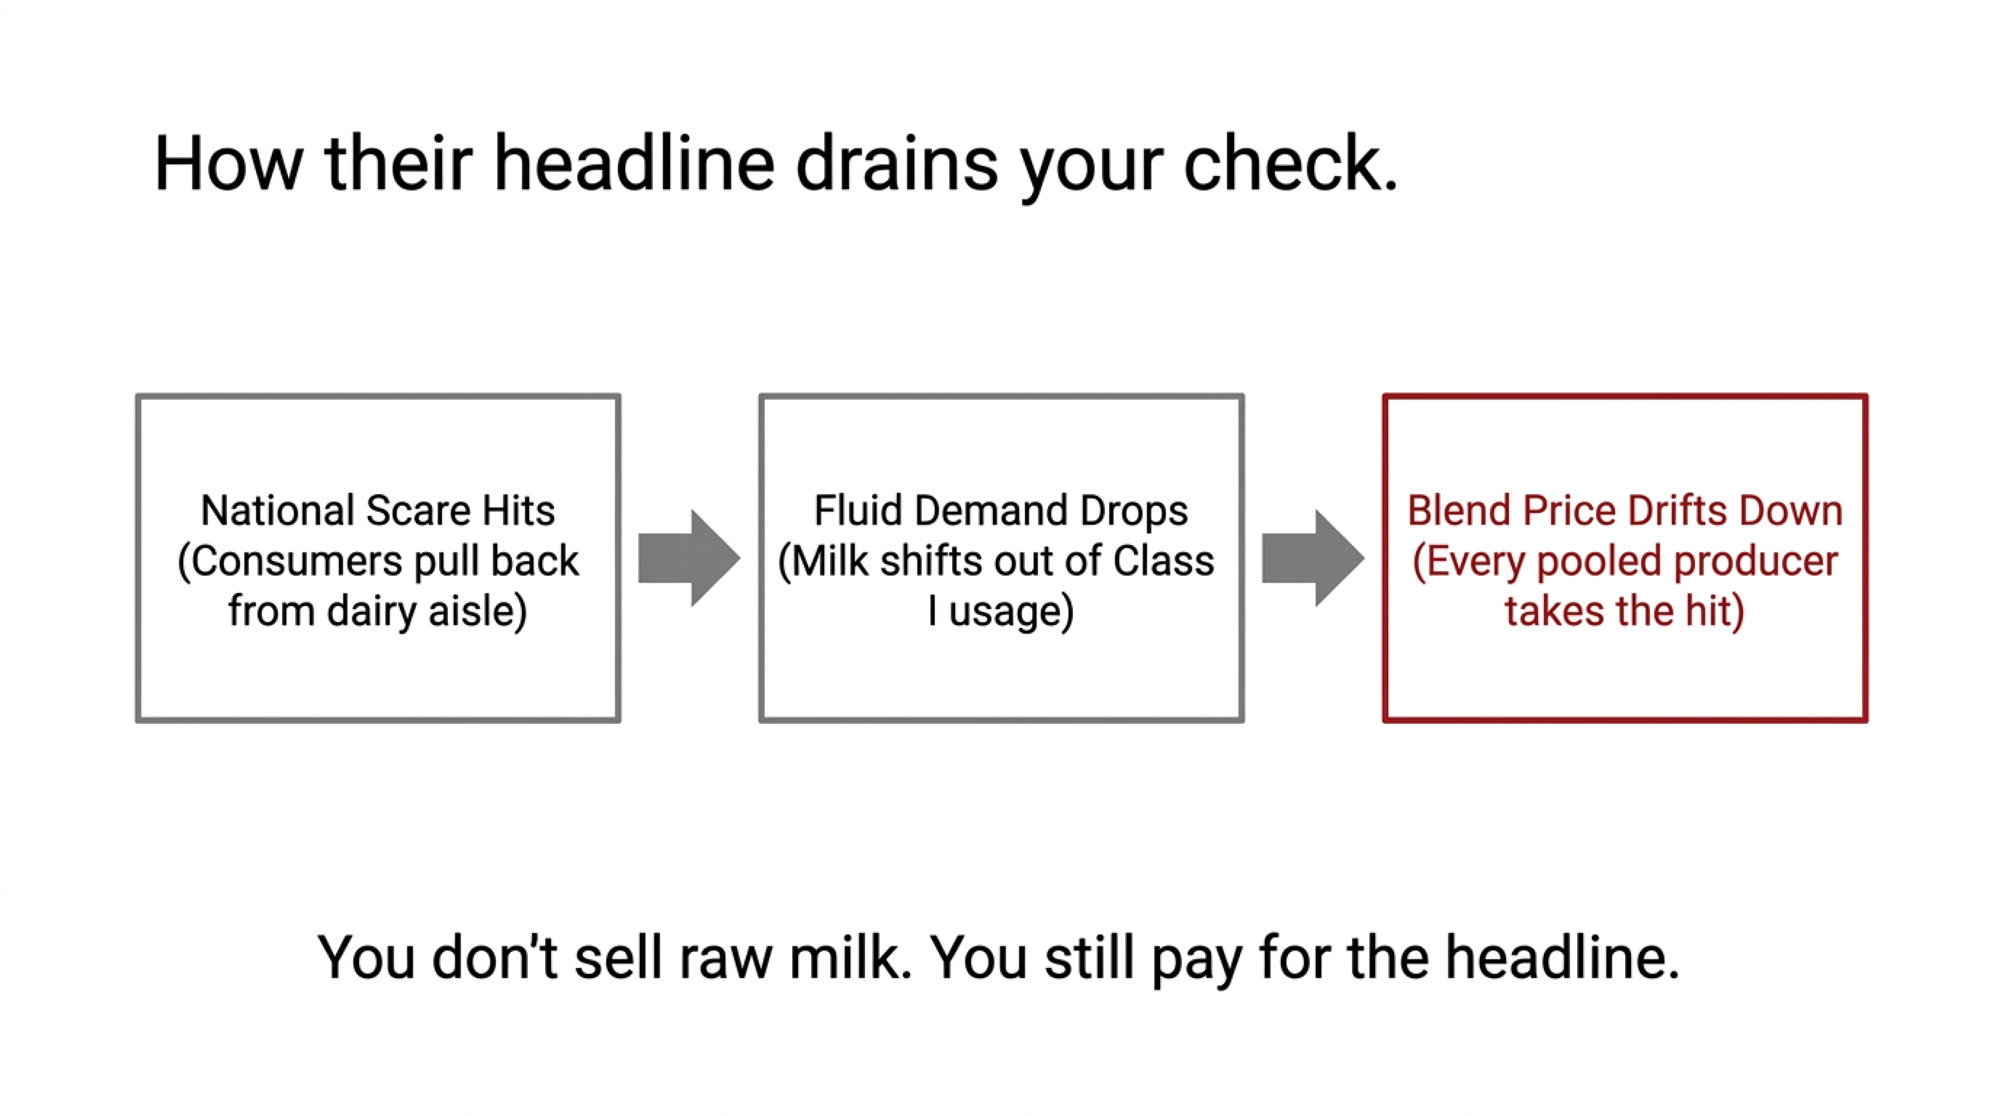
Here’s the barn-math version, and you can map it to your own numbers. Run a 200-cow herd shipping 75 pounds a day, and you’re moving roughly 5.48 million pounds of milk a year — almost exactly the volume Raw Farm pushes. Now picture a fluid-demand wobble after a national raw-milk scare. Class I — fluid milk — is the highest-value use in the federal pool, and your blend price is a weighted average of how that pool’s milk gets used. Soften fluid demand, shift milk into lower-value manufacturing classes, and the uniform price every pooled producer receives drifts down — whether your milk ever touched a fluid bottle or not. You don’t sell raw milk. You’d still help pay for the headline.

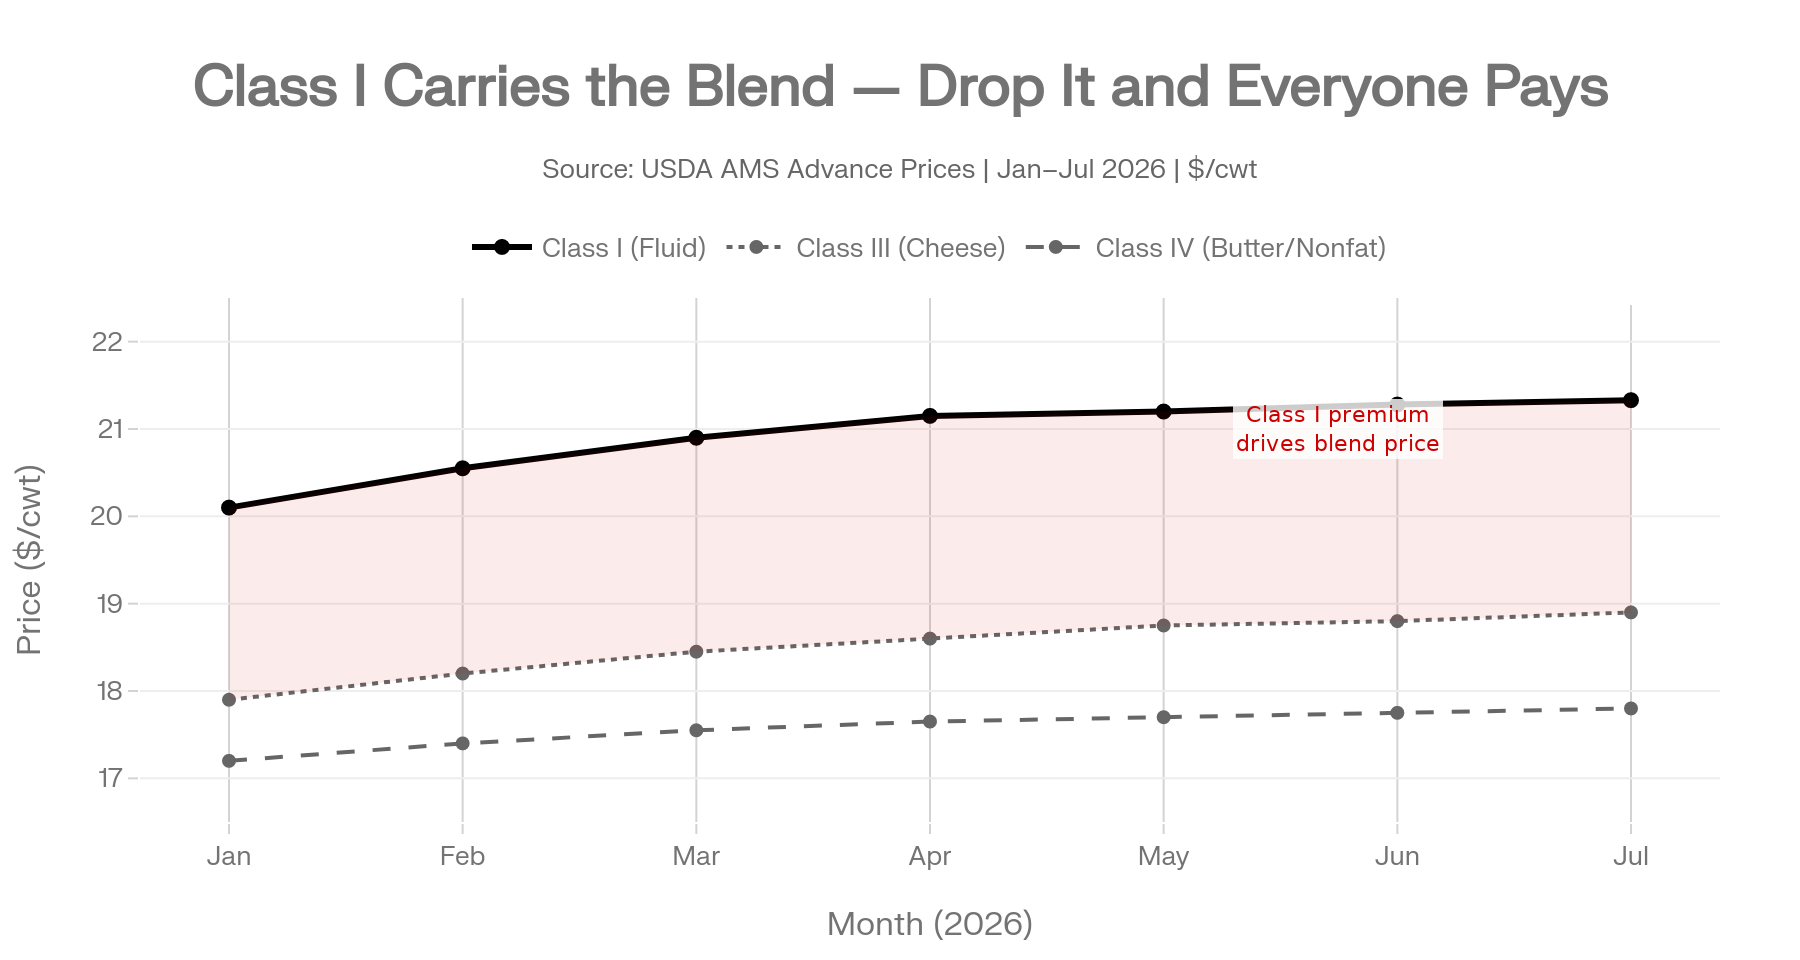
How big is the drift? Use the system’s own arithmetic. The July 2026 base Class I price ran $21.33/cwt — well above Class III and IV manufacturing values most months. For perspective on how the formula moves real money: USDA’s 2025 make-allowance change alone permanently cut class prices by roughly 85 to 93 cents per hundredweight and pulled an estimated $337 million out of producer pools. That wasn’t even a demand event — just a formula tweak. A genuine, sustained dip in fluid demand pushes the same lever in the same direction. The exact cents-per-hundredweight depends on the depth and length of any scare, and pinning that figure needs a full pool model — which is exactly what the Tier 3 follow-up runs. The mechanism is settled. The magnitude is the open question.

Price EventTriggerClass Price ImpactEst. Producer Pool Impact
2025 USDA make-allowance adjustmentFormula change (USDA rulemaking)–85 to –93¢/cwt–$337M from producer pools
Hypothetical raw-milk demand scareConsumer trust erosion; Class I fluid shiftTBD — depends on scare durationDirectionally same lever, formula already set
July 2026 Class I base priceUSDA advance pricing$21.33/cwtHighest-value pool position — most to lose
2024 bird flu / avian influenza dairy scareDisease outbreak; consumer concernModest Class I softeningLocalized; recovered within quarters
PatternAny event softening fluid demandPushes milk to lower manufacturing classesEvery pooled producer pays; raw or not

Options and Trade-Offs for Your Operation

You can’t control RFK Jr., you can’t control H.R. 7880, and you sure can’t control McAfee. You can control how your operation and your message are positioned when the next headline hits. Three paths, depending on where you sit.

ActionWho It’s ForCost to ActCost to Skip
Publish clear “we’re pasteurized” message across all channelsEvery fluid producer, farmers’ market sellerOne afternoon; near $0Improvising on camera when a reporter calls
Pull product-liability policy; ask about category-contamination coverageProcessors, large consumer-facing operations1 hour + possible premium reviewDiscovering coverage gap mid-recall
Put raw-milk bill status on monthly review calendarAnyone in a state with active raw-milk legislation15 min/monthBlindsided by overnight competitive shift
Brief co-op board or checkoff committee on category-trust riskBoard members, checkoff directorsOne agenda itemNo institutional response plan when headlines hit
Run your own blend-price sensitivity: what does –$0.50/cwt do to your operation?Any pooled producerSpreadsheet hourTreating a structural risk as background noise
Review recall plan; confirm chain-of-custody documentationAnyone with consumer-facing brandQuarterly ops reviewRecall conversation you’re having for the first time during a recall

Tighten your own message discipline — start this month. Within the next 30 days, sit down with whoever speaks for your farm — on social, at the co-op, at the farmers’ market — and draw the line in plain language: your milk is pasteurized, your safety record is separate, and you don’t get lumped in with raw. This works for everyone and costs almost nothing but an afternoon. The limit: messaging can’t fix a problem you actually have, so it only helps if your own house is in order first.

Pressure-test your liability and recall posture. This fits processors and larger operations carrying real consumer-facing exposure. Pull your product-liability coverage and your recall plan, and ask your insurer the direct question: are we covered if a category-wide raw-milk scare drags our brand into a recall conversation we didn’t cause? It requires an honest hour with your agent and maybe a premium conversation. The risk of skipping it is finding the gap during the crisis instead of before it.

Watch your state’s raw-milk rules like a hawk. This is for anyone in a state where raw-milk law is in play — and with H.R. 7880 live, that list could grow fast. If your state opens an interstate lane, the competitive and reputational math in your region shifts. The forward signal to watch isn’t a poll. It’s your statehouse calendar and the bill’s committee progress.

Key Takeaways — Decisions, Not a Recap

  • If you sell anything fluid and consumer-facing, lock in your “we’re pasteurized, we’re separate” message within 30 days — before a scare forces you to improvise it on camera.
  • If you carry brand or processing exposure, call your insurer this quarter and get the category-contamination question answered in writing, not assumed.
  • If your state has a live raw-milk bill, track its committee progress monthly — treat the statehouse calendar as a competitive-intelligence feed, not background noise.
  • If you sit on a checkoff or promotion board, the question to put on the table is whether your consumer messaging can survive being lumped in with a raw-milk outbreak — and if it can’t, that’s the gap to close now.

Raw Farm has weathered eight outbreaks and kept selling. The open question isn’t whether McAfee can keep climbing his mountain — he’s made clear he intends to. It’s whether the rest of the dairy case gets billed for the trust he spends on the way up. So pull your own numbers. Where does your brand sit if the next “raw milk sent kids to the hospital” headline runs on a Tuesday, and a customer can’t tell your bottle from his?

Run Your Numbers

Dairy Profit Projector — A raw-milk scare you didn’t cause can still soften fluid demand and drag your blend price down. Run your herd through the Projector to pressure-test what a milk-price dip does to your next 12 months of IOFC, breakeven, and whole-herd margin — before the headline hits.

Complete references and supporting documentation are available upon request by contacting the editorial team at editor@thebullvine.com.

Learn More

The Sunday Read Dairy Professionals Don’t Skip.

Every week, thousands of producers, breeders, and industry insiders open Bullvine Weekly for genetics insights, market shifts, and profit strategies they won’t find anywhere else. One email. Five minutes. Smarter decisions all week.
NewsSubscribe
First
Last
Consent

Send this to a friend