Archive for milk check basis

25 Extra Miles Is Where Your Milk Check Starts Bleeding

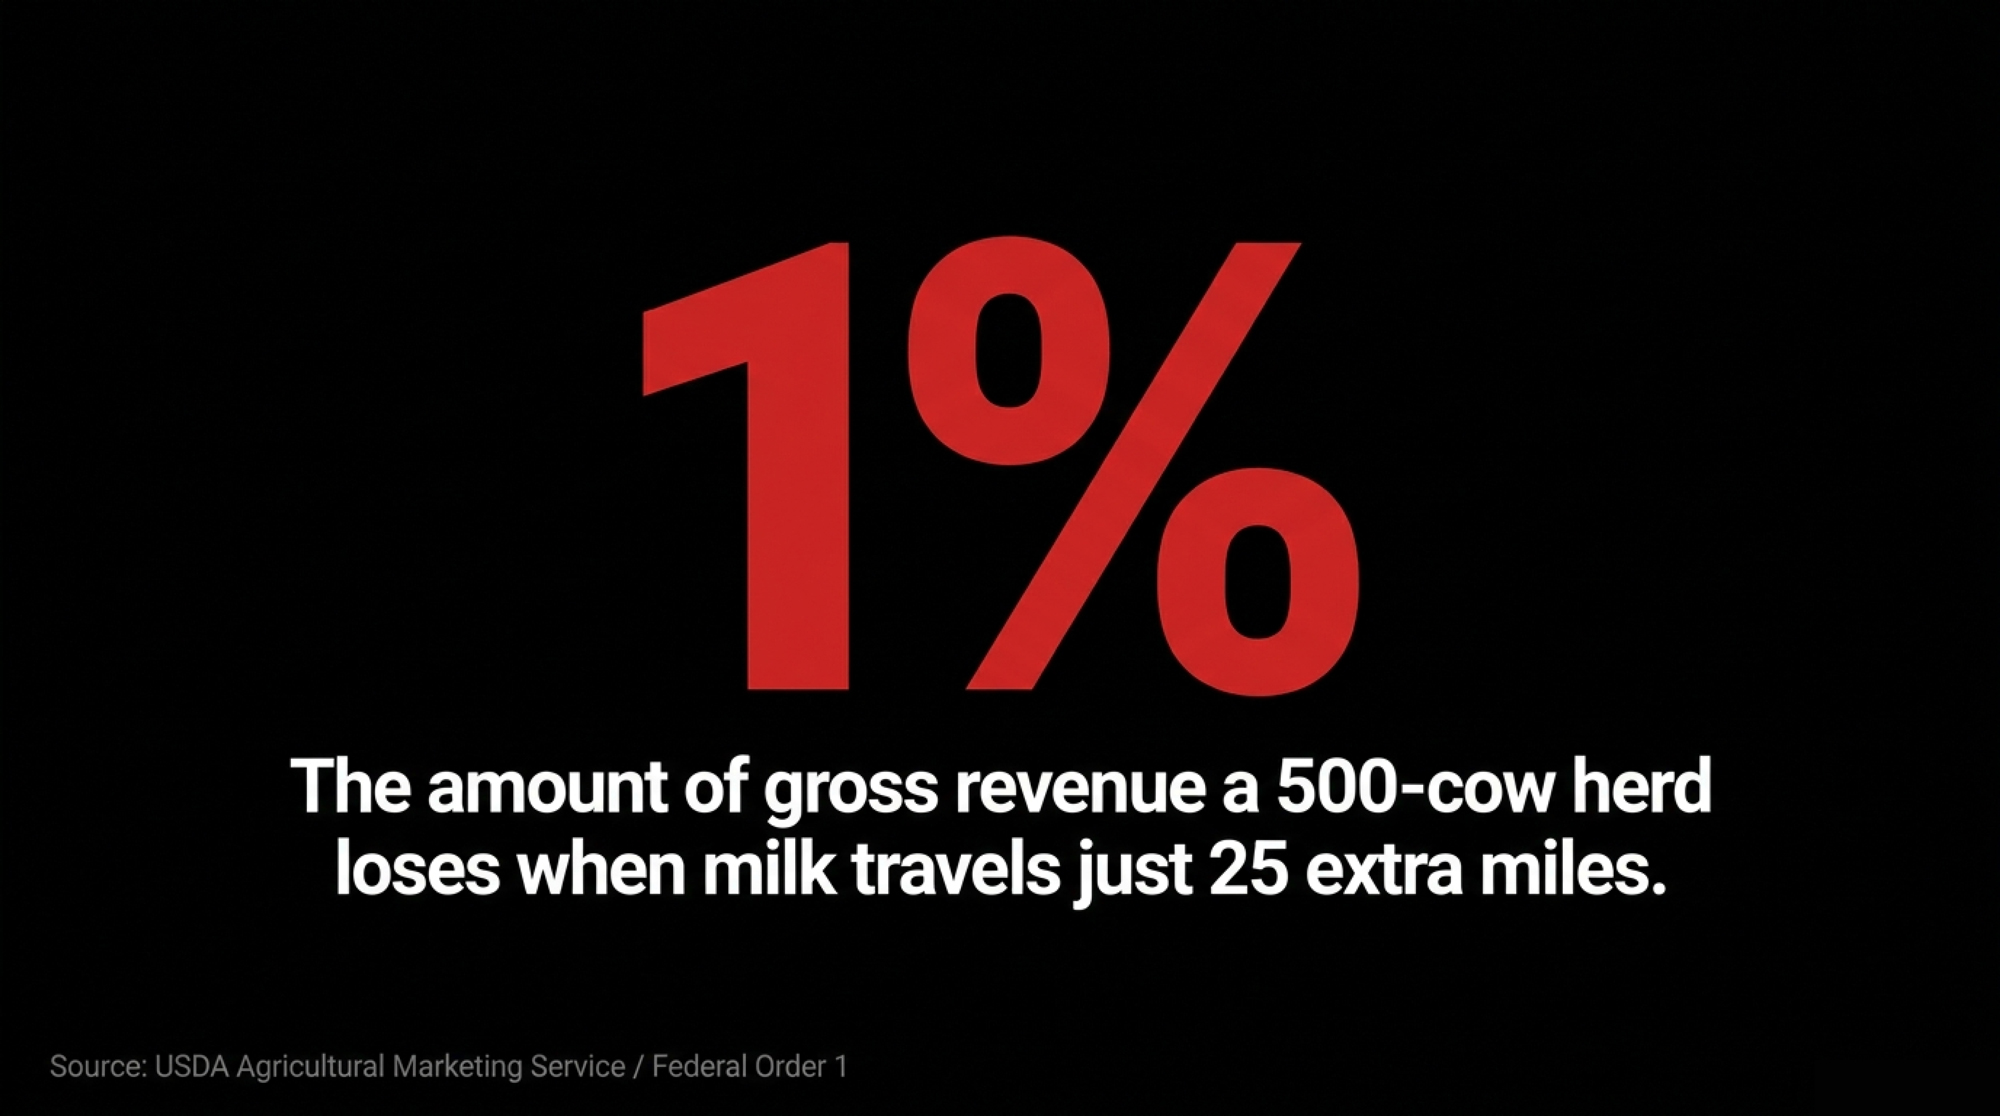
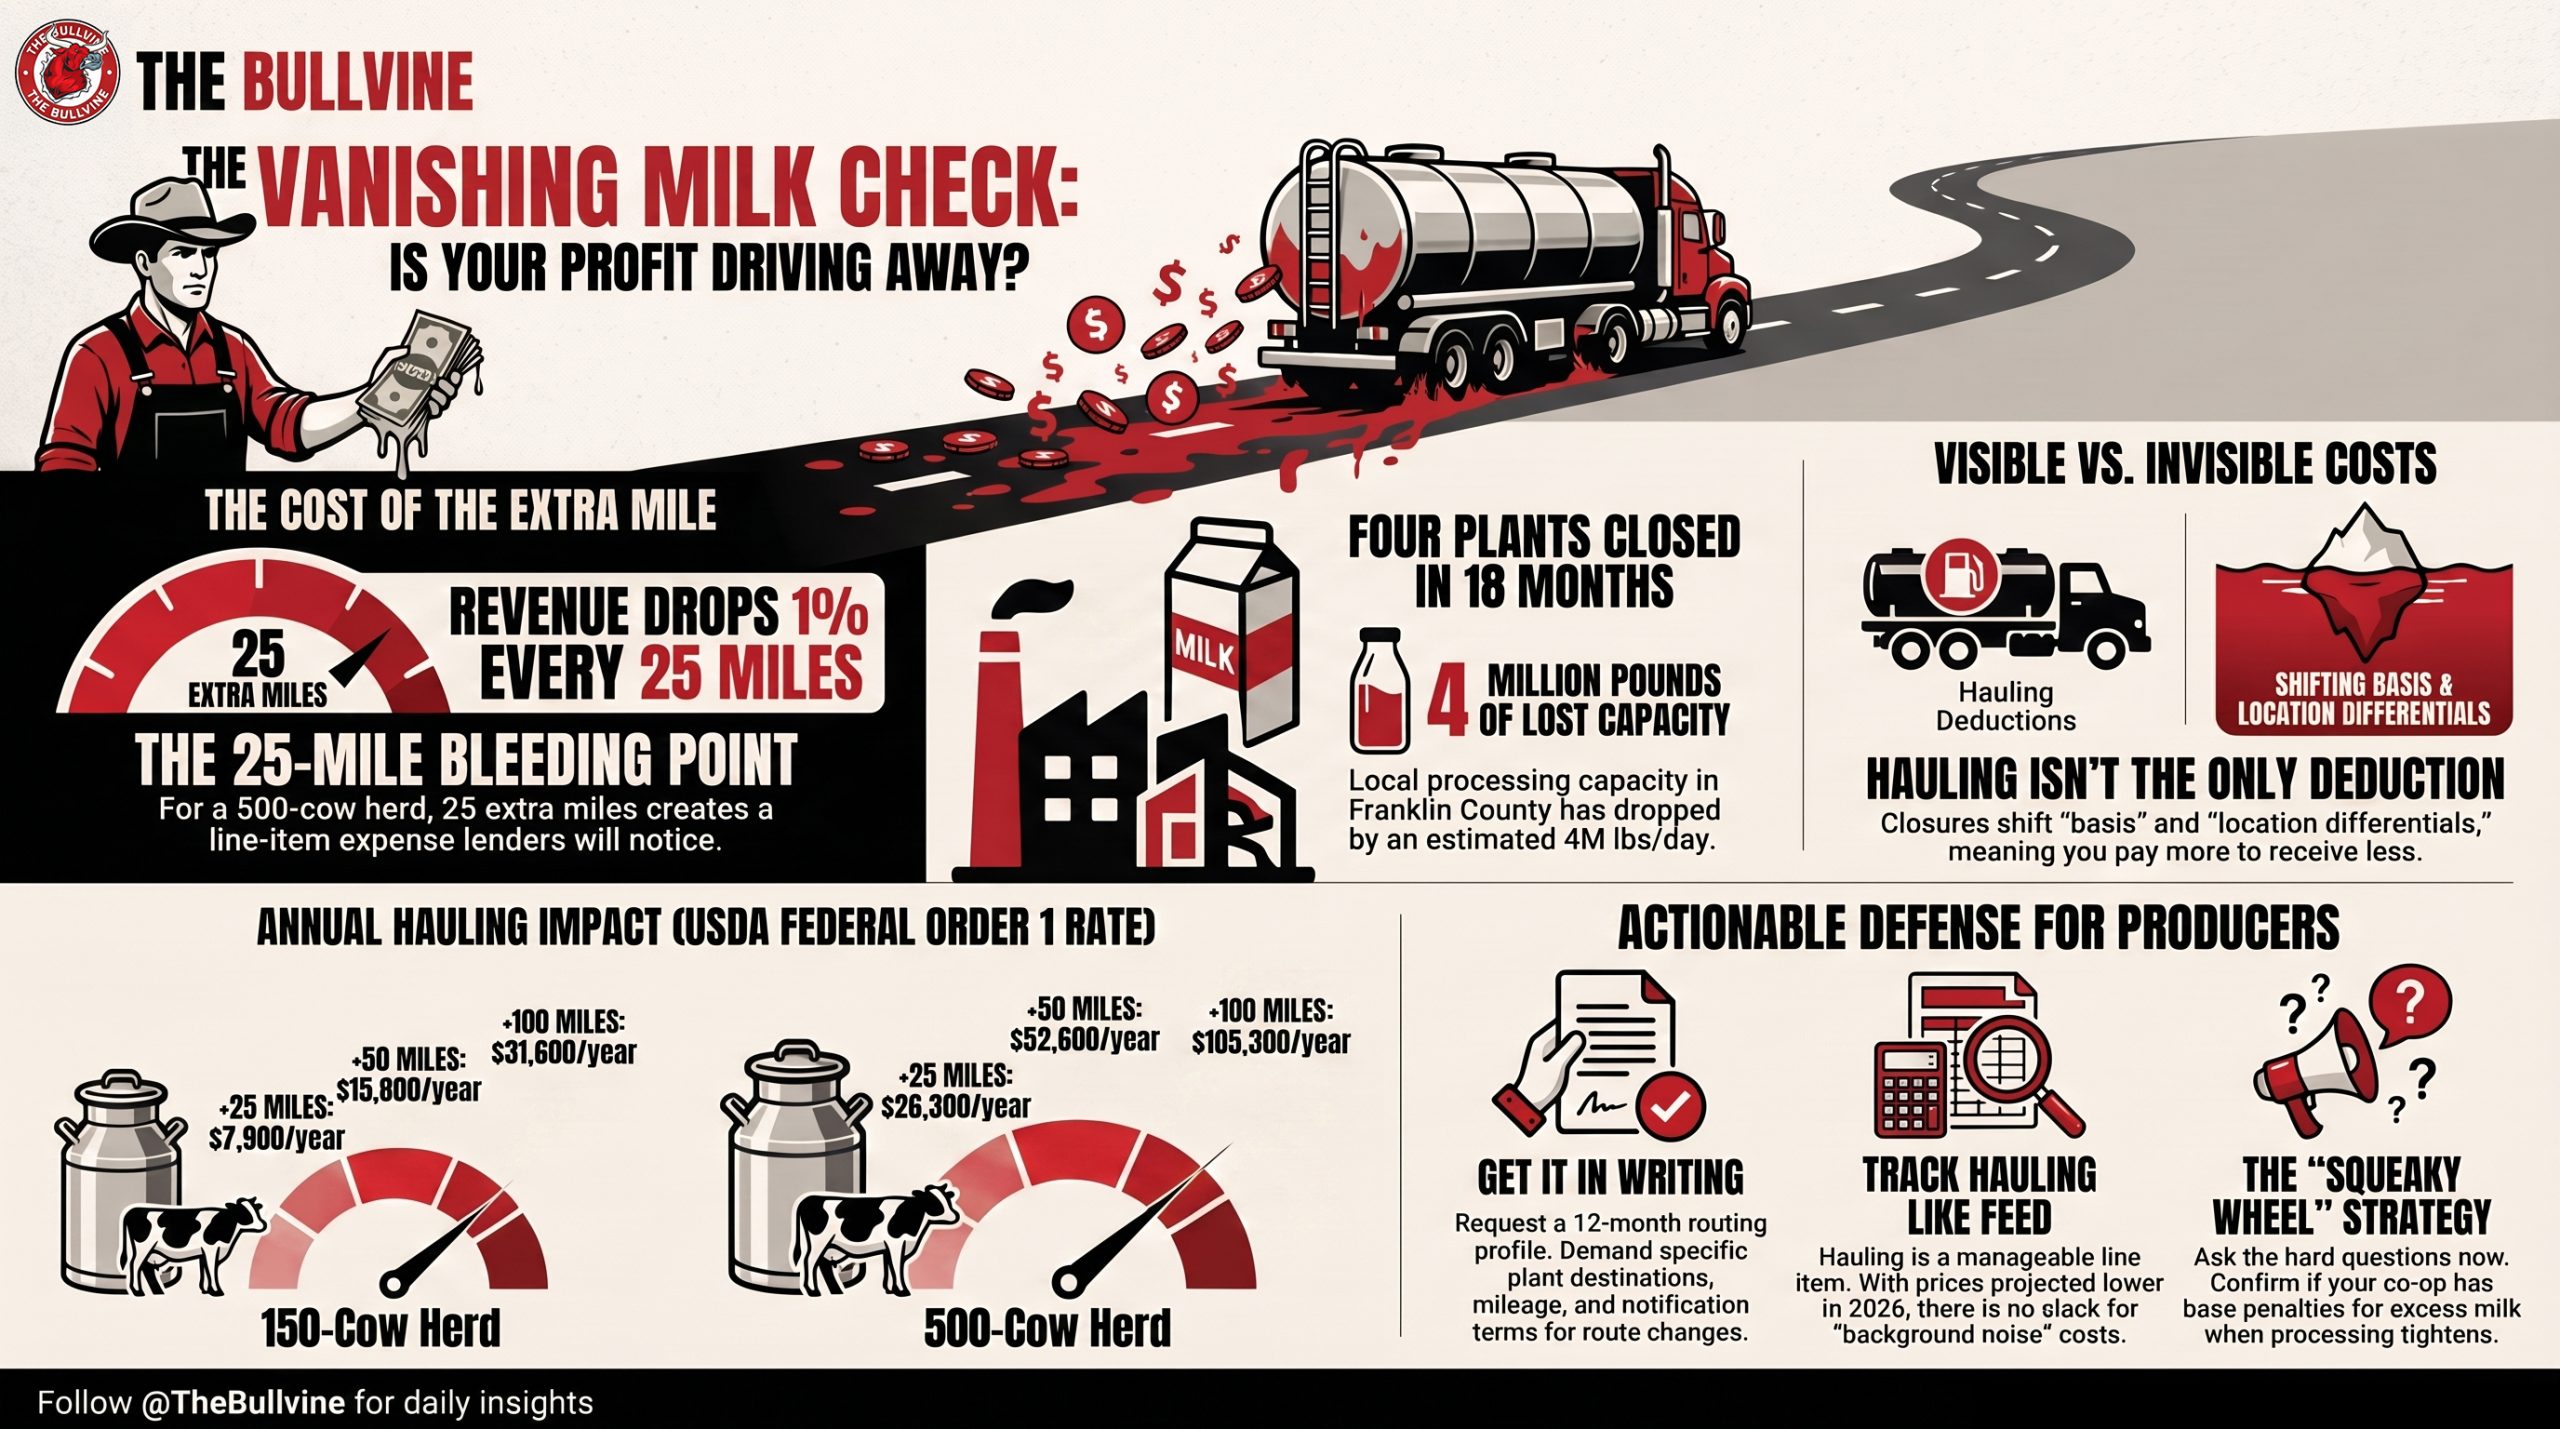
At about 25 extra miles, the haul line stops being noise. Past that, a 500-cow herd starts losing 1% of gross before feed or labor. Where’s your nearest plant now that four are gone?

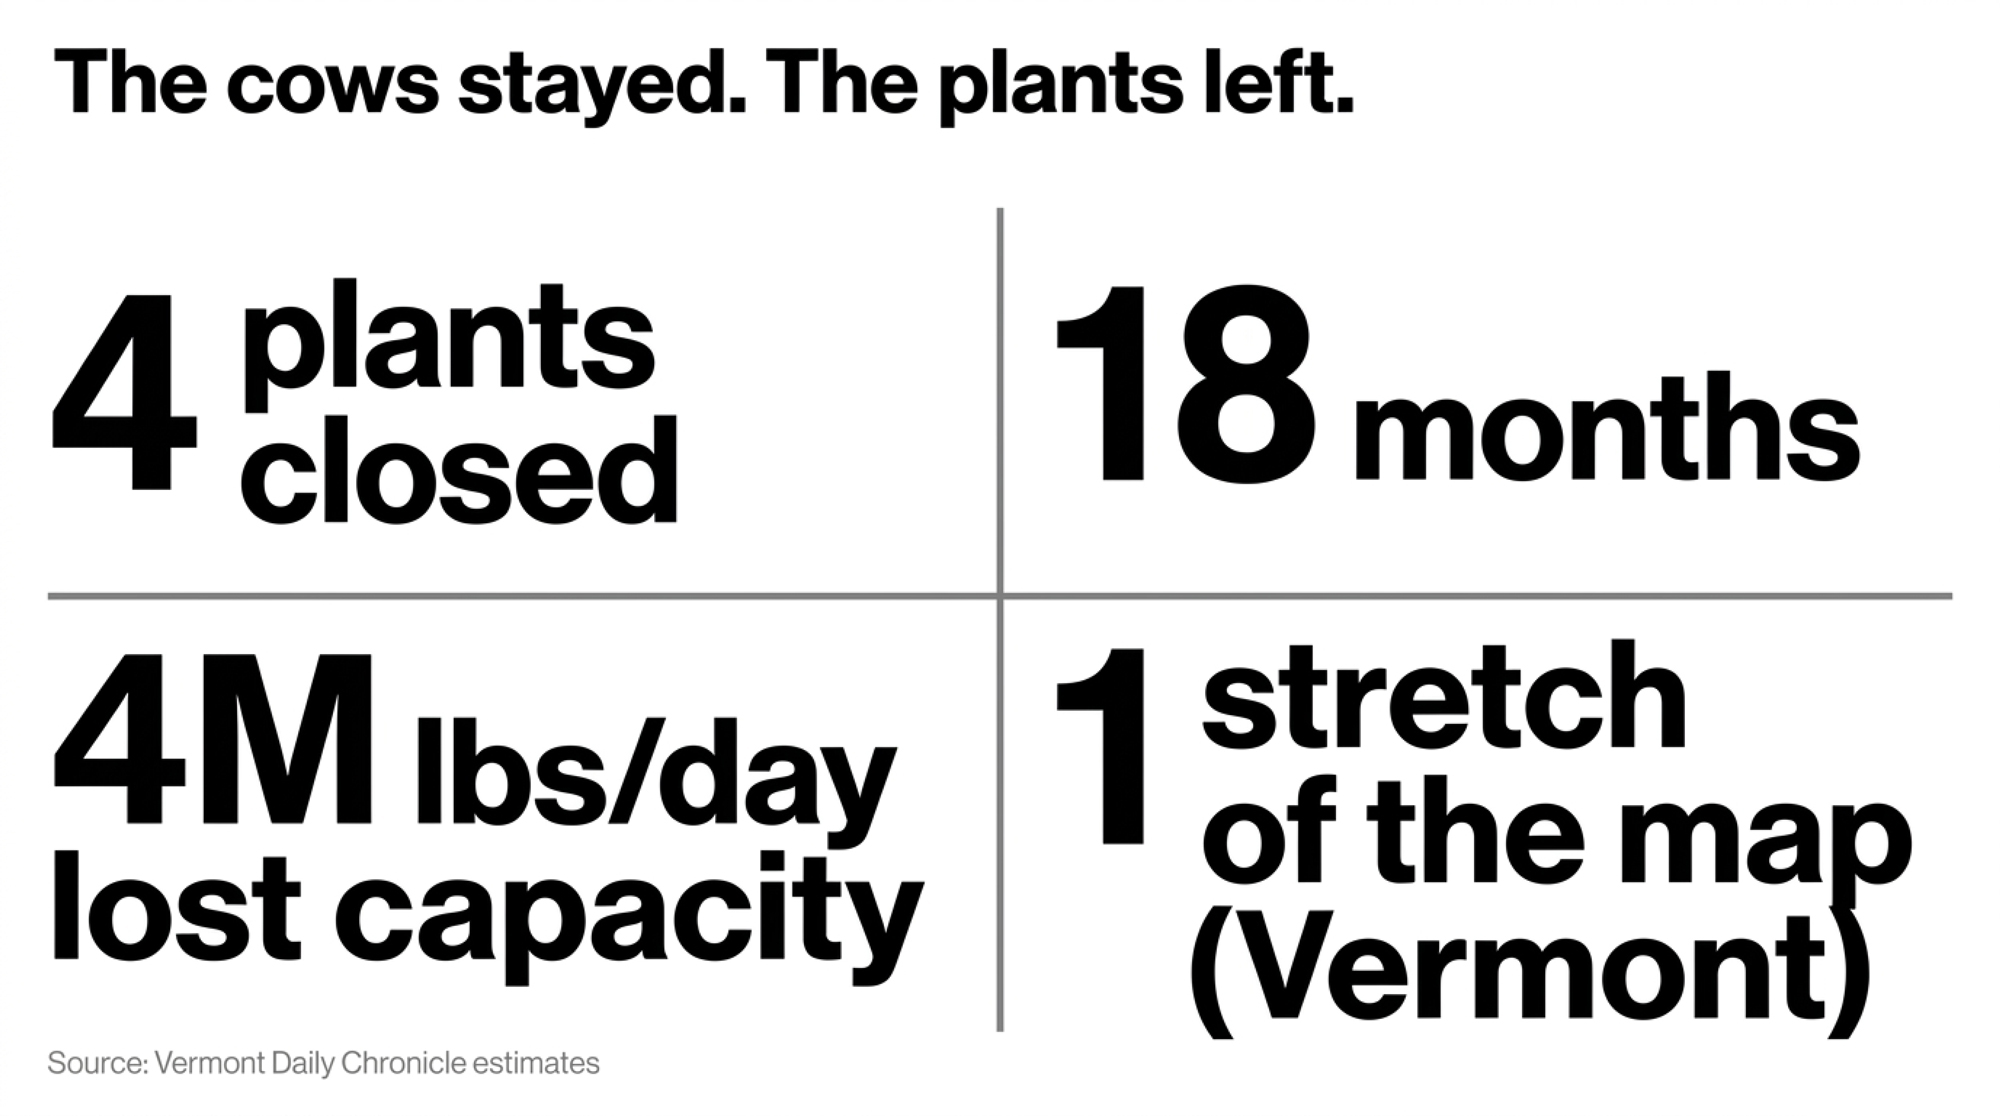
Franklin County is Vermont’s dairy capital, and in roughly 18 months, Vermont has watched four processing plants go dark or announce closures — three of them in Franklin County alone. The cows didn’t leave. The plants did. And when local processing disappears, but the milk keeps coming, that milk has to travel — at a per-cwt cost that lands on the farmer, not the co-op press release. The jobs make the headlines. The hauling math is what keeps costing money long after the cameras pack up. If you ship milk anywhere in the Northeast, the mechanics of what’s happening here are worth your attention this month, not next year. 
What’s Changing and Why

Start with the scale of what’s gone. In about a year and a half, the corner of Vermont that runs more dairy farms than anywhere else in the state has lost or is losing four plants. Booth Brothers in Barre — operated by HP Hood, in Washington County, not Franklin — closed in April 2026 after roughly 80 years, becoming the state’s last commercial fluid bottler. Franklin Foods in Enosburg Falls, a 125-year-old cream cheese maker, is closing this summer. DFA’s St. Albans plant idles on August 17 with about 80 jobs lost, and Perrigo’s infant formula plant rounds out the four. 

Each closure has its own story, and they aren’t the same story. Booth Brothers was fluid milk — the bottling end. Franklin Foods and DFA St. Albans were further down the value chain, turning raw milk into cream cheese and other products that travel and store. Lose the bottler, and you lose a fluid outlet; lose the cheese and Class III homes, and you lose the plants that soak up volume when fluid demand dips. Four plants, one stretch of the map, eighteen months — and a county that suddenly has far fewer doors for its milk to walk through. Three of the four sit in Franklin County; Booth Brothers was a county over. But the milkshed doesn’t care about county lines — pull this much processing out of the region and the milk drives farther regardless.
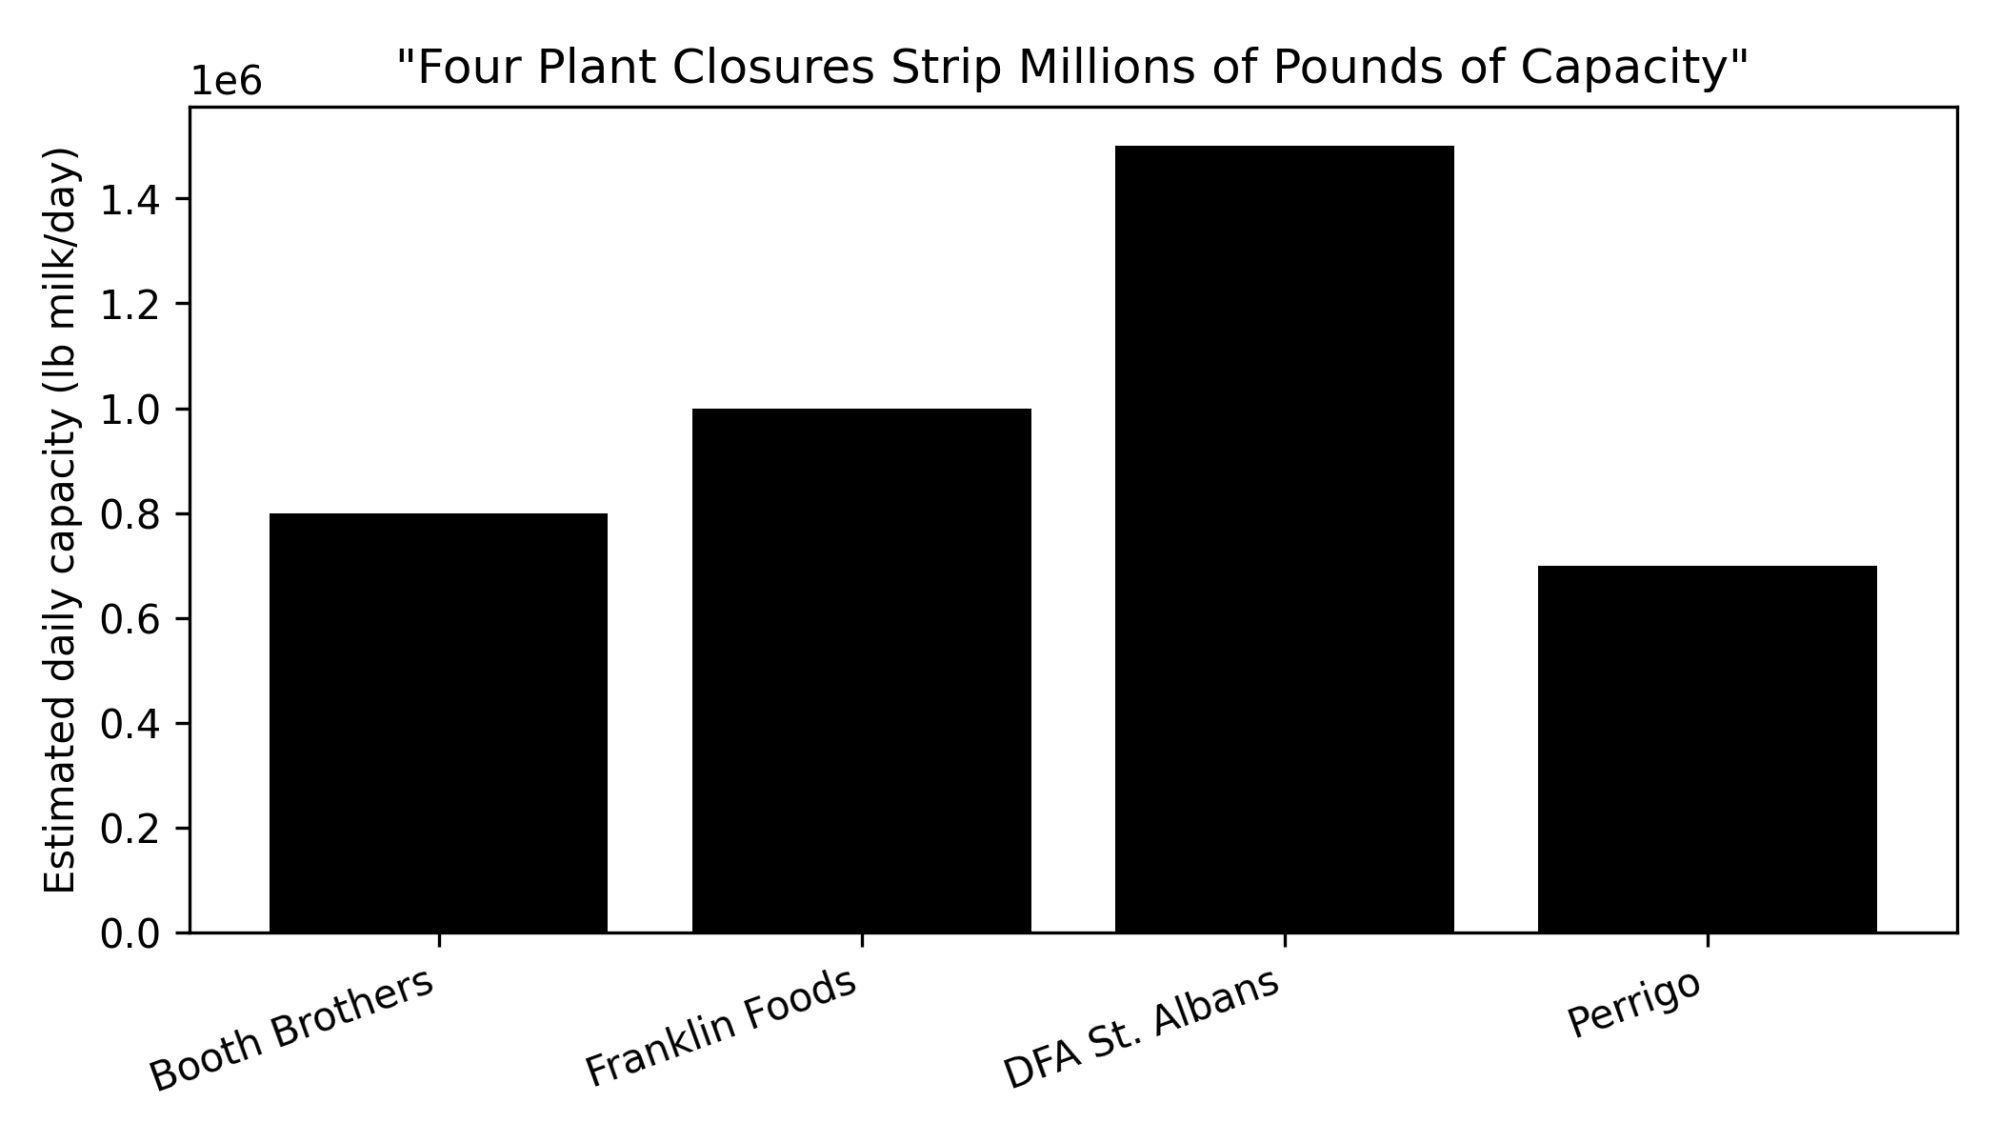
Here’s the part that lands on your operation. Vermont still produces around 2.4 to 2.5 billion pounds of milk a year — roughly two-thirds of New England’s total. What’s vanishing is the local capacity to do something with it. Vermont Daily Chronicle estimates the four closures represent close to 4 million pounds a day of processing tied to the region, though those plant-level figures are the columnist’s estimates, not company-confirmed numbers, so treat them as scale, not gospel. 

When processing leaves but milk stays, the milk has to travel. DFA says milk from St. Albans will be handled at plants in New York, Massachusetts, or Maine, “ensuring a market for regional dairy farmers and continued service to customers without disruption.” DFA’s statement speaks to market access — that your milk will still have a buyer. It doesn’t address hauling cost or basis, and the company didn’t detail per-farm hauling impact in its public statements. That’s the part that lands on your check. Here’s the math.

How This Plays Out on Real Farms

Tim Smith has watched the whole run from the front row. As executive director of the Franklin County Industrial Development Corporation, he’s spent years recruiting and keeping employers in the county. “We’ve had years of good news, and now we’re riding a wave of bad news, for sure,” he told Vermont Public. That wave is the backdrop. The hauling math is the bill. 

Milk hauling under Federal Order 1 comes straight out of your check and scales with distance. USDA’s Agricultural Marketing Service sets a mileage rate factor of $0.00824 per hundredweight per mile, effective March 2024. The National Milk Producers Federation pegs real-world hauling higher — roughly $0.92 to $1.00 per cwt per 100 miles — and says those costs have “almost tripled” since the original price differentials were set. The table below uses the USDA regulatory factor, which sits a notch below NMPF’s real-world figure. So if anything, these numbers are conservative — your actual hauler invoice may run higher. 
Run it on your own barn. Take a 500-cow herd shipping 70 pounds a cow — figure your own herd’s average, but this runs 350 cwt a day, about 127,750 cwt a year. If your milk now has to travel an extra 50 miles to reach the remaining plant, that’s roughly $52,600 a year in added hauling costs. Stretch it to 100 miles, and you’re near $105,300. Push to 180 miles — not far-fetched if loads head into New York or coastal New England — and you’re looking at close to $189,500.

Smaller operation? The number shrinks but doesn’t disappear. Here’s the same math across three herd sizes and four added distances so that you can find the line closest to your own:
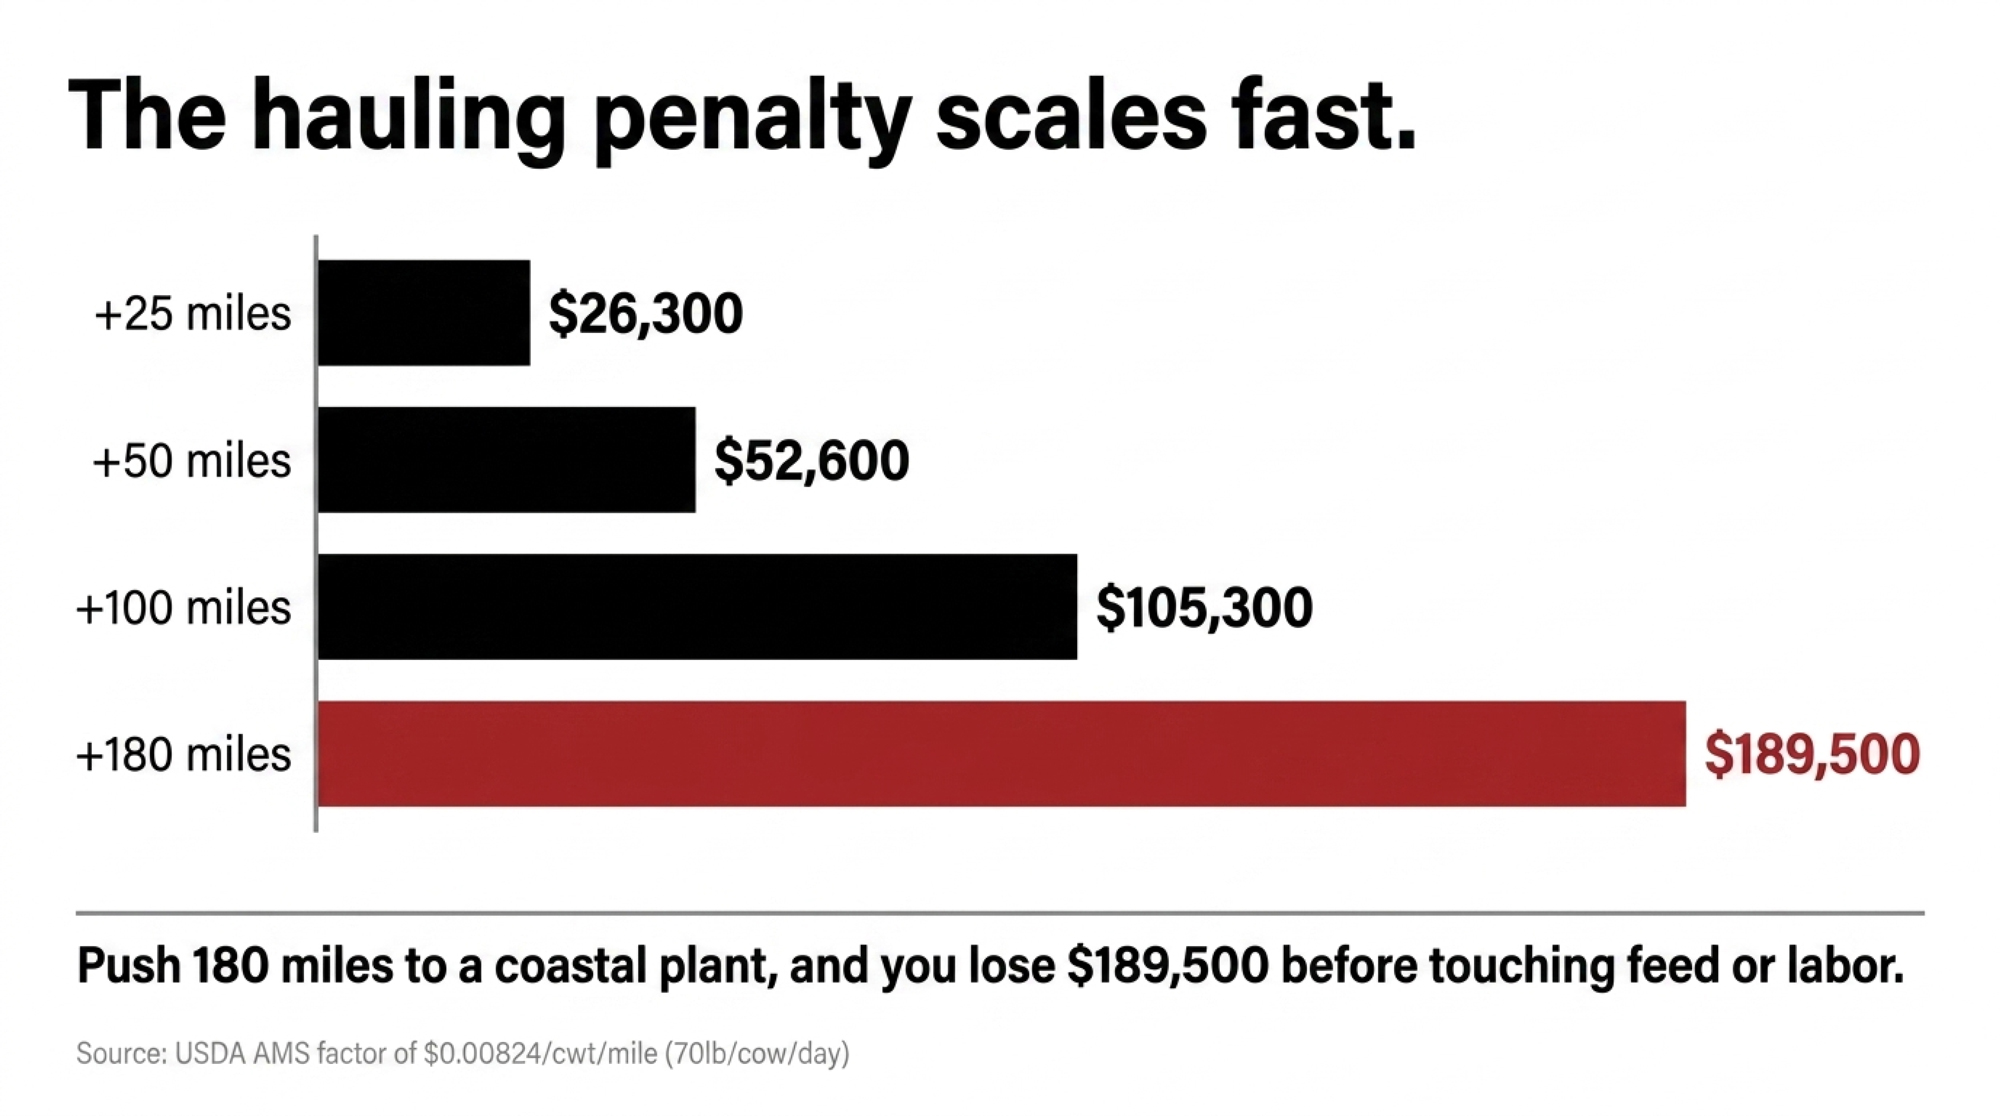
Added One-Way MilesAdded Cost per cwt150-Cow Herd300-Cow Herd500-Cow Herd
+25 miles$0.21$7,900 / yr$15,800 / yr$26,300 / yr
+50 miles$0.41$15,800 / yr$31,600 / yr$52,600 / yr
+100 miles$0.82$31,600 / yr$63,200 / yr$105,300 / yr
+180 miles$1.48$56,800 / yr$113,700 / yr$189,500 / yr

Method: each herd at 70 lb/cow/day, 365 days, times the USDA AMS Federal Order 1 mileage rate factor of $0.00824/cwt/mile. Miles are added one-way to your nearest remaining plant. Swap in your own production, and you’ve got your number.

Notice what the table does and doesn’t say. It doesn’t claim every Franklin County farm faces $52,600 — that’s the 500-cow herd at 50 added miles, nothing more. A 150-cow operation 25 miles farther out is looking at closer to $7,900. The point isn’t the headline figure. It’s that you can run your own line in about two minutes, and the closer your remaining plant, the smaller the bite — but at current Northeast prices, even a 25-mile stretch starts showing up on the year-end statement.

For the full per-cwt breakdown on a single named closure, see our earlier hauling-cost analysis of the DFA St. Albans plant.

The Mechanics Behind the Outcomes

One reroute can hit your milk check twice. There’s the cost you see on the deduction line, and the cost you have to dig for in the differential tables.
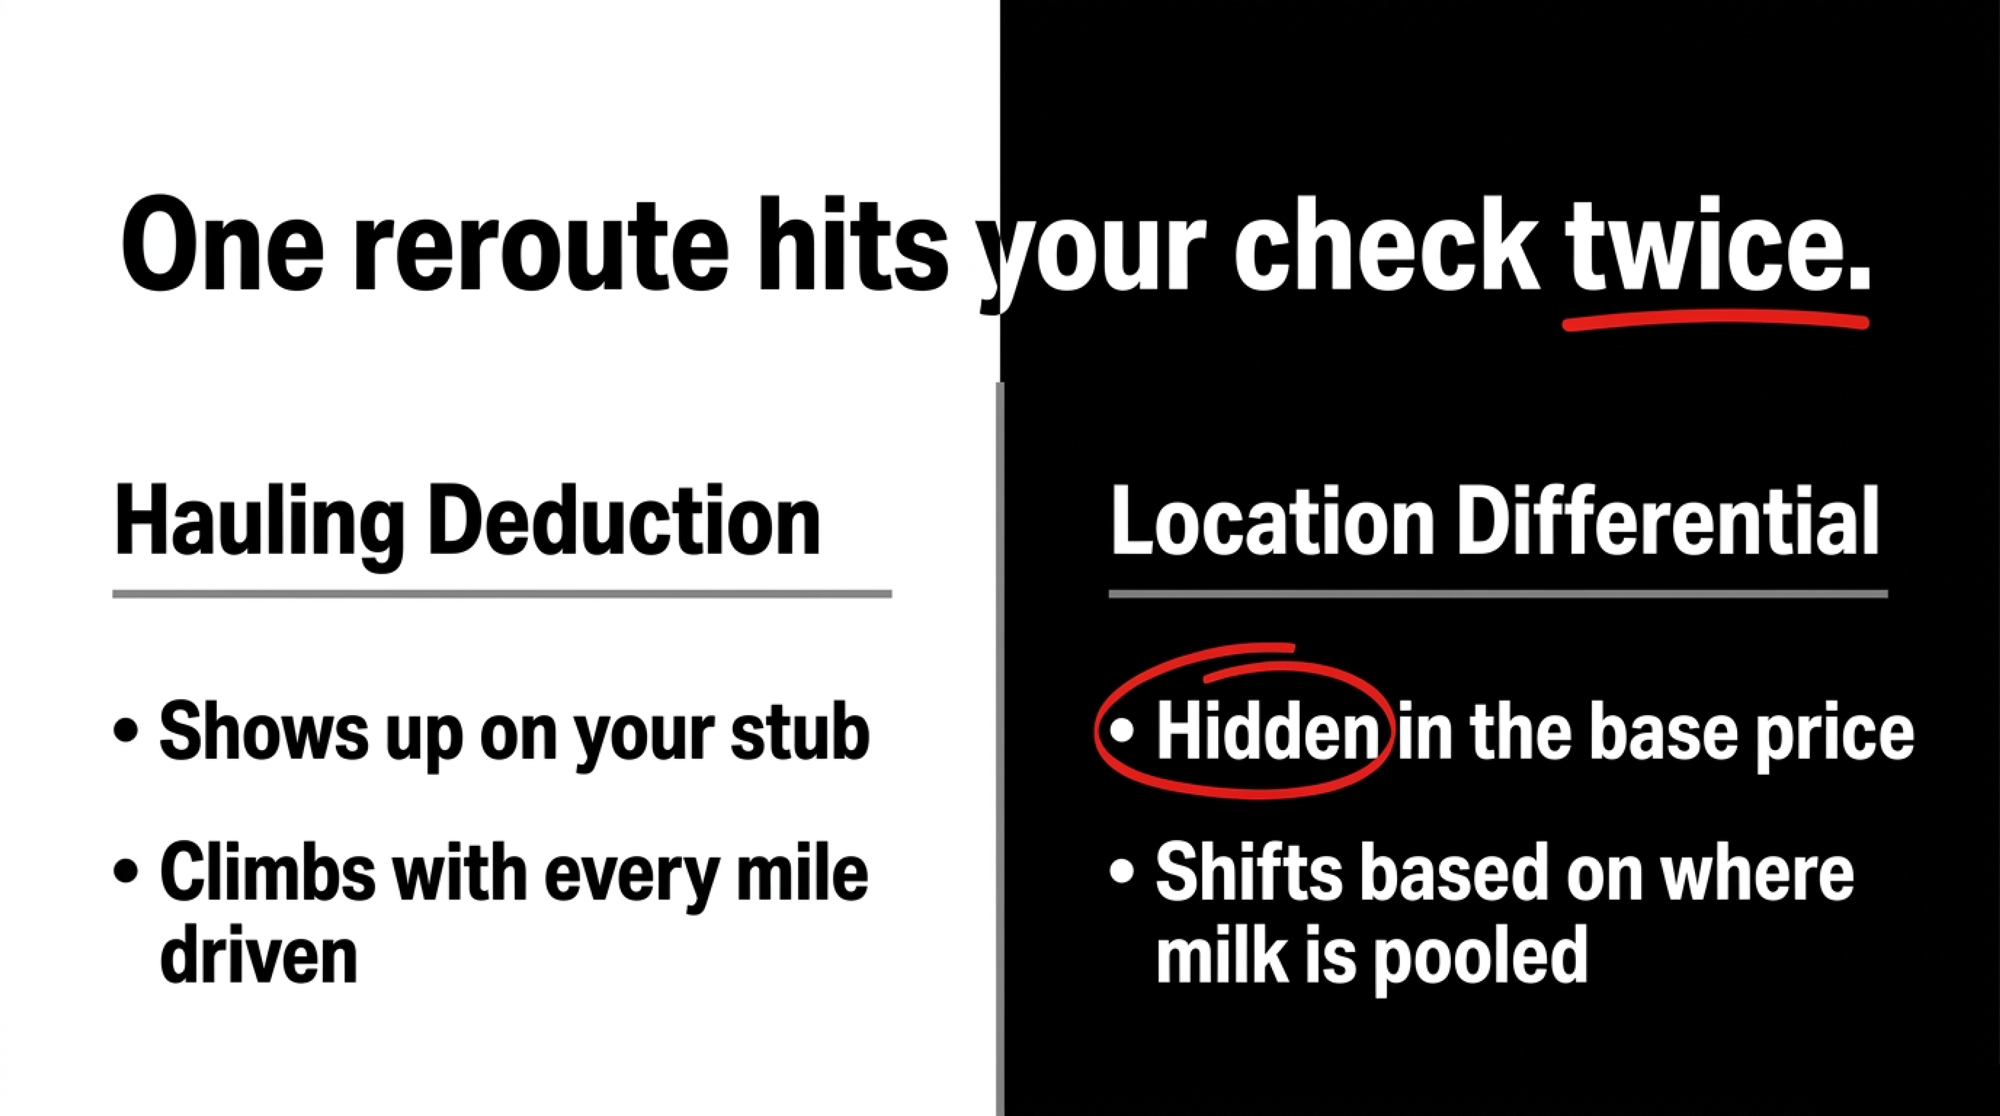
The visible cost — hauling. This shows up on your stub as a per-cwt deduction that climbs with every mile. It’s the $0.00824/cwt/mile factor, the number in the table above, the line you can point to. 

The invisible cost — basis and location differentials. This one doesn’t announce itself. It’s baked into your base price through where your milk is pooled, and it usually only surfaces when a letter shows up. 

Here’s why a plant idling shifts the pricing map so hard. Under Federal Order 1, the location of the plant receiving your milk helps drive Class I differentials and is part of your basis. When a nearby plant idles, your milk doesn’t just drive farther — it gets pooled at a different point on the map, and that point carries its own location adjustment. So the closure quietly resets two inputs at once: the miles you pay for, and the price zone you’re paid from. 

Both moved in 2026, in opposite directions. The June 2025 FMMO reform raised Class I location differentials across the Northeast, thereby lifting the Class I price and the producer price differential for the order. But pulling the other way, recent FMMO make-allowance changes trimmed class prices by roughly $0.85 to $0.93 per cwt nationally in their first three months, pulling an estimated $337 million out of producer pools, according to American Farm Bureau analysis. Less money in the pool, more cost credited to the processor. You feel both ends — the longer haul and the thinner pool. For a plain-language walk-through, here’s how the new FMMO make-allowance math hits your check. 
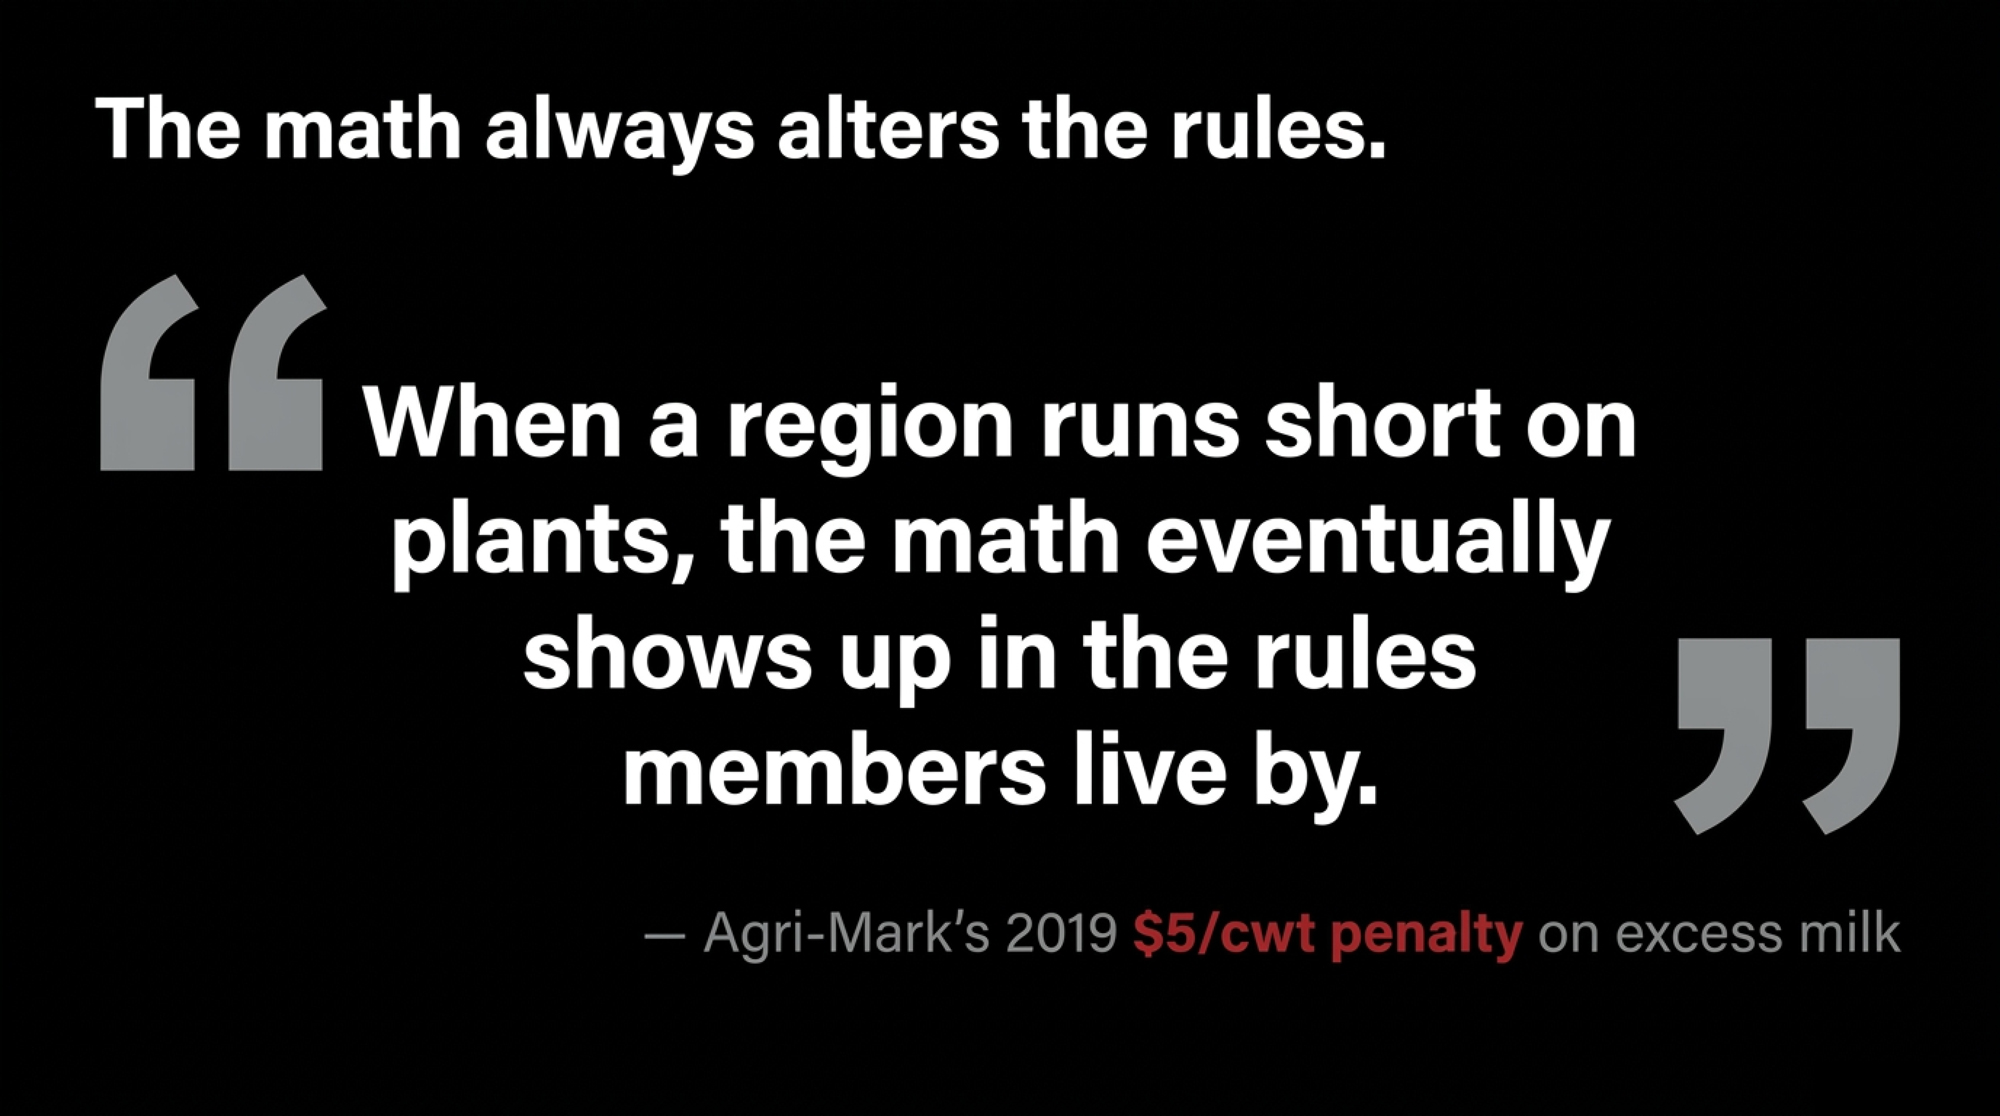
Then there’s a piece of regional history worth keeping handy, because it’s the closest thing the Northeast has to a dress rehearsal for what tight processing does to a co-op’s rules. In October 2019, Agri-Mark told its members that, starting in January 2020, any milk shipped above each farm’s base would incur a $5/cwt penalty. The co-op tied it directly to what it called “significant losses on excess milk” — too much milk, not enough room to process it. Farms under 2 million pounds a year were exempt; bigger herds felt it. The lesson wasn’t that one co-op got tough. It was that when a region runs short on plants, the math eventually shows up in the rules members live by. 

DFA says it doesn’t cap how much milk a member can produce, and it hasn’t announced any base or penalty program tied to these closures. The Agri-Mark episode isn’t a prediction about DFA. It’s a reminder that across the Northeast, base programs have historically shown up when processing tightens — so it’s a fair question to put to your own co-op, whoever that is. 

How Many Extra Miles Before It Actually Hurts Your Milk Check?
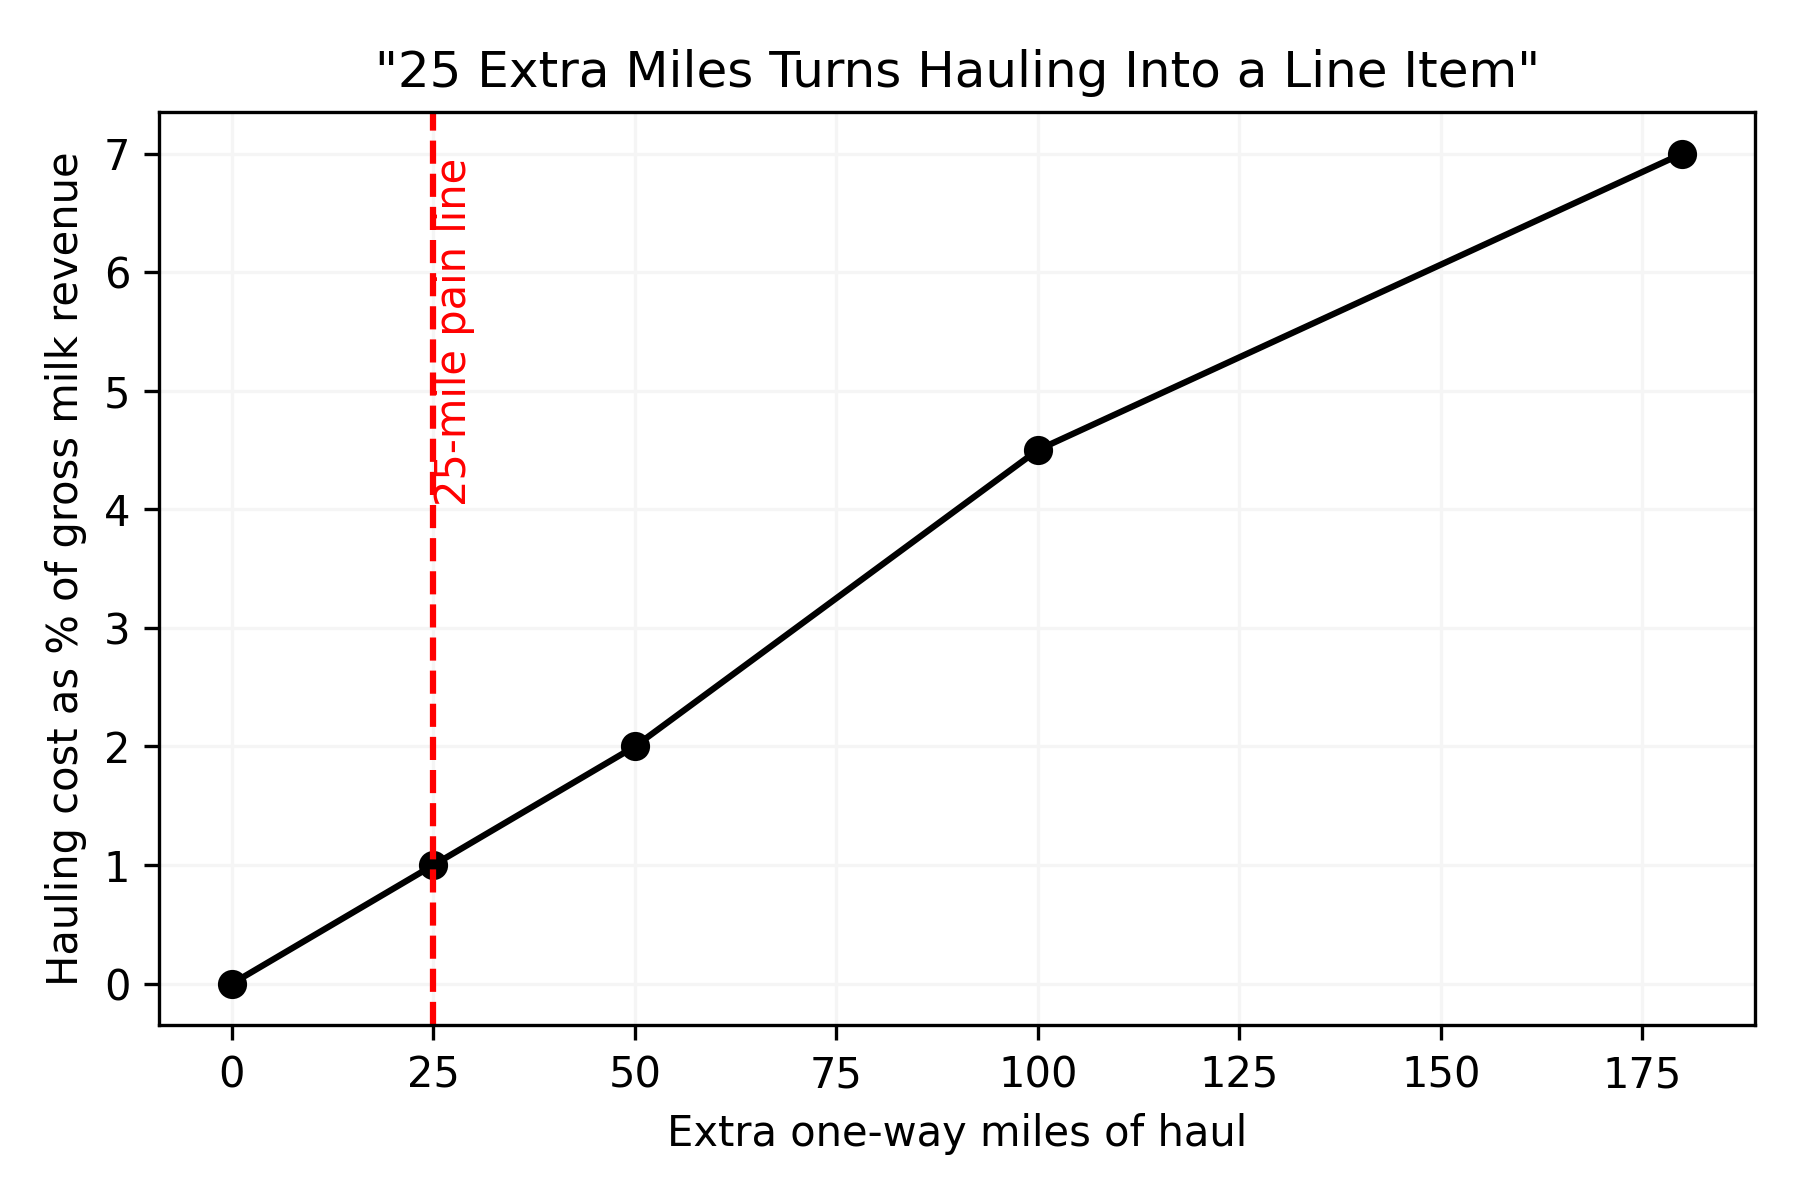
Closer than you’d guess. On that same 500-cow herd, gross milk revenue at a blend forecast of $21.07 per cwt runs around $2.69 million a year. A 1% hit — the kind your lender notices on the year-end statement — is about $26,900. Plug in the FMMO mileage factor, and that threshold shows up at roughly 26 extra miles of haul. Run it against USDA’s lower 2026 all-milk forecast of $20.70, and the trigger barely moves — about 25 miles. 

ScenarioBlend price (USD/cwt)Gross revenue (USD/year)Extra miles (one-way)Hauling cost as % of gross
Baseline, no reroute21.072,691,00000.0%
“Pain line” threshold21.072,691,000261.0%
USDA all-milk forecast lower case20.702,643,000251.0%
Long-haul case (+100 miles, current price)21.072,691,0001004.5%

So the working rule is blunt. Once your milk is traveling more than about 25 miles farther than it used to, the hauling line stops being background noise and starts being a line item you manage. At 100 to 180 miles, you’re handing over roughly 4 to 7% of a year’s gross before you’ve touched feed, labor, or interest. And that’s haul alone — fold in a basis swing from the new plant’s location, and the real number sits higher. Where does your breakeven sit if hauling jumps 40 to 80 cents a cwt? If you can’t answer that fast, it’s the number to find this week.

What’s the One Question Almost Nobody Asks Their Co-op?
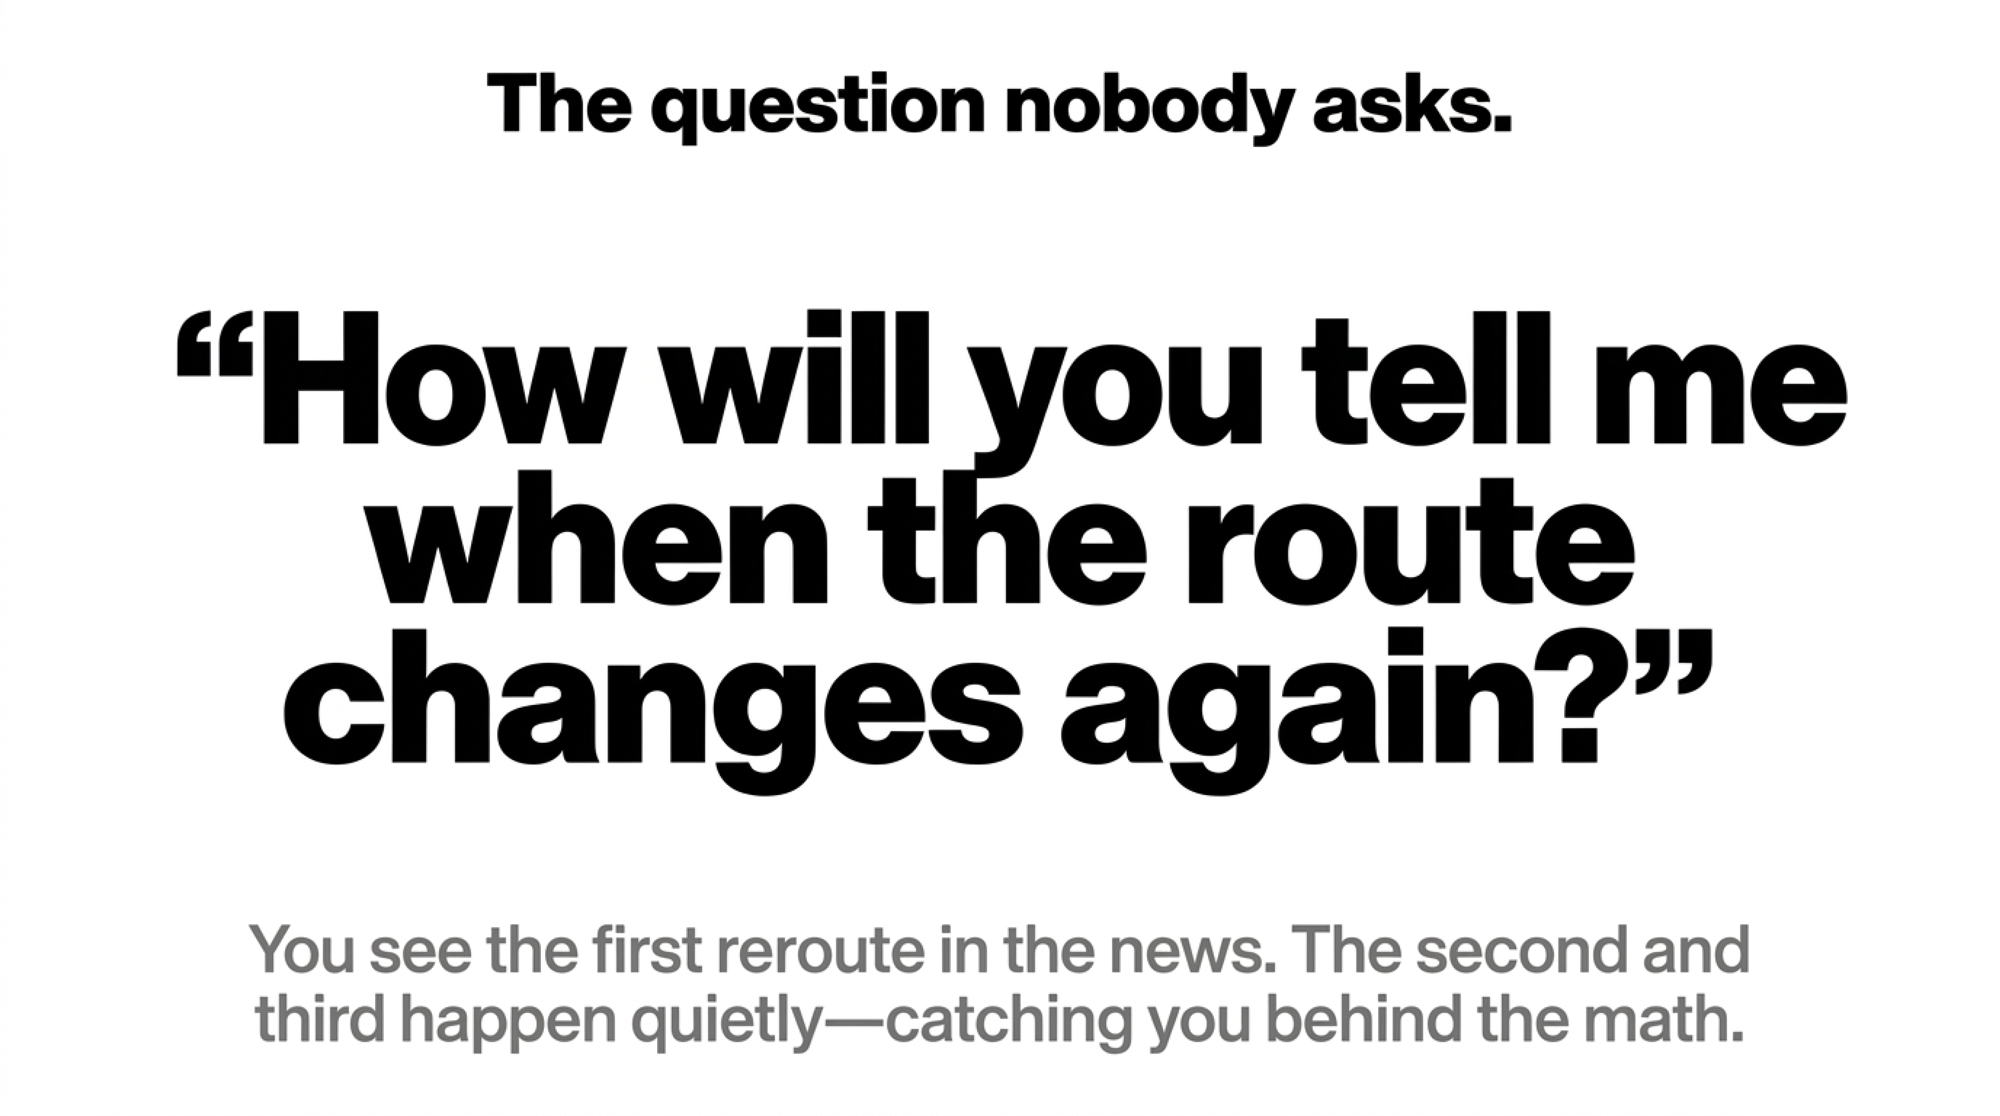
Most farmers will now ask where their milk is headed. Far fewer ask the harder one: how will you tell me when the route changes again?

That’s the dangerous gap. The first reroute, you’ll see coming — it’s in the news. It’s the second and third, the quiet ones, six or twelve months out, when shipping requirements shift and the milk gets moved again without much notice, that catch you behind the math. You want a written commitment on how and when you’ll be notified. Without it, you find out when the check arrives with a new hauling deduction, a different basis, and maybe a note explaining why you’re suddenly over base.

There’s a counter-story running underneath all this, and it’s worth holding onto. John Ovitt has walked into the same Enosburg Falls cream cheese plant for 37 years. When Hochland, the German company that owns Franklin Foods, decided to shut its U.S. operations this year, Ovitt didn’t just stay through the closure — he moved to buy the building himself. On September 1, he plans to reopen it as Franklin County Cheese with about 20 workers, down from the nearly 100 the plant employed before. “I have worked here for 37 years and been through all the changes and did not want to see it close,” he told VTDigger. His bet on a small local plant is, in its own way, a vote that nearby processing matters for more than jobs — it’s what keeps milk from having to drive three states to find a home. 

Options and Trade-Offs for Farmers

No path here is free. Each one trades one thing for another.

Stay with your co-op and demand better numbers. Makes sense if your co-op still gives you the best market access and the relationships are solid. What it requires: you treat hauling like a feed cost — tracked, questioned, and pinned down in writing. The risk is that co-ops don’t always move fast on transparency, and you might be the one asking uncomfortable questions. With milk prices projected to be $2.50 to $3.00 lower in 2026 than in 2025, there’s no slack to leave on the table. Squeaky beats silent. 

Shop for a different plant within your radius. Makes sense if there’s another processor within 75-100 miles. What it requires: the same barn math on the new option — basis, premiums, volume commitment, hauling. The catch is real, though. Vermont Daily Chronicle notes the Northeast conventional market is “essentially closed” as co-ops limit new members. Worth a phone call. Don’t assume the door’s open. 

Move a slice of volume into shorter, higher-value milk. Makes sense if you’re near schools, direct markets, or a small processor like Ovitt’s Franklin County Cheese. What it requires: a home for the rest of your milk and the appetite to manage two channels. It won’t replace a big contract. But shaving 10 to 15% off to go to closer, higher-value outlets can buy room when long-haul costs spike. 

The 30-day move: Before any of the above, sit down with your field rep and get a written, farm-specific routing and hauling profile for the next 12 months — what plant, how many miles, what rate per cwt, what location differential, and how you’ll be told when it changes. That single conversation exposes your real exposure before the next reroute, not after.
Key Takeaways

  • If your milk route lengthens by more than about 25 miles and your hauling line doesn’t change clearly to match, treat it as a flag and ask for the numbers in writing — that’s roughly where a 500-cow herd starts losing 1% of revenue to haul. 
  • If your co-op can’t name the specific plant taking your milk, you can’t run real hauling or basis math. “New York, Massachusetts, or Maine” isn’t an answer you can budget against. 
  • If your milk moves to a plant in a different Order 1 location, pull both Class I location adjustments and price the swing — the basis shift hides where the haul deduction doesn’t. 
  • If you don’t have a written routing-and-notification agreement for the next 12 months, that’s the single most important ask to put on the table this month.
  • If you ship above the base level, pull the Agri-Mark 2019 precedent ($5/cwt over base) and ask your co-op directly how it would handle excess milk if regional processing continues to tighten. 
  • If a large share of your volume rides with a single buyer, run your concentration risk now — before a closure forces the question for you.
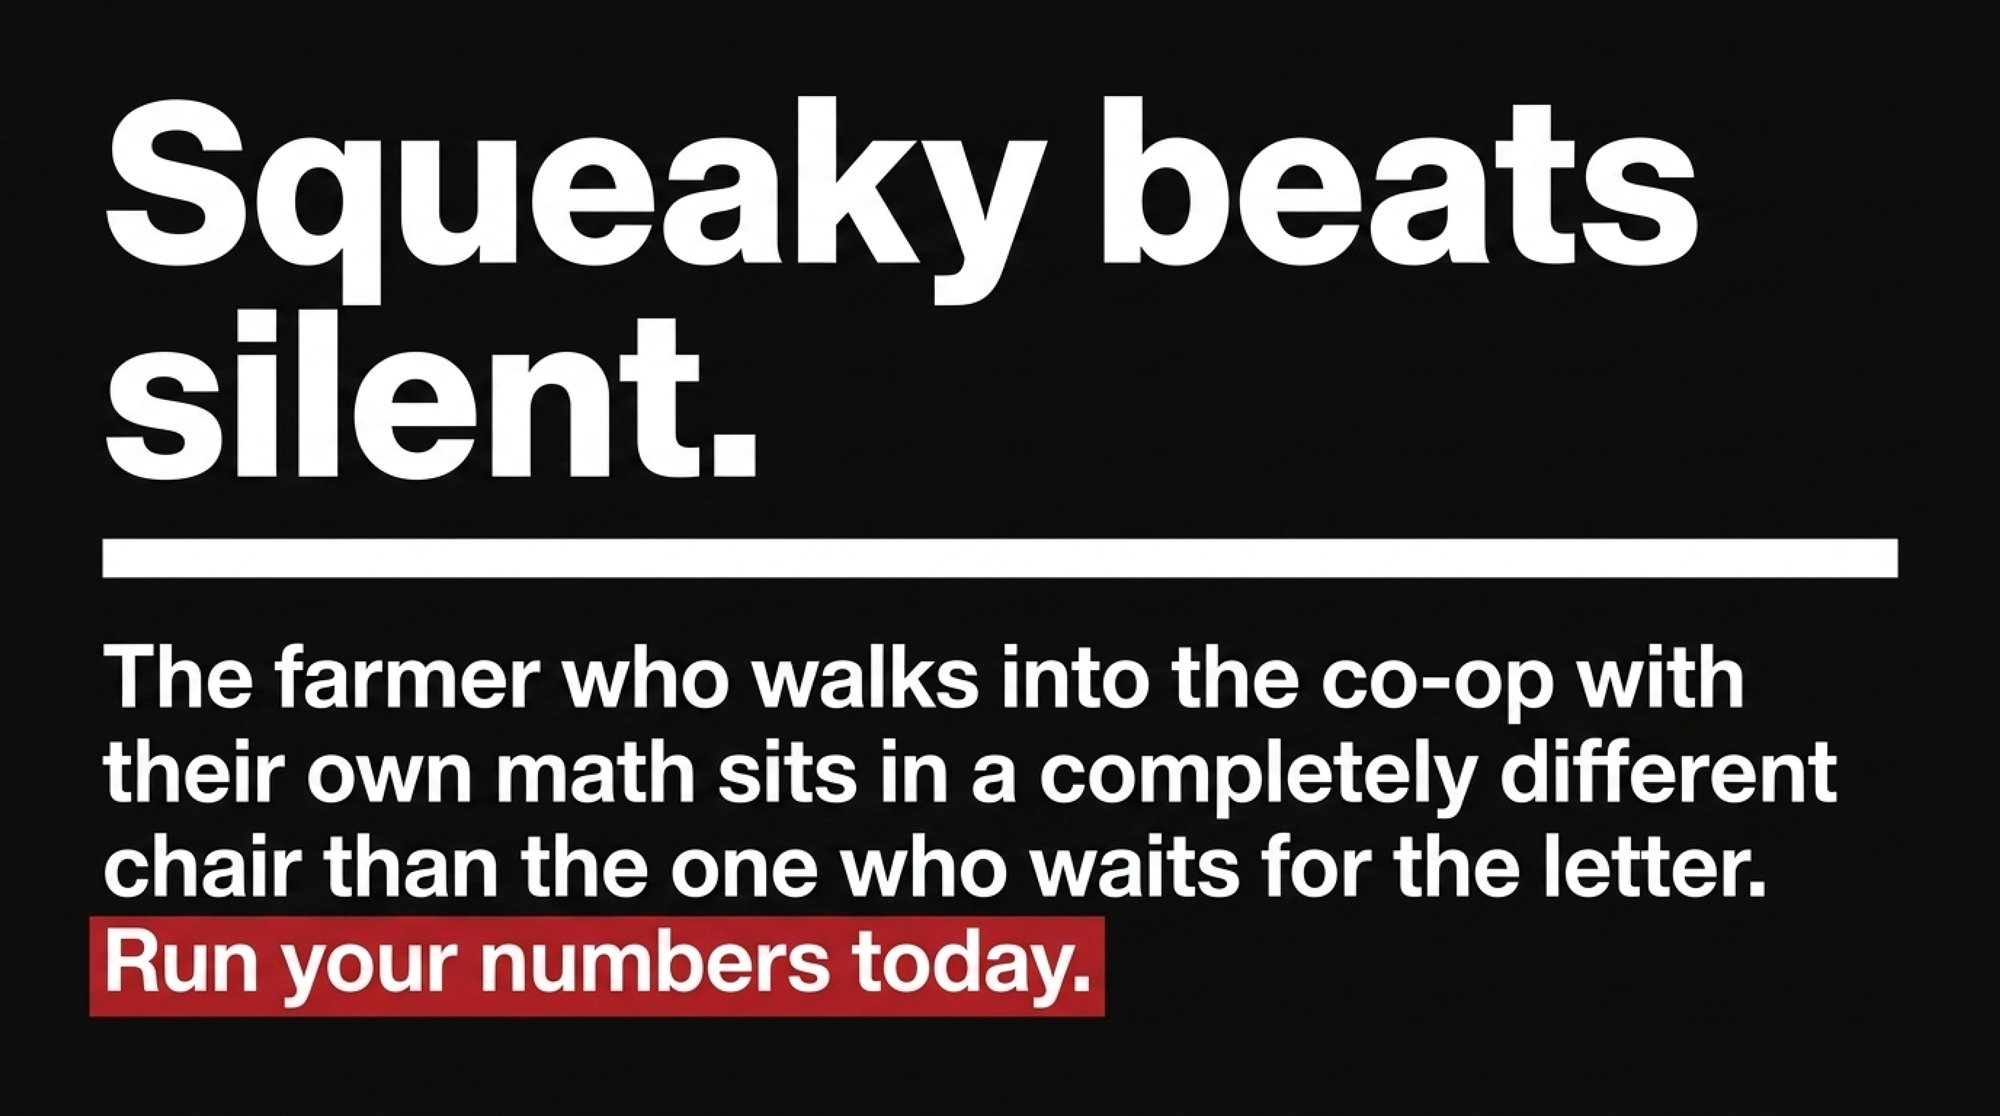
A Franklin County farmer reads this tomorrow morning. The plants are closing, whether or not anyone runs the numbers — but the farmer who pulls three milk stubs, sketches what another 25, 50, or 100 miles does to his own herd, and walks into the co-op office with that math is sitting in a very different chair than the one who waits for the letter. John Ovitt looked at a shuttered plant and saw something worth saving. The question for the rest of us is quieter: when your milk starts driving farther, will you be the first to know, or the last?

Dairy Hauling & Basis Impact Calculator

Adjust the sliders to mirror your barn’s current metrics and evaluate your real financial exposure under the new regional processing footprint.

Annual Volume
0 cwt
Added Hauling Cost
$0
Basis Equity Loss
$0
Total Annual Hit
$0

Complete references and supporting documentation are available upon request by contacting the editorial team at editor@thebullvine.com.

Learn More

The Sunday Read Dairy Professionals Don’t Skip.

Every week, thousands of producers, breeders, and industry insiders open Bullvine Weekly for genetics insights, market shifts, and profit strategies they won’t find anywhere else. One email. Five minutes. Smarter decisions all week.
NewsSubscribe
First
Last
Consent

38,000 Trucks, Four Days, One Question Your Co-op Hasn’t Answered About Your Milk Check

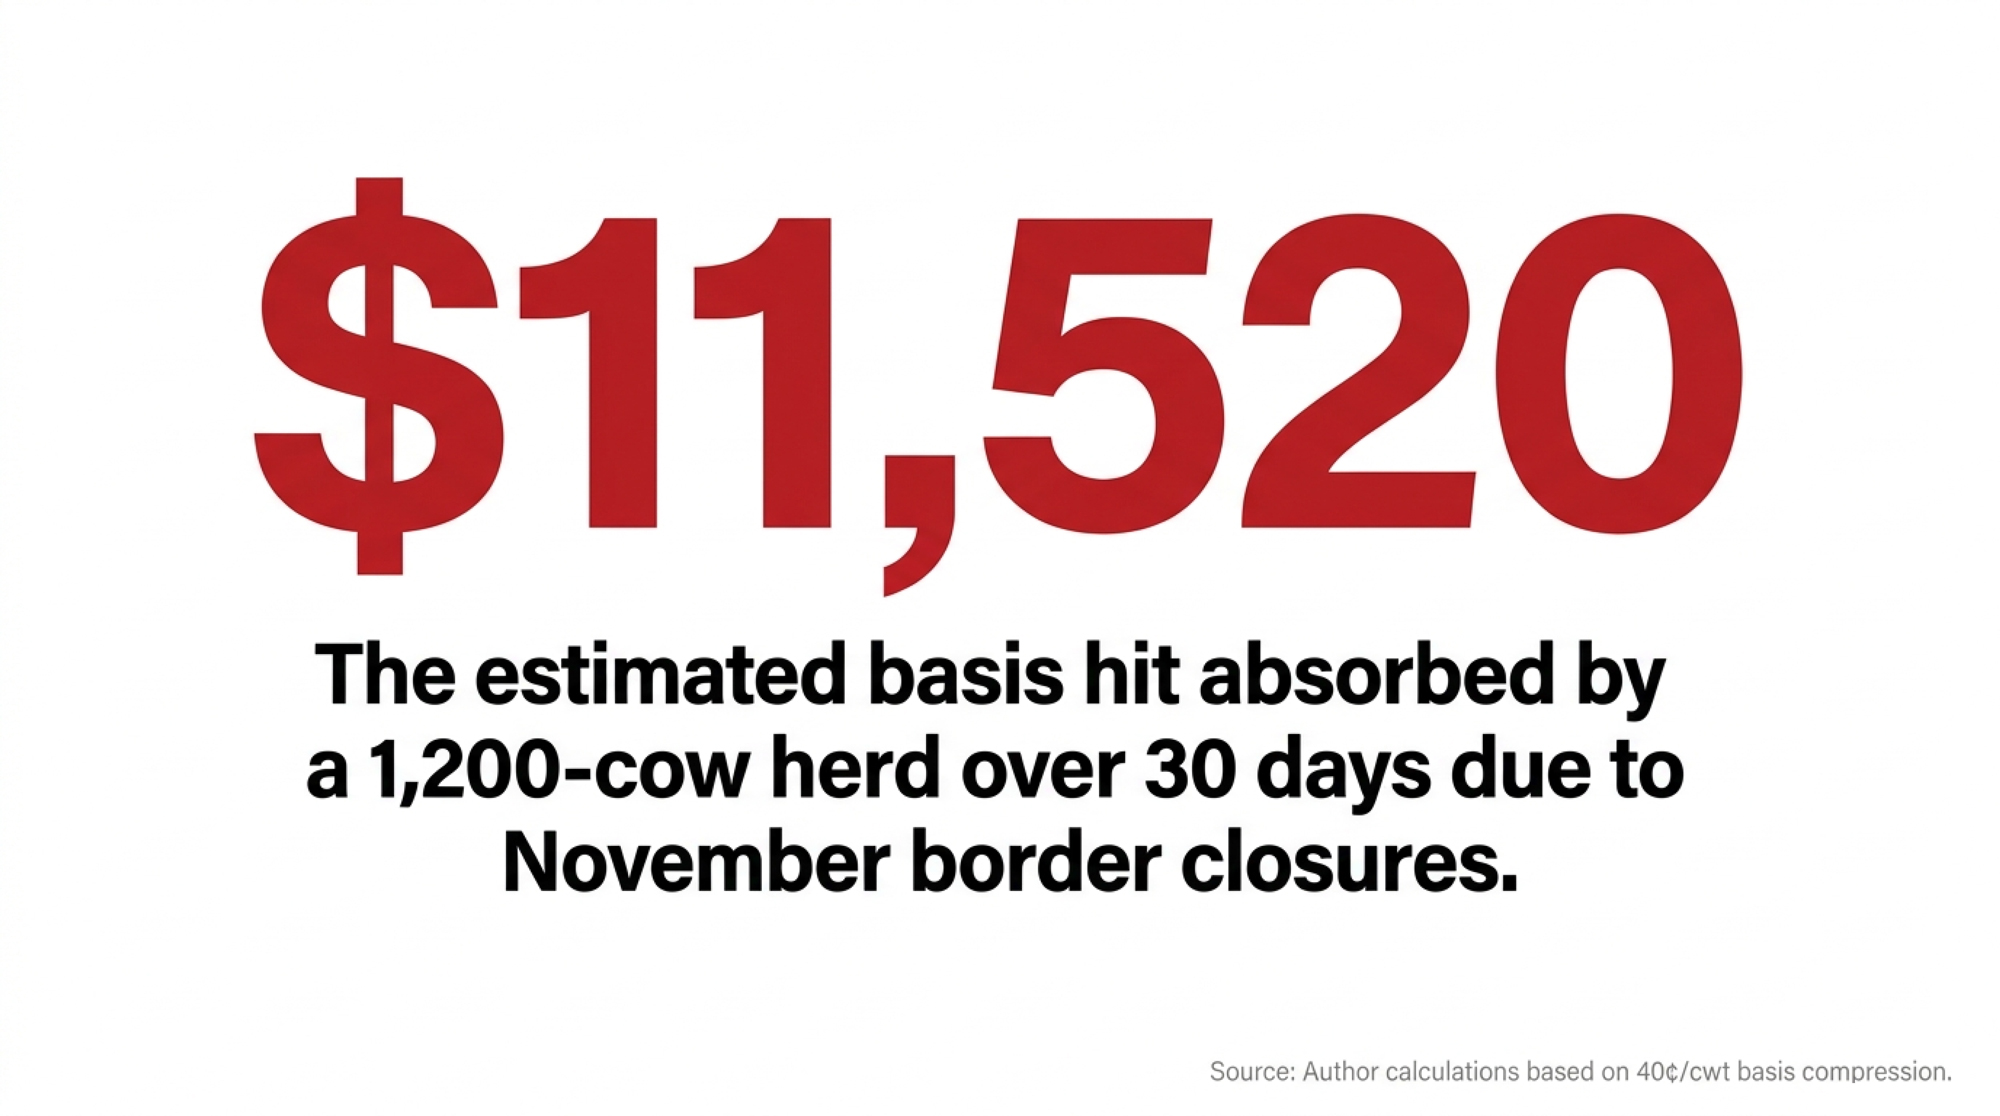
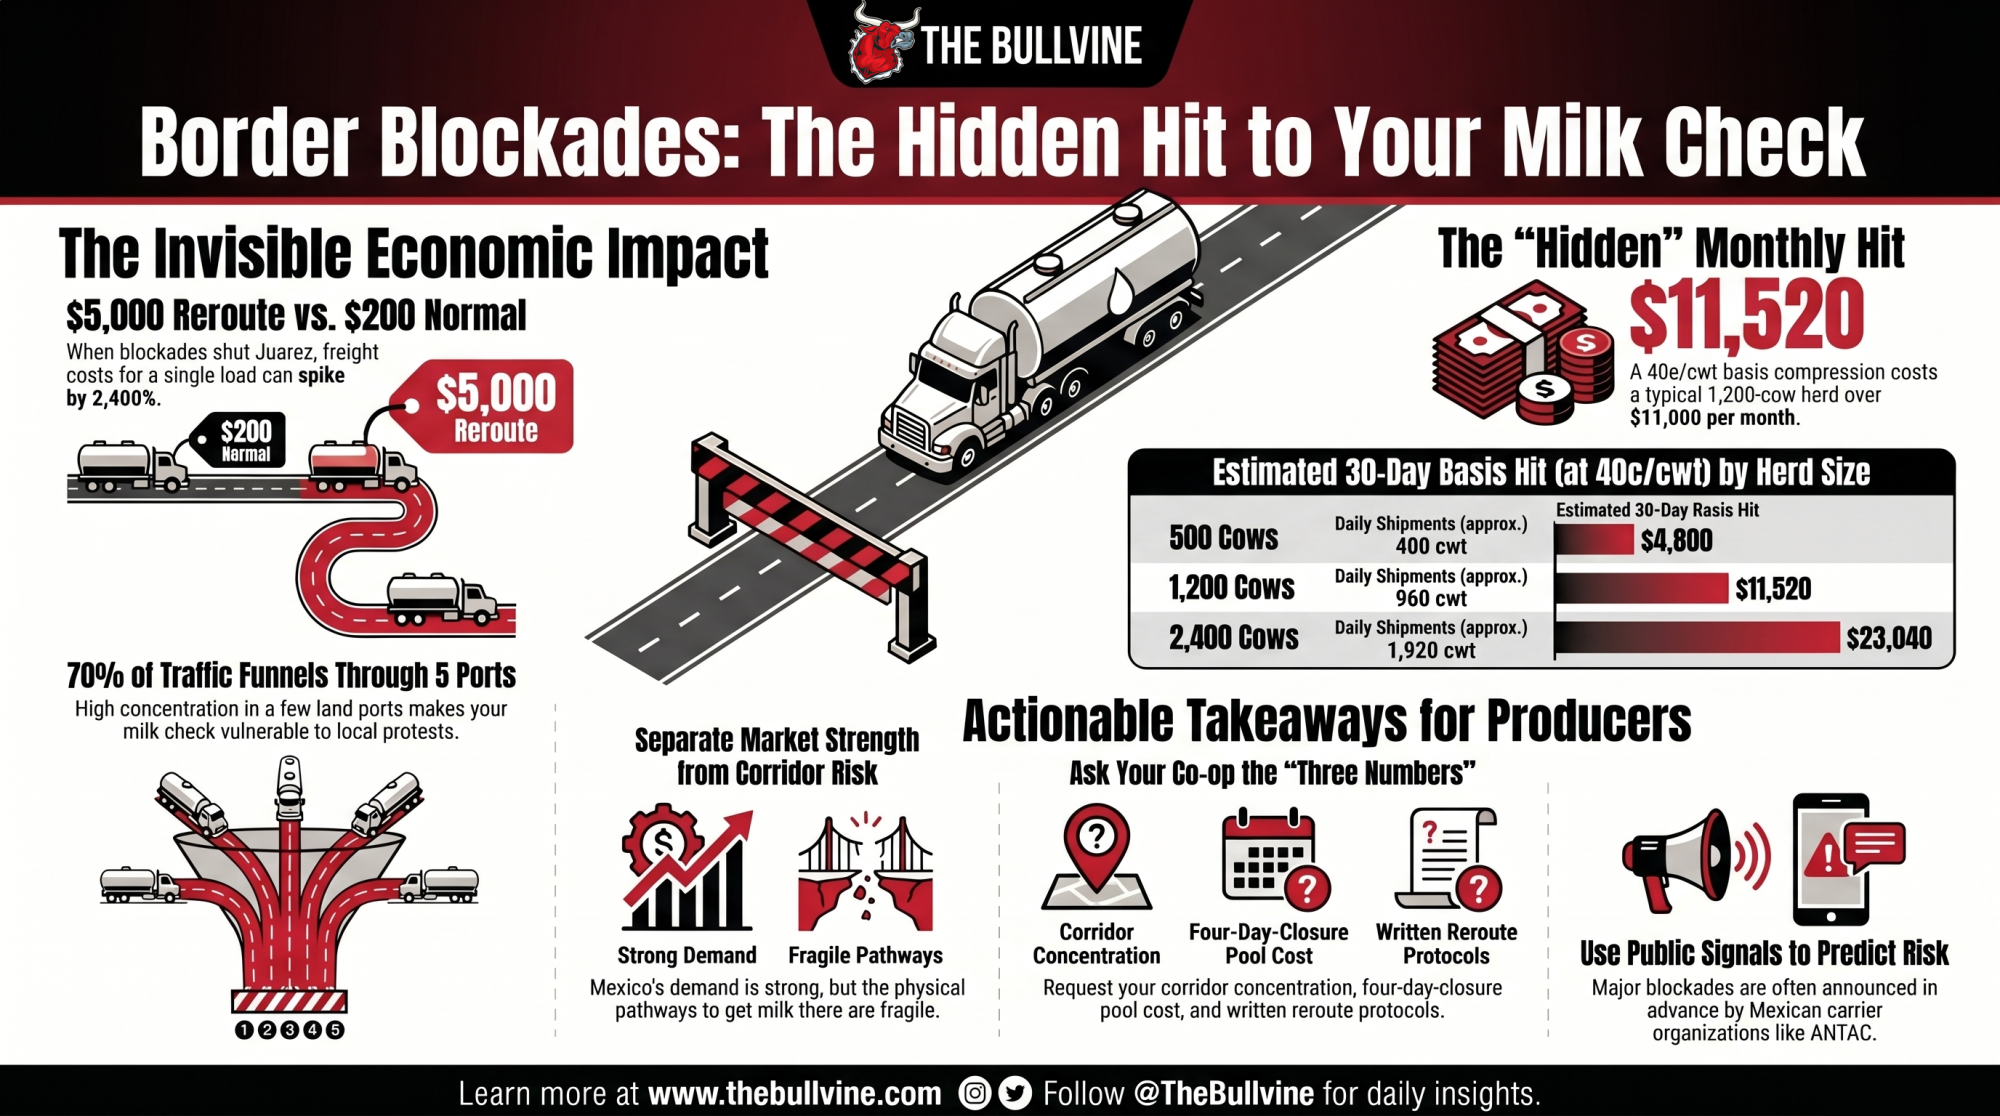
Four days of closed bridges. About $5,000 per reroute versus $200. On a 1,200-cow herd, ~40¢/cwt of compression for a month is roughly $11,520 — and your field rep can’t tell you why.

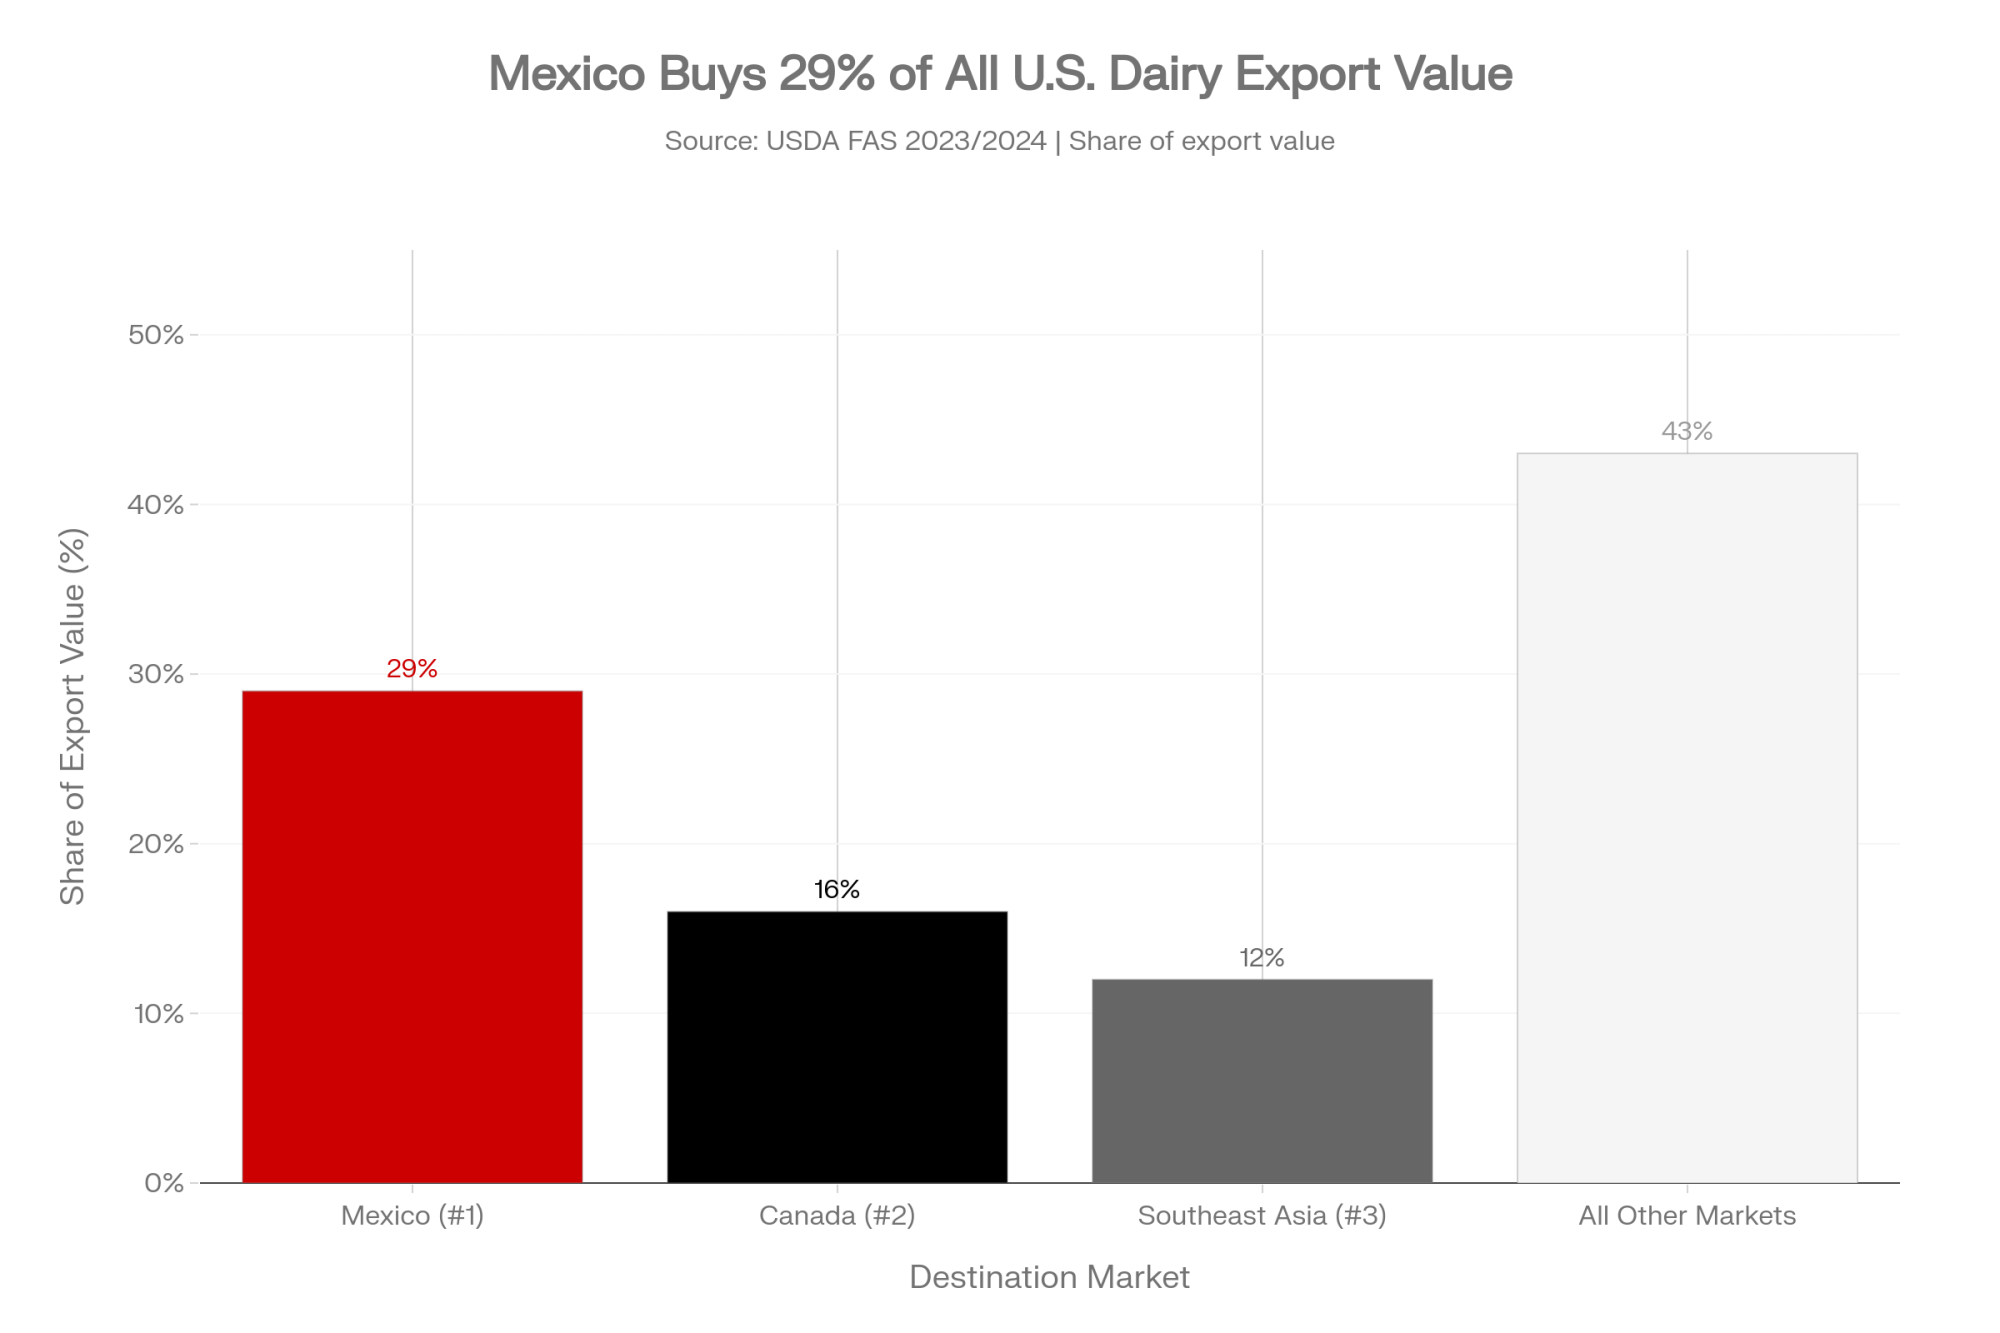
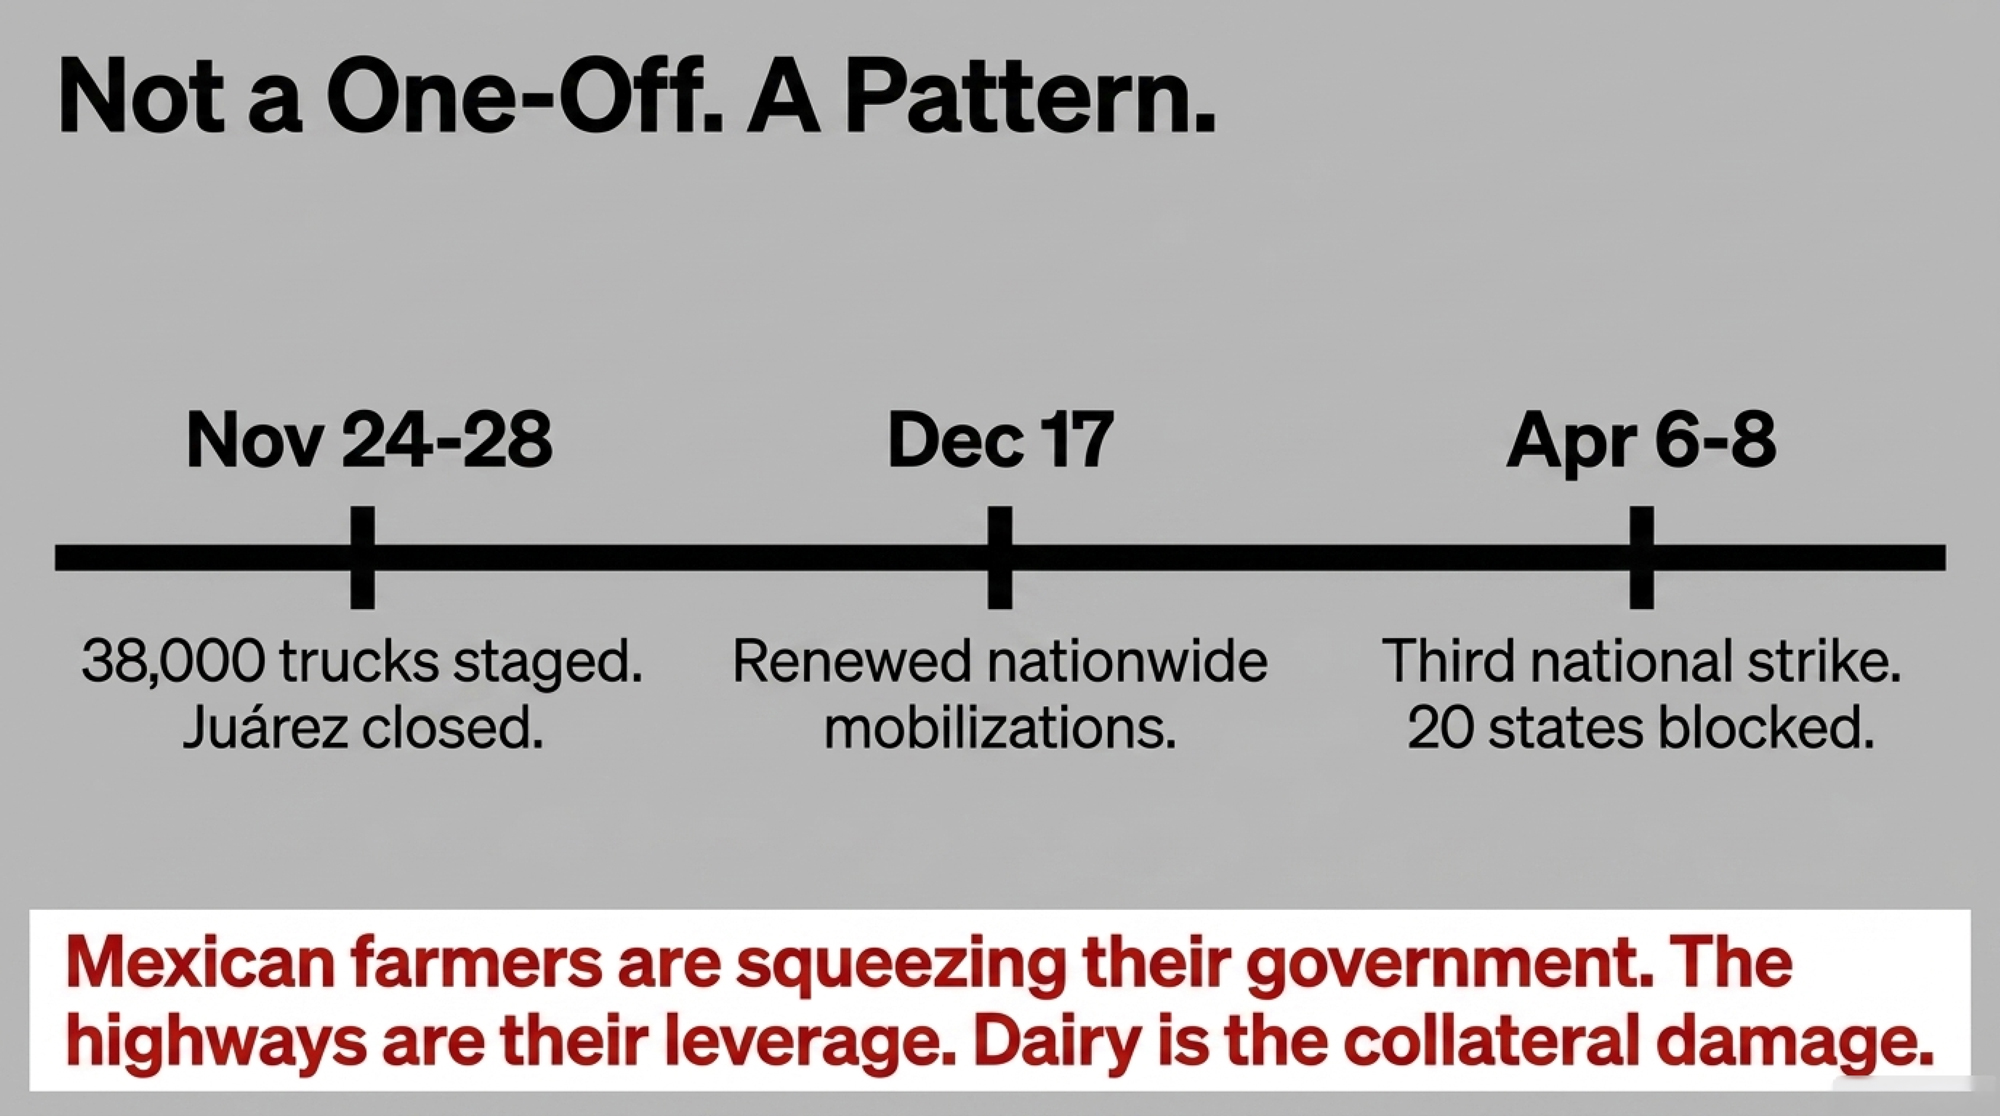
Executive Summary: Three coordinated farmer-and-trucker blockades in five months — November 24–28, December 17, and April 6–8 — shut down the Juárez–El Paso corridor that moves the highest commercial volume of any land border on earth, staging 38,000 trucks during the November round alone. Mexico now buys roughly 29% of U.S. dairy export value, about $2.32 billion in 2023 per USDA FAS, and more than 70% of that traffic funnels through five land ports. When co-op export desks rerouted through Nogales, costs jumped from $150–$200 a load to roughly $5,000 — and that compression got pooled and showed up as a soft export month, not a line item. On a 1,200-cow herd shipping 80 lbs/cow/day, a 40¢/cwt basis hit over 30 days runs about $11,520, and most producers can’t tell you whether November cost them that, double, or half. The wrinkle: December 2025 exports still finished +13% YoY, the strongest since 2022, so the aggregate headline and your co-op’s actual routing reality may be telling very different stories on the same milk check. With the USMCA review deadline July 1, 2026 and three blockade dates already announced publicly before they hit, the highest-leverage move is asking your co-op — this week — what percentage of your Mexico volume runs through Juárez and what a four-day closure costs the pool. If the field rep can’t answer, that’s the answer.

Mexico dairy export blockade

By the time Manuel Sotelo spoke to El Paso reporters during the November 24–28, 2025 closure, the standard freight workarounds had stopped working.

Sotelo serves as vice president of the Mexican Chamber of Cargo Transportation for Northern Mexico, the trade association representing northern Mexican freight carriers. According to the Chamber’s public materials, he’s logged roughly two decades in cross-border logistics across the Juárez–El Paso corridor — the highest-volume commercial land border on earth.

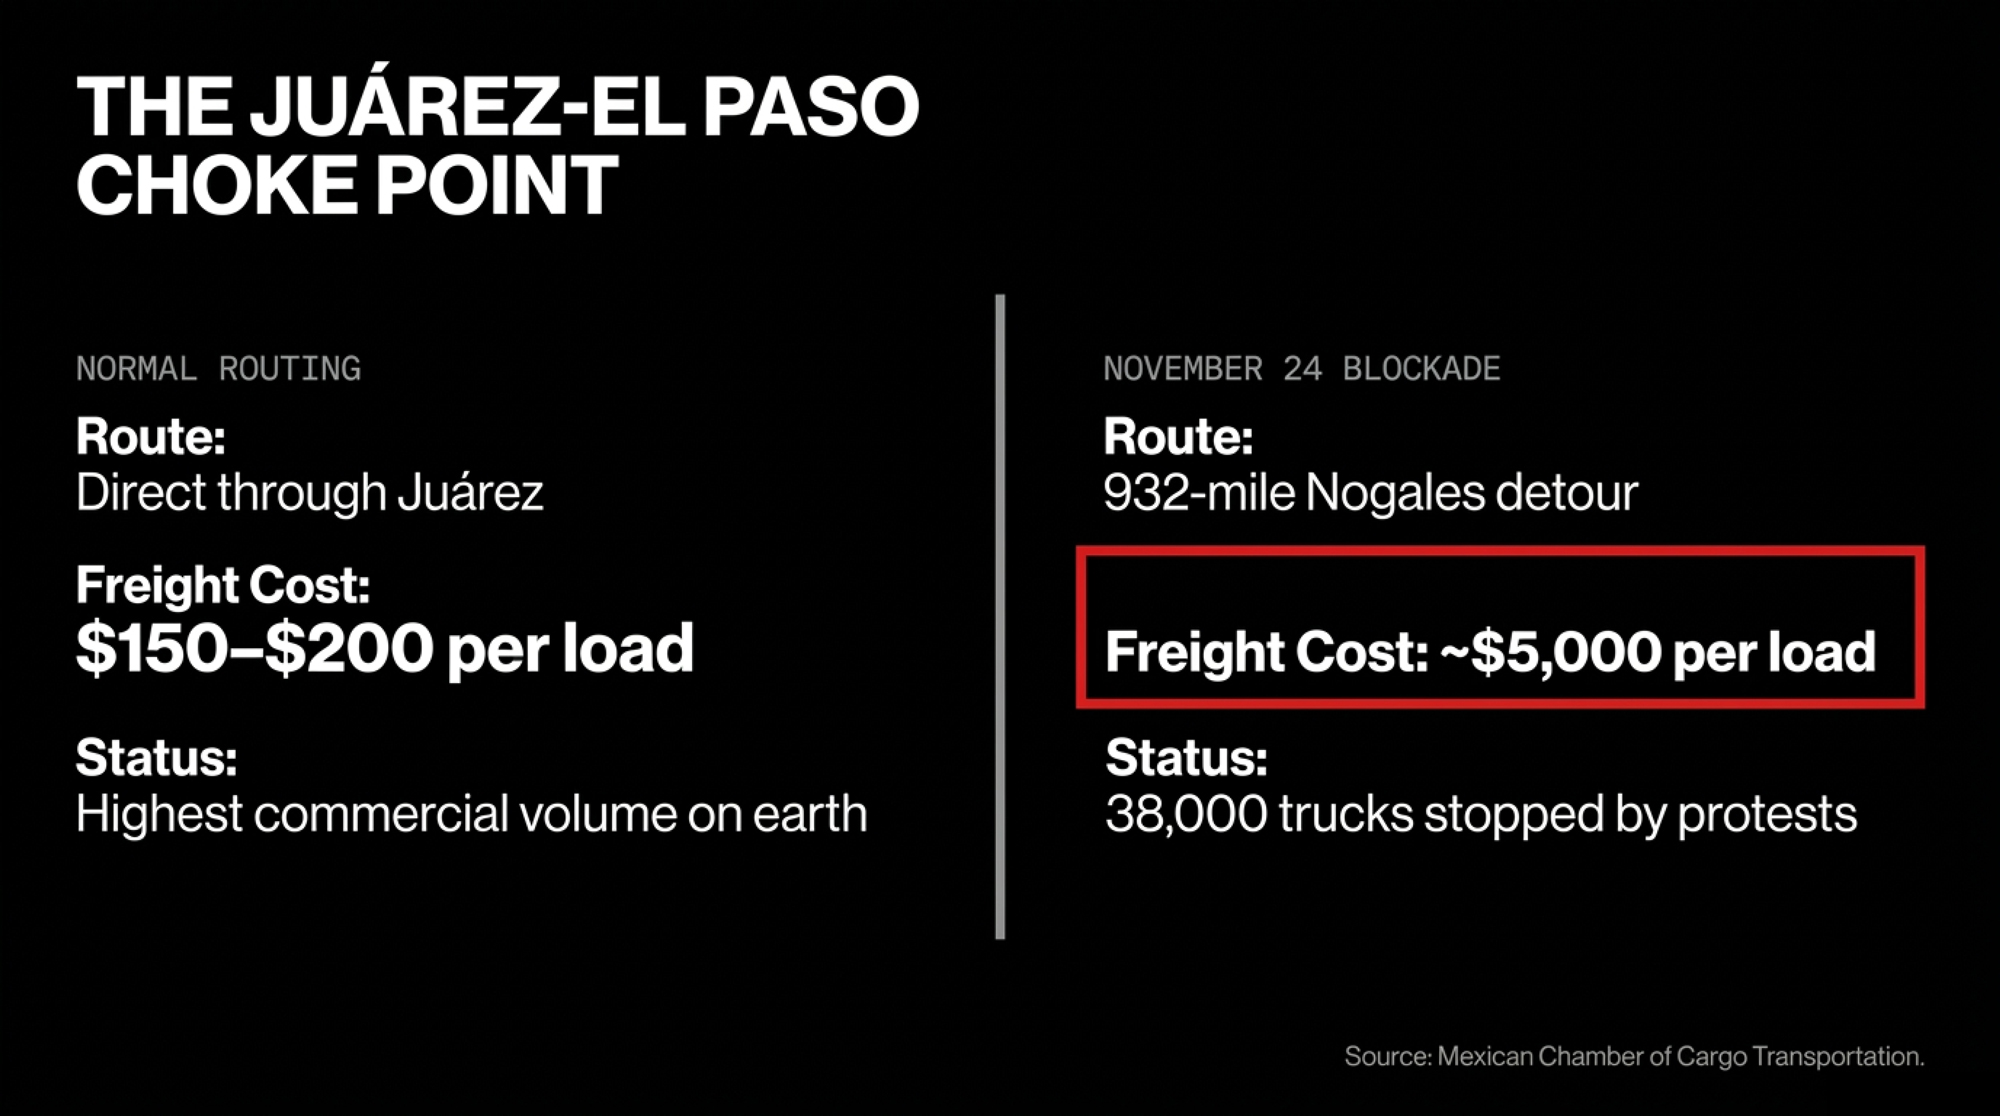
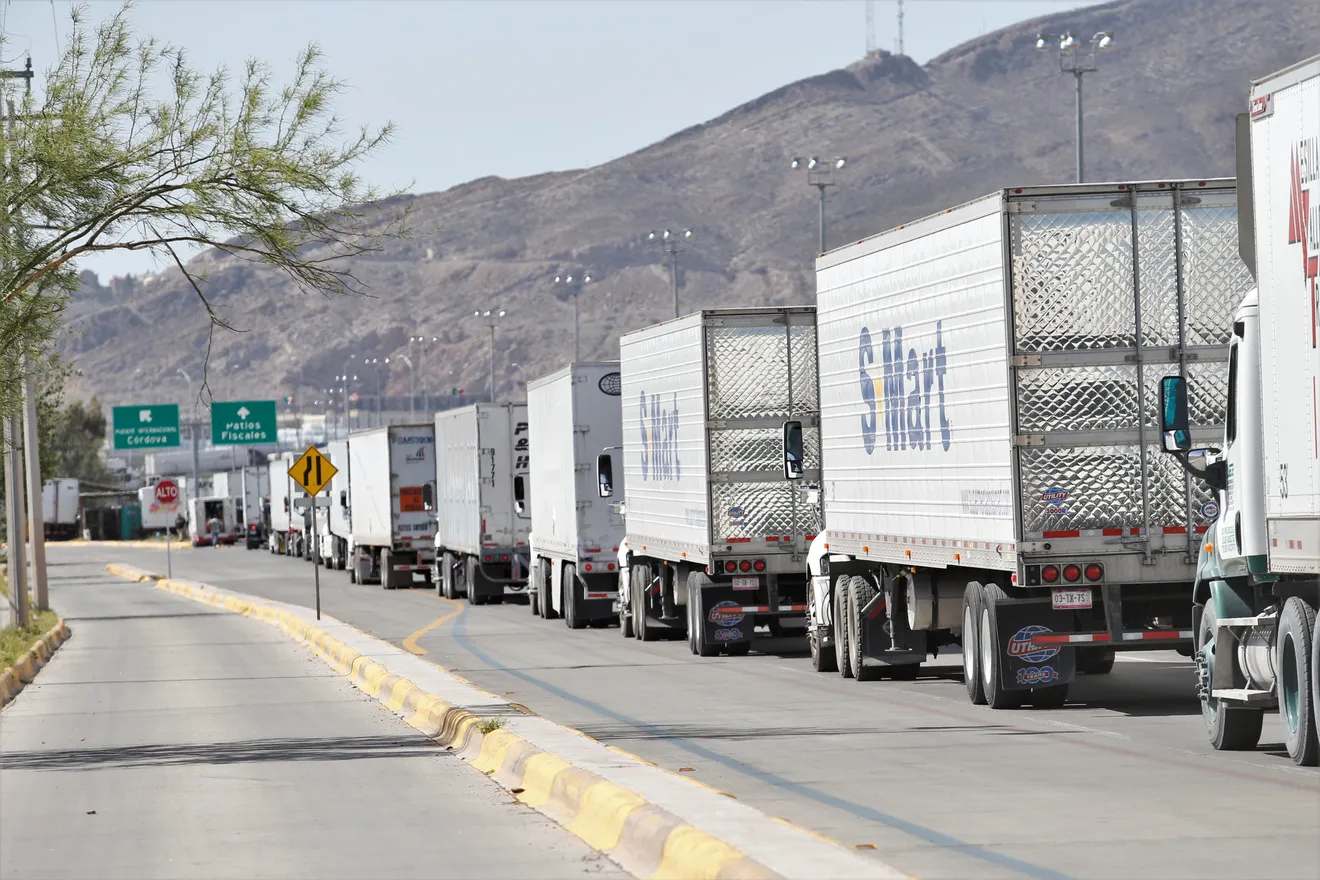
“There was no possibility on Tuesday or Wednesday to cross anything,” he told KFOX/ABC-7 in El Paso during the closure. The Ysleta–Zaragoza bridge: closed. The Córdova–Las Américas bridge: closed after protesters broke into the customs facility. The Colombia bridge to the north: barely functional. An estimated 38,000 trucks were staged at the Juárez–El Paso crossing alone — not delayed, not rerouted, but stopped. Nogales and Nuevo Laredo had already absorbed the overflow and hit their own ceilings. Gas stations across the Juárez region began running dry because the region itself couldn’t receive product from the south.

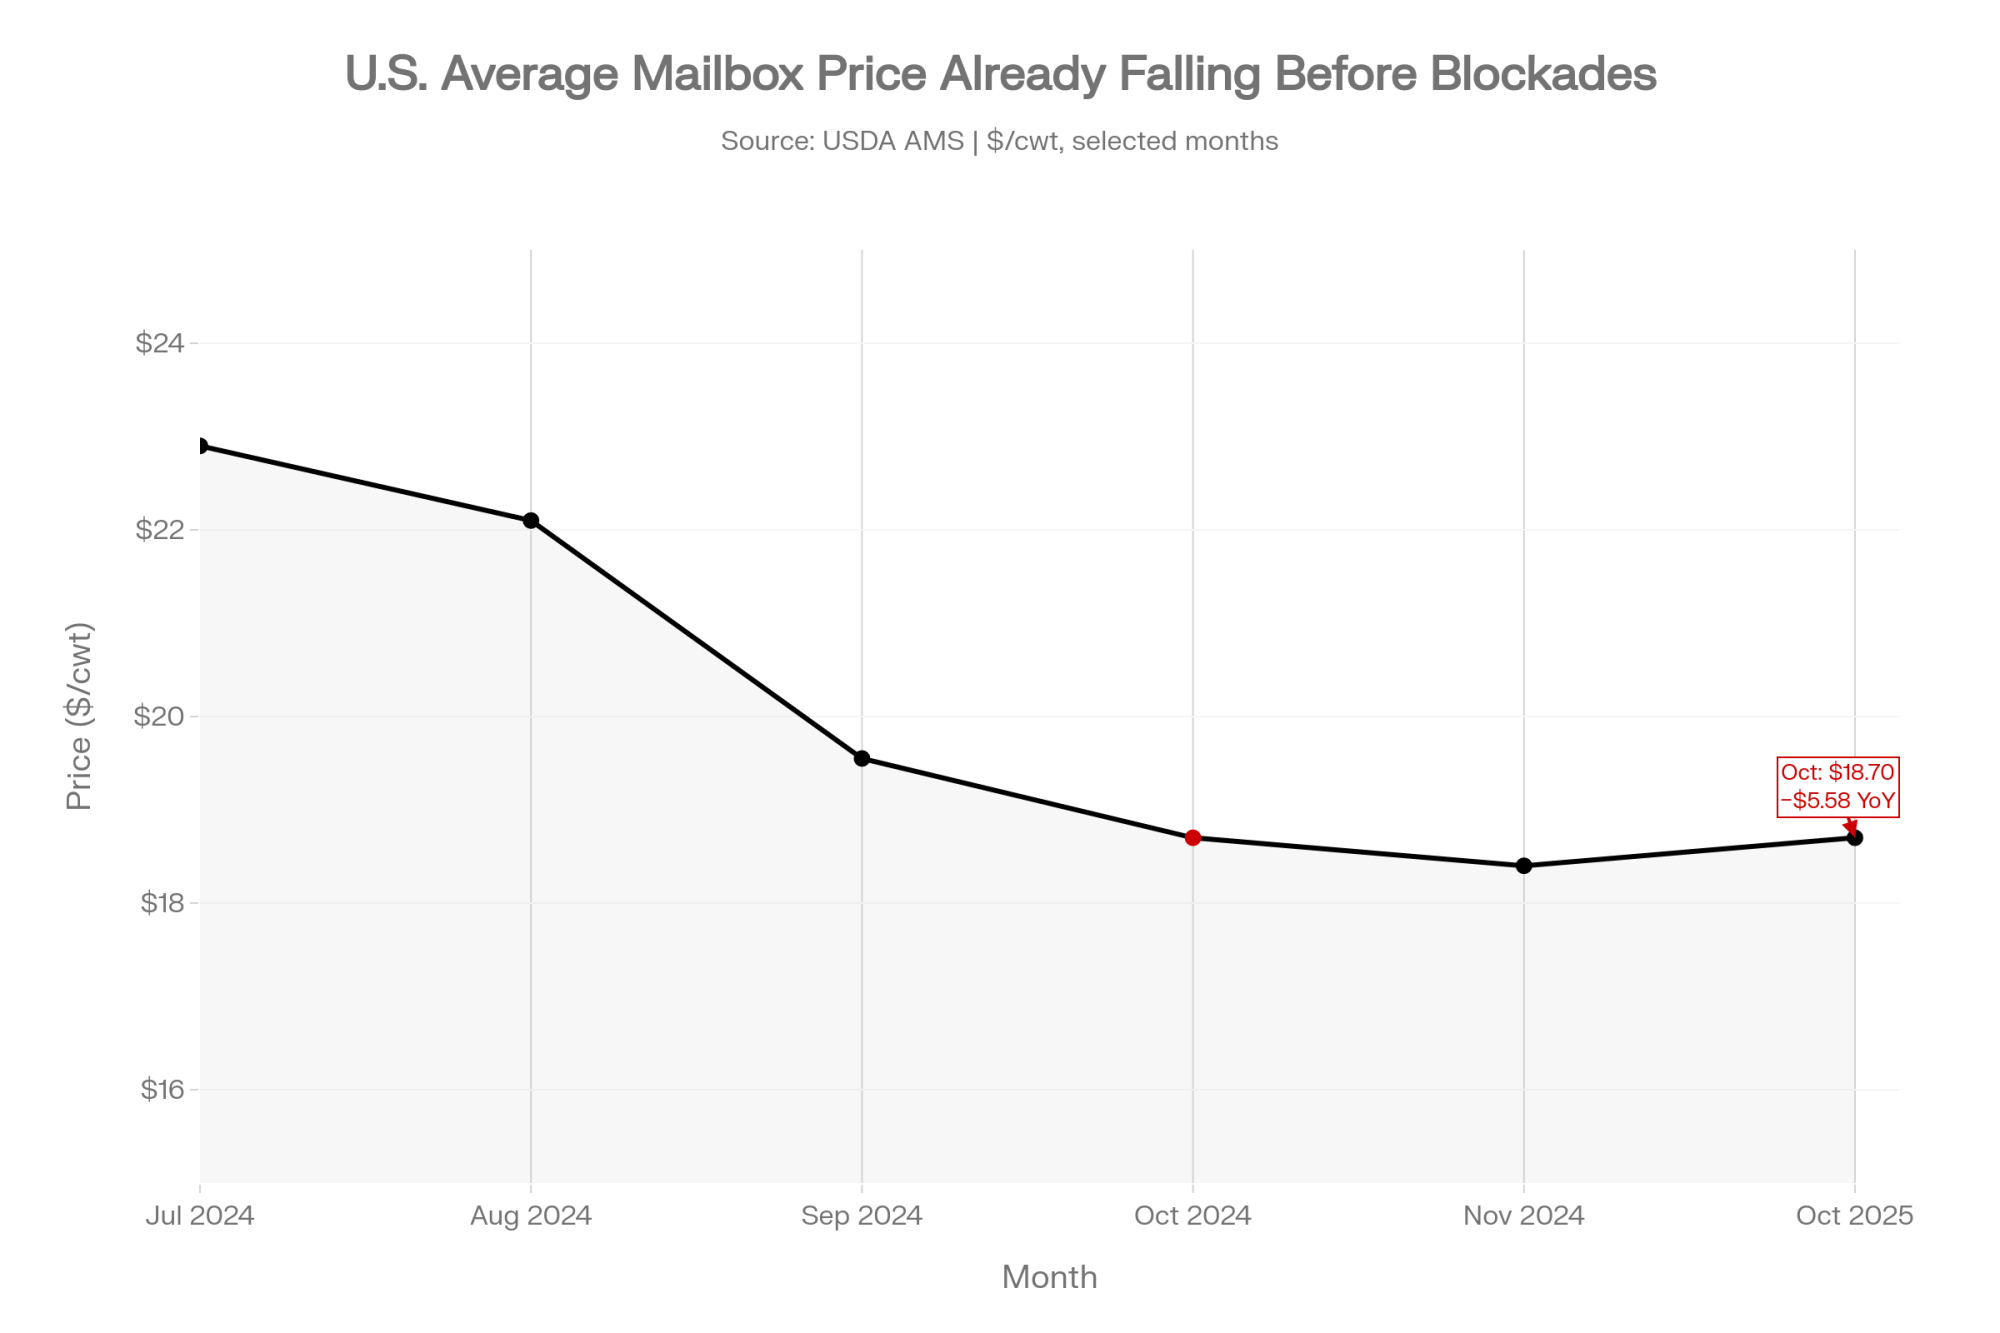
Six hundred miles north, in dairy country across the Upper Midwest and California, you were probably reading milk statements that didn’t quite reconcile. October’s U.S. average mailbox price had already dropped 85 cents in a single month to $18.70/cwt — $5.58 below the same month a year prior, according to USDA AMS. Then November and December came and went. For most producers, no one from the co-op called to explain what role the corridor closures played in the basis you’d just absorbed.

That gap — between what Sotelo’s industry was managing in real time and what generally surfaced on producer milk checks weeks later — is the part of this story that hasn’t been written yet. It’s also the part that matters most for what happens next.

The Blockade That Wasn’t a One-Off

The November 2025 mobilization didn’t surprise the organizations that launched it. The National Front for the Rescue of Mexican Farmland (FNRCM) and the National Association of Carriers (ANTAC) had been escalating since October, when a wave of highway closures across 17 Mexican states forced the federal government to the table. Mexico City offered a 25% increase in corn payments and a 950 peso per tonne subsidy. FNRCM said it wasn’t enough. They were demanding 7,200 pesos per tonne for white corn while receiving 5,050 to 5,200.

By the time the November 24 mobilization hit, 29 separate blockade sites were active across 25 states. The Confederation of National Chambers of Commerce, Services and Tourism (Concanaco-Servytur) estimated accumulated losses of 3 to 6 billion pesos — roughly $150 to $300 million USD at prevailing exchange rates — by day four. The National Confederation of Mexican Transporters (Conatram) pegged daily losses in excess of 100 million pesos, around $5 million USD, in fuel waste and contractual penalties alone. The first product to run short on shelves in northern Mexico wasn’t electronics or auto parts. It was dairy.

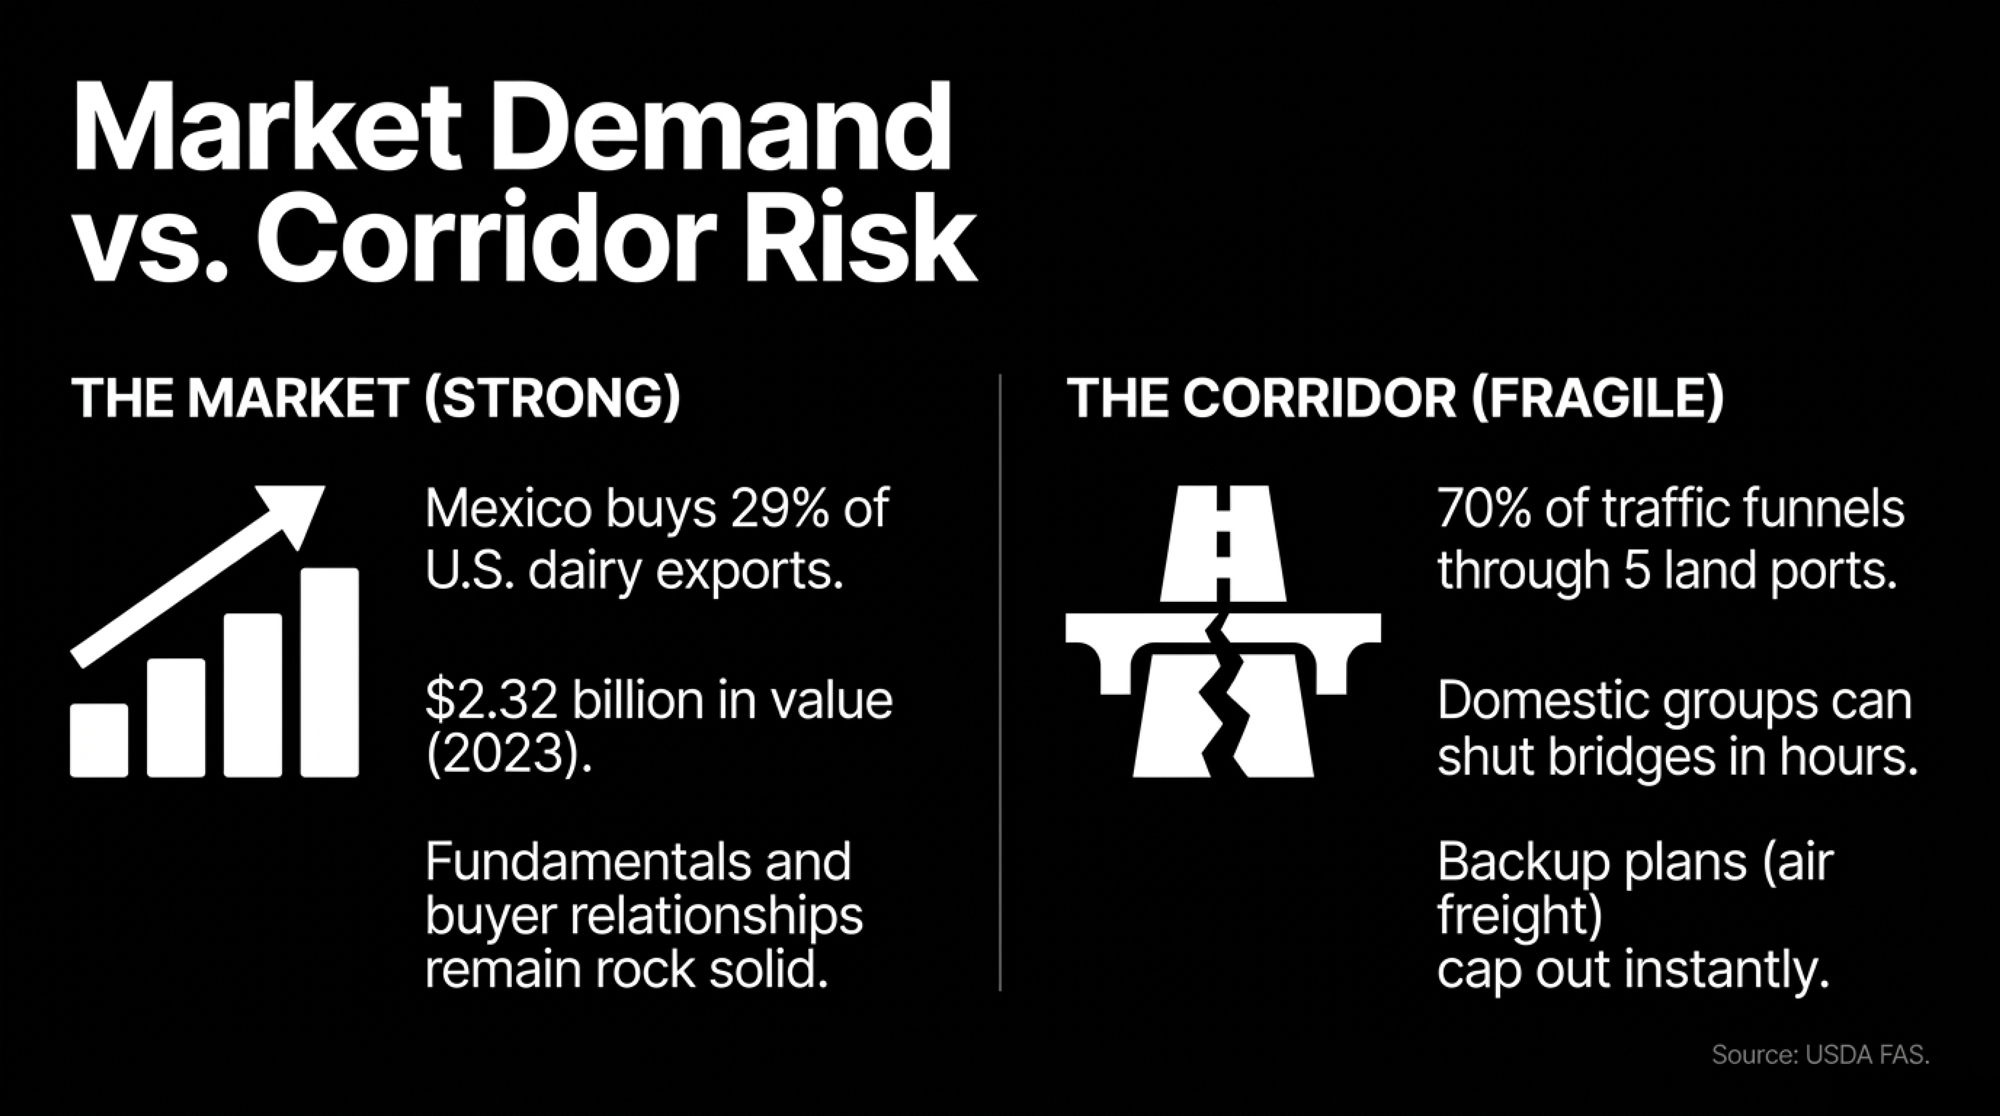
Here’s why that matters to anyone shipping into a co-op with Mexico exposure. Mexico has grown to roughly 29% of all U.S. dairy product export value, according to USDA Foreign Agricultural Service data through 2024 — making it the single largest customer by a wide margin. In 2023, Mexico imported roughly $2.32 billion in U.S. dairy products. Volume reached 1.38 billion pounds on a milk-solids basis, up 42% over the prior decade.

But more than 70% of that commercial traffic crosses through five land ports. The Juárez–El Paso cluster — Ysleta, Córdova, and Zaragoza — handles the highest commercial throughput of any land border crossing on earth. Organized groups proved in November that they can close it in hours.

What Your Co-op Was Doing While You Watched the News

The co-op export desk knew what was happening in real time. When C.H. Robinson — one of the largest freight brokers in North America — issued an emergency client advisory on the morning of November 24, the operative guidance came down to this: monitor local traffic authorities for resolution updates. That isn’t evasion. It’s the honest ceiling of what professional logistics infrastructure can offer when public protests are negotiating directly with their own federal government over corn prices.

What the export desks did next was rational, and largely invisible to producers. They rerouted loads through Nogales — 466 miles in one direction on the Mexican side, 466 miles back on the U.S. side, to reach the same El Paso destination. Sotelo’s company made that move. “It cost us over 100,000 Mexican pesos per shipment,” he told KVIA in December. That’s roughly $5,000 per load versus $150 to $200 through Juárez. Some product moved through domestic spot channels at prices nobody had modeled. Some sat in staging. The export premium that Mexico-market volume supports began compressing.

That compression settled into pool pricing, got averaged across member volume, and eventually appeared on milk statements as softer export conditions. Picture what that meant on the ground at three operation scales:

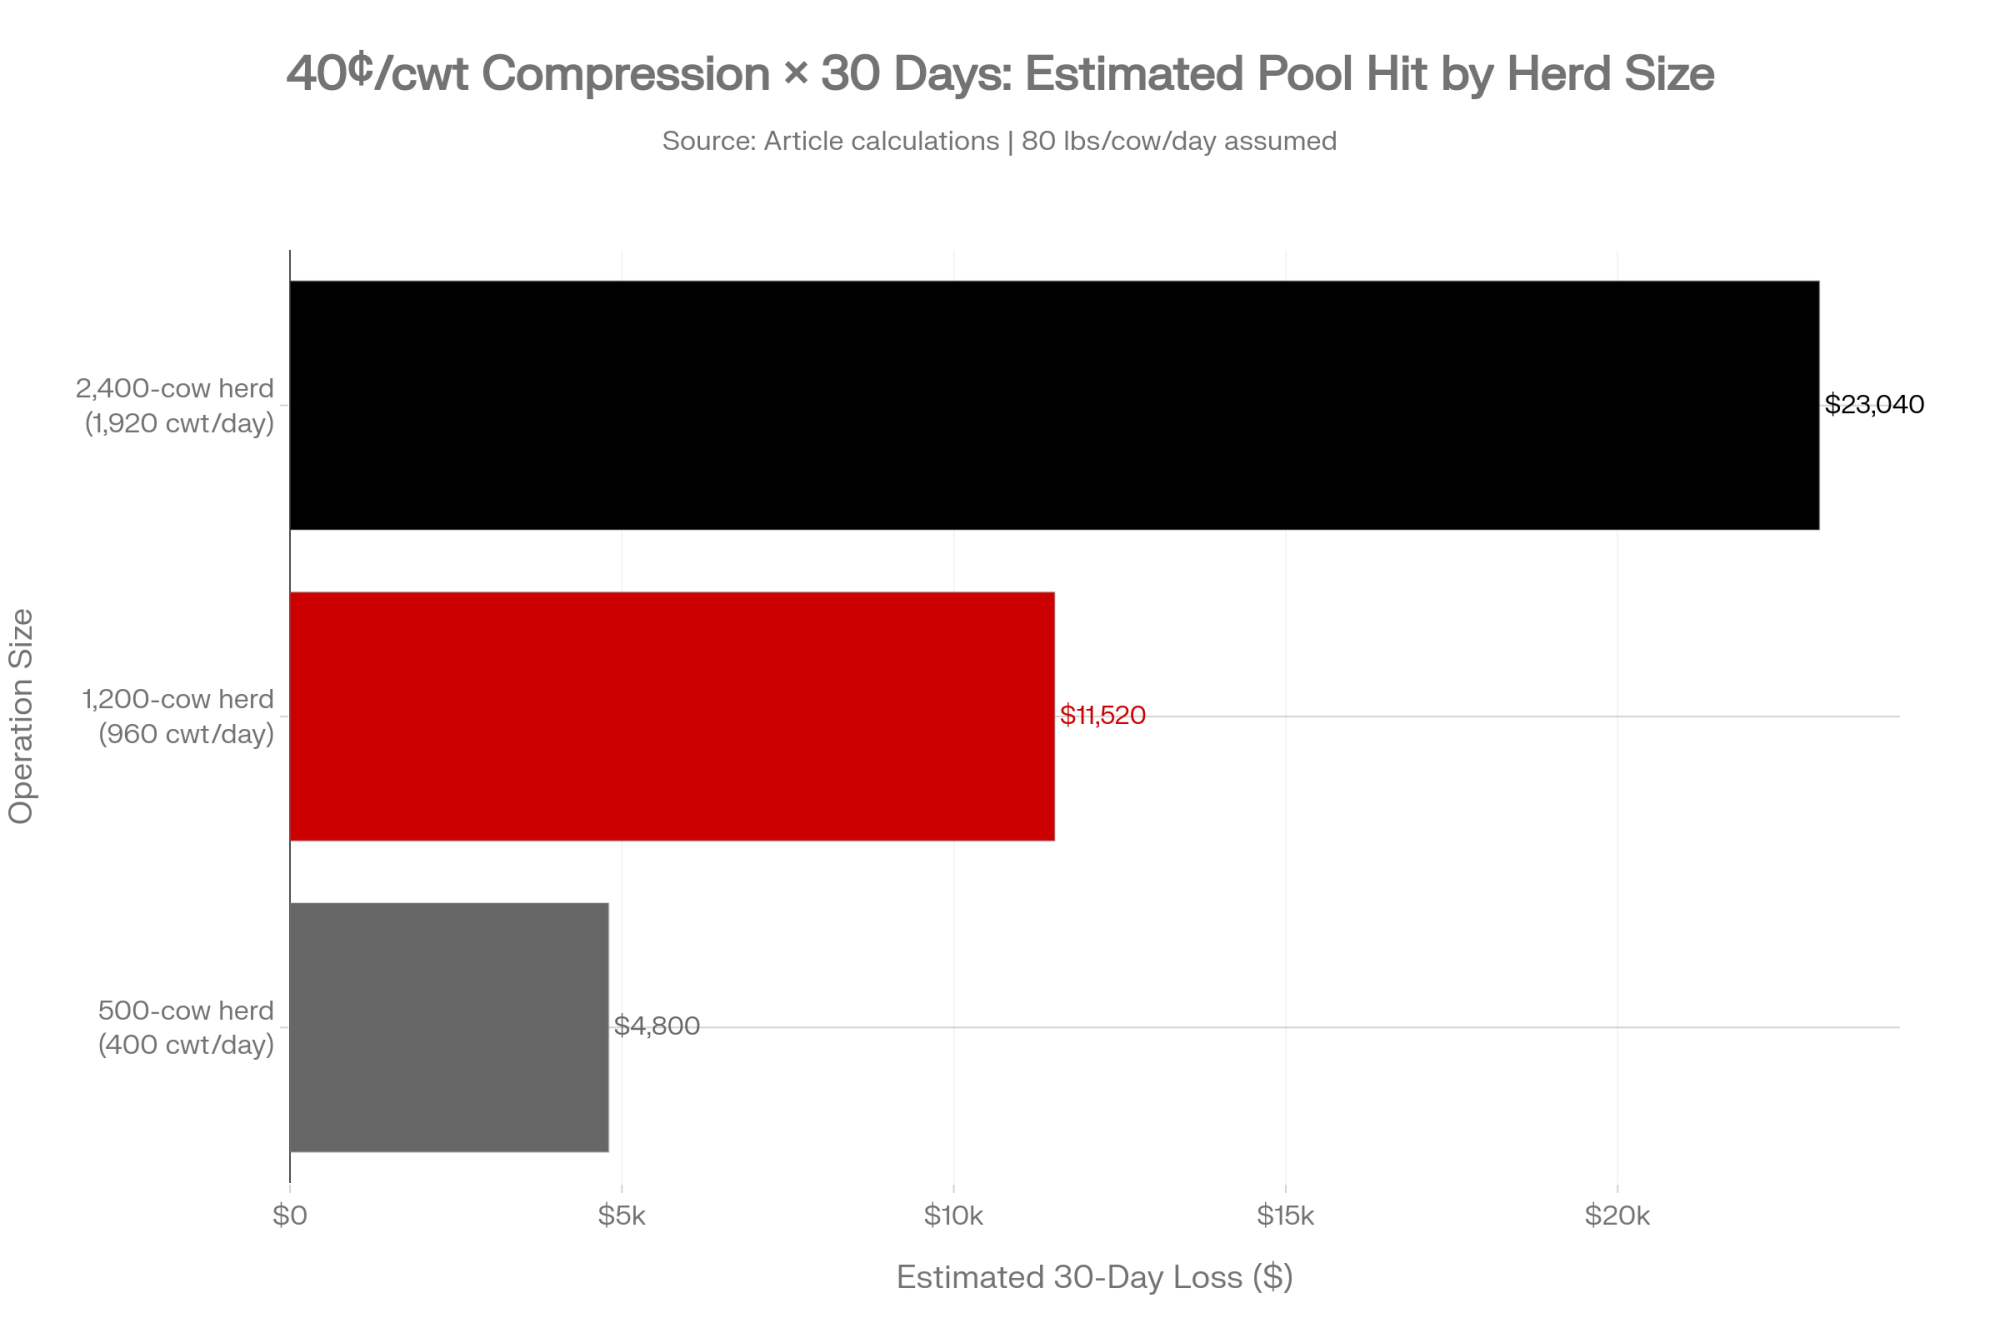
  • On a 500-cow operation shipping 400 cwt per day (roughly 80 lbs/cow/day), a 40 cent/cwt basis compression over 30 days works out to roughly $4,800 — about a month of one full-time labor cost.
  • On a 1,200-cow operation shipping 960 cwt per day (same per-cow assumption): roughly $11,520.
  • On a 2,400-cow operation: approximately $23,040.

Those figures are illustrative. Actual basis impact depends on your co-op’s specific Mexico exposure and routing. But the pattern is the point. Every operation shipping into a co-op with meaningful Mexico volume absorbed something in November and December. Most producers couldn’t tell you how much, because the information needed to calculate it lives inside co-op logistics departments — not in producer communications.

Why the Field Rep Didn’t Have Your Answer

A co-op’s pooling structure protects you from single-market volatility. It also obscures the specific source of disruption when something goes wrong. When the export desk absorbs rerouting costs and spot-channel discounts, those losses get averaged across total pool volume. They don’t appear on a milk statement as: the Juárez corridor was closed for four days and cost you X cents per cwt. They appear as a soft export month.

The field rep isn’t withholding information. They’re communicating at the resolution the system produces. Their training covers milk pricing, component premiums, and program updates — not cross-border freight logistics or corridor risk stratification by port of entry. That gap was never a problem when disruptions to the Mexico corridor were short and infrequent.

Because co-ops blend these logistics costs directly into pool pricing, isolating the exact pennies lost per hundredweight remains nearly impossible from the outside looking in. It requires a level of corridor-specific disclosure that isn’t currently standard practice in producer communications — but should be.

That changed in November. And the resolution wasn’t a resolution. When Interior Minister Rosa Icela Rodríguez announced the November deal on day four, Mexican media reported FNRCM and ANTAC framing the agreement as a truce rather than a settlement. The pattern that followed proved that framing accurate:

  • December 17, 2025: Renewed nationwide mobilizations launched by FNRCM and freight transport organizations. December 18 negotiations produced another truce — government commitments on highway security, escort programs, and a roadmap for price-support mechanisms (pignoración) for corn, beans, sorghum, wheat, barley, and soy. Sotelo’s December warning about the limits of contingency planning came in the middle of this round.
  • April 6–8, 2026: A third nationwide strike led by the National Transport Association (ANT) and FNRCM blocked routes in at least 20 states, including Mexico–Querétaro, Mexico–Puebla, the Culiacán–Mazatlán corridor, and access routes to Tijuana, Mexicali, and Ciudad Juárez. Protesters cited cargo crime, soaring diesel costs from Strait of Hormuz disruption, and stagnant grain prices.
Blockade EventDatesLead OrganizationsPrimary TriggerJuárez Corridor StatusEstimated Economic Loss
Mobilization #1Nov 24–28, 2025FNRCM, ANTACCorn price (demand: 7,200 vs. 5,050–5,200 MXN/tonne)Fully closed — Ysleta, Córdova, Zaragoza bridges shut3–6 billion MXN (~$150–$300M USD)
Mobilization #2Dec 17–18, 2025FNRCM, freight orgsNov truce violations; price-support commitments unmetPartial closure — routes disrupted nationwide100M+ MXN/day (~$5M USD/day) in fuel waste & penalties
Mobilization #3Apr 6–8, 2026ANT, FNRCMCargo crime + diesel costs (Hormuz) + stagnant grain pricesPartial closure — 20+ states, Juárez access routes blockedNot yet formally estimated
All Three Events5-month windowMultiple national coalitionsStructural: water law, grain prices, cargo security, fuel costsPattern established— corridors closed on avg every ~6 weeks~$11,520 est. basis hit on a 1,200-cow herd over 30 days

Three coordinated, politically-driven national mobilizations in five months. The pattern is established.

The structural drivers aren’t going away. Mexico’s new General Water Law removed the ability for agricultural users to transfer water concessions during land sales and granted CONAGUA broad discretionary authority to reduce existing water volumes during drought. Farmers describe the change as an existential threat to long-term land values and credit access. Cargo theft on Mexican federal highways has remained a persistent operational risk over recent years according to publicly reported industry tracking, and now diesel cost pressure from Middle East disruption compounds the squeeze. Corn prices remain well below break-even demands. The pressure for future mobilizations is intact.

If the highways close again, not just the customs facilities, Sotelo told KVIA the only fallback is air freight. “They don’t have as many planes as we do with ground transportation.” The infrastructure ceiling of the backup plan is the cargo capacity of Juárez International Airport. Against thousands of daily commercial export crossings averaging tens of thousands of dollars in value each, that ceiling closes fast.

How Much Did the November Blockade Actually Cost Your Milk Check?

The honest answer: it depends on your co-op’s Mexico exposure, and most producers haven’t been given enough information to calculate it.

Here’s what’s documented. The four-day November closure plus a roughly ten-day recovery backlog created about two weeks of compressed export throughput for co-ops routing significant volume through Juárez. During that window, loads moved at reroute cost or spot-channel discount. Those costs got pooled. October’s mailbox had already dropped 85 cents in a single month to $18.70/cwt — $5.58 below October 2024. September had been $19.55, $5.23 below the prior year. The November and December disruptions hit inside an already-deteriorating pricing environment, which is part of why their specific contribution is hard to isolate from your vantage point.

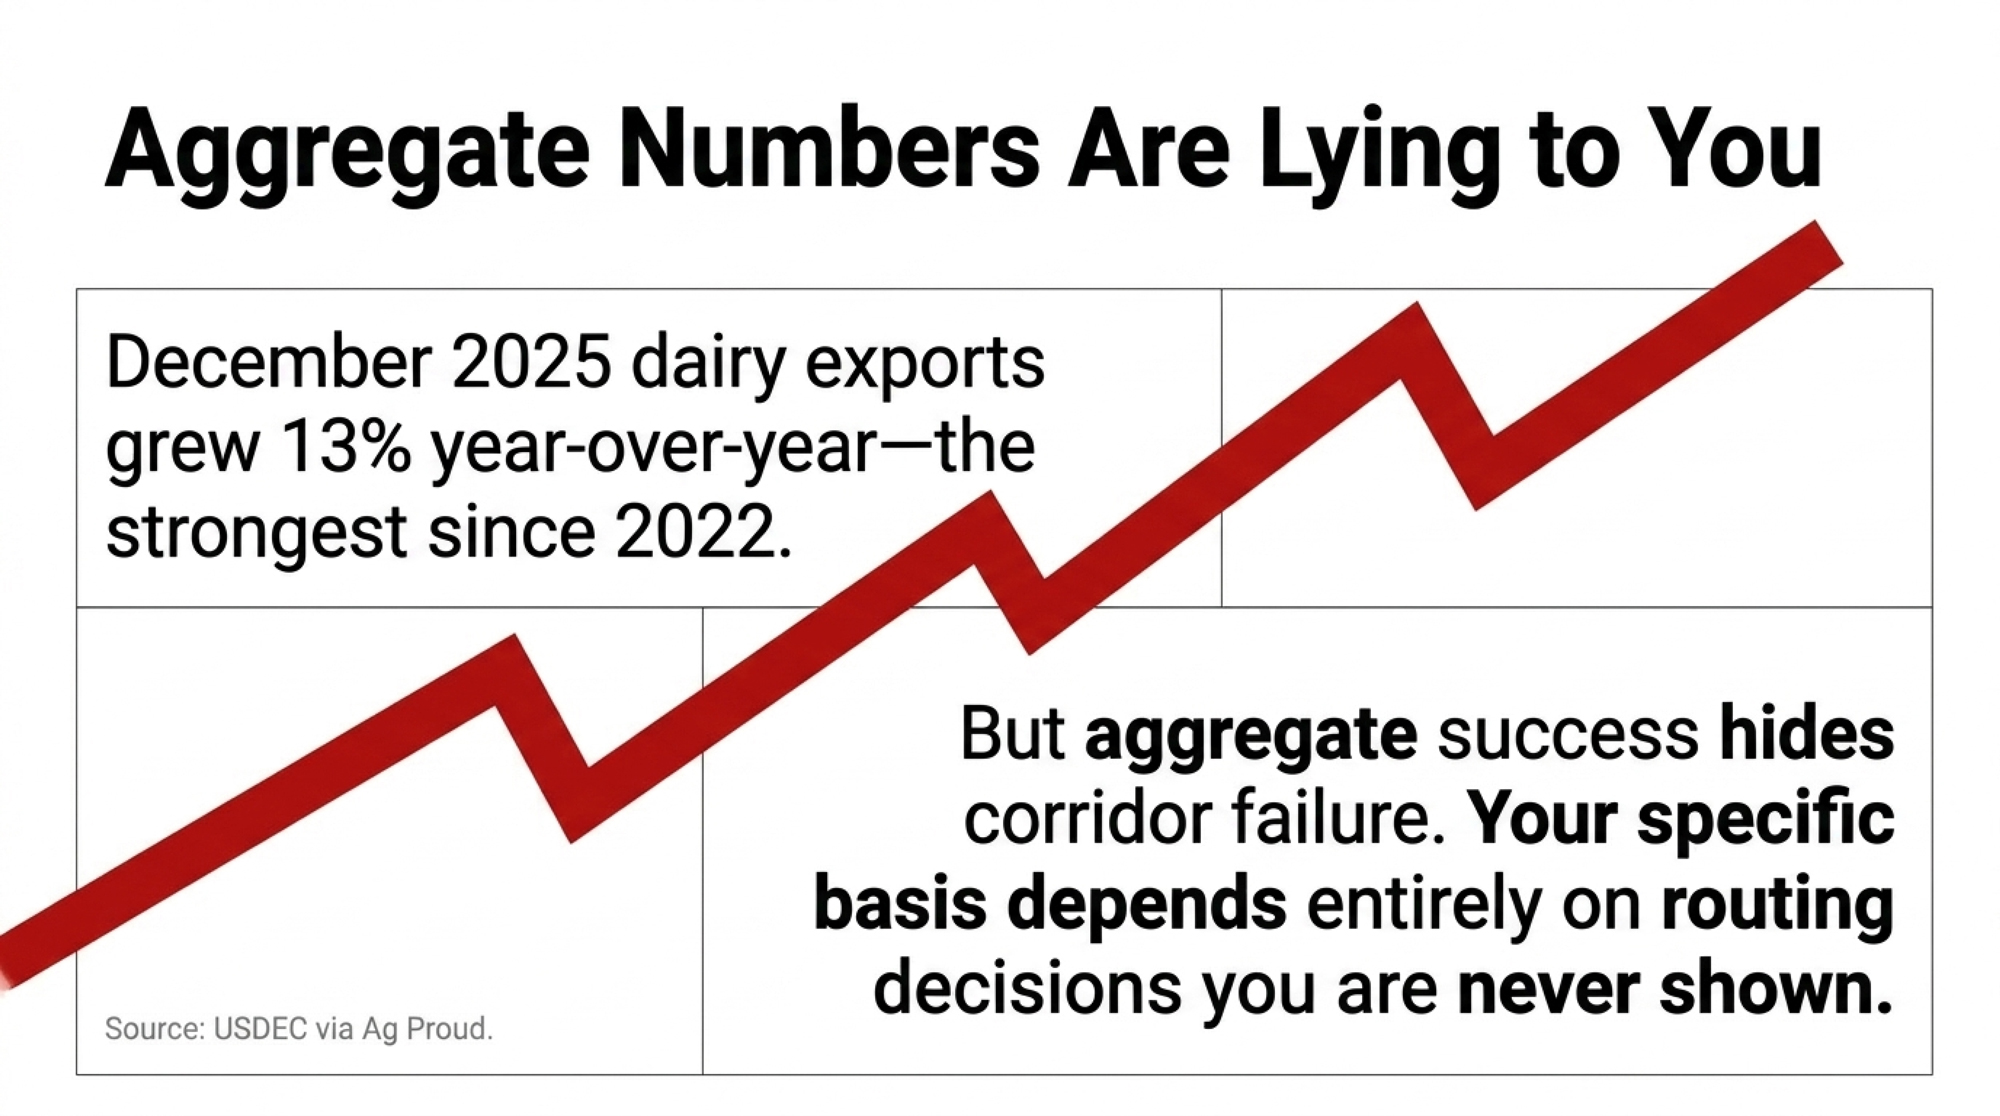
And here’s the wrinkle that complicates everything. Year-end U.S. dairy export volumes actually finished strong — December 2025 dairy product exports grew 13% year-over-year, reaching levels not seen since 2022, according to USDEC via Ag Proud. The aggregate story was good. The corridor-specific story was something else. Whether your co-op’s December basis reflected the strong aggregate or the disrupted corridor depends on routing decisions you almost certainly weren’t shown.

That’s the gap. Not a cover-up. A structural mismatch between where the information lives and who needs it.

Is Your Co-op’s Mexico Program Built for the Risk Environment That Actually Exists Now?

The USMCA review deadline arrives July 1, 2026 — 39 days from this writing. Mexican farm organizations have explicitly stated they want basic grains removed from the agreement. U.S. dairy groups want stronger market access enforcement. The December 18 government settlement with FNRCM included the creation of a formal institutional channel under Mexico’s Ministry of Economy specifically to analyze USMCA-related issues from the Mexican producer side.

Whatever the review produces, it won’t create an obligation for Mexican bridges to stay open during domestic protests. That gap — between what a trade agreement governs and what actually controls your load’s ability to move — exists regardless of the review outcome.

The co-ops best positioned for the next disruption aren’t necessarily the ones with the strongest Mexico buyer relationships. They’re the ones that have pre-negotiated reroute capacity at Nogales and Nuevo Laredo, modeled corridor-specific exposure for their member base, and have a communication protocol ready before the next mobilization date circulates — not after the bridges close. Those aren’t complex systems. They’re the difference between managing an event and being surprised by it.

For broader context on how trade policy is reshaping the export environment, see how the broader trade war is reshaping dairy export economics.

Options and Trade-Offs for Producers

The goal here isn’t alarm. It’s calibration. A few practical paths worth considering now:

1. Ask your co-op for corridor-specific exposure information — within 30 days. Your co-op’s export desk knows which crossings carry the majority of your Mexico-bound volume. Asking for that breakdown, even a rough percentage by corridor, is a legitimate member inquiry. You don’t need their full routing database. You need enough to understand whether a four-day Juárez closure is a minor inconvenience or a real basis risk for your operation. If the field rep can’t answer, ask them to escalate.

When it makes sense: Any operation whose co-op does meaningful Mexico export volume. What it requires: A direct, polite ask — email is fine. Key limit: Co-ops vary in how they handle governance-level member inquiries. Some have this conversation readily. Others route you through layers before anyone with the data responds. The response itself often tells you something useful about the institution.

2. Separate “market reliability” from “corridor reliability” in your risk thinking. These are different things, and the industry has communicated them as one. Mexico as a dairy market is genuinely strong — demand fundamentals, volume, and buyer relationships are real. But Mexico as a logistics corridor runs through infrastructure that organized domestic groups have demonstrated they can close in hours. Building both into your mental model doesn’t mean abandoning the export program. It means hedging differently. If you’re scenario-planning for milk price downside, add a 30-day corridor disruption scenario alongside your standard price sensitivity analysis.

When it makes sense: Larger operations where basis variance moves real dollars. What it requires: About 30 minutes with your accountant or risk manager. Key limit: Without corridor-specific exposure data from your co-op, you’re estimating. An estimate still beats nothing.

3. Track ANTAC, ANT, and FNRCM mobilization signals — they announce dates publicly. All three organizations communicated their dates in advance. The November 24 date circulated for weeks. The December 17 date was set within days of the November truce. The April 6 mobilization was announced openly. A Google Alert on “ANTAC blockade,” “FNRCM huelga,” or “Mexico carriers strike” gives you more lead time than most co-op communications currently provide. That lead time isn’t a trading signal. It’s context for timing decisions about forward sales and export-dependent premium months.

When it makes sense: Any producer who wants a more complete picture of export risk. What it requires: Five minutes of setup. Key limit: Knowing a date is circulating doesn’t tell you whether it’ll escalate to full closure. That depends on whether the Mexican government makes meaningful concessions in the interim.

4. If you sit on a co-op board or advisory committee, bring the governance question. The three numbers every producer with Mexico export exposure should have access to — percentage of volume through each corridor, estimated cost of a four-day closure to the pool, and the written reroute protocol — aren’t proprietary. They’re basic operational transparency. With the USMCA review deadline arriving July 1, the timing for raising those questions formally is now.

When it makes sense: Anyone with governance-level standing in their co-op. What it requires: A written request before the next board or delegate meeting. Key limit: Some boards receive this kind of question as constructive. Others read it as a confidence challenge. Knowing which culture you’re in is its own useful data.

Key Takeaways

  • If your co-op exports to Mexico and you haven’t asked which crossings carry your volume, send the email this week. That’s the single highest-leverage move available before July 1.
  • If your risk model treats market access and corridor access as one thing, fix it. They’ve been communicated as one. They aren’t.
  • If the next mobilization date is circulating in Mexican press and your co-op hasn’t flagged it, your information lag is the problem worth solving. ANTAC, ANT, and FNRCM announce publicly. Google Alerts close the gap.
  • If you sit on a board or advisory committee, ask the three numbers before the next meeting. Corridor concentration, four-day-closure pool cost, written reroute protocol. None are proprietary.
  • If the strong aggregate export number is reassuring you past the corridor question, you’re reading the wrong signal. The headline figure and your co-op’s routing reality can tell different stories on the same milk check.

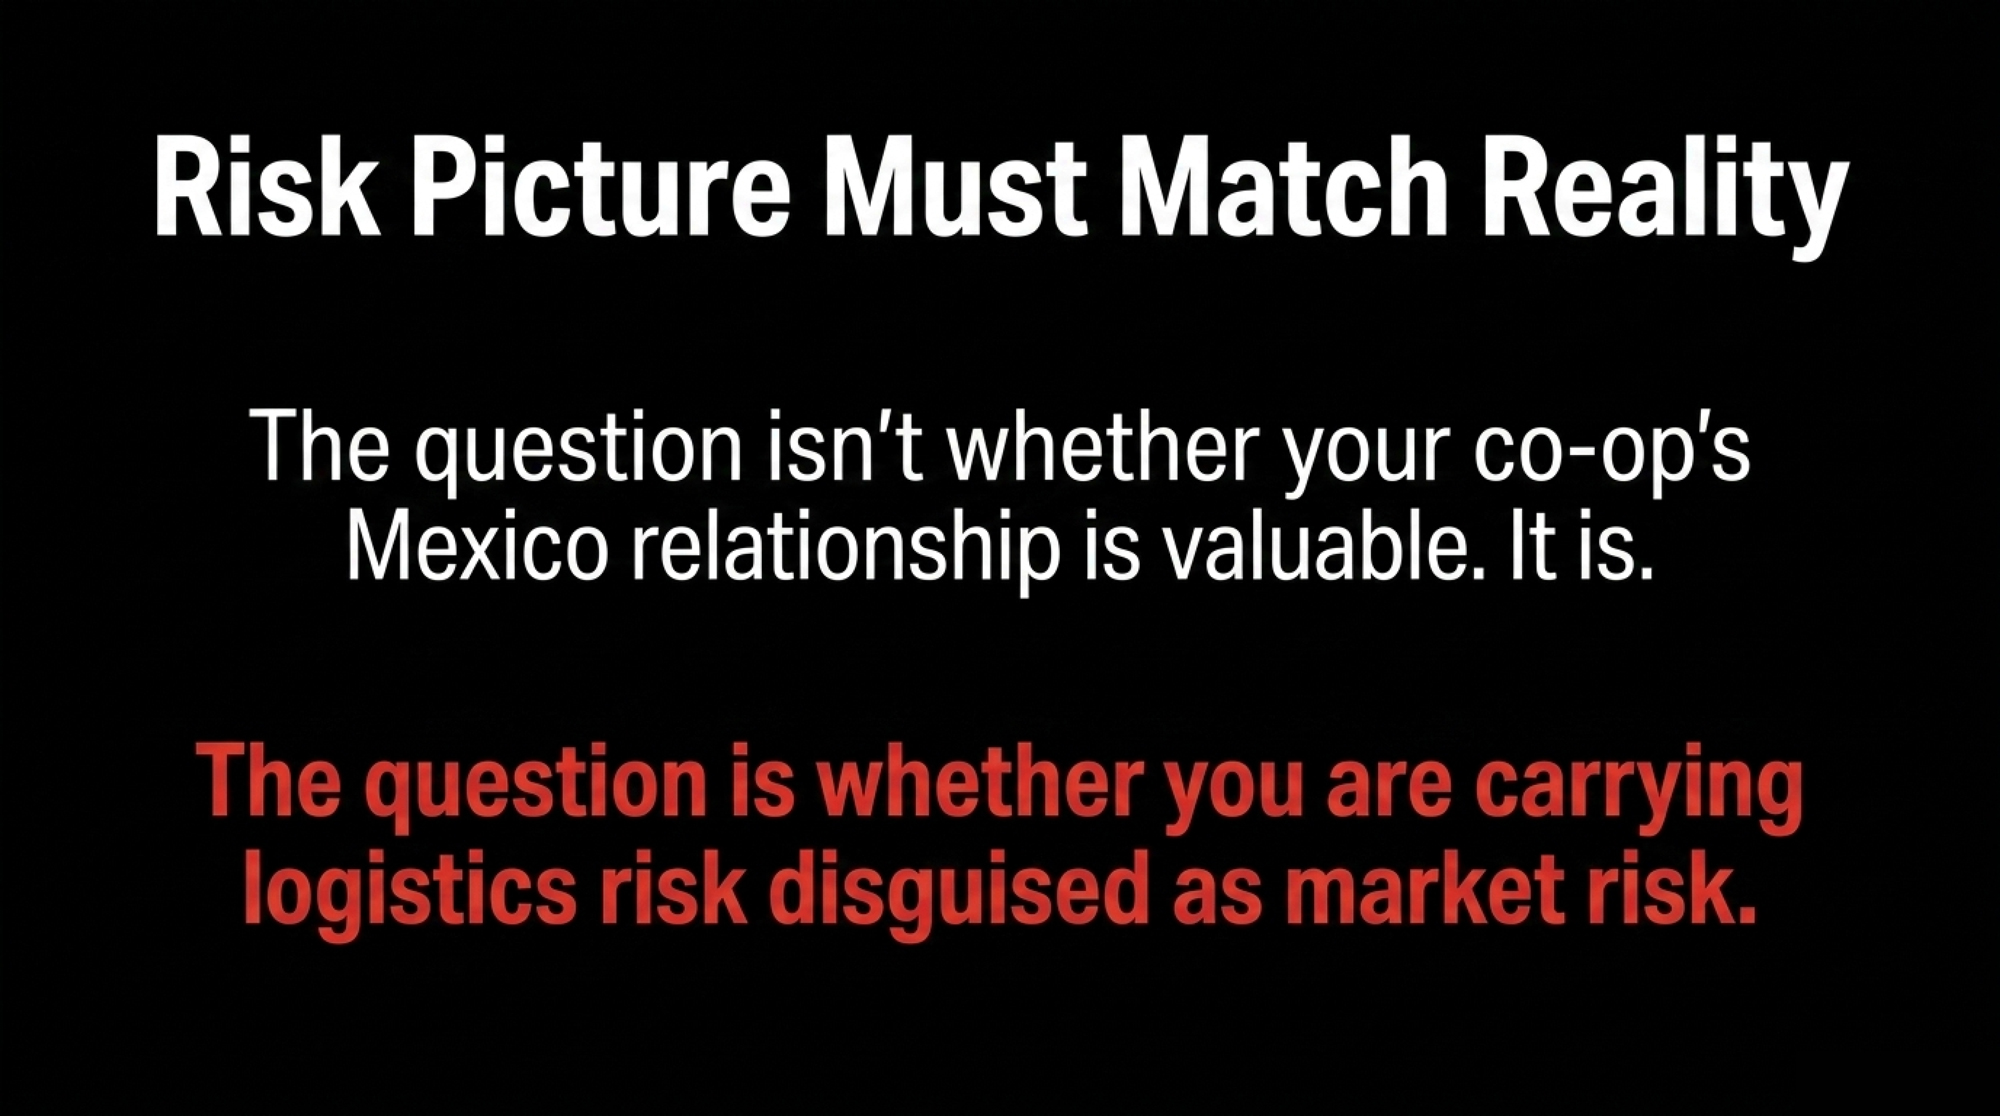
The question isn’t whether your co-op’s Mexico relationship is valuable. It is, and the export numbers support that — December 2025 closed with the strongest year-over-year export growth since 2022. The question is whether the risk picture you’ve been given matches the risk you’re actually carrying. For most producers, those two pictures haven’t been the same since November 24.

Worth knowing before the next date circulates.

Complete references and supporting documentation are available upon request by contacting the editorial team at editor@thebullvine.com.

Learn More

The Sunday Read Dairy Professionals Don’t Skip.

Every week, thousands of producers, breeders, and industry insiders open Bullvine Weekly for genetics insights, market shifts, and profit strategies they won’t find anywhere else. One email. Five minutes. Smarter decisions all week.
NewsSubscribe
First
Last
Consent
Send this to a friend