


January 28: a 400-cow Upper Midwest dairy banked $14.59 Class III milk against a $20.89 full-cost breakeven. At $17 milk, that gap bleeds $425,955 a year — and the lender already ran the math.
Executive Summary: A 400-cow Upper Midwest dairy banked $14.59 Class III milk on January 28, 2026 against a $20.89/cwt full economic breakeven — a $6.30/cwt gap that erases $425,955 of equity a year if Class III holds at $17. USDA’s 2026 all-milk forecast swung from $21.15 in May 2025 to $18.25 in WASDE-667, then back to $21.25 in WASDE-671 (May 12, 2026); any budget anchored on a single print was wrong by the next release. June 2025’s FMMO make allowance reform pulled another $0.85–$0.92/cwt off Class III for cheese-pooled operations — a permanent recalibration, not a market move. Stack a $4.40/bu corn season-average forecast, $310/ton SBM, $4,000–$4,100 replacement heifers per CoBank, and 7% repriced term debt, and 250–600 cow herds in Wisconsin, Minnesota, and western Michigan are running cash-positive milk checks while bleeding $200K–$425K a year in invisible economic cost. Lenders have already shifted to forward DSCR against $18 milk on Q3/Q4 strips; the producer who hasn’t run that calculation walks into a credit conversation the lender opened with a stress test the producer never saw. Three calls in November and December — to the lender, the grain merchandiser, and the herd manager — separated the operations that came out of Q1 with extended lines and locked rates from those that didn’t. Run the full economic breakeven on your own numbers, against $18 milk, before the next quarterly review lands.
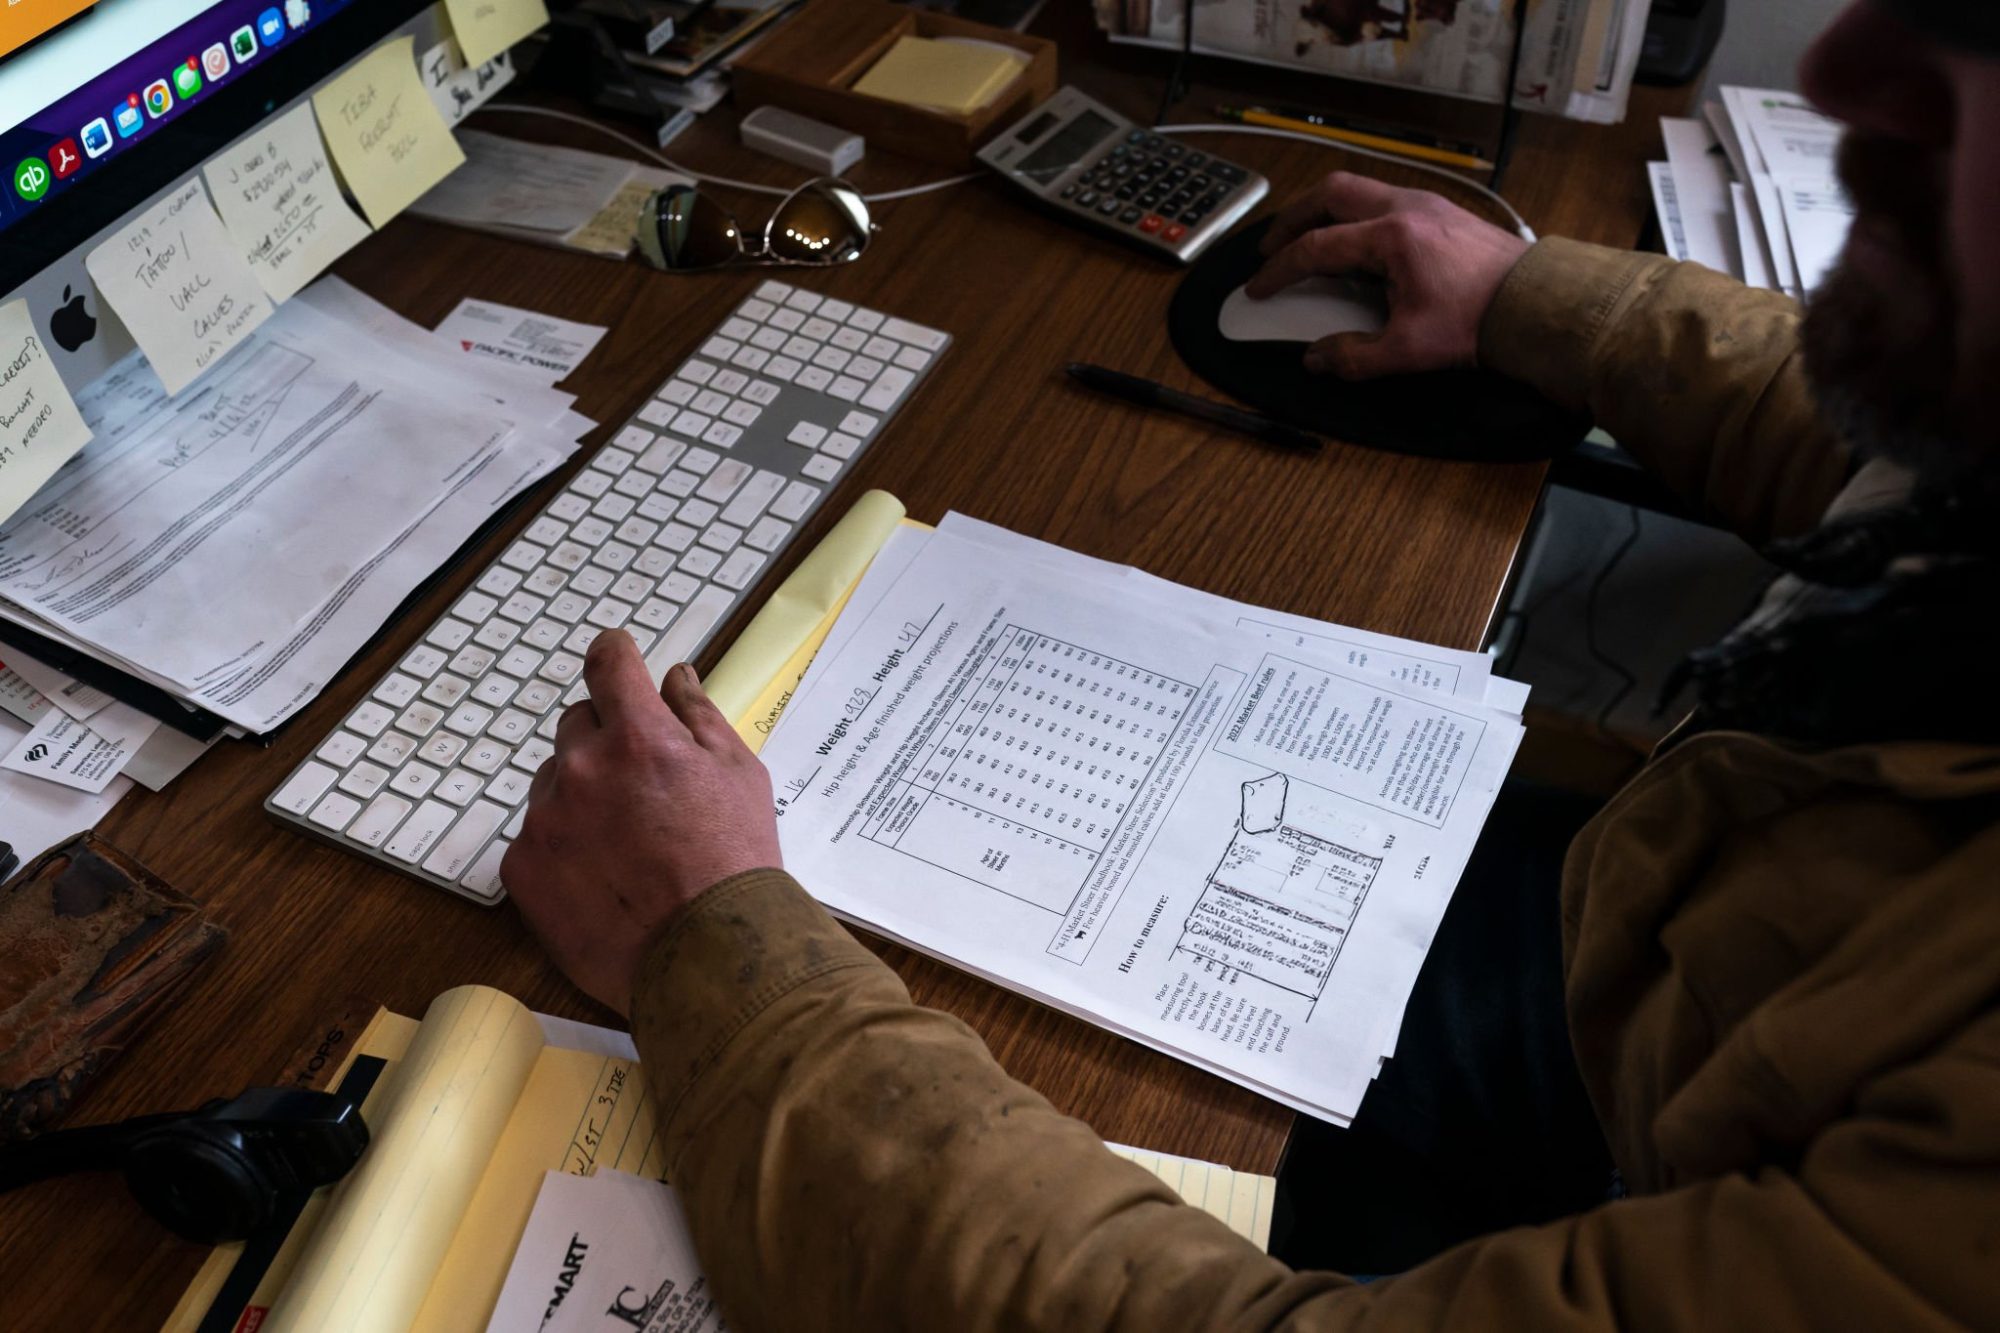
The deposit hit on January 28, 2026 — payment for milk shipped in November 2025, settled at USDA AMS’s announced Class III price of $14.59/cwt. On a representative 400-cow Upper Midwest operation moving roughly 109,500 cwt a year, that single month’s settlement sat $6.30/cwt below a full economic breakeven of $20.89/cwt. The check looked manageable against the operating line. The forward strip for Q1 didn’t.
That gap — between what the envelope said and what the next four quarters of feed contracts and repriced debt service will actually demand — is where 250–600 cow family operations are losing equity quietly through the 2026 dairy margin cycle. Most operations haven’t yet mapped that gap against their own 2026 margin over feed.
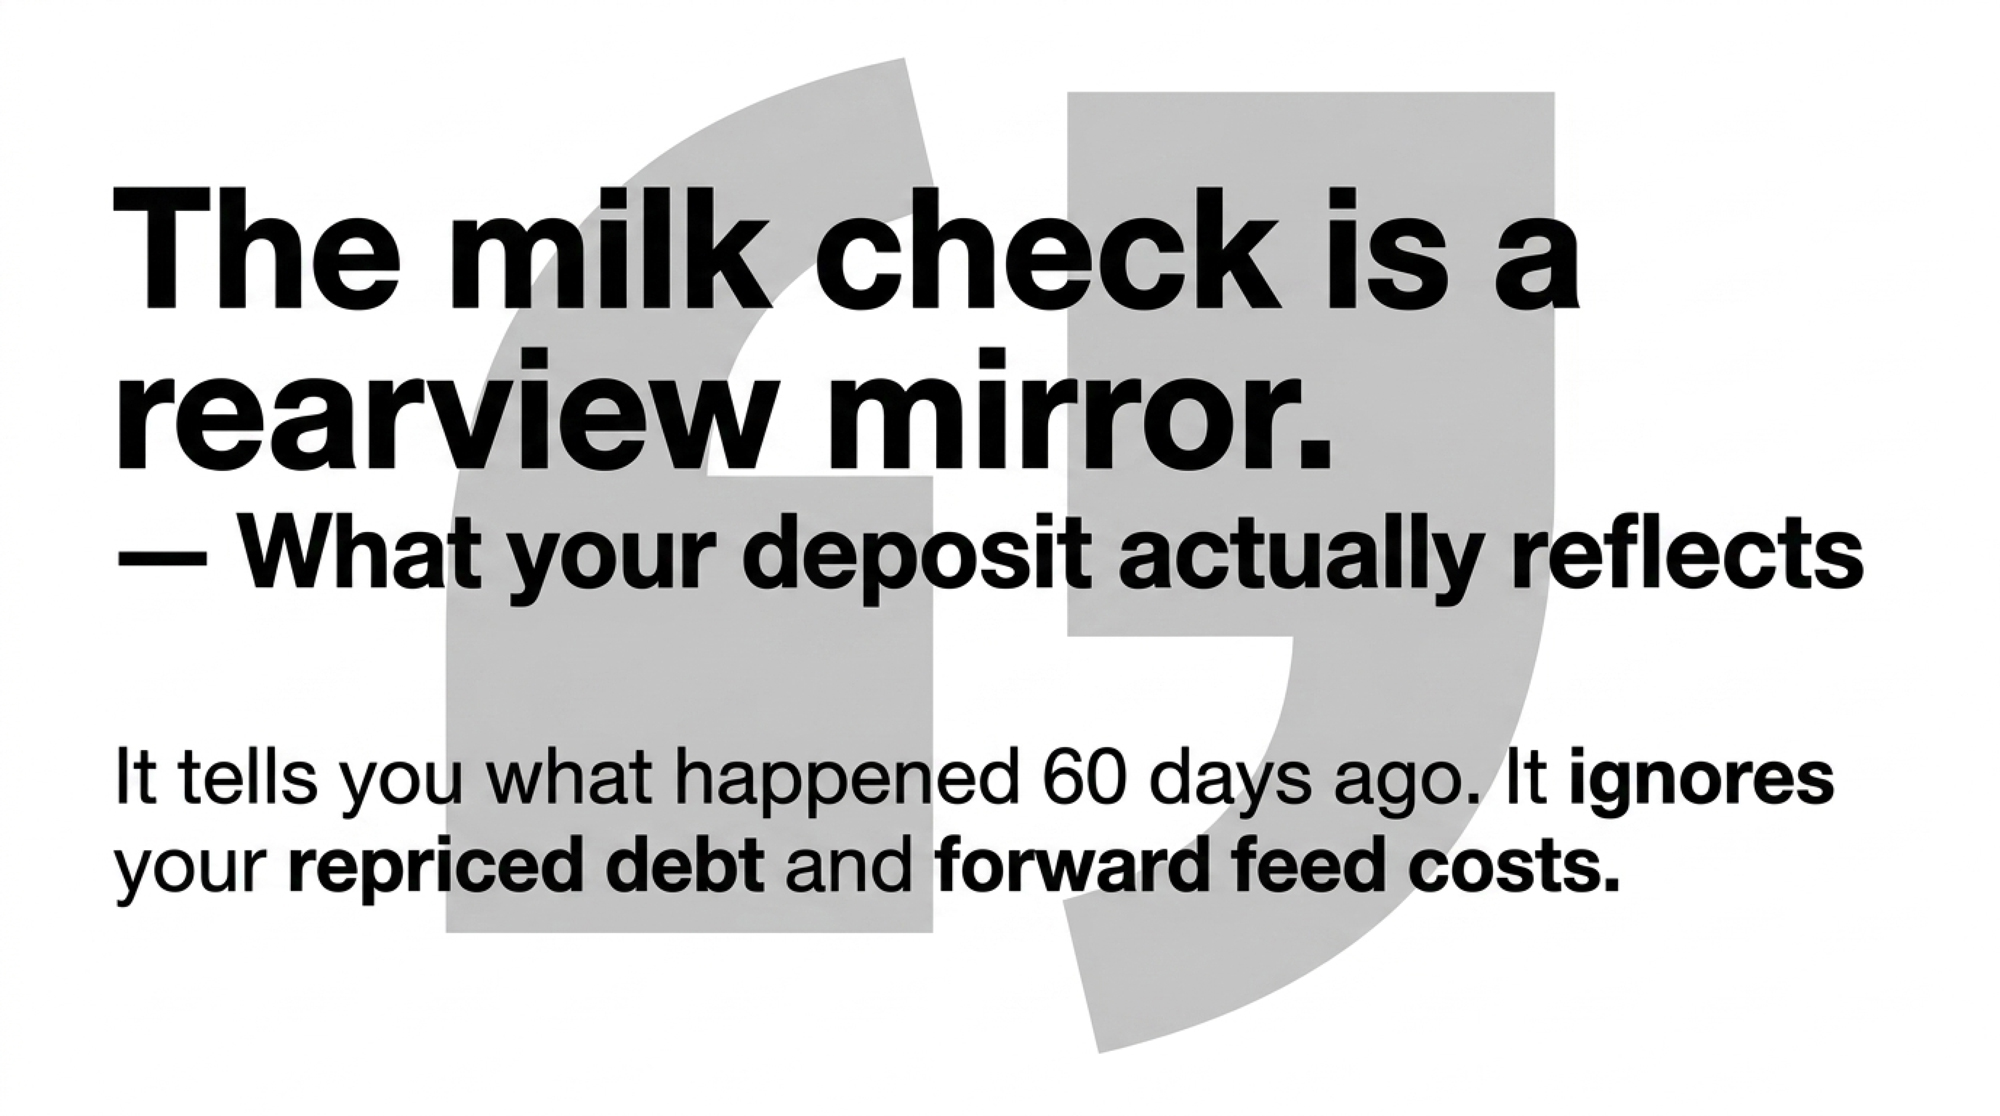
“The check was a rearview mirror.”
The 400-cow Upper Midwest operation referenced throughout this article is a composite case. Every financial input traces directly to University of Illinois FBFM 2024 enrollment data published via farmdoc daily, Cornell PRO-DAIRY DFBS reporting, USDA WASDE on the dates cited, ERS national dairy cost-of-production data, and CoBank’s August 2025 Knowledge Exchange on heifer markets. No real producer is being characterized.
What That January 28 Check Actually Reflected
The deposit reflected milk shipped 60–75 days earlier. November 2025 Class III settled at $15.86/cwt per USDA AMS. December settled at $14.59. By the time the cooperative wired the funds, the forward strip for Q1 2026 was already trading below $16, and the WASDE annual all-milk forecast for 2026 had been cut from January’s WASDE-667 print of $18.25/cwt to $18.95/cwt in February’s WASDE-668.
The check was a rearview mirror.
What it couldn’t reflect: the corn the operation hadn’t yet contracted for spring and summer feeding, in a market where May 2026’s WASDE-671 (released May 12, 2026) projects 2026/27 marketing-year corn at a season-average $4.40/bu and soybean meal at $310/short ton. It also couldn’t reflect the 132 replacement heifers per year; a 33% cull rate consumes, at the $4,000–$4,100/head prices CoBank Knowledge Exchange documented in August 2025 and The Bullvine reported again in January 2026.
Three Invisible Cuts: WASDE Whiplash, FMMO Reform, and the Heifer Line
Everyone assumed the WASDE all-milk forecast was a budgeting baseline. The 2025–2026 revision history says it isn’t.
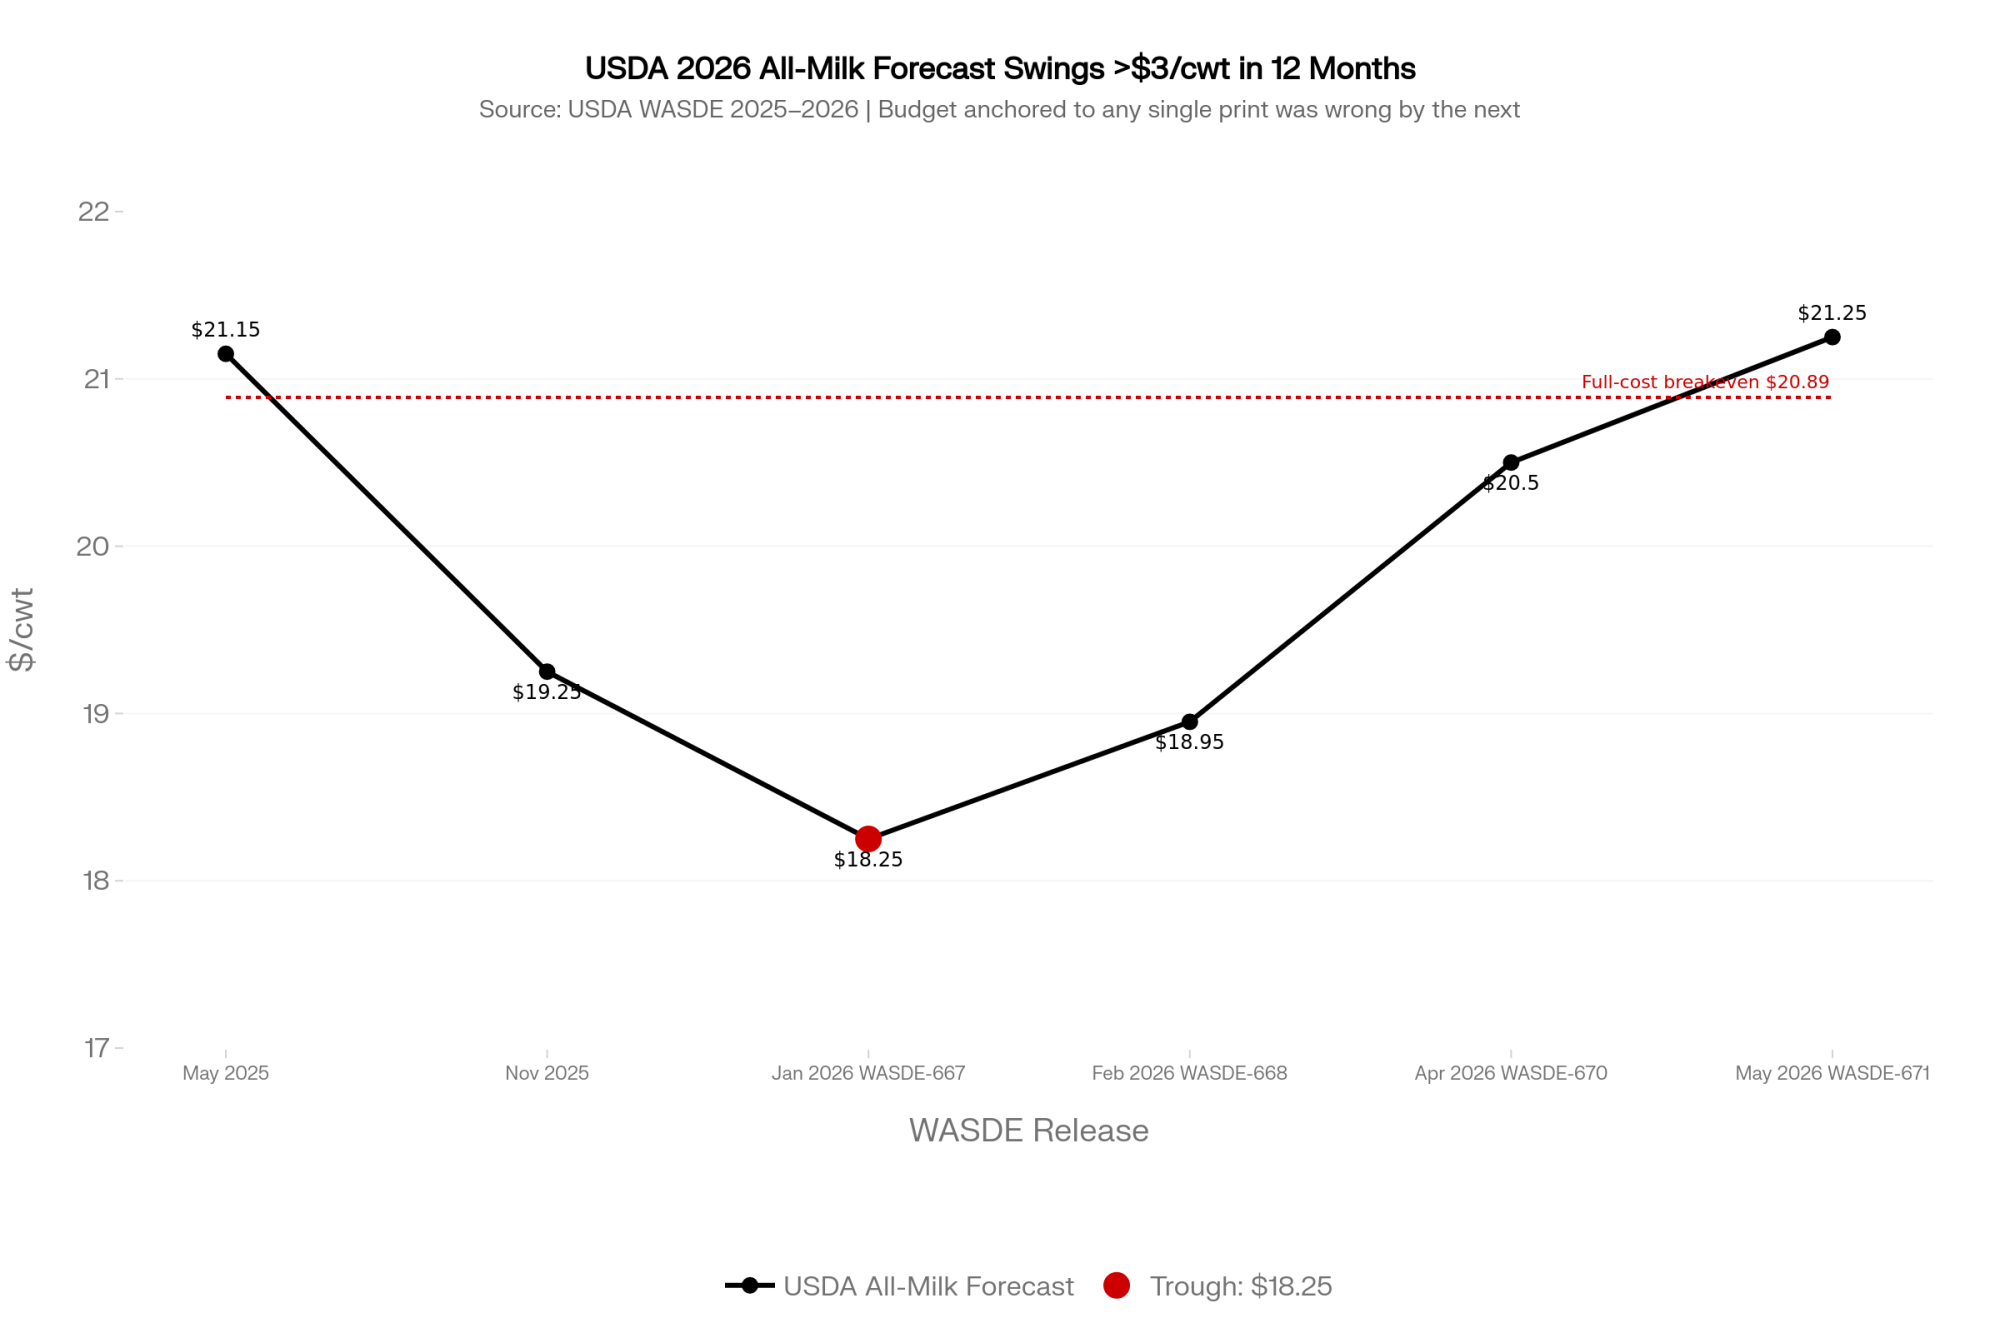
USDA’s documented sequence of 2026 all-milk forecasts moved from $21.15/cwt in the May 2025 WASDE, down to $19.25 by November 2025, $18.25 in January 2026’s WASDE-667, $18.95 in February’s WASDE-668, $20.50 in April’s WASDE-670, and back to $21.25 in May’s WASDE-671. That’s more than $3.00/cwt of peak-to-trough revision on the same calendar year. A budget anchored on any single one of those prints would have been wrong by the next monthly release.
| WASDE Release | Date | All-Milk Forecast | vs. $20.89 Full Breakeven | Budget Implication |
|---|---|---|---|---|
| May 2025 WASDE | May 2025 | $21.15/cwt | +$0.26/cwt | Appeared profitable — thin margin |
| November 2025 WASDE | Nov 2025 | $19.25/cwt | -$1.64/cwt | Below breakeven: $179,580/yr loss |
| WASDE-667 | Jan 2026 | $18.25/cwt | -$2.64/cwt | $289,080/yr equity erosion |
| WASDE-668 | Feb 2026 | $18.95/cwt | -$1.94/cwt | $212,430/yr equity erosion |
| WASDE-670 | Apr 2026 | $20.50/cwt | -$0.39/cwt | Still below breakeven: $42,705/yr |
| WASDE-671 | May 12, 2026 | $21.25/cwt | +$0.36/cwt | Barely profitable: $39,420/yr |
The second cut arrived June 1, 2025, when FMMO make allowance reform, raising the cheese make allowance from $0.2003/lb to $0.2519/lb — a structural pricing change estimated to have reduced Class III prices by roughly $0.85–$0.92/cwt for predominantly Class III pooled operations, based on The Bullvine’s June 2025 analysis of the make allowance changes. That’s not a market move. That’s a permanent recalibration of the price formula.
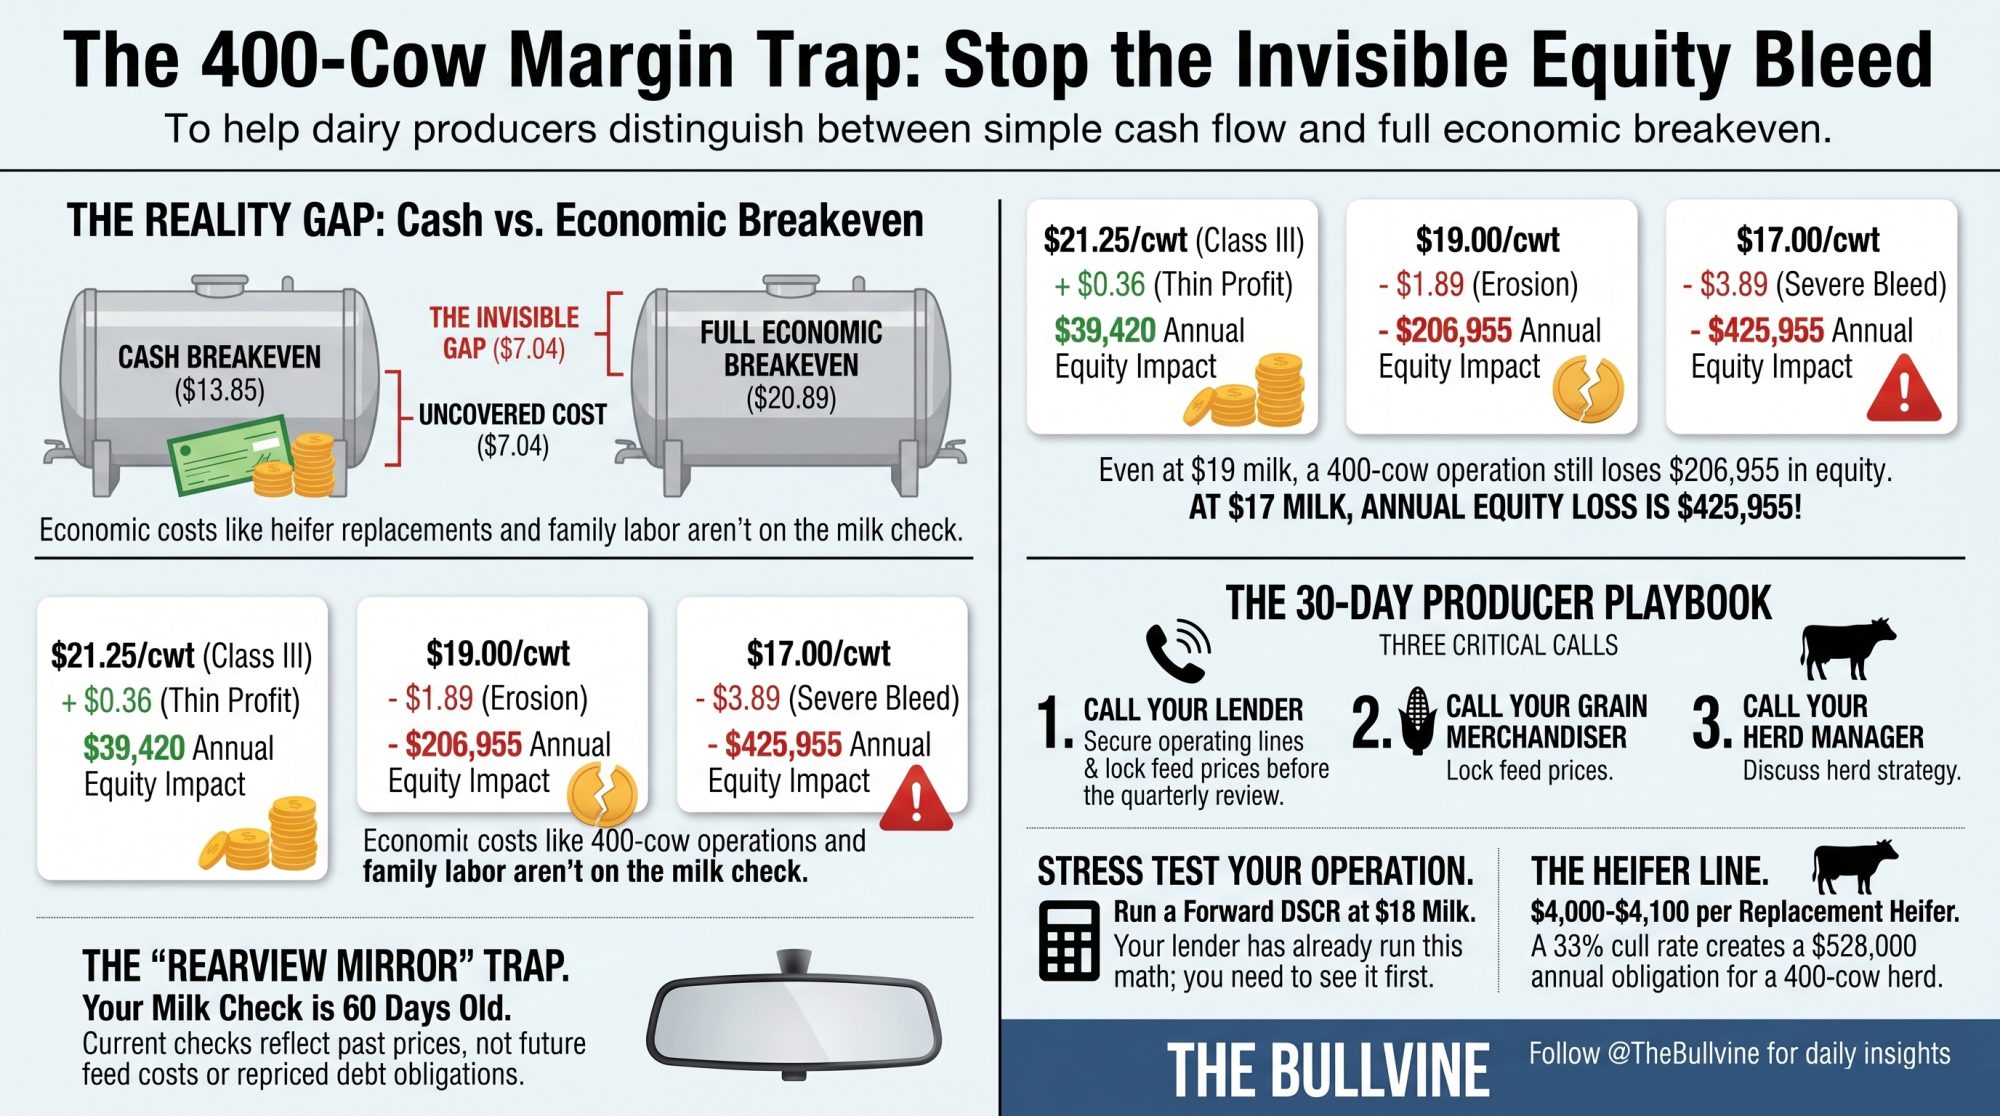
The third cut is the heifer line. CoBank’s Knowledge Exchange flagged 438,844 fewer replacement heifers projected for 2026 than 2025. On a 400-cow herd running a 33% cull rate, replacement obligations translate to roughly $528,000/year at current market — capital that comes out of the operating line if it isn’t budgeted as an explicit reserve.
What’s the Real Gap Between Cash Breakeven and Full Economic Breakeven on a 400-Cow Herd?
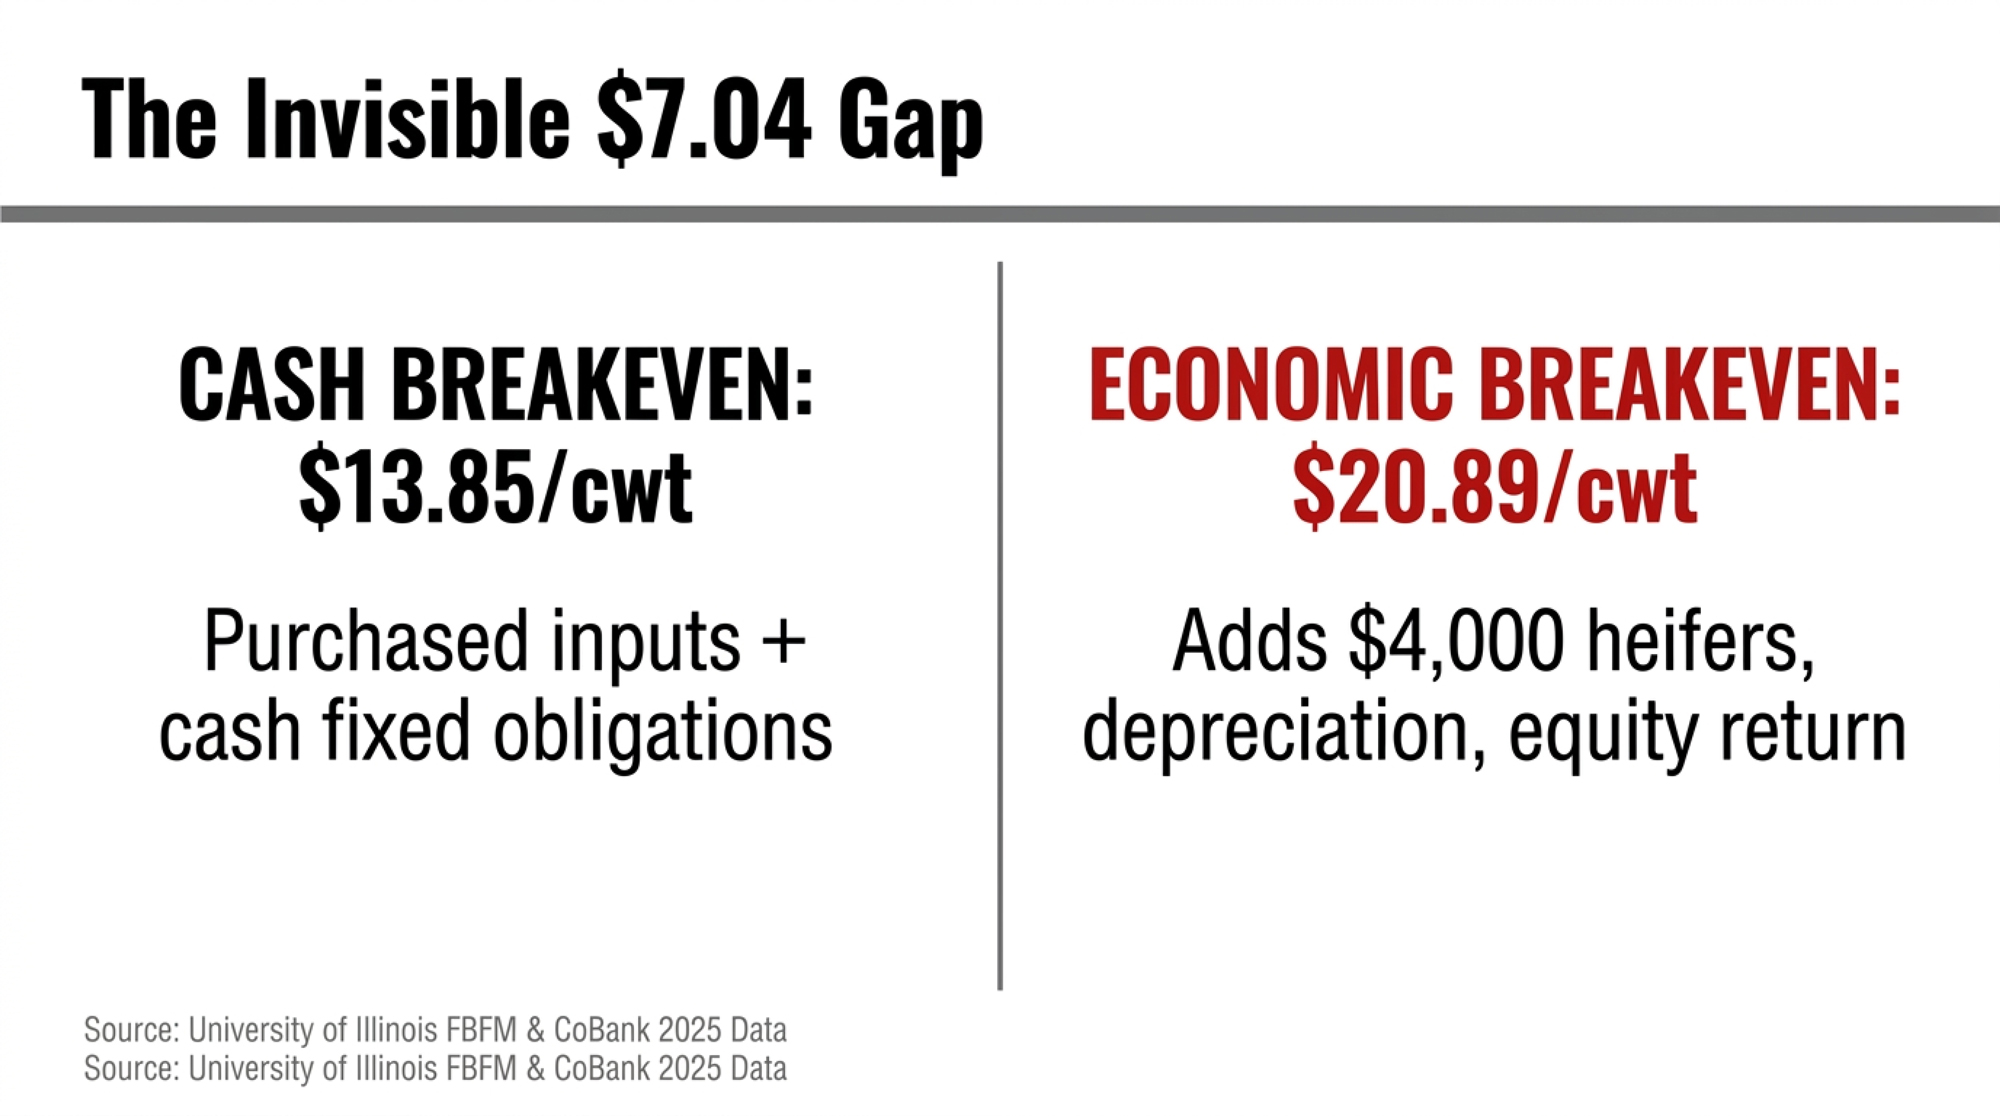
Cash breakeven and full economic breakeven aren’t the same number. The gap between them is where mid-size operations bleed equity invisibly while the checking account still shows green.
University of Illinois FBFM data published via farmdoc daily in December 2025 puts 2024 total economic costs for enrolled Illinois dairies at $23.56/cwt against an average price received of $21.63 — a fifth consecutive year of negative economic returns. FBFM enrollees self-select toward better-than-average recordkeeping. The structural gap is real, and it compounds across cycles.
Minnesota FINBIN’s 2024 Annual Report shows cost of production averaging $19.52/cwt across enrolled dairies, with a range from roughly $17/cwt for herds over 500 cows up to $20.22/cwt for herds under 50 cows. USDA ERS national cost-of-production estimates put the largest U.S. herds (2,000+ cows) at $19.14/cwt and 200–499-cow operations at near $20.85/cwt. Among the herd-size scale bands ERS publishes, the 200–499-cow group has the highest cost of production, and that’s the band the 250–600-cow target operation overlaps directly.
Running the Numbers — A 400-Cow Upper Midwest Operation, Calendar Year 2026
A 400-cow herd at 75 lbs/cow/day ships approximately 109,500 cwt/year (400 × 75 × 365 ÷ 100). Every input below traces to FBFM 2024 benchmarks, CoBank August 2025 heifer market data, May 2026 WASDE-671 feed prices, or ERS national dairy cost categories. Plug in your own numbers where they differ. The arithmetic doesn’t care about averages.
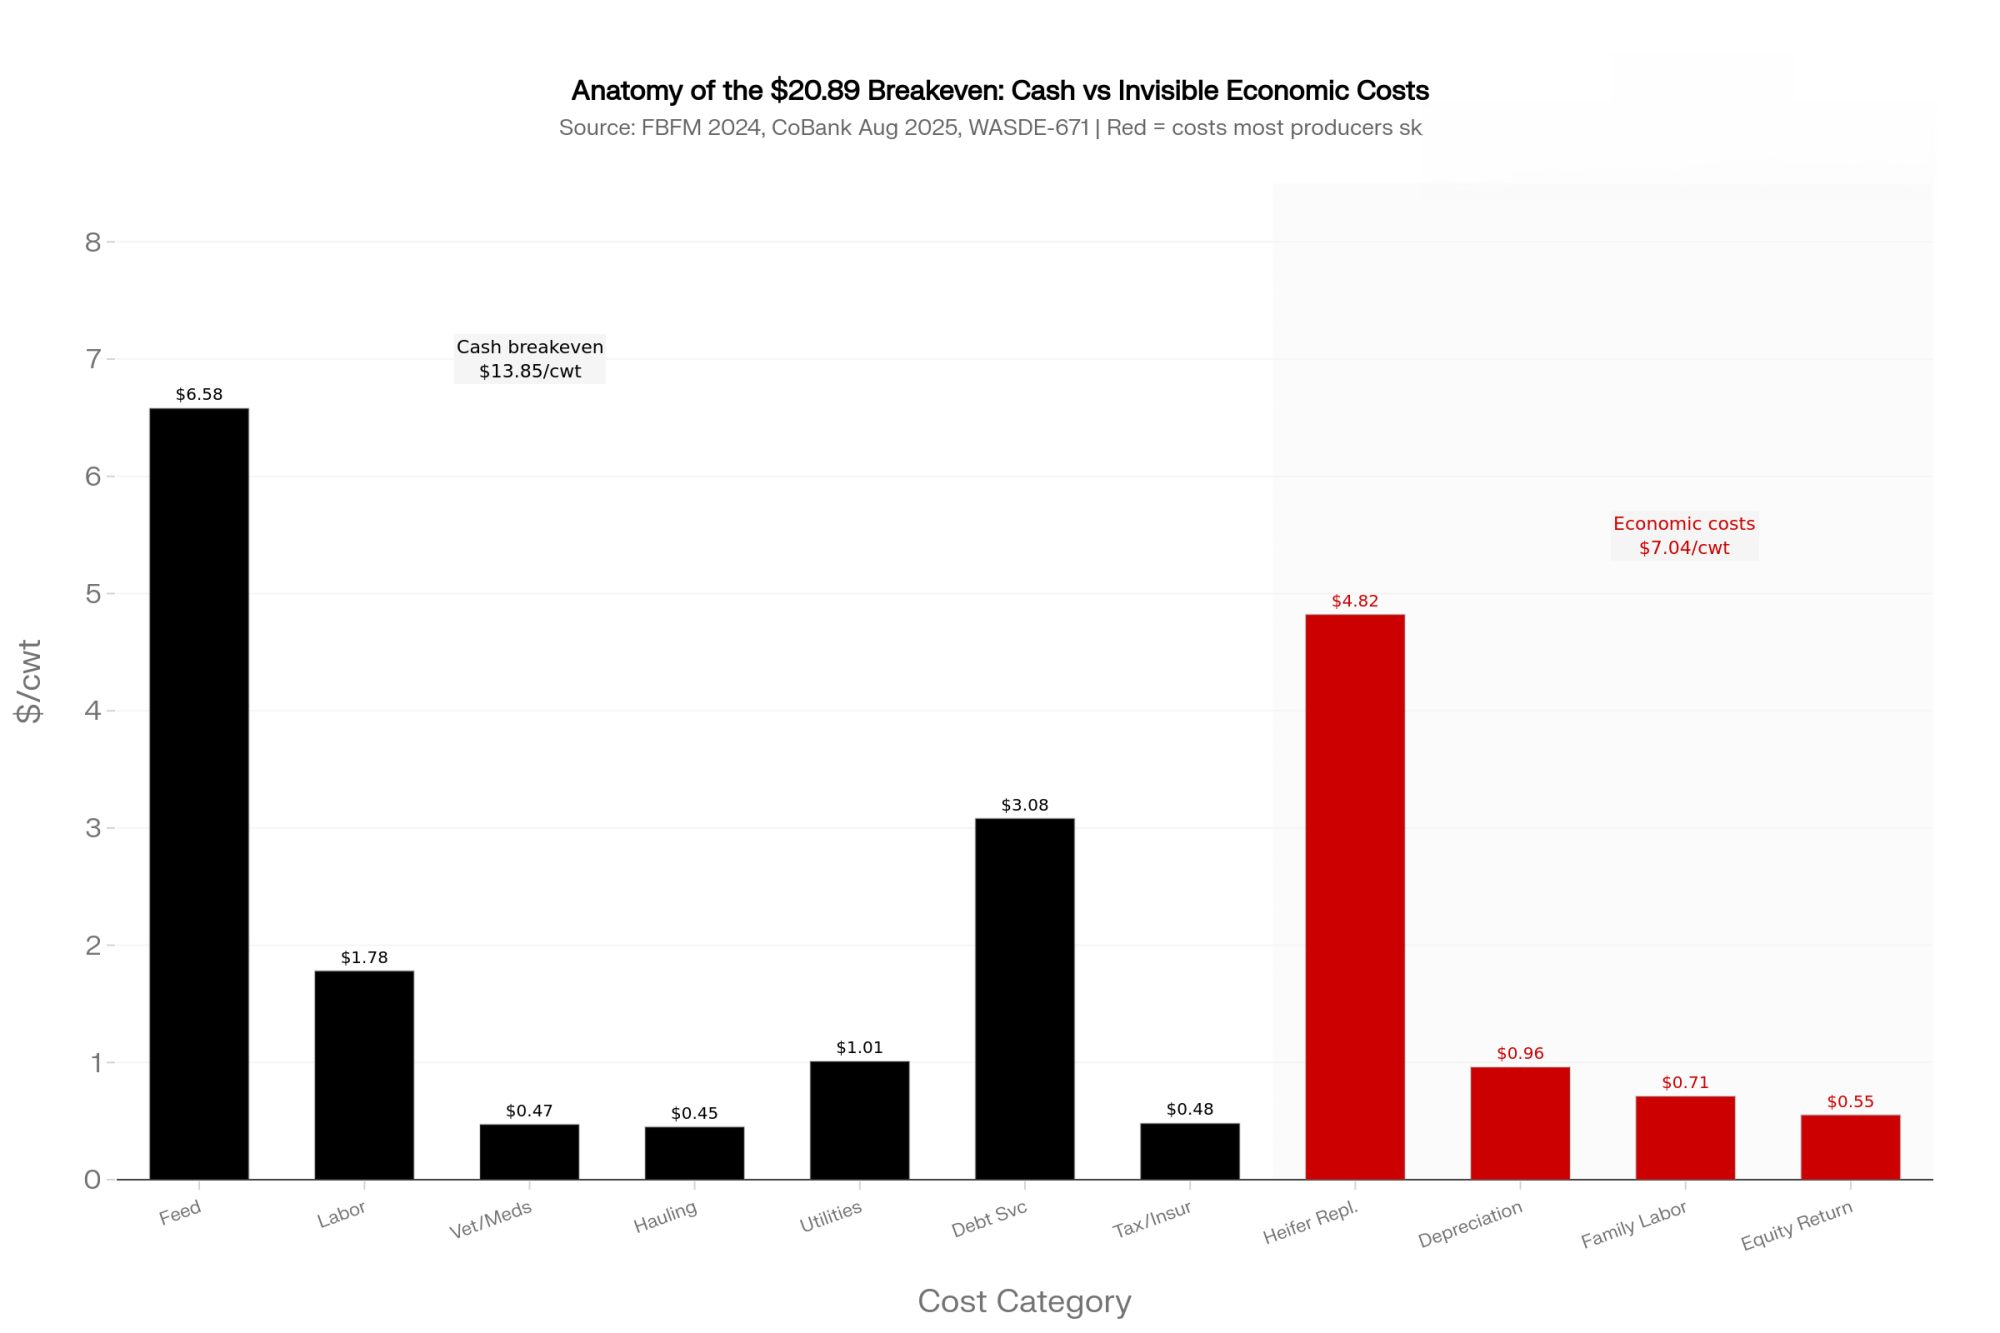
Cash operating costs (purchased inputs)
- Purchased grain and protein at WASDE-671 prices ($4.40/bu corn, $310/ton SBM, plus minerals): $720,000 → $6.58/cwt
- Hired labor: $195,000 → $1.78/cwt
- Veterinary and medicine: $52,000 → $0.47/cwt
- Hauling and co-op dues: $49,000 → $0.45/cwt
- Utilities, supplies, fuel, repairs: $111,000 → $1.01/cwt
- Subtotal: $10.29/cwt
The feed line above reflects only purchased grain and protein. Operations that include homegrown forage at full production cost should substitute their actual total feed number — Illinois FBFM put the 2024 average total feed cost at $11.64/cwt.
Fixed cash obligations
- Term debt service (principal $148,000 + interest at 7% on average outstanding balance, on $4.5M term debt — illustrative for an operation that expanded at 2021–2023 asset prices): $337,000 → $3.08/cwt
- Property taxes and insurance: $53,000 → $0.48/cwt
- Subtotal: $3.56/cwt
Cash breakeven (purchased-input basis): $13.85/cwt
Economic costs (the invisible ones)
- Heifer replacement: 132 head × $4,000/head (CoBank August 2025 baseline-plus-premium midpoint) = $528,000 → $4.82/cwt
- Facility/equipment depreciation at replacement cost: $105,000 → $0.96/cwt
- Unpaid family labor at market wage (1.5 FTE × $52,000): $78,000 → $0.71/cwt
- Modest equity return (3% on $2M owner equity): $60,000 → $0.55/cwt
- Subtotal: $7.04/cwt
Full economic breakeven: $20.89/cwt
Three scenarios, same herd:
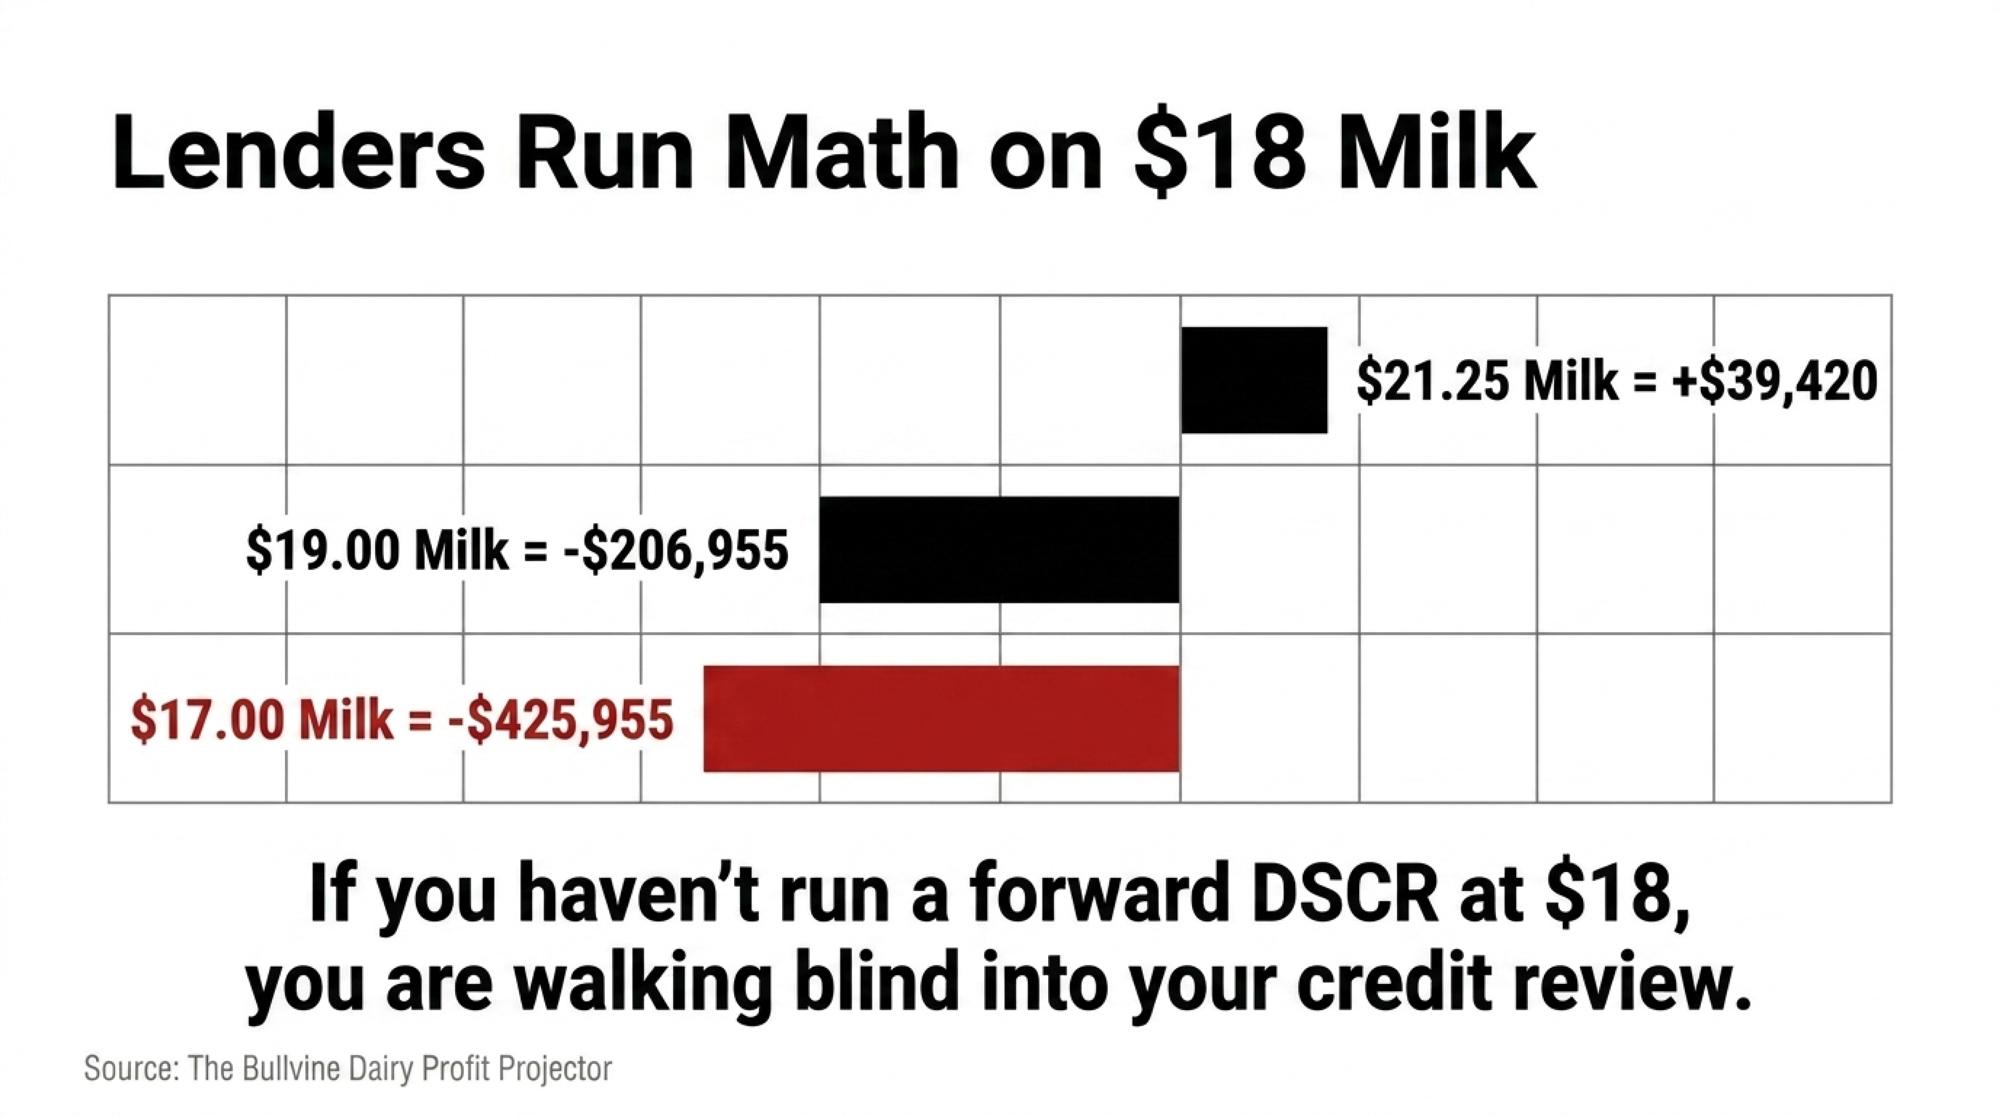
- At $21.25/cwt (May 2026 WASDE-671 base case): margin above breakeven = $0.36/cwt → roughly $39,420/year in true economic profit. Thin.
- At $19.00/cwt: shortfall = $1.89/cwt → $206,955/year in equity erosion.
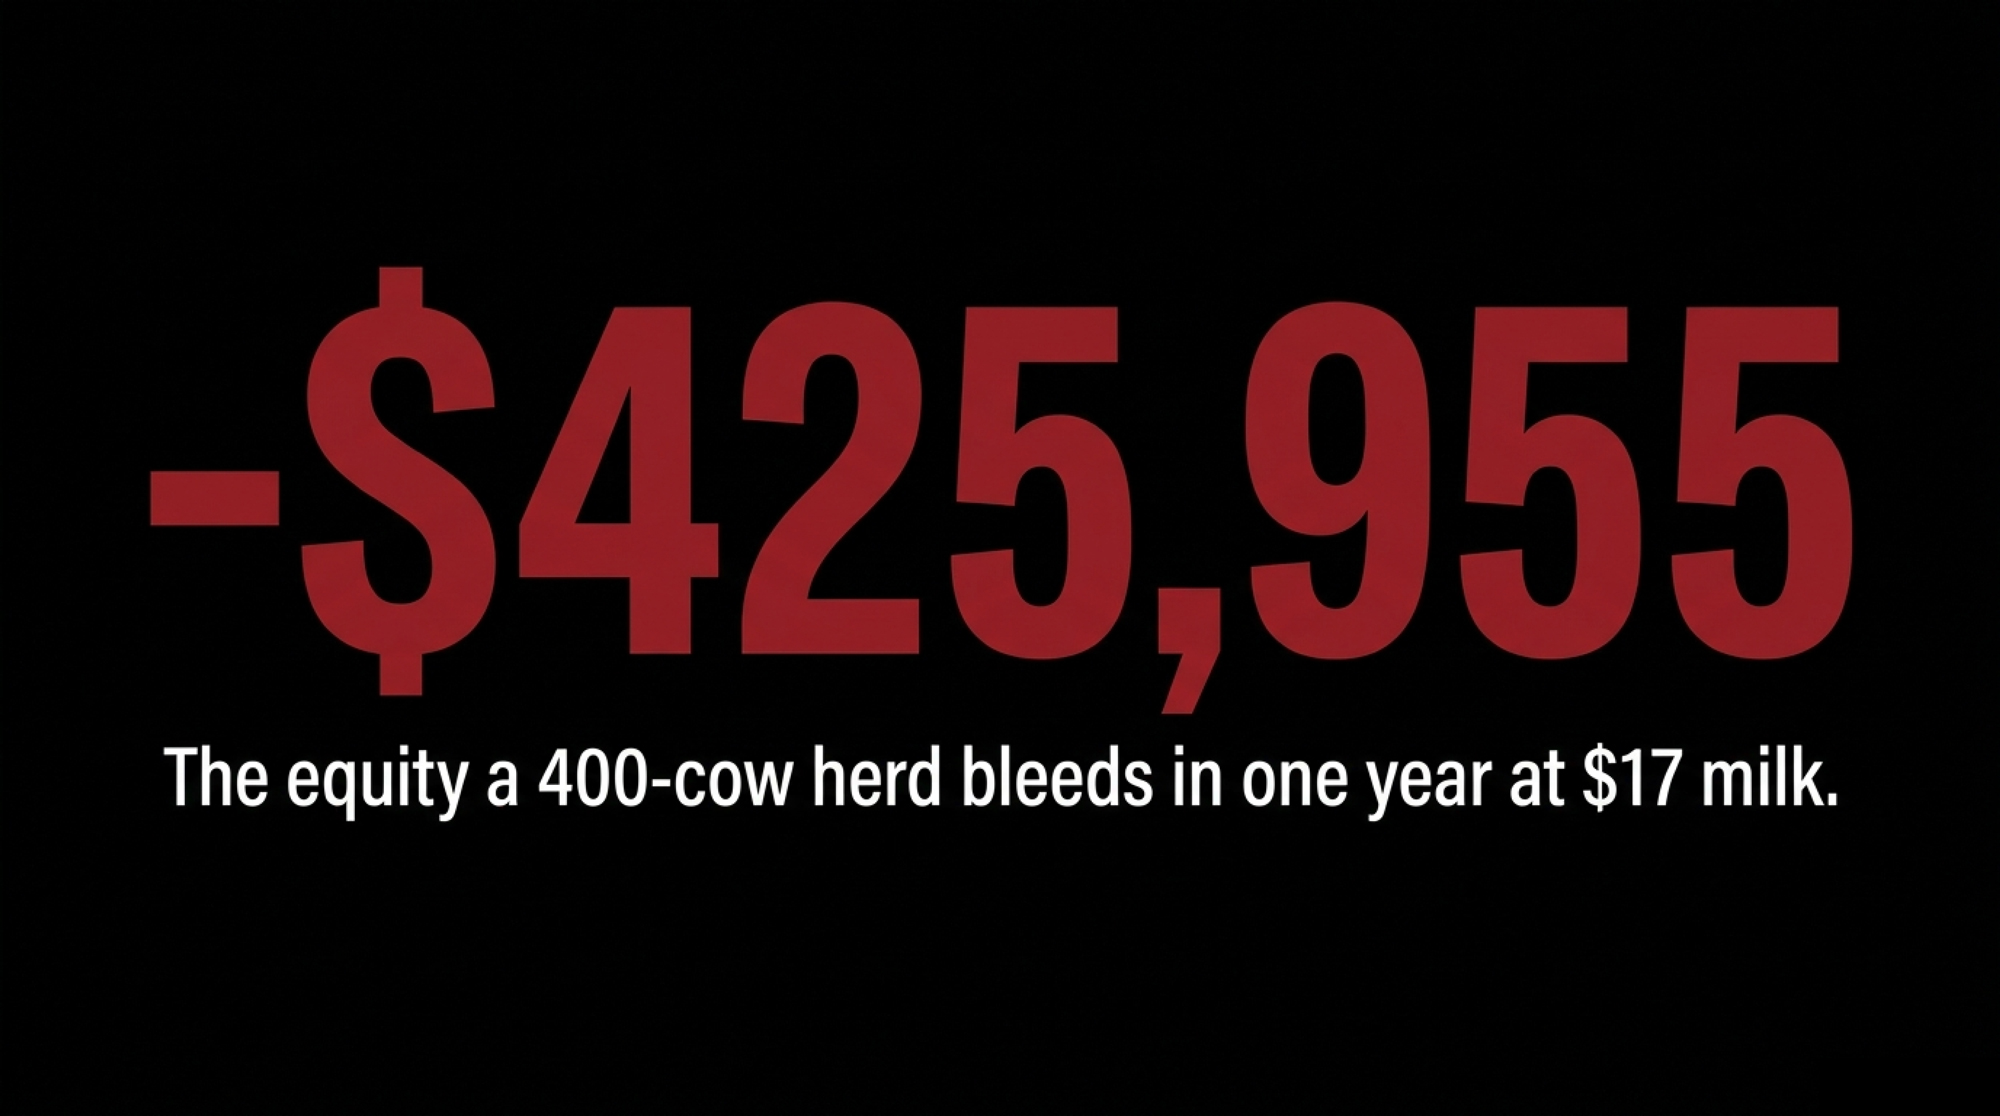
- At $17.00/cwt (where Class III actually traded for parts of Q1 2026): shortfall = $3.89/cwt → $425,955/year in equity erosion.
| Metric | $17.00/cwt Milk | $19.00/cwt Milk | $21.25/cwt Milk (WASDE-671) |
|---|---|---|---|
| Revenue (109,500 cwt) | $1,861,500 | $2,080,500 | $2,326,875 |
| Cash Breakeven Cost | $1,516,575 | $1,516,575 | $1,516,575 |
| Cash Margin | +$344,925 | +$563,925 | +$810,300 |
| Full Economic Breakeven Cost | $2,287,455 | $2,287,455 | $2,287,455 |
| Economic Margin | -$425,955 | -$206,955 | +$39,420 |
| Implied $/cwt Gap vs. Breakeven | -$3.89/cwt | -$1.89/cwt | +$0.36/cwt |
| Annual Equity Erosion | $425,955 | $206,955 | None — barely profitable |
| Lender Forward DSCR Signal | 🔴 Crisis threshold | 🔴 Below 1.15× likely | 🟡 Marginal — stress-test |
A Note for Canadian Readers
Quota-protected operations in Ontario and across the supply-managed system face the same problem in a different form. The lag isn’t milk price — it’s the cost-of-production formula adjustment. Through the 2026 cycle, the Canadian Dairy Commission’s blend price formula adjusts on a slower cadence than market feed and energy costs, which means a quota-holder reading a stable farmgate price can still be running a feed bill the formula has not yet incorporated. The barn math above changes shape but not principle: cash breakeven, full economic breakeven, and the invisible heifer and depreciation lines apply regardless of the pricing system.
Has Your Lender Already Run Your Forward DSCR at $18 Milk?
The lender conversation has shifted. Eighteen months ago, ag lenders ran trailing 12-month DSCR — did last year’s net farm income cover last year’s debt service, with strong prior years carrying the conversation forward? Backward-looking by definition.
That’s not the conversation in 2026.
Industry trade press through 2025–2026 has documented a shift among major U.S. agricultural lenders toward forward DSCR analysis calculated against Q3/Q4 forward strips with current debt-service costs. For operations whose term debt was underwritten at $20.50 milk and whose variable rates have repriced toward the 7% range over the 2024–2025 cycle, that forward calculation produces materially different numbers than the trailing one. On $4.5M term debt, the rate move alone adds roughly $112,500–$135,000 in annual interest on average outstanding balance — about $1.02–$1.23/cwt on 110,000 cwt of production. That’s exactly the margin band most mid-size operations are trying to defend.
Cornell PRO-DAIRY’s 2024 DFBS reporting documents that the lowest-profit quartile of enrolled operations carries materially lower debt-service coverage than the herd-average benchmark, and the gap widens under stressed forward milk price assumptions.
The shift isn’t a criticism of how producers manage their books. It’s a change in methodology for how the credit conversation is opened. The lender now arrives with a forward stress test already run on your operation. The producer who hasn’t run the same calculation walks into a conversation they didn’t know was happening.
Three Calls That Did the Real Work in November and December 2025
Operations of 250–600 cows across Wisconsin, Minnesota, and western Michigan that came out of Q1 2026 with extended operating lines and locked rates didn’t get there because milk recovered. Based on industry conversations and trade press through late 2025 and early 2026, they got there because they ran the numbers in November and December — before the January Class III settlement and ahead of the lender’s annual review cycle.
Three calls did most of the work.
The first call was to the lender in early December. The producer arrived with a full-cost breakeven, a forward DSCR at $18 milk, and a specific ask: extend the operating line as a precautionary buffer, lock the variable rate while the curve allowed it, frame the conversation as planning rather than crisis. That framing matters when debt sits at $11,250/cow — well above the $6,638/cow figure dairy financial consultant Greg Bethard identified in The Bullvine’s prior coverage as a debt level above which lender scrutiny commonly increases.
The second call was to the grain merchandiser, while December 2025 corn was trading roughly $4.00–$4.10/bu. Contracting 60% of projected corn through June 2026 at near $4.05/bu wasn’t a bet that prices would rise. It was a hedge against being 100% spot through the summer feeding window.
The third call was internal — the herd manager. Reviewing the cull list and deferring elective culls on cows that were marginal but functional. Every heifer not bought in Q1 2026 at $4,000–$4,100/head was capital not pulled from a stressed operating line.
By February, those operations weren’t comfortable. $14.59 Class III is painful regardless of preparation. They were positioned. An operation that hadn’t run the calculation, reading the same January check, faced a different set of constraints: an operating line already at high utilization, 2026 grain costs running spot, and the lender’s annual review arriving on the lender’s timeline rather than its own.
The 30/90/365-Day Playbook for a 400-Cow Operation in This Position
30-Day Actions — Urgent Checks
1. Recalculate net mailbox price per cwt.
- What to do: Pull the last 12 milk checks and net out hauling, co-op dues, and FMMO PPD adjustments to get a true rolling average mailbox price.
- Trigger: Trailing 12-month average runs more than $1.50/cwt below the current WASDE all-milk forecast.
- Backfire watch: Don’t read a one-month basis anomaly as a structural problem. Use the rolling average, not a single check.
2. Build the full economic breakeven on paper.
- What to do: Layer the four invisible lines onto your cash budget — heifer replacement at CoBank August 2025 market data ($4,000–$4,100/head), facility depreciation at replacement value, unpaid family labor at market wage, modest equity return.
- Trigger: Number lands above $21/cwt on a 250–600 cow herd.
- Backfire watch: Capital structure may be misaligned with the milk price environment that has actually materialized; don’t assume averages will rescue the calculation.
3. Run forward DSCR against $18 milk.
- What to do: Calculate 2026 debt service against an $18/cwt assumption using current rates.
- Trigger: DSCR lands below 1.15×.
- Backfire watch: The lender call moves to this week, not next quarter.
4. Pull forward feed cost coverage.
- What to do: Document what percentage of projected corn and SBM through November is contracted or priced.
- Trigger: Coverage sits below 40%.
- Backfire watch: Request a current quote before Friday. You don’t have to execute — get the number on paper so the next decision is made with current data.
90-Day Actions — Structural Adjustments
1. Initiate a proactive lender conversation.
- What to do: Walk in with a current balance sheet, an honest forward DSCR, and a specific ask.
- What it requires: 2–3 hours of preparation, a current balance sheet, and an honest forward DSCR.
- Trigger: Any DSCR below 1.20× under $18 milk assumptions.
- Backfire watch: Walking in unprepared invites the lender to set the agenda; walking in over-confidently invites a deeper review than you wanted.
2. Forward-contract 50–65% of feed needs through Q4 2026.
- What to do: Layer in coverage against May 2026 WASDE-671 baselines ($4.40/bu corn, $310/ton SBM).
- What it requires: A merchandiser relationship and storage or basis flexibility.
- Backfire watch: Don’t over-hedge a position you can’t deliver against if production drops or feed needs shift mid-year.
3. Restructure variable-rate term debt to fixed where the math supports it.
- What to do: Get a current fixed-rate quote and run the comparison against your existing variable structure.
- What it requires: Lender willingness, possibly a fee, and a current rate quote.
- Trigger: Fixed-rate quote sits within 0.50% of your variable rate.
- Backfire watch: Locking long-term at the top of a rate cycle.
365-Day Strategic Positioning
1. Reassess herd-size targets against full economic breakeven.
- What to do: Decide on expansion, hold, or consolidation against full-cost breakeven, not cash breakeven.
- Pause-expansion trigger: Full-cost breakeven above $21/cwt and cannot be reduced through structural cost work.
- Opportunity signal: Full economic breakeven below $19/cwt and forward DSCR at $18 milk above 1.30× — room to evaluate selective expansion or capital improvement.
2. Build a heifer replacement reserve as an explicit balance sheet line.
- What to do: Fund the reserve from operating cash during stronger price periods; draw down during compression.
- Why it matters: Operations carrying $462,000–$528,000/year in implicit replacement obligations against zero explicit reserve are running a structural deficit that compounds across cycles.
3. Reassess your component profile against your processor’s Class III/IV utilization.
- What to do: Map your check’s class composition against your component capacity.
- Why it matters: Operations whose checks are 70%+ Class III pooled took a larger relative hit from the June 2025 make allowance reform than operations with heavier Class IV exposure.
- Backfire watch: Don’t chase components without nutritional or genetic capacity to hold them.
Run Your Numbers
Every figure in this article can be replaced with your own. Plug your herd size, your purchased feed cost, your debt service, your heifer line, and your component profile into The Bullvine Dairy Profit Projector and run the same three scenarios on your own operation:
What This Means for Your Operation
The milk check is a 60-day-old document. It tells you what happened in November when you read it in late January. It doesn’t tell you what your forward feed costs, your repriced debt service, or your replacement heifer obligations will demand from the next four quarters.
You get cash visibility from the milk check. You get margin visibility only from the underlying calculation. Operations building only the first one makes decisions on lagging data. Operations building both walk into the lender conversation with the same forward stress test that the lender already ran.
The barn math doesn’t care about averages. It runs on your specific feed cost, debt service, heifer line, and component profile.
What’s your real margin over feed per cwt this month versus 90 days ago — and where does your full economic breakeven sit against the futures strip? Your January milk check is already lagging.
If the answer is “I haven’t run it” — the next 30 days are about that calculation, not next quarter’s milk price.
Key Takeaways
- Cash breakeven and full economic breakeven aren’t the same number. On a 400-cow Upper Midwest herd at WASDE-671 feed prices, that gap runs from $13.85 to $20.89/cwt — and the second number is the one your lender is now stress-testing.
- A single WASDE print isn’t a budget. The 2026 all-milk forecast moved more than $3.00/cwt between May 2025 and May 2026; build your plan against $18 milk and check what breaks.
- The three calls that mattered happened in November and December — to the lender, the grain merchandiser, and the herd manager — before the January Class III settlement landed. If you haven’t made them, the next 30 days are about that calculation, not next quarter’s milk price.
- Heifer replacements at $4,000–$4,100/head and 7% repriced term debt are the two invisible lines that turn a positive milk check into $200K–$425K/year in equity erosion. Treat them as explicit budget lines, not afterthoughts.
Complete references and supporting documentation are available upon request by contacting the editorial team at editor@thebullvine.com.
Learn More
- Surviving the $0.94/cwt Dairy Make Allowance Hit — Protection from hidden regulatory drains requires running the accurate mailbox math exposed here. This operational breakdown demonstrates how permanent pricing updates strip six-figure sums from cheese-pooled herds, allowing you to re-evaluate variable inputs before your lender pulls the credit line.
- More Milk, Fewer Farms, $250K at Risk: The 2026 Numbers Every Dairy Needs to Run — Strategic edge over a production-heavy, low-margin environment comes from identifying the precise quarter-million-dollar gap built into current global supply projections. This executive map traces structural shifts to help managers size, hold, or exit contracts.
- The $585‑Per‑Service Beef‑on‑Dairy Trap: What a 500‑Cow Herd Reveals About Your Replacement Pipeline— Overcoming the quiet cannibalization of future milking strings requires executing the strict genetic tiering model delivered in this guide. This deep analysis dismantles the illusion of short-term calf premiums by quantifying the true multi-year cost of a depleted heifer crop.
 The Sunday Read Dairy Professionals Don’t Skip.
 The Sunday Read Dairy Professionals Don’t Skip.
Every week, thousands of producers, breeders, and industry insiders open Bullvine Weekly for genetics insights, market shifts, and profit strategies they won’t find anywhere else. One email. Five minutes. Smarter decisions all week.
