Archive for dairy carbon footprint

The Carbon Rule Everyone Misread: Britain Didn’t Vote a Cull, But Your Herd Is Still in the Crosshairs

MPs did vote on Britain’s carbon budget. The panic headline was wrong—but the 27% herd cut it quietly assumes can still land on your milk cheque.

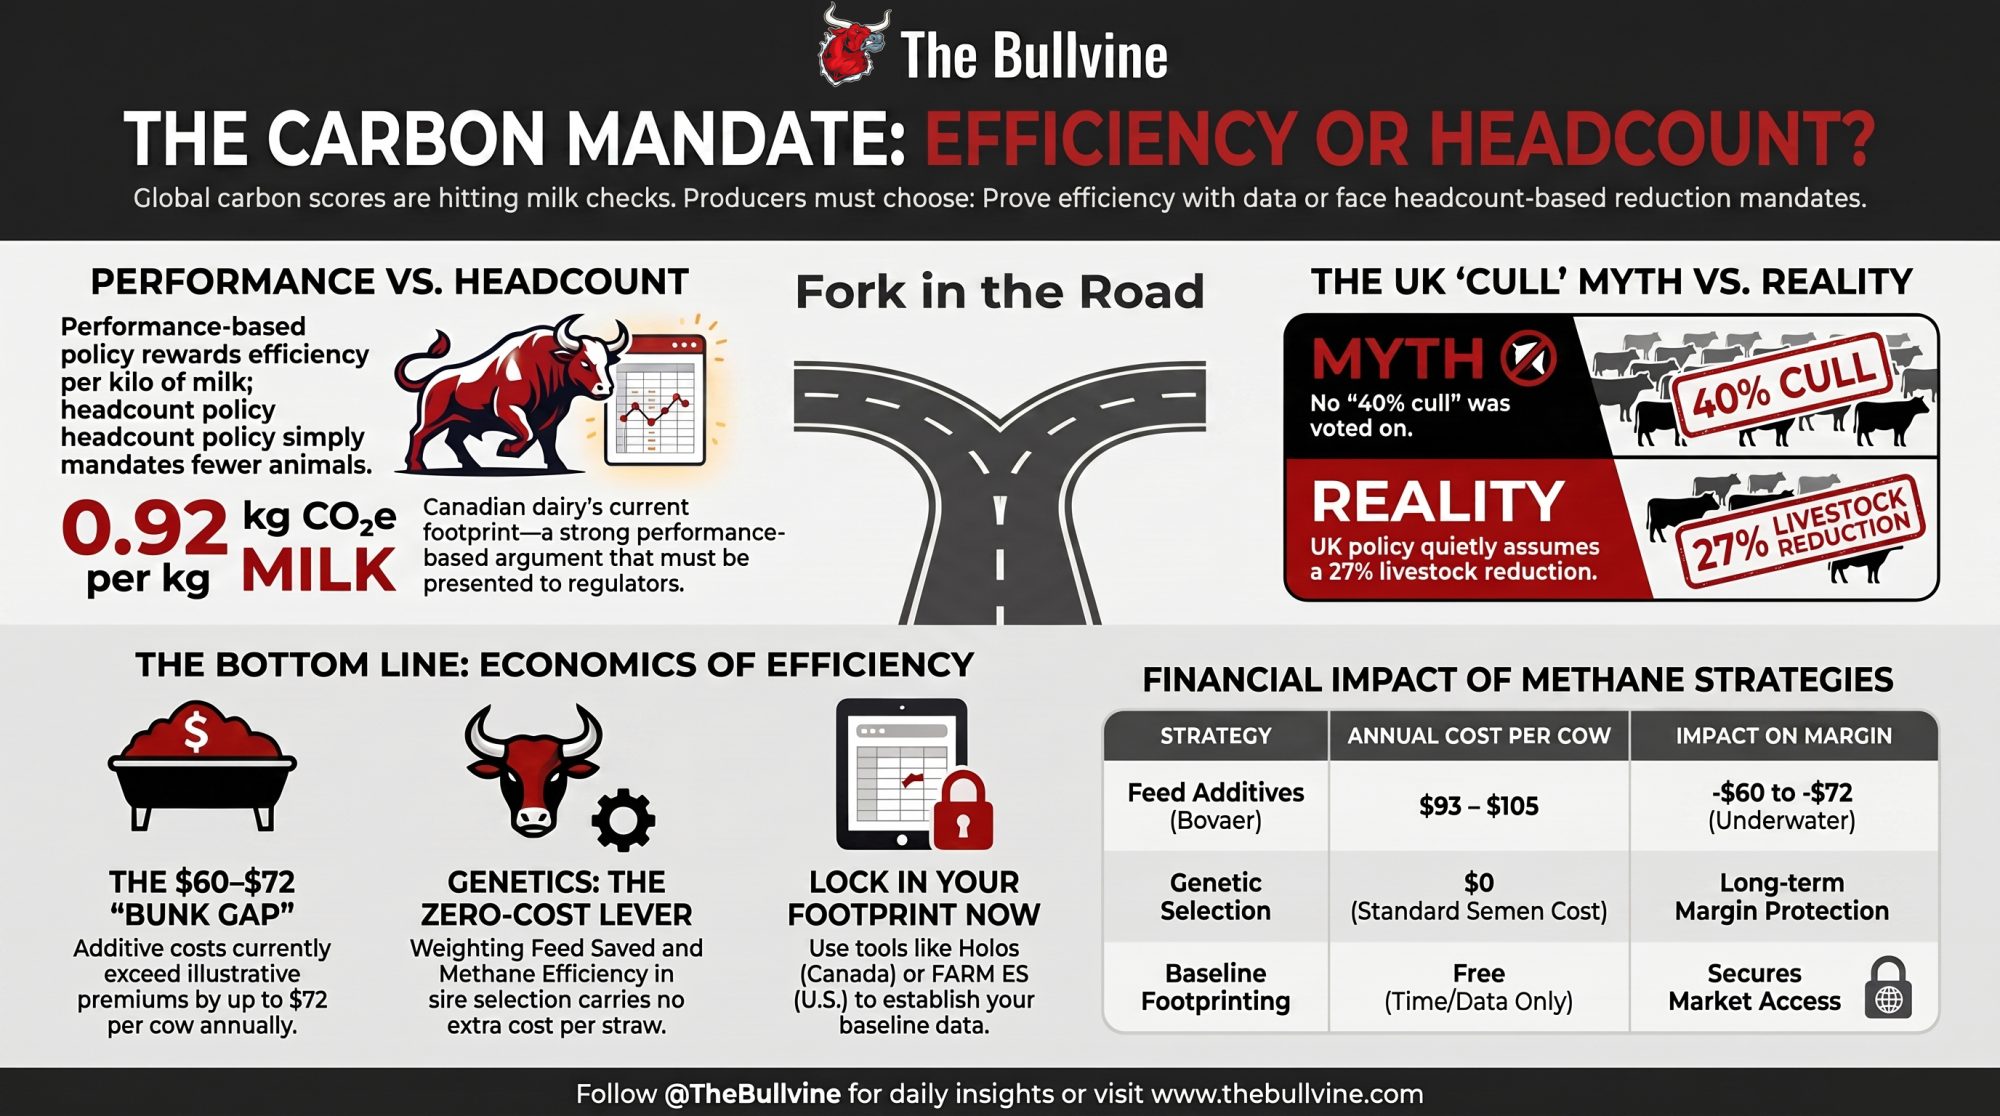
Executive Summary: Britain’s new carbon budget quietly assumes a 27% cut in cattle and sheep by 2040, and MPs just voted to legislate it, even though nobody voted to “cull 40% of cows.” That framework is already pushing toward North American barns through processor demands for farm‑level carbon footprints, not through tariffs first. On the feed side, chasing methane reduction with Bovaer currently runs about $93–$105/cow/year against an illustrative 12¢/cwt premium worth only ~$33/cow, leaving you roughly $60–$72/cow underwater unless someone else pays the difference. At the same time, genetic tools like Lactanet’s Environmental Impact Index and CDCB’s Net Merit revision now weight Feed Efficiency, Methane Efficiency, and Feed Saved heavily — a zero‑cost premium if you actually use those traits when you pick bulls. The opportunity is to lock in your own whole‑farm footprint number within the next 30 days using Holos, FARM ES/RuFaS, or COMET-Farm, and start shifting sire selection toward efficiency so you can argue for performance rather than headcount as buyers and regulators tighten rules. The risk is signing methane‑credit or additive contracts that look green on paper but quietly shave tens of dollars per cow off your margin every year while policymakers find it cheaper to cap animals than reward efficient milk.
dairy carbon footprint

Editor’s Note: The producer described in this article is a composite scenario modeled from typical mid-size Ontario and Upper-Midwest dairy operations, not a single named individual. All policy, economic, and genetic figures are real and sourced.

Picture a 250-cow operator somewhere between Listowel and Fond du Lac, sitting down this spring to book semen. The milk’s been shipping fine. Then the processor’s field rep asks a question that wasn’t on last year’s list: what’s the carbon footprint of your milk? No number ready. And no clear idea why the question suddenly matters. That’s the moment this story is really about — because the reason that question is landing in North American barns traces straight back to a document most producers have never read.

A screenshot circulated in the farm group chats claiming that UK MPs had voted to legislate a 40% cut in cattle by 2040. It traveled fast — that kind of number always does. Here’s the twist: MPs did vote on the carbon plan in late June, but nothing in it culls a cow. The “40% cull” part is invented. 

That document is the UK Climate Change Committee’s Seventh Carbon Budget — and what it actually says matters more to your milk cheque than any screenshot.

What the Document Actually Says

The Climate Change Committee — the CCC — is the UK government’s statutory climate advisor. Its Seventh Carbon Budget covers 2038 to 2042, and for the first time, it includes livestock reductions in the plan as a named tool, not a side effect.
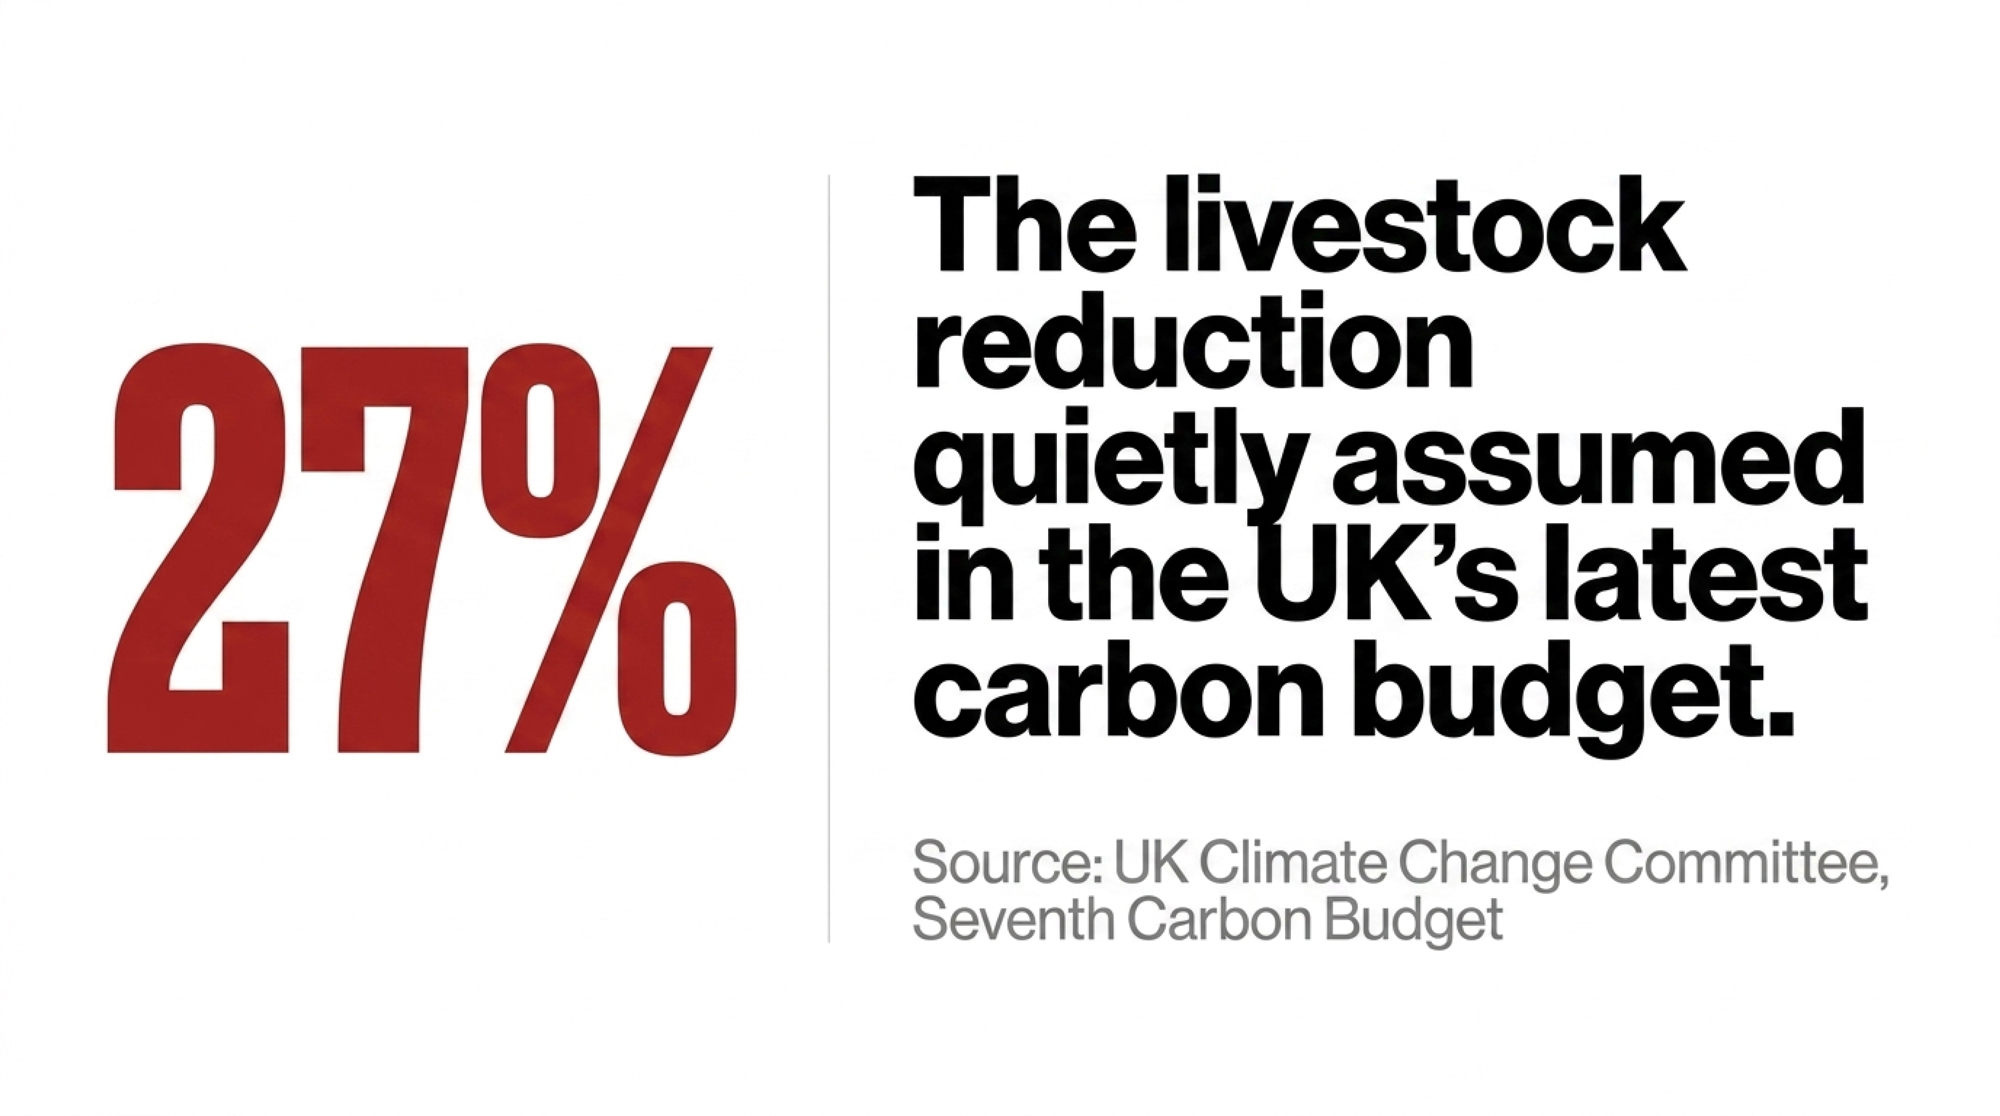
The modeling assumes a 27% cut in cattle and sheep numbers between 2023 and 2040, which the CCC’s own math indicates would account for a 32% reduction in agricultural emissions. On the land side, the plan aims for 16% of the UK to be under woodland by 2040 and 12% of grassland to be released for other uses. Nobody’s culling a herd. The CCC handed government a spreadsheet, and the internet turned it into a herd-cull headline. 

The vote itself was real, though. In late June 2026, MPs moved to legislate the budget level — a 535 MtCO₂e cap for 2038–2042, about an 87% cut on 1990 levels — ahead of the statutory June 30 deadline. That’s almost certainly the event that got garbled into “they voted to cull.” The delivery plan, which spells out how the cuts happen, comes next. 

So where did “40% by 2040” come from? The CCC’s pathway also assumes a 20% drop in dairy consumption by 2035 sustainweb and a broader red-meat-and-dairy shift of roughly 260 grams per person per week — and in the retelling, those got mashed together and welded onto the 2040 date. Several different numbers, one scary headline. 

Why a British Spreadsheet Lands in a North American Barn

Britain is a first mover here, not an outlier. Once a G7 climate plan treats “fewer cattle” as legitimate policy and bolts a percentage to it, the idea stops being fringe and starts being precedent.

It’s already spreading in the UK before it crosses the ocean. Scotland’s climate plans target a 26% cut in livestock by 2035; Northern Ireland’s, 31% by 2040. Same logic, three jurisdictions. When the framework replicates that fast at home, betting it stops at the water’s edge is a bet, not a plan. 

Will This Reach You as a Tariff or as a Phone Call From Your Processor?

Probably the phone call — the same one our composite operator just got. And that’s the part most coverage misses.

Here’s the formal mechanism first. Britain launches a Carbon Border Adjustment Mechanism (CBAM), a levy on imports priced according to their embedded carbon, on January 1, 2027. Right now it covers aluminum, cement, fertilizers, hydrogen, and steel. Dairy isn’t in scope. But the government has said CBAM’s scope will remain under review beyond 2027, and the Country Land & Business Association has already floated a food CBAM in its response to Carbon Budget 7. So the door isn’t open. It’s just unlocked. 

The quieter mechanism is the one that bites first. As British farmers absorb herd cuts and tighter standards, British retailers and processors are starting to treat carbon-verified milk as the floor, not the bonus. Anything above their intensity benchmark becomes a commercial liability. An Ontario processor shipping cheese or milk powder into that market wouldn’t get hit with a tariff — it’d get asked for farm-level emissions numbers, and lose the contract if it couldn’t produce a credible one. The market-access problem shows up on a spec sheet long before it shows up in a law.

What Does This Cost at the Feed Bunk Today?

The cleanest dollar math you can run right now isn’t on the trade side. It’s at the bunk — and it tells you exactly what a carbon-scored world rewards and what it doesn’t.

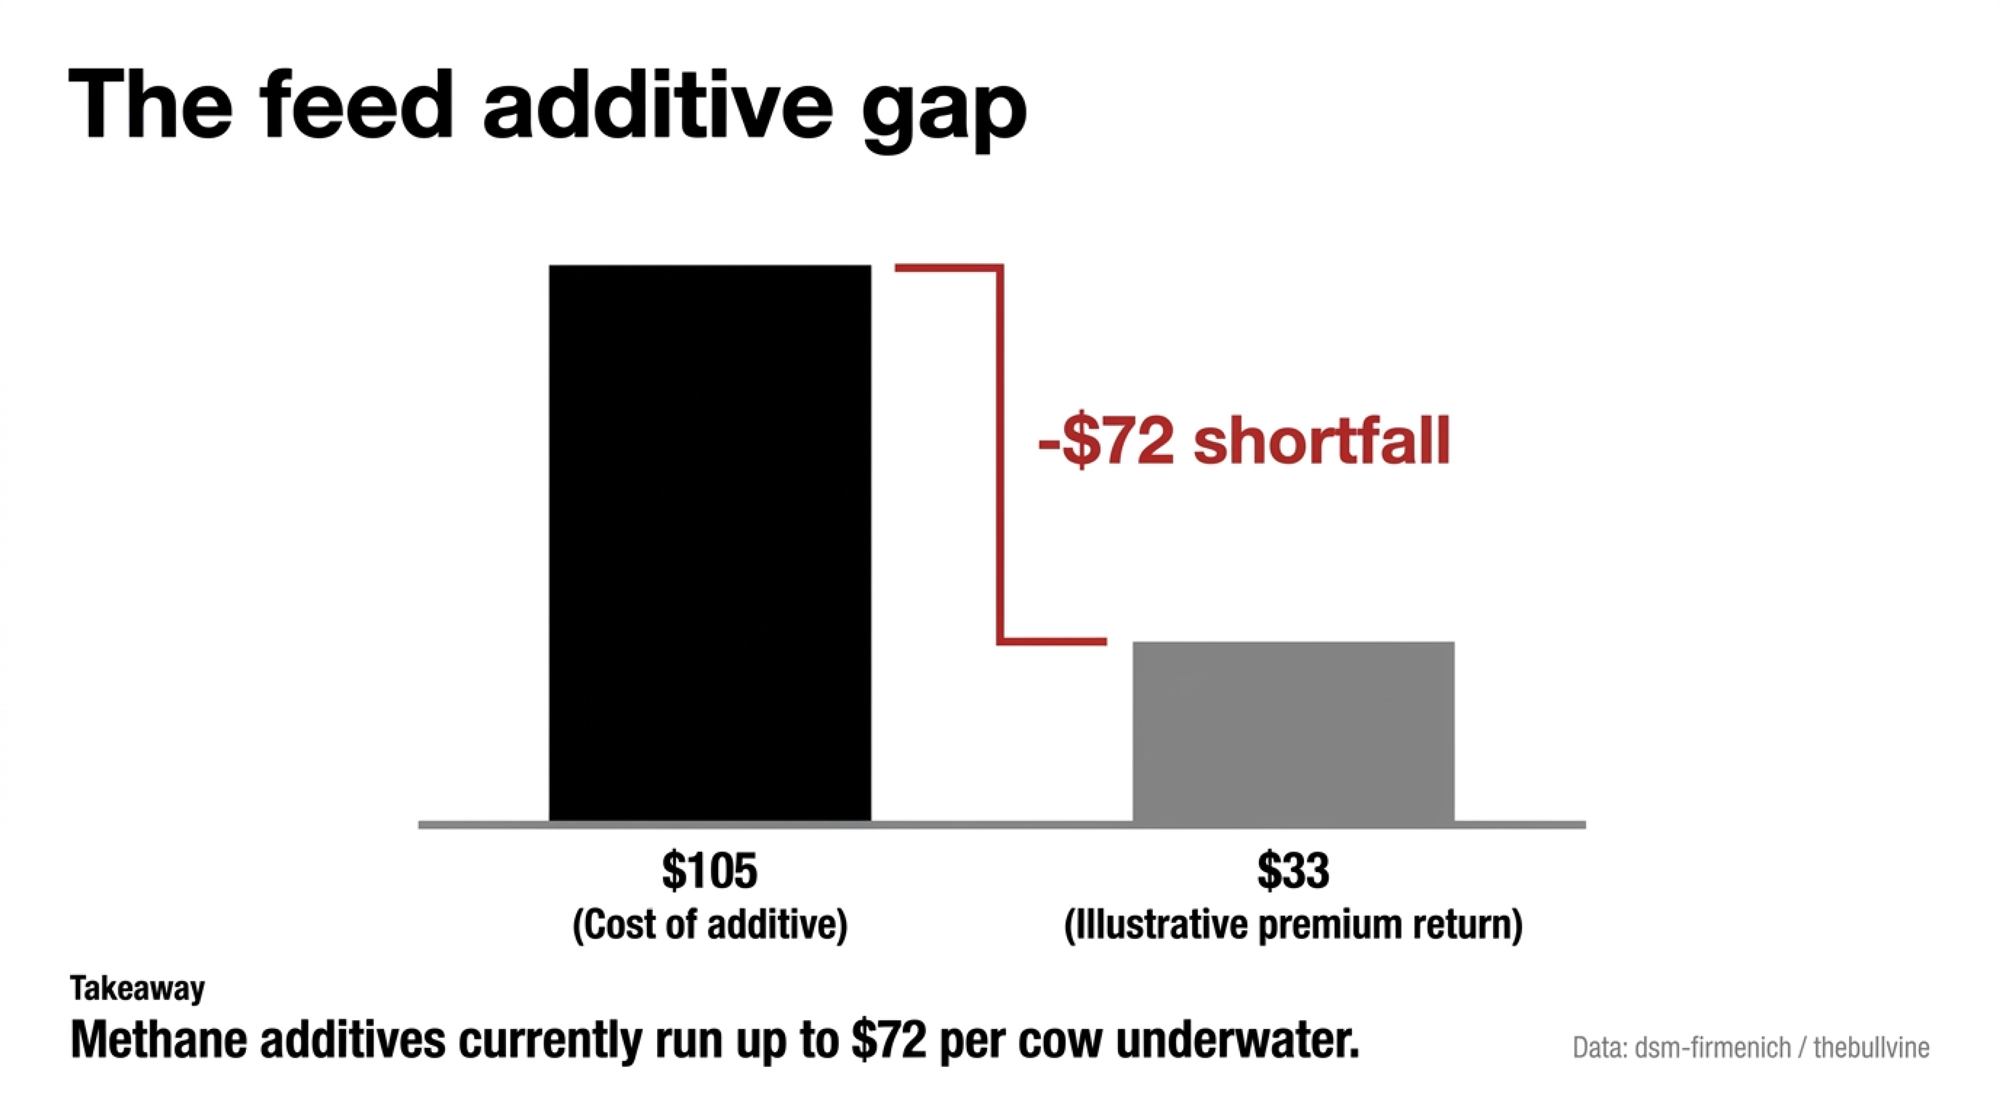
Take a methane-reducing feed additive like Bovaer. The math comes out lopsided fast:
LinePer cow/yearSource
Bovaer cost (lactating-cow basis)$93–$105dsm-firmenich 
12¢/cwt premium (illustrative)~$33thebullvine
Net gap (what you eat)–$60 to –$72

Two things to flag before you map that to your own barn. The 12¢/cwt premium is illustrative — real sustainability premiums vary by processor and aren’t a published standard yet. And that $33 return is the same per cow whether you milk 200 or 2,000, because the premium scales with milk shipped, not with herd size. At 75 lbs/day, every cow earns back about $33 and costs you up to $105 in additive. You’re roughly $60 to $72 a head underwater before moving a single carbon-verified load. The tools exist. The premium doesn’t cover them yet. 

Bovaer’s other wrinkles, quickly:

  • Cost may fall. A new dsm-firmenich plant in Dalry, Scotland, is projected to pull the price toward $58–$64/cow/year — shrinks the gap, doesn’t close it. 
  • Safety is under review. After Denmark’s late-2025 mandate, the Danish Dairy Farmers’ Association reported farms experiencing yield declines and digestive issues, and EFSA opened a fresh review in 2026 that remains ongoing. 
  • The maker disagrees. dsm-firmenich and the U.S. FDA maintain the additive is safe and effective. 

The takeaway isn’t “Bovaer is bad.” It’s that if a methane-credit contract you’re eyeing requires it, watch how that review lands before you sign.

Two Roads: Do They Count Your Efficiency or Just Your Cows?

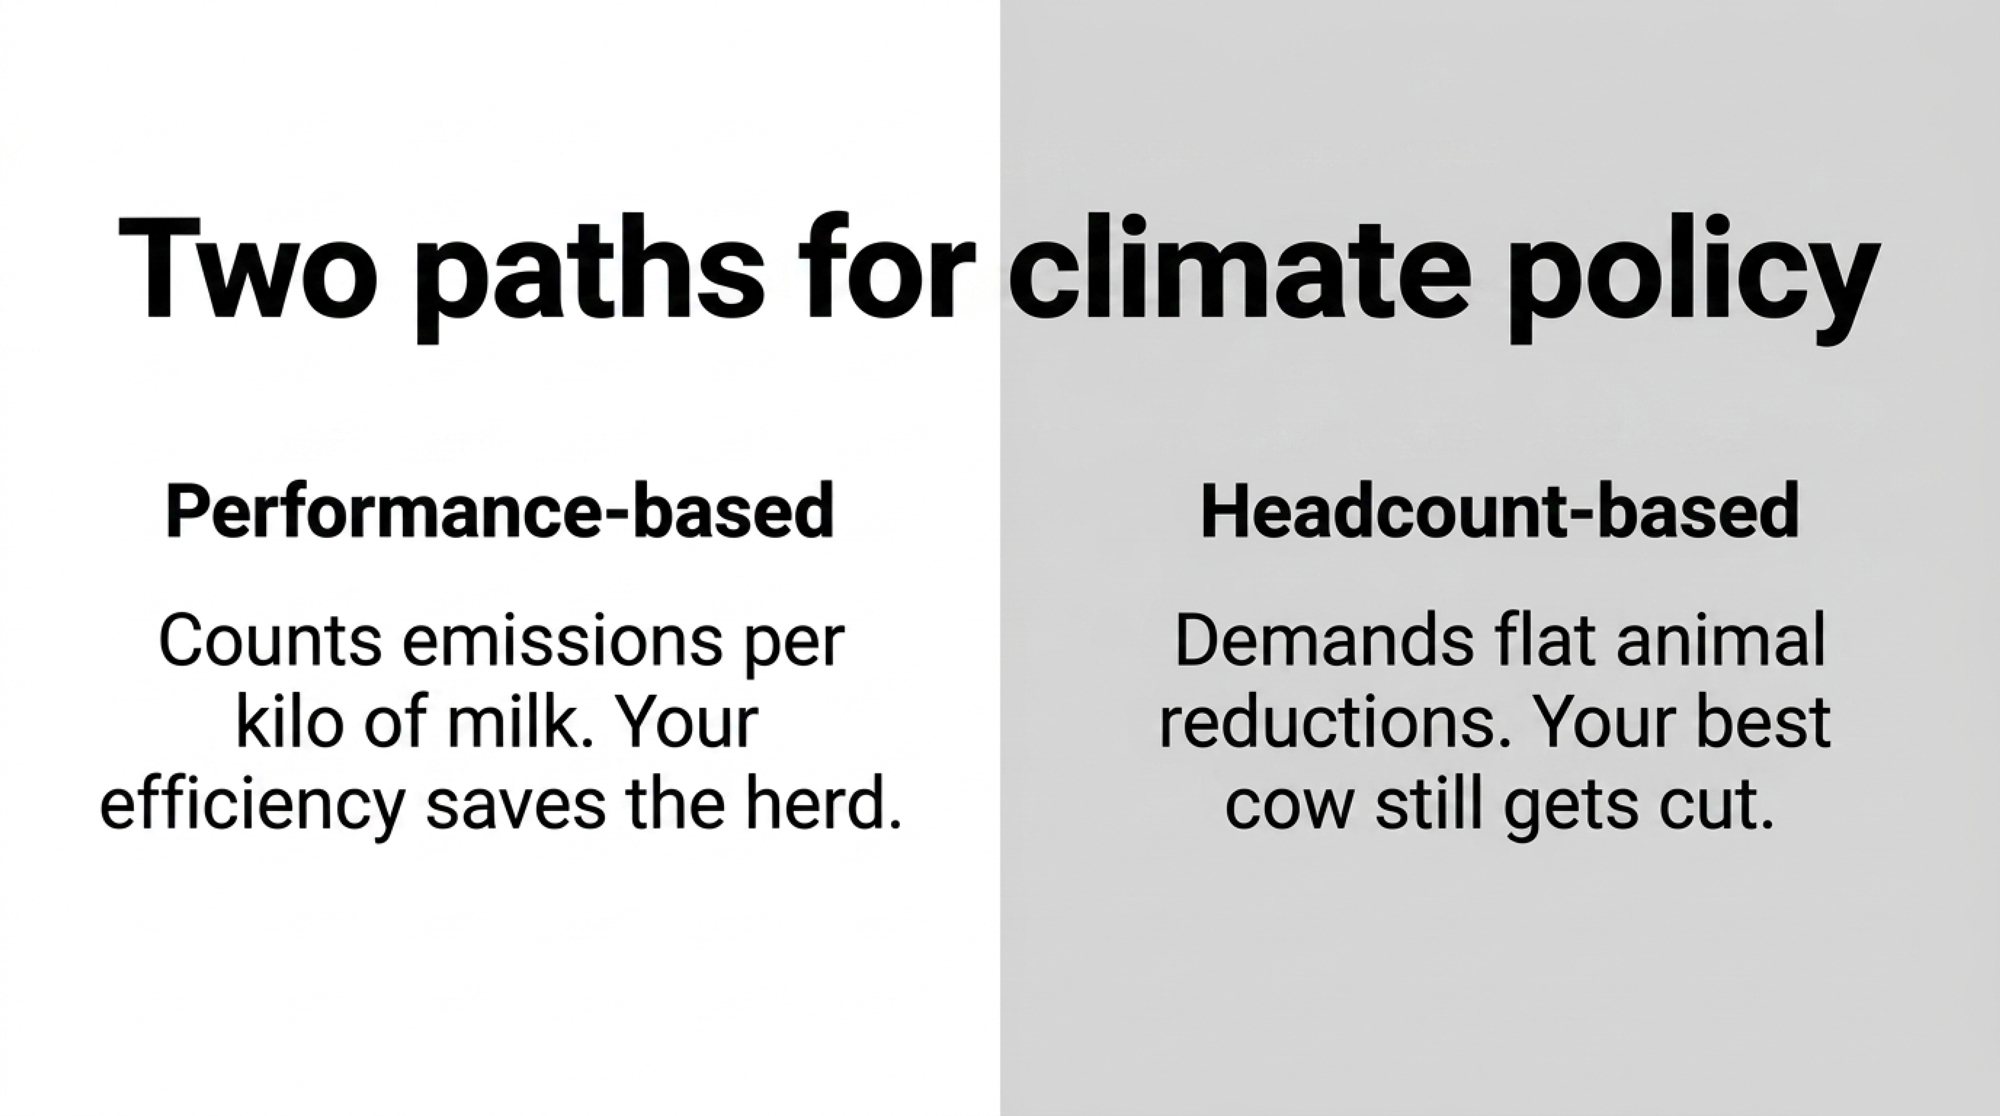
Underneath all of it sits one fork, and it decides everything. Climate policy splits into two roads, and which one your regulators walk decides whether an efficient farm keeps its herd or shrinks it.

Performance-based policy asks one question: how many kilos of CO₂-equivalent come off your farm per kilo of milk? Drive that number down with genetics, feed efficiency, and manure management, and your cows stay on the landscape. California’s SB 1383 goes this way — a 40% cut in dairy methane by 2030, pursued through digesters, manure management, and efficiency rather than mandated herd reductions. A UC Davis CLEAR Center and California Dairy Research Foundation analysis projects that the state’s dairies will hit that target and reach climate neutrality around 2030, as long as voluntary, incentive-based adoption holds. 
Headcount-Based PolicyPerformance-Based Policy
Core question askedHow many animals do you have?How many kg CO₂e per kg milk?
Best-known exampleNetherlands farm buyouts (€1.81B / 723 farms)California SB 1383 (40% methane cut by 2030)
UK Carbon Budget 7 alignment✅ 27% cattle & sheep cut assumed by 2040❌ Not the primary lever in CB7
Impact on efficient farmsYour best cow still gets cutEfficiency is the competitive moat
Policy cost tool usedHerd cap / buyoutDigester incentives, genetics, feed management
Risk to North American exportersBlanket intensity benchmarks on imported milkMust demonstrate verified farm-level footprint
Your counter-argumentHard to make — you’re just a numberStrong — if you have the verified data ready

Headcount-based policy skips the efficiency question entirely. It just says: fewer animals. The Netherlands is the hard version — the Dutch agriculture ministry spent €1.81 billion to buy out 723 farms, in which herd size, not emissions per liter, was the lever that mattered. Carbon Budget 7 leans the same direction. In a headcount world, your best cow still gets caught in a blanket cut. 

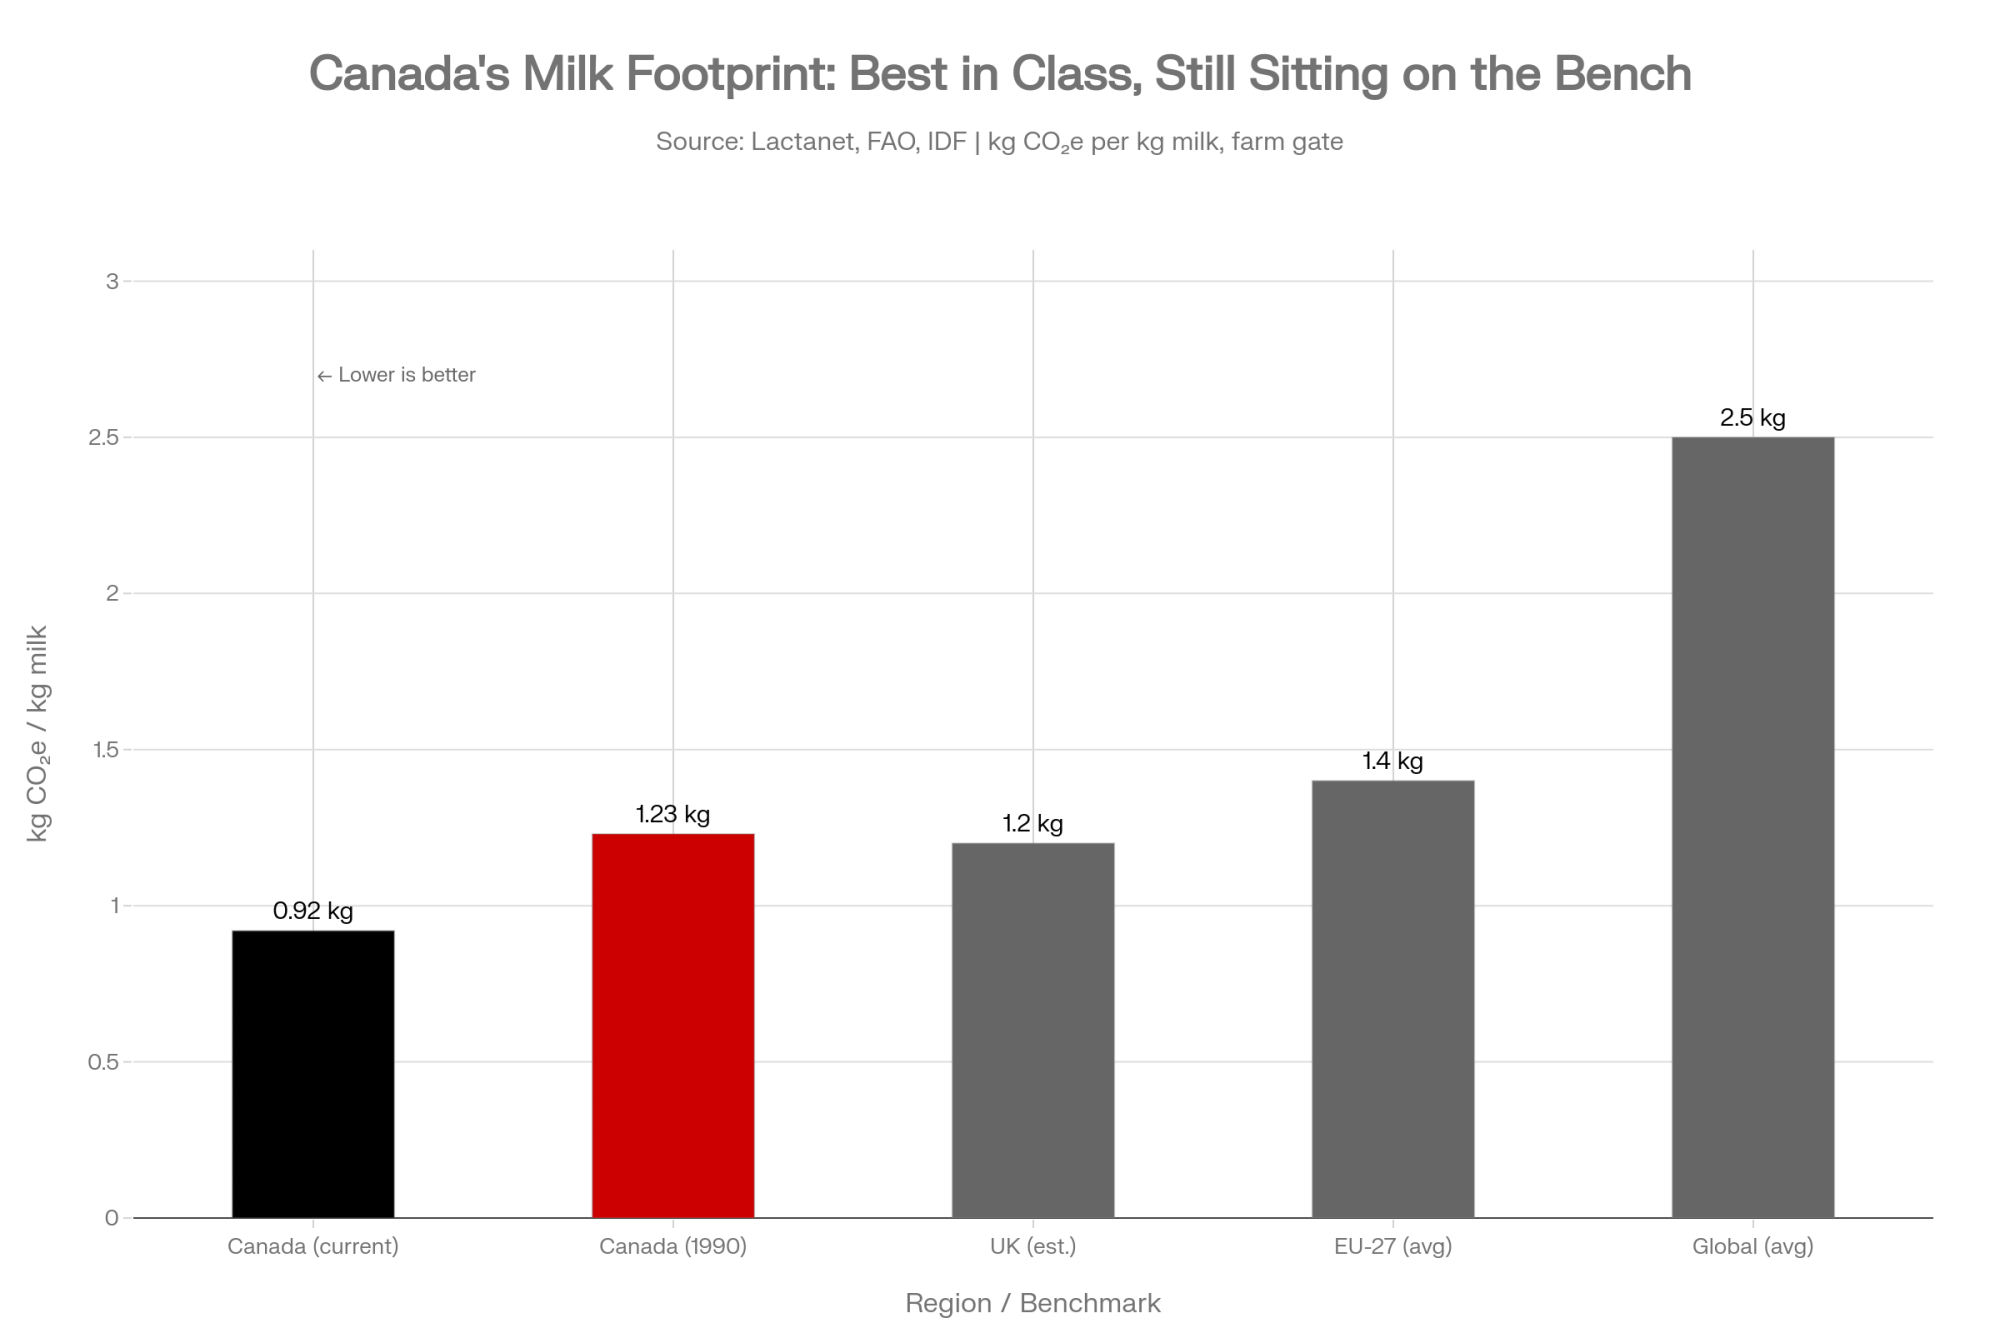
Here’s the irony that ought to sting. North American dairy already has the receipts to win the performance argument. Lactanet’s published figure puts the carbon footprint of Canadian milk at 0.92 kg CO₂-equivalent per kilogram at the farm gate — a 2016 analysis, down about 25% since 1990, with the whole sector under 1.3% of national emissions. That’s a Canadian number, though, built on a different life-cycle modeling approach than the U.S. uses — so don’t hand a U.S. buyer the Canadian stat and call it yours. The data’s sitting in PDFs while other people write the rules. 

Is the Performance Argument Actually Winnable?

On paper, yes. The Canadian footprint numbers, California’s methane trajectory, and the evidence on breeding efficiency give the sector a genuinely strong, data-backed case that efficient milk belongs on the land. 
But here’s the honest part. It’s only winnable if the industry shows up before the headcount framework hardens into law somewhere that matters to your exports. A 2024 Navius analysis for Canada found that capping emissions is the cheapest, most efficient way to cut farm climate impact, with a livestock cap as the next-cheapest option. Read that twice. The blunt instruments are already sitting on policymakers’ desks, scored as the cheap option. Receipts don’t argue for themselves. Somebody has to put them on the table. 

Is Your Bull Team Already Behind on Methane?

This is where the fork stops being a policy debate and lands in your sire selection — the exact decision our composite operator was sitting down to make. Lactanet’s modernized LPI now includes an Environmental Impact Index based on Feed Efficiency, Methane Efficiency, and Body Maintenance, initially released for Holsteins. And it’s not just a Canadian play: CDCB’s April 2025 Net Merit revision lifted Feed Saved to 17.8% of the index — up from 12% — while cutting Body Weight Composite, a shift The Bullvine has called a $57-per-point “weight tax” on big Holsteins. Both systems are actively refining these traits — Lactanet can now predict methane from milk spectral data at low cost across many cows. 

Here’s the part that should land with anyone staring at that $60–72/cow Bovaer gap: selecting for high-efficiency genetics carries a zero-cost premium. You’re already buying semen. Weighting Feed Saved and Methane Efficiency in your index costs nothing extra per straw, while the additive runs you up to $105 a cow every year it’s in the ration. One’s a recurring input cost. The other’s a free lever you’re either pulling or leaving on the floor. It won’t move your footprint this lactation — but the herd you breed this summer is the number you’ll hand a buyer in 2035.

Bovaer / Feed AdditiveGenetic Selection (Feed Saved / Methane Efficiency)
Annual cost per cow$93–$105 (current); ~$61 (future Dalry plant)$0 incremental over base semen cost
Index toolN/A — contract-basedLactanet EII, CDCB Net Merit (Feed Saved = 17.8%)
When benefit showsImmediately (current ration year)2030+ herd profile
ReversibilityEasy — stop the contractPermanent genetic change in herd
Regulatory statusEFSA review open (2026); Danish concerns on yield/healthNo regulatory risk; standard breeding practice
Stacks with each other?Yes — but gap must close firstYes — foundation layer regardless
Bottom lineOnly pencils if premium covers $60–72 gapFree lever — pull it now regardless of premium

Options and Trade-Offs for Your Operation

There’s no single right move here. A few clear paths, and which one fits depends on how exposed your milk is to export markets and tightening rules.

Get your own footprint number — start this month. Run a credible whole-farm emissions-intensity figure on a peer-reviewed tool, and pick the one built for your side of the border. In Canada, Agriculture and Agri-Food Canada’s Holosis a free whole-farm model that estimates your emissions and lets you test “what if I change feed or tillage” scenarios before you spend a dollar. In the U.S., the dairy-specific FARM Environmental Stewardship program — now running on the updated Ruminant Farm Systems model — gives a cradle-to-farmgate estimate that processors and co-ops already aggregate up the supply chain. For broader cropping and soil-carbon accounting, the USDA-backed COMET-Farm is the other free U.S. option. It costs you data you mostly already keep — milk records, ration, manure, energy — and the number is only as good as what you feed it. Do this one now; everything else sits on top of it. 

ToolGeographyWhat It CoversWho Uses ItCost
HolosCanadaWhole-farm: livestock, feed, manure, tillageSupply chain reporting, processor auditsFree (AAFC)
FARM ES / RuFaSU.S.Cradle-to-farmgate dairy; co-op aggregatedFARM-participating co-ops and processorsFree (NMPF)
COMET-FarmU.S.Soil carbon, cropping, some livestockMixed operations with significant row crop acresFree (USDA)
COMET-PlannerU.S.Conservation practice scenario modelingProducers evaluating cover crops, tillage changesFree (USDA)
⚠️ Cross-border warningCanadian 0.92 kg CO₂e stat uses different LCA methodology than U.S. toolsDo NOT use Canadian Lactanet figure for U.S. buyer claims

Breed for the efficiency traits — your slowest lever, so start early. Weight Feed Efficiency and Methane Efficiency in your sire selection this season. It fits every herd, carries no per-straw cost, and won’t dent production if you balance the index. The catch is time: you’re breeding for 2030 and beyond, not this year’s tank, so the longer you wait, the more ground you give up. 

Feed additives — a bet, not a margin play, until the premium moves. This one only pencils if a processor is actually paying enough to close that $60–72/cow gap, or a buyer’s spec sheet starts demanding it. You’d want the premium in writing — and, given the Danish reports and the open EFSA review, a hard look before you commit. Move early, and you’re wagering on where prices and premiums go, not banking a return today. 

The forward signal to watch sits on these paths, not in a crystal ball: if a food CBAM moves into “under review” with a date attached, or a major processor publishes an intensity benchmark with a number on it, the footprint path stops being optional and the additive path stops being a bet. 
Key Takeaways

  • If your milk touches an export market — directly or through your processor — get a credible whole-farm footprint number this quarter, because the first ask will be for data, not a tariff payment.
  • If you’re booking semen this season, weight Feed Efficiency and Methane Efficiency now; it’s a zero-cost lever, and the herd you breed today is the number you hand a buyer in 2035. 
  • If a processor offers you a sustainability premium, run it against the $60–72/cow gap before you sign — at an illustrative 12¢/cwt, the additive math still runs underwater. 
  • If you’re weighing a Bovaer-based methane-credit contract, watch how EFSA’s open 2026 review lands before committing; Danish farmer groups have raised yield and health concerns, while the maker and the FDA say it’s safe. 
  • If you operate in Canada, you’re sitting on a strong footprint number — 0.92 kg CO₂e/kg milk — but it only counts if the sector puts it on the table before the headcount framework hardens. 

Back to that semen order and the processor’s question nobody had a number for. Where does your own emissions-intensity figure sit right now — and could you produce it tomorrow if a buyer asked? Most operations couldn’t, and that’s the real exposure, not a viral screenshot about a vote that never happened the way the post claimed.

We ran the simple version of the barn math here. If you want the full model — additive cost curves, premium break-even by herd size, and what a food CBAM would actually do to Canadian and U.S. export margins — that’s the deeper Tier 3 economics piece, and the running numbers land in The Bullvine Weekly newsletter as Carbon Budget 7 moves from vote to delivery plan. 

Run Your Numbers

Component Value Tracker — Before you sign a sustainability premium against that $60–72/cow Bovaer gap, run the Component Value Tracker. Its nutrition break-even module pressure-tests whether an additive clears your real component prices, and the sire module prices fat and protein per daughter so your breeding lever earns its keep.

Complete references and supporting documentation are available upon request by contacting the editorial team at editor@thebullvine.com.

Learn More

The Sunday Read Dairy Professionals Don’t Skip.

Every week, thousands of producers, breeders, and industry insiders open Bullvine Weekly for genetics insights, market shifts, and profit strategies they won’t find anywhere else. One email. Five minutes. Smarter decisions all week.
NewsSubscribe
First
Last
Consent

Cut Your Replacement Rate by 7 Points. Save $210,000. Lower Your Carbon Footprint. Here’s How.

Forget carbon credits. The real money is in your cull rate. Farms that dropped 7 points kept $210,000—and watched their emissions fall. No new tech. Just management.

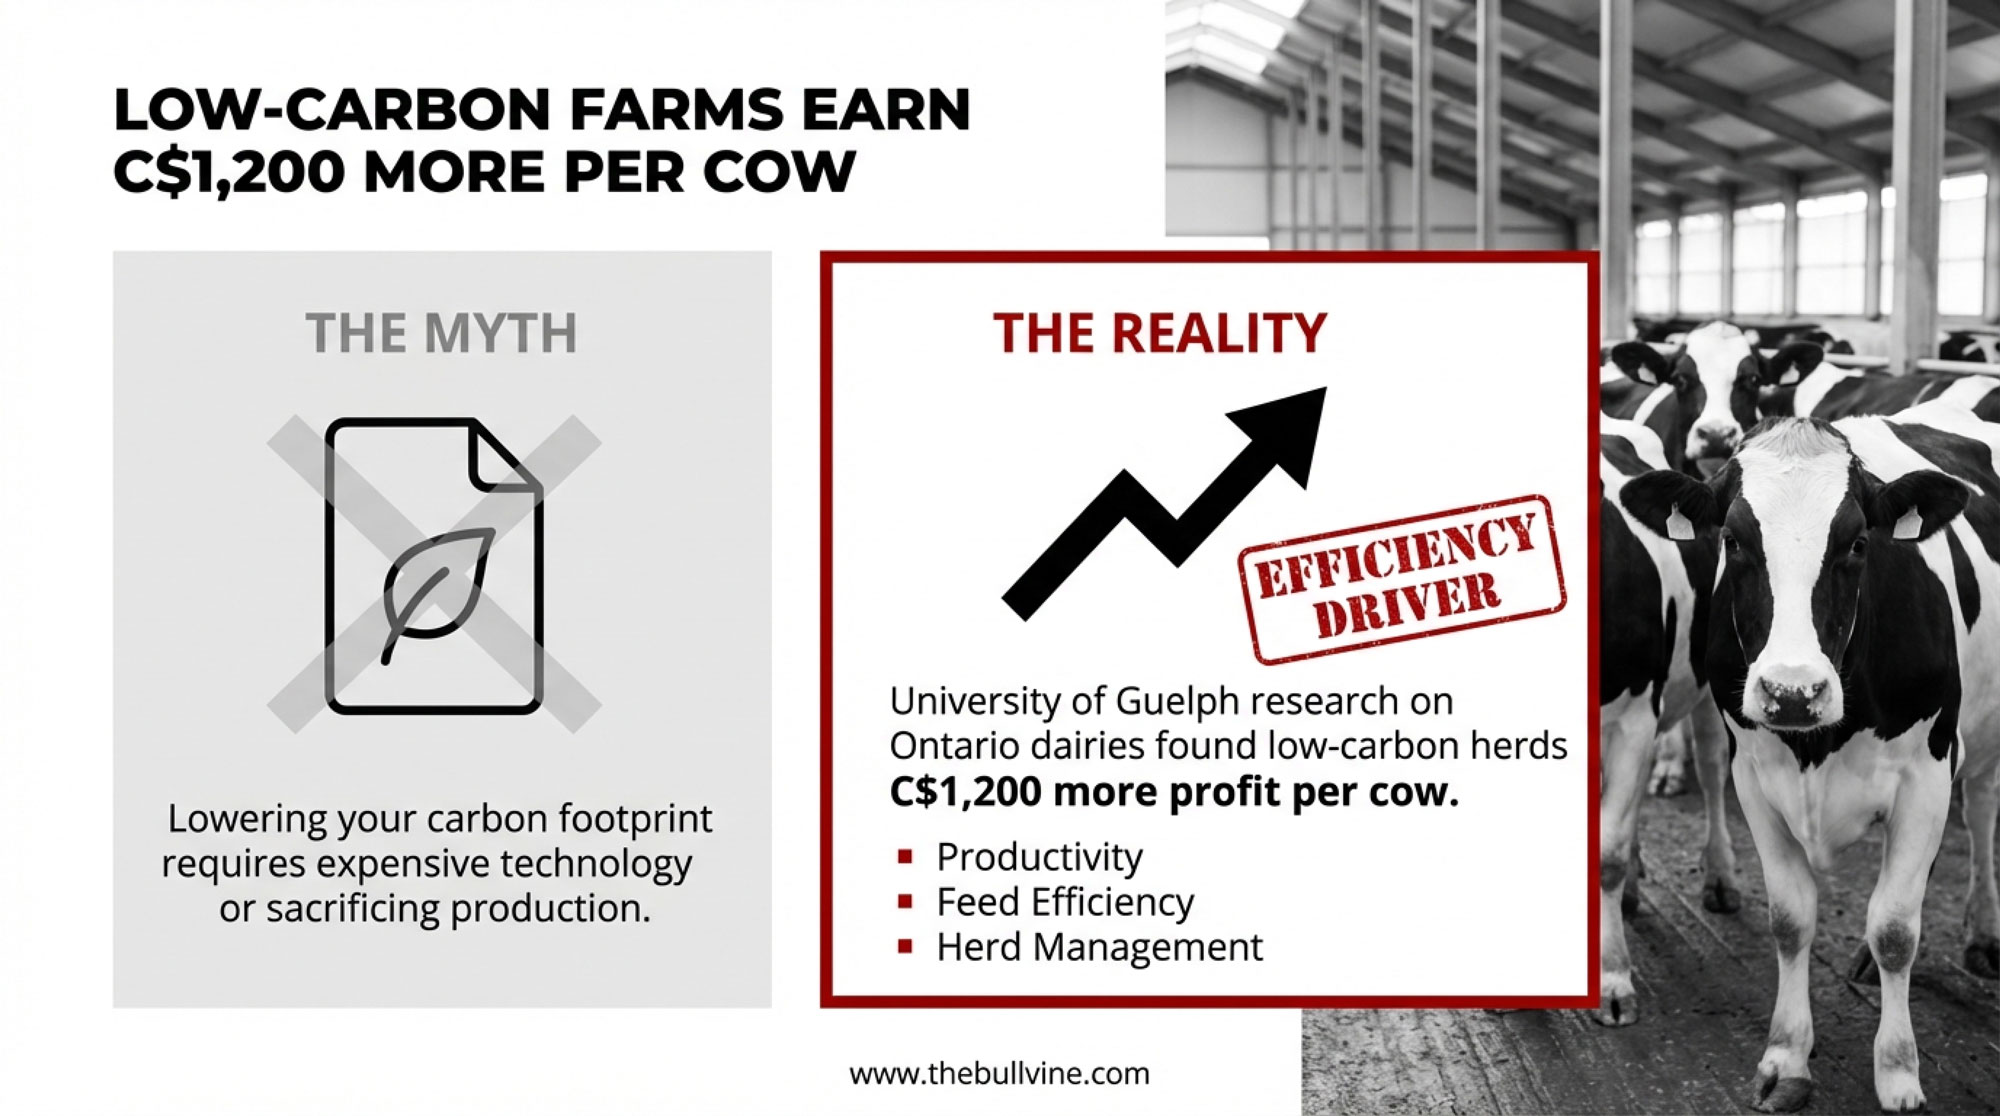
EXECUTIVE SUMMARY: The farms with the lowest carbon footprints aren’t sacrificing profit—they’re the ones making more of it. University of Guelph research found low-carbon Ontario dairies earned C$1,200 more per cow, driven by feed efficiency and herd management rather than carbon credits or new tech. Replacement rate is where the big money hides: dropping from 35% to 28% on a 1,000-cow herd saves roughly $210,000 annually, while eliminating nearly two years of feed, manure, and methane from 70 heifers you no longer need to raise. Factor in mastitis averaging C$662/cow/year and feed accounting for 50-65% of production costs, and the efficiency gains compound quickly. This article delivers the research, the math, and a 90-day action plan that works whether you’re running a 70-cow tie-stall in Quebec or a 400-cow freestall in Wisconsin. The bottom line: emissions and margin aren’t competing goals—they respond to the same management decisions you’re already making.

dairy replacement rate economics

Walk into any dairy meeting this winter, and you can almost bet carbon footprints, “Scope 3,” and net-zero targets will show up on the agenda before the coffee cools. Processors are publishing sustainability reports, retailers are promising climate-friendly shelves, and a lot of producers are quietly asking the same thing: “Alright, but how does any of this actually show up in my milk cheque?”

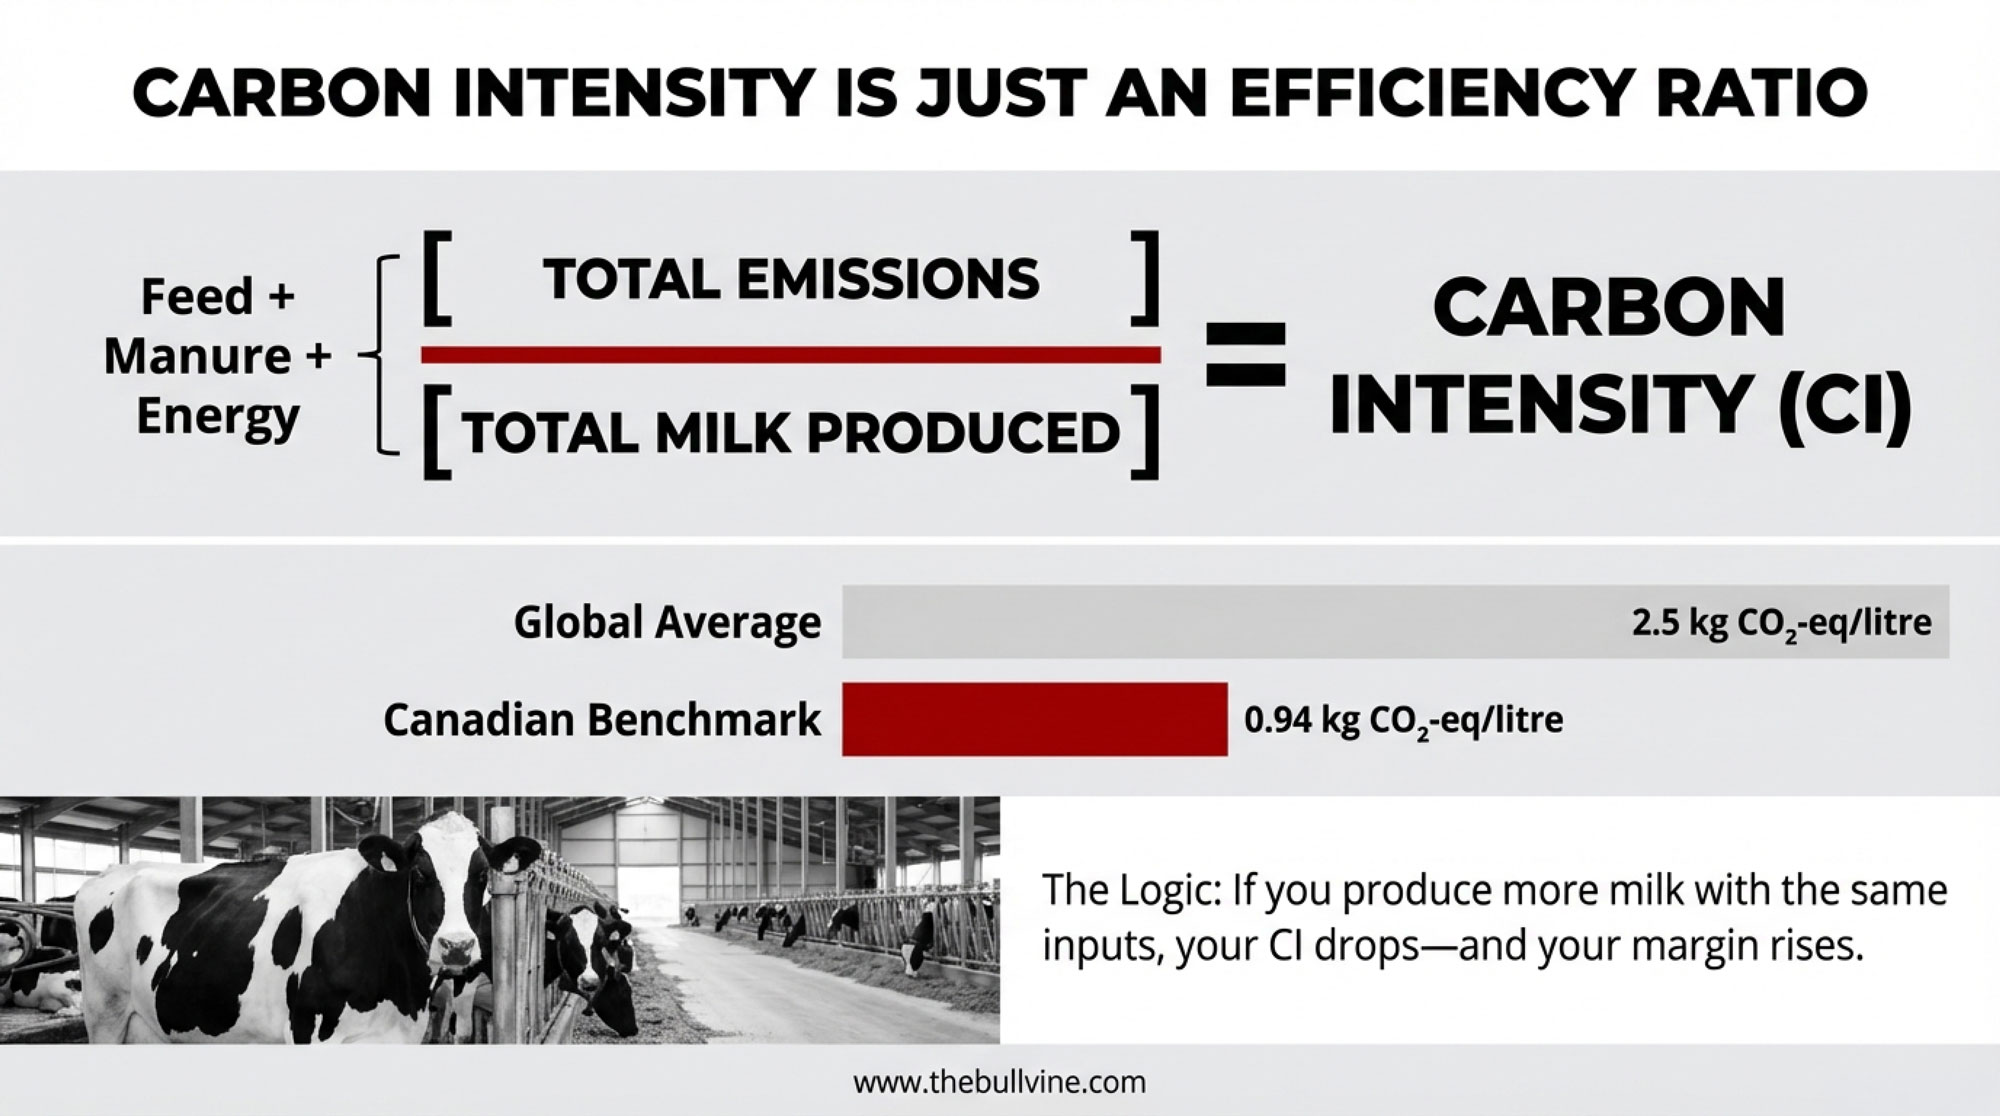
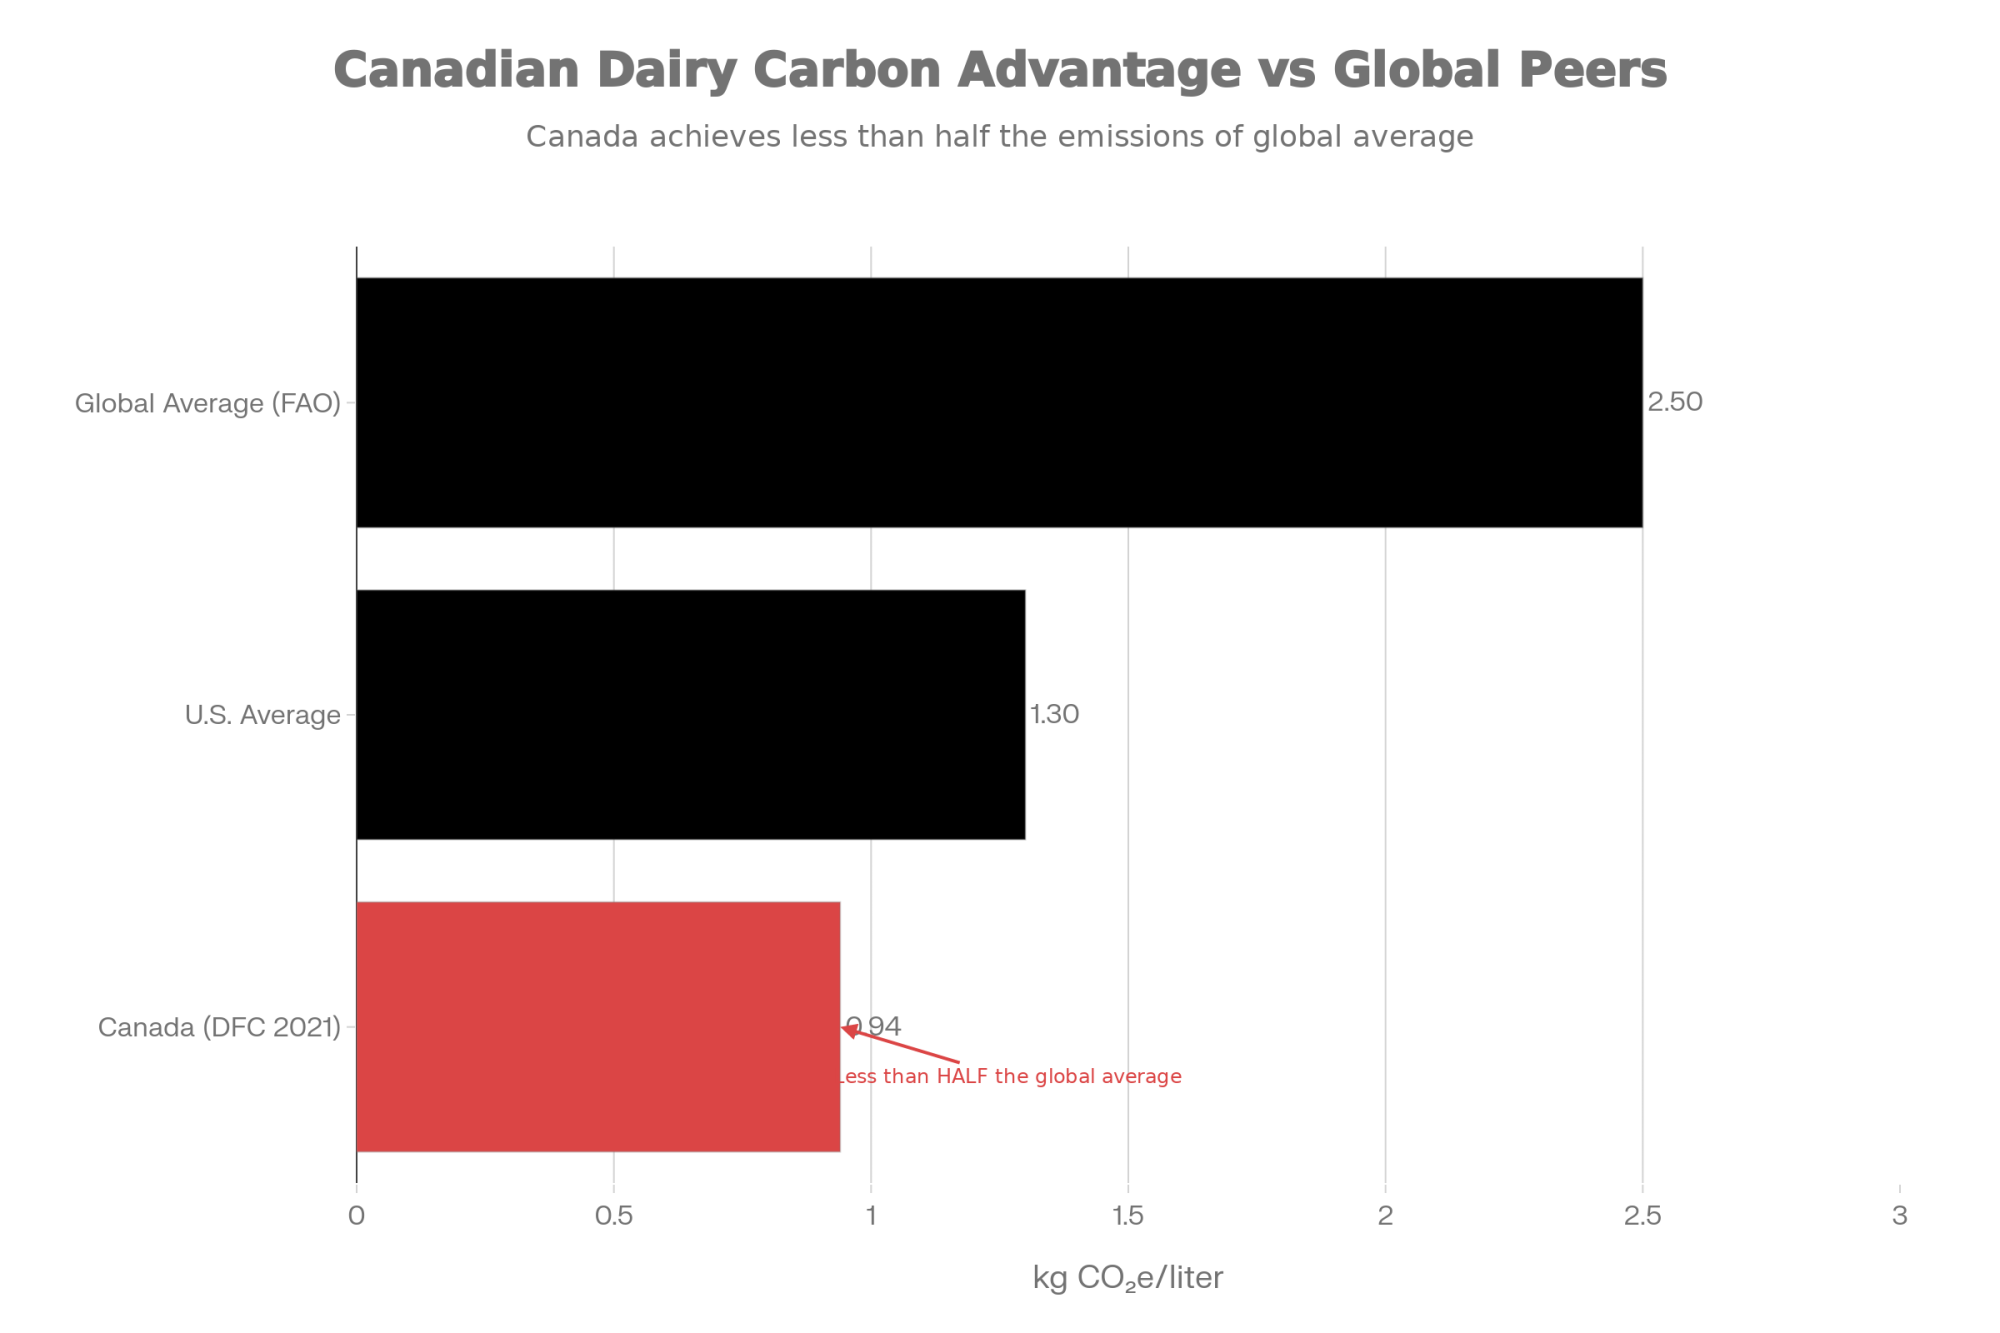
Here’s what’s interesting. When you get past the buzzwords and look at credible numbers, a pretty consistent story emerges. The same management decisions that bring down greenhouse gas emissions per kilogram of milk are often the ones that improve margin per cow. In Canada, the latest national life cycle assessment led by Groupe AGÉCO for Dairy Farmers of Canada shows that producing a litre of milk at the farm gate now generates about 0.94 kilograms of CO₂-equivalent—and that footprint fell by 9 percent between 2011 and 2021 as milk per cow rose and feed efficiency improved. What’s encouraging is that Canadian milk’s footprint per litre sits at less than half the global average of 2.5 kilograms, according to FAO data. That’s thanks largely to relatively high yields and solid feed and manure management across our systems.

On the profit side, a University of Guelph Alliance project took real numbers from Ontario dairy farms and found something that caught my attention. Lower-footprint herds weren’t sacrificing income at all. Research associate Dr. Susantha Jayasundara and greenhouse gas specialist Prof. Claudia Wagner-Riddle found that farms with a lower carbon footprint per unit of milk profited by more than C$1,200 per cow compared to higher-footprint farms in the same study. And the dominant drivers weren’t offsets or big infrastructure projects—they were productivity, feed efficiency, and herd management.

So what farmers are finding is this: when you manage the herd more efficiently, emissions per kilogram of milk tend to go down, and profit per stall often goes up. Replacement rate, feed efficiency, and health losses are doing more to shape both your footprint and your margin per cwt than any carbon program ever will.

What Low-Carbon Farms Are Actually Doing

It helps to pin down what “low-carbon” really means in practical terms. A life cycle assessment adds up all the greenhouse gas emissions associated with milk production on the farm—enteric methane from the cows, manure storage and spreading, feed production, and on-farm energy use—and divides that total by the amount of milk produced.

In Canada’s most recent LCA update from Dairy Farmers of Canada, the national average farm-gate footprint sits at 0.94 kilograms of CO₂-equivalent per litre of fat- and protein-corrected milk. The improvement since 2011 has mainly come from higher milk yield per cow, better feed efficiency, and improved manure and fertilizer management. And as many of us have seen in practice, livestock management plus feed production account for the great majority of a dairy farm’s greenhouse gas footprint.

South of the border, work presented through the American Dairy Science Association last year estimated average field-to-farm-gate carbon intensity in 2020 at about 1.3 kilograms of CO₂-equivalent per kilogram of milk. That analysis found that to reach greenhouse gas neutrality by 2050, the U.S. dairy sector would need to reduce its intensity to roughly 0.67 kilograms—nearly a 50 percent cut from current levels.

Now, the part that really matters in your barn is how those lower-footprint farms actually run. In the Ontario data set, the Guelph team didn’t find that low-footprint farms were defined by being huge or packed with state-of-the-art technology. The herds with lower footprints and higher profits tended to:

  • Rely heavily on homegrown feed, especially high-quality corn silage and alfalfa-grass hay, as the backbone of the ration
  • Use grouped feeding and well-designed total mixed rations to match nutrients to the stage of lactation and production level
  • Maintain shorter calving intervals and heifer programs that kept more stalls filled by third- and fourth-lactation cows—animals that usually have excellent feed efficiency and butterfat performance

As Prof. Wagner-Riddle summarized this work: “A lot of the improvement in carbon footprint has to do with feed efficiency and how producers are managing their herds.”

From what I’ve noticed across different regions, those traits keep showing up. Whether it’s a 70-cow tie-stall in Quebec, a 180-cow freestall in eastern Ontario, a 400-cow sand-bedded barn in Wisconsin, or a 2,000-cow dry lot system in California’s Central Valley, the herds that look good on both profit and footprint tend to be the ones that have been quietly tuning up forage quality, fresh cow management, and herd structure for years.

Replacement Rates: The Quiet Link Between Emissions and Margin

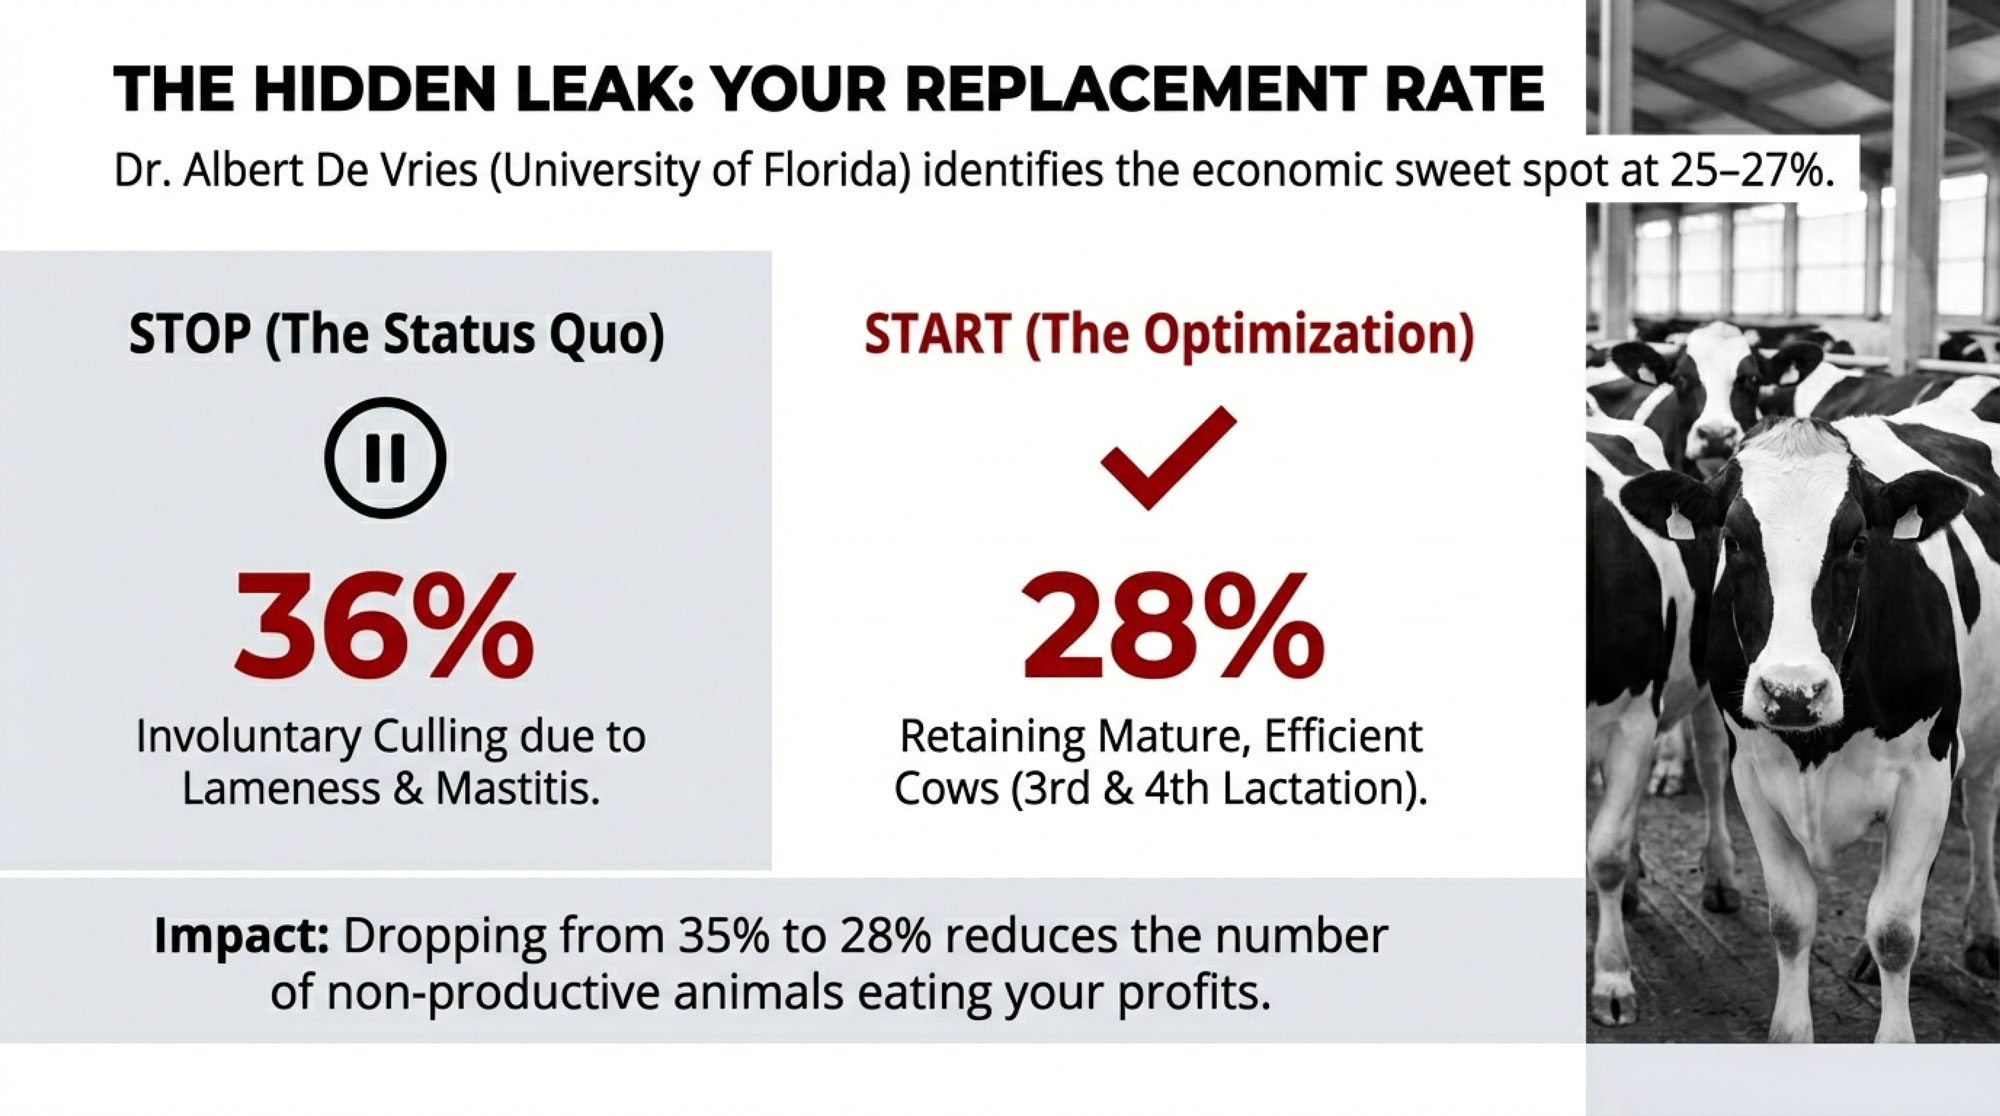
Replacement rate is one number that quietly connects the economic and environmental sides of the story. In many Holstein freestall herds in Ontario, the Northeast, and upper Midwest states like Wisconsin and Minnesota, annual replacement or culling rates around 36 percent are still common—Dr. Albert De Vries at the University of Florida has documented this extensively in his work on dairy production economics. Fertility, mastitis, and lameness remain the main reasons cows leave the herd.

A 36 percent replacement rate may be “normal” on paper, but that doesn’t mean it’s the profit-maximizing or emissions-smart choice for your herd. De Vries has shown that economically optimal cull rates often fall in the 25-27 percent range when heifer-rearing costs are significant and involuntary culling can be controlled. And when you run scenarios through whole-farm models, the answer is often “you can do better than that.”

System-level modeling studies in countries like Australia and New Zealand have demonstrated that cutting replacement rates—from, say, 35 percent down to 20–25 percent—reduces the greenhouse gas intensity per kilogram of milk solids. The reason is straightforward: you’re raising fewer non-productive heifers. One Australian analysis using graze-based dairy systems found that reducing replacement by around 15 percentage points lowered emissions intensity by roughly a kilogram of CO₂-equivalent per kilogram of milk solids.

The ideal target will vary. In quota systems like Canada, quota policy, land base, and forage capacity limit how fast you can push production per cow. In non-quota regions, like much of the U.S., cash flow, milk price volatility, and contracts with heifer growers come into play. But across systems, the data suggests that if you can reduce preventable culling and avoid replacing cows too soon, you’re often better off on both cost and emissions.

You probably know this already, but heifer economics are significant. Recent extension budgets from Penn State, University of Wisconsin, and University of Nebraska-Lincoln commonly estimate the cost to raise a replacement heifer from birth to first calving at roughly US$2,000–2,800 per head, depending on feed, labour, and housing. Bred heifer prices reported by USDA market services over 2023–2024 have ranged from around US$2,000 to over US$2,850 in Midwest auctions, with premium animals commanding even more in tight markets.

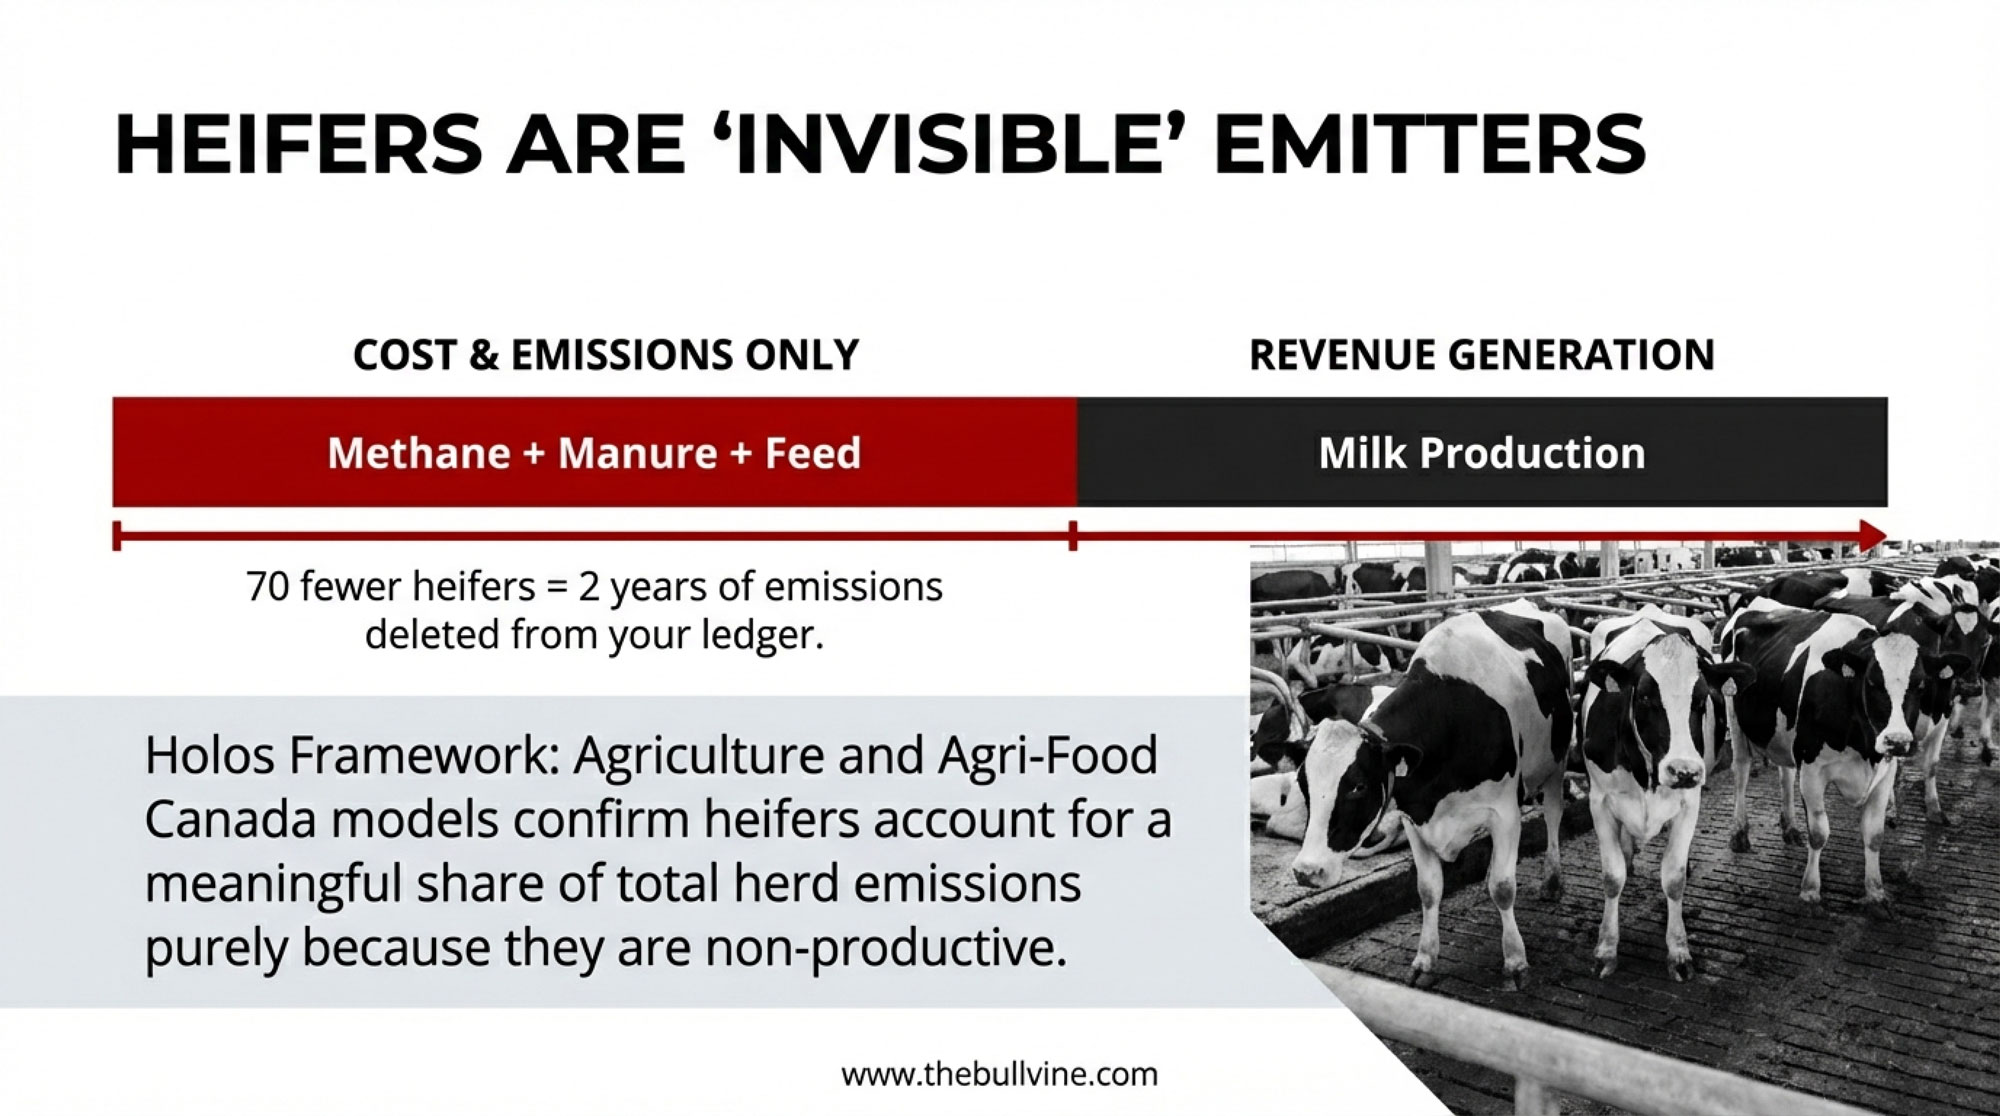
So, for the sake of discussion, consider a 1,000-cow freestall herd in Wisconsin running at a 35 percent replacement rate. That’s 350 replacements per year. If your all-in cost per heifer—whether raised or purchased—averages US$2,500–3,000, you’re tying up roughly US$875,000-US$1.05 million a year in replacement capital. If, over a couple of years, you improve fresh cow management, hoof health, and reproduction enough to bring that rate down to 28 percent, you’d need around 280 replacements. That’s 70 fewer heifers, which at US$2,500–3,000 each is on the order of US$175,000–210,000 less capital committed annually.

What Replacement Rate ControlsAt 36% (Industry Avg)At 28% (Optimized)Hidden Impact
Heifer Capital Tied Up$990,000 annually$770,000 annually$220,000 freed up
Non-Productive Animal-Years720 heifer-years560 heifer-years160 animal-years eliminated
Mature Cow Share of HerdLower (more 1st-lactation)Higher (more 3rd+ lactation)Better feed efficiency & components
Emissions from ReplacementsHigher methane loadLower methane load~2 years feed & methane saved

What’s interesting here is that the emissions picture moves in the same direction. Those 70 “missing” heifers represent nearly two years of feed, manure, and methane that don’t occur because you’ve kept more mature, efficient cows in the herd instead. Whole-system models, such as Agriculture and Agri-Food Canada’s Holos framework, consistently show that replacement heifers account for a meaningful share of total emissions in dairy herds precisely because they’re non-productive for an extended period.

I’ve noticed that when farms start documenting every cull for a couple of months, patterns emerge that weren’t obvious before. Often, you’ll see clusters of young cows leaving for transition-related problems that might respond to better fresh cow management, or repro culls that never had a full exam, or “low-milk” culls coming out of the same group where feed access or cow comfort is compromised. That’s where targeted changes can help both the milk cheque and the carbon story at the same time.

Feed Efficiency: Where Feed Costs and Carbon Meet

You don’t need anyone to tell you feed is your biggest cost. What’s worth emphasizing is that it’s also one of the biggest levers in your greenhouse gas footprint.

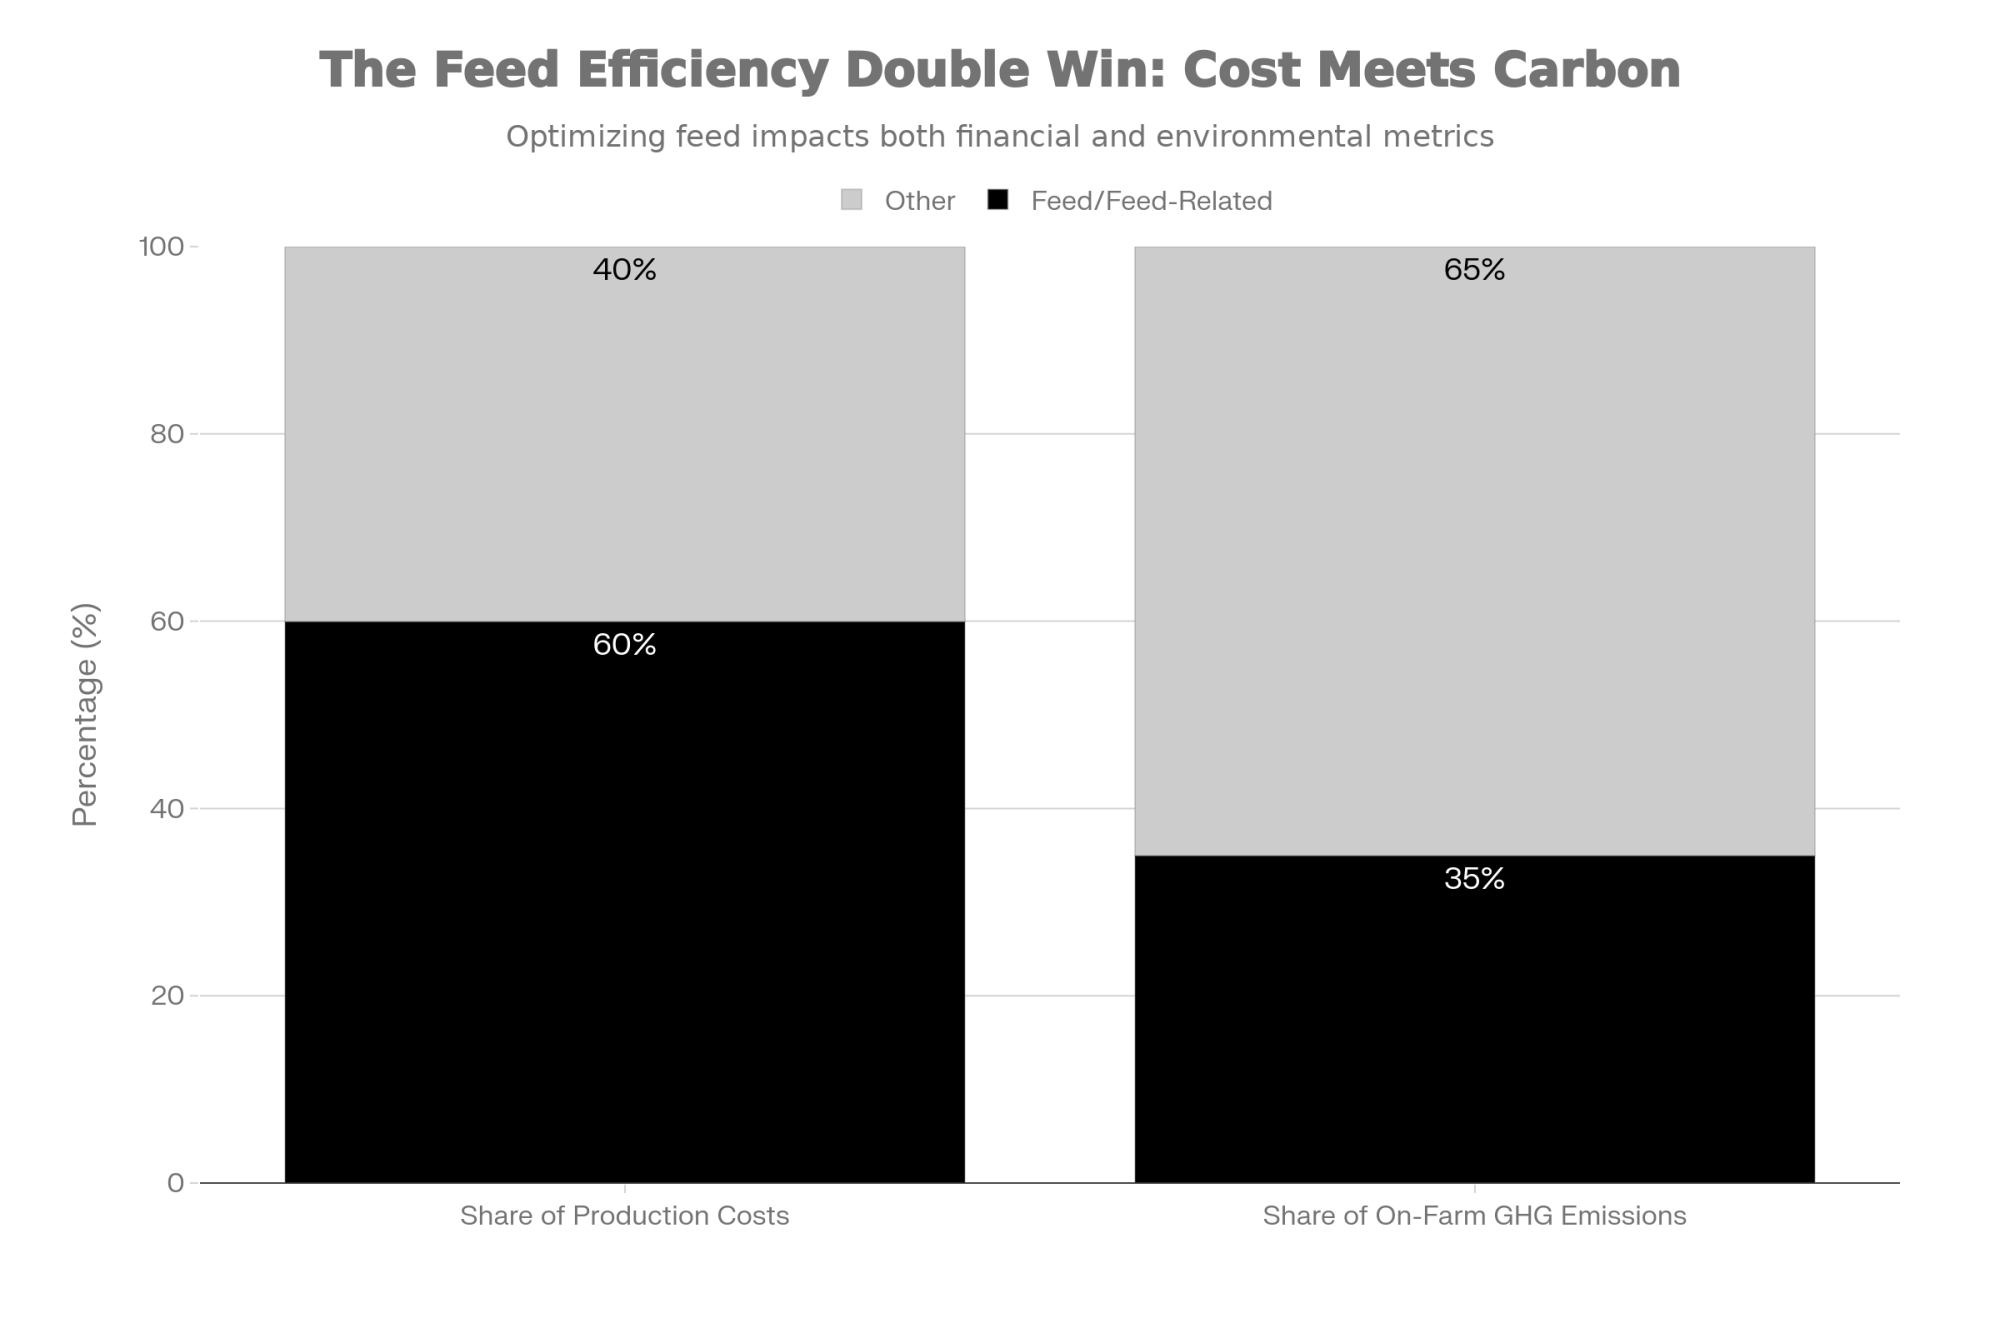
The DFC life-cycle assessment work shows that livestock management and feed production are the main sources of emissions on Canadian dairy farms. Feed production—including fertilizer and field operations—can account for around a third of farm-gate emissions, with enteric methane and manure management accounting for the rest.

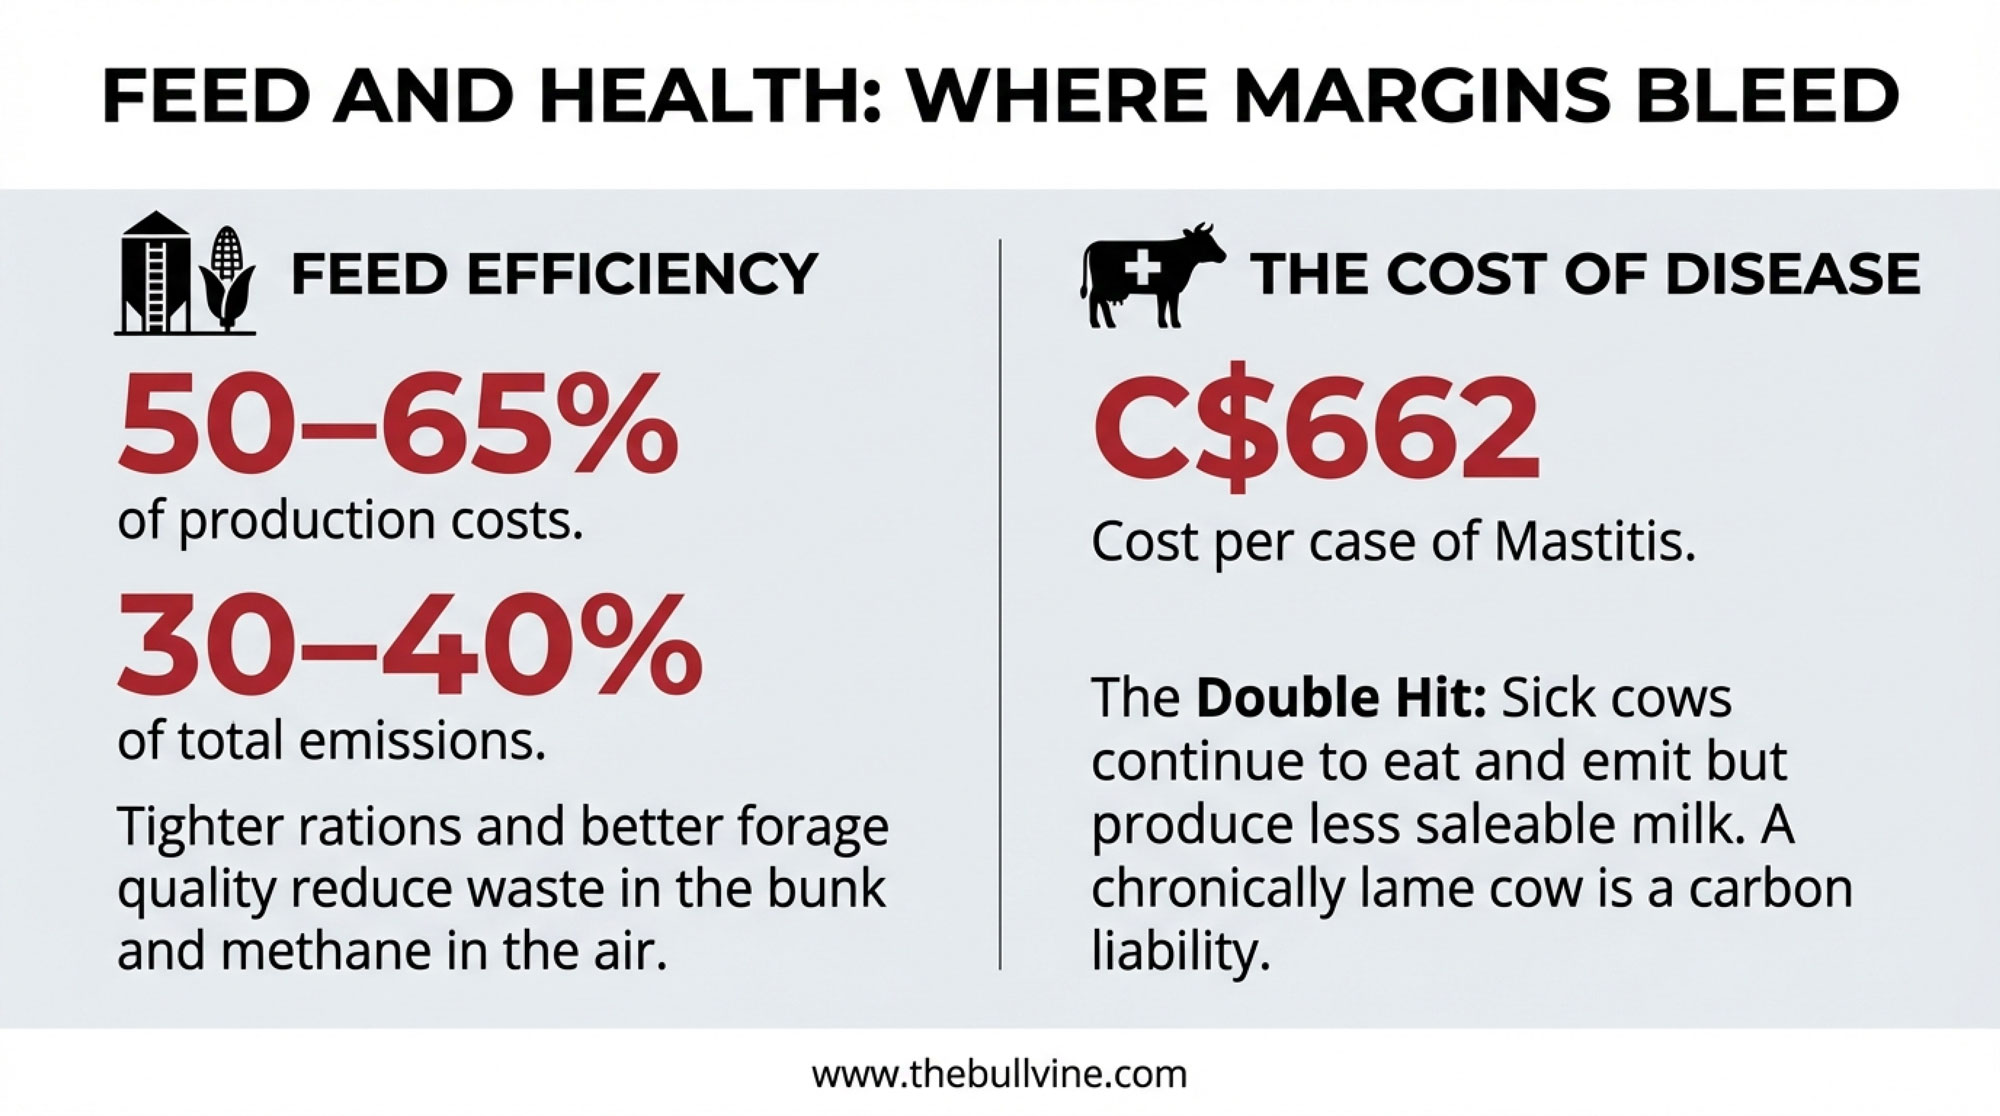
International reviews of dairy systems are similar. FAO and academic analyses often estimate feed-related emissions at 30–40 percent of on-farm totals, depending on the system and region. And with feed taking 50–65 percent of production costs on many North American dairies—California operations often running at the higher end of that range—even meaningful improvements in feed efficiency show up fast on the cash flow.

Analysis from last year shows that moving from around 1.3 kg CO₂-equivalent per kilogram of milk down to roughly 0.67 by 2050 will require major improvements in feed efficiency and overall productivity, alongside emerging tools such as methane-reducing feed additives and improved manure systems. But the researchers stress that those new tools are complements, not replacements, for efficient feeding and strong herd management.

On farms in very different regions, the lower-intensity herds that also look good on cost tend to share some feed-related habits:

  • They consistently achieve strong milk per kilogram of dry matter across key groups—that reflects genetics, cow comfort, and rations tuned to production level and butterfat performance
  • They have forage programs that deliver. In Ontario and the Northeast, that often means high-digestibility corn silage and well-managed alfalfa-grass haylage. In Wisconsin and Minnesota, more grass and small-grain silages are part of the mix. In California’s Central Valley, high-quality corn silage and alfalfa hay are balanced against heat stress and water constraints.
  • They group and feed with intent. Instead of a single universal TMR, they adjust for fresh and high cows versus mid- and late-lactation cows and heifers, so each group gets what it needs without costly overfeeding.

A Canadian whole-systems analysis using the Holos model compared alfalfa-silage-based and corn-silage-based systems and found that differences in greenhouse gas footprint were driven more by system-wide factors—milk yield, stocking rate, nutrient balance—than by forage choice alone. That fits what many nutritionists see in practice: it’s the integration of crop rotation, ration design, feeding management, and manure handling that really drives cost and emissions.

Extension work from institutions like Cornell and Penn State has shown that better forage testing, tighter batching, and smarter grouping can often deliver meaningful feed cost savings, with payback periods typically measured in years rather than months. The opportunity will look different in a 70-cow tie-stall in Quebec than in a large dry lot system in California, but the underlying principle holds across systems.

On the genetics side, both Lactanet in Canada and USDA genetic evaluations in the U.S. are increasingly accounting for traits related to feed efficiency, fertility, and longevity, alongside production and type traits. As those traits get more weight in sire selection, herds gradually shift toward cows that convert feed into milk more efficiently, stay healthier, and remain in the herd longer.

From a carbon perspective, the logic is simple: when you produce more milk and components from roughly the same feed and manure base, emissions per kilogram of milk go down. What’s encouraging is that the management changes that improve feed efficiency are the same ones that help you ride out tight feed markets and lower your cost per hundredweight.

Health and Disease: The Hidden Emissions in Everyday Problems

Most producers already know that mastitis, lameness, and transition-period issues are expensive. The last decade of research has sharpened our understanding of just how expensive it is.

On the mastitis front, a 2018 study of Canadian dairy farms led by researchers at the University of Guelph and published in Frontiers in Veterinary Science estimated median mastitis-associated costs at about C$662 per cow per year, accounting for treatment, discarded milk, lost production, increased culling, and prevention costs. Earlier economic work from Europe estimated the cost of a generic clinical mastitis case at roughly US$200–300, depending on milk price, culling risk, and fertility impacts.

Lameness has a similar profile. Studies from Europe and North America show that lame cows produce less milk, have longer calving-to-conception intervals, incur higher treatment costs, and are more likely to leave the herd early, with per-cow annual costs often reaching several hundred dollars.

From an emissions point of view, European whole-farm models that incorporate disease incidence into greenhouse gas calculations have found that higher rates of mastitis and lameness can increase emissions per kilogram of milk by several percent—typically in the low- to mid-single-digit range—because more resources are going into maintenance and recovery and fewer into saleable milk. From a carbon standpoint, that sick cow is doing more harm than her treatment bill suggests: a chronically lame or mastitic cow in a freestall, tie-stall, or dry lot system still eats, still produces manure, and still emits methane, but often ships less milk and is more likely to be replaced early, adding heifer-rearing emissions into the mix.

What farmers are finding is that when they really lean into fresh cow management, udder health, and hoof care, the benefits show up in both the financial and emissions stories. Herds that focus on transition-period nutrition and cow comfort, maintain consistent milking routines and hygiene, and invest in regular hoof trimming and early detection tend to see fewer early-lactation problems, less discarded milk, more cows completing profitable later lactations, and lower replacement pressure. That pulls both cost per hundredweight and emissions per kilogram of milk in the right direction.

Carbon Intensity: Making an Abstract Metric Useful

“Carbon intensity” can sound like something dreamed up in an office far away from the parlour, but at its core, it’s just a ratio: total greenhouse gas emissions divided by total milk produced. If a farm emits 100 kilograms of CO₂-equivalent to ship 100 hundredweights of milk, its intensity is 1.0 kilogram of CO₂-equivalent per cwt. Simple enough.

At the U.S. national level, analysis reports a current average of 1.3 kg CO₂-equivalent per kilogram of milk and outlines how achieving roughly 0.67 kg CO₂-equivalent per kilogram would align the sector with climate-neutrality goals by 2050. For Canada, the DFC life-cycle assessment yields a farm-gate footprint of 0.94 kg CO₂-equivalent per litre of milk—among the lowest in the world on a per-litre basis.

Most of the calculators and tools being rolled out—whether by processors, co-ops, or government programs—break your intensity number into components you already recognize: animal numbers and age structure, milk yield and components, feed intake and ration makeup, manure storage and handling, fuel and electricity use.

When you see carbon intensity laid out that way, it’s not a mysterious figure anymore. It’s another way of looking at the same replacement decisions, feed efficiency, herd health, and energy use you already manage.

The Canadian LCA work, the Guelph Alliance project, and global reviews keep landing on the same message: farms that show lower emissions per kilogram of milk are usually the ones that already run a tight ship—they waste less feed, cull fewer cows prematurely, and move more milk through the same barns and milking systems.

Why Some Buyers Are Starting to Pay Attention

On the market side, some large buyers are starting to reflect this in how they work with suppliers. Companies like Danone have used tools such as the Cool Farm Tool to estimate farm-level emission factors and develop reduction plans with producers. And we’re seeing processors in Europe and North America begin testing practice-based sustainability programs—though program structures and payment levels vary significantly from one region and processor to the next. Early carbon marketplaces like Athian in the U.S. are exploring ways for verified on-farm emission reductions to generate credits that processors and branded products can purchase from participating farms.

Some lenders and co-ops are also beginning to consider environmental metrics as part of their risk and long-term resilience assessments—Farm Credit Services and some provincial programs have started incorporating sustainability factors into their conversations with producers. It’s early days, and there’s still a lot of uncertainty around how these programs will settle out, especially for smaller family farms and different contract structures. But the direction of travel seems clear: lower carbon intensity is increasingly seen not just as an environmental goal, but as a marker of an efficient, resilient dairy business.

You don’t need to sign a carbon contract tomorrow. But it’s worth noting that these programs are now rewarding the same efficiencies you already track.

Three Metrics Worth Watching on Your Farm

If you don’t want to spend your winter evenings diving into LCA spreadsheets but you do want to put your operation in a stronger position—both financially and in terms of footprint—here are three metrics worth watching. Many producers find it useful to review these monthly, then sit down with their vet, nutritionist, and financial advisor for a deeper review each quarter.

Replacement rate. Based on De Vries’s economic work at the University of Florida, economically optimal replacement rates often fall in the 25–27 percent range for herds with solid health and fertility programs—well below the 36 percent average he’s documented across North American Holsteins. The right target for your farm will depend on heifer-rearing cost, quota or non-quota status, land base, and whether you rear heifers on-farm or use custom growers. The evidence suggests that reducing involuntary culling and avoiding premature replacement can often improve both profit and emissions by increasing the share of mature, efficient cows in the herd.

Feed cost per cwt and milk per kilogram of dry matter. Alongside feed as a percentage of total cost, it’s valuable to track feed cost per hundredweight shipped and milk or fat-corrected milk per kilogram of dry matter in your major groups. Comparing those figures to benchmarks for similar herds in your region—freestall to freestall, tie-stall to tie-stall, pasture-based to pasture-based—can highlight where the biggest opportunities lie. The specifics will look different in a small tie-stall in Quebec than in a large dry lot system in California, but the underlying math is similar.

Disease-related losses. Instead of just counting cases, try putting a dollar figure on mastitis, lameness, and transition-period problems. That Canadian research suggests mastitis-related costs can reach around C$662 per cow per year when all factors are included. When you translate those numbers into dollars per cow and per hundredweight, investments in cow comfort, fresh cow monitoring, milking routine refinement, and hoof care often start to look more like solid investments than “extra costs.”

You don’t need a carbon calculator to track these metrics. But if you later plug your farm data into a footprint tool—whether through your processor, a co-op, or a government program—you’ll likely see that improvements in replacement, feed efficiency, and disease control show up as lower emissions per kilogram of milk as well.

A 90-Day, No-Capital Starting Plan

So, practically speaking, what can you do in the next 90 days without pouring new concrete or signing a lease on major equipment? Here’s a simple plan that herds in Ontario, the Prairies, the Northeast, and the Midwest have used as a starting point. Whether you’re milking 60 cows or 600, the basics scale up or down.

Put culling decisions under a 48-hour lens. For the next 60–90 days, before any cow leaves, have someone on your team fill out a basic cull review sheet: cow ID, lactation number, days in milk, primary cull reason, last three test-day yields and somatic cell counts, breeding history, and major health events in the last 90 days. And one question: “Is this realistically fixable inside 30 days, and what would it cost?”

This isn’t about keeping every marginal cow. It’s about making culling decisions with more context and then stepping back after two or three months to see what patterns emerge. De Vries’s research suggests that a meaningful share of removals are tied to issues that can be reduced with better fresh cow management, hoof care, and reproductive programs. If you looked back at your last year of culls with this lens, how many would fall into the “avoidable with better management” bucket?

Hold a weekly health huddle. Once a week, bring together the fresh cow team, the person who handles treatments, and whoever manages breeding to talk through how many calvings occurred and any difficult or high-risk calvings, fresh cow health events, new clinical mastitis cases and which pens or strings they’re in, new lameness cases and any common threads, and any recent changes in routines, pens, bedding, or rations that might be linked.

Herd-health research has shown that disease events often cluster in specific pens, time windows, or management situations rather than being random. A weekly “health huddle” is a simple way to catch those clusters early. It also signals to your team that their observations matter, which often improves reporting and early detection.

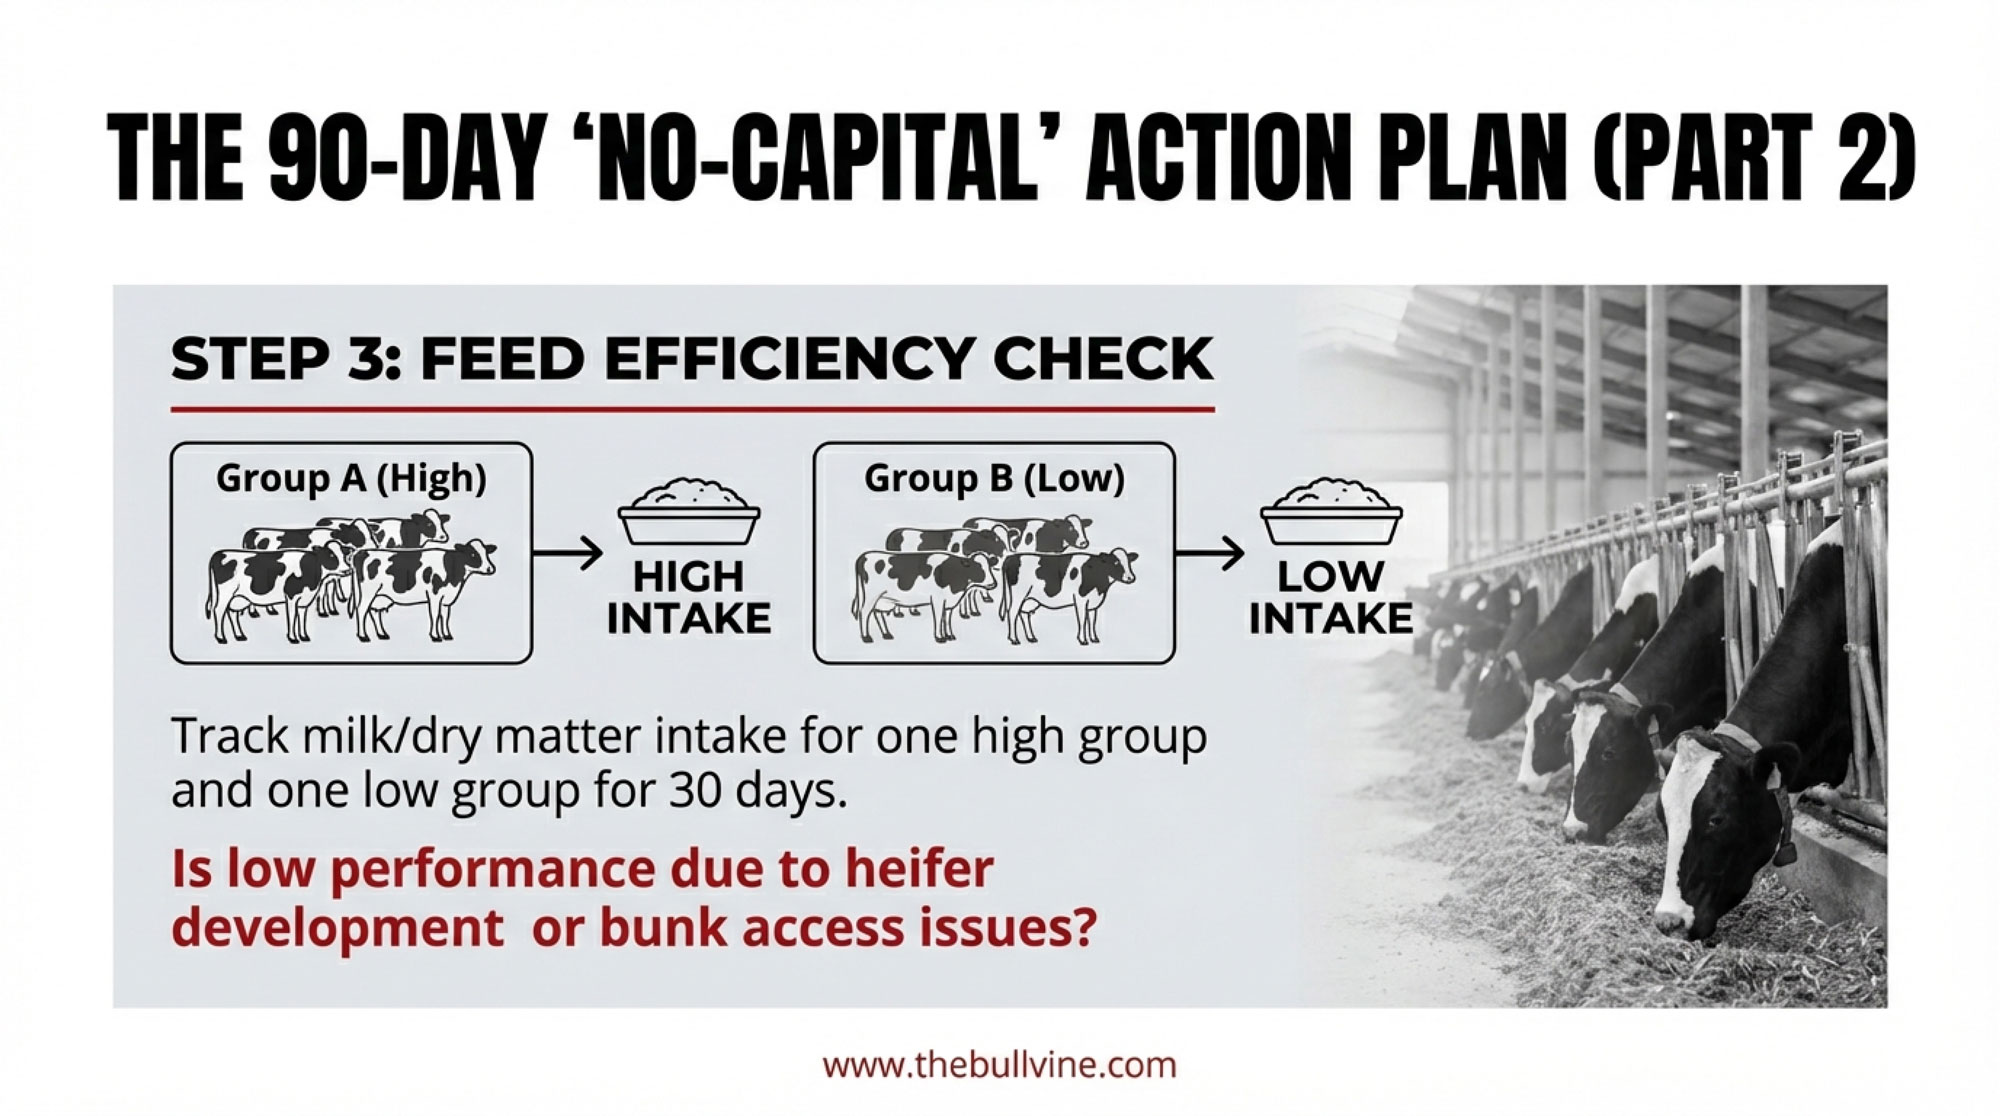
Run a basic feed efficiency check. Choose two groups of cows on the same ration—one from roughly the top third of the herd for milk or fat-corrected milk, one from the lower third, making sure cows are otherwise healthy and at similar days in milk. For about 30 days, track milk and component yields, body condition changes, any health events, and age and lactation distribution.

Then ask yourself: Is the lower group dominated by first-calf heifers and cows with a history of mastitis or lameness? If so, that points toward heifer development and health. Or is it a mix of ages and histories, suggesting issues with grouping, bunk access, or ration delivery?

At the end of the 90 days, sit down with your vet, nutritionist, and financial advisor to review what you’ve learned from these three exercises. In many herds, one or two clear priorities emerge—whether it’s fresh cow management, hoof care, grouping, or repro—which can then be tackled in a more structured way.

The Bottom Line

Looking across the research and on-farm experience, the message is fairly consistent. Emissions per kilogram of milk and profitability per stall aren’t pulling in opposite directions; most of the time, they’re reflecting the same core management decisions. High replacement rates, chronic health problems, weak fresh-cow management, and poor feed efficiency all drive up the cost per hundredweight and emissions per kilogram of milk. When you tighten those areas up, both lines tend to move in your favour.

What’s encouraging is that the herds showing up as “low-footprint” in Canadian and international work aren’t necessarily the biggest or the most high-tech. They’re the ones that have been steadily improving forage quality, feed efficiency, fresh cow management, hoof health, and culling strategies over time. The current focus on carbon intensity is simply putting a new lens on practices that already make economic sense.

There’s still a lot we’re learning—about methane-reducing feed additives, manure treatment technologies, and how carbon markets and processor programs will work for different farm sizes and regions. Those tools will matter, especially for larger supply chains trying to document in-value-chain emission reductions. But they’re likely to be add-ons to strong fundamentals rather than replacements for them.

In the next quarter, pick one of the three metrics—replacement rate, feed cost per cwt, or mastitis and lameness losses—and commit to measuring and improving it. Ask your team one simple question at your next herd meeting: “Where are we wasting cows, feed, or health in ways that don’t show up on our carbon report yet—but do show up in our bank account?”

The next time someone asks you about your “carbon number,” it might help to think of it as one more KPI alongside milk per cow, butterfat performance, pregnancy rate, and SCC. If you’re making progress on replacement rate, feed efficiency, and herd health, chances are good that both your cost per hundredweight and your emissions per kilogram of milk are moving in the right direction—even if the carbon program cheque hasn’t arrived yet.

KEY TAKEAWAYS 

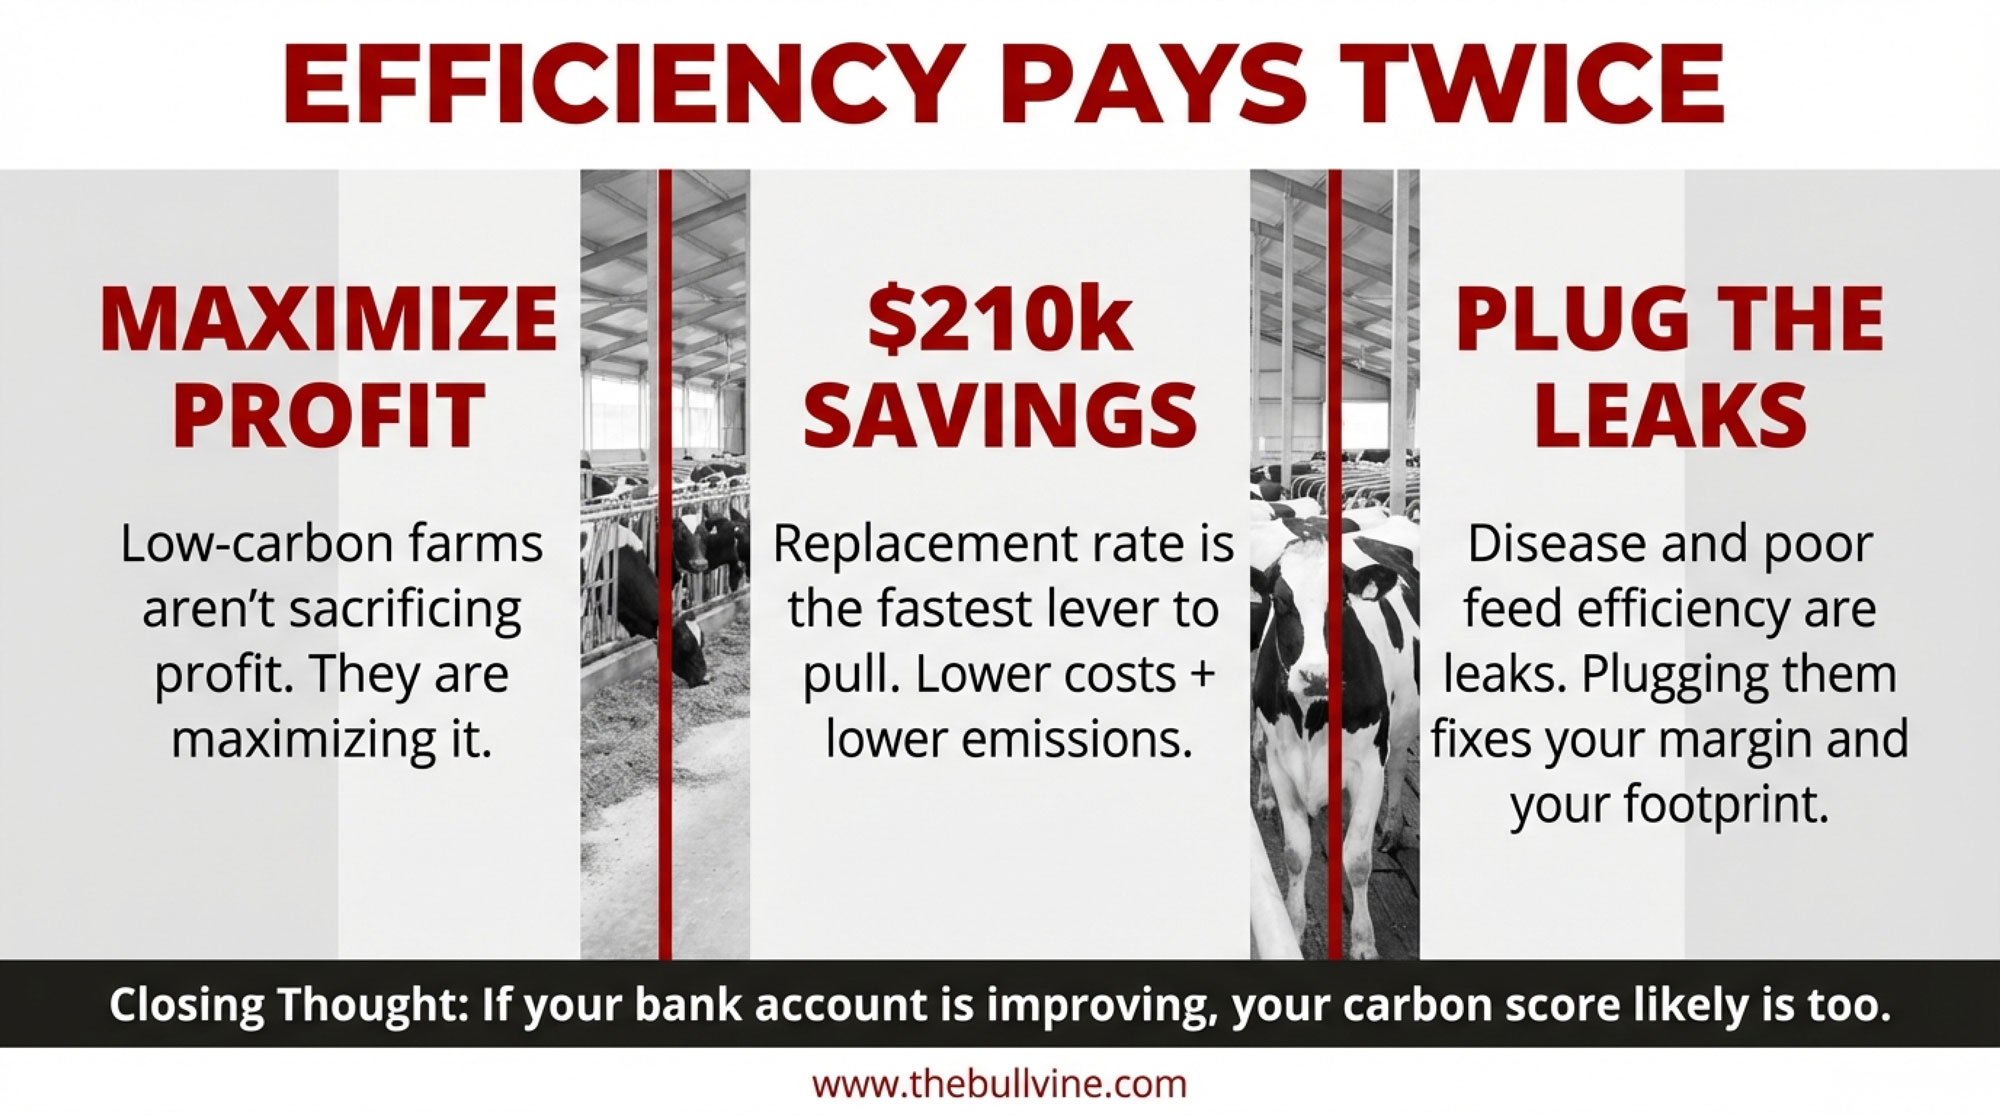
  • Low-carbon farms aren’t sacrificing profit—they’re making more. Guelph research found low-footprint Ontario dairies earned C$1,200 more per cow. The drivers? Feed efficiency and herd management—not carbon credits or fancy tech.
  • Your replacement rate is bleeding cash and carbon. Dropping from 35% to 28% on a 1,000-cow herd saves $210,000 annually—and cuts nearly two years of feed, manure, and methane from 70 heifers you won’t need to raise.
  • Feed efficiency pays twice. Feed takes 50-65% of your costs and 30-40% of your emissions. Tighten your rations, win on both lines.
  • Sick cows leak margin and carbon. Mastitis averages C$662/cow/year, and those cows keep eating and emitting while shipping less milk. That’s a double hit to your numbers.
  • 90 days, no capital, clear direction. Document every cull, hold weekly health huddles, and run a basic feed efficiency check. The patterns will show you exactly where the money is hiding.

Complete references and supporting documentation are available upon request by contacting the editorial team at editor@thebullvine.com.

Learn More

The Sunday Read Dairy Professionals Don’t Skip.

Every week, thousands of producers, breeders, and industry insiders open Bullvine Weekly for genetics insights, market shifts, and profit strategies they won’t find anywhere else. One email. Five minutes. Smarter decisions all week.
NewsSubscribe
First
Last
Consent
Send this to a friend