










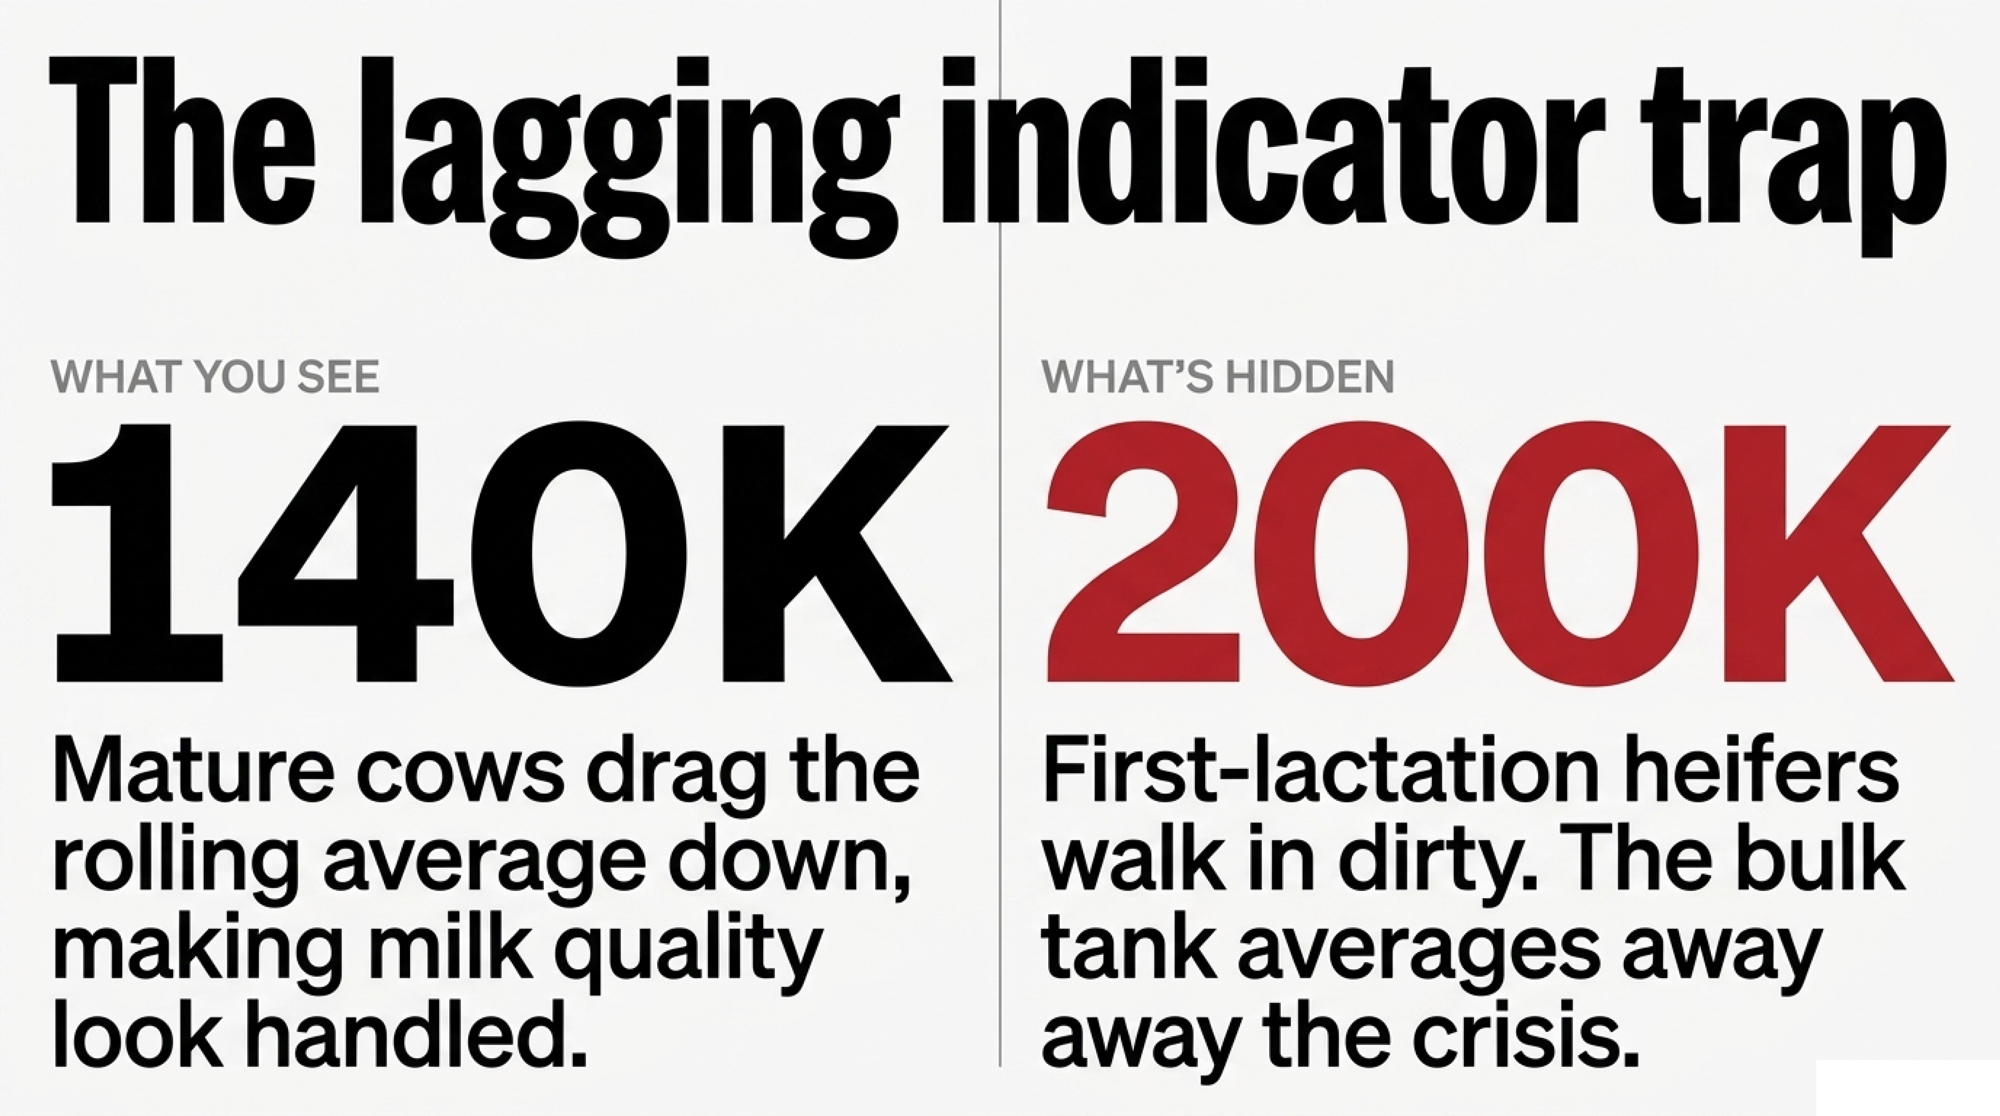
Pull the first-test SCC by lactation group tonight. If your heifers walk in at 200K while your mature cows hold the rolling average near 140K, your bulk tank’s been lying to you.
Executive Summary: The national DHI somatic cell average has stayed flat at 181,000 cells for two years running, and new University of Minnesota research suggests part of the reason may be hiding in your heifer pen, not your parlor. A study from Brad Heins’s WCROC program — presented at ADSA 2026 by Ph.D. researcher I. M. Rott — is testing whether a heifer’s residual feed intake during growth tracks with the somatic cell count she’ll carry into her first lactation, on the theory that more efficient animals have more energy left for immune development. The catch for most herds: a clean bulk tank reading 140K can mask first-lactation heifers walking in at 200K, because mature, lower-SCC cows drag the rolling average down and bury the problem. That matters because first-test SCC is largely a forecast, not a snapshot — a 2005 J. Dairy Science study associated heifers fresh at 50,000 cells with 119–155 kg more milk across the lactation than those at 1,000,000, and the damage doesn’t reset. Run the barn math: on a 300-cow herd at 24,000 lbs, the federal SCC adjustment for a 250K-to-150K move is lunch money (~$6,000/yr), but a $1.00/cwt over-order quality premium is worth ~$72,000 a year — roughly $216,000 over three years — riding on whether your replacements freshen clean. The genetics gap is real, too: CDCB’s Feed Saved index is built on lactating-cow data, so it isn’t yet capturing any heifer-period RFI-to-SCC link, and nobody’s published whether chasing efficiency hard helps or hurts SCS. The 30-second takeaway — pull your first-test SCC by lactation group; if your heifers run more than 50,000 cells above your rolling average, your tank’s been lying to you, and the fix is 18–24 months upstream.
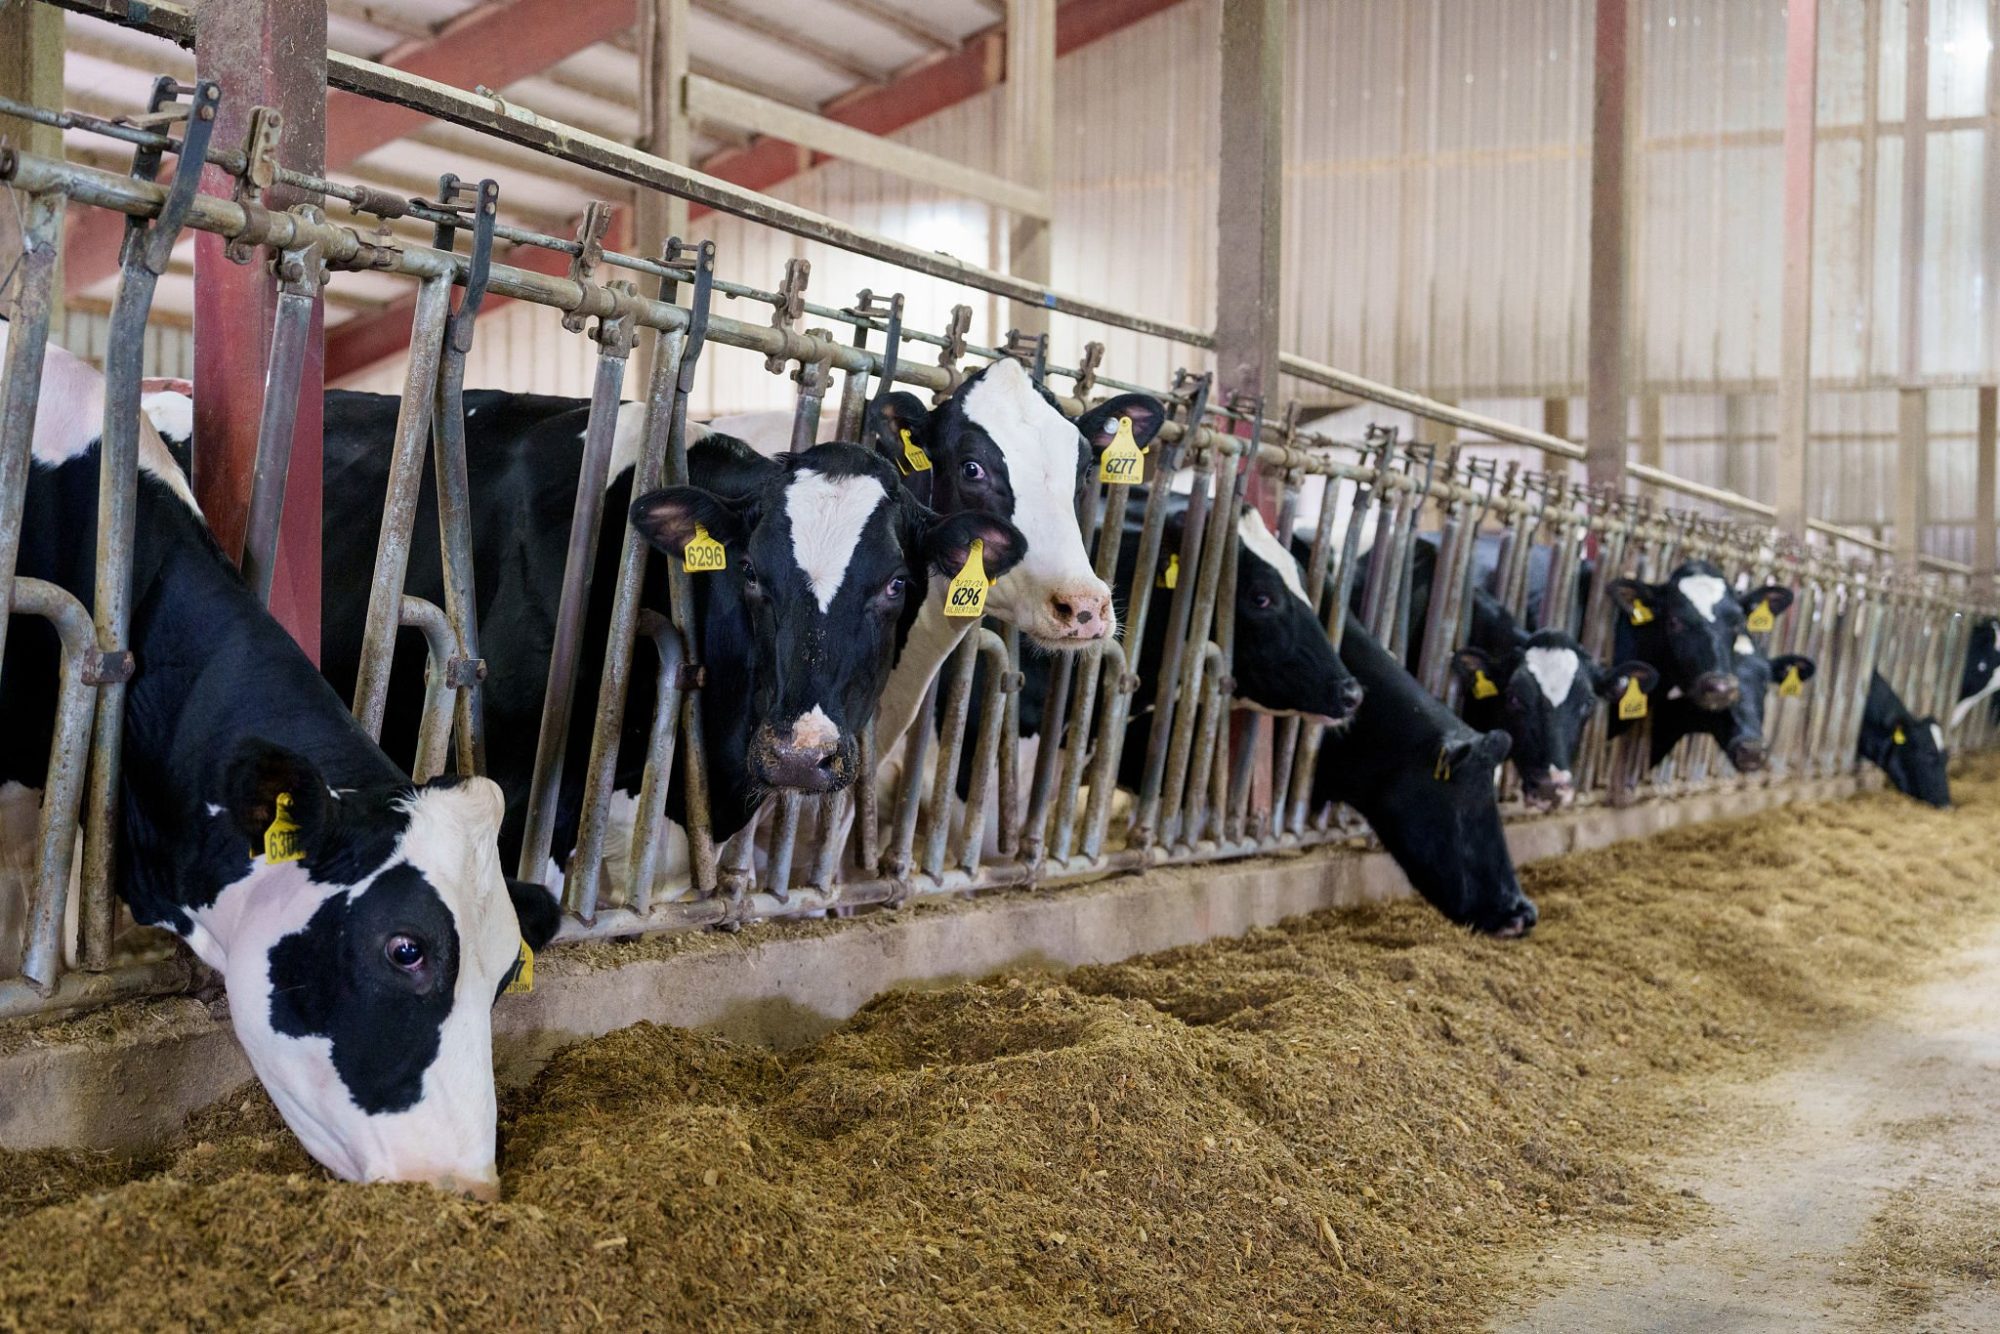
It’s 9 PM at the kitchen table. The DHI report is open on the laptop, the rolling bulk tank somatic cell count reads a comfortable 140,000 cells per milliliter, and by every number a producer usually checks, this herd has milk quality handled.
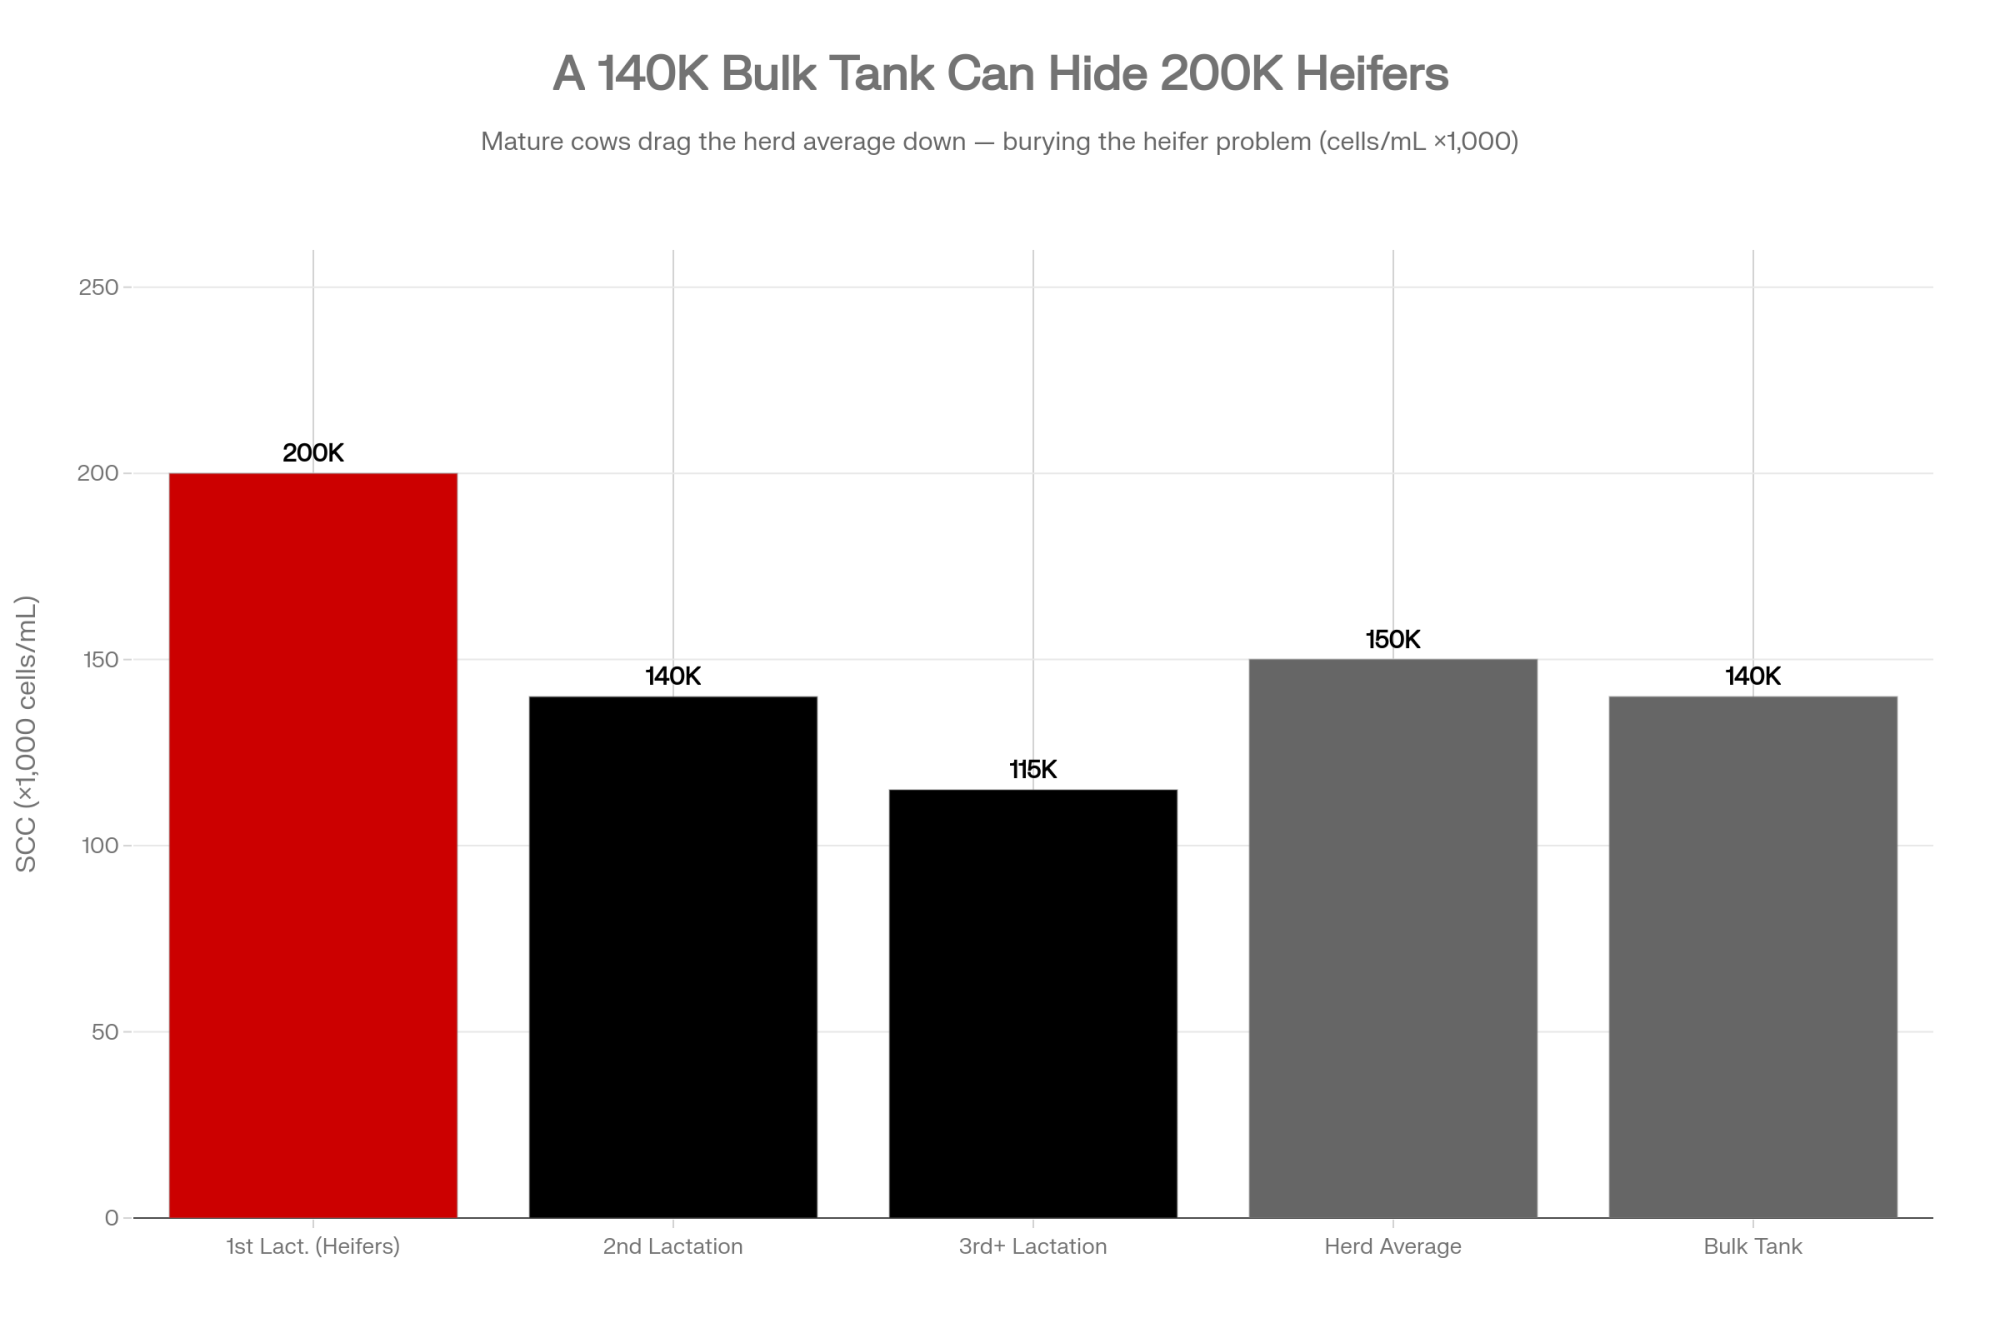
Then pull one more report — first-test SCC broken out by lactation group — and a different story shows up. The first-lactation heifers are walking in at 200,000 cells, while the second- and third-lactation cows quietly drag the average back down. The bulk tank isn’t lying. It’s just answering the wrong question. Read by lactation group, though, and the heifers tell on themselves.
That gap is the thread behind new research out of the University of Minnesota, presented this week at the 2026 ADSA Annual Meeting in Milwaukee. And it’s why a producer who’s sure he’s beaten his somatic cell problem might be one heifer group away from one he never saw coming.
Two Years Flat While Premiums Have Never Paid Better
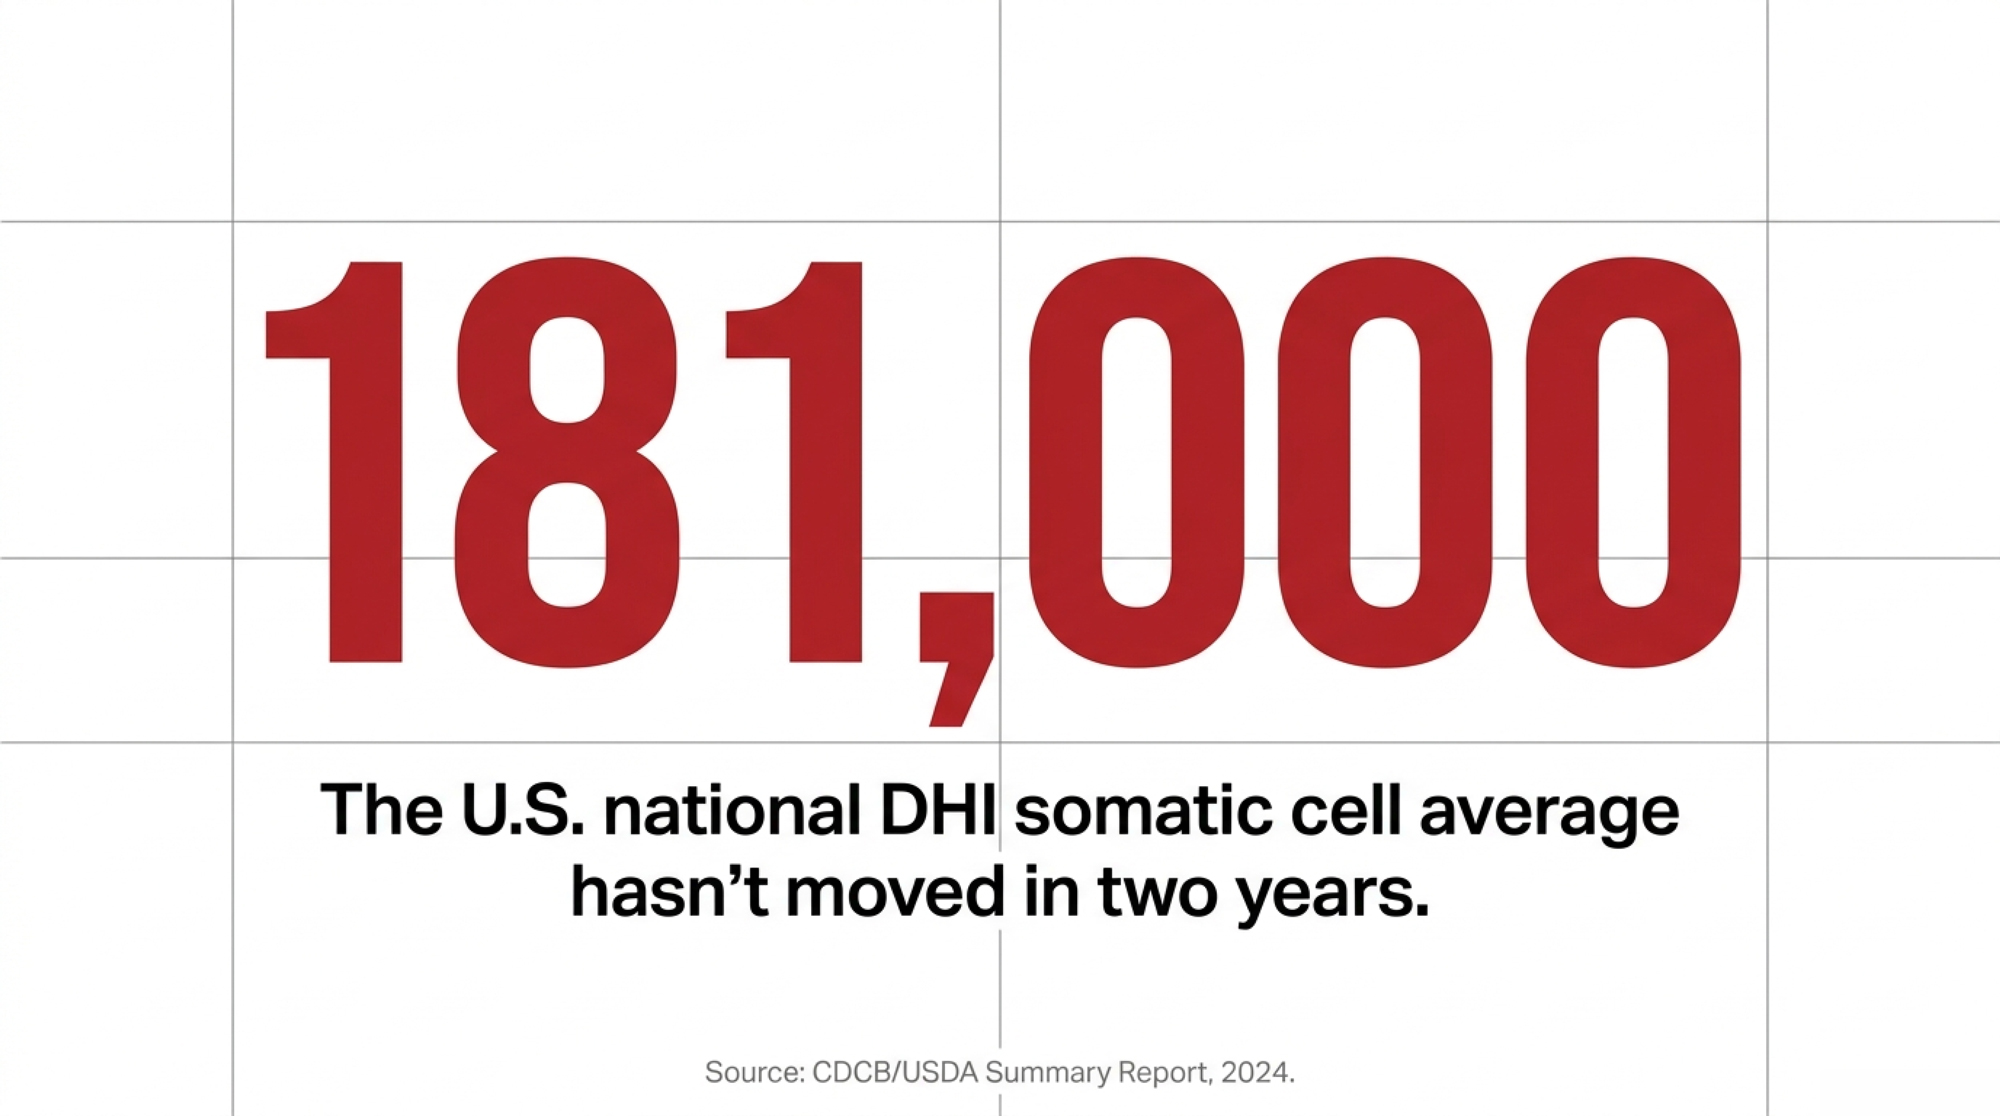
Here’s the number that should bug anyone watching a milk check. The U.S. national DHI test-day average somatic cell count sat at 181,000 cells per milliliter — unchanged from 2023 to 2024, according to a CDCB/USDA summary report (reported via Agproud/Progressive Dairy, June 2025). Two years. No movement. And milk quality premiums have rarely paid more than they do right now.
The work prompting a rethink comes out of the University of Minnesota’s West Central Research and Outreach Center (WCROC) in Morris, where Dr. Brad Heins runs the dairy program. A study from that group — presented at ADSA 2026 by Ph.D. researcher I. M. Rott, with co-authors Isaac Salfer, Brad Heins, and Isaac Haagen — digs into the genetics of how efficiently young animals eat. The starting point sits roughly two years before a cow ever walks into the parlor — in the heifer barn, with something most producers have never tied to udder health at all: how efficiently she eats.
The producer who’ll see himself in this isn’t the one fighting a visible SCC crisis. It’s the one whose rolling average looks fine, who stopped sweating milk quality a while back, and who has no idea his replacement pipeline is quietly restocking a subclinical problem with every group that freshens.
And that’s the trap. A clean rolling average is a lagging indicator built mostly from cows who’ve already proven themselves. It tells you how your mature herd is milking today. It tells you almost nothing about the heifers about to replace them.
The Parlor Is a Warning Light. The DHI Report Is a Diagnostic.
Why is early SCC so hard to walk back? Because the damage doesn’t reset.
A 2005 study in the Journal of Dairy Science (88:938–947) tracked first-lactation heifers and found that those testing at 50,000 cells in early lactation were associated with an estimated 119 to 155 kg more milk over the lactation than heifers testing at 500,000 or 1,000,000 cells. The effect held across nearly the whole lactation, even when later test-day counts came back down. Once a subclinical infection sets up at freshening, you’re managing around it for the rest of that lactation, not erasing it.
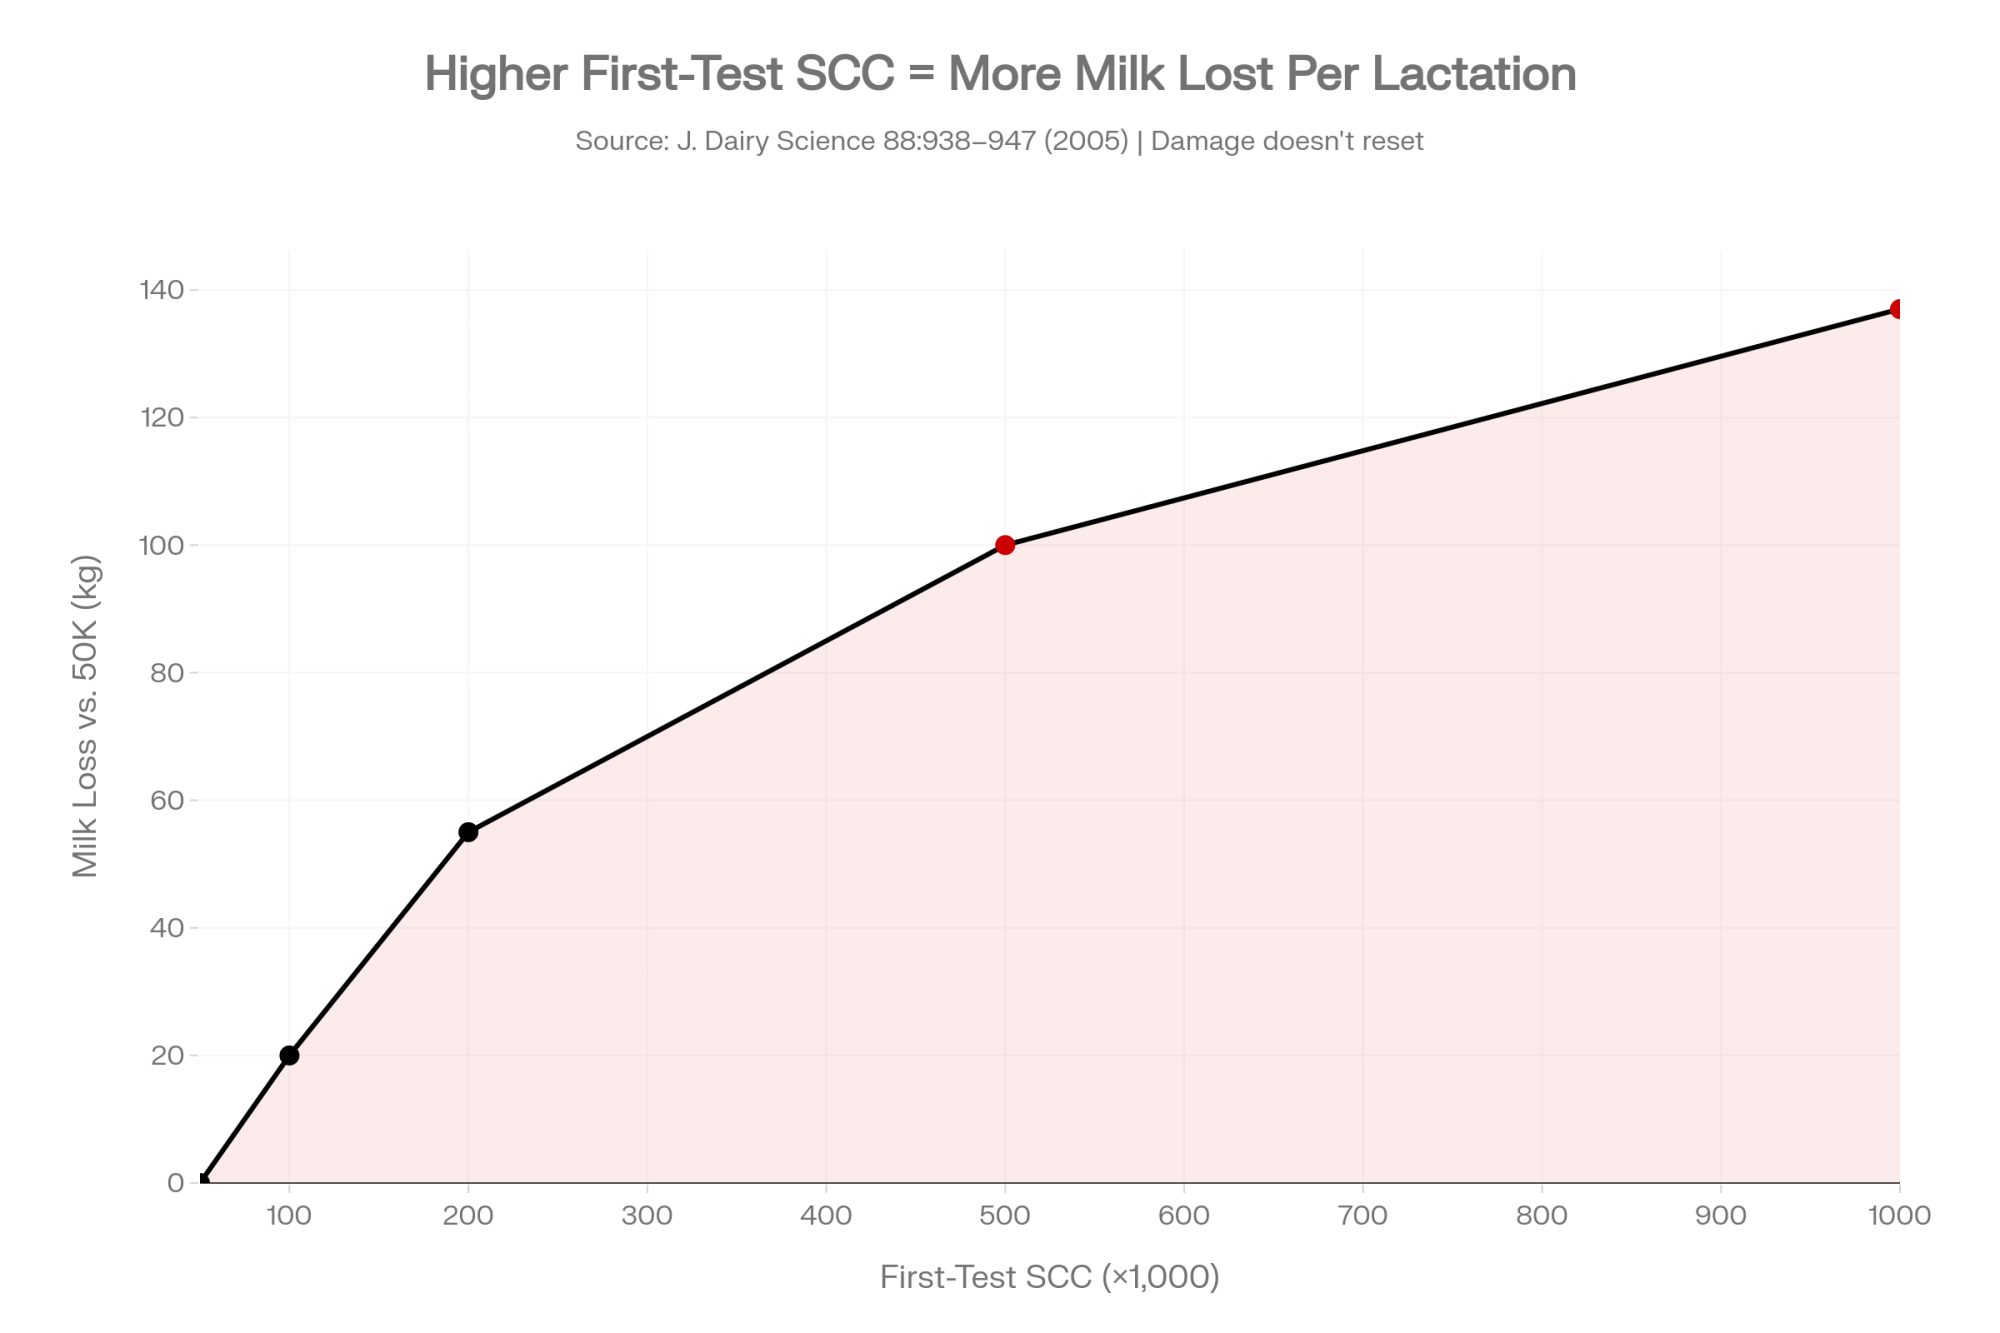
That’s what makes a heifer’s first-test SCC the most predictive cell count she’ll ever post. It’s not a snapshot. It’s a forecast.
So the parlor protocol — the teat dips, the dry-cow therapy, the milking hygiene the industry has spent 30 years sharpening — is often cleaning up downstream of a problem that was already locked in. Put it this way: your bulk tank tells you something’s wrong. Your DHI report, read by lactation number, tells you where it came from.
Much of that infection never announces itself, either. Analysis of large-scale first-test data, summarized through Progressive Dairy in 2024, points to fresh-heifer mastitis — much of it subclinical, much of it established at or before calving — as a primary driver of first-lactation SCC. Subclinical infection at freshening commonly runs three to five times the clinical rate.
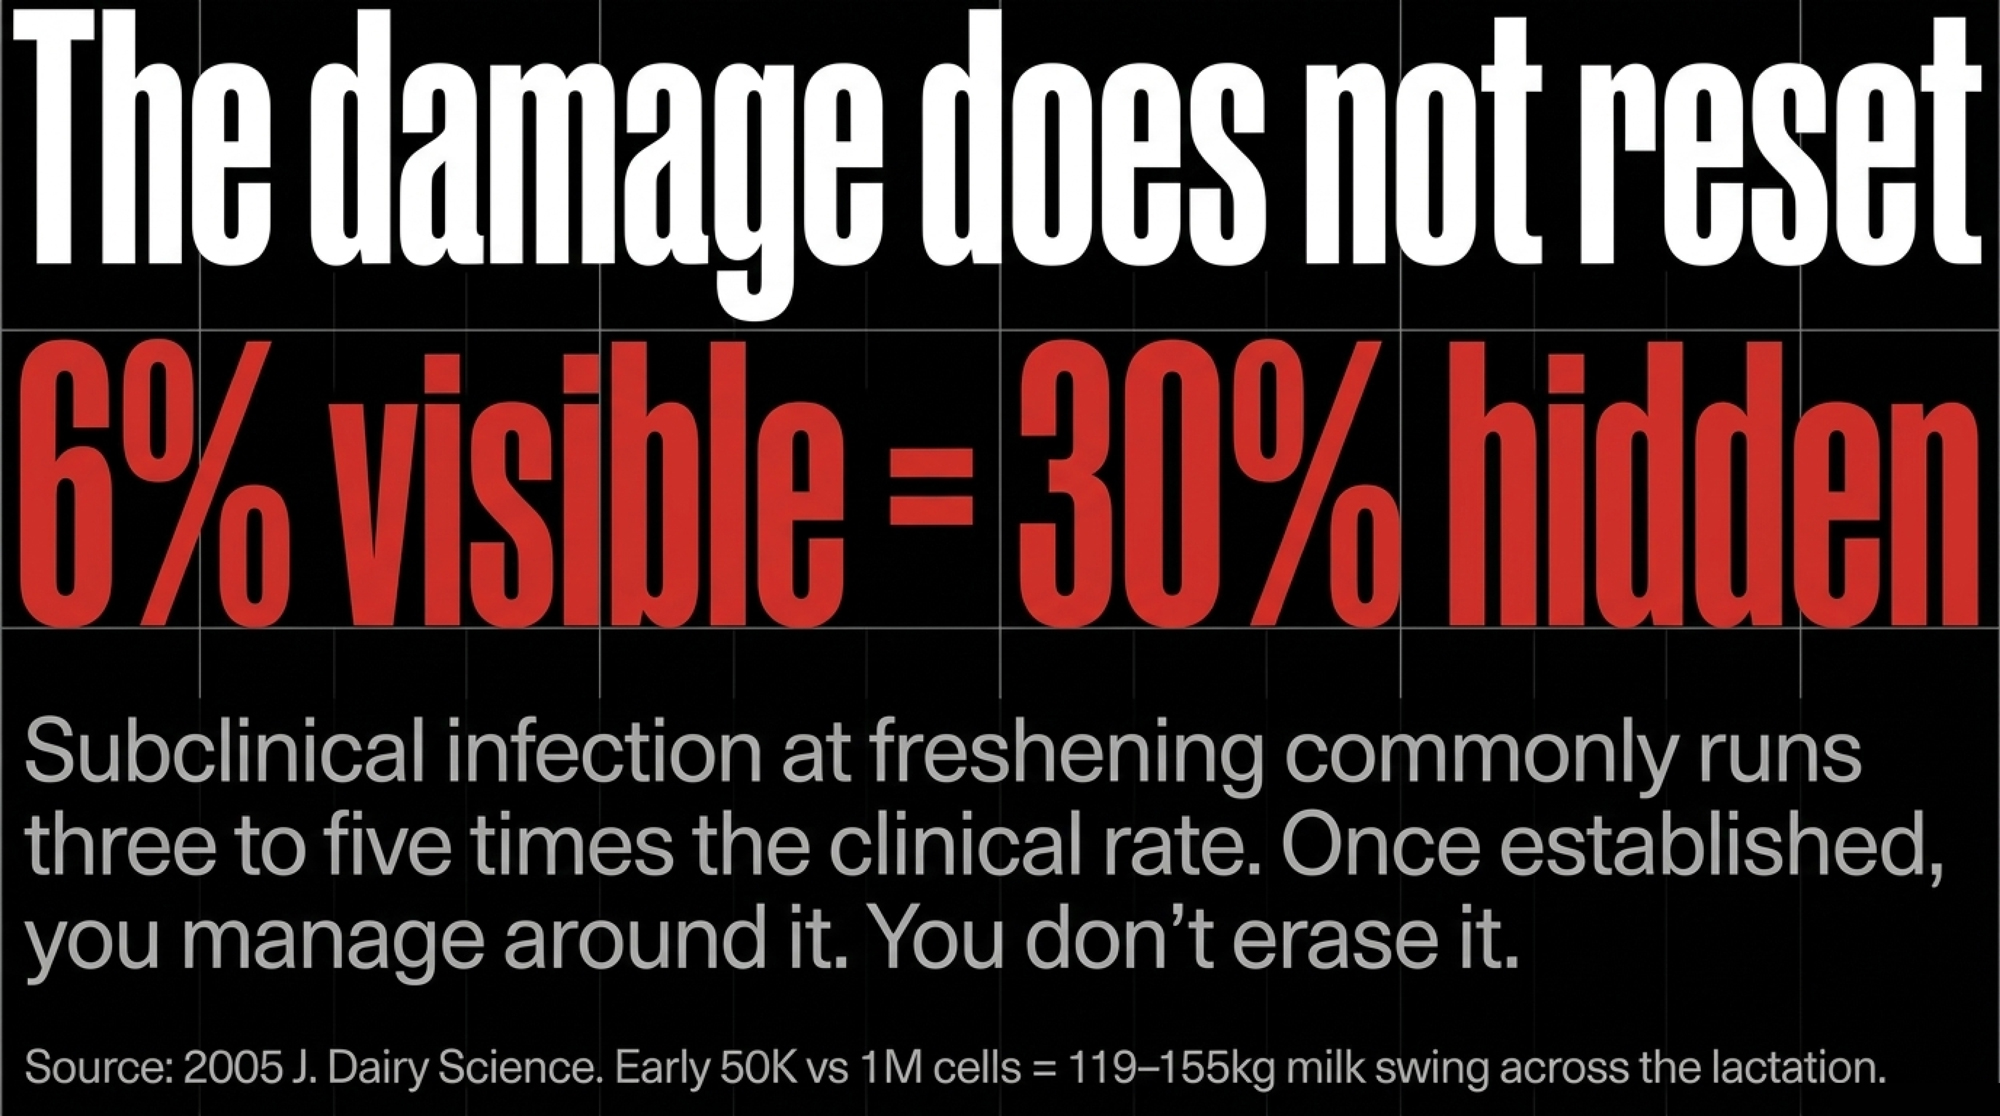
The Subclinical Iceberg: A herd showing a 6% clinical mastitis rate in fresh heifers is often sitting on an implied 18–30% subclinical infection rate that never lands in a single health record.
Think about what that means for a replacement strategy. You can buy the best fresh-cow protocol money can rent, and it still won’t touch the heifer who walked in already infected. The window to influence her closed months earlier, in a pen that most operations manage as a cost center and nothing more.
What Does Feed Efficiency Have to Do With a Clean Udder?
This is the connection nobody’s drawn yet, and it’s the heart of what the Minnesota group — Rott, Salfer, Heins, and Haagen in UMN’s Department of Animal Science — is working to characterize. The link runs through Residual Feed Intake, or RFI.
RFI strips out body size and growth rate and asks one clean question: is this heifer using her feed well, or burning extra to make the same gain as her pen-mates? A negative-RFI heifer is efficient. A positive one is eating more than her growth justifies.
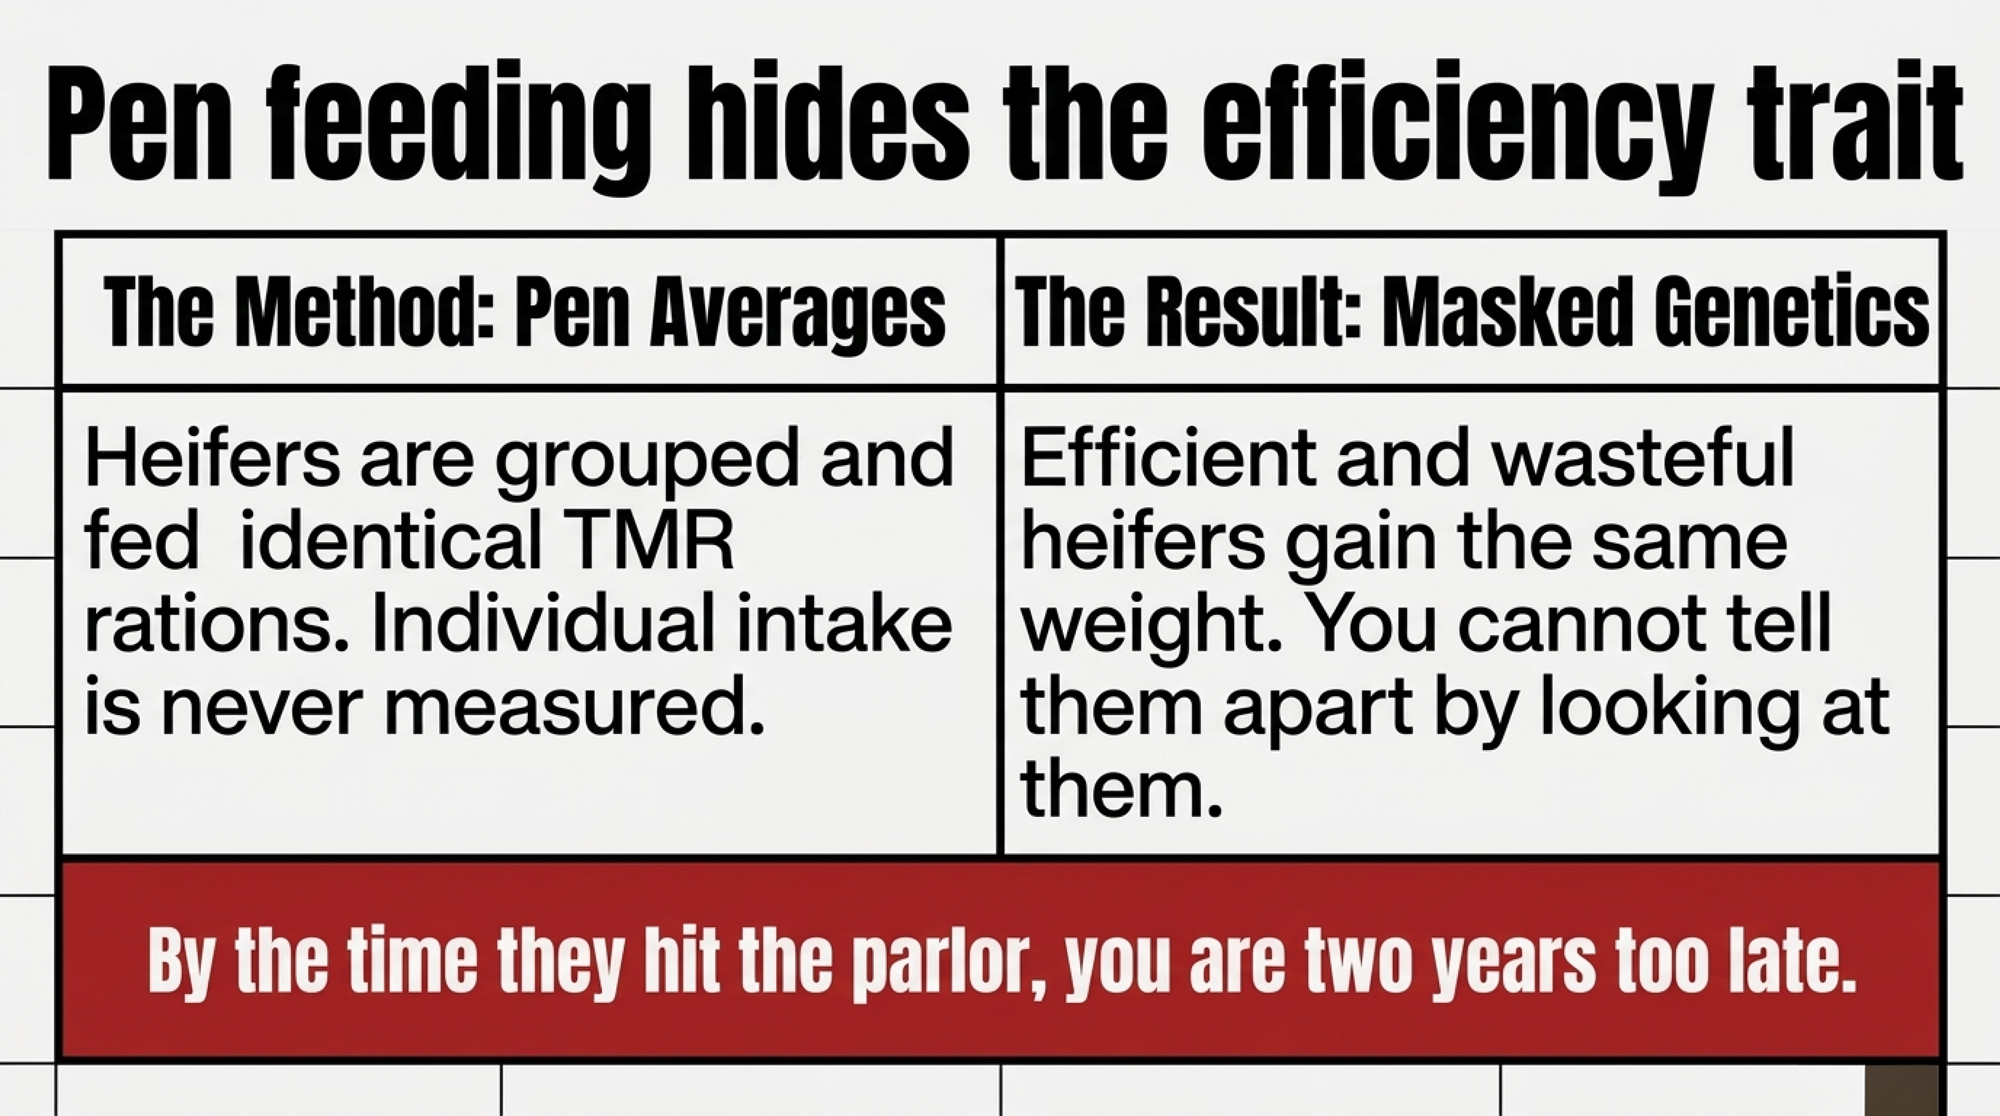
The WCROC dairy measures this with precision automated feeders that capture individual dry matter intake — not pen averages. That distinction matters more than it sounds. Most heifer programs feed by pen, which means the efficient heifers and the wasteful ones eat the same ration, gain similar weight, and nobody can tell them apart until they freshen. By then, it’s two years too late to do anything about that group.
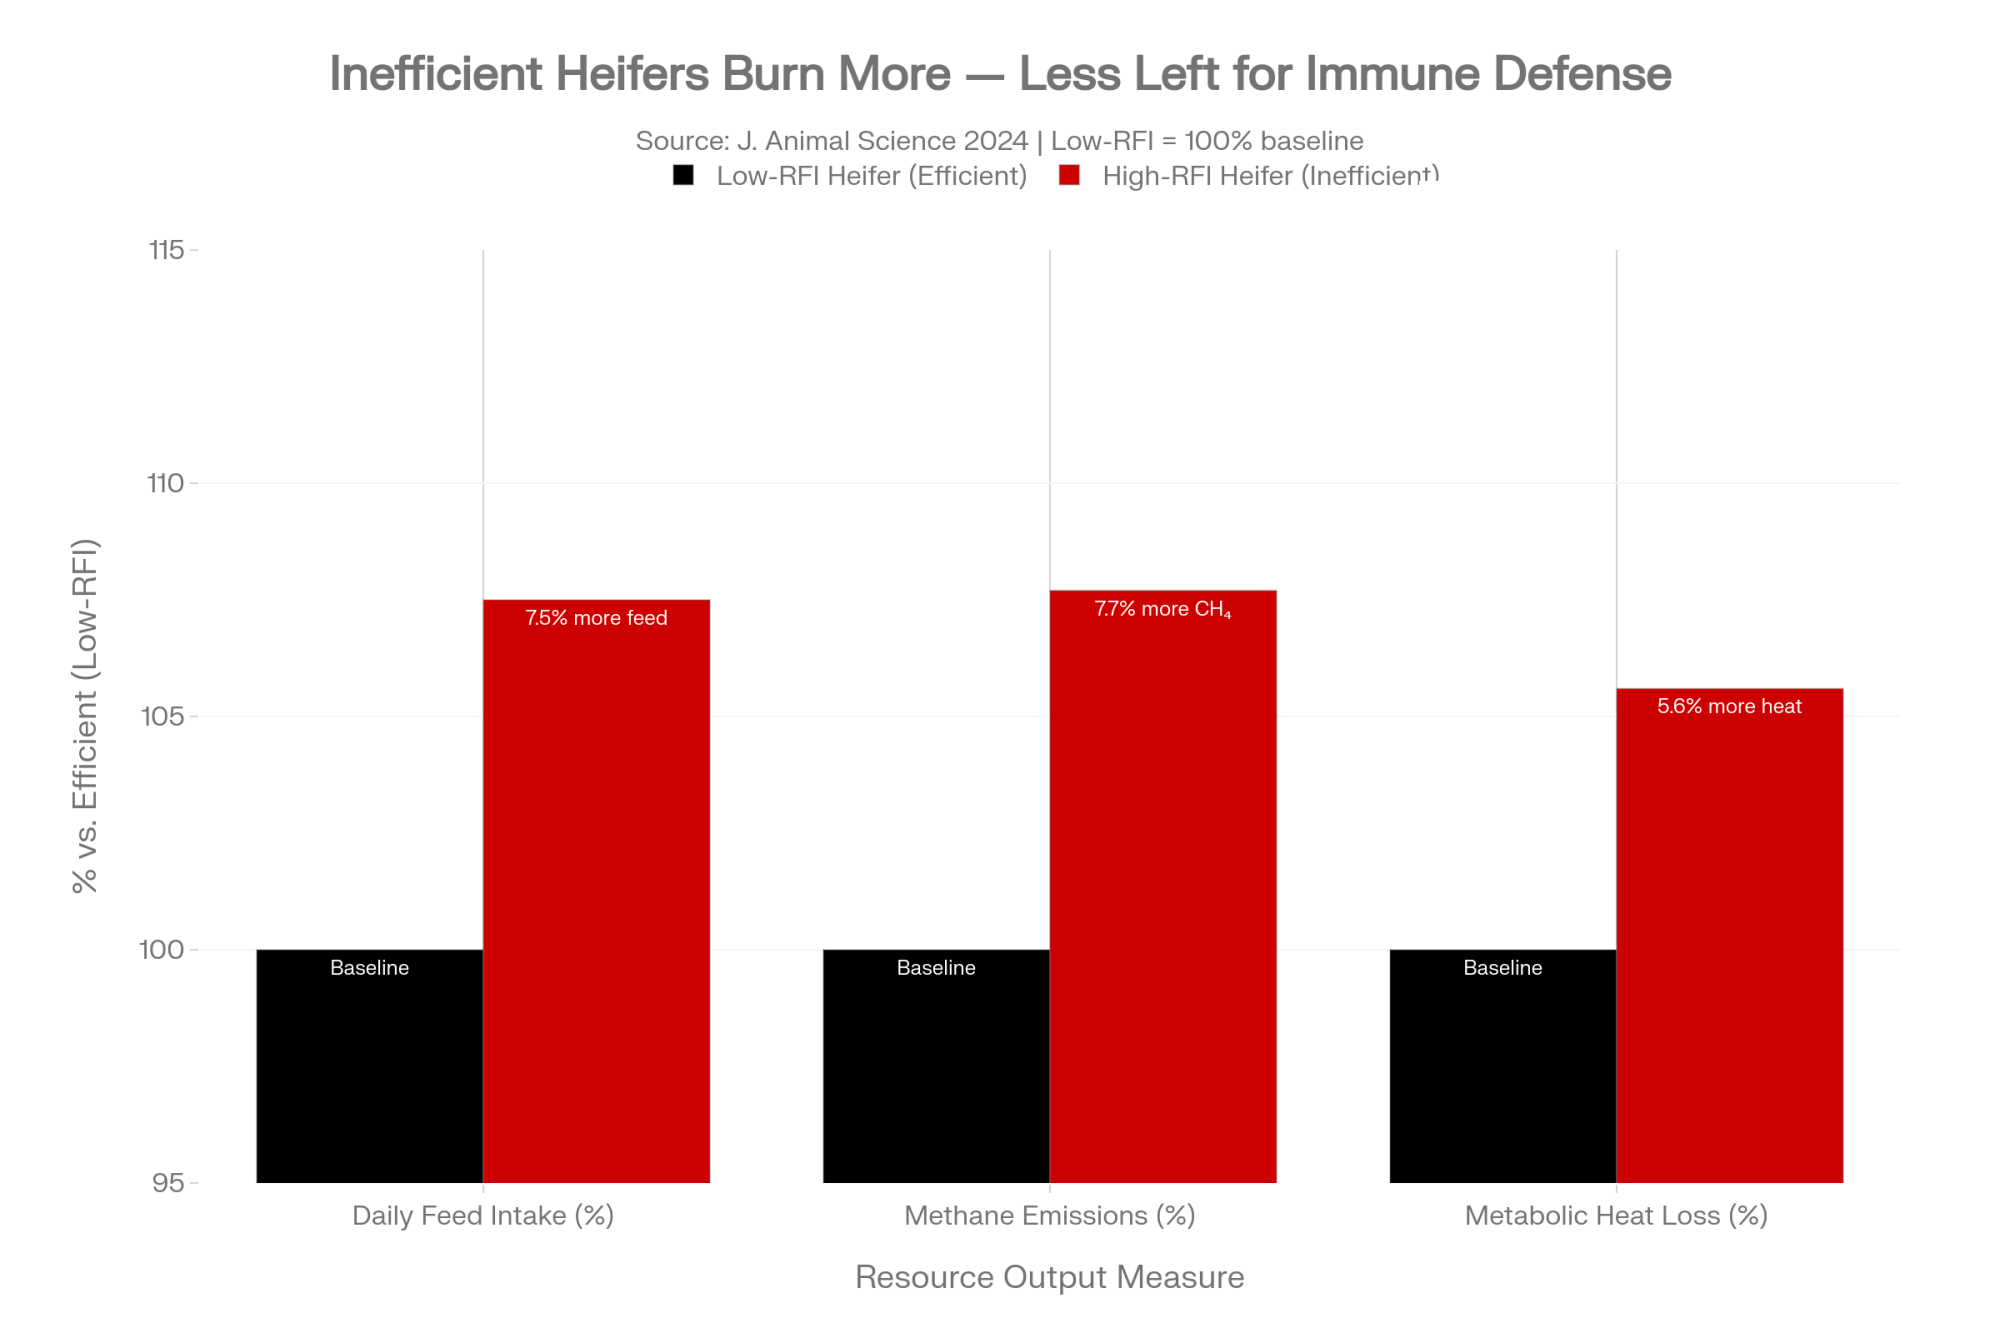
The efficiency signal itself is well documented. A 2024 study in the Journal of Animal Science found that low-RFI Holstein heifers ate 7.5% less feed per day than high-RFI herdmates, with no difference in body weight or average daily gain, and produced 7.7% less methane and gave off 5.6% less metabolic heat in the process. The Minnesota team’s ADSA 2026 abstract (Rott et al., “Genetic parameters for residual feed intake traits in Holstein calves”) takes the next step: pinning down how heritable that calf-stage efficiency is, and how it correlates with other traits.
What the early WCROC direction suggests — and what the full data set will test — is that the efficient, negative-RFI heifers tend to post lower first-test SCC. But here’s the honest line, and it stays in. The specific effect size — how strong the genetic correlation is between calf-stage RFI and somatic cell score, across how many animals — isn’t something this article should state until it’s read straight off the abstract or a published paper.
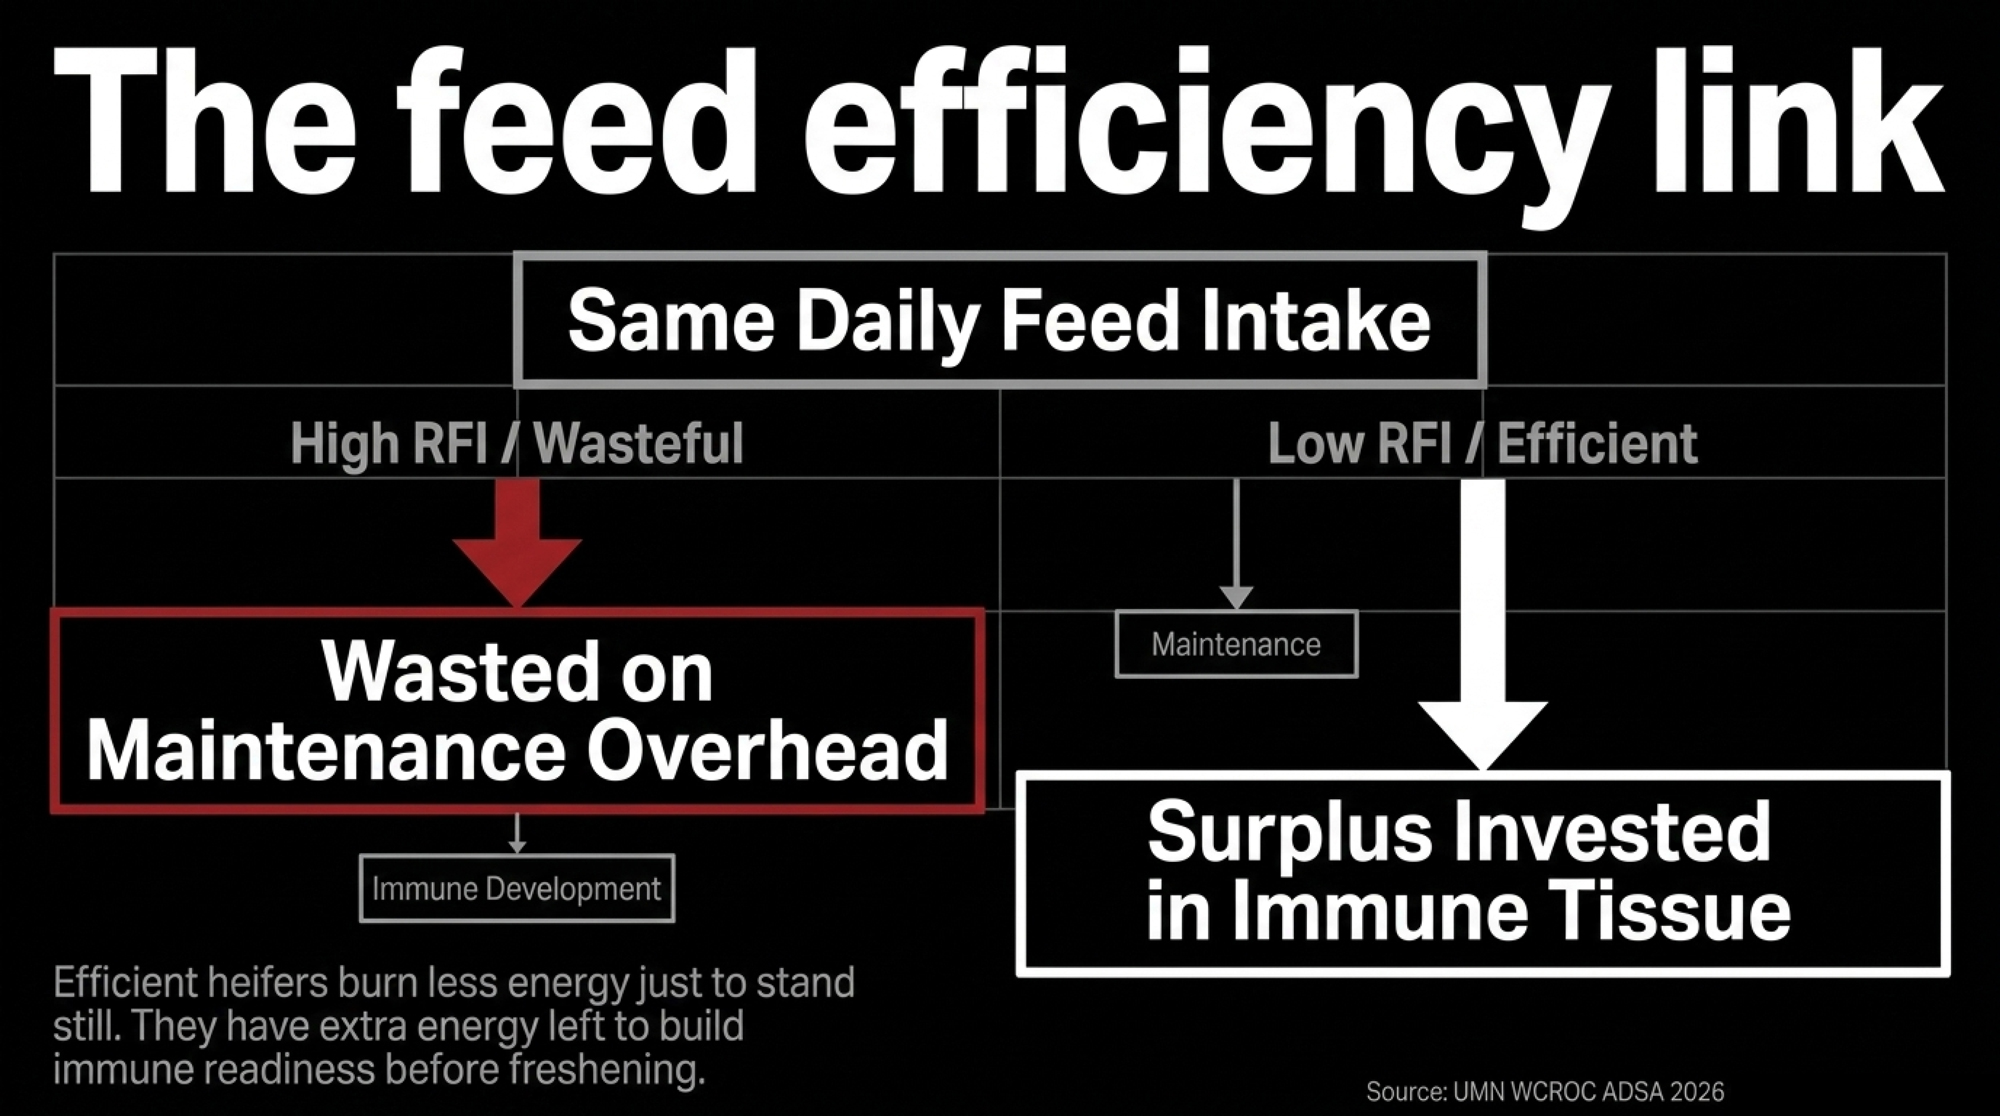
The Immune-Development Hypothesis — Why the Link Is Plausible
So why would feed efficiency and udder health travel together at all? The leading hypothesis is about where the energy goes.
A growing heifer partitions every megacalorie she eats — toward frame, toward fat, toward maintenance, toward immune-tissue development. An efficient animal, the thinking goes, wastes less on maintenance overhead and has more left to build the tissue that defends her, including the immune machinery around a developing mammary gland. An inefficient heifer burns more just to stand still, leaving less for everything else. Same ration. Different allocation.
There’s biological backing for the energy-partitioning piece. Research on heat production — including work showing that low-RFI heifers give off 5.6% less metabolic heat — indicates that efficient animals lose less energy to maintenance. The leap the Minnesota team is testing is whether the spared energy actually translates into better immune readiness at freshening, measured as lower first-test SCC.
This is where the discipline matters. Right now, this is a hypothesis with a plausible mechanism and early directional data — not a proven causal chain. The data suggest an association. They haven’t yet proven that feeding for efficiency causes a cleaner udder. A producer who treats it as settled science is getting ahead of the researchers themselves. But a producer who ignores it until it’s textbook-confirmed is leaving a two-year lead time on the table. The honest middle ground: it’s plausible enough to shape a mating list and a heifer-pen conversation, not yet strong enough to bet the farm on.
What’s not in doubt is the cost of getting udder health wrong. A 2018 Journal of Dairy Science analysis found that a cow at 250,000 cells produces about 1.6 kg less milk per day than one at 50,000, and converts feed less efficiently by roughly 0.04 kg of milk per kg of dry matter. She costs you milk and burns extra feed. That penalty is worth running barn math on even before the genetic correlation is nailed down.
The Barn Math, Built Step by Step
Here’s where the SCC story stops being academic and starts showing up on a milk check. Walk through it with clearly labeled assumptions so you can swap in your own.
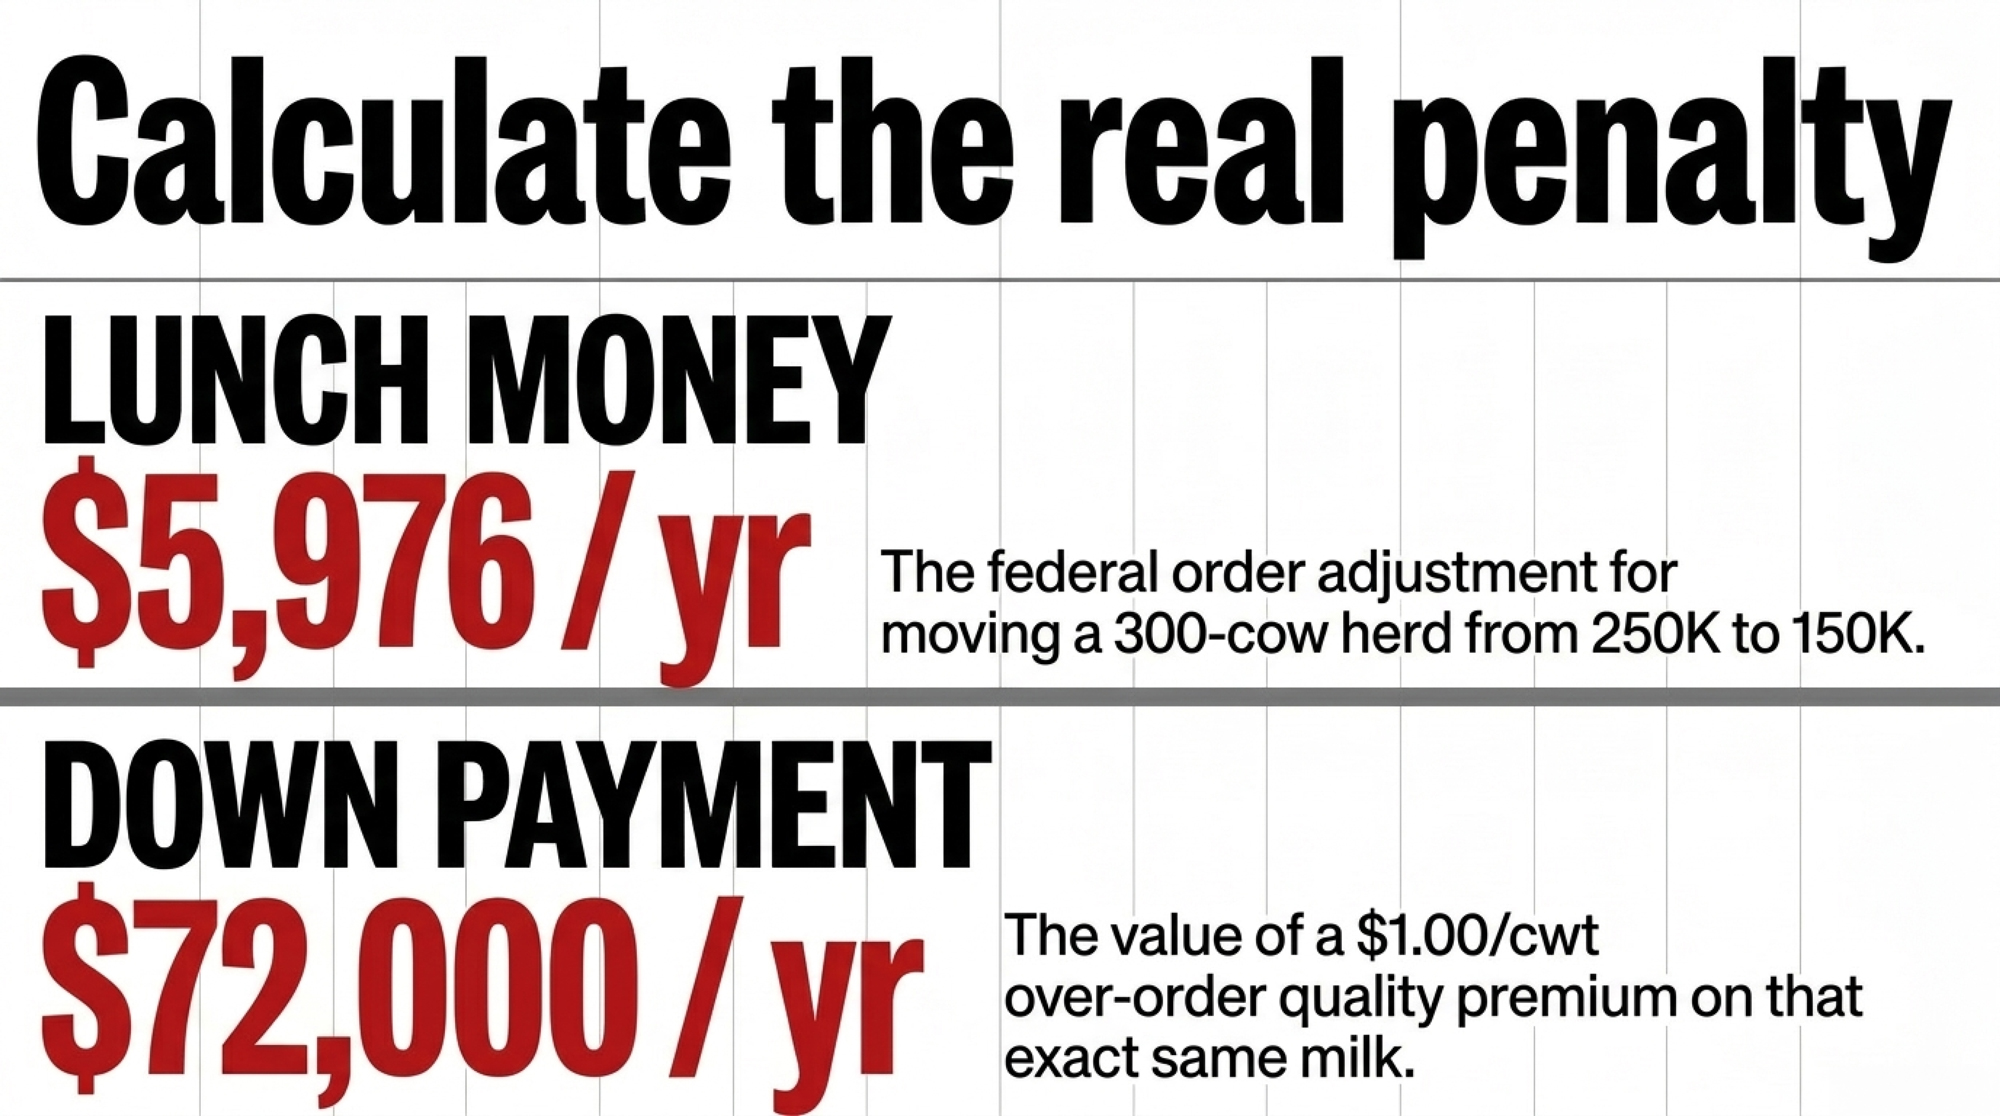
Start with a 300-cow herd milking 24,000 lbs per cow per year — that’s 7.2 million lbs, or 72,000 cwt annually. Now the premium. The federal-order SCC adjustment itself is modest: at mid-2026 cheese prices, roughly $0.00083 per cwt for every 1,000 cells below the 350,000-cell benchmark. Moving a herd from 250K to 150K — a 100,000-cell improvement — is worth about $0.083/cwt on that mechanism alone. On 72,000 cwt, that’s roughly $5,976 a year — call it $18,000 over three years. Real, but not the headline.
The headline lives in the over-order and processor quality premiums, which are contract-specific and far larger than the federal adjustment. Many Upper Midwest and premium-tier processors pay tiered quality bonuses that can stack $0.50 to well over $1.00/cwt for consistently low-SCC milk. At a conservative $1.00/cwt spread between a threshold herd and a premium-tier herd, 72,000 cwt is $72,000 a year. Hold that for three years, and you’re looking at a $216,000 swing — most of it riding on whether your replacement heifers freshen clean or freshen at 200K.
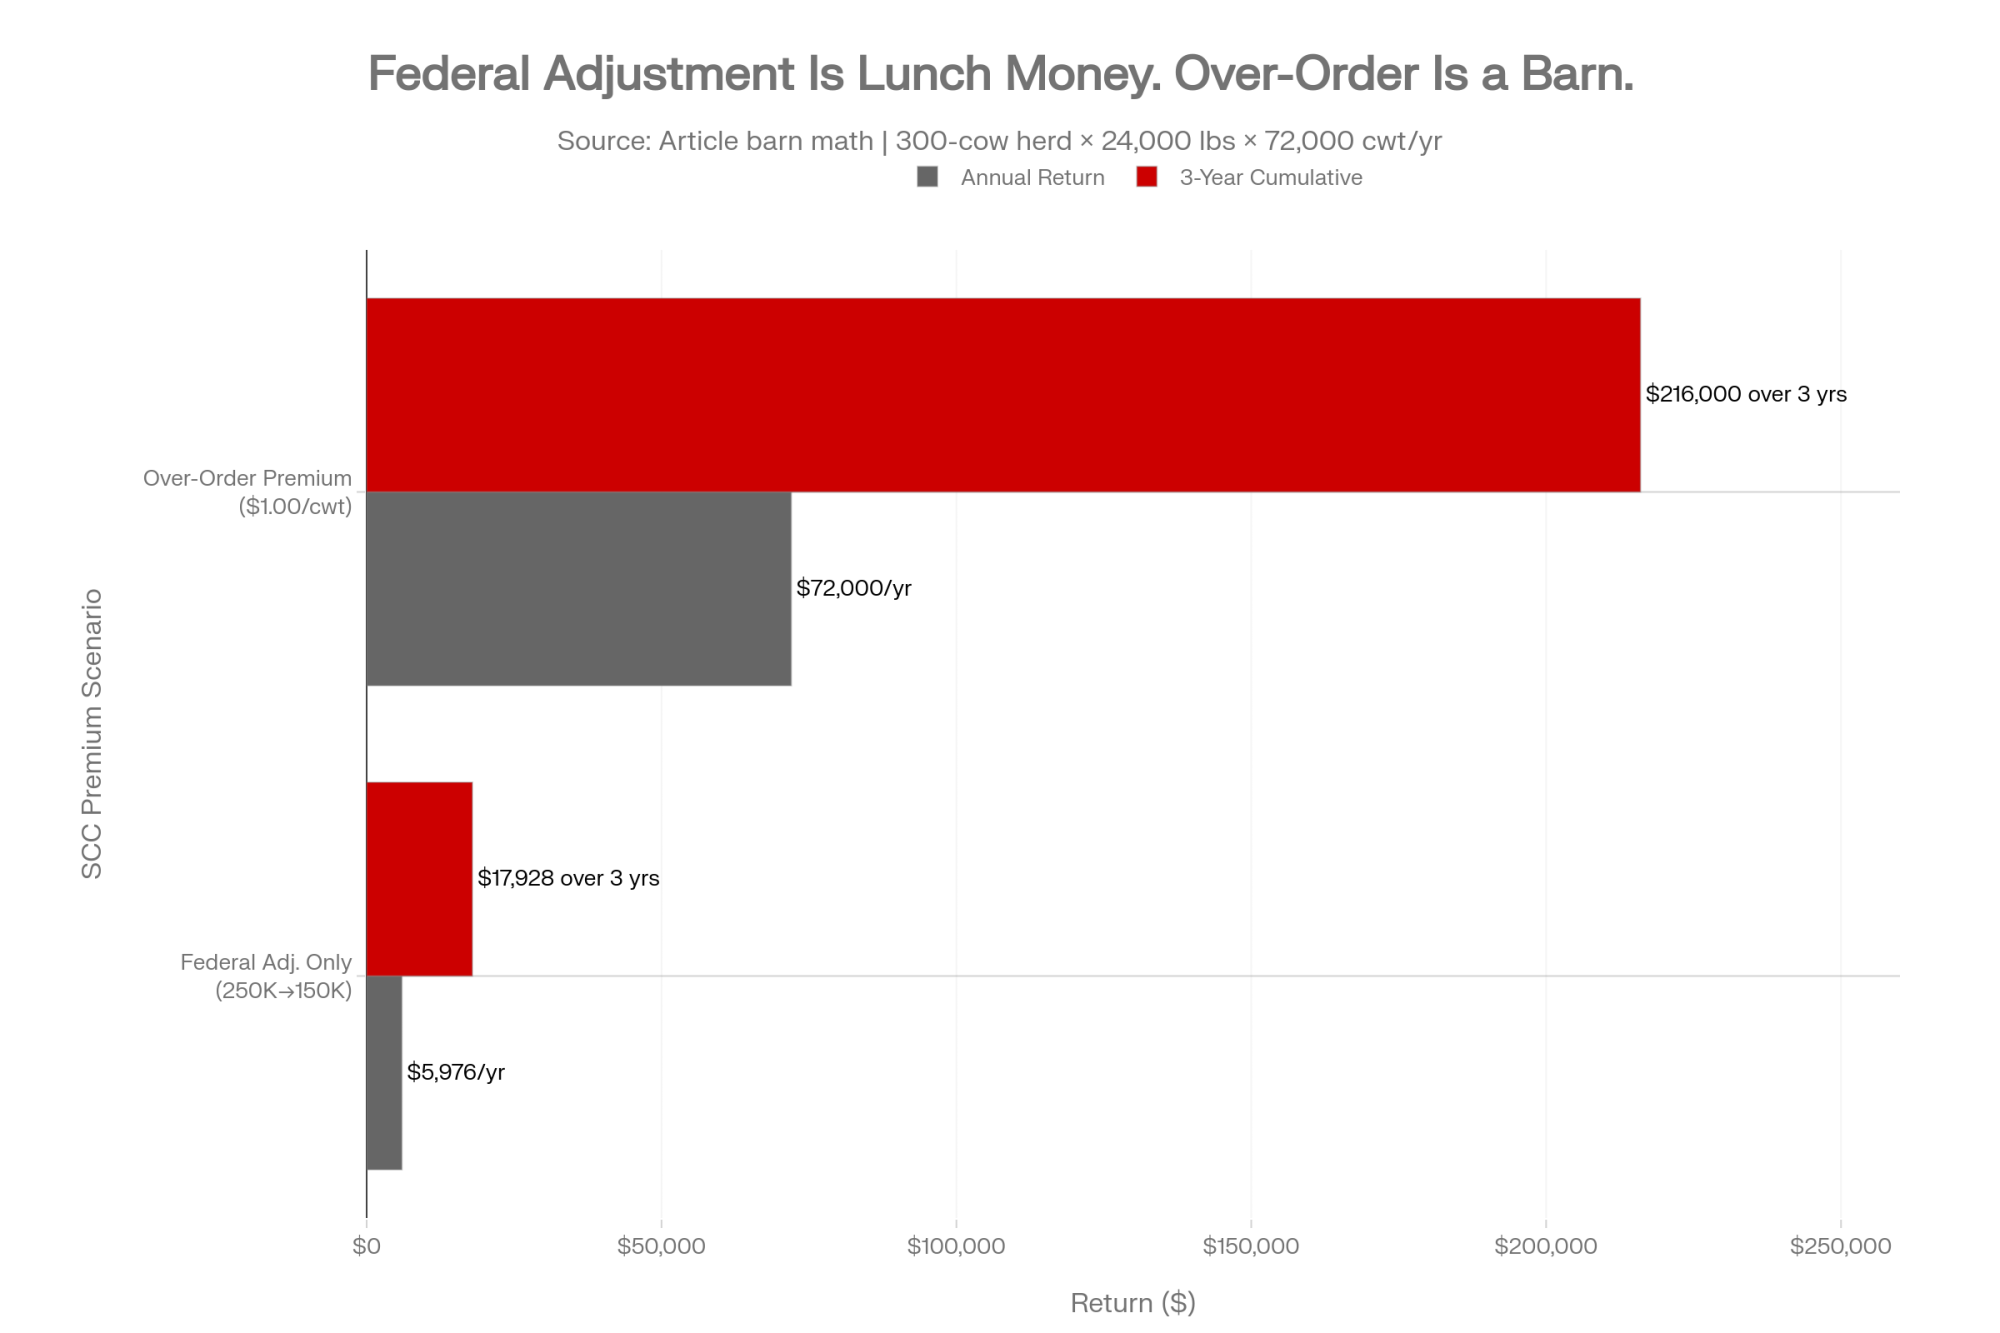
The numbers tell the real story: the federal adjustment is lunch money, but the over-order tier is a down payment on a barn. That’s why the heifer pen is a milk-quality investment, not just a feed cost — and why the action step below is a phone call to find out which tier your milk actually qualifies for.
Does This Hold for Grazing and Organic Herds?
Most of the RFI research base — and the CDCB index built on it — comes from confinement Holsteins on a TMR. WCROC is a useful exception worth flagging, because it runs both a conventional and a certified-organic, pasture-based dairy at Morris, and Heins’s program has long worked in grazing and crossbred systems.
That matters for how you read this. On pasture, individual intake is harder to measure, and RFI rankings can shift because grazing animals express efficiency differently than animals at a feed bunk. The directional logic — efficient heifers may freshen cleaner — may travel across systems if the immune-development mechanism holds, though the Rott et al. calves were measured at WCROC and the specific system behind the data isn’t confirmed in the abstract title. The specific numbers almost certainly won’t transfer one-to-one from a confinement trial to a grazing herd regardless.
So a grass-based or organic producer reading this should treat the diagnostic — pull your first-test SCC by lactation group — as fully portable, and the genetic and ration specifics as “watch this space until the system-matched data lands.”
What Your Sire Lineup Isn’t Telling You
Here’s where the genetics catch up to the management — and where they don’t, yet.
CDCB publishes two feed-efficiency tools inside Net Merit: an RFI evaluation and Feed Saved, a composite of RFI and Body Weight Composite. The 2025 Net Merit revision lifted Feed Saved to 17.8% of the index while cutting Body Weight Composite to −11%, so efficiency now carries real weight in how bulls rank (CDCB Net Merit 2025; values current as of the April 2026 CDCB evaluation run). But by CDCB’s own published methodology, both tools are built from lactating-cow data — they aren’t designed to model a heifer-period RFI-to-SCC link. That’s not a knock on the index. It’s a question the research is only now asking, and the index reflects the data it was built on.
What’s solid: the genetic correlation between clinical mastitis and somatic cell score runs 60–80%. Selecting against SCS is already selecting against mastitis. The WCROC research is probing whether selecting for heifer-period feed efficiency yields an SCS dividend once the animal freshens. If the data confirm it, the index can fold it in over time. CDCB builds these connections deliberately, on the data, and that data is still being gathered.
There’s a real selection-pressure question buried here, too. With Feed Saved now at 17.8% of Net Merit and more producers chasing efficiency hard, nobody has published whether selecting aggressively for feed efficiency drags SCS in a favorable direction, a neutral one, or — the worst case — an antagonistic one. The honest answer today is that the correlation between heifer-period feed efficiency and adult SCC isn’t established in the public literature. That’s a question worth putting directly to a CDCB geneticist, and it’s one the WCROC work — the Rott et al. genetic-parameter estimates included — may help answer.
So the practical move sits with you, tonight, in the sire catalog. A bull strong on negative SCS and positive Feed Saved isn’t just an efficient cow that milks cleaner. He may be feeding immune development during the heifer period, which sets his daughters up for a cleaner first test. That’s the hypothesis the work is building toward. Not confirmed — but close enough to shape a mating list.
Run the Diagnostic Before You Run the Math
Before you decide whether any of this is your problem, pull three reports you already generate. None of this needs new software or new data collection. It needs the data you’ve got, read through a different lens.
1. Pull First-Test SCC by Lactation Group — DHI / DairyComp 305. Isolate your last 12 months of freshening heifers and set their average first-test SCC next to your second- and third-lactation cows. If first-lactation runs higher, that’s a clear heifer-development signal — the older cows had a full lactation to clear infections, the heifers never did.
2. Apply the 50,000-Cell Rule — Herd math analysis. If your first-lactation first-test SCC runs more than 50,000 cells above your rolling herd average, you’ve got a hidden heifer problem being masked by older, cleaner cows. (On 300 cows — 100 heifers at 200K, 200 mature cows at 125K — a cow-weighted average lands near 150K, and your bulk tank sits close to it.)
3. Audit the Cohort Trend — Identify systemic issues. Look at your last three freshening groups. One bad group is an environmental event; three in a row above 150,000 cells points to a structural, system-wide problem in your heifer program.
One logistics note: not every DHI platform puts first-test SCC by parity on a standard report. DairyComp 305 pulls it readily; some cloud platforms need a request to tech support. Ask specifically for “first-test SCC by lactation number.”
| Metric | Group A (Acceptable) | Group B (Watch) | Group C (Structural Problem) |
|---|---|---|---|
| First-test SCC — Heifers (cells/mL) | <100,000 | 100,000–150,000 | >150,000 |
| Gap vs. mature cow first-test SCC | <30,000 | 30,000–50,000 | >50,000 |
| Cohort trend (last 3 groups) | All below 100K | Mixed / improving | 3 in a row above 150K |
| Implied subclinical mastitis rate | ~5–8% | ~10–15% | 18–30%+ |
| Recommended action | Monitor quarterly | Prepartum CMT testing | Prepartum CMT + heifer program audit + sire screen |
| 3-year financial exposure at risk | Minimal | $50K–$100K | $150K–$216K+ |
The 5-Step Kitchen Table Audit
Diagnosis is half the job. Here’s the full sequence — three reads and two moves — you can run from the same chair where you found the problem.
| # | Step | What you’re deciding |
| 1 | Read first-lactation vs. mature first-test SCC. If first-lactation runs higher than second-lactation, the fix isn’t in the parlor — it’s 18–24 months upstream in the heifer barn. | Is your problem behind you or ahead of you? |
| 2 | Apply the 50,000-cell rule. First-lactation first-test more than 50K above your rolling average means your mature cows are hiding a heifer problem. | Is a clean bulk tank masking a dirty pipeline? |
| 3 | Check the cohort trend. Three freshening groups in a row above 150K is structural, not bad luck. | Bad luck, or bad program design? |
| 4 | Run a dual sire screen. Sort your active AI lineup (April 2026 CDCB run) on SCS (negative better) and Feed Saved (positive better) at once. Bulls strong on both are your heifer-mating shortlist. | Are you selecting on one trait and ignoring the other? |
| 5 | Call your co-op fieldperson. Get your exact contract quality specs — what cell count triggers your next premium tier, and what missing it costs. | Do you even know what your milk could qualify for? |
For heifers already freshening above 150K, initiate a prepartum check before anything else. Teat-end scoring and California Mastitis Testing (CMT) on heifers two to four weeks pre-calving identifies infections established before they ever cross the parlor wood — labor and a vet conversation, not capital. The 30-day move that costs nothing is step 4; the move that protects every group coming behind it is the prepartum check.
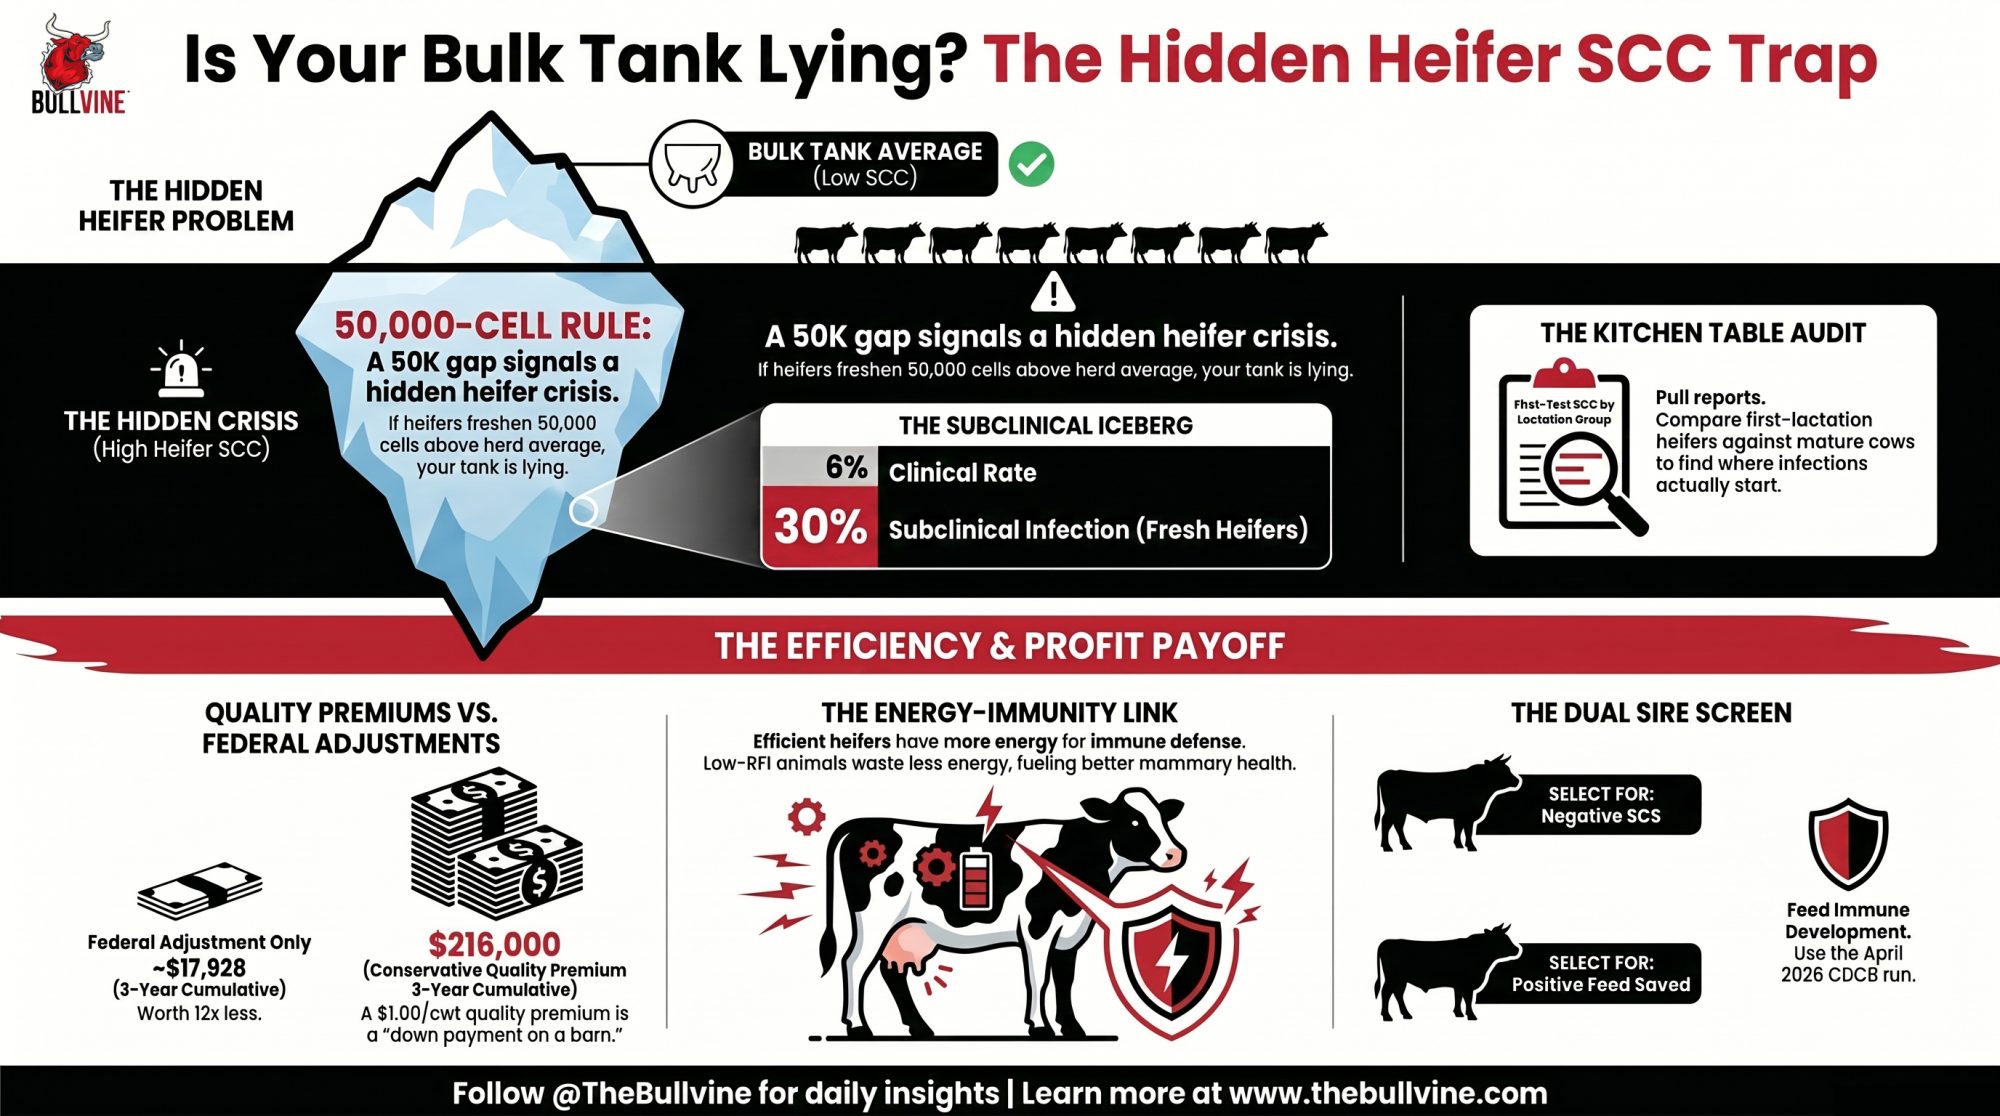
The producer who runs this audit and finds his heifers freshening at 200K hasn’t failed. He’s just been asking his data the wrong question — and he caught it at his own kitchen table, before the bank or the co-op caught it for him. The number sitting in his heifer pen tonight is already two years old. The only real question left is whether his second-lactation string, three years from now, tells him a story he could have rewritten this week. So — when’s the last time you read your DHI report by lactation number rather than by bulk tank?

Run Your Numbers
Herd Health ROI Calculator — This article shows fresh-heifer mastitis costs you twice: lost milk and a missed SCC premium. Plug in your herd size, mastitis rate, cull rate, and replacement cost to put a real dollar value on cleaning up that pipeline — and see what inaction is costing you right now.
Complete references and supporting documentation are available upon request by contacting the editorial team at editor@thebullvine.com.
Learn More
- The Missing Piece in Genomic Selection: Why the Best Herds Still Walk the Pens — Genotyping alone won’t secure your replacement strategy. Get a concrete playbook on running hard cutoff thresholds combined with simple structural pen-walking criteria to prevent expensive heifer culls before breeding age.
- Dairy Cattle Genetics 2026: TPI, NM$ and Genomics — Master the widening split between high-fat Net Merit weightings and the massive 17.8% emphasis shift onto Feed Saved. Protect long-term margins by aligning your herd selection philosophy directly with contract pricing demands.
- How ‘Feed-Saved’ Trait Can Slash Your Dairy Farms’ Costs — Capitalize on quantitative PTA benchmarks to identify outliers that consume up to 200 pounds less dry matter per lactation. Leverage precision metabolic metrics to aggressively slash your farm’s single largest overhead expense.
 The Sunday Read Dairy Professionals Don’t Skip.
 The Sunday Read Dairy Professionals Don’t Skip.
Every week, thousands of producers, breeders, and industry insiders open Bullvine Weekly for genetics insights, market shifts, and profit strategies they won’t find anywhere else. One email. Five minutes. Smarter decisions all week.




