Archive for cost per cwt

NMPF and 13 Co-ops Sued Over a 2¢/cwt Program. A Legal Bill Could Cost Members More

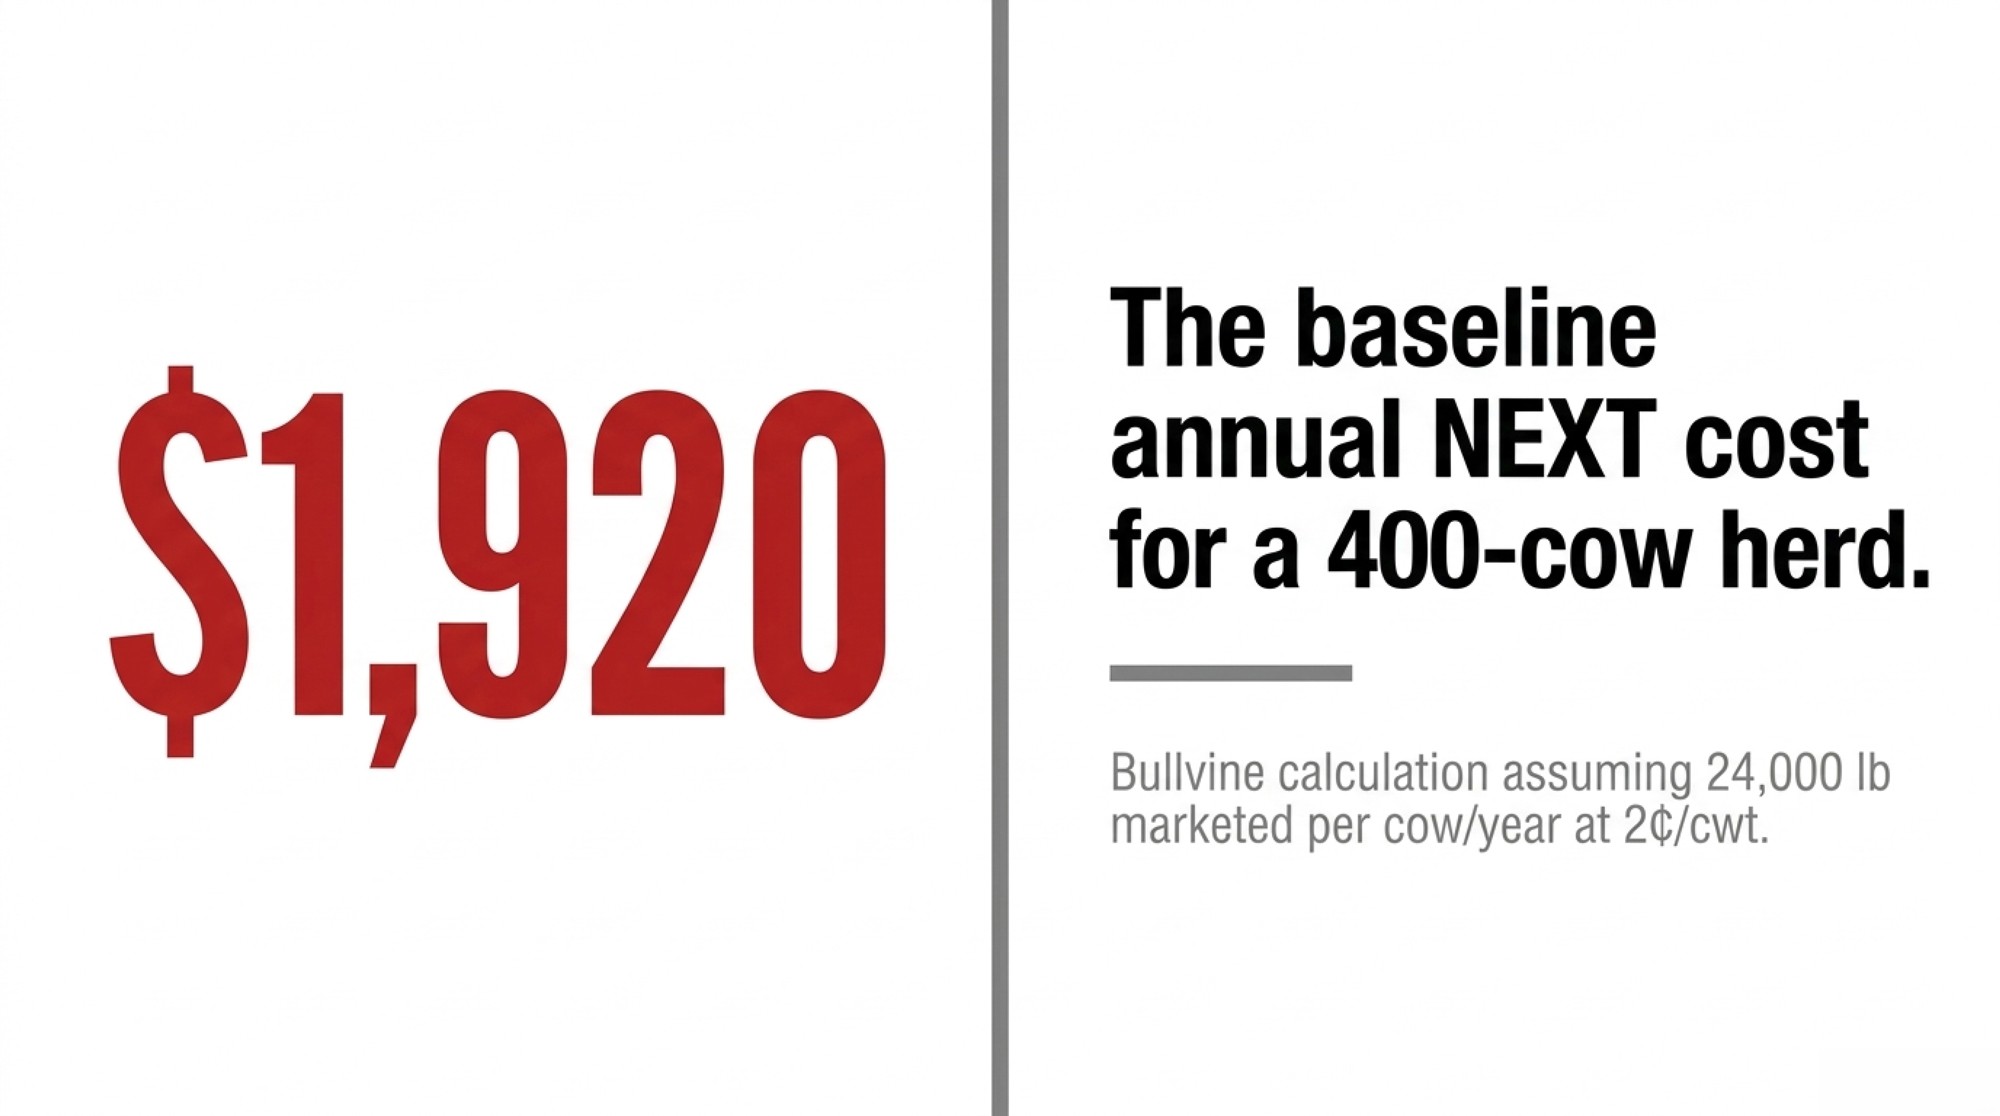
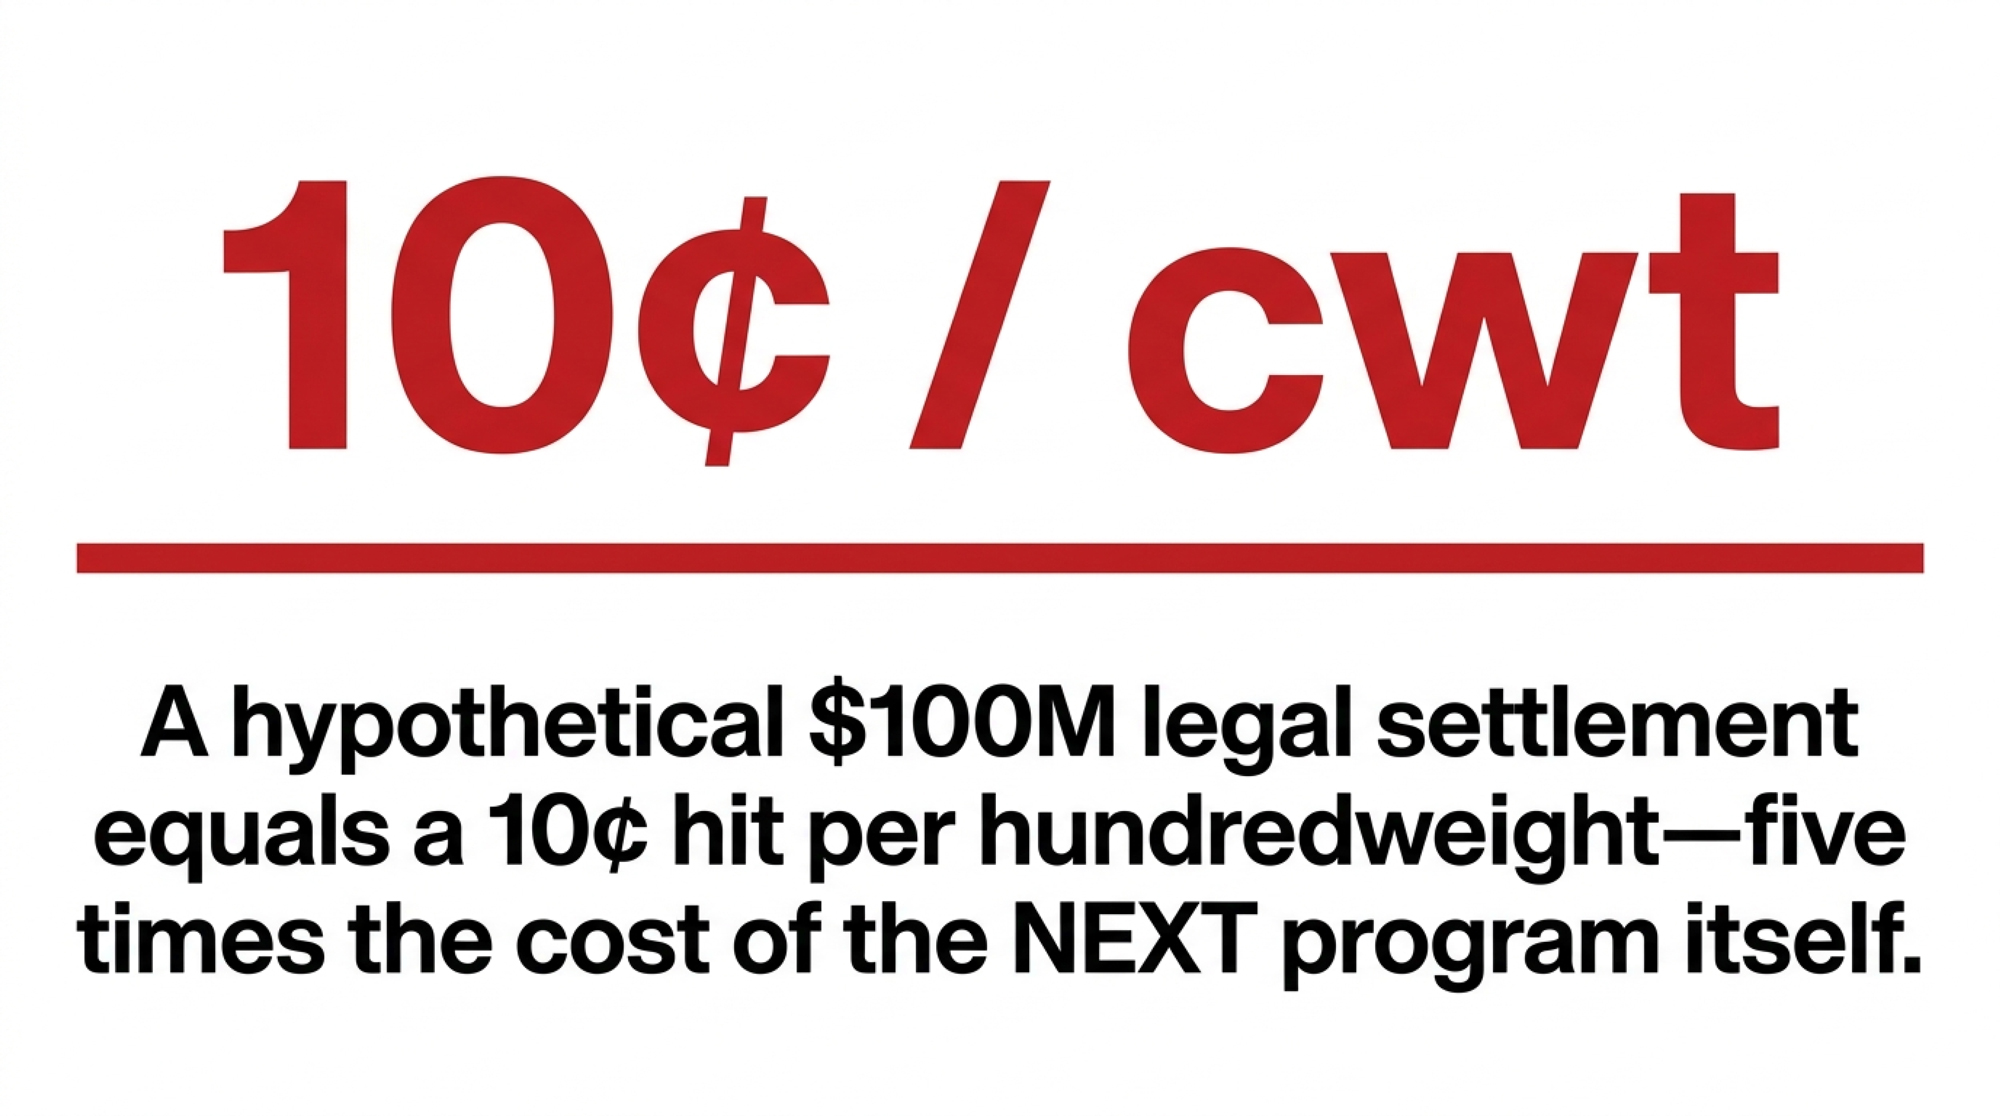
A 400-cow herd’s NEXT share runs about $1,920 a year. Run a hypothetical $100M legal bill over 100B lb, and it’s 10¢/cwt. Where would your board book it?

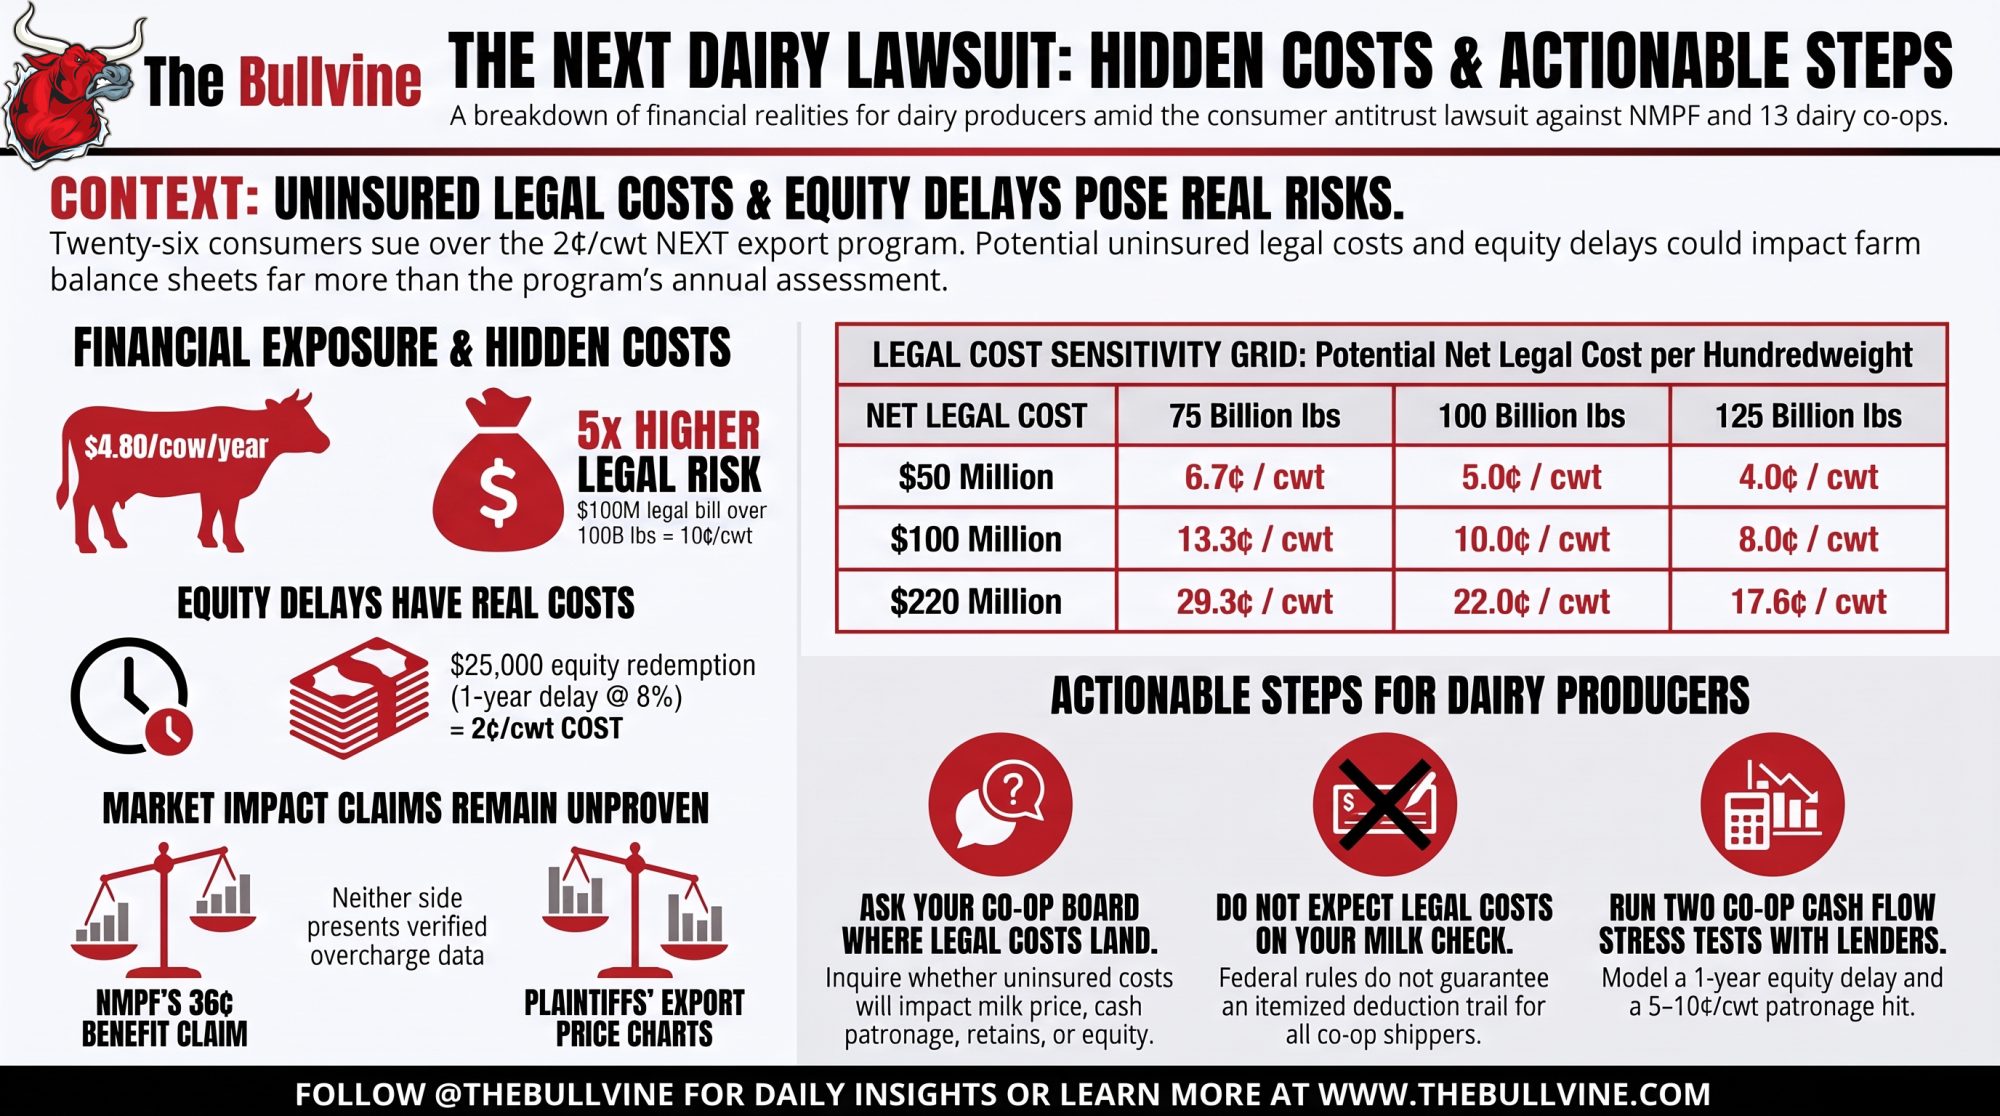
Executive Summary: Twenty-six consumers sued NMPF and 13 dairy co-ops, DFA, Darigold, and Tillamook among them, in Norfolk federal court on October 5. They allege the 2¢/cwt NEXT export program, and CWT before it, raised retail dairy prices from 2018. No court has ruled. The Bullvine’s grid puts a hypothetical $50 million net legal cost at 5¢/cwt over 100 billion lb, 2.5 times the assessment members already fund. A one-year equity delay on a $25,000 redemption at 8% costs a 400-cow herd about 2¢/cwt, with no deduction on the statement. The complaint’s 70% share figure dates to 2011. Its export-price charts are correlations, not an overcharge estimate.

The complaint, filed October 5 in the U.S. District Court for the Eastern District of Virginia, Norfolk Division, names Yvette Oriakhi of New York as lead plaintiff, plus 25 others from 18 more jurisdictions, from Arizona to Vermont. The case is Oriakhi et al. v. National Milk Producers Federation et al., No. 2:26-cv-01093. Its public docket is open on CourtListener.

Most coverage will stop at “consumers sued.” For a member-owner, the better question is the funding. NMPF says member co-ops fund NEXT at 2¢ per hundredweight of milk marketed. The complaint alleges the named cooperatives agreed to contribute that 2¢ to NEXT or its predecessor. The Bullvine has asked each cooperative to confirm whether it still participates and how the assessment is paid. If legal costs fall on those co-ops, they’d sit on member-owned balance sheets.

The defendants named in the caption are:

  • National Milk Producers Federation
  • Agri-Mark, Inc.
  • Bongards Creameries
  • Cooperative Milk Producers Association
  • Dairy Farmers of America, Inc.
  • Lanco Dairy Farms Coop, Inc.
  • Lonestar Milk Producers
  • Maryland & Virginia Milk Producers Cooperative d/b/a Maola Local Dairies
  • Michigan Milk Producers Association
  • Mount Joy Farmers Co-operative Association
  • Northwest Dairy Association d/b/a Darigold
  • Prairie Farms Dairy, Inc.
  • Tillamook County Creamery Association
  • United Dairymen of Arizona

The caption also lists “Does 1–100,” placeholders for other program members the plaintiffs may add later.

Glasser and Glasser of Norfolk filed the complaint as local counsel. Steve Berman and Raffi Melanson of Hagens Berman, along with Yagman PLLC, are listed with pro hac vice applications still to be filed.

These are allegations. No court has ruled on the merits, and no class has been certified. As of October 8, the public docket listed no answer or motion from any defendant.

The Antitrust Allegations

The theory fits in one sentence from ¶5 of the complaint: members “agree to use their voluntary contributions to subsidize each other’s exports of dairy products to foreign markets.” The plaintiffs argue this pulls cheese, butter, and other products out of the domestic market and raises U.S. prices. Because the money moves among competitors rather than coming from government, they call the program more anticompetitive than a government export subsidy.

The proposed class is end consumers who bought dairy at retail. The complaint alleges they “have paid, and continue to pay, supracompetitive prices from January 1, 2018, to the present” (¶6). That start date falls years after CWT’s 2003 launch, and clear of the herd-retirement years already settled.

Four counts, no dollar figure

CountClaimRelief sought
ISherman Act §1, via Clayton Act §16Injunction only
IIState antitrust laws in Illinois Brick repealer states (32 jurisdictions)Damages, trebled where state law allows
IIIState consumer-protection laws (35 jurisdictions)Damages, restitution, and disgorgement
IVUnjust enrichmentRestitution and disgorgement

The federal claim asks only for an injunction. Every damages claim runs through state law, in states that let indirect purchasers recover, though at least one early trade report described treble damages under federal antitrust law. The complaint names no damages amount. It says only that the case exceeds the Class Action Fairness Act’s $5 million threshold.
Using NMPF’s Own Numbers Against It

The complaint quotes NMPF’s 2018 Activities and Accomplishments Report: CWT sales “improved dairy farmer milk prices by an estimated average of $0.36/cwt. per year – a return nine times the investment” (¶155). It also quotes former NMPF CEO Jim Mulhern saying the program could “improve the milk prices received by all U.S. dairy farmers by as much as $0.50/cwt., according to both external and internal estimates” (¶4). That line traces to a December 6, 2018 Feedstuffs story, reprinted by eDairy News. These are NMPF’s own claims, not court findings, and the plaintiffs are using them as evidence of intent.

The complaint’s own harm evidence

The plaintiffs present their own charts (¶¶196–202):

  • Exports and farm price. Each extra 100,000 metric tons of monthly U.S. dairy exports is associated with an all-milk price about $4.20/cwt higher (¶199).
  • Farm to retail. A $1 rise in the all-milk price is associated with retail increases of $1.09 for whole milk, $1.26 for Cheddar, and $0.69 for butter, per cwt of milk equivalent (¶¶201–202).
  • 2008–09. The all-milk price fell about 38% between September 2008 and June 2009 as exports collapsed (¶198).

These are correlations. The export series is total U.S. dairy exports by product weight, not milk equivalent (fn. 60), and it isn’t the volume CWT or NEXT assisted. Strong world demand raises exports and U.S. prices at the same time, so that line would slope upward whether or not any subsidy moved the market. The complaint offers no overcharge figure that separates assisted pounds from everything else.

The 70% problem

The complaint uses “70%” three different ways:

  • ¶6: “as much as 70% of the U.S.’s dairy-marketing cooperatives”
  • ¶93: CWT farmers produce “as much as 70% of the nation’s dairy products”
  • ¶124: CWT’s members “comprise as much as 70% of the dairy production”

The figure traces to a November 2011 CWT release. A 2015 release quoted in ¶135 spread that 70% across 37 co-ops and more than 100 individual farmers, not 13. Early coverage reported co-ops “controlling up to 70%” of U.S. milk production, but whatever the 13 defendants’ combined share is today, the complaint doesn’t establish it.

Capper-Volstead

If the co-ops’ Capper-Volstead immunity holds, the federal claim is in trouble, and the state-law damages counts become the fight. The complaint attacks the immunity two ways. It argues NEXT is an output restraint rather than collective marketing (¶¶211–212). It also says National Farmers Organization, which the complaint calls a non-producer, took part (¶213). The Supreme Court has stripped the immunity where non-producers were members, in Case-Swayne (1967) and National Broiler (1978). In Maryland & Virginia Milk Producers (1960), it held the immunity doesn’t extend to conduct that suppresses competition beyond collective marketing.

How NEXT works

NMPF’s board authorized NEXT, short for NMPF Exports & Trade, in June 2025. It replaced CWT’s export program on July 1, 2025. Under NMPF’s program rules, eligible member co-ops bid for assistance on specific export sales. Payment comes only after delivery to the end customer is documented.

What members have paid

PeriodRateSource
Dues collected from January 20122¢/cwtCWT/NMPF release, June 2011 (complaint ¶127)
July 1, 2013 – Dec. 31, 20154¢/cwtCWT release, June 2013 (¶134)
Extended through 2018, then through 20214¢/cwtNMPF releases, 2015 and 2018 (¶¶135–136)
Through June 2025 (last CWT year)4¢/cwtNMPF: NEXT is “half the CWT assessment”
July 2025 through 2028 (NEXT)2¢/cwtNMPF

What the program reported moving

YearReported volumeBasis
201581.8M lb product; 1.07B lb milk equivalentContracted (¶135)
2018Nearly 1.3B lb milk equivalentContracts “so far this year,” per Mulhern
2024 (last CWT year)About 182M lb product, implied by NMPF’s “73% greater” comparisonBullvine calculation
July 2025 – July 2026 (NEXT year one)More than 315M lb product“Committed” assistance

The units keep changing: product pounds, milk equivalent, contracts, and commitments. None of these numbers shows how many sales would have happened without assistance.

In NMPF’s year-one release, CEO Gregg Doud said NEXT “committed export assistance on more than 315 million pounds of dairy products destined for international markets.” He called that a 73% greater volume than in 2024, at a cost to members half that of the CWT assessment. The complaint quotes his description of NEXT as “more targeted, more flexible, and more transparent” than CWT (¶139).

Running the numbers

The figures in this section are Bullvine models built from stated assumptions. They are not company data. All cent figures are gross, before tax treatment or patronage allocation.

What NEXT costs a herd

Assumptions: 24,000 lb marketed per cow per year, or 240 cwt. The full 2¢ is treated as an economic cost spread across that milk. That doesn’t mean every co-op deducts 2¢ on the milk statement.
HerdAnnual milkAnnual cwtNEXT at 2¢/cwtPer month
100 cows2.4M lb24,000$480$40
400 cows9.6M lb96,000$1,920$160
2,000 cows48.0M lb480,000$9,600$800

Run your own: cows × lb per cow ÷ 100 × 0.02 = annual NEXT cost in dollars. At 24,000 lb per cow, that’s $4.80 per cow per year. At 22,000 lb it’s $4.40, and at 26,000 lb it’s $5.20.

If a legal cost lands on the co-ops

There’s no damages figure, no settlement, and no finding of liability, so this is a sensitivity grid, not a forecast. The formula: cents per cwt = (10 × X) ÷ V, where X is net cost in millions of dollars and V is defendant milk volume in billions of pounds.
Net cost to co-opsSpread over 75B lb100B lb125B lb
$50M6.7¢5¢4¢
$100M13.3¢10¢8¢
$220M29.3¢22¢17.6¢

Read the grid with these limits:

  • Volume bands. The 75, 100, and 125 billion lb columns are illustrative. For scale, U.S. farms marketed about 231 billion lb in 2025. The Bullvine hasn’t assembled a consistent same-year total for all 13 named cooperatives, so treat the grid as a scale test, not an allocation estimate.
  • Net cost means settlement plus unreimbursed defense costs, minus insurance recovery.
  • The $220M row is a scale reference only. It’s the reported size of the earlier First Impressions settlement, not an estimate for this case.

Then decide how much reaches members:

Member-allocation caseShare of net costEffect at 10¢/cwt gross400-cow herd
Low0%0¢$0
Central50%5¢$4,800
High100%10¢$9,600

The 10¢ gross case is a $100 million net cost spread over 100 billion lb. In the central case, a 400-cow herd takes a one-time hit equal to about 2.5 years of its NEXT contributions. So a 2¢ program could carry a legal tail several times its own annual cost. That isn’t a prediction that it will.

The cost nobody bills

A cooperative may never put a legal assessment on the milk check, and a cost can still reach members through the balance sheet. The quietest route is time. USDA Rural Development’s Research Report 220 (2010) surveyed 792 cooperatives on equity redemption. It treats redemption as a board decision, made under the bylaws when finances allow. When capital gets tight, the revolving cycle can stretch, and that costs the member money even though nothing new is deducted.

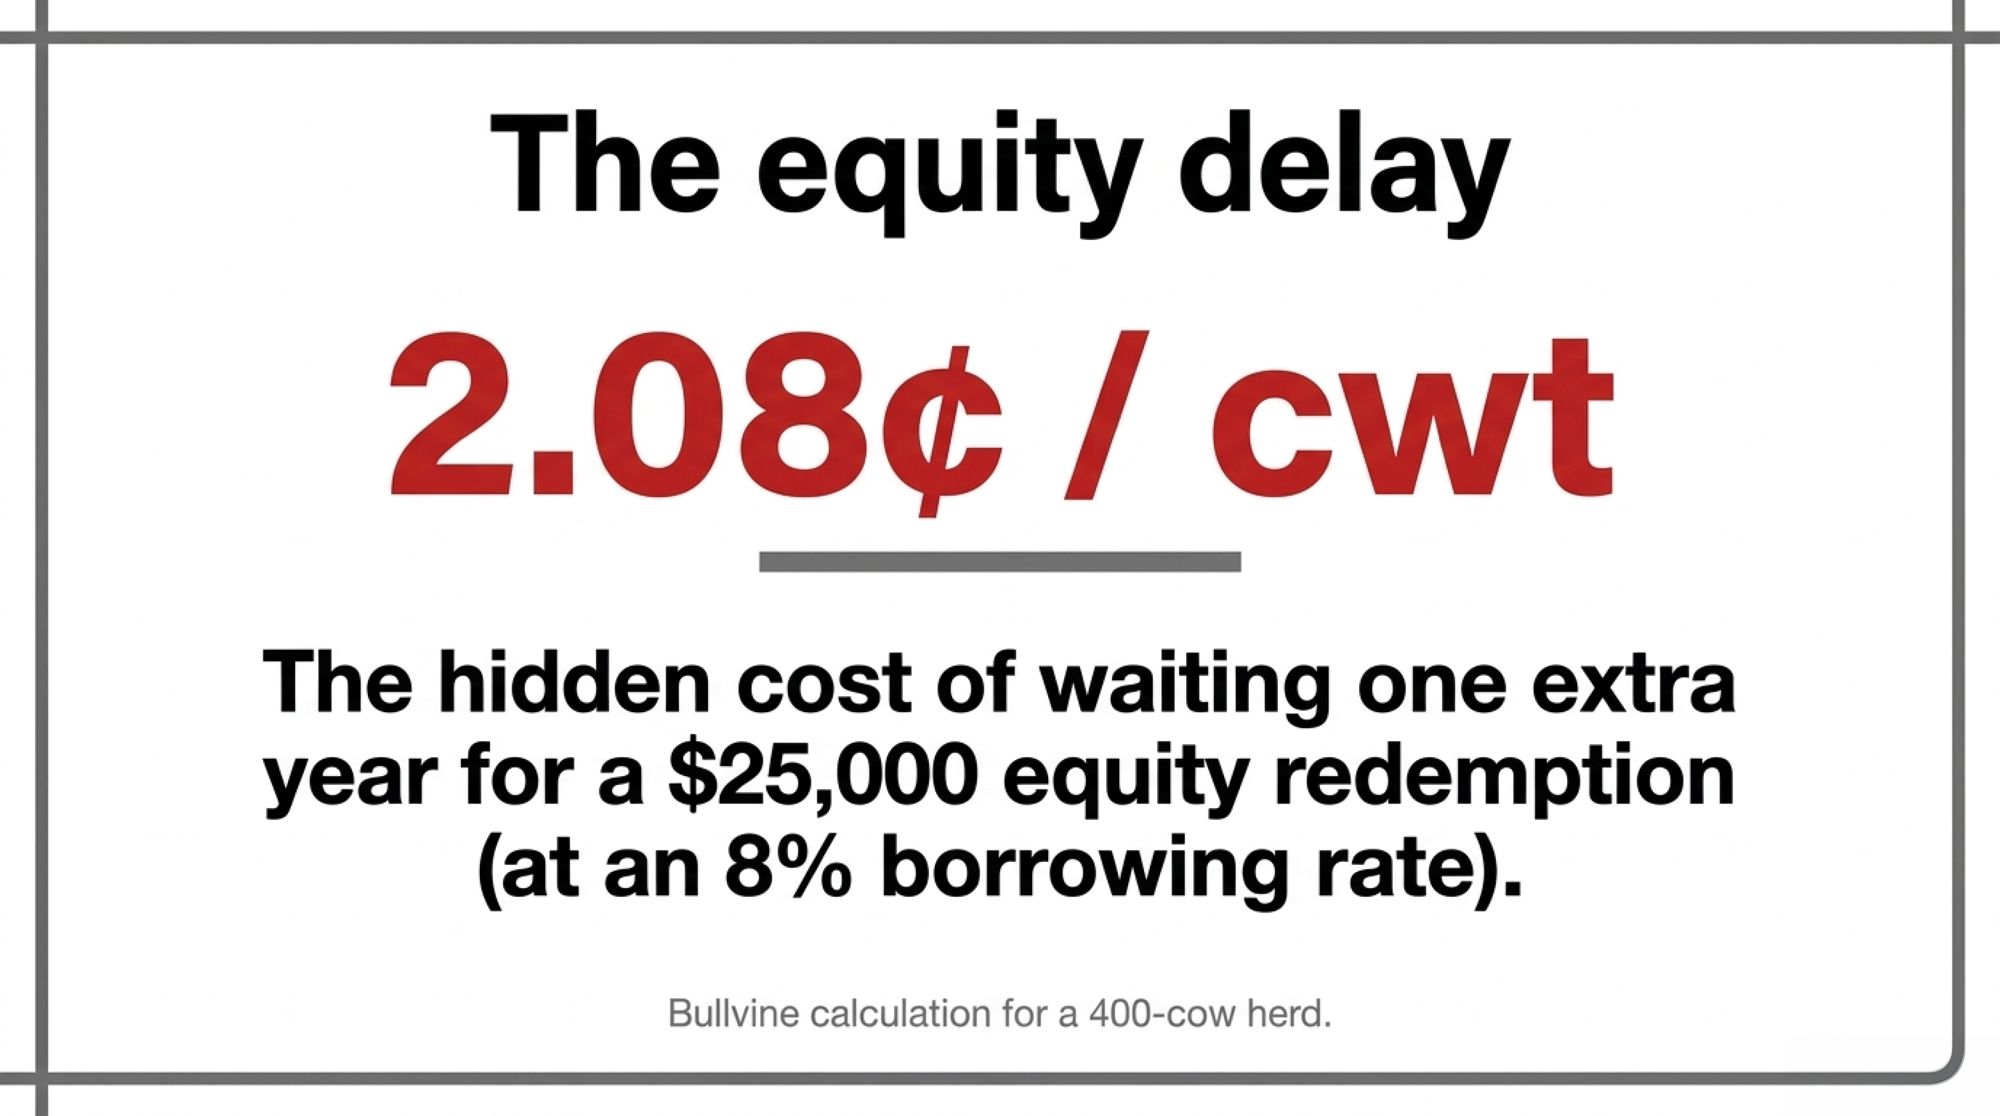
As an illustration only, not evidence of any defendant’s practice, take a member expecting a $25,000 equity redemption who waits one more year:
Member borrowing rateOne-year carrying costPer cwt, 400-cow herd
6%$1,5001.56¢
8%$2,0002.08¢
10%$2,5002.60¢

At 8%, a one-year delay costs about as much per cwt as NEXT itself. Nothing new appears on the milk statement. The member just waits.

Where the uninsured dollar goes

A co-op’s communications team will be ready for “how big is the lawsuit?” The harder question is where any uninsured cost would actually land.

In the Northeast order, 7 CFR 1001.73 requires handlers to give producers a statement showing each deduction’s nature and amount or rate. It excludes producers whose milk is received from cooperative-association handlers described in §1000.9(a) or (c). That doesn’t mean any defendant has hidden anything. It means the federal rule doesn’t guarantee every member the same itemized trail, and whether the exclusion applies depends on each co-op’s handler status in each order. The Bullvine’s Chobani Rome plant analysis walks through the same carve-out.

USDA guidance on cooperative equity and per-unit retains describes the routes. Net margin can be paid out as cash patronage or kept as member equity, and per-unit retains are documented through written notices. Those routes leave very different trails:

RouteWhen a member might noticeHow visible
Direct assessmentNext milk statementHighest
Extra per-unit retainStatement or annual equity noticeHigh
Lower cash patronageAfter year-endMedium: blended with margins and capital spending
More co-op debtAnnual reportLow: the borrowing shows, its purpose may not
Delayed equity redemptionWhen the expected check doesn’t comeLowest: nothing new happens

For more on what the milk check doesn’t have to show, see The Bullvine’s Milk Check Transparency Co-op Exemptionand Class III/IV Spread Depooling.

Tracking Pounds vs. Member Benefit

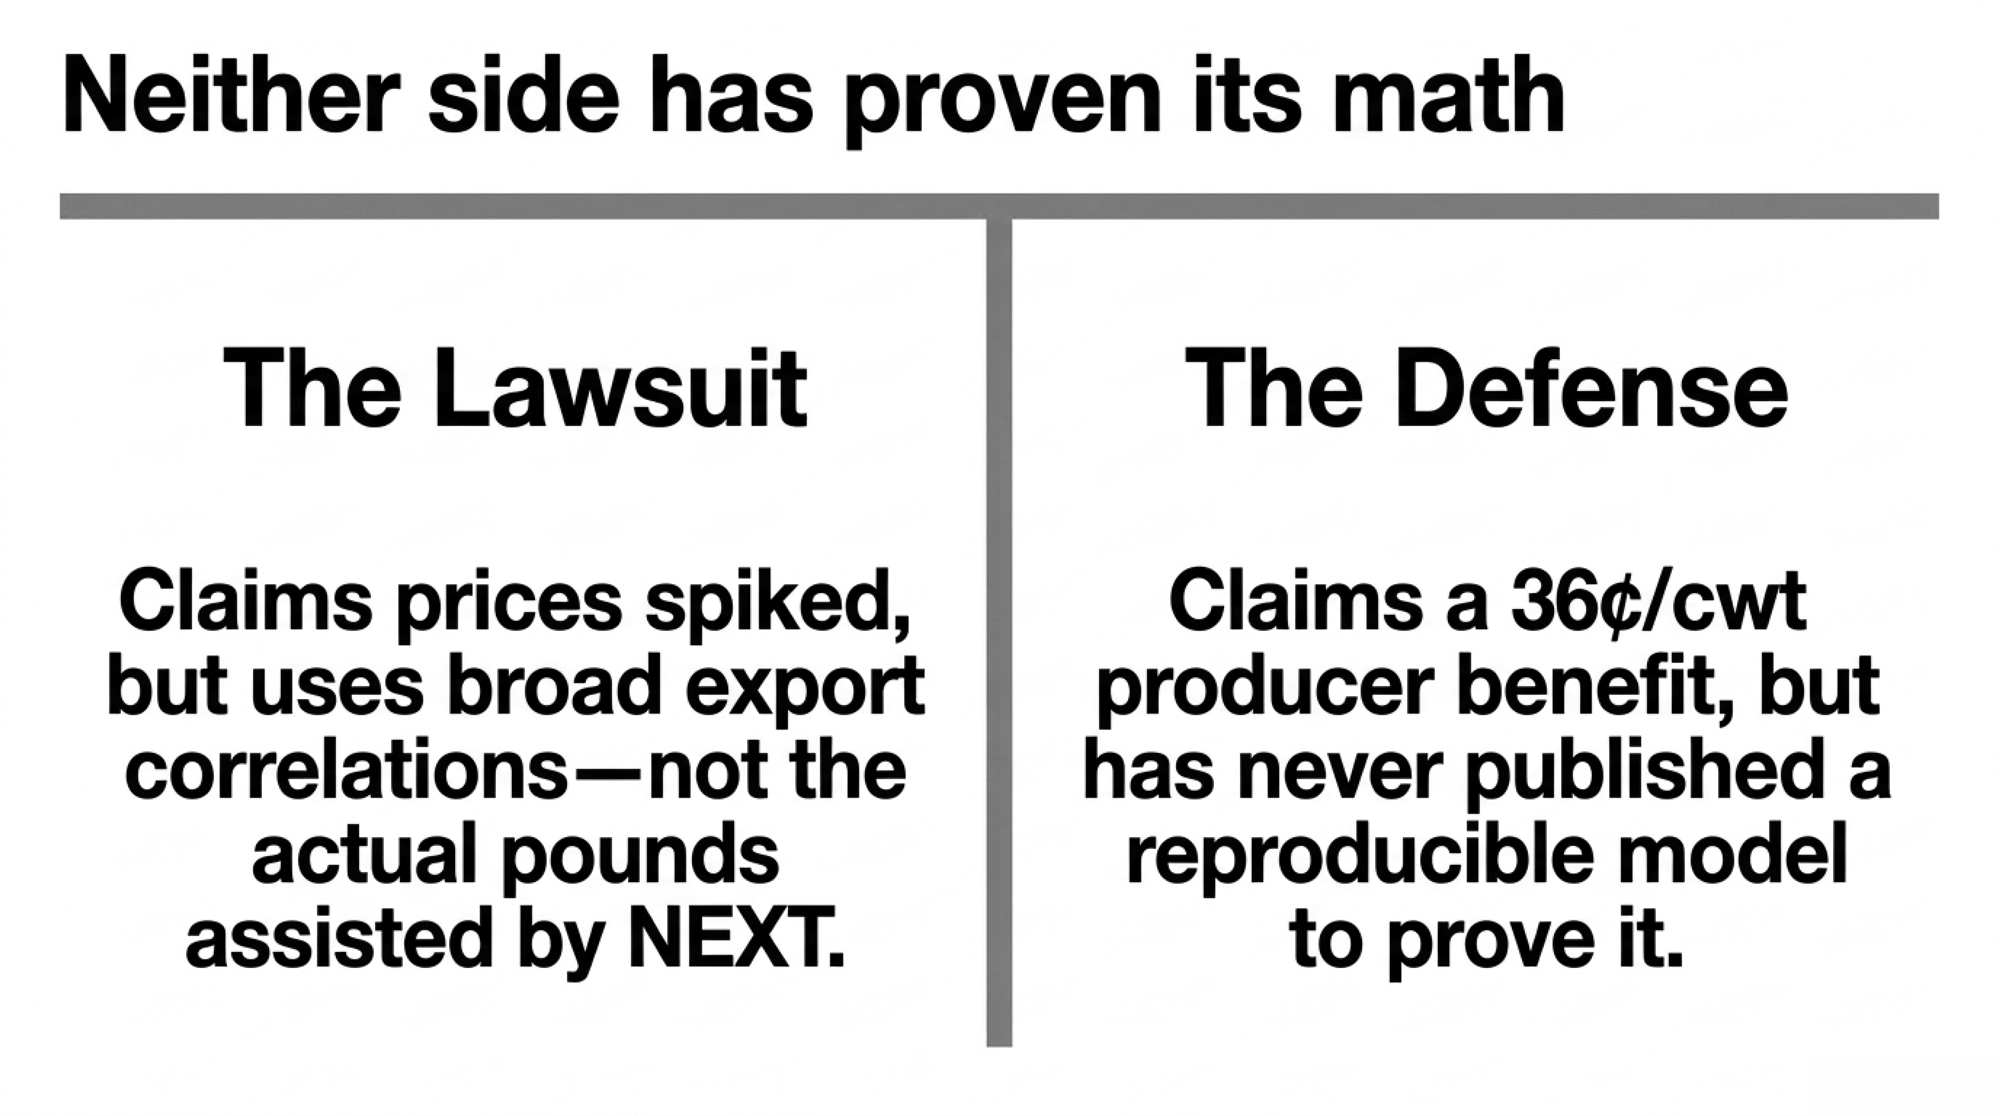
Past industry coverage, The Bullvine’s included, has often reported CWT and NEXT activity in pounds assisted. It has rarely set assessment dollars against independently verified member benefit. NMPF’s 36¢ claim and Mulhern’s “as much as” 50¢ both rest on estimates that, as far as The Bullvine can find, have never been published as a model anyone could reproduce. The complaint now uses those same numbers as evidence of intent.

The test this piece applies: pounds are activity, and benefit is what changed because those pounds moved. If NMPF released the 36¢ model and it held up, that would answer the market-level question for the years it covers. It still wouldn’t show how much reached the members who paid, or where an uninsured legal dollar would land.

Is this CWT again?
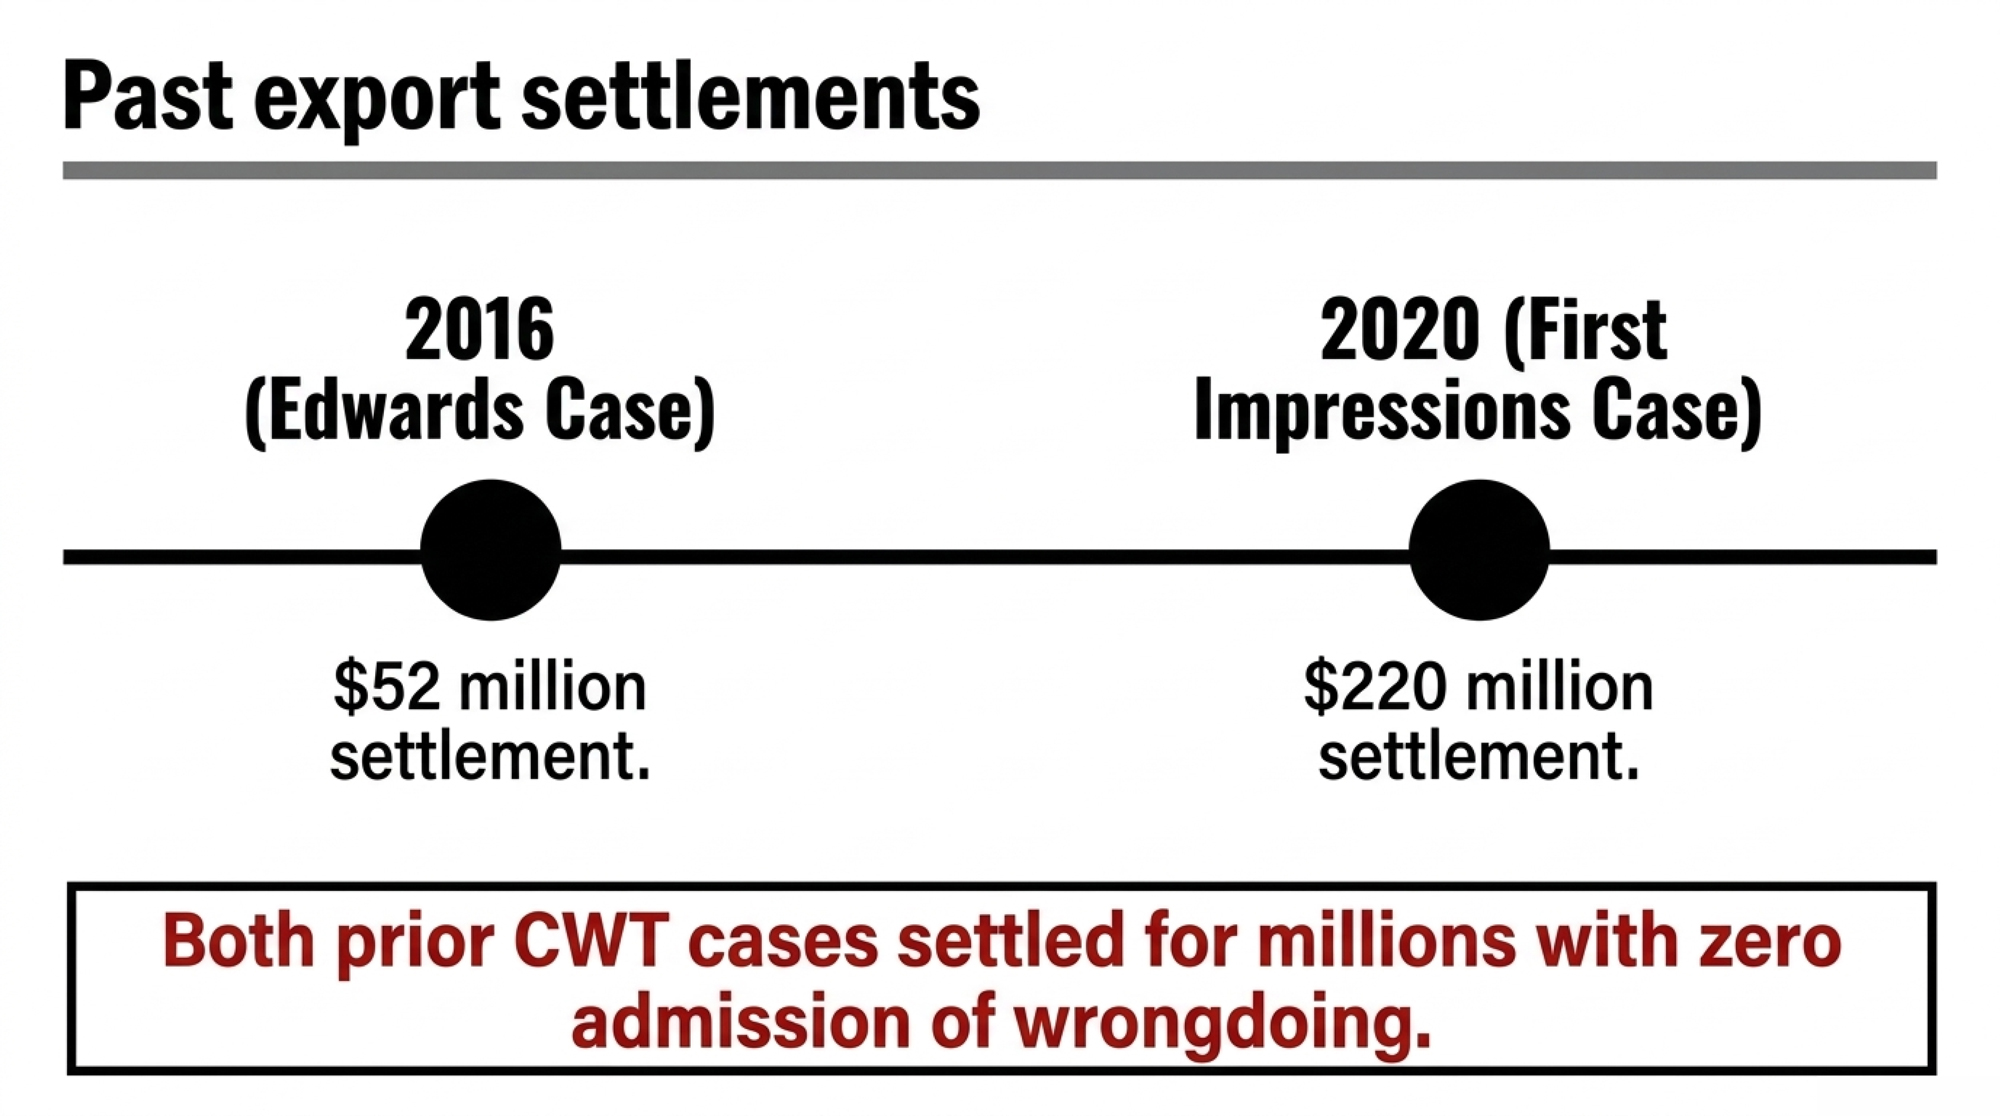
Not quite. Two earlier cases challenged CWT’s herd-retirement program, and the Oriakhi complaint puts their combined settlements at “nearly $272 million” (¶4):

  • Edwards v. NMPF (N.D. Cal., No. 11-cv-04766). The Oriakhi complaint says this consumer case settled in 2016 for $52 million. Progressive Dairy reported that the settlement included no admission of wrongdoing.
  • First Impressions Salon v. NMPF (S.D. Ill., No. 3:13-cv-00454). Direct purchasers alleged in the S.D. Illinois case that herd buyouts from 2003 to 2010 inflated milk, butter, and cheese prices. The Oriakhi complaint says the case settled in 2020 for $220 million. Courthouse News reports that the defendants admitted no wrongdoing.

The old cases targeted fewer cows; this one targets product shipped abroad. Both rest on related supply-restriction theories. That makes them useful for gauging scale and strategy, but they don’t decide this case.

What happens next

The first defense filings will likely target standing, the indirect-purchaser rules, the state-law counts, and Capper-Volstead. The Bullvine will update this story from the federal docket when a defendant responds. For how antitrust cases move from allegation to evidence, see Cattle Auction Bid Rigging 2026 and the DOJ A.I. Bid-Rigging Probe.

What this means for your operation

The 2026 NDB/NMPF/UDIA Joint Annual Meeting opens October 19 at the Gaylord Palms in Kissimmee. Email these questions to your co-op board member or member-relations contact before then:

  • Is the 2¢ deducted on member statements, or paid out of co-op operating funds?
  • How much NEXT assistance did our co-op receive, compared with what it contributed?
  • Has the board approved a policy for uninsured legal costs?
  • Could this litigation change our equity revolvement schedule?

For lenders: this isn’t a probable liability yet, and booking it as one would overstate the risk. Two stress tests are still reasonable for co-op shippers with tight cash flow. The first is a one-year equity delay: about 2¢/cwt at 8% on a $25,000 redemption. The second is a 5–10¢/cwt patronage hit, which matches the $50–100 million rows of the grid at 100 billion lb.

“We’re insured” doesn’t answer the real question, and neither does “the case has no merit.” A real answer names the route, the threshold, and how members will be told. If you ask only one thing, ask this, in writing:

The question to put to your board: “If NEXT or this lawsuit creates costs insurance doesn’t cover, where will they show up for members (milk price, cash patronage, retains, equity redemption, or debt), and will the board report the effect in cents per hundredweight?”
Key Takeaways

  • Nothing’s been proven yet. No court has ruled or certified a class, and the federal count asks only for an injunction, so every damages claim runs through state law.
  • Cents per cwt = 10 × net legal cost in $M ÷ volume in billion lb. A First Impressions-sized $220M bill over 100B lb is 22¢, 11 times NEXT’s 2¢. That’s a scale check, not a forecast.
  • Neither side has shown its math. NMPF’s 36¢/cwt benefit hasn’t been published as a reproducible model, as far as we can find, and the complaint’s charts track total exports, not assisted pounds.
  • Don’t count on the milk statement to flag a legal cost. In the Northeast order, the itemized-deduction rule excludes milk received through certain co-op handlers, and a delayed equity check puts nothing on the statement.

Complete references and supporting documentation are available upon request by contacting the editorial team at editor@thebullvine.com.

Learn More

The Sunday Read Dairy Professionals Don’t Skip.

Every week, thousands of producers, breeders, and industry insiders open Bullvine Weekly for genetics insights, market shifts, and profit strategies they won’t find anywhere else. One email. Five minutes. Smarter decisions all week.
NewsSubscribe
First
Last
Consent

The Hidden Labor Bill That Makes “Ethical Robot Dairies” Pencil — And Who’s Quietly Paying It

Two robots, 100 cows, a calm barn — and a milk cheque that only balances because mom, the kid who “helps out,” and the farmer at hour fourteen all work for free.

Scroll through the parenting and ethics corners of Reddit, and you’ll keep hitting the same question: is more humane, ethical dairy even possible? Every so often an actual dairy farmer wanders in to answer it, describing a cow‑health‑first operation milking around 100 cows on a pair of robots — cows coming and going as they please, nobody setting a 4 a.m. alarm. It’s the dream a lot of tired producers and ethics‑minded consumers want to believe in. And honestly, parts of it are real.

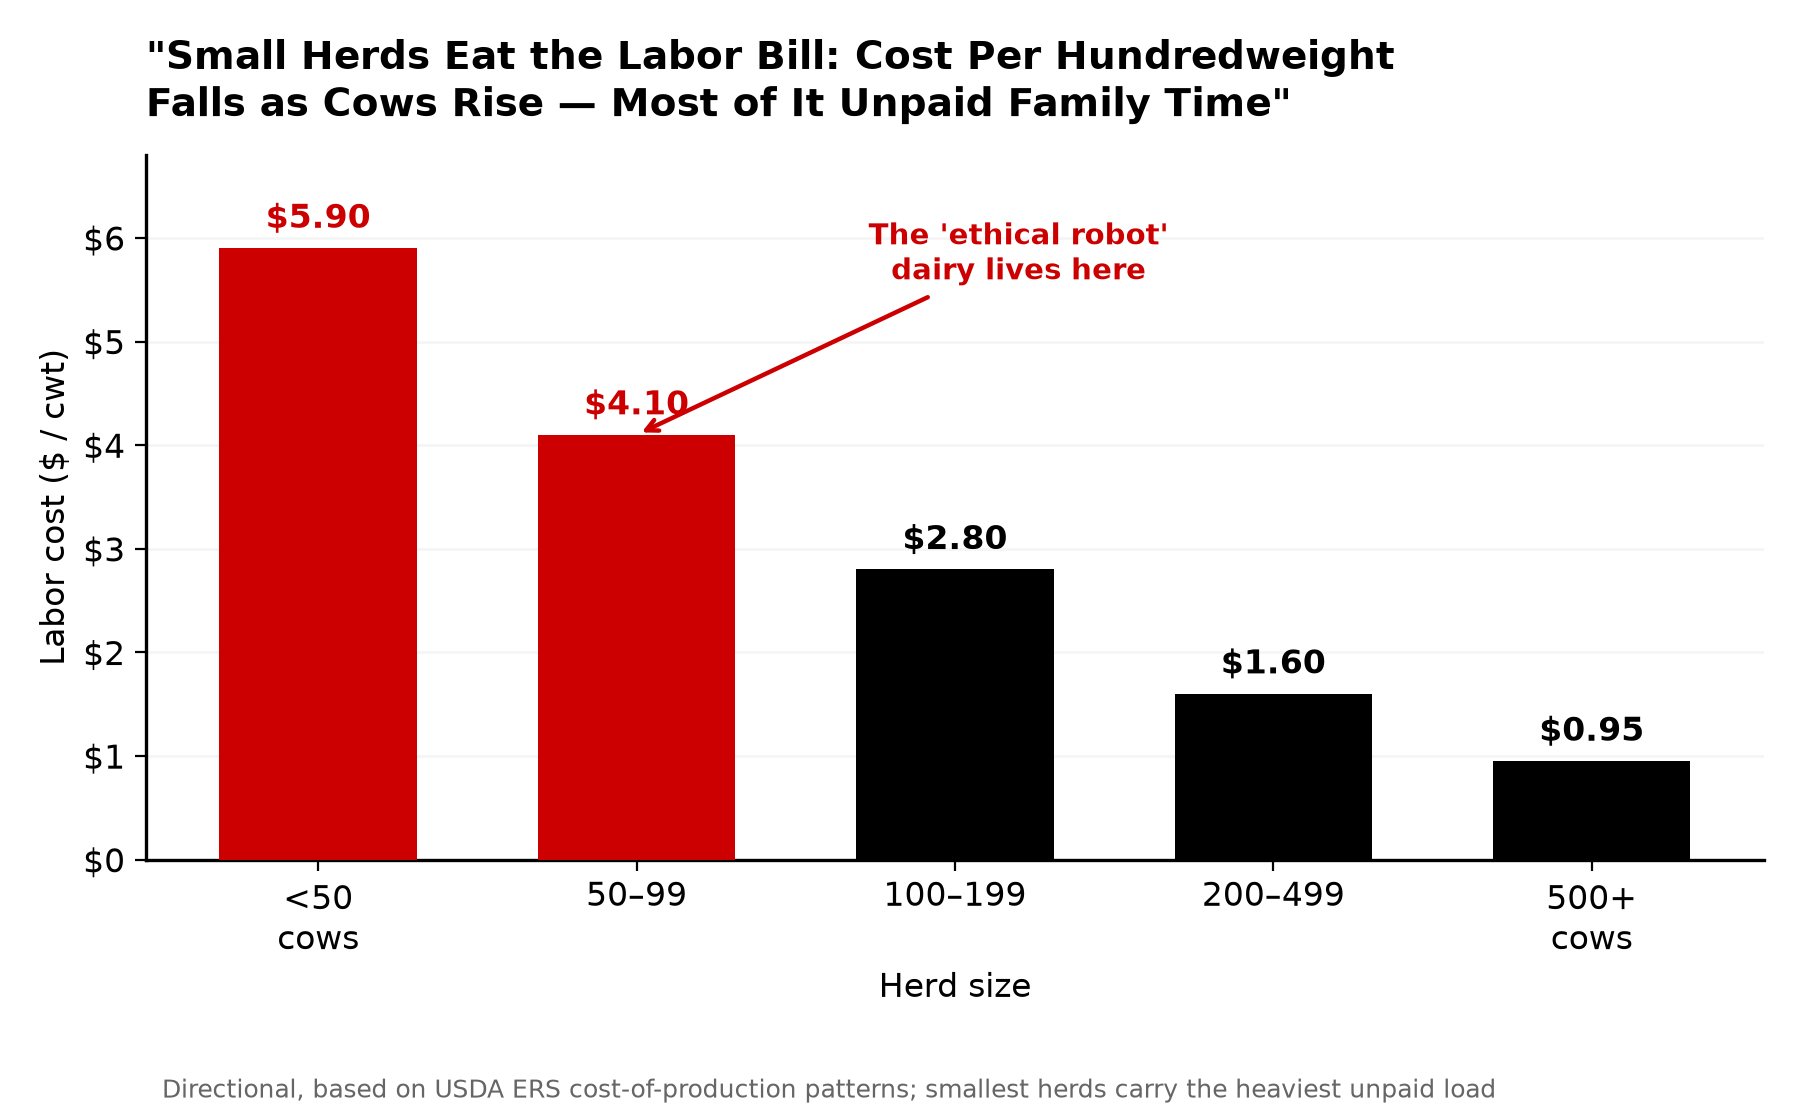
Here’s the part those threads never price. At 100 cows on commodity milk, that “ethical robot dairy” usually only balances because somebody’s labor is valued at zero. USDA’s Economic Research Service shows small herds carry far more labor cost per hundredweight than big ones — and on the smallest operations, most of it is the imputed value of unpaid family hours that never hit a payroll line. Robots don’t erase that line. They make it easier to pretend the time is free. Who’s actually paying for the “ethical” part is the question this whole story turns on.

What’s Changing and Why

Robotic milking has stopped being exotic. USDA’s ERS reports box robots milked about 6% of U.S. milk by 2021, with the fastest uptake on 150‑to‑499‑cow farms. And the headline finding everyone repeats holds up: in ERS’s June 2026 analysis, robotic milking raised dairy net returns by $3.15/cwt on average, relative to non‑adopters.

That number’s real. It’s just shown at the wrong resolution. ERS measures it as an average across adopters — and the strongest returns lean toward larger, well‑utilized herds, not the 80‑to‑120‑cow place. The “ethical robot” dairy that keeps getting shared online sits on commodity milk, often with no premium channel at all. That average wasn’t built on farms like that one.

So the farms most exposed to the gap are exactly the ones the humane‑dairy story celebrates — small, family‑run, welfare‑forward, betting on robots to make the lifestyle last. They’re not wrong that robots improve daily life. They’re wrong if they assume the average return shows up on their balance sheet just because they bought the box.

How This Plays Out on Real Farms

Iowa State extension economist Larry Tranel has run AMS cash flow for years, and his models tell the part the dealer’s payback chart skips.

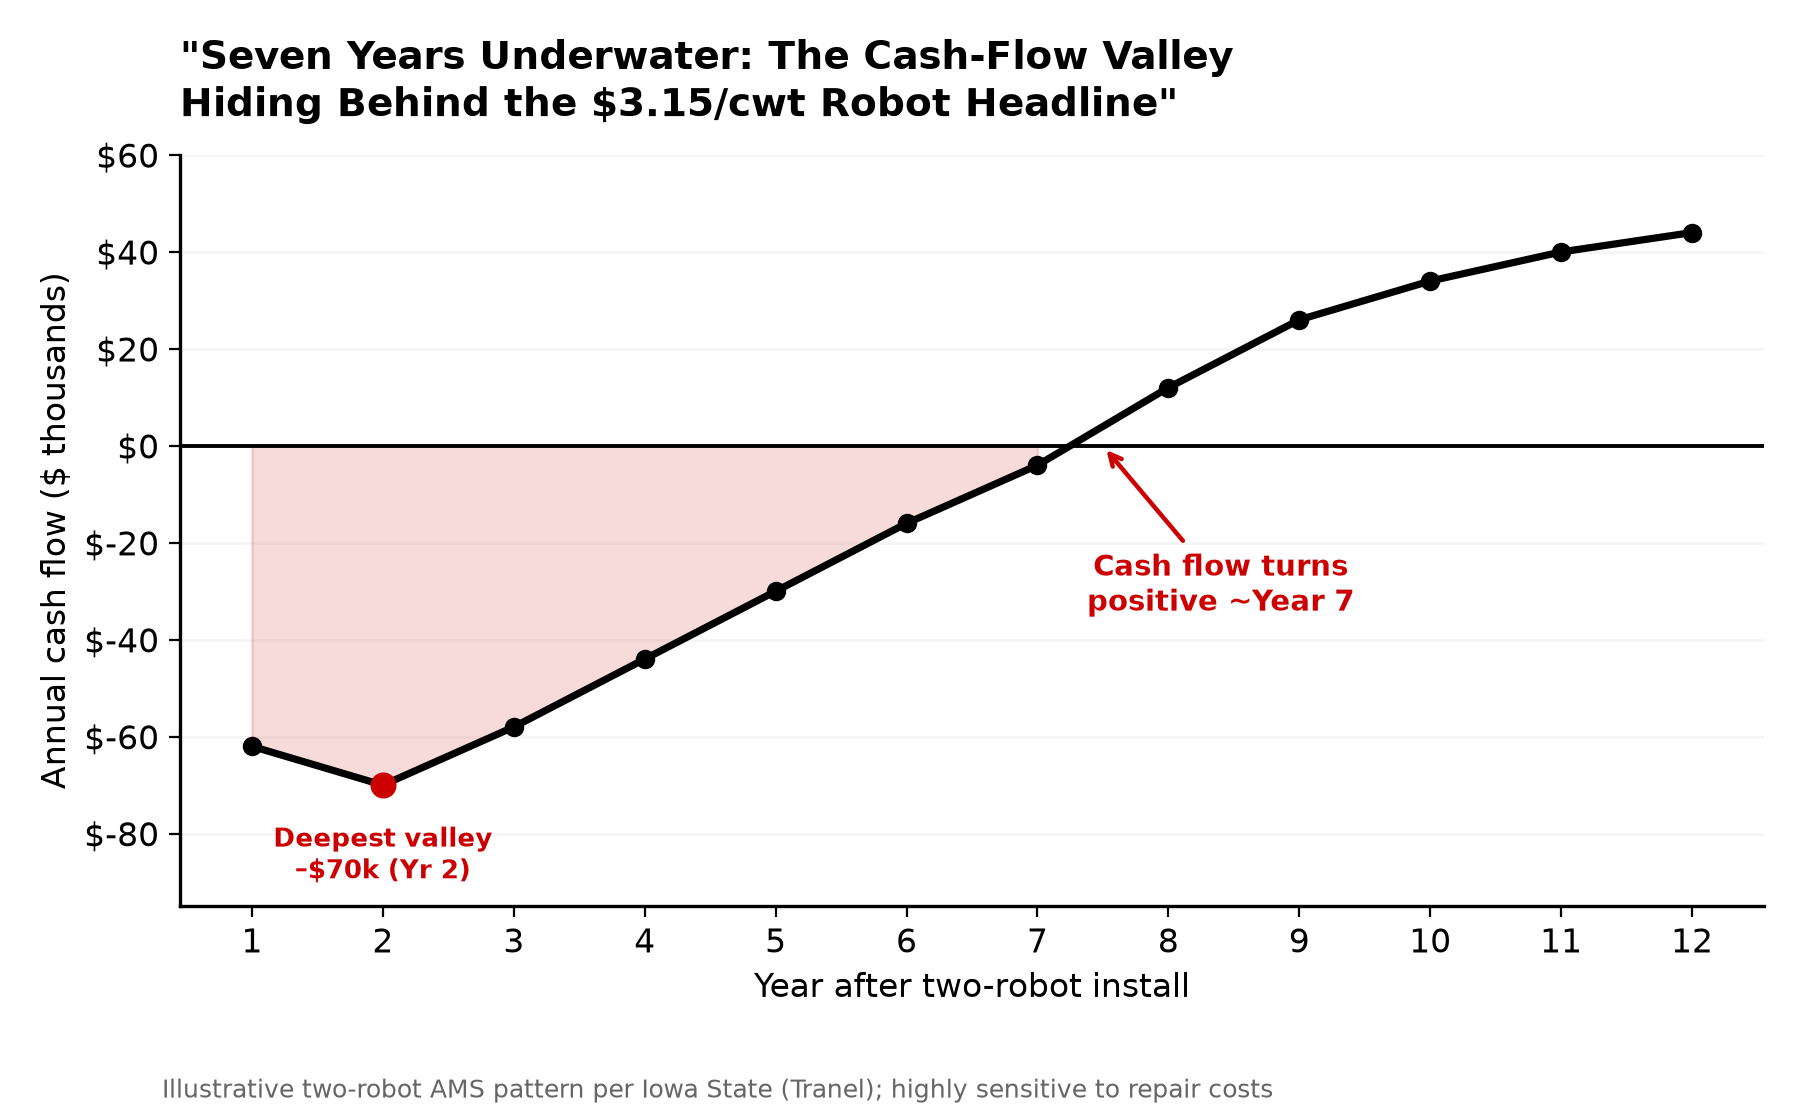
“Cash flow of a robot tends to be very negative in the first seven years, then pretty positive for the rest of the life of the AMS — but that is dependent on many variables, especially repair costs across the whole life of the robot.” — Larry Tranel, Iowa State University Extension.

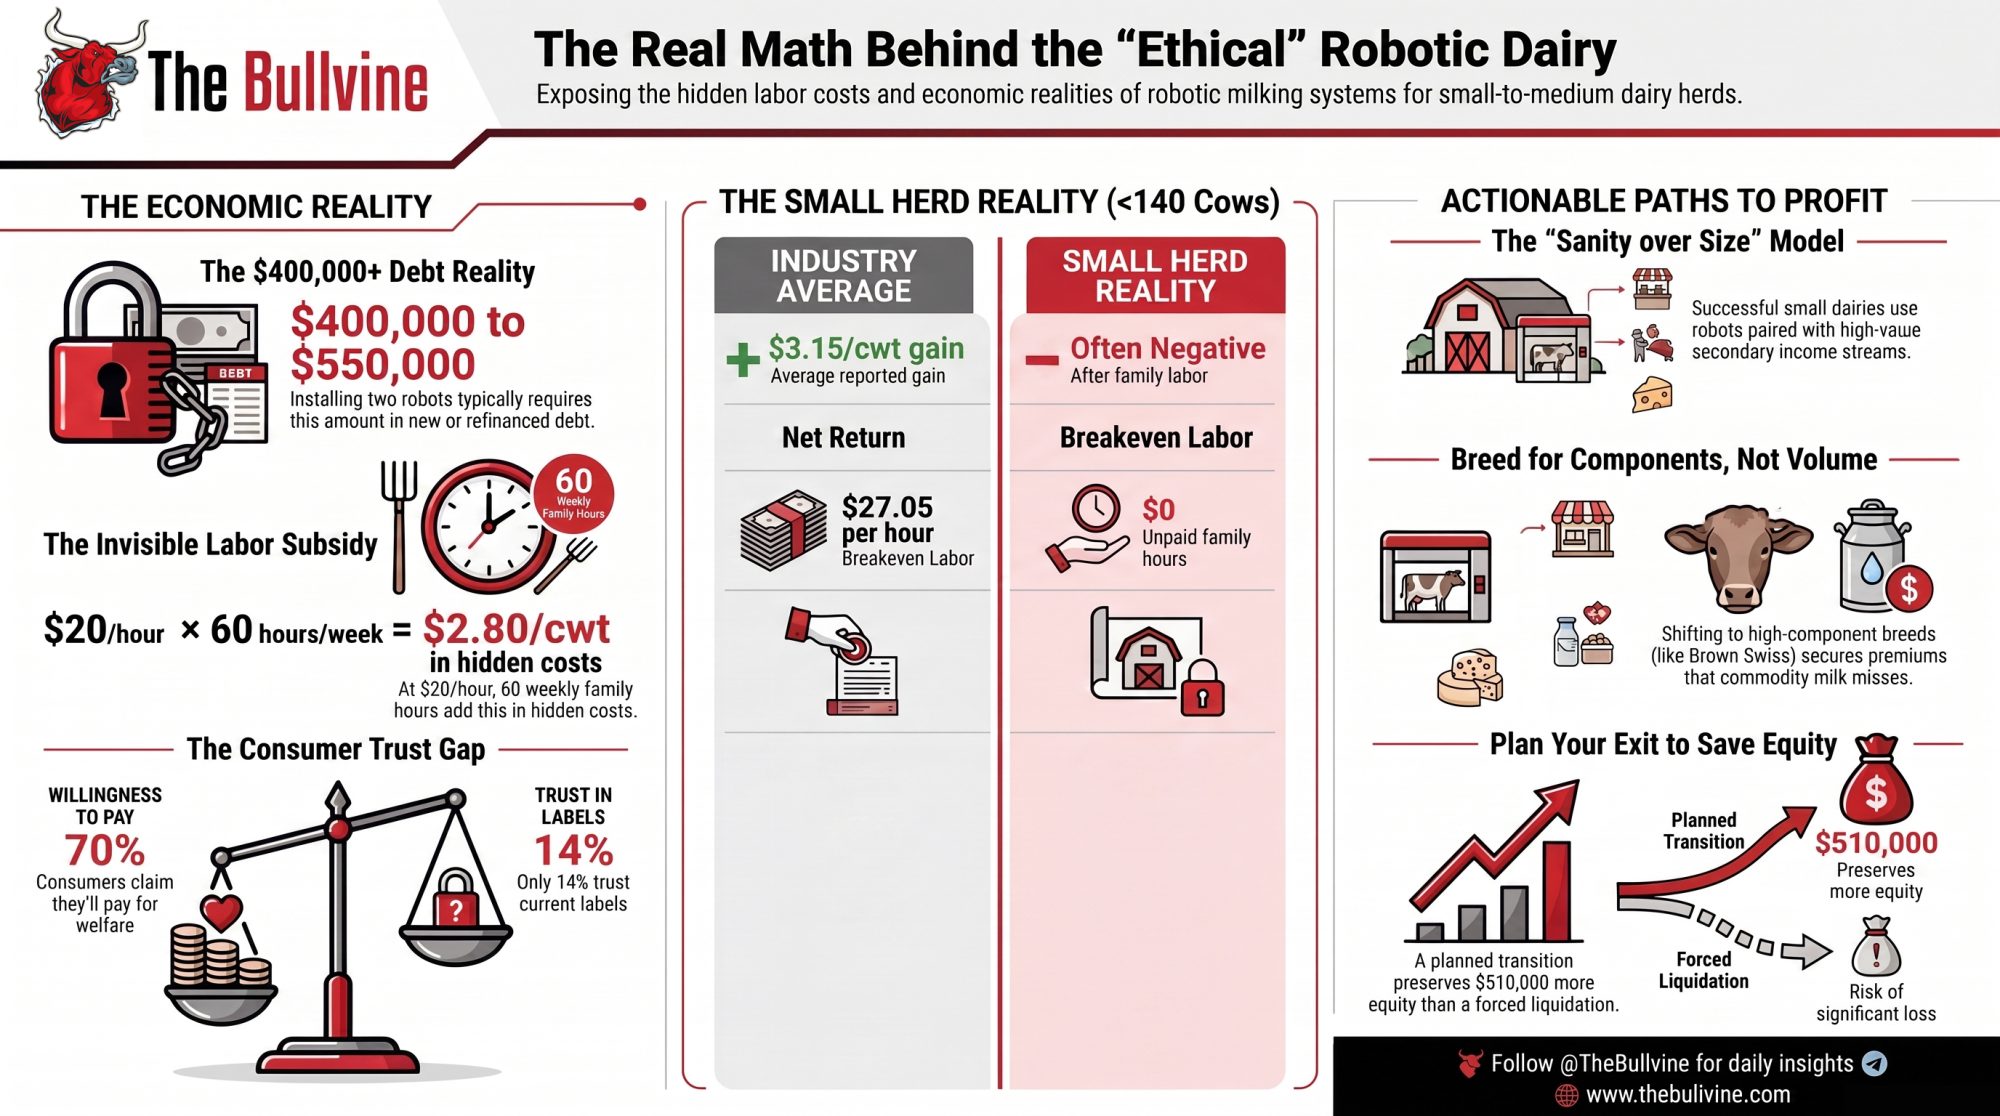
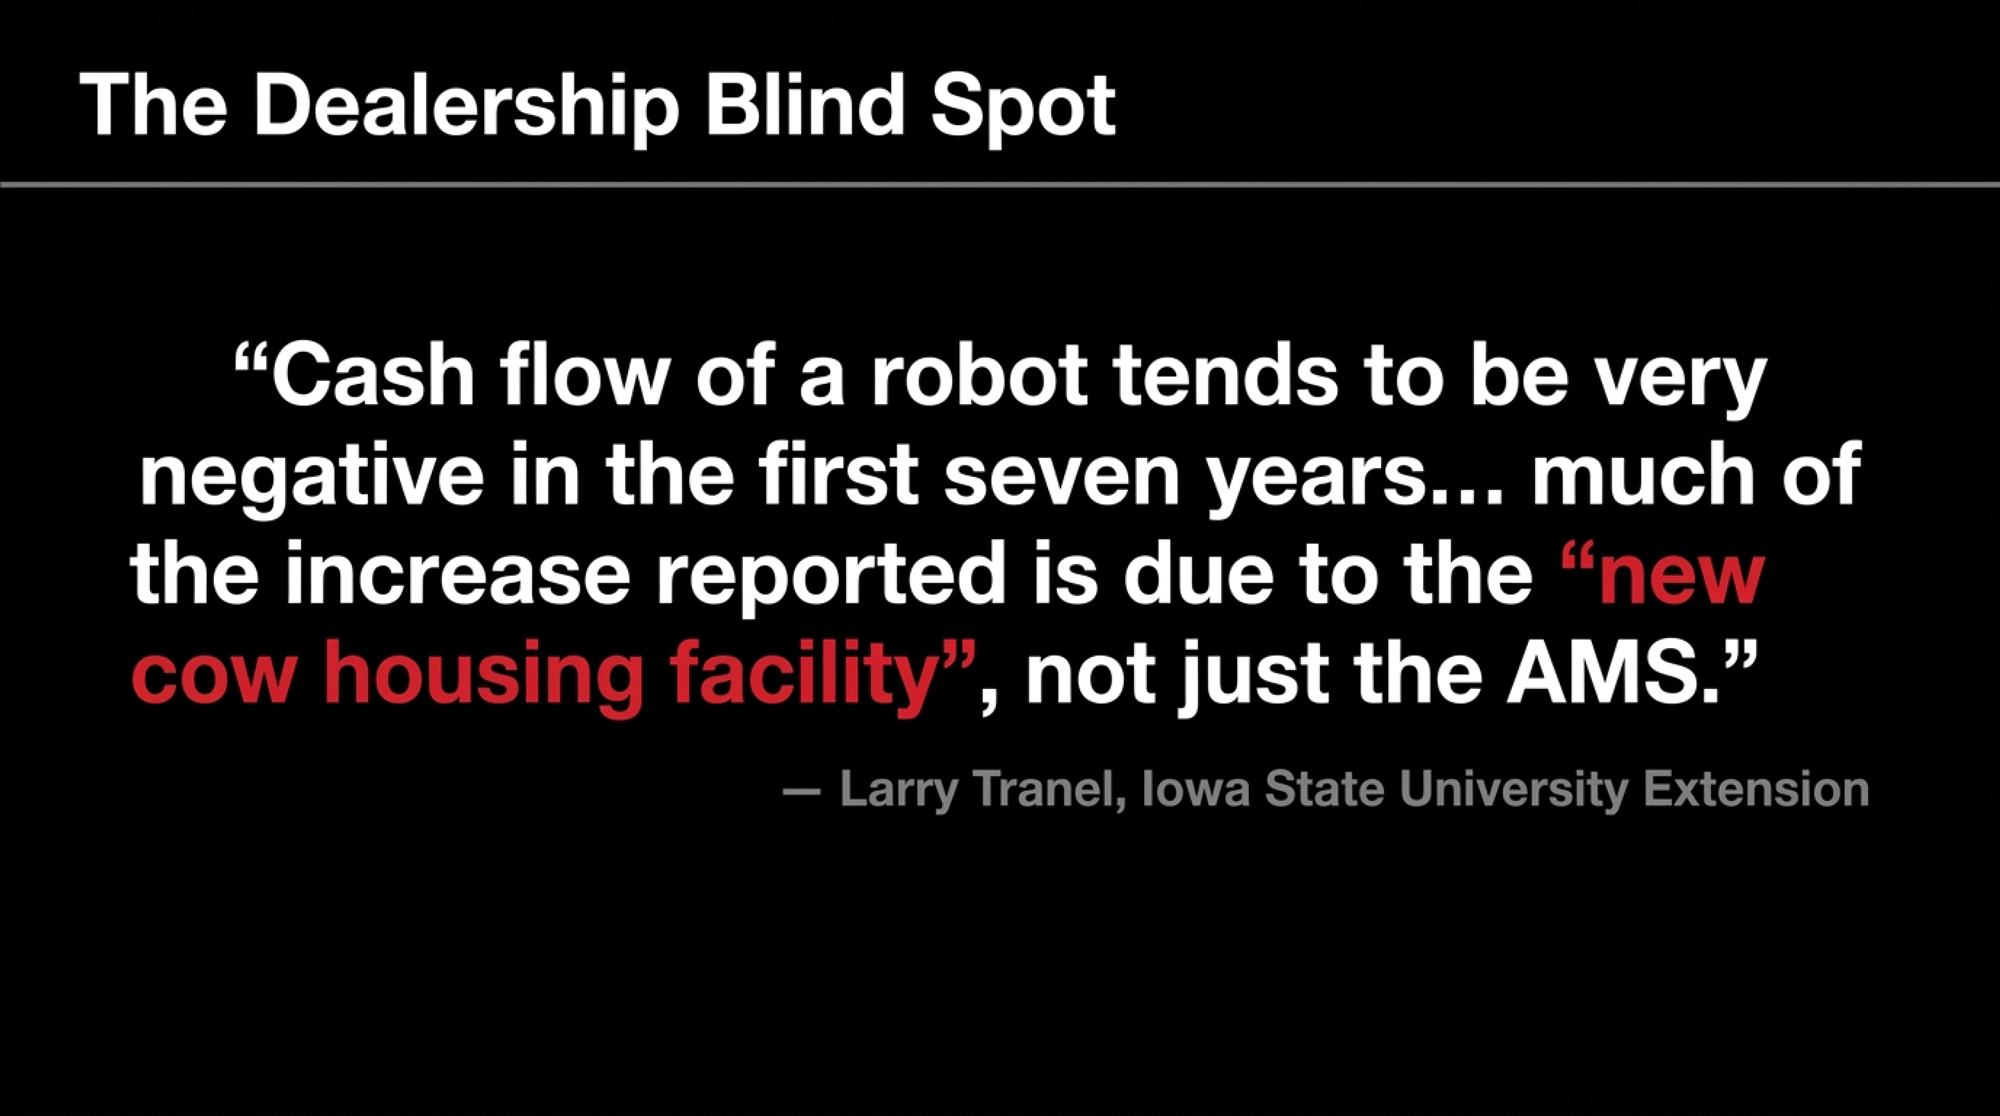
Two robots plus barn work routinely lands a family $400,000 to $550,000 in new or refinanced debt. And there’s a trap hiding inside the production bump. Tranel warns that “much of the increase reported on AMS is due to the new cow housing facility, not just the AMS, as new facilities often increase production 6 to 8 percent over old, worn‑out facilities.” In plain terms: families credit the robot for gains the new barn delivered, then build their projections on repeating them.

Smaller robot stories can work — but rarely on the dairy alone. The ones that hold together almost always have a second income stream quietly carrying the cash‑flow valley. Marcus and Paige Dueck of Four Oak Farms near Kleefeld, Manitoba are the cleanest example you’ll find. When Western Canada’s first rail‑mounted Robomax milker rolled into their old tie‑stall barn in July 2020, it wasn’t a freedom play — it was a math problem. “My parents were looking to slow down their involvement in the barn, we had a new baby, and we had to make a decision,” Marcus told Farm Forum. “Expanding just wasn’t a financially feasible option.”

Notice what they didn’t do. They didn’t scale up to chase the robot’s economics — they kept a herd of about 50 cows and changed almost everything else. They swapped Holsteins for Brown Swiss, betting on temperament and component premiums over volume. “You don’t need more cows,” Marcus says. “You just need the right cows — ones that make milk that pays better.” Production per cow climbed roughly 40% over five years, driven by a shift to three‑times‑a‑day milking and cow‑level data — not more animals.

The dairy alone still wouldn’t carry it, and the Duecks are blunt about that. Half their roughly 900 acres goes to a high‑value hay business aimed at performance‑horse owners across Canada and the U.S., built around a German composite baler nobody else in their market runs. The other half is cash crop. On top of that sits Four Oak Ag Solutions, a manure‑and‑nutrient consulting firm Marcus grew from helping one neighbor with a manure plan. “In dairy, you can’t have all your eggs, or your milk, in one basket anymore,” he says. That diversification — not the robot — is what makes a 50‑cow operation work. It earned them Manitoba’s 2024 Outstanding Young Farmers title and a philosophy worth stealing: “We see a lot of farms chasing size, not sanity,” Paige says. “You can scale without losing peace.” Their model is the exception that proves the rule — robots fit inside a diversified business; they don’t rescue a bare commodity dairy.

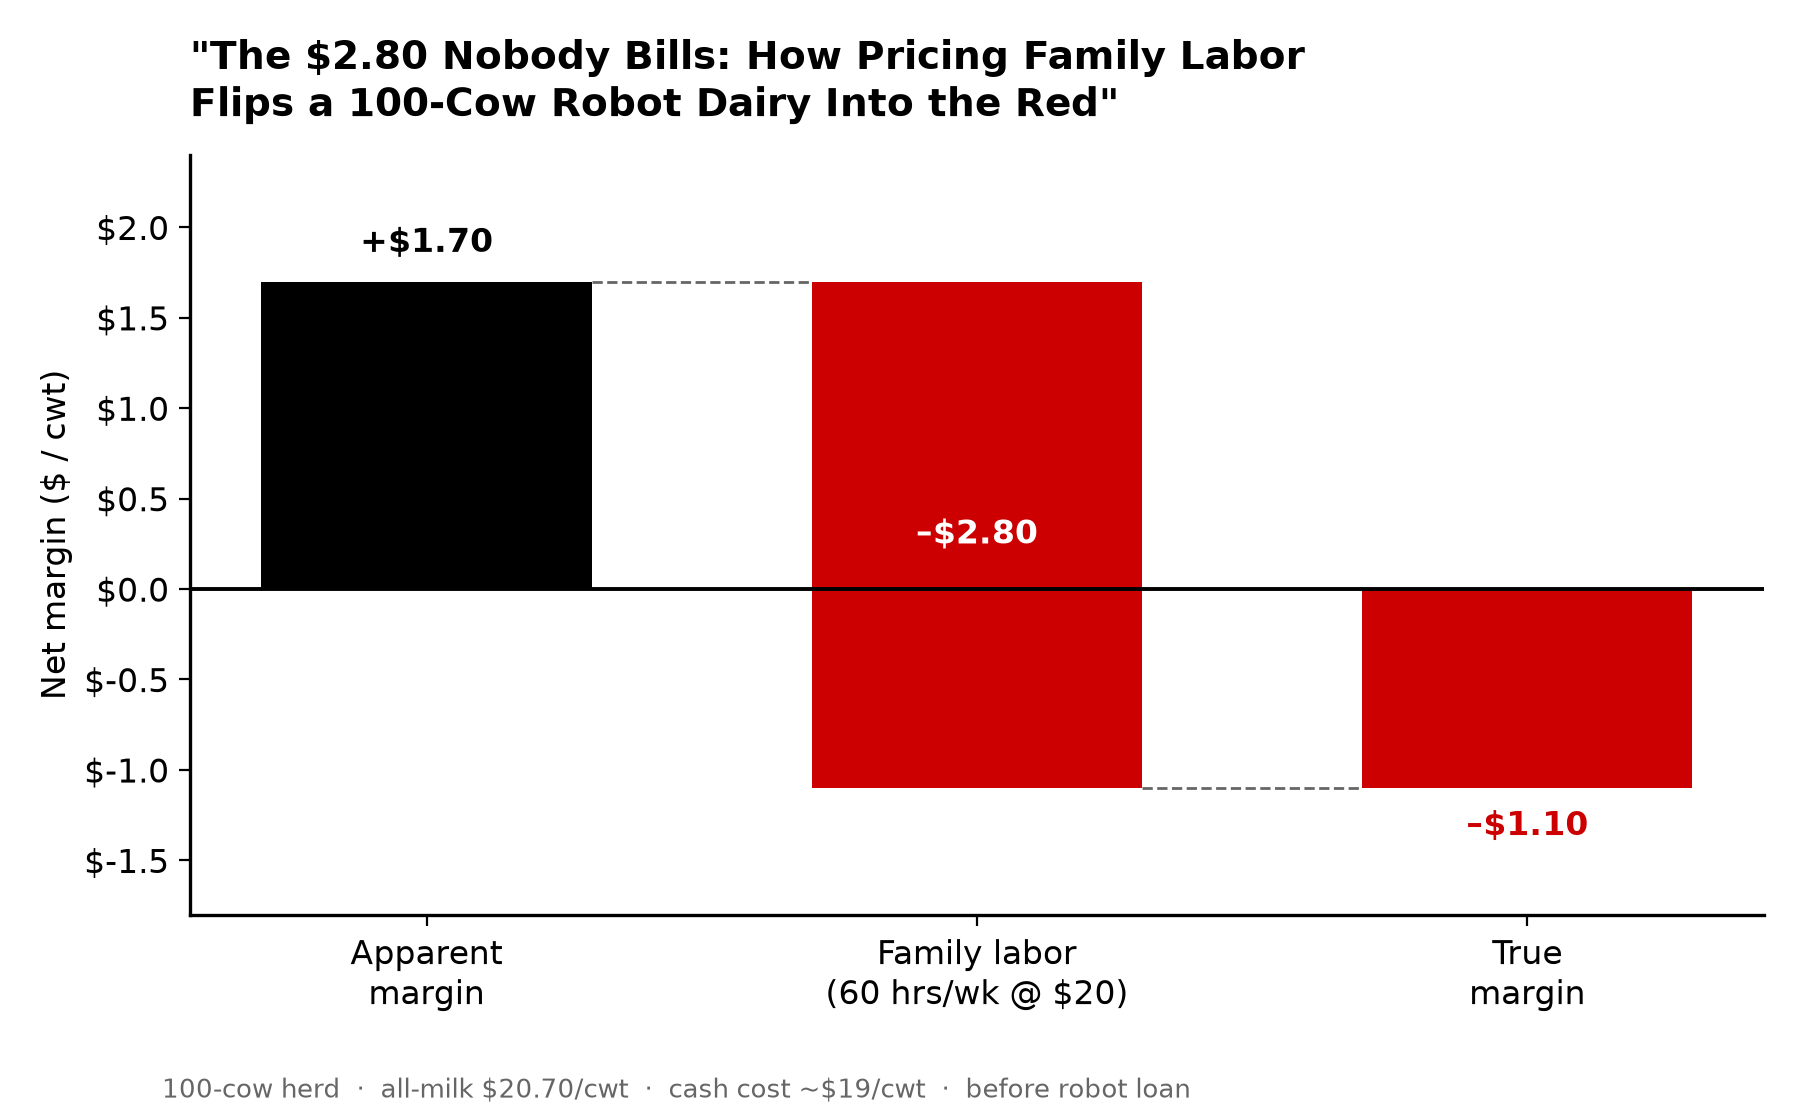
Now the micro barn‑math that should stop the room cold. USDA lowered its 2026 all‑milk forecast by 55 cents in June to $20.70/cwt, and the market’s still drifting. Say your 100‑cow place runs cash costs near $19/cwt and looks like it’s clearing a couple of dollars. Then you price the family hours honestly.

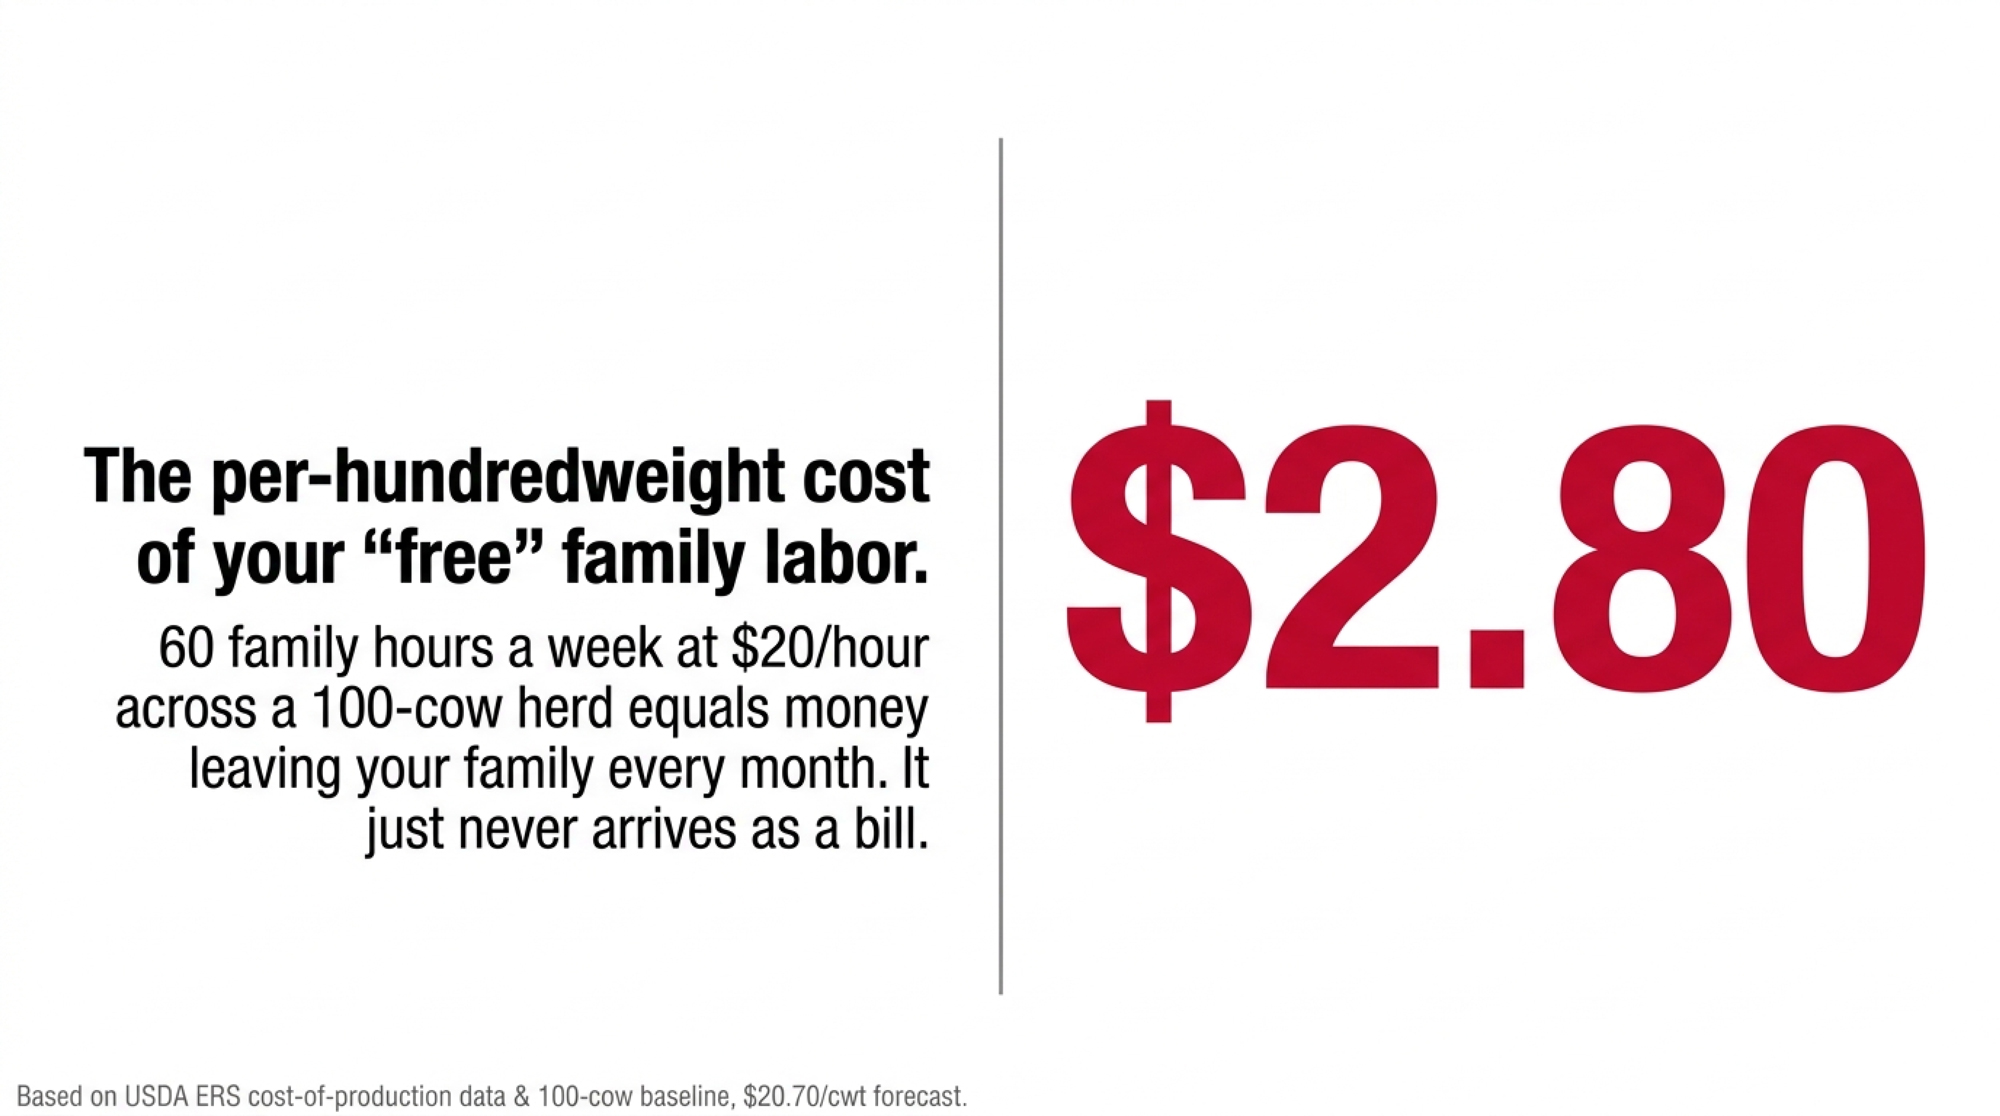
Run your own version: 60 family hours a week at $20/hour is about $62,400 a year — spread across roughly 2.2 million lbs of milk, that’s near $2.80/cwt you’re absorbing before you’ve paid a robot loan. ERS’s own cost‑of‑production work shows the smallest herds carry the heaviest labor load per hundredweight, much of it unpaid family time. Add that real labor bill back, and a comfortable‑looking margin can flip negative in a hurry. On 100 cows, that’s money leaving the family every month. It just never arrives as a bill.

The Mechanics Behind the Outcomes

Three hidden subsidies make the ethical robot story pencil on paper. None of them show up in the brochure, and all of them are load‑bearing.

Hidden SubsidyWho Pays ItWhat The Data Says
Unpaid family laborMom, the kid, the farmer at hour 14Robots cut milking labor 21%+, but U. of Minnesota found robot herds less profitable per cow — the edge only appears per full-time worker
Paid-off land / off-farm incomeThe second business or the mortgage-free balance sheetFour Oak Farms carries the cash-flow valley on hay + consulting income — not the robot
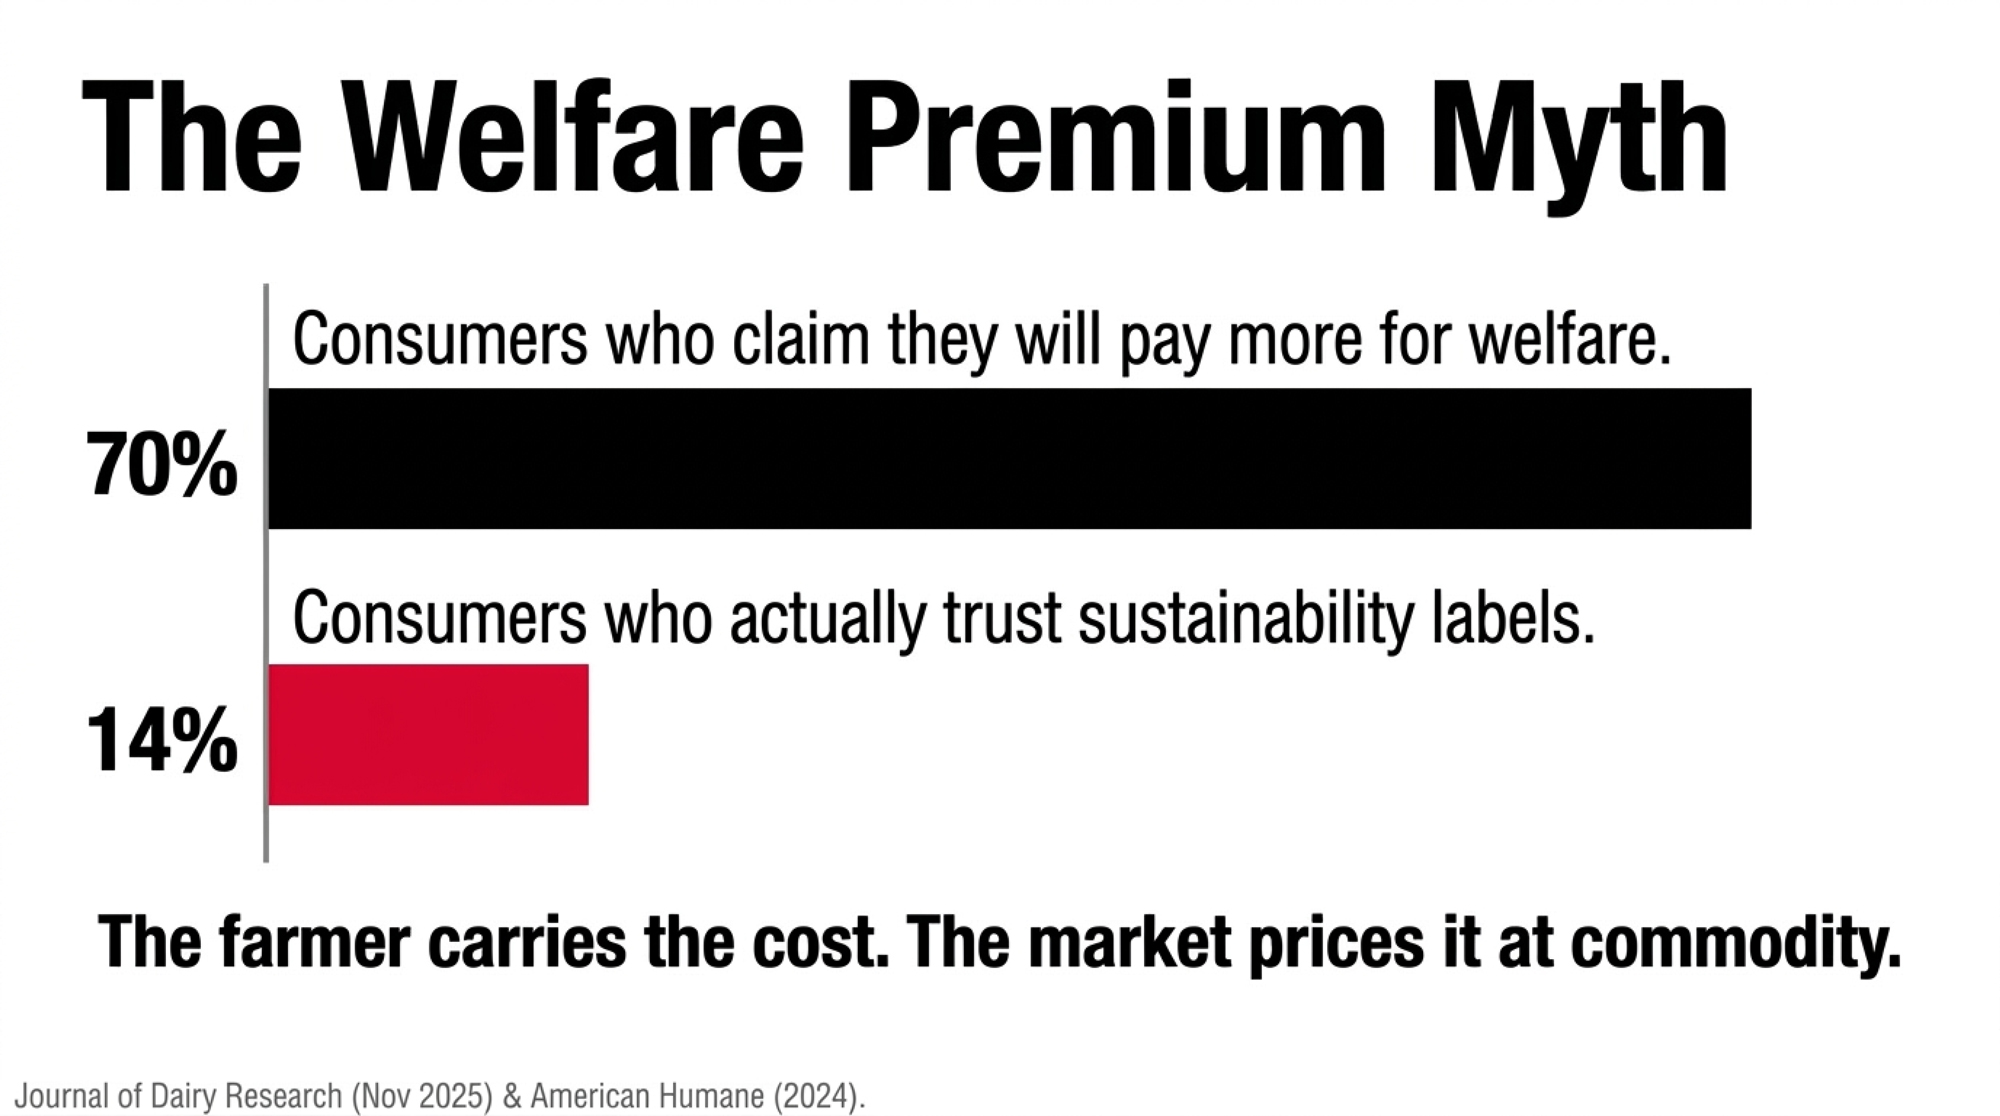
Welfare premium that never arrivesThe farmer’s conviction, priced at commodity70% say they’ll pay more; only 14% trust the label; 60% think brands are “just pretending”
  • Unpaid family labor. Robots cut hands‑on milking sharply — adopters in one multi‑box study reported labor‑cost cuts of over 21% — but they shift the rest of the work from physical to managerial and on‑call: the 2 a.m. alarm, the software, the fetch cows. University of Minnesota work found robot herds were actually less profitable per cow than conventional herds; the advantage only showed up once profit got measured per full‑time worker. Robots make your people more productive. They don’t make the labor free. They make it invisible.
  • Paid‑off land or off‑farm income. The small robot farms that genuinely work tend to own their ground outright or run a second paycheck that quietly absorbs the cash‑flow valley. The Duecks’ hay and consulting income is exactly this — and they’ll tell you so. That’s an exception worth naming honestly, not a model to bolt onto a leveraged start‑up.
  • The welfare premium that never reaches the milk cheque. A November 2025 study in the Journal of Dairy Research found 70% of consumers say they’ll pay more for animal‑welfare‑certified dairy. But only 14% of U.S. consumers fully trust sustainability claims on labels, and 60% figure companies are “just pretending.” The farmer carries the cost and the conviction of high‑welfare care while the market prices it at commodity. The handful who capture real premiums — Jasper Hill, Maple Hill, Alexandre Family Farm — do it through certification and brand, not by owning a robot.
MetricFigureWhat It Means For The Cheque
Consumers who say they’ll pay more for welfare-certified dairy70%Stated intent — the brochure number
Consumers who fully trust sustainability label claims14%Intent evaporates without a trusted third party
Consumers who think brands are “just pretending”60%Baseline skepticism working against you
Consumers emphasizing third-party certification (American Humane, 2024)67%No independent label = no reliable premium

How Much Does Your “Ethical” Story Cost Once You Price the Labor?

Run the reality check this month. Three questions, three numbers, and you’ll know more than most operators who’ve already signed.

What’s your true cost per cwt at your actual cows‑per‑robot utilization — not the dealer’s glossy target? How many unpaid family hours are propping up the story, and what are they worth at your local wage? And what premium per cwt would a processor or direct customer need to pay before the welfare narrative covers its own freight? If you can’t answer all three, you don’t yet know whether you own a business or a very expensive family project. Where does your breakeven actually sit right now?

Want to go deeper on that first number? See why small herds carry the heaviest labor cost per hundredweight.

Is the Robot the Reason Your Kids Stay — Or the Reason They Can’t Leave?

The succession pitch is powerful, and it’s not cynical: your kids won’t have to milk at 4 a.m. There’s real signal behind it. Bullvine’s own reporting has tied a tech‑savvy, balanced approach to a sharp rise in next‑generation interest — one figure put it as high as a 340% jump, though that stat traces to a single source and is best treated as directional, not gospel. Robots can genuinely make dairy a life a young person chooses instead of endures.

But technology doesn’t fix succession — economics and planning do. Only a small fraction of family operations survive to the third generation, and a robot doesn’t change those odds. When a heavily leveraged robot barn becomes the reason the next generation signs on, the “freedom” can quietly turn into a golden handcuff. They didn’t inherit cows and choice. They inherited $400,000‑plus in tech debt and an obligation to make it pay. The robot keeps them on the farm. It doesn’t necessarily keep the farm viable past their watch.

Options and Trade-Offs for Farmers

There’s no single right answer here. There are three honest paths, and your own math points to the one that fits.

PathWorks WhenRequired ConditionThe Risk
1 — Scaled, cost-competitiveClimbing toward larger, well-utilized herds~55 cows/robot utilization; labor valued at $27.05/hr breakevenBelow ~140 cows on commodity milk, the math rarely closes
2 — Robot + 2nd income / real premiumYou have a genuine second business or a paying market channelThe Four Oak model: diversified revenue + component-premium breedWTP collapses at checkout — 67% demand third-party certification
3 — Stop pretending robots fix itStructurally negative 100-cow operationRun true cost/cwt with family hours priced inWaiting 18 months too long burns ~$575,000 in equity
  • Path 1 — Robots as a scaled, cost‑competitive system. Makes sense if you’re climbing toward the larger, well‑utilized herd size where ERS sees the strongest returns, with utilization near the 55 cows per robot extension benchmarks favor. Requires ruthless cost tracking and labor valued at market — University of Minnesota pegs the breakeven labor cost around $27.05/hour. The risk: below roughly 140 cows on commodity milk, the math rarely closes.
  • Path 2 — Robots plus a second income or a real premium. This is the Four Oak Farms model — a robot paired with diversified off‑farm revenue (the Duecks’ hay business and Four Oak Ag Solutions consulting) and a breed strategy built on butterfat and protein premiums rather than volume. Requires either a genuine second business or a market channel paying a measurable $/cwt over commodity. The risk: stated willingness‑to‑pay collapses at the checkout without a trusted third‑party label — 67% of consumers in American Humane’s 2024 survey specifically emphasized third‑party certification.
  • Path 3 — Stop pretending robots fix an unprofitable commodity dairy. Sometimes the honest move within the next 30 days is to run your true cost per cwt — family hours priced in — and accept that a structurally negative 100‑cow operation needs a different decision than more debt. Bullvine’s exit‑math work shows waiting 18 months too long on a negative position can quietly burn around $575,000 in equity; a planned transition preserved $765,000 versus $255,000 in a forced liquidation. No robot out‑runs that gap.

We’re building the full seven‑year cash‑flow valley behind that $3.15/cwt return — laid out year by year by herd size — as a follow‑up; watch for it in the coming weeks.

Key Takeaways

  • If your robot herd “breaks even” on paper, rerun it with every family hour priced at your local wage. If that move pushes you into the red, you’re subsidizing the operation, not running it.
  • If you’re below ~140 cows on commodity milk with no premium channel, treat the $3.15/cwt average net return as somebody else’s number until your own utilization and labor math say different.
  • If you’re banking on a welfare premium, get the contract or certification in writing first — 70% say they’ll pay, only 14% trust the label, and your co‑op rarely converts welfare compliance into $/cwt.
  • If you’re going to make a small robot herd work, copy the Duecks before you copy the brochure: a second income stream and a component‑premium breed strategy did the heavy lifting, not the robot.
  • If your operation’s been structurally negative for 18 months or more, run the exit‑versus‑reinvest math before you sign robot debt. The equity gap between a planned and a forced transition runs into six figures.
  • If robots are the reason your kids are staying, separate the lifestyle promise from the balance sheet. Make sure they’re choosing a viable business, not inheriting an obligation.

The Question to Take to the Kitchen Table

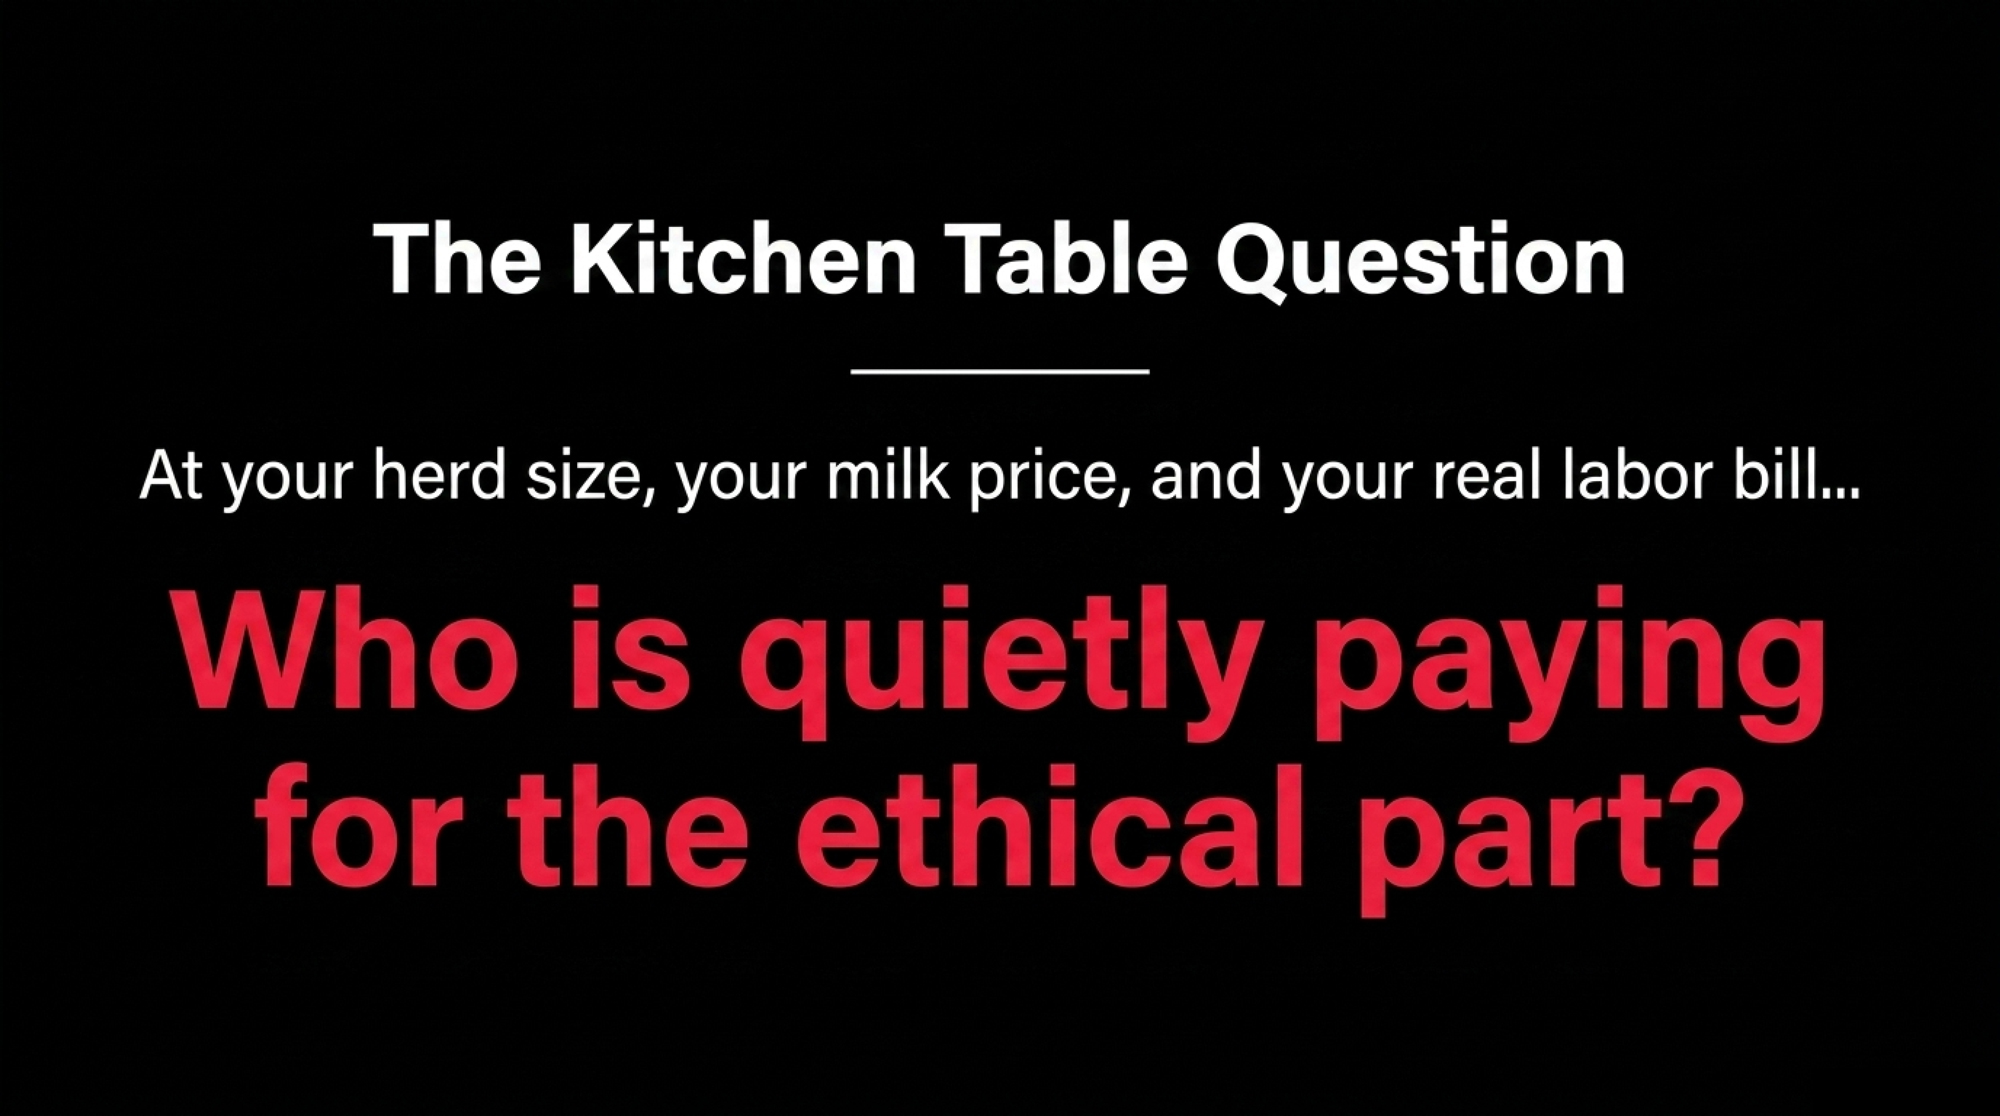
That farmer answering the “is ethical dairy even possible” question isn’t wrong to want a calmer barn and cows that get to be cows. The question that decides whether the dream survives contact with the milk cheque is the one nobody in the showroom asks: at your herd size, your milk price, and your real labor bill, who’s quietly paying for the “ethical” part — the market, or your own family?

Run those three numbers this week. Then take them to your lender and your kids before you take them to the equipment rep. And if you want to see how a robot, Brown Swiss, hay, and consulting actually came together on one real Manitoba farm, read how the robots hum and the cows stay calm at Four Oak Farms.

Complete references and supporting documentation are available upon request by contacting the editorial team at editor@thebullvine.com.

Learn More

The Sunday Read Dairy Professionals Don’t Skip.

Every week, thousands of producers, breeders, and industry insiders open Bullvine Weekly for genetics insights, market shifts, and profit strategies they won’t find anywhere else. One email. Five minutes. Smarter decisions all week.
NewsSubscribe
First
Last
Consent

−$8,776 a Year for Seven Years: The Real Cash-Flow Curve Behind Your Dairy’s Robot Note

On a 140-cow herd, that −$8,776/year robot valley isn’t theory — it’s seven milk checks’ worth of red ink before the dealer’s “payback” ever shows up.

Editor’s note: The farmer and his daughter described below are a composite scenario modeled from typical 120–160-cow Midwest and Ontario family operations, not a single real individual. All farm cases drawn from named, published sources are identified as such.

Picture a 58-year-old farmer at the kitchen table on a 140-cow operation, a robot dealer’s proposal sitting between the coffee cups. Two boxes, a tidy three-year payback, and that line everybody’s heard: “the labor savings pay the payment.” His daughter’s leaning in the doorway, half-deciding whether there’s a future here worth coming home to. That’s where robotic milking actually gets decided. Not in a spreadsheet — at a table, with a payment book on one side and a balance sheet on the other.

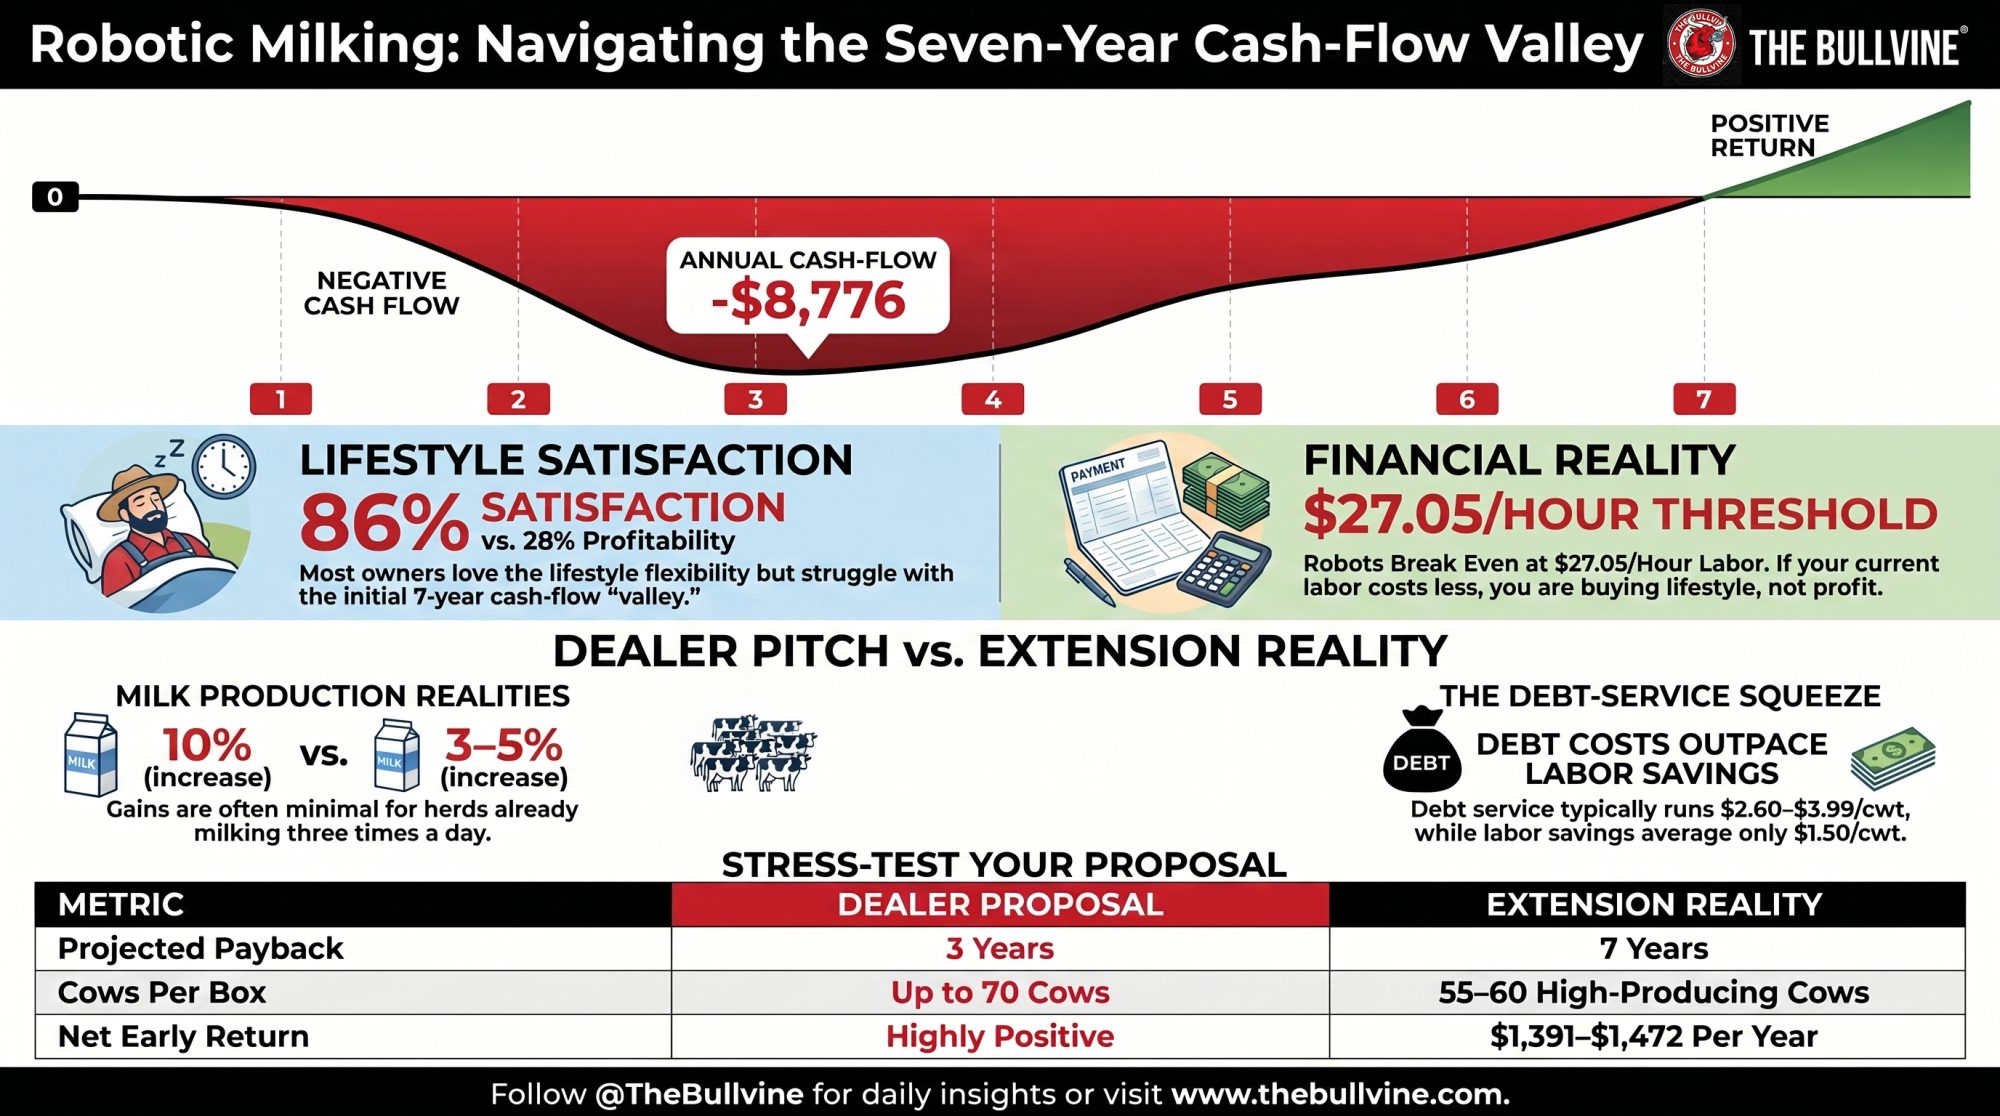
Here’s the number that should be sitting there too. Across Iowa State surveys and Bullvine’s own analysis, 86% of robot owners are satisfied — but only 28% find it profitable. That gap is the reason you can love your robot and still be patching cash-flow with off-farm income.

What’s Changing — and Why the Gap Is So Wide

Robotic milking has gone mainstream fast, and the appeal is real: fewer 4 a.m. shifts, more flexibility, a barn that runs while you sleep. A 2021 University of Guelph study of 28 Ontario robotic-milking farms, published in Animal Welfare, found that farmers who paired robots with automated feeding reported lower stress, anxiety, and depression — and that better farmer well-being tracked with healthier, less-lame cows. That’s the kind of thing the 86% satisfaction number is really capturing. Quality of life. And on that score, robots usually deliver exactly what they promised.

Profitability is a different ledger. In January 2026, USDA’s Economic Research Service published ERR-356 — the first nationally representative study of its kind — and found that box robots increase dairy net returns by 13% — about $3.15 per cwt — relative to nonadopters. But that’s an average built on average assumptions. What your farm actually sees rides on your herd size, your capital cost, and how well you run the barn.

One number is about your life — your sleep schedule and who’s in the barn at 4 a.m. The other is about your loan — the payment book on the fridge. You need to be clear which ledger you’re really buying in before you sign.

How This Plays Out on Real Farms

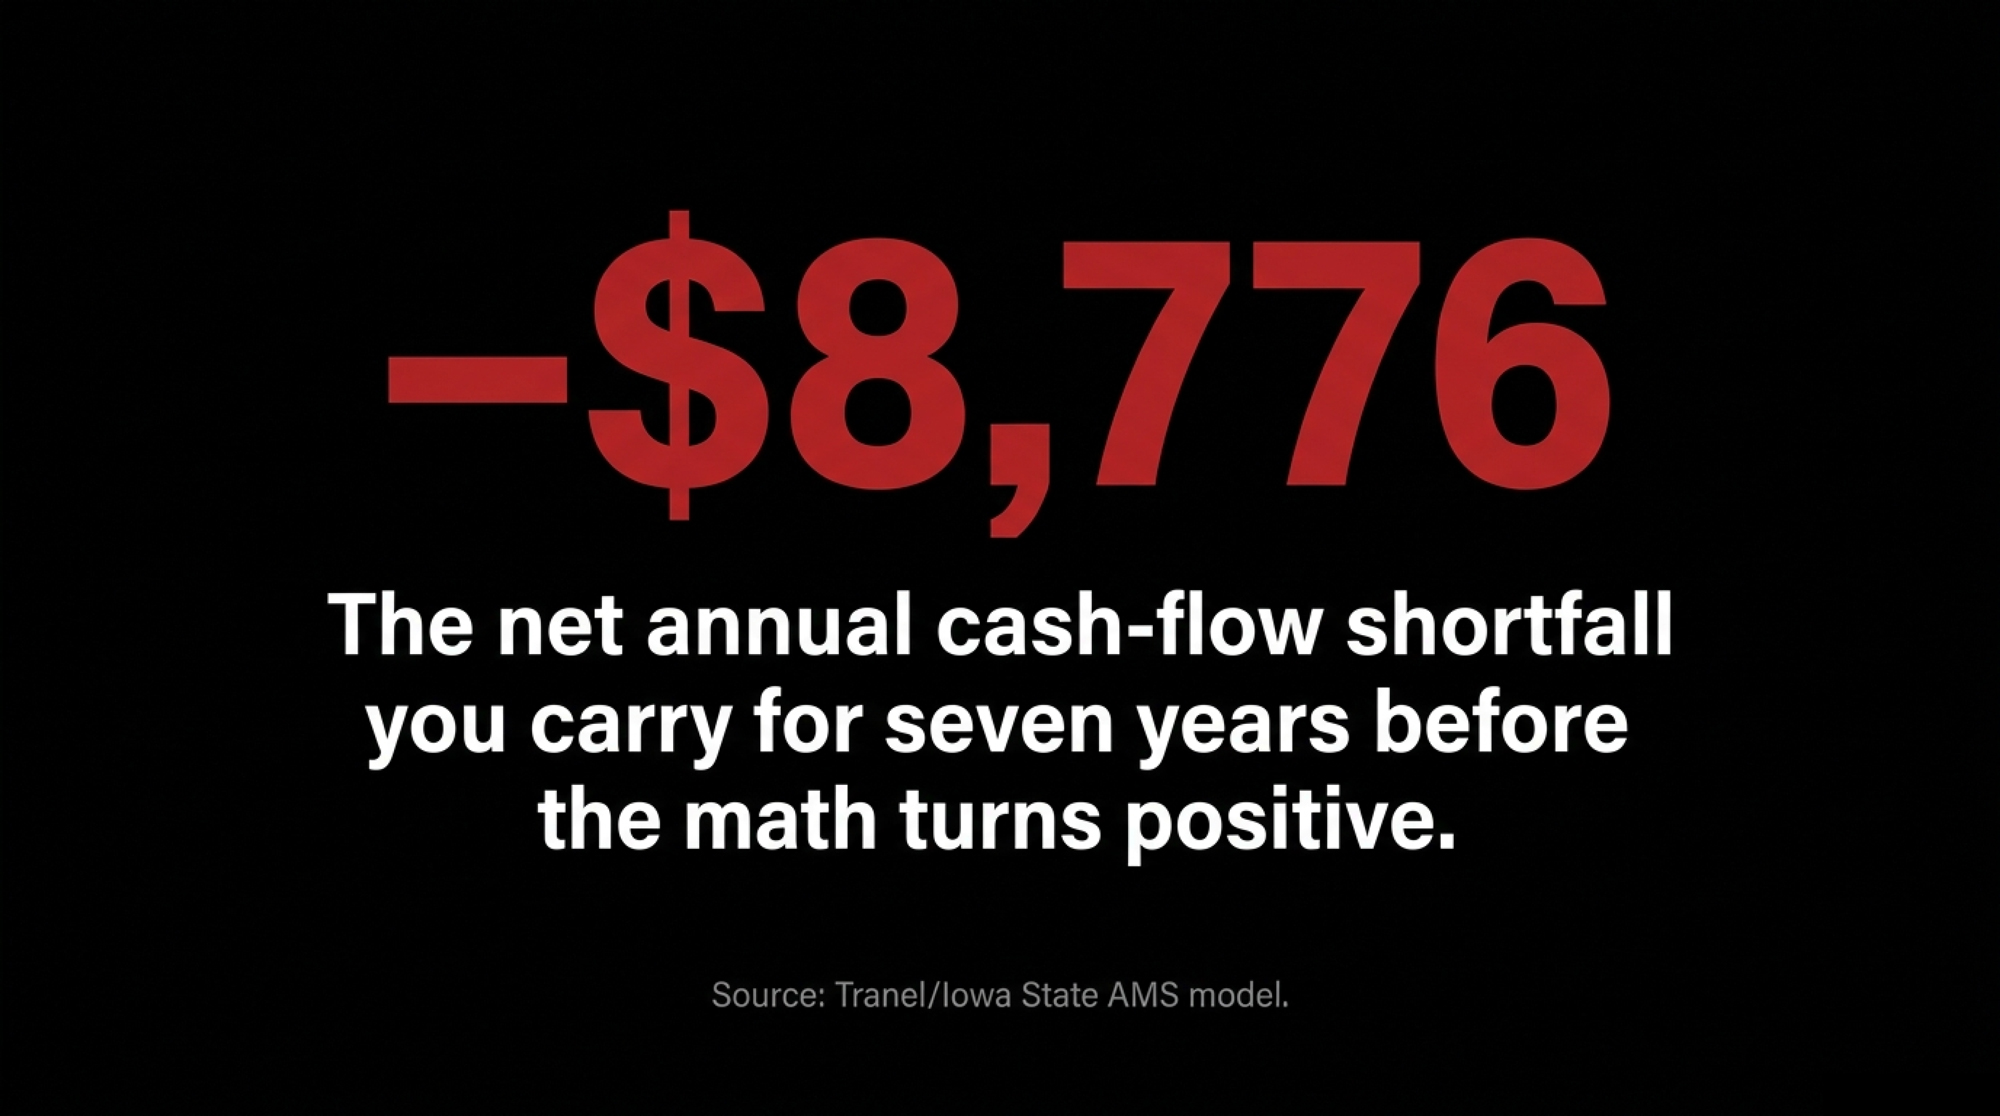
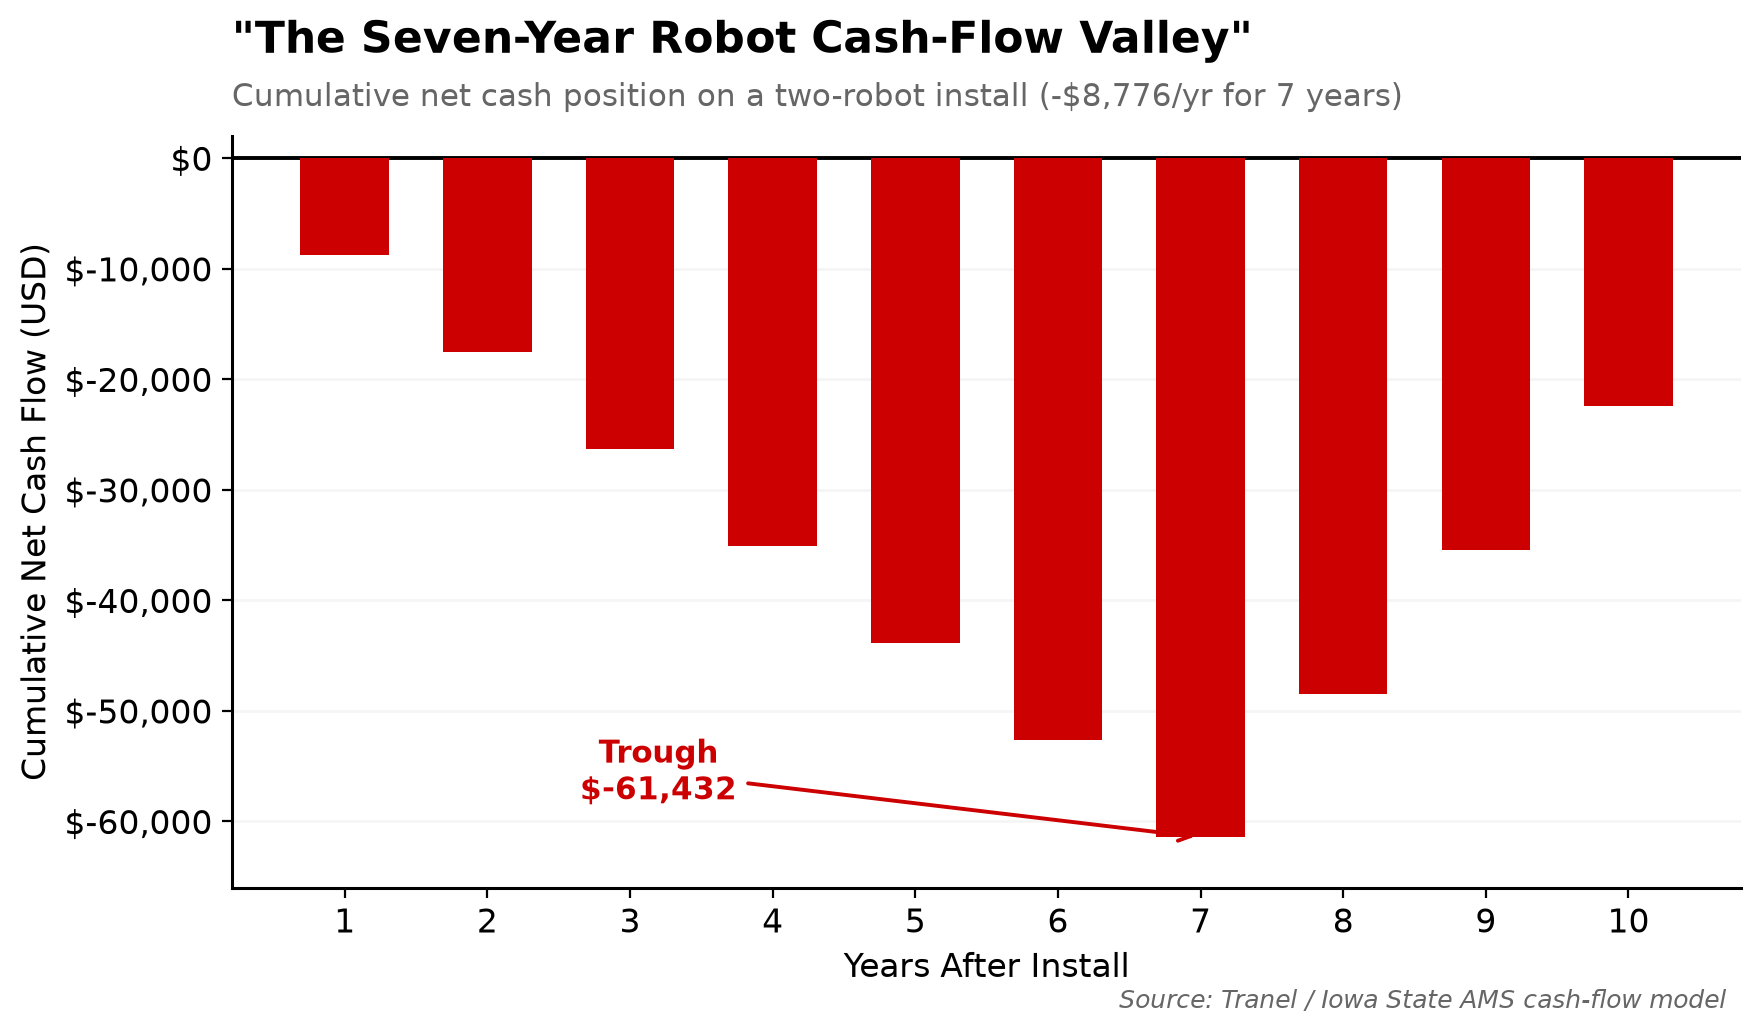
Iowa State dairy economist Larry Tranel has been running AMS economics for years, and his cash-flow model tells the part of the story the payback chart skips. A typical two-robot install — about $400,000 all-in — carries roughly $62,000 a year in ownership costs plus $69,000 in loan payments, against only a slim net financial benefit in those early years: about $1,391 a year in the partial-budget run this article follows, and $1,472 in Iowa State’s published 2018 example, depending on herd size and inputs. Run Tranel’s full model — ownership, payments, labor savings, and production gains all netted together — and you land on a cash-flow gap of about $8,776 a year for seven years before the math turns positive. That $8,776 isn’t payments minus benefit; it’s the net annual shortfall after every offset is counted.

Stack it up and that $8,776 hole runs to roughly $60,000 before the valley ends. You don’t need a consultant to tell you what that would feel like on your own balance sheet. Tranel’s modeling shows robot cash flow running sharply negative for roughly the first seven years before turning positive, and he’s clear that the swing depends heavily on lifetime repair costs across the whole life of the machine.

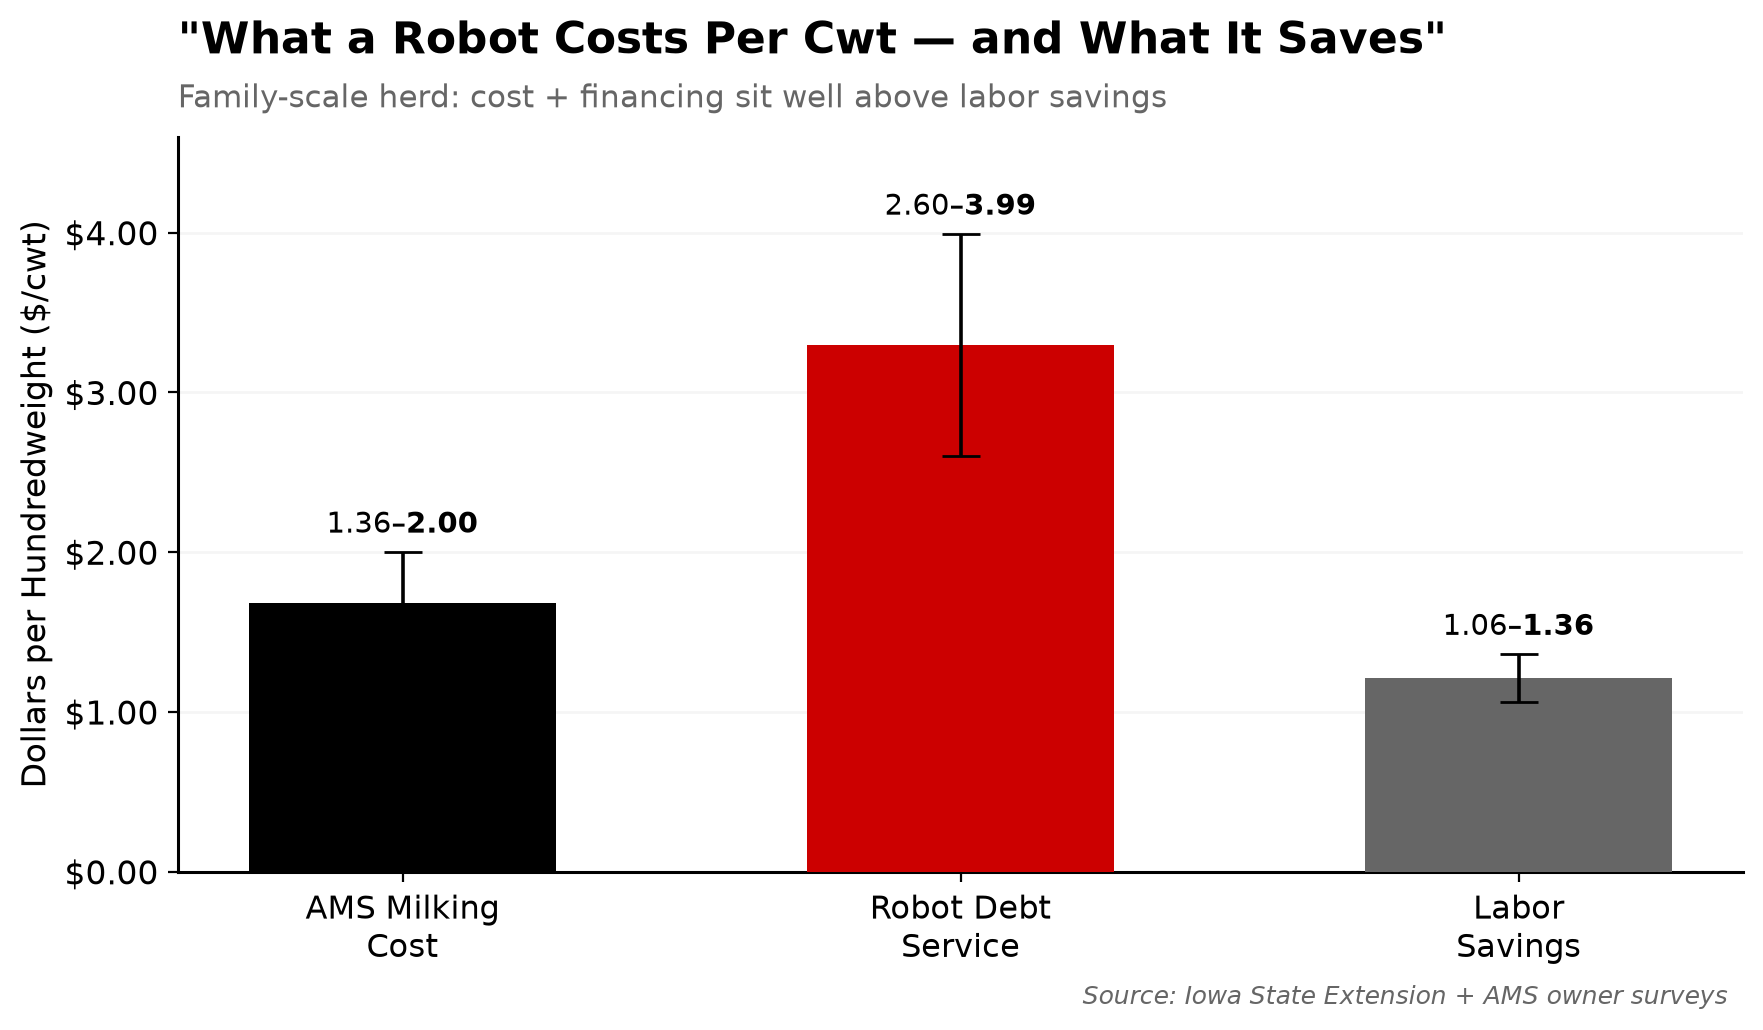
Run it on your own herd. Average AMS labor savings come in around $1.50/cwt across surveyed herds — but debt service on the robots runs $2.60 to $3.99/cwt. On a 140-cow herd shipping roughly 8 million pounds a year, that $1.50/cwt of labor savings is about $120,000. Real money. But if your robot debt service lands at $3.00/cwt, that’s $240,000 going the other way. The production bump and the management value have to cover the difference. Sometimes they do. Often they don’t.

The Dealer Pitch vs. Extension Reality

Put the brochure side by side with the university numbers and the gap stops being abstract. Here’s where the two stories diverge on the figures that actually drive your payment book:

Financial MetricDealer Proposal PitchUniversity Extension Reality
Projected payback3 years7 years — the cash-flow valley
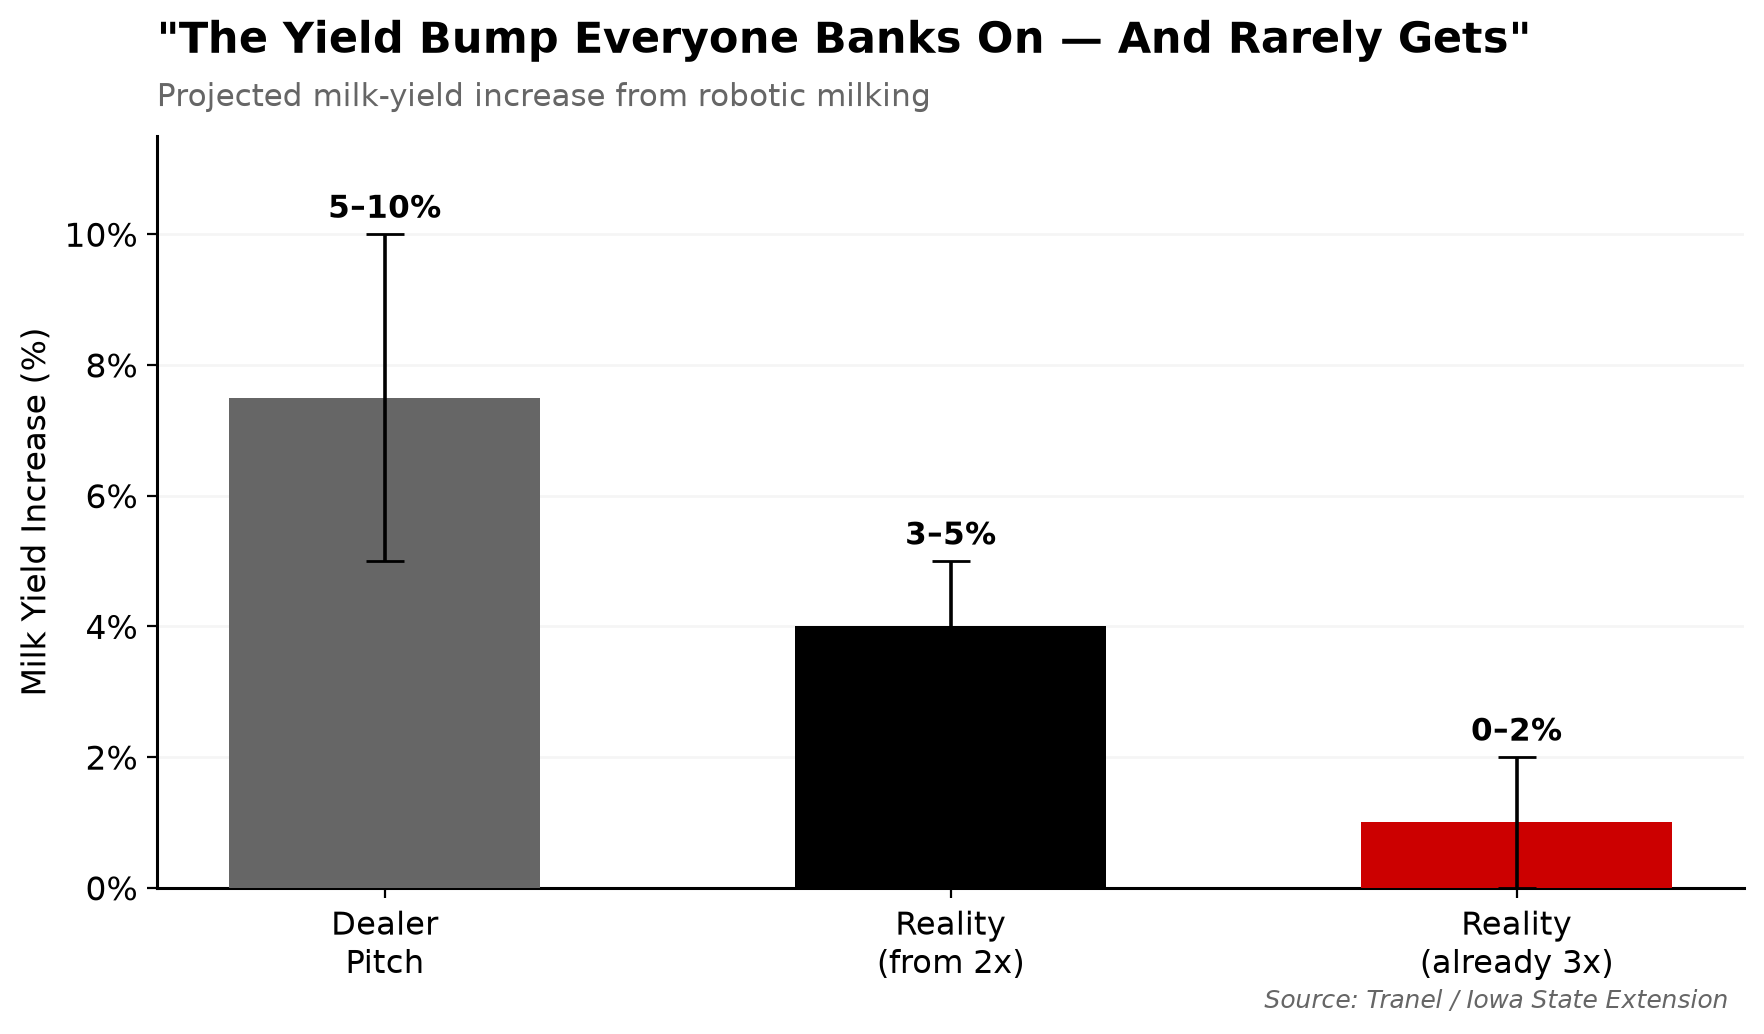
Milk yield bump5% to 10% increase3% to 5%; near zero if you’re already milking 3x
Cows per robot boxUp to 70 cows55 to 60 high-producing cows
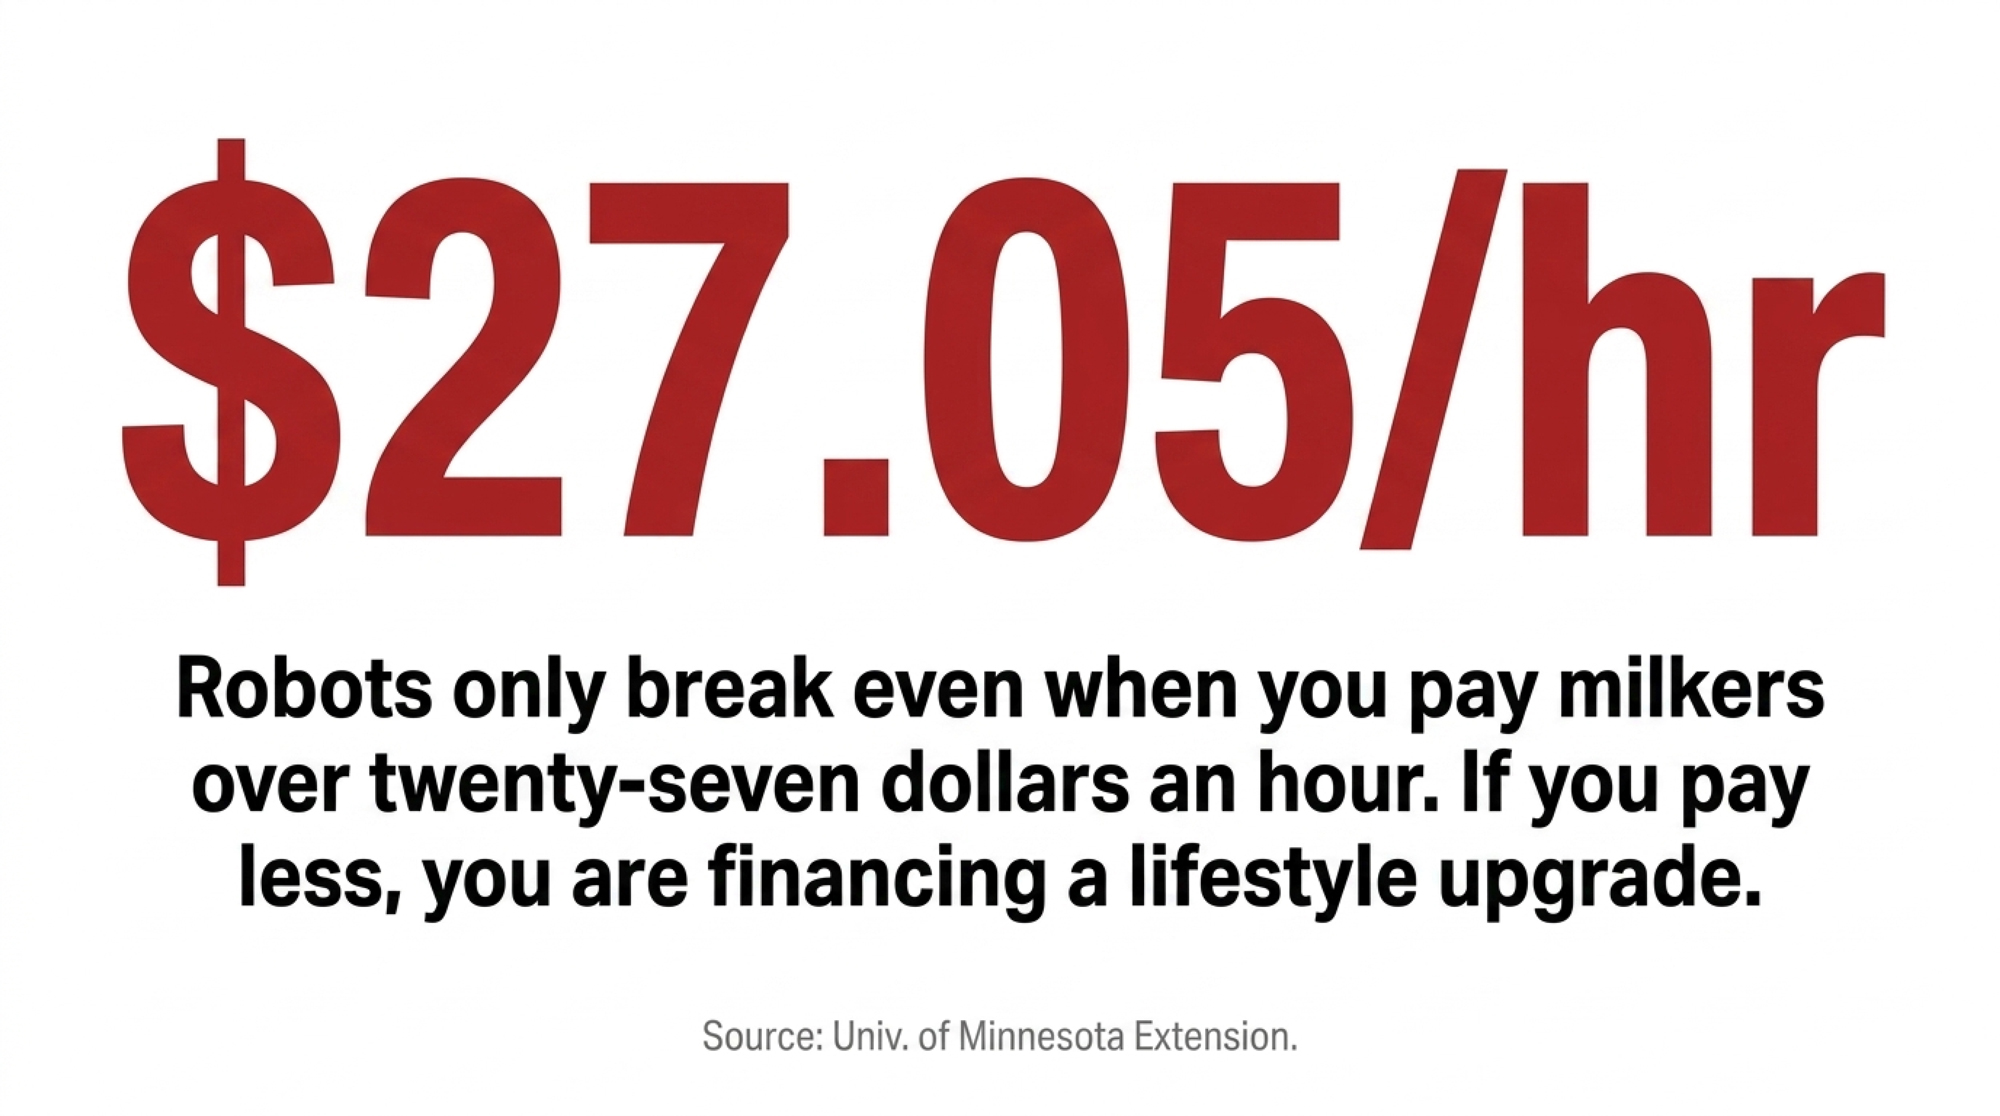
Break-even labor wage“Pays for itself”Only balances if current labor costs $27.05/hr
Net early annual returnHighly positive$1,391 to $1,472/year net cash flow

None of the dealer’s numbers are lies, exactly. They’re best-case inputs presented as expected ones. The extension column is what the same machine does in an average barn with average cows and an average loan — which is the barn most of us actually farm.

What Does a Robot Actually Cost Per Cwt — and What Does It Really Save?

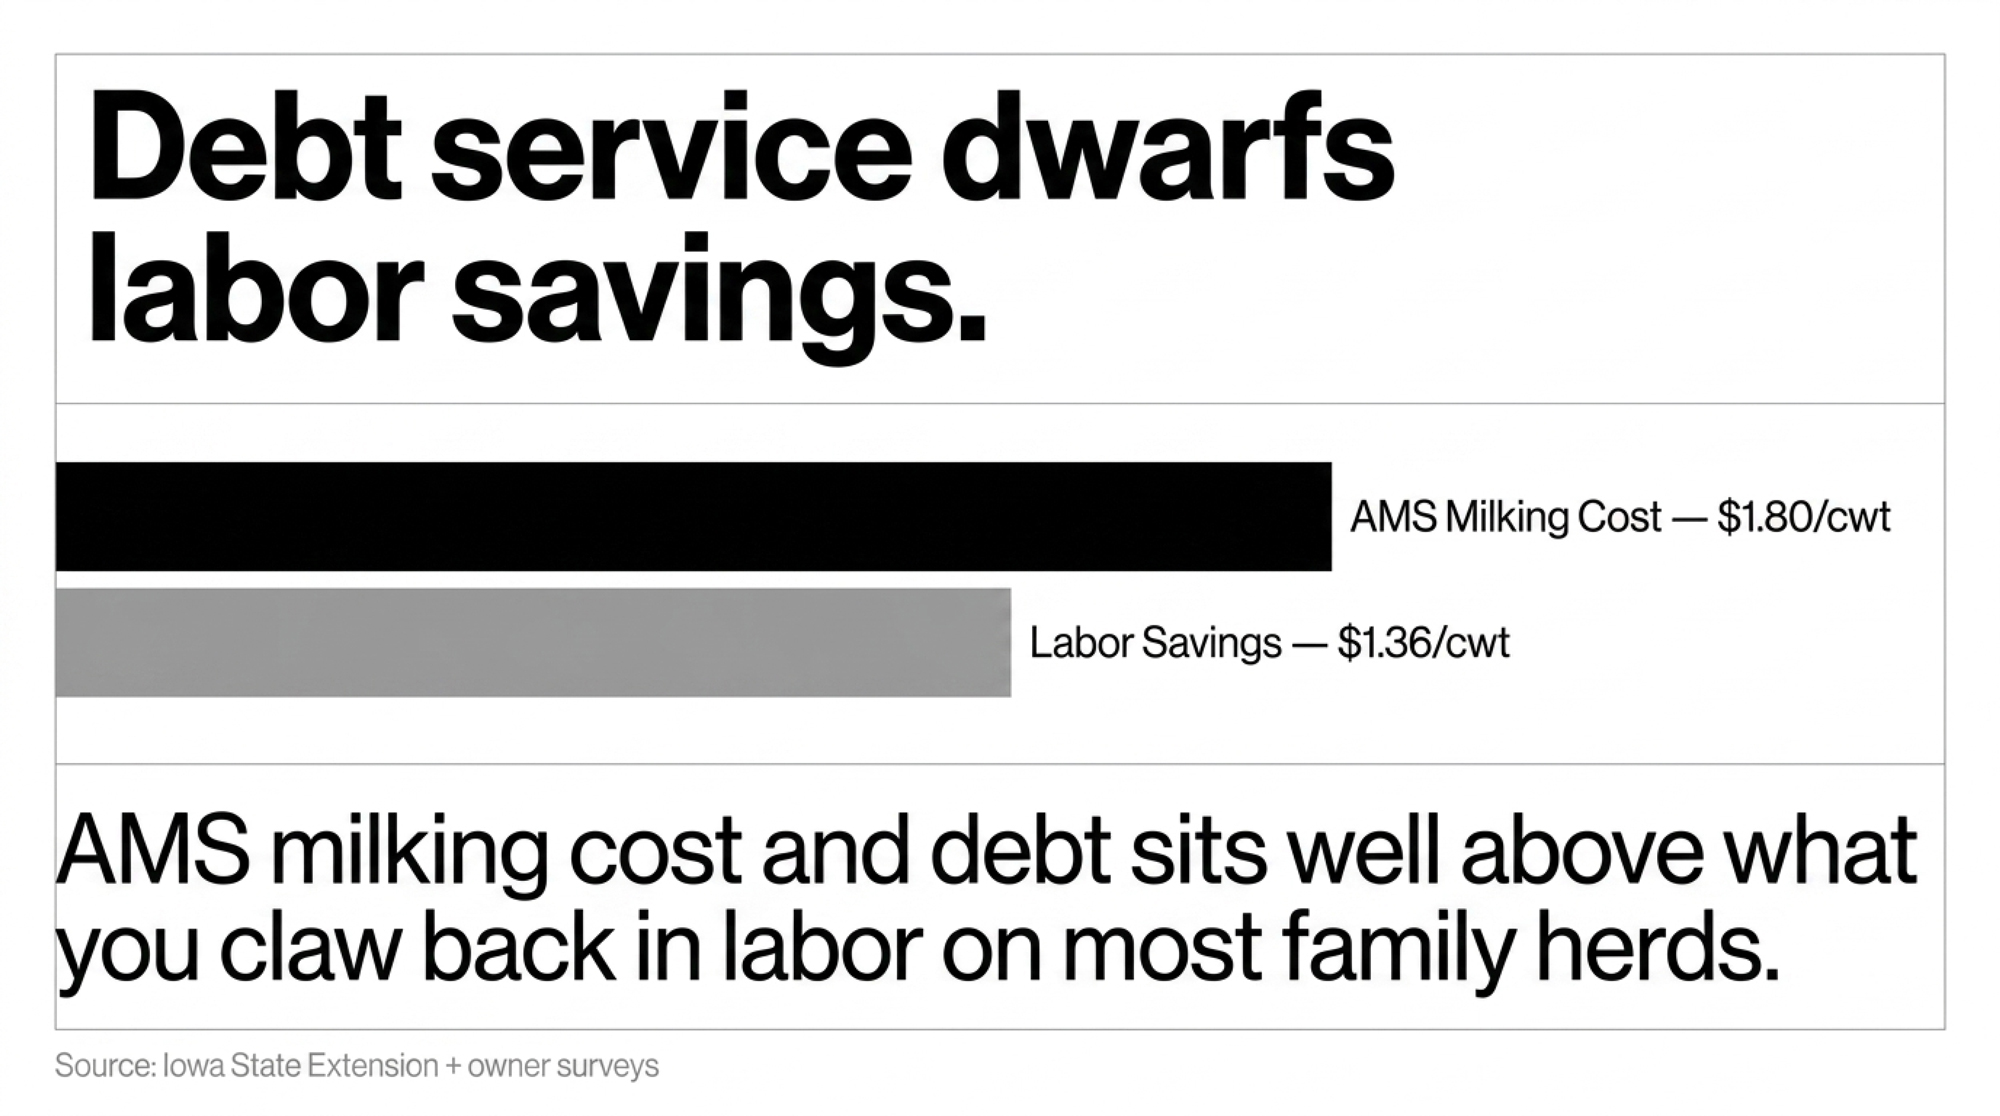
This is where the dealer math and the extension math part ways. Iowa State pegs the AMS milking cost at about $1.80/cwt, with a realistic range of $1.36 to $2.00 once you account for a leased two-robot setup at roughly $32,819 per unit per year. The labor savings that are supposed to offset it? Iowa State puts those at $1.06 to $1.36/cwt on a 120-cow herd — real, but thinner than the pitch implies. Line those bars up against debt service and the early-year squeeze stops being abstract.

Look at the gap and the lesson lands without anybody having to spell it out. The cost of running the robot plus the cost of financing it sits well above what you claw back in labor on most family-scale herds. That’s not an argument against robots. It’s an argument for knowing exactly where your own numbers fall inside those ranges before you treat the dealer’s single tidy figure as gospel. Pull your real labor hours and your real quoted payment, drop them onto this chart, and see whether your bars cross.

📖 Go deeper: Want the cash-flow valley walked through one year at a time? See our companion breakdown, Robotic Milking Pays 13% More — After 7 Years of Red Ink.

The Mechanics Behind the Outcomes

The most fragile number on a typical robot ROI proposal is the assumed milk-yield bump. Proposals routinely pencil in a 5 to 10% production increase. Tranel and the extension data put the realistic gain at 3 to 5% for herds coming off twice-daily milking — and for herds already on 3x, that per-cow response can run lower still. If you’re milking 3x in a good parlor today, that gap can shrink toward zero. And every other line on the spreadsheet is riding on it.

Tranel points to a cleaner predictor anyway: milk per robot box, not milk per cow. He’s blunt that milk per AMS unit is “very highly correlated” with profitability, more so than per-cow yield. Dealers rate the boxes for up to 70 cows. Extension guidance from Iowa State, Wisconsin, and Lactanet pegs the realistic profit sweet spot closer to 55 to 60 high-producing cows per robot. Push past that to make the numbers sing, and box time climbs, fetch lists grow, and the system quietly bleeds.

Then there’s the labor assumption holding the whole thing up. University of Minnesota Extension’s Jim Salfer found robots and a well-run parlor only break even when you’re paying milkers $27.05 an hour — or gaining about 3 pounds per cow per day more milk than your current 3x system. For you, if you’re not paying $27 an hour for milking labor, robots are first a lifestyle call. That’s a fair reason to buy one. It’s just not the same as a profit upgrade, and it’s worth being honest with yourself about which one you’re signing for.

Does the Math Change North of the Border?

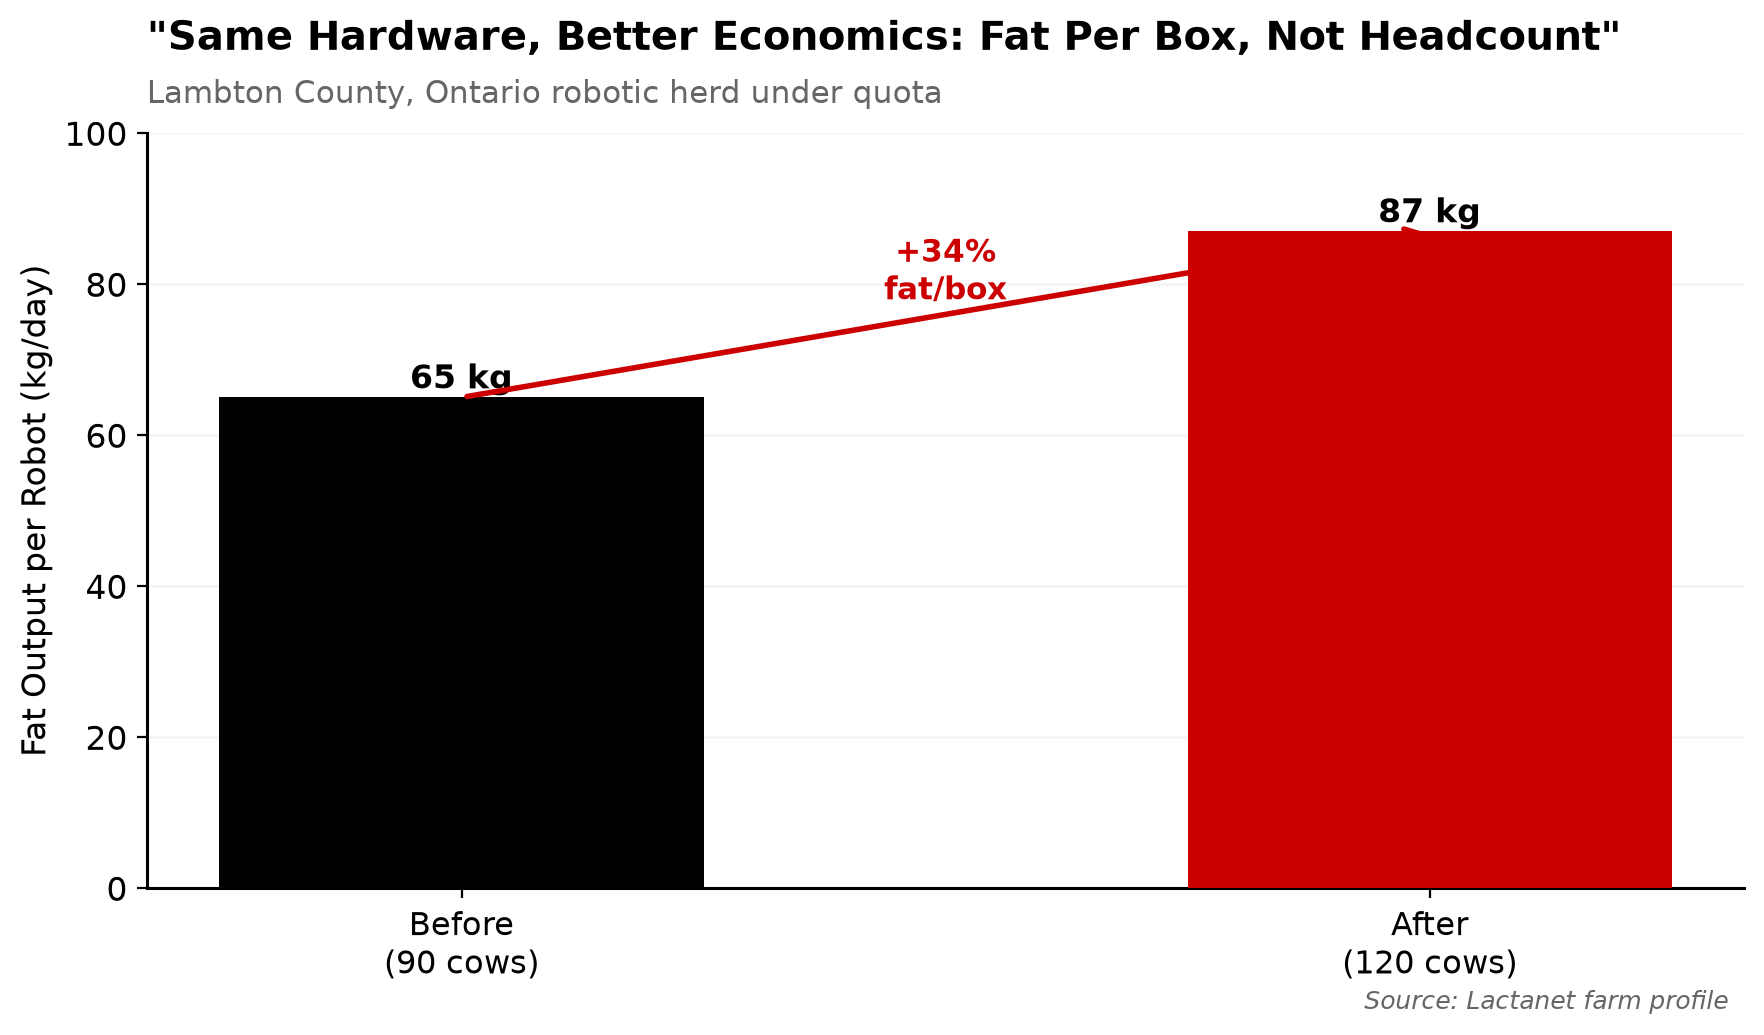
It does, and not in the direction most people assume. Under Canada’s quota system, the constraint isn’t selling more milk — it’s making more fat per kilogram of quota you already own. That flips the robot equation from “milk more cows” to “push more fat through each box.” A Lactanet-profiled farm in Lambton County, Ontario, shows what that looks like in practice: they grew from 90 cows producing 130 kg of fat a day to 120 cows on 175 kg of quota, lifting output per robot from 65 to 87 kg of fat a day. Same hardware, far better economics — because they optimized fat per box, not headcount.

But quota cuts the other way on the debt side. Lactanet has warned that with $20,000 of debt per kilogram of quota, a 2% interest-rate bump can add $225 per kilogram per year, and for a 100-cow farm with 113 kg of quota that’s an extra $2,000 to $3,500 a month before you’ve bought a single robot. Stack a $400,000 AMS loan on top of an already quota-leveraged balance sheet and the seven-year valley gets steeper, not shallower. If you farm under quota, you need to run the robot decision as a fat-per-box question and a debt-stacking question at the same time — not as the volume play the US extension models describe.

Options and Trade-Offs for Your Operation

There’s no single right answer here. There’s a right answer for your barn, your labor market, and your balance sheet. Four paths producers are actually walking:

PathWhen It FitsCapital / PaybackThe Risk (flagged)
Buy the robotsLabor scarce, wages mid-$20s, purpose-built barn~$400,000, 2 boxesRetrofit + cheap labor = financing the problem
Go hybrid (parlor + tech)Herds under 180 cowsMonitors: 7–14 mo paybackManages a shortage; doesn’t solve a true one
Fix the herd firstLameness or poor cow flowNear-zero (audit only)Skip it and the 7-yr valley gets deeper, fast
Wait & stress-testTight financesModel at $18 milk$18 milk pushed one pitch from $2.03 to $4.07/cwt
  • Buy the robots — when labor is scarce and expensive. Makes sense when you genuinely can’t hire or keep milkers, wages are pushing into the mid-$20s, and you’ve got a purpose-built barn with good cow flow and low lameness. Needs a strong start: a manager who likes living in the data, sand-bedded freestalls, tight box utilization. The risk — in a retrofit barn with cheap labor, you’re financing your problems, not fixing them.
  • Go hybrid — parlor plus targeted tech. For herds under the 180-cow threshold where activity monitors and precision feeding consistently out-return robots, you can capture much of the benefit at a fraction of the capital. The Bullvine’s 2025 tech-ROI analysis puts the automation sweet spot squarely between 180 and 400 cows — below it, monitors with a 7- to 14-month payback usually win. The risk — it manages around a labor shortage; it doesn’t solve a true one.
  • Fix the herd first — and start this month. Before you sign anything, run a real milking-routine and lameness check. Tranel’s seven-year valley gets deeper fast if cows won’t walk to the box. This is the cheapest move on the list, and it tells you whether your throughput problem is a robot problem or a management problem.
  • Wait and stress-test. If your finances are tight, model the proposal at $18 milk before you commit. A 240-cow Upper Midwest family ran their dealer’s four-robot pitch at $18 instead of the dealer’s $22 and watched the projected milking cost jump from $2.03 to $4.07/cwt. The risk cuts both ways — waiting costs you too if your labor situation is actively falling apart.

📖 Go deeper: If you’re milking under 500 cows and weighing robots against hired help, read Robots Won’t Save Your Dairy If You’re Alone: 5 Hard Truths About Labor and Robotic Milking ROI Under 500 Cows.

How Much Does That Seven-Year Valley Actually Cost a Family?

Year three is where it gets real. The robot has kept its promise on lifestyle — the early mornings are gone, the data’s slick, the barn looks modern enough that the neighbors slow down to look. But the bank’s promise on profitability is still on layaway. The monthly reality is $8,000-plus in annual red ink getting patched with off-farm income, a deferred repair, or a quiet draw on equity that nobody mentions at supper.

Try the debt-service coverage check your lender actually runs. DSCR is just your net farm income available for debt service divided by your total annual payments. Say you’ve got $260,000 available and $200,000 in existing payments — that’s a 1.30x ratio, comfortable. Add, say, an $80,000 robot payment and the same income now covers $280,000 of debt, dropping your DSCR to roughly 0.93x. Below 1.0x means the farm isn’t generating enough to cover its own payments, and that’s when a lender turns cautious. The University of Waterloo’s dairy-robotics case study put it bluntly: adopting AMS “may require a transition period of up to four years to achieve profitability.” That’s a polite description of the same valley.

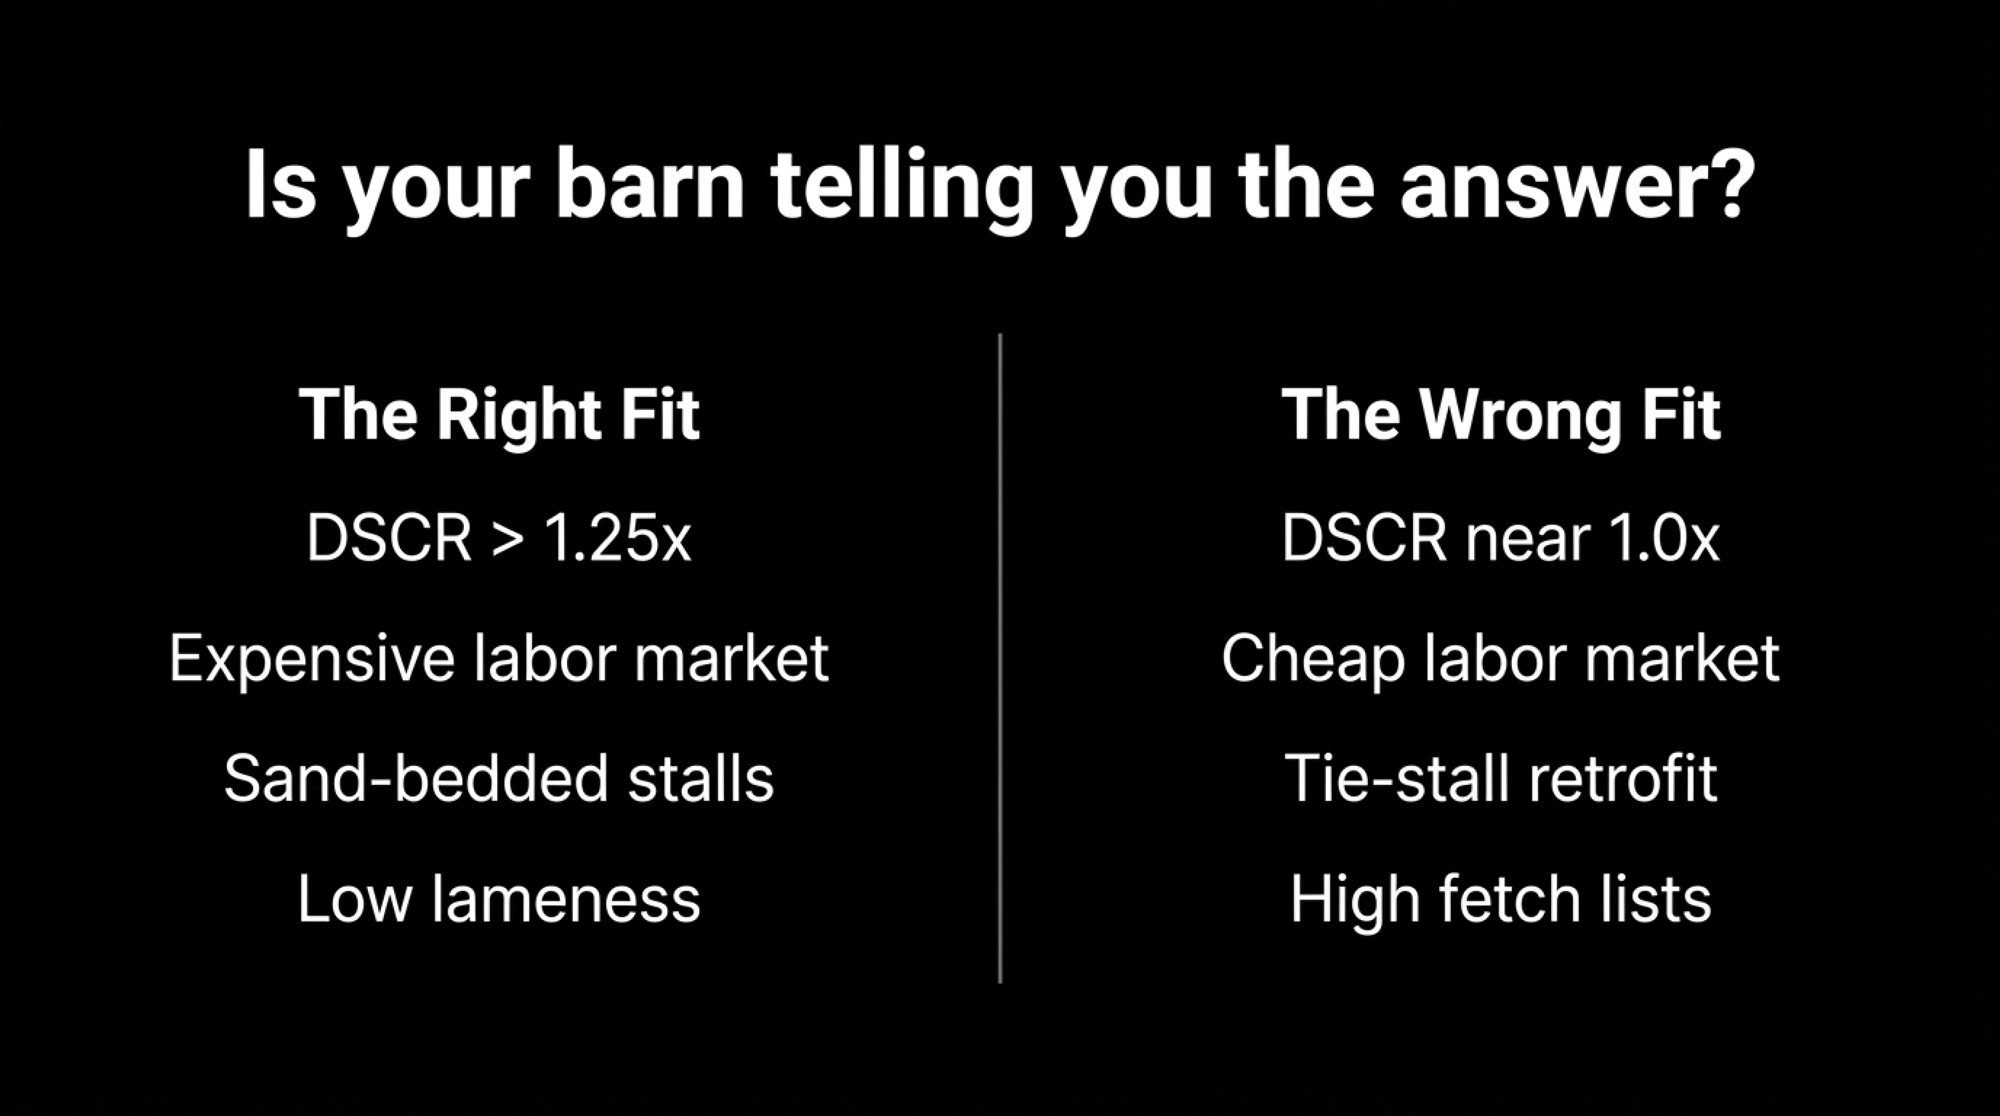
Is Your Barn Already Telling You the Answer?

You can spot the fit before the decision’s even made — no hindsight required. The farm that should buy robots has high, hard-to-fill labor, a DSCR comfortably above 1.25x, sand-bedded stalls, clean feet, and cows already hitting strong milk per box. The infrastructure was doing the hard work. Robots just monetize it. Walk that barn and the cows are calm, the alleys flow, the fetch list is short.

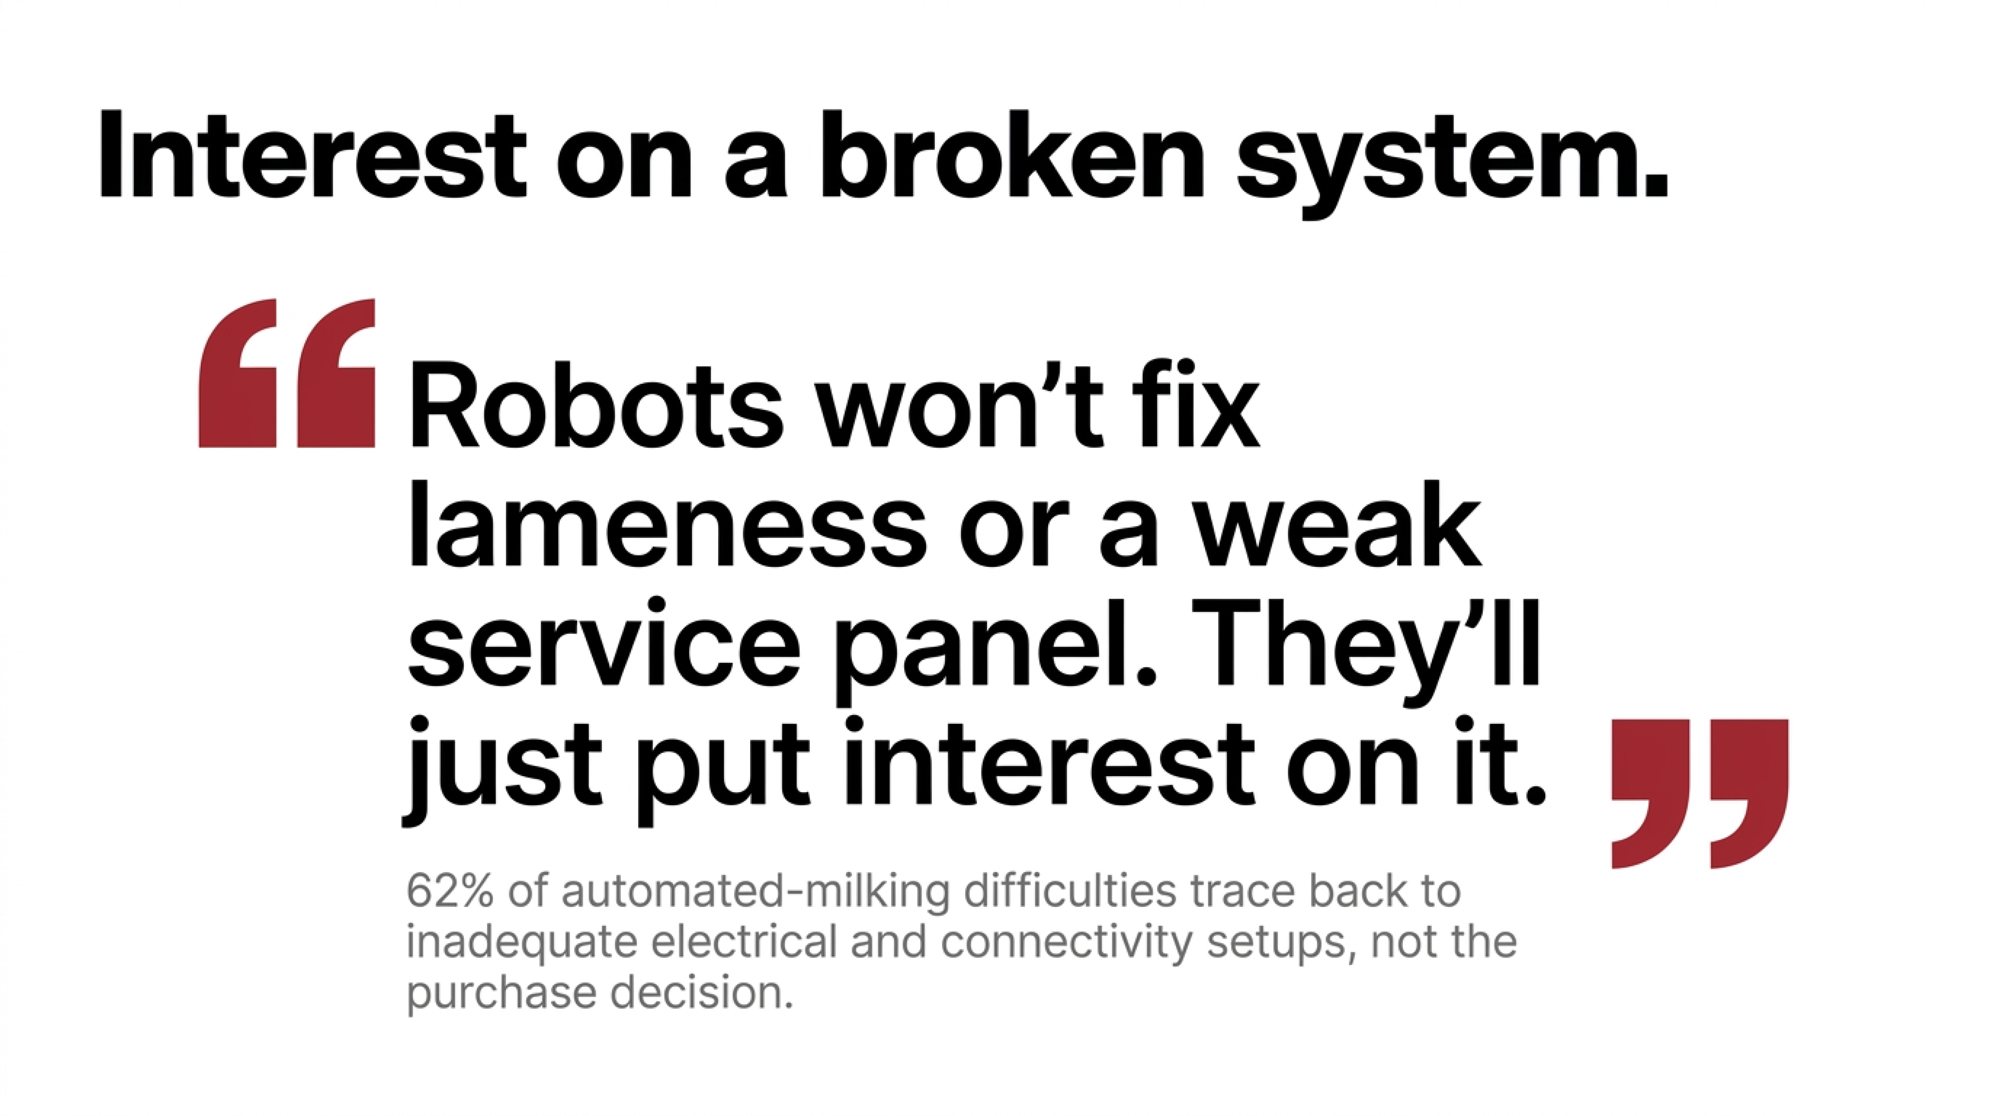
The farm that shouldn’t is the tie-stall retrofit with cheap labor, a debt-service ratio already flirting with 1.0x, lameness in every alley, and a fetch list that’d make a robot tech wince. There’s a hard infrastructure truth underneath this, too: Bullvine’s 2025 tech-ROI work found 62% of automated-milking difficulties trace back to inadequate electrical and connectivity setup, not the purchase decision. Robots won’t fix lameness or a weak service panel. They’ll just put interest on it. Here’s what the glossy proposal tends to underplay: the robot is an amplifier, not a cure. Watch a milking, walk the alleys, look at the feet — your barn usually answers the question before the dealer does.

What About the Next Generation Standing in the Doorway?

Now put the daughter back in the picture. Only about 16.5% of dairy farms make it to the third generation — the other 83.5% don’t, and it’s usually planning and debt structure that sink them, not markets. Lenders generally want debt-to-EBITDA under 4:1 and term-debt coverage of at least 1.25x before they’ll bless new debt. So the question across that table isn’t really “robots or no robots.”

It’s whether you want to hand her a business with room to breathe — or a high-tech barn strapped to a payment schedule she’ll spend her thirties servicing. A clean balance sheet with good cows is a bigger inheritance than a laser arm. Robots can absolutely be part of a strong handoff. But only when they’re turning a real labor crisis into durable margin in a barn that already works — not when they’re bolting cutting-edge debt onto a structure that was already wobbling.

📖 Go deeper: Before you add a dime of debt, walk through Why 83% of Dairy Farms Will Disappear: How to Beat the Succession Odds Before It’s Too Late.

📋 The Kitchen-Table Checklist

Financial Guardrails

  • The DSCR target: If your debt-service coverage ratio sits below 1.15x before adding robot debt, treat it as a flashing yellow light — model the new payment against your income before you fall for the technology.
  • The stress test: Run the proposal at $18 milk, not $22 — then add one $10,000-to-$15,000 maintenance spike. If it still covers payments and family living, proceed. If it only works at $22, you’ve found your real answer.
  • The yield assumption: Make the dealer put the milk bump in writing. If it’s above 3 to 5% and you’re already milking 3x, demand retrofit-specific data before you sign.

Operational Realities

  • The break-even wage: Check your actual milking-labor wage. If you’re paying well under $27/hour, you’re buying a lifestyle upgrade, not a profit margin — fine, as long as you decide with that clear.
  • Box efficiency: Keep plans capped at 55 to 60 high-producing cows per box. Push past that and your fetch lists spike while box utilization tanks.
  • The quota flip (Canada): Judge the system on fat per box, not head count. Follow the Lambton County model — they hit 87 kg of fat per robot per day by optimizing that, not headcount.

Before You Sign

  • Infrastructure first: Have an electrician audit your service panel and connectivity. 62% of automated-milking failures trace back to poor electrical/connectivity setup, not the purchase.
  • The free option: Book a comprehensive milking-routine and lameness audit this month. If cows won’t walk to the box voluntarily, your cash-flow valley gets deep, fast — and it’s the cheapest check on this list.

The One Question to Put on the Table

So if you could ask just one thing across that kitchen table, make it this: If I plug my own last 12 months of milk checks, my real labor cost, and my actual barn into Tranel’s cash-flow model and Salfer’s breakeven wage, does this robot still make money — or am I just financing a lifestyle upgrade? It’s a fair question. It just forces the dealer’s averages to collide with your numbers — which is exactly the collision a glossy proposal is built to avoid.

So where does your breakeven really sit? Before you sign a $400,000 note, run your own numbers against the ones the brochure left out, and have that conversation with your lender and your kid in the same week. We’ve built the full cost-per-cwt model by herd size — plus the $18-milk stress test and the quota-side fat-per-box math — in this week’s Bullvine Weekly breakdown. That’s where the real numbers live, and it’s worth an evening before the dealer’s truck comes back down the lane.

Key Takeaways

  • If your DSCR is under roughly 1.15x before the robot note, treat that as a yellow light and run the $18 milk stress test before you sign.
  • Robots make the most sense where labor is truly scarce and expensive, cows are sound, and you can keep box use in the 55–60 high-producing cows range.
  • If you’re paying well under $27/hour for milking labor, be honest that you’re mostly financing lifestyle, not margin, and decide with that clear.
  • Before any AMS contract, do the cheap work first: a full milking-routine, lameness, and infrastructure audit in the next 30 days to see if you’re fixing management or just buying hardware.

Run Your Numbers

Before you accept any dealer’s three-year payback, drop your own installed cost, labor wage, milk price, interest rate, and downtime into the Robot ROI Reality Check. It turns the dealer’s averages into your breakeven and shows whether the seven-year valley is real on your balance sheet.

Learn More

The Sunday Read Dairy Professionals Don’t Skip.

Every week, thousands of producers, breeders, and industry insiders open Bullvine Weekly for genetics insights, market shifts, and profit strategies they won’t find anywhere else. One email. Five minutes. Smarter decisions all week.
NewsSubscribe
First
Last
Consent
Send this to a friend