Archive for Farm Economics & Management – Page 4

Two Fresh Cows, Same Day 1: One Tops the String, One’s a Wreck

Same morning, same flat look, both in third lactation. By day 4, one’s your top cow and one’s a train wreck — and Cornell’s Jess McArt says rumination told you which on day 2.

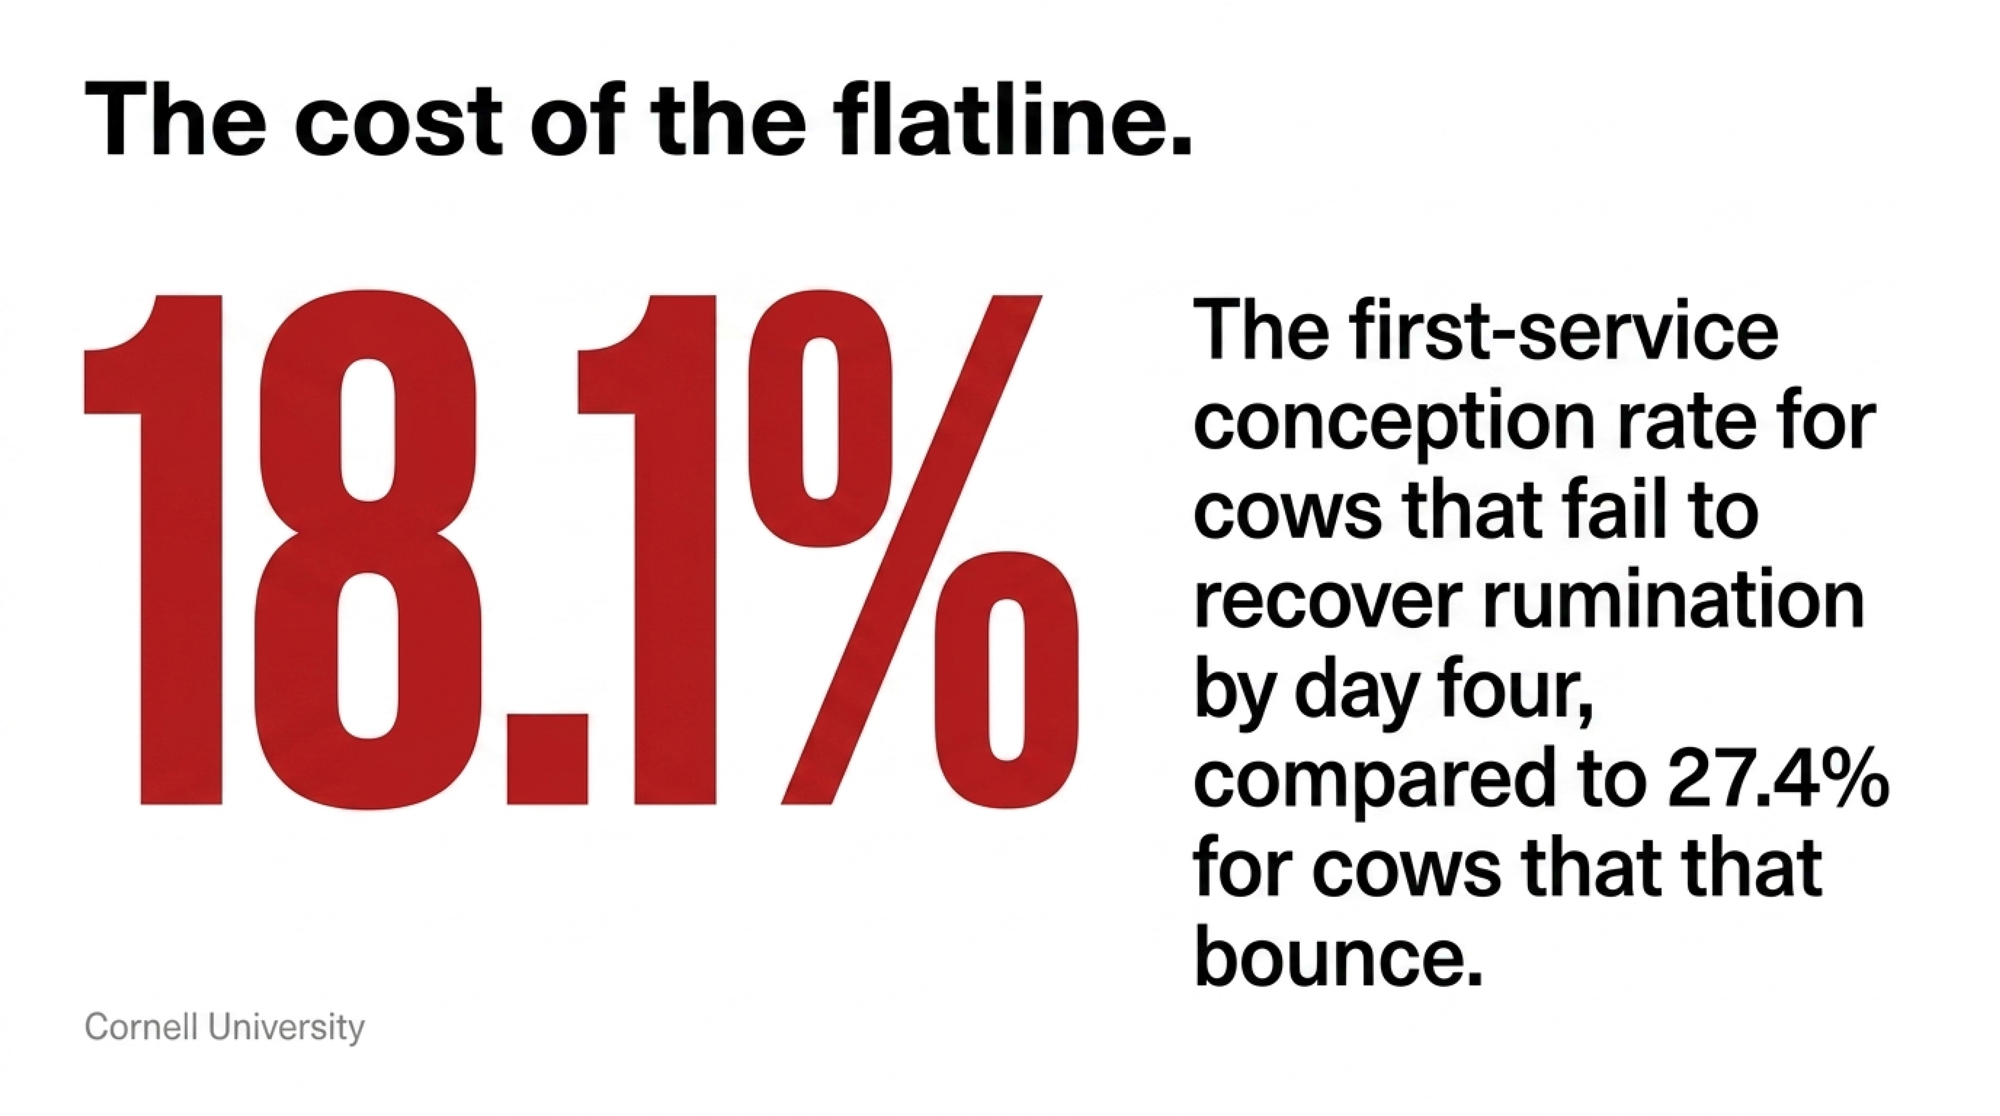
Executive Summary: Subclinical hypocalcemia is the fresh-cow problem hiding in plain sight, and Cornell’s Dr. Jess McArt says the cow worth chasing isn’t the one that drops calcium hardest — it’s the one still flat at four days in milk. Her group stopped sorting cows by how low they go and started watching how fast they recover, because the day-1 dipper that climbs back is often your top producer, while the cow that holds flat carries roughly double the adverse-event odds and a first-service conception rate of 18.1% versus 27.4% for cows that bounce. The cheap on-farm tell is rumination: most cows calve around 200 minutes a day and should push toward 400 by two to three days fresh, and the ones that don’t make that climb are your real red list. That matters for the milk check because blanket bolusing every fresh cow in a 1,000-cow herd runs about $7,000–$8,000 a year, much of it spent on cows already winning the lactation. McArt’s call is to target rather than treat-them-all: oral calcium for the cows whose curve indicates they’re struggling, leave the climbers alone, and reserve IV for genuine clinical milk fever, since spiking a standing cow is usually detrimental. The catch — she’s blunt: most of this is still observational, and the trials to nail down exactly which cows benefit are in progress. Read the full piece if you run a multiparous-heavy herd with collars and want the day-4 protocol spelled out.
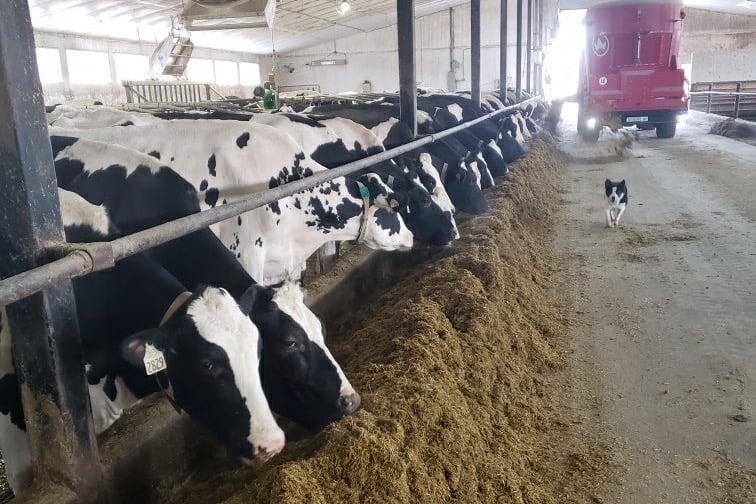
subclinical hypocalcemia

She’s standing. She’s chewing. She walked to the bunk this morning like nothing was wrong. And on day one, you genuinely can’t tell whether she’s about to be your best cow of the year or the most expensive animal in the fresh pen.

That’s the uncomfortable truth at the center of Dr. Jess McArt’s discussion of subclinical hypocalcemia on The Dairy Podcast Show hosted by Barry Bradford (Episode 196, “Hypocalcemia and Inflammation in Dairy Herds,” released May 2026). McArt is a professor of ambulatory and production medicine at the Cornell University College of Veterinary Medicine, and chairs its department of population medicine and diagnostic sciences. The dramatic down cow — classic milk fever, cold ears, flat out — is the problem the industry has mostly beaten. The fresh cow she worries about today never goes down at all. She fails to recover, loses a chunk of her lactation, and never lands on your treatment list until the money’s already gone.

The Problem You Already Solved Was Hiding a Bigger One

Twenty years ago, calcium was simple. Watch for milk fever. Hang a bottle. The cow stands up and walks away. McArt learned it that way in vet school. So did most of the people reading this.

Negative DCAD diets changed the game. By acidifying the prepartum cow — dropping her blood pH just slightly — you give her better access to calcium right when lactation starts pulling it out, so she rebounds faster. In some large herds, McArt says clinical milk fever has declined to the point that training new employees to recognize a case is genuinely hard now. They rarely see one. That’s a real win, and nobody should undersell it. (Transition Cow Success: the high-stakes game that makes or breaks your dairy’s profit)

But pull blood from a hundred fresh cows, and you’ll still find a stack of them sitting below normal calcium levels. They’re just not falling over. The subclinical form affects nearly half of multiparous cows as they transition into lactation, going back to Reinhardt’s 2011 national prevalence survey, and in older, third-plus-lactation cows the share has been reported as high as 73%. For years, McArt says, the subclinical problem was too hard to study because everyone tested on different days in milk and used different cut points. There was no agreed-upon number to point to. So her group went after the more useful question: which day in milk actually predicts whether a cow is in trouble.

The old habit was to treat every low number the same. McArt’s work says that’s exactly the mistake — and it’s costing herds in ways the records don’t make obvious.

Stop Chasing the Wrong Cow

Here’s the reframe that changes how you walk the pen. McArt’s group stopped sorting cows by how low they drop and started sorting them by when — and whether — they bounce back. The split at four days in milk is stark enough to put in a table and tape to the parlor wall:
Cow Type at Day 4 DIMDay 1 RuminationTrajectory by Day 3–4First-Service ConceptionAdverse-Event OddsRecommended Action
Transient (Bouncer)~195 min/dayClimbs to 400+ min/day27.4%1.0× (reference)Leave alone — don’t interrupt momentum
Persistent (Flat-liner)~190 min/dayStays at 195–205 min/day18.1%~2.0×Oral Ca bolus (Day 1 + Day 2 if flat)
Clinical Milk FeverRecumbent / off bunkN/A — cow is downNot applicableHigh — emergencyIV calcium — genuine clinical case only
Healthy No-dip Heifer180–220 min/daySteady climb, parity-adjustedBaseline for group1.0× (reference)Monitor vs. your parity benchmark

So the cow you panicked about on day one might be your best producer, and the one quietly coming apart on day four might never even have made your list. You’re not hunting low calcium. You’re hunting for failure to recover. (The $42,000 Transition Mistake: Why Blanket Protocols Are Failing Your Best Cows)

Two Cows, Same Morning, Different Endings

Picture the split with two cows out of the same fresh group — a composite drawn from the patterns McArt describes, not one real barn, but the shape plays out in pens everywhere. Call them 412 and 388. Both calve overnight, both third-lactation, both look a little flat at the morning check. On a blanket protocol, they’d get the same two boluses and the same shrug.
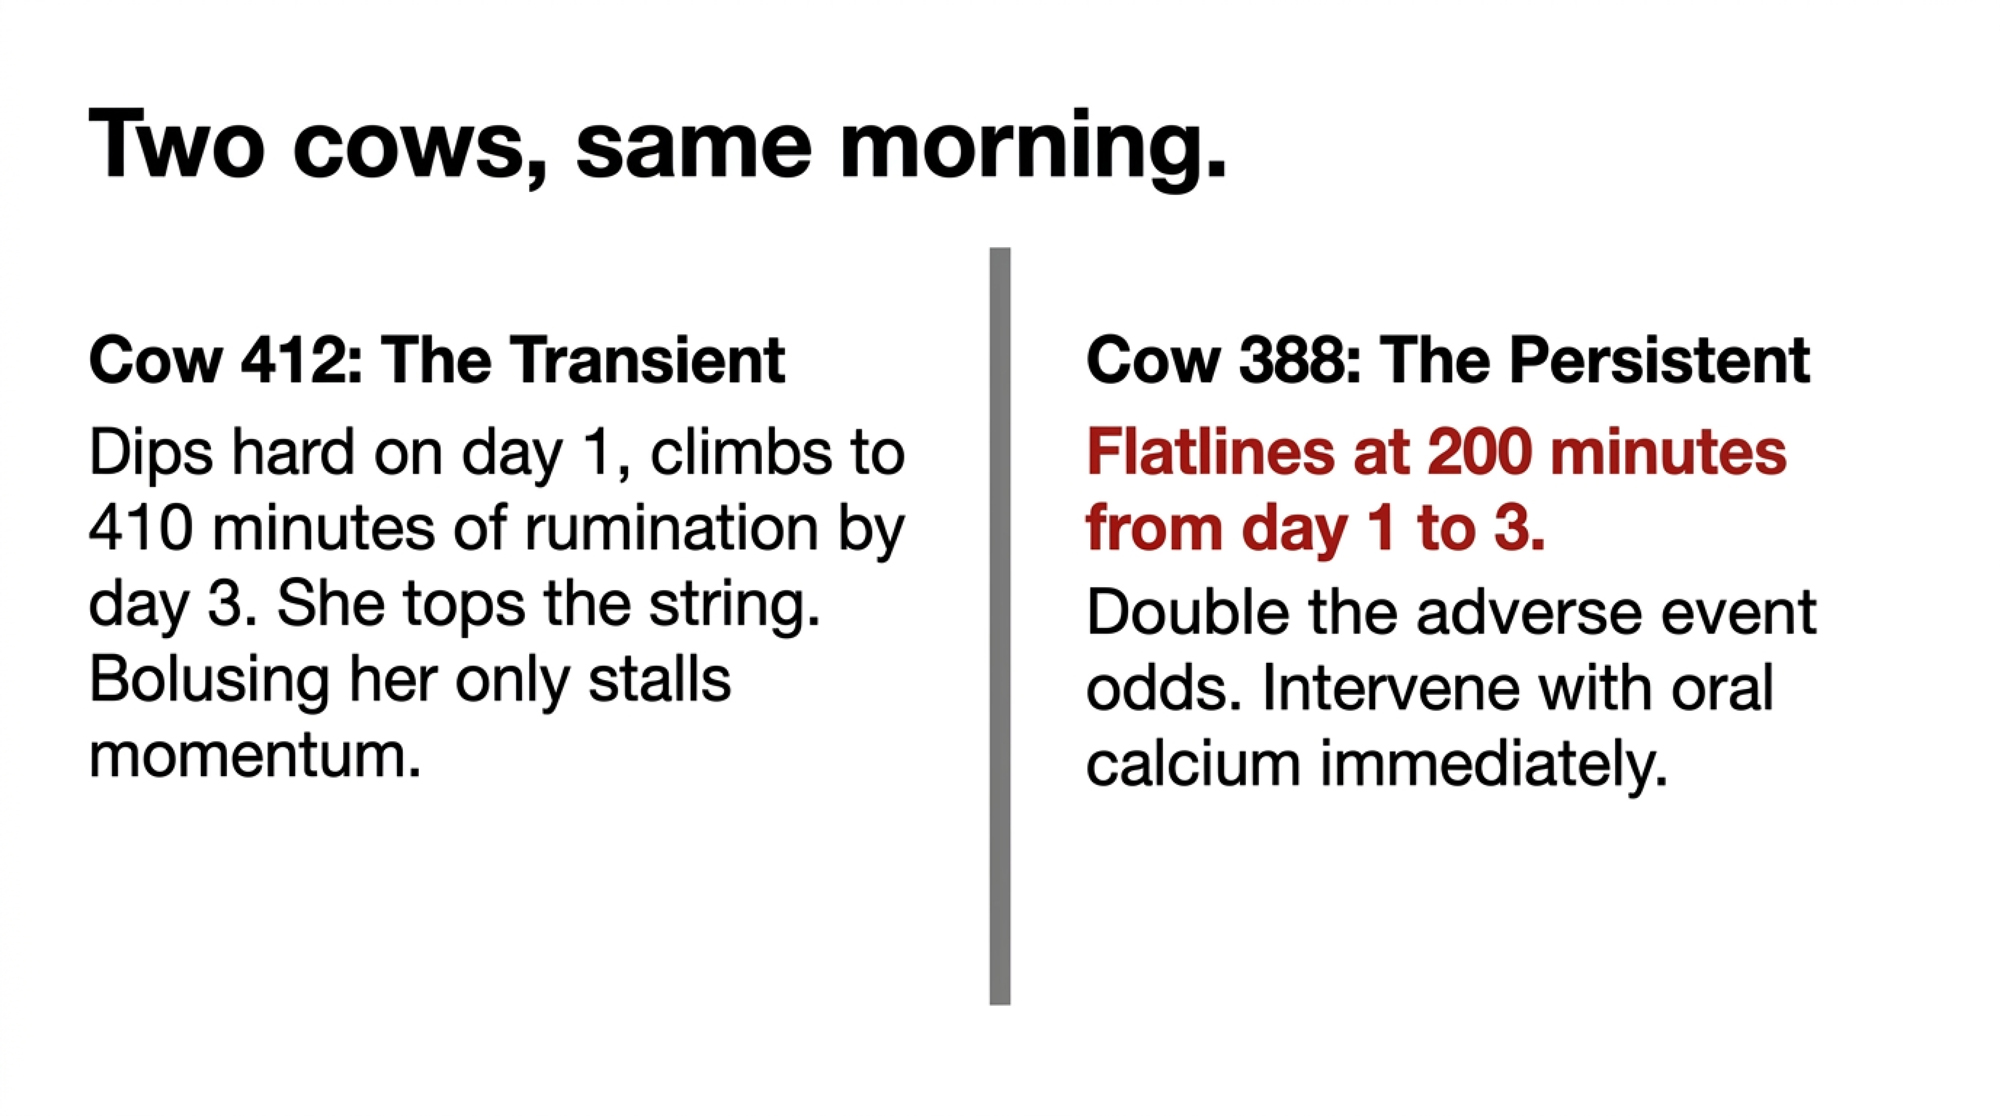
Cow 412’s rumination collar tells one story: 195 minutes the day she calves, 310 the next morning, pushing 410 by day three. She’s the textbook transient — dipped hard, climbed hard, and she’s the cow who’ll top the string by 100 days. Bolus her twice “to be safe” and the best case is you did nothing; the realistic case is you spent labor and product stalling a cow who was already winning.
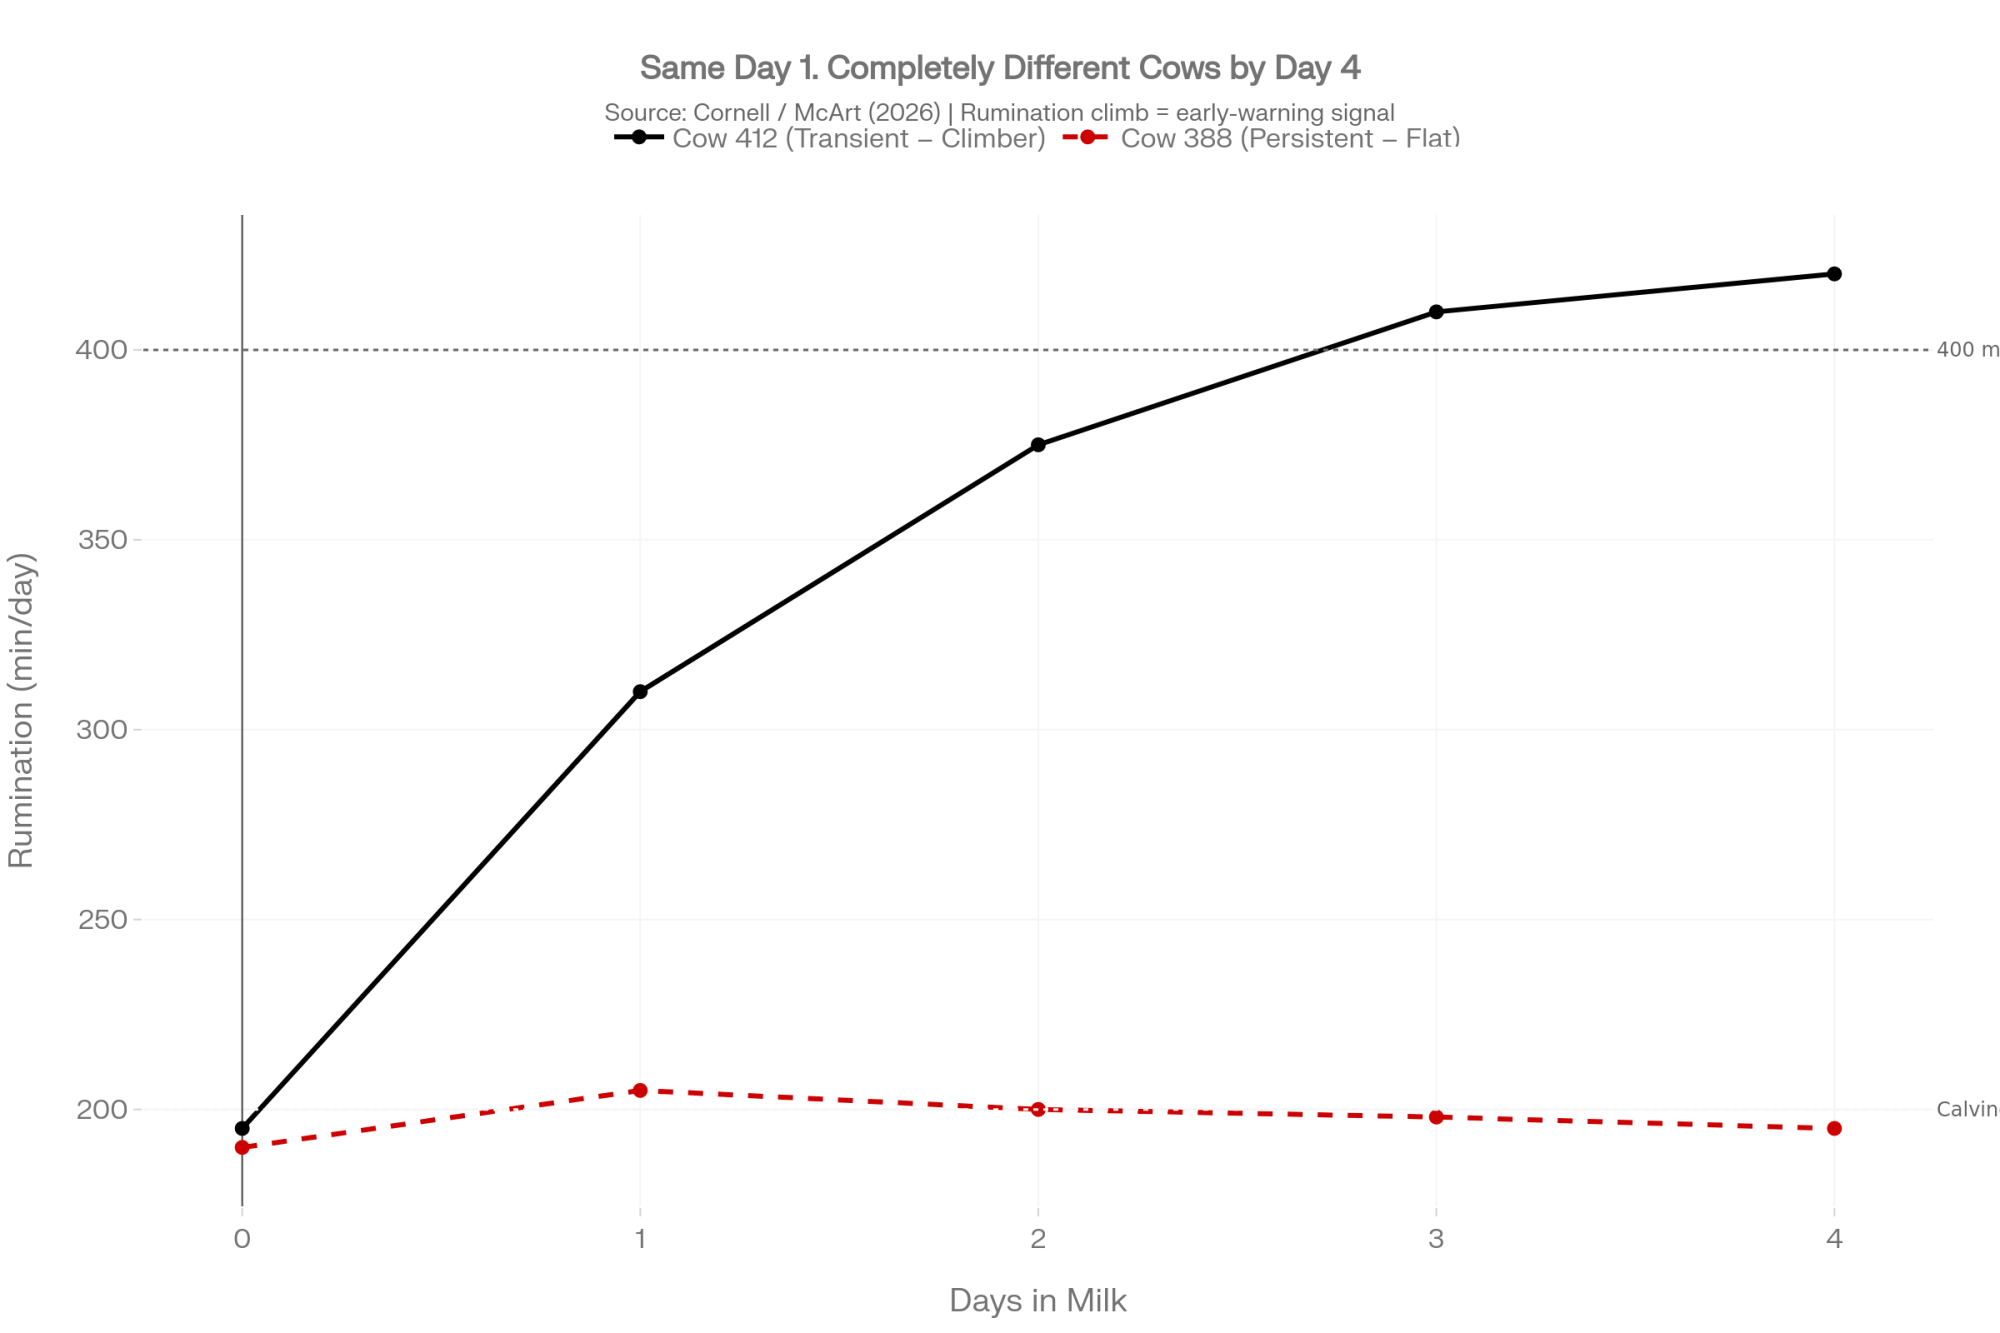
Cow 388 reads the opposite. She opens at 190 minutes and sits there: 205 the next day, 200 the day after that, no climb. That flat line is the warning the cow throws before she looks sick. She’s the persistent-low animal in the table: roughly double the odds of an adverse event, a few kilos down on intake, and a first-service breeding that’s far likelier to come up empty. Same morning, same look, completely different cow — and the only thing that separated them by day four was the slope of a line you already had on a screen.
Why McArt Is Watching Inflammation Now

Most producers still see the calcium drop as the problem. McArt’s group is chasing something underneath it. She’s blunt that most of their work so far is observational — they’re still trying to figure out why these dynamics happen — but one thing keeps surfacing: it’s all highly tied to intake.

Cows that calve, start eating well, and stay on a good ration don’t look back. The cows that end up dyscalcemic at four days often look fine for a few hours after calving, and then their rumination and intake start to slide. It might only last four or five days, but that’s long enough in early lactation to bend the whole lactation curve.

That’s why her newer work is digging into how these calcium dynamics tie to inflammation, and which cows might actually benefit from treatment and when. She isn’t saying calcium stopped mattering. She’s saying the calcium number is one readout of a system that may already be under stress, and the answers aren’t in yet.

And this is where the honest limits of the science show. Most of what McArt’s group has done so far is observational. They can see the associations between low day-four calcium, dropping intake, and more disease, but observation can’t tell you which way the arrow points or which cow an anti-inflammatory would actually help. That’s the gap the next wave of work has to close before anybody starts reaching for a different bottle. (Mastering the Transition: a holistic approach to dairy cow health)

Putting the Science to Work: How Do You Actually See Her?

With your eyes? You usually can’t — not early enough. By the time she looks sick, she’s already paid the bill. And here’s the wall McArt keeps hitting: there’s still no easy, cheap, on-farm test for most of this. Calcium’s hard enough; an inflammatory marker like haptoglobin, which she admits she spends a borderline-crazy amount of time thinking about, can’t be measured cowside at all yet. That gap is exactly what stops many producers from acting — they don’t know which cows to treat.

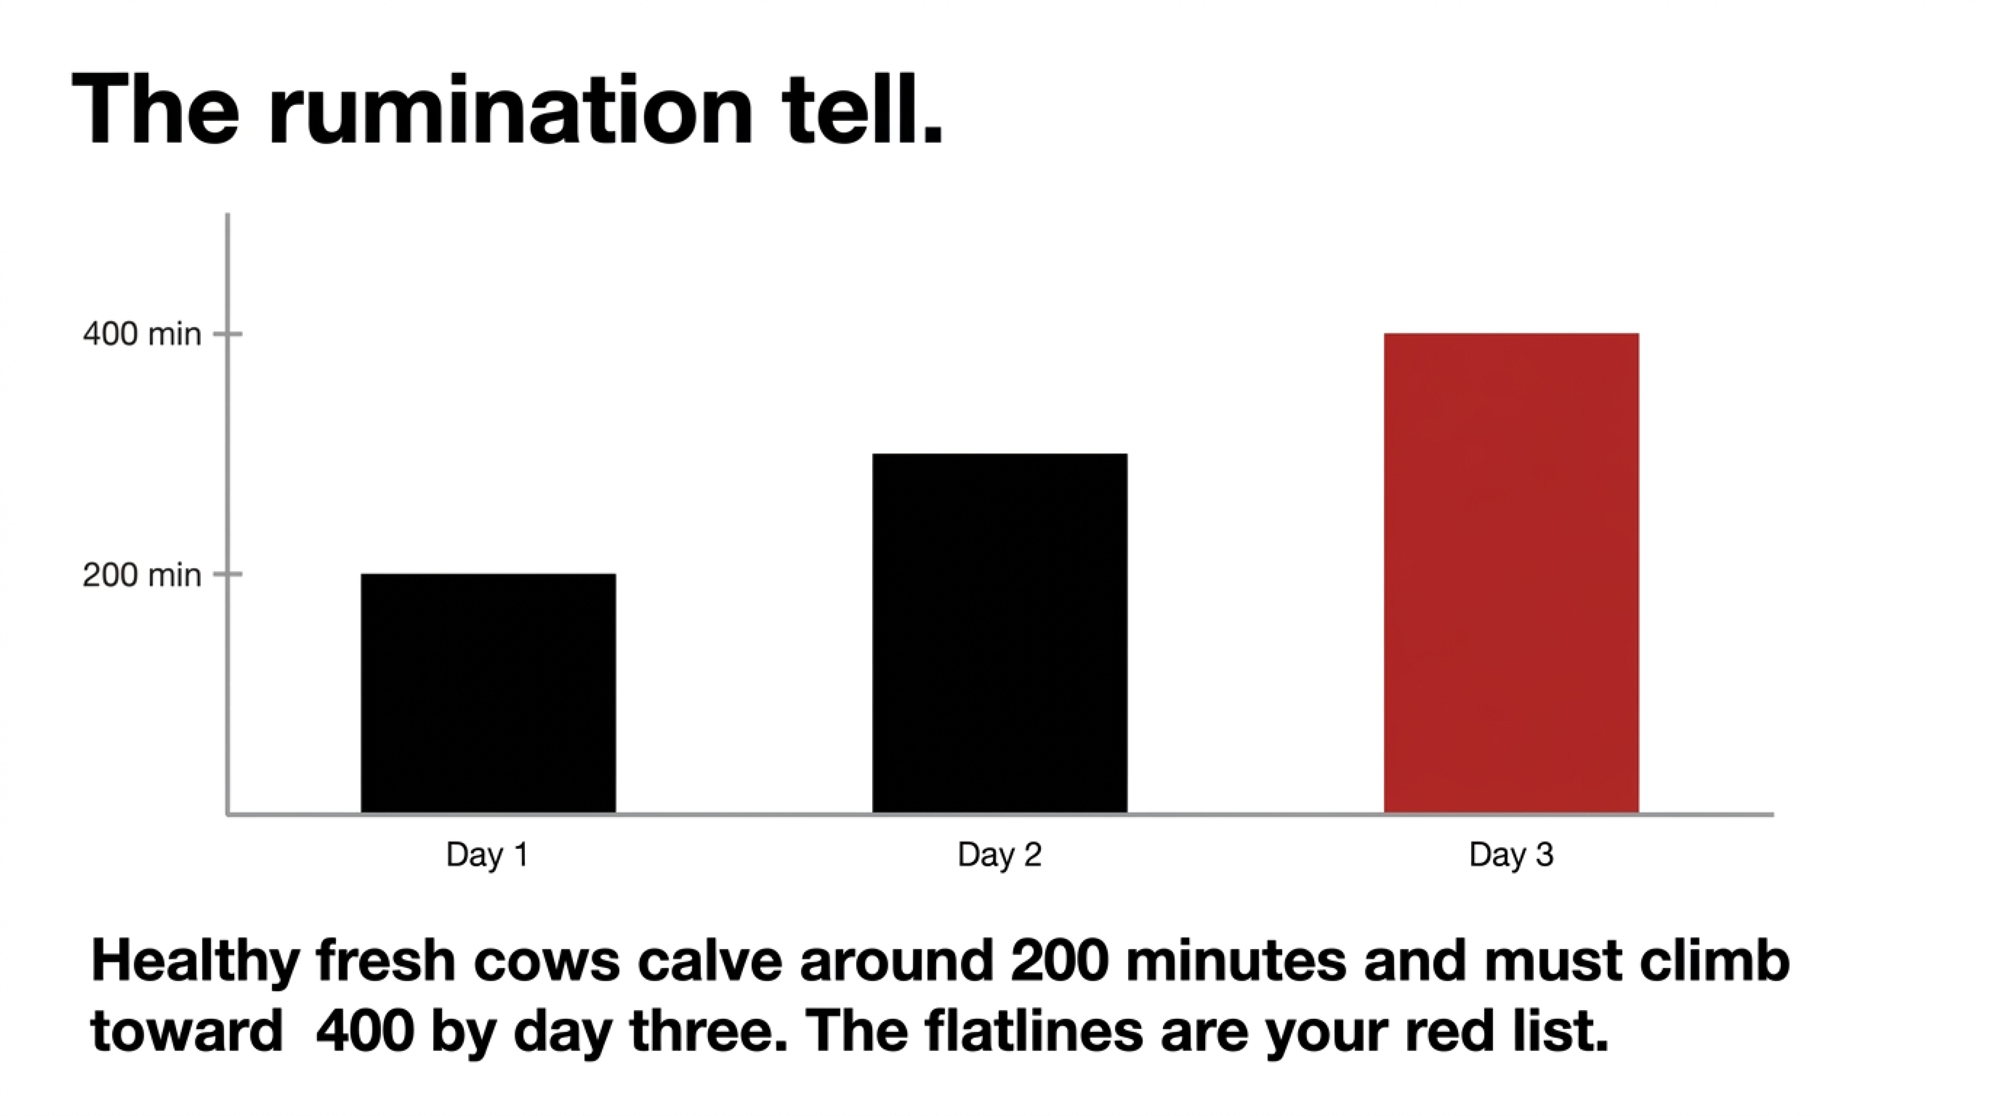
So McArt’s favorite practical tool right now is the one many herds already have: rumination time. Rumination tracks intake closely, and the faster a cow’s rumination climbs after calving, the higher her milk yield tends to be. A flat or slow-rising line is an early warning the cow throws before she ever looks off.

THE NUMBER TO TAPE TO THE WALL: Most cows calve in around 200 minutes of rumination a day and should climb toward 400 minutes by two to three days fresh. The cows that don’t make that climb are your red list.

Her own worked example is the barn-math worth stealing. The cows that haven’t made that 200-to-400 climb are the ones you bolus — one that day, one the next — and the cows tracking up, you leave alone. That’s a real threshold you can build off your own collar data this week, not a research abstraction.

Build Your Own Baseline Before You Trust the Threshold

One caution before you bolt McArt’s 200-to-400 numbers onto your barn: those are her illustrative figures, not a universal cutoff. Rumination baselines drift with your collar brand, your ration, your housing, even your breed mix. The smart move is to pull 30 to 60 of your own healthy, no-treatment fresh cows from the last few months and chart their average minutes per day for the first week.

Do it by parity, because a mature cow and a first-calf heifer don’t ramp the same way, and a heifer benchmark borrowed from the cow pen will have you chasing animals that are fine. Once you’ve got your own healthy curve, the flag isn’t a magic number. It’s any fresh cow tracking well below her own parity group’s normal climb by day two or three. That turns a borrowed rule of thumb into a threshold your own data earned.

What the Live Research Is Still Working Out

McArt’s rumination idea isn’t settled science yet. It’s an active research front, and she names the people running it. Clara Seeley at the University of New Hampshire and Luciano Caixeta at the University of Minnesota are looking specifically at how oral calcium bolusing affects rumination time after calving.

The logic they’re testing is exactly the one a producer would want proven before betting labor on it: if rumination is such a tight proxy for intake, then a cow whose rumination slope climbs faster after a bolus is probably a cow the bolus actually helped, and one whose line stays flat probably wasn’t going to benefit no matter what you hung on her. Get that right, and rumination stops being a vague “she looks slow” hunch and becomes a tool you can use to both diagnose the cow on-farm and confirm whether your treatment did anything.

That’s the honest state of play. The threshold logic is sound, and McArt is comfortable recommending rumination as today’s best on-farm proxy. But the trials to nail down exactly how much, how fast, and for which cows are still in progress. Read it as a strong working rule, not a finished protocol.

The Elite Cow, and the Mistake That Costs You Both Ways

Tell a producer that some of his low-calcium cows are his best, and you’ll get a look. But that’s what the dynamics show, and McArt thinks it’s an underused opening. We spend all our energy dragging the stragglers up to the herd, she points out. But those transient cows that crash on day one and fire right back up because they’re milking and eating hard? Maybe we should be asking how to push their ceiling higher and get them onto a high-energy diet faster, instead of only ever patching the bottom of the pen.

So the difference between elite and in trouble isn’t the depth of the dip. It’s the recovery. The calcium system is almost absurdly good at this — the cow turns over her entire blood calcium pool roughly every two hours, and as McArt puts it, it’s incredible how well it works the vast majority of the time. Almost set up to fail. Dips early, eats hard, rumination climbs, normal by day four: that’s a machine doing her job. Still low at day four, curve flat or falling: that’s the cow in trouble.
Here’s the part worth sitting with. McArt’s preference for oral calcium over IV in standing cows comes down to harm. Giving IV calcium to a cow that’s up and otherwise fine is usually detrimental — Wisconsin’s extension guidance is just as blunt, warning against giving IV calcium to a cow with subclinical milk fever and no symptoms. Reaching for the IV bottle on a standing cow isn’t just unnecessary; it’s an elegant way to sabotage her own regulatory system. You aren’t being diligent. You’re playing defense against a machine that’s trying to do its job. Oral calcium is the opposite bet: it does no harm, and give it to too many cows and the only thing you bruise is your pocketbook — a very different gamble than an anti-inflammatory with milk withhold and pen moves.

TreatmentIndicationCow StatusBenefit ProfileHarm RiskApprox. Cost/DoseMcArt / Wisconsin Guidance
IV CalciumClinical milk fever onlyDown / recumbentFast blood calcium correctionDetrimental in standing cows — disrupts regulatory system~$5–10/bottleReserve strictly for recumbent or near-recumbent cows
Oral Calcium BolusPersistent flat curve (Day 2–4)Standing, off-feed patternSupports recovery without overrideMinimal — worst case is wasted spend~$8/bolusPreferred for subclinical cases; safe even if over-applied
No TreatmentTransient dipper with climbing ruminationStanding, eating, rumination risingCow is already self-correctingNone — intervention would stall momentum$0Active recommendation: leave climbers alone
Anti-inflammatoryInflammatory co-morbidity (research stage)AnyTBD — trials in progressMilk withhold, pen move, economic disruption$15–25+Not yet a standard protocol — observational data only

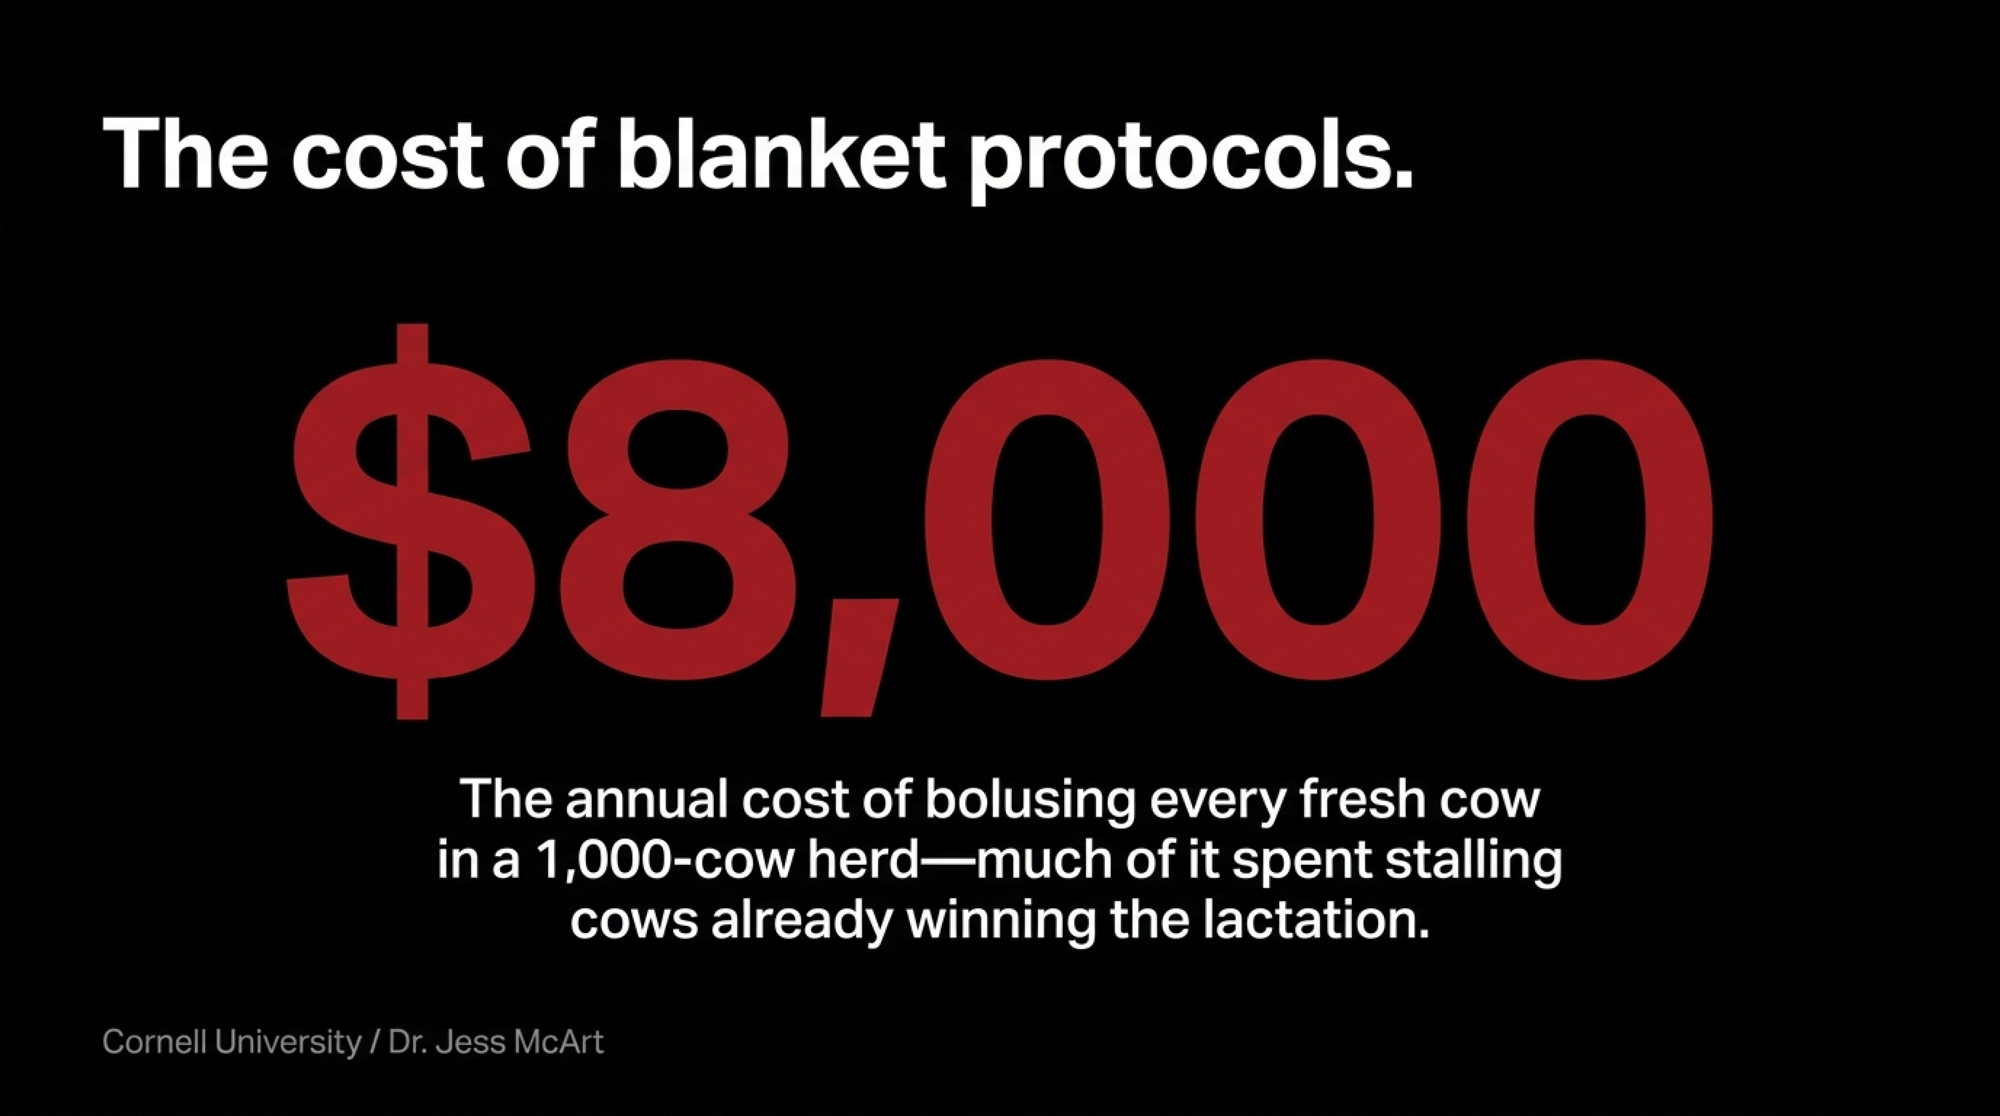
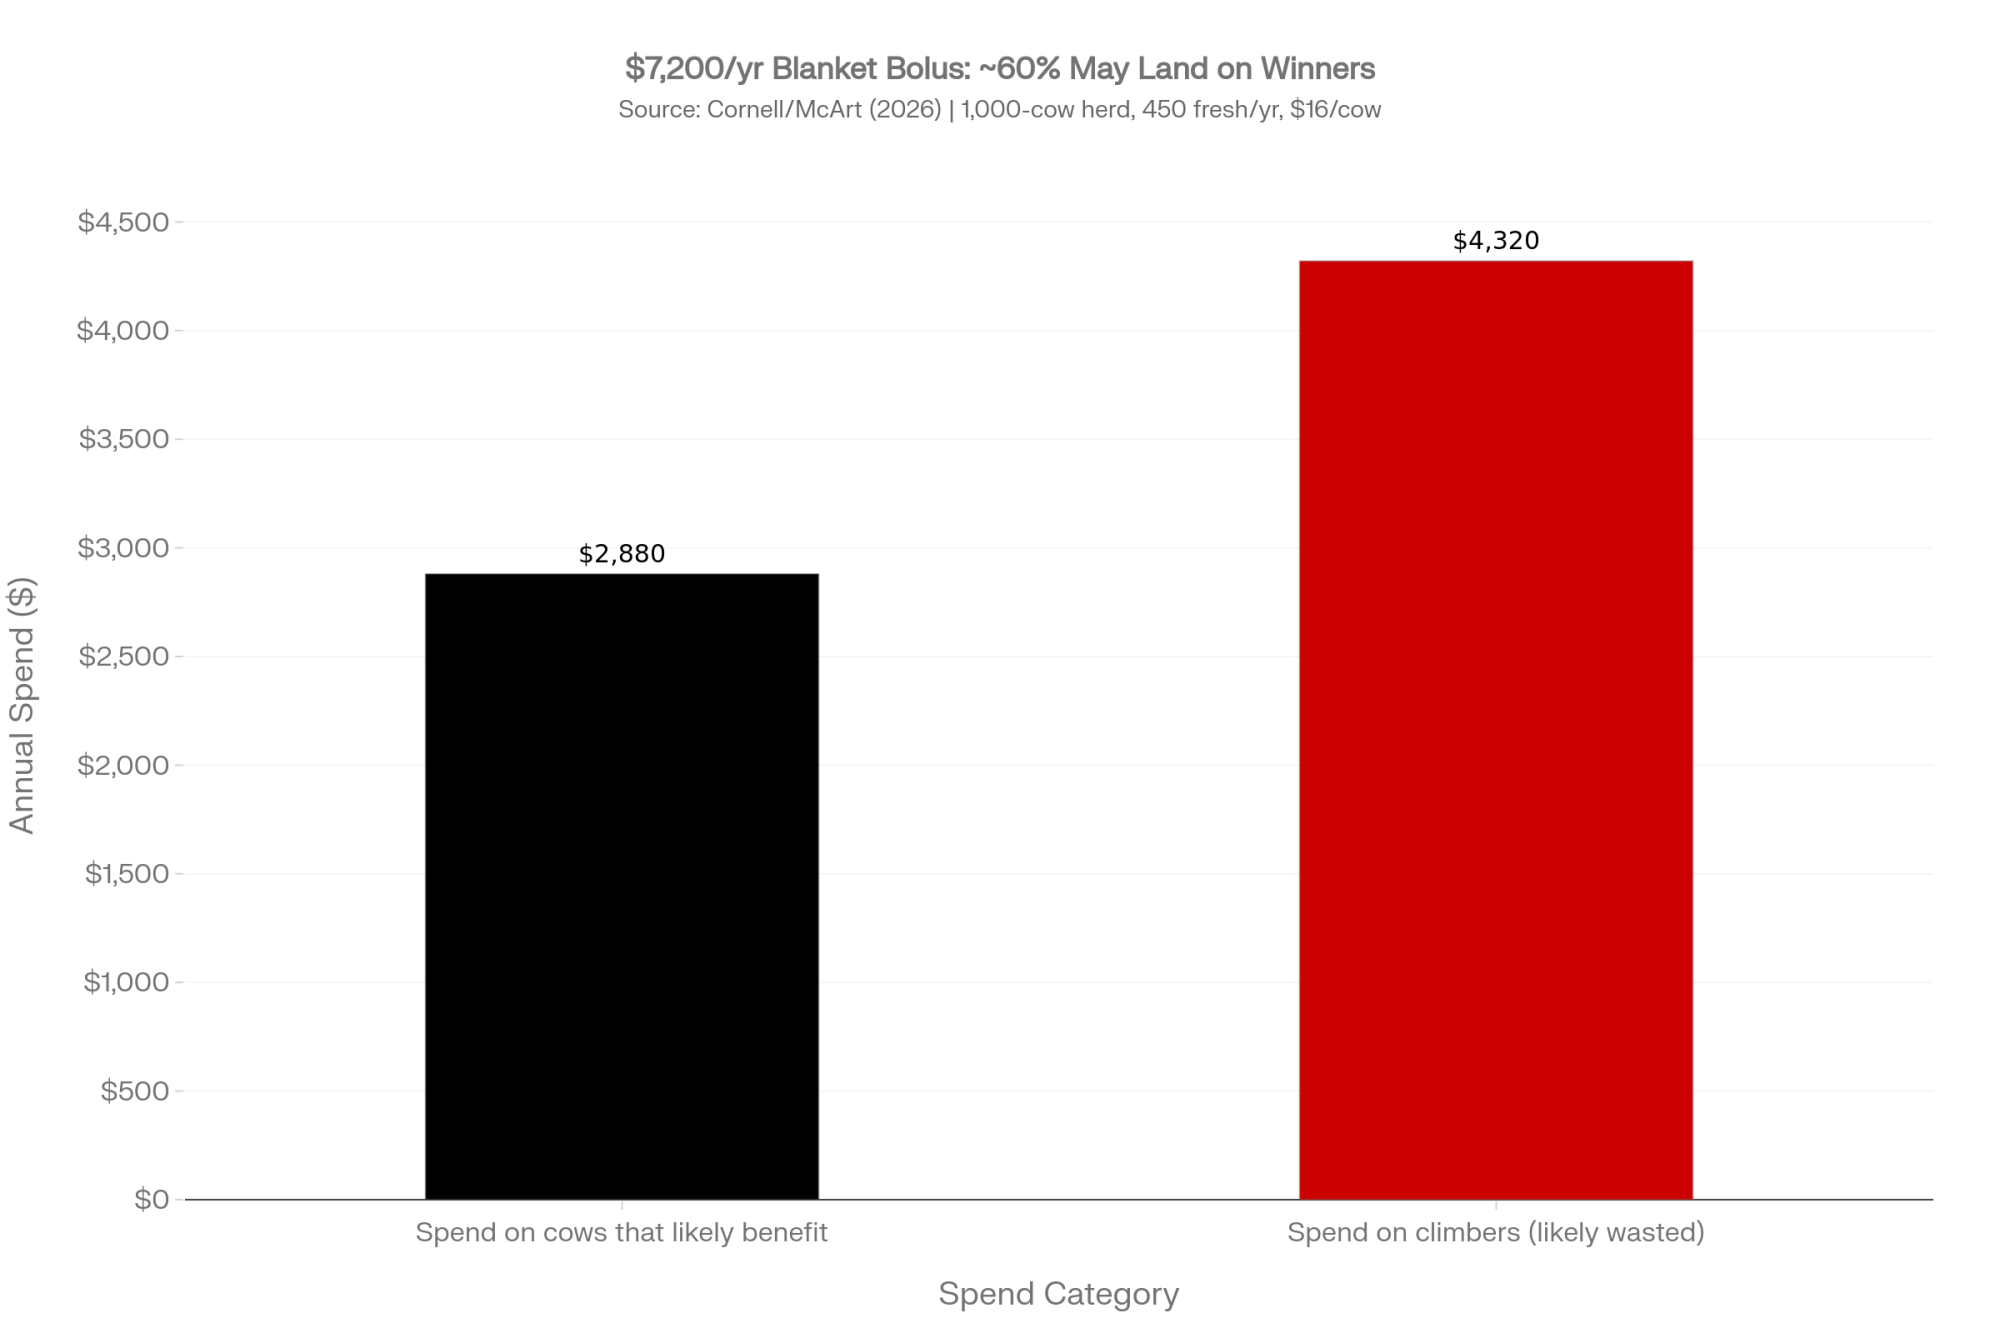
THE BLANKET-BOLUS MATH (illustrative): At roughly $8 a bolus — about $16 a cow for two doses — a 1,000-cow dairy freshening 35-40 head a month spends around $7,000-$8,000 a year dosing every fresh cow twice. Cornell’s work says only a subgroup actually benefits.

Run the pocketbook side of it, and treat those numbers as a back-of-the-envelope scenario, not a quote from any one farm. A big slice of that spend lands on animals already winning the lactation. Bolus the cows whose curves show they’re struggling, leave the ones who are climbing, and you stop paying on both ends.
A Realistic Monday-Morning Protocol for a Big Herd

Big numbers, high throughput, labor stretched thin. The cow that fails to recover is hardest to catch in exactly that environment, so let the data sort before anyone walks the pen.

Start at the computer, not the pen. Pull the fresh-cow rumination report for multiparous cows 0 to 4 days fresh, and compare each one to your own herd’s “healthy fresh cow” benchmark — the parity-specific curve you built above. On a big pen that shortlists a handful of cows, not 80 head. The software triages; your people only see the red list. (Ditch the Daily Walks: how precision monitoring cuts labor by 40%)

Then a ten-minute red-list check. Your fresh-cow person walks only the flagged IDs: quick visual, bunk behavior, and temperature if she’s three to four days fresh with a flat curve. Clears the screen and trending up? Watch, don’t treat. Fails it? That’s the cow who popped on rumination before she ever looked sick.

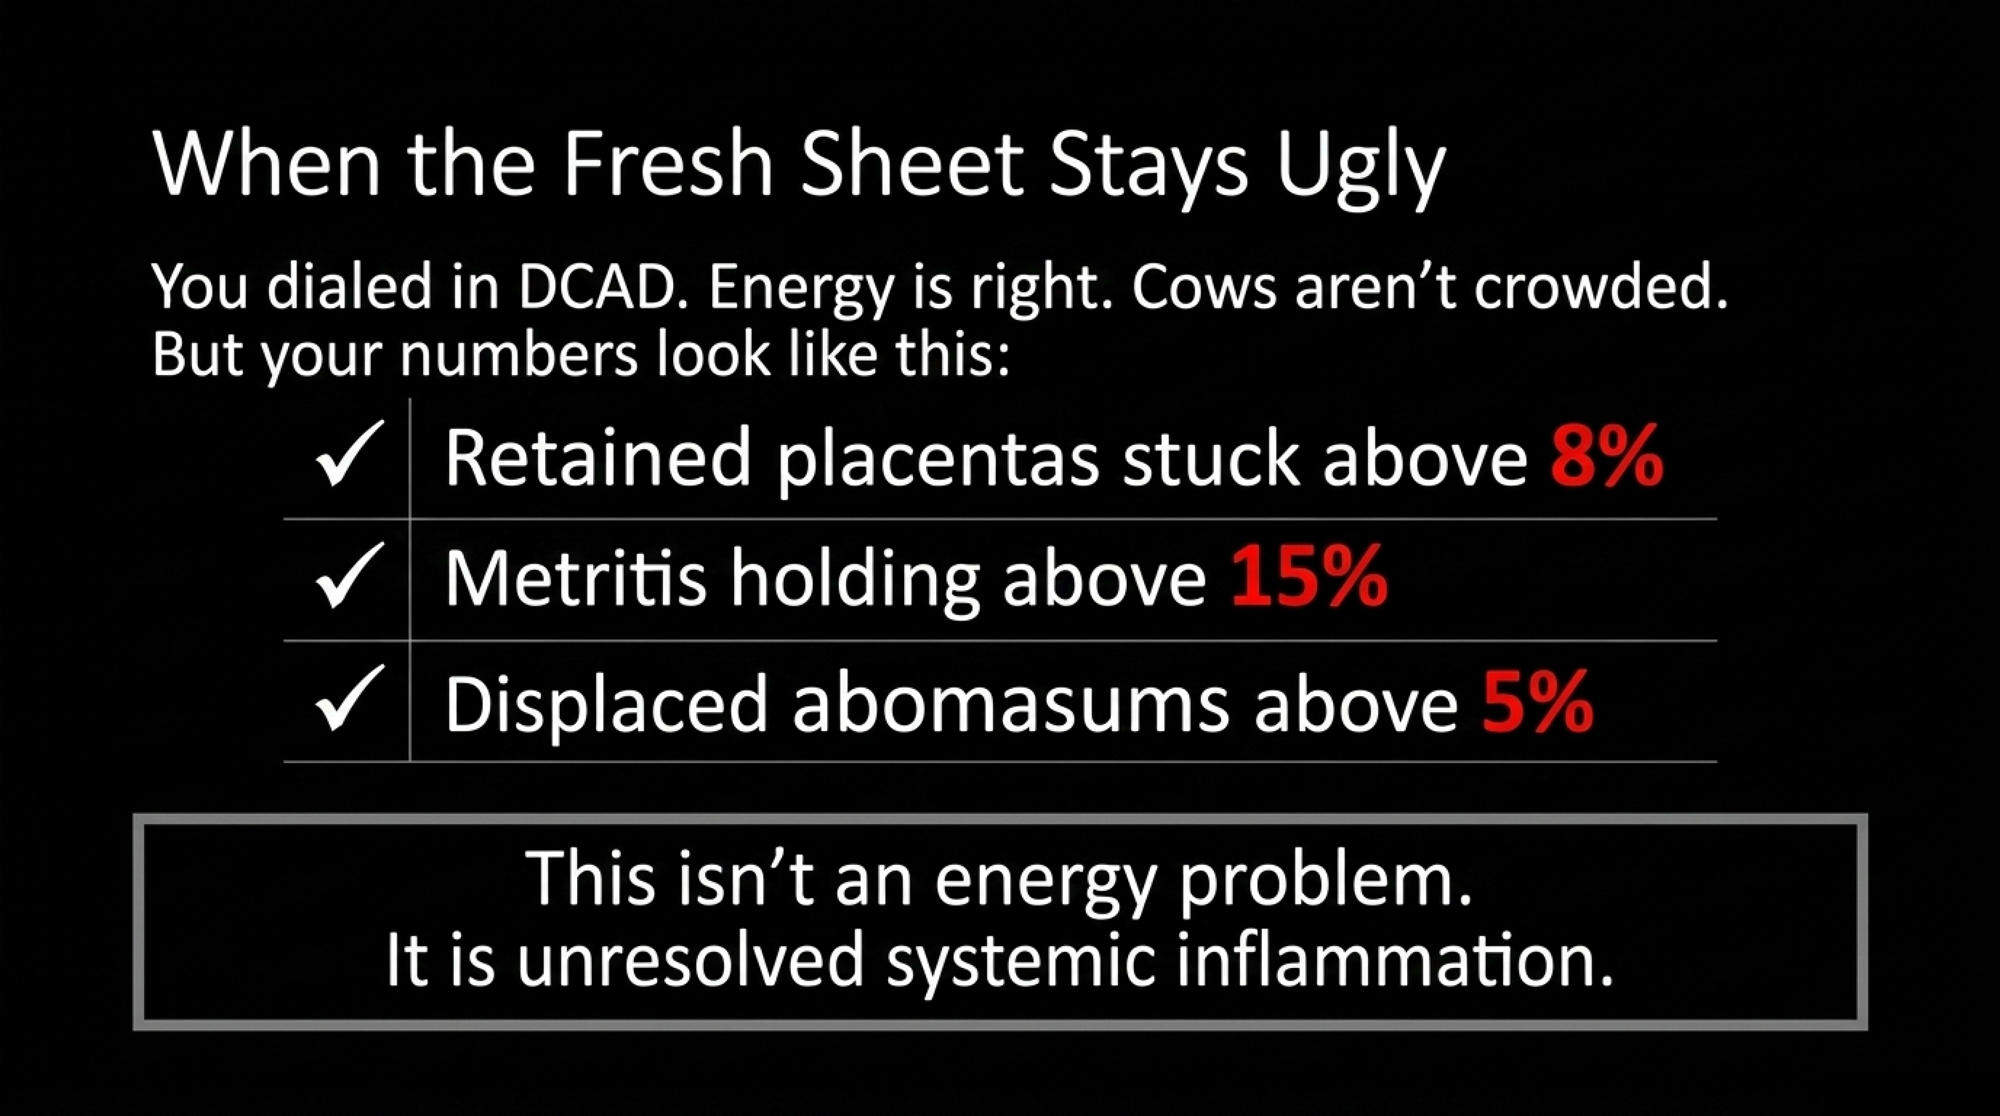
Tie the intervention to the curve, not the calendar. A flagged cow gets oral calcium now, and a second bolus the next day only if her rumination doesn’t start climbing, which is close to the day-one/day-two bolus logic McArt floats off her own threshold example. A cow still flat at four days gets worked harder, with a hard look for metritis, mastitis, and a displaced abomasum. You’re not bolusing every fresh cow twice because that’s the routine. You’re spending labor and product on the cows whose curve says they’re failing the adaptation test.

No Collars? You Can Still Run This

Plenty of good herds don’t have rumination sensors, and the thinking doesn’t change. You trade the algorithm for a structured set of eyes. The trap is the casual walk-through, where a standing, cudding cow reads as “fine” and the slow-fading one blends in until she’s sick. The fix is to make the read deliberate and repeatable. Implement a 2x-Daily Fresh Pen Audit and run it with the same discipline a collar herd runs its software:

  • The Timing: Audit exactly 20 minutes after fresh feed delivery, when a healthy fresh cow should already be driving for the bunk.
  • The Target: Flag cows that fail to lock up, show gaunt flanks, or stand idle while herdmates chew.
  • The Rule of Two: One slow read is noise. The same cow flagged morning and afternoon — or two days running — is your manual “flat-line” warning.

The action threshold is the same as the sensor herd’s: a cow who keeps showing up two to three days fresh gets oral calcium and a real exam, and a cow still hanging back at four days gets the harder workup for the inflammatory triggers underneath. It’s cruder than a rumination graph, and it leans on consistent labor. But the principle is identical: you’re tracking the trajectory across days, not judging a single snapshot.

The Once-a-Year Mystery Cluster

Keep one eye on the calendar’s odd visitor: the sporadic mid-lactation hypocalcemia cluster that shows up once or twice a year, then vanishes no matter what you do. McArt — who’s fielded the same question from vets as far away as Germany — thinks it’s usually a high-yielding cow with an abrupt stop in intake, whether from a heat or a bunk left empty too long.

Run the math, and it stops looking mysterious. At the onset of lactation, a cow’s daily calcium excretion jumps from roughly 10 grams to 30 grams almost overnight, and with the blood pool turning over every couple of hours, a heavy milker doesn’t have much buffer. So even a half-day off feed — a heat that’s got her walking and bawling instead of eating, a bunk that ran empty during a staffing gap — can be enough to tip her into a recumbent calcium crash that looks like it came out of nowhere. Pull her rumination or intake history after the fact, and you’ll often find the drop that came first. The cluster isn’t random; it’s a management event you didn’t see, hitting the cows with the least margin.

Seven Questions for Your Own Barn

Run these against your own barn before the next fresh group calves. Half are decisions to make, half are thresholds to act on:

  • Can you tell today which fresh cows recovered by day four — or do you only ever learn which ones eventually got sick? If you can’t answer that, you don’t yet have a fresh-cow system; you have a sick-cow system.
  • Build your baseline before you trust any threshold. Pull 30-60 healthy, untreated, fresh cows by parity and chart their first-week rumination climb; flag cows that track well below their own group’s normal by day two or three.
  • If a cow dips early, eats hard, and is normal by day four, leave her alone. Cornell’s data show those transient cows out-milk cows that never dipped at all; bolusing her only stalls momentum.
  • Reserve IV calcium for genuine clinical milk fever. In standing cows, oral calcium is the safer bet, and even overusing it mostly hurts the checkbook, not the cow.
  • Audit the blanket-bolus spend. On a 1,000-cow herd freshening 35-40 a month, that’s roughly $7,000-$8,000 a year, much of it landing on cows already winning the lactation; targeting the curve stops you paying on both ends.
  • This month, pull your last year of fresh-cow records. Flag every cow treated, pulled, or dead before 60 DIM, and check whether a drop in rumination or activity appeared first. If it did, your early-warning system is already in the data — you’re just not acting on it yet.
  • When the once-a-year mid-lactation cluster hits, check the bunk and the breeding board first. A heat or an empty feed alley usually beats the calcium crash to the punch.

The hardest sell in all of this isn’t the science. It’s telling someone who’s run a profitable dairy for 30 years to do less — fewer reflex bottles, fewer blanket boluses, fewer cows worked twice “because that’s what we do.” Doing more feels like diligence. McArt argues that we finally have the technology to stop managing every fresh cow the same and start telling them apart. So here’s the question to chew on before your next fresh pen fills up: if you pulled your own cull list and treatment records tomorrow, would they tell the story you think they’re telling — or hers?
Key Takeaways

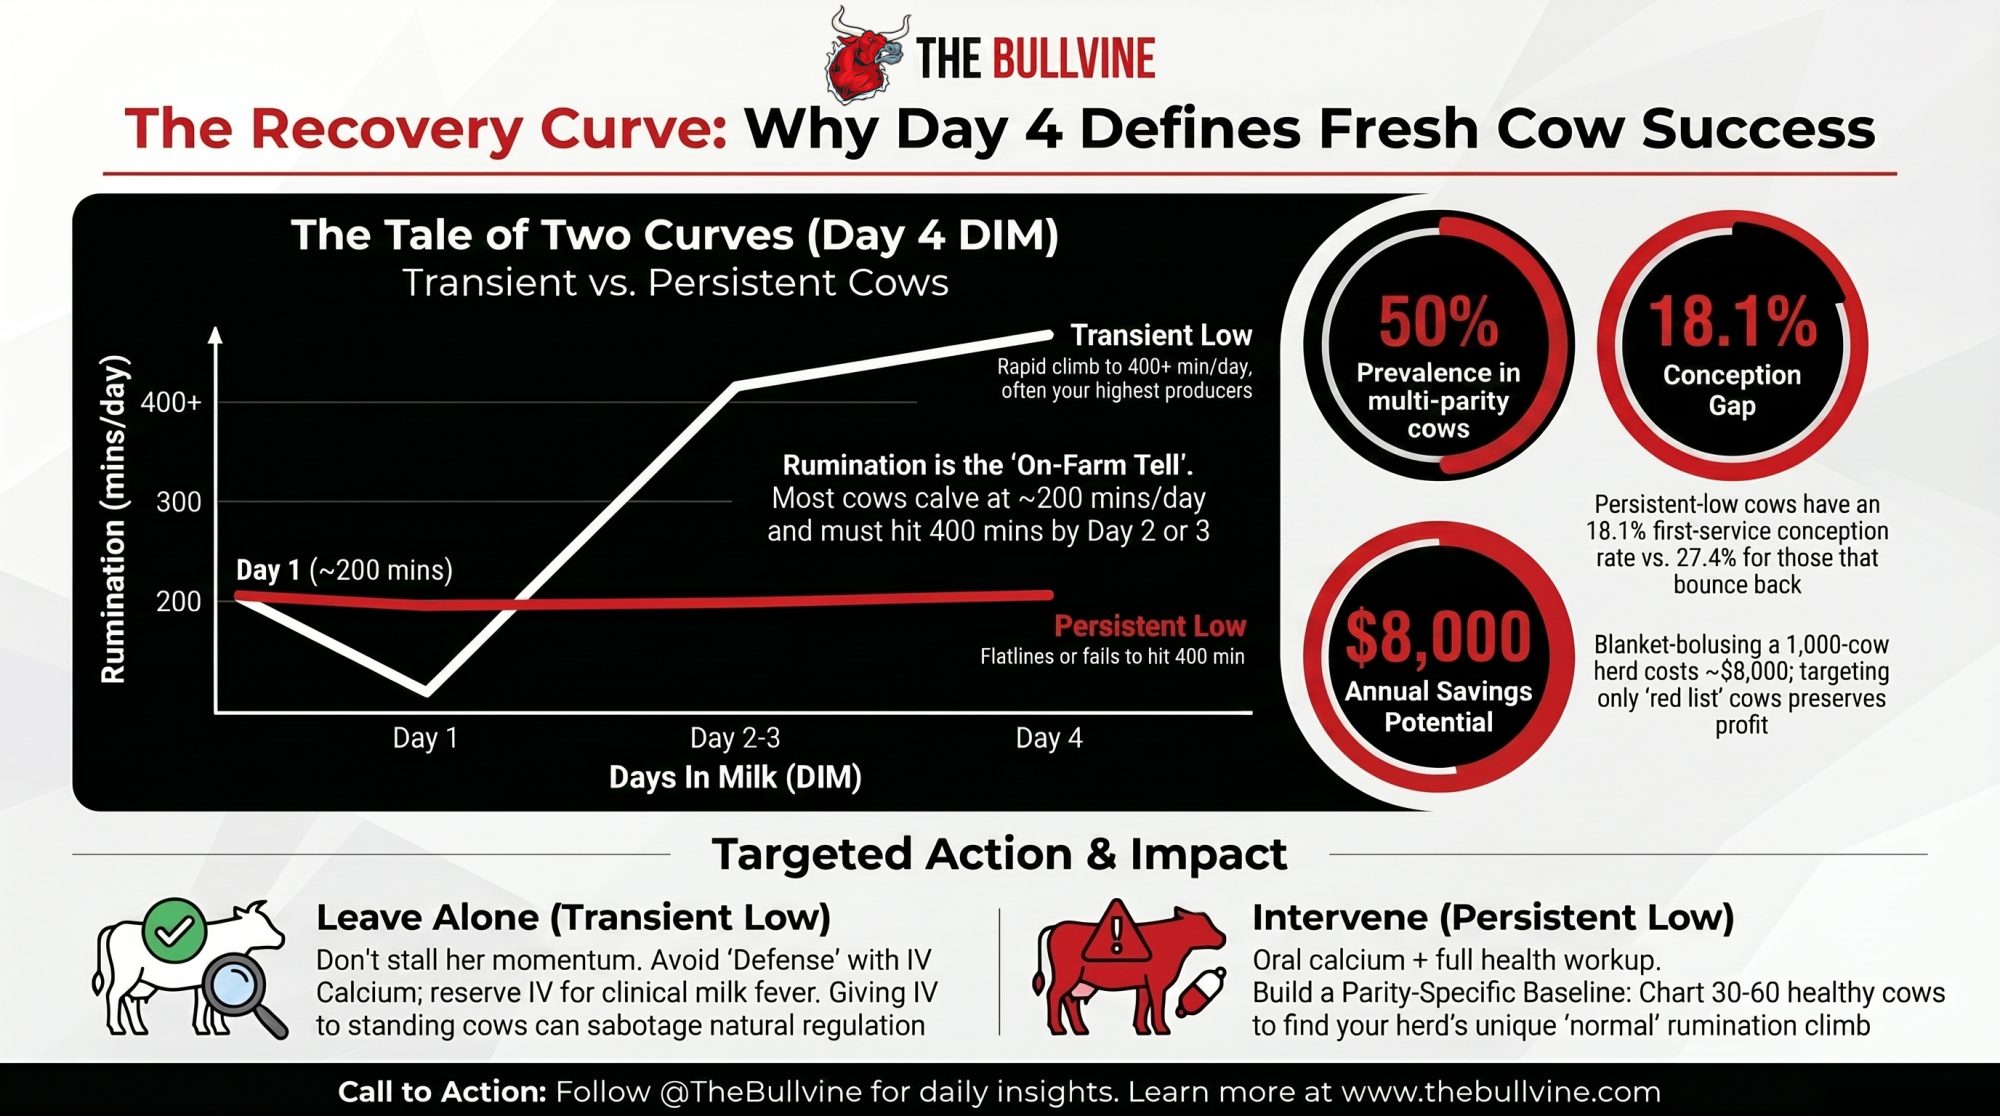
  • The cow that drops calcium hardest on day 1 isn’t your problem — the one still flat at day 4 is. Recovery speed, not the low number, separates your top producer from the train wreck.
  • Rumination is the cheap proxy you likely already own. Most cows calve near 200 minutes and should climb toward 400 by two to three days fresh; the flat lines are your real red list. Build your own baseline by parity before you trust any cutoff.
  • Blanket-bolusing every fresh cow can run $7,000–$8,000 a year on a 1,000-cow herd, much of it spent on cows already winning. Treat flat curves with oral calcium, leave the climbers alone, and reserve IV for true clinical milk fever.
  • This month, pull your last year of fresh-cow records — flag every cow treated, pulled, or dead before 60 DIM, and check whether a drop in rumination or intake showed up first.

Run Your Numbers

Health ROI Calculator — This article argues the expensive damage happens before a fresh cow ever looks sick. Run your culling rate, mastitis incidence, and replacement cost through the Health ROI Calculator to put a dollar value on what those hidden transition failures are costing you — and whether tightening your fresh-cow protocol actually pays.

Complete references and supporting documentation are available upon request by contacting the editorial team at editor@thebullvine.com.

Learn More

The Sunday Read Dairy Professionals Don’t Skip.

Every week, thousands of producers, breeders, and industry insiders open Bullvine Weekly for genetics insights, market shifts, and profit strategies they won’t find anywhere else. One email. Five minutes. Smarter decisions all week.
NewsSubscribe
First
Last
Consent

H5N1 Is Back in 15 Dairies in 30 Days – and Only 1 in 4 Parlor Workers Wore a Respirator

Texas, Idaho, and Utah confirmed fresh detections this spring. The science says the riskiest spot on your farm is the one place your crew protects least – the parlor.

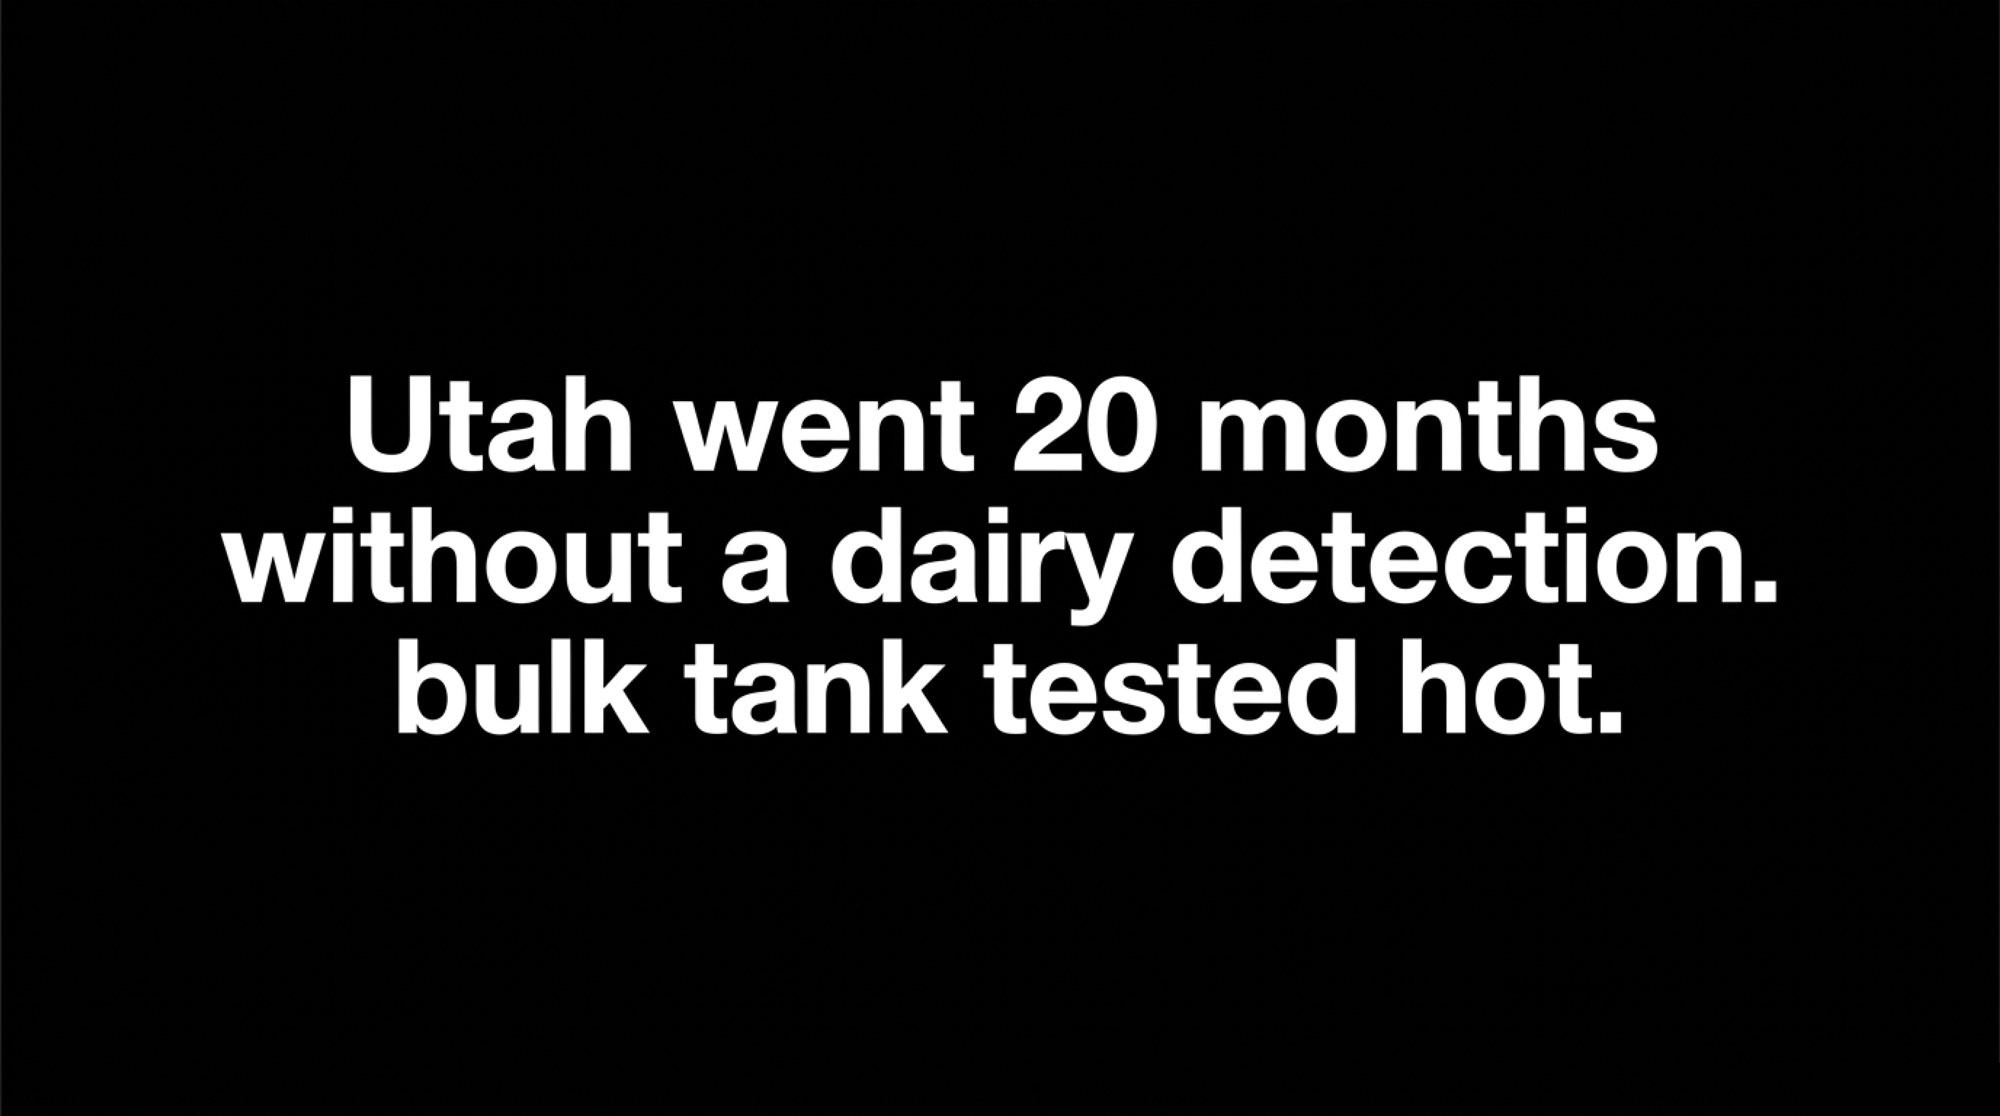
A dairy in Cache County, Utah, shipped milk like any other morning this June. Then the bulk-tank test came back hot — confirmed by the Utah Department of Agriculture and Food on June 1, 2026, the first H5N1 in a Utah dairy herd since the eight-farm Cache County cluster back in October 2024. Nearly twenty months of quiet, and the virus walked right back in. Now the herd’s quarantined, the milk’s getting diverted, and the owner is doing exactly what you’d do: scrambling to figure out where it came from and who got exposed. 

Here’s the part that should stop you cold. By the time that tank tested positive, the cows had likely been shedding virus for days — and most of them never looked sick. That’s the trap with H5N1 in dairy cattle right now. It’s quiet, it’s already moving, and the spot on your farm where it’s most dangerous to your people is the one place nobody’s geared up.

15 Herds in 30 Days Isn’t a Trend. It’s a Live Outbreak.

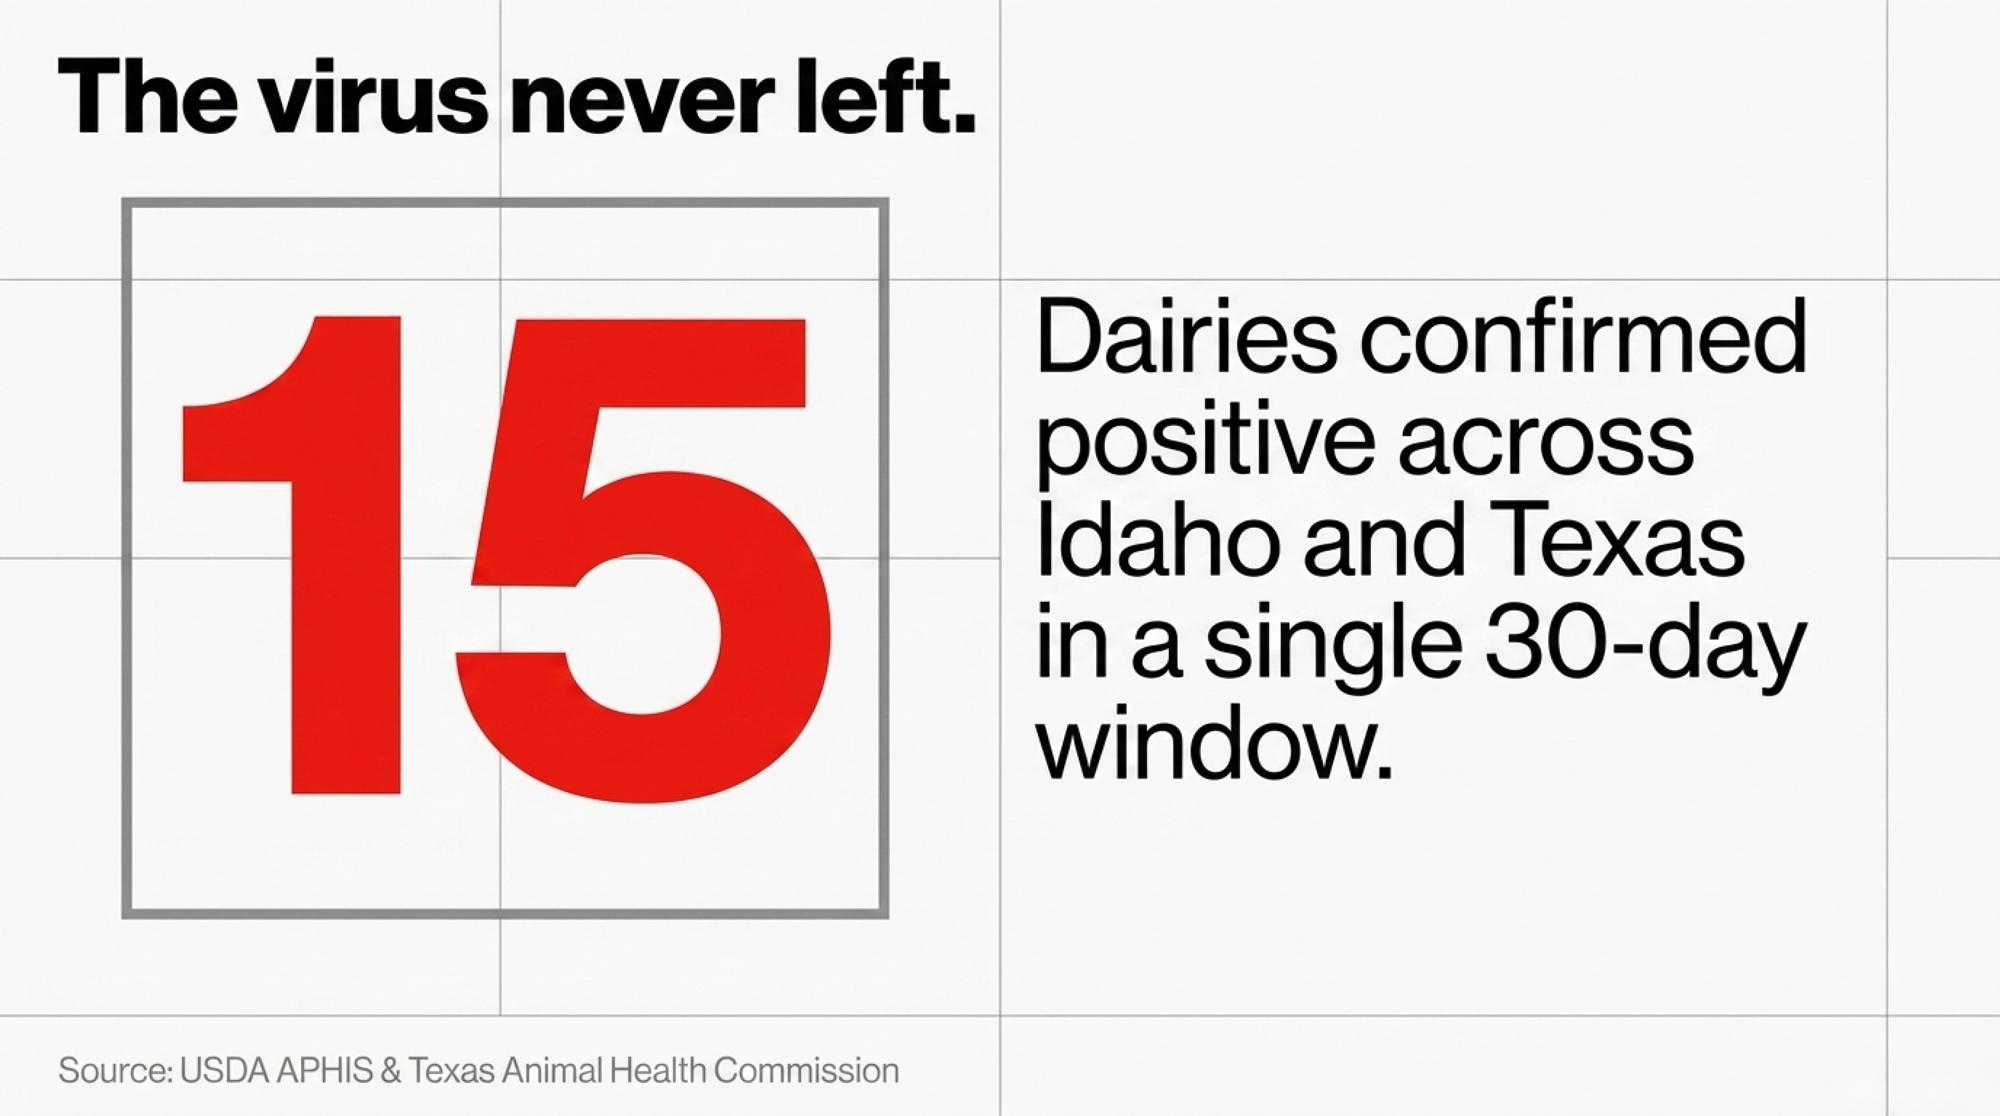
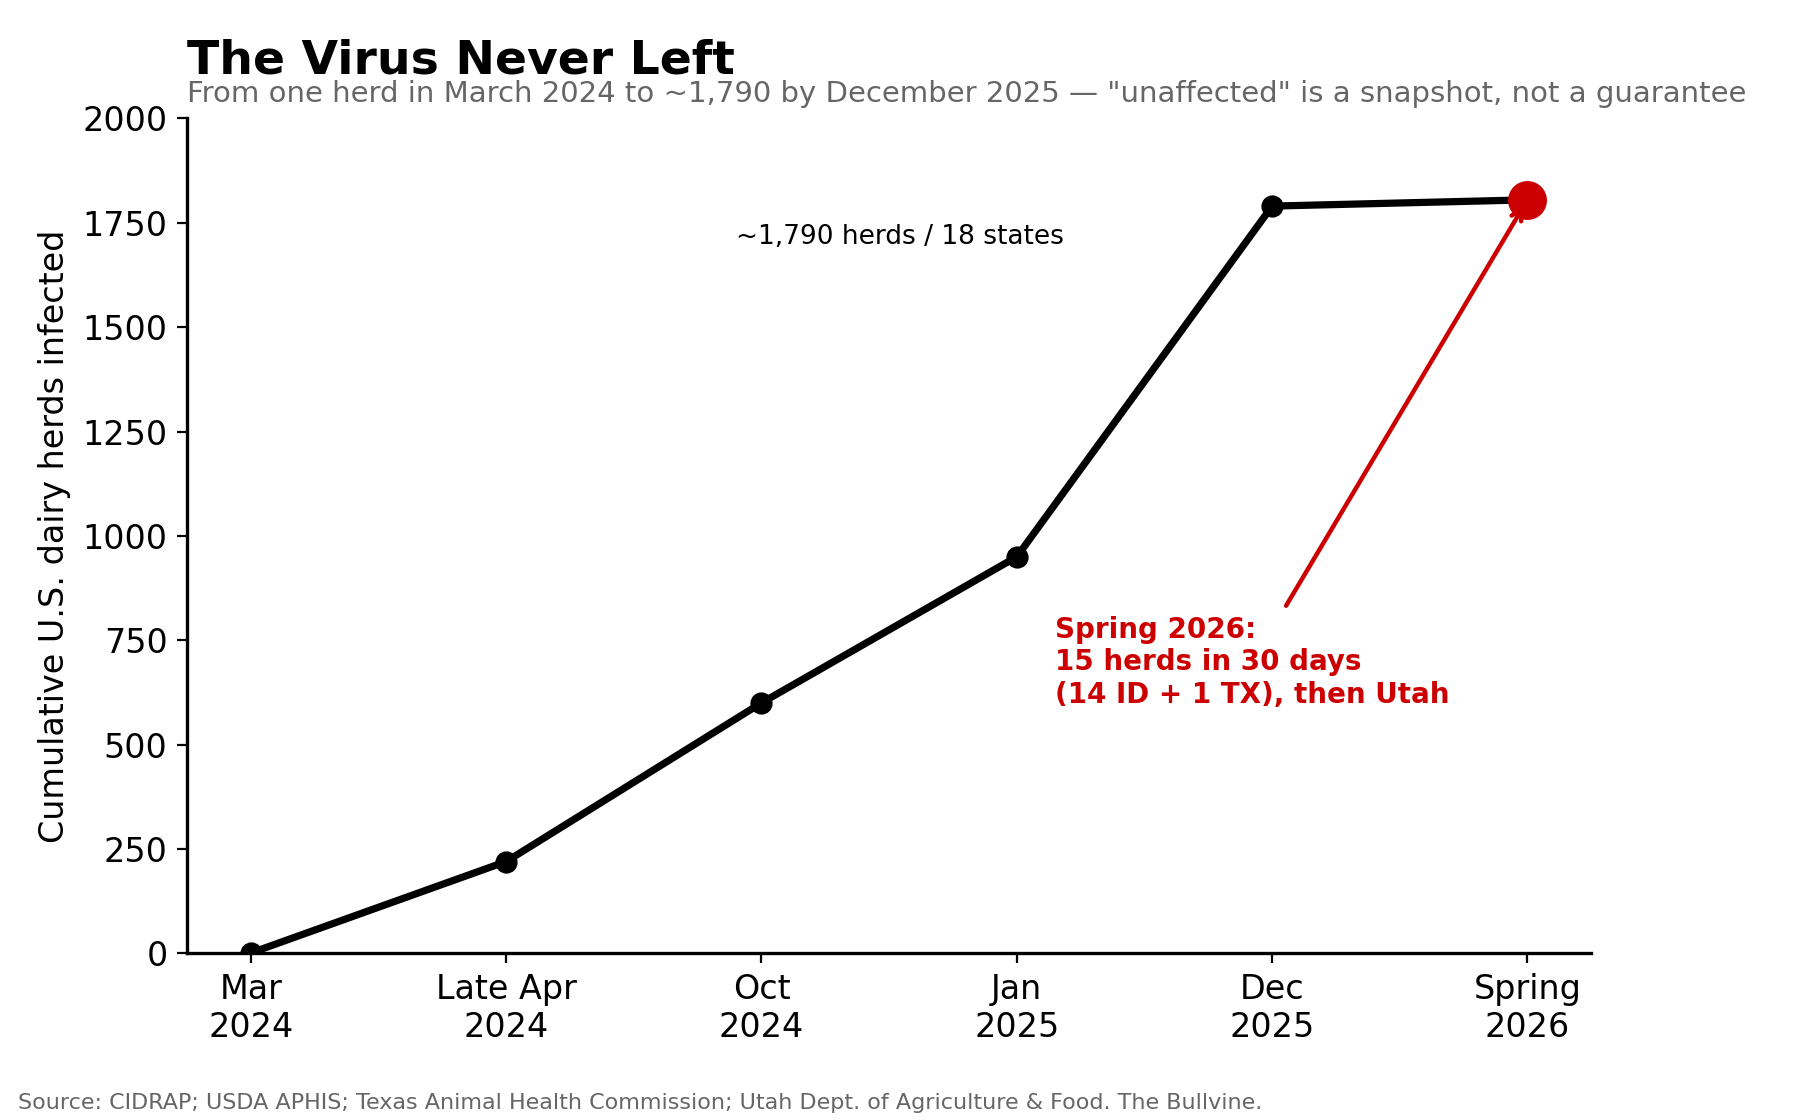
For the first time in 2026, H5N1 hit Texas dairy cattle again — confirmed by the Texas Animal Health Commission and USDA APHIS in late May. Idaho’s been the bigger story: APHIS tracked the virus through Idaho herds throughout May, and across both states, 15 dairies were confirmed positive in a single 30-day window (14 in Idaho, 1 in Texas). Utah’s Cache County case landed days later. 

This isn’t new territory. H5N1 first appeared in U.S. dairy cattle in March 2024, and by December 2025, it had reached roughly 1,790 herds across 18 states, per CIDRAP. What the spring 2026 cluster tells you is simple: the virus never left, and “unaffected” status is a snapshot, not a guarantee. Utah went nearly twenty months between dairy detections — and still got hit again. 

Quarantine and milk diversion are the standard playbook. When a herd tests positive, the operation goes under state quarantine, milk from affected animals gets diverted from the commercial tank or destroyed, and positive cattle can’t move interstate for 30 days. None of that milk reaches the store — but all of that disruption lands on the farm. 

How Idaho Became the Epicenter

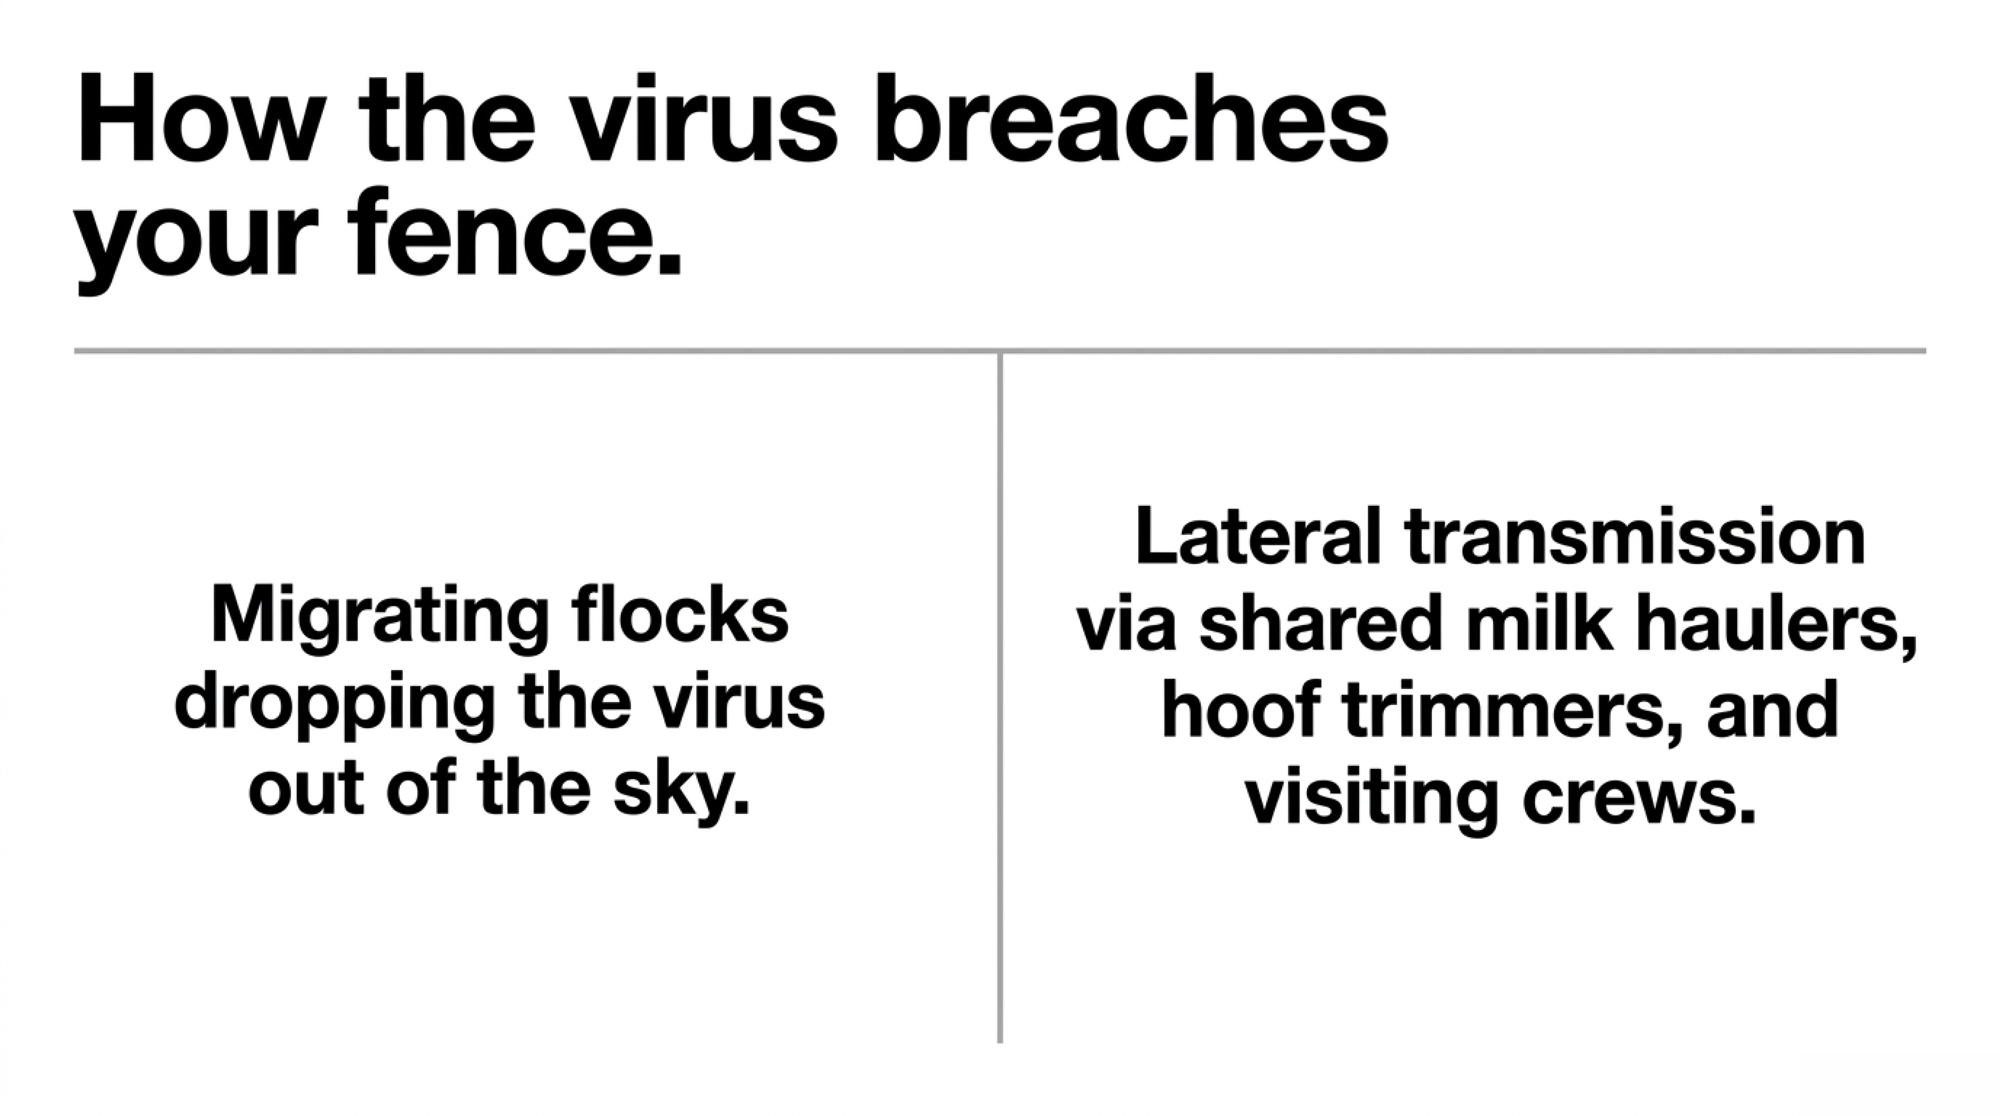
Idaho’s spring run didn’t come out of nowhere. The state has been a recurring H5N1 hotspot since 2024, and the 2026 cluster concentrated in its dense south-central dairy counties, where herds sit close together and equipment, trucks, and crews move between them constantly. That density is the accelerant. When operations share a milk hauler, a hoof trimmer, or a relief milker, the virus gets a ride from one bulk tank to the next without a single bird involved. 

Investigators tracking earlier Idaho spread pointed to lateral transmission — cattle movement, shared milking equipment, and worker traffic between premises — as much as to wild birds. That matters to you because it rewires your mental model. Plenty of producers still picture H5N1 as something that drops out of the sky with a migrating flock. Sometimes it does. But once it’s in a region, the bigger threat is the truck backing up to your bulk tank and the contractor who was at a positive farm yesterday. 

The takeaway from Idaho isn’t “be afraid of geese.” It’s “know who and what crossed your fence line this week.”

The Human Tally: Real, but Smaller Than the Headlines

The honest version of the human risk helps more than the panic version. The CDC reports 71 human H5 cases in the U.S. since 2024, with 41 tied specifically to dairy cattle exposure — most presenting as mild conjunctivitis. There have been two U.S. deaths over that period, and neither was linked to dairy cattle. The dairy-related cases clustered in California, Michigan, Colorado, Nevada, and Texas, almost entirely in workers with direct cow contact. 

No sustained human-to-human spread has been detected, and the CDC still rates the general-public risk as Low. The people carrying real, moderate-to-high exposure risk are the ones in your parlor every day. That’s the honest scope: low for the public, not low for your crew. 

One scientific wrinkle is worth watching, stated plainly because the data is still emerging. A peer-reviewed PLOS Biology surveillance study published in May 2026 found H5N1 in California parlor air and detected an HA mutation (position 189) in one air sample associated with better binding to human-type receptors. Whether that change actually improves the virus’s ability to infect people “remains to be determined,” the authors write. Emerging signal — not a reason to panic. But a reason to protect your people. 

Is Pasteurized Milk Actually Safe — or Is That Just the Official Line?

Pasteurized milk is safe, and the data backing that is unusually strong. The FDA tested 464 retail dairy products and found no viable virus in a single sample. PCR did pick up viral fragments — dead genetic remnants — in retail milk at the peak: 36.3% of samples in late April 2024, dropping to 6.9% by the December 2024–January 2025 round, per Emerging Infectious Diseases. But the gold-standard egg-inoculation test grew no live virus from any of them. 

Raw milk is the opposite story, and that’s where the science gets pointed. Infected cows shed enormous viral loads directly into their milk, which makes raw milk the primary vehicle for spreading H5N1 cow-to-cow and farm-to-farm. If you’re feeding raw waste milk or colostrum to calves, you’re potentially running a transmission line through your own herd. Heat-treat or pasteurize waste milk before it goes anywhere near a calf — and remember the public-health risk only stays Low when that raw line is closed. 

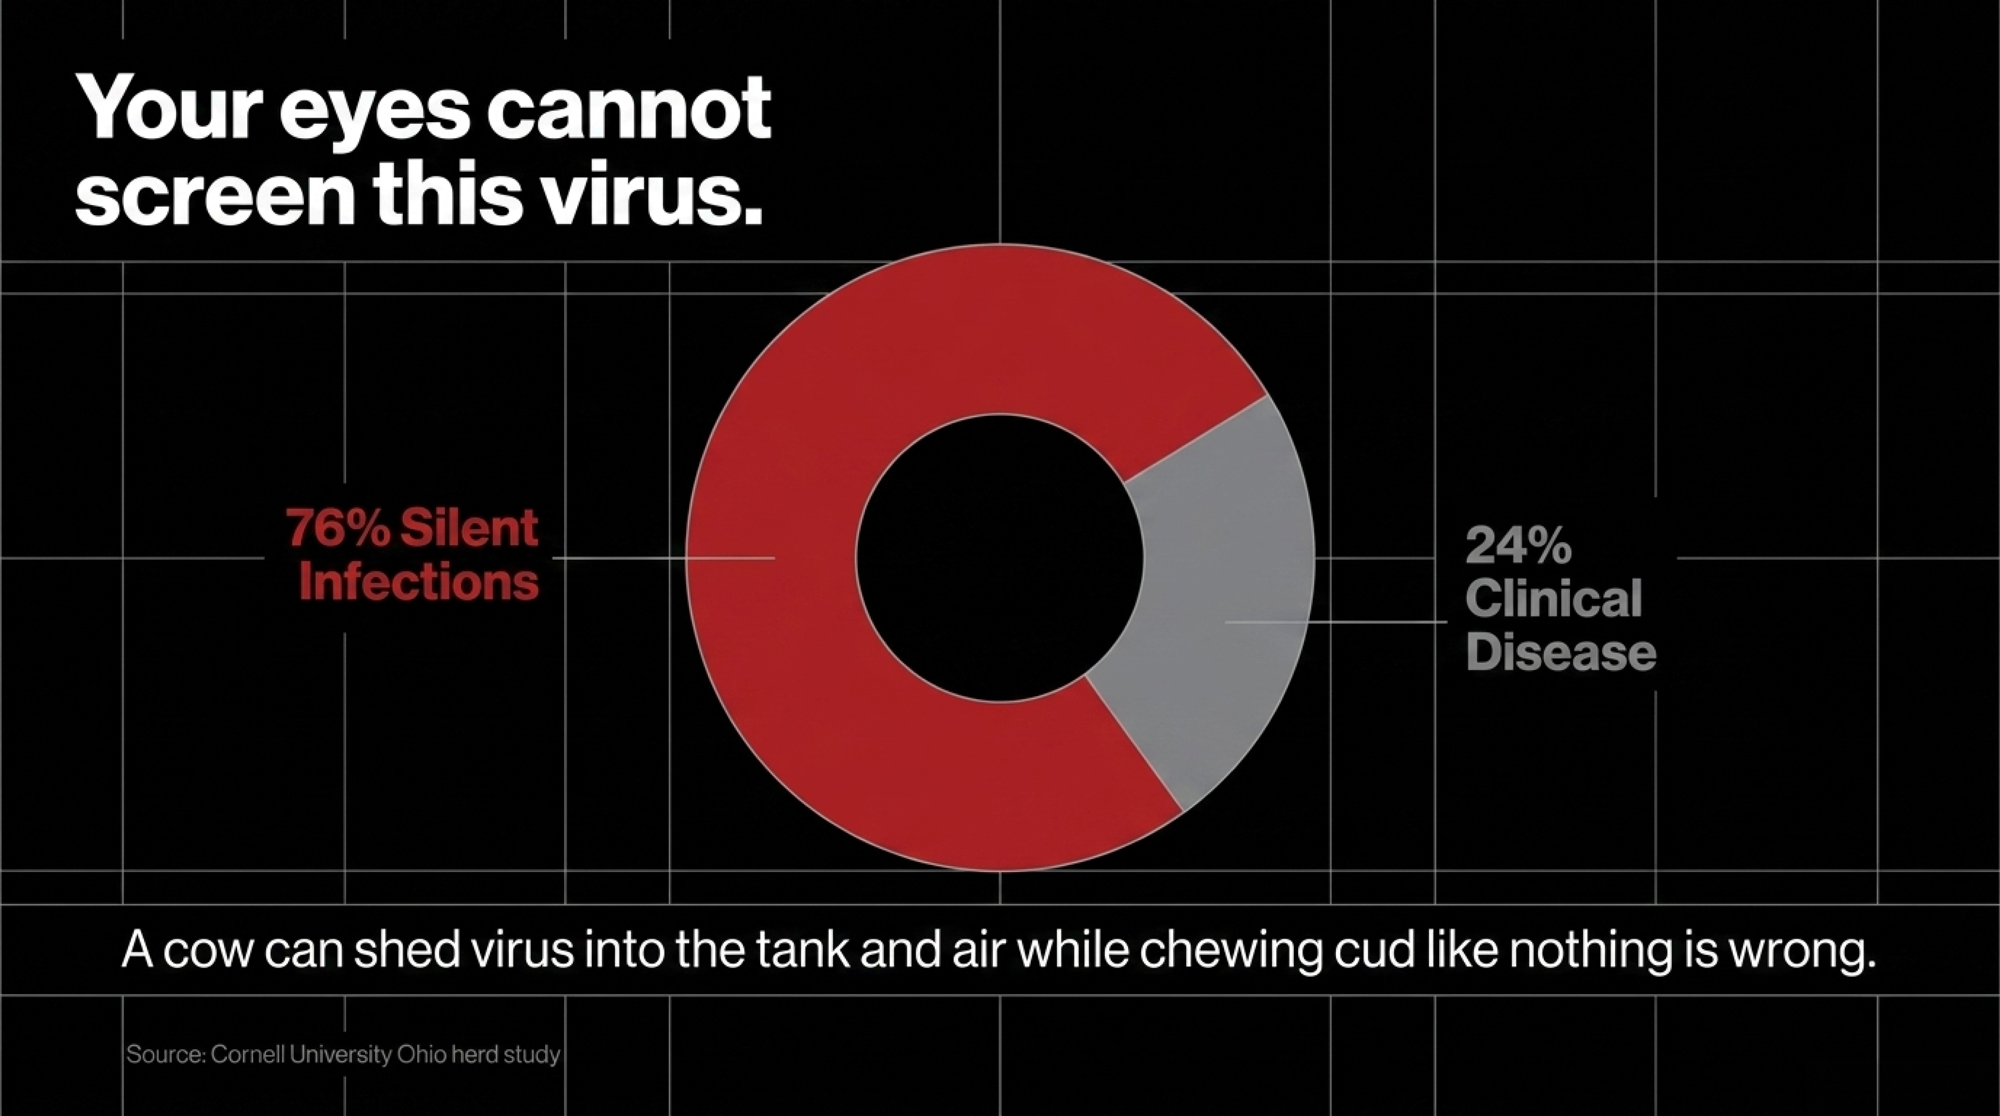
For the operations that learned this the hard way, the lesson lives in the bulk tank — and why 76% of infected cows show no symptoms at all breaks down how detection lags spread.

Why the Parlor Is the Riskiest Room on Your Farm

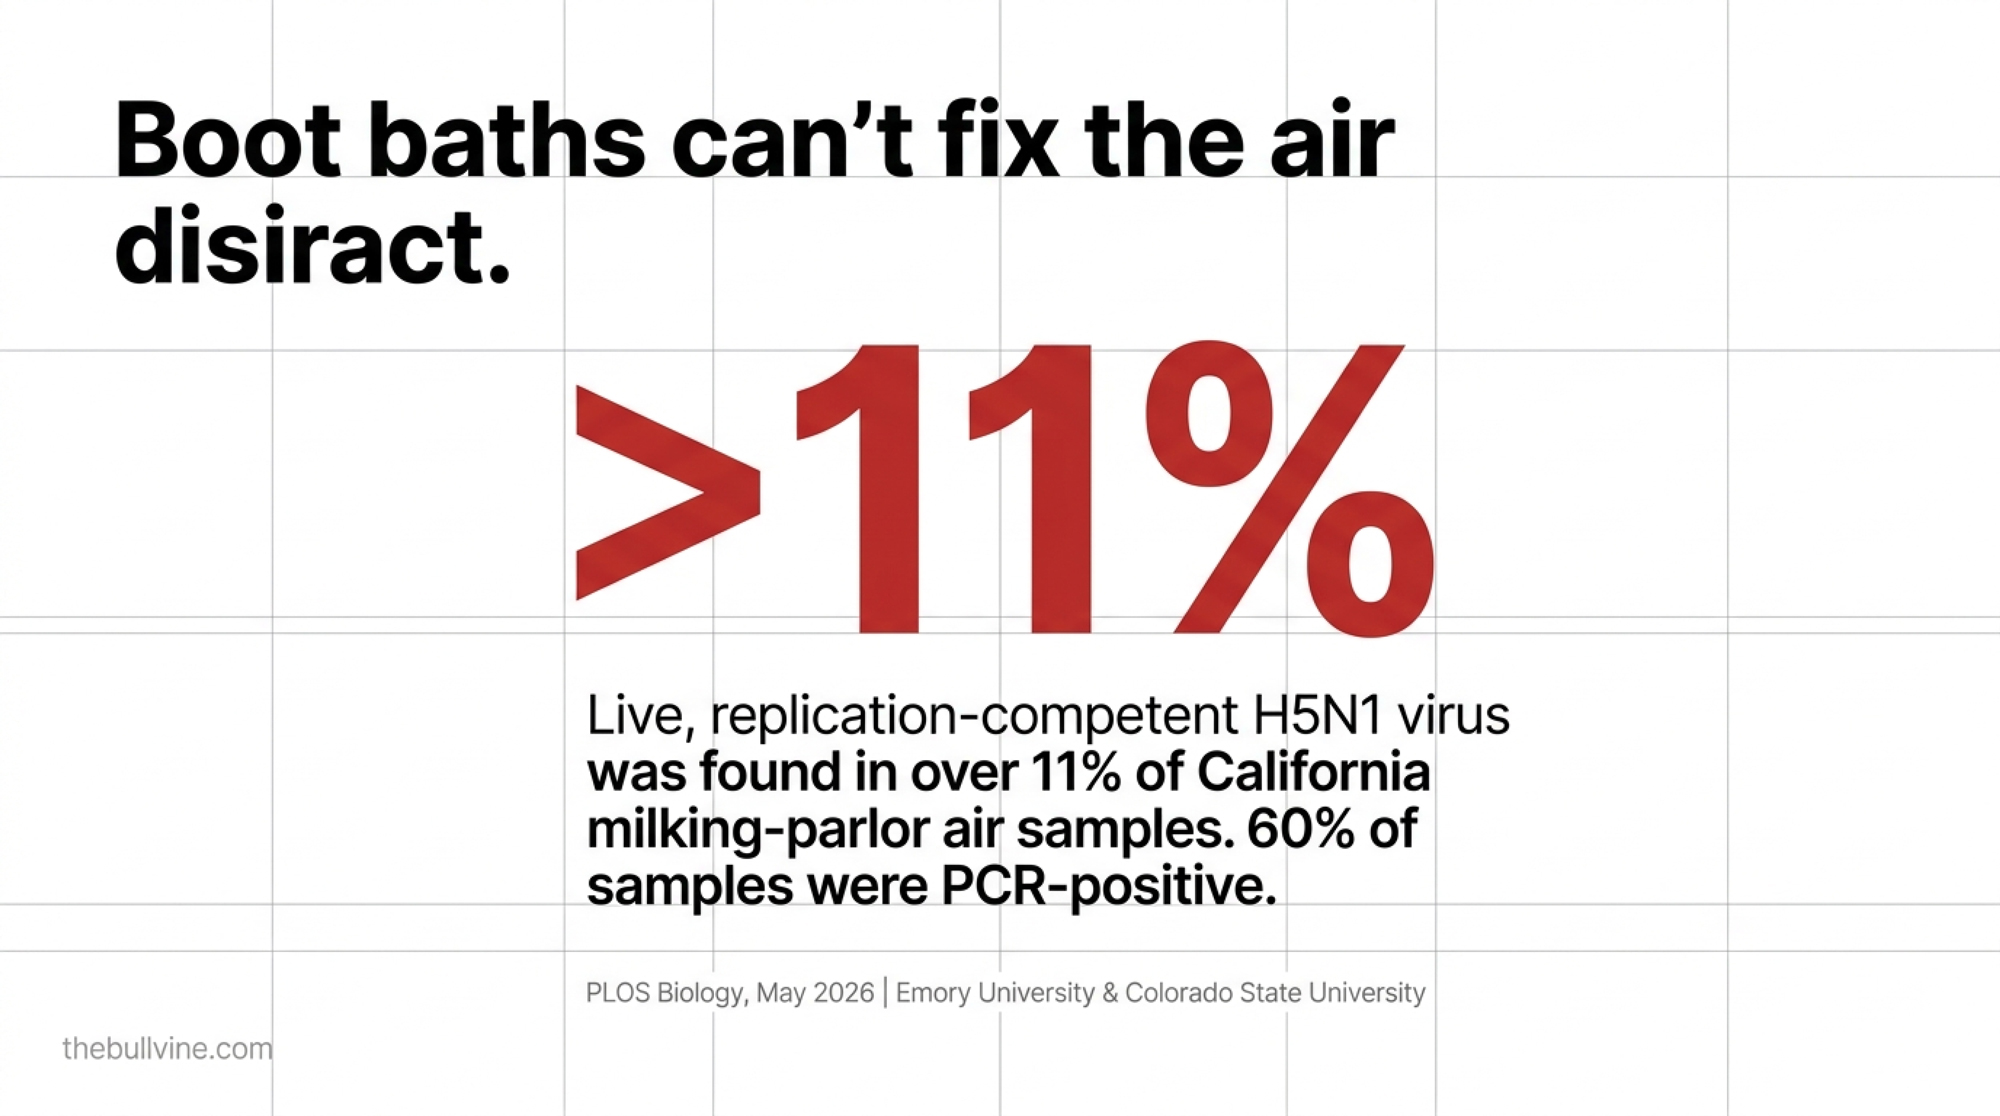
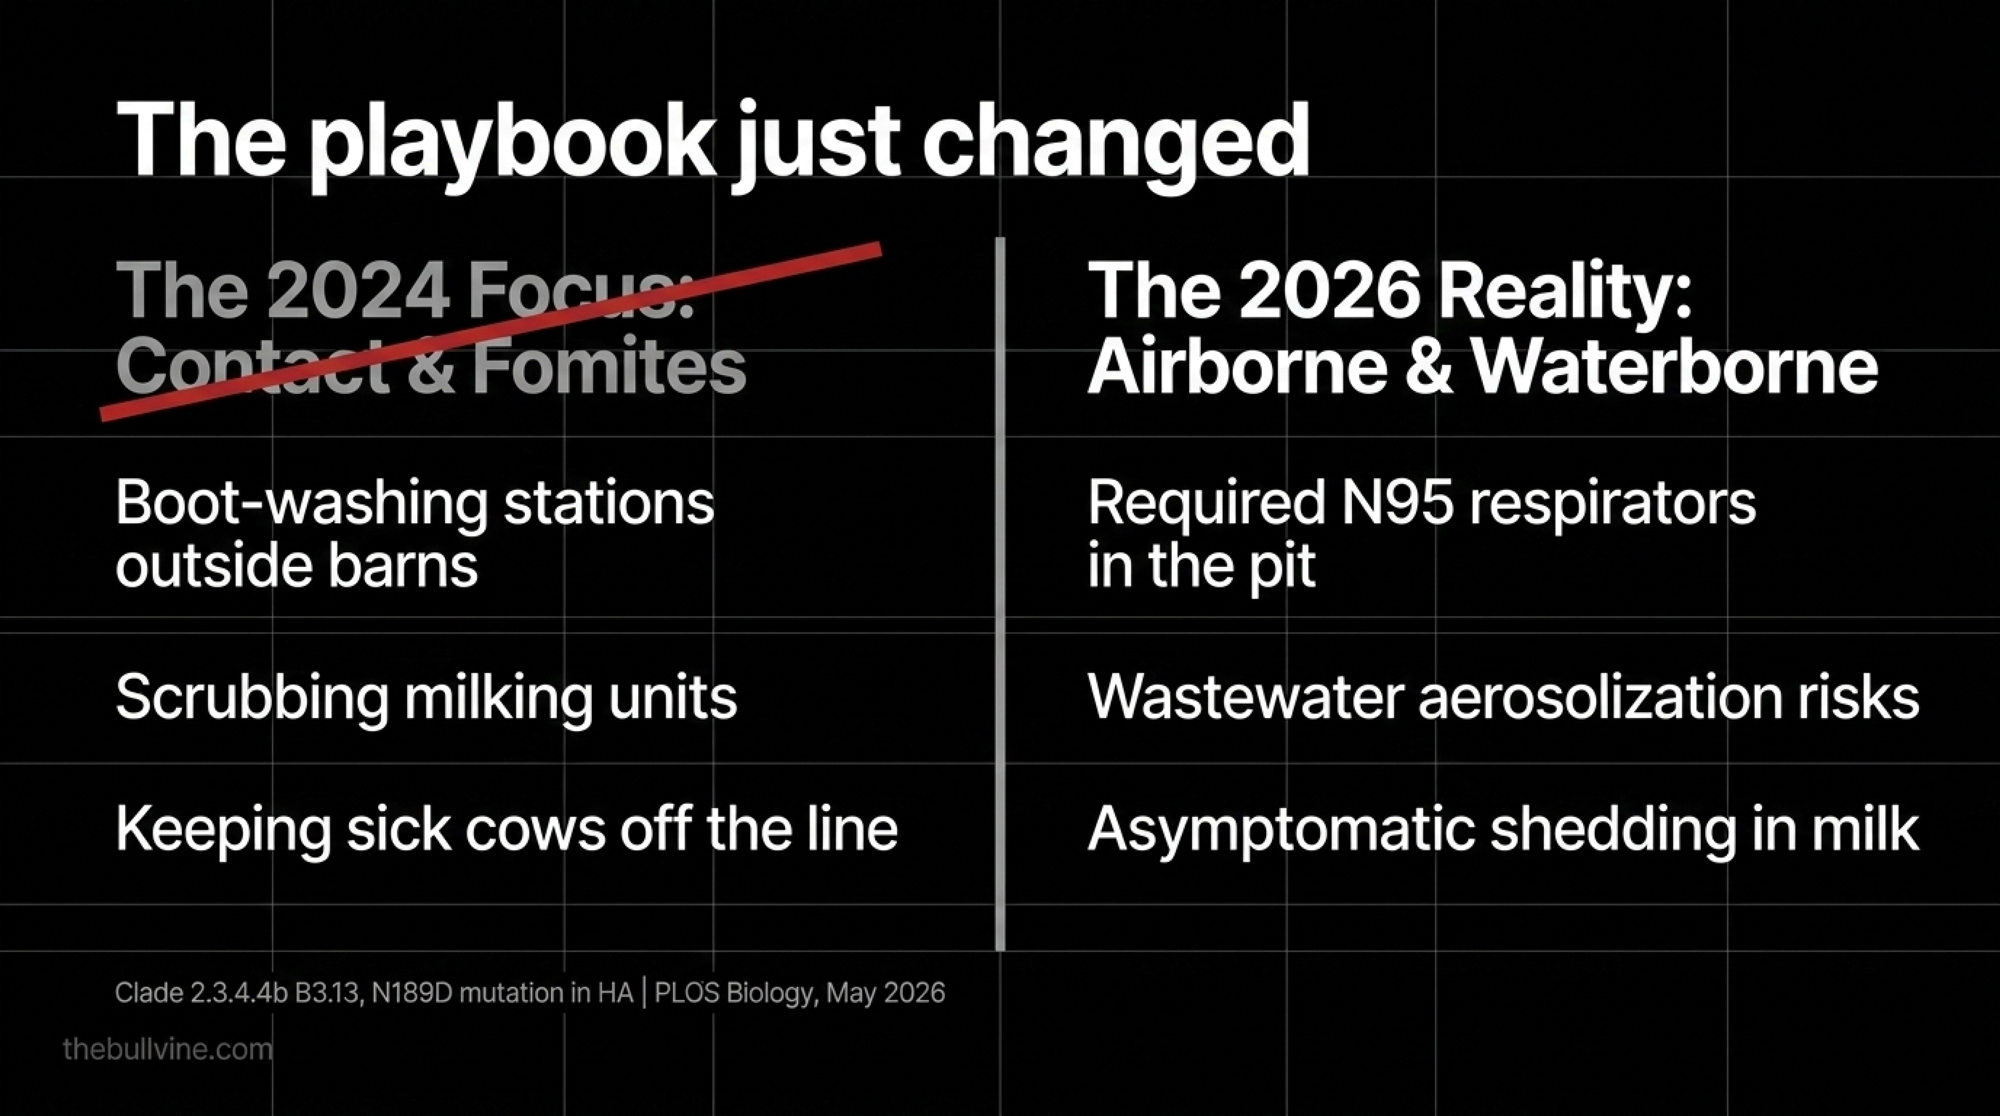
Here’s the finding that should reshape how you think about worker safety. In the PLOS Biology surveillance work across positive California farms, researchers found H5N1 viral RNA in 21 of 35 air samples taken in milking parlors — and confirmed live, infectious virus in four of them. The virus isn’t just on surfaces. It’s airborne, right where your crew is breathing. 

Forestripping and routine milking aerosolize raw milk into fine droplets. The parlor’s usually enclosed, so those droplets hang and settle on faces, eyes, and equipment. Open-air housing pens were far lower risk — it’s the parlor that concentrates exposure. The same team also found infectious virus in farm wastewater and lagoons that migratory birds use, closing a loop right back to wild-bird reintroduction. 

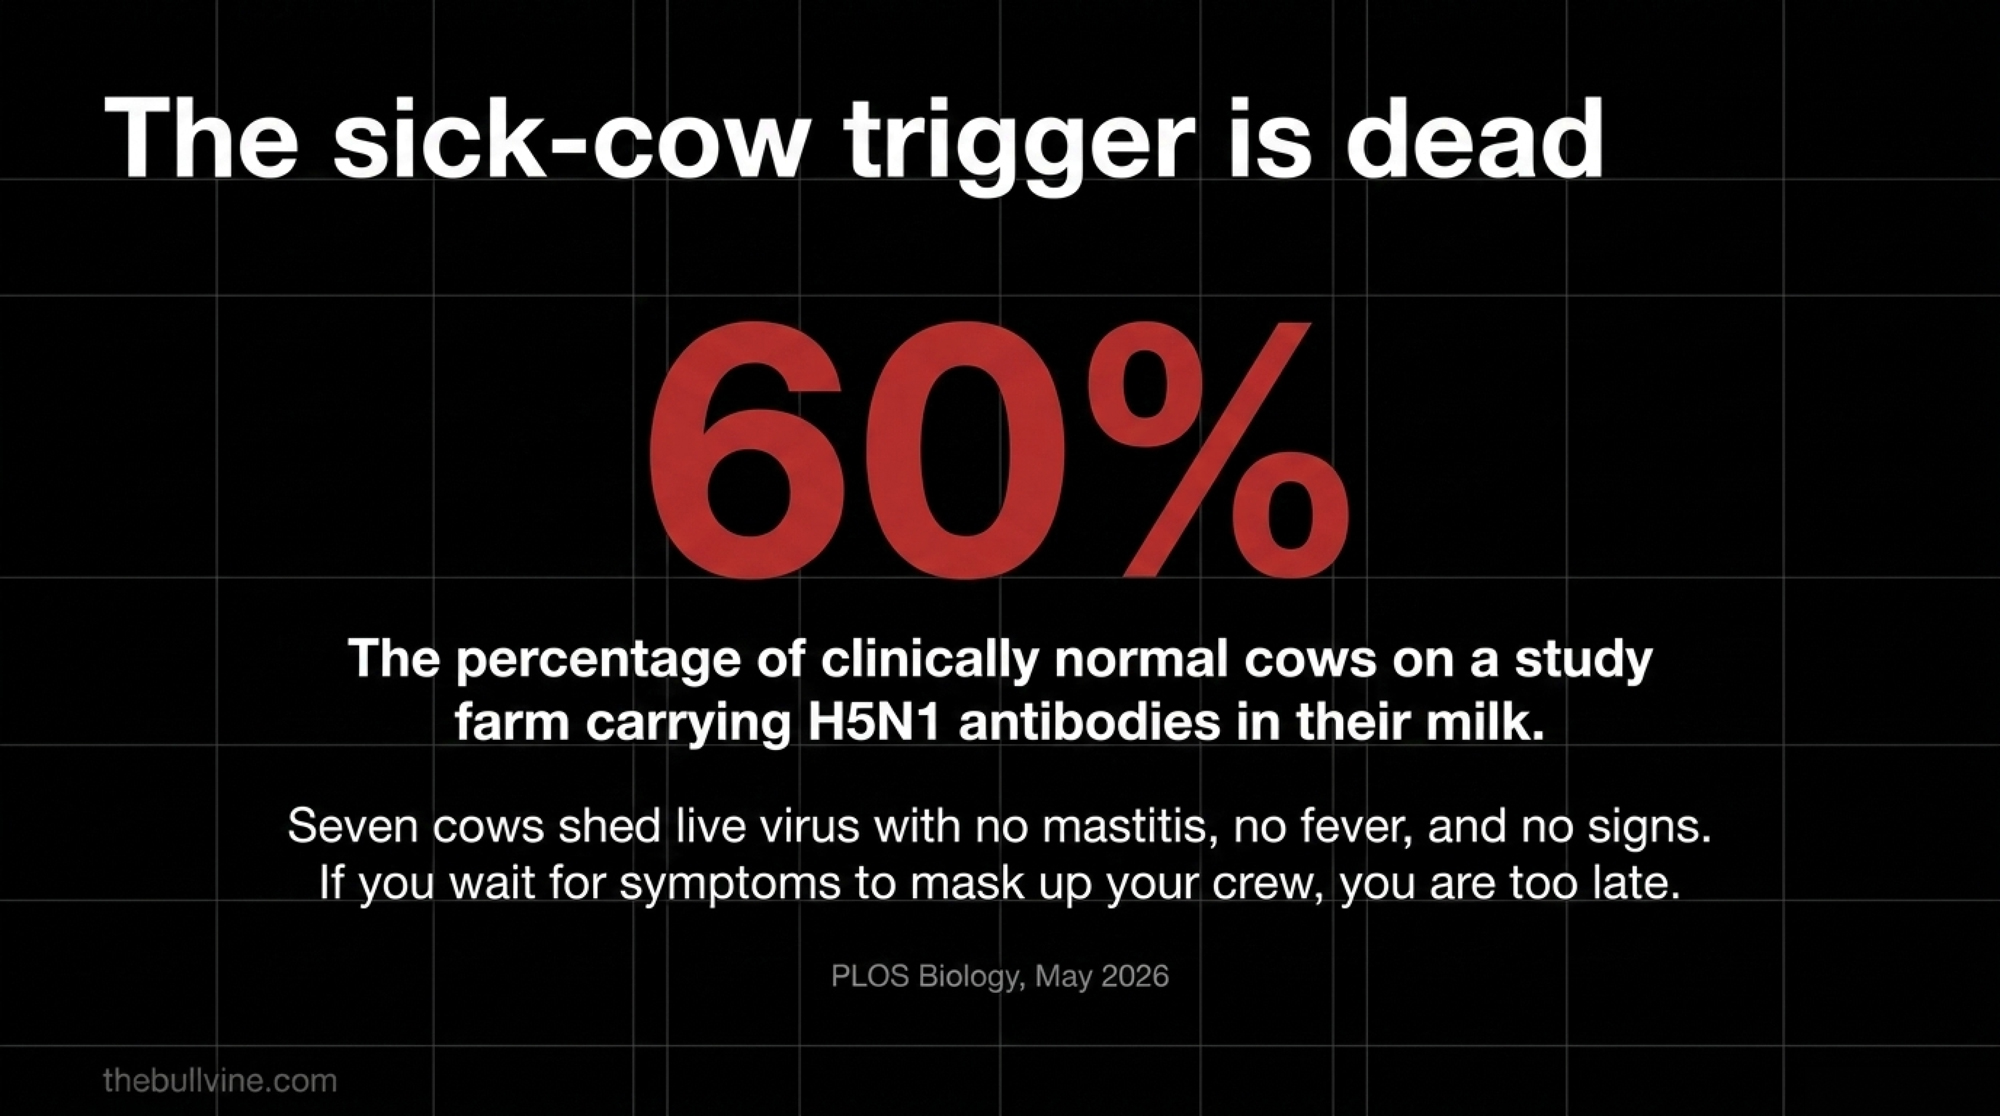
And the cows hiding it? The Cornell University team that studied a 3,876-cow Ohio herd saw clinical disease in only about 24% of cows, while roughly 76% of infections ran silent. So your eyes aren’t a screening tool. A cow can be shedding into the tank and into the air while chewing cud like nothing’s wrong. 

Population studiedShowed clinical signsRan silent / asymptomaticWhat it means for you
Dairy cows (3,876-cow Ohio herd)~24%~76% infected, no signsA cow can shed into the tank looking healthy
Exposed workers (MI & CO serology, n=115)4 of 8 recalled illness4 of 8 felt nothing at allHalf of infected workers never knew
Workers wearing an N9526%74% unprotectedThe exposed majority has no barrier
Retail pasteurized milk (FDA, n=464)0 viable virus6.9–36.3% PCR fragments (dead)Store milk is safe; the farm is where it moves

That’s exactly why Utah moved straight to mandatory weekly bulk-tank testing for every dairy in Cache County. State Veterinarian Daniel Christensen, DVM, has said mandatory surveillance and animal-movement restrictions are the key steps to stopping further spread. Visual inspection alone isn’t enough — by the time a herd shows a drop in production, the virus has usually been amplifying in the milking environment for days. 

Getting Your Crew to Actually Wear the Gear

Here’s where good intentions go to die. You can stock every shelf with N95s and face shields, and compliance still slips by mid-shift — and it’s rarely about carelessness. A respirator gets hot under a hose-down. Fogged-up eye protection in a 100-cow parlor is a hazard in itself. And a crew running 14-hour days will shed anything that slows them down by the third turn.

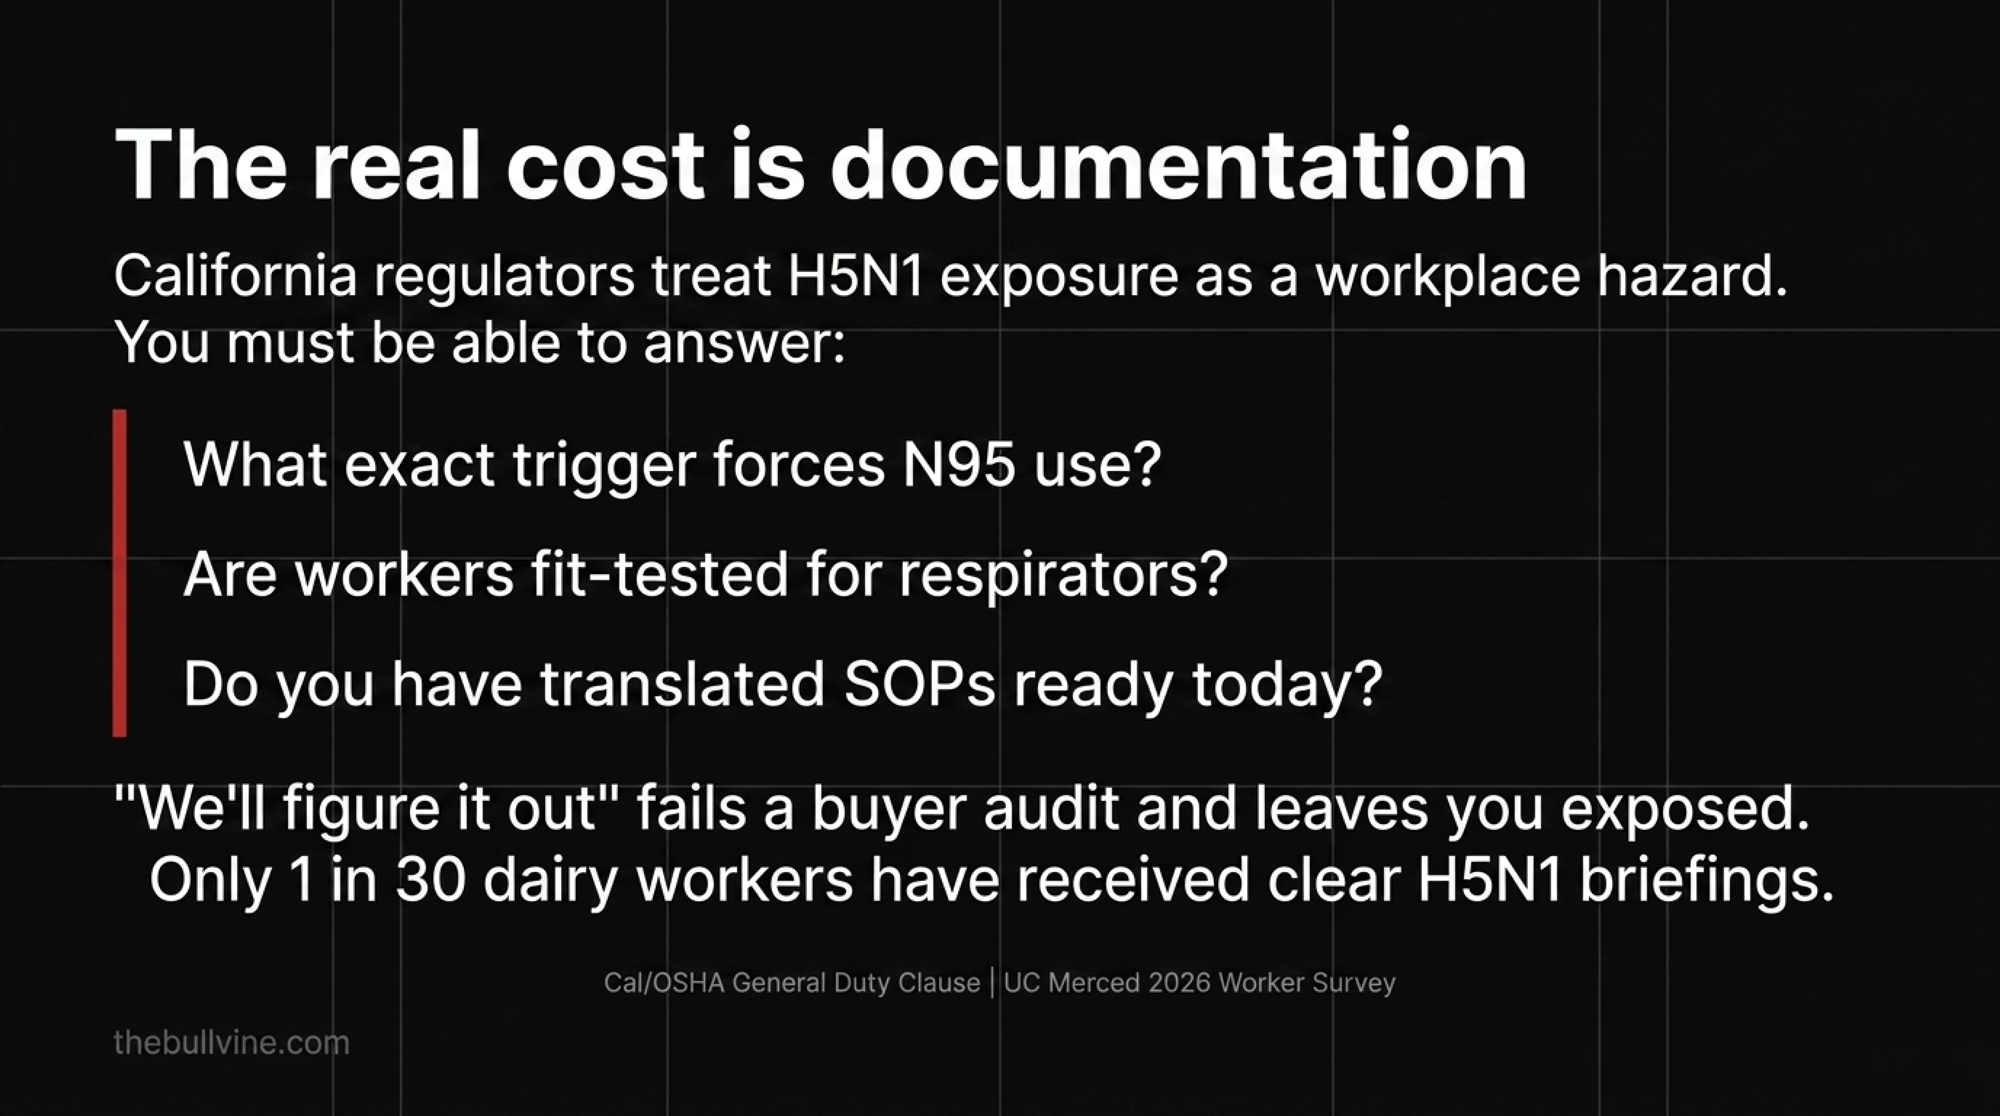
Treat it as a systems problem, not a discipline problem. The farms that hold compliance tend to do a few unglamorous things: they fit-test respirators so they actually seal, they keep spares within arm’s reach of the pit, and they put one person in charge of restocking instead of hoping it happens. In parlor heat, some operations swap N95s for powered air-purifying respirators (PAPRs) and build in mask breaks so the gear stays on through the shift. The barn-floor truth is that PPE only protects the workers who’ll wear it through the last cow of the night — so the goal isn’t a one-day rollout, it’s a habit that survives a bad week. 

How Much Does One Skipped Respirator Actually Cost You?

The exposure math is brutal in its simplicity. A CDC study published in Morbidity and Mortality Weekly Report(November 2024) found only 26% of dairy workers exposed to infected cows wore an N95 respirator — roughly one in four. A companion CDC serology study of 115 workers in Michigan and Colorado found 8 (7%) had antibodies showing recent H5N1 infection — and half of them, four of eight, didn’t recall feeling sick at all. Low PPE adherence and silent infection, side by side, in the same workforce. 

Now the dollars. Cornell University researchers, publishing in Nature Communications on July 15, 2025, pegged the loss at $950 per clinically affected cow — about $737,500 for the single Ohio herd they studied. On a 500-cow dairy, if 24% show clinical signs like that Ohio herd, that’s roughly 120 cows at $950 — about $114,000 in direct losses before you count labor, vet bills, and quarantine disruption. A $15 box of N95s and a face shield is the cheapest line item you’ll ever weigh against that. The full breakdown of the biosecurity math every dairy should run goes well past that first $950. 

What Actually Happens When Your Tank Tests Positive?

Knowing the sequence ahead of time takes some of the panic out of the phone call. A confirmed detection triggers a state quarantine on the premises — your animals stay put, and lactating cows can’t move interstate until they test negative and clear the 30-day window. Milk from clinically affected cows gets diverted or dumped; milk entering the commercial supply still goes through pasteurization, which is why your detection doesn’t become a grocery-store problem. 

Picture how that quarantine week actually runs on a herd like the Cache County operation. The milk check takes an immediate hit while affected cows are diverted. The state vet’s office wants samples, movement logs, and a list of every truck and contractor that crossed the yard. Your crew is nervous and asking questions you may not have answers to yet. And you’re still milking three times a day through it all, because the cows don’t care that you’re under quarantine. That’s the real shape of the disruption — not one dramatic event, but a couple of weeks of running your operation with one hand tied behind your back while the paperwork stacks up.

There’s money on the table to soften the blow, and many operators leave it there. USDA’s Emergency Assistance for Livestock, Honeybees, and Farm-raised Fish (ELAP) program reimburses 90% of the per-cow milk-loss rate, calculated using a 21-day no-production window plus 7 days at half production, paid once per cow during the 120-day window after your first positive test. You file a notice of loss within 30 days after the loss becomes apparent, and the application deadline runs through January 30 of the following year. To qualify, you need a confirmed positive test and documentation of eligible cows, so the time to understand the paperwork is before you’re standing in a quarantined parlor, not after. Producers who came through earlier outbreaks in better shape generally had two things going for them: a written response plan and a relationship with their state animal-health office before the call came. 

Options and Trade-Offs: What You Can Actually Run This Week

You don’t need a biosecurity consultant to start. You need to pick the path that fits your operation and move on it.

MoveCost / effortWhere it failsRun it if…
Gear up parlor crew (N95 + eye protection)Low cost, high effort to sustainCompliance craters when no one’s watchingAnyone forestrips or pulls units — do this first
Lock down the waste-milk linePasteurizer, or citric acid to pH 4.1Closes one route, not allYou feed raw waste milk/colostrum to calves
Tighten shared-equipment & vehicle hygieneModerate — slows the dayBusy operations skip the wash stepTrucks or crews move between sites
Bulk-tank surveillance over visual checksEnroll in National Milk Testing StrategyConfirms infection, doesn’t prevent itEverywhere — silent infection makes eyes useless
Map ELAP eligibility before you need itPaperwork, done in advanceNo payout without a confirmed positive + docsYou want the 90% milk-loss reimbursement

Gear Up the Parlor Crew — Your 30-Day Move

  • Do this first: Eye protection and N95s on anyone forestripping or pulling units. Lowest cost, highest return, because the virus is airborne in the parlor. 
  • What it takes: A stocked PPE supply, fit-tested respirators, and a crew that’ll actually wear them.
  • Where it fails: Compliance craters the second a supervisor looks away — treat it as a culture fix, not a supply order.

Lock Down the Waste-Milk Line

  • When it makes sense: Any farm feeding raw waste milk or colostrum to calves — a documented cow-to-cow transmission route APHIS flags explicitly. 
  • What it takes: A pasteurizer or an acidification protocol — UC Davis showed citric acid to pH 4.1 inactivates H5N1 in six hours, a cheaper alternative for some operations. 
  • The limit: It closes one route, not all of them.

Tighten Shared-Equipment and Vehicle Hygiene

  • When it makes sense: If trucks, feed equipment, or crews move between sites — the exact path that spread H5N1 across Idaho’s hotspot counties. 
  • What it takes: Power-wash and disinfect tires and equipment that cross on-farm vehicle paths; require clean, dedicated footwear. 
  • The trade-off: It slows your day, and busy operations skip that.

Lean on Bulk-Tank Surveillance Instead of Your Eyes

  • When it makes sense: Everywhere — silent infection makes visual screening nearly useless. 
  • What it takes: Enrolling in the National Milk Testing Strategy sampling that already caught Nevada’s D1.1 outbreak; Utah now mandates it weekly for every dairy in Cache County. 
  • The catch: A positive tank confirms you’re already infected, so surveillance buys response time, not prevention.

Where’s this heading? Utah’s jump to mandatory weekly testing after one detection is the direction of travel — the early-warning system leans harder on bulk-tank surveillance every season, so the farms treating their tank data as a smoke detector, not a formality, are the ones that’ll catch the next spread early. And the ELAP backstop means the prevention spend isn’t all on you: document your biosecurity costs and milk losses now so you can recover them if the worst happens. 

Key Takeaways: Decisions to Make This Week

  • If anyone in your parlor forestrips or pulls units without eye protection and an N95, fix it before your next milking — the CDC found only 26% of exposed workers wearing one, and the virus is airborne in the parlor. 
  • If you’re feeding raw waste milk or colostrum to calves, stop until you can heat-treat, pasteurize, or acidify it — APHIS calls it a documented cow-to-cow transmission route. 
  • If you’re relying on spotting sick cows to gauge your herd’s status, recalibrate: only about 24% show clinical signs, so the tank tells you more than your eyes do. 
  • If trucks or crews move between your sites uncleaned, build in a power-wash and disinfection step now — shared equipment and worker movement drove spread across Idaho’s hotspot counties. 
  • If you haven’t mapped ELAP eligibility, do it before you need it — the 90% milk-loss reimbursement requires a confirmed positive test and documentation, and the notice-of-loss clock starts at 30 days. 
  • If you think 18 quiet months mean you’re clear, ask Cache County, Utah — it went nearly 20 months between dairy detections and still got hit again this June. 

The Question Worth Asking at Tomorrow’s Milking

Walk into your parlor tomorrow morning. Count how many of your people are wearing eye protection and a respirator while the units are running. If the honest answer is “about one in four” — the exact number the CDC found in the field — then you already know where your weakest link is, and it isn’t your bulk tank. 

The barn-level question isn’t whether H5N1 is coming back. Texas, Idaho, and Utah already answered that this spring. It’s whether your parlor crew is protected before it returns to your county — and whether your tank surveillance is a real early-warning system or just a box you check. The Wayne County safety playbook every operation should stealpairs with the full bulk-tank surveillance and parlor-PPE breakdown by herd size in the next Bullvine Weekly. That’s where the operational detail lives.

Run Your Numbers

Herd Health ROI Calculator — Before you decide a $15 box of N95s and tighter biosecurity isn’t worth the hassle, run the numbers. The calculator puts a per-cow dollar value on lower culling, fewer health losses, and the replacement cost an outbreak forces on you — so you can weigh prevention against the $950-a-cow hit before it lands.

Complete references and supporting documentation are available upon request by contacting the editorial team at editor@thebullvine.com.

Learn More

The Sunday Read Dairy Professionals Don’t Skip.

Every week, thousands of producers, breeders, and industry insiders open Bullvine Weekly for genetics insights, market shifts, and profit strategies they won’t find anywhere else. One email. Five minutes. Smarter decisions all week.
NewsSubscribe
First
Last
Consent

A CA$686M Co-op Just Sent Maritime Farmers the Hauling Bill

Agropur posted CA$686M in EBITDA, then closed Sussex. Reroute math runs CA$32K–111K a year for a 150-cow herd — and the P5 pool buries it so you never see it on your cheque.

Executive Summary: Up CA$76.8 million year over year, with leverage cut to 1.4x, Agropur posted CA$686.4 million in EBITDA in fiscal 2025 — and then announced it’s closing the Sussex Butternut Valley plant by the end of 2028. That’s the tell: this isn’t a co-op short on cash, it’s one moving roughly 74 million litres of butter-and-powder volume off the books while it spends CA$20M-plus expanding liquid capacity at Miramichi. The hit lands on the ~62 farms in the Sussex catchment, where rerouted milk pencils out to somewhere between CA$32,000 and CA$111,000 a year in added hauling for a 150-cow herd, depending on your distance and load share. Here’s the part that should worry every New Brunswick producer, not just Sussex-area ones: under the P5 pool, that freight gets equalized across the province per hectolitre, so it never shows up as a line on any single milk cheque — it just quietly shaves the blend. The whole transition also hangs on Bedford, NS getting board and regulatory approval by end-2026, and there’s no public interim plan if it slips. With Atlantic producers holding one seat out of sixteen on the board, the question your DFNB rep needs to answer before the next meeting is simple: does the pool eat this freight, or does your catchment?

Agropur Sussex closure

A 150-cow dairy in Kings County, New Brunswick, is looking at between CA$32,000 and CA$111,000 a year in additional hauling once Agropur shuts its Sussex plant and the milk has to travel farther. That’s the routing-cost range for the roughly 62 farms in the Sussex catchment, the figure Dairy Farmers of New Brunswick General Manager Steve Michaud confirmed to CBC in April 2026. Here’s the part the press release skipped: under the Maritime milk pool, that cost may never appear as a line on any single milk cheque — but somebody still pays it. 

This is the Agropur Sussex closure story for New Brunswick dairy 2026, and the only open question about cost is who bears it. Not whether it exists.

Agropur announced on April 23, 2026, that it’s closing the Sussex Butternut Valley facility by the end of 2028 and putting more than CA$20 million into a 50 percent capacity expansion at Miramichi, backed by a CA$2.4 million provincial modernization grant. The official framing is regional investment and modernization. The framing the math supports is narrower: a strong co-op moves production to where it runs cheapest, and Maritime producers absorb the freight. 

A Co-op Sitting on CA$686 Million in EBITDA Made This Call

When a plant closes, the reflex is to assume the company couldn’t afford to keep it open. Agropur’s own books say the opposite.

The cooperative reported CA$686.4 million in EBITDA for fiscal 2025, up CA$76.8 million year over year. It cut debt leverage from 2.0x to 1.4x EBITDA in the same year. It returned CA$70 million to its roughly 2,700 member-producers — CA$17.5 million in cash and CA$52.5 million in Class A shares. Total assets hit CA$4.8 billion. 

A strong balance sheet doesn’t make consolidation wrong. A co-op that runs lean serves its members better across the full cycle, and idle capacity helps no one. What the balance sheet changes is the conversation Agropur owes those members. This wasn’t a forced retreat. It was a choice. And choices invite questions that “we had no option” lets a company skip.

Where Kings County Milk Goes After 2028 Is Still Unanswered

Steve Michaud runs Dairy Farmers of New Brunswick, the board representing every milk producer in the province. After the April announcement, he told CBC the Sussex and Moncton corridor holds the largest concentration of dairy farms in New Brunswick. That’s the catchment in question — not a handful of farms on the edge of a service area, but the densest cluster of dairy in the province. 

What nobody has spelled out is where that milk goes after Butternut Valley shuts down. Per Agropur’s facility profile, Sussex processes roughly 74 million litres a year on an industrial stream — butter and powdered milk. Miramichi is being rebuilt as the regional center for liquid milk. 

That distinction is the whole problem. Fluid milk and industrial butter-and-powder run on different processing lines, so a larger liquid plant at Miramichi can’t simply absorb Sussex’s product mix. The butter and powder volume has to land somewhere else — and that somewhere is a proposed mega-plant in Bedford, Nova Scotia. Which means the routing future of every farm in the Sussex catchment hangs on a board-and-regulatory approval that hasn’t happened yet, in another province. 

Agropur has said the majority of production will transition to Miramichi “by the following spring” — spring 2029, per the company’s transition language — once the reorganization is complete. The plant meant to anchor the displaced industrial volume is Bedford. And Bedford isn’t approved yet. 

What Does the Bedford Approval Timeline Mean for Your Milk in 2029?

The whole plan rests on one load-bearing assumption: Bedford gets approved and built on schedule. Agropur’s own language is that the Bedford and Beauceville investments “remain subject to final approval by the end of 2026.” Sussex will close by the end of 2028. Two timelines, running close, with little slack between approval, construction, and shutdown. 

Stack them that tight and the risk writes itself. If approval slips into 2027, a billion-dollar plant doesn’t compress its build to cover the gap. So where does Sussex’s butter and powder go in the meantime?

MilestoneStatusDeadlineRisk if Slipped
Bedford, NS plant — board & regulatory approvalPendingEnd-2026No industrial anchor for Sussex butter/powder volume
Sussex Butternut Valley — closureConfirmedEnd-202874M L of industrial stream has nowhere confirmed to go
Miramichi expansion — liquid capacity +50%In progressSpring 2029Fluid milk absorbed; industrial stream still open
Interim routing plan for Sussex volumeNo public planProducers carry unknown cost with no contractual protection
DFNB pool vs. direct-charge decisionUnconfirmedPre-closureDetermines whether 62 farms or all NB producers absorb freight

No interim plan has been announced publicly. The record says approval is expected by the end of 2026, that Sussex closes by the end of 2028, and that members are asked to trust the sequence. “Pending final approval” is a condition, not a commitment. Conditions slip. When the co-op asking its Maritime members to plan around that condition is carrying CA$686 million in EBITDA, those members have standing to ask what the fallback is.

One Atlantic Seat Out of Sixteen

The second assumption worth retiring is that membership in Agropur means the co-op is structurally on your side as a Maritime producer. The governance math says hold on — and it’s worth being precise about why. This isn’t bad faith. It’s geometry.

Quebec holds the equity, so Quebec holds the votes. Agropur processes 6.7 billion litres a year, with the bulk of its Canadian volume and most of its 2,700 members in Quebec. Atlantic producers hold one of sixteen seats on the board. A cooperative weights its votes toward where the milk and the equity sit, and for Agropur, that’s Quebec. The board that approved this restructuring reflects exactly the ownership structure it’s built on. No conspiracy required. The Maritime voice is one-sixteenth of the room, and the decision went the way one-sixteenth of the room usually goes. 

This isn’t the first Atlantic pullback, either. Agropur sold its St. John’s operation in 2024 and cut Atlantic positions in earlier rounds. Sussex is the latest move in a decade-long trajectory, not a one-off. 

EventYearMoveAtlantic Impact
St. John’s operation2024Sold / divestedNewfoundland loses local processing
Atlantic staffing rounds2021–2023Position cutsReduced regional headcount
Sussex Butternut Valley2028 (announced)Plant closure~62 farms lose local processor; ~74M L rerouted
Miramichi expansion2026–2029CA$20M+ liquid capacityFluid milk centralized; industrial stream TBD
Bedford, NS mega-plantPending (end-2026 approval)New industrial hubButter/powder anchor — not yet approved

Running the Numbers: What Rerouting Costs a Maritime Dairy

Here’s the barn math, with every assumption on the table so you can swap in your own herd.

Take a 150-cow herd at roughly 10,000 litres per cow per year — about 1.5 million litres annually, or 15,000 hectolitres. On every-other-day pickup, that’s about 180 milk-truck runs a year. The Sussex-to-Miramichi reroute adds roughly 150 to 175 kilometres to a one-way trip, depending on farm location, based on the road distance between the two plants. Maritime bulk hauling runs in the range of CA$2.50 to CA$3.50 per loaded kilometre, and a single farm shares a load rather than filling it, so only a portion of that incremental distance lands on any one operation. 

Run it across the plausible band:

ScenarioAdded one-way kmEffective $/km load shareAdded annual hauling costAdded cost per hectolitre
Low~150 km~$2.50, ~20% share~CA$32,000~CA$2.13
Mid~165 km~$3.00, ~33% share~CA$63,000~CA$4.20
High~175 km~$3.50, ~50% share~CA$111,000~CA$7.40

The same band scaled to other herd sizes shows how fast this moves with cow numbers — an 80-cow herd sits well below the figures above, a 300-cow herd well above.

Two honest caveats. The per-kilometre rate and the load-share fraction are the swing variables — change those and the whole range moves, which is exactly why this is shown as a band, not a single number. And the distance is plant-to-plant; your farm’s actual additional kilometres depend on where you sit within the catchment.

Now, the part that changes how you should read every figure above.

The P5 Pool Doesn’t Erase This Cost. It Hides It.

Everyone assumes transport is the trucking company’s problem, or the processor’s. In the Maritime system, it’s neither — and that’s the turn.

New Brunswick milk is pooled through the P5 Eastern Canadian agreement, which equalizes transport and revenue across producers on a per-hectolitre basis rather than billing each farm for its own truck. So the Kings County farmer may never see a CA$63,000 line on a statement. The cost gets spread across the provincial pool and comes to a few cents per hectolitre on everyone’s blend. 

Read that twice, because it cuts two ways. Dilution isn’t absorption. The cost doesn’t vanish into the pool — it just becomes untraceable on any single milk cheque. Every producer in the New Brunswick pool helps carry the freight for a closure that benefits a co-op booking CA$686 million in EBITDA. The pool protects you from a catastrophic individual hit. It also makes it nearly impossible to point at a number and say, “That one’s Agropur’s decision.” 

That’s the question your board has to answer: does DFNB absorb this into the provincial pool and spread it thin, or does Agropur negotiate a catchment-specific hauling arrangement that sticks the bill to the Sussex-area farms directly? The answer decides whether this is everyone’s nickel or 62 farms’ dollar.

The 30/90/365-Day Playbook for Herds in the Sussex Catchment

30-Day Actions — urgent checks

  • Pull your last three milk cheques and find the transport and hauling deduction line. Know what you pay per hectolitre today, before anything reroutes. What it requires: ten minutes and your statements. Trigger to escalate: if you can’t find the line at all, call DFNB and ask how transport is allocated in your pool — you can’t track a change you can’t see.
  • Ask DFNB directly where your milk routes after end-2028 and whether the cost flows through the pool or a separate catchment charge. What it requires: one phone call. Where it backfires: a vague answer is itself information — note who said it and when.

90-Day Actions — structural

  • Get the routing question on the DFNB meeting agenda in writing, with the pool-versus-direct-charge decision explicitly named. What it requires: a few producers raising it together; one voice is easy to table. Trigger: do this before the Bedford approval decision lands at the end of 2026, not after — once capital’s committed, your leverage drops.
  • Model your own farm’s added kilometres, not the plant-to-plant figure. What it requires: your location, your pickup schedule, and the rate band above. Where it backfires: assuming the mid-case applies to you when your geography puts you at the high end.

365-Day Moves — strategic positioning

  • Watch the Bedford approval decision as your real signal. If it clears on schedule by the end of 2026, the transition timeline holds; if it slips, the interim-volume question becomes live, and you want to be the producer already asking it. Opportunity signal: if DFNB commits in writing to pool-based equalization of reroute costs, your individual exposure stays a few cents per hectolitre, and you can plan around it. If it won’t commit, treat the high-case as your planning number until proven otherwise.

What This Means for Your Operation

Strip away the press release, and the trade-off is plain. Agropur gains processing efficiency by concentrating volume. Maritime producers carry the routing cost in a pool structure that makes it hard to see and harder to contest. You gain the stability of a financially strong co-op. You give up a clear line of sight into who pays when that co-op optimizes around you.

The number to demand isn’t in the announcement. It’s the one DFNB and Agropur haven’t published: the confirmed post-2028 routing plan for Kings County milk, and whether its cost flows through the provincial pool or onto 62 specific farms.

So before the next DFNB meeting, pull your transport deduction line and answer the only question that decides your exposure — when Sussex closes, does your pool eat the freight, or does your catchment?

Key Takeaways

  • Agropur closed Sussex while sitting on CA$686.4M in EBITDA — read this as a cost-driven efficiency move, not a co-op in trouble, and judge the transition on that basis.
  • If your milk runs through Sussex, the reroute pencils out to CA$32K–111K a year on a 150-cow herd, but the P5 pool spreads it per hectolitre so you won’t see it as a line on your cheque.
  • Watch the Bedford, NS approval decision due by end-2026 — if it slips, there’s no public plan for where Sussex’s butter-and-powder volume goes before the 2028 closure.
  • Before your next DFNB meeting, get one answer in writing: does the provincial pool absorb this freight, or does your catchment get charged directly?


Complete references and supporting documentation are available upon request by contacting the editorial team at editor@thebullvine.com.

Learn More

The Sunday Read Dairy Professionals Don’t Skip.

Every week, thousands of producers, breeders, and industry insiders open Bullvine Weekly for genetics insights, market shifts, and profit strategies they won’t find anywhere else. One email. Five minutes. Smarter decisions all week.
NewsSubscribe
First
Last
Consent

Microsoft Got a “Tolerance Decision.” Dutch Dairies Got Closure Orders.

Same nitrogen law, same critical-load maps. Microsoft’s data center got a “tolerance decision” to keep building. The dairy down the road got a buyout letter and an EU-wide ban on ever milking again.

How a court ruling, a vanishing manure exemption, and a cross-border non-compete clause are redrawing dairy country in the Netherlands — and what that pattern looks like, very early, in your region.

Across Dutch dairy country in early 2026, kitchen tables have been carrying the same letter. It isn’t from the bank. It’s from the state, qualifying the operation for “termination with compensation” under the LBV-plus scheme — the Dutch buyout program targeting peak emitters near Natura 2000 reserves. This isn’t a single farmer’s story. It’s the composite scene from the January 2026 Omroep Gelderland / NRC / Follow the Money investigation, walking through how Dutch nitrogen policy actually lands on a fourth-generation dairy.

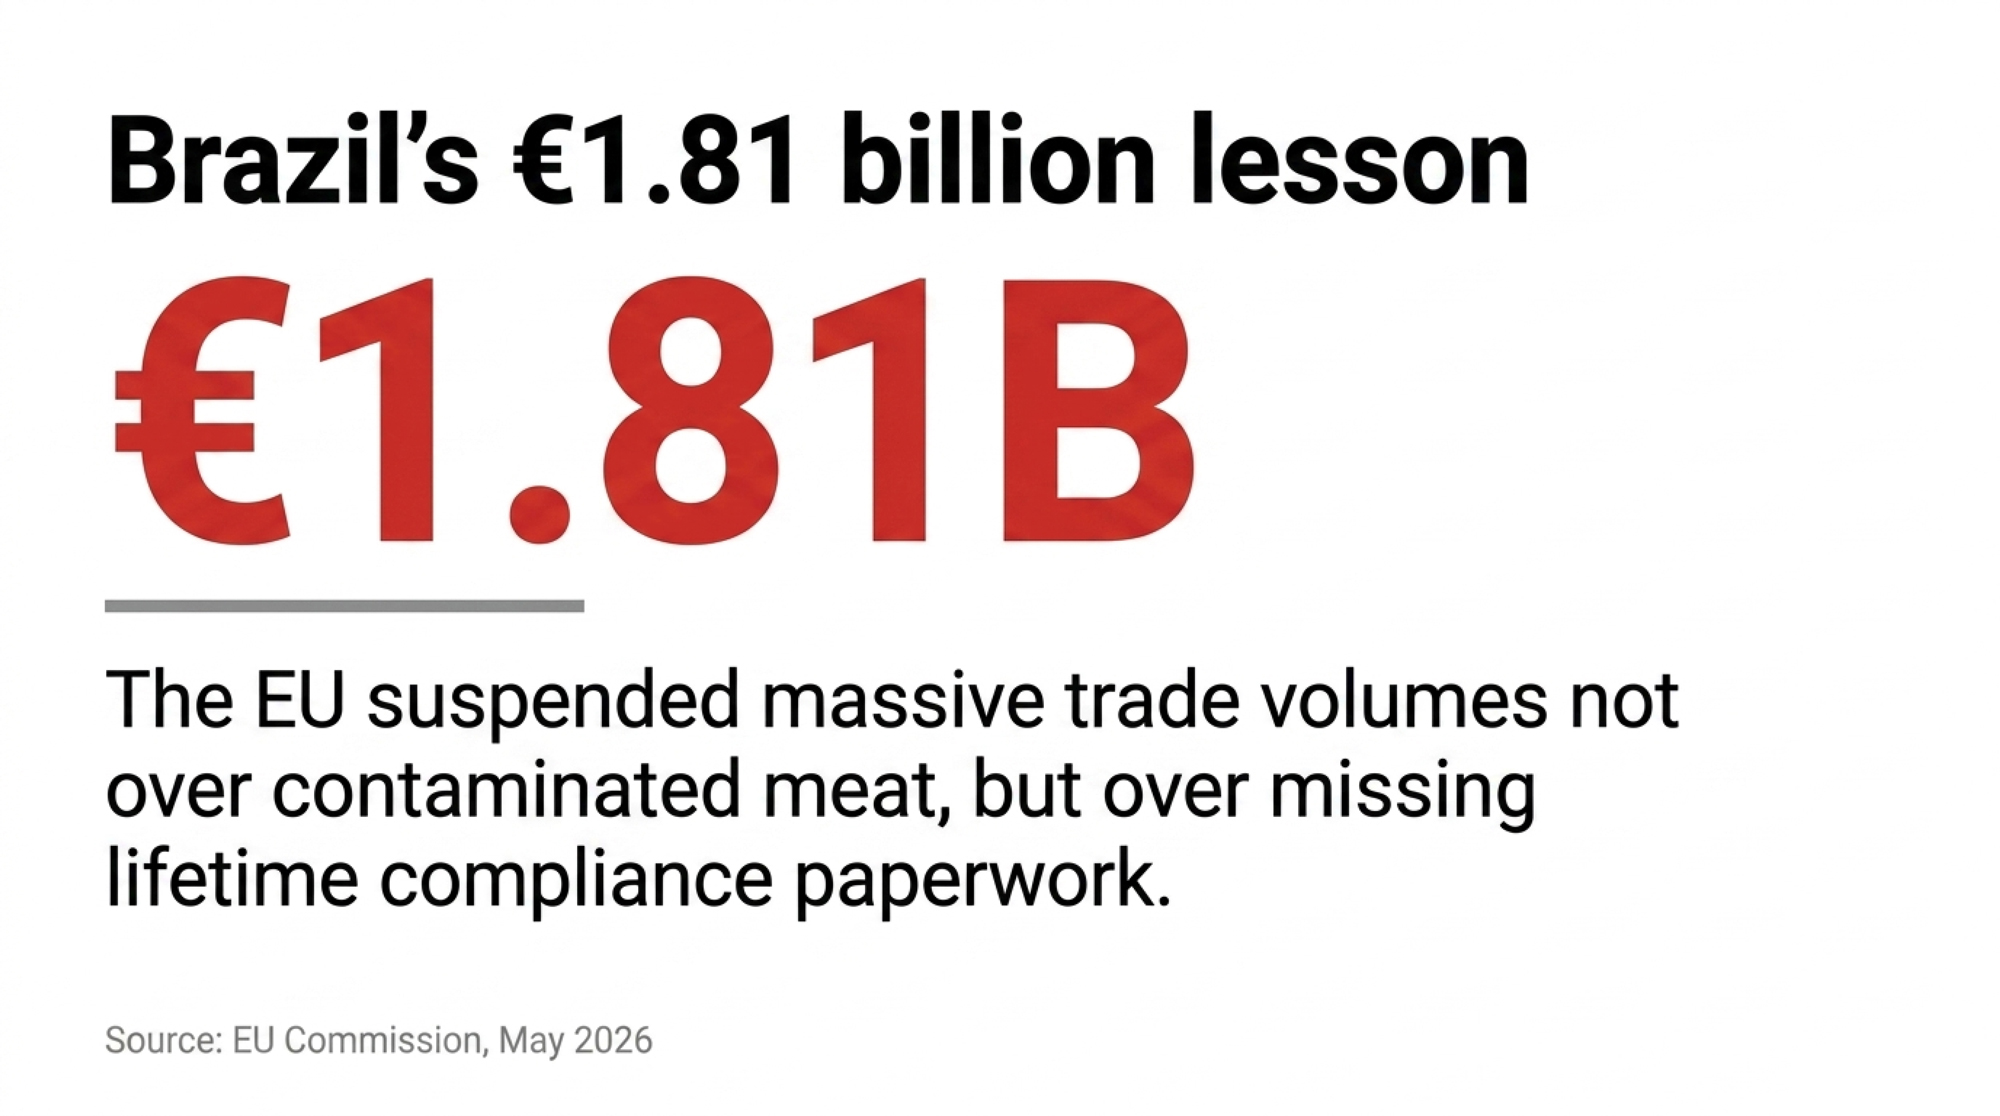
By the time those letters started moving in volume, the cold version of the story looked like this: that same investigation found that the Dutch Ministry of Agriculture had spent €1.81 billion to close 723 farms, resulting in an estimated 8% reduction in the national nitrogen surplus. To understand how a buyout letter ends up on a kitchen table, you have to follow the legal chain backward from 2025.

Why the Dutch Nitrogen Crackdown Started in Court

Dutch nitrogen policy didn’t start as a political program. It started as a permit collapse. In May 2019, the Council of State ruled that the country’s existing framework — the Integrated Approach to Nitrogen, or PAS — violated the EU’s Habitats Directive by issuing permits based on promised future emissions cuts. About 18,000 housing, industrial, and farm projects were paused almost overnight, according to Dutch government estimates, in what locals nicknamed the “nitrogen lockdown.”

The ruling created a new legal category overnight: the “PAS-melder.” Under the prior Programmatic Approach to Nitrogen, the Dutch government had told thousands of farmers and rural businesses that they could expand or modernize simply by reporting their nitrogen emissions rather than applying for a full environmental permit. After May 2019, those same operations — thousands of them, spanning dairy, pig, poultry, contracting, biomass, and infrastructure — were retroactively found to be without secure permits. Many formally requested legalization. Years on, most still don’t have secure permits. They spent that time in regulatory limbo, having done exactly what the state had asked them to do.

The follow-up came on January 22, 2025, when the District Court of The Hague ruled in favor of Greenpeace and ordered the state to bring at least half of all nitrogen-sensitive nature areas below their critical deposition thresholds by the end of 2030, attached to a €10 million penalty for non-compliance. The court told the government to act with immediate effect, regardless of any pending appeals.

None of this means the underlying ecological pressure isn’t real. Dutch nitrogen deposition has measurable impacts on Natura 2000 ecosystems, and the science behind critical loads isn’t seriously contested. The fight is over which sectors carry the cost of the response — and on what timeline.

The math is where the asymmetry shows up. Agriculture accounts for roughly 46% of national nitrogen deposition, primarily as ammonia from livestock manure. But under the framework designed to meet those 2030 targets, the sector has been assigned up to 70% of the required cuts. Aviation, with around 13% of nitrogen oxides per RIVM data, has received structural leniency. Heavy industry, at roughly 2.1% per RIVM data, sits inside national economic competitiveness rules that buy it time. That mismatch is the engine driving everything else in this story.

What the Manure Derogation Collapse Means for Dutch Dairies

For Dutch dairy producers, the pressure shows up in three reinforcing layers. The first is the manure derogation collapse. Since 2006, Dutch dairies have been legally allowed to apply 230–250 kg of manure nitrogen per hectare on high-yield grass under a special EU exemption. In September 2022, the European Commission set a phase-out: the ceiling drops back to the standard 170 kg N/ha by 2026. By 2024, about 87% of Dutch dairy farms and 94% of pig and poultry operations were producing more manure than they could legally apply on their own land.

The second layer is price. USDA FAS reporting and Wageningen analysis confirm that slurry disposal costs reached €25–30 per cubic meter by 2024, roughly double 2022 levels, with costs varying by region. Try this barn-math moment: a 200-cow Dutch dairy producing slurry at the Wageningen planning norm of 24–30 m³ per cow per year is staring down something on the order of 4,800–6,000 m³ a year. Even partially exporting that volume at €25–30/m³ stacks five- to six-figure annual costs on top of normal operating expenses, before a single new compliance investment.

Run it the other way, and the pinch gets sharper. At the low end — 4,800 m³ at €25 per m³ — that’s €120,000 per year. At the high end — 6,000 m³ at €30 — it’s €180,000. Even if the farm only has to export a third of its slurry because it can still spread the rest on its own ground, you’re looking at €40,000 to €60,000 in additional annual costs for a 200-cow operation. That’s not a line item. That’s the difference between a profitable year and a loss for many family-scale dairies, and it shows up before anyone even factors in the buyout conversation.

Scenario (200-cow dairy)Volume (m³/yr)Rate (€/m³)Annual disposal cost
Low end, full export4,800€25€120,000
High end, full export6,000€30€180,000
Export ⅓ only, low rate1,600€25€40,000
Export ⅓ only, high rate2,000€30€60,000
Per-cow planning norm24–30 m³/cowProfit-vs-loss swing for family-scale

Here’s the part that should land hardest for a North American reader. The same cost mechanism is embedded in California’s spread limits, Ontario’s nutrient management plans, and Ireland’s own derogation fight — Ireland’s exemption was cut to 220 kg N/ha in its most recent European Commission review, and Dutch producers are watching it because they’ve already lived through the next chapter. When application ceilings tighten, manure flips from a free fertilizer asset to a metered disposal liability almost overnight. The Dutch just hit the wall first.

The third layer is the buyout itself. The EU-approved LBV (€500 million) and LBV-plus (€975 million) schemes target livestock sites near vulnerable Natura 2000 areas. LBV pays up to 100% of “losses incurred” on closure; LBV-plus pays up to 120% for peak emitters, plus demolition costs. The catch is in the covenant. Signing means permanent closure of that production capacity and a legal ban on restarting the same livestock activity anywhere in the Netherlands or the wider EU. The state buys the business, not the land — leaving the underlying parcel free to be rezoned for housing, industry, or data infrastructure.

Why the Same Nitrogen Law Treats Two Emitters Very Differently

Why does this travel? Three structural reasons.

Once a court locks in a hard cap on local nitrogen deposition, somebody has to allocate scarce “nitrogen space” between sectors. Agriculture turns out to be the cheapest, fastest place to extract reductions. It’s spatially diffuse — tens of thousands of small point sources you can shut one at a time without triggering a single big political fight. And it’s politically fragmented — dairy, pig, and poultry producers don’t show up as one unified corporate lobby; they show up as individual permit holders. It’s also already heavily monitored — every animal is registered, every cubic meter of manure is tracked, and the RIVM’s National Emission Model for Agriculture (NEMA) links farm-level inputs to specific Natura 2000 polygons.

That last point is the quiet kicker. The same precision data that earned Dutch farmers their reputation as world-leading sustainable producers — a 64% drop in NOx and ammonia emissions between 1990 and 2018, and a 57% drop in nitrogen surplus by 2023 — also pinpointed them as the most cleanly quantifiable units to remove. The system rewarded them with maps that made them targetable.

Large industrial projects have faced very different rules on the same legal turf. Microsoft’s Hollands Kroon hyperscale data center, built on agricultural land roughly 50 kilometers outside Amsterdam, was granted a “tolerance decision” by the local environment authority — the regulator’s own term — that permitted construction to continue while its nitrogen footprint was still being assessed. In Amsterdam, the FTM/NRC investigation reported that a three-tower Microsoft project was approved as three separate smaller permits during the same period the 2022 national hyperscale moratorium was in effect. In Zeewolde, a Meta campus equal to 310 American football fields was planned on reclaimed agricultural polder land before being canceled in 2022 amid political pushback.

Look at what the construction phase alone demands. A hyperscale data center build runs diesel generators, hundreds of truck movements, and heavy machinery for months — all nitrogen-emitting, all on the same critical-load maps that flag a dairy barn. The difference isn’t the chemistry. It’s that a data center arrives as one large applicant a government wants to keep, with lawyers and a permitting strategy, while a dairy arrives as one of tens of thousands of individually liable permit holders. Same nitrogen law. Two enforcement cultures. Neither Microsoft nor Meta responded to questions about those decisions in time for publication.

FactorDairy operationHyperscale data center
Regulatory treatmentRetroactively unpermitted; buyout letter“Tolerance decision” — build continues during assessment
Status under the lawOne of tens of thousands of liable permit holdersSingle large applicant the government wants to keep
Permitting strategyIndividual; limited national appealLawyers; 3-tower project split into 3 smaller permits
Nitrogen-emitting construction phaseStanding barn on critical-load mapDiesel generators, hundreds of truck trips — same maps
Land outcomeClosed, rezonable for housing/industry/dataBuilt on former agricultural land

How Much Does the Math Actually Punish the Middle?

The number that should land hardest is buried in the per-farm math. Dividing the €1.81 billion across the 723 closed farms works out to roughly €2.5 million per operation, based on a blended average that includes scheme spending, administration, and demolition support, as reported in the Omroep Gelderland / NRC / FTM investigation. On paper, that sounds generous. The covenant is what reframes it. Read against the covenant terms, the payment functions as compensation for exit, not transition — it ends the business, locks the land out of livestock use, and bars the family from restarting the same activity anywhere in the EU.

The same investigation flagged a sharper alternative. Mediator Johan Remkes argued that targeting only the largest peak emitters near Natura 2000 borders could have delivered the same 8% nitrogen reduction by closing roughly 133 farms for €330 million. That’s a €1.5 billion gap between two policy choices — wide net versus precise scalpel — and it isn’t an environmental cost. It’s a political one. For producers in North America, this is the math worth memorizing: when a regime decides to cast a wide net rather than a precise one, mid-sized family operations are exactly the size that gets caught first — and as the PAS-melder cohort learned, the risk isn’t only that the rules tighten. It’s that the rules you currently comply with can be retroactively invalidated by a single ruling on the framework itself.

Is Your Operation in the “Easy to Remove” Band?

Dutch farmers ran the wrong diagnostic five years too late. The one worth running today comes down to three structural features that made certain farms the first targets:

  • Highly invested mid-to-large family farms with recent CAPEX in low-emission housing, robots, and nutrient tech, making them visible in every dataset.
  • Locations near sensitive ecosystems, water sources, or other regulated zones where future buffer requirements could compress operations regardless of compliance history.
  • Reliance on regulatory exemptions — like the manure derogation — whose removal could be triggered by a single EU- or court-level decision, with limited national appeal.

If two or three of those describe your operation, you’re in the same structural band that took the heaviest hit in the Netherlands. That doesn’t mean exit. It means being deliberate, now, about leverage and visibility before the lines on a map are drawn.

Structural featureLower exposureHigher exposure (Dutch-pattern)
Capital profileOlder facilities, low recent CAPEXRecent low-emission housing, robots, nutrient tech — visible in every dataset
LocationDistant from sensitive zonesNear Natura-style reserve, water source, or buffer zone
Regulatory footingOwns full permit, no exemption relianceDepends on a derogation removable by one court/EU ruling
Herd size band<80 or >800 cows80–800 mid-family band — big enough to track, small to lobby
VerdictWatch and documentPrioritize legal/policy engagement now

Options and Trade-Offs for Farmers

The Dutch story doesn’t predict what happens in Wisconsin, Ontario, Cork, or California. But the early signals are visible enough to act on. California’s SB 1383 mandates a 40% cut in dairy and livestock methane from 2013 levels by 2030. Canadian federal climate policy commits to a 30% reduction in methane emissions from 2020 levels by 2030 under the Global Methane Pledge, with longer-horizon discussions tied to the 2050 net-zero target. Ontario continues to review and tighten its nutrient management framework under the existing Nutrient Management Act. Four paths are emerging.

  • Path 1 — Read the policy language, not just the rules. Watch for the shift from “emissions intensity per kg of milk” to “absolute sector reductions by year X.” Intensity targets reward efficiency. Absolute targets reward removal. The Dutch experience shows how fast that quiet linguistic shift translates into farm closures. Risk: this means real time spent reading consultation drafts and provincial or state climate plans, not just farm media summaries.
  • Path 2 — Build leverage you don’t currently have. (30-day action.) Dutch farms were structurally exposed because they were spatially diffuse and politically fragmented. Mid-band family operations sit in the same vulnerable middle — big enough to show up in every dataset, small enough to lack corporate-scale lobbying clout. Within 30 days, take a hard look at where your operation has irreplaceable value: an anchor supplier to a regional plant, a watershed steward, an employer in a rural municipality, a source of distinct genetics. Document it. If you can’t name three institutional parties — processor, municipality, watershed group — who would experience real loss if you closed, you have a leverage gap to fix this month. Trade-off: this strengthens your political position, but it also reveals your dependency map to potential acquirers.
  • Path 3 — Don’t volunteer your data without understanding the long arc. ESG dashboards, sustainability premiums, and methane-reduction cost-shares all require detailed barn- and field-level reporting. Today, that data flows into corporate sustainability reports. The Dutch case is a warning that the same datasets will serve as the basis for future regulatory targeting. Trade-off: you may need that data to access premiums or grants, but it’s worth asking — in writing — exactly how regulators will and won’t use it downstream.
  • Path 4 — Engage upstream, not downstream. Dutch farmers lost the legal architecture fight before they realized it was happening. The Greenpeace ruling, the Habitats Directive interpretation, and the LBV covenant design were all settled in courtrooms and ministries — not in barns. When it makes sense: now, while methane and nutrient frameworks in your region are still in pilot or consultation phase. What it requires: working with your dairy organizations on the legal and judicial side, not just the agronomic one. Central trade-off: every hour spent on policy is an hour not spent on barn-level efficiency, but the Dutch case shows efficiency alone doesn’t buy you a future when the legal architecture has already been written. The PAS-melders are the proof: thousands of farms that followed the law to the letter were left in legal limbo not because they did anything wrong, but because the framework they relied on was struck down above their heads.

Key Takeaways

  • If your regional climate or nutrient policy is shifting from “intensity per unit” to “absolute sector reductions by date,” treat that as a Dutch-pattern signal worth tracking month by month.
  • If your jurisdiction tightened application or storage rules, run the manure cost math at current rates and project it forward for 24 months before signing your next CAPEX commitment.
  • If you can’t name three institutional parties — processor, municipality, watershed group — who’d experience real loss if your farm closed, you have a leverage gap to fix in the next 30 days.
  • Before signing up for any sustainability program that requires barn- or field-level emissions data, ask in writing how regulators may use that data over the next 5–10 years.
  • If your operation falls in the 80–800-cow mid-family band and has recent environmental CAPEX near a sensitive area, prioritize legal and policy engagement through your dairy organization over the next 90 days.
  • Map your 2030 compliance scenario against two cases: a 30% absolute reduction target and a hard local deposition cap. If neither fits your balance sheet, you have a strategy gap, not a compliance gap.
  • If your dairy organization isn’t currently tracking the legal framework itself — not just the emissions rules but the court rulings and consultation drafts that shape them — that’s the PAS-melder gap. Close it before the next ruling, not after.

A Question Worth Asking Before the Letter Arrives

The Dutch story isn’t really about the Netherlands anymore. It’s about which parts of that pattern arrive in your region, in what order, and how much warning you get.

So here’s the question worth carrying back to your kitchen table this week: what would it take for your farm to be structurally un-replaceable in your region — not just efficient, not just compliant, but so woven into the local food system, land base, and community that you’re the last operation a planning office could justify pushing out? 

Run Your Numbers

Consolidation Clock — 5-Question Decision Engine — Five questions, sixty seconds. It turns herd size, cost position, succession, and capital access into one signal: expand, hold, pivot, transition, or exit. Find out which structural band you’re in before a planning office decides for you.

Complete references and supporting documentation are available upon request by contacting the editorial team at editor@thebullvine.com.

Learn More

The Sunday Read Dairy Professionals Don’t Skip.

Every week, thousands of producers, breeders, and industry insiders open Bullvine Weekly for genetics insights, market shifts, and profit strategies they won’t find anywhere else. One email. Five minutes. Smarter decisions all week.
NewsSubscribe
First
Last
Consent

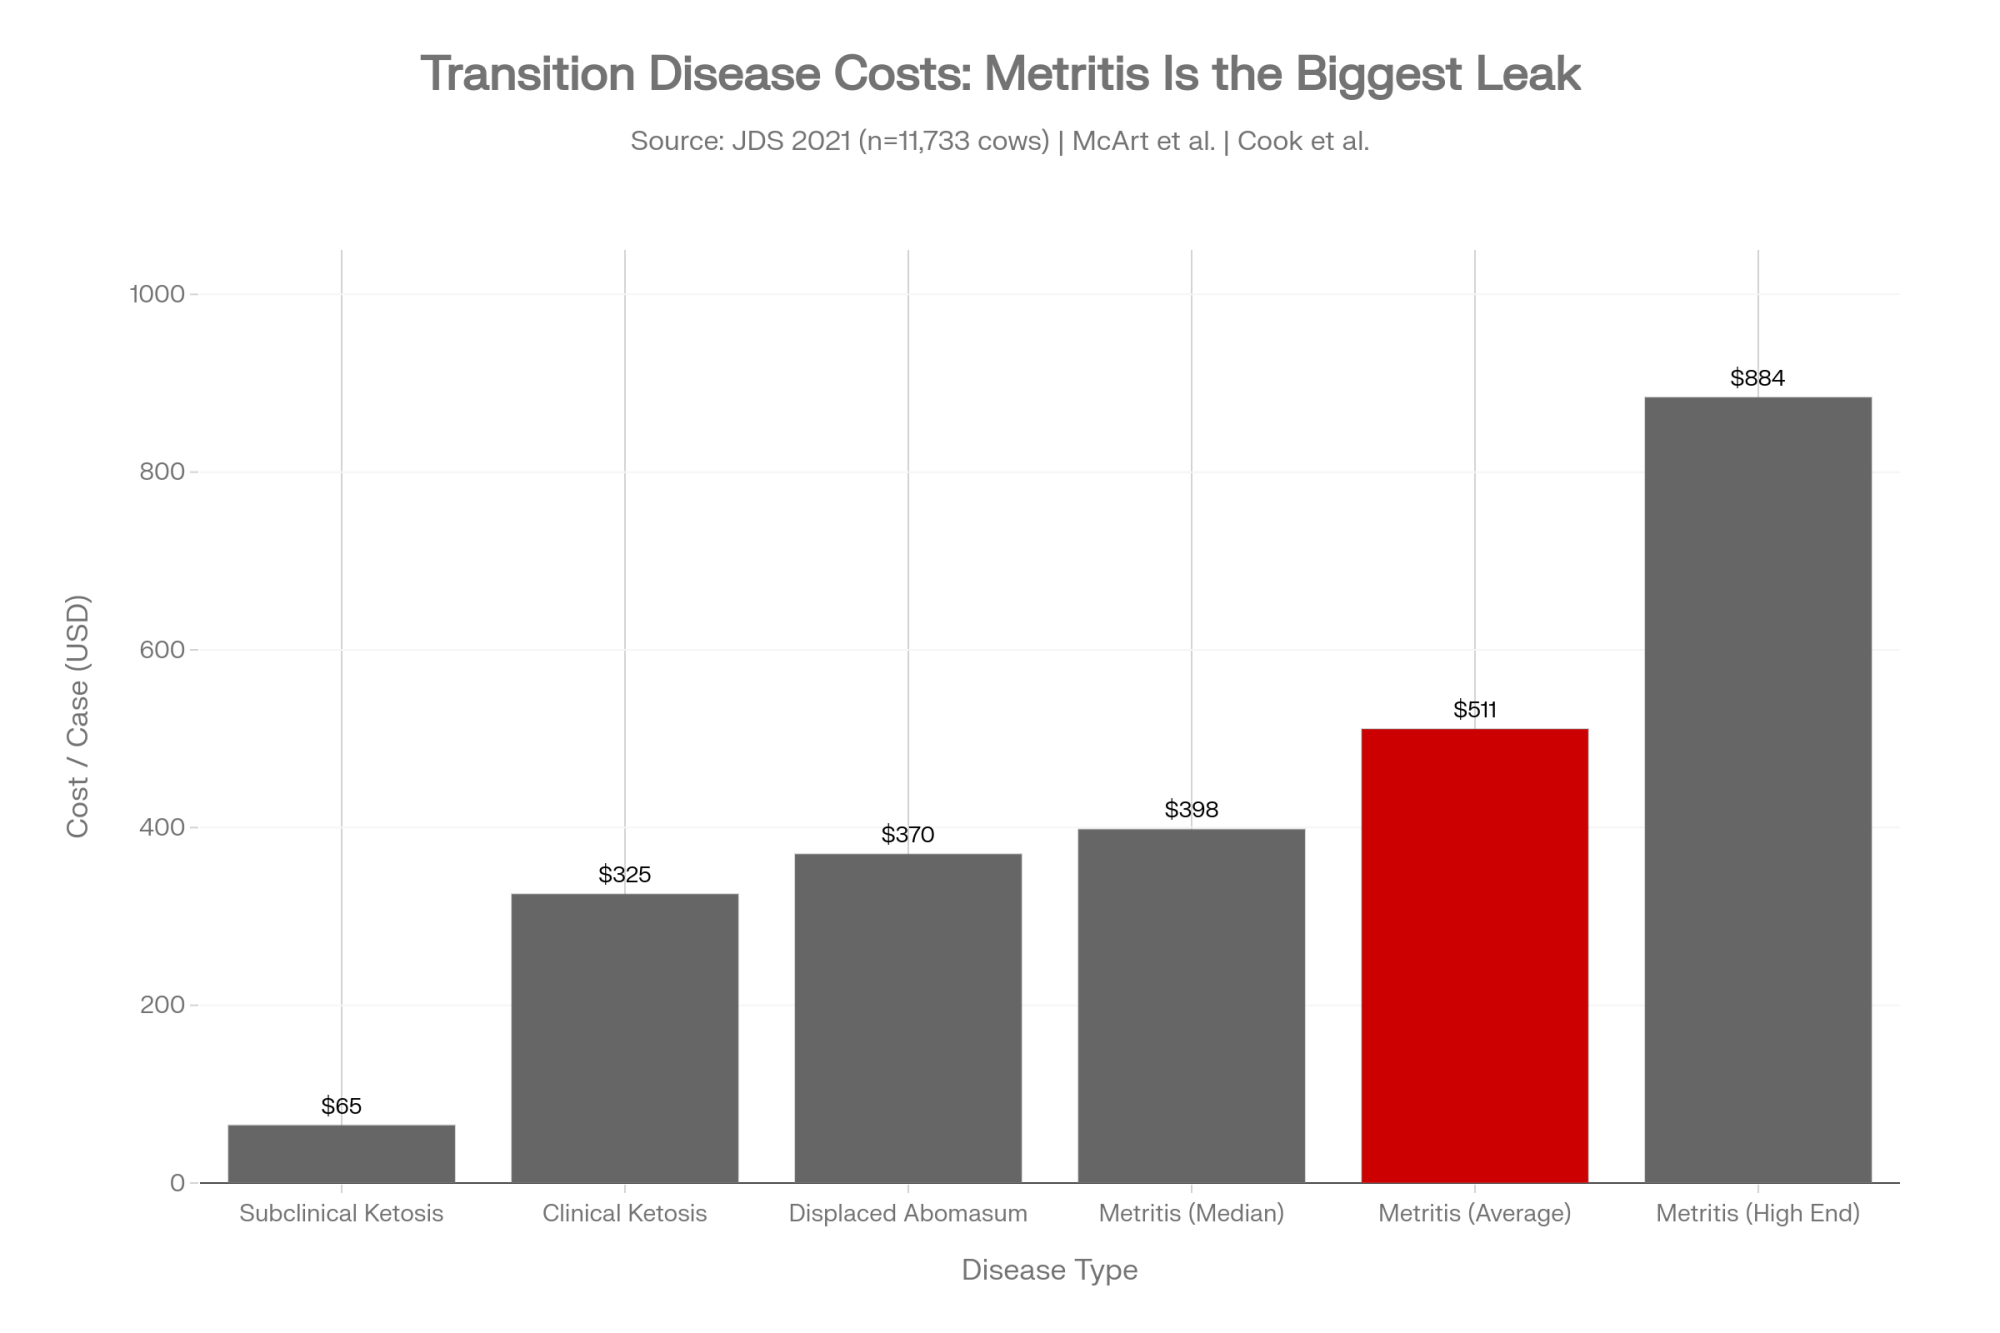
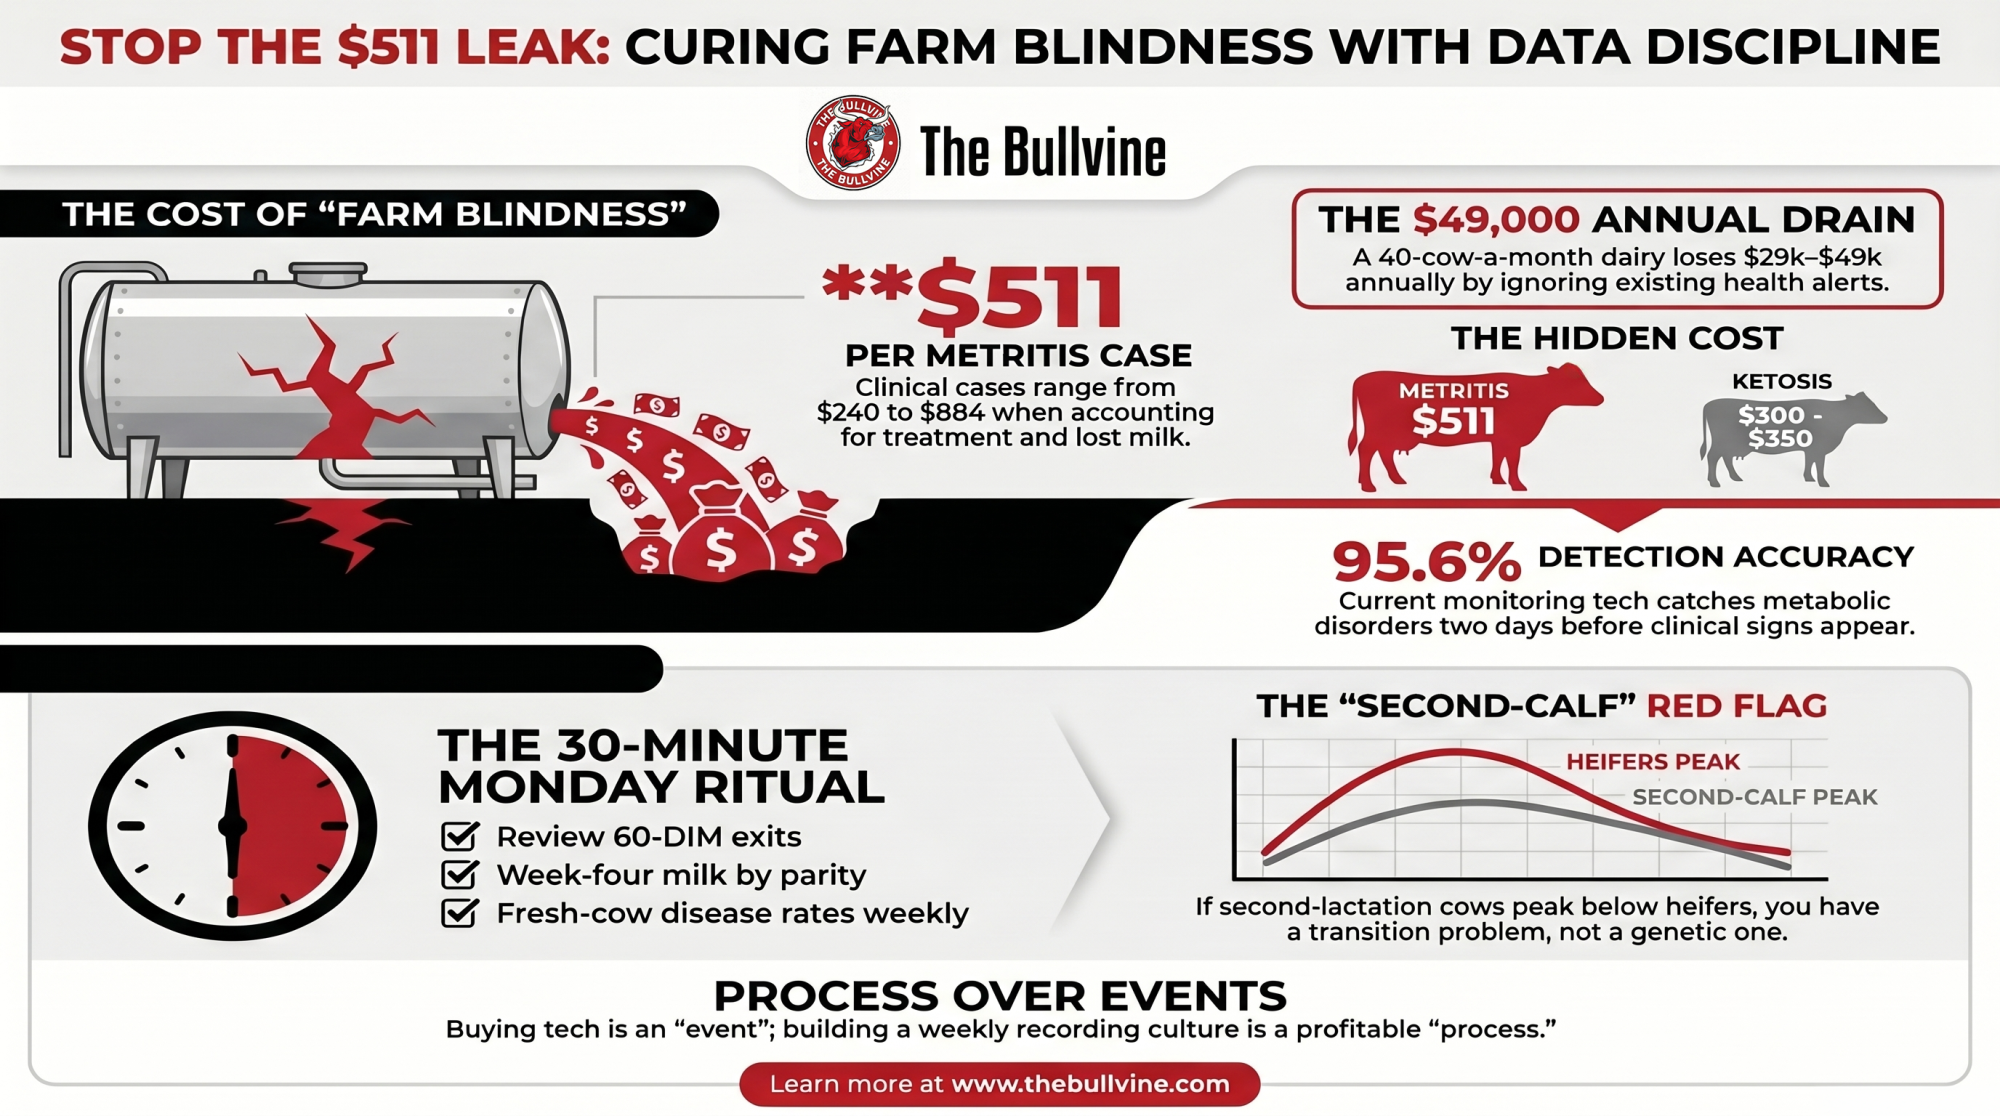
The $511 Cow Your DHI Report Finds 30 Days Too Late

She’s a $511 metritis case waiting to happen, and she sat unflagged till Day 34. By then the cure window’s gone and you’re pricing a $3,130 replacement. Two new DRMS tools surface her first.

Executive Summary: A fresh cow goes wrong on Day 3, but your monthly DHI report doesn’t flag her until Day 34 — and by then the subclinical ketosis cure window has dropped from 75.6% at 1–9 DIM to 54.3% past three weeks. DRMS just shipped two HerdHQ tools, RapidReports and BovineBio, that let you build custom alert-driven reports and pull a cow’s full health, repro, and genetic history onto one screen, instead of printing the report and hunting it down with a highlighter. The real money’s in the cull call: that “open” cow you’re about to ship for a breeding failure may have just been sitting in the sick pen when the sync protocol came around, and at $3,130 a springer in May 2026, a wrong cull costs four figures. Run the metritis math on a 400-cow herd at $511 a case and 16–20% incidence and you’re staring at $31,000–$38,800 a year, some of it sitting inside a detection window you control. DRMS technical analyst Katie England frames both tools around one question: how fast can you get from the cow to the decision? HerdHQ comes at no added cost for herds already processing through DRMS, so the tool isn’t the line item — the decision is. Read the full piece for the three-question RapidReports checklist to run every week and the barn math behind it.

DRMS RapidReports

Katie England knows the old workflow because she’s described doing it herself: print the herd report, then sit there with a highlighter marking the cows that need attention before you can act on a single one. On the DairyVoice podcast this spring, that manual grind is exactly the problem she framed DRMS’s new tools as a solution to. You don’t lack the data, she points out. You lack a quick way to get to it before the cow who needs you slips past the window where help still matters.

That gap is the whole story. And on a fresh cow, it’s not a small one.

England is a Technical Support Analyst with DRMS — Dairy Records Management Systems, based in Ames, Iowa. This spring, she walked through two new tools inside the company’s HerdHQ platform, RapidReports and BovineBio, on the DairyVoice podcast with host Mike Opperman. The Bullvine doesn’t cover product launches. We cover decision tools — but only when a named professional can turn a feature into a specific management action with a dollar consequence attached. England can. So that’s the test this piece runs them through.

The Problem Nobody Names at the Coffee Shop

Here’s the tension every herd manager already carries, whether they’ve put a number on it or not. A cow freshens. Something goes sideways on Day 3 — she’s still eating, still moving, her milk’s a touch off, but she’s not waving a flag. There are 28 cows in that fresh pen, and three of them look worse. So she gets watched. Not treated.

The monthly DHI report lands on Day 34 and confirms what the barn already learned the hard way.

That lag isn’t a rounding error. The transition-disease research frames the stakes in two numbers:

  • Roughly one in three fresh cows picks up at least one clinical disease in the first three weeks of lactation. [VERIFY: source for one-in-three fresh-cow disease rate]
  • Nearly 25% of cows that leave the herd do so inside the first 60 days in milk. [VERIFY: source for 25%-leave-by-60-DIM]

The first 21 days decide a lot about whether a cow stays in your barn or leaves it early.

Treatment timing is where the money lives. A 2022 study in Frontiers in Veterinary Science put hard numbers on it for subclinical ketosis — same disease, same treatment, the only variable was how fast it got caught:

  • 1–9 DIM: 75.6% cure
  • 10–15 DIM: 67.5% cure
  • 16–21 DIM: 58.1% cure
  • 22+ DIM: 54.3% cure

A reporting cycle that delivers on Day 34 isn’t early detection. It’s a post-mortem.

On DairyVoice, England put the human version of it plainly: producers often know something needs attention, she said — the hard part is figuring out where to start when the data’s overwhelming. If you run a fresh pen, you’ve lived that sentence. This one’s for you.

What Was the Highlighter Actually Doing?

Start with what each tool is, in DRMS’s own words, because the spec sheet matters before the story does.

RapidReports lets users build, edit, and export custom herd reports from any web browser using Test Day or DartSync data, with user-defined alerts. You sort, you filter, you set the thresholds that make a cow pop, and you drill straight into a single cow’s page from the list. No software to install. No waiting for the office computer to free up. DRMS frames the target user as the producer who rarely pauses for a break, much less for office time reviewing the latest Test Day results.

BovineBio is the other half of the same idea, aimed at the individual animal rather than the list. It’s a customizable, cow-level page with drag-and-drop tools that pulls one cow’s full record — health, reproduction, genetics, lifetime trends — onto a single screen. Note what it is and isn’t. Despite the name, it’s not a sire-selection or genomic-comparison engine. It’s a cow biography: her whole story, arranged the way you want to read it, instead of scattered across tabs and reports. More on why that distinction earns its keep in a minute.

England described RapidReports as the manual grind she used to do. She’d have the report printed out, she said on DairyVoice, then still be going through it, highlighting the information she needed. Pairing a visual alert with the report, in her telling, is what lets you stop digging through the data and have it surface on its own.

The highlighter was never the problem. The lag between the report printing and the highlighter finding the right cow — that was the problem. On a fresh cow, the time spent digging is real money walking out the door.

The Cow That Almost Got Shipped

This is the part that should make you set the phone down and walk out to the pen.

England walked through a scenario she’s watched play out. A cow doesn’t catch on her last round of Timed AI. The reflex is to read that as a fertility failure and start the cull conversation. But pull her full profile, and the story flips.

The tell, in England’s example, was group movement. The cow had been out of her normal pen and over in the sick pen, which is how she fell through the cracks on her breeding window in the first place. Spot that, England said, and you can get her back on track before her days in milk run out, and you’re staring at a culling decision instead of a calf on the ground.

Read it twice. The missed breeding wasn’t about her reproductive tract. It was a pen-management gap — she was in the hospital pen when the sync protocol came around, and nobody joined those two facts because they lived on different screens.

That’s the question BovineBio is built to answer, and it’s a different question than RapidReports asks:

FeatureRapidReportsBovineBio
Primary questionWhich cows need attention today?Why is this cow underperforming?
View levelHerd list / groupSingle animal
Key functionCustom alert-driven filtered reportsFull cow biography on one screen
Data sourcesTest Day, DartSyncHealth, reproduction, genetics, lifetime trends
User-defined thresholds✅ Yes✅ Yes (drag-and-drop layout)
Primary use caseFresh cow flagging, SCC sweeps, cull auditPen-movement investigation, cull/breed decision
Requires software install❌ No — browser-based❌ No — browser-based
Added cost (DRMS herds)$0 — included in HerdHQ$0 — included in HerdHQ
Weekly check triggerEvery Monday before pen walkBefore any cow ships
Decision it preventsMissing a treatable fresh cowCulling a fixable cow for the wrong reason

The sire summary on a bull tells you about his daughters in the aggregate. It can’t tell you that the open cow in your bottom third spent two weeks in the hospital pen during her breeding window. Only her own consolidated record does that.

Without the consolidated view, she goes down the road. With it, she’s back on a protocol, catches the next round, and there’s a calf on the ground in nine months instead of a hole in the string and an early replacement bill. That’s not a feature demo. That’s a cow who almost wasn’t there.

What Does the Detection Gap Actually Cost? Run the Math.

Let’s put a floor under it, assumptions showing, because a barn tool is only worth what you can pencil out from it.

Start with calvings and the right number. Every cow in the milking string has to calve to be in it, so a 400-cow herd runs close to 400 calvings a year — call it ~380 after you back out mortalities and abortions. Turnover doesn’t shrink that figure; it just decides how many of those calvings come from heifers versus cows. This is where a lot of back-of-the-napkin barn math goes wrong, and it understates the exposure badly.

Now the disease rate. Metritis incidence across 20 U.S. herds averaged 16%, ranging from 4.2% to 29.2% farm to farm. MSU and University of Florida extension figures center closer to 20%, with some farms north of 40%. A 2021 study in the Journal of Dairy Science — 11,733 cows across 16 herds in four U.S. regions — pegged the mean cost of metritis at $511 per case, median $398, already accounting for lost milk, longer days open, and higher cull odds.

Put it together for a 400-cow herd:

Metritis Cost Exposure — 400-Cow Herd (Illustrative Model)

InputFigureSource
Calvings per year (~400 minus ~5% loss)~380Herd size, not cull rate
Metritis incidence range16–20%20-herd study; MSU & UF extension
Estimated cases per year61–76Calculated
Mean cost per case$511 (median $398)Pérez-Báez et al., J. Dairy Sci.2021
Annual metritis exposure~$31,000–$38,800Calculated
Recoverable at 25% earlier detection~$7,800–$9,700/yrIllustrative — not a DRMS outcome
Metritis only — before ketosis, mastitis, or DAs hiding in the same window.  

That’s three times the number you’d get if you were wrongly anchored to turnover rather than to herd size. The real exposure to one disease in one 400-cow barn is north of $30,000 a year.

Now, the honest caveat on that bottom row. The 25% is an illustration, not a measured RapidReports outcome — nobody’s run that trial, and DRMS hasn’t published one. RapidReports doesn’t treat cows; it surfaces them. So plug in whatever recovery rate your own fresh-cow protocol can actually defend, and treat the result as a target to test, not a promise to bank.

The Cull-or-Keep Call Is the Four-Figure One

Metritis is the recurring leak. The cull-versus-breed decision is the big single hit, and it’s where the detection gap gets expensive fast.

Ship a cow at 150-plus DIM you could’ve kept, and you don’t just lose her. You pull a replacement heifer up early to fill her stall, which drags your whole replacement schedule forward and ties up money you’d planned to spend next year. Raising that heifer from birth to first calving commonly runs $2,000–$2,800, per extension and Bullvine figures, and you’ve now spent it sooner than the budget said.

Buying instead of raising hurts worse right now. The national average for dairy-replacement milk cows hit $3,130 a head in May 2026, up from $2,980 in January, with top Holstein springers clearing $4,000 in tight regions. That’s not a soft market you can wait out — it’s a heifer shortage that turns every avoidable cull into a four-figure purchase at the worst possible time.

Run the two paths side by side on the cow from England’s example. Cull her, and you’re out a productive animal plus the early replacement cost — call it the heifer’s raised value or that $3,130 sticker if you’re buying. Catch the pen-movement story instead, get her bred back, and you keep the cow, keep the calf she’ll drop, and leave your replacement schedule where you planned it. The decision turns entirely on whether you saw her record before the cull list got built.

Decision PathwayCatch Early & KeepMiss & Cull
Trigger scenarioFresh cow flagged Days 1–9 via RapidReports alertCow reaches Day 34 unflagged; DHI report flags her
Subclinical ketosis cure rate75.6% (1–9 DIM)54.3% (22+ DIM)
Metritis cost if treated promptly~$250–$350 (treated early, lower milk loss)$511 mean (Pérez-Báez et al., 2021)
Cull path — replacement costN/A — cow stays$3,130 national avg springer, May 2026
Cull path — heifer rearing costN/A$2,000–$2,800 if raised (extension est.)
Calf on ground in 9 months✅ Yes❌ No
Replacement schedule impactNonePulls forward; budget disrupted
Information needed to decide1 screen — BovineBio pen historyScattered across reports; easy to miss
Total 4-figure risk exposureContained$3,130–$5,930+ (replace + lost production)
Tool that makes the differenceRapidReports (flag) → BovineBio (verify)Monthly DHI report — arrives too late

So the cow who “fell through the cracks” isn’t a $511 problem. She’s a four-figure decision riding on one question: did anyone connect her two weeks in the hospital pen to her open status before someone marked her to go?

England’s framing of the stakes, on DairyVoice: when it takes too long to get the information and sort through it, she said, opportunities get missed, or problems grow bigger before anyone catches them.

And the tool itself isn’t the line item. Per the DRMS pricing page, HerdHQ is included at no additional cost for all herds processing through DRMS, with a Large Herd Discount on processing fees and DHIA reports for herds over 500 cows, applied on a sliding scale. The decision is the line item.

Three Decisions to Run Through RapidReports This Week

Here’s the evergreen part — the reason to bookmark this. Three questions to put to RapidReports every week, each tied to a real decision and a dollar consequence. Build the filter once, run it weekly.

1. The fresh-cow flag check: Which cows that calved in the last 21 days have a test-day milk or component alert I haven’t acted on? This is the whole ballgame on early intervention — cure rates fall from 75.6% in the first nine days to 54.3% past three weeks. A fresh-cow alert sitting unreviewed for 30 days is a case you’ve already lost. Set a user-defined alert on fresh-pen cows and clear it every week without exception.

2. The SCC trend review: Which cows have logged two consecutive test-day SCC results above my threshold, and what pen are they in? Two strikes is the line between a blip and a chronic cow. Build a sorted, filtered list, export it, and hand it to your milkers or vet as an action sheet — not a spreadsheet someone has to rebuild. The pen column tells you whether you’ve got a cow problem or a parlor-and-bedding problem.

3. The reproduction-to-cull audit. Which eligible cows are past 150 DIM with no confirmed pregnancy — and before I cull any of them, what does each one’s full record say? This is where RapidReports hands off to BovineBio. The list flags the candidates; the cow page indicates whether the open status is a fertility story or a pen-movement story, as in England’s example. Don’t ship one until you’ve looked.

Print those three on a card by the office computer. That’s the tool working for you instead of you working the highlighter.

“I Already Have Too Many Alerts”

Here’s the objection sitting in your chest if you milk 400-plus: I don’t need more data. I’m already buried under three systems that all think they’re urgent. I need less noise, not more.

You’re right. And that’s the point.

The alerts in RapidReports are the ones you define — you set the thresholds for what pops up. That’s a big part of why preset alerts start to feel like noise: the thresholds weren’t yours to begin with. When someone else decides what deserves a notification, you end up tuning out the whole stream. This one asks you to choose. The highlighter was yours. So is the threshold.

And here’s why we’re judging these tools on logic and math instead of trial data: they shipped this spring. There are no multi-year university outcome studies on RapidReports or BovineBio yet, and there won’t be for a while. That’s not a knock — it’s exactly why a working producer reasons from the decision science underneath the tool and from his own herd’s numbers, not from a journal that won’t weigh in for three lactations. Even the underlying science has live debate: the value of acting within the fresh-cow window is about as well-established as anything in transition management, but which treatments actually pay is still debated. A 2025 study published in PMC found that cows given oral propylene glycol for subclinical ketosis showed no measurable lift in milk yield or reproductive performance — a reminder that catching a cow early and treating every flagged case are two different propositions.

This isn’t theory for the producers already living it in public. Pennsylvania dairyman Steve Harnish, who runs roughly 200 cows and tracks his herd from his phone, walked through which software reports he actually leans on for daily calls on DairyVoice in April 2026. Matt Hendel of Hendel Farms did the same on the Progressive Dairy Podcast in May 2026, discussing how to turn daily data into cow-side decisions. Neither has tied a dollar figure to these two tools by name — so treat the barn math above as a framework for your own numbers, not a borrowed result. The logic stands on its own; the trials will catch up.

What This Means for Your Operation

The tools matter only if they change a decision this week. Three checks, framed as questions you can actually answer from your own records:

  • Measure your detection lag. What’s the real gap between when a fresh cow goes wrong and when you catch her — Day 3, or Day 34? Few barns track it directly. Measure it for one month, and you’ve measured your exposure.
  • Total your own metritis line. Run your herd’s actual incidence × $511. At 16–20% on a 400-cow string, that’s $31,000–$38,800 a year you may never have totaled — decide what even a partial recovery is worth before you discount it.
  • Price your next avoidable cull at today’s market. With springers at $3,130 and climbing, a cow you keep instead of replace is a four-figure save, so the threshold for “is she worth one more look?” just moved.
  • Audit who owns your report cadence. Is it you, or your consultant’s visit schedule? And does that match who’s standing in the fresh pen at 5:30 a.m.?

And one thing to actually do in the next 30 days: pick one borderline cull — a cow past 150 DIM and open — and pull her full record in BovineBio before she ships. See whether her story is fertility or pen movement. That single look is the whole argument for the tool, tested on one cow, for free.

Key Takeaways

  • If your detection window is longer than your treatment window, you’re paying for it whether you see the bill or not. SCK cure rates run 75.6% in the first nine days and fall to 54.3% past three weeks.
  • If a borderline cull rests on a single repro miss, check her pen history before she ships. The miss may be a management gap, not a fertility one.
  • If your metritis incidence runs near 16–20%, a 400-cow herd carries roughly $31,000–$38,800 a year in that one disease, and some of that sits within the detection window you control.
  • If you’re replacing that cow instead of keeping her, you’re buying into a $3,130 national average, so the cull-versus-keep call is a four-figure decision, not a hunch.
  • If you’re already drowning in alerts, the fix isn’t another system. It’s owning the thresholds on the one you’ve got.

On DairyVoice, England described the point of the tools as moving from reacting to problems toward staying ahead of them. That’s the right frame, but it hands the work back to you, not the software. The data’s been in your account. The principle that early beats late in the fresh pen is about as solid as transition-cow management gets. The only variable ever in play is how fast you get from the cow to the decision. So here’s the question to carry to the pen tomorrow morning: in your barn, how many cows are sitting in the gap right now — and would you even know?

The treatment window opens at calving and closes early. It doesn’t wait for the report.

Run Your Numbers

Herd Health ROI Calculator — Plug in your herd size, culling rate, mastitis incidence, and today’s $3,130 replacement cost. The calculator shows what premature culling and chronic mastitis are actually costing you per cow per year — before you decide the next one ships.

Complete references and supporting documentation are available upon request by contacting the editorial team at editor@thebullvine.com.

Learn More

The Sunday Read Dairy Professionals Don’t Skip.

Every week, thousands of producers, breeders, and industry insiders open Bullvine Weekly for genetics insights, market shifts, and profit strategies they won’t find anywhere else. One email. Five minutes. Smarter decisions all week.
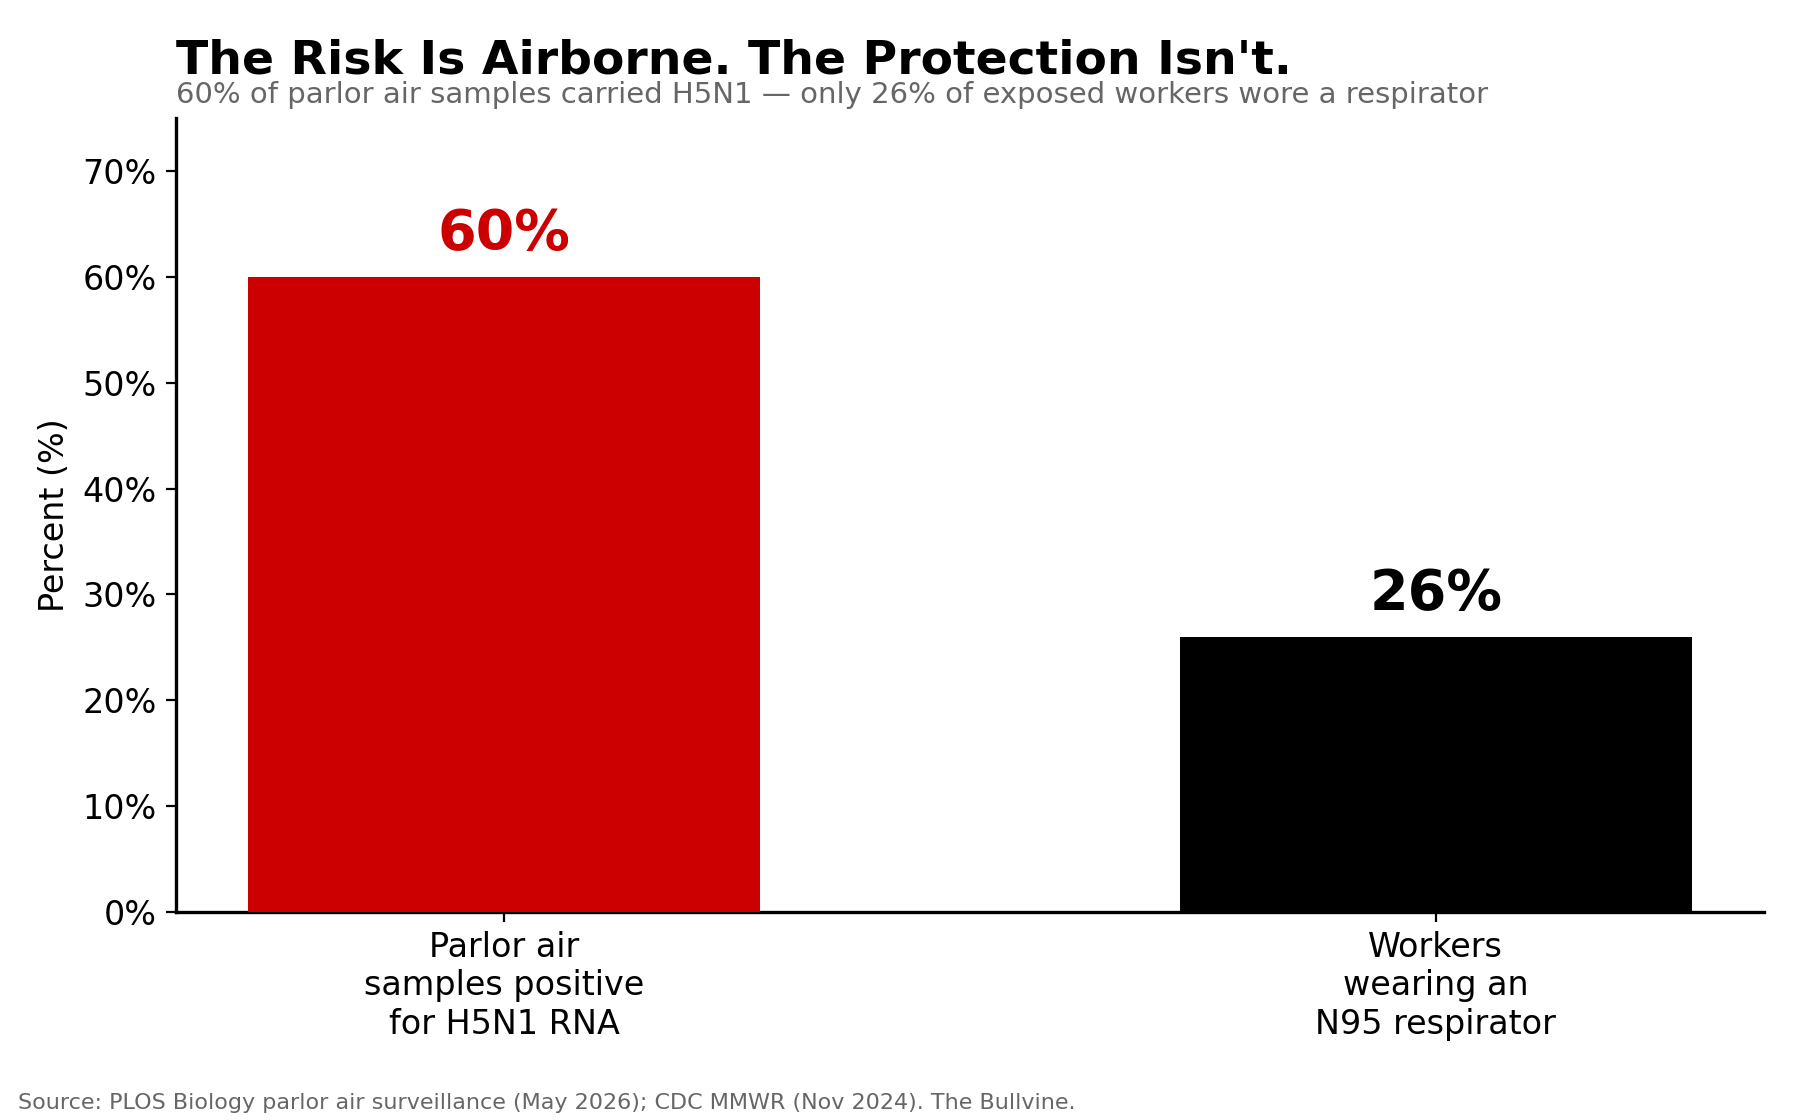
NewsSubscribe
First
Last
Consent

Dairy Bet $1.6B on the Fastest-Drying Part of the Ogallala

Hilmar and Leprino built 8-million-pound-a-day cheese plants right over the thinnest Ogallala water — and the lenders financing the dairies that fill those tankers are already pricing the decline.

Executive Summary: Southwest Kansas lost 1.52 feet of Ogallala water in 2024, its steepest single-year drop yet, and a 2025 University of Tennessee–USDA study found that every 14 feet the aquifer falls lines up with a 26% jump in production-loan delinquencies. That turns your section map into a credit document. Meanwhile, dairy committed about $1.6 billion to new cheese plants in Texas, Kansas, and the I-29 corridor — and the herds filling those plants sit right on the fastest-failing parts of the aquifer. One University of Texas projection has up to 70% of the Texas Panhandle’s section unusable within roughly 20 years, well inside the life of a barn note signed today. The 30-minute move that beats your banker to the math: pull your groundwater district’s section-level report and find out whether you’re in sustainable, extended, or managed-depletion territory before your next renewal.

The Ogallala Aquifer underlies parts of Colorado, Kansas, Nebraska, New Mexico, Oklahoma, South Dakota, Texas, and Wyoming. From wheat and cows to corn and cotton, the regional economy depends almost exclusively on agriculture irrigated by Ogallala groundwater. But according to the Fourth National Climate Assessment (NCA4), producers are extracting water faster than it is being replenished, which means that parts of the Ogallala Aquifer should be considered a nonrenewable resource.

A-Tex Dairy in the Texas Panhandle did something that tells you exactly where dairy is headed: it cut corn acres. The operation grows fewer acres of corn now and leans harder on drought-hardier crops like sorghum and wheat, because it was responding directly to water shortages. “Double cropping” is how they describe stretching the same ground further on less water. That’s not a conservation gesture. That’s an operator reading the well and adjusting before the well forces the issue.

Here’s why it matters to you, wherever you milk. The Ogallala Aquifer is one of the largest underground stores of freshwater in the nation, and it’s dropping fast in exactly the places where dairy has expanded hardest. In the groundwater area covering southwest Kansas, levels fell 1.52 feet in 2024 — a bigger drop than the 1.43-foot decline the year before. And a 2025 study presented at the AAEA & WAEA Joint Annual Meeting found that as the aquifer thins, farm loan delinquencies climb, so the people who finance dairies have real reason to treat that decline as a credit risk, not an environmental footnote. When your banker starts pricing your water, the Ogallala stops being a someday problem. It’s a balance-sheet problem.

What’s Actually Changing

The Ogallala supplies the western third of Kansas and supports roughly a fifth of the nation’s agricultural output, providing close to a third of the groundwater used for irrigation in the U.S. For decades, irrigators have drawn water out faster than rain puts it back. Recharge across much of the region runs about an inch a year. The declines get measured in feet.

The 2024 numbers from the Kansas Geological Survey are blunt. Southwest Kansas, down 1.52 feet. Northwest Kansas, down 1.34 feet — a far steeper slide than the 0.47-foot drop the year before. Across the line, the University of Nebraska-Lincoln’s statewide monitoring report shows groundwater levels fell again in 2025, down an average of 0.29 feet after several years of drought, with the steepest, most stubborn declines landing in the state’s heavily irrigated stretches. Governor Laura Kelly said it without softening it: “Forget making it 75 years down the road — some parts of western Kansas don’t have groundwater enough to last another 25 years.”

Those declines aren’t evenly spread, and that’s what catches operators off guard. Two farms in the same county, ten miles apart, can sit over very different saturated thickness — one with 40 years of pumping left, the other with 15. The county-level headline number tells you almost nothing about your own well. Your groundwater district’s section-level data tells you everything.

Where the Milk Money Went

Now look at where dairy put its chips this decade. Since 2020, Hilmar, Leprino, and Valley Queen have committed about $1.6 billion in new cheese capacity across Texas, Kansas, and the I-29 corridor — Leprino’s Lubbock, Texas plant alone runs $870 million. Hilmar’s Dodge City, Kansas plant and the Lubbock facility are each built to take in roughly 8 million pounds of milk a day, and both sit on the stressed western end of the aquifer.

Run the feed math on a plant that size and the water exposure gets real fast. Eight million pounds of milk a day is the output of well over 100,000 cows, and those cows have to eat. The forage and grain to feed a herd that large — most of it irrigated in this part of the country — is where the aquifer draw actually lands. The plant doesn’t pump the water. The dairies filling those tankers do, and they’re concentrated in exactly the sections showing the steepest declines.

That’s the collision worth naming plainly. One projection from the University of Texas Bureau of Economic Geology has up to 70% of the Texas Panhandle’s section becoming unusable within roughly 20 years at current pumping rates. Other studies push the steepest statewide declines later, toward 2060 or 2070. Either way, the timeline lands inside the life of a barn note signed today — and inside the payback window for an $870 million plant that needs those tankers to keep showing up.

How This Shows Up on Real Farms

From the outside, aquifer depletion sounds like a slow-motion documentary. On the ground, it shows up small and personal first.

Here’s how it tends to look. You go in to renew an operating line or talk about adding a barn, and the conversation feels different. The lender wants well logs and your groundwater district’s reports — paperwork that never came up before. Maybe the rate comes back a quarter-point higher with a vague line about “regional risk.” Maybe the term runs a year shorter than last time. None of it screams crisis, but put together, it’s the bank telling you your water is now part of your file.

The on-farm water math stacks up fast, too. A milking cow drinks 30 to 35 gallons a day. Add wash, cooling, and parlor water on top, and total on-farm use can run past 30,000 gallons per cow a year. Run that across a 1,500-cow dairy and you’re north of 45 million gallons annually — before a single acre of irrigated feed gets counted. And the feed is where the real water lives: USDA and university water-use work puts irrigated feed crops for cattle at the single largest water draw in the West, around 32% of all use.

The response is already showing up in what High Plains dairies plant. Sorghum silage needs roughly 75% of the water corn would use for top yield, and as drought tightens, more operations have been signing wheatlage and sorghum contracts to lean on crops that ask less of the well. If you want how the corn-to-sorghum swap actually pencils on a real ration, that’s its own piece — but the direction of travel is already clear. Plenty of herds, though, are still pumping the way they always have. The wells still run, and nobody’s sat at the kitchen table with the aquifer map next to the loan schedule.

MetricCorn SilageForage SorghumDifference
Water requirement (top yield)100% baseline~75% of corn-25% water use
Irrigation cost savings (40% swap)BaselineUp to -60% irrigation costSignificant — Nebraska Extension
Production cost per acre~$800–$900/acre (High Plains est.)~$215/acre lower than corn-$215/acre
Feed cost impact (% of ration)Baseline-15 to -25% feed costDependent on local water price
Nutritional trade-offHigher starch, energy densityHigher fiber, lower starchRequires nutritionist ration adjustment
Yield consistencyHigh, stable year-to-yearMore variable — climate-dependentMore risk in drought years

The Mechanics Behind It

Dairy is more exposed here than row-crop farming, and it comes down to three things that compound.

First, you can’t move. A grain farmer who decides the water’s done can shift to dryland wheat, fallow some ground, and shrink his exposure in a season or two. Your freestall barn, parlor, and lagoon are poured into the ground and financed over 15 to 30 years. Those assets only pay out if cows keep milking and feed keeps growing — which quietly pressures you to pump one more year, then one more after that.

Then there’s the layering. Row crops use water to grow a crop. You use water to grow the crop and to water the animals eating it. When pumping depth increases or an allocation tightens, it hits feed cost and herd management at the same time.

And the timeline doesn’t line up. A dairy runs on a 20- to 30-year capital and breeding horizon. The worst Ogallala projections land squarely inside a barn financed in the last few years. Water doesn’t vanish overnight. But more struggling wells, deeper pumping, and higher costs all show up before that note is paid. To a lender looking at land values and collateral, that’s not abstract. That’s default risk.

How Should You Read Your Lender’s Next “No”?

When a banker says “we’re tightening up” or “we need more information,” it’s easy to take it as a knock on your management. Sometimes it is. Increasingly, it isn’t.

The link between water and credit isn’t a hunch anymore — it’s measured. In a 2025 paper with the pointed title “Overdraft Fees? Groundwater Depletion and Agricultural Loan Performance,” University of Tennessee agricultural economist Gabriela Perez-Quesada and the USDA Economic Research Service’s Aaron Hrozencik found that as the High Plains Aquifer thins, farm loan delinquencies rise. A 10% drop in saturated thickness — about 14 feet, which most counties over the aquifer have already lost across three decades — lines up with a 26% jump in production-loan delinquency rates. Their conclusion is plain: falling groundwater “may impact the risk in agricultural credit markets, which has important implications for banks’ underwriting decisions.”

Walk that into a real renewal and you can see how it bites. Say your section has already given up its 14 feet over the last 30 years — which puts you in the same boat as most counties over the aquifer. To the loan officer running the numbers, your operation now carries about 26% more production-loan delinquency risk than a comparable dairy sitting over stable water, before you’ve said a word about your own cash flow. You can have clean books, strong components, and a tight cull rate, and still draw a harder conversation purely because of where your wells sit. That’s the part that stings — it isn’t about how you farm.

So ask yourself the plain question: what changed since the last time this renewal was easy? Did your wells drop? Did your district turn up in a state groundwater report? Are your neighbors fielding the same questions? If the answer’s yes, the move isn’t to argue with the loan officer — it’s to walk in knowing at least as much about your water position as the bank already does. Bring your section’s saturated-thickness trend and your feed-water plan to the meeting. Don’t let the bank be the only one in the room who’s done the math.

Is Your Barn Built for a World Where the Water Never Runs Out?

Most dairies built in the last 20 years in Ogallala country rest on a quiet assumption: the water will always be there. Enough to cool cows, run the parlor, and grow feed at the scale the banker underwrote. In some districts, that assumption is expiring while the concrete stays put.

So it’s worth asking the uncomfortable version. If your district’s data puts your section on a 10-to-25-year glide path, does your capital plan match that? What happens to your breakeven if pumping costs keep climbing as you chase a dropping water table deeper? Could your herd size and ration still pencil with less home-grown irrigated forage and more purchased feed trucked in from outside the region? None of those are fun questions. They’re a lot easier to answer now, on your schedule, than across the desk from a lender who’s already made up his mind.

Find Your Zone

Before you change anything, figure out which situation you’re actually in. The 2024 Ogallala Aquifer Summit and state agencies sort ground into three categories — and the right move looks different in each.

ZoneSaturated Thickness TrendEstimated RunwayIrrigation Cost TrajectoryLoan Delinquency ExposureRecommended Capital Move
Sustainable UseStable or declining <0.3 ft/yr50+ yearsModest increasesBaseline riskLong-horizon investment pencils; efficiency upgrades pay back
Extended UseDeclining 0.3–1.0 ft/yr20–50 yearsRising, manageable+26–52% vs. stableMatch new debt terms to remaining water; shift to sorghum/wheatlage
Managed DepletionDeclining >1.0 ft/yr (SW KS = 1.52 ft in 2024)<20 yearsSteep — chasing depth+78–130%Run stay-adapt-or-exit math now; avoid new fixed capital; accelerate debt paydown

Kansas posts section-level maps every January through the Geological Survey, and most Ogallala states have an equivalent. Half an hour with that map tells you which row above is yours — and saturated thickness is the same number the loan-delinquency research keys on, so you’re reading your ground the way a careful lender now does.

Your Options, In Order

You don’t control the aquifer. You do control how fast you look at your own number — and what you do next. Work these in sequence, because each one depends on the answer to the one before it.

Step 1 — Pull your district report (do this in the next 30 days). This is the cheapest, highest-leverage move on the list. Find your zone in the table above before you spend a dollar on anything else. Thirty minutes. It changes every decision that follows.

Step 2 — Buy time with efficiency, while it’s still worth buying. Once you know you’ve got water left to manage, make it go further. Smart irrigation controllers can save up to 20% of the water a traditional setup applies, and tighter scheduling stretches that further. California dairies that moved silage ground to subsurface drip have reported far larger cuts — in the range of 47 to 67% less water than flood or older sprinkler systems on the same acres. But the catch is real: drip and variable-rate pivots cost money up front, take management to run well, and only pay off where there’s water left underneath to manage. They stretch a resource. They don’t resurrect a dry hole. In a managed-depletion zone, spending heavy on efficiency can just mean you reach the bottom a little slower and a lot poorer.

Step 3 — Change the feed, not just the hardware. Some of the highest-leverage moves are about what you grow, not what you pump. Sorghum silage runs on about 75% of corn’s water, and Nebraska extension work shows dairies replacing 40% of their corn silage with sorghum cutting irrigation costs by as much as 60%. Independent studies put forage sorghum’s total production cost at roughly $215 an acre below corn silage, and where water’s pricey that swap can trim feed bills 15 to 25%, depending on local rates and management. It isn’t free money, though. Run any of it past your nutritionist, not just your seed rep — sorghum carries more fiber and less starch, so the ration loses some energy density and you’ll be working to hold components and milk, and yields can swing more year to year than you’re used to with corn.

Step 4 — Start the stay-adapt-or-exit conversation early. Nobody wants this one while the parlor’s full and the notes still renew. But in the thinnest zones of the Texas Panhandle and western Kansas, the math may eventually favor paying debt down hard and planning an orderly transition over piling fixed capital onto a shrinking water base. That means matching your remaining water horizon to your debt horizon — and being honest about land values if water-risk discounts start showing up in appraisals. Whatever a banker weighs in a 2026 loan file, an operation that gets ahead of this picks its own timing. The one that waits gets its timing picked for it — by a dry well, or by the credit committee.

Key Takeaways

  • If you can’t say whether your section sits in sustainable, extended, or managed-depletion territory, pull your groundwater district’s latest report this month. Every other decision is a guess until you do.
  • If you’re carrying 15 to 20 years of barn and parlor payments, check whether local projections actually show that much usable irrigation under your ground. If there’s a gap, plan for it now — not at the next renewal.
  • If you’re weighing an irrigation upgrade, treat it as a financial tool, not a green gesture. Run the payback against your remaining water, because precision systems only earn out where there’s water left to manage.
  • If your lender starts asking about wells and water reports, assume water risk is in your file. The research backs the instinct — every 14 feet the aquifer drops lines up with about 26% more production-loan delinquency — so get your own data organized before the meeting, not after.
  • If you’re sitting in one of the thinnest zones, run the stay-adapt-or-exit math while you still have options, not when the bank hands you one.

You can’t refill the Ogallala. You can decide whether your next big call gets made by you — or made for you by someone who read your water before you did. So where does your section actually sit on the map, and when did you last look?

Run Your Numbers

Consolidation Clock — 5-Question Decision Engine — This article asks whether your operation should build, expand, pivot feed strategy, or exit in a depleting-aquifer zone. Answer five questions and the Decision Engine turns herd size, cost position, succession, and capital access into one strategic signal — expand, specialize, optimize, transition, or exit — before your next capital conversation.

Complete references and supporting documentation are available upon request by contacting the editorial team at editor@thebullvine.com.

Learn More

The Sunday Read Dairy Professionals Don’t Skip.

Every week, thousands of producers, breeders, and industry insiders open Bullvine Weekly for genetics insights, market shifts, and profit strategies they won’t find anywhere else. One email. Five minutes. Smarter decisions all week.
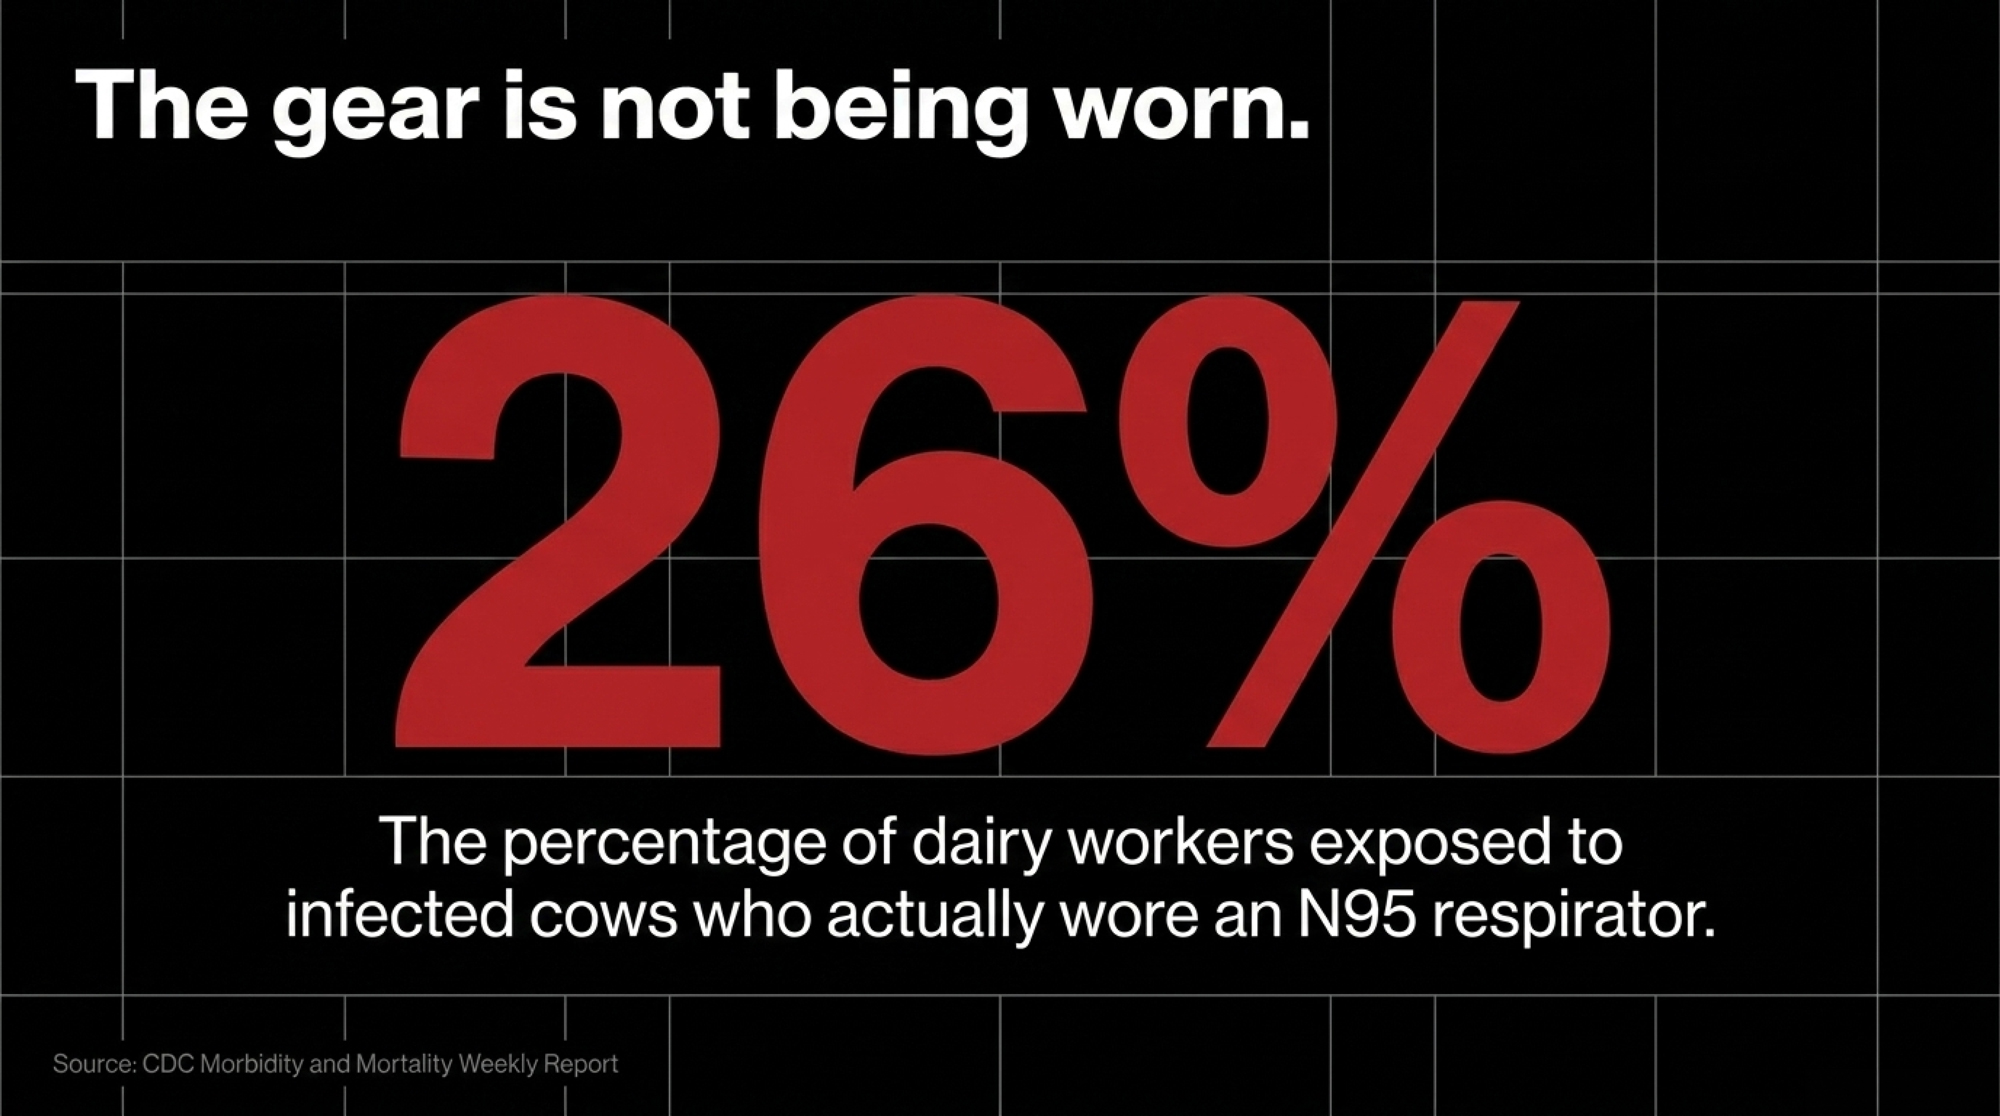
NewsSubscribe
First
Last
Consent

Paul Tompkins Is Losing £1,500 a Day. His Processor Just Posted a Record Profit.

Tompkins chairs the NFU’s Dairy Board and milks 500 cows at 29p against a 40p cost. In its most recent results, First Milk booked a record £20.5m profit. The difference isn’t the market — it’s the contract.

Executive Summary: At 29p a litre against a 40p cost, NFU Dairy Board chair Paul Tompkins was losing more than £1,500 a day in January. Over the same broad period, First Milk posted a record £20.5m operating profit and Arla banked record €15.1bn revenue — so this isn’t symmetric pain, it’s a transfer. UK prices have fallen up to 40% since October 2025, but the number that actually decides your fate is the gap between an aligned contract and an exposed one: Müller’s Advantage holds 34.5p while manufacturing litres sit nearer 29–32p. On a 200-cow herd shipping 1.5m litres, a 4p contract gap is roughly £60,000 a year — and even the aligned farms are now under cost, so the real question is how fast you’re bleeding, not whether. FDOM24 makes your processor show its working, but it sets no price floor, so it’s a seatbelt, not a rescue. Pull your last three milk statements, run your average against the 34.5p aligned benchmark, and if you’re several pence short, the global market isn’t your problem — your contract is. U.S. readers should read it as a mirror: FMMO make allowances pulled $337m out of producer pools in 90 days while cheese prices never dropped.

UK dairy farmer in freestall barn at milking, milk price contract crisis 2026

Paul Tompkins chairs the NFU’s Dairy Board, farms in the Vale of York, and milks a herd of around 500 Holsteins. He told broadcasters in January 2026 that his milk was fetching around 29p a litre against a cost of roughly 40p — leaving him, by his own account, losing more than £1,500 a day.

Sit with that for a second. The man who chairs the national dairy board — who knows milk contracts as well as anyone in the country — can’t price his way out of the hole. That’s not a story about one farmer making bad calls. It’s a story about a milk system where the gap between what you’re paid and what it costs you has become the line between staying in and getting out. And right now, the size of that gap depends largely on which contract you signed.

Why a U.S. reader should care about a UK milk price. This is a British case study, but read it as a crystal ball. The same structure — farmers absorbing the cut while processors hold their margin — is now baked into the 2026 FMMO modernization resets. Higher make allowances that took effect June 1, 2025, cut Class III prices by about 92¢/cwt and, according to AFBF’s modeling, pulled $337 million out of producer pools in 90 days, while cheese and butter prices never dropped. Manufacturing-heavy orders like the Upper Midwest and Central are taking the heaviest pool losses. Different country, different mechanism, identical question: who’s absorbing the loss, and who isn’t?

VariableUK Market (2025–26)US FMMO (2025–26)
Mechanism of lossContract gap: exposed farms paid 29–32p vs 40p costHigher make allowances cut Class III by ~92¢/cwt from June 2025
Who absorbs itIndividual farmer on manufacturing/B-litre contractProducers in manufacturing-heavy orders (Upper Midwest, Central)
Processor margin impactFirst Milk op. profit up to record £20.5m; Arla €415m netProcessor cost basis reduced; cheese/butter prices unchanged
Scale of transferUK “all milk” avg down ~22% YoY by April 2026$337m pulled from producer pools in 90 days (AFBF modeling)
Regulatory bufferFDOM24: transparency only, no price floorFMMO: make allowances are built into the formula, not negotiable
Farmer leverageSwitch contract if aligned buyer has capacityLimited — pool participation largely mandatory by order
Recovery triggerGlobal supply tightening + GDT price bounceClass III recovery requires cheese/butter to outpace make allowance drag
Bottom lineContract type decides your fate, not the marketMake allowances decide your take, not the commodity price

What’s Actually Changing

UK milk prices have fallen fast and hard. Processor payments to many farmers have dropped by up to 15p a litre — around 40% — since October 2025, according to Reuters, as a wave of global production has swamped the market. Some contracts that were paying 48p have fallen to 32p.

But the headline number hides the real story. Two farmers in the same county, milking similar cows, shipping similar volumes, can be living in completely different realities this spring. Arla cut its conventional price by 3.5p in December to 39.21p, and has since trimmed it further into the mid-30s by early 2026. Müller cut its aligned Advantage price to 34.5p from 1 March 2026. Manufacturing and B-litre contracts fell further and faster.

That divide is the whole game now. The spread between a held aligned price and an exposed manufacturing litre can run into double digits per litre — in the same week, in the same market. One farmer’s contract is cushioning the crash. The other is passing the whole thing straight through to the bank account.

Read more: The Contract Clause Deciding Which UK Dairies Survive 2026

How This Plays Out on Real Farms

Put the gap in barn terms, because that’s where it stops being abstract.

Tompkins reckons he’s losing more than £1,500 a day on around 500 cows. He’s not alone at that scale — Farmers Weekly reported some larger farms losing more than £1,000 a day as the collapse bit. Now scale it down to a 200-cow herd. Say you’re shipping around 1.5 million litres a year and your contract leaves you 10p short of cost. That’s £150,000 walking off the farm over twelve months — before a single other cost line moves.

And here’s why you can’t just turn the tap down to stop it. You can’t turn a dairy herd on a sixpence. Cut feed, and you risk yield, fertility, and next season’s performance. Sell cows, and you lose the genetics you spent years building — and you still owe on the buildings. The cost side is stubborn. When the milk price drops like a stone, nothing else politely shrinks to match.

The exits, when they come, come quietly — one family at a time. That’s the part that doesn’t show up in a market report until it’s already happened.

The Mechanics: Why the Same Market Pays Two Prices

Here’s the part that’s hard to swallow if you’re on the wrong side of it. The crash looks like a pure market event from the outside, and a lot of it is. The main driver is global oversupply — 2025 was a strong year for grass and for cows, and the extra milk had to go somewhere. GB production for the 2025/26 season hit a record, with December deliveries running several percent above the prior year, per AHDB.

The same stretch that squeezed farmgate prices saw processors post strong results. First Milk, a farmer-owned co-op, reported its best year ever for the year to March 2025 — turnover up 20% to £570 million and operating profit climbing to £20.5 million, from £16.8 million. Arla reported record revenue of €15.1 billion for 2025 with net profit of €415 million. Both have publicly tied those results to factors such as strong ingredient and protein demand rather than to liquid-milk margins. As a co-op, First Milk’s profits also flow back to its farmer members.

So why do two farms in the same market end up so far apart? Strip it back, and the reason is structural, not a stitch-up. On an exposed contract, the farmgate price is contractually the most movable number in the chain, so it tends to adjust first when the market falls. A processor can lean on its ingredients arm or efficiency programs to protect its own margin; the individual farmer on a manufacturing litre doesn’t have those levers. If that mechanism sounds familiar to a U.S. reader, it should — it’s the same logic by which higher FMMO make allowances quietly route value to the processing side before the farmer sees a dime.

The price picture, in one place

Here’s the same crisis laid out as a handful of numbers on one page. This is the gap, in pence per litre, against a cost of production sitting near 40–49p depending on the system:

What you’re shipping onPrice per litre (early 2026)Position vs. cost of production
Müller aligned Advantage34.5p (from 1 March 2026)Several pence under cost
Arla conventionalMid-30s (after Dec + further cuts)Several pence under cost
UK “all milk” average (Defra)35.61p early 2026, 33.99p by April, down ~22% YoYBelow cost
Exposed manufacturing / standard litre~32p, some toward 29pDouble-digits under cost

Read that table against your own milk statement, and one thing jumps out. The top of the column and the bottom are separated by several pence a litre, and on a million-plus-litre operation, every penny is real money. The lower row isn’t a different market. It’s the same market, paid through a different contract. That’s the lever most of this debate ignores.

What Are the Aligned Farms Actually Getting?

This is where the “it’s just the market” story falls apart. Müller’s aligned Advantage farmers are sitting on 34.5p. A producer shipping on a manufacturing litre is looking at something nearer 29–32p. Same week, same wall of milk, same global oversupply — and a gap that can run 3–5p, sometimes more.

Now run that gap as barn math.

The contract gap, in money you’d recognize A 200-cow herd (~1.5m litres/year) with a 4p contract gap loses ~£60,000 a year. A 500-cow herd at Tompkins’ scale, on the same 4p gap, loses ~£150,000 a year. None of that turns on how well you milk cows. It’s the contract line on your statement.

Here’s the uncomfortable part: even the aligned farms are now at a loss. With production costs at 40p and beyond, a 34.5p Advantage price still loses money — it just bleeds more slowly. So the contract decision isn’t “profit versus loss” right now. It’s “how fast am I bleeding, and how long can I last at that rate?” For many farms, that’s the only question that matters this spring.

Read more: 28p vs. £300 Million: The 2025 Milk Price Gap Nobody’s Explaining

Does FDOM24 Actually Protect You?

The government’s answer was the Fair Dealing Obligations (Milk) Regulations 2024 — FDOM24 — with contracts required to comply by 9 July 2025. It forces processors to be transparent about how they set price changes and gives you clearer terms and notice. Genuine progress, and the NFU fought for it for more than a decade.

But it’s a seatbelt, not a rescue helicopter. FDOM24 makes a processor explain how it sets the number. It doesn’t set a floor under it. You’ll get a clearer paper trail showing exactly how your price was cut — which is useful at renewal, and cold comfort at the bank. Read the small print on notice periods and exclusivity before you assume the regulation has your back.

FDOM24 ProvisionWhat It DeliversWhat It Doesn’t DeliverRisk Level
Price change transparencyProcessor must explain how price is changedNo floor under the price itself🔴 HIGH
Notice periodsClearer advance warning of cutsDoesn’t prevent a cut from happening🔴 HIGH
Contract term clarityLegible terms at renewalDoesn’t stop exclusivity or volume lock-in🟡 MEDIUM
Dispute resolution pathwayFormal route to challenge a changeSlow; cold comfort mid-crisis🟡 MEDIUM
Aligned benchmark referenceSets a comparator for negotiationNot a contractual guarantee🟡 MEDIUM
Price floor mechanismNot included🔴 HIGH
Emergency minimum priceNot included🔴 HIGH

How Do You Tell If It’s the Market or Your Contract?

This is the question worth answering before your next milk cheque lands. You can do it tonight — three statements and a calculator, ten minutes at the kitchen table.

The 10-minute contract check. Step 1 — Pull your last three milk statements and work out your average received price per litre across them. One number. Step 2 — Find the published UK average: Defra put the UK “all milk” figure at 35.61p in early 2026, falling to 33.99p by April, down 22.3% year-on-year, and AHDB updates processor price changes regularly. Step 3 — Compare against an aligned benchmark: Müller’s Advantage sits at 34.5p today, roughly what a held contract is paying. Step 4 — Read the gap: if your number is several pence under that aligned benchmark, the global market isn’t your main problem. Your contract is.

One of those problems corrects when supply tightens. The other only corrects when you take action. (U.S. readers: the same test works on a milk check — print January 2025 and January 2026 statements, strip out the Class III, IV, and butter moves, and whatever gap is left is structural, not a bad month.)

What Does Doing Nothing Actually Cost?

There’s a perfectly rational way to ride this out — if your contract genuinely covers your costs and your relationship with your processor is solid, waiting for the cycle to turn is a real strategy. It has turned before. AHDB even noted firmer tones at the January Global Dairy Trade event, with most products ticking up a percent or two.

But “wait for recovery” is only a plan if your balance sheet survives the wait. AHDB cautioned the bounce could be a dead-cat blip, with record volumes flowing into the spring flush keeping prices under pressure. And the official average kept falling — Defra had the UK at 33.99p by April 2026. Run it against Tompkins’ own numbers: at more than £1,500 a day, even a few months’ wait is six figures gone. On a 200-cow herd losing 10p a litre, six more months is roughly £75,000. The question isn’t whether you believe in the cycle. It’s whether your overdraft does.

Options and Trade-Offs

Contract type isn’t carved in stone. But the better roads need you moving before the window shuts, not after.

Get onto a retail-aligned contract — start asking this month. Aligned pools held better than exposed contracts because they price off cost trackers rather than the spot market — Müller’s Advantage at 34.5p still beats a 29–32p manufacturing litre. Your 30-day move is finding out which aligned buyers are taking on supply, what they require, and where your farm fits. Works when: you’re a liquid milk producer with steady volume and quality. Risk: seats come with strings — volume commitments, exclusivity, specification, sometimes investment. You trade flexibility for a steadier price.

Look hard at direct vending — if you’ve got the footfall. On-farm vending is returning £1.20–£1.60 per litre against wholesale near 33p, with around 400 machines now operating nationally; a unit costs roughly £15,000–£30,000. Works when: you’re near consumer traffic or already run a farm shop. Risk: demand is local and finite — it’s a margin play on a slice of your milk, not a replacement for the underlying wholesale contract.

Run the organic numbers — but respect the lead time. Organic has held a wide premium over conventional — Arla’s organic price sat near 56p against conventional’s mid-30s in early 2026. Works when: you’ve got a financial runway and a buyer lined up. Risk: transition runs two to three years, with upfront costs, and the premium market has a ceiling — a wave of conversions could thin it out.

Key Takeaways

  • If your received price is more than 3–4p under what comparable aligned farms are getting today — Müller Advantage is at 34.5p — you’re not just riding the market. Your contract is the problem. That’s a call to your advisor this week, not next quarter.
  • On a 200-cow herd, a 4p contract gap is roughly £60,000 a year; a 10p shortfall to cost is about £150,000. If you’re on an exposed deal, find out which aligned buyers are taking supply inside 30 days.
  • FDOM24 upgraded your contract’s terms, not your price. Before you renew, know exactly what it does and doesn’t protect. It’s a seatbelt, not a rescue.
  • Even aligned farms are under cost right now. The question isn’t profit versus loss — it’s how fast you’re bleeding and how long you can last at that rate.
  • If you’re farming under a U.S. FMMO, run the same logic on your make-allowance drag: a ~92¢/cwt structural cut doesn’t reverse when the cheese price recovers.
  • “Wait for the cycle” is only a plan backed by a balance sheet. If the January GDT bounce proves to be a blip, can your overdraft carry you through to the real recovery?

The cycle will turn. It always does. The real question is whether your specific contract, your overdraft, and the recovery timeline are pointing the same way — or whether you’re carrying a structural gap that a market rebound won’t close on its own.

So pull the statements. Run your number against what your neighbor on an aligned contract is getting. Then decide whether you’re fighting the market or fighting your contract, because those are two different fights with two different exits. If you want the full breakdown — the contract-by-contract barn math by herd size, what the aligned-buyer applications actually demand, and where the real numbers sit — that’s what we’re laying out in this week’s Bullvine Weekly.

⚠️ Before you carry this one alone. If the numbers on your own statements are keeping you up at night, you don’t have to sit with it by yourself. This kind of pressure is heavy, and reaching out is the strong move, not the weak one. 
UK — RABI: free, confidential, 24/7 — 0800 188 4444
UK — Farming Community Network: 03000 111 999, answered in person 7am–11pm, every day of the year. 
US — 988 Suicide & Crisis Lifeline: call or text 988, 24/7. 
US — Farm Aid Farmer Hotline: 1-800-FARM-AID (1-800-327-6243), Mon–Fri 9am–9pm ET (Spanish line available). 
Canada — National Farmer Crisis Line: 1-866-FARMS01 (1-866-327-6701), 24/7, English and French.

Complete references and supporting documentation are available upon request by contacting the editorial team at editor@thebullvine.com.

Learn More

  • Coles and Brownes Just Exposed The $386000 Hole In Your Milk Contract — Arms you with a 90-day cash exposure protocol to stress-test your operation against hidden processor volume caps. Details the exact formula to calculate unpriced counterparty liability on automated milking infrastructure before your bank forces a debt covenant workout.
  • The $20 Milk Paradox: Solving 2026 Dairy Basis Risk — Delivers the strategic blueprint to navigate the widening gap between headline USDA price predictions and real-world regional clearing basis. Follows the money on the permanent class-price cuts triggered by recent federal order make-allowance amendments.
  • The $11 Billion Reality Check: Why Dairy Processors Are Banking on Fewer, Bigger Farms — Exposes the structural processing shift that has quietly pre-secured supply through mega-dairy exclusive agreements. Explains why a permanent cost-of-production variance forces rapid tier consolidation, rendering conventional commodity price cycles obsolete for independent operators.

The Sunday Read Dairy Professionals Don’t Skip.

Every week, thousands of producers, breeders, and industry insiders open Bullvine Weekly for genetics insights, market shifts, and profit strategies they won’t find anywhere else. One email. Five minutes. Smarter decisions all week.
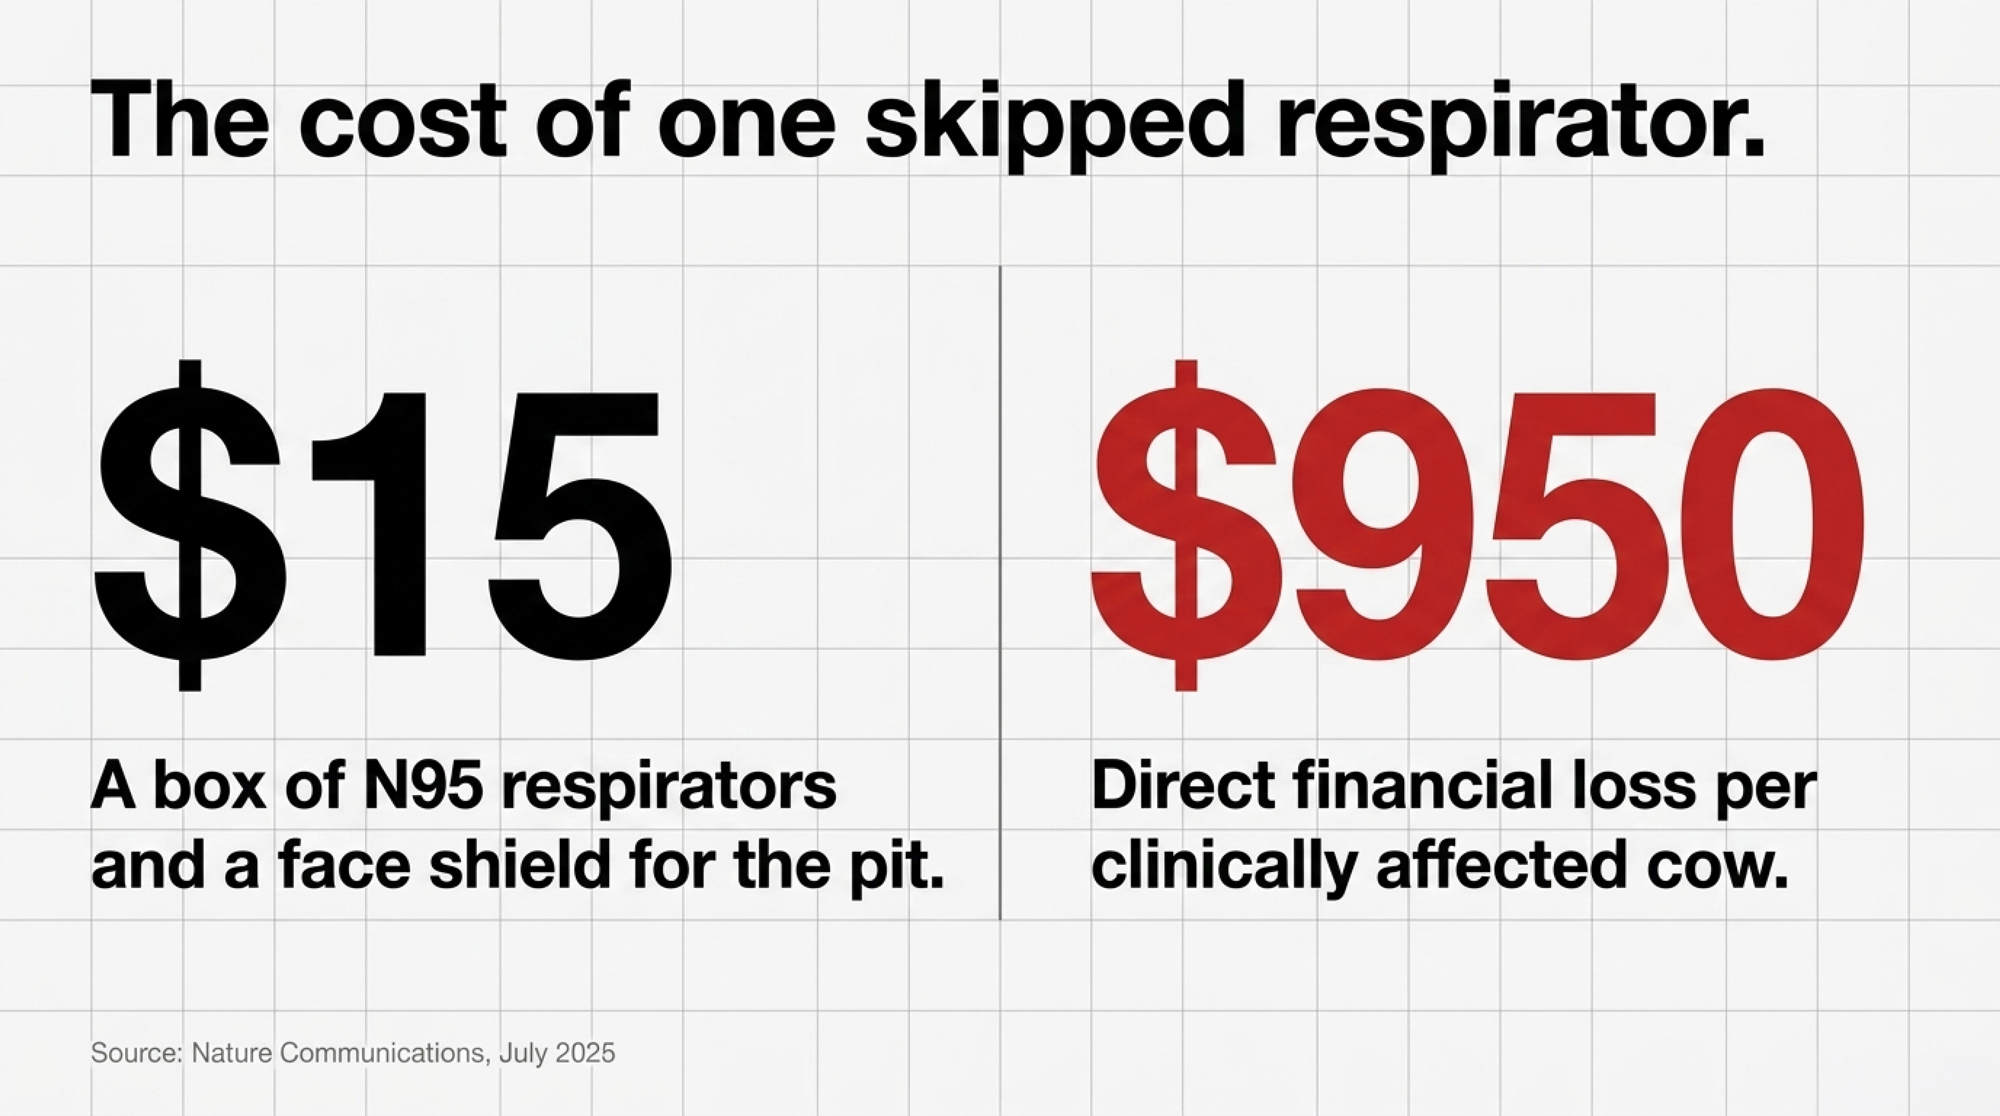
NewsSubscribe
First
Last
Consent

Fonterra Owners Found Out 2 Years Late. Your Co-op Bylaws Might Hide the Same Gap.

Fonterra’s lawyers reached the PM’s adviser through a personal email. Its 8,300 owners learned it from the news, two years on. Does your bylaw even require the board to tell you?

Executive Summary: Fonterra sent a confidential briefing — its legal strategy to kill the Smith v Fonterra climate case, complete with draft statutory wording — to the Prime Minister’s chief policy adviser through his personal email in mid-2024, and the co-op’s 8,300 farmer-owners didn’t find out until RNZ reported it two years later. New Zealand’s Ombudsman and Department of Internal Affairs are both investigating; nobody’s been found to have broken the law, and Fonterra concedes the private-email route wasn’t “consistent with its own policies”. But the real story isn’t NZ politics — it’s that no co-op bylaw, in NZ, the U.S., or Canada, forces a board to tell members about legal strategy before it lands on their milk check. That gap has a price: the 2025 FMMO make-allowance hike (cheddar up 25.8%) trimmed roughly $0.30/cwt off the all-milk price, and on a 400-cow herd shipping 48,000 cwt, even a 30¢ drag runs $14,400 a year — closer to $45,000 at the documented 94¢ total. Add co-op legal exposure like DFA’s $34.4M Othart settlement or Fonterra’s NZD $183M Danone bill, and you’re looking at owner money that quietly never reaches the farm gate. If you ship to a processing co-op, the move this week is a signed, dated letter to your board chair asking — in writing — for the exact bylaw provision covering legal-strategy disclosure.

co-op bylaw transparency

The news broke this month. What it revealed happened in secret two years ago. In mid-2026, RNZ reported — and Prime Minister Christopher Luxon’s office confirmed — that back on or around June 26, 2024, a member of Fonterra’s government affairs team printed a briefing note and handed it to Luxon’s then chief policy adviser, Matt Burgess, and also sent it to his personal email account. Burgess himself hasn’t been accused of wrongdoing; the open questions concern disclosure and record-keeping, and the investigations are still ongoing. The document wasn’t a milk price update or a sustainability report. It was a briefing on Smith v Fonterra — the climate tort case the NZ Supreme Court had cleared for trial in February 2024 —, and it proposed a two-sentence amendment to the Climate Change Response Act that would shut the case down.

For two years, Fonterra’s farmer-owners had no idea. They weren’t in that room. They didn’t get a memo. They found out the way everyone else did — off a news report, in 2026. And here’s the detail that should stop any co-op member cold: that personal inbox sat outside the official systems an Official Information Act request would normally search. When the Environmental Law Initiative asked the PM’s office in March 2025 for records tied to the case, the reply — released in May 2025 — never mentioned the briefing note.

This reads like a New Zealand political story. It isn’t. Strip away the Beehive and the climate case, and you’re left with one question that lands on every farmer who’s ever signed a milk contract with a processing co-op: Does your bylaw give you the right to know what your board is doing before it shows up on your check?

What’s Actually Confirmed — and What Isn’t Yet

Let’s be careful here, because this is an accountability story and the details matter. Fonterra told RNZ the document was sent to the personal address “at the staff member’s request” and acknowledged that this was “not appropriate, nor consistent with its own policies”. Luxon said it “has definitely not met the high standard that I have of staffers in the Beehive” and that communicating through private email “doesn’t help build transparency or public trust”. Mike Smith, the iwi leader who won the right to sue in 2024, has accused the government of “a coordinated campaign of secret lobbying”.

One thing worth stating plainly: nobody’s been found to have broken the law. The Ombudsman is investigating the “apparent withholding” of official information, and the Department of Internal Affairs is reviewing the former staffer’s accounts to capture anything that should’ve been on the public record. Neither has reported back. We’re not getting ahead of it.

But here’s what doesn’t need a verdict to be true. The co-op’s own structure let this happen. No bylaw stopped it, and no member-disclosure rule flagged it. Fonterra has roughly 8,300 farmer-shareholders who own the co-op and elect its board. It also runs an elected Co-operative Council whose published job is to keep members informed about the co-op’s performance and strategy and to hold the board to account. None of that machinery surfaced in the lobbying before a reporter did.

What’s Changing and Why

The shift here isn’t Fonterra’s behavior. It’s visibility. Most farmers have never read the fine print on what their board can do without telling them — and this case dragged that gap into daylight for the whole industry.

The pattern shows up across continents and across completely different legal systems, which tells you it’s structural, not a one-off. The U.S. Capper-Volstead Act of 1922 handed dairy cooperatives an antitrust exemption so farmers — the little guys — could band together against powerful processors. New Zealand’s Dairy Industry Restructuring Act of 2001 put guardrails on Fonterra, preventing a dominant company from squeezing its suppliers. Good architecture for its moment. Both were built to protect the farmer from outside power.

Nobody rewrote those rules for the day the co-op became the power. And that’s not hypothetical. In April 2022, a group of New Mexico producers led by Othart Dairy Farms sued Dairy Farmers of America and Select Milk Producers, alleging that the two used a joint agency to underpay farmers for raw milk across New Mexico, Texas, and parts of three other states. A federal judge allowed the case to proceed in March 2024 — a procedural step, not a finding of wrongdoing — and the cooperatives later settled in 2025 for $34.4 million without admitting liability. That figure split $24.5 million from DFA and $9.9 million from Select, under a deal that dissolved the joint marketing agency at the center of the case. The loyalty scaled up. The accountability rules didn’t.

How This Plays Out on Real Farms

A governance gap doesn’t show up as a scandal on your farm. It shows up as a smaller number on your milk check, and you usually can’t trace it back to the room where the decision got made.

Look at the 2025 Federal Milk Marketing Order make-allowance change — the cost credits processors deduct before they calculate your pay. The cheddar make-allowance jumped from $0.2003 to $0.2519 a pound, a 25.8% increase. Here’s why that lands directly on you: Federal Order end-product pricing formulas calculate the raw milk component values by subtracting the manufacturing make allowance from wholesale commodity prices. So when the processor’s credit goes up, the raw milk value the formula spits out goes down — automatically, before anyone touches your contract. A higher make allowance is a direct deduction from your base pay. The adjustment had a real basis; processing costs had genuinely climbed. But the reforms cut the U.S. all-milk price by roughly $0.30/cwt at the outset, before later component updates clawed some of it back for high-component herds. The rulemaking played out in Washington, shaped by industry input through USDA’s hearing process. The farmers who paid for it found out at the mailbox.

Here’s the math you can run against your own operation. Take a 400-cow herd shipping about 48,000 hundredweight a year — that’s a deliberately conservative 12,000 lbs per cow, and a higher-producing herd would roughly double the numbers below. Hit that herd with even a 30-cent-per-cwt structural drag, the low end of what the FMMO change delivered, and you’re looking at about $14,400 a year. Push it to the 94-cent total drag. The Bullvine has documented after premiums and class moves, and it’s closer to $45,000 a year. That’s not a basis move you can hedge. So run your own version: your annual CWT times whatever shift you think is realistic, against your current pay price.

And this isn’t a U.S.-only problem. Fonterra’s 2013 contamination scare — later confirmed a false alarm — triggered the Danone arbitration. In November 2017, the Singapore tribunal ordered Fonterra to pay Danone NZD $183 million — about €105 million, or US$125 million at the time. Money that never reached the farm gate. No member voted on that legal exposure. They just absorbed it, one season’s payout at a time.

How Much Does Staying Silent Actually Cost You?

Stack it across a decade, and the picture sharpens fast. A 30-to-94-cent structural drag, held over ten years, runs from roughly $140,000 to well over $400,000 on that same 400-cow herd — and that’s only if you assume the pressure holds, which is a big if. Add a co-op legal failure on top, like the Danone bill or a $34.4 million settlement split across members, and you’re looking at earnings that quietly never make it to your account. Each hit is survivable. The compounding is what gets you.

But there’s a cost here that isn’t a number, and it’s the one worth sitting with. The farmer who never asks loses the standing to complain when the next failure surfaces. Three or four years from now, someone’s going to ask, “Did you send the letter?” Did you raise it at the annual meeting? If the answer’s no, then the co-op’s failure becomes partly a story about owners who didn’t act like owners — and you’ll know it. That’s harder to carry than a check reduction.

The Mechanics Behind the Outcomes

So why does the gap survive in co-op after co-op? Because the rulebooks were written when the co-op was the underdog, and nobody went back to update them when it stopped being one.

Dig into the statutes, and the pattern’s the same across three countries. Plenty about milk pricing transparency, financial reporting, and antitrust standing — almost nothing requiring the board to tell members about legal strategy or government lobbying before it lands on their payout. Here’s how the three big frameworks stack up side by side:

Governance LeverFonterra — New ZealandDairy Farmers of America — U.S.Dairy Farmers of Ontario — Canada
Founding frameworkDairy Industry Restructuring Act 2001Capper-Volstead Act 1922; FMMO system1965 Ontario Milk Act; O. Reg. 209/99
Financial disclosure to membersAnnual report to shareholdersBylaws subordinate farmer payments to debt serviceAudited annual statement within 4 months of year-end
Disclosure of legal strategy / lobbyingNo explicit bylaw requirementNo public bylaw clause; separately enjoined from sharing sensitive dataNo explicit rule beyond annual operations report
Accountability bodyElected Co-operative CouncilElected delegate / board structureLocal producer committees + DFO board
Recent flashpointRNZ lobbying disclosure case, 2024–26$34.4M Othart settlement, 2025Glengarry committee resigned in protest, 2020

The takeaway isn’t that one co-op is the villain. It’s that across three completely different systems, the disclosure rule that would’ve caught the Fonterra briefing doesn’t exist in any of them. Ontario at least forces an audited annual report into producers’ hands within four months — more than Fonterra’s or DFA’s documents promise on legal strategy. And the DFA settlement hints at where this is heading: the deal required the cooperatives to dissolve the joint agency and stop sharing certain non-public pricing information. Courts are starting to bolt on the disclosure rules that the bylaws never contained.

Options and Trade-Offs for Farmers

You can’t rewrite your bylaws by Friday. But you’re not stuck waiting for the next failure, either. Here’s what farmers are actually using.

  • Send one written question this week — the 30-day move. Not an email. A signed letter, certified or hand-delivered with a date stamp, to your board chair or CEO, asking one thing: show me, in writing, the bylaw provision that gives me the right to know about material legal strategy or government lobbying before it affects my milk price. When it makes sense: always, any co-op, any herd size. What it takes: 20 minutes and about $6 for certified mail. The risk: you get a non-response — but a documented non-response is itself information, and it’s the start of your paper trail.
  • Work with your district delegate. Big co-ops route governance through elected district or regional reps who answer to local members in a way the national board doesn’t. When the Glengarry County producer committee in Ontario hit a program it couldn’t stomach in 2020, the whole committee resigned in protest — and made the board answer for it publicly. When it makes sense: when you want leverage beyond one voice. What it takes: knowing who your delegate is. The limit: delegates vary a lot in how engaged they actually are.
  • Push accountability to the body, not just the board. If your co-op has a Co-operative Council or equivalent, holding the board accountable is literally its job. When it makes sense: when the board stonewalls. What it takes:knowing the body’s real mandate. The risk: some of these look stronger on paper than they are in the room.
  • Read what you actually signed. Pull your member agreement and bylaws and hunt for three things: any disclosure obligation on the board, the process for filing an annual-meeting question that requires a written response, and the threshold to propose a bylaw amendment. The catch: DFA’s bylaws aren’t posted publicly in full — outsiders mostly learn their terms through credit ratings and court filings — so if yours aren’t public either, document that fact and raise it in your letter.

The forward-looking signal sits inside that first path. The DFA settlement already forced new pricing-conduct obligations through the courts, and the Fonterra disclosure question is now out in the open in New Zealand. The pressure’s moving in one direction. Getting your question on record now means you’re ahead of it, not chasing it after the fact.

Is Asking Hard Questions Worth the Social Cost?

Let’s be honest about what really stops a farmer with a hand half-raised at the annual meeting. It’s rarely the bylaws. It’s the room. Your father shipped to this co-op. Your neighbor sits on the district committee. The field rep who walked you through that mastitis problem last February is standing by the coffee urn. You don’t interrogate the people who show up for you, and that loyalty is real and earned.

Here’s the reframe. A written governance question isn’t disloyalty — it’s the harder version of the same loyalty. It says you believe in the institution enough to make it work the way it promised. The Glengarry committee that walked out in 2020 wasn’t disloyal to Ontario dairy — they were the most invested people in the room. And if a board gets cagey when a member asks for a written disclosure policy? That discomfort is diagnostic. It’s telling you something the bylaws won’t.

Key Takeaways

  • If you can’t find your co-op’s full bylaws posted publicly — and DFA members can’t — treat that as a flag worth documenting, then ask for them in writing.
  • If your board hasn’t put a legal-strategy disclosure policy in front of its members, send a signed, dated letter this month requesting the exact provision. Verbal answers don’t count — get it in writing.
  • If your next annual meeting is more than 60 days out, find your district delegate or committee rep now, before the agenda deadline closes.
  • If you want your real exposure, take your annual CWT times a 30- to 94-cent drag against your current pay price — that’s your cost from regulatory and legal decisions you didn’t vote on.
  • If the board answers verbally rather than in writing, send a follow-up letter noting that you asked for a written response. Build the paper trail before you need it, not after.
  • If you’re the only one asking, find two or three other members in your district doing the same. Not a coalition — a conversation. It changes what a board can quietly manage.

The Fonterra matter will run its course, and New Zealand will sort out who knew what and when. But that’s not the question that should keep you up. The closer one is this: if your board made a decision tomorrow that reshaped your contract or your regulatory environment, would you hear about it before it hit your check, or two years later, off a news report?

You can start answering that this week, for the price of a certified letter. The deeper work — how a governance gap converts into real cost-per-cwt by herd size, and what enforceable disclosure language actually looks like inside a co-op bylaw — is where this gets operational. 

Complete references and supporting documentation are available upon request by contacting the editorial team at editor@thebullvine.com.

Learn More

The Sunday Read Dairy Professionals Don’t Skip.

Every week, thousands of producers, breeders, and industry insiders open Bullvine Weekly for genetics insights, market shifts, and profit strategies they won’t find anywhere else. One email. Five minutes. Smarter decisions all week.
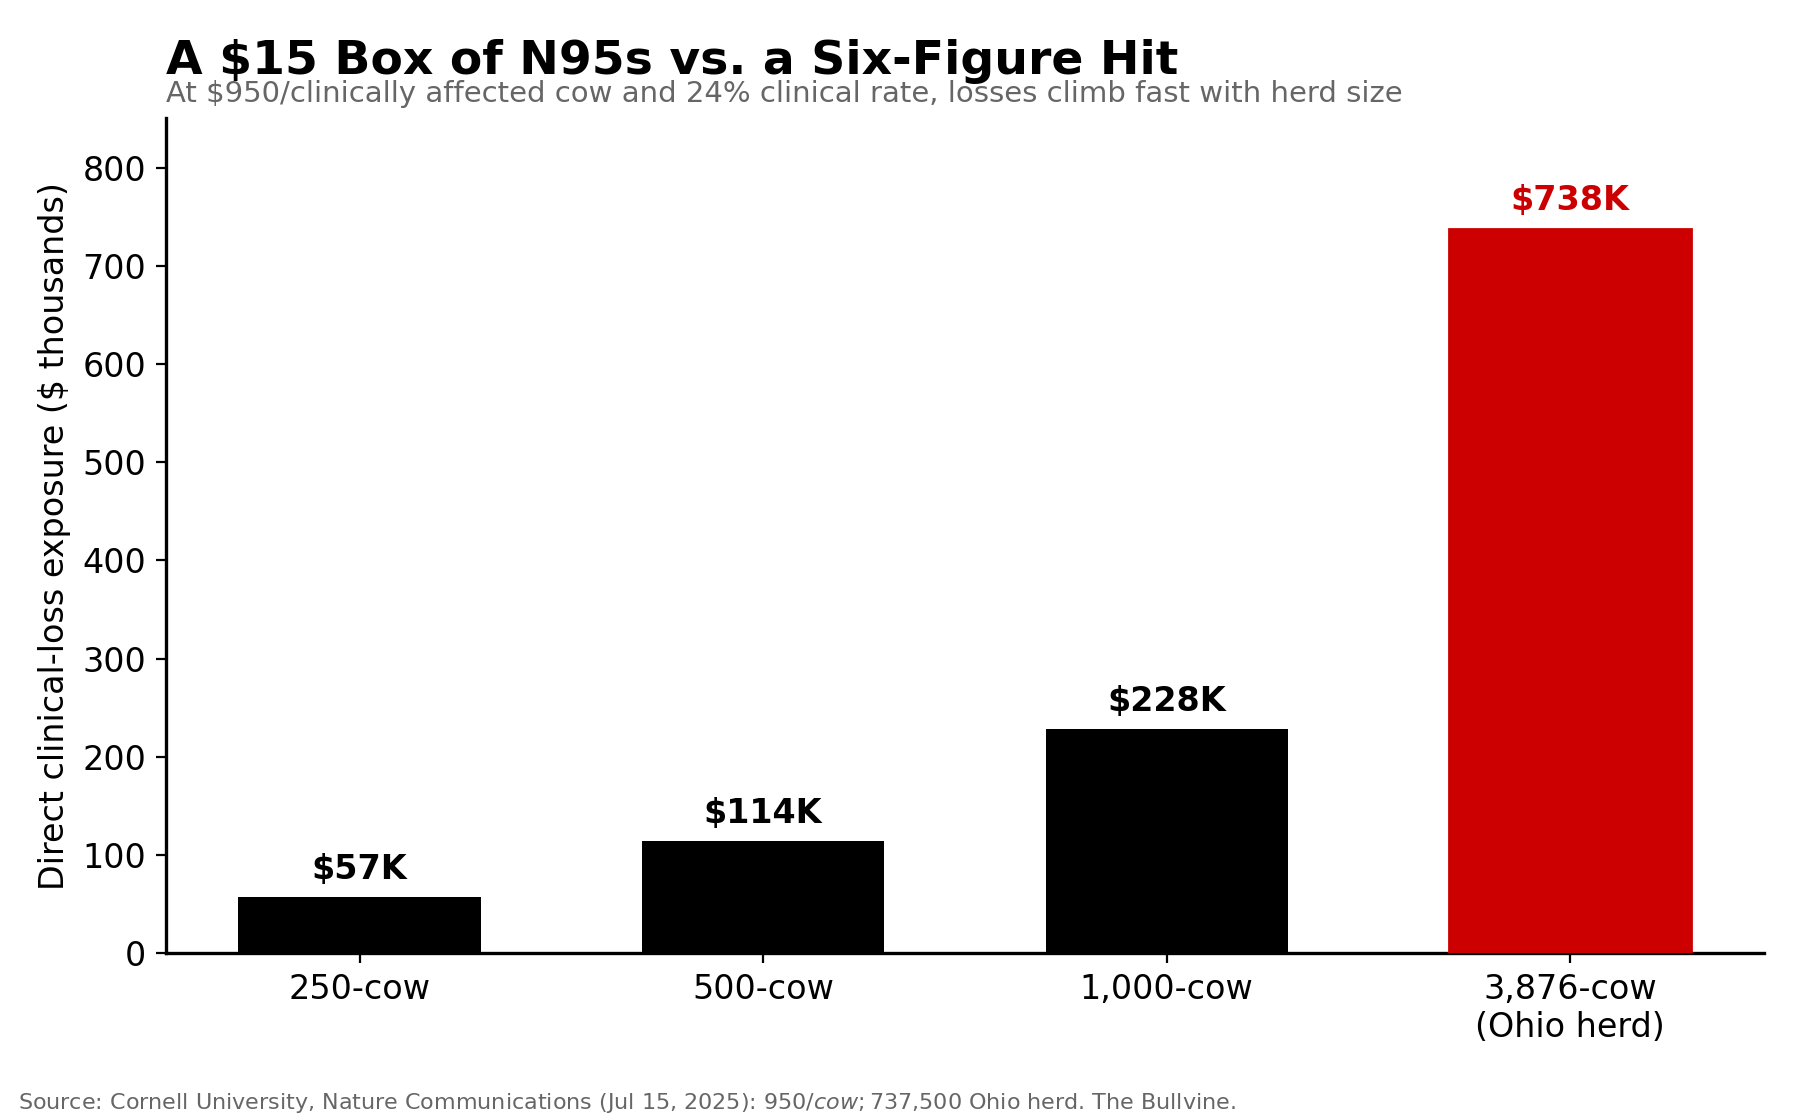
NewsSubscribe
First
Last
Consent

Class IV Is Soaring. Your Cheese-Route Blend Check Isn’t.

Class IV closed $5.40 over Class III in May. If your milk goes to cheese, almost none of that hits your blend check — and here’s the ten-minute math that proves it.

Executive Summary: Class IV closed in May 2026 at $22.32/cwt, against Class III at $16.92 — a $5.40 spread — after Class IV jumped $2.10 in a single month while Class III moved a dime (USDA AMS, CLS-0526). If your milk ships to a cheese plant in FMMO Order 30, almost none of that Class IV strength reached your blend check, because depooling lawfully let the high-value milk walk out of the pool and drag the blend down for everyone who stayed. Run the barn math, and it stings: a 500-cow herd at 75 lbs/day with 35% blend exposure is looking at roughly $259,000 in annual exposure at the May spread — about $310,000 at Krentz’s 600-cow scale. Kevin Krentz, who milks near Berlin, Wisconsin, already knows the number; he testified that a prior spread cost his farm nearly $200,000. The gap has widened in every month of 2026, and USDA’s May WASDE and FCS America both expect Class IV to remain strong through the back half of the year. There’s a ten-minute, three-milk-check calculation that tells you your own exposure — and a $10,000-a-month trigger for the call to your marketing desk that most 500-cow operations never make. The desk won’t ring you about this; the incentive runs the other way. 

Class III Class IV spread

Kevin Krentz can tell you, almost to the dollar, what a milk price spread costs, because one has already cost him close to $200,000. He and his wife, Holly, milk about 600 cows near Berlin, in Waushara County, Wisconsin, and he runs the Wisconsin Farm Bureau.

Back in the 2023 federal order hearings, he testified that negative producer price differentials hit his farm for nearly that much (Krentz testimony, USDA AMS FMMO hearing, August 30, 2023; Brownfield Ag News, August 30, 2023). Different spread, opposite direction. Same trap. 

That trap is open again in 2026, and it widened every single month this year.

📊 The Number That Should Stop You — May 2026: Class IV closed at $22.32/cwt, Class III at $16.92. That’s a $5.40/cwt spread, Class IV on top — and Class IV jumped $2.10 in a month while Class III moved a dime. (USDA AMS Announcement of Class and Component Prices, CLS-0526, June 3, 2026) 

If you ship to a cheese plant, almost none of that Class IV strength reached your blend check. This milk price spread doesn’t look like a crisis. It shows up as a milk check that’s quietly lighter than the headlines say it should be.

Why Doesn’t a Strong Class IV Show Up in Your Milk Check?

Here’s the part that trips people up. Every trade outlet is running a “strong dairy markets” story right now, and they’re not wrong.

Nonfat dry milk averaged $2.08/lb in the May class-price formula — the best sustained powder run in years (USDA AMS, CLS-0526). Powder is hot. Butter is firm. Class IV is flying. 

But Class IV strength only helps you if your milk goes where Class IV gets made. In Federal Order 30 — the Upper Midwest — roughly four of every five pounds of producer milk heads to Class III cheese, with fluid use down in the single digits (FMMA30 order reports, 2025–26). 

Krentz’s milk goes to cheese. It never sees a powder dryer. So when powder runs north of $2.00, that money lands with the butter-powder plants, not in the blend paid to the cheese-route producers sharing his pool.

Then depooling turns the screw. The order doesn’t pay you the Class III or Class IV price directly — it pays a blend, a weighted average of every class in the pool.

Here’s the nuance worth nailing down: even in a Class III–heavy pool, you’re still exposed to the Class IV gap. When Class IV milk can earn more outside the pool than the blend pays, those plants pull out — and the pool loses that high Class IV value entirely. Your blend drops because the money that should have lifted it walked out the door.

It’s legal. It’s in the fine print. And it drags the blend down for everyone who stays.

That’s not a theory this spring. Iowa State Extension laid out the mechanics in a May 12, 2026, analysis: by March, pooled milk in the Central order had dropped to 1.35 billion pounds, down from more than 1.50 billion a year earlier.

Class III utilization inside the pool jumped to 48.2%. Class IV fell to 12.0% (Iowa State NW Iowa Dairy Outlook, May 12, 2026). The high-value milk walked out, lawfully, and producers who stayed got a blend that no longer reflected what Class IV was worth. 

Was This Always a Slow Build, or Did It Snap?

It built, then it snapped. Look at the Class IV-minus-Class III gap month by month, and the story tells itself.

January opened with Class III actually above Class IV by about a dollar — the normal cheese-state order of things. February flipped it. By March, the spread had stretched to $2.78; by April, to $3.40; and by May, to $5.40 (USDA AMS, CLS-0526). Five straight months of Class IV pulling away, and the last jump was the biggest. 

That progression matters because it kills the “wait and see” instinct. A one-month blip, you ride out. A gap that widens every month for five months running, with the biggest move most recent? That’s a trend with momentum, and the depooling that rides along with it compounds the longer it runs.

The Iowa State pool data shows the compounding in real time. When Class IV milk left the Central pool, the pounds that remained got more Class III–heavy — 48.2% by March, meaning the blend leaned harder on the lower-value class with each passing month. The math doesn’t reset at the start of every announcement. It stacks. 

What Does a $5.40 Spread Actually Cost a 500-Cow Herd?

Stop thinking about the spread as a number on a futures screen. It only matters as spread times your milk times the share of your blend that’s exposed.

And the gap has done nothing but widen all year.

📊 The Spread Widened Every Month — Class IV minus Class III, 2026: Jan –$1.04 · Feb +$1.35 · Mar +$2.78 · Apr +$3.40 · May +$5.40. The June CME curve points higher still, with Class IV near $22.10 against Class III near $16.13 as of June 2–3. (USDA AMS CLS-0526, June 3, 2026; CME Group settlements via Barchart, June 2–3, 2026) 

Take a 500-cow Upper Midwest herd shipping 75 lbs/cow/day. That’s 136,875 cwt a year. Here’s how the exposure scales — by spread, by blend percentage, by herd size.

HerdSpreadBlend exposureAnnual exposurePer month
500-cow$3.40 (April actual) 35%$162,881~$13,573
500-cow$5.40 (May actual) 35%$258,694~$21,558
500-cow$5.40 (May actual) 50%$369,563~$30,797
600-cow (Krentz scale)$5.40 (May actual) 35%$310,433~$25,869

That 600-cow figure now runs well past what Krentz testified a past negative-PPD stretch cost him. 

A fair caution: that’s the scale of the decision, not a guaranteed transfer. Your real exposure depends on your handler’s plant mix and how your pool is built, not a dial you turn alone. 

But the math answers the only question that matters here — is it worth a phone call? Above 300 cows, yes.

The Ten-Minute Check: Run Your Own Number Tonight

You don’t need the futures screen or a consultant for this. Three milk checks and ten minutes.

Step 1 — Find your effective blend price. Pull your last three milk checks and work out what you actually got paid per cwt after everything netted out.

Step 2 — Set it against Class III. Look up the announced Class III price for those same months — USDA AMS posts them by the 5th of the following month. Note the gap between what your milk earned and what it was paid.

Step 3 — Get your handler’s real split. Ask your marketing desk, in writing, for your handler’s most recent monthly Class III/Class IV utilization. It’s derivable from the public USDA FMMO pool reports for your order.

Step 4 — Do the one-line calc. Blend exposure × spread × your annual cwt. That’s your number.

🚩 The Trigger — If that figure clears $10,000/month at today’s spread and you haven’t called your marketing desk this quarter, treat it as urgent. Above 300 cows shipping 65+ lbs, the call pays for itself many times over.

One warning on Step 3: don’t accept an order average instead of a handler-level figure. Order averages hide everything.

Here’s how Step 4 plays out with real numbers. Say your handler comes back and tells you the plant ran 35% Class IV utilization in a normal month, but during the May depooling that dropped to 12% — the same collapse Iowa State documented across the Central order. On your 136,875 cwt, that 23-point swing at the $5.40 May spread is the difference between a blend that captured most of the Class IV premium and one that barely touched it. Plug your own utilization numbers into the same line, and you’ll see exactly where your check landed on that spectrum. 

That’s the whole point of doing it yourself. The order average tells you what the pool did. Your handler’s split tells you what your milk did. Those two numbers can sit a long way apart in a depooling month, and only one of them shows up in your bank account.

Why the Powder Run Won’t Sort Itself Out by Fall

You might be tempted to wait this out. Markets swing, spreads close, why chase it? The problem is that this one’s built on concrete that never got poured.

Class IV lives on butter and powder. For years, processor money went into cheese and whey instead of new powder drying, so when global demand for powder showed up, the dryers weren’t there.

Nasonville Dairy in Marshfield, Wisconsin, makes around 150,000 pounds of cheese a day but breaks even on most of it — what keeps the lights on is whey, the New York Times reported in July 2025. That’s the math that built whey and cheese instead of dryers, all across the industry. Smart at the plant. Expensive at your end. 

The forecasts don’t see it closing soon. USDA’s May 2026 WASDE bumped the 2026 Class III estimate to $17.00/cwt and the all-milk estimate to $21.25/cwt, citing strength across cheese, whey, and powder (USDA WASDE, May 21, 2026). 

FCS America expects the Class III–IV spread to hold near $2.45/cwt through the back half of 2026 (FCS America Dairy Quarterly, March 25, 2026). Nobody credible is calling for the gap to vanish by harvest. 

Why Won’t Your Co-op Call and Tell You This?

Fair question, and the answer isn’t a villain. It’s how the desk is built.

A co-op marketing desk exists to move milk and keep plant relationships humming. It has almost no reason to ring up 400 members and say, “Our cheese utilization means you’re not seeing the Class IV premium, and here’s what May cost you.”

That sentence is true. It’s useful. And it quietly raises a question the co-op would rather not field — would this member do better with a different handler?

So the call stays at the market level. Class IV’s strong, here’s the forward curve, here’s your DRP renewal. All accurate. None of it tells you what the spread is worth on your operation.

This isn’t bad faith — it’s incentives. The best, most honest marketing person on staff is still paid to keep milk in co-op plants.

There’s also a transparency gap baked into the rules: proprietary handlers have to itemize milk-check payments, but cooperatives — which handle the bulk of the nation’s milk — are largely exempt from those same disclosure requirements, a gap AFBF economist Danny Munch has been pushing USDA to close (Brownfield Ag News, June 11, 2025). 

The myth to drop is that the desk is your advisor. Structurally, it isn’t. An independent milk marketing advisor, paid by you, can run this same math without the tug-of-war — and most 500-cow family operations, the ones most exposed in Order 30, never make that call.

Options and Trade-Offs

You’ve got a few honest paths here, and they’re not mutually exclusive.

Revisit your DRP weighting (the 90-day move). If you set a Class III–heavy weighting back in Q3 2025 when Class IV was soft and haven’t touched it, a market where Class IV leads by $5.40 means your coverage no longer matches your exposure.

What it requires: your current declaration and an open enrollment window. The trade-off: you gain protection against the gap, but over-weighting Class IV right before a reversal can sting — pair the move with the 2027 outlook, not just today’s number. 

Look at your handler options (the long game). In competitive milk sheds — parts of Wisconsin, Idaho, some Northeastern markets — you actually have somewhere to go, and co-ops there tend to disclose more because opacity costs them members.

The signal to watch: if a competing plant carries meaningfully higher Class IV or fluid use while your basis holds, you’ve got room to negotiate.

The caution: USDA projects Class III rising and Class IV softening in 2027, with all-milk easing to $20.95/cwt (USDA WASDE, May 21, 2026). This window is 12 to 18 months, not forever. Don’t anchor a barn expansion to a spread the curve says compresses next year. 

One more on the horizon: the USMCA six-year dairy trade review is due July 1, 2026. Export demand for powder is propping up Class IV right now — if Canadian market access becomes a bargaining chip, that’s a real pressure point on the spread.

Key Takeaways

  • If the spread holds above $1.50/cwt for two announced months in a row, call your marketing desk — it cleared that line in March 2026 (Class III $16.16, Class IV $18.94) and ran to $5.40 by May. Five straight months of Class IV pulling away. The call’s overdue. 
  • If your blend-exposure math clears $10,000/month, the phone call pays for itself many times over. Above 300 cows shipping 65+ lbs, it almost always will.
  • If your desk won’t give you handler-level Class III/IV utilization in writing, that’s your signal to bring in an independent advisor.
  • If you set your DRP weighting before this spring, it no longer matches your exposure. Revisit it before your next enrollment window closes.

So here’s the question worth carrying into the barn tomorrow: when did you last pull your own utilization split and actually run this math — and what would it say if you did it tonight?

Run Your Numbers

Dairy Profit Projector — Drop in your herd size, blend, and current Class III and Class IV futures, then watch the spread move your IOFC, breakeven milk price, and 12-month margin. Pressure-test 35% versus 50% Class IV exposure before your next call to the marketing desk.

Complete references and supporting documentation are available upon request by contacting the editorial team at editor@thebullvine.com.

Learn More

The Sunday Read Dairy Professionals Don’t Skip.

Every week, thousands of producers, breeders, and industry insiders open Bullvine Weekly for genetics insights, market shifts, and profit strategies they won’t find anywhere else. One email. Five minutes. Smarter decisions all week.
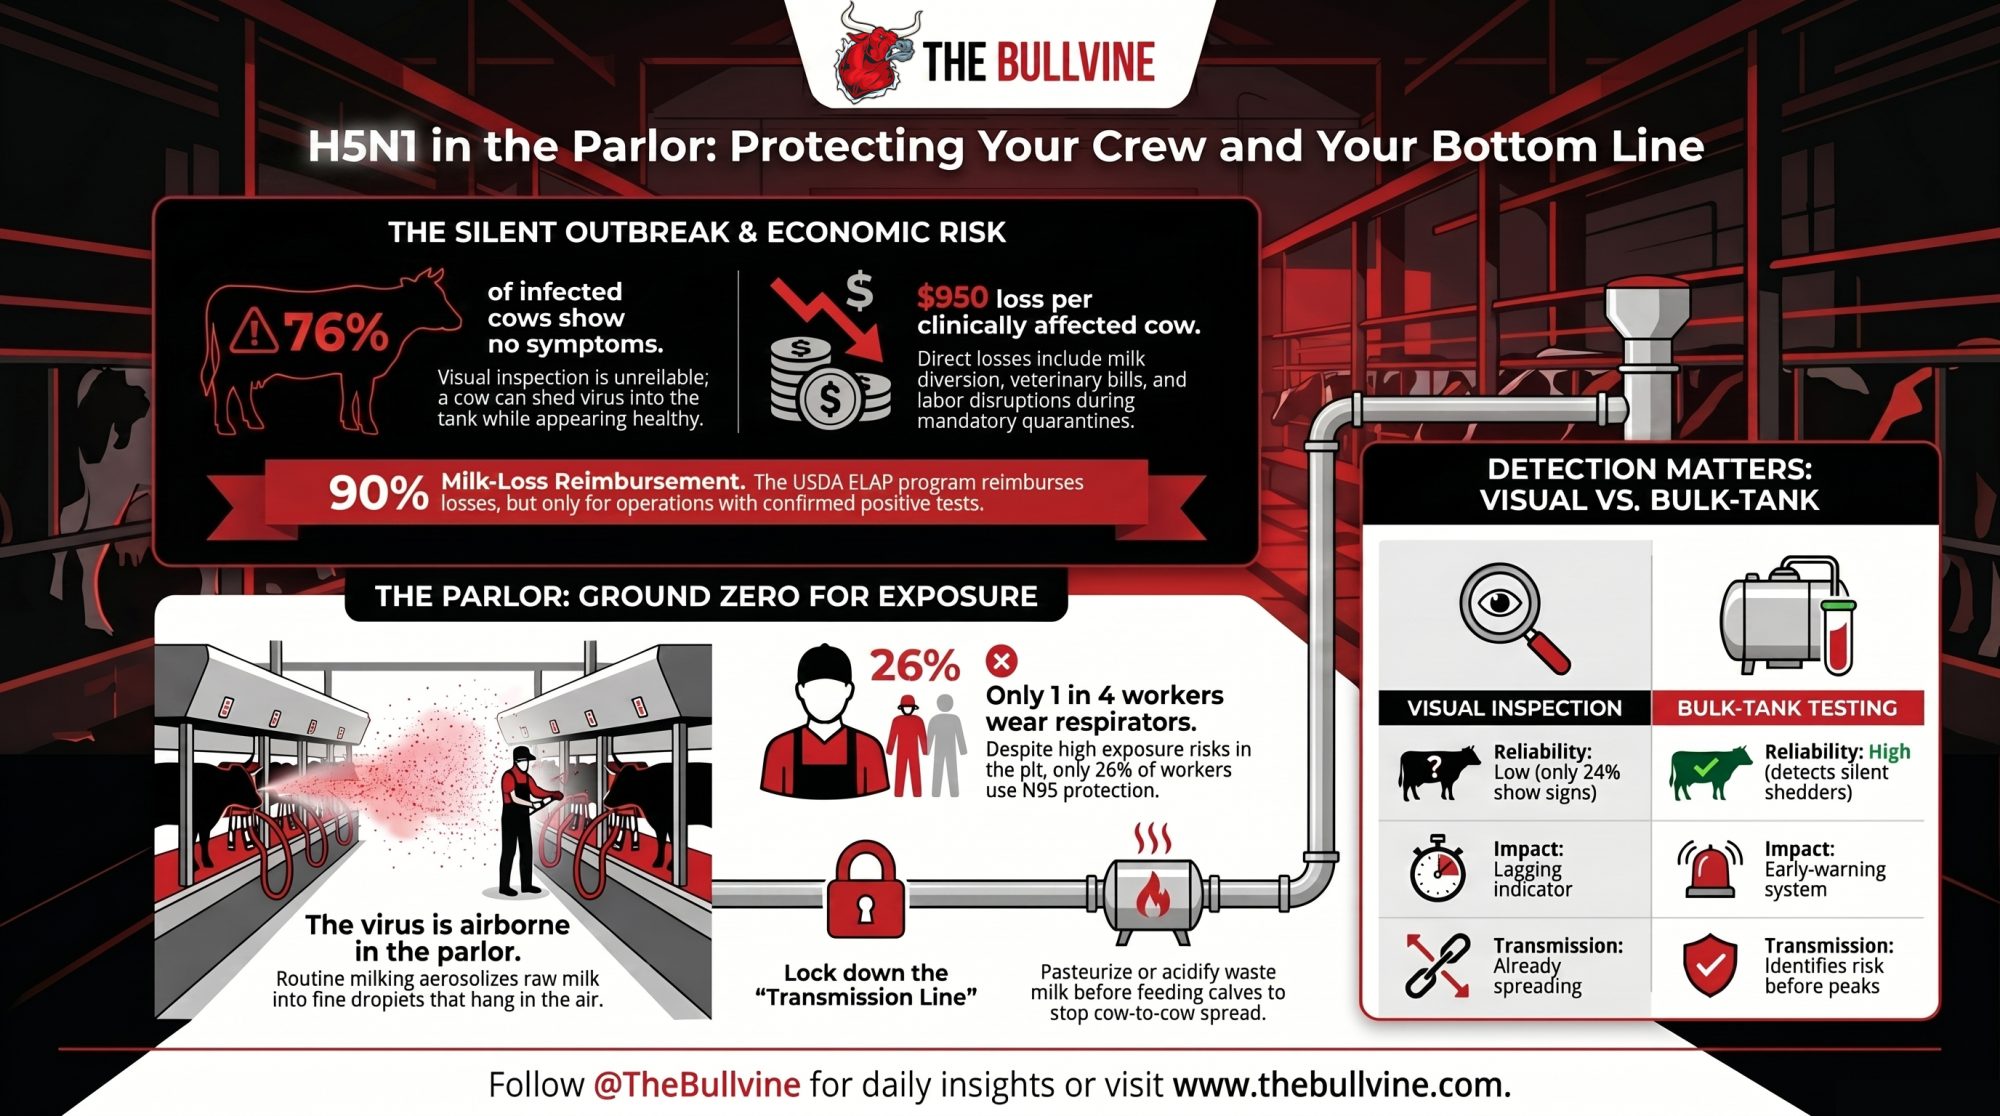
NewsSubscribe
First
Last
Consent

Screwworm Just Hit a Texas Calf — And the Plant Built to Fight It Won’t Make a Single Fly Until 2027

The first U.S. New World screwworm case turned up in a 3-week-old calf in Zavala County. For dairies near the border, the real problem isn’t the parasite — it’s the 18-month gap before the eradication engine is even built.

Executive Summary: New World screwworm just turned up in a 3-week-old calf near La Pryor, Texas — — and a 20-km quarantine zone now locks down every warm-blooded animal in Zavala County until it’s inspected. For dairies, this lands harder than for cow-calf operations: you can hold beef cattle on pasture and wait out a quarantine, but the parlor runs twice a day and you can’t hold back milk. The cash-flow hit comes from the withdrawal clock, and the paperwork doesn’t agree — 19.5 days in some conditional-approval documents, “not established” on Zoetis’ EUA fact sheet for milking cows — so pin the number down with your vet before you treat. Run it yourself: one 200-cow pen shipping 75 lbs/day, held off the tank 19.5 days, dumps roughly 293,000 lbs of milk before you’ve paid a vet bill. Here’s the part that should worry you most — the $750M sterile-fly production plant at Moore Air Base in Edinburg won’t make a single fly until late 2027, so for about 18 months you’re on containment, not eradication. The work that protects your herd is yours: daily checks on navels, fresh-cow perineums, and any dehorning or surgical site, plus a same-day report to your state vet (NWS is reportable within 24 hours). Read the full piece if you want the milk-dump math by herd size and a straight read on whether the federal response is built for 2026.

New World screwworm dairy

It started with a navel. A three-week-old calf on a ranch near La Pryor, Texas, had larvae burrowing into its umbilical area — the kind of wound that, on any dairy, can read at first like a stubborn infection. On June 3, 2026, USDA Secretary Brooke Rollins confirmed what the National Veterinary Services Laboratories in Ames, Iowa had found: New World screwworm. A 20-kilometer quarantine zone went up around Zavala County, and every warm-blooded animal inside it — cattle, horses, even the family dog — now needs an inspection before it can move. 

That’s the official posture, and the Texas Animal Health Commission has been clear about it: all warm-blooded animals in the zone face movement restrictions, and NWS must be reported within 24 hours of suspicion. Dr. Lewis “Bud” Dinges — the state veterinarian and TAHC’s executive director — has led the state’s response since the threat was still south of the river. Here’s the part that should keep a South Texas dairy operator up at night. The plant built to actually beat this thing back isn’t finished. USDA’s sterile-fly production facility at Moore Air Base in Edinburg — backed by roughly $750 million in federal funding — won’t produce its first flies until late 2027. So for roughly 18 months, dairies near the border are working with a containment system — not an eradication one. And they’re carrying the risk in between. 

What Changed, and Why It Landed on a Tuesday

USDA slammed the border shut to live Mexican cattle in May 2025. That one move disrupted roughly $119 million in annual trade and about 1.25 million head, according to USDA figures. Governor Greg Abbott issued a statewide disaster declaration and Texas stood up its NWS response. The detections kept marching north — then, as Rollins recounted, a goat turned up in Coahuila about 25 miles south of the border on June 2, the closest case yet. A day later, it was in a Texas calf. 

Here’s why this hits a dairy differently than a cow-calf outfit. You can hold beef cattle back on pasture during a quarantine and wait it out. You can’t hold back milk. The parlor runs twice a day, quarantine or not — so the financial pressure point for dairy isn’t dead animals so much as milk you can’t ship. And Texas is the nation’s third-largest milk state, which means a South Texas problem doesn’t stay in South Texas. 

How Screwworm Actually Gets Into Your Herd

Screwworm doesn’t behave like the horn flies and stable flies you fight all summer. The female lays her eggs at the edge of a wound, and when they hatch, the larvae burrow into living tissue — feeding and tearing as they go, not just cleaning up dead flesh like a common blowfly. One untreated wound can host hundreds of larvae and turn septic fast. 

On a dairy, the open doors are everywhere. Fresh navels on newborn calves. The vulva and perineum on a fresh cow, raw 24 to 72 hours after calving. Teat injuries, mastitis lesions, dehorning sites, tag holes. The La Pryor calf was infested through its navel — the most common entry point in young calves, and exactly the spot a dairy crew handles by the dozen during a busy calving stretch. 

There’s a tell that separates this from ordinary fly strike. Veterinary diagnosticians describe a “chain of abscesses” — clusters of lesions, often anywhere from blueberry- to golf-ball-sized, rather than one clean wound. TAHC tells producers to watch body openings — nose, ears, umbilicus, genitalia — for drainage or enlargement, and to report suspect cases even when they’re not sure. Add a foul, rotting smell and an animal that’s isolating or off feed, and you’re likely looking at something a herdsman can’t afford to shrug off. 

How This Plays Out on Real Farms — in Milk, Not Theory

The damage that hurts most isn’t the vet bill. It’s the milk you have to dump. Once you’re treating, that milk goes down the drain, not into the tank — and the withdrawal clock decides how long.

The Texas Association of Dairymen has called the spread a serious threat to both livestock health and dairy farmer livelihood, and built out a resource hub aimed at safeguarding herds, the milk supply, and the long-term sustainability of the state’s dairy industry. Producers across the state are landing on the same answer: get ahead of it now. As Texas stocker Wayne Cockrell put it back in February, ramping up animal-health practices is the crucial piece of the fight — “you’ve got to put” the work in on management before the parasite arrives, not after. That logic hits a dairy harder than a stocker operation, because a dairy’s wounds come on a calendar. 

ScenarioWithdrawal (days)Milk lost (lb)Milk revenue lost ($)
Single pen, short course10150,00033,000
Single pen, conditional 19.5‑day window19.5292,50064,350
Single pen, 35‑day withdrawal assumption35525,000115,500
Single pen, 60‑day worst‑case parasiticide60900,000198,000

This is where you need to read the label carefully, because the numbers don’t all agree. Zoetis’ Dectomax-CA1 (doramectin) earned conditional approval for the prevention and treatment of NWS in cattle, including newborn calves and certain classes of dairy cattle. On May 19, 2026, FDA issued a separate Emergency Use Authorization extending its use to the milking string — we broke down the May 19 EUA math here, and it’s worth your time before you reach for the bottle. And the withdrawal figures don’t line up neatly across the paperwork: industry briefings cite a 468-hour (19.5-day) milk-withdrawal window in some conditional-approval documentation, an FDA FOI document assigns a 35-day withdrawal for certain labeled uses of doramectin in deer, and Zoetis’ EUA fact sheet for milking cows states a milk withdrawal period “has not been established”. The point isn’t the spread itself — it’s that you cannot eyeball this. Confirm the exact withdrawal with your veterinarian for your specific use before you treat a single cow. Older or extra-label parasiticides can stretch withdrawal as far as 60 days, per NMPF guidance. 

Run the math on a single pen and it gets real. Take a 200-cow group shipping 75 pounds a day. Hold that group off the tank for a 19.5-day withdrawal and that’s roughly 293,000 pounds of milk gone — just one pen, before vet costs or retreats. Push the window to 35 days and you’re past 525,000 pounds. The withdrawal number you land on isn’t a footnote. It’s the whole ballgame. 

Scale it up and you hit the number that makes people quiet. In a worst case — a full 1,000-cow herd treated and held off the tank for 60 days at roughly 80 pounds a cow — Bullvine modeling puts the loss near 4.8 million pounds of milk, over $1 million down the drain at recent pricing. That’s a ceiling, not an expectation; real outbreak responses are usually targeted, not whole-herd. But even a treated fraction of your cows, times a withdrawal measured in weeks, turns “a pest we’re watching” into a cash-flow event you have to fund. 

The Mechanics Behind the 18-Month Gap

The entire eradication strategy rests on one number: how many sterile flies you can put in the air. Release enough sterilized males and wild females mate but produce nothing. The wild population collapses. It’s proven science — it’s how the U.S. won in 1966 — but only at saturation scale. 

Right now, the COPEG plant in Panama is the only sterile-fly production facility operating in the region, turning out about 100 million sterile flies a week as it works to hold the line in Mexico. A sterile-fly dispersal facility at Moore Air Base is already up and running and can release up to 100 million flies a week — but it relies entirely on sterile pupae shipped in from COPEG and other sites. It doesn’t make its own flies. The big domestic production plant in Edinburg — the one that takes the U.S. from borrowing flies to making its own — is still under construction, with first output of about 100 million flies a week targeted for late 2027 and a phased build to 300 million a week by 2028. 

So the system can ring-fence a known detection and flood one corridor. What it can’t do yet is blanket a wide region the moment a case pops in a new county. There’s promising work on a “male-only” fly strain that would roughly double usable output without new buildings, but it’s pending EPA review, not in the field. Until capacity catches up, more of the load falls on the part you control — your daily inspections and your willingness to report. Your calf barn is part of the eradication machinery now, whether anyone told you so. 

How Much Screwworm Risk Can Your Cash Flow Actually Handle?

Most operators haven’t run this number, and it’s the one that should drive every other call. That 293,000-pound figure on a single 200-cow pen isn’t an abstraction once a confirmed case forces your hand. It’s the difference between a manageable vet event and an awkward phone call with your lender. We ran a version of this against a typical milking schedule last September and landed near an $800K liability — and that was before the parasite crossed the river. 

Herd size (milking cows)60‑day milk lost (lb)Milk revenue lost ($)Risk signal
200960,000211,200Manageable but painful
5002,400,000528,000Lender conversation zone
1,0004,800,0001,056,000Red‑line for many operators
4,00019,200,0004,224,000System‑level stress test

So the most useful step here isn’t on any government poster. It’s a three-way conversation — you, your veterinarian, and your lender, in the same room. Decide on paper, before the parasite shows up, how much milk you can afford notto ship and still service your debt. Set that ceiling and everything downstream gets clearer: which animals you’d treat, when you’d pull a pen, whether you delay a dehorning round. Where does your milk-dump ceiling actually sit right now? If you can’t answer it in dollars, that’s the gap to close this week.

Is Your Calving Routine Built for This?

The operational reality is simpler and harder than the economics. Screwworm finds wounds, and a dairy manufactures wounds on a schedule — calving, dehorning, tagging, the odd surgery. The fix isn’t exotic. It’s tightening what you already do.

Walk your calving and fresh-cow pens daily with screwworm in mind: navels on the newborns, the perineum on fresh cows, udder cleft, any recent surgical site. Texas A&M AgriLife is telling producers to get elective wounding done early in spring or late in fall — outside peak fly pressure — and to watch animals after any procedure until they’re fully healed. None of that needs new equipment. It needs a trained set of eyes that knows a chain of abscesses from an ordinary scrape — and the discipline to look every day, not just when something already seems off. The emergency-fund and inspection playbook we ran in August lays out exactly how to build that routine without burning out your crew. 

Options and Trade-Offs for Farmers

Here’s where the rubber meets the road: every response is a trade between labor, cash, and risk. Lay it out that way and the choices get clearer.

OptionWhen it makes senseWhat it demands mostBiggest risk or limit
Tighten daily inspection of high-risk sites — start this within 30 daysAny herd within a few counties of a detection, and really any Southern dairy this summer Labor: trained people walking calves and fresh cows every day, checking navels, perineum, udder cleft, surgical sitesYou pay in hours. A half-trained program that still misses cases is worse than honest vigilance.
Re-time elective wound proceduresHigh-risk regions during warm months, when fly pressure peaks Planning: breaking your usual calendar on dehorning, castration, some surgeriesYou can’t postpone everything; some procedures are time-sensitive for calf welfare.
Pre-plan treatment and withdrawal economics with your vetAny dairy that could face a case — so, all of themCash-flow clarity: agreeing on which product, on which animals, with which milk-withdrawal assumption Approvals and emergency-use rules are still shifting; this plan needs revisiting every few weeks.
Map your quarantine-zone status and movement optionsAnyone shipping heifers, calves, or culls out of South Texas.Logistics: live contacts with your state vet and APHIS, inspection booked before you book the truckZone lines move with each new case; this isn’t set-and-forget.

You don’t have to do all of this at once. But you can’t afford to do none of it and hope that polygon never lands on your milk shed.

Key Takeaways

  • If you’re within a few counties of the Zavala detection, confirm your exact position relative to the 20-km zone this week — and don’t move a single animal without knowing the inspection rule first. 
  • If your calving program runs without a daily wound-inspection routine, treat that as a training or hiring decision to make now, not after a confirmed case forces it. 
  • If you haven’t pinned down the exact milk withdrawal for the product and animal class you’d use, do that before you treat — the figures vary widely across the paperwork, and your vet has to make the call for your situation. 
  • If you’ve never put a dollar figure on milk-dump tolerance, run the math on one pen at both a short and a multi-week withdrawal window. If that number threatens your debt service, start the financing conversation. 
  • If your dehorning or surgery round is scheduled for peak fly season, ask your vet whether it can shift. 
  • Program the TAHC veterinarian-on-call line, 1-800-550-8242, your APHIS contact, and screwworm.gov into your phone today. NWS is reportable within 24 hours of suspicion — there’s no wait-and-see. 

So here’s the question to carry into your next vet visit: if a calf in your barn turned up like that La Pryor calf did, do you know — to the dollar and to the day — what it would cost you to do the right thing? Most operators can’t answer that yet. The ones who work it out before the polygon drifts their way are the ones who’ll make decisions from a plan instead of from panic.

We’re building out the full milk-withdrawal cost model by herd size — across short and multi-week withdrawal windows — plus a zone-by-zone movement playbook in an upcoming Bullvine Weekly. That’s where the real numbers live, and where a 200-cow dairy and a 4,000-cow dairy will find very different answers.

Run Your Numbers

Health ROI Calculator — Before a screwworm case forces your hand, run the Health ROI Calculator to put a real-dollar figure on milk withdrawal, culling, and treatment losses for your herd size and milk price. Its “Cost of Inaction” view turns “a pest we’re watching” into the number you take to your vet and lender.

Complete references and supporting documentation are available upon request by contacting the editorial team at editor@thebullvine.com.

Learn More

The Sunday Read Dairy Professionals Don’t Skip.

Every week, thousands of producers, breeders, and industry insiders open Bullvine Weekly for genetics insights, market shifts, and profit strategies they won’t find anywhere else. One email. Five minutes. Smarter decisions all week.
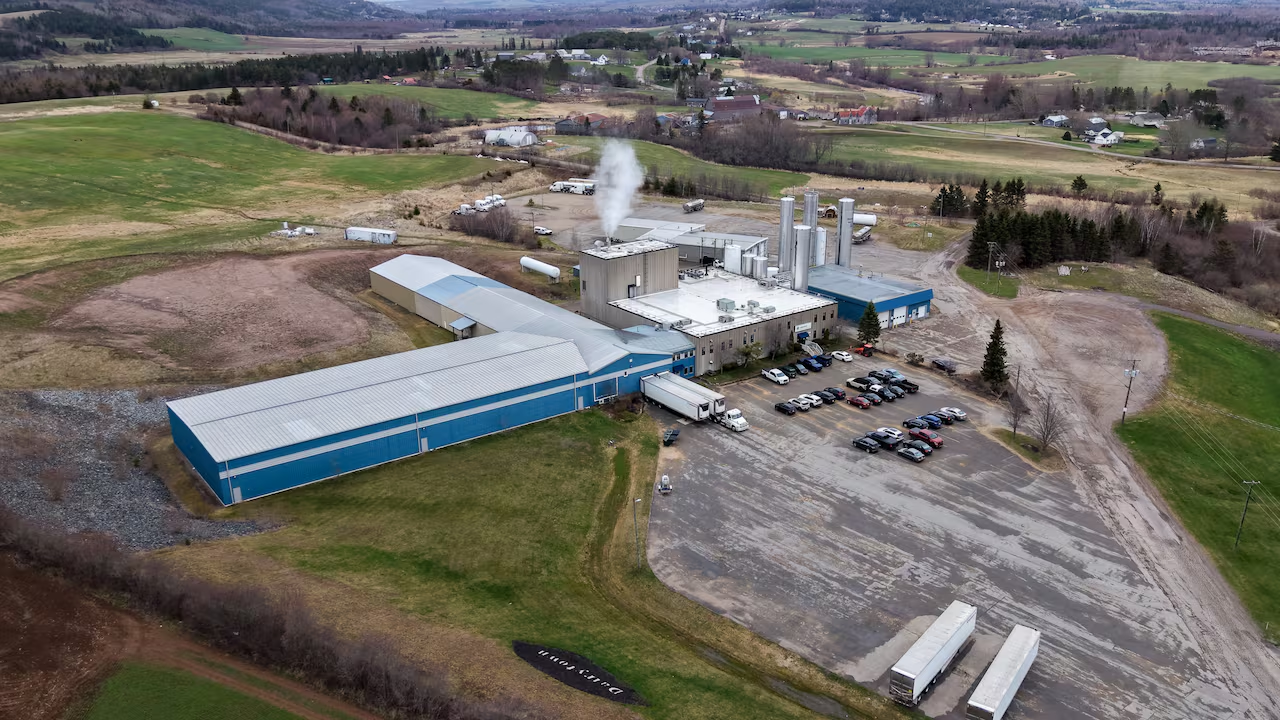
NewsSubscribe
First
Last
Consent

Saputo Opened at A$8.80. That’s a A$119,000 Hole on a 400-Cow Herd.

Saputo opened 2026–27 at A$8.80/kgMS; farmers wanted A$9.50. On a 400-cow herd that’s roughly A$119,000 a year — and a step-up nobody’s promised won’t cover July.

Executive Summary: The A$119,000 question for southern suppliers this month is whether they can carry Saputo’s A$8.80–8.90/kgMS opening — near the bottom of a board topping out at Bulla’s A$9.95 — when farmers said they needed A$9.50 just to cover surging costs. On a 400-cow Victorian herd shipping around 170,000 kgMS, that A$0.70 gap is roughly A$119,000 a year, and against the top of the board it stretches past A$170,000. ADF president Ben Bennett says processors aren’t gouging — “there’s no fat in the system” with fuel, freight, and exchange rates all biting — but that doesn’t change what an A$8.80 opening does to your July–September cash flow. Producers are betting on a mid-season step-up, except Saputo’s last one was A$0.15/kgMS, came in October, and was tied to exclusive supply — so it never touched the early-season squeeze. With Fonterra exiting its Australian consumer business and Lactalis absorbing Mainland, you’ve also got fewer doors to walk your milk to, which is exactly why a soft opening costs a processor less than it used to. The same lesson travels north: Saputo buys inside Canada’s supply-managed floor but sets its own number in deregulated Australia — so your real protection is the structure under your cheque, not the company on it. Run your own cost of production against the board this month, before July 1, and decide whether you can carry the gap or need to move.

Cost DriverReported ChangeSource / ContextRisk Level
Urea (nitrogen fertilizer)↑ ~110% YoYStuart Timms / The Weekly Times🔴 Critical
Maritime freight (Baltic Dry Index)↑ Significant YoYArticle (Baltic Dry Index cited)🔴 High
Fuel & transport costs↑ OngoingADF president Ben Bennett statement🟠 Elevated
Interest rates↑ ElevatedRabobank “limited margin for error”🟠 Elevated
Labour costs↑ ClimbingRabobank 2026–27 outlook🟡 Moderate
Exchange rate headwinds↑ UnfavorableBen Bennett statement🟡 Moderate
Milk opening price (Saputo)A$8.80 (–A$0.70 vs benchmark)Dairy Code disclosure🔴 Critical
Saputo milk price

Stuart Timms milks 1,000 KiwiCross cows on a pasture-based system at Elingamite North, in western Victoria’s dairy country. His nitrogen fertilizer bill jumped sharply year-on-year, he told The Weekly Times, and he isn’t alone — urea has run up roughly 110%, and maritime freight is up hard on the Baltic Dry Index. The costs climb while the opening price steps down. That’s the squeeze heading into 2026–27, and it’s real cash flow out the door before the season even starts.

And if you ship to a private processor anywhere — Canada or the US included — the mechanics behind it are worth ten minutes. Saputo, one of the dominant buyers in southern Australia, also runs plants across Quebec, Ontario, and Wisconsin.

What’s Changing and Why

The soft opening didn’t land in a vacuum. Western Victorian producers are climbing out of one of the worst dry spells some districts have seen in decades, and a better autumn has finally delivered pasture. A strong March (up 2.8%) wasn’t enough to lift the full 2025–26 season, which still closed down about 0.7%.”

The contraction underneath it is real. Rabobank reports that season-to-date Australian milk production as of January 2026 was down 1.2% year-on-year, and forecasts another 1.2% national decline for 2026–27 — the third straight year of falling output. The bank’s read on the season is blunt: a “limited margin for error,” with fuel, fertilizer, labour, water, and interest costs all climbing. The farms feeling it worst are pasture-based southern manufacturing-pool suppliers in Victoria and Tasmania — operations like Timms’s — who can’t lean on a fresh-milk premium to cushion a flat opening number.

What Did Farmers Actually Ask For?

A$9.50/kgMS. That was the benchmark producers and advocacy groups collectively targeted as the minimum to offset inflation and elevated interest rates. Saputo’s A$8.80 floor sits A$0.70 below that line; even its A$8.90 top end is A$0.60 short.

The processors who released opening prices this week, under the Dairy Code of Conduct’s requirement to publish a month before the financial year, spread across a wide band:

Processor2026–27 opening (A$/kgMS)
BullaA$9.15–9.95
Dairy Farmers CorporationA$9.20–9.80
FrestineA$9.39
LactalisA$8.65–9.45 (Mainland)
KYValley DairyA$8.45–9.29
UDCA$9.20
Australian Consolidated MilkA$9.10
BegaA$9.04
Burra FoodsA$8.90–9.40
SaputoA$8.80–8.90

Note: Opening weighted averages; individual farm-gate prices vary by region, components, and loyalty

That spread is the story: same season, same cost pressures, and Saputo sitting near the bottom of a board that runs all the way up to Bulla’s A$9.95 top end.

A Wound That Goes Back to 2016

To understand why a soft opening stings the way it does, go back to the Murray Goulburn collapse. For decades, Murray Goulburn was the farmer-owned co-op that anchored southern Australian dairy, processing more than a third of the national milk pool. In April 2016, it slashed its farmgate price mid-season, clawing back money farmers had already earned and spent. Suppliers were left carrying debt on milk they’d already shipped.

DateEventImpact on Suppliers
Pre-2016Murray Goulburn farmer co-op anchors southern AU dairyFarmers held ownership stake; co-op structure provided implicit floor
April 2016MG slashes farmgate price mid-season; claws back earningsSuppliers left with debt on milk already shipped and spent
2016–17MG never recovers; seeks buyerStructural collapse of farmer-owned processing in southern AU
26 Oct 2017Saputo announces MG acquisitionTransition from cooperative model to private multinational
3 April 2018ACCC clears acquisitionRegulatory green light; no ownership alternative offered
30 April 2018Deal closes at ~A$1.3 billionSouthern suppliers become price-takers from Montreal-HQ processor
2024–25Fonterra exits Australian consumer/ingredients businessFewer independent buyers at the table
2025Lactalis absorbs Mainland assetsFurther consolidation; supplier switching power weakens
June 2026Saputo opens 2026–27 at A$8.80Lowest major processor on a A$1.50-wide board; no co-op alternative

The co-op never recovered. Saputo announced the acquisition on October 26, 2017, the ACCC cleared it on April 3, 2018, and the deal closed on April 30, 2018, for roughly A$1.3 billion. Many southern suppliers once owned Murray Goulburn outright; today, they’re price-takers from a Montreal-headquartered processor. That shift in ownership — not any single price — is what shapes how an opening number lands. The vote to sell wasn’t a mistake. It kept plants running when the alternative was collapse. But it was a permanent trade, and ownership doesn’t come back.

The consolidation didn’t stop there. Fonterra is now exiting its Australian consumer and ingredients business — described by Rural News Group as “a major event” for the market — with Lactalis moving on the Mainland assets. Every time a processor changes hands, suppliers wake up with a new owner and a pricing philosophy they didn’t vote for. Fewer buyers at the table means fewer places for your milk to go when an opening price disappoints. That’s the backdrop to this season’s board: a shrinking pool of processors, each one a little less worried about losing you.

How This Plays Out on Real Farms

Run the numbers on a 400-cow Victorian dairy. Assume about 425 kgMS per cow per year — a conservative pasture figure — which lands annual production near 170,000 kgMS. This is a model with stated assumptions, not one farm’s actual books, so treat it as a yardstick you can hold against your own.

ScenarioPrice (A$/kgMS)Milk income (170,000 kgMS)Gap vs. Saputo opening
Saputo openingA$8.80~A$1,496,000
Lactalis openingA$9.30~A$1,581,000+A$85,000
Farmer benchmark A$9.50–9.80~A$1,615,000–1,666,000+A$119,000–170,000

The gap between Saputo’s A$8.80 opening and the A$9.50 benchmark farmers asked for is about A$119,000 a year on this model herd — just 170,000 kgMS times the A$0.70 difference. Move to A$9.80 top end, and the gap stretches past A$170,000. Same cows, same litres. Different number in the tank.

The point isn’t that any single farm sees exactly those figures. But a A$0.60-to-A$1.00/kgMS difference is no rounding error — it’s six figures on a mid-sized herd. A farm of Timms’s size runs more than twice that exposure. Do it for one season, and you tighten the belt and grind through. Do it across three years of falling income, and you start to see why the milk pool keeps draining.

The Mechanics Behind the Outcomes

Here’s what’s easy to miss staring at the opening letter: opening prices are round one, not the final word. Because the national pool has contracted, plants are under pressure to secure raw milk to keep factories full and cover fixed overheads. Producers are hoping that pressure will force competitive step-ups later in the season to stop milk from defecting to rival buyers.

The processors say the soft board reflects a genuinely tight market, not opportunism. Australian Dairy Farmers president Ben Bennett, who farms at Pomborneit near Colac, put it plainly in a statement: “Processors are hurting too. We’re operating in a tight global environment, and everyone in the supply chain needs to get a return. There’s no fat in the system at the moment.” Bennett pointed to exchange-rate movements, Middle East conflict, fuel and freight costs, and a possible strong El Niño as the forces underpinning the conservative numbers. It’s a fair caution — and it doesn’t change what an A$8.80 opening does to a cash-flow plan.

A step-up is discretionary, and history shows the pattern. Saputo’s recent step-up was A$0.15–0.20/kgMS, tied to exclusive supply, and landed mid-season — not in time for the early-season squeeze. Note the timing and the condition: it arrives well into the season, and only for farms on an exclusive agreement. That doesn’t ease the cash squeeze of July through September — for Timms, the same stretch the fertilizer spike hits hardest — and it doesn’t reach farms outside an exclusive agreement. You carry the early-season risk. The processor keeps the choice. And with Fonterra exiting and Lactalis absorbing Mainland, the southern market has fewer independent buyers than a decade ago — so a soft opening costs a processor fewer defections than it once did.

How Much Does Waiting for the Step-Up Actually Cost You?

Do the math on the wait. A step-up of A$0.15/kgMS across a full year on the 400-cow model is worth about A$25,500. But a step-up announced in October only covers part of the season, so the cash that actually lands is less, and none of it touches the July–September stretch when feed bills and a fertilizer spike hit hardest.

So the real question isn’t “will the price improve?” It’s “can my operation absorb an opening near the bottom of the board for three or four months while I wait on a top-up nobody’s promised — and that’s tied to exclusive supply?” If the answer is no, the step-up isn’t a safety net. It’s a rescue you’re hoping shows up in time.

Why Should a Canadian or US Producer Care About a Victorian Price?

Because the same kind of company operates under very different rules in each market — and those rules, more than the company, determine how much protection is available to the farmer. In Canada, Saputo buys milk within a supply-managed system in which the Canadian Dairy Commission sets the farmgate floor price. In Australia, there’s no administered floor, so the opening number is left to the processor to set, and Saputo’s started at A$8.80. The structure, not the postcode, sets the floor.

None of that is an accusation. Where a system sets a floor, farmers have one; where it doesn’t, the opening number is the processor’s to file. The lesson travels regardless of border: your floor is only as solid as the structure beneath it. If the one thing between your cost of production and your milk cheque is a processor’s discretion, you want to understand that before the next downturn, not during it.

Options and Trade-Offs for Farmers

No single move fixes a soft opening. But suppliers — in Australia and beyond — are working a few real paths.

Pull your supply agreement and read the step-up clause this month

Inside the next 30 days, find the actual language. Saputo’s recent step-up was tied to exclusive supply — is yours? What’s your notice period to switch? This costs you an hour with the contract and a call to your field rep, and the downside is mild: you may learn you’re more locked in than you assumed. Better to know that now than in October.

Benchmark your own cost of production to the cent

The A$9.50 figure was an industry-wide ask, but your real number may sit above or below it. Pull your actual feed, fertilizer, fuel, and labour figures, then run it. There’s no real risk here — and it’s the single most useful number you can carry into any price conversation.

Compare processors on expected season value, not the opening number

This season’s board ran from KYValley’s A$8.45 floor to Bulla’s A$9.95 top — a A$1.50 spread. If you’re free of exclusivity or near a decision, model the likely season-end value, including step-up history, rather than reacting to a single headline. Just remember that with Fonterra exiting and Lactalis consolidating, your switching options are thinner than they were, and switching costs can quietly eat a paper gain.

Watch the supply-contraction signal

A third straight year of national decline eventually changes a processor’s math, because tight supply is the one force that pushes competition onto the opening price. Treat this as the backdrop to every decision above. The catch: “eventually” may move slower than your cash flow can wait.

Key Takeaways

  • If you don’t know your exact cost of production in A$/kgMS (or $/cwt), run it this month — you can’t tell whether Saputo’s A$8.80 or anyone’s opening clears your breakeven until you do.
  • If your step-up access is tied to an exclusive supply clause, decide before July 1 whether that lock-in is worth the mid-season cents you’re betting on.
  • If you’re judging a processor on the opening number alone, stop — this year’s board spanned A$8.45 to A$9.95, so model the likely season-end value before you sign anything.
  • If an opening near the bottom of the board would strain your July–September cash flow, treat the step-up as a hope, not a plan, and build your buffer accordingly.
  • If consolidation has thinned the buyer base in your region, factor weaker switching power into every contract decision — fewer doors mean less leverage.
  • If the only thing under your milk cheque is a processor’s discretion, ask what it would take to put something firmer there — a contract clause, a co-op stake, or a benchmark.

Six months from now, a step-up will probably have landed, and the season-end number will look better than the opening did. The relief will be real. But it’ll be relief you’re renting, not relief you own. So here’s the question worth carrying into the dairy on a cold October morning, after everyone else has moved on: who actually decides where your floor sits — and as the buyers around you keep merging, are you content to leave that decision in someone else’s hands?

Run Your Numbers

Dairy Profit Projector — Saputo’s A$8.80 leaves zero margin on paper, but what does it do to your bottom line? Drop in your herd size, milk price, and ration to see your breakeven milk price, IOFC per cow per day, and whole-herd margin before you sign anything.

Complete references and supporting documentation are available upon request by contacting the editorial team at editor@thebullvine.com.

Learn More

The Sunday Read Dairy Professionals Don’t Skip.

Every week, thousands of producers, breeders, and industry insiders open Bullvine Weekly for genetics insights, market shifts, and profit strategies they won’t find anywhere else. One email. Five minutes. Smarter decisions all week.
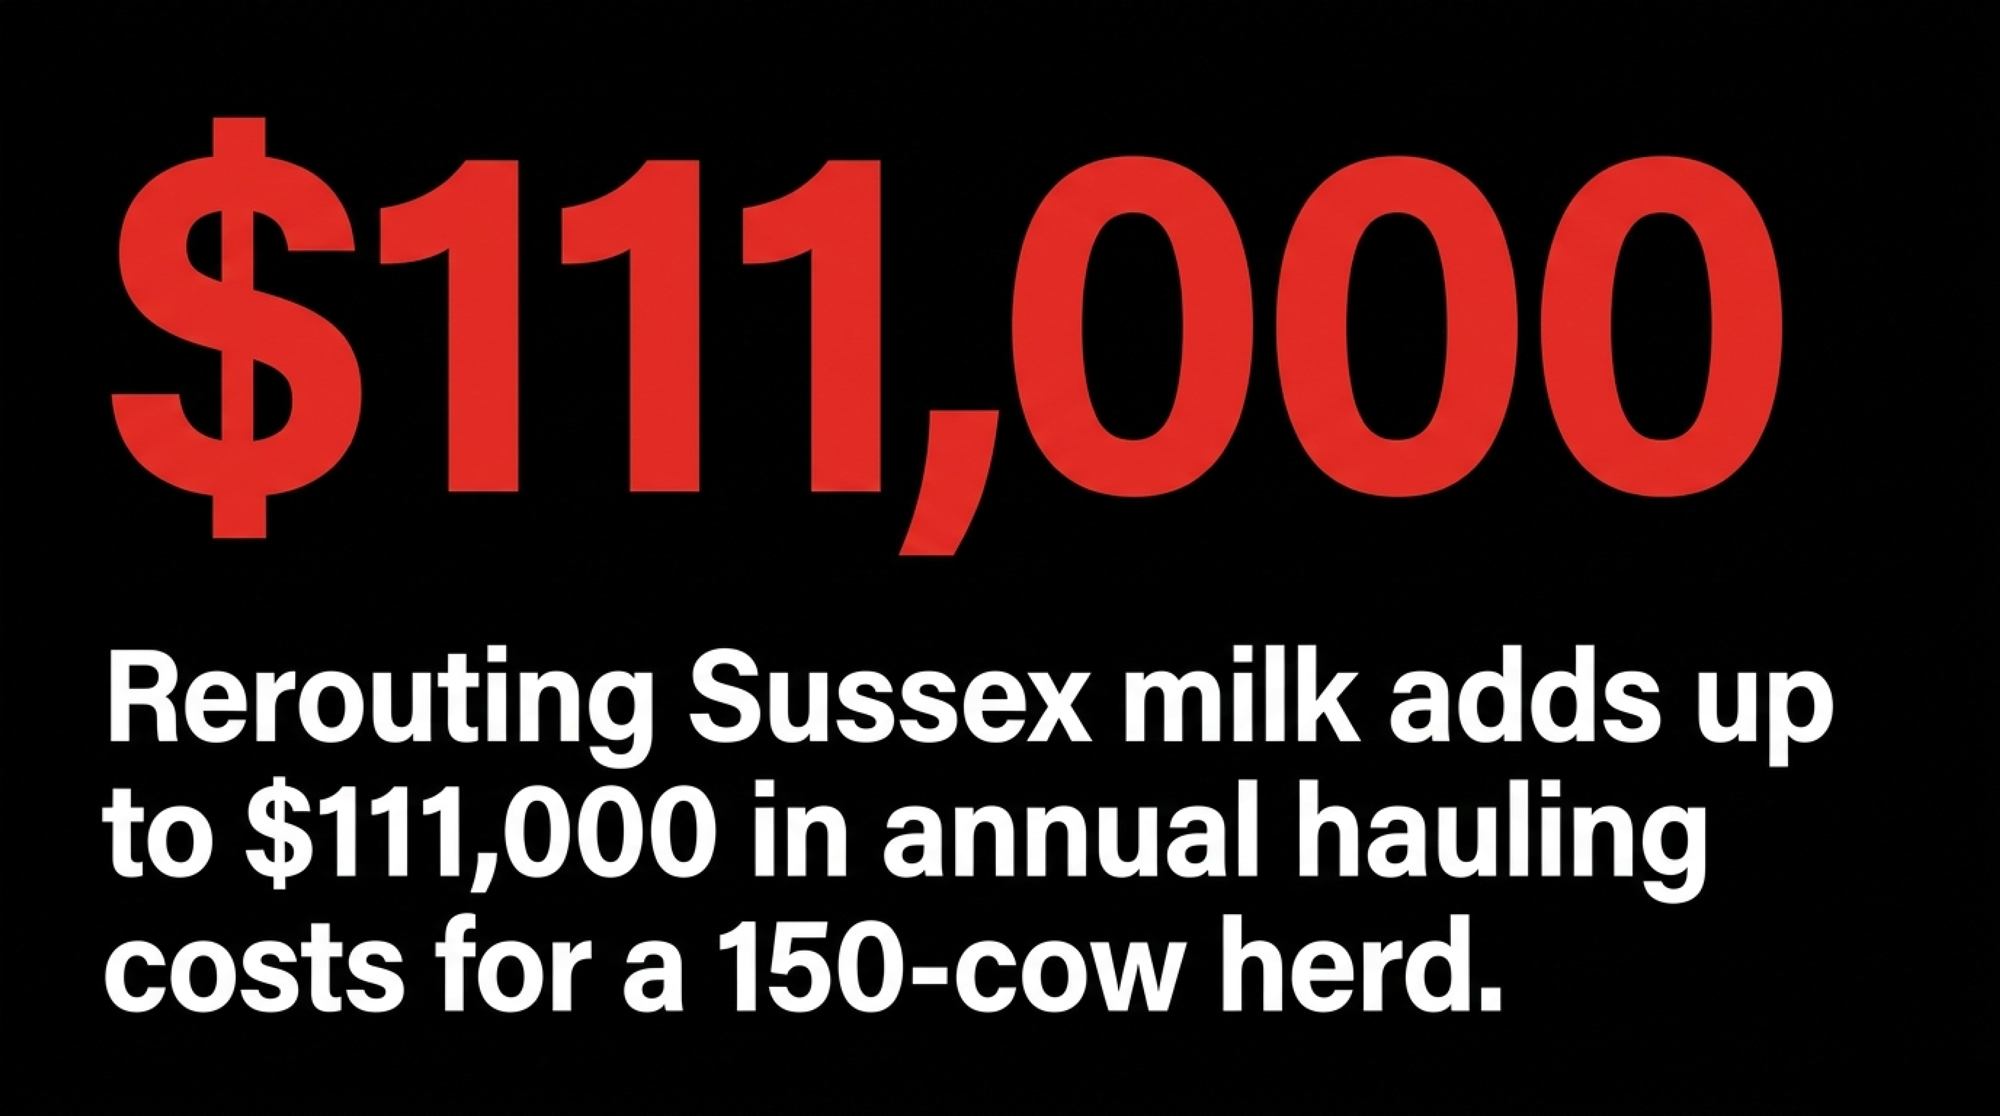
NewsSubscribe
First
Last
Consent

A 400-Cow Herd Loses $27,800 a Year to Ketosis – Then Pays Twice for “Rumen-Protected” Additives That Never Reach the Cow

At 24.1% subclinical ketosis, a 400-cow herd writes off up to $27,800 a year — then spends again on “rumen-protected” choline that may degrade before it ever reaches the cow.

At a 24.1% subclinical ketosis rate — the benchmark average from a 2018 global prevalence study of 8,902 cows on 541 farms across 12 countries (published in the Journal of Dairy Science line of transition research; the earlier Suthar et al. 2013 European survey of 10 countries put it at 21.8%) — a 400-cow dairy is quietly writing off roughly $12,400 to $27,800 a year before anyone treats a single visibly sick cow. That’s the dairy on the hook, whether it sits in Wisconsin or Ontario. And here’s the trap it walks into in 2026: the money it spends to prevent that loss can be degraded in the rumen before it ever reaches the cow, because “rumen-protected” is a label with a definition but no delivery threshold.

Most of that ketosis loss never shows up as a vet bill. It shows up as milk that wasn’t produced, cows that left early, and breedings that didn’t take. The cost is invisible, and invisible costs don’t get managed.

Why this matters right now: feed and additive costs remain the largest single line on the 2026 ration sheet, and protected additives are among the priciest ingredients in the mix. When every gram is expensive, paying for grams that never reach the cow is no longer a rounding error. This isn’t a scare piece. Every number below carries a date, a scope, and a source. The point is narrow and sharp: the transition-additive purchase you make every season hinges on one piece of data the market is structured not to hand you.

What a 24% Ketosis Rate Costs a 400-Cow Herd

Start with prevalence, because that’s where most operations fool themselves. The 2018 global survey put average subclinical ketosis (SCK) at 24.1%, ranging from 8.3% up to 40.1% across countries. Well-run herds still land in the 15–30% range. On-farm, the gap between what a producer assumes and what testing finds can be ugly — extension work and recent on-farm testing have documented SCK rates of 40–46% even in herds management considered solid.

The per-case cost is settled science. The Cornell deterministic model (McArt and Nydam, Journal of Dairy Science, 2015) puts the total cost of a hyperketonemia case at $289, with lower-bound component estimates landing nearer $129 once you strip out the worst cascade cases. What drives the number, from the same body of transition research:

  • A cow with SCK gives up roughly 2.2 to 5.3 lbs of milk per day in her first week fresh. Severe cases reduce yield by up to 13.2 lbs/day during the first 30 days in milk, flattening her entire lactation curve.
  • SCK sharply increases the risk of displaced abomasum and co-occurs with other fresh-cow disorders, which is why the cost can double when one problem triggers the next.
  • Reproductive lag — extra days open, lower conception odds — and higher early-lactation culling risk make up the biggest, least visible share of the bill.

Run the prevalence against the herd, and the leak comes into focus:

CalculationResult
400 cows freshening × 24.1% SCK rate~96 affected cows/year
96 cows × $129 per case$12,400/year (low)
96 cows × $289 per case$27,800/year (high)

That’s the $12,400–$27,800 range you saw up top — and it climbs as prevalence runs hotter.

The table below breaks down each fresh-cow disorder into direct treatment costs and indirect costs, drawn from the McArt 2015 component model. The column that matters is the total per case, and the gap between the two cost columns. For nearly every disorder, the indirect loss — milk you never sold, cows you culled early, breedings that slipped — dwarfs the treatment bill. That’s the money a working transition program is fighting to claw back.

DisorderDirect treatmentIndirect (milk/repro/culling)Total per case
Subclinical ketosisMinimal diagnosticSubstantial early-lactation milk loss$129–$289
Clinical ketosis$64 (labor/therapy)Future milk, repro lag, culling$111–$375
Displaced abomasumHigh (surgical)Severe milk loss, high cull risk$432 (primiparous)–$639 (multiparous)
MetritisHormonal/uterine therapyReduced conception, more days open$171 (primiparous)–$262 (multiparous)
Clinical mastitis$77Discarded + lactational milk loss$325 (primiparous)–$426 (multiparous)

Source: McArt and Nydam, Journal of Dairy Science, 2015

Every figure in that table is the recoverable pool, which is exactly why the next question matters more than the price on the bag.

The Active Ingredient Is the Commodity. The Protection Is the Product.

Here’s the myth, said plainly. Most producers — and plenty of the nutritionists writing their rations — judge a transition additive by the active ingredient and the inclusion rate on the tag. Grams of choline. Grams of methionine. Price per bag.

The data says the active ingredient is close to a commodity. What decides whether it works is the protection technology wrapped around it.

The mechanism isn’t up for debate. Raw choline chloride is degraded in the rumen at rates above 99%. Across the B-vitamin complex, ruminal disappearance runs from roughly 45% for biotin to 97% for folic acid — measured, published rates. Raw lysine and methionine get chewed up the same way. Feed an unprotected version, and you’re not supplementing the cow. You’re feeding her rumen microbes and shipping the balance to the manure pit.

Protected products exist to solve a real problem. The catch is that protection quality swings wildly, and “rumen-protected” on a label tells you nothing about which end of that swing you bought. One product can carry an 80% active payload and deliver only a sliver of it to the small intestine. Another can post a 95% rumen-escape rate purely because its coating is indigestible — it survives the rumen and then passes straight through the cow without dissolving where she could absorb it. Both can legally print “rumen-protected” on the bag.

When the protection is real, the payback is on the record. The landmark rumen-protected choline meta-analysis (Arshad et al., Journal of Dairy Science, 2020), covering 21 transition experiments and 1,313 pre-calving cows, found that at a median 12.9 g/day of active choline ion, supplemented cows gained:

  • +3.5 lbs/day of milk (1.6 kg)
  • +3.7 lbs/day of energy-corrected milk (1.7 kg)
  • ~12% better feed efficiency, with a tendency toward less retained placenta and mastitis

A separate 2025 meta-analysis in the Journal of Dairy Science landed in the same neighborhood — milk yield peaking around a 13 g/day dose with a ~1.29 kg/day lift. That’s the kind of independent cross-validation that should make you trust the category and question the product. Rumen-protected methionine meta-analyses show gains in milk protein and fat yields when supplementation starts before calving. The science behind the category is strong. The variance is in whether the specific product on your mill sheet delivers what its category can.

Why Won’t Suppliers Give You the One Number That Matters?

The number that settles it is the in vivo intestinal delivery rate — the percentage of the active ingredient that actually reaches the cow’s bloodstream, measured in live cows and confirmed by an independent, peer-reviewed trial. Not the in vitro screen. Not the company white paper. Not the rep’s testimonials.

The methods exist. In vivo plasma dose-response against a duodenal infusion calibration is the gold standard for amino acids. Fecal free amino acid recovery aligns well with it. The in situ nylon-bag technique is the one to watch out for — it measures rumen escape only, not intestinal absorption, so a product can ace it and still pass through undissolved. Knowing which method generated a number is half of reading the answer.

So why doesn’t the market publish it? Because the incentives are misaligned, not because of any one villain. Where a product’s protection technology is weaker, there’s little commercial incentive to publish delivery data that would expose a poor cost per gram absorbed. In many commercial setups, the same party recommends and supplies the product — a structural conflict that can dull the incentive to demand delivery data, regardless of any individual’s good faith. The journals and extension have done their part. The science is published. What hasn’t formed is the buying norm. “Demand the in vivo delivery rate” never became standard, unlike the bulk-tank somatic cell count, which became a standard milk-quality check.

And the label is thinner than it looks. AAFCO does define “rumen protected” — a nutrient fed in a form that increases the flow of that nutrient, unchanged, to the abomasum — but the definition attaches no minimum intestinal-release threshold, no percentage a product must meet to use the term. As of 2026, neither AAFCO in the US nor CFIA in Canada has pinned down a number. Without a threshold, the label is a direction, not a guarantee. The accountability gap is spread across the whole chain — manufacturer, channel, and the producer who never thought to ask.

Ontario vs. Wisconsin: Same Science, Different Math

The science doesn’t change at the border. The economics of the decision do, and that difference is the lens that should reframe how you read every quote a supplier gives you.

On a Wisconsin open-margin herd, a recovered ketosis case feeds straight into milk sold at a market price — the delivery-rate gamble plays out in volatile revenue, and a high-delivery additive is a hedge against a margin you don’t control. Miss on the delivery rate, and you’ve spent money to protect a margin you then failed to protect. The leak and the recovery both move with the milk check.

Under Canadian supply management, the math runs through a different gate. An Ontario herd within its quota doesn’t capture extra revenue by simply making more milk — the value of a recovered fresh cow shows up in lower involuntary culling, fewer replacements bought under quota-constrained economics, better component yield relative to the butterfat-weighted blend, and tighter days open. The recoverable pool is just as real. It just sits in cost avoidance and herd efficiency rather than in marginal milk sold. Same additive, same delivery question, different line on the page where the payback lands.

One more regional wrinkle: a US herd buys under AAFCO’s labeling regime, a Canadian herd under CFIA’s. Neither pins down “rumen-protected” with a release threshold, so the buyer’s homework is identical on both sides — but verify which country’s label you’re reading, because a product cleared for one market isn’t automatically carrying the same backing in the other.

Running the Numbers: What Does Your Protected Additive Actually Cost Per Gram Delivered?

This is the calculation that belongs on your phone, because it flips the purchase decision in about thirty seconds. Never buy a protected additive on cost per ton or cost per bag. Buy on cost per gram of nutrient that actually reaches the cow.

RUNNING THE NUMBERS — Cost per gram absorbed

The core formula:

Cost per gram ABSORBED = Cost per gram of active ÷ Verified delivery rate

The delivery rate is the multiplier that turns a cheap bag into an expensive program. Using the published target dose of 12.9 g/day of active choline ion (Arshad et al., 2020), here’s the active you have to feed to land that same delivered dose:

Product A — 75% delivery: 12.9 ÷ 0.75 = 17.2 g/day of active needed

Product B — 25% delivery: 12.9 ÷ 0.25 = 51.6 g/day of active needed

Product B requires three times the amount of the active ingredient to deliver the same dose.

Now run it against price. Take each product’s cost per gram of active off your supplier quote, then divide it by that product’s verified delivery rate — that’s your true cost per gram absorbed. For Product B to break even against Product A, it has to be priced at roughly one-third of A per gram of active. It rarely is.

Scaling the recoverable pool (400-cow herd, 2026):

400 cows × 24.1% SCK rate = ~96 affected cows/year

96 cows × $129 per case = $12,400/year (low estimate)

96 cows × $289 per case = $27,800/year (high estimate)

Published RPC trial responses support clawing back a meaningful share of that pool — not all of it. A program delivering 75% of its payload competes for that money. A program delivering 25% competes for almost none of it while costing nearly the same on the bag.

The cheaper-looking bag is usually the more expensive program once you count what actually reaches the cow. Ask for the delivery rate before you ask for the price. The price means nothing without it.

The 30/90/365-Day Playbook for Any Herd Running a Transition Program in 2026

30-Day Actions — measure and ask

  • Pull your fresh-pen BHBA data. If you’re not blood- or milk-testing fresh cows for BHBA, start now. You can’t manage a 24% problem you’re estimating at 4%. Requires: a BHBA meter or a milk-test add-on, plus a consistent sampling routine throughout the full fresh window. Red-flag trigger: if measured SCK clears 25% on any recent batch, treat this as urgent this week, not next quarter. Backfire watch: one spot-check on day three isn’t a herd rate. Sample across days two through fourteen post-fresh before concluding.
  • Ask the delivery-rate question before your next meeting with your nutritionist — and don’t leave without an answer. Specifically: “What’s the verified in vivo intestinal delivery rate on this product, and was it measured in an independent peer-reviewed trial or an internal company study?” Requires: nothing but the nerve to ask it.Red-flag trigger: if the answer pivots immediately to price comparisons or testimonials, that’s data. Backfire watch: an in vitro number isn’t an in vivo number. Confirm which method was used.
  • Score the answer by the three-bucket rule. Published independent peer-reviewed trial — that’s real. Internal white paper — ask whether it has been peer-reviewed and, if so, in which journal. A pivot to price comparisons and testimonials without any delivery data — that’s your answer, and it tells you as much as a number would.
Supplier Response to “What’s Your In Vivo Delivery Rate?”Evidence QualityWhat It SignalsBuy Decision
Published, independent, peer-reviewed in vivo trial with intestinal release %✅ Verified — highest tierManufacturer confident in real-world deliveryYou’re buying a program
Internal white paper with peer-reviewed backing, journal named⚠️ Acceptable — verify journalSome accountability; assess independence of study designProceed with scrutiny
Internal white paper, no journal, no peer review⚠️ Low tier — flag itDelivery rate unverified by third partyAsk follow-up or retest
In vitro data only (nylon-bag or lab screen, no live-cow trial)❌ Incomplete — rumen escape ≠ intestinal absorptionProduct may pass rumen but not dissolve in small intestineDo not equate with in vivo result
Price comparison, testimonials, and rep rep’s endorsement — no delivery data offered❌ No data = dataManufacturer likely knows delivery is poorYou’re buying a label at program prices

90-Day Actions — re-price the program

  • Run the cost-per-gram-absorbed math on every protected additive in your transition ration. Requires:supplier price-per-gram-active quotes and a verified delivery rate for each product currently on your mill sheet. Trigger: do this before renewing any contract or placing a seasonal order. Backfire watch: if a supplier can’t or won’t produce a verified delivery rate, treat the blank as a data point, not a pass. A blank answer and a weak answer mean the same thing.
  • Confirm your choline program covers the full transition window. Continuous pre- and postpartum RPC — roughly 21 days before calving through early lactation — is supported by the trial data. Recent work confirms the benefit is strongest when fed both before and after calving, not just on one side of the line. Backfire watch:prepartum-only feeding showed no lasting postpartum benefit in milk or ketosis in the published literature. Cutting off at calving leaves the cow unprotected exactly when her liver’s fat-export system faces peak demand. Don’t pay for half a program.

365-Day Moves — make the question a standard

  • Build the delivery-rate question into your annual supplier review the same way SCC sits in your milk-quality review — a standing agenda item, not an occasional challenge. Opportunity signal: a supplier who hands over independent in vivo data without hesitation is signaling confidence in their product. That’s a relationship worth consolidating. A supplier who deflects is telling you something, too. Backfire watch: don’t let a strong relationship substitute for the data. Relationships don’t show up in the fresh pen.
  • Weight your spend by how deep the evidence runs. Rumen-protected choline and methionine carry deep, peer-reviewed bioavailability data and consistent meta-analytic results. Microencapsulated organic-acid and botanical blends show strong in vitro stability and convincing in vivo heat-stress and performance trials, but delivery mechanisms are less directly measured in the transition literature. Rumen-protected vitamins beyond biotin have thinner published bioavailability literature in transition cows. Backfire watch: don’t pay proven-category prices for emerging-category evidence. The categories aren’t interchangeable.

For the mechanism underneath all of this — negative energy balance, NEFA mobilization, and how fatty liver tips into the ketosis spiral — see our deep dive on how your ketosis cut-point can leak $25,000 a year.

On the amino-acid side, balancing metabolizable lysine and methionine for milk protein and nitrogen efficiency: the benefits of rumen-protected methionine for transition cows.

And this piece extends the cost-of-disease thread from how a fresh pen can cost a 500-cow herd $90,000.

What This Means for Your Operation

The disease math is settled. The science behind the additive categories is published, peer-reviewed, and cross-validated. The only variable left is whether the specific product you’re buying lands its payload in the cow or in the manure pit.

You gain real margin protection when the delivery rate is high and verified. You give up nothing but the discomfort of asking a question your supplier may not be used to hearing. That’s the trade.

So before the next mill sheet gets signed, pull the spec sheet for every protected additive in your transition ration and find the in vivo delivery number. If your supplier can show you an independent, peer-reviewed figure, you’re buying a program. If the answer is a price sheet and a testimonial, you’re buying a label — and paying program prices for it. What does the data on your current transition additive actually say about intestinal delivery — and who measured it?

Key Takeaways

  • At 24.1% subclinical ketosis, a 400-cow herd is bleeding $12,400 to $27,800 a year before a single visibly sick cow gets treated — most of it in lost milk, early culls, and missed breedings, not vet bills.
  • The active ingredient is close to a commodity; the protection technology is the product. “Rumen-protected” has a definition but no delivery threshold under AAFCO or CFIA, so the label guarantees nothing about what reaches the cow.
  • Buy on cost per gram absorbed, not cost per bag: divide cost per gram of active by the verified in vivo delivery rate. At 25% delivery you feed 51.6 grams to land the same dose; 75% delivery hits it with 17.2.
  • Before the next mill sheet, ask one question and grade the answer — an independent peer-reviewed in vivo number means you’re buying a program; a price sheet and a testimonial mean you’re buying a label.

Learn More

The Sunday Read Dairy Professionals Don’t Skip.

Every week, thousands of producers, breeders, and industry insiders open Bullvine Weekly for genetics insights, market shifts, and profit strategies they won’t find anywhere else. One email. Five minutes. Smarter decisions all week.
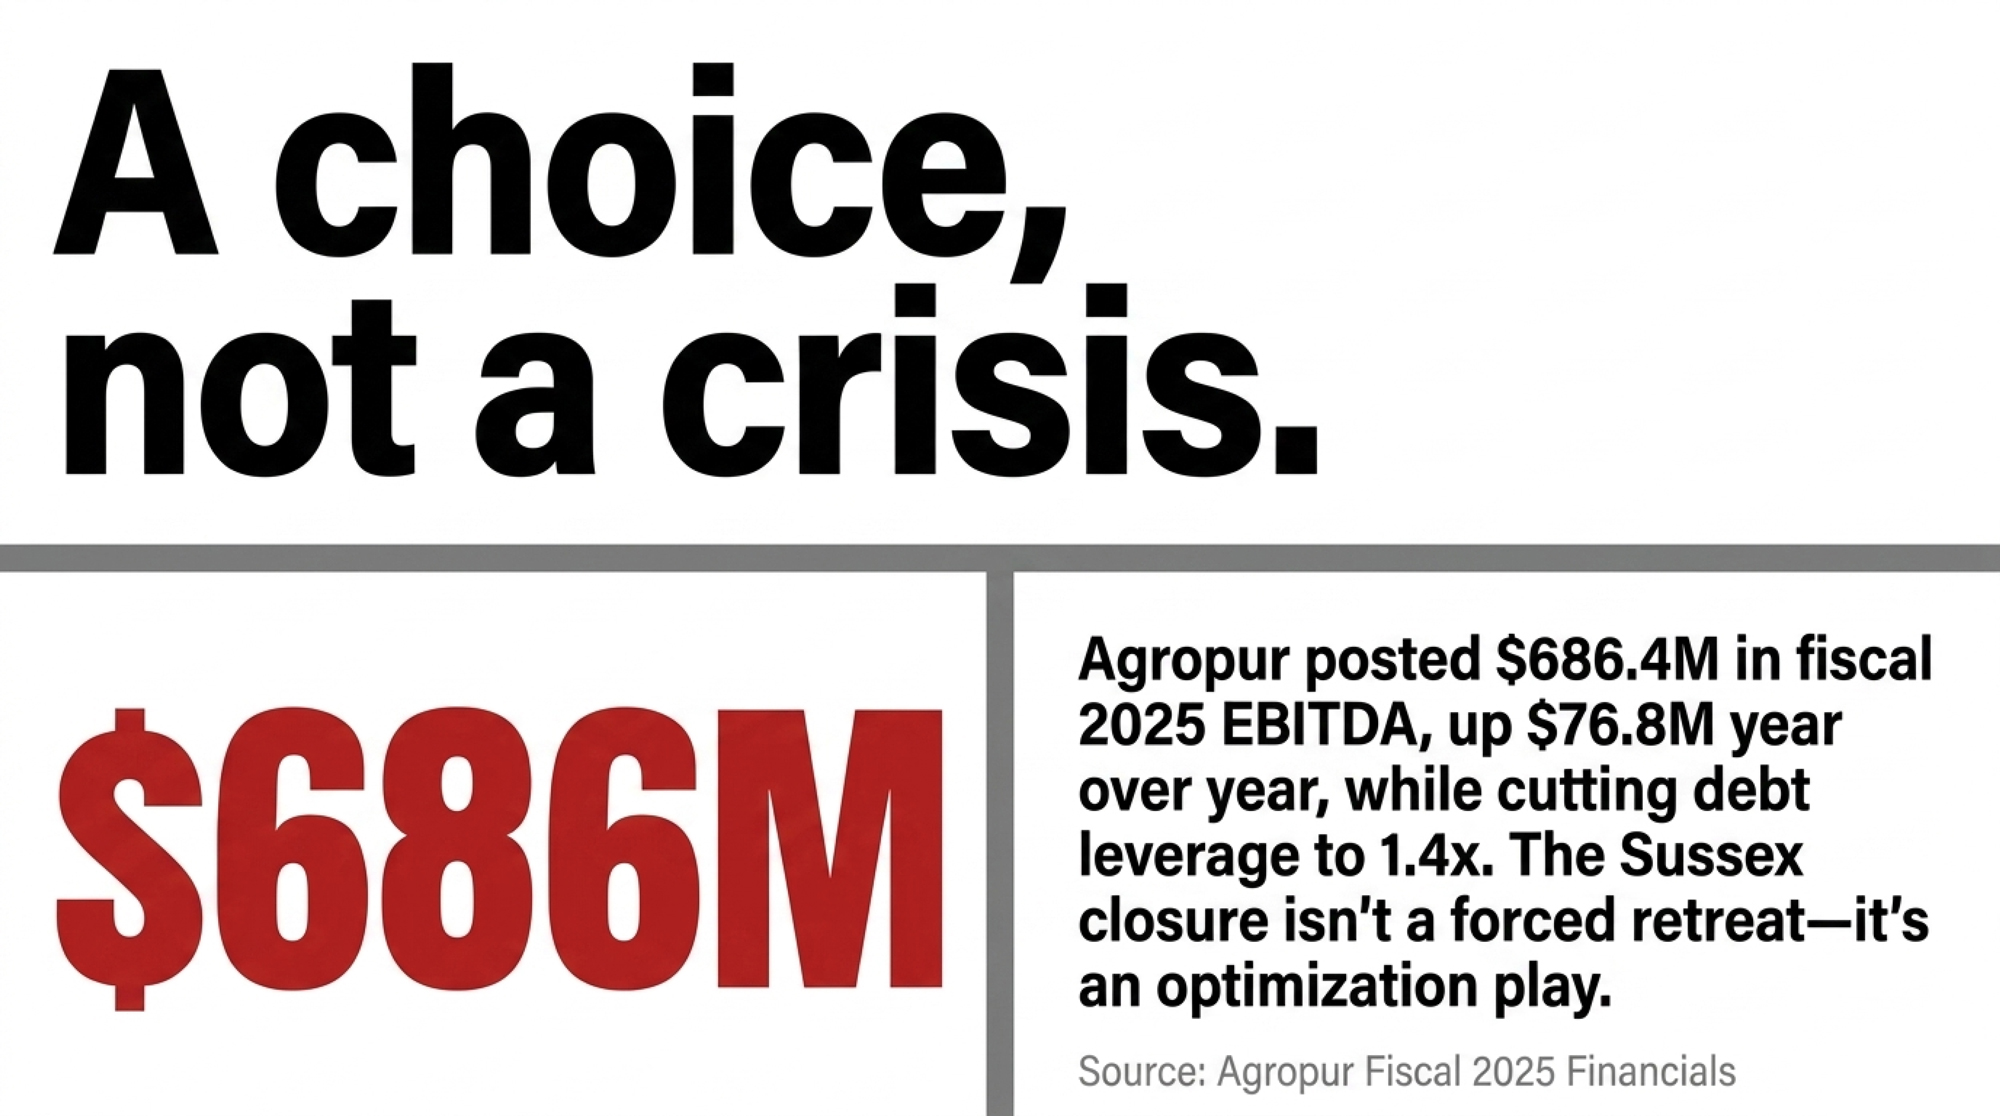
NewsSubscribe
First
Last
Consent

Metritis: $511 a Case, and Your Records Already Saw It Coming

A $511 metritis case rarely announces itself — it hides in the herd average. But your fresh-cow records flagged it days early. Here’s the 30-minute Monday habit that catches the cow before the tank does.

Executive Summary: Metritis quietly pulls $29,000 to $49,000 a year out of a 40-cow-a-month dairy, one $511 case at a time — and most of those cases were visible in your records before they ever hit the tank. Most mid-size dairies already own the tech to catch them; Cornell’s monitoring work flags fresh-cow trouble at 95.6% accuracy, about two days before clinical signs. The leak isn’t the gear — it’s that nobody reads the reports the system’s already generating, what Teagasc’s John Mee calls “farm blindness.” Watch your second-calf cows especially: when they peak under your first-calf heifers, that’s a transition signal, not a genetics one, and it’s fixable from the dry pen. The fix costs nothing you haven’t already bought — a 30-minute Monday review of three numbers: 60-DIM exits, week-four milk by parity, and fresh-cow disease per 100 calvings. Pull those before the barn takes over tomorrow, and if you can’t pull them cleanly, that’s your first finding.

transition cow records

One operator walks into the office on Monday morning, grabs a coffee, and spends 20 minutes reviewing a transition report before he starts the day. Another walks in to three sick cows from the weekend and a list of fires to put out. Both are milking roughly the same number of cows. Only one of them is actually making money.

That gap — between a farm that uses the data it already has and one that keeps buying the next shiny thing — is where many mid‑size dairies are either quietly winning or slowly bleeding out. And the leak isn’t small. A single clinical ketosis case runs an estimated $300 to $350 once feed, treatment, lost milk, and reproduction are added up. Metritis is worse: a 2021 Journal of Dairy Science study of 11,733 cows across 16 U.S. herds pegged the average metritis case at $511 (median $398), with most cases ranging from $240 to $884.

Miss a handful of those a month, and you’re not running a dairy. You’re running a slow drain.

The squeezed middle nobody wants to talk about

Mid‑size dairies sit in a brutal spot. Too big to run on family labor and gut feel alone. Too small to spread the cost of every sensor, software platform, and specialist across thousands of cows. They feel it every month.

So they do what the industry’s been telling them to do for years. They install activity monitors. They add fresh‑cow tags. They buy the herd‑management platform. Then they run all of it at maybe half of what it could deliver, because the management side — the recording discipline, the clear protocols, the person who actually reads the reports — never catches up to the capital they poured in.

Here’s the irony. The technology has gotten genuinely good. Cornell work led by Julio Giordano found activity‑and‑rumination monitoring flagged illness across an 80‑day‑in‑milk window with 95.6% accuracy, catching metabolic disorders an average of about two days before clinical signs, at a false‑positive rate of just 2.4%. Farms that act on those early warnings report 40 to 70% lower treatment costs through earlier intervention. The warning is sitting in the system, days ahead of the problem. It’s the looking that’s missing.

What you get instead isn’t a crash. It’s a drift. A few more retained placentas than there should be. Fresh cows that always seem “a bit slow.” Ketosis that feels “about normal for us.” Over time, those patterns stop reading as problems. They just become your farm.

Teagasc researcher John Mee gave that drift a name in a 2020 paper: farm blindness — the misperception that what you see every day on your own place is normal, even when it isn’t. A new normal you quit questioning. And the data that would prove something’s off is usually already on the farm. It’s just not getting used.

Why does the shiny object always win?

Walk through what happens when a salesperson offers you a new piece of technology.

You can see a sensor on the cow. You can show your banker the invoice. You can tell your neighbor, “We just put in fresh cow monitoring.” It feels like a decision you can point to. You write a cheque, and something physical shows up.

Discipline doesn’t look like anything. It’s the weekend employee logging a metritis case on the right day in milk, with the right definition. It’s the written rule about who checks the alert list at 6 a.m. and what they do when rumination drops on three fresh cows. It’s the operator who actually pulls a week‑four milk report every Monday and reads it.

Nobody gives you a dealer discount for that. You can’t stand up at a producer meeting and say, “We wrote a better protocol,” and expect applause.

Tech marketing leans on a quiet promise: this will solve your problem. The framing implies the problem is a lack of technology, not a lack of execution. So a farm that already struggles to follow through buys a system that assumes follow‑through. When the results don’t show, it’s easier to say “we need a newer system” than “we never built the discipline around the one we have.” Worth knowing, too: only about 5% of commercial monitoring tools have been externally validated, even as the precision‑livestock market hit $5.59 billion in 2025.

Events feel like progress. Processes feel like work. Buying is an event. Building a culture where people record, review, and act every single week is a process. It doesn’t impress anyone. But it’s the thing that actually pays.

Two Mondays, same herd size, very different futures

Put two Monday mornings side by side. Same gear, same cow numbers, same week.

The bleeding Monday — reactive, looking backward:

  • Three sick cows turned up over the weekend; nobody caught them when they were just a little off.
  • The freshening date in the software is wrong, so days‑in‑milk can’t be trusted.
  • A Saturday metritis case got logged as a vague “uterine infection” by weekend staff, so it won’t count right anywhere.
  • Week‑four milk by parity? Not pulled. The nutritionist arrives Wednesday to a cold start.
  • The close‑up pen is overcrowded because the predicted fresh list got buried two weeks ago.
  • A Friday alert on four cows with dropping rumination is still sitting there, unread.

This operator isn’t lazy. He’s in the barn, the parlor, on the phone all day. But everything he touches is cleanup on problems that started days or weeks ago.

The profitable Monday — same effort, pointed forward:

  • He opens the report before the barn. Week‑four milk is split by parity; first‑lactation cows are on target, second‑lactation cows are a few pounds light. That gets a note for tomorrow’s vet visit.
  • Two weekend rumination alerts both show an intervention, both logged within hours.
  • Close‑up stocking is right because he moved cows Thursday off a predicted fresh list he pulled the Monday before.
  • He already knows his monthly metritis number before his advisor brings it up. If it’s high, the question is “why,” not “if.”

Then he goes and works a day that, from the road, looks a lot like the first operator’s. The difference is direction. The data he already owns is steering what he does next.

How one 500-cow dairy turned its own data back on

Here’s where it gets concrete. Picture a mid‑size operator — call him the profitable Monday — running about 500 cows. Tags on every animal. A herd‑management platform he’d mostly been using for heat detection. His fresh‑cow program was “fine.” Cows got looked at twice a day. Problems got handled when someone caught them. On paper, a well-run dairy.

Then he hit a stretch of fresh‑cow losses he couldn’t explain. Three cows down in a bad ten days, two of them culled before 60 DIM. Nothing in the weather, nothing in the ration he’d changed. Just a run of bad cows — or so it felt at the time. His vet, flipping back through the records during a herd check, said the line that stuck: “This has been building for a couple of months. It’s in your numbers.” That’s the moment farm blindness cracks. The losses hadn’t come out of nowhere. He just hadn’t been looking where they were written down.

So he stopped buying and started reading. First move: he pulled week‑four milk by parity, something his test‑day data already supported and he’d never broken out. His second‑calf cows were peaking below his first‑calf heifers — a clear flag that something in transition was costing him, and exactly the pattern the research warns about, since a cow’s second freshening runs harder on body reserves than her first. Second move: he fixed how disease got recorded. One definition for metritis, logged at a consistent day in milk, no more weekend “uterine infection” guesses that counted nowhere. Third move: the 6 a.m. alert list became one named person’s job, with a standing rule that anything off-target went to the vet by noon.

None of that came off an invoice. He didn’t add a sensor or swap platforms. He turned the gear he already owned back on, on the management side.

The research says that loop pays, and it isn’t subtle. Cornell’s work found that acting on the automated alerts the system was already generating produced greater early‑lactation milk yield and fewer cows culled than visual observation alone. Poor transition management quietly costs 10 to 20 pounds of peak production per cow, and preventing clinical disease lifts 305‑day yield by roughly 3.5%. For a 500-cow herd, even a few pounds of recovered peak across the fresh string is real money in the tank — the kind that shows up without a single new piece of hardware on the cow.

That’s the uncomfortable part for many farms. The system that’s “not working” is usually working fine. It’s the record‑review‑decide loop on the human side that broke. And it’s the one part nobody’s selling you.

What does a transition cow cost when it goes wrong?

Most farms never run the math on what their transition problems actually cost. It’s easier to wave off the odd loss as “one of those things” than to see the pattern.

So here’s the pattern, with real numbers under it. McArt and colleagues’ foundational work, adjusted for current feed and treatment costs, puts clinical ketosis at roughly $300 to $350 a case. The 2021 Journal of Dairy Science metritis study put the average at $511. Crowd a dry pen, and the milk loss compounds: a 2024 Journal of Dairy Science study by Cook and colleagues, covering 2,780 cows in two UK herds, linked higher close‑up stocking density and shorter close‑up time directly to more early‑lactation disease.

Run it on your own barn: Say you average 40 calvings a month and metritis runs at 20% — realistic for a lot of herds. That’s 8 cases a month. At the conservative end, $300 a case, that’s about $2,400 walking out the door every month, and closer to $4,000 at the study’s $511 average. Over a year, that’s $29,000 to $49,000 on metritis alone — before you count the ketosis sitting right next to it.

The ugly part is that most of those losses were visible in the data weeks before you felt them in the tank. The system recorded the rumination drop. The fresh list showed the cows that never got going. The question isn’t “do we have the data?” It’s “will we look at it every week?”

KPITarget / BenchmarkCommon “Normal” ExcuseFarm Blindness Red Flag
Metritis rate (% of calvings)< 10%“We’re around 15–20%, same as everyone”Exceeds 20%; cases unlogged or misdefined
Clinical ketosis rate< 5%“A few cases a month is just transition”> 8%; subclinical not screened
60-DIM cull/death rate< 5–8%“We had a rough stretch”Persistent > 10%; no root-cause review
Week-4 milk: 2nd-lact vs. 1st-lact2nd lact ≥ 1st lact“Our second-calvers always lag a bit”2nd lact consistently 5+ lbs below heifers
BCS at dry-off3.0–3.25 (5-pt scale)“She looked fine going in”Cows routinely entering dry at 3.75+
Close-up pen stocking density≤ 100% of headlocks“We’re a bit tight but it’s temporary”Chronically > 120%; no action on fresh list
Alert response time (activity/rum)Same-day, logged with action“Someone checks it when they have time”Alerts accumulate unread over 48+ hours
Disease cases per 100 calvings (first 21 DIM)< 15 combined“It’s seasonal / the bull / the weather”Stable elevated rate with no protocol change

Why your second-calf cows quietly underperform

If you want to catch these leaks early, you have to know where to look. On many mid‑size dairies, the most expensive leak hides in plain sight within one group: your second‑calf cows.

Next time you pull week‑four milk by parity, watch for second‑lactation cows peaking under your first‑calf group. It’s common, it’s costly, and it’s almost always a transition story, not a genetics one.

The physiology backs that up. A 2023 Journal of Dairy Science study following cows through their first and second calvings found second‑calving cows ran lower circulating insulin and IGF‑1 through transition and posted a lower early peak than expected. Plain version: a cow’s second freshening is metabolically harder than her first, and she leans harder on body reserves to get going. If she walked into the dry pen too fat, sat in a crowded close‑up group, or carried a subclinical ketosis nobody caught, that second start gets stunted. And the milk she doesn’t make in those first weeks never fully comes back.

This is exactly the kind of trend that hides inside a herd average. Lump all the cows together, and the tank looks fine. Split it by parity, and a soft second‑lactation curve jumps off the page — and now it’s a problem you can do something about, before she’s three months in and the lactation’s already lost.

The dry pen sets the table — are you reading it?

If the milking string is where transition problems show up, the dry pen is where most of them get built. Two numbers carry most of the weight: body condition at dry‑off and calving, and how long cows actually sit dry.

On body condition, the extension consensus is tight. Ontario’s scoring guide targets a BCS of 3.0 to 3.25 at both dry‑off and calving on the 5‑point scale, with no cow swinging more than about 0.5 to 0.75 between stages. Cows calving over‑conditioned — say 3.75 and up — eat less right when they need energy most, mobilize more fat, and face a higher risk of ketosis and a slower start. A practical rule many good herds use: flag any cow heading toward dry‑off at BCS 3.75 or higher, because she’s telling you the late‑lactation ration let her get fat on your dime.

Dry‑period length is the other lever, and the data is blunt. Roughly 60 days dry still maximizes next‑lactation yield across parities, and cows pushed to very short or no dry periods can give meaningfully less milk the following lactation. Shortened dry periods of around 40 days have a real research case — better pre‑fresh intake and faster rumen recovery — but they’re a deliberate strategy, not an accident. The trap on most mid‑size farms isn’t the planned 40‑day program. It’s the cow who drifts to 80 days dry because nobody flagged her, gets over‑conditioned doing nothing, then calves into trouble. That’s a recording problem wearing a nutrition costume.

What actually makes the habit stick?

Knowing you should read the numbers and actually doing it every week are two different animals. The farms that make that Monday ritual non‑negotiable don’t get there by accident.

It usually starts with pain, not inspiration. Few operators develop discipline just by reading an article. Most build it after something hurts enough that they can’t shrug it off — a run of fresh‑cow losses, a pregnancy‑rate slide that took three months to surface, a vet pointing at a trend and saying “this has been building for weeks.” Those moments crack farm blindness open. You can blame the market, or you can decide you’re not getting blindsided like that again.

Someone has to own the numbers by name. “The manager reviews the data” doesn’t survive a busy week. A named person, a set time, and a clear next step does: the transition report gets pulled every Monday before 8 a.m., and anything off target goes to the vet by noon. On mid‑size herds, the owner’s already wearing a dozen hats, so if Monday’s review belongs to “management,” it’s the first thing to vanish when a calf gets sick, or a pump fails. Put a name on it — even if it’s your own — and ownership stops floating in the air.

The review has to drive a decision within the same week. If data goes into a report and nothing changes, recording discipline rots fast. People watch their entries disappear into a screen that never answers back. The farms that keep people recording make sure something visible happens: the employee who logged three metritis cases sees them on the vet report and hears the conversation that follows. Record → review → decide → adjust. Stretch that loop over months, and the ritual dies.

Start with a small, sharp win. The fastest way to kill a new habit is to make it too big. The profitable operator doesn’t open with a twelve‑KPI dashboard. He starts with two or three numbers he already half has that carry obvious benchmarks, and that’ll show a trend within a month. Week‑four milk by parity is a perfect first pick — the test‑day data’s already there; it just needs to be broken out by lactation group. Once that habit’s solid, add the next metric. The structure grows out of something that works, not a wish list.

Pull the advisory team inside the ritual. On many farms, the vet and nutritionist only see data when they show up. The operations that make Monday stick send the week’s transition numbers out ahead of the visit, so the conversation opens with “here’s what we’re seeing — here are our questions.” An outside audience changes how the numbers feel. You prepare differently when you know someone else will see the trend before they walk the pen.

What This Means for Your Operation

  • If your transition problems feel like bad luck instead of a pattern, assume you’re flying blind. The data to prove it is probably already in your software, days ahead of the next sick cow.
  • If your second‑calf cows peak below your first‑calf heifers, look at the dry pen and the close‑up ration before you blame the bull. That gap is a transition signal, not a genetic one, and it’s fixable.
  • If no one on your farm can say, “I pull this report every Monday,” then no one owns the numbers.Ownership is what turns an unread alert into an action.
  • If recording disease feels like paperwork that goes nowhere, the problem isn’t your staff — it’s the broken loop from record to decision. Close it, and the entries start to matter again.
  • If you’ve bought technology faster than you’ve built discipline, expect the next cheque to feel good and change nothing. The gear is rarely the variable.
  • Do this within 30 days: pull three numbers for the last 60–90 days — percent of cows gone by 60 DIM (culled or dead), week‑four milk split by first/second/third‑plus lactation, and metritis‑plus‑ketosis cases in the first 21 DIM per 100 calvings. They’re already in your herd software, milk‑recording reports, or vet records. If you can’t pull them cleanly, that’s your first finding.

Key Takeaways

  • If you can’t name the person who reads the transition report each week, fix that before you spend another dollar on hardware.
  • If a number looks wrong — 60‑day exits too high, second‑lactation cows lagging, disease higher than you thought — take that specific figure to your vet or nutritionist and ask “why” this month.
  • If your system “isn’t working,” check the human loop before you replace the gear; the alert that fired and nobody read is the real failure.
  • If you’re starting from scratch, start with three numbers and one Monday — not a dashboard you’ll abandon by spring.

The math doesn’t care whether you look at it. So pull those three numbers tomorrow, before the barn takes over the day. If you don’t like what you see, that uncomfortable feeling is the point — the only real question left is whether you’ll keep choosing events over processes, or finally make the Monday review as non‑negotiable as feeding. Which one are you this week?

Editor’s Note: The operators described in this piece are composites, modeled from patterns common on mid-size North American and UK dairies rather than single real farms. The research cited is real and sourced.

Run Your Numbers

Herd Health ROI Calculator — This article says early detection cuts culling and replacement cost; the calculator puts a dollar figure on it. Plug in your herd size, culling rate, and mastitis cases to see what those fresh-cow losses are costing you now — and what closing the record-review gap is actually worth per cow.

Complete references and supporting documentation are available upon request by contacting the editorial team at editor@thebullvine.com.

Learn More

The Sunday Read Dairy Professionals Don’t Skip.

Every week, thousands of producers, breeders, and industry insiders open Bullvine Weekly for genetics insights, market shifts, and profit strategies they won’t find anywhere else. One email. Five minutes. Smarter decisions all week.
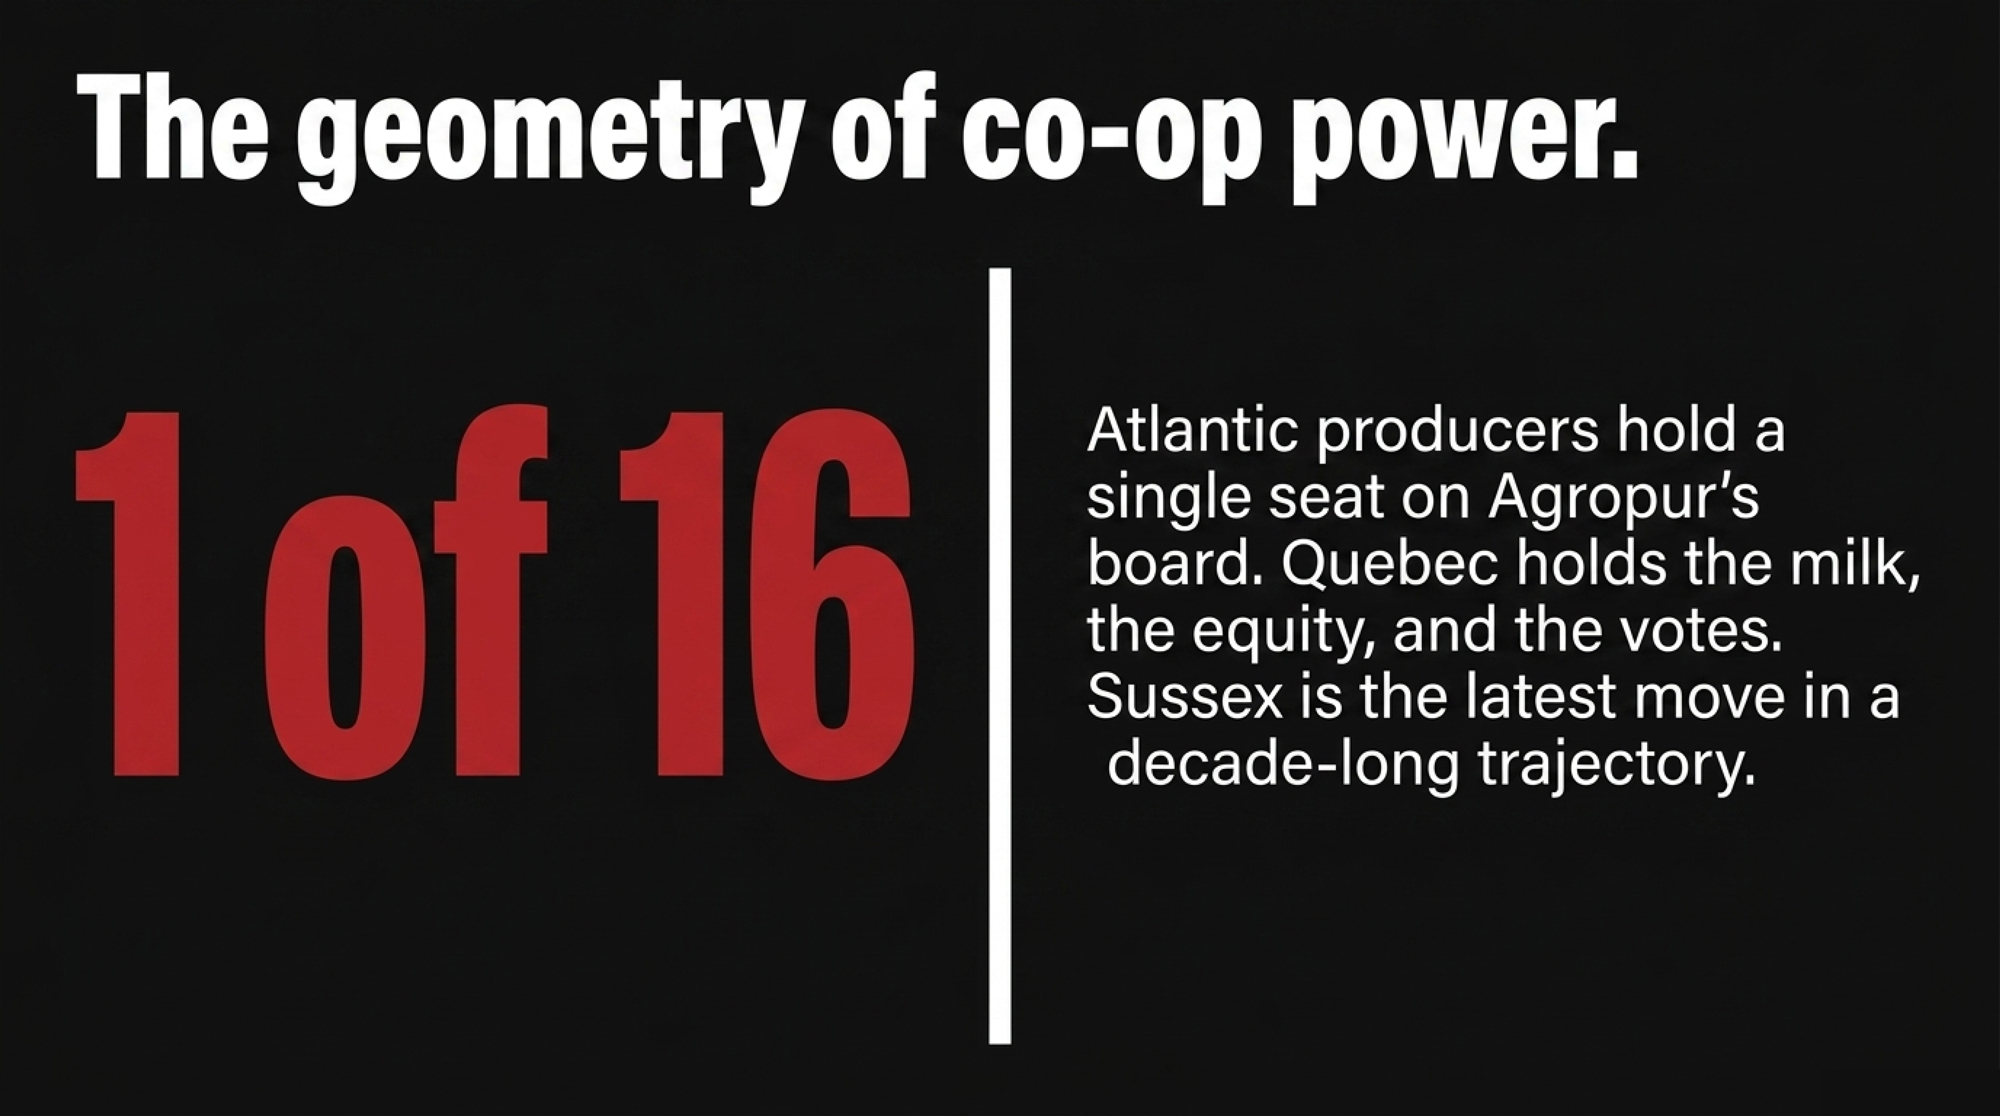
NewsSubscribe
First
Last
Consent

Your Fans Can’t Fix Half of Heat Stress. Your Ration Can.

About half your summer milk loss happens inside the cow, not at the bunk — and no number of fans touches it. A $15 forage test and the right DCAD do. Here’s the play.

Executive Summary: Only 20–50% of summer milk loss comes from cows eating less — the rest happens inside the cow, where heat shunts blood from the gut, the barrier leaks, and inflammation burns the energy that should’ve gone in the tank. That’s why hanging more fans never fully closes the gap: the fix is as much ration as it is air. On a 100-cow herd, a DCAD miss and reactive feeding can cost roughly 2 lb/cow/day across a 90-day heat window — about $3,500 at USDA’s May 2026 all-milk price of $19.70/cwt — while the wet-chemistry forage panel that would’ve caught it runs about $15 a sample. The play the best herds run by late April: test forage minerals by wet chemistry (not NIR), push lactating DCAD to +35–40 with K at 1.5–1.8% and magnesium raised alongside, build it with both sodium and potassium, and cool the dry cows — because UF/IFAS ties an uncooled dry period to ~10 lb/day less next lactation plus a penalty in the daughters. Canadian producers have the sharpest stake, since a July butterfat slide can leave hard-bought quota unfilled. None of it is extra work — it’s the same scramble you’d do in July, just moved to spring when you’ve got time to think. If you’re still treating heat stress as a fan problem, this is the piece that resets the math. 

dairy cows feeding summer barn

By the time the first run of 28°C days shows up, the farm that handles heat stress well already knows exactly what its high-group ration will do. The summer bunk’s been pre-built. The dry cows are under fans. And the feeder knows there’s a second drop coming in the evening. The neighbor down the road? He’s still telling people it got hot “all of a sudden.”

That gap — between the operations that decide early and those that react late — is the whole story of heat-stress nutrition. And here’s the part that should bother you: it’s rarely a knowledge problem. The research has been settled for decades. The difference is when the decisions get made.

What’s Actually at Stake When the THI Climbs

Heat stress doesn’t just make cows uncomfortable. It rewires their biochemistry, and it starts earlier than most producers act on it. High-producing cows can begin losing milk once the temperature-humidity index crosses 68, not the 72 that many people still treat as the trigger. Research has documented a loss of 4 to 5 pounds of milk per cow per day after roughly 17 hours of continuous exposure at THI 68. Dry matter intake can decline by 8 to 12% once THI exceeds 72. 

The producer who’ll see himself in this story is the one who’s been at it 20 or 30 years, runs a tight operation, and still watches his tank slide every July. He’s not lazy, and he’s not behind. He’s stuck in a reactive pattern. And the cost of that pattern stays invisible until somebody sits down and does the math.

That’s the trap. The cow you fail to manage in August shows up as a lighter milk cheque in November. The connection is real, but it’s buried in noise — easy to pin on the corn silage fermentation, the parlor, or last week’s weather.

The Part of the Loss Your Fans Were Never Going to Fix

Here’s the piece that reframes everything. For years, the standard line was simple: cows get hot, cows eat less, milk drops. Cool them down, fix the intake, fix the problem. But the research doesn’t back that clean story.

Reduced feed intake accounts for only about 20% to 50% of the milk loss during heat stress. The rest comes from inside the cow. Under heat load, blood gets shunted away from the gut to the skin for cooling, the intestinal barrier loosens, and bacterial toxins leak into the bloodstream — what researchers now call “leaky gut.” That triggers systemic inflammation, and fighting inflammation burns energy that would otherwise go into the tank. 

So a cow can be eating reasonably well and still bleed production, because half the damage isn’t about the bunk at all. That’s why cooling alone never fully closes the gap, and why the nutrition side — electrolytes, DCAD, rumen stability — does real work that fans can’t. You’re not just keeping her eating. You’re defending the gut and the acid-base balance while she pants off carbon dioxide and throws her blood chemistry out of whack. 

The Decision That Has to Come First

Ask the farms that hold production through a heat wave what they do differently, and it’s not a product. It’s a forage test — done in spring, with the right chemistry.

By late April, these operations collect fresh samples of every major forage and send them for wet-chemistry mineral analysis, including potassium, sodium, chloride, and sulfur. Not NIR. Near-infrared is fast and cheap, but its mineral predictions ride entirely on the calibration database behind them, and they can miss the swings that matter most. Wet chemistry directly isolates and measures minerals, and minerals are exactly what drive the dietary cation-anion difference. 

AttributeNIR AnalysisWet-Chemistry Mineral Panel
Cost per sample~$8–12~$15 (add-on)
Turnaround24–48 hours3–5 business days
Mineral accuracyCalibration-database dependentDirect measurement of K, Na, Cl, S
Forage K predictionCan miss 1–3% DM swingCatches full potassium range
DCAD reliabilityUnreliable for anion/cation balanceRequired for real DCAD formulation
Best use caseEnergy, protein, NDF screeningPre-summer ration build, DCAD setting
Risk if you skip itNone for energy; fine for bulk screeningDCAD miss = ~$3,546 per 100 cows

Here’s why it matters. Alfalfa can run anywhere from 1% to 3% potassium on a dry-matter basis, depending on soil, cutting, and variety. That’s a threefold spread. Swing your forage potassium that far, and your ration DCAD moves with it — enough to be the line between a ration that holds summer production and one that quietly undercuts it. 

You can’t set a real DCAD target without knowing your actual forage minerals. You can’t decide whether you need supplemental potassium or how much without knowing what the silage and alfalfa already contain. Skip the test, and every decision downstream is a guess wearing a lab coat. Run a lab report through our Forage Quality Value Calculator to see exactly where a given cutting fits before you build the summer ration around it. 

For producers weighing which analysis to order, our breakdown of feed analysis technology and ration accuracy lays out where NIR earns its keep and where wet chemistry is worth the wait. 

What DCAD Should Your Summer Ration Actually Target?

Watch a well-run operation in May, and it looks almost boring. That’s the tell.

They’ve already modeled the summer version of their rations. Lactating cows are pushed toward a DCAD of +35 to +40 mEq/100g of dry matter, with potassium targeted at 1.5% to 1.8% to cover electrolyte losses that spike in heat. That target isn’t a Bullvine invention — Wisconsin extension, drawing on long-standing NRC guidance, puts the summer potassium window at 1.5–1.6% of dry matter and sodium at 0.4–0.6%, while Manitoba’s dairy specialists land on roughly 1.5% potassium, 0.5% sodium, and 0.35% magnesium for heat-stressed cows. Fresh and early-lactation pens are first in line for the full bump and the best forages — these operations treat that group as the highest priority heading into summer. 

Here’s where those targets land for the two pens that matter most in a heat wave:

Mineral (% of DM)High/Early LactationDry & Close-UpWhy It Matters in Heat
Potassium (K)1.5–1.8%Moderate; avoid high-KReplaces electrolytes lost through panting & sweat
Sodium (Na)0.4–0.6%0.4–0.5%Builds DCAD alongside K; Saskatchewan trial links Na to milk fat
Magnesium (Mg)0.35–0.40%0.35–0.40%Must rise with K — high K suppresses Mg absorption
Chloride (Cl)MinimizeElevate for close-up DCADAnion that pulls close-up DCAD negative for transition
DCAD (mEq/100g DM)+35 to +40Negative / lowAcid-base buffer critical while cow pants off CO₂
Ration K sourceHigh-K alfalfa + K carbonate blendAvoid potassium carbonateAnhydrous K₂CO₃ in wet TMR can heat and suppress intake

They’ve also already settled which ingredient carries the potassium. If they’ve got high-K alfalfa near the top of that 1-to-3% band, they know how far they can lean on it before something else in the ration breaks. If they’re using potassium carbonate, they’ve lined up a stabilized or coated form — or agreed on a liquid-dissolution protocol — so they don’t discover in July that standard anhydrous K₂CO₃ can heat up on contact with wet feed and pull intake down. 

The economics of getting that DCAD call right are bigger than most producers price in — our deep dive on Nigel Cook’s heat-stress math and how +400 DCAD protects milk fat runs the full numbers. 

Potassium or Sodium — and Why the Answer Is “Both”

Once you’ve decided to raise DCAD, the next question is which cation does it: potassium, sodium, or some mix. This is where a lot of rations leave money on the table by leaning too hard on one.

A 2024 University of Saskatchewan trial found that increasing DCAD by increasing sodium supply during mild heat stress improved blood acid-base balance and may increase milk fat yield. But older work is equally clear that the best milk-yield response comes when both sodium and potassium are used to build DCAD, with the lowest yields occurring when the ration leans on one cation alone. The practical read: don’t try to hit your whole DCAD target with potassium carbonate and call it done, and don’t lean on sodium bicarb alone either. Blend them. The buffer trade has its own ratio logic — the rumen-buffer economics piece covers where the sodium-bicarb-to-potassium-carbonate ratio actually pays. 

There’s a magnesium catch that bites herds every summer. When you push potassium up, magnesium absorption drops, so the higher-K summer ration needs magnesium raised right alongside it — extension targets sit around 0.35% to 0.40% of dry matter. Miss that, and you can chase a clean DCAD number while quietly starving the cow of available magnesium. The cations don’t work in isolation; the winning ratio treats them as a system, not a checklist. 

Why That Sodium Study Matters More in Canada Than the U.S.

That Saskatchewan milk-fat finding isn’t a footnote — it’s worth more to some producers than others, and the reason is how you get paid.

In the U.S. fluid-and-component market, a summer fat dip costs you a slice of your component cheque, but you’re still selling the volume. In Canada, under supply management, the math is sharper. Returns hinge on butterfat, so a July fat slide doesn’t just trim your per-pound return — it can leave you short of the butterfat quota you’ve already paid dearly to hold. That’s quota capacity sitting idle, which is about the most expensive thing a Canadian dairy can do. So a strategy that defends milk fat through heat — like building DCAD partly through sodium, per the Saskatchewan work — is arguably worth more to an Ontario or Quebec producer than to a fluid-market herd facing the same heat. 

The chemistry doesn’t care about the border. A cow in Ontario sweats off the same electrolytes as one in Wisconsin, and Ontario’s own extension service points to the same playbook — maximize ventilation, fog the front third of the pad, pack nutrients into smaller volumes, feed most of the ration overnight. But the milk-cheque consequences of getting it wrong aren’t evenly distributed. The producer most exposed to a summer fat drop has the most reason to pre-build the ration that prevents it. 

The Dry-Cow Blind Spot

There’s one piece of this that consistently costs the most and gets the least attention: the dry pen.

The farms that get heat stress right walk their dry-cow facilities in April the same way they walk the high group. By mid-to-late May, the shade, fans, and any soakers in the dry and close-up pens are checked and running — not just the parlor holding area. Water, space, and flow get the same treatment because late-gestation cows under heat stress drink more, too. 

Why the urgency over cows that aren’t even milking? Because the research is blunt about it. University of Florida work led by Geoffrey Dahl and Jimena Laporta found that dry cows denied cooling lose an average of about 10 pounds of milk per day in the next lactation, and the effect holds whether they’re deprived for half the dry period or all of it. Their daughters carry the penalty forward — UF/IFAS reports that calves born to heat-stressed dry cows produced roughly 5 pounds less milk per day across both their first and second lactations. The same UF/IFAS work puts the sector-wide cost of failing to cool dry pregnant cows at up to $595 million a year, once you factor in lost productive life and extra heifer rearing. 

That’s not an August problem. That’s a problem you pay for the following winter — and again two years later, when those heifers freshen. Which is exactly why dry-cow cooling shows up on the spring to-do list right beside planting, not in the “if we have time” column.

Water, Bunk Timing, and the Cheap Wins Producers Skip

Nutrition on paper means nothing if the cow can’t get to water or won’t eat when feed’s in front of her. Two of the highest-return moves in a heat plan cost almost nothing — and both get skipped under pressure.

Start with water, because it’s the single most important nutritional input in summer. A heat-stressed cow’s water intake climbs sharply — research has documented increases of around 30% or more — and access right after milking matters most, when she’s walked back hot and thirsty. An extra trough on the return alley from the parlor, troughs cleaned to drinking-water standard, and chilled water in the 21–27°C range all measurably lift intake. One waterer per cow is the hot-weather benchmark — not the year-round standard. 

Then there’s when the feed goes out. Cows shift their feeding to the cooler hours and will refuse the bunk during peak heat, so farms that focus on production push the bulk of the ration into the evening. Feeding 60–70% of the ration between roughly 6 p.m. and 8 a.m. is the standing recommendation from Ontario and Manitoba dairy extension to maintain summer intake and milk production. More frequent feeding and push-ups keep fresh feed in front of cows and keep the TMR from heating and spoiling — and an organic-acid stabilizer buys bunk life when the silage face is fighting July heat. None of this is exotic. It’s just decided in advance, rather than improvised at 2 p.m. on the first 30°C day. 

The Math Nobody Runs Until It’s Too Late

The reason this stays broken on most farms is that the cost is never calculated for this farm this summer. The industry-wide figure — heat stress costing the U.S. dairy sector somewhere between $897 million and $1.5 billion a year in lactating losses alone — lands as somebody else’s problem. 

So run a version you can feel. Take a 100-cow herd. Say a DCAD miss and a reactive feeding schedule cost you a conservative 2 pounds of milk per cow per day across a 90-day heat window. That’s 18,000 pounds of milk you didn’t have to lose. At USDA’s May 2026 WASDE all-milk forecast of $19.70 per hundredweight, that’s about $3,546 off the cheque — traced straight back to a forage test you didn’t run and a ration you didn’t pre-build. Call it the better part of $3,500, gone, on a 100-cow herd that did nothing wrong except react late. 

Now put that next to the fix. The wet-chemistry mineral panel that would have caught the DCAD miss runs about $15 a sample as an add-on to a standard NIR package. Test your three or four main forages a couple of times throughout the season, and you’re into low double-digit dollars rather than a four-figure loss. That’s the whole trade the headline points at: a few dollars of testing on one side, thousands in lost milk on the other. The test is never an expensive decision. Skipping it is. 

Is this a national pattern or a single-herd quirk? Both. The biology is universal — every lactating cow loses potassium through panting, sweating, and milk when it gets hot. What varies is execution, and execution is a choice each operation makes on its own calendar. 

Where to Start — and What It Costs You to Get It Wrong

There’s no single right answer here. It depends on herd size, your forage base, and how much risk you’re willing to carry into summer. Ranked roughly by return on effort, here’s the sequence the best-run farms follow — and where each move bites if you botch it.

1. Pre-build the summer ration off spring forage tests — the 30-day move. In the next month, pull fresh forage samples, order wet-chemistry minerals, and book an hour with your nutritionist to recalculate DCAD, potassium, and magnesium for the high group and fresh pens first. About $15 a sample and one focused session. Worst case, you confirm the ration’s already right — information worth having. This is the move that everything else depends on. 

2. Fix water and bunk timing now — the free wins. Add a trough on the parlor return, commit to feeding 60–70% of the ration in the cool hours, and schedule more frequent push-ups before the heat lands. Costs mostly labor and discipline. It only backfires if it gets written down and then ignored when things get busy. 

3. Lock in the cation decision before June. Decide whether you’re leaning on high-K forage, a stabilized potassium carbonate, sodium bicarb, or a blend — and remember the trial data says a mix of both cations beats either alone. Most critical for corn-silage-heavy rations, where natural potassium levels run low. Where it backfires: grabbing off-the-shelf anhydrous K₂CO₃ and feeding it into wet TMR — the intake problem is real. 

4. Treat dry-cow cooling as a spring capital project. Walk the dry pen in April, as you would the high group, for any herd that hasn’t audited dry-cow shade, fans, and water since last summer. The trap is skipping it because those cows “aren’t milking” — the cost shows up two years out, in their lactation and their daughters’. 

5. Build the monitoring tripwires before the heat. Agree with your nutritionist on the indicators you’ll watch and the if-this-then-that rules once THI clears 68. Costs a conversation, not hardware — and only works if the rules actually get followed. 

What This Means for Your Operation

  • If you only do one thing this month, run wet-chemistry mineral analyses on your forages — about $15 per sample — and rebuild your summer ration based on the results. Every downstream decision depends on those numbers. 
  • If you think cooling alone fixes heat stress, remember that intake accounts for only 20–50% of the loss — the rest is gut and inflammation, and that’s the nutrition side’s job. 
  • If you’re building DCAD, use sodium and potassium together, and raise magnesium with potassium — the cations work as a system, not as a single lever. 
  • If you milk in Canada, protecting summer milk fat isn’t optional — a fat slide can leave butterfat quota unfilled, so the sodium-DCAD strategy matters more to your cheque than to a U.S. fluid-market herd’s. 
  • If your dry cows get shade but no fans, treat that as this spring’s highest-ROI cooling fix — UF/IFAS data ties uncooled dry periods to roughly 10 lb/day less next lactation, plus a penalty in the daughters. 
  • If you wait for “cows off feed” calls to act, you’re already two weeks into the loss. Set your THI 68 tripwires, water, and overnight feeding now. 

Key Takeaways

  • If your forage potassium hasn’t been measured by wet chemistry this spring, your DCAD target is a guess — fix that before you touch anything else. 
  • If you’re hanging more fans and still losing milk, you’ve maxed the 20–50% of the loss that’s about intake and ignored the other half that lives in the gut. 
  • If you build DCAD with one cation, you’re leaving milk on the table — the data says blend sodium and potassium and lift magnesium alongside. 
  • If your dry cows aren’t cooled, that’s your single highest-ROI fix this spring, and the bill comes due in the next lactation, plus two years out in the daughters. 

What should sit with you is how little of this is actually extra work. Pre-building the ration, testing the forage, cooling the dry cows, moving the feed to the cool hours — it’s the same work you’d scramble through in July, just moved to March when you’ve got time to think instead of time to panic. The farms that get this right didn’t find a secret additive. They moved their decisions earlier on the calendar. So here’s the real question for your barn: when the first heat wave lands this year, are you going to be running a plan you already wrote — or writing one while the tank slides?

Run Your Numbers

Forage Quality Value Calculator — Punch in your spring forage tests and milk price, and this tool turns them into $/ton DM, $/cow/day, and annual herd impact so you can see exactly what a bad DCAD guess or missed K swing is really costing.

Complete references and supporting documentation are available upon request by contacting the editorial team at editor@thebullvine.com.

Learn More

The Sunday Read Dairy Professionals Don’t Skip.

Every week, thousands of producers, breeders, and industry insiders open Bullvine Weekly for genetics insights, market shifts, and profit strategies they won’t find anywhere else. One email. Five minutes. Smarter decisions all week.
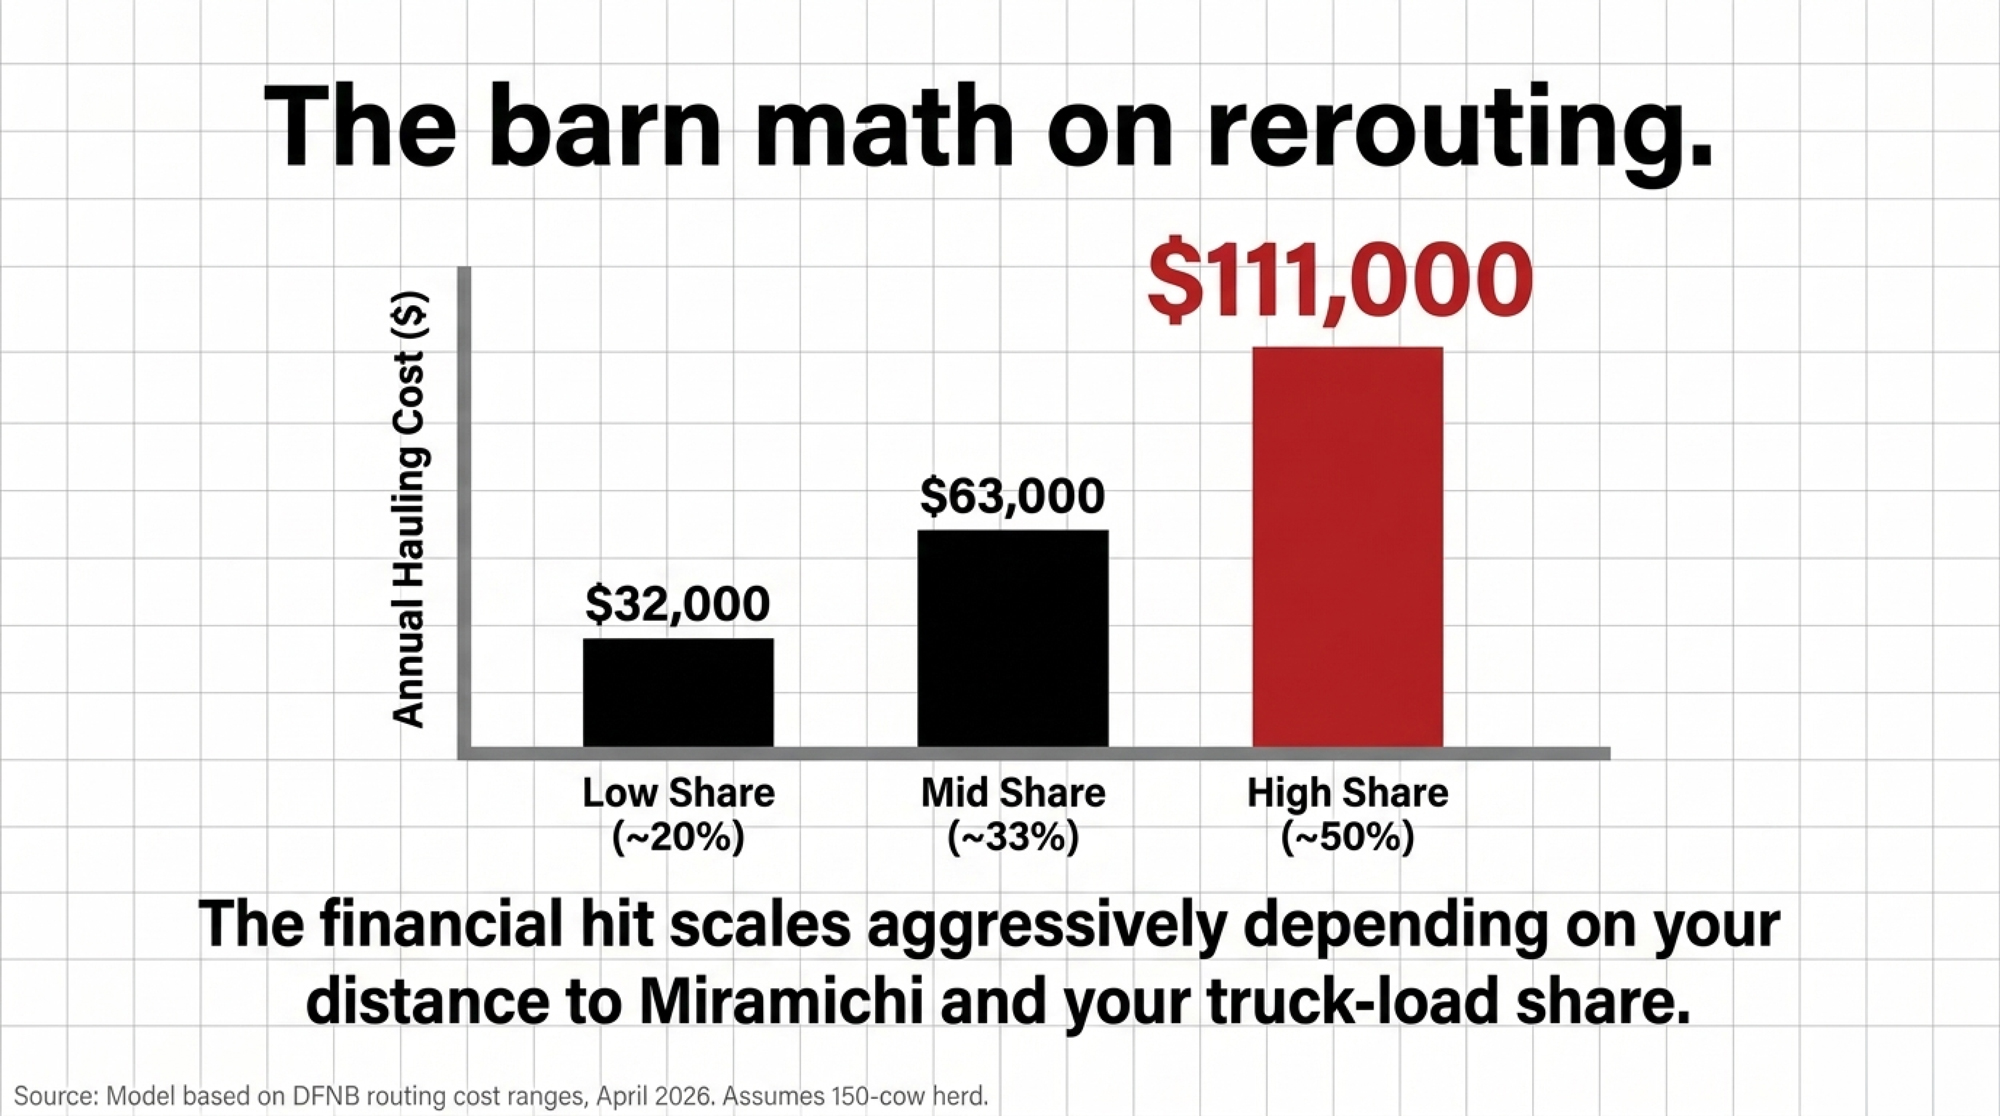
NewsSubscribe
First
Last
Consent

June Dairy Month Turns 89 — and Farmers Now Keep Just 25¢ of Every Dairy Dollar

They’ll ask you to pose with a calf this June. Then you go home to the milk check: $1.97 of that $3.98 gallon is yours. The other $2.01 never reaches the tank — and a Wisconsin firm wants a say over your 15¢ next.

Editor’s note: “the Reillys” below is a composite scenario, modeled from public ERS price data and typical Northeast fluid-shipper economics — not a single real farm. Every number attached to them is sourced and real; the operation itself is illustrative, in the same way our $97,000 Breeding Meeting feature was framed.

Picture a 140-cow tie-stall in the St. Lawrence Valley — call them the Reillys, a stand-in for the fluid shippers across the Northeast doing exactly this math. June Dairy Month banners go up at the co-op, the FFA kids hand out string cheese at the county fair, and somebody asks the Reillys to pose with a calf for the local paper. They smile for it. Then they go home and look at the milk check.

Because here’s the question that’s been gnawing at operations like theirs: of the $3.98 a consumer paid for a gallon of whole milk in 2024, how much actually landed in their tank?

About $1.97. The other $2.01 went to everybody between the bulk tank and the dairy case.

That’s not a grievance — it’s USDA Economic Research Service data, the agency’s own farm-share series, released June 2025. And honestly, for fluid whole milk, 49% isn’t a bad number. It’s the rest of the dairy aisle where the floor fell out. This June, that number collides with a courtroom: a Wisconsin law firm that just settled an 11-month case against USDA says the checkoff every farmer like the Reillys funds is its next target.

The lawyers showed up to the party uninvited

On May 27, 2026, Wisconsin Institute for Law and Liberty deputy counsel Daniel Lennington told Brownfield Ag News the dairy checkoff is “an unconstitutional program.” The timing isn’t subtle. He’s raising the fight during the one month of the year the checkoff is most visible.

Lennington alleges checkoff dollars are flowing into “ESG, environmental social governance programs (including) the Dairy Net Zero program” — work that, in his words, goes “to basically blame dairy farmers and blame cows for global warming,” while requiring “even small farmers to fill out all sorts of disclosures.” The program’s legal mandate, he says, is to promote the purchase of dairy products, “and nothing more.” There’s a factual core under the claim: the Foundation for Food & Agriculture Research announced a $10 million grant supporting dairy’s Net Zero Initiative in 2021, a program co-created with the Innovation Center for U.S. Dairy. The industry casts that work as protecting market access and meeting its 2050 stewardship goals — not as an attack on farmers.

This isn’t an idle threat. The same firm just settled the Adam Faust case, in which USDA agreed to strip race- and sex-based “socially disadvantaged” designations from three federal programs — the Dairy Margin Coverage fee, the Loan Guarantee Program, and EQIP — after the U.S. Department of Justice announced on February 9, 2026 that it would abandon its defense of two of them as unconstitutional. They win cases. So when they say the checkoff is next, the Reillys’ co-op delegate is right to pay attention.

To be clear about what this is and isn’t: these are allegations and legal arguments, not court findings. No complaint against the checkoff has been filed yet. And the legal ground is genuinely contested history. A federal appeals court actually struck the dairy checkoff down once — in Cochran v. Veneman (2004), the Third Circuit ruled that compelling Pennsylvania dairy farmers to fund generic milk promotion violated the First Amendment. Then the Supreme Court changed the landscape a year later: its 2005 Johanns v. Livestock Marketing Association decision — a beef checkoff case — held that checkoff promotion is the government’s own speech, and therefore immune from compelled-subsidy challenge. That government-speech doctrine has shielded the dairy program ever since. WILL’s new theory tries to thread that needle: if checkoff dollars fund environmental messaging that falls outside “promotion of the sale and consumption of dairy products,” is it still the government speech Johanns protects? That’s the question no court has been asked in those exact terms.

It’s not the only mandatory dairy program in court this spring, either. In a separate and unrelated case, Organic Valley, Horizon, and Aurora filed constitutional challenges to the Federal Milk Marketing Order system in spring 2026, with a group of Organic Valley farmers adding a Fifth Amendment takings claim. Different program, different argument — but a sign that the legal machinery underneath dairy’s mandatory structures is being tested from several directions at once.

June Dairy Month was always a marketing play — and that’s the point, not the insult

Start with the origin story, because it explains everything that followed. June Dairy Month launched in the late 1930s as “National Milk Month,” a response to a seasonal milk surplus. The goal wasn’t sentiment. It was inventory.

Refrigeration had improved, cows were flush on spring grass, and the market was drowning in milk. The industry needed Americans to drink the surplus before it spoiled. So it built a celebration around the problem.

Nearly nine decades later, the machine is bigger and the surplus never left. USDA’s February 2026 WASDE pegged the 2026 all-milk price at $18.95 per hundredweight, down from a revised $21.17 in 2025. And January 2026’s announced Class III price came in at just $14.59. The cows are still flush. The market’s still long. And June still arrives like clockwork to remind everyone how wholesome it all is.

Here’s the part nobody prints on the banner: the Reillys are paying for the party.

You fund the celebration at 15¢ per hundredweight — and you don’t control most of it

Every hundredweight the Reillys ship carries a 15-cent checkoff assessment, mandated under the federal Dairy Production Stabilization Act of 1983 and the Dairy Promotion and Research Order. Here’s the split most farmers can’t recite from memory: producers can direct up to 10¢ of that 15¢ to a qualified state, regional, or local program — and the other 5¢ goes to the national checkoff, the National Dairy Promotion and Research Board, which funds Dairy Management Inc.

Checkoff TierAmount (¢/cwt)Who Controls SpendingBenefit-Cost Ratio (fluid milk context)
State/Regional ProgramsUp to 10¢Farmer-elected boards at state/regional levelVaries by program; farmer has direct delegate influence
National (NDPRB → DMI)5¢ mandatoryDairy Management Inc. — not direct farmer vote$1.63 on fluid milk (1995–2022 eval) ⚠️
Total Producer Assessment15¢Split as above$5.23 aggregate all-dairy (most recent Report to Congress)
MilkPEP (processors)Separate: ~2¢/gal equivalentProcessor-governed; funds fluid milk campaignsFluid-specific; MilkPEP funds fluid promotion separately
2022 aggregate collected$352.1M producers + $79.7M MilkPEP$431.8M total checkoff pool

The dollars are real money in aggregate. In 2022, the most recent audited year in USDA’s September 2024 Report to Congress, the 15¢ producer assessment added up to $352.1 million, plus another $79.7 million from fluid milk processors through MilkPEP. DMI is the entity that turns the national share into demand campaigns — the “undeniably dairy” work, the pizza-chain partnerships, the sports tie-ins.

DMI’s own 2024 audited financials show total revenue of $165.7 million, down from $178.3 million in 2023. Domestic marketing ran $127.1 million; export programs took another $23.7 million. The catch for a fluid shipper: most of where that money lands isn’t something the Reillys vote on.

Does it work? Depends what you’re measuring. USDA’s congressionally mandated evaluation, authored by Texas A&M economist Oral Capps Jr., pegs the aggregate all-dairy benefit-cost ratio at $5.23 per dollar spent for the 1995–2022 period — meaning the model estimates $5.23 in economic value for every checkoff dollar. That’s a government-published number, and it’s the strongest case for the program.

But read the category breakdown in the same report, because not all dairy dollars perform alike. Butter returned $17.73 per dollar invested. Cheese returned $3.87. Exports, $8.63. And fluid milk — the product the Reillys anchor to — came in dead last at $2.68, the lowest-returning category of everything the checkoff promotes. Cheese, butter, and exports carry the program; the jug barely keeps pace. We laid that gap out in our recent breakdown of where the checkoff money actually goes. So when the checkoff celebrates June, the dollars are largely working for cheese and exports. The Reillys’ fluid-milk dollar is along for the ride.

Why do you keep half a fluid gallon but only a quarter of the basket?

Now the line that matters most. And it needs a careful read, because two different USDA numbers get mashed together constantly.

For a gallon of fluid whole milk, the farm share was 49% in 2024 — $1.97 of a $3.98 retail gallon, up from 47% the year before. The point figures move year to year, so treat any single year as a snapshot, not a trend line. Fluid milk still passes roughly half the retail price back to the farm.

For the total dairy basket — milk, cheese, butter, yogurt, ice cream, all of it — the farm-value share sat at 25% in 2024, up from 23% in 2023 but down from 28% in 2022. Here’s the contrast that should ruin the Reillys’ appetite:

What’s being measuredFarm share, 2024What it tells you
Butter57% ($2.71 of $4.74)Less processing, bigger farm slice
Whole milk gallon49% ($1.97 of $3.98)Half the retail price still gets back to you
Cheddar cheese32% ($1.80 of $5.66)Processing and aging eat the difference
Total dairy basket25%Processed product keeps three-quarters downstream
Regular ice cream19% ($1.17 of $6.13)The further from raw milk, the thinner your cut

Source: USDA Economic Research Service, farm-to-retail price spreads, released June 2025. Butter and ice cream prices are per pound and per half-gallon, respectively.

Why the gap between 49% and 25%? Because America stopped drinking milk and started eating processed dairy. Cheese, ice cream, and value-added products carry far more processing and marketing value downstream — and almost none of it flows back to the farm gate. The more the dairy case tilts toward processed product, the smaller the Reillys’ slice of the total basket, even when their fluid share holds steady. We traced that erosion in our piece on how the milk dollar collapsed to 25¢. It’s the part of the story the June Dairy Month banner has never centered on.

“But milk’s a bargain” — true, and that’s exactly the trap

Here’s the defense you’ll hear, and it isn’t wrong. Adjusted for inflation, milk is cheaper than it was when the Reillys poured their last freestall. Consumers are getting a deal.

The problem is who’s absorbing the discount. The 2024 ERS data shows the moving parts: the retail whole-milk gallon actually fell five cents year over year, while the farm value rose nine cents — so that year, fluid milk’s farm share ticked up. But zoom out to all food and farmers kept just 11.8¢ of every dollar in 2024, down from 12.1¢ the year before, according to ERS’s Food Dollar series as summarized by the American Farm Bureau Federation in March 2026. After expenses, the same AFBF analysis puts farmers’ and ranchers’ combined net at 5.8¢ of the food dollar. The processing-and-retail middle is where the money sits, and it isn’t shrinking.

So “milk is a bargain” is true. The Reillys are just not the ones setting the price of the bargain.

How do you run the math on your own gallon — before the cake gets cut?

You don’t need a spreadsheet for this. Five minutes at the kitchen table turns a vague grievance into a number you can take to a lender or a co-op meeting. Here’s the four-step version the Reillys ran:

Step 1. Grab your latest mailbox price per hundredweight.

Step 2. Divide it by 11.6. (A gallon is about 8.6 lbs of milk, so a hundredweight covers roughly 11.6 gallons.) That’s your farm value per gallon.

Step 3. Stack it against the $3.98 retail gallon.

Step 4. Divide your number by $3.98. That’s your real farm share.

Run it at two prices and watch how exposed a fluid shipper is:

Milk priceFarm value per gallonShare of the $3.98 gallon
$20.90 mailbox~$1.80~45%
$14.59 Class III (Jan 2026)~$1.26~32%

That bottom row uses a raw Class III base, not a mailbox price — so it’s a floor, not what actually hits a check after premiums and producer price differential. Either way, the point holds: you keep somewhere between a third and a half of a fluid gallon, and a lot less once the milk turns into cheese or ice cream.

Now the checkoff side. Shipping roughly 38,000 hundredweight a year (see the methodology note for the assumption behind that), the Reillys’ 15¢/cwt assessment comes to about $5,700 leaving the tank annually — and up to 10¢ of it can be directed to a qualified state program, with the national nickel funding DMI regardless. A 200-cow herd at the same per-cow output crosses $8,000; a 500-cow dairy clears $20,000. Small money per cow. Real money in aggregate — and most of it spent without a direct vote.

What does your processor’s product mix do to your check?

Here’s the operational piece the farm-share average hides. Two farms can ship identical milk and bring home different money, depending on what their buyer makes with it. A co-op spinning your milk into private-label fluid and commodity cheddar passes back a thinner slice than one selling branded specialty product, because every processing step downstream eats into the share that can flow back to raw milk.

That’s why the Reillys’ real exposure isn’t the national 25% — it’s their own buyer’s spread. If their co-op’s processing margin widened last year while the farmgate price fell, the squeeze this article describes is happening inside their own supply chain, not just in an ERS chart.

Options and trade-offs for your operation

This isn’t a problem you fix with a better breeding decision or a tighter ration. It’s structural. But three moves sit inside the Reillys’ control — and yours.

Pull your co-op’s annual report and check the spread — within 30 days. Find the processing margin alongside the farmgate price they announced. Then ask one question: did that spread widen when milk prices fell last year? You’re a member-owner. You’re allowed to ask. Costs nothing but an afternoon. The catch: a co-op that won’t break out processing margins has told you something too.

Confirm where your 10¢ is going, and weigh the checkoff against your product mix. You can’t opt out — it’s mandatory, and that’s exactly the fight WILL is picking. But up to 10¢ of your 15¢ can be credited to a qualified state or regional program where farmer-elected boards direct the spending. Pull a milk settlement statement, find the checkoff line, and confirm with your handler. And if you ship into a fluid market like the Reillys, fluid’s $2.68 benefit-cost ratio — the lowest of any category the checkoff funds — says the national promotion is doing the least for you. A reason to lean on your delegates, loudly.

Watch the WILL case as a real variable, not background noise. If a constitutional challenge is filed and advances, the assessment and how it’s spent could come under pressure within a couple of years. That’s not a reason to build your budget around it. It is a reason to know where your producer organizations stand before the question reaches you. The risk: these cases move slowly, and nothing may change for a long time.

Key takeaways

  • If you ship into a fluid market, the checkoff has returned $2.68 per dollar on your product — the lowest of any category it funds, versus $17.73 for butter — so push your co-op delegates on spending priorities rather than assuming the promotion works for you.
  • If you can’t name your own farm-share number, you can’t argue it. Run the four-step gallon math before your next lender or co-op meeting.
  • If your 10¢ isn’t credited to a qualified state program, you’re losing local governance, not money — confirm with your handler this week.
  • If your co-op won’t show you its processing margin next to the farmgate price, treat that opacity as data — and ask louder.
  • If the WILL challenge is filed and advances, expect the checkoff’s structure and spending to come under pressure; know your producer org’s position now.

So what’s your real number?

The cows don’t know it’s June. They’ll eat the same ration, fill the same tank, and somebody in a boardroom will still build a campaign around it. The party’s real. So is the 25¢. The Reillys will pose with the calf again next year, because that’s who they are — but they’ll do it knowing exactly what their gallon is worth and exactly what their 15¢ is buying.

Methodology note. Farm-share and price figures are from USDA Economic Research Service farm-to-retail price-spread data, released June 2025 (2024 reference year): whole milk farm share 49% ($1.97 farm value / $3.98 retail gallon, up from 47% in 2023); butter 57% ($2.71 / $4.74 per lb); cheddar 32% ($1.80 / $5.66 per lb); regular ice cream 19% ($1.17 / $6.13 per half-gallon); total dairy basket 25% (23% in 2023, 28% in 2022). The 11.8¢ all-food farm share and 5.8¢ net figure are from ERS’s Food Dollar series, 2024 reference year, as summarized by the American Farm Bureau Federation, March 2026. Checkoff structure: 15¢/cwt assessment under the Dairy Production Stabilization Act of 1983 and Dairy Promotion and Research Order; producers may direct up to 10¢ to qualified state/regional programs, with 5¢ going national to the National Dairy Promotion and Research Board, which funds Dairy Management Inc. (per USDA AMS). The 2022 assessment totals ($352.1M producer; $79.7M MilkPEP processor) and all benefit-cost ratios are from USDA’s 2022 Dairy Report to Congress (published September 2024; covering 1995–2022; quantitative evaluation by Texas A&M economist Oral Capps Jr.): aggregate all-dairy BCR 5.23; fluid milk 2.68; cheese 3.87; butter 17.73; export 8.63; DMI-specific spending 6.51. (The fluid-milk BCR had fallen across prior evaluations — 3.26, then 1.91, then 1.63 — before rising to 2.68 in the current report.) DMI revenue figures ($165.7M in 2024; $178.3M in 2023; $127.1M domestic marketing; $23.7M export) are from DMI’s 2024 audited financial statements. Milk prices are from USDA WASDE/ERS (February 2026 WASDE: 2026 all-milk $18.95/cwt; 2025 revised $21.17/cwt; January 2026 announced Class III $14.59/cwt). Legal matters: the checkoff challenge is attributed to Daniel Lennington of the Wisconsin Institute for Law and Liberty as reported by Brownfield Ag News (May 27–28, 2026); the Adam Faust settlement details are from WILL’s May 2026 release and reflect the DOJ’s February 9, 2026 announcement; the $10M FFAR grant to dairy’s Net Zero Initiative was announced in 2021. Cochran v. Veneman (3rd Cir. 2004) struck the dairy checkoff down on First Amendment compelled-speech grounds; Johanns v. Livestock Marketing Association (U.S. 2005), a beef-checkoff case, established the “government speech” doctrine that has shielded checkoff programs since. The Federal Milk Marketing Order challenges by Organic Valley, Horizon, and Aurora are separate from the checkoff and were filed in spring 2026. Barn math: the ~$5,700 figure assumes a 140-cow herd at approximately 75 lbs/cow/day over 365 days (~38,300 cwt) × $0.15/cwt; per-herd figures scale at the same per-cow output. Gallon conversion uses 1 gallon ≈ 8.6 lbs of milk. All figures are USD.

Limitations. National averages may not reflect your region, herd size, product mix, or operation. Single-year farm-share figures are snapshots, not trends. Benefit-cost ratios are model estimates from a single congressional evaluation, not farm-level guarantees.

Conflict of interest. The Bullvine has no business relationship with Dairy Management Inc., the Wisconsin Institute for Law and Liberty, the Foundation for Food & Agriculture Research, or any party named in this article.

Corrections. Spot an error? Tell us. We correct publicly, at the top of the article, dated.

This article is based on reporting and public records available as of June 1, 2026. The legal claims described are allegations, not court findings. “The Reillys” is a disclosed composite scenario, not a single real farm; all attached figures are sourced.

Learn More

The Sunday Read Dairy Professionals Don’t Skip.

Every week, thousands of producers, breeders, and industry insiders open Bullvine Weekly for genetics insights, market shifts, and profit strategies they won’t find anywhere else. One email. Five minutes. Smarter decisions all week.
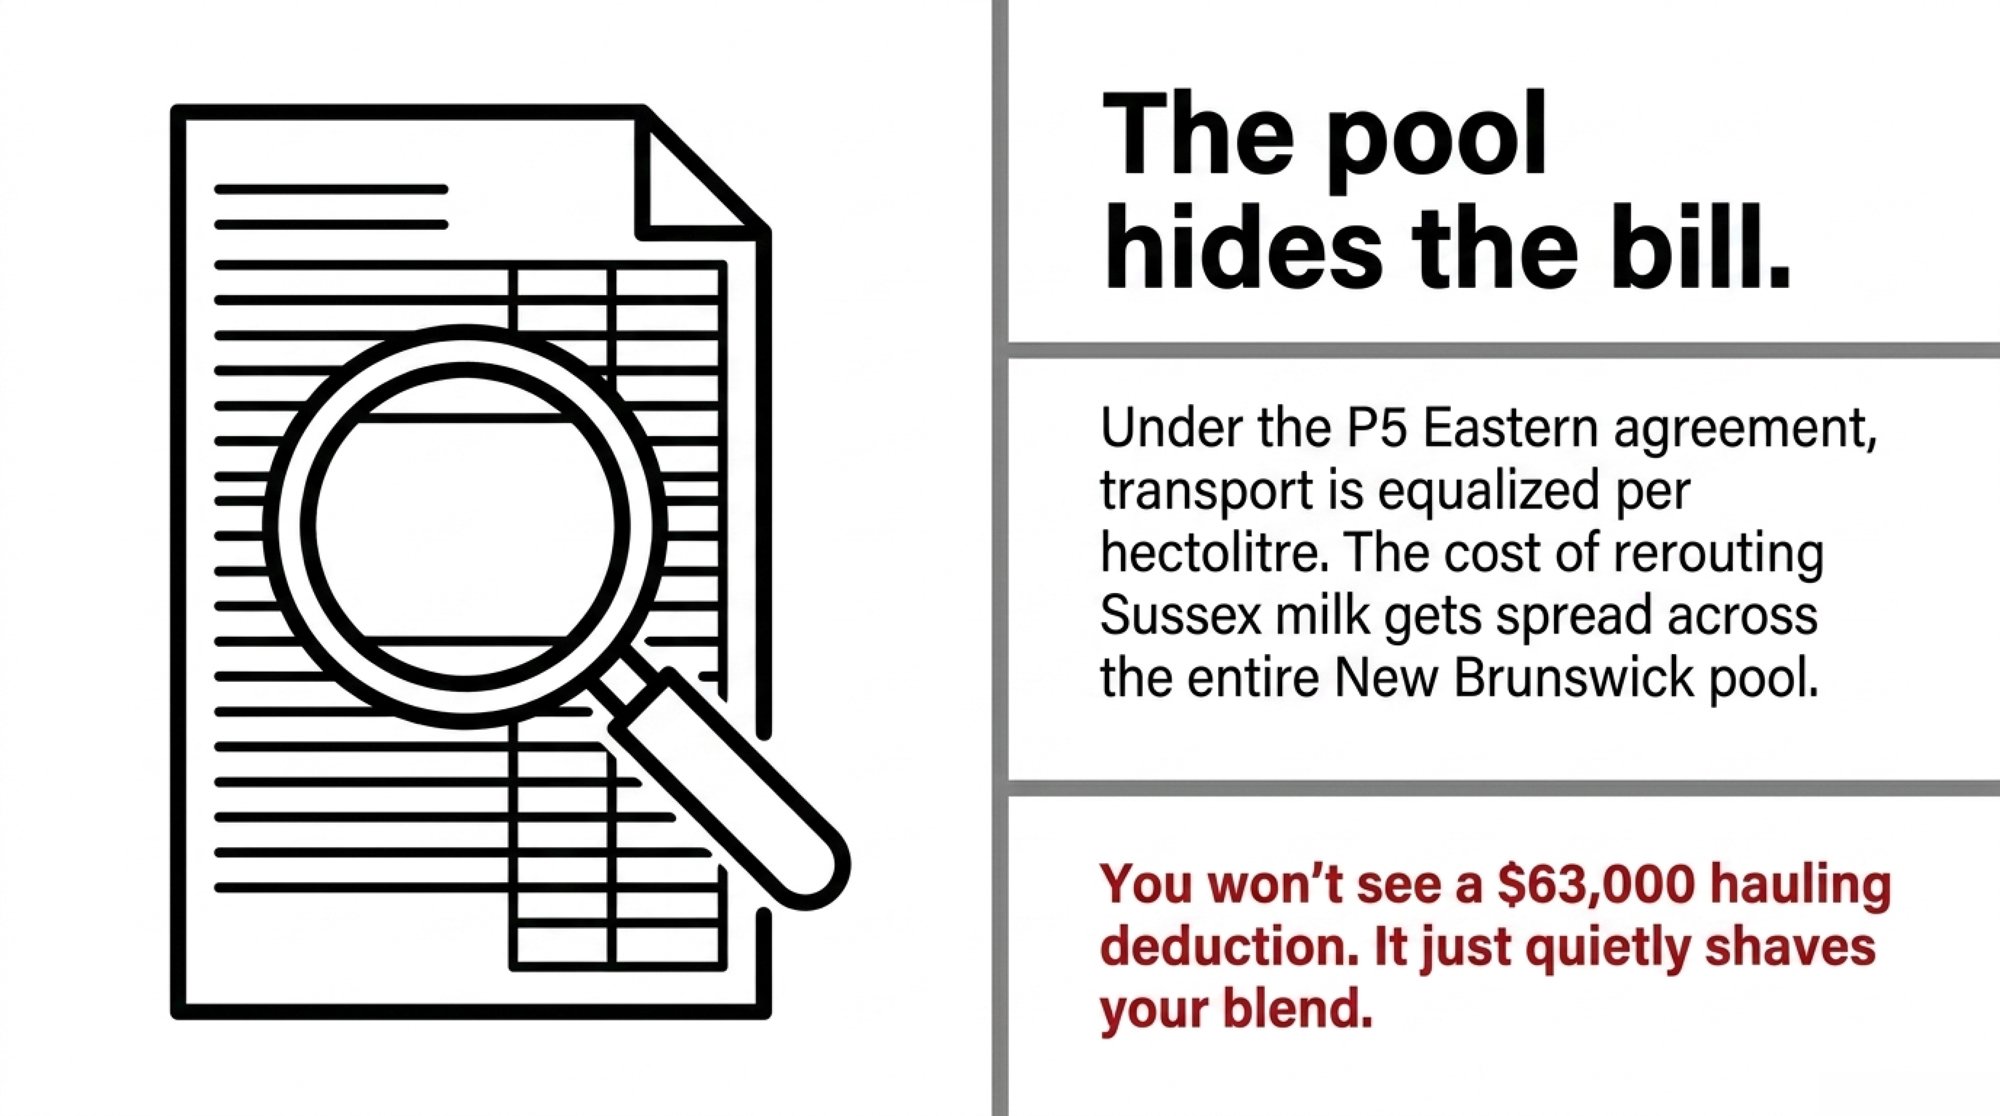
NewsSubscribe
First
Last
Consent

€88,500: The Revenue Swing Waiting for DMK Farmers in 2028

A 2.2-cent top-up cushions DMK and DOC farmers through March 2028. Then component pricing kicks in — and on 1.5M kg, the swing runs to €88,500. Which way does yours break?

Executive Summary: On June 1, Arla absorbs Germany’s DMK and the Dutch co-op DOC to form Europe’s largest farmer-owned dairy, 11,200 members and €20 billion in revenue trading under one name. DMK and DOC farmers get a 2.2-cent-per-kg transition top-up — but it runs out in March 2028, and that’s the date that matters. After it, everyone shifts to Arla’s component-based pricing, and by The Bullvine’s modeling the annual swing on a 1.5-million-kg operation runs to €88,500 depending on your butterfat, protein, and where butter and powder markets land. The upside is real: the deal scales Arla and DMK’s whey JV right as WPC80 clears €17,000 a tonne in Europe, though that margin reaches you diluted across 11,200 members and split between today’s milk price and tomorrow’s capital projects — not as a cheque marked “your share.” The catch is leverage: at this scale your vote on the pricing formula thins to noise, and even EMB president Kjartan Poulsen, an Arla member himself, says co-ops this big “neither live up to their responsibility nor meet the standards they themselves set out.” Your move before the cushion ends is unglamorous — pull your current price, volume, and components now, and start the butterfat work this season, because it doesn’t move fast. Ask Fonterra’s farmers how long it took to force the brands-versus-milk question; the ones who came out ahead tracked their own numbers early instead of waiting for the reckoning.

Arla DMK merger

Editor’s Note: The two-farmer comparison that opens this piece is a composite scenario, modeled from published DMK, DOC Kaas, and Arla milk-price data — not a single real, named producer. The co-ops have not released farm-level pricing. The figures are sound; the farmers are illustrative.

Picture two dairy farmers, each shipping 1.5 million kg a year. One sells to DMK in Germany at roughly €0.473 per kilogram. The other sells to Arla at about €0.509. Same milk, same workload — and, by The Bullvine’s modeling, a gap of nearly €54,000 a year at that volume. As of June 1, those two farmers are in the same cooperative.

That’s the story sitting under the biggest dairy deal in Europe this year. On May 28, 2026, the European Commission unconditionally approved Arla Foods’ acquisition of Germany’s DMK and the Dutch cooperative DOC. By Arla and DMK’s own announcement, the merger brings together 11,200 dairy farmers across seven countries, 28,800 colleagues, a 19.4 billion kg milk pool, and pro forma revenue above €20 billion — all trading under the Arla name as of June 1. The press releases talk about resilience and food security. But if you’re milking cows in Germany, the question is narrower: will that scale actually show up in your milk cheque? And the honest answer doesn’t land until the transition payments run out in 2028.

What’s Changing and Why

European milk production is shrinking, and that’s the engine behind all of this. The European Commission’s 2023–2035 outlook projected the EU dairy herd would contract by 13% by 2035 relative to the 2021–2023 average; its newer 2024–2035 edition softened that to an 11% decline, but the direction is the same either way. Stack on input-cost pressure, tightening environmental rules, and a handful of grocery chains setting the terms, and cooperatives face a blunt choice. Get bigger, or get squeezed between the global processors above them and the retailers below.

DimensionDMK/DOC Farmers — NowArla-DMK Farmers — Post-March 2028
Milk pricing modelFlat regional rate (~€0.473/kg)Component-based: butterfat, protein, quality
Transition support+€0.022/kg top-up, paid quarterlyTop-up expires; no published replacement floor
Annual revenue swing (1.5M kg)Stable, predictable±€88,500 depending on components & markets
Commodity riskAbsorbed by co-op balance sheetTransferred to individual farm P&L
Governance weightRegional co-op structure1 farm voice across 11,200 members, 7 countries
Whey/ingredients upsideLimited direct accessScaled JV — but diluted into performance price
Butterfat premium signalMinimal pricing incentiveDirect revenue impact per 0.1% BF shift
Walk-away leverageModerate — regional alternatives existShrinking — fewer large buyers as herd contracts
Producer org rights (EU law)Standard cooperative rules applySame — lighter transparency obligations than arms-length processors
Key action deadlineBaseline audit before June 1, 2026Component/nutrition work before March 2028

That’s why consolidation is sweeping the continent. FrieslandCampina merged with Milcobel — a deal that took effect January 1, 2026 — to form a cooperative worth roughly €14 billion, and now Arla-DMK clears €20 billion. The two partners aren’t strangers, either — they’ve jointly run a whey-processing venture for over a decade, so this is a deepening of an existing relationship rather than a leap into the dark.

Who feels it most? German and Dutch producers — and the reason sits in the raw scale gap between the two sides.

What each side bringsArlaDMK
Revenue into the deal€15.1 billion€5.3 billion
Milk pool14.3 billion kg5.1 billion kg
Recent farmer payout50.9 EUR-cent/kg performance price — its second-highest everRevenue down 6.7%, partly as producers walked after the deal was announced

That’s not a merger of equals — it’s nearly a 3-to-1 gap on both revenue and milk. Arla members already sit toward the top of the pricing scale. DMK and DOC farmers are the ones whose cheques face the real change, and some voted with their feet before the ink was dry.

Don’t Forget the Dutch Side

DMK gets most of the attention because it’s the bigger of the two acquired co-ops, but DOC Kaas is the third party in this deal, and its farmers face the same pricing question on the same timeline. DOC is the Dutch cooperative folded in alongside DMK, and its members receive the same 2.2-euro-cent transition top-up through March 2028. Same bridge, same cliff at the end of it.

The Dutch piece matters for a reason beyond size. Producers in the Netherlands are already squeezed by some of the tightest environmental and nitrogen rules in Europe, so a DOC farmer weighing the post-2028 pricing switch is doing so on top of herd-size and land-use pressures that a German or Danish member may not feel as acutely. The merger doesn’t change those rules. It just changes who buys the milk and how the cheque gets calculated. So if you’re a DOC member, the transition-year math in this piece is yours too — and the regulatory backdrop only sharpens the case for knowing your numbers cold before the cushion ends.

How This Plays Out on Real Farms

The merger softens the immediate blow with a bridge payment. From 2026 through 2028, DMK and DOC Kaas farmers receive an extra 2.2 euro cents per kilogram, paid quarterly and drawn from the merged entity’s common equity — not by cutting anyone’s current price. The schedule runs in installments through to a final payment in March 2028. Genuine money in the near term. But a bridge, not a raise.

Here’s where it gets real for herds at your scale. When the top-up ends in 2028, every member shifts onto Arla’s component-based pricing — milk value set by butterfat, protein, and quality rather than a flat regional rate, as laid out in DMK’s milk-price model summary. According to The Bullvine’s modeling, that can swing annual revenue for a 1.5 million kg operation by as much as €88,500, depending on your components and where commodity markets land — the full scenario assumptions are in our component-pricing breakdown. That’s a modeled range, not a published Arla figure; the co-op hasn’t released a farm-level formula.

Think about what an €88,500 swing covers. A year and a half of tractor payments. A full parlour renovation. The farms that come out ahead are the ones with strong butterfat and protein levels and enough cash reserves to ride out volatility. The marginal producers are the ones who tend to exit in the years after, and in a shrinking market, that attrition tightens the milk pool on its own, with no formal decision required and no one announcing a cut. That’s how pay-for-quality systems work everywhere, not a quirk of this deal.

The Mechanics Behind the Outcomes

Component pricing isn’t a trick. It’s standard across much of the dairy world, and it genuinely rewards quality milk. But it also hands you commodity risk the cooperative’s balance sheet used to absorb. Your cheque now rides global butter and powder markets you don’t control.

The deeper tension sits one level up. The same cooperative that’s supposed to fight for high milk prices for its members is also the buyer trying to source raw milk as cheaply as it can. Arla and DMK both frame “the highest possible milk price” as the core purpose of the merged co-op. But at 11,200 members across seven countries and several languages, your individual influence shrinks toward statistical noise.

Picture how a decision actually gets made in a co-op this size. You don’t vote on the milk-price formula at your kitchen table. You elect a district representative, who sits on a regional council that sends delegates to a board of representatives, which hires the management team that runs the pricing model day-to-day. By the time a pricing decision reaches you, it’s passed through three or four layers — and at each one, your single farm’s weight gets diluted against thousands of others. That’s not corruption. It’s arithmetic. Kjartan Poulsen — an Arla member himself, and president of the European Milk Board — argues cooperatives at this scale “neither live up to their responsibility nor meet the standards they themselves set out.”

There’s a regulatory wrinkle most farmers never hear about, too. As Poulsen and the European Milk Board frame it, this is a structural feature of EU cooperative law, not of any one co-op: because members own the business, the contract-transparency rules that bind arms-length processors often don’t apply, and members generally can’t form independent producer organizations to negotiate price. So a large cooperative can operate under lighter pricing-transparency obligations than a standard processor contract, while the farmers inside it have fewer outside tools to push back. You gain scale. You give up leverage.

The Whey Upside: Does the Margin Come Back to You?

Now, the genuinely promising part of this deal. The whey protein and ingredients business is Arla-DMK’s strongest card. WPC80 — whey protein concentrate, the high-value stuff bound for sports nutrition, infant formula, and clinical nutrition — hit nearly €17,000 per tonne in Europe and over €18,000 in the US in spring 2026, driven by structural supply bottlenecks and surging protein demand. The existing whey joint venture already turns DMK’s cheese-stream byproduct into that product, and the merger scales it hard.

Follow the milk to see why that matters. Cheesemaking turns only about a tenth of your milk into cheese — the rest, the bulk of it, leaves the vat as whey. For decades, that stream was a disposal cost; now it’s the highest-margin product in the building. A merged co-op with a bigger cheese footprint generates more whey, and more whey at €17,000 a tonne is real money. The question is whose money.

In Arla’s model, the answer runs like this. Arla pays members a single performance price — a blended per-kilo figure that already accounts for whatever it earns downstream, including ingredients — and what isn’t paid out is retained as member equity on the cooperative’s balance sheet. So whey margin doesn’t arrive as a separate cheque marked “your share of WPC80.” It either lifts the performance price for everyone, or it sits as retained equity funding the next dryer or acquisition — value you technically own but can’t spend until you exit the co-op. That’s the real mechanism behind the tease. Ingredient profit reaches you diluted across 11,200 members and split between today’s milk price and tomorrow’s capital projects, and you don’t get a vote on that split line by line. DMK’s materials promise that the merger will “further grow the value of our milk,” but there’s no published formula that ties whey EBITDA to your individual price. Until there is, “grows the value of our milk” and “raises my cheque this year” are not the same sentence — and that’s the question worth raising out loud at your regional meeting.

Options and Trade-Offs: Your Pre-2028 Sequence

No single path fits every operation, but the order matters. These four moves run from “this week” to “before the cushion ends” — work them in sequence, because each one sets up the next.

Step 1 — Within 30 days: lock down your baseline. Pull your milk statements and write down three numbers: your exact current price, your trailing 12-month volume, and your component profile (butterfat %, protein %, somatic cell average). It takes an afternoon, it carries zero risk, and it’s the only way you’ll know — once component pricing fully takes over in 2028 — whether the new math is rewarding your milk or quietly clipping it. Skip this, and you’re flying blind into the switch.

Step 2 — This quarter: decide what the 2.2-cent top-up is for. Treat it as one-time income, not a raise — push it into working-capital reserves or component-improving nutrition, not new fixed costs. That works if your operation is stable, but it takes discipline while the cash flow feels good. And don’t finance a tractor on money that disappears in 2028.

Step 3 — This season: start the component work, because it’s slow. Lifting butterfat 0.2–0.3% takes ration work, genetics decisions, and forage quality — none of it moves fast. Begin before the March 2028 cutoff, not after, especially with European processors already signalling they want less butterfat than farmers have been breeding for. Start now, or you’ll be adjusting after the window closes.

Step 4 — Before the cushion ends: know your walk-away number. UK cost analysis puts structural unprofitability for many farms at around €0.38–0.43/kg, depending on cost structure and debt — a German or Dutch figure may look different. Run a 12-month cash flow at three milk prices: current, 10% down, and 15% down. If the 15%-down case sinks you, build the contingency plan now, while the transition cushion still exists.

Run alongside all four — the governance play: work your regional council, not just the central board. Arla runs through regional farmer structures, and the merged co-op pledges “representation and decision making among all members.” Show up in 2026–2027, while the cooperative still needs farmers’ goodwill to ensure smooth integration. One farm won’t reshape a €20 billion pricing model — but a documented record of asking the hard question is leverage you’ll want later.

How Much Does Waiting Until 2028 Actually Cost You?

The honest answer: nobody can hand you a hard post-2028 figure yet, because the long-run pricing formula hasn’t been published in farm-level detail. And that’s exactly the problem. The leverage you hold today comes from the cooperative needing your cooperation to integrate smoothly. Once the bridge payments stop in March 2028 and the new model locks in, that leverage shifts toward management.

Look at Fonterra for the cautionary version. New Zealand’s farmer-owners spent years debating how far their cooperative should chase consumer brands versus focus on the milk pool. In October 2025, they settled it — voting to sell the entire Consumer and associated businesses (Mainland Group) to Lactalis for NZ$4.22 billion, with 88.47% of votes cast in favour. A decisive verdict that the cooperative’s best returns came from milk, not brands. The lesson for Arla-DMK members isn’t the outcome — it’s the years it took farmers to force the question. The ones who fared best didn’t wait for the collective reckoning. They tracked their own numbers early.

Is Your Herd’s Component Profile Ready for the Switch?

Under a flat-rate structure, the gap between a herd at 4.2% butterfat and one at 3.8% might not move your cheque much. Under component pricing, that same gap can meaningfully change annual revenue on a 1.5 million kg farm — and it’s a live issue right now, with European processors already signalling they want less butterfat than farmers have been breeding for. That’s not a rounding error. That’s whether your kid can take over the operation.

The window to adjust components is now, during the transition years — not once the new math is fully live in 2028. Nutrition tweaks, genetics decisions, and forage quality all move the needle, but slowly. If your butterfat and protein are out of step with where your processor’s premiums are headed, that’s the number to start working this season. Where does yours sit right now?

Your Decision Triggers

If you only act on one thing this year, make it the first row. Each trigger below maps a situation to a move and a deadline — pull the dates onto your own calendar.

If this is youDo thisBy when
You ship to DMK or DOCWrite down your exact current price, 12-month volume, and component profile so you have a baselineBefore June 1, 2026
You’re getting the 2.2-cent top-upBank it or spend it on components — run the post-2028 cashflow before committing it to anything fixedThis quarter
Your butterfat/protein is out of step with your processor’s premium signalsStart ration and genetics work — component shifts take yearsThis season
A 15%-below-current milk price would break youRun a three-scenario cashflow and build the contingency plan while the cushion existsBefore March 2028
You want a say in the post-2028 formulaGet to your regional council meetings and ask for the pricing math in writing2026–2027
You don’t know your walk-away priceCalculate the per-kg point where you burn equity every monthBefore the cushion ends

What’s Your Number?

The merger will almost certainly succeed as a business. The open question is whether “Europe’s largest farmer-owned cooperative” still behaves like a cooperative at 11,200 members across seven countries — or whether scale quietly turns member-owners into shareholders in a €20 billion food company. We won’t know until the cheques arrive after 2028. And management, fair to say, knows a great deal more about that answer right now than you do.

So before the transition years lull anyone to sleep, two questions are worth sitting with. Where does your breakeven actually sit? And could your operation absorb an €88,500 revenue swing if components and commodity markets turn against you simultaneously? You now own a piece of the biggest dairy cooperative on the continent. The only thing that determines whether that’s an asset or a slow squeeze is whether you’re watching your own numbers as closely as their management watches theirs.

Key Takeaways

  • The 2.2-cent top-up runs out in March 2028. Treat it as one-time money, not a raise — bank it or put it toward components, and don’t finance anything fixed on it.
  • Once component pricing takes over, the swing on a 1.5-million-kg farm runs to €88,500 depending on your butterfat, protein, and where butter and powder land. Pull your current price, volume, and components now so you’ve got a baseline.
  • Lifting butterfat 0.2–0.3% takes ration, genetics, and forage work that doesn’t move fast. Start this season, not after the cutoff.
  • At 11,200 members your vote on the pricing formula thins out, so work your regional council in 2026–2027 while the co-op still needs farmer goodwill to integrate.

Run Your Numbers

Component Value Tracker — Before 2028 turns butterfat and protein into your milk-check math, run the Component Value Tracker to see what 0.1 point of fat or protein is actually worth in your herd — and pressure-test whether your components leave you on the winning or losing side of that €88,500 swing.

Complete references and supporting documentation are available upon request by contacting the editorial team at editor@thebullvine.com.

Learn More

The Sunday Read Dairy Professionals Don’t Skip.

Every week, thousands of producers, breeders, and industry insiders open Bullvine Weekly for genetics insights, market shifts, and profit strategies they won’t find anywhere else. One email. Five minutes. Smarter decisions all week.
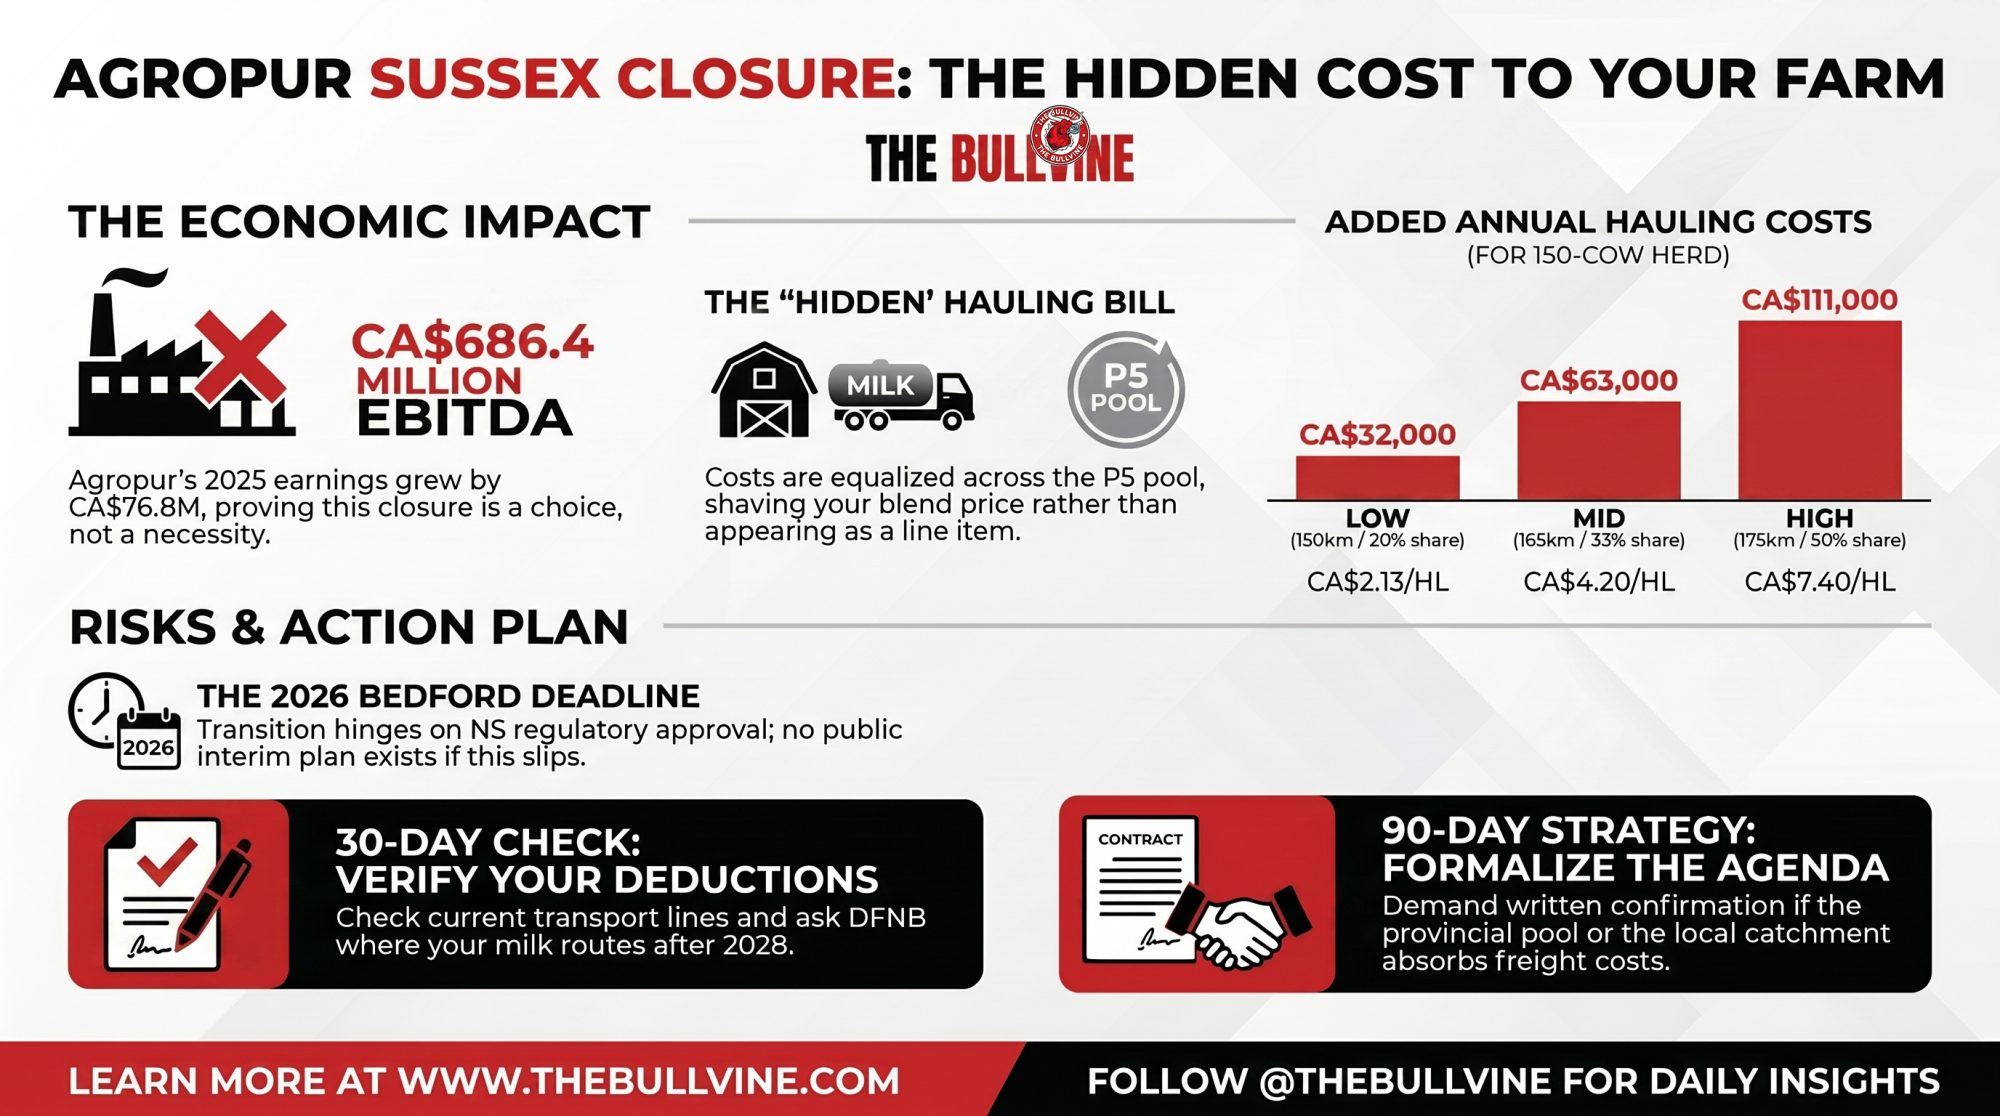
NewsSubscribe
First
Last
Consent

Oakfield Corners Dairy Lost 17 Genotyped Heifers Overnight. The Dairy Community Brought Them Home

Seventeen genotyped Holsteins — $3,500 to $5,000 a head — gone from Lamb Farms’ pen overnight. No GPS found them. A fast-moving dairy network did, in roughly 48 hours.

Picture walking out to your calf facility at daybreak and finding the pen empty. That’s what happened at Lamb Farms on Bliss Road in Oakfield, New York, after 17 five-month-old Holstein heifers went missing between 1 and 3 a.m. Sunday, according to The Batavian’s report on the farm’s Facebook alert (The Batavian). About 48 hours later, WKBW reported that all 17 calves had been located and confirmed safe by the Genesee County Sheriff’s Office (WKBW).

UPDATE — June 5, 2026: Arrests made. A Lockport couple has been charged in the overnight theft of 17 calves from Lamb Farms.

A husband and wife from Lockport, New York, are facing multiple felony charges in connection with the 17 genotyped calves taken from Lamb Farms in Oakfield. Torrence A. Schmitt, 25, and Kerisa J. Schmitt, 26, were taken into custody Wednesday in Jamestown, with assistance from Chautauqua County sheriff’s deputies, and transferred to the Genesee County Jail to await arraignment, The Daily News reported.

Both are charged with third-degree burglary, third-degree grand larceny, tampering with evidence, and first-degree falsifying business records. Each is also accused of removing and destroying the identification tags from 16 of the calves — the genotyping ear tags that ultimately made the animals traceable.

The calves disappeared overnight on May 24. According to investigators, a neighbor’s security camera on Lockport Road in Alabama captured a heavy-duty pickup pulling a cattle trailer, followed closely by a second vehicle, at 1:21 a.m. The animals were recovered May 27 at Lebanon Valley Livestock Market in Pennsylvania — roughly halfway between Harrisburg and Reading — and returned to Lamb Farms. Their total value was placed at $41,000.

The investigation was led by the Genesee County Criminal Investigations Division. Both Schmitts were released under the supervision of Genesee Justice and are scheduled to appear in Genesee County Court at a later date.

The Schmitts are charged but have not been convicted; the allegations described above are drawn from law enforcement and court information as reported by The Daily News.

The original industry-wide alert, published May 24, follows below.

Oakfield Corners Dairy confirmed all 17 stolen heifers were located and safe in this May 26 update, crediting the dairy community and social media for the tips that brought them home — and deferring further comment to the sheriff’s ongoing investigation. (Oakfield Corners Dairy via Facebook)

That rarely happens. Calves move fast, tags get cut, and a trailer can be three counties gone before anyone’s had their first coffee. Oakfield beat the clock — and not because the system ran perfectly. It happened because a farm community moved fast enough to keep the animals visible. Here’s the whole story of how 17 genotyped Holstein heifers vanished and came home, and the playbook every registered herd should copy.

Why did the dairy community recover these calves before the trail went cold?

The Bullvine’s original alert pegged the group as 17 five-month-old genotyped Holstein heifers from Oakfield Corners Dairy, a division of Lamb Farms, hauled off in a truck and cattle trailer that headed west on Lockport Road (The Bullvine). With the Thruway right there, those calves could’ve been three states away by chore time.

Then the network kicked in. Public reporting confirms the recovery but leaves key details unanswered: where the heifers were located, which tip or tips moved the case, and whether any recovery details are being withheld because the investigation remains open (WKBW). That restraint matters. A clean public alert helps investigators; a rumor storm can wreck a case.

Investigators didn’t hide where the help came from. The Genesee County Sheriff’s Office confirmed the recovery, said the case is still open, and credited the ag community for the tips that moved it (WKBW).

That’s the real story here. A sheriff’s office can take the call. But it’s the farm community that makes stolen animals impossible to move — and then hands over the one tip that turns a missing-cattle report into a recovery.

How does a single tip beat a stolen trailer with a head start?

Run the timeline in your head. The heifers left Bliss Road overnight. By Sunday morning, the theft had been reported, and Lamb Farms had an alert up asking anyone who’d seen cattle being moved to speak up (The Batavian). About 48 hours after that, the calves were located out of state and headed home (WKBW).

That gap — head start versus recovery window — is the whole ballgame. Every hour the thieves move freely, the calves slide closer to a private sale or an informal channel where they stop looking stolen and start looking like inventory. What slammed that window shut wasn’t a GPS ping. It was a person who saw something that didn’t add up and knew exactly who to call.

And here’s the part worth sitting with: a watch list moving through the dairy community doesn’t stop at the county border. Neither does a trailer, a hauler, an order buyer, or a neighbor who clocks that a load of fresh five-month-old Holsteins showing up out of nowhere just doesn’t fit. Neither does a hauler, an order buyer, or a neighbor who clocks that a load of fresh five-month-old Holsteins showing up out of nowhere just doesn’t fit. That cross-border reach is exactly the kind of weak spot cattle thieves count on you not closing.

Social media did the one job rural networks couldn’t

Farmers have warned each other by phone tree, coffee shop, and sale-barn whisper network forever. Facebook just made that network visible — and fast. Lamb Farms’ Facebook alert asked neighbors with cameras to check for a truck hauling a cattle trailer between 1 and 3 a.m. Sunday and asked cattle people to watch for anyone trying to sell calves fitting the description (The Batavian). WKBW later reported that law enforcement credited the agricultural community’s tips as central to the recovery (WKBW).

Stolen cattle don’t vanish into thin air. They move through real places — roads, trailers, auctions, back lots, holding pens. The Bullvine’s alert asked sale barns, order buyers, auction yards, neighbors, folks with driveway cameras, and haulers to keep an eye out and call the Genesee County Sheriff’s Office (The Bullvine).

The Facebook alert Oakfield Corners Dairy posted hours after the theft, showing reference calves that match the stolen group’s age, size, and layered ID — 5-month-old genotyped Holsteins with an EID button, dual ear tags, and an ear-punch site. The post drew 3.5K shares and the description that fed the recovery tips. (Oakfield Corners Dairy via Facebook)

That’s where a post earns its keep. Not in outrage — in distribution. One good post puts a calf’s description in front of the guy unloading a trailer, the neighbor checking her camera, and the breeder who knows Oakfield cattle well enough to say, “That doesn’t belong there.”

The flip side writes itself: social media can also turn into a rumor mill with a keyboard. This one worked because the message stayed useful — missing calves, description, who to call, and a clear ask. No suspect names. No armchair detectives. And watch what Lamb Farms did after the recovery: they went quiet and let law enforcement work. That restraint is as much a part of the playbook as the alert itself.

These weren’t anonymous calves — and that changed everything

Oakfield Corners isn’t running feeder calves. It’s a division of Lamb Farms built on elite Holstein cow families, a large ET and IVF program, and both high-GTPI and show-quality stock (Oakfield Corners Dairy). GENEX’s profile of Alicia Lamb puts the combined operation at about 11,000 cows across three farms in western New York and one in western Ohio, with roughly 99% Holstein (GENEX).

So these weren’t commodity calves headed for a feedlot. The Bullvine’s original alert described them as fully genotyped heifers with layered ID — an EID button, visual management tags, and a tissue-punch site from which the genotype sample was taken (The Bullvine).

The Bullvine’s alert valued the group at $3,500 to $5,000 per head (The Bullvine). Do the kitchen-table math: 17 head at $3,500 is $59,500. At $5,000, you’re looking at $85,000 — and that’s before you factor in staff time, lost breeding opportunities, donor potential, or the gut-punch of losing animals from a program you’ve spent years building.

In New York, property worth more than $50,000 crosses into second-degree grand larceny, a class C felony (NY Penal Law 155.40). Nobody’s been charged with that here — the case is open, and charging calls belong to prosecutors (WKBW). But it tells you this isn’t a “couple kids grabbed a calf” story. It’s serious money, serious crime — and it landed in a replacement market where comparable animals are expensive and hard to source.USDA Agricultural Prices data, tracked by CoBank, put replacement heifers at an average of $3,010 per head nationally as of July 2025 — up 75% from $1,720 in April 2023 and near record highs (The Bullvine). When the pipeline’s that tight, stolen animals are that much harder to replace at any price.

Does a genotype actually help you get an animal back?

Honest answer: not directly, and public reporting has not confirmed that genomic data was used in this recovery. The break came from a tip, not a lab. What the records do change is what a thief can actually do with the animals once they’ve got them.

Think about where stolen calves usually disappear — a sale barn, an order buyer, a quiet private deal. That exit ramp is mostly closed when the calves are elite registered Holsteins. A pen of fresh five-month-old genotyped heifers from a program like Oakfield Corners isn’t anonymous in the registered world. People recognize this kind of cattle, and a load that shows up from nowhere raises eyebrows fast. That’s the same network The Bullvine alert leaned on when it asked sale barns, order buyers, and auction yards to watch (The Bullvine). The genotype doesn’t ping a location — but it can make calves harder to launder into legitimate cattle channels, which may buy time for tips, records, and investigators to catch up.

Here’s the formal backstop. ICAR defines animal-identification confirmation as the use of genomic markers to determine whether a tissue sample can be excluded as originating from a particular animal (ICAR). CDCB’s SNP-based parentage service runs those markers and returns a verdict — accepted, doubtful, or excluded (CDCB). Holstein Association USA will verify parentage when an animal’s ID gets challenged (Holstein Association USA).

In plain terms, with the records and a clean sample, a genotyped animal is a lot harder to sell into the legitimate cattle business. Not impossible. Harder. When a recovered calf shows up with a cut tag and a story that doesn’t hold, a genotype is the difference between “we think she’s ours” and “we can prove she’s ours.”

What a genotype won’t do is tell you where a calf spent Tuesday night, or prove who cut a tag, or replace video and witnesses. USDA APHIS is blunt: animal disease traceability exists to trace animals during disease outbreaks — it’s not a theft-tracking app (USDA APHIS). Still, biology’s a stubborn witness. Tags disappear. Paperwork gets creative. DNA’s a lot harder to argue with.

Your 840 EID tag is not a GPS — don’t bet your herd on it

This is where a few farms need a cold splash of water. An 840 tag tells the world an animal is who you say she is. It does not tell you where she is. Farm Progress reported in November 2024 that 840 tags carry no GPS and broadcast no location, at roughly $3 a head per NCBA (Farm Progress). USDA APHIS requires official eartags to carry a unique ID and be tamper-evident and high-retention — that’s identification infrastructure, not a tracking collar (USDA APHIS).

That matters because of how this theft actually ended. No tag pinged a location. A person did. The tag’s job starts later — once the animals are in hand, and someone has to prove who owns them before a prosecutor.

No single layer carries the load alone. EID proves identity. Genomics backstops it. Cameras show how she left. A social post turns one farm’s bad night into an industry-wide watch list. A tip from inside that network finds the animals. Law enforcement ties it together. Oakfield got its calves back because several of those layers fired at once — and the one that actually found them was human, not technological.

What happens to your insurance claim if those calves never come home?

If those 17 heifers hadn’t turned up, the ugly question follows fast: what were they insured as? Penn State Extension’s farm insurance guidance is clear that property coverage may include theft, but policies vary by company, limits cap what you can collect, and losses are valued at actual cash value, replacement cost, or functional replacement cost depending on the policy (Penn State Extension).

Here’s where the gap gets expensive. Take the worst-case spread: a policy that pays bare commodity actual cash value — the kind of payout a non-scheduled policy can default to — near the roughly $3,010-a-head replacement average reported by USDA and CoBank in mid-2025 (The Bullvine), set against the top of Oakfield’s genetics value at $5,000. On 17 head, that’s about $51,000 in your pocket against roughly $85,000 in real value — a gap of nearly $34,000 you’d eat, before any donor or show upside. Your insurer doesn’t pay for the cow family you spent a decade building unless the schedule says so.

There’s a sharper trap stacked on top. Penn State warns that animals being hauled in a truck or trailer often aren’t covered by the vehicle policy unless they’re specifically listed, and farms that move stock regularly need to confirm they’re covered under the farm owner’s policy (Penn State Extension).

A registered, genotyped Holstein heifer isn’t just “one head.” She might be a donor prospect, a bull-mother candidate, an IVF flush waiting to happen. If your insurance schedule doesn’t know that, neither will your claim. Plenty of registered operations are carrying a genetics portfolio on a commodity insurance frame — the same blind spot that makes genotyped females worth far more on paper than your balance sheet admits, and the kind of thing that should make any lender or herd advisor sit up.

Ohio shows the version where it doesn’t end well

Oakfield is the hopeful case. Ohio is the warning shot. Sixty-four Holstein calves were stolen from a farm near Coldwater in Mercer County sometime between 10 p.m. Saturday, May 2, and the early hours of May 3 — valued at up to roughly $128,000 for the group (Farm and DairyDayton 24/7 Now).

Mercer County Sheriff Doug Timmerman called it “highly coordinated.” As of his office’s May 7 update, there were no suspects, and investigators were still asking anyone with information to call the detective division at 419-586-7724 (Farm and Dairy). As of the May 5 Dayton 24/7 Now report and the May 7 Farm and Dairy update, no recovery had been reported in those articles.

Same crime, very different ending. That doesn’t prove genomics or any single tool would’ve guaranteed Oakfield’s outcome — their break came from a tip, and tips don’t run on a schedule. What it proves is that every hour matters and every layer counts. Once calves are commingled, sold quietly, or pushed through informal channels, the trail thins. Once the alert goes cold, the tips dry up. Once the video overwrites, you’ve got nothing. The lesson isn’t that every theft ends well. It’s that fast, accurate, community-wide attention narrows the escape route — and the farms that get their cattle back are usually the ones who were ready before the trailer ever pulled in.

Options and trade-offs: building a theft plan that actually works

If you run registered cattle, your recovery plan can’t live in your head. Four layers do the heavy lifting. Here’s what each one takes — and where each one bites.

1. Build the animal packet (do this within 30 days)

What it is: current photos, official ID, visual tag number, registration info, genotype sample ID, dam and sire, birth date, and ownership docs on every high-value heifer — stored where your team can pull them at 2 a.m. Holstein USA notes you can tie TSU numbers to ID and test ordering through Enlight to make this less of a chore (Holstein Association USA).

  • When it works: recovery and insurance claims move fast, and you can prove ownership across a state line.
  • Where it bites: it’s tedious to build, and a packet nobody can find at 2 a.m. is worthless.

2. Wire up the alert list — not just your Facebook followers

What it is: sheriff, neighbors, employees, haulers, sale barns, order buyers, your vet, breed contacts, genetics reps, local dairy media. Program your county sheriff’s non-emergency line into every barn phone now, so your people have a clear place to send a tip, as Oakfield’s network did.

  • When it works: you get eyes on the real choke points, across regions — not just inside your county.
  • Where it bites: a list you’ve never tested goes stale fast.

3. Put cameras where trailers move, not where they look nice

What it is: coverage on the exits and load-out points, not the pretty barn shot. Farm Progress reported that a basic farm video setup can run a few hundred dollars if you already have internet, while a professional five-camera system with software can cost several thousand (Farm Progress). Retail cellular and solar cameras run roughly $100–$400 each, before data plans and installation (Tractor Supply).

  • When it works: you hand investigators a plate or a vehicle description within the first hour.
  • Where it bites: footage overwrites in days — review it fast or lose it.

4. Call your broker this week with one uncomfortable question

What it is: ask flat out, “If my top 20 genotyped heifers walk off tonight and never come back, what check do I actually get?” Penn State’s guidance makes it clear that your policy limits, valuation method, and scheduled coverage determine what a loss becomes when it becomes a claim (Penn State Extension).

  • When it works: you find the gap before the gap finds you.
  • Where it bites: closing it may cost more in premium — pay now or pray later.

Key Takeaways

  • Build the animal packet this month. Oakfield’s calves were found across a state line, and proof of ownership rides with the records, not the animal — if your team can’t pull photos and ID at 2 a.m., you can’t prove what’s yours.
  • Call your broker about hauling coverage. Penn State warns animals in a truck or trailer often aren’t covered unless they’re scheduled on the farm policy — don’t assume the vehicle policy has you (Penn State Extension).
  • Schedule your genetics, or expect a commodity check. A policy paying actual cash value lands closer to $3,010 per head than $5,000 — on 17 head, that’s roughly a $34,000 hole you eat, comparing the mid-2025 USDA/CoBank replacement average to the top of the genetics range.
  • Point your cameras at the exit. Investigators need the trailer route and the load-out, not the front gate — put the lenses where animals actually leave.
  • Alert first, then go quiet. Call law enforcement before you post, push one factual alert, then step back and let them work — the way Lamb Farms did to protect the prosecution.
  • Sample DNA the right way. If animals come back with cut or altered tags, ask law enforcement and your vet how to document samples without breaking the chain of custody — that’s what turns “looks like ours” into proof.

So, where does your operation actually sit? If 17 head walked off your place tonight, could you get a clean, shareable alert in front of the right people before sunrise — and would the insurance check match what those animals are really worth? Oakfield got its calves back because the community moved fast, the alert stayed useful, and someone with information got it to the right people. The next stolen trailer might not be theirs, and the next tip might not come in time.

Pull your numbers, walk your camera angles, and make the broker call you’ve been putting off. If you want the full breakdown on what genotyped females are really worth on your balance sheet — and how to schedule them so a claim pays out instead of leaving you $34,000 short — that’s coming in our upcoming piece on insuring genotyped females, landing first in The Bullvine Weekly. Oakfield got the calves back. The rest of us got the warning.

Complete references and supporting documentation are available upon request by contacting the editorial team at editor@thebullvine.com.

Learn More

The Sunday Read Dairy Professionals Don’t Skip.

Every week, thousands of producers, breeders, and industry insiders open Bullvine Weekly for genetics insights, market shifts, and profit strategies they won’t find anywhere else. One email. Five minutes. Smarter decisions all week.
NewsSubscribe
First
Last
Consent

The CTS Saw 58 Missing Calves Before APHA Reached the Cornwall Gate

58 calves the database already flagged. Cornwall Council’s case file shows the regulator was watching the paperwork before anyone looked at the cattle. What’s your reconciliation number?

Executive Summary: Cornwall dairy farmer Martin John Charles Hambly walked out of Truro Crown Court on May 22 with a five-year ban from keeping farm animals, an 18-week suspended sentence, £10,000 in costs, and 60 days to dispose of his cattle — but the prosecution didn’t start with the collapsed heifer that grabs the headlines. It started with 58 calves never registered to BCMS inside the 27-day window and 16 calves never tagged on time, a pattern the Cattle Tracing System flagged before APHA ever walked through the gate at Trenant or Ley. On a 200-cow English dairy, that scale of registration gap immobilizes roughly £4,600–£11,600 of expected calf revenue and locks every late-registered animal out of the food chain permanently — your only legal exits are the hunt kennel or the knacker’s yard. The case also exposes a structural risk every county-farm tenant carries: Cornwall Council is both Trenant’s landlord and the Trading Standards authority that prosecuted, with the same files flowing between both functions by operation of law. Pull your registration latency this week — the average days between calving and BCMS submission across the last 12 months — and reconcile it against your CTS pull line by line; if the numbers don’t match exactly, the gap is what an inspector already sees. The fix at scale is a 15-minute Wednesday check with one named owner and a day-20 trigger instead of day-27, which costs you nothing the working dairy isn’t already spending on admin time. Read on if “I’d have to check” is your honest answer to what your reconciliation number looks like right now.

 BCMS calf registration

On May 22, 2026, Martin John Charles Hambly stood in Truro Crown Court and pleaded guilty to 13 animal welfare offences across two farms — Trenant and Ley — near Menheniot in Cornwall. He left with an 18-week suspended sentence, 150 hours of unpaid work, £10,000 in costs, a £26 victim surcharge, and a five-year ban from keeping farm animals. Cornwall Council gave him two months to dispose of his cattle. Trenant — a Council-owned property on Cornwall’s county farms estate — was already advertised for re-letting under a 15-year tenancy with stricter compliance terms three weeks before sentencing.

The detail that makes most farmers wince is the collapsed heifer found near death without food or water. But that’s not where the case started. It started with 58 calves not registered with the British Cattle Movement Service (BCMS) inside the 27-day window, and 16 calves not ear-tagged in time. 74 animals on a working dairy whose absence from the government’s traceability database was visible to the regulator before any inspector walked through the gate.

If you run a dairy in England, that’s the part you need to think about this week. Not the conviction. The CTS audit started it.

The Database Saw It Before APHA Did

The Cattle Tracing System (CTS) isn’t a filing cabinet. It’s a live surveillance tool the Animal and Plant Health Agency (APHA) can query continuously, building a picture of your farm whether you’re paying attention or not. Whether it’s the UK’s CTS, the USDA APHIS electronic identification rule for interstate cattle movement that took effect in November 2024, or the Canadian Cattle Identification Agency’s national traceability framework, the principle is the same on both sides of the Atlantic — big data is the new inspector, and it’s already on duty.

Every dairy calf in England needs a primary ear tag within 36 hours of birth, a secondary tag by day 21, and a passport application submitted to BCMS by day 27. Miss any of those windows on a single calf and you’ve got a paperwork problem. Miss them across a calving season and you’ve got a data pattern visible to the regulator before they ever schedule an inspection. The UK average dairy herd hit 219 cows in the year to March 2024, according to Kingshay’s costings benchmark, generating roughly one calf every other day on an all-year-round system. When registrations stop appearing in the CTS but your declared movement records don’t match, the gap is statistical, dated, and automatic.

Cornwall Council and APHA jointly inspected Hambly’s farms in January 2024, found multiple welfare breaches, and issued a formal caution with detailed written guidance on his obligations. A re-inspection the following year confirmed the violations were continuing. The prosecution followed. Whether the registration pattern itself prompted the January 2024 visit or compounded findings made during it isn’t on the public record — what is on the record is that both data streams supported the eventual prosecution.

How 58 Unregistered Calves Actually Happens

It’s rarely deliberate. On a 200-cow operation, calving is rarely one person’s job end to end. The night-shift stockperson finds the calf, pulls it, tags it (or means to). The farm manager writes it up later — sometimes the same day, sometimes not. Whoever handles BCMS — manager, owner, farm secretary — registers the birth on CTS Online when they get to it. Three roles, three workflows, one calf. The handoff between the barn floor and the admin desk is where it breaks.

The 36-hour tag deadline is a physical, barn-floor task. The 27-day registration deadline is an office task with no daily trigger. Most farms batch registrations: the I’ll-do-them-on-Friday approach. That works fine until Friday is silage week, or the person who does it is off sick, or the secretary’s on holiday. The batch doesn’t run. Calves age past their window invisibly. Nothing on the farm changes — they still eat, grow, and take up the same pen space. Only the CTS knows.

Now run the math. A Holstein bull calf in the UK typically clears the farm in the first two weeks of life, depending on buyer and route to market. Miss the BCMS deadline and that calf cannot legally move alive from your holding except under a movement licence — and the only permitted destinations under a movement licence are a hunt kennel or knacker’s yard. The animal cannot enter the food chain. Ever.

The Cash That Walks Off the Balance Sheet

  • 58 calves × £80–£200 per head = roughly £4,600–£11,600 of expected calf revenue that just stopped existing
  • Holstein bulls sit at the lower end of the UK dairy calf market; beef-cross premiums currently run higher
  • That’s before fines, legal fees, or scheme-audit costs
  • Bull calves stop being a sale and start being a stocking density problem

The case file does not enumerate Hambly’s specific calf revenue loss — that figure isn’t on the public record. The math here is the diagnostic any farm can run on its own books.

There’s a knock-on layer worth thinking through. Both Red Tractor and RSPCA Assured publish standards that include BCMS compliance and welfare baselines, and individual scheme decisions on suspension or audit are made on a case-by-case basis under each scheme’s published procedures. From an operator’s perspective, the practical point is simple: a publicly reported prosecution is the kind of event that may prompt scheme attention, and what your records show on the day will shape how that conversation goes. The structural exposure is identical for any tenanted or contracted dairy in England.

Why Crown Court, Not Magistrates’

The reason BCMS gaps and welfare findings hit so hard together — and the reason this case landed at Crown Court rather than magistrates’ — is that the two evidence streams corroborate each other through one shared inference: the farm wasn’t monitoring its animals.

The Statutory Stack

  • Welfare of Farmed Animals (England) Regulations 2007: ill or injured animals must receive care “without delay,” with veterinary advice obtained “as soon as possible” if treatment is unsuccessful.
  • Animal Welfare (Sentencing) Act 2021: Crown Court sentencing ceiling raised to five years for the most serious offences.
  • Animal By-Products (Enforcement) (England) Regulations 2013: fallen stock must be collected by an approved collector without undue delay, with a commercial document retained on farm.
  • Sentencing Council 2023 cruelty guidelines: ignoring prior advice is a high-culpability indicator.

Your defence against a welfare charge is good faith — that you noticed, you acted, you escalated. That defence depends on records: treatment logs, vet call notes, dated observations.

A farm that hasn’t registered 58 calves within 27 days has demonstrated, through an independent government dataset, that it wasn’t tracking 58 individual animals through their required documentation lifecycle. The CTS doesn’t lie and doesn’t forget. Once that pattern is on the record, the welfare defence — we were attentive, we were responding — becomes structurally harder to argue. Where any case sits in the five-year sentencing range depends heavily on whether the farm can show it was managing in good faith. Hambly’s guilty plea closed that door.

Stack a traceability failure, a welfare failure, and a fallen-stock failure on the same prosecution file and you’re not arguing about one bad day. You’re explaining a pattern. A continued breach after a January 2024 caution is the textbook definition of ignoring prior advice under the 2023 sentencing guidelines.

LegislationWhat It Actually RequiresThe Record That Defends YouPenalty Exposure
Welfare of Farmed Animals (England) Regs 2007Care “without delay” for ill/injured animals; vet advice “as soon as possible”Dated treatment log, vet call notesProsecution, disqualification
Animal Welfare (Sentencing) Act 2021Sets Crown Court ceiling at 5 yearsDemonstrated good faith + prior recordsUp to 5 years custody
Animal By-Products Regs 2013Fallen stock collected by approved collector “without undue delay”Commercial document retained on farmProsecution + farm audit
BCMS / CTS Registration RulesPrimary tag ≤36 hrs; secondary tag ≤Day 21; passport by Day 27Matching calving register + CTS pullLoss of food chain status for calf
Sentencing Council 2023 GuidelinesPrior advice ignored = high-culpability indicatorWritten caution response + action logSentence uplift to higher band
Red Tractor / RSPCA Assured StandardsBCMS compliance + welfare baselineClean scheme audit recordScheme suspension, market access loss

How Much Does Waiting 30 Days Actually Cost?

The honest answer: more than the fix.

Take a 200-cow herd at 20% lameness incidence — a working assumption at the lower edge of UK herd prevalence, which published surveys put at roughly 20–40%. AHDB puts the cost of an untreated case of lameness at roughly £50 per cow per year, with milk losses of 270–574 kg per lactation per affected animal. Run the math: 200 cows × 20% × £50 = £2,000 in direct annual cost on that herd before any enforcement risk enters the picture. The treatment log isn’t compliance theatre. It’s the document that supports the work you’re already paying your vet for, and the document that defends you when an inspector observes a lame cow on the day.

Stack the BCMS side. A reconciliation gap of just 20 calves on a 200-cow herd — roughly six weeks’ worth of late registrations on an all-year-round system — represents £1,600–£4,000 in foregone calf sale revenue if those animals can’t be remediated through the DNA pathway, plus £600–£1,000 in remediation lab fees if they can — before vet attendance time and a £20 replacement passport fee per animal. 

What Does Your Landlord Actually See?

If you’re farming on a county council estate — Cornwall, Devon, Staffordshire, anywhere with a county farms operation — there’s a structural detail this case makes impossible to ignore. Cornwall Council holds the dual role of county farms landlord and welfare-enforcement authority, and Hambly’s prosecution spanned a Council estate property and an adjacent farm. Same authority, same building, same files.

That’s not an allegation of misconduct. It’s how information flows when one organisation holds both roles. A council that owns the land also operates the Trading Standards team that enforces animal welfare legislation. From a tenant’s perspective, the practical reality is that information observed during one council interaction can lawfully be available to the council’s other functions, subject to standard data-sharing rules between local-authority departments. 

The Tenant Farmers Association, in its public input to Cornwall Council on the county farms strategy, has raised concerns about compliance costs and margin pressure on dairy tenants and has argued for estate models that support in-situ progression. That strategy is expected to publish in June 2026. Whatever it contains, the Hambly prosecution shows the dual enforcement authority is active, not theoretical. Your tenancy agreement won’t enumerate your welfare obligations — they apply by operation of law, and your landlord’s enforcement team applies them.

Action Plan: Where Does Your Dairy Sit Today?

Three positions a working dairy can be in right now. Each has a different fix, and only one of them carries genuine enforcement risk.

Position 1: Tight Protocol, Clean Reconciliation

  • Status: Your calving register and CTS records match exactly for the last 12 months. Registration latency averages five to ten days from birth. Treatment log is current to within a week.
  • The Fix: Maintenance. A 15-minute weekly check on a fixed Wednesday morning slot, one named owner. Cost is approximately zero. Stay here.

Position 2: Compliant But Fragile

  • Status: Registrations are landing inside the 27-day window, but right on the edge — latency averages 22 to 26 days. Treatment log exists but isn’t always current. One bad week of silage, a staff flu outbreak, or a software change breaks the chain.
  • The Fix: Move the registration trigger to day 20, not day 27. Build a mandatory treatment log routine that runs whether or not anyone has a problem to log. Cost: a half-day of process redesign and a software notification.

Position 3: The Threat Is Already Real

  • Status: Your calving register and CTS don’t reconcile. There are animals on your farm the system doesn’t know about. This is the 30-day action zone.
  • The Fix: Register every calf still inside its 27-day window today. For any calf past day 27, contact BCMS to initiate the DNA testing pathway — vet on-farm, dam-and-calf samples, lab confirmation of the genetic link. The published lab fee anchor remains £30–£50 per test from the original Defra schedule. On 20 animals, that’s roughly £600–£1,000 in lab fees plus vet time and the £20-per-animal replacement passport fee. Then book your vet for a dated herd welfare assessment before any inspector arrives. A dated welfare record from this week, on file, is the difference between a farm that found a problem and acted versus a farm that waited to be found.
SignalPosition 1: TightPosition 2: FragilePosition 3: Exposed
Avg. registration latency5–10 days22–26 daysUnknown / >27 days
CTS vs. calving register matchExactApproximateGap exists
Treatment log currencyCurrent within 7 daysExists, not always currentMissing or outdated
Registration trigger usedDay 20 protocolDay 27 deadlineNo formal trigger
Enforcement risk levelMinimalModerateActive / Real
Recommended action15-min weekly checkMove trigger to Day 20Act today — 30-day window
Cost of fix~£0Half-day process redesign£600–£4,350+ in remediation

Key Takeaways

  • If you don’t know your registration latency — the average days between calving and BCMS registration over the last 12 months — you don’t know your real exposure. Pull the number this week.
  • If your calving register and CTS pull don’t reconcile exactly for the last 12 months, the gap between them is the number an APHA inspector already has. Close it before they do.
  • If you’ve received a formal caution from APHA or Trading Standards, treat the re-inspection as scheduled, not possible. The only question is what it finds.
  • If your treatment log isn’t current to within seven days, you don’t have a defence against the next welfare observation — you have a confession. Lameness intervention windows are 48 hours by AHDB’s evidence-based standard.
  • If you farm on a county council estate, your landlord’s enforcement function operates within the same authority that holds your tenancy. Closing your reconciliation gap removes the administrative trigger that puts you in the inspection queue.
  • If a calf is past day 25 with no registration submitted, that’s today’s task — not Friday’s. Day 27 is a hard cliff with no grace period.
  • If you’re past day 27 on any animal, the DNA remediation pathway exists, but it costs more than the registration would have, and it’s conditional on the test confirming the dam-calf link.

So — What’s Your Reconciliation Number?

Not your refused-passport rate. That’s a backward-looking number. The forward-looking question is the one your inspector is already asking: of every calf born on your holding in the last 12 months, can you produce a dated record showing it was registered with BCMS, and does that number match your CTS pull exactly?

If the answer is yes, you’ve got the architecture that defends a working dairy. If the answer is “I’d have to check,” that’s the question worth answering before someone else does. We’re publishing the full operational walkthrough in next week’s Bullvine Weekly — the day-20 protocol, the treatment log template, and the cost-per-cwt math on what compliance friction actually runs at different herd sizes. That’s where the real numbers live. The CTS is counting either way.

Sources: Cornwall Council press release (May 28, 2026); Truro Crown Court proceedings (May 22, 2026); GOV.UK guidance on cattle identification and BCMS registration; Welfare of Farmed Animals (England) Regulations 2007; Animal Welfare (Sentencing) Act 2021; Animal By-Products (Enforcement) (England) Regulations 2013; Sentencing Council guidelines 2023; Kingshay Dairy Costings 2024; AHDB Healthy Feet Programme; Tenant Farmers Association public submissions on county farms strategy.

Learn More

The Sunday Read Dairy Professionals Don’t Skip.

Every week, thousands of producers, breeders, and industry insiders open Bullvine Weekly for genetics insights, market shifts, and profit strategies they won’t find anywhere else. One email. Five minutes. Smarter decisions all week.
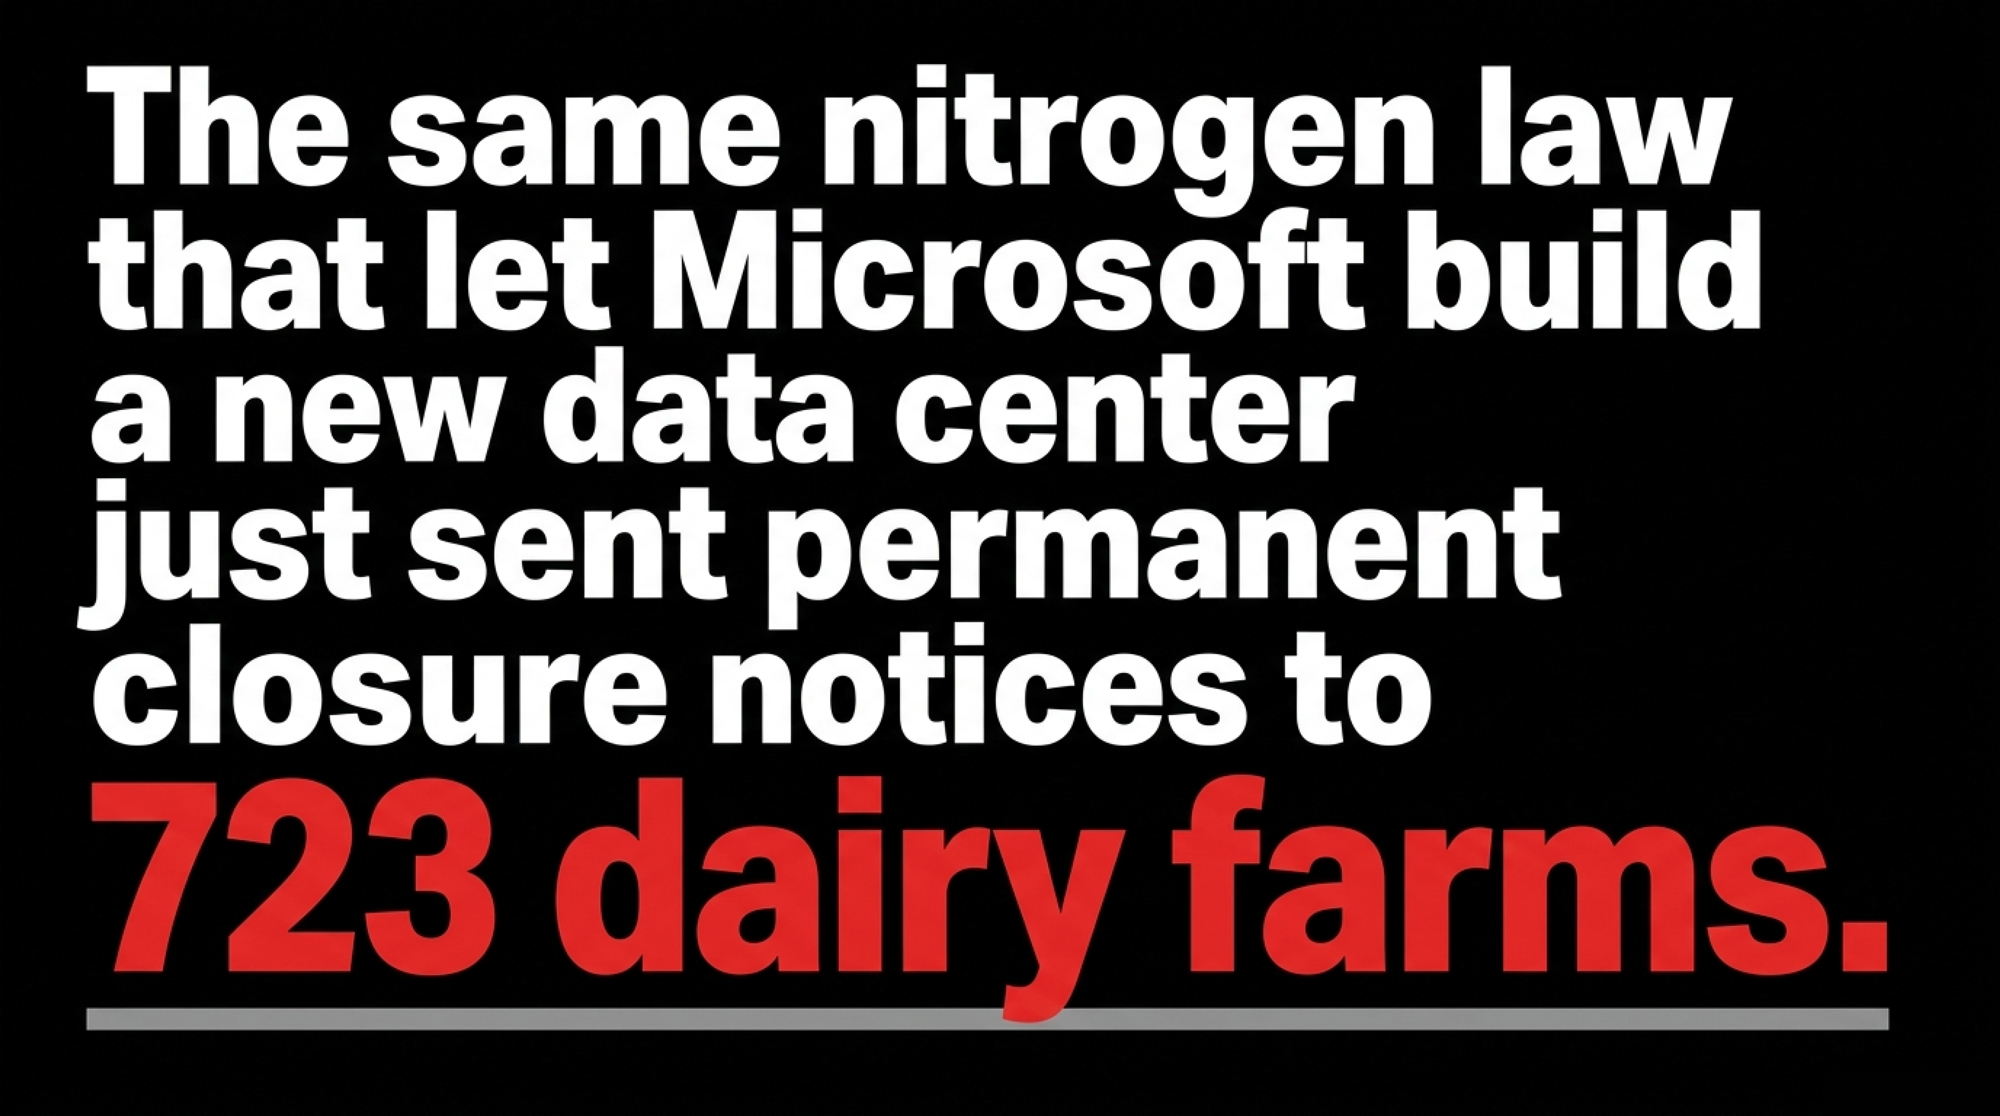
NewsSubscribe
First
Last
Consent

Adam Faust Beat USDA in 11 Months. The Checkoff May Be Next.

A Wisconsin law firm walked USDA into a settlement in 11 months. Now they’re studying the $18,000-a-year checkoff bill on a 500-cow dairy. No complaint filed yet — but the math already is.

Executive Summary: A Wisconsin law firm just settled a federal case against USDA in eleven months, and on May 27 attorney Daniel Lennington told Brownfield Ag News he’s preparing the next one against the dairy checkoff. No complaint is filed yet — but the legal theory is already clear: the 1983 statute authorizes “promotion of dairy products,” while DMI’s 2024 audited financials show $110.5M of a $254.6M budget flowing into a “Reputation” category measured by environmental-perception shifts in Forbes and the LA Times. Every conventional U.S. dairy pays the 15¢/cwt assessment regardless — about $7,200 a year on 200 cows, $18,000 on 500, $54,000 on 1,500 — and the 5¢ national share is what’s actually at stake. Even if WILL files and wins, plan for an 18- to 30-month window before any operational change, which is roughly $27K–$45K more in assessments on a 500-cow dairy. The realistic remedy is prospective relief, not a refund check, and the under-discussed risk is co-op governance: a named plaintiff is announcing a public conflict with the body that signs the milk settlement check. The 30-day move for any producer reading this is smaller and cheaper — confirm with your handler that the 10¢ state share is being credited to a USDA-certified qualified program, not defaulting into DMI’s national pool.

In this photo released by The Wisconsin Institute for Law and Liberty, Faust’s attorneys, Wisconsin dairy farmer Adam Faust, who is suing the Trump administration alleging discrimination against white farmers like him, poses inside his dairy barn in Chilton, Wisconsin, in 2021. (The Wisconsin Institute for Law and Liberty via AP)

Adam Faust runs a dairy in Chilton, Wisconsin. In June 2025, he became the named plaintiff on a federal lawsuit filed by attorney Daniel Lennington at the Wisconsin Institute for Law & Liberty, challenging USDA program eligibility criteria. Within months, the Department of Justice walked back its defense of the challenged programs. By May 18, 2026, USDA settled — agreeing to remove the contested criteria from a wide range of programs nationwide. Eleven months from filing to settlement. 

Then on May 27, 2026 — yesterday, by this article’s publication clock — Lennington told Brownfield Ag News reporter Larry Lee something that should land on every conventional dairy producer’s desk this week: WILL “is preparing another case against the federal government related to the dairy check-off program.” One sentence. No complaint filed. No plaintiff was named publicly. But the same firm that just walked USDA into a settlement in under a year is now studying the 15¢/cwt mandatory assessment that every conventional dairy farm in the country pays — about $18,000 a year on a 500-cow operation, $54,000 on a 1,500-cow operation.

“WILL is preparing another case against the federal government related to the dairy check-off program.” — Daniel Lennington, attorney, Wisconsin Institute for Law & Liberty, to Brownfield Ag News, May 27, 2026

The fight isn’t about whether dairy promotion works. It’s about whether what the checkoff has quietly become — a $254 million program with $110.5 million flowing to “Reputation” work — still fits inside the narrow lane Congress drew in 1983. And whether you, as the farmer writing the check, have any say in it.

This is an analysis grounded in public filings, audited annual reports, and on-the-record statements. No new allegations are being made.

What’s Actually Being Challenged

The Dairy Production Stabilization Act of 1983 authorizes three things, and only three. “Advertisement and promotion of the sale and consumption of dairy products.” “Research projects related thereto.” “Nutrition education projects.” That’s the lane. Producers ratified the program in a national referendum after the Act took effect.

The program looks different now. Dairy Management Inc.’s 2024 audited financials show $254.6 million in total expenditures, with $110.5 million — 43.4% of the entire budget — flowing into a category called “Reputation.” That category includes 46.8 million media impressions placed in Forbes, the New York Times, the Los Angeles Times, and USA Today, telling dairy’s “sustainability and nutrition story” to institutional audiences. One LA Times placement, according to DMI’s own annual report, produced an 8.3% lift in the belief that “dairy farmers are taking steps to help the environment.”

WILL’s likely argument is straightforward: a 1983 statute authorizing promotion of milk and cheese to consumers is now funding work that DMI itself measures by environmental perception shifts among urban readers of national broadsheets. The factual framing comes from DMI’s own reporting. The legal characterization — whether that fits inside “promotion of the sale and consumption of dairy products” — is the question no court has been asked in those exact terms, and the one WILL is preparing to put before one.

1983 Statute AuthorizesDMI 2024 Actual Program ActivityAlignment with Statute?
“Advertisement and promotion of the sale and consumption of dairy products”$110.5M “Reputation” category — measured by environmental-perception shifts in Forbes and LA Times among institutional readers🔴 Disputed — metric is perception, not consumption intent
“Research projects related thereto”Research allocated within overall $254.6M budget✅ Clearly within scope
“Nutrition education projects”Nutrition content included in DMI programming✅ Clearly within scope
(Not authorized)8.3% lift in belief “dairy farmers are taking steps to help the environment” — cited as campaign outcome in DMI 2024 annual report🔴 No statutory basis — environmental trust ≠ sale/consumption promotion
(Not authorized)46.8M media impressions in national broadsheets targeting ESG-adjacent institutional audiences⚠️ Contested — who is the intended consumer here?

What the Math Looks Like in Your Barn

The 15¢/cwt assessment is split into two components with very different governance structures. Run it at three common herd sizes, using a 24,000-lb/cow average — conservative relative to the 2024 U.S. national average of approximately 24,178 lb/cow.

OperationAnnual cwtTotal Checkoff (15¢)🔴 National 5¢ Share (disputed)🟢 State/Regional 10¢ Share (local control)
200-cow dairy48,000$7,200/year$2,400$4,800
500-cow dairy120,000$18,000/year$6,000$12,000
1,500-cow dairy360,000$54,000/year$18,000$36,000

The red column is what’s at stake in any WILL lawsuit. That’s the national 5¢ flowing to DMI for the Reputation, sustainability, and institutional-trust work the legal theory is targeting. The green column gets deducted from your milk check, regardless — that part of the assessment isn’t going anywhere. The question with the 10¢ is governance: is it being credited to a USDA-certified, qualified state program where farmer-elected boards direct the spending, or is it defaulting to DMI’s national pool because no state program is properly receiving it?

That distinction matters. On a 500-cow dairy, $12,000 a year either gets directed by Midwest Dairy, Dairy Farmers of Wisconsin, or another state body whose board you can vote for and call, or it gets absorbed into the same national budget WILL is now scrutinizing. Same dollars off your milk check. Wildly different control over how they’re spent.

That gap is your first decision point this week. Pull your last three milk settlement statements, find the checkoff line, and confirm with your handler that the 10¢ is being routed to a qualified state program. It costs nothing to ask. It can be worth real money to know. For the broader picture of where the remaining 5¢ goes, our 76% of Your Dairy Checkoff Funds Cheese and Exports breakdown lays out the national pool category by category.

Brenda Cochran was the lead plaintiff in the 2004 challenge that briefly succeeded before Johanns reset the doctrine. The legal arguments she advanced then — that the assessment functions as compelled funding of speech farmers don’t choose — track closely with the theory WILL is now preparing. She’s still paying. Our profile, Brenda Cochran has been here before, gives the full timeline of how that 2004 case rose, won, and was vacated.

The Mechanics Behind the Legal Fight

To see why this case is harder to bring than it looks, you need the legal architecture in plain language.

In Johanns v. Livestock Marketing Association (2005), the Supreme Court upheld the beef checkoff under the government speech doctrine. The reasoning ran like this: because the Secretary of Agriculture has ultimate authority over checkoff messaging, the campaigns are government speech, immune from First Amendment challenge by private objectors. That ruling is what protects the dairy checkoff today, and it’s the structure WILL would have to work around.

Legal FrameworkJohnanns v. LMA (2005) — Status QuoPost-Loper Bright (2024) — New Landscape
Core DoctrineGovernment speech — USDA controls checkoff messaging, so no First Amendment challengeCourts now read statutes independently; no deference to USDA’s own interpretation of its authority
Who Decides What “Promotion” MeansUSDA/DMI define scope; courts deferFederal judge reads the 1983 statute text cold — without agency deference
Vulnerability in Current CheckoffLow — consumer promotion campaigns clearly government speechHigher — “Reputation” campaigns attributed to “U.S. dairy industry,” not USDA; measured by ESG metrics
Best-Case Defense for DMIInstitutional trust → consumer demand → “promotion of sale and consumption”Same argument, but a judge applying plain textual reading may reject it without Chevron cover
Likely Claim Type if WILL FilesFirst Amendment compelled speech (harder post-Johanns)Statutory ultra vires — USDA exceeding 1983 Congressional authorization
Precedent Needed to WinMust distinguish or overturn JohannsDoes not need to touch Johanns — textual argument runs independently

That’s the doctrinal architecture. Here’s the crack in it.

The vulnerability is real. Johanns assumed the government was the genuine author of the speech, not just the administrator of the fund paying for it. That assumption holds cleanly for “Got Milk?”-style consumer promotion. It gets harder to defend when the campaign is attributed to “U.S. dairy” as an industry brand, targets institutional ESG-adjacent audiences, and is measured by shifts in environmental perception rather than consumption intent.

There’s a parallel argument that doesn’t even need to win on First Amendment grounds. Call it the exceeding-authority claim — that USDA is spending checkoff money on activities Congress never authorized in the 1983 statute. After Loper Bright Enterprises v. Raimondo (2024) eliminated Chevron deference, courts now read statutes independently rather than deferring to agency interpretations. A federal judge reading “promotion of the sale and consumption of dairy products” without deference, against a factual record showing institutional sustainability reputation campaigns, has a real textual problem to grapple with. Our prior DMI’s $165M Checkoff Bet coverage walks through the audited 2024 spending breakdown line by line.

DMI’s defensible position is that institutional trust is instrumental to consumer demand — if processors, retailers, and media gatekeepers trust dairy’s environmental story, they stock more product and resist pressure from plant-based substitutes. That’s a real argument. It’s also a defense that has never been tested in court under Loper Bright. DMI’s 2024 annual report identifies environmental perception shift as the published outcome metric for the LA Times placement; whether a metric of that type satisfies the 1983 statute’s “promotion of the sale and consumption” language is precisely the question WILL would put before a federal judge. Requests for comment sent to Dairy Management Inc., USDA Agricultural Marketing Service, and the National Milk Producers Federation regarding whether the 2024 Reputation campaigns received messaging-level review by USDA or only budget-category approval were not returned by press time. The reporting record in the public domain — DMI’s own 2024 annual report and USDA AMS oversight documents — describes USDA’s authority over checkoff messaging in general terms without specifying the level of review.

How Much Does This Actually Cost a Farmer Who Wants to Push Back?

The short answer: between now and any court-ordered relief, you keep paying the assessment exactly as it stands today. Here’s what the realistic timeline looks like in seasons your operation actually plans around.

PhaseTiming from Today (May 28, 2026)What Changes for Your Operation
Pre-filingJune 2026 → late 2026 (3–9 months)Nothing. WILL builds the case and selects a plaintiff.
Complaint filedLate 2026 to Q1 2027Nothing operationally. Legal news cycle begins.
Preliminary injunction motion6–12 months after filingPossible — but unlikely — first moment the program could pause.
Earliest realistic operational shiftLate 2027 to mid-2028Roughly two breeding cycles and two crop years from now.

These phases reflect typical federal civil litigation timelines for agency action cases; the case-specific schedule will only firm up after a complaint is filed. For a 500-cow dairy at $18,000/year, the gap math runs roughly $27,000 to $45,000 in checkoff assessments collected during an 18- to 30-month window, regardless of how the litigation ultimately resolves. That’s the number a lender or financial advisor will ask about if the topic surfaces in a 2027 operating loan conversation.

The honest framing has to include this: the realistic remedy is prospective — an injunction, a structural change, or a forced congressional reauthorization — not a check in the mail for past assessments. Farmers chasing this for retroactive recovery will be disappointed. The litigation value is the injunction that stops future collection for unauthorized purposes. Or, in the strongest scenario, a referendum that puts the question — what should the checkoff fund? — back in front of the people writing the checks.

What Does Joining a Federal Lawsuit Mean for Your Co-Op Relationship?

This is the question most legal coverage skips. And it’s the one that probably matters most.

Most conventional dairy farmers sell through cooperatives. Cooperatives have institutional relationships with DMI and NMPF, and commercial incentives to maintain checkoff funding for programs that benefit their branded product portfolios. A member who becomes a named plaintiff in a federal constitutional challenge to that funding structure isn’t just filing a lawsuit. You’re announcing a public conflict of interest with the organization that processes your milk, signs your settlement check, and may hold your operating credit.

That’s not paranoia. It’s a realistic reading of how cooperative governance works in practice. In any constitutional challenge of this kind, plaintiff selection typically weighs operational independence alongside legal standing — particularly when the named plaintiff faces predictable counterparty pressure from milk handlers or co-op leadership. Cooperative structures, by design, prioritize collective decision-making over individual member dissent — which is why a referendum on current spending may never reach the floor through normal governance channels. Our case study on what happens when co-op governance breaks down traces that dynamic in detail.

Brenda Cochran’s position, twenty-two years after she first sued, is the only producer voice currently on the public record in this fight, and it’s a clarifying one: she paid the assessment in 2004, won at the Third Circuit, watched the doctrine reset under Johanns, and is still paying it today. That’s the practical answer to the “what happens to producers who challenge this” question. The check keeps going out. The argument doesn’t go away.

Options and Trade-Offs

Four practical paths are available to a producer who wants to engage with this issue. None of them is fast. None of them is free.

PathAction RequiredAnnual Cost ImpactTimeline to ResultCo-op Relationship RiskWho It’s For
1. Confirm State CreditOne call to milk handler$0 — but up to $12,000/yr redirected locallyImmediate (30 days)NoneEvery conventional producer
2. Engage Co-op BoardWritten request for DMI ROI audit; board access$0 direct6–18 months⚠️ Moderate — may be seen as dissentProducers with board standing
3. Support OFF ActCall your senator’s office (5 minutes)$01–3 years (legislative)NoneAny producer wanting reform without confrontation
4. Signal to WILL as PlaintiffSelf-assess co-op independence; contact WILL$0 direct — but $27K–$45K kept flowing during litigation18–30 months to earliest change🔴 High — named public conflict with milk handlerOperationally independent producers only

Path 1: Confirm your state credit. Do this within 30 days. The 10¢ portion comes off your milk check regardless — the question is whether it’s routed to a USDA-certified, qualified state program where you have governance access, or defaults to DMI’s national pool. Pull three milk settlement statements, find the checkoff line, and call your handler to confirm where the 10¢ is going. When it makes sense: always — this is about local control, not protest. Risk: minimal. What it requires: one phone call.

Path 2: Engage your co-op board on accountability. Most cooperatives bloc-vote member assessments and are institutionally aligned with DMI. A board member or active co-op participant can request audited farm-size ROI breakdowns from DMI and propose resolutions on automatic bloc-voting. When it makes sense: if you have standing on your co-op board or close access to those who do. Risk: you may appear out of step with co-op leadership. What it requires: a working relationship with directors and a willingness to make written requests.

Path 3: Support the OFF Act. The Opportunities for Fairness in Farming Act, reintroduced in the 119th Congress by Senators Mike Lee (R-UT) and Cory Booker (D-NJ), would prohibit checkoff programs collecting more than $20 million in annual assessments from contracting with policy-influencing groups, mandate USDA Inspector General audits, and require public budgets. When it makes sense: if you want reform without confrontation. Risk: legislative paths move slowly, and this bill has been introduced before without passing. What it requires: a phone call to your senator’s office. No litigation list. No co-op exposure.

Path 4: Signal interest to WILL as a potential plaintiff. The case hasn’t been filed. WILL is in the plaintiff selection phase. Adam Faust had the right profile in 2025 — a named, publicly visible producer with the operational independence to take on the lawsuit. WILL will be looking for that profile again. When it makes sense: if you’re a conventional producer with operational independence from co-op governance pressure and a willingness to be publicly named. Risk: the highest-cost path, with cost mostly relational. What it requires: honest self-assessment of your milk-marketing relationships before you make the call.

A forward-looking signal worth anchoring here: if DMI’s 2025 and 2026 program reporting begins narrowing the Reputation category back toward consumer promotion and away from institutional ESG framing, that’s a preemptive restructuring move — and probably the best outcome the industry can produce on its own without a court forcing the question. Watch the next two annual reports closely.

Key Takeaways

  • If your 10¢/cwt isn’t being credited to a qualified state program, you’re not losing money — but you are losing local governance over $12,000 a year on a 500-cow dairy. Confirm with your handler this week.
  • If you support sustainability work in principle but believe it should be voluntary or congressionally reauthorized, you’re closer to WILL’s likely legal theory than the ideological framing suggests.
  • If you’re modeling the financial impact, plan for an 18- to 30-month timeline from filing to any operational change. That’s roughly two breeding cycles. Treat any “this changes everything tomorrow” framing — from either side — with skepticism.
  • If you’d vote no on current spending in a farmer referendum but you depend on the co-op to stand behind your milk contract or operating loan, you’re in the position any plaintiff-selection process is built around — and you’re also the producer least able to engage publicly. Acknowledge that tension honestly before you pick up the phone.
  • If the OFF Act lands on your senator’s desk with a constituent call attached, that’s the lowest-cost lever you have. It doesn’t require a lawsuit, a co-op confrontation, or a checkbook. It does require five minutes.
  • If DMI’s 2025 annual report — due later this year — shows the Reputation category narrowing toward consumer-promotion metrics, that’s the industry signaling it sees legal exposure. If it doesn’t, the litigation pressure stays on.

What Now

Pull your last twelve milk settlement statements. Add up the checkoff line. Then ask yourself a harder question than “is this legal” — ask whether you can describe, in one sentence, what that money funded, and whether that’s the program you’d vote to authorize today if anyone asked you.

If your answer is yes, this fight isn’t yours, and the cost of joining it is real. If your answer is no, you have more options this month than you probably realized — most of which don’t require a lawsuit. We’re breaking down the full Reputation-category audit, the Loper Bright statutory mechanics, and what each of the four paths actually costs at five different herd sizes in next week’s Bullvine Weekly. That’s where the deeper math lives.

Run Your Numbers

Farm Benchmark Snap Check — Pull your last three milk settlement statements and run the 15¢/cwt assessment against your actual herd size. The tool translates the disputed 5¢ national share and the 10¢ state share into your annual exposure, so you walk into that handler call knowing exactly what’s on the line.

Complete references and supporting documentation are available upon request by contacting the editorial team at editor@thebullvine.com.

Learn More

The Sunday Read Dairy Professionals Don’t Skip.

Every week, thousands of producers, breeders, and industry insiders open Bullvine Weekly for genetics insights, market shifts, and profit strategies they won’t find anywhere else. One email. Five minutes. Smarter decisions all week.
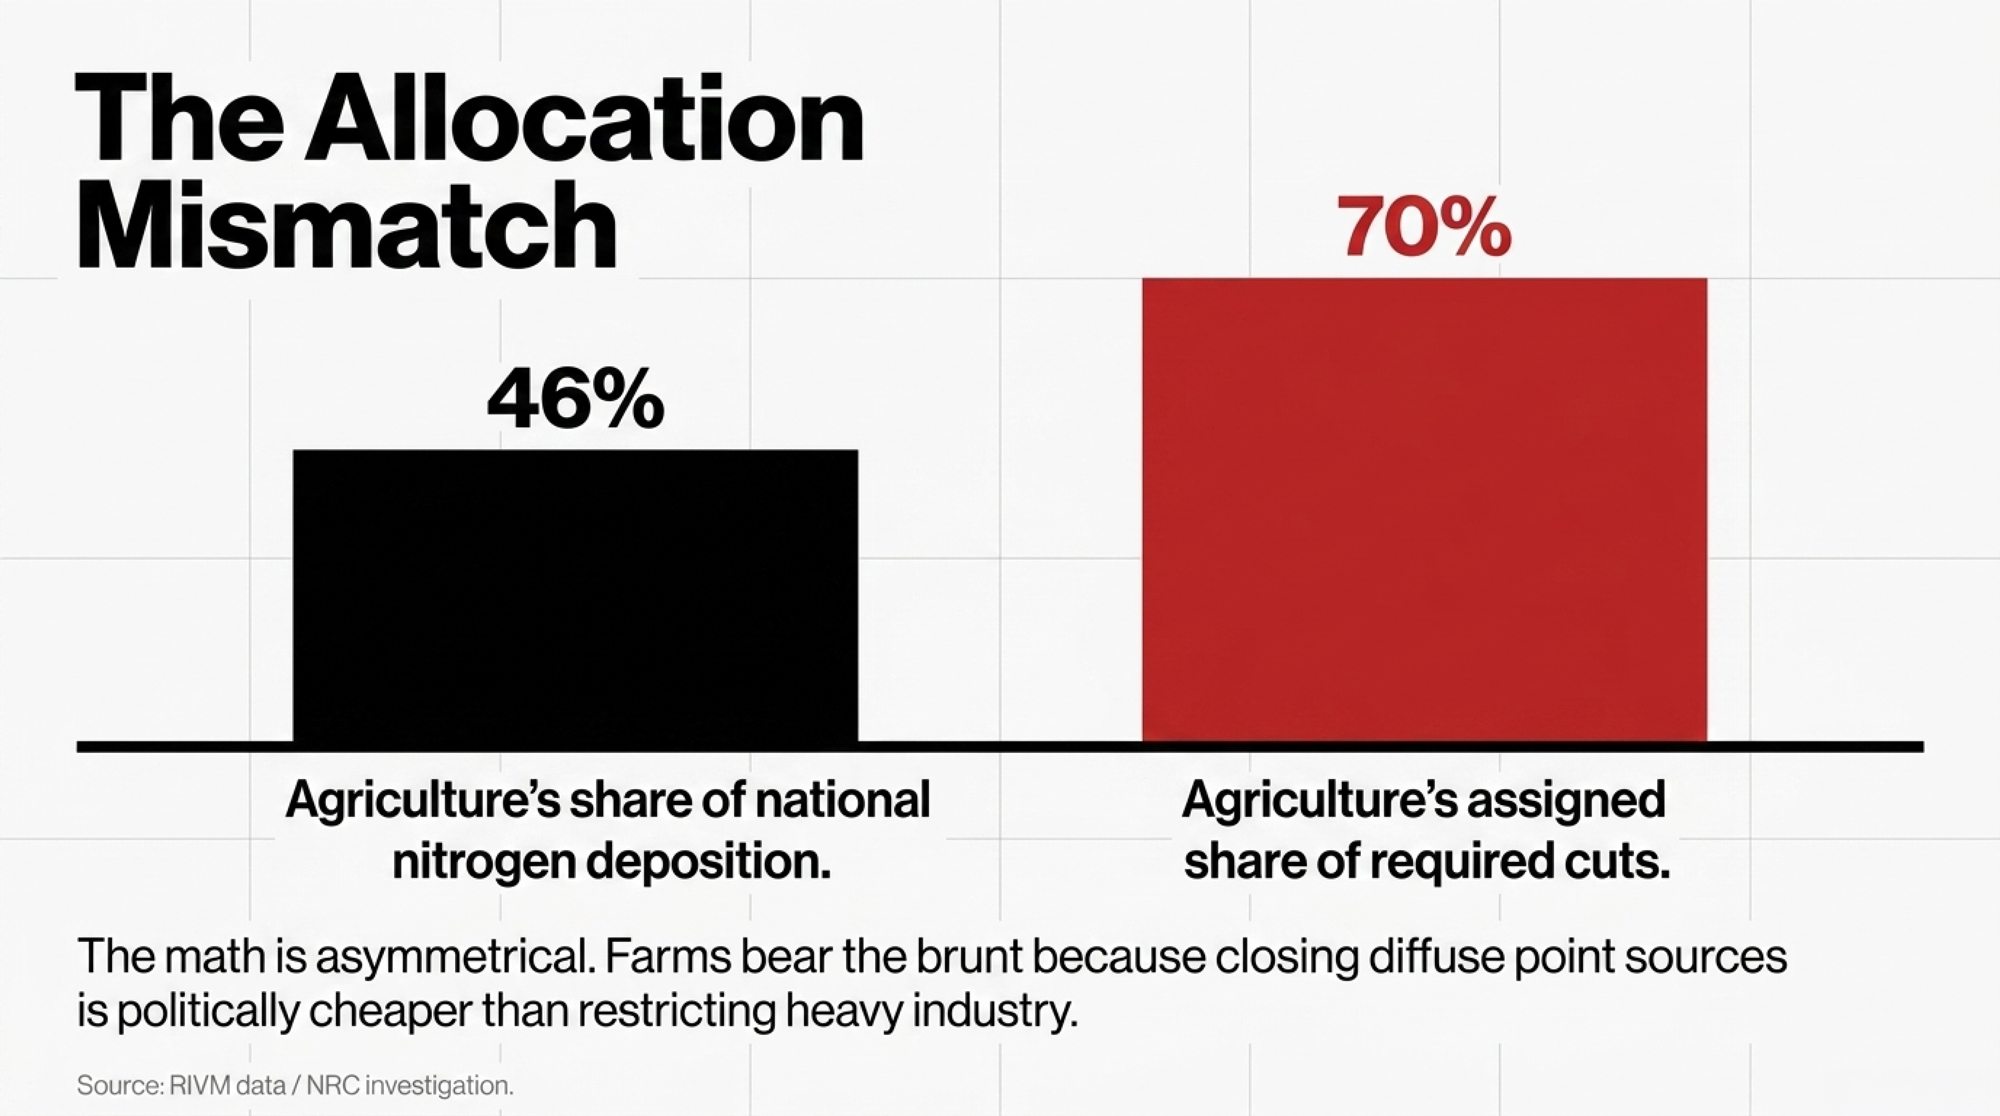
NewsSubscribe
First
Last
Consent

When the Methionine Standard Hit the Fat Bin: One Midwest Dairy’s $50,000 Omega‑3 Reckoning

A 500‑cow freestall realized more than 85% of the EPA and 75% of the DHA on their feed tag were being destroyed in the rumen. Here’s how a stuck fresh‑cow sheet started looking like a fat‑program problem.

Editor’s Note: The 500‑cow Midwest dairy in this piece is a composite scenario modeled on common transition and heat‑stress patterns reported by progressive Midwest freestall operations. The disease rates, ration components, dialogue, and decision sequence are illustrative and representative of multiple herds, not drawn from a single named farm. All cited research, USDA prices, and published cost‑of‑disease ranges are real and sourced.

The calves were coming easy that February. The fresh‑cow sheet still looked ugly.

In the farm office, the owner, the herd vet, and the nutritionist leaned over a laptop. DCAD was dialed in. Rumen‑protected methionine sat in both close‑up and fresh rations. Energy density matched targets. Cows weren’t overstocked or overfat. The numbers wouldn’t move. Retained placentas wouldn’t drop into single digits. Metritis hung high. Every summer, milk fell harder than feed refusals could explain.

Then the vet pointed at one line on the ration sheet and asked the question nobody around that table had a clean answer for: what was the actual in‑vivo rumen bypass rate for EPA and DHA in their omega‑3 product, at the dose they were feeding?

When the team went digging, work from Cornell’s Bauman lab on calcium salts of fish oil showed rumen biohydrogenation of EPA above 85% and DHA above 75% in cows fed those products. More than three‑quarters of the omega‑3 they thought they were buying for inflammation control wasn’t getting past the rumen.

The product was protecting the rumen from the fat. It wasn’t protecting the fat from the rumen.

The Double Standard Hiding in Their Fat Program

By the time this dairy added rumen‑protected methionine, they were already treating bypass data as non‑negotiable. The nutritionist could rattle off the target — published in‑vivo bypass values land in the 75–85% range for the major RP‑Met products. If a Met source couldn’t show how much survived the rumen, it never made it into their bins.

The fat program ran on a fuzzier standard. The herd used a common calcium salt blend that included fish oil, and the tag listed EPA and DHA alongside palmitic and other fatty acids. For years, everyone around that office table assumed that ticked the omega‑3 box for retained placenta, metritis, and inflammation control.

Then they sat down with the Cornell biohydrogenation data and the Resolution of Metabolic Inflammation review out of Penn. Two things became hard to argue with. Calcium salts are excellent at keeping fat from burning the rumen. But published biohydrogenation data — including Cornell Bauman‑lab work on calcium salts of fish oil — show they’re substantially less efficient at delivering intact EPA and DHA than technologies designed specifically for omega‑3 protection.

Why Doesn’t the Calcium Salt Carry EPA and DHA Through?

The chemistry isn’t exotic. Rumens don’t like free polyunsaturated fats. Bugs like Butyrivibrio fibrisolvens hydrogenate double bonds to protect themselves, turning unsaturated fatty acids into saturated stearic acid. Calcium salts help by binding fatty acids at rumen pH so they don’t float free and nuke the microbes.

That works fine for palmitic and other less‑unsaturated fats. EPA carries five double bonds. DHA carries six. The more double bonds a fatty acid has, the weaker its bond with calcium at rumen pH gets. EPA and DHA pop off the calcium early, float free, and become exactly the kind of toxin rumen bacteria rush to saturate.

Some Ca‑salt manufacturers are working on improved omega‑3 protection chemistry, and that work may close part of this gap over time. The decision facing this herd today, though, was based on what their current product was actually delivering.

The end result is simple. Plenty of calories make it past the rumen as saturated fat. Very little EPA or DHA reaches the small intestine or gets built into tissue membranes. For this Midwest herd, the math suggested they were spending omega‑3 dollars and mostly getting saturated fat energy — while still living with sticky uteruses, summer milk loss, and DAs that wouldn’t budge.

That raised the harder question. If you’d never accept a methionine product with 15–25% bioavailability, why are you letting an omega‑3 product off the hook with the same profile?

How an Omega‑3 Failure Showed Up in the Fresh‑Cow Pen

On paper, this herd looked like a lot of progressive Midwest dairies. Close‑up DMI was steady. Body condition wasn’t a problem. Transition pens weren’t overcrowded. Fans and soakers were in. RP‑Met went in at the right rate. A fat blend with fish oil hit the mixer every day.

The fresh sheet kept telling a different story. Retained placentas wouldn’t get into single digits no matter what they tried with DCAD or close‑up grouping. Metritis stayed stubbornly high through whole calving stretches. DAs picked off cows who had given them no warning at all on the feed pad. None of it was catastrophic. It was just persistently “not where we want them.” Familiar?

The vet kept asking the same question every month at the meeting. If we’re doing all the obvious things right, what are we missing? Cow comfort wasn’t it. Energy wasn’t it. The team was running out of obvious answers.

When Heat Stress Stops Looking Like an Intake Problem

The vet’s question clicked into place with something else they’d been reading. Reviews on transition biology show systemic inflammation is almost universal right after calving, even when cows don’t look sick. That early fire is necessary; it helps deliver the calf and clear the uterus. The problem is what happens if the cow doesn’t have enough raw material to put it out.

Modern TMRs don’t help her. With corn silage, grains, and by‑products, omega‑6:omega‑3 ratios in dairy diets regularly run 10:1 to 25:1 instead of the 1–2:1 a grazing cow on lush pasture sees. Plenty of arachidonic acid to drive inflammatory pathways. Not much EPA or DHA to compete at the same enzymes.

Pasture‑heavy and graziers’ herds start in a different place. Fresh forage delivers meaningful baseline alpha‑linolenic acid, and the omega‑3 gap this herd was chasing is narrower in those systems. The math in this article is built for confinement and freestall operations whose cows see little or no grass.

Pair‑feeding research keeps showing only about half of heat‑stress milk loss is explained by intake. The other half is the physiological and inflammatory cost of being hot. Industry write‑ups summarizing recent heat‑stress trial work cite roughly 4.4 lb more milk per day and about 50% lower LBP — a blood marker of endotoxin load — in cows receiving abomasally infused or highly protected EPA/DHA. Treat those figures as a directional indicator drawn from secondary industry summaries rather than a fixed expectation pulled from a single named trial.

That sounded a lot like the “extra” milk this herd kept losing every July. They stopped assuming the fish oil line on the tag meant inflammation was covered.

The Day They Put Real Numbers to the Problem

Once the team accepted they had an inflammation problem, the next step was the kind of barn math any 500‑cow herd can run. They started by writing the actual numbers on the whiteboard. Retained placentas were running roughly 12%of calvings against a target near 5%. Metritis sat in the 16–18% range against a 10% target. DAs were holding at 4–5%against a target closer to 3%. Summer milk loss hit 7–8 lb/cow/day, and intake drops only explained 3–4 lb of it.

University benchmarks and field experience generally land under 5–8% RP, under 10–15% metritis, and under 3–5% DAs for Holsteins. This herd kept landing on the wrong side of every line — even after fixing the big stuff like DCAD and cow comfort.

Then they ran the disease math. RP at 12% versus a 5% target meant 35 extra cases a year. Metritis at 18% versus 10% meant another 40. DAs at 5% versus 3% meant 10 more. Not laboratory science. A realistic, conservative comparison for a herd doing most things right.

They pulled cost‑per‑case ranges from extension and economic summaries. RP runs about $150–$389/case. Metritis lands at $171–$386/case. DAs come in at $432–$639/case. Using mid‑range values: 35 × ~$270 ≈ $9,450. Forty × ~$280 ≈ $11,200. And 10 × ~$535 ≈ $5,350.

That’s roughly $26,000 a year in “above‑benchmark” transition disease cost without one clinical train wreck in the bunch. Worth keeping on the wall as a caveat: these are mid‑range cost‑per‑case values; actual herd costs vary with labor, lost milk, and culling assumptions.

Then they looked at heat stress. With 8 lb/cow/day of summer milk loss and intake explaining only 3–4 lb, that left a 4 lb “inflammation gap.” Over a 90‑day heat season, 4 lb × 500 cows × 90 days = 180,000 lb of milk. At a Class III milk price near $16.16/cwt — the figure carried through this thread for the March 2026 reference period — the math runs 180,000 ÷ 100 × $16.16 ≈ $29,088 in unexplained lost revenue. Run the same calculation against your current Class III or mailbox price before any decision; the dollar figure moves with the market, but the structural gap doesn’t.

Stack the two pieces and this 500‑cow herd was comfortably over $50,000 a year in avoidable transition disease and heat‑stress drag. Nobody at the table believed omega‑3 alone would erase that. Suddenly there was a big enough pot of money to justify checking whether their omega‑3 dollars were actually making it into cows.

“Cheap” Calcium Salts vs Real Omega‑3 Delivery: The Barn‑Math Flip

The farm wasn’t ready to throw calcium salts out of the ration. Palmitic‑based Ca‑salts still gave them the cheapest calories per pound of dry matter. But it was getting obvious they’d been expecting Ca‑salts to do a job they weren’t designed to do. The nutritionist drew up a comparison on the office whiteboard, using current commercial price ranges as the working assumption.

For the comparison, assume Product A is a calcium salt with fish oil at 250 g/kg EPA+DHA on the label, priced in the low single digits per kilogram. Product B is a verified bypass omega‑3 at the same 250 g/kg label claim, priced at roughly twice that. The ratio fits commonly observed price gaps but should be checked against your own supplier quotes before any commitment. Rumen data suggest roughly 80% of EPA and DHA are hydrogenated in Ca‑salt fish oil systems, leaving about 20% survival. The bypass technology is designed to protect EPA and DHA themselves; trials reported roughly 80% rumen bypass in protected forms.

MetricProduct A — Ca‑Salt + Fish OilProduct B — Verified Bypass
Label claim EPA+DHA250 g/kg250 g/kg
Working price assumption~1× (low single digits/kg)~2× Product A
Rumen survival of EPA+DHA~20%~80%
EPA+DHA delivered per kg fed~50 g~200 g
Cost per gram delivered~$0.06~$0.03
kg/cow/day to deliver 10 g EPA+DHA past rumen~0.20 kg~0.05 kg
Relative $/cow/day at that delivered target~2×~1×

Cost‑per‑gram figures use a notional $3/kg for Product A and $6/kg for Product B to illustrate the 1×–2× price ratio described above. The ratio is what matters; replace with your own current supplier quotes before any commitment.

On the price assumptions above, the bypass product cost about half as much per cow per day to hit the same delivered EPA+DHA target. That changed the conversation from “bypass is too expensive” to “we’re paying more per gram of EPA/DHA delivered with this approach than we realized.” Calcium salts stayed in the ration for energy. The omega‑3 job moved.

Why They Started Treating EPA and DHA Like Methionine

This dairy was already paying for RP‑Met because they believed the biology. Methionine supports phosphatidylcholine and VLDL export from the liver, antioxidant systems like glutathione, and protein synthesis when cows are deep in negative energy balance. Let the rumen torch most of it and the cow pays for it later in early lactation.

EPA and DHA work a different but complementary side of the transition problem. EPA competes with arachidonic acid at COX and LOX enzymes, capping how hot and how long inflammatory peaks run. DHA is the precursor for resolvins, protectins, and maresins — molecules that actively shut inflammation down and promote tissue repair.

Work from Joseph McFadden’s lab at Cornell, with co‑supplementation findings reported in the Journal of Dairy Science, shows that when cows get both bypass EPA+DHA and rumen‑protected methionine, the story changes. Liver Functionality Index improves. Energy‑corrected milk goes up versus cows missing one or both. Reproductive performance within roughly 150 DIM tracks better in supplemented groups. Specific volume and issue numbers for the McFadden JDS co‑supplementation paper will be added at copy‑edit once the citation is pulled from the lab’s publication list.

For this herd, that was the last puzzle piece. Their methionine program was doing its job. Without enough EPA and DHA actually reaching tissues, the immune system was burning glucose longer than needed and the liver was fighting a bigger inflammatory load than it should — especially in older cows.

According to project communications from Australia’s Dairy UP program, lipidomic work led by researcher David Sheedy and colleagues drew on roughly two thousand blood samples from a cross‑section of commercial herds and tracked phospholipid fatty acids against health outcomes. The exact published sample frame and herd count will be reconciled with the Dairy UP source document at copy‑edit. Herds and cows with higher omega‑3‑rich lipid species tended toward better health and longevity. As cows moved into later parities, omega‑3 status dropped and risk of leaving the herd climbed. Not a controlled product trial. But it fit what this farm kept seeing: third‑ and fourth‑lactation cows were the ones that “didn’t bounce back” after calving or summer.

Options and Trade‑Offs for Farmers

Most dairies don’t need to copy this herd‘s ration to steal their decision process. The useful part is the framework, and there are several honest paths through it depending on your scale, labor, and risk tolerance.

Path 1 — Run the supplier audit first (30‑day action; works for any herd). Before you change a single pound of the ration, ask every “omega‑3” supplier this question: Show me in‑vivo rumen bypass or biohydrogenation data for EPA and DHA — not total fat or total PUFA — at the inclusion rate we’re feeding. If they can answer with real numbers, you’ve learned something useful. If they can’t, you’ve also learned something useful. Where it shines: zero ration risk, zero capital cost, immediate clarity on what you’re actually buying. Where it hurts: you might find out your favorite product can’t back up the line on the tag, and that’s an uncomfortable conversation.

Path 2 — Keep Ca‑salts for energy, move the omega‑3 job (most common). Palmitic‑based calcium salts still belong in high‑energy rations; nobody is arguing that. The flip is putting the EPA/DHA inflammation job on a product designed specifically for omega‑3 bypass, and feeding it where it pays — close‑up and the first 40–60 DIM, plus the heat‑stress window. Where it shines: lets you keep your cheapest energy source while finally putting real EPA/DHA into tissues. Where it hurts: higher per‑kg sticker on the bypass omega‑3 product even when the cost‑per‑gram‑delivered math goes the other way; expect pushback at first quote.

Path 3 — Run a paired on‑farm trial (90‑day action). Work with your nutritionist to compare a transition pen on calcium‑salt omega‑3 against a transition pen on documented‑bypass EPA/DHA. Track RP, metritis, DAs, early milk, and summer milk vs intake. Where it shines: turns a vendor argument into your own data. Where it hurts: requires real recordkeeping discipline, and small herds may not generate enough fresh cows in 90 days to make the numbers move convincingly.

Path 4 — Wait and watch the Ca‑salt category innovation. Some calcium salt manufacturers are working on improved omega‑3 protection chemistry. If your fresh‑cow numbers are already at benchmark and your summer milk loss is fully explained by intake drop, sitting tight while the category catches up is a defensible call. Where it shines:no change cost. Where it hurts: every summer and every transition cycle you’re above benchmark is real money walking off the farm — and “we’re already at benchmark” is a higher bar than most herds clear honestly.

The forward‑looking signal worth watching across all four paths: peer‑reviewed in‑vivo bypass data on calcium‑salt fish‑oil reformulations. If the gap closes, the math in Path 2 changes. Until it does, the gap is the gap.

What This Means for Your Operation

  • Apply your methionine standard to your fat bin. If your nutritionist demands in‑vivo bypass numbers on RP‑Met, they should be demanding the same on any product carrying EPA and DHA on the tag. One conversation, this month.
  • Read your fresh‑cow sheet for inflammation, not just energy. RP stuck above 8%, metritis above 15%, or DAs above 5% after DCAD, energy, and cow comfort are clean is a different problem than most herds are diagnosing.
  • Pull last summer’s milk and intake graphs side by side. If milk fell faster than intake — by 3 lb/cow/day or more — quantify the gap before next heat season. That’s your “inflammation bill” in real numbers, on your milk price.
  • Audit suppliers before you audit the ration. The 30‑day question — “show me in‑vivo EPA and DHA bypass data at our inclusion rate” — costs nothing and changes the buying conversation immediately.
  • Watch parity 3+ specifically. If your culls and transition wrecks cluster in older cows, treat that as an omega‑3 status flag, not a “those cows just got old” excuse. Dairy UP lipidomic work points the same direction.
  • Don’t throw the Ca‑salts out. Palmitic‑based calcium salts still earn their slot for energy. The job that moves is the EPA/DHA inflammation job — not the calorie job.
  • Keep watching Ca‑salt reformulations. If peer‑reviewed in‑vivo bypass data on next‑generation Ca‑salt fish oil ever closes the gap, the math in Path 2 changes. Until then, plan on the gap being real.

Key Takeaways

  • If you wouldn’t buy rumen‑protected methionine without in‑vivo bypass data, don’t let any product call itself your omega‑3 strategy unless it has in‑vivo EPA and DHA bypass numbers at the rate you feed.
  • If RP is stuck above 8%, metritis above 15%, or DAs above 5% even after fixing DCAD, energy, and cow comfort, you’re probably treating symptoms of unresolved inflammation rather than the nutritional gap that helps resolve it.
  • If summer milk regularly runs 3–5 lb/cow/day below what your intake drop predicts, you’re paying a real “inflammation gap” bill — and heat‑stress trials suggest verified bypass EPA/DHA can claw back roughly 4 lb of that in the right setups.
  • Calcium salts of palm fats still belong in high‑energy rations. For inflammation‑focused EPA and DHA delivery, the evidence reviewed here suggests omega‑3‑specific bypass technologies deliver more EPA/DHA per dollar than fish‑oil calcium salts.
  • If third‑ and fourth‑lactation cows are over‑represented in your transition wrecks or early culls, treat that pattern as a parity‑driven omega‑3 status flag — not a “those cows just got old” excuse.

This 500‑cow Midwest dairy didn’t fix everything in one ration change. They started by holding their fat program to the same standard they were already demanding from their amino acid program — and once they did, the cost of not doing it stopped looking abstract.

Look at your own fresh‑cow sheet and your last summer’s milk graph. Where would the gap have to be on your operation before you’d ask your nutritionist for in‑vivo bypass data on every “omega‑3” line on the tag — and what would it cost you to wait another transition cycle to find out?

Complete references and supporting documentation are available upon request by contacting the editorial team at editor@thebullvine.com.

Learn More

The Sunday Read Dairy Professionals Don’t Skip.

Every week, thousands of producers, breeders, and industry insiders open Bullvine Weekly for genetics insights, market shifts, and profit strategies they won’t find anywhere else. One email. Five minutes. Smarter decisions all week.
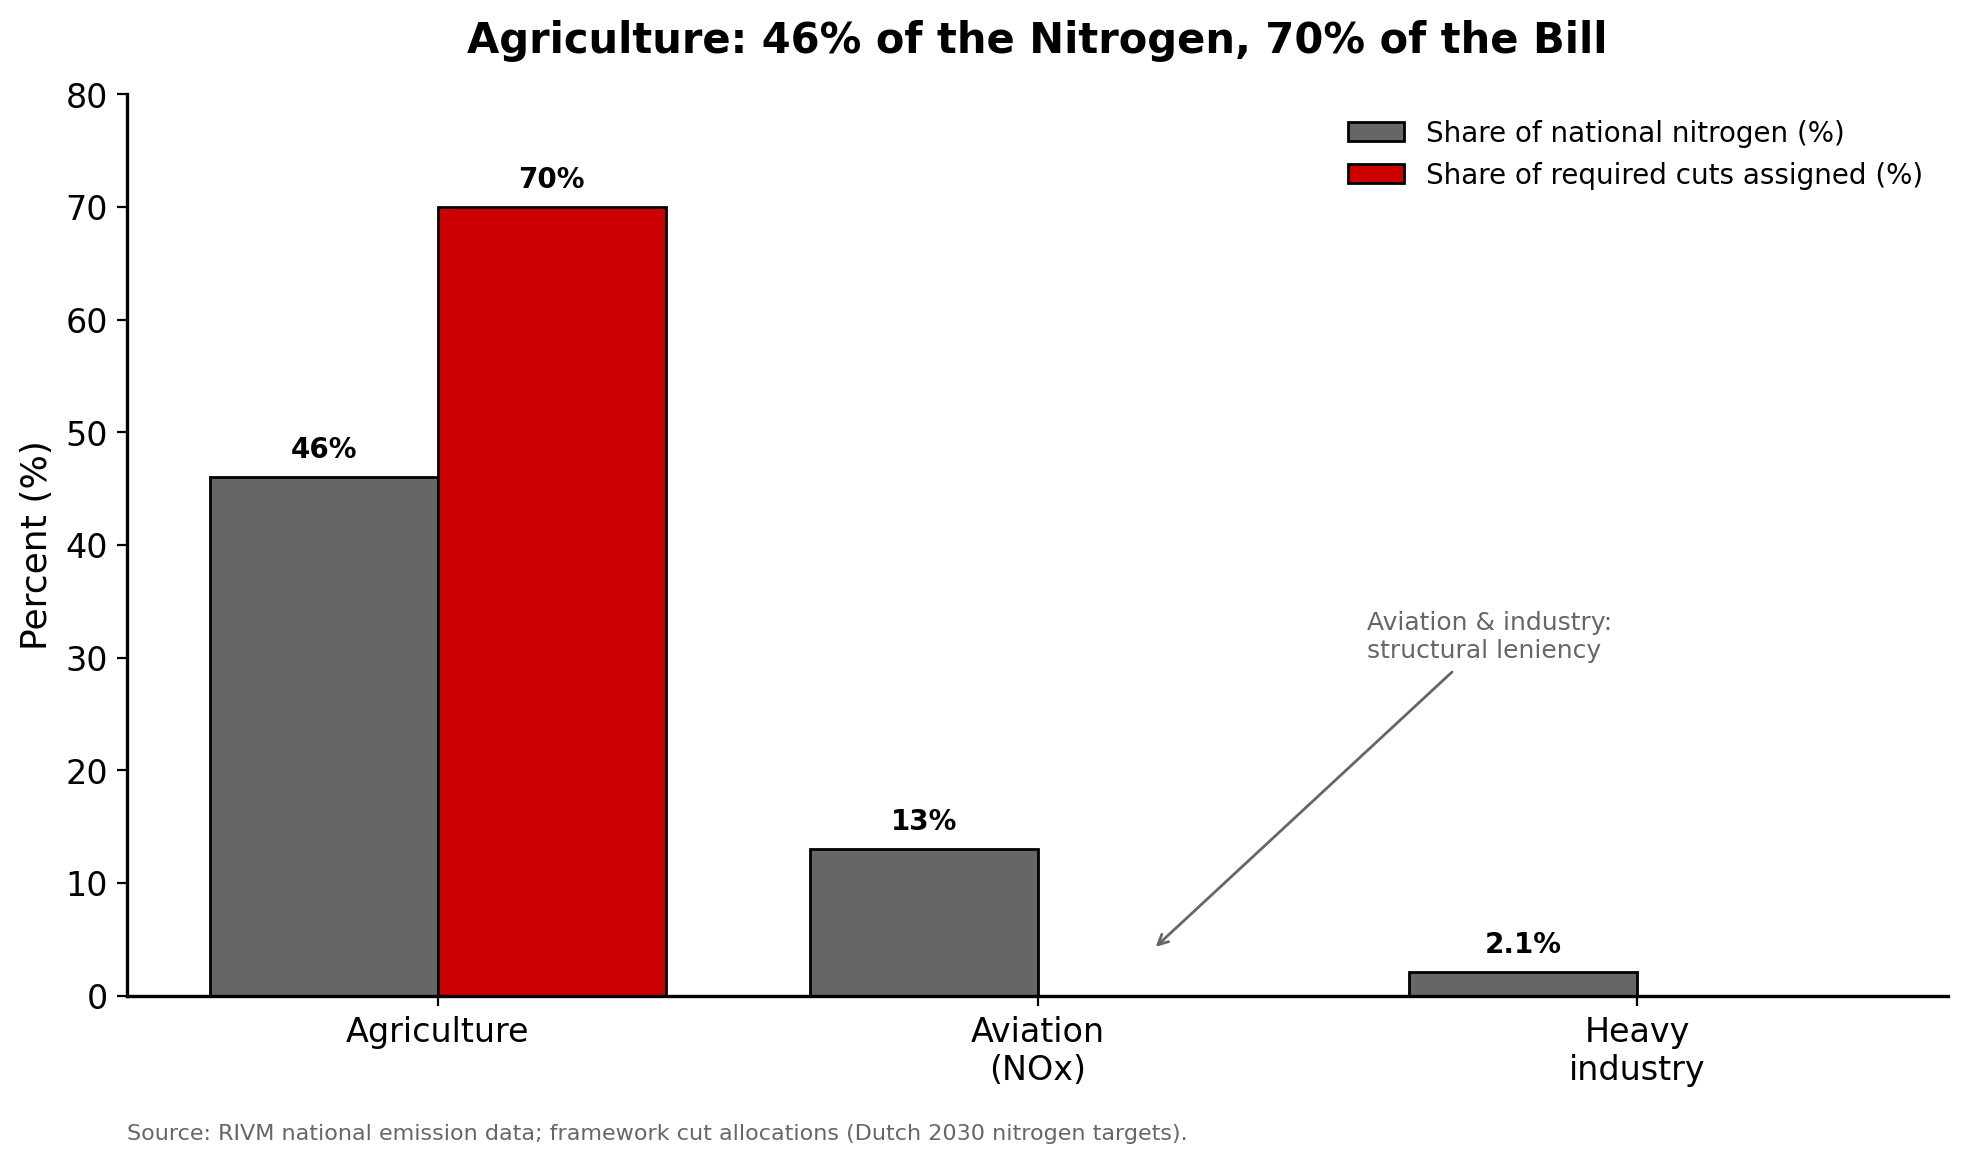
NewsSubscribe
First
Last
Consent

The May 19 EUA Made Screwworm Treatment Legal in the Milking String. It Didn’t Make It Smart.

FDA cleared Dectomax-CA1 for the milking string on May 19. At 175 miles from the line, three “2” wounds and a $42,000 load say targeted beats reflex. Here’s the math.

Executive Summary: FDA’s May 19, 2026 EUA on Dectomax-CA1 (doramectin) is the first systemic screwworm tool corridor operators can legally run through the milking string — but the closest active Mexican case still sits roughly 175 miles south of the Texas line, and that geography hasn’t moved. On a 600-cow Panhandle herd at 45% beef-on-dairy, three “2”-scored wounds in a $42,000 loadout pen cost about a dollar a head in drug and roughly $1,500 in buyer “biosecurity discount” if the contract language isn’t pre-negotiated. The protocol that works isn’t reflex treatment — it’s a written 0/1/2 wound score, two-layer spotter-decider review, and 12-hour treatment on confirmed “2” wounds only. Two clocks now run on the same needle: a pre-slaughter withdrawal on beef-cross calves, and an EUA-defined milk discard window on lactating cows, and the treatment record has to log which clock started on which animal. The three-year math matters too: 19 targeted doses a year preserves doramectin for the screwworm fight ahead, while 80+ reflex doses accelerates the macrocyclic-lactone resistance load already documented in cattle ticks and GI worms. Adjacent-zone operators (100–300 miles) should sit down with their vet this month, write the wound-scoring card in the language the crew speaks, and read the next loadout contract for a treatment-disclosure clause before three wounds force the conversation under deadline. Treatment access without surveillance discipline is a worse position than no treatment access at all.

screwworm treatment dairy cattle

Editor’s Note: The 600-cow Texas Panhandle operation in this piece is a composite scenario modeled from publicly available regional production data and current beef-on-dairy contracting patterns, following the precedent set by The Bullvine’s ,000 Breeding Meeting feature. Sensory and pen-floor framing is anchored to that disclosed composite, not to any named real individual or farm. All regulatory, surveillance, and resistance citations are sourced as named.

It’s a Tuesday afternoon in a Panhandle calf barn, and the herd manager is looking at a dehorning wound that doesn’t look right. The smell is wrong. Not the usual stale iodine, day-three infection smell. Sweeter than that. Closer to rotting meat. The stump is bigger than it was yesterday, instead of smaller, and the calf won’t stop shaking its head against the panel. The crew is standing back, waiting for the call.

Roughly 175 miles south, the closest confirmed New World screwworm case in Mexico is still creeping north. Sterile flies are dropping along the border. A buyer contract on the next pen of beef-cross calves specifies loadout in 14 days with no force majeure clause for parasites. Six months ago, this herd manager wouldn’t have had a broadly available systemic tool to use on this calf if it really were screwworm. As of May 19, 2026, that changed.

This is the 12-hour decision.

May 18 vs. May 19: What the EUA Actually Changed

On May 18, a Texas Panhandle dairy with a fresh dehorning gone bad on a mature cow had no broadly available systemic NWS tool inside the milking string. Topicals, wound hygiene, and a phone call to a state vet were the practical toolkit.

The next morning, the FDA issued an emergency use authorization expanding access to Dectomax/Dectomax-CA1 (doramectin injection) for use in dairy cattle. Under the conditional approval alone, corridor operators had been working with a label limited to beef cattle and young dairy heifers. The EUA brought a systemic doramectin product into the dairy-cattle authorization space under emergency authority — a meaningful expansion of access for a milking-string animal with a wound nobody wants to misread.

That regulatory shift is what kept many southern-corridor dairy vets from designing whole-herd wound protocols around a systemic tool until last week. With the EUA in hand, those same vets are quietly redesigning what happens in the first 12 hours after a dehorning, castration, or fresh navel — and asking herd managers harder questions about surveillance distance, withdrawal timing, and contract language than they were asking last fall.

The operator who recognizes themselves in this story runs 400 to 600 cows in Texas, New Mexico, southern Arizona, or Florida, breeds 40 to 45% beef-on-dairy, and ships short-weaned calves under contract to backgrounders. The screwworm threat isn’t theoretical. Neither is the buyer paperwork.

The Two Clocks That Define the Tool

Two clocks start the moment a doramectin needle goes into the neck. They don’t run in the same direction, and they don’t apply to the same animals. Reading the EUA letter against the full Dectomax label is what tells you which clock starts on which animal.

For beef-cross calves and any animal heading to slaughter, doramectin’s full FDA-approved label has historically carried a 35-day pre-slaughter withdrawal. Most corridor vets and Panhandle backgrounders already know that number off the top of their heads. The EUA letter is the document that confirms whether the same window applies under emergency authorization for dairy cattle use, and the herd’s vet should read it line by line before the first dose goes in.

For lactating dairy cows, the picture is sharper and stricter. Doramectin’s full FDA-approved label historically did not include use in female dairy cattle of breeding age due to unresolved milk-residue concerns. That gap is exactly what the May 19 EUA was written to address. The EUA specifies the emergency milk discard period operators must observe when treating mature dairy cows under this authorization — a defined window during which milk from treated cows is held out of the bulk tank.

The point isn’t the exact number of hours. The point is that two different clocks now apply to the same drug — one for the calf headed to a backgrounder, one for the cow headed to the parlor — and the protocol you build has to log which clock started on which animal, every time. Same drug, two completely different downstream consequences. The dump tank, the bulk-load schedule, the milk cheque, and the pen-load contract all live on different sides of that line.

FactorBeef-Cross Calf (heading to backgrounder)Lactating Dairy Cow (milking string)
EUA ApplicabilityPre-existing label + EUA confirmationNew access via May 19 EUA only
Withdrawal TypePre-slaughter (days)Milk discard window (hours)
Primary Risk if IgnoredViolates packer/backgrounder SLAMilk residue in bulk tank
Clock Start EventDate of injectionDate of injection
Record Column RequiredAnimal ID + treatment date + slaughter dateAnimal ID + treatment date + milk-hold end date
Marketing ImpactDelayed if sold within withdrawal windowMilk check loss for discard period
Protocol PriorityConfirm slaughter date > 35 days outConfirm bulk tank segregation before treatment

What Does a 12-Hour Wound Actually Look Like?

The protocol isn’t “treat everything.” It’s a wound-severity score the crew runs consistently, twice a day, in pens nobody else is watching that closely.

USDA APHIS, Texas A&M AgriLife, and CDC all describe the same red-flag wound: a sweet, rotting odor distinct from normal infection; a wound enlarging or deepening instead of drying; visible larvae or white “grains”; bloody or serous discharge that should have crusted; behavior out of proportion to the wound’s age — head-shaking, kicking, isolation. Eggs hatch in 12 to 24 hours. Untreated newborn calves can die in 7 to 14 days.

What’s different now isn’t the biology. It’s that the crew on a 175-mile-from-the-line operation has a written 0/1/2 scoring card and a vet-backed rule.

  • 0 = Normal. Clean, dry, no smell, calf indifferent. Log it and keep walking.
  • 1 = Watch. Some swelling or thin discharge, no odor, calf mostly normal. Recheck the same day.
  • 2 = Call. Any odor, visible larvae, blood-tinged fluid, a wound bigger or deeper than yesterday, or a calf obsessing over it. Tag the calf, time-stamp it, call the herd manager.
ScoreVisual SignsSmellAnimal BehaviorWound TrendProtocol ActionTimeframe
0 — NormalClean, dry, no discharge, edges approximatedNone / faint iodineIndifferent, eating normallyDrying/shrinking as expectedLog and keep walkingN/A
1 — WatchMild swelling, thin clear/serous dischargeNone or faintMostly normal, occasional head-shakeStableRecheck same shift; note in logSame day
2 — CallVisible larvae or white granules; bloody or wet discharge; edges enlargingSweet, rotting meat odorHead-shaking, kicking, isolation, won’t eatBigger or deeper than yesterdayTag animal, time-stamp, call herd manager immediatelyTreat within 12 hours

The two-layer review is the part most operations skip. One spotter — calf tech, pen rider, whoever’s eyes are on those calves first — flags. One decider — herd manager or designated vet tech — calls the shot. The spotter’s job is to surface anything wrong without fear of over-calling. The decider’s job is to sort the genuinely suspicious wounds from the ugly-but-normal ones, because every unnecessary dose chips away at something the FDA flagged in its EUA guidance: long-term resistance.

The Math on Three Calves

Picture the pen the way the herd manager sees it. Sixty beef-cross calves, averaging 250 to 300 pounds, contracted at roughly $700 a head — a price point consistent with the current Panhandle short-weaned beef-cross trade. That’s $42,000 in inventory tied to a load scheduled to leave in 14 days. The buyer plans to background them another 90 to 120 days before they hit a finishing program. Slaughter is 140 to 180 days out.

Three of those calves caught a “2” on the wound score today. The protocol says to treat within 12 hours.

The drug math is small. Label dose is 1 mL per 110 pounds, subcutaneous in the neck. A 250-pound calf takes roughly 2.3 mL. At publicly available retail pricing in the range of $0.30 to $0.45 per mL on a 500 mL bottle, that’s roughly a dollar per head in drug at retail. Three calves: a few dollars total.

The pre-slaughter withdrawal clock starts today. With the buyer’s slaughter window more than 100 days out, the withdrawal doesn’t disrupt the marketing plan — provided nobody panics and sells. The risk isn’t the packer timetable. It’s the buyer’s contract language and the buyer’s perception.

If the contract has a “no systemic antiparasitic within 14 days of delivery” clause and treatment hasn’t been pre-cleared, three treated calves can become a contract problem stretching across all 60. A 30-day delay on the load is a $42,000 cash-flow gap on a credit line that wasn’t built to absorb it. A flat $25-per-head “biosecurity discount” applied to the whole pen is $1,500 off the check.

Treatment-disclosure clauses and rights to discount or reject are the kind of language corridor vets and herd managers report seeing in purchase-agreement drafts this spring, even where screwworm isn’t named explicitly. The Bullvine is reporting that pattern with named buyers in a forthcoming piece; until then, treat the contract risk as anecdotal but live. For background on how loadout discipline shaped a real beef-on-dairy closeout check, see The Bullvine’s 168 Steers, One Closeout, $33,000 Riding on the Sire Sheet You Ordered Last Fall.

What Does Treating This Calf Cost the Tool Three Years From Now?

FDA’s EUA guidance carries a warning that’s easy to skim past. The agency directs producers — in language paraphrased here from FDA’s NWS Animal Drugs guidance — to use these drugs only when medically necessary and as part of a comprehensive parasite management strategy, to preserve effectiveness and reduce the risk of resistance.

Recent peer-reviewed work on macrocyclic lactone resistance in livestock — including reviews published in Veterinary Parasitology and reports presented at the American Association of Veterinary Parasitologists proceedings — documents the development of resistance in cattle ticks and gastrointestinal worms, with cross-resistance among molecules in the same class. Heavy, repeated use selects for parasites that survive. None of that is news to a working corridor vet. It’s the part that gets quietly ignored when a screwworm scare lands on top of an already-heavy parasite program.

Run a quick three-year load math on the same 600-cow operation. Those 270 beef matings a year produce roughly 238 weaned beef-cross calves after losses. If 8% of those calves catch a true “2” wound in a given year — call it a working scenario rate, not a sourced one — that’s about 19 doramectin doses on the calf side annually. Low-frequency, targeted use. Stretch that to a “Dectomax Wednesday” reflex, hitting one in three calves just in case, and the same operation is suddenly running 80-plus extra doses through the calf pens every year, on top of whatever the cow side and the deworming program already use.

Used sparingly on truly high-risk wounds in a high-risk zone, Dectomax-CA1 stays sharp for the screwworm fight ahead. Used as a reflex, it accelerates the day doramectin doesn’t clean up a tick load the way it used to — and the day a screwworm population that finally crosses the line shrugs it off. That’s the long-term tool-preservation argument. It runs straight into the short-term reality that one missed screwworm case can detonate movement, contracts, and confidence on a single farm. The honest answer at 175 miles in an active threat band: spend the tool, but spend it carefully. The discipline lives in the protocol that decides when.

Tracking the Line Without Going Crazy

Risk band changes everything. USDA APHIS guidance and corridor-state extension materials roughly split into three working zones:

ZoneDistance from active caseDefault protocol posture
ConfirmedWithin 100 milesPostpone elective wounds; treat suspect wounds aggressively; daily surveillance on every pen; report any “2” to the state vet same day.
Adjacent100–300 milesTwice-daily wound surveillance; 0/1/2 scoring active; treat “2” wounds inside 12 hours; pre-negotiate contract language with buyers; weekly APHIS check.
Remote>300 miles, stableTraining and equipment only; no prophylactic Dectomax-CA1; ensure vet can ID a “2” wound on a 30-minute drive-out.

The 600-cow operation in this piece is 175 miles away. That’s squarely in the adjacent band — exactly where targeted treatment of high-risk wounds pencils out, and blanket prophylaxis still doesn’t. Move that pin to 95 miles next month if Mexican cases keep moving north, and the posture shifts to confirmed. Move it to 350 miles by next fall if the sterile-fly program holds and pushes the active line south, and the same operation throttles back to training and equipment.

The protocol isn’t static. The line moves. APHIS updates its current-status page on a regular cadence; corridor operations check it the same way they check the milk-price board. For working surveillance distance and the active case map, check the USDA APHIS New World Screwworm response page directly.

Four Options, Honestly

There are four real plays a corridor operator can run on this set of facts. Each has a cost, a backfire mode, and a herd type it fits.

OptionProtocolAnnual Drug CostPrimary RiskBackfire ModeBest Fit Herd
1 — Targeted + Written Protocol0/1/2 wound score, treat “2” only, pre-negotiate contractLow (~$20–$30/yr on 19 doses)Card lives in a binder nobody opensDiscipline failure mid-season100–300 mi corridor, stable buyer relationship
2 — Prophylactic on Every Elective DayTreat all elective-wound animals regardless of scoreHigh (80+ doses, withdrawal mgmt on dozens)Biosecurity discount applied to whole loadAccelerated ML resistance; buyer rejects pen<100 mi confirmed zone, threat no longer theoretical
3 — Postpone Elective WoundsDelay dehorning, castration, tagging until line movesNoneSchedule backlog in peak summer pen densityWeaning targets blown, labor crunchSmaller herds with flexible wound calendar
4 — Exit Beef-on-Dairy EntirelyRebuild calf revenue program, renegotiate contractsNone (calf revenue lost)Leaves a tested revenue stream over a manageable threatAlmost irreversible short-termAlmost nobody at 175 mi now; real if U.S. line crossed

Option 1 — Targeted treatment, written protocol, contract pre-negotiation. Cost: a vet visit and an afternoon writing the 0/1/2 card with the crew, plus modest annual drug spend on a low-double-digit number of doses. Backfire: a card that lives in a binder nobody opens. Fits: corridor operations at 100–300 miles with a stable buyer relationship and a vet who’ll walk pens.

Option 2 — Prophylactic Dectomax-CA1 on every elective-wound day. Cost: high drug spend, withdrawal management on dozens of calves at once, contract risk multiplied across the load. Backfire: accelerated resistance, and a “biosecurity discount” buyers apply to the whole pen instead of three calves. Fits: confirmed-zone operations under 100 miles where the threat is no longer theoretical.

Option 3 — Postpone elective wounds until the line moves. Cost: dehorning, castration, and tagging schedules pushed by weeks, with downstream labor and pen-flow consequences. Backfire: a backlog that hits the worst pen-density week of the summer. Fits: operations that can flex their wound calendar without breaking weaning targets — usually smaller herds or those with redundant labor.

Option 4 — Walk away from beef-on-dairy in the corridor entirely. Cost: rebuilding the calf-revenue program and renegotiating contracts. Backfire: leaving a tested revenue stream over a threat the protocol can manage. Fits: almost nobody at 175 miles right now, but a real conversation if the line crosses into the U.S. and stays.

The 600-cow herd in this scenario is running Option 1 by default and keeping Option 3 on the shelf in case the line moves. That’s the honest call on the trade-off. The wrong call is treating Option 2 as the default because the EUA made it easier.

For corridor operators rebalancing the broader beef-on-dairy share question, see the calf-math piece from last week.

What This Means for Your Operation

  • Which clock applies to this animal? Beef-cross headed to a backgrounder runs on the pre-slaughter withdrawal in the EUA. A lactating cow under the EUA runs on the emergency milk discard period. If your treatment record doesn’t capture which clock starts on which animal, build that column into the chart this week.
  • Have you read your next loadout contract for a treatment-disclosure clause? If the buyer hasn’t added one yet, ask whether they’re drafting one. If they have, pre-negotiate the “treated with FDA-authorized antiparasitic” line before three “2” wounds force the conversation under a deadline.
  • Where is your operation in the risk-zone table — confirmed, adjacent, or remote? Pin the closest active Mexican NWS case to a map this morning and check the distance. Re-check it weekly. The protocol you run is the one your distance number says you should be running, not the one you ran last fall.
  • Is your crew running a written 0/1/2 wound score with two-layer review, or are you relying on whoever happens to walk the pen first? Spotter flags, decider calls. If your barn doesn’t have both roles named on the wall, you’re not running this protocol — you’re hoping.
  • 30-day action. This month, sit down with your vet and write a 0/1/2 wound-scoring card in the language your crew actually uses — bilingual if your crew is bilingual. Walk pens together once. Establish the two-layer review. Cost: a vet visit and an afternoon. Backfire risk: a card that lives in a binder nobody opens. The card only works if the crew helped write it.

Key Takeaways

  • If your operation sits inside 300 miles of an active NWS case, the May 19 EUA changed your toolkit but not your geography. Treatment access without surveillance discipline is a worse position than no treatment access at all.
  • If you treat reflexively rather than by wound score, you’re spending the tool faster than the screwworm threat warrants. Targeted use on “2” wounds preserves doramectin for the year a real outbreak crosses the line; reflex use does not.
  • If you don’t pre-negotiate treatment language with your buyer, three treated calves can cost you a $1,500 discount on a $42,000 load — or worse. The conversation is cheaper before the wound than after.
  • If your crew can’t tell you which clock starts when the needle goes in, the protocol on the wall isn’t the protocol in the barn. Train on the two clocks, log them each time, and audit the record at the end of each month.

Walk that pen with your own eyes tomorrow morning. Could your crew tell you, without flinching, which version of this protocol your operation is actually running?

Run Your Numbers

Farm Benchmark Snap Check — Pressure-test what a 30-day calf-movement disruption, a $1,500 biosecurity discount, or a held loadout actually does to your milk check and your credit line before three “2” wounds force the decision under deadline.

Complete references and supporting documentation are available upon request by contacting the editorial team at editor@thebullvine.com.

Learn More

The Sunday Read Dairy Professionals Don’t Skip.

Every week, thousands of producers, breeders, and industry insiders open Bullvine Weekly for genetics insights, market shifts, and profit strategies they won’t find anywhere else. One email. Five minutes. Smarter decisions all week.
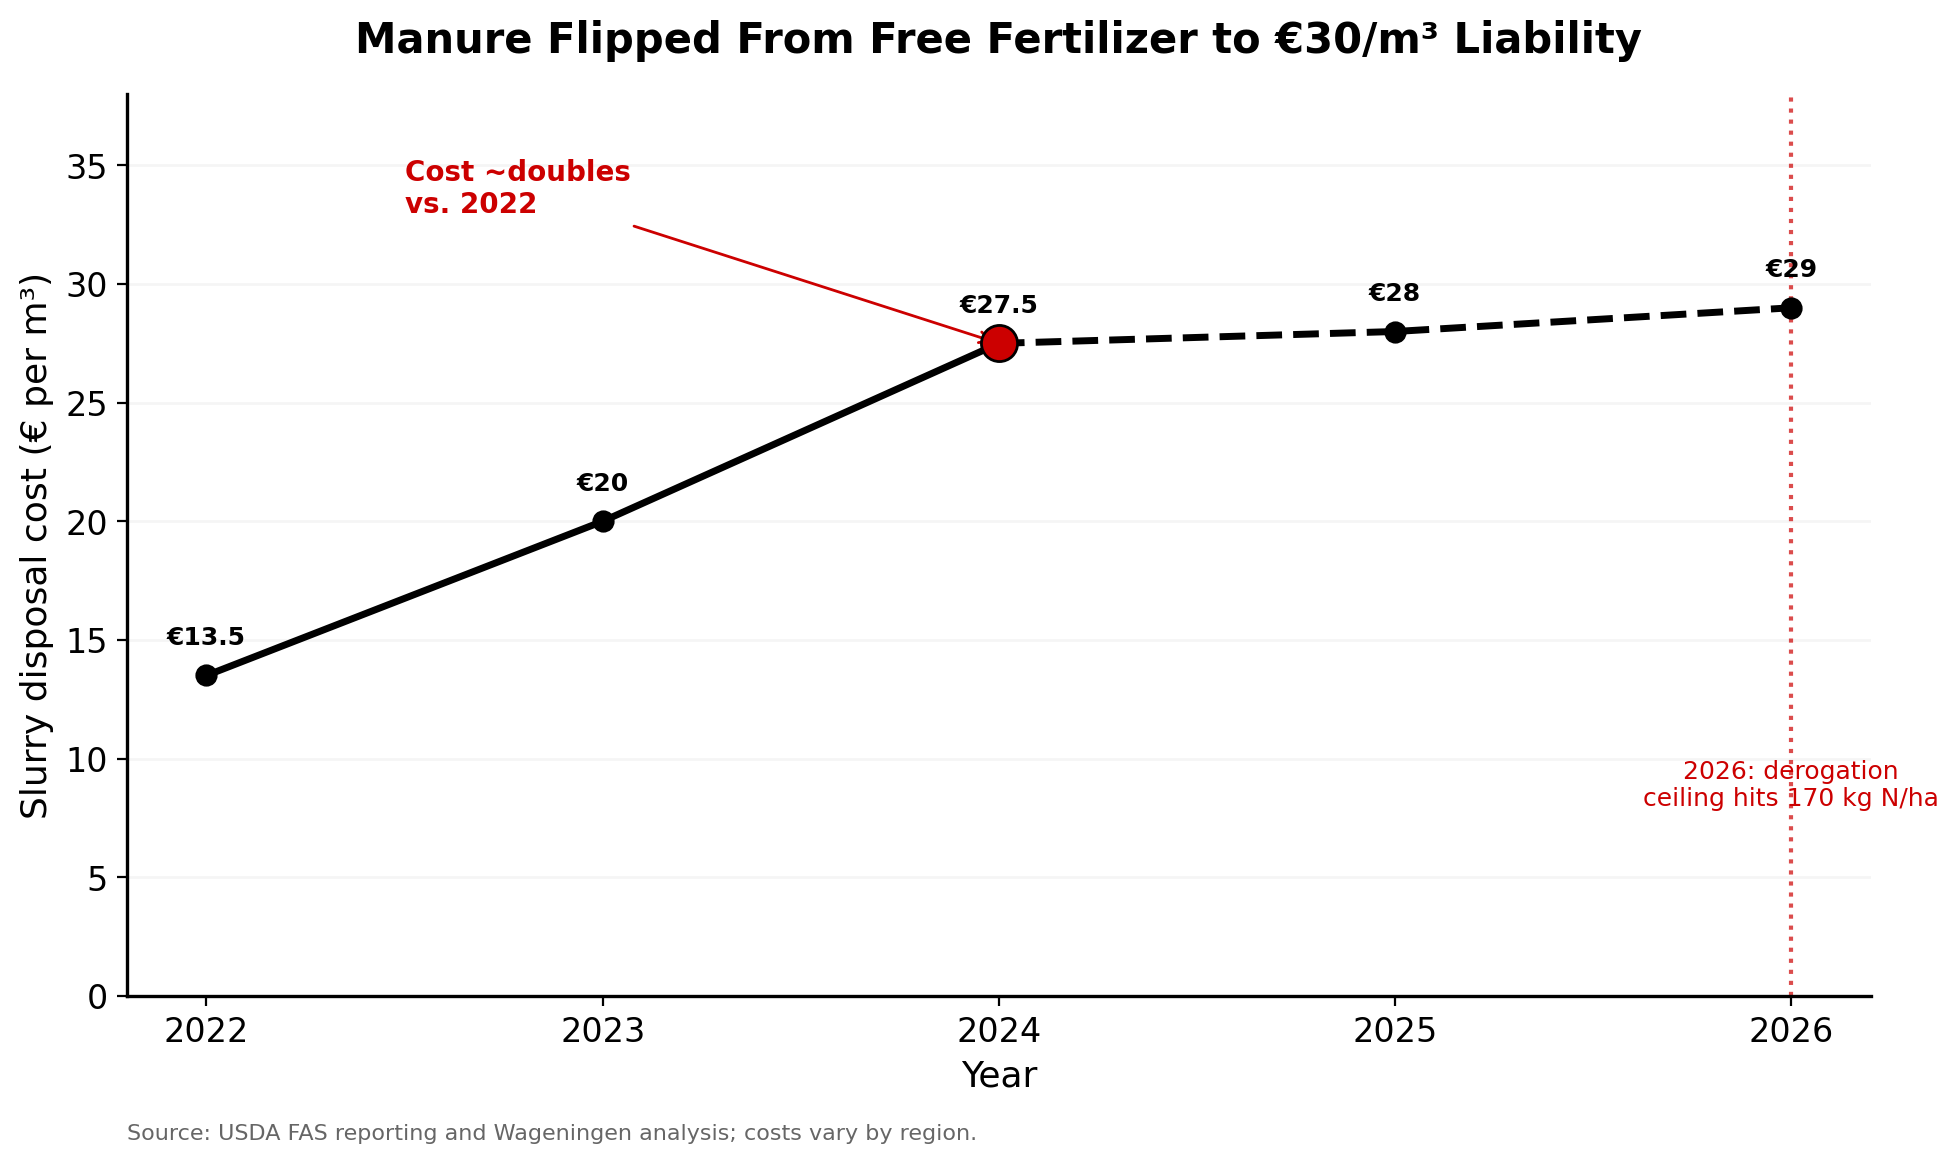
NewsSubscribe
First
Last
Consent

Organic Valley’s Lawsuit Is About $0.72. The Risk on Your Farm Is $19.89.

Four federal filings on April 28. The pool drag in court is $0.72/cwt. On a 200‑cow organic herd, the real spread is $19.89/cwt — $875,160 a year if your contract walks.

Executive Summary: Organic Valley/CROPP, Aurora, and Horizon filed four federal lawsuits on April 28, 2026 — in the Western District of Wisconsin, the District of Colorado, and the U.S. Court of Federal Claims — to pull organic milk out of the FMMO and recover more than $60 million in six years of pool payments. Plaintiffs, including CROPP owner‑member Elvin Ranck of Mifflin, PA, peg the implied drag at roughly $0.72/cwt; that’s about $31,680/year on a 200‑cow organic herd producing 44,000 cwt. The bigger barn‑math number isn’t in court. With NODPA’s 2025 weighted‑average organic pay price at $38.39/cwt and the Order 1 statistical uniform price hovering near $18.50/cwt in early 2026, the spread is $19.89/cwt — or $875,160/year if a premium contract walks and the FMMO floor is all that’s left. Layer in the June 2025 make‑allowance reset (AFBF: $0.85–$0.93/cwt) and “protection” looks like an insurance policy with a deductible roughly half your milk check. The 30‑day move: pull your supply agreement and loan docs, highlight every premium, pooling, MAC, and DSCR clause, and walk a three‑scenario sheet — $38.39, $34.55, $18.50 — into your lender’s office before fall contract review. Court speed won’t decide your 2027 pay program; your contract and your covenants will.

Organic Valley FMMO lawsuit

The quote that kicked this loose is blunt. “The federal government has locked in an updated dairy pricing regulation that actively harms organic dairy farmers. It systematically siphons tens of millions of dollars away from organic dairy farmers like me for the benefit of conventional dairy farmers.” That’s Elvin Ranck, an organic producer near Mifflin, Pennsylvania, and a CROPP Cooperative (Organic Valley) owner‑member, in the April 28 class‑action announcement from the Coalition for Organic Dairy Exemption (CODE).

Ranck is one of the named plaintiffs behind four federal lawsuits filed April 28, 2026 — in the Western District of Wisconsin, the District of Colorado, and the U.S. Court of Federal Claims. CODE wants two things: an exemption for organic dairy from the Federal Milk Marketing Order (FMMO) system, and more than $60 million in damages for six years of pool payments plaintiffs say never came back to organic farms. That’s the legal fight. The barn math underneath is what should land on your kitchen table well before the next round of organic contract “adjustments.”

On a 200‑cow certified organic herd, the modeled gap between today’s contract price and the FMMO floor isn’t a rounding error.

$875,160 / year

The modeled milk‑revenue gap on a 200‑cow certified organic herd if the premium contract walks and FMMO pooling is all that’s left.

Editor’s note: This article relies on the public CODE class‑action filings and announcements, on‑record reporting in various media reports including: Sentient Media, Brownfield, Dairy Processing, and NatLawReview, and published USDA AMS, NODPA, and AFBF data. Organic Valley/CROPP, Aurora Organic Dairy, Horizon Organic Dairy, NMPF, IDFA, and USDA were not contacted directly for additional comment for this piece. The 200‑cow herd referenced throughout is a transparent modeled scenario, not a single named operation.

What the Lawsuits Actually Say

CODE — CROPP Cooperative, Aurora Organic Dairy, and Horizon Organic Dairy — argues that organic milk doesn’t belong in a Depression‑era pooling system built for fungible conventional milk. Organic milk must be physically segregated, sourced from certified herds, and can’t be swapped for conventional product. Yet organic handlers still pay into FMMO pools like everyone else.

The coalition’s Washington release calls those pools ones that “don’t serve” organic handlers, even though organic dollars keep flowing in. The class‑action filing in the Court of Federal Claims pegs damages at more than $60 million over six years. Spread across CROPP’s volume in that period, that pencils out to an implied pool drag of roughly $0.72/cwt on organic milk — a CODE estimate, not a court finding. CODE also estimates that organic milk has transferred close to $400 million into conventional‑focused pools since 2006 — a coalition calculation, not a court‑adjudicated figure.

Adam Warthesen, Organic Valley’s senior director of government and industry affairs, shared on April 27 that the FMMO pulls tens of millions of dollars out of organic dairy farms each year, and that CROPP is seeking an exemption because the current system doesn’t reflect how organic milk is produced or marketed. Sentient Media puts the organic share of U.S. fluid milk at about 7% of milk products sold in 2025 — small in volume, but large enough to move real dollars when those Class I premiums are pulled into the pool.

The National Milk Producers Federation and the International Dairy Foods Association — both long‑standing public advocates for the FMMO system — have not yet issued a detailed response in public coverage of the lawsuits. USDA hasn’t commented on the specific lawsuits either. Your milk check won’t wait for the docket.

How Big Is the Gap on a 200‑Cow Organic Farm?

Now the barn math. Take a 200‑cow certified organic herd you’d actually see in Pennsylvania, Vermont, or Wisconsin:

  • 200 cows · 22,000 lb/cow/year · 4,400,000 lb/year · 44,000 cwt/year

For the organic price, use NODPA’s latest national figure. In its May 2026 Pay and Feed Prices update, the Northeast Organic Dairy Producers Alliance reports a weighted‑average producer pay price of $38.39/cwt for 2025. For the floor, anchor on a recent Northeast Order 1 statistical uniform price. Bullvine markets coverage and USDA reports place that uniform price near $18.50/cwt in early 2026, depending on components and utilization.

The Three‑Scenario Cliff (44,000 cwt/year)

ScenarioPay PriceAnnual RevenueΔ vs. Today
1 — Premium holds$38.39/cwt$1,689,160
2 — Premium compresses 10%$34.55/cwt$1,520,200−$168,960
3 — Contract gone, FMMO floor only$18.50/cwt$814,000−$875,160

The fight in court is the small number. The fall is the big one.

$19.89/cwt

The modeled spread between today’s organic premium and the Order 1 statistical uniform price.

× 44,000 cwt = $875,160/year

One contract clause, one bad winter — half your milk income.

CODE’s implied pool drag, by contrast, lands at about $31,680/year on the same farm — $0.72/cwt × 44,000 cwt. Real money. Also roughly one‑twenty‑seventh of what disappears the day your premium contract walks out the door.

The lawsuits are built around the small number. Your banker’s built around the big one.

What the FMMO Is Really Doing for You

Two prices live on every organic milk check, and they don’t touch the same envelope.

The FMMO pool draw is what your handler pays into and pulls out of the federal pool. USDA AMS’s May 19, 2026 announcement set the base Class I skim milk price for June 2026 at $16.75/cwt, up $2.63 from May. Layer in butterfat, location, and Boston’s differential and the June Class I mover lands in the low‑20s per cwt. The pool pays handlers back at the weighted‑average statistical uniform price, which has hovered in the $18–$19/cwt band in early 2026. The gap between Class I in and uniform price out is the dollar value CODE’s lawsuits are challenging.

Your premium contract is something else entirely. Organic producers don’t get paid out of the pool — they get paid through private supply agreements with co‑op pay programs at Organic Valley, or contracts with buyers like Horizon or Aurora. NODPA’s monthly reports place those programs in the $33–$45/cwt range nationally, with grass‑fed and branded premiums into the high‑40s. The FMMO uniform price sits well below that world. It’s a backstop, not a livelihood.

The June 1, 2025 FMMO amendments permanently reset the make‑allowance formulas. Bullvine’s “$20 Milk Paradox” coverage, citing American Farm Bureau Federation analysis, put the hit at roughly $0.85–$0.93/cwt off announced class prices in many orders. On 44,000 cwt, that’s another $37,400–$40,920/year in lost revenue for any portion of your check that tracks those class values. The “floor” is on a slow slide of its own.

So what does the FMMO actually do for you as an organic producer?

  • It forces your handler to pay into a pool at a high Class I price.
  • It returns money at a lower uniform price.
  • It sets a floor at $18–$19/cwt — well below organic cost of production.

NODPA’s monthly producer reports peg all‑in organic mailbox costs in the mid‑30s per cwt across many Northeast herds, with feed, labor, and certification overhead doing most of the lifting. At an $18–$19/cwt uniform price, you’re not “saved.” You’re losing money slightly more slowly than if your check hit zero.

How Much Does FMMO “Protection” Actually Buy You?

Treat FMMO participation like an insurance policy and the deductible becomes obvious.

What FMMO Costs YouWhat FMMO Protects You From
$31,680/year pool drag (CODE estimate)A zero milk check
$0.72/cwt × 44,000 cwtNot from a negative DSCR
Tens of thousands a year, every yearOnly kicks in after ~half your milk income is already gone

You’re paying tens of thousands of dollars a year into a system whose “benefit” only kicks in after you’ve already lost roughly half your milk income. And once you hit that floor, your cost structure still looks like an organic farm — feed, labor, certification, and all — not a conventional one.

So when somebody tells you the FMMO protects organic farmers, translate it into barn language. It protects you from a zero milk check. It does not protect you from a negative DSCR.

What Should You Be Asking Your Lender Before September?

If you’re shipping organic and carrying term debt, your lender conversation this summer needs to be more than small talk about feed costs. You’re trying to answer three questions before anyone touches your 2026 contract.

1. “What happens to my loans if my organic contract is cut or terminated?” Sit down with your loan documents and your lender. Make them point to the DSCR or coverage covenants and how often they’re tested. Find out whether a covenant miss caused by a documented contract loss or premium cut is an automatic event of default, or something the bank can waive. Read every line of any Material Adverse Change (MAC) language that lets them accelerate, re‑price, or freeze your operating line if milk income drops sharply.

2. “At what DSCR do you stop giving me the benefit of the doubt?” You don’t need their internal credit playbook. You do need a number. Is 1.25× where they get nervous? 1.0×? Lower? Then run your own three‑scenario math: DSCR at $38.39/cwt today, DSCR at $34.55/cwt with a 10% premium cut, and DSCR at $18.50/cwt if the contract walks. If the floor scenario pulls you below 1.0×, you want that on the table now — not after the fact.

3. “Can we document what happens if my pay price drops $3–$5/cwt?” It doesn’t have to be a contract addendum. An email recap of your meeting will do: “Confirming my understanding — if my DSCR drops below 1.0× due to a documented contract change of $3–$5/cwt, the bank will first explore restructure options (amortization change, temporary interest‑only) before considering acceleration.” If your lender won’t put any version of that in writing, you’ve learned a lot about how much real flexibility you have.

Options and Trade‑Offs for Farmers

You can’t litigate your way to a safe milk check. Even if CODE wins an exemption or a payout, your day‑to‑day risk still lives in your contract and on your balance sheet. Here’s where producers are actually moving right now.

Option 1 — Stay in the co‑op and engage on pooling policy from the inside. This is the path most Organic Valley members are on. It makes sense if your organic pay price is still in the high‑30s to low‑40s per cwt, your DSCR sits at or above 1.25× at today’s price, and you believe member pressure can move board policy. What it takes is showing up with numbers, not feelings — asking for audited breakdowns of total FMMO pool payments, organic vs conventional contributions, and how those costs are allocated in the pay program. The risk: co‑op governance moves at board speed, not milk‑check speed. With AFBF flagging organic class‑price pressure from the June 2025 make‑allowance reform and pay prices already drifting in NODPA’s monthly reports, plan for the possibility that pay‑program terms get reviewed before pooling policy is resolved.

Option 2 — Stay, but run the contract + covenant checkup in the next 30 days. This is the highest‑return move almost every organic farm can make this summer. Within a month, print your milk supply agreement and highlight every reference to “premium,” “over‑order premium,” “pooling,” “FMMO,” “regulatory charges,” “market adjustments,” “termination,” “notice,” and “volume caps.” Print your loan documents and highlight DSCR or coverage covenants and any MAC clauses. Build a one‑page summary — current pay price and DSCR, DSCR at a 10% premium cut, and DSCR at the floor — and walk it into your lender’s office. Risk is minimal. Time investment is a weekend and one serious meeting. Payoff is knowing exactly how much runway you have if your premium gets “reviewed” this winter.

Option 3 — Map an exit to a different organic buyer. Some producers are already having quiet conversations with other organic handlers. This only makes sense if there’s another buyer in hauling range who actually wants your volume and will put a number on paper. Assume 6–24 months from “I want out” to “I’m stable with a new buyer,” a likely $2–$5/cwt premium haircut on the new deal, and a redemption horizon that, in many dairy cooperatives, runs several years; build cash flow assuming retained equity isn’t available immediately, and verify your co‑op’s actual schedule with its member services office. On 44,000 cwt, every $1/cwt haircut is $44,000/year. A $3/cwt cut is about $132,000/year off the top — enough to push many farms with thin DSCR cushions into covenant territory in a hurry, depending on debt service and operating costs. You’re trading pool‑policy risk for immediate cash‑flow pressure. Sometimes that’s the right trade. Sometimes it isn’t.

Option 4 — Diversify how you sell milk. This is the long, hard path. It can look like on‑farm bottling and direct sales, a branded partnership with a regional organic label, or a hybrid where part of your volume stays with the co‑op and part flows into a higher‑margin, lower‑volume channel. It needs capital for processing or packaging, real compliance and marketing horsepower, and an honest read on how many cwt your local market can absorb. Risk is high. But if you’re already at 1.0× DSCR with today’s premium, it might be the only path that ever gets you out from under the FMMO‑vs‑contract crossfire.

OptionTime to StabilityEst. $/cwt ImpactDSCR Risk at FloorCapital NeededBest For
Stay in co-op, engage on poolingOngoing0 (today) — risk of future cutHigh if premium fallsLowDSCR ≥ 1.25× today
Stay + 30-day contract/covenant audit30 days0 (awareness only)Identifies risk earlyNoneEvery organic farm
Map exit to different organic buyer6–24 months-$2 to -$5/cwt haircutModerate-High during transitionLow-mediumDSCR > 1.1× with options in hauling range
Diversify to on-farm/branded sales2–5 yearsPotentially +$5–$15/cwtHigh during buildoutHigh (processing/packaging)DSCR ≥ 1.0× with capital access

Key Takeaways

  • If your DSCR drops below 1.0× at a 10–15% premium cut, your first job is a lender plan, not a co‑op fight. That’s the line where bankers stop being patient.
  • If your supply agreement lets a buyer change pooling or utilization strategy without re‑negotiating price, treat that as a built‑in price‑cut option. The lawsuit doesn’t alter that clause.
  • If your co‑op can’t show, with numbers, how organic over‑order premiums and FMMO pool costs are tracked separately from conventional, push for policy clarity, not reassurance.
  • If your exit plan depends on co‑op equity coming back quickly, redo the math. Confirm your own co‑op’s redemption schedule in writing, and run cash flow without assuming early payouts.
  • If your lender won’t put anything in writing about a $3–$5/cwt pay‑price drop, you’ve already learned something. Get an email summary of your DSCR conversation in the next 30 days.
  • If you’re at 1.25× DSCR or better at today’s price, you have time to engage on pooling policy. Below 1.1×, the bigger threat is contract loss and covenant pressure, not the pool itself.

Before You Sign the Next Contract

The CODE lawsuits will move at court speed, not barn speed. Even if organic eventually wins an FMMO exemption or a refund, that ruling won’t tell your lender how many bad years they’ll tolerate or your co‑op how to structure your 2027 pay program. Those decisions still live in your contracts, your covenants, and your own numbers.

So before this fall’s contract review season hits, ask yourself three questions. Where does your DSCR break if your premium drops 15%? Which lines in your milk agreement let someone else move the goalposts on pooling and premiums without your signature? And if a new contract showed up in your mailbox tomorrow, could you and your lender sit down, run the barn math, and know — not guess — what it does to your 200‑cow operation? 

Run Your Numbers

Farm Benchmark Snap Check — Stress-test your milk check against a $19.89/cwt swing before fall contract review. Plug in your own cwt, debt service, and premium, and see where your DSCR breaks if the organic contract walks or compresses 10%.

Complete references and supporting documentation are available upon request by contacting the editorial team at editor@thebullvine.com.

Learn More

The Sunday Read Dairy Professionals Don’t Skip.

Every week, thousands of producers, breeders, and industry insiders open Bullvine Weekly for genetics insights, market shifts, and profit strategies they won’t find anywhere else. One email. Five minutes. Smarter decisions all week.
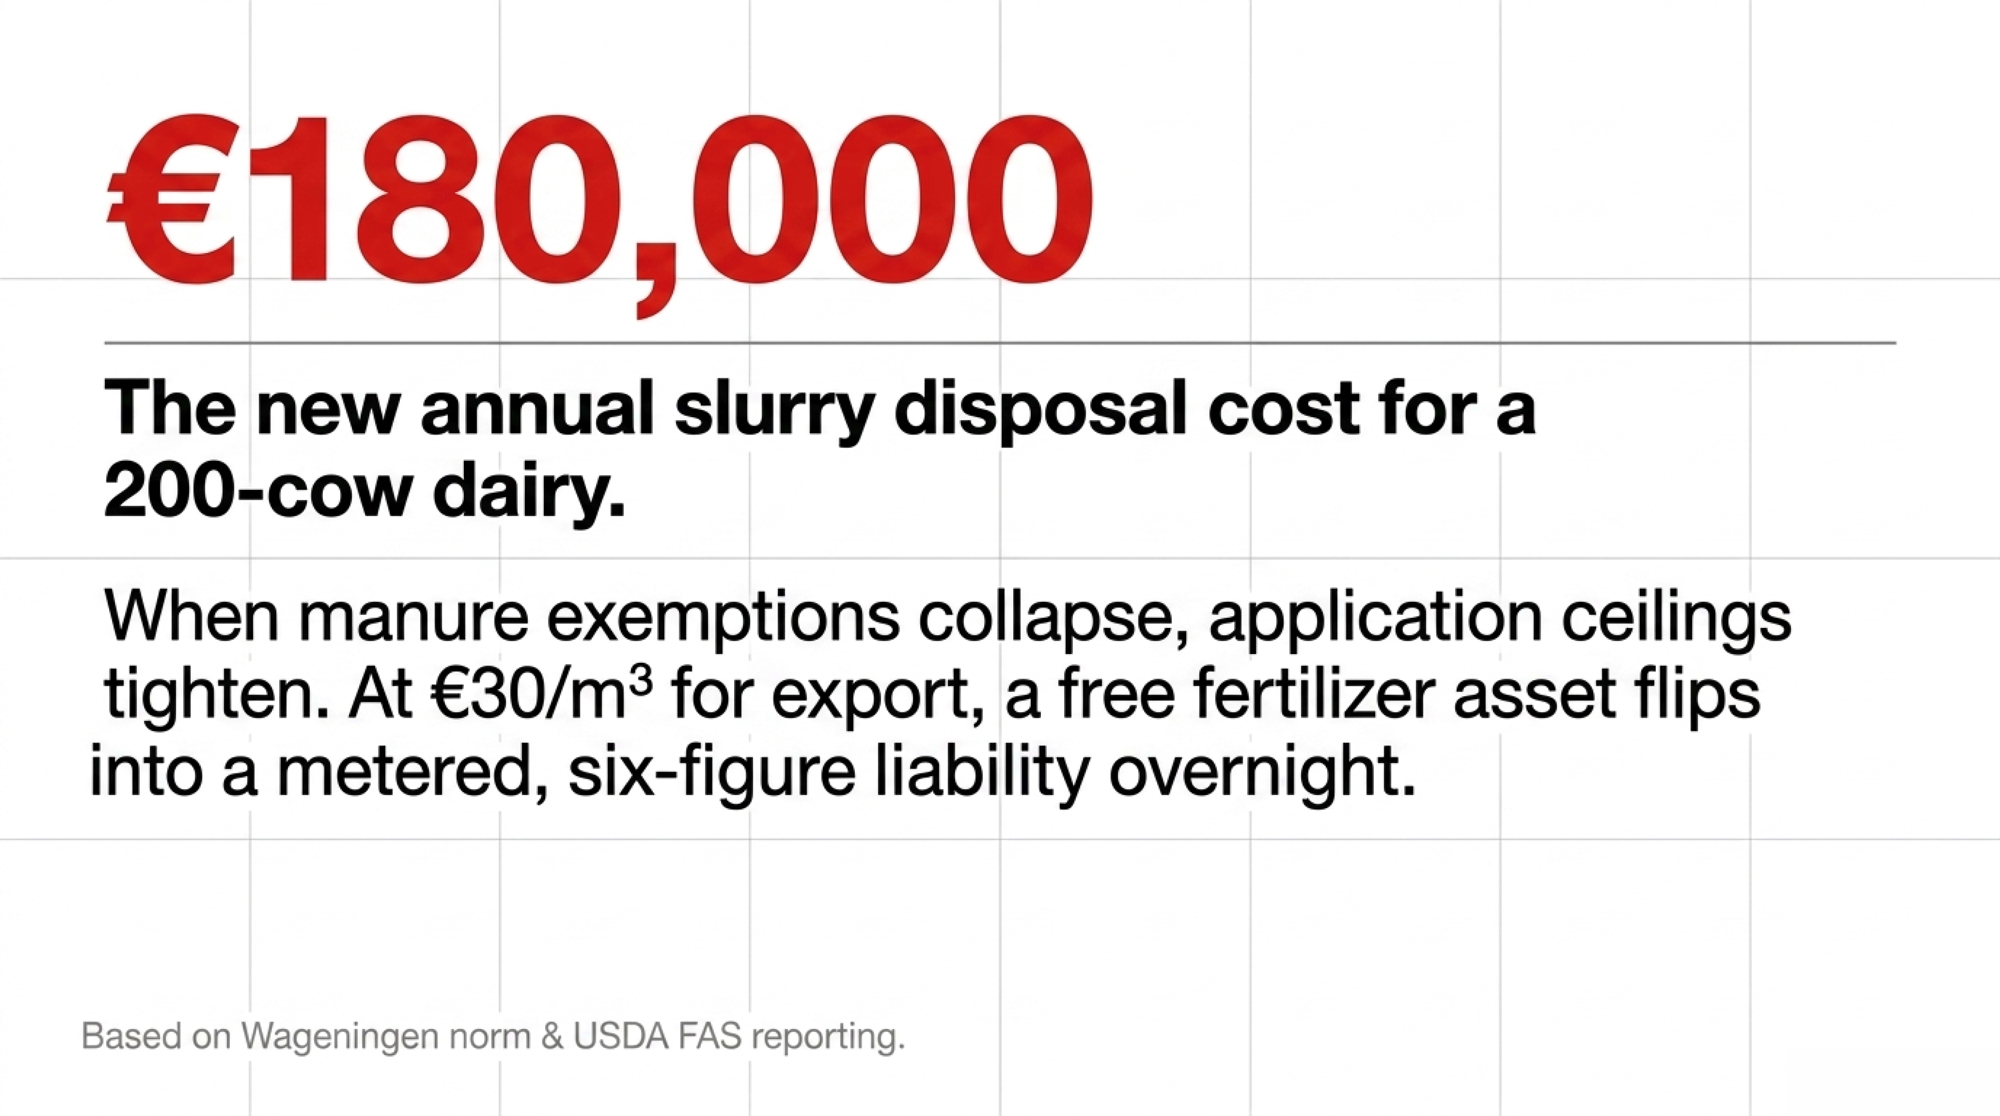
NewsSubscribe
First
Last
Consent

Henry Yoder’s $3,447‑Per‑Cow Mastitis Wake‑Up Call: From 10–12 Cows Out of the Tank to 5–6 on His 1,100‑Cow Wisconsin Dairy

Henry Yoder had 10–12 cows out of the tank every single day. Same barns, same crew, same seven‑day treatments on repeat. Then he stopped reaching for the tubes first.

Henry Yoder of More‑To‑Do Farms in Durand, Wisconsin — the herd manager whose 1,100‑cow Holstein operation cut mastitis treatments 50–75% and dropped daily hospital cows from 10–12 down to 5–6 by putting biofilm‑first protocols in front of the antibiotic cabinet.

When Henry Yoder looked at his treatment logs for More‑To‑Do Farms’ 1,100 Holsteins in Wisconsin, he didn’t see a mastitis “program.” He saw the same cows cycling through seven‑day antibiotic treatments, over and over, with 10–12 cows out of the tank every single day. That’s a lot of milk in the hospital pen instead of on the milk check.

Two years later, Henry’s numbers look very different. Mastitis treatments are down 50–75%, hospital cows dropped to 5–6 a day, treatment duration shrank from seven days to two or three, and one barn has held bulk tank SCC under 100,000 for two straight months — on sawdust, not sand.

This isn’t a story about a magic new tube. It’s about changing what you aim at: biofilm‑protected udder infections that antibiotics alone were never designed to solve, and a different way to think about mastitis economics when replacement heifers are sitting around $3,000 a head.

What Changed on Henry’s Farm — And Why It Matters

Henry manages two Holstein dairies under the More‑To‑Do Farms umbrella in Wisconsin — about 1,150 milking and dry cows across two milking sites, plus roughly 650 head of heifers raised by a custom grower. The business was founded by Doug Knoepke in 1978 and has grown into a seven‑site operation united by a simple mission: “Passionate with Integrity and Ingenuity, for Our People, Our Cows, and Our Land.”

On paper, Henry’s herd looked solid. Cows were monitored with smaXtec boluses, which flag health problems via changes in internal temperature and rumination, roughly 24 hours before your milkers would spot them. His crew was steady. Stalls were clean. Milk was headed to Grassland for butter starting January 15, so every pound counted.

But the mastitis log told a different story. Cows were getting seven‑day courses of Spectrum SLC, clearing up, then flaring again a month later with the same quarter hot and the same cow back in red bands. Across the two dairies, they still averaged 10–12 cows out of the tank every day. 

“We are not here to milk a cow for three years. We want long‑term cows that are going to be here for 10 years.” — Henry Yoder.

So Henry did something uncomfortable: he changed the order of operations. Instead of reaching for antibiotics first, he put AHV’s quorum sensing inhibition (QSI) boluses in front of the drug cabinet and let smaXtec call the shots on which cows to touch.

What’s Really Driving These Chronic Mastitis Cases?

You already know the basics. When bacteria first hit an udder, they’re floating free — planktonic — and that’s where your intramammary tubes do their best work.

Trouble starts when those bacteria get organized. Through quorum sensing, they “talk” to each other chemically. When enough of them are present, they build a biofilm: a slimy, protective fortress embedded in udder tissue that shields them from immune cells and antibiotics.

Here’s the ugly part:

  • Bacteria inside a biofilm can be 10–1,000 times less susceptible to antibiotics than the same strain floating free.
  • Biofilms are involved in roughly 80% of chronic and recurrent infections in people and animals.

So when you treat that high‑SCC cow and she looks good for a month, then blows up again after calving or a pen move, it’s not always “treatment failure.” Often, it’s biofilm success. You killed the scouts. The fortress stayed.

Henry saw it in his own barn: “If you use a certain drug for years and years and years, they’ve got to build some resistance to it. … With Spectrum, all of a sudden you’re treating her three times in a lactation.” With the AHV protocol, he says, “there are very few cows that we treat with Spectrum twice in their lactation.”

That’s the pattern this QSI approach is trying to break.

How Does Quorum Sensing Inhibition Fit In?

AHV’s whole play is built around quorum‑sensing inhibition — essentially jamming the communication channelsbacteria use to organize and form biofilms.

Instead of trying to force more antibiotics through the fortress, AHV’s boluses use plant‑derived compounds to disrupt bacterial signaling. Knock out communication, and bacteria can’t coordinate biofilm formation or switch on their virulence genes. They stay exposed, and the cow’s immune system has a fair shot again.

Dr. Gertjan Streefland, AHV’s founder and chief science officer, puts it in barn‑language:

“If you have a group of nasty people, you blindfold them and make them deaf. They cannot communicate anymore. So you’re immediately harmless.”

External RTI lab work backs up the lab‑side claims: AHV’s patented compounds inhibit biofilm formation in field bacteria from both gram‑positive and gram‑negative species, with no resistance development detected in their tests. Because you’re not killing bacteria directly — you’re disabling their communication — there’s less selective pressure for resistance.

That’s the science layer. The question is whether it actually moves the needle in real barns like yours.

What Did Henry Actually Change Day‑to‑Day?

Henry didn’t throw out antibiotics. He just stopped letting them be the first move every time a cow blipped.

Here’s his current play on mastitis‑type alerts:

  • Step 1: Let the tech holler first. smaXtec flags a health problem — usually a temperature or rumination change — often a full day before anyone in the parlor would have noticed.
  • Step 2: Hit biofilms first. The flagged cow gets an AHV Quick bolus right away, followed by Aspi. That’s the first line of defense now, not the last.
  • Step 3: Wait 2–3 days. They give the cow’s immune system time to work with the bolus. If she clears, they never open the antibiotic drawer. If she doesn’t, then they treat — but it’s the exception, not the rule.

“Before, they were treating these cows for seven days,” Henry says. “All of a sudden, they were treating these cows for two to three days, and then back in the tank. Then we put the protocol in that they’re going to wait two to three days after the pill before we start treating. After that, all of a sudden, we hardly had any treated cows.”

He still leans on the broader udder‑health protocol — Quick, Extra, Aspi, and Booster — around high‑risk windows like dry‑off and the first weeks fresh. But the everyday story is simple: detect early, hit biofilms first, only reach for tubes if you still need them.

There’s also a human piece. “Nobody likes treating the cow,” Henry says. “Anytime we don’t have to treat a cow and put red bands on it, it is a positive thing.” More‑To‑Do doesn’t run a separate sick‑cow pen, so fewer treated cows also mean fewer chances for withheld milk to sneak into the tank.

StepOld Protocol (Antibiotic-First)New Protocol (Biofilm-First)Why It Changed
Detection triggerMilker spots clinical signs in parlorsmaXtec temp/rumination alert ~24 hrs earlyEarlier catch = smaller biofilm load
First intervention7-day Spectrum SLC intramammary courseAHV Quick bolus + Aspi immediatelyTarget biofilm communication, not just planktonic bacteria
Wait windowTreat continuously for 7 daysWait 2–3 days; let immune system workAntibiotic decision made after biology has a chance
Antibiotic decisionDefault YES on day 1Only if cow doesn’t turn corner by day 3Exceptions, not the rule
Avg treatment duration7 days2–3 daysFewer withhold days, less labor
Retreatment rateSame cow, same quarter, multiple times/lactationRare second treatment per lactationBiofilm disruption reduces cycling
Cows out of tank10–12/day5–6/day (Farm 1); 1.5/day (Farm 2)Hospital pen nearly eliminated on Farm 2
Milk dumped riskHigh (red bands on multiple cows daily)Low (red band cows are an exception)Fewer chances for a missed band to dump a tank

Micro Barn Math: What Did That Change Put Back in the Tank?

Let’s run Henry’s numbers with today’s price deck so you can map it to your own herd.

USDA’s March 2026 WASDE pegs the 2026 all‑milk price at $19.70/cwt, down about $1.47 from 2025’s revised average of $21.17.

On Henry’s first farm, he went from 10–12 cows out of the tank daily to 5–6 cows. Call it 5.5 cows recovered on an average day.

Assume:

  • 75 lbs/day per cow.
  • At $19.70/cwt, that’s $0.197 per lb.
  • Each recovered cow puts 75 × $0.197 ≈ $14.78/day back into saleable milk.
  • Over a year: 5.5 cows × $14.78 × 365 ≈ $29,680 of milk that used to live in the hospital pen. (Bullvine estimate using Henry’s reported reduction and USDA March 2026 WASDE price.)

That’s just the recovered milk, not counting fewer tubes, less labor catching treated cows, or the risk of dumping a whole tank if someone misses a leg band.

On Henry’s second site — 570 cows — he’s averaging just 1.5 cows out of the tank on a given day. That’s less than 0.3% of the herd. He actually has to pull some high‑SCC cows from the tank to have enough whole milk to feed calves — a problem you don’t hear often.

Now scale that down. If you’re a 500‑cow herd with, say, 5 cows out of the tank most days, and you cut that in half, you’re recovering roughly:

  • 2.5 cows × $14.78/day × 365 ≈ $13,500/year in milk alone.

You can plug in your own pounds and price, but the shape of the math won’t change much.

How Big Is the Mastitis Hole in Your Own Budget?

You already know mastitis isn’t cheap. But putting some numbers around it helps you decide whether a protocol shift is worth the fight.

A few benchmarks:

  • Bovine mastitis is estimated to cost the global dairy sector up to $35 billion a year.
  • Dr. Pam Ruegg’s work on 37 Wisconsin dairies (averaging ~1,300 cows) found per‑case clinical mastitis treatment costs ranging from $120 to $330 for essentially the same disease, depending on how the farm managed days treated and drug choices.
  • In that same dataset, 83% of farms treated clinical mastitis longer than the label allows — meaning a big chunk of cost was self‑inflicted.

Now overlay today’s replacement math.

USDA and CoBank data show replacement heifers hitting about $3,010 per head in July 2025 — up roughly 164%from around $1,140 in April 2019. Later USDA estimates pushed that as high as $3,110 in late 2025 before backing off slightly, but top heifers in some regions still clear well above that.

According to AHV’s Benelux Longevity TIS, a multi‑farm dataset of 2,161 cows built on CRV records, the protocol works out to a lifetime ROI of $3,447.20 per cow, tied to:

  • 8,653 kg more lifetime milk per cow.
  • About €0.44 more revenue per day of life.
  • 19.8% lower replacement rate compared to Dutch CRV averages.

That’s not Henry’s own ROI sheet; it’s a multi‑farm European dataset. But it tells you this much: if you can safely keep cows productive longer and keep them out of the hospital pen, the compound economics are very real.

Can Other Farms Really Reproduce What Henry Is Seeing?

No two herds are the same. But Henry isn’t the only one seeing this kind of shift. AHV’s trial and field data, plus farm stories from different regions, point in the same general direction: less antibiotic use, fewer repeats, and more years on good cows.

Here’s what’s been measured so far:

RegionFarms / CowsKey ResultsSource & Timing
UK14 farms, 2,774 cows62% less antibiotic use for mastitis, 42% fewer clinical cases+29.3% 1st‑service conceptionAHV HHP Progress, 2023–2024
Germany6 farms, 325 cows75.7% drop in SCC (P<0.05), ROI 1.65, ≈€140 per cowAHV Udder Health TIS, 2021–2022
Germany (Thünen Institute)1 farm, 11 cows (pilot)€1.54 return per €1 invested, ~260.6 kg less waste milk per cowFederal research institute, 2024
USA (Reactive udder health)8 farms, 3,316 cows6 fewer hospital days per cow; $151.53 lower cost/cow from less waste milk and laborAHV TIS, 2022–2023
Benelux (Longevity)2,161 cows+8,653 kg lifetime milk, €0.44 more per day, 19.8% lower replacement$3,447.20 ROI/cowAHV Benelux Longevity TIS, based on CRV data
USA (Transition & Fertility)8 farms, 4,495 cows+3.2 kg/day milk first 100 DIM, −34% metritis, ROI 5.04 (~$160.76 per cow)AHV Transition/Fertility TIS, 2024

There’s also an independent trial you’ll want to watch: Texas A&M’s SARE project OS24‑178, “Evaluating a Non‑antibiotic Treatment of Mastitis in Organic Dairy Cows.” The project calls for about 120 lactating Holsteins in a Texas organic herd, randomized to AHV vs. organic standard care, with bacteriology, PCR, and SCC performed at TAMU.

That’s the kind of third‑party data vets like Ruegg have been asking for. Results are still pending. Until they land, you’re looking at:

  • Company‑associated multi‑farm field data.
  • A small but credible federal pilot (11 cows at Thünen).
  • Real‑world stories like Henry’s and Karl Gabrielse at Quonset Farms, where fresh cow problems dropped from 20% to 2% and conception rates climbed 6 points after implementing AHV protocols.

It’s not a slam‑dunk RCT portfolio yet. But it’s enough signal that serious producers are at least testing QSI, not just dismissing it outright.

Is the $3,447 ROI Number Something You Can Bank On?

You shouldn’t bank on anyone’s ROI number — ours, AHV’s, or your neighbor’s — without running your own. But you can use it as a reference point.

The $3,447.20 per cow comes from AHV’s Benelux Longevity TIS, built on CRV data across 2,161 cows. It represents extra lifetime milk, fewer replacements, and more revenue per day of life. It’s an average across many herds in a European system, not a guaranteed outcome for your barn in Wisconsin, Ontario, or New York.

Treat it like a sire proof:

  • Directionally useful.
  • Needs to be filtered through your milk price, your cull rate, and your vet’s comfort level.

If you want the deep dive on how longevity, replacement cost, and cull‑rate math actually stack up, that’s a follow‑up article on its own.

What Does This Look Like Operationally in Your Barn?

Switching any protocol — AHV or otherwise — creates friction. You’re asking people to change how they’ve done things for years.

Based on Henry’s experience and the trial data, you can expect a few things if you go down this road:

  • Less time in the hospital pen. AHV’s US reactive udder‑health TIS showed 6 fewer hospital days per cow, and Henry’s own numbers match that direction.
  • Shorter treatment windows. Seven‑day courses turned into two‑to‑three‑day interventions, often without tubes at all.
  • Fewer withhold headaches. Fewer drugged cows mean fewer chances for a red‑band miss to turn into a dumped tank.
  • Higher bar for milker prep. Henry is blunt: “It’s everything hand in hand. It’s on the milkers too — they have to do a good job of prepping. Clean stalls, everything plays hand in hand.”

If your stalls are sloppy and your prep is inconsistent, no bolus in the world is going to bail you out. Quorum sensing inhibition is a layer, not a shortcut past basic udder hygiene.

How Bad Is Your Udder Problem Really, and Is It Worth Changing Protocols?

First move is boring and free, but it’s the one most farms skip: audit your own records.

In the next 30 days, sit down with your DHIA reports and cull log and do three things:

  1. Calculate udder‑related culls for the past 12 months.
    1. What percentage of involuntary culls are tagged to mastitis, high SCC, or udder health?
    1. If you’re north of 20%, you’ve probably got a structural udder‑health issue, not just bad luck.
  2. Count your average hospital‑pen load.
    1. On a typical day, how many cows are out of the tank?
    1. If more than 1–1.5% of your herd lives there, you’re leaving more on the table than you think.
  3. Pick three “problem cows” and follow the money.
    1. How many times have you treated each this lactation?
    1. How many days was each cow out of the tank per treatment?
    1. Are they still in the string or on a truck?

Once you see those numbers on paper, you’ll know if a biofilm‑first approach is worth trialing — or if you’re mostly dealing with basics you can tighten up without changing products.

MetricGreen ZoneYellow ZoneRed Zone — Act NowHenry’s Farm 1 Start
Udder-related culls (% of involuntary culls)< 10%10–20%> 20%Not disclosed
Hospital pen load (% of herd on any day)< 0.5%0.5–1.5%> 1.5%~1.0% (10–12 of 1,100)
Avg treatment duration per clinical case≤ 3 days4–6 days7+ days7 days
Cow retreatment rate (same quarter, same lactation)Rare (<1/cow/yr)OccasionalCycling repeaters on your listSame cows monthly
Bulk tank SCC (cells/mL)< 100,000100,000–200,000> 200,000Not disclosed (Farm 2 now < 100k)
Replacement heifer cost (current regional price)< $2,000$2,000–$2,500> $2,500~$3,010 (national avg, July 2025)

If You Try a Biofilm‑First Protocol, Where Do You Start So It Doesn’t Blow Up in Your Face?

If your audit says, “Yeah, we’ve got an udder problem,” the next question is where to start without turning the barn upside down.

Best candidates for a trial:

  • Chronic repeaters you’re already thinking about culling.
  • High‑SCC cows caught early by monitoring systems (SCR, smaXtec, activity collars) before a quarter blows up.
  • Herds where stalls and prep are decent, but the same cows keep showing up on the treatment list.

Henry’s path looked like this:

  • Add smaXtec (or use what you already have) for early alerts.
  • When an alert hits, reach for Quick + Aspi first, not tubes.
  • Give it 2–3 days and let the cow’s immune system work with the bolus.
  • Only bring in antibiotics if she doesn’t turn the corner.

The big operational risk is confusion. Your team has to know:

  • Which cows are “AHV only.”
  • Which cows are on antibiotics.
  • Exactly when each cow is safe to go back in the tank.

The win is when “red‑band” cows become the exception — not a daily pattern your milkers are numb to.

Sponsored Post

Options and Trade‑Offs for Farmers

Path 1: 30‑Day Paper Audit (No Products, Just Records)

When it makes sense: If you don’t actually know your udder‑related cull rate or your average hospital‑pen load, this is your starting line.

What it requires:

  • One afternoon with your DHIA reports, cull records, and a notepad.
  • Maybe your lender, vet, or nutritionist on the phone for a second set of eyes.

What you get:

  • A clean “here’s where we stand” view on udder‑related culls, hospital‑pen load, and retreatment patterns.
  • The ability to plug your numbers into any ROI discussion — whether it’s AHV, a different product, or just tightening milking routines.

If your numbers are already good — low udder culls, low hospital counts, stable SCC — you may decide you’re doing enough. If they’re rough, at least you know you’re not imagining it.

Path 2: 90‑Day Pilot on Your Worst Group

When it makes sense: If your audit shows a clear udder problem and you’ve got a handful of chronic cows chewing up labor and drug spend, but you’re not ready for a whole‑herd flip.

What it requires:

  • Agreement with your herd vet on which cows qualify and how you’ll track them.
  • A written protocol — for example, “AHV Quick + Aspi on first alert, wait 2–3 days, then decide on antibiotics.”
  • Clean notes on SCC, hospital days, and total treatments over those 90 days.

What it costs:

We do know from German and US TIS data that:

  • In Germany, AHV’s udder‑health protocol showed an ROI of 1.65 and about €140 per cow benefit, driven by lower SCC and less waste milk (AHV Udder Health TIS, 2021–2022).
  • In US reactive udder‑health trials, farms saw 6 fewer hospital days per cow and about $151.53 per cow in reduced costs between waste milk and labor (AHV TIS, 2022–2023).

Risks and limits:

  • If your basics are weak, you might not see much improvement.
  • If your team isn’t on board, partial compliance will muddy the waters and make the trial look “inconclusive.”

At the end of 90 days, you should know if your chronic problem cows are still chronic — or if you’ve actually broken the cycle.

Path 3: 12‑Month Whole‑Herd Strategy Shift

When it makes sense: If you’ve nailed the basics, your hospital pen is still busier than you like, and you’re serious about pushing cows to fifth lactation and beyond — the way Henry is aiming for 20% of his herd there.

What it requires:

  • Full buy‑in from your vet, herd manager, and parlor crew.
  • A clear written protocol around dry‑off, fresh cows, and “alert” cows.
  • The patience to let biology catch up to your ideas — you’re changing the baseline, not flipping a switch.

Upside:

  • Higher probability of hitting the kinds of numbers seen in the AHV Benelux Longevity TIS — more older cows, lower replacement pressure, more milk per day of life.
  • A different relationship with antibiotics, which matters as regulations and consumer expectations tighten around antimicrobial use.

Risks and limits:

  • You’re betting on company‑associated data plus one small independent pilot and an in‑progress Texas A&M trial. The science of biofilms is solid, but product‑specific proof is still developing.
  • If milk prices or replacement markets swing again, the economics of longevity can shift too.

This is not a “set it and forget it” option. It’s a management philosophy change.

Key Takeaways

  • If more than ~20% of your culls are udder‑related or more than 1–1.5% of your herd lives in the hospital pen, you’ve got a structural udder‑health problem. Start with the 30‑day record audit before you try to buy your way out of it.
  • If the same cows keep cycling through mastitis treatments, there’s a good chance biofilms are part of your problem. That’s when it makes sense to at least pilot a biofilm‑first protocol with your vet, whether it’s AHV or another approach.
  • If replacement heifers are running in the $3,000 ballpark in your region, every cow you keep productive for one more lactation is worth a second look. Longevity‑driven ROI like the $3,447/cow figure (AHV Benelux Longevity TIS) comes from compounding effects — more older cows, fewer replacements, more milk per day of life — not just drug savings.
  • If your stalls are dirty, your prep is inconsistent, or your milking system is out of tune, fix those first. No QSI bolus, no matter how clever, will outrun bad basics. Even Henry is clear: the science helps, but it rides on cow comfort and routine.

You don’t have to be sold on AHV for this article to matter. You have to answer some uncomfortable questions about how many cows you’re really losing to udder health and how much milk is living in your hospital pen instead of on your milk check.

Henry didn’t change because of a white paper. He changed because his own numbers wouldn’t shut up.

In the meantime, pull your records, count your hospital cows, and ask yourself a simple question:

What would your barn feel like if half the red‑band cows disappeared from the string next month — for the right reasons?

Complete references and supporting documentation are available upon request by contacting the editorial team at editor@thebullvine.com.

Learn More

The Sunday Read Dairy Professionals Don’t Skip.

Every week, thousands of producers, breeders, and industry insiders open Bullvine Weekly for genetics insights, market shifts, and profit strategies they won’t find anywhere else. One email. Five minutes. Smarter decisions all week.
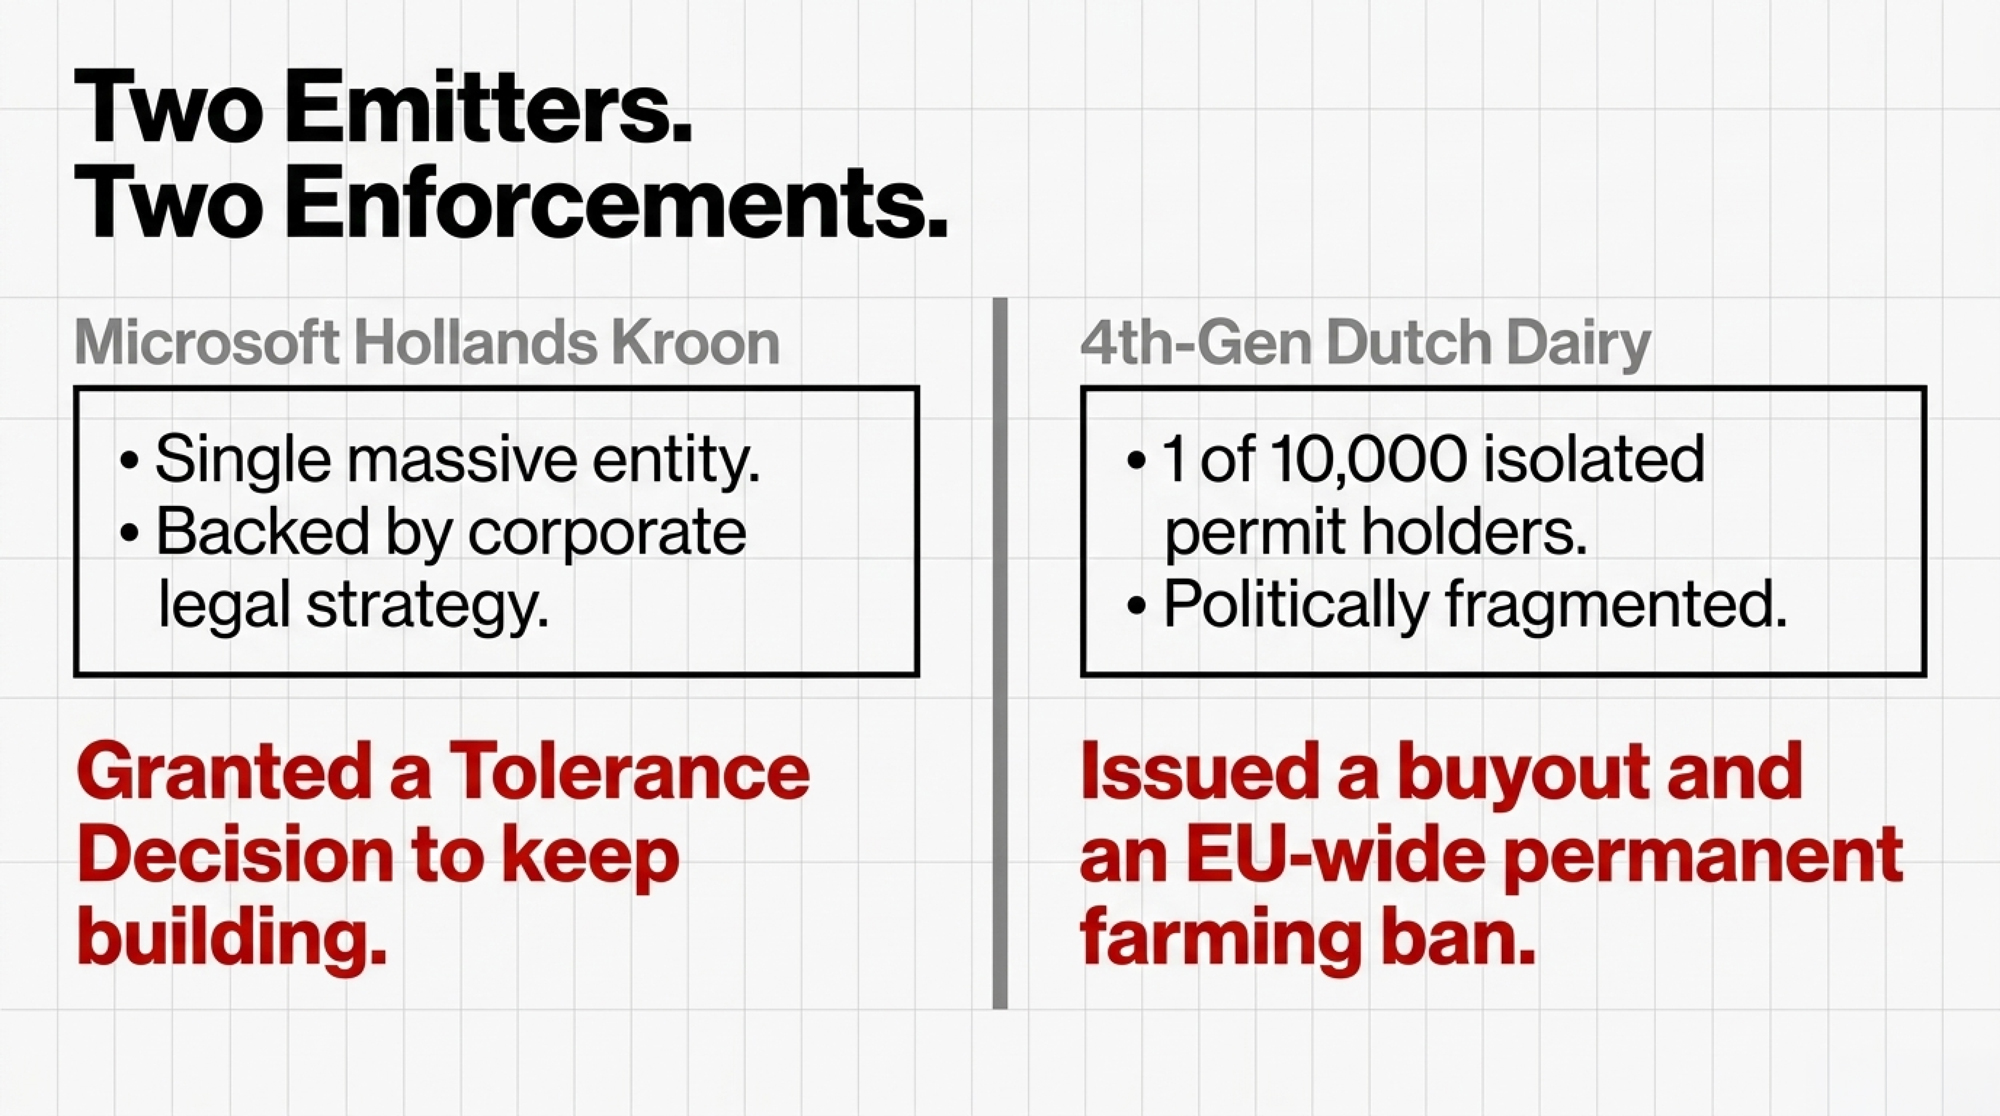
NewsSubscribe
First
Last
Consent

USDA Says 2027 Class III Is $17.55. Mexico Just Made That the Ceiling.

A 50,000 MT EU powder quota and a protected cheese-name register say the floor’s gone. The barn math, inside.

Executive Summary: USDA’s May WASDE put 2027 Class III at $17.55/cwt, all-milk at $20.95, and NDM at $1.575/lb — and that forecast was published ten days before Mexico signed a trade deal with the EU on May 22 that USDA never priced in. The Interim Trade Agreement opens a 50,000 MT duty-free SMP quota (about 15% of Mexico’s 335,000 MT annual import book), 25,000 MT of cheese TRQs, unlimited blue cheese, and — the bigger story — locks in protection for hundreds of EU geographical indications, putting US “Parmesan,” “Asiago,” and “Fontina” labels on the clock with no clear grace period. Mexico is 27% of the US dairy export book by value ($2.6B in 2025, including $1.1B in NFDM/SMP and $965M in cheese), so the displacement risk lands squarely on Upper Midwest Class III milk and Western powder plants. On a 500-cow Upper Midwest dairy shipping ~118,625 cwt/year, the moderate scenario costs $35,588–$71,175; the aggressive GI-enforcement scenario runs $118,625–$207,594. The July 1, 2026, USMCA Article 34.7 review is the last clean leverage point before the iTA likely enters provisional application in late 2026 or early 2027 — same window EU-Mercosur cleared in four months. If your co-op hasn’t stress-tested Mexico exposure or your 2027 hedge book is empty, this piece is the Monday-morning checklist; if you’re already 30–50% covered above breakeven, skim and forward to your lender.

EU-Mexico dairy deal

At $17.55/cwt — USDA’s May 2026 forecast for 2027 Class III, per the May WASDE — the Upper Midwest dairies that already locked in a 2027 floor are sleeping. The ones whose co-ops haven’t briefed them on the EU-Mexico trade deal are about to learn what 50,000 metric tons of duty-free European powder and a freshly protected EU geographical-indications register do to a Wisconsin milk check. On a 500-cow Class III dairy shipping ~118,625 cwt/year, the moderate displacement scenario takes $35,588 to $71,175 off the top line. That’s the margin over feed dairy 2026 problem nobody on the supply chain side is naming out loud.

Shawna Morris, EVP of trade policy at NMPF, spent the first half of 2026 fighting Canada’s USMCA tariff-rate quota fill rates. The Bullvine’s April 29 analysis took her published USMCA scenarios and modeled a $0.31/cwt twelve-month spread on Class III: +$0.08/cwt upside, -$0.23/cwt downside. Canada-only. Then on May 22, 2026, in Mexico City, Claudia Sheinbaum and Ursula von der Leyen signed the EU-Mexico Modernised Global Agreement (MGA) and the companion Interim Trade Agreement (iTA) — both sides framing it as a counter to Trump tariffs, per Reuters’ coverage from the signing.

The Morris math just got a second pressure point. And it’s bigger than Canada.

Quick Glossary

TermPlain English
TRQ (Tariff-Rate Quota)A volume of imports allowed in at a low or zero duty; everything above gets the full tariff.
iTA (Interim Trade Agreement)The fast-track trade-only piece. Needs European Parliament + EU Council. Goes live first.
MGA (Modernised Global Agreement)The full deal — trade plus politics. Needs all 27 EU member states + the Mexican Senate. Years away.
GI (Geographical Indication)A legally protected product name tied to a place (Parmigiano Reggiano, Feta). Blocks competitors from using the name.
BasisThe gap between the futures price and what your milk check actually pays. Where co-op exposure shows up.

The 2027 Trap Hiding Inside USDA’s Own Forecast

Before Europe ships a kilo, here’s what’s already on paper. USDA’s May 2026 WASDE forecasts 2027 NDM at $1.575/lb, down 19.5 cents from 2026. Whey at $0.640/lb, down 2.5 cents. Class III at $17.55/cwt. All-milk at $20.95/cwt, $0.30 below 2026.

USDA ERS’s May 2026 Livestock, Dairy and Poultry Outlook attributes that 2027 weakness to domestic supply growth and rising per-cow productivity. A supply-side story. Not a trade story.

That distinction matters. WASDE is supply-and-demand accounting, not a trade-shock model. It can’t — and didn’t — incorporate a deal signed days after it published. Mexico displacement risk from the iTA is additive downside USDA hasn’t priced in. The $1.575/lb NDM line is the pre-deal baseline. Not the floor. The starting point.

The deal doesn’t cause 2027 weakness. It removes the structural floor that would normally let prices recover.

What the EU Just Won in Mexico’s Dairy Aisle

The dairy chapter is published and specific. From the European Commission factsheet (qanda_25_249) and Global Dairy Trade’s reading of the agreement text:

ProductTRQ VolumeDuty at TRQ RatePhase-InUS Displacement Risk
EU Skim Milk Powder (SMP)50,000 MT0%5-yearHigh — ~15% of Mexico’s 335k MT annual SMP imports
“Other” Cheese20,000 MT0% within quotaAt entry into forceModerate — direct competition with US “other cheese”
Fresh & Processed Cheese5,000 MT0% within quotaAt entry into forceModerate — quality tier overlap with US product
Blue CheeseUnlimited0% (no cap)ImmediateLow volume, high symbolic precedent
EU Geographical IndicationsNo volume limitN/A — name banAt entry into force🔴 Critical — bans Parmesan, Asiago, Fontina labels

Mexico imports roughly 335,000 MT of SMP annually (2024 baseline, GDT analysis). The 50,000 MT EU TRQ is about 15% of that whole import market. US dairy exports to Mexico hit $2.5 billion in 2024 and $2.6 billion in 2025, with $1.1 billion of that NFDM/SMP and $965 million cheese, per USDEC’s February 2026 trade data release. Mexico is 27% of the entire US dairy export book by value.

“It’s Not in Force Yet” Is Doing a Lot of Work

The deal is signed. It is not yet in force. The iTA needs European Parliament consent plus EU Council adoption — provisional application possible as early as late 2026 or early 2027. The full MGA needs all 27 EU member states plus the Mexican Senate. 2028–2029 minimum.

The closest precedent is EU-Mercosur: signed January 2026, provisional application May 1, 2026, per Dairy Reporter coverage. Roughly four months. If EU-Mexico tracks that pattern, the dairy quotas go live during the 2027 milk year— exactly when USDA already forecasts weaker NDM and whey.

Why Morris’s $0.31/cwt Range Just Became the Light Scenario

The April 29 modeling of Morris’s USMCA scenarios was Canada-only risk. EU-Mexico is additive, not substitutive. Both pressures compound on the same milk check. Five variables make a single-number forecast actively dangerous: TRQ fill rate, implementation timing, the EU-US price spread at activation, GI enforcement pace, and whether USDA updates its baseline mid-year. None of those are knowable today.

Ranges, not point estimates, are the only honest framing. Anchor to a single number and you’ll budget to it. Work in scenarios and you’ve got a hedge plan when one of them prints.

Running the Numbers — 500-Cow Upper Midwest Class III Dairy

Stress-test outputs. Not predictions. Bullvine modeling drawing on USDA and university extension trade-shock literature, extrapolated to the EU-Mexico TRQ structure.

Production baseline: 500 cows × 65 lbs/cow/day × 365 days ÷ 100 = 118,625 cwt/year (65 lbs/day held conservative against USDA NASS Milk Production data for early 2026.)

Class III hit × annual cwt = annualized milk-check exposure.

ScenarioMarket Penetration / GI ActionEstimated Class III HitAnnualized Loss (500-Cow Dairy)
Light FillEU SMP fills 10k–15k MT (~3–4% of Mexico’s annual SMP imports).-$0.10 to -$0.25/cwt-$11,863 to -$29,656
Moderate FillEU SMP fills ~25k MT (7–8% share) + 5% EU cheese capture (~9,600 MT against US cheese-to-Mexico volume of ~192,778 MT in 2024, per USDEC).-$0.30 to -$0.60/cwt-$35,588 to -$71,175
Aggressive Fill + GIsFull TRQ utilization + active GI enforcement banning US “Parmesan” and “Feta” labels.-$1.00 to -$1.75/cwt-$118,625 to -$207,594

Plug your own cwt and your own breakeven into the same arithmetic. Same shape, different dollars.

Run Your Numbers

Dairy Profit Projector — Stress-test your 2027 milk check against the moderate ($0.30–$0.60/cwt) and aggressive ($1.00–$1.75/cwt) EU-Mexico displacement scenarios in this article. Plug in your herd size, ration, and current futures, and see exactly where breakeven, IOFC, and margin per cwt break before the iTA goes provisional.

Why Are EU Geographical Indications a Bigger Threat Than the Tariff Quota?

Here’s the part producers aren’t hearing from their co-ops: the GI provisions matter more than the volume quotas.

A TRQ is a volume valve. EU exporters can ship up to 50,000 MT of SMP into Mexico at 0% duty. Whether they fill it depends on the EU-US price spread, which Dairy Reporter pegged in Q4 2025 with EU prices running roughly 40% above US prices. The quota wouldn’t fill aggressively on day one. Capacity for displacement, not immediate displacement.

GI enforcement is an architecture story. It permanently tilts which products are legally allowed on Mexican shelves under US-familiar names.

Mexico moves fast when it decides to. NOM-051 front-of-pack labeling, effective October 2020, ended exemptions overnight, per USDEC member alerts from that period. SAT (Mexican customs) became the enforcement authority at port of entry. US dairy shipments without compliant Spanish labels were detained until relabeled. USDEC negotiated a 60-day non-enforcement grace period because non-compliant product was technically subject to sanction on day one.

Replace “missing sugar icon” with “the word ‘Parmesan’ on a US cheese label,” and you have the GI enforcement playbook. Mexican regulators have shown they can flip the switch.

The 8-year transition period that’s getting all the attention applies only to Feta, and only for prior users who relabel with prominent origin statements, per USDA FAS Mexico’s February 2026 GAIN report. Names like Parmesan, Asiago, Gorgonzola, and Fontina don’t appear with explicit grace periods in the public summaries. NMPF’s December 2025 USMCA brief said it directly: Mexico still hasn’t codified its USMCA common cheese name commitments into domestic regulation, and the EU GI package now creates an explicit conflict with those USMCA obligations.

What Happens at the July 1, 2026 USMCA Review?

USMCA Article 34.7 requires a joint review on July 1, 2026 — the structural decision on whether to extend the agreement another 16 years or enter a six-year wind-down. USTR Jamieson Greer told the House Ways and Means Committee in May 2026 that the dairy dispute would either be resolved soon through USMCA negotiations or settled through an enforcement action.

NMPF and USDEC have filed coordinated priorities, including pushing Mexico to codify USMCA common cheese name protections into domestic law. Mexico just signed a deal in May 2026 committing it to protect the EU GI package — a list that, in the read of trade observers, conflicts with the USMCA cheese-name protections US negotiators thought they’d locked in.

When that contradiction lands on the desk of IMPI (Mexico’s industrial property institute), the Secretaría de Economía, and COFEPRIS, the structural incentives appear to pull toward Brussels. The EU GI list is numerically defined and clean to administer. USMCA’s common name protections are open-textured and procedural.

July 1 is the last obvious leverage point before the EU GI clock starts running.

USMCA Review OutcomeCheese-Side Implication
Best caseGreer extracts binding Mexican commitments to treat Parmesan, Feta, etc. as customary terms protected under USMCA.
Worst caseReview consumes its energy on Canada’s TRQ fill rates; Mexico’s common-name obligations get punted to a side letter.

What If You Ship to a Canadian Processor?

Canadian supply management is buffered from direct EU-Mexico exposure on the production side. The bigger Ontario and Quebec read is structural: if US Class III softens on Mexico displacement, global benchmarks that influence quota valuations and processor negotiations face downward pressure on review years.

Bill C-202 protects supply management from USMCA concessions. It doesn’t insulate Canadian milk against global price transmission. EU-Mercosur landing provisional in May 2026 plus EU-Mexico signed in May 2026 is the EU actively building a dairy trade network that routes around the North American architecture. That’s the slower-moving story Canadian producers should be tracking through the back half of 2026.

What Question Should You Be Asking Your Co-op on Monday Morning?

Most producers won’t ask this. The ones who do will get a real answer or learn how prepared their co-op is.

The question, word for word:

“What percentage of the milk I ship you ends up in products exported to Mexico, and have you run a Class III and cheese price stress test assuming we lose 10–20% of that Mexico volume to EU product under the new EU-Mexico trade deal?”

Follow it immediately with:

“Show me, in writing, the price range you used in that stress test and how it changes our mailbox price if Class III trades $0.50–$1.50/cwt under USDA’s current 2027 forecast.”

If they can’t answer cleanly, you’ve learned something about the analysis behind your milk check. That’s information you can act on.

The 30/90/365-Day Playbook for Herds Like Morris’s Constituents

The action isn’t “monitor the situation.” It’s repositioning your floor before the iTA enters provisional application.

30-Day Actions

ActionWhat It RequiresTrigger / ThresholdWhere It Backfires
Pull your last three milk checks. Calculate margin over feed per cwt using actual feed bills, not modeled ration costs.Milk check stubs, feed invoices, an hour at the kitchen table.Establish your real breakeven, written down.Modeled ration costs understate your real exposure.
Call your DRP agent. Ask: “If 2027 Class III trades $16.50 or lower because Mexico takes less of our powder and cheese, what coverage keeps my floor above breakeven?”DRP-licensed advisor.Forces a calculation, not an opinion.Vague answers signal the wrong advisor.
Locate your existing 2027 coverage position.5 minutes with your hedge file.Red flag: DSCR under 1.2 for three straight months under your lender’s method + zero 2027 coverage = top of the list.Treating zero coverage as a default rather than a decision.

90-Day Actions

ActionWhat It RequiresTrigger / ThresholdWhere It Backfires
Move from 0% to 30–50% covered against the moderate displacement scenario. Use DRP endorsements that floor at or above breakeven if Class III settles in the $16–$17 band. Larger operations: structured puts or option collars.Current breakeven, premium budget, advisor with DRP authority.Hedge to your breakeven, not to your hopes.Over-hedging at a temporarily soft price locks in pain that may not arrive.
Get explicit with your processor or co-op about Mexico exposure in your milk’s product mix. Push for basis transparency and ask about export-exposed risk-sharing pools.Contract document, willingness to push, possibly a board-level conversation if member-governed.Written answer required.A verbal answer is no answer.
Re-run 2027 cash flow against three Class III scenarios — $17.55 (USDA baseline), $17.00 (moderate), $16.20 (aggressive).Updated cost-of-production model.Find where debt service coverage breaks. That’s the number you protect.Stress-testing only the optimistic scenario.

365-Day Moves

ActionWhat It RequiresTrigger / ThresholdWhere It Backfires
Watch two implementation triggers: European Parliament vote on the iTA (likely late 2026) and Mexican COFEPRIS labeling guidance updates referencing GI terms.News-feed discipline.Either signals provisional application is imminent.Treating “signed” and “in force” as the same thing.
If July 1 produces binding Mexican commitments on common cheese names, reduce hedge ratios or extend out the curve.Coverage flexibility.Opportunity signal: Class III futures rally above $18.00 on a clean USMCA outcome + margin over feed holds positive = layer in 2028 coverage at better strikes.Reducing coverage before the ink is dry.
If the review stalls or punts the common-names issue, treat 2027–2028 as a structurally weaker price environment. Adjust herd size, heifer inventory, and capex accordingly.Lender alignment, board buy-in.Sustained Class III below $17.00 with no near-term policy catalyst.Cutting heifer inventory during a weather-driven price spike that masks the underlying displacement. Read the basis, not the headlines.

What Your Contract Actually Says

A year from now, in June 2027, some producer is going to call his marketer with Class III at $16.20 on the screen and ask why the EU-Mexico deal didn’t show up in any conversation he had this spring. The conversation that follows is brutal: triage the cash flow, hedge what’s left of 2027 and 2028, cut heifers that aren’t earning their keep, and walk into the lender’s office with updated numbers before the lender walks into yours.

The question that prevents that call is the one your contract probably doesn’t answer in plain language. What does your processor actually do with your milk, and who pays the price when one of their export markets sees a 50,000 MT European TRQ open up overnight?

Hedging now buys margin certainty. The cost is upside if the deal stalls or the EU never fills its quota. Real trade. Named numbers on both sides.

Pull your contract today. Find the basis clause, the export risk language, and the volume penalty terms. If you can’t find them or don’t understand them, your contract is an answer to a question that’s already changed.

What does your current processor contract say about basis when 27% of the US dairy export book by value gets a new competitor — and where does your real margin over feed per cwt sit this month versus 90 days ago?

Key Takeaways

  • The May 22 EU-Mexico trade agreement introduces unpriced, additive downside risk that transforms USDA’s 2027 Class III forecast of $17.55 from a conservative baseline into a hard price ceiling.
  • Strict enforcement of 336 European geographical indications poses a swift structural threat that could abruptly block US cheese labels like Parmesan and Feta from Mexican retail shelves.
  • Producers must establish a true, kitchen-table breakeven margin over feed now and move toward a 30% to 50% covered position before provisional application shifts global trade architecture.
  • Demanding immediate basis transparency and running multi-scenario cash flow stress tests with your co-op determines whether your processor contract can handle a more competitive export landscape.

Complete references and supporting documentation are available upon request by contacting the editorial team at editor@thebullvine.com.

Learn More

  • Class III Milk Price, DRP, and Your Spring 2026 Risk Plan — Arms you with execution strategies for defensive, balanced, and aggressive risk management lanes. It details five critical herd numbers needed on paper to establish a floor that protects thin operating cash cushions against unexpected market swings.
  • The 400-Cow Margin Trap: When $14.59 Milk Bleeds $425K in 2026 — Exposes the hidden economic cost of multi-year equity erosion driven by four-figure replacement heifers. This analysis delivers a structural blueprint to stress-test your three-year cash flow against softening WASDE price projections and tight lender thresholds.
  • DAIRY TRADE DECEPTION: How the US-Canada USMCA Deal Failed American Farmers — Dismantles the political rhetoric surrounding North American market access by revealing dismal 42% tariff-rate quota fill rates. It highlights how domestic regulatory maneuvers and structural trade barriers continue to insulate processors, routing global price shocks directly to US checkbooks.

The Sunday Read Dairy Professionals Don’t Skip.

Every week, thousands of producers, breeders, and industry insiders open Bullvine Weekly for genetics insights, market shifts, and profit strategies they won’t find anywhere else. One email. Five minutes. Smarter decisions all week.
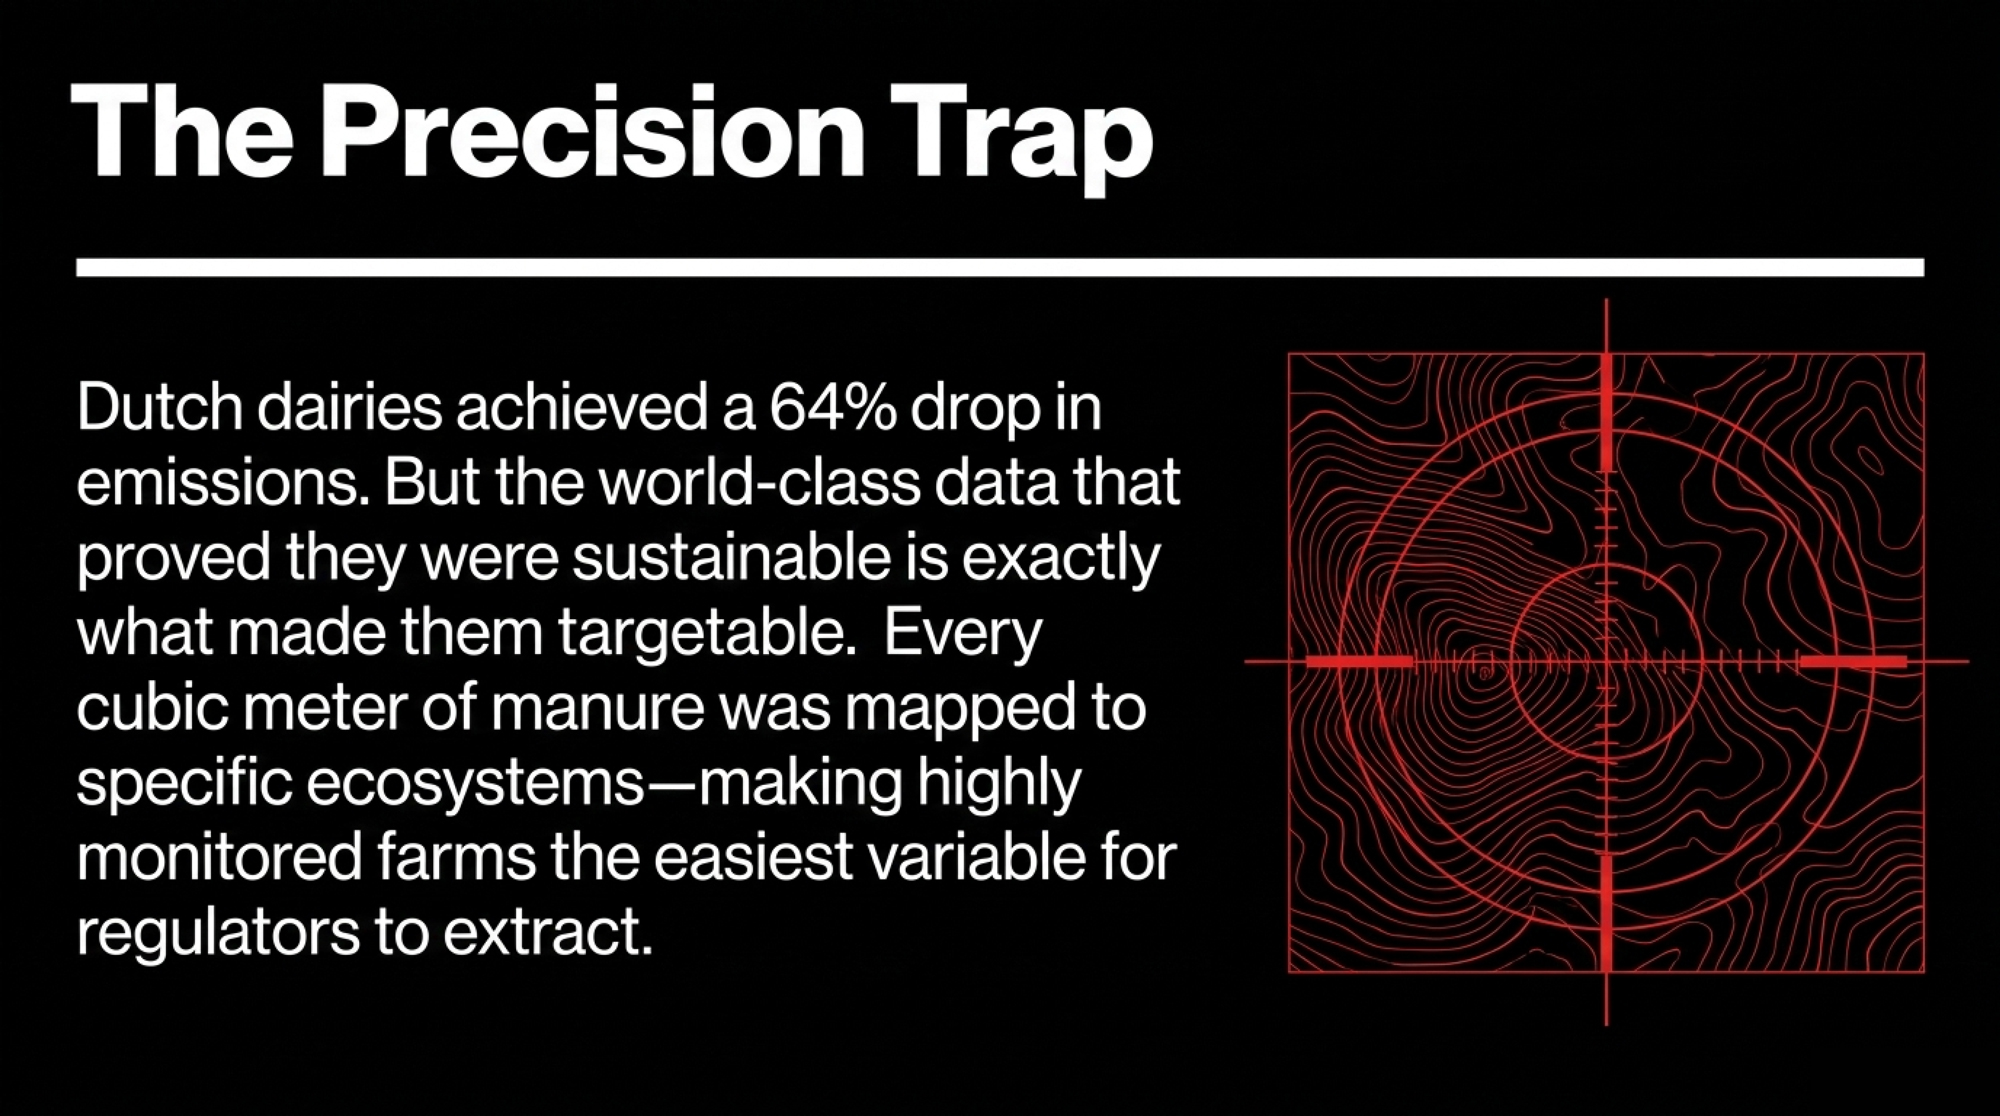
NewsSubscribe
First
Last
Consent

The $97,000 Breeding Meeting: How a 500-Cow Dairy Capped Beef at 35%

The calf buyer wanted more. The spreadsheet said cap it at 35%. ERS forecasts 25.31B lbs of beef in 2027 and heifers near $3,800. The lever’s on your breeding sheet right now.

Editor’s Note: The following case study is a composite scenario modeled from multiple Eastern U.S. herds reviewed by The Bullvine and its consulting sources in Spring 2026.

The breeding meeting was a kitchen table, three coffees, and a stack of October calf tickets the buyer had been calling about for weeks. A 500-cow Eastern dairy was about to push beef semen from 45% of services up to 55%. Day-old beef-on-dairy calves were clearing roughly $1,200 a head. The math for “more beef” looked like free money.

By the end of the meeting, beef was capped at 35%. That single line on the consultant’s spreadsheet — going from 45% to 55% beef — carried roughly $97,000 a year in net profit risk under the herd’s real assumptions. That’s the beef-on-dairy economics 2026 story most spreadsheets aren’t catching.

What USDA Just Told Both Sides of the Barn

USDA’s Economic Research Service released its May 2026 Livestock, Dairy, and Poultry Outlook (LDP-M-383) in mid-May. The cattle headlines are loud. ERS forecasts U.S. beef production at 25.547 billion pounds in 2026 — down 243 million pounds from April’s projection — and 25.310 billion pounds in 2027, a 0.9% year-over-year decline and one of the lowest annual U.S. beef production figures of the past decade.

Feeder steers in the 750–800 lb range at the Oklahoma City National Stockyards traded near record territory the first week of May 2026, with reported daily averages around $388/cwt in the AMS Oklahoma City weekly summary. Slaughter steers ran in the same neighborhood, in the $258/cwt range on the AMS 5-Area Weekly Weighted Average for the same window. ERS expects new highs across feeder, slaughter, and cull cattle through 2027.

Then there’s the line dairy operators should read twice. ERS notes dairy cow slaughter is running at multi-year lows, partly because beef-cross calf returns are keeping marginal cows in the parlor longer.

That’s a feedback loop, not a coincidence. More beef-on-dairy calves means tighter beef supply means stronger cattle prices means even more beef-on-dairy calves. It also masks how thin your replacement pipeline has become.

The Other USDA Report Nobody’s Putting on the Same Page

Flip to NASS and CoBank, and the picture inverts. The January 30, 2026 NASS Cattle Inventory shows roughly 3.90 million dairy replacement heifers as of January 1, 2026 — the lowest count in the recent NASS historical series. CoBank Knowledge Exchange’s Q1 2026 dairy quarterly modeling has the U.S. short about 800,000 heifers through 2026, with 2027 adding back only around 285,000.

National replacement heifer prices sit near $3,010/head in current AMS National Dairy Market News reporting. Tight regional markets — Equity Cooperative Livestock Sales Association at Reedsville, Wisconsin and Northeast dairy auctions through April and May 2026 — have been clearing $3,800–$4,800/head. That’s the 2027 heifer pen showing up early.

Two charts. One collision. Beef-on-dairy calf revenue has rarely paid better. The dairy replacement pipeline has rarely been thinner. The same lever on your breeding sheet — beef semen percentage — controls both numbers, and the cost of getting it wrong is bigger in both directions than it was even two years ago.

Running the Numbers: 35% vs 55% Beef on a 500-Cow Eastern Dairy

ScenarioHeifers to First CalvingNet Heifer StatusBeef Calf RevenueNet Calf+Heifer Balance
35% Beef~231+66 Surplus$210,000$408,000
45% Beef~196+31 Surplus$270,000$363,000
55% Beef~160-5 Deficit$330,000$311,000 (–$97K vs 35%)

This is the spreadsheet that ended the meeting. Every figure here reflects the herd’s stated assumptions, not a regional benchmark. Plug your own numbers in and watch what happens.

The consultant who chaired the meeting summed up the cap this way: when the calf market is hot and the heifer market is hotter, you don’t pick the percentage that maximizes today’s revenue — you pick the one your 2028 milking string can survive. That’s the rule that landed beef at 35%.

The inputs:

  • 500 cows, 30% cull rate
  • Age at first calving (AFC): 24-month target, 26-month actual
  • Heifer non-completion (born to first calving): 21% (79% completion), consistent with USDA NAHMS Dairy mortality and culling commentary
  • Beef-cross day-old calf value: $1,200/head
  • Replacement heifer purchase price: $3,800/head
  • Surplus heifer sale price: $3,000/head
  • Sexed dairy semen: 42% conception, 90% heifer ratio, 79% rearing-completion, drawn from the 85-herd commercial Holstein dataset associated with Dr. Michael Overton’s published Zoetis work
  • Beef semen conception: 57%
  • Services-per-pregnancy: 2.4 sexed dairy / 1.8 beef, consistent with the consultant’s economic matrix

The Forward Replacement formula every operator should know by heart:

Replacements Needed = Herd Size × (Actual AFC ÷ 24) × Cull Rate × (1 + Non-Completion Rate)

Plug it in: 500 × (26/24) × 0.30 × 1.21 ≈ 197 heifers/year to hold herd size at this herd’s actual AFC and non-completion. Note the gap. The herd’s original spreadsheet baseline was 165 heifers, built off a 24-month AFC and a 10% non-completion default. The scenarios below run against that 165 figure — the same number the consultant’s spreadsheet used the day of the meeting. Run yours against your own real-world AFC and non-completion before quoting any of this as your own.

The table that ended the meeting

ScenarioHeifers to First CalvingNet Heifer StatusBeef Calf RevenueNet Calf-and-Heifer Balance
35% Beef~231+66 (Surplus)$210,000$408,000
45% Beef~196+31 (Surplus)$270,000$363,000
55% Beef~160–5 (Deficit)$330,000$311,000

Net-net: 55% beef adds $120,000 in calf cheques and quietly costs $97,000 once the replacement bill arrives. Bigger top line. Smaller bottom line.

“The calf cheque got bigger. The bank account got smaller.”

What’s the Trap Hiding Inside a $1,200 Calf?

Timing. The calf cheque shows up tomorrow. The replacement bill shows up two breeding seasons from now.

That’s the whole trap. There’s no way to make it disappear. The biology runs on a 24-to-30-month clock, so by the time a thin pipeline shows up empty in the parlor, the cows that should have been bred to sexed dairy are dry, sold, or already gone. You can’t unwind a 2025 breeding decision in 2027. You can only pay for it.

Everyone assumed the calf cheque was pure upside. The math says it’s a loan against your 2028 milking string, and the interest rate depends on what replacements cost when the bill arrives.

Scaling Up: What This Looks Like at 1,200 Cows

Run the same Eastern-herd inputs at a 1,200-cow operation and the modeled gap between 35% and 55% beef widens to roughly $235,000 in net calf-and-heifer balance. Drop the calf price toward $900 — within the range U.S. markets have hit before — and the gap widens further, because the lost calf revenue inside the 55% scenario can no longer cover the locked-in heifer purchase exposure.

The October 2025 Warning Shot

AMS regional calf reporting in mid-October 2025 described day-old beef-on-dairy calf values dropping in the $150-plus per-head range over roughly two weeks of trade. Anyone running a breeding program built on top-of-cycle calf prices got an unwelcome stress test, fast.

What Does Your Calf Have to Clear to Beat a Sexed Dairy Service?

The right comparison isn’t calf price. It’s expected value per service. Here’s the cleanest version of the math.

Using the Overton/Zoetis 85-herd Holstein assumptions (42% sexed-dairy conception, 90% heifer ratio, 79% rearing-completion, 95% pregnancy survival), gross expected value per sexed-dairy service comes to roughly $854 at $3,010 replacements, ~$993 at $3,500, and ~$1,163 at $4,100. These are gross EV figures before rearing and opportunity-cost adjustments. Apply your own cost stack to land on a net EV for your operation. Beef-on-dairy at a $1,200 calf and 57% conception comes in around $650/service after a small marketing-and-mortality adjustment.

That sets the crossover — the day-old beef calf value where beef finally matches sexed dairy on EV. On a pure gross-EV equivalence (EV ÷ 0.57 conception), the crossovers come in at roughly $1,498 / $1,742 / $2,040 at $3,010 / $3,500 / $4,100 replacements. Layering in rearing and opportunity-cost terms — heifers cost real money to grow, and a sexed dairy service forecloses a beef calf that day — pushes the crossovers to roughly $1,580 / $1,931 / $2,262 in the consultant’s full cost-adjusted matrix.

Replacement Heifer PriceGross EV Crossover ($/calf)Full Cost-Adjusted Crossover ($/calf)Typical Regional Market (May 2026)Below Crossover?
$3,010/head$1,498$1,580~$1,200Yes — $380 below
$3,500/head$1,742$1,931~$1,200Yes — $731 below
$4,100/head$2,040$2,262~$1,200Yes — $1,062 below
$3,800 (AMS tight mkts)$1,895$2,100~$1,200Yes — $900 below

The exact crossover dollar varies by which cost stack you use. The conclusion doesn’t: most regional U.S. calf markets we’ve reviewed are clearing well below either set of numbers. A lot of breeding sheets look profitable on the calf invoice and quietly leak value on the replacement side.

Is Your Heifer Pipeline Already Telling You Something Your Spreadsheet Isn’t?

The metric most operators don’t track monthly: total replacement heifers in inventory divided by total milking cows. Treat it as a Bullvine planning framework consistent with Penn State Extension replacement-economics commentary.

  • 0.80–0.90 = Optimal
  • 0.70–0.80 = Caution
  • Below 0.70 = Red

In the 500-cow Eastern model this article is built on, the pipeline ratio sat at 0.70–0.75 when the breeding meeting started. Eighteen months out, with the modeled 35% beef cap and sexed dairy locked onto the top genomic and high-fertility cows, the projected ratio climbs into the mid-0.80s. That’s a model projection from the consultant’s spreadsheet — not a measured outcome — and the phase pattern is what’s worth borrowing even if your numbers don’t match.

Pregnancy mix typically shifts within ~90 days of a protocol change. Heifer birth pattern shifts at roughly six months.

The pipeline ratio itself doesn’t catch up until ~9 months out. It often lands behind the spreadsheet because real-world non-completion (closer to 21% than the 10% most working spreadsheets default to) and AFC drift take bigger bites than projected.

That gap — between NAHMS-documented heifer non-completion and the assumptions sitting inside most working spreadsheets — is the one most often catching operators by surprise. Run your own Forward Replacement formula with your actual AFC and your actual non-completion before you set a beef percentage. Not last year’s. This month’s.

Options and Trade-Offs for Farmers

Action 1: Execute the 30-Day Pipeline Audit

Pull your last 12 months of heifer births, multiply by 0.79 to estimate completions (that’s 1 minus the 21% non-completion rate), and stack it against your (herd size × cull rate). Calculate your heifers-per-cow ratio and your real annual replacement need. If your ratio drops below 0.80, your beef percentage is already too high — no matter what the calf buyer is promising today. Requires clean DHIA or on-farm records, two to four hours depending on how clean those records are, and the willingness to act on the answer. Where it backfires: sloppy birth or AFC records produce false confidence in either direction. Forward-looking signal: if ERS’s 2027 forecast holds and replacement prices stay firm into 2028, this audit is the cheapest defense against a 2028 milking-string shortage.

Action 2: Implement a Dynamic Breeding Band

Stop treating beef percentage as a static number. Base it at 35% only when your 21-day pregnancy rate stays above 30% and your pipeline ratio sits comfortably between 0.80–0.90. If either metric slips, aggressively choke beef back to 25–30%. Pull beef entirely if dairy pregnancies drop below 42% of weekly total for three consecutive weeks. Requires weekly repro reporting and someone with veto authority who can hold the cap when the calf market argues against it. Let the metrics run the cap, not the calf market.

Action 3: Enforce Strict Genomic Quartiles

Lock sexed dairy onto your top 25–30% cows by GTPI/NM$ and components. Beef goes on the bottom genomic quartile, repeat breeders, and old parities. Period. No “she looks good” overrides. That’s how the protocol collapses by month three.

What this requires in practice: genomic testing on every heifer (commercial Holstein testing runs $40–$50 per animal, varying by lab and CDCB nomination fees), a written eligibility rule, and an exception protocol that forces a one-for-one heifer trade rather than a one-way override. If average GTPI on your fresh 2-year-old string ticks up materially over 18 months, the protocol is working before the pipeline ratio fully catches up.

Action 4: Stress-Test the Plan at $900 Calves

If the math only works at $1,200, you don’t have a strategy. You have a bet on the top of the cycle. Build a scenario column at $1,200, $900, and $700 calves. Trigger: if 55% beef only beats 35% beef at $1,200+ calves, the cap stays at 35%. Pair it with USDA RMA’s Livestock Risk Protection coverage on feeder cattle and slaughter cattle if your calf marketing pattern fits the LRP coverage windows under current RMA program rules.

Key Takeaways

  • If your heifers-per-cow ratio is below 0.80, cap beef tighter than the calf market is asking — your 2028 milking string is already getting short.
  • If your 55% beef scenario only beats your 35% beef scenario at $1,200+ calves, your beef percentage stays at 35%. Don’t let the calf cheque run the breeding sheet.
  • If your AFC is 26 months instead of 24, you need about 8% more replacements per year to hold herd size. Real non-completion at 21% instead of 10% adds another 10% on top.
  • Your top genomic quartile getting beef semen because she’s a repeat breeder? She’s the first cow to move back to sexed dairy — not the last.
  • If your local calves are clearing under your crossover price, beef belongs capped tighter than your calf buyer is suggesting.

What’s Your Move?

ERS is telling you cattle prices stay strong through 2027. NASS and CoBank are telling you replacements stay short and expensive. So what does your breeding sheet actually say about heifers per cow, AFC, and real non-completion this month — and what does your calf buyer’s contract look like 18 months from now if you keep your beef percentage exactly where it is today?

Learn More

The Sunday Read Dairy Professionals Don’t Skip.

Every week, thousands of producers, breeders, and industry insiders open Bullvine Weekly for genetics insights, market shifts, and profit strategies they won’t find anywhere else. One email. Five minutes. Smarter decisions all week.
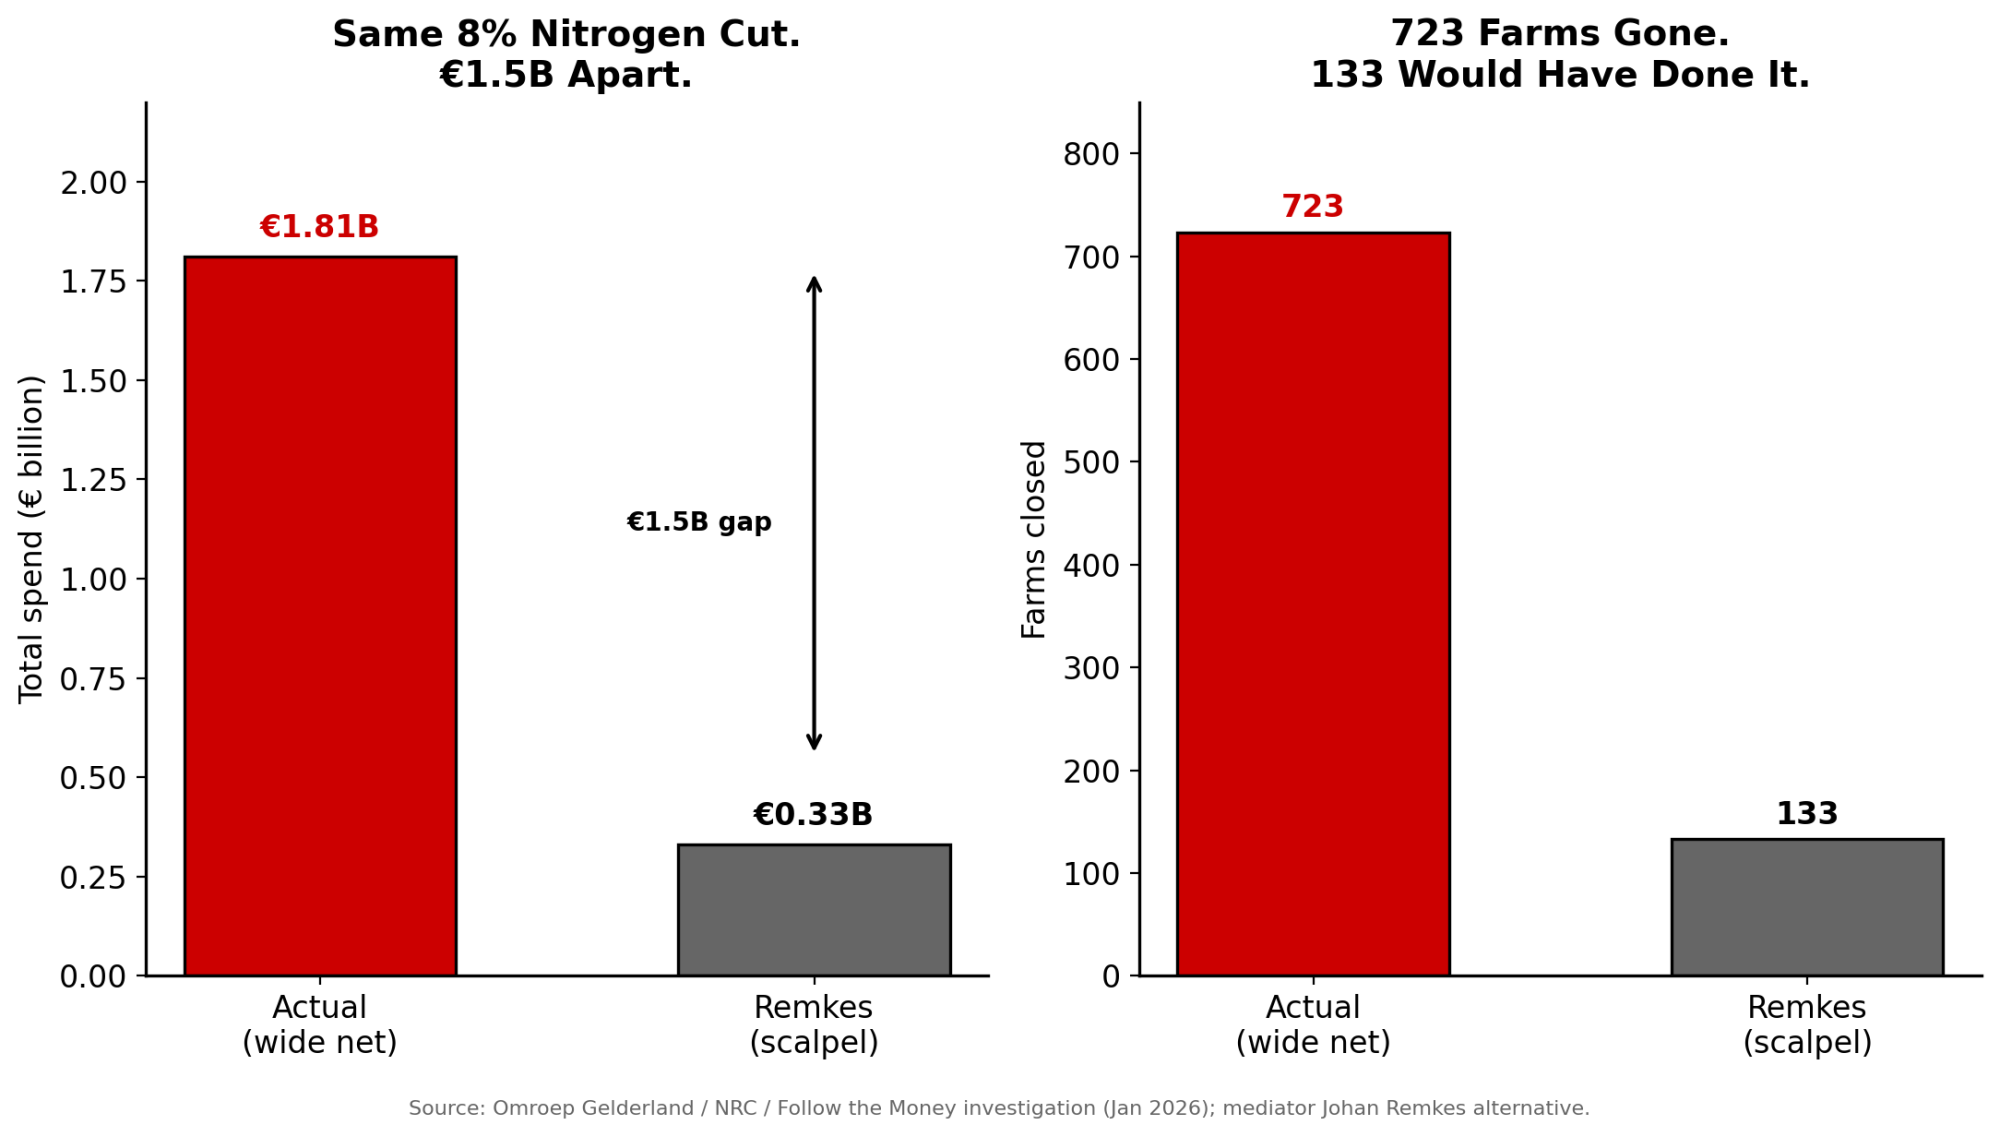
NewsSubscribe
First
Last
Consent

$56,250 Gone in a Weekend: The DRP Window Sitting Open on Most Mid-Size Dairies

USDA just rewrote the 2027 livestock insurance rule book. The tools got better. The empty chair on most mid-size dairies didn’t.

Executive Summary: USDA’s 2027 livestock insurance package — Product Management Bulletin PM-26-024, released May 18, 2026 — extends LRP cull cow coverage to 52 weeks, opens concurrent DRP/LRP/LGM stacking, adds a 6.0–9.0 cwt Unborn Dairy Weight 2 calf category for backgrounded beef-on-dairy, and shifts the DRP sales close to the next calendar day. It also auto-cancels any policy that earns no premium for three consecutive years, which is going to surprise producers who lapsed coverage in 2024–2025. On a 600-cow dairy shipping 37,500 cwt a quarter, hesitating on a $1.50/cwt DRP move at 90% coverage walks past $56,250 in floored revenue — one decision, one quarter. Two hard dates: June 30, 2026 to confirm or transfer your DRP provider, July 1, 2026 to audit which of your existing policies is already ticking toward auto-cancellation. The real question isn’t whether the toolkit got better — it did — but whether anyone on your operation is named, in writing, with authority to lock coverage on a Friday afternoon before Monday’s market move makes the decision for you.

DRP 2027 changes

Picture a Friday afternoon in late 2025. RMA had just posted new DRP rates. A 600-cow Upper Midwest dairy got the email from his crop insurance agent late that afternoon: lock about $17.75/cwt on a full quarter of Q4 milk at 90% coverage, and you’ve got a defensible floor going into a soft market.

Editor’s note: The producer in this opening scene is a composite, drawn from patterns multiple Upper Midwest crop insurance agents describe seeing across their dairy books in 2025. The DRP coverage levels and adverse-move scenario are illustrative. The math reflects real DRP coverage mechanics and reconciles to documented program rules.

He read it between afternoon milking and chores. Told himself he’d think about it over the weekend and call his agent Monday. By Monday afternoon, futures had moved roughly $1.50/cwt. The endorsement at that price was gone. On 37,500 cwt of covered milk for that quarter, the hesitation worked out to about $56,250 in revenue he could’ve floored — and didn’t.

He didn’t lose his farm. He absorbed a quarter’s worth of milk check without protection and went back to work. He’s not unusual. He’s the median dairy operator in America’s current risk landscape — and he’s exactly who USDA’s 2027 livestock insurance updates are aimed at.

The question for every mid-size producer reading this: when the next Friday email lands, who in your operation is actually authorized to say “yes, lock it” before chores?

What’s Changing and Why

USDA’s Risk Management Agency, with FCIC Board approval, dropped a sweeping set of revisions for the 2027 crop year through Product Management Bulletin PM-26-024, released May 18, 2026. The headline changes affect three programs that already touch most serious dairies: Dairy Revenue Protection (DRP), Livestock Risk Protection (LRP), and Livestock Gross Margin (LGM).

The big ones for dairy:

  • DRP sales period close moves to the following calendar day — the same window LRP and LGM already use. No more Monday-morning cutoff catching producers who wanted to think over the weekend.
  • LRP cull cow coverage extended from 13 weeks to a maximum of 52 weeks under the Fed Cattle Specific Coverage Endorsement.
  • A new “Unborn Dairy Weight 2” LRP category covers 6.0 to 9.0 cwt target weight calves — built for backgrounded beef-on-dairy crosses, not day-old sales.
  • LGM cattle weight maximums increased, with target finishing weights bumped accordingly to match current feedyard practice and the LGM dairy margin model.
  • Concurrent coverage between similar livestock programs is now explicitly permitted, so a dairy can hold DRP on milk, LRP on cull cows, and LRP on calves at the same time without policy conflicts.
  • Policies earning no premium for three consecutive policy years are now subject to automatic cancellation.

The context matters as much as the changes themselves. Farmer-paid LRP premiums went from about $13 million in 2018 to roughly $1.7 billion in 2025, per RMA Summary of Business data. Insured headcounts climbed from 71,000 in 2017 to about 7.5 million by mid-2025. These programs are no longer a footnote.

In RMA’s May 18, 2026 release, the agency framed the package as expanding coverage options for producers and meeting evolving risk-management needs. Whether the tools actually do that depends on something USDA can’t legislate.

How This Plays Out on Real Farms

The 600-cow scenario in the lede isn’t a one-off. Crop insurance agents working the dairy book describe the same Friday-email-to-Monday-regret pattern across mid-size operations — even as DRP and LRP adoption surges at the larger end of the industry.

Run the cull cow math under the new 52-week rule. Pre-2027, protecting cull revenue meant writing four 13-week endorsements quarterly. Post-2027, a single annual endorsement covers the entire projected cull flow — provided someone actually picks up the phone. The same logic, scaled across herd sizes, produces three very different conversations with a lender.

Non-Milk Asset Exposure by Herd Size — A Side-by-Side

The table below uses a $120/cwt midpoint cull price (within the $110–$130 range observed across regional auctions in 2025–2026) and $1,000/head day-old beef-on-dairy calves. Cull weight assumptions reflect typical regional patterns: 1,350 lbs for Upper Midwest Holstein-dominant herds, 1,400 lbs for larger Western and Plains operations carrying heavier-conditioned culls.

Cull and calf prices reflect 2025–2026 regional midpoints. Pull current local auction reports before using these figures for your own planning.

Metric600-Cow Dairy1,200-Cow Dairy2,500-Cow Dairy
Annual cull rate30%32%33%
Annual cull cows (head)180384825
Avg cull weight1,350 lbs1,350 lbs1,400 lbs
Cull cow revenue exposure~$291K~$622K~$1.39M
Day-old beef-on-dairy calves/yrVariable~700~1,400
Calf value exposure (@$1,000/hd)Variable~$700K~$1.4M
Combined non-milk exposure~$291K~$1.3M~$2.7M
Annual milk volume (25K lbs/cow)150,000 cwt300,000 cwt625,000 cwt
Missed floor @ $1.50/cwt adverse, 90% coverage/quarter$50,625$101,250$210,938
Named risk decision-maker present?🔴 Rare🟡 Sometimes🟡 Inconsistent
Written authority playbook?🔴 Rare🟡 Sometimes🟡 Inconsistent
Typical risk roleMissingController or adviserController or CFO

Calf counts at the 1,200-cow and 2,500-cow lines assume roughly 55–60% of the herd is bred to beef. Adjust to your own breeding share before concluding.

Read across any row, and the governance question changes character. At 600 cows, the dairy is making decisions about a quarter-million-dollar cull stream with no one formally watching the windows. At 2,500 cows, the dairy is running roughly $2.7 million in non-milk exposure through a finance function that may have the right title but not the written authority to execute on a Friday afternoon.

The dairies running layered portfolios well almost always have a named risk person — a family member, a controller, or a contracted adviser through outfits like Crop Growers, AgCountry, or GreenStone — whose job description includes “watch the windows.” The dairies sitting at 600 cows with no defined risk role tend to use one program reactively, lapse on it for two years, and then scramble back to the agent during a downturn. The new three-year cancellation rule will surprise some of those operators.

The Mechanics Behind the Outcomes

The 2027 changes reduce mechanical friction. They don’t reduce decision complexity. If anything, they raise it.

2027 ChangeWhat It FixesWhat It Doesn’t FixWho It Helps
DRP closes next calendar dayNo more Sunday-night panic; weekend rates are actionableProducers with no pre-agreed trigger rule still won’t actActive DRP users with a named decision-maker
LRP cull cow coverage extended to 52 weeksEliminates quarterly re-writing; one annual endorsementDoesn’t protect dairy-cull basis vs. beef-breed index spreadDairies with predictable, planned culling cycles
New LRP Unborn Dairy Weight 2 (6–9 cwt)Opens federal floor for backgrounded beef-on-dairyDecision must precede breeding — sale-barn timing is too lateRetained-ownership operations only
Concurrent DRP + LRP + LGM stackingComplete multi-stream risk architecture now federally possibleRequires half-day/quarter of recordkeeping + engaged adviserOperations ≥750 cows with dedicated risk bandwidth
3-year no-premium auto-cancellationCleans up lapsed, inactive policies automaticallyWill silently cancel policies operators think are still activeNobody — this is a trap for lapsed users
LGM cattle weight maximums increasedBetter alignment with actual feedyard finishing weightsStill settles on futures index, not local basisBeef-on-dairy operators in retained-ownership models

DRP timing is genuinely easier now. The next-calendar-day window means a Friday rate posting can be acted on through the weekend without the old Sunday-night panic. That fixes a real friction point for active users. It doesn’t help producers who never had a rule for when to lock coverage in the first place.

The 52-week cull cow extension only pays off if your culling pattern is predictable enough to write a single annual endorsement against. For dairies pulling cows reactively as they fail rather than on a planned cycle, shorter-window endorsements may still fit better. The decision work just shifted from your agent’s calendar to yours.

Concurrent coverage is the structural change with the biggest implications. Three programs covering three revenue streams — milk, calves, culls — give you a more complete risk architecture than dairy has ever had access to under federal subsidies. But the same head still can’t be insured under multiple policies simultaneously, which means head-level recordkeeping (breeding logs, pregnancy checks, birth records, marketing receipts within strict calendar windows) becomes part of the compliance work. That’s manageable with the right adviser. It’s a paperwork trap without one.

The bigger surprise sits in the Unborn Dairy Weight 2 category. Most beef-on-dairy dairies still sell calves under 60 lbs within two weeks of birth — a pattern consistent with industry surveys and how DFA’s beef-on-dairy programs are structured. That’s Weight 1 territory, and those operators have already had unborn calf coverage available since July 2025. Weight 2 is built for a different model: dairies retaining calves through backgrounding to 600–900 lbs, often as part of profit-sharing arrangements with feedyards. The same pattern points to a directional shift over the last several years, visible in beef-on-dairy semen sales and retained-ownership pilots.

If you’re not in that game today, Weight 2 isn’t your tool. If you’re considering moving toward retained ownership, the floor is what makes the math work.

How Much Does Hesitation Actually Cost on a Mid-Size Dairy?

Here’s the math behind the lede, plain and simple. A 600-cow herd at 25,000 lbs/cow annual production ships 150,000 cwt a year. Divide by four quarters, and you get roughly 37,500 cwt of milk per quarter. At 90% coverage with a $1.50/cwt adverse move, that’s 37,500 × $1.50 = $56,250 in floor revenue you walked past.

That’s one decision, one quarter, one program. Repeat the pattern across cull cow timing, calf coverage windows, and DRP layering across four quarters, and the cumulative cost of “I’ll think about it” easily reaches into six figures over a couple of years.

The compounding effect is what most producers underestimate. A dairy that misses one DRP window per year, lets cull cow coverage lapse during calm markets, and never engages with calf LRP isn’t catastrophically wrong any single year. They’re structurally exposed across cycles. When a real downturn lands, peers with consistent — even modest — coverage typically absorb less of the hit, though specific outcomes vary by program use, timing, and local basis. Risk advisers writing publicly about DRP timing describe the same pattern: producers wait for prices that feel “good enough,” and the window closes.

Who in Your Operation Owns the Friday Decision?

This is the question every mid-size dairy needs to answer before July 1, 2026. On most 600-cow operations, the role is simply missing. The crop insurance agent emails when they remember. The lender raises it once a year at the annual review. The producer is between parlor and TMR mixer when the email lands, and “let’s see what Monday looks like” feels safer than committing on a Friday afternoon.

The dairies that use DRP and LRP well share one structural feature. Someone is named, in writing, with explicit authority to execute coverage decisions according to a pre-agreed playbook. That person can be a family member, a controller, or a contracted adviser through AgCountry, GreenStone, or a similar lender-aligned risk desk. What matters is that ownership has explicitly said that if they follow the rules everyone agreed on, no one gets to second-guess after the fact. That permission structure is what keeps the role from defaulting to whoever happens to read the email first.

Options and Trade-Offs for Farmers

Four practical paths most mid-size dairies should be evaluating right now. One is a 30-day move; the others stretch into the 2027 crop year.

Path 1: Audit your existing policy status before July 1, 2026 — this is your 30-day action.

The new three-year no-premium cancellation rule is quiet and easy to miss. If you’ve held a DRP or LRP policy that hasn’t earned a premium since 2024, it’s at risk. Call your agent this week and confirm policy status. The June 30, 2026 DRP provider transfer deadline also closes the window to switch agents before the 2027 crop year begins. This is the lowest-effort, highest-payoff move on the list — and the one most likely to be skipped.

Path 2: Use the 52-week cull cow LRP if your culling is predictable — but understand what the index actually protects.

A 600-cow herd with a stable culling rhythm can write one endorsement covering the year’s projected cull flow, lock a price floor against the CME Feeder Cattle or Fed Cattle Index, and stop scrambling quarterly. Here’s the trade-off an experienced peer would push you on. LRP settles against the CME Feeder Cattle Index or Fed Cattle Index, both of which are structurally built around beef-breed cattle. A Holstein cull already carries a structural quality and yield discount at slaughter relative to beef-breed counterparts. A Jersey cull carries an even larger one. The LRP coverage you write protects against a drop in the broader cattle market — directional declines in the index. It does not protect against a blowout in the dairy-beef basis differential. If beef cull prices hold steady but dairy-cull discounts widen because of a quality or yield spread shift, your endorsement won’t pay even though your local cull check did. That’s the gap to size before you sign.

Path 3: Layer concurrent coverage if you’re above 750–1,000 cows.

Holding DRP on milk, plus LRP on culls and calves, gives lenders a complete, protected revenue picture. The combined documentation supports DSCR covenants and borrowing base calculations. The trade-off: this requires either dedicated risk management bandwidth or a highly engaged agent. Plan on roughly a half-day a quarter of bookkeeping, plus a standing 30-minute call with your agent the week each program’s window opens — minimum. Below 750 cows, the administrative cost likely outpaces the marginal protection benefit unless you’ve already built the governance to run it.

Path 4: Consider Weight 2 only if you’re moving toward retained ownership.

Day-old calf sellers stay in Weight 1. The Weight 2 category opens real options for dairies backgrounding their own beef-on-dairy crosses at 700–900 lbs, with endorsement windows that run through the months leading up to marketing. The trade-off: the decision has to precede breeding, not weaning. Operators thinking about calf coverage at the sale barn have already missed the window.

For each path, the honest filter is the same. Do you have someone in the operation whose job is to watch the trigger and execute? If not, fixing that comes first.

Is Your Operation Already Behind on the Risk-Governance Curve?

Lenders are moving — quietly, in advisory blogs and credit committee conversations — from “DRP is encouraged” toward DRP/LRP governance as the new baseline for serious dairies. Farm Credit advisory content across 2026 increasingly treats LRP as standard equipment rather than exotic — an assumption embedded in stability-planning guidance from multiple Farm Credit associations. The shift from Phase 1 to Phase 2 is happening in the language before it shows up in the term sheets.

If your last conversation with your lender included the phrase “let’s talk about your risk plan” — and you didn’t have a one-page answer ready — you’re already in the Phase 2 conversation. You just may not have noticed.

Key Takeaways

  • If you’ve held a DRP or LRP policy that earned no premium in 2024 or 2025, call your agent before June 30, 2026 to confirm status. The new three-year cancellation rule may already be ticking on your policy.
  • If your culling is predictable enough to forecast a year out, run the 52-week LRP cull cow numbers — but pull your local dairy-cull basis against the CME Feeder Cattle and Fed Cattle indices before assuming the endorsement is full protection.
  • If you’re still selling beef-on-dairy calves under 60 lbs, Weight 1 is your category. Weight 2 is for retained-ownership operations and demands a breeding-stage decision, not a sale-barn one.
  • If your herd is above 750 cows and your lender is asking about layered coverage, treat concurrent DRP + LRP + LRP as a borrowing base conversation, not a checkbox.
  • If you’re at 2,500 cows with a controller but no written risk playbook, the gap between “we have someone who could do this” and “someone is authorized to do this” is what will cost you in 2027.
  • If nobody in your operation can answer “who locks coverage when the trigger hits?” — fix that before you fix anything else. Name the person, write the playbook, give them authority.
  • If your last conversation with your lender got vague when risk management came up, your next one likely won’t.

Grade Your Own Farm’s 2027 Risk Readiness — Before You Close This Tab

Print this. Screenshot it. Tape it to the office door. Answer yes or no, today.

  • ☐ I can name, in 10 seconds, the person on my farm authorized to lock DRP or LRP coverage on a Friday afternoon without calling me first.
  • ☐ That authority is written down somewhere — even one paragraph — and the lender, the agent, and ownership have all seen it.
  • ☐ I know whether each of my active DRP and LRP policies earned premium in 2024 and 2025, and I’ve confirmed status before the new three-year cancellation rule applies.
  • ☐ I’ve made a deliberate decision before June 30, 2026 about whether to keep or transfer my DRP provider for the 2027 crop year.
  • ☐ I’ve sized my annual cull cow exposure against the 52-week LRP option and pulled my local dairy-cull basis against the CME Feeder Cattle and Fed Cattle indices, not assuming the index protects my actual check.
  • ☐ If I run beef-on-dairy, I know which weight category (1 or 2) matches how I actually market calves — and I haven’t bought the wrong one.
  • ☐ If my herd is above 750 cows, I’ve modeled what concurrent DRP + LRP + LRP would do to my DSCR and borrowing base, and I’ve shared that with my lender before they ask.
  • ☐ The last time my lender said “let’s talk about your risk plan,” I had a one-page answer ready.

Six or fewer checks means you’re in the Phase 1 group lenders are quietly moving past. Seven or eight means you’re already running the playbook the 2027 toolkit was built for.

Run Your Numbers

Farm Benchmark Snap Check — Pressure-test where your operation sits before the next DRP window opens. The tool flags margin exposure, non-milk asset risk, and the governance gaps that turn a $1.50/cwt market move into a $56,250 hole on your milk check.

Closing

So the question isn’t whether USDA built better tools for 2027. They did. The question is whether your operation has someone whose job description includes acting on them before Friday afternoon turns into Monday regret.

Complete references and supporting documentation are available upon request by contacting the editorial team at editor@thebullvine.com.

Learn More

The Sunday Read Dairy Professionals Don’t Skip.

Every week, thousands of producers, breeders, and industry insiders open Bullvine Weekly for genetics insights, market shifts, and profit strategies they won’t find anywhere else. One email. Five minutes. Smarter decisions all week.
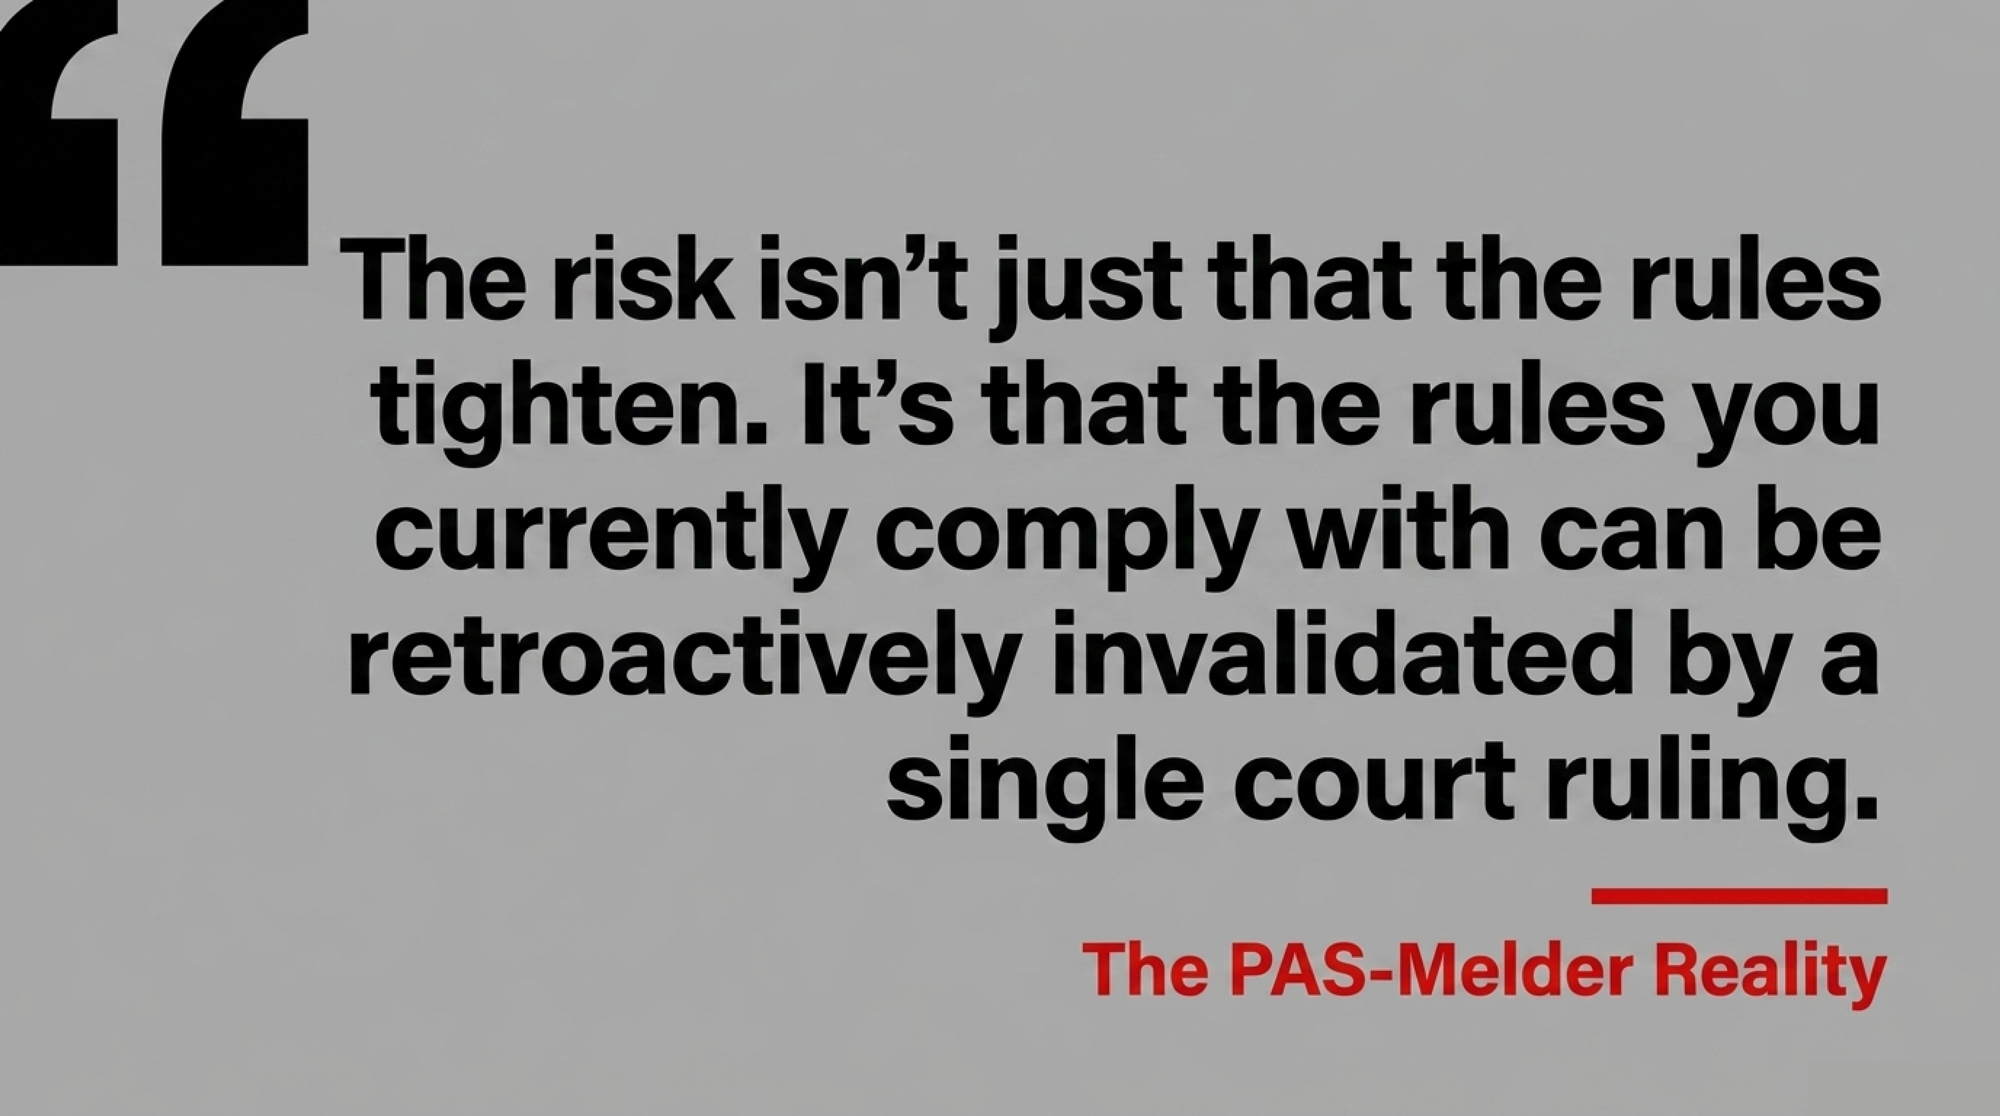
NewsSubscribe
First
Last
Consent

Coles and Brownes Just Exposed The $386,000 Hole In Your Milk Contract

A$39,600 in fines on the other side of the world. The same clause language sits unredlined in North American milk contracts — and on an 800-cow robot barn, the 90-day math runs $386,000.

exclusive milk supply contract, ACCC Coles Brownes, Class III pricing, robotic milking debt, DSCR dairy lending, co-op bylaws, milk contract volume cap

The Australian Competition and Consumer Commission’s May 21, 2026 announcement confirmed it had accepted infringement notices from the supermarket Coles and the processor Brownes Foods Operations for alleged breaches of the Australian Dairy Code of Conduct — A$39,600 each. ACCC alleged Coles published two milk-supply agreements requiring exclusive supply to the retailer while capping the maximum volume of milk farmers could produce. ACCC alleged Brownes published two agreements that didn’t clearly set out the minimum prices applying across the full supply period, or justify the reasons for those prices. Under Australian law, infringement notices aren’t admissions of liability, and neither company had publicly responded to the May 2026 action by publication time. 

The fine is rounding-error money. The clause language ACCC went after lives freely in North American milk contracts and co-op bylaws right now — with no equivalent code to back you up. 

Picture the contract on your desk. Five-year term. Exclusive supply. A 16,000 cwt monthly minimum. “Competitive pricing tied to Class III.” Your banker won’t release the robot loan until it’s signed. Now picture an 800-cow operation that just signed off on a robotic parlor. Fourteen robots at roughly $195,000 per unit — within the published 2026 range commonly cited by Compeer Financial and university extension robotics economic models — puts the equipment alone at $2.73 million, with retrofit and infrastructure pushing the total package past $3.5 million. Compeer Financial’s 2026 published guidance flags principal-and-interest payments above $2.50/cwt of milk production as the threshold at which dairy debt service gets uncomfortable. On 230,400 cwt a year, that ceiling pencils to roughly $48,000 a month in total debt service. The deal works — barely — at $22/cwt and 19,200 cwt a month, against USDA’s $18.95 milk forecast and $19.14 cost forecast for the year. Then the renewal lands. 

What’s Changing And Why

ACCC didn’t go after Coles and Brownes over the prices they paid. ACCC went after the structure. Under the Australian Dairy Code, processors must publish contracts that include defined minimum prices and volumes. Clauses blocking farmers from supplying anyone else while letting the buyer cap intake aren’t allowed in exclusive deals. 

Brownes has been here before. In 2021, the processor paid A$22,200 in infringement-notice penalties over alleged Code breaches that ACCC said involved open-ended supply periods and unilateral price step-down rights. ACCC has flagged increased Code enforcement since 2021. The 2026 action is part of a pattern, not a one-off. 

ClauseStandalone RiskCombined RiskAustralian Dairy CodeNorth American Status
Exclusivity— all milk to one buyerLow if price/volume are solidHIGH — traps milk if cap invoked❌ Must offer non-exclusive alternative✅ Standard; no equivalent rule
Volume cap / “subject to capacity”Moderate — buyer manages plant loadHIGH — combined with exclusivity, you can’t redirect❌ Not permitted in exclusive deals✅ Freely used; labeled “capacity-subject intake”
Vague pricing (“tied to Class III”)Moderate — price drifts inside termHIGH — no floor means deductions compound❌ Minimum price must be defined across full supply period✅ Common; no defined-spread requirement
Tiered pricing (Tier A/Tier B)Low — standard revenue managementHIGH — erases expansion economics at cap volume❌ Requires non-exclusive alternative if combined with exclusivity✅ Unregulated; UK FDOM now requires fairness test

North America has no equivalent rule. In the US, supply terms vary by federal order, co-op, and private milk processor contract — there’s no national code that says “if you cap volume, you must release exclusivity.” In Canada, supply management sets prices and quotas at the provincial level, but the underlying co-op membership rules and processor agreements still carry exclusivity, notice, and discipline language buried in bylaws most members never re-read. The same clause families show up under different names — “base-excess pricing,” “market adjustment factors,” “capacity-subject” intake language — depending on who drafted your agreement. 

The UK went the other direction in 2025. Under the Fair Dealing Obligations (Milk) regulations phased in across 2024 and 2025, contracts combining exclusivity with tiered pricing must satisfy a fairness test that effectively forces processors to offer a non-exclusive alternative — closing the same gap North American producers carry without protection. The producers most exposed are the ones financing expansion — robots, parlors, freestall barns, sexed semen, genomics programs — on the assumption their milk has a guaranteed home. That assumption is contractual, not natural. 

How This Plays Out On Real Farms

Run the stress test on the 800-cow scenario. Two years into the renewal, the processor loses a major retail account and invokes a volume cap clause — the kind that lets them reduce intake by 10–15% on 60 days’ notice. Accepted volume drops from 19,200 to 16,320 cwt. The other 2,880 cwt a month is still being produced. Still being fed. And under typical exclusivity language, you can’t ship that milk to anyone else without the buyer’s written consent. 

Here’s the micro barn math any producer can map to their own herd. Lost monthly revenue: 2,880 cwt × $22/cwt = $63,360. USDA’s 2025 dairy outlook projected feed costs around $11.56/cwt at corn near $4.35 a bushel. At that input, the uncovered feed exposure on 2,880 cwt of trapped milk runs roughly $33,000 a month — sunk into milk that won’t sell. The robot debt service still drafts on schedule, even when the math says it shouldn’t have to. 

Stack three months together and the curve gets ugly fast. Incremental losses from lost revenue and uncovered feed run between $274,000 and $289,000 over 90 days, depending on where the variable feed cost actually lands. Layer in robot debt service still drafting against milk that won’t ship — roughly two months of P&I at $48,000 — and the cumulative cash strain on the 800-cow scenario pushes past $386,000. The 500-cow version trims the absolute number but not the shape of the problem. 

Exposure on a 90-day volume cap800-cow operation500-cow operation
Capped milk per month2,880 cwt1,800 cwt
Lost monthly revenue at $22/cwt$63,360$39,600
Uncovered feed exposure at $11.56/cwt~$33,000~$21,000
Total monthly hit~$96,000~$60,000
90-day incremental loss~$289,000~$181,000
Robot/expansion debt serviceContinues drafting all 90 daysContinues drafting all 90 days

The shock absorber gets smaller. The pressure on the bank conversation does not. 

The Mechanics Behind The Outcomes

Three clauses do the damage when they show up together. None is automatically bad on its own. Combined, they let a processor turn your expansion volume into a free buffer for their plant or retail-account risk. 

  • Exclusivity. All milk produced goes to one buyer; selling to anyone else requires written consent.
  • Volume cap or “subject to capacity” language. The buyer’s obligation to take milk is limited to a stated maximum — or whatever their plant decides it can handle. ACCC’s 2026 enforcement action against Coles alleged exactly this combination. 
  • Vague pricing. “Competitive pricing tied to Class III” with no defined spread or deduction list lets the buyer adjust the effective price downward inside the term — the same gap ACCC alleged against Brownes, where ACCC said the minimum price wasn’t clearly set out across the supply period. 

None of those would survive the Australian Dairy Code in an exclusive contract. All three live freely in North American agreements. 

Layer in tiered pricing — say $23/cwt on the first 15,000 cwt, $19/cwt above that — and the expansion case quietly collapses. With a 16,320 cwt cap, you earn $345,000 on Tier A and $25,080 on Tier B, total $370,080 a month. Without the cap, full 19,200 cwt would have generated $424,800. That’s $54,720 a month of revenue erased on milk the contract said the buyer could simply refuse to take. Under UK FDOM rules, that combination of exclusivity plus tiered pricing requires a non-exclusive alternative. North American milk processor contracts don’t. 

How Much Does An Exclusive Milk Processor Contract Without A Release Actually Cost?

Honest answer: it depends on whether the buyer ever pulls the trigger. If they don’t, the cost is zero and you feel smart for signing. If they do, the cost compounds in three layers. 

Layer one is direct revenue loss on capped milk — in the 800-cow case, roughly $63,000 a month at $22/cwt. Layer two is uncovered fixed costs: feed on milk with no buyer, robot debt that doesn’t pause, labor already scheduled. Layer three is the one your banker cares about — debt service coverage ratio. FCC flags 1.25x DSCR as a common ag lending threshold for expansion loans, and most US lenders sit in the same range. Once a 90-day cap event lands on top of that, the math turns fast. 

Run this through the kind of DSCR worksheet most ag lenders use, and a 90-day cap during a Class III soft patch compresses trailing DSCR straight toward covenant thresholds — even when every payment is current. With Class III at $16.16/cwt confirmed for March 2026 and Class IV at $18.94/cwt the same month, the cushion between forecast and covenant is already thin. That’s the moment the conversation with the bank shifts from planning to workout. 

Is Your Co-Op Bylaw Doing The Same Thing As An Exclusive Contract?

For a lot of North American producers, the answer is yes. Most haven’t read the document closely enough to see it. Co-op membership agreements often include exclusive supply requirements, disciplinary powers for “bringing the co-op into disrepute,” and rules about how losses from recalls or lost retail accounts get spread across the pool. 

The mechanics look different from a private supply agreement. The leverage is similar. Members can’t easily ship elsewhere, and the board controls how downstream pain gets allocated. Watch for “termination for cause” clauses tied to vague conduct standards, capital-retain rules that lock equity in the co-op for years after you stop shipping, and notification language that lets the co-op invoke recall-loss allocation without member consent. 

The ByHeart organic infant formula recall in late 2025 is a recent reminder of how downstream brand-owner events can hit upstream producers without warning. Producers inside contamination footprints often discover only after a recall what their notification rights actually were — or weren’t. Contract risk lives in bylaws too, not just in the supply agreement on top of them. 

Options and Trade-Offs for Farmers

There’s no single fix here. Four paths are showing up in producer–processor conversations right now. Each carries a real trade-off. 

ProtectionAustralia (Dairy Code 2020)UK (FDOM 2024–25)Canada (Supply Mgmt)USA (Federal Order)
Defined minimum price across full term✅ Required✅ Required✅ Quota price set provincially❌ No requirement
Volume cap with exclusivity release✅ Prohibited without release✅ Must offer non-exclusive alternativeN/A — quota governs volume❌ No requirement
Closed deduction list✅ Required✅ Fairness testPartial — provincial variation❌ Processor discretion
Minimum notice on volume reduction✅ Defined in Code✅ 3-month minimum✅ Quota adjustment via board❌ Varies by contract; often 30–60 days
Co-op bylaw conduct/discipline rulesCode overrides bylawRegulatedProvincial oversight❌ Member agreement only; no federal floor
Producer redress mechanism✅ ACCC enforcement✅ AHDB / Groceries Code✅ Provincial marketing boards❌ Litigation only

1. Negotiate an exclusivity release tied to volume reductions. This is the highest-leverage clause to push for. Plain language: if the buyer cuts accepted volume below the monthly minimum by more than 10%, exclusivity is suspended on the surplus and you can ship it elsewhere. Best fit on any 5-year-plus contract tied to new debt. Bring your banker into the conversation as a second voice — a lender’s signature on the loan gives you cover to ask. The risk: many North American processors and co-ops will say no, possibly flat. Your fallback is shorter notice periods, defined minimums, and a closed list of allowable deductions instead of a true release. 

2. Define the minimum price. Replace “competitive pricing tied to Class III” with a real formula — Class III monthly average minus a stated spread, plus a closed list of premiums and deductions, with any change requiring a written amendment. This is the exact gap ACCC alleged against Brownes. Worth pushing whenever the contract runs more than two years. You’ll need a clean set of recent milk cheques to negotiate the spread. The buyer may push back on locking in a five-year formula — an annual review window is a reasonable compromise. 

3. Buy the price floor in the market, not the contract. If the contract won’t define a minimum price, hedging tools — DMC, Dairy Revenue Protection, private margin contracts — can synthesize one. Best fit when the contract is otherwise acceptable but the pricing language is vague. You’ll need an adviser who actually understands DRP basis risk. Hedging costs eat margin in normal years, and they don’t fix the volume-cap problem at all. 

4. Right-size the operation to the contract, not the barn. If you can’t get a release clause, the next-best move is to scale to guaranteed volume, not theoretical max. If the buyer commits to 16,000 cwt, build the herd, ration, and labor plan around 16,500–17,000 cwt — not 19,200. Makes sense in one-buyer regions where there’s no realistic alternate market. Requires discipline on heifer inventory and culling. 

The trade-off on Path 4: lost upside if the buyer never invokes the cap. With Class III sitting at $16.16/cwt for March 2026 and Compeer’s May 2026 published outlook flagging tighter dairy margins ahead, the cost of being right-sized is smaller than the cost of being over-built into a soft market. 

30-Day Action — Do This Now. Pull every supply contract, membership agreement, and co-op bylaw out of the file cabinet and read the exclusivity, volume, notice, and termination language line by line. Mark every clause that lets the buyer adjust volume or price without your written consent. Bring that marked-up copy to your banker before your next renewal meeting. That’s the audit list for negotiation, and the document your loan officer needs to actually price the risk you’re being asked to carry. 

Key Takeaways

  • If your contract has exclusivity AND a volume cap AND no written release, treat any expansion debt tied to it as carrying unpriced counterparty risk. Tell your banker before they tell you.
  • If “competitive pricing tied to Class III” is the only price language in your contract, that’s not a price — it’s the same gap ACCC alleged against Brownes. Push for a defined formula and a closed list of deductions before signing.
  • If a “minus 15% volume” scenario drops your DSCR below 1.0x, that’s the number you take to your lender — not a hypothetical worth ignoring.
  • If your principal-and-interest payments run above $2.50/cwt of production, your robot loan is already carrying more weight than Compeer’s own published guidance recommends. Adding contract risk on top of that is two compounding strikes.
  • If your buyer won’t add an exclusivity release, ask for two fallbacks instead: 90- to 120-day minimum notice on volume reductions, and a hard floor below which exclusivity automatically suspends.
  • If you ship through a co-op, read the bylaws on discipline, recall loss allocation, and notification rights this month. That’s where most of the real risk lives.
  • If your contract renewal is on the desk in the next 90 days, the audit conversation with your banker happens before the negotiation, not after.

If your processor or co-op invokes every option the contract gives them tomorrow, what does your DSCR look like 90 days later? And does anyone at your bank actually know that number?

Run Your Numbers

Farm Benchmark Snap Check — Pressure-test your own contract exposure against the $386,000 scenario. Plug in your herd size, milk price, feed cost, and debt service to see what a 90-day volume cap actually does to your DSCR before the renewal lands on your desk.

Complete references and supporting documentation are available upon request by contacting the editorial team at editor@thebullvine.com.

Learn More

The Sunday Read Dairy Professionals Don’t Skip.

Every week, thousands of producers, breeders, and industry insiders open Bullvine Weekly for genetics insights, market shifts, and profit strategies they won’t find anywhere else. One email. Five minutes. Smarter decisions all week.
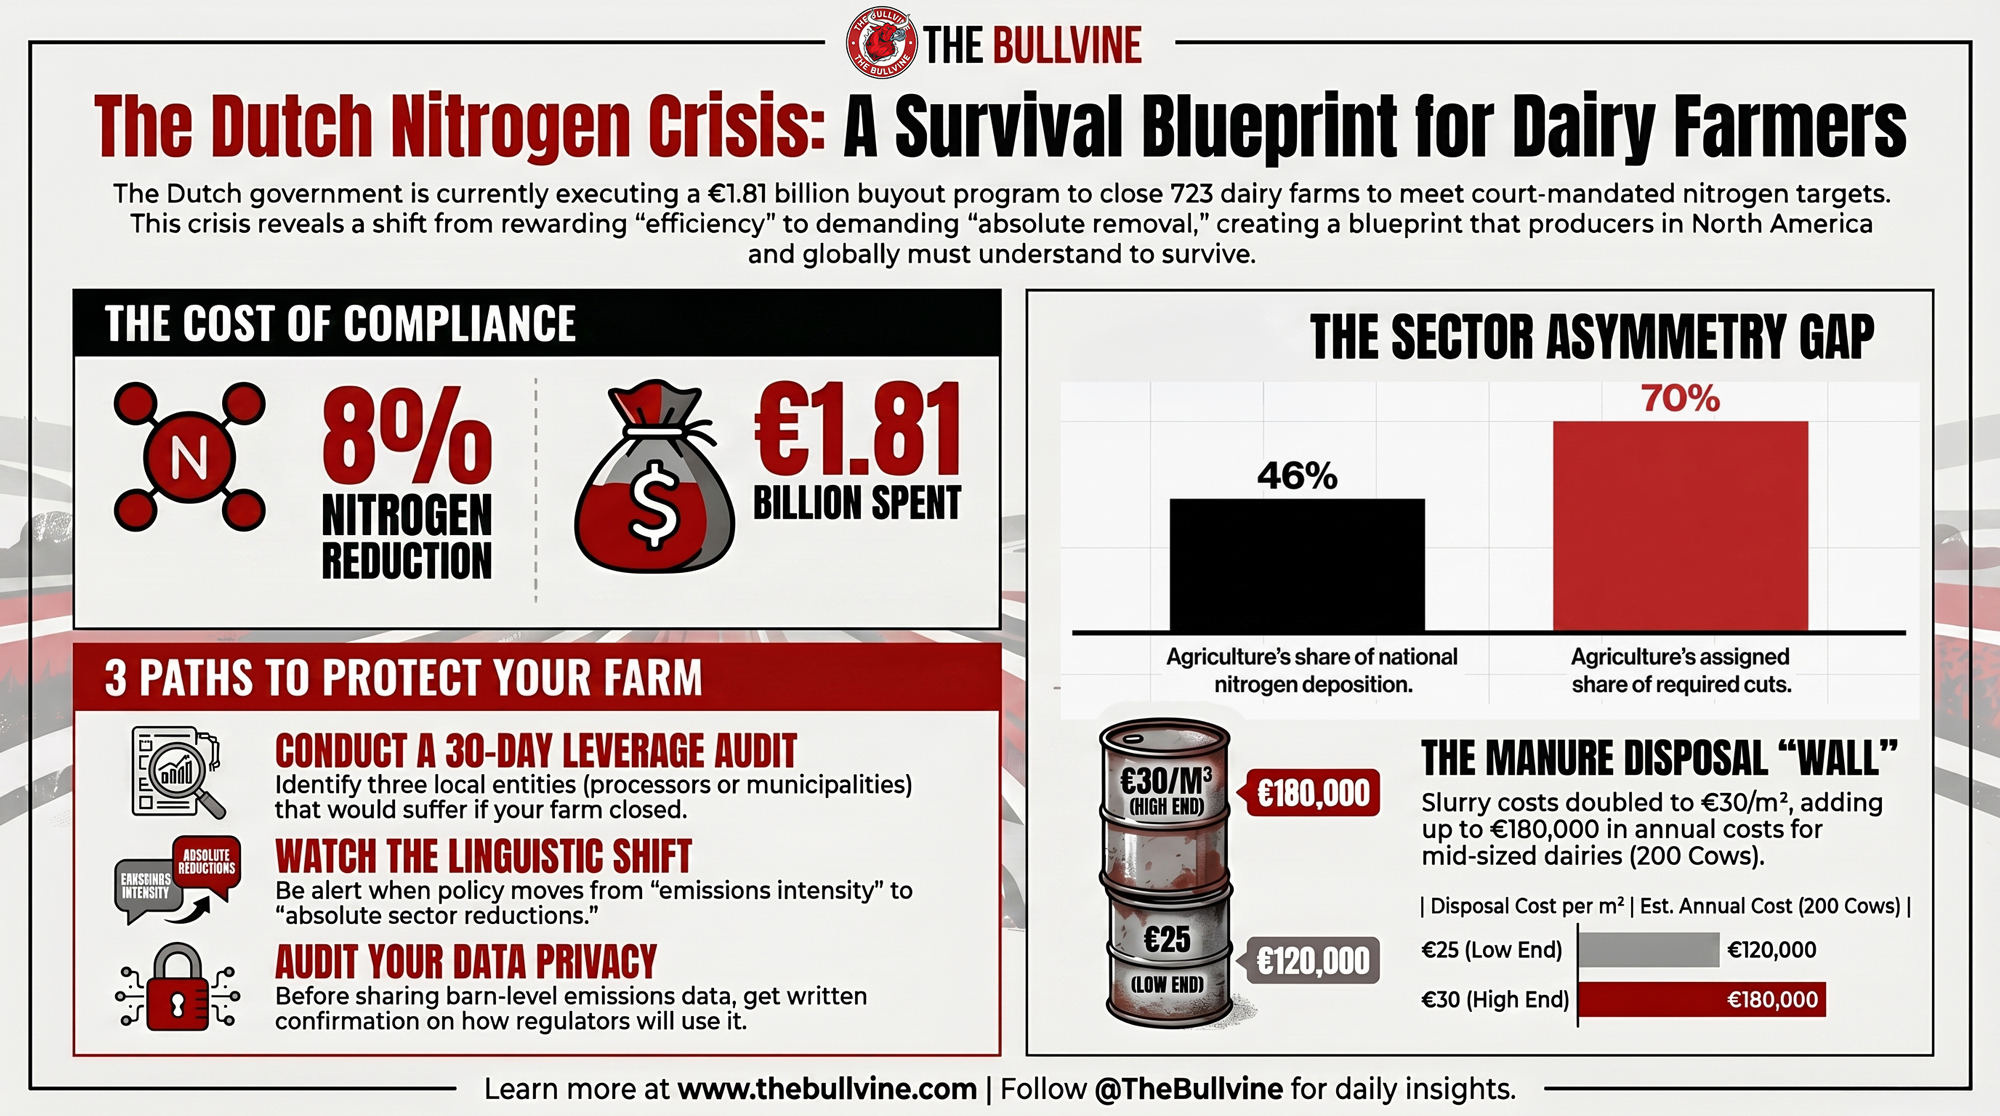
NewsSubscribe
First
Last
Consent

55 Dairies, Zero Phone Calls: The Contract Clause the ByHeart Recall Exposed

Ten weeks between the FDA’s recall and the powder plant operator’s notification. The 55 dairies behind him? They got it from the news. Pull your marketing agreement — odds are the clause isn’t there.

Executive Summary: The 55 organic dairies supplying the powder plant behind ByHeart’s November 2025 nationwide recall didn’t get a phone call — they got a news alert, and the powder plant operator himself wasn’t notified until late January 2026, roughly ten weeks after the FDA went public. Pull your milk marketing agreement and you almost certainly won’t find a clause requiring written upstream notification when product made with your milk hits a recall, hold, or regulatory action; that gap is the default in U.S. co-op contracts, not a loophole. On a 150-cow organic operation shipping 75 lbs/cow/day, even a $2/cwt premium erosion over twelve months runs roughly $82,000 absorbed at the farm gate; at 600 cows the same shift works out to about $328,000 — illustrative, but the cost of contract silence isn’t theoretical. The exposure widens once you factor in processor-side decisions you can’t audit, like USDA-FSIS Listeria Alternative 3 — the sanitation-only pathway operating at Boar’s Head’s Jarratt facility before the 2024 outbreak that killed at least 10 people and pulled 7 million pounds of product. FSMA 204’s lot-level traceability mandate has been pushed to July 2028, which means the upstream end of the chain isn’t getting easier to investigate any time soon. The 30-day action: pull your contract, identify the renewal window, and draft a one-paragraph addendum requiring written notification within a defined timeframe — and find out which counterparties take the ask seriously.

ByHeart recall dairy farms

The first cases turned up in California in August 2025. The state’s Infant Botulism Treatment and Prevention Program was logging unusual Type A clusters — the kind that aren’t supposed to cluster like that. By November 8, 2025, the FDA had contacted ByHeart, a premium organic infant formula brand, and recommended a voluntary recall of two production lots. Three days later, ByHeart pulled every can of every lot it had ever sold, nationwide.

According to FDA outbreak reporting at the time of the recall, dozens of infants were hospitalized across more than a dozen states, with a significant share in intensive care. Somewhere in that chain — supplying organic whole milk into a powder plant in Fallon, Nevada, which fed into ByHeart’s single production facility — were 55 certified organic dairy farms whose milk was now part of the story.

Those farms found out the same way you probably did. From the news.

Not from ByHeart. Not from the powder plant. Not from their co-op, their organic certifier, or the fieldman who’d been out to verify their practices last spring. The FDA press release went public. A wire story moved. For most of those 55 farms, that’s how the news arrived — through a feed, not a phone call.

That gap — between a supply chain marketed as traceable and a notification system that stayed silent — is the architecture every producer needs to understand. It’s not a ByHeart problem. It’s an architecture problem. And it matters for every producer shipping milk into a processed product, whether you’re organic or conventional, 80 cows or 800.

What’s Changing — and Why the Old Assumptions Don’t Hold

For most of the last 40 years, dairy farmers operated on a reasonable assumption: the co-op was close enough, the chain was short enough, and the people involved were known enough that informal accountability filled the gaps in the paperwork. Your fieldman knew your name. The plant down the road processed your milk into cheese. If something went wrong, someone called.

That assumption was never written into a contract. It was held together by proximity and relationship. Consolidation has been quietly dismantling it for decades.

According to USDA Economic Research Service data, the four-firm concentration ratio in U.S. dairy processing has climbed past the 50 percent threshold in several key manufacturing categories. Translation: in segments such as fluid milk and certain cheese categories, four firms account for more than half the volume. When a single plant fails, that concentration turns a local incident into a national retail event within days.

A converter like Great Lakes Cheese Co. can pack private-label cheese for multiple national retail chains simultaneously from a single Ohio facility, which is exactly why a single quality event there moves product across dozens of states at once. When Great Lakes Cheese issued a metal-fragment recall in December 2025, FDA notices documented a pullback across multiple major retailers in roughly two dozen states. The farms supplying raw milk into that system had nothing to do with the metal fragment. They were two steps upstream.

Upstream doesn’t mean insulated. When a converter that size pulls product, the ripple finds the milk cheque.

How This Plays Out on Real Farms

The ByHeart case is the sharpest version of this because of what those 55 farms believed they’d signed up for. Organic certification costs real money — input restrictions, the documentation burden, premium feed, annual inspections. Farmers who go through that process aren’t just selling a commodity. They’re joining a supply chain that’s supposed to mean more transparency, more accountability, and a closer relationship with whoever buys their milk.

ByHeart’s brand was built on the language of trust and traceability. That language was probably true in a narrow sense — the certifications were on file, the farm names sat in a database somewhere. But knowing where something came from and having an obligation to tell the farmer when something goes wrong are two completely different commitments. Only one was in the contract.

According to PBS NewsHour reporting on the recall, the operator of the organic powder plant identified as ByHeart’s whole milk powder supplier said he was informed that his product had tested positive in late January 2026 — roughly ten weeks after the public recall. The farms supplying him were even further back in the notification queue. That timeline tells you the architecture: if the powder plant didn’t know until late January, the dairies behind the powder plant didn’t know on any defined schedule at all.

Here’s the barn-math version of why the delay matters. Organic fluid milk has historically earned a meaningful premium above the conventional blend price. Picture a 150-cow organic operation shipping 75 lbs/cow/day. That’s roughly 4.1 million lbs/year, or 41,000 cwt. If a recall event triggers customer questions, processor routing changes, or premium adjustments — and even a $2/cwt erosion of premium follows for twelve months — that’s roughly $82,000absorbed at the farm gate. Scale that to a 600-cow organic operation and the same $2/cwt shift works out to roughly $328,000. The $2/cwt figure is illustrative, not a documented post-recall outcome. The farm didn’t cause the problem. It would absorb part of the cost anyway.

The Mechanics Behind the Outcomes

The reason no one calls the farmer isn’t malice. It’s architecture.

Standard U.S. co-op marketing agreements — the contracts that govern most farmer-to-co-op relationships — were designed around one transaction: the farmer delivers milk, the co-op accepts, grades, and markets it. The legal relationship is considered complete at the loading dock. What happens downstream is the co-op’s and processor’s business. The farmer was never a party to those downstream contracts.

In that legal frame, the recall is a downstream event. It happens in the processor-to-brand-to-retailer chain. The farmer has no standing in any of those contracts, so there’s no natural hook to pull anyone into a phone call. Notification flows through the chain that owns the legal relationships — and the farm is sitting outside that chain, even though its milk is inside the product.

The Fairlife/Fair Oaks settlement made the cost of opacity in dairy supply chains a matter of public record. The class action — driven by the 2019 undercover footage of animal abuse at Fair Oaks Farms, the high-profile supplier behind Fairlife branding — concluded with a court-approved consumer-class settlement of approximately $21 million. That was the price tag for a transparency promise the supply chain couldn’t keep. The farms supplying milk into that system weren’t named defendants. But the brand collapse, the routing disruptions, and the premium erosion that followed didn’t stop at the processor’s gate. Different ledger. Same address.

How Much Does Contract Silence Actually Cost You?

This is the question every producer should be running right now. Pull your milk marketing agreement. Look for any clause that obligates the buyer to notify you, in writing, within a defined window, when product made with your milk is subject to a recall, hold, or regulatory action.

You probably won’t find one.

U.S. co-op marketing agreements typically don’t include any provision requiring upstream notification when a downstream recall occurs — a gap industry legal reviews have flagged repeatedly without producing a model template producers can ask for. That’s not a loophole. It’s the default. The co-op marketing agreement was designed around grading, hauling, and pay price. It wasn’t designed for a world where one converter feeds two dozen states’ worth of retail in a single week.

The financial exposure isn’t theoretical. Premium erosion, customer questions, processor routing changes, and inspection cascades land on the farm gate even when no upstream party is named in any litigation. Producers two or three steps upstream don’t sit at any settlement table — and that’s exactly the problem.

Why Should a Dairy Farmer Care About a Processor’s Listeria Alternative?

Here’s where the Boar’s Head case becomes a teaching moment for every milk producer in the country, not just deli operators.

USDA-FSIS gives ready-to-eat processors three pathways for managing Listeria. Alternative 1 combines a post-lethality treatment (like high-pressure processing) with a growth inhibitor in the product. Alternative 2 uses one of those tools — either the kill step or the inhibitor. Alternative 3 uses neither. It relies entirely on sanitation programs to keep the pathogen out of the plant in the first place. No post-lethality kill step. No in-product growth inhibition. Just rigorous cleaning, environmental swabbing, and the assumption that the sanitation regime will hold.

None of the three alternatives is illegal. Alternative 3 is fully sanctioned under USDA-FSIS rules. The point isn’t that your processor is breaking the law. The point is that you have no contractual right to know which legal pathway they’ve chosen — and the choice changes how exposed your milk cheque is when something goes wrong.

According to publicly released USDA-FSIS records, the Boar’s Head Jarratt facility was operating under Alternative 3 in the period leading into the 2024 outbreak, and the facility had accumulated dozens of documented noncompliance citations during that period. The 2024 outbreak associated with the facility was linked, according to CDC outbreak reporting, to at least 10 deaths and triggered a recall of more than 7 million pounds of product. Congressional letters and oversight reports issued in the wake of the outbreak have described Alternative 3 as the weakest of the three options available under the framework, particularly when paired with weak environmental controls.

This is why it matters to you, even if you’ve never set foot in a Virginia deli plant. When a processor relies on sanitation alone and gets hit with a recall, every input stream in that plant becomes part of the investigation. Your milk, sitting in a holding tank or already converted into product, is suddenly stranded — held, tested, rerouted, downgraded, or in the worst case destroyed. The processor’s regulatory choice — made in a room you weren’t in, recorded in a document you can’t see — determines how exposed your milk cheque is when something goes wrong.

The traceability tool that would shorten future investigations — FDA’s Food Safety Modernization Act Section 204 final rule, which mandates digital lot-level tracking for high-risk foods — has had its compliance deadline pushed to July 2028. According to FDA and CDC outbreak reporting, the Prairie Farms Listeria investigation closed in May 2025 spanned roughly seven years across one dairy product category. Faster traceability might have shortened that investigation considerably, according to public health investigators.

What Can You Audit Before You Sign Again?

Here’s the operational angle most producers haven’t actually walked through. Before your next contract renewal — whether co-op marketing agreement, direct-ship contract, or organic supply agreement — there are four questions worth getting on paper.

  • Which Listeria management alternative does your processor operate under, and is that listed anywhere in your file?
  • What is the processor’s facility inspection history, and does the contract give you any right to request it?
  • What’s the notification protocol — by entity, by timeframe, in writing — when product containing your milk enters a recall, hold, or investigation?
  • Where in the supply chain does your milk actually go after the loading dock, and how often does that routing change?

You may not get straight answers on all four. But the process of asking changes the conversation. And it surfaces which of your buyers treat you as a partner versus a sealed-off input.

Options and Trade-Offs for Farmers

There’s no single fix here, and anybody selling you one is probably selling something else. But there are four paths producers are actively walking, and each has a real-world economics signature.

Path 1 — Add a notification clause at renewal (do this within 30 days). This is the lowest-friction action and the one worth taking this month. Pull your contract. Identify the renewal window. Draft a one-paragraph addendum requiring written notification within a defined timeframe — most retail food-supply contracts measure these windows in hours, not days, so “reasonable promptness” isn’t a sufficient standard — when product containing your milk enters a recall, hold, or regulatory action. Bring it to your fieldman or contract manager. You may not get every word you ask for. You will learn quickly which counterparties take your concerns seriously. When it works: mid-size to large operations with direct relationships and renewal leverage. Where it fails: small operations in pooled-supply co-ops where the contract is a take-it-or-leave-it template.

The bottom line: If your marketing agreement doesn’t require written notice when your milk ends up in a recall, you don’t have a notification problem — you have a contract problem. Fix the contract.

Path 2 — Diversify processor exposure. If 100% of your milk routes through one buyer that converts into one downstream brand, a single event can move your whole margin. Producers who’ve split supply — even partially — between a fluid co-op and a manufacturing-grade buyer have absorbed shocks better. When it works: operations with the volume and logistics to ship multiple buyers. Where it fails: solo-buyer regions, organic supply contracts that require exclusivity, or operations where the second buyer’s pickup costs eat the diversification benefit.

The bottom line: One buyer feeding one downstream brand is a single point of failure with your name on it. Even a partial split changes how hard the next event hits your margin.

Path 3 — Push your co-op for governance reform. Member-director elections, district meetings, and resolution processes are still the formal channels through which producers shape co-op decision-making, and they remain the legitimate venue for asking what notification protocols your co-op has negotiated on your behalf. Show up with specific contract questions. Ask which processors your co-op markets to, what those processors’ Listeria alternatives are, and what notification protocol exists when downstream events occur. When it works: co-ops with active districting and engaged member-directors. Where it fails: co-ops where the contract terms with downstream processors are treated as confidential and outside the scope of member governance.

The bottom line: Your co-op is negotiating downstream terms on your behalf whether you participate or not. The question is whether your district meeting hears producer concerns or rubber-stamps the management slide deck.

Path 4 — Build farm-side documentation that survives an investigation. Lot-level milk shipping records, on-farm sanitation logs, mastitis treatment records, and tank temperature data don’t prevent a downstream contamination event. They do something else — they let you defend your operation cleanly when the investigation arrives at your gate. With FSMA 204 compliance pushed to July 2028, the upstream end of the chain isn’t going to get easier to investigate. The farms with the cleanest paper survive that scrutiny best. When it works: every operation, regardless of size. Where it fails: nowhere — but it requires real time and probably one new line item in your management software.

The bottom line: Treat July 2028 as your real deadline, not the day FSMA 204 enforcement begins. The farms with audit-ready records when the next investigation lands are the ones that route around the worst of the disruption.

Key Takeaways

  • If your milk marketing agreement contains no upstream-notification clause, treat your next renewal — not your next recall — as the deadline to add one.
  • If 100% of your volume routes through a single buyer feeding a single downstream brand, you’re carrying a concentration risk your contract won’t acknowledge. Run the diversification math against your pickup-cost reality and decide.
  • If your processor operates under USDA-FSIS Listeria Alternative 3, the contract should give you a documented right to know — and a documented notification protocol when an investigation begins.
  • If your farm-side records aren’t lot-traceable today, July 2028 is your working deadline, not the FSMA 204 enforcement date. The investigation that lands at your gate before then will use whatever paper you already have.
  • If your co-op district meeting doesn’t put downstream processor terms and recall protocols on the agenda, that’s the agenda item to bring.

Closing

The question isn’t whether the next recall comes. It’s whether your contract, your processor relationship, and your farm-side records hold up when it does — and whether you find out by phone call or by news alert.

Editor’s note: This article is based on FDA recall notices, USDA-FSIS records, CDC outbreak reporting, USDA Economic Research Service data, FDA FSMA 204 rulemaking documents, and PBS NewsHour reporting on the November 2025 ByHeart recall and its supply chain. ByHeart, the operator of the Nevada-based organic powder plant identified in PBS NewsHour reporting, Boar’s Head, and Prairie Farms were not contacted for this piece, which is built on publicly released regulatory records and previously published reporting. Case totals from the August–November 2025 ByHeart outbreak reflect figures available at the time of the recall.

Complete references and supporting documentation are available upon request by contacting the editorial team at editor@thebullvine.com.

Learn More

The Sunday Read Dairy Professionals Don’t Skip.

Every week, thousands of producers, breeders, and industry insiders open Bullvine Weekly for genetics insights, market shifts, and profit strategies they won’t find anywhere else. One email. Five minutes. Smarter decisions all week.

NewsSubscribe
First
Last
Consent

38,000 Trucks, Four Days, One Question Your Co-op Hasn’t Answered About Your Milk Check

Four days of closed bridges. About $5,000 per reroute versus $200. On a 1,200-cow herd, ~40¢/cwt of compression for a month is roughly $11,520 — and your field rep can’t tell you why.

Executive Summary: Three coordinated farmer-and-trucker blockades in five months — November 24–28, December 17, and April 6–8 — shut down the Juárez–El Paso corridor that moves the highest commercial volume of any land border on earth, staging 38,000 trucks during the November round alone. Mexico now buys roughly 29% of U.S. dairy export value, about $2.32 billion in 2023 per USDA FAS, and more than 70% of that traffic funnels through five land ports. When co-op export desks rerouted through Nogales, costs jumped from $150–$200 a load to roughly $5,000 — and that compression got pooled and showed up as a soft export month, not a line item. On a 1,200-cow herd shipping 80 lbs/cow/day, a 40¢/cwt basis hit over 30 days runs about $11,520, and most producers can’t tell you whether November cost them that, double, or half. The wrinkle: December 2025 exports still finished +13% YoY, the strongest since 2022, so the aggregate headline and your co-op’s actual routing reality may be telling very different stories on the same milk check. With the USMCA review deadline July 1, 2026 and three blockade dates already announced publicly before they hit, the highest-leverage move is asking your co-op — this week — what percentage of your Mexico volume runs through Juárez and what a four-day closure costs the pool. If the field rep can’t answer, that’s the answer.

Mexico dairy export blockade

By the time Manuel Sotelo spoke to El Paso reporters during the November 24–28, 2025 closure, the standard freight workarounds had stopped working.

Sotelo serves as vice president of the Mexican Chamber of Cargo Transportation for Northern Mexico, the trade association representing northern Mexican freight carriers. According to the Chamber’s public materials, he’s logged roughly two decades in cross-border logistics across the Juárez–El Paso corridor — the highest-volume commercial land border on earth.

“There was no possibility on Tuesday or Wednesday to cross anything,” he told KFOX/ABC-7 in El Paso during the closure. The Ysleta–Zaragoza bridge: closed. The Córdova–Las Américas bridge: closed after protesters broke into the customs facility. The Colombia bridge to the north: barely functional. An estimated 38,000 trucks were staged at the Juárez–El Paso crossing alone — not delayed, not rerouted, but stopped. Nogales and Nuevo Laredo had already absorbed the overflow and hit their own ceilings. Gas stations across the Juárez region began running dry because the region itself couldn’t receive product from the south.

Six hundred miles north, in dairy country across the Upper Midwest and California, you were probably reading milk statements that didn’t quite reconcile. October’s U.S. average mailbox price had already dropped 85 cents in a single month to $18.70/cwt — $5.58 below the same month a year prior, according to USDA AMS. Then November and December came and went. For most producers, no one from the co-op called to explain what role the corridor closures played in the basis you’d just absorbed.

That gap — between what Sotelo’s industry was managing in real time and what generally surfaced on producer milk checks weeks later — is the part of this story that hasn’t been written yet. It’s also the part that matters most for what happens next.

The Blockade That Wasn’t a One-Off

The November 2025 mobilization didn’t surprise the organizations that launched it. The National Front for the Rescue of Mexican Farmland (FNRCM) and the National Association of Carriers (ANTAC) had been escalating since October, when a wave of highway closures across 17 Mexican states forced the federal government to the table. Mexico City offered a 25% increase in corn payments and a 950 peso per tonne subsidy. FNRCM said it wasn’t enough. They were demanding 7,200 pesos per tonne for white corn while receiving 5,050 to 5,200.

By the time the November 24 mobilization hit, 29 separate blockade sites were active across 25 states. The Confederation of National Chambers of Commerce, Services and Tourism (Concanaco-Servytur) estimated accumulated losses of 3 to 6 billion pesos — roughly $150 to $300 million USD at prevailing exchange rates — by day four. The National Confederation of Mexican Transporters (Conatram) pegged daily losses in excess of 100 million pesos, around $5 million USD, in fuel waste and contractual penalties alone. The first product to run short on shelves in northern Mexico wasn’t electronics or auto parts. It was dairy.

Here’s why that matters to anyone shipping into a co-op with Mexico exposure. Mexico has grown to roughly 29% of all U.S. dairy product export value, according to USDA Foreign Agricultural Service data through 2024 — making it the single largest customer by a wide margin. In 2023, Mexico imported roughly $2.32 billion in U.S. dairy products. Volume reached 1.38 billion pounds on a milk-solids basis, up 42% over the prior decade.

But more than 70% of that commercial traffic crosses through five land ports. The Juárez–El Paso cluster — Ysleta, Córdova, and Zaragoza — handles the highest commercial throughput of any land border crossing on earth. Organized groups proved in November that they can close it in hours.

What Your Co-op Was Doing While You Watched the News

The co-op export desk knew what was happening in real time. When C.H. Robinson — one of the largest freight brokers in North America — issued an emergency client advisory on the morning of November 24, the operative guidance came down to this: monitor local traffic authorities for resolution updates. That isn’t evasion. It’s the honest ceiling of what professional logistics infrastructure can offer when public protests are negotiating directly with their own federal government over corn prices.

What the export desks did next was rational, and largely invisible to producers. They rerouted loads through Nogales — 466 miles in one direction on the Mexican side, 466 miles back on the U.S. side, to reach the same El Paso destination. Sotelo’s company made that move. “It cost us over 100,000 Mexican pesos per shipment,” he told KVIA in December. That’s roughly $5,000 per load versus $150 to $200 through Juárez. Some product moved through domestic spot channels at prices nobody had modeled. Some sat in staging. The export premium that Mexico-market volume supports began compressing.

That compression settled into pool pricing, got averaged across member volume, and eventually appeared on milk statements as softer export conditions. Picture what that meant on the ground at three operation scales:

  • On a 500-cow operation shipping 400 cwt per day (roughly 80 lbs/cow/day), a 40 cent/cwt basis compression over 30 days works out to roughly $4,800 — about a month of one full-time labor cost.
  • On a 1,200-cow operation shipping 960 cwt per day (same per-cow assumption): roughly $11,520.
  • On a 2,400-cow operation: approximately $23,040.

Those figures are illustrative. Actual basis impact depends on your co-op’s specific Mexico exposure and routing. But the pattern is the point. Every operation shipping into a co-op with meaningful Mexico volume absorbed something in November and December. Most producers couldn’t tell you how much, because the information needed to calculate it lives inside co-op logistics departments — not in producer communications.

Why the Field Rep Didn’t Have Your Answer

A co-op’s pooling structure protects you from single-market volatility. It also obscures the specific source of disruption when something goes wrong. When the export desk absorbs rerouting costs and spot-channel discounts, those losses get averaged across total pool volume. They don’t appear on a milk statement as: the Juárez corridor was closed for four days and cost you X cents per cwt. They appear as a soft export month.

The field rep isn’t withholding information. They’re communicating at the resolution the system produces. Their training covers milk pricing, component premiums, and program updates — not cross-border freight logistics or corridor risk stratification by port of entry. That gap was never a problem when disruptions to the Mexico corridor were short and infrequent.

Because co-ops blend these logistics costs directly into pool pricing, isolating the exact pennies lost per hundredweight remains nearly impossible from the outside looking in. It requires a level of corridor-specific disclosure that isn’t currently standard practice in producer communications — but should be.

That changed in November. And the resolution wasn’t a resolution. When Interior Minister Rosa Icela Rodríguez announced the November deal on day four, Mexican media reported FNRCM and ANTAC framing the agreement as a truce rather than a settlement. The pattern that followed proved that framing accurate:

  • December 17, 2025: Renewed nationwide mobilizations launched by FNRCM and freight transport organizations. December 18 negotiations produced another truce — government commitments on highway security, escort programs, and a roadmap for price-support mechanisms (pignoración) for corn, beans, sorghum, wheat, barley, and soy. Sotelo’s December warning about the limits of contingency planning came in the middle of this round.
  • April 6–8, 2026: A third nationwide strike led by the National Transport Association (ANT) and FNRCM blocked routes in at least 20 states, including Mexico–Querétaro, Mexico–Puebla, the Culiacán–Mazatlán corridor, and access routes to Tijuana, Mexicali, and Ciudad Juárez. Protesters cited cargo crime, soaring diesel costs from Strait of Hormuz disruption, and stagnant grain prices.
Blockade EventDatesLead OrganizationsPrimary TriggerJuárez Corridor StatusEstimated Economic Loss
Mobilization #1Nov 24–28, 2025FNRCM, ANTACCorn price (demand: 7,200 vs. 5,050–5,200 MXN/tonne)Fully closed — Ysleta, Córdova, Zaragoza bridges shut3–6 billion MXN (~$150–$300M USD)
Mobilization #2Dec 17–18, 2025FNRCM, freight orgsNov truce violations; price-support commitments unmetPartial closure — routes disrupted nationwide100M+ MXN/day (~$5M USD/day) in fuel waste & penalties
Mobilization #3Apr 6–8, 2026ANT, FNRCMCargo crime + diesel costs (Hormuz) + stagnant grain pricesPartial closure — 20+ states, Juárez access routes blockedNot yet formally estimated
All Three Events5-month windowMultiple national coalitionsStructural: water law, grain prices, cargo security, fuel costsPattern established— corridors closed on avg every ~6 weeks~$11,520 est. basis hit on a 1,200-cow herd over 30 days

Three coordinated, politically-driven national mobilizations in five months. The pattern is established.

The structural drivers aren’t going away. Mexico’s new General Water Law removed the ability for agricultural users to transfer water concessions during land sales and granted CONAGUA broad discretionary authority to reduce existing water volumes during drought. Farmers describe the change as an existential threat to long-term land values and credit access. Cargo theft on Mexican federal highways has remained a persistent operational risk over recent years according to publicly reported industry tracking, and now diesel cost pressure from Middle East disruption compounds the squeeze. Corn prices remain well below break-even demands. The pressure for future mobilizations is intact.

If the highways close again, not just the customs facilities, Sotelo told KVIA the only fallback is air freight. “They don’t have as many planes as we do with ground transportation.” The infrastructure ceiling of the backup plan is the cargo capacity of Juárez International Airport. Against thousands of daily commercial export crossings averaging tens of thousands of dollars in value each, that ceiling closes fast.

How Much Did the November Blockade Actually Cost Your Milk Check?

The honest answer: it depends on your co-op’s Mexico exposure, and most producers haven’t been given enough information to calculate it.

Here’s what’s documented. The four-day November closure plus a roughly ten-day recovery backlog created about two weeks of compressed export throughput for co-ops routing significant volume through Juárez. During that window, loads moved at reroute cost or spot-channel discount. Those costs got pooled. October’s mailbox had already dropped 85 cents in a single month to $18.70/cwt — $5.58 below October 2024. September had been $19.55, $5.23 below the prior year. The November and December disruptions hit inside an already-deteriorating pricing environment, which is part of why their specific contribution is hard to isolate from your vantage point.

And here’s the wrinkle that complicates everything. Year-end U.S. dairy export volumes actually finished strong — December 2025 dairy product exports grew 13% year-over-year, reaching levels not seen since 2022, according to USDEC via Ag Proud. The aggregate story was good. The corridor-specific story was something else. Whether your co-op’s December basis reflected the strong aggregate or the disrupted corridor depends on routing decisions you almost certainly weren’t shown.

That’s the gap. Not a cover-up. A structural mismatch between where the information lives and who needs it.

Is Your Co-op’s Mexico Program Built for the Risk Environment That Actually Exists Now?

The USMCA review deadline arrives July 1, 2026 — 39 days from this writing. Mexican farm organizations have explicitly stated they want basic grains removed from the agreement. U.S. dairy groups want stronger market access enforcement. The December 18 government settlement with FNRCM included the creation of a formal institutional channel under Mexico’s Ministry of Economy specifically to analyze USMCA-related issues from the Mexican producer side.

Whatever the review produces, it won’t create an obligation for Mexican bridges to stay open during domestic protests. That gap — between what a trade agreement governs and what actually controls your load’s ability to move — exists regardless of the review outcome.

The co-ops best positioned for the next disruption aren’t necessarily the ones with the strongest Mexico buyer relationships. They’re the ones that have pre-negotiated reroute capacity at Nogales and Nuevo Laredo, modeled corridor-specific exposure for their member base, and have a communication protocol ready before the next mobilization date circulates — not after the bridges close. Those aren’t complex systems. They’re the difference between managing an event and being surprised by it.

For broader context on how trade policy is reshaping the export environment, see how the broader trade war is reshaping dairy export economics.

Options and Trade-Offs for Producers

The goal here isn’t alarm. It’s calibration. A few practical paths worth considering now:

1. Ask your co-op for corridor-specific exposure information — within 30 days. Your co-op’s export desk knows which crossings carry the majority of your Mexico-bound volume. Asking for that breakdown, even a rough percentage by corridor, is a legitimate member inquiry. You don’t need their full routing database. You need enough to understand whether a four-day Juárez closure is a minor inconvenience or a real basis risk for your operation. If the field rep can’t answer, ask them to escalate.

When it makes sense: Any operation whose co-op does meaningful Mexico export volume. What it requires: A direct, polite ask — email is fine. Key limit: Co-ops vary in how they handle governance-level member inquiries. Some have this conversation readily. Others route you through layers before anyone with the data responds. The response itself often tells you something useful about the institution.

2. Separate “market reliability” from “corridor reliability” in your risk thinking. These are different things, and the industry has communicated them as one. Mexico as a dairy market is genuinely strong — demand fundamentals, volume, and buyer relationships are real. But Mexico as a logistics corridor runs through infrastructure that organized domestic groups have demonstrated they can close in hours. Building both into your mental model doesn’t mean abandoning the export program. It means hedging differently. If you’re scenario-planning for milk price downside, add a 30-day corridor disruption scenario alongside your standard price sensitivity analysis.

When it makes sense: Larger operations where basis variance moves real dollars. What it requires: About 30 minutes with your accountant or risk manager. Key limit: Without corridor-specific exposure data from your co-op, you’re estimating. An estimate still beats nothing.

3. Track ANTAC, ANT, and FNRCM mobilization signals — they announce dates publicly. All three organizations communicated their dates in advance. The November 24 date circulated for weeks. The December 17 date was set within days of the November truce. The April 6 mobilization was announced openly. A Google Alert on “ANTAC blockade,” “FNRCM huelga,” or “Mexico carriers strike” gives you more lead time than most co-op communications currently provide. That lead time isn’t a trading signal. It’s context for timing decisions about forward sales and export-dependent premium months.

When it makes sense: Any producer who wants a more complete picture of export risk. What it requires: Five minutes of setup. Key limit: Knowing a date is circulating doesn’t tell you whether it’ll escalate to full closure. That depends on whether the Mexican government makes meaningful concessions in the interim.

4. If you sit on a co-op board or advisory committee, bring the governance question. The three numbers every producer with Mexico export exposure should have access to — percentage of volume through each corridor, estimated cost of a four-day closure to the pool, and the written reroute protocol — aren’t proprietary. They’re basic operational transparency. With the USMCA review deadline arriving July 1, the timing for raising those questions formally is now.

When it makes sense: Anyone with governance-level standing in their co-op. What it requires: A written request before the next board or delegate meeting. Key limit: Some boards receive this kind of question as constructive. Others read it as a confidence challenge. Knowing which culture you’re in is its own useful data.

Key Takeaways

  • If your co-op exports to Mexico and you haven’t asked which crossings carry your volume, send the email this week. That’s the single highest-leverage move available before July 1.
  • If your risk model treats market access and corridor access as one thing, fix it. They’ve been communicated as one. They aren’t.
  • If the next mobilization date is circulating in Mexican press and your co-op hasn’t flagged it, your information lag is the problem worth solving. ANTAC, ANT, and FNRCM announce publicly. Google Alerts close the gap.
  • If you sit on a board or advisory committee, ask the three numbers before the next meeting. Corridor concentration, four-day-closure pool cost, written reroute protocol. None are proprietary.
  • If the strong aggregate export number is reassuring you past the corridor question, you’re reading the wrong signal. The headline figure and your co-op’s routing reality can tell different stories on the same milk check.

The question isn’t whether your co-op’s Mexico relationship is valuable. It is, and the export numbers support that — December 2025 closed with the strongest year-over-year export growth since 2022. The question is whether the risk picture you’ve been given matches the risk you’re actually carrying. For most producers, those two pictures haven’t been the same since November 24.

Worth knowing before the next date circulates.

Complete references and supporting documentation are available upon request by contacting the editorial team at editor@thebullvine.com.

Learn More

The Sunday Read Dairy Professionals Don’t Skip.

Every week, thousands of producers, breeders, and industry insiders open Bullvine Weekly for genetics insights, market shifts, and profit strategies they won’t find anywhere else. One email. Five minutes. Smarter decisions all week.
NewsSubscribe
First
Last
Consent

Your 35-Pound Dry-Off Threshold Is Wrecking Colostrum – Six Weeks Before You Notice

IgG starts loading into the udder around day 40 of the dry period. Dry off at 77 lbs, and that window closes before it opens.

Composite Story — read this first. This is a composite story. The herd, manager, vet, nutritionist, and owner described here are not a single real farm or real individuals — they’re a composite drawn from multiple U.S. Holstein operations facing the same dry‑off and colostrum issues. Quotes are illustrative composites, not the words of any real person.The science, dollar figures, mastitis odds, and FPT data are real and sourced to published research.

Executive Summary: IgG starts loading into the udder around day 40 of the dry period — which means a cow dried off at 65–70 lbs/day may still be in late-lactation mode when that window opens, and her first-milking colostrum pays the price. University of Guelph colostrogenesis research shows cows with high mammary activity in the far-off period consistently produce weaker IgG at calving, and a single-herd 0/30/60-day dry-period trial puts hard numbers on it: 60-day cows averaged ~515 g total IgG per first milking versus ~280 g for 30-day cows — barely enough to clear the 200–300 g delivery floor Lombard et al. (2020, J Dairy Sci) set for adequate passive transfer in a single feed. Quarters dried off above ~35 lbs/day carry 7.1× the new intramammary infection risk at calving, and FPT calves run roughly double the pre-weaning mortality and cost your operation an average of $65–$70 USD per calf (Raboisson et al., 2016, Prev Vet Med) — a bill that traces back to the far-off pen, not the calf barn. One composite U.S. Holstein herd fixed it with two rules: nothing over 35 lbs/day at dry-off, and a hard target of 45–60 days dry, enforced with a seven-day once-a-day milking lead-in for high producers. A 30-cow pilot showed a clear right-shift in first-milking Brix and fewer dry-period mastitis events — no new products, no close-up ration changes. If a third of your cows are still over 55 lbs/day when you stop milking them, the colostrum problem you keep chasing in the close-up pen started six weeks earlier than you’re looking.

dry-off colostrum threshold

A 500‑cow Holstein dairy in the U.S. Upper Midwest thought it had colostrum dialed in.

The herd manager could recite the close‑up ration by heart. The calf‑barn protocol was laminated on the wall — “1 gallon within 2 hours, 22% Brix minimum.” Then the vet stopped in front of a three‑weeks‑dry cow with a rock‑hard, leaking bag and asked one question that landed harder than anyone expected, highlighting why your colostrum feeding protocol has to match what the cow’s actually doing six weeks before calving:

“How many pounds was she giving the day you dried her off?”

Nobody knew. Two months later, that cow’s heifer calf came in borderline failure of passive transfer on a serum total protein test. That’s when the herd realized the real colostrum quality story didn’t start in the close‑up pen. It started six weeks earlier — in how hard they were asking their best cows to slam into the dry period.

“We Were Obsessing Over the Wrong Two Weeks”

This is a high‑output dairy — about a 90‑lb (≈40‑kg) rolling herd average, with plenty of cows peaking well over 100 lbs. The culture is classic 2026: push production, protect fresh cows, hit repro numbers, grow the milk check.

On paper, they were nailing it. Calf records said otherwise. Failure of passive transfer (FPT) rates were drifting up. Brix readings bounced around more than they should in a herd this tight on everything else. Each round of FPT failures sent them back to the close‑up ration — tweaking energy, tweaking minerals, tweaking the close‑up move date. Nothing moved the needle.

Then the vet brought in slides summarizing colostrogenesis research published by the University of Guelph in the early 2020s, where Holstein cows had pre‑partum udder secretions sampled at frequent intervals before calving — a running log of when IgG first appeared and how it climbed.

The result reframed the conversation. In some cows, IgG started moving into the udder as early as six weeks before calving. Cows that started earlier and accumulated gradually ended up with better first‑milking colostrum. Cows that only ramped up in the last 7–14 days didn’t catch up. When that same group measured mammary blood flow and nutrient uptake, the picture sharpened: cows with high mammary activity during the far‑off dry period — the cows that didn’t really shut off — were the ones with poorer colostrum IgG at calving.

“That’s literally the cow we’re staring at in the dry pen,” the herd manager said. “Three weeks dry, still tight, still dripping. And we kept telling ourselves colostrum is all about the last two weeks.”

Two Cows, Same Pen, Two Very Different Calves

After seeing the Guelph data, the team walked the far‑off pen with the vet 10 days post‑dry‑off, notebook in hand. The plan was simple: write down what each udder looked like and match it to the dry‑off yield later.

Cow A had peaked over 100 lbs and was still around 77 lbs/day (≈35 kg) on her last test before dry‑off. The morning after they stopped milking her, her udder looked like they’d missed a milking — tight, shiny, under pressure. A week in, nothing had really changed. By 21 days dry, dried milk was tracked down her legs and her teat ends were crusted. Her mammary gland was still in late‑lactation mode, not in the rest‑and‑regeneration state colostrogenesis appears to require.

Cow B is the cow every dry‑cow manager quietly loves. Solid producer, but she tails off on her own. By her dry‑off date she was down to about 35 lbs/day (≈16 kg). Ten days later her udder was small and soft. No leaks. No drama. The kind of low‑idle gland that quietly starts making colostrum on schedule.

The Guelph data lined up with what they were seeing in real time. The “Cow A” profile — high mammary activity in the far‑off period — corresponded to weaker IgG in the first milking. The “Cow B” profile — early involution, low activity — lined up with earlier IgG accumulation and stronger colostrum.

MetricCow A (High Yielder)Cow B (Natural Taper)
Yield at dry-off77 lbs/day (~35 kg) — RED FLAG35 lbs/day (~16 kg)
Udder at 10 days dryTight, shiny, under pressureSmall, soft, no leaks
Udder at 21 days dryStill leaking; crusted teat endsQuiet, fully involuted
Mammary activity (far-off)High — late-lactation modeLow — rest & regeneration mode
IgG accumulation timelineDelayed ramp-upEarly onset, gradual build
First-milking Brix (expected)<22% — likely FPT risk24–26%+ — adequate PT
Mastitis IMI risk at calving7.1× elevatedBaseline
Calf passive transfer outcomeBorderline/FPT likelyAdequate PT likely

The vet put it bluntly: “If we’re drying off a third of this herd over 55 pounds a day, we’re fighting the biology of colostrum, not helping it.”

What a 0/30/60-Day Dry Period Trial Made Impossible to Ignore

A week later the nutritionist came back with a single‑herd European trial on her laptop and a one‑line message: “This isn’t just theory.”

In that commercial Holstein herd, cows were randomized to 0‑, 30‑, or 60‑day dry periods, with first‑milking colostrum yield and IgG measured directly. The numbers are uncomfortable for anyone flirting with shorter dry periods:

Dry Period LengthFirst‑Milking Colostrum YieldIgG ConcentrationTotal IgG Mass Supplied
60 Days~17 lbs (≈7.7 kg)~66.9 mg/mL~515 g (safely covers 1–2 feedings)
30 Days~11–12 lbs (≈5.1–5.3 kg)~54.0 mg/mL~275–286 g (barely covers 1 calf)

Field and extension guidelines point dairy producers at 200–300 g of total IgG delivered in the first 24 hours, consistent with the four‑category passive‑transfer thresholds published by Lombard and colleagues in the Journal of Dairy Science in 2020. In the trial, a 60‑day cow could cover that target with a single 1‑gallon feed and still bank a backup. A 30‑day cow had just enough total IgG to barely cover one calf at the high end — with nothing left for a twin, a slow drinker, or the next morning’s calf.

When researchers followed those calves, the pattern carried. Calves out of 0‑day dry dams had lower natural antibody levels in the first two weeks of life than those from 30‑ or 60‑day cows, even when later vaccine responses looked fine. Those first two weeks are exactly when scours and pneumonia hit hardest.

Zoom out across multiple herds and the economics get ugly.

The True Cost of FPT: Meta‑analyses show FPT calves face roughly double the mortality risk and up to 1.9× the disease risk before weaning. On average, FPT quietly drains around $65–$70 USD per dairy calf right off your bottom line, with a published range running from a few dollars per calf to well over $100 depending on herd context (Raboisson et al., 2016, Preventive Veterinary Medicine — original figure €60, range €10–109).

Published clinical‑outcome work has reported sharply higher mortality among FPT calves than among calves with adequate passive transfer on the same dairy — in one frequently cited study, roughly a tenfold gap between the two groups before weaning.

At the kitchen table, the owner cut the discussion short. “We’ve bred cows to milk like crazy. Now we’re finding the weak point we never thought we had is 60 days before calving.” That triggered a deeper look into what shorter dry periods really do to milk yield, colostrum and calf immunity.

“Our Dry-Off Program Was Still Built for 33-Pound Cows”

The next hard look was at their own records. One year of dry‑off dates pulled against test‑day yields. The pattern was familiar to anyone running modern, high‑yield genetics, and it tracks with what 30-kg dry-off cows are doing to colostrum six weeks before calving.

Plenty of cows were under 45 lbs/day at dry‑off. Those weren’t the worry. But a third of cows scheduled for dry‑off in the next two weeks were still 55 lbs/day (≈25 kg) or higher, and a chunk of older cows were banging out 65–70 lbs/day (≈30–32 kg). All of them got the same treatment: full milk one day, “dry” the next.

That worked when most cows naturally coasted down to about 33 lbs/day (≈15 kg) on their own. That’s the era much of the older dry‑off guidance was built around. This herd had pushed performance so far that they were now asking 65‑lb cows to do what 33‑lb cows used to do — and were surprised when the glands didn’t cooperate.

Then came the mastitis piece, and it landed hard.

The 35‑Pound Rule for Mastitis Prevention: Quarters from cows producing more than ~35 lbs/day (≈16 kg) at dry‑off are 7.1 times more likely to develop a new intramammary infection at calving compared with cows dried off under that threshold. A separate field study showed that for every extra 11 lbs (≈5 kg) of milk at dry‑off above ~27 lbs (≈12.5 kg), the odds of an environmental IMI at calving climbed by at least 77%.

Tight, full, leaking udders in the far‑off pen aren’t cosmetic. They’re associated with more new intramammary infections at calving and, per the Guelph work, with a gland that hasn’t shifted out of late‑lactation mode into the rest‑and‑regeneration state colostrogenesis appears to require. This herd wasn’t just taking a colostrum hit. They were doubling down on fresh‑cow mastitis risk at the same time.

Is 35 Pounds the Line in the Sand at Dry-Off?

Nobody in the room wanted a change that would blow up the milking routine. Fixed parlor, finite labor, a lot of cows to get through twice or three times a day. They needed something simple and enforceable.

They drew one line they could live with:

“We don’t dry a cow off if she’s over about 35 pounds a day, unless we absolutely can’t avoid it.”

Once that decision was made, the work became how to get more cows under that line without wrecking the rest of the system.

Step One: Find the Cows Doing the Most Damage

The first pass was data triage. The manager used the herd software to flag cows due to calve in roughly 60 days, sorted by projected daily yield.

Anything projected at 55 lbs/day or higher at dry‑off got a red mark and became a “managed dry‑off.” Lower‑yield cows kept the existing protocol. Nobody was trying to overhaul everything on day one.

“We wanted to take the high‑pressure cows out of the blind spot,” the manager said. “Those are the udders working against us when we get to colostrum and mastitis.”

Step Two: One Week of Once-a-Day Milking

The second step was small but powerful: a one‑week, once‑a‑day milking lead‑in for those flagged cows.

Seven days before the planned dry‑off date, those cows moved into a small group, milked once a day in the morning. The ration shifted to a slightly lower energy mix — more straw or low‑energy forage, a bit less grain — to nudge yields down without crash‑dieting.

Field experience and research suggest once‑a‑day milking in late lactation can drop yield by roughly a third in a week. That’s exactly what they saw. Many of the 55–65 lb cows drifted into the high 30s and low 40s by day seven. A few hard‑milking outliers stayed high, but the overall picture changed.

The actual dry‑off step didn’t change — same antibiotic and sealant protocol, same pen move. They’d just stopped asking 65‑lb udders to slam into involution overnight.

Step Three: Respect the 45–60-Day Dry Period

Days dry was the other half of the equation. Their numbers showed more short dry periods than anyone liked. Some of it was late preg checks. Some of it was “just how we’ve always done it.”

A second rule went on the whiteboard: where they could control it, the target was 45–60 days dry. Shorter dry periods were only allowed with a documented reason. That meant tighter pregnancy diagnosis and more discipline around final breeding decisions. Not glamorous work — but it built the runway IgG actually needs.

Together, those two rules — under 35 lbs at dry‑off, and 45–60 days dry — gave the gland both the signal and the timeto drop into the low‑activity state colostrogenesis appears to need.

Did the 35-Pound Rule Actually Move Brix?

The vet knew the team would trust barn‑level numbers more than any paper. So they ran a small pilot on roughly 30 high‑yielding cows going through the new program, knowing they’d need at least one full dry‑off cycle of data before drawing conclusions.

For those 30 cows, the team tracked:

  • Milk yield in the last week before the once‑a‑day switch and at dry‑off.
  • Udder condition and leakage at ~10 and ~21 days dry.
  • Brix on first‑milking colostrum at calving.
  • Any dry‑period or fresh‑cow mastitis cases.

Nothing else changed. No new products. No tweaks to calf feeding. Just data.

By the end of the pilot, the office whiteboard told the story. The managed cows showed:

  • Far fewer tight, leaking udders in the far‑off pen.
  • A clear right‑shift in colostrum Brix versus the same cohort six months earlier.
  • Fewer dry‑period mastitis events in that group.

Not perfect. Some stubborn cows. Some messy data points. But the direction of travel was obvious enough that nobody wanted to roll it back.

Banking Colostrum While the System Catches Up

Even with better dry‑off, this herd would be living with past decisions for a while. Cows already in late gestation couldn’t be retro‑fixed. So they shored up the calf side at the same time, knowing exactly why failure of passive transfer quietly shows up on your milk check over the next two lactations.

Every first‑milking colostrum sample now got a Brix reading, with percent and cow ID written right on the bucket. Research suggests 22–26% Brix maps roughly to 50–75 g/L IgG. Feed a gallon promptly and a cow at the upper end of that range clears the 200–300 g IgG target on a single feed; cows on the low end (right at 22% Brix) come in just under it, which is why a second feed within 12 hours matters. Anything in that range from cows with decent dry periods went into a labeled freezer bank. Cows that calved with low‑Brix colostrum — especially older cows with short dry periods — had their heifer calves fed from the bank or a high‑quality replacer instead of a single weak milking.

It didn’t solve the whole problem. But fewer calves were now at the mercy of any one high‑yield, short‑dry cow. As more cows passed through the new dry‑off program, the freezer became a backstop instead of a crutch.

What This Means for Your Operation

You don’t need to copy this herd bolt‑for‑bolt. But if you’ve pushed production hard over the last decade, their experience gives you sharp questions to ask in your own barn.

Audit CheckOld Standard (33 lb avg cow)High-Output Standard (90 lb RHA herd)Your Herd?
Dry-off yield threshold45–55 lbs acceptable≤35 lbs target; flag >55 lbslbs
Dry period length target45–60 days45–60 days strict; document exceptionsdays avg
% cows >55 lbs at dry-offNot tracked<15% of dry-offs; >33% = problem%
Lead-in protocol for high producersNone7-day once-a-day milking groupYes / No
Far-off pen udder walkNot standard10–14 days post dry-off; count leakersYes / No
First-milking Brix testingOccasional100% tested; cow ID recorded%
FPT rate (serum TP or IgG)Not measured<15% FPT target; test 20 calves/cycle%
Colostrum freezer bankRareMaintained as backstop, not crutchYes / No
  • Do you actually know your dry‑off yields? In the next 30 days, pull last month’s dry‑off list and write down how many cows were still over 55 lbs/day on their last test. That number tells you how big your high‑pressure group really is.
  • What does your far‑off pen look like 10–14 days after dry‑off? Take a slow walk and count full, tight, or leaking udders. Those are the “Cow A” glands the Guelph data ties to high mammary activity and weaker IgG.
  • How many cows are actually getting 45–60 days dry? Run a simple report on days dry over the last 12 months. A long tail under 40 days is IgG runway you’re cutting off before the cow can build the colostrum you’re expecting.
  • Are you using Brix as a learning tool, or just a pass/fail gate? For one week, Brix‑test every first‑milking and write the reading and cow ID on the bucket. Then overlay those numbers against dry‑off yields and days dry. Patterns you can’t unsee will show up.
  • Do you know your FPT rate, or just your calf treatment bill? Work with your vet to pull serum total protein or IgG on the next 20 heifer calves. If more than about 15% come back in failure of passive transfer, the real problem probably started in the dry period — not the calf room.
  • Can you manage a small once‑a‑day group, even if you can’t overhaul the barn? Start with the 20–30 highest‑yielding cows at dry‑off. It’s a manageable trial, and your own numbers will tell you fast whether the 35‑pound target is worth chasing in your system.

Run Your Numbers

Health ROI Calculator — Put a dollar value on tightening your dry-off threshold. The calculator stress-tests how fewer fresh-cow mastitis cases, lower FPT-driven calf losses, and reduced replacement pressure stack up against the labor of running a once-a-day lead-in group. Run it before you decide the 35-pound rule isn’t worth the hassle.

Key Takeaways

  • If your best cows are still over 35 lbs/day at dry‑off, you’re asking their udders to slam from full production into involution at exactly the moment IgG transfer needs to ramp up.
  • If your herd routinely runs less than 45 days dry, especially on older high producers, the 0/30/60‑day data say you’re leaving total IgG on the table and shrinking your colostrum safety margin.
  • If you’re not Brix‑testing first‑milking colostrum and tying it back to dry‑off yield and days dry, you’re guessing about where your colostrum and FPT problems actually start.
  • If you’re breeding cows that will sit at 65 pounds on the day you’d like them dry, the question isn’t whether your close‑up nutrition is good enough. It’s whether your dry‑off program has kept up with the genetics you’ve created.

So the next time you’re in the far‑off pen and see a three‑weeks‑dry cow with a full, leaking udder, don’t shrug and walk past. Ask the harder question: is that udder still working for your milk check — or is it quietly stealing from your next generation of heifers?

Complete references and supporting documentation are available upon request by contacting the editorial team at editor@thebullvine.com.

Learn More

The Sunday Read Dairy Professionals Don’t Skip.

Every week, thousands of producers, breeders, and industry insiders open Bullvine Weekly for genetics insights, market shifts, and profit strategies they won’t find anywhere else. One email. Five minutes. Smarter decisions all week.
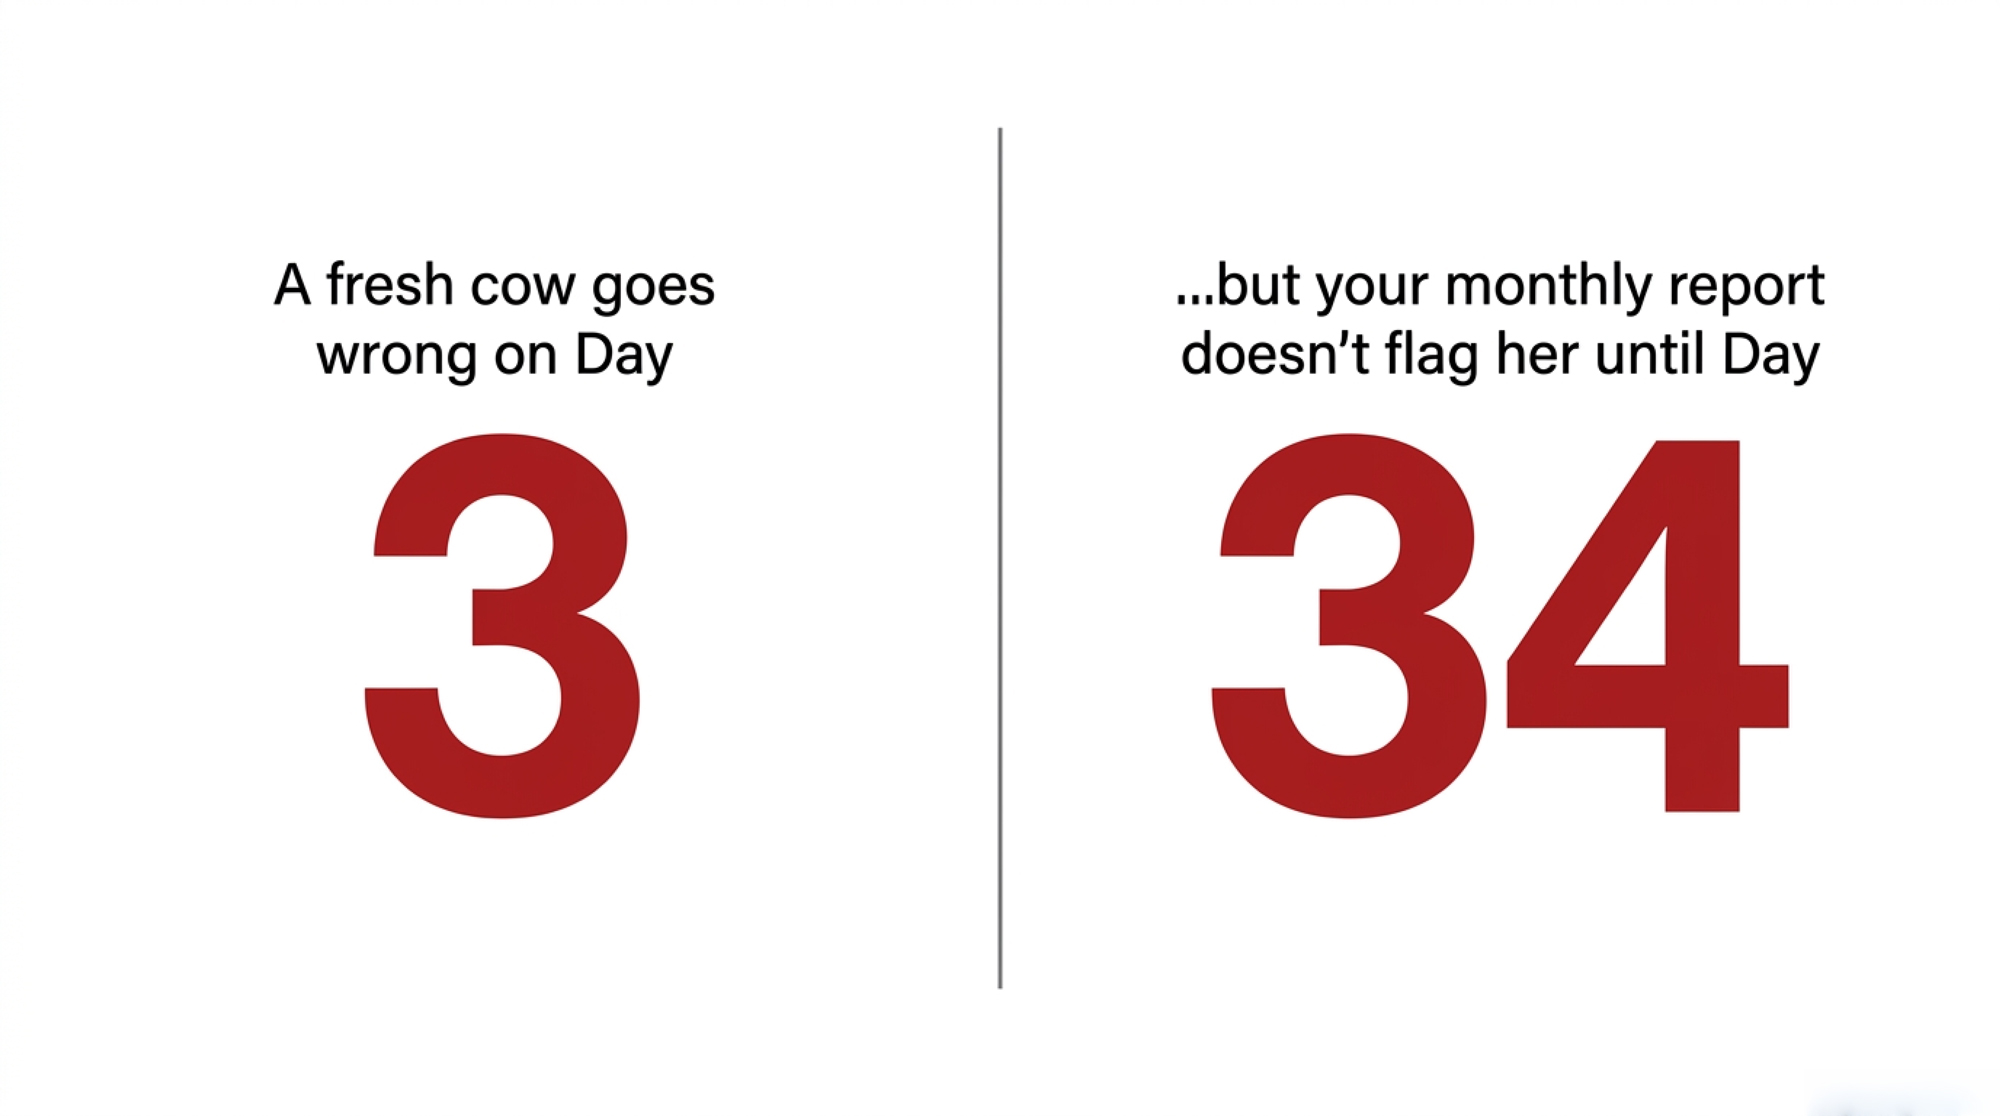
NewsSubscribe
First
Last
Consent

The 400-Cow Margin Trap: When $14.59 Milk Bleeds $425K in 2026

January 28: a 400-cow Upper Midwest dairy banked $14.59 Class III milk against a $20.89 full-cost breakeven. At $17 milk, that gap bleeds $425,955 a year — and the lender already ran the math.

Executive Summary: A 400-cow Upper Midwest dairy banked $14.59 Class III milk on January 28, 2026 against a $20.89/cwt full economic breakeven — a $6.30/cwt gap that erases $425,955 of equity a year if Class III holds at $17. USDA’s 2026 all-milk forecast swung from $21.15 in May 2025 to $18.25 in WASDE-667, then back to $21.25 in WASDE-671 (May 12, 2026); any budget anchored on a single print was wrong by the next release. June 2025’s FMMO make allowance reform pulled another $0.85–$0.92/cwt off Class III for cheese-pooled operations — a permanent recalibration, not a market move. Stack a $4.40/bu corn season-average forecast, $310/ton SBM, $4,000–$4,100 replacement heifers per CoBank, and 7% repriced term debt, and 250–600 cow herds in Wisconsin, Minnesota, and western Michigan are running cash-positive milk checks while bleeding $200K–$425K a year in invisible economic cost. Lenders have already shifted to forward DSCR against $18 milk on Q3/Q4 strips; the producer who hasn’t run that calculation walks into a credit conversation the lender opened with a stress test the producer never saw. Three calls in November and December — to the lender, the grain merchandiser, and the herd manager — separated the operations that came out of Q1 with extended lines and locked rates from those that didn’t. Run the full economic breakeven on your own numbers, against $18 milk, before the next quarterly review lands.

dairy margin trap 2026

The deposit hit on January 28, 2026 — payment for milk shipped in November 2025, settled at USDA AMS’s announced Class III price of $14.59/cwt. On a representative 400-cow Upper Midwest operation moving roughly 109,500 cwt a year, that single month’s settlement sat $6.30/cwt below a full economic breakeven of $20.89/cwt. The check looked manageable against the operating line. The forward strip for Q1 didn’t.

That gap — between what the envelope said and what the next four quarters of feed contracts and repriced debt service will actually demand — is where 250–600 cow family operations are losing equity quietly through the 2026 dairy margin cycle. Most operations haven’t yet mapped that gap against their own 2026 margin over feed.

“The check was a rearview mirror.”

The 400-cow Upper Midwest operation referenced throughout this article is a composite case. Every financial input traces directly to University of Illinois FBFM 2024 enrollment data published via farmdoc daily, Cornell PRO-DAIRY DFBS reporting, USDA WASDE on the dates cited, ERS national dairy cost-of-production data, and CoBank’s August 2025 Knowledge Exchange on heifer markets. No real producer is being characterized.

What That January 28 Check Actually Reflected

The deposit reflected milk shipped 60–75 days earlier. November 2025 Class III settled at $15.86/cwt per USDA AMS. December settled at $14.59. By the time the cooperative wired the funds, the forward strip for Q1 2026 was already trading below $16, and the WASDE annual all-milk forecast for 2026 had been cut from January’s WASDE-667 print of $18.25/cwt to $18.95/cwt in February’s WASDE-668.

The check was a rearview mirror.

What it couldn’t reflect: the corn the operation hadn’t yet contracted for spring and summer feeding, in a market where May 2026’s WASDE-671 (released May 12, 2026) projects 2026/27 marketing-year corn at a season-average $4.40/bu and soybean meal at $310/short ton. It also couldn’t reflect the 132 replacement heifers per year; a 33% cull rate consumes, at the $4,000–$4,100/head prices CoBank Knowledge Exchange documented in August 2025 and The Bullvine reported again in January 2026.

Three Invisible Cuts: WASDE Whiplash, FMMO Reform, and the Heifer Line

Everyone assumed the WASDE all-milk forecast was a budgeting baseline. The 2025–2026 revision history says it isn’t.

USDA’s documented sequence of 2026 all-milk forecasts moved from $21.15/cwt in the May 2025 WASDE, down to $19.25 by November 2025, $18.25 in January 2026’s WASDE-667, $18.95 in February’s WASDE-668, $20.50 in April’s WASDE-670, and back to $21.25 in May’s WASDE-671. That’s more than $3.00/cwt of peak-to-trough revision on the same calendar year. A budget anchored on any single one of those prints would have been wrong by the next monthly release.

WASDE ReleaseDateAll-Milk Forecastvs. $20.89 Full BreakevenBudget Implication
May 2025 WASDEMay 2025$21.15/cwt+$0.26/cwtAppeared profitable — thin margin
November 2025 WASDENov 2025$19.25/cwt-$1.64/cwtBelow breakeven: $179,580/yr loss
WASDE-667Jan 2026$18.25/cwt-$2.64/cwt$289,080/yr equity erosion
WASDE-668Feb 2026$18.95/cwt-$1.94/cwt$212,430/yr equity erosion
WASDE-670Apr 2026$20.50/cwt-$0.39/cwtStill below breakeven: $42,705/yr
WASDE-671May 12, 2026$21.25/cwt+$0.36/cwtBarely profitable: $39,420/yr

The second cut arrived June 1, 2025, when FMMO make allowance reform, raising the cheese make allowance from $0.2003/lb to $0.2519/lb — a structural pricing change estimated to have reduced Class III prices by roughly $0.85–$0.92/cwt for predominantly Class III pooled operations, based on The Bullvine’s June 2025 analysis of the make allowance changes. That’s not a market move. That’s a permanent recalibration of the price formula.

The third cut is the heifer line. CoBank’s Knowledge Exchange flagged 438,844 fewer replacement heifers projected for 2026 than 2025. On a 400-cow herd running a 33% cull rate, replacement obligations translate to roughly $528,000/year at current market — capital that comes out of the operating line if it isn’t budgeted as an explicit reserve.

What’s the Real Gap Between Cash Breakeven and Full Economic Breakeven on a 400-Cow Herd?

Cash breakeven and full economic breakeven aren’t the same number. The gap between them is where mid-size operations bleed equity invisibly while the checking account still shows green.

University of Illinois FBFM data published via farmdoc daily in December 2025 puts 2024 total economic costs for enrolled Illinois dairies at $23.56/cwt against an average price received of $21.63 — a fifth consecutive year of negative economic returns. FBFM enrollees self-select toward better-than-average recordkeeping. The structural gap is real, and it compounds across cycles.

Minnesota FINBIN’s 2024 Annual Report shows cost of production averaging $19.52/cwt across enrolled dairies, with a range from roughly $17/cwt for herds over 500 cows up to $20.22/cwt for herds under 50 cows. USDA ERS national cost-of-production estimates put the largest U.S. herds (2,000+ cows) at $19.14/cwt and 200–499-cow operations at near $20.85/cwt. Among the herd-size scale bands ERS publishes, the 200–499-cow group has the highest cost of production, and that’s the band the 250–600-cow target operation overlaps directly.

Running the Numbers — A 400-Cow Upper Midwest Operation, Calendar Year 2026

A 400-cow herd at 75 lbs/cow/day ships approximately 109,500 cwt/year (400 × 75 × 365 ÷ 100). Every input below traces to FBFM 2024 benchmarks, CoBank August 2025 heifer market data, May 2026 WASDE-671 feed prices, or ERS national dairy cost categories. Plug in your own numbers where they differ. The arithmetic doesn’t care about averages.

Cash operating costs (purchased inputs)

  • Purchased grain and protein at WASDE-671 prices ($4.40/bu corn, $310/ton SBM, plus minerals): $720,000 → $6.58/cwt
  • Hired labor: $195,000 → $1.78/cwt
  • Veterinary and medicine: $52,000 → $0.47/cwt
  • Hauling and co-op dues: $49,000 → $0.45/cwt
  • Utilities, supplies, fuel, repairs: $111,000 → $1.01/cwt
  • Subtotal: $10.29/cwt

The feed line above reflects only purchased grain and protein. Operations that include homegrown forage at full production cost should substitute their actual total feed number — Illinois FBFM put the 2024 average total feed cost at $11.64/cwt.

Fixed cash obligations

  • Term debt service (principal $148,000 + interest at 7% on average outstanding balance, on $4.5M term debt — illustrative for an operation that expanded at 2021–2023 asset prices): $337,000 → $3.08/cwt
  • Property taxes and insurance: $53,000 → $0.48/cwt
  • Subtotal: $3.56/cwt

Cash breakeven (purchased-input basis): $13.85/cwt

Economic costs (the invisible ones)

  • Heifer replacement: 132 head × $4,000/head (CoBank August 2025 baseline-plus-premium midpoint) = $528,000 → $4.82/cwt
  • Facility/equipment depreciation at replacement cost: $105,000 → $0.96/cwt
  • Unpaid family labor at market wage (1.5 FTE × $52,000): $78,000 → $0.71/cwt
  • Modest equity return (3% on $2M owner equity): $60,000 → $0.55/cwt
  • Subtotal: $7.04/cwt

Full economic breakeven: $20.89/cwt

Three scenarios, same herd:

  • At $21.25/cwt (May 2026 WASDE-671 base case): margin above breakeven = $0.36/cwt → roughly $39,420/year in true economic profit. Thin.
  • At $19.00/cwt: shortfall = $1.89/cwt → $206,955/year in equity erosion.
  • At $17.00/cwt (where Class III actually traded for parts of Q1 2026): shortfall = $3.89/cwt → $425,955/year in equity erosion.
Metric$17.00/cwt Milk$19.00/cwt Milk$21.25/cwt Milk (WASDE-671)
Revenue (109,500 cwt)$1,861,500$2,080,500$2,326,875
Cash Breakeven Cost$1,516,575$1,516,575$1,516,575
Cash Margin+$344,925+$563,925+$810,300
Full Economic Breakeven Cost$2,287,455$2,287,455$2,287,455
Economic Margin-$425,955-$206,955+$39,420
Implied $/cwt Gap vs. Breakeven-$3.89/cwt-$1.89/cwt+$0.36/cwt
Annual Equity Erosion$425,955$206,955None — barely profitable
Lender Forward DSCR Signal🔴 Crisis threshold🔴 Below 1.15× likely🟡 Marginal — stress-test

A Note for Canadian Readers

Quota-protected operations in Ontario and across the supply-managed system face the same problem in a different form. The lag isn’t milk price — it’s the cost-of-production formula adjustment. Through the 2026 cycle, the Canadian Dairy Commission’s blend price formula adjusts on a slower cadence than market feed and energy costs, which means a quota-holder reading a stable farmgate price can still be running a feed bill the formula has not yet incorporated. The barn math above changes shape but not principle: cash breakeven, full economic breakeven, and the invisible heifer and depreciation lines apply regardless of the pricing system.

Has Your Lender Already Run Your Forward DSCR at $18 Milk?

The lender conversation has shifted. Eighteen months ago, ag lenders ran trailing 12-month DSCR — did last year’s net farm income cover last year’s debt service, with strong prior years carrying the conversation forward? Backward-looking by definition.

That’s not the conversation in 2026.

Industry trade press through 2025–2026 has documented a shift among major U.S. agricultural lenders toward forward DSCR analysis calculated against Q3/Q4 forward strips with current debt-service costs. For operations whose term debt was underwritten at $20.50 milk and whose variable rates have repriced toward the 7% range over the 2024–2025 cycle, that forward calculation produces materially different numbers than the trailing one. On $4.5M term debt, the rate move alone adds roughly $112,500–$135,000 in annual interest on average outstanding balance — about $1.02–$1.23/cwt on 110,000 cwt of production. That’s exactly the margin band most mid-size operations are trying to defend.

Cornell PRO-DAIRY’s 2024 DFBS reporting documents that the lowest-profit quartile of enrolled operations carries materially lower debt-service coverage than the herd-average benchmark, and the gap widens under stressed forward milk price assumptions.

The shift isn’t a criticism of how producers manage their books. It’s a change in methodology for how the credit conversation is opened. The lender now arrives with a forward stress test already run on your operation. The producer who hasn’t run the same calculation walks into a conversation they didn’t know was happening.

Three Calls That Did the Real Work in November and December 2025

Operations of 250–600 cows across Wisconsin, Minnesota, and western Michigan that came out of Q1 2026 with extended operating lines and locked rates didn’t get there because milk recovered. Based on industry conversations and trade press through late 2025 and early 2026, they got there because they ran the numbers in November and December — before the January Class III settlement and ahead of the lender’s annual review cycle.

Three calls did most of the work.

The first call was to the lender in early December. The producer arrived with a full-cost breakeven, a forward DSCR at $18 milk, and a specific ask: extend the operating line as a precautionary buffer, lock the variable rate while the curve allowed it, frame the conversation as planning rather than crisis. That framing matters when debt sits at $11,250/cow — well above the $6,638/cow figure dairy financial consultant Greg Bethard identified in The Bullvine’s prior coverage as a debt level above which lender scrutiny commonly increases.

The second call was to the grain merchandiser, while December 2025 corn was trading roughly $4.00–$4.10/bu. Contracting 60% of projected corn through June 2026 at near $4.05/bu wasn’t a bet that prices would rise. It was a hedge against being 100% spot through the summer feeding window.

The third call was internal — the herd manager. Reviewing the cull list and deferring elective culls on cows that were marginal but functional. Every heifer not bought in Q1 2026 at $4,000–$4,100/head was capital not pulled from a stressed operating line.

By February, those operations weren’t comfortable. $14.59 Class III is painful regardless of preparation. They were positioned. An operation that hadn’t run the calculation, reading the same January check, faced a different set of constraints: an operating line already at high utilization, 2026 grain costs running spot, and the lender’s annual review arriving on the lender’s timeline rather than its own.

The 30/90/365-Day Playbook for a 400-Cow Operation in This Position

30-Day Actions — Urgent Checks

1. Recalculate net mailbox price per cwt.

  • What to do: Pull the last 12 milk checks and net out hauling, co-op dues, and FMMO PPD adjustments to get a true rolling average mailbox price.
  • Trigger: Trailing 12-month average runs more than $1.50/cwt below the current WASDE all-milk forecast.
  • Backfire watch: Don’t read a one-month basis anomaly as a structural problem. Use the rolling average, not a single check.

2. Build the full economic breakeven on paper.

  • What to do: Layer the four invisible lines onto your cash budget — heifer replacement at CoBank August 2025 market data ($4,000–$4,100/head), facility depreciation at replacement value, unpaid family labor at market wage, modest equity return.
  • Trigger: Number lands above $21/cwt on a 250–600 cow herd.
  • Backfire watch: Capital structure may be misaligned with the milk price environment that has actually materialized; don’t assume averages will rescue the calculation.

3. Run forward DSCR against $18 milk.

  • What to do: Calculate 2026 debt service against an $18/cwt assumption using current rates.
  • Trigger: DSCR lands below 1.15×.
  • Backfire watch: The lender call moves to this week, not next quarter.

4. Pull forward feed cost coverage.

  • What to do: Document what percentage of projected corn and SBM through November is contracted or priced.
  • Trigger: Coverage sits below 40%.
  • Backfire watch: Request a current quote before Friday. You don’t have to execute — get the number on paper so the next decision is made with current data.

90-Day Actions — Structural Adjustments

1. Initiate a proactive lender conversation.

  • What to do: Walk in with a current balance sheet, an honest forward DSCR, and a specific ask.
  • What it requires: 2–3 hours of preparation, a current balance sheet, and an honest forward DSCR.
  • Trigger: Any DSCR below 1.20× under $18 milk assumptions.
  • Backfire watch: Walking in unprepared invites the lender to set the agenda; walking in over-confidently invites a deeper review than you wanted.

2. Forward-contract 50–65% of feed needs through Q4 2026.

  • What to do: Layer in coverage against May 2026 WASDE-671 baselines ($4.40/bu corn, $310/ton SBM).
  • What it requires: A merchandiser relationship and storage or basis flexibility.
  • Backfire watch: Don’t over-hedge a position you can’t deliver against if production drops or feed needs shift mid-year.

3. Restructure variable-rate term debt to fixed where the math supports it.

  • What to do: Get a current fixed-rate quote and run the comparison against your existing variable structure.
  • What it requires: Lender willingness, possibly a fee, and a current rate quote.
  • Trigger: Fixed-rate quote sits within 0.50% of your variable rate.
  • Backfire watch: Locking long-term at the top of a rate cycle.

365-Day Strategic Positioning

1. Reassess herd-size targets against full economic breakeven.

  • What to do: Decide on expansion, hold, or consolidation against full-cost breakeven, not cash breakeven.
  • Pause-expansion trigger: Full-cost breakeven above $21/cwt and cannot be reduced through structural cost work.
  • Opportunity signal: Full economic breakeven below $19/cwt and forward DSCR at $18 milk above 1.30× — room to evaluate selective expansion or capital improvement.

2. Build a heifer replacement reserve as an explicit balance sheet line.

  • What to do: Fund the reserve from operating cash during stronger price periods; draw down during compression.
  • Why it matters: Operations carrying $462,000–$528,000/year in implicit replacement obligations against zero explicit reserve are running a structural deficit that compounds across cycles.

3. Reassess your component profile against your processor’s Class III/IV utilization.

  • What to do: Map your check’s class composition against your component capacity.
  • Why it matters: Operations whose checks are 70%+ Class III pooled took a larger relative hit from the June 2025 make allowance reform than operations with heavier Class IV exposure.
  • Backfire watch: Don’t chase components without nutritional or genetic capacity to hold them.

Run Your Numbers

Every figure in this article can be replaced with your own. Plug your herd size, your purchased feed cost, your debt service, your heifer line, and your component profile into The Bullvine Dairy Profit Projector and run the same three scenarios on your own operation:

Try the full-screen Dairy Profit Projector — free, no login.

What This Means for Your Operation

The milk check is a 60-day-old document. It tells you what happened in November when you read it in late January. It doesn’t tell you what your forward feed costs, your repriced debt service, or your replacement heifer obligations will demand from the next four quarters.

You get cash visibility from the milk check. You get margin visibility only from the underlying calculation. Operations building only the first one makes decisions on lagging data. Operations building both walk into the lender conversation with the same forward stress test that the lender already ran.

The barn math doesn’t care about averages. It runs on your specific feed cost, debt service, heifer line, and component profile.

What’s your real margin over feed per cwt this month versus 90 days ago — and where does your full economic breakeven sit against the futures strip? Your January milk check is already lagging.

If the answer is “I haven’t run it” — the next 30 days are about that calculation, not next quarter’s milk price.

Key Takeaways

  • Cash breakeven and full economic breakeven aren’t the same number. On a 400-cow Upper Midwest herd at WASDE-671 feed prices, that gap runs from $13.85 to $20.89/cwt — and the second number is the one your lender is now stress-testing.
  • A single WASDE print isn’t a budget. The 2026 all-milk forecast moved more than $3.00/cwt between May 2025 and May 2026; build your plan against $18 milk and check what breaks.
  • The three calls that mattered happened in November and December — to the lender, the grain merchandiser, and the herd manager — before the January Class III settlement landed. If you haven’t made them, the next 30 days are about that calculation, not next quarter’s milk price.
  • Heifer replacements at $4,000–$4,100/head and 7% repriced term debt are the two invisible lines that turn a positive milk check into $200K–$425K/year in equity erosion. Treat them as explicit budget lines, not afterthoughts.

Complete references and supporting documentation are available upon request by contacting the editorial team at editor@thebullvine.com.

Learn More

The Sunday Read Dairy Professionals Don’t Skip.

Every week, thousands of producers, breeders, and industry insiders open Bullvine Weekly for genetics insights, market shifts, and profit strategies they won’t find anywhere else. One email. Five minutes. Smarter decisions all week.
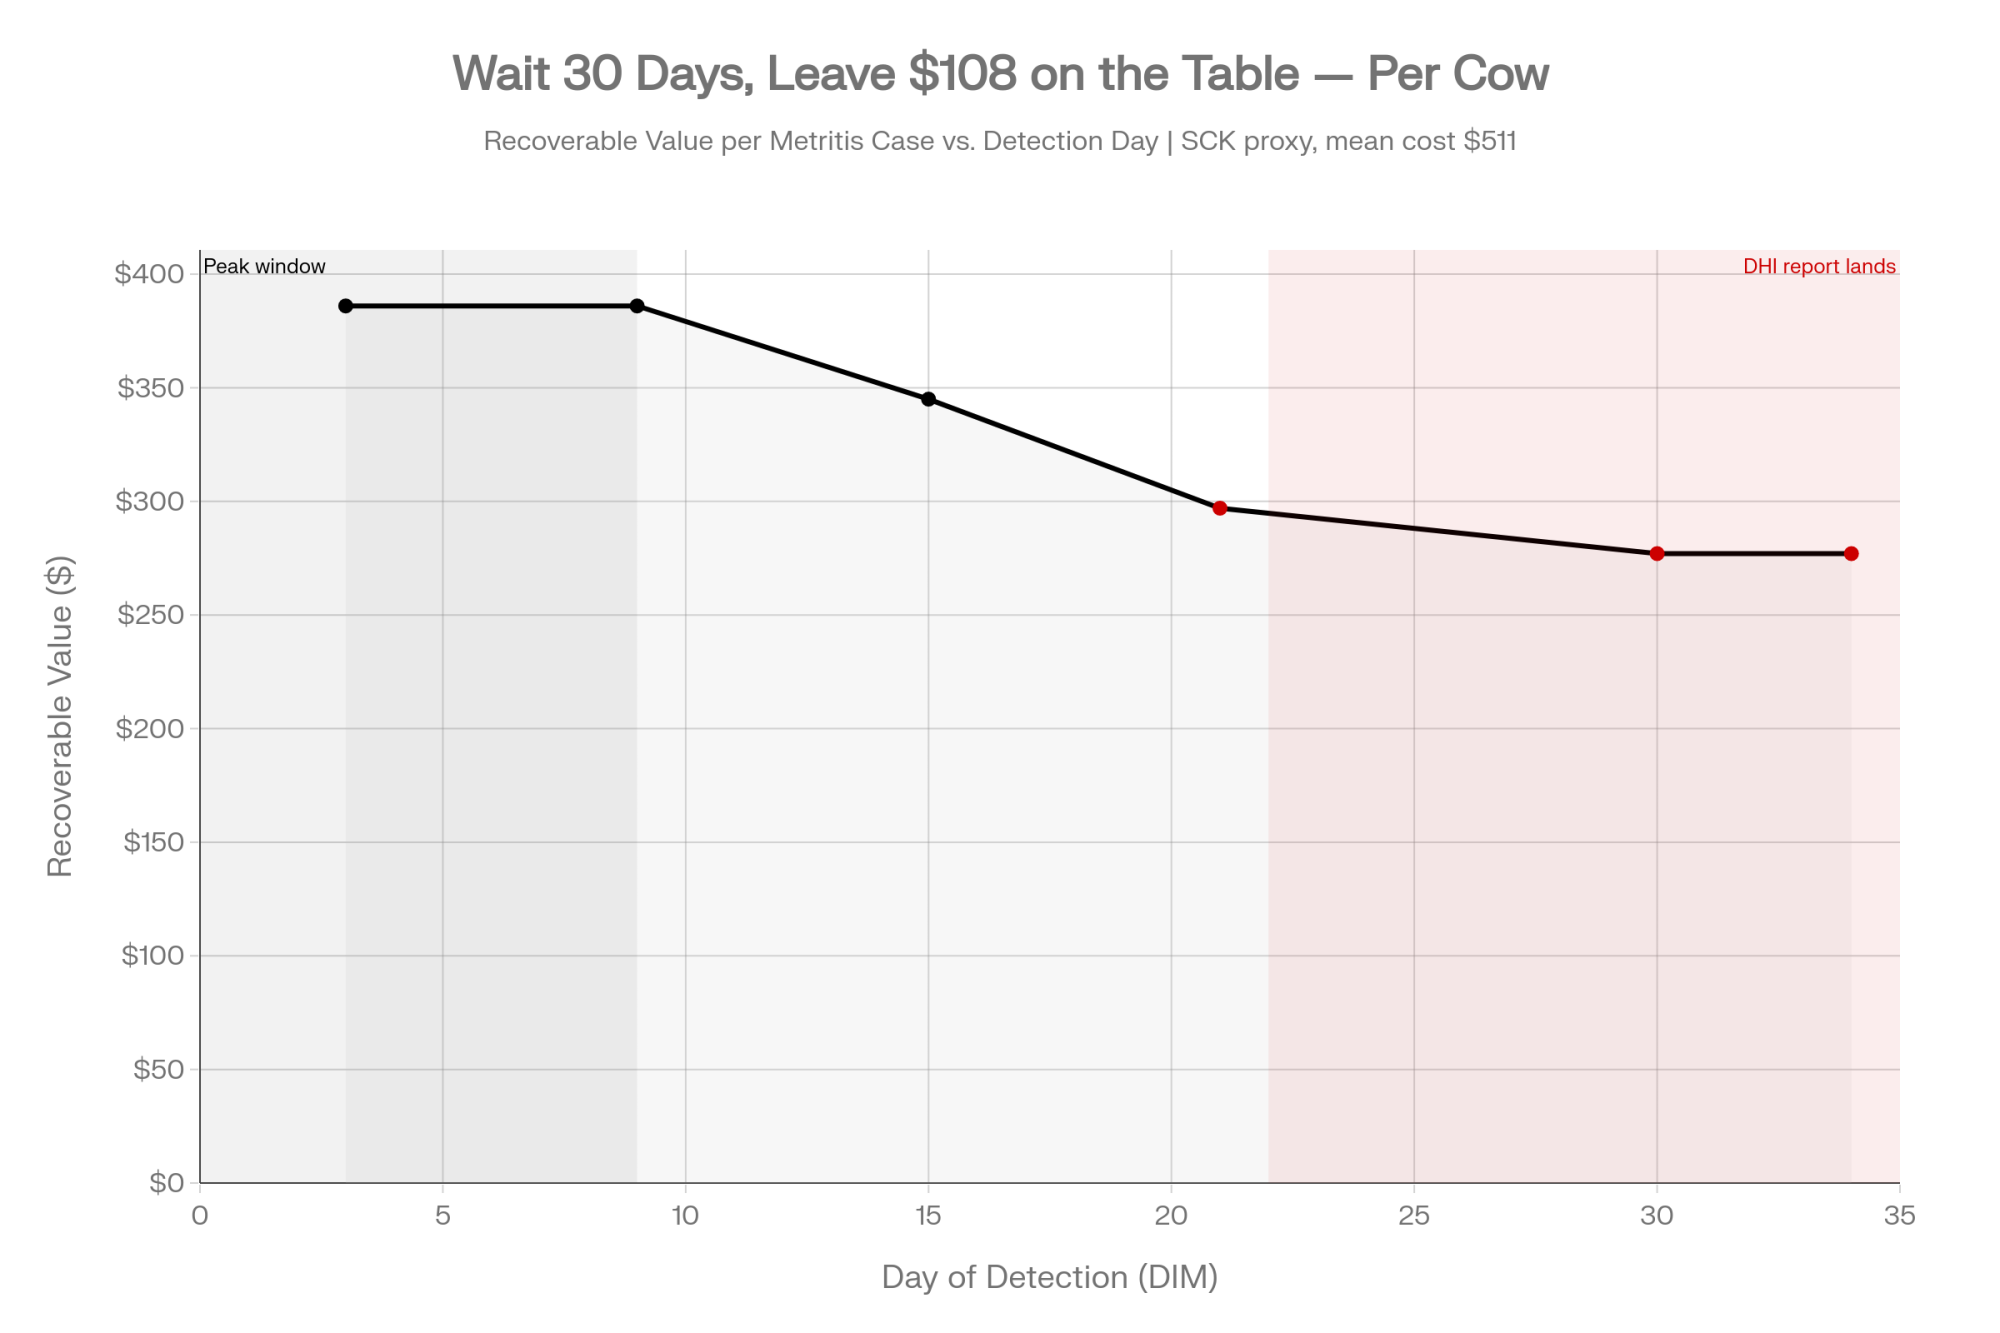
NewsSubscribe
First
Last
Consent

$3,150 vs $30,000: The Whole‑Herd Genotyping Math on a 300‑Cow Herd

$3,150 a year buys whole‑herd genotyping on 300 cows. The Genomic Engine puts the leak at $30,000–$45,000 — most of it bleeding through misallocated sexed semen and beef straws.

Executive Summary: $3,150 a year buys whole‑herd genotyping on 300 cows. The Genomic Engine analysis puts the annual leak at close to $30,000–$45,000 on that scale — and $120,000–$180,000 on a 1,200‑cow operation — most of it bleeding through sexed semen and beef‑on‑dairy straws allocated at 20–25% parent‑average reliability instead of 70%‑range genomic reliability. Producers running early‑2026 USDA AMS beef‑on‑dairy premiums of about $377 per head and Iowa State’s $2,651 conventional heifer rearing cost are the ones losing the most to coin‑flip allocation. The March 2, 2026, Zoetis–Neogen $160M deal raises a second decision: enroll, but build CDCB data flow, 48‑hour SNP portability, and dual‑track NM$/DWP$ cow‑side display into the contract before signing. Wait until 2027, and three things don’t come back — the calf crops you didn’t sample, the multi‑year FSAV trend data processor sustainability programs will reward by 2028, and the compounding generations of health and fertility selection parent averages can’t deliver. Under‑150‑cow herds are honestly flagged: the full program doesn’t pencil; target specific cow families instead. The 30‑day move is small — pull last year’s sexed‑semen invoices against your yearling list and run retroactive PA rankings on the top and bottom 20 — and the disagreement you’ll find usually pays for year one of genotyping before the audit is finished.

whole-herd genotyping ROI

Editor’s note: The 300‑cow operator and the allocation‑meeting scene in this piece are illustrative composites drawn from The Genomic Engine analysis and recent Bullvine conversations with progressive US producers. They are not based on any single named individual or farm. The dollar figures come straight from the source analysis cited throughout.

Picture an operator working through this season’s breeding plan. Good cows. High‑reliability sires in the tank. Sexed dairy on the front end, beef semen on the back. A herd manager he trusts and an AI tech who’s been with him for a decade. He’s writing six‑figure checks on reproductive technology every year, and he takes genetics seriously.

He’s also making most of those decisions on parent averages. That gap — between the tools he’s paying for and the information layer underneath them — is where The Genomic Engine analysis puts the annual leak at $30,000 to $45,000 on a 300‑cow herd running whole‑herd genotyping. On a 1,200‑cow herd in the same analysis, the leak runs $120,000 to $180,000. The fix on the small end costs about $3,150 a year.

What’s Really at Stake on a 300‑Cow Operation

The tension isn’t whether the cows are good. They are. The tension is whether the decisions about which heifers to breed forward, sell, or designate as beef crosses are running on 20–25% reliability or 70–77% reliability — the gap between pedigree‑based parent averages and genomic breeding values at birth for young Holstein females on NM$, per CDCB, and the Lactanet reference figures cited in The Genomic Engine. Zoetis’s own CLARIFIDE validation work against USDA‑CDCB data put traditional NM$ reliability for young Holstein females (≤12 months) at 22%, and CLARIFIDE genomic reliability approaching 70% — per the Zoetis CLARIFIDE technical bulletin, based on USDA‑CDCB evaluation as of April 2014. CDCB has recalibrated NM$ and genomic reliability several times since 2017, with further recalibrations in 2021 and ongoing; the gap between parent‑average and genomic reliability has remained meaningful, though the absolute percentages have shifted. Treat the 22% / ~70% figures as illustrative of the directional gap, not as 2026 absolute values.

The operator who’ll recognize this setup isn’t the laggard. He’s the one already doing the expensive work. He’s writing checks for sexed semen at roughly 2x the price of conventional straws, running a beef‑on‑dairy program pulling early‑2026 US auction premiums of about 7 per head over straight dairy calves, per USDA AMS auction data cited in the same analysis.

He’s just pointing those tools at the wrong animals more often than he realizes.

How It Plays Out in the Barn

Picture a typical allocation conversation on a herd this size. The herd manager, the AI tech, the genetics consultant — looking down a list of about 105 yearling heifers (35% replacement rate on 300 cows, roughly 105 heifer calves a year).

Without genotypes, they’re sorting on dam records, sire EBVs, and the herd manager’s read of the animal. Informed judgment. Not guesswork. But it’s running on a reliability ceiling that Mendelian sampling puts at roughly a quarter of the truth. Two full sisters out of the same 99% reliability sire and the same dam can end up in opposite percentiles of the herd. Parent averages can’t tell you which sister got the good draw.

So here’s what’s happening on herds in this profile, as the source analysis describes it:

  • Some of the expensive sexed dairy straws are landing on heifers who’ll rank middle‑of‑the‑pack once genotyped.
  • Some of the genuinely elite heifers — the ones whose pedigrees under‑predict them — are getting conventional or beef semen because nothing on the record flagged them.
  • The bottom ~15% of the cohort, who should be sold or designated beef‑only at eight weeks, are being raised to 22–24 months at a total cost of about $2,651 per head on a conventional 26,000 lb herd, per Iowa State Extension’s 2024 heifer raising cost study. Jersey and pasture‑based systems run a few hundred dollars less; higher‑input Northeast herds run higher.

The herd is good. The allocation is a coin flip wearing a lab coat.

How Does the Barn Math Really Work?

The test bill is four figures. The leak is five or six. — 300‑cow model: $3,150 test vs $30,000–$45,000 recovered. 1,200‑cow model: $11,520 test vs $120,000–$180,000 recovered. (The Genomic Engine)

Metric300‑Cow Herd Profile1,200‑Cow Herd Profile
Annual heifer cohort~105 heifer calves (35% replacement)~384 heifer calves (32% replacement)
Annual genotyping cost$3,150 ($30/test)$11,520 ($30/test)
Bottom‑cohort culls~15 animals culled at 8 weeks~40 animals culled at 8 weeks
Rearing cost saved~$30,000 ($2,000–$2,651/head avoided)~$80,000 ($2,000/head avoided)
Added revenue captureOptimized sexed semen + beef‑on‑dairy allocationCorrectly targeted beef‑on‑dairy + IVF donor discipline
Total net annual return$30,000–$45,000$120,000–$180,000

Sources: The Genomic Engine analysis; Iowa State Extension 2024 heifer raising cost study ($2,651 on a conventional 26,000 lb herd); USDA AMS auction data, early 2026. The lower end of the rearing cost range accounts for partial recovery via cull‑heifer or bull‑calf sale revenue. The 1,200‑cow model assumes a 32% replacement rate vs the 300‑cow model’s 35%, consistent with how The Genomic Engine scales replacement rates by herd size. The 10% vs 15% cull threshold is a management call every operator makes differently.

The takeaway: For both operation sizes modeled by The Genomic Engine, the cost to build the data layer runs roughly 10% or less of the direct capital leaking out of the barn through misallocated reproductive decisions.

A 600‑cow operator sits between those two models and can do the arithmetic on his own replacement rate and heifer costs, but the shape of the curve is clear.

The harder‑to‑price gain is the one that compounds. CDCB’s own genomic impact analysis shows average annual Net Merit gain roughly doubled from $40.33 per year (2005–2010) to $79.20 per year (2016–2020) as genomic selection matured in the US Holstein population. Running parent averages on most of the herd means genetic progress on low‑heritability traits — mastitis, metritis, daughter pregnancy rate — progresses meaningfully more slowly than in operations using GEBVs, particularly on traits parent averages predict poorly. Five years of that gap compounds into the equivalent of losing roughly a decade of genetic progress by 2040 — editorial math, not a cited projection, but the direction is clear.

The Cost of Delay: A Chronological View

Three landmarks you can’t get back. Each one becomes more expensive the closer you get to it.

The Current Cohort — 2025–2026. Every heifer calf you skip is selected on a 20–25% parent‑average reliability ceiling. These animals will become your dominant milking string by 2028–2030. There is no retroactive rewind button on genetic misallocation, and there’s no way to genotype a calf crop that has already left the farm.

The Sustainability Baseline — 2027–2028 Processor frameworks begin tying premium payouts to documented resource efficiency. Early adopters leverage two to three years of historical Feed Saved (FSAV) trend data — the US evaluation CDCB has published since December 2020, with a documented link to methane output through residual feed intake. Canadian producers have a separate tool: Lactanet launched what it described as the world’s first national genetic evaluation for direct methane efficiency in April 2023, built on mid‑infrared spectroscopy with an 85% genetic correlation to GreenFeed measurement (per Lactanet). US producers don’t have a parity methane evaluation yet, so for an American operation, FSAV is the trend line that matters today. Delayed operations start at zero with a baseline and an explanation.

The Compounding Generation Gap — 2030+ Low‑heritability traits — mastitis resistance, daughter pregnancy rate, metritis — require multi‑generational, high‑reliability selection to move the needle. Missing three generations of selection on those traits creates a genetic lag that no checkbook fixes in year four.

The remaining kinks, as of 2026, aren’t technical. They’re operational: sample collection discipline, staff buy‑in at the “cull the healthy calf” moment, and contract structure with the genomic vendor. Waiting doesn’t make those easier.

The Platform Question Worth Raising Before You Sign

What follows is editorial analysis. The factual record on the Zoetis–Neogen transaction is summarized below; the commentary on platform consolidation reflects The Bullvine’s editorial perspective on what integrated genomic platforms mean for producer leverage.

Here’s the piece that’s starting to surface in operator conversations. On March 2, 2026, Zoetis announced a definitive agreement to acquire Neogen Corporation’s animal genomics business for 0 million, subject to customary closing adjustments. Zoetis expects to close in the second half of 2026; Neogen’s filing says the transaction is expected to close by the end of the first half of Neogen’s 2027 fiscal year, pending regulatory approval. The deal brings the GeneSeek laboratory network — five labs across the US, Brazil, Australia, China, and the UK, serving customers in 120+ countries — into Zoetis’s Precision Animal Health platform.

That consolidation concentrates the full genomic value chain — the test, the lab, the proprietary wellness index (CLARIFIDE Plus / DWP$), the mating software integration, and increasingly the processor‑facing sustainability verification — under one roof. Credit where it’s due on the components: DWP$ is a substantive, wellness‑weighted tool, GeneSeek brings real lab capacity and accreditation, and CLARIFIDE’s automatic CDCB submission is a genuinely producer‑friendly default. The editorial concern here is what integrated platforms mean for producers’ leverage over the long haul — not about the underlying technology or lab capability.

The defensible move isn’t to refuse the platform. It’s to build optionality into the relationship from day one — and to do it in this order, before money or samples change hands.

The Dual‑Track Enrollment Protocol

Contract ClauseWhat to ConfirmRisk if Missing
CDCB Data FlowNM$/Pro$ actively visible on cow-side screen, not just background submissionYou’re paying for national evaluation but flying blind on the public index
SNP File PortabilityRaw SNP files delivered to producer within 48 hours of written request, in standard formatPlatform switch requires re-genotyping entire herd — sunk cost trap
Dual-Index DisplayDWP$ and NM$ shown side-by-side in DairyComp/PCDART/BoviSync active cow screenProprietary index runs unchecked; no independent benchmark for mating decisions
Data Deletion RightsExit clause specifies what happens to your herd’s genomic data if contract endsGenomic profile of your genetics may remain on vendor servers post-exit
Lab AccreditationProcessing lab is CDCB-approved and genotypes submitted under your herd IDDelays or denials in national evaluation submission; loss of CDCB history

1. Verify CDCB data flow — Pre‑Enrollment. Confirm with your vendor representative that the national CDCB evaluation data is actively flowing back into your local interface. Every CLARIFIDE sample carries a CDCB service fee that Zoetis collects and forwards to CDCB (per the published Zoetis CDCB Fee Schedule and CDCB’s genomic evaluations documentation), so the national evaluation is happening in the background. Visual presentation of the NM$ metric on the cow‑side screen is a software configuration choice, not a universal default.

2. Secure SNP portability clauses — Contract Review. Require a written guarantee in the service contract specifying that raw genomic SNP files must be ported directly to the producer in a standardized format within 48 hours of a formal request. Before signing, confirm at least one alternate CDCB‑approved lab is on your short list — not because you expect to switch, but because optionality is cheaper to build in upfront than to retrofit.

3. Configure cow‑side displays — Day 1 Integration. Set up your herd management software (DairyComp, PCDART, BoviSync) to display the proprietary index (DWP$) and the public national index (NM$ or Pro$) side‑by‑side on the active cow screen. If only one index is visible, your dual‑track strategy remains theoretical.

The plumbing already exists. National evaluations are built to accept genotypes from accredited labs, including GeneSeek, and CDCB fees accompany every commercial submission. These three steps — CDCB flow, SNP portability, cow‑side display — aren’t always front and center in genomic vendor enrollment conversations. Whether your specific representative covers them in detail can vary. Either way, the prudent move is to add them to your enrollment checklist before signing.

The Bullvine’s editorial position on platform consolidation reflects analysis of publicly disclosed transaction terms; Zoetis has been invited, on standing terms, to respond to producer‑leverage concerns raised in our coverage.

Options and Trade‑Offs for Your Operation

Not every operator needs the same playbook. A few realistic paths, with honest trade‑offs:

Full whole‑herd genotyping with dual‑track data governance. Test every heifer calf, route results to both a commercial index and the national evaluation. Fits operations above roughly 300 cows running sexed semen and beef‑on‑dairy. Demands contract scrutiny at enrollment. It backfires if the 90‑day implementation is botched and the “dual‑track” stays theoretical because the software was never configured to display both indexes.

Top‑half genotyping as a phased entry. Genotype only heifer calves from the top 50% of dams in Year 1 — about 53 calves on a 300‑cow herd. Cuts the test bill in half and captures most of the bottom‑cohort identification. Fits cash‑flow‑tight operations, staging the investment. It backfires if the underlying dam rankings are themselves off, meaning high‑potential outliers in bottom‑50% dams never get tested.

Do nothing, but with a calendar date. If an operator genuinely isn’t ready, the defensible version is to set a specific review date — spring 2027, for example — track current reproductive‑technology spending, and commit to dual‑track setup at that point. The indefensible version is drift. Drift costs calf crops.

One honest caveat: for herds of about 150 cows or fewer, the full program often doesn’t pencil out the same way. The Retention Payoff infrastructure and mating software integration carry fixed costs that don’t scale down gracefully, which the source analysis describes as small herds being “structurally excluded.” Those operators are better served by targeted genotyping of specific cow families rather than whole‑herd barcoding.

The 30‑Day Action, Regardless of Which Path You Pick

In the next month, pull the last 12 months of sexed semen invoices against the current yearling list. Mark, which heifers received sexed dairy semen, which received beef semen, and which received conventional semen. Then ask the genetics consultant to run retroactive parent‑average rankings on the 20 highest and 20 lowest animals in that cohort.

You won’t get genomic reliability. But you’ll see how much spread parent averages alone hide on animals your program already treats as interchangeable. Most operators who run this exercise find enough disagreement between the allocation and the ranking to pay for the first year of genotyping before the audit is finished.

By day 90, the follow‑up check is simple: your herd management software should display DWP$ (or whatever proprietary index you use) and NM$ side by side on the cow screen. If only one number is visible, the dual‑track isn’t real yet. That’s a 30‑day check and a 90‑day configuration — not a 12‑month genetic strategy overhaul — and it’s the sequence that makes every other decision in this article concrete.

What This Means for Your Operation

  • How many of your last 12 months of sexed semen straws landed on heifers you’ve never genotyped? If the answer is most of them, your reproductive technology is running on a coin flip.
  • Pull your current heifer inventory. Raising more than 110% of replacement need means you’re raising “just‑in‑case” animals and paying about $2,651 per head, per Iowa State’s 2024 figures, to find out which ones didn’t work.
  • Check your last IVF donor list. How many of those cows would still be on it if you’d ranked the herd on 70%‑range reliability data instead of pedigree and hunches?
  • If your processor announces a tiered methane or feed‑efficiency incentive in 2028, can you produce three years of herd‑level FSAV trend data — or a baseline and an apology?
  • Audit your current or proposed genomic vendor contract for three clauses specifically: raw SNP file portability within 48 hours of request, cow‑side display of both proprietary and national‑evaluation indexes, and exit data‑deletion rights. CDCB submission happens automatically on a CLARIFIDE invoice; the rest does not.
  • Name the single person on your org chart accountable for reproductive‑technology allocation outcomes. If nobody owns the leak, nobody will fix it.
  • Have the barn conversation before the first cull list is issued. A long‑tenured herdsperson asked to cull a healthy eight‑week‑old needs to hear the stewardship reframe — “we’re not culling your work, we’re pointing your labor at the right animals” — long before the first calf leaves.

Key Takeaways

  • If you’re running sexed semen and beef‑on‑dairy without genotyping, the tools are 2026, and the information layer is 1995. The Genomic Engine analysis puts that gap at $30,000–$45,000 a year on a 300‑cow herd against a $3,150 test bill.
  • If you wait until 2027 to start, three things are non‑recoverable: the calf crops you didn’t sample, the multi‑year FSAV trend data processor sustainability programs will reward, and the compounding generations of health and fertility selection that parent averages can’t deliver.
  • If you adopt, adopt a dual‑track on day one. CDCB evaluation is already running in the background on every CLARIFIDE invoice; the battle is whether NM$ shows up next to DWP$ on the cow‑side screen. The incremental cost to configure that at enrollment is small. The cost to retrofit in year three is not.
  • If you’re under 150 cows, don’t force the full program. Target specific cow families instead, and push your breed association and genomic vendor on the fixed‑cost problem — the “structurally excluded” gap is real and worth making noise about.

The Decision Underneath the Decision

The operator picturing himself in this scenario isn’t really deciding whether to spend $3,150 on genotyping. He’s deciding whether the cows in his milking string in 2028, 2029, and 2030 were selected on parent‑average reliability or genomic reliability. He’s deciding whether, when a processor program lands with real premium money attached, he walks into that meeting with a four‑year trajectory or a one‑year baseline.

Money, he can catch up on. Three calf crops of compounding genetic lag, and the data history that proves improvement, don’t come back on any timeline a checkbook can fix. So the real question isn’t whether the technology is proven. It’s the chair the operator is going to be sitting in when the 2030 processor meeting happens — and whether the allocation decisions his herd manager makes in the next 90 days are the ones he’ll want to defend to his kids in 2035.

Complete references and supporting documentation are available upon request by contacting the editorial team at editor@thebullvine.com.

Learn More

The Sunday Read Dairy Professionals Don’t Skip.

Every week, thousands of producers, breeders, and industry insiders open Bullvine Weekly for genetics insights, market shifts, and profit strategies they won’t find anywhere else. One email. Five minutes. Smarter decisions all week.
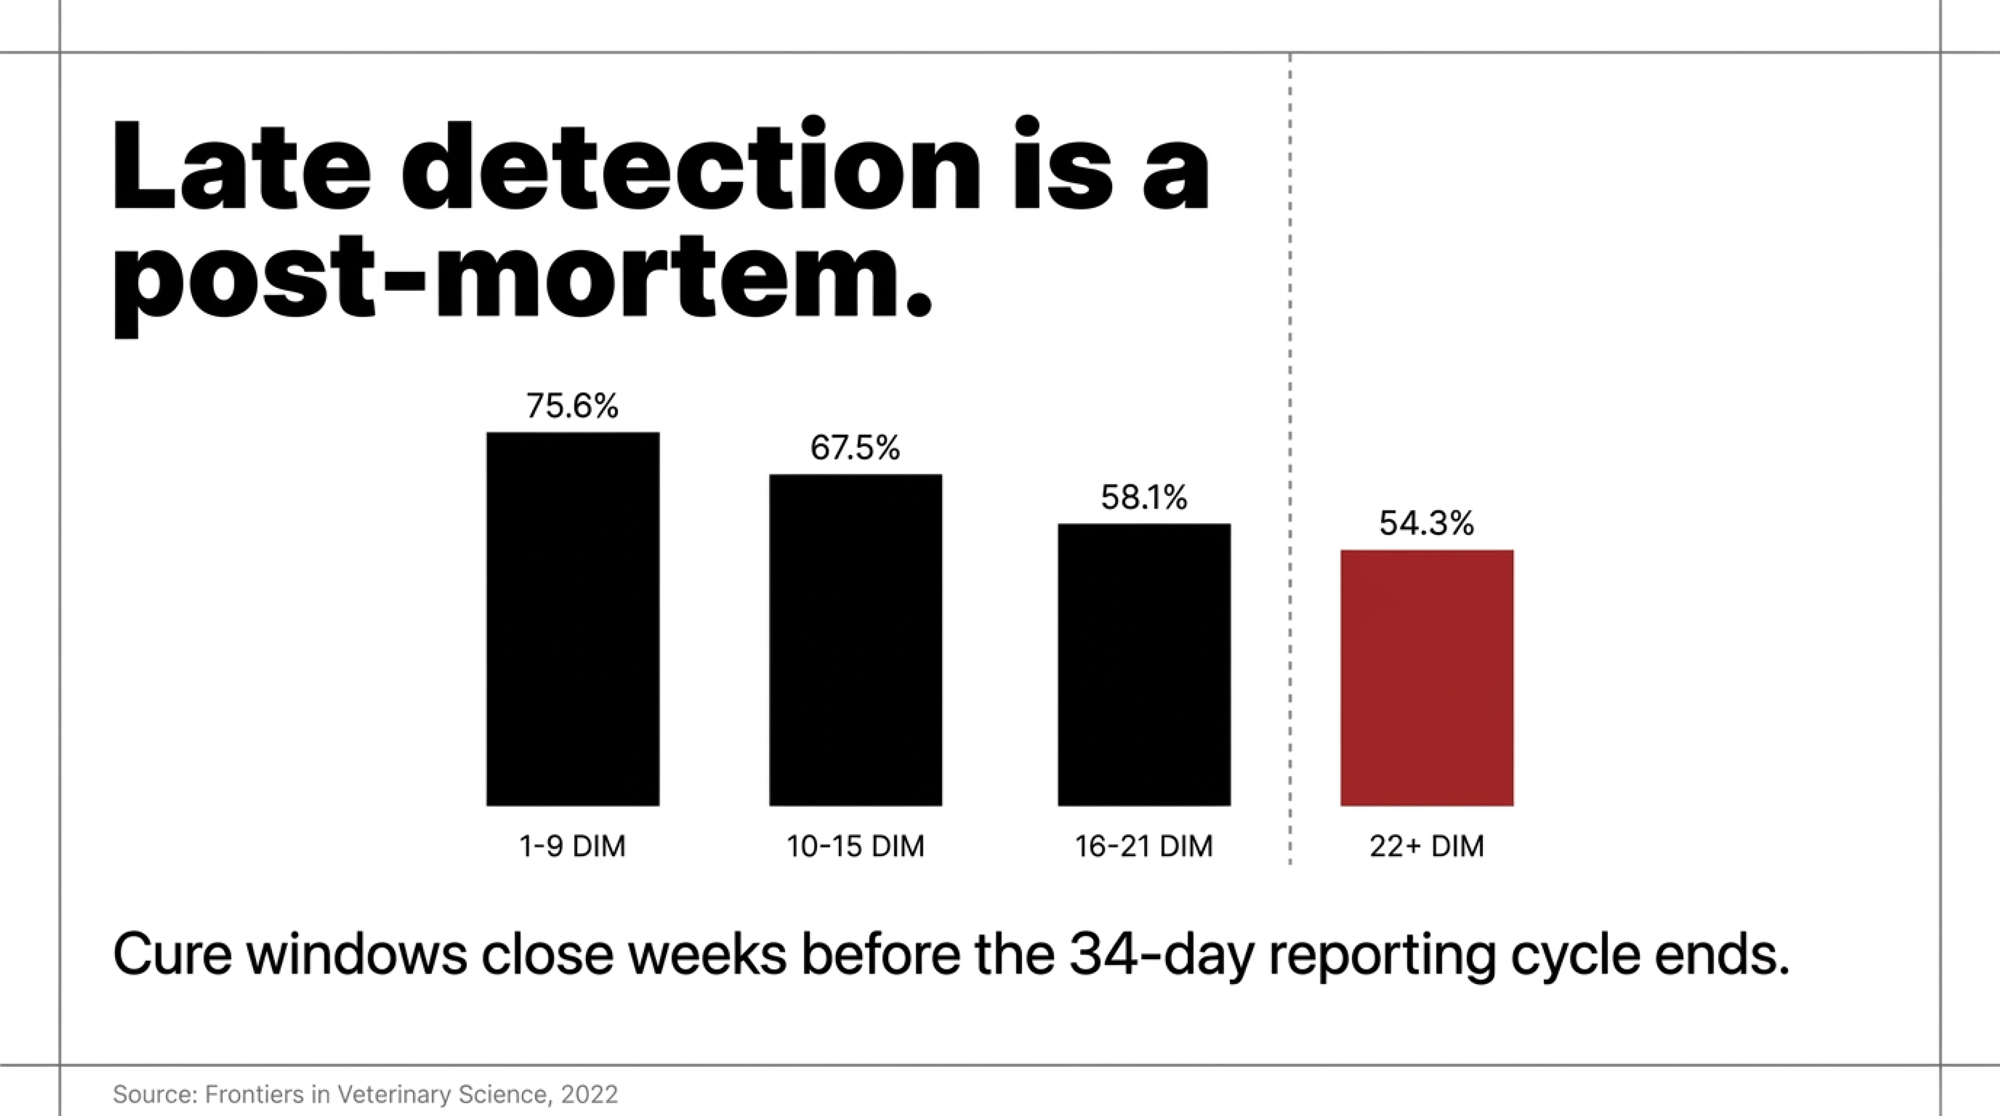
NewsSubscribe
First
Last
Consent

Bivalve Dairy Did Everything Right. The H5N1 Air Data Just Added $0.04/cwt to Dairy 2026.

John Taylor put boot‑baths outside every barn. Then a PLOS Biology study found live H5N1 in 11% of California parlor air samples — and $7,200–$12,500/year in your 2026 budget.

Executive Summary: A May 2026 PLOS Biology study from Emory and Colorado State sampled 14 H5N1‑positive California dairies and found 60% of milking‑parlor air samples PCR‑positive — with more than 11% carrying live, replication‑competent virus capable of infecting cells. That single data point reframes H5N1 from a contact‑and‑milk problem into an airborne and waterborne one, and pushes a baseline biosecurity adder of $7,200–$12,500/year onto a 1,000‑cow herd before any wastewater capital — roughly $0.025–$0.043/cwt of new margin‑over‑feed pressure stacked on a 2024 DMC year that left some regions at –$1.05/cwt. On one study farm, about 60% of clinically normal cows already carried H5N1 antibodies in milk and 7 cows shed live virus with no clinical signs, so a sick‑cow trigger is the wrong trigger. Operations like Bivalve Dairy in Marin County did what 2024 guidance asked — boot‑washes, fomite control — but standard parlor SOPs don’t address what crews are breathing or what’s cycling through reused flush water and lagoons. The real cost is documentation: PPE schedules, water‑flow maps, monthly bulk‑tank PCR, and a written trigger that flips your parlor from voluntary to required N95 use before a positive bulk tank, a Cal/OSHA inspector, or a 2027 DRP underwriter forces the conversation. Read the full piece for the herd‑by‑herd cost table (500/1,000/2,000 cows) and a 30/90/365‑day playbook that protects your worker‑safety position and your insurance terms whether H5N1 hits your postal code or not.

H5N1 dairy biosecurity cost

A new Emory/Colorado State study published in PLOS Biology (May 2026) found live, replication‑competent H5N1 in the air of California milking parlors, in reclaimed flush water, and in manure lagoons — and for U.S. dairies building 2026–27 budgets, that translates into roughly $7,200–$12,500/year of new H5N1 dairy biosecurity cost 2026 on a 1,000‑cow herd before anyone touches wastewater capital. On a herd shipping about 80 lb/cow/day, that’s roughly $0.025–$0.043/cwt of extra margin‑over‑feed pressure for dairy 2026 — stacking on top of a year when DMC didn’t come close to covering the real gap for many herds. 

That gap is already visible at operations like Bivalve Dairy in Marin County, California, where owner John Taylor told Peninsula Press he installed boot‑washing stations outside every barn after H5N1 swept through the state’s herds in late 2024. Taylor told the publication he isn’t taking any chances — “We’re disinfecting our boots, we’re being extra careful, washing things down extra,” he said, even as he kept the farm running on its normal milking rhythm. By every standard dairy biosecurity playbook at the time, that contact‑and‑fomite control was the right move. The standard playbook was looking in the wrong place. 

What 14 California Dairies and 71 Air Samples Just Changed About Dairy Biosecurity in 2026

For most of 2024 and 2025, H5N1 on dairies was framed as a contact‑and‑milk problem. Keep sick cows off the line. Scrub the units. Pasteurize. Keep the virus off boots and out of the milkline. 

Taylor’s response at Bivalve Dairy followed that playbook to the letter. Peninsula Press reports he installed boot‑washing stations outside every barn after H5N1 spread through California herds in late 2024. Across the border, Canadian surveillance bodies like WeCAHN have been tracking the same U.S. dairy outbreak through 2024–2025 to inform Canadian farm biosecurity. 

A research team led by Dr. Seema Lakdawala at Emory University and Dr. Jason Lombard at Colorado State went further. They sampled 14 H5N1‑positive California dairies across two regions between October 2024 and January 2025, pulling air, wastewater, and milk samples to map how the virus actually moves. In the first phase, 71 air sampleswere collected from parlors, barns, and outdoor areas; multiple parlor and cow‑breath samples tested positive for H5N1 RNA. In a focused second phase across three Southern California farms, 21 of 35 milking‑parlor air samples (60%) tested PCR‑positive, and 4 of 35 (more than 11%) contained live, replication‑competent virus — not fragments, but virus capable of infecting cells. 

The 2026 Reality Check: In the milking parlor — where workers spend hours at flank level — 60% of air samples tested PCR‑positive, and more than 11% contained live, replication‑competent virus (PLOS Biology, May 2026). Standard boot‑baths do not protect against what your crew is breathing in the pit. 

In a statement on Emory’s release of the study, Dr. Lakdawala said: “Our data confirm the presence of infectious H5N1 virus in the air and reclaimed farm wastewater sites.” The authors went further: “Dairy parlors, which are often enclosed spaces and where aerosolization of milk occurs, pose the greatest threat from inhalation of the virus to dairy farm workers.” 

Sequencing pinned the same clade 2.3.4.4b B3.13 subclade circulating in U.S. cattle, with an N189D mutation in the HA protein linked to increased binding to human‑type receptors. California, under State Veterinarian Dr. Annette Jones, remains the leading state for H5N1 detections in dairy herds. 

Emory/CSU Study at a Glance

MetricResult
Study dairies sampled (H5N1‑positive)14 across two California regions 
Sampling windowOct 2024 – Jan 2025 
Total air samples (Phase 1)71 
Parlor air samples PCR‑positive (Phase 2)21 of 35 (60%) 
Parlor air samples with live, replication‑competent virus4 of 35 (>11%) 
Peak viral load in parlor airUp to 10⁴ genome copies/L 
Subclade identified2.3.4.4b B3.13, N189D mutation in HA 
Clinically normal cows seropositive (one farm)~60% 
Cows shedding live virus with no clinical signs7 on one farm 

Why “Healthy” Cows Might Be Your Most Expensive Number

Here’s the line every herd manager should sit with: on one study farm, about 60% of cows that appeared clinically normal had H5N1 antibodies in their milk — already infected, already recovered, never flagged. On another, seven cows were actively shedding live virus in their milk, with no mastitis, no fever, and no obvious clinical signs. The team described “high viral loads and H5 antibodies in the milk of cows, including those without clinical signs, suggesting that multiple modes of H5N1 transmission likely exist on farms.” 

If your herd‑health protocol relies on a sick cow as the trigger, you’re triggering on the wrong signal.

Put workers back in the picture. CDC lists dairy workers handling potentially infected cattle or raw milk as higher‑risk for novel influenza A and recommends NIOSH‑approved particulate respirators (N95 or better), eye protection, and protective clothing. California’s Department of Industrial Relations states directly that “workers who have job‑related contact with birds or dairy cows infected with the H5N1 virus are at risk of becoming infected with bird flu,” including those “handling or otherwise being exposed to animals that are infected but not showing symptoms.” Cal/OSHA treats that exposure as a General Duty Clause obligation for employers. 

The Hidden Cost Few Operators Budget: A UC Merced survey of 30 dairy workers across 8 Central Valley citiesfound only 1 in 30 had received a clear H5N1 briefing tied to their job. Training time, translated SOPs, and fit‑testing don’t live in the “supplies” column on most 2026 budgets. 

Running the Numbers: H5N1 Biosecurity on a 1,000‑Cow California Dairy

Cheap on paper. Add it up across two shifts and 365 days, and it stops being cheap.

Operation profile: 1,000 milking cows, double‑X parlor, 3 milkers per shift, 2 shifts daily — 6 parlor workers per day, 365 days/year.

PPE unit‑cost assumptions (NIOSH‑approved disposables; non‑vendor public procurement ranges, 2024–25):

PPE / Test ItemUnit CostUse Rate (1,000 cows, 6 workers/day, 2 shifts)Annual Cost (Low–High)
N95 Respirator$0.75–$1.25 each1 per worker per shift$3,285–$5,475
Nitrile Gloves$0.10–$0.20/pair3 pairs per worker per shift$1,314–$2,628
Reusable Goggles / Targeted Coveralls$6–$10/worker, 2–3×/yearReplacement for parlor crew$1,400–$2,000
Bulk-Tank PCR Testing$30–$50/test40–50 tests/year$1,200–$2,500
TOTAL — 1,000-Cow Herd$7,200–$12,500/year

Annual PPE math (1,000‑cow model, both shifts):

  • N95s: 6 workers × 365 days × 2 shifts × $0.75–$1.25 → $3,285–$5,475/year
  • Gloves: 6 workers × 365 days × 2 shifts × 3 pairs × $0.10–$0.20 → $1,314–$2,628/year
  • Goggles + targeted coveralls (2–3 per worker/year + replacement) → $1,400–$2,000/year
  • Total milking‑parlor PPE: ~$6,000–$10,000/year

Bulk‑tank PCR layer: 40–50 tests/year at $30–$50/test → $1,200–$2,500/year.

All‑in baseline biosecurity adder (PPE + bulk‑tank PCR), before wastewater capital: $7,200–$12,500/year. A 1,000‑cow herd at ~80 lb/cow/day produces about 292,000 cwt/year, so that adds $0.025–$0.043/cwt.

Annual H5N1 Biosecurity Cost by Herd Size

Herd SizeAnnual Parlor PPE (Low–High)Annual Bulk‑Tank PCRTotal Annual Biosecurity AdderMargin Pressure (per cwt)
500 cows$3,000–$5,000$1,200–$2,500$4,200–$7,500$0.029–$0.051/cwt
1,000 cows$6,000–$10,000$1,200–$2,500$7,200–$12,500$0.025–$0.043/cwt
2,000 cows$12,000–$20,000$1,200–$2,500$13,200–$22,500$0.023–$0.039/cwt

Per‑cwt assumes ~80 lb/cow/day, 365 days. PPE scales with parlor headcount and shifts; bulk‑tank PCR scales with tanks/loads, which is why mid‑size and large herds often stay in the same testing band.

For context, the 2024 federal Dairy Margin Coverage program calculated a national average margin of $11.98/cwt and never triggered payments at the popular $9.50/cwt coverage level — even as some regions saw real production costs closer to $23.65/cwt and on‑farm margin running roughly –$1.05/cwt. On a 200‑cow Northeast herd shipping 75 lb/cow/day, that’s about $57,500 of negative margin DMC didn’t touch.

Stack PPE, testing, and (eventually) wastewater on top of that. Each line looks manageable alone. They don’t arrive alone.

The Loop From Your Parlor Drain to Your Workers’ Lungs

Walk the water through your dairy. Parlor floors drain into collection pits. Pits pump to lagoons. Lagoon water comes back through flush lines to clean alleys, scrape lanes, or irrigate forage.

The Emory/CSU team found a live virus throughout that loop. H5N1 viral RNA was detected “throughout the wastewater stream, including in manure lagoons used by migratory birds and in fields with grazing cows.” 

The Risk Vector Nobody Drew on the Whiteboard: Drain → lagoon → flush line → mist at hoof level → parlor air → next cow → worker at her flank. The authors describe “extensive environmental contamination of H5N1 on affected dairy farms” that “identifies additional sources of viral exposure for cows, peridomestic wildlife, and humans.” 

When a recycled flush hits concrete under pressure, it throws a fine mist at hoof level. That’s air your cows and your people share. Open lagoons attract wild birds, which is how this whole thing landed in commercial cattle in the first place. Lab and wastewater modeling studies suggest influenza A virus carries a half‑life on the order of half a day at room temperature, with extended survival in cooler conditions. If lagoon water cycles back through flush lines on a shorter loop than that decay curve — without chlorination, UV, or deliberate holding time — you’re spraying live virus on concrete every shift. 

Put the “healthy” cows back on that path. Up to 60% of clinically normal cows on some study farms had already been exposed. A handful were actively shedding into the parlor drain. Drain feeds the lagoon. Lagoon feeds flush. Flush feeds the air. Air feeds the next cow — and the worker at her flank. 

Once you can draw that loop on your own dairy, the priorities shift.

Is Your 2026 Parlor SOP Built for an Airborne Pathogen?

Most parlor SOPs were written for mastitis. Gloves. Dips. Water temperature. Residue protocol. Almost none mention respirators, goggles, or exposure to airborne pathogens in the pit.

The PLOS Biology paper documented influenza virus in the parlor air at concentrations up to 10⁴ genome copies per liter of air sampled. At that level, “wear gloves and wash up” stops being a defensible protocol if a worker‑comp claim, a buyer audit, or a plaintiff’s attorney shows up. California’s Department of Industrial Relations already treats H5N1 dairy exposure as an actionable workplace hazard, including from asymptomatic animals. 

Three questions you should be able to answer this month without hedging:

  • At what trigger — county‑level detection, suspicious tank drop, positive bulk tank — do parlor workers move from voluntary to required N95 use?
  • Has anyone on your crew been fit‑tested for an N95, or are you guessing on sizes?
  • If your bulk tank comes back positive next week, do you have a one‑page worker briefing ready in the languages your crew actually speaks?

If any of those answers is “we’ll figure it out,” that’s where the real cost lives. Not in the PPE invoice. In the day, you have to figure it out under a microphone.

Let’s Sit Down at the Kitchen Table: The 30/90/365‑Day Playbook for Herds Like Bivalve Dairy’s

None of these moves requires new capital this week. They do require you to write things down — because in 2026, “we talked about it” is not a documented program.

30‑Day Actions: Get These Done Before Your Next Milk Check

Price your parlor PPE for your real headcount. Pull your shift schedule. Multiply parlor positions × 365 days × 2 shifts × your local N95 and glove prices. Know what the year looks like at $6,000 versus $10,000, then put that number in the 2026 operating budget — not “miscellaneous.”

Map your water on one page. Draw every parlor drain, hospital‑pen sump, lagoon cell, flush line, and irrigation lateral. Circle every place where sick milk or wash water enters the system. One evening, a herd manager and a marker — the only way to see the real risk path on your dairy.

Write the trigger. One paragraph that names the local conditions — county‑level detection, an unexplained tank drop, a positive bulk tank — that flips your parlor from voluntary masking to required. If you can’t write it down, your team can’t follow it on a Sunday night.

Red‑flag trigger. If your DSCR has been below 1.2 for three consecutive months on your lender’s worksheet, don’t take on new biosecurity capital this cycle without first renegotiating the term. Treat that as urgent.

90‑Day Actions: Structural Moves That Require Planning

Set a testing cadence. Monthly bulk‑tank PCR is the working baseline most state programs reference; weekly during local flare‑ups or after suspicious clinical patterns. At $30–$50/test, you’re committing roughly $1,200–$2,500/year. Cheap insurance — but only if a positive triggers actual isolation, not a meeting about isolation.

Get an engineer on the wastewater question. If you reuse flush water, you have three real options: separate cells for high‑risk streams, extended holding time before reuse to ride the virus’s decay curve, or targeted disinfection on the hottest branch. Published general water‑sanitation work (municipal and non‑dairy settings) suggests ballpark operating cost for practical chlorination or UV often lands around $0.50–$1.00 per 1,000 gallons, depending on dose and energy. This is not a dairy‑specific number — have your engineer and state regulator validate any design and cost for your system before committing capital. 

Where it backfires, disinfection chemistry can corrode equipment, alter nutrient handling, and trigger permit issues. Not a back‑of‑the‑envelope decision.

365‑Day Moves: Position for 2027

Start the insurance conversation now. Heading into 2027, Dairy Revenue Protection or your liability renewal, ask your agent three plain questions:

  • How are you treating H5N1 parlor exposure in the 2027 underwriting?
  • Does a documented PPE and wastewater program reduce my liability or workers’ comp exposure?
  • What biosecurity baseline are you assuming for my current coverage?

Insurers will likely look more favorably on operations that can show a documented program, but specific premium impact depends on your carrier, your policy, and your claims history. Have that conversation now, not after a claim. A 2026 DRP guidance already advises producers to “incorporate DRP into your broader business plan and strategy for 2026… including budgeting, investment plans and risk management strategies.” 

Build the one‑folder defense. PPE invoices. Training logs. Water‑flow map. Testing cadence and results. One binder. That’s what an inspector, buyer, auditor, or plaintiff’s attorney asks for first.

Watch for the opportunity signal. If H5N1 detections in your state begin to fall and your bulk‑tank tests stay clean, that could be a useful moment to talk with your agent about 2027 coverage before carriers fully build this exposure into pricing.

The Trade‑Off at the Heart of H5N1 Dairy Economics in 2026

The instinct is to wait. Wait for a confirmed case in your county. Wait for a buyer audit to ask. Wait for the renewal packet that forces the conversation.

The PLOS Biology data argue hard against that. By the time clinical signs appear, the air has already been carrying the virus, and a meaningful share of the herd may have seroconverted. Documentation built reactively under pressure costs more, holds up worse in litigation, and lands when operating cash is already strained. 

The trade is simple. You spend $7,200–$12,500/year on a risk you didn’t budget for, and it may never hit your postal code. You buy documentation that defends your worker‑safety position, your insurance terms, your buyer audit, and your liability exposure across the next 24 months — whether the virus shows up in your herd or not.

Operations like Bivalve Dairy installed boot‑station and fomite controls before the air data was published — exactly what the guidance said at the time. The new science doesn’t make that work wrong. It adds an airborne and waterborne layer that the previous playbook didn’t address. 

Take this back to your own books. What does your current parlor SOP actually say about respirator use on the day a positive bulk tank comes back? And what’s your real margin‑over‑feed dairy 2026 cost per cwt — at $0.025, $0.043, or higher — of finding out you don’t know?

Key Takeaways

  • The Emory/CSU PLOS Biology study (May 2026) puts live H5N1 in 11% of California parlor air samples and 60% PCR‑positive — your sick‑cow trigger is the wrong trigger when ~60% of clinically normal cows on one study farm already had antibodies in milk.
  • Budget $7,200–$12,500/year ($0.025–$0.043/cwt on 1,000 cows) for PPE + monthly bulk‑tank PCR before any wastewater capital, and scale it for your real headcount using the 500/1,000/2,000‑cow table — not “miscellaneous.”
  • In the next 30 days, map every drain, lagoon, and flush line on one page and write the trigger that flips your parlor from voluntary to required N95 use; if your DSCR’s been under 1.2 for three months, renegotiate term before you add biosecurity capital.
  • Start the 2027 DRP, liability, and workers’ comp conversation now — a documented PPE, water, and testing program is what defends your number when an inspector, buyer auditor, or underwriter shows up, whether or not H5N1 ever hits your postal code.

Complete references and supporting documentation are available upon request by contacting the editorial team at editor@thebullvine.com.

Learn More

The Sunday Read Dairy Professionals Don’t Skip.

Every week, thousands of producers, breeders, and industry insiders open Bullvine Weekly for genetics insights, market shifts, and profit strategies they won’t find anywhere else. One email. Five minutes. Smarter decisions all week.
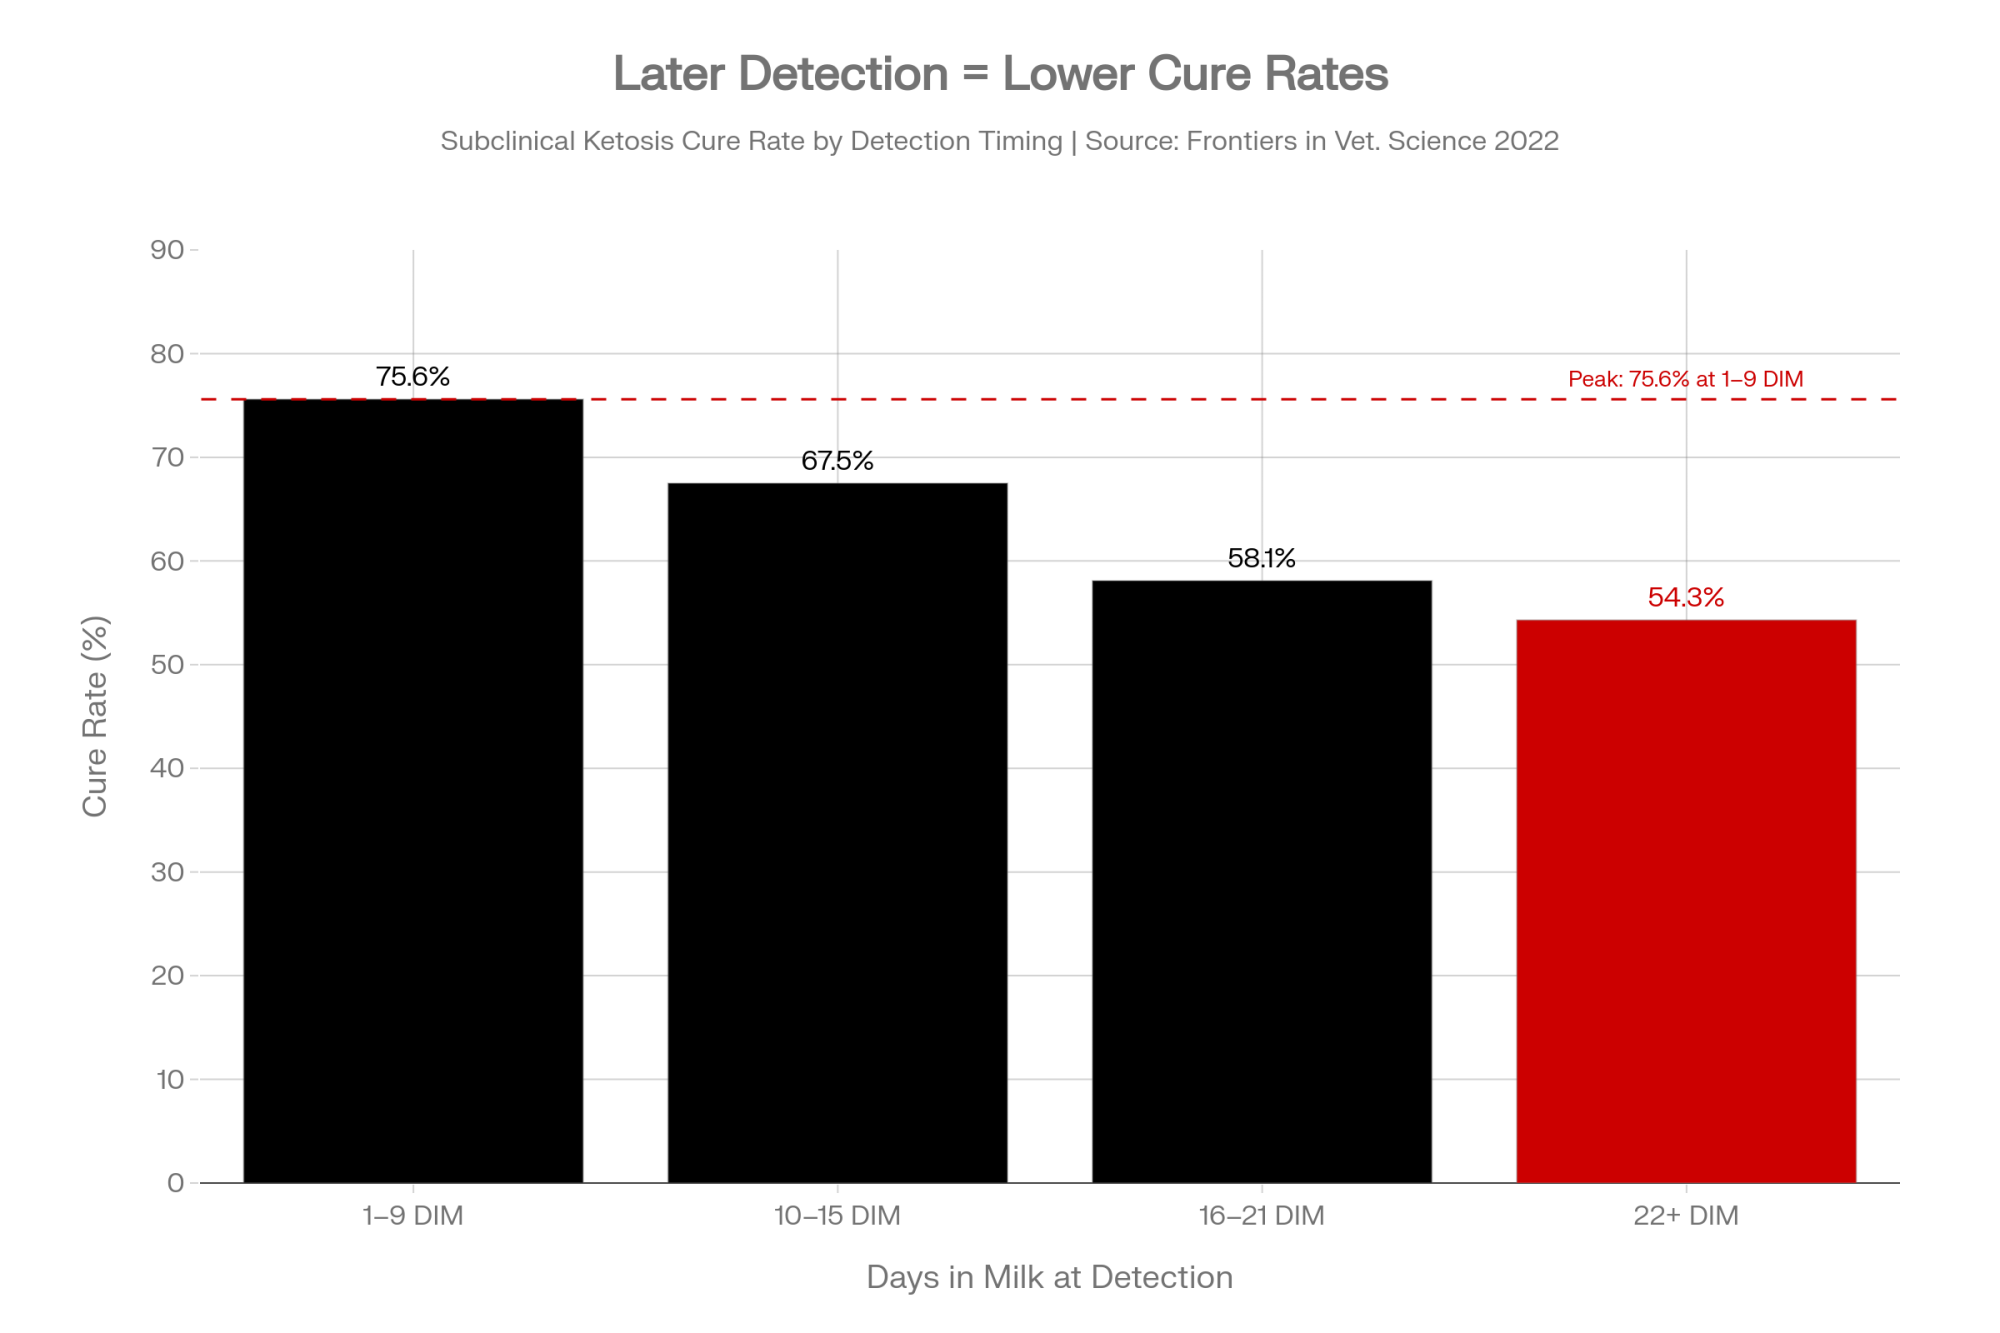
NewsSubscribe
First
Last
Consent

$3,010 Heifers and the $40,000 Calf Program Math You’re Not Running

On a 500‑cow herd with 220 heifer calves a year, even 4% pre‑weaning mortality buries about $27,000 in lost heifers alone — at $3,010 per head, before genomics or sexed semen. At 5–6%, that same line item passes $40,000. Still think your $30 calf program is “good enough”?

Replacement heifers are at their lowest U.S. inventory since 1978, and CoBank analyst Abbi Prins doesn’t expect supplies to really recover until 2027 — with replacements already averaging over $3,000 a head in many markets. Out by the hutch row, that doesn’t feel like a market report. It feels like a dead calf that suddenly got a whole lot more expensive. In a heifer market that’s roughly 800,000 head short over 2025–2026, every calf that dies in the hutch row isn’t bad luck. It’s a four‑figure hole in a pipeline you can’t easily refill.

We Built the Beef‑on‑Dairy Exit. Now We’re Paying for the Entrance Back In.

Ken McCarty of McCarty Family Farms in Colby, Kansas, still remembers standing by the loading chute when Holstein bull calves were “two for $5” and nobody wanted them. That kind of pain helps explain why so many U.S. dairies were quick to shift more cows to beef‑on‑dairy as calves started bringing $600, then $1,000, then $1,400 a head in some markets. For a while, the bottom‑tier “beef exit” finally worked — cash today, fewer problem calves tomorrow.

Related Reading: $3,010 Per Heifer. 800,000 Short. Your Beef‑on‑Dairy Bill Is Due.

At the same time, sexed dairy semen quietly went from niche tool to default button on the better cows. NAAB’s 2024–2025 semen data — which The Bullvine unpacked in “NAAB’s $327.6 Million Semen Boom vs. $3,000 Heifers” — shows just under 66 million bovine semen units sold and $327.6 million in export value. Inside the roughly 16.5 million dairy units used on U.S. cows, the mix has flipped: about 10.6 million are gender‑selected dairy semen (64%of dairy units), around 6.0 million are conventional dairy, and about 8.1 million units are beef semen used on dairy cows. Put simply, you’re running roughly 43% sexed dairy, 24% conventional dairy, and 33% beef‑on‑dairy across all semen used on dairy cows in the U.S. today.

That cocktail made sense when replacement heifers were cheap and the pipeline was full. It doesn’t anymore. USDA NASS’s January 2025 Cattle report put U.S. dairy replacement heifers 500 pounds and over at 3.914 million head — down 0.9% from 2024 and the lowest level since 1978. CoBank’s August 2025 analysis projects inventories will shrink by an estimated 800,000 head over 2025–2026 before starting to rebound in 2027, with replacement prices likely to “climb well above $3,000 per head.”

McCarty’s “two for $5” bull calves are gone. The heifers replacing them are $3,010 animals riding on the thinnest replacement pipeline you’ve seen in your career. His generation gave away bull calves. Yours is leaking value in the heifer hutches — just more expensively. In that reality, you can’t afford to run a $30 calf program and call it good enough.

How $3,010 Heifers Die on $30 Calf Programs

Let’s put some barn math under the gut feeling.

Take a 500‑cow herd freshening about 220 heifer calves per year. NAHMS 2014, analyzed by Urie and colleagues, reported 5.0% pre‑weaning mortality in U.S. heifer calves nationally, with many real‑world herds today running closer to 3–5% when records are tight. Use 4% as a realistic working number for your operation. That’s about 9 dead heifer calves before weaning.

At $2,660 per head — the U.S. average replacement cow price in January 2025 — those 9 deaths represent about $24,000 in lost heifers. At $3,010–3,110 per head — mid‑ to late‑2025 averages in several U.S. markets — you’re burying roughly $27,000–28,000 in heifers alone. If your number drifts up toward 5–6%, that line item climbs past $33,000–40,000 quickly — and that’s the math behind this article’s headline.

And that’s just the heifer value. It doesn’t include:

  • $40–50 per heifer in genomic testing, with CLARIFIDE®‑type programs commonly around $43/head.
  • $15–30 per straw premium for sexed semen over conventional, consistent with economic work and current semen price sheets.
  • IVF or ET on your top donors — often hundreds of dollars per live heifer calf after you spread donor, flush, lab, and recipient costs across pregnancies.

When a genomic‑tested, sexed semen heifer calf dies in the hutch at 19 days, you’re not just losing “a calf.” You’re losing a four‑figure replacement you can’t easily buy back — plus the semen and IVF bills stacked underneath her.

Investment ItemCost per CalfRunning Total
Sexed Semen Premium$15–$30$15–$30
Genomic Test$40–$50$55–$80
IVF/ET (per live calf)$200–$400$255–$480
Subtotal (Genetics)$255–$480
Extra Nutrition (Penn State)$42–$50$297–$530
TOTAL PER HEIFER CALF$297–$530

The slower leak is the one that doesn’t show up in the dead loss column, but still costs you. Calves that survive scours or pneumonia but limp along on growth often freshen late, give less milk in early lactations, and leave the herd sooner. On a 500‑cow dairy, a couple dozen of those “almost fine” cows can flatten herd progress for years without ever making the problem list.

Buying the Ferrari, Using Regular Gas: The $30 Management Leak

You’re already paying for the Ferrari with sexed semen, genomic tests, and IVF on your best cows. The question is whether you’re still putting regular gas in it.

Colostrum and passive transfer. U.S. calf‑health work shows that on many dairy operations, 20–40% of calves still fail to achieve adequate passive transfer [VERIFY: cite Lombard et al. 2020 review or NAHMS Dairy 2014 — confirm exact source/date]. A major review of passive transfer failures found that these calves are about twice as likely to get sick or die early as calves that reach target IgG levels. The reasons are painfully familiar: first feeds drifting past the 2‑hour mark, “we got about two quarts in” instead of a full volume, and colostrum “quality” judged by color and cow parity instead of a Brix reading. A Brix refractometer costs less than one‑tenth of a dead heifer at $3,010.

Related Reading: [INTERNAL LINK: Bullvine calf-mortality-economics piece — hidden gem candidate] → Suggested anchor text: “The Critical Economics of Calf Mortality: Why Every Life Counts More Than Ever.”

Pre‑weaning nutrition. Soberon and Van Amburgh’s work pulled data from a Cornell research herd and a commercial herd. For each 1 kg/day increase in pre‑weaning average daily gain, first‑lactation milk yield increased by about 850 kg in the research herd and 1,113 kg in the commercial herd. A 2016 Journal of Dairy Science review confirmed that keeping average daily gain above 0.5 kg/day with adequate nutrients is linked to higher milk, fat, and protein yields in first lactation. But if that extra nutrition is going into dirty bottles, under‑bedded hutches, or calves that never got decent passive transfer, you’re just buying more expensive scours.

Disease pressure. Urie et al. reported that digestive and respiratory disease together account for a majority of pre‑weaning heifer deaths on U.S. dairies. Other studies have linked early‑life disease to reduced growth, higher treatment costs, and greater odds of early culling. In the “two for $5” bull‑calf era, you could absorb a handful of fragile replacements. In a market where USDA has heifer inventories at their lowest since 1978, every sick, slow‑growing calf is a capital asset you may never fully earn back.

Every weak link in the first 60 days turns a high‑genetic heifer into either a dead loss or a lower‑yield, shorter‑lived cow. That’s always been bad management. At $3,000‑plus per heifer, it’s pipeline suicide. The herds that flip those numbers don’t do it with a new binder — they do it by giving one person clear ownership of the hutch row, which is exactly what the I‑29 case in Option 3 below shows.

How Much Is “Cheap” Calf Nutrition Actually Saving You on $3,010 Heifers?

Here’s where the “we can’t afford a better replacer” argument starts to fall apart.

Penn State’s 2023 bulletin “Economics and Effects of Accelerated Calf Growth Programs” compared a standard 20:20 milk replacer at $80 per 50‑lb bag to a higher‑quality replacer at $100 per bag in a 56‑day feeding program (2023 prices — adjust to your current bag cost). In a scenario where calves moved from gaining 1.1 lb/day to 1.5 lb/day, feed cost increased by about:

  • $41.92 per calf on the $80/bag program.
  • $50.26 per calf on the $100/bag program.

Spread over 56 days, that works out to roughly:

  • $0.75 per calf per day extra on the cheaper program.
  • $0.90 per calf per day extra on the higher‑quality program.

Round it, and you’re talking about $42–50 extra per calf to run a higher plane of nutrition. On 200 heifer calves a year, that’s an additional $8,400–10,000 in milk replacer cost.

Related Reading: 17–26x ROI: Why Top Dairies Stopped ‘Saving’ Calves and Started Preventing Loss.

Now put today’s heifer prices on the other side of the ledger. At $3,010 per head, if tightening up colostrum and stepping up nutrition together drop heifer calf mortality from 4% to 2% on those 200 heifers, that’s 4 extra heifers alive. Four at $3,010 is $12,040 — more than enough to cover the $8,400–10,000 in extra feed.

You don’t even need a full 2‑point drop to break even. If you spend $10,000 more on calf feed and each heifer is worth $3,010, you need to save about 3.3 heifers. On 200 heifers a year, that’s roughly 1.6 percentage points of mortality improvement. At the lower feed cost ($8,400), the breakeven is closer to 1.4 points. Either way, you’re still only aiming to save one to two extra heifers per 100 born.

Will every farm see that from a replacer change alone? No. Colostrum timing, housing, bedding, and people following the protocol all matter. But at current heifer values, the breakeven for a better calf program has moved much closer than it used to be.

What’s the Real Cost of Your Calf Program?

The easiest way to dodge this question is to say, “Our calf program is fine.” The harder way is to pull the numbers and see if it actually matches the genetics bill you’re paying.

Start with last year’s heifer calf crop. If you had 220 heifer calves born and lost 4% before weaning, that’s about 9 heifer calves dead. At your replacement value — anywhere from $2,660 in early 2025 to $3,110 by late 2025 — you’re looking at a $24,000–28,000 line item just for dead heifers. Then add in the extras: sexed semen premiums, genomic tests, and any IVF work you did on the cows those heifers came from. If that number doesn’t make you uncomfortable, check it again.

Now compare your calf program spend to that loss. Penn State’s math shows an extra $42–50 per calf in replacer cost on 200 heifer calves — call it $8,400–10,000 per year — can break even if you save just one or two extra heifers per hundred born at $3,010 each. Does your current calf program pass or fail that simple barn‑math test?

Who Really Owns the Hutch Row?

On paper, you might say, “Our calf team handles it.” In practice, that often means whoever finishes milking first or whoever drew the short straw that week.

Ask yourself one blunt question: if you walked into the office right now and asked, “Who owns calf outcomes here?” would you get one name in under five seconds — or a vague, “We all do”? Herds that win this game usually have a single person who owns colostrum, calves, and the key numbers: FPT %, heifer calf mortality, and weaning weights.

You don’t need a fancy HR plan to get there. You need to pick the person who notices calves first, give them clear authority over calf protocols, and put their numbers on the board every month next to pregnancy rate and SCC. When calf care is shared across whoever has time, even $3,010 heifers can quietly get less focused attention than they really need.

MetricWhat It MeasuresTargetAction Threshold
FPT %Calves failing passive transfer (serum total protein <5.2 g/dL)<10%>15%
Pre-Weaning Heifer Mortality %Heifer calves dead before weaning<3%>4%
Average Daily Gain (Pre-Weaning)Pounds gained per day, birth to weaning>1.5 lb/day<1.1 lb/day
Weaning WeightAverage weight at 8 weeks>200 lb<180 lb
Days to First CalvingAge at first calving<24 months>26 months

Options and Trade‑Offs for Farmers

You don’t have to fix everything this month. But you do need to stop running a $30 calf program under a $3,010 heifer reality. Here are four paths, how they work, and where they can bite you.

1. Lock Down Colostrum — Your 30‑Day Action

If your heifer replacements are worth more than about $2,500 and your heifer calf mortality is over roughly 3–4%, that’s a strong signal that this is where you start.

In the next 30 days, pull the last 12 months of heifer‑calf data and calculate your actual pre‑weaning heifer mortality. Not a gut feel — the real number from your records. Brix‑test colostrum from every fresh cow for at least one full week and draw a hard line: nothing under 22% Brix goes into heifer calves. Then draw blood from every calf born during that week at 24–48 hours and run serum total protein. If more than 10–15% of those calves fall below the accepted passive‑transfer threshold, your most expensive pipeline leaks.

When this path makes sense: any time replacements are valuable, and you haven’t done a proper FPT audit in the last 12 months. What it requires: a Brix refractometer, some blood tubes, a small lab bill, and a willingness to change how quickly and how much colostrum gets fed. Where it fails: you collect the numbers and then write them off as “just a bad week” instead of changing milking‑fresh, storage, and first‑feeding routines.

2. Upgrade Calf Nutrition With Numbers, Not Hope

This path is for herds already investing in genomics and sexed semen but still seeing 4–5% heifer calf mortality and a thick treatment notebook.

You’re basically asking one question: does the extra $42–50 per calf Penn State lays out for a higher‑plane program pay off at $3,010 per heifer in your barn? Use their math as the backbone and plug in your own replacer price, mixing rate, and days on feed. Then compare that extra spend to what saving one or two extra heifers per hundred born is worth in your herd.

You’ll also need to tighten mixing accuracy, feeding schedule, and hygiene. A better bag doesn’t fix dirty bottles or inconsistent solids.

When this path makes sense: you’ve already got decent colostrum numbers but still see too many sick, slow‑growing calves. What it requires: shifting away from “whatever 20:20 is cheapest” toward a consistent, all‑milk‑protein replacer and enforcing protocol discipline. Where it fails: you upgrade the replacer but leave colostrum, housing, and staff training the same. That’s just a more expensive way to keep the same problems.

3. Put Real Ownership on the Calf Barn

On some dairies, the calf barn turns not because a consultant writes a binder, but because one person quietly decides, “These calves are mine.”

Maybe it’s the herdsman’s daughter who has a knack for spotting dull eyes and droopy ears. Maybe it’s the feeder who hates seeing the same calf on the treatment list twice. On one 600‑cow I‑29 herd a consultant works with, the turning point was simple: the owner told their sharpest young employee, “You own hutches and colostrum. I’ll measure you on FPT %, death loss, and weaning weights — and I’ll back you when you need changes.” Within a year, that farm’s heifer calf mortality had dropped, and the owner quit saying, “Our calves are just weaker.”

When this path makes sense: nobody in your place can answer “Who owns calf outcomes here?” without looking around. What it requires: giving one person clear authority over calf protocols and tying their success to three KPIs: FPT %, heifer calf mortality, and weaning weights. Then sitting down monthly to review those numbers alongside repro and SCC. Where it fails: you give someone the title but not the time, training, or authority. If calf chores are still what happens when people finish everything else, the numbers won’t move.

4. Benchmark Calves the Way You Benchmark Cows

With CoBank’s shortage timeline and beef‑on‑dairy locked in for 2026, flying blind on calf performance is the wrong gamble.

Sponsored Post

Related Reading: Updated NAAB Data Cuts CoBank’s Heifer Shortage Projection — The Barn Math Says It Doesn’t Matter Yet.

When this path makes sense: you genuinely don’t know how your calf metrics stack up against herds that look like yours. What it requires: pull a year of heifer‑calf data and break mortality into 0–3 days, 4–21 days, and 22 days to weaning. Add FPT % and weaning weights. Then work with your vet, nutritionist, or a university project to benchmark against peer herds. Where it fails: you see that your numbers sit in the bottom third and decide “our calves are just weaker” instead of changing something.

Key Takeaways

  • If your heifer replacement value is above roughly $2,500 and your heifer calf mortality is over 3–4%, stop treating that as background noise. Treat it like an economic leak. Multiply last year’s dead‑heifer count by $2,660–3,110 and ask whether you’d accept that line item if it showed up as a bill from your vet or semen rep.
  • If you’re running a high beef‑on‑dairy percentage without a locked‑in heifer plan, you’re stacking two bets: that beef calf premiums stay strong and that replacements will be there when you need them. CoBank’s 800,000‑head shortfall and USDA’s lowest‑since‑1978 inventory should make you nervous about the second part.
  • If you’re willing to spend about $43 per heifer on genomics and pay a $15–30 sexed‑semen premium,balking at an extra $42–50 per calf on a better colostrum and nutrition program doesn’t pencil. The breakeven is saving roughly one to two heifers per 100 born at $3,010 each.
  • If nobody on your farm “owns” calf outcomes with data, your calf program is still operating more like a chore than a managed system. Name a calf manager and give them three numbers to live by: FPT %, heifer calf mortality, and weaning weights.
  • If you haven’t Brix‑tested colostrum and run serum total protein on a batch of calves in the last 12 months, your colostrum program is still a story, not a fact. Make that your 30‑day project.

Your Calf Barn Checklist — Print This and Take It Outside

  • ☐ The Brix Test: Is every gallon of colostrum for heifer calves testing at or above 22% Brix before it goes into a bottle?
  • ☐ The 2‑Hour Rule: Are calves reliably getting their first colostrum within 2 hours of birth, or are there still “shift change” calves waiting longer?
  • ☐ The FPT Audit: Have you checked serum total protein on the last 10 heifer calves born? What percentage cleared the passive‑transfer threshold?
  • ☐ The Mortality Number: Can you write down your actual 12‑month pre‑weaning heifer calf mortality rate — not a guess, but the number from your records?
  • ☐ The Cost‑Per‑Death: Take that mortality rate, multiply by your annual heifer calf crop, then by $3,010. That’s what lost heifers cost you last year — before you add in genomics, sexed semen, or IVF.
  • ☐ The Replacer Math: How much does your current milk replacer cost per calf through weaning? What would an upgrade cost? How many extra heifers per 100 born would need to live for that to pay off at $3,010 per head?
  • ☐ The Pipeline Check: How many bred heifers and springers do you have on hand right now, divided by how many replacements you actually need each year? If that ratio is under 1.0, you’re already short. Under 0.8, you’re in trouble if CoBank’s 2027 recovery timeline holds.
  • ☐ The Owner Question: Is there one name — not “the team” — on this farm who owns those calf numbers?

Heifers aren’t about to get cheaper. USDA NASS’s January 2025 report and follow‑up analysis put replacement heifers at 3.914 million head, the lowest since 1978, and CoBank’s best‑case scenario has inventories just starting to recover in 2027. The genetics you’re putting into cows today are some of the most expensive you’ve ever bought. The calf barn is where you decide whether that money turns into cows or compost.

So here’s the real question: do your calf numbers match the genetics bill you’re paying — or are you still running a $30 program under a $3,010 heifer reality?

Run Your Numbers

Bullvine Pipeline Index Calculator — This free tool turns your heifer pipeline into a single 0–100 score and shows whether your current calf losses, beef-on-dairy use, and cull rate can actually support tomorrow’s herd. Use it to see if your $30 calf program matches your $3,010 heifer reality.

Learn More

The Sunday Read Dairy Professionals Don’t Skip.

Every week, thousands of producers, breeders, and industry insiders open Bullvine Weekly for genetics insights, market shifts, and profit strategies they won’t find anywhere else. One email. Five minutes. Smarter decisions all week.
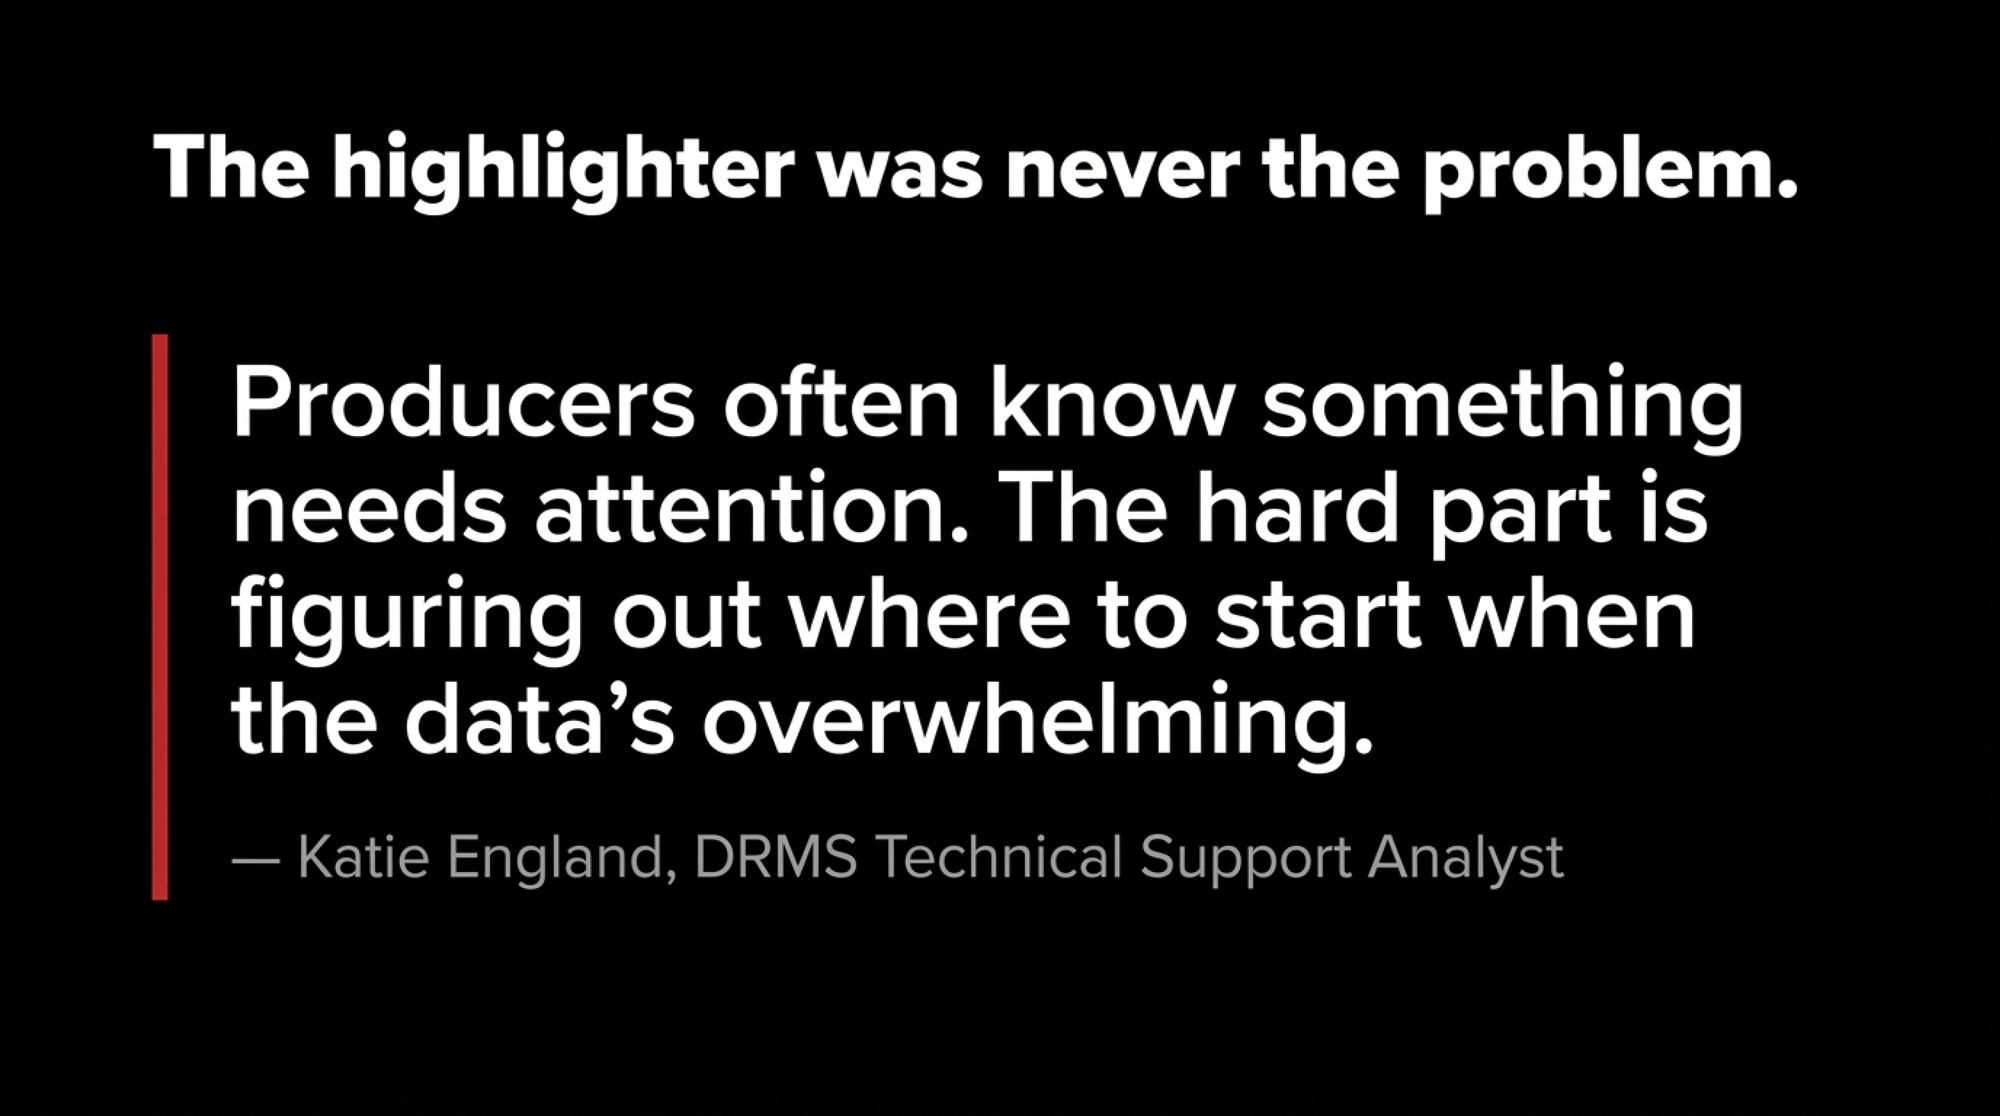
NewsSubscribe
First
Last
Consent

168 Steers. One Closeout. $33,000 Riding on the Sire Sheet You Ordered Last Fall.

A 480-cow Panhandle dairy pulled its full-year beef-on-dairy closeout this spring. The verified load grading alongside it cleared $33,000 more. Same plant, same months, different sire decisions made 18 months ago.

Executive Summary: The sire decisions you made 18 months ago are already on the packer’s grading sheet — and on a 480-cow dairy running 35% beef-on-dairy, the spread between a verified, high-marbling program and a generic one runs roughly $33,000 a year in carcass value on 168 head. Penn State’s published trial puts Red Angus × Holstein crosses at marbling score of 5.03 versus Limousin crosses at 4.14 — a gap that translates to $50–$150/head on a typical Choice/Select grid, stretching past $150 when spreads blow out the way they did in Q4 2025. Add Premier Select Sires’ reported $190–$210/head ProfitSOURCE carcass premium (vendor-published, no independent replication yet), and the math isn’t theoretical — it’s a line item that’s already being paid to somebody. The replacement side makes it worse: that same 480-cow operation is staring at a near-$200,000 springer liability in 2027 against $235,200 in beef calf revenue, leaving roughly $35,000 net before any other cost — and CoBank’s August 2025 report projects roughly 800,000 missing dairy replacements across 2025–2026, so the heifer market won’t soften the blow. The fix is on this week’s semen order, not next year’s purchase ledger: any beef bull on your sheet posting a Marbling EPD below CAB’s +0.65 “Targeting the Brand” floor is costing you on the grid, and any load leaving without EID tags and sire records is forfeiting the $50–$200/head verification premium that tagged loads from the same dairy could already be earning. Pull last year’s beef semen invoices and check the average Marbling EPD — that number tells you more about your 2026 carcass cheque than anything happening at the sale barn right now.

beef-on-dairy sire selection

Picture a little after dawn at a Texas Panhandle packer. A 480-cow Holstein operator is sitting at a procurement desk with the cumulative closeout for his entire year’s beef-on-dairy crop in front of him — 168 head, twelve months of kill dates, every grading line tallied. The kind of plant visit a producer arranges when he wants to see what 18 months of beef semen decisions actually paid.

What the closeout shows isn’t a wreck. It’s worse, in a way.

The cattle are stuck in the middle. Too much Select. Almost no Prime. A clutch of yield grade 4s pulling discounts. And on the same screen, beside that year’s tally, sits a verified beef-on-dairy closeout from another dairy — heavier carcasses, higher marbling, a clean Prime/CAB column. Same plant. Same twelve months. Very different cheques.

The packer already knows which dairy sent which calves. Most producers are the ones flying blind.

Editor’s note: this profile is a composite drawn from NAAB, USDA AMS, CoBank Knowledge Exchange, ProfitSOURCE, and Penn State data, representative of mid-size Panhandle operations running 35% beef-on-dairy.

What’s Changing and Why

Beef-on-dairy isn’t a side hustle anymore.

NAAB’s 2024 Regular Members Semen Sales Report shows roughly 9.7 million units of beef semen sold in the U.S., with the majority going into dairy herds — industry trade reporting derived from NAAB-CSS export-segmented data has consistently put the dairy share well above three-quarters of the total. NAAB’s 2025 report (released March 10, 2026) carries the trajectory forward: beef-on-dairy now represents roughly a third of all U.S. dairy services — the continuation of a decade-long climb tracked by CattleFax.

CattleFax estimates beef-on-dairy crossbred calf production climbed from roughly 50,000 head in 2014 to about 3.22 million in 2024. The dairy barn has quietly become a year-round terminal protein factory. And packers are pricing accordingly.

The data trail is what’s shifting now

Plants increasingly know exactly which dairy a load came from, which sires those cattle trace back to, and how earlier loads from the same source closed out.

CoBank’s February 24, 2025 Knowledge Exchange report — Emerging Data Begins to Quantify Value Beef and Dairy Crossbred Cattle Bring to U.S. Beef Supply Chain — found program-verified beef-on-dairy averaging slightly above purebred beef and well above straight dairy steers.

USDA Cattle Contracts Library data, summarized by Farm Progress on September 18, 2024, put the per-head “beef/dairy cross” discount versus native beef at about $18.75 simple average ($2.34/cwt), with straight dairy steers absorbing several times that discount in the same dataset. That gap shows up in the same series Brad Kooima walked through when he called beef-on-dairy “a packer’s dream” — and the $117K bill that came with it.

Decisions made in the breeding barn — which bulls, which cows, which percentage to beef — show up months later as premiums or discounts most producers never see itemized. The herds most exposed: mid-size and large operations running 25–40% beef-on-dairy without verification, mixing sires by price, and assuming “Angus” on the invoice does the work. It usually doesn’t.

How This Plays Out on Real Farms

Take that 480-cow Panhandle operation. About 35% of services to beef — roughly 168 beef matings a year, give or take.

The story everyone in the coffee group was telling: $1,400–$1,700 a head for beef-on-dairy calves through this spring’s USDA AMS Iowa and South Dakota auction series, easy money compared to $700–$900 Holstein bulls. On paper, that’s $235,000–$285,000/yr in beef calf revenue.

Then the other side of the ledger came due.

USDA AMS National Dairy Replacement Heifer Report (spring 2026): springers averaging roughly $3,000/head nationally, with top Panhandle pens clearing $3,500–$4,500.

A heifer pipeline running closer to a low-eighties birth-to-fresh completion rate — the working benchmark in DCHA Gold Standards and Penn State’s Heifer Investment Model — doesn’t keep the parlor full at that scale. Suddenly the calf cheque doesn’t look like profit. It looks like a down payment on the heifers you’ll have to buy back.

The simple version of the math

Run the pipeline backward: at 35% beef share, the dairy is breeding ~312 cows to dairy and getting roughly half female; at industry-typical completion rates against a ~168-fresh-heifer-per-year requirement, the conservative shortfall on this herd lands near 50 head.

Line itemFigure
50 missing heifers × $4,000 springer$200,000 replacement liability
168 beef calves × $1,400 mid-range$235,200 revenue
Net before any other cost~$35,000

The “win” gets eaten before the trucks even leave the yard. It’s the same hole 22 Tuesdays of beef breeding can dig into a 480-cow heifer pen — and the bill lands in 2027, not this quarter.

Path30-Day Action$/Head UpsideKey RiskIdeal For
Tighten sire listCut to 2–3 bulls ≥ +0.65 Marbling EPD$50–$150 carcass upliftBuying commodity straws that still yield SelectHerds with stable replacement pipeline
Cap beef % at 20–25%Shift top-third cows to sexed dairyHeifer pipeline protected by 2027–28Forfeit some beef calf revenue this yearHerds already short on replacements
Join verified programEID tags + sire records on every calf$50–$200 calf-stage premiumColostrum/vaccination protocol complianceOperations shipping full loads consistently
Build feedyard relationshipCommit to sire/health consistencyRepeat bids, less price discovery riskOne bad load can cost future bids for yearsAny herd size, if management is consistent
Do nothing (status quo)None$0~$18.75/head generic beef/dairy discount already baked into every bidNobody — this is the hole the article is describing

Now overlay the rail data

Premier Select Sires reports, in its April 2024 ProfitSOURCE brochure, that ProfitSOURCE carcasses in the company’s own multi-yard research averaged $190 to $210 more per head than carcasses from cattle in unnamed competing programs harvested alongside them — driven by carcass weight and marbling. The figure is vendor-published; independent third-party replication isn’t yet in the public record.

Even taken at the company’s stated range, on a 168-head load that works out to $31,920–$35,280 a year in carcass value moving to whichever dairy did the verification work. That midpoint — $200/head × 168 head — is where the $33,000 in the headline lives.

Not a guess. A grid line item.

The Mechanics Behind the Outcomes

Three things drive the difference, and none of them are mysterious.

1. Marbling

The Penn State sire-breed comparison published in Translational Animal Science (Basiel et al., 2024; PMC11005759) compared 262 beef × Holstein steers.

Sire breedMarbling scoreUSDA grade context
Red Angus × Holstein5.03Right at Small⁰⁰ — bottom of low Choice
Angus × Holstein4.82Top of Slight, brushing the Choice line
Limousin × Holstein4.14Slight territory, below the Choice threshold most grids reward

Limousin and Continental sires are typically selected for cutability and yield rather than marbling — different trait priorities, different grid outcomes.

A high-marbling Angus sire — Marbling EPD at or above CAB’s “Targeting the Brand” floor of +0.65 — can put the majority of his calves into Choice or better, per the Certified Angus Beef Sire Selection Tool. A bargain bull at +0.30 to +0.45 leaves a far thicker tail of his calves stuck in Select.

On a typical 2024–2025 grid example with a $12/cwt Choice/Select spread, $4/cwt CAB premium, and $15/cwt Prime, that distribution gap is worth roughly $50–$100/head. It pushes past $150/head when Choice/Select spreads blow out the way they did in late 2025.

2. Dressing percentage and feedlot efficiency

Beef-on-dairy cattle still run about a percentage point lower in dressing percentage than purebred beef. That’s structural to the dairy dam, not fixable by sire choice.

But sire breed shifts ADG meaningfully. In the same Penn State trial:

  • Angus crosses gained 1.76 kg/day
  • Wagyu crosses gained 1.39 kg/day — needing roughly 24–26 extra days on feed

A trade-off Wagyu programs accept in exchange for premium-meat marbling outcomes outside this study’s grid scope. The feedlot pencils every one of those extra days into next year’s bid for your calves.

3. Verification

Without sire records and EID tags, your calves get bucketed as generic “beef/dairy cross.” That’s where the $18.75/head, $2.34/cwt average discount lives in the USDA Cattle Contracts Library data — and that’s exactly what the feedlot already knows when your $1,400 calf shows up without a sire record. Feedlot buyers price that risk in. They have to.

How Much Is the Wrong Sire Actually Costing You Per Head?

In normal grid conditions, the gap between an Angus bull whose calves consistently land in upper Choice and one whose calves flood Select runs about $50–$100/head in marbling-driven value.

When the Choice/Select spread widens and Prime premiums run hot — like they did across Q4 2025 — that same gap can stretch past $150/head on the same live weight.

On a 168-head load: $8,400 at the low end. Over $25,000 at the high end. Every year. Every load. Compounding quietly while the breeding sheet stays the same.

That’s before verification. Combine the marbling math with Premier Select Sires’ reported $190–$210/head ProfitSOURCE premium, and you’re looking at roughly $33,000 a year in carcass value moving in or out of your pocket on a 168-head program.

The number isn’t theoretical. It’s already getting paid to somebody. The only open question is whether it’s being paid to you.

Is Your Breeding Sheet Already Behind the Market?

Quick gut check. Pull last year’s beef semen invoices and ask three questions:

  • How many different bulls are on it?
  • What’s the average Marbling EPD across those bulls?
  • How many of your beef calves left the farm with sire ID and program tags?

If the answer is “more than five bulls, mixed carcass EPDs, no program,” your operation is almost certainly in the bucket buyers price as generic beef-on-dairy. The fix isn’t a new system. It’s the next semen order — and that’s the part you can actually move this week.

Options and Trade-Offs for Farmers

There’s no silver bullet. But there are a few clear paths producers are walking right now, and each one has a different ceiling and a different risk.

Path 1 — Tighten the sire list this week (the 30-day move)

Cut to 2–3 high-marbling beef bulls that clear CAB’s +0.65 Marbling EPD floor and post strong beef-on-dairy indexes (American Angus Association’s $AxH or American Simmental Association’s Terminal Index).

  
Reward$50–$150/head in marbling-driven carcass value; visible on next closeout
RiskThe trap of buying low-tier commodity beef straws that yield Select carcasses — per-straw cost climbs before calf premiums catch up
When it worksWhen you can commit enough straws to actually shift the carcass distribution on your next load
TimingNext week’s straw order. The move you make first.

Path 2 — Cap the beef percentage

Pull beef-on-dairy back from 35–40% of services to 20–25% on herds already short on replacements, and put more sexed dairy on the top genomic third of cows.

  
RewardRefilled heifer pipeline by 2027–28; protection against the kind of Panhandle Springer Tax already sitting on a 500-cow breeding sheet
RiskForfeit some beef calf revenue this year
When it worksWhen your heifer math says you’re heading into a $150K+ replacement liability
BackdropCoBank’s August 2025 heifer report projects roughly 800,000 missing dairy replacements across 2025 and 2026 — the springer market won’t bail you out

Path 3 — Get into a verified program

ProfitSOURCE, Beef InFocus, and similar platforms tie sire, health, and birth records to an EID.

  
Reward$50–$200/head calf-stage premium for verified, sire-identified calves over generic crosses (Purina 2024 Beef-on-Dairy Industry Report; AgProud, October 2022) — before any downstream carcass uplift
RiskReal protocol follow-through on colostrum, vaccinations, tagging — the paperwork has to match the calf
When it worksWhen you can reliably ship loads, not onesies

Path 4 — Build the relationship, not just the genetics

Some dairies are signing direct or repeat arrangements with feedyards and order buyers who get to know their cattle.

  
RewardRepeat bids, better price discovery, fewer surprise discounts
RiskOne bad load can quietly cost future bids — UW–Madison Livestock Extension (August 2024) reported about 25% of buyers will not bid at all on cattle from sellers with a negative reputation. Rebuilding takes years.
When it worksAny size, if you commit to consistency

Quick Checklist: Five Bulls to Pull from Your Beef Semen Order This Week

  • Any beef bull with a Marbling EPD below +0.65 (CAB’s “Targeting the Brand” floor).
  • Any bull bought on price, not on a published carcass index.
  • Bulls with no published Ribeye or Yield Grade EPD on the breed-association database.
  • Any bull whose only selling point on the rep’s sheet is “black hide.”
  • Bulls being used as clean-up after your top picks — the same straws are landing in your tank without scrutiny.

Key Takeaways

  • If your beef calf check is funding more than 60% of your projected replacement liability, the breeding sheet is the lever — not the calf market.
  • If any beef bull on your sheet posts a Marbling EPD below +0.65, either replace him or run the math on what his Select-heavy distribution is costing you per head.
  • If your birth-to-fresh completion sits in the low eighties and your beef share is above 30%, your fresh-heifer count is probably running about a third short of need. Map it before next breeding season.
  • If your beef calves leave without EID tags and sire records, you’re forfeiting the $50–$200/head verification premium that tagged loads from the same dairy could earn.
  • If your replacement plan currently relies on buying $3,500–$4,500 springers in 2027, the cheaper fix is on this year’s semen order, not next year’s purchase ledger.
  • If you’ve never seen one of your loads grade, ship a verified load and an unverified load through the same channel this quarter. Compare the bids. The spread will answer the question better than any spreadsheet.

What Will Your Next Load Tell?

The producer in the composite isn’t a villain. He’s the one who actually went to the plant and pulled the year’s cumulative closeout. Most don’t, which means most never see the pattern that tells them their breeding sheet is 18 months behind the market.

The next load off your dairy is already being graded in someone’s head — feedlot buyer, order buyer, plant procurement — whether you’ve seen the data or not.

So when your next 168 head close out at the rail, what will the grading sheet say about the bulls you ordered last fall? If you’re not sure, that’s the answer.

We’re running the full barn-math model — sire-selection premium, replacement deficit, and the verification stack — across different herd sizes in next week’s Bullvine Weekly. That’s where the per-cow numbers live.

Run Your Numbers

BPI Index Calculator — Pressure-test the breeding sheet behind the $33,000 closeout gap. The BPI Index scores your replacement pipeline across heifer supply, price signal, culling pressure, and semen mix momentum, so you can see whether 35% beef-on-dairy is paying you or quietly draining the 2027 heifer pen.

Complete references and supporting documentation are available upon request by contacting the editorial team at editor@thebullvine.com.

Learn More

The Sunday Read Dairy Professionals Don’t Skip.

Every week, thousands of producers, breeders, and industry insiders open Bullvine Weekly for genetics insights, market shifts, and profit strategies they won’t find anywhere else. One email. Five minutes. Smarter decisions all week.
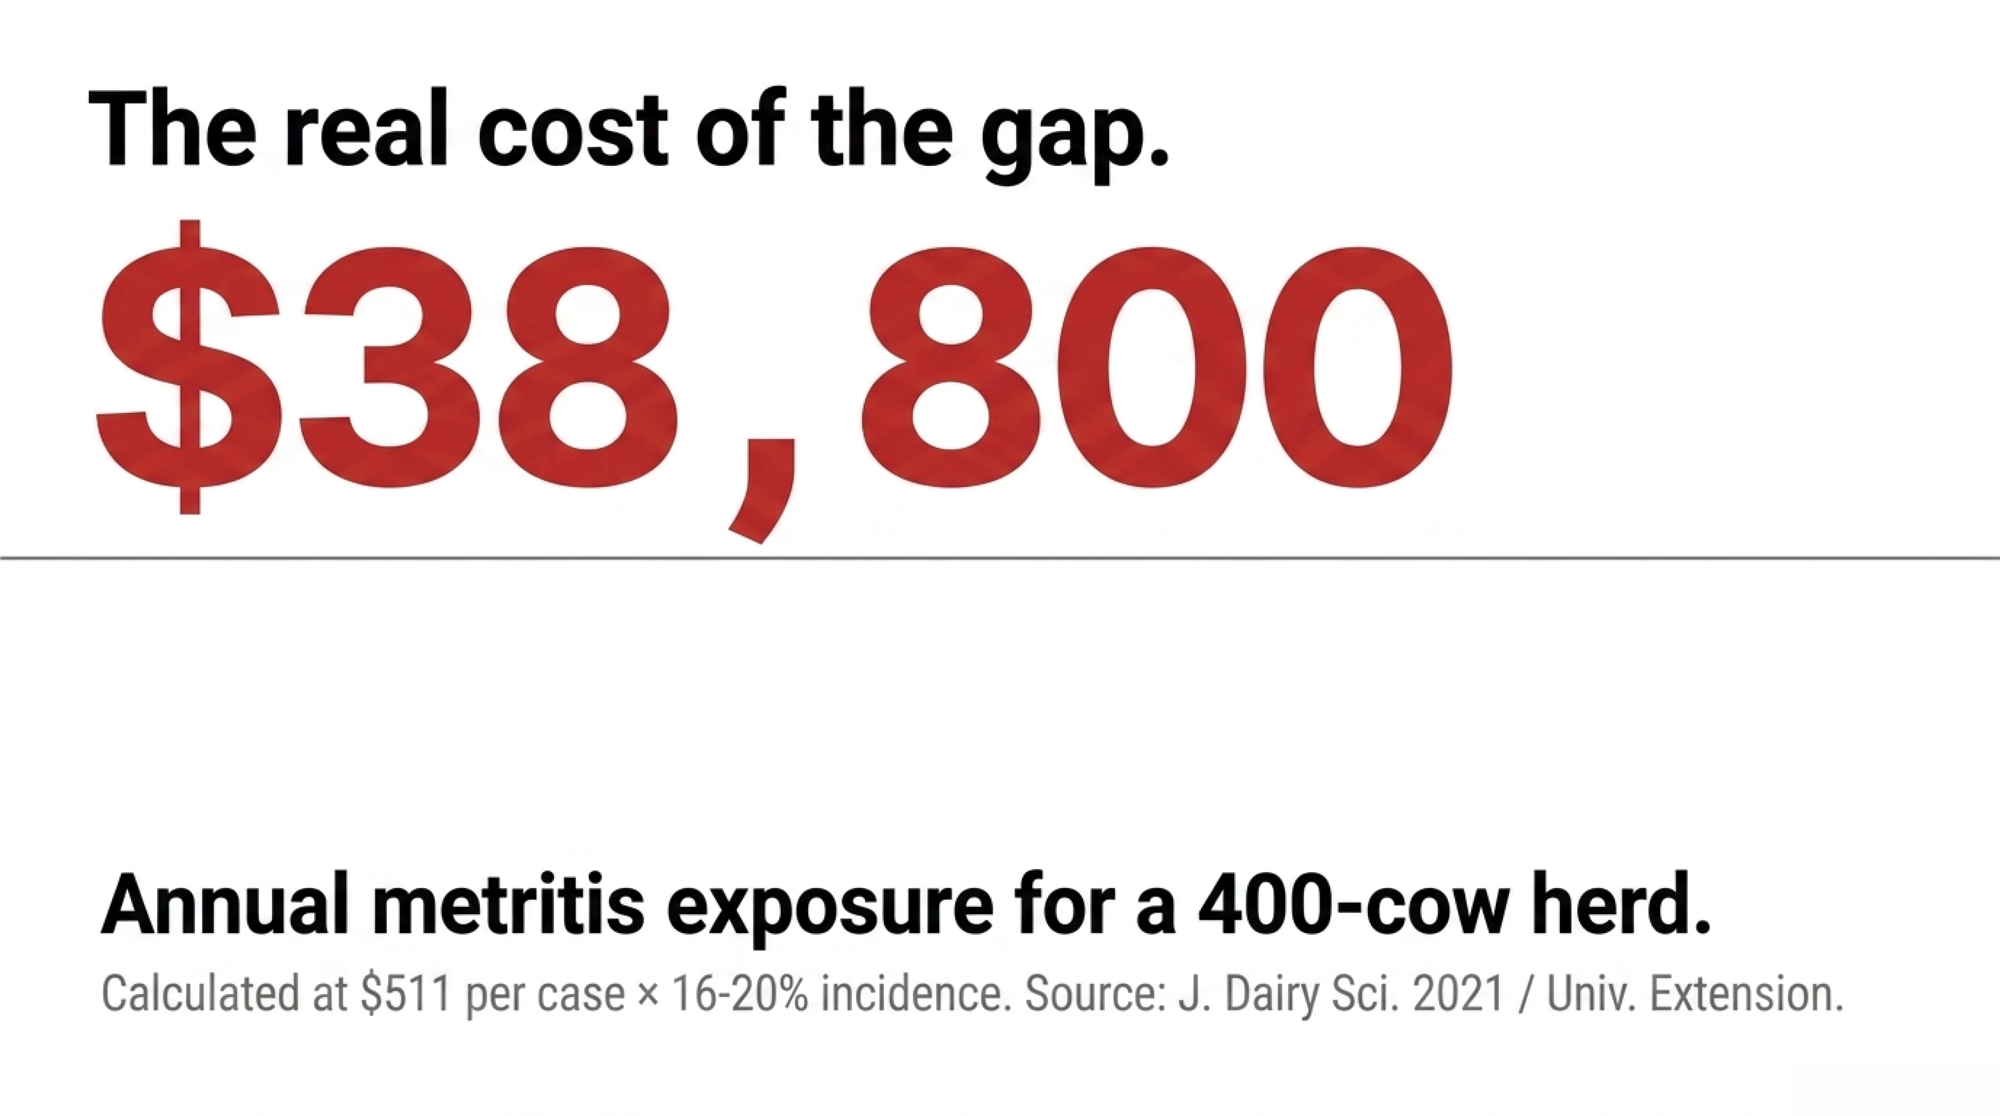
NewsSubscribe
First
Last
Consent

Kansas Added a Vermont’s Worth of Cows – and the $16.82 Milk Math Is Ugly

Kansas added ~47,000 milk cows in twelve months and now sits near 234,000. A modeled 5,000‑cow Edwards County build needs $19.07/cwt to clear DSCR. April Class III: $16.82.

Executive Summary: A modeled 5,000‑cow Edwards County–scale southwest Kansas greenfield ($8,000/stall, $40M note, 7% money over 20 years, 1.20x DSCR) needs farm gate milk near $19.07/cwt to clear covenant. USDA AMS’s April 2026 Class III printed near $16.82, a $2.25/cwt parity gap or roughly $234,000/month of negative cash flow. Kansas added ~47,000 milk cows in twelve months to reach 234,000 head. Each $0.50/cwt move is worth ~$625,000/year on the modeled 5,000‑cow build versus ~$27,375/year on a 200‑cow Midwest herd. The corridor’s break‑even is your contract pressure gauge for the next twelve months.

Kansas dairy expansion

Editor’s note: Operational details below reflect publicly available Kansas Department of Agriculture (KDA) and Kansas Department of Health and Environment (KDHE) Livestock Waste permit data and company materials. This article makes no claims about any individual operation’s financial condition. The 5,000‑cow build modeled here is illustrative and is not the financials of any named operation referenced.

A representative Edwards County–scale southwest Kansas greenfield — 5,000 cows, $8,000 per stall, a $40,000,000 construction note — needs farm gate milk to average about $19.07/cwt to clear a 1.20x DSCR covenant on the math below. USDA AMS’s Class III milk price for April 2026 sits near $16.82/cwt, leaving the modeled build short roughly $2.25/cwt at parity, or about $234,000 a month in negative cash flow before the cows are at full capacity. That’s the margin over feed dairy 2026 problem in a single line: scale, plant access, and a banker’s blessing don’t override the milk check when the underlying Class III prints below break‑even.

A quick price hygiene note. Class III is the federal benchmark, not the milk check a Kansas greenfield actually deposits. The All‑Milk Price and farm gate net include regional basis, component premiums (butterfat, protein, other solids), volume incentives, and hauling deductions — and they can run above or below Class III depending on plant, region, and contract. Highly leveraged corridor builds are uniquely exposed to raw Class III when hedging coverage lapses, plant capacity caps premiums, or basis tightens, because every $0.50/cwt of give‑back hits the same DSCR line.

What lenders are watching at $16.82 Class III. Highly leveraged southwest Kansas greenfields with 7% money and a 1.20x DSCR covenant don’t have much room before refinancing requests, principal deferrals, or basis renegotiations move from “cycle conversation” to “covenant conversation.” The first place that pressure usually shows up isn’t a missed payment — it’s a quiet rework of contract terms with the processor or the lender, before the milk check tells the rest of the story.

What Margin Over Feed Looks Like for 5,000‑Cow Builds in 2026

USDA NASS data shows Kansas milk cow inventory near 234,000 head at the most recent quarterly Milk Production report, up from roughly 187,000 head a year earlier. That’s a gain of about 47,000 cows in twelve months. Stretched out, Kansas has moved from roughly 110,000 cows a decade ago to about 234,000 today — on the order of 124,000 cows over ten years, per USDA NASS state inventory series. Vermont, by comparison, averaged roughly 113,000 milk cows in 2025, per USDA NASS. Kansas has effectively absorbed an entire Vermont‑sized herd in a decade.

The growth is volume, not magic. Kansas cows produce about 2,025 lb/month, or roughly 24,300 lb/year — almost identical to the U.S. national average around 24,390 lb in 2025, per USDA NASS Milk Production data. The state’s production surge is being driven by adding mature cows, not by squeezing extra pounds out of each one.

The cows are landing in a tight band of southwest counties — Hamilton, Edwards, Thomas, Kearny, Haskell — where land is cheaper than coastal dairy states and big plants anchor demand. A major Hilmar cheese plant in Dodge City and a Danone supply pipeline through McCarty Family Farms’ Rexford unit, as publicly described in company materials, have pulled capital and cows into the corridor at industrial speed.

Five Operations Visible in the Public Permit Records

OperationCountyPermitted HeadMilking CowsParlor TypeProcessor PartnerModel
Twin Circle Dairy (Blue Sky Farms)Edwards~23,700~19,0002× 120-cow rotaryHilmar, Dodge CityPlant-integrated cheese supply
Rexford Dairy (McCarty Family Farms)Thomas~10,000~10,000Climate-controlled indoorDanone, Fort WorthVertically integrated condensing
Lakin Dairy (Lakin Group)Kearny~3,900~3,900Double-37 parallelIrrigation-linked expansion
Kendall Dairy (Lakin Group)Hamilton~1,800~1,800Double-25 parallelSatellite freshening/dry cow unit
KDD Heifer Ranch (KS Dairy Development)Kearny~80,000 capacityHeifer ranchInternal corridor supplyIn-corridor heifer self-sufficiency

Public KDA and KDHE Livestock Waste permit records describe five large operations active in the corridor:

  • Twin Circle Dairy (Blue Sky Farms, Edwards County): about 23,700 head permitted, roughly 19,000 milking, two 120‑cow rotaries milking around 1,750 cows/hour, direct‑shipping to Hilmar in Dodge City. A model for plant‑integrated cheese supply at scale.
  • Rexford Dairy Unit (McCarty Family Farms, Thomas County): about 10,000 cows in a climate‑controlled indoor unit with on‑farm condensing, processing up to roughly 2.2 million lb of raw milk daily for Danone in Fort Worth. A model for vertically integrated condensing supply.
  • Lakin Dairy (Lakin Group, Kearny County): about 3,900 cows on a double‑37 parallel parlor, supported by roughly 1,380 pivot‑irrigated acres. A model for irrigation‑linked expansion.
  • Kendall Dairy (Lakin Group, Hamilton County): about 1,800 cows on a double‑25 parallel parlor as the freshening and dry‑cow satellite. A model for satellite‑unit specialization.
  • KDD Heifer Ranch (Kansas Dairy Development, Kearny County): roughly 80,000‑head capacity, contract‑growing replacements from day one through pre‑calving springers. A model for in‑corridor heifer self‑sufficiency.

These aren’t ordinary dairies. They’re dedicated supply legs for specific cheese and condensing plants. A 3,000‑cow herd is a side conversation in this corridor. A 5,000‑ to 20,000‑cow herd is a contract.

For the contract mechanics behind these supply legs, see Bullvine’s pillar on how plant‑integrated supply contracts actually price your milk.

Running the Numbers: A Modeled 5,000‑Cow Edwards County–Scale Greenfield at $16.82 Class III

This model is illustrative and is not the financials of any of the named operations referenced above. Inputs are benchmarks built on KSU farm management figures, USDA AMS milk price data, and KDA/KDHE permit records.

Inputs (Spring 2026)

  • Herd size: 5,000 cows.
  • Build cost: $8,000 per cow space, fully integrated SW Kansas greenfield (rotary parlors, manure dry stacks, wastewater retention), per KSU dairy construction cost benchmarks.
  • Total CAPEX: 5,000 × $8,000 = $40,000,000.
  • Loan: 7% interest, 20‑year amortization (commercial ag benchmark, current credit environment).
  • Lender DSCR covenant: 1.20x (standard ag bank minimum).
  • Production: 25,000 lb/cow/year = 250 cwt/cow → 5,000 × 250 = 1,250,000 cwt/year.
  • High Plains cash operating cost: $15.50/cwt (feed, labor, vet, fuel, crop inputs), per KSU 2025–2026 large‑herd dairy enterprise budget.
  • Milk price reference: USDA AMS Class III, April 2026 ≈ $16.82/cwt. Farm gate realized price will differ once basis, components, and hauling are netted.

Annual debt service. Standard amortization on $40,000,000 at 7% over 20 years ≈ $3,720,816/year($310,068/month). Per cow: $3,720,816 ÷ 5,000 = $744.16/cow/year in fixed capital cost.

DSCR‑adjusted cash flow requirement. $3,720,816 × 1.20 = $4,464,979/year of cash earmarked for debt coverage. Per cow: $4,464,979 ÷ 5,000 = $893/cow/year before anyone in the family draws a paycheck. Per cwt: $4,464,979 ÷ 1,250,000 = $3.57/cwt of milk shipped.

Break‑even farm gate milk price. Operating cost + DSCR coverage = $15.50 + $3.57 = $19.07/cwt realized at the farm gate. If basis to Class III runs roughly flat with neutral components, a Class III handle near $19.07 is the floor; with a +$0.50 basis and strong components, the Class III equivalent floor falls toward $18.57; if basis turns negative when corridor volumes flood the plant, the required Class III handle moves higher.

The gap at April 2026 prices. $16.82 − $19.07 = −$2.25/cwt at parity. Monthly volume: 1,250,000 ÷ 12 ≈ 104,167 cwt/month. Cash flow gap at parity: 104,167 × $2.25 ≈ −$234,375/month, or roughly −$2.81 million/year if April’s Class III holds and farm gate basis is neutral.

Sensitivity strip on this same modeled build (Class III parity assumed):

  • $18.00 milk → −$1.07/cwt → ≈ −$1.34 million/year.
  • $19.00 milk → −$0.07/cwt → ≈ −$87,000/year.
  • $20.00 milk → +$0.93/cwt → ≈ +$1.16 million/year.
  • Each $0.50/cwt move on this herd ≈ $625,000/year. Each $1.00/cwt move ≈ $1.25 million/year.

What it would take to close the $2.25/cwt gap. Drop CAPEX by $1,000/cow (from $8,000 to $7,000) and operating cost by $0.50/cwt (from $15.50 to $15.00), and the recomputed break‑even falls to about $18.13/cwt — still above April 2026 Class III, but a reachable target with a longer build cycle and tighter feed contracting. Push the amortization to 25 years and ease the DSCR covenant to 1.15x, and the break‑even gets closer to the high‑$17s. Anything less than that combination leaves the model dependent on milk averaging above $19 over the cycle, or on basis and component premiums doing the heavy lifting.

ScenarioBuild Cost/CowOperating Cost/cwtAmort.DSCR Req.Break-even NeededGap vs. $16.82Annual Cash Flow
Base case (modeled)$8,000$15.5020 yr1.20×$19.07−$2.25−$2.81M
Lower CAPEX + tighter ops$7,000$15.0020 yr1.20×~$18.13−$1.31~−$1.36M
Extended amort + eased covenant$8,000$15.5025 yr1.15×~$17.80–$18.00~−$1.00~−$1.25M
Both levers applied$7,000$15.0025 yr1.15×~$17.20−$0.38~−$395k
Break-even scenario$8,000$15.5020 yr1.20×$19.07$0.00$0
Profitable scenario$8,000$15.5020 yr1.20×$20.00+$0.93+$1.16M

Why Are Plants and Lenders Still Saying Yes at $16.82 Milk?

Plant gravity is the first force at work. A major cheese plant doesn’t want pen pals. It wants pipelines — predictable, high‑solids milk under long‑term contracts with a handful of mega‑suppliers, not 100 small herd conversations a week. Scale isn’t just a strategy in the High Plains; it’s the price of admission to be a primary supplier.

Leverage with thin cushion is the second. A debt structure built on $15.50/cwt operating cost only really works when farm gate milk averages above $19/cwt over the cycle. There’s not much room between “just fine” and “covenant conversation” when each $1.00/cwt swing is worth roughly $1.25 million a year on the modeled 5,000‑cow build. Hedging programs and basis contracts are the lever most builders pull to bridge that gap — but those bridges narrow when plant capacity gets tight and processors trim component or volume premiums to manage their own intake.

The corridor’s quiet trade‑off. The same plant capacity that lets a 5,000‑cow build exist in the first place is what caps the upside. When intake fills, basis softens, premiums get rationed, and the builder’s margin gets squeezed from the price side at the worst possible moment for the debt side.

The aquifer is the force no one wants to mention at the kitchen table. Kansas Geological Survey data shows substantial Ogallala depletion in western Kansas, with saturated thicknesses dropping 25 to more than 200 feet in places since predevelopment and continued declines projected over the next 50 years. Some Groundwater Management Districts have implemented Local Enhanced Management Areas (LEMAs) that cut allowable irrigation, in some cases by roughly 10%, per KDA Division of Water Resources material. Senior water rights can drive cropland values from a Kansas average around $4,460/acre up to $6,000–$8,000/acre for parcels with irrigation, per USDA NASS Land Values and KSU AgManager benchmarks.

In Bullvine’s view, current corridor conditions reward volume and capital intensity over farm‑level profitability — that’s analysis, not a claim about any single operator’s decisions. Plants stay full. Lenders book big notes. The aquifer keeps the corridor running. The farm gate is where the slack disappears.

For the prior installment in this series, see the same $20 milk math that just killed a 400‑cow Midwest expansion. For the water side, see what LEMA cuts are doing to feed budgets in southwest Kansas.

The Turn: A Plant‑Connected Greenfield Can Still Be Underwater on Paper

Here’s the myth this build math breaks. Everyone assumed that with national‑average production, a competitive High Plains operating cost near $15.50/cwt per KSU 2025–2026 large‑herd benchmarks, and a direct line to a Hilmar or Danone pipeline, scale would carry the math on its own. The modeled 5,000‑cow greenfield says otherwise. At April 2026’s $16.82 Class III, the modeled build is short $2.25/cwt at parity and burning roughly $234,000/month before any of the “upside levers” show up — and those upside levers (basis, components, volume premiums) only matter if hedging holds and plant capacity hasn’t clipped the premium ladder.

The Turn — what changes when you put it on paper. The build pencils on a slide deck and dies on a milk check. A 5,000‑cow note that needed $19+ Class III over the cycle to make sense looked fine in a 2022 model. At $16.82, every $0.50/cwt of basis or component give‑back is $625,000/year out of the same DSCR line your lender is staring at.

That changes the lens for mid‑size operators in Wisconsin, Pennsylvania, New York, Vermont, and Ontario who’ve been watching High Plains expansion with envy. They’ve absorbed structural Class III pressure from recent USDA AMS Federal Order make‑allowance rulemaking, felt commercial replacement rates push higher under tight credit, and watched heifer markets stay tight as commercial springer supply lags demand. None of that means the High Plains model is comfortably profitable today on the math we can see. The modeled build runs negative cash flow at the same milk price that’s squeezing your 400‑cow Wisconsin barn.

For the human side of that decision, see what succession actually looks like with a $40M note on the table.

Does an Ontario or P5 Producer Need to Care About a Kansas Greenfield?

Yes — through the back door. Quota systems insulate Canadian producers from Class III swings, but corridor‑scale builds change the global cost curve, the heifer market, and the genetics demand pattern on both sides of the border. When a Kearny County heifer ranch with permitted capacity at this scale matures, the structural pull on Vermont, New York, and Ontario calf markets shifts whether or not any individual operation changes its sourcing.

Component pricing under P5 plus exposure to U.S.‑driven cheese, butter, and powder markets means an Ontario operator with a refinance or expansion decision in 2026 should still be reading the $19.07/cwt break‑even on the Kansas modeled build. It’s a useful pressure gauge for what your processor’s next contract conversation might look like — and what spec creep on butterfat, protein, or hauling could do to your own margin over feed.

The 30/90/365‑Day Playbook for Herds in This Corridor Story

This is structured for two reader types: a Kansas builder evaluating or already inside a $40M corridor bet, and a 200–500‑cow Midwest, Northeast, or Ontario operator deciding how to position around the shift.

30‑day actions (urgent checks)

  • Pull your last three milk checks and compute margin over feed per cwt at the farm gate, not Class III. Compare against the High Plains $15.50/cwt operating benchmark and your own land‑grant or DFO budget. If the gap is widening month over month, treat it as urgent. Backfire risk: running the test on outdated feed costs.
  • Stress‑test DSCR at $17, $18, and $19/cwt farm gate milk with current feed costs. Red‑flag trigger: if your DSCR has been under 1.20 for three consecutive months on your lender’s method, that’s the call to make this week, not next quarter. Backfire risk: assuming your historical basis holds when corridor volumes climb.
  • For Kansas builders or operators in the corridor: confirm with your Groundwater Management District where your feed base sits relative to the nearest LEMA boundary and the most recent allocation changes. Backfire risk: assuming today’s pumping rules hold for your full 20‑year note.

90‑day actions (structural adjustments)

  • Diversify your buyer concentration. If a single processor, heifer buyer, or co‑op accounts for more than ~30% of your annual revenue, build at least one credible alternative relationship inside this quarter. Requires: contract review, time, and willingness to leave a comfortable seat. Backfire risk: trading a known basis for a worse one without modeling it side‑by‑side.
  • Re‑run herd‑size targets against realistic 24‑month milk prices. For mid‑size herds, model what happens if you stay at 350 cows with lower debt per cow versus pushing to 600 cows on new debt at 7% money. Requires: your CPA, your nutritionist’s feed cost outlook, and a hard conversation with a successor. Backfire risk: building a 600‑cow business that only works above $20 milk.
  • For Kansas operations: re‑run the build at $7,000/cow and $9,000/cow, with $14.50, $15.50, and $16.50/cwt operating costs. Find the milk price band where DSCR clears 1.20x with a real cushion, not a bare pass.

365‑day moves (strategic positioning)

  • Pick a model and own it. Decide whether your operation is built for the corridor model, the diversified mid‑size model, or the “sell while it’s still bid” path. Each is legitimate. None of them is free.
  • For Vermont, Northeast, Upper Midwest, and Ontario herds losing High Plains heifer demand as Kearny County–scale heifer ranches mature: reposition breeding strategy around beef‑on‑dairy, components, or local replacement contracts. Requires: a 12–18‑month genetic plan, not a single semen order. See Bullvine’s pillar on positioning a 200–500‑cow herd for beef‑on‑dairy under tight heifer demand.
  • Opportunity signal for Kansas: if your basis to a corridor pipeline holds within a tight band while your margin over feed stays above your DSCR threshold for two full quarters, that’s the window to negotiate term, basis, or hauling concessions — not when you’re in a covenant call.

Key Takeaways

  • A modeled 5,000‑cow Edwards County build needs ~$19.07/cwt farm gate to clear a 1.20x DSCR, but April 2026 Class III printed $16.82 — that’s $2.25/cwt short, or ~$234,000/month bleeding before any “upside lever” kicks in.
  • Scale only protects you on the operating cost line; on the price line it works against you. Each $0.50/cwt move is ~$625,000/year on the modeled corridor build versus ~$27,375/year on a 200‑cow Midwest herd.
  • In the next 30/90 days, stress‑test DSCR at $17/$18/$19 farm gate milk on your real feed costs, and if any single processor or heifer buyer is north of 30% of revenue, start building a credible alternative this quarter.
  • Wisconsin, Pennsylvania, New York, Vermont, and Ontario operators should watch the corridor’s break‑even as a contract pressure gauge — basis, component premiums, and heifer demand on your side of the border move with what Hilmar and Danone’s Kansas pipelines do next.

Complete references and supporting documentation are available upon request by contacting the editorial team at editor@thebullvine.com.

Run Your Numbers

Dairy Profit Projector — Run your herd’s milk price, feed cost, and ration assumptions through the Dairy Profit Projector to pressure-test IOFC, breakeven milk price, and whole-herd margin before you sign a build note or stress a covenant. It puts the corridor’s $19.07 break-even on your own milk check, not someone else’s slide deck.

Learn More

The Sunday Read Dairy Professionals Don’t Skip.

Every week, thousands of producers, breeders, and industry insiders open Bullvine Weekly for genetics insights, market shifts, and profit strategies they won’t find anywhere else. One email. Five minutes. Smarter decisions all week.
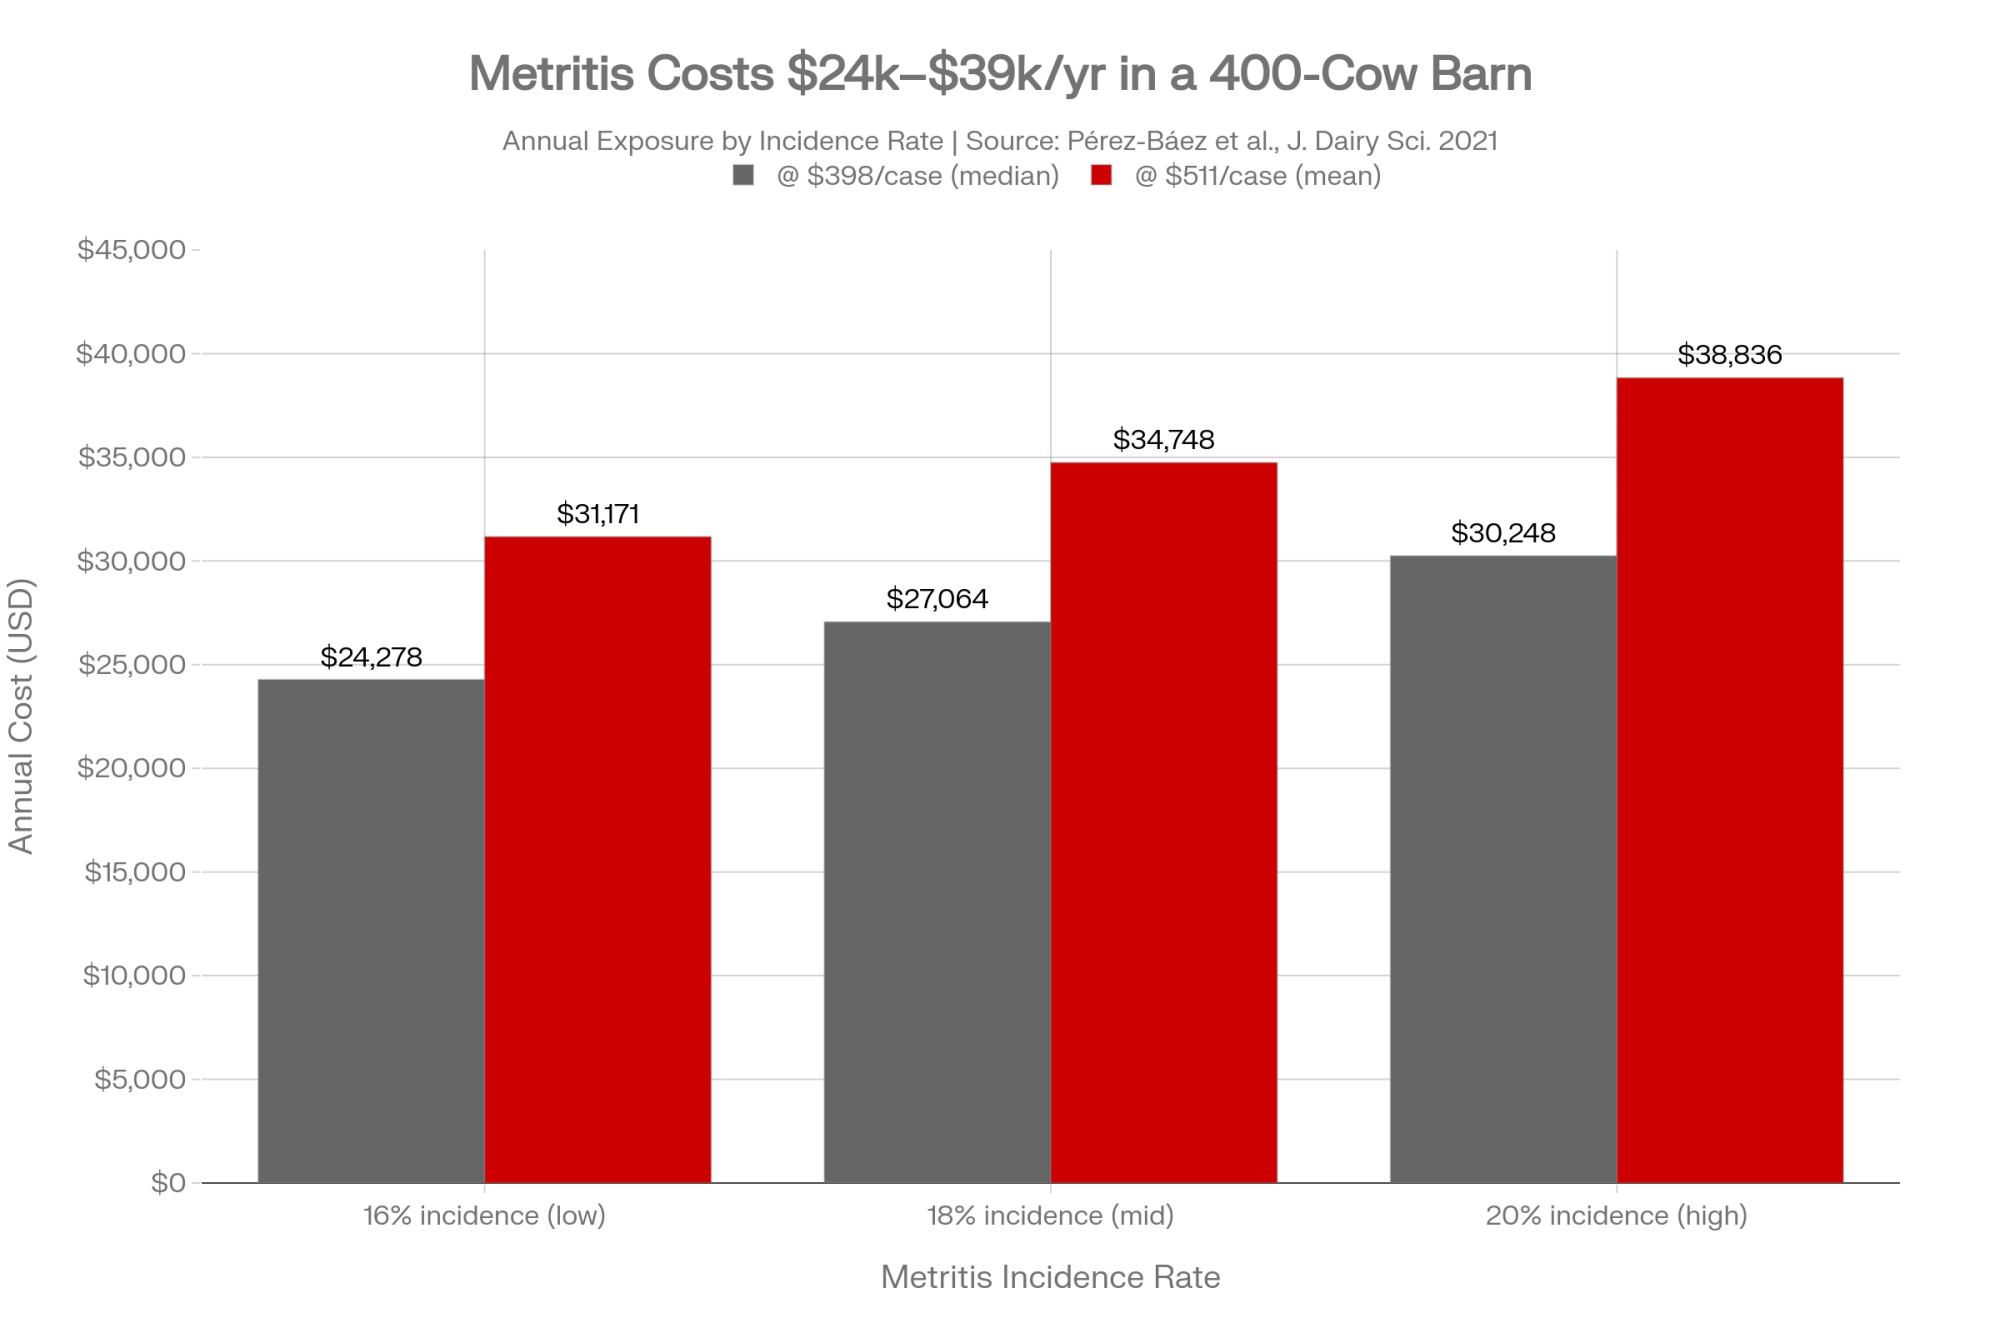
NewsSubscribe
First
Last
Consent

$137.50/Cow and a June 11 Deadline: USDA Just Yanked 10 Lenders

 On May 11, your REAP biodigester deal is penciled at 4.75% FSA money. On May 12, your lender lost OneRD approval. That’s $137.50/cow on a 400-cow dairy — and June 11 is the transfer deadline.

Executive Summary: USDA removed 10 lenders from the OneRD-approved list on May 12, and producers with REAP, B&I, or Community Facilities commitments through them have until June 11 to transfer the deal or lose it. The named ten: Bank of Montgomery, Byline Bank, Celtic Bank, Community Bank & Trust – West Georgia, Genisys Credit Union, Greater Nevada Credit Union, North Avenue Capital, Optus Bank, U.S. Eagle Federal Credit Union, and ReadyCap Commercial. One was already in FDIC receivership eleven days before Rollins announced anything. The replacement-rate math is brutal: 4.75% FSA Direct against a 7.50% Q3 2025 Chicago Fed commercial rate runs $55,000/year on a $2M operating line — $137.50/cow on a 400-cow Midwest dairy, a +$1.25/cwt breakeven shift on Cornell DFBS basis. FSA-guaranteed operating lines through these institutions are unaffected; the hit is concentrated on capital projects mid-build. If your DSCR’s been under 1.15x for three months running and your conditional commitment letter is sitting unread, the next 23 days decide whether the project pencils or strands.

USDA lender revocation

Dairy producers working with ten major national and regional lenders have until June 11 to rescue their OneRD infrastructure financing. USDA’s May 12 revocation of OneRD lending privileges for institutions holding roughly $620 million in delinquencies — about 47% of USDA Rural Development’s total delinquent loan portfolio concentrated in just 1% of approved lenders — moved the deadline from theoretical to immediate. Mid-sized operators are facing a brutal reality with REAP biodigesters, B&I-financed processing upgrades, and Community Facilities loans now caught in transfer.

The kind of 400-cow Western Michigan operator running this math today — a modeled scenario based on the named herd-size band and standard REAP guarantee parameters — is staring at a 4.75% FSA Direct Operating rate against a 7.50% commercial replacement rate on a $2 million operating line. That’s $55,000 a year in extra interest, $137.50 per cow. A +$1.25/cwt breakeven shift on the Cornell DFBS basis. The producers feeling that the USDA lender revocation of dairy 2026 will squeeze hardest are the ones whose lenders showed up on the May 12 list — and the State USDA Rural Development office is the contact point the announcement directs them to.

USDA framed the action as accountability. The timeline reads less like enforcement readiness than political cover: the announcement landed eleven days after Community Bank & Trust – West Georgia entered FDIC receivership. For producers mid-application on a REAP biodigester, a B&I-financed processing upgrade, or a Community Facilities loan through any of the ten named institutions, June 11 isn’t an abstraction. It’s the line between a viable capital project and a stranded asset.

What Did USDA Actually Do on May 12 — and What Did They Leave Out?

Secretary Brooke Rollins announced the removal of ten lenders from the OneRD Guaranteed Lending Program on May 12. The named ten: Bank of Montgomery, Byline Bank, Celtic Bank, Community Bank & Trust – West Georgia, Genisys Credit Union, Greater Nevada Credit Union, North Avenue Capital, Optus Bank, U.S. Eagle Federal Credit Union, and ReadyCap Commercial.

Here’s what the press release didn’t lead with. Community Bank & Trust – West Georgia was already in FDIC receivership as of May 1, 2026, per the Georgia Department of Banking and Finance. Publicly reported regulatory pressure preceded the May 1 receivership. By the time Rollins stepped to the podium, Georgia state banking authorities had formally seized that institution for eleven days.

Removing a bank already in receivership functions as documentation rather than enforcement. The institution had already been seized.

The timeline gets worse. RBCS Administrator J.R. Claeys sent an open warning letter to 775+ active OneRD lenders on February 20, 2026. That letter disclosed program-wide delinquencies exceeding $1 billion and $300 million in losses realized over the prior 12 months. Eighty-one days passed between Claeys’ letter and the May 12 revocation. Producers who entered conditional commitments through those ten lenders during that window are the ones now racing the clock.

LenderState/RegionPrimary SectorNotable Pre-May 12 StatusFDIC/Regulatory Flag
Community Bank & Trust – West GeorgiaGeorgiaCommunity bankingIn FDIC receivership May 1, 2026 — 11 days before removal⚠️ Already seized
ReadyCap CommercialNational (NJ-based)SBA/USDA guaranteed lendingHigh small-business SBA 7(a) delinquency concentrationElevated
North Avenue CapitalNationalCommercial RE / hospitality$168.5M in 90-day delinquencies, CRE/hospitality concentration⚠️ High
Genisys Credit UnionMichigan (Auburn Hills)Credit union, 280,000+ membersActive USDA & SBA guaranteed lending; Michigan dairy exposureRemoved
Greater Nevada Credit UnionNevadaCredit unionRural community lending, OneRD B&I exposureRemoved
Byline BankIllinoisCommercial bankingActive OneRD originator, FSA guaranteed lines intactRemoved
Celtic BankUtahFintech-adjacent SBA lenderNationwide USDA program partnerRemoved
Bank of MontgomeryAlabamaCommunity bankingRural community bankRemoved
Optus BankSouth CarolinaCDFI-affiliated community bankMinority depository institutionRemoved
U.S. Eagle Federal Credit UnionNew MexicoCredit unionRural Southwest lendingRemoved

OneRD or FSA: Which USDA Loan Program Are You Actually In?

Before you panic, verify. The OneRD program isn’t a farm operating loan program. It’s a rural business and infrastructure guarantee umbrella covering Business and Industry (B&I), Rural Energy for America Program (REAP), Community Facilities, and Water and Waste Disposal. FSA operating loans run through a completely separate channel — the Farm Service Agency, not Rural Development.

Loan TypeAdministered ByAffected by May 12?Action Required
FSA Direct Operating LoanUSDA Farm Service AgencyNoNo action needed
FSA Guaranteed Operating LoanFSA via commercial lenderNo — guarantee survivesVerify with lender in writing
OneRD B&I GuaranteeUSDA Rural DevelopmentYESTransfer by June 11
OneRD REAP GuaranteeUSDA Rural DevelopmentYESTransfer by June 11
OneRD Community FacilitiesUSDA Rural DevelopmentYESTransfer by June 11
Water & Waste DisposalUSDA Rural DevelopmentYESTransfer by June 11

If your FSA-guaranteed operating line runs through Byline Bank or Genisys Credit Union, your guarantee is intact. The lender can’t originate new OneRD-program loans going forward. If your REAP biodigester, B&I-financed milk processing upgrade, or value-added packaging plant runs through any of the ten — you’re in the window. June 11 applies to existing conditional commitments and new originations through the revoked institutions; closed loans with guarantees already obligated remain in force under standard servicing terms.

How to Check Your Lender’s Status in Three Steps

  • Step 1. Go to the USDA Rural Data Gateway at rd.usda.gov/rural-data-gateway and open the Lender Lens portal. Search by lender name. Confirm current OneRD approved status as of the date you’re checking — bookmark the URL with the timestamp.
  • Step 2. Cross-reference with your conditional commitment letter. The program designation (B&I, REAP, Community Facilities) and the lender’s tax ID should match. If they don’t, request clarification in writing before calling your State RD office.
  • Step 3. Email your loan officer and the lender’s USDA program compliance officer simultaneously. Subject line: “Confirmation of OneRD approved-lender status, file [your loan ID].” Request a written response within five business days.

Why Did USDA Wait 81 Days, and What Did It Cost Producers?

USDA had legal authority under 7 CFR Part 5001 to remove lenders in February. The audit data was sufficient — Claeys’ own letter disclosed it. Bullvine’s read of the timeline: the agency waited for political cover, the kind a visible institutional collapse provides when it frames a broader removal as decisive accountability rather than belated damage control.

Community Bank & Trust – West Georgia’s failure on May 1 provided that frame. Without it, the announcement reads as ten lenders removed for portfolio concentration concerns — a narrative that generates congressional inquiries from delegations representing affected lenders, plus likely litigation. With it, the announcement reads as a cleanup after an already-public failure.

The cost of those 81 days falls on producers who entered binding financing agreements through any of the ten lenders during the window. USDA hasn’t published the commitment-issuance volume by lender for the period. That number is the accountability question that hasn’t been asked on the record.

The 400-Cow Margin Trap at 4.75% Versus 7.50%

The replacement-rate math is where this story stops being an enforcement headline and becomes a barn-level decision. The USDA Farm Service Agency Direct Operating Loan rate sits at 4.750% as of May 1, 2026, per the USDA FSA current rate sheet. The Federal Reserve Bank of Chicago’s Q3 2025 commercial agricultural operating loan rate clocked 7.50%, and the St. Louis District ran 7.78% — the most recent published district surveys, with current commercial quotes likely in a similar range. That’s a 2.75 to 3.00 percentage-point spread between FSA-subsidized capital and the commercial market, displaced borrowers now have to enter.

Running the Numbers — 400-Cow Midwest Dairy, $2M Operating Line

Inputs:

  • Herd size: 400 cows
  • Operating line: $2,000,000 ($5,000 of working capital per cow)
  • Annual milk shipped (Cornell DFBS basis, 110 cwt/cow): 44,000 cwt
  • FSA Direct Operating rate, May 1, 2026: 4.750% (USDA FSA rate sheet)
  • Commercial replacement rate, Q3 2025: 7.50% (Federal Reserve Bank of Chicago / Purdue Center for Commercial Agriculture)

The arithmetic:

  • FSA annual interest cost: $2,000,000 × 0.0475 = $95,000/year
  • Commercial annual interest cost: $2,000,000 × 0.0750 = $150,000/year
  • Annual differential at 2.75 points: $55,000/year
  • Per cow per year: $55,000 ÷ 400 = $137.50/cow
  • Per cwt shipped (Cornell DFBS basis): $55,000 ÷ 44,000 = +$1.25/cwt breakeven shift

Interest Spread Impact Matrix (Cornell DFBS 110 cwt/cow basis)

Herd SizeOperating Line1.50% Spread (Guaranteed to Mid-Market)2.75% Spread (FSA Direct vs. Commercial)3.00% Spread (Severe Commercial Penalty)
400 cows$2.0M$30,000/yr (+$0.68/cwt)$55,000/yr (+$1.25/cwt)$60,000/yr (+$1.36/cwt)
600 cows$3.0M$45,000/yr (+$0.68/cwt)$82,500/yr (+$1.25/cwt)$90,000/yr (+$1.36/cwt)
1,000 cows$5.0M$75,000/yr (+$0.68/cwt)$137,500/yr (+$1.25/cwt)$150,000/yr (+$1.36/cwt)

Operating-line size assumes $5,000/cow working capital; scale proportionally for differing leverage. The per-cow burden stays constant — $75/cow at 1.5 points, $137.50/cow at 2.75 points, $150/cow at 3.0 points — because the line scales linearly with herd size on that assumption.

Now drop that math into where the dairy economy actually sits in Q2 2026. The USDA ERS all-milk forecast runs $20.40 to $20.50/cwt. Producers in long-milk regions — Idaho, New Mexico, parts of Texas — are realizing $15.00 to $16.97/cwt at the farm gate after basis adjustments, per regional cooperative settlement reporting. Federal Milk Marketing Order formula adjustments implemented earlier in 2026 reduced Class III and Class IV pricing by roughly $0.85 to $0.93/cwt under the current order. Cornell’s 2023 Dairy Farm Business Summary — the most recent published — put bottom-quartile DSCR at 0.36x. Current 2026 conditions remain stressed.

Adding $30,000 to $60,000 in annual interest expense on a 400-cow operation, on top of that structure, compresses margin further on operations already running below 1.0x DSCR.

Why the Old Playbook Doesn’t Work for the Western Michigan Caseload

Take the kind of operator at the top of this article — a modeled scenario, with figures illustrative based on USDA REAP guarantee parameters and the named herd-size band. 400 cows, a $2M operating line through a regional ag bank, and a separate $1.4M REAP conditional commitment through Genisys for an anaerobic digester project that’s 60% complete. The digester financing was the piece that made the project pencil — REAP guarantees compressed lender risk, which compressed the rate, which made the energy savings line up with the debt service. On May 11, the deal was on track. On May 12, the lender lost its OneRD approval. Now everything downstream of that commitment moves to a different institution at a different rate, with a different appraisal, on a 30-day clock.

The Loss of Local Ag Intelligence

Genisys Credit Union, headquartered in Auburn Hills, served 280,000+ members and operated as one of Michigan’s largest credit unions with active USDA and SBA guaranteed lending. Replacing it with a blind entry from a national USDA directory loses two critical assets:

  • Local economic nuance. The understanding of unique Lower Peninsula vs. Western Michigan herd dynamics — the difference between a Lower Peninsula 400-cow operation and a 1,200-cow Western Michigan herd — sits inside membership relationships, not lender lists.
  • Speed of underwriting. National outfits cannot rebuild a cooperative credit infrastructure on a tight 30-day clock. The institutional knowledge of Michigan dairy operating economics that the credit union represented in its own membership base doesn’t transfer to a directory entry.

Michigan USDA RD invested $889 million across the state in early 2026, with $45 million earmarked for agribusiness and economic development, per the agency’s state announcement. Every project in the OneRD queue at one of the ten removed lenders is either scrambling toward June 11 or already stalled.

The NAC Mirror

North Avenue Capital tells the same story from the other direction. It’s $168.5 million in 90-day delinquencies concentrated in commercial real estate and hospitality categories rather than core agricultural production. The OneRD B&I program’s eligibility-by-geography structure permits any rural business regardless of sector, and NAC’s portfolio reflected that breadth.

Everyone assumed USDA-approved lender status meant your capital relationship was insulated from federal program risk. The data says it’s a procedural compliance certification, not a credit-quality signal. The ten lenders removed on May 12 were all approved lenders on May 11.

The 30/90/365-Day Playbook for Herds Caught in the June 11 Window

The producers who survive this transition treat the deadline as non-negotiable and work backward from it. The ones waiting for their revoked lender to “figure it out” hit Day 27 with no deal and a contractor sending lien notices.

30-Day Actions — Before June 11

  • Pull your conditional commitment letter and your loan note guarantee today. The program designation (B&I, REAP, Community Facilities, FSA Guaranteed Operating) is on the documents themselves. If you can’t find them, request copies from your lender in writing — email both the loan officer and the compliance officer with a timestamped subject line referencing the May 12 revocation.
  • Call your State USDA Rural Development office directly, not the local coordinator. Verify current contacts through rd.usda.gov/contact-us/state-offices before the call. Request written confirmation of your conditional commitment status under 7 CFR Part 5001 transfer provisions.
  • Open parallel conversations with three approved replacement lenders. Verify approved status through the USDA Lender Lens portal in the Rural Data Gateway before you call. Prioritize Farm Credit (regional association), one regional ag bank with documented dairy expertise, and one second-tier commercial lender with active OneRD volume — not a lender that closes one of these a year.
  • Red-flag trigger: If your DSCR has been below 1.15x on lender-method calculations for three consecutive months, this moves to the top of your list today. New-lender independent underwriting will price that exposure aggressively or decline outright. Where this can backfire: walking into a new lender conversation without your own current numbers gives them control of the framing.

90-Day Actions — Through August 2026

  • Run your own cash flow stress test before the new lender does. Model $15.00, $18.00, and $20.40/cwt milk against the 7.50% commercial replacement rate. If the project doesn’t pencil at your realistic milk price — not the headline forecast — re-scope before the lender models it for you. What it requires: trailing 12-month financials, a current marketing letter from your buyer, and the original project pro forma showing projected energy savings or processing revenue.
  • Negotiate the LTV gap actively. Expect the new lender to compress LTV from 80% on the original guarantee to 60-65% on a partially-completed project — an illustrative range, with actual terms varying by lender and project status. Identify your equity gap source now: subordinated operating advance, equipment lease, contractor financing, or sale-leaseback on paid-off assets. Where this can backfire: closing the gap with unsecured personal debt converts a project problem into a household balance-sheet problem.
  • Order your own independent appraisal of any in-progress capital project on Day 11, not Day 18. Half-built REAP infrastructure appraises at salvage value, not completion value. Knowing how low your number is determines your negotiating position.

365-Day Moves — Into 2027

  • Diversify your capital sources. USDA-approved lender status is a procedural certification, not a credit-stability guarantee. Build relationships with at least two non-OneRD funding channels — Farm Credit relationship lending, a regional commercial bank with on-balance-sheet ag lending, or a state-level revolving loan fund.
  • Coordinate with other producers on capital procurement. Individual mid-sized dairies have limited negotiating leverage. Producer groups aggregating $10-15M in annual capital needs across six to ten operations have real leverage. Wisconsin and Michigan extension offices are the natural coordination point.
  • Opportunity signal: If your DSCR holds above 1.25x on trailing 12-month data and your milk basis stays within $1.00 of the regional benchmark, you have negotiating room with new lenders that displaced borrowers under stress don’t. That’s the time to lock terms — not after the next round of revocations forces you into the same scramble.

What the Next Round Looks Like

If ten lenders held 47% of OneRD delinquencies, the residual is roughly $380 million distributed across the 750+ approved institutions Claeys addressed in his February letter. That’s a significant remainder, and it’s not an even spread. Any next-tier institutions would be identifiable from the same loan-level data USDA used to evaluate the ten removed on May 12, though USDA hasn’t made tier-by-tier concentration data public.

The pattern from the May 12 timeline suggests when the next round happens: not when the data crosses a threshold, but when one of them fails publicly and forces USDA’s hand. Producers caught in the next round are likely to be the ones who saw warning signs in regulatory filings — Federal Reserve consent orders, FDIC asset-quality downgrades, trade press reporting on capital adequacy — and assumed USDA would act ahead of the failure. The May 12 sequence suggests otherwise.

What’s the Trade-Off, and What Should You Check?

The ten lenders are the visible cases. The program design — under which USDA backs 80-90% of loss exposure under standard OneRD terms while lenders retain origination revenue and fee income, per USDA Rural Development program documentation — is the structural read of the data. Rollins didn’t change that design on May 12. She removed the most concentrated cases and reset the clock.

You gain access to subsidized capital through OneRD. You give up control over when your lender’s procedural status changes. That’s the trade-off, and it sat invisible until the press release.

Pull your conditional commitment letter this morning. When was the last time your lender provided written confirmation of their current OneRD-approved-lender standing? If the answer is “never,” you’re being treated as a captive borrower — and June 11 is exactly the wrong deadline to learn what that costs.

Key Takeaways

  • Ten lenders just lost OneRD approval, and you have until June 11 to transfer any active REAP, B&I, or Community Facilities commitment. FSA-guaranteed operating lines through the same banks are unaffected, so verify which program your file actually sits in before you panic.
  • The replacement-rate spread runs $137.50/cow on a 400-cow Midwest dairy at 4.75% FSA versus 7.50% commercial, a +$1.25/cwt breakeven shift on Cornell DFBS basis — small enough to look survivable on paper, large enough to bury a project running below 1.0x DSCR.
  • If your DSCR’s been under 1.15x for three consecutive months on lender-method calculations, this moves to the top of your list today; pull your conditional commitment letter, call your State USDA RD office directly, and open parallel conversations with three approved replacement lenders.
  • USDA-approved-lender status is a procedural certification, not a credit-stability guarantee — the ten removed on May 12 were all approved on May 11, and the residual $380M in delinquencies across the remaining 750+ institutions suggests another round is a question of timing, not whether.

Run Your Numbers

Snap Check — Pressure-test what a 2.75-point rate jump does to your operation before you walk into a replacement-lender conversation. Snap Check benchmarks your margin exposure quickly so you know where your $/cow and DSCR sit against the 4.75% vs. 7.50% spread driving this story.

Complete references and supporting documentation are available upon request by contacting the editorial team at editor@thebullvine.com.

Learn More

The Sunday Read Dairy Professionals Don’t Skip.

Every week, thousands of producers, breeders, and industry insiders open Bullvine Weekly for genetics insights, market shifts, and profit strategies they won’t find anywhere else. One email. Five minutes. Smarter decisions all week.
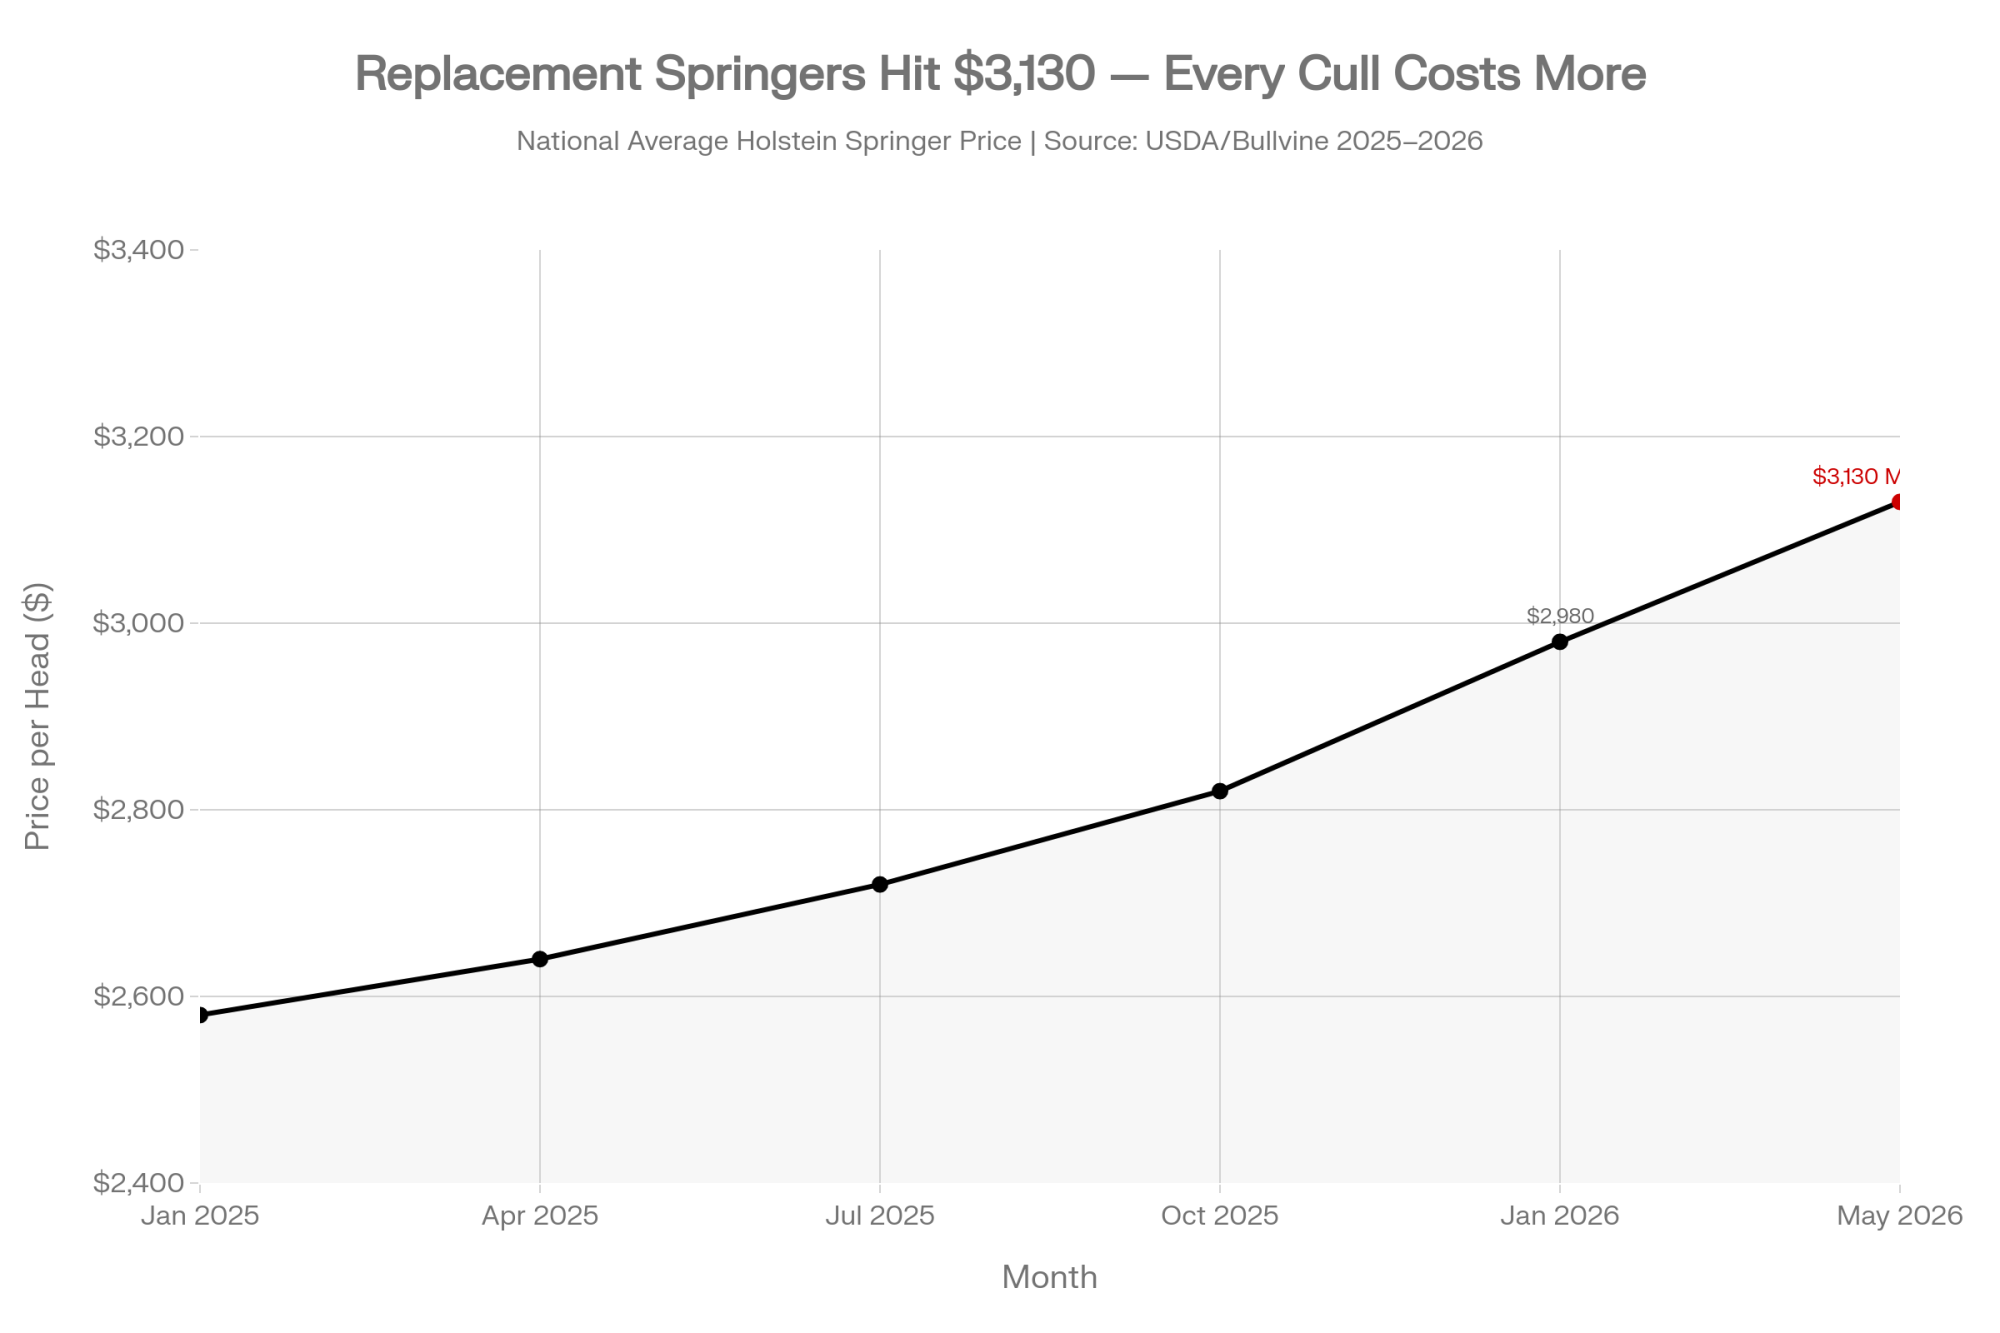
NewsSubscribe
First
Last
Consent

A 1943 Land Girl Cost More Per CWT Than Your 2026 Crew. The H‑2A Math Explains Why.

 Inflation-adjusted, a 1943 6‑cow British dairy and hired labor lands in the mid‑single‑digit dollars per cwt. Your 2,000‑cow neighbor on H‑2A pays $2.20. Memorial Day is the receipt.

Executive Summary: A 1943 6‑cow British dairy spent more on hired labor per cwt — in 2026 dollars — than a modern 2,000‑cow U.S. operation does today. USDA ERS pegs hired labor at roughly $2.20/cwt for 2,000+ cow herds, $4.19/cwt total labor for the 200–499 cow band, and $15.99/cwt full economic cost for sub‑50 cow farms once you price family time honestly. The 2026 H‑2A AEWR sits in the upper teens across the Midwest and California, ESDC’s 2026 SAWP schedule lands in the upper‑$17 to mid‑$19 CAD/hr range, and the Canadian Dairy Commission lifted farmgate price 2.33% effective February 1, 2026 to recover producer labour cost. Texas A&M and NMPF research (Adcock, Anderson & Rosson, 2015) indicates immigrant labor is roughly half of hired U.S. dairy crews and produces a majority of the country’s milk — pull it out and the model loses thousands of farms with retail milk roughly doubling. A 50¢/cwt labor gap on a 300‑cow herd shipping 75 lbs/day is $3,125/month walking out the door while you’re “thinking about it.”

dairy labor cost per cwt

A nineteen‑year‑old Land Girl pushes through a damp British byre in 1943, lantern in one hand, dented milk pail in the other. The farm’s sons are gone — some buried in Italy, some still between boot camp and the front — and her job is to keep forty cows milking and the country fed. She earns 38 shillings a week, minus 14 for board. Run her 24‑shilling net through standard ONS inflation indexing across a 50‑hour Land Army workweek and you land near the equivalent of roughly a dollar and change an hour in 2026 money. For hand‑milking before sunrise.

Now picture a 500‑cow Wisconsin freestall this morning. Illustrative composite, not a named farm. The owner has compliance paperwork stacked on the desk, three milkers wondering whether to risk another season, and a recruiter on hold quoting an H‑2A Adverse Effect Wage Rate (AEWR) in the upper teens — the kind of number the U.S. Department of Labor’s 2026 schedule now puts in front of any Midwest dairy that goes through the program.

That’s where this Memorial Day piece sits. Your dairy labor cost per cwt has been quietly outsourced to “emergency” labor since 1942, and the people who keep your parlor running are still on the most fragile legal footing in the supply chain.

The Land Girls Were Real. So Are the Receipts.

Britain’s Women’s Land Army peaked at 80,000+ members in 1943, and the Imperial War Museums Sound Archive holds a public oral history collection of recorded interviews with Land Girls who served between 1939 and 1950 — including the dairy farm accounts preserved under IWM Archive Catalogue No. 11624. They are named, dated, and catalogued. They are the receipts.

That paper trail matters because the same architecture is still load‑bearing in your barn. Eighty‑four years on, the people doing essential dairy work in the U.S. and Canada are still the most fragile legal piece in the supply chain.

The Barn Math That Flips the Story

Here’s the part that throws people. WWII dairy labor was cheap by the hour and expensive per cwt. Today’s labor is expensive by the hour and cheap per cwt — but only if you’re big enough to spread it.

In 1944, the average U.S. cow produced about 4,500 lbs/year (USDA NASS historical). A 6‑cow family farm shipped roughly 270 cwt annually. The USDA Bureau of Agricultural Economics January 1942 Farm Labor Report pegged the national average hired farm wage without board at roughly $2.12/day — about 4¢/hour on a 50‑hour week. On a 6‑cow farm shipping 270 cwt, that translates to pennies per cwt in 1942 dollars.

Run those pennies through the BLS CPI‑U series (January 1942 base to 2026), and a roughly 19.8× multiplier lifts the figure into the $5.00–$5.50/cwt range in 2026 money — hired labor only, on a 6‑cow farm. That’s the upper end of the per‑cwt math carrying the headline.

📊 Dairy Labor Cost vs. Economic Scale (USDA ERS Breakdown)

Herd Size CategoryHired Labor CostUnpaid Family TimeTotal Effective Labor Cost
Sub‑50 Cows$0.53 / cwt$15.46 / cwt$15.99 / cwt (Family Subsidy)
200–499 Cows$2.53 / cwt$1.66 / cwt$4.19 / cwt
2,000+ Cows~$2.20 / cwt~$0.25 / cwt~$2.45 / cwt (Scaled Minimum)

Methodology note: ERS prices unpaid family labor at the regional ag wage rate, which is why the sub‑50‑cow herd carries a $15.46/cwt unpaid line. If you don’t price your own time, you’ve quietly hidden it.

Read those side by side and the punchline lands. An inflation‑adjusted 1942 6‑cow farm spent more on hired labor per cwt than a modern 2,000‑cow operation does today. Real wages tripled. Per‑cwt cost fell. Productivity ate the difference — average milk per cow climbed from 4,500 lbs in 1944 to 24,178 lbs in 2024 (USDA NASS).

But that’s the easy half of the story.

The Vulnerability the Numbers Don’t Show

Industry research — specifically Adcock, Anderson & Rosson (2015), The Economic Impacts of Immigrant Labor on U.S. Dairy Farms, Center for North American Studies, Texas A&M AgriLife Research, CNAS Report 2015‑1 — has consistently found that immigrant labor accounts for roughly half of hired U.S. dairy workers and produces a majorityof America’s milk. Strip immigrant labor out of the model and the same study projects millions fewer cows, tens of billions fewer pounds of milk, thousands of farms gone, and retail milk prices roughly doubling.

That’s a peer‑reviewed shock model talking. Not a pundit.

Memorial Day usually pulls our heads toward crosses on foreign soil. It rarely lands on the people who stayed home and kept food moving — the 80,000+ Land Girls of 1943, the roughly 4.5 million Mexican laborers who passed through the Bracero Program between 1942 and 1964, Canada’s Farmerettes and “Soldiers of the Soil.” Different uniforms, different decades, same deal: do the work, accept the precarious legal status, disappear when the emergency is “over.”

Eighty‑four years later, your barn is still running on a version of that bargain. And the bargain has never been less stable.

How This Plays Out in Real Barns

The official numbers don’t care about your zip code. Your reality does.

Picture a 300‑cow Wisconsin freestall — illustrative composite, not a named farm. Three full‑time milkers at a current Midwest H‑2A wage rate — base wage in the low six figures, plus roughly 25% in payroll taxes, workers’ comp, and H‑2A housing and transportation obligations — works out to around $145,000/year. Spread that across 75,000 cwt(~75 lbs/cow/day) and you’re at about $1.93/cwt for those three positions alone. Add a herd manager, calf staff, and family time priced honestly at $25/hr, and you can land at or above the $4–$5/cwt total labor range ERS reports for 200–499 cow herds.

Now pull a thread. If federal enforcement intensifies in your region — a real possibility given the policy direction since 2025 — and a neighbor poaches your two best milkers for a higher‑paying crop operation that can legally use H‑2A while you can’t, because dairy is technically year‑round. Suddenly you’re staring at the same problem a 1943 farmer had when three sons shipped out. Cows still need milking at 4 a.m.

Canada looks calmer at a glance. Under the Seasonal Agricultural Worker Program (SAWP) and the Agricultural Stream, ESDC’s 2026 wage schedule sets the Ontario baseline agricultural minimum at $17.60 CAD/hr, with specialized livestock handlers sliding into the $19.00+ CAD/hr range under the updated National Commodity List. The Canadian Dairy Commission folds producer labour cost directly into its national pricing formula and implemented a 2.33% farmgate price increase effective February 1, 2026 to account for rising feed and on‑farm labour metrics.

Don’t read that as “Canada solved it.” The CDC mechanism makes labor more recoverable, not more available. CAHRC’s long‑range outlook forecasts the domestic dairy labour gap expanding to 5,000 vacant positions by 2030, with domestic worker supply dropping 17% and foreign workers expected to fill roughly 80% of that structural shortfall. Different policy architecture, same fragile pipeline.

The Mechanics Behind the Reversal

Three forces explain why higher real wages now produce lower per‑cwt cost.

Start with productivity. A Land Girl hand‑milked maybe 8–10 cows an hour. A modern parlor worker can run 100+ cows an hour in a double‑20, and one tech can keep 60–70 cows on robots. Pair that with a roughly  lift in milk per cow since the 1940s and the same crew is producing exponentially more cwt.

But scale is the quieter half of the answer. The 1940s dairy averaged about 6 cows. The 2022 USDA Census of Agriculture put the average U.S. herd at 283 cows, and the only herd‑size category still growing is 2,500+ cows. When you’ve got a herd manager, a mechanic, and an HR binder, more cwt means lower fixed labor per cwt.

Then there’s policy, which never caught up. H‑2A is the modern descendant of the WWII programs, and it still excludes year‑round livestock work from full eligibility, which is why dairy uses it awkwardly when it uses it at all. The U.S. Department of Labor’s H‑2A Interim Final Rule, published and enacted October 2, 2025, fundamentally reshaped wage floors by shifting exclusively to the BLS Occupational Employment and Wage Statistics (OEWS) survey — creating the two skill‑level AEWR categories dairies are wrestling with right now in 2026.

Cornell PRO‑DAIRY and Texas A&M AgriLife both publish regularly on dairy cost of production, and the labor share has trended up across recent industry analyses. It’s now the variable most likely to determine whether your business model survives the next policy cycle.

How Much Does Waiting 30 Days Actually Cost You?

A lot of farms treat labor changes like a someday project. The math disagrees.

Say you’re running 300 cows, shipping ~75 lbs/cow/day — that’s about 6,250 cwt a month. If your current labor cost is $3.50/cwt and a tighter schedule, cross‑training, or one piece of automation could realistically drop you to $3.00/cwt, that 50¢ gap is $3,125/month. Wait three months to make the call and that’s nearly $9,400 that walked out of your operating account while you were “thinking about it.”

Now flip it the other way. If your regional AEWR is in the upper teens and your current crew is on undocumented or off‑program arrangements at lower wages, it’s tempting to wait. But the Adcock, Anderson & Rosson shock model puts the downside at thousands of farms closed and retail milk prices roughly doubling. Your real choice isn’t “cheap labor or expensive labor.” It’s “known higher cost now or unknown catastrophic loss later.” “We’ll deal with this next year” is itself a very expensive decision.

For the deeper read on what the October 2, 2025 Interim Final Rule actually changed for AEWR, including the OEWS shift and the new skill‑level categories, see our recent Tier 3 breakdown.

Is Your Crew Plan Still Running on 1942 Assumptions?

The instinct in any labor crunch is to reach for “temporary help.” That’s exactly what the Land Army and Bracero Program were — emergency patches, not architecture.

Dairy is a permanent, year‑round business. Cows don’t file demobilization papers. Three honest questions worth asking this week:

  • Do you know your labor cost per cwt and where it sits versus the ERS benchmark for your herd size?
  • If your foreign‑born crew vanished in 48 hours, what specifically breaks first — milking schedule, calf care, or breeding program?
  • Is your next major capital decision (robots, parlor upgrade, expansion, exit) penciled at today’s wages or at where AEWR/SAWP rates are clearly headed?

Two names worth bookmarking. Cornell’s Andrew Novakovic holds the E.V. Baker Professorship Emeritus of Agricultural Economics, and Texas A&M AgriLife’s Dr. David Anderson — co‑author of the Adcock, Anderson & Rosson CNAS report cited above — is a long‑tenured agricultural economist whose team’s cost‑of‑production work is where the deeper math lives.

Options and Trade‑Offs for Your Operation

You can’t rewrite immigration law from the office. You can change your exposure.

1. Double down on scale and efficiency. Works when you’re already 400+ cows with cow flow and access to capital. Needs parlor or robot investments and standardized workflows. The risk: you’re adding debt into a 2026 milk price USDA ERS expects to soften — the latest Livestock, Dairy and Poultry Outlook keeps all‑milk projections in the high‑teens to low‑$20s — while make‑allowance changes nibble the check. You also become more exposed to losing three workers at a 2,400‑cow scale than one at 80. For the operational side, see how scaled dairies are squeezing more cows per worker without burning people out.

2. Use automation selectively in the 150–400 cow band. Robots and automatic feeders can legitimately replace 2–3 FTEs without destroying cash flow — but only if your ROI math uses AEWR‑level wages, not what you wish you were paying. The trade is real: you swap milker risk for high‑skill technician risk, and you lock into a tech path that’s hard to unwind if interest rates stay sticky. We walk through the honest payback math on robots vs. high‑efficiency parlors in a separate piece worth a read before you sign a contract.

3. Tighten your labor mix and legal exposure (the 30‑day action). This is the one to start this month. Cross‑train one more family member or domestic part‑timer into the parlor. Audit your I‑9s and housing. Map which jobs could legitimately move onto H‑2A, TFWP, or SAWP and which can’t. You may raise your average wage in the short run; you definitely lower the chance of a Tuesday morning that empties your barn.

4. Optimize inside your scale. If you’re 60–180 cows and not chasing a multi‑million expansion, your biggest lever is measuring labor hours per cwt and trimming the drag. ERS pegs total labor on under‑50‑cow herds at $15.99/cwt on a full economic basis when family time is priced honestly. That’s not sustainable forever — but it’s manageable if you go in with eyes open about processor and lender preferences for larger, year‑round suppliers — and worth pairing with our coverage of the $3,010 heifer and 30% labor jump squeezing mid‑size herds.

That’s where the numbers stop being history and start being your 2027 budget planning. We’re mapping out the full ERS cost‑of‑production breakdown by herd size, regional data, and state‑by‑state AEWR maps in next week’s Bullvine Weekly and the Tier 3 dashboard.

Key Takeaways

  • If your total labor cost is above the ERS 200–499 cow benchmark of $4.19/cwt, you’re giving up margin scaled peers are capturing — run the comparison this month.
  • If you’re below $3/cwt only because unpaid family time isn’t priced, you’ve quietly recreated a 1942 Land Army model in your own kitchen — price it honestly before your next lender meeting.
  • If you depend on immigrant labor, model your wage bill at the full AEWR range published in the U.S. DOL’s 2026 schedule, or at the $17.60–$19.00+ CAD/hr Ontario SAWP floor.
  • If you operate in Canada, treat labor as a recoverable cost inside the CDC formula — but don’t assume the bodies will be there. CAHRC’s 5,000‑position gap by 2030 is the harder constraint.
  • If you’re weighing robots in the next 12 months, pencil the ROI at AEWR wages plus 10%, not last year’s payroll. Anything tighter is wishful thinking.
Herd BandHired Labor $/cwtUnpaid Family $/cwtTotal Effective $/cwt1943 Equivalent (2026$)Status Signal
Sub-50 Cows$0.53$15.46$15.99~$5.25 (hired only)🔴 Hidden family subsidy — price your time
50–199 Cows~$1.80~$3.50~$5.30~$5.25 (hired only)🟡 Narrow margin over 1943 baseline
200–499 Cows$2.53$1.66$4.19~$5.25 (hired only)🟡 Below 1943 on total; watch unpaid share
500–999 Cows~$2.75~$0.60~$3.35~$5.25 (hired only)🟢 Scaled advantage, but AEWR pressure building
2,000+ Cows~$2.20~$0.25~$2.45~$5.25 (hired only)🟢 Scaled minimum — H-2A exposure is the risk

What This Means For Your Operation

StrategyBest Fit (Herd Size)Capital RequiredLabor Cost ImpactKey RiskTimeline
1. Scale + Efficiency400+ cowsHigh ($500k–$2M+)Potential drop to ~$2.20–$2.50/cwtDebt load in softening milk price; 2,400-cow crew loss is catastrophic2–5 years
2. Selective Automation150–400 cowsMedium ($80k–$350k)Replaces 2–3 FTEs; net neutral to +$0.25/cwt short-termLocks into tech path; swaps milker risk for technician risk12–36 months
3. Tighten Legal MixAll sizesLow ($5k–$25k audit)Short-term wage rise; long-term compliance bufferRaises avg. wage in transition30–90 days
4. Optimize Within Scale60–180 cowsNone–LowMeasure & trim drag; ERS benchmark is $15.99/cwt at sub-50Not sustainable forever; lender/processor preference for larger suppliersImmediate

Three things to do before Memorial Day weekend ends:

  1. Pull last year’s payroll, divide by cwt shipped, and write your hired labor $/cwt on a sticky note.
  2. Compare it to the ERS bracket for your herd size in the table above.
  3. If the gap is more than $1/cwt, book one conversation this month — with your lender, your nutritionist, or a labor advisor — about which of the four paths above fits your balance sheet.

That’s it. No grand strategy. Just the same kind of small, specific decision every farm in this story has been forced to make for 84 years.

Memorial Day is built on the idea that some work is essential enough to be worth giving your life for. In 1942, that meant young men in uniform and young women in Land Army smocks, tied together by a brutal truth: somebody had to keep the milk, meat, and bread moving or the war was already lost.

If the people doing that essential work in your barn disappeared tomorrow, what would your cows, your community, and your own family story look like next Memorial Day?

Complete references and supporting documentation are available upon request by contacting the editorial team at editor@thebullvine.com.

Learn More

The Sunday Read Dairy Professionals Don’t Skip.

Every week, thousands of producers, breeders, and industry insiders open Bullvine Weekly for genetics insights, market shifts, and profit strategies they won’t find anywhere else. One email. Five minutes. Smarter decisions all week.
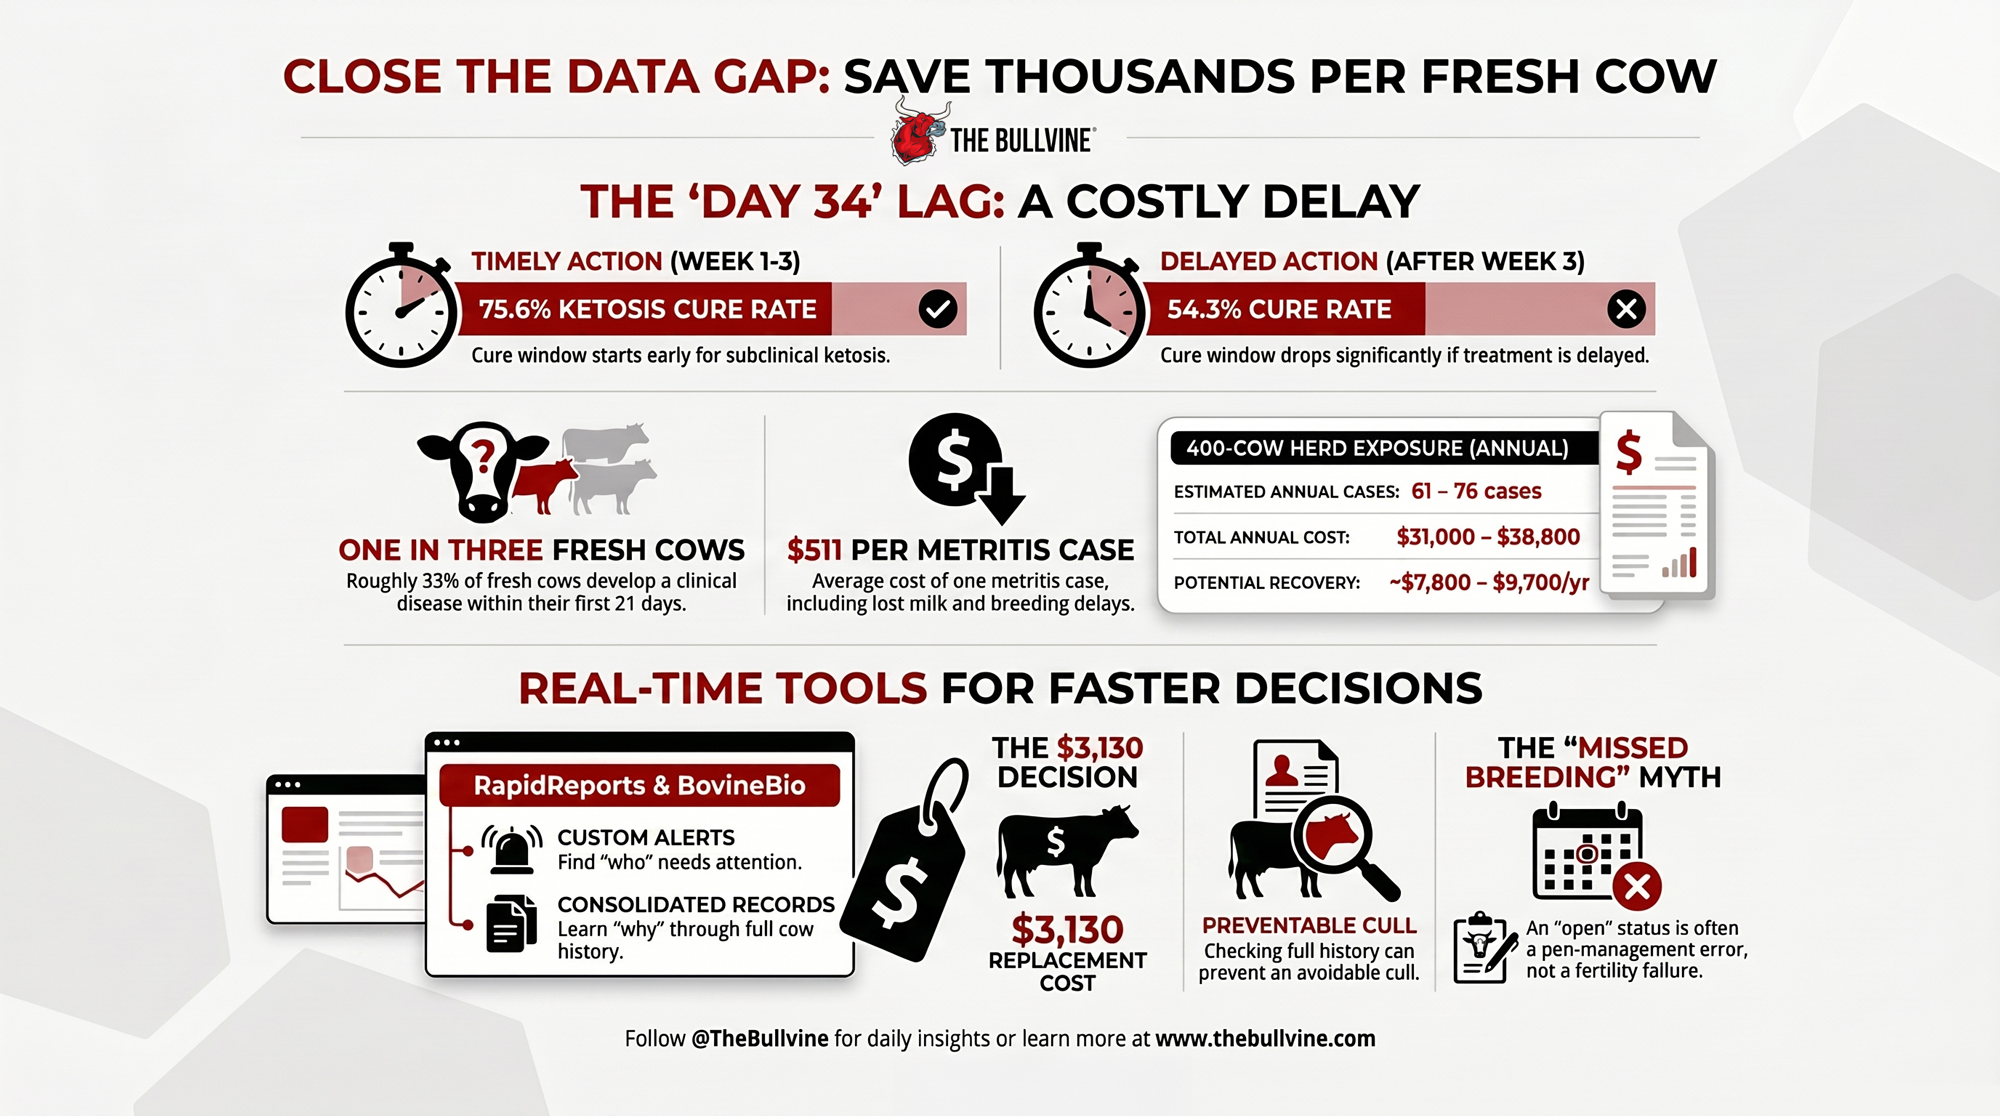
NewsSubscribe
First
Last
Consent

The Hydrogenobody Quietly Rewrote Your 2027 Methane Contract – Before You Even Signed It

Same ration. Same additive. Same paperwork. A Science paper in April just explained the 35-50 kg/day gap — and it’s the slice of methane your 2027 Bovaer contract assumed didn’t exist.

Executive Summary: A Science paper in April identified a new organelle inside rumen ciliates — the hydrogenobody — that powers an estimated 15-35% of enteric methane through a pathway 3-NOP can’t fully reach, which means every flat-30% Bovaer-linked 2027 contract on the continent is carrying biological risk nobody priced in. Two 500-cow herds on the same TMR and the same additive can now sit 35-50 kg of methane per day apart, purely on ciliate community: a low-ciliate herd can honestly land near a 30% reduction, while a holotrich-heavy herd ceilings around 20-25% and burns the difference straight through the contract’s minimum trigger. The hit lands somewhere between and a cow on most deals, depending on dose, premium tier, and carbon price — real money on a 500-cow shipper. Single-additive tools like Bovaer aren’t broken; they’re working on one of two hydrogen pipelines, which is why asparagopsis, nitrates, and most next-gen inhibitors hit the same plateau. The 30-day move is pulling your contract and reading three lines: who owns the shortfall, whether payment triggers on dosing or delivered performance, and whether there’s a re-opener clause for new science. The 90-day move is deciding whether early-life 3-NOP dosing through 14 weeks plus methane-aware Lactanet/CDCB sire selection are on the table for replacements — that’s where the structural reductions for your 2028-2030 contracts actually live.

hydrogenobody methane contract

A Science paper in April identified a cell structure inside rumen ciliates that powers an estimated 15-35% of enteric methane through a pathway current feed additives can’t fully reach — and every flat-30% Bovaer deal on the continent now carries biological risk that wasn’t priced in.

Picture a 500-cow Holstein dairy in southern Ontario — the kind of mid-size family operation you find every twenty minutes off Highway 401. Late last year, the owner signed a 2027 Bovaer-linked carbon and premium deal. The front-page math looked clean: feed 3-NOP, hit a modeled 30% reduction in enteric methane, collect a per-cwt sustainability premium, and a per-head carbon credit through Elanco’s Athian marketplace. Six months in, the cows are eating it, the milk is shipping, and the owner is starting to wonder whether the rumen ever read the contract.

In April, a paper in Science dropped a new piece of biology into the middle of every methane deal on the continent. Fei Xie and colleagues identified a previously unknown organelle inside rumen ciliates — the hydrogenobody — that helps power an estimated 15-35% of total enteric methane through a pathway current feed additives can’t fully reach (Xie et al., Science, April 2026). If you’ve already signed, or you’re about to, that single discovery rewrites the risk math on your contract.

What’s Changing and Why

For two decades, the industry has treated enteric methane as basically one pipe. Fermentation makes hydrogen, free-living methanogens in rumen fluid turn that hydrogen into methane, an inhibitor like 3-NOP knocks them back, and you book a reduction. That single-pipe assumption is baked into the 20-30% headline quoted for Bovaer in dairy cows and into the carbon methodologies that pay on it.

The April 2026 study — built on 450 rumen ciliate genomes and validated against 2,492 cattle across five countries — showed there’s a second pipe. Rumen ciliates, the protozoa that make up roughly half of rumen microbial biomass, carry a single-membrane organelle at the base of their cilia. That organelle produces hydrogen and strips oxygen at the same time, creating tiny anaerobic safe zones where attached methanogens churn out methane right on the ciliate surface.

Most current feed additives weren’t designed for that micro-zone. They work where hydrogen is floating in bulk rumen fluid, not where it’s being handed cell-to-cell. Translated to a feed bunk: a chunk of your methane lives in a part of the rumen your contract assumed your additive could reach. The new paper puts that estimated share at 15-35% of total enteric methane, and higher in herds loaded with holotrich ciliates like Dasytricha.

How This Plays Out on Real Farms

Two 500-cow Holstein dairies on the same TMR, shipping to the same processor, can now end up on very different sides of the same contract. The Xie study found high-methane sheep on the same diet carried nearly 100 times more Dasytricha than low-methane sheep, and each of those cells packed about 28 times the hydrogenobody density of a common low-emission ciliate genus. On a dairy, that means a holotrich-hot herd is running more of its methane through the protected pipeline. Same additive program, lower ceiling.

These reduction ceilings aren’t measured outcomes from a single trial. They’re inferences from layering the hydrogenobody paper’s two-pipeline framing on top of published 3-NOP efficacy ranges. The directional logic is solid. The precise plateau on your farm will depend on your herd’s ciliate profile — and the only way to know which barn you’re standing in is a rumen fluid sample run for ciliate community composition, still primarily a research-lab service today, but one your nutritionist or extension specialist can route through a university partner if you want a real answer rather than an industry assumption.

Here’s the barn math at the methane level. Set the dollars aside for a moment. Take a higher-producing Holstein at roughly 600-700 g of enteric methane per cow per day — a range consistent with peer-reviewed Journal of Dairy Science enteric-methane work on NA lactating cows fed typical TMRs. A lower-ciliate herd may have about 20% of its methane locked in hydrogenobody zones, so a well-run 3-NOP program can honestly land near the 30% headline reduction — putting it around 430 g/cow/day post-additive. A holotrich-heavy herd, with 30-35% of methane in that protected zone, can do everything right and still plateau around 20-25%, landing closer to 530 g/cow/day. Same ration, same additive, same paperwork — different rumen.

Two 500-Cow Herds, Same Ration, Different Rumens

Rumen Ciliate ProfileMethane in Protected ZoneRealistic 3-NOP ReductionPost-Additive Methane per Cow/DayTotal Herd Methane per Day (500 cows)Contract Shortfall Risk
Low-ciliate herd~20%~30% (target hit)~430 g~215 kgLow / on track
Holotrich-heavy herd30-35%20-25% (plateau)~530 g~265 kgHigh — 35-50 kg/day gap

Inputs: ~600-700 g/cow/day pre-additive baseline (peer-reviewed NA lactating Holstein range, J Dairy Sci); reduction percentages reflect inferred biological ceiling under the two-pipeline framing of Xie et al. 2026, not measured trial outcomes. Per-cow and per-herd numbers scale linearly to your own herd size and baseline.

That kilogram gap is what your contract’s dollar math sits on top of. Whether it costs you something closer to $40 a cow or something closer to $73 a cow depends on dose, premium tier, and carbon price — and the full cow-by-cow teardown runs in next week’s Methane Contract Files.

The Mechanics Behind the Outcomes

Picture two hydrogen economies in the same rumen. The first is the open one. Hydrogen released into rumen fluid, picked up by free-living methanogens, is turned into methane. 3-NOP, the active ingredient in Bovaer, inhibits methyl-coenzyme M reductase in those methanogens, and that’s where most of its 20-30% reduction comes from.

The second economy is the ciliate one. The hydrogenobody, sitting at the base of the hair-like cilia, generates hydrogen and scrubs oxygen out of its immediate neighborhood. Methanogens latch onto the ciliate surface and tap that hydrogen directly. They never really mix it into the open rumen fluid. An inhibitor floating in bulk fluid has a hard time reaching reactions in those nanometre-scale pockets.

That’s why the reduction curve from a single additive bends. You get a steep early drop as the bulk-fluid pathway is suppressed. Then the line flattens as more of the remaining methane sits in the ciliate-protected pipeline. Genetics, early-life colonization, and feed history all shape how big that protected slice is — host genes like SPINK5, which influence rumen wall structure and local oxygen gradients, help decide which ciliates can colonize and thrive. In other words, your herd’s methane ceiling is partly baked in long before any product hits the feed bunk.

Why This Goes Beyond Bovaer

This isn’t just a 3-NOP problem. Any additive that works primarily on free-living methanogens in bulk rumen fluid runs into the same wall. Asparagopsis seaweed, nitrate-based products, certain ionophores, and most next-gen inhibitors in commercial trials all share that mechanism family. The two-pipeline framing applies to every one of them.

Ciliate-targeting tools — tannins, saponins, defaunation strategies, and the early-life microbiome interventions now in research — work on the other pipe. That’s why the Science paper matters beyond a single product launch. It reframes the entire commercial methane stack as a hydrogen-supply problem with two valves, not one inhibitor problem with a 30% ceiling. Your 2027 contract may be priced on Bovaer, but the next contract cycle will be written on a stack.

Options and Trade-Offs for Farmers

There’s no single move that fixes this. There are four practical paths, and most operations will end up combining pieces of them.

PathBest For30-Day Action2027 Contract Risk2030 Impact
1. Single-tool, stress-test contractAlready signed, dosing dialled inPull contract; find performance trigger languageHIGH if payment on delivered reductions — holotrich herd may plateau at 20–25%Low — no structural change
2. Stack 3-NOP + tannins/saponinsNutritionist sees holotrich-dominant profilesAdd tannin/saponin layer; monitor DMI + NDF digestibilityMODERATE — may close gap to high 20s, not close it fullyModerate — partial ceiling lift
3. Genetics + early-life dosingRaising your own replacementsDose calves 0–14 wks; audit sire lineup for methane indicesLow for 2027 — no near-term impactHIGH VALUE — structural reduction baked into 2030 herd
4. Renegotiate nowSigned before April 2026 Science paperDocument compliance data; bring Xie et al. to repCRITICAL — waiting means underwriting the biological shortfall aloneHigh — sets correct baseline for next contract cycle

Sources: Article (Hydrogenobody/Xie et al. 2026); Meale et al. 2021, Scientific Reports (early-life 3-NOP); article’s four-path framework.

  • Path 1 — Stay single-tool, but stress-test the contract. When it makes sense: you’ve already signed, and dosing is dialed in. What it requires: a 30-day contract teardown. Risks/limits: if the deal pays on delivered reductions with a hard floor rather than dosing compliance, you’re carrying biological risk that wasn’t priced. Pull the contract this month, find the language on performance triggers, minimum reductions, and clawbacks, and map them against a realistic 20-25% biological ceiling for a ciliate-heavy herd.
  • Path 2 — Stack a second mechanism on top of 3-NOP. When it makes sense: your nutritionist sees holotrich-dominant rumen profiles. What it requires: a moderate, well-managed tannin or saponin program. Risks/limits:gains are conditional on dose, ration, and whether you can hold DMI and fiber digestibility steady. Used carefully, this may move a holotrich-heavy herd from a 22-25% wall toward the high 20s. This is a nutritionist conversation, not a “throw it in the TMR” decision.
  • Path 3 — Invest in the next herd, not just this one. When it makes sense: you raise your own replacements. What it requires: early-life 3-NOP dosing plus methane-aware sire selection. Risks/limits: won’t move 2027 numbers — it changes what your 2030 contract can honestly promise. Calves dosed with 3-NOP from birth through about 14 weeks held lower methane out to at least 60 weeks of age in published trials (Meale et al., 2021, Scientific Reports), with shifts in the underlying microbial community.
  • Path 4 — Renegotiate now, while the science is fresh. When it makes sense: you signed before the Sciencepaper hit. What it requires: documented compliance, real reduction data, and the hydrogenobody science walked into the room. Risks/limits: relationship cost — your rep or broker may push back hard. The alternative is eating the gap quietly for the next four years.

How Much Does Waiting 30 Days Actually Cost?

On a 500-cow herd already running a single-additive program, the cost of waiting hides in two places: contract risk and lost renegotiation timing.

Run it on your own deal. Every month you wait to tighten the contract, layer in a second mechanism, or formally flag the biological risk to your rep is another month you’re underwriting a reduction your rumen may not deliver — without anyone else on the contract sharing that exposure. The faster you put the hydrogenobody science in front of the people who wrote the deal, the cleaner the conversation about who eats the shortfall.

Is Your Herd’s Genetic Strategy Already Behind?

Methane and feed-efficiency traits are now available in mainstream NA sire indices through Lactanet and CDCB, but uptake data and A.I. sales mix suggest most herds still rank sires primarily on production, components, type, and health. If your processor or carbon partner is steering toward stricter methane targets through 2030, that gap shows up later as a herd whose rumen architecture quietly fights your mitigation stack.

The practical move this month is small but real. Ask your genetics rep where your active sire lineup sits on whatever methane or feed-efficiency indices they offer, and whether they can flag bulls already in your list that lean lower-emission without giving up milk or fertility. You don’t have to rebuild your mating plan tomorrow. But you want to know whether the daughters entering your parlor in three years will make your two-pipeline strategy easier or harder.

Key Takeaways

  • If your contract assumes a flat 30% reduction with a single additive, treat that as a working hypothesis, not a guarantee — the hydrogenobody work suggests an estimated 15-35% of enteric methane sits in a ciliate-protected pipeline that current tools can’t fully reach.
  • Pull your current contract this month and check three lines: who owns the shortfall if reductions come in low, whether payment triggers on dosing or on delivered performance, and whether there’s a re-opener clause for new science.
  • If you’re running 3-NOP solo on a holotrich-heavy herd, model a 20% reduction scenario against your contract’s minimum trigger before you sign anything new — that’s the realistic biological floor, not the 30% headline.
  • If your nutritionist sees holotrich-dominant rumen profiles, ask about a tannin or saponin layer — but only with NDF digestibility, DMI, and component impacts on the same spreadsheet.
  • If you raise replacements, decide within 90 days whether early-life 3-NOP dosing through about 14 weeks and methane-aware sire selection are on the table — that’s where the structural reductions live for 2028-2030 herds.

📋 4 Questions to Ask Before Signing Your Next Methane Deal

  1. Where does your model account for the protected ciliate pipeline?
  2. Is my payout based on strict dosing compliance, or on delivered methane performance metrics?
  3. How does this contract handle baseline shortfalls in high-ciliate (holotrich-dominant) herds?
  4. Do you credit stacked mitigation mechanisms (for example, 3-NOP + tannins) separately?

What This Looks Like at Your Bunk

The question isn’t whether your contract still works on the slide deck. It’s whether your specific rumen, on your specific ration, with your specific replacements, can deliver the number your processor and broker are quietly counting on. Where does your breakeven sit if you only hit 22% instead of 30% — and how much of that gap is your operation willing to wear before someone else has to come back to the table?

Run Your Numbers

Component Value Tracker — Before you sign a flat-30% Bovaer-linked premium, run your fat, protein, and other solids through the Component Value Tracker to see what each per-cwt sustainability premium is actually worth on your milk check — and how much margin a 22% rumen plateau eats into before the contract bonus catches up.

Complete references and supporting documentation are available upon request by contacting the editorial team at editor@thebullvine.com.

Learn More

The Sunday Read Dairy Professionals Don’t Skip.

Every week, thousands of producers, breeders, and industry insiders open Bullvine Weekly for genetics insights, market shifts, and profit strategies they won’t find anywhere else. One email. Five minutes. Smarter decisions all week.
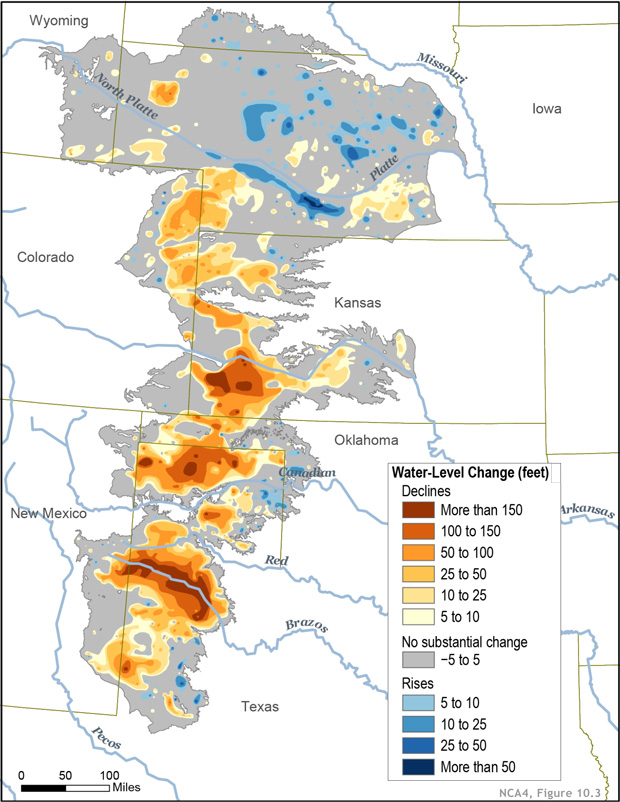
NewsSubscribe
First
Last
Consent

1 in 5 RWA Cattle Tested Positive. The EU Just Made That a Trade Problem.

USDA’s own peer-reviewed sampling found antibiotic residues in 37 of 185 RWA-labeled cattle. On September 3, the EU’s documentation rules go live — and your AB-free premium math changes overnight.

Executive Summary: On May 12, 2026, the European Commission cut Brazil from its authorized animal-product exporters list — €1.81 billion in annual trade suspended September 3, not over residues, but over Brazil’s failure to document lifetime antimicrobial compliance under EU Reg 2023/905. The same standard is now heading for every North American AB-free, RWA, and quality-program dairy premium, and your bulk-tank test is no longer a legal shield. USDA’s own FSIS sampling, published peer-reviewed in JAFC in December 2024, found antibiotic residues in 37 of 185 cattle from RWA-labeled beef plants — roughly 1 in 5 — and FSIS’s August 2024 guideline now requires substantiation of controls “valid from birth to slaughter.” For a 400-cow U.S. herd at the 2025 NASS average of 24,390 lbs/cow, that’s 97,560 cwt/year, and an AB-free differential of $1.50–$2.50/cwt puts $146,340–$243,900 of annual premium revenue on top of records most operations couldn’t pull cow-by-cow inside an hour. Six months of suspended premium during a documentation rebuild runs ,000–3,000 on a 300–600 cow herd — not a gap most mid-size dairies absorb without touching herd size or debt structure. Canadian operators sit closer to compliance through proAction’s cow-level architecture, but processors shipping into EU-aligned export chains inherit the same audit logic. The premium isn’t disappearing; the right to collect it on a supplier affidavit is, and the read-or-skip question is whether your last 12 months of treatment records would survive a buyer audit landing tomorrow.

AB-free dairy premium

The May 12 announcement caught the trade press. The September 3 effective date should be catching every North American AB-free dairy supplier, processor compliance lead, and quality-program contract administrator with documentation gaps they haven’t tested. The trigger wasn’t a contaminated container — it was a missing paper trail, and the same logic is heading for the supplier affidavit propping up your per-cwt premium.

If you’re a mid-size dairy collecting a per-cwt premium for “raised without antibiotics” or equivalent claims, the question isn’t whether your milk is clean today. It’s whether your records can prove every cow’s drug history on demand. That’s a different standard than most North American AB-free and RWA programs were built to meet.

Evaluation MetricTypical North American RWA ProgramEU Lifetime Compliance Standard
Scope of CoverageProgram enrollment forwardLifetime (birth to slaughter or full milking life)
Prohibited SubstancesWithdrawal-managed antimicrobialsPermanently excluded human-reserved list (Reg 2022/1255)
Verification MethodSupplier affidavit + bulk tank testingCow-level digital records + official certification
Enforcement TriggerChemical residue detected at slaughter or tankDocumentation failure or missing paper trail
Financial ExposureLoss of per-batch or localized premiumFull market access suspension and retroactive clawbacks

What the EU Just Did, in Plain Terms

The legal mechanism is Article 118 of EU Regulation 2019/6, paired with Delegated Regulation 2023/905. Trade lawyers call it the “mirror measure.” It applies the same antimicrobial rules EU farmers have operated under since January 28, 2022, to anyone shipping animal products into the bloc, with import-side enforcement effective September 3, 2026.

Two prohibitions matter most. Antibiotics used as growth promoters have been off the EU table for years under the broader veterinary medicinal products framework established by Reg 2019/6. The second category — antimicrobials reserved for human medicine — is set out in Implementing Regulation (EU) 2022/1255. That’s the list any animal headed for an EU plate must never have touched, from birth forward.

The shift that changes everything operationally is the move from Maximum Residue Limits at slaughter to compliance throughout the life of the animal. A clean tank test doesn’t fix a treatment from two lactations ago. A respected withdrawal period doesn’t matter if the drug is on the prohibited list. The drug history is the product.

Brazil’s €1.81 Billion Lesson

Brazil’s exposure breaks down into roughly €1.04 billion in beef and €762.9 million in poultry, with smaller volumes in honey, aquaculture, and live equines. The other Mercosur members — Argentina, Paraguay, Uruguay — kept their access. They had paperwork to back the claim.

India’s case is the more useful precedent for North American operators. Delisted from EU aquaculture exports in October 2024, reinstated around the same time Brazil was cut, after upgrading residue monitoring and lab-backed certification systems. The mechanism rewards documentation and punishes its absence. It doesn’t care whether your product is actually clean — only whether you can prove it. For a North American dairy processor reading this story, a clean bulk-tank test is no longer the legal shield it used to be. It’s the baseline.

The Tension: Your AB-Free Premium Sits on Three Weak Points

Most published North American AB-free programs share three structural features that don’t survive a lifetime-compliance audit. Treatment logs are typically built around withdrawal compliance, not lifetime exclusion. Program rules generally apply from enrollment, not from the day the calf hits the ground. Verification leans on supplier affidavits and tank-level residue tests rather than cow-level treatment histories cross-referenced against a prohibited substance list.

USDA’s own Food Safety and Inspection Service ran the most uncomfortable test of this gap. In September 2023, FSIS and USDA’s Agricultural Research Service launched a sampling program targeting cattle from establishments processing “raised without antibiotics”-labeled beef, screening for more than 180 veterinary drugs.

1 in 5. A peer-reviewed analysis of the FSIS sampling, published in the Journal of Agricultural and Food Chemistry in December 2024, reported antibiotic residues in 37 of approximately 185 sampled animals, with multiple antibiotics confirmed in 11 of those.

FSIS’s response: the August 28, 2024, Guideline on Substantiating Animal-Raising or Environment-Related Labeling Claims, which requires written documentation of controls “valid from birth to slaughter” as the preferred substantiation path and strongly encourages third-party certification and routine sampling.

What it stopped short of: mandatory testing.

That’s the language regulators use right before they start enforcing.

Mastitis is where the whole structure bends the hardest. Industry literature consistently identifies mastitis as a leading driver of antimicrobial use on dairy farms, with treatment frequency varying by region, season, and herd management system. The protocol most likely to fail an audit runs at 4:30 a.m. under time pressure, with the person on the morning shift deciding in 90 seconds whether to treat with an intramammary tube or culture and wait. On paper, that treatment flips the cow out of the AB-free pool permanently. In practice, the flag often doesn’t follow her milk through shift changes, software handoffs, and the next pickup.

Running the Numbers: The Financial Risk Profile

Using the 2025 USDA NASS national average of 24,390 lbs/cow as the production baseline, here’s the documentation-failure exposure across common herd sizes. The AB-free premium range below ($1.50–$2.50/cwt) is illustrative for U.S. AB-free programs — Canadian premium structures differ under quota — and you should verify your actual differential against your own contract or processor program before acting on these figures.

Inputs

  • Herd size: 400 cows
  • Milk per cow per year: 24,390 lbs (USDA NASS Milk Production annual summary, 2025 U.S. national average)
  • Annual production: 400 × 24,390 ÷ 100 = 97,560 cwt
  • AB-free premium range (illustrative, U.S. context): $1.50–$2.50/cwt

Annual premium revenue at risk — 400-cow herd

Premium6-month exposure12-month exposure
$1.50/cwt$73,170$146,340
$2.50/cwt$121,950$243,900

Scaling by herd size

  • 200-cow herd: 48,780 cwt → $73,170–$121,950/year at $1.50–$2.50/cwt
  • 1,000-cow herd: 243,900 cwt → $365,850–$609,750/year

Threshold to act on

Herd sizeAnnual cwt (24,390 lbs/cow)Premium @ $1.50/cwtPremium @ $2.50/cwtAction posture
200 cows48,780$73,170$121,950Stage the work
300 cows73,170$109,755$182,925Stage / monitor
400 cows97,560$146,340$243,900Act this contract cycle
600 cows146,340$219,510$365,850Urgent — 3× rule triggered
1,000 cows243,900$365,850$609,750Urgent — capex-justified

If your AB-free or quality-program premium covers a credible compliance build-out by 3× or more on annual revenue, urgency is high. Under 1.5× coverage, you have room to watch and stage the work.

What this box can’t tell you

The cost of building EU-grade documentation is harder to pin down than the premium-loss exposure. Industry estimates range from the tens of thousands for farm-side software, cow ID upgrades, and protocol changes to the low six figures for processor-level traceability platform builds — with significant variation by vendor, existing infrastructure, and supply-base size. The premium-loss number is more sharply quantifiable today than the compliance-cost number. The next piece in this series prices out those build costs with named platform examples.

📋 The 30-Day Audit-Proof Checklist

Run this diagnostic immediately. If any answer is No, your premium is exposed.

  • Individual Traceability: Can you retrieve the last 12 months of individual treatment records by distinct cow ID in under an hour?
  • Substance Mapping: Do you have a documented list of every active antimicrobial ingredient used on-farm this calendar year?
  • The “Red List” Check: Have you verified that zero on-farm medications sit on the EU Reg 2022/1255 human-reserved list?
  • Data Hand-off: Does your herd management software automatically flag treated animals so the data travels cleanly to your processor?
  • Paper Trail: Do you have your processor’s written, formal substantiation, and audit protocols on file?
  • Baseline Math: Have you calculated your exact premium differential using your last three consecutive milk checks?

What’s Different for Canadian Suppliers Under Quota?

Canadian operators read this story through a different lens than their U.S. peers. Quota and pooled pricing dampen immediate per-cwt premium volatility, and proAction’s existing record-keeping and traceability architecture already captures treatment data at the cow level. Many Canadian dairies are closer to lifetime documentation standards than they realize.

The exposure is on the export side. Canadian processors shipping cheese, ingredients, or branded fluid into EU-aligned markets — or into U.S. customers who in turn supply Europe — will inherit the same lifetime-compliance expectations. The question for a Canadian supplier isn’t “will my milk check change tomorrow?” It’s “which of my processor‘s export programs am I in, and can my proAction treatment records map cleanly into their export documentation chain?”

No equivalent CFIA dairy export advisory specific to antimicrobial lifetime compliance has been published as of this writing. That’s a watch-list item, not an all-clear.

The Turn: This Stopped Being a Marketing Claim

The assumption baked into most North American AB-free programs has been that USDA and CFIA would stay on the “guidance and encouragement” path indefinitely. That assumption is starting to look strained.

FSIS has already moved once. The September 2023 sampling program was the signal. The December 2024 peer-reviewed publication of its findings was the evidence. The August 2024 guideline’s explicit “birth to slaughter” documentation language was the formal shift. That’s not the posture of a regulator planning to keep relying on affidavits.

Outside North America, the direction is harder to argue with. Australia’s Department of Agriculture communicated to its beef sector in March 2026 that EU antimicrobial rules apply from September 3, “regardless of exporting country,” and updated its EUCAS certification scheme accordingly. EU member states are tightening internal compliance under the same regulation. EU-aligned export markets are writing those expectations into buyer specs.

The signal isn’t that AB-free is going away. It’s that AB-free is shifting from a marketing claim verified by the seller to a documentation standard verified by the auditor. The premium isn’t disappearing. The right to collect it without lifetime records is.

How Much Does Waiting Actually Cost a 300–600 Cow Dairy?

The honest answer is that waiting costs nothing — until it costs the entire premium in a single cycle. When a buyer pulls a misbranded line, three things tend to happen at once. Affected lots lose the premium retroactively. Claw-back charges hit historical sales. Volume shifts to a competitor with cleaner records.

For a 300–600 cow herd at 24,390 lbs/cow/year, annual premium revenue runs from roughly 0,000 (low end: 300 cows × .50/cwt) to 5,850 (high end: 600 cows × .50/cwt). Six months of suspended premium during a documentation rebuild is $55,000 to $183,000. That’s not a gap most mid-size operations absorb without adjusting herd size, debt structure, or both.

The trade-off is straightforward. You spend money up front to make the premium audit-proof, or you carry the audit risk against the full annual premium. Neither path is free.

Is Your Mastitis Protocol Already an Export Liability?

Most farms run mastitis treatment as a clinical decision. Diagnose, treat, respect withdrawal, and get the cow back in the tank. Under EU-style rules, the same decision becomes a compliance event with a paper trail attached.

Did the active ingredient come from the human-reserved class under Reg 2022/1255? Does your vet know which products in your current intramammary rotation are on that list, and does your herd software flag that distinction at the individual cow level? Did the cow’s status update in the system, and does that flag travel with her milk to the processor? Can you reconstruct the full decision six months from now, on demand, when an auditor asks?

The dairies that hold their premium when others lose it aren’t the ones with no mastitis. They’re the ones whose mastitis decisions are captured as structured data, governed by written protocols, and integrated upstream into the processor’s traceability system. That operating standard is achievable on a 12–18 month build for most mid-size operations. It’s also exactly where buyer specs are quietly heading.

The 30/90/365-Day Playbook for a 300–600 Cow AB-Free Dairy

30-Day Actions — Find the Gap

  • Pull your last 12 months of treatment records and your full list of on-farm antimicrobials. Cross-check against the EU prohibited-substance list under Implementing Regulation 2022/1255. If you can’t produce a cow-level history in under an hour, that’s the gap — the same documentation gap that cost Brazil its market access. Red-flag trigger: if your annual AB-free premium differential covers a credible compliance build-out by 3× or more and your records can’t pass a 1-hour cow-level audit, treat this as urgent before your next contract cycle.
  • Calculate your real annual premium dollars at risk. Use your last three milk checks. Annualize the AB-free or quality-program differential per cwt and multiply by your annual cwt shipped. Compare that number to the realistic cost of digital treatment recording and cow ID upgrades. Where it can backfire: anchor on your best month, and you’ll overstate urgency. Use a conservative 12-month trailing average.
  • Request your processor’s traceability roadmap in writing. Ask specifically: Is my milk currently in a premium SKU touching export markets? What is your substantiation protocol for that claim? What cost-share is available for farm-side documentation upgrades? A processor that can’t answer all three in writing is its own signal about where your premium sits in their risk stack.

90-Day Actions — Close the Largest Single Gap

  • Standardize digital treatment entry across the parlor and hospital pen. The goal is structured, time-stamped antimicrobial entries tied to individual cow IDs in your herd software — not handwritten board notes transcribed twice and delivered to the processor as a supplier affidavit. What it requires: a written protocol, software discipline, and roughly 90 days of consistent capture before records become defensible as audit evidence. Where it can backfire: a half-built system with inconsistent entry is worse than no system if it creates the impression of documentation that doesn’t actually hold up.
  • Rewrite your mastitis SOPs around culture-guided treatment and selective dry cow therapy where clinically appropriate. This isn’t about treating fewer sick cows. It’s about generating cleaner records and reducing the total number of antimicrobial events in the protocol most likely to trip an audit. Where it can backfire:pushing selective dry cow therapy without the lab infrastructure to support it raises somatic cell counts, which hits a different line of the milk check.
  • Map your intramammary rotation against Reg 2022/1255 with your vet. If any active ingredient in your standard first-line treatment is on the human-reserved list and that cow’s milk is entering a premium pool, the product swap is your first compliance move. What it requires: one conversation, a willingness to adjust the protocol, and a modest shift in drug cost.

365-Day Moves — Position for the Next Premium Tier

  • Achieve cow-level treatment integration with your processor’s traceability platform. This is the structural lift — capex on the processor side, protocol discipline on yours — and it’s the move that converts your operation from claim-eligible to audit-ready. Negotiate it into your supply agreement as a defined deliverable, not a goodwill gesture. Where it can backfire: committing to the platform upgrade without a defined premium structure in exchange locks you into cost without revenue.
  • Push for explicit cost-share in your supply contract. If your processor is building or planning an EU-aligned or export-spec premium tier, mid-size farms have significantly more leverage on software, ID equipment, and training subsidies than they typically exercise. Get it in writing before the build is complete, and the leverage is gone.
  • Watch for the three triggers that signal the window is closing: FSIS moving from guidance to enforcement on RWA label claims; your top retail or export buyers tightening substantiation requirements in writing; competitors marketing “third-party verified” where you’re still on “program-enrolled.” When two of three are moving simultaneously, the cost of waiting has likely crossed the cost of acting. Opportunity signal: if a processor in your region launches an EU-aligned premium tier and your records are already 80% of the way to audit-ready, you’re positioned to capture incremental $/cwt while operations still on affidavits get downgraded or removed from the program.

What This Means for Your Operation

The Brazil delisting isn’t a Brazil story. It’s a documentation story that happens to carry a €1.81 billion price tag. The same machinery — lifetime compliance, official certification, cow-level traceability — is being written into more buyer specs and more export markets every quarter.

For a 300–600 cow North American dairy in an AB-free or RWA program, the math is unsentimental. The premium is real. The records behind it are uneven. The cost to upgrade is meaningful but increasingly knowable as more processors and co-ops build out their documentation platforms. The cost of getting caught short is also meaningful — and only knowable in retrospect.

The trade-off won’t get easier. You either spend now to make the premium audit-proof, or you carry the audit risk against the full annual premium until the day a buyer asks for proof you don’t have.

What does your current AB-free contract actually say about premium eligibility if a buyer audits cow-level treatment data — and what would your last 12 months of records prove if that audit landed tomorrow?

Key Takeaways

  • The September 3 EU rule isn’t about residues — it’s about records. Brazil lost €1.81 billion because its paperwork couldn’t prove lifetime antimicrobial compliance, and the same audit logic is heading toward every North American AB-free, RWA, and quality-program premium contract.
  • Run the 3× rule before your next contract cycle. If your AB-free differential covers a credible documentation build by 3× or more on annual premium revenue, treat it as urgent; under 1.5×, you can stage the work — but only if you can pull a cow-level treatment history inside an hour.
  • Mastitis is where the audit breaks. If your standard intramammary rotation includes anything on the EU Reg 2022/1255 human-reserved list and that milk’s entering a premium pool, the product swap and the cow-level flag are your first two compliance moves — not a 365-day project.
  • Canadian operators on quota sit closer to compliance than they think through proAction’s cow-level architecture, but processors shipping into EU-aligned export chains inherit the full audit standard. Get your processor’s substantiation protocol and cost-share position in writing before the build, not after.

Complete references and supporting documentation are available upon request by contacting the editorial team at editor@thebullvine.com.

Run Your Numbers

Component Value Tracker — Translates your AB-free or quality-program differential into per-cow, per-day, and annual revenue impact using your actual production. Stress-test the 3× rule against your real premium dollars before your next contract cycle — and see exactly what’s at risk if a buyer audits cow-level treatment data.

Learn More

The Sunday Read Dairy Professionals Don’t Skip.

Every week, thousands of producers, breeders, and industry insiders open Bullvine Weekly for genetics insights, market shifts, and profit strategies they won’t find anywhere else. One email. Five minutes. Smarter decisions all week.
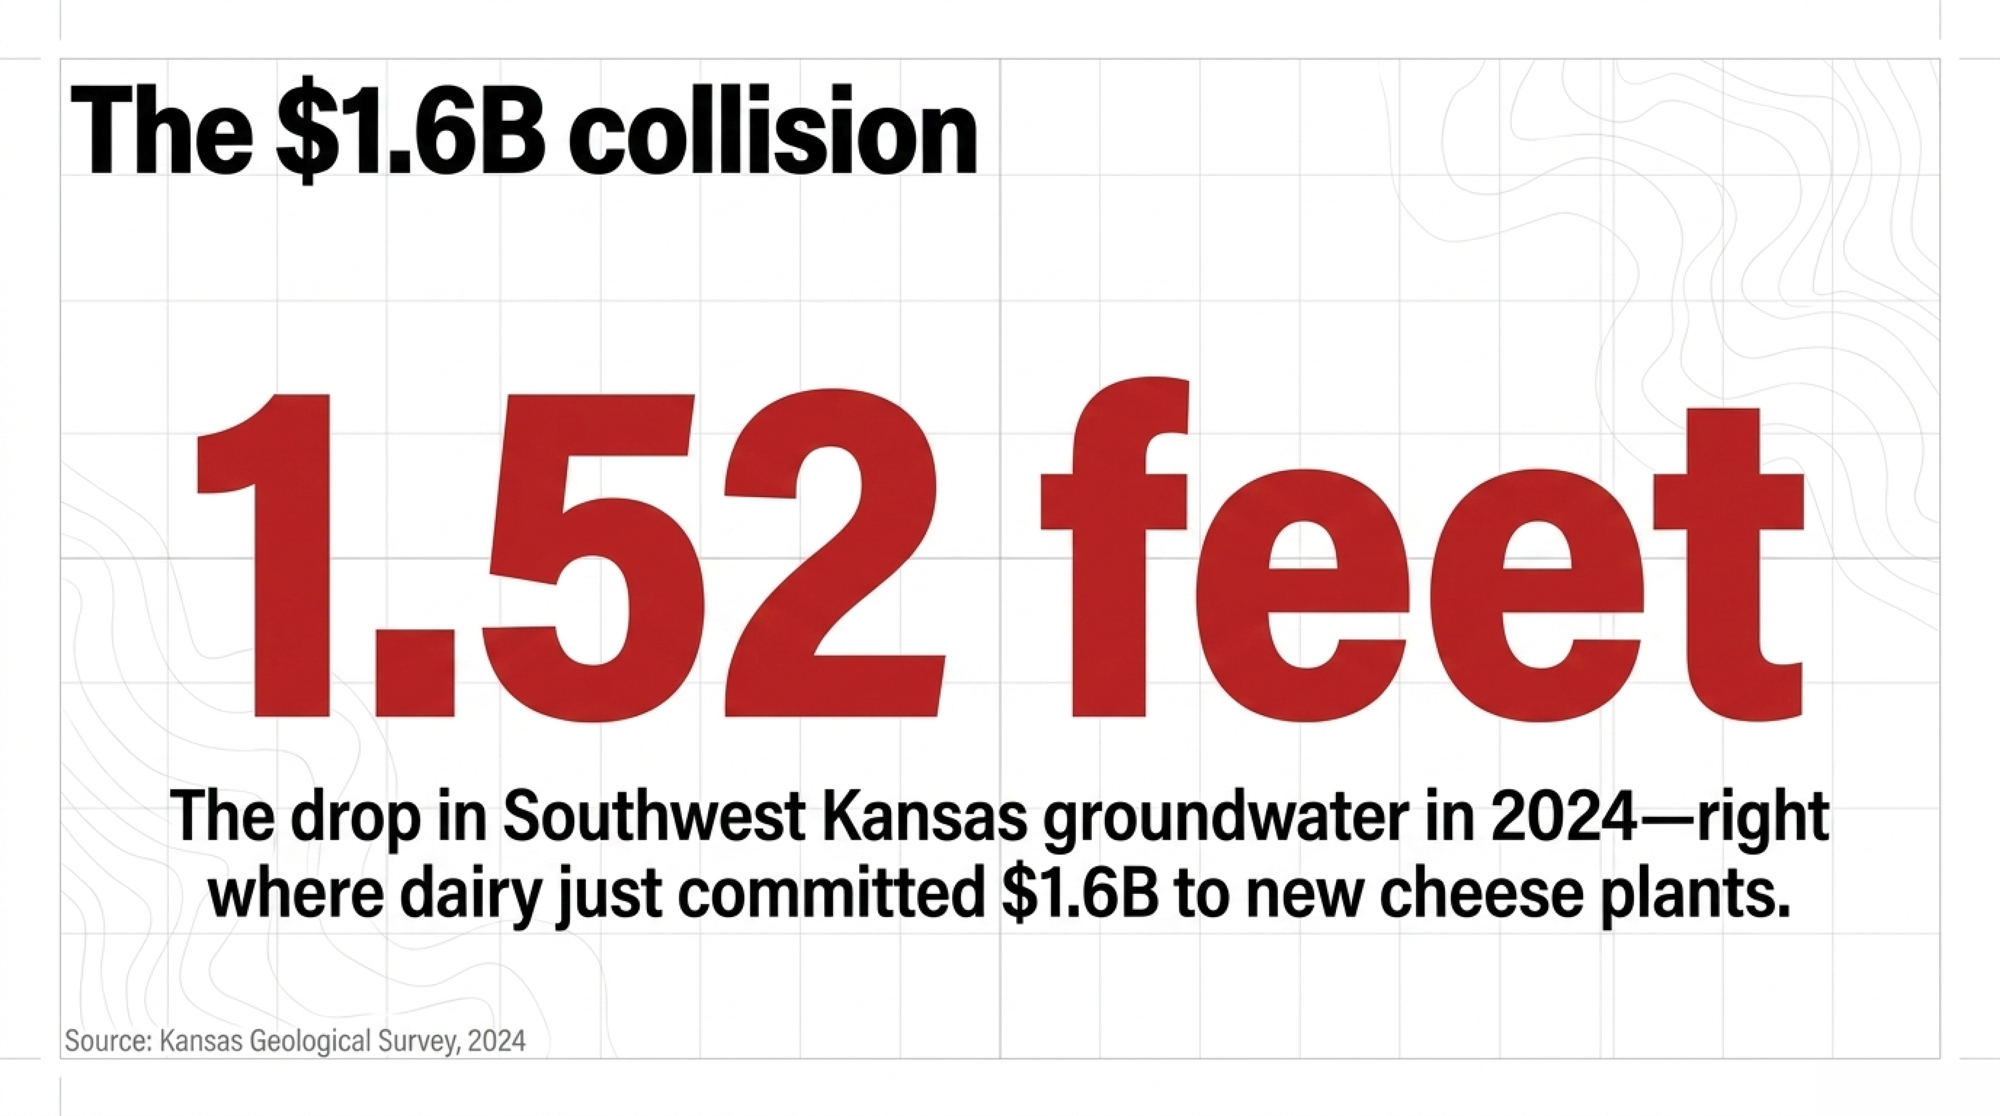
NewsSubscribe
First
Last
Consent
Send this to a friend