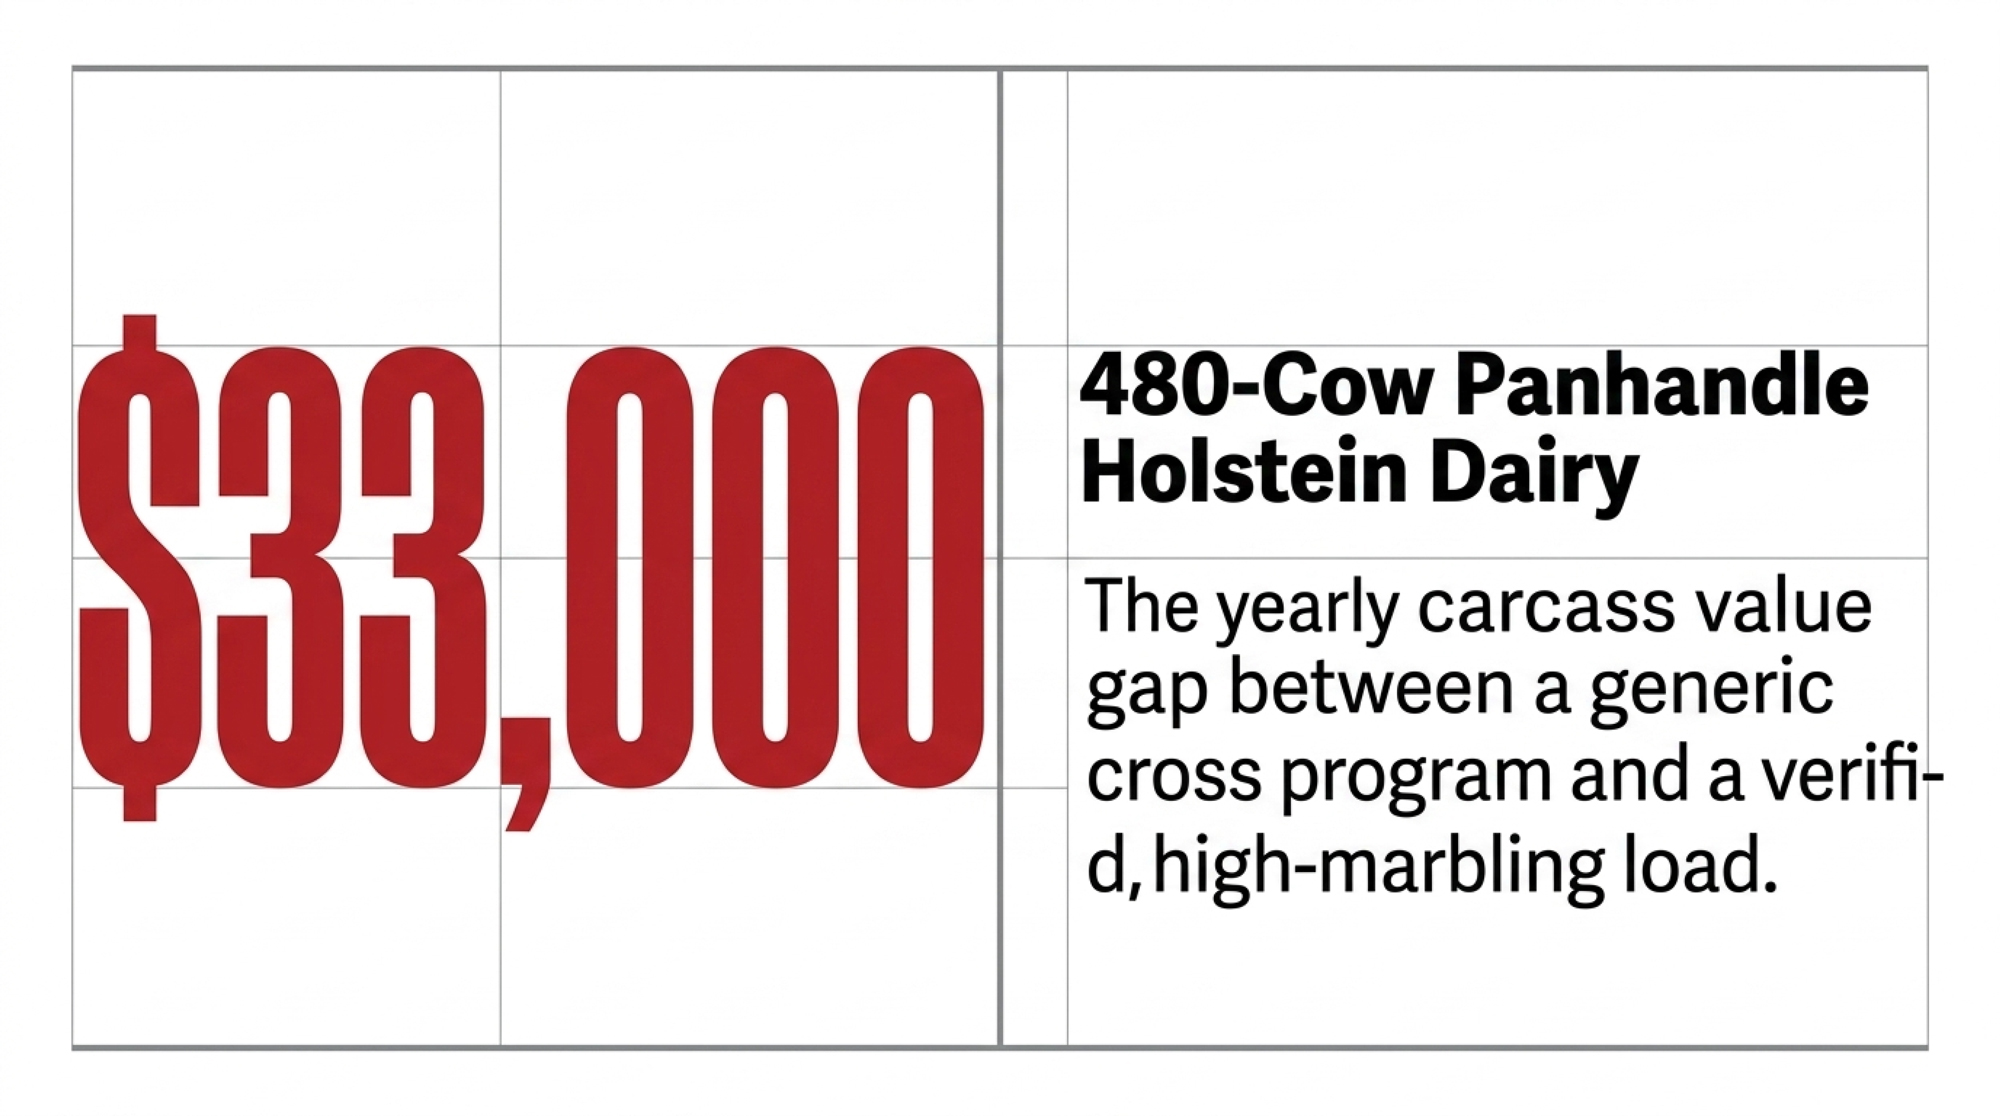
A 480-cow Panhandle dairy pulled its full-year beef-on-dairy closeout this spring. The verified load grading alongside it cleared $33,000 more. Same plant, same months, different sire decisions made 18 months ago.
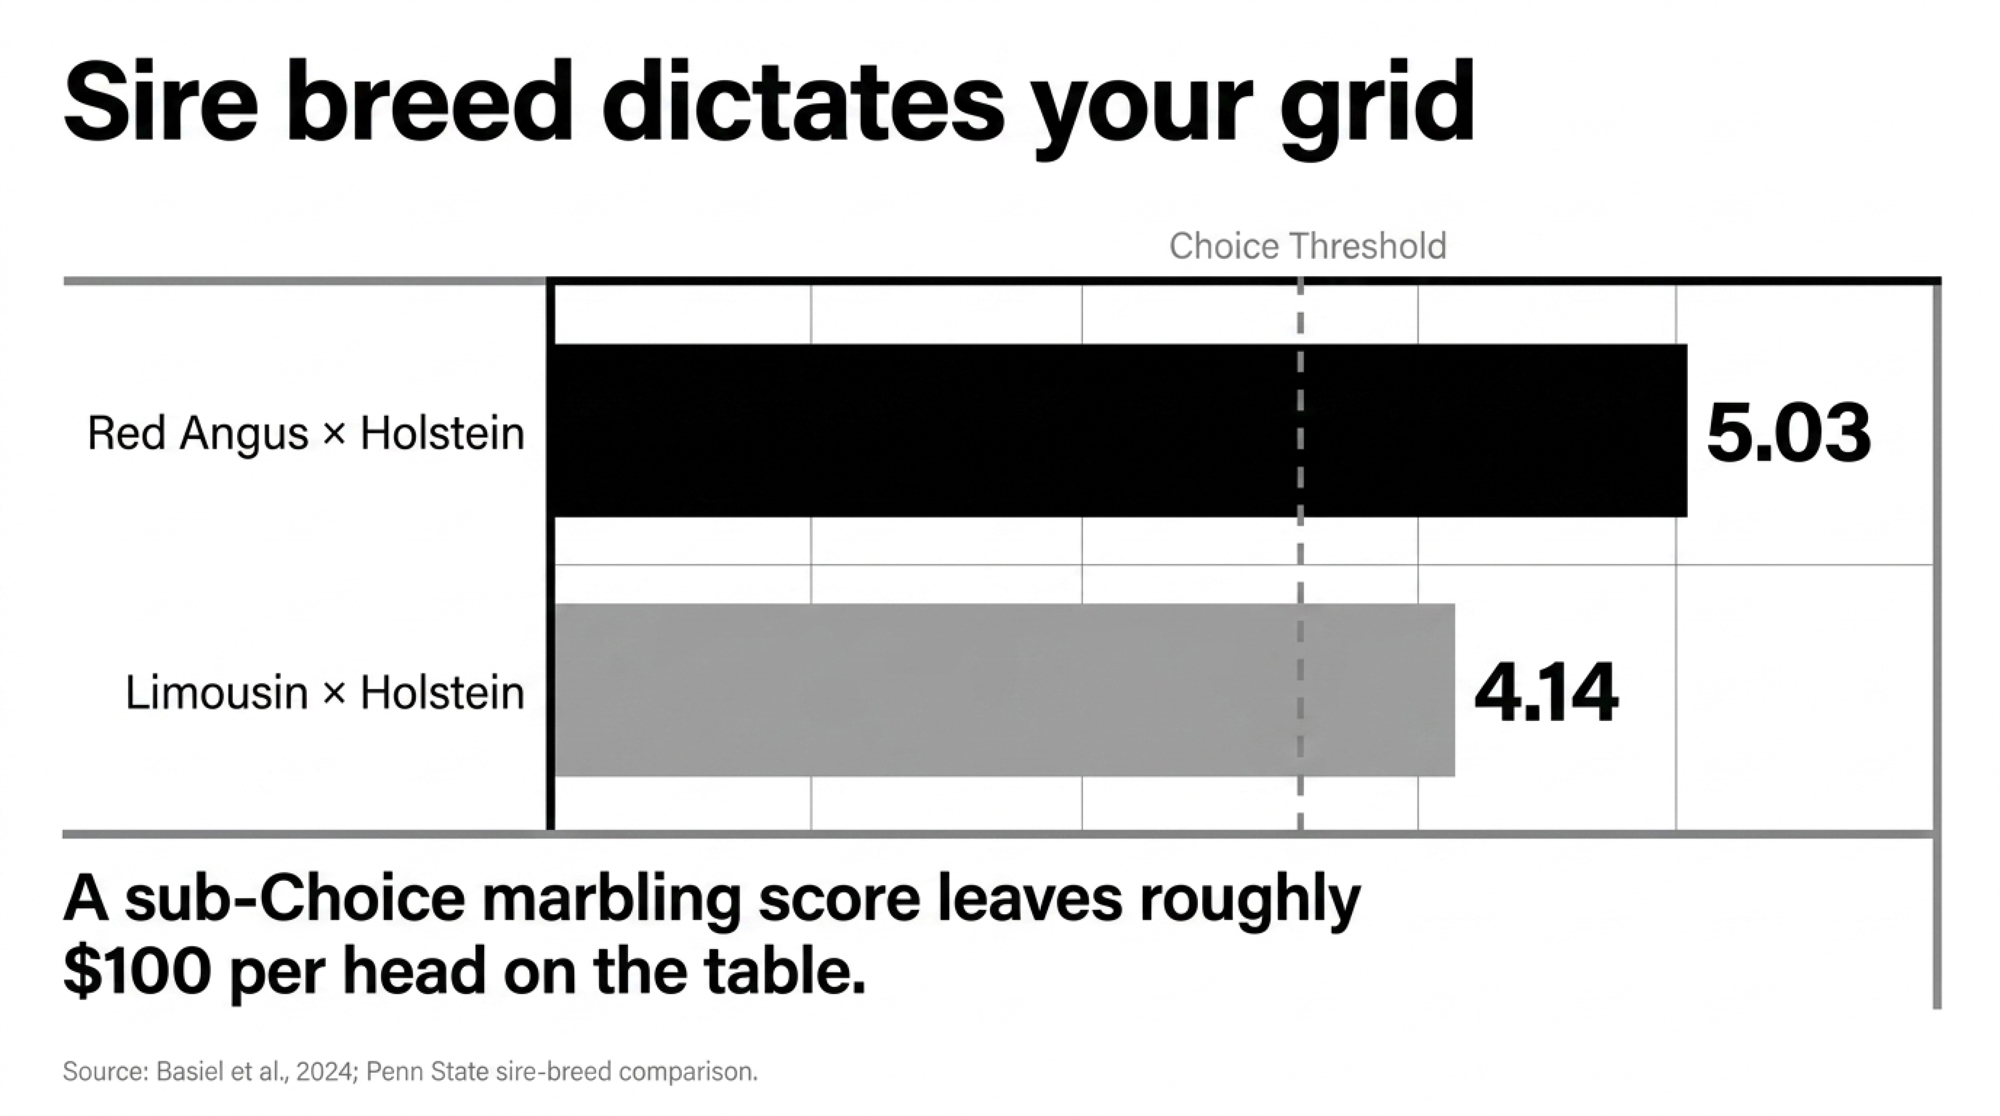
Executive Summary: The sire decisions you made 18 months ago are already on the packer’s grading sheet — and on a 480-cow dairy running 35% beef-on-dairy, the spread between a verified, high-marbling program and a generic one runs roughly $33,000 a year in carcass value on 168 head. Penn State’s published trial puts Red Angus × Holstein crosses at marbling score of 5.03 versus Limousin crosses at 4.14 — a gap that translates to $50–$150/head on a typical Choice/Select grid, stretching past $150 when spreads blow out the way they did in Q4 2025. Add Premier Select Sires’ reported $190–$210/head ProfitSOURCE carcass premium (vendor-published, no independent replication yet), and the math isn’t theoretical — it’s a line item that’s already being paid to somebody. The replacement side makes it worse: that same 480-cow operation is staring at a near-$200,000 springer liability in 2027 against $235,200 in beef calf revenue, leaving roughly $35,000 net before any other cost — and CoBank’s August 2025 report projects roughly 800,000 missing dairy replacements across 2025–2026, so the heifer market won’t soften the blow. The fix is on this week’s semen order, not next year’s purchase ledger: any beef bull on your sheet posting a Marbling EPD below CAB’s +0.65 “Targeting the Brand” floor is costing you on the grid, and any load leaving without EID tags and sire records is forfeiting the $50–$200/head verification premium that tagged loads from the same dairy could already be earning. Pull last year’s beef semen invoices and check the average Marbling EPD — that number tells you more about your 2026 carcass cheque than anything happening at the sale barn right now.
Picture a little after dawn at a Texas Panhandle packer. A 480-cow Holstein operator is sitting at a procurement desk with the cumulative closeout for his entire year’s beef-on-dairy crop in front of him — 168 head, twelve months of kill dates, every grading line tallied. The kind of plant visit a producer arranges when he wants to see what 18 months of beef semen decisions actually paid.
What the closeout shows isn’t a wreck. It’s worse, in a way.
The cattle are stuck in the middle. Too much Select. Almost no Prime. A clutch of yield grade 4s pulling discounts. And on the same screen, beside that year’s tally, sits a verified beef-on-dairy closeout from another dairy — heavier carcasses, higher marbling, a clean Prime/CAB column. Same plant. Same twelve months. Very different cheques.
The packer already knows which dairy sent which calves. Most producers are the ones flying blind.
Editor’s note: this profile is a composite drawn from NAAB, USDA AMS, CoBank Knowledge Exchange, ProfitSOURCE, and Penn State data, representative of mid-size Panhandle operations running 35% beef-on-dairy.
What’s Changing and Why
Beef-on-dairy isn’t a side hustle anymore.
NAAB’s 2024 Regular Members Semen Sales Report shows roughly 9.7 million units of beef semen sold in the U.S., with the majority going into dairy herds — industry trade reporting derived from NAAB-CSS export-segmented data has consistently put the dairy share well above three-quarters of the total. NAAB’s 2025 report (released March 10, 2026) carries the trajectory forward: beef-on-dairy now represents roughly a third of all U.S. dairy services — the continuation of a decade-long climb tracked by CattleFax.
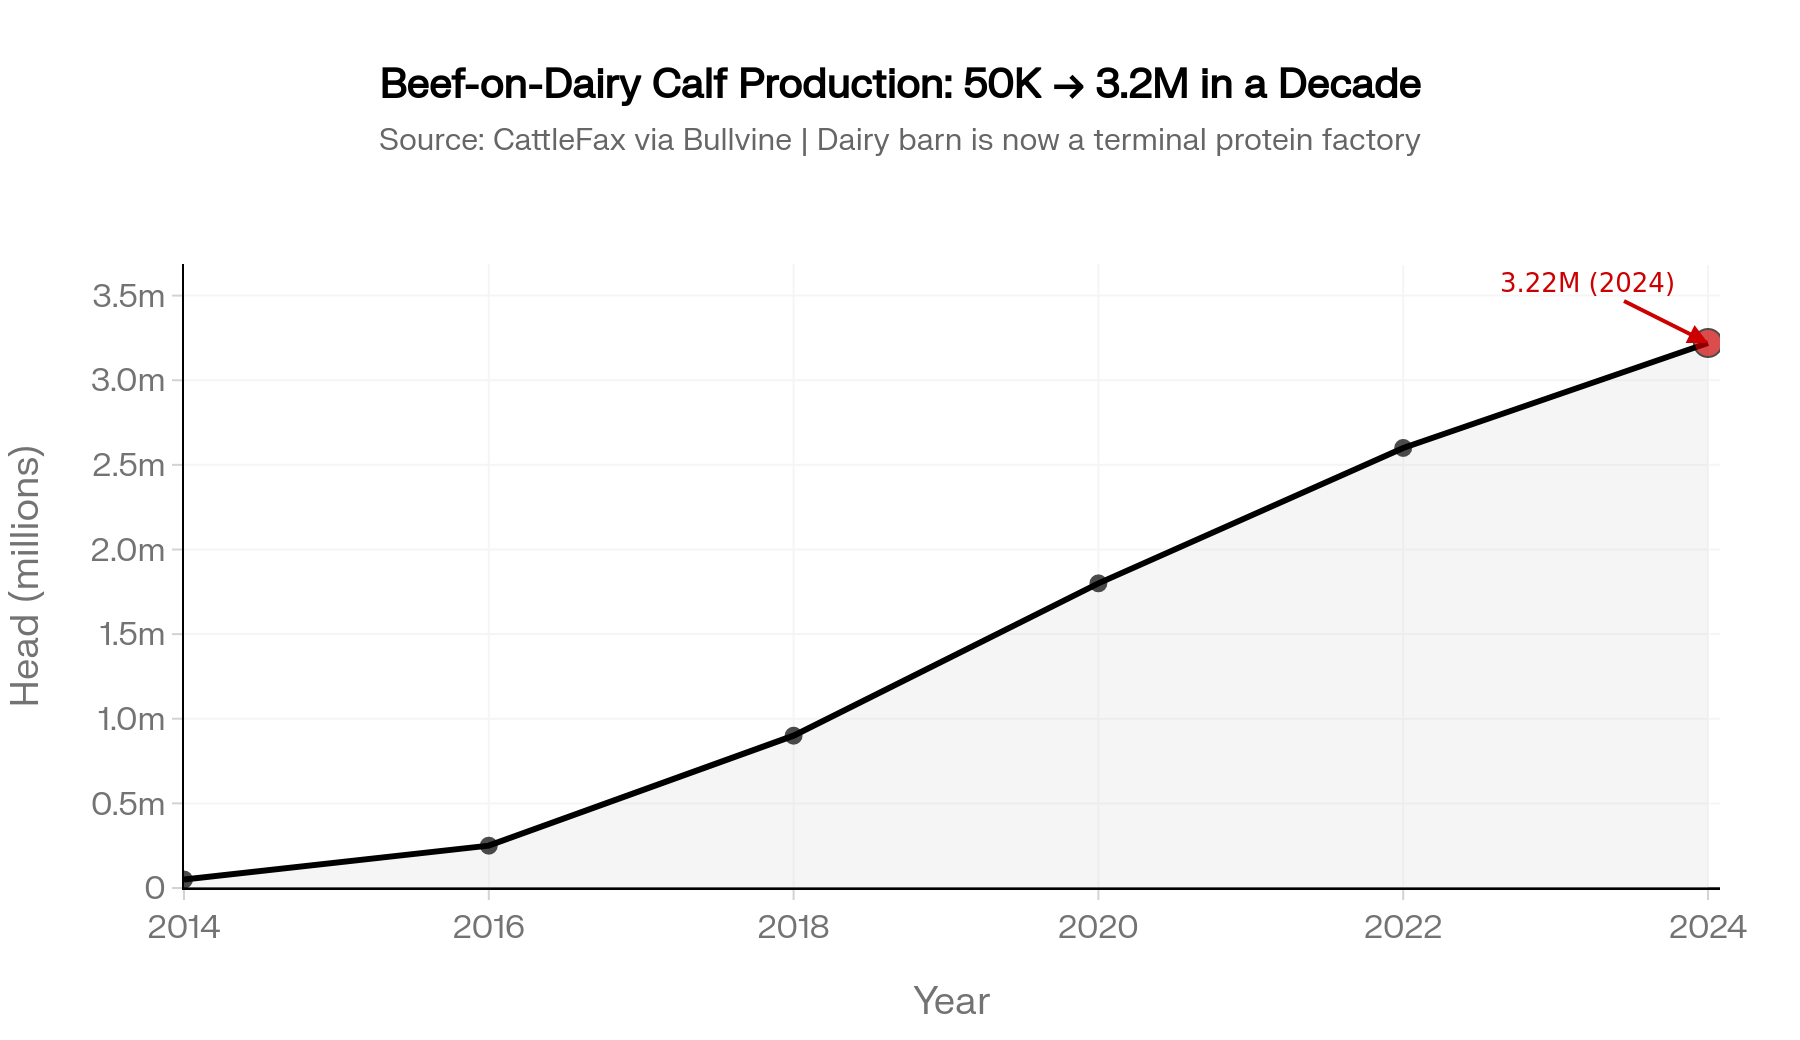
CattleFax estimates beef-on-dairy crossbred calf production climbed from roughly 50,000 head in 2014 to about 3.22 million in 2024. The dairy barn has quietly become a year-round terminal protein factory. And packers are pricing accordingly.
The data trail is what’s shifting now
Plants increasingly know exactly which dairy a load came from, which sires those cattle trace back to, and how earlier loads from the same source closed out.
CoBank’s February 24, 2025 Knowledge Exchange report — Emerging Data Begins to Quantify Value Beef and Dairy Crossbred Cattle Bring to U.S. Beef Supply Chain — found program-verified beef-on-dairy averaging slightly above purebred beef and well above straight dairy steers.
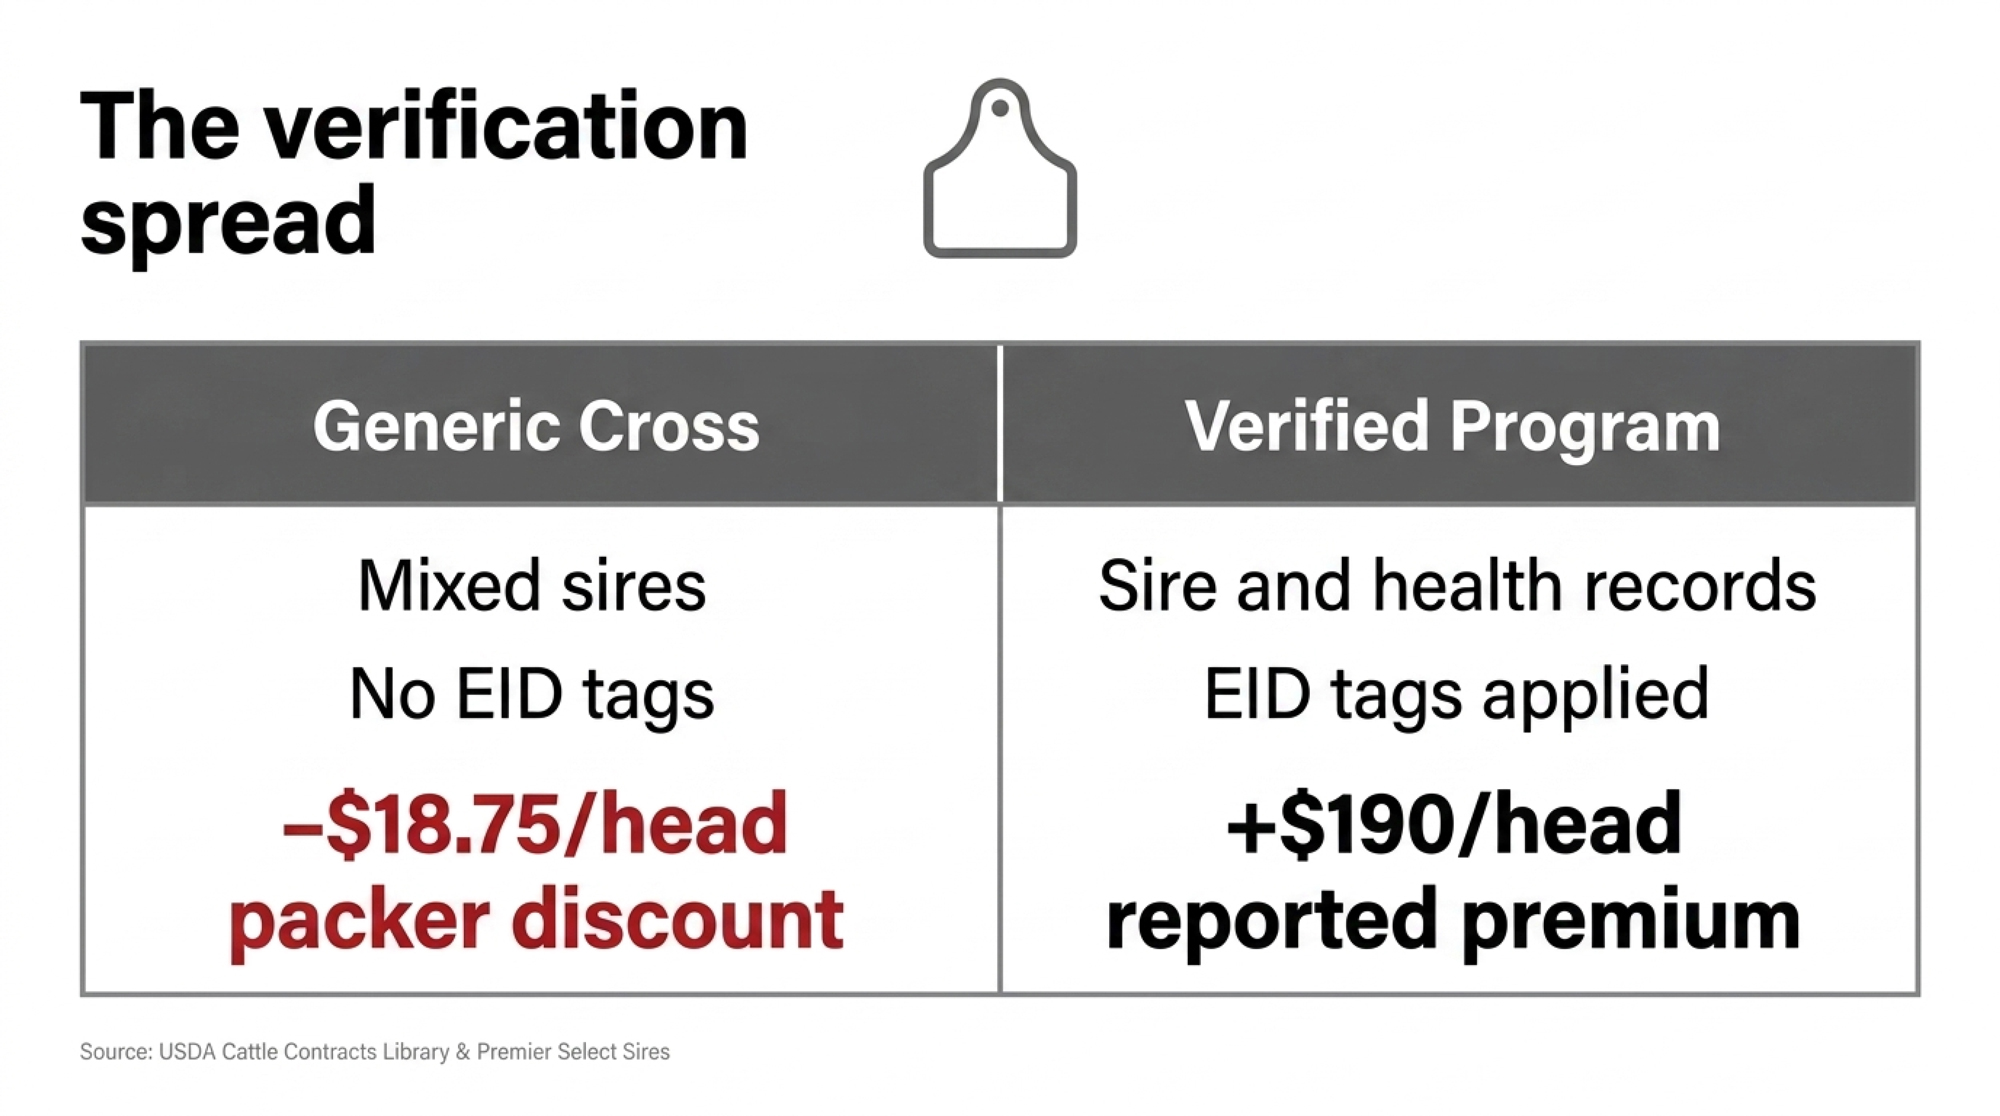
USDA Cattle Contracts Library data, summarized by Farm Progress on September 18, 2024, put the per-head “beef/dairy cross” discount versus native beef at about $18.75 simple average ($2.34/cwt), with straight dairy steers absorbing several times that discount in the same dataset. That gap shows up in the same series Brad Kooima walked through when he called beef-on-dairy “a packer’s dream” — and the $117K bill that came with it.
Decisions made in the breeding barn — which bulls, which cows, which percentage to beef — show up months later as premiums or discounts most producers never see itemized. The herds most exposed: mid-size and large operations running 25–40% beef-on-dairy without verification, mixing sires by price, and assuming “Angus” on the invoice does the work. It usually doesn’t.
How This Plays Out on Real Farms
Take that 480-cow Panhandle operation. About 35% of services to beef — roughly 168 beef matings a year, give or take.
The story everyone in the coffee group was telling: $1,400–$1,700 a head for beef-on-dairy calves through this spring’s USDA AMS Iowa and South Dakota auction series, easy money compared to $700–$900 Holstein bulls. On paper, that’s $235,000–$285,000/yr in beef calf revenue.
Then the other side of the ledger came due.
USDA AMS National Dairy Replacement Heifer Report (spring 2026): springers averaging roughly $3,000/head nationally, with top Panhandle pens clearing $3,500–$4,500.
A heifer pipeline running closer to a low-eighties birth-to-fresh completion rate — the working benchmark in DCHA Gold Standards and Penn State’s Heifer Investment Model — doesn’t keep the parlor full at that scale. Suddenly the calf cheque doesn’t look like profit. It looks like a down payment on the heifers you’ll have to buy back.
The simple version of the math
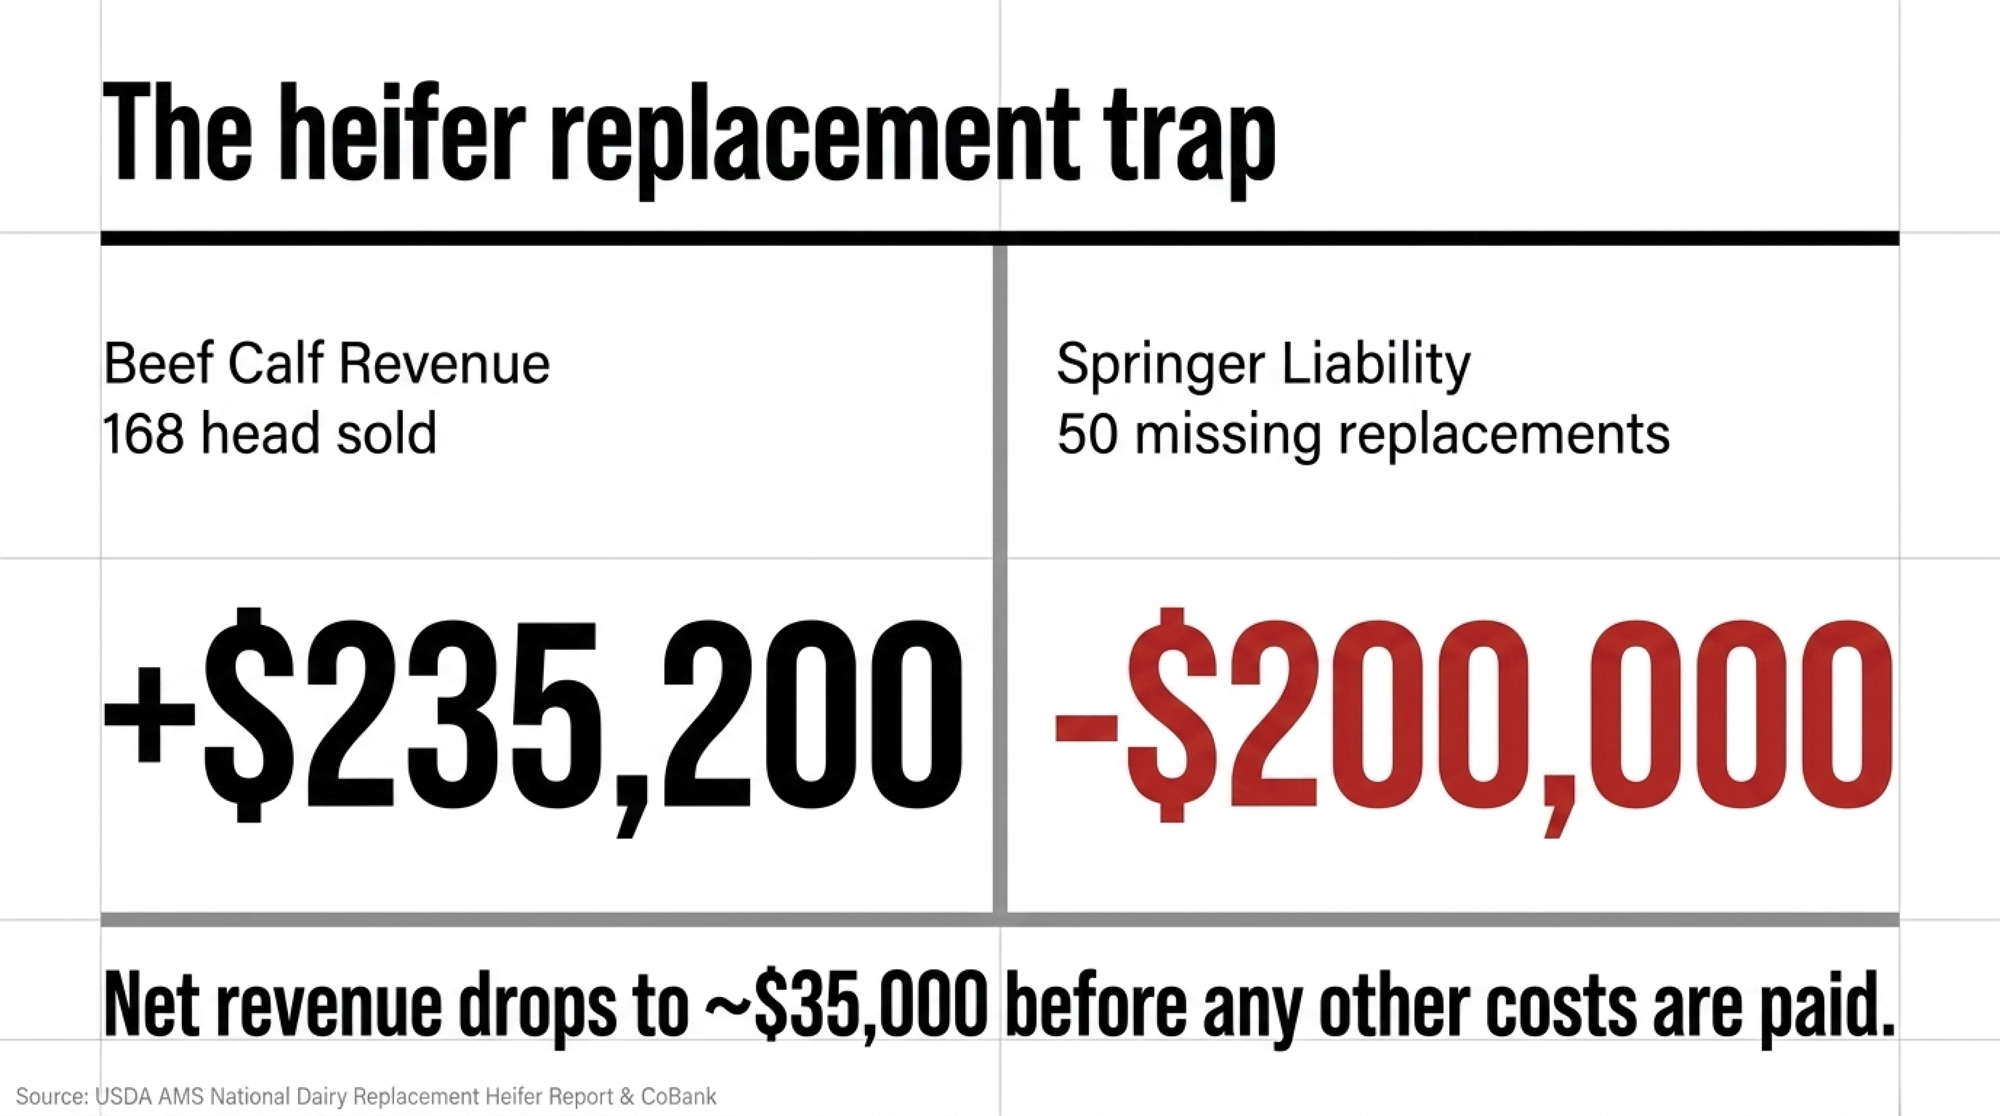
Run the pipeline backward: at 35% beef share, the dairy is breeding ~312 cows to dairy and getting roughly half female; at industry-typical completion rates against a ~168-fresh-heifer-per-year requirement, the conservative shortfall on this herd lands near 50 head.
Line item
Figure
50 missing heifers × $4,000 springer
$200,000 replacement liability
168 beef calves × $1,400 mid-range
$235,200 revenue
Net before any other cost
~$35,000
The “win” gets eaten before the trucks even leave the yard. It’s the same hole 22 Tuesdays of beef breeding can dig into a 480-cow heifer pen — and the bill lands in 2027, not this quarter.
Path
30-Day Action
$/Head Upside
Key Risk
Ideal For
Tighten sire list
Cut to 2–3 bulls ≥ +0.65 Marbling EPD
$50–$150 carcass uplift
Buying commodity straws that still yield Select
Herds with stable replacement pipeline
Cap beef % at 20–25%
Shift top-third cows to sexed dairy
Heifer pipeline protected by 2027–28
Forfeit some beef calf revenue this year
Herds already short on replacements
Join verified program
EID tags + sire records on every calf
$50–$200 calf-stage premium
Colostrum/vaccination protocol compliance
Operations shipping full loads consistently
Build feedyard relationship
Commit to sire/health consistency
Repeat bids, less price discovery risk
One bad load can cost future bids for years
Any herd size, if management is consistent
Do nothing (status quo)
None
$0
~$18.75/head generic beef/dairy discount already baked into every bid
Nobody — this is the hole the article is describing
Now overlay the rail data
Premier Select Sires reports, in its April 2024 ProfitSOURCE brochure, that ProfitSOURCE carcasses in the company’s own multi-yard research averaged $190 to $210 more per head than carcasses from cattle in unnamed competing programs harvested alongside them — driven by carcass weight and marbling. The figure is vendor-published; independent third-party replication isn’t yet in the public record.
Even taken at the company’s stated range, on a 168-head load that works out to $31,920–$35,280 a year in carcass value moving to whichever dairy did the verification work. That midpoint — $200/head × 168 head — is where the $33,000 in the headline lives.
Not a guess. A grid line item.
The Mechanics Behind the Outcomes
Three things drive the difference, and none of them are mysterious.
1. Marbling
The Penn State sire-breed comparison published in Translational Animal Science (Basiel et al., 2024; PMC11005759) compared 262 beef × Holstein steers.
Sire breed
Marbling score
USDA grade context
Red Angus × Holstein
5.03
Right at Small⁰⁰ — bottom of low Choice
Angus × Holstein
4.82
Top of Slight, brushing the Choice line
Limousin × Holstein
4.14
Slight territory, below the Choice threshold most grids reward
Limousin and Continental sires are typically selected for cutability and yield rather than marbling — different trait priorities, different grid outcomes.
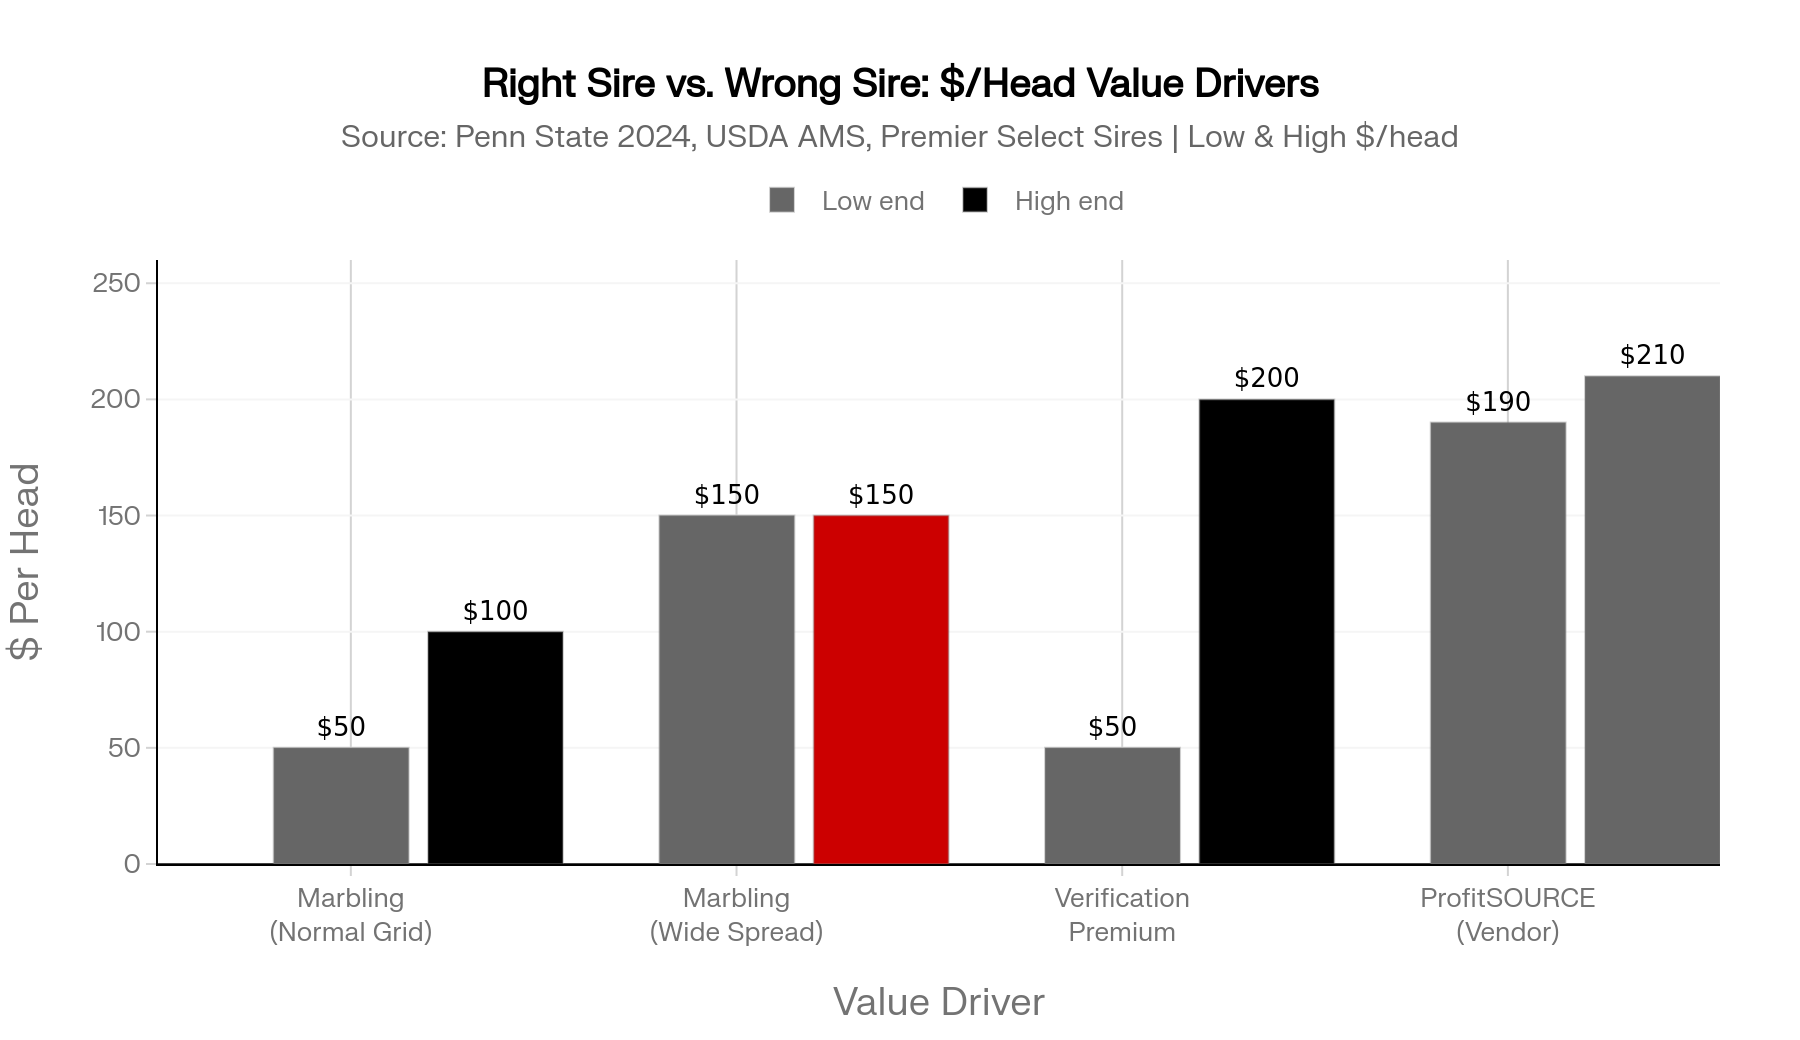
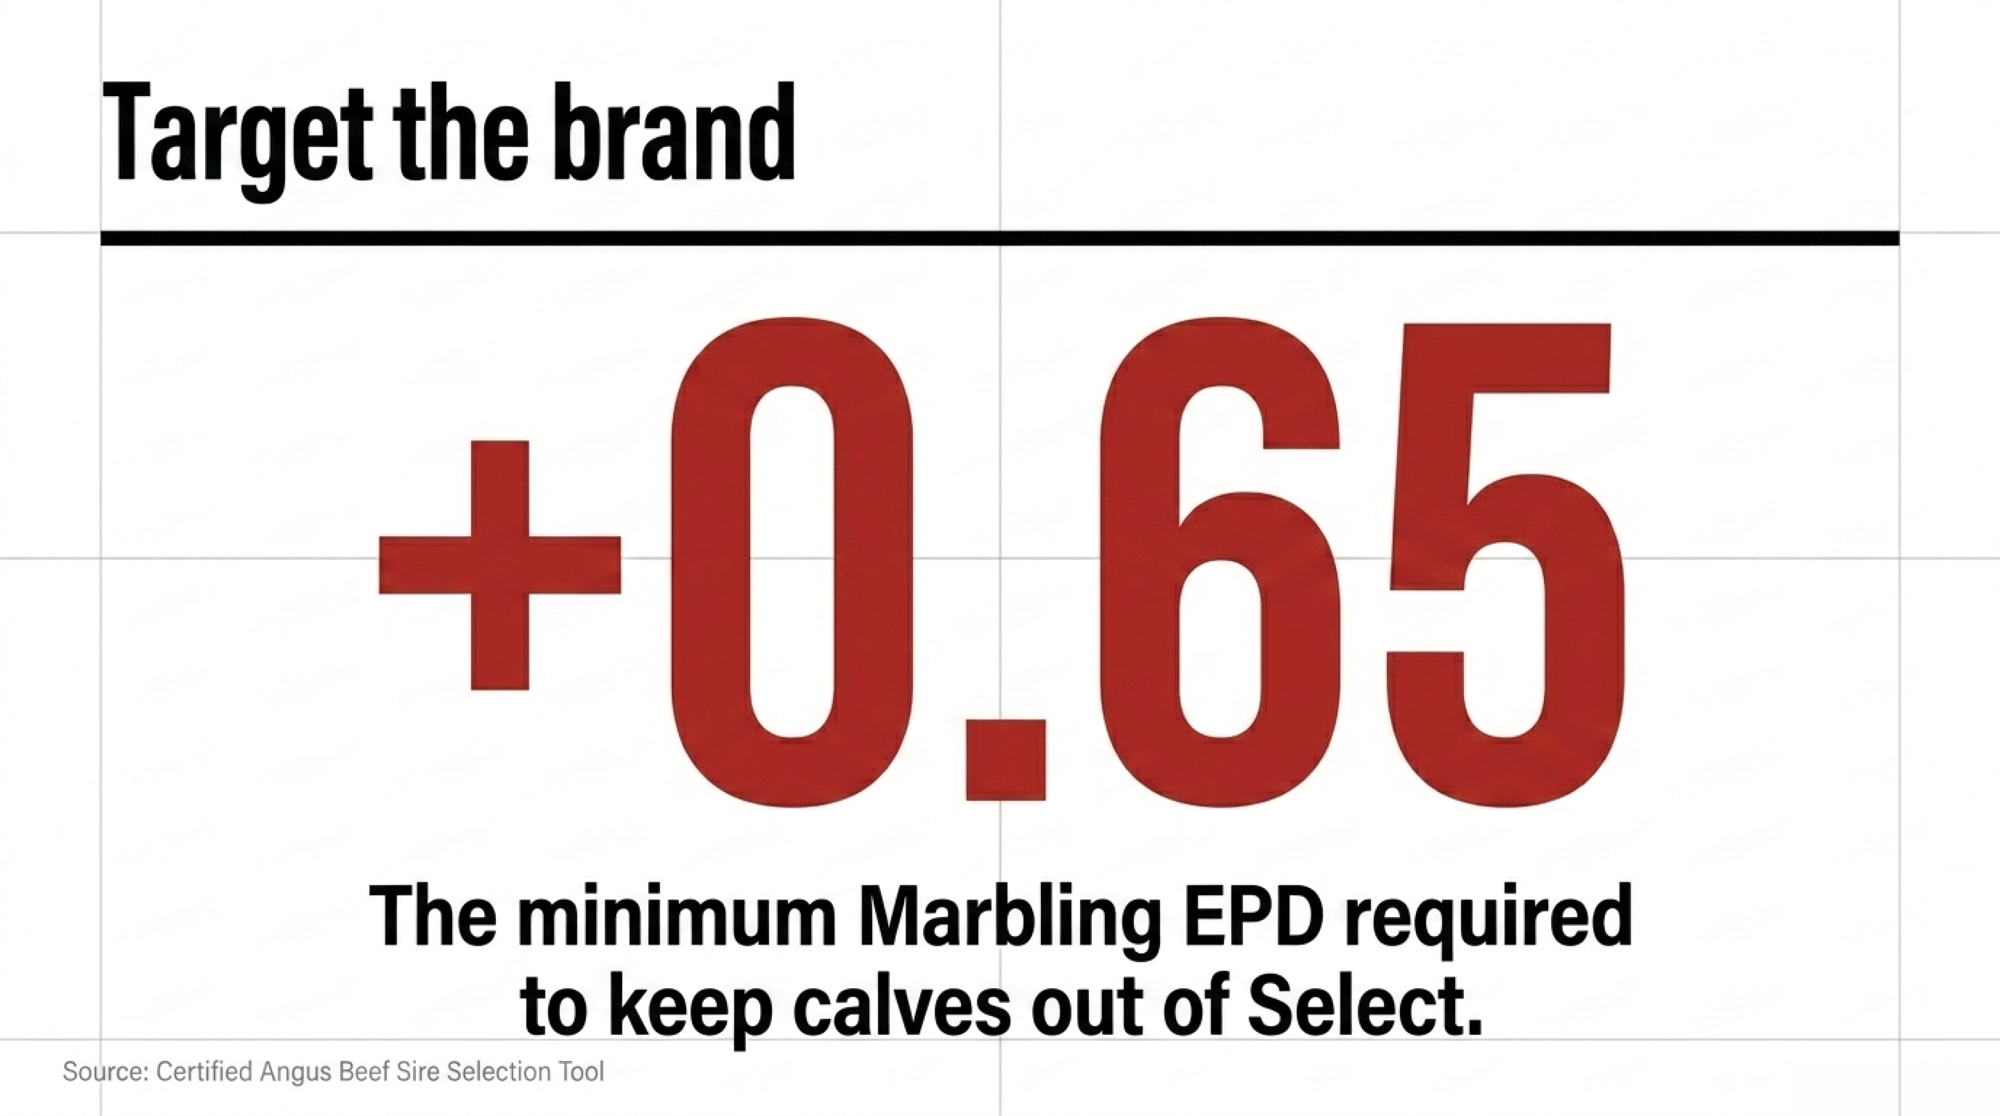
A high-marbling Angus sire — Marbling EPD at or above CAB’s “Targeting the Brand” floor of +0.65 — can put the majority of his calves into Choice or better, per the Certified Angus Beef Sire Selection Tool. A bargain bull at +0.30 to +0.45 leaves a far thicker tail of his calves stuck in Select.
On a typical 2024–2025 grid example with a $12/cwt Choice/Select spread, $4/cwt CAB premium, and $15/cwt Prime, that distribution gap is worth roughly $50–$100/head. It pushes past $150/head when Choice/Select spreads blow out the way they did in late 2025.
2. Dressing percentage and feedlot efficiency
Beef-on-dairy cattle still run about a percentage point lower in dressing percentage than purebred beef. That’s structural to the dairy dam, not fixable by sire choice.
But sire breed shifts ADG meaningfully. In the same Penn State trial:
Angus crosses gained 1.76 kg/day
Wagyu crosses gained 1.39 kg/day — needing roughly 24–26 extra days on feed
A trade-off Wagyu programs accept in exchange for premium-meat marbling outcomes outside this study’s grid scope. The feedlot pencils every one of those extra days into next year’s bid for your calves.
3. Verification
Without sire records and EID tags, your calves get bucketed as generic “beef/dairy cross.” That’s where the $18.75/head, $2.34/cwt average discount lives in the USDA Cattle Contracts Library data — and that’s exactly what the feedlot already knows when your $1,400 calf shows up without a sire record. Feedlot buyers price that risk in. They have to.
How Much Is the Wrong Sire Actually Costing You Per Head?
In normal grid conditions, the gap between an Angus bull whose calves consistently land in upper Choice and one whose calves flood Select runs about $50–$100/head in marbling-driven value.
When the Choice/Select spread widens and Prime premiums run hot — like they did across Q4 2025 — that same gap can stretch past $150/head on the same live weight.
On a 168-head load: $8,400 at the low end. Over $25,000 at the high end. Every year. Every load. Compounding quietly while the breeding sheet stays the same.
That’s before verification. Combine the marbling math with Premier Select Sires’ reported $190–$210/head ProfitSOURCE premium, and you’re looking at roughly $33,000 a year in carcass value moving in or out of your pocket on a 168-head program.
The number isn’t theoretical. It’s already getting paid to somebody. The only open question is whether it’s being paid to you.
Is Your Breeding Sheet Already Behind the Market?
Quick gut check. Pull last year’s beef semen invoices and ask three questions:
How many different bulls are on it?
What’s the average Marbling EPD across those bulls?
How many of your beef calves left the farm with sire ID and program tags?
If the answer is “more than five bulls, mixed carcass EPDs, no program,” your operation is almost certainly in the bucket buyers price as generic beef-on-dairy. The fix isn’t a new system. It’s the next semen order — and that’s the part you can actually move this week.
Options and Trade-Offs for Farmers
There’s no silver bullet. But there are a few clear paths producers are walking right now, and each one has a different ceiling and a different risk.
Path 1 — Tighten the sire list this week (the 30-day move)
Cut to 2–3 high-marbling beef bulls that clear CAB’s +0.65 Marbling EPD floor and post strong beef-on-dairy indexes (American Angus Association’s $AxH or American Simmental Association’s Terminal Index).
Reward
$50–$150/head in marbling-driven carcass value; visible on next closeout
Risk
The trap of buying low-tier commodity beef straws that yield Select carcasses — per-straw cost climbs before calf premiums catch up
When it works
When you can commit enough straws to actually shift the carcass distribution on your next load
Timing
Next week’s straw order. The move you make first.
Path 2 — Cap the beef percentage
Pull beef-on-dairy back from 35–40% of services to 20–25% on herds already short on replacements, and put more sexed dairy on the top genomic third of cows.
Reward
Refilled heifer pipeline by 2027–28; protection against the kind of Panhandle Springer Tax already sitting on a 500-cow breeding sheet
Risk
Forfeit some beef calf revenue this year
When it works
When your heifer math says you’re heading into a $150K+ replacement liability
Backdrop
CoBank’s August 2025 heifer report projects roughly 800,000 missing dairy replacements across 2025 and 2026 — the springer market won’t bail you out
Path 3 — Get into a verified program
ProfitSOURCE, Beef InFocus, and similar platforms tie sire, health, and birth records to an EID.
Reward
$50–$200/head calf-stage premium for verified, sire-identified calves over generic crosses (Purina 2024 Beef-on-Dairy Industry Report; AgProud, October 2022) — before any downstream carcass uplift
Risk
Real protocol follow-through on colostrum, vaccinations, tagging — the paperwork has to match the calf
When it works
When you can reliably ship loads, not onesies
Path 4 — Build the relationship, not just the genetics
Some dairies are signing direct or repeat arrangements with feedyards and order buyers who get to know their cattle.
One bad load can quietly cost future bids — UW–Madison Livestock Extension (August 2024) reported about 25% of buyers will not bid at all on cattle from sellers with a negative reputation. Rebuilding takes years.
When it works
Any size, if you commit to consistency
Quick Checklist: Five Bulls to Pull from Your Beef Semen Order This Week
Any beef bull with a Marbling EPD below +0.65 (CAB’s “Targeting the Brand” floor).
Any bull bought on price, not on a published carcass index.
Bulls with no published Ribeye or Yield Grade EPD on the breed-association database.
Any bull whose only selling point on the rep’s sheet is “black hide.”
Bulls being used as clean-up after your top picks — the same straws are landing in your tank without scrutiny.
Key Takeaways
If your beef calf check is funding more than 60% of your projected replacement liability, the breeding sheet is the lever — not the calf market.
If any beef bull on your sheet posts a Marbling EPD below +0.65, either replace him or run the math on what his Select-heavy distribution is costing you per head.
If your birth-to-fresh completion sits in the low eighties and your beef share is above 30%, your fresh-heifer count is probably running about a third short of need. Map it before next breeding season.
If your beef calves leave without EID tags and sire records, you’re forfeiting the $50–$200/head verification premium that tagged loads from the same dairy could earn.
If your replacement plan currently relies on buying $3,500–$4,500 springers in 2027, the cheaper fix is on this year’s semen order, not next year’s purchase ledger.
If you’ve never seen one of your loads grade, ship a verified load and an unverified load through the same channel this quarter. Compare the bids. The spread will answer the question better than any spreadsheet.
What Will Your Next Load Tell?
The producer in the composite isn’t a villain. He’s the one who actually went to the plant and pulled the year’s cumulative closeout. Most don’t, which means most never see the pattern that tells them their breeding sheet is 18 months behind the market.
The next load off your dairy is already being graded in someone’s head — feedlot buyer, order buyer, plant procurement — whether you’ve seen the data or not.
So when your next 168 head close out at the rail, what will the grading sheet say about the bulls you ordered last fall? If you’re not sure, that’s the answer.
We’re running the full barn-math model — sire-selection premium, replacement deficit, and the verification stack — across different herd sizes in next week’s Bullvine Weekly. That’s where the per-cow numbers live.
Run Your Numbers
BPI Index Calculator — Pressure-test the breeding sheet behind the $33,000 closeout gap. The BPI Index scores your replacement pipeline across heifer supply, price signal, culling pressure, and semen mix momentum, so you can see whether 35% beef-on-dairy is paying you or quietly draining the 2027 heifer pen.
Complete references and supporting documentation are available upon request by contacting the editorial team at editor@thebullvine.com.
Learn More
Beef-on-Dairy Calf Profit: The $150 Leak Killing Your Premium — Reveals how poor colostrum management and sub-optimal pre-weaning average daily gain inflict a hidden $130–$225 per head penalty on crossbred cattle that downstream buyers directly discount from your next auction bid.
Beef-on-Dairy’s $6,215 Secret: Why 72% of Herds Are Playing It Wrong — Dismantles standard crossbreeding models by introducing a performance-tiered economic framework, proving that matching aggressive beef semen deployment to real herd pregnancy rates dictates thousands in monthly margin variance.
The Sunday Read Dairy Professionals Don’t Skip.
Every week, thousands of producers, breeders, and industry insiders open Bullvine Weekly for genetics insights, market shifts, and profit strategies they won’t find anywhere else. One email. Five minutes. Smarter decisions all week.
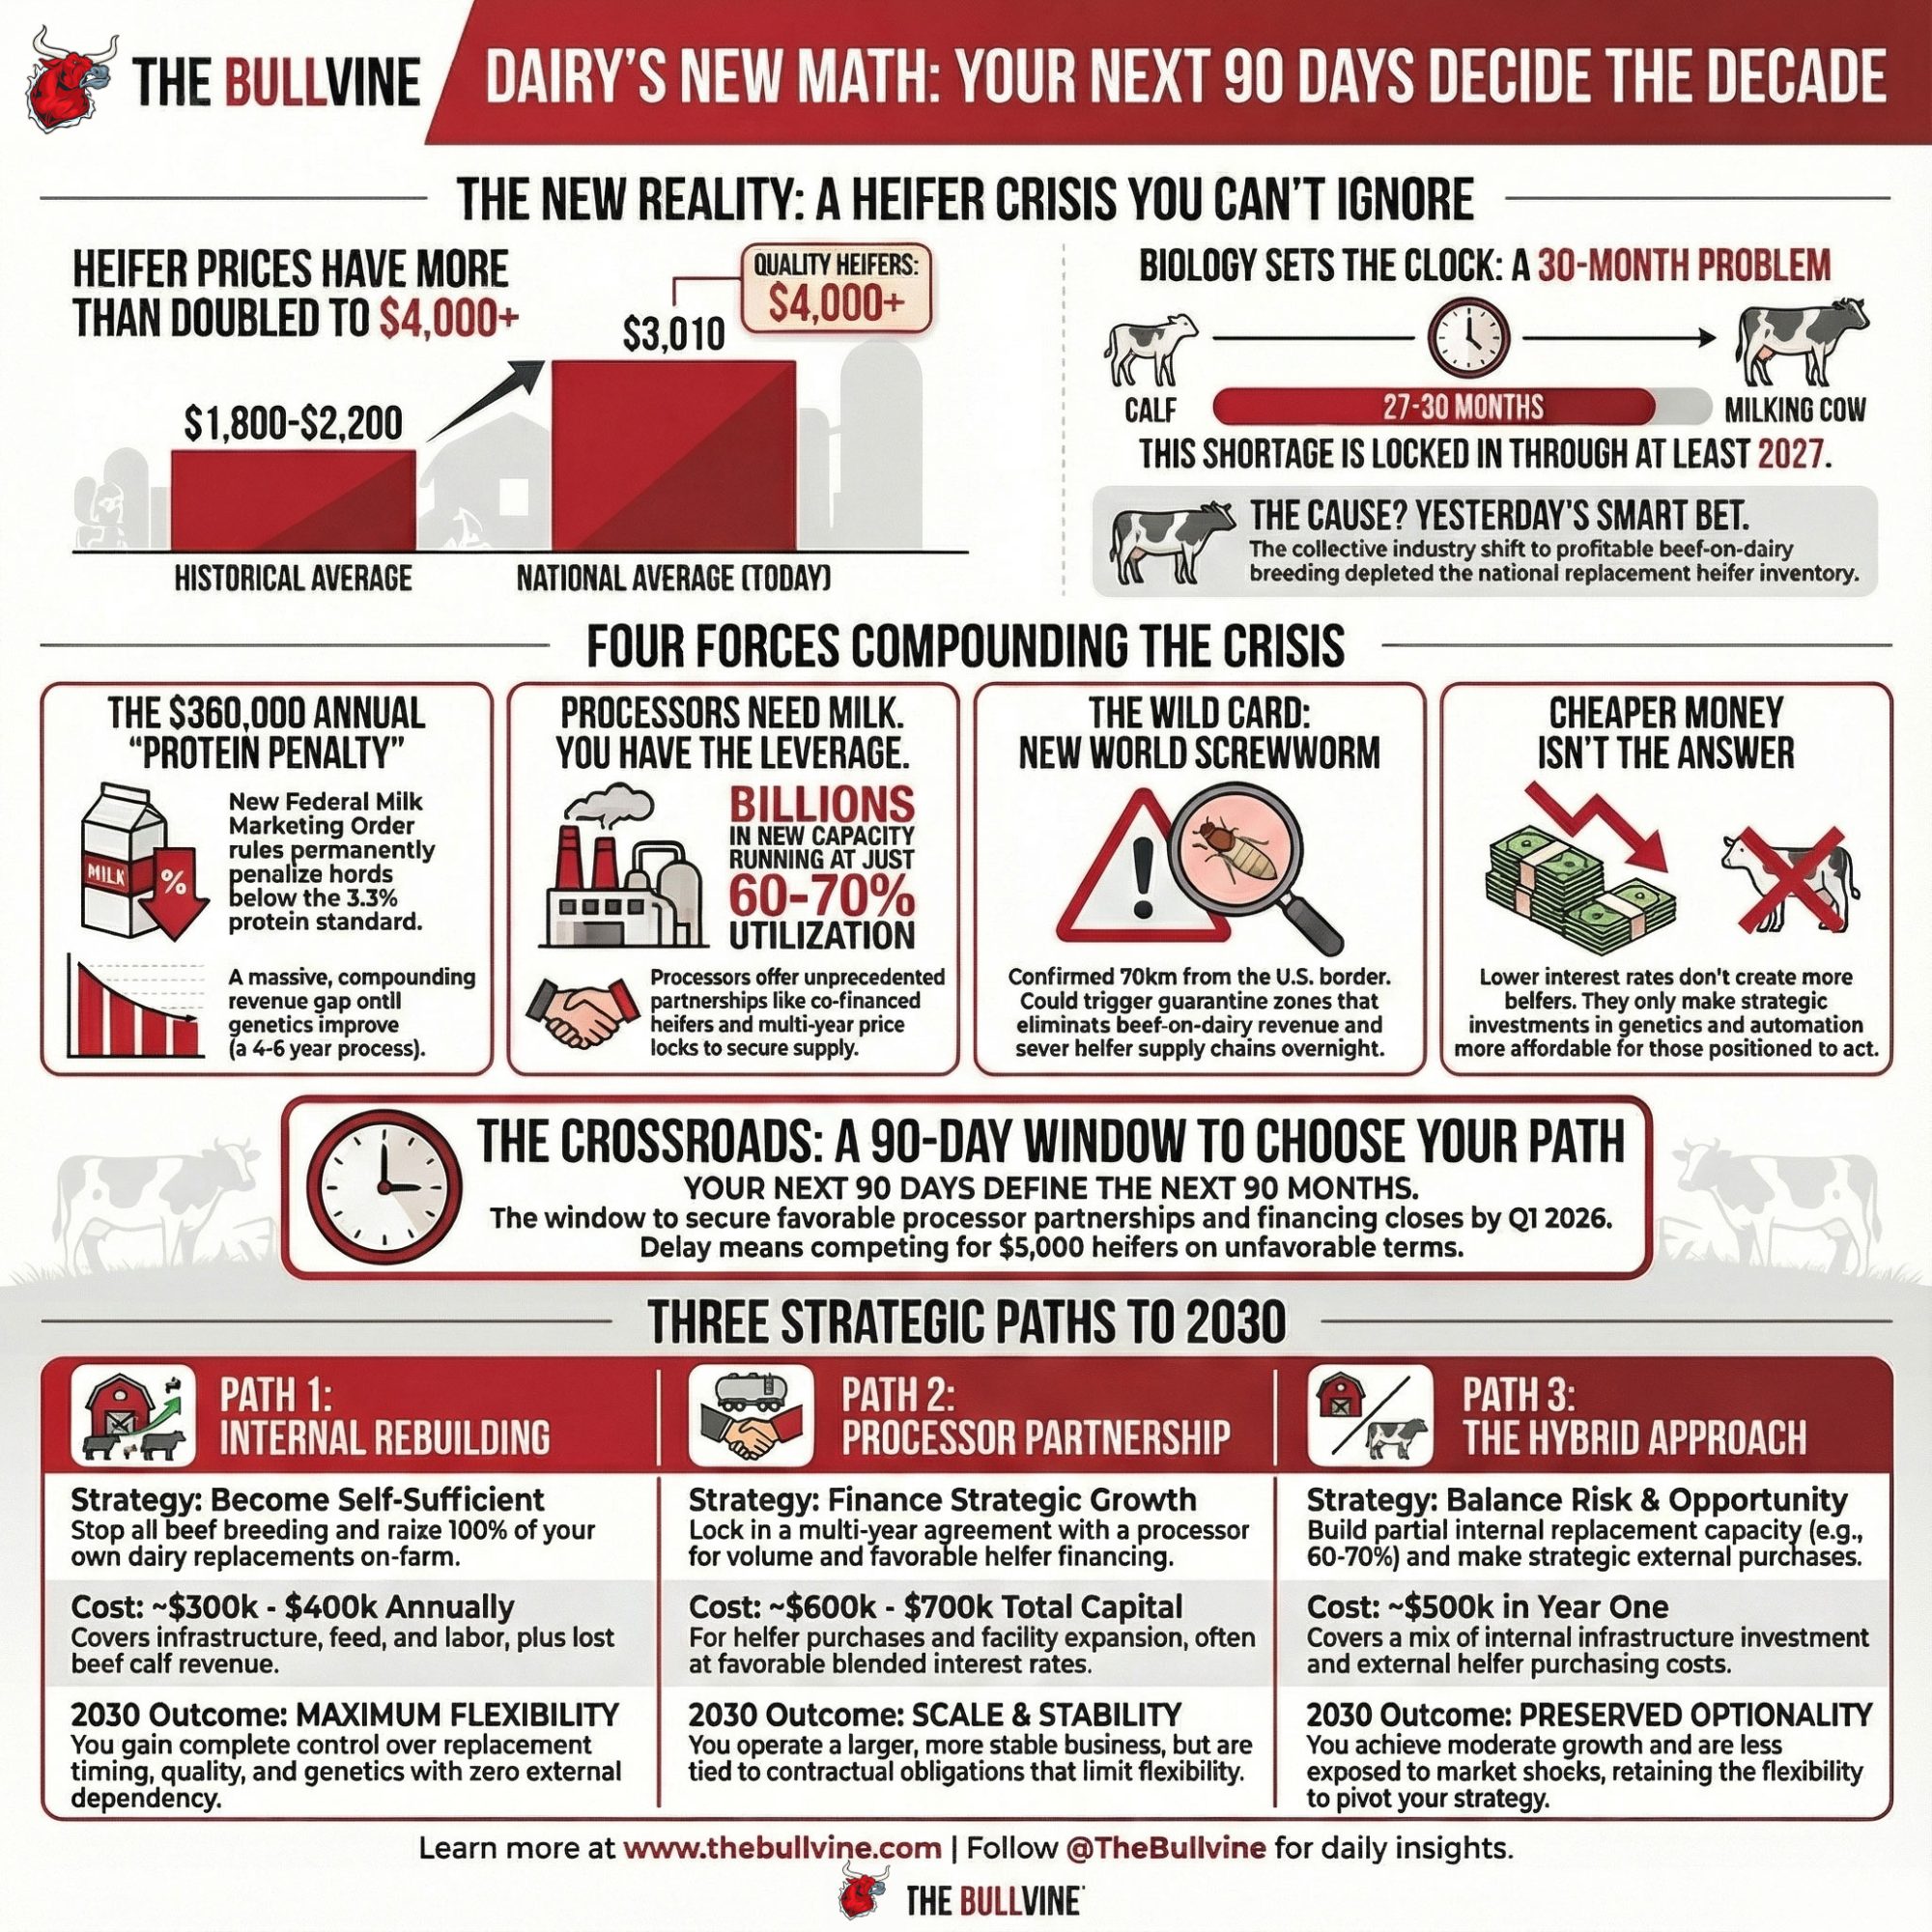
Processors need milk. Heifers don’t exist. The 90-day window where you have leverage—not them—closes Q1 2026. Three strategic paths. Choose wrong, and you’re buying $5,000 heifers in 2027.
EXECUTIVE SUMMARY: The dairy industry just got repriced—not by markets, but by biology. Collective beef-on-dairy breeding depleted replacement inventories, pushing heifer prices from $1,800-2,200 to $3,010 nationally (USDA AMS), while 27-30 month biological timelines ensure scarcity persists through 2027. December’s Federal Milk Marketing Order component changes permanently widened revenue gaps to $360,000 annually for operations below 3.3% protein—a penalty that compounds each year until genetics improve. Processors who invested billions in new capacity now run plants at 60-70% utilization and are offering unprecedented partnerships: co-financed heifers, equipment subsidies, multi-year pricing locks. New World Screwworm confirmed 70 kilometers from the border could trigger quarantine zones that eliminate beef-on-dairy revenue and remove entire regions from heifer sourcing networks within weeks. Three strategic paths exist—internal rebuilding ($300K-400K annually), processor partnerships ($600K-700K total), or hybrid approaches ($500K first year)—but the 90-day window closes early 2026 when competitive advantages solidify for the rest of the decade.
The headlines coming out of 2025 paint a confusing picture, don’t they? Record export numbers alongside compressed milk prices, billion-dollar processing investments during a heifer shortage, and interest rate cuts that haven’t translated to expansion opportunities the way conventional wisdom suggested they would.
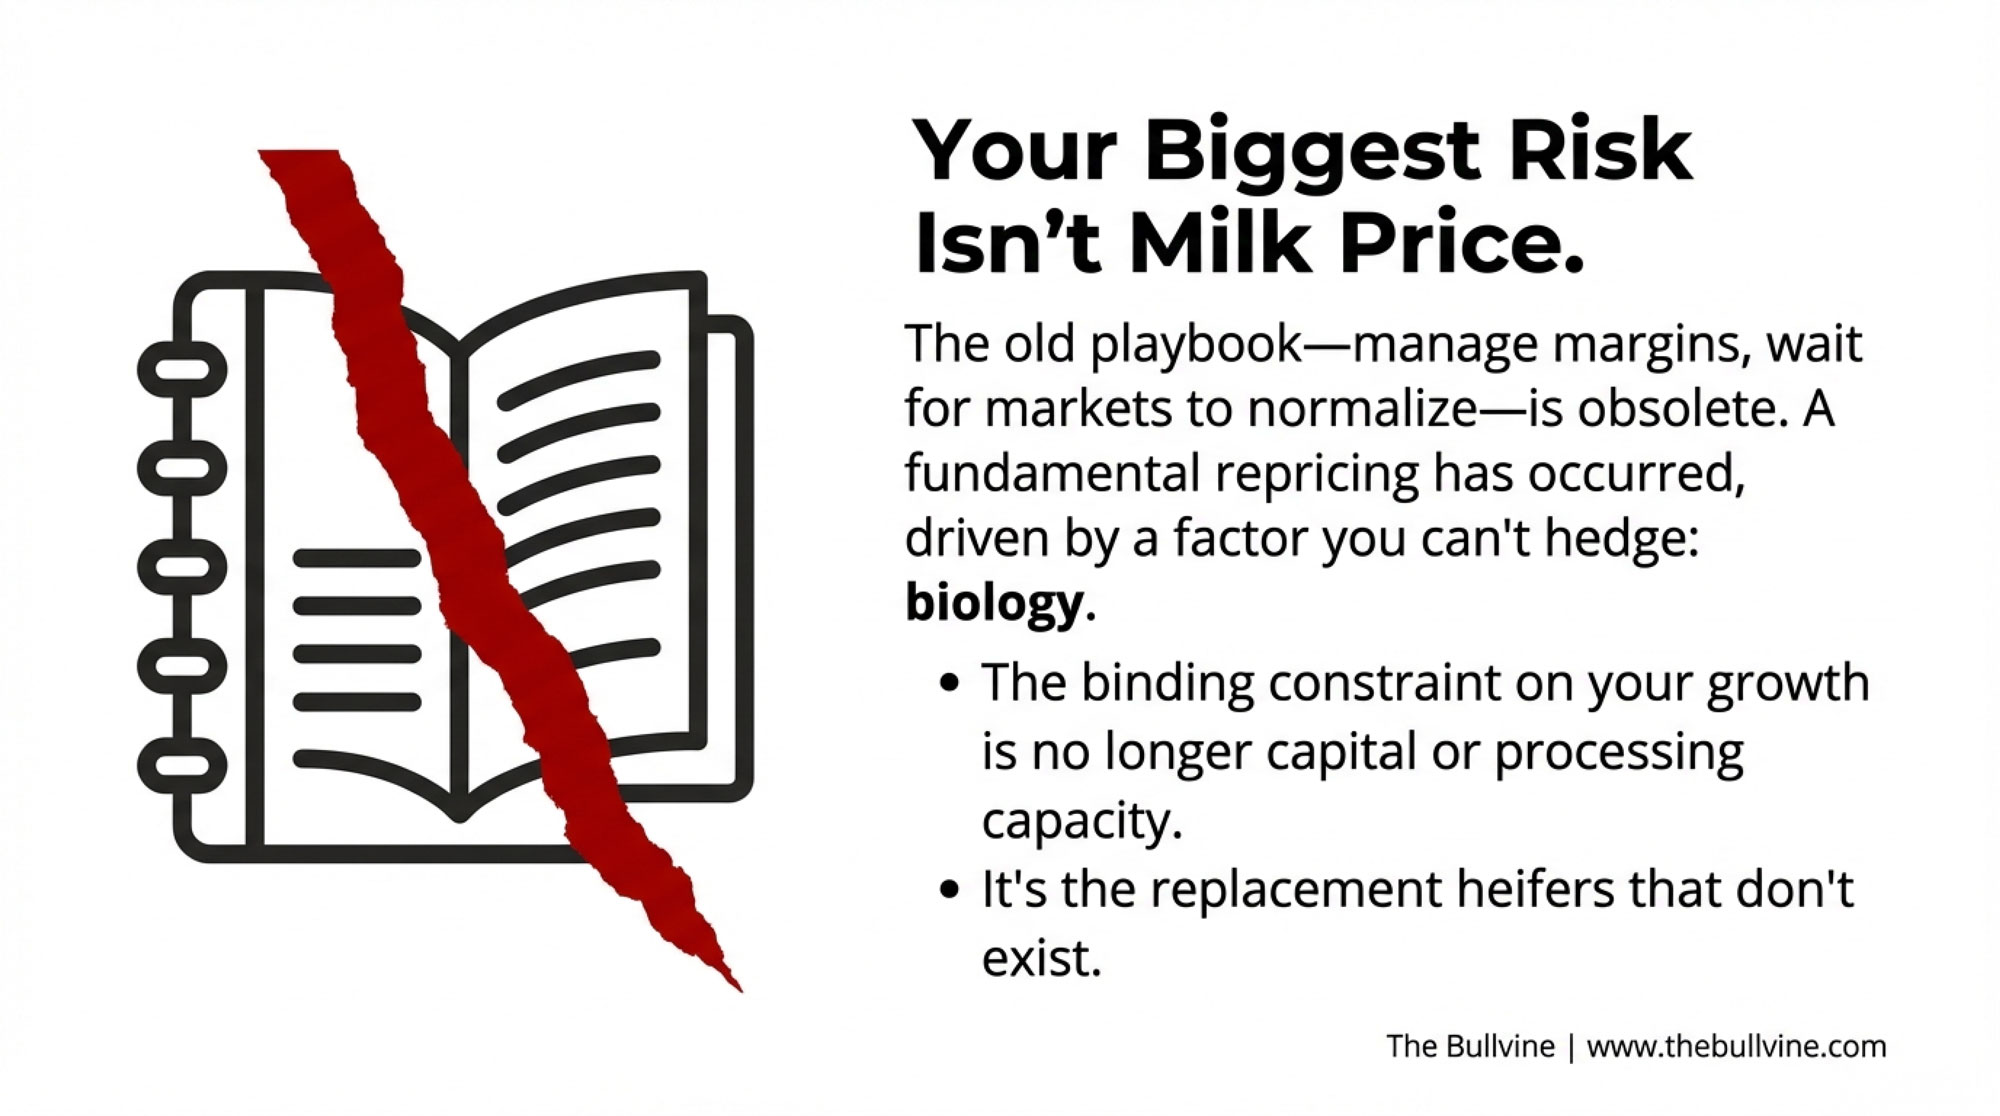
For those of us trying to navigate what comes next, the old playbook—watch milk prices, manage margins, wait for markets to normalize—seems to be missing something critical. And after spending considerable time examining what actually happened this year, from Federal Milk Marketing Order reforms to New World Screwworm biosecurity developments, a clearer picture emerges.
The dairy industry isn’t experiencing temporary market volatility that’ll self-correct by next year. We’re seeing a fundamental repricing of what constitutes competitive operations. And the binding constraint isn’t capital, processing capacity, or even milk demand. It’s replacement heifers.
Understanding why the heifer strategy has become the single most important decision for mid-to-large operations requires connecting dots that most market reports treat as separate stories. So let’s walk through what’s actually happening.
Why Everyone’s Beef-on-Dairy Bet Created a Heifer Crisis
You probably remember the breeding decisions many of us made during 2022-2024. They seemed perfectly rational at the time. Beef-on-dairy calves were commanding $1,200-$1,800 while dairy bull calves brought maybe $50 if you were lucky. So operations shifted aggressively toward beef genetics—Angus, Limousin, Wagyu crosses. Some farms bred 60-70% of their herds to beef bulls, capturing that premium calf revenue while still generating enough dairy replacements to maintain herd size.
The strategy worked brilliantly. Until everyone did it simultaneously.
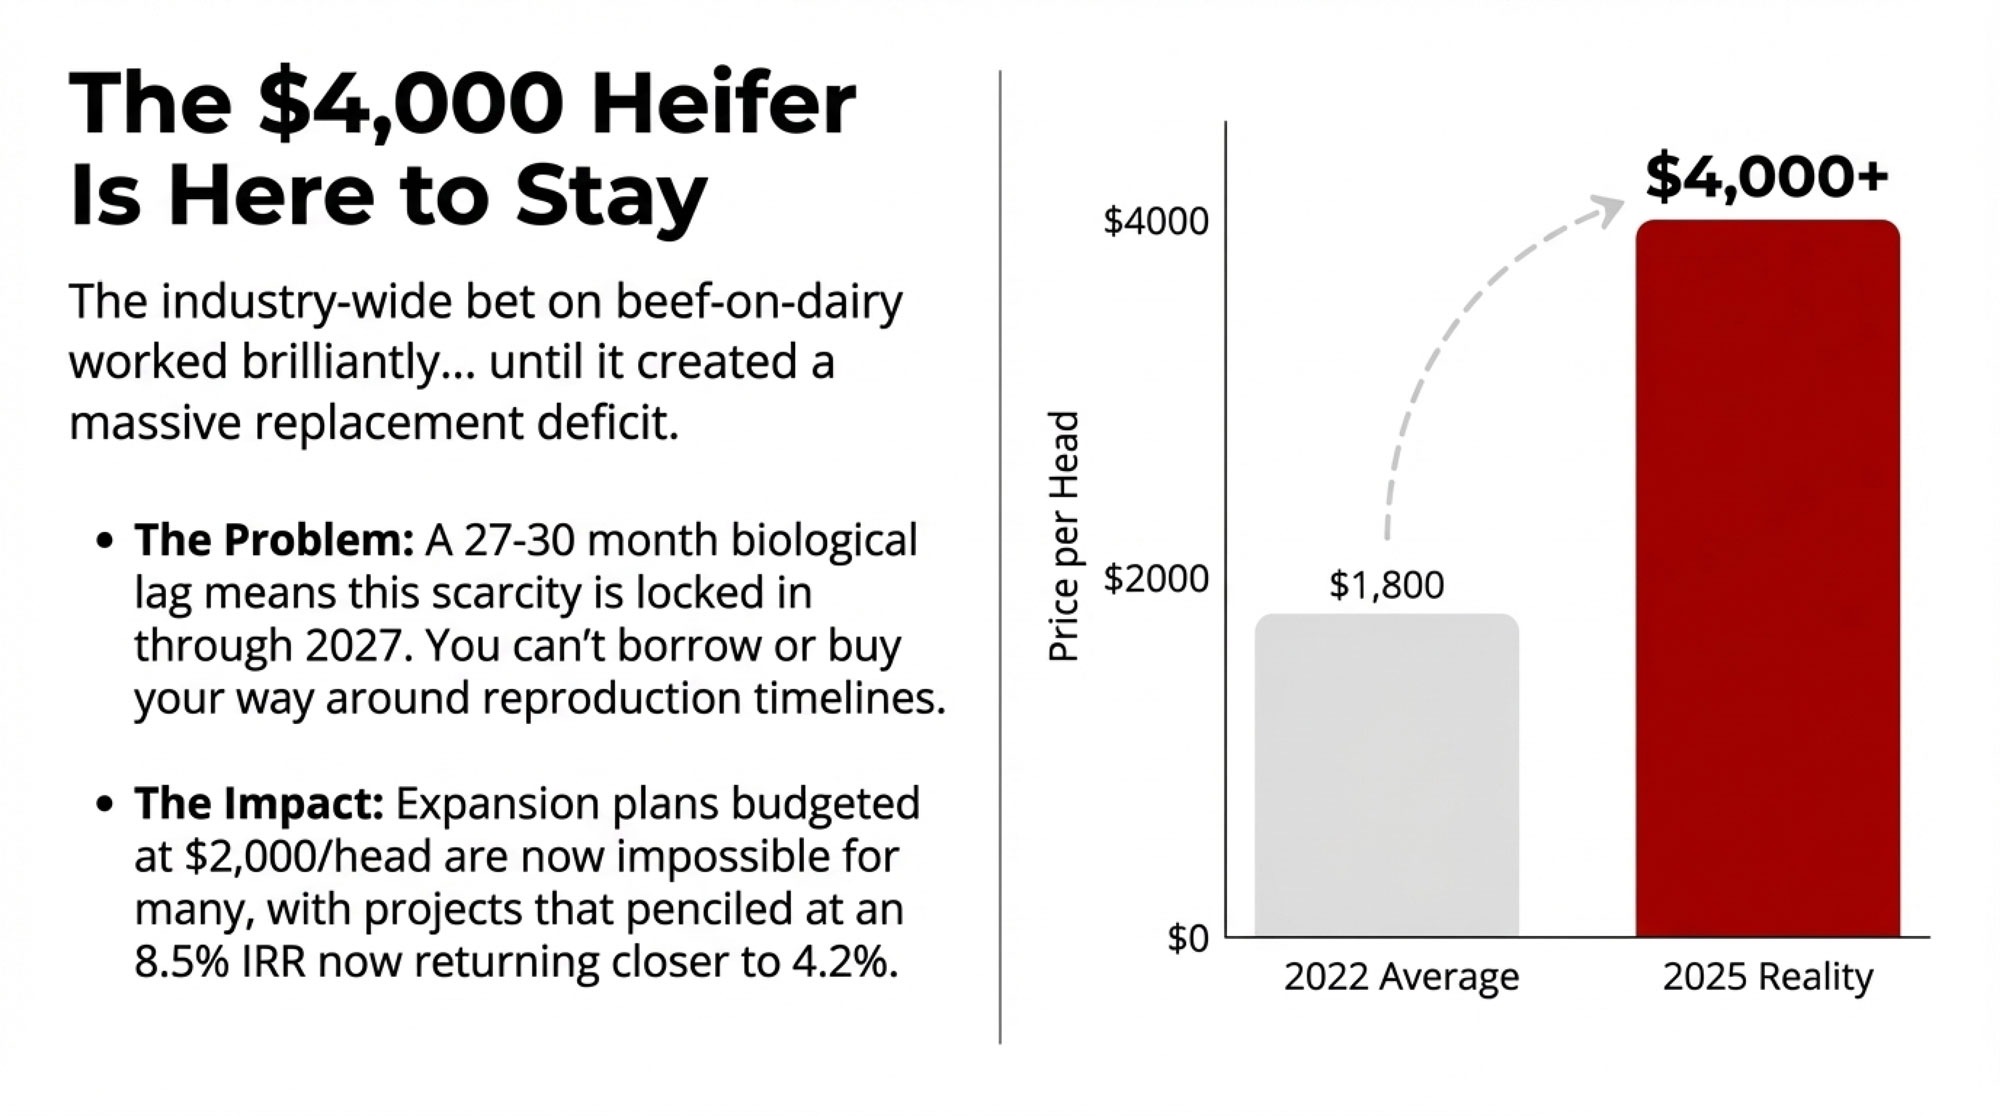
USDA cattle inventory reports through 2025 show heifer numbers well below historical levels, and the market responded accordingly. Heifer prices, which historically averaged $1,800-2,200, spiked to an average of $3,010 nationally, according to mid-2025 USDA Agricultural Marketing Service livestock reports. Quality animals? You’re looking at $4,000 or more in many regions.
The Heifer Price Cliff: Biology Created a 150% Price Spike in 36 Months
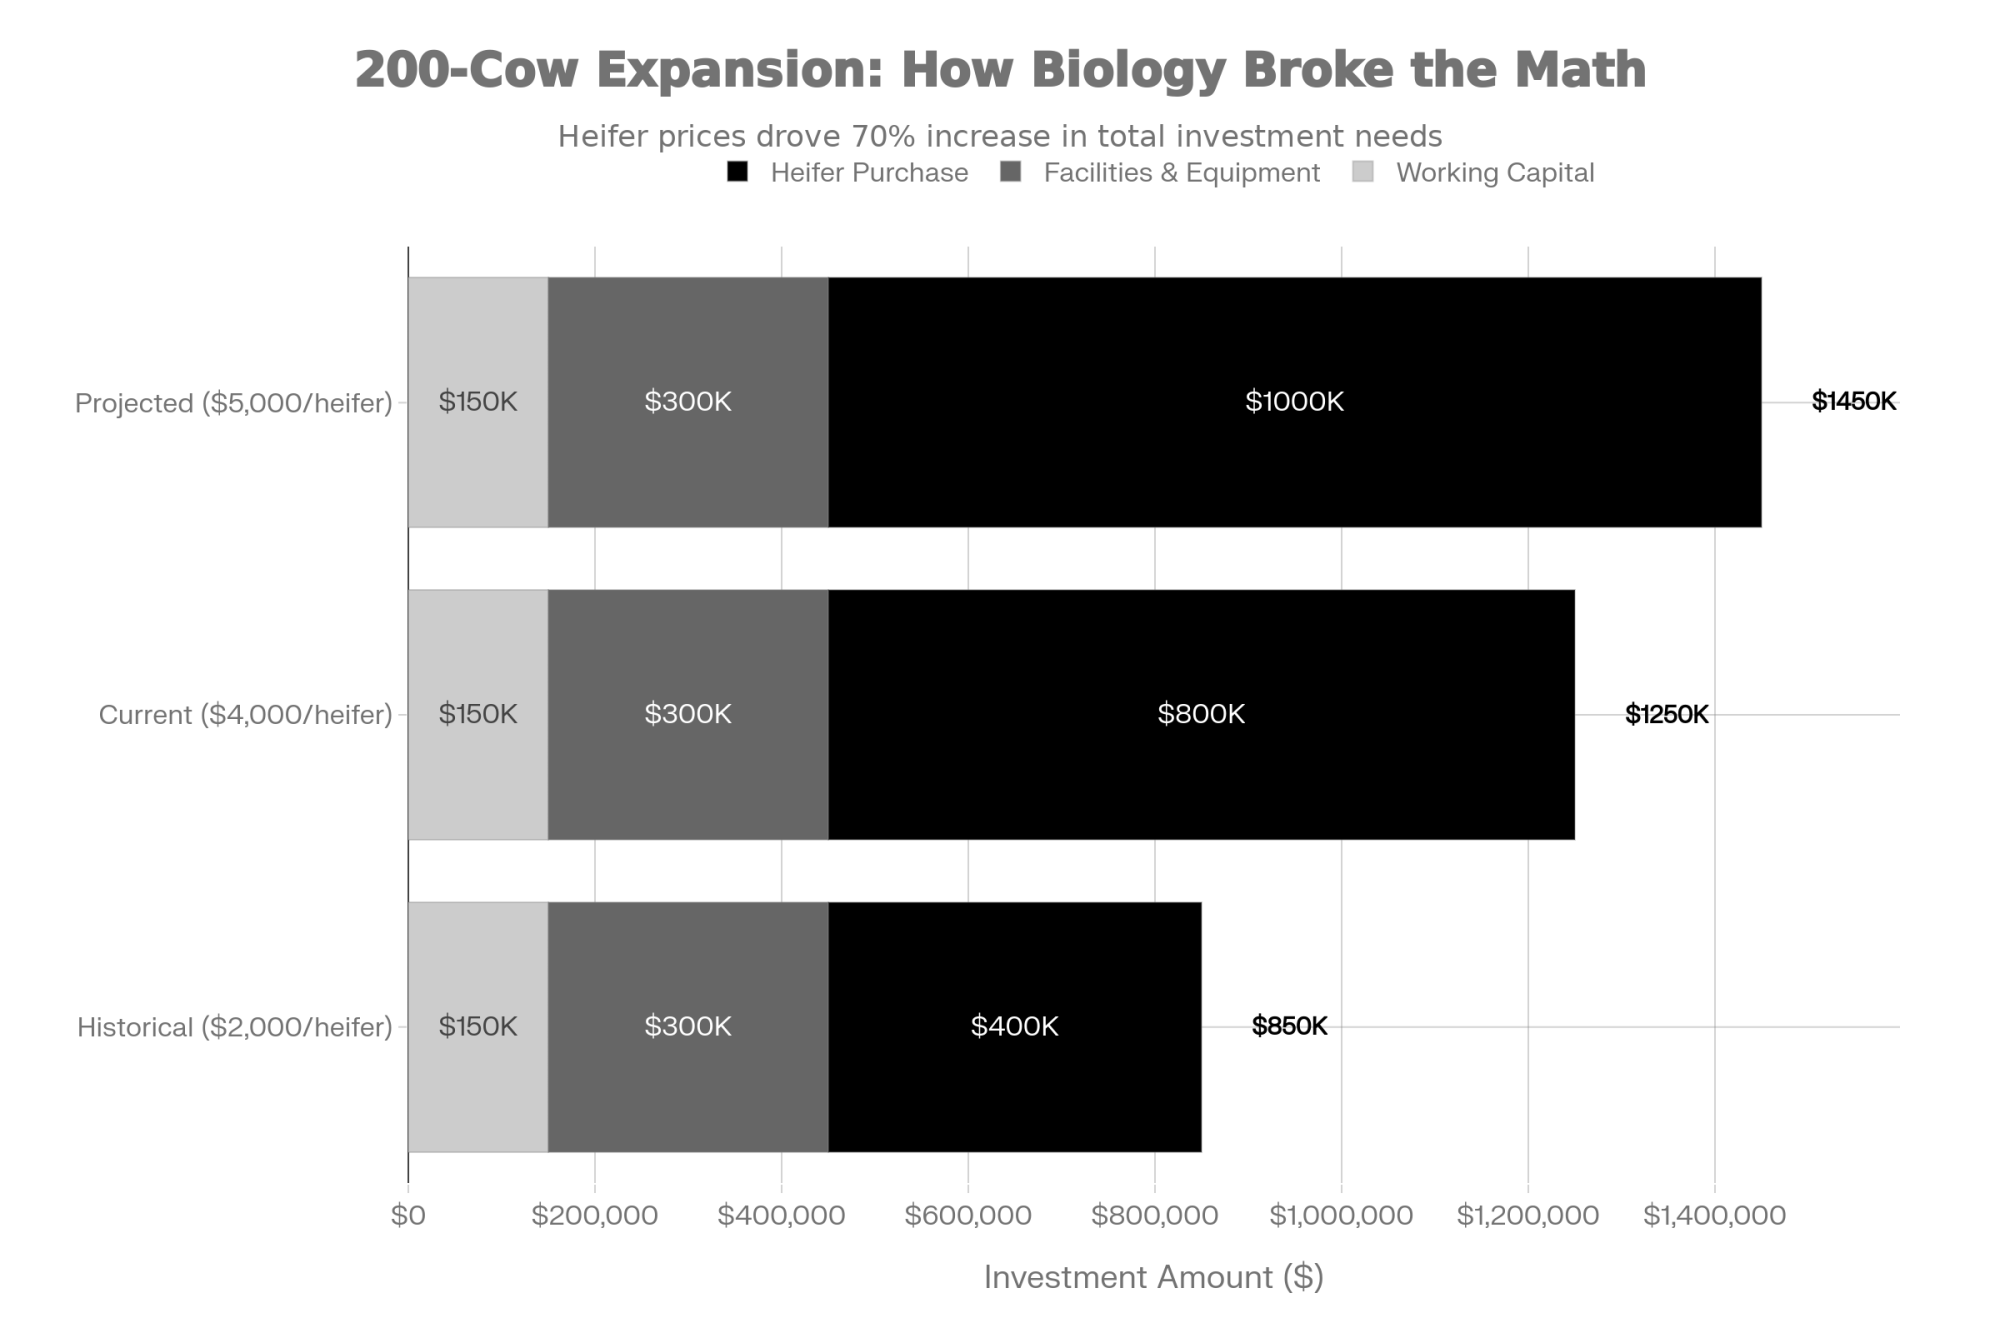
Picture this scenario: a producer planning a 200-cow expansion with an initial budget assuming $400,000-440,000 in heifer purchases. When it actually came time to source them this fall, the requirement had jumped to $760,000-$800,000—and that’s before facilities, equipment, or working capital. The project fundamentals changed so dramatically that many lenders couldn’t approve at the revised numbers.
What sets this apart from typical commodity price volatility is the timeline. Say you recognize the shortage today and immediately shift to aggressive sexed semen protocols. You’re still facing a 27-30 month lag before those breeding decisions yield fresh cows entering the milking string. The biological constraint is absolute. You can’t negotiate faster gestation periods, you can’t pay a premium for accelerated heifer maturity, and you can’t borrow your way around reproduction timelines.
Agricultural economists studying dairy expansion economics have been clear about how this reshapes project viability. When expansion plans that looked viable at $2,000 heifers become questionable at $4,000 heifers, that internal rate of return you calculated at 8.5% might drop to 4.2%. If your lender wants a minimum of 6% for ag expansion loans—and many do in this rate environment—the expansion you’ve been planning just became impossible. Not because milk prices crashed, but because the biological input you need doesn’t exist at a price that makes the economics work.
Expansion Economics Shattered: Heifer Costs Doubled Total Investment Requirements
Billions in Processing Capacity Nobody Can Fill
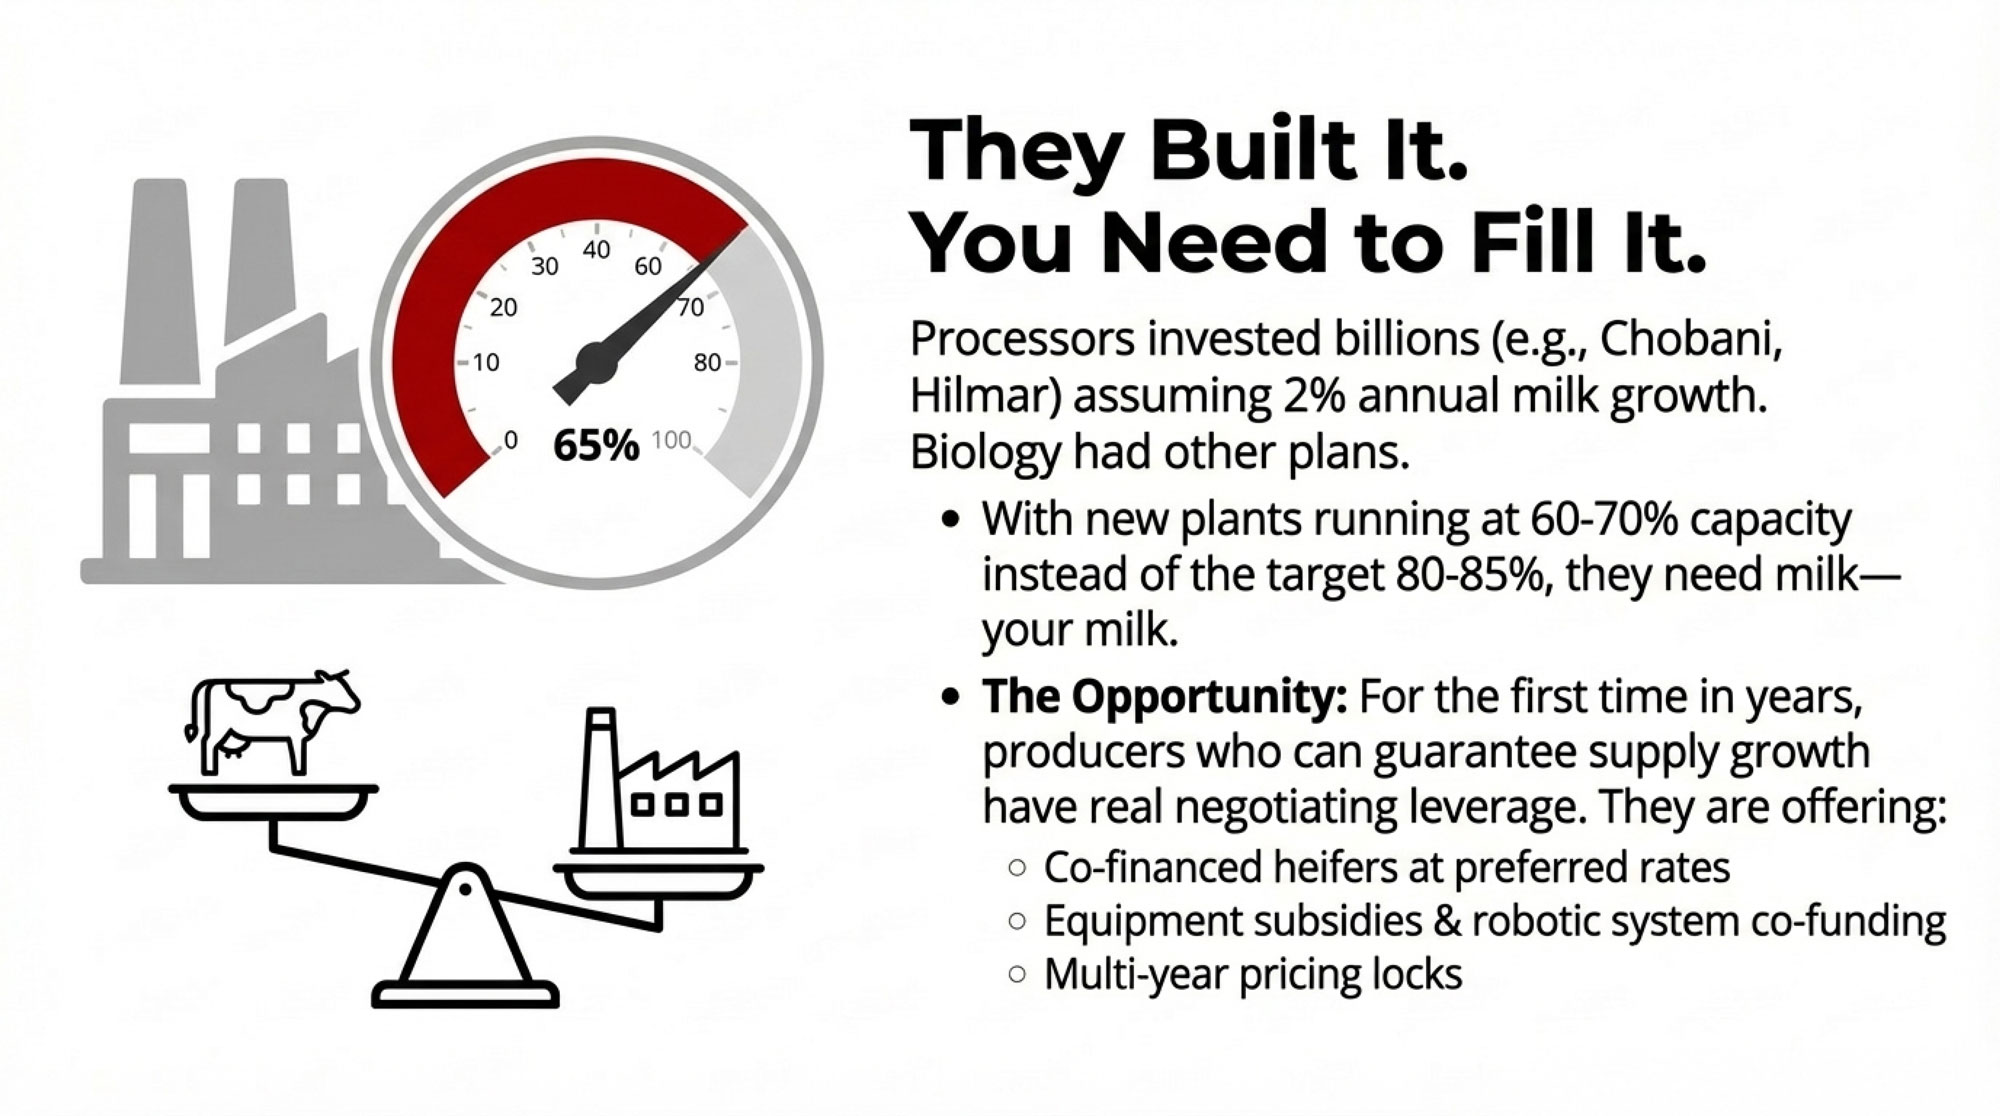
While we were grappling with heifer scarcity, dairy processors made massive capital commitments based on different assumptions about milk supply growth.
Chobani’s investment in Twin Falls expansion and their new Rome, Georgia facility—we’re talking $1.7 billion total—will require roughly 6 billion pounds of milk annually when fully operational, according to company announcements and Idaho dairy industry projections. Hilmar Cheese Company’s Dodge City, Kansas, plant, which opened in 2024, was designed to process 6-8 million pounds per day at full capacity, according to Kansas Department of Agriculture assessments.
And it’s not just the big names. California Dairies Inc., Darigold, and other regional processors have added significant cheese processing capacity through 2025. USDA Dairy Market News tracking shows substantial infrastructure investment across multiple regions. Nebraska saw its first major fluid milk processing plant in more than 60 years—that’s how much capital has been flowing into dairy processing infrastructure.
These investments shared common modeling assumptions—that U.S. milk production would continue to grow 1.5-2% annually, as historical trends from 2010-2020 suggested, providing sufficient supply to fill new capacity while maintaining competitive procurement costs.
But biology created different outcomes. With replacement heifer inventories down and many of us keeping marginal cows longer rather than replacing them at $4,000/head, the sustainable milk supply growth processors modeled simply isn’t materializing at expected rates.
The numbers tell the story. USDA data shows weekly dairy cow slaughter trailed year-earlier levels for 98 of 106 weeks through mid-2025, with cumulative declines exceeding 556,000 head. Why? Because many operations chose to keep lower-producing cows rather than pay those premium replacement costs. This extended herd retention created a temporary production boost from increased cow numbers, but it’s constraining long-term genetic improvement and herd health optimization—something we’ll feel the effects of for years.
The capital mismatch this created is…well, it’s significant. Processors need plants running at 80-85% capacity to hit their ROI targets. Industry observers note concerns about whether new processing capacity is achieving the utilization rates needed for acceptable returns on these substantial investments.
Metric
Value
New Processing Capacity Added (2024-2025)
12-15 billion lbs/year
Milk Needed at Full Capacity
12-15 billion lbs/year
Current Utilization Rate
60-70%
Heifer Inventory vs. 2020 Baseline
-35% to -40%
Replacement Cost Increase
+67% ($2,000 → $3,010)
And this creates an unusual negotiating environment for producers. When processors face utilization challenges, the dynamics shift. Anecdotal reports suggest some processors may be offering enhanced contractual terms to secure committed supply, though specific arrangements are rarely publicized. The dynamic differs substantially from periods of milk oversupply when processors held most of the negotiating leverage.
What’s particularly noteworthy is that some processors are beginning to explore not just pricing adjustments but actual capital investment partnerships. We’re talking co-funding barn expansions or robotic milking systems in exchange for long-term volume commitments. For producers with consistent volume and quality, this represents a different kind of conversation than we’ve had in recent years—but only if you can deliver the growth processors need. And that circles right back to heifer availability.
The partnership dynamics vary substantially by region and processor structure. Northeast operations working with Dairy Farmers of America or Agri-Mark cooperatives navigate different leverage points than independent processors, where member ownership can influence capital partners’ willingness. Mountain West producers in Idaho and Utah working within Glanbia or Gossner supply chains may find processor partnership opportunities shaped by these companies’ growth trajectories and existing producer relationships. The core dynamic—processors needing committed supply growth they can’t otherwise secure—creates opportunity, but the specific terms reflect regional processor economics and competitive positioning.
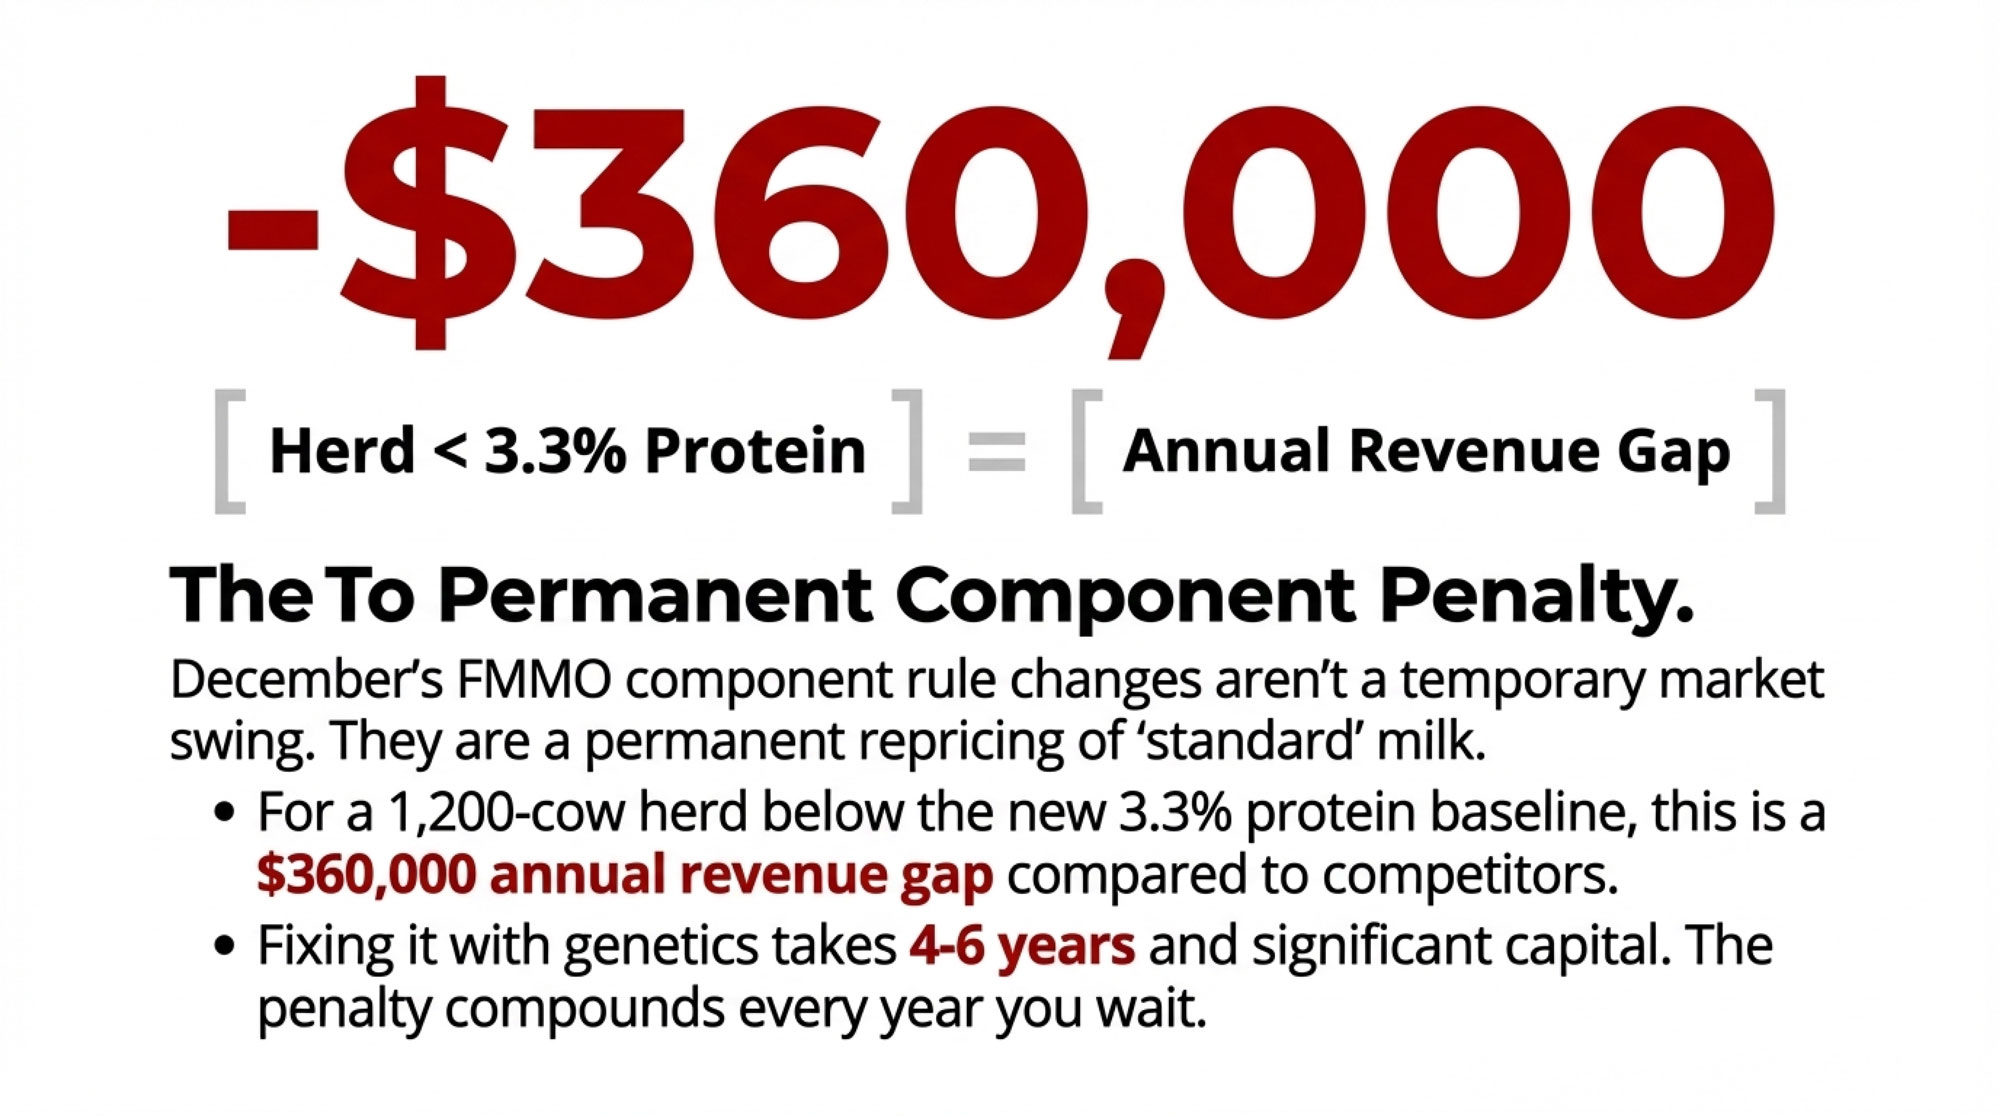
December’s Component Rule Change Just Made It Permanent
While heifer dynamics played out, another structural shift many producers are still coming to terms with took effect on December 1: the Federal Milk Marketing Order changes.
The updated component factor standards—moving from 3.0% to 3.3% protein, 5.7% to 6% other solids, and 8.7% to 9.3% nonfat solids—represented more than technical adjustments in formulas. USDA Agricultural Marketing Service finalized these changes after extensive industry input throughout 2024-2025. What they did was permanently reprice what constitutes “standard” milk under federal pricing formulas.
The changes reflect actual component levels in the U.S. milk supply more accurately than standards last updated decades ago. And that’s fair enough from a policy standpoint. But it creates real winners and losers operationally.
For operations already producing above the new standards, the changes validated the genetic investment made over the years. Say your herd averages 3.5% protein—you’re now receiving credit for delivering 0.2% more protein than the formula assumes. Based on typical Class III component valuations from mid-2025, that’s roughly $0.50-$0.60 per hundredweight premium above producers hitting the 3.3% baseline.
But if you’re averaging 3.0% protein? The penalty widened. The spread between high-component and low-component operations increased from roughly $1.00-$1.10 per hundredweight under previous standards to $1.25-$1.50 under the new framework, depending on your butterfat and other solids performance.
To illustrate the economics: on a 1,200-cow operation producing 28.8 million pounds annually, that component differential represents approximately $360,000 in annual revenue variance compared to competitive operations. Every year. Permanently. Until genetics improve through breeding or herd replacement.
And the complication is that fixing genetics through breeding requires at least 4-6 years to see meaningful herd-average improvements. This reflects biological realities we can’t shortcut. Calves born from improved genetics in 2026 don’t enter the milking string until 2028, and it takes several more years of selective breeding and culling to shift overall herd composition significantly.
Take this example: an operation averaging 3.1% protein—not terrible by historical standards, but now sitting below the new baseline. Running the numbers on genetic improvement shows that purchasing high-component genetics would cost $2.1-2.9 million to replace 50-60% of a 1,200-cow herd at current heifer prices. That’s challenging capital to finance, given typical industry leverage positions.
University dairy management specialists studying genetic improvement economics note that hybrid approaches—combining strategic purchases with aggressive sexed semen protocols on top genetic performers—can spread costs over 5-7 years at roughly $135,000-160,000 annually. This makes the investment more manageable from a cash flow perspective, but you’re still facing a significant capital commitment over an extended timeline.
For producers in their late 50s or early 60s without clear successors, the timeline creates difficult questions. Will the investment pay back within your operational horizon? That’s a personal decision each operation has to make based on specific circumstances and succession planning.
What “Record Exports” Actually Tell Us About Supply
Trade headlines from 2024-2025 painted what looked like an optimistic picture. U.S. dairy exports totaled $8.2 billion, up 2% from 2023, with cheese exports reaching all-time highs and rallying 17% in key markets like Mexico and Central America. USDA’s Foreign Agricultural Service export-tracking documents these gains, and the numbers look impressive.
But we need to dig deeper into what those export figures actually mean for our operations.
USDA data shows U.S. milk production grew 4.2% year-over-year in mid-2025, driven primarily by per-cow efficiency gains and temporary increases in cow numbers as many of us retained marginal animals longer. Meanwhile, domestic consumption—based on food availability data and industry consumption tracking—increased by roughly 1-2% across the fluid milk, cheese, butter, and yogurt categories.
So what happened to that 2.2-3.2% production surplus? It needed export markets to absorb it and prevent domestic price collapse from oversupply.
What the data reveal is that “strong U.S. dairy exports” in this context really means we’re producing more milk than domestic markets want to consume at prevailing price levels. We needed export outlets to clear inventory. This is fundamentally different from demand-driven export growth, where global buyers actively seek U.S. dairy at premium prices to alternatives.
The distinction matters significantly for expansion planning, and it’s worth understanding the difference.
Mexico represents genuine structural demand. The country faces a dairy deficit of 25-30% annually—it simply cannot produce enough milk domestically to meet consumption needs. USDA Foreign Agricultural Service analysis confirms Mexico imports roughly 1 million metric tons of dairy products annually, with the U.S. supplying over 80% of that shortfall. Why? Proximity, trade agreement terms under USMCA, and established quality relationships.
As Mexican GDP grows and incomes rise, dairy consumption increases. This creates expanding structural demand that isn’t dependent on temporary price arbitrage or trade policy positions. You can reasonably factor this kind of export relationship into medium-term planning because the fundamentals are solid.
Supply-driven export growth looks different. U.S. whey powder and nonfat dry milk volumes shipped to China and other Asian markets throughout 2024 represented valuable outlets for commodity products that domestic markets couldn’t absorb at certain price points. But when China imposed retaliatory tariffs on U.S. dairy products in early 2025—starting at 10%, rising to 25%, and eventually reaching 125%—U.S. exporters scrambled to find alternative buyers at competitive prices.
New Zealand and European Union suppliers, not facing similar tariff barriers, stepped in to serve Chinese buyers. Our market share declined as price competitiveness evaporated under tariff pressure. It happened quickly.
Now, the November framework agreement between the U.S. and China—announced jointly on November 10—suspended those retaliatory tariffs and restarted facility registrations for U.S. infant formula plants. This was genuinely positive news that stabilized short-term market sentiment and reopened commercial channels.
But—and this is critical—the agreement serves as a framework for ongoing dialogue rather than a permanent resolution. The official language emphasized that parties agreed to “resolve trade tensions through continued engagement.” Translation: tariff suspensions could be reinstated if broader trade negotiations encounter difficulties or political circumstances shift.
So for those of us evaluating expansion decisions, the key point is this: plan growth around export markets only when the demand is structural, like Mexico’s import dependency. Don’t build expansion plans on opportunistic export relationships, such as China’s commodity markets, that depend on favorable tariff treatment. Those can disappear quickly, and expansion economics often can’t absorb such a sudden loss of market access.
How DMC Works Differently for Strong vs. Struggling Operations
The Dairy Margin Coverage program—extended through 2031 in recent legislation—plays different roles depending on who’s using it and how.
The program improvements included expanding Tier I coverage from 5 million to 6 million pounds, updating production history calculations to reflect 2021-2023 levels, and establishing a 25% premium discount for producers committing to multi-year enrollment. USDA Farm Service Agency documented these changes in program announcements.
For well-run operations with solid fundamentals, DMC functions as genuine catastrophic insurance. Think about a 600-cow operation in the Upper Midwest with strong genetics—3.4% protein, 4.2% butterfat—efficient production around 26,000 pounds per cow annually, and moderate leverage around 35% debt-to-asset ratio.
This operation might pay $11,000-13,000 annually for $9.50 per hundredweight margin coverage under current premium structures. In typical years, they might receive $25,000-35,000 in payments during minor margin squeezes when feed costs spike or milk prices soften temporarily. That creates a net cost of $10,000- $ 20,000 for insurance protection.
But in catastrophic years? That’s where the program shows its value. In 2023, DMC paid out $1.2 billion across 17,130 participating operations, according to USDA program data. For operations enrolled at high coverage levels, payments ranged from $120,000 to $ 180,000. For many producers, these payments represented the difference between maintaining debt service and covenant compliance versus facing foreclosure or forced asset sales.
Agricultural economists studying risk management note that producers who use DMC strategically view it as what it’s designed to be—catastrophic risk protection, not an operating subsidy. These operations manage their businesses assuming zero DMC payments. When payments arrive, they flow to debt reduction, capital reserves, or strategic investments—not covering routine operating expenses.
For operations with structural challenges, DMC serves a different function. During 2023’s severe margin compression, operations with below-average genetics, lower production per cow, and high leverage might have received substantial DMC payments that covered operating loan interest, partial property tax obligations, and minimum debt service—preventing immediate foreclosure.
This creates legitimate policy questions about whether farm programs should support operations that struggle to achieve profitability without government payments. There are thoughtful perspectives on both sides. From an economic efficiency standpoint, some argue that enabling operations that would otherwise consolidate delays industry rationalization. From a rural community perspective, others contend that preventing catastrophic forced liquidations allows gradual, managed transitions that preserve community stability.
What producers are finding is that DMC’s actual role depends entirely on underlying competitive positioning. Operations with strong fundamentals use DMC to protect downside while pursuing growth strategies. Operations with weak fundamentals sometimes use DMC to delay strategic decisions about succession or exit.
The practical takeaway: DMC is extended through 2031 with improved terms. The 25% premium discount for multi-year commitments makes long-term enrollment economically attractive. If you’ve got strong fundamentals, DMC represents genuinely inexpensive catastrophic insurance. If you’ve got weak fundamentals, DMC might be sustaining your operation, which requires an honest assessment of whether you’re building toward viable, long-term competitive positioning or simply postponing inevitable transitions.
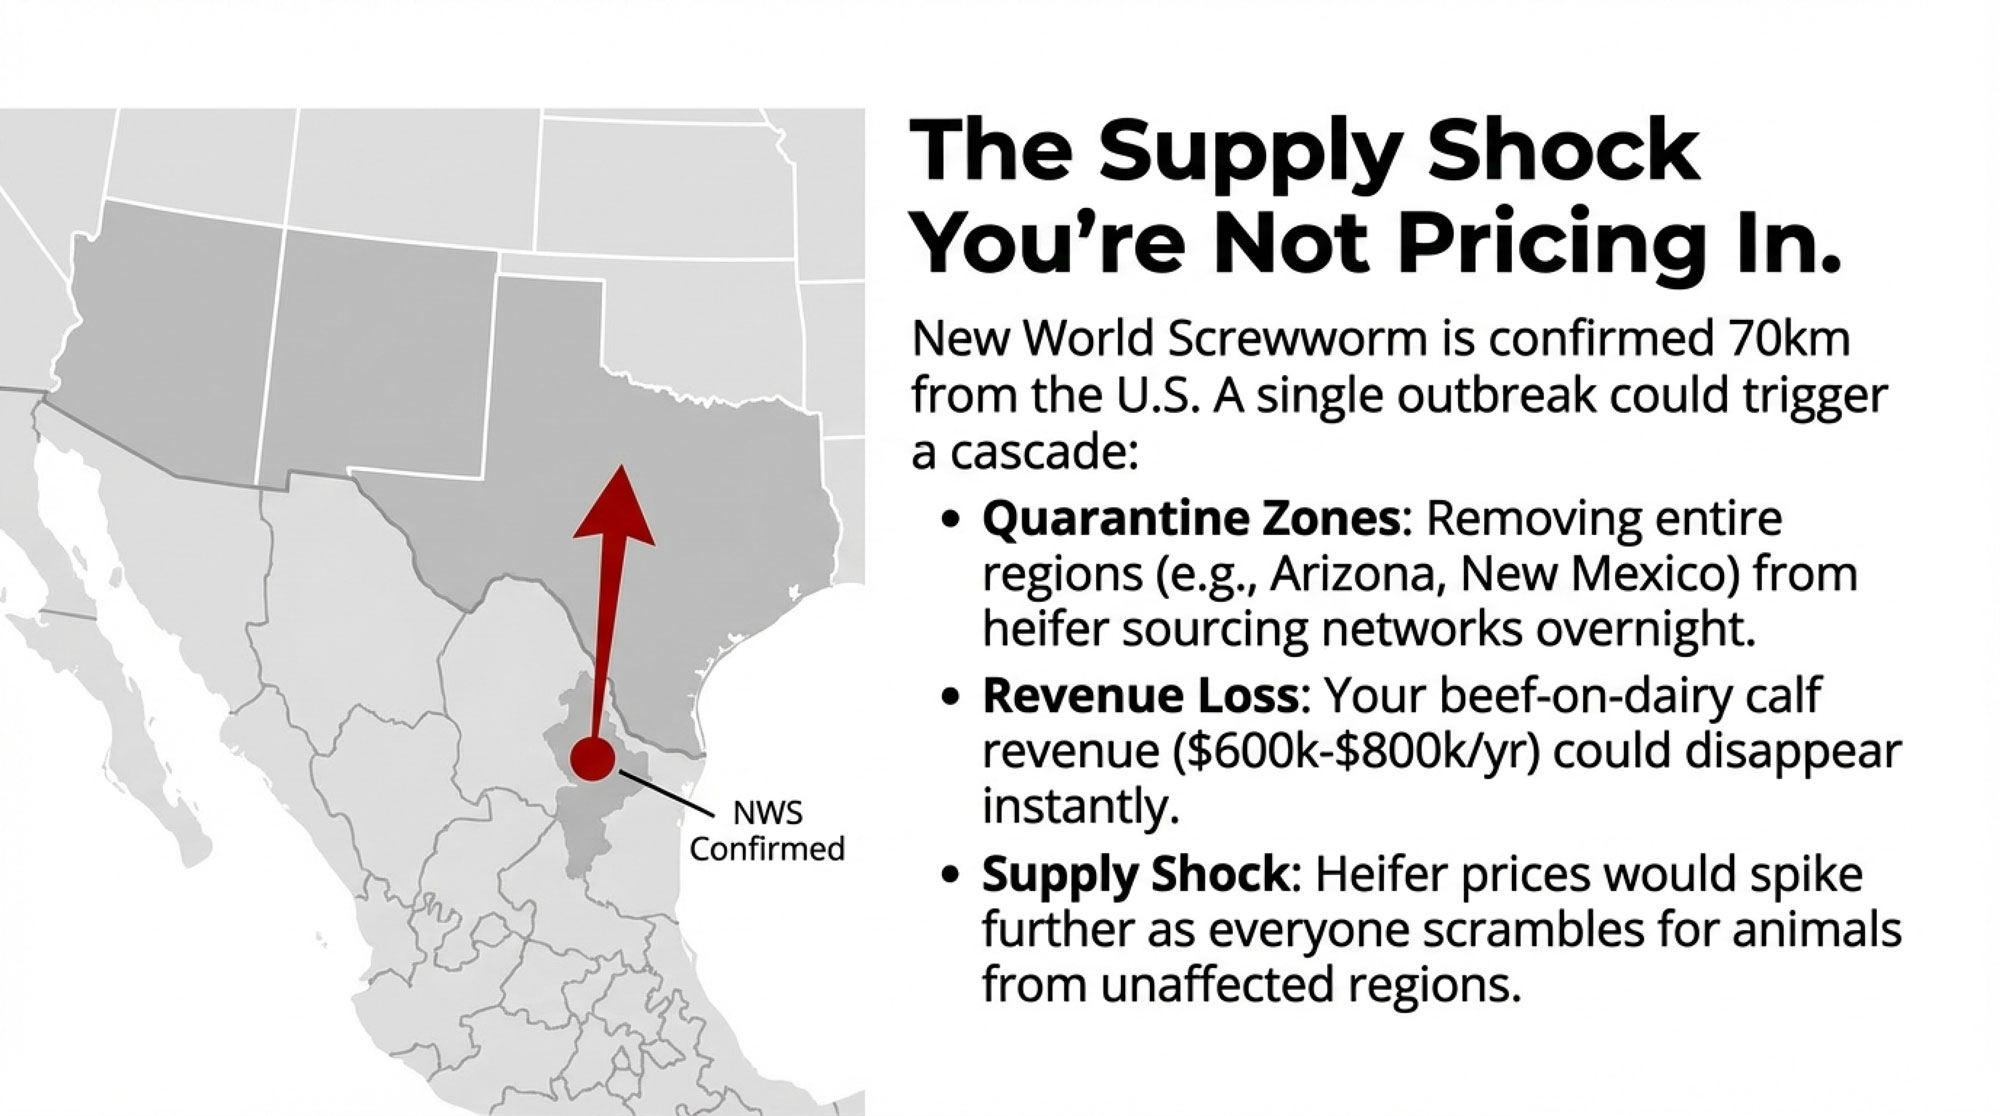
The Supply Shock Nobody’s Pricing Into Heifer Strategy
While structural forces like heifer scarcity and component repricing unfold over years, New World Screwworm represents a different threat—a potential overnight disruption to the already-stressed heifer supply equation that most of us aren’t fully accounting for yet.
The parasitic fly was confirmed in Sabinas Hidalgo, Nuevo León—less than 70 miles from the U.S.-Mexico border—on September 18. USDA Animal and Plant Health Inspection Service guidance indicates this fly can kill a full-grown cow in 10 days if infestations aren’t treated aggressively. Mexican cattle imports to the U.S. have been completely closed since May after initial detections in southern Mexican states.
What makes the September detection particularly concerning for heifer markets: it occurred in a certified commercial feedlot in northern Mexico, and the infected animal had recently moved from southern Mexico. USDA situation reports documented this. What it demonstrates is that the fly moved northward despite extensive surveillance—8,000 monitoring traps deployed across Mexican states, more than 13,000 screening samples processed, and sterile fly releases attempting biological suppression.
Veterinary specialists note that the parasite’s movement pathway is particularly challenging to control because animals can be infected without showing obvious symptoms initially, and commercial livestock operations regularly move cattle across regions as part of normal marketing processes.
Here’s how this connects to heifer availability: if NWS establishes in the U.S.—and veterinary epidemiologists consider it a real possibility given proximity to current infestations and biological pressure during favorable spring and summer conditions—the cascade affects both supply and cost structures simultaneously.
Timeline
Event
Risk Level
Action Window
Beef-on-Dairy Revenue at Risk
Sept 2025
Confirmed 70km from border
Medium
6 months
$0
Dec 2025
Winter containment window
Medium-High
3 months
$0-200K
Jan-Mar 2026
Critical decision period
High
90 days
$600K-800K
Apr-Jun 2026
Spring expansion season
Critical
Closing
$600K-800K
Q3 2026+
Potential establishment
Catastrophic
Too late
$600K-800K
Looking at historical patterns from the 1950s eradication efforts, establishment typically follows a predictable sequence: Detection occurs on a commercial operation. Within 24-48 hours, livestock markets within 200-300 miles stop accepting cattle from affected regions because buyers anticipate quarantine zones. Feeder cattle prices decline $2-5 per hundredweight in affected regions within the first week.
USDA announces quarantine zones—typically 300 kilometer radius around confirmed detections—within 7-14 days. Movement restrictions require veterinary inspection and negative testing for any cattle transport. State veterinary authorities implement interstate movement protocols.
For those running operations integrated with beef calf production—which many became during 2022-2024’s beef-on-dairy premium period—the impact compounds the heifer shortage. Calves already in affected feedlots can’t move or be sold during quarantine periods. You’re looking at 30-90 days of feeding costs with no revenue pathway. New calves have no placement options because feedlots restrict intake from quarantine regions.
That beef-on-dairy revenue stream, many operations built into financial models—$1,500-2,000 per calf, potentially generating $600,000-800,000 annually for larger operations—can disappear within weeks of detection. This forces immediate return to dairy genetics for replacement production, putting additional pressure on an already-constrained heifer market. Operations that delayed rebuilding internal replacement capacity suddenly compete for the same limited external heifer supply.
The supply shock dynamic: quarantine zones don’t just restrict the movement of infected animals. They effectively remove entire regions from the heifer sourcing networks for months. An operation in California that routinely sources heifers from Arizona feedlots suddenly loses that supply channel if quarantine zones are established. The remaining unaffected regions see immediate price spikes as buyers compete for shrinking available inventory.
If you’re operating in southern or southwestern regions—such as south Texas, Arizona, New Mexico, or southern California—this risk is immediate. Even operations in the Southeast (Georgia, North Carolina) and the Mountain West (Idaho, Utah) should monitor developments, given how quickly commercial cattle movements can spread infestations beyond initial detection zones. Secure commitments from alternative feedlots 300+ miles from potential quarantine zones now, while supply relationships remain flexible. Discuss covenant flexibility with your agricultural lender before potential quarantine scenarios eliminate options and heifer costs spike further.
The June sterile fly program aircraft accident in Mexico—confirmed in USDA reports—highlighted operational vulnerabilities in biological control efforts. Continuous aircraft operations are essential for maintaining sterile fly releases that suppress wild populations. Any extended disruption creates gaps that can allow infestations to expand rapidly.
NWS is currently about 70 kilometers from the U.S. border. Spring 2026 brings ideal conditions for northward movement. For operations already navigating $4,000 heifer costs and limited availability, a quarantine-driven supply shock could push heifer acquisition from difficult to impossible. We’ve perhaps got a few months to develop contingency plans before this potential scenario compounds the heifer mathematics further.
Why Lower Interest Rates Don’t Fix the Heifer Problem
Federal Reserve rate cuts, bringing the federal funds rate to the 4-4.25% range during late 2025—documented in committee meeting statements—created conventional wisdom that cheaper money equals expansionary times.
But for most of us facing current heifer constraints and component economics, that conventional wisdom doesn’t quite align with reality. This is where the fundamental repricing becomes clear: when biology sets the constraint rather than markets, traditional financial levers like interest rates can’t solve the core problem.
The expansion math still doesn’t work at 5% financing if heifers cost $3,800-4,000, and biological availability caps how many you can actually procure. Lower rates make challenging economics slightly less challenging—but that doesn’t transform value-destroying investments into profitable ones. You can’t finance your way around a 27-30 month gestation and development timeline, and you can’t borrow replacement animals that simply don’t exist at any reasonable price.
Where rates do create genuine strategic advantage is in specific applications that align with the structural positioning you’ve already built.
Genetic improvement programs, for example. To illustrate the economics: a $675,000- $ 900,000 investment over 6 years to improve component performance through genomic testing, sexed semen protocols, and strategic culling incurs different financing costs depending on interest rates. At 8% rates, carrying costs add roughly $360,000 over the program timeline based on standard agricultural loan amortization. At 5% rates, carrying costs drop to approximately $202,500. That’s $157,500 in savings—about a 15% reduction in total cost.
For operations where component improvement barely pencils out at higher rates—specifically, operations at 3.1-3.2% protein trying to reach 3.3-3.4% where the revenue benefit is meaningful but not enormous—that 15% financing cost reduction can shift ROI from slightly negative to modestly positive over the investment horizon.
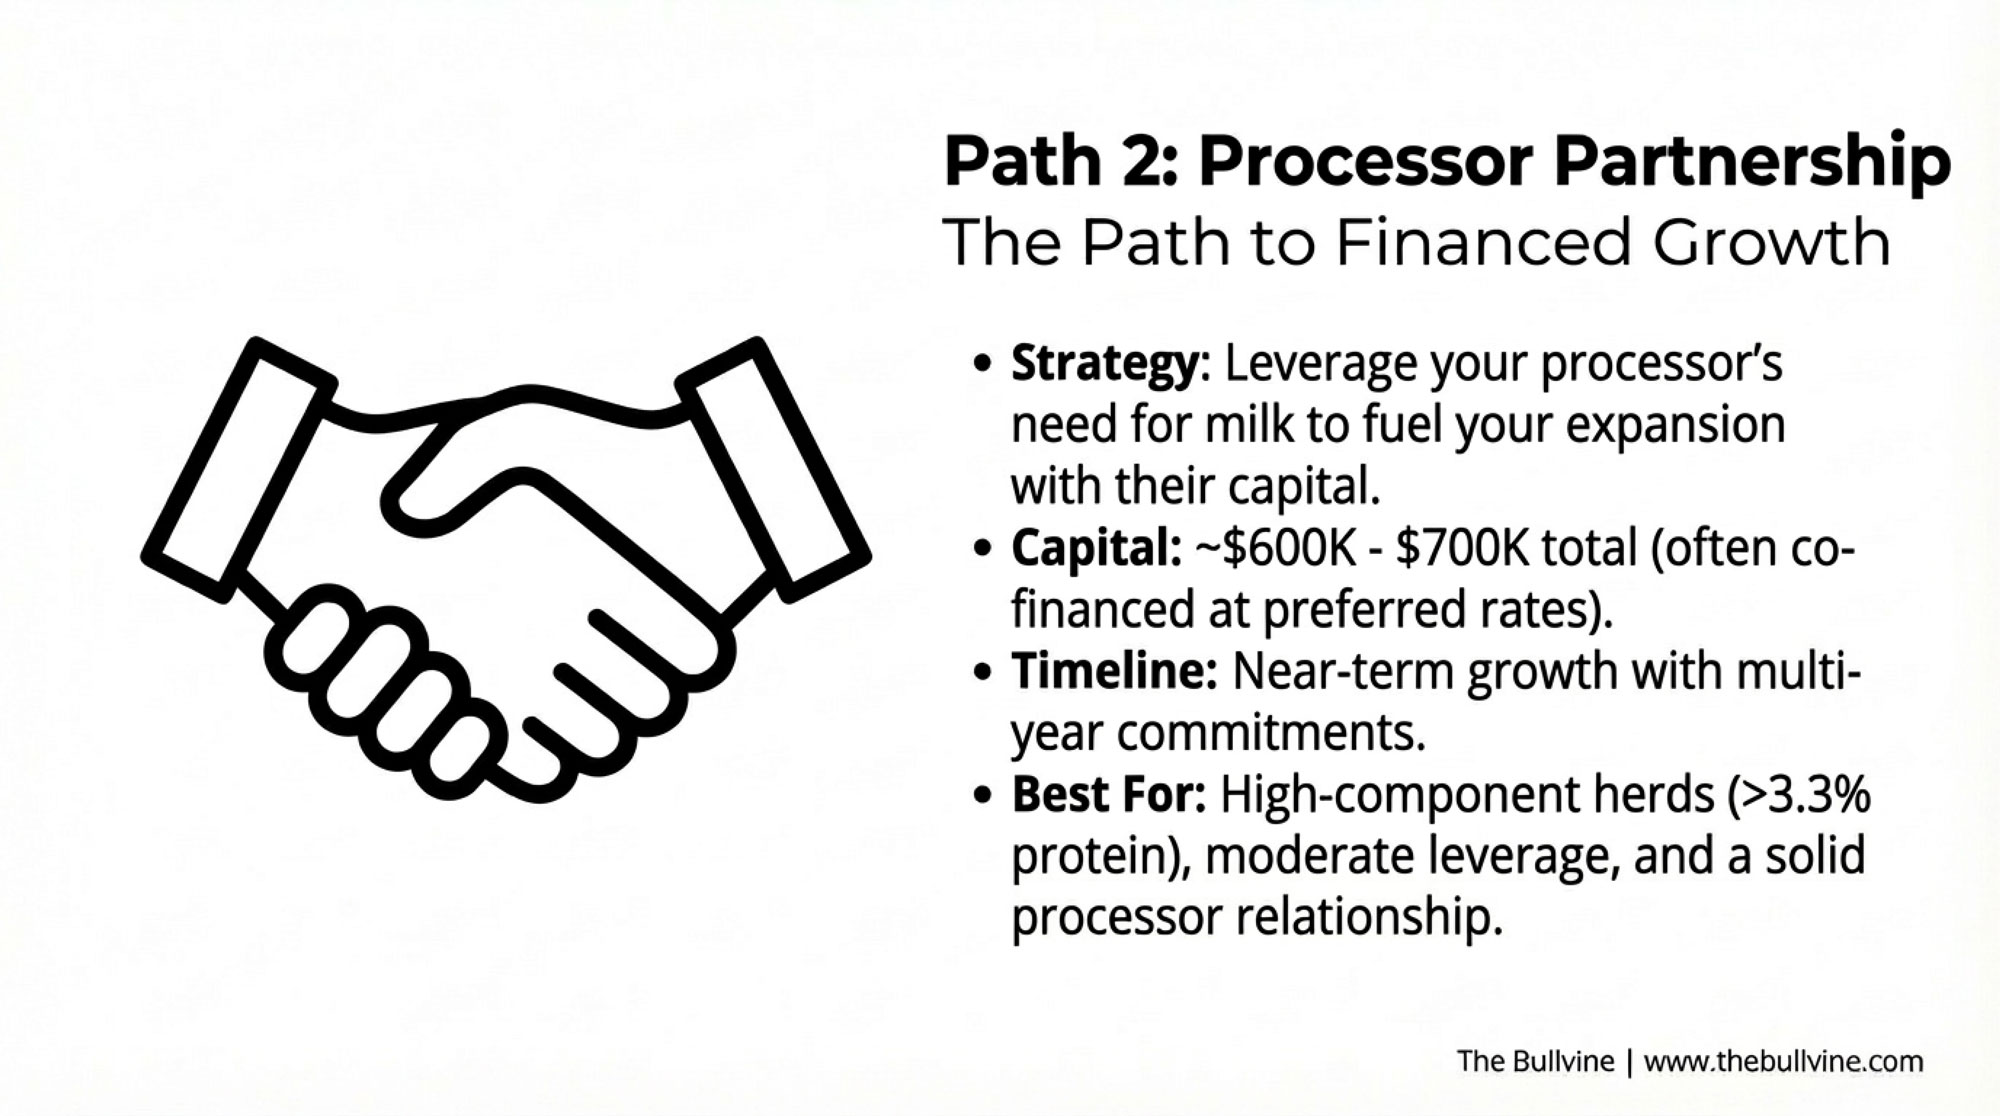
Processor partnerships represent another area where current rates create opportunities. Some processors, facing underutilized plants, are exploring capital partnerships to secure committed milk supply growth. These arrangements might include co-financing heifer purchases at preferred rates, subsidizing genetic improvement programs, or guaranteeing multi-year milk pricing.
At current interest rates, processors can potentially finance heifer purchases at 4-5%—representing their typical cost of capital from corporate debt markets—and pass through 5-6% terms to producers. That’s more favorable than many of us could secure through traditional agricultural lenders for livestock purchases.
To illustrate how this might work in practice: picture a scenario where a processor needs committed volume to improve utilization at a new facility. They could co-finance heifer purchases at 5.5%, lock in milk pricing for 36 months, and both parties improve their economics. From the processor’s perspective, moving plant utilization from the low 60s to the mid-70s percentage range creates substantial value from relatively modest heifer financing commitments.
Automation and labor-replacing technology benefits from the current rate environment in practical ways. Robotic milking systems costing $500,000-700,000 installed can reduce labor requirements 40-60% according to manufacturer data and university research. These systems historically required payback periods of 5-7 years.
The economics shift with interest rates. At 8% financing, a $600,000 robotic system carries roughly $54,000 annual debt service using typical 10-year agricultural equipment loan terms. If labor savings amount to $40,000-45,000 annually—achievable by eliminating 1-1.5 full-time milking positions—the system runs at a cash flow deficit during the financing period.
At 5% financing, annual debt service drops to approximately $30,000 for the same system, creating positive cash flow from installation. In a heifer-constrained environment where biological limitations cap herd expansion, automation becomes the primary lever to increase production per operation. Lower rates make that lever financially viable.
The strategic window appears to be now through early spring. Heifer prices have stabilized at current elevated levels, but could spike further as more producers recognize that scarcity persists. Processors remain actively recruiting committed milk supply. Interest rates are at recent cycle lows.
If you can coordinate heifer strategy development, processor relationship negotiations, and favorable financing arrangements over the next few months, you may lock in structural advantages that competitors attempting similar moves later won’t be able to access at comparable terms.
Three Strategic Paths for the New Heifer Reality
Every structural force we’ve examined—biology, components, processing capacity, trade relationships, interest rates, biosecurity risks—flows through a single bottleneck: the replacement heifer strategy.
The heifer shortage caps the potential for expansion regardless of other favorable conditions. You simply cannot grow beyond what biological replacement availability allows.
Heifer sourcing determines your negotiating leverage with processors. If you can deliver growth with certainty—through internal heifer programs or strategic arrangements—you can potentially negotiate better terms. If you’re purchasing heifers on open markets competing with every other buyer, you’ve got minimal differentiation.
Heifer genetics determine component position for years into the future. Those December 1 component standard changes aren’t temporary policy positions. If you’re producing below 3.3% protein, you’re facing ongoing revenue penalties. Fixing genetics requires years through breeding programs or substantial capital through strategic purchases.
For those of us facing these realities, there are essentially three distinct paths, each with different capital requirements, timelines, and suitability profiles. Understanding where each path positions you five years out helps clarify which aligns with your operational objectives and constraints.
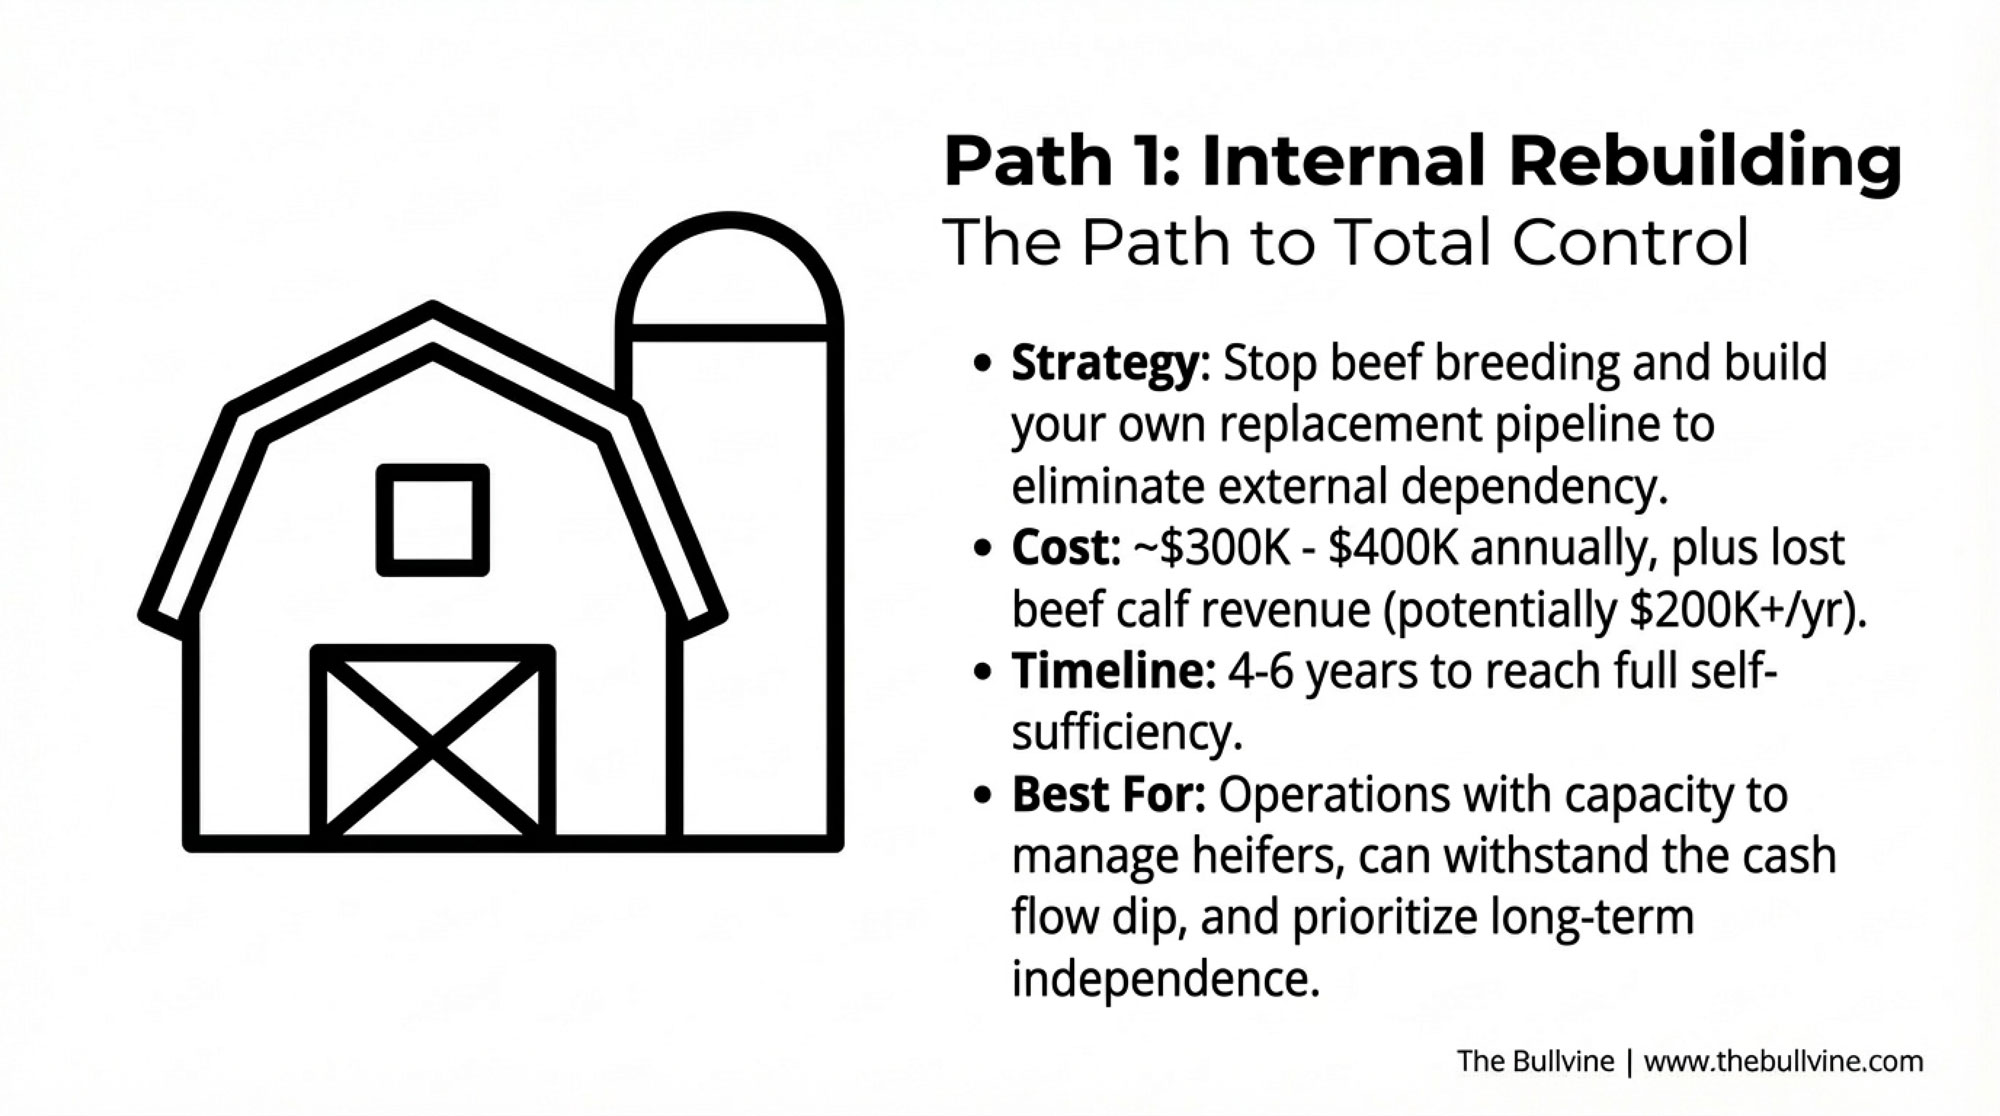
The first path focuses on rebuilding internal heifers through breeding. You stop beef breeding, raise all replacements on-farm through dairy genetics, and build self-sustaining heifer production capacity that eliminates external purchase dependency.
Factor
Internal Rebuilding
Processor Partnership
Hybrid Approach
Initial Investment
$300K-400K/year
$600K-700K total
$500K Year 1
Timeline to ROI
4-6 years
2 years
2-3 years
5-Year Total Cost
$1.2M-1.6M
$800K-1M
$900K-1.2M
Heifer Independence by 2030
100% self-sufficient
Still dependent
60-70% self-sufficient
Processor Commitment Required
None
Multi-year volume lock
Minimal
Strategic Flexibility
Maximum
Limited
High
Best For
Over-leveraged ops with facility capacity
Strong fundamentals, moderate leverage
Moderate leverage, uncertain succession
Based on typical industry cost structures, annual investment runs approximately $300,000-400,000 for heifer-raising infrastructure, feed, labor, and veterinary protocols over a 3-4 year buildout period. The opportunity cost includes lost beef calf revenue—potentially $200,000+ annually for operations that had built significant beef-on-dairy programs.
Timeline extends 4-6 years to achieve full replacement capacity. This reflects biological realities: breeding decisions made in early 2026 produce calves later that year, which don’t enter the milking string until 2028, with several additional years required to build surplus capacity.
Five-year positioning: By 2030, you’re a self-sufficient heifer self-sufficient with complete control over replacement timing, quality, and genetics. You’ve foregone roughly $1 million in cumulative beef calf revenue, but you have zero external heifer dependency and can potentially generate revenue selling surplus animals. Your operational flexibility is maximum—no processor commitments limiting strategic options, no exposure to heifer market price spikes. The trade-off: you’ve allocated significant capital and operational capacity to heifer raising rather than milk production optimization.
This path works best if you’re over-leveraged and need to reduce external heifer cash outlays, have facility and labor capacity to absorb heifer-raising operations, and can weather 3-4 years of beef calf opportunity cost without a cash flow crisis.
The second path builds on processor relationships through strategic partnerships. You lock multi-year agreements with specific volume commitments, potentially secure favorable terms for heifer acquisition, and commit to modest but certain herd expansion.
Using typical financing structures, total capital deployment runs in the $600,000-700,000 range, including heifer purchases, facilities for expanded capacity, and working capital. Financing might be split between traditional bank equipment loans and processor participation, creating blended rates in the low 5% range.
Based on standard dairy economics, the return timeline could show a substantial annual margin benefit by the second year as the expanded herd produces incremental milk revenue at locked pricing.
Five-year positioning: By 2030, you’re operating an expanded herd with processor capital deployed in your infrastructure and multi-year pricing agreements providing revenue stability. Your scale has increased meaningfully, and locked pricing has protected margins during volatile periods. The trade-off: contractual volume commitments limit strategic flexibility. If you want to exit, scale back, or shift to different markets, processor agreements may constrain options. You’re still dependent on external heifer markets for replacement animals, though potentially at preferential terms negotiated through processor relationships.
This path works best if you’ve got strong fundamentals, including components at or above new standards and efficient production, existing processor relationships where conversations about future supply are already underway, moderate leverage that allows expansion financing, and operational capacity to absorb growth. The approach is particularly relevant where processor partnerships align with regional dynamics—whether that’s working with cooperative structures in the Northeast or independent processors in growth markets.
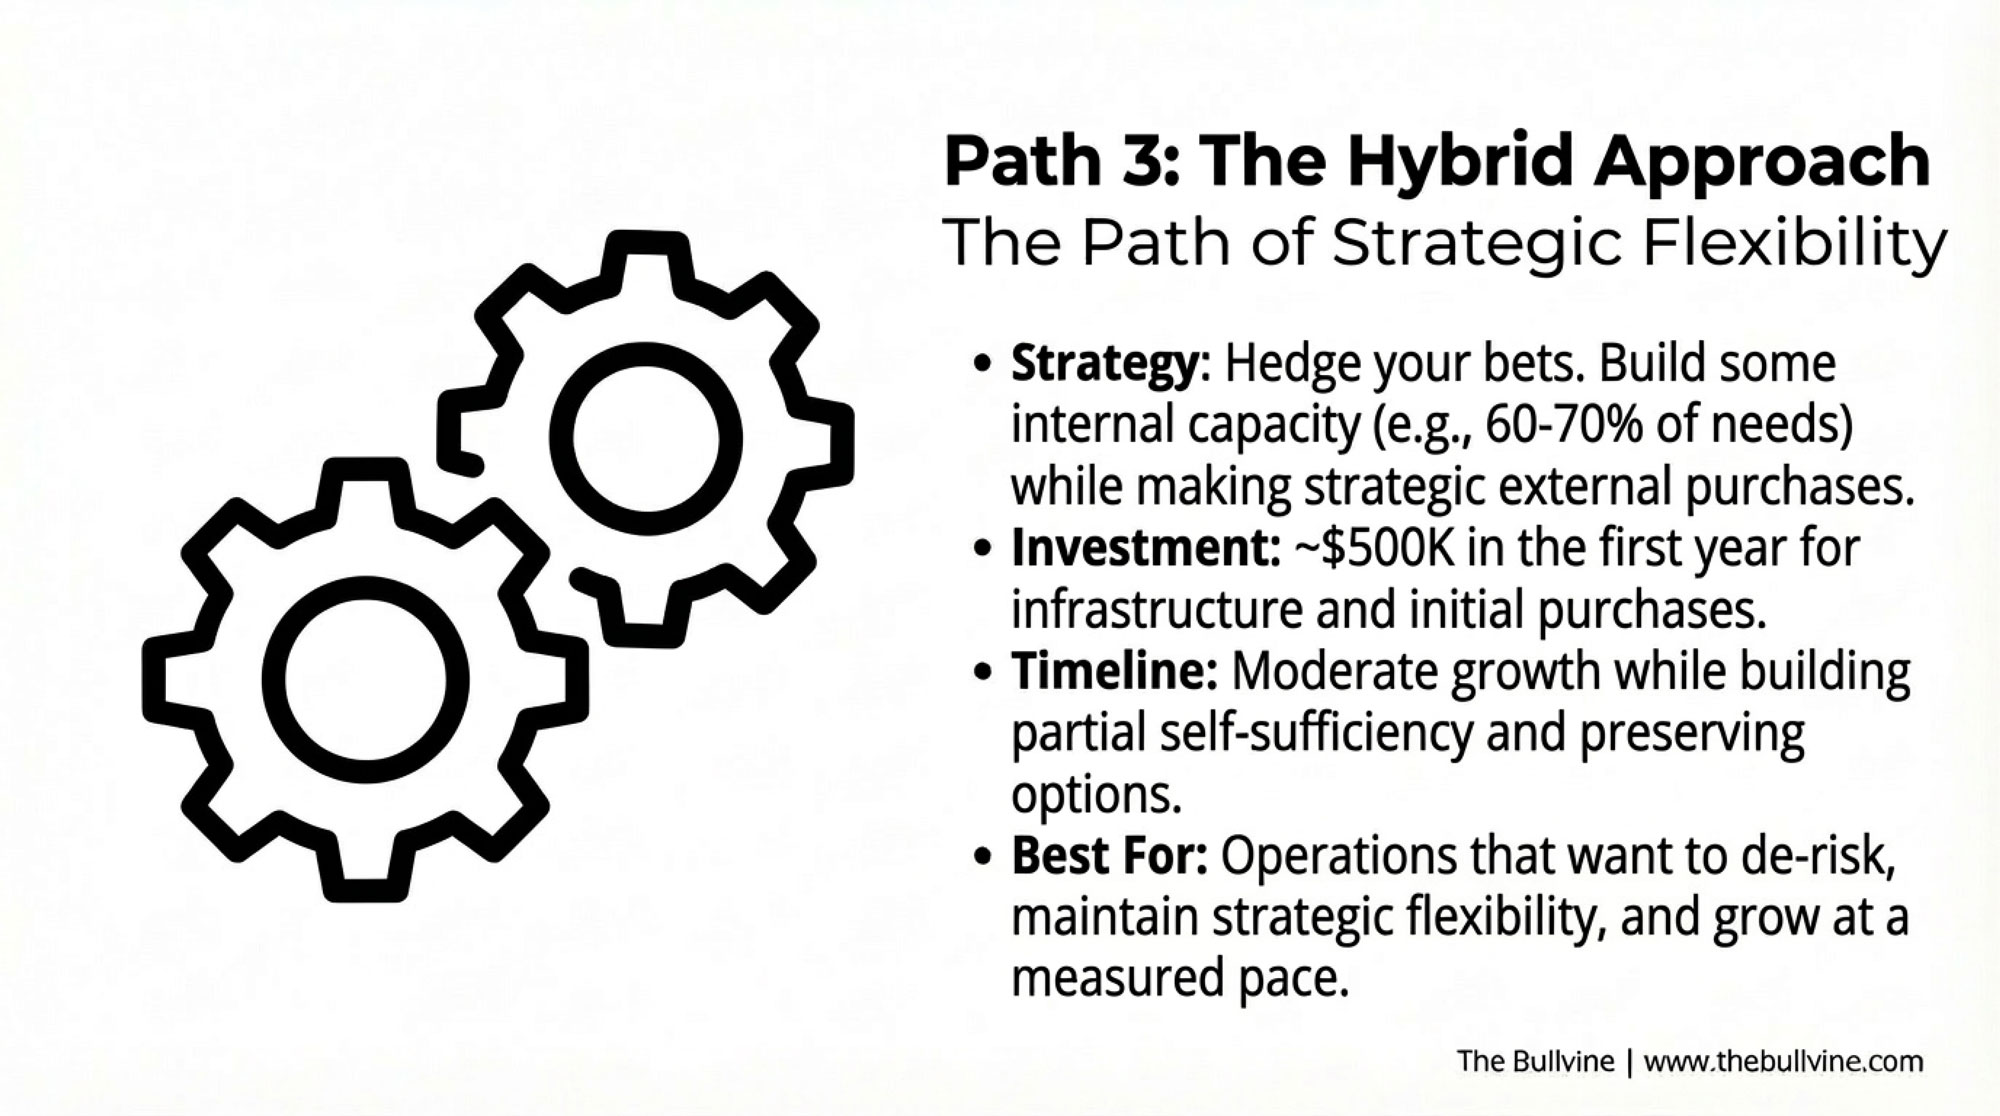
The third path combines internal development with strategic purchases in a hybrid approach. You build modest internal replacement capacity by reducing beef breeding, potentially finance some external heifer purchases, and pursue moderate herd growth that doesn’t overextend capital or operational capacity.
Using typical cost assumptions, first year investment runs around $500,000, including internal heifer-raising infrastructure, any external purchases, and modest facility expansion. The return timeline could show a meaningful annual benefit by the second year, as combined internal heifer capacity and strategic growth create incremental margin.
Five-year positioning: By 2030, you’ve achieved moderate herd growth while building partial heifer self-sufficiency. You’re producing perhaps 60-70% of your replacement needs internally, purchasing the balance externally. Strategic flexibility remains high—you’re not locked into major processor commitments, but you’ve also not committed all resources to heifer production. You maintain exposure to external heifer-market pricing for 30-40% of your replacement needs, but that exposure is manageable rather than existential. The approach offers flexibility: you can accelerate toward full self-sufficiency if heifer markets deteriorate further, or pursue processor partnerships from a position of partial independence.
This path works best if you’ve got moderate leverage that limits aggressive expansion but allows measured growth, want to build long-term heifer sustainability while maintaining flexibility, and have some uncertainty about long-term farm viability that makes preserving multiple strategic options valuable.
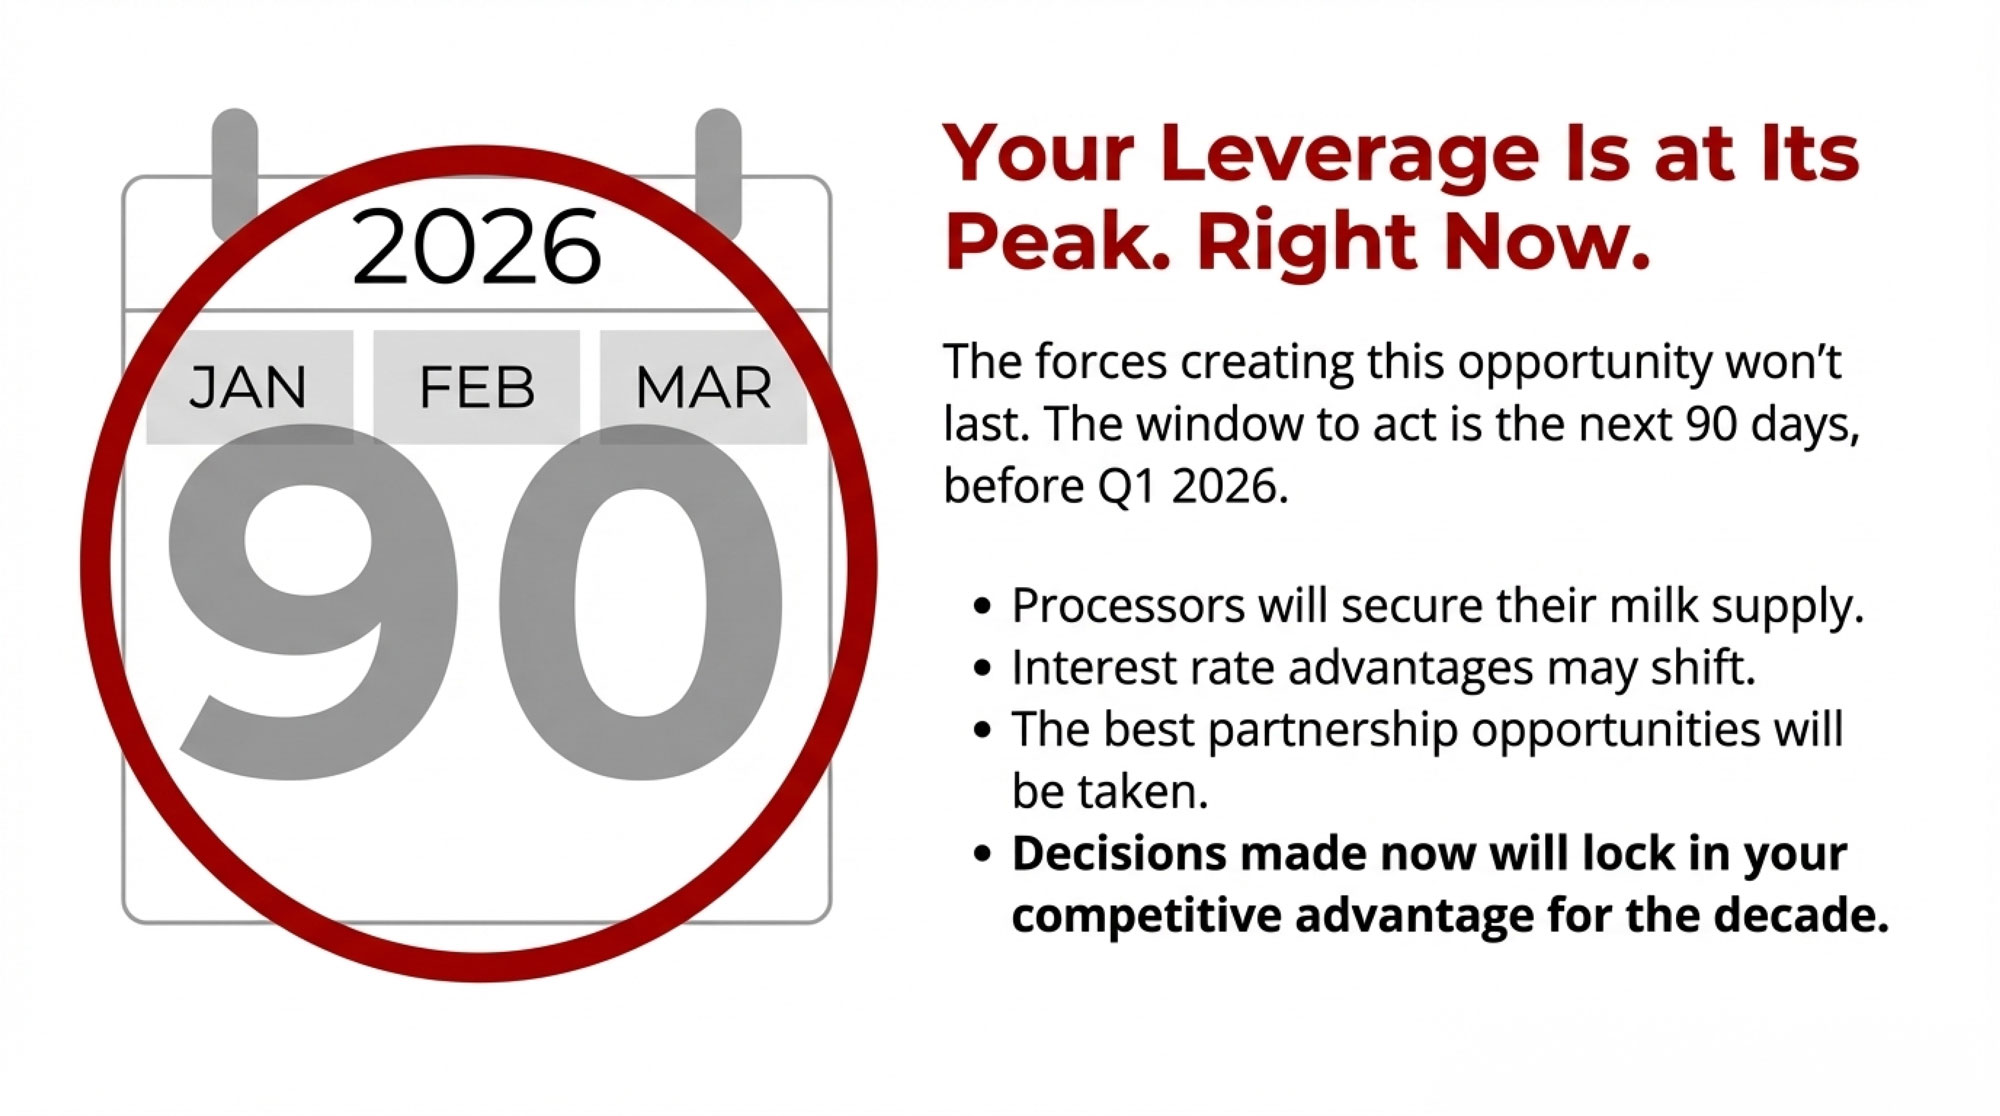
Why the Next 90 Days Matter More Than the Next 90 Months
The reality we’re facing: there’s about a 90-day window for implementing heifer strategies that’ll determine competitive positioning through the rest of this decade.
This is the essence of how biology repriced dairy. Markets respond to supply and demand signals within weeks or months. But biological constraints—gestation periods, heifer development timelines, genetic improvement programs—operate on multi-year cycles that can’t be accelerated with capital or policy changes. The strategic decisions you make during this narrow window will either position you to thrive within these biological realities or leave you competing for increasingly scarce resources on unfavorable terms.
Beyond the first quarter of 2026, several factors may narrow options. Processor recruitment efforts could ease as milk supply gradually stabilizes. Interest rate trajectory may shift as the Federal Reserve approaches the terminal rate. Heifer market competition could intensify as more producers recognize that supply scarcity extends well into the future. Processor relationships already established by other operations reduce available partnership opportunities.
The producer who acts in January or February, when processors genuinely need committed supply growth, may have more leverage than someone approaching the same conversations next fall.
For operations with strong fundamentals—components with protein at or above 3.3%, efficient production, and moderate leverage—the next few months represent a genuine strategic opportunity. Consider locking multi-year processor agreements with specific volume commitments where appropriate. Evaluate whether modest expansion or automation investments make sense with current financing terms. View DMC as inexpensive catastrophic insurance and maximize coverage.
For operations facing component challenges—protein below 3.2% and substantial revenue penalties—an honest assessment of the genetic improvement timeline against succession plans is essential. If you’ve got ten-plus years ahead and a successor engaged with the operation, a hybrid heifer strategy with a genetic improvement focus could position you competitively for the next generation. If you’re within five years of planned retirement and have no identified successor, a genetic improvement investment may not yield adequate payback within your ownership timeframe.
For all of us, regardless of current positioning: Heifer strategy isn’t optional or something we can defer. It’s the binding constraint determining competitive viability. Choose your path—internal rebuilding, processor-financed growth, or hybrid approach—deliberately based on leverage position, succession timeline, and relationships.
Don’t wait for heifer markets to normalize. Industry analysis and biological modeling consistently indicate that replacement constraints persist well into the future.
If you’re operating in regions vulnerable to NWS establishment, map biosecurity risk now. Secure alternative cattle sourcing contingencies and discuss covenant flexibility with lenders before potential quarantine scenarios eliminate options and compound the heifer supply shock.
When evaluating export opportunities, distinguish structural demand relationships, such as Mexico’s import dependency, from opportunistic trade situations that depend on favorable tariff treatment.
The fundamental shift: Dairy economics no longer reward volume production alone. The new competitive framework rewards component quality and operational efficiency, strategic processor relationships that provide pricing stability, and heifer program sustainability that enables predictable growth or replacement.
Operations optimized for the previous competitive environment—maximizing pounds, managing commodity pricing cycles, treating heifer purchases as routine input procurement—face structural disadvantage against operations aligned with current economics that prioritize components, efficiency, strategic relationships, and biological sustainability.
The window to reposition strategically is measured in weeks rather than years. What separates operations that strengthen competitive position from those that consolidate won’t be milk price timing or hoping that structural forces reverse. It’ll be whether we recognized the fundamental repricing happening right now and acted decisively while options remained open and terms were favorable.
That’s the heifer math that’ll determine which operations thrive through 2028. The equation is clear. The variables are defined. The only remaining question is whether we’ll solve it proactively during the next few months or whether market forces will solve it for us on less favorable terms as the decision window closes.
Note: Financial examples throughout this article represent illustrative calculations based on typical industry cost structures and financing terms. Actual results vary by operation, region, and specific circumstances.
KEY TAKEAWAYS
Biology sets the pace, not capital — Heifer scarcity ($3,010 average, $4,000+ for quality) persists through 2027 due to 27-30 month replacement timelines. You can’t negotiate faster gestation or borrow around biological constraints.
$360K annual revenue gap—compounding permanently. Operations below December’s new 3.3% protein baseline face widening penalties every year until genetics improve through 4-6-year programs costing $135K-160K annually.
Processors have the capital; you have the leverage — New plants running 60-70% capacity are offering unprecedented partnerships: co-financed heifers at preferred rates, equipment subsidies, multi-year pricing locks. But only while they’re desperate.
New World Screwworm could eliminate your Plan B — NWS confirmed 70km from the U.S. border threatens quarantine zones that simultaneously kill beef-on-dairy revenue ($600K-800K annually) and remove entire regions from heifer sourcing within weeks.
Three strategic paths, 90-day decision window — Internal rebuilding ($300K-400K/year), processor partnerships ($600K-700K total), or hybrid approach ($500K first year). Early 2026 timing locks advantages; delay means competing for $5,000 heifers with closed partnerships.
Complete references and supporting documentation are available upon request by contacting the editorial team at editor@thebullvine.com.
Learn More
Beef-on-Dairy’s $6,215 Secret: Why 72% of Herds Are Playing It Wrong – Stops the bleeding on your breeding program by exposing the exact math behind the winners. Analyzes the pregnancy rate thresholds that determine if you’re generating $6,000 in monthly premiums or silently burning cash on a strategy your herd performance can’t support.
Every week, thousands of producers, breeders, and industry insiders open Bullvine Weekly for genetics insights, market shifts, and profit strategies they won’t find anywhere else. One email. Five minutes. Smarter decisions all week.
To provide the best experiences, we use technologies like cookies to store and/or access device information. Consenting to these technologies will allow us to process data such as browsing behavior or unique IDs on this site. Not consenting or withdrawing consent, may adversely affect certain features and functions.
Functional
Always active
The technical storage or access is strictly necessary for the legitimate purpose of enabling the use of a specific service explicitly requested by the subscriber or user, or for the sole purpose of carrying out the transmission of a communication over an electronic communications network.
Preferences
The technical storage or access is necessary for the legitimate purpose of storing preferences that are not requested by the subscriber or user.
Statistics
The technical storage or access that is used exclusively for statistical purposes.The technical storage or access that is used exclusively for anonymous statistical purposes. Without a subpoena, voluntary compliance on the part of your Internet Service Provider, or additional records from a third party, information stored or retrieved for this purpose alone cannot usually be used to identify you.
Marketing
The technical storage or access is required to create user profiles to send advertising, or to track the user on a website or across several websites for similar marketing purposes.
To provide the best experiences, we and our partners use technologies like cookies to store and/or access device information. Consenting to these technologies will allow us and our partners to process personal data such as browsing behavior or unique IDs on this site and show (non-) personalized ads. Not consenting or withdrawing consent, may adversely affect certain features and functions.
Click below to consent to the above or make granular choices. Your choices will be applied to this site only. You can change your settings at any time, including withdrawing your consent, by using the toggles on the Cookie Policy, or by clicking on the manage consent button at the bottom of the screen.
Functional
Always active
The technical storage or access is strictly necessary for the legitimate purpose of enabling the use of a specific service explicitly requested by the subscriber or user, or for the sole purpose of carrying out the transmission of a communication over an electronic communications network.
Preferences
The technical storage or access is necessary for the legitimate purpose of storing preferences that are not requested by the subscriber or user.
Statistics
The technical storage or access that is used exclusively for statistical purposes.The technical storage or access that is used exclusively for anonymous statistical purposes. Without a subpoena, voluntary compliance on the part of your Internet Service Provider, or additional records from a third party, information stored or retrieved for this purpose alone cannot usually be used to identify you.
Marketing
The technical storage or access is required to create user profiles to send advertising, or to track the user on a website or across several websites for similar marketing purposes.


 The Sunday Read Dairy Professionals Don’t Skip.
 The Sunday Read Dairy Professionals Don’t Skip.