


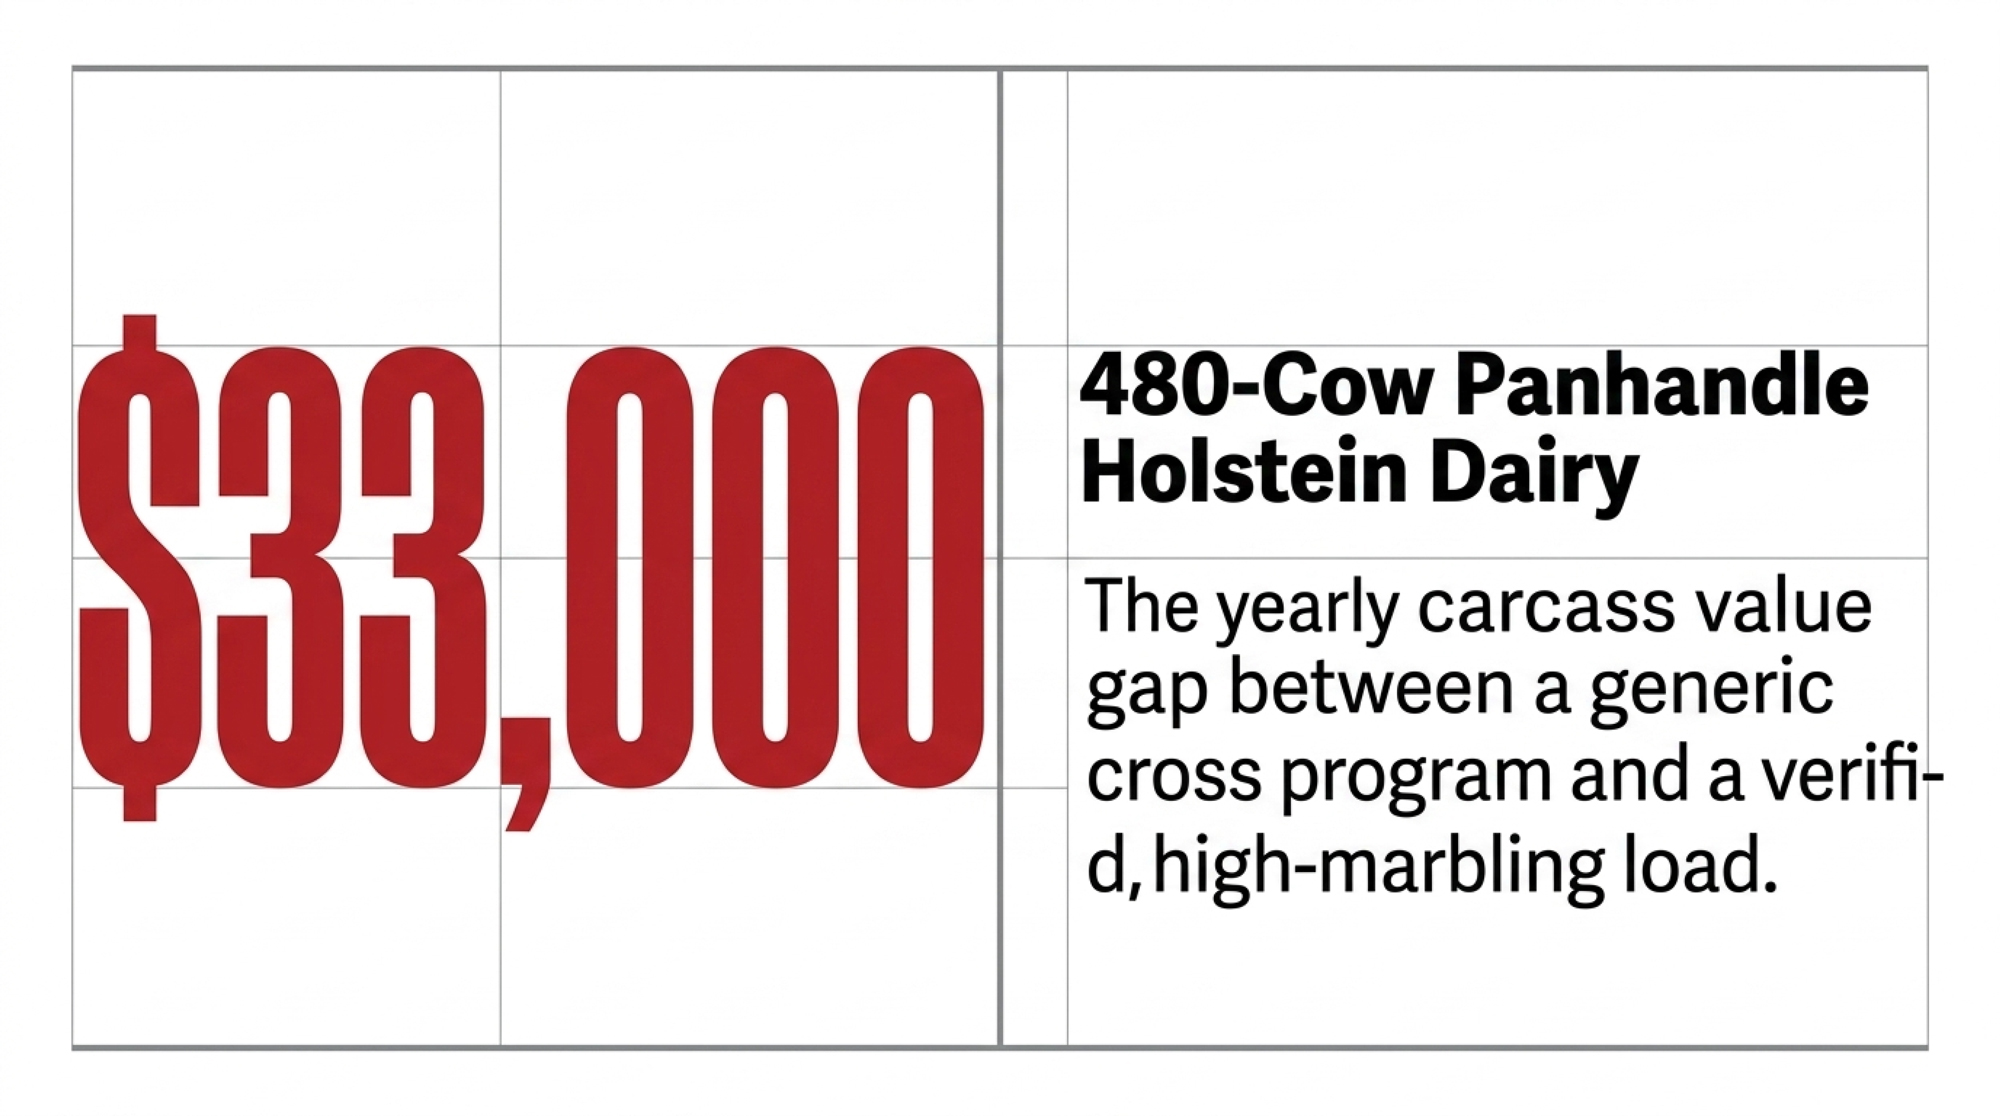
A 480-cow Panhandle dairy pulled its full-year beef-on-dairy closeout this spring. The verified load grading alongside it cleared $33,000 more. Same plant, same months, different sire decisions made 18 months ago.
Executive Summary: The sire decisions you made 18 months ago are already on the packer’s grading sheet — and on a 480-cow dairy running 35% beef-on-dairy, the spread between a verified, high-marbling program and a generic one runs roughly $33,000 a year in carcass value on 168 head. Penn State’s published trial puts Red Angus × Holstein crosses at marbling score of 5.03 versus Limousin crosses at 4.14 — a gap that translates to $50–$150/head on a typical Choice/Select grid, stretching past $150 when spreads blow out the way they did in Q4 2025. Add Premier Select Sires’ reported $190–$210/head ProfitSOURCE carcass premium (vendor-published, no independent replication yet), and the math isn’t theoretical — it’s a line item that’s already being paid to somebody. The replacement side makes it worse: that same 480-cow operation is staring at a near-$200,000 springer liability in 2027 against $235,200 in beef calf revenue, leaving roughly $35,000 net before any other cost — and CoBank’s August 2025 report projects roughly 800,000 missing dairy replacements across 2025–2026, so the heifer market won’t soften the blow. The fix is on this week’s semen order, not next year’s purchase ledger: any beef bull on your sheet posting a Marbling EPD below CAB’s +0.65 “Targeting the Brand” floor is costing you on the grid, and any load leaving without EID tags and sire records is forfeiting the $50–$200/head verification premium that tagged loads from the same dairy could already be earning. Pull last year’s beef semen invoices and check the average Marbling EPD — that number tells you more about your 2026 carcass cheque than anything happening at the sale barn right now.
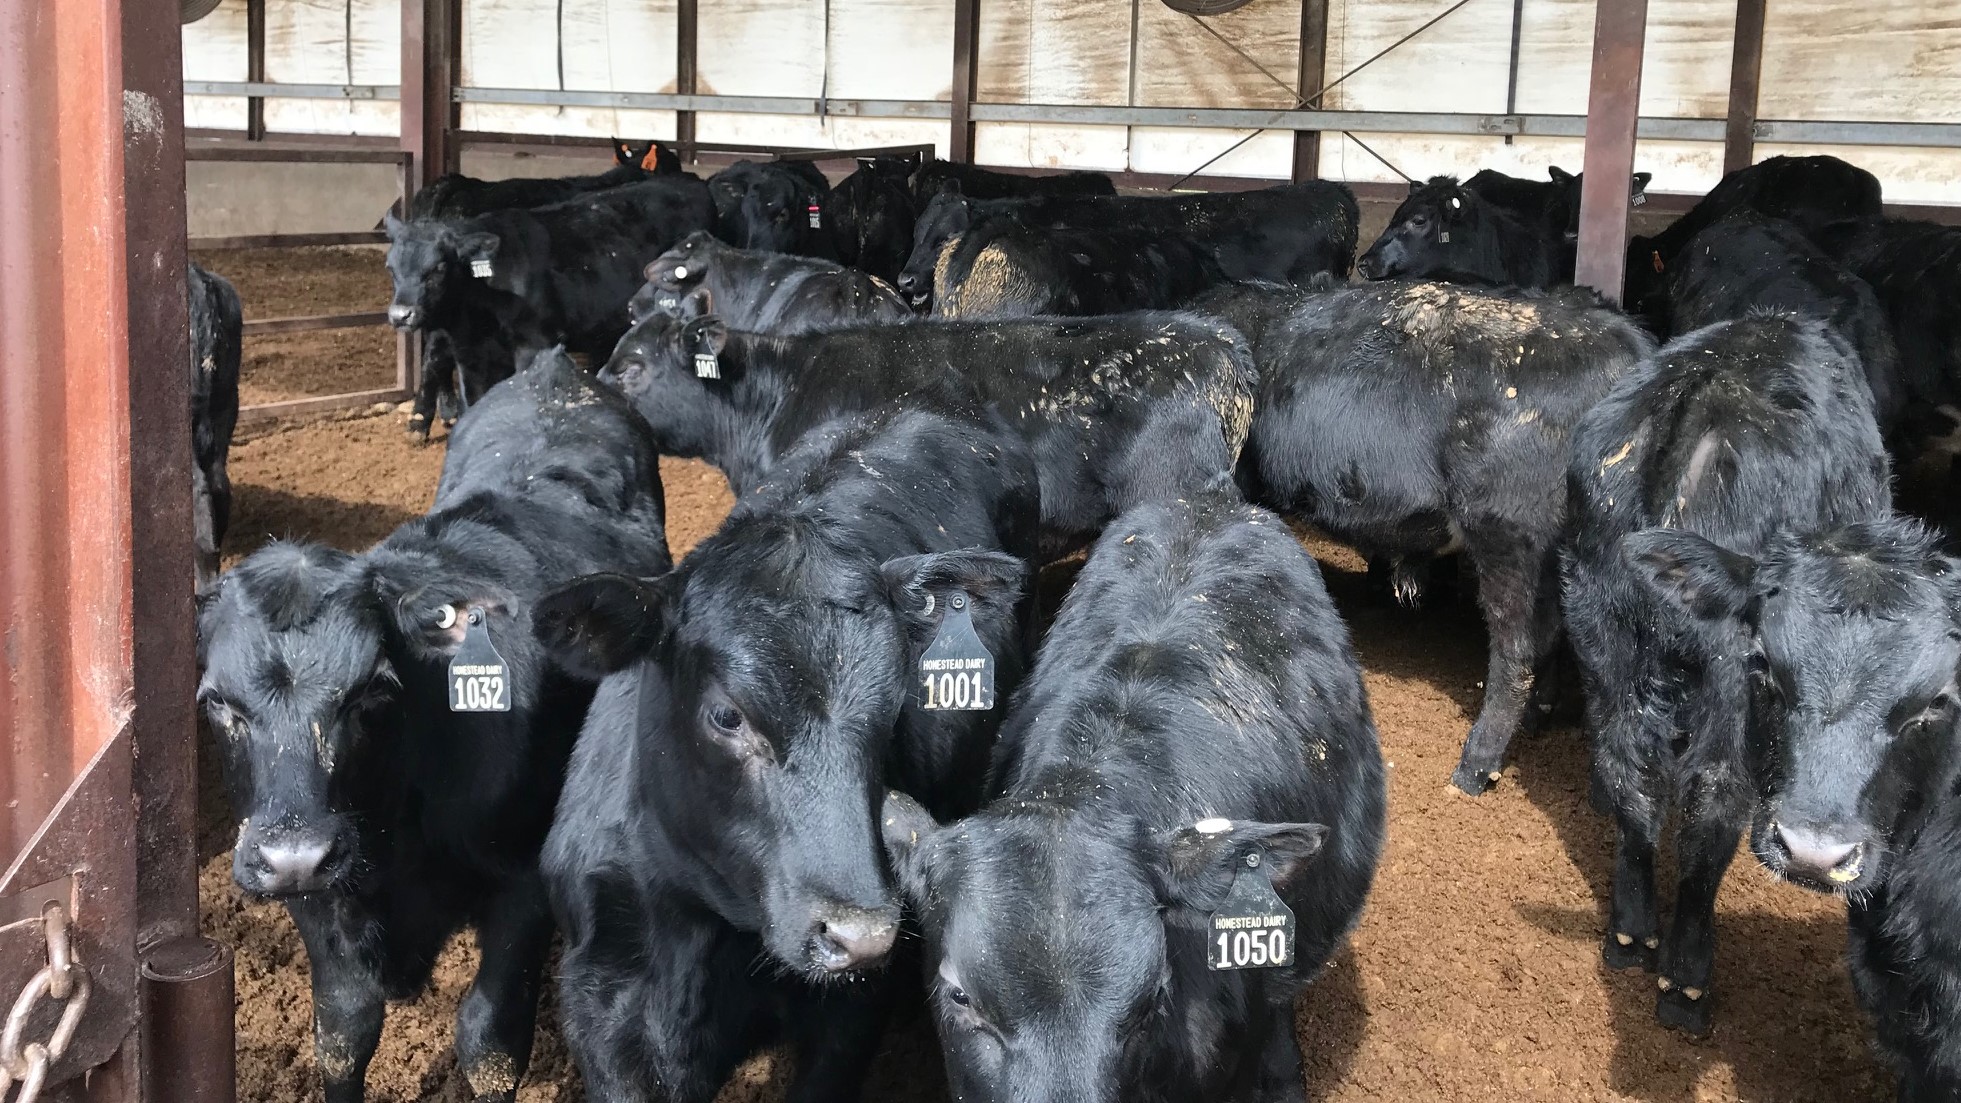
Picture a little after dawn at a Texas Panhandle packer. A 480-cow Holstein operator is sitting at a procurement desk with the cumulative closeout for his entire year’s beef-on-dairy crop in front of him — 168 head, twelve months of kill dates, every grading line tallied. The kind of plant visit a producer arranges when he wants to see what 18 months of beef semen decisions actually paid.
What the closeout shows isn’t a wreck. It’s worse, in a way.
The cattle are stuck in the middle. Too much Select. Almost no Prime. A clutch of yield grade 4s pulling discounts. And on the same screen, beside that year’s tally, sits a verified beef-on-dairy closeout from another dairy — heavier carcasses, higher marbling, a clean Prime/CAB column. Same plant. Same twelve months. Very different cheques.
The packer already knows which dairy sent which calves. Most producers are the ones flying blind.
Editor’s note: this profile is a composite drawn from NAAB, USDA AMS, CoBank Knowledge Exchange, ProfitSOURCE, and Penn State data, representative of mid-size Panhandle operations running 35% beef-on-dairy.
What’s Changing and Why
Beef-on-dairy isn’t a side hustle anymore.
NAAB’s 2024 Regular Members Semen Sales Report shows roughly 9.7 million units of beef semen sold in the U.S., with the majority going into dairy herds — industry trade reporting derived from NAAB-CSS export-segmented data has consistently put the dairy share well above three-quarters of the total. NAAB’s 2025 report (released March 10, 2026) carries the trajectory forward: beef-on-dairy now represents roughly a third of all U.S. dairy services — the continuation of a decade-long climb tracked by CattleFax.
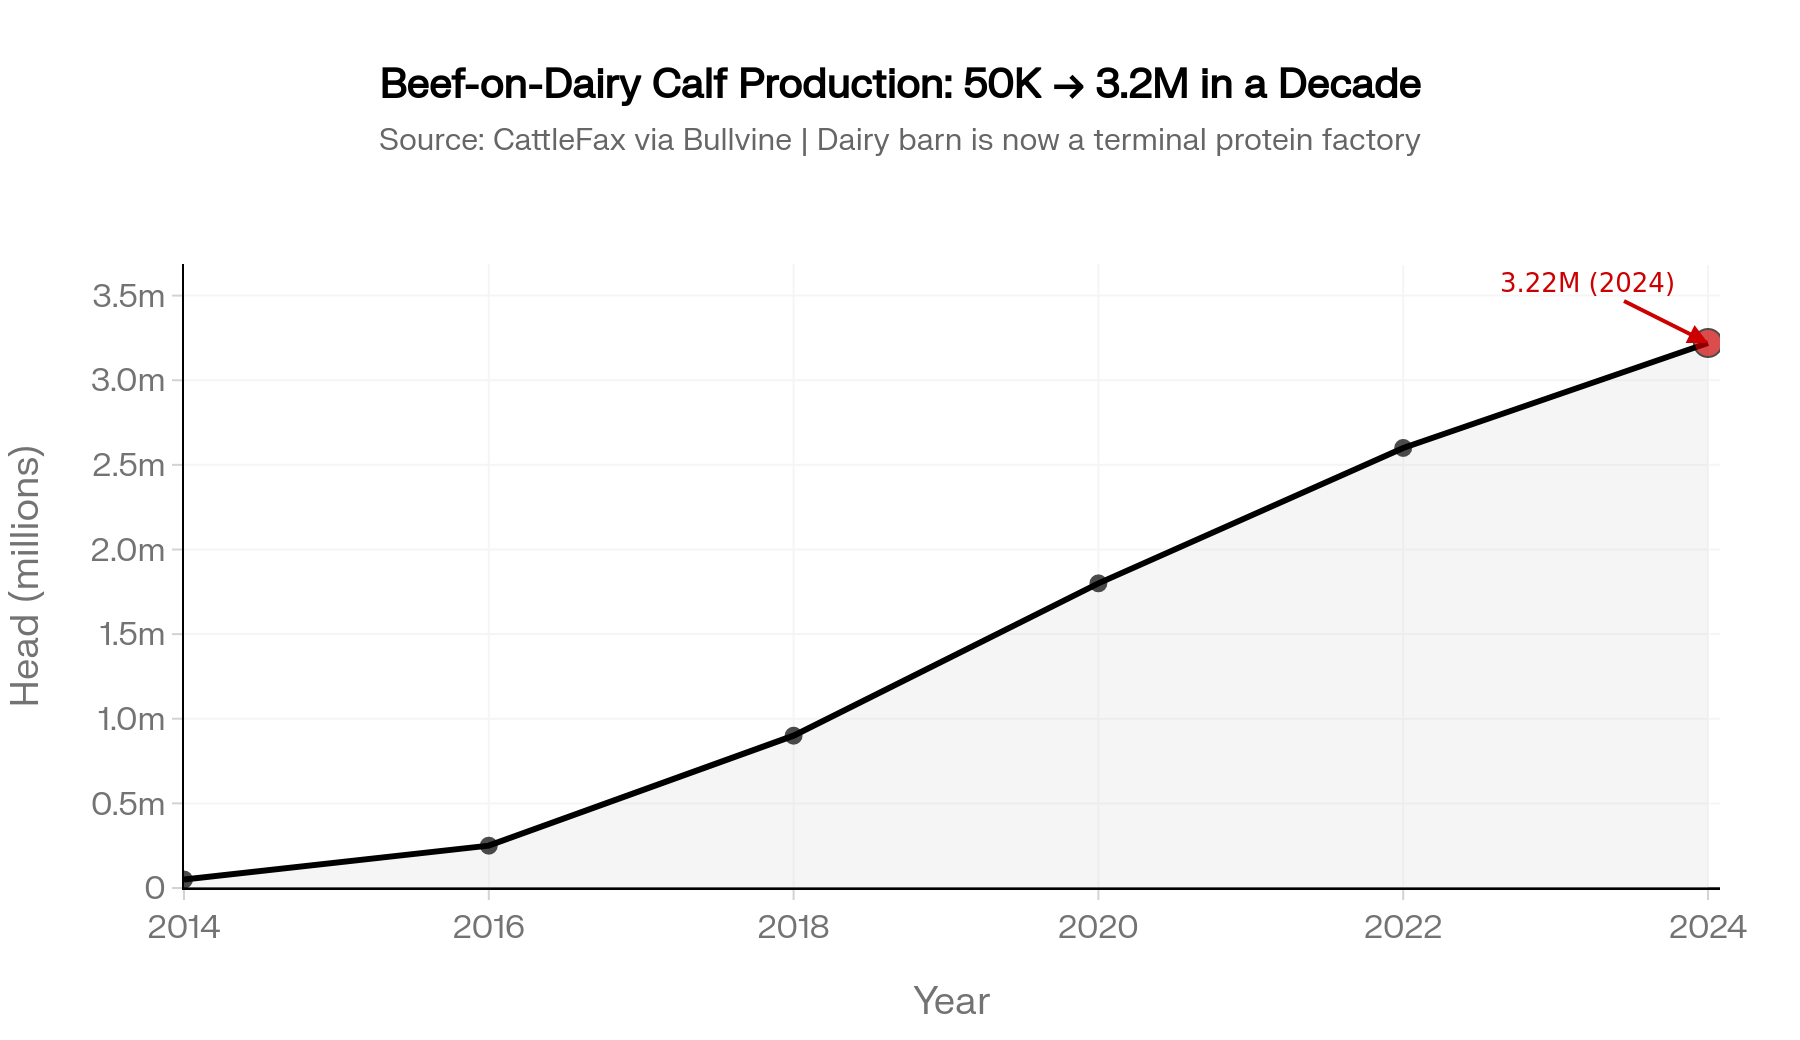
CattleFax estimates beef-on-dairy crossbred calf production climbed from roughly 50,000 head in 2014 to about 3.22 million in 2024. The dairy barn has quietly become a year-round terminal protein factory. And packers are pricing accordingly.
The data trail is what’s shifting now
Plants increasingly know exactly which dairy a load came from, which sires those cattle trace back to, and how earlier loads from the same source closed out.
CoBank’s February 24, 2025 Knowledge Exchange report — Emerging Data Begins to Quantify Value Beef and Dairy Crossbred Cattle Bring to U.S. Beef Supply Chain — found program-verified beef-on-dairy averaging slightly above purebred beef and well above straight dairy steers.
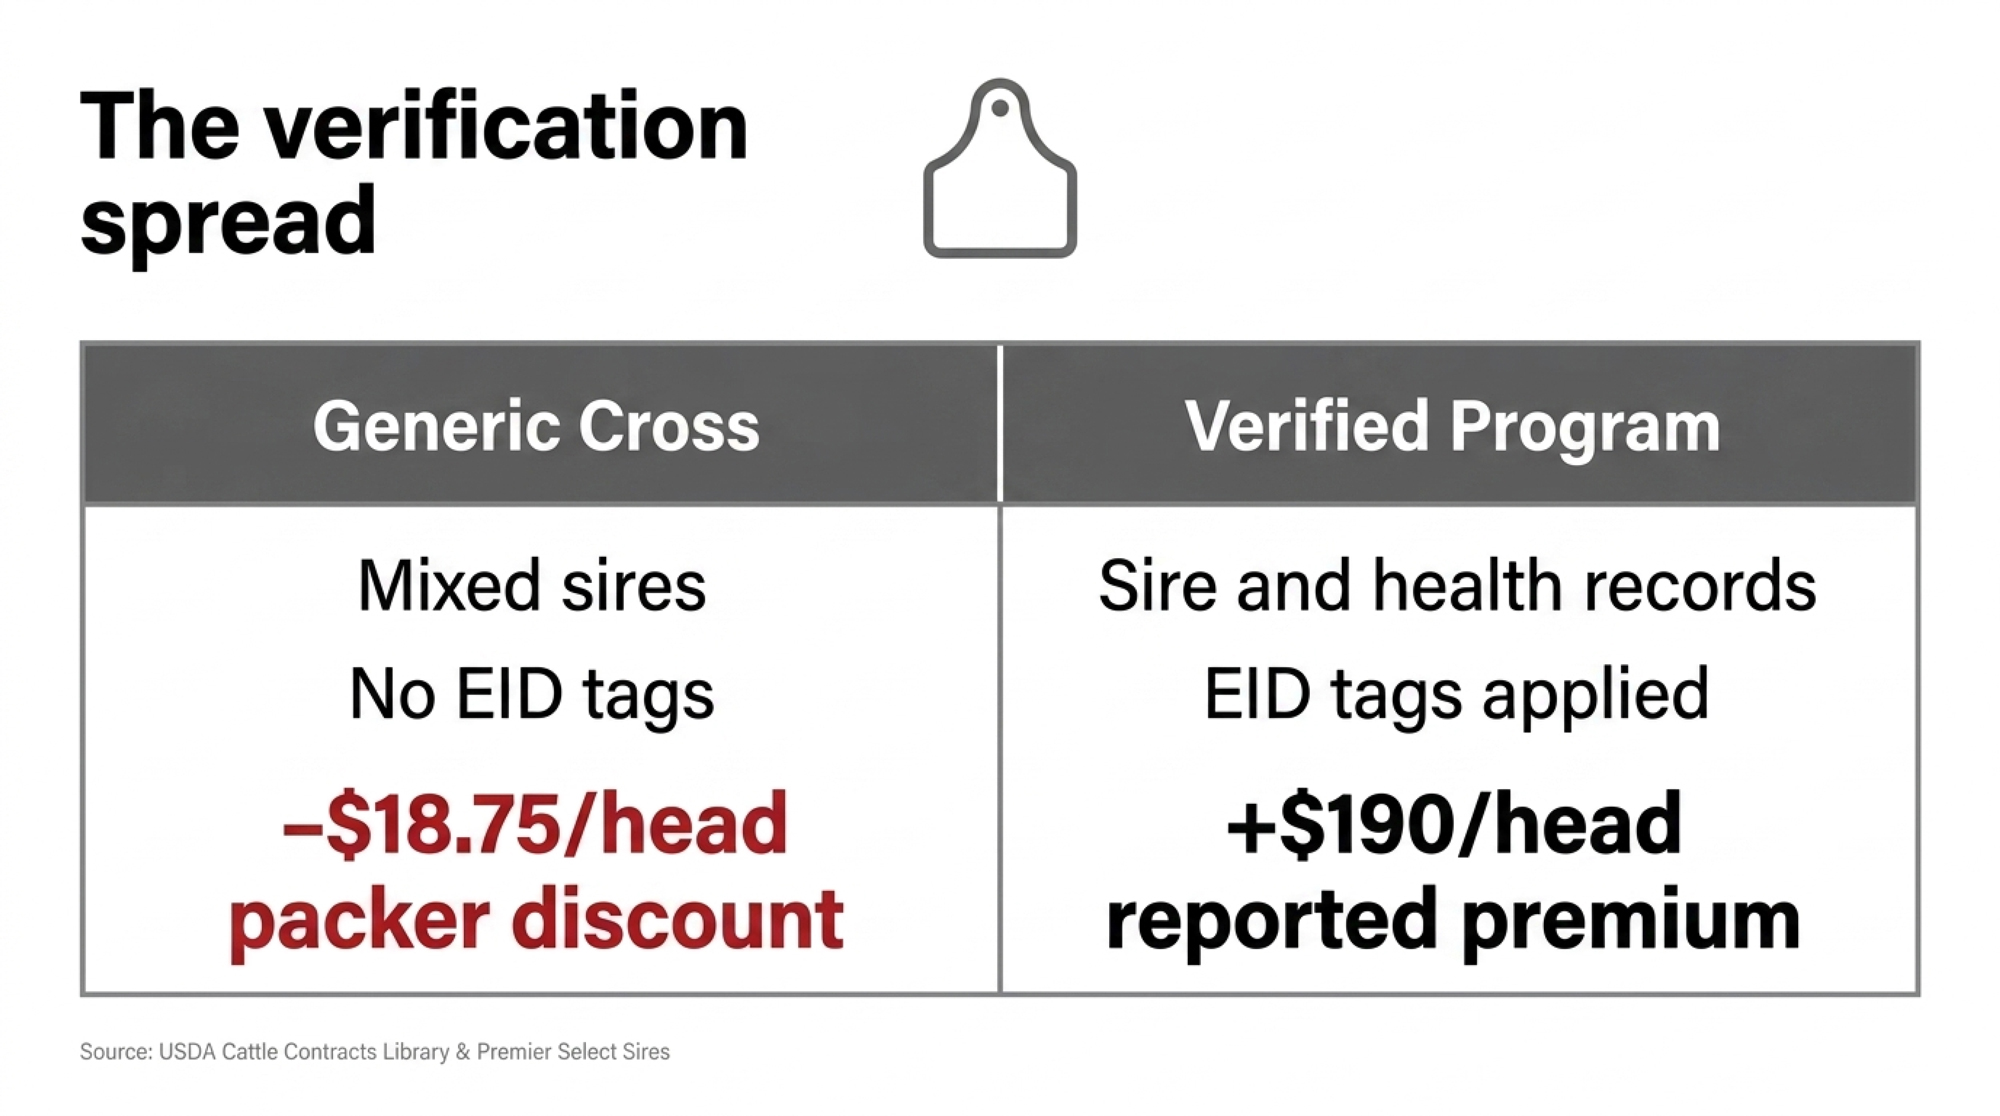
USDA Cattle Contracts Library data, summarized by Farm Progress on September 18, 2024, put the per-head “beef/dairy cross” discount versus native beef at about $18.75 simple average ($2.34/cwt), with straight dairy steers absorbing several times that discount in the same dataset. That gap shows up in the same series Brad Kooima walked through when he called beef-on-dairy “a packer’s dream” — and the $117K bill that came with it.
Decisions made in the breeding barn — which bulls, which cows, which percentage to beef — show up months later as premiums or discounts most producers never see itemized. The herds most exposed: mid-size and large operations running 25–40% beef-on-dairy without verification, mixing sires by price, and assuming “Angus” on the invoice does the work. It usually doesn’t.
How This Plays Out on Real Farms
Take that 480-cow Panhandle operation. About 35% of services to beef — roughly 168 beef matings a year, give or take.
The story everyone in the coffee group was telling: $1,400–$1,700 a head for beef-on-dairy calves through this spring’s USDA AMS Iowa and South Dakota auction series, easy money compared to $700–$900 Holstein bulls. On paper, that’s $235,000–$285,000/yr in beef calf revenue.
Then the other side of the ledger came due.
USDA AMS National Dairy Replacement Heifer Report (spring 2026): springers averaging roughly $3,000/head nationally, with top Panhandle pens clearing $3,500–$4,500.
A heifer pipeline running closer to a low-eighties birth-to-fresh completion rate — the working benchmark in DCHA Gold Standards and Penn State’s Heifer Investment Model — doesn’t keep the parlor full at that scale. Suddenly the calf cheque doesn’t look like profit. It looks like a down payment on the heifers you’ll have to buy back.
The simple version of the math
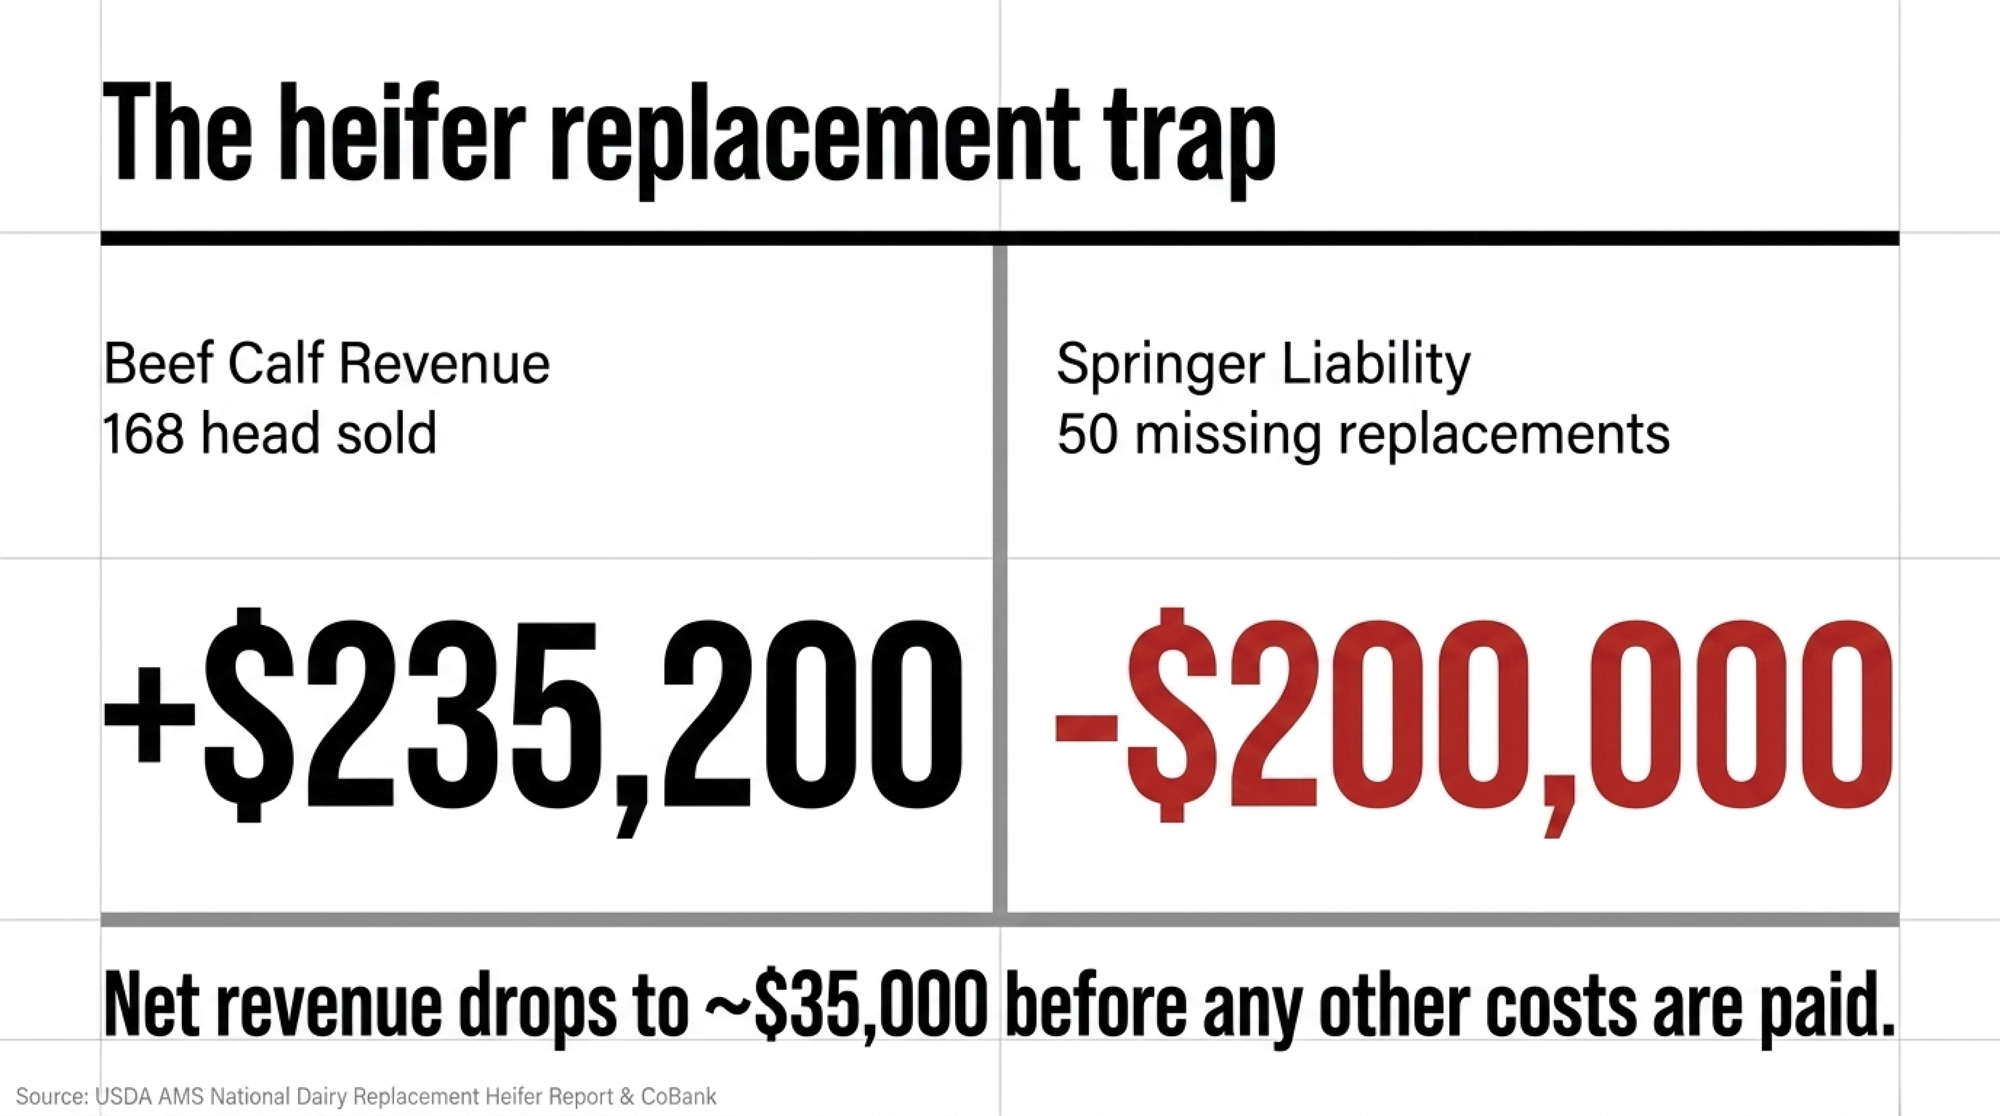
Run the pipeline backward: at 35% beef share, the dairy is breeding ~312 cows to dairy and getting roughly half female; at industry-typical completion rates against a ~168-fresh-heifer-per-year requirement, the conservative shortfall on this herd lands near 50 head.
| Line item | Figure |
| 50 missing heifers × $4,000 springer | $200,000 replacement liability |
| 168 beef calves × $1,400 mid-range | $235,200 revenue |
| Net before any other cost | ~$35,000 |
The “win” gets eaten before the trucks even leave the yard. It’s the same hole 22 Tuesdays of beef breeding can dig into a 480-cow heifer pen — and the bill lands in 2027, not this quarter.
| Path | 30-Day Action | $/Head Upside | Key Risk | Ideal For |
|---|---|---|---|---|
| Tighten sire list | Cut to 2–3 bulls ≥ +0.65 Marbling EPD | $50–$150 carcass uplift | Buying commodity straws that still yield Select | Herds with stable replacement pipeline |
| Cap beef % at 20–25% | Shift top-third cows to sexed dairy | Heifer pipeline protected by 2027–28 | Forfeit some beef calf revenue this year | Herds already short on replacements |
| Join verified program | EID tags + sire records on every calf | $50–$200 calf-stage premium | Colostrum/vaccination protocol compliance | Operations shipping full loads consistently |
| Build feedyard relationship | Commit to sire/health consistency | Repeat bids, less price discovery risk | One bad load can cost future bids for years | Any herd size, if management is consistent |
| Do nothing (status quo) | None | $0 | ~$18.75/head generic beef/dairy discount already baked into every bid | Nobody — this is the hole the article is describing |
Now overlay the rail data
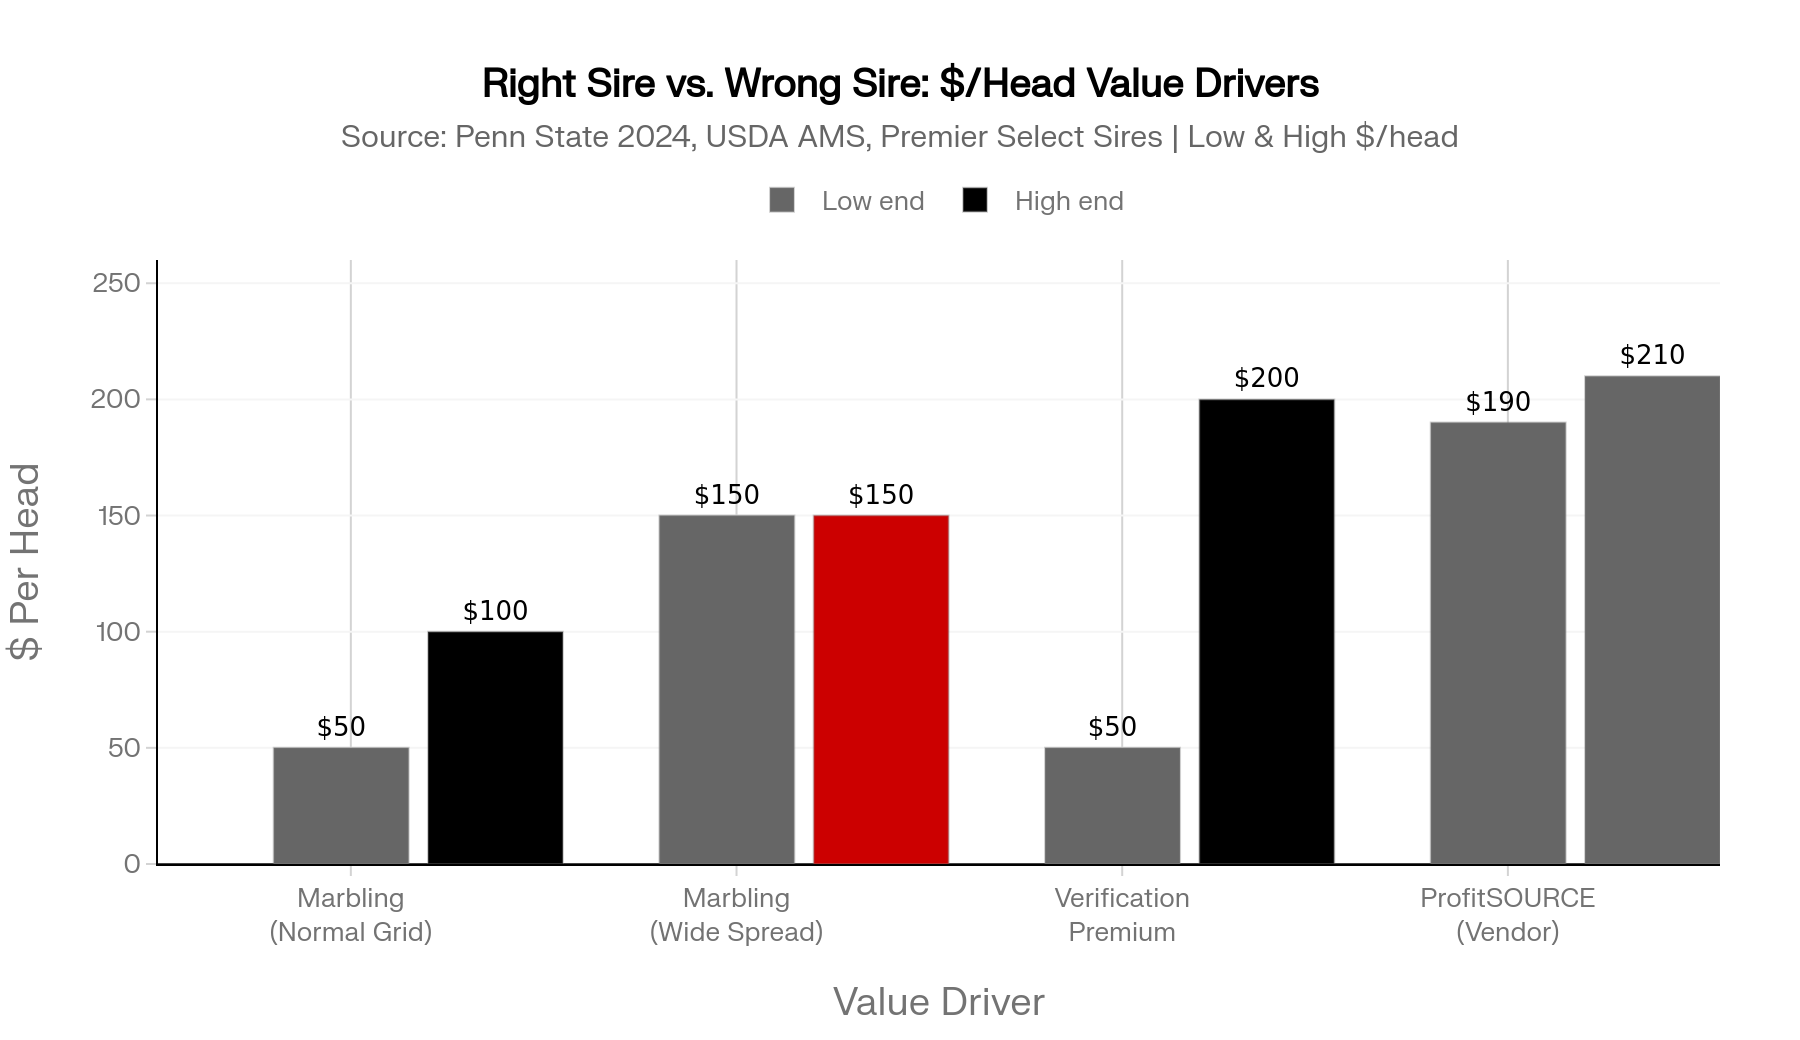
Premier Select Sires reports, in its April 2024 ProfitSOURCE brochure, that ProfitSOURCE carcasses in the company’s own multi-yard research averaged $190 to $210 more per head than carcasses from cattle in unnamed competing programs harvested alongside them — driven by carcass weight and marbling. The figure is vendor-published; independent third-party replication isn’t yet in the public record.
Even taken at the company’s stated range, on a 168-head load that works out to $31,920–$35,280 a year in carcass value moving to whichever dairy did the verification work. That midpoint — $200/head × 168 head — is where the $33,000 in the headline lives.
Not a guess. A grid line item.
The Mechanics Behind the Outcomes
Three things drive the difference, and none of them are mysterious.
1. Marbling
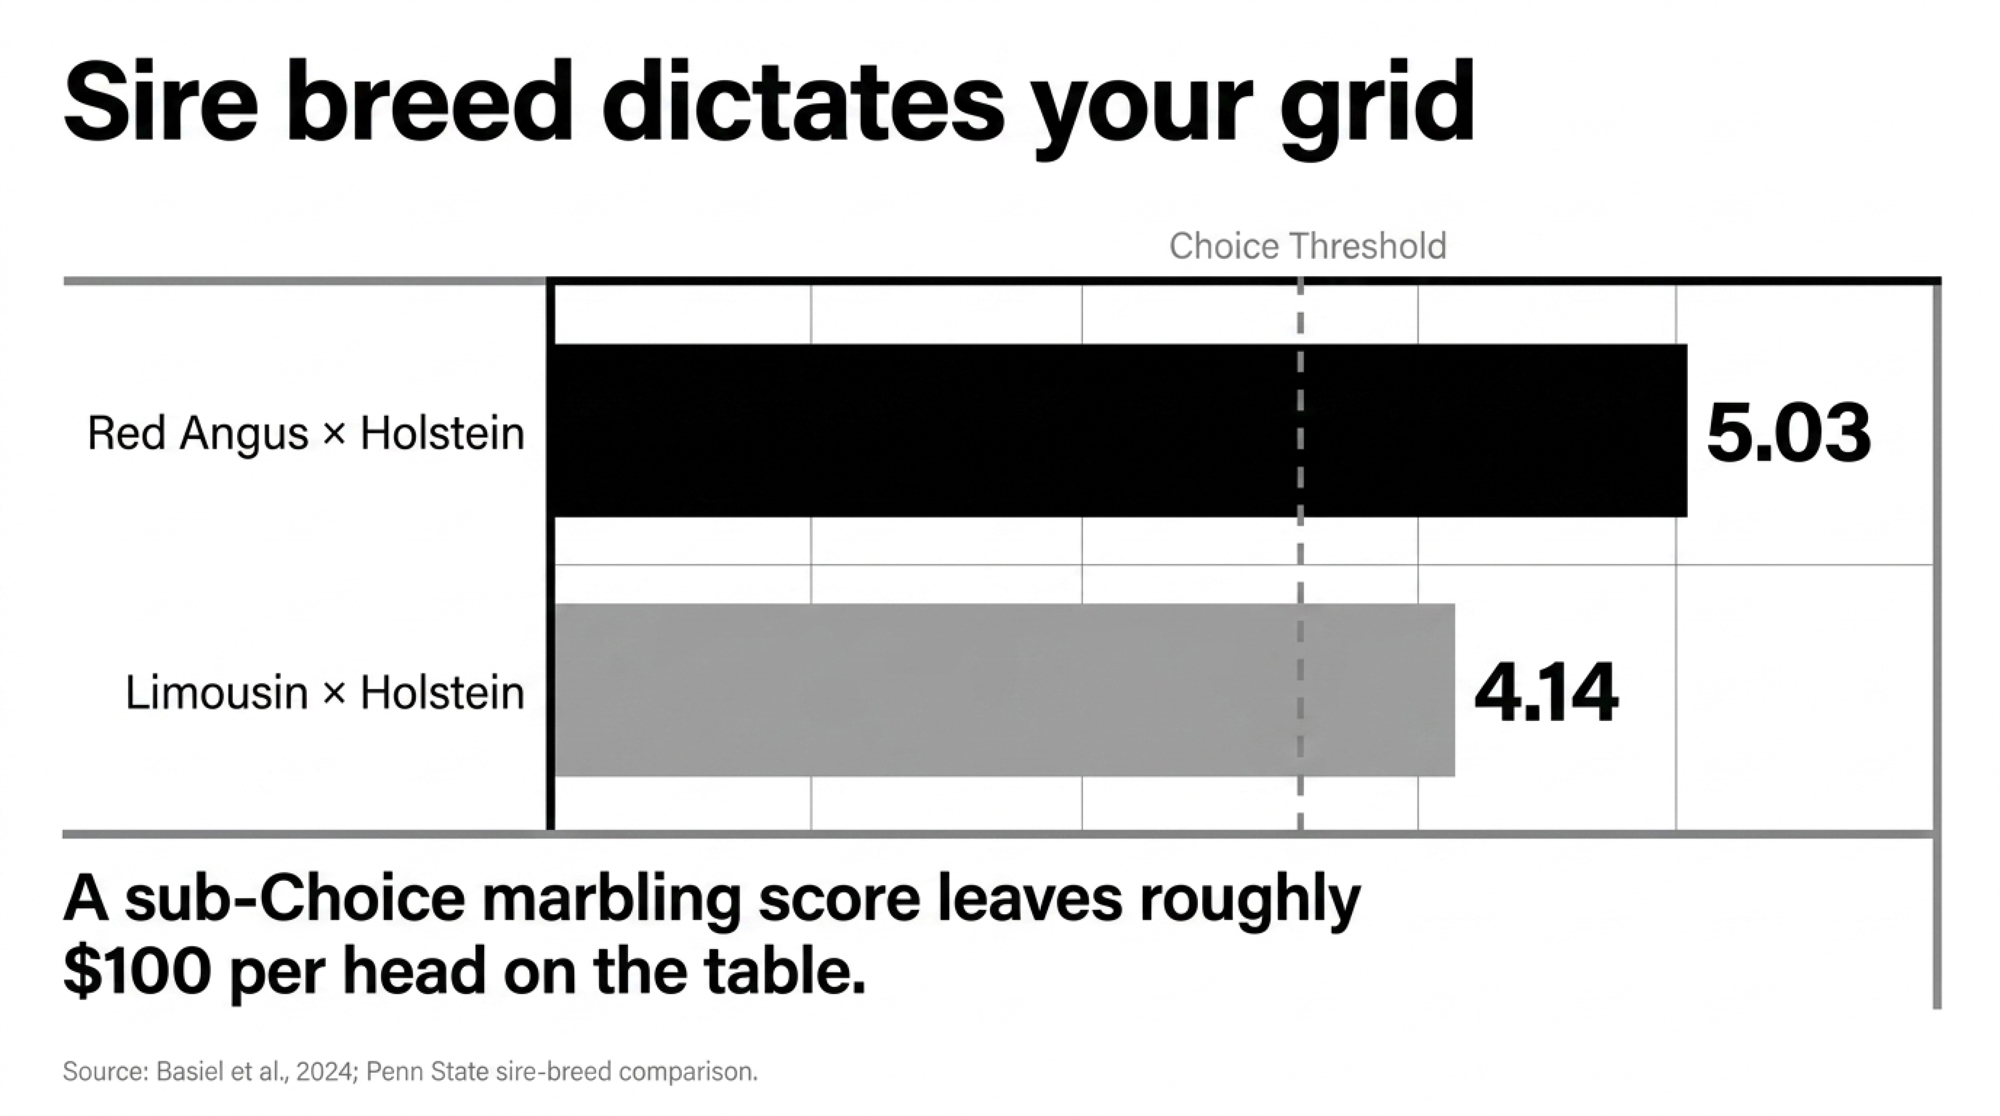
The Penn State sire-breed comparison published in Translational Animal Science (Basiel et al., 2024; PMC11005759) compared 262 beef × Holstein steers.
| Sire breed | Marbling score | USDA grade context |
| Red Angus × Holstein | 5.03 | Right at Small⁰⁰ — bottom of low Choice |
| Angus × Holstein | 4.82 | Top of Slight, brushing the Choice line |
| Limousin × Holstein | 4.14 | Slight territory, below the Choice threshold most grids reward |
Limousin and Continental sires are typically selected for cutability and yield rather than marbling — different trait priorities, different grid outcomes.
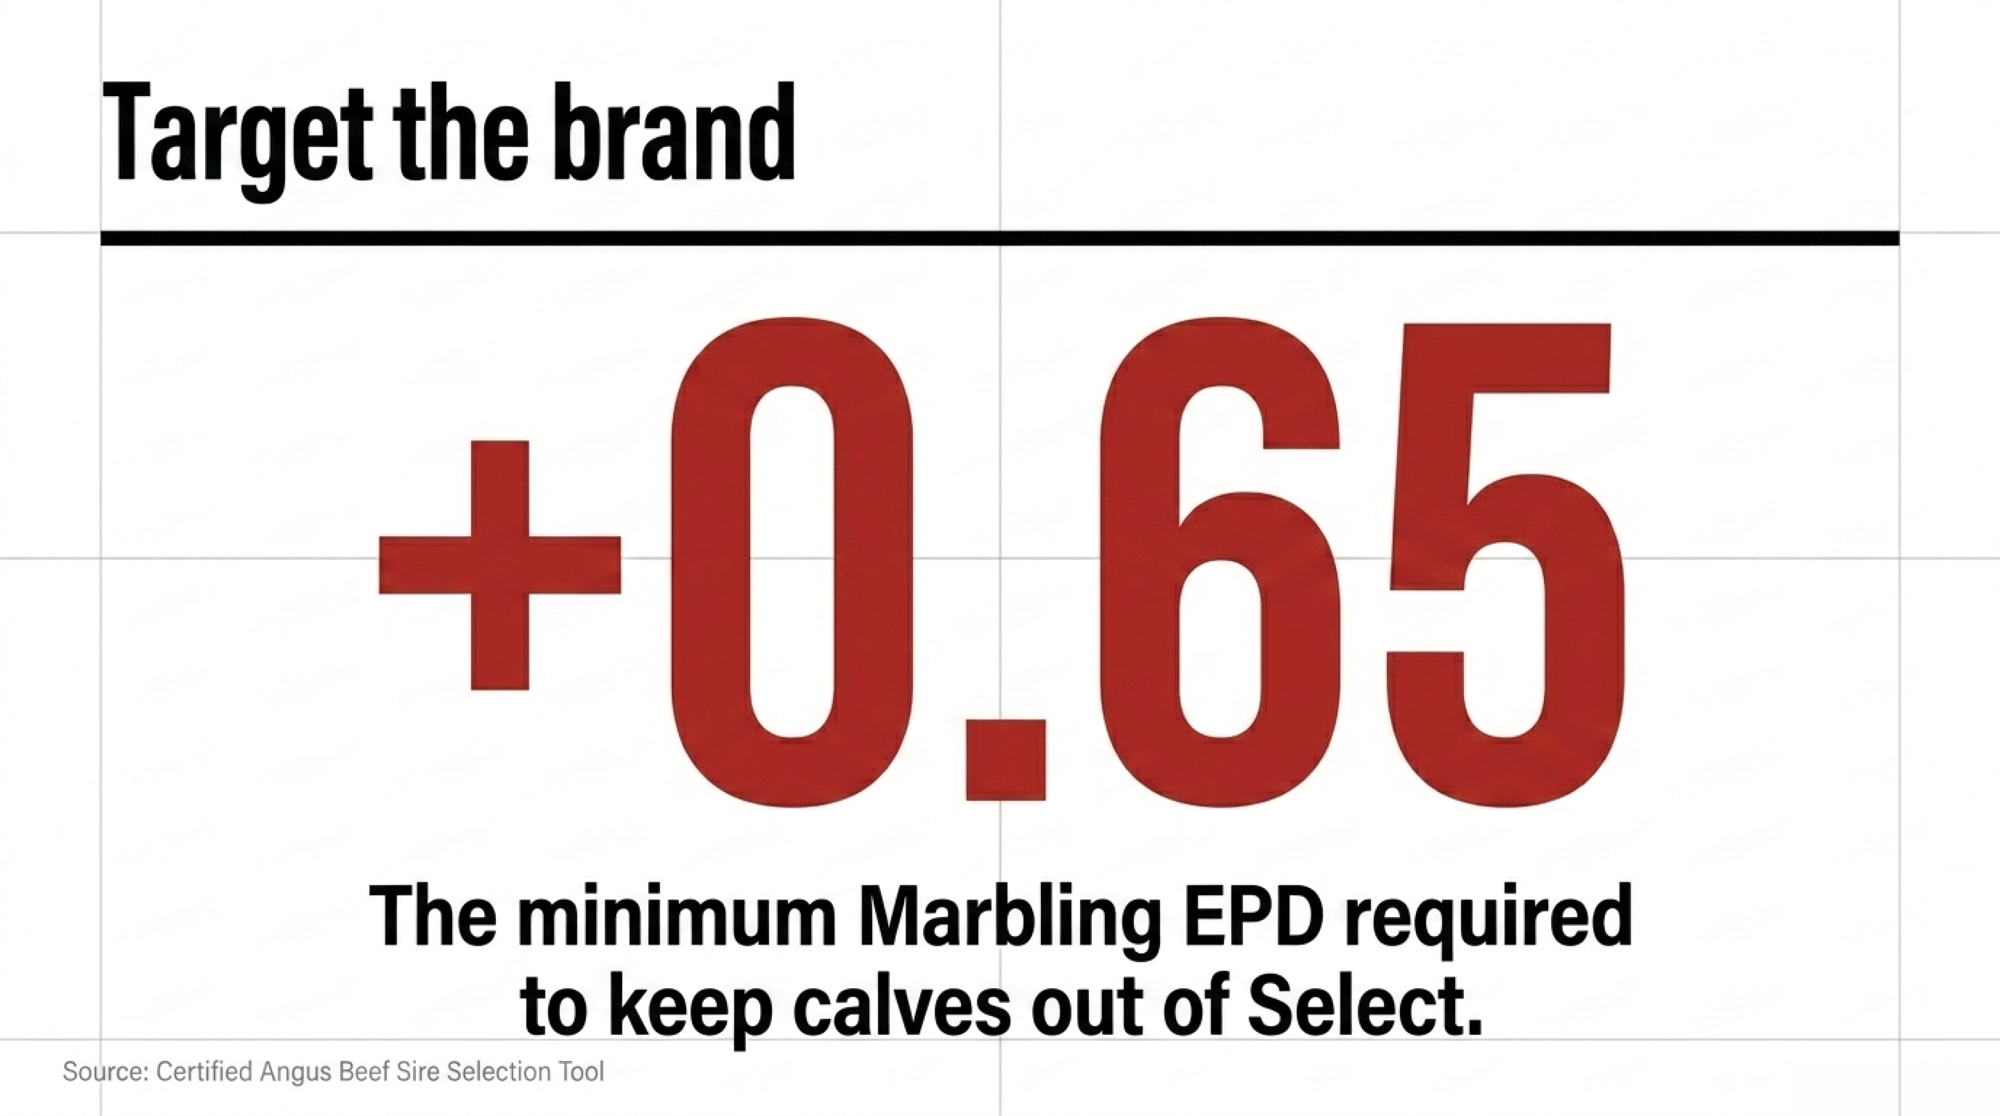
A high-marbling Angus sire — Marbling EPD at or above CAB’s “Targeting the Brand” floor of +0.65 — can put the majority of his calves into Choice or better, per the Certified Angus Beef Sire Selection Tool. A bargain bull at +0.30 to +0.45 leaves a far thicker tail of his calves stuck in Select.
On a typical 2024–2025 grid example with a $12/cwt Choice/Select spread, $4/cwt CAB premium, and $15/cwt Prime, that distribution gap is worth roughly $50–$100/head. It pushes past $150/head when Choice/Select spreads blow out the way they did in late 2025.
2. Dressing percentage and feedlot efficiency
Beef-on-dairy cattle still run about a percentage point lower in dressing percentage than purebred beef. That’s structural to the dairy dam, not fixable by sire choice.
But sire breed shifts ADG meaningfully. In the same Penn State trial:
- Angus crosses gained 1.76 kg/day
- Wagyu crosses gained 1.39 kg/day — needing roughly 24–26 extra days on feed
A trade-off Wagyu programs accept in exchange for premium-meat marbling outcomes outside this study’s grid scope. The feedlot pencils every one of those extra days into next year’s bid for your calves.
3. Verification
Without sire records and EID tags, your calves get bucketed as generic “beef/dairy cross.” That’s where the $18.75/head, $2.34/cwt average discount lives in the USDA Cattle Contracts Library data — and that’s exactly what the feedlot already knows when your $1,400 calf shows up without a sire record. Feedlot buyers price that risk in. They have to.
How Much Is the Wrong Sire Actually Costing You Per Head?
In normal grid conditions, the gap between an Angus bull whose calves consistently land in upper Choice and one whose calves flood Select runs about $50–$100/head in marbling-driven value.
When the Choice/Select spread widens and Prime premiums run hot — like they did across Q4 2025 — that same gap can stretch past $150/head on the same live weight.
On a 168-head load: $8,400 at the low end. Over $25,000 at the high end. Every year. Every load. Compounding quietly while the breeding sheet stays the same.
That’s before verification. Combine the marbling math with Premier Select Sires’ reported $190–$210/head ProfitSOURCE premium, and you’re looking at roughly $33,000 a year in carcass value moving in or out of your pocket on a 168-head program.
The number isn’t theoretical. It’s already getting paid to somebody. The only open question is whether it’s being paid to you.
Is Your Breeding Sheet Already Behind the Market?
Quick gut check. Pull last year’s beef semen invoices and ask three questions:
- How many different bulls are on it?
- What’s the average Marbling EPD across those bulls?
- How many of your beef calves left the farm with sire ID and program tags?
If the answer is “more than five bulls, mixed carcass EPDs, no program,” your operation is almost certainly in the bucket buyers price as generic beef-on-dairy. The fix isn’t a new system. It’s the next semen order — and that’s the part you can actually move this week.
Options and Trade-Offs for Farmers
There’s no silver bullet. But there are a few clear paths producers are walking right now, and each one has a different ceiling and a different risk.
Path 1 — Tighten the sire list this week (the 30-day move)
Cut to 2–3 high-marbling beef bulls that clear CAB’s +0.65 Marbling EPD floor and post strong beef-on-dairy indexes (American Angus Association’s $AxH or American Simmental Association’s Terminal Index).
| Reward | $50–$150/head in marbling-driven carcass value; visible on next closeout |
| Risk | The trap of buying low-tier commodity beef straws that yield Select carcasses — per-straw cost climbs before calf premiums catch up |
| When it works | When you can commit enough straws to actually shift the carcass distribution on your next load |
| Timing | Next week’s straw order. The move you make first. |
Path 2 — Cap the beef percentage
Pull beef-on-dairy back from 35–40% of services to 20–25% on herds already short on replacements, and put more sexed dairy on the top genomic third of cows.
| Reward | Refilled heifer pipeline by 2027–28; protection against the kind of Panhandle Springer Tax already sitting on a 500-cow breeding sheet |
| Risk | Forfeit some beef calf revenue this year |
| When it works | When your heifer math says you’re heading into a $150K+ replacement liability |
| Backdrop | CoBank’s August 2025 heifer report projects roughly 800,000 missing dairy replacements across 2025 and 2026 — the springer market won’t bail you out |
Path 3 — Get into a verified program
ProfitSOURCE, Beef InFocus, and similar platforms tie sire, health, and birth records to an EID.
| Reward | $50–$200/head calf-stage premium for verified, sire-identified calves over generic crosses (Purina 2024 Beef-on-Dairy Industry Report; AgProud, October 2022) — before any downstream carcass uplift |
| Risk | Real protocol follow-through on colostrum, vaccinations, tagging — the paperwork has to match the calf |
| When it works | When you can reliably ship loads, not onesies |
Path 4 — Build the relationship, not just the genetics
Some dairies are signing direct or repeat arrangements with feedyards and order buyers who get to know their cattle.
| Reward | Repeat bids, better price discovery, fewer surprise discounts |
| Risk | One bad load can quietly cost future bids — UW–Madison Livestock Extension (August 2024) reported about 25% of buyers will not bid at all on cattle from sellers with a negative reputation. Rebuilding takes years. |
| When it works | Any size, if you commit to consistency |
Quick Checklist: Five Bulls to Pull from Your Beef Semen Order This Week
- Any beef bull with a Marbling EPD below +0.65 (CAB’s “Targeting the Brand” floor).
- Any bull bought on price, not on a published carcass index.
- Bulls with no published Ribeye or Yield Grade EPD on the breed-association database.
- Any bull whose only selling point on the rep’s sheet is “black hide.”
- Bulls being used as clean-up after your top picks — the same straws are landing in your tank without scrutiny.
Key Takeaways
- If your beef calf check is funding more than 60% of your projected replacement liability, the breeding sheet is the lever — not the calf market.
- If any beef bull on your sheet posts a Marbling EPD below +0.65, either replace him or run the math on what his Select-heavy distribution is costing you per head.
- If your birth-to-fresh completion sits in the low eighties and your beef share is above 30%, your fresh-heifer count is probably running about a third short of need. Map it before next breeding season.
- If your beef calves leave without EID tags and sire records, you’re forfeiting the $50–$200/head verification premium that tagged loads from the same dairy could earn.
- If your replacement plan currently relies on buying $3,500–$4,500 springers in 2027, the cheaper fix is on this year’s semen order, not next year’s purchase ledger.
- If you’ve never seen one of your loads grade, ship a verified load and an unverified load through the same channel this quarter. Compare the bids. The spread will answer the question better than any spreadsheet.
What Will Your Next Load Tell?
The producer in the composite isn’t a villain. He’s the one who actually went to the plant and pulled the year’s cumulative closeout. Most don’t, which means most never see the pattern that tells them their breeding sheet is 18 months behind the market.
The next load off your dairy is already being graded in someone’s head — feedlot buyer, order buyer, plant procurement — whether you’ve seen the data or not.
So when your next 168 head close out at the rail, what will the grading sheet say about the bulls you ordered last fall? If you’re not sure, that’s the answer.
We’re running the full barn-math model — sire-selection premium, replacement deficit, and the verification stack — across different herd sizes in next week’s Bullvine Weekly. That’s where the per-cow numbers live.
Run Your Numbers
BPI Index Calculator — Pressure-test the breeding sheet behind the $33,000 closeout gap. The BPI Index scores your replacement pipeline across heifer supply, price signal, culling pressure, and semen mix momentum, so you can see whether 35% beef-on-dairy is paying you or quietly draining the 2027 heifer pen.
Complete references and supporting documentation are available upon request by contacting the editorial team at editor@thebullvine.com.
Learn More
- Beef-on-Dairy Calf Profit: The $150 Leak Killing Your Premium — Reveals how poor colostrum management and sub-optimal pre-weaning average daily gain inflict a hidden $130–$225 per head penalty on crossbred cattle that downstream buyers directly discount from your next auction bid.
- The $3,000 Heifer Hangover: How Beef‑on‑Dairy Emptied Your Pipeline and Left the U.S. 800,000 Head Short— Exposes the structural macroeconomic market squeeze driving replacement heifers to historic national averages of $3,010 per head after massive beef-cross breeding strategies emptied national dairy heifer youngstock pipelines.
- Beef-on-Dairy’s $6,215 Secret: Why 72% of Herds Are Playing It Wrong — Dismantles standard crossbreeding models by introducing a performance-tiered economic framework, proving that matching aggressive beef semen deployment to real herd pregnancy rates dictates thousands in monthly margin variance.
 The Sunday Read Dairy Professionals Don’t Skip.
 The Sunday Read Dairy Professionals Don’t Skip.
Every week, thousands of producers, breeders, and industry insiders open Bullvine Weekly for genetics insights, market shifts, and profit strategies they won’t find anywhere else. One email. Five minutes. Smarter decisions all week.


