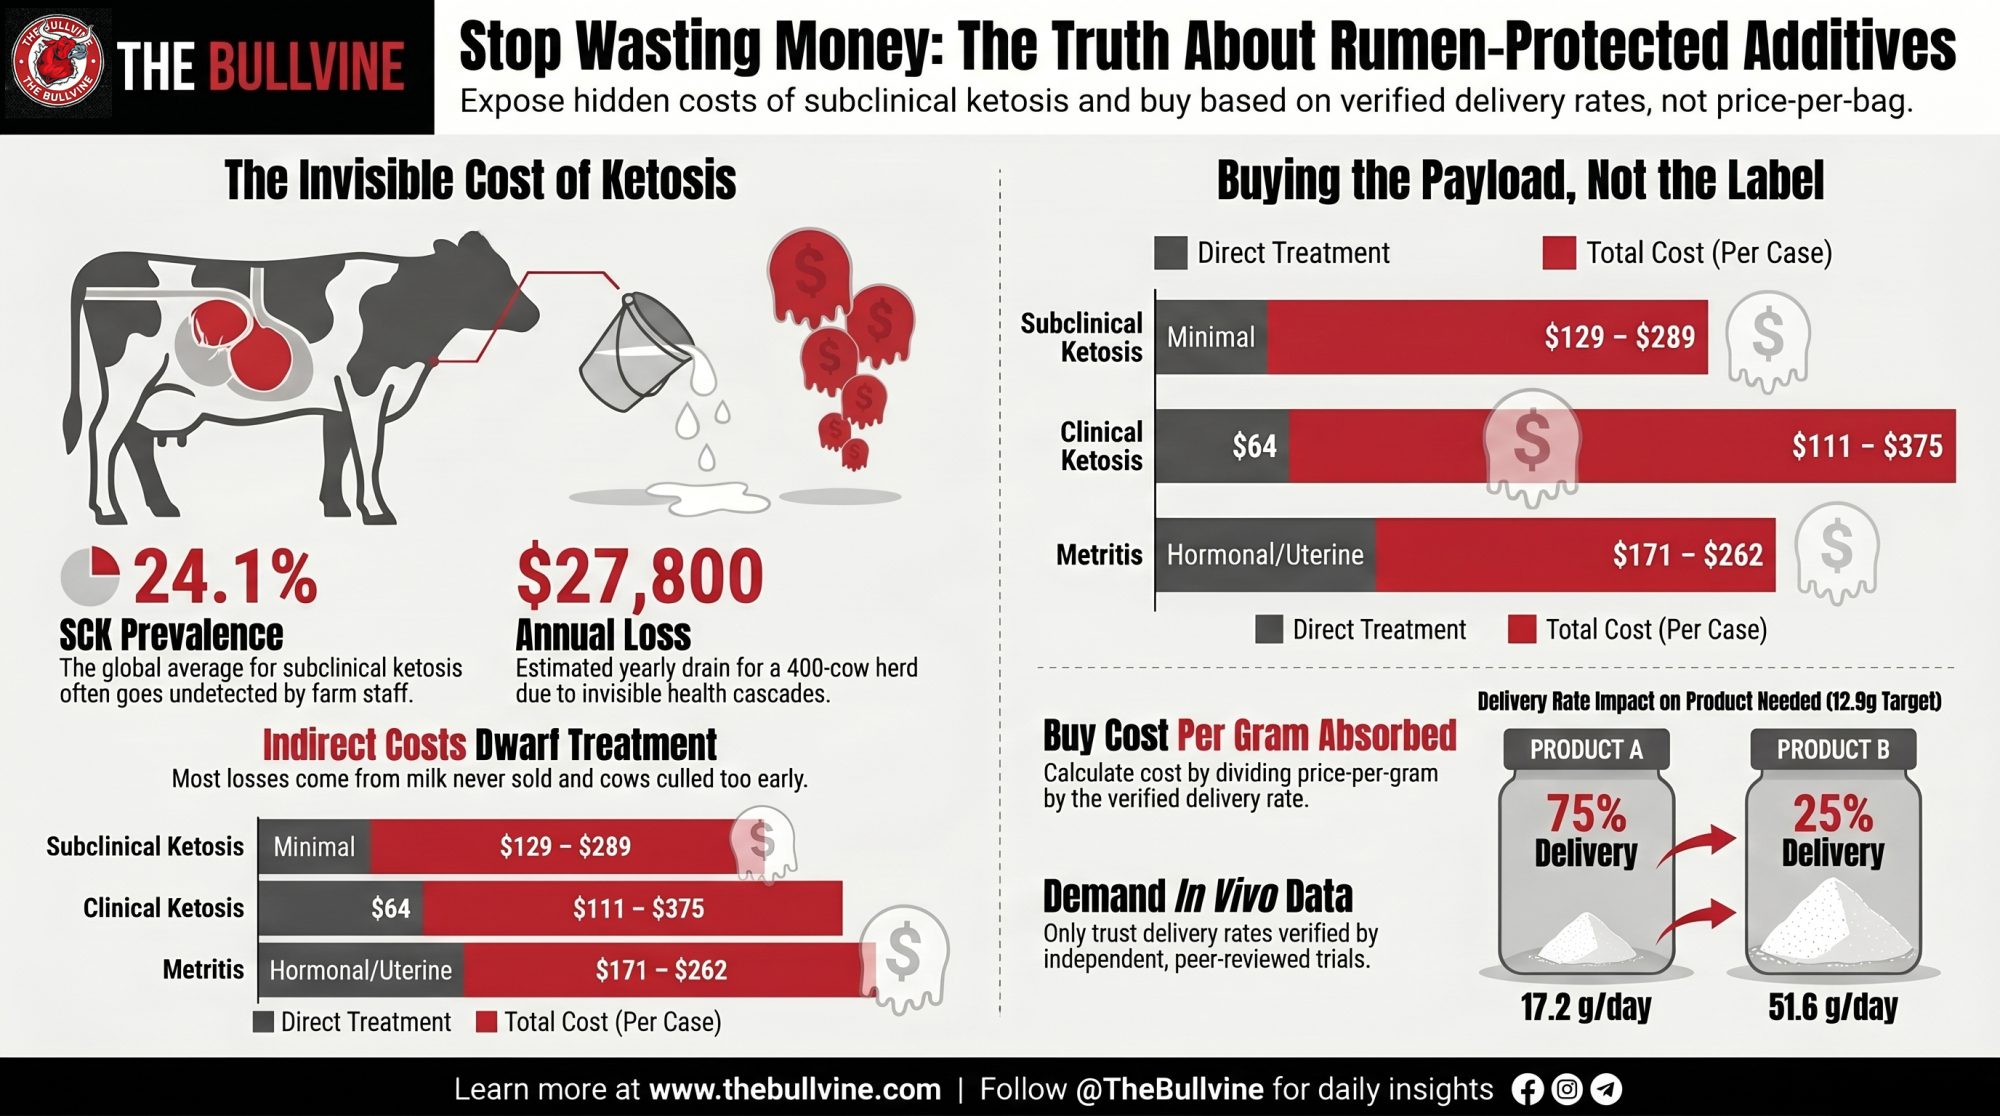
At 24.1% subclinical ketosis, a 400-cow herd writes off up to $27,800 a year — then spends again on “rumen-protected” choline that may degrade before it ever reaches the cow.
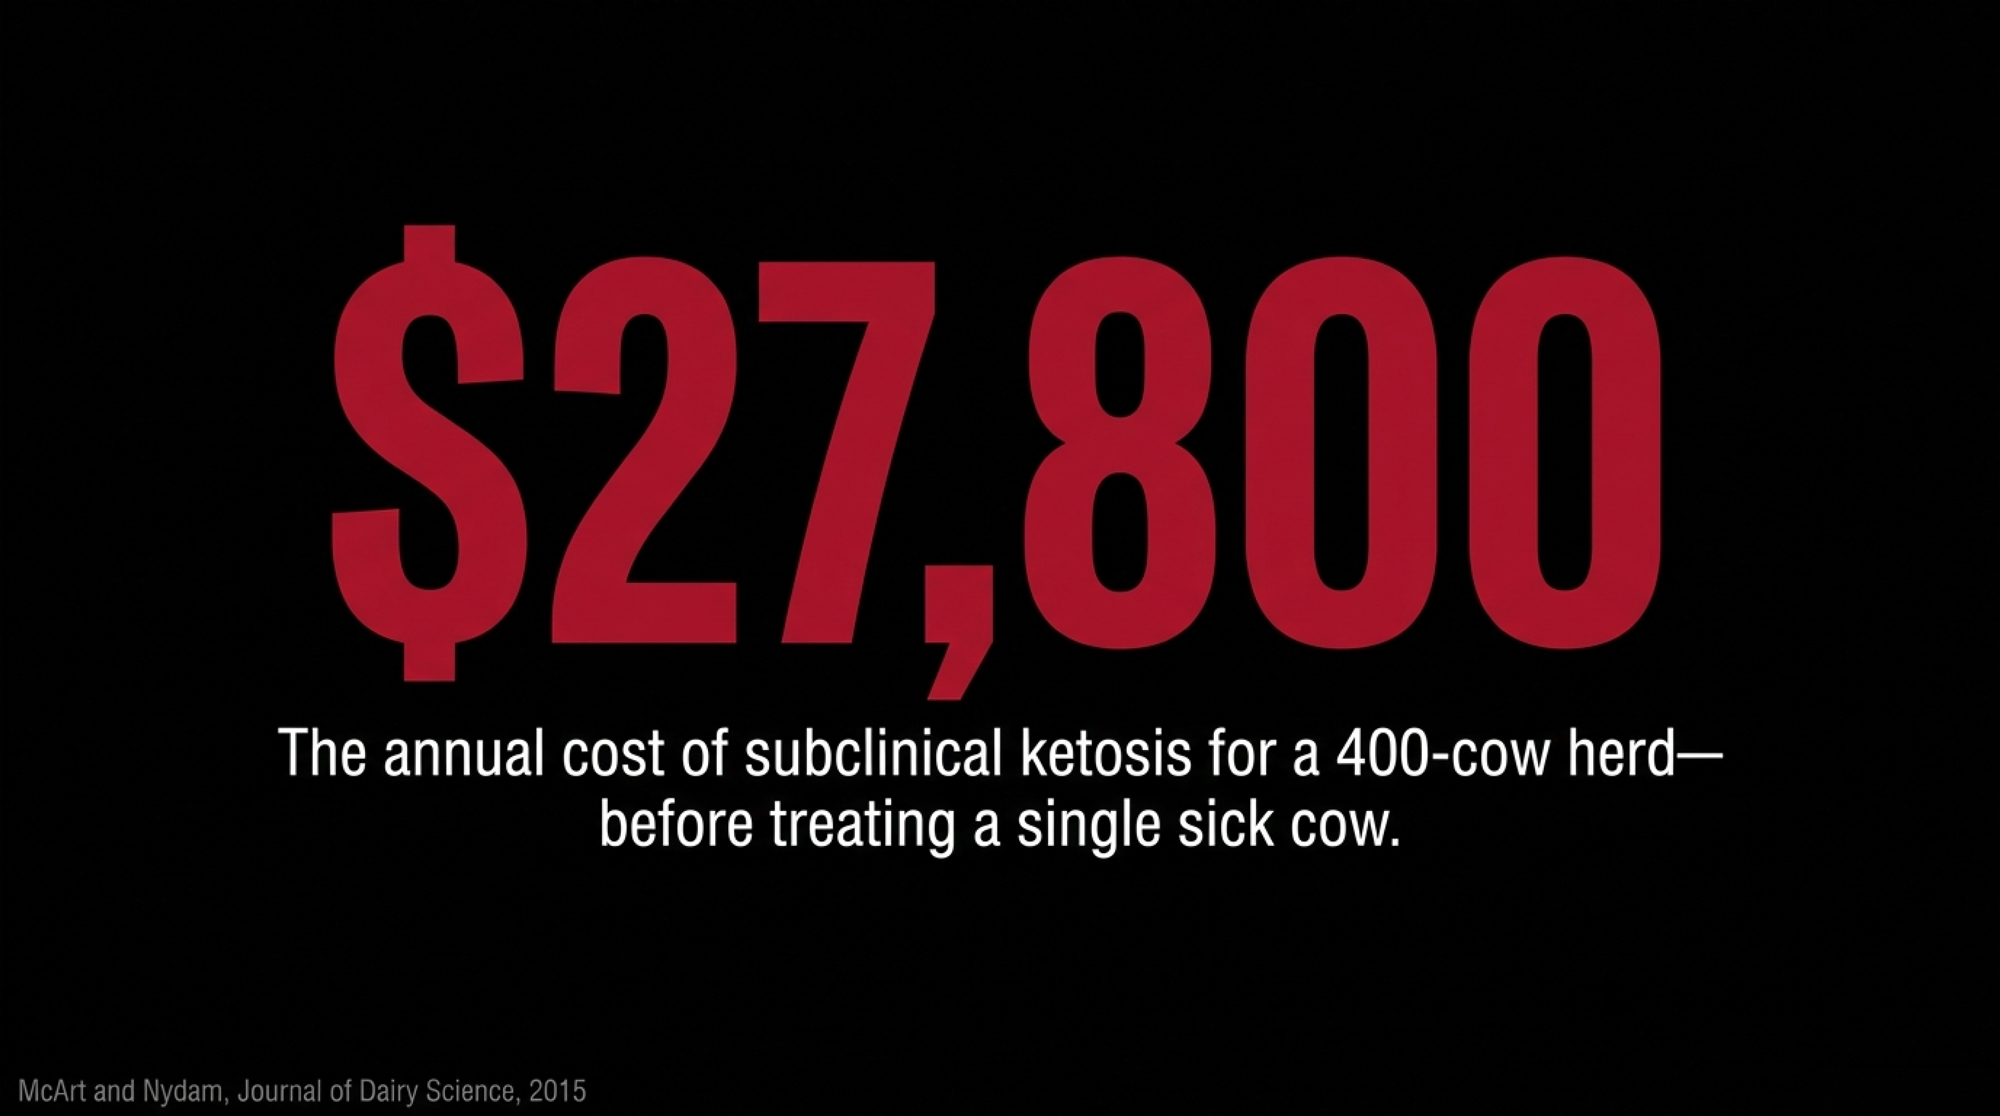
At a 24.1% subclinical ketosis rate — the benchmark average from a 2018 global prevalence study of 8,902 cows on 541 farms across 12 countries (published in the Journal of Dairy Science line of transition research; the earlier Suthar et al. 2013 European survey of 10 countries put it at 21.8%) — a 400-cow dairy is quietly writing off roughly $12,400 to $27,800 a year before anyone treats a single visibly sick cow. That’s the dairy on the hook, whether it sits in Wisconsin or Ontario. And here’s the trap it walks into in 2026: the money it spends to prevent that loss can be degraded in the rumen before it ever reaches the cow, because “rumen-protected” is a label with a definition but no delivery threshold.
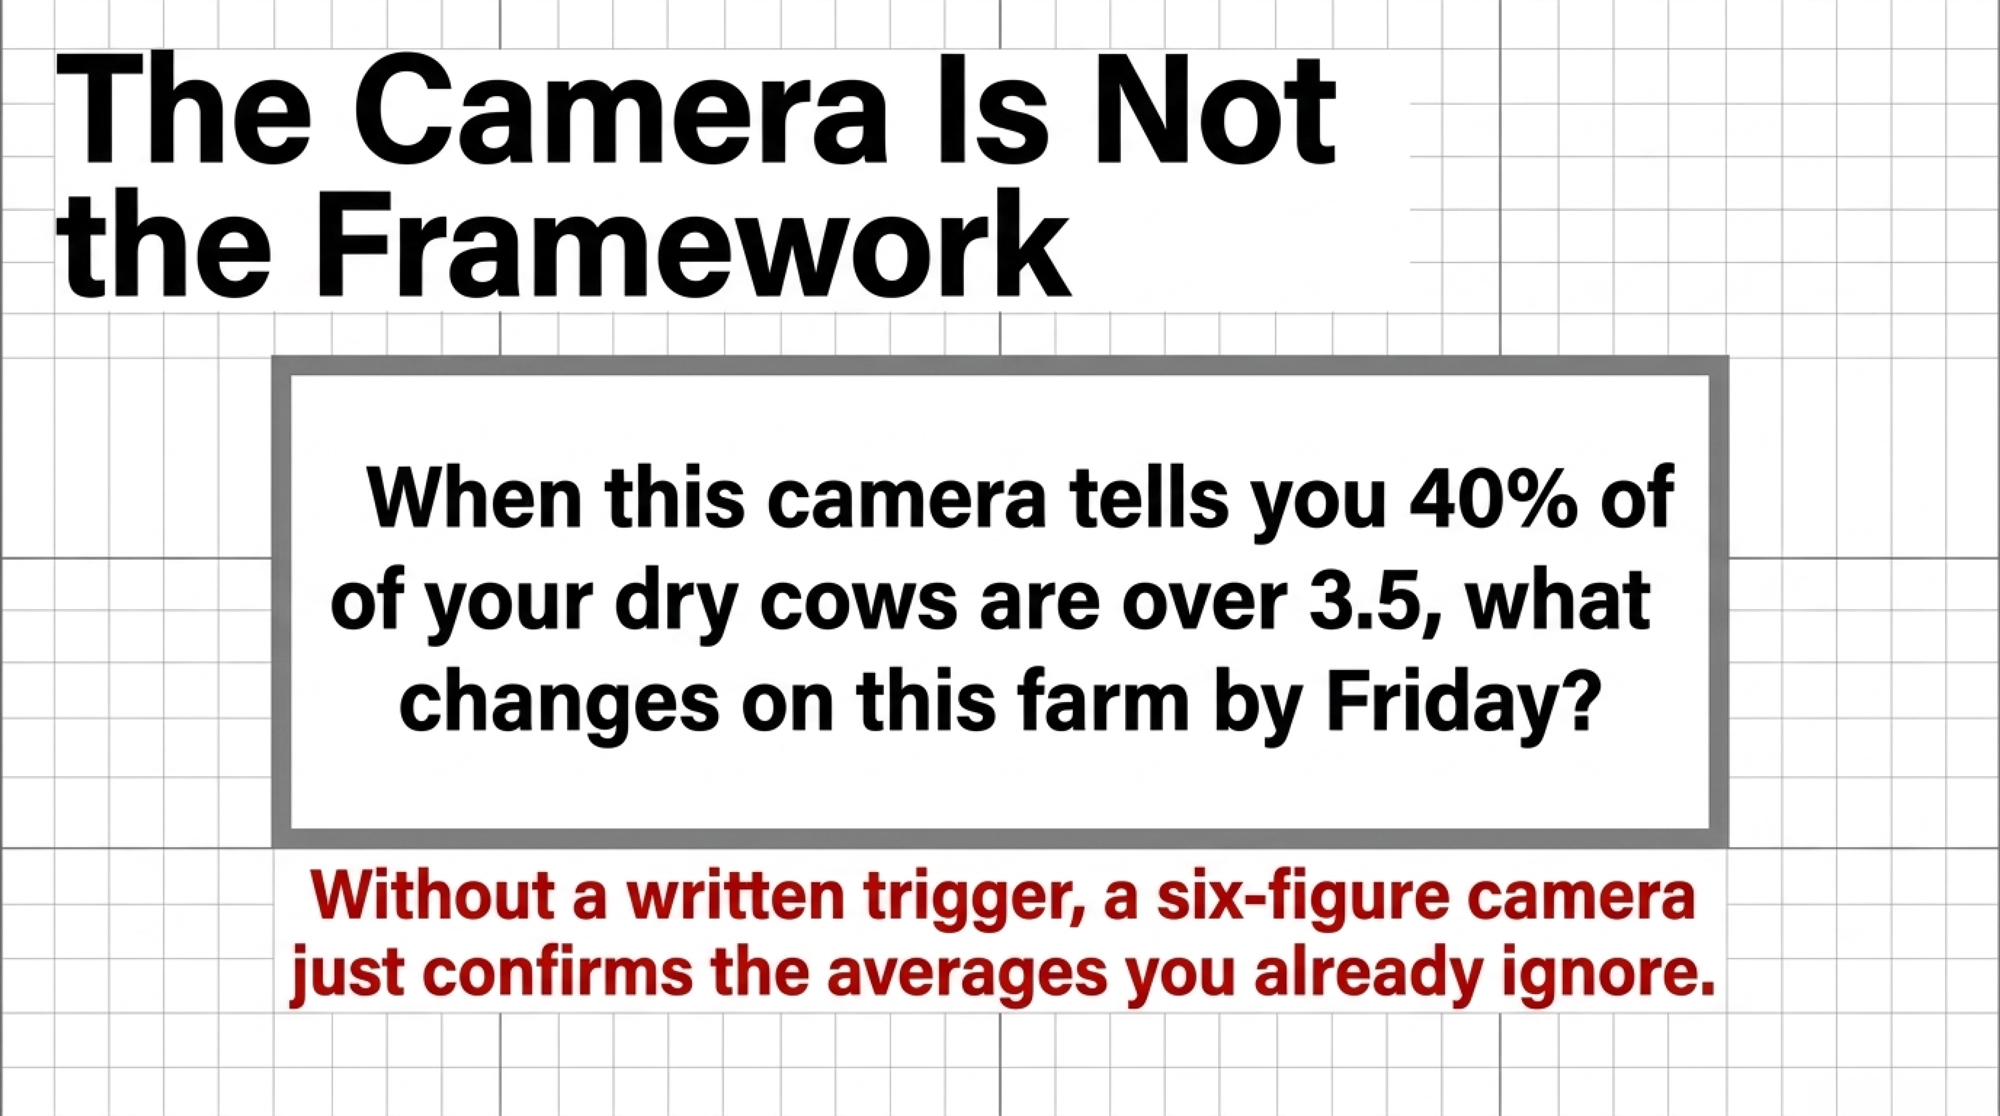
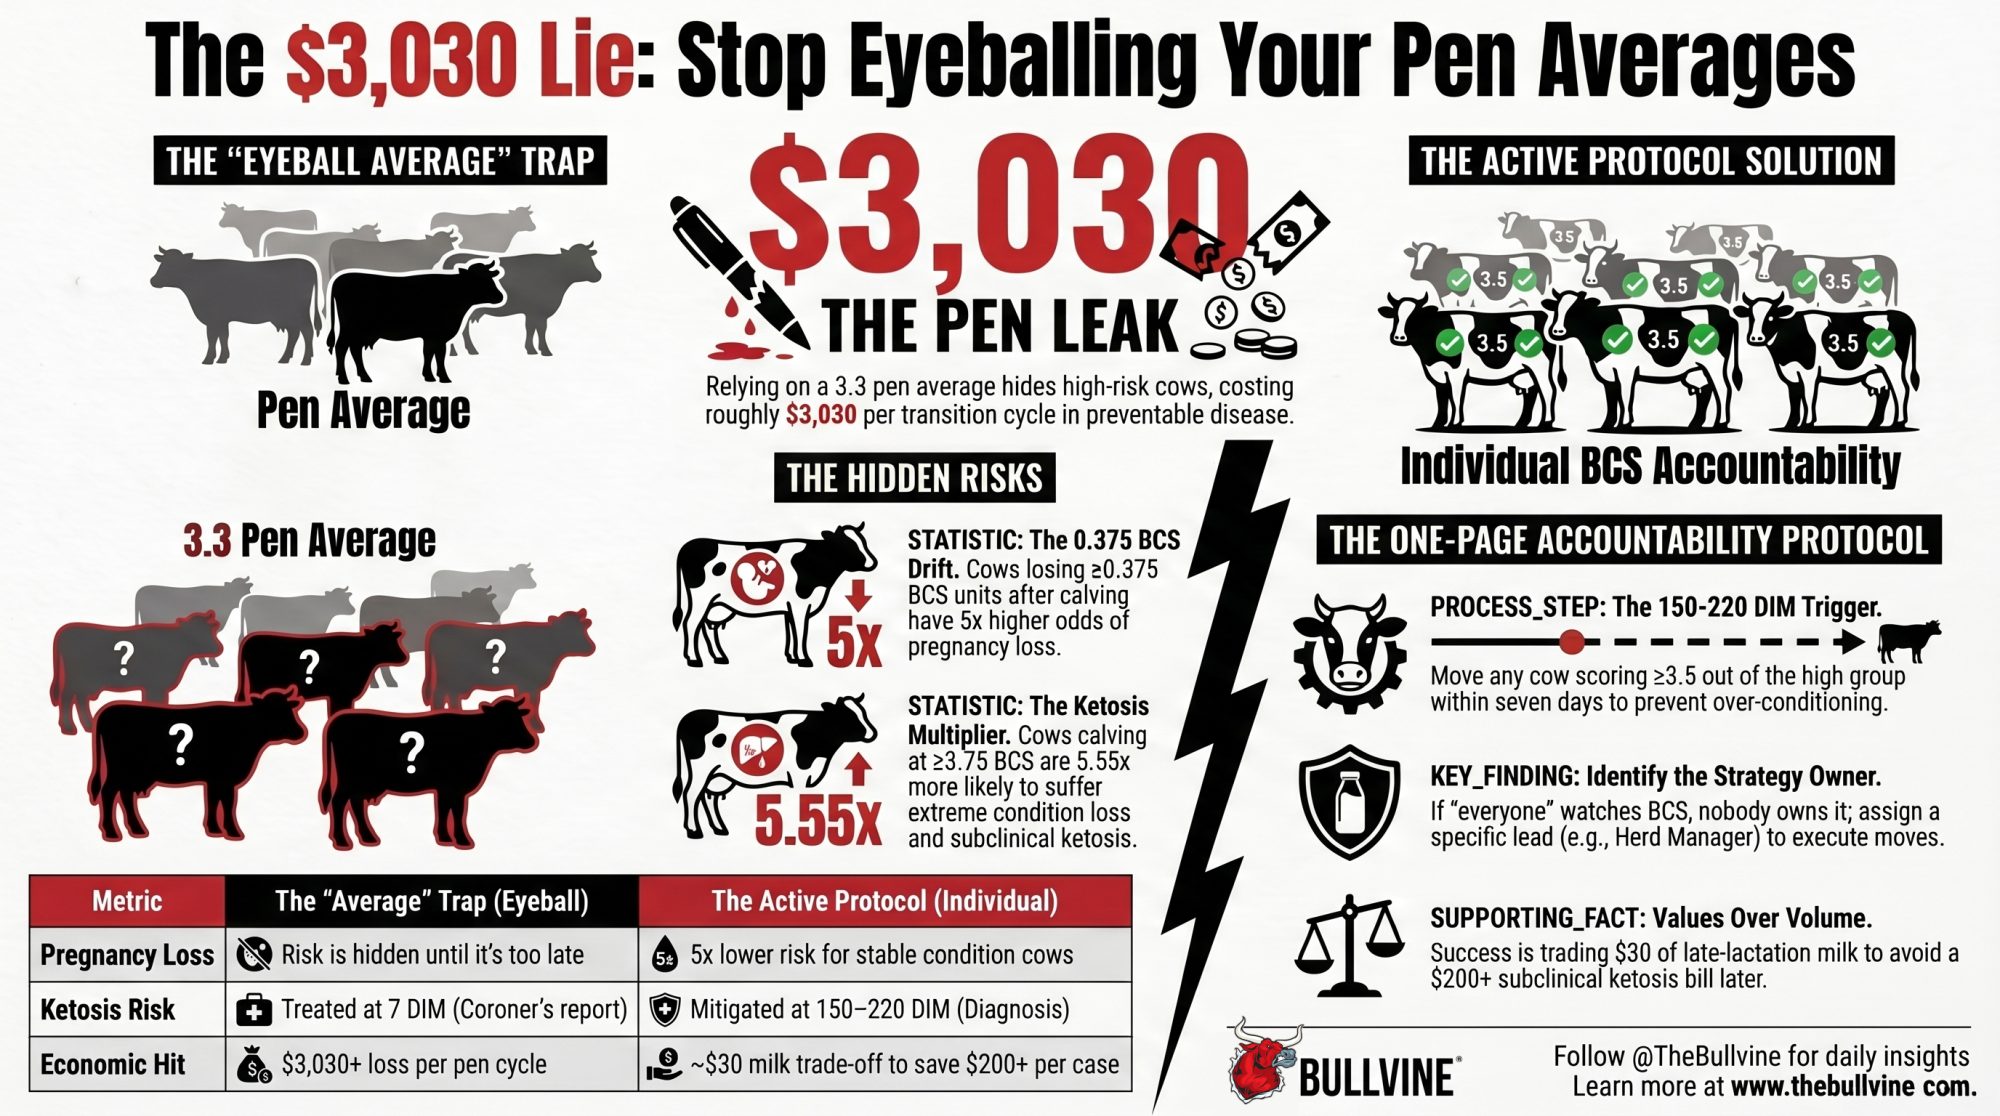
Most of that ketosis loss never shows up as a vet bill. It shows up as milk that wasn’t produced, cows that left early, and breedings that didn’t take. The cost is invisible, and invisible costs don’t get managed.
Why this matters right now: feed and additive costs remain the largest single line on the 2026 ration sheet, and protected additives are among the priciest ingredients in the mix. When every gram is expensive, paying for grams that never reach the cow is no longer a rounding error. This isn’t a scare piece. Every number below carries a date, a scope, and a source. The point is narrow and sharp: the transition-additive purchase you make every season hinges on one piece of data the market is structured not to hand you.
What a 24% Ketosis Rate Costs a 400-Cow Herd
Start with prevalence, because that’s where most operations fool themselves. The 2018 global survey put average subclinical ketosis (SCK) at 24.1%, ranging from 8.3% up to 40.1% across countries. Well-run herds still land in the 15–30% range. On-farm, the gap between what a producer assumes and what testing finds can be ugly — extension work and recent on-farm testing have documented SCK rates of 40–46% even in herds management considered solid.
The per-case cost is settled science. The Cornell deterministic model (McArt and Nydam, Journal of Dairy Science, 2015) puts the total cost of a hyperketonemia case at $289, with lower-bound component estimates landing nearer $129 once you strip out the worst cascade cases. What drives the number, from the same body of transition research:
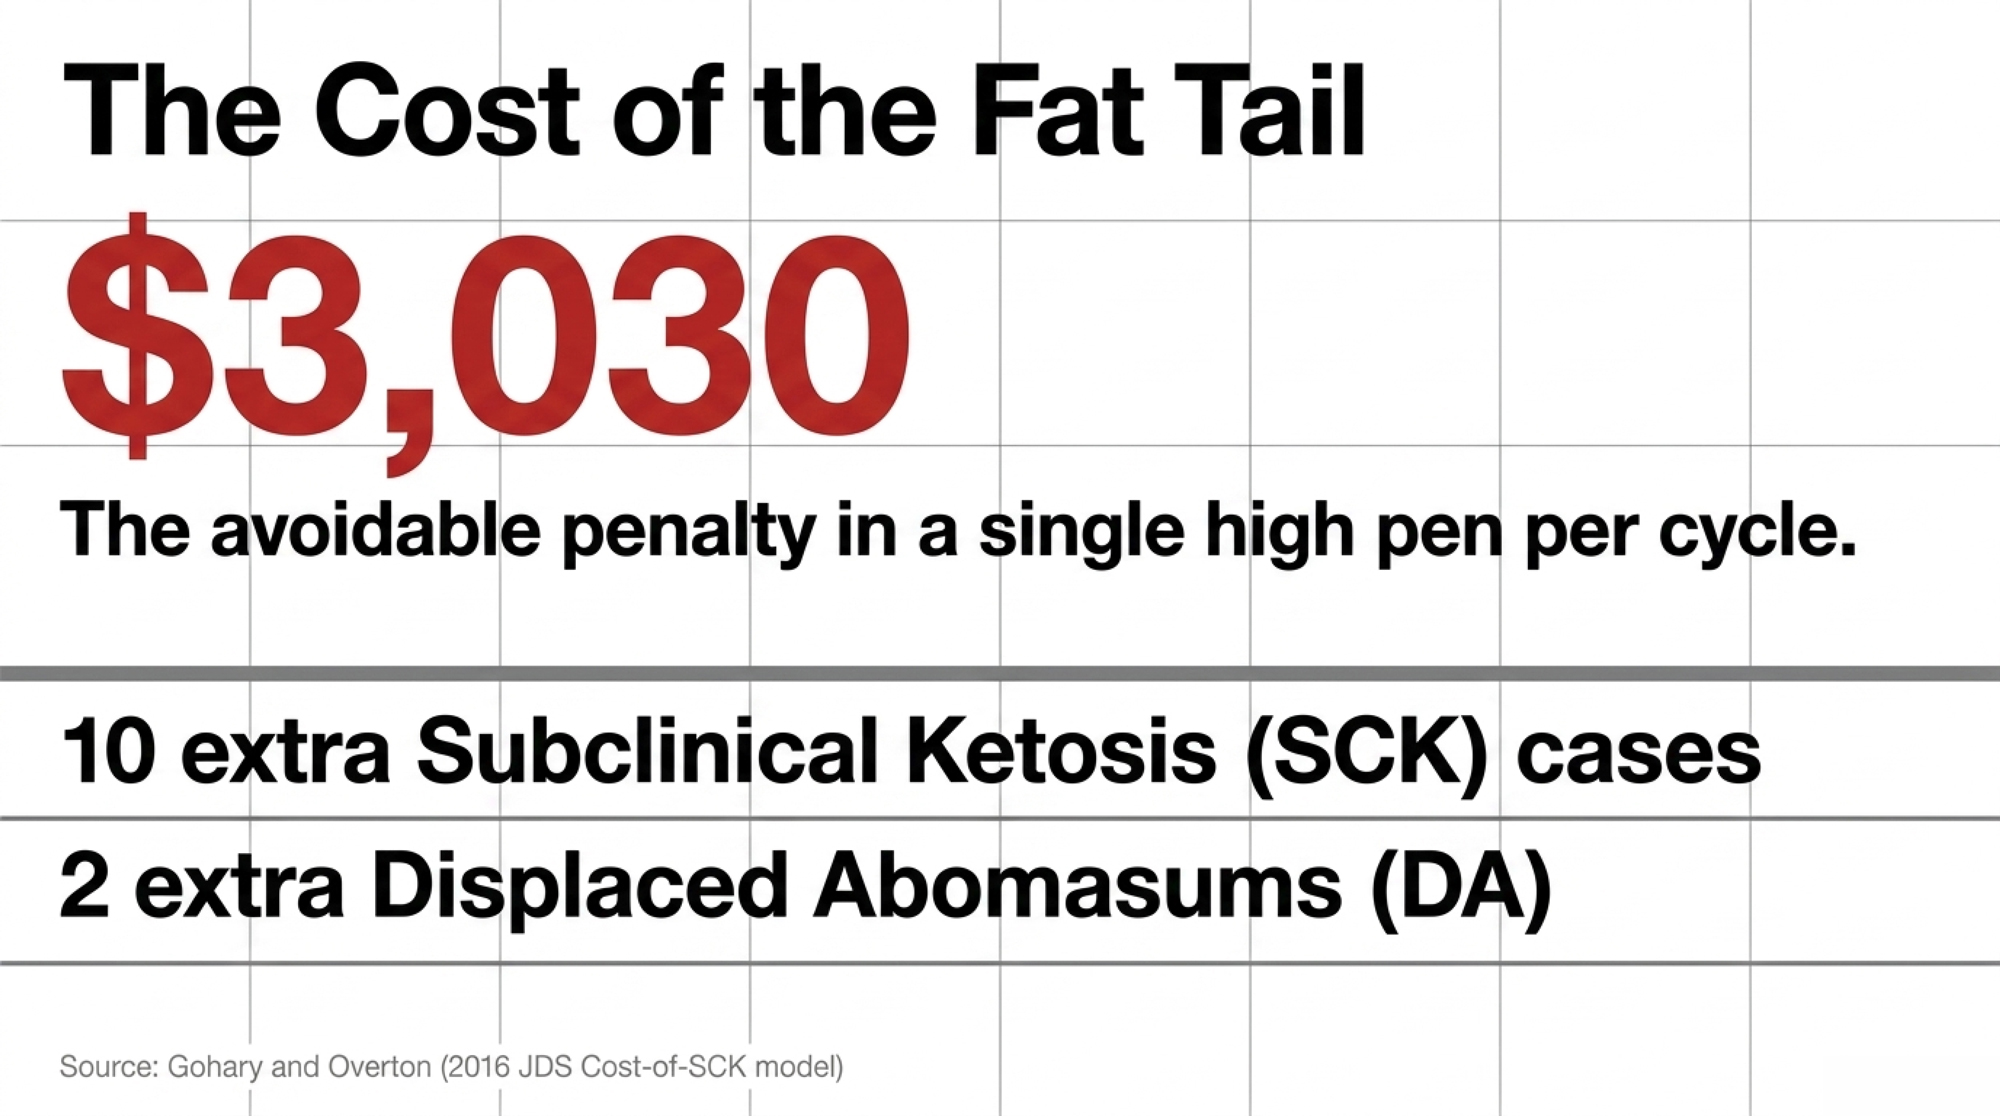
- A cow with SCK gives up roughly 2.2 to 5.3 lbs of milk per day in her first week fresh. Severe cases reduce yield by up to 13.2 lbs/day during the first 30 days in milk, flattening her entire lactation curve.
- SCK sharply increases the risk of displaced abomasum and co-occurs with other fresh-cow disorders, which is why the cost can double when one problem triggers the next.
- Reproductive lag — extra days open, lower conception odds — and higher early-lactation culling risk make up the biggest, least visible share of the bill.
Run the prevalence against the herd, and the leak comes into focus:
| Calculation | Result |
| 400 cows freshening × 24.1% SCK rate | ~96 affected cows/year |
| 96 cows × $129 per case | $12,400/year (low) |
| 96 cows × $289 per case | $27,800/year (high) |
That’s the $12,400–$27,800 range you saw up top — and it climbs as prevalence runs hotter.
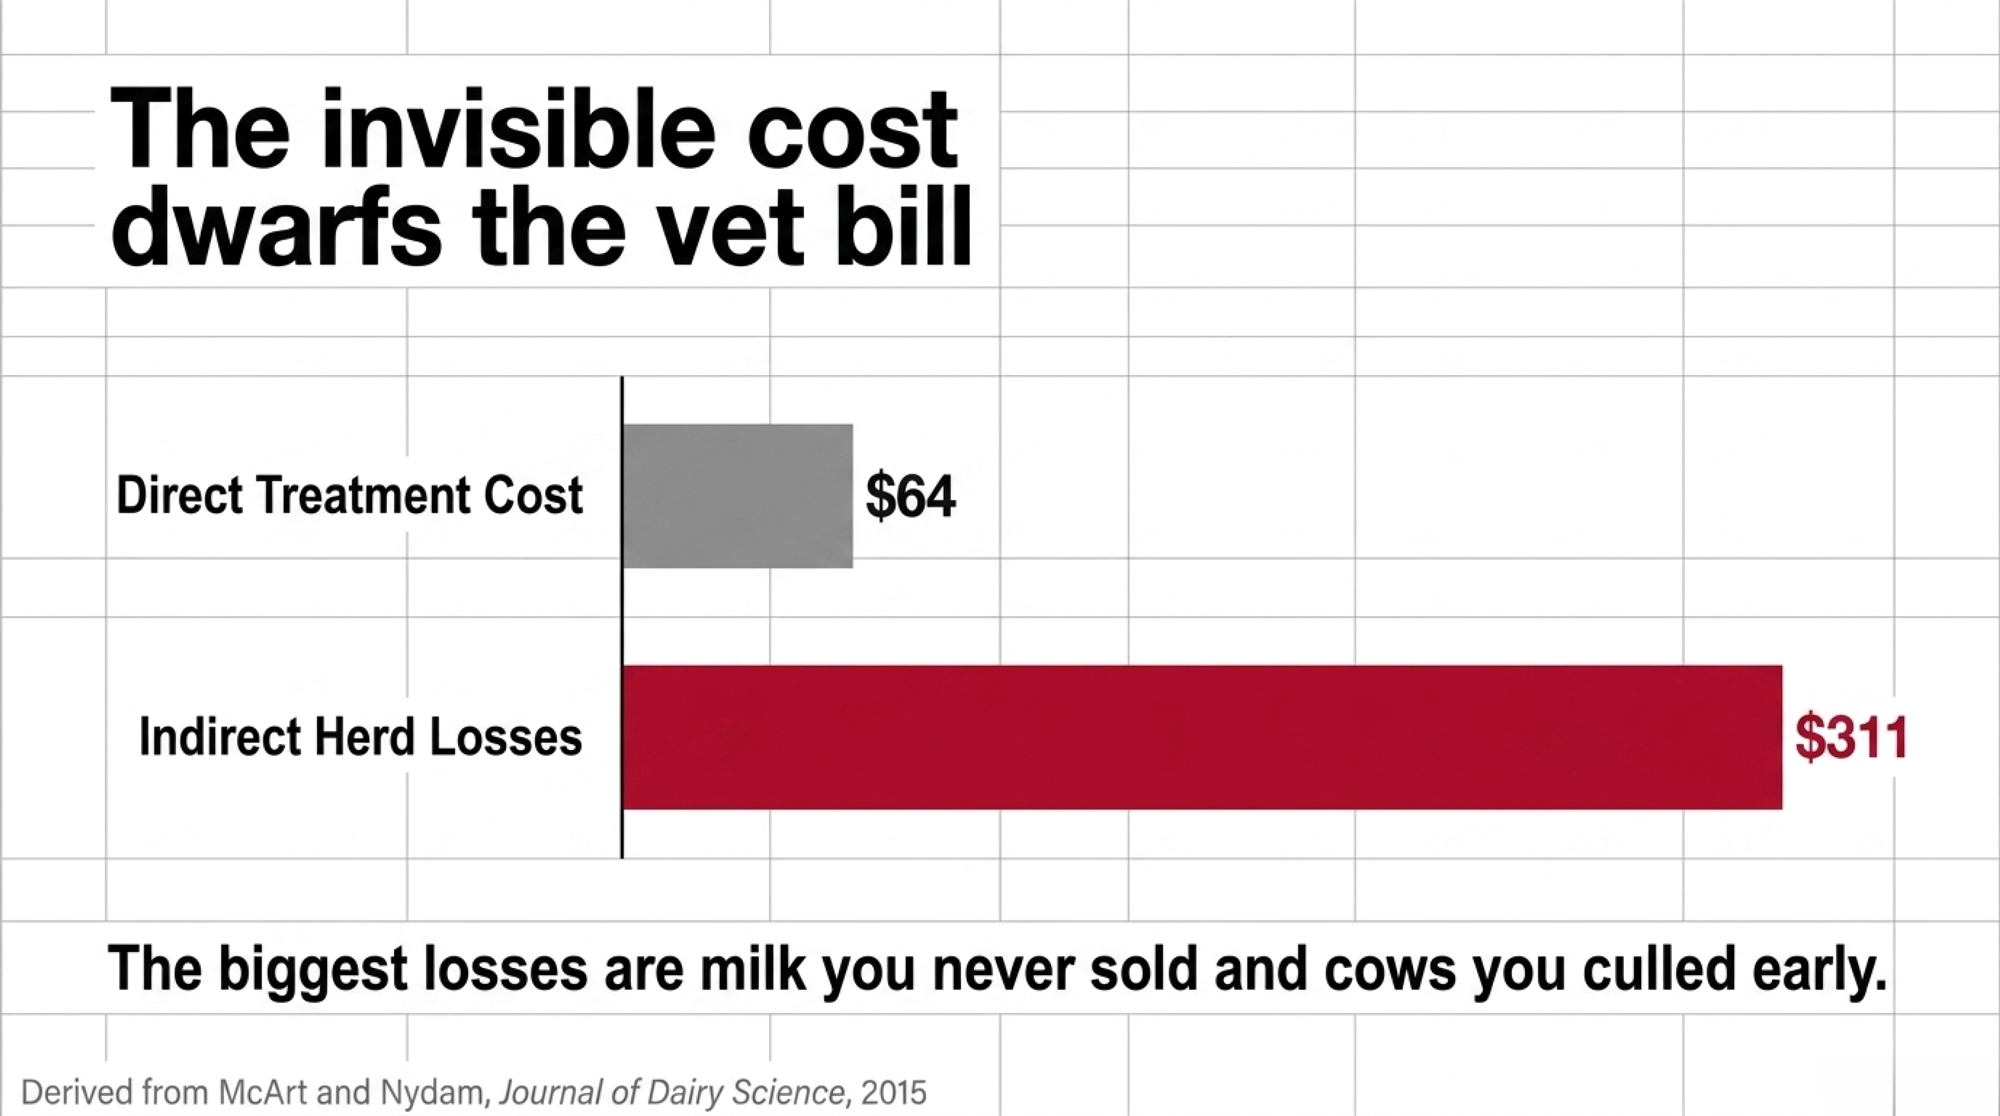
The table below breaks down each fresh-cow disorder into direct treatment costs and indirect costs, drawn from the McArt 2015 component model. The column that matters is the total per case, and the gap between the two cost columns. For nearly every disorder, the indirect loss — milk you never sold, cows you culled early, breedings that slipped — dwarfs the treatment bill. That’s the money a working transition program is fighting to claw back.
| Disorder | Direct treatment | Indirect (milk/repro/culling) | Total per case |
| Subclinical ketosis | Minimal diagnostic | Substantial early-lactation milk loss | $129–$289 |
| Clinical ketosis | $64 (labor/therapy) | Future milk, repro lag, culling | $111–$375 |
| Displaced abomasum | High (surgical) | Severe milk loss, high cull risk | $432 (primiparous)–$639 (multiparous) |
| Metritis | Hormonal/uterine therapy | Reduced conception, more days open | $171 (primiparous)–$262 (multiparous) |
| Clinical mastitis | $77 | Discarded + lactational milk loss | $325 (primiparous)–$426 (multiparous) |
Source: McArt and Nydam, Journal of Dairy Science, 2015
Every figure in that table is the recoverable pool, which is exactly why the next question matters more than the price on the bag.
The Active Ingredient Is the Commodity. The Protection Is the Product.
Here’s the myth, said plainly. Most producers — and plenty of the nutritionists writing their rations — judge a transition additive by the active ingredient and the inclusion rate on the tag. Grams of choline. Grams of methionine. Price per bag.
The data says the active ingredient is close to a commodity. What decides whether it works is the protection technology wrapped around it.
The mechanism isn’t up for debate. Raw choline chloride is degraded in the rumen at rates above 99%. Across the B-vitamin complex, ruminal disappearance runs from roughly 45% for biotin to 97% for folic acid — measured, published rates. Raw lysine and methionine get chewed up the same way. Feed an unprotected version, and you’re not supplementing the cow. You’re feeding her rumen microbes and shipping the balance to the manure pit.
Protected products exist to solve a real problem. The catch is that protection quality swings wildly, and “rumen-protected” on a label tells you nothing about which end of that swing you bought. One product can carry an 80% active payload and deliver only a sliver of it to the small intestine. Another can post a 95% rumen-escape rate purely because its coating is indigestible — it survives the rumen and then passes straight through the cow without dissolving where she could absorb it. Both can legally print “rumen-protected” on the bag.
When the protection is real, the payback is on the record. The landmark rumen-protected choline meta-analysis (Arshad et al., Journal of Dairy Science, 2020), covering 21 transition experiments and 1,313 pre-calving cows, found that at a median 12.9 g/day of active choline ion, supplemented cows gained:
- +3.5 lbs/day of milk (1.6 kg)
- +3.7 lbs/day of energy-corrected milk (1.7 kg)
- ~12% better feed efficiency, with a tendency toward less retained placenta and mastitis
A separate 2025 meta-analysis in the Journal of Dairy Science landed in the same neighborhood — milk yield peaking around a 13 g/day dose with a ~1.29 kg/day lift. That’s the kind of independent cross-validation that should make you trust the category and question the product. Rumen-protected methionine meta-analyses show gains in milk protein and fat yields when supplementation starts before calving. The science behind the category is strong. The variance is in whether the specific product on your mill sheet delivers what its category can.
Why Won’t Suppliers Give You the One Number That Matters?
The number that settles it is the in vivo intestinal delivery rate — the percentage of the active ingredient that actually reaches the cow’s bloodstream, measured in live cows and confirmed by an independent, peer-reviewed trial. Not the in vitro screen. Not the company white paper. Not the rep’s testimonials.
The methods exist. In vivo plasma dose-response against a duodenal infusion calibration is the gold standard for amino acids. Fecal free amino acid recovery aligns well with it. The in situ nylon-bag technique is the one to watch out for — it measures rumen escape only, not intestinal absorption, so a product can ace it and still pass through undissolved. Knowing which method generated a number is half of reading the answer.
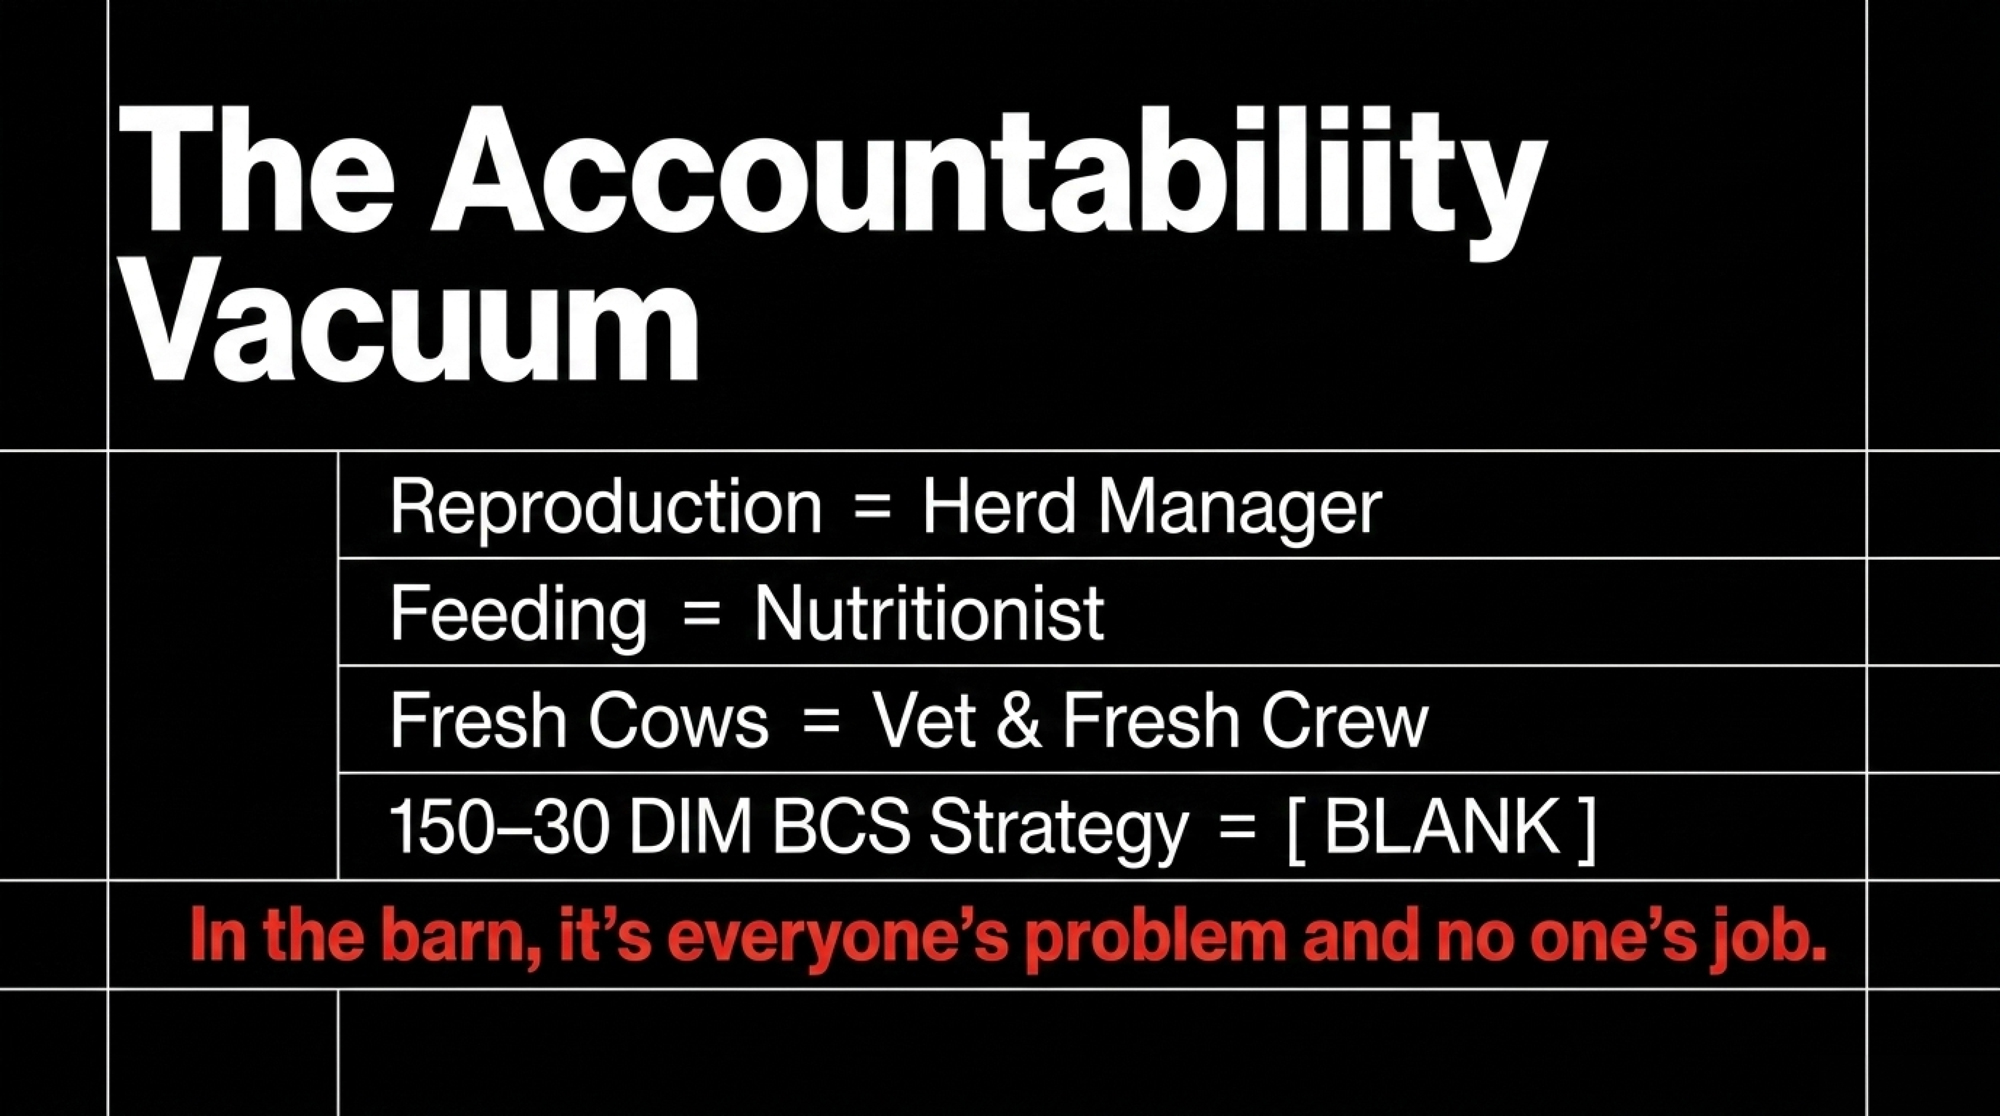
So why doesn’t the market publish it? Because the incentives are misaligned, not because of any one villain. Where a product’s protection technology is weaker, there’s little commercial incentive to publish delivery data that would expose a poor cost per gram absorbed. In many commercial setups, the same party recommends and supplies the product — a structural conflict that can dull the incentive to demand delivery data, regardless of any individual’s good faith. The journals and extension have done their part. The science is published. What hasn’t formed is the buying norm. “Demand the in vivo delivery rate” never became standard, unlike the bulk-tank somatic cell count, which became a standard milk-quality check.
And the label is thinner than it looks. AAFCO does define “rumen protected” — a nutrient fed in a form that increases the flow of that nutrient, unchanged, to the abomasum — but the definition attaches no minimum intestinal-release threshold, no percentage a product must meet to use the term. As of 2026, neither AAFCO in the US nor CFIA in Canada has pinned down a number. Without a threshold, the label is a direction, not a guarantee. The accountability gap is spread across the whole chain — manufacturer, channel, and the producer who never thought to ask.
Ontario vs. Wisconsin: Same Science, Different Math
The science doesn’t change at the border. The economics of the decision do, and that difference is the lens that should reframe how you read every quote a supplier gives you.
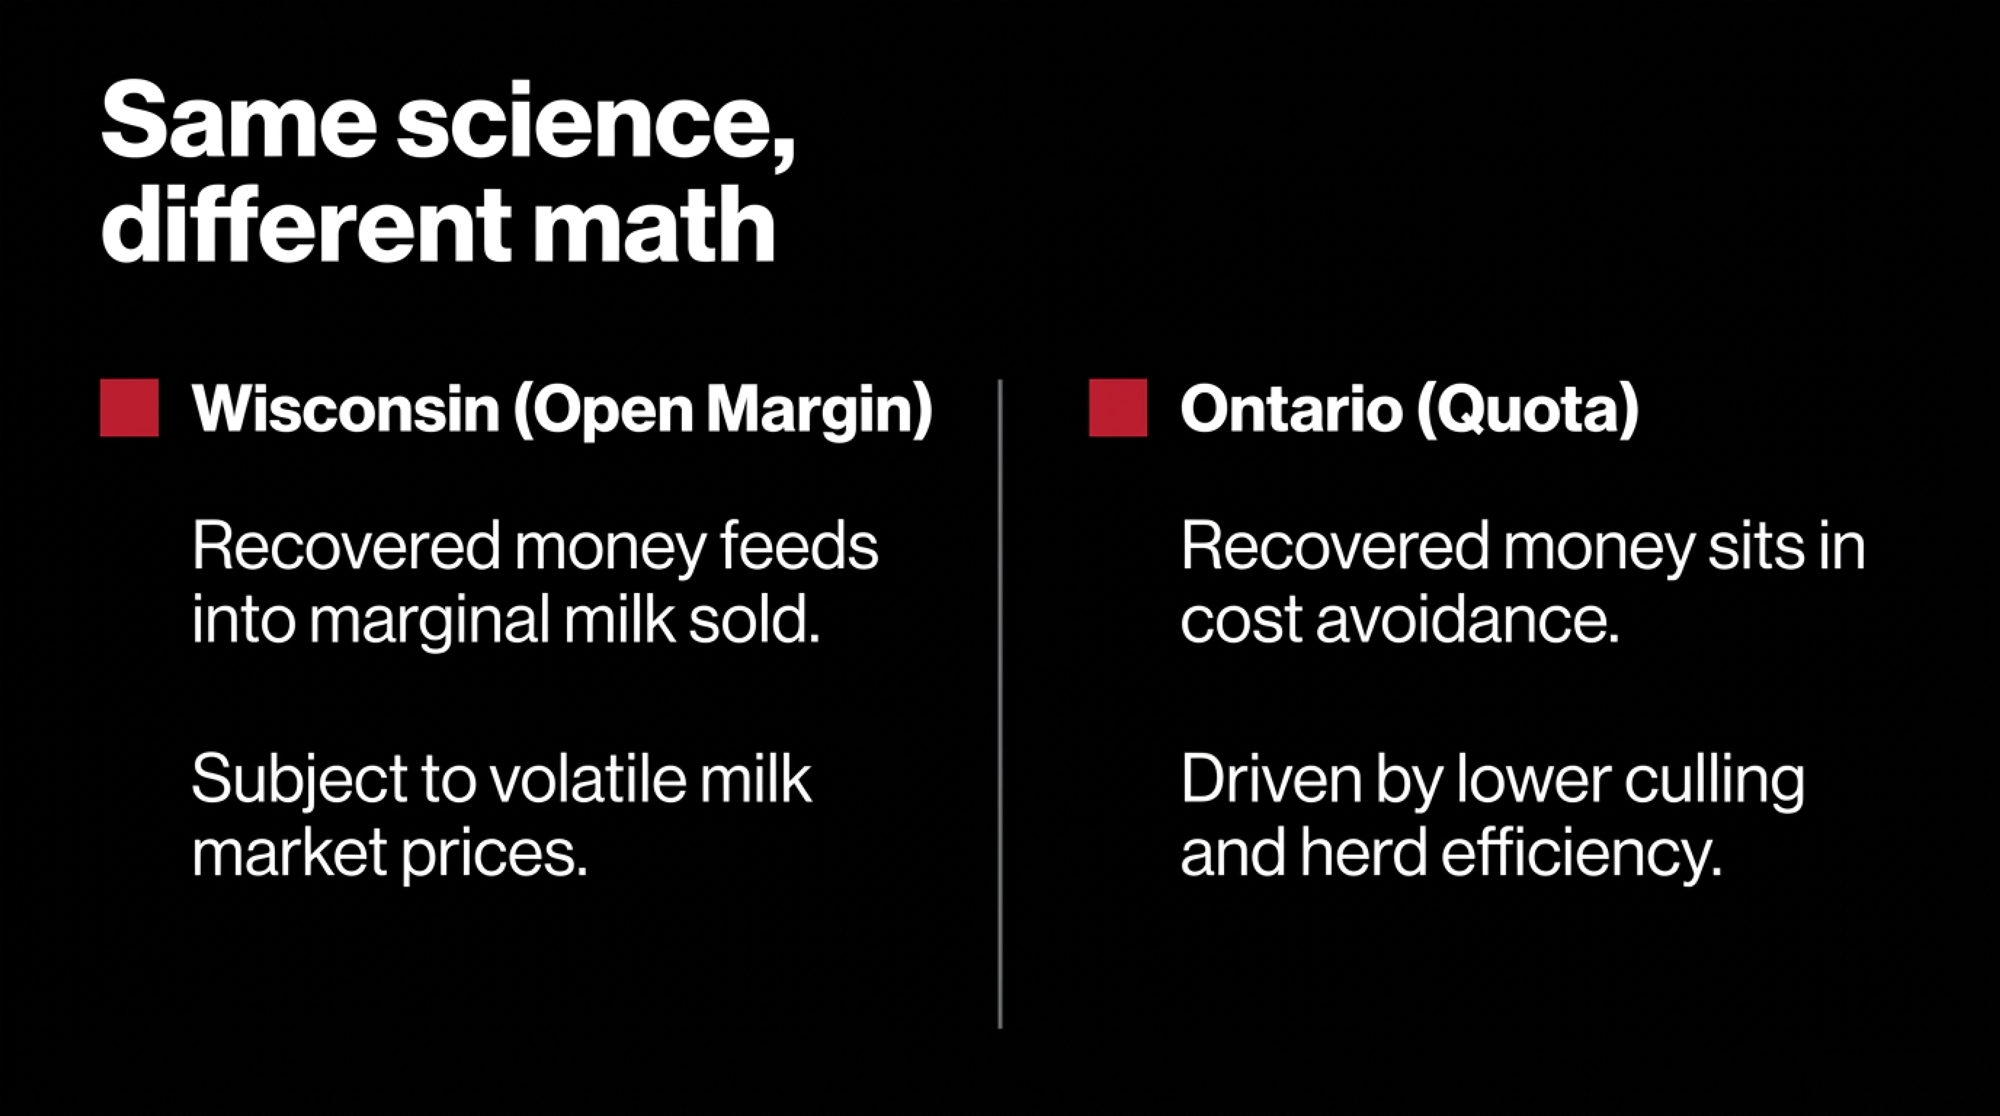
On a Wisconsin open-margin herd, a recovered ketosis case feeds straight into milk sold at a market price — the delivery-rate gamble plays out in volatile revenue, and a high-delivery additive is a hedge against a margin you don’t control. Miss on the delivery rate, and you’ve spent money to protect a margin you then failed to protect. The leak and the recovery both move with the milk check.
Under Canadian supply management, the math runs through a different gate. An Ontario herd within its quota doesn’t capture extra revenue by simply making more milk — the value of a recovered fresh cow shows up in lower involuntary culling, fewer replacements bought under quota-constrained economics, better component yield relative to the butterfat-weighted blend, and tighter days open. The recoverable pool is just as real. It just sits in cost avoidance and herd efficiency rather than in marginal milk sold. Same additive, same delivery question, different line on the page where the payback lands.
One more regional wrinkle: a US herd buys under AAFCO’s labeling regime, a Canadian herd under CFIA’s. Neither pins down “rumen-protected” with a release threshold, so the buyer’s homework is identical on both sides — but verify which country’s label you’re reading, because a product cleared for one market isn’t automatically carrying the same backing in the other.
Running the Numbers: What Does Your Protected Additive Actually Cost Per Gram Delivered?
This is the calculation that belongs on your phone, because it flips the purchase decision in about thirty seconds. Never buy a protected additive on cost per ton or cost per bag. Buy on cost per gram of nutrient that actually reaches the cow.
RUNNING THE NUMBERS — Cost per gram absorbed
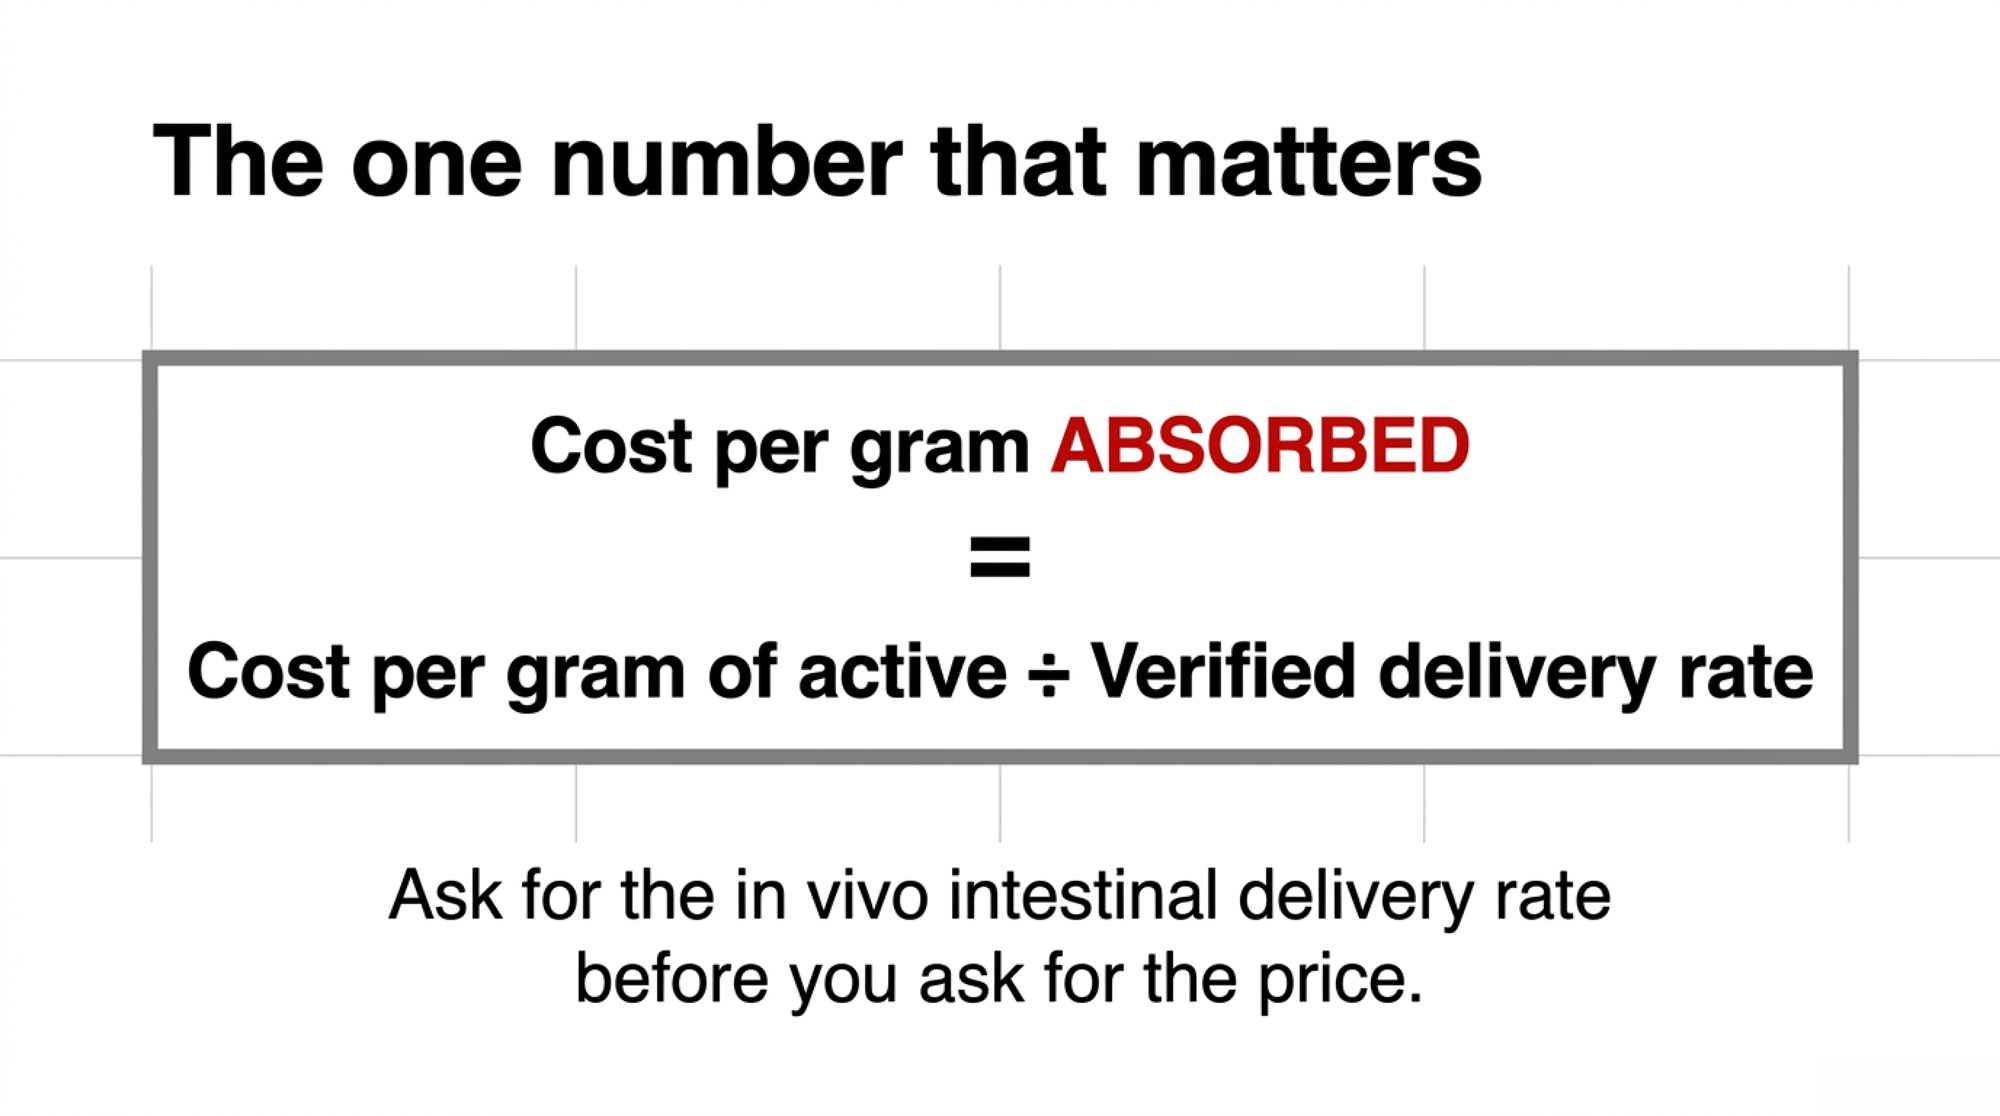
The core formula:
Cost per gram ABSORBED = Cost per gram of active ÷ Verified delivery rate
The delivery rate is the multiplier that turns a cheap bag into an expensive program. Using the published target dose of 12.9 g/day of active choline ion (Arshad et al., 2020), here’s the active you have to feed to land that same delivered dose:
Product A — 75% delivery: 12.9 ÷ 0.75 = 17.2 g/day of active needed
Product B — 25% delivery: 12.9 ÷ 0.25 = 51.6 g/day of active needed
Product B requires three times the amount of the active ingredient to deliver the same dose.
Now run it against price. Take each product’s cost per gram of active off your supplier quote, then divide it by that product’s verified delivery rate — that’s your true cost per gram absorbed. For Product B to break even against Product A, it has to be priced at roughly one-third of A per gram of active. It rarely is.
Scaling the recoverable pool (400-cow herd, 2026):
400 cows × 24.1% SCK rate = ~96 affected cows/year
96 cows × $129 per case = $12,400/year (low estimate)
96 cows × $289 per case = $27,800/year (high estimate)
Published RPC trial responses support clawing back a meaningful share of that pool — not all of it. A program delivering 75% of its payload competes for that money. A program delivering 25% competes for almost none of it while costing nearly the same on the bag.
The cheaper-looking bag is usually the more expensive program once you count what actually reaches the cow. Ask for the delivery rate before you ask for the price. The price means nothing without it.
The 30/90/365-Day Playbook for Any Herd Running a Transition Program in 2026
30-Day Actions — measure and ask
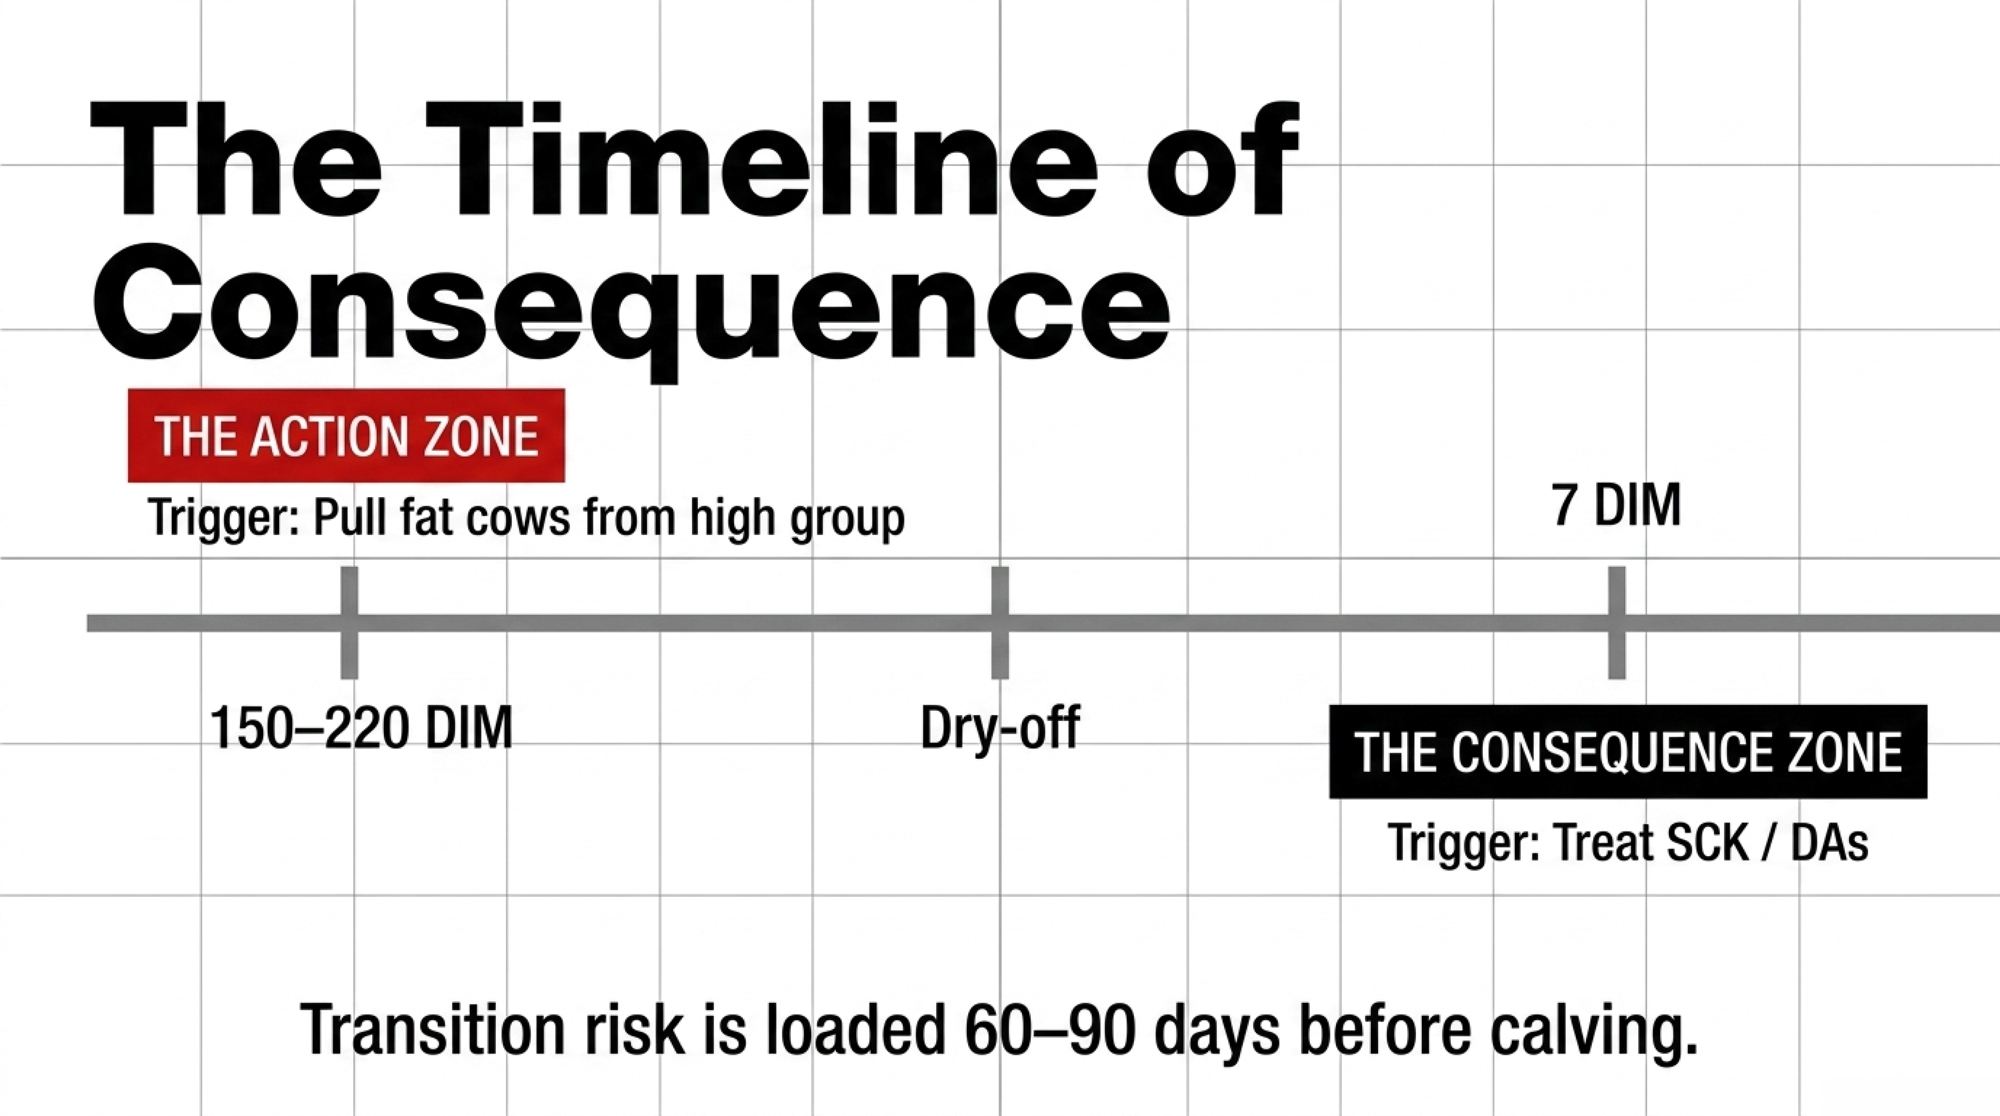
- Pull your fresh-pen BHBA data. If you’re not blood- or milk-testing fresh cows for BHBA, start now. You can’t manage a 24% problem you’re estimating at 4%. Requires: a BHBA meter or a milk-test add-on, plus a consistent sampling routine throughout the full fresh window. Red-flag trigger: if measured SCK clears 25% on any recent batch, treat this as urgent this week, not next quarter. Backfire watch: one spot-check on day three isn’t a herd rate. Sample across days two through fourteen post-fresh before concluding.
- Ask the delivery-rate question before your next meeting with your nutritionist — and don’t leave without an answer. Specifically: “What’s the verified in vivo intestinal delivery rate on this product, and was it measured in an independent peer-reviewed trial or an internal company study?” Requires: nothing but the nerve to ask it.Red-flag trigger: if the answer pivots immediately to price comparisons or testimonials, that’s data. Backfire watch: an in vitro number isn’t an in vivo number. Confirm which method was used.
- Score the answer by the three-bucket rule. Published independent peer-reviewed trial — that’s real. Internal white paper — ask whether it has been peer-reviewed and, if so, in which journal. A pivot to price comparisons and testimonials without any delivery data — that’s your answer, and it tells you as much as a number would.
| Supplier Response to “What’s Your In Vivo Delivery Rate?” | Evidence Quality | What It Signals | Buy Decision |
|---|---|---|---|
| Published, independent, peer-reviewed in vivo trial with intestinal release % | ✅ Verified — highest tier | Manufacturer confident in real-world delivery | You’re buying a program |
| Internal white paper with peer-reviewed backing, journal named | ⚠️ Acceptable — verify journal | Some accountability; assess independence of study design | Proceed with scrutiny |
| Internal white paper, no journal, no peer review | ⚠️ Low tier — flag it | Delivery rate unverified by third party | Ask follow-up or retest |
| In vitro data only (nylon-bag or lab screen, no live-cow trial) | ❌ Incomplete — rumen escape ≠ intestinal absorption | Product may pass rumen but not dissolve in small intestine | Do not equate with in vivo result |
| Price comparison, testimonials, and rep rep’s endorsement — no delivery data offered | ❌ No data = data | Manufacturer likely knows delivery is poor | You’re buying a label at program prices |
90-Day Actions — re-price the program
- Run the cost-per-gram-absorbed math on every protected additive in your transition ration. Requires:supplier price-per-gram-active quotes and a verified delivery rate for each product currently on your mill sheet. Trigger: do this before renewing any contract or placing a seasonal order. Backfire watch: if a supplier can’t or won’t produce a verified delivery rate, treat the blank as a data point, not a pass. A blank answer and a weak answer mean the same thing.
- Confirm your choline program covers the full transition window. Continuous pre- and postpartum RPC — roughly 21 days before calving through early lactation — is supported by the trial data. Recent work confirms the benefit is strongest when fed both before and after calving, not just on one side of the line. Backfire watch:prepartum-only feeding showed no lasting postpartum benefit in milk or ketosis in the published literature. Cutting off at calving leaves the cow unprotected exactly when her liver’s fat-export system faces peak demand. Don’t pay for half a program.
365-Day Moves — make the question a standard
- Build the delivery-rate question into your annual supplier review the same way SCC sits in your milk-quality review — a standing agenda item, not an occasional challenge. Opportunity signal: a supplier who hands over independent in vivo data without hesitation is signaling confidence in their product. That’s a relationship worth consolidating. A supplier who deflects is telling you something, too. Backfire watch: don’t let a strong relationship substitute for the data. Relationships don’t show up in the fresh pen.
- Weight your spend by how deep the evidence runs. Rumen-protected choline and methionine carry deep, peer-reviewed bioavailability data and consistent meta-analytic results. Microencapsulated organic-acid and botanical blends show strong in vitro stability and convincing in vivo heat-stress and performance trials, but delivery mechanisms are less directly measured in the transition literature. Rumen-protected vitamins beyond biotin have thinner published bioavailability literature in transition cows. Backfire watch: don’t pay proven-category prices for emerging-category evidence. The categories aren’t interchangeable.
For the mechanism underneath all of this — negative energy balance, NEFA mobilization, and how fatty liver tips into the ketosis spiral — see our deep dive on how your ketosis cut-point can leak $25,000 a year.
On the amino-acid side, balancing metabolizable lysine and methionine for milk protein and nitrogen efficiency: the benefits of rumen-protected methionine for transition cows.
And this piece extends the cost-of-disease thread from how a fresh pen can cost a 500-cow herd $90,000.
What This Means for Your Operation
The disease math is settled. The science behind the additive categories is published, peer-reviewed, and cross-validated. The only variable left is whether the specific product you’re buying lands its payload in the cow or in the manure pit.
You gain real margin protection when the delivery rate is high and verified. You give up nothing but the discomfort of asking a question your supplier may not be used to hearing. That’s the trade.
So before the next mill sheet gets signed, pull the spec sheet for every protected additive in your transition ration and find the in vivo delivery number. If your supplier can show you an independent, peer-reviewed figure, you’re buying a program. If the answer is a price sheet and a testimonial, you’re buying a label — and paying program prices for it. What does the data on your current transition additive actually say about intestinal delivery — and who measured it?
Key Takeaways
- At 24.1% subclinical ketosis, a 400-cow herd is bleeding $12,400 to $27,800 a year before a single visibly sick cow gets treated — most of it in lost milk, early culls, and missed breedings, not vet bills.
- The active ingredient is close to a commodity; the protection technology is the product. “Rumen-protected” has a definition but no delivery threshold under AAFCO or CFIA, so the label guarantees nothing about what reaches the cow.
- Buy on cost per gram absorbed, not cost per bag: divide cost per gram of active by the verified in vivo delivery rate. At 25% delivery you feed 51.6 grams to land the same dose; 75% delivery hits it with 17.2.
- Before the next mill sheet, ask one question and grade the answer — an independent peer-reviewed in vivo number means you’re buying a program; a price sheet and a testimonial mean you’re buying a label.
Learn More
- Is Your Fresh Pen Costing You $90000? The 90-Day Transition Fix for Pregnancy Rate — Gain an immediate operational edge with a practical roadmap that links fresh cow metabolic diseases to reproduction, providing simple farm protocols to monitor bunk space and implement systematic whole-herd blood-BHBA screening dashboards.
- The $1750 Calf: Is Your 2026 Breeding Plan Leaving $800 a Head on the Table? — Exposes how record-high bred heifer replacement costs and multi-billion dollar capacity investments require a strategic 3–5 year transition planning reframe, arming you with a critical calculation to stress-test your heifer inventory.
- Selection for Increased Resistance to Metabolic Diseases — Delivers a forward-looking, game-changing genetic edge by showing how selecting sires for Metabolic Disease Resistance indexes reduces subclinical ketosis incidence by 5.5% and prevents long-term lactational milk losses.
 The Sunday Read Dairy Professionals Don’t Skip.
 The Sunday Read Dairy Professionals Don’t Skip.
Every week, thousands of producers, breeders, and industry insiders open Bullvine Weekly for genetics insights, market shifts, and profit strategies they won’t find anywhere else. One email. Five minutes. Smarter decisions all week.