


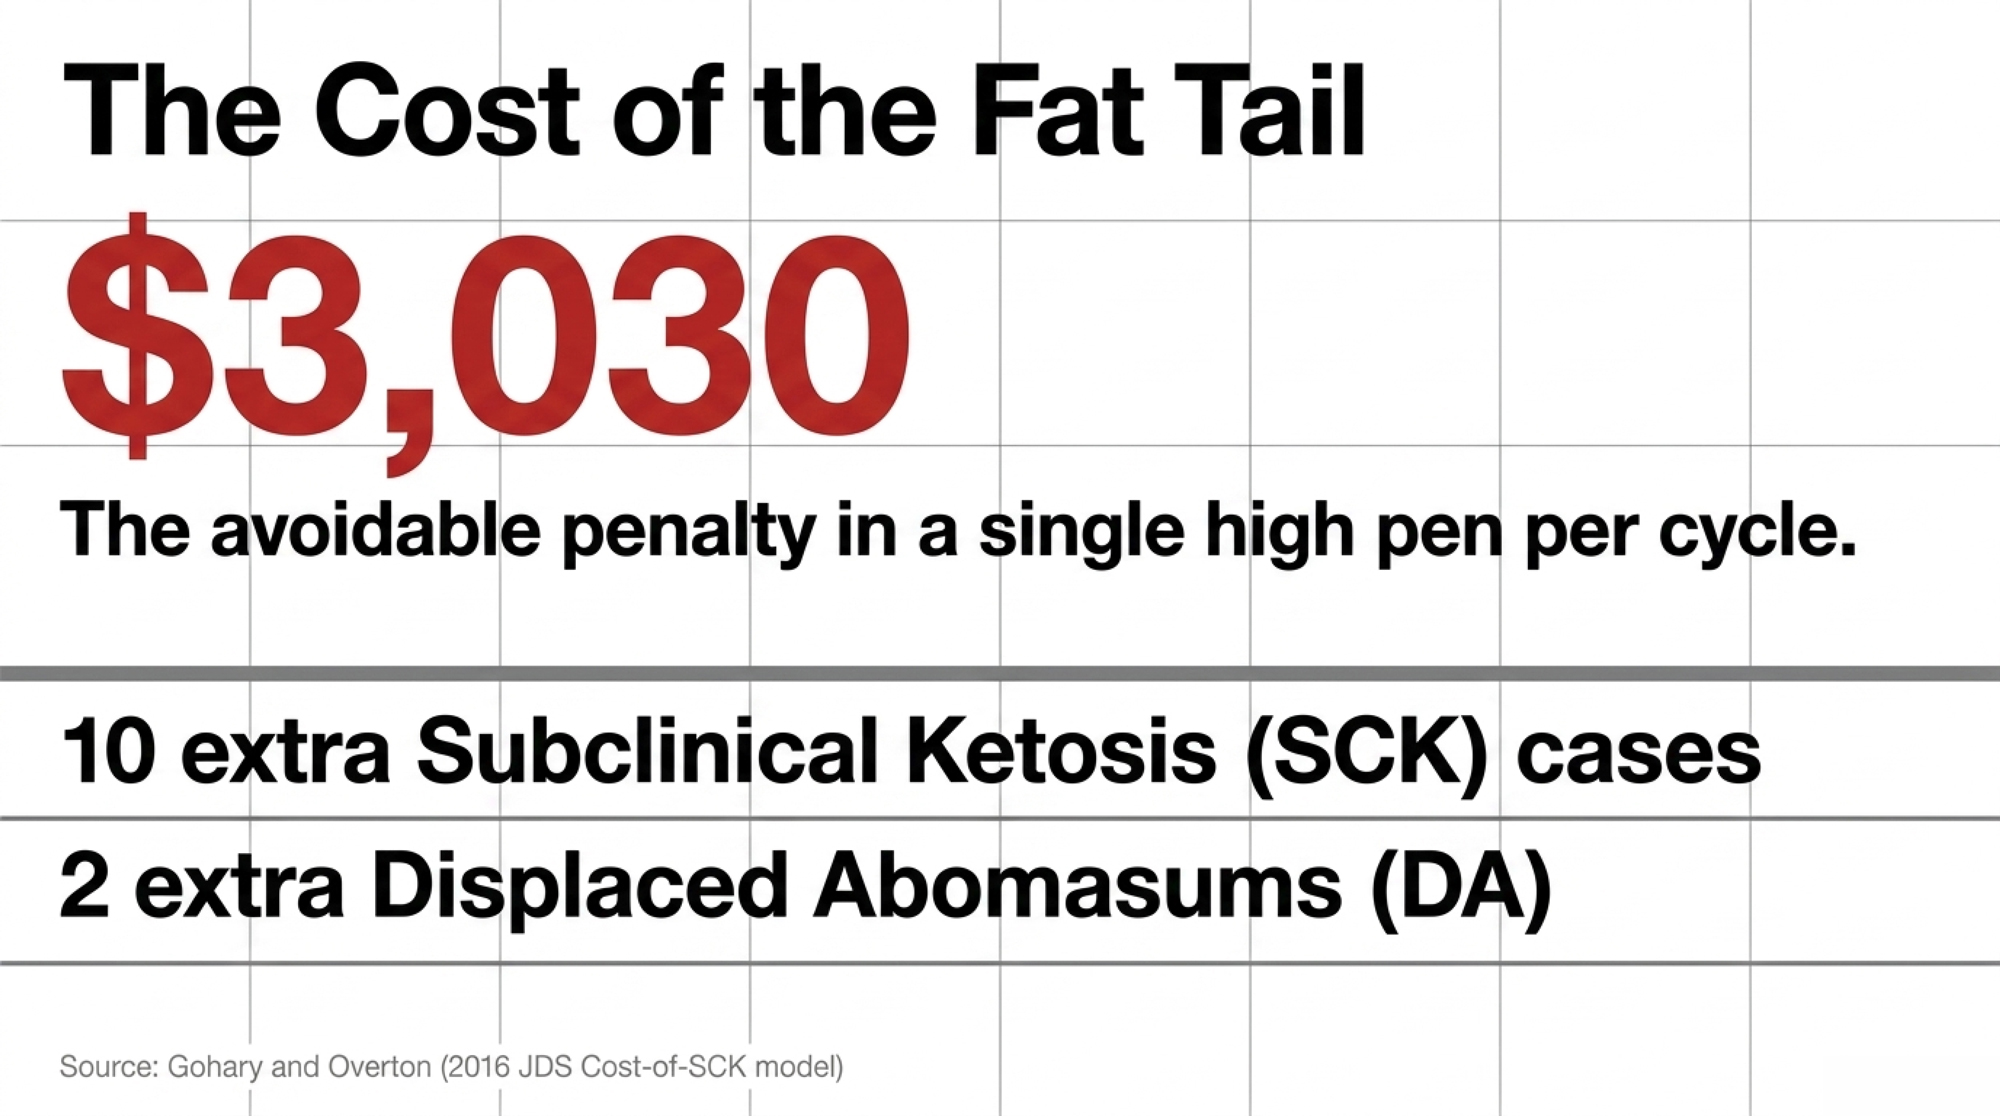
A nutritionist calls the high pen 3.3 and moves on. Ninety days later it’s costing $3,030 in SCK and DAs — and Ohio State says the wreck was locked in at 180 DIM, not the close-up pen.
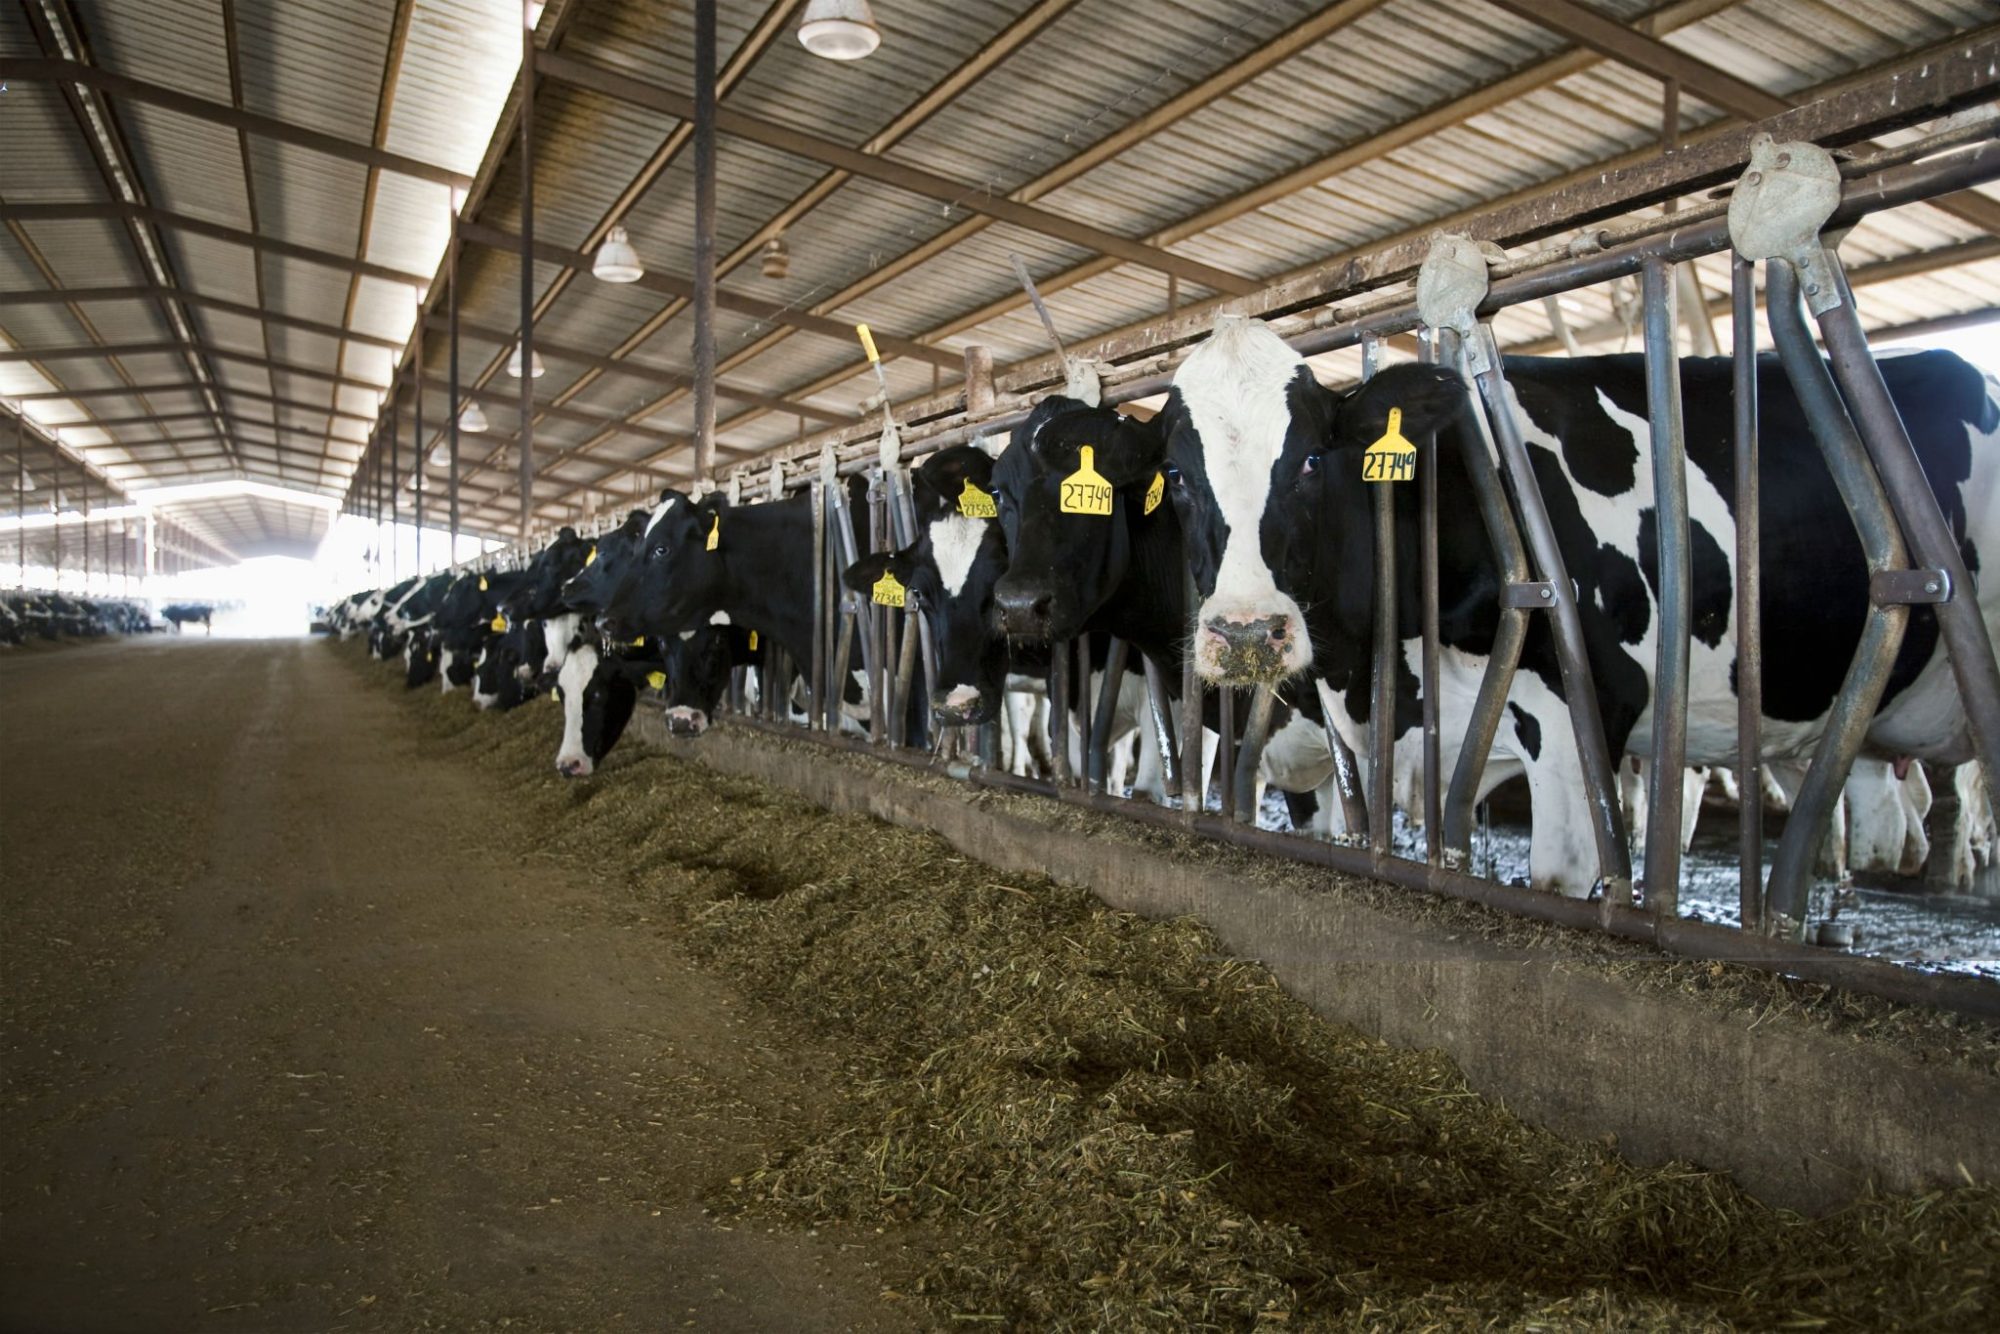
A nutritionist walks the late-lactation pen on a cold Midwestern morning, eyes the cows, and calls the group 3.25 to 3.3. Ninety days later the same farm is chasing a subclinical ketosis rate that won’t quit, a couple of unexpected DAs, and first-service conception that feels off — all of it locked in by the pen walk nobody wrote down. That’s the gap Ohio State’s Anaclara Daudet and Lucas González-Chappe examined in the April 2026 Buckeye Dairy News: not a measurement problem, but an accountability problem hiding inside the comfortable illusion of an average.
BCS gets this treatment on most farms — a quick scan, a shared nod, no number written on a single animal. The herd manager agrees. The feeder nods. Everyone moves on to feed push-ups and the fresh-cow list, and the transition cycle three months out is quietly loaded while they work.
Quick Stats — The 0.375 Drift
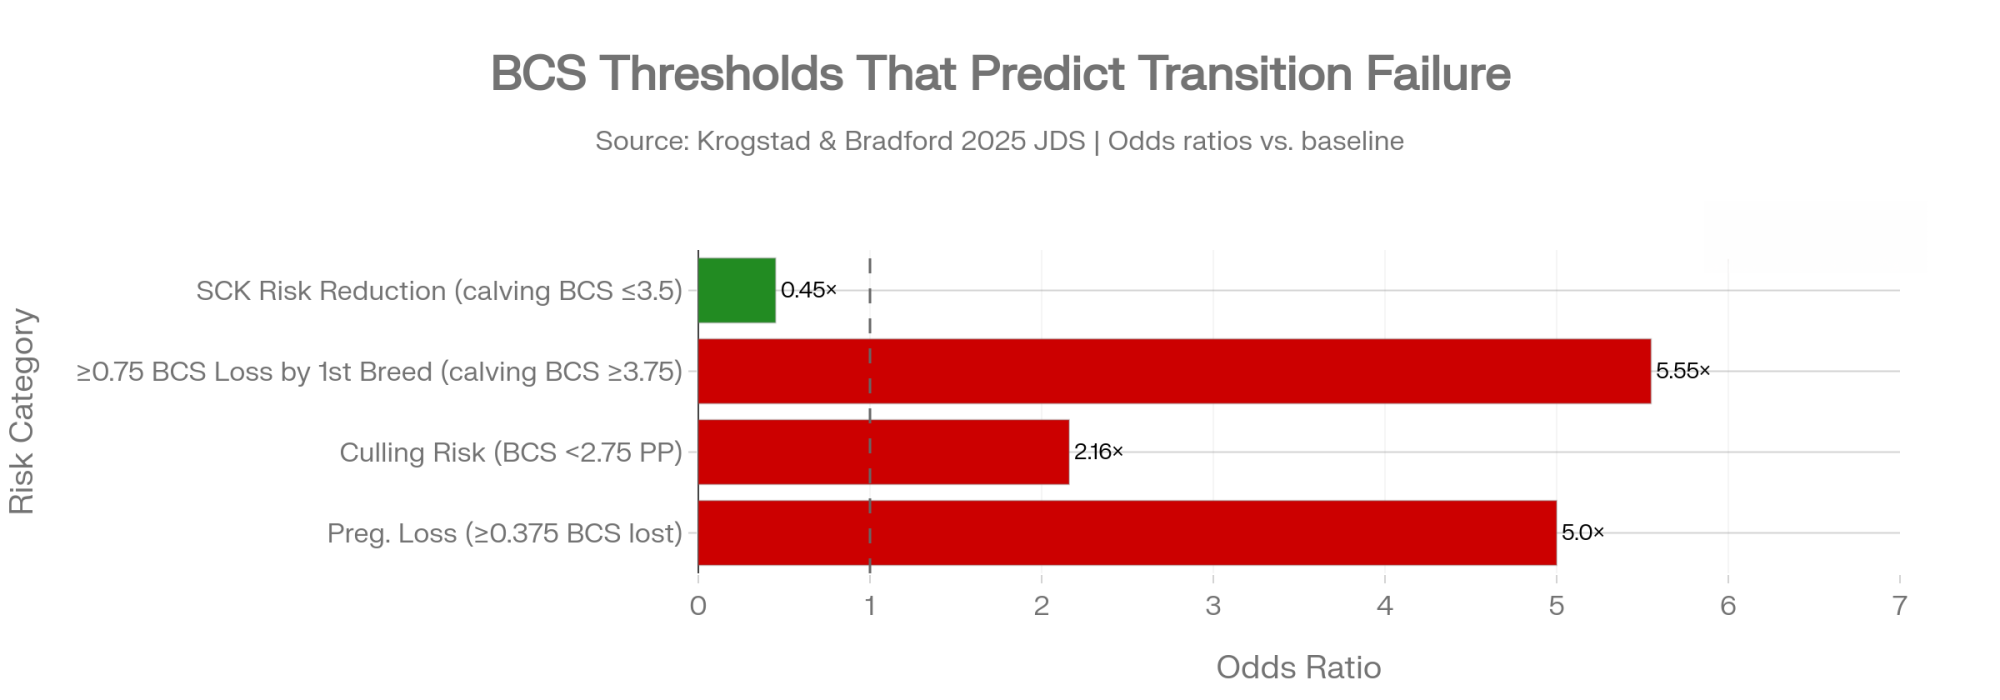
- ≥0.375 BCS units lost after calving → roughly 5× higher odds of pregnancy loss (Krogstad & Bradford, 2025 Journal of Dairy Science)
- BCS below 2.75 postpartum → reported odds ratio of roughly 2.16 for culling
- Calving at ≥3.75 BCS → 5.55× more likely to lose ≥0.75 units by first breeding (separate 2025 peer-reviewed analysis)
- Calving at ≤3.5 BCS → 0.45× as likely to go subclinical ketotic
- Herd setting: commercial Michigan dairy on automated milking, scored prepartum and postpartum
So What Does a 0.375-BCS Change Actually Cost You?
| BCS Threshold | Timing | Consequence | Odds Ratio / Magnitude | Source |
|---|---|---|---|---|
| ≥0.375 BCS units lost | Post-calving | Pregnancy loss | ~5.0× higher odds | Krogstad & Bradford 2025 JDS |
| BCS <2.75 postpartum | 0–30 DIM | Culling risk | OR ~2.16 | Krogstad & Bradford 2025 JDS |
| Calving BCS ≥3.75 | At dry-off/calving | ≥0.75 BCS loss by 1st breed | 5.55× more likely | Separate 2025 peer-reviewed analysis |
| Calving BCS ≤3.5 | At calving | Subclinical ketosis | 0.45× as likely (protective) | Separate 2025 peer-reviewed analysis |
| <0.5 BCS lost | Calving to peak | 1st-service conception | 65% conception rate | Butler & Smith 1989 JDS |
| >1.0 BCS lost | Calving to peak | 1st-service conception | 17% conception rate | Butler & Smith 1989 JDS |
| ≥3.5 BCS at 150–220 DIM | Late lactation | Fat-tail SCK loading | No move = ~$2,030/pen cycle | Gohary & Overton 2016 JDS |
| ≥3.75 BCS dry-off | Dry period | Over-conditioning, SCK | Standard far-off ration insufficient | Drackley lab / Alberta Ag extension |
The OSU extension piece leans on a 2025 Journal of Dairy Science paper from Kirby Krogstad and Barry Bradford, whose recent transition-cow work is associated with Michigan State. The pair followed a commercial Michigan dairy running automated milking, scoring BCS prepartum and postpartum across multiple transition windows.
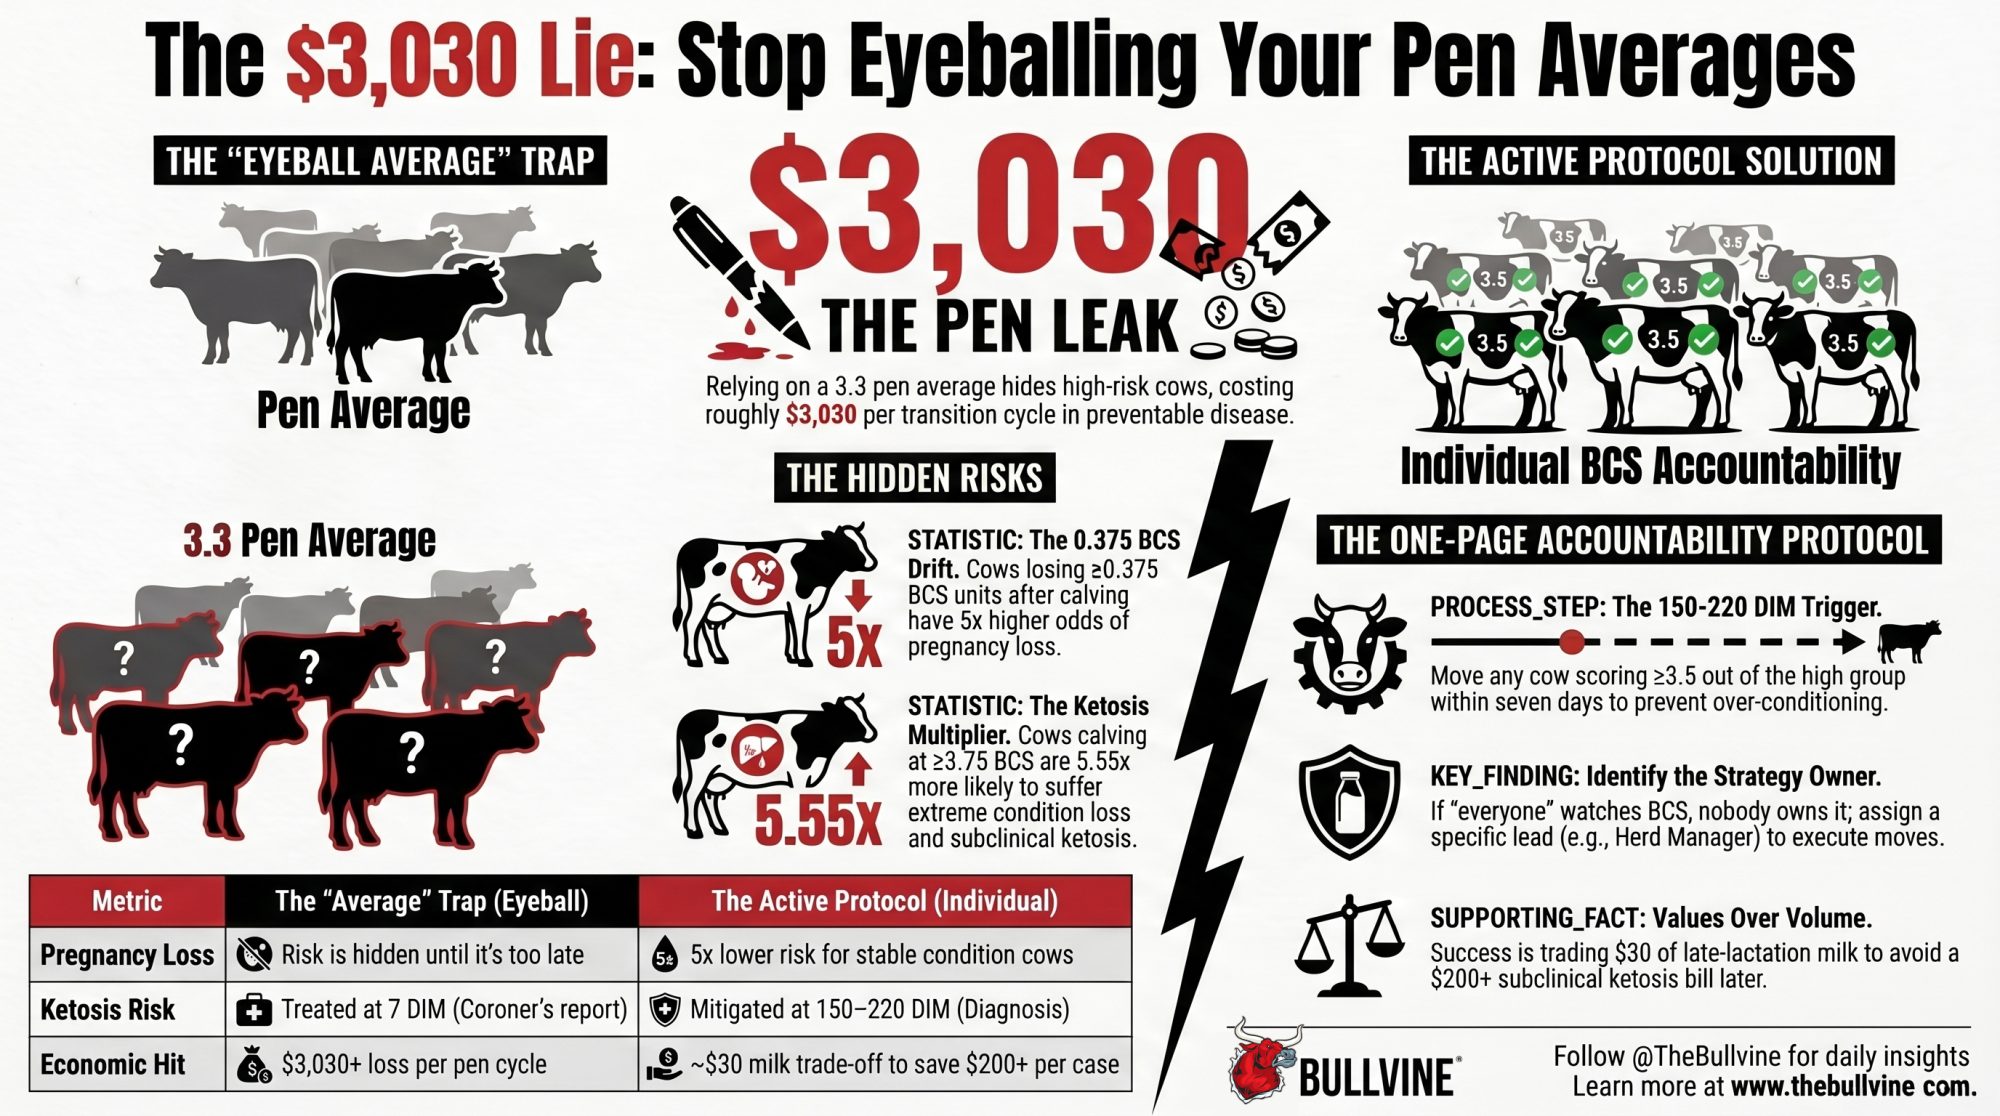
The headline numbers are worth taping to the office wall. Cows losing ≥0.375 BCS units after calving had roughly five-fold higher odds of pregnancy loss. Cows losing ≥0.75 units had significantly higher odds of leaving the herd. Thin postpartum cows — BCS under 2.75 — carried a reported odds ratio of roughly 2.16 for culling.
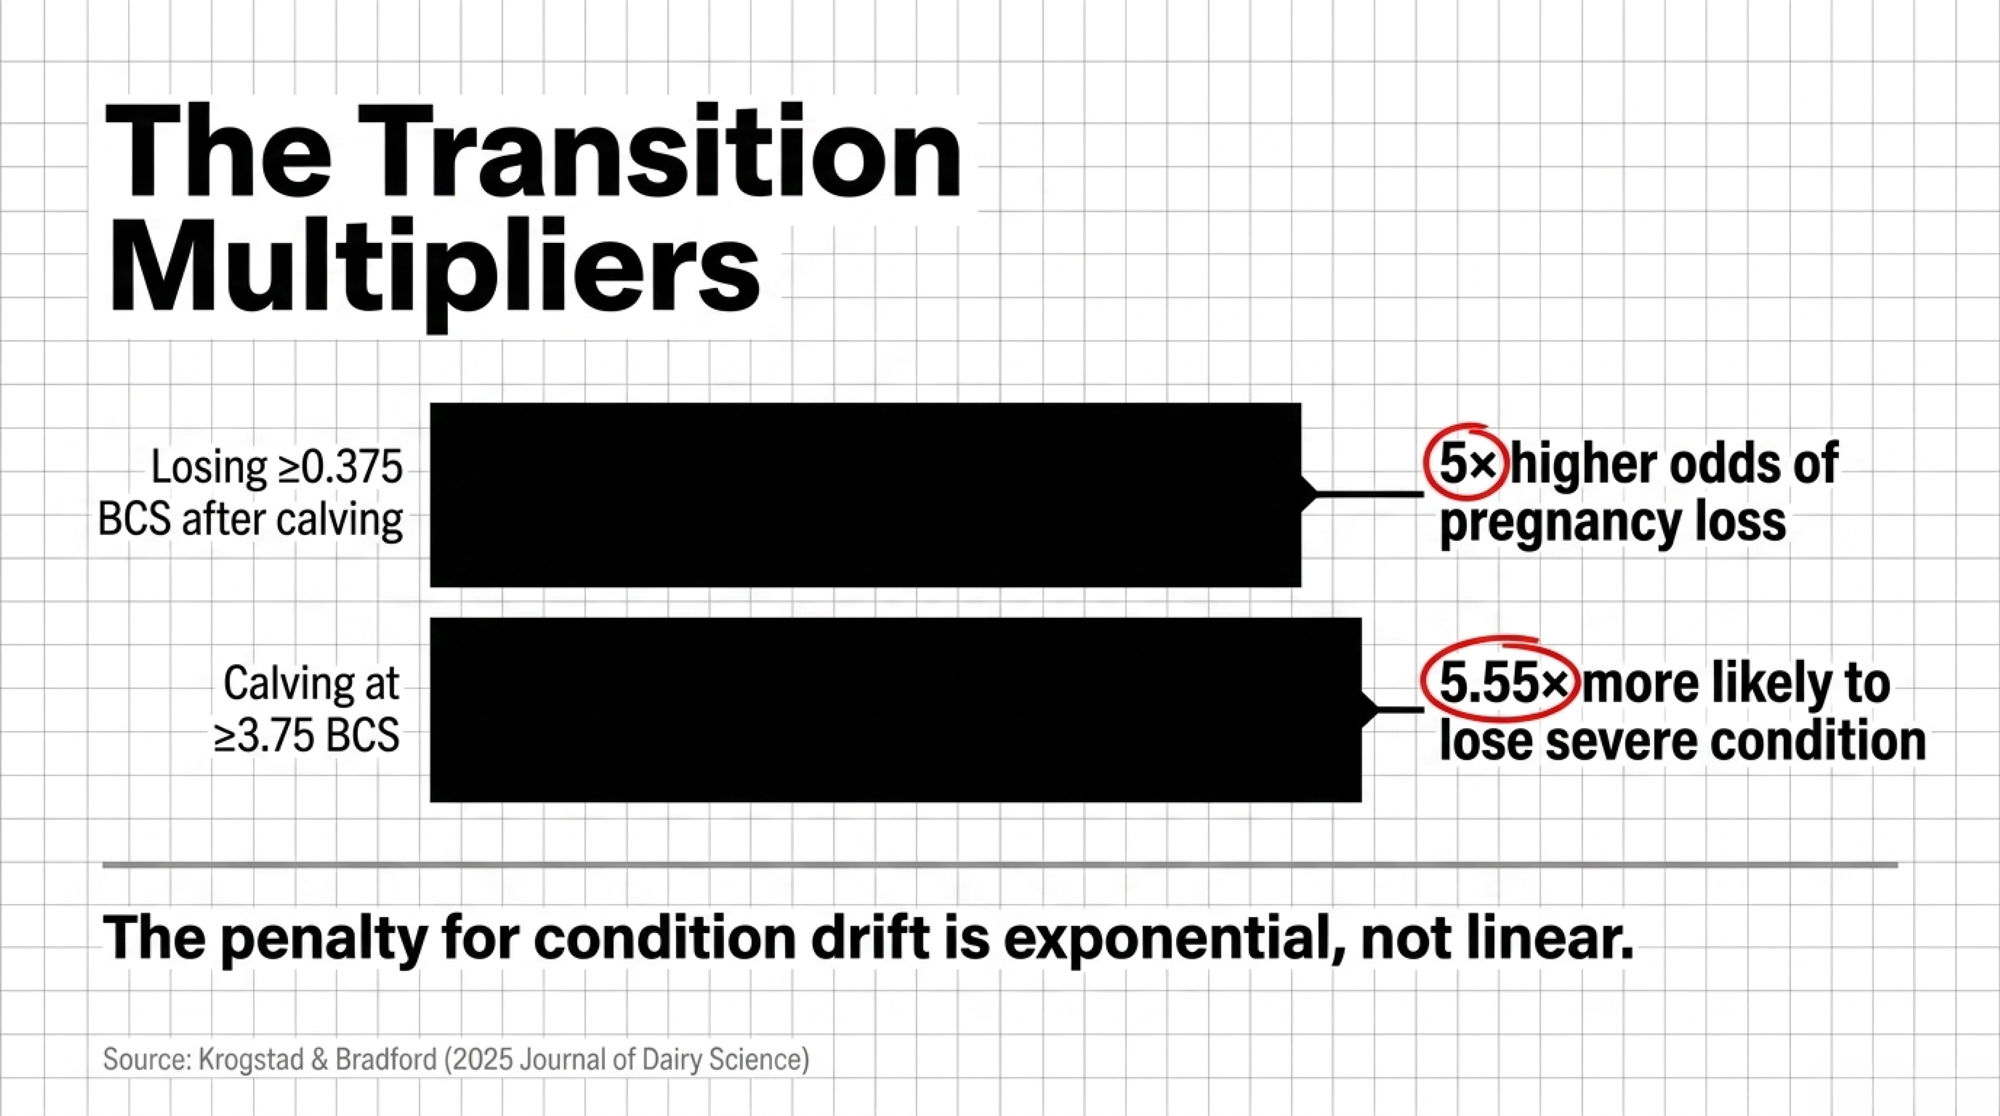
A separate 2025 peer-reviewed analysis on BCS at calving and subclinical ketosis sets the other bookend. Cows calving at ≥3.75 BCS were 5.55× more likely to lose ≥0.75 units by first breeding than cows calving at ≤3.5. Cows at ≤3.5 at calving were only 0.45× as likely to go subclinical ketotic.
None of this is radical. Butler and Smith’s 1989 JDS paper already showed first-service conception dropping from 65% in cows losing under 0.5 BCS units to 17% in cows losing more than 1.0. And older University of Kentucky extension work from Jeffrey Bewley, traceable to 2008, suggested only a small share of U.S. herd managers record individual BCS on a structured basis. The scoring card has been on every extension pamphlet since before most fresh-cow crews were born. The adoption number tells you what that’s worth in the barn.
Why Is Your Fresh-Cow List Uglier Than Your Feed Software Predicts?
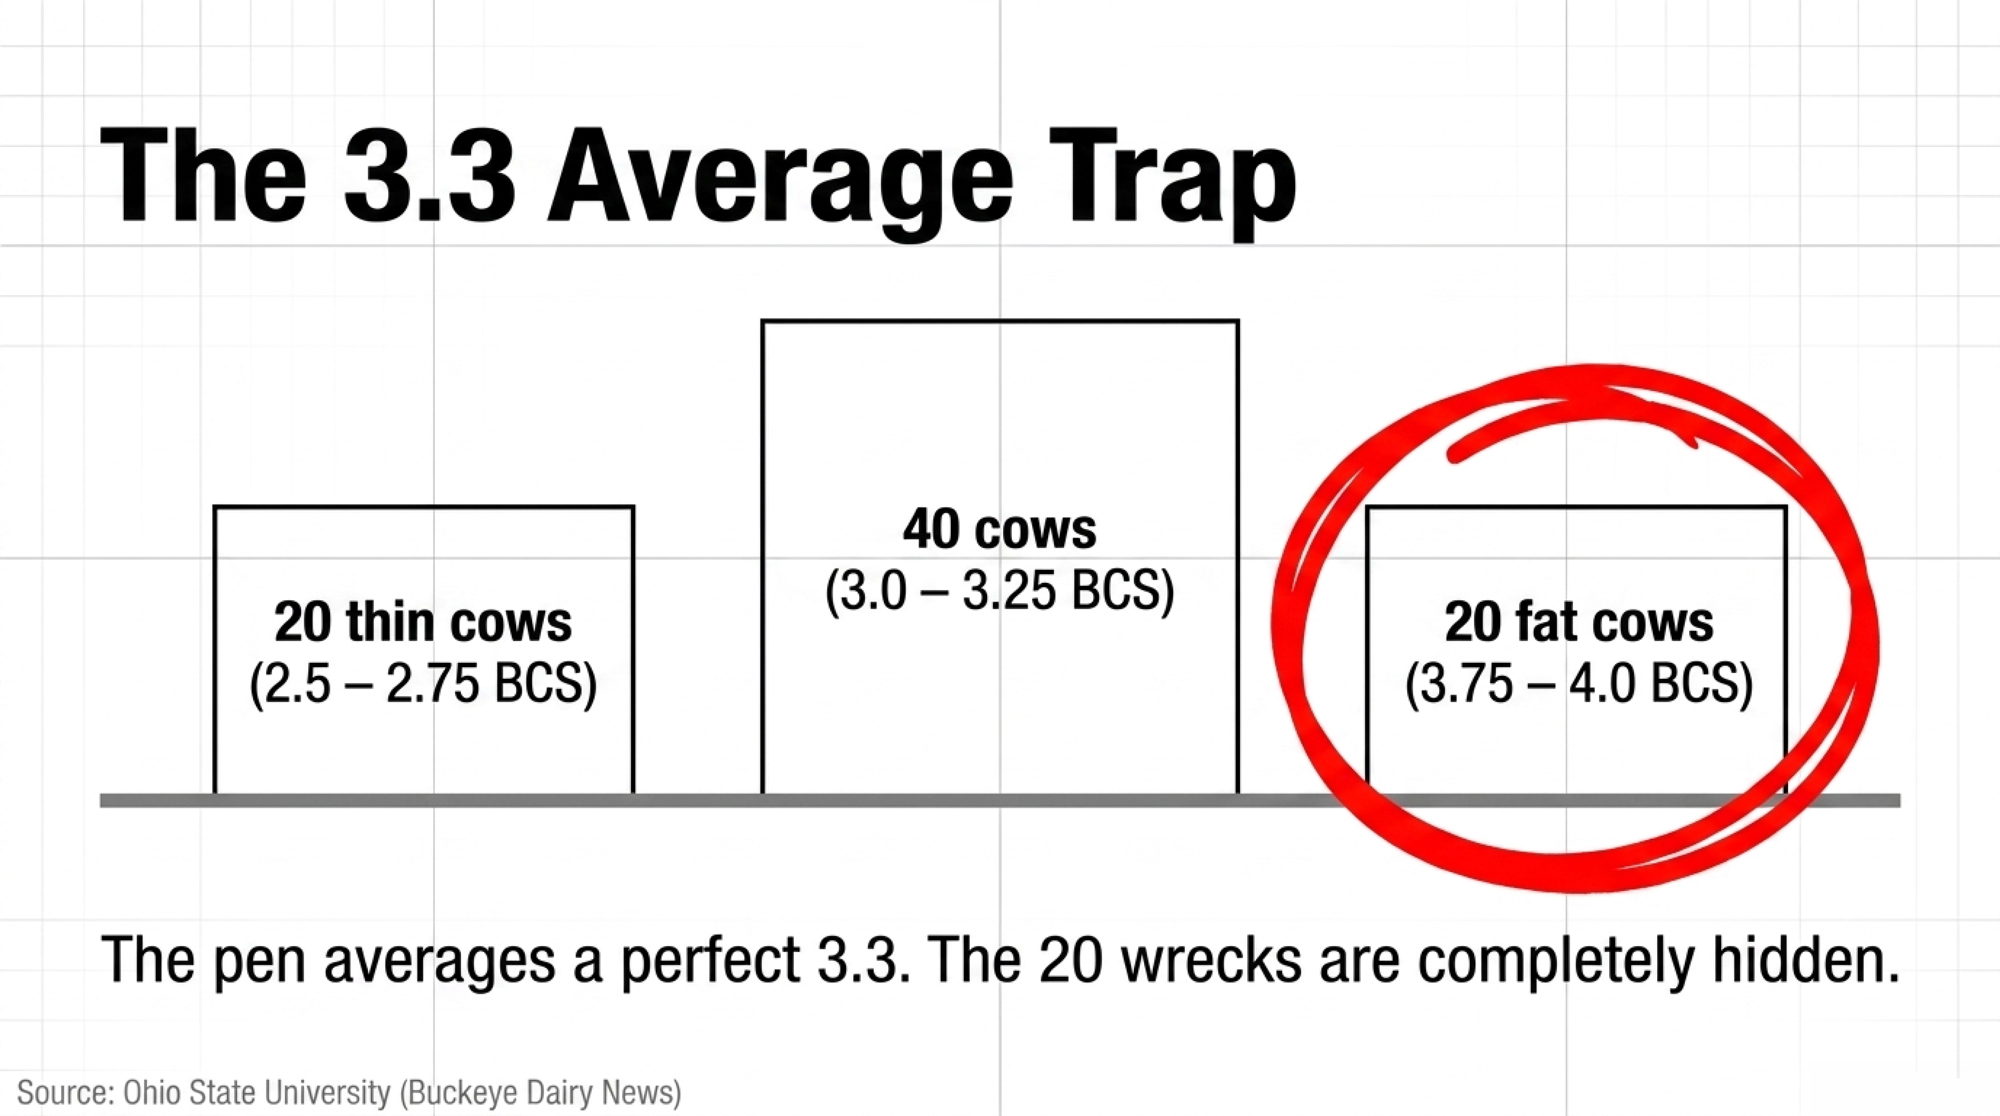
Here’s the uncomfortable math on a “3.3 average” late-lactation pen. Picture 80 cows in the high group. The nutritionist eyeballs 3.3. Score every animal individually and that pen will almost never match the eyeball average. An illustrative distribution — 40 cows at 3.0–3.25, 20 at 2.5–2.75, 20 at 3.75–4.0 — still averages near 3.3. The average is also lying.
Run the barn math on the fat tail. Using Gohary and Overton’s 2016 JDS cost-of-SCK model on Canadian herds — roughly $203 per case, split across clinical disease, extra days open, extra culling, and lost milk — up to 10 extra cases in that 20-cow fat-tail cohort pencil out to roughly $2,030. Add two DAs at a commonly cited $500 each, a midrange within DA cost ranges of roughly $250 to $900+ per case in U.S. and Canadian extension literature, and the total lands near $3,030 in one pen, in one transition cycle, before any pregnancy losses are factored in — the same 60-to-90-day cascade that writes your fresh-cow bill, sitting under a number every one of them signed off on.
Note the currency and scope. The Gohary and Overton figure is Canadian, circa 2016. 2026 U.S. costs likely run higher given feed, treatment, and replacement inflation. The $3,030 is illustrative, not a bank statement.
Scale it to your operation. On a 500-cow herd, the proportional numbers drop by roughly two-thirds. On a 3,000-cow operation, the same fat-tail share can stack into five-figure annual transition losses once you count multiple pens and multiple calving cycles. Order-of-magnitude math, not a precise forecast — but no dashboard labeled “3.3 average” would have flagged any of it. Layer in even one early pregnancy loss — a 2019 South American analysis modelled the average hit at roughly $2,333 per event — and the cost of leaving the fat tail alone gets harder to wave off. That’s the real cost of a lost pregnancy, before anyone factors in the cull-cow ripple.
A second scenario, scaled up. A 1,500-cow herd running roughly 600 calvings a year (depending on calving distribution) with a 15% baseline SCK rate is carrying about 90 SCK cases annually. Shift the calving-BCS distribution down — fewer cows at ≥3.75, more at ≤3.5 — and the 2025 SCK paper’s 5.55× and 0.45× multipliers say a meaningful share of those cases come off the board. Even a conservative 20-case reduction at $203 per case pencils to roughly $4,060 in avoided cost, before any DA or pregnancy-loss savings. Conservative. Directional. Worth pulling your own SCK rate and running the same math against your real calving distribution.
The Status Quo vs. The Active Protocol
| Metric | The “Average” Trap (3.3 Eyeball) | The Active Protocol (Individual Sorting) |
| Pregnancy loss odds | Baseline risk hidden inside the pen average | Roughly 5× lower for cows that hold condition |
| SCK risk in the fat tail | Hidden, treated downstream at 7 DIM | Identified at 150–220 DIM and mitigated before dry-off |
| Decision owner | “Everyone watches it” — nobody owns it | Named lead: herd manager, nutritionist, vet |
| Economic hit per pen / cycle | About $3,030+ in avoidable SCK and DA | About $30 milk traded per cow to save $200+ per SCK case |
| Tools driving the decision | Pen-average dashboards, fresh-cow surveillance | Individual scores, written triggers, 7-day move rule |
The Accountability Vacuum Nobody Owns
Ask a 1,500-cow operation who owns reproduction. Instant answer. Who owns feeding? The nutritionist. Fresh cows? The vet and the fresh-cow crew.
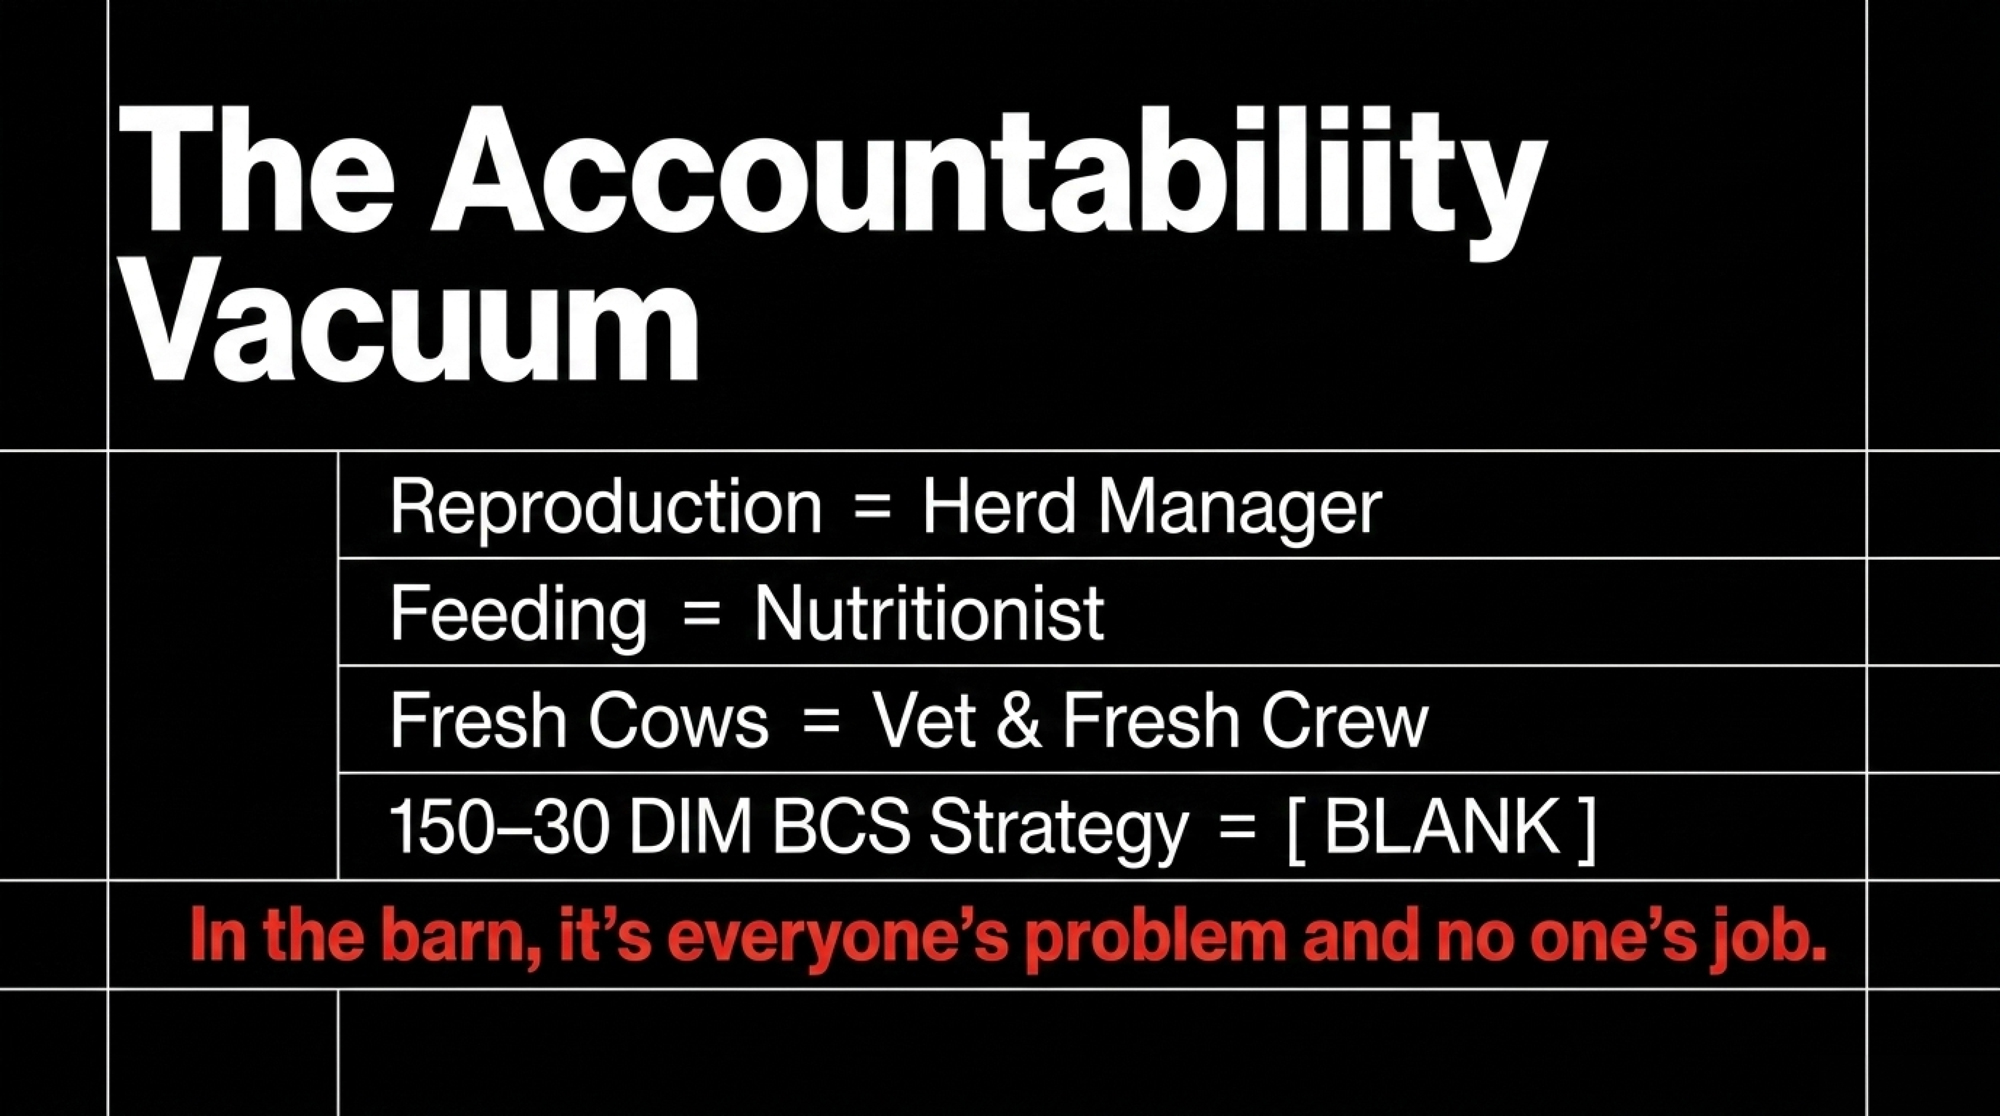
Now ask who owns BCS strategy from 150 DIM through 30 DIM of the next lactation. The usual answer is silence, or some version of “we all keep an eye on it.” On paper, the feeder and nutritionist should own over-conditioning. The herd manager should own group moves. The vet should tie BCS back to disease risk. In the barn, it’s everyone’s problem and no one’s job. A 2020 UBC-affiliated study on transition-management barriers found farmers and veterinarians working on the same farms held meaningfully different views of what the transition window even covered.
Recent behavioural research makes that harder to dismiss. A peer-reviewed study on BCS adoption found producers often described scoring as difficult or unnecessary on their operations, despite nearly five decades of extension pushing it. The barrier wasn’t knowledge. It was structure, time pressure, and the lack of a clear payoff landing in the same week the scoring did.
The honest read from advisors who walk these barns: most herds don’t have a disagreement about whether BCS matters. They have a disagreement about whose calendar it lives on. And until that calendar question gets answered in writing, the score on the page changes nothing in the pen.
What a Composite Midwestern Herd Saw When It Finally Scored Every Cow
Picture a 1,200-cow Midwestern operation — an illustrative composite, not a real farm — drawn from patterns Bullvine has seen on multiple 1,000–1,500 cow herds. Good people, good facilities, proud of the tank. One far-off dry pen, no fat-dry group. The nutritionist eyeballed late lactation at 3.25 to 3.3, and everyone was comfortable.
A note on the case study: The 1,200-cow operation below is a composite drawn from patterns Bullvine has seen across multiple 1,000–1,500 cow herds. No real farm is named. Cost figures are illustrative and anchored to the cited research, not to any single dairy’s books.
Over one winter, fresh-cow SCK on weekly strips drifted from the mid-teens into the mid-twenties. DAs ticked up by one or two per month. First-service conception dipped. The whole team started chasing: close-up ration, DCAD, fresh-pen stocking density. Six months later, the vet finally pushed for one month of individual scoring on every dry cow. The average came back 3.6. Roughly a third of the dry pen was ≥3.75.
In the composite, the moment of seeing three pages of individual scores against an eyeball average held for two years is the structural rethink. The DAs and most of the SCK cases were clustered inside that 3.75+ tail.
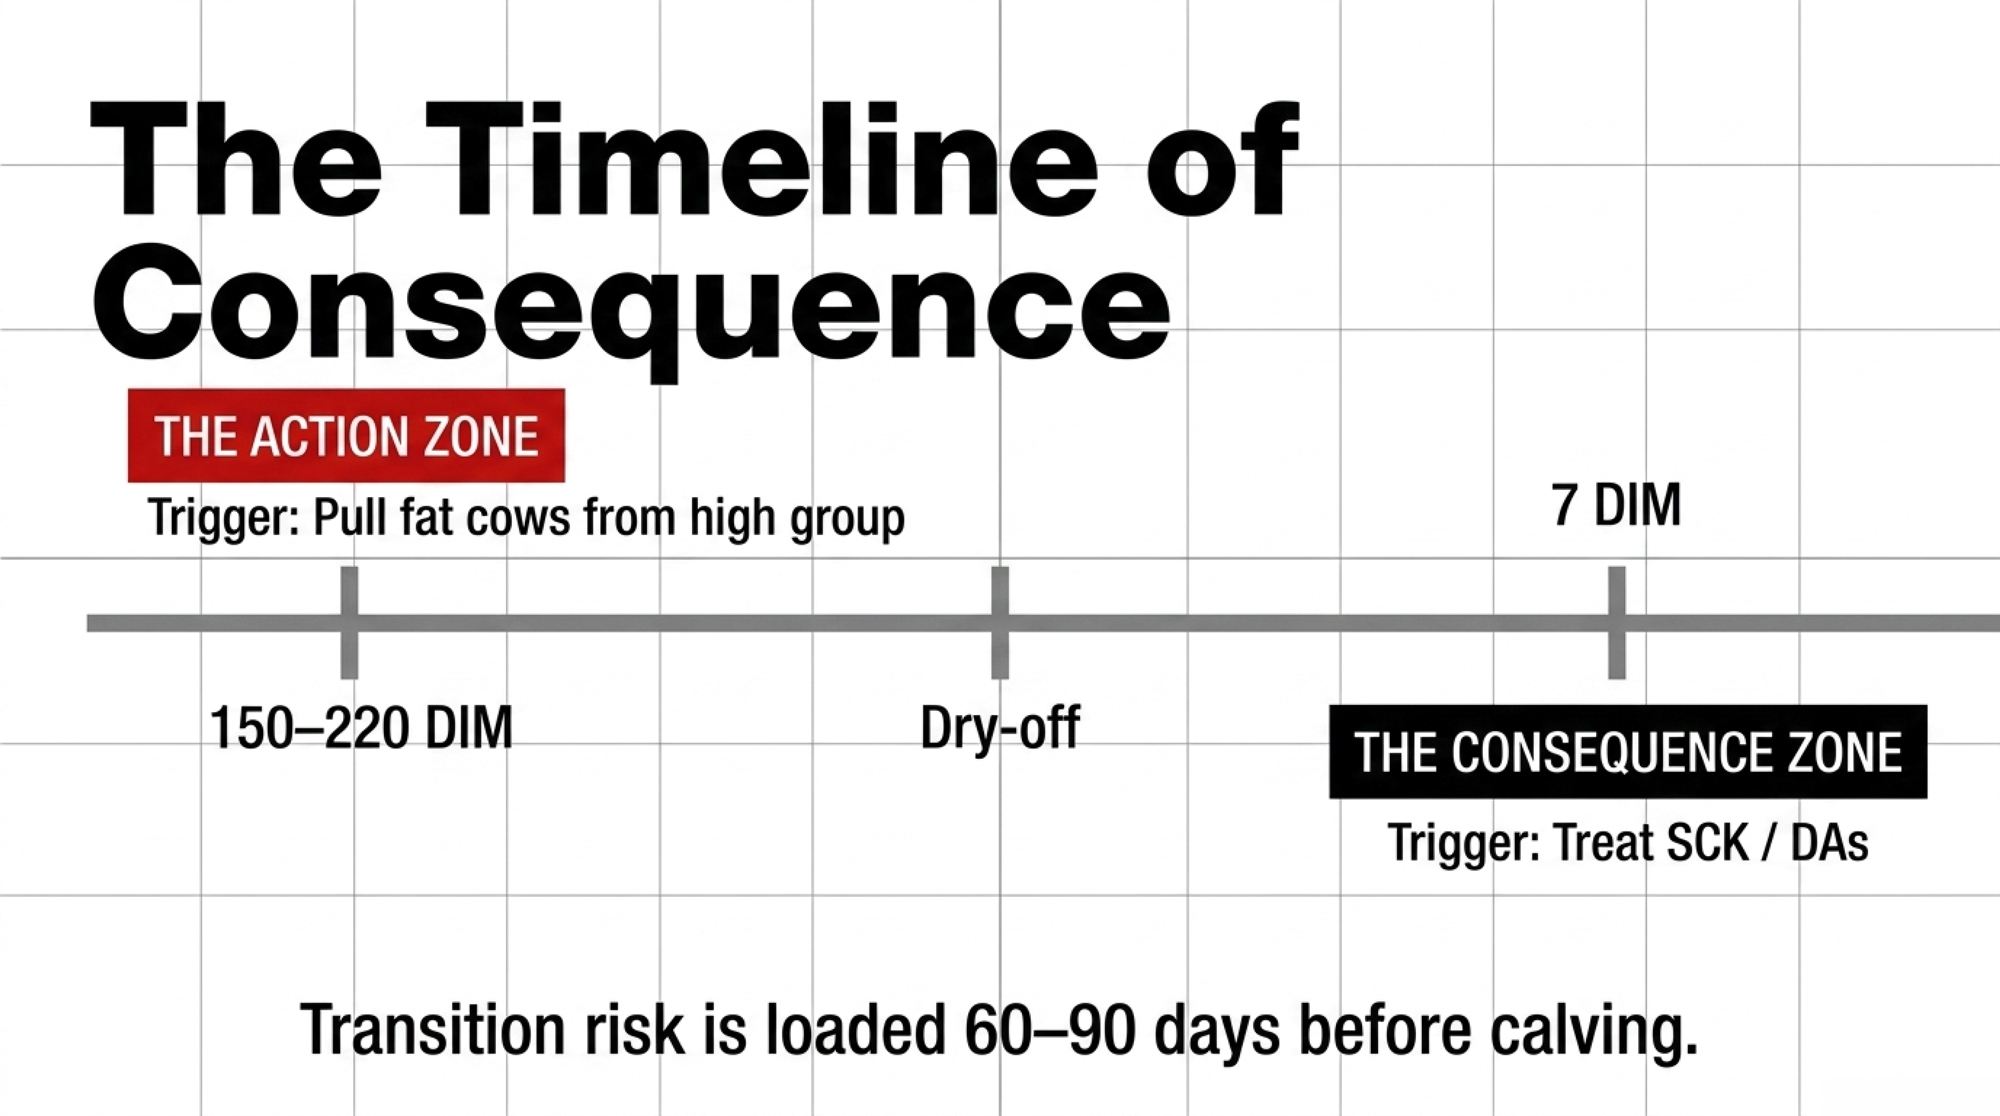
That’s the “oh, damn” moment. The problem wasn’t in the three weeks the team had been obsessing over. It was in the 150–220 DIM window and the dry pen nobody had scored.
Fresh-Pen Myopia Is Counting Casualties
| Tool / Practice | Window It Operates In | Type | What It Actually Detects | Decision Point It Can Change |
|---|---|---|---|---|
| BHB strips at 7 DIM | 0–14 DIM | 🔴 Surveillance | SCK after the fact | Treatment, not prevention |
| Rumination collars | Fresh pen | 🔴 Surveillance | Post-calving stress signal | Treatment timing |
| Inline milk BHB analyzers | Fresh pen | 🔴 Surveillance | Metabolic status post-calving | Treatment, extended VWP |
| Manual BCS at 150–220 DIM | Late lactation | 🟢 Prevention | Fat-tail loading in real time | Group move within 7 days |
| Manual BCS at dry-off | Far-off entry | 🟢 Prevention | Over-conditioned cows before they crash | Fat-dry pen assignment |
| Written BCS trigger protocol | Any stage | 🟢 Decision layer | Accountability gap | Moves, ration changes, vet flag |
| AI/overhead BCS camera | Any stage | 🟡 Depends on protocol | Individual scores at scale | Only preventive if written trigger exists |
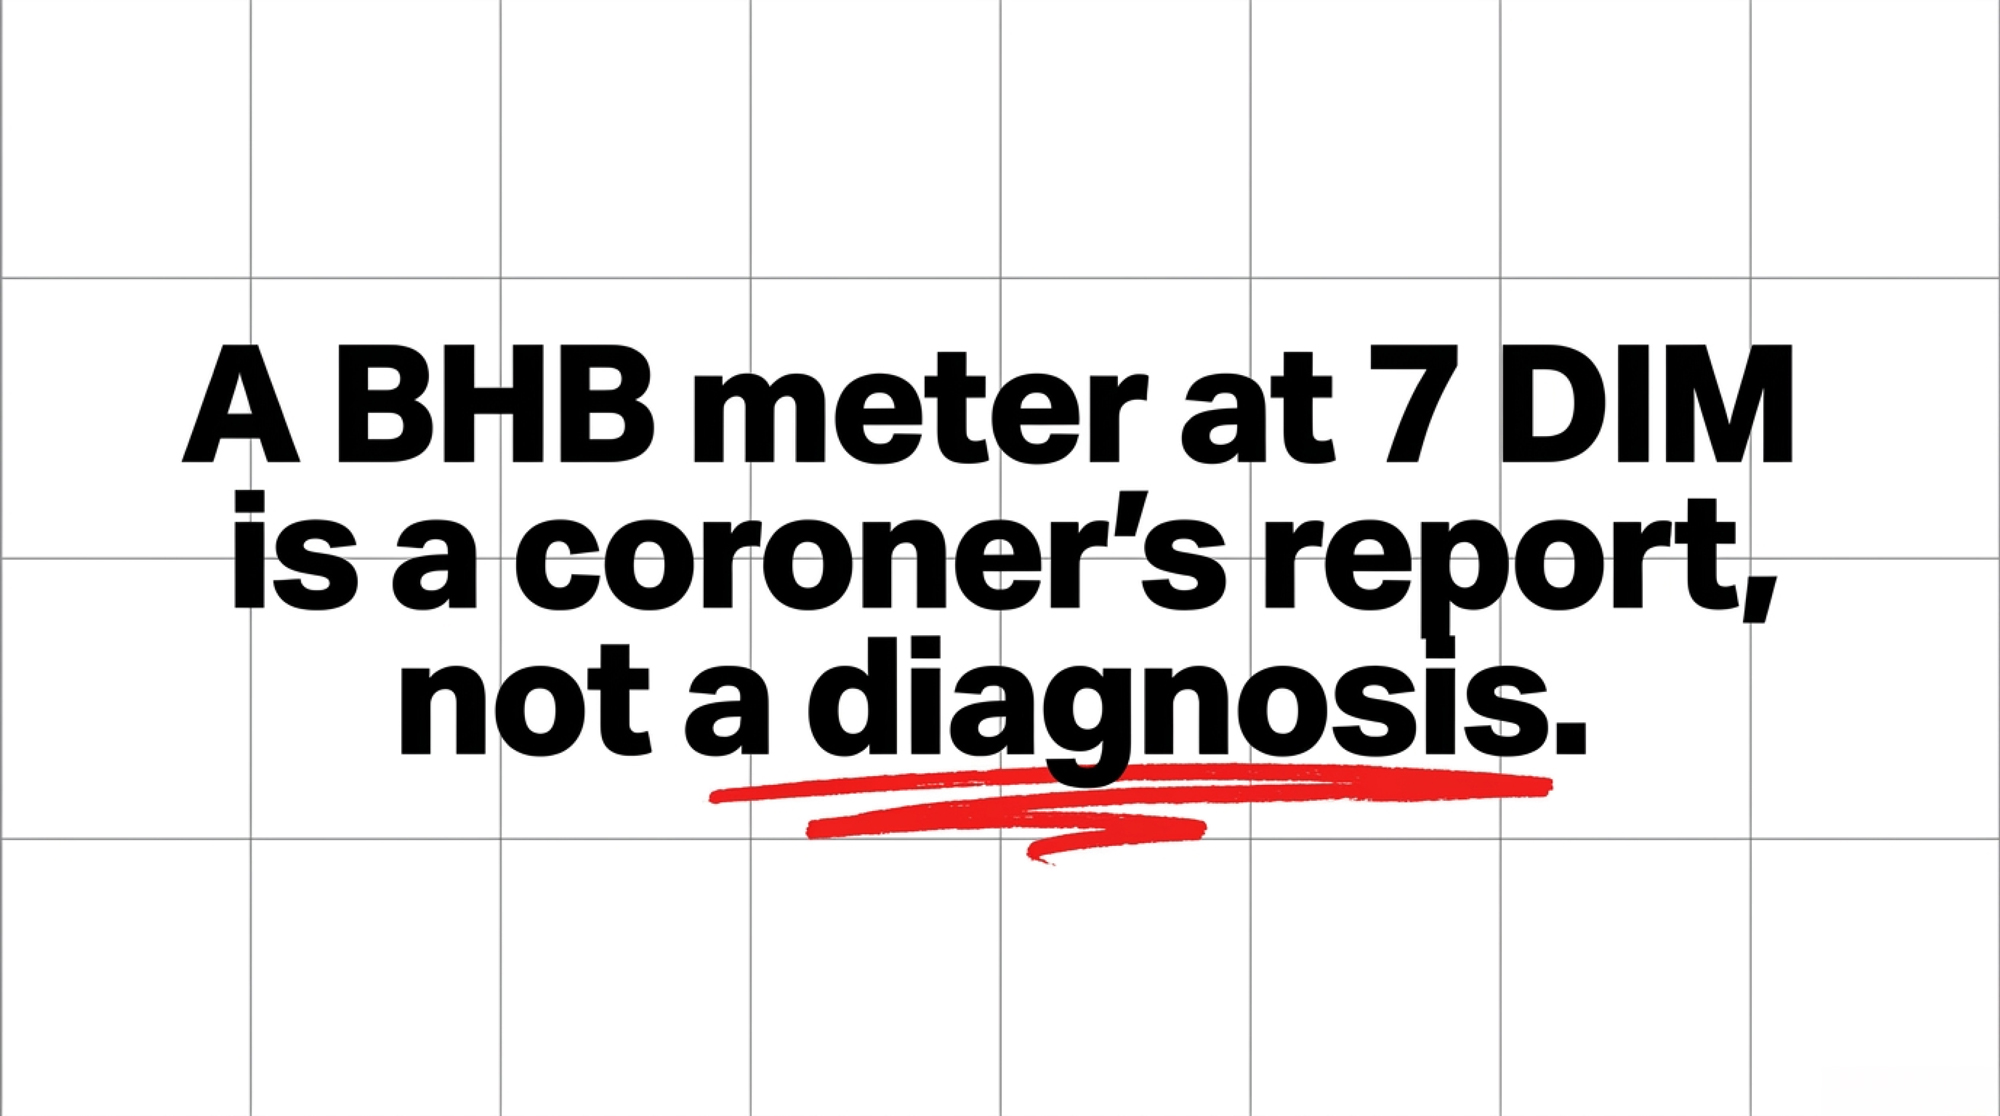
Most “precision” transition programs aren’t managing transition risk. They’re surveilling fresh cows. BHB meters at 7 DIM, rumination collars, inline analyzers, chalk on the rump — all tracking consequences that got locked in 60 to 90 days earlier, when a cow drifted from 3.25 to 3.75 and nobody moved her. A BHB meter at 7 DIM is a coroner’s report, not a diagnosis.
Extension guidance from Penn State’s dairy team, including Virginia Ishler and Jud Heinrichs, is blunt: if cows are consistently calving above 3.75, late-lactation energy intakes are too high and the calving-interval problem has to be addressed. Two uncomfortable conversations — ration and repro — packaged as one BCS observation. Most operations would rather note the pen is “a touch heavy” and keep milking. That’s where the transition gap between your neighbour’s fresh cows and yours often starts.
Can Your BCS Protocol Actually Fit on One Page?
If a farm can’t write down, on a single page, what specific action each BCS threshold triggers and who owns it, then BCS isn’t actually integrated into transition management. It’s just another number collected.
| Protocol Trigger | Threshold | Timing | Named Owner Required | Pass Criteria | Common Fail Mode |
|---|---|---|---|---|---|
| Late-lac fat-cow move | BCS ≥3.5 | 150–220 DIM | Herd manager approves; feeder executes | Written, name on file, executed within 7 days | “We watch the pen” — no move date, no name |
| Dry-off over-cond. group | BCS ≥3.75 at dry-off | Dry-off day | Nutritionist adjusts receiving ration | Separate fat-dry pen or documented ration change | Single dry-pen, no differentiation |
| Early-lac BCS-loss flag | ≥0.375 BCS units lost | Calving to 14–30 DIM | Vet + repro lead review breeding plan | Tagged in herd software; ketone screen mandatory | Bred on standard timeline regardless of BCS loss |
| Values statement sign-off | $30 milk traded vs. 0+ SCK | Ongoing | Farm owner / manager | Written, signed, posted | Verbal agreement only; quietly reversed under milk price pressure |
Three non-negotiable lines for a 1,500-cow operation:
- Trigger 1 — Late-lactation fat-cow move. Any pregnant cow at 150–220 DIM scoring ≥3.5 moves out of high group within seven days. Owner: herd manager approves, feeder executes, nutritionist adjusts the receiving pen’s ration by the next visit.
- Trigger 2 — Dry-off “fat dry” decision. Any cow at ≥3.75 BCS at dry-off goes to an over-conditioned dry group on a controlled-energy, high-forage ration — the approach Jim Drackley’s Illinois lab has published on since the mid-2000s. The goal isn’t to crash-diet her. Alberta Agriculture extension guidance on BCS and energy balance is explicit that over-conditioned cows at dry-off should not be fed to lose condition. Prevent further gain. Soften the postpartum crash.
- Trigger 3 — Early-lactation BCS loss red flag. Any cow losing ≥0.375 BCS units from calving to 14–30 DIM is tagged high-risk in herd software, gets mandatory ketone screening, and has her breeding plan reviewed by the vet and repro lead before first service.
None of that replaces ration design, close-up management, or heat abatement. It’s a trigger layer sitting on top of them. Where those fundamentals are already broken, BCS monitoring alone won’t fix them. If more than 20–25% of your dry cows score ≥3.75 consistently, the math on a second dry-cow pen starts to pencil against the labor and capex of building it.
The Fourth Line — The Values Statement
“We will pull profitable high-producers out of high group early if their BCS crosses 3.5 at 150–220 DIM.”
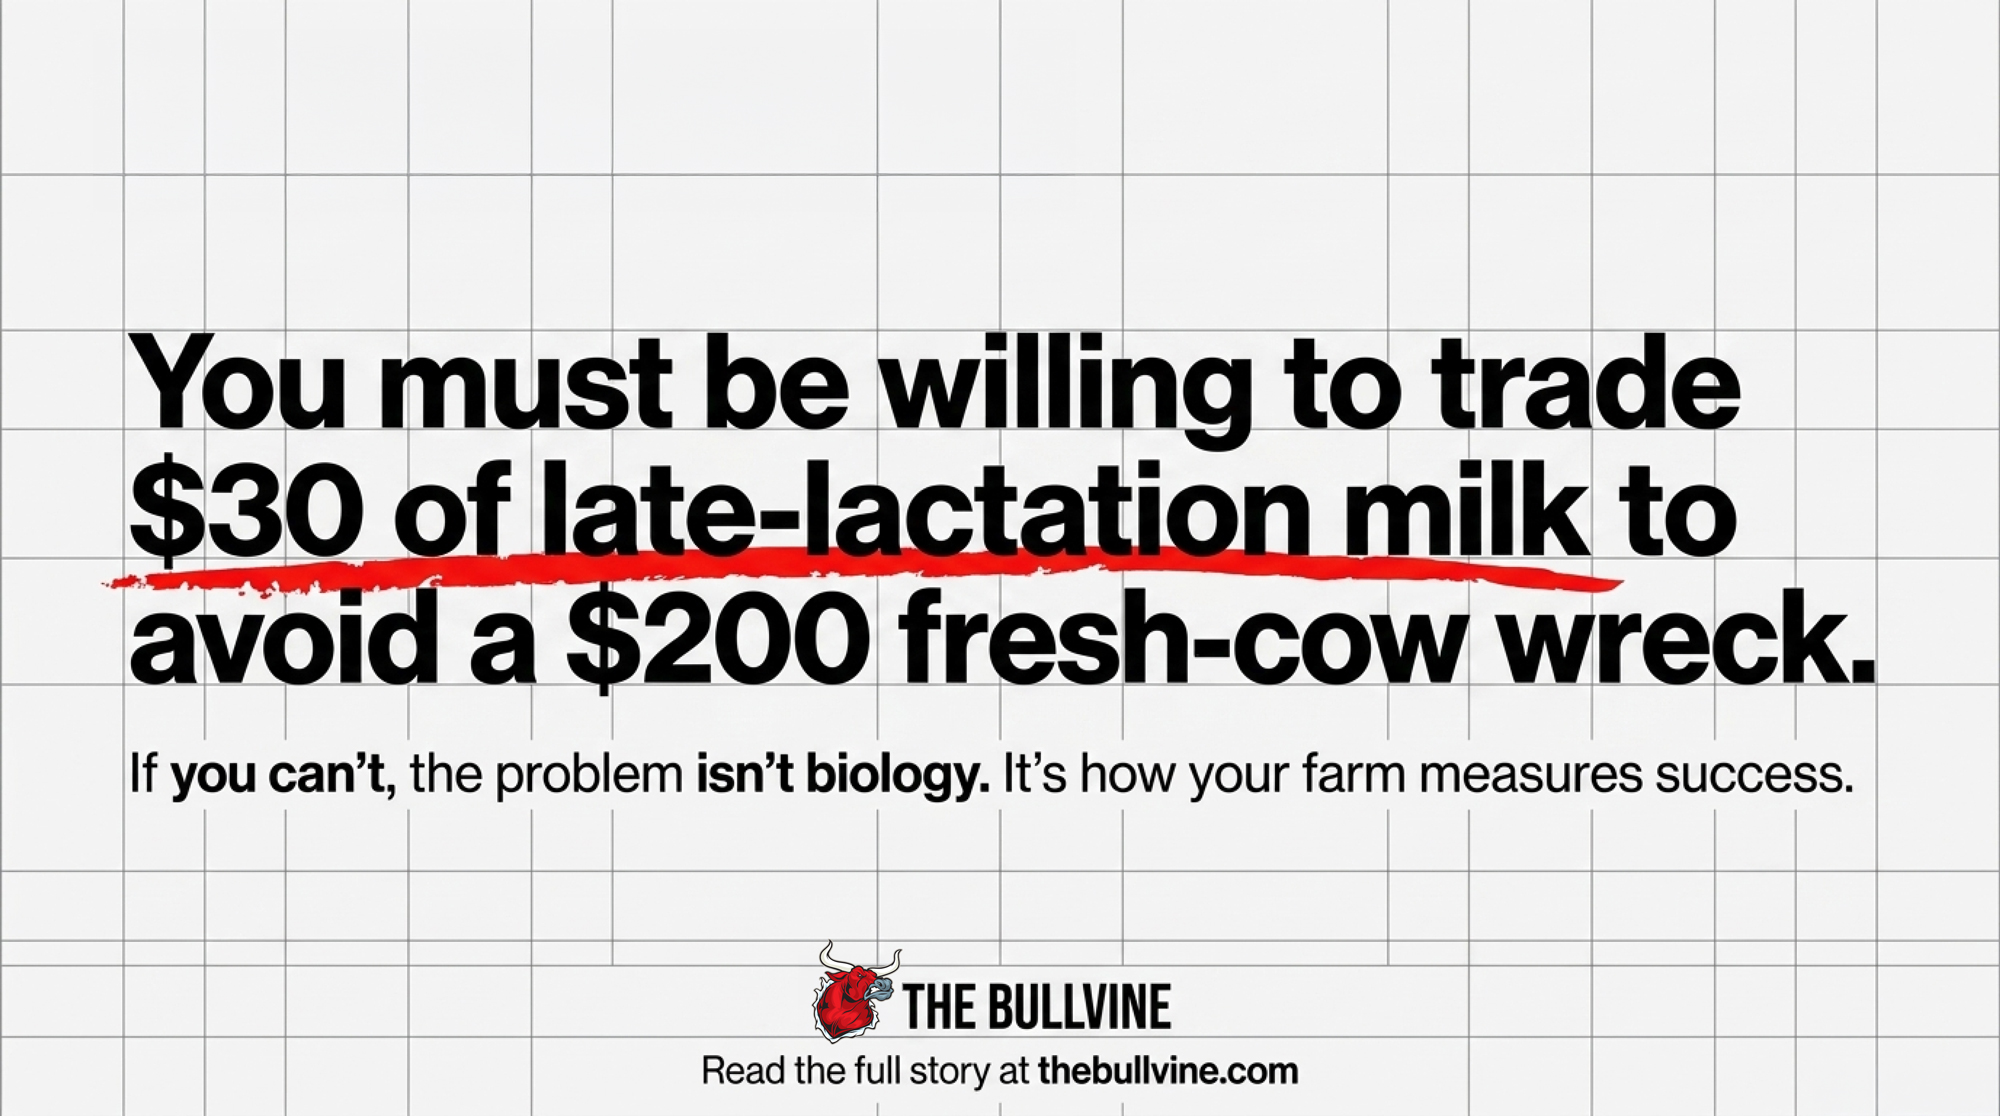
That’s not a protocol tweak. It’s a values statement. It says the farm will trade roughly $30 of late-lactation milk per cow — 5 lb/day lost across 30 days at a milk price near $0.20/lb, adjusted to your regional mailbox price before running the trade for your own herd — for a shot at avoiding a $200+ SCK bill, or a much larger pregnancy-loss hit, three months later.
Until someone with authority signs that line, the other three triggers get quietly neutered.
Before You Spend Six Figures on a BCS Camera
DeLaval, CattleEye, and Herd-i are among the vendors active in this space. The independent peer-reviewed validation base for overhead AI BCS systems on commercial AMS herds remains thin, particularly at the high and low ends of the BCS distribution. That’s where the highest-risk cows live — and that’s the part of the curve any farm weighing a six-figure install needs published evidence on.
A 2019 University of Kentucky validation study compared an automated 3D BCS system against manual scoring on a research herd; the published agreement statistics and the conditions under which agreement declined are available in the paper and should be read directly before any purchase conversation. DeLaval, CattleEye, and Herd-i were offered the opportunity to comment on the independent validation landscape ahead of publication; their responses, where received, are reflected in this section.
Before any camera — from any vendor — lands on a purchase order, request the underlying peer-reviewed validation studies and read them yourself. Pay attention to herd type (AMS vs. parlor), herd size, lighting conditions, and behaviour at the BCS extremes. The labor trade-off cuts the other way: a weekly manual scoring protocol on a 1,500-cow operation costs real herd-manager hours — predictable, cheaper than a six-figure install, and under your team’s control. A camera removes the labor. It doesn’t remove the harder problem.
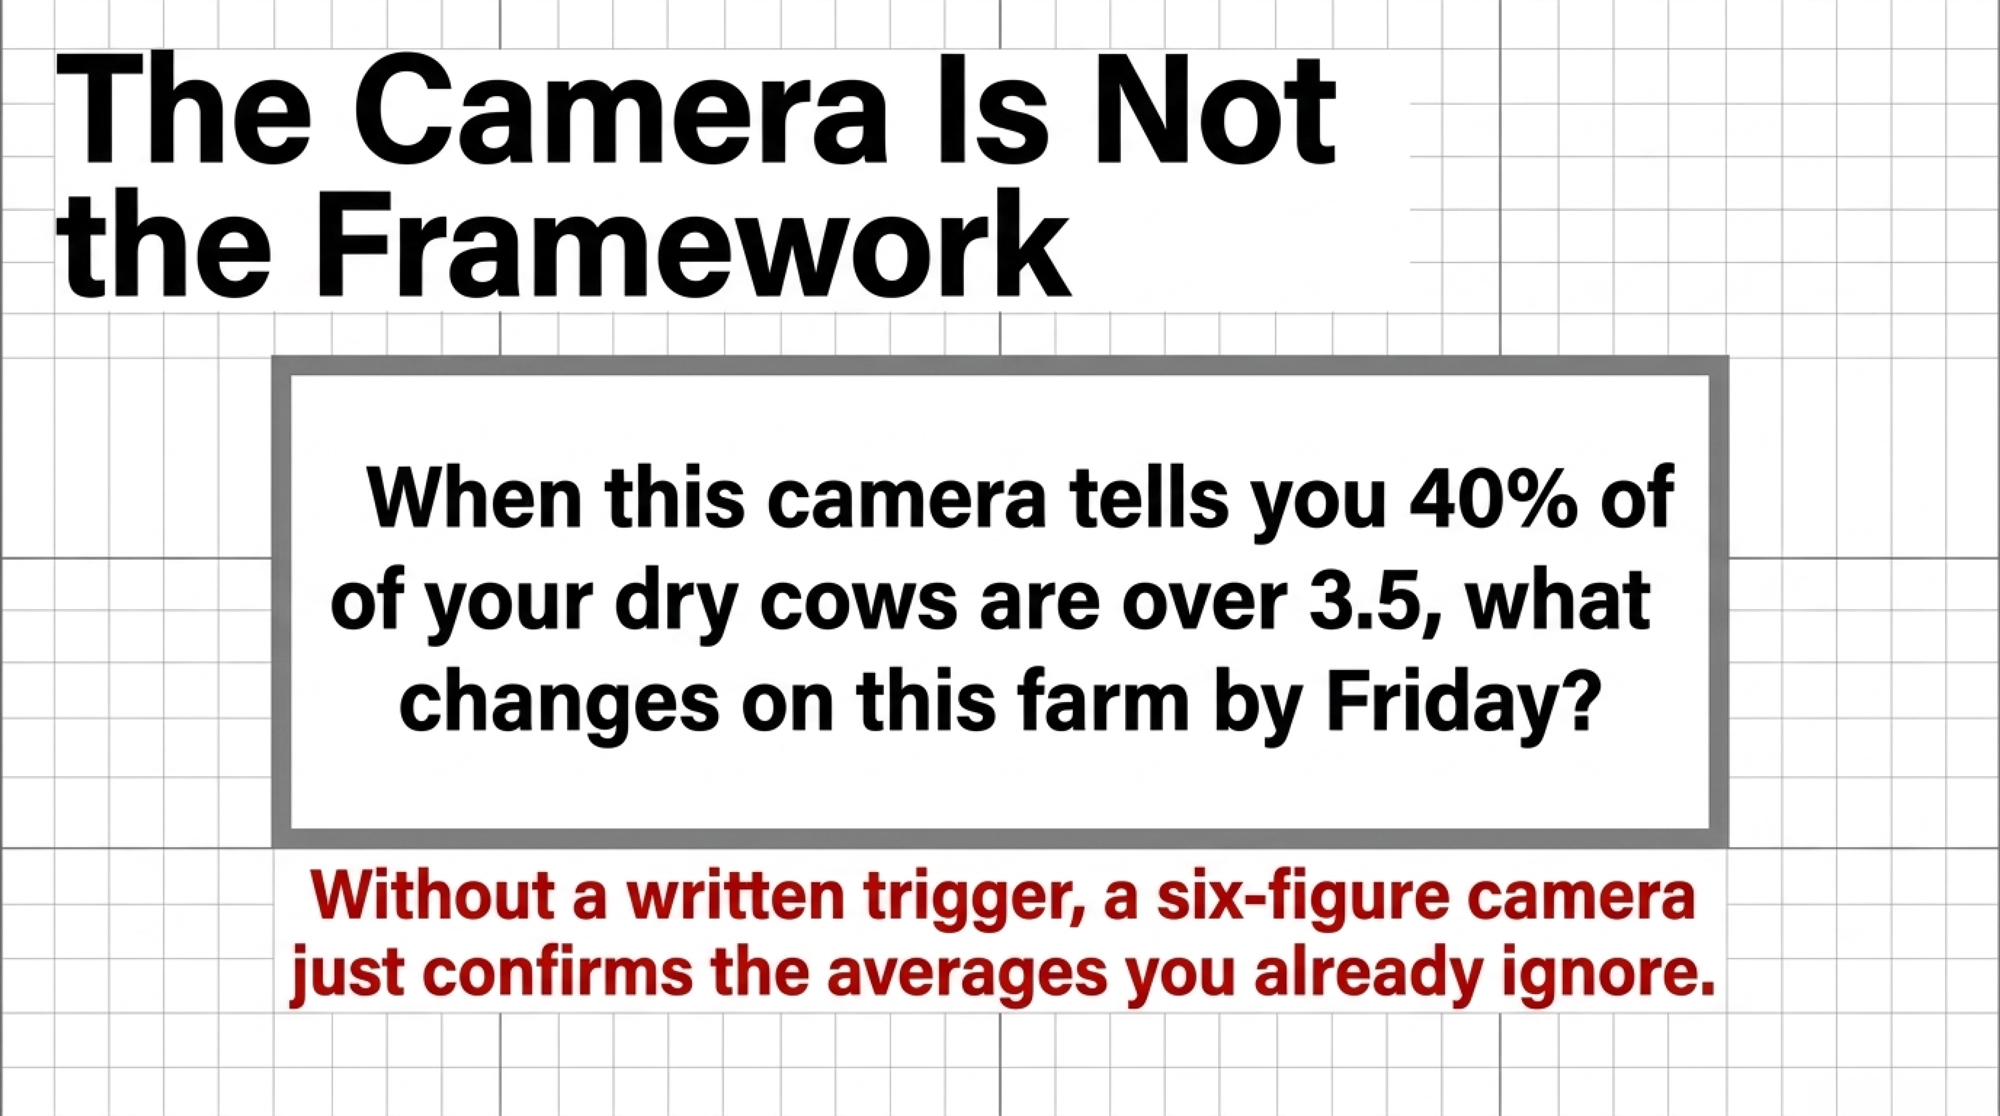
That harder problem is the decision link. Sit across from the farm before any install and ask one question: “When this thing tells you 40% of your dry cows are over 3.5 next month, what changes on this farm by Friday?” The usual answers — calling the nutritionist, watching them closer, considering moves — signal the missing written link between data and action. Without that link, adding any camera is a more expensive way to confirm the same averages the farm has been ignoring. The tool isn’t the problem. The missing decision framework is.
What This Means for Your Operation
- Can you name, by name, the person who owns BCS strategy from 150 DIM through 30 DIM of the next lactation? If the answer is “we all watch it,” nobody does.
- Do you have the actual BCS distribution of your current dry pen — not the nutritionist’s eyeball average? Pull one pen this week and score every cow individually. Compare what you find to what you would have guessed.
- What specific, written action triggers when an individual cow hits 3.5 at 180 DIM? If “we’ll catch her at dry-off” is still the plan, published dry-period data suggests that usually doesn’t work — over-conditioned cows tend to hold or keep drifting on a standard far-off ration.
- Is your dry-cow program one pen or two? If it’s one, what happens to the 20–30% of cows who calve at ≥3.75 without a separate strategy?
- When a cow loses ≥0.375 BCS in her first 30 DIM, does anything change in her breeding plan, or does she get bred on the same timeline as a cow that held condition? Krogstad and Bradford’s numbers say she shouldn’t.
- What’s the shortest sentence your herd manager and nutritionist can both agree on that describes when a high-producing pregnant cow leaves high group? If that sentence doesn’t exist, neither does your protocol.
- If a camera system lands tomorrow and flags 40% of your dry cows at ≥3.5, what exact action does that trigger by Friday? The answer needs to be shorter and more specific than you’d like.
Key Takeaways
- If more than 10% of your 150–220 DIM cows are ≥3.5 BCS, per the cited research your transition risk is already loaded 60–90 days before calving — not at the close-up pen.
- If dry-off BCS averages ≥3.5 across the herd and first-30-DIM subclinical ketosis sits above 15%, the cited research suggests those are almost certainly connected, not coincidental.
- If your one-page protocol can’t fit on one page, it isn’t a protocol. It’s a philosophy.
- If you can’t trade $30 of late-lactation milk per cow to avoid a $200+ SCK bill on the same cow, the economic problem isn’t BCS. It’s how your farm measures success.
What to Do in the Next 30 Days
This month, pull one pen — late lactation or dry — and score every cow individually. Write the distribution, not the average. If more than one in five cows is above 3.5 where you didn’t expect them, you’ve found the tail that’s quietly loading your next transition cycle.
Then sit down with your nutritionist, herd manager, and vet and answer one question in writing: Who owns what this data says, and what happens because of it, within seven days?
The 90-day test: pull fresh-cow SCK, DA, and metritis rates for the cohort calving after the protocol goes live and compare to the six months before. The 365-day test: decide whether the year-over-year change in disease rate and pregnancy loss justifies infrastructure changes — a fat-dry pen, a camera, a low-energy late-lactation group.
The Binary You’re Actually Deciding
The math isn’t just about biology. It’s about the integrity of your management system. A herd that refuses to manage the fat tail because it’s chasing the last five pounds of late-lactation milk isn’t being aggressive. It’s being reckless with its own future.
If you can’t see the individual cow through the fog of the pen average, you aren’t managing a transition program. You’re just waiting for the wreck to happen. So which pen will you score first — and whose name goes next to it on Monday?
All cost figures in this article are illustrative; no real farm is named in the case study. Research findings are attributed by author, paper, and year; readers wanting full statistical detail are directed to the cited primary sources.
Run Your Numbers
Herd Health ROI Calculator — Plug in your herd size, culling rate, mastitis incidence, and milk price to see what reducing SCK, premature culling, and transition disease is actually worth per cow — in real dollars, not extension estimates.
Learn More
- The Hidden Money in Every Step: Turning Hoof Health into Strategic Dairy Profit — Mastering the timing of hoof trims secures your fresh-pen investments against cascading disease costs. This breakdown connects lame close-up cows directly to transition failures, revealing how one schedule shift protects the exact vulnerable window Ohio State exposed.
- Holstein Canada’s Governance Rewrite Passed. 0.8% of Members Voted — Follow the money on a 141-year governance rewrite that fundamentally shifts breed control away from local producers. Exposing the operational deficit behind recent surplus claims proves how structural association changes will directly dictate the value of your genetic portfolio.
- The Economic Reality of Pellet-Free Robotic Milking. A Retrofit Barn Could Lose $71K Trying — Hard fetch-rate data dismantles the pellet-free automation hype currently sweeping AMS dealer meetings. This analysis arms you with the unvarnished free-flow traffic numbers required before you risk a massive revenue hit chasing lower feed bills in a retrofit barn.
 The Sunday Read Dairy Professionals Don’t Skip.
 The Sunday Read Dairy Professionals Don’t Skip.
Every week, thousands of producers, breeders, and industry insiders open Bullvine Weekly for genetics insights, market shifts, and profit strategies they won’t find anywhere else. One email. Five minutes. Smarter decisions all week.
