


Hilmar and Leprino built 8-million-pound-a-day cheese plants right over the thinnest Ogallala water — and the lenders financing the dairies that fill those tankers are already pricing the decline.
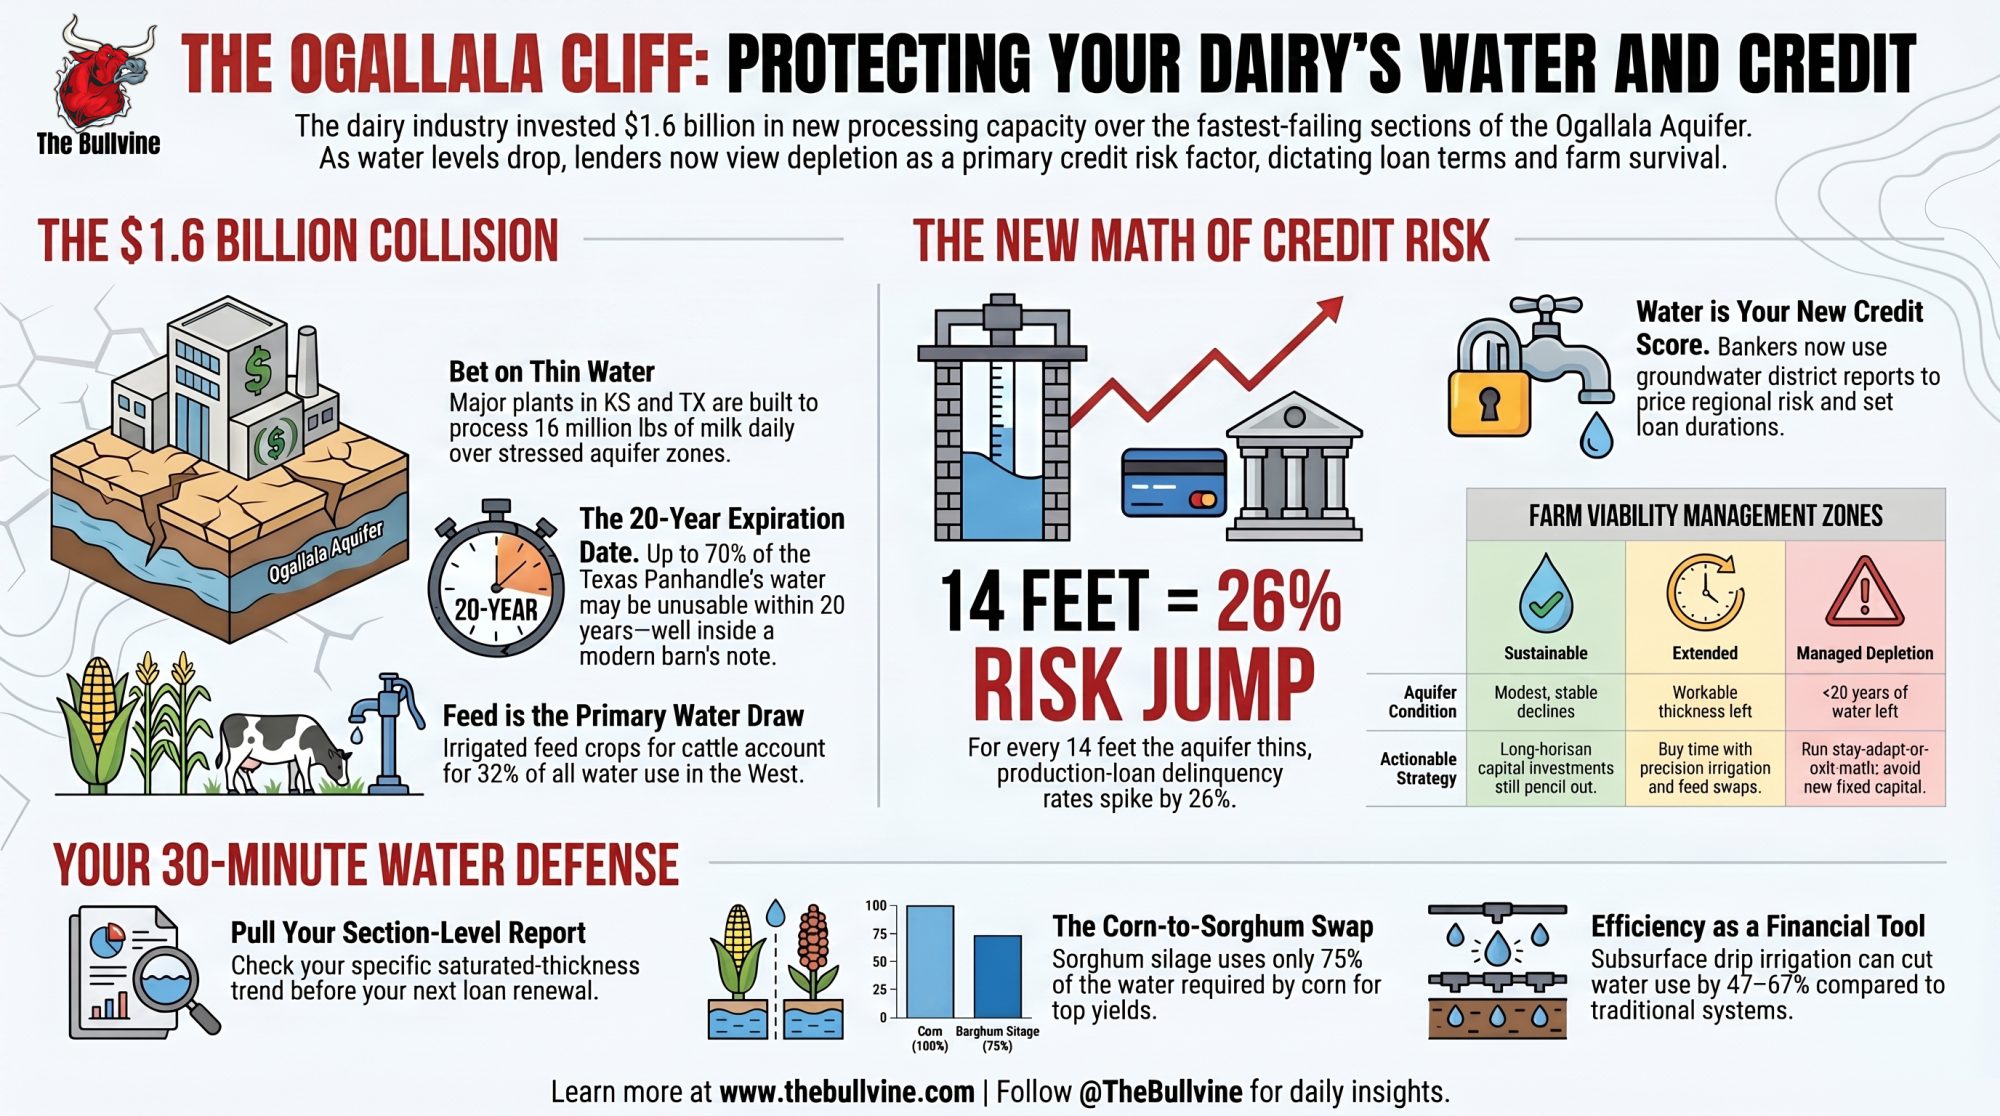
Executive Summary: Southwest Kansas lost 1.52 feet of Ogallala water in 2024, its steepest single-year drop yet, and a 2025 University of Tennessee–USDA study found that every 14 feet the aquifer falls lines up with a 26% jump in production-loan delinquencies. That turns your section map into a credit document. Meanwhile, dairy committed about $1.6 billion to new cheese plants in Texas, Kansas, and the I-29 corridor — and the herds filling those plants sit right on the fastest-failing parts of the aquifer. One University of Texas projection has up to 70% of the Texas Panhandle’s section unusable within roughly 20 years, well inside the life of a barn note signed today. The 30-minute move that beats your banker to the math: pull your groundwater district’s section-level report and find out whether you’re in sustainable, extended, or managed-depletion territory before your next renewal.
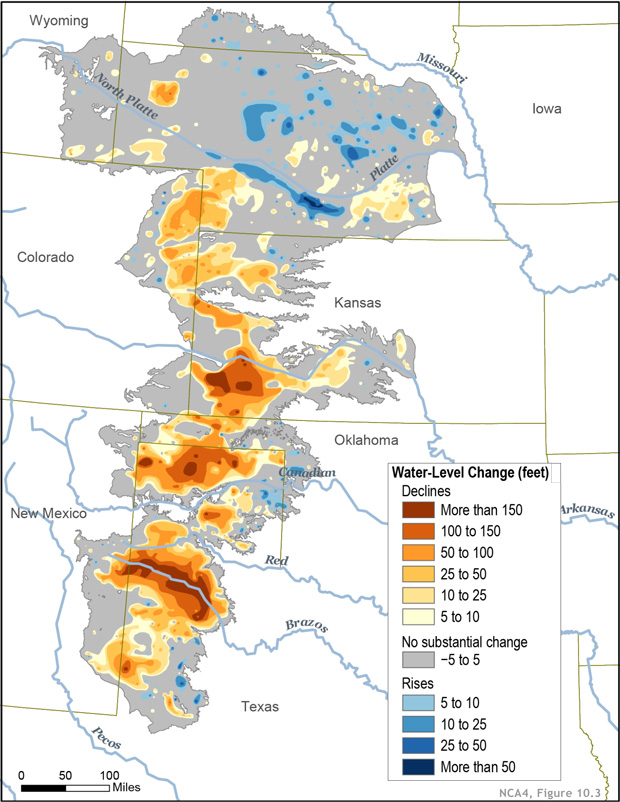
The Ogallala Aquifer underlies parts of Colorado, Kansas, Nebraska, New Mexico, Oklahoma, South Dakota, Texas, and Wyoming. From wheat and cows to corn and cotton, the regional economy depends almost exclusively on agriculture irrigated by Ogallala groundwater. But according to the Fourth National Climate Assessment (NCA4), producers are extracting water faster than it is being replenished, which means that parts of the Ogallala Aquifer should be considered a nonrenewable resource.
A-Tex Dairy in the Texas Panhandle did something that tells you exactly where dairy is headed: it cut corn acres. The operation grows fewer acres of corn now and leans harder on drought-hardier crops like sorghum and wheat, because it was responding directly to water shortages. “Double cropping” is how they describe stretching the same ground further on less water. That’s not a conservation gesture. That’s an operator reading the well and adjusting before the well forces the issue.
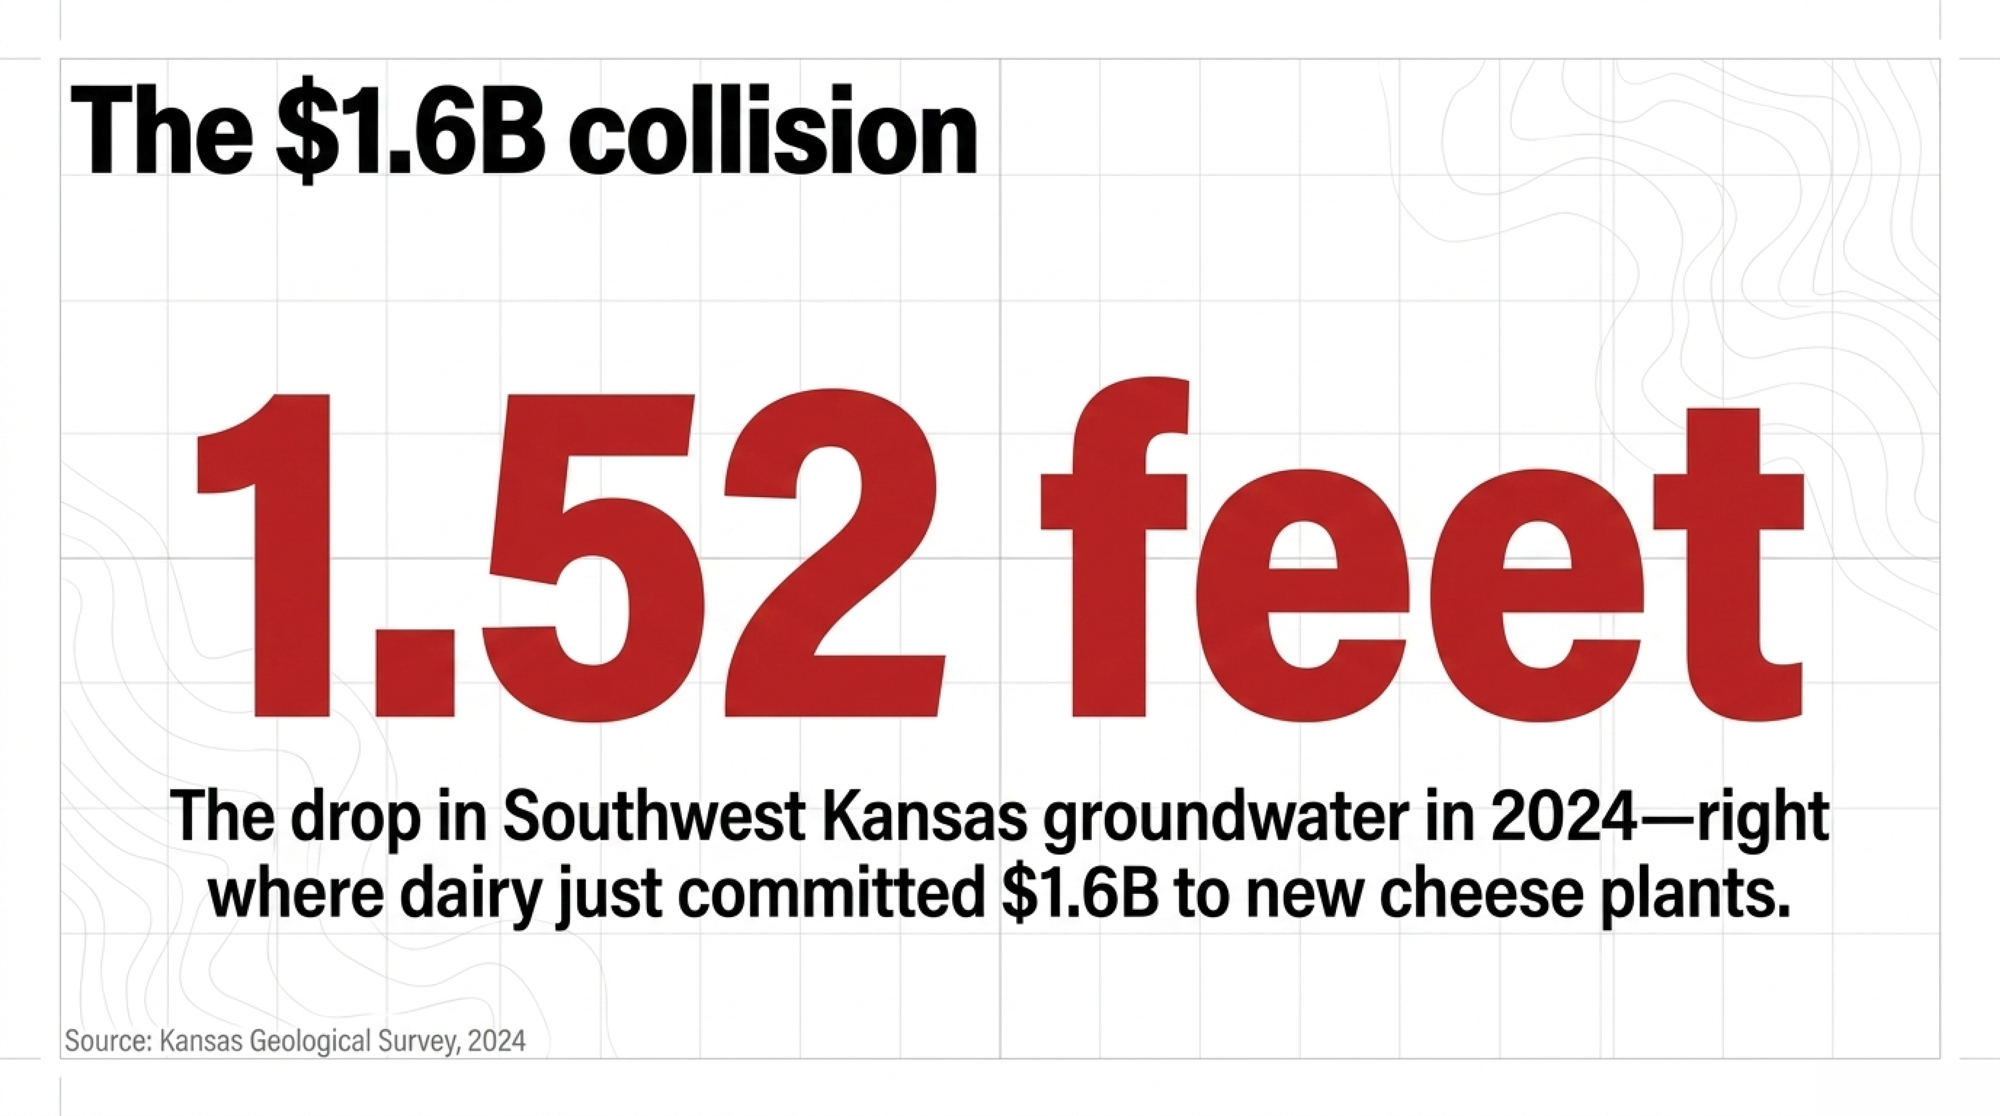
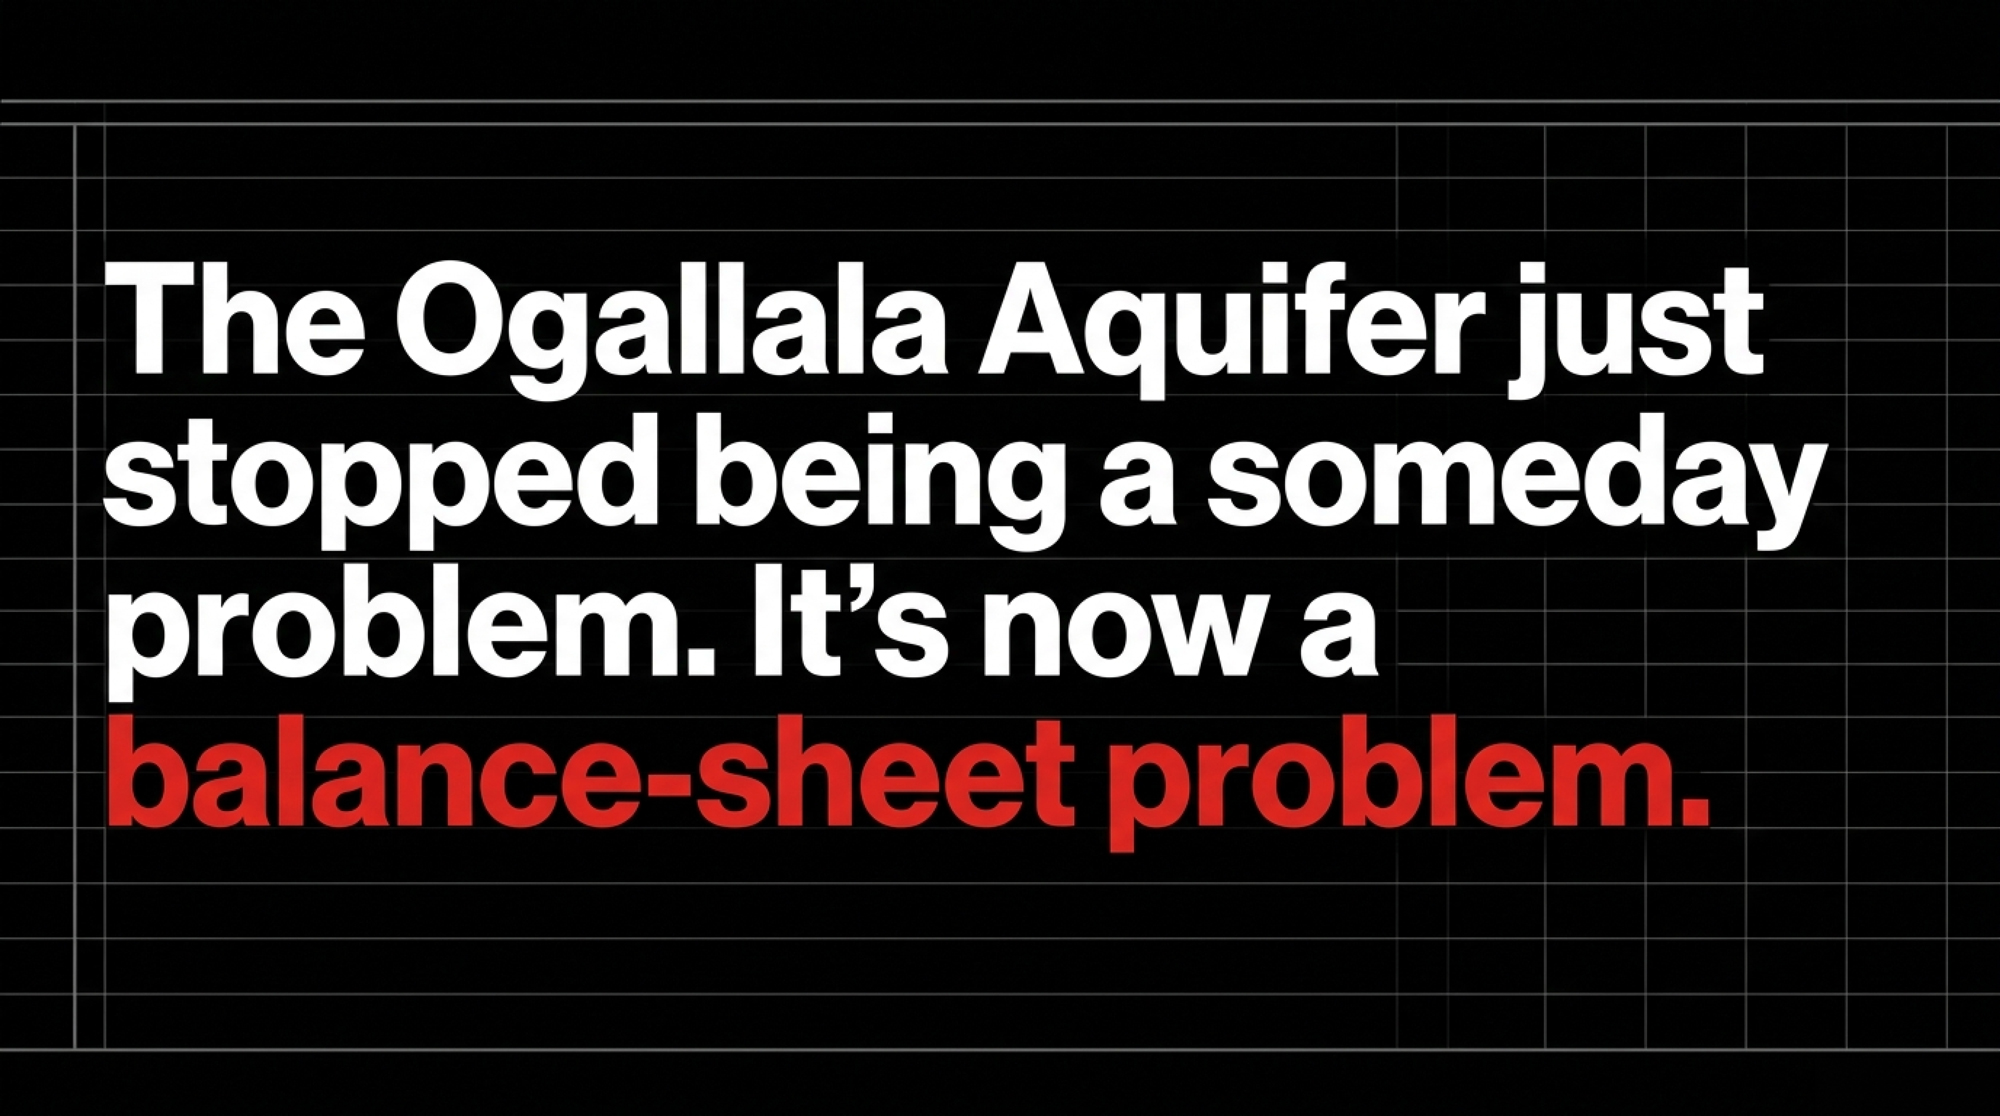
Here’s why it matters to you, wherever you milk. The Ogallala Aquifer is one of the largest underground stores of freshwater in the nation, and it’s dropping fast in exactly the places where dairy has expanded hardest. In the groundwater area covering southwest Kansas, levels fell 1.52 feet in 2024 — a bigger drop than the 1.43-foot decline the year before. And a 2025 study presented at the AAEA & WAEA Joint Annual Meeting found that as the aquifer thins, farm loan delinquencies climb, so the people who finance dairies have real reason to treat that decline as a credit risk, not an environmental footnote. When your banker starts pricing your water, the Ogallala stops being a someday problem. It’s a balance-sheet problem.
What’s Actually Changing
The Ogallala supplies the western third of Kansas and supports roughly a fifth of the nation’s agricultural output, providing close to a third of the groundwater used for irrigation in the U.S. For decades, irrigators have drawn water out faster than rain puts it back. Recharge across much of the region runs about an inch a year. The declines get measured in feet.
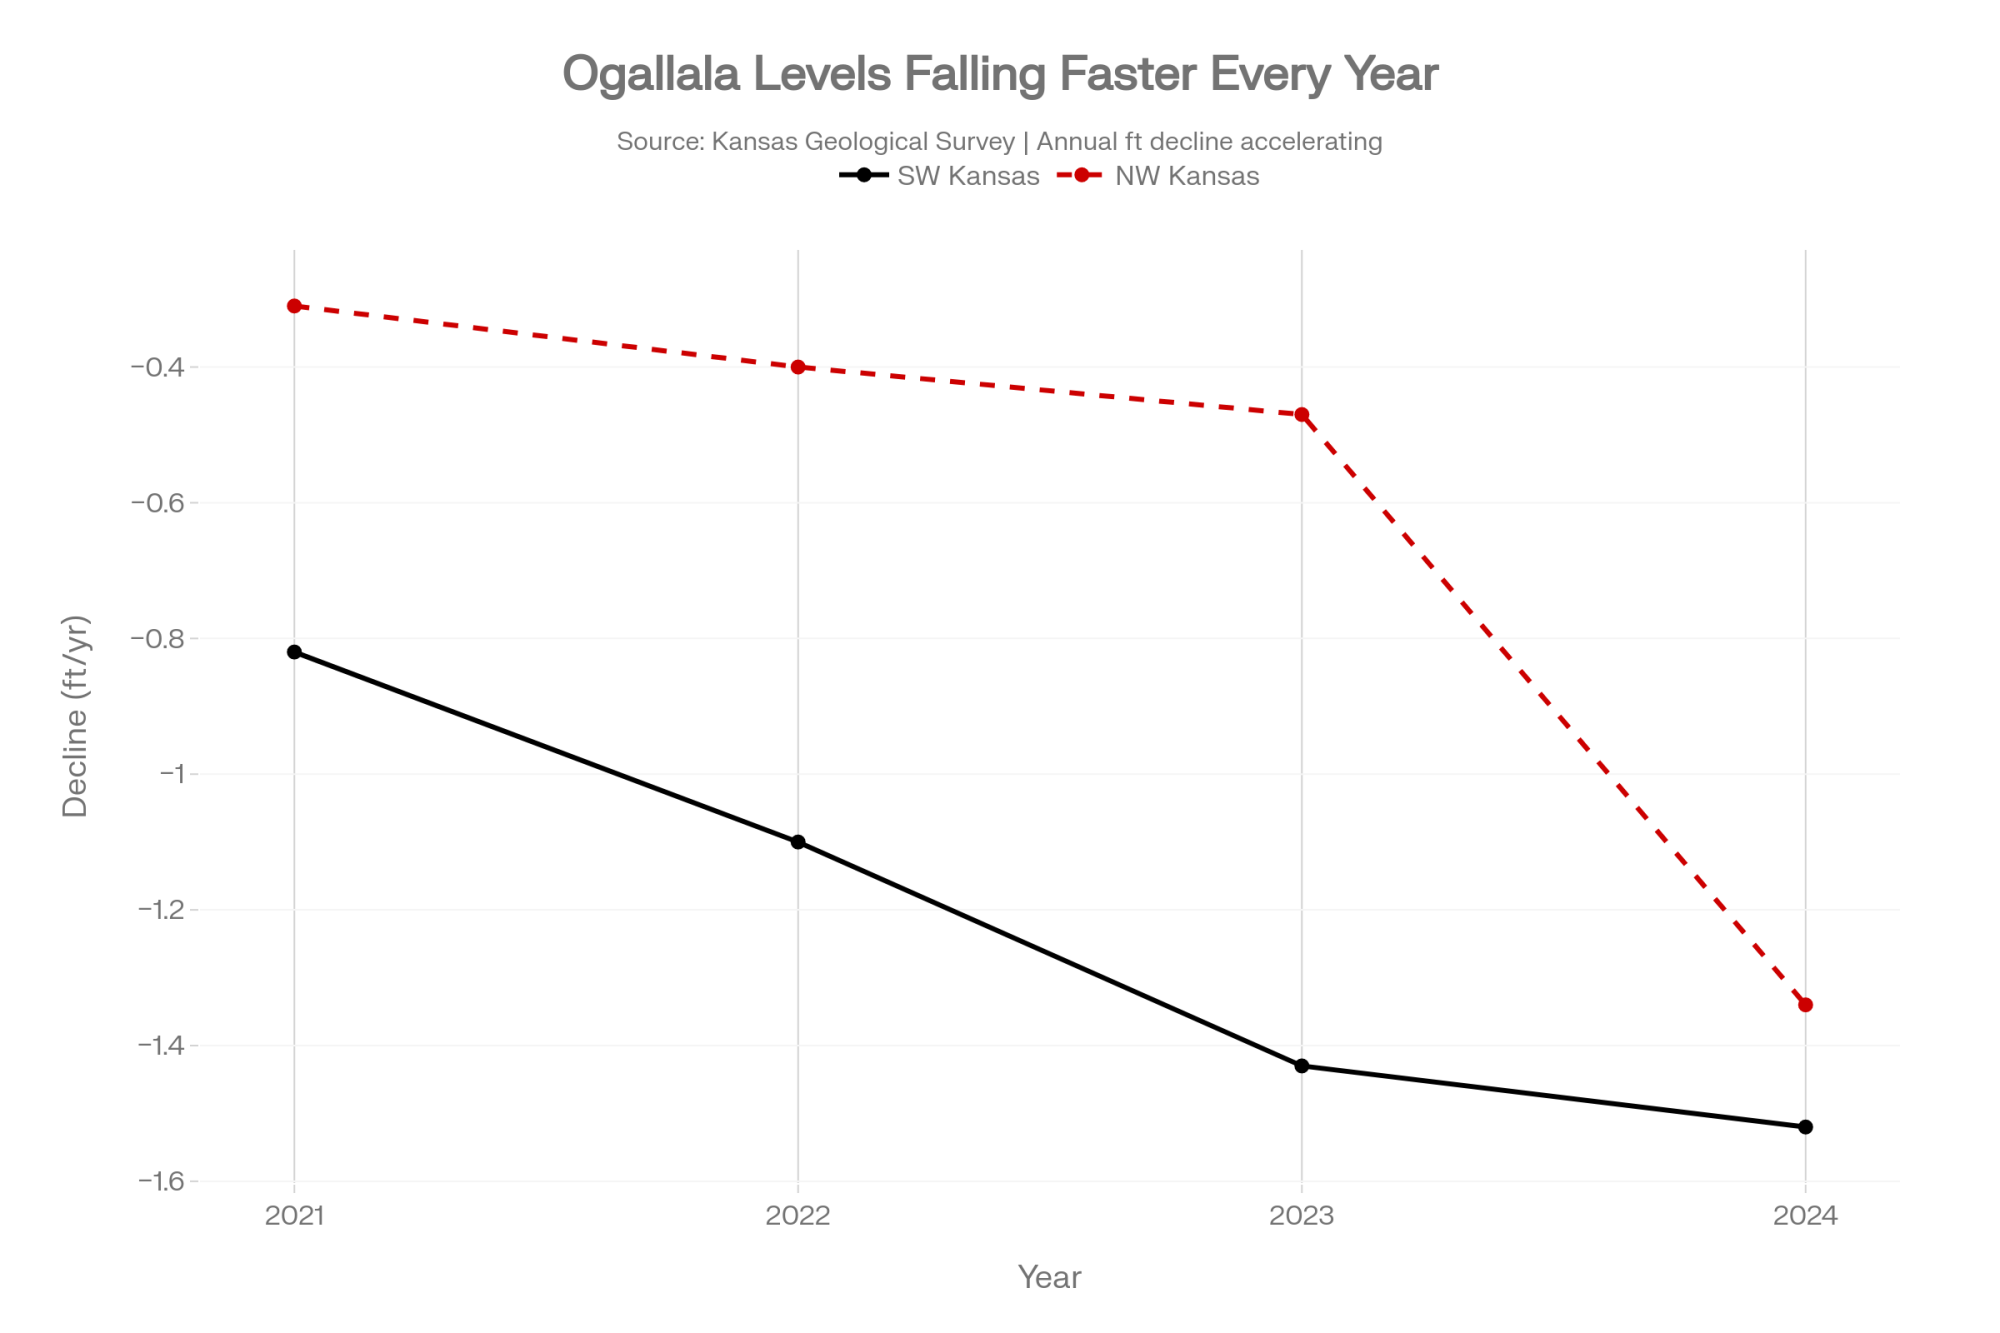
The 2024 numbers from the Kansas Geological Survey are blunt. Southwest Kansas, down 1.52 feet. Northwest Kansas, down 1.34 feet — a far steeper slide than the 0.47-foot drop the year before. Across the line, the University of Nebraska-Lincoln’s statewide monitoring report shows groundwater levels fell again in 2025, down an average of 0.29 feet after several years of drought, with the steepest, most stubborn declines landing in the state’s heavily irrigated stretches. Governor Laura Kelly said it without softening it: “Forget making it 75 years down the road — some parts of western Kansas don’t have groundwater enough to last another 25 years.”
Those declines aren’t evenly spread, and that’s what catches operators off guard. Two farms in the same county, ten miles apart, can sit over very different saturated thickness — one with 40 years of pumping left, the other with 15. The county-level headline number tells you almost nothing about your own well. Your groundwater district’s section-level data tells you everything.
Where the Milk Money Went
Now look at where dairy put its chips this decade. Since 2020, Hilmar, Leprino, and Valley Queen have committed about $1.6 billion in new cheese capacity across Texas, Kansas, and the I-29 corridor — Leprino’s Lubbock, Texas plant alone runs $870 million. Hilmar’s Dodge City, Kansas plant and the Lubbock facility are each built to take in roughly 8 million pounds of milk a day, and both sit on the stressed western end of the aquifer.
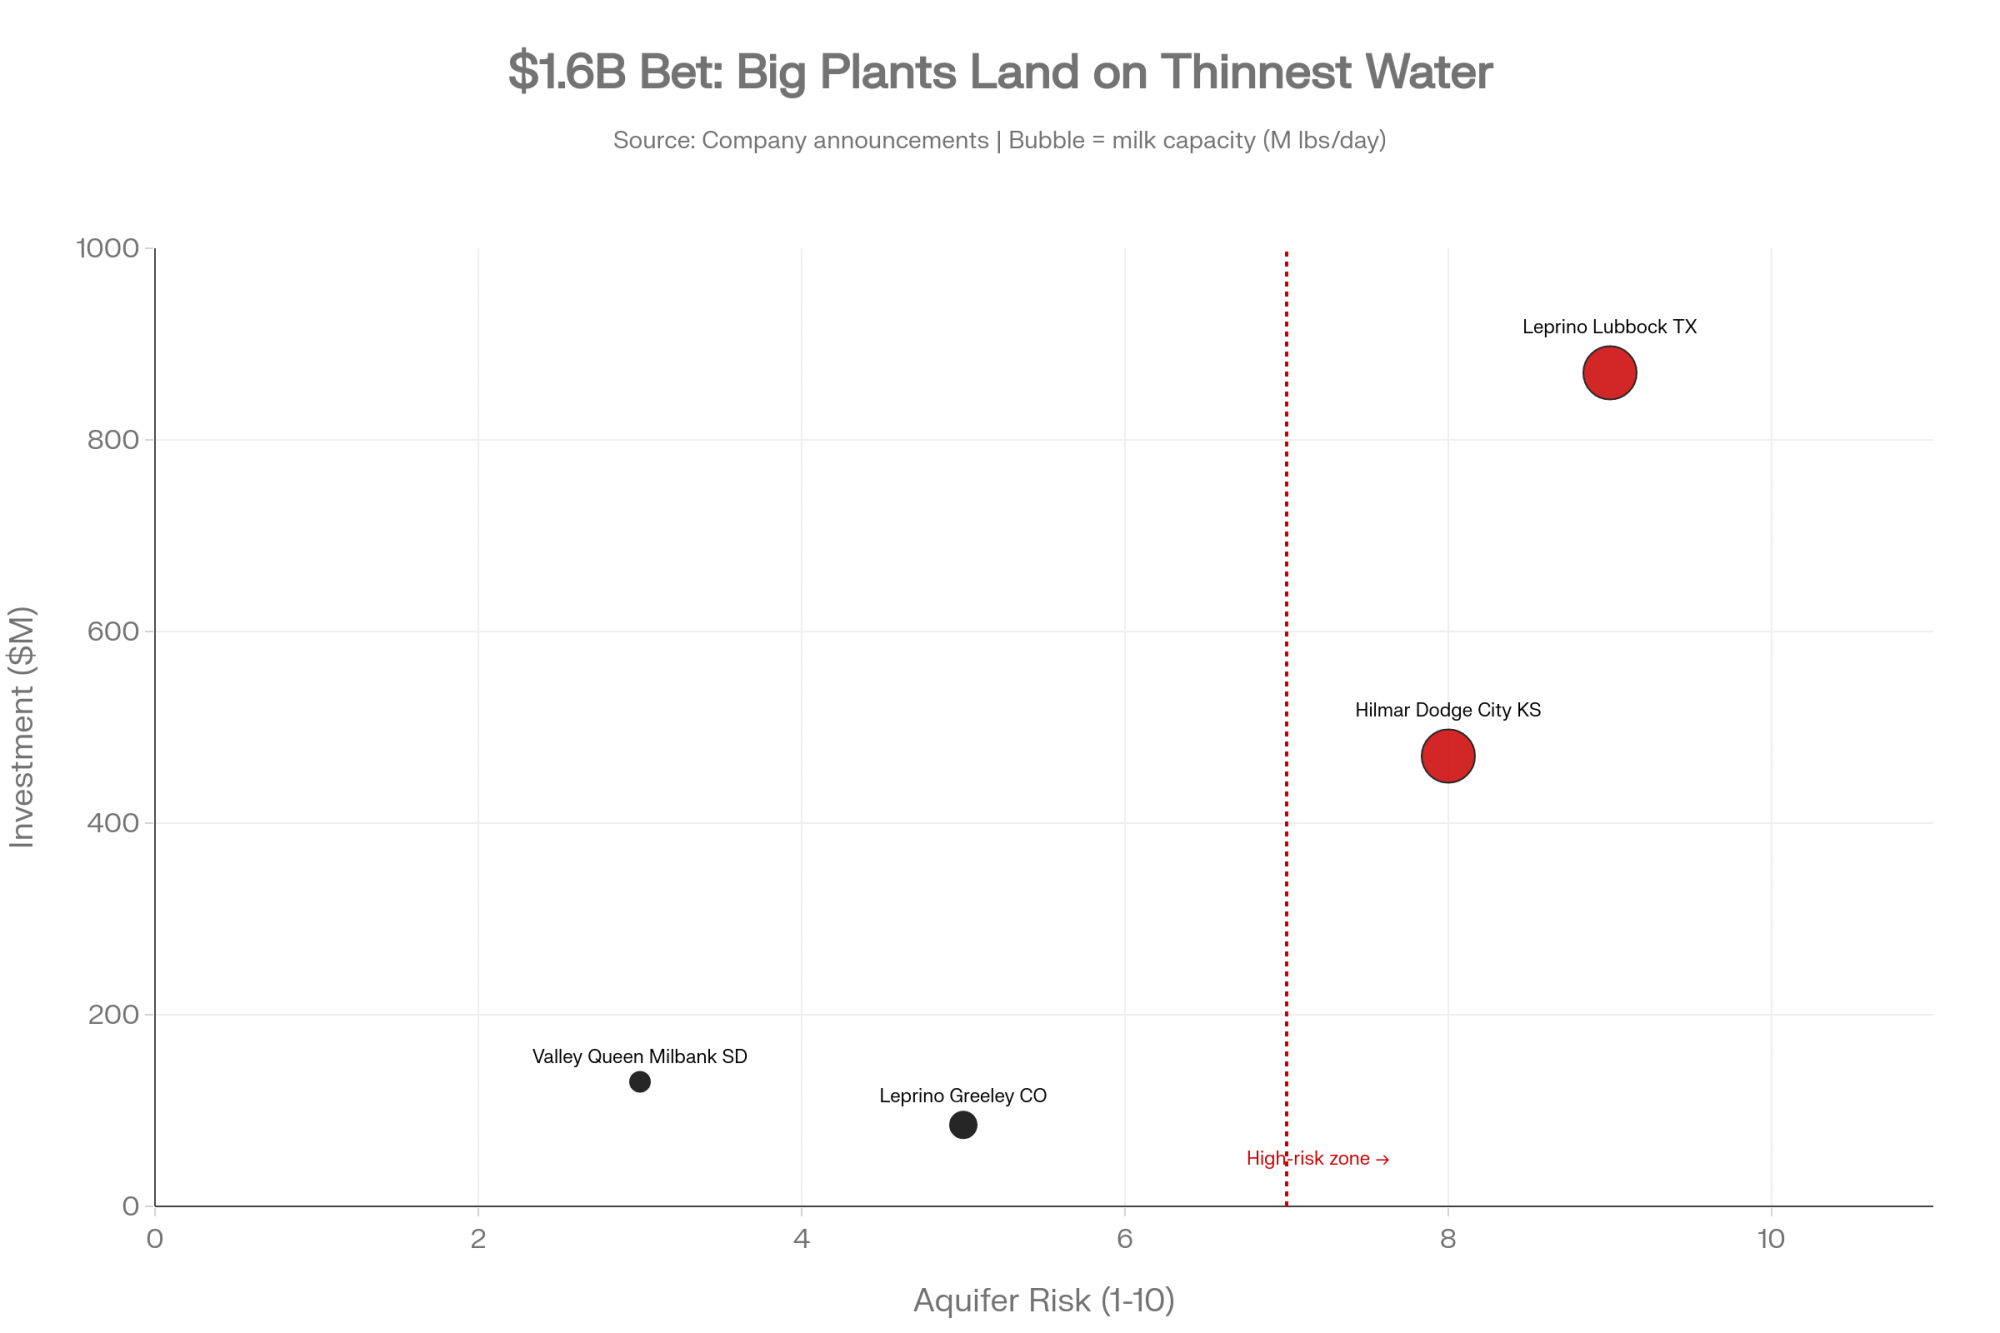
Run the feed math on a plant that size and the water exposure gets real fast. Eight million pounds of milk a day is the output of well over 100,000 cows, and those cows have to eat. The forage and grain to feed a herd that large — most of it irrigated in this part of the country — is where the aquifer draw actually lands. The plant doesn’t pump the water. The dairies filling those tankers do, and they’re concentrated in exactly the sections showing the steepest declines.
That’s the collision worth naming plainly. One projection from the University of Texas Bureau of Economic Geology has up to 70% of the Texas Panhandle’s section becoming unusable within roughly 20 years at current pumping rates. Other studies push the steepest statewide declines later, toward 2060 or 2070. Either way, the timeline lands inside the life of a barn note signed today — and inside the payback window for an $870 million plant that needs those tankers to keep showing up.
How This Shows Up on Real Farms
From the outside, aquifer depletion sounds like a slow-motion documentary. On the ground, it shows up small and personal first.
Here’s how it tends to look. You go in to renew an operating line or talk about adding a barn, and the conversation feels different. The lender wants well logs and your groundwater district’s reports — paperwork that never came up before. Maybe the rate comes back a quarter-point higher with a vague line about “regional risk.” Maybe the term runs a year shorter than last time. None of it screams crisis, but put together, it’s the bank telling you your water is now part of your file.
The on-farm water math stacks up fast, too. A milking cow drinks 30 to 35 gallons a day. Add wash, cooling, and parlor water on top, and total on-farm use can run past 30,000 gallons per cow a year. Run that across a 1,500-cow dairy and you’re north of 45 million gallons annually — before a single acre of irrigated feed gets counted. And the feed is where the real water lives: USDA and university water-use work puts irrigated feed crops for cattle at the single largest water draw in the West, around 32% of all use.
The response is already showing up in what High Plains dairies plant. Sorghum silage needs roughly 75% of the water corn would use for top yield, and as drought tightens, more operations have been signing wheatlage and sorghum contracts to lean on crops that ask less of the well. If you want how the corn-to-sorghum swap actually pencils on a real ration, that’s its own piece — but the direction of travel is already clear. Plenty of herds, though, are still pumping the way they always have. The wells still run, and nobody’s sat at the kitchen table with the aquifer map next to the loan schedule.
| Metric | Corn Silage | Forage Sorghum | Difference |
|---|---|---|---|
| Water requirement (top yield) | 100% baseline | ~75% of corn | -25% water use |
| Irrigation cost savings (40% swap) | Baseline | Up to -60% irrigation cost | Significant — Nebraska Extension |
| Production cost per acre | ~$800–$900/acre (High Plains est.) | ~$215/acre lower than corn | -$215/acre |
| Feed cost impact (% of ration) | Baseline | -15 to -25% feed cost | Dependent on local water price |
| Nutritional trade-off | Higher starch, energy density | Higher fiber, lower starch | Requires nutritionist ration adjustment |
| Yield consistency | High, stable year-to-year | More variable — climate-dependent | More risk in drought years |
The Mechanics Behind It
Dairy is more exposed here than row-crop farming, and it comes down to three things that compound.
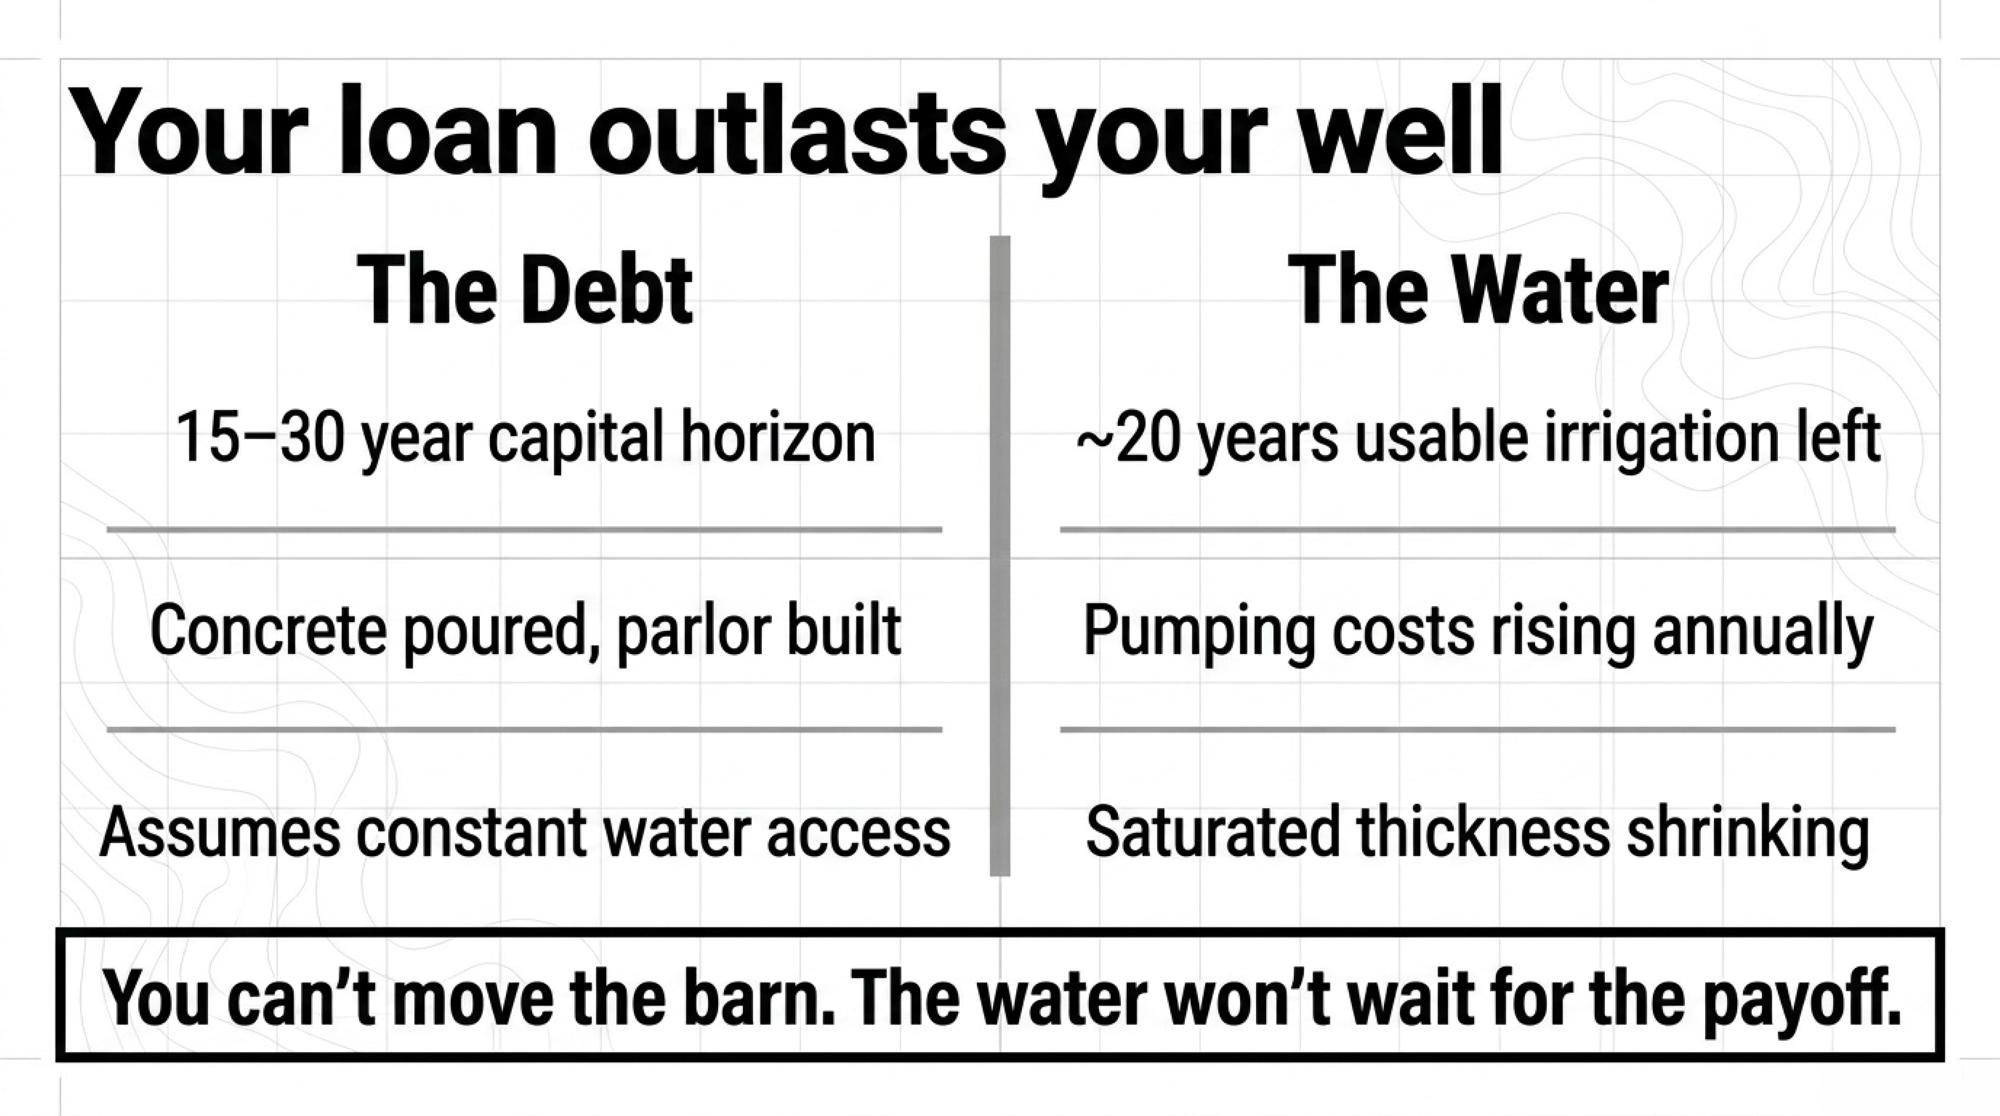
First, you can’t move. A grain farmer who decides the water’s done can shift to dryland wheat, fallow some ground, and shrink his exposure in a season or two. Your freestall barn, parlor, and lagoon are poured into the ground and financed over 15 to 30 years. Those assets only pay out if cows keep milking and feed keeps growing — which quietly pressures you to pump one more year, then one more after that.
Then there’s the layering. Row crops use water to grow a crop. You use water to grow the crop and to water the animals eating it. When pumping depth increases or an allocation tightens, it hits feed cost and herd management at the same time.
And the timeline doesn’t line up. A dairy runs on a 20- to 30-year capital and breeding horizon. The worst Ogallala projections land squarely inside a barn financed in the last few years. Water doesn’t vanish overnight. But more struggling wells, deeper pumping, and higher costs all show up before that note is paid. To a lender looking at land values and collateral, that’s not abstract. That’s default risk.
How Should You Read Your Lender’s Next “No”?
When a banker says “we’re tightening up” or “we need more information,” it’s easy to take it as a knock on your management. Sometimes it is. Increasingly, it isn’t.
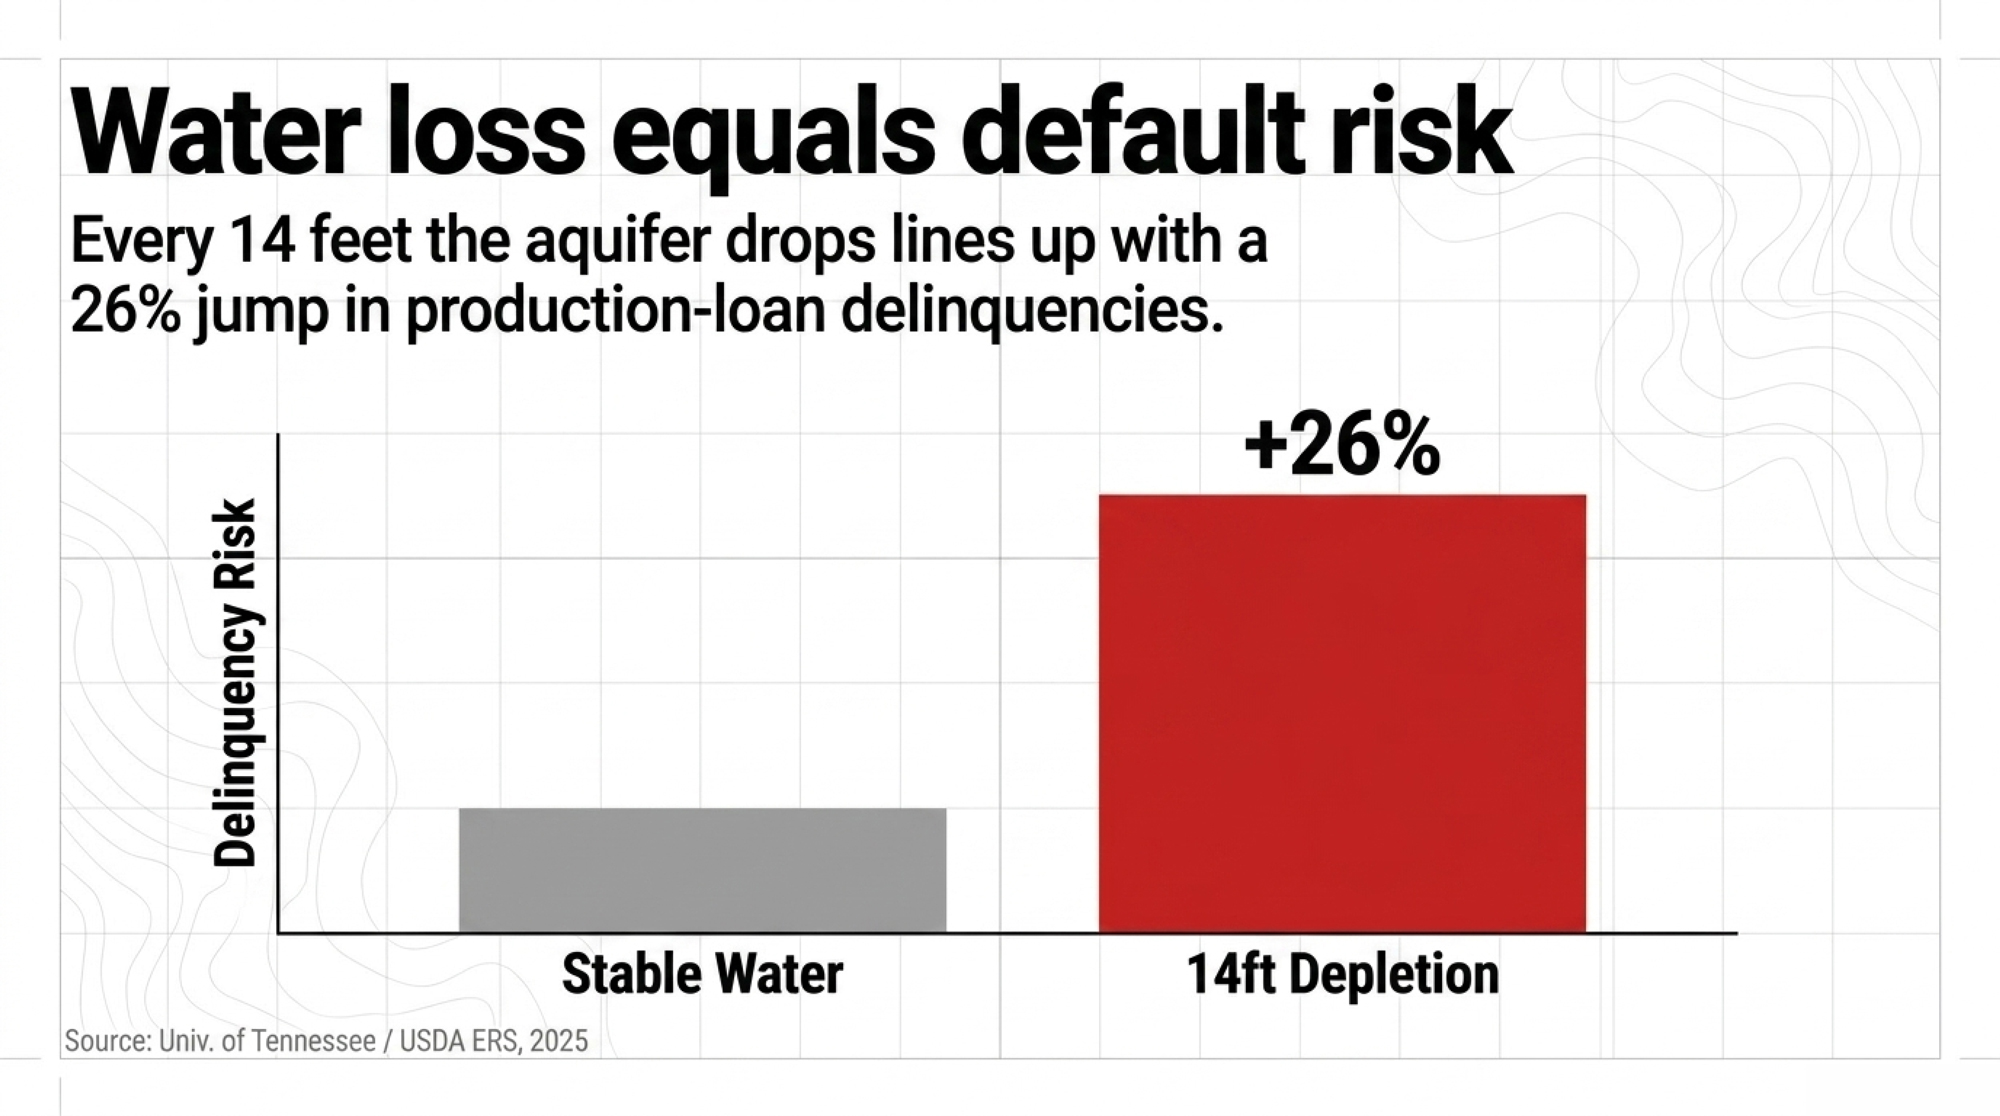
The link between water and credit isn’t a hunch anymore — it’s measured. In a 2025 paper with the pointed title “Overdraft Fees? Groundwater Depletion and Agricultural Loan Performance,” University of Tennessee agricultural economist Gabriela Perez-Quesada and the USDA Economic Research Service’s Aaron Hrozencik found that as the High Plains Aquifer thins, farm loan delinquencies rise. A 10% drop in saturated thickness — about 14 feet, which most counties over the aquifer have already lost across three decades — lines up with a 26% jump in production-loan delinquency rates. Their conclusion is plain: falling groundwater “may impact the risk in agricultural credit markets, which has important implications for banks’ underwriting decisions.”
Walk that into a real renewal and you can see how it bites. Say your section has already given up its 14 feet over the last 30 years — which puts you in the same boat as most counties over the aquifer. To the loan officer running the numbers, your operation now carries about 26% more production-loan delinquency risk than a comparable dairy sitting over stable water, before you’ve said a word about your own cash flow. You can have clean books, strong components, and a tight cull rate, and still draw a harder conversation purely because of where your wells sit. That’s the part that stings — it isn’t about how you farm.
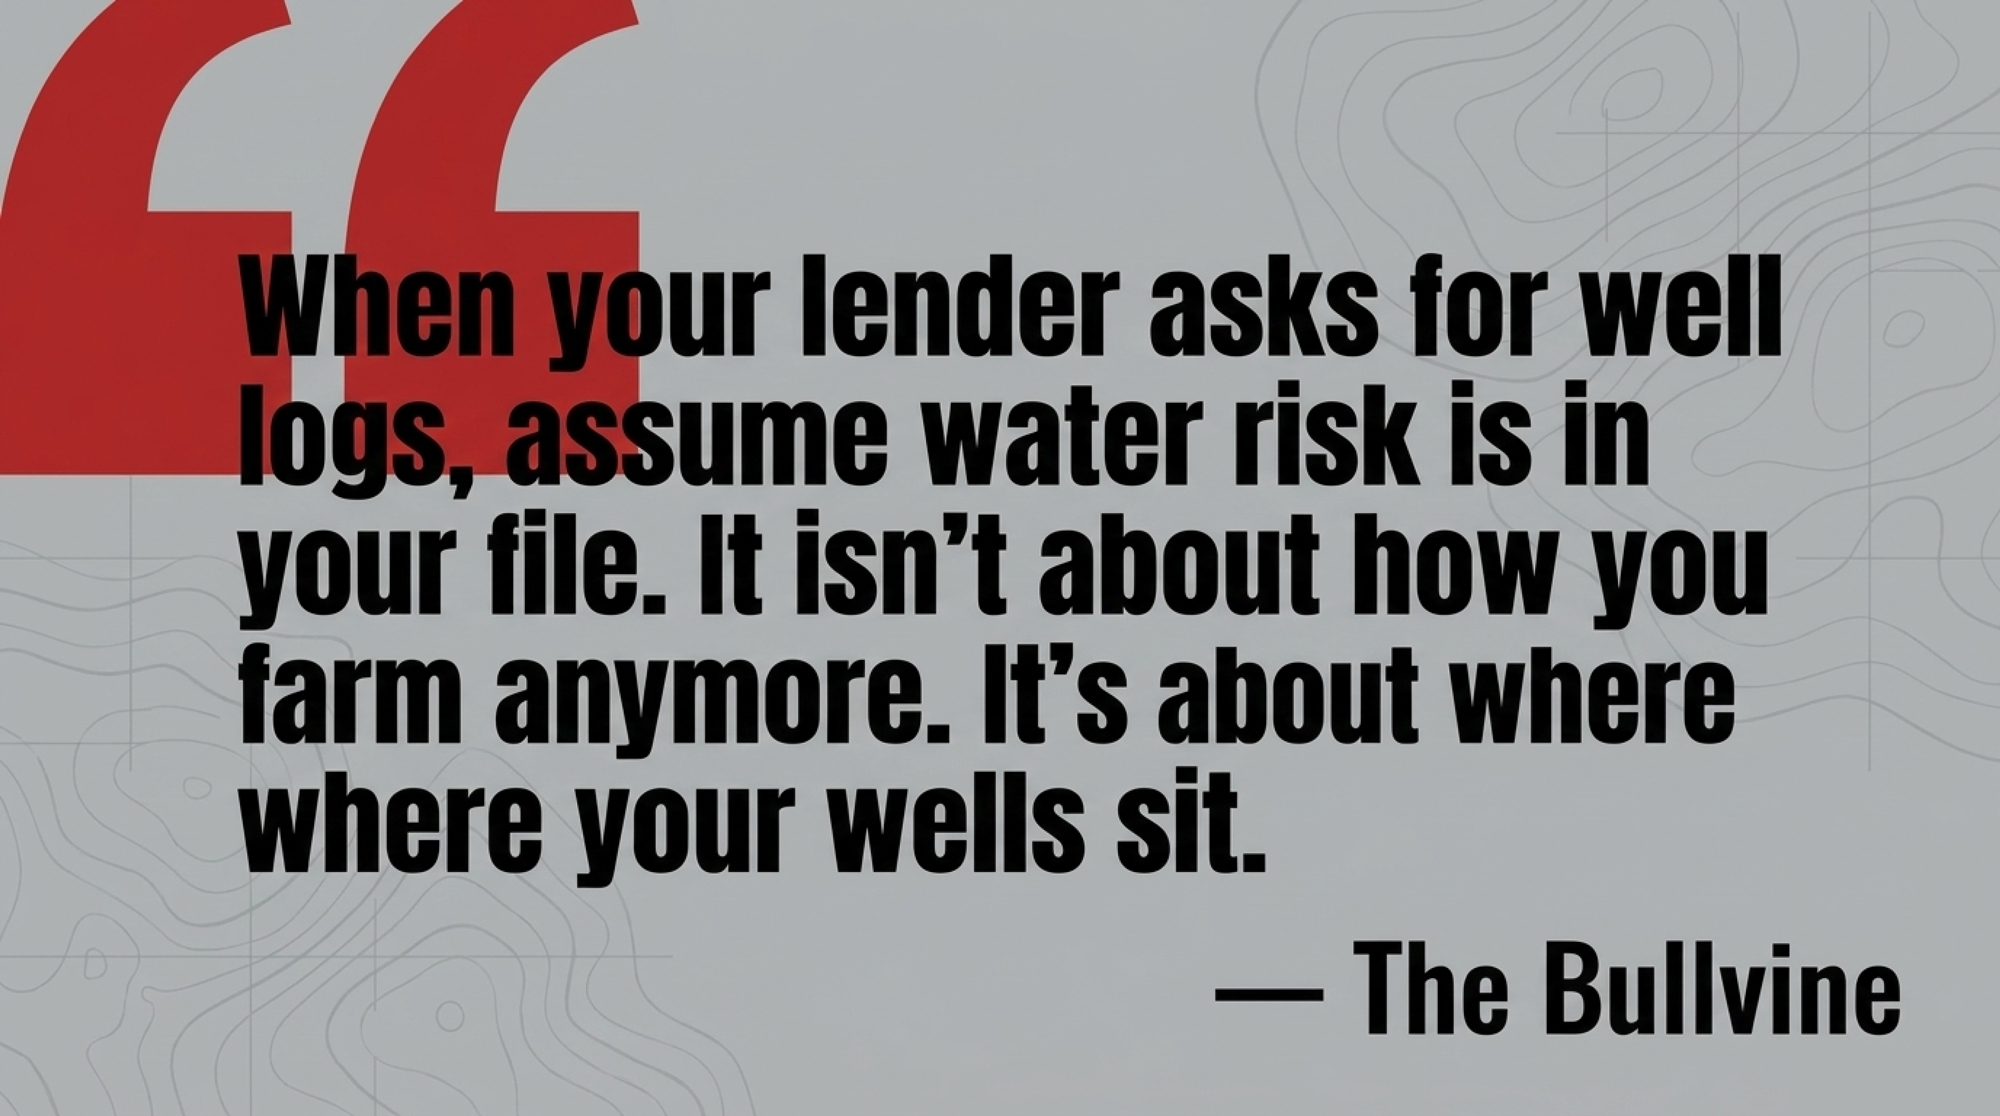
So ask yourself the plain question: what changed since the last time this renewal was easy? Did your wells drop? Did your district turn up in a state groundwater report? Are your neighbors fielding the same questions? If the answer’s yes, the move isn’t to argue with the loan officer — it’s to walk in knowing at least as much about your water position as the bank already does. Bring your section’s saturated-thickness trend and your feed-water plan to the meeting. Don’t let the bank be the only one in the room who’s done the math.
Is Your Barn Built for a World Where the Water Never Runs Out?
Most dairies built in the last 20 years in Ogallala country rest on a quiet assumption: the water will always be there. Enough to cool cows, run the parlor, and grow feed at the scale the banker underwrote. In some districts, that assumption is expiring while the concrete stays put.
So it’s worth asking the uncomfortable version. If your district’s data puts your section on a 10-to-25-year glide path, does your capital plan match that? What happens to your breakeven if pumping costs keep climbing as you chase a dropping water table deeper? Could your herd size and ration still pencil with less home-grown irrigated forage and more purchased feed trucked in from outside the region? None of those are fun questions. They’re a lot easier to answer now, on your schedule, than across the desk from a lender who’s already made up his mind.
Find Your Zone
Before you change anything, figure out which situation you’re actually in. The 2024 Ogallala Aquifer Summit and state agencies sort ground into three categories — and the right move looks different in each.
| Zone | Saturated Thickness Trend | Estimated Runway | Irrigation Cost Trajectory | Loan Delinquency Exposure | Recommended Capital Move |
|---|---|---|---|---|---|
| Sustainable Use | Stable or declining <0.3 ft/yr | 50+ years | Modest increases | Baseline risk | Long-horizon investment pencils; efficiency upgrades pay back |
| Extended Use | Declining 0.3–1.0 ft/yr | 20–50 years | Rising, manageable | +26–52% vs. stable | Match new debt terms to remaining water; shift to sorghum/wheatlage |
| Managed Depletion | Declining >1.0 ft/yr (SW KS = 1.52 ft in 2024) | <20 years | Steep — chasing depth | +78–130% | Run stay-adapt-or-exit math now; avoid new fixed capital; accelerate debt paydown |
Kansas posts section-level maps every January through the Geological Survey, and most Ogallala states have an equivalent. Half an hour with that map tells you which row above is yours — and saturated thickness is the same number the loan-delinquency research keys on, so you’re reading your ground the way a careful lender now does.
Your Options, In Order
You don’t control the aquifer. You do control how fast you look at your own number — and what you do next. Work these in sequence, because each one depends on the answer to the one before it.
Step 1 — Pull your district report (do this in the next 30 days). This is the cheapest, highest-leverage move on the list. Find your zone in the table above before you spend a dollar on anything else. Thirty minutes. It changes every decision that follows.
Step 2 — Buy time with efficiency, while it’s still worth buying. Once you know you’ve got water left to manage, make it go further. Smart irrigation controllers can save up to 20% of the water a traditional setup applies, and tighter scheduling stretches that further. California dairies that moved silage ground to subsurface drip have reported far larger cuts — in the range of 47 to 67% less water than flood or older sprinkler systems on the same acres. But the catch is real: drip and variable-rate pivots cost money up front, take management to run well, and only pay off where there’s water left underneath to manage. They stretch a resource. They don’t resurrect a dry hole. In a managed-depletion zone, spending heavy on efficiency can just mean you reach the bottom a little slower and a lot poorer.
Step 3 — Change the feed, not just the hardware. Some of the highest-leverage moves are about what you grow, not what you pump. Sorghum silage runs on about 75% of corn’s water, and Nebraska extension work shows dairies replacing 40% of their corn silage with sorghum cutting irrigation costs by as much as 60%. Independent studies put forage sorghum’s total production cost at roughly $215 an acre below corn silage, and where water’s pricey that swap can trim feed bills 15 to 25%, depending on local rates and management. It isn’t free money, though. Run any of it past your nutritionist, not just your seed rep — sorghum carries more fiber and less starch, so the ration loses some energy density and you’ll be working to hold components and milk, and yields can swing more year to year than you’re used to with corn.
Step 4 — Start the stay-adapt-or-exit conversation early. Nobody wants this one while the parlor’s full and the notes still renew. But in the thinnest zones of the Texas Panhandle and western Kansas, the math may eventually favor paying debt down hard and planning an orderly transition over piling fixed capital onto a shrinking water base. That means matching your remaining water horizon to your debt horizon — and being honest about land values if water-risk discounts start showing up in appraisals. Whatever a banker weighs in a 2026 loan file, an operation that gets ahead of this picks its own timing. The one that waits gets its timing picked for it — by a dry well, or by the credit committee.
Key Takeaways
- If you can’t say whether your section sits in sustainable, extended, or managed-depletion territory, pull your groundwater district’s latest report this month. Every other decision is a guess until you do.
- If you’re carrying 15 to 20 years of barn and parlor payments, check whether local projections actually show that much usable irrigation under your ground. If there’s a gap, plan for it now — not at the next renewal.
- If you’re weighing an irrigation upgrade, treat it as a financial tool, not a green gesture. Run the payback against your remaining water, because precision systems only earn out where there’s water left to manage.
- If your lender starts asking about wells and water reports, assume water risk is in your file. The research backs the instinct — every 14 feet the aquifer drops lines up with about 26% more production-loan delinquency — so get your own data organized before the meeting, not after.
- If you’re sitting in one of the thinnest zones, run the stay-adapt-or-exit math while you still have options, not when the bank hands you one.
You can’t refill the Ogallala. You can decide whether your next big call gets made by you — or made for you by someone who read your water before you did. So where does your section actually sit on the map, and when did you last look?
Run Your Numbers
Consolidation Clock — 5-Question Decision Engine — This article asks whether your operation should build, expand, pivot feed strategy, or exit in a depleting-aquifer zone. Answer five questions and the Decision Engine turns herd size, cost position, succession, and capital access into one strategic signal — expand, specialize, optimize, transition, or exit — before your next capital conversation.
Complete references and supporting documentation are available upon request by contacting the editorial team at editor@thebullvine.com.
Learn More
- Your Silage Is Lying to You: The $180000 Annual Loss Most Farms Never Calculate — Reveals how weekly dry matter adjustments and strict management of bunker face exposure eliminate silent feed drift losses, saving a mid-sized dairy upwards of $5,000 monthly in wasted corn silage.
- The $20 Milk Paradox: Solving 2026 Dairy Basis Risk – The Bullvine — Exposes the $4/cwt gap between headline USDA projections and lender stress-test models, arming you with a baseline toolkit to audit local hauling constraints and contract base terms before signing new debt.
- When VandeHaar’s br2 short corn beat BMR: 2.5 lb more ECM on mid‑lactation cows — Delivers data on a short-stature silage hybrid that provides a 3.5:1 return on seed premiums by boosting energy-corrected milk by 1.1 kg daily while protecting fields against late-season lodging.
 The Sunday Read Dairy Professionals Don’t Skip.
 The Sunday Read Dairy Professionals Don’t Skip.
Every week, thousands of producers, breeders, and industry insiders open Bullvine Weekly for genetics insights, market shifts, and profit strategies they won’t find anywhere else. One email. Five minutes. Smarter decisions all week.
