Archive for dairy lender DSCR

Organic Valley’s Lawsuit Is About $0.72. The Risk on Your Farm Is $19.89.

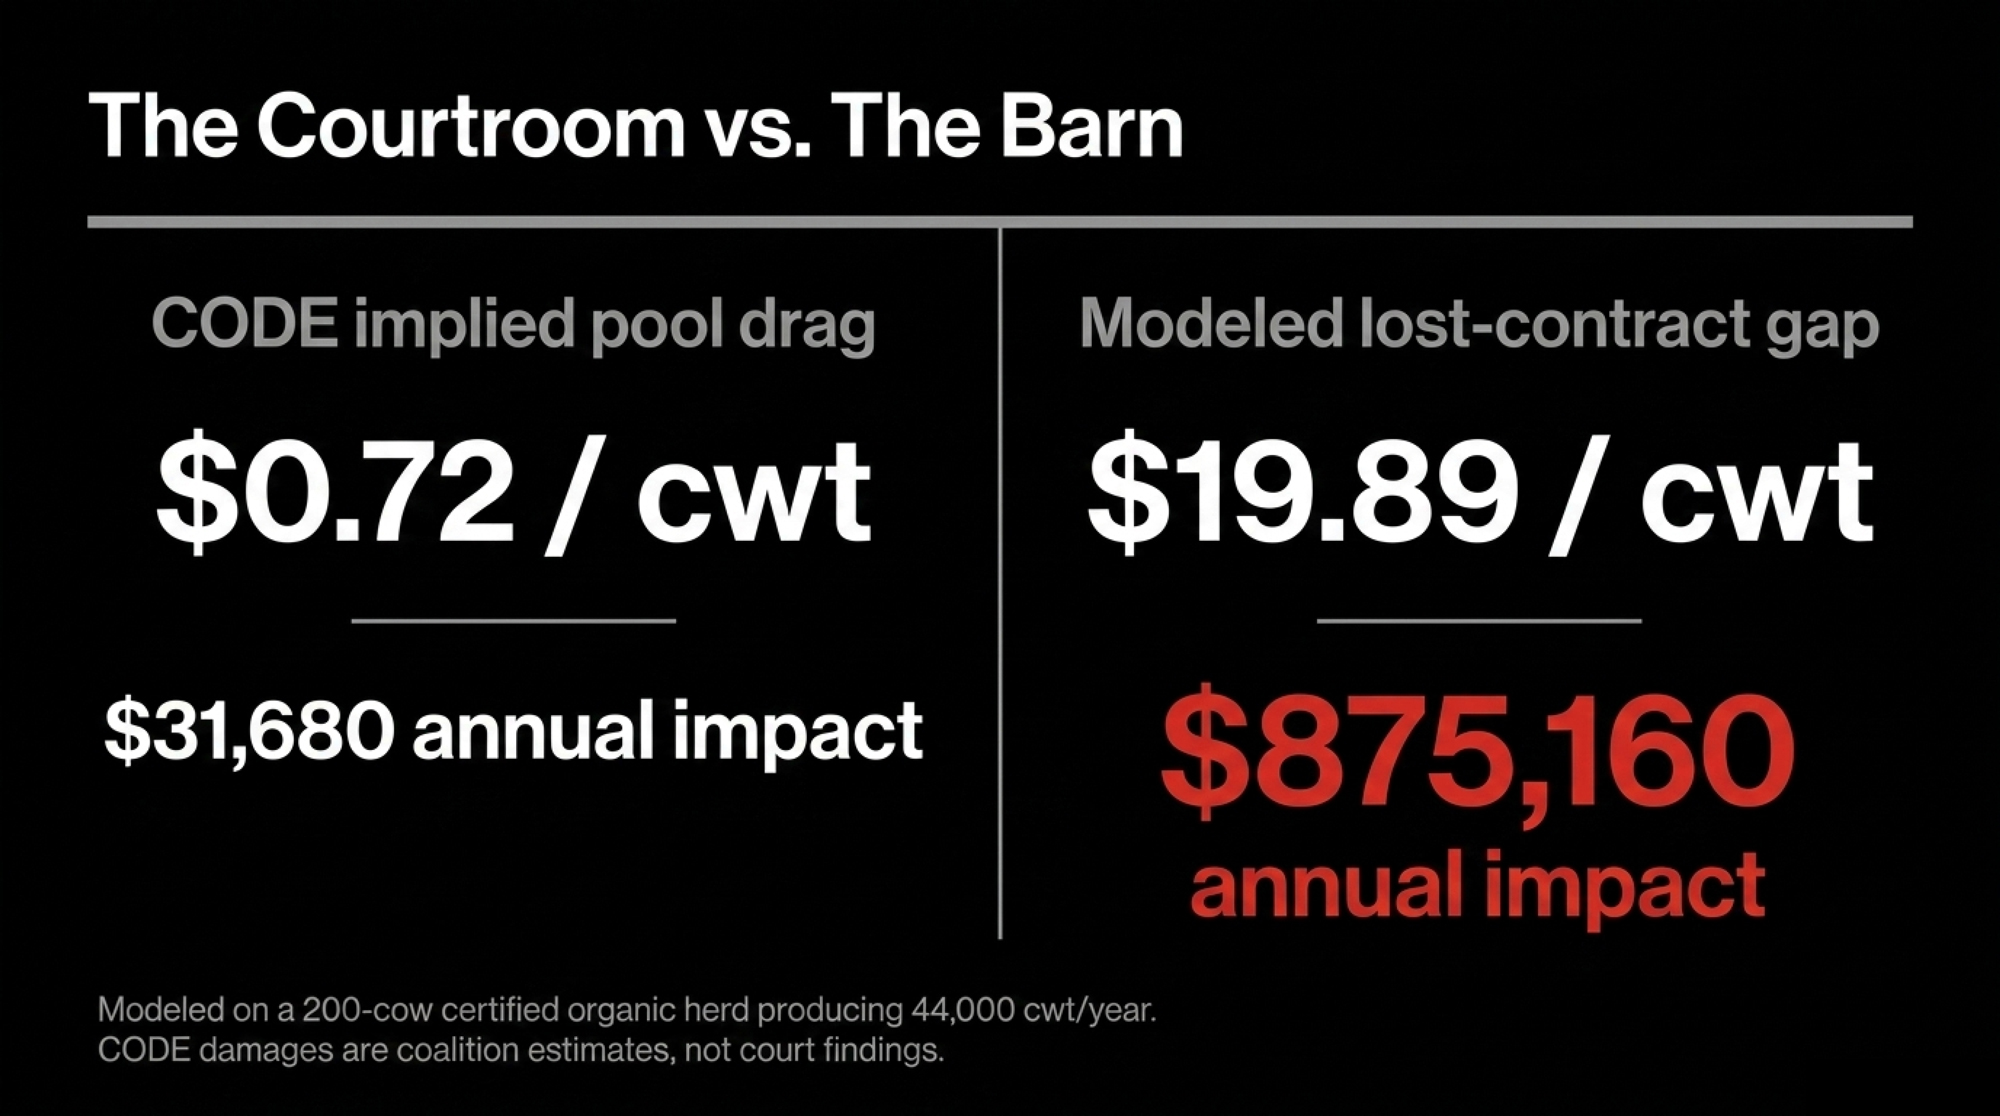
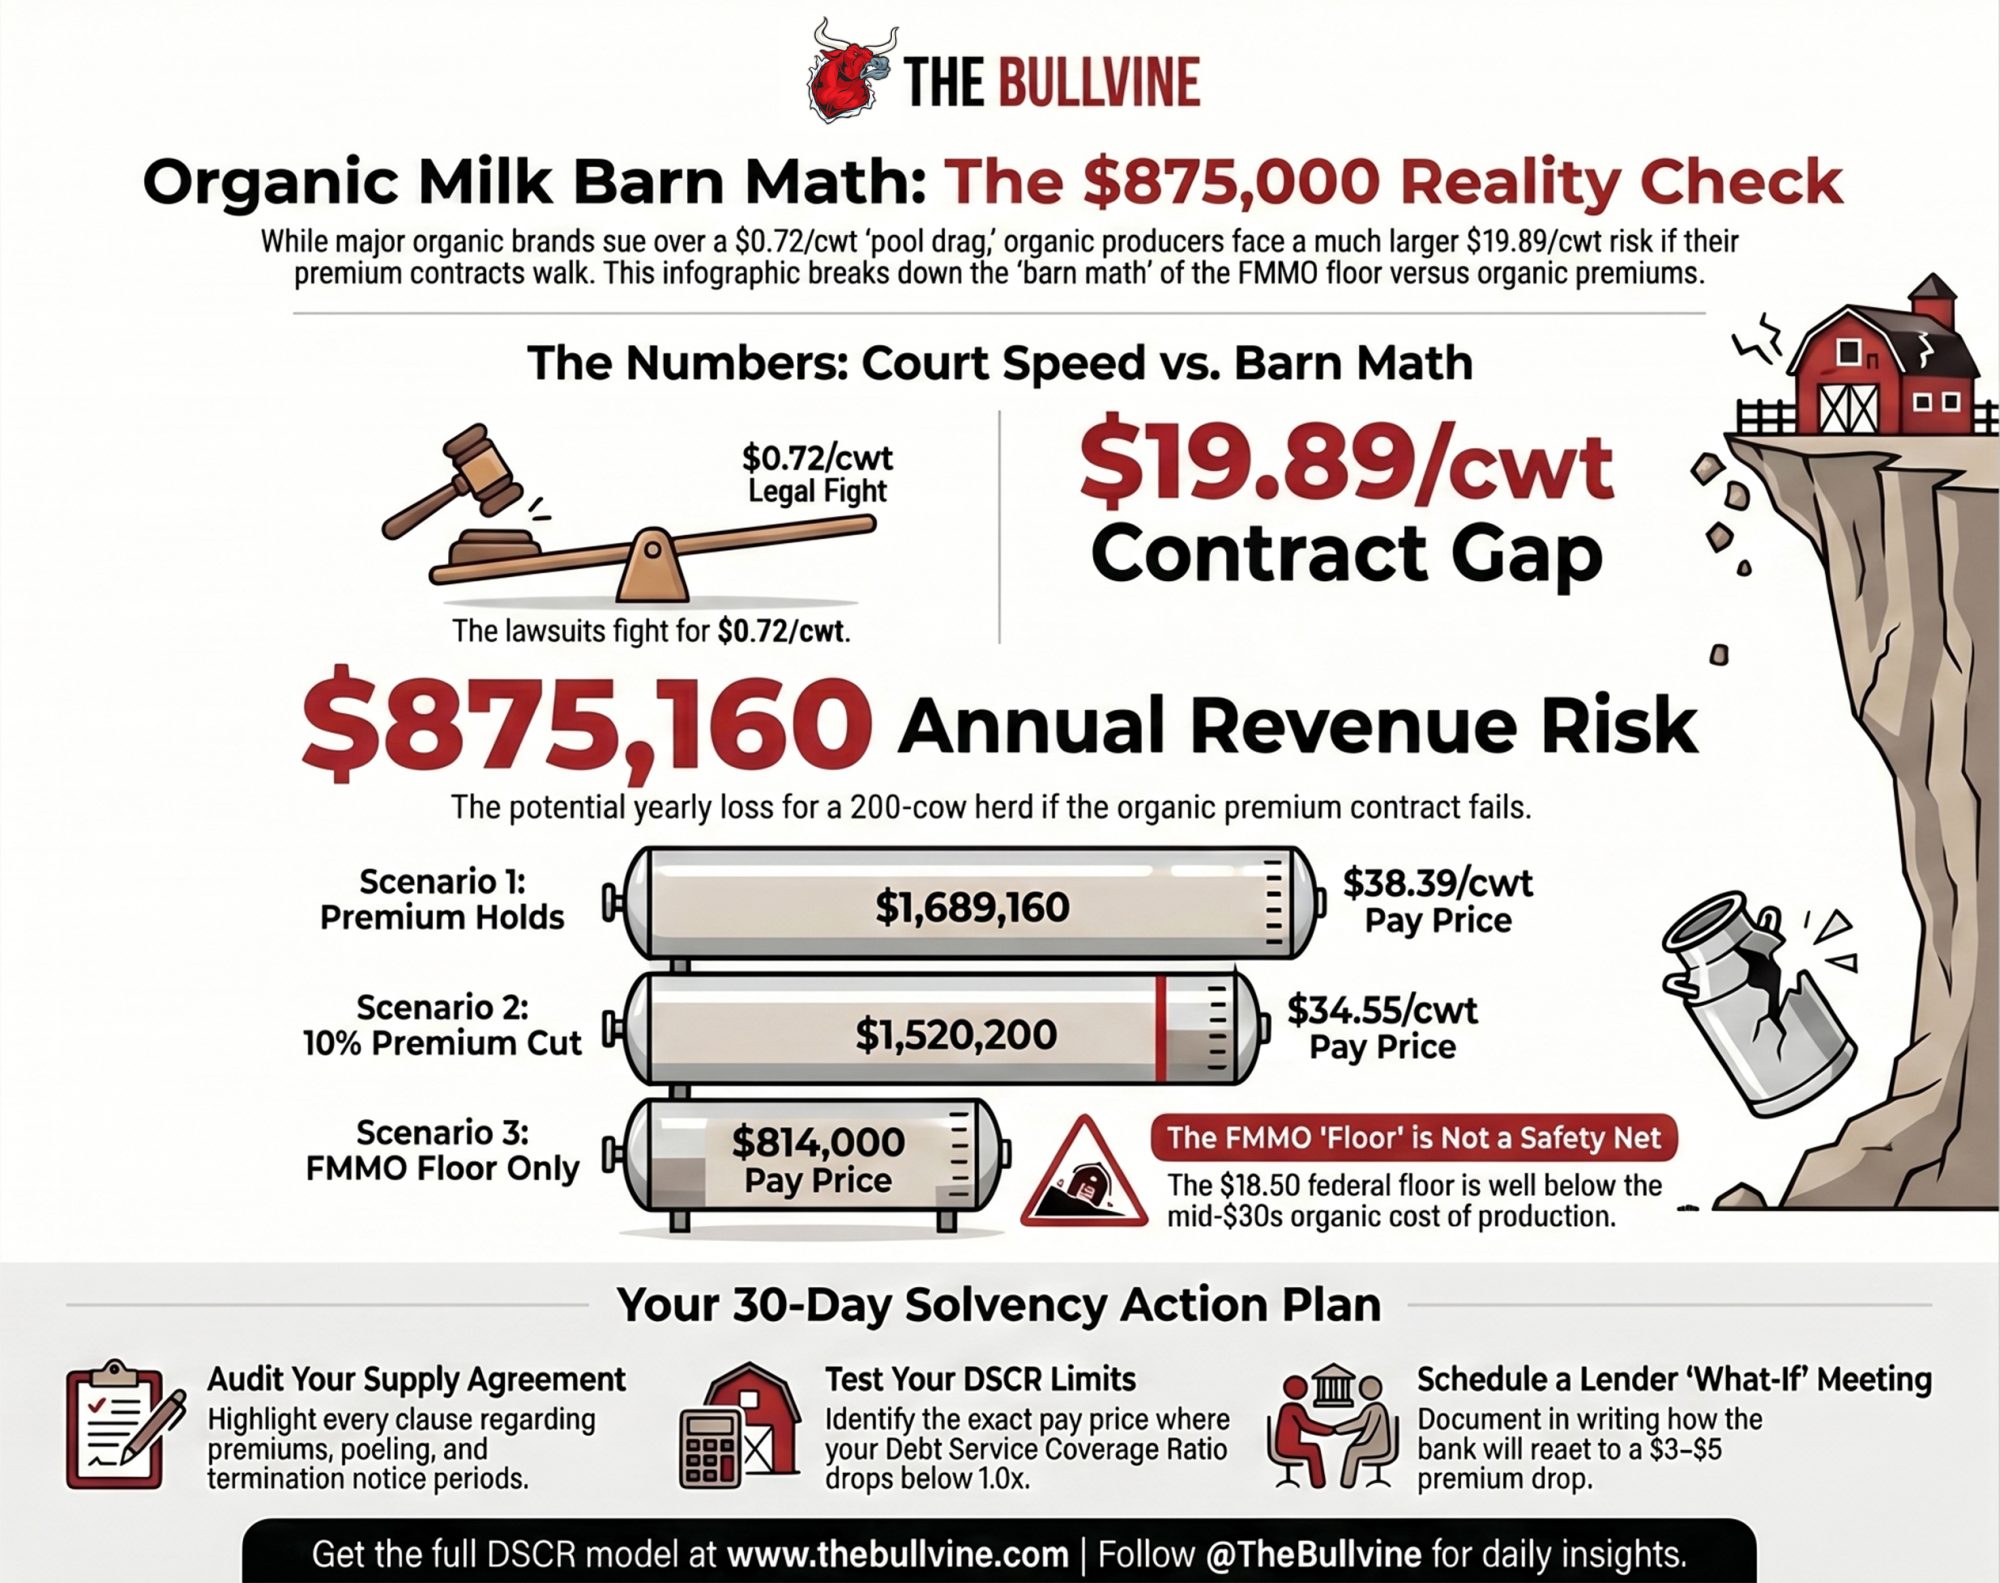
Four federal filings on April 28. The pool drag in court is $0.72/cwt. On a 200‑cow organic herd, the real spread is $19.89/cwt — $875,160 a year if your contract walks.

Executive Summary: Organic Valley/CROPP, Aurora, and Horizon filed four federal lawsuits on April 28, 2026 — in the Western District of Wisconsin, the District of Colorado, and the U.S. Court of Federal Claims — to pull organic milk out of the FMMO and recover more than $60 million in six years of pool payments. Plaintiffs, including CROPP owner‑member Elvin Ranck of Mifflin, PA, peg the implied drag at roughly $0.72/cwt; that’s about $31,680/year on a 200‑cow organic herd producing 44,000 cwt. The bigger barn‑math number isn’t in court. With NODPA’s 2025 weighted‑average organic pay price at $38.39/cwt and the Order 1 statistical uniform price hovering near $18.50/cwt in early 2026, the spread is $19.89/cwt — or $875,160/year if a premium contract walks and the FMMO floor is all that’s left. Layer in the June 2025 make‑allowance reset (AFBF: $0.85–$0.93/cwt) and “protection” looks like an insurance policy with a deductible roughly half your milk check. The 30‑day move: pull your supply agreement and loan docs, highlight every premium, pooling, MAC, and DSCR clause, and walk a three‑scenario sheet — $38.39, $34.55, $18.50 — into your lender’s office before fall contract review. Court speed won’t decide your 2027 pay program; your contract and your covenants will.

Organic Valley FMMO lawsuit

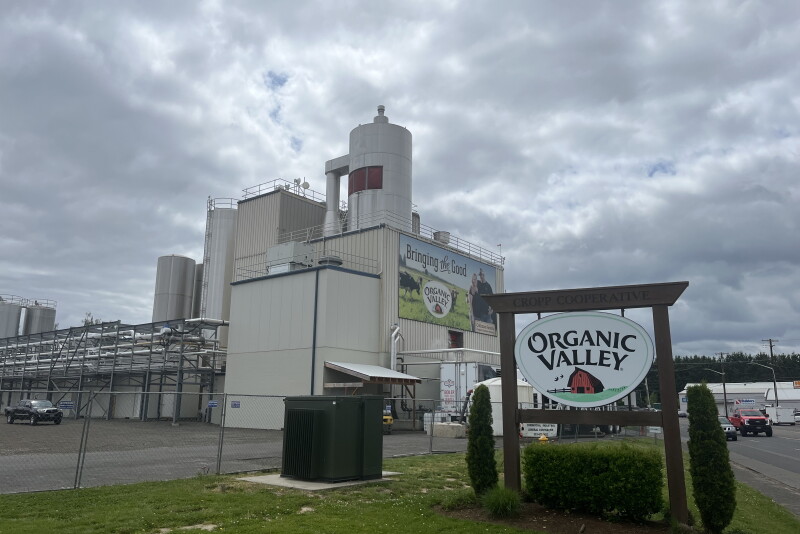
The quote that kicked this loose is blunt. “The federal government has locked in an updated dairy pricing regulation that actively harms organic dairy farmers. It systematically siphons tens of millions of dollars away from organic dairy farmers like me for the benefit of conventional dairy farmers.” That’s Elvin Ranck, an organic producer near Mifflin, Pennsylvania, and a CROPP Cooperative (Organic Valley) owner‑member, in the April 28 class‑action announcement from the Coalition for Organic Dairy Exemption (CODE).

Ranck is one of the named plaintiffs behind four federal lawsuits filed April 28, 2026 — in the Western District of Wisconsin, the District of Colorado, and the U.S. Court of Federal Claims. CODE wants two things: an exemption for organic dairy from the Federal Milk Marketing Order (FMMO) system, and more than $60 million in damages for six years of pool payments plaintiffs say never came back to organic farms. That’s the legal fight. The barn math underneath is what should land on your kitchen table well before the next round of organic contract “adjustments.”

On a 200‑cow certified organic herd, the modeled gap between today’s contract price and the FMMO floor isn’t a rounding error.

$875,160 / year

The modeled milk‑revenue gap on a 200‑cow certified organic herd if the premium contract walks and FMMO pooling is all that’s left.

Editor’s note: This article relies on the public CODE class‑action filings and announcements, on‑record reporting in various media reports including: Sentient Media, Brownfield, Dairy Processing, and NatLawReview, and published USDA AMS, NODPA, and AFBF data. Organic Valley/CROPP, Aurora Organic Dairy, Horizon Organic Dairy, NMPF, IDFA, and USDA were not contacted directly for additional comment for this piece. The 200‑cow herd referenced throughout is a transparent modeled scenario, not a single named operation.

What the Lawsuits Actually Say

CODE — CROPP Cooperative, Aurora Organic Dairy, and Horizon Organic Dairy — argues that organic milk doesn’t belong in a Depression‑era pooling system built for fungible conventional milk. Organic milk must be physically segregated, sourced from certified herds, and can’t be swapped for conventional product. Yet organic handlers still pay into FMMO pools like everyone else.

The coalition’s Washington release calls those pools ones that “don’t serve” organic handlers, even though organic dollars keep flowing in. The class‑action filing in the Court of Federal Claims pegs damages at more than $60 million over six years. Spread across CROPP’s volume in that period, that pencils out to an implied pool drag of roughly $0.72/cwt on organic milk — a CODE estimate, not a court finding. CODE also estimates that organic milk has transferred close to $400 million into conventional‑focused pools since 2006 — a coalition calculation, not a court‑adjudicated figure.

Adam Warthesen, Organic Valley’s senior director of government and industry affairs, shared on April 27 that the FMMO pulls tens of millions of dollars out of organic dairy farms each year, and that CROPP is seeking an exemption because the current system doesn’t reflect how organic milk is produced or marketed. Sentient Media puts the organic share of U.S. fluid milk at about 7% of milk products sold in 2025 — small in volume, but large enough to move real dollars when those Class I premiums are pulled into the pool.

The National Milk Producers Federation and the International Dairy Foods Association — both long‑standing public advocates for the FMMO system — have not yet issued a detailed response in public coverage of the lawsuits. USDA hasn’t commented on the specific lawsuits either. Your milk check won’t wait for the docket.

How Big Is the Gap on a 200‑Cow Organic Farm?

Now the barn math. Take a 200‑cow certified organic herd you’d actually see in Pennsylvania, Vermont, or Wisconsin:

  • 200 cows · 22,000 lb/cow/year · 4,400,000 lb/year · 44,000 cwt/year

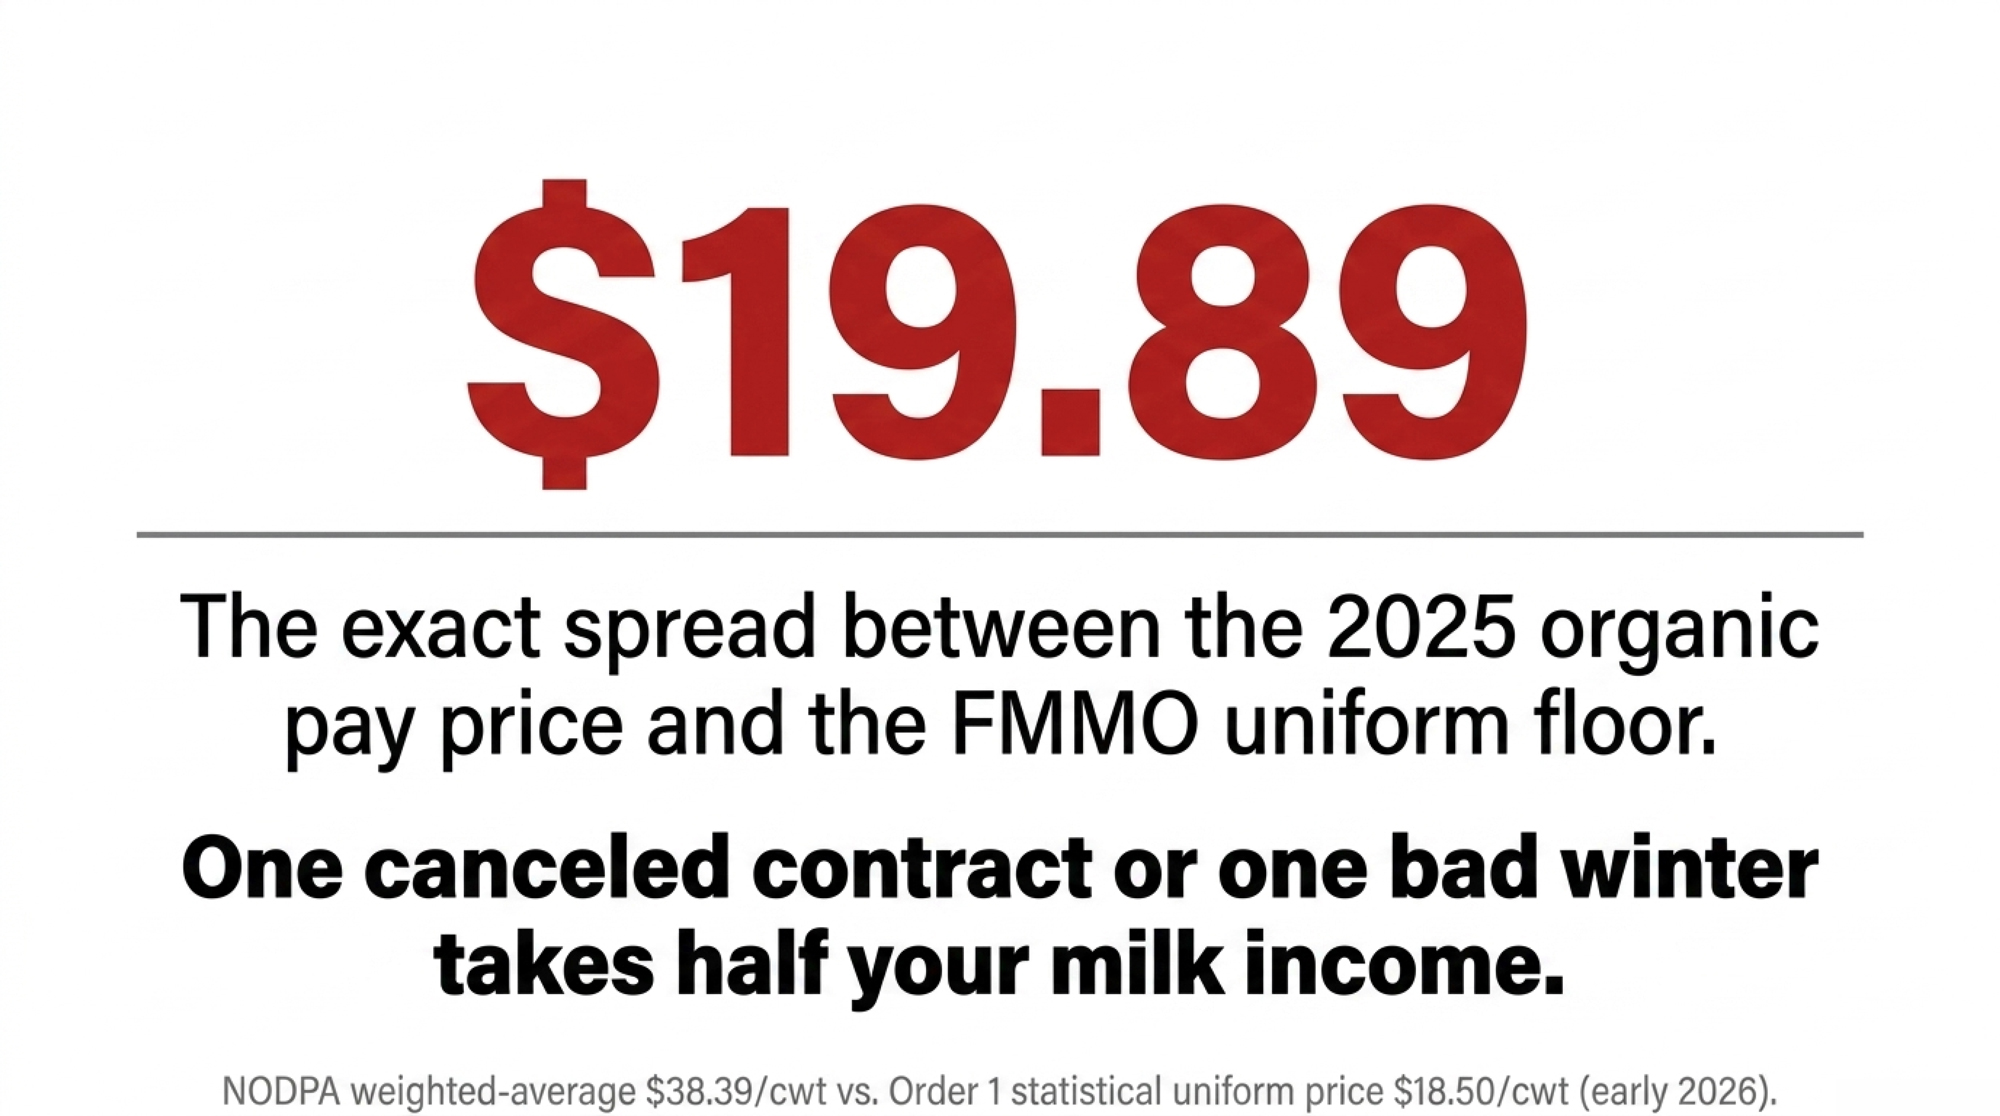
For the organic price, use NODPA’s latest national figure. In its May 2026 Pay and Feed Prices update, the Northeast Organic Dairy Producers Alliance reports a weighted‑average producer pay price of $38.39/cwt for 2025. For the floor, anchor on a recent Northeast Order 1 statistical uniform price. Bullvine markets coverage and USDA reports place that uniform price near $18.50/cwt in early 2026, depending on components and utilization.

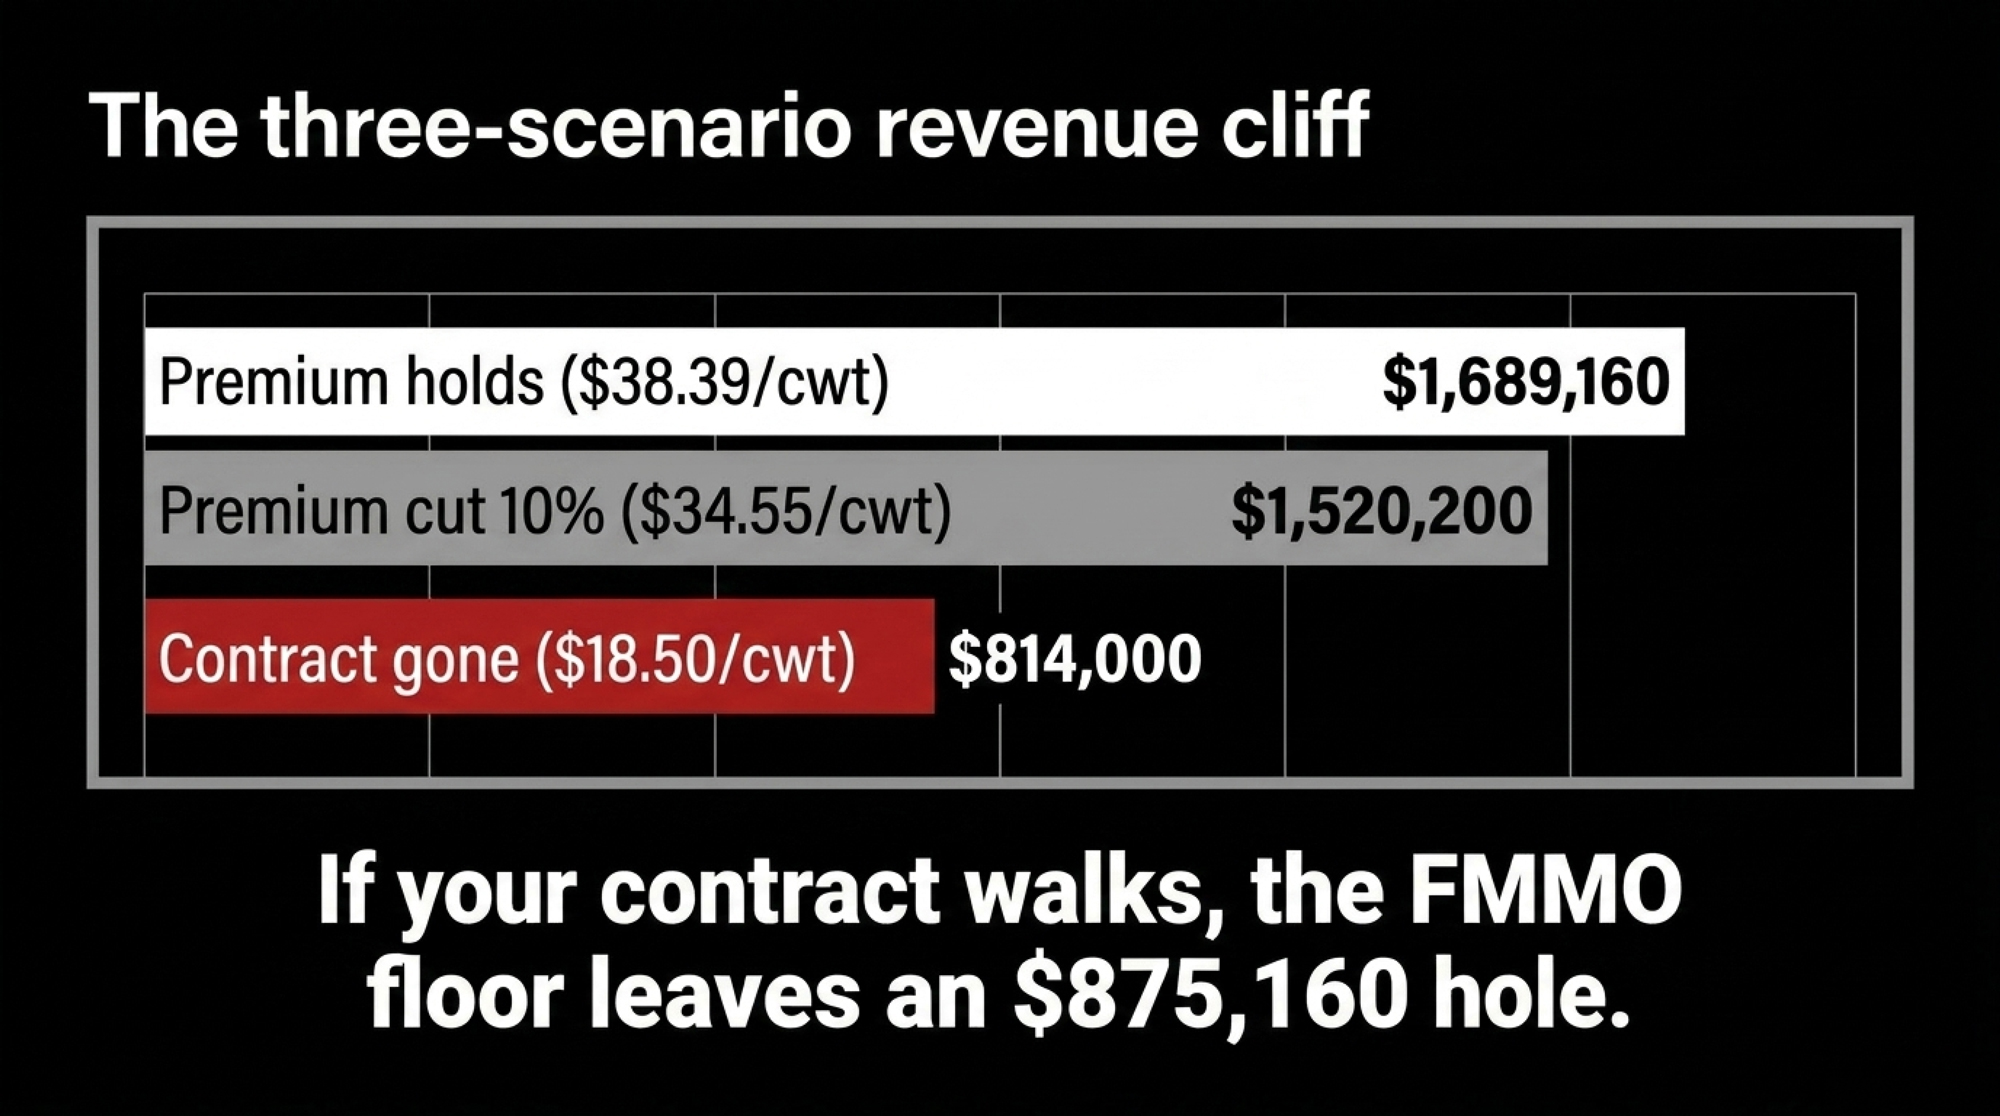
The Three‑Scenario Cliff (44,000 cwt/year)

ScenarioPay PriceAnnual RevenueΔ vs. Today
1 — Premium holds$38.39/cwt$1,689,160
2 — Premium compresses 10%$34.55/cwt$1,520,200−$168,960
3 — Contract gone, FMMO floor only$18.50/cwt$814,000−$875,160

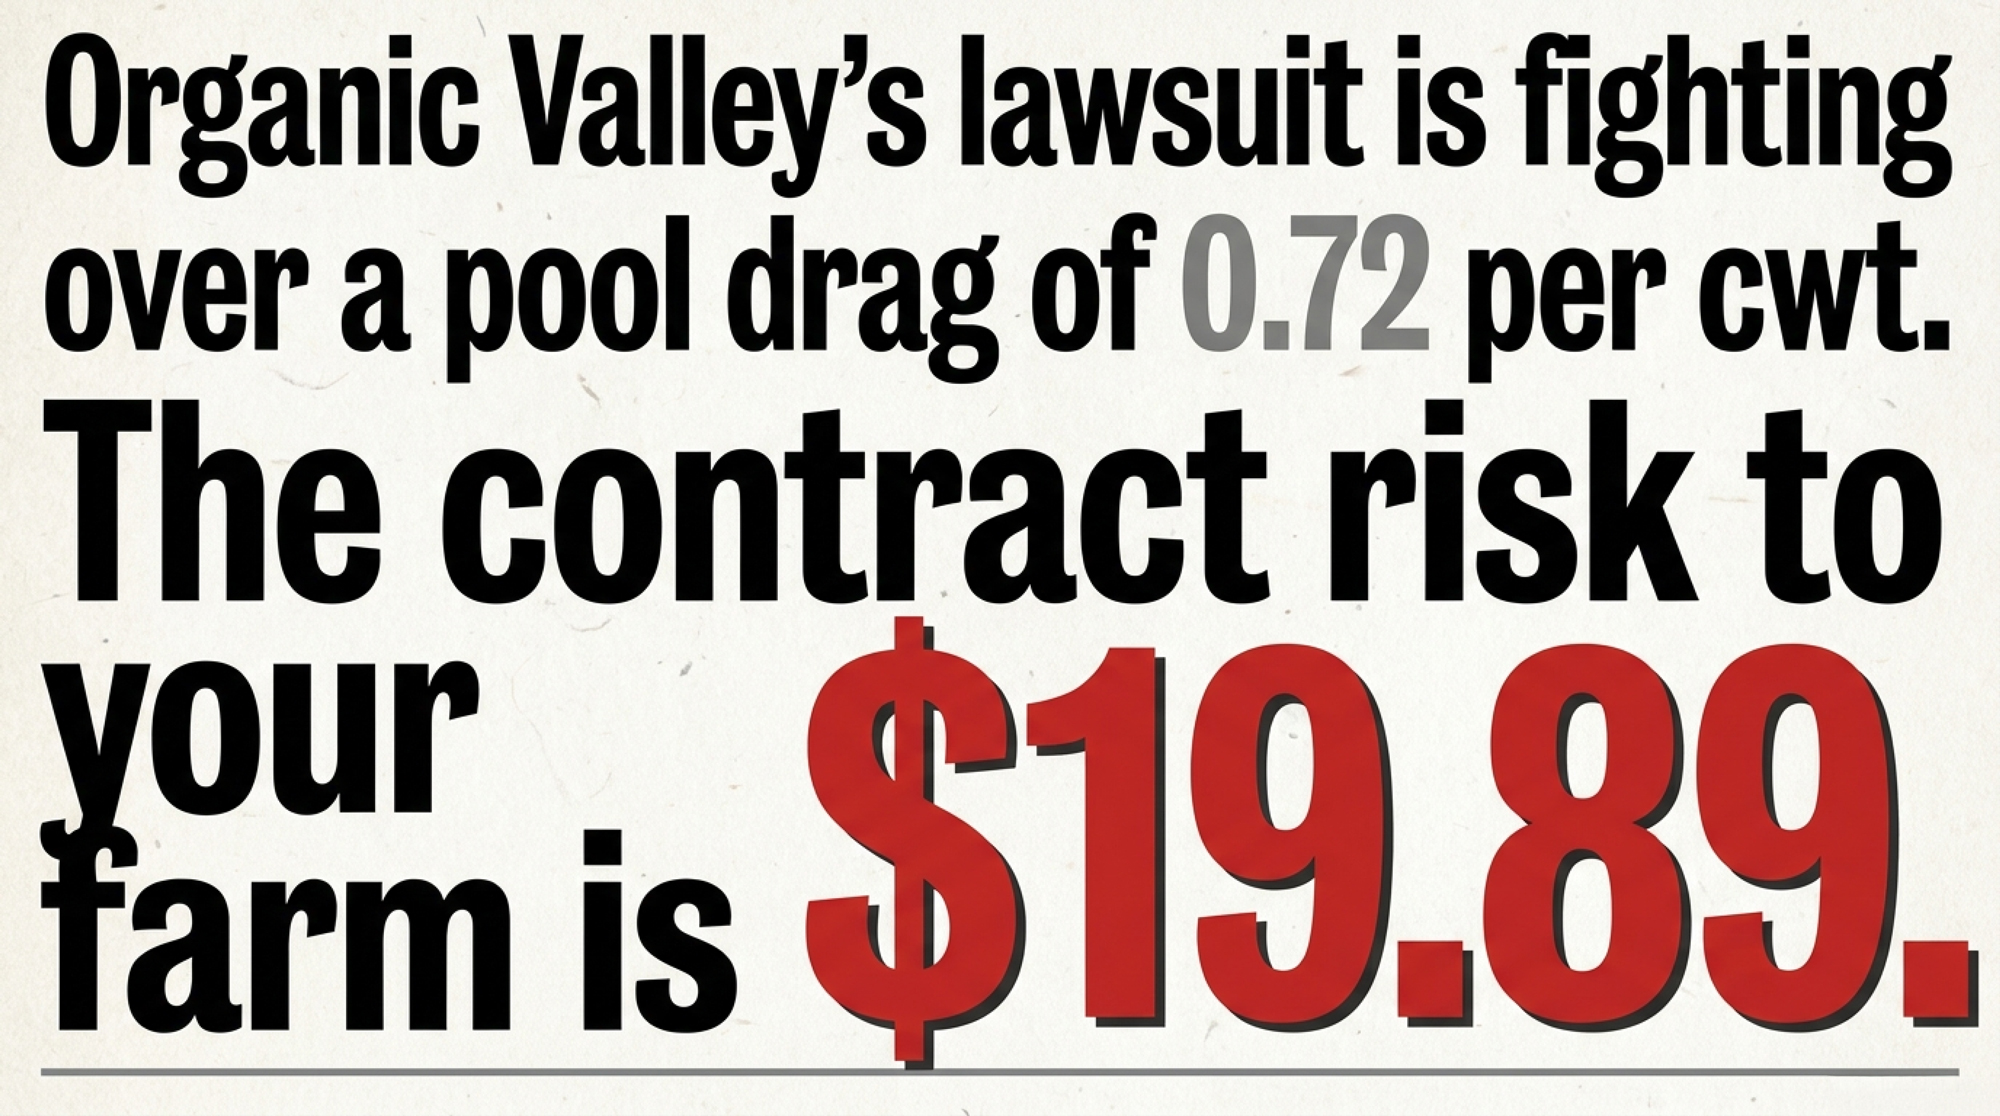
The fight in court is the small number. The fall is the big one.

$19.89/cwt

The modeled spread between today’s organic premium and the Order 1 statistical uniform price.

× 44,000 cwt = $875,160/year

One contract clause, one bad winter — half your milk income.

CODE’s implied pool drag, by contrast, lands at about $31,680/year on the same farm — $0.72/cwt × 44,000 cwt. Real money. Also roughly one‑twenty‑seventh of what disappears the day your premium contract walks out the door.

The lawsuits are built around the small number. Your banker’s built around the big one.

What the FMMO Is Really Doing for You

Two prices live on every organic milk check, and they don’t touch the same envelope.

The FMMO pool draw is what your handler pays into and pulls out of the federal pool. USDA AMS’s May 19, 2026 announcement set the base Class I skim milk price for June 2026 at $16.75/cwt, up $2.63 from May. Layer in butterfat, location, and Boston’s differential and the June Class I mover lands in the low‑20s per cwt. The pool pays handlers back at the weighted‑average statistical uniform price, which has hovered in the $18–$19/cwt band in early 2026. The gap between Class I in and uniform price out is the dollar value CODE’s lawsuits are challenging.

Your premium contract is something else entirely. Organic producers don’t get paid out of the pool — they get paid through private supply agreements with co‑op pay programs at Organic Valley, or contracts with buyers like Horizon or Aurora. NODPA’s monthly reports place those programs in the $33–$45/cwt range nationally, with grass‑fed and branded premiums into the high‑40s. The FMMO uniform price sits well below that world. It’s a backstop, not a livelihood.

The June 1, 2025 FMMO amendments permanently reset the make‑allowance formulas. Bullvine’s “$20 Milk Paradox” coverage, citing American Farm Bureau Federation analysis, put the hit at roughly $0.85–$0.93/cwt off announced class prices in many orders. On 44,000 cwt, that’s another $37,400–$40,920/year in lost revenue for any portion of your check that tracks those class values. The “floor” is on a slow slide of its own.

So what does the FMMO actually do for you as an organic producer?

  • It forces your handler to pay into a pool at a high Class I price.
  • It returns money at a lower uniform price.
  • It sets a floor at $18–$19/cwt — well below organic cost of production.

NODPA’s monthly producer reports peg all‑in organic mailbox costs in the mid‑30s per cwt across many Northeast herds, with feed, labor, and certification overhead doing most of the lifting. At an $18–$19/cwt uniform price, you’re not “saved.” You’re losing money slightly more slowly than if your check hit zero.

How Much Does FMMO “Protection” Actually Buy You?

Treat FMMO participation like an insurance policy and the deductible becomes obvious.

What FMMO Costs YouWhat FMMO Protects You From
$31,680/year pool drag (CODE estimate)A zero milk check
$0.72/cwt × 44,000 cwtNot from a negative DSCR
Tens of thousands a year, every yearOnly kicks in after ~half your milk income is already gone

You’re paying tens of thousands of dollars a year into a system whose “benefit” only kicks in after you’ve already lost roughly half your milk income. And once you hit that floor, your cost structure still looks like an organic farm — feed, labor, certification, and all — not a conventional one.

So when somebody tells you the FMMO protects organic farmers, translate it into barn language. It protects you from a zero milk check. It does not protect you from a negative DSCR.

What Should You Be Asking Your Lender Before September?

If you’re shipping organic and carrying term debt, your lender conversation this summer needs to be more than small talk about feed costs. You’re trying to answer three questions before anyone touches your 2026 contract.

1. “What happens to my loans if my organic contract is cut or terminated?” Sit down with your loan documents and your lender. Make them point to the DSCR or coverage covenants and how often they’re tested. Find out whether a covenant miss caused by a documented contract loss or premium cut is an automatic event of default, or something the bank can waive. Read every line of any Material Adverse Change (MAC) language that lets them accelerate, re‑price, or freeze your operating line if milk income drops sharply.

2. “At what DSCR do you stop giving me the benefit of the doubt?” You don’t need their internal credit playbook. You do need a number. Is 1.25× where they get nervous? 1.0×? Lower? Then run your own three‑scenario math: DSCR at $38.39/cwt today, DSCR at $34.55/cwt with a 10% premium cut, and DSCR at $18.50/cwt if the contract walks. If the floor scenario pulls you below 1.0×, you want that on the table now — not after the fact.

3. “Can we document what happens if my pay price drops $3–$5/cwt?” It doesn’t have to be a contract addendum. An email recap of your meeting will do: “Confirming my understanding — if my DSCR drops below 1.0× due to a documented contract change of $3–$5/cwt, the bank will first explore restructure options (amortization change, temporary interest‑only) before considering acceleration.” If your lender won’t put any version of that in writing, you’ve learned a lot about how much real flexibility you have.

Options and Trade‑Offs for Farmers

You can’t litigate your way to a safe milk check. Even if CODE wins an exemption or a payout, your day‑to‑day risk still lives in your contract and on your balance sheet. Here’s where producers are actually moving right now.

Option 1 — Stay in the co‑op and engage on pooling policy from the inside. This is the path most Organic Valley members are on. It makes sense if your organic pay price is still in the high‑30s to low‑40s per cwt, your DSCR sits at or above 1.25× at today’s price, and you believe member pressure can move board policy. What it takes is showing up with numbers, not feelings — asking for audited breakdowns of total FMMO pool payments, organic vs conventional contributions, and how those costs are allocated in the pay program. The risk: co‑op governance moves at board speed, not milk‑check speed. With AFBF flagging organic class‑price pressure from the June 2025 make‑allowance reform and pay prices already drifting in NODPA’s monthly reports, plan for the possibility that pay‑program terms get reviewed before pooling policy is resolved.

Option 2 — Stay, but run the contract + covenant checkup in the next 30 days. This is the highest‑return move almost every organic farm can make this summer. Within a month, print your milk supply agreement and highlight every reference to “premium,” “over‑order premium,” “pooling,” “FMMO,” “regulatory charges,” “market adjustments,” “termination,” “notice,” and “volume caps.” Print your loan documents and highlight DSCR or coverage covenants and any MAC clauses. Build a one‑page summary — current pay price and DSCR, DSCR at a 10% premium cut, and DSCR at the floor — and walk it into your lender’s office. Risk is minimal. Time investment is a weekend and one serious meeting. Payoff is knowing exactly how much runway you have if your premium gets “reviewed” this winter.

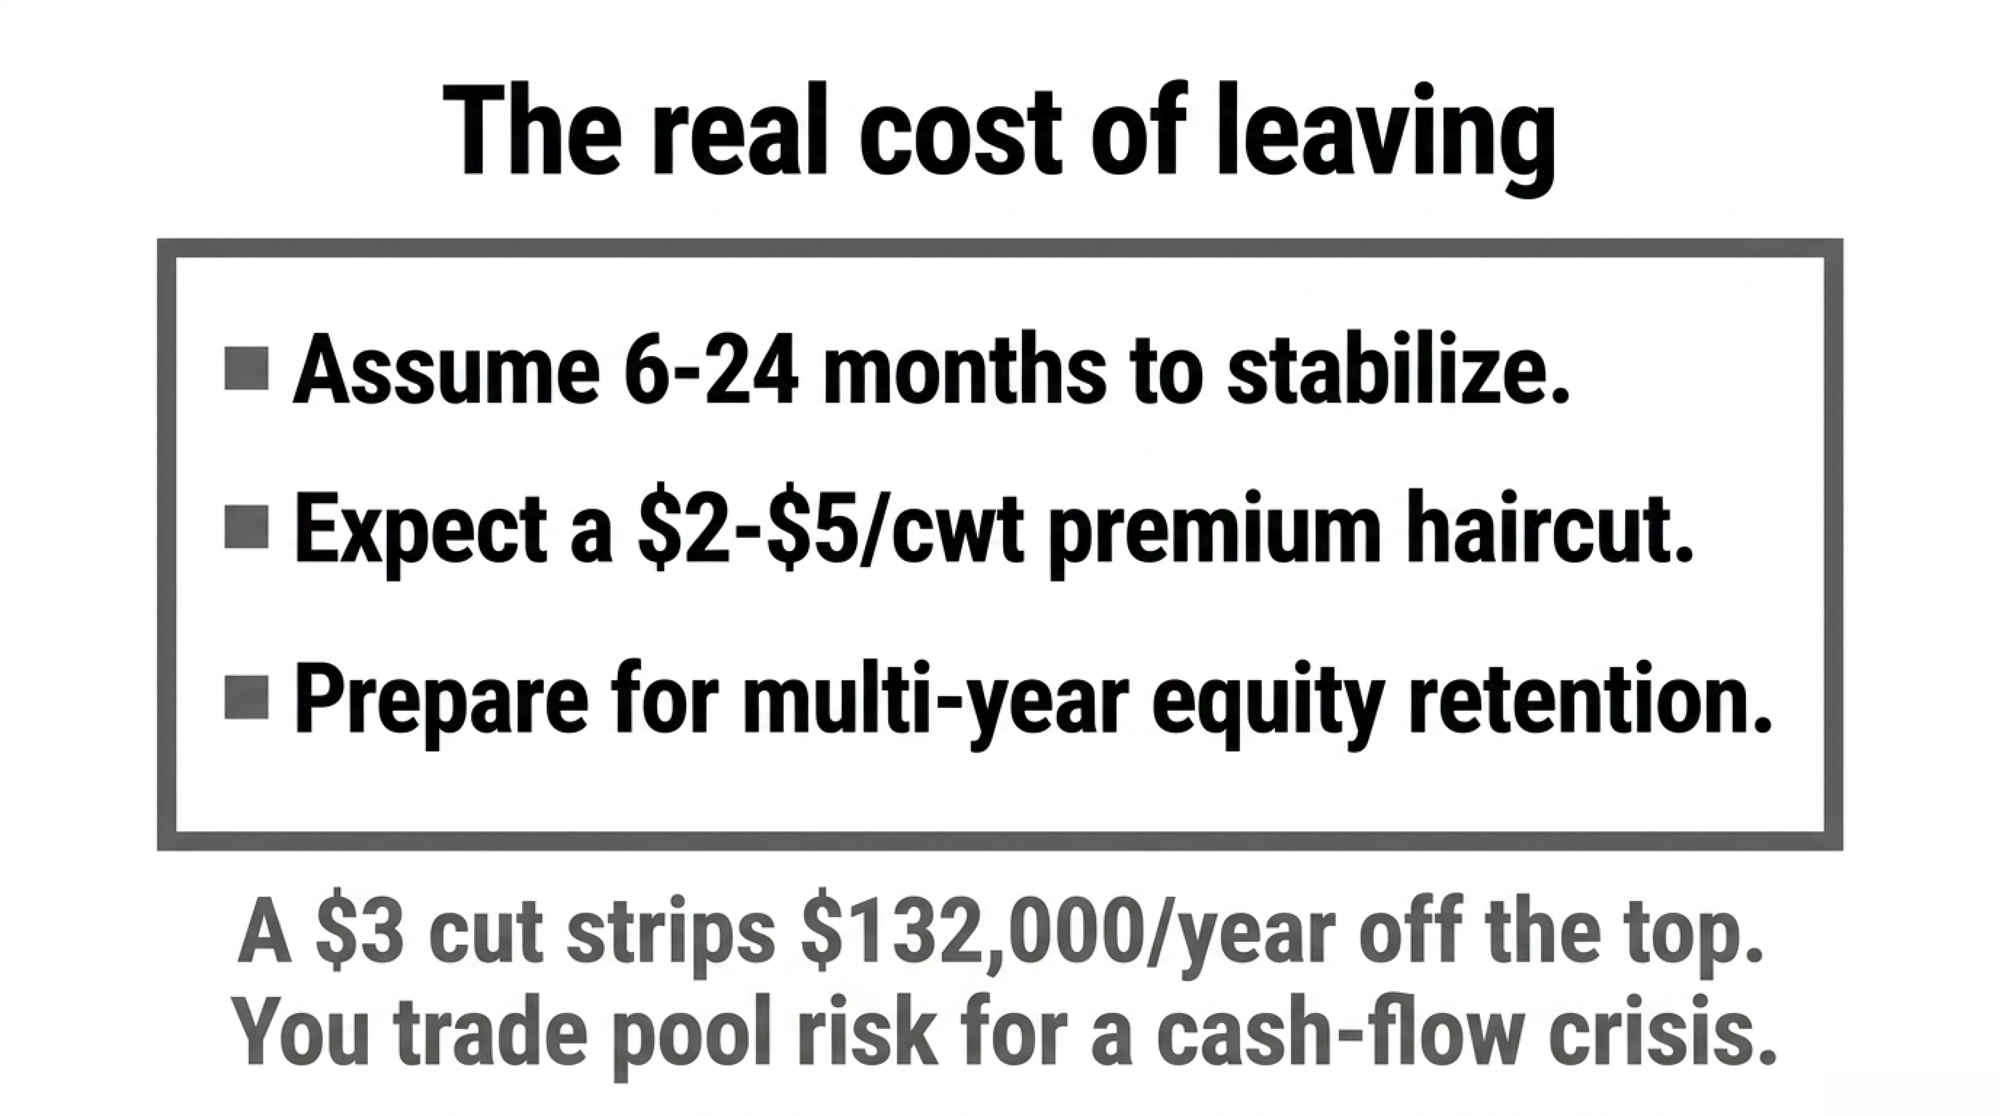
Option 3 — Map an exit to a different organic buyer. Some producers are already having quiet conversations with other organic handlers. This only makes sense if there’s another buyer in hauling range who actually wants your volume and will put a number on paper. Assume 6–24 months from “I want out” to “I’m stable with a new buyer,” a likely $2–$5/cwt premium haircut on the new deal, and a redemption horizon that, in many dairy cooperatives, runs several years; build cash flow assuming retained equity isn’t available immediately, and verify your co‑op’s actual schedule with its member services office. On 44,000 cwt, every $1/cwt haircut is $44,000/year. A $3/cwt cut is about $132,000/year off the top — enough to push many farms with thin DSCR cushions into covenant territory in a hurry, depending on debt service and operating costs. You’re trading pool‑policy risk for immediate cash‑flow pressure. Sometimes that’s the right trade. Sometimes it isn’t.

Option 4 — Diversify how you sell milk. This is the long, hard path. It can look like on‑farm bottling and direct sales, a branded partnership with a regional organic label, or a hybrid where part of your volume stays with the co‑op and part flows into a higher‑margin, lower‑volume channel. It needs capital for processing or packaging, real compliance and marketing horsepower, and an honest read on how many cwt your local market can absorb. Risk is high. But if you’re already at 1.0× DSCR with today’s premium, it might be the only path that ever gets you out from under the FMMO‑vs‑contract crossfire.

OptionTime to StabilityEst. $/cwt ImpactDSCR Risk at FloorCapital NeededBest For
Stay in co-op, engage on poolingOngoing0 (today) — risk of future cutHigh if premium fallsLowDSCR ≥ 1.25× today
Stay + 30-day contract/covenant audit30 days0 (awareness only)Identifies risk earlyNoneEvery organic farm
Map exit to different organic buyer6–24 months-$2 to -$5/cwt haircutModerate-High during transitionLow-mediumDSCR > 1.1× with options in hauling range
Diversify to on-farm/branded sales2–5 yearsPotentially +$5–$15/cwtHigh during buildoutHigh (processing/packaging)DSCR ≥ 1.0× with capital access

Key Takeaways

  • If your DSCR drops below 1.0× at a 10–15% premium cut, your first job is a lender plan, not a co‑op fight. That’s the line where bankers stop being patient.
  • If your supply agreement lets a buyer change pooling or utilization strategy without re‑negotiating price, treat that as a built‑in price‑cut option. The lawsuit doesn’t alter that clause.
  • If your co‑op can’t show, with numbers, how organic over‑order premiums and FMMO pool costs are tracked separately from conventional, push for policy clarity, not reassurance.
  • If your exit plan depends on co‑op equity coming back quickly, redo the math. Confirm your own co‑op’s redemption schedule in writing, and run cash flow without assuming early payouts.
  • If your lender won’t put anything in writing about a $3–$5/cwt pay‑price drop, you’ve already learned something. Get an email summary of your DSCR conversation in the next 30 days.
  • If you’re at 1.25× DSCR or better at today’s price, you have time to engage on pooling policy. Below 1.1×, the bigger threat is contract loss and covenant pressure, not the pool itself.

Before You Sign the Next Contract

The CODE lawsuits will move at court speed, not barn speed. Even if organic eventually wins an FMMO exemption or a refund, that ruling won’t tell your lender how many bad years they’ll tolerate or your co‑op how to structure your 2027 pay program. Those decisions still live in your contracts, your covenants, and your own numbers.

So before this fall’s contract review season hits, ask yourself three questions. Where does your DSCR break if your premium drops 15%? Which lines in your milk agreement let someone else move the goalposts on pooling and premiums without your signature? And if a new contract showed up in your mailbox tomorrow, could you and your lender sit down, run the barn math, and know — not guess — what it does to your 200‑cow operation? 

Run Your Numbers

Farm Benchmark Snap Check — Stress-test your milk check against a $19.89/cwt swing before fall contract review. Plug in your own cwt, debt service, and premium, and see where your DSCR breaks if the organic contract walks or compresses 10%.

Complete references and supporting documentation are available upon request by contacting the editorial team at editor@thebullvine.com.

Learn More

The Sunday Read Dairy Professionals Don’t Skip.

Every week, thousands of producers, breeders, and industry insiders open Bullvine Weekly for genetics insights, market shifts, and profit strategies they won’t find anywhere else. One email. Five minutes. Smarter decisions all week.

NewsSubscribe
First
Last
Consent

A $45 Test, A $149,840 Gap: Inside Kansas’s 700-Cow Genomic Trap

A 700-cow Kansas freestall tests 250 heifer calves at $45/head, files the report, and breeds the herd the same way it bred last year. The 2026 modeled gap: $149,840.

For U.S. commercial freestall dairies in the 500–1,500-cow band, it costs $2,651 to raise one Holstein heifer to calving, per Iowa State University Extension’s heifer cost of production work. The $45 line on your genomic testing invoice is the cheapest number in the stack. The expensive number is what that test didn’t change in the alley at 4:30 a.m.

Run that math on a 700-cow Kansas freestall that tests its full 2024 heifer crop and then keeps every heifer anyway, and the 2026 dairy economics of genomic testing produce a modeled 9,840 annual gap between testing spend and routing discipline. That figure is a scenario comparison against an enforced genomic-routing benchmark, built from a $45-per-head lab contract and published Iowa State Extension, CDCB, Lactanet, and Bullvine inputs. Not a P&L forecast.

Same test. Different decisions. Different milk checks.

Is Genomic Testing Worth It for Commercial Dairy Herds in 2026?

U.S. benchmark pricing on commercial genomic tests has held in the $40–$45/head range through 2024–2026. Reliability on Net Merit and Productive Life now runs 73–79%, with Daughter Pregnancy Rate around 74%, based on CDCB-published reliability tables cited in that same guide. Genetic gain in NM$ has accelerated to roughly per year under genomic selection, consistent with CDCB’s published national trend data reported in the Bullvine May 2025 guide.

TraitCDCB Reliability RangeWhat It Means in PracticeEnforcement Implication
Net Merit (NM$)73–79%High confidence — ranking is stable across re-runsSafe to print on breeding sheet as decision rule
Productive Life (PL)73–79%Longevity signal strong at this reliabilityBottom-quartile PL animals are real culling targets
Daughter Pregnancy Rate (DPR)~74%Solid — fertility signal actionable at farm levelUse to flag beef-routing candidates, not just sire selection
Fat Yield (PTA Fat)~78–82%*Highest reliability in the index post-2025 revision31.8% NM$ weight now makes this the dominant sort variable
Feed Saved~65–70%*Improving but widest confidence band in the indexUse directionally; don’t cull solely on Feed Saved at this stage

Layer in the 2025 NM$ revision. CDCB’s April 2025 NM$ formula revision moved PTA Fat near 31.8% relative emphasis and Feed Saved to roughly 14%, as reported in the May 2025 guide and anchored to the CDCB primary release linked there. On paper, the case writes itself.

Some commercial herds use genomic data primarily for sire selection and donor identification, where ROI capture doesn’t require the kind of cull-and-route discipline this article emphasizes. Those strategies have their own economics. The case below is built for the much larger commercial cohort that buys the test, files the report, and breeds the herd the way it bred last year.

For Canadian and other supply-managed readers, the cull-and-route economics shift under quota systems — the beef-cross premium and rearing-avoidance lines still apply, but the replacement-pressure math changes when quota expansion governs herd growth rather than market-priced milk volume. The thesis below is built for U.S. market-priced systems.

The recommended commercial playbook surfacing across major U.S. genomic test provider strategy guides and university extension materials The Bullvine has reviewed across 2024–2026 looks consistent: test the full heifer crop at the lab’s $40–$45 contract rate, cull the bottom 15–20% as calves, route the bottom cows to beef semen, pull donor candidates from the top 5%.

Plan on paper. Plan in practice: often barely touched.

What Does It Cost When a 700-Cow Herd Tests Every Heifer But Culls None?

The pattern The Bullvine has documented across commercial freestalls in 2024–2026 breaks one assumption flat. Everyone assumed genomic data and genomic decisions were the same thing. The 2024 barns say otherwise.

A run of transition wrecks tightens springer inventory. A load of heifers moves at a strong price right after calving and tightens it further. By the time the genomic reports land, the quiet decision has already been made in herds this size: keep every heifer, use the rankings to pick donors, move on.

In herds The Bullvine reviewed during 2024–2026 where genomic testing was paid for but routing wasn’t enforced on paper, the observable pattern is that breeding decisions often continue to follow visual and temperament cues rather than the genomic ranking. The ranking isn’t wrong. It just isn’t the rule. Where the ranking isn’t printed on the daily breeding sheet, it’s rarely the operative input at the tank. That’s an enforcement pattern, not a technician failing.

Three forces keep this pattern alive in 500–1,500-cow herds. Muscle memory beats spreadsheets when the tech is working in the dark. Visual bias defends favorite cow families against any ranking that contradicts them. Pay structures tie breeding staff to pregnancy rate and services-per-conception, not to whether the semen pulled matched the genomic tier.

Strategy without enforcement drifts into decoration. That’s what the testing line item is paying for when it pays for nothing else.

How the Execution Leak Happens — The Genomic Routing Funnel

Three Cash Flows That Move the Wrong Way

Against an enforced routing benchmark, three lines on the 700-cow Kansas scenario’s 2024 cash flow move in the wrong direction.

Rearing dollars not recaptured. Rearing dollars not recaptured. A $45 × 250-heifer test flags a clear bottom-quartile group — roughly 50 animals running below the top half on NM$ and components. Pull 30 as calves under a disciplined sort-and-cull plan modeled on The Bullvine’s February 2026 execution-leak work, and you avoid roughly 30 × $2,651 in rearing cost over the next 24 months. Pull three instead of 30, and the other 47 stay on feed, in pens, on the balance sheet.

Beef-cross revenue not captured. The beef-cross premium over a straight Holstein bull calf ran $350–$700 per head through late 2024 and into 2025, consistent with USDA AMS bull calf price ranges over the same period. That’s a national/trade-press benchmark; Kansas and Plains-region premiums vary, so cross-check against local sale barn or regional trade reporting before applying this range to your own math. At 450 cows bred in a cycle and an enforced top-half-dairy/bottom-half-beef rule — a framework consistent with routing discipline operators have described to The Bullvine in 2024–2026 interviews — 220–225 cows land in the beef-eligible bucket. When a herd this size books 95 beef-cross calves for the year, the modeled gap sits at roughly 125 additional cows not routed (rounded to 120 in the table below for arithmetic simplicity).

Stall value that ages poorly. A third- or fourth-lactation cow can carry genetics $250–$400 behind the 2023–2024-born heifers coming up behind her, derived from 85/year NM$ gain (CDCB national trend data). The Bullvine’s November 2025 Retention Payoff framework puts the three-year advantage of swapping a genetically lagging cow for a top-index replacement at roughly $1,350 per cow, with an approximate $233 per cow per year genetic opportunity cost derived from that same gain rate. Without genomic culling pressure, stalls age in the wrong direction.

Running the Numbers — Modeled Kansas Scenarios at 400, 700, and 1,000 Cows

This is a modeled comparison, not any single operation’s P&L. Inputs come from Iowa State Extension’s 2024 heifer cost work, CDCB trend figures, Lactanet 2024 inbreeding data, The Bullvine’s 2024–2025 reporting, and a $45/head lab contract. Convention: Year-1 gap = rearing avoided + beef premium captured + stall drag. Testing investment is shown separately as the ante. Beef-routing line uses 120 cows at the 700-cow scenario for table simplicity (exact math = 125).

Herd SizeTesting AnteRearing Avoided (24-mo)Beef Premium (Year 1)Stall Drag (Opportunity)Total Year-1 Gap
400 cows$6,525$47,718$31,500$9,320$88,538
700 cows (lead scenario)$11,250$79,530$54,000$16,310$149,840
1,000 cows$16,200$119,295$78,750$23,300$221,345

Inputs behind the table

  • Herd: 32% replacement rate, Kansas freestall, 2024 calf crop tested at $45/head.
  • Heifer raising cost: $2,651/head to calving (Iowa State Extension, 2024).
  • Beef-cross premium: $350–$700/head, $450 midpoint (USDA AMS, 2024–2025).
  • Stall drag: ~$233/cow/year, derived from 85/year NM$ gain (CDCB national trend data).
  • Rearing line is realized over 24 months; beef premium and stall drag are Year-1.
  • Cull depth and beef-eligible count move with your replacement strategy, not just your herd size.

Separate three-year frame (700-cow scenario)

  • Retention Payoff on 70 stall upgrades: 70 × $1,350 = $94,500 across three years, or roughly $31,500 per year amortized (Bullvine, November 2025). Don’t fold this into the Year-1 number. It’s a different horizon.

Plug in your own cull depth, routing rate, and beef premium midpoint. The range is directional.

Why the Testing Line Is the First Thing Lenders Ask About in 2026

The turn is showing up in Q4 lender meetings, not in the barn.

In The Bullvine’s 2025–2026 editorial conversations with commercial dairy operators in the 500–1,500-cow segment across the U.S. Midwest and Plains, multiple operators reported that their regional ag lenders raised a version of the same question at 2025 working capital renewals: the genomic testing line is up, where is it showing up on the milk check? Operators who can’t tie specific animals on the ranking report to specific routing decisions are finding those conversations harder to navigate than in prior cycles. That pattern aligns directionally with widely reported 2024–2025 ag-credit tightening across U.S. dairy.

EDITOR’S INSIGHT

In 2026, the milk check tells the story of your past decisions. The genomic report tells the story of your next ones.

One 2025 Lender Conversation, Illustrative and Anonymized

Read this as composite, not verbatim. The figures below are derived from the modeled 700-cow Kansas scenario above, not from any single operator’s records. It reflects the pattern operators have described to The Bullvine across the U.S. Midwest and Plains during 2025 renewal cycles, not any single exchange.

Lender: Your testing line went from $7,400 in 2023 to $11,250 in 2024. Walk me through what changed on the milk check.

Operator: We’re testing every heifer now.

Lender: I can see that. Your beef-cross calf count went from 82 to 95. Your springer inventory is up eleven head year-over-year. Which animals on the 2024 ranking report did you cull or route differently because of what the test said?

Operator: (pause) We’d have to pull the list.

That silence is the product. Not the $45 invoice.

A 2024 DSCR under 1.2 — the working-capital threshold widely used by U.S. ag lenders — sitting on the ledger next to a five-figure genomic testing bill and a ranking report whose bottom-quartile heifers are still in the springing pen answers the lender’s question for them. The test wasn’t the product. The decision rule was.

The other half of the pattern shows up at the barn level. The list wasn’t the rule, so the list wasn’t the input. Visual appraisal won because nothing in the daily workflow required anything else. That single dynamic explains most of the daylight The Bullvine has been documenting across commercial dairies reviewed in 2025–2026.

The 30/90/365-Day Playbook for Herds Testing Without a Rule

The fix isn’t more testing. It’s less freelancing. This playbook blends the restructured 2025–26 protocols The Bullvine has reviewed, the routing discipline operators have described, and the February 2026 execution-leak findings.

30 Days: Stopping the Bleed

  • Tag the bottom 20% so the alley can see them. Rank every heifer on hand by NM$ from your 2024 and 2025 genomic reports. Tag the bottom 20% with a physical signal — leg band, ear tag color, pen flag — within 30 days. Requires one morning with your genomicist and your software. Red-flag trigger: if your genomic testing spend is up year-over-year and your beef-cross calf count hasn’t moved, this is week one. Backfire watch: over-culling into a replacement shortage if your sexed semen program isn’t already creating surplus. Pull your 12-month projected heifer inventory before acting.
  • Print the ranking on the daily breeding sheet. Rewrite the daily breeding sheet with your AI tech. Every line prints with an assigned semen type — SEXED DAIRY, CONVENTIONAL DAIRY, or BEEF — derived from genomic tier, not tech discretion. Requires 2–3 hours in your herd management software (DairyComp, MPT, or equivalent). Trigger: if semen calls are being made at the tank rather than from a printed list, this is the highest-leverage 30-day fix.
  • Track tier compliance for one month. Target 95% by day 30, per The Bullvine’s editorial recommendation. Watch for excuses that start with “she looked good.”

90 Days: Systematizing the Rule

  • Install the one barn rule in writing. Band the breeding herd into top 30% sexed dairy only, middle 40% conventional or flex, bottom 30% beef only. Publish it in writing to everyone who touches the tank. Requires current genomic indexes on every eligible animal, a family meeting, and a plan for cultural pushback before it happens at 4:30 a.m. Threshold: if compliance runs below 90% in month two, the rule isn’t the rule yet. Backfire watch: resentment if you enforce without backing the tech when a well-presenting cow in the bottom band gets beef. The rule isn’t the rule until the tech has been backed up in front of the owner.
  • Pay for the rule, not just the pregnancy. Rewrite your breeding tech’s performance metric to include tier compliance alongside conception rate, tracked as paired numbers on the same weekly dashboard. Requires one conversation and one line change. Watch for gaming — compliance without conception progress isn’t the goal.
  • Audit inbreeding before the next mating cycle. Have your genomicist generate genomic inbreeding coefficients and Genomic Future Inbreeding scores for every breeding candidate. Flag any potential mating over 9% projected progeny inbreeding. Canadian Lactanet 2024 data points to roughly $60–$78 per cow per lactation of drag per additional 1% inbreeding. On a 300-cow herd, a 2-point reduction held across three lactations pencils to about 300 × 2 × $70 × 3 = $126,000 in avoided lifetime drag, using the $70 midpoint of the Lactanet $60–$78 range.

365 Days: Repositioning the Operation

  • Re-baseline the heifer pen around enforced culling. By end of year one, your heifer pen should be smaller, genetically stacked at the top, and funding a visible beef-cross calf revenue line on the cash flow your lender reviews. Requires one full breeding cycle under the rule. Opportunity signal: if your 2026 calf crop shows beef-cross count rising while springer projections hold within your 24-month replacement target, you have room to tighten the top tier further.
  • Run the donor program on index, not pedigree alone. Commercial IVF pregnancies typically run into the several-hundred-dollar range per confirmed pregnancy; confirm current rates with your provider before committing. The Bullvine’s editorial view on donor economics: the strongest pedigrees don’t always produce the strongest genomic profiles, and donor economics work best when the index decision leads the pedigree decision. For the legacy view of how disciplined index-led mating built famous breeding programs.
  • Rebuild sire selection around the 2025 NM$ weightings. Review sire selection through a component and inbreeding lens, not a top-10 list lens. Align your bull roster to the 2025 NM$ weightings and layer genomic relationship checks on top. Requires your mating software provider’s current release and a half-day with your genetics consultant.

What This Means for Your Operation

Testing isn’t the product. The rule is. That’s why the same $45 test lands as a six-figure decision on one farm and a line item on another.

The trade-off is plain. You gain margin by letting genomic ranks decide who gets raised, who gets bred dairy, who gets beef. You give up the comfort of family tradition, eye appraisal, and the peace of never arguing with your herdsman at 4:30 a.m. You also need a sexed semen program already doing real work. No surplus, no cull room. No cull room, no ROI on the test.

Across the commercial herds The Bullvine reviewed in 2025–2026 that installed a printed tier-routing rule, the editorial pattern has been beef-cross calf counts rising in the first full breeding cycle under the rule, testing spend holding roughly flat, and tier compliance converging on the 90–95% range within a quarter. The sample is the herd cohort described in the Behind the Numbers toggle below, not a national survey. October 2026 working capital reviews are five months out. The math is already moving on the herds that rewrote their breeding sheets this spring.

▶ RUN YOUR NUMBERS — Open the Genomic Testing ROI Calculator

The calculator walks you through your own herd’s test cost, cull depth, beef-routing rate, and replacement value in under ten minutes. Pull it up before your next breeding-sheet review.

Pull your 2024 and 2025 genomic reports. Answer one question honestly. Which specific animals did you actually treat differently — culled, routed to beef, moved out of the replacement pipeline — because of what the test said? Walk to the office. Find last week’s breeding sheet. Count the semen assignments that came from the genomic tier versus the tech’s judgment.

Key Takeaways

  • The $45 invoice isn’t the cost. The $149,840 modeled gap on a 700-cow Kansas freestall is what happens when the ranking lives in the office and the breeding sheet doesn’t change.
  • Genomic ROI shows up only when the rule is printed: top 30% sexed dairy, middle 40% conventional, bottom 30% beef — and the tech gets backed up the first time a well-presenting cow in the bottom band gets beef.
  • Tag the bottom 20% in 30 days, install the routing rule in writing in 90, and re-baseline the heifer pen by the 2026 calf crop. Your October 2026 working capital review is the deadline, not your next lab invoice.
  • If your testing line is up year-over-year and your beef-cross calf count hasn’t moved, your lender already knows the answer. Pull last week’s breeding sheet before they ask again.

What does your current breeding protocol actually say, on paper, about the bottom 30% — and when did it last change a single decision at the tank?

This article draws on The Bullvine’s 2024–2026 editorial review of commercial freestall dairies in the 500–1,500-cow segment, built from aggregated operator interviews and on-farm record reviews conducted across the U.S. Midwest and Plains during that window. The cohort referenced in the article reflects herds The Bullvine has reviewed in that segment during 2024–2026; specific herd counts are not disclosed to protect operator anonymity. The 700-cow Kansas scenario is modeled, not drawn from any single operation’s records.

The anonymized 2025 lender conversation is composite and illustrative, constructed from the pattern of exchanges operators described to The Bullvine during 2025 working capital renewal cycles. The dialogue’s specific figures are derived from the modeled 700-cow Kansas scenario inputs, not from any single operator’s ledger. No individual operator, herdsman, or lender is named or profiled. The DSCR-under-1.2 threshold reflects a working-capital line widely used by U.S. ag lenders and is cited as a common-practice benchmark, not as a specific institution’s policy.

Learn More

The Sunday Read Dairy Professionals Don’t Skip.

Every week, thousands of producers, breeders, and industry insiders open Bullvine Weekly for genetics insights, market shifts, and profit strategies they won’t find anywhere else. One email. Five minutes. Smarter decisions all week.

NewsSubscribe
First
Last
Consent
Send this to a friend