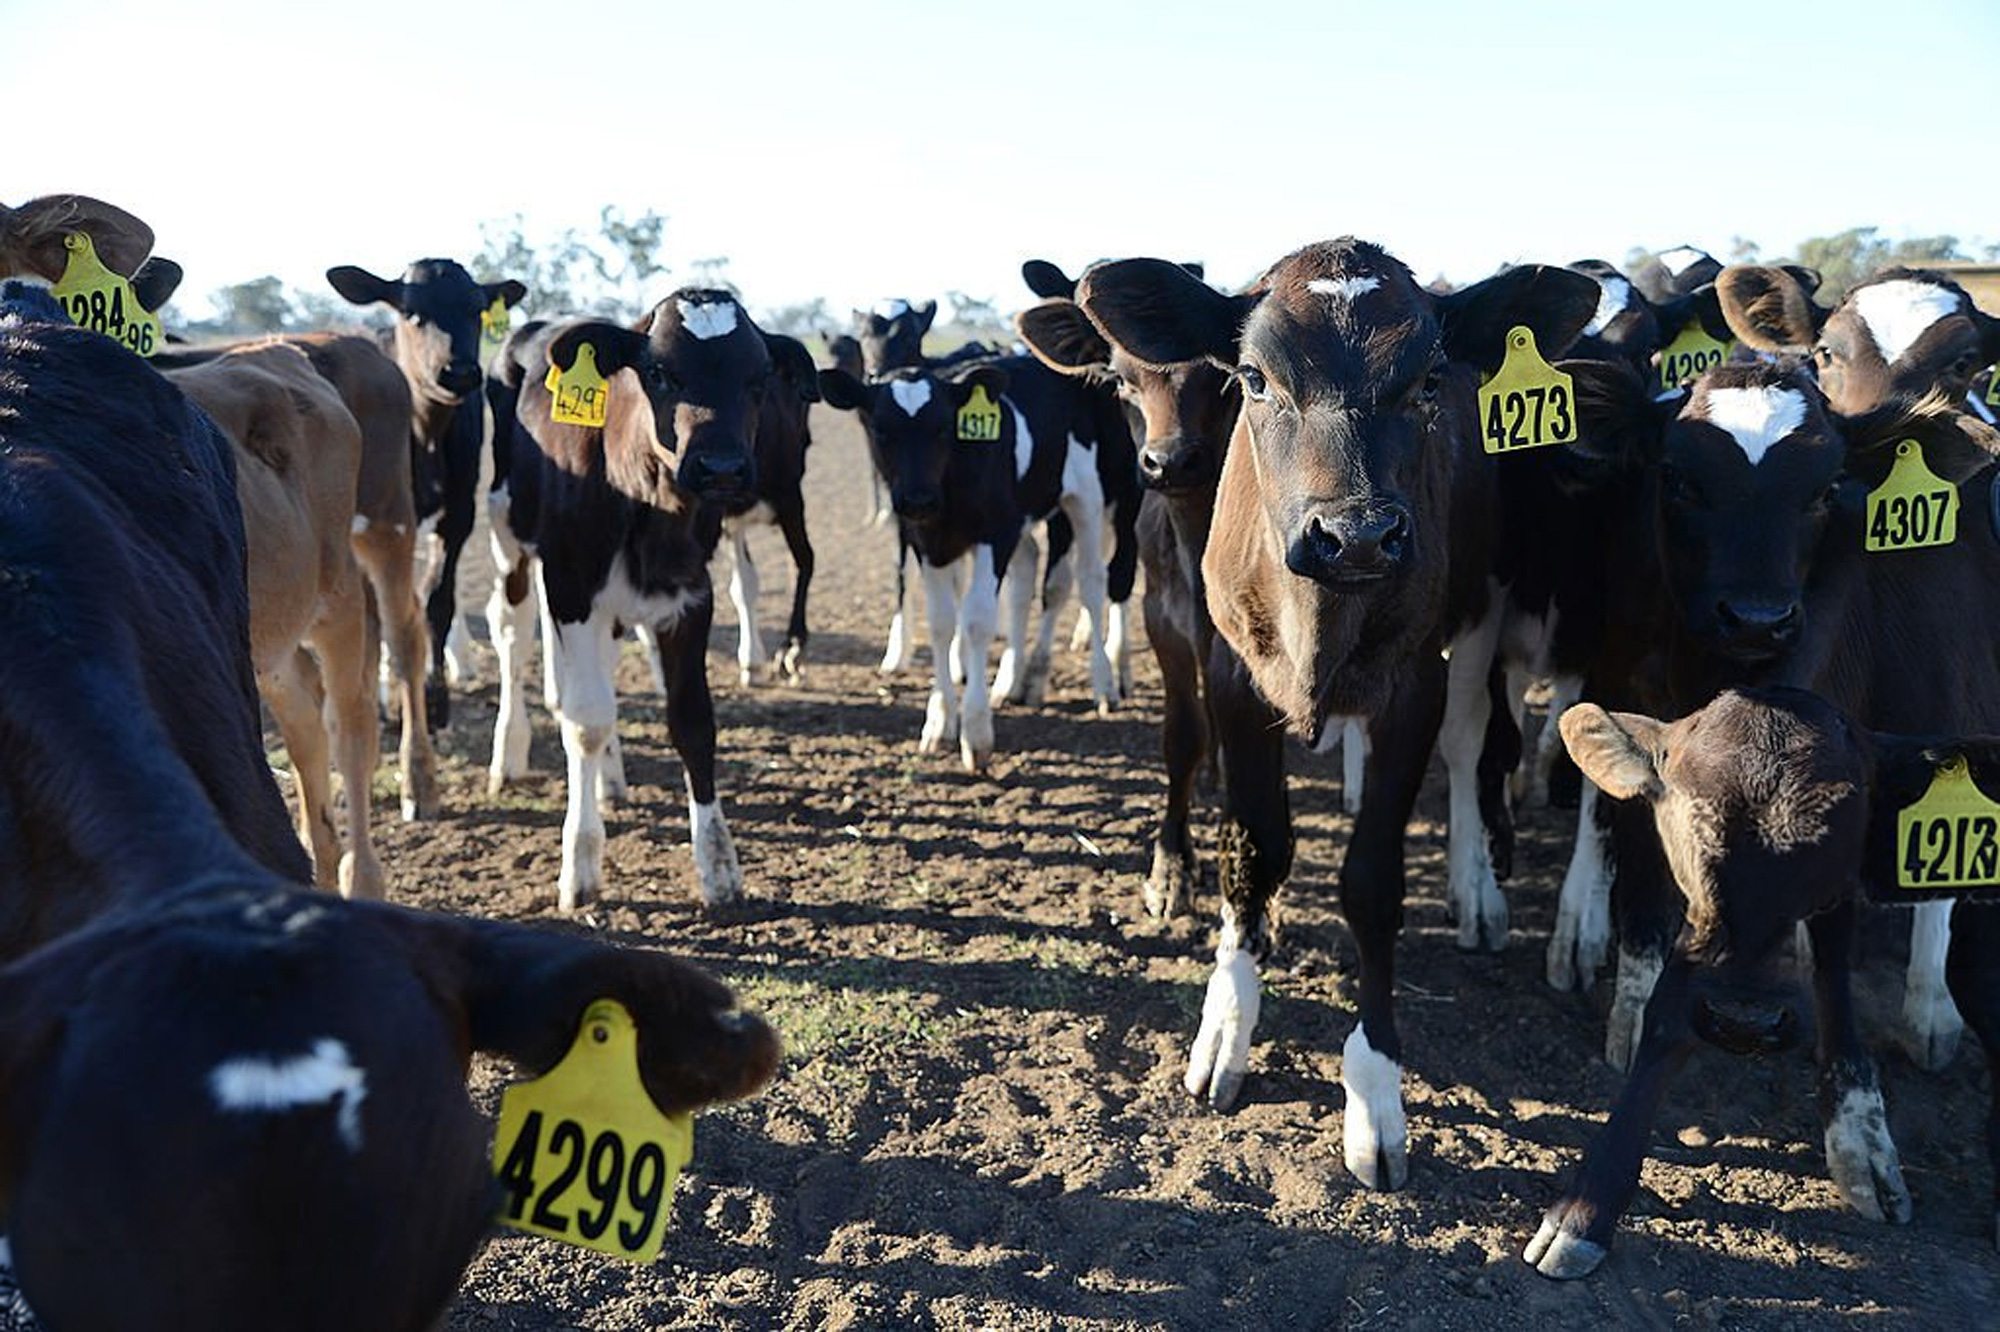
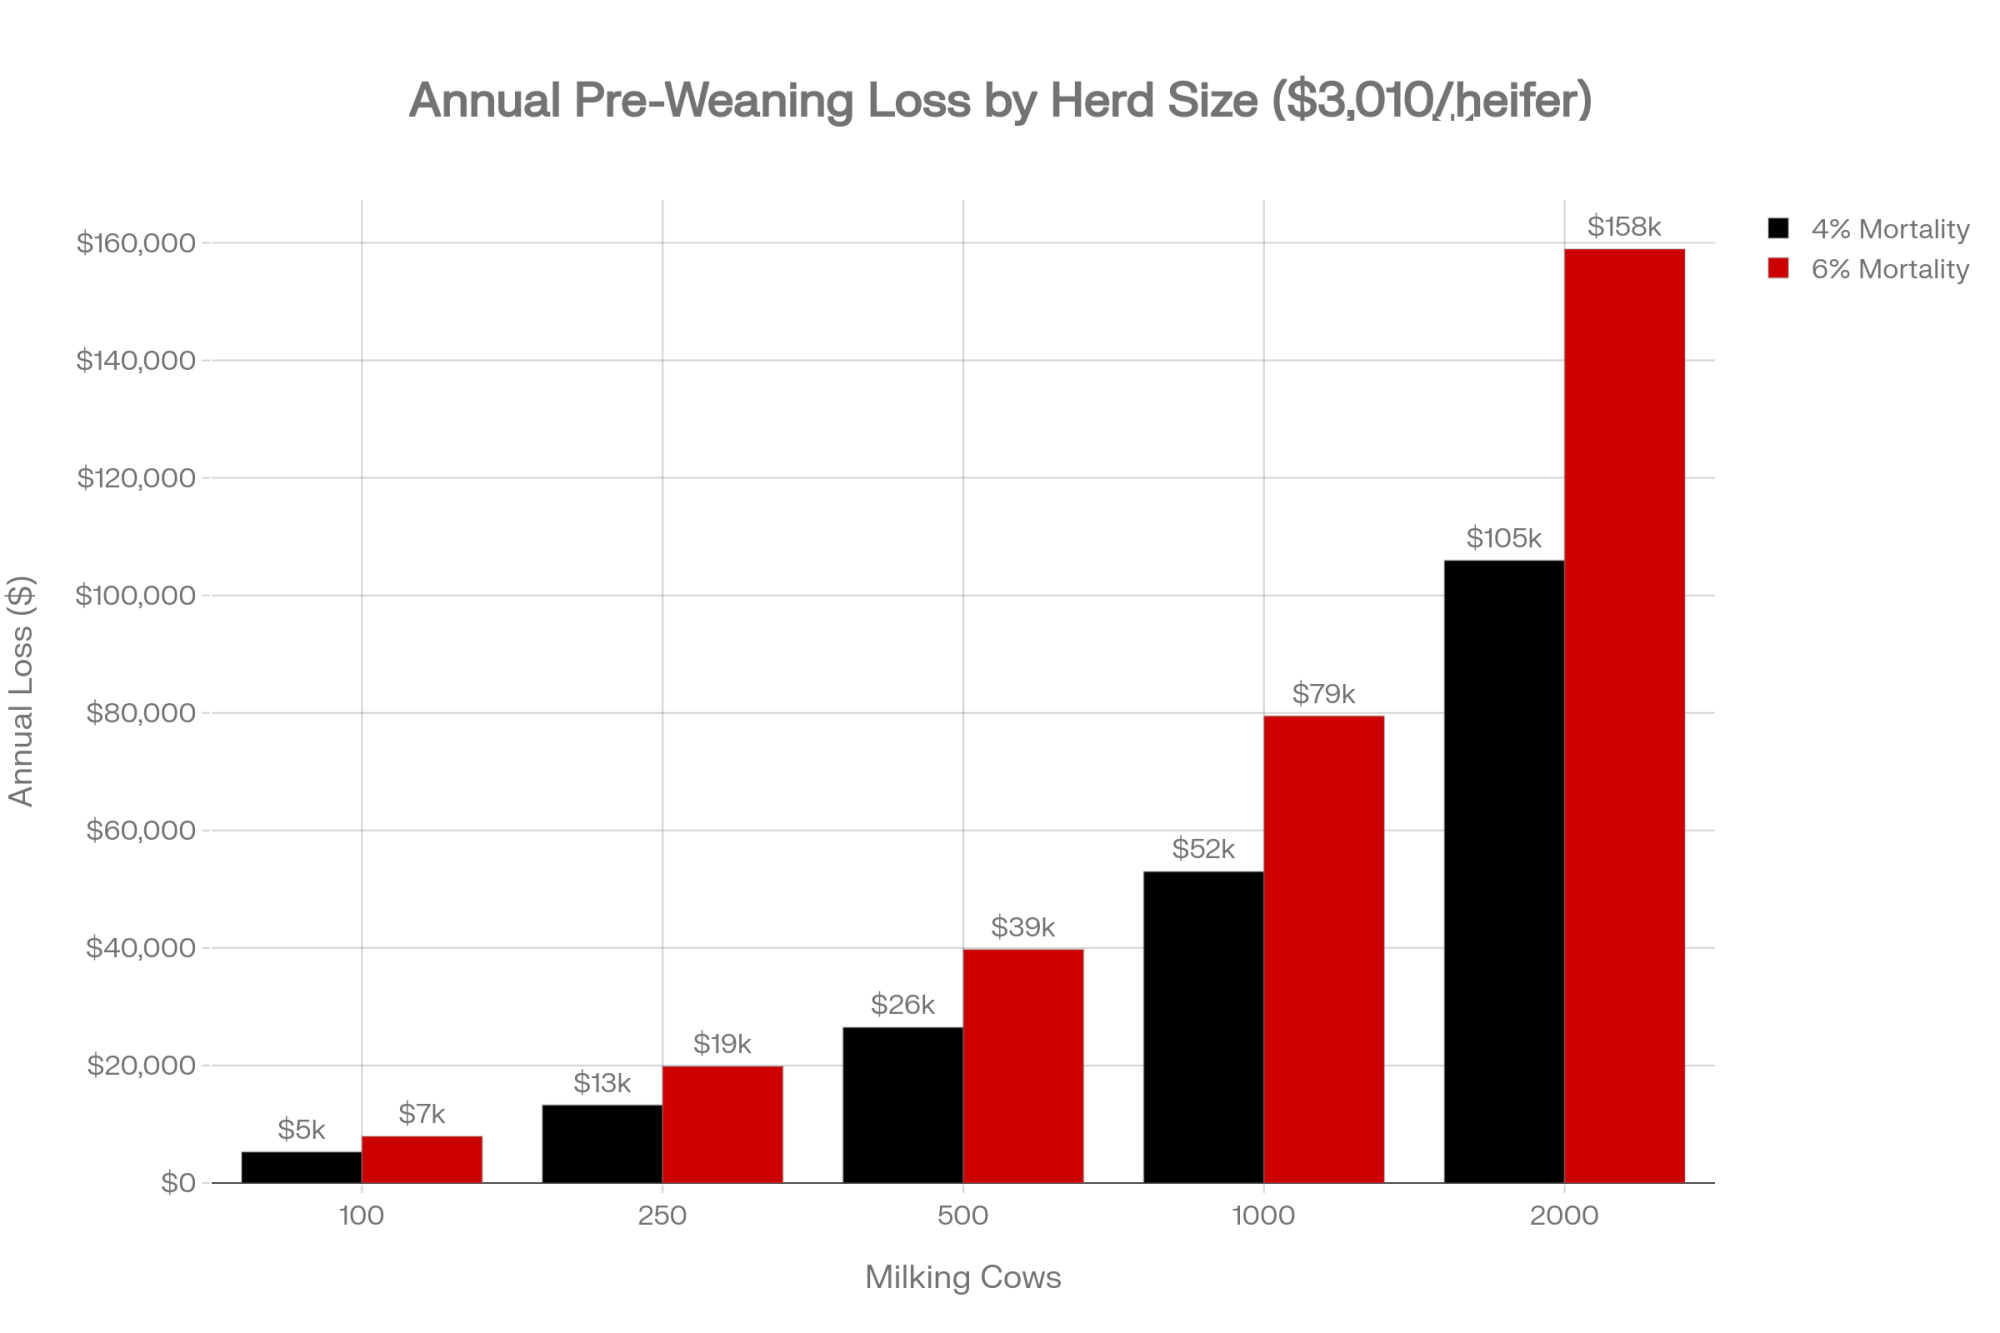
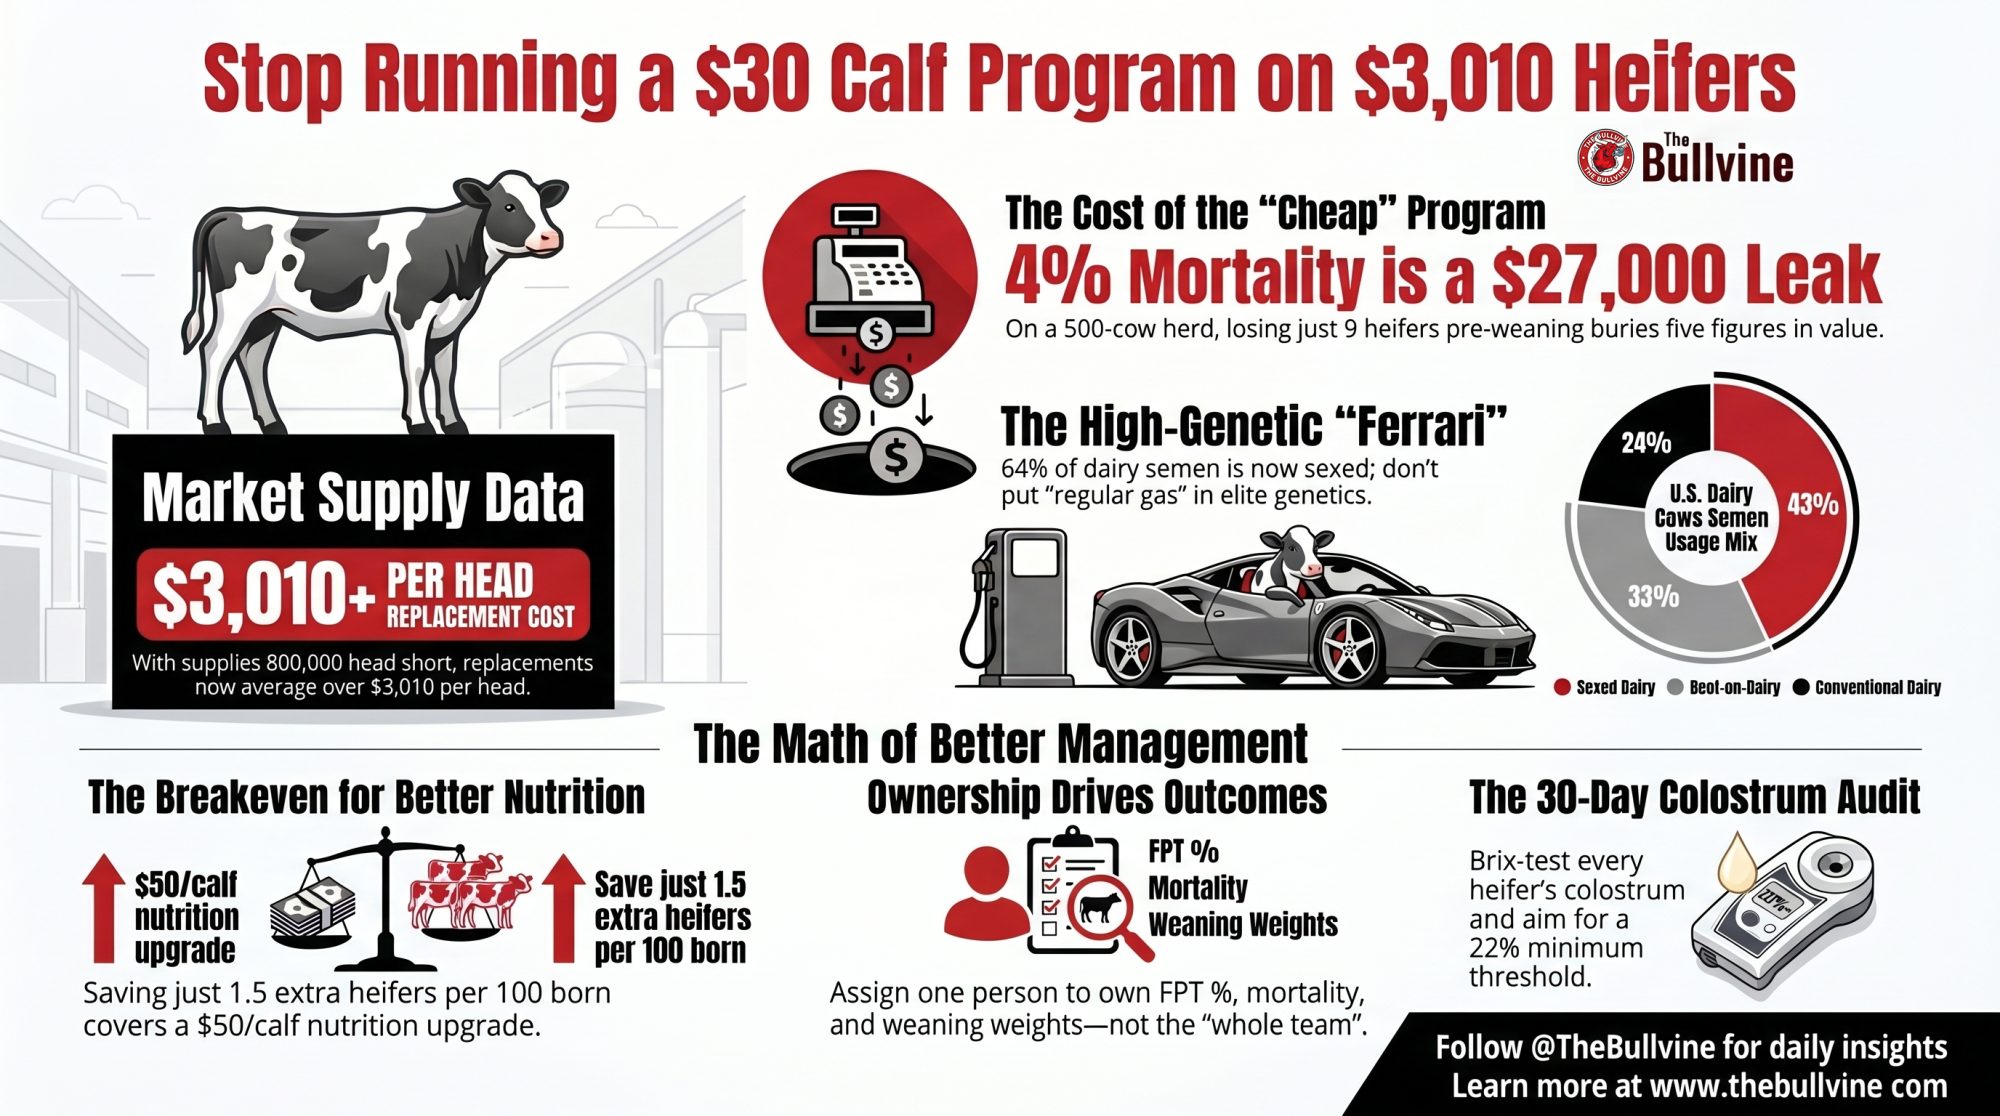
On a 500‑cow herd with 220 heifer calves a year, even 4% pre‑weaning mortality buries about $27,000 in lost heifers alone — at $3,010 per head, before genomics or sexed semen. At 5–6%, that same line item passes $40,000. Still think your $30 calf program is “good enough”?
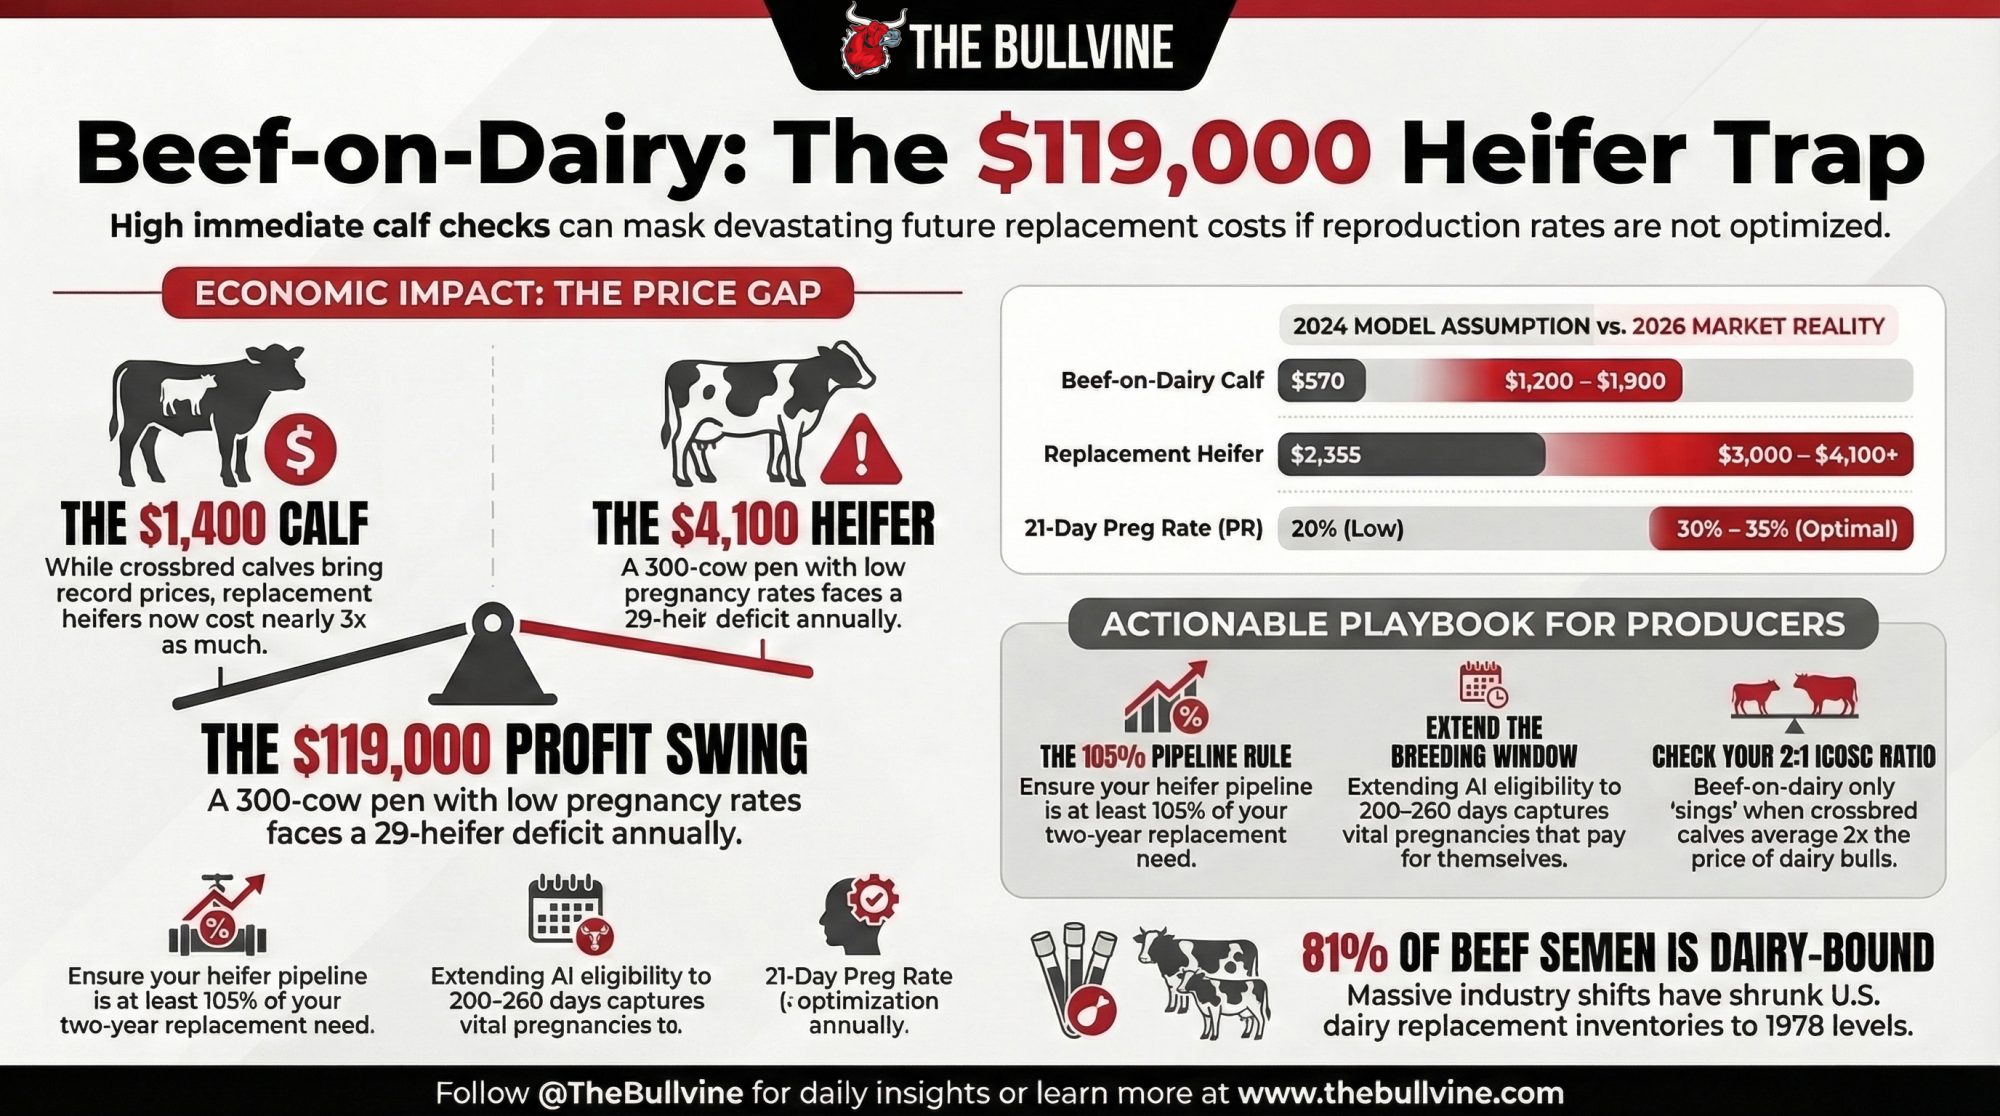
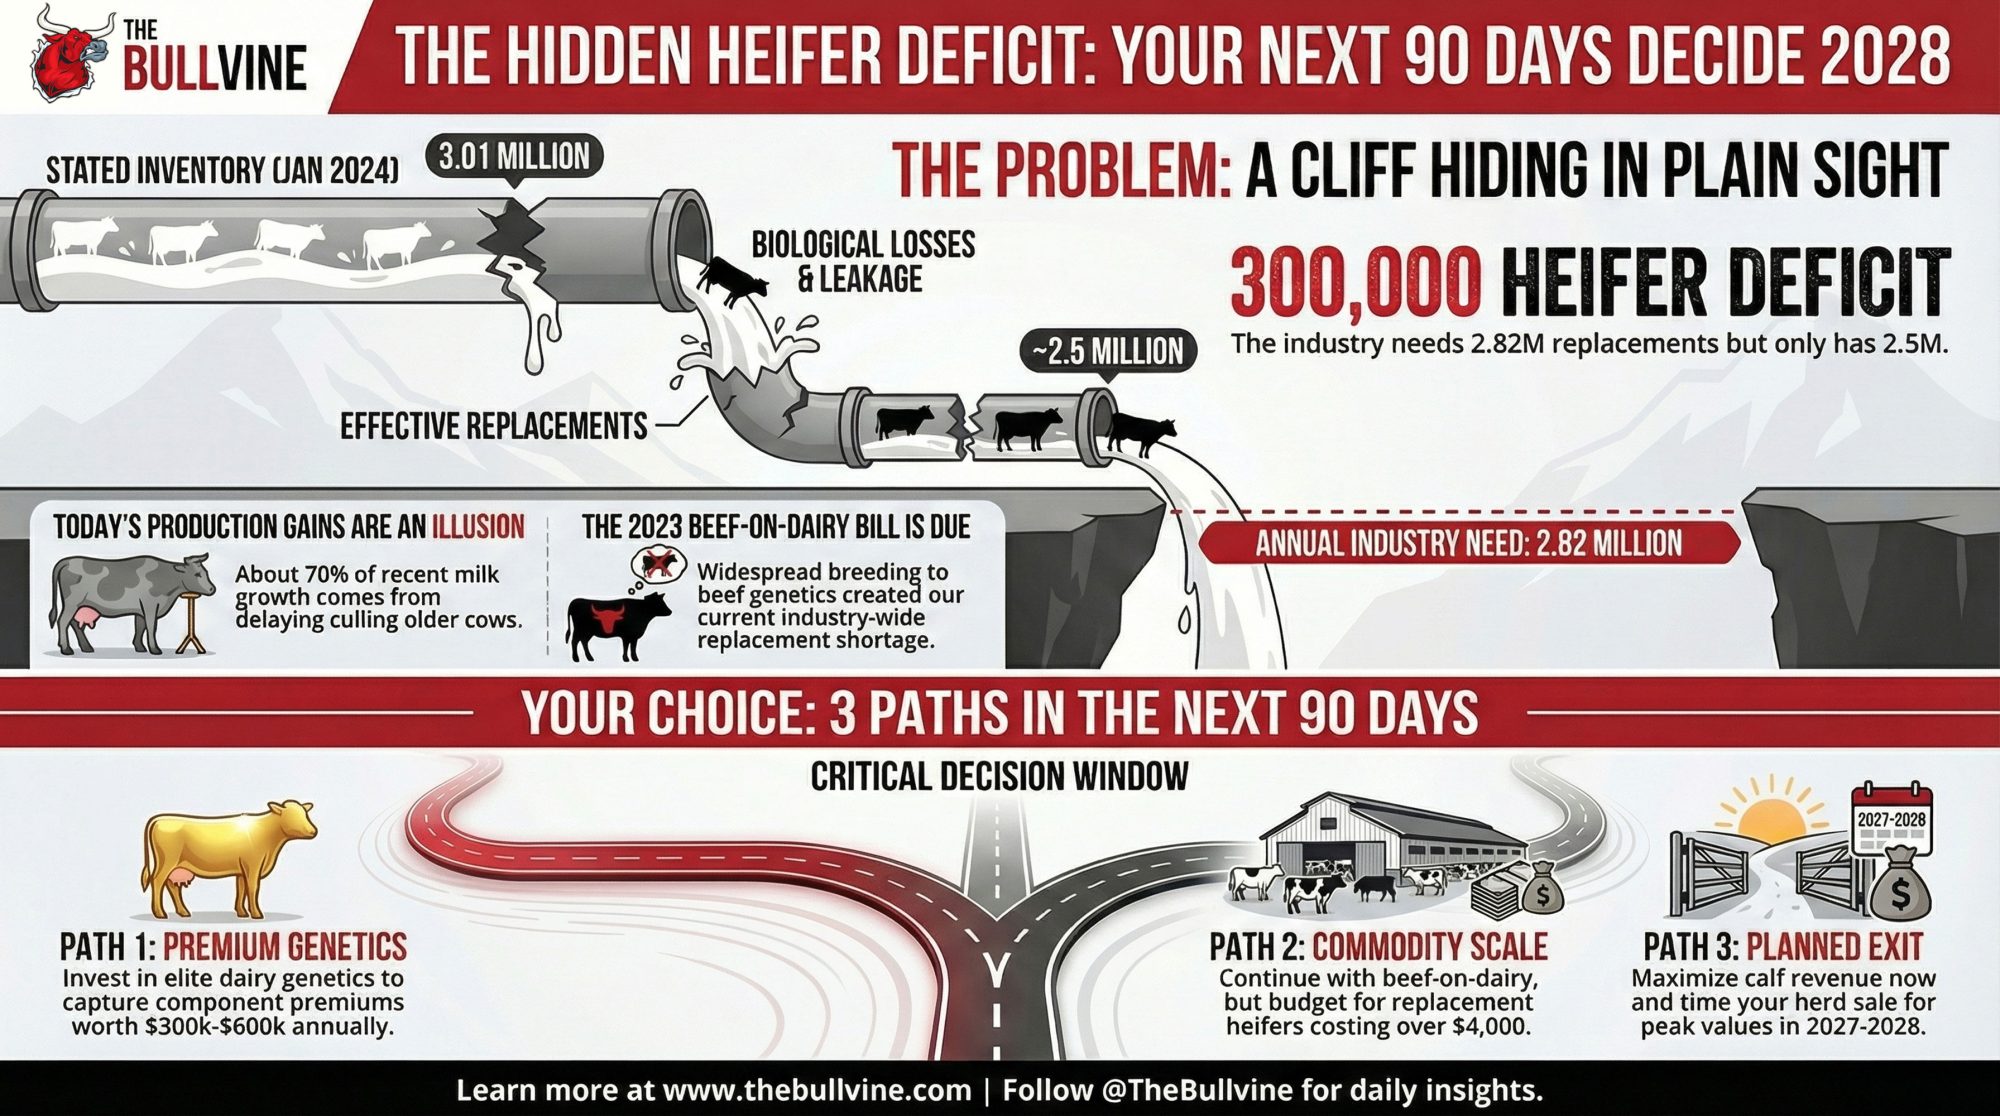
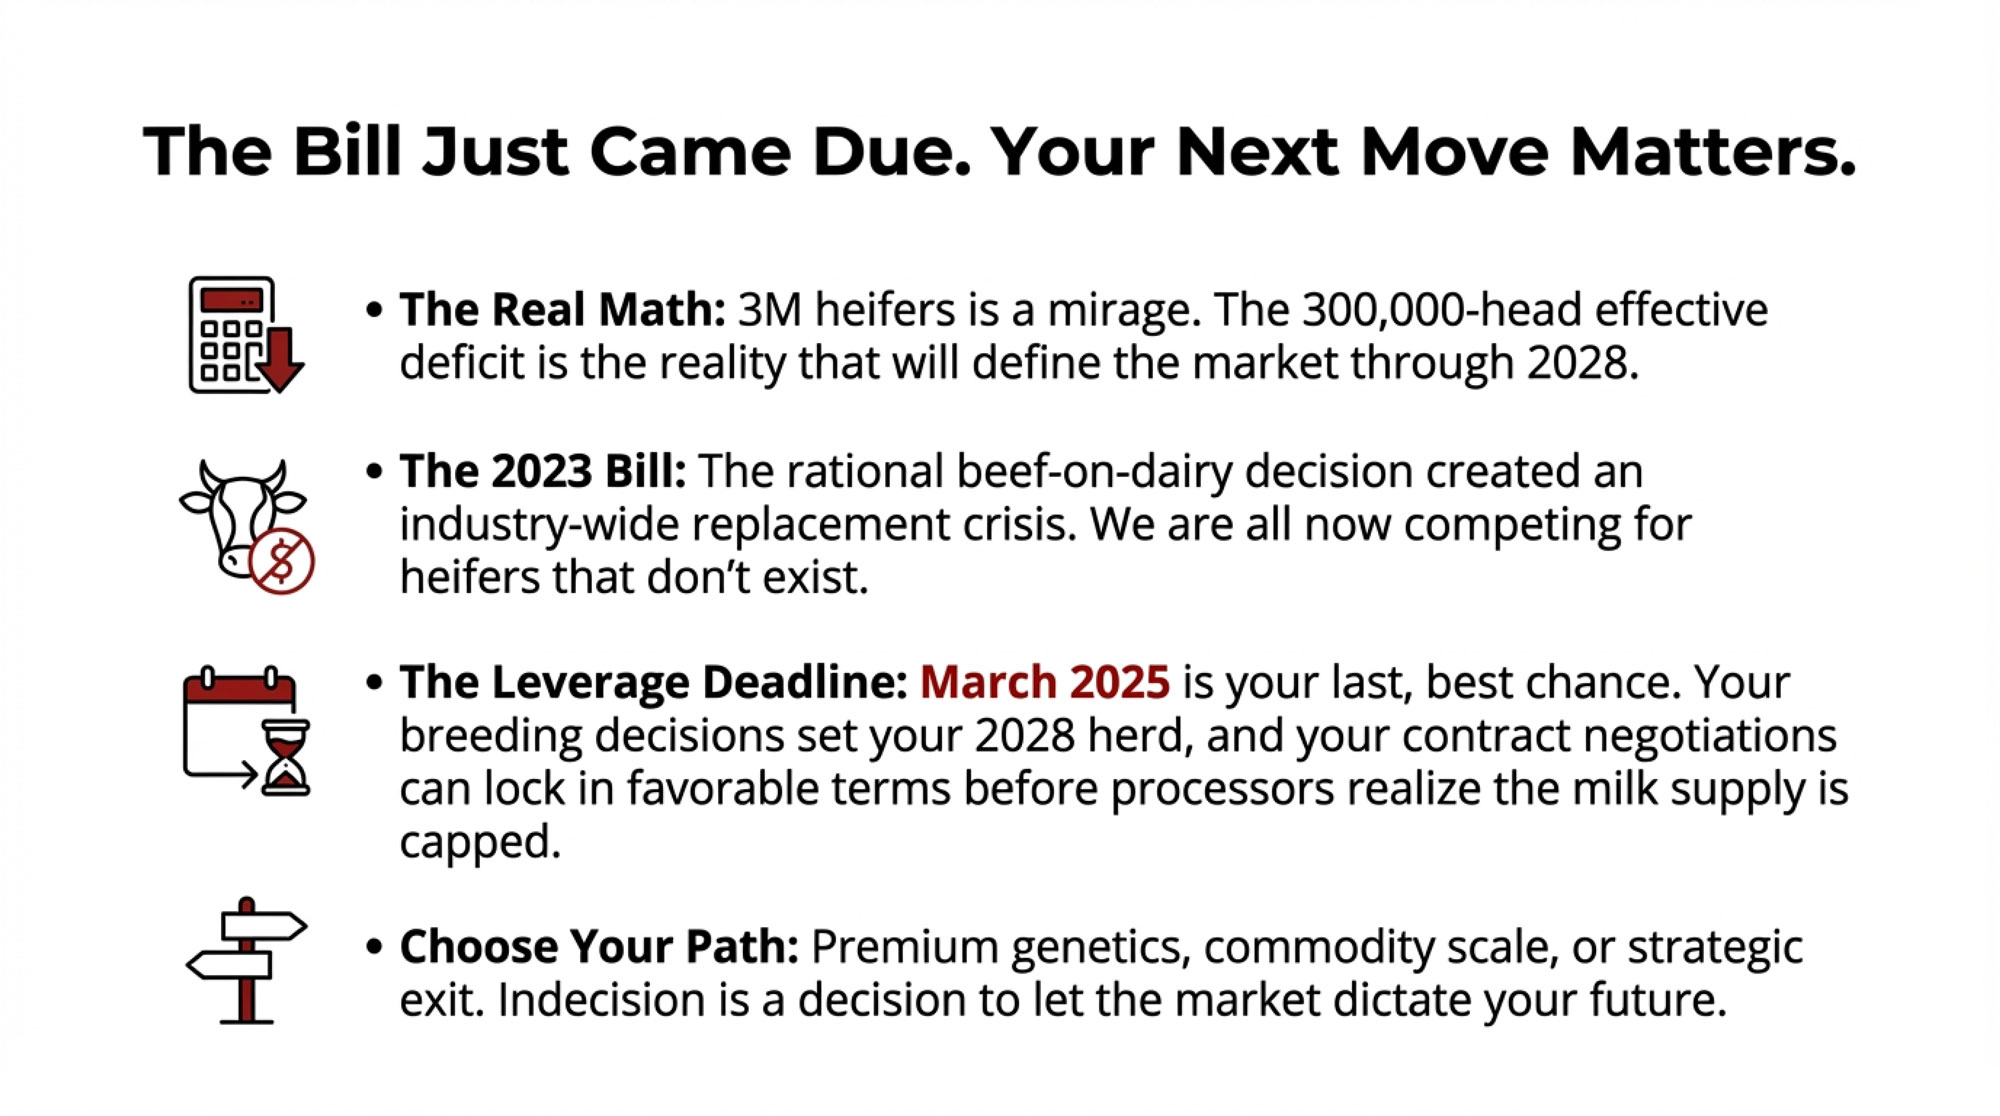
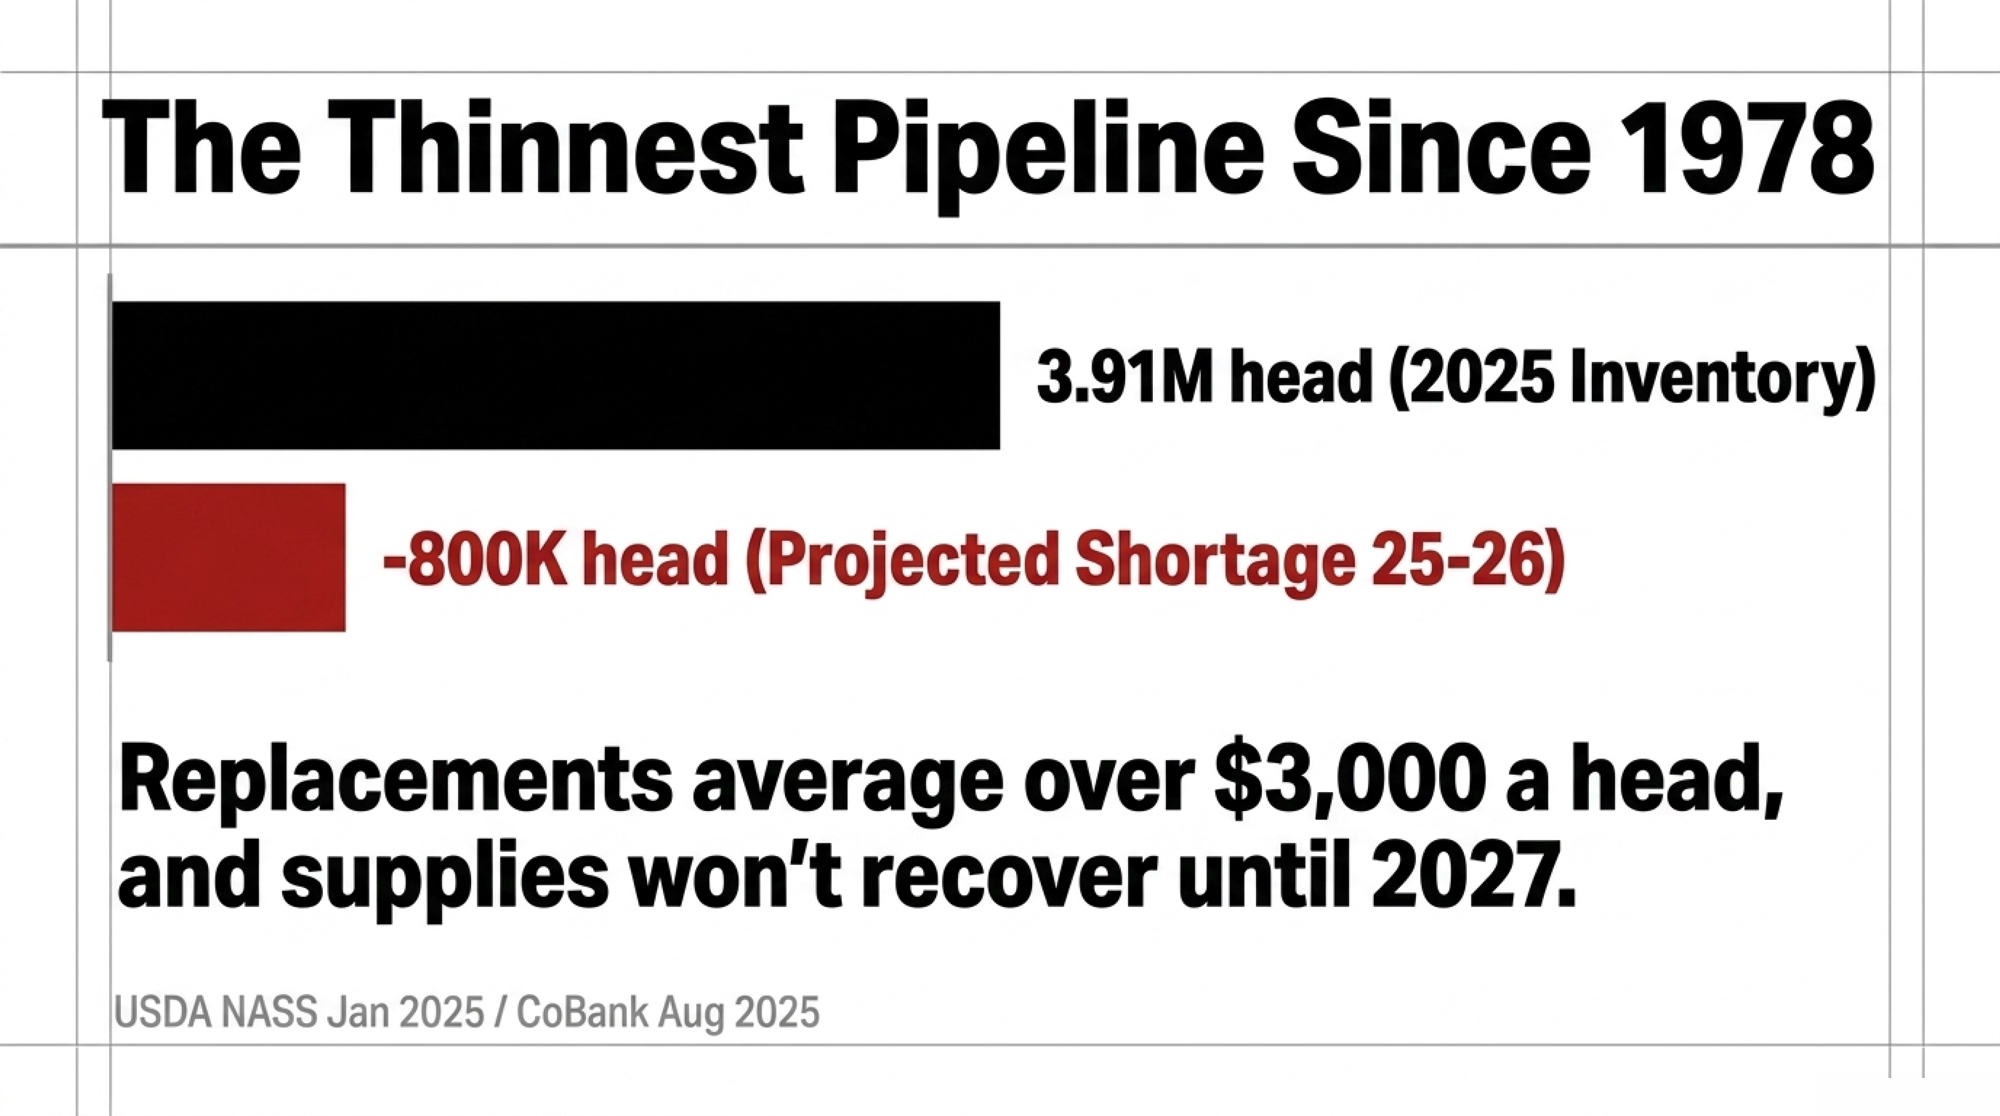
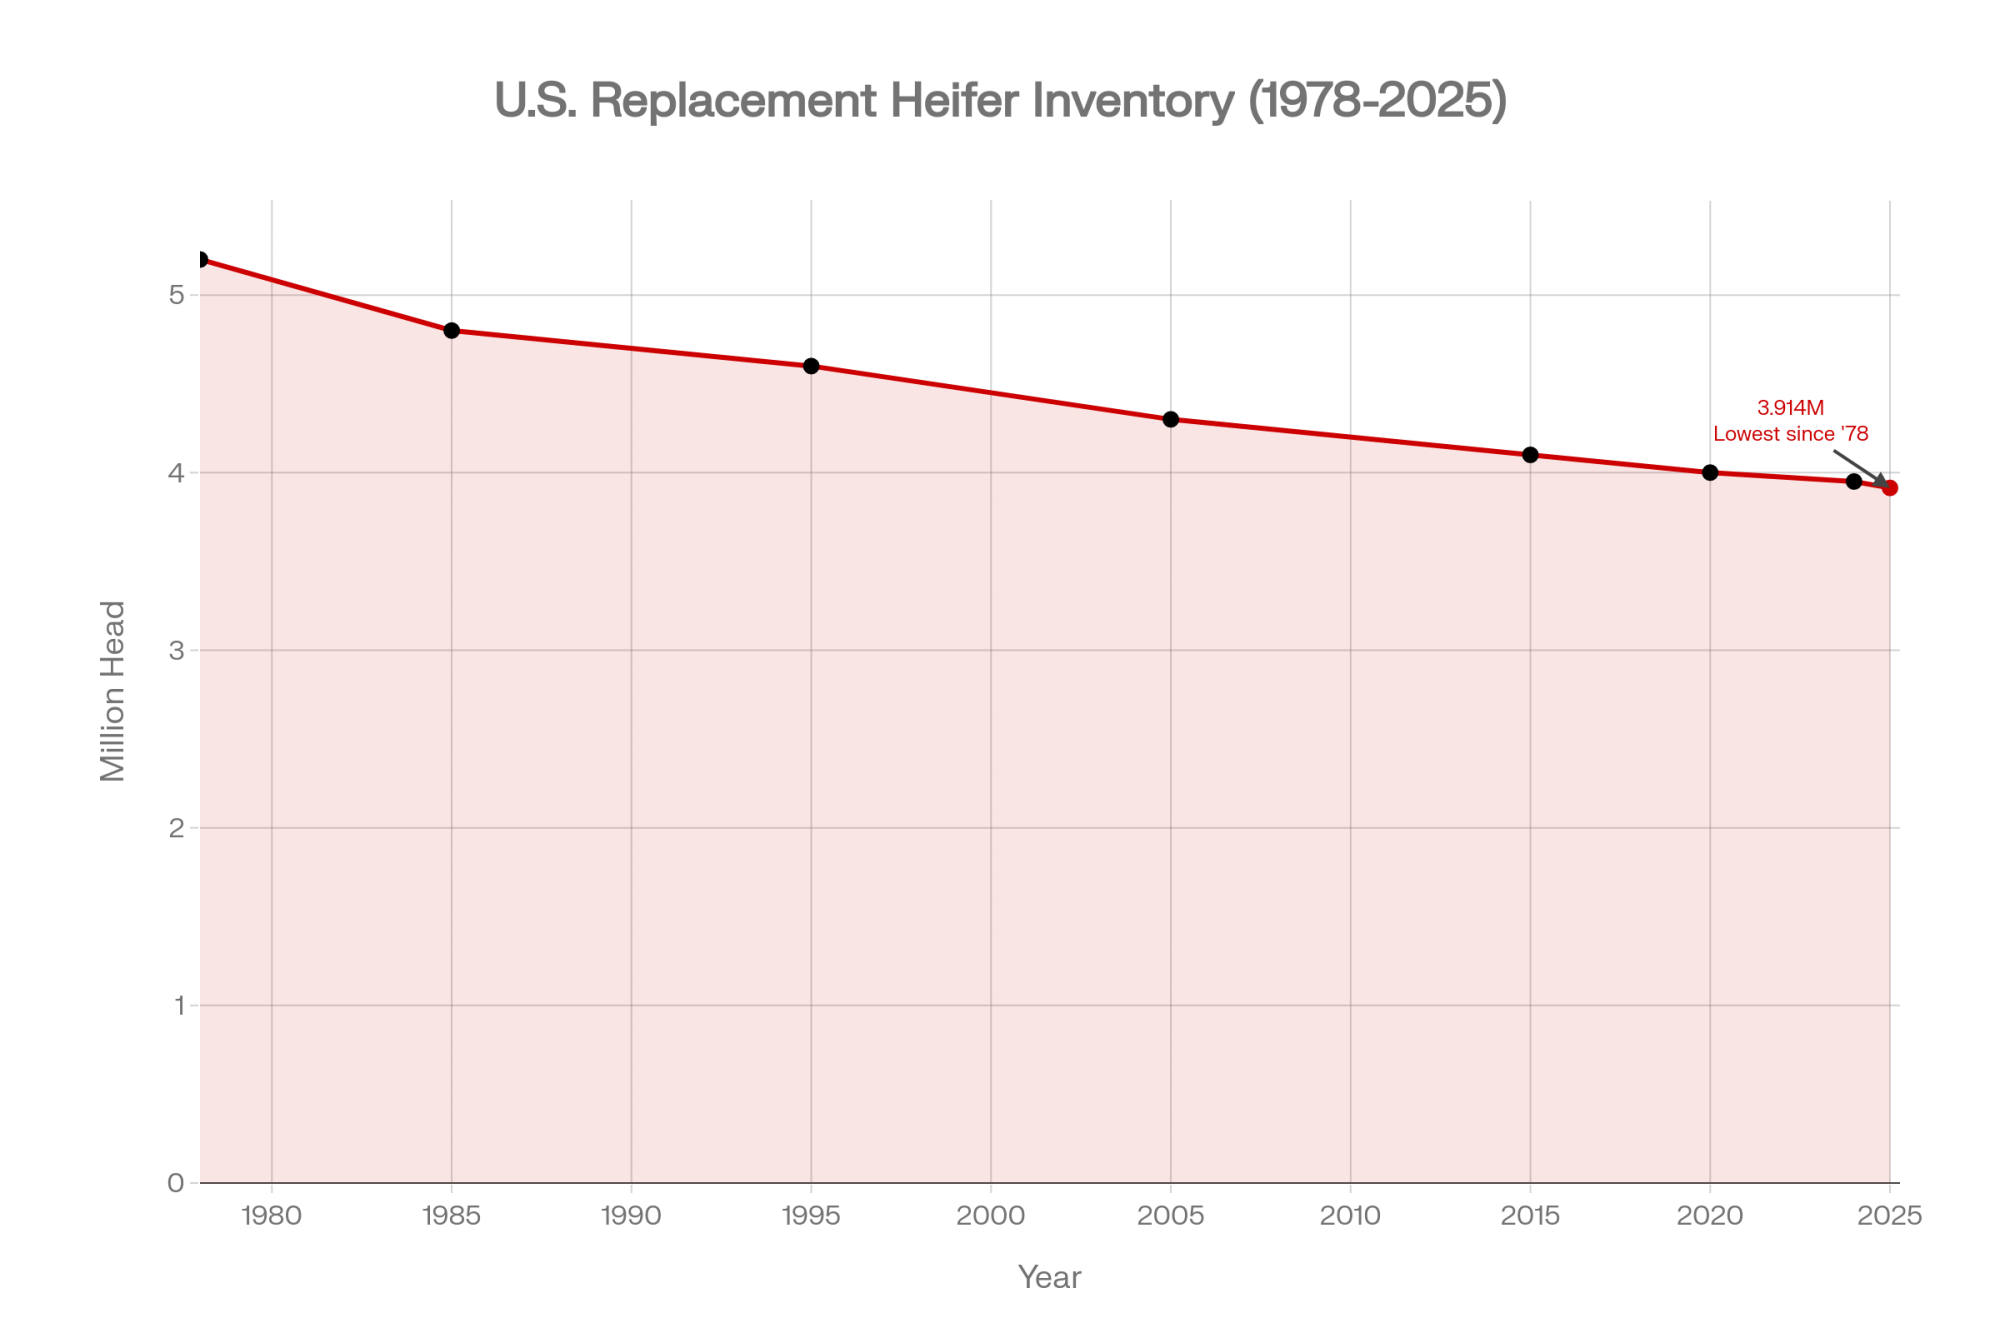
Replacement heifers are at their lowest U.S. inventory since 1978, and CoBank analyst Abbi Prins doesn’t expect supplies to really recover until 2027 — with replacements already averaging over $3,000 a head in many markets. Out by the hutch row, that doesn’t feel like a market report. It feels like a dead calf that suddenly got a whole lot more expensive. In a heifer market that’s roughly 800,000 head short over 2025–2026, every calf that dies in the hutch row isn’t bad luck. It’s a four‑figure hole in a pipeline you can’t easily refill.
We Built the Beef‑on‑Dairy Exit. Now We’re Paying for the Entrance Back In.
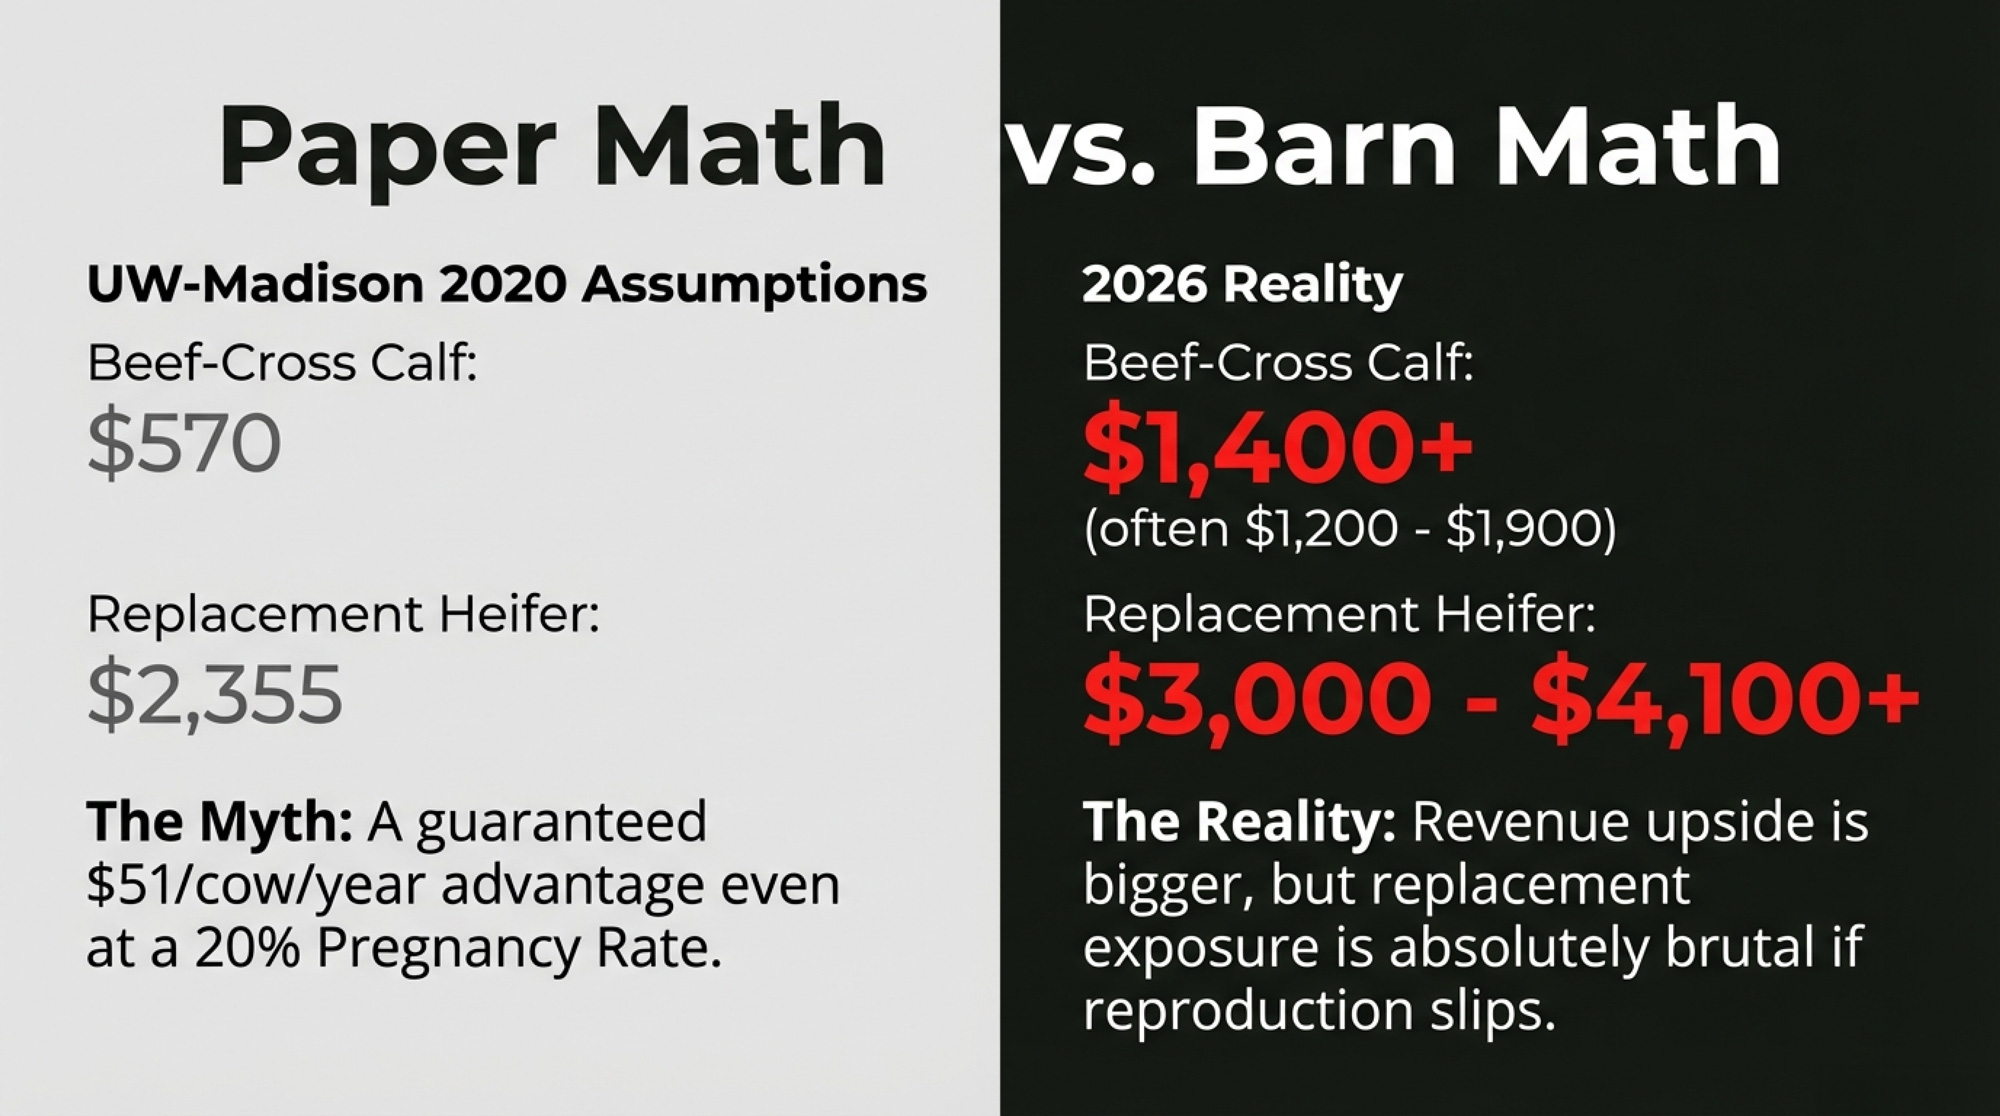
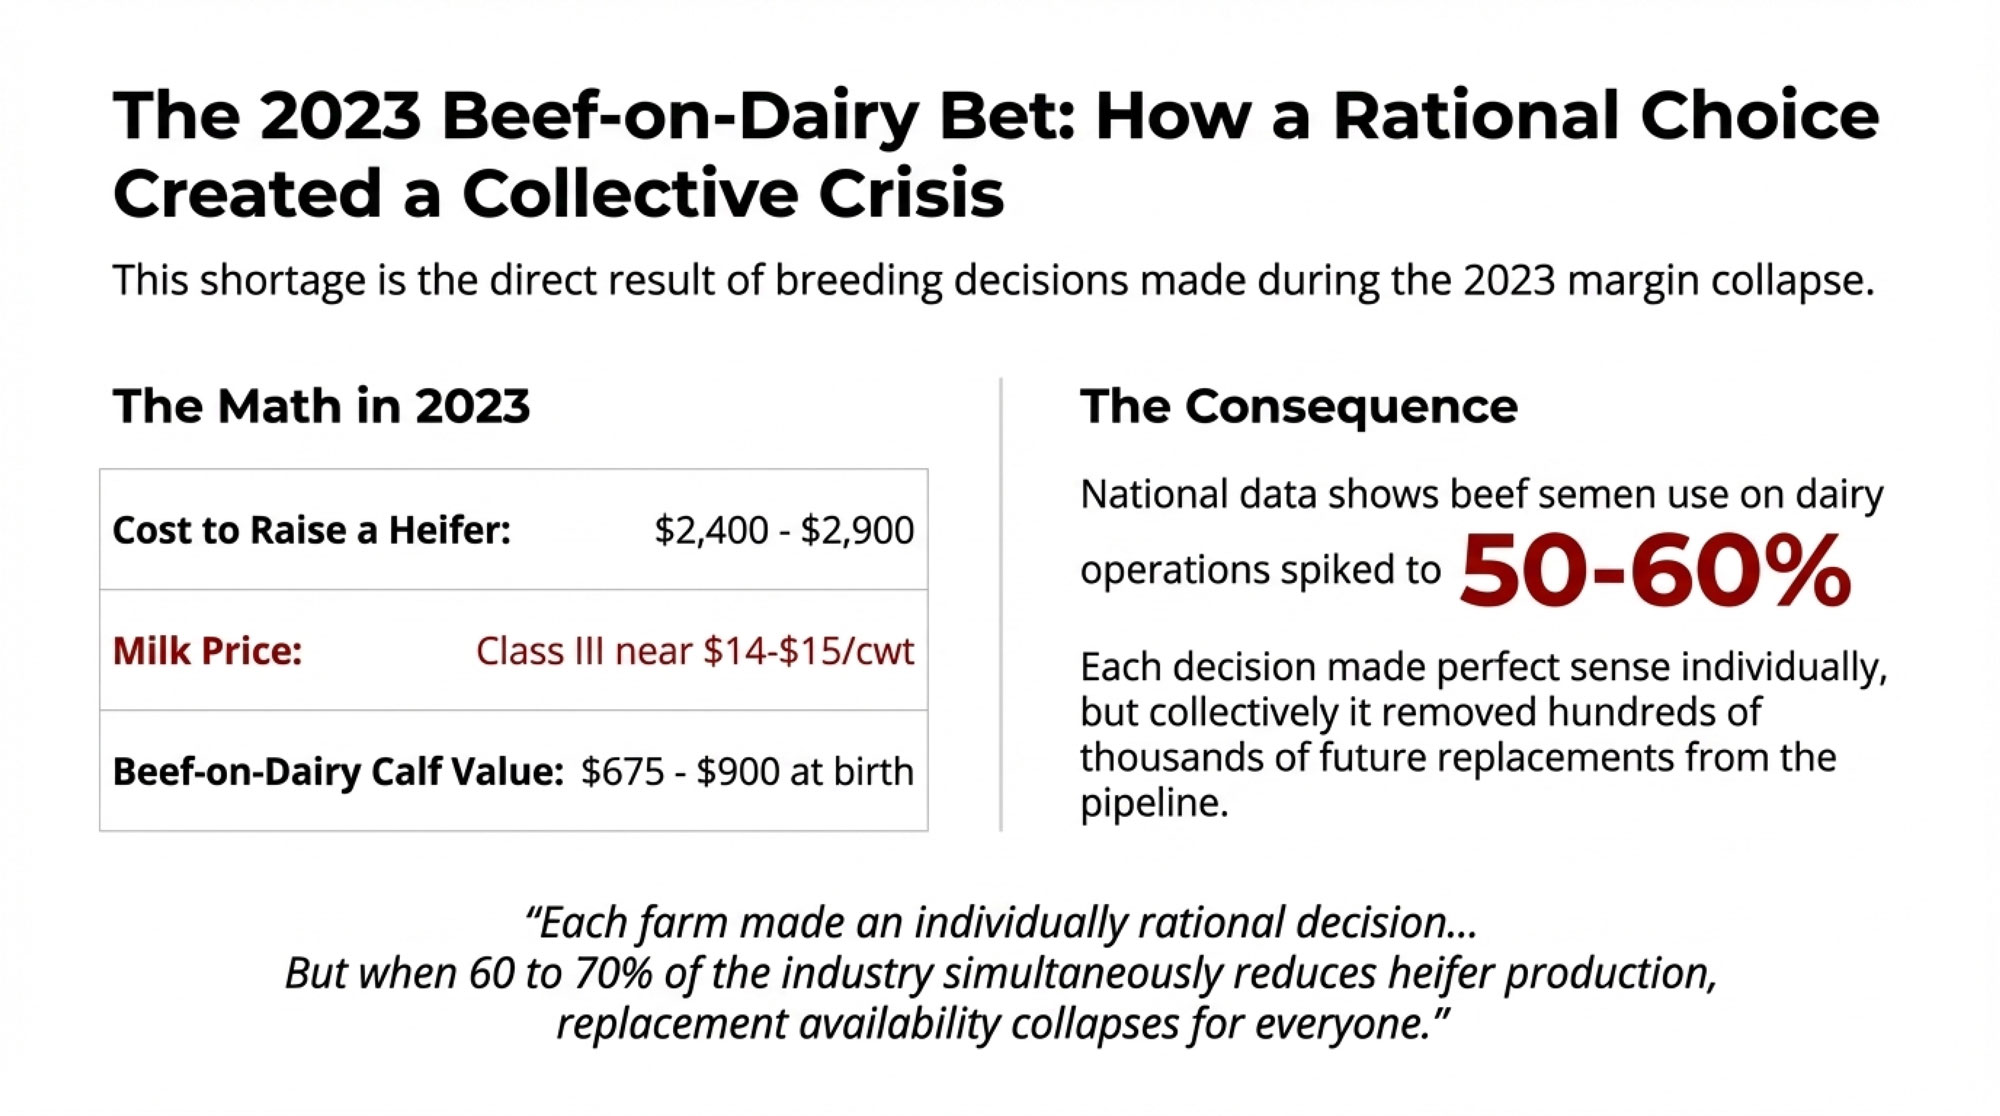
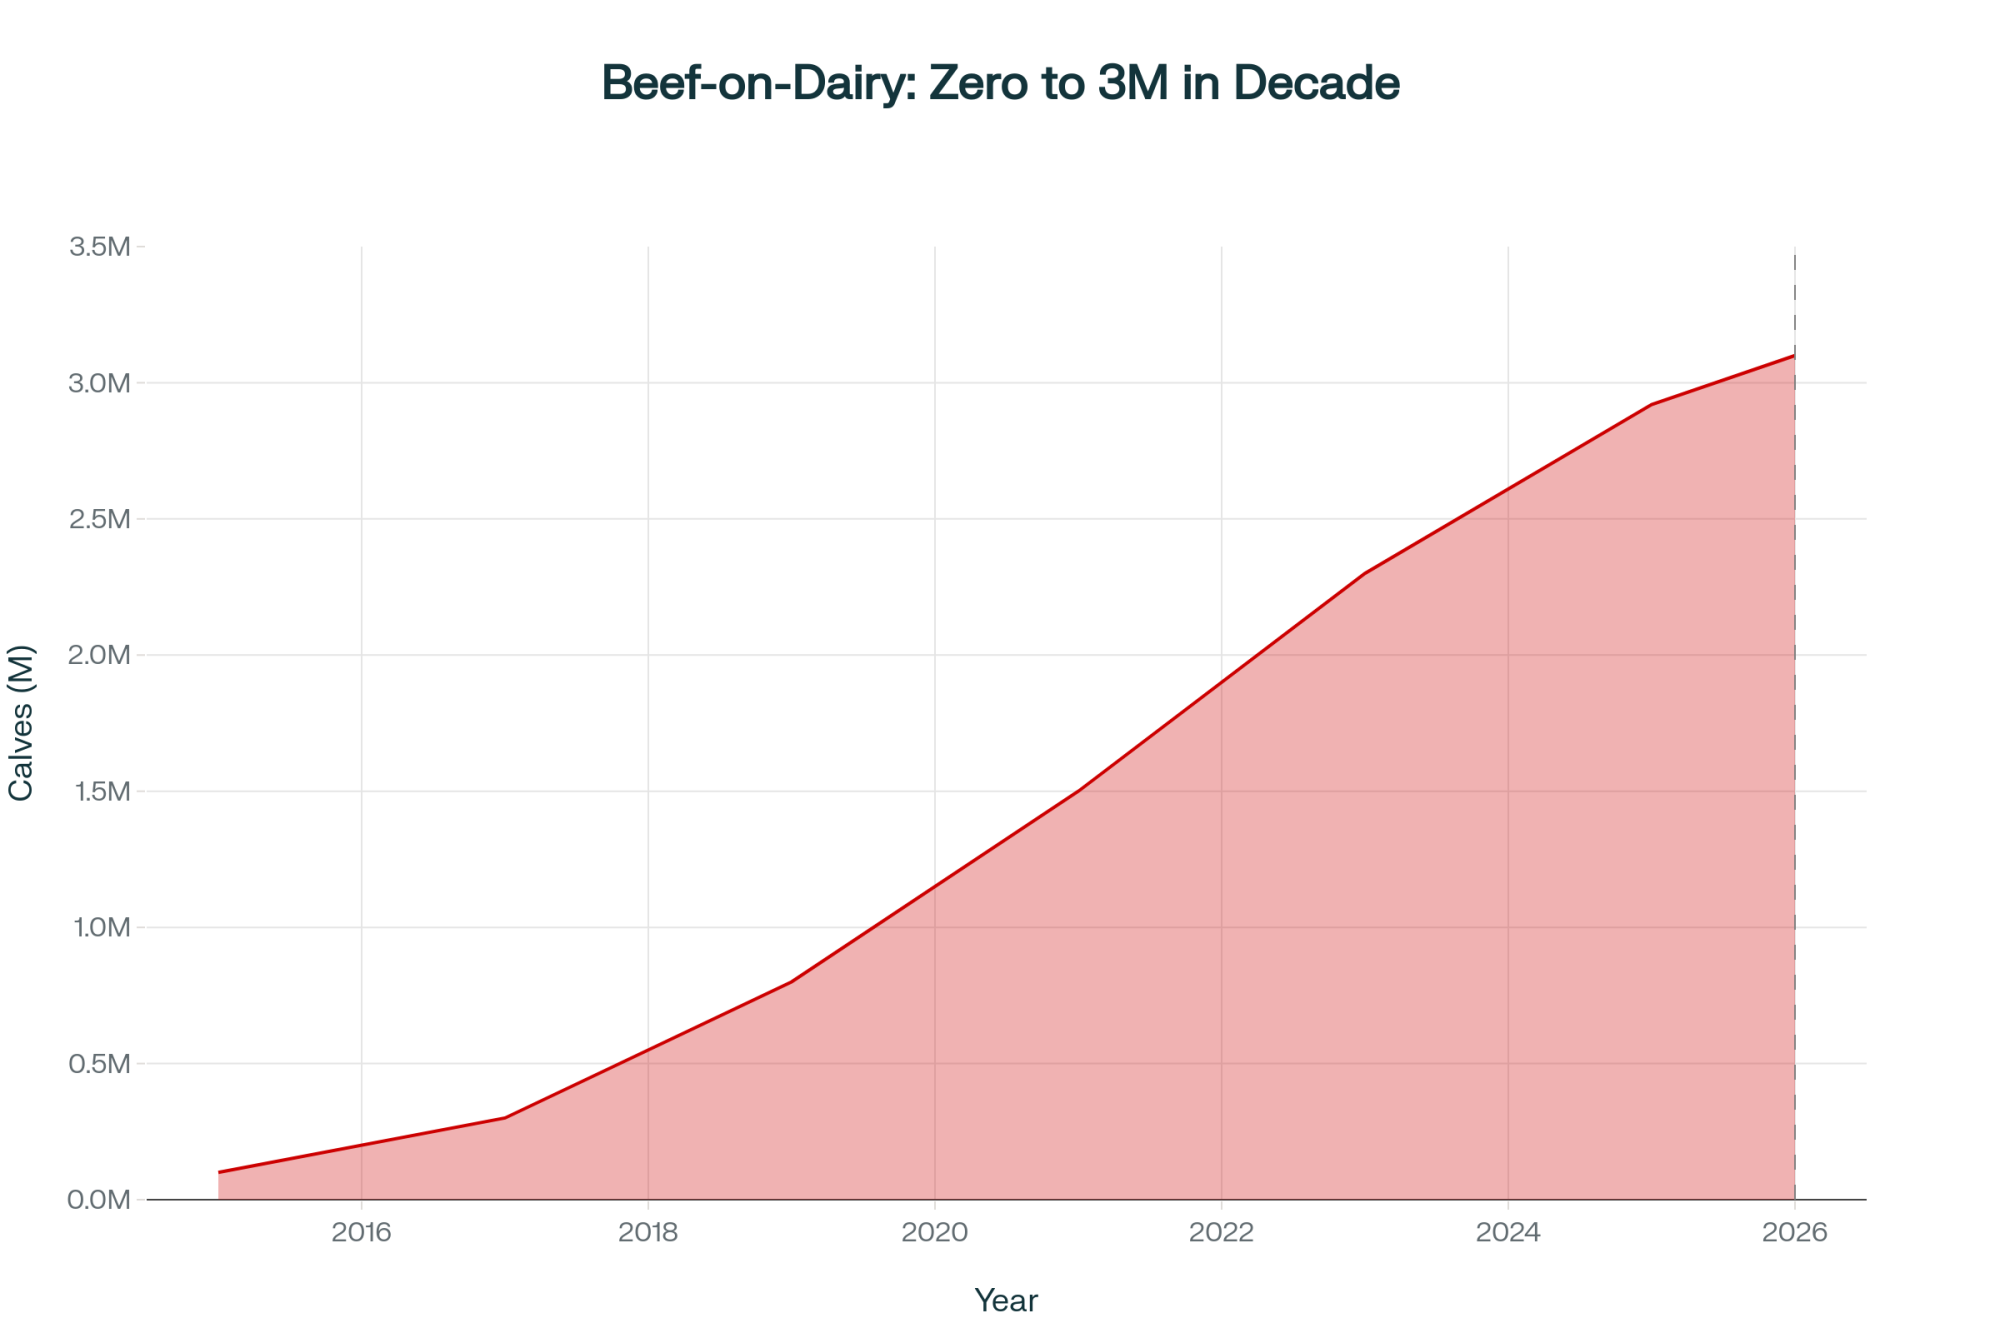
Ken McCarty of McCarty Family Farms in Colby, Kansas, still remembers standing by the loading chute when Holstein bull calves were “two for $5” and nobody wanted them. That kind of pain helps explain why so many U.S. dairies were quick to shift more cows to beef‑on‑dairy as calves started bringing $600, then $1,000, then $1,400 a head in some markets. For a while, the bottom‑tier “beef exit” finally worked — cash today, fewer problem calves tomorrow.
Related Reading: $3,010 Per Heifer. 800,000 Short. Your Beef‑on‑Dairy Bill Is Due.
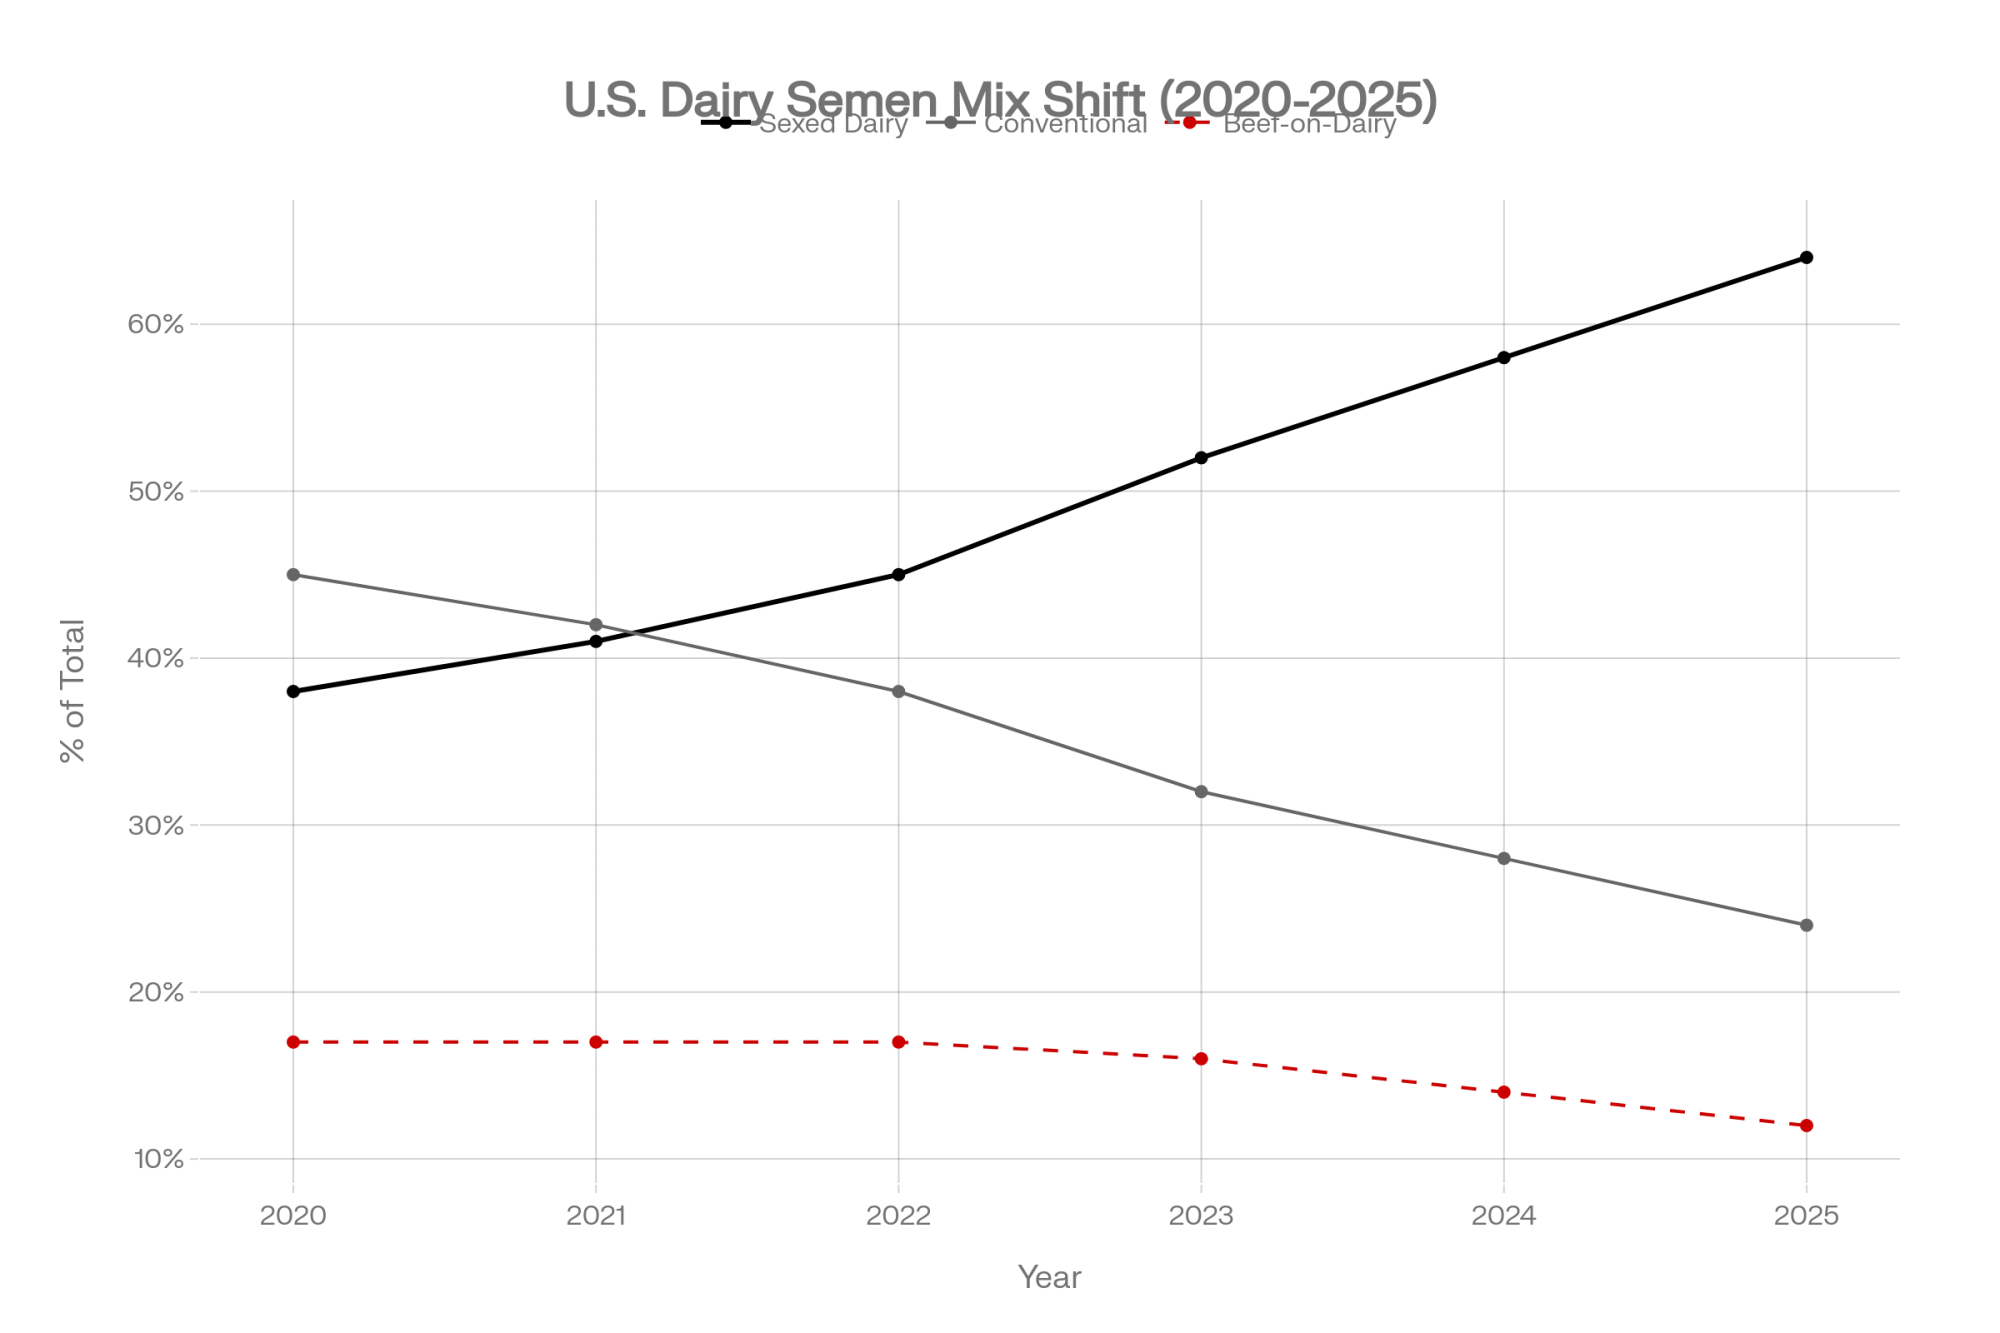
At the same time, sexed dairy semen quietly went from niche tool to default button on the better cows. NAAB’s 2024–2025 semen data — which The Bullvine unpacked in “NAAB’s $327.6 Million Semen Boom vs. $3,000 Heifers” — shows just under 66 million bovine semen units sold and $327.6 million in export value. Inside the roughly 16.5 million dairy units used on U.S. cows, the mix has flipped: about 10.6 million are gender‑selected dairy semen (64%of dairy units), around 6.0 million are conventional dairy, and about 8.1 million units are beef semen used on dairy cows. Put simply, you’re running roughly 43% sexed dairy, 24% conventional dairy, and 33% beef‑on‑dairy across all semen used on dairy cows in the U.S. today.
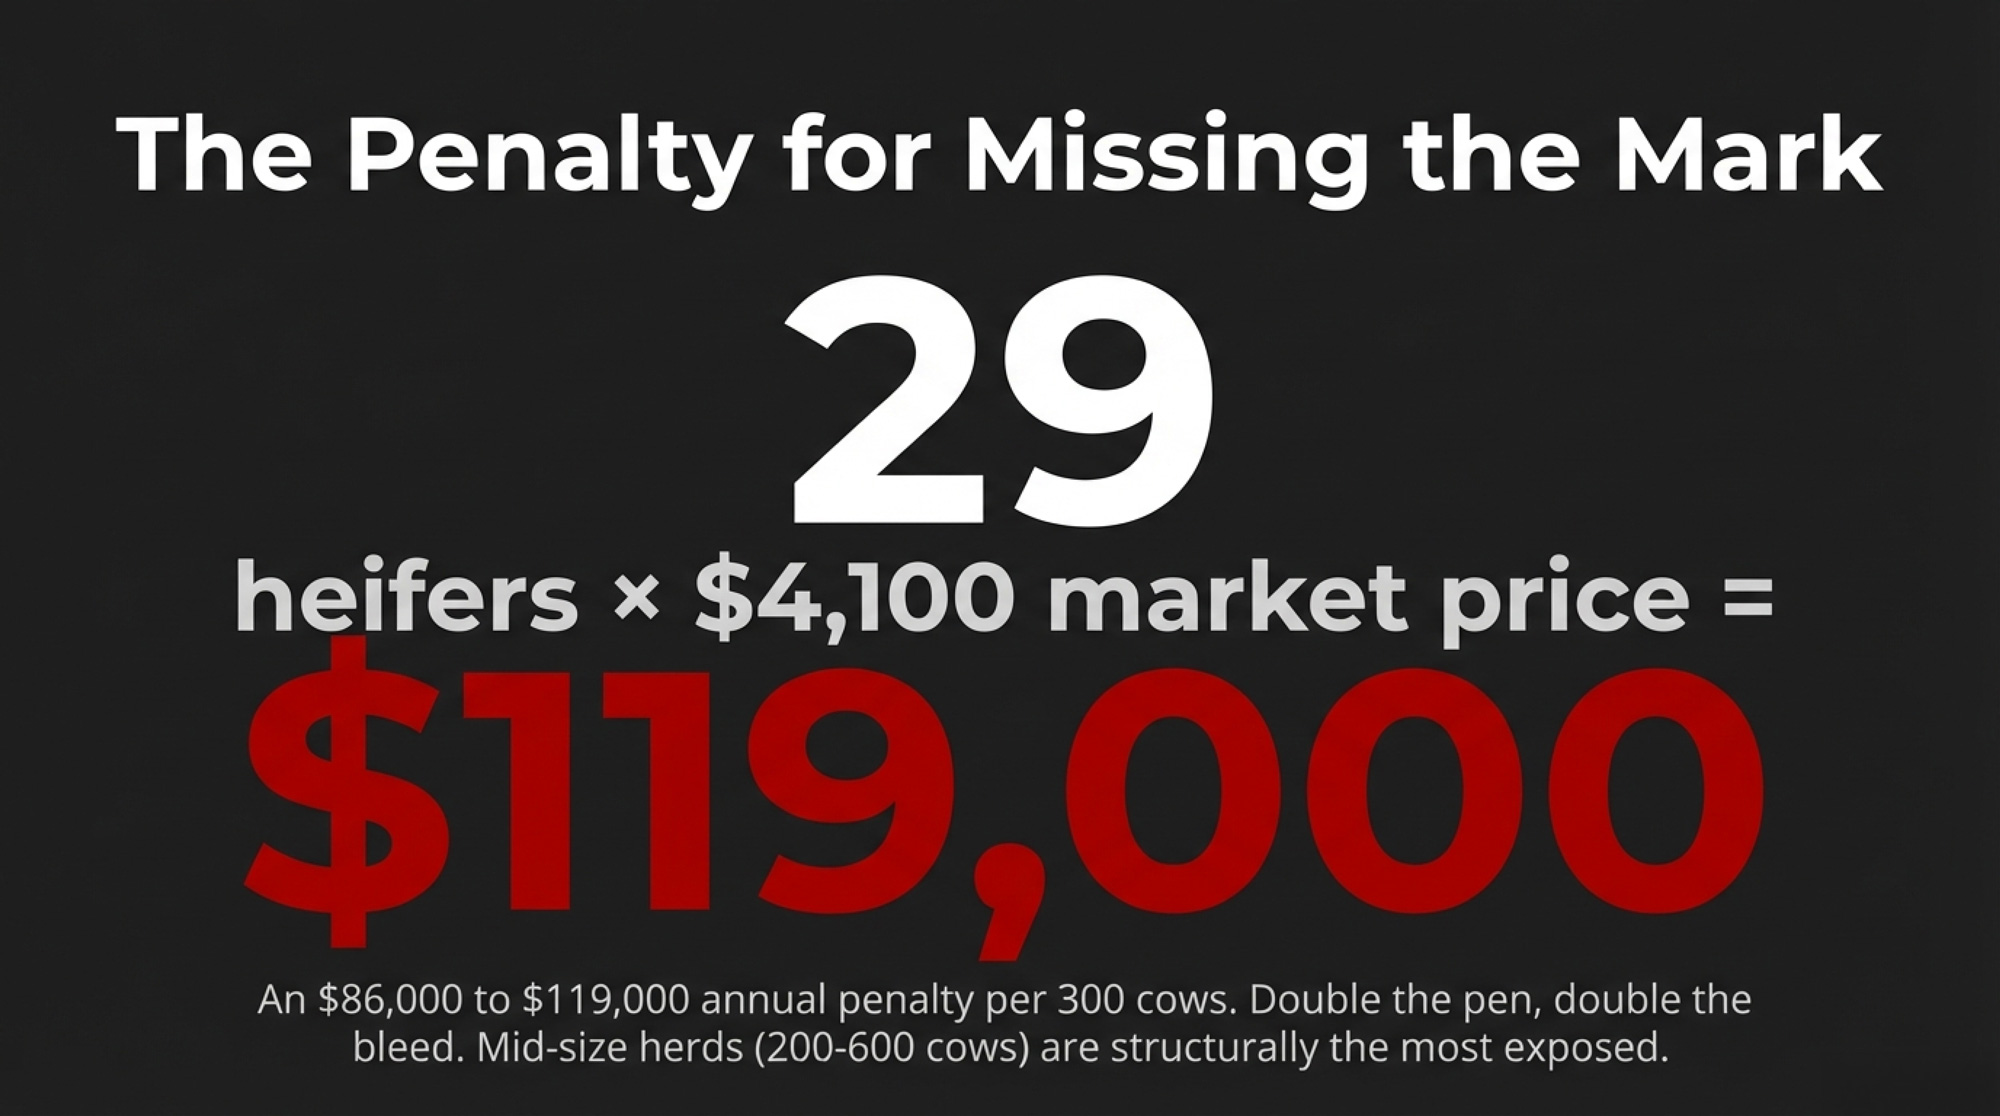
That cocktail made sense when replacement heifers were cheap and the pipeline was full. It doesn’t anymore. USDA NASS’s January 2025 Cattle report put U.S. dairy replacement heifers 500 pounds and over at 3.914 million head — down 0.9% from 2024 and the lowest level since 1978. CoBank’s August 2025 analysis projects inventories will shrink by an estimated 800,000 head over 2025–2026 before starting to rebound in 2027, with replacement prices likely to “climb well above $3,000 per head.”
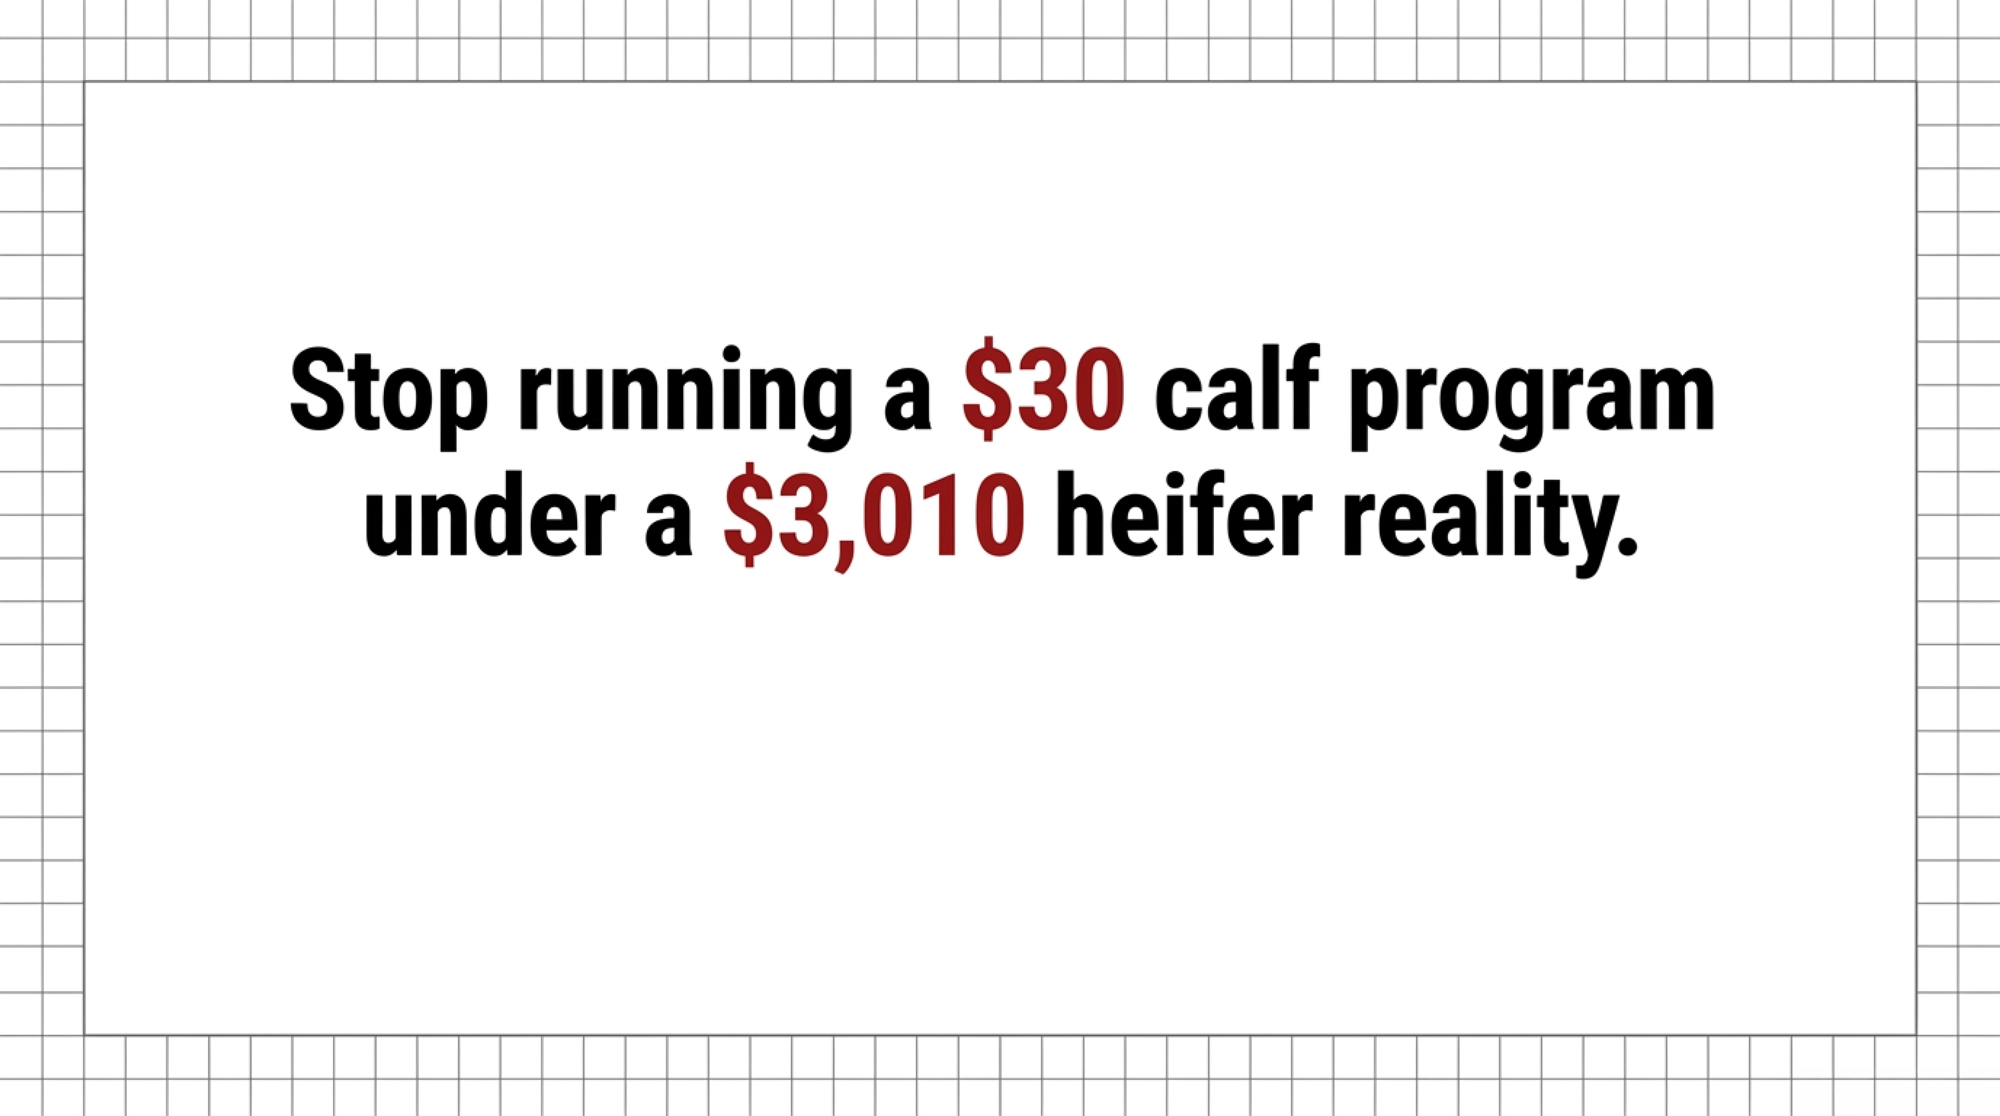
McCarty’s “two for $5” bull calves are gone. The heifers replacing them are $3,010 animals riding on the thinnest replacement pipeline you’ve seen in your career. His generation gave away bull calves. Yours is leaking value in the heifer hutches — just more expensively. In that reality, you can’t afford to run a $30 calf program and call it good enough.
How $3,010 Heifers Die on $30 Calf Programs
Let’s put some barn math under the gut feeling.
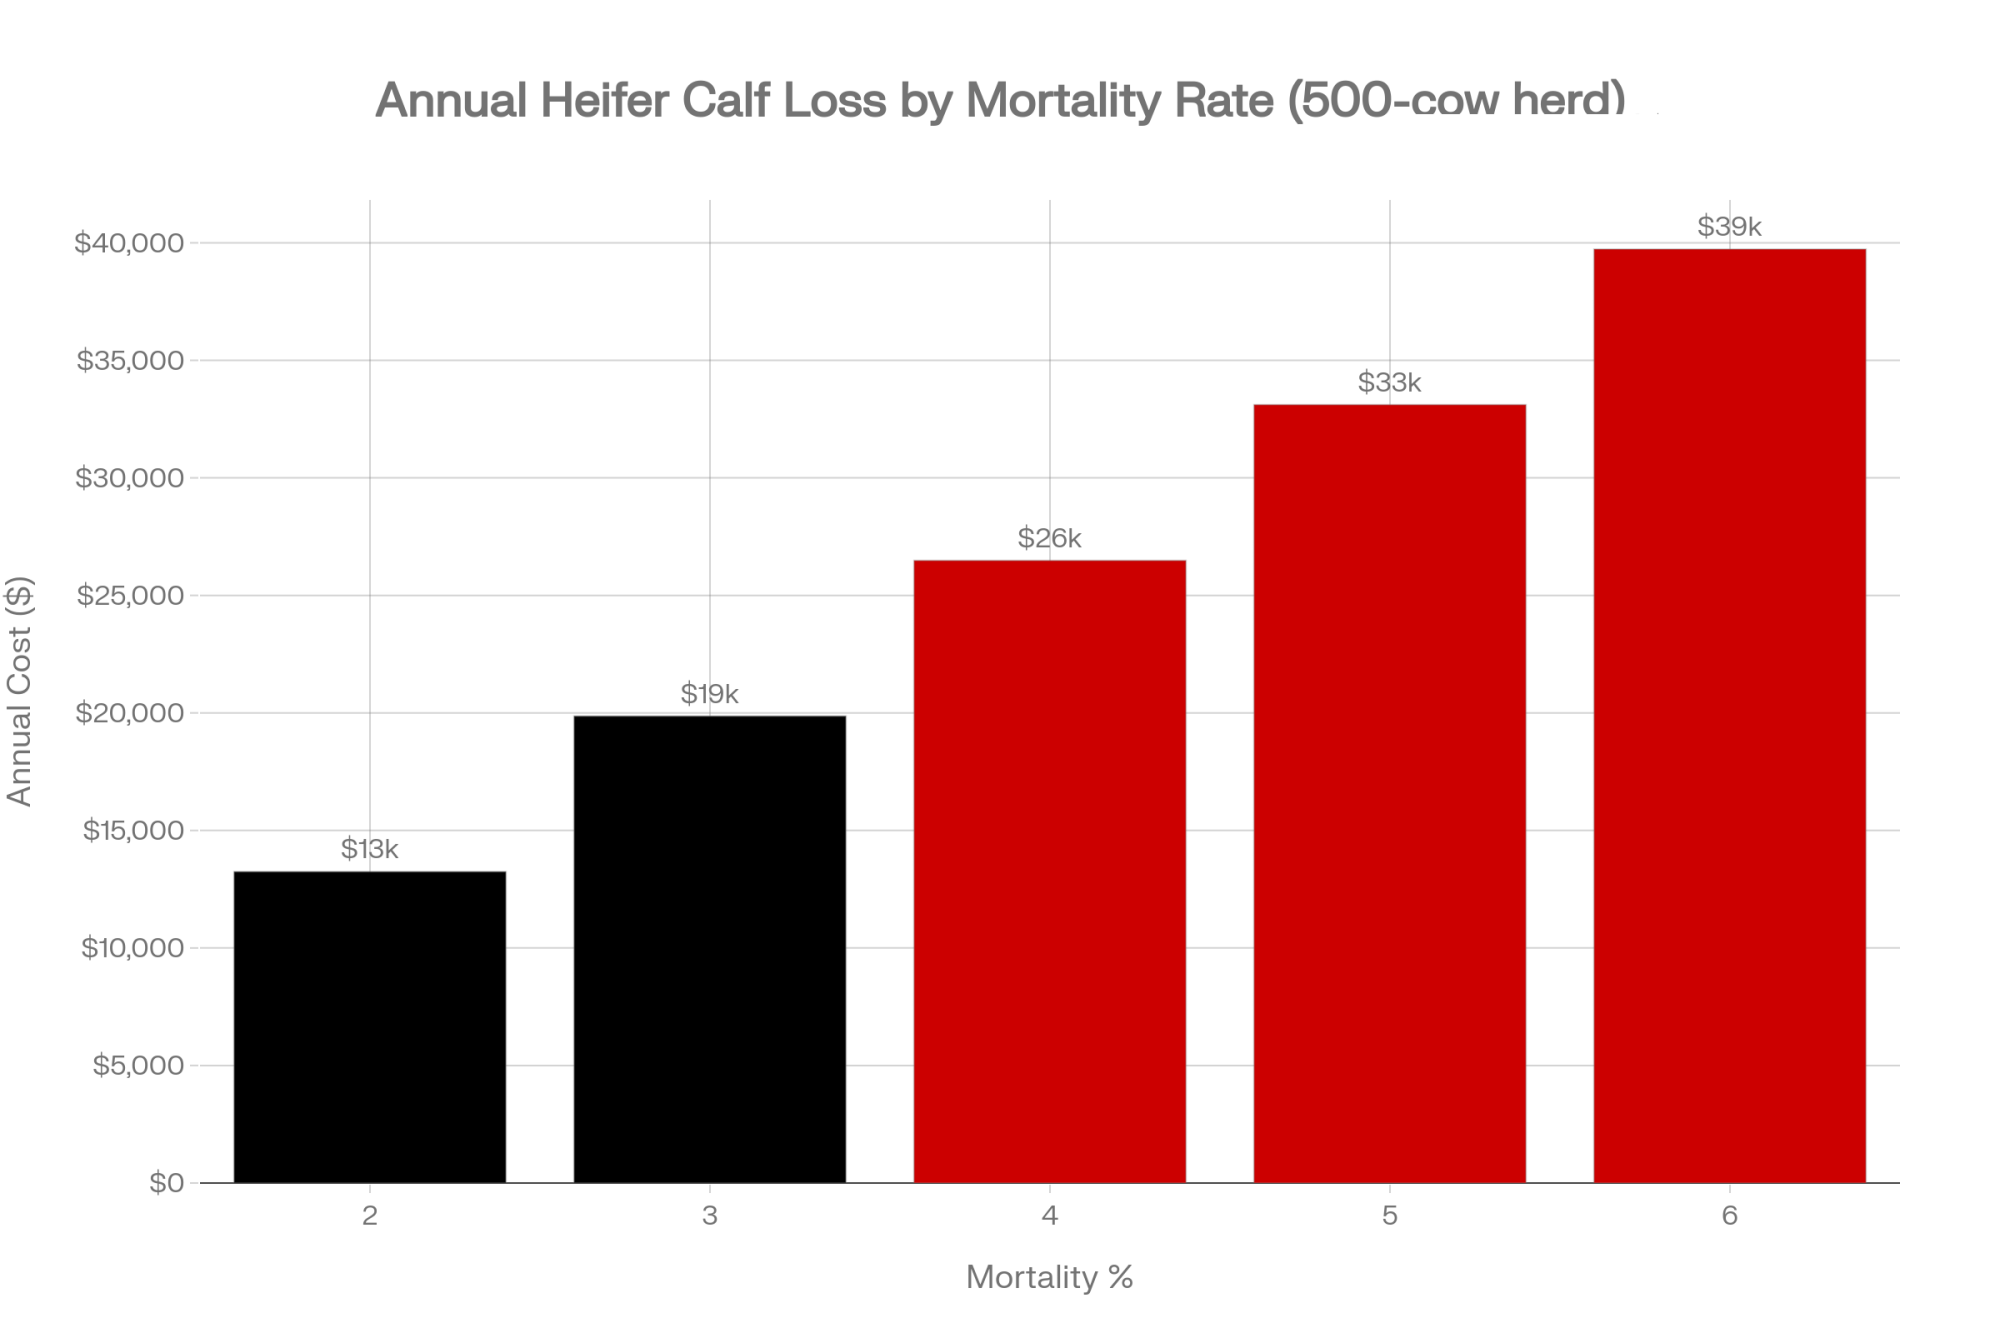
Take a 500‑cow herd freshening about 220 heifer calves per year. NAHMS 2014, analyzed by Urie and colleagues, reported 5.0% pre‑weaning mortality in U.S. heifer calves nationally, with many real‑world herds today running closer to 3–5% when records are tight. Use 4% as a realistic working number for your operation. That’s about 9 dead heifer calves before weaning.
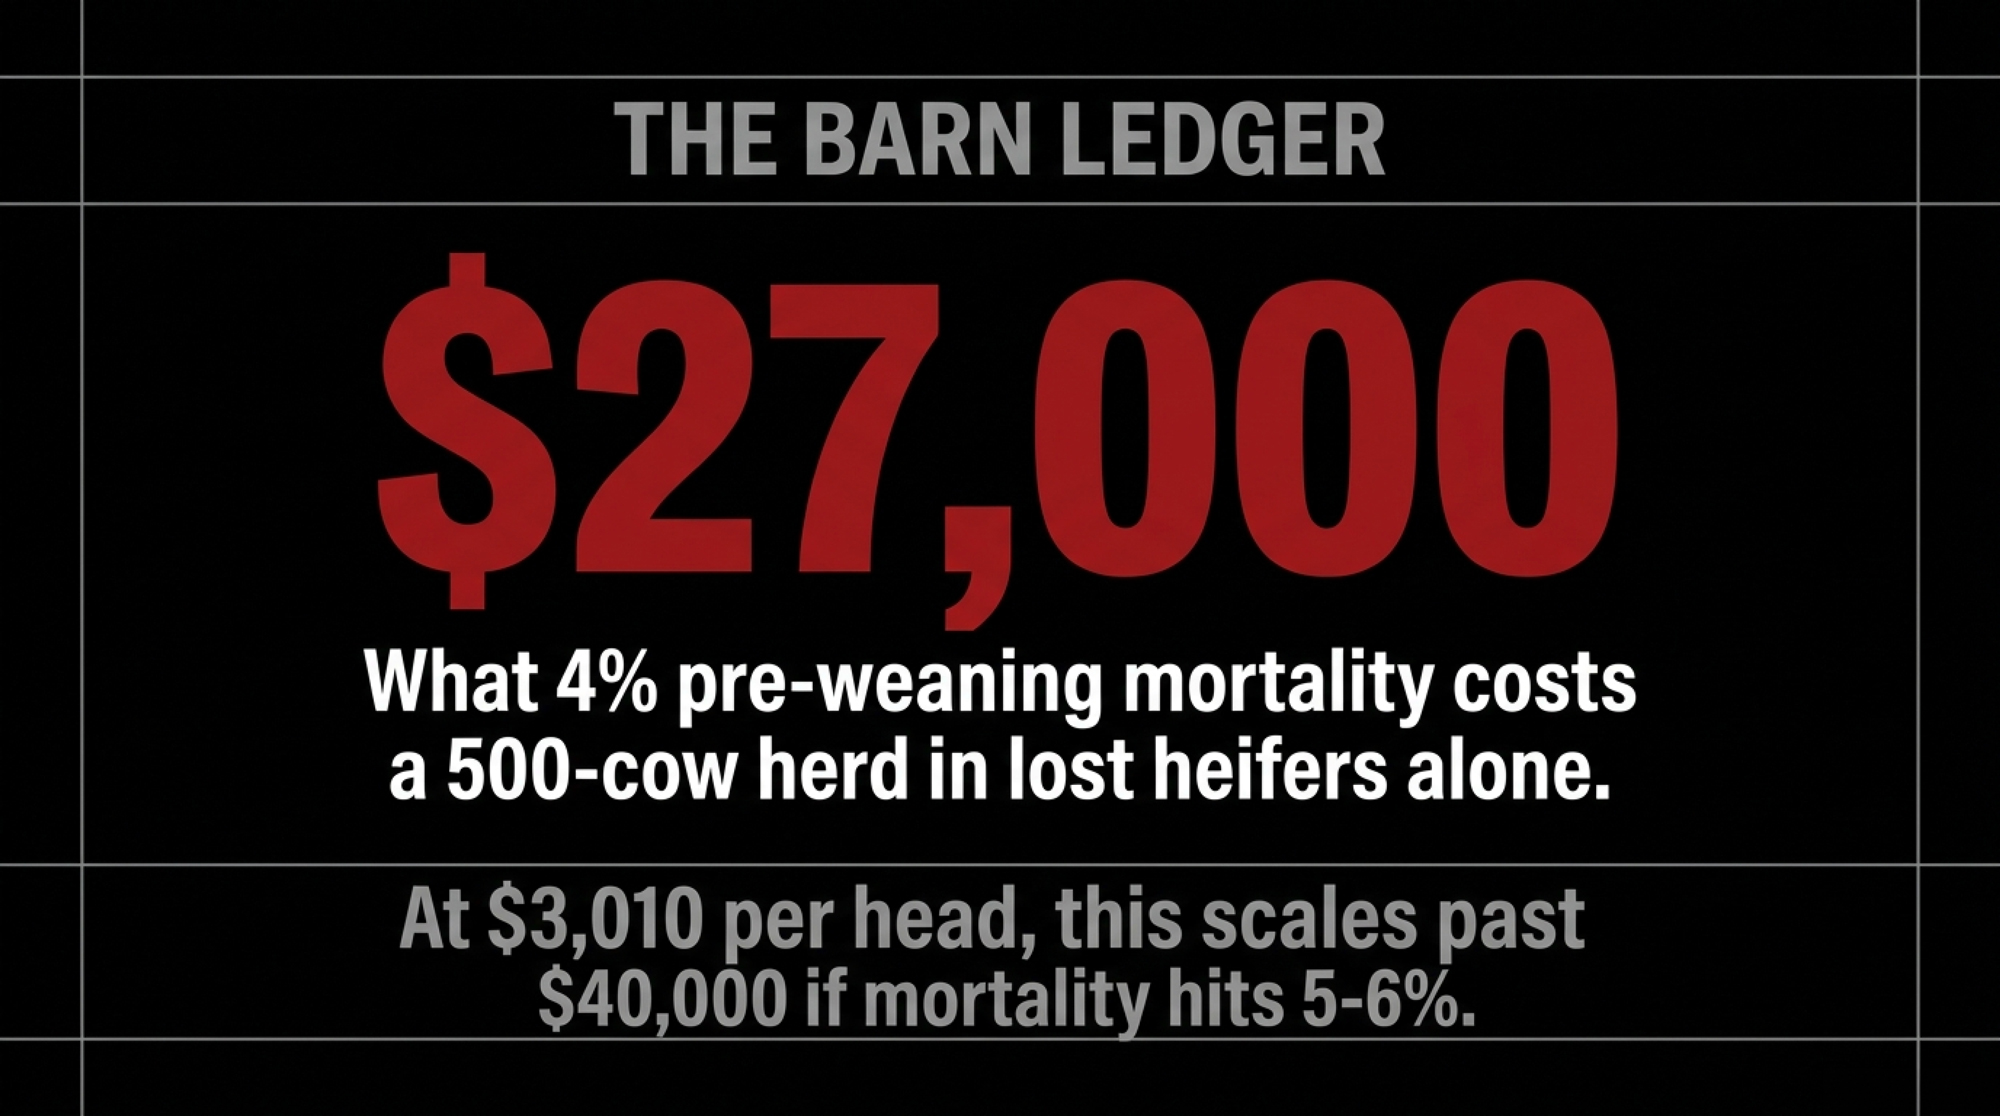
At $2,660 per head — the U.S. average replacement cow price in January 2025 — those 9 deaths represent about $24,000 in lost heifers. At $3,010–3,110 per head — mid‑ to late‑2025 averages in several U.S. markets — you’re burying roughly $27,000–28,000 in heifers alone. If your number drifts up toward 5–6%, that line item climbs past $33,000–40,000 quickly — and that’s the math behind this article’s headline.
And that’s just the heifer value. It doesn’t include:
- $40–50 per heifer in genomic testing, with CLARIFIDE®‑type programs commonly around $43/head.
- A $15–30 per straw premium for sexed semen over conventional, consistent with economic work and current semen price sheets.
- IVF or ET on your top donors — often hundreds of dollars per live heifer calf after you spread donor, flush, lab, and recipient costs across pregnancies.
When a genomic‑tested, sexed semen heifer calf dies in the hutch at 19 days, you’re not just losing “a calf.” You’re losing a four‑figure replacement you can’t easily buy back — plus the semen and IVF bills stacked underneath her.
| Investment Item | Cost per Calf | Running Total |
|---|---|---|
| Sexed Semen Premium | $15–$30 | $15–$30 |
| Genomic Test | $40–$50 | $55–$80 |
| IVF/ET (per live calf) | $200–$400 | $255–$480 |
| Subtotal (Genetics) | — | $255–$480 |
| Extra Nutrition (Penn State) | $42–$50 | $297–$530 |
| TOTAL PER HEIFER CALF | — | $297–$530 |
The slower leak is the one that doesn’t show up in the dead loss column, but still costs you. Calves that survive scours or pneumonia but limp along on growth often freshen late, give less milk in early lactations, and leave the herd sooner. On a 500‑cow dairy, a couple dozen of those “almost fine” cows can flatten herd progress for years without ever making the problem list.
Buying the Ferrari, Using Regular Gas: The $30 Management Leak
You’re already paying for the Ferrari with sexed semen, genomic tests, and IVF on your best cows. The question is whether you’re still putting regular gas in it.
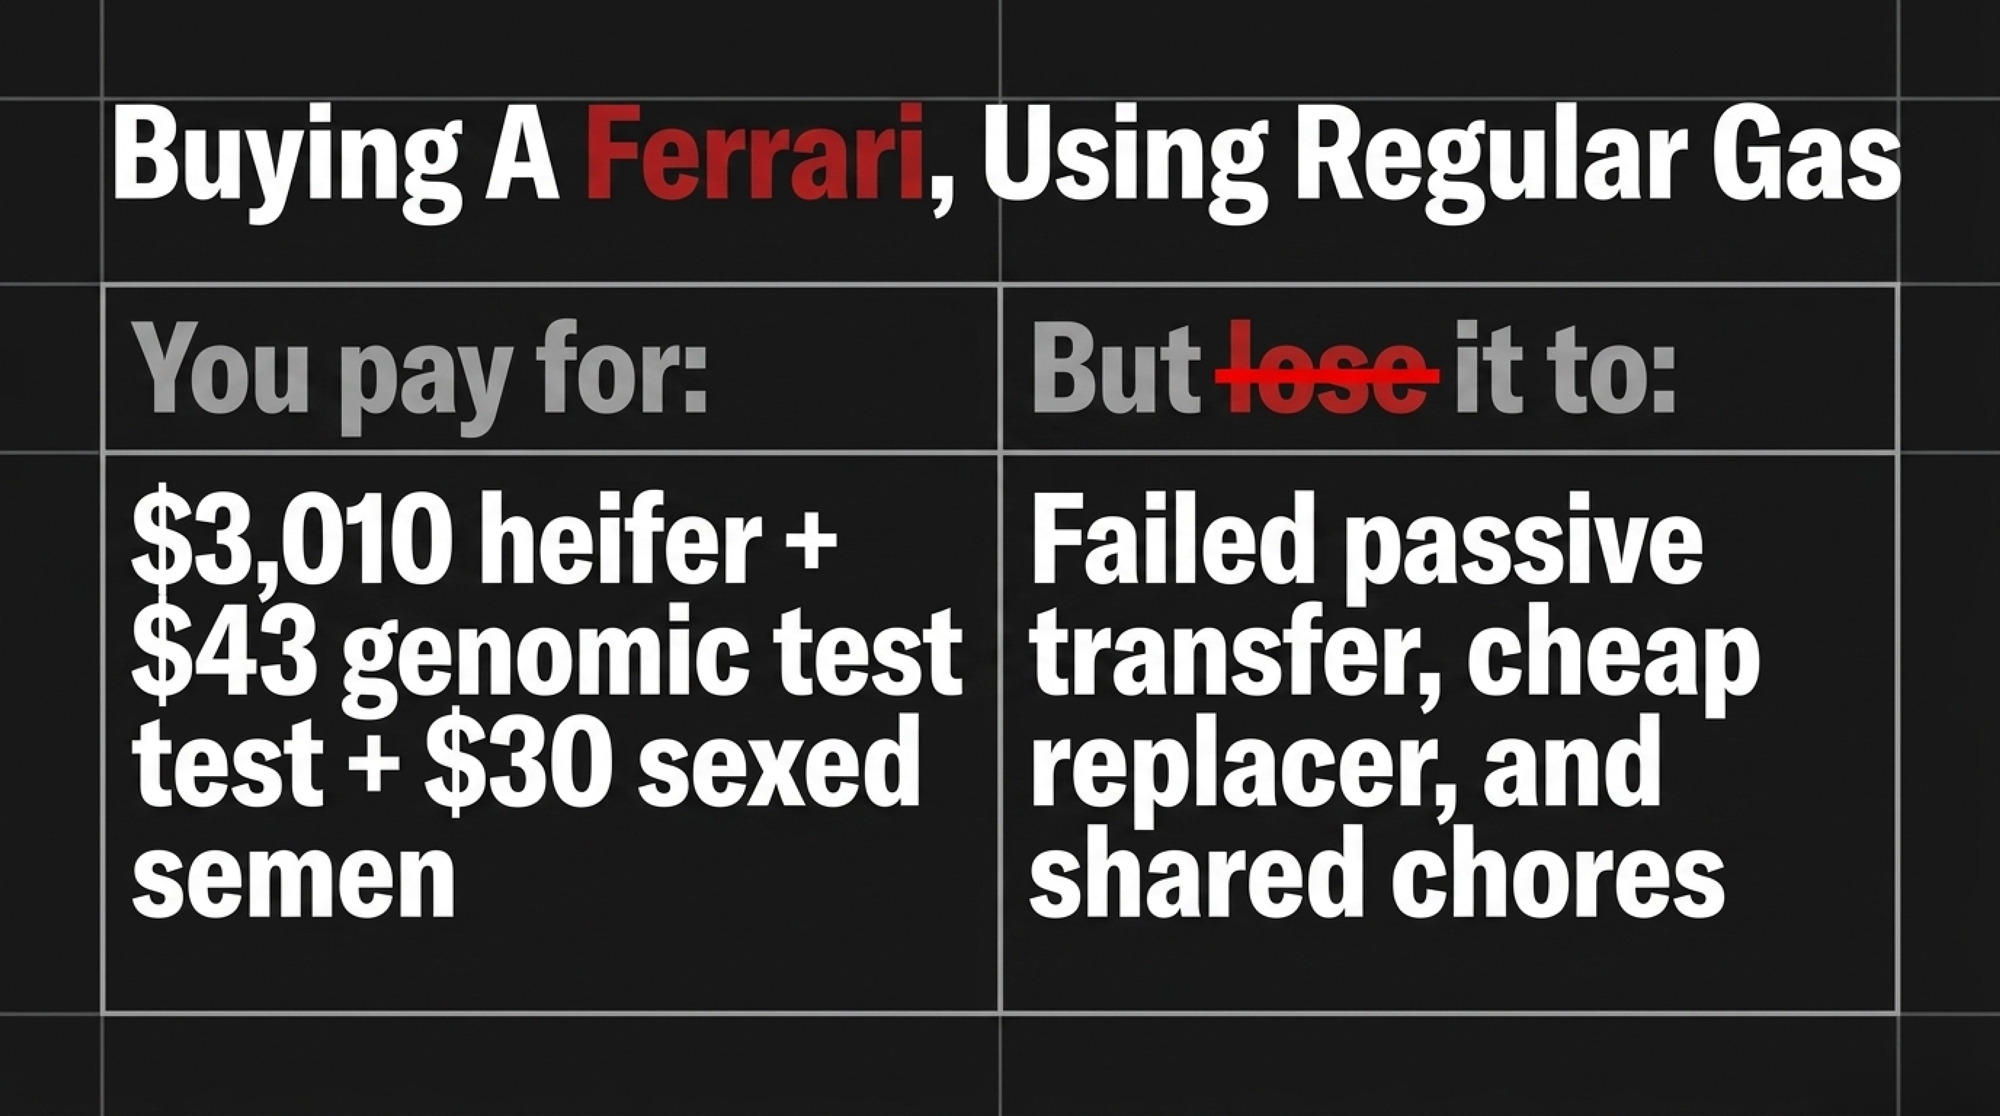
Colostrum and passive transfer. U.S. calf‑health work shows that on many dairy operations, 20–40% of calves still fail to achieve adequate passive transfer [VERIFY: cite Lombard et al. 2020 review or NAHMS Dairy 2014 — confirm exact source/date]. A major review of passive transfer failures found that these calves are about twice as likely to get sick or die early as calves that reach target IgG levels. The reasons are painfully familiar: first feeds drifting past the 2‑hour mark, “we got about two quarts in” instead of a full volume, and colostrum “quality” judged by color and cow parity instead of a Brix reading. A Brix refractometer costs less than one‑tenth of a dead heifer at $3,010.
Related Reading: [INTERNAL LINK: Bullvine calf-mortality-economics piece — hidden gem candidate] → Suggested anchor text: “The Critical Economics of Calf Mortality: Why Every Life Counts More Than Ever.”
Pre‑weaning nutrition. Soberon and Van Amburgh’s work pulled data from a Cornell research herd and a commercial herd. For each 1 kg/day increase in pre‑weaning average daily gain, first‑lactation milk yield increased by about 850 kg in the research herd and 1,113 kg in the commercial herd. A 2016 Journal of Dairy Science review confirmed that keeping average daily gain above 0.5 kg/day with adequate nutrients is linked to higher milk, fat, and protein yields in first lactation. But if that extra nutrition is going into dirty bottles, under‑bedded hutches, or calves that never got decent passive transfer, you’re just buying more expensive scours.
Disease pressure. Urie et al. reported that digestive and respiratory disease together account for a majority of pre‑weaning heifer deaths on U.S. dairies. Other studies have linked early‑life disease to reduced growth, higher treatment costs, and greater odds of early culling. In the “two for $5” bull‑calf era, you could absorb a handful of fragile replacements. In a market where USDA has heifer inventories at their lowest since 1978, every sick, slow‑growing calf is a capital asset you may never fully earn back.
Every weak link in the first 60 days turns a high‑genetic heifer into either a dead loss or a lower‑yield, shorter‑lived cow. That’s always been bad management. At $3,000‑plus per heifer, it’s pipeline suicide. The herds that flip those numbers don’t do it with a new binder — they do it by giving one person clear ownership of the hutch row, which is exactly what the I‑29 case in Option 3 below shows.
How Much Is “Cheap” Calf Nutrition Actually Saving You on $3,010 Heifers?
Here’s where the “we can’t afford a better replacer” argument starts to fall apart.
Penn State’s 2023 bulletin “Economics and Effects of Accelerated Calf Growth Programs” compared a standard 20:20 milk replacer at $80 per 50‑lb bag to a higher‑quality replacer at $100 per bag in a 56‑day feeding program (2023 prices — adjust to your current bag cost). In a scenario where calves moved from gaining 1.1 lb/day to 1.5 lb/day, feed cost increased by about:
- $41.92 per calf on the $80/bag program.
- $50.26 per calf on the $100/bag program.
Spread over 56 days, that works out to roughly:
- $0.75 per calf per day extra on the cheaper program.
- $0.90 per calf per day extra on the higher‑quality program.
Round it, and you’re talking about $42–50 extra per calf to run a higher plane of nutrition. On 200 heifer calves a year, that’s an additional $8,400–10,000 in milk replacer cost.
Related Reading: 17–26x ROI: Why Top Dairies Stopped ‘Saving’ Calves and Started Preventing Loss.
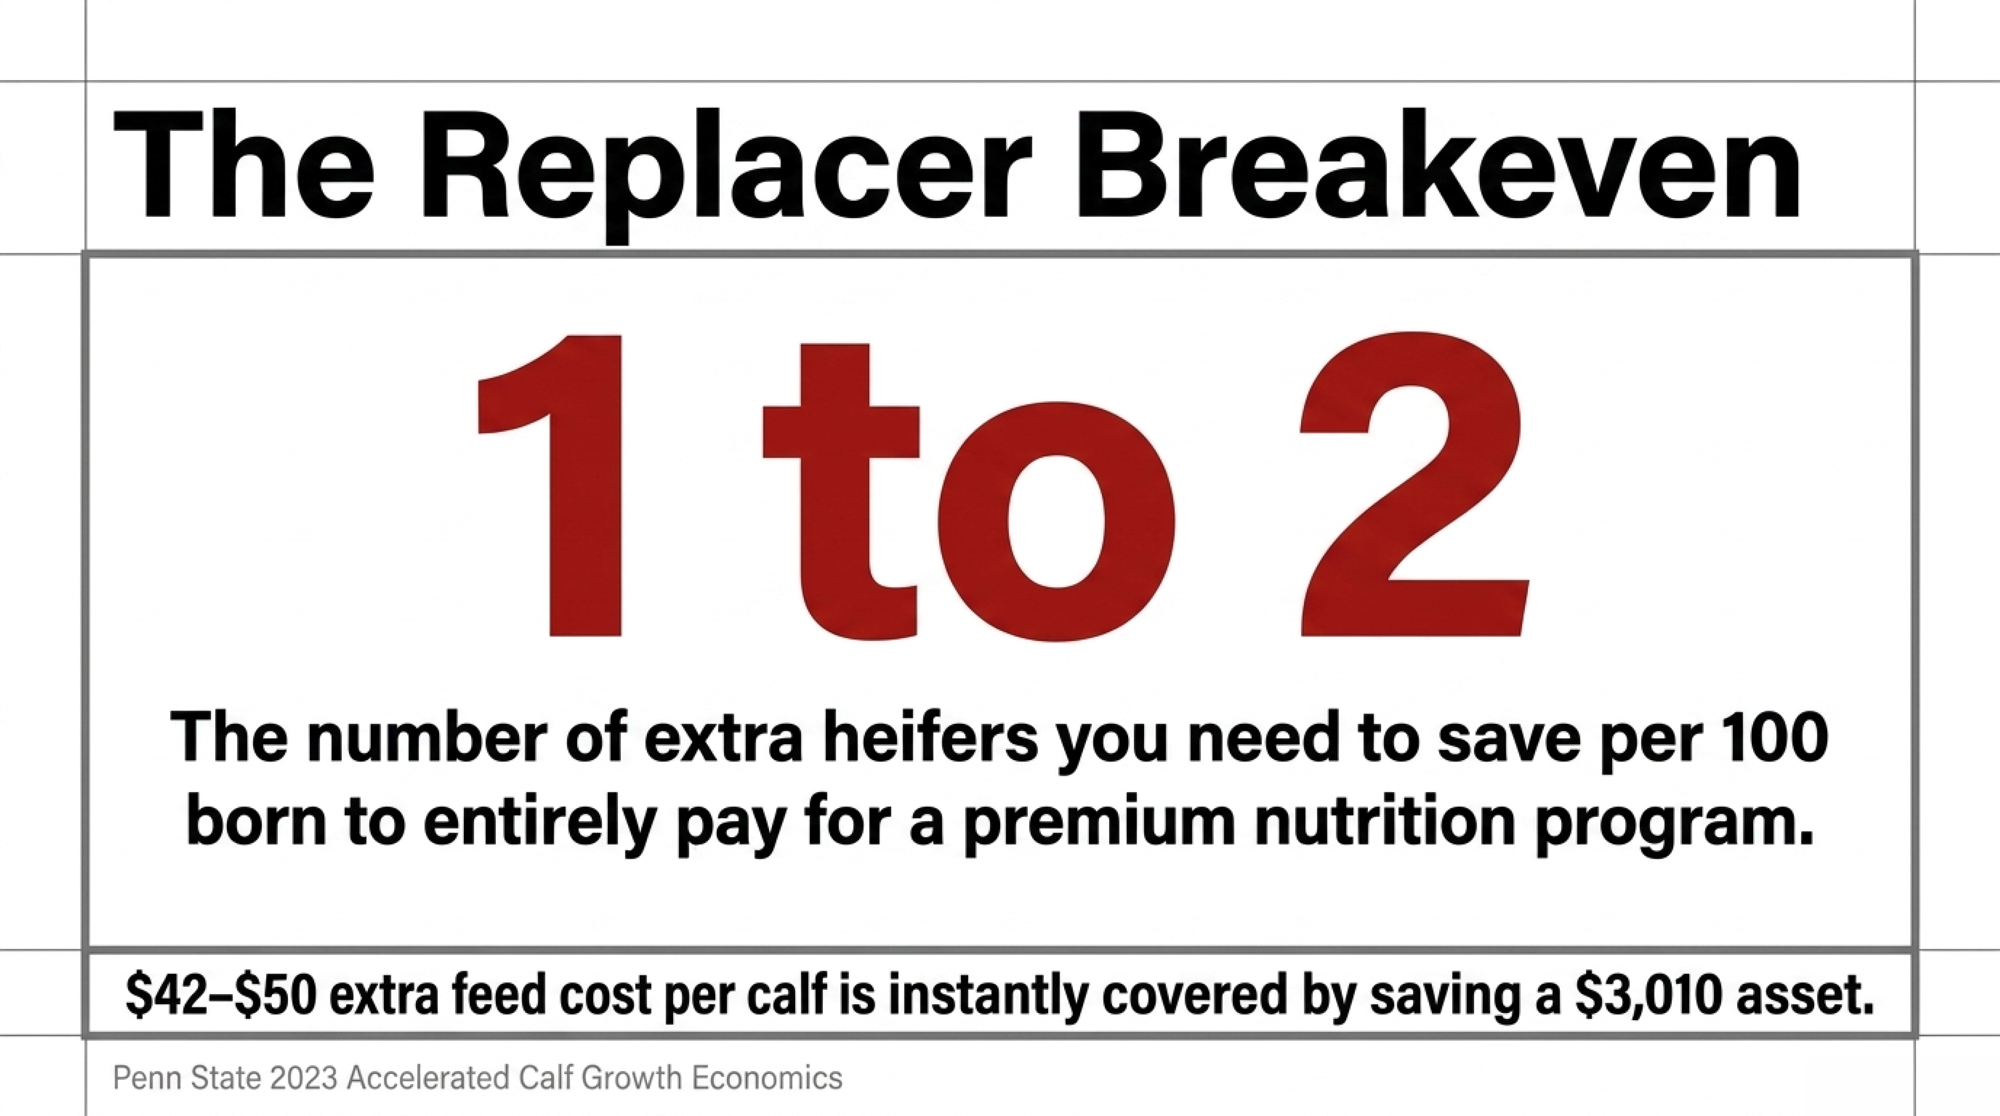
Now put today’s heifer prices on the other side of the ledger. At $3,010 per head, if tightening up colostrum and stepping up nutrition together drop heifer calf mortality from 4% to 2% on those 200 heifers, that’s 4 extra heifers alive. Four at $3,010 is $12,040 — more than enough to cover the $8,400–10,000 in extra feed.
You don’t even need a full 2‑point drop to break even. If you spend $10,000 more on calf feed and each heifer is worth $3,010, you need to save about 3.3 heifers. On 200 heifers a year, that’s roughly 1.6 percentage points of mortality improvement. At the lower feed cost ($8,400), the breakeven is closer to 1.4 points. Either way, you’re still only aiming to save one to two extra heifers per 100 born.
Will every farm see that from a replacer change alone? No. Colostrum timing, housing, bedding, and people following the protocol all matter. But at current heifer values, the breakeven for a better calf program has moved much closer than it used to be.
What’s the Real Cost of Your Calf Program?
The easiest way to dodge this question is to say, “Our calf program is fine.” The harder way is to pull the numbers and see if it actually matches the genetics bill you’re paying.
Start with last year’s heifer calf crop. If you had 220 heifer calves born and lost 4% before weaning, that’s about 9 heifer calves dead. At your replacement value — anywhere from $2,660 in early 2025 to $3,110 by late 2025 — you’re looking at a $24,000–28,000 line item just for dead heifers. Then add in the extras: sexed semen premiums, genomic tests, and any IVF work you did on the cows those heifers came from. If that number doesn’t make you uncomfortable, check it again.
Now compare your calf program spend to that loss. Penn State’s math shows an extra $42–50 per calf in replacer cost on 200 heifer calves — call it $8,400–10,000 per year — can break even if you save just one or two extra heifers per hundred born at $3,010 each. Does your current calf program pass or fail that simple barn‑math test?
Who Really Owns the Hutch Row?
On paper, you might say, “Our calf team handles it.” In practice, that often means whoever finishes milking first or whoever drew the short straw that week.
Ask yourself one blunt question: if you walked into the office right now and asked, “Who owns calf outcomes here?” would you get one name in under five seconds — or a vague, “We all do”? Herds that win this game usually have a single person who owns colostrum, calves, and the key numbers: FPT %, heifer calf mortality, and weaning weights.
You don’t need a fancy HR plan to get there. You need to pick the person who notices calves first, give them clear authority over calf protocols, and put their numbers on the board every month next to pregnancy rate and SCC. When calf care is shared across whoever has time, even $3,010 heifers can quietly get less focused attention than they really need.
| Metric | What It Measures | Target | Action Threshold |
|---|---|---|---|
| FPT % | Calves failing passive transfer (serum total protein <5.2 g/dL) | <10% | >15% |
| Pre-Weaning Heifer Mortality % | Heifer calves dead before weaning | <3% | >4% |
| Average Daily Gain (Pre-Weaning) | Pounds gained per day, birth to weaning | >1.5 lb/day | <1.1 lb/day |
| Weaning Weight | Average weight at 8 weeks | >200 lb | <180 lb |
| Days to First Calving | Age at first calving | <24 months | >26 months |
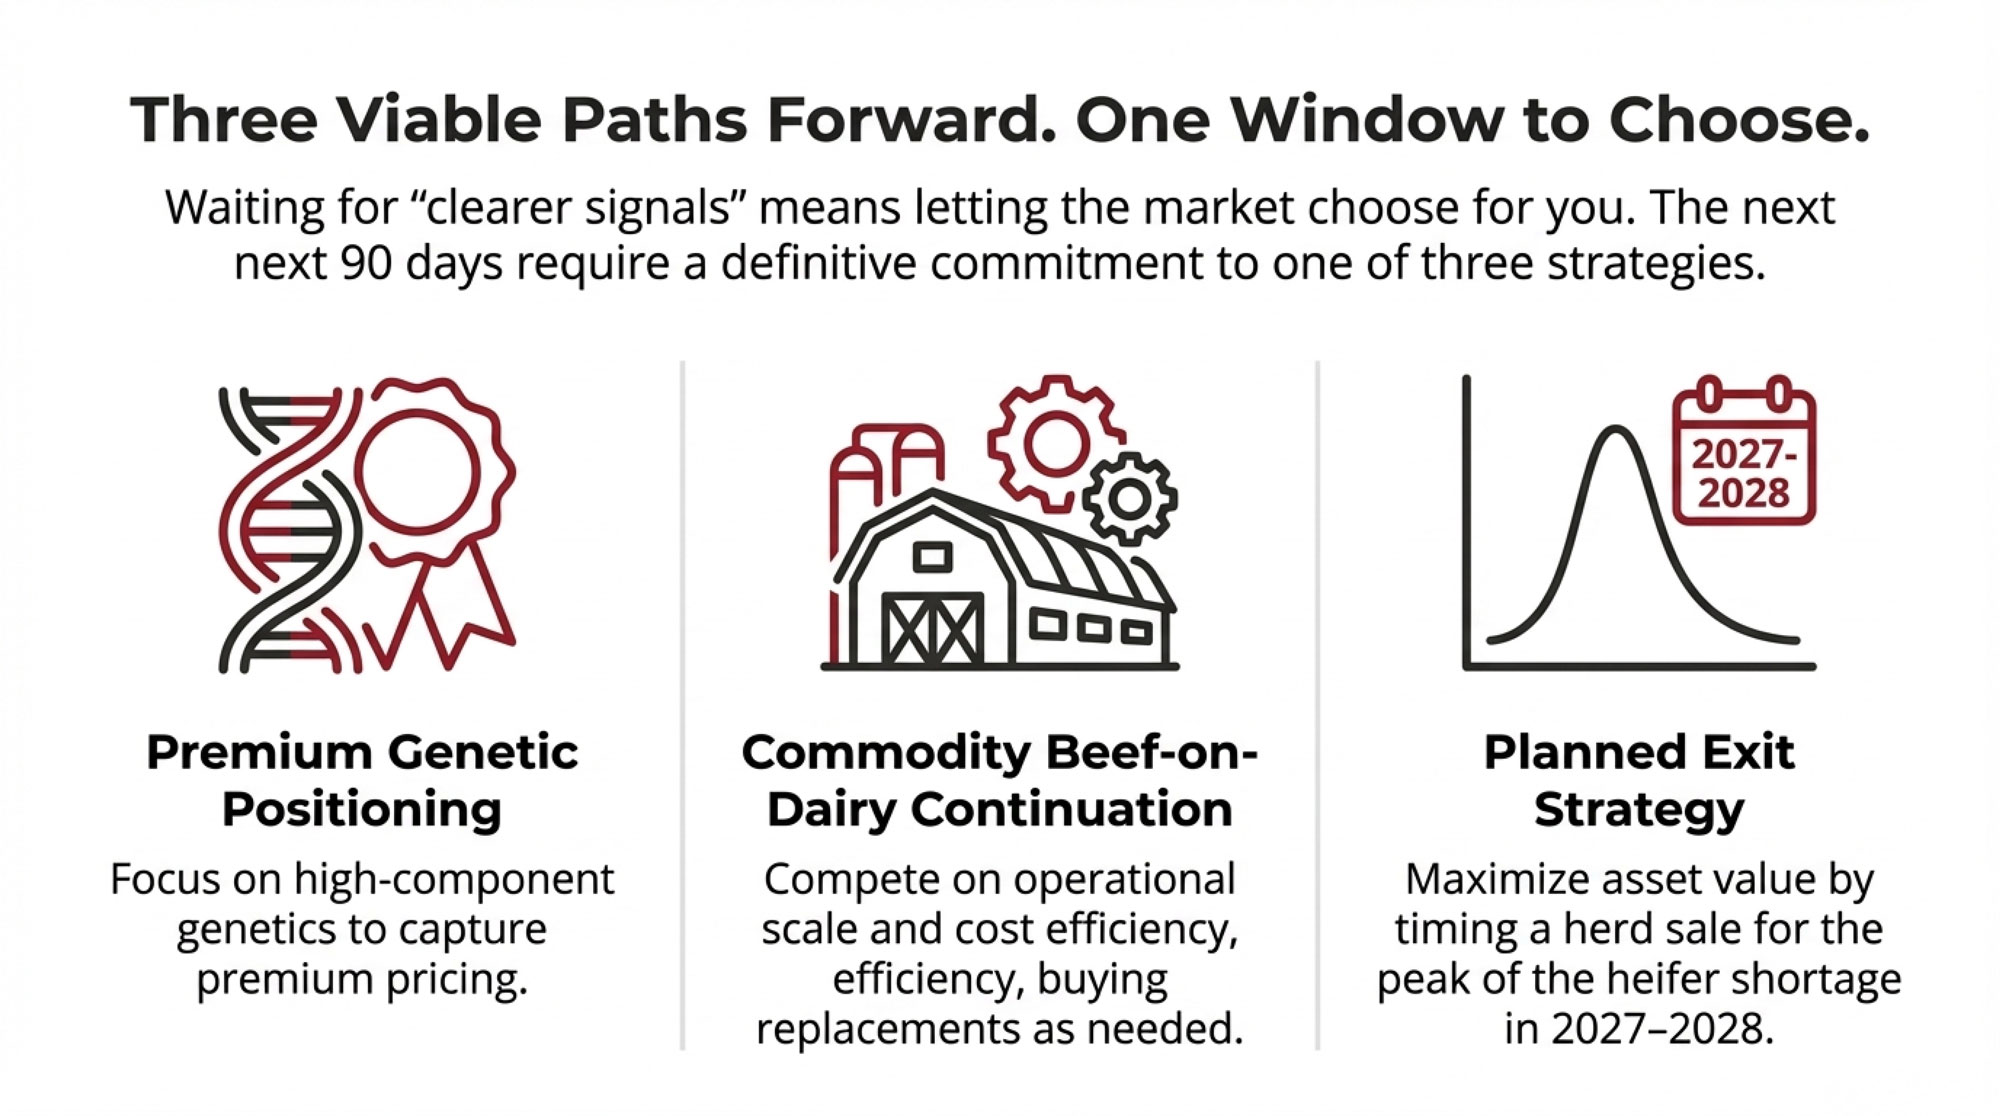
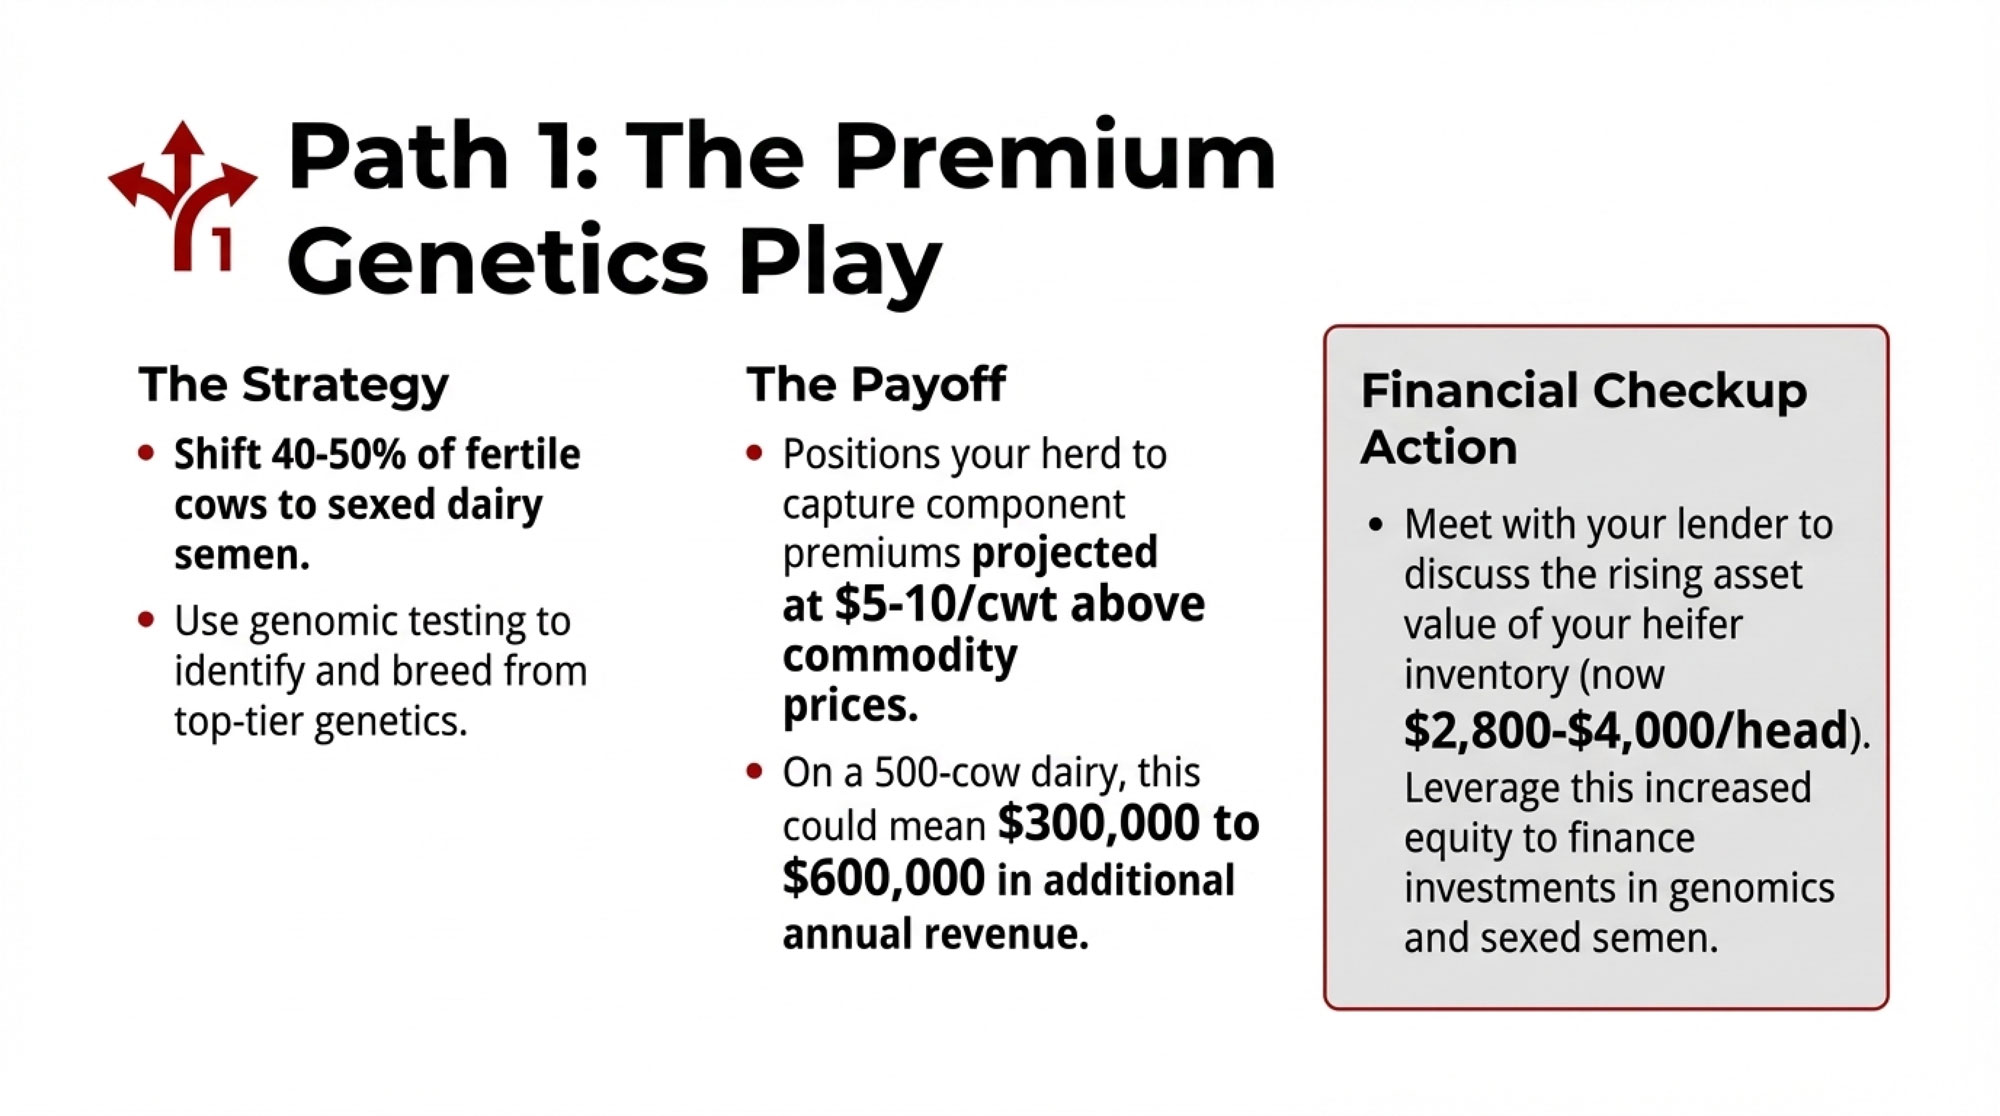
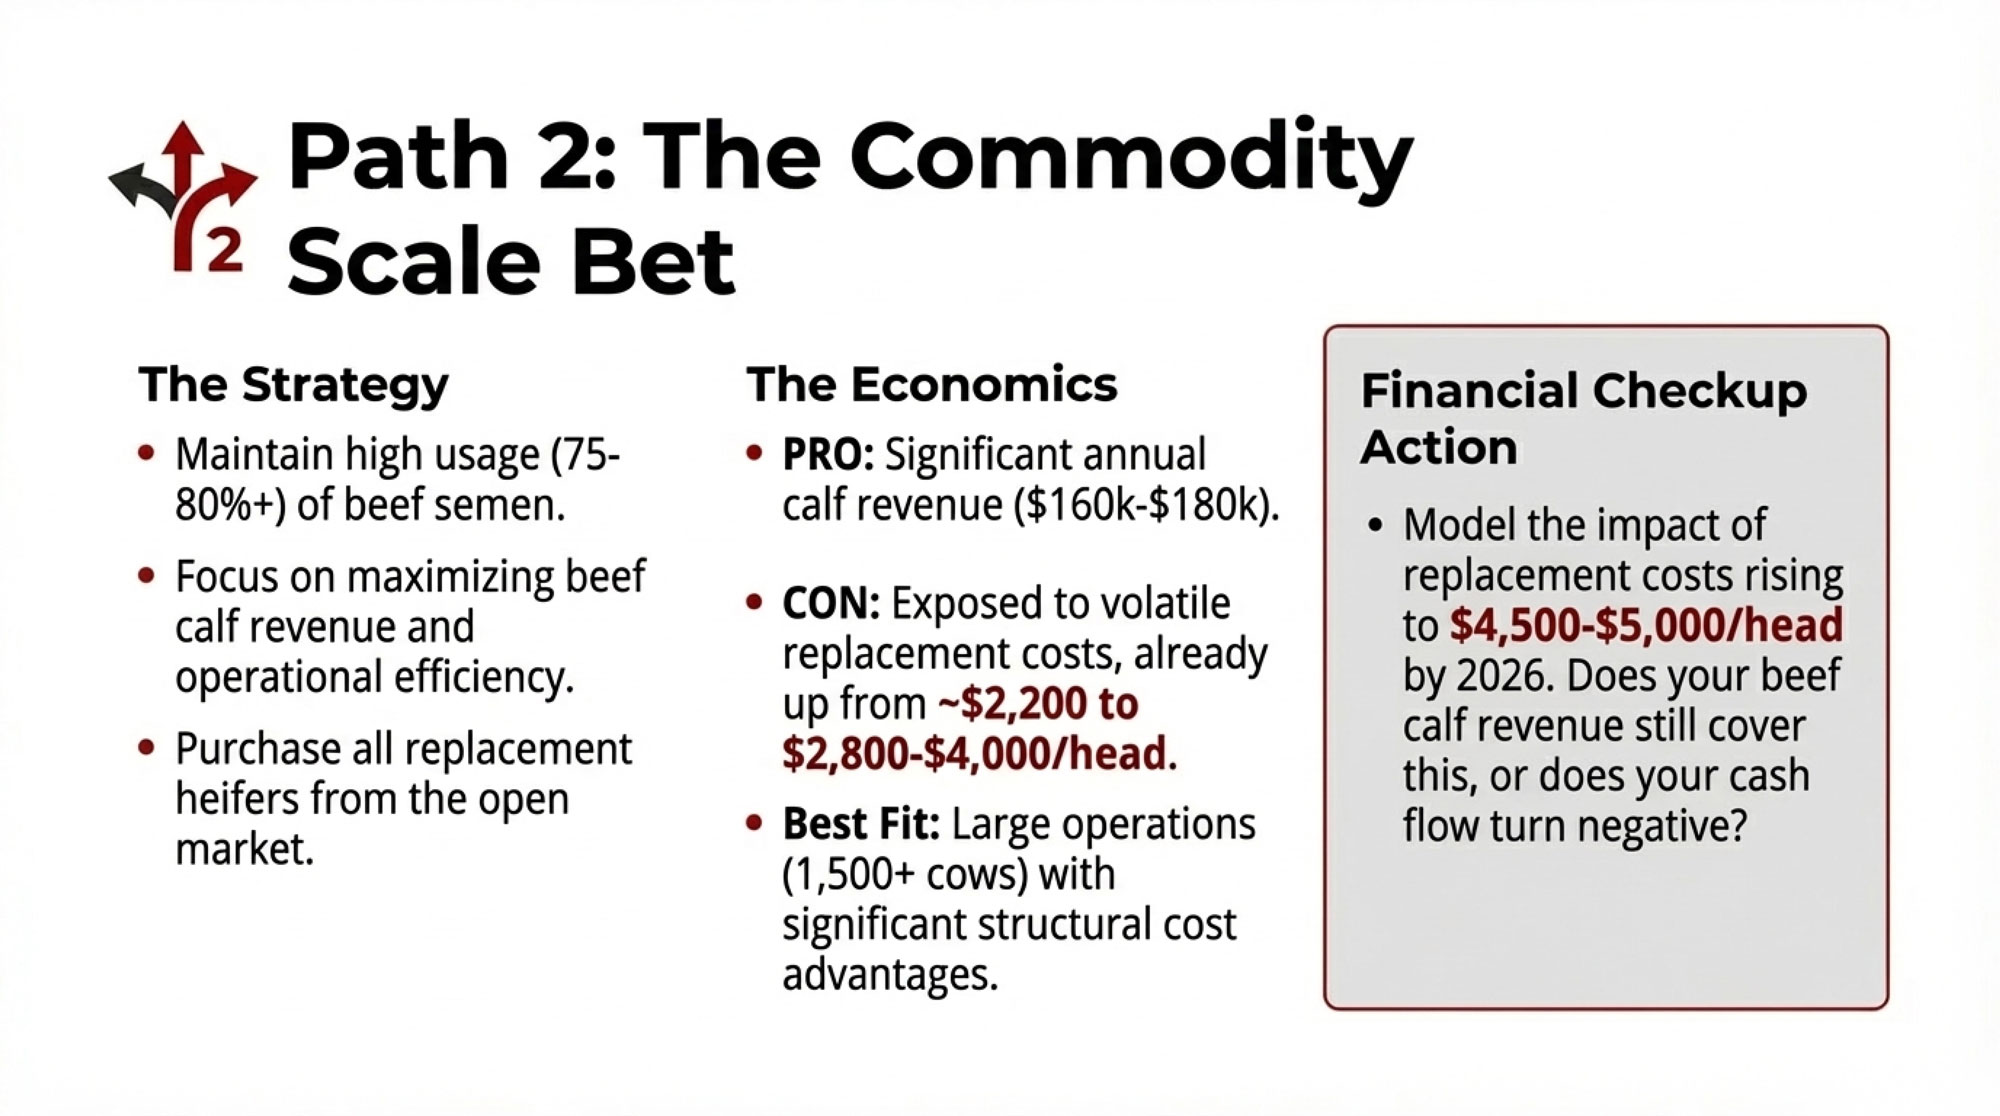
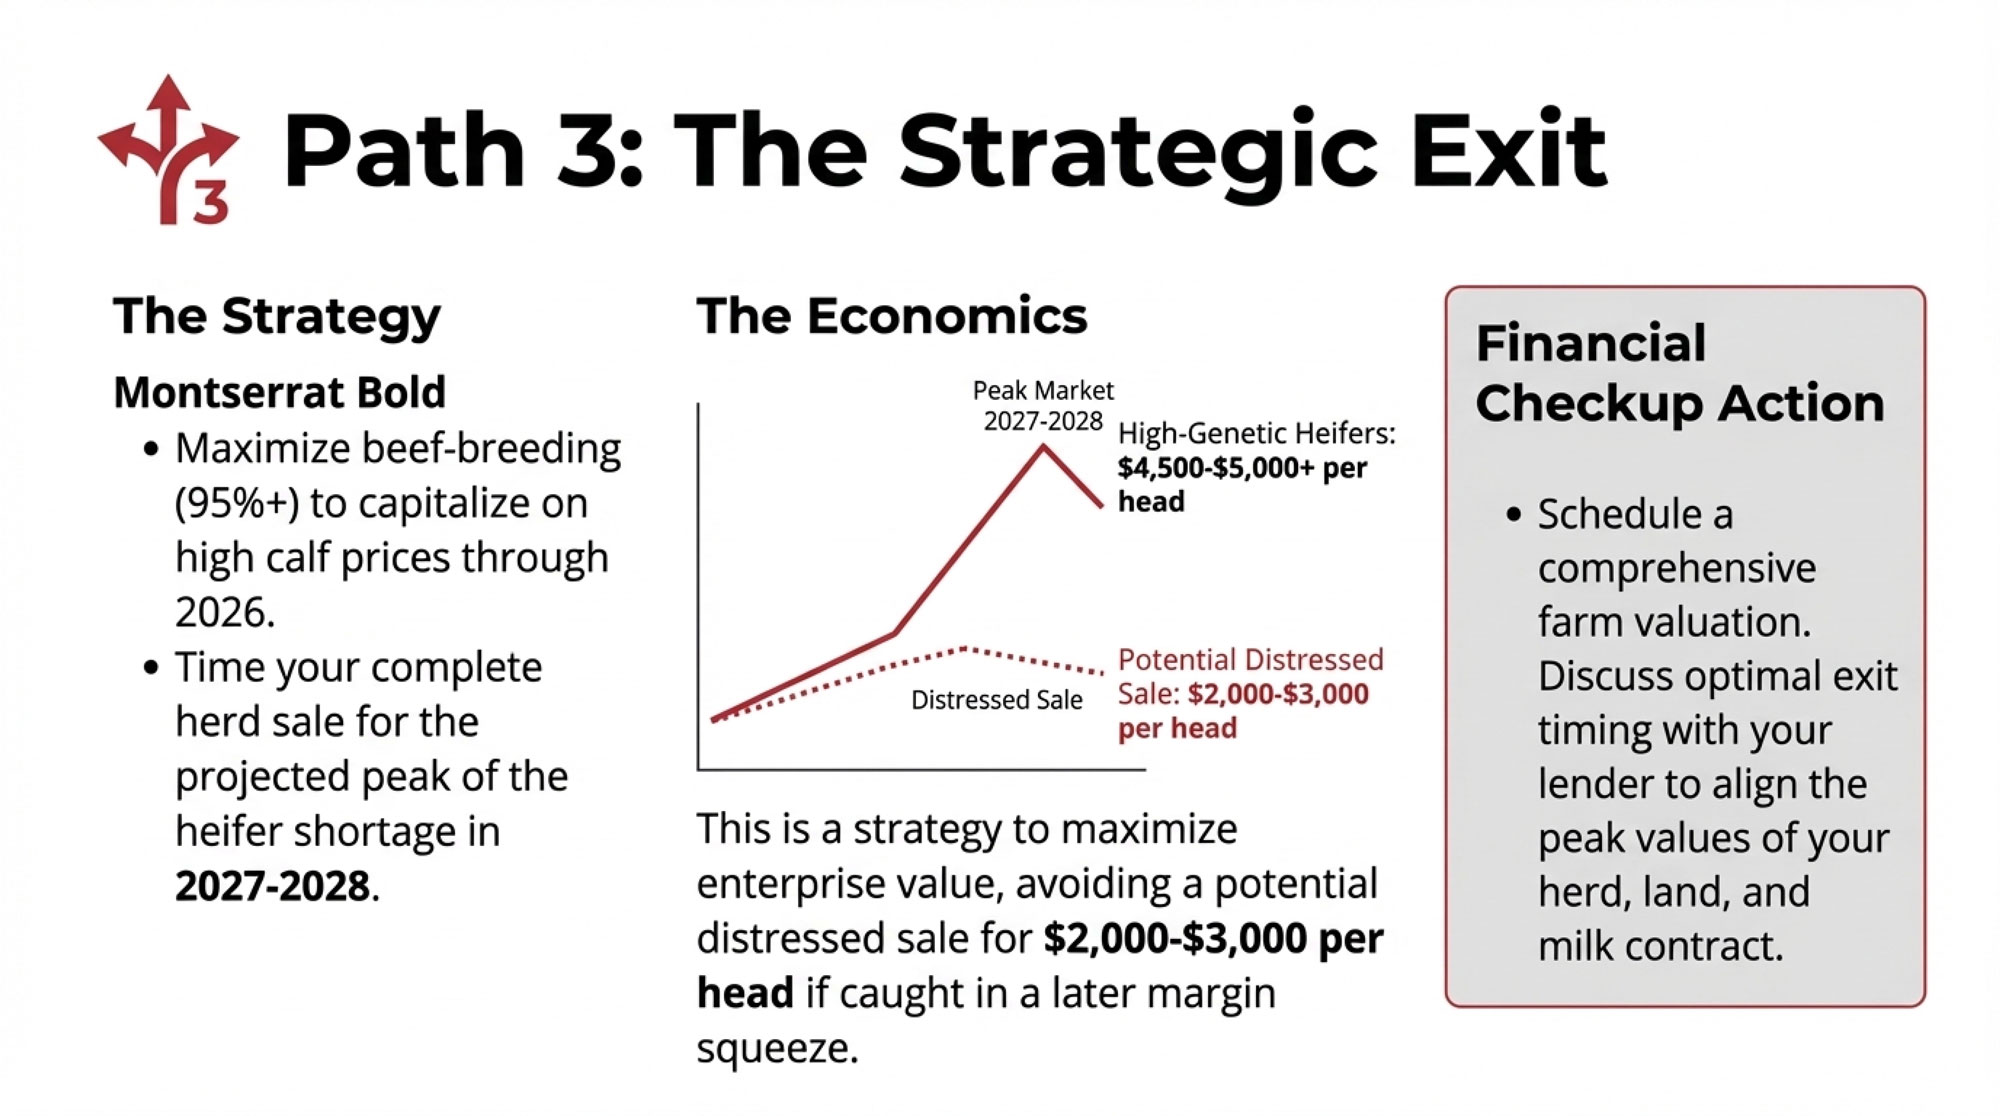
Options and Trade‑Offs for Farmers
You don’t have to fix everything this month. But you do need to stop running a $30 calf program under a $3,010 heifer reality. Here are four paths, how they work, and where they can bite you.
1. Lock Down Colostrum — Your 30‑Day Action
If your heifer replacements are worth more than about $2,500 and your heifer calf mortality is over roughly 3–4%, that’s a strong signal that this is where you start.
In the next 30 days, pull the last 12 months of heifer‑calf data and calculate your actual pre‑weaning heifer mortality. Not a gut feel — the real number from your records. Brix‑test colostrum from every fresh cow for at least one full week and draw a hard line: nothing under 22% Brix goes into heifer calves. Then draw blood from every calf born during that week at 24–48 hours and run serum total protein. If more than 10–15% of those calves fall below the accepted passive‑transfer threshold, your most expensive pipeline leaks.
When this path makes sense: any time replacements are valuable, and you haven’t done a proper FPT audit in the last 12 months. What it requires: a Brix refractometer, some blood tubes, a small lab bill, and a willingness to change how quickly and how much colostrum gets fed. Where it fails: you collect the numbers and then write them off as “just a bad week” instead of changing milking‑fresh, storage, and first‑feeding routines.
2. Upgrade Calf Nutrition With Numbers, Not Hope
This path is for herds already investing in genomics and sexed semen but still seeing 4–5% heifer calf mortality and a thick treatment notebook.
You’re basically asking one question: does the extra $42–50 per calf Penn State lays out for a higher‑plane program pay off at $3,010 per heifer in your barn? Use their math as the backbone and plug in your own replacer price, mixing rate, and days on feed. Then compare that extra spend to what saving one or two extra heifers per hundred born is worth in your herd.
You’ll also need to tighten mixing accuracy, feeding schedule, and hygiene. A better bag doesn’t fix dirty bottles or inconsistent solids.
When this path makes sense: you’ve already got decent colostrum numbers but still see too many sick, slow‑growing calves. What it requires: shifting away from “whatever 20:20 is cheapest” toward a consistent, all‑milk‑protein replacer and enforcing protocol discipline. Where it fails: you upgrade the replacer but leave colostrum, housing, and staff training the same. That’s just a more expensive way to keep the same problems.
3. Put Real Ownership on the Calf Barn
On some dairies, the calf barn turns not because a consultant writes a binder, but because one person quietly decides, “These calves are mine.”
Maybe it’s the herdsman’s daughter who has a knack for spotting dull eyes and droopy ears. Maybe it’s the feeder who hates seeing the same calf on the treatment list twice. On one 600‑cow I‑29 herd a consultant works with, the turning point was simple: the owner told their sharpest young employee, “You own hutches and colostrum. I’ll measure you on FPT %, death loss, and weaning weights — and I’ll back you when you need changes.” Within a year, that farm’s heifer calf mortality had dropped, and the owner quit saying, “Our calves are just weaker.”
When this path makes sense: nobody in your place can answer “Who owns calf outcomes here?” without looking around. What it requires: giving one person clear authority over calf protocols and tying their success to three KPIs: FPT %, heifer calf mortality, and weaning weights. Then sitting down monthly to review those numbers alongside repro and SCC. Where it fails: you give someone the title but not the time, training, or authority. If calf chores are still what happens when people finish everything else, the numbers won’t move.
4. Benchmark Calves the Way You Benchmark Cows
With CoBank’s shortage timeline and beef‑on‑dairy locked in for 2026, flying blind on calf performance is the wrong gamble.
Sponsored Post
Related Reading: Updated NAAB Data Cuts CoBank’s Heifer Shortage Projection — The Barn Math Says It Doesn’t Matter Yet.
When this path makes sense: you genuinely don’t know how your calf metrics stack up against herds that look like yours. What it requires: pull a year of heifer‑calf data and break mortality into 0–3 days, 4–21 days, and 22 days to weaning. Add FPT % and weaning weights. Then work with your vet, nutritionist, or a university project to benchmark against peer herds. Where it fails: you see that your numbers sit in the bottom third and decide “our calves are just weaker” instead of changing something.
Key Takeaways
- If your heifer replacement value is above roughly $2,500 and your heifer calf mortality is over 3–4%, stop treating that as background noise. Treat it like an economic leak. Multiply last year’s dead‑heifer count by $2,660–3,110 and ask whether you’d accept that line item if it showed up as a bill from your vet or semen rep.
- If you’re running a high beef‑on‑dairy percentage without a locked‑in heifer plan, you’re stacking two bets: that beef calf premiums stay strong and that replacements will be there when you need them. CoBank’s 800,000‑head shortfall and USDA’s lowest‑since‑1978 inventory should make you nervous about the second part.
- If you’re willing to spend about $43 per heifer on genomics and pay a $15–30 sexed‑semen premium,balking at an extra $42–50 per calf on a better colostrum and nutrition program doesn’t pencil. The breakeven is saving roughly one to two heifers per 100 born at $3,010 each.
- If nobody on your farm “owns” calf outcomes with data, your calf program is still operating more like a chore than a managed system. Name a calf manager and give them three numbers to live by: FPT %, heifer calf mortality, and weaning weights.
- If you haven’t Brix‑tested colostrum and run serum total protein on a batch of calves in the last 12 months, your colostrum program is still a story, not a fact. Make that your 30‑day project.
Your Calf Barn Checklist — Print This and Take It Outside
- ☐ The Brix Test: Is every gallon of colostrum for heifer calves testing at or above 22% Brix before it goes into a bottle?
- ☐ The 2‑Hour Rule: Are calves reliably getting their first colostrum within 2 hours of birth, or are there still “shift change” calves waiting longer?
- ☐ The FPT Audit: Have you checked serum total protein on the last 10 heifer calves born? What percentage cleared the passive‑transfer threshold?
- ☐ The Mortality Number: Can you write down your actual 12‑month pre‑weaning heifer calf mortality rate — not a guess, but the number from your records?
- ☐ The Cost‑Per‑Death: Take that mortality rate, multiply by your annual heifer calf crop, then by $3,010. That’s what lost heifers cost you last year — before you add in genomics, sexed semen, or IVF.
- ☐ The Replacer Math: How much does your current milk replacer cost per calf through weaning? What would an upgrade cost? How many extra heifers per 100 born would need to live for that to pay off at $3,010 per head?
- ☐ The Pipeline Check: How many bred heifers and springers do you have on hand right now, divided by how many replacements you actually need each year? If that ratio is under 1.0, you’re already short. Under 0.8, you’re in trouble if CoBank’s 2027 recovery timeline holds.
- ☐ The Owner Question: Is there one name — not “the team” — on this farm who owns those calf numbers?
Heifers aren’t about to get cheaper. USDA NASS’s January 2025 report and follow‑up analysis put replacement heifers at 3.914 million head, the lowest since 1978, and CoBank’s best‑case scenario has inventories just starting to recover in 2027. The genetics you’re putting into cows today are some of the most expensive you’ve ever bought. The calf barn is where you decide whether that money turns into cows or compost.
So here’s the real question: do your calf numbers match the genetics bill you’re paying — or are you still running a $30 program under a $3,010 heifer reality?
Run Your Numbers
Bullvine Pipeline Index Calculator — This free tool turns your heifer pipeline into a single 0–100 score and shows whether your current calf losses, beef-on-dairy use, and cull rate can actually support tomorrow’s herd. Use it to see if your $30 calf program matches your $3,010 heifer reality.
Learn More
- Beef-on-Dairy Calf Profit: The $150 Leak Killing Your Premium — Arms you with precise weaning strategies and protocol adjustments to eliminate a hidden $130–$225 per head value leak. It details why feedlots slash bids on calves carrying subclinical health issues, protecting your immediate revenue.
- The $3,000 Heifer Hangover: How Beef‑on‑Dairy Emptied Your Pipeline and Left the U.S. 800,000 Head Short— Exposes the structural 800,000-head deficit locking in high replacement costs through 2027. It models regional supply crunches and provides the long-term market intelligence required to insulate your herd from a devastating inventory collapse.
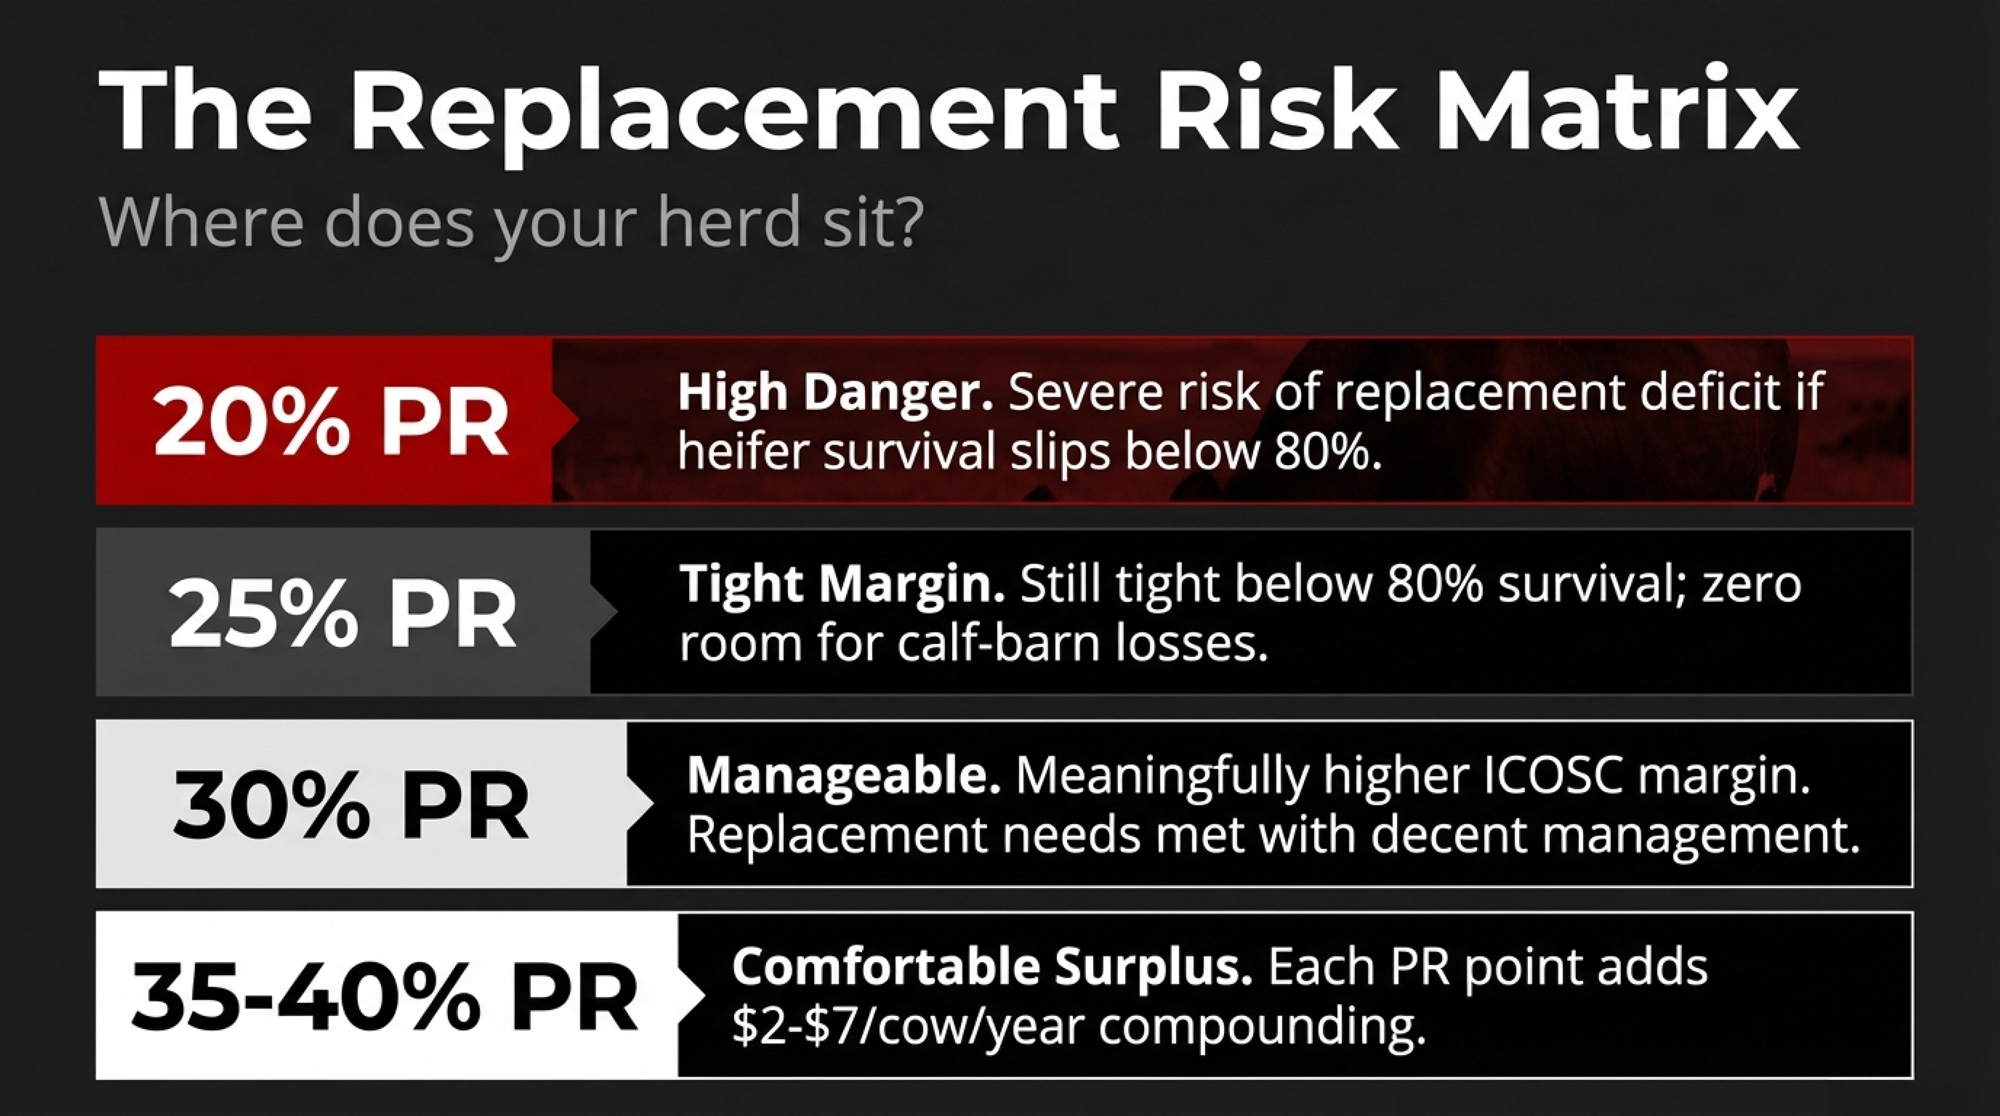
- Beef-on-Dairy’s $6,215 Secret: Why 72% of Herds Are Playing It Wrong — Delivers an unarguable reproductive matrix that proves why herds with under a 20% pregnancy rate capture zero net profit from beef crossbreeding. It dismantles generic breeding advice, forcing a rigorous re-evaluation of your sexed semen allocation.
 The Sunday Read Dairy Professionals Don’t Skip.
 The Sunday Read Dairy Professionals Don’t Skip.
Every week, thousands of producers, breeders, and industry insiders open Bullvine Weekly for genetics insights, market shifts, and profit strategies they won’t find anywhere else. One email. Five minutes. Smarter decisions all week.