


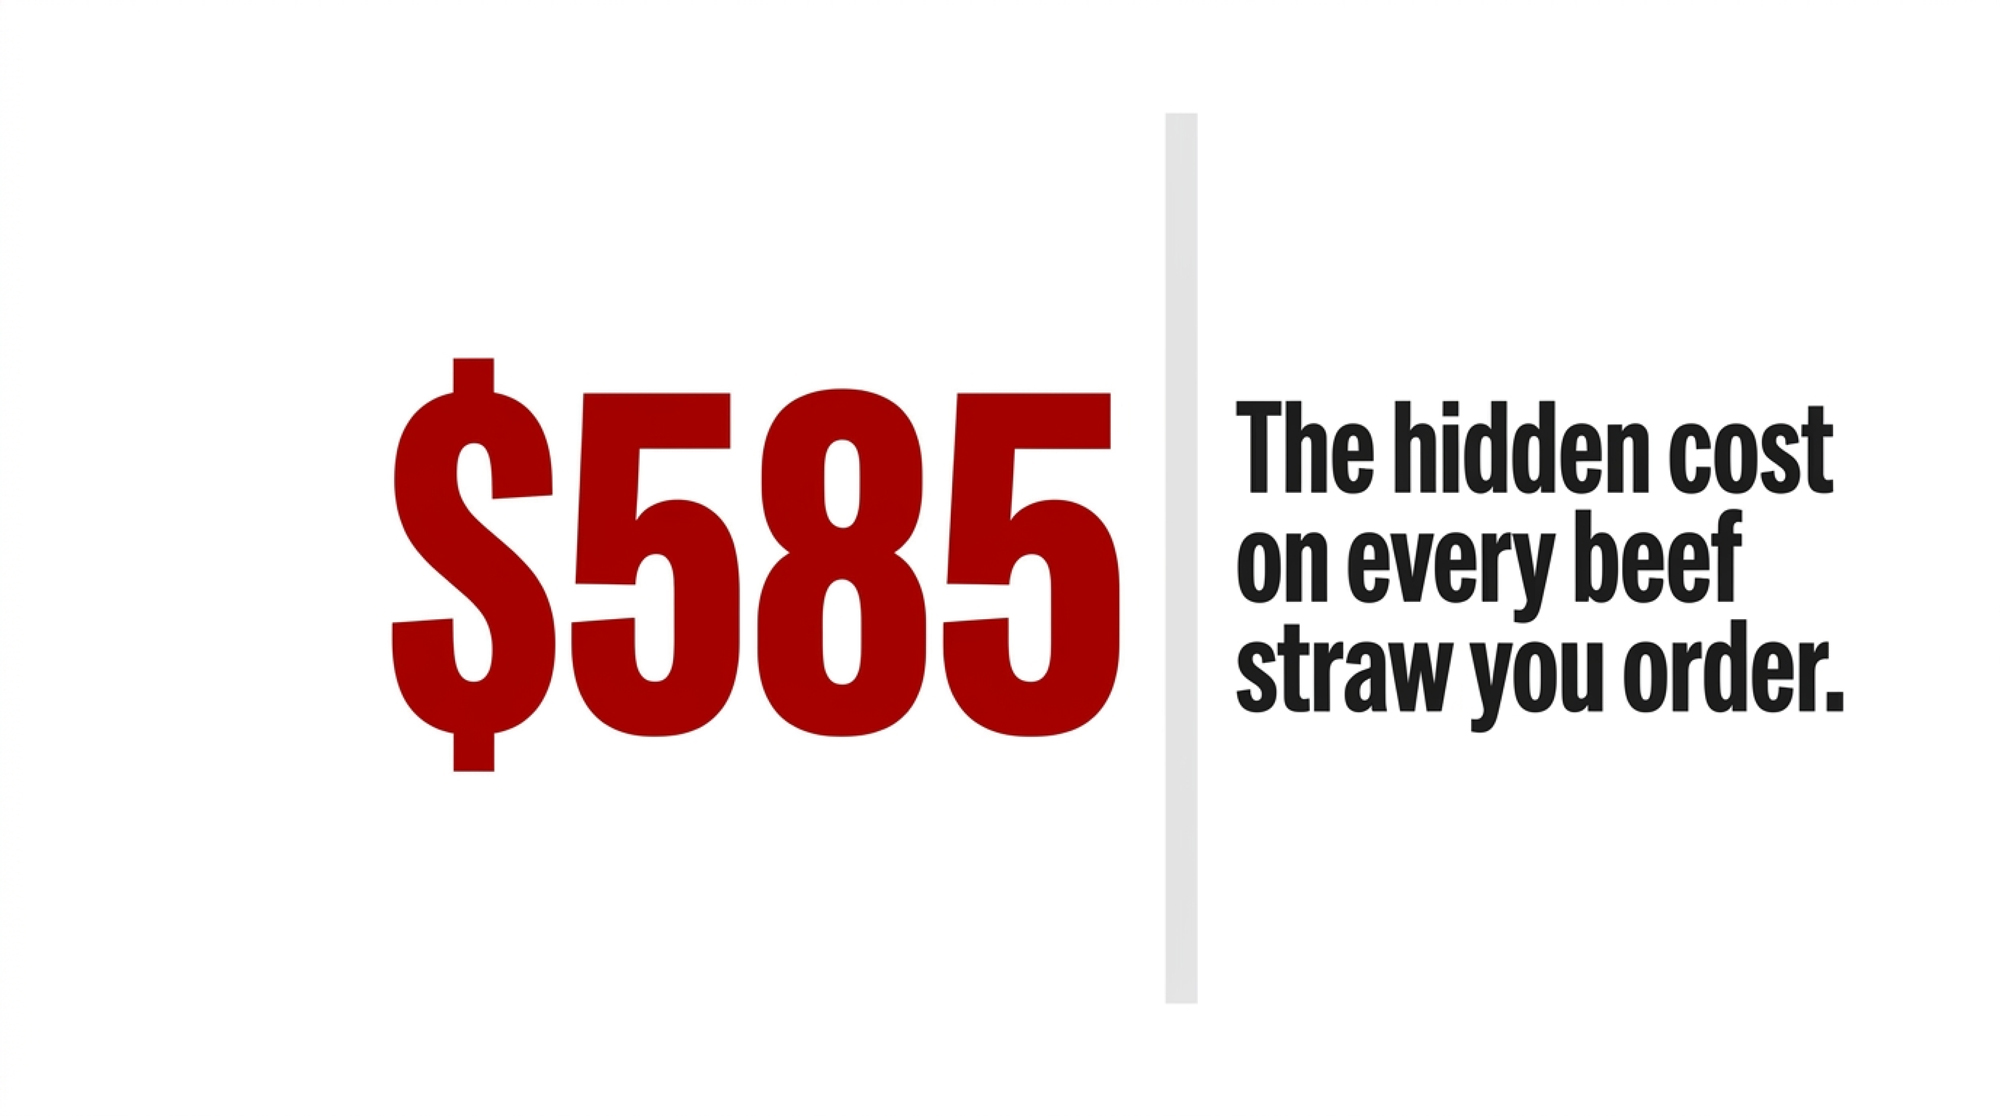
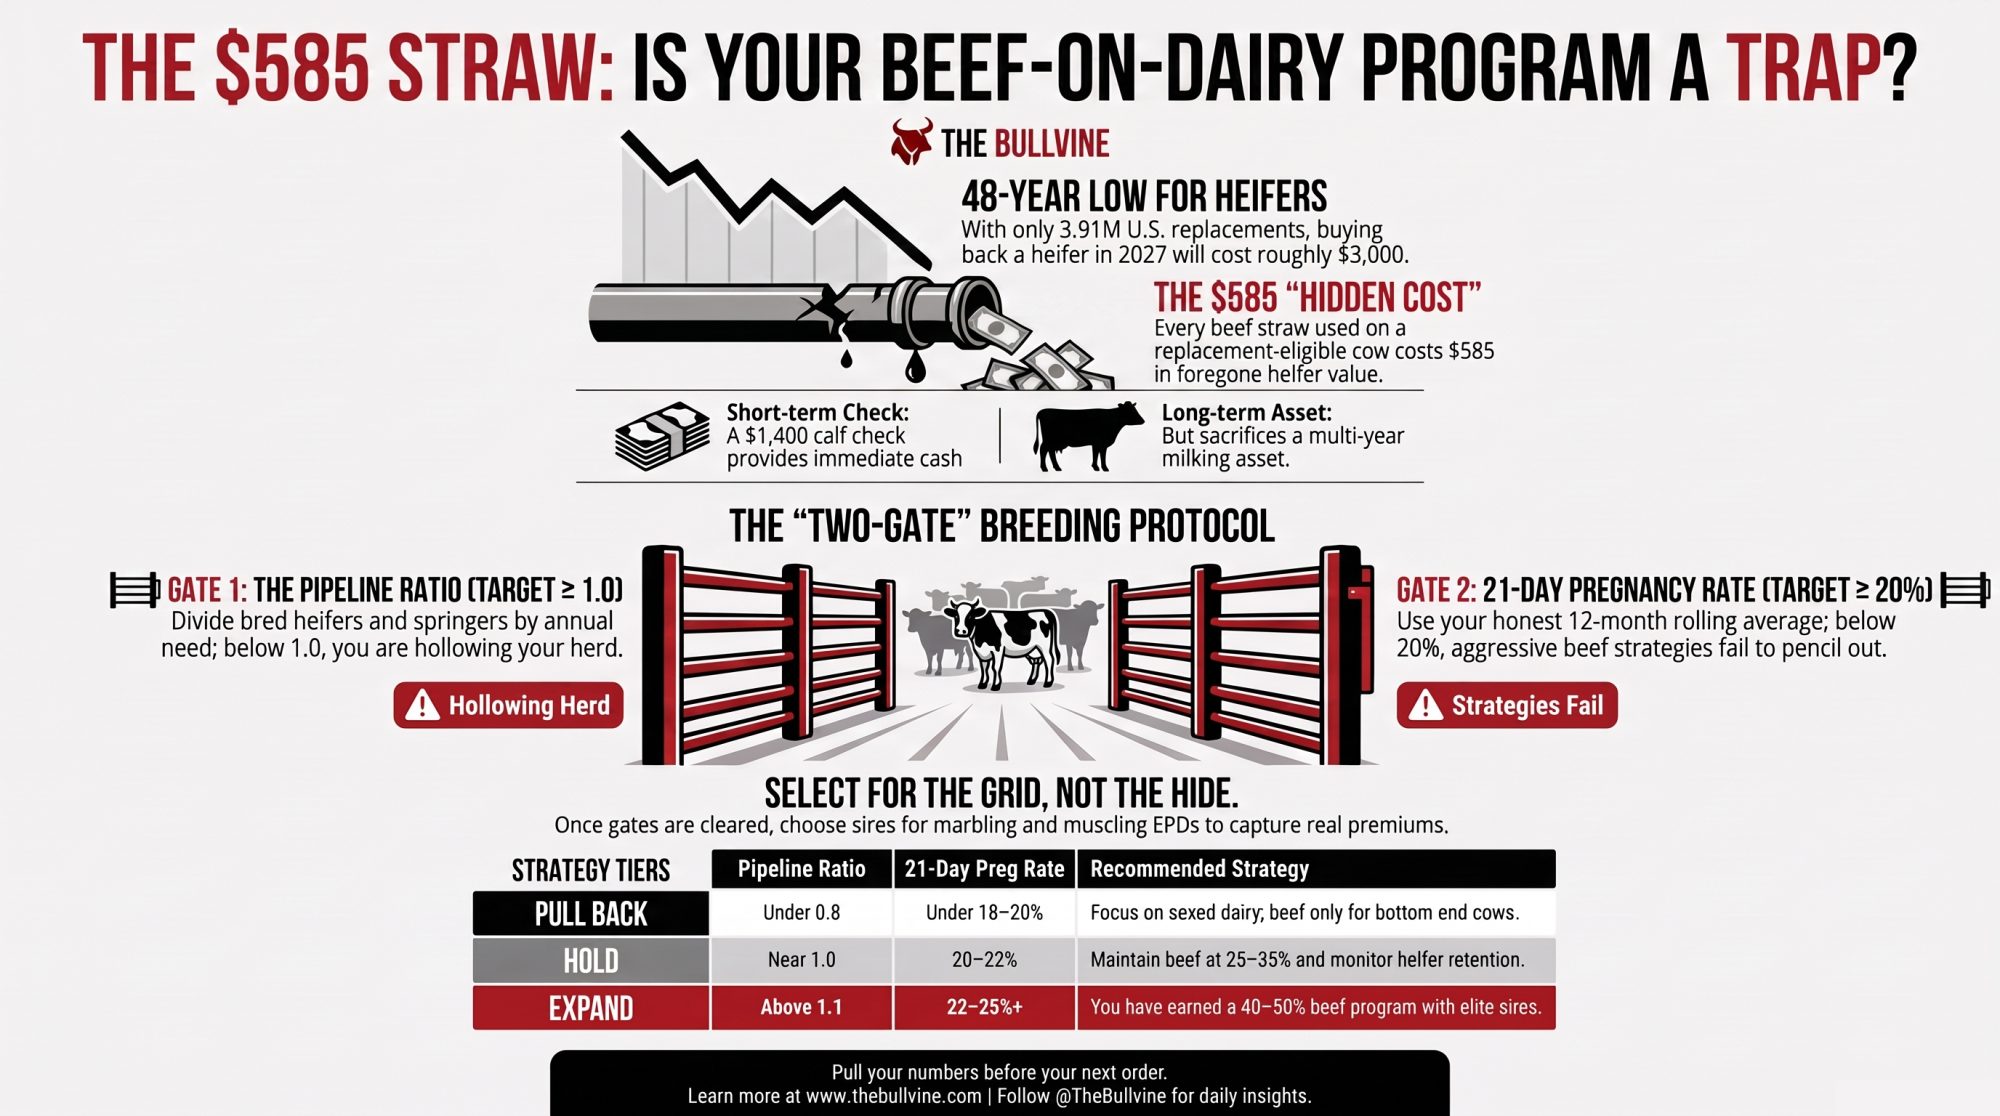
$585. That’s what one beef straw really costs once you count the $3,000 replacement you didn’t breed — with heifers at a 48-year low, that calf check isn’t free money. It’s borrowed.
Executive Summary: With U.S. replacements at 3.91 million head — the lowest since 1978 — a single beef straw carries a hidden $585 cost: the $3,000 replacement heifer you didn’t breed and will buy back in 2027. Run 200 beef services on a 500-cow herd, and you’re looking at roughly $117,000 in foregone replacement value the calf check quietly hides. Whether that’s a smart play or a slow leak comes down to two numbers most herds never pull before the semen order: your pipeline ratio (bred heifers plus springers ÷ annual replacement need — you want ≥1.0) and your honest rolling 12-month 21-day pregnancy rate (≥20%). Below either line, UW–Madison’s modeling says there’s no aggressive beef strategy that pencils once you’ve covered replacements — you’re drawing down the herd you’ll need when milk tightens and everyone’s bidding on the same scarce heifer. Clear both gates and the leak moves to the bull: carcass-trait selection, not hide colour, is where the grid premium actually lives. Before your next order goes in, pull those two numbers and decide if your beef percentage is earning its place — or costing you a herd you’ll rebuy at $3,000 a head.
Editor’s note: The breeding-meeting scene and the two herd scenarios below are composites, modeled from multiple U.S. dairy operations to illustrate how the math plays out at different pipeline and reproduction levels. The cow numbers, replacement rates, ratios, and pregnancy rates in those examples are illustrative. Every market figure, study result, and economist quote is real and sourced as cited.
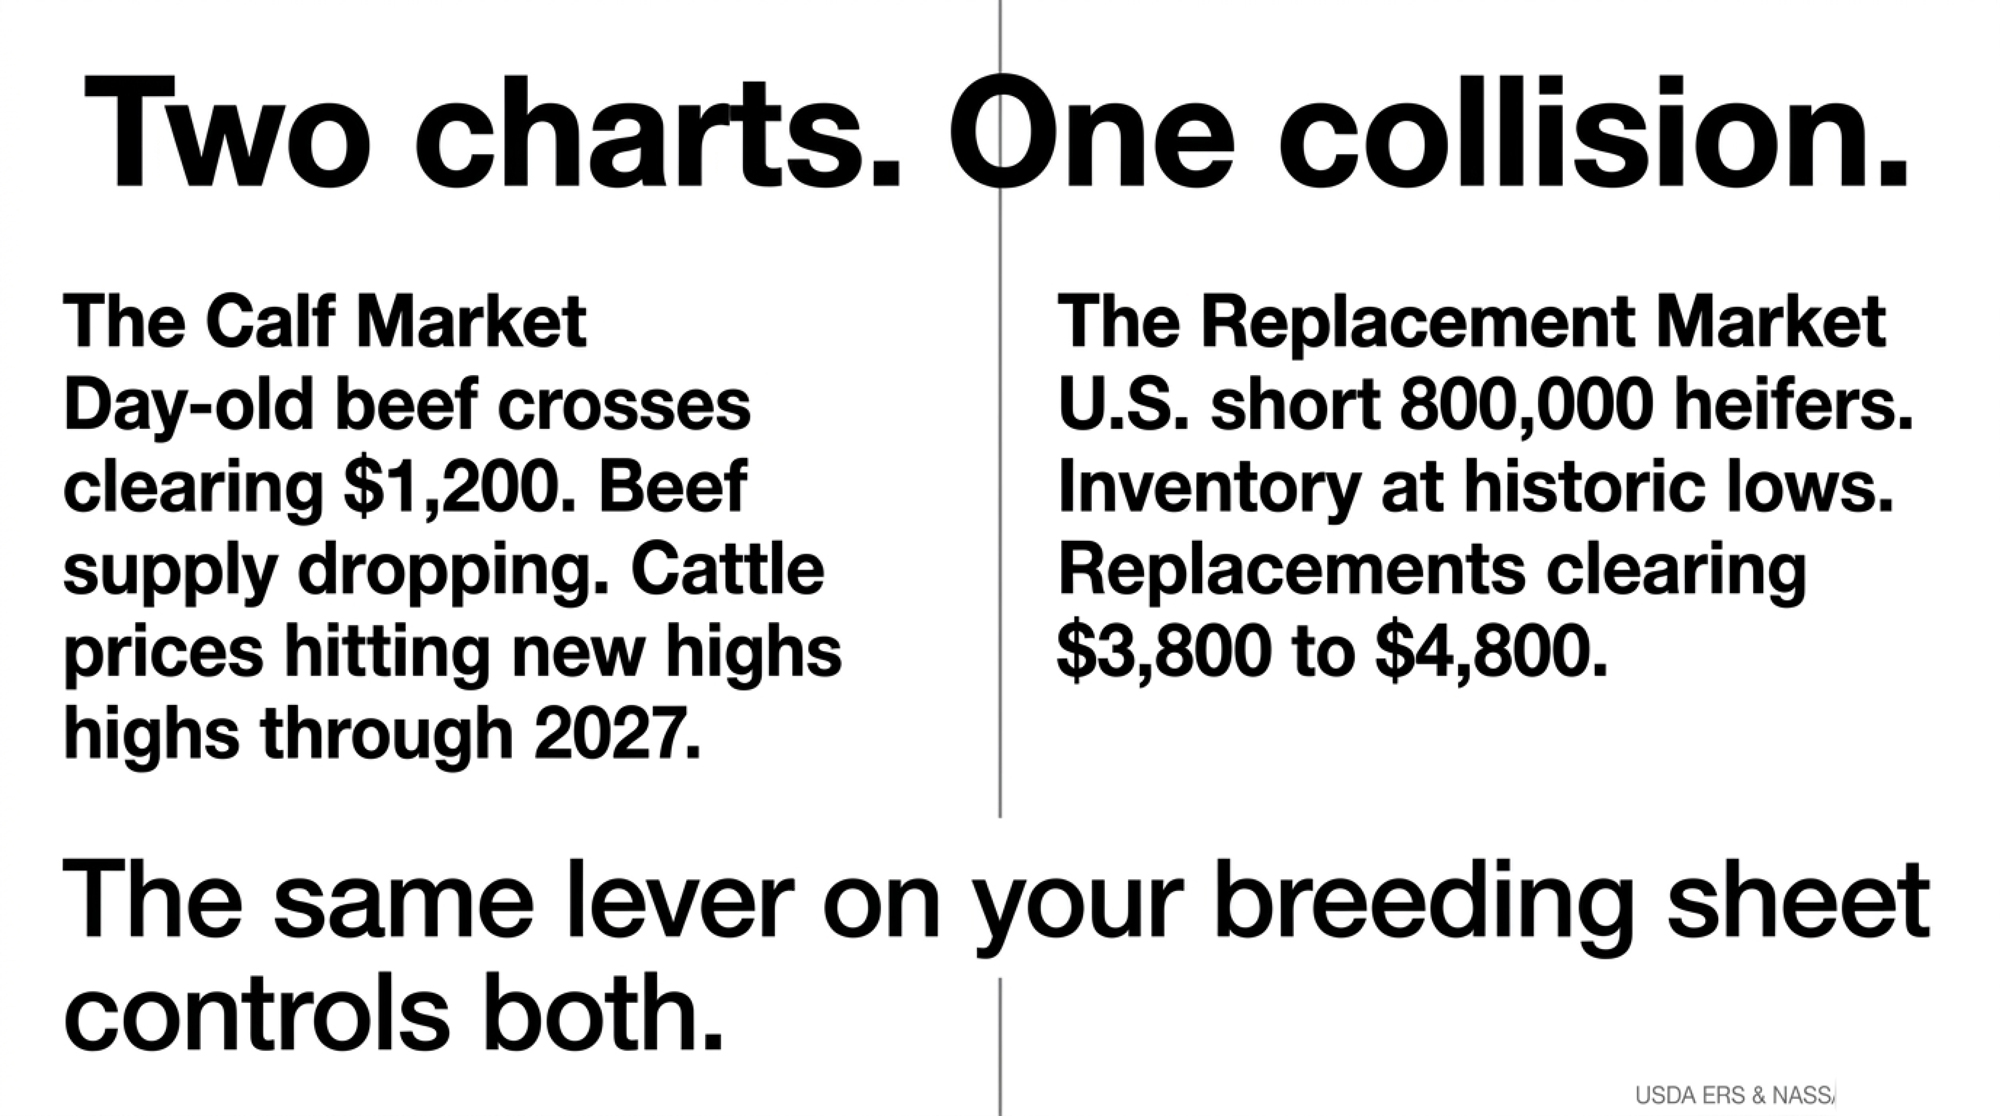
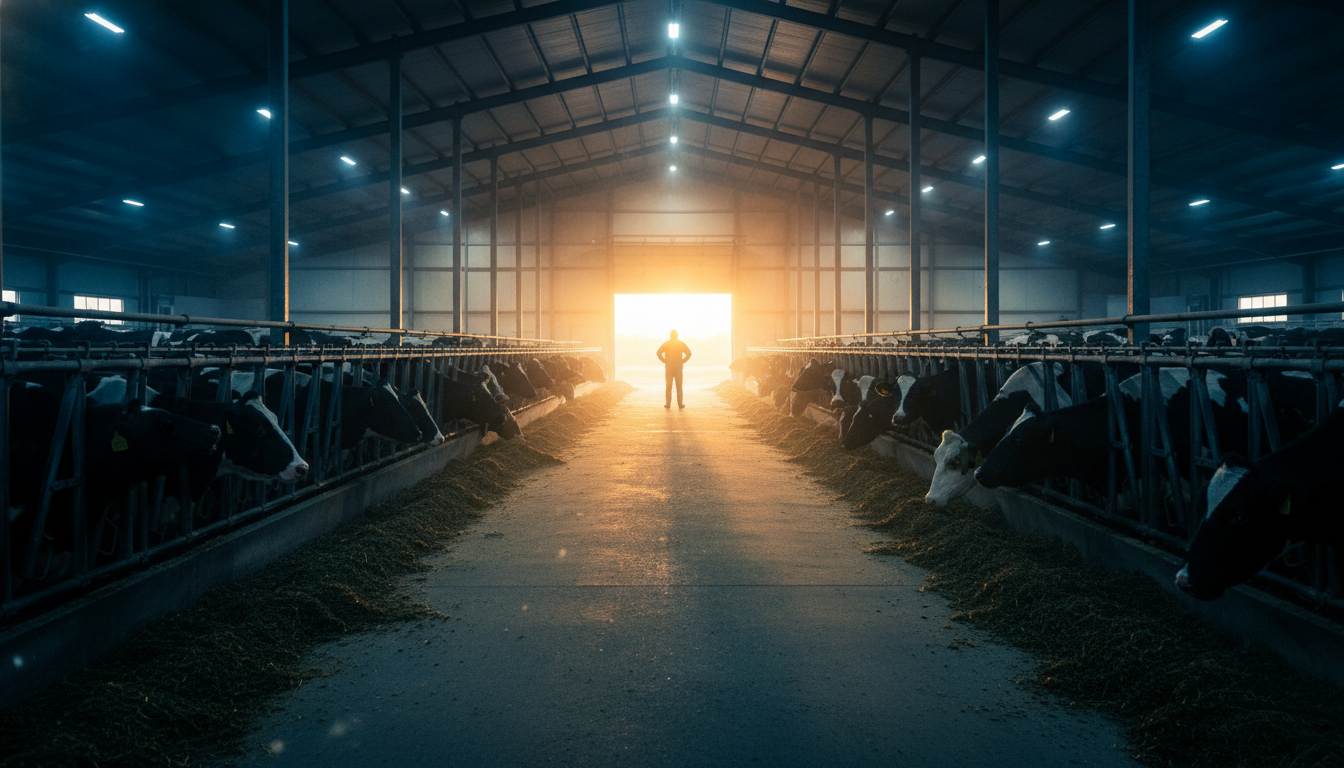
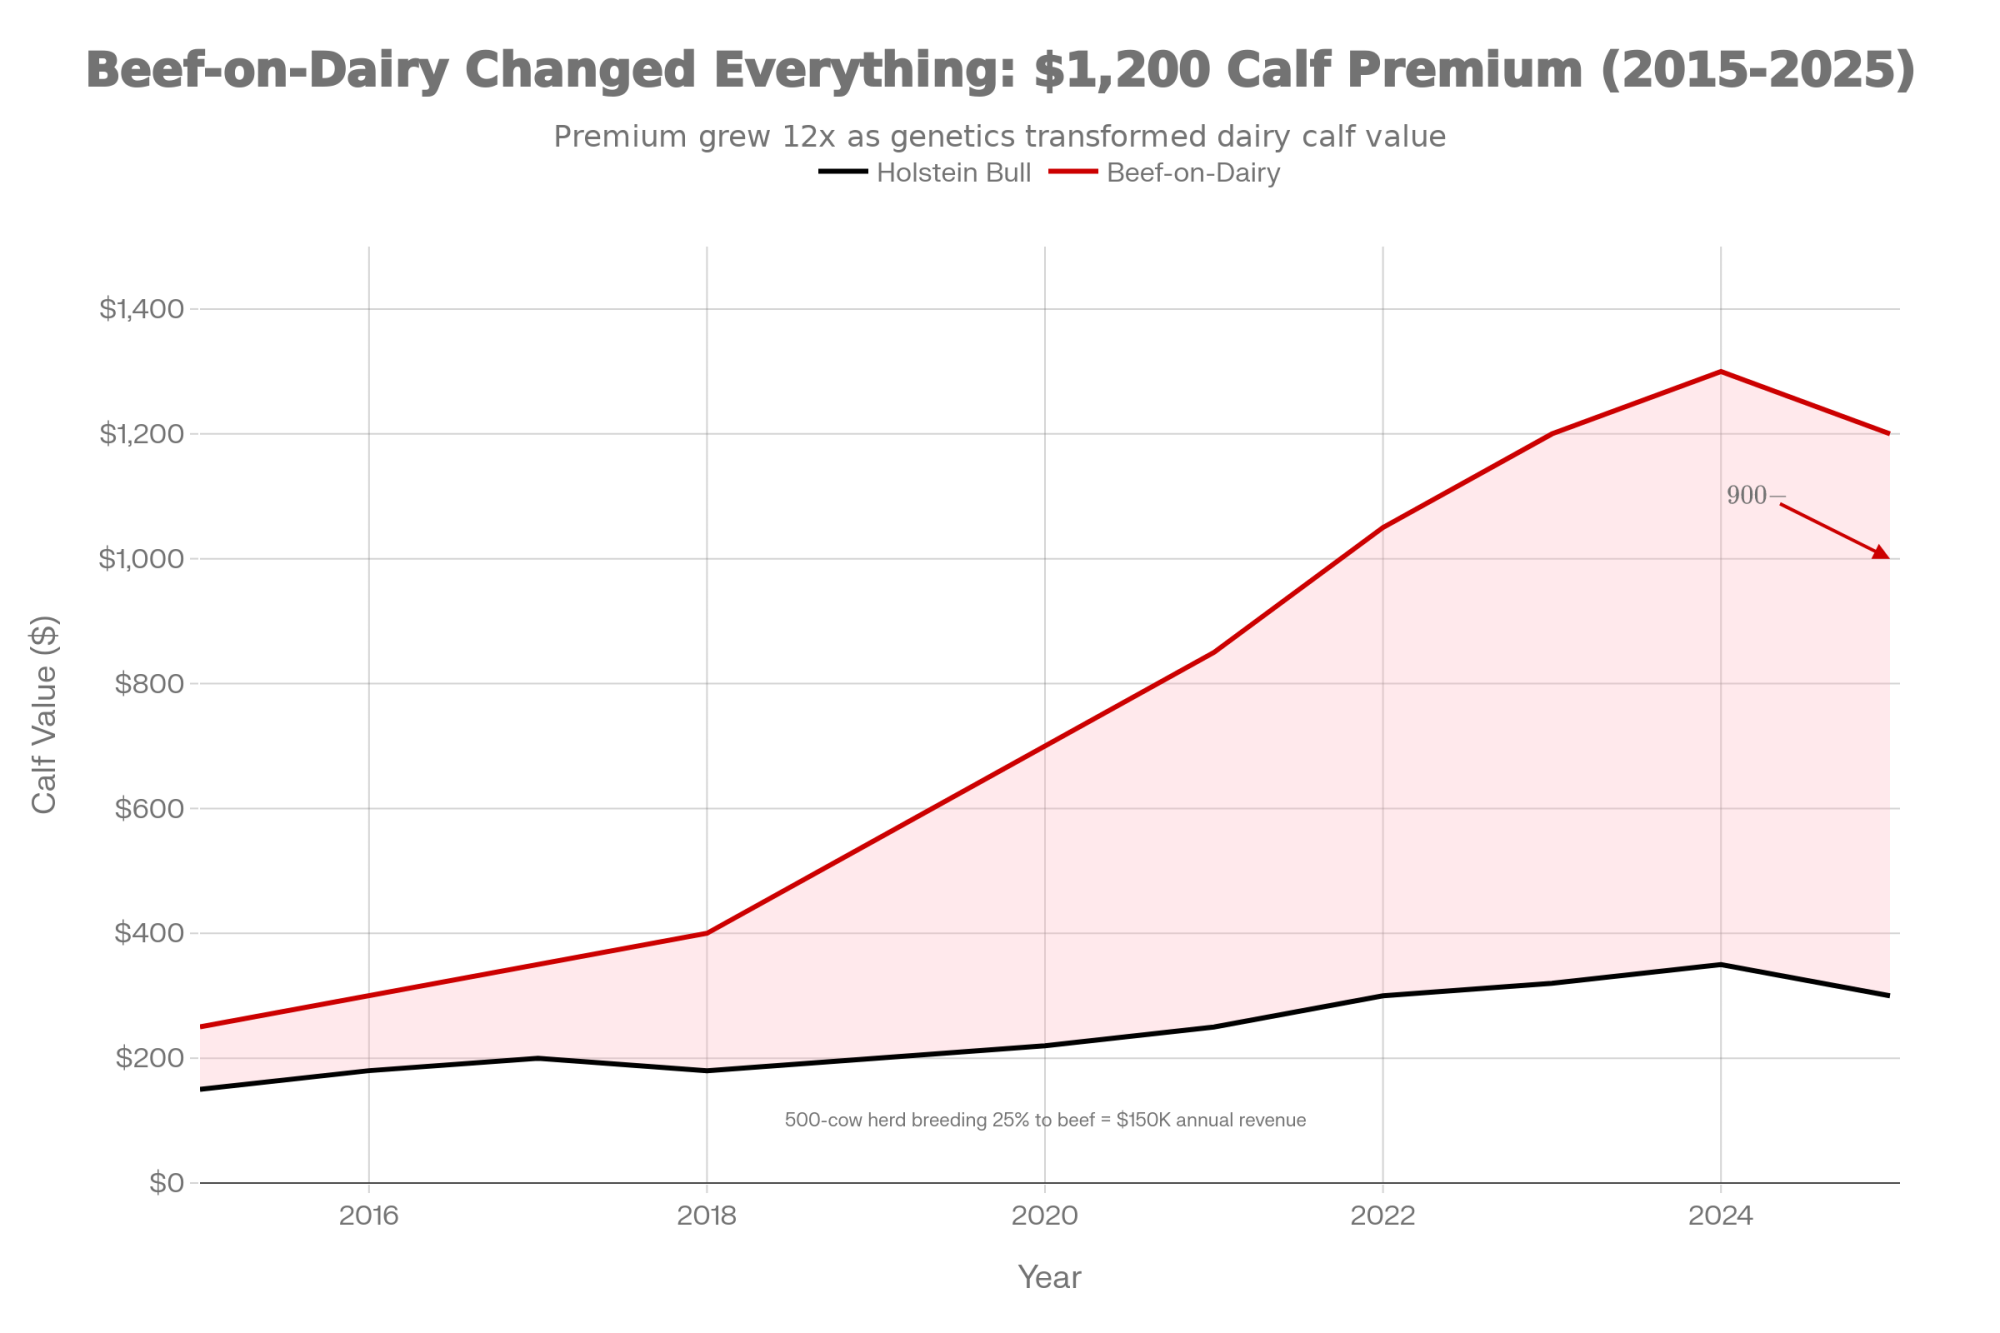
The breeding meeting starts the same way on a lot of farms right now. Someone slides the calf-sale receipts across the table — beef-cross calves cashing $1,200, $1,400, even $1,700 a head — and asks the obvious question. Why aren’t we breeding more cows to beef? The calf buyer wants more. The semen rep has a black bull he loves. And the milk check, forecast under $19/cwt for 2026, isn’t doing anyone any favors.
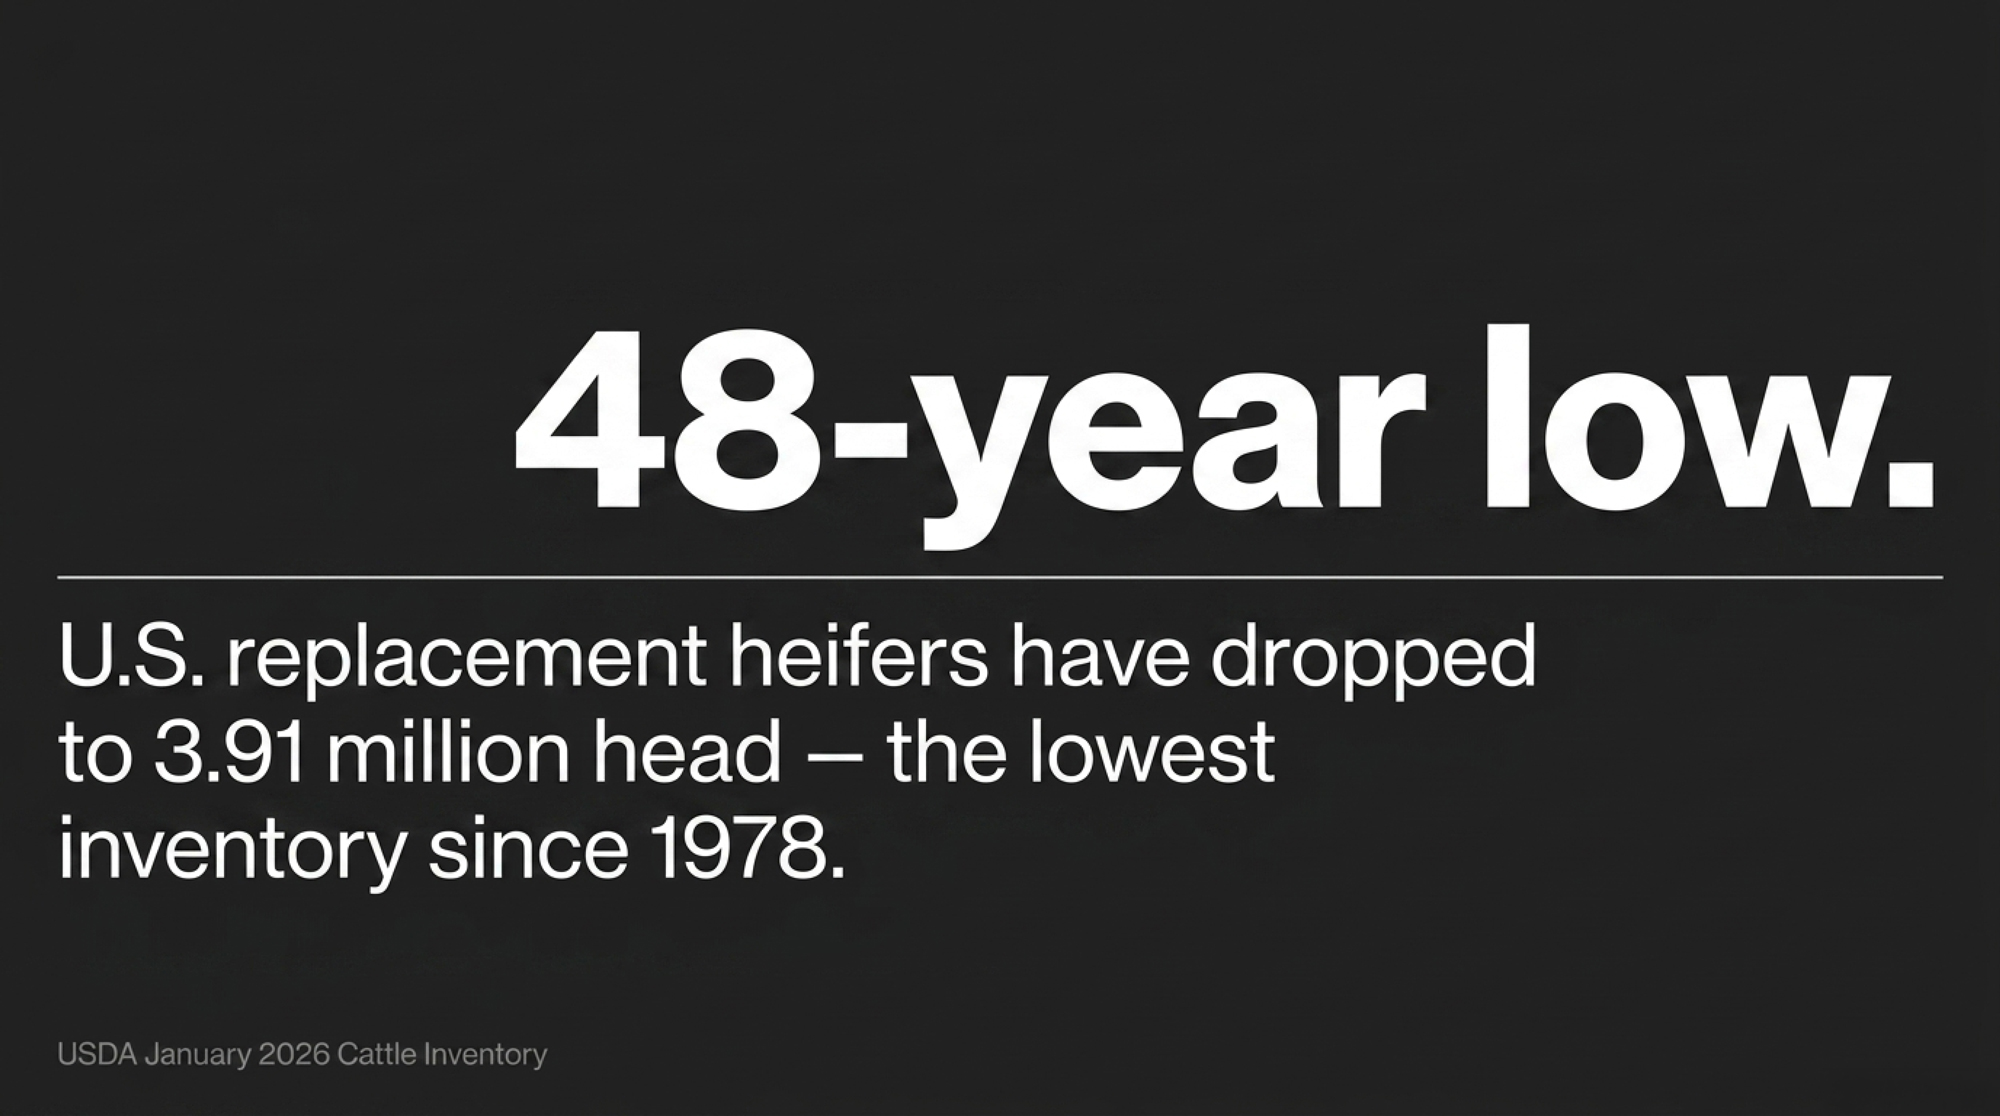
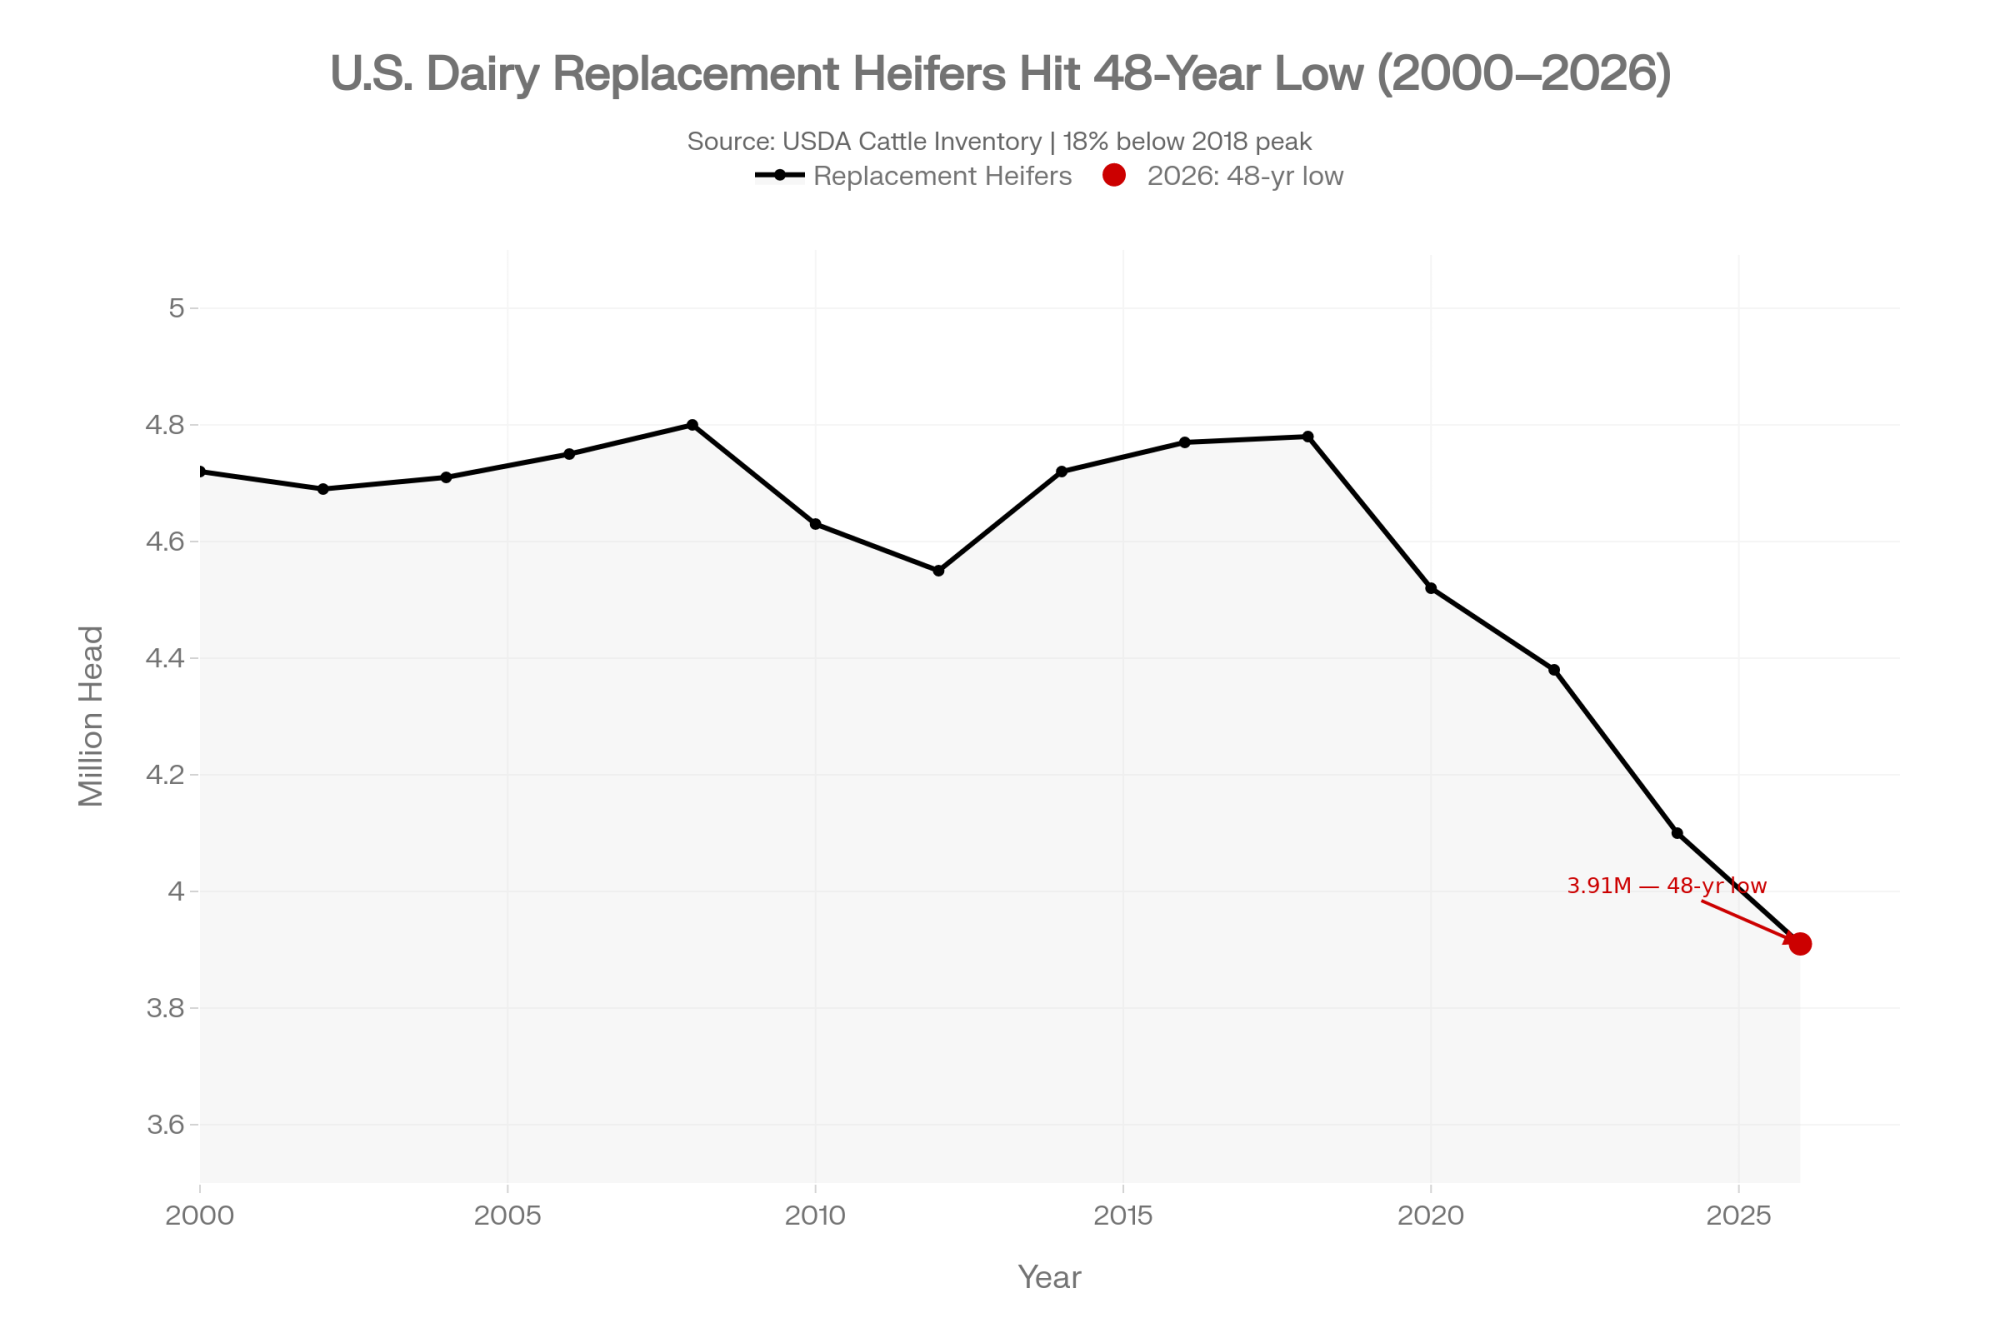
Here’s the tension nobody at that table is pricing in. Every one of those beef calves is a dairy heifer that doesn’t exist. With U.S. replacement heifers now at a 48-year low, that missing heifer isn’t free — you’ll buy her back in 2027, at roughly $3,000 a head. On many farms, the beef-on-dairy premium is no longer a bonus. It’s become load-bearing. And that’s exactly when it gets dangerous.
What’s Really at Stake When You Order Semen
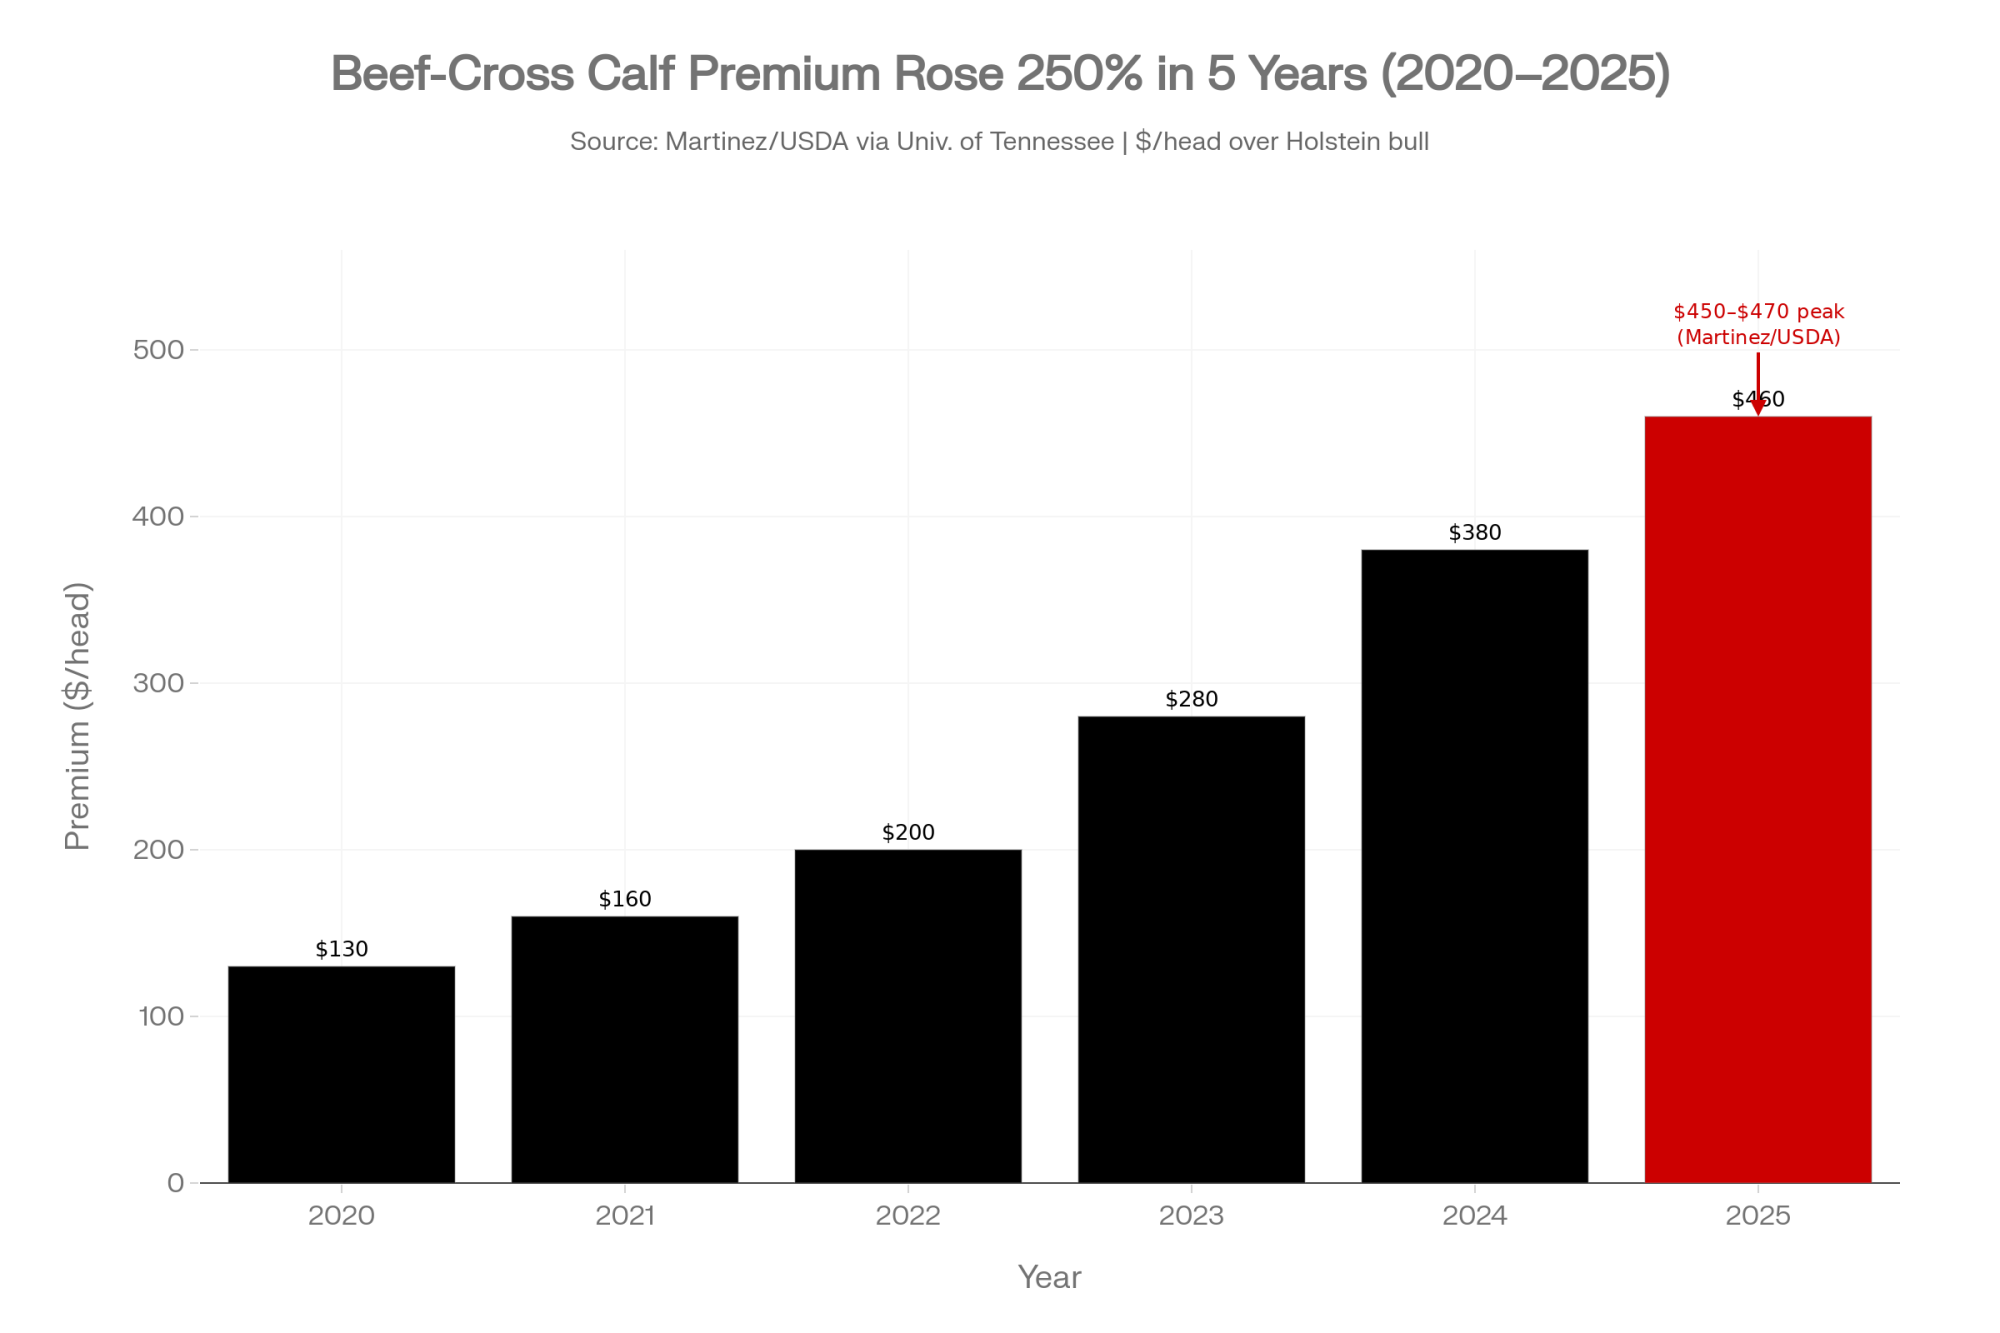
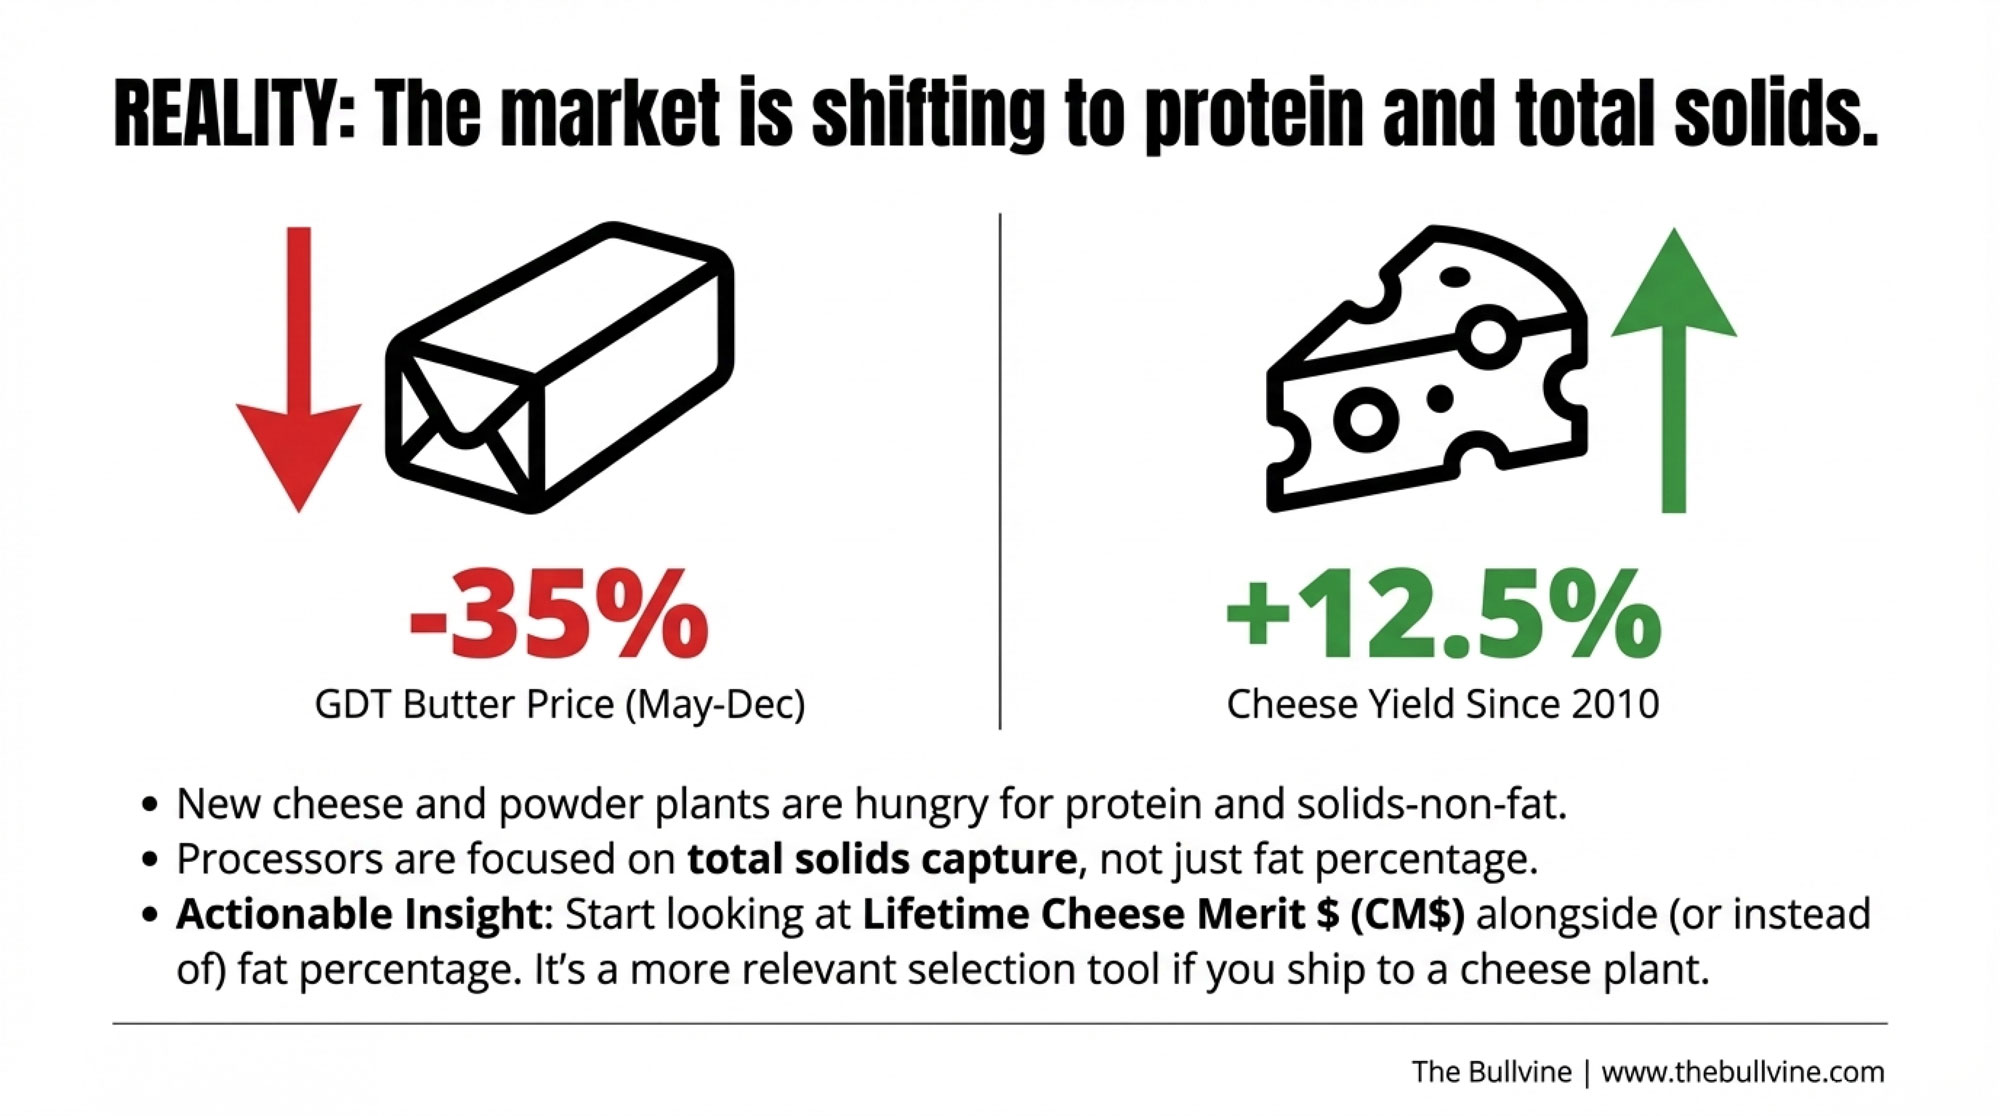
The calf premium is real. University of Tennessee economist Charley Martinez, summarizing USDA data, pegged the typical 2020–2024 beef-cross premium at $130–$200 per head, climbing to a $450–$470 peak in 2025. Nobody’s arguing beef-cross calves don’t pay better than Holstein bulls. They do.
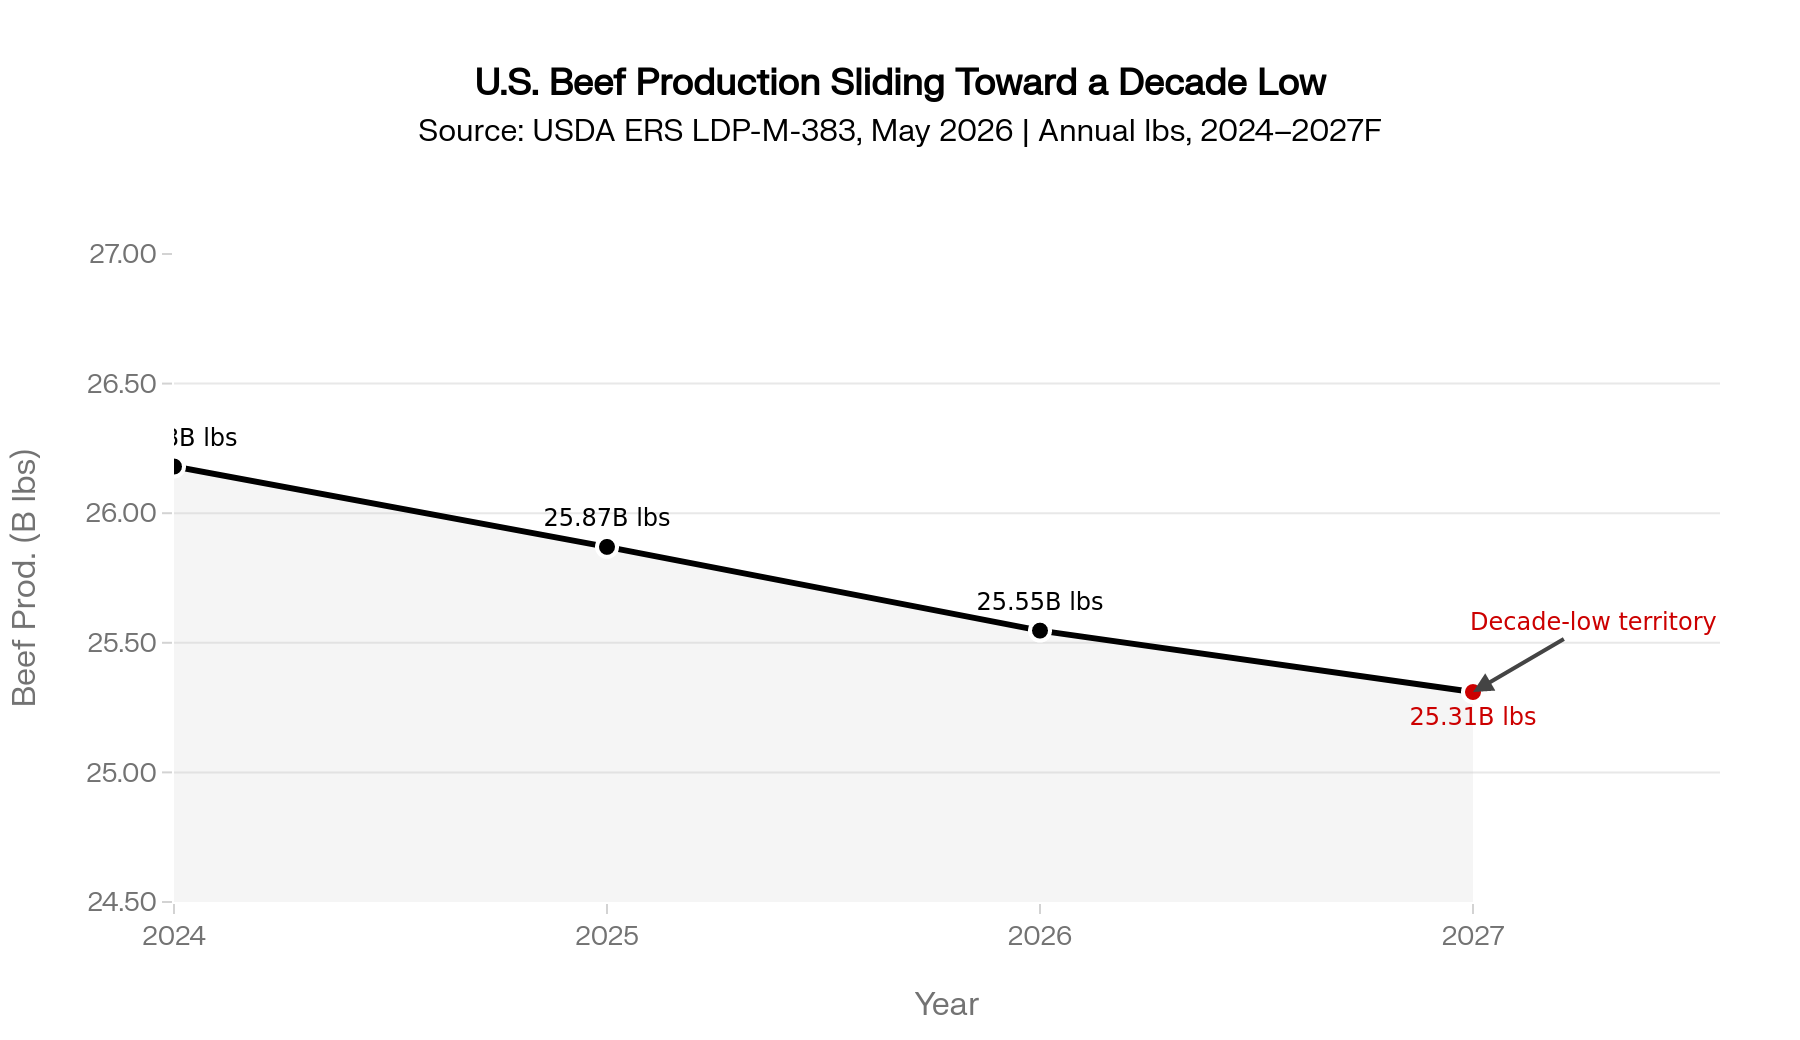
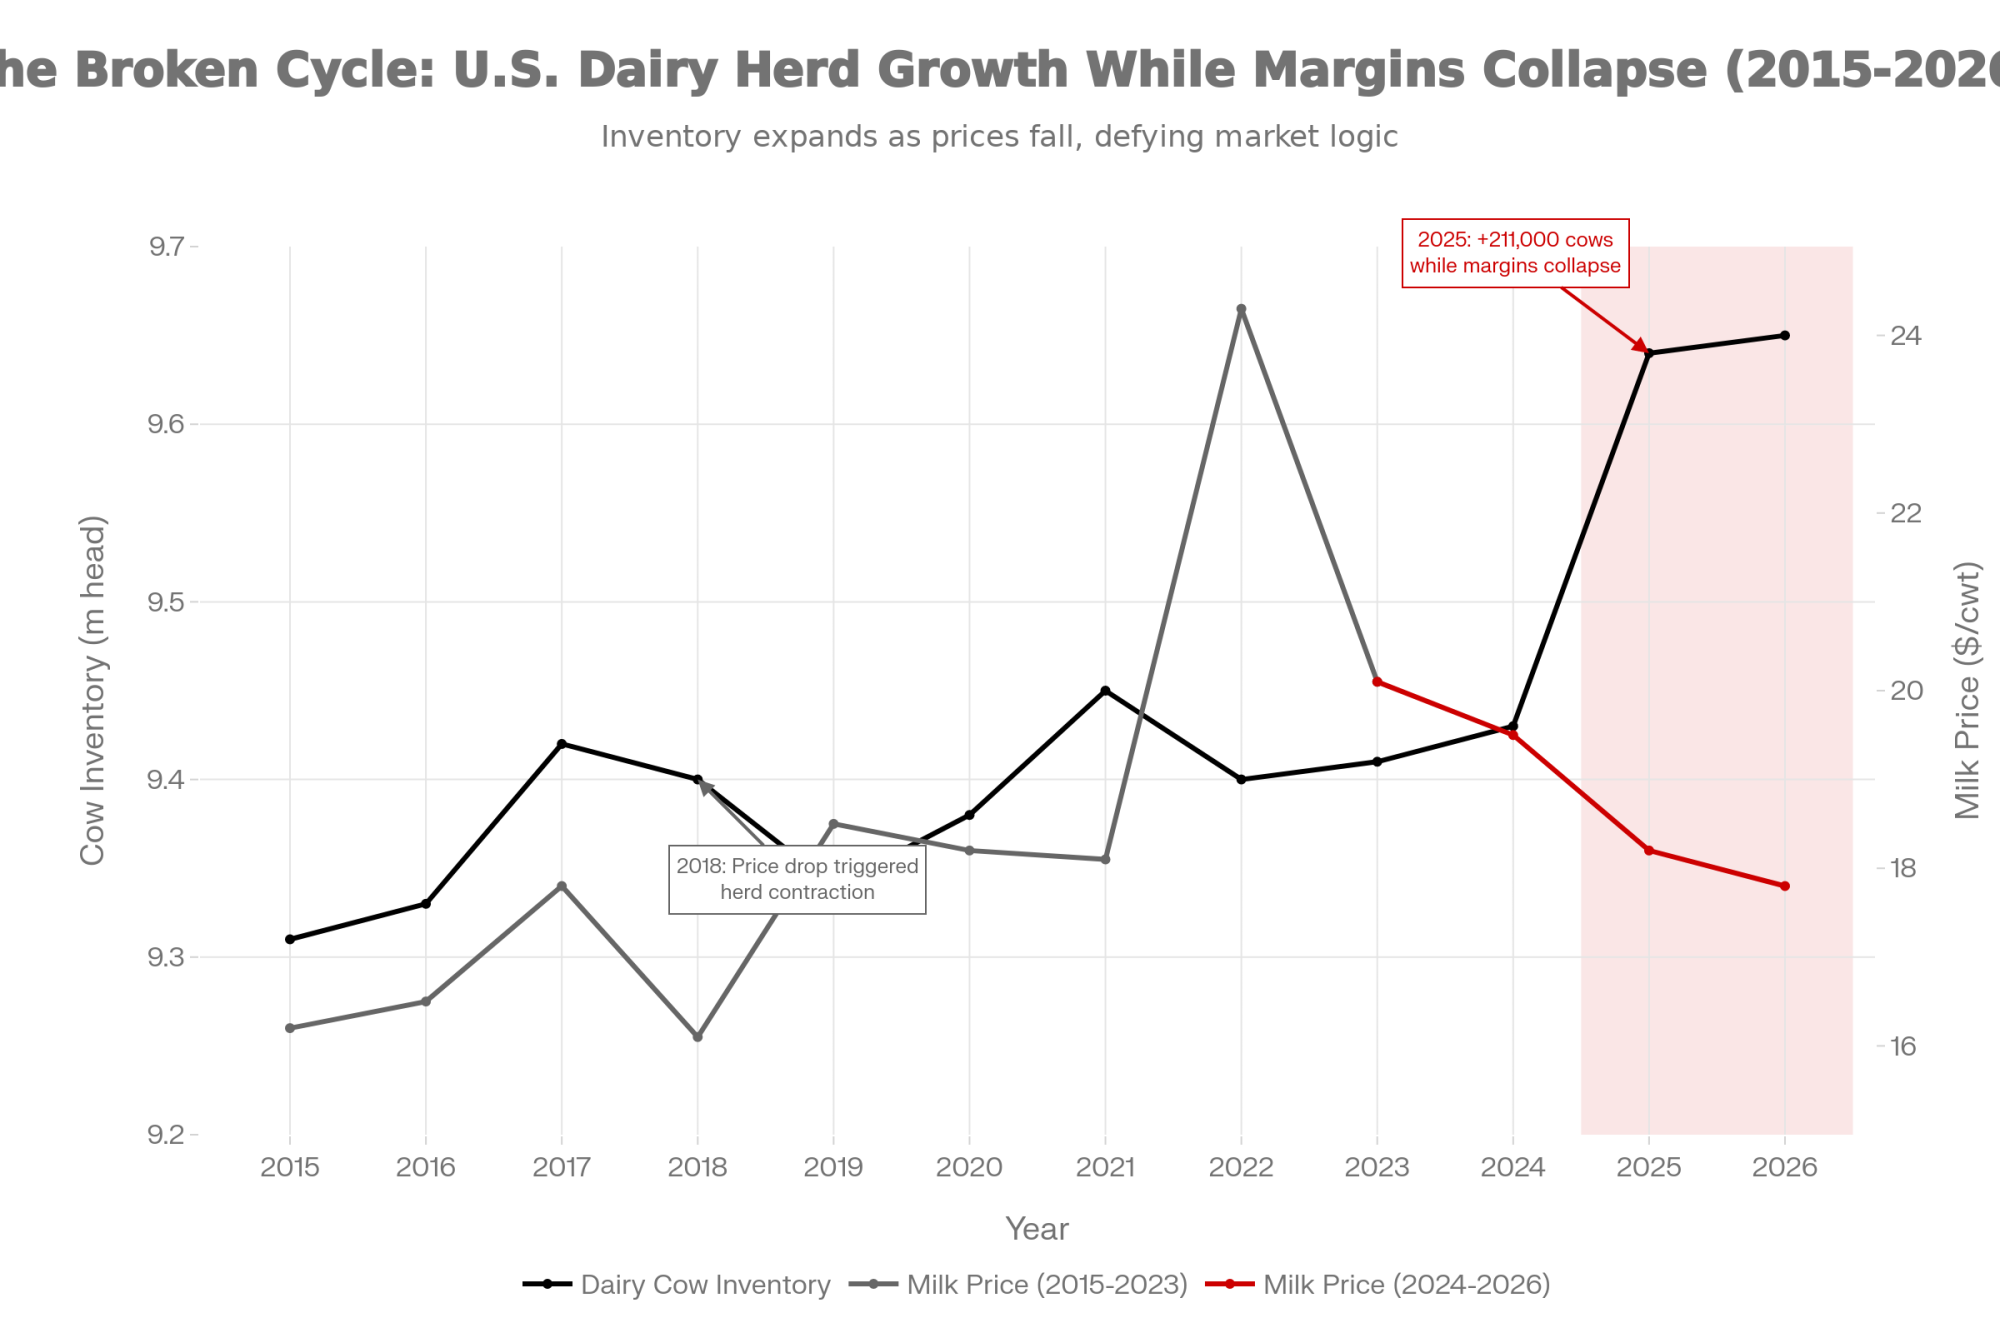
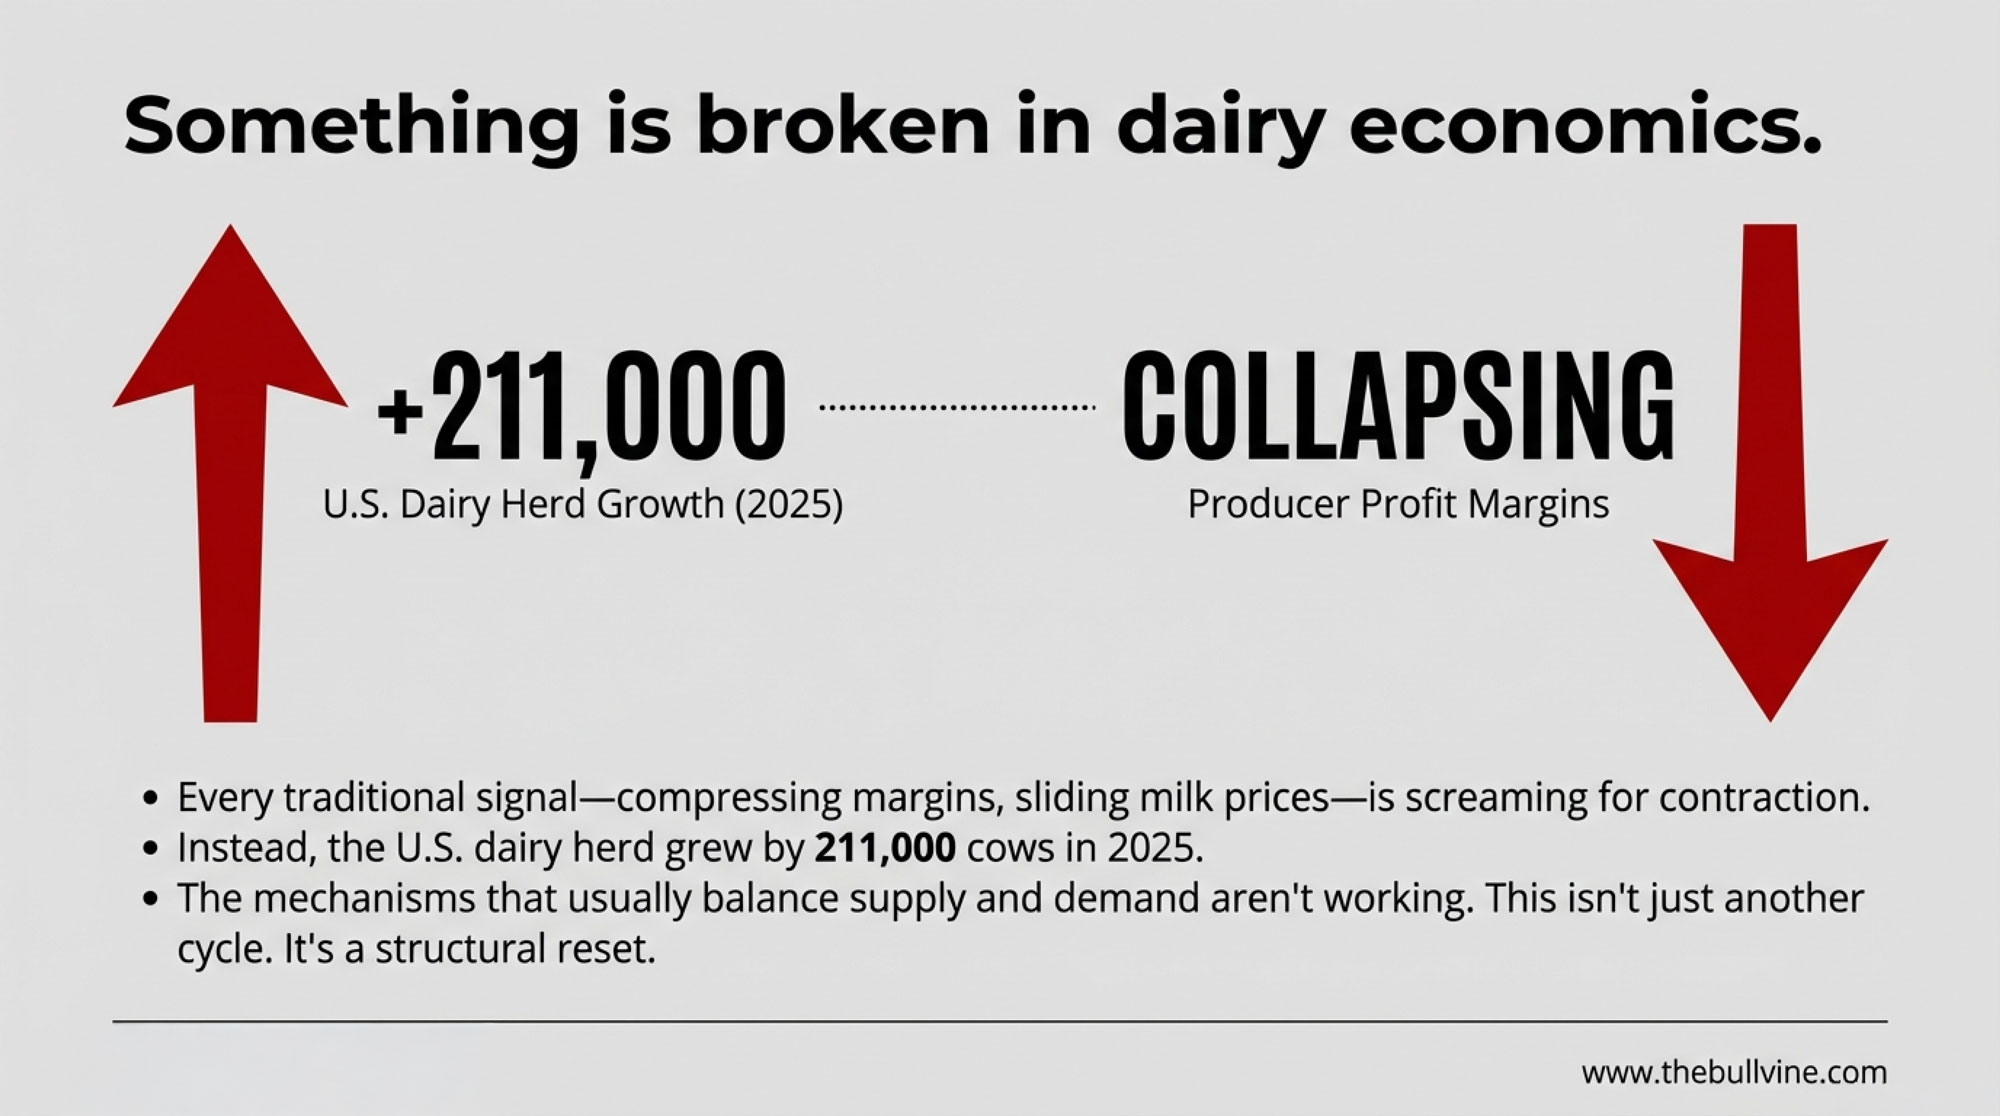
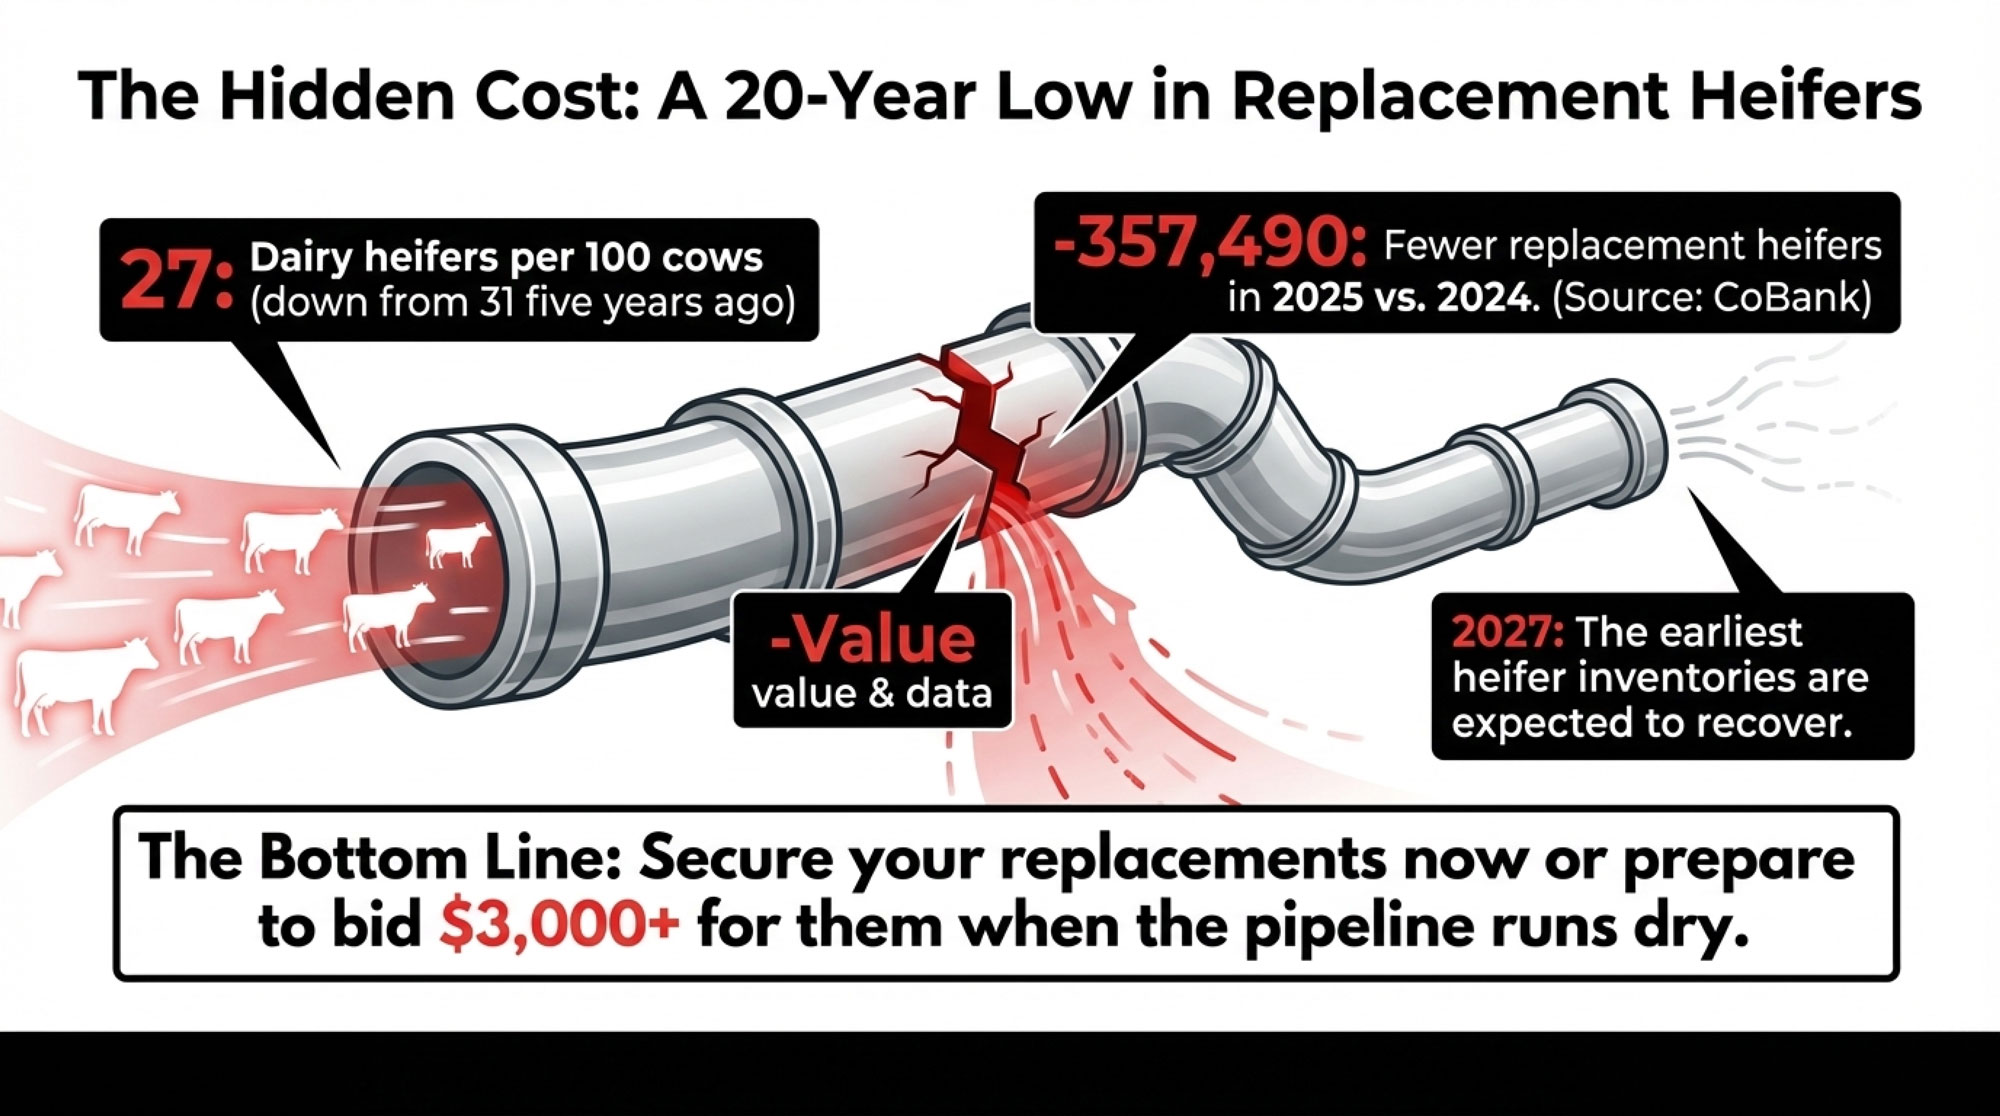
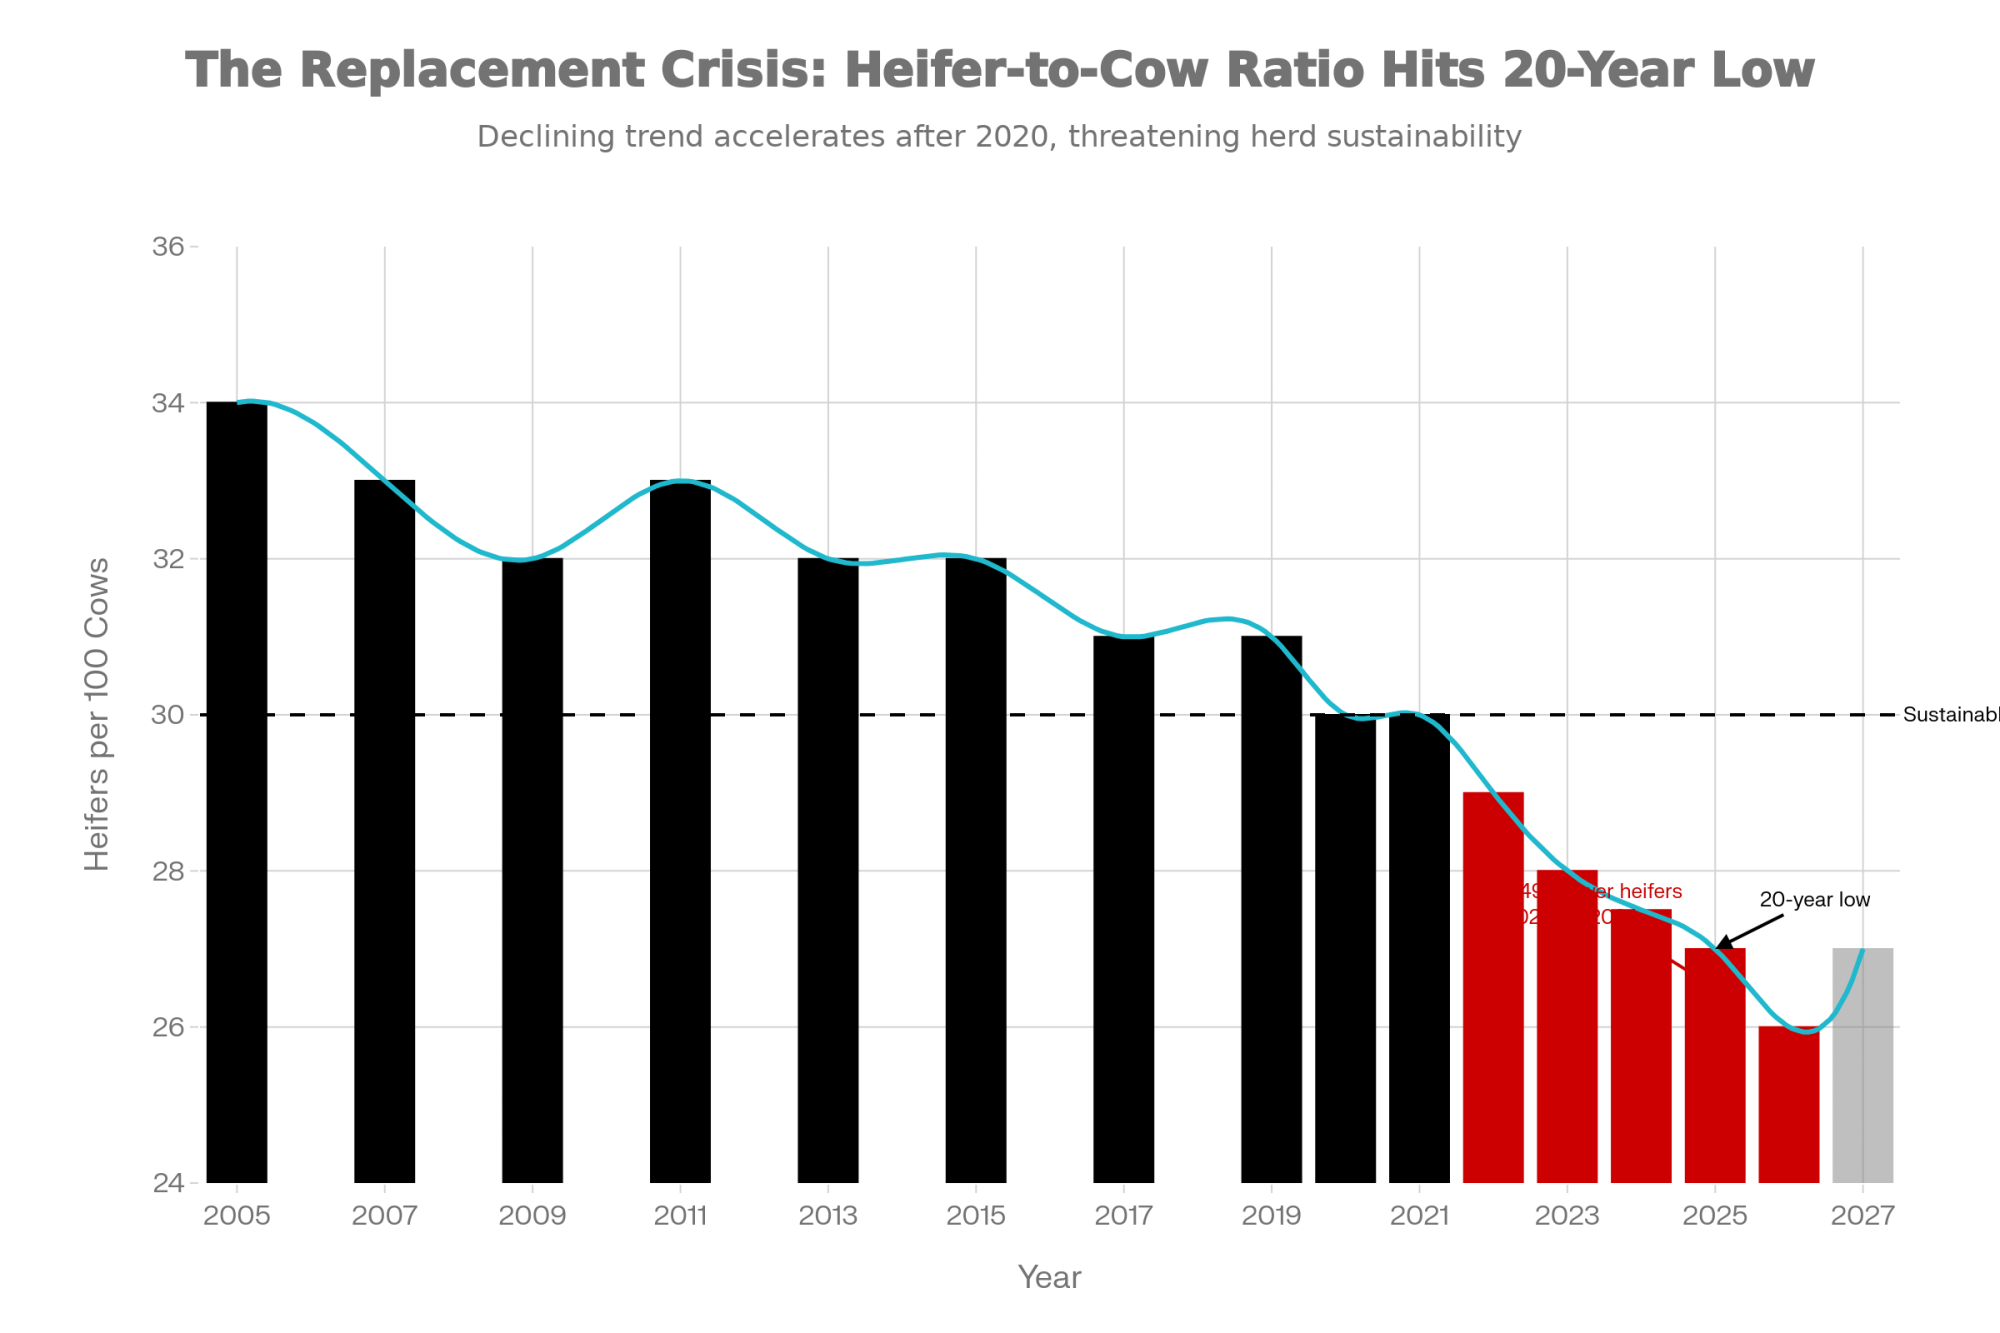
But the calf check is one side of a two-sided ledger, and the other side is getting expensive fast. USDA’s January 30, 2026 Cattle Inventory pegged dairy replacement heifers at roughly 3.91 million head — the lowest since 1978 and about 18% below the 2018 peak. The American Farm Bureau’s read on that same report was blunt: milk cow numbers are at their highest since 1993, even as the replacement pipeline thinned to a 48-year low, a divergence the Farm Bureau tied to short-term herd management decisions rather than true expansion. Translation: a lot of those missing heifers got bred to beef.
CoBank’s lead dairy economist Corey Geiger put it plainly on Iowa PBS in May 2026: “This year we’re going to have 438,000 fewer dairy replacements becoming milk cows compared to last year. And this won’t rebound until 2027, when we see an improvement of 285,000.” So the real Monday-morning question isn’t “what will the calf pay?” It’s “what will the heifer cost me?” That reframe is the whole story.
The $585 That Stops the Room
Most operators know what a beef-cross calf is worth, and what a straw costs. What they haven’t done is multiply two numbers they each accept on their own.
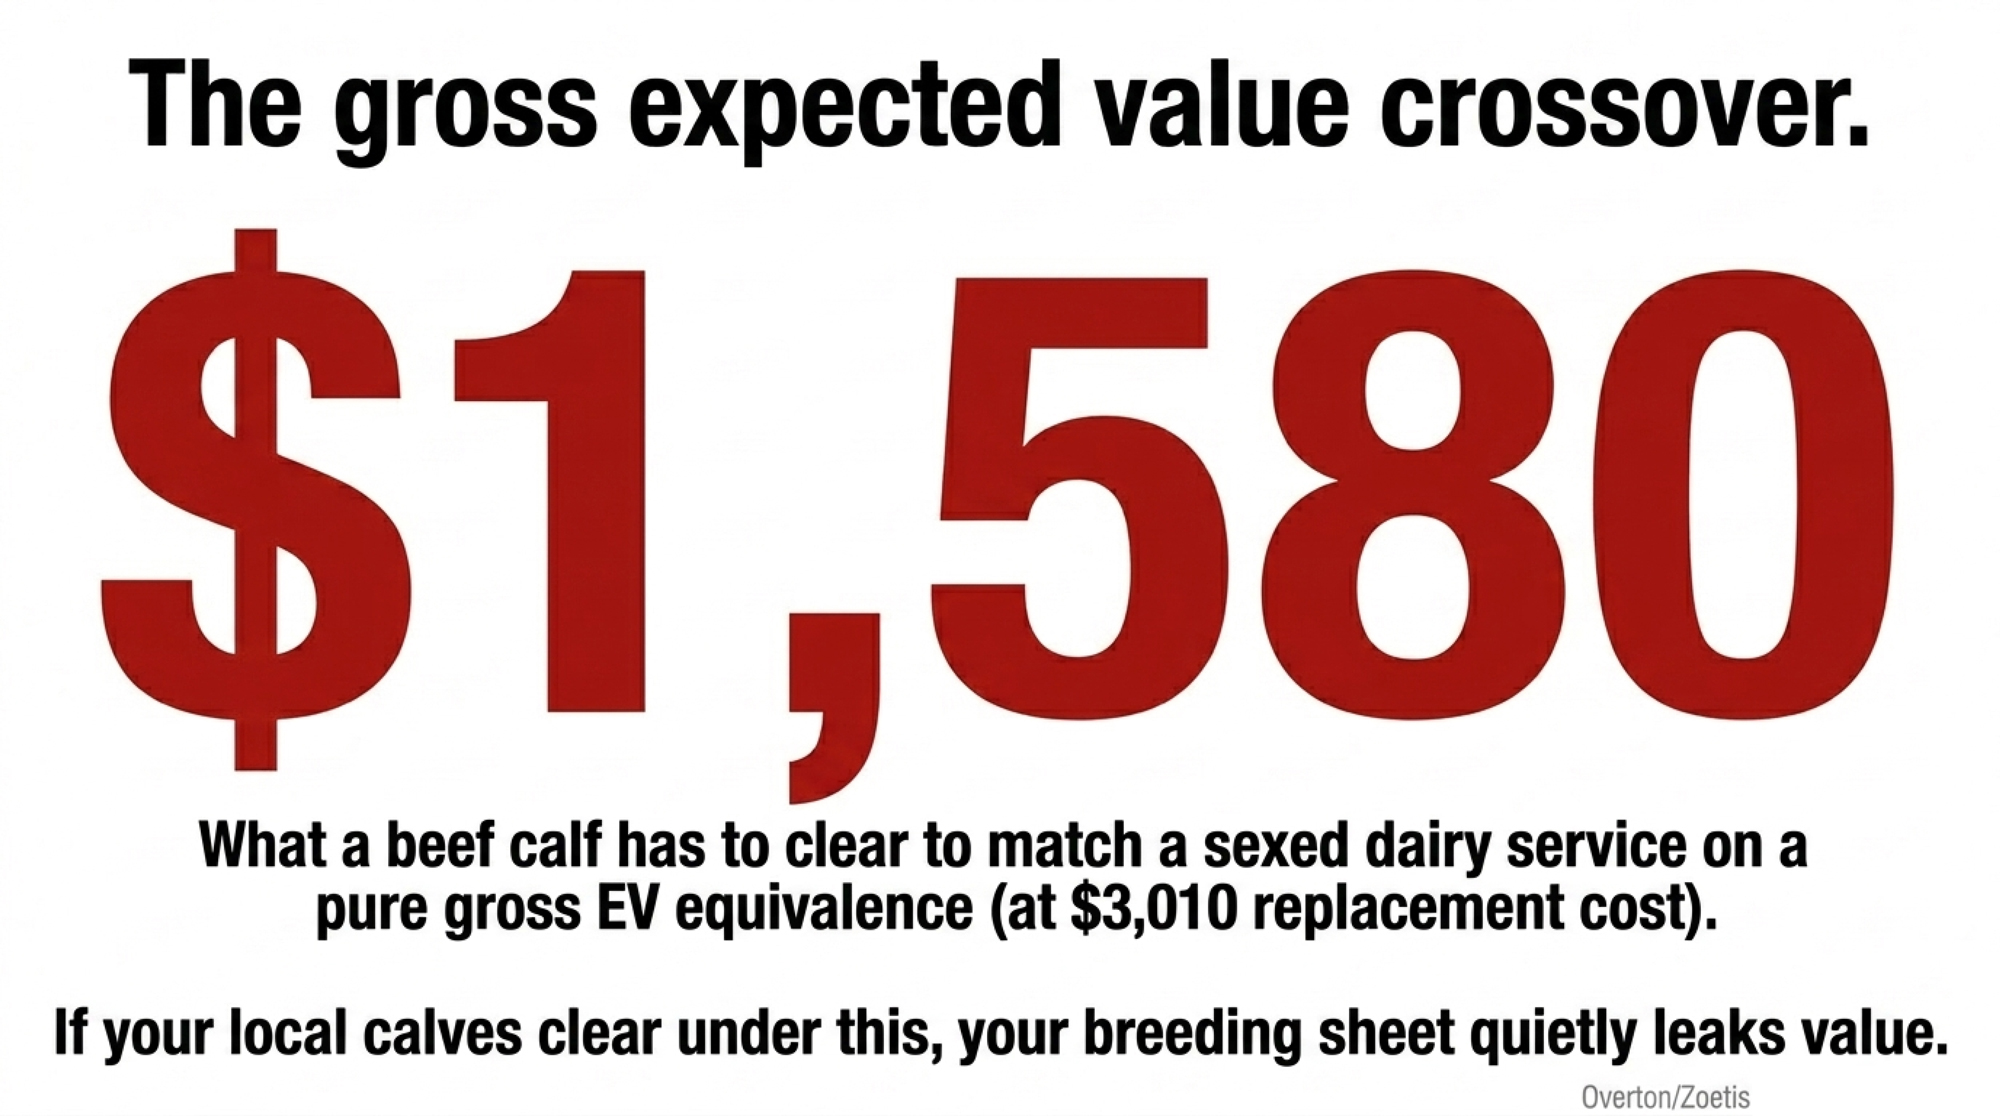
Walk it through, one step at a time. A sexed-semen service on a replacement-eligible cow produces — in typical field and modeling terms — somewhere around 0.33 to 0.35 heifers, once you account for conception and calf losses. Multiply that by a replacement value of roughly $3,000 to $3,300 — USDA’s January 2026 inventory put the range right there — and you’ve got roughly $1,000 to $1,150 of future heifer riding on that single service. That’s the most expensive heifer market in a generation: USDA Agricultural Prices data put the 2025 replacement average in the $2,860–$3,110 range, more than double where it sat five years earlier. This isn’t a soft number.
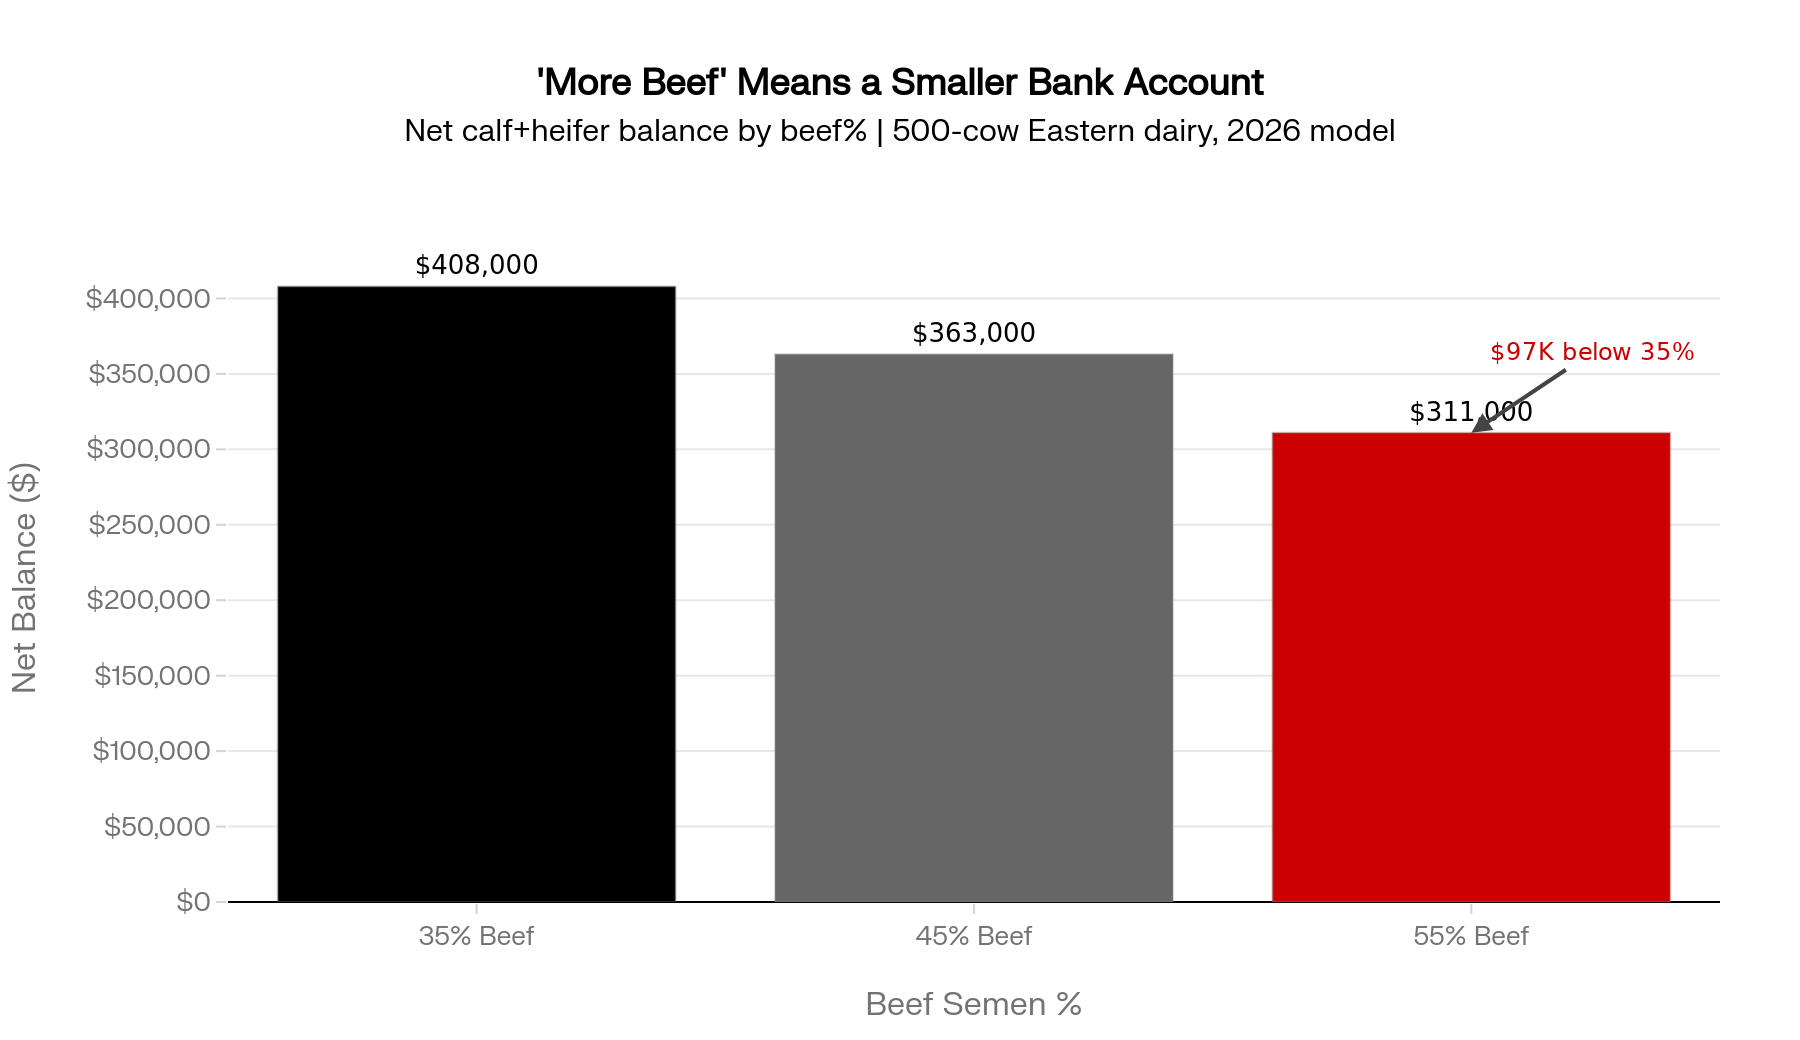
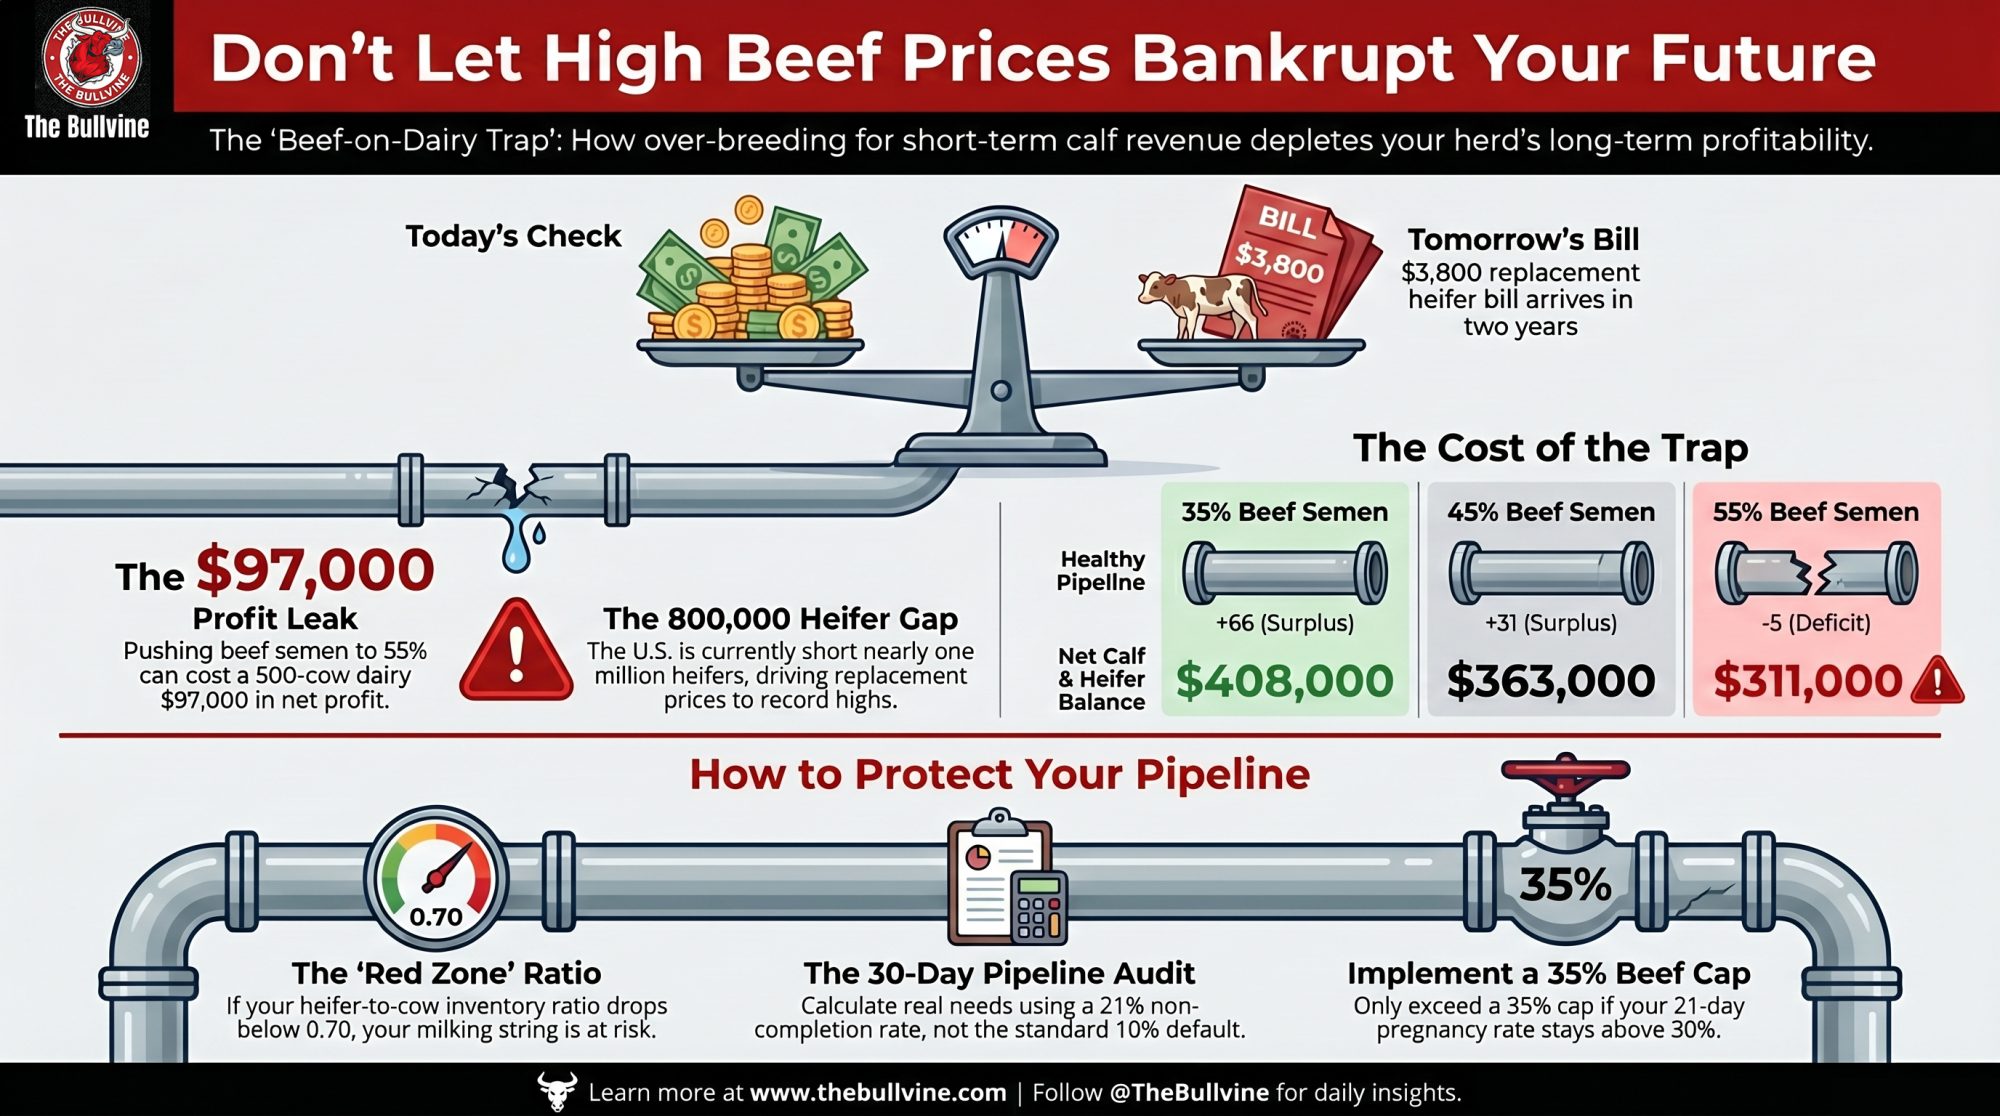
Now net it against the beef calf. Take the midpoint of that foregone value — call it about $1,085 — and subtract a calf advantage of roughly $500, which sits at the top of the premium range Martinez tracked in 2025. You land near a $585-per-service true cost on every beef straw you put into a cow that could have made a replacement. Run 200 of those services on a 500-cow herd, and you’re looking at roughly $117,000 in foregone replacement value. Use a fatter premium and the cost shrinks; use today’s $3,000-plus heifer, and it grows. Either way, it’s real money the calf check hides.
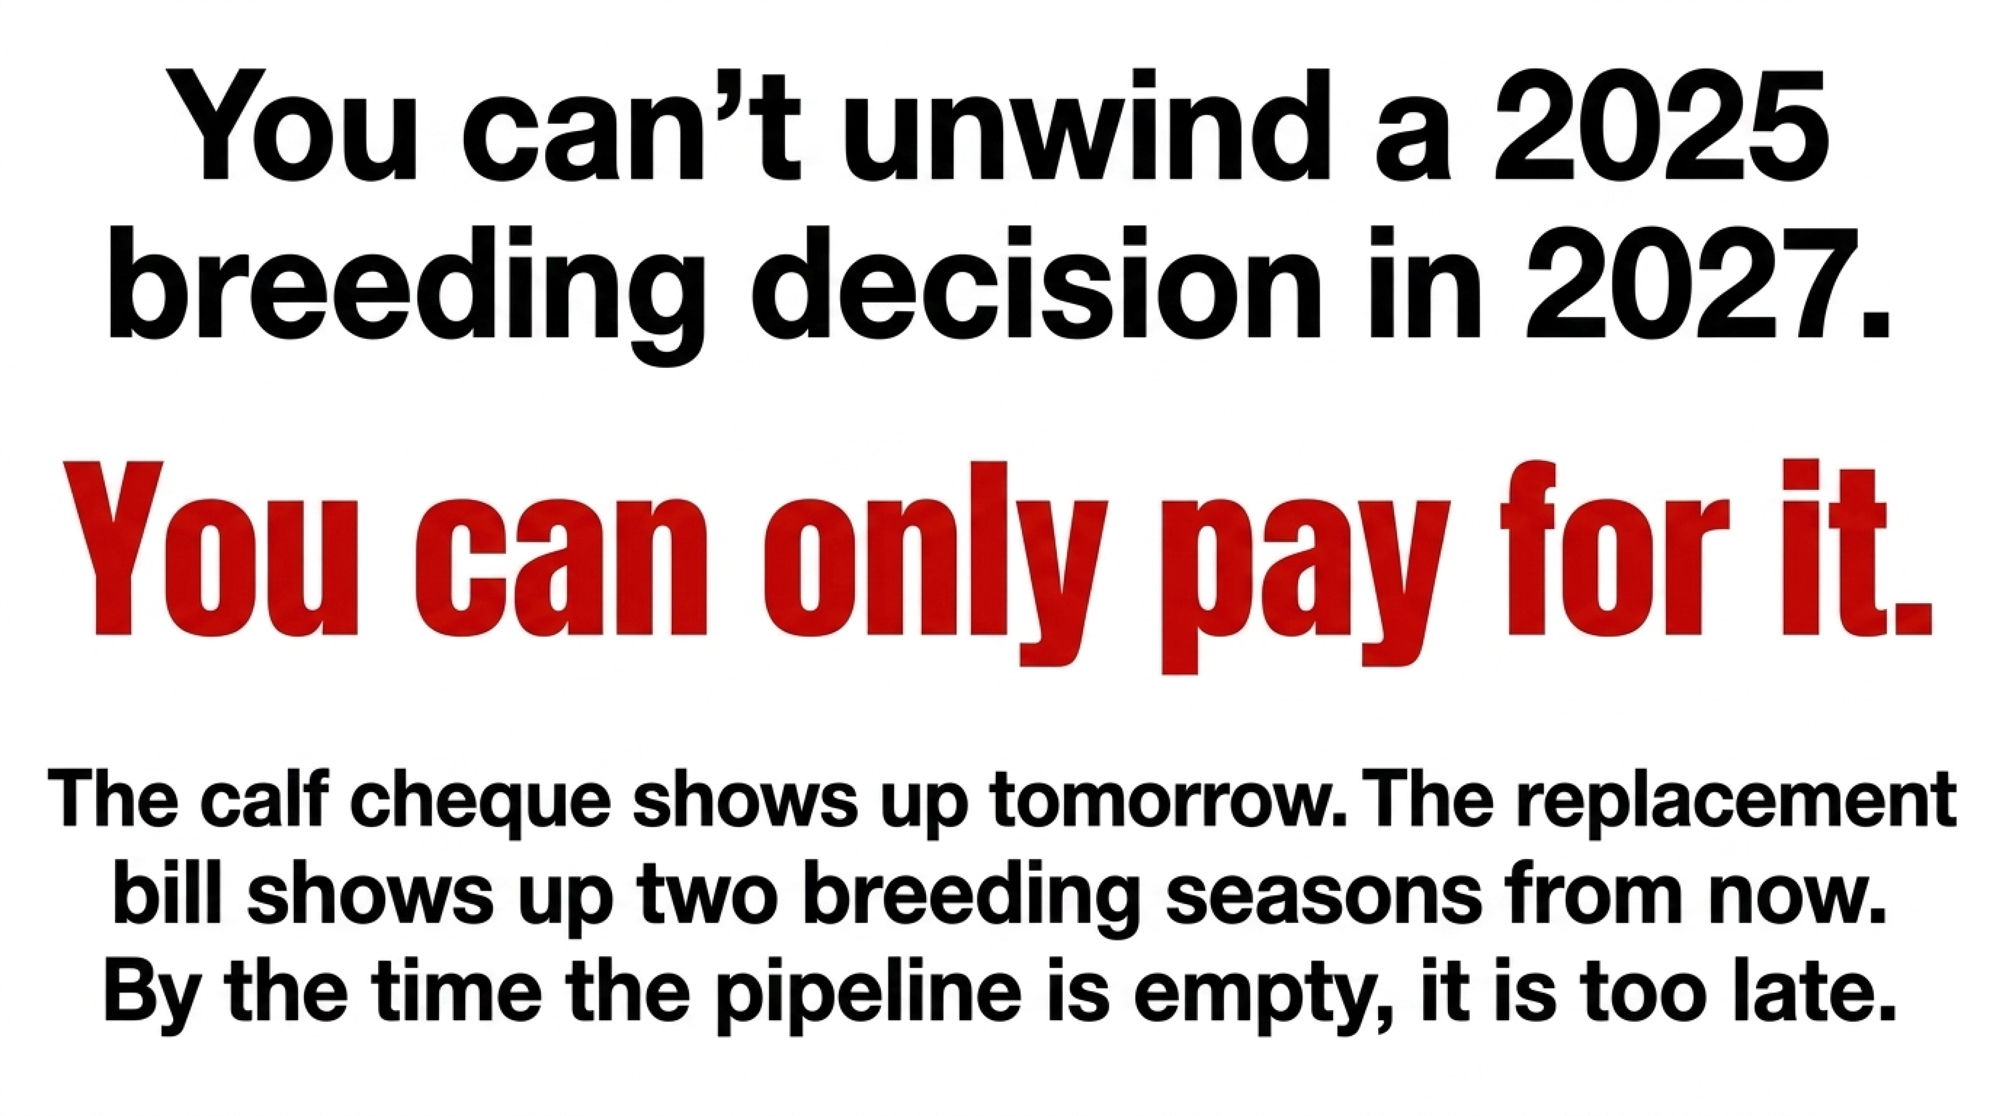
The calf clears in three weeks. The heifer would’ve milked for years. That’s the multiplication most breeding meetings never finish — the pieces get accepted one at a time, so the total never has to land. (Run your own numbers in The Bullvine’s Pipeline Index Calculator.)
“I Can’t Afford to Stop” — Is That a Reason, or a Trap?
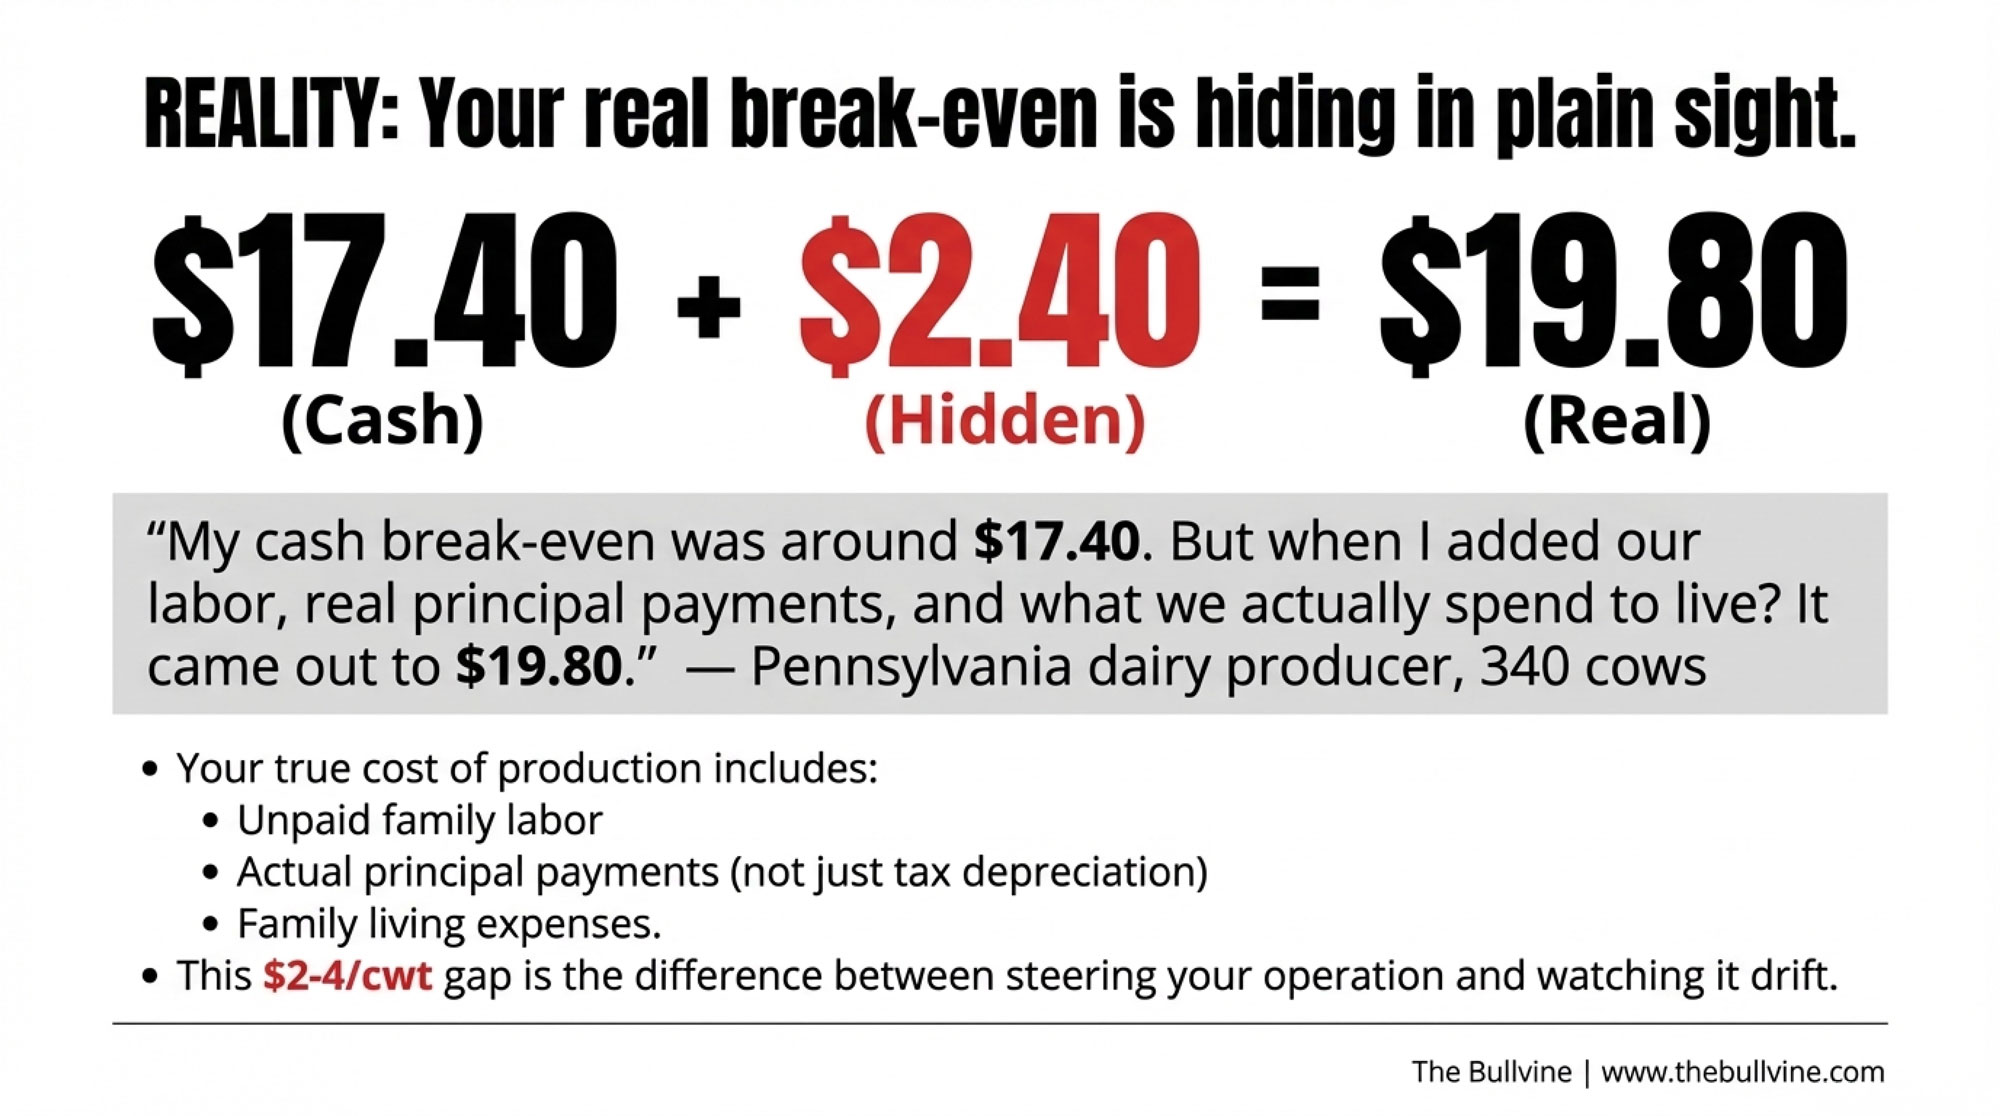
When the $585 finally lands, the pushback usually isn’t “your math is wrong.” It’s “I can’t afford to stop.” That line tells you everything. The calf premium has stopped being gravy and become structural — it’s covering feed bills and loan payments, not buying anyone a new pickup.
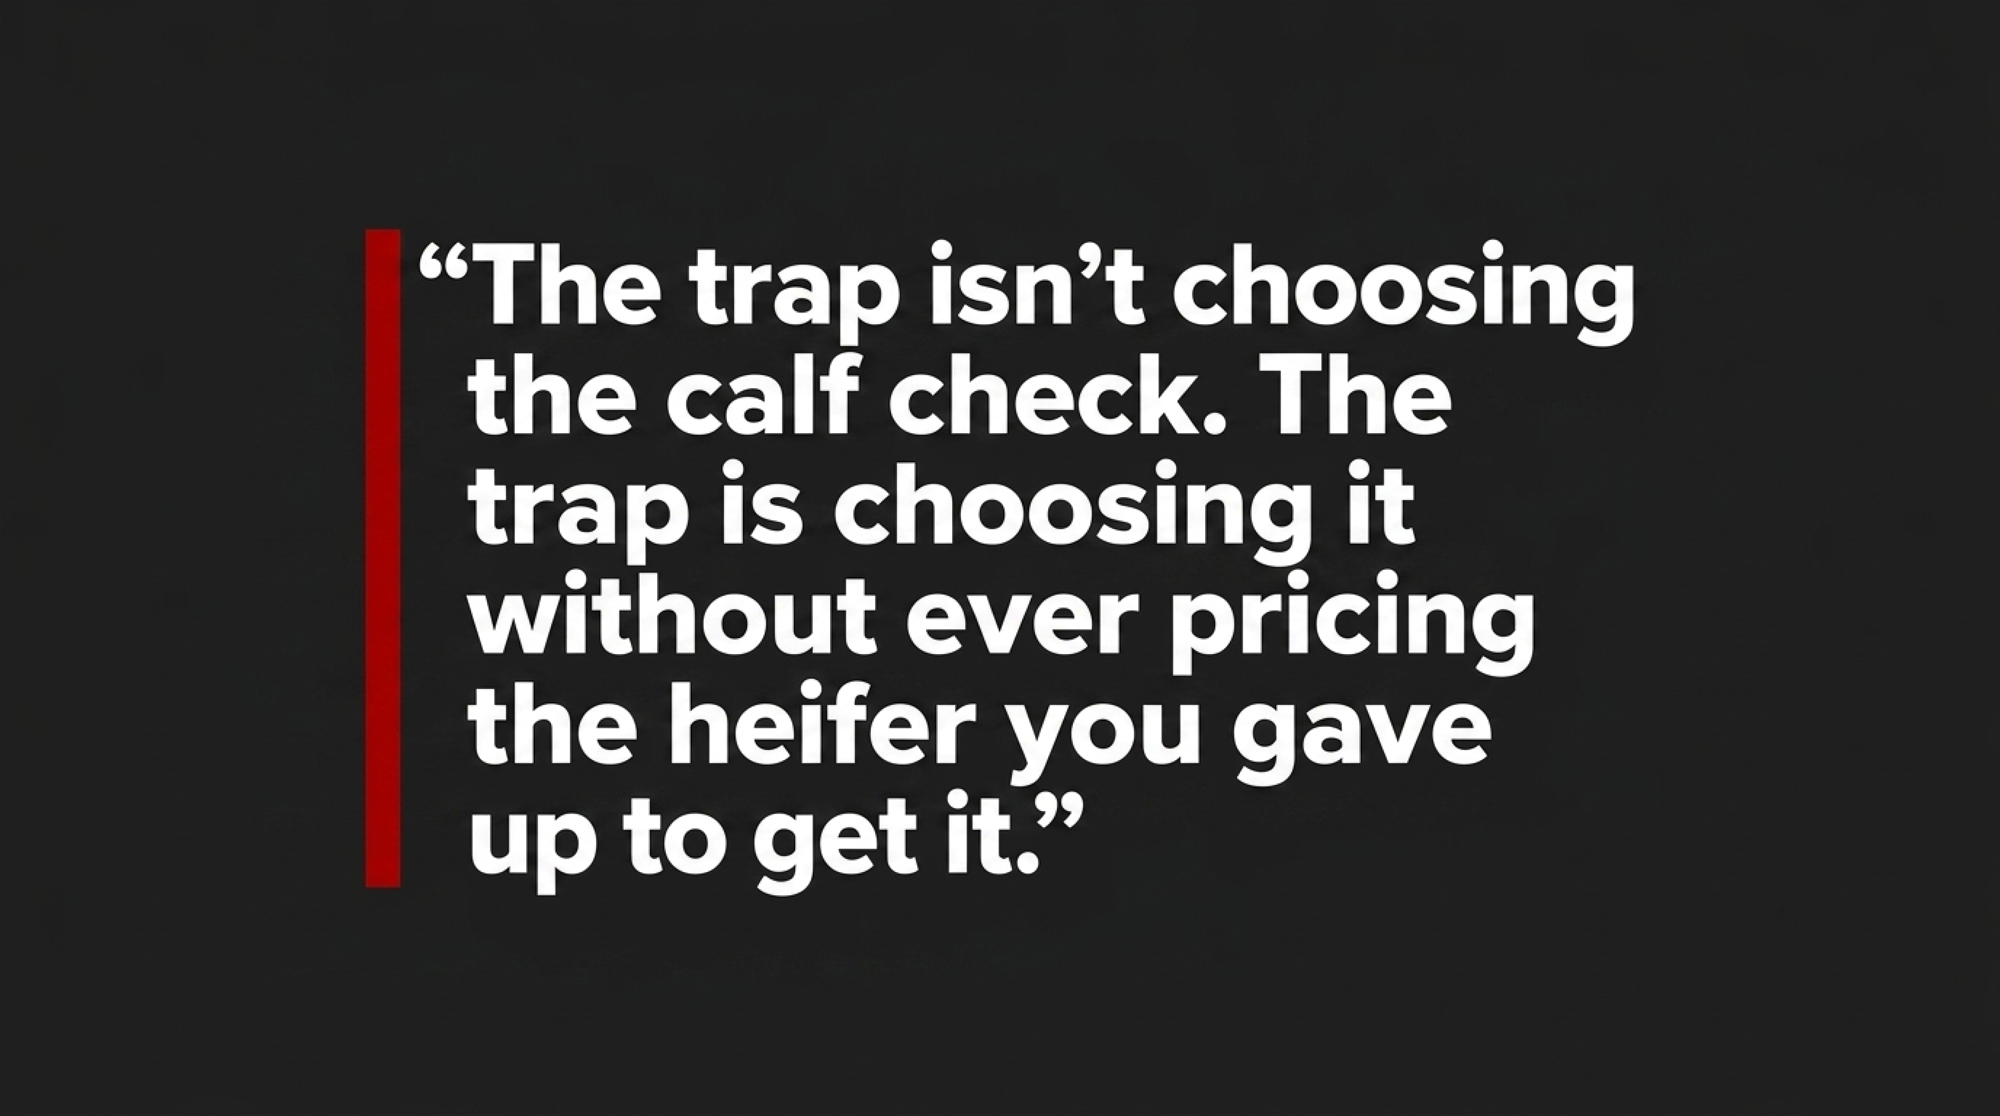
And that’s the real bind. It’s hard to buy breeding strategy for 2028 when you’re trying to make next Tuesday’s payment. A $1,400 calf check that keeps the line of credit off its limit is a powerful argument, and pretending otherwise insults anyone who’s actually run a barn through a sub-$19 milk year. The trap isn’t choosing the calf check. The trap is choosing it without ever pricing the heifer you gave up to get it.
A few defenses come up again and again, and each holds a kernel of truth. The calves are paying the bills — fair, and HighGround Dairy projected beef income above $4.50/cwt over a twelve-month window in its October 2025 analysis. I’ll buy heifers back if I need them — except you’d be buying into a structurally short market, with CoBank’s modeling pointing to a combined 796,000 fewer replacements entering the milking herd across 2025 and 2026. The university says beef-on-dairy is a win — but UW–Madison’s Cabrera model built its $51/cow/year advantage on $570 calves and $2,355 heifers, not the $1,500 calves and $3,000-plus heifers we’re actually breeding into today.
| Input Parameter | UW–Madison Cabrera Model Assumption | 2025–2026 Actual Market | Direction of Risk |
|---|---|---|---|
| Beef-cross calf value | $570/head | $1,400–$1,700/head | ↑ Favorable |
| Replacement heifer value | $2,355/head | $3,000–$3,300/head 🔴 | ↑ Hugely unfavorable |
| Foregone heifer per beef service | ~$800 | ~$1,050–$1,150 🔴 | ↑ Cost overstated |
| Net advantage per cow/year | $51/cow | Recalculated lower 🔴 | ↓ Shrinks significantly |
| Replacement heifer availability | Ample market | 48-year low — 3.91M 🔴 | ↑ Supply risk |
| Milk price assumption | ~$20–22/cwt | <$19/cwt forecast 2026🔴 | ↓ Margin pressure |
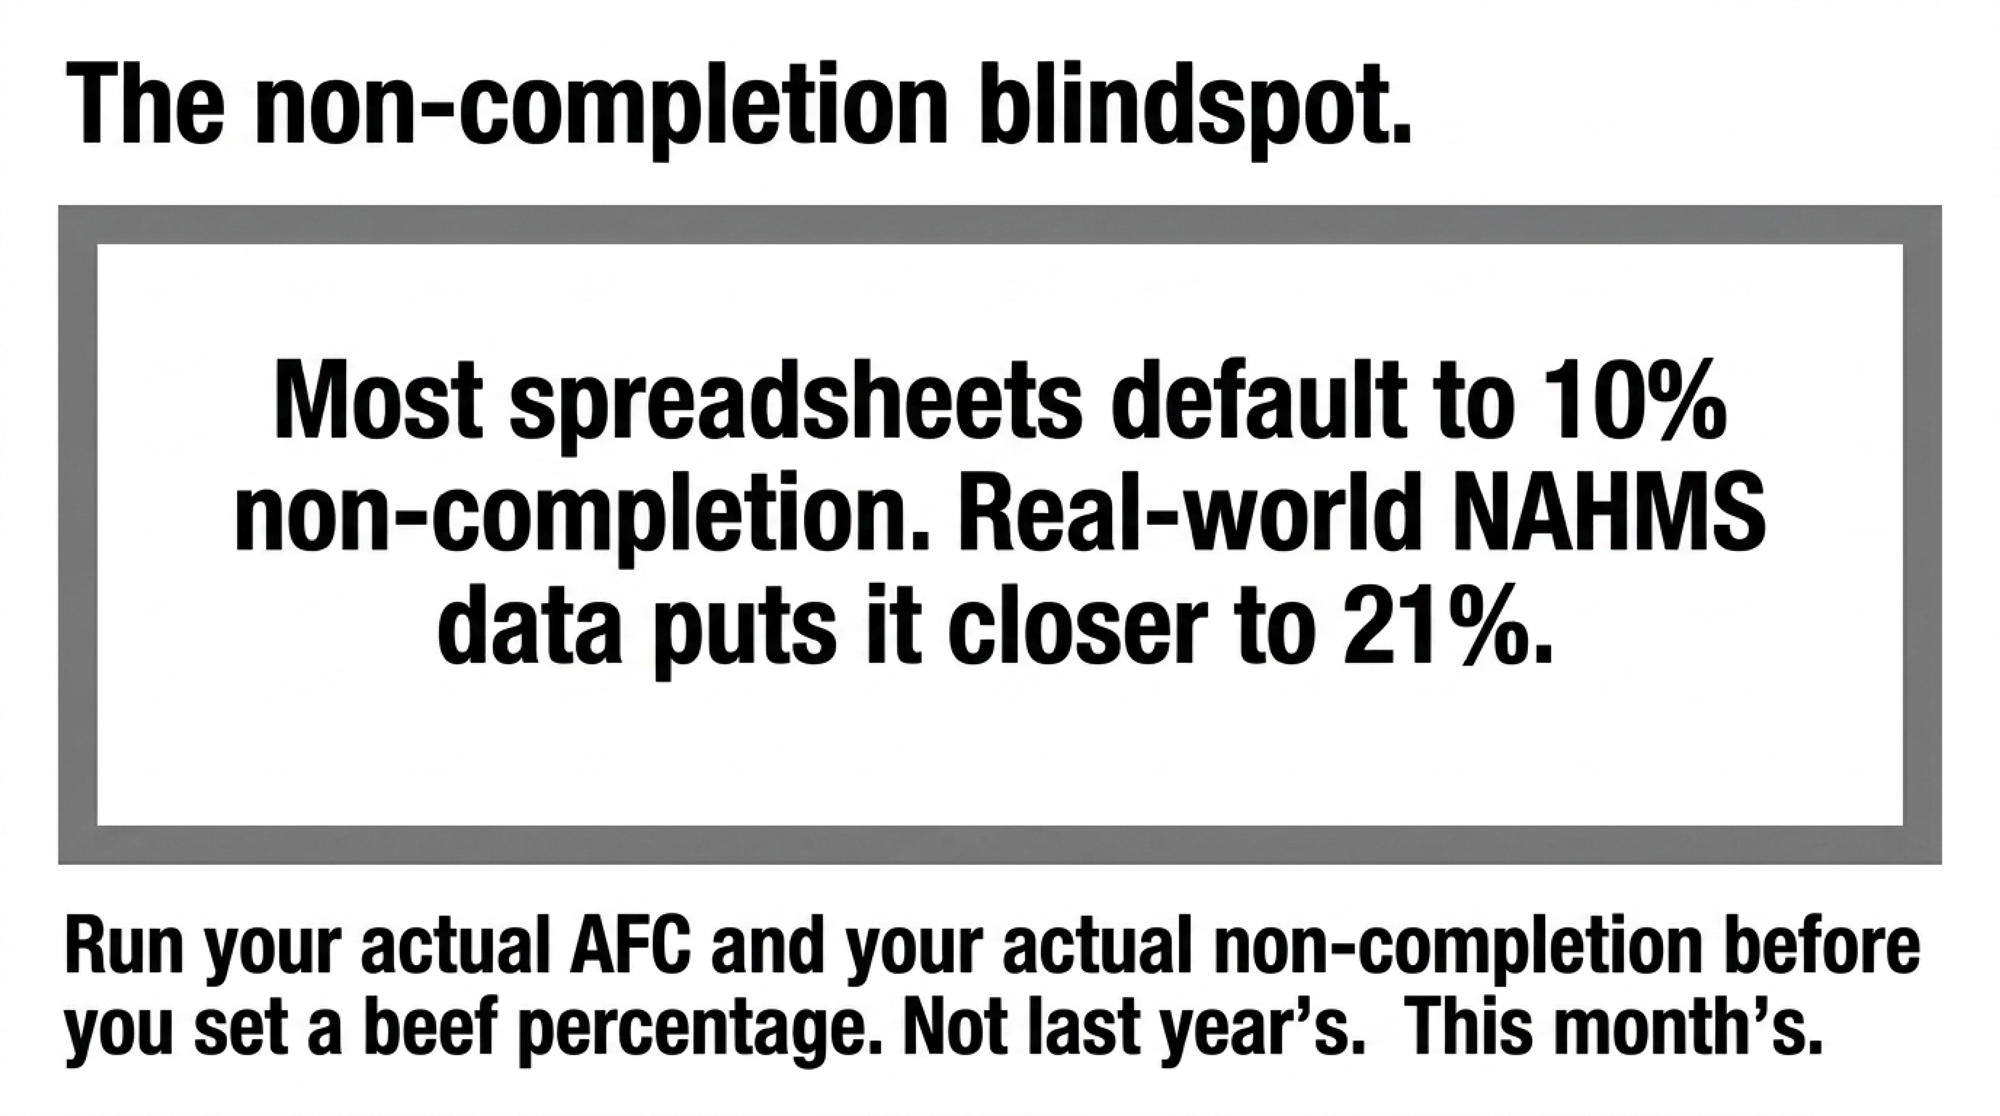
| Heifer completion rate assumed | ~90% | 79% actual (Overton, 85 herds) 🔴 | ↓ Pipeline cushion smaller |
None of those is a dumb argument. They don’t erase the foregone heifer. They postpone the moment you have to look at it. The honest read: beef-on-dairy can be a smart play or a slow leak, and the difference comes down to two numbers most herds aren’t checking before they pick up the phone.
Have You Actually Earned the Right to Run Beef?
That’s the question that reframes everything. Plenty of producers treat beef-on-dairy like a right. The math says it’s a privilege you qualify for — and you qualify with two numbers, pulled before the semen rep answers.
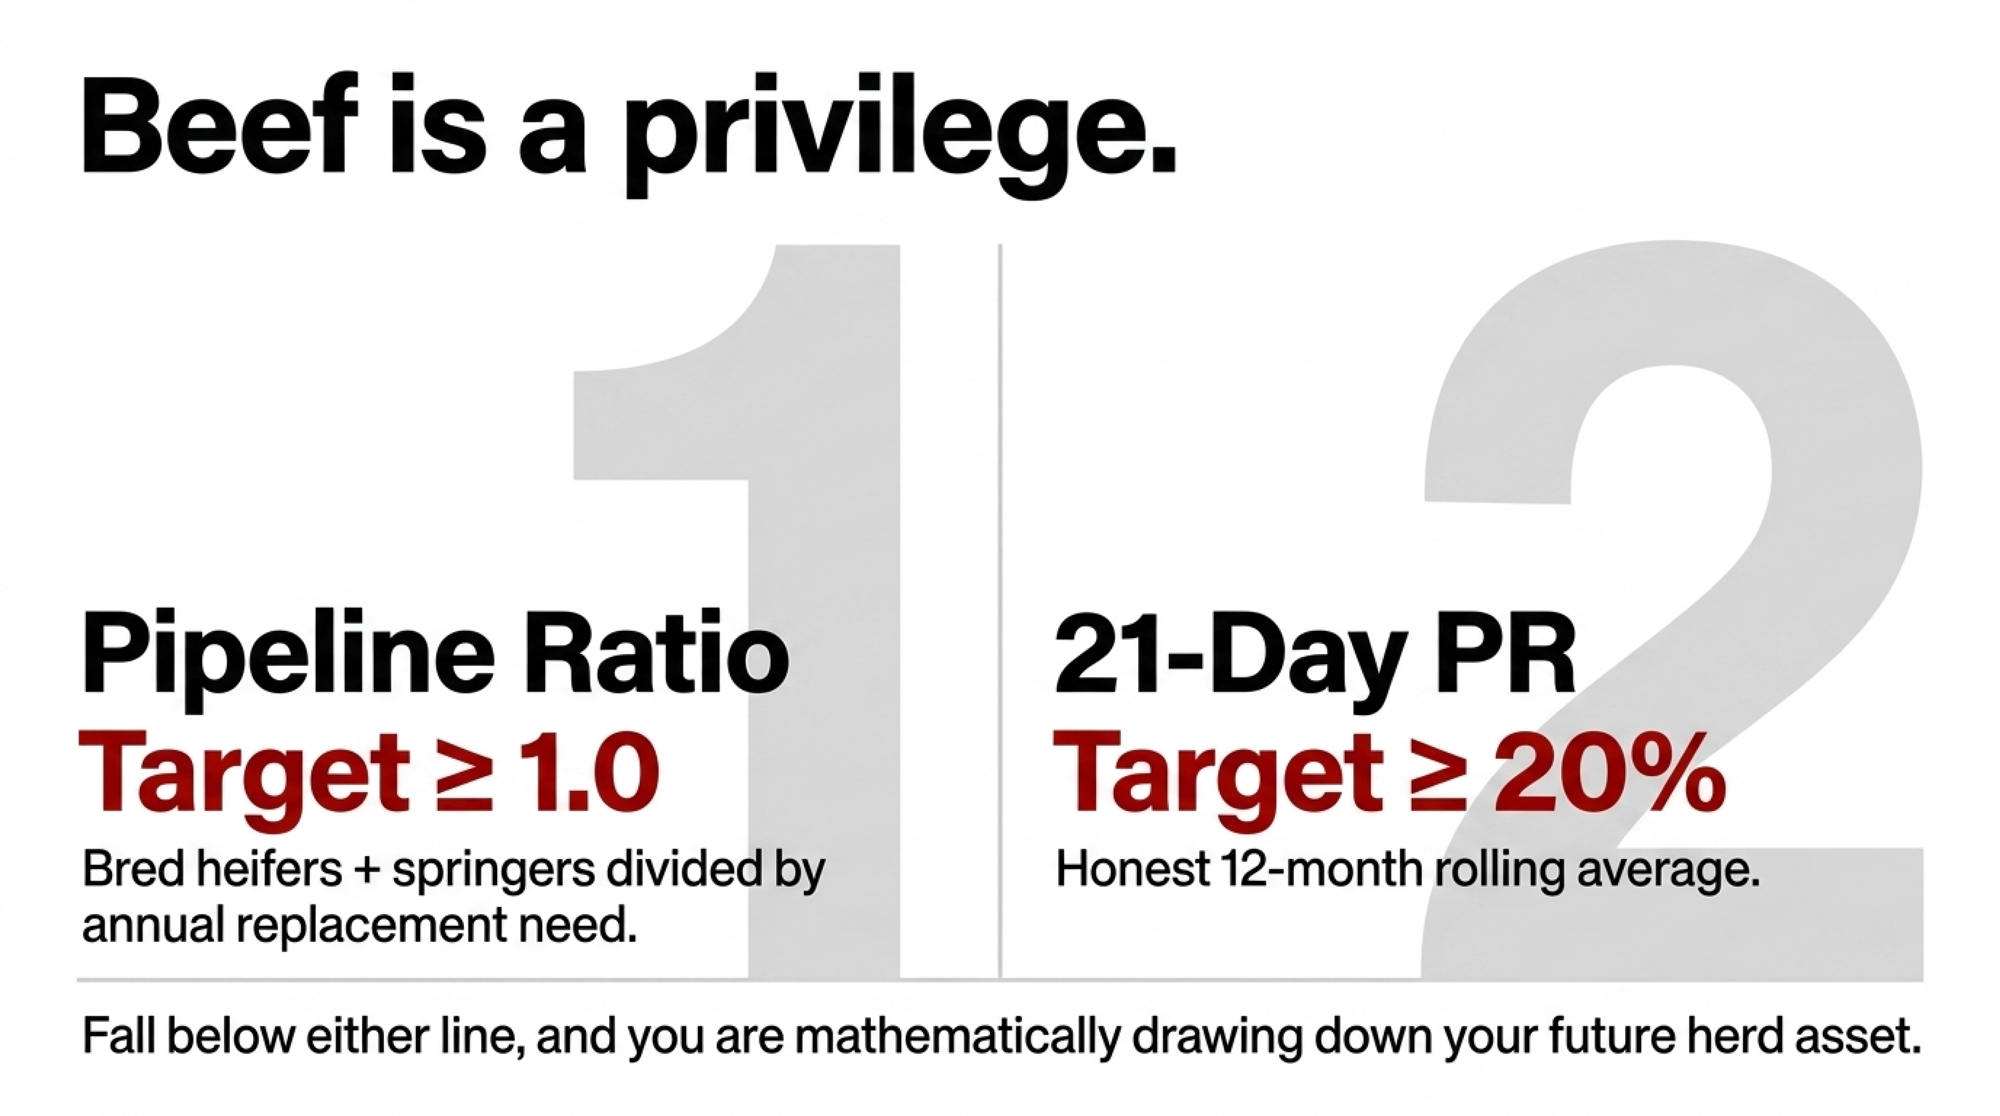
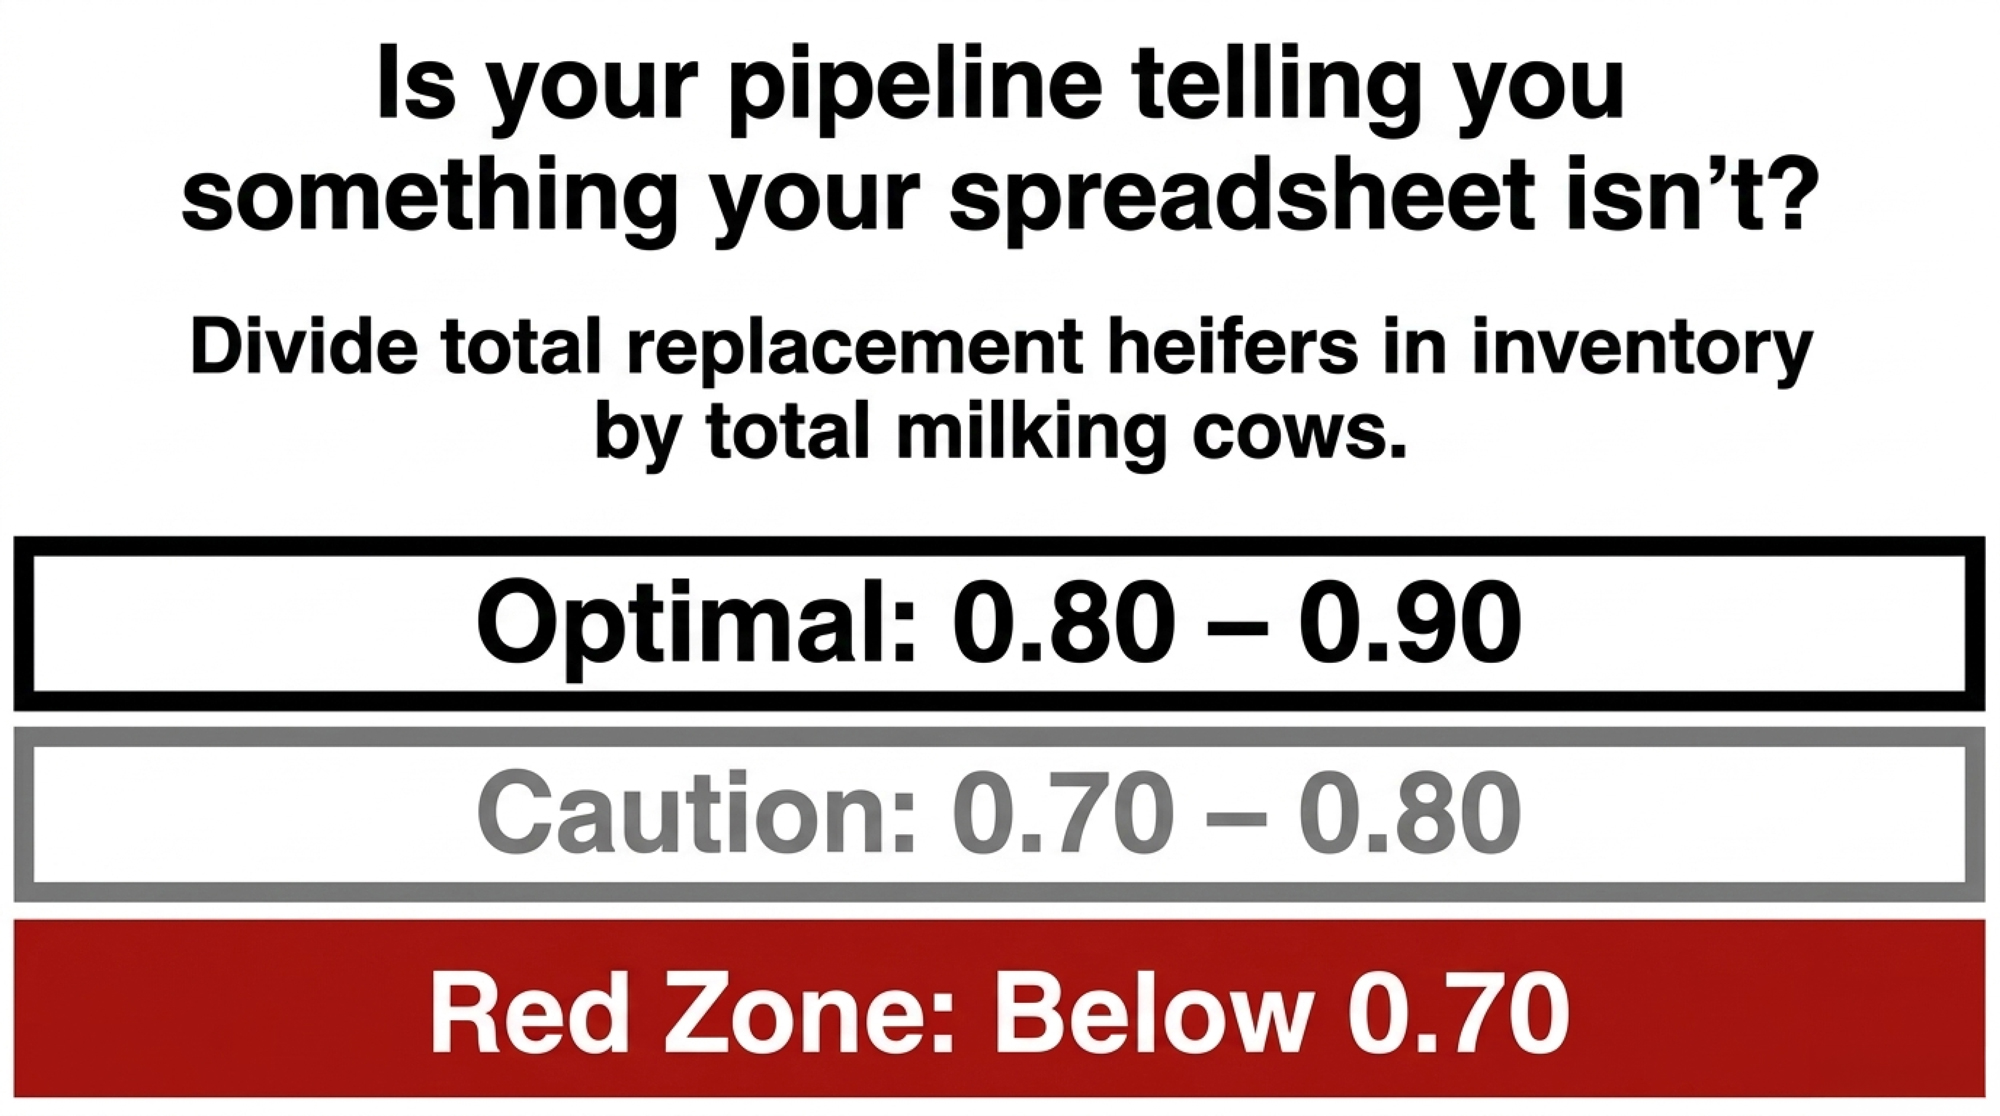
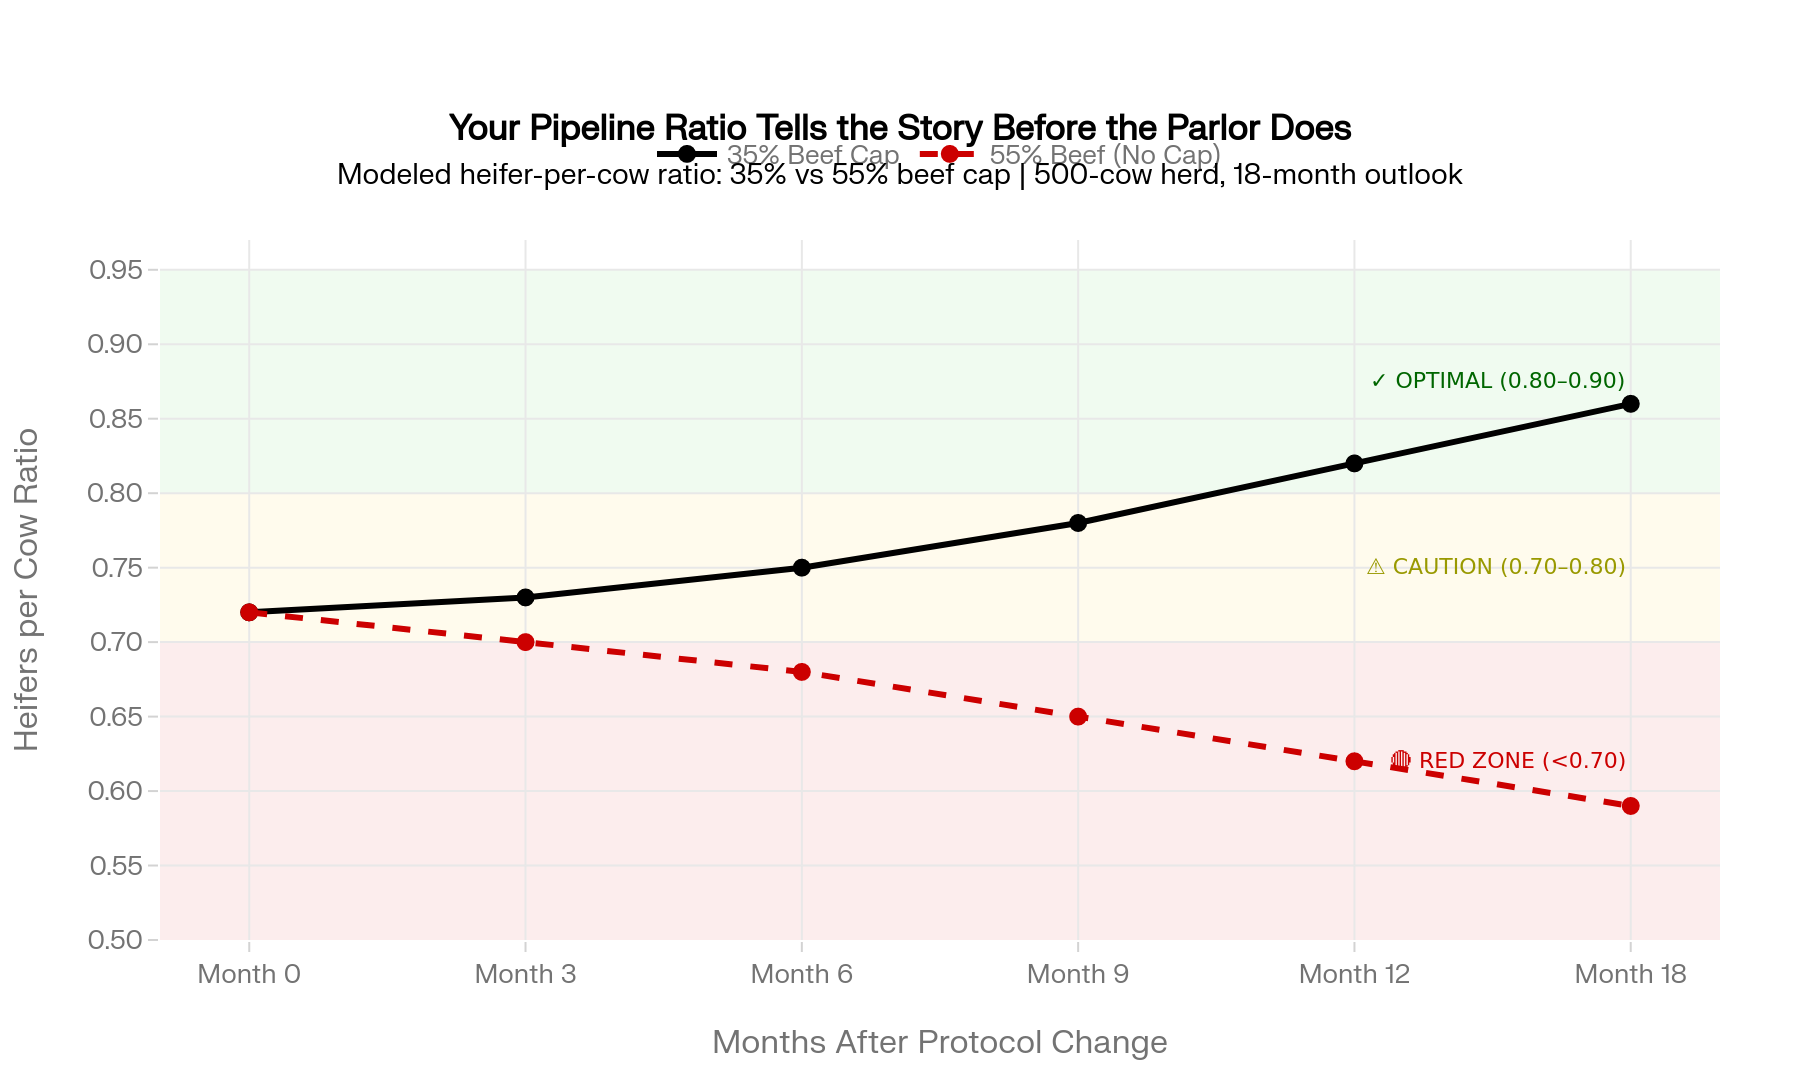
The first is the pipeline ratio: bred heifers plus springers on hand, divided by annual replacement need. Take a 500-cow herd at a 27% replacement rate. That’s 135 heifers needed a year. If you’ve got 120 bred heifers and springers on the ground, your ratio is about 0.89 — already underwater. The Bullvine’s April 2026 thresholds are blunt: at or above 1.0, you’re covering your need; below 1.0, you’re already short; below 0.8, you’re mathematically short by 2027 in every scenario, including the optimistic one. (How chasing beef premiums broke the replacement pipeline.)
The second is your rolling 12-month 21-day pregnancy rate — the real number off your DHI or herd-management software, not the target you’d like to hit. As The Bullvine framed it in December 2025, the figure that matters is your actual rolling 12-month 21-day pregnancy rate, not your target — that single number largely determines which strategies fit your operation. A lot of producers think they’re sitting at 25–30%. Pull the report, and a fair share are actually living in the 18–22% range — wrong in the direction that flatters them. (Check the dollars with the Pregnancy Rate Economics Calculator.)
Two Herds, Same Calf Market, Opposite Calls
Numbers in the abstract don’t change behavior. Two herds reading the same January inventory do. The two operations below are illustrative composites, built to show how the same calf market drives opposite right answers.
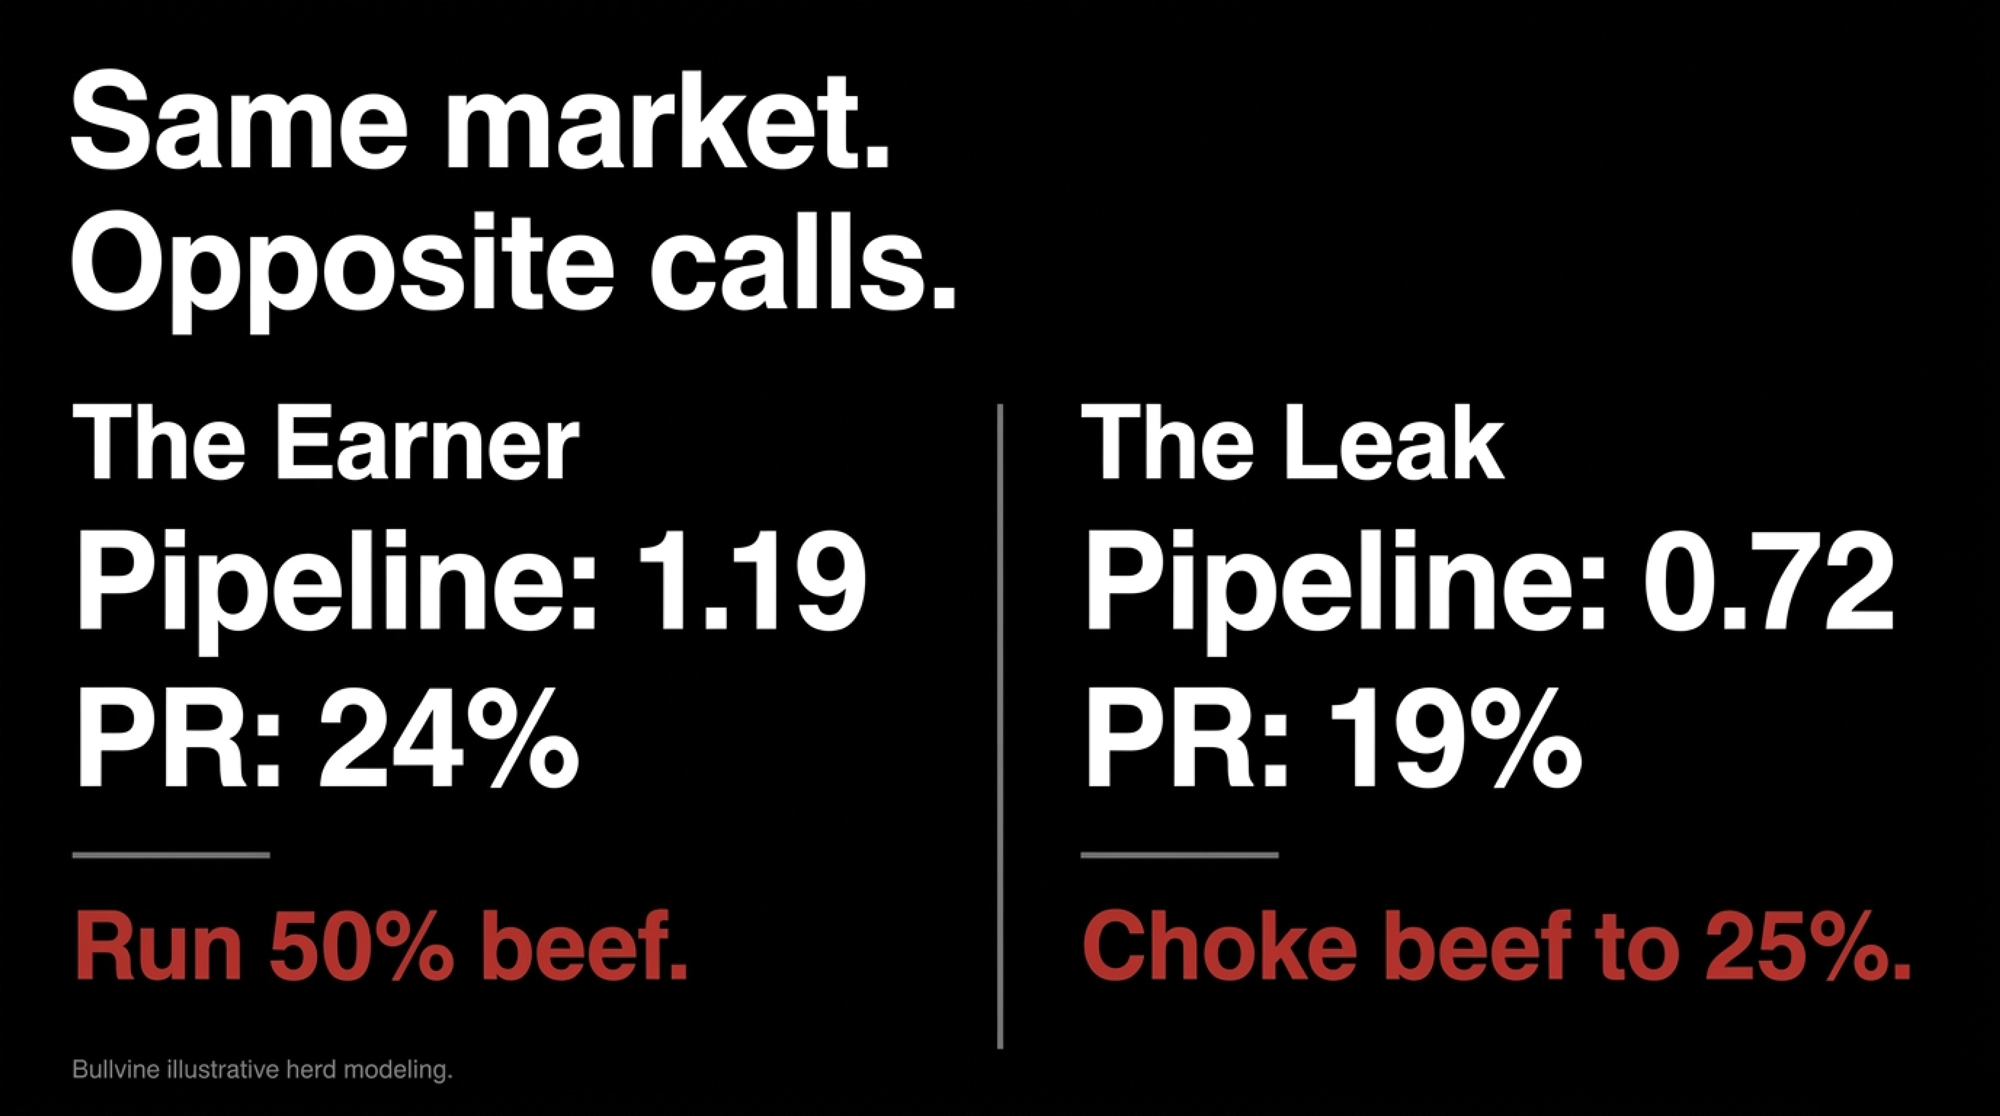
Picture a 250-cow herd running a 25% replacement rate — 63 heifers needed a year — with 75 bred heifers and springers in the yard. That’s a pipeline ratio near 1.19, and a verified 21-day PR around 24%. This herd has earned its program. It can run beef on 45–50% of the herd, push sexed dairy onto its best cows, and bank the calf check without bleeding future replacements. The $585 math still applies to each straw, but the herd is generating heifers faster than it needs them, so the foregone-heifer cost is cushioned by surplus.
Now picture a 600-cow herd at a 30% replacement rate — 180 heifers needed — sitting on 130 bred heifers and springers. Ratio: about 0.72. Its 21-day PR, pulled honestly off the software, comes back at 19%, not the 26% the manager assumed. Same calf buyer, same black bulls, same tempting receipts. But this herd is already short, and at a sub-20% pregnancy rate, the UW–Madison modeling says there’s no aggressive beef strategy that pencils once replacements are covered. The right call here is to choke beef back to 25–30%, lock sexed dairy onto the top end, and rebuild the pipeline before chasing the calf premium. Two herds, one market, two completely different right answers — and the difference is two numbers, not the calf check.
| Metric | Herd A: Pipeline-Healthy | Herd B: Pipeline-Broken |
|---|---|---|
| Herd size | 500 cows | 600 cows |
| Replacement rate | 25% | 30% |
| Annual heifer need | ~63 head | ~180 head |
| Bred heifers & springers | 75 head | 130 head |
| Pipeline ratio | 1.19 ✅ | 0.72 🔴 |
| Verified 21-day PR | 24% ✅ | 19% 🔴 |
| Max defensible beef % | 45–50% | 25–30% max |
| $585 cost absorbed by surplus? | Yes — generating ahead of need | No — deepening the hole |
| Recommended action | Run full program, upgrade bull team | Choke beef back, fix repro first |
What the Numbers Say You Can Run
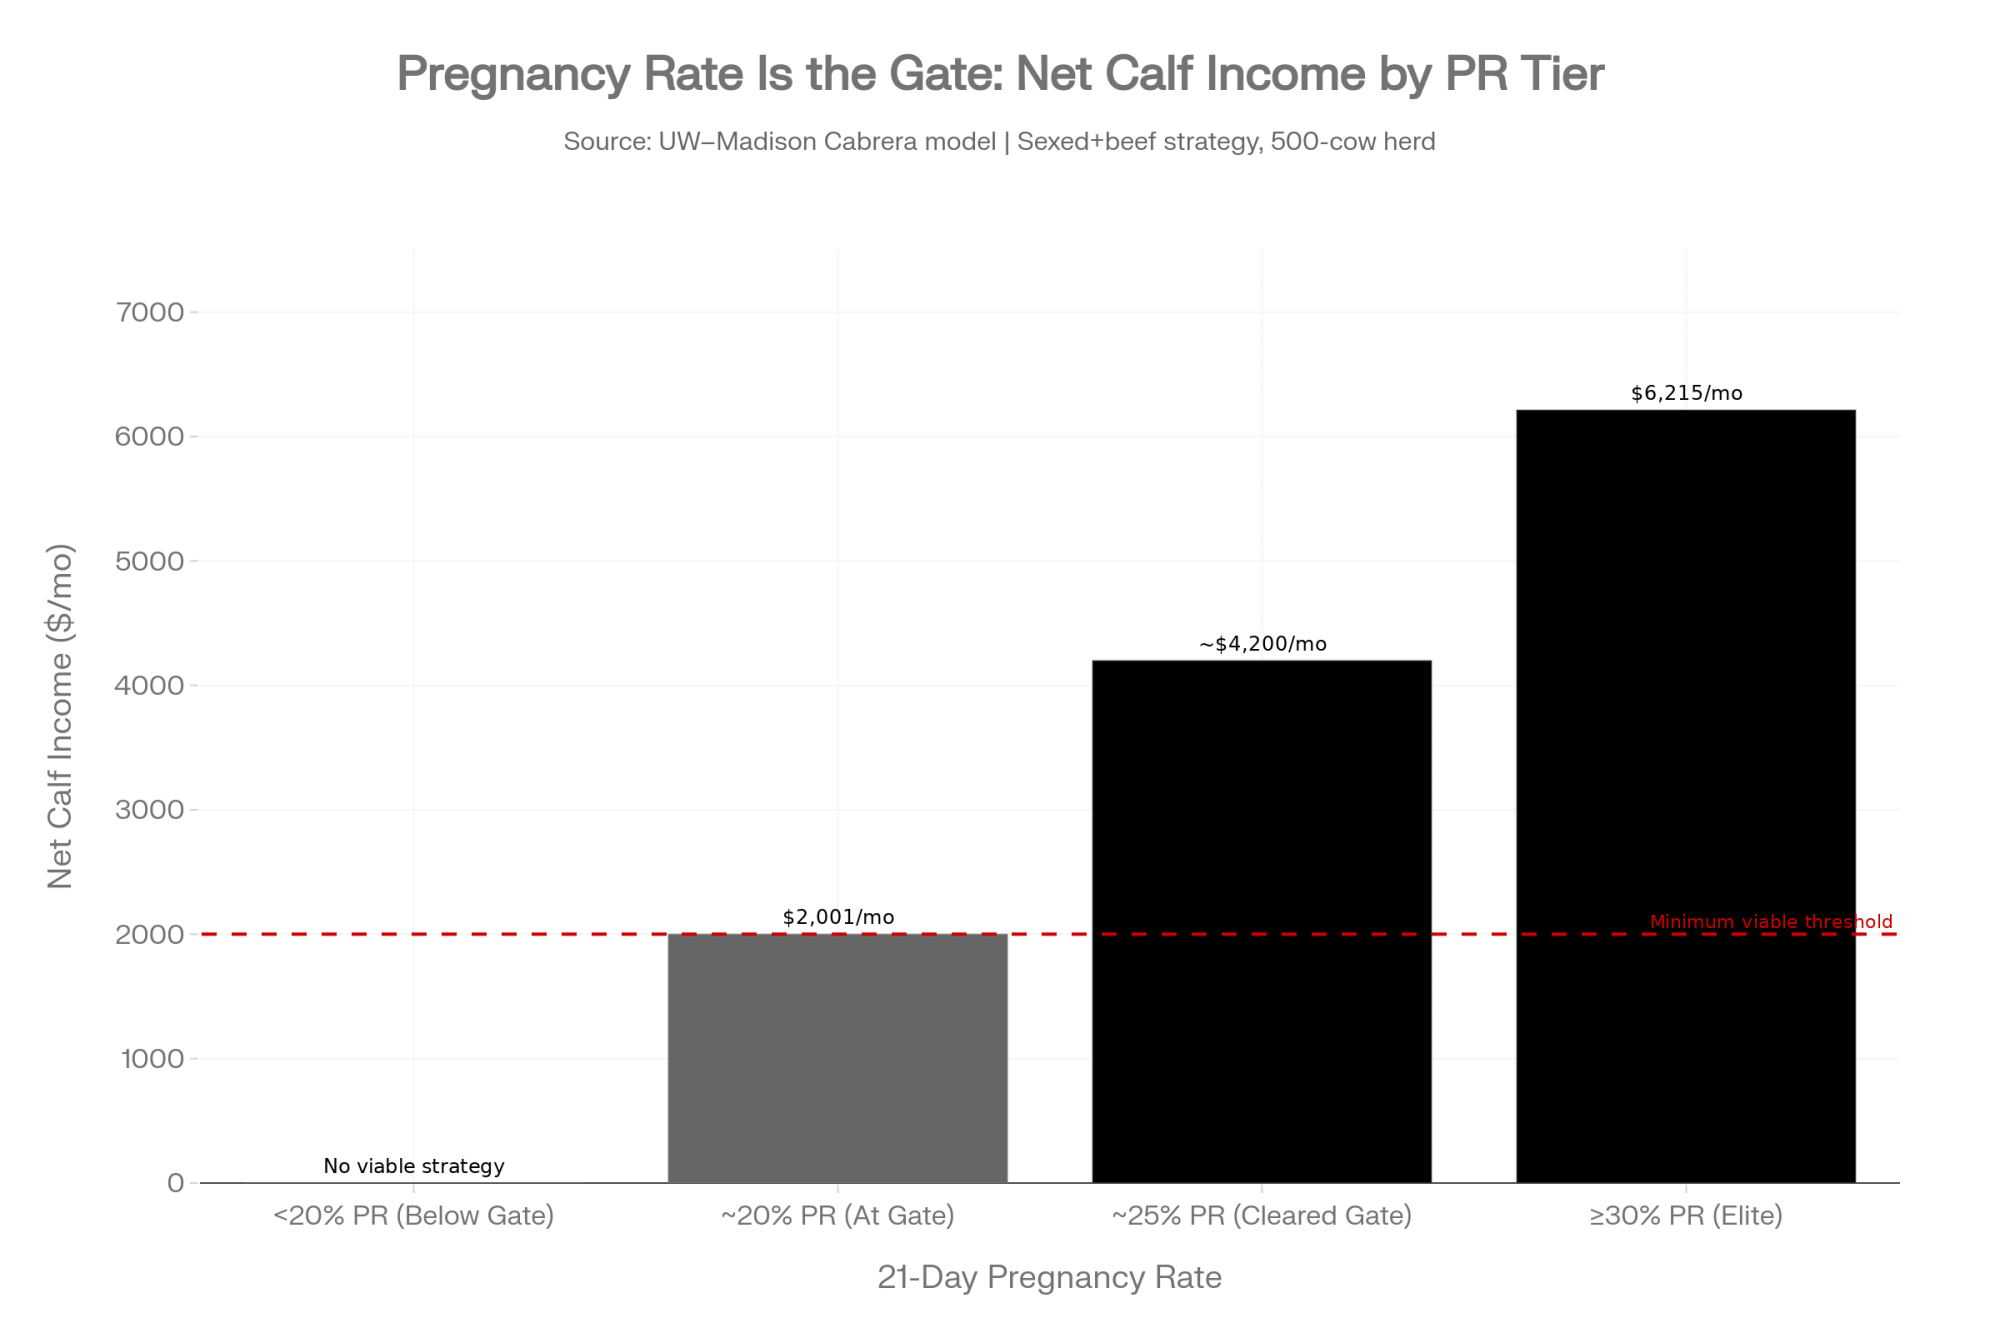
UW–Madison’s modeling, translated into herd-level terms by The Bullvine, sketches the tiers clearly. Herds at 30%+ 21-day PR can see roughly $6,215/month in net calf income from a sexed-plus-beef strategy. Herds near 20% drop to about $2,001/month. And below 20%, the research found no economically viable beef semen strategy once replacement needs were covered. The repro rate isn’t a footnote. It’s the gate.
The replacement side sets the other gate. Bullvine’s modeling, working from a 35% beef-cap framework, describes herds walking into breeding meetings with a pipeline ratio sitting at 0.70–0.75 — and the call is to choke beef back to 25–30% until the ratio recovers, with sexed dairy locked onto the top cows. Pair the two numbers, and you get a working rule of thumb:
- Pipeline ratio under 0.8, or 21-day PR under 18–20%: Pull beef back hard. Order more sexed and conventional dairy on cows you’d want daughters from. Beef goes only on clear bottom-end and late-lactation cows.
- Ratio near 1.0, 21-day PR around 20–22%: Hold beef where it is — often the 25–35% range — and revisit in six to twelve months once repro or heifer retention improves.
- Ratio at or above 1.0–1.1, 21-day PR 22–25%+: You’ve earned a real program at 40–50% beef. Now the job shifts to picking the right bulls.
There’s a reality check buried in those replacement numbers, too. Overton’s 85-herd beef-on-dairy study found an average heifer completion rate — liveborn heifer calf to first calving — of just 79%, not the 90% a lot of breeding plans quietly assume. If only four of every five heifer calves actually make it into the milking string, your pipeline math needs more cushion than you think, not less.
Does the Border Change the Math?
The framework travels; the inputs don’t. The $585 figure and the USDA inventory numbers above are U.S. data — American replacement values, an American calf market, FMMO milk pricing. The logic underneath is just arithmetic: foregone heifer value minus calf premium. That holds anywhere.
North of the border, the inputs shift significantly. Canadian replacement heifers trade strong — The Bullvine’s own September 2025 market coverage put dairy replacements averaging north of $3,000 with the best animals topping $4,000 at major auctions — and quota asset values reward a highly predictable milk volume, so the penalty for a hollowed-out pipeline is arguably even steeper than in the U.S. The calf-premium side differs too, dictated by local packer grids rather than U.S. frameworks. The takeaway for a Canadian reader isn’t to dismiss the math — it’s to plug local numbers into the same two gates. Same gates, different dollar signs.
The Sire Gap: Paying First-Class, Flying Coach
Say you’ve cleared both gates. You’ve earned a real program. Here’s the last leak — and it’s a quiet one.
A 2021 UW–Madison Extension survey of 40 Wisconsin dairy farms found producers ranked beef sire selection on the “three C’s”: conception rate, calving ease, and cost per unit. Carcass traits lagged. USDA ARS’s summary of the same work was blunter — relatively few farms weighted carcass traits such as muscling, marbling, or terminal indexes, traits ARS describes as critical to lifting dairy-beef carcass value. The selection is still dairy-centric, built to protect the cow and the semen invoice. The money, meanwhile, has moved to the packer grid.
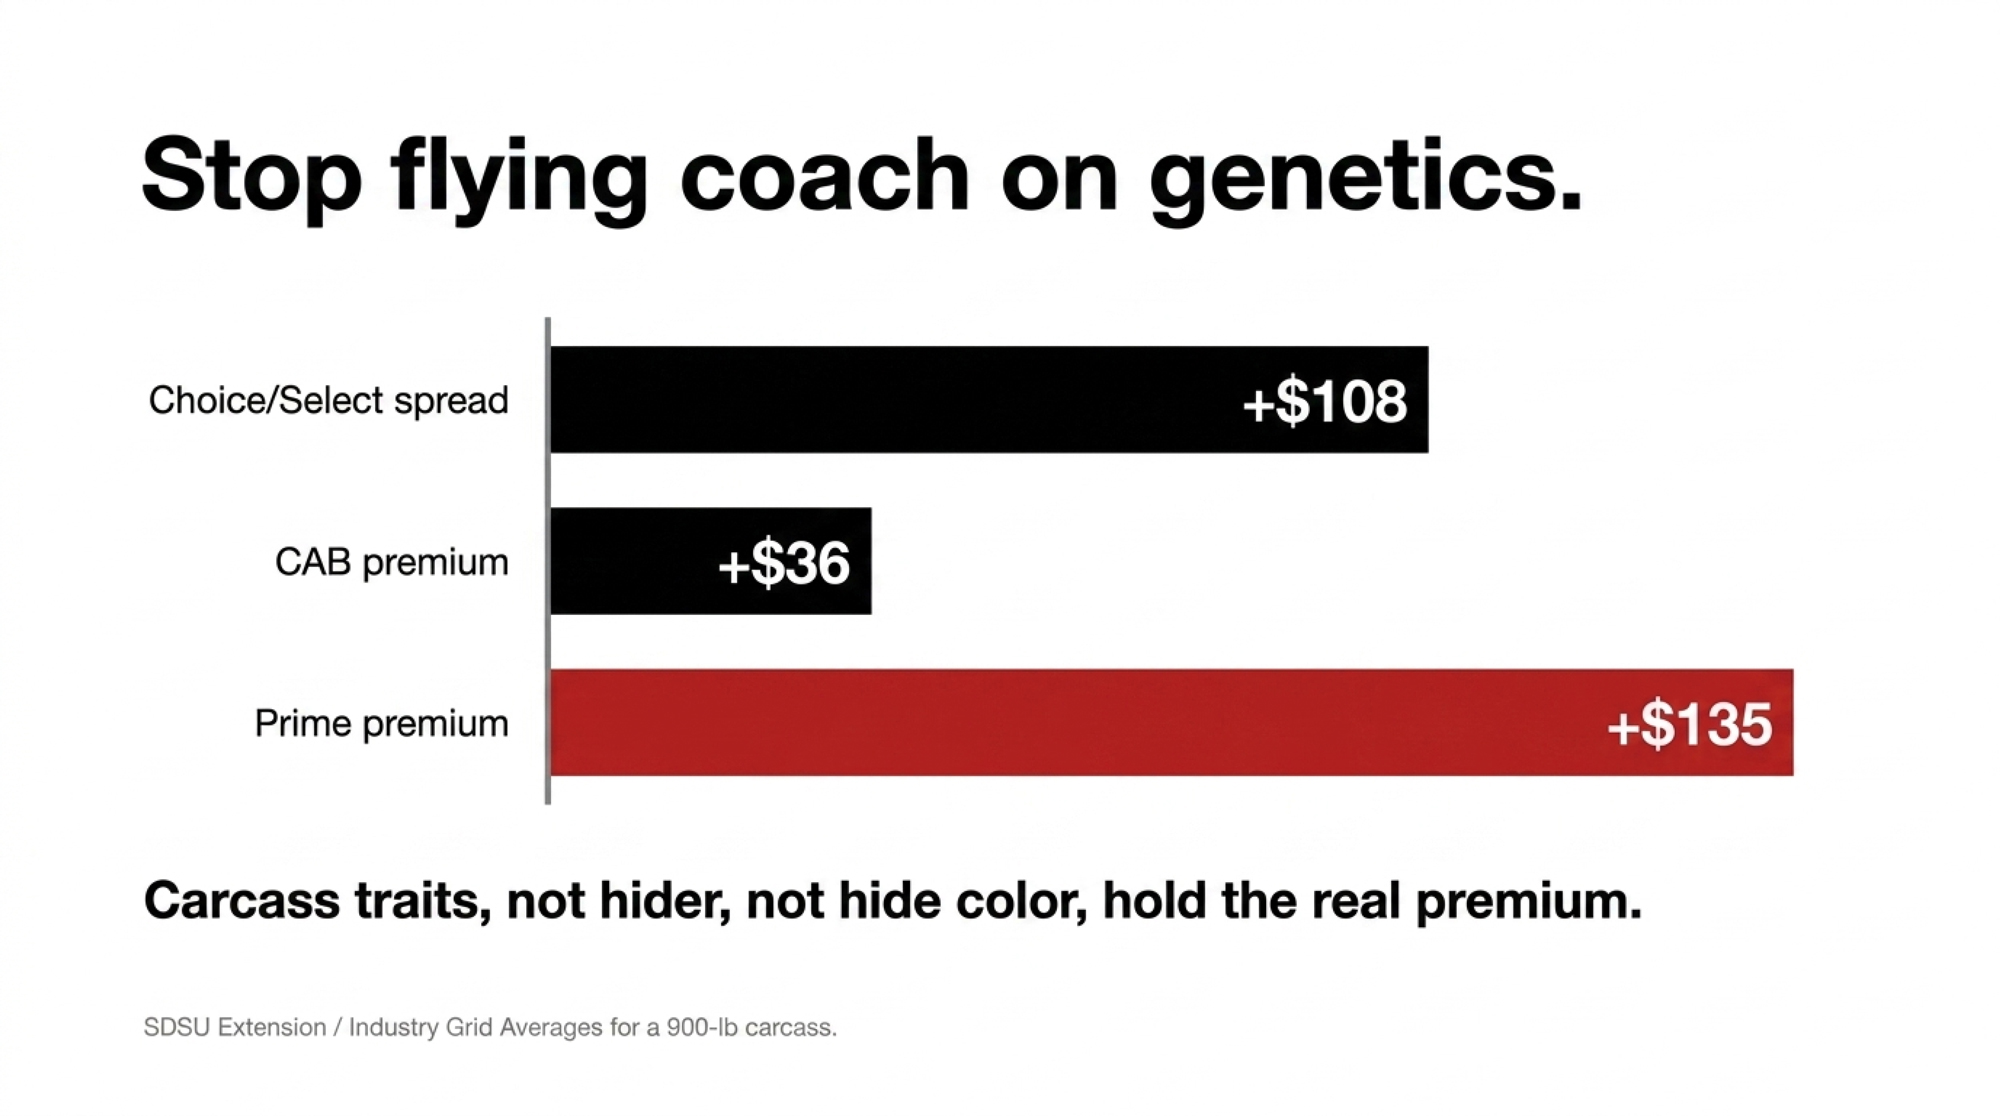
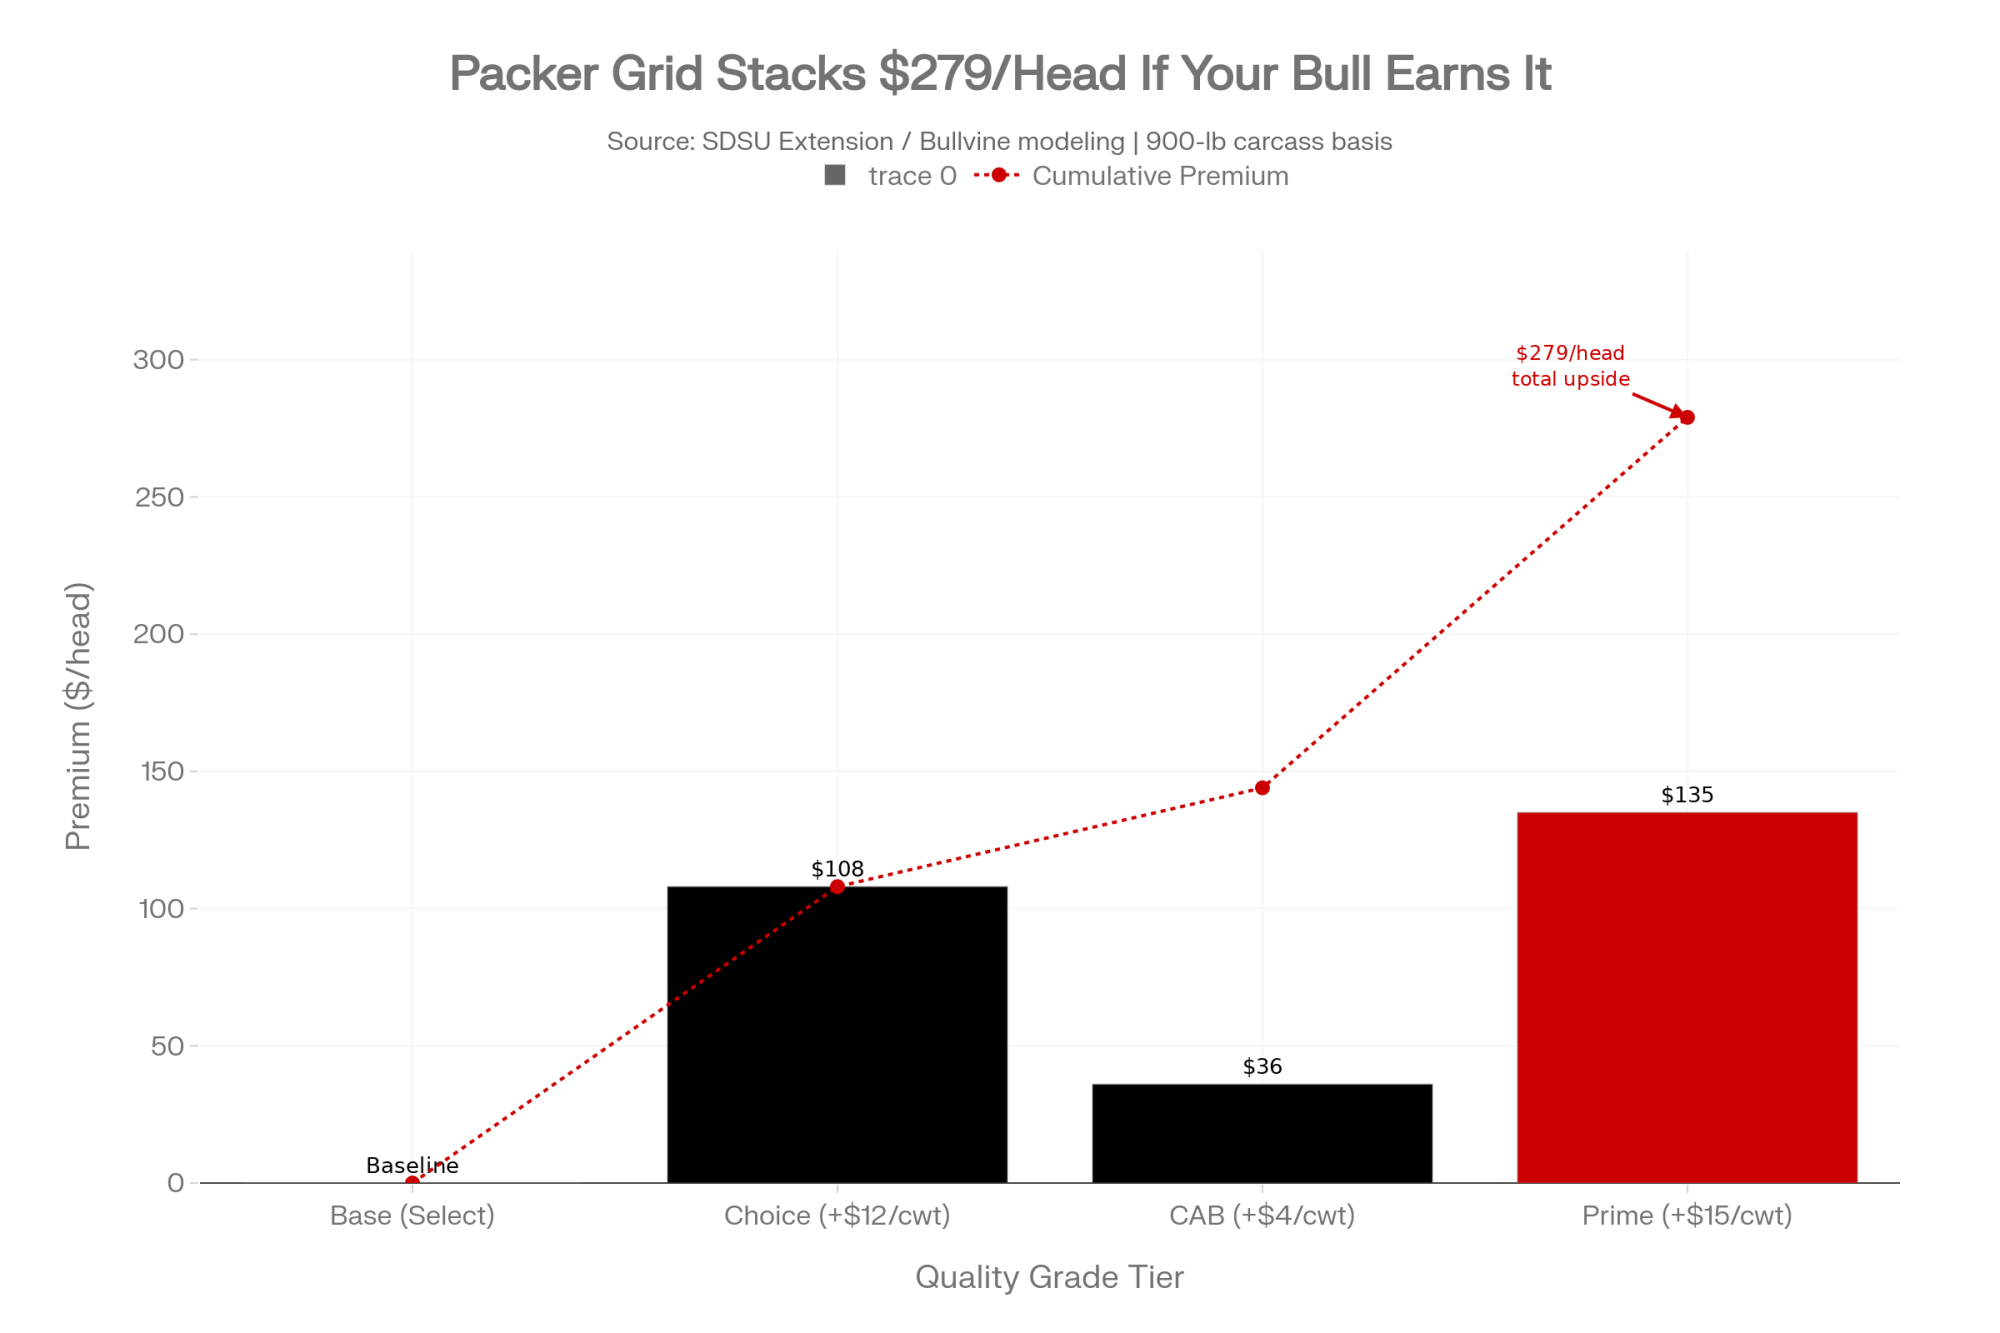
Work the grid for a second, because this is where the leak shows up in dollars. SDSU Extension warned back in 2020 that picking beef sires to throw a black-hided calf creates cattle that lack the muscling and ribeye improvements needed to merit any premium over straight Holstein beef. Take a finished beef-on-dairy carcass near 900 pounds — in the range trial data has reported for these cattle — and the grid premiums stack up fast, scaling with whatever your own carcasses actually weigh. On a 900-pound carcass, a $12/cwt Choice/Select spread is worth about $108 a head; clearing the bar for a $4/cwt CAB premium adds roughly $36; hitting Prime at a $15/cwt premium is another $135 on top. The bull either gets your calf into those tiers or it doesn’t. Bullvine’s June 2026 modeling put the gap between a high-marbling sire at +0.65 Marbling EPD and a bargain bull near +0.30 at $50 to $100 per head. Premier Select Sires’ April 2024 ProfitSOURCE brochure reported program carcasses — sired by its TD Beef genetics — bringing roughly $190 to $210 more per head than the comparison cattle on a grid basis. That’s the company’s own data, not an independent study, and the major AI studs all run competing carcass-value programs — but it points the same direction as the grid math: carcass-trait selection, not hide colour, is where the premium lives. (How sire selection sets your grid cheque.)
That’s the picture in one line. You take all the replacement risk, all the repro risk, and then hand the grid upside to the packer because the bull didn’t clear the spec. First-class ticket, coach seat.
The Two-Gate Breeding Protocol
Before the next semen order goes in, run these three steps in order. The first two decide whether you’ve earned a beef program at all; the third decides whether it pays once you have.
1. Check the pipeline ratio — target ≥ 1.0. Divide your total bred heifers and springers by your annual replacement need. If you’re below 1.0, stop. You don’t have surplus heifers; you’re actively drawing down your future herd asset, and every beef straw deepens the hole.
2. Verify the 21-day pregnancy rate — target ≥ 20%. Pull the hard 12-month rolling average from your management software, not the target in your head. If your actual PR is under 18–20%, choke beef semen back to 25% or less. Aggressive beef-on-dairy needs elite reproductive efficiency to avoid a pipeline crash.
3. Select for the packer grid — target real market premiums. If you clear both gates, stop buying beef straws on cost and conception alone. Target carcass traits, marbling EPDs, and a defined dairy-beef index so the calf actually lands in the Choice, CAB, and Prime tiers you’re paying genetics for.
What This Means for Your Operation
- Run the pipeline ratio before you run anything else. Bred heifers plus springers, divided by annual need. Under 1.0 and the calf market doesn’t get a vote — you’re drawing down a herd asset you’ll rebuy at $3,000-plus.
- Pull the real 21-day pregnancy rate, not the one in your head. If your honest rolling 12-month number is under 18–20%, fix reproduction before you expand beef. The economics don’t close below that line.
- Treat each beef straw on a replacement-eligible cow as a ~$585 decision, not a free calf check. Decide whether your pipeline has the surplus to absorb that cost.
- If you’ve cleared both gates, the leak moves to the bull. Ask whether your current beef sires actually clear your buyer’s marbling and ribeye spec, or just throw a black calf.
- If you farm under quota, re-run both gates with your own numbers. The penalty for a hollow pipeline is steeper north of the border, not softer.
- Ask whether you could defend your current beef percentage to your lender using your pipeline ratio and 21-day PR — not the national average.
Key Takeaways
- If your pipeline ratio is under 1.0, order more sexed dairy before you add a single beef straw — every beef straw below that line is borrowed against a heifer you’ll buy back at $3,000-plus.
- If your verified 21-day PR is below 18–20%, fix reproduction before you expand beef; the economics don’t close below that line.
- If you’ve earned a real program, a small, disciplined bull team that clears your buyer’s specs beats a tank full of cheap black straws.
- If two herds can read the same calf market and land on opposite right answers, the calf check was never the deciding number — your pipeline and your repro rate are.
- This month: pull your rolling 12-month 21-day pregnancy rate and count your bred heifers and springers against your annual need. Two numbers, written down, before the next order goes in.
The national semen mix on dairy cows ran about 43% sexed, 24% conventional, and 33% beef in NAAB’s 2025 year-end report. But that one-third beef figure is an average sitting on top of a herd base with only 3.91 million replacements behind it. So the question at your next breeding meeting isn’t whether you belong in that third — it’s whether your own numbers earned the spot, or whether you’re about to pay $3,000 a head to join it late. Which number is setting your breeding strategy right now: your pipeline, or last week’s calf check?
Run Your Numbers
Bullvine Pipeline Index Calculator — Feed in your herd size, heifer inventory, cull rate, replacement cost, and sexed-vs-beef mix, and the Index scores your replacement pipeline green, yellow, or red. It turns the pipeline-ratio question into one number: are you replacing faster than you’re rebuilding, or bleeding heifers to that beef check?
Complete references and supporting documentation are available upon request by contacting the editorial team at editor@thebullvine.com.
Learn More
- $3010 Per Heifer. 800000 Short. Your Beef-on-Dairy Bill Is Due. — Arms you with an immediate framework to audit your breeding sheet and balance current calf checks against the soaring cost of replacements. Discover how to protect cash flow without leaving your herd vulnerable to regional heifer shortages.
- The 800000-Heifer Shortage Reshaping Dairy: Why Some Farms Will Thrive While Others Exit — Delivers a stark macroeconomic breakdown of structural dairy restructuring, charting how a 16% reliance on beef-cross checks impacts asset valuation. Learn to position your business against major processing disruptions and regional heifer capacity swings over the next five years.
- The Heifer Crisis Hiding in Plain Sight: Why Your Next 90 Days Determine Your 2028 Herd — Exposes the hidden biological leakage killing your pipeline, tracing exactly how mortality and breeding failures turn 3 million replacement animals into a devastating 300,000-head industry deficit. Master the precise math to secure long-term herd health today.
 The Sunday Read Dairy Professionals Don’t Skip.
 The Sunday Read Dairy Professionals Don’t Skip.
Every week, thousands of producers, breeders, and industry insiders open Bullvine Weekly for genetics insights, market shifts, and profit strategies they won’t find anywhere else. One email. Five minutes. Smarter decisions all week.


 Join the Revolution!


