Archive for Farm Economics & Management – Page 5

DMC Paid 0 in 2024. A 200‑Cow Northeast Farm Lost $57,500.

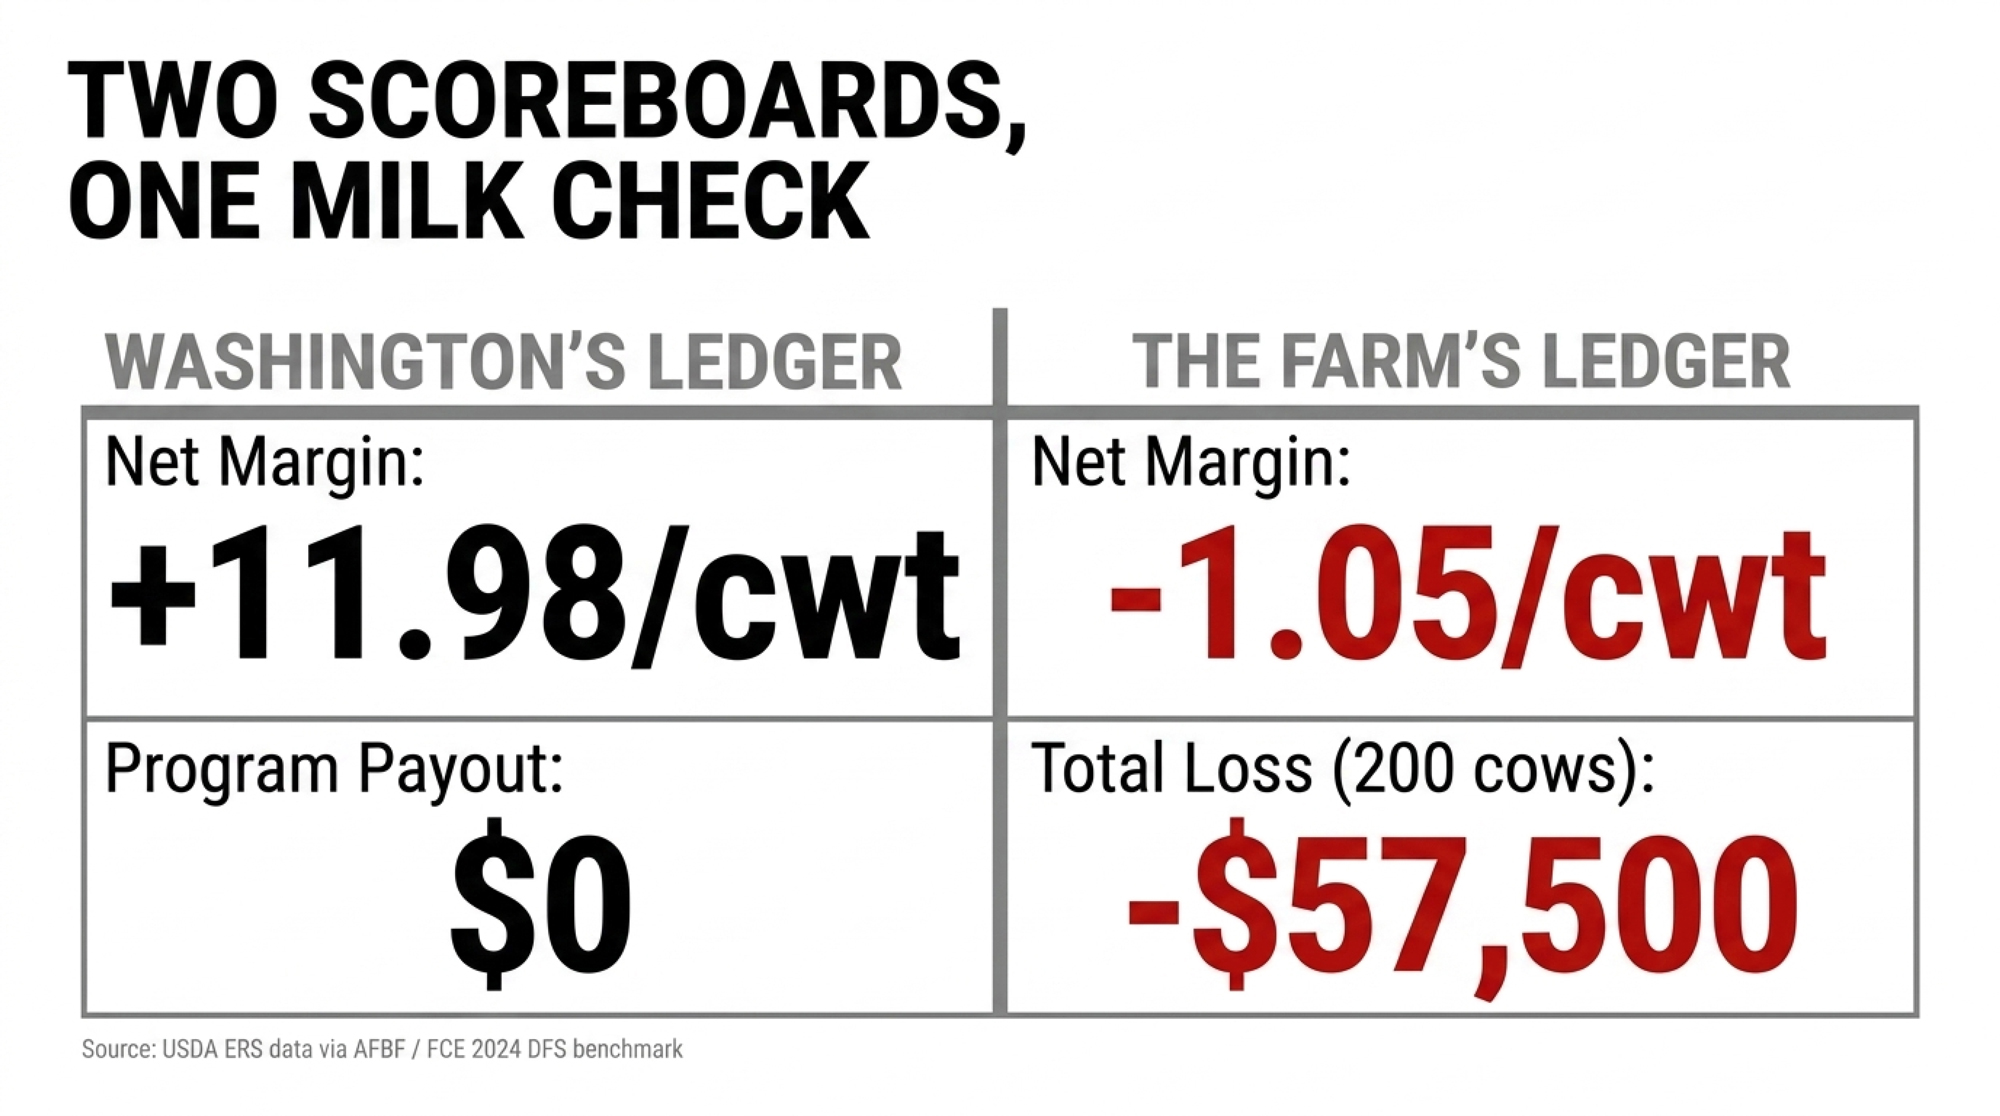
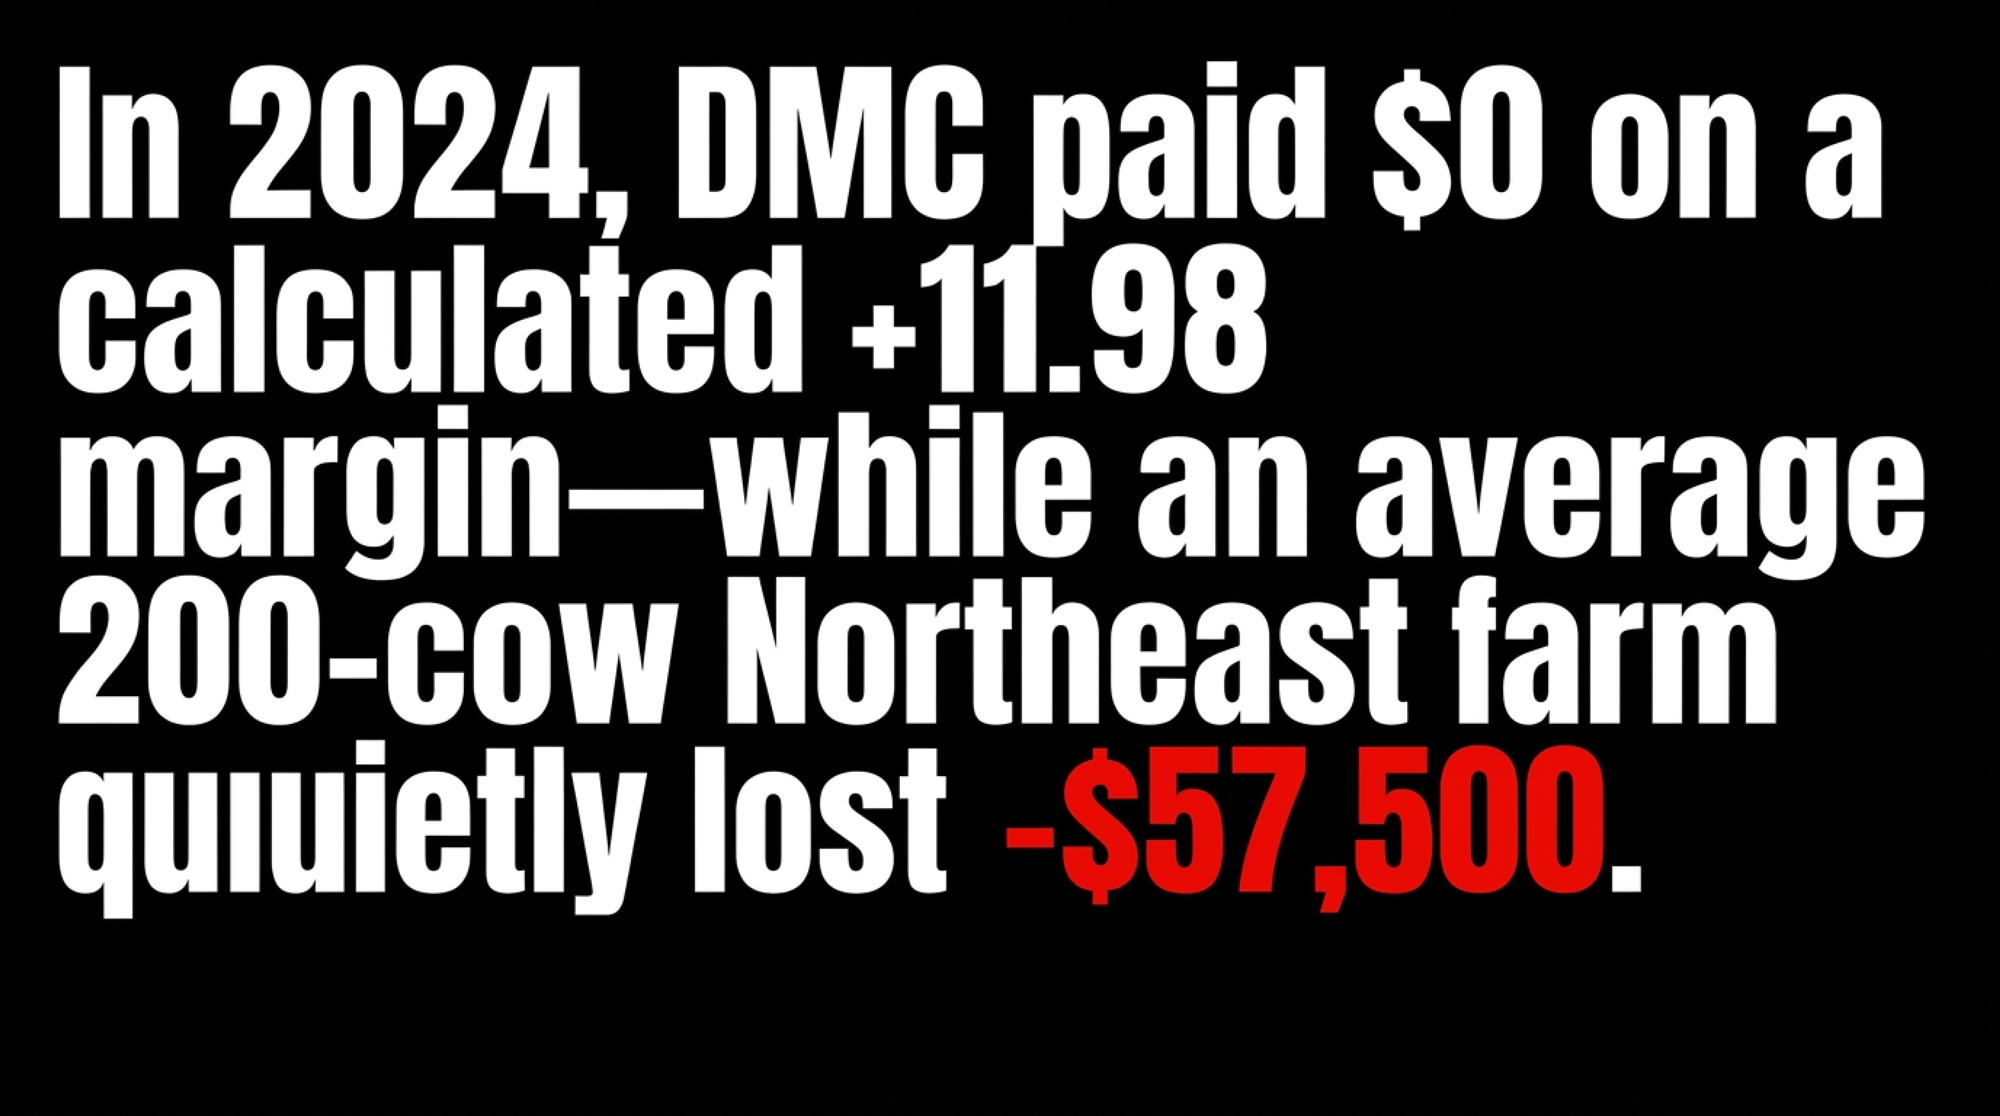
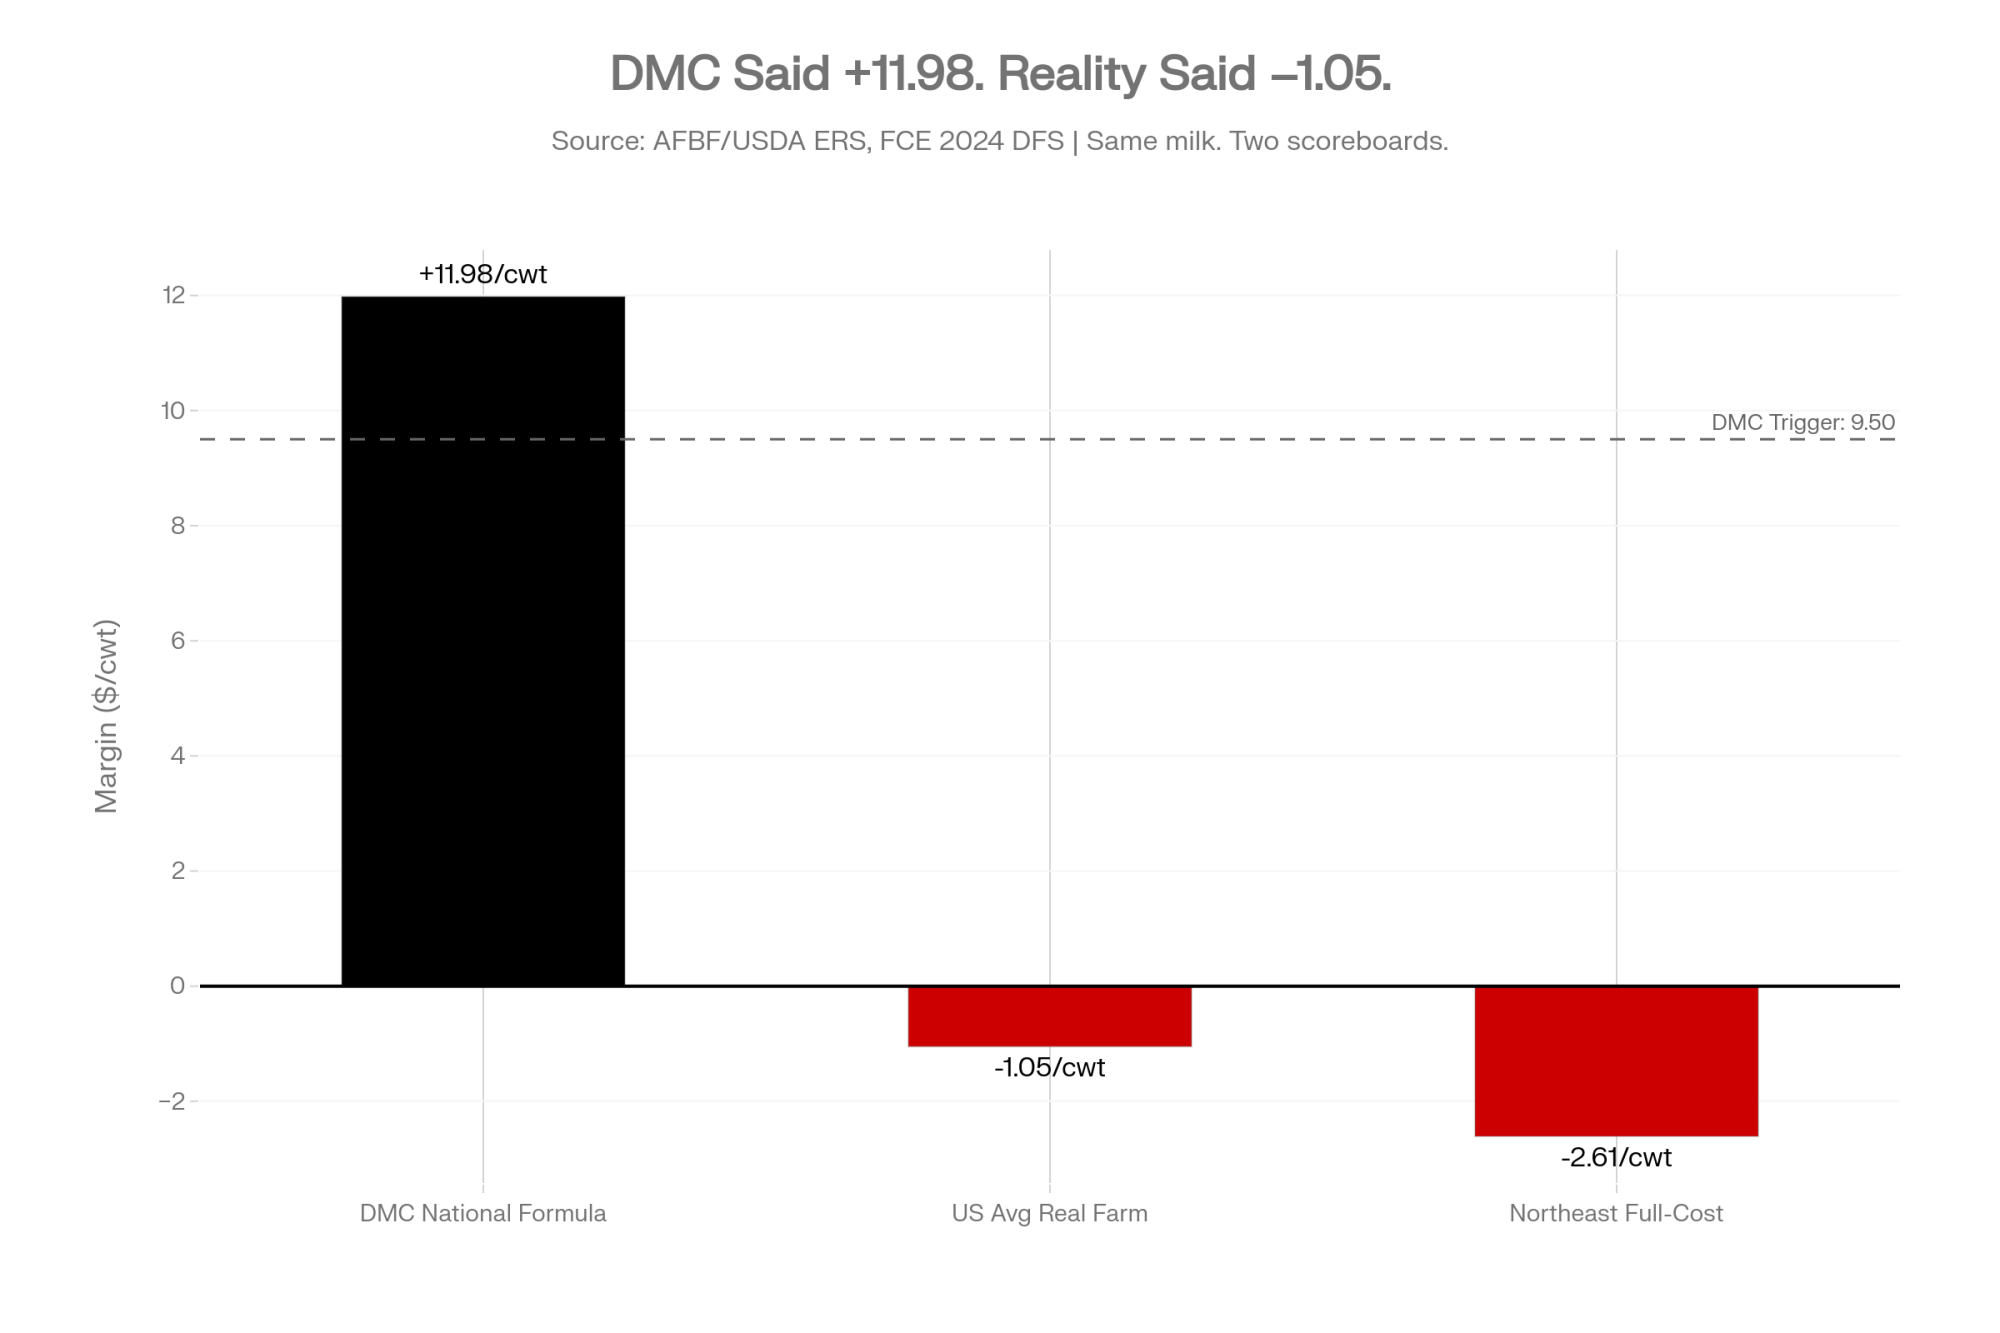
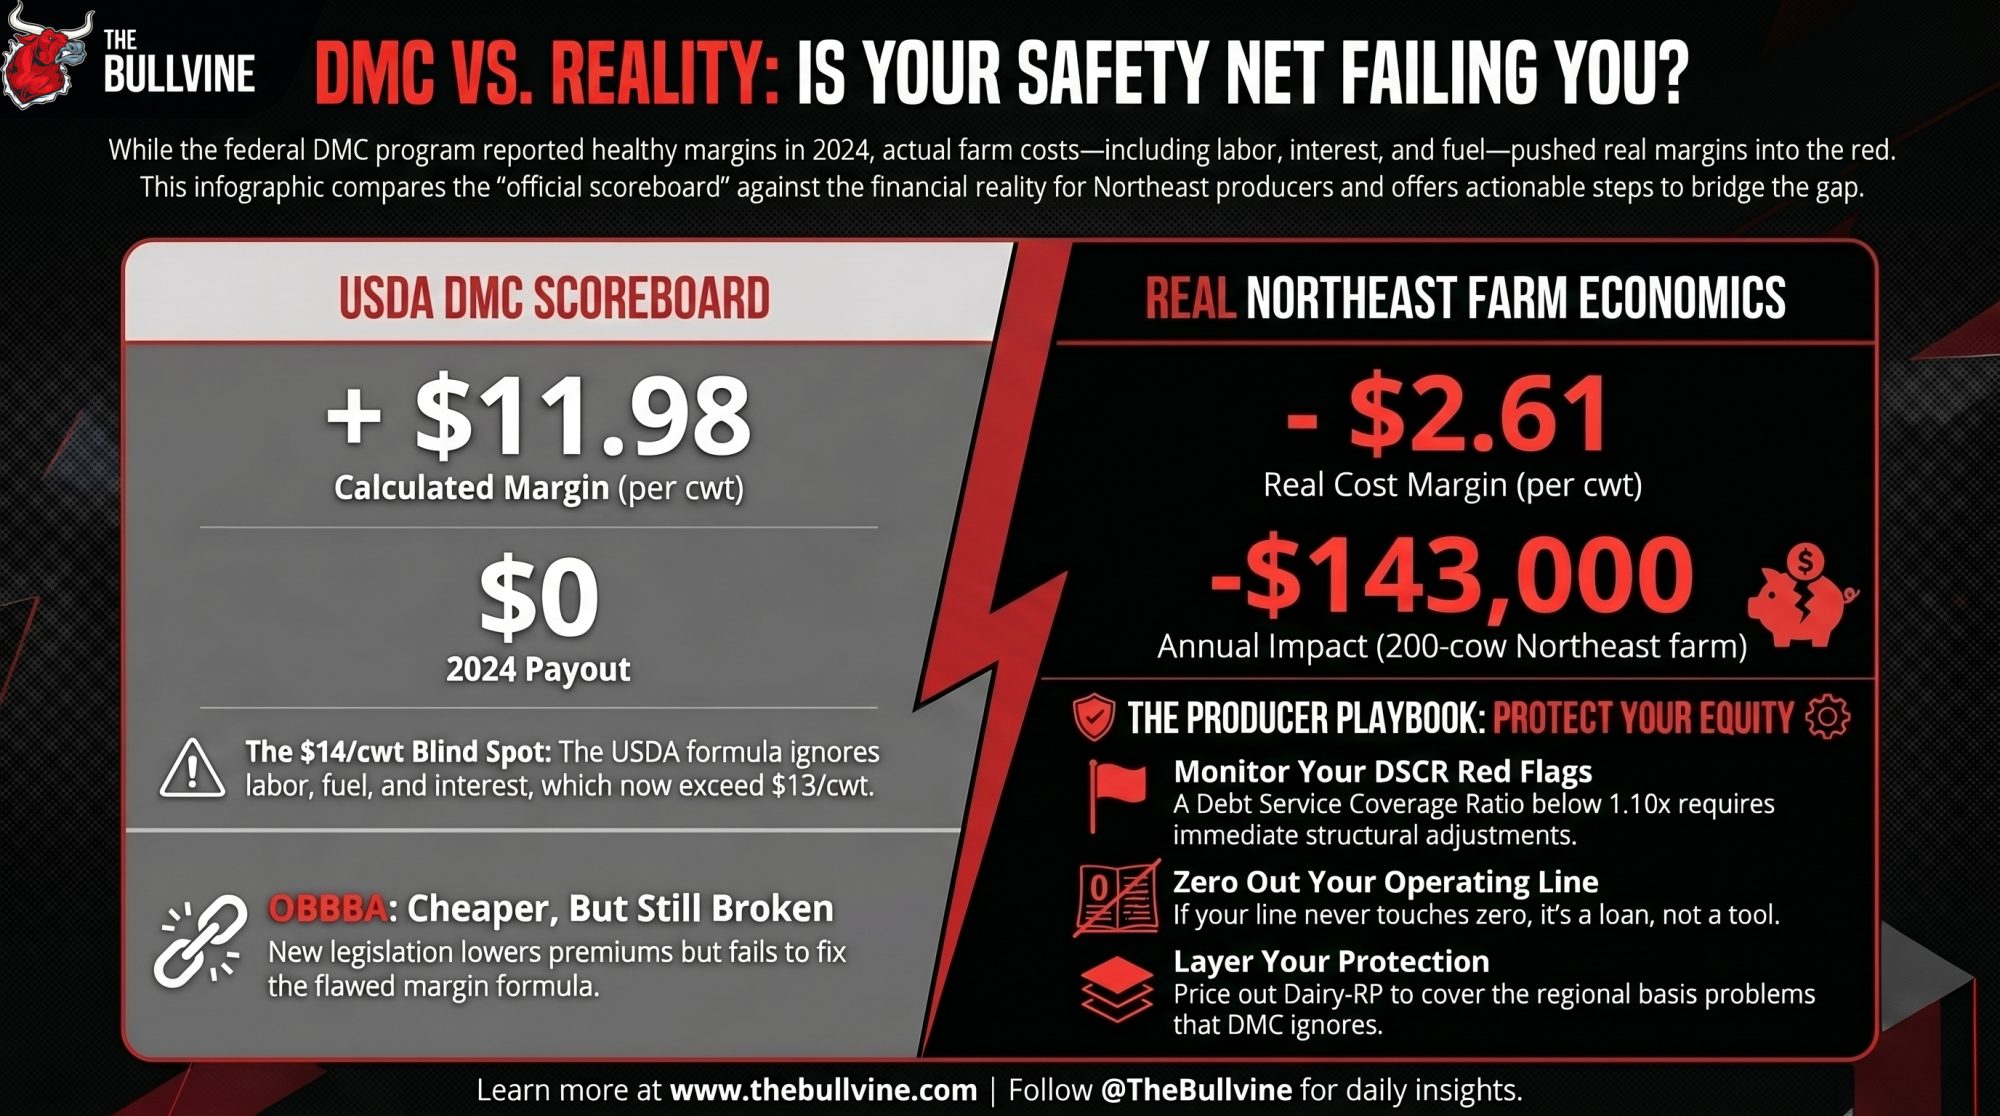
USDA’s 2024 DMC margin printed 11.98/cwt and triggered nothing. Run the same year’s actual costs through a 200‑cow Northeast barn, and you’re at –1.05/cwt. Your banker already knows.

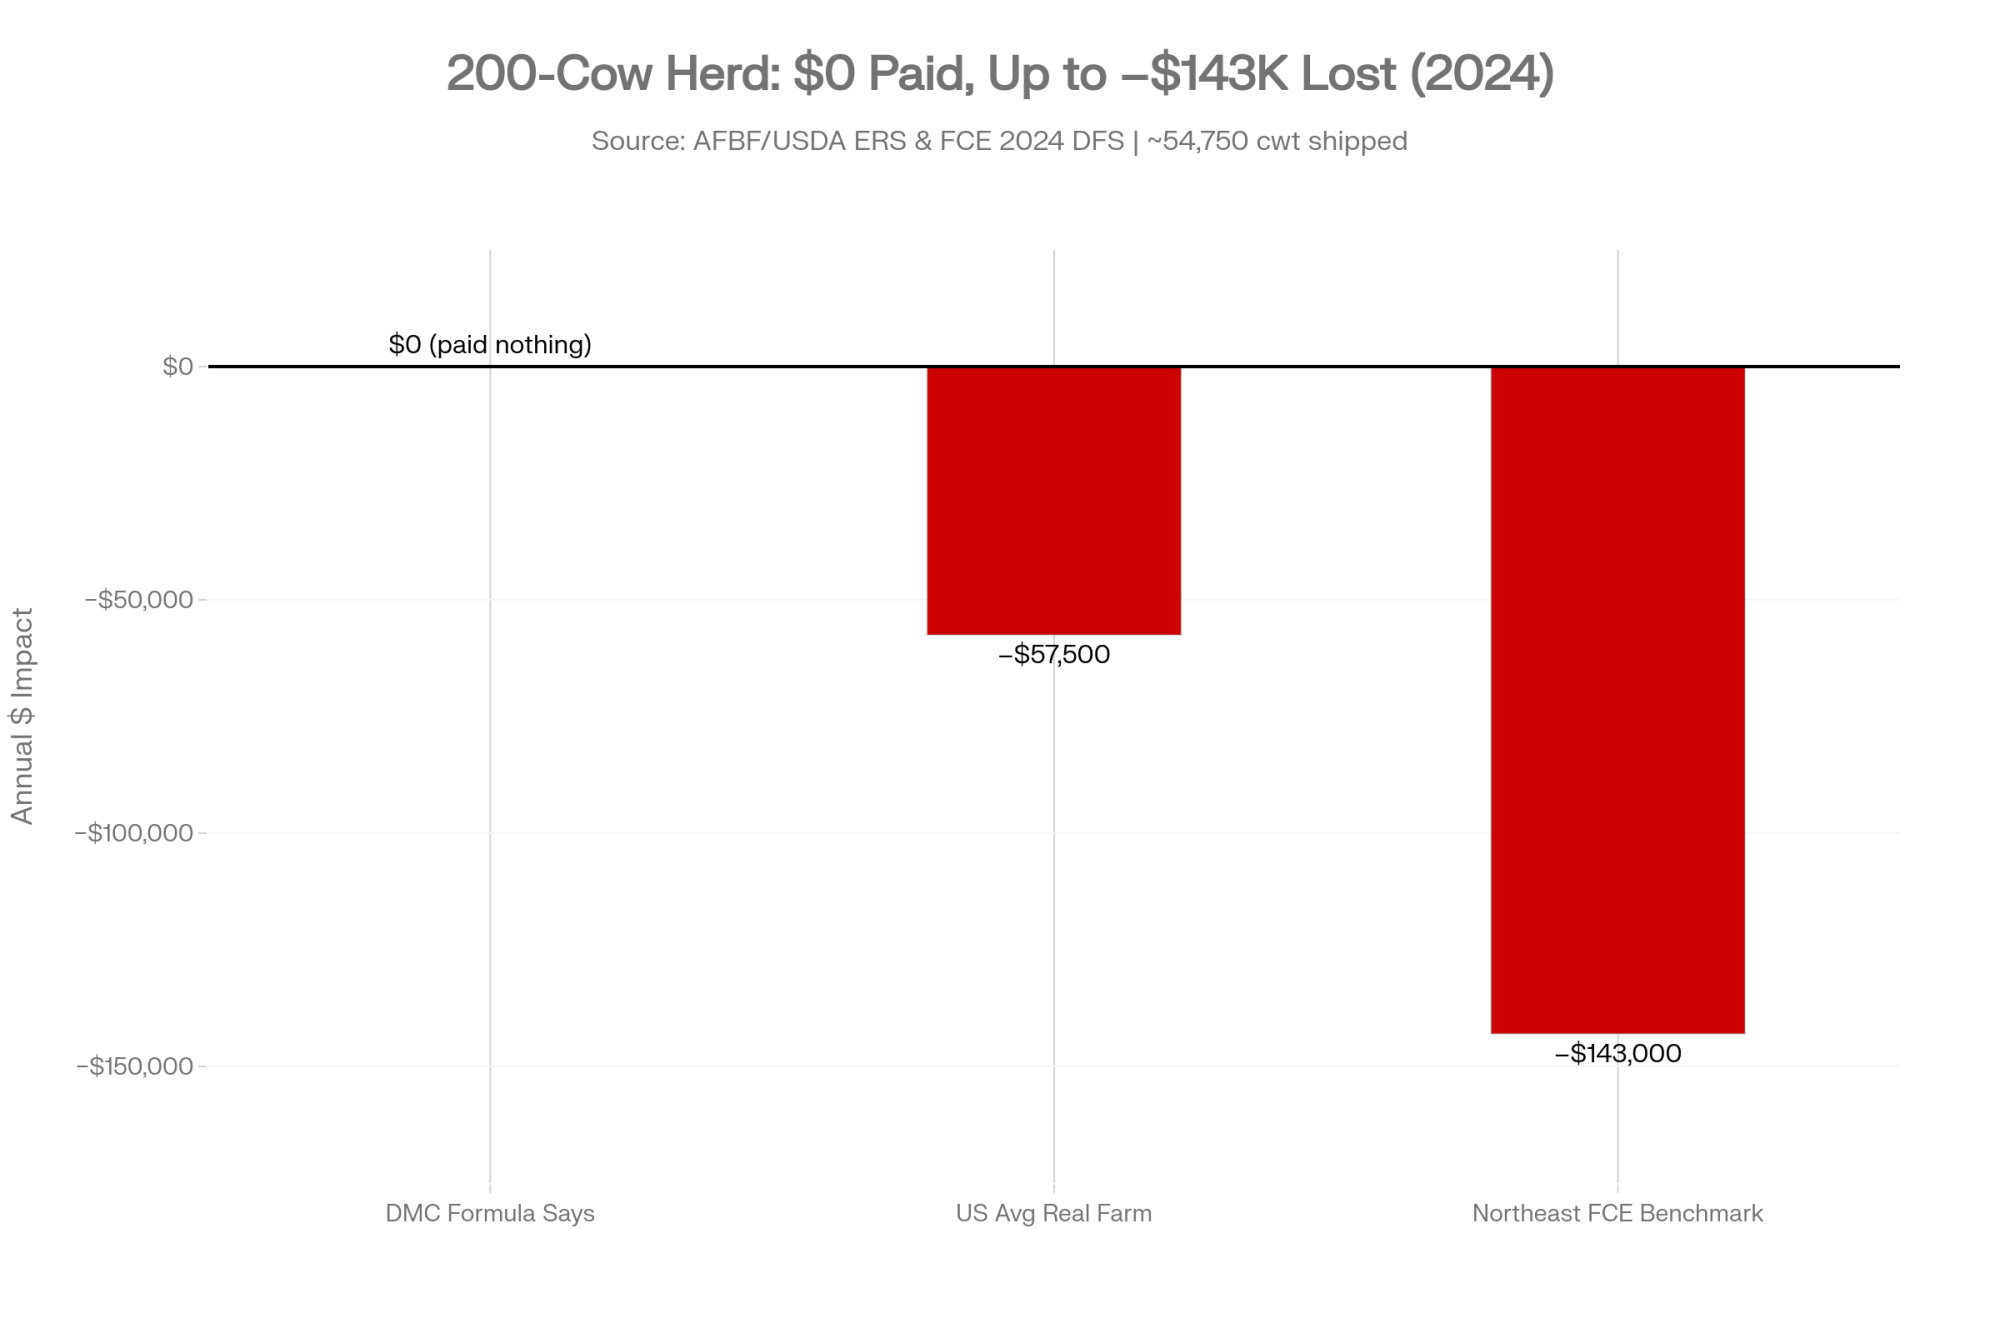
Executive Summary: USDA’s 2024 Dairy Margin Coverage program calculated an 11.98/cwt national margin, never tripped its 9.50 trigger, and paid almost nothing, while AFBF’s March 2026 analysis of USDA ERS data shows the average U.S. dairy ran a real margin near –1.05/cwt on $23.65/cwt of total cost. Run those national 2024 averages through a 200‑cow Northeast barn shipping ~54,750 cwt, and you compute to roughly –$57,500/year on a full‑cost basis. A 2024 Northeast Dairy Farm Summary (122‑farm benchmark) puts the regional gap wider: 23.93/cwt milk against 26.54/cwt total expenses, or about –$143,000/year on the same herd. OBBBA raised the Tier 1 cap to 6 million pounds and discounted premiums 25% through 2031, but it didn’t touch the formula — which still ignores labor, fuel, repairs, vet, interest, and a New York forage basis the formula doesn’t see. The producers feeling it most are mid‑size, labor‑heavy Northeast dairies whose DSCRs are sliding under 1.10x while DMC tells Washington everything’s fine. Inside: a side‑by‑side scoreboard, the lender language at 0.94 DSCR, and a 30/90/365 playbook for a 200‑cow Northeast herd — including whether the 6‑year DMC lock‑in saves enough ($12,375 on a 5.5M‑lb shipper) to be worth it.
Dairy Margin Coverage 2026

In 2024, the average U.S. dairy carried roughly 23.65/cwt in total production costs against a 22.60/cwt all‑milk price— a real margin near –1.05/cwt, per AFBF’s March 2026 analysis of USDA ERS milk cost‑of‑production data. The federal Dairy Margin Coverage program calculated a national margin of 11.98/cwt that same year, well above its 9.50 trigger, and paid almost nothing for most of 2024 and 2025, per AFBF March 2026 and USDA FSA monthly margin tables.
Same milk. Same year. Two scoreboards.

MetricDMC FormulaUS Avg Real FarmNortheast FCE Benchmark
All-milk price$22.60/cwt$22.60/cwt$23.93/cwt
Feed cost / allowance$10.62/cwt$10.31/cwtIncluded in total below
Non-feed overheadNot calculated$13.34/cwtIncluded in total below
Total cost of production$23.65/cwt$26.54/cwt
Net margin+$11.98/cwt–$1.05/cwt–$2.61/cwt
Tier 1 payout (2024)$0
Annual impact, 200-cow herd$0≈ –$57,500≈ –$143,000

Sources: USDA ERS via AFBF March 2026; 2024 Northeast Dairy Farm Summary (122-farm benchmark, July 2025)

Mid‑size, labor‑heavy Northeast dairies — operations like Center Creek Farm in South Wales, New York — are feeling that gap most. New York Farm Bureau president David Fisher has consistently raised regional cost variation as a structural concern in DMC’s design, in NYFB public statements on federal dairy policy. The producers feeling it most are exactly the ones DMC was sold to protect.

What DMC 2026 Actually Covers After OBBBA

DMC is built on a deliberately simple equation. Take the U.S. all‑milk price, subtract a national feed cost based on corn, soybean meal, and premium alfalfa hay, and that’s your “margin.” If the monthly figure drops below your elected coverage level — up to 9.50/cwt in Tier 1 — the program pays, per USDA FSA program rules.

What it never sees is the rest of the P&L: hired labor, electricity, fuel, repairs, vet, breeding, insurance, property taxes, manure handling, and interest. None of it lives inside the formula. The cost of growing your own forage doesn’t either.
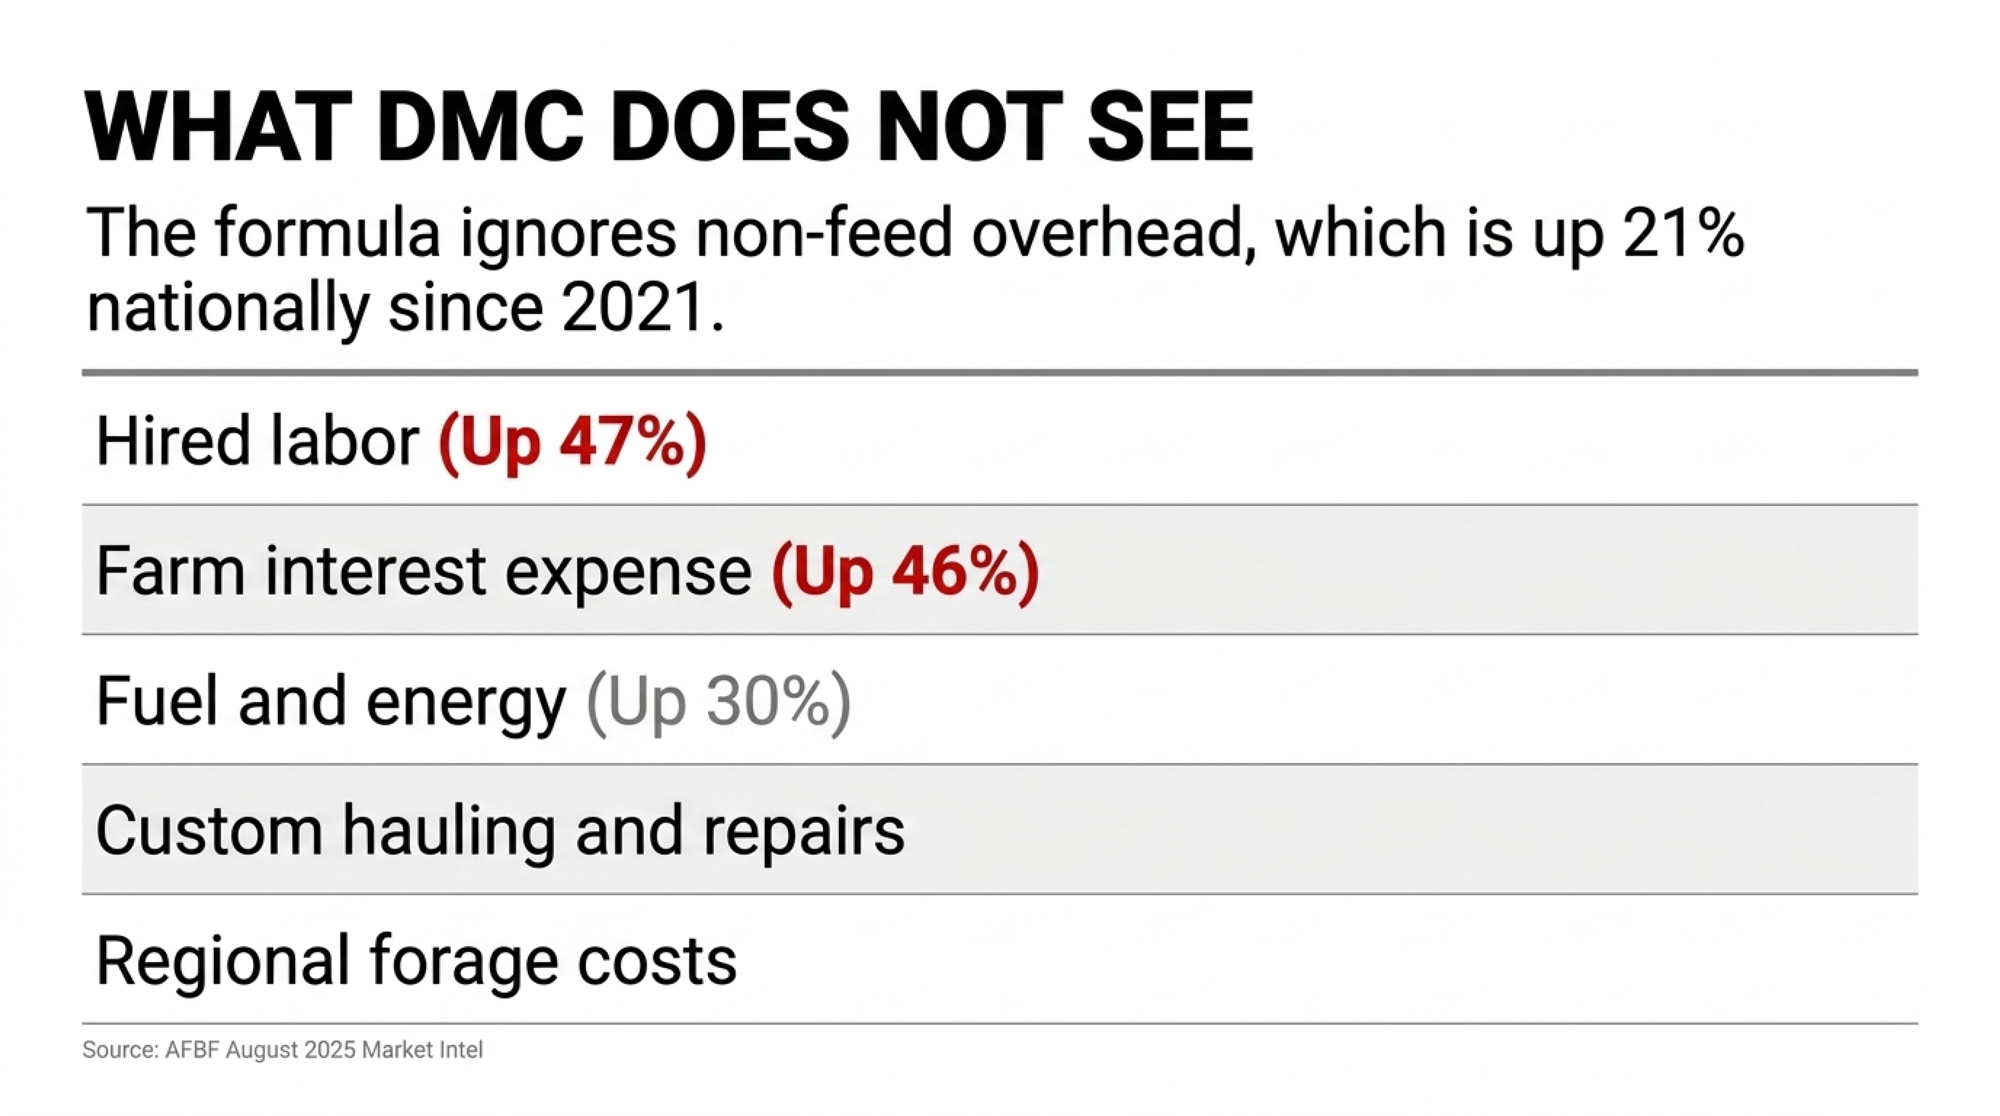
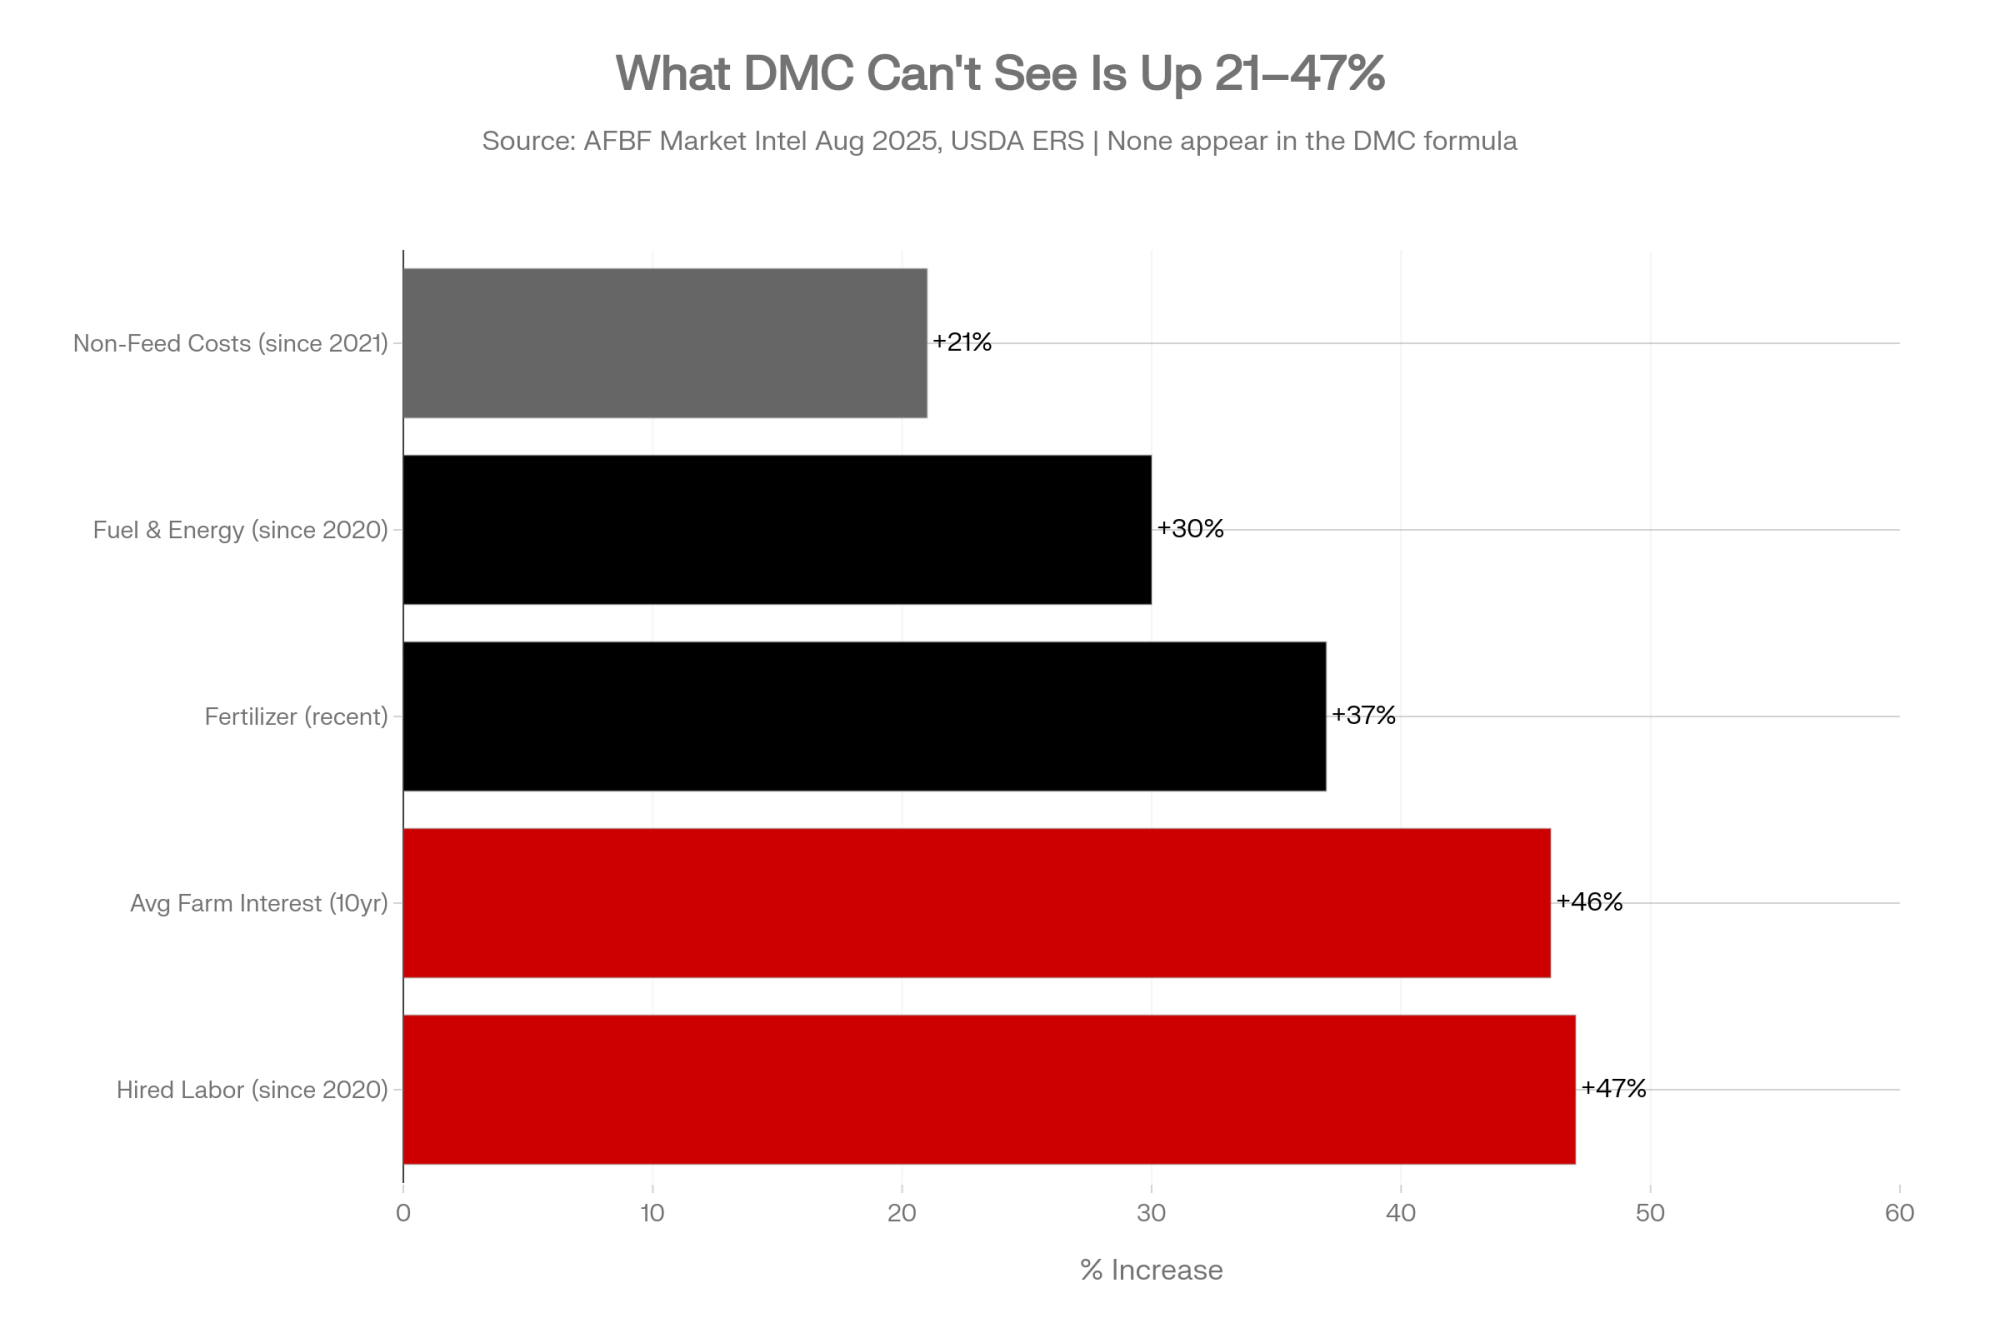
That’s exactly what set up the trap. AFBF estimates non‑feed costs are up roughly 21% since 2021 nationally and aren’t coming back down, per its August 2025 Market Intel using USDA ERS components. Hired labor is up around 47% since 2020. Fuel and energy are up more than 30% over the same window. Fertilizer is up about 37%. Average farm interest expense has climbed roughly 46% over the last decade, with most of the increase concentrated in the last few years. None of those line items show up in the formula USDA uses to decide whether the safety net trips.
The One Big Beautiful Bill Act, signed July 4, 2025, made DMC slightly cheaper and broader. Tier 1 expanded from 5 million to 6 million pounds of production history. Producers who lock in coverage from 2026 through 2031 receive a 25% premium discount, taking the Tier 1 9.50 premium from 0.15/cwt to about 0.1125/cwt. Base history was reset to the highest of 2021, 2022, or 2023, per AFBF March 2026 and USDA FSA’s 2026 enrollment notice. What OBBBA didn’t change is the formula itself. You can buy more of the same scoreboard. The scoreboard still doesn’t see your overhead.

The Northeast Basis Problem Inside the National Average

DMC’s second blind spot is geographic. One national margin is meant to describe California, Idaho, Wisconsin, and New York at the same time, and the numbers don’t cooperate.

A 2024 Northeast Dairy Farm Summary, drawn from a benchmark sample of 122 dairies across its territory, pegs net cost of production at 21.49/cwt. Once family living and total expenses load in, the figure climbs to roughly 26.54/cwt, per FCE’s July 2025 release. Northeast milk price averaged 23.93/cwt that year. Even on the average — not the bottom quartile — Northeast farms came up about 2.61/cwt short of total expenses while DMC was telling Washington everything was fine.

Inside New York, the spread by management and scale is wider still. Cornell PRO‑DAIRY’s 2023 NY Dairy Farm Business Summary shows a meaningful gap between the lowest‑earning and highest‑earning quartiles on the total cost of producing milk. A “comfortable” 9‑12 DMC margin on paper means very different things to those two operations.
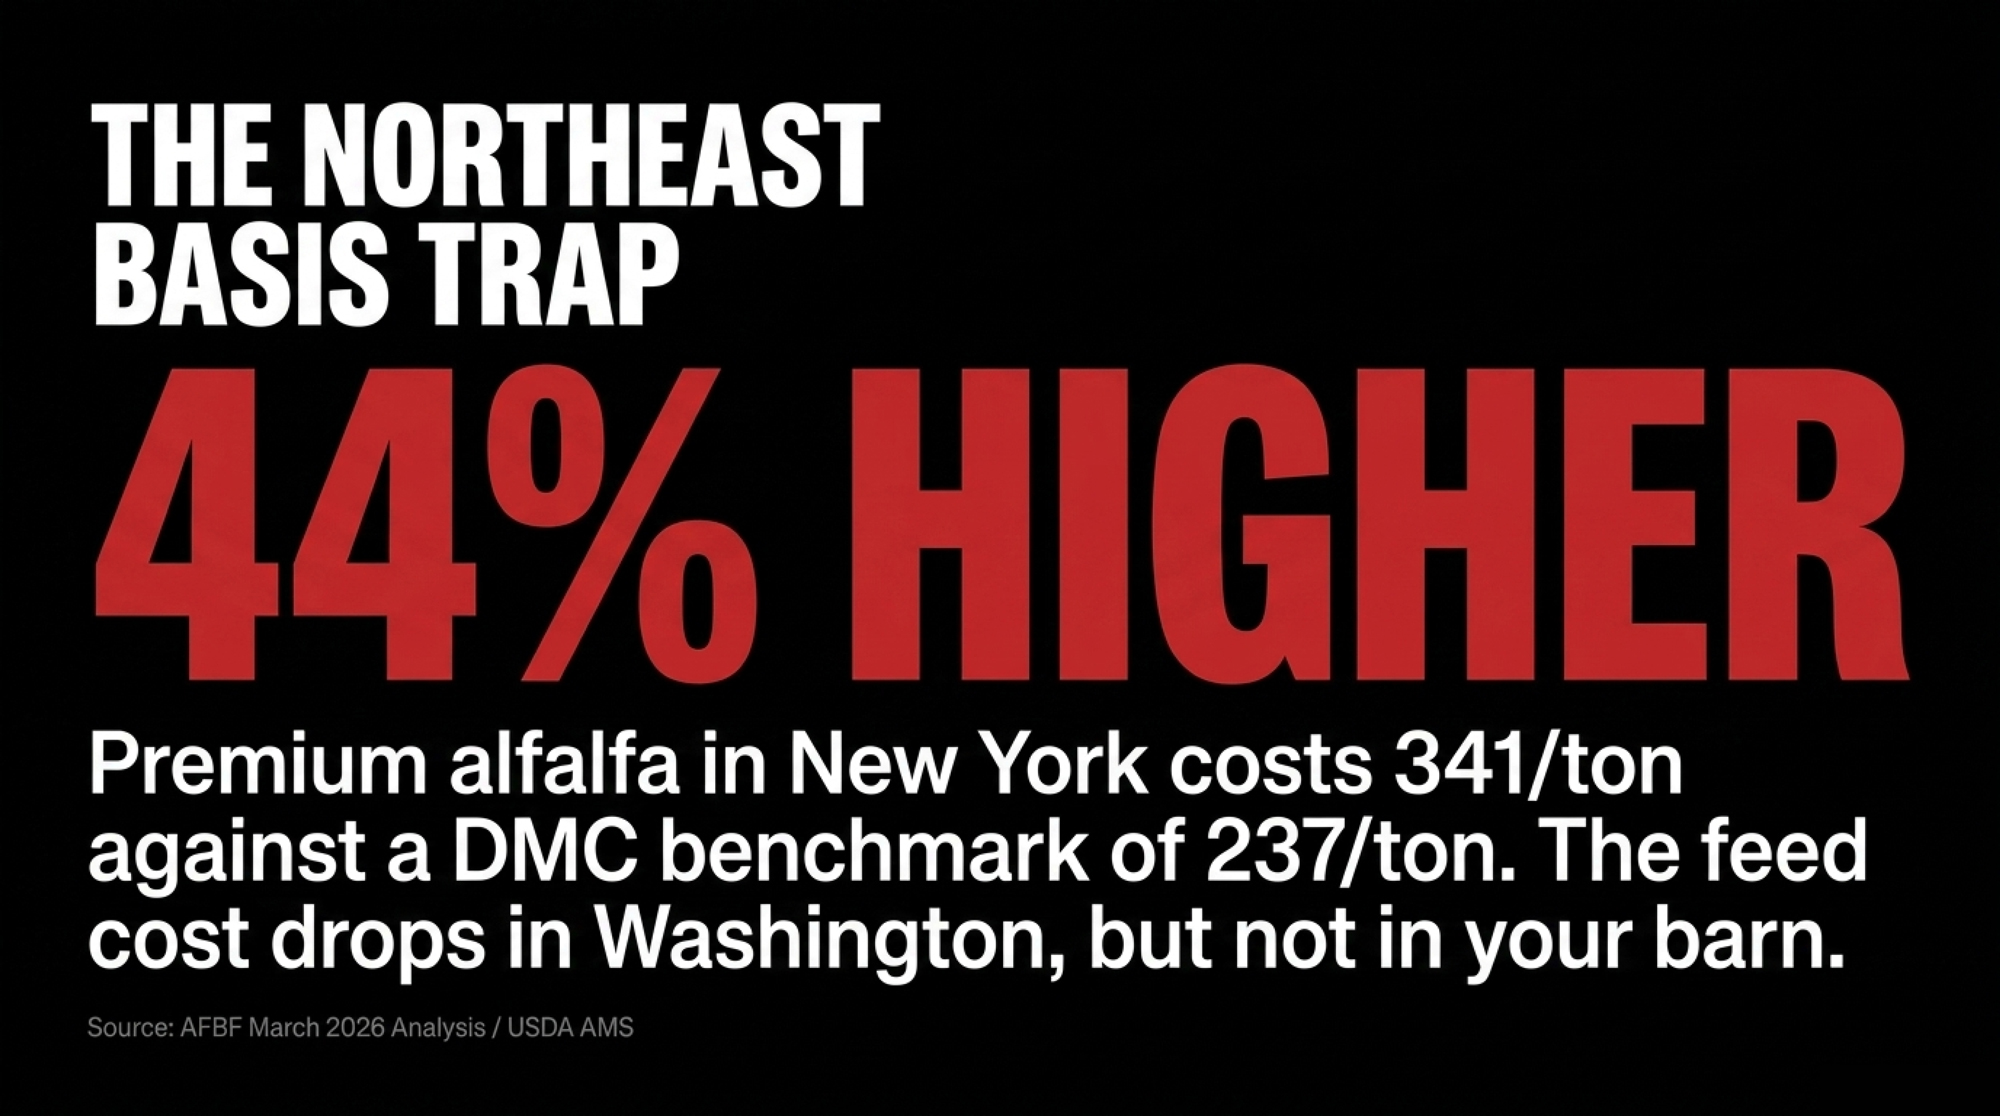
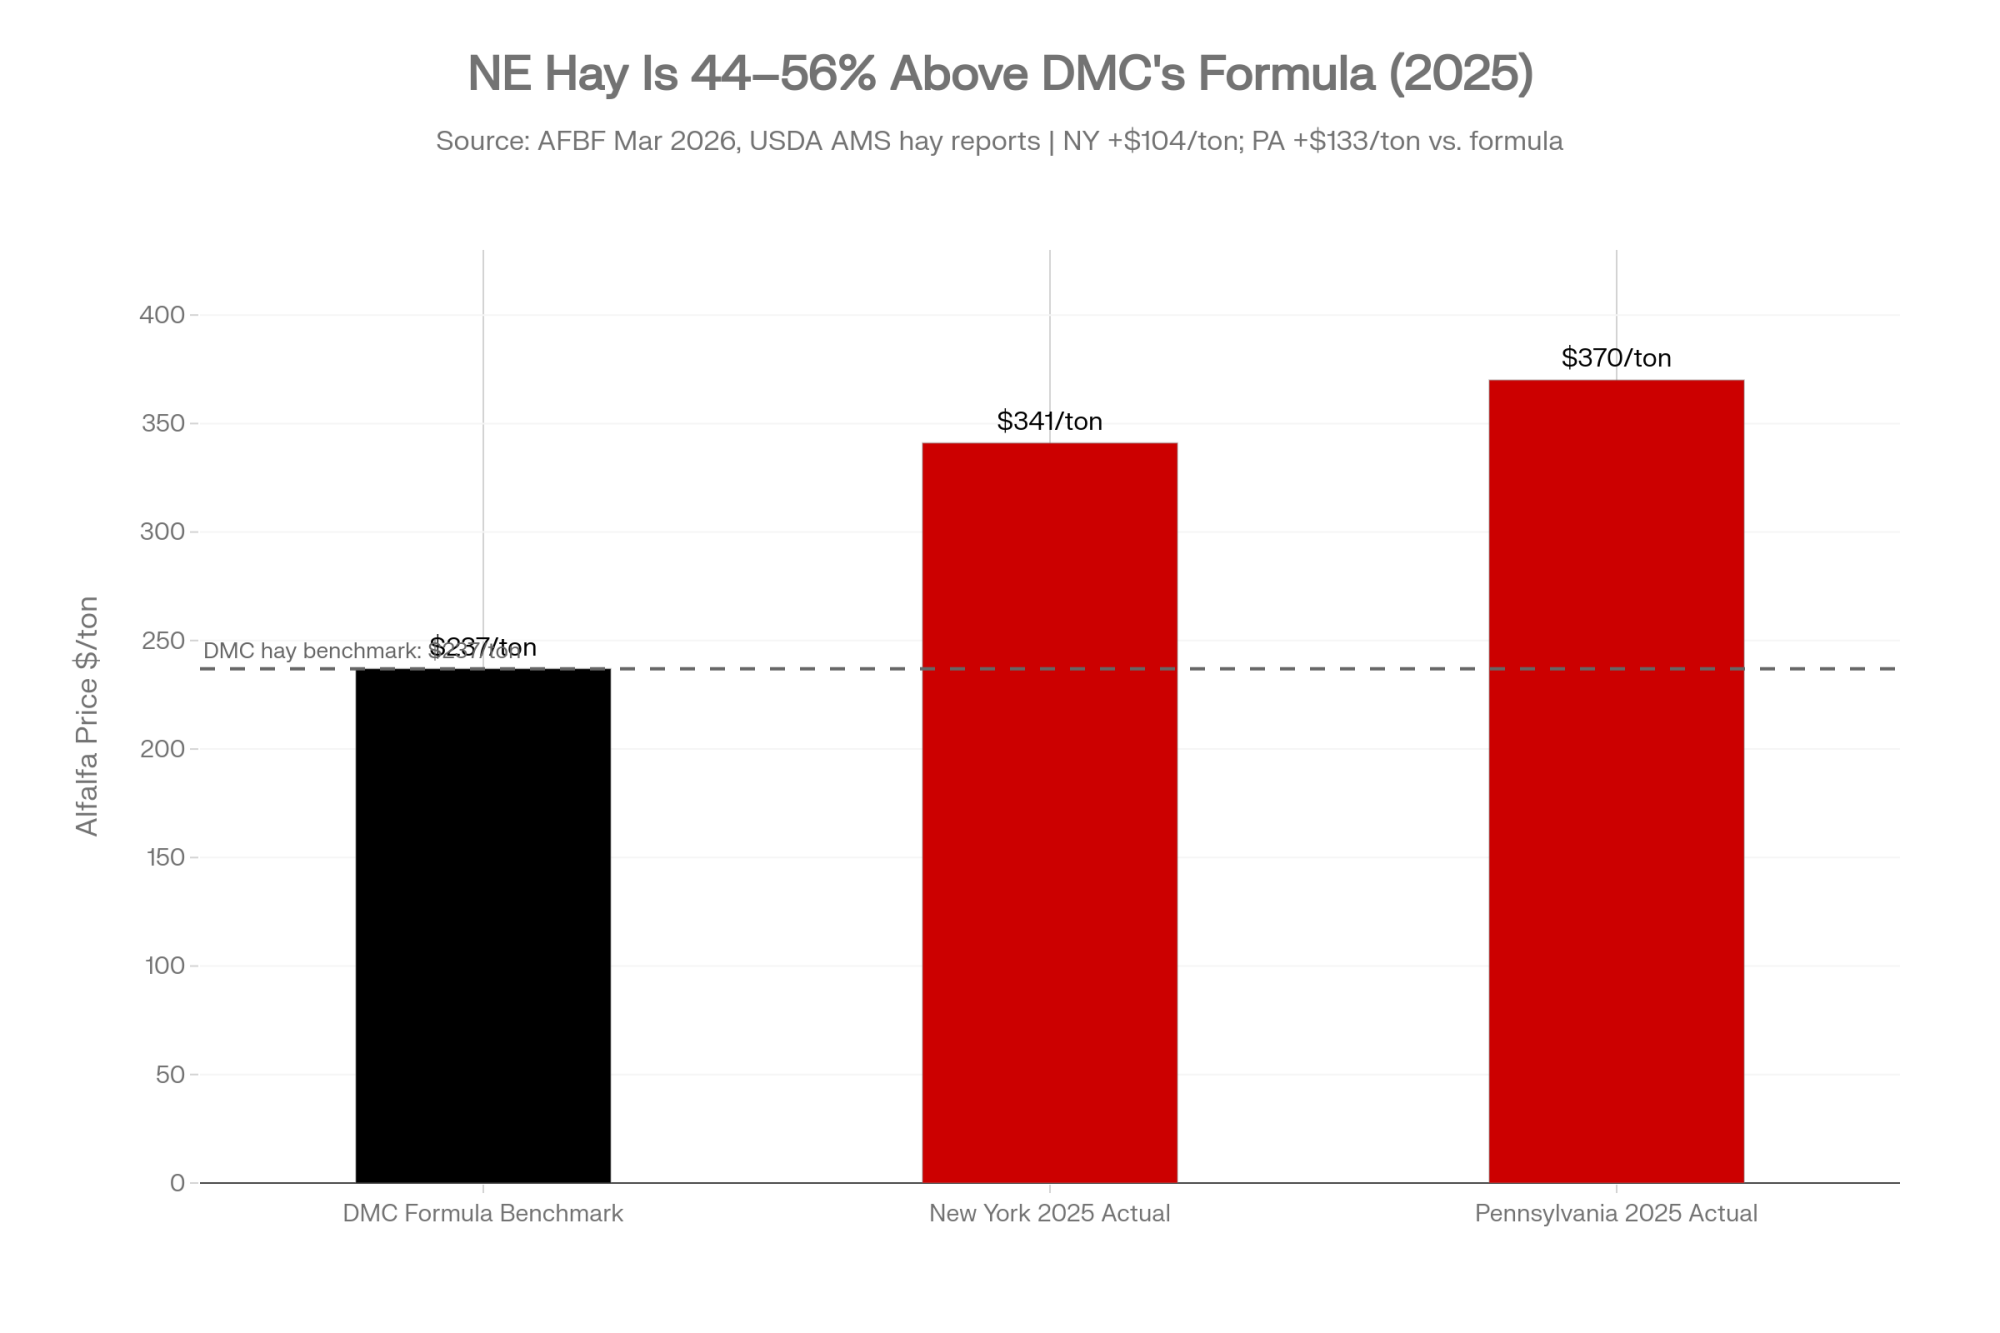
The forage piece tightens it further. AFBF’s March 2026 analysis flags premium alfalfa landing near 341/ton in New York in 2025 against a DMC benchmark closer to 237/ton — about 44% above the formula assumption — while Pennsylvania ran near 370/ton, drawing on USDA AMS hay reports. Northeast operations grow a meaningful share of their own forage. CME corn softens. The DMC feed cost falls. Your barn doesn’t.

Running the Numbers: 2024 Margin Scoreboard, Policy vs. Reality
Sources: National figures from USDA ERS milk cost‑of‑production data via AFBF March 2026; Northeast figures from a 2024 Northeast Dairy Farm Summary (July 2025), 122‑farm benchmark sample. The Northeast column shows total expense, including family living, per FCE’s 2024 DFS, not the same DMC‑style feed/non‑feed split as the national column. 200‑cow herd assumption: 75 lb/cow/day × 365 days ≈ 54,750 cwt shipped. Premium math elsewhere uses 5.5M lb / ≈ 55,000 cwt as a round shipping figure for the same 200‑cow herd; the 250‑cwt difference is rounding.
Metric / Line ItemDMC National FormulaReal Farm Economics (US Avg, 2024)Northeast Full‑Cost (FCE Benchmark, 2024)
All‑milk price22.60/cwt22.60/cwt23.93/cwt
Feed cost / allowance10.62/cwt10.31/cwtincluded in total expense below
Non‑feed overheadnot calculated13.34/cwtincluded in total expense below
Total cost of production23.65/cwt26.54/cwt (incl. family living)
Net calculated margin+11.98/cwt−1.05/cwt−2.61/cwt
Tier 1 program payout$0
Annual impact, 200‑cow herd (~54,750 cwt)$0≈ −$57,500≈ −$143,000
Illustrative gap at 13/cwt (not a predicted loss)$650,000 on 5M lb shipped; $1,300,000 on 10M lb shipped

Two takeaways from one table. The federal scoreboard says +11.98 and pays nothing. Your real scoreboard, especially in the Northeast, says you came up short of total expenses — and your lender already has the second number.
What Does It Look Like When DMC Pays But Your Banker Still Says No?

Picture a Northeast operator walking into Farm Credit at the end of February for renewal. The scene below is composite — built from FCE’s DFS patterns and the DSCR thresholds widely used across Northeast ag lending — not a single named meeting. Every line is something operators are hearing right now.

The lender doesn’t open with policy. They open with the ratio.
“Your debt service coverage ratio came in at 0.94 last year, under 1.0. Your earnings didn’t fully cover principal and interest from operations. I want to help you get out in front of this.”

The producer pushes back. USDA’s own numbers say margins were strong. The banker nods, then pivots — direct, but without flinching from the work ahead together:

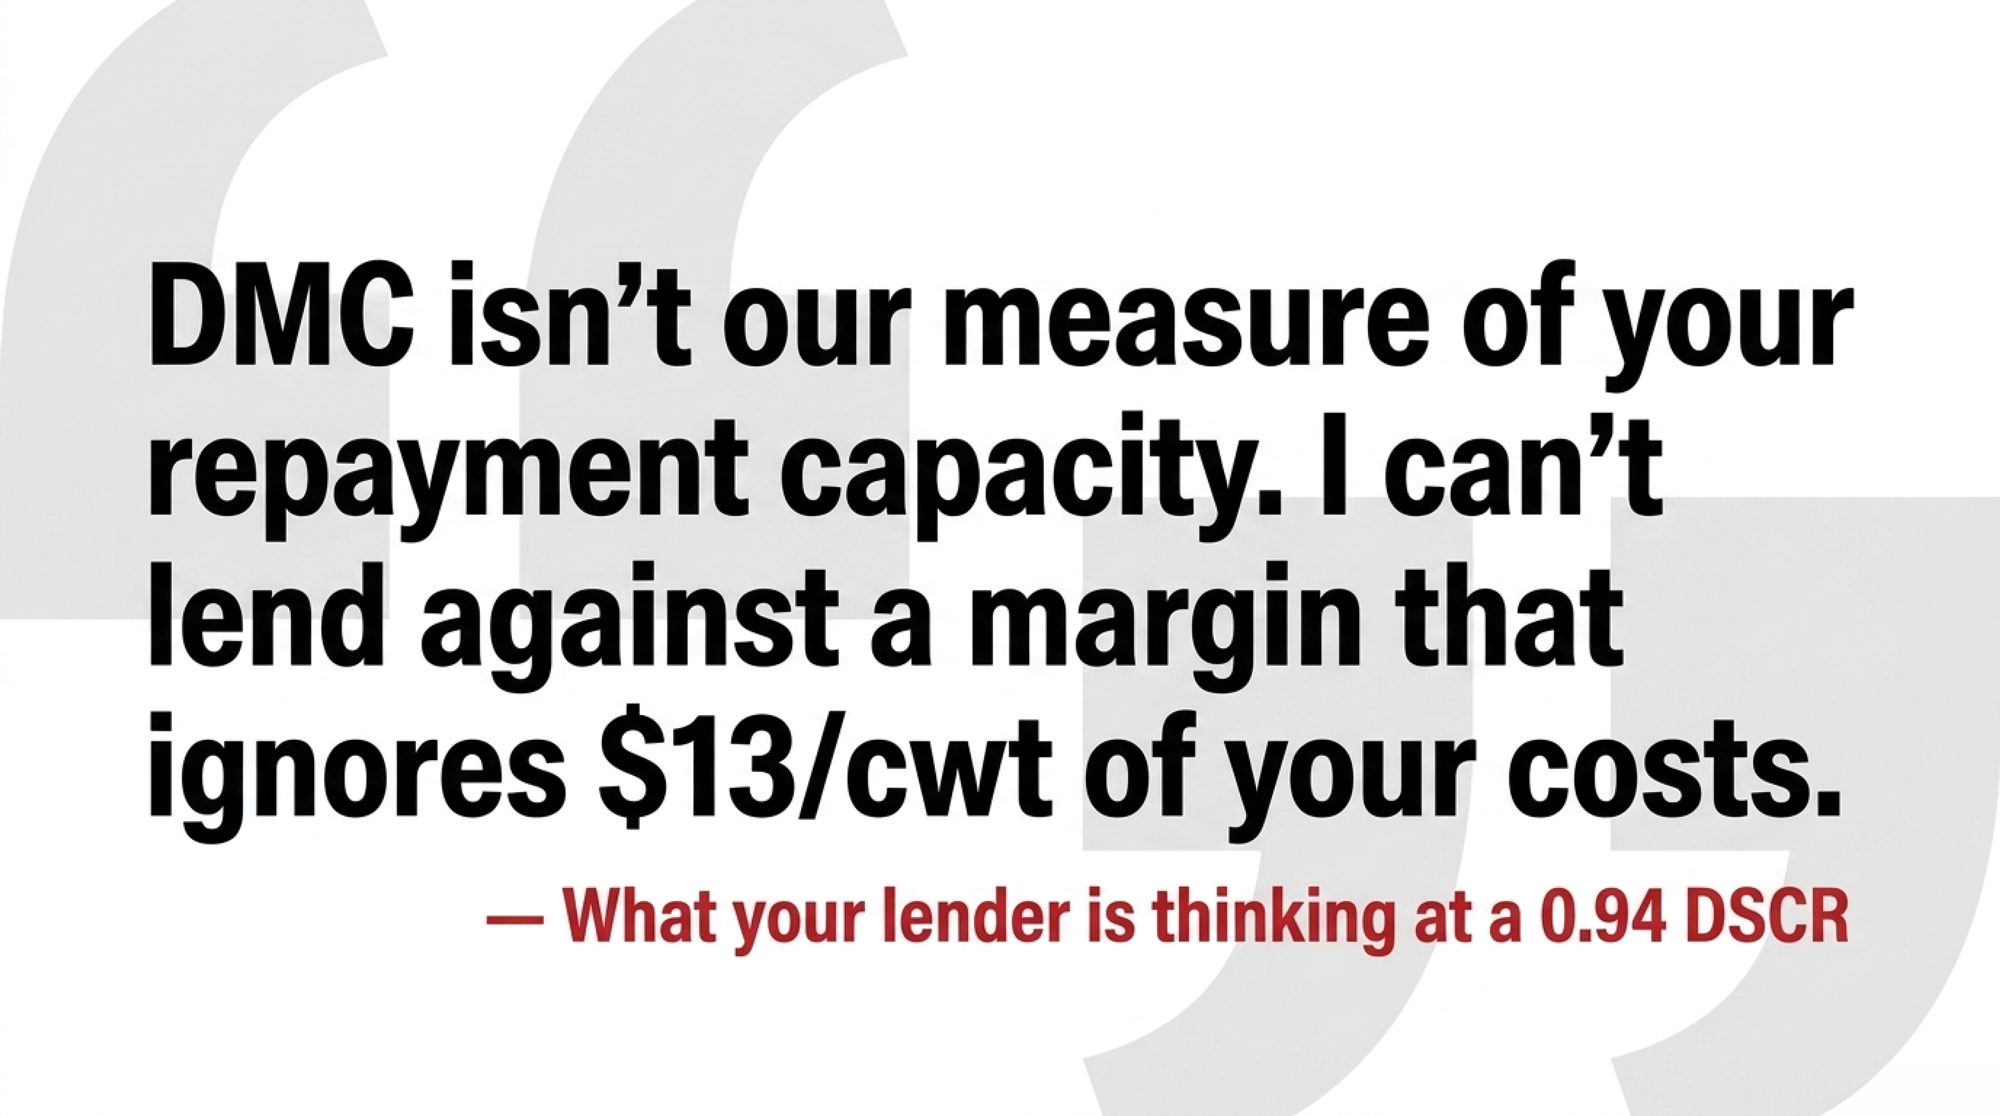
“DMC isn’t our measure of your repayment capacity. We underwrite to your actual cost of production. We’ll take any DMC checks that come — they help. But I can’t lend against a margin that ignores 13/cwt of your costs. So let’s build a plan you and I can both defend to committee.”

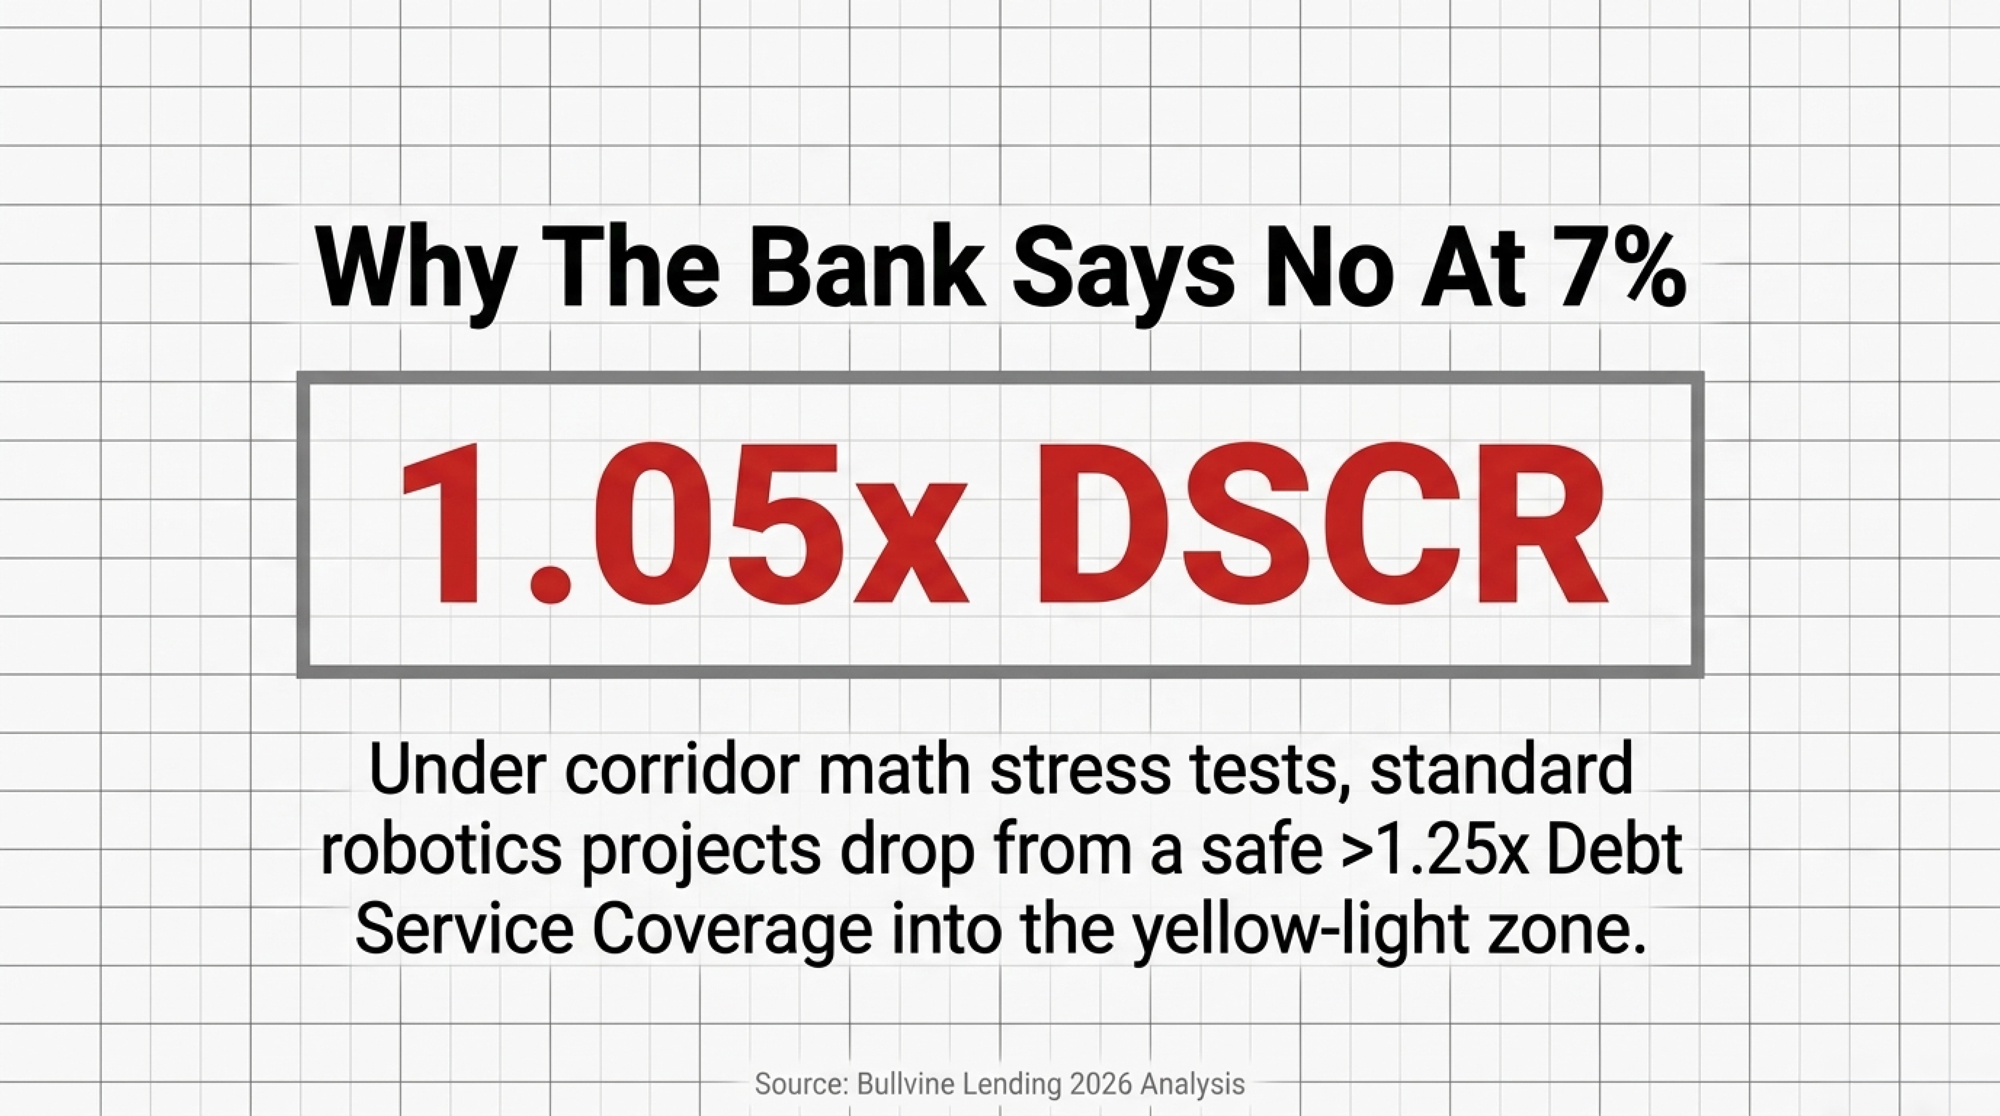
Specific cutoffs vary by institution, but the internal language is consistent across the region. Above 1.10x DSCR is comfort. Between 1.00 and 1.10 is a watch list. A run of 0.85–1.00 starts producing the words “restructuring” and “right‑size.” Below roughly 0.75–0.80, with sliding equity, “orderly” and “exit plan” enter the conversation. Thresholds vary by institution.

Layer that on top of the formula problem, and you get an unforgiving feedback loop. DMC margins look healthy. Real margins go negative. Operating lines stop cycling down. Repair invoices climb while capital purchases stall. Equity erodes a little each year. None of it shows up in DMC. All of it shows up in the credit memo.

DSCR RangeLender StatusTypical LanguageAction Signal
Above 1.20xComfortable“Strong position; room to grow”Refinancing & expansion optionality open
1.10x – 1.20xWatch list entry“We’re watching trends here”Bring real CoP to renewal proactively
1.00x – 1.10xActive watch list“Coverage is thin; covenant tightening”60-day pre-renewal meeting now
0.85x – 1.00xRestructuring zone“Right-size operations; explore options”Operating line review; capital plan required
Below 0.75x – 0.80xExit territory“Orderly exit plan”Equity erosion check; legal/financial counsel

Note: DSCR thresholds vary by institution. Ranges drawn from FCE DFS patterns and Northeast ag lending conventions cited in the article.

Is Your Farm Quietly Drifting Into the “Controlled Crash” Zone?

Most lenders won’t use the phrase out loud. The pattern is consistent anyway. Watch your own books for:

  • An operating line that doesn’t cycle down to zero anymore — an operating line behaving like a term loan is the number one red flag for credit committees.
  • Repair invoices climbing while capital purchases stall.
  • DMC margins that look fine while your real cost‑of‑production margin drifts negative.
  • Equity slipping a couple of points a year, even in “okay” milk‑price years.

If two or three of those are happening at once, you’re not in a rough year. You’re in a pattern. Patterns are what lenders price.

Why Producers Still Mail That Premium Check Anyway

Plenty of operators have stopped believing the DMC margin describes their business — and they still enroll every year. That isn’t habit.

At Tier 1 9.50 with the OBBBA lock‑in discount, you’re paying about 0.1125/cwt for catastrophic feed‑shock coverage on the first 6 million pounds. On a 200‑cow herd shipping 5.5 million pounds, that pencils to roughly $6,200/year for an option that paid out enough to matter in 2021 and 2023. AFBF estimates DMC has delivered more than $2.7 billion in net support since 2019, with payouts above $1 billion in both 2021 and 2023.

There’s a political layer too. Enrollment numbers are the first data point staffers reach for when the next Farm Bill cycle opens. Walking away from a subsidized backstop in your region weakens the case your senators and Farm Bureau make on your behalf — and risks leaving you outside the eligibility line if a future ad‑hoc fix is bolted onto “enrolled producers.” Most operators read that risk clearly and stay in.

The honest framing: DMC is a cheap option on a feed‑shock year and a participation chip in the next reform fight. It isn’t a margin tool, and it never will be, until the formula itself changes.

The 30/90/365‑Day Playbook for a 200‑Cow Northeast Herd

You can’t fix the formula from the kitchen table. You can change which scoreboard governs your decisions.

30‑Day Actions (urgent checks)

  • Rebuild your 2024 and 2025 cost of production line by line, with non‑feed broken out: labor, power, repairs, vet, fertilizer/seed for homegrown forage, insurance, interest. Lay it next to your DMC margin for the same months. The number you’re looking for is your own gap between USDA’s margin and your real margin. Requires:clean GL data, a CPA or an analyst hour, an honest non‑feed split. Where it backfires: it surfaces hard truths you might prefer to leave unsaid.
  • Pull your last twelve months of operating‑line statements and mark every month the line touched zero. If it never zeroed out, your operating line is behaving like a term loan — which is the number one red flag for credit committees. Treat it as a structural pressure, not a seasonal one.
  • Red‑flag trigger: if your DSCR has been under 1.10x for three or more consecutive quarters by your lender’s or CPA’s calculation, treat that as urgent. That’s the level where covenant language and stress tests start tightening, even if no one says so out loud.

90‑Day Actions (structural adjustments)

  • Schedule a pre‑renewal meeting 60–90 days before your line expires, not the week of. Bring a one‑page capital plan, your real cost‑of‑production worksheet, and a written summary of any Dairy‑RP, LGM, or LRP coverage you carry. Requires: about 60 days of prep, a written narrative on equity and capital plans. Where it backfires: you can’t un‑show the numbers; bring them anyway.
  • Price out a Dairy‑RP layer on top of DMC for your state. Dairy‑RP indexes covered milk to your region and protects up to 95% of expected revenue against quarterly declines — directly addressing the basis problem DMC ignores, per USDA RMA’s Dairy Revenue Protection product description. Pull a current sample premium for your state and coverage band from your crop insurance agent so you can compare it line‑by‑line against your DMC premium for the same production. Requires: an insurance agent who actually knows dairy products, premium capacity, bandwidth to manage quarterly endorsements. Where it backfires: premiums can be heavy in volatile markets, and lapses in coverage can affect lender posture if they’ve quietly built it into underwriting.
  • Build a deferred‑capital schedule for parlor, milking, manure, and forage equipment. Two or more unplanned major repair events in 18 months is a deferred‑maintenance signal, not bad luck.

365‑Day Moves (strategic positioning)

  • Decide whether the 6‑year DMC lock‑in fits your structure. The 25% premium discount saves about (0.15 − 0.1125) × 55,000 × 6 = $12,375 on a 200‑cow / 5.5M‑lb herd — real money on a cheap option, but it ties you to an unreformed formula through 2031.
  • If you’re Northeast and growing a meaningful share of your own forage, run a homegrown‑feed cost breakdown against the national DMC ration. If your real feed cost stays well above the formula even when CME corn is soft, you have a quantified basis case to bring to your delegation and your co‑op.
  • Opportunity signal: if your DSCR rebuilds above 1.20x for two consecutive years and your equity trend turns positive, you regain real optionality — refinancing, measured expansion, or selective herd upgrades — that operations stuck under 1.0x don’t have.

What This Means For Your Operation

The DMC formula won’t start seeing your labor, your power bill, or your custom hauling invoice in time to save your next renewal cycle. The fix that would matter most — a regional non‑feed allowance baked into the margin calculation — isn’t in OBBBA, and as of May 2026 isn’t in any public House Ag, Senate Ag, or NMPF reform draft currently circulating.

You can still control which scoreboard governs your decisions. Keep DMC as a cheap option for the one scenario it actually covers. Stop running the business as if its margin number is your margin number. Walk into your next lender meeting with the same numbers your banker is already looking at — before they’re the ones explaining them to you.

The trade‑off is uncomfortable but clean. You can manage to two scoreboards for a while. Only one of them decides whether the farm survives the next down‑cycle, and it isn’t the one in Washington.

Pull your last three milk checks and your last operating‑line statement. What does that gap actually show — and how far is it from the DMC margin you’ve been quoted for the same period?

Run Your Numbers

Farm Benchmark Snap Check — Stack your real cost of production, milk price, and DSCR against Northeast benchmarks so you walk into renewal with the same numbers your lender’s already looking at — not the DMC margin USDA prints. Stress-test whether the 6-year lock-in actually pencils on your shipping volume.
Key Takeaways

  • DMC’s 2024 scoreboard read +11.98/cwt and paid almost nothing, but a 200‑cow Northeast barn ran a real margin near –1.05/cwt nationally and –2.61/cwt on the FCE benchmark — that’s roughly –$57,500 to –$143,000/year the formula can’t see.
  • OBBBA made DMC cheaper (Tier 1 to 6M lb, 25% premium discount through 2031), but it didn’t touch the formula. Treat DMC as a cheap option on a feed‑shock year, not a margin tool.
  • If your DSCR has been under 1.10x for three or more consecutive quarters, or your operating line is behaving like a term loan, walk into renewal early with your real cost of production — not USDA’s margin number.
  • Before you sign the 6‑year lock‑in, price out a Dairy‑RP layer for your state. The lock‑in saves about $12,375 on a 5.5M‑lb shipper, but Dairy‑RP is the product that actually covers the basis problem DMC ignores.

Complete references and supporting documentation are available upon request by contacting the editorial team at editor@thebullvine.com.

Learn More

The Sunday Read Dairy Professionals Don’t Skip.

Every week, thousands of producers, breeders, and industry insiders open Bullvine Weekly for genetics insights, market shifts, and profit strategies they won’t find anywhere else. One email. Five minutes. Smarter decisions all week.
NewsSubscribe
First
Last
Consent

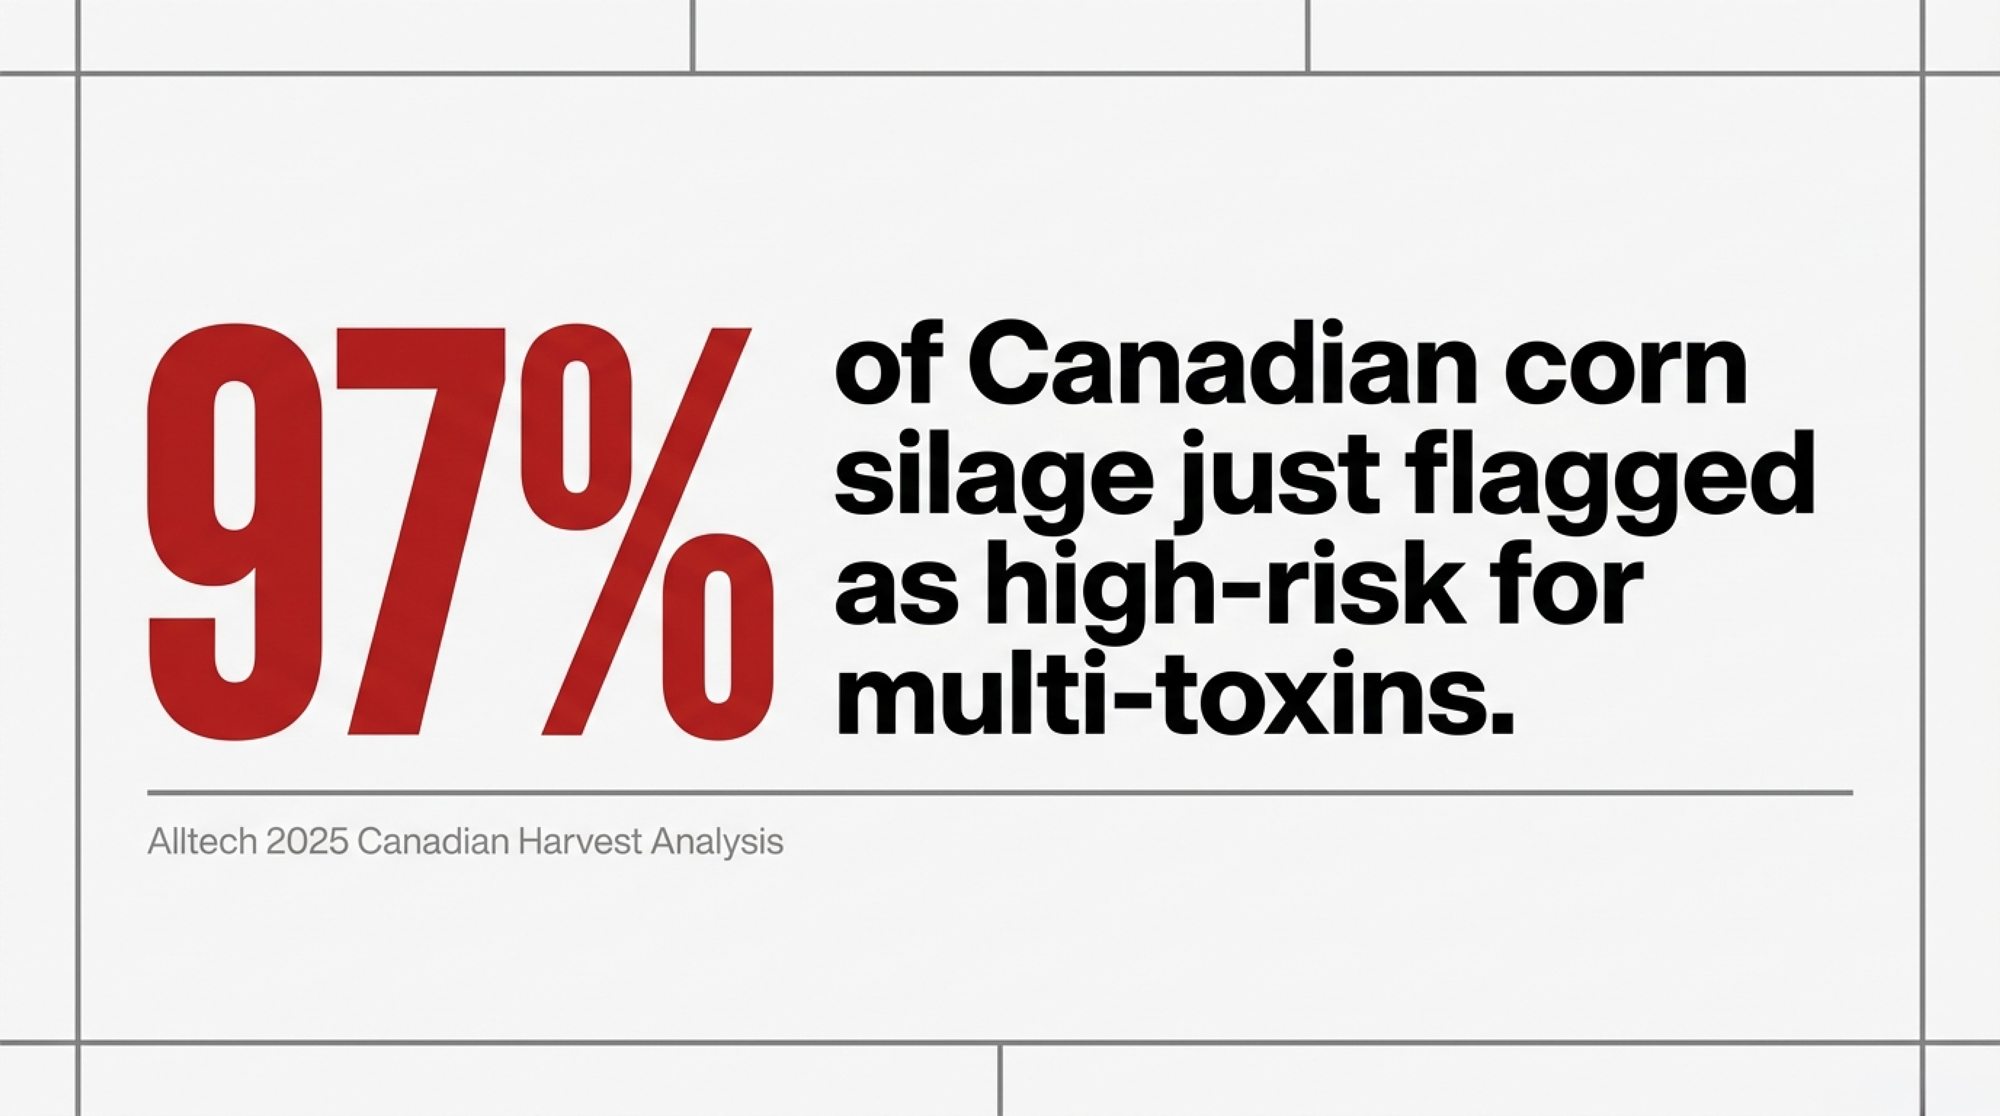
97% of Canadian Corn Silage Just Flagged High-Risk. The Grain Didn’t.

Alltech’s 2025 data hit 97% moderate-to-high multi-toxin risk on Canadian corn silage. Ontario grain corn? 98% clean below 2 ppm DON. Same fields. Different feed. Different decision.

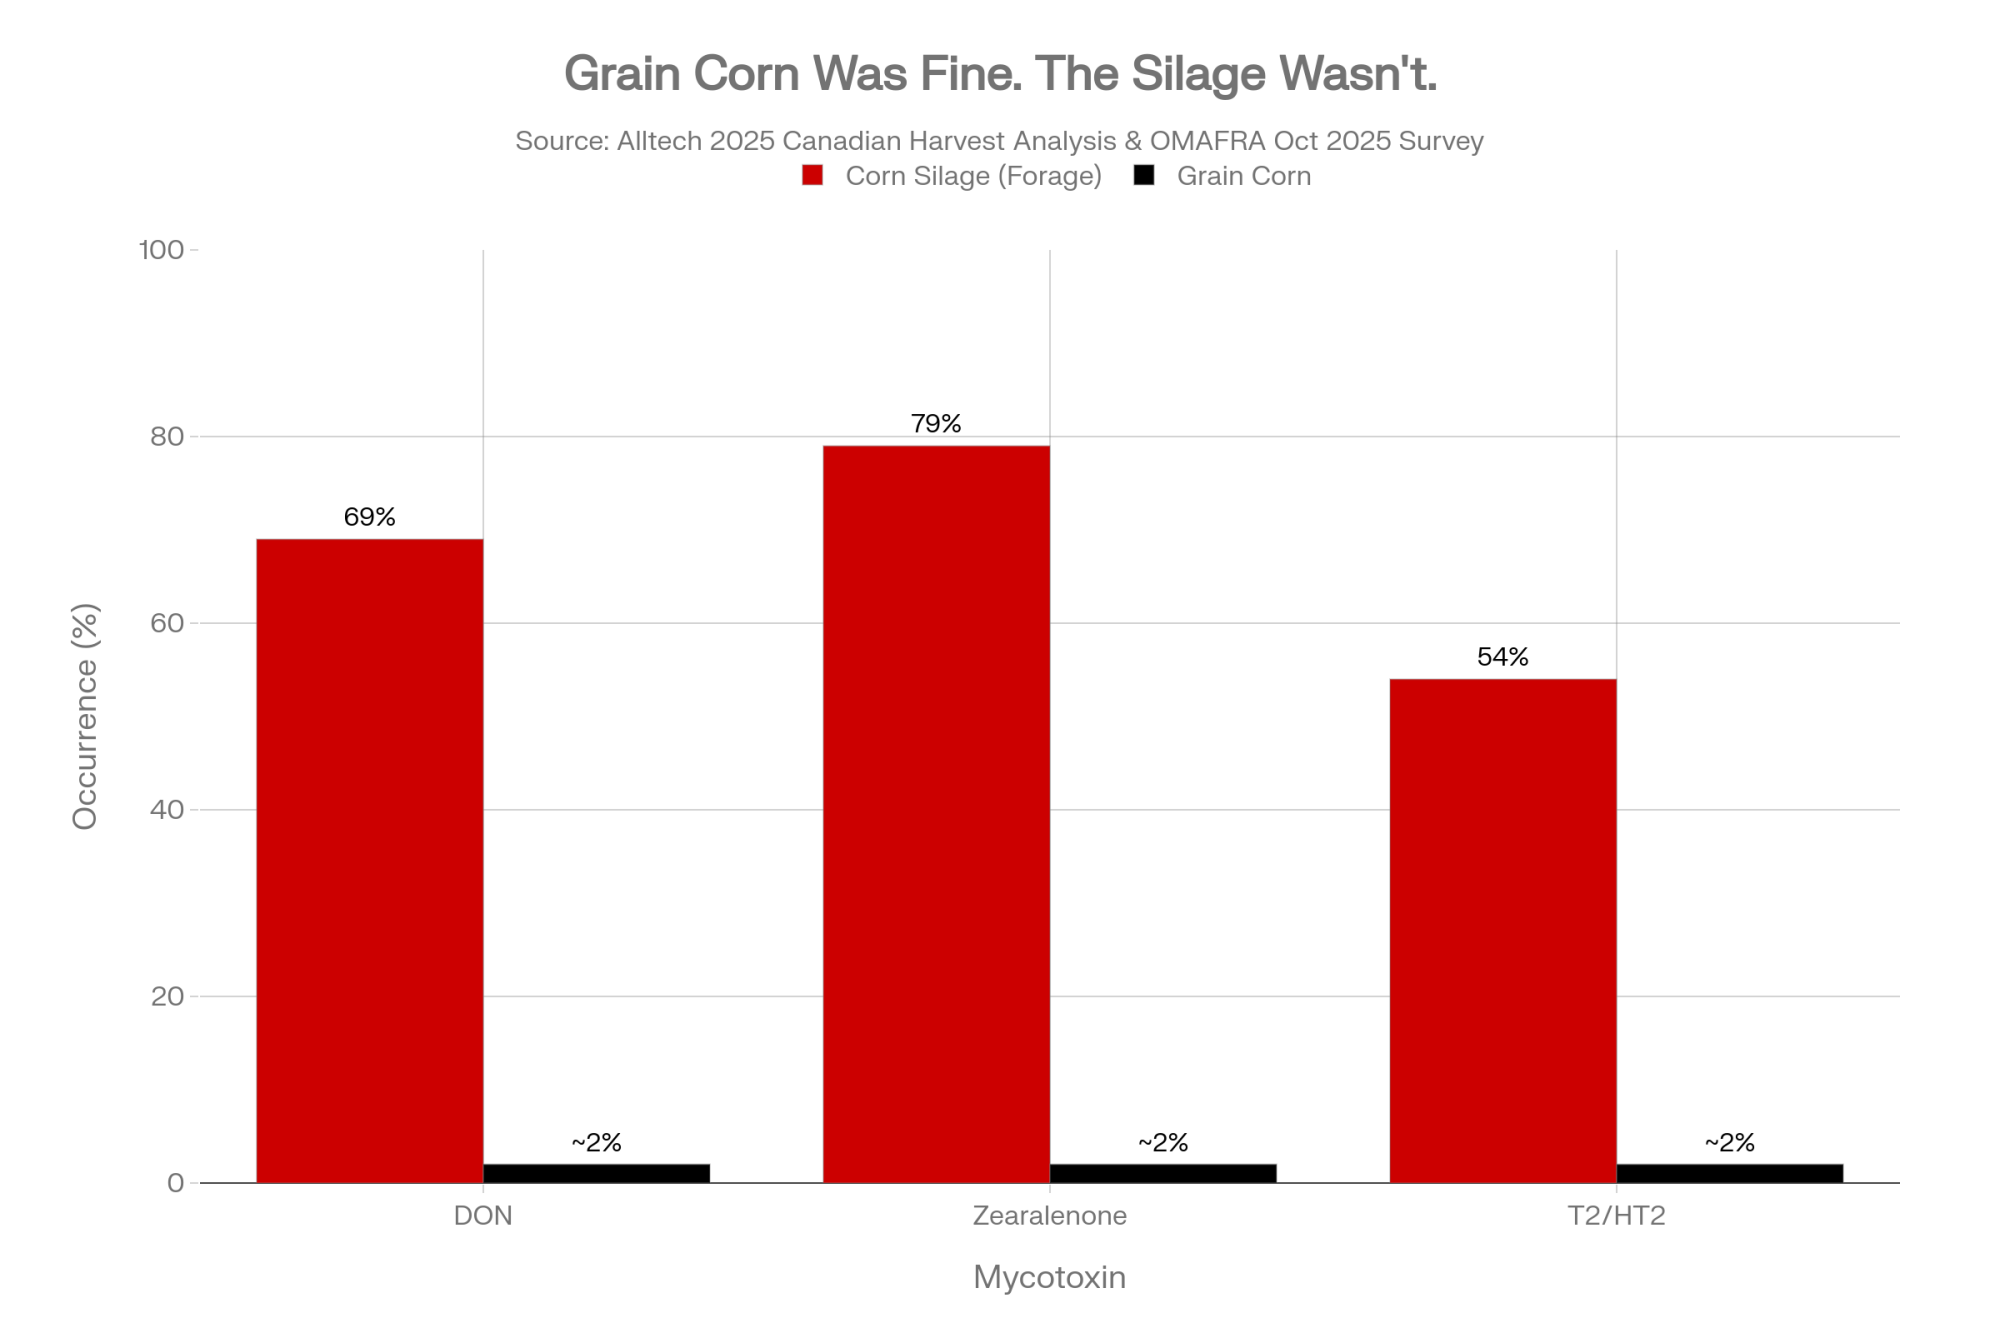
Executive Summary: Alltech’s 2025 Canadian Harvest Analysis flagged 97% of Canadian corn silage samples as moderate-to-high multi-toxin risk on the REQ model, while OMAFRA’s October 2025 Ontario survey returned 98% of 231 grain corn samples below 2 ppm DON — one of the cleanest grain corn years on recent record. The contamination didn’t disappear; it concentrated in forages, where 69% of national samples carried DON, 79% carried zearalenone, and 54% carried T2/HT2. That matters because forages are 40 to 70% of every TMR you mix. The standard protocol — single-toxin grain ELISA plus bentonite — catches 86% of aflatoxin but only 18% of DON and 29% of ZEA, per Kihal et al.’s 2022 meta-analysis. On a 2.2 ppm DON corn silage at 12 kg DM in a 26 kg DMI ration, dietary DON lands at 1.02 ppm — just over CFIA’s 1 ppm limit — and a 0.5 kg DM swap fixes it; add 0.6 ppm haylage and the same swap doesn’t, which is the call most operations never make because they never tested the haylage. Subclinical losses show up as flat milk, creeping SCC without a mastitis pathogen, and days open extending past the repro program’s window — a pattern hiding in plain sight on herds still feeding 2025-crop silage. The 30-day move is a composite multi-toxin panel on every 2025-crop forage in active feeding before this month’s next ration review; the 2026 move is shifting that test to harvest, so the result lands in November and protects a full feeding season instead of limiting damage in April.

Canadian silage mycotoxin

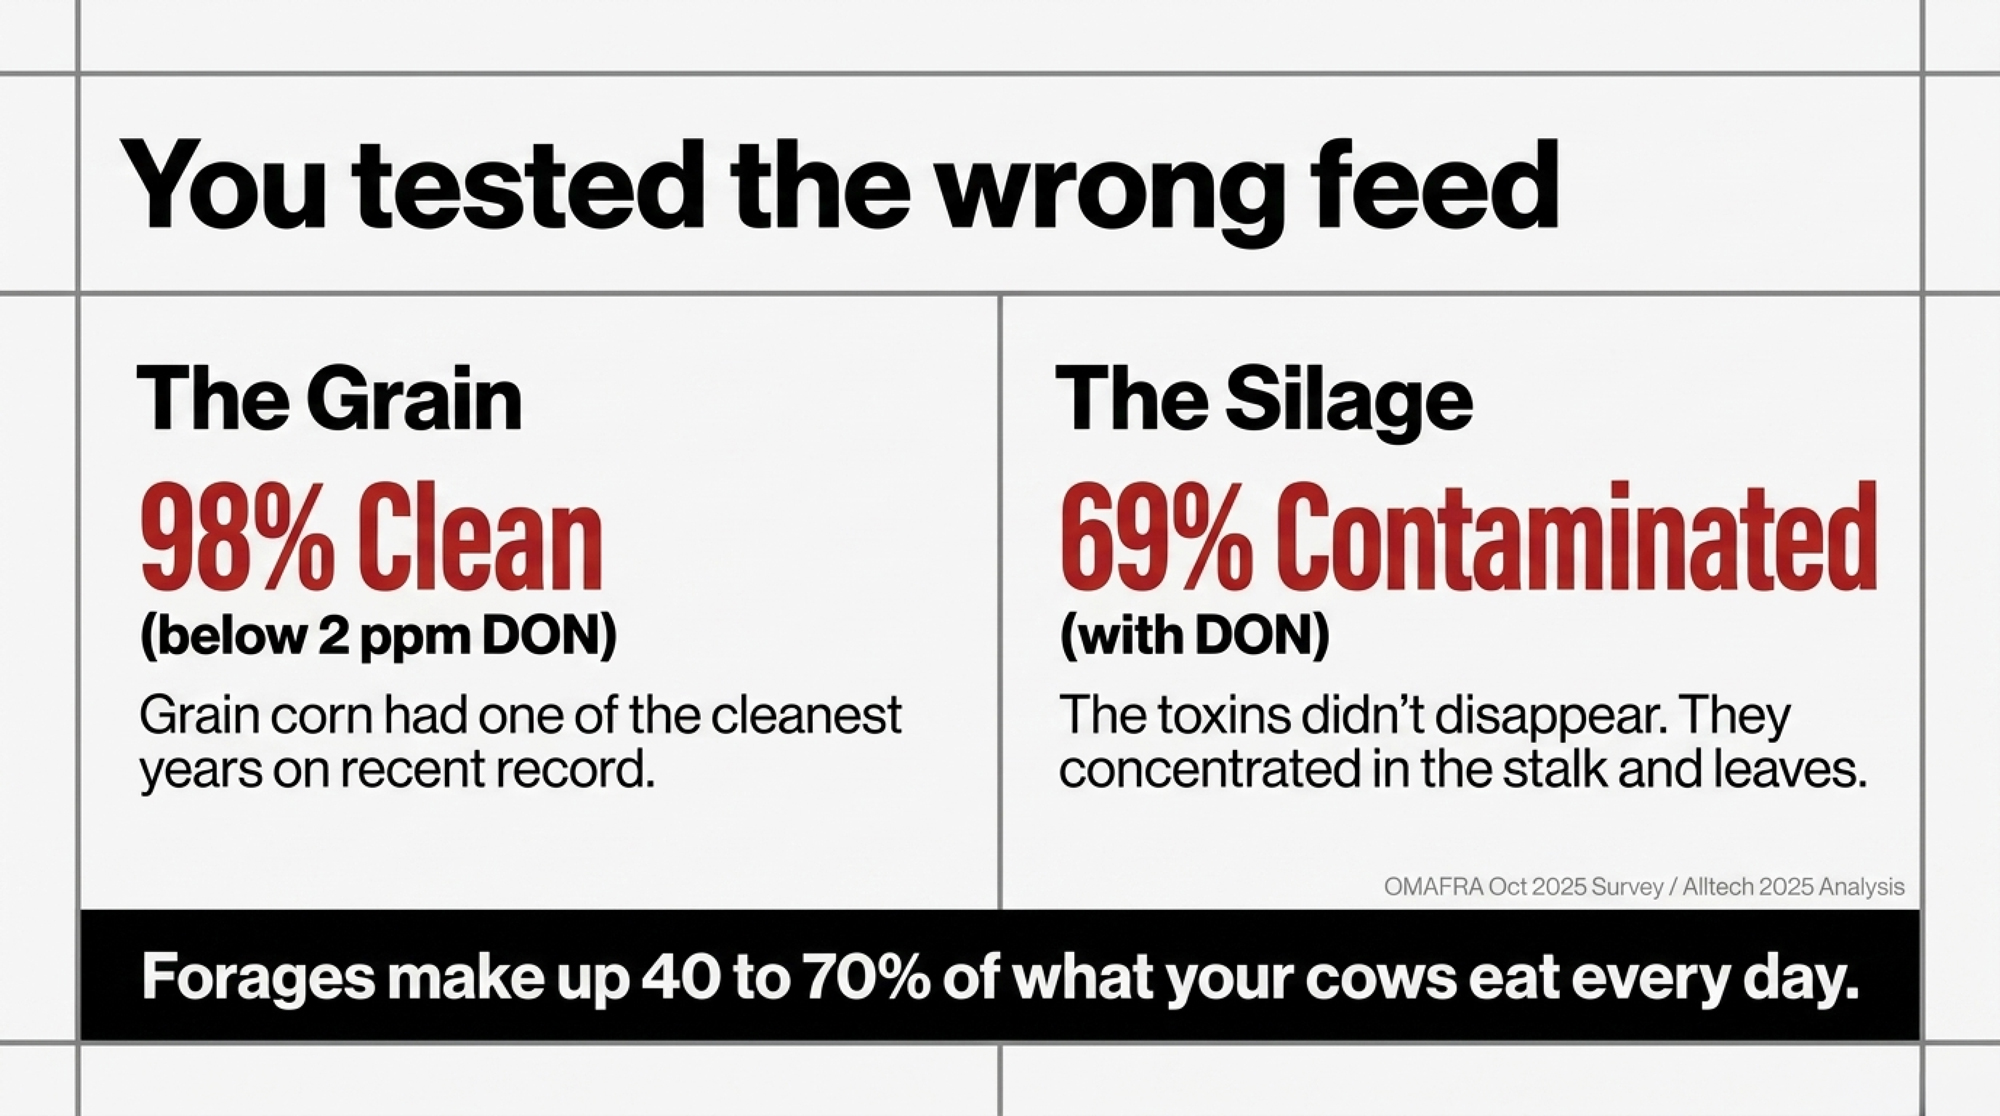
If you tested grain corn last fall, got a passing DON number, and moved on, you weren’t wrong about the grain. You were looking at the wrong feed. Field Crop News’s October 29, 2025, Ontario grain corn ear mould and DON survey by Ben Rosser returned 98% of 231 Ontario grain corn samples — collected September 22 through October 3 — below 2 ppm DON. One of the cleanest Ontario grain corn results on recent record.

Now look at what came off the same fields as forage. The Alltech 2025 Canadian Harvest Analysis — 800 Canadian crop and forage samples collected July through December 2025 — found national forage-wide occurrence of DON in 69% of samples, zearalenone in 79%, and T2/HT2 in 54%. Run that data through Alltech’s proprietary Risk Equivalent Quantity model — a multi-toxin weighting system, not a regulatory threshold — and 97% of Canadian corn silage samples rated moderate-to-high risk. Alltech’s Quebec special report layered the regional detail: 76 Quebec corn silage samples returned an unusual 76% occurrence across all three Fusarium toxin classes — DON, ZEA, and T2/HT2 — pointing to widespread tri-toxin co-contamination rather than dominance by any single toxin. Progressive Dairy’s May 14, 2026, Canadian harvest analysis by Alexandra Weaver confirmed Ontario showed Fusarium occurrence rates of 73 to 85% in corn silage, with DON maximum concentrations up to 21 ppm.

While this data tracks Canadian bunkers, the biological reality crosses every border. A late-season weather shift can leave ears pristine while Fusarium runs rampant through the stalk and leaves. If you’re farming in the US Midwest or Northeast, the geography changes — the diagnostic trap doesn’t. Alltech’s 2025 U.S. Harvest Analysis, covering more than 1,000 U.S. crop and feed samples collected July through December 2025, found corn silage averaged 5.5 mycotoxins per sample, predominantly Fusarium species.

The grain tested fine. The forages didn’t. And forages are 40 to 70% of what your cows are eating every day.

Is Your Mycotoxin Protocol Looking at the Wrong Feed?

This isn’t a feed quality crisis. It’s a diagnostic frame pointing at the wrong commodity.

The standard protocol — test grain corn, run a single-toxin DON ELISA, add a clay-based binder if the number looks elevated — was built for an aflatoxin-and-grain-DON contamination world. That isn’t 2025. The contamination is in corn silage, haylage, and later-cut grass forages. And it’s almost always more than one toxin at a time.

If you’re running 200 to 600 cows in Ontario, Quebec, Manitoba, or anywhere across the US Midwest and Northeast right now, the symptoms may be hiding in plain sight. Flat milk. SCC creeping up without an obvious mastitis pathogen. Days open extending past where the repro program said they should land. Each one individually has a dozen explanations. Together, on a herd feeding 2025-crop forages, they form a pattern.

Why the Standard Binder Isn’t Doing What You Think

The chemistry is straightforward, but it rarely gets walked through end-to-end. Per Kihal et al.’s 2022 meta-analysis of 68 peer-reviewed binder efficacy studies in Animal Feed Science and Technology, the geometry of the toxin determines whether your clay binder catches it or lets it walk through to the cow.

MycotoxinPrimary 2025 SourceBentonite Efficacy2025 Canadian Forage OccurrenceRegulatory Limit (CFIA RG-8 dairy)
AflatoxinGrain / stored concentrate86%Low (<5% forage samples)20 ppb total diet
Zearalenone (ZEA)Corn silage / forages29% ⚠️79% of national samplesNo specific dairy limit; estrogenic effects at >100 ppb
DON (Vomitoxin)Corn silage / forages18% 🔴69% of national samples1 ppm total diet DM
T2/HT2Forages / late-cut grassMinimal (<15%)54% of national samplesNo specific Canadian dairy limit

Aflatoxin fits into the interlayer galleries of montmorillonite clay almost like a key in a lock. DON is a non-planar trichothecene with an epoxide and multiple hydroxyl groups — polar, water-soluble, and structurally incompatible with the ionic adsorption clay relies on. At rumen pH, water competes successfully for the binding sites. The DON stays in solution. The clay catches almost none of it.

Zearalenone has its own twist. Microbial activity in the rumen converts ZEA to alpha-zearalenol, a metabolite with significantly higher estrogen receptor affinity than the parent compound. The lab number on the feed report describes what you fed. What’s actually hitting the cow’s reproductive system is more potent than that.

For operations whose 2025 multi-toxin panel comes back showing aflatoxin as the dominant contaminant — a real but small share of Canadian forages — bentonite stays the right first-line tool. The argument here isn’t that clay binders don’t work. It’s that they’re being deployed against the wrong toxin in 2025 forages.

The Multi-Toxin Math No One Is Running

ScenarioDON (ppm)ZEA (ppm)T2/HT2 (ppm)Single-Toxin Pass/FailMulti-Toxin REQ Risk Rating
Silage A — single toxin dominant1.80.050.03⚠️ FAIL (DON >1 ppm)High
Silage B — co-contamination0.70.400.20✅ PASS (all below threshold)🔴 High
Silage C — tri-toxin low level0.50.300.25✅ PASS🔴 Moderate–High
Silage D — clean baseline0.20.080.05✅ PASSLow
Quebec avg (76-sample survey)~1.2~0.35~0.15⚠️ BORDERLINE🔴 High (76% tri-toxin co-contam)

This is the conceptual gap underneath everything else.

DON and ZEA come from the same fungal genera — Fusarium graminearum, F. culmorum — and the two toxins co-occur frequently in Canadian forage data. Industry survey reporting from DSM-Firmenich’s PROcheck Canadian corn silage panel has shown a substantial share of recent samples — well above two-thirds — containing two or more mycotoxins simultaneously. That co-occurrence pattern is the signal the workflow has to catch.

Here’s why a single-toxin assay misses it. A DON ELISA returning 0.7 ppm shows a passing result. It tells you nothing about whether ZEA is sitting at 0.4 ppm in the same sample, pushing combined exposure past an effective threshold the regulatory framework doesn’t capture. Run four single-toxin tests on the same silage, get four passing results, and the multi-toxin REQ model could still rate that silage as high risk. Not because anyone made a mistake — because the additive exposure is happening in a space the workflow doesn’t measure.

Running the Dilution Math

Here’s what an actual decision looks like when the lab finally returns a multi-toxin panel.

Say corn silage tests at 2.2 ppm DON, dry matter basis. Inclusion is 12 kg DM/cow/day on a total DMI of 26 kg. The corn silage’s contribution to total dietary DON is 2.2 × (12/26) = 1.02 ppm — just above the CFIA RG-8 recommended maximum of 1 ppm DON in total diet dry matter for lactating dairy.

Pulling the silage feels like the safe call. It’s also expensive, disruptive, and on a 1.02 ppm result, probably unnecessary. Drop corn silage to 11.5 kg DM, replace the difference with a confirmed-clean forage at 26 kg total DMI, and the math runs 2.2 × (11.5/26) = 0.97 ppm. A minor formulation change with a working safety margin against day-to-day mixing variability — not a feed crisis.

Now add haylage testing at 0.6 ppm DON, included at 5 kg DM. That contributes 0.6 × (5/26) = 0.115 ppm. Suddenly the same corn silage adjustment isn’t enough — required corn silage drops to about 10.5 kg DM, which is a real ration change requiring a confirmed-clean replacement source. The decision flipped because of one ingredient most operations never test.

That’s the calculation that separates intervention from theatre — the same upstream-decision discipline that drives ration efficiency in high-producing Canadian herds. Without it, nutritionists either over-react and pull a silage that a small adjustment would have fixed, or under-react and stay on a contaminated pile with a clay binder program delivering 18% DON protection.

Four Paths, Depending on Where You Sit Today

OptionBest FitCost SignalWhat It CatchesKey Risk If SkippedPriority
1 — 8-sub-sample composite ELISA (DON+ZEA+T2)All operations feeding 2025-crop silage nowLow ($80–150/panel)Sampling error eliminated; individual toxin levels confirmedSingle grab sample = wasted lab fee; false securityDo this month
2 — Match chemistry to toxin profile (YCW, biotransformation, ZEA hydrolase)Operations with confirmed co-contaminationMedium ($0.15–0.40/cow/day depending on stack)DON de-epoxidation, ZEA hydrolysis, rumen-stable bindingStacking products for a toxin profile you don’t haveAfter panel results
3 — Harvest-phase testing (August–October 2026)All operations — full feeding season protectionLow (same panel, better timing)Full season managed before damage; ration set in NovemberApril result only limits damage already taken2026 gold standard
4 — Full multi-modal program (YCW + bioTransform + antioxidants)Large herds 300+ cows where subclinical losses compoundHigher ($0.35–0.60/cow/day)Multi-toxin + oxidative stress + immune compromiseDeploying without test data = no performance benchmarkAfter harvest panel, for high-risk herds

Option 1: The Minimum Defensible Upgrade. Implement an 8-sub-sample composite ELISA protocol at feed-out, covering DON, ZEA, and T2/HT2. Sampling error accounts for the bulk of total mycotoxin test uncertainty under DSM-Firmenich and Romer Labs sampling guidance. The Risk: Skip the composite protocol, and a single grab sample makes the lab fee a complete waste.

Option 2: Match Chemistry to Toxin Profile. Deploy targeted interventions based on lab reports — yeast cell wall components for ZEA, biotransformation products containing Saccharomyces cerevisiae cell wall preparations for DON de-epoxidation, ZEA hydrolase enzyme chemistry where ZEA is the dominant toxin and repro numbers are slipping. Clay stays in the program for the small share of samples carrying aflatoxin. The Risk: Stacking products without a panel means buying chemistry your herd doesn’t need.

Option 3: Harvest-Phase Testing (The Gold Standard). Pull composites from incoming truckloads before sealing the bunker. Results land by November, giving you months to adjust rations before damage occurs. Same upstream principle that drives transition pen and dry pen returns — different feed window.

Option 4: The Full Multi-Modal Program. Combine YCW, biotransformation enzymes, ZEA-active chemistry, and targeted antioxidant support (vitamin E, selenium). Best fit for larger high-producing herds where subclinical losses compound quickly across the lactation pen — and where a forthcoming Bullvine ROI walk-through on a 400-cow herd at 2026 milk prices will pencil out the actual program math. The Risk: Deploying without testing means you don’t know whether the program is working or whether the herd was never contaminated to begin with.

The 30-Day Action

This fall, build mycotoxin testing into your harvest protocol the same way you build dry matter sampling into chopping decisions. Pull 8-sub-sample composites from the first loads of each forage going into the bunker. Multi-toxin panel — DON, ZEA, T2/HT2, fumonisin, aflatoxin. Result in hand by November. Ration designed against the actual contamination profile, not against last year’s assumptions.

The right-now version, for May 2026 readers feeding 2025-crop forage: before this month’s next ration review, pull a composite multi-toxin panel on every 2025-crop forage in active feeding. Today’s lab result lets you adjust this month’s ration. The fall harvest test is for next year’s losses. Periparturient and early-life immune compromise lower the effective tolerance threshold below the regulatory number — fresh cow pens and early calves carry tighter margins than the herd average suggests.

What This Means for Your Operation

  • If grain corn is your only mycotoxin test, you’re protocol-blind in 2025. Ontario’s 98% clean grain corn result is real. It does not describe the silage in the bunker, and the same diagnostic trap applies wherever 2025-crop forages are being fed.
  • If your binder is bentonite-based and the lab confirms DON or ZEA as the dominant toxins, the program is delivering 18 to 29% of the protection it was bought for.
  • If two or more toxins land on the report — even individually below action levels — assume the dietary effect is closer to the additive total than the highest single number.
  • If total dietary DON sits between 1.0 and 1.3 ppm, run the dilution math before pulling the silage. A 0.5 to 1.5 kg DM adjustment is often the right answer.
  • If you change one thing this year, move forage testing to harvest. The October result gives you the entire feeding season to manage. The April result only limits damage already taken.

Key Takeaways

  • If your only 2025 mycotoxin test was on grain corn, you’ve tested the cleanest commodity in the system.Pull a multi-toxin forage panel before the next ration review.
  • If your binder is bentonite-based and DON or ZEA dominates the lab report, you’re getting 18–29% of the protection you’re paying for. Match chemistry to toxin profile or accept the gap.
  • If two or more toxins hit the report, assume an additive dietary effect. Single-toxin “below threshold” results don’t describe what the cow is metabolizing.
  • If dietary DON is 1.0–1.3 ppm, run dilution math before pulling silage. A 0.5–1.5 kg DM adjustment usually beats a feed-source switch.
  • If you change one thing this cycle, move forage testing to harvest. October data gives a full feeding season to manage; April data only limits damage already taken.

The Decision You Make This Fall

The 2025-crop losses weren’t primarily a science problem. The science is published. The contamination data is published. The binder efficacy data is published. What didn’t catch up was the management calendar — protocols still scheduling mycotoxin assessment as a diagnostic response after clinical signs, instead of a feeding-program input before the first scoop hits the mixer.

When the 2026 corn silage comes off the chopper this September or October, the question isn’t whether to test. It’s whether you’ll know what’s in the pile before it’s sealed, or whether you’ll find out next April when the milk cheque tells you something the cows have known all winter.

Run Your Numbers

Forage Quality Value Calculator — Punch in your 2025-crop corn silage and haylage lab numbers to see net margin per cow per day, annual herd impact, and where each forage actually belongs in the ration before you run the dilution math against your DON results. Cross-check the calculator’s output against a multi-toxin panel — fermentation profile and mycotoxins aren’t modeled in the tool itself.

Complete references and supporting documentation are available upon request by contacting the editorial team at editor@thebullvine.com.

Learn More

The Sunday Read Dairy Professionals Don’t Skip.

Every week, thousands of producers, breeders, and industry insiders open Bullvine Weekly for genetics insights, market shifts, and profit strategies they won’t find anywhere else. One email. Five minutes. Smarter decisions all week.
NewsSubscribe
First
Last
Consent

 Your 2027 Bovaer Contract Prices 30%. Denmark’s Real Number Doesn’t Exist Yet.

Roughly 1,600 Danish herds. Seven months on Bovaer. Zero published efficacy data. Wageningen’s year-long field number ran 21–27%. Your contract assumes 30%. Who eats the gap?

Executive Summary: Denmark mandated Bovaer across roughly 1,600 conventional herds starting October 1, 2025, and seven months in, the commercial methane reduction figure North American 2027 contracts are pricing against still hasn’t been published — not by Aarhus, not by SEGES, not by EFSA. The 30% claim driving those contracts is an EFSA controlled-trial figure; the only year-long field measurement that exists, Wageningen’s, ran 21–27%, and FrieslandCampina’s 158-farm Netherlands pilot landed at 28%. A late-April 2026 Science paper helped explain why: a newly identified rumen ciliate organelle called the hydrogenobody runs upstream of where 3-NOP can reach, making 28–30% a structural ceiling rather than a target. At $0.45/cow/day — $164.25/cow/year on a 1,000-cow herd — the deficit at field-realistic 24% efficacy lands near $97/cow, or about $97,000/year a producer absorbs unless the processor backstops the input cost the way FrieslandCampina and the Danish government did. Verra’s VM0041 audits dosing, not delivered methane, so an ERF set at 30% on a herd delivering 22% is invisible to verification until a downstream buyer commissions independent supply-chain checks. Producers signing 2027 contracts now are pricing a regulatory necessity Denmark won’t actually measure until the 2030 climate-tax deadline forces it, while Lactanet RBV (April 2023), Zoetis RUMiN (April 2026 DWP$ update), and VikingGenetics’ Nordic Methane Index already let you build a permanent genetic reduction at zero incremental cost. If your aggregator can’t put 24% in writing as a downside scenario, the contract isn’t priced for your barn.

Bovaer 2027 contract

There’s a 2027 Bovaer contract sitting in dairy mailboxes from Wisconsin to Ontario right now, priced against a 30% methane reduction assumption. Meanwhile, in Europe, roughly 1,600 conventional Danish herds have been on the additive for seven months under a regulatory mandate — and the commercial efficacy figure that would actually validate those North American contracts hasn’t been published. Not by Aarhus. Not by SEGES. Not by EFSA. Not in peer-reviewed form anywhere.

That’s the strange shape of the largest real-world test of an enteric methane additive ever run. The mandate started on October 1, 2025. Compliance was legally required. A national subsidy softened the additional cost — the structure of North American contracts notably doesn’t replicate. By any measure, this should have produced the field efficacy figure that aggregators have spent two years promising producers. It hasn’t. And the contracts being offered for 2027 are priced as if they had.

What Denmark’s Mandate Actually Tested

The Danish climate law required conventional herds with 50 or more cows to feed Bovaer for at least 80 days a year, or switch to a high-fat diet. Compliance checks. Fines for non-compliance. National subsidy on the additional cost.

Here’s the part most coverage has missed: the mandate was designed around climate tax compliance, not methane measurement. Farms weren’t required to install GreenFeed units, SF6 tracer systems, or any direct enteric measurement device. So the world’s biggest commercial Bovaer deployment is producing exactly the data the mandate asked for — proof of dosing — and not the data the contracts in your inbox depend on.

What did show up: a SEGES Innovation survey of several hundred Danish dairy herds in autumn 2025 reported hundreds of farms describing milk yield declines and reduced dry matter intake, with substantial overlap reporting both at once. Self-reported, not peer-reviewed. The European Commission ordered EFSA to reassess safety, with a data deadline of April 10, 2026, and as of mid-May, the reassessment opinion was still pending.

In May 2026, Aarhus University released the first formal study from the deployment. An Aarhus team examined 73 farms and concluded that within the available data, there was no clear influence of Bovaer on production, disease rate, or mortality. The team hedged the finding explicitly. The study could not prove the opposite either, and the herds studied varied greatly.

The Aarhus team studied welfare and mortality. Not methane.

Where Does the 30% Number Actually Come From?

The 30% figure didn’t fall from the sky. EFSA established it through its 2021 safety and efficacy opinion, drawing on DSM-Firmenich’s controlled trial submissions. EFSA evaluated efficacy under defined conditions: consistent TMR, label dose, controlled feeding systems. That figure became the EU authorization basis, the sales deck headline, and now the contract pricing assumption.

DSM-Firmenich has consistently maintained the 30% figure as a controlled-trial result under EFSA-evaluated conditions, and the company is participating in EFSA’s ongoing reassessment process. That’s the public position the contract math rests on.

The Ceiling Nobody’s Pricing Around

In late April 2026, four weeks before Aarhus was published, the science changed.

A team reporting in Science cataloged rumen ciliate genomes and identified a previously undescribed organelle inside those single-celled microbes — the hydrogenobody. It produces hydrogen and scrubs oxygen from its immediate environment, creating a perfect microenvironment for methanogens operating right at the cell surface.

Bovaer (3-NOP) targets the methanogens floating in bulk rumen fluid. The hydrogen body sits upstream, at the hydrogen supply origin, where 3-NOP concentrations don’t reach therapeutic levels.

The sheep data carries the punchline. High-methane animals on identical rations carried far more Dasytricha ciliates — a high-hydrogenobody genus — than low-methane animals on the same feed. Penn State research has separately documented that 3-NOP suppresses methanogenesis effectively while free rumen hydrogen accumulates rather than dissipating. The downstream engine gets partially suppressed. The upstream supply keeps running.

That’s the practical 28–30% ceiling, mechanistically explained. It’s not a dosing problem. It’s a structural one — the Science finding maps why field results consistently land below the controlled-trial number, and why animal-genetics researchers are already framing the work as an opening to modulate the rumen microbiome more precisely rather than as a verdict on Bovaer itself.

The Field Record Versus the Sales Number

Here’s the evidence hierarchy a producer should weigh before signing:

  • DSM-Firmenich published claim, controlled trials: 30%
  • Elanco/Athian via FDA review (September 2025), controlled: ~30%, or 1.2 MT CO2e/cow/year
  • Kebreab et al. controlled-trial meta-analyses: results cluster in the high twenties to low thirties
  • FrieslandCampina Netherlands pilot, 158 farms, six months: 28% — the best large-scale commercial figure that exists
  • Wageningen year-long full-lactation trial: 21–27%, with efficacy declining within the lactation
  • Denmark mandatory deployment, ~1,600 herds, seven months: not measured, not published

The Wageningen year-long study is the outlier precisely because it was long enough to capture what short controlled trials can’t — efficacy drift across a full lactation as ration composition, lactation stage, and microbial population shift.

The Barn Math at $0.45 Per Cow Per Day

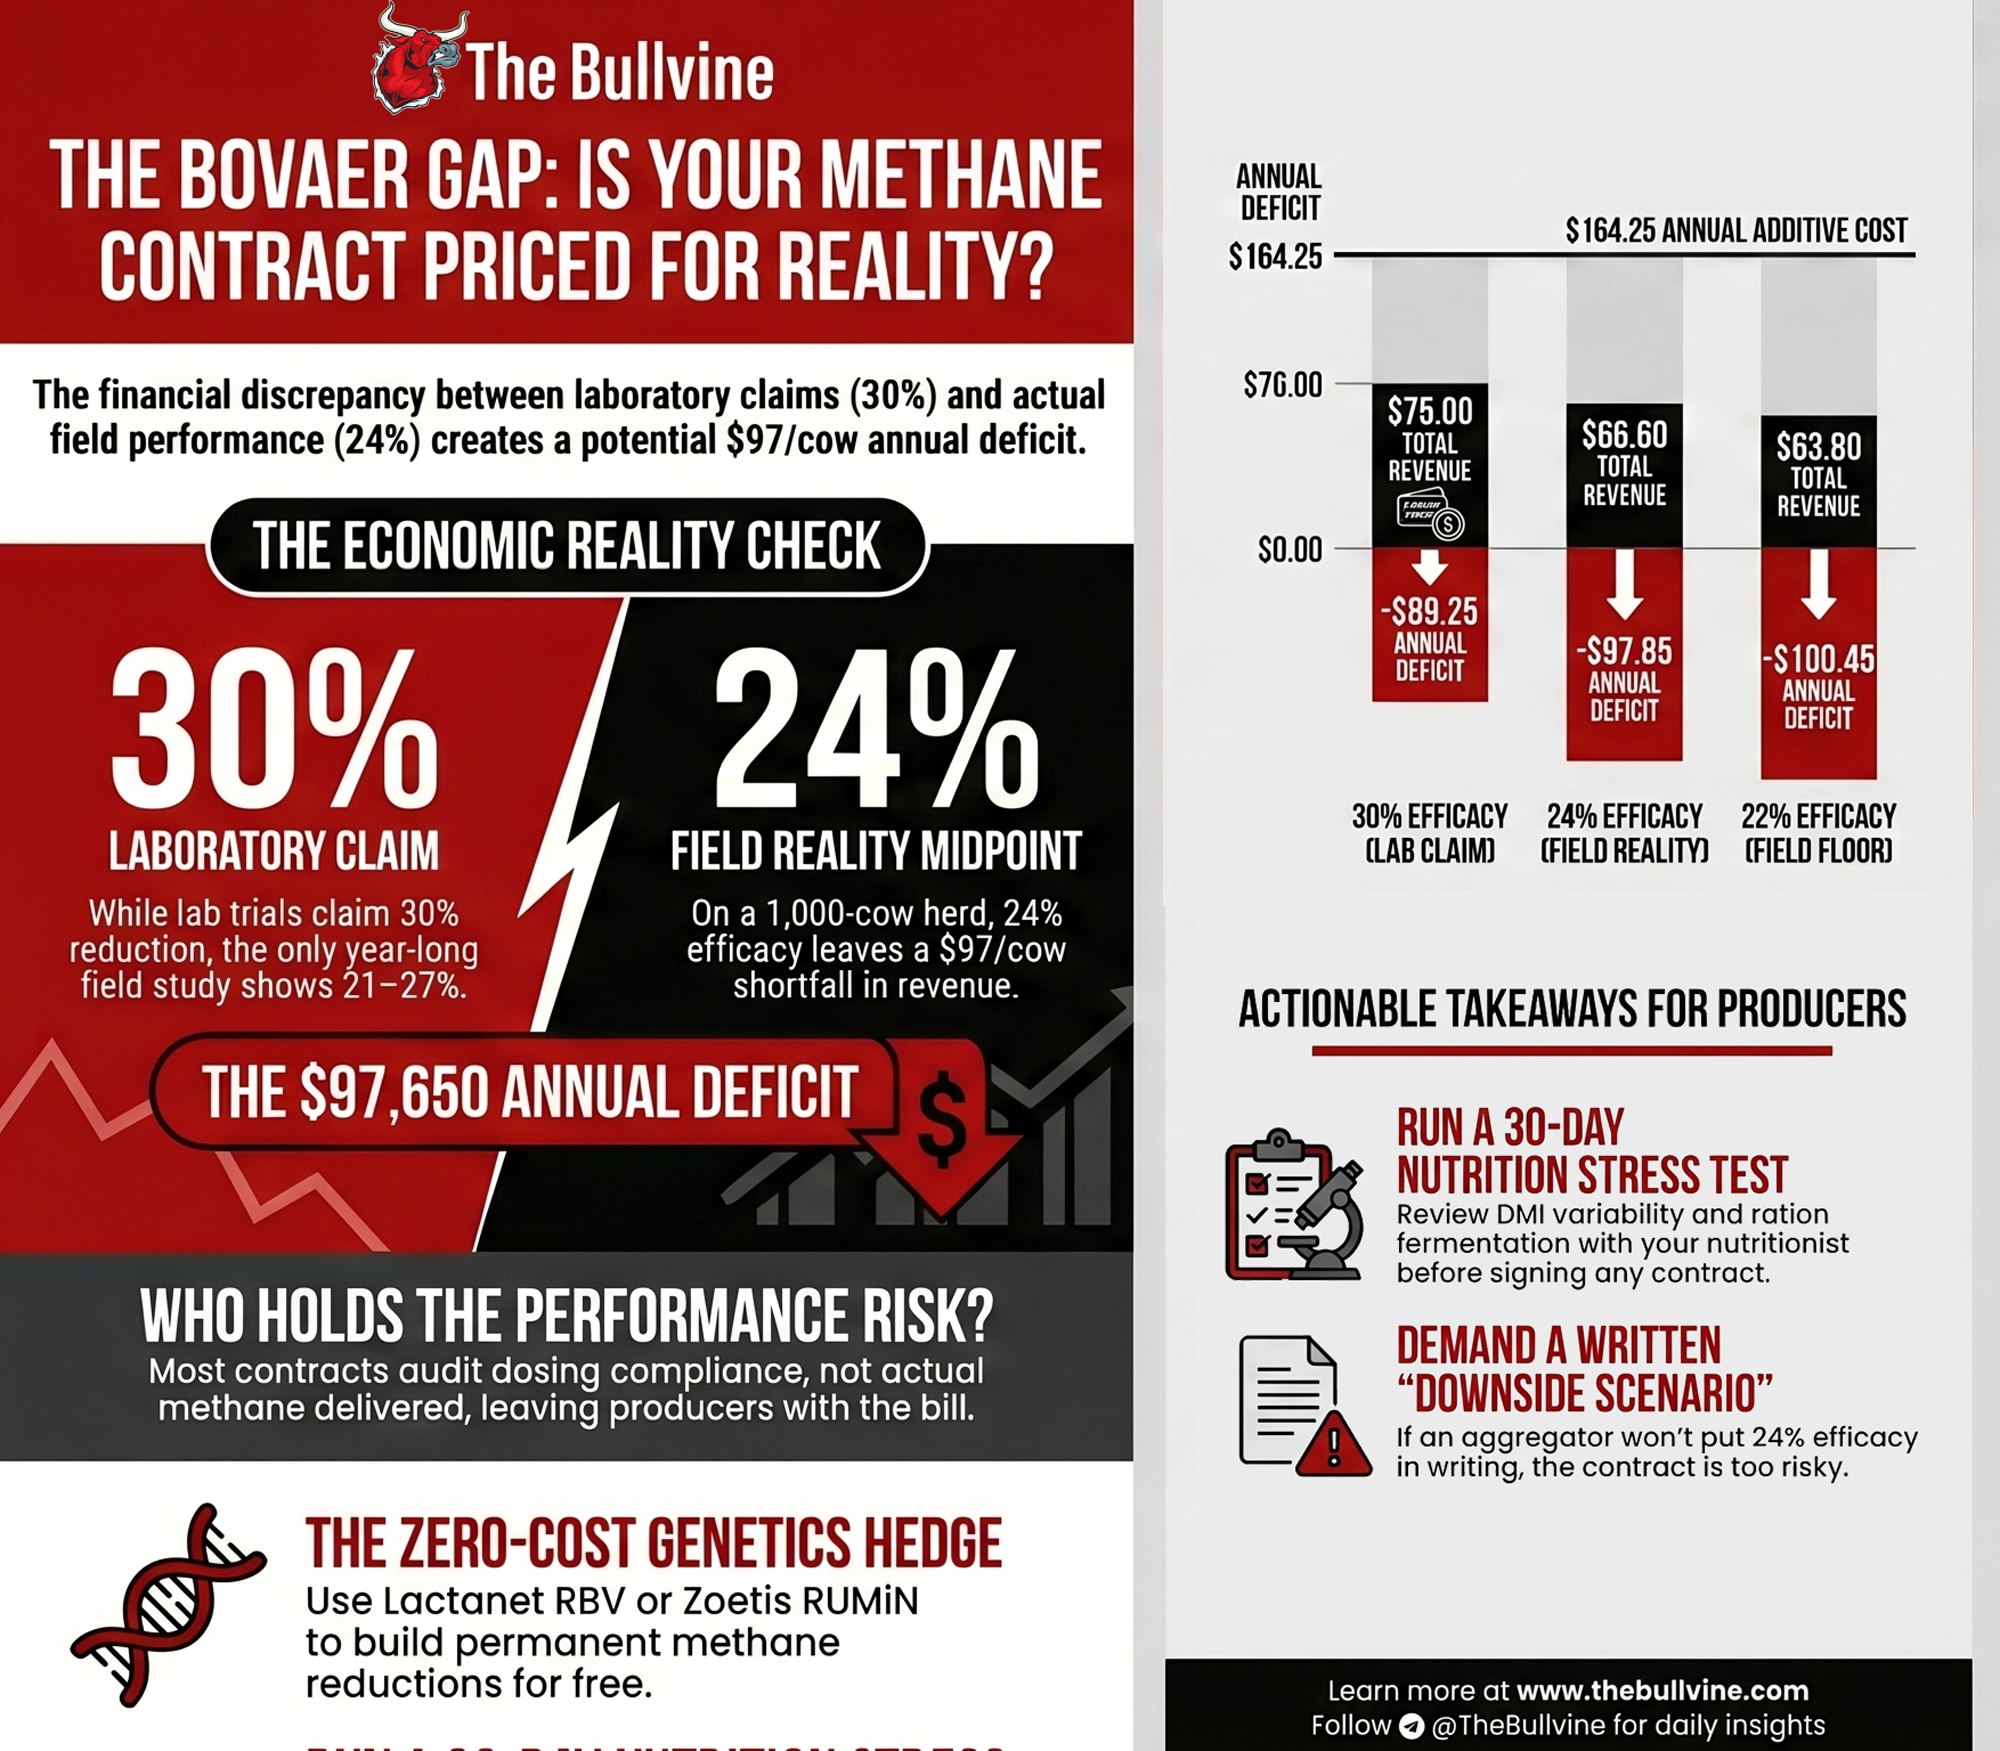
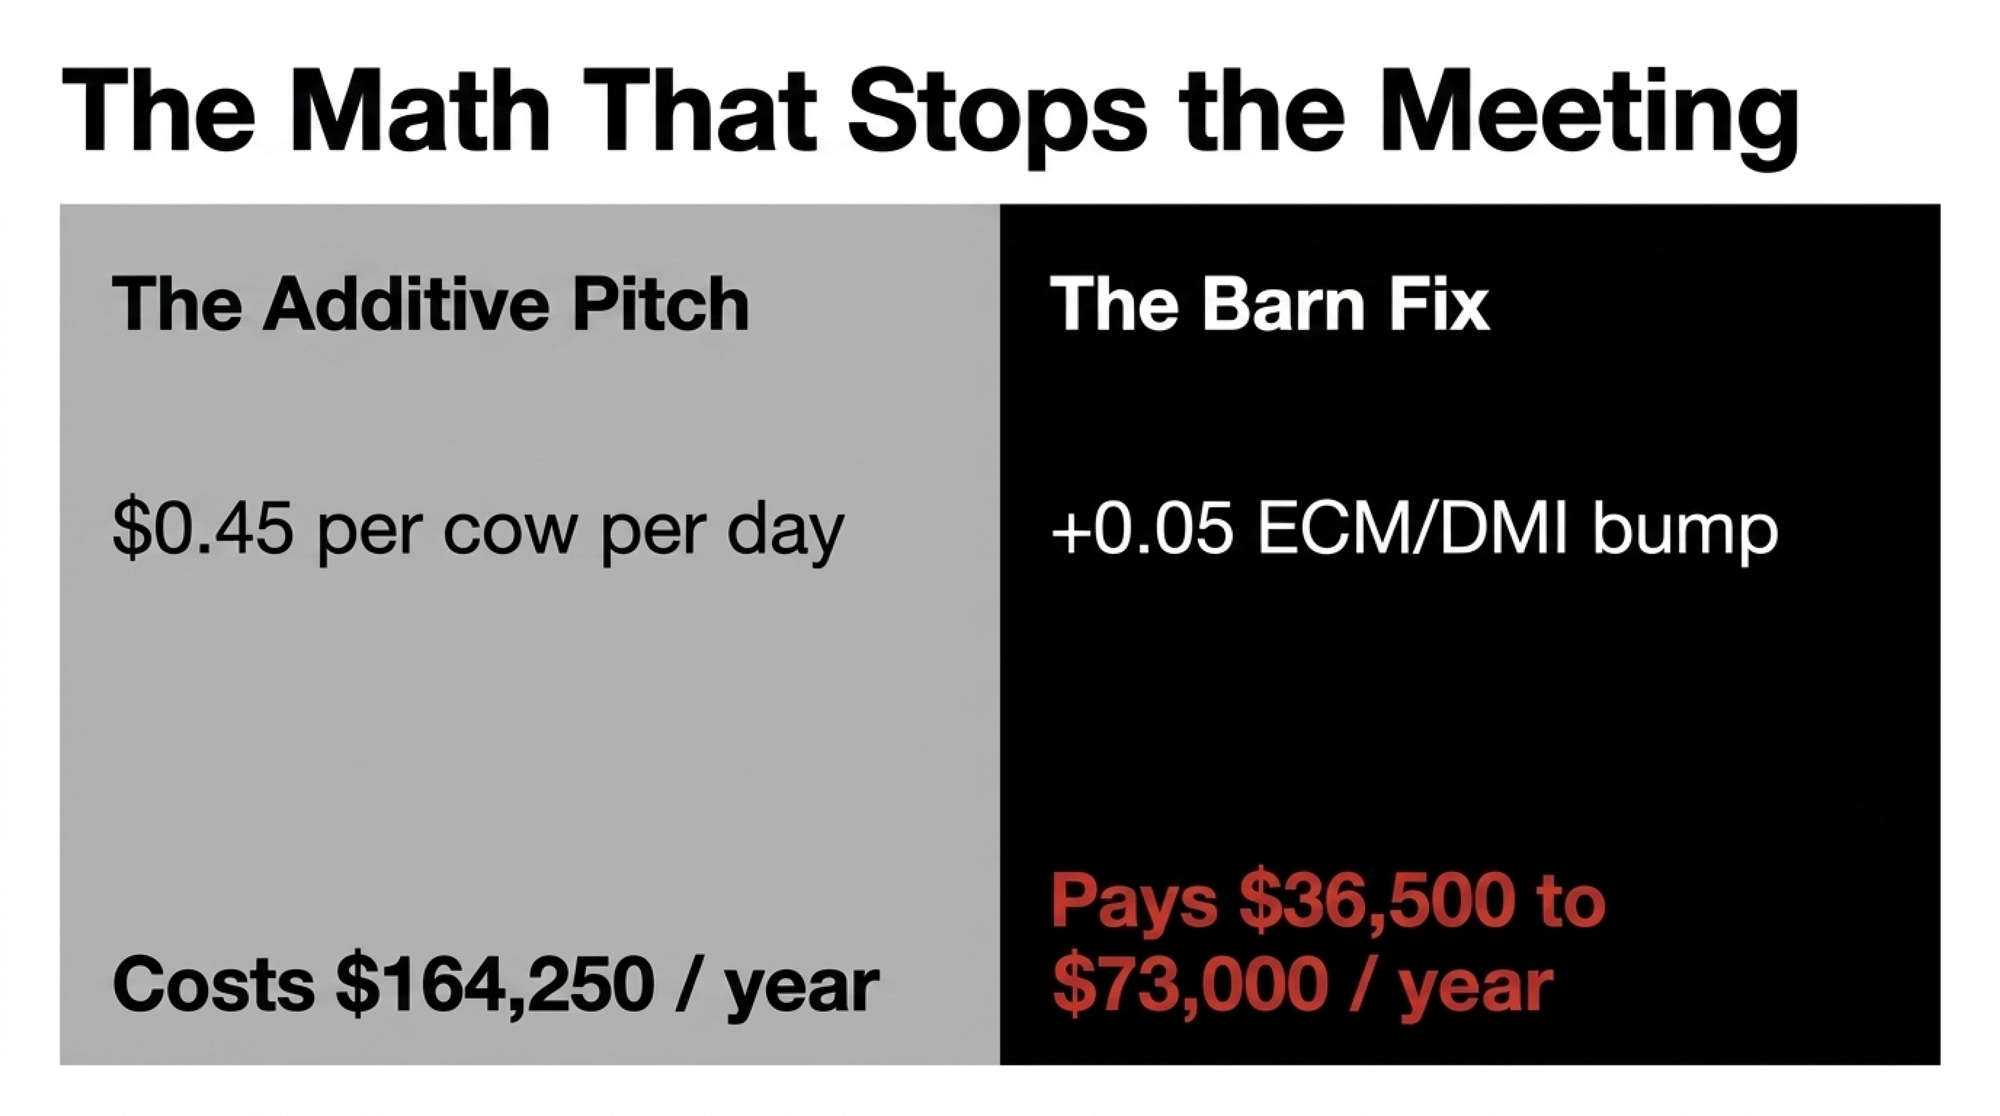
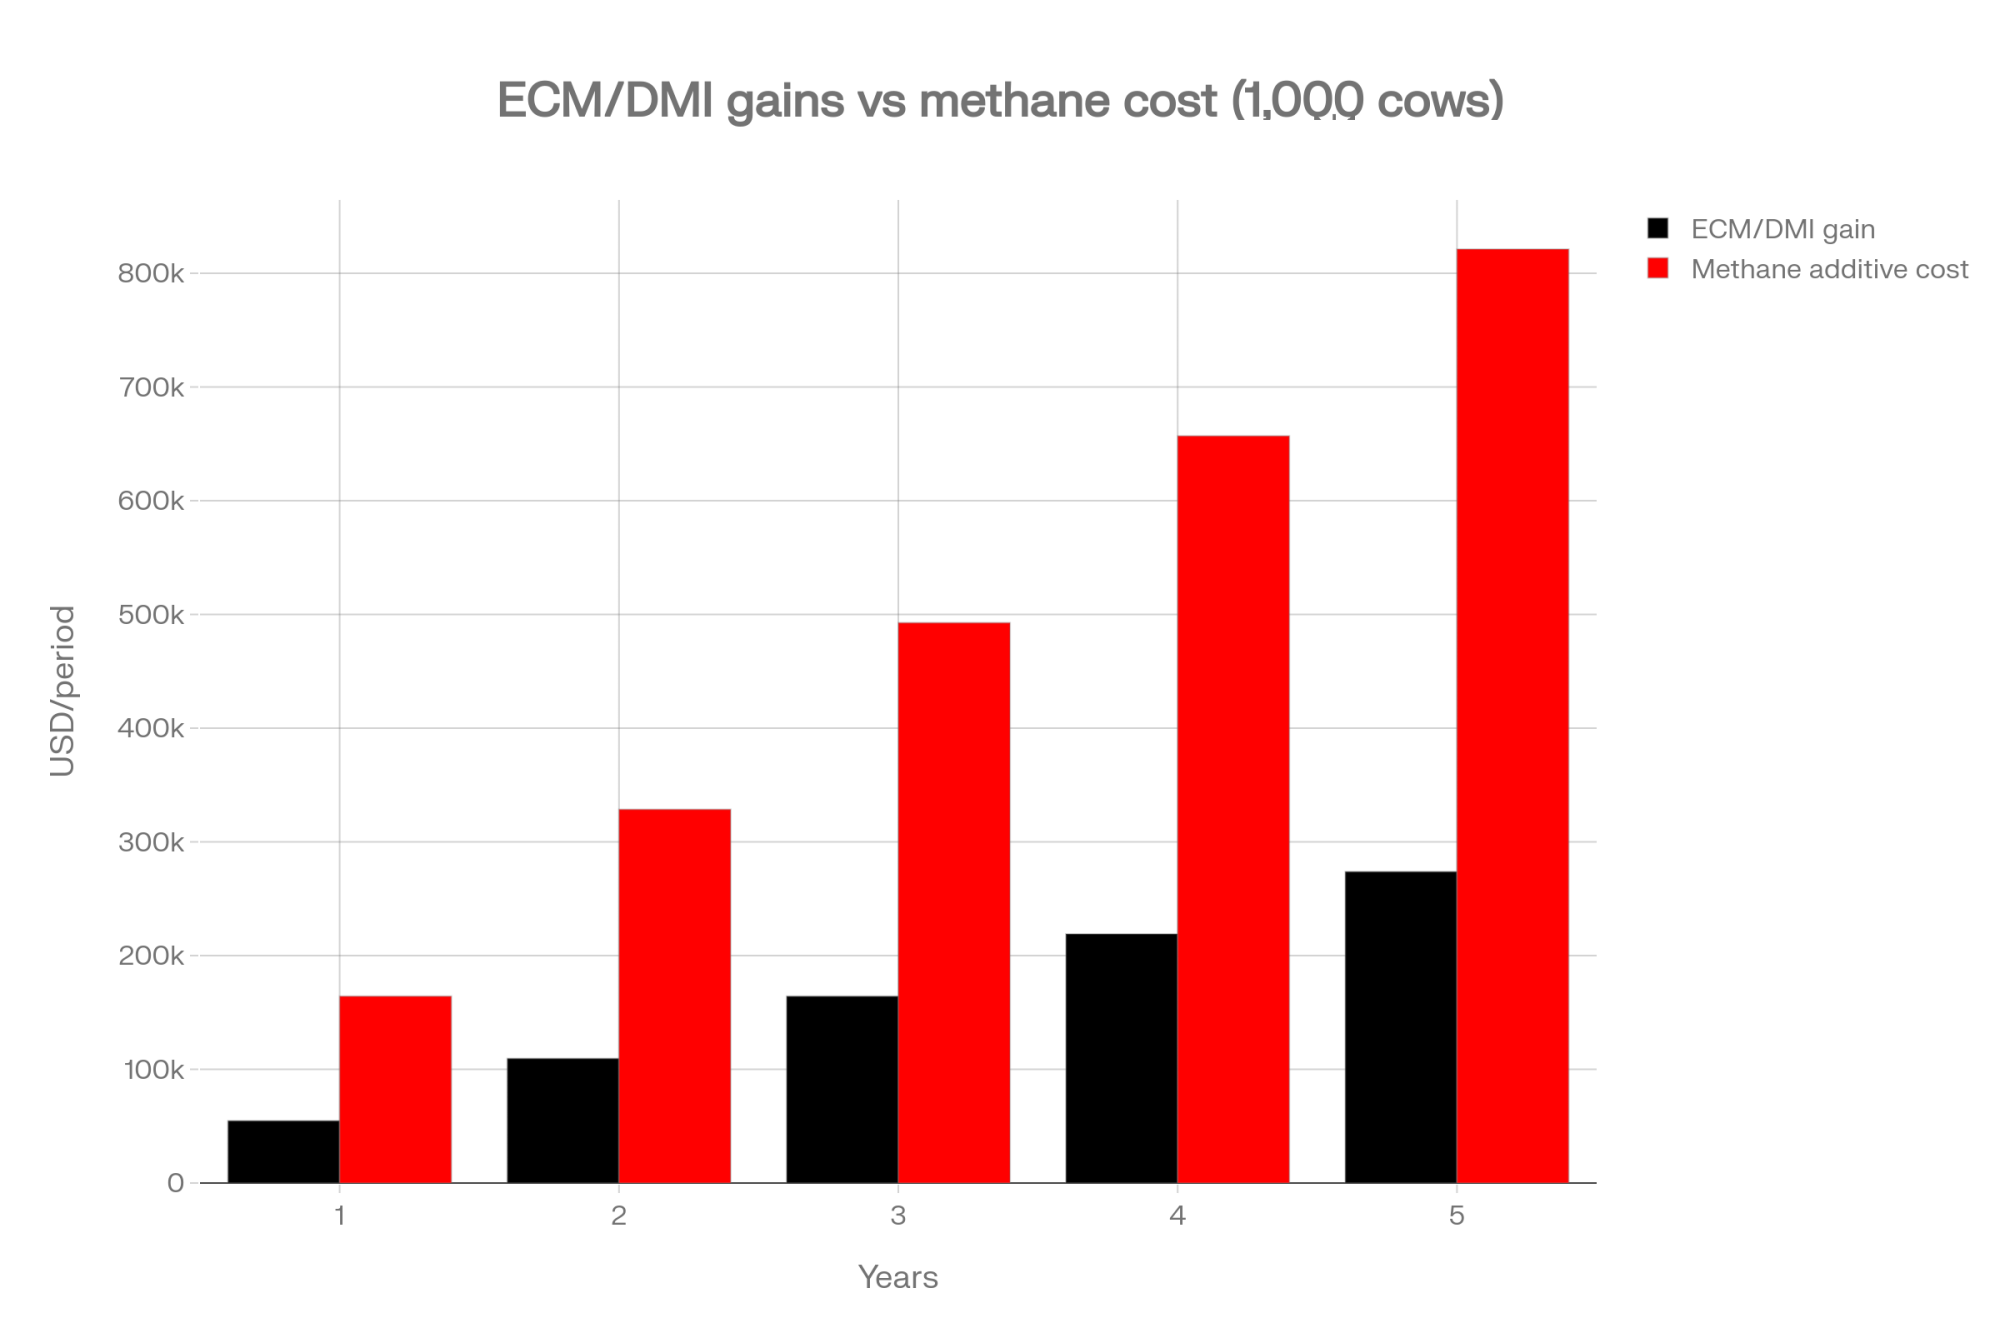
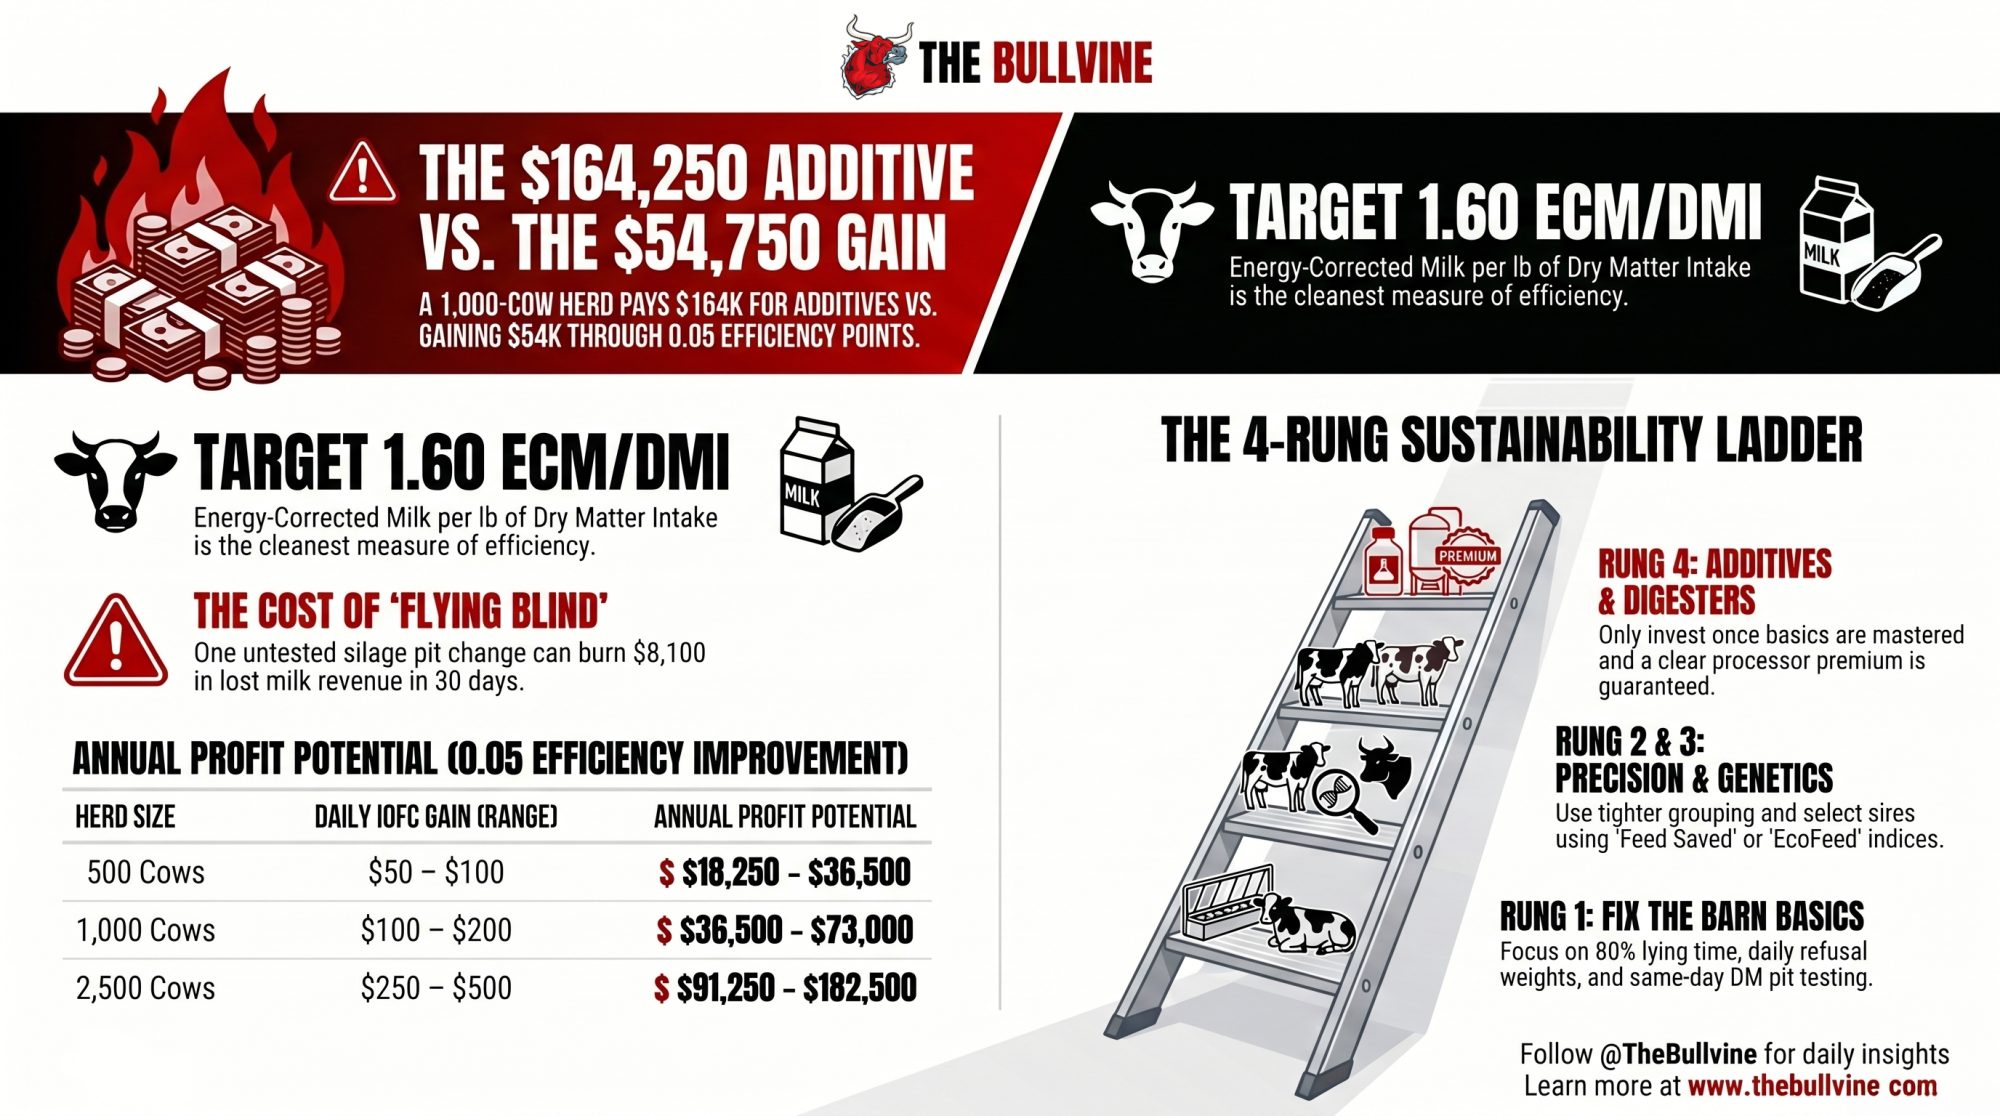
Run the numbers honestly on a 1,000-cow herd. Annual additive cost at $0.45/cow/day, the contract pricing The Bullvine has modeled across this franchise: $164.25 per cow, $164,250 total.

Revenue side, modeled at $35/tonne supply-chain inset pricing (mid-market) plus a sustainability premium of $0.10–$0.15/cwt typical of current US program structures. Using the midpoint ($0.125/cwt) at 75 lbs/day, the premium works out to about $34/cow/year, rounded to $33 in the table for readability:

Efficacy LevelDelivered CO2e / Cow / YrCarbon Revenue (@ $35/T)Sustainability PremiumTotal RevenueAnnual Deficit / Cow
30% (Claimed)1.20 MT$42.00$33.00$75.00$89.25
28% (NL Pilot)1.12 MT$39.20$33.00$72.20$92.05
24% (Wageningen Midpoint)0.96 MT$33.60$33.00$66.60$97.65
22% (Field Floor Model)0.88 MT$30.80$33.00$63.80$100.45

The honest number to model isn’t 30%. It’s 24% — the midpoint of the only year-long full-lactation field measurement that exists. That puts the deficit at roughly $97/cow on a 1,000-cow operation, or about $97,000 a year that has to come from somewhere outside the carbon revenue stack. Stress-test it at 22%, and the deficit climbs past $100/cow.

If the contract uses Elanco’s projection of approximately $20/cow through Athian instead of $35/tonne tonnage pricing, the deficit is fixed at roughly $111/cow regardless of efficacy, which makes the efficacy risk invisible until verification fails.

Who’s Bearing the Performance Risk

VM0041 — Verra’s dominant methodology for enteric methane credits — calculates issuance from an emission reduction factor (ERF) that the project proponent establishes at project start. Not from real-time methane sensors on your farm. Auditors verify dosing compliance, not delivered performance.

If your herd delivers 22% but the ERF is set at 30%, the gap is structurally invisible to the verification process — until a downstream credit buyer commissions independent supply-chain verification and discovers their Scope 3 claim is overstated. Verra is acknowledging this gap. The proposed VM0041 v3.0 revision, currently under expert review, would tighten how ERFs get established. It is not in force.

That revision helps producers in one specific way and creates a new exposure in another. Tighter ERFs shrink clawback risk — a 24% ERF with verified 22% delivery is a 2-point gap, not 8. But fewer credits per cow means lower carbon revenue. The additive cost doesn’t change. Marginal contracts that pencil out at 30% ERFs may no longer be commercially viable to offer at all under the revised framework.

What the Six Pre-Enrollment Questions Look Like

The Danish field reports that should sit on every nutritionist’s desk are the severe ones. Whole-herd diarrhea. Milk drops that pulled production materially below baseline. Cattle losses on individual operations. Recovery shortly after Bovaer was discontinued, according to Danish reporting — a pattern more consistent with pharmacological clearance than lasting microbiome damage, though the specific day-by-day timelines haven’t been published.

Worth keeping in proportion: those severe cases are real, but the broader Aarhus safety study across 73 farms found no clear influence of Bovaer on production, disease rate, or mortality at the population level. The severe pattern represents extreme herd-specific management and ration interactions, not a universal baseline. The point isn’t that Bovaer breaks every herd. The point is that some herd contexts are far worse candidates than others, and the contract structure makes that distinction the producer’s risk to identify.

The mechanism researchers are working through: 3-NOP suppresses the final step of methanogenesis, hydrogen accumulates in the rumen, and what happens next depends on whether the resident microbial population can productively redirect that hydrogen toward propionate. In a tightly managed TMR herd, it usually can. In a herd with variable intake, recent antibiotic exposure, or a forage-heavy ration, that buffer thins fast — and falling intake creates a feedback loop where the cows still eating receive a higher effective dose per kg DMI than the trial protocol assumed.

That’s why the FrieslandCampina Netherlands pilot reported no production changes while Denmark’s mandated, speed-ramped deployment generated hundreds of yield-decline reports. The molecule didn’t change. The deployment context did.

Before enrollment, the conversation a 1,200-cow operator should be having with their nutritionist:

  • Baseline dry matter intake variability. What’s our DMI coefficient of variation, and does it move more than 10% seasonally? Tight, consistent intake gives you a buffer. Wide variation doesn’t.
  • Ration fermentation profile. Is our fermentation pattern starch-driven (more propionate-producing capacity, better hydrogen capture) or fiber-driven (closer to the Danish grass-clover diet that didn’t deliver the same results)?
  • Transition cow load. What percentage of the lactating group is within 60 days of freshening at any given time? Fresh cows are the worst candidates for an initial intake suppression event.
  • Recent microbiome disruptions. Have we had broad-spectrum antibiotic treatments, ration reformulations, or acidosis events in the last 90 days?
  • Per-cow dose consistency. If intake drops 15% in a cohort, what happens to their effective 3-NOP concentration — and can our delivery system respond in real time?
  • Exit protocol if intake signals show in the first 21 days. What’s the threshold that triggers protocol review, who makes the call, and what’s the contract penalty for early exit?

If more than two of those answers are “we’d have to watch and see,” that’s a signal to pause enrollment, not push through it.

What Closes the Gap — and Who Actually Has That Lever

Three things can close the $97-per-cow deficit at 24% efficacy. Only one of them sits in the producer’s control.

The first is a processor subsidy on the input cost. The contracts that pencil, pencil because the processor is absorbing part of the additive cost directly — flat per-cow subsidy, milk price premium that offsets additive spend, or full input coverage with the producer taking a smaller credit revenue share. FrieslandCampina structured it that way in the Netherlands. Denmark’s government did it via national subsidy. North American contracts where the producer eats the full $164.25/cow don’t pencil at any realistic efficacy number under current carbon pricing. Ask in writing: what’s my net additive cost after program subsidies?

The second is the OFCAF cost-share. USDA’s program covers 65–85% of practice costs, but caps at $75,000 per farm. On a 1,000-cow operation’s annual $164,250 additive cost, the cap covers roughly 46% — closing about half the gap in year one. Larger herds hit the cap faster. The program is competitive, requires application and conservation activity documentation, and depends on appropriations. A contract that pencils only with OFCAF is a contract that doesn’t pencil without it — and that risk lands on the producer, not the aggregator.

The third is carbon price appreciation, and most operators don’t realize they’re making this bet. For the gap to close on carbon economics alone, inset pricing would need to roughly double from current mid-market levels while additive costs hold flat. That’s a market call, not a farm economics calculation.

The Genetics Hedge That Costs Nothing Incrementally

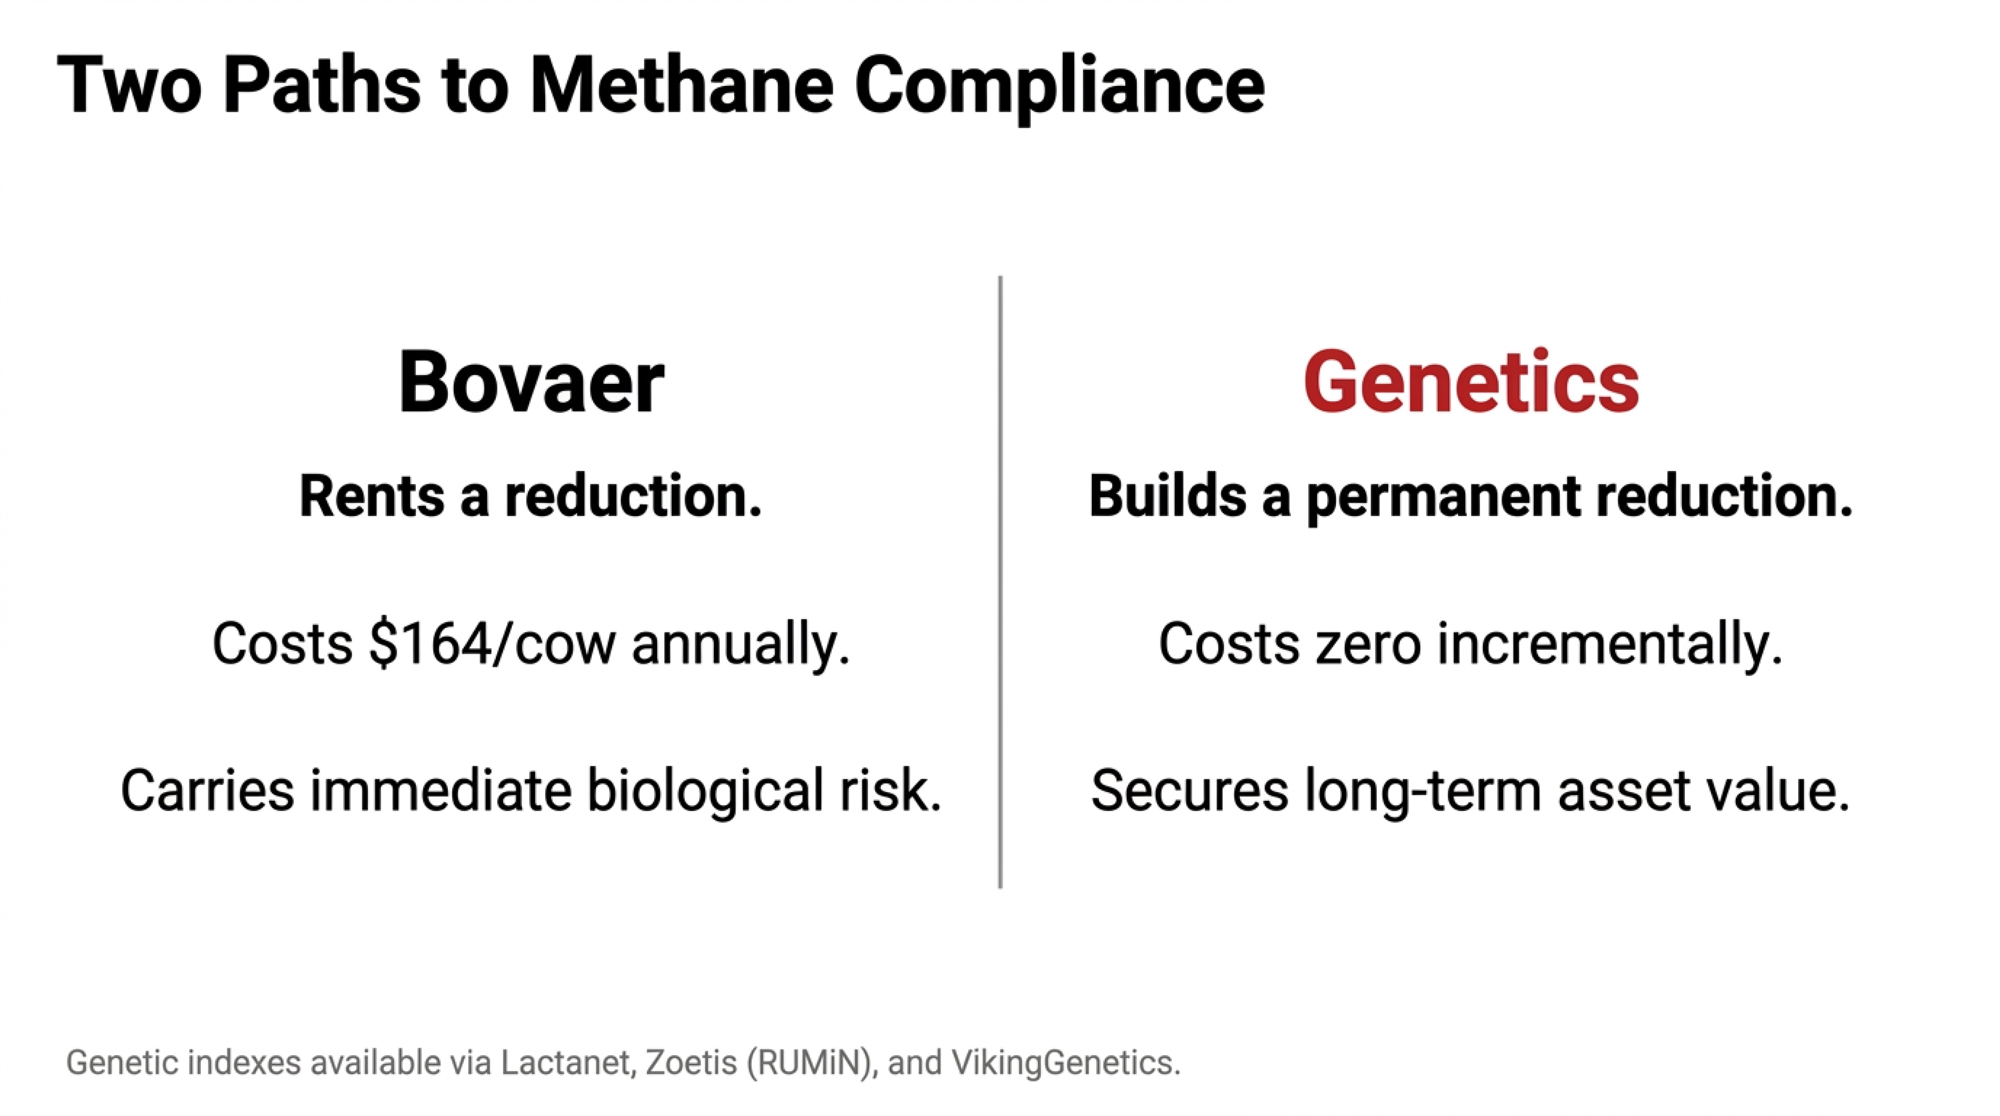
Bovaer rents a reduction. Genetic selection builds a permanent one. The two strategies aren’t mutually exclusive — and treating them as either-or usually serves the seller more than the producer.

Lactanet’s Methane Efficiency RBV has been published on Holstein females in eDHI since April 2023, with genomic reliability strong enough on young bulls to drive sire selection decisions. Zoetis RUMiN was integrated into the April 2026 DWP$ update. VikingGenetics’ Nordic Methane Index draws on automated sniffer data from a large-scale commercial database across Denmark, Sweden, and Finland, producing breeding values with strong correlation to directly measured methane.

Timeline to herd-level expression: 5–7 years from a sire selection change. Not fast. But filtering 2026 sire decisions on methane breeding values costs nothing incrementally — and it builds a documented genetic trajectory that will matter when outcome-based verification standards tighten in the late 2020s, with no recurring additive spend attached.

The April Science paper makes the genetics path more interesting, not less. If high-hydrogenobody ciliate density is genetically influenced — which the paper implies but hasn’t yet quantified in cattle at scale — then selecting against high-methane phenotypes may also be selecting against the ciliate composition that caps Bovaer’s ceiling. That’s a hypothesis, not a confirmed finding. But it’s worth carrying into the next conversation about what your herd is being bred for.

What This Means for Your Operation

  • If your contract assumes 30% efficacy, model it at 24% before you sign. The midpoint of the only year-long full-lactation field study puts the deficit at roughly $97/cow on a 1,000-cow operation. If the math doesn’t work at field-realistic numbers, the contract isn’t priced for your barn.
  • If your payment trigger is delivered methane performance, not dosing compliance, you’re holding 100% of the biological risk. Confirm in writing which structure your contract uses. Verra’s VM0041 verification audits dosing — your contract may not.
  • If your processor is not absorbing part of the additive cost, the contract probably doesn’t pencil.FrieslandCampina did it in the Netherlands. Denmark did it via national subsidy. North American producers signing without that backstop are eating the full $164.25/cow.
  • If you can’t answer four of the six pre-enrollment nutrition questions with certainty, pause the enrollment. The herds that reported problems in Denmark weren’t randomly distributed. Variable DMI, fiber-heavy rations, recent microbiome disruptions, and high transition cow load are the risk markers.
  • If your 2026 sire decisions don’t already filter on methane breeding values, change that in this proof run.Lactanet RBV, Zoetis RUMiN, and VikingGenetics Methane Index cost nothing incrementally. The genetic trajectory you build now is the asset you’ll have when outcome-based verification tightens in the late 2020s.
  • If EFSA’s reassessment opinion lands during your contract term, who absorbs the regulatory cost? The April 10 data deadline has passed. The opinion is still pending. Build a 90-day exit-with-cause clause before you need it.
  • If VM0041 v3.0 passes during your contract term, who bears the ERF adjustment cost? Tighter ERFs shrink clawback risk and shrink credit revenue at the same time. Get the answer in writing.

Key Takeaways

  • If the contract pencils only with OFCAF cost-share, it doesn’t pencil. USDA’s $75,000 per-farm cap covers roughly 46% of a 1,000-cow operation’s annual additive cost in year one. Year two depends on appropriations that the aggregator can’t guarantee.
  • If your aggregator quotes 30%, ask them to put 24% in writing as a downside scenario. A refusal tells you which side of the table is holding the efficacy risk.
  • Within 30 days, pull your last six months of DMI records and run the six pre-enrollment questions with your nutritionist. That’s the lowest-cost stress test of your herd’s candidacy that exists.
  • Within 30 days, filter your next proof run’s sire shortlist on methane breeding values. Lactanet RBV, Zoetis RUMiN as integrated into the April 2026 DWP$ update, and VikingGenetics Methane Index are all available now at no incremental cost.
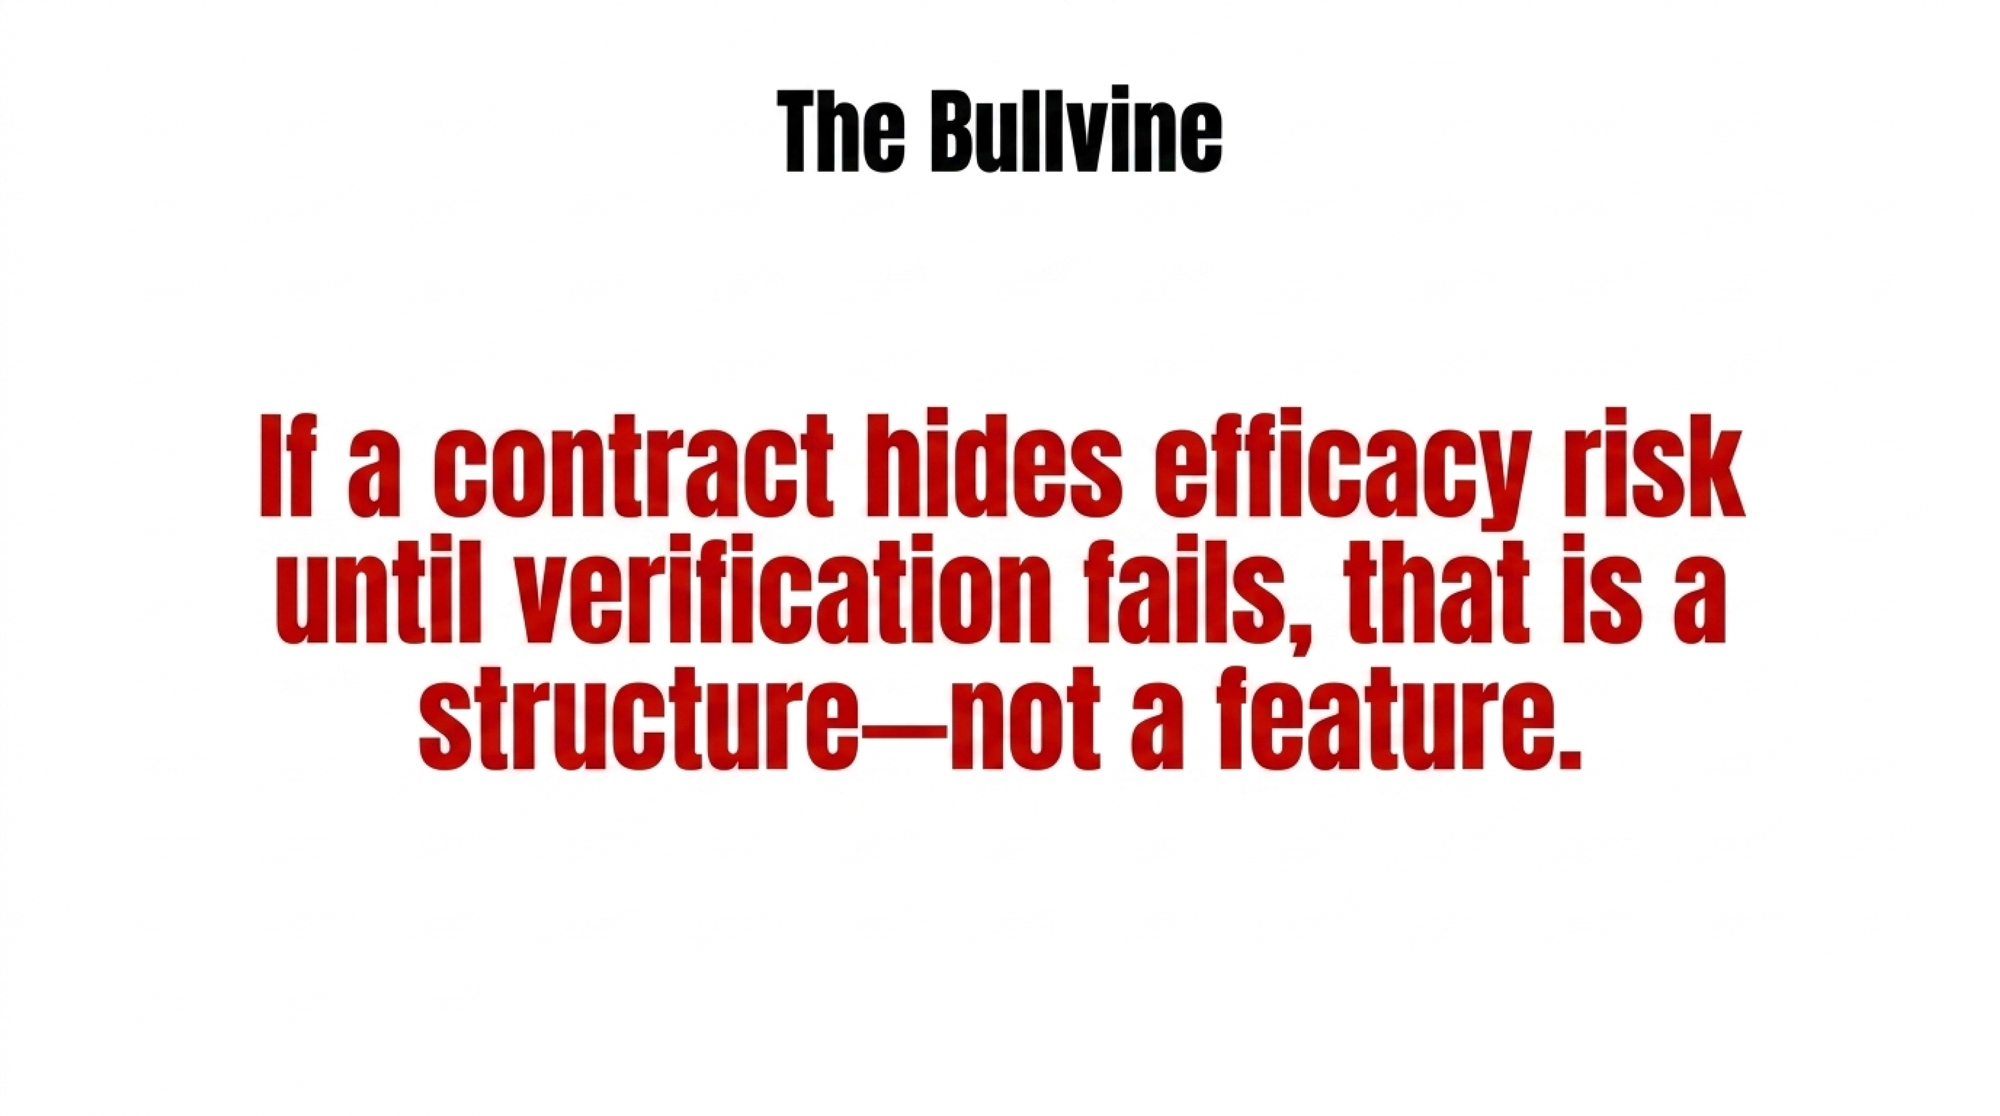
  • If a contract structure makes the efficacy risk invisible until verification fails, that’s the structure — not a feature. The 1,600-herd Danish dataset will eventually surface a real commercial efficacy number. North American producers signing now are pricing against laboratory conditions, not real-world barns.

So here’s where this lands. The 1,600-herd Danish dataset will eventually give us the real commercial efficacy numbers we need. Denmark’s tax structure makes that measurement a regulatory necessity by 2030. Until those figures land in peer-reviewed form, every offer being signed in North America is pricing against a flawless laboratory environment, not a real-world barn. If your aggregator can’t tell you in writing what you’re paid on at 24% delivered efficacy, what’s the contract really pricing — and which side of the table is holding the bag?

Run Your Numbers

Health ROI Calculator — Before you sign a 2027 Bovaer contract, pressure-test the math at field-realistic 22–24% efficacy, not the 30% on the sales sheet. The tool puts a per-cow dollar value on the additive spend, the credit revenue, and the gap your processor isn’t backstopping — so you walk into the contract conversation knowing exactly which number has to move.

Learn More

The Sunday Read Dairy Professionals Don’t Skip.

Every week, thousands of producers, breeders, and industry insiders open Bullvine Weekly for genetics insights, market shifts, and profit strategies they won’t find anywhere else. One email. Five minutes. Smarter decisions all week.
NewsSubscribe
First
Last
Consent

$60 Silage, $220 Delivered: The 28% Hidden Premium on a 500-Cow Bunker

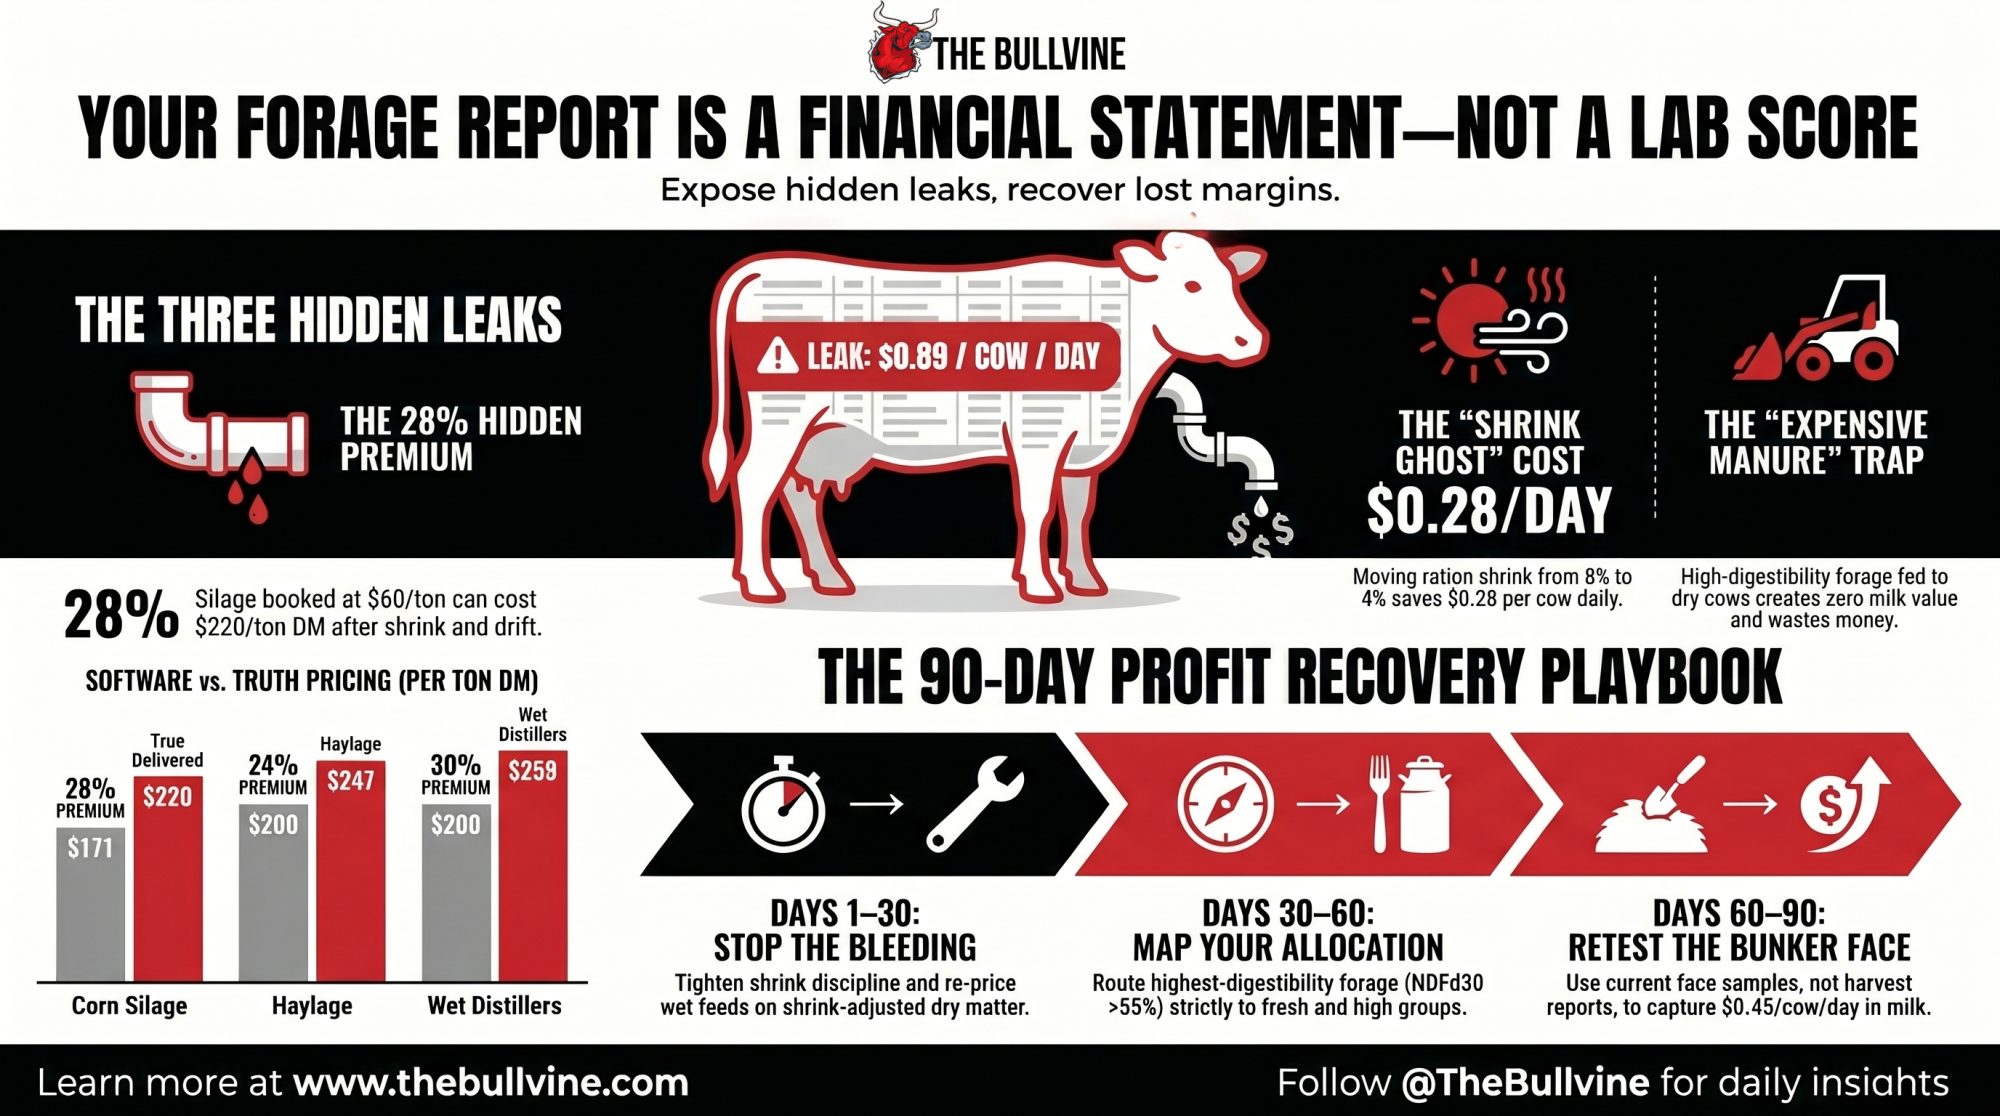
A 500-cow Southwest dairy booked corn silage at $60/ton. Shrink-adjusted, the cows ate $220/ton DM. Same pit, same lab sheet, $0.89/cow/day bleeding out before the milk hit the tank.

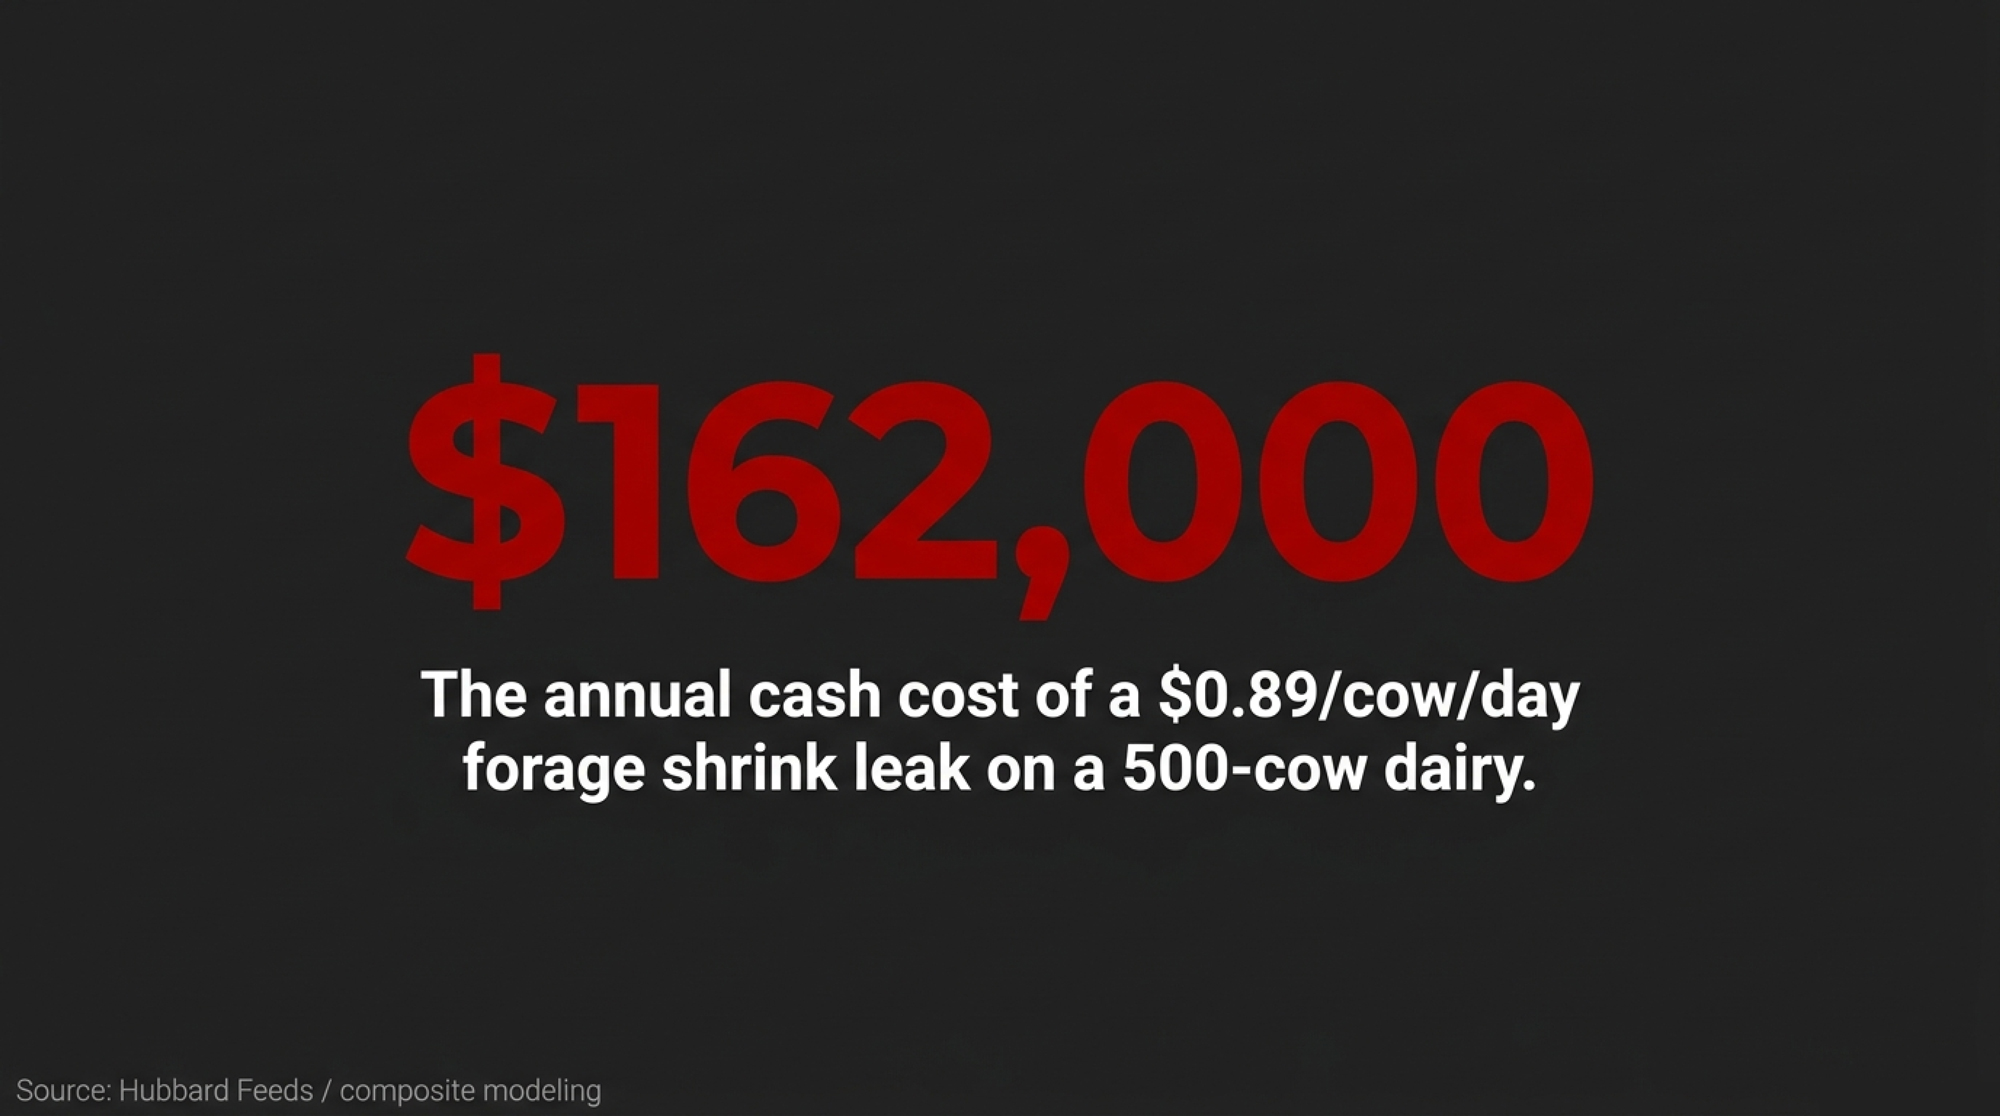
Run that $0.89 daily leak across 500 cows for 365 days and you land at $162,000 a year — the cash cost of treating a forage report as a lab score instead of a delivered-cost statement. Hubbard Feeds’ 2021 shrink-cost work documents the per-cow-per-day mechanics behind that order of magnitude on a comparable 300- to 500-cow herd running an $8 ration with loose shrink discipline. That’s what a forage economics blind spot costs in cash on a Southwest dairy in 2026.

Editor’s note: This walkthrough is an explicitly composite scenario, modeled by The Bullvine from documented forage-economics research and editorial observation across early-2026 Southwest feed-center conversations. No individual farm, operator, processor, or lab is identified. One Southwest dairy nutritionist is quoted on background at their request. Figures are modeled within documented research ranges; your own numbers will move with herd size, milk price, ration cost, regional shrink exposure, and group structure.

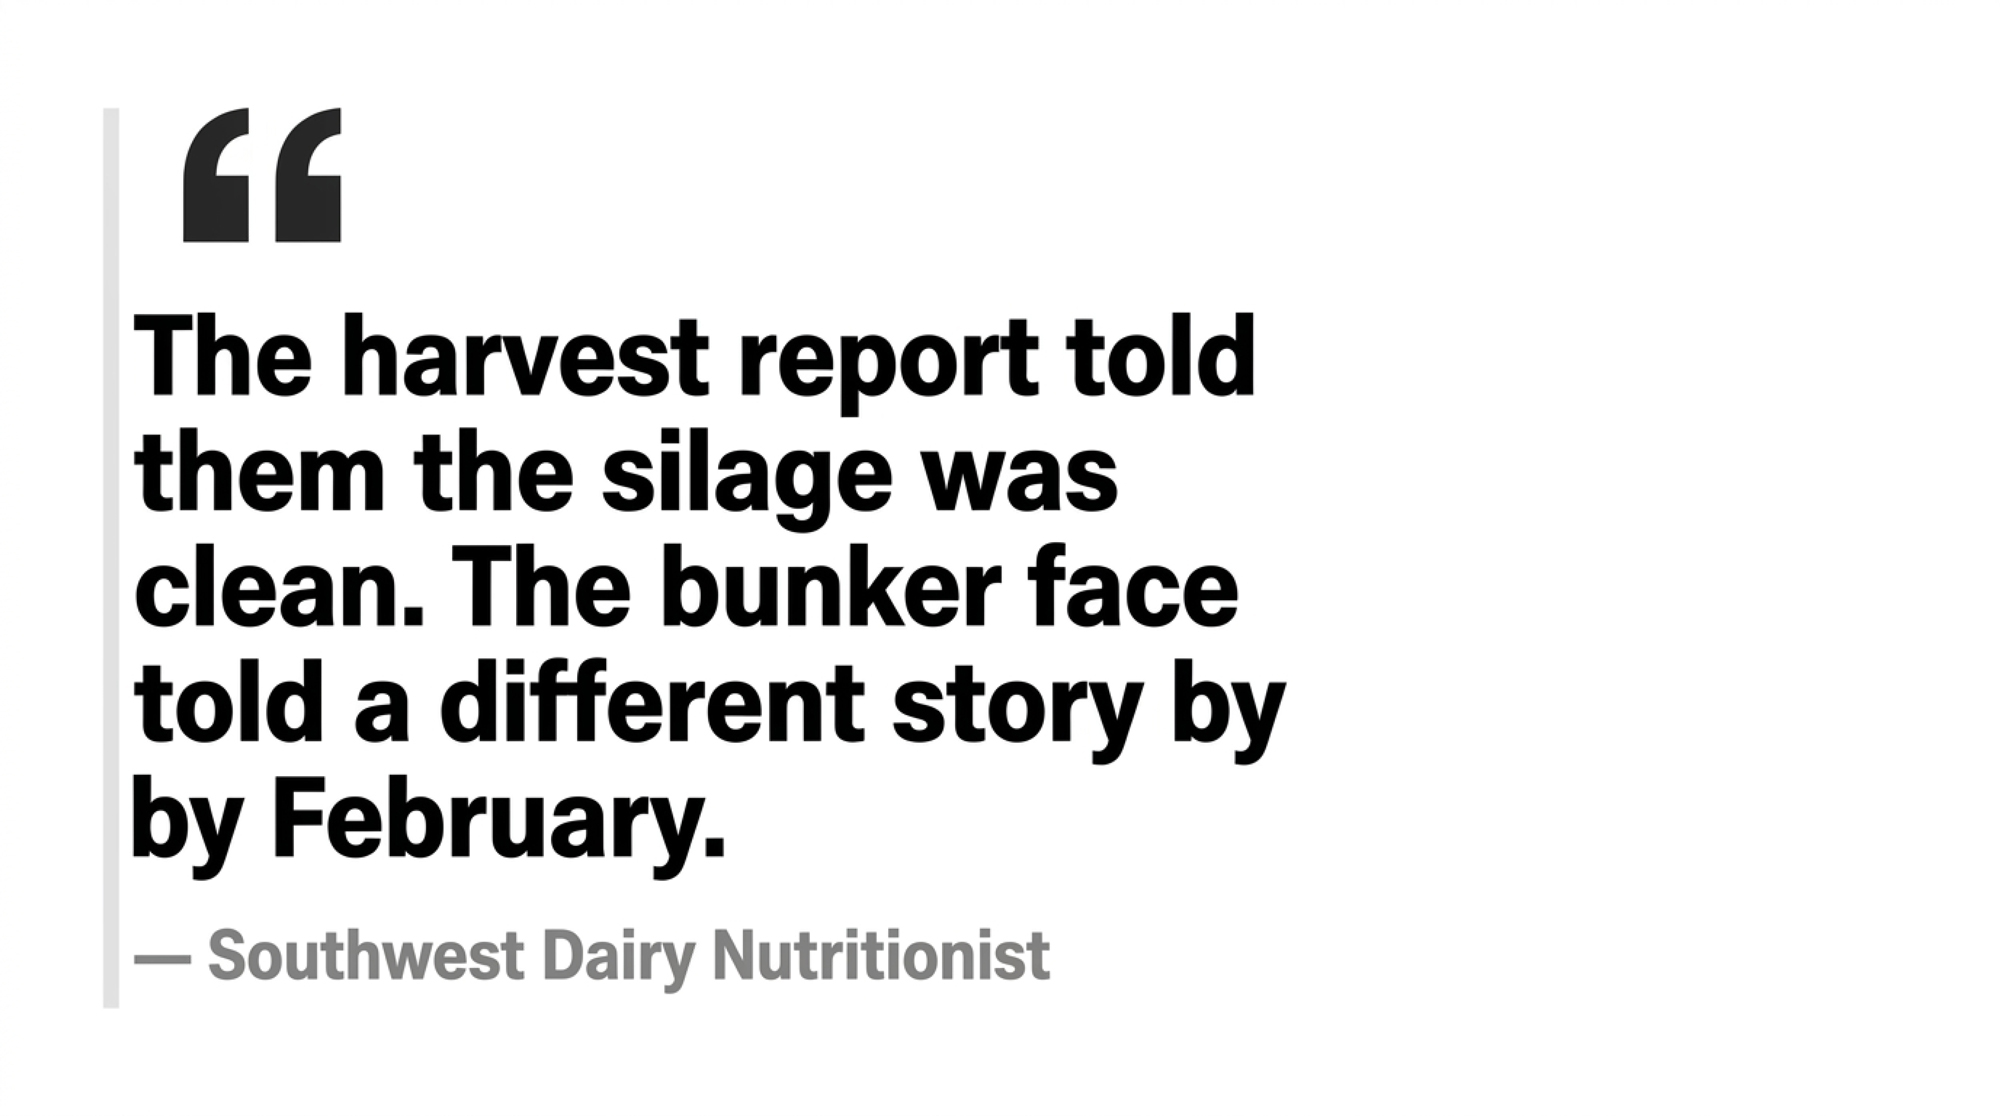
“The harvest report told them the silage was clean. The bunker face told a different story by February.” That’s how one Southwest dairy nutritionist, speaking to The Bullvine on background in early 2026, described the pattern.

Your forage report isn’t a report card. It’s a financial statement. Plenty of 300- to 500-cow dairies still read it as lab scores instead of delivered-cost economics, and the gap never shows up on the forage sheet — it shows up on the feed-cost-per-cwt line.

Why a “Good” Forage Test Can Still Hide a $0.89 Leak

The composite operation has the structural setup typical of a 300- to 500-cow Southwest dairy: multiple milking groups, dry-cow pens, and on-farm forage storage. The 2025 harvest report looked clean — RFV in a solid range, CP where it should be, NDF inside the window. On paper, the high group had no reason to stall.

It stalled anyway.

Everyone assumed the lab sheet was the answer. The lab sheet is a starting point, not a destination. The trap has three layers, and a herd like this pays into all three at once.

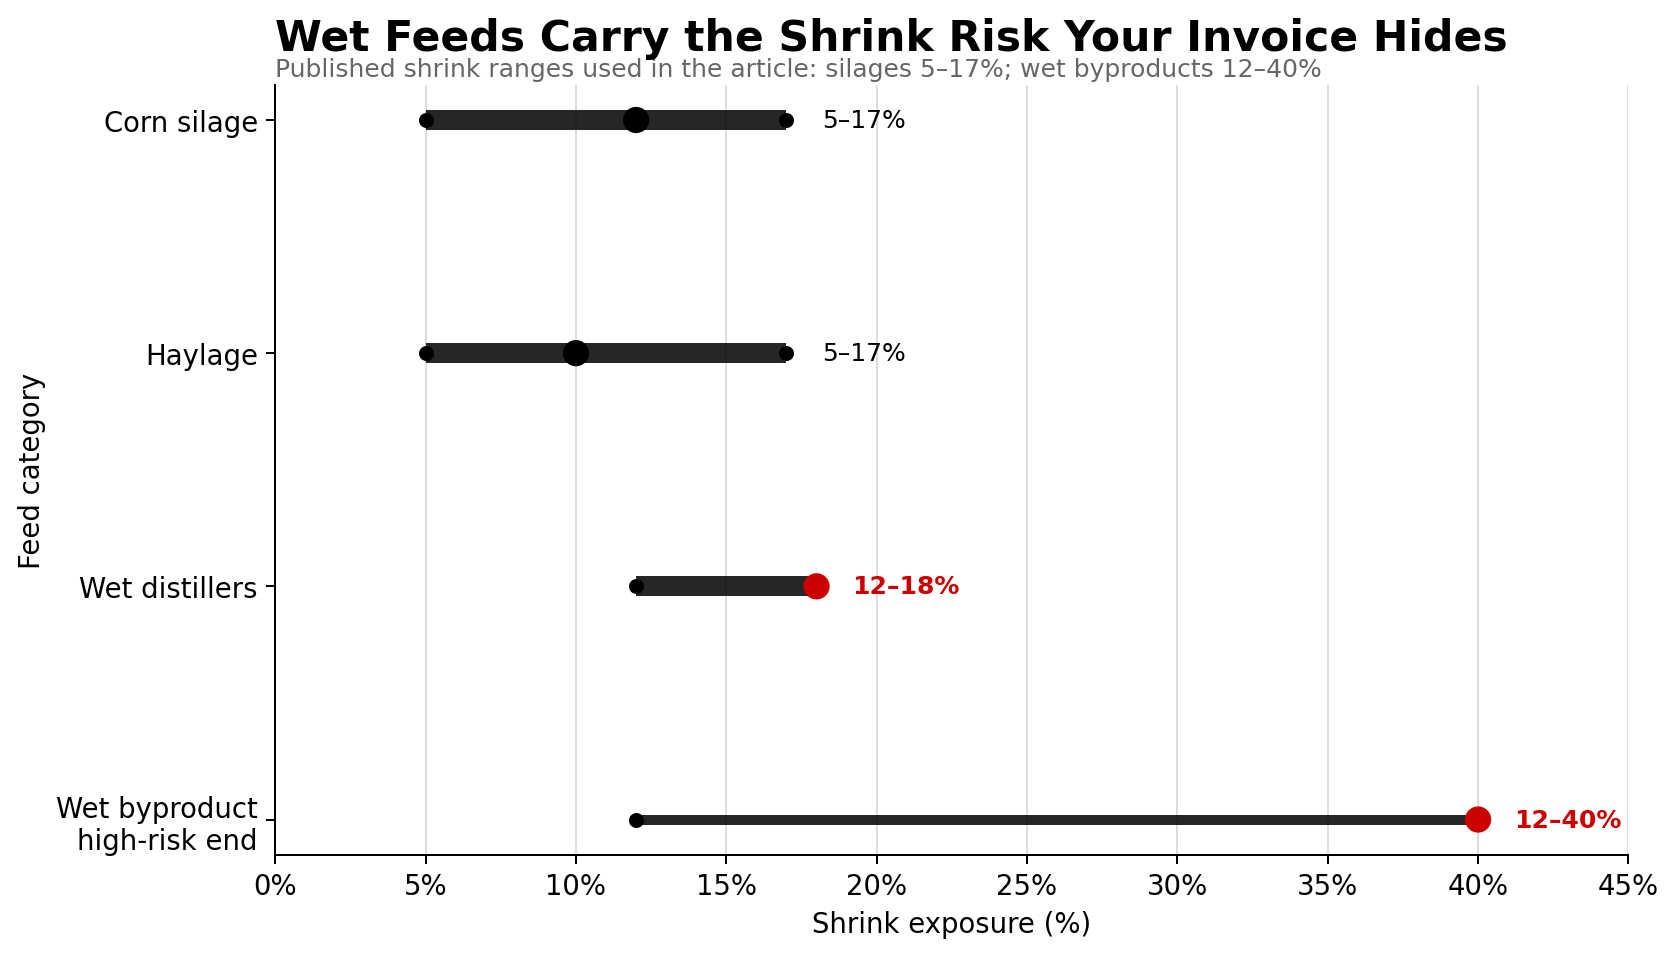
Layer one: shrink as a ghost line. On-farm corn silage and haylage shrink typically runs 5–17%; wet-byproduct shrink runs 12–40% (Hubbard Feeds, 2021). Hubbard’s own shrink math shows that moving ration shrink from ~8% to ~4% cuts true feed cost by about $0.28/cow/day on an $8 ration. Cornell PRO-DAIRY’s published feed-shrink case work on commercial dairies has reported similar per-head-per-day savings — in the same order of magnitude — from cutting ingredient shrink in half. Neither figure lives on the ration sheet. Both show up as “feed cost per cwt feels high,” and nothing more specific.

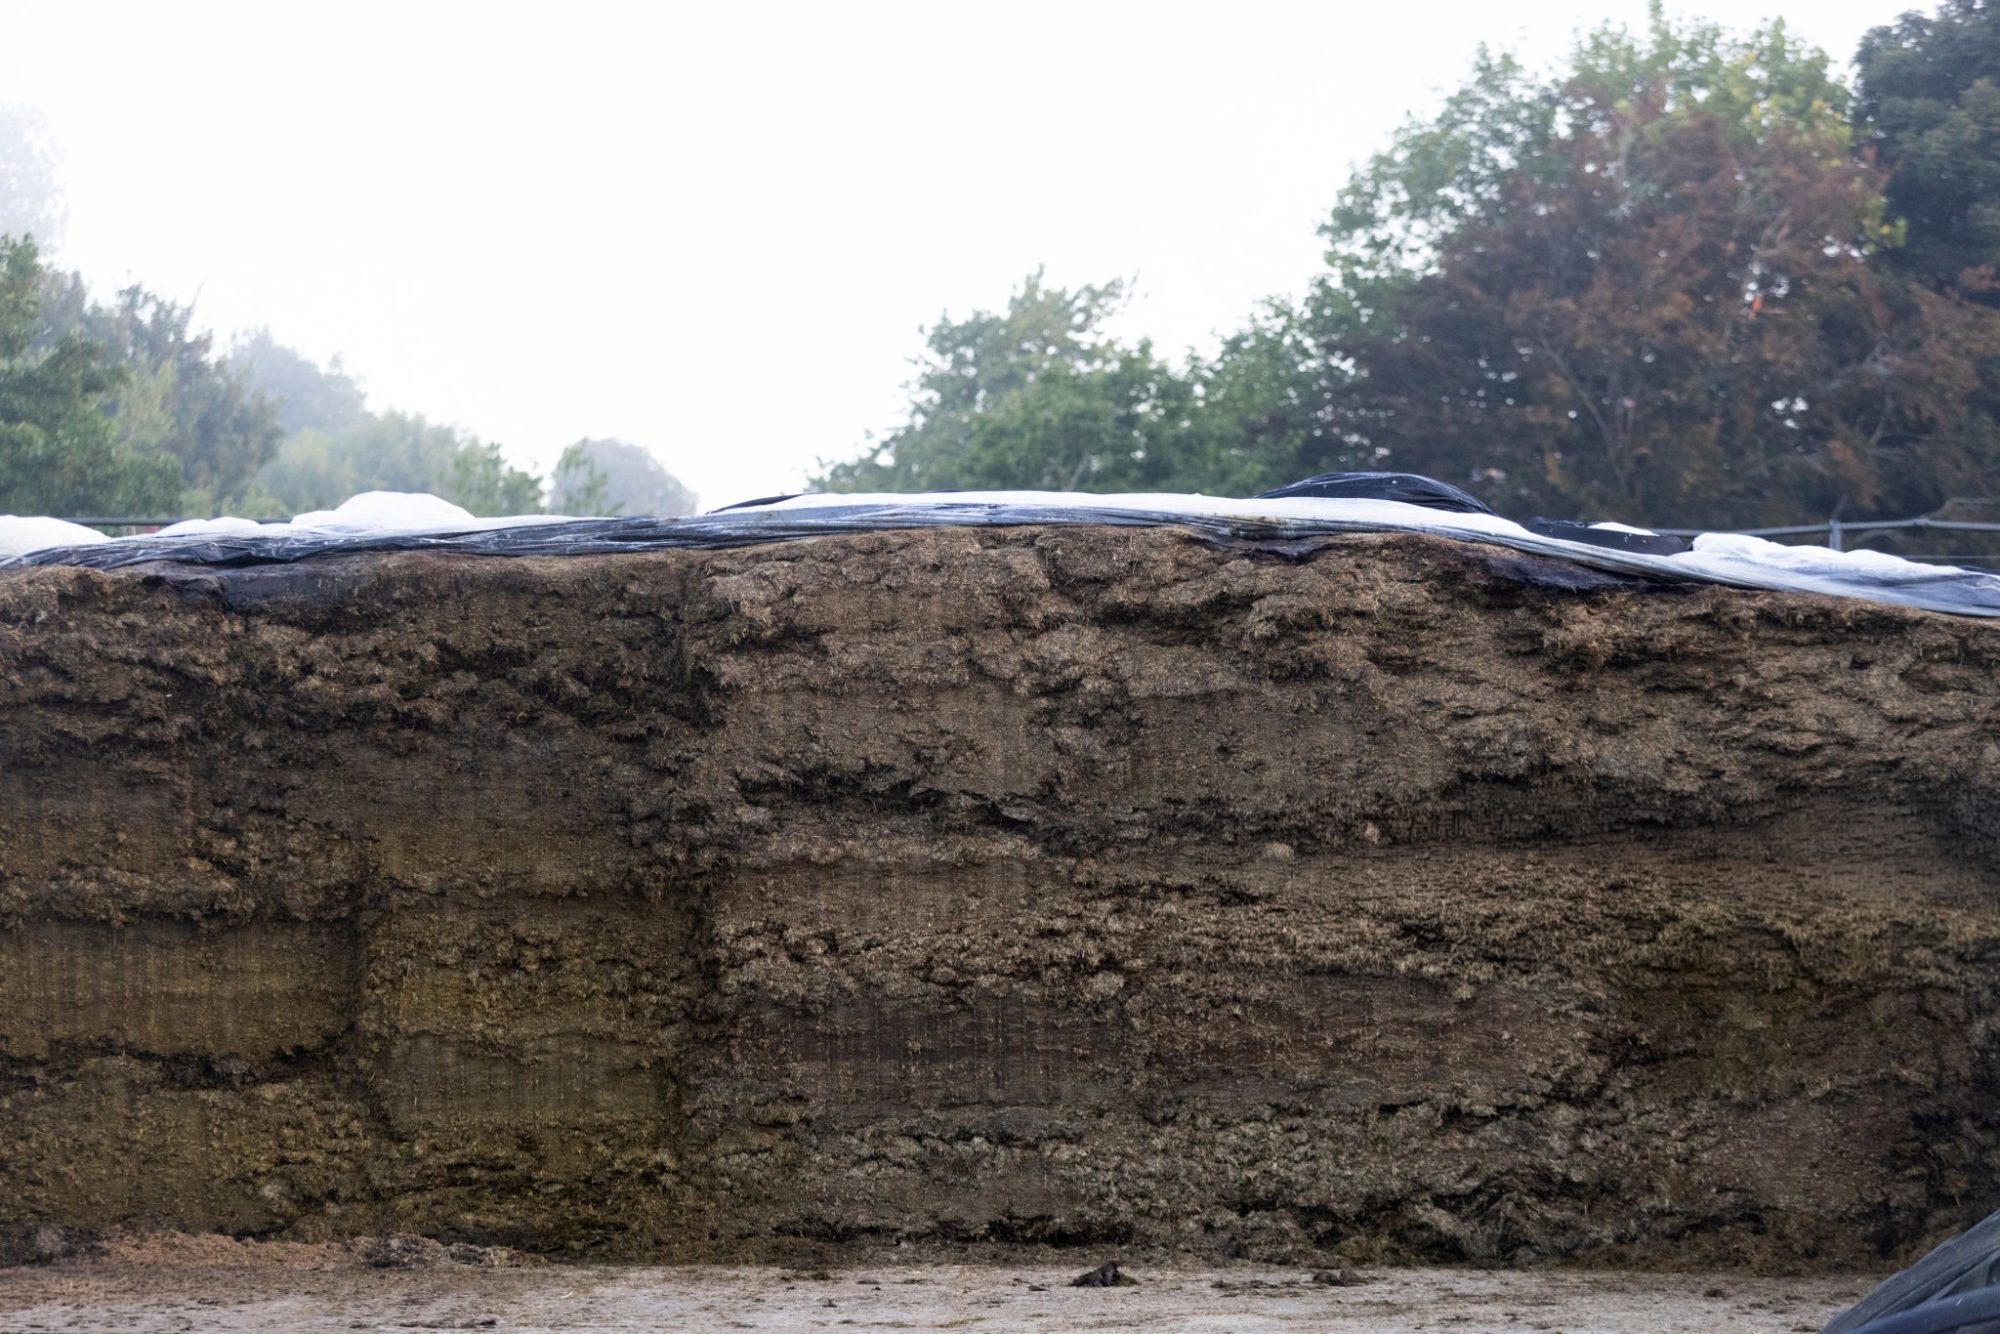
Layer two: DM drift, with Southwest 2026 heat as the accelerant. Penn State Extension’s 2023 feed-inventory guidance is blunt: wet forages need frequent DM testing through winter and at every weather change. In a 2026 Southwest summer, the bunker face isn’t drifting — it’s cooking. Sustained heat speeds secondary aerobic fermentation at the exposed face, where yeasts and molds metabolize residual sugars and lactic acid the moment oxygen reaches them (Kung, U Delaware; Shaver, UW–Madison Extension, Silage Spoilage and Aerobic Stability). DM disappears as CO₂ and water before the loader touches it.

A corn silage face booked at 35% DM in late summer can drift to 31% DM by February — illustrative for the composite, but inside published Penn State and Miner Institute field ranges. The high-group feeding rate doesn’t move. Real delivered DM drops by (35 − 31) / 35, or about 11%. At a 50-lb as-fed feeding rate, that’s ~2 lb of silage DM per cow per day the ration model thinks it’s feeding and isn’t.

Layer three: group misallocation. The better lot runs across every pen — high, mid, close-up, far-off dry — because it’s closest to the mixer. UW–Madison Extension’s 2021 Does Forage Quality Pay? bulletin is direct: feed the most digestible forage to cows in early lactation. Michigan State puts the uNDF240 gut-fill ceiling near 0.4% of body weight for high-producing cows; Miner Institute and Cornell peg the rumen uNDF240 pool ceiling at roughly 0.48–0.62% of body weight.

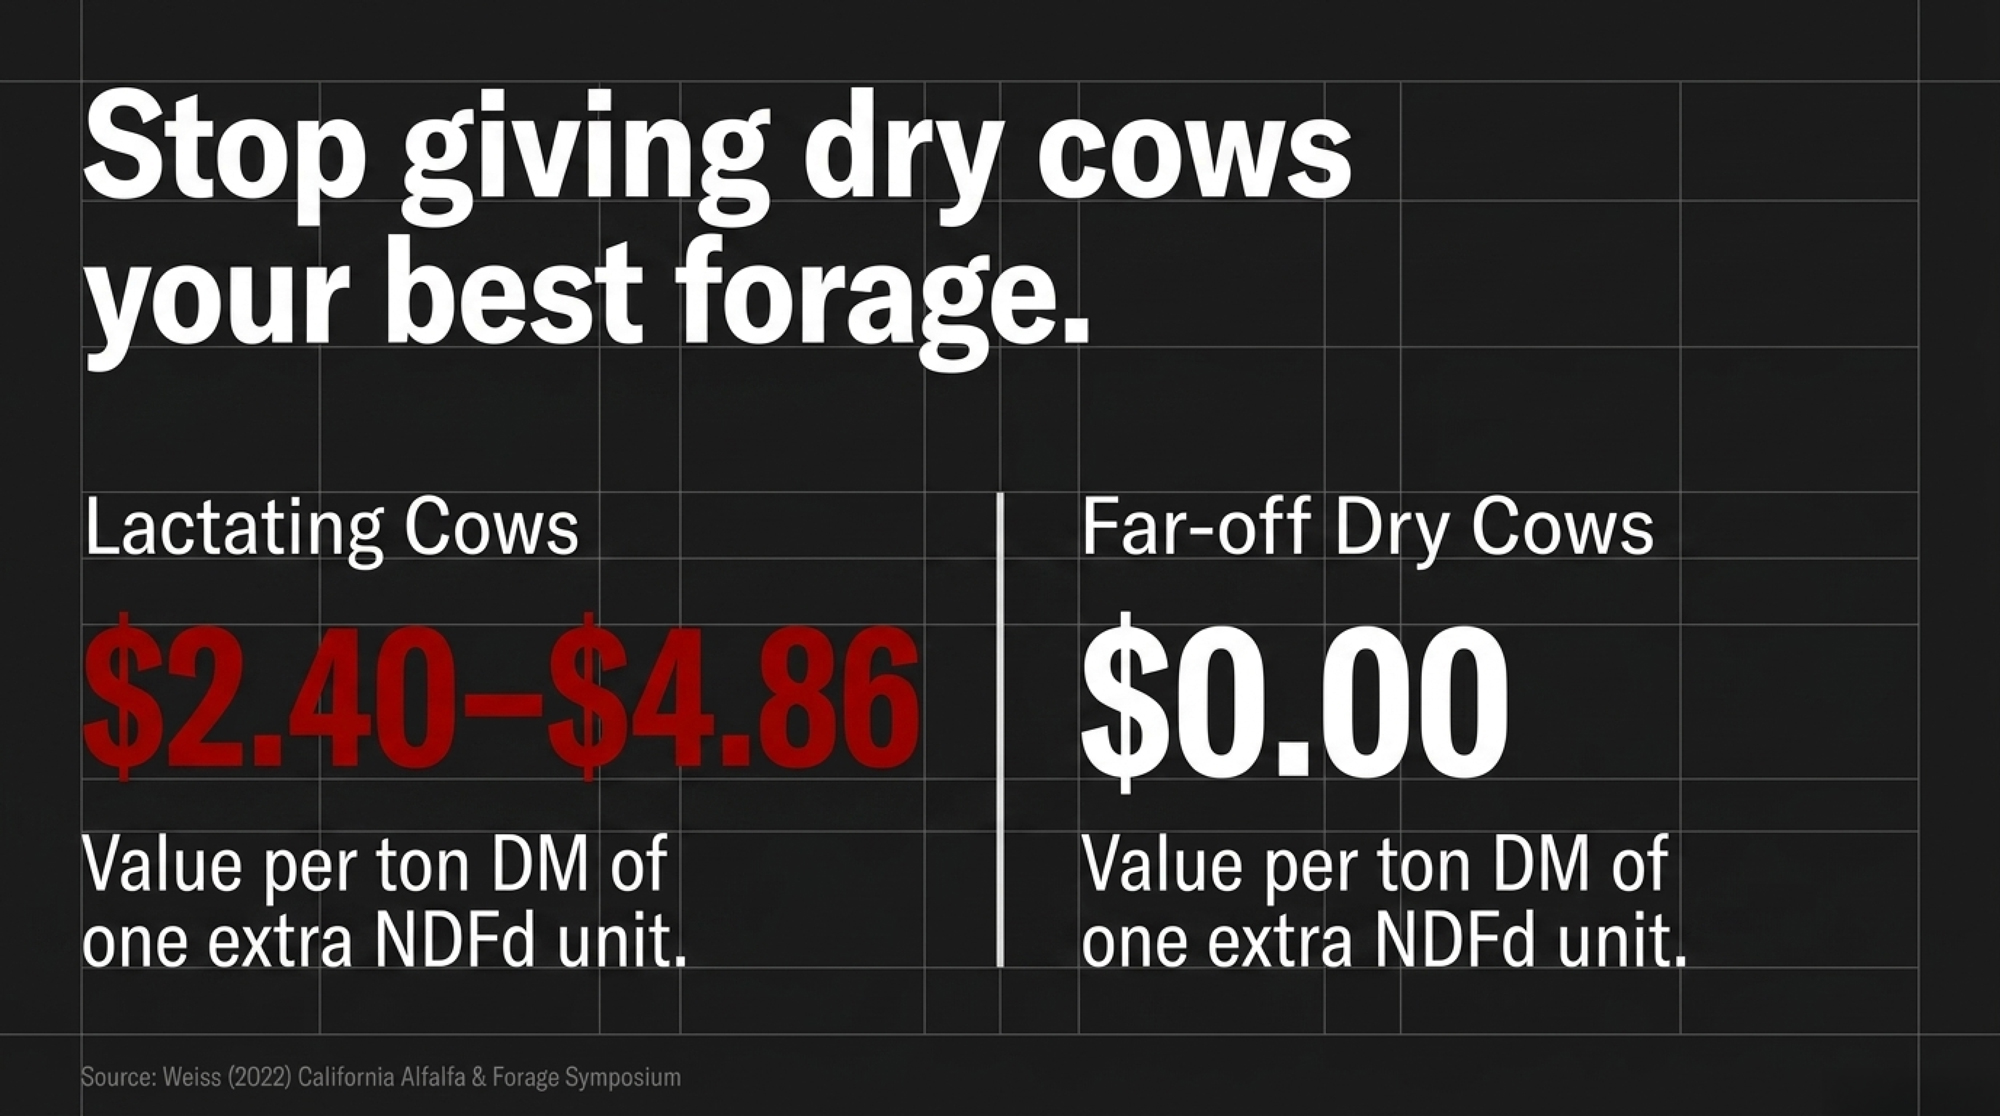
Dry cows don’t convert extra NDFd into salable milk. Often, they benefit from more uNDF240 by design. Feeding your highest-NDFd silage to far-off dry cows isn’t being kind to the cows — it’s an expensive way to produce high-quality manure.

Three leaks. One ration model that can’t see any of them. And a regional milk-price picture that won’t forgive the drift.

How Much Milk Is 4 NDFd30 Points Actually Worth on Your Operation?

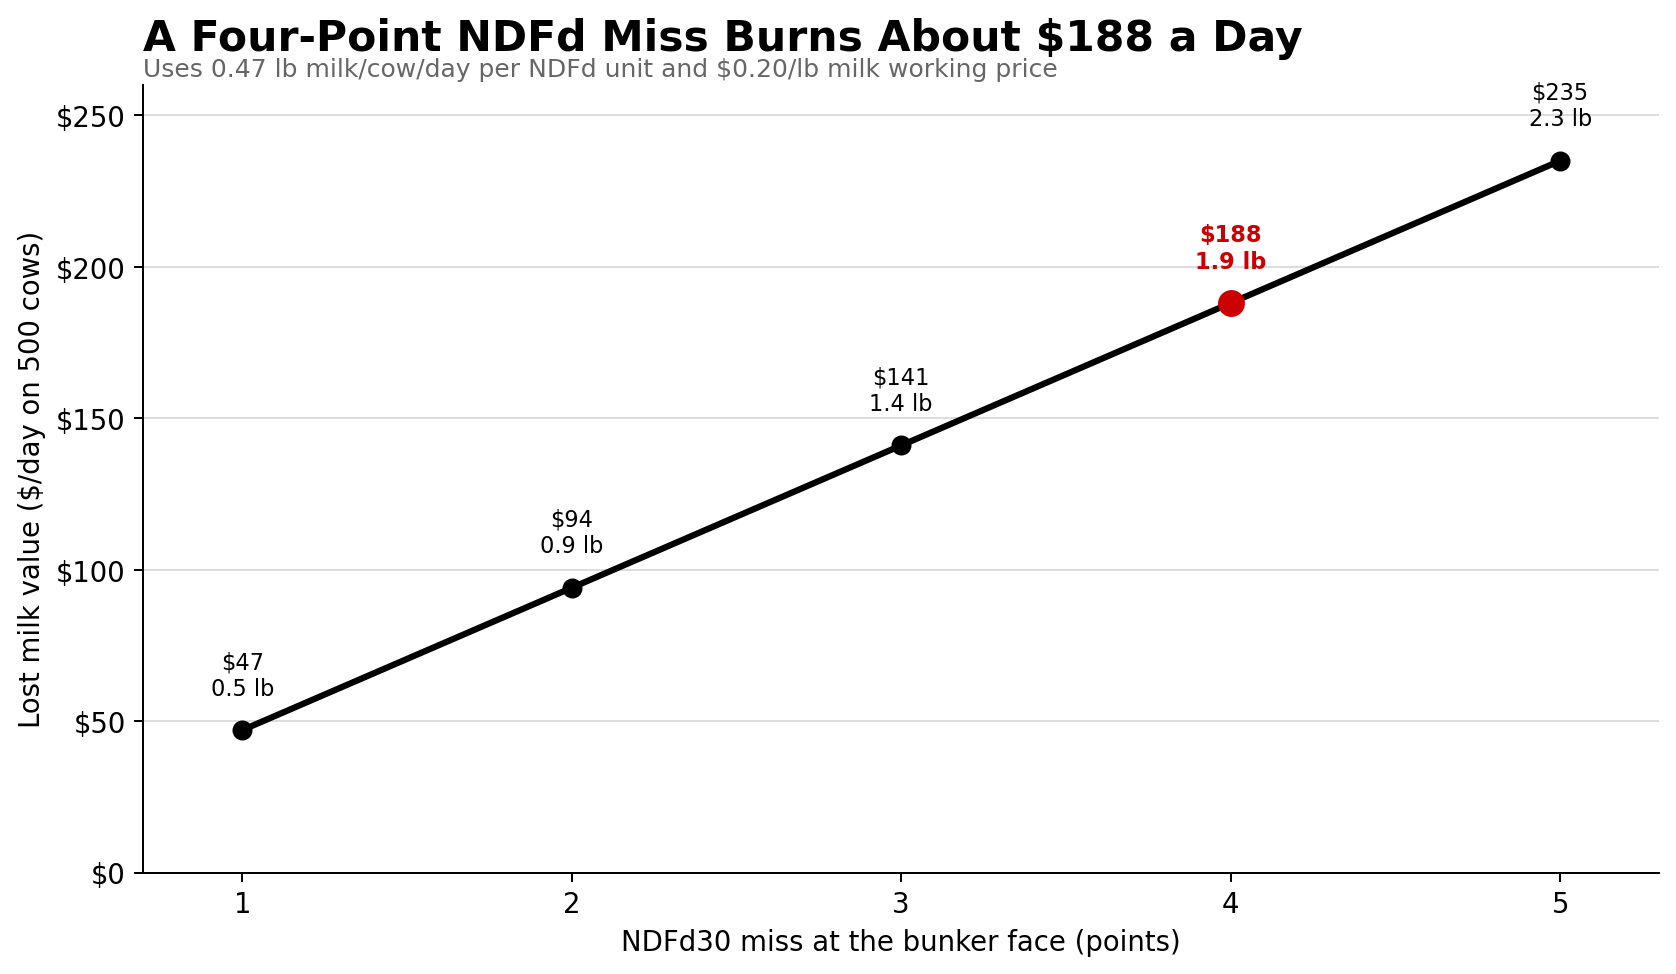
Oba and Allen’s 1999 Journal of Dairy Science meta-analysis is still the anchor: about 0.25–0.55 lb per day of 4% fat-corrected milk per one-unit bump in in vitro NDF digestibility within a forage class, with a central estimate near 0.47 lb. A four-point NDFd miss on the bunker face actually feeding your high group pencils to roughly 1.9 lb of milk per cow per day the model promised and the cow never delivered.

Bill Weiss’s 2022 California Alfalfa & Forage Symposium paper translated that biology into ration economics at roughly $2.40 to $4.86 per ton of DM per IVNDFD unit, scaled to milk-price band. The same NDFd unit is worth effectively zero in far-off dry cows.

Same ton of silage. Two entirely different economies. One pen pays you for quality. The other doesn’t.

Related reading: Dairy Cow Nutrition 2026: Ration Formulation, Forage Quality, Feed Efficiency — thebullvine.com/nutrition-2026-ration-formulation

What’s the Difference Between $/Ton As-Fed and Shrink-Adjusted $/Ton DM?

“Once we re-priced the silage on what the cows actually got, the cheap pit wasn’t cheap anymore.” That’s how the same Southwest nutritionist framed the moment the math flipped.

The shift isn’t complicated. It’s arithmetic most farms never run.

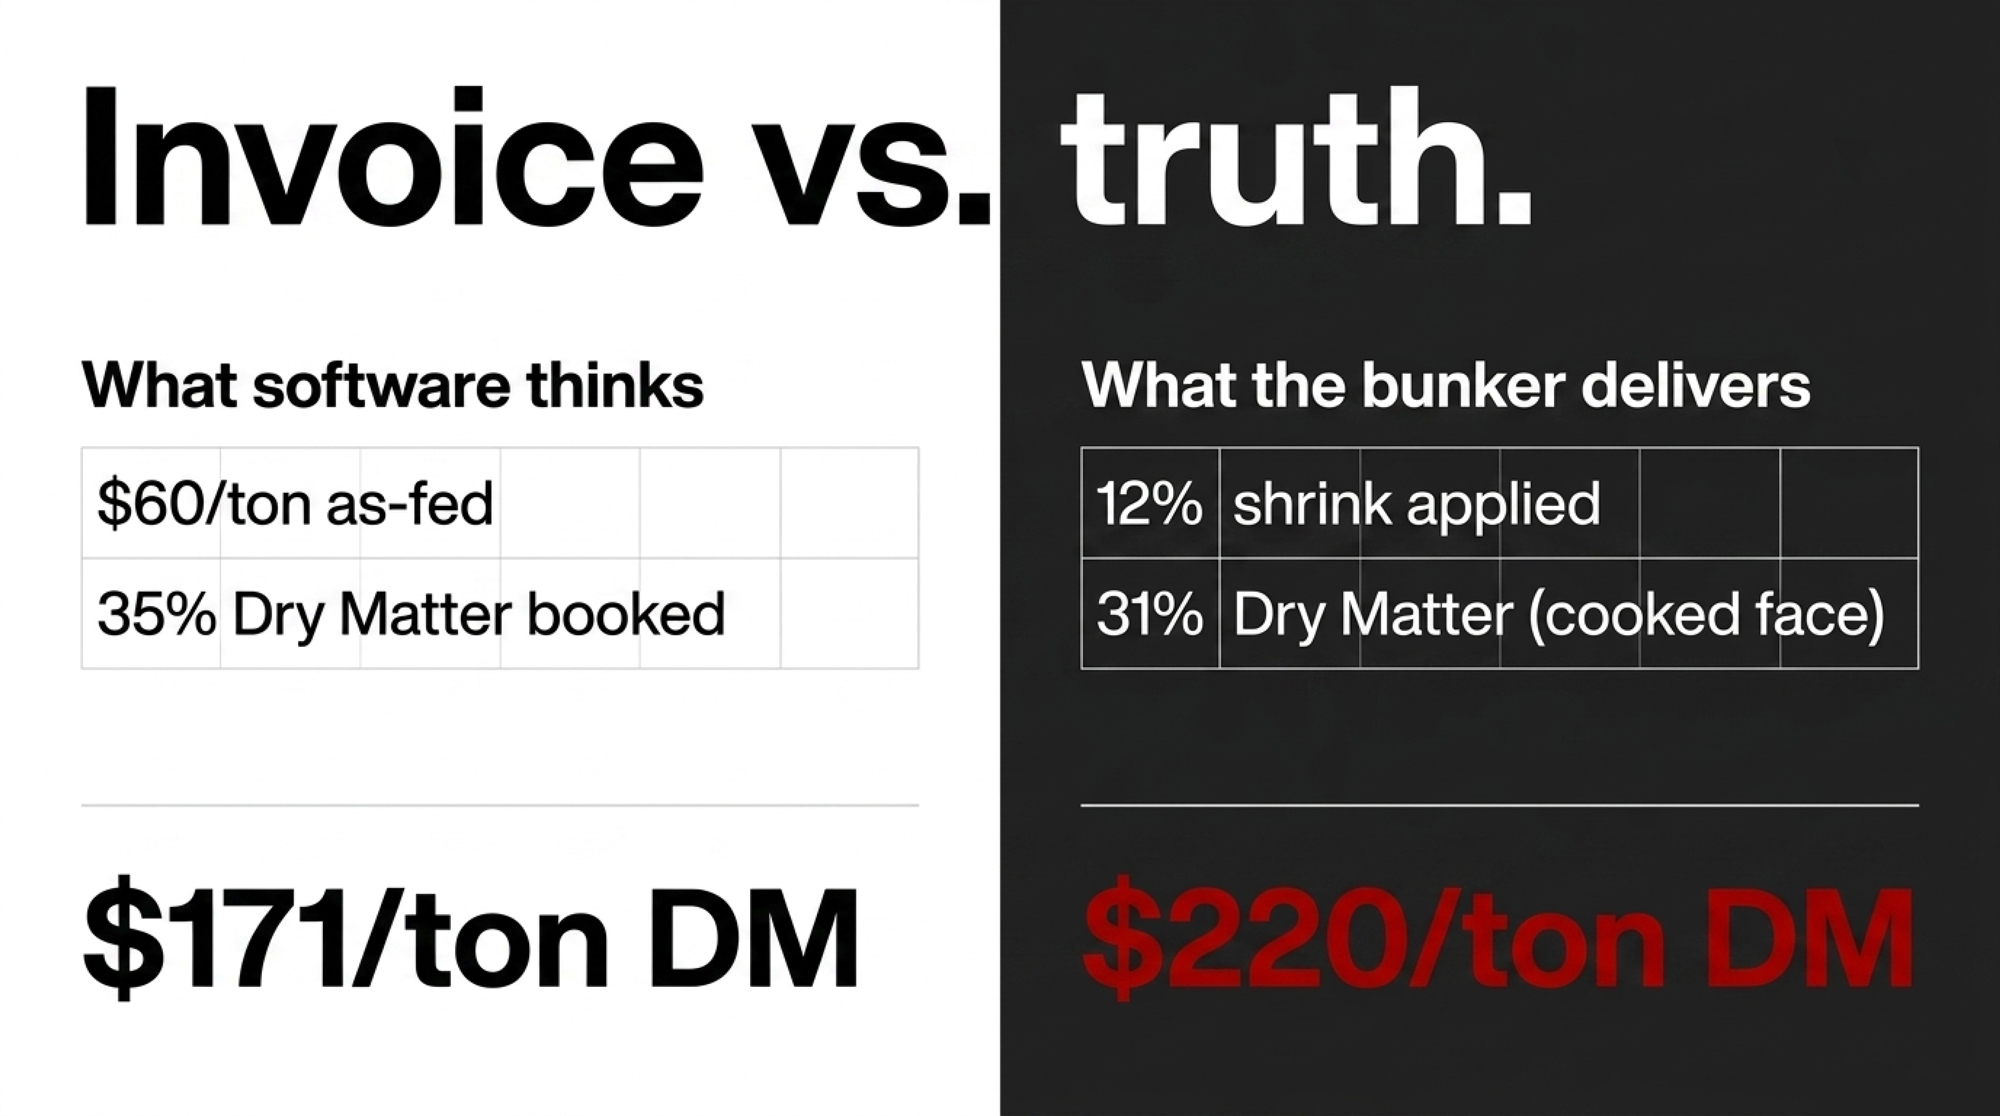
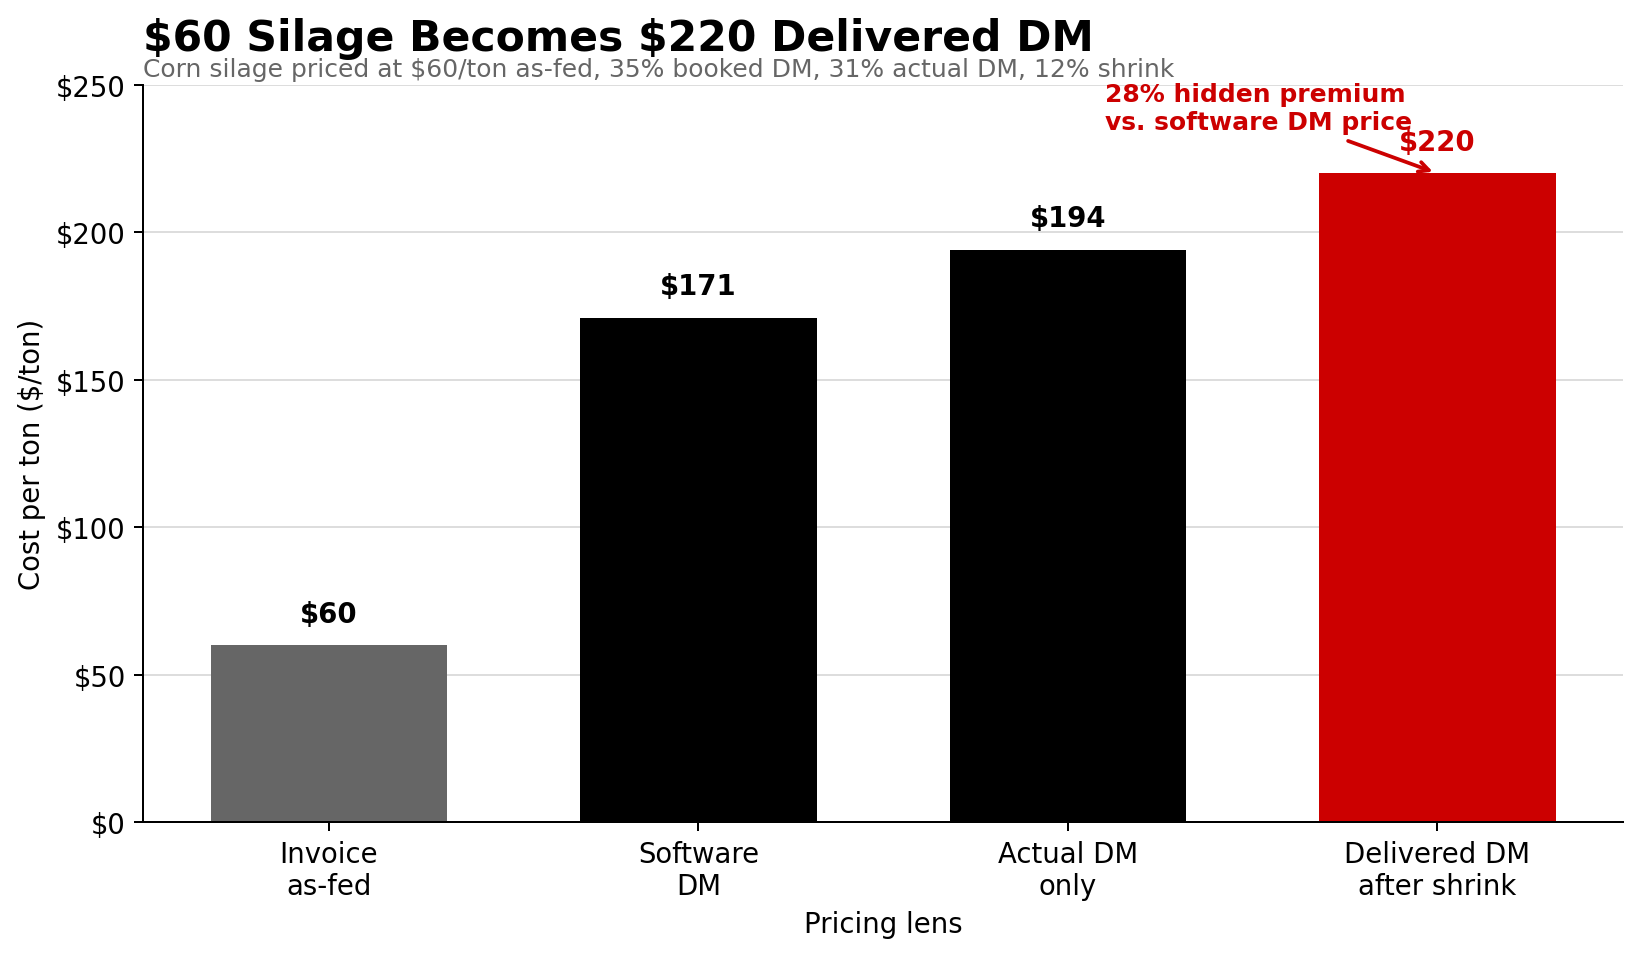
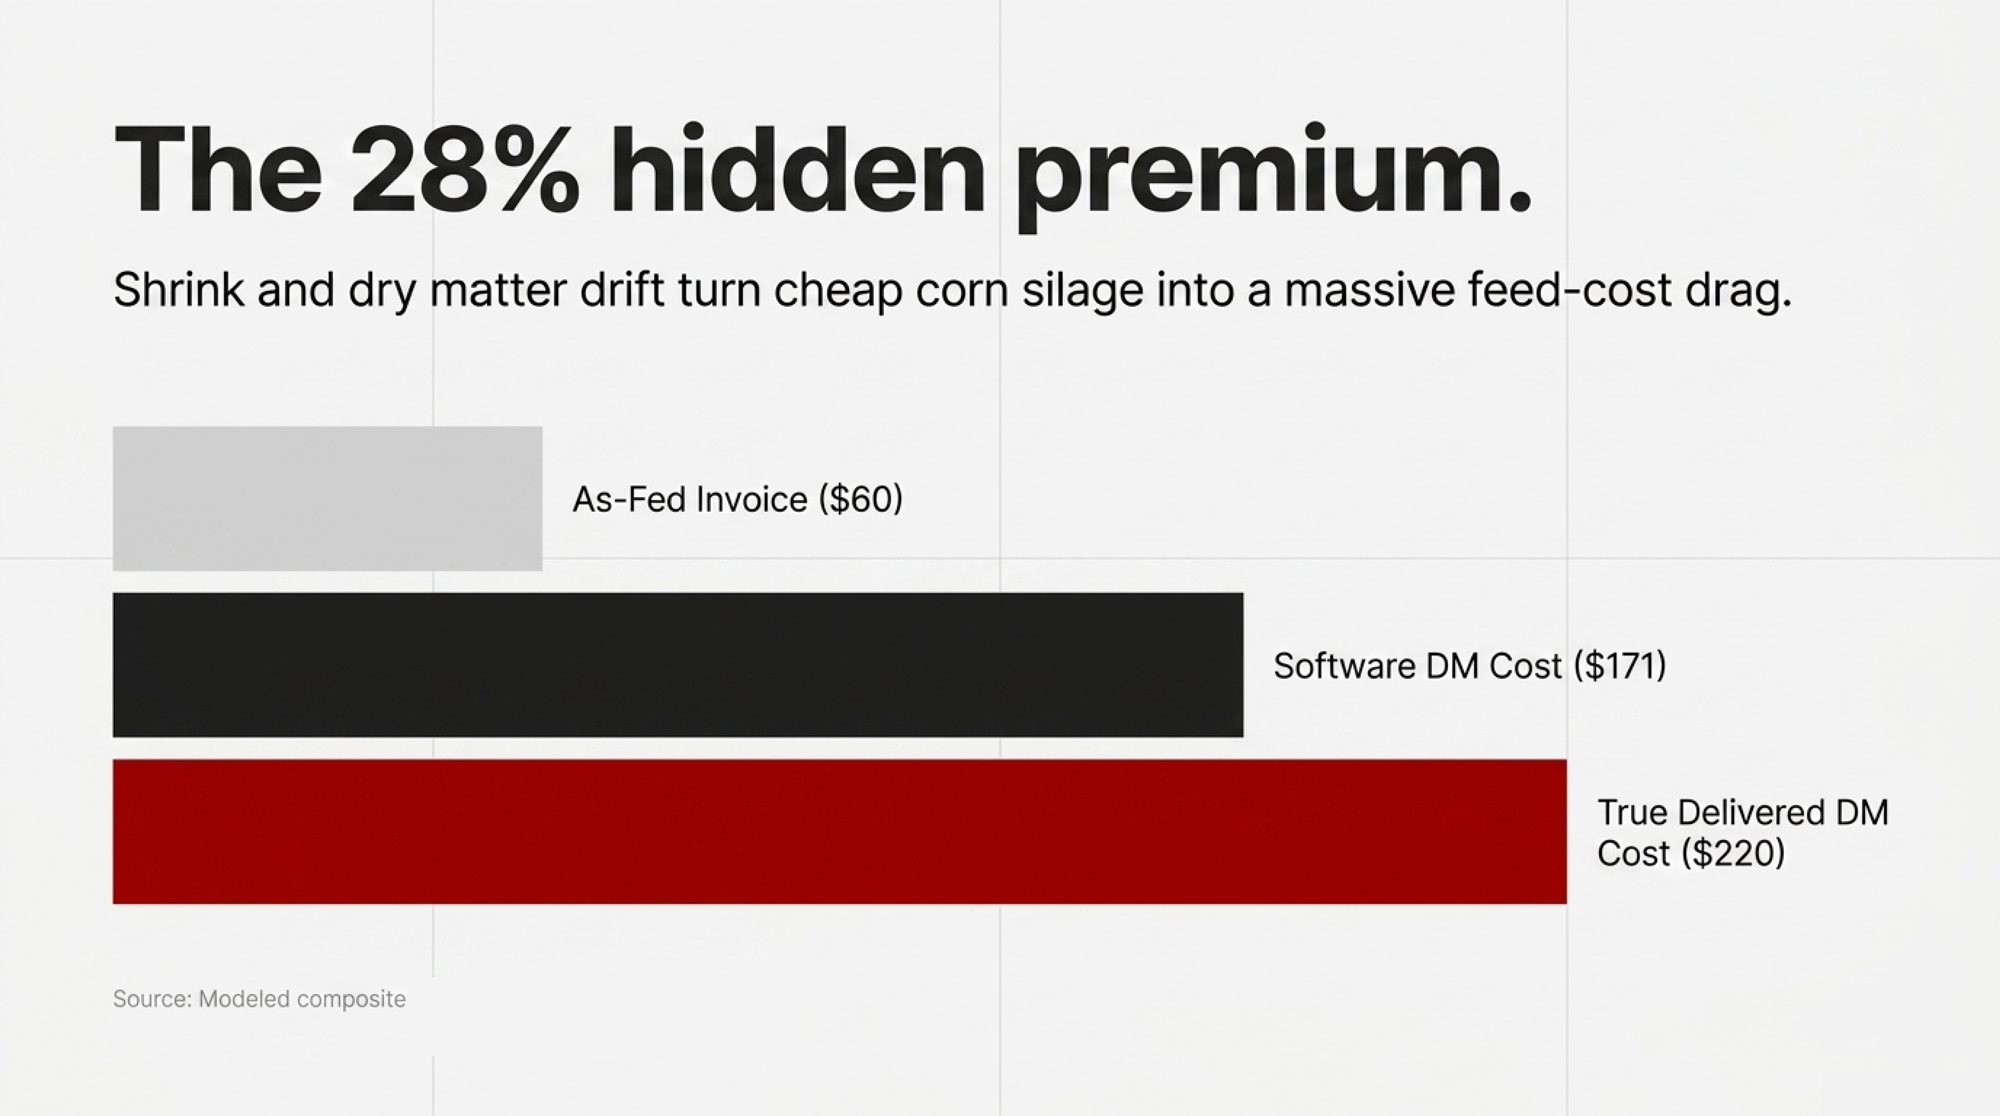
Priced two ways, the same lot tells two different stories. The ration software has a lot booked at $60/ton as-fed and 35% DM. Cost per ton DM on the invoice: $60 ÷ 0.35 = $171/ton DM. Re-run the same lot at the real 31% DM and a 12% shrink loss, and the true cost per delivered ton of DM is $60 ÷ (0.31 × (1 − 0.12)) = $220/ton DM. That’s a 28% hidden premium on a feed the software treated as cheap.

Before vs After: What Your Ration Software Thinks vs What the Bunker Delivers

FeedBook DM %Actual DM %Shrink %$/ton as-fedSoftware $/ton DMTrue $/ton DMHidden Premium
Corn silage35%31%12%$60$171$22028% warning
Haylage40%36%10%$80$200$24724% warning
Wet distillers35%33%18%$70$200$25930% warning
Wet byproduct, high-risk shed32%30%25%$72$225$32042% warning

Re-price every forage and wet feed on shrink-adjusted DM and two things happen fast. Ingredients that looked cheap on invoice slide off the inclusion list. Forages that looked expensive suddenly pencil, because the “cheap” alternative was hauling an 18% shrink penalty (AgProud, 2022, wet-byproduct range: 12–40%). Distillers at 18% shrink in an open commodity shed under Southwest summer heat isn’t hypothetical — it sits comfortably inside AgProud’s documented 12–40% range, and the heat that drives face fermentation drives commodity-shed shrink right alongside it.

The second move is a forage allocation map. One page, one ID per lot, with NDFd30, uNDF240, 7-hour IVSD, CP, and starch tagged on each, and a written group assignment. Fresh and high groups get NDFd30 above 55% and uNDF240 below 10% of DM — inside MSU, Miner, and Cornell thresholds. Dry cows get the higher-uNDF, lower-digestibility lot on purpose. Not by accident. Not by loader convenience.

The myth — “good forage is good for everyone” — dies on that whiteboard.

GroupBest-Fit Forage ProfileEconomic LogicWarning if Misallocated
Fresh cowsNDFd30 >55%, uNDF240 <10% DM, strong 7-hr IVSDConverts digestibility into milk, components, and early-lactation intakeLost peak milk and slower start
High groupHighest NDFd lot, stable face, current DM testPays for premium forage through milk response1.9 lb milk/cow/day at risk on 4-point NDFd miss
Mid/late lactationModerate NDFd, consistent DM, balanced starchProtects margin without burning the best lotOverfeeding quality where response is smaller
Far-off dry cowsHigher uNDF, lower digestibility, controlled energyFill and rumen health matter more than salable milkPremium forage becomes expensive manure
Close-up dry cowsControlled uNDF, stable palatability, clean fermentationIntake consistency beats headline RFVPalatability dip can cost transition performance

Running the Numbers: A 500-Cow, 90-Day Forage Economics Walkthrough

Modeled composite scenario. Inputs drawn from documented 2020–2026 response ranges applied to a 500-cow Southwest baseline. Milk price working figure: $0.20/lb, approximating the early-2026 US all-milk price band reported in USDA NASS’s Agricultural Prices monthly release. Federal Milk Marketing Order pool prices and basis will move the end result materially in the Northeast versus the Southwest, and Canadian producers should adjust for their provincial board component-pricing structure. Ration cost working figure: $8/cow/day, from Hubbard Feeds 2021 carried forward — 2026 ration costs may run higher; scale your $/cow/day savings proportionally. NDFd30 lab cost: ~$25–$40/sample at recently published rates from DairyOne, Rock River Laboratory, and Cumberland Valley Analytical.

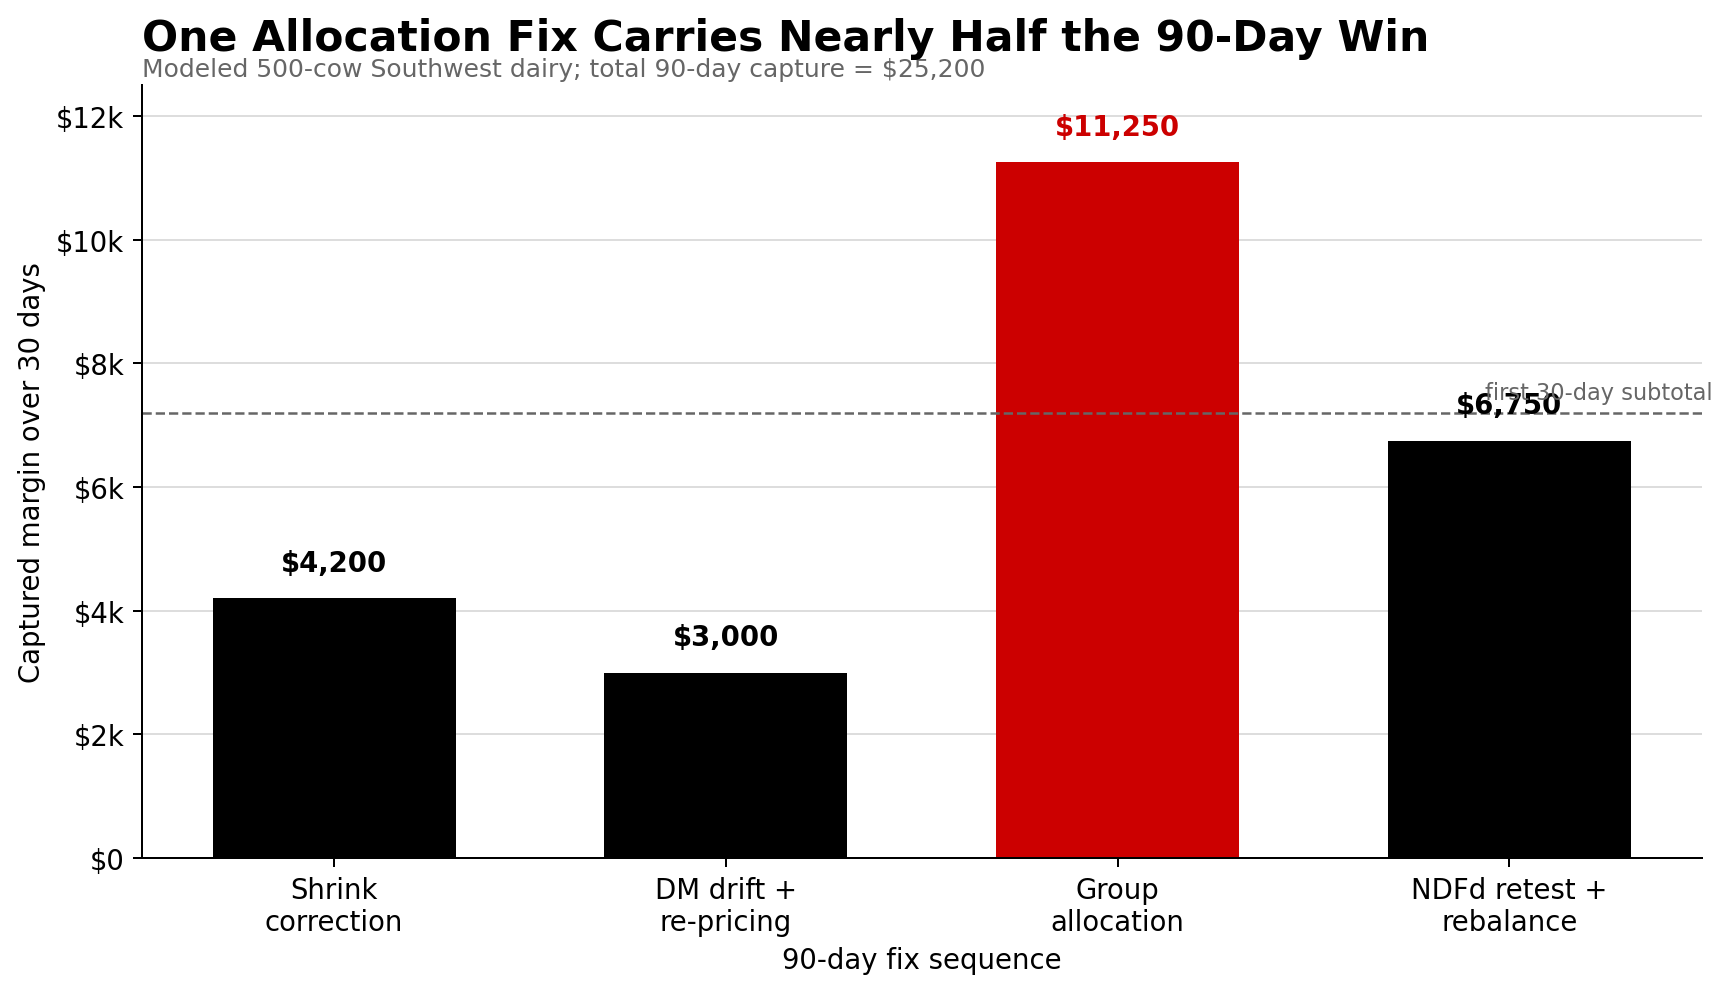
Step 1 — Shrink correction (Days 1–30). Ration shrink moves ~8% → ~4%. Hubbard Feeds (2021): about $0.28/cow/day saved on an $8 ration. 500 × $0.28 × 30 = $4,200.

Step 2 — DM drift fix and re-pricing fake-cheap ingredients (Days 1–30). Silage DM corrected (35% → 31%); high-shrink wet byproducts removed or re-priced on shrink-adjusted DM. Documented savings range: $0.10–$0.30/cow/day (AgProud, 2022; Cornell PRO-DAIRY commercial-dairy case work). Midpoint $0.20. 500 × $0.20 × 30 = $3,000.

First 30-day cost-side subtotal: ~$7,200.

Step 3 — Group allocation fix (Days 30–60). Top lot routed to fresh and high; mid lot to mid and late; lowest-quality lot to dry cows. UW–Madison 2021 documents per-cow-per-day IOFC gains above $2.00 in top-responding high groups. Applied here as a conservative herd-weighted midpoint of $0.75/cow/day (range $0.50–$1.00 in documented cases, scaled by the share of cows in the high group). 500 × $0.75 × 30 = $11,250.

Running total through Day 60: ~$18,450.

Step 4 — Honest NDFd and IVSD on the current bunker face (Days 60–90). Updated NDFd30 and 7-hour IVSD; ration rebalanced. Capture half of a 4-unit NDFd miss on the high group, weighted to herd average — assuming the high group represents the bulk of milk production: ~1.5 lb milk/cow/day × $0.20 = $0.30/cow/day. Add $0.15 in smarter concentrate use as the ration stops chasing phantom forage energy. 500 × $0.45 × 30 = $6,750.

Total Impact — 90-Day Win on 500 Cows

Step 1 (Shrink correction): $4,200 Step 2 (DM drift + re-pricing): $3,000 Step 3 (Group allocation fix): $11,250 Step 4 (Honest NDFd retest): $6,750

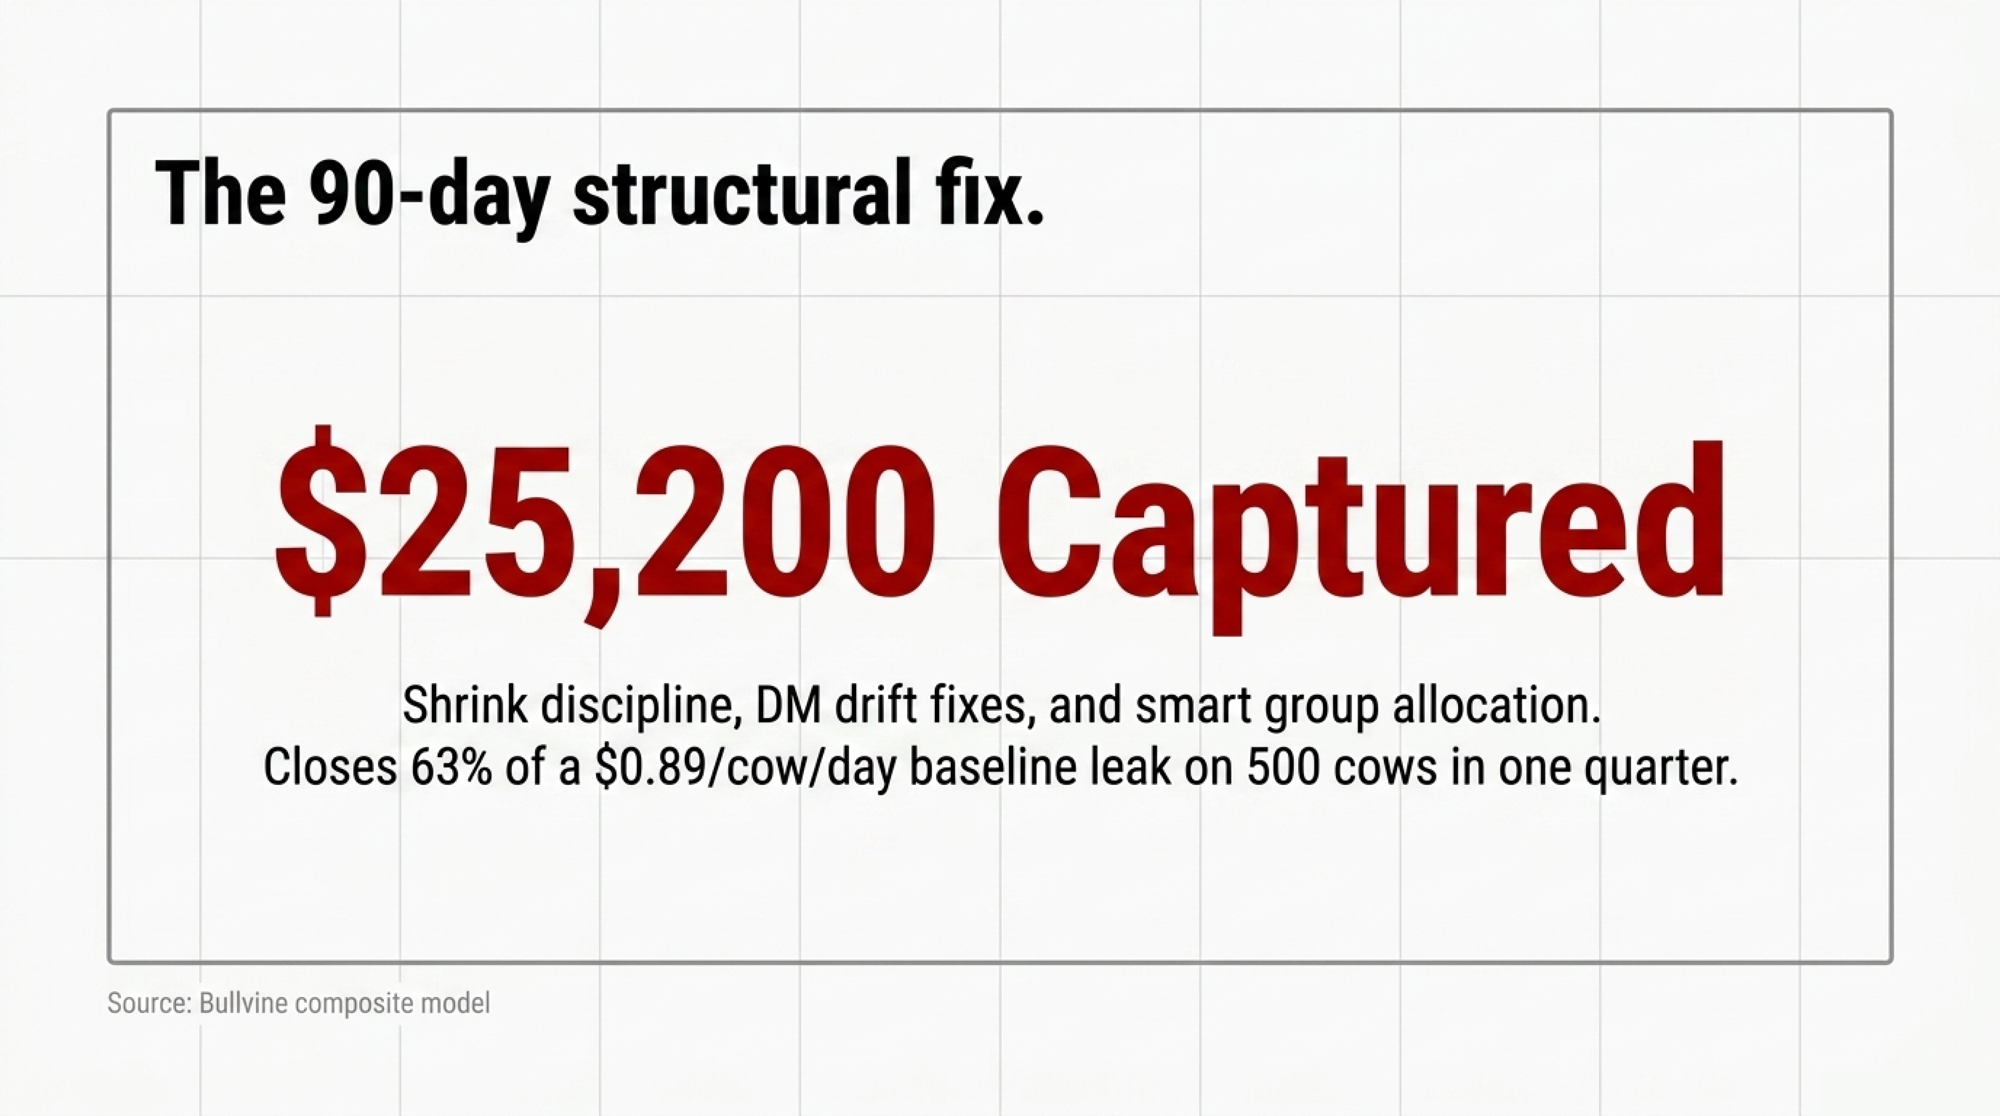
90-day total: ~$25,200. That’s roughly $0.56/cow/day captured across the 90-day window — closing about 63% of the $0.89/cow/day baseline leak in a single quarter. Most of that capture is structural, not seasonal.

Don’t annualize that linearly. Shrink correction and the allocation fix are one-time structural captures; their ongoing run-rate continues only if the discipline holds. A modeled first-year range, with the fixes held in place all year, is $60,000–$100,000 on 500 cows — an editorial projection from the 90-day walkthrough, not a Bullvine-surveyed benchmark. A modeled Year-2 ongoing benefit lands closer to $40,000–$60,000, driven by sustained shrink discipline and NDFd accuracy rather than fresh structural fixes.

Breakeven check for premium forage purchases: buy up when (IVNDFD unit gain × milk response × milk price per lb) > (cost/ton DM premium ÷ feeding rate in lb DM per cow per day). Plug in your own herd size, ration cost, milk price, and shrink estimate. The formula doesn’t care about your logo.

What Does a Shrink-Adjusted Ration Mean for Your Operation in 2026?

Many commercial ration models drift on three inputs at once: as-fed prices instead of shrink-adjusted DM prices, stale forage DM that no longer matches the face, and a harvest-composite NDFd that stopped reflecting reality the day the bunker opened. Fix those three, and group allocation, grain inclusion, and protein strategy all start optimizing against what’s actually in the ration — not a report card from last August.

Weiss’s 2022 framework puts the quality premium at roughly $2.40–$4.86 per ton of DM per IVNDFD unit in lactating cows, and effectively zero in far-off dry cows. On a farm burning top-tier forage on dry cows, that’s money lit on fire every day.

Regional exposure varies, and Southwest 2026 is its own category. Heat-driven secondary fermentation lengthens the spoilage zone behind the face, raises commodity-shed shrink on wet byproducts, and chews through DM in the carryover pit between morning and afternoon feedings. Midwest farms with shorter feedout windows and tighter-packed bunkers tend to land near the low end of published shrink ranges. Northeast operations on haylage-heavy rations face a different DM-drift exposure, and FMMO pool prices shift the milk-response math.

Canadian producers under supply management run the same biology with a different economic overlay. An Ontario dairy on DFO component pricing earns most of its forage-quality return through butterfat and protein yield, not fluid volume — quota cost, butterfat differential, and the provincial blend price all change what one extra pound of NDFd-driven milk is actually worth in a given month. Same shrink math, same allocation logic, different milk-revenue side of the equation.

One watch-out: when shrink and DM fixes expose previously masked energy deficits, don’t let grain creep solve a forage problem. Higher-digestibility forage matched to honest intake is the goal. A bigger concentrate line is not a substitute.

When peak milk stalls, the first number to re-check isn’t CP or RFV. It’s NDFd30 on the current bunker face — not the harvest report. A single retest can be worth more than a day’s milk response on a four-unit NDFd miss on a 300-cow herd.

A working benchmark some lenders and nutritionists watch: if your feed cost per cwt drifts more than ~8% against your regional DHIA or extension benchmark for two consecutive quarters with no ration change, the problem is almost certainly upstream of the ration. Your lender is already looking at that drift, even if you aren’t.

The 30/90/365-Day Playbook for Southwest 500-Cow Operations

30-Day Actions — stop the bleeding.

  • Pull a current DM on every wet forage and wet byproduct this week. Trigger: any silage face not DM-tested recently, per Penn State Extension’s 2023 guidance to test frequently and at every weather change. Under Southwest summer heat with visible heating at the face, tighten the editorial floor to weekly. Requires: a Koster or microwave test and one ration update. Backfire risk: sampling only the center of the face — pull top, middle, and bottom.
  • Re-price every forage and wet feed on shrink-adjusted DM, not invoice. Use a real shrink estimate from the AgProud 2022 range (5–17% silages, 12–40% wet byproducts). Red-flag trigger: if nobody on your team can state your current ration shrink percentage in one sentence, this goes to the top of the list.
  • Pull an updated NDFd30 and 7-hour IVSD on the exact bunker face feeding your high group — not a harvest composite. Cost: ~$25–$40/sample at recently published rates from DairyOne, Rock River, and Cumberland Valley. Backfire risk: a single sample tells you one point — pull two across the face.
  • Build a one-page forage allocation map. Every open lot gets an ID and a written group assignment based on NDFd30, uNDF240, IVSD, CP, and starch. Related reading: Fine-Tuning Haylage and Cereal Silage Quality for Different Life Stages Within the Dairy Herd — thebullvine.com/haylage-cereal-silage-life-stages

90-Day Actions — structural change.

  • Split rations more aggressively. Route top-tier forage to fresh and high (NDFd30 >55%, uNDF240 <10% of DM, inside MSU/Miner/Cornell thresholds). Push higher-uNDF forage to dry cows and heifers by design. Requires: nutritionist time, two weeks of baseline IOFC data, and loader-route discipline. Backfire risk: mid group squeezed on energy when the top lot moves — monitor DMI and milk in mid cows for 14 days post-change.
  • Reconcile what the ration thinks you feed against what actually leaves the feed center. The composite 500-cow walkthrough above closes about 63% of a $0.89/cow/day baseline leak on this reconciliation alone. Related reading: The 89¢ Per Cow Per Day Leak Found in a Feed Center — thebullvine.com/89-cent-per-cow-leak-feed-center
  • Re-run breakeven milk response on every premium forage purchase before the next growing season, using Weiss’s 2022 $2.40–$4.86/ton DM per IVNDFD unit framework at your milk-price band. Backfire risk: anchoring on milk-price highs — model at both a conservative and an optimistic band before committing.
  • Watch palatability and DMI when you trim wet byproducts. You can gain $0.20/cow/day on ingredient cost and lose it right back on a 1.5-lb DMI drop.

365-Day Moves — strategic positioning.

  • Rebuild your harvest plan around time-in-silo economics and Southwest face-management reality. UW–Madison Extension and Penn State silage-fermentation work, including 2023 Journal of Dairy Sciencepublications on zein protein matrix proteolysis, show corn silage 7-hour IVSD climbing roughly 10–15 percentage units over four to six months of ensiling. Opportunity signal: if your IVSD at pit-opening is below 70% and you have carryover inventory, defer feeding that lot to the high group by 60–90 days rather than blending it in early.
  • Move to lot-level forage accounting. Each bunker, bag, or stack gets an ID, a lab sheet, a shrink estimate, and a written group assignment. Forage inventory becomes a portfolio with assigned margin roles, not a pile.
  • Stand up a quarterly review with your nutritionist and lender where feed cost per cwt, IOFC, feed efficiency (ECM lb / DMI lb), and shrink percentage all sit on the same page. Trigger: feed cost per cwt drifts more than ~8% against your regional DHIA or extension benchmark for two consecutive quarters with no ration change — escalate. Opportunity signal: shrink holds under 5% and NDFd30 stays above 55% on your high-group face for two quarters — you’ve earned room to buy premium hybrids for the next harvest without blowing your ration cost ceiling.

The Contract Check That Closes the Loop

The acres didn’t change. The cows didn’t change. The forage math did. That’s the entire story.

You gain margin when you price forage on shrink-adjusted DM, allocate it by digestibility, and re-test the bunker face rather than the harvest core. What you give up is the comfort of a single “good” lab sheet and a loader route that treats every pen identically. That’s the trade-off. It’s worth making.

Calculate What Your Forage Is Really Worth

Your forage test isn’t a report card. It’s a margin signal. Use The Bullvine Forage Quality Value Calculator to turn lab results into cost, milk response, break-even, and ration-group decisions.

Prefer to open it full-screen? Launch the calculator here.

Two questions before your next nutritionist meeting. What is the real shrink-adjusted DM cost of the forage feeding your high group this week? And when was NDFd30 on that specific bunker face last re-tested — not the harvest report, the current face?

If you can’t answer both in under two minutes, your forage report isn’t a report card. It’s a financial statement you’re not reading.

What does your current ration sheet actually price your silage at — invoice, or truth?

Methodology: This walkthrough is an explicitly composite scenario. It blends documented per-cow-per-day response ranges from Oba & Allen (1999, Journal of Dairy Science), Weiss (2022, California Alfalfa & Forage Symposium), Hubbard Feeds (2021), AgProud / Progressive Forage (2022), UW–Madison Extension (2021, Does Forage Quality Pay?), Michigan State Extension, Miner Institute, Cornell PRO-DAIRY, and Penn State Extension (2023), with editorial observation drawn from Bullvine Q1 2026 Southwest feed-center conversations.

Key Takeaways

  • Price every forage and wet feed on shrink-adjusted DM, not invoice. The $60/ton silage that eats $220/ton DM after shrink and drift is a 28% hidden premium your ration software won’t flag.
  • Same ton of silage, two different economies. NDFd is worth $2.40–$4.86/ton DM per unit in lactating cows and effectively zero in far-off dry cows — feed your best lot to fresh and high, not to the closest pen.
  • The 90-day fix on a 500-cow Southwest herd closes about 63% of a $0.89/cow/day leak. Most of that is shrink discipline, group allocation, and an honest NDFd30 retest on the current bunker face.
  • If your feed cost per cwt has drifted more than ~8% against your regional benchmark for two quarters with no ration change, the problem is upstream of the ration — and your lender is already looking at it.

Complete references and supporting documentation are available upon request by contacting the editorial team at editor@thebullvine.com.

Learn More

  • Feed Shrink: The Silent Profit Killer — Recover $0.30/head/day through an audit of commodity bay protocols and loader operator discipline. Arms you with a checklist to identify exactly where “ghost” tons vanish before reaching the mixer.
  • Dairy Farm Profitability: Strategies for 2025 — Secure your feed-cost-per-cwt against 2027 market volatility by quantifying the multi-year ROI of bunker infrastructure upgrades. Dismantles the myth that weather alone dictates your silage quality and bottom line.
  • Precision Dairy Farming: The Future of Feed Management — Capture a technical edge using automated bunk-monitoring sensors and real-time DM adjustment tools. Follows the money on hardware that replaces the Koster tester with laser-accurate intake data for high-producing groups.

The Sunday Read Dairy Professionals Don’t Skip.

Every week, thousands of producers, breeders, and industry insiders open Bullvine Weekly for genetics insights, market shifts, and profit strategies they won’t find anywhere else. One email. Five minutes. Smarter decisions all week.
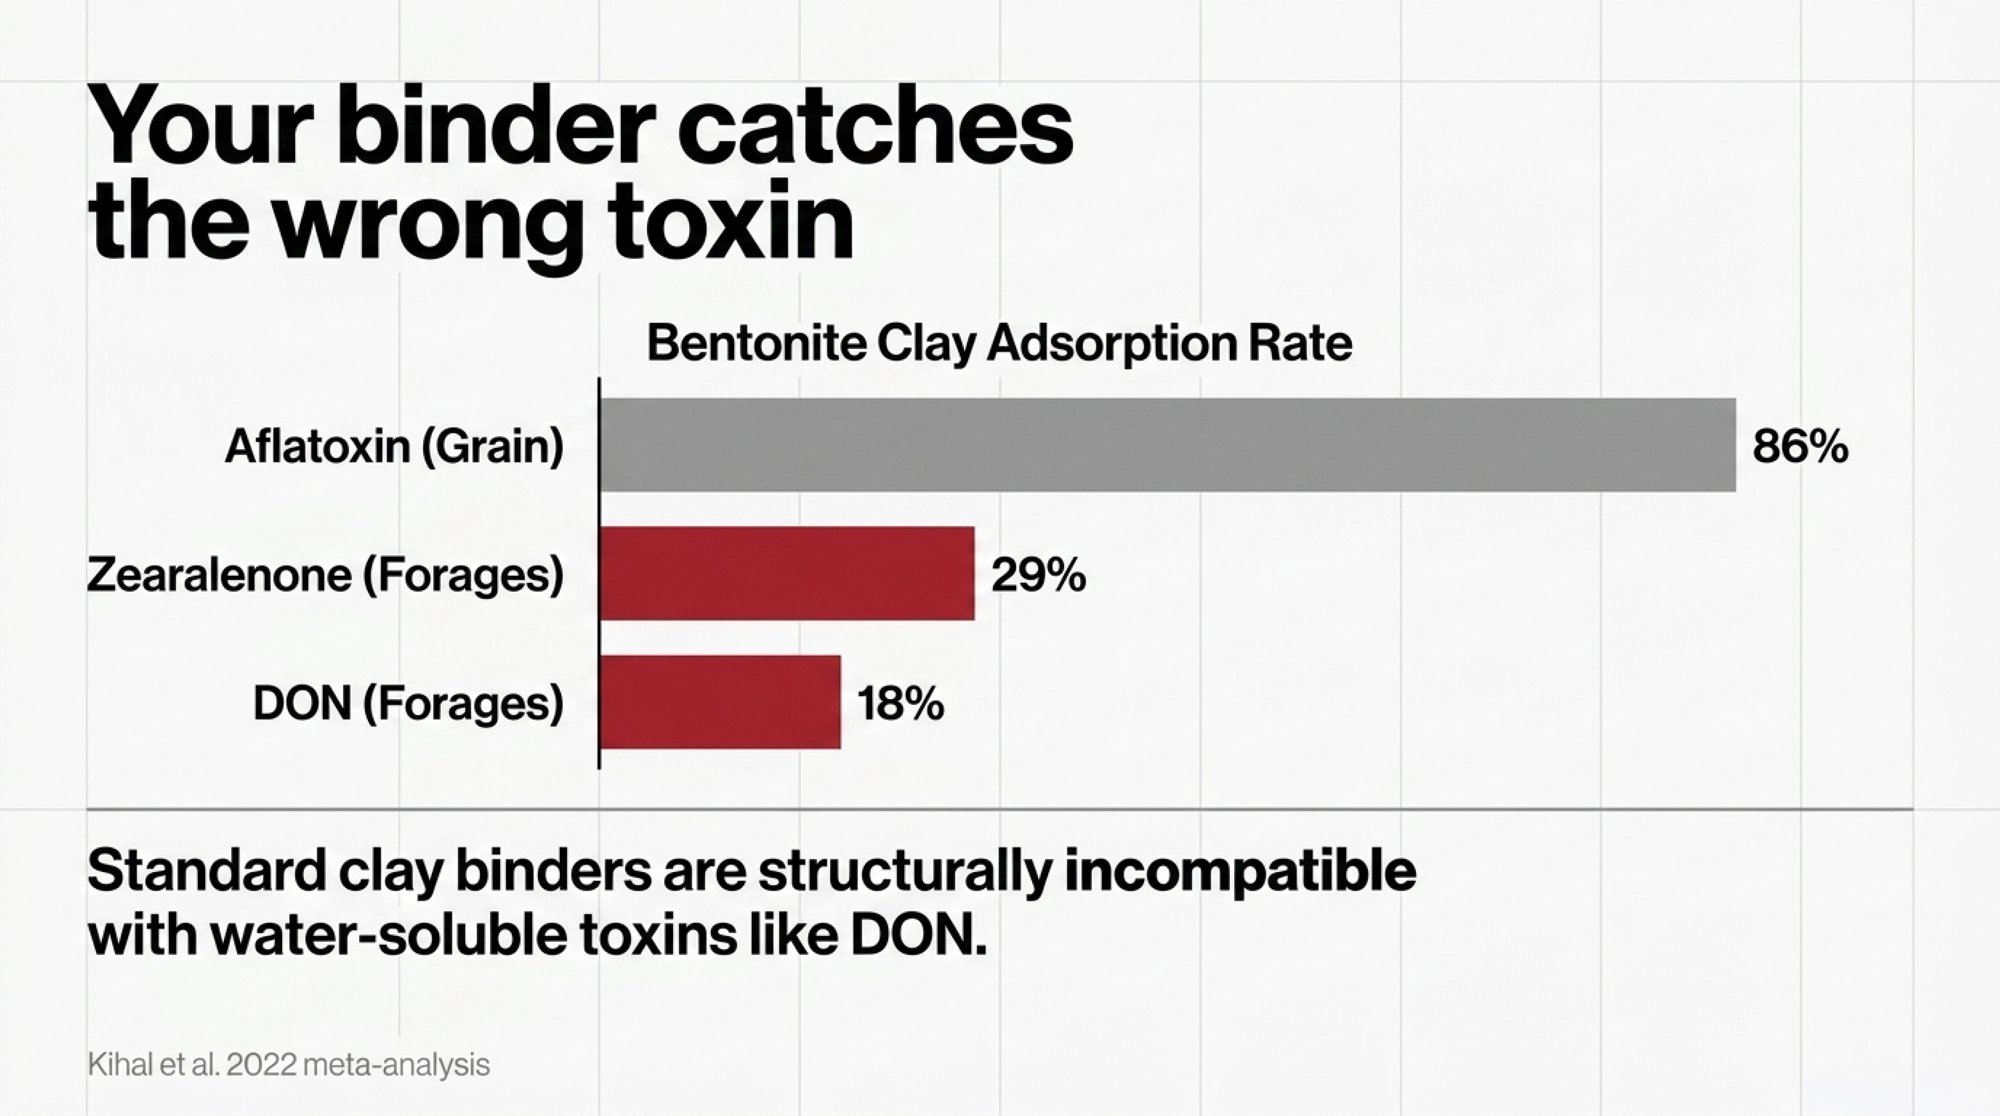
NewsSubscribe
First
Last
Consent

Wegner Has 200K Followers. Your Checkoff Spent $431.8M. Guess Who Consumers Trust.

A 400‑cow herd ships about $16,800/yr into a $431.8M checkoff built around pizza cheese and exports. Wegner builds trust on a phone for $0. We ran the 8¢/cwt math.

Executive Summary — The U.S. dairy checkoff pulled in $431.8M in 2022, about $352.1M of it from producers at 15¢/cwt. Capps’ published model credits the system with roughly $1/cwt of all‑milk lift, but the bulk of that lift sits in cheese, exports, and foodservice — not the jug. Plant‑based milk now holds about 14% of category dollars (GFI 2024). A 400‑cow herd shipping 112,000 cwt sends ~$16,800/yr into checkoff promotion. A 0.4%‑of‑revenue farm‑level story budget pencils out to about 8¢/cwt and a plausible 16¢/cwt return. Four paths follow, each with a 30‑day first step.

Annaliese Wegner, known online as Modern-Day Farm Chick, at Wegnerlann Dairy in Wisconsin, where she milks 650 Holstein cows with her family while building bridges between farms and consumers through authentic storytelling that has earned her over 200,000 social media followers.

Editor’s note: Editorial analysis based on public USDA, DMI, AFBF, GFI, EIT, CCFI, CRDC, and corporate disclosures available as of publication. Where Bullvine offers interpretation of the data, we say so.

Annaliese Wegner runs “Modern Day Farm Chick” from her family’s Wisconsin dairy, posting Reels and short videos to a combined following of more than 200,000 people across Instagram, Facebook, and TikTok. Her public feed shows calves being fed, kids around the barn, and the occasional manure‑splattered moment that doesn’t make it into a corporate dairy ad. (Read more: From Farm Boots to Facebook Fame: How Annaliese Wegner is Changing the Face of Dairy)

Followers report shifting from worry about GMOs to asking for real milk from real cows and saying they feel like they know a dairy family. None of that time, gear, or reach shows up anywhere in the national dairy marketing budget. Wegner has built the platform independently of any checkoff or industry funding.

The national dairy checkoff, meanwhile, collected $431.8 million in 2022 from producers and importers, the most recent total reported to Congress. Economists can tell you how much extra cheese a QSR partner moved because of those dollars and how much that lifted the all‑milk price. They can’t tell you what a single Wegner post — or a Hoof GP video from a hoof‑trimming chute in Scotland — did for fluid milk, plant‑based defections, or policy risk in your county.

That’s the gap this story pokes at.

Why Does This $431.8 Million Gap Matter Now?

On paper, dairy’s marketing machine looks impressive.

USDA’s most recent Report to Congress and DMI’s audited statements show the national checkoff system took in $431.8 million in 2022 — about $352.1 million from producers at 15¢/cwt, plus $79.7 million from fluid milk processors and importers. DMI’s 2024 pro forma shows program investments of roughly $121.4 million, with major buckets including:

  • Export: about $31.8 million, including $25.0 million for USDEC and $6.8 million for international partners.
  • Reputation: about $30.5 million across sustainability, farmer relations and outreach, strategic intelligence, impact funding, and planning.
  • Sustainability: around $11.6 million inside that reputation bucket.

Texas A&M economist Oral Capps ran the big checkoff ROI model for the 2009–2024 period. His analysis, summarized by DMI and USDA, suggests checkoff programs generated roughly $6 billion in cumulative economic value, delivered roughly a 3.5:1 return on foodservice partnerships under Capps’ attribution model, and left the average all‑milk price around $1/cwt higher than in a no‑checkoff world. DMI’s published position emphasizes that this aggregate all‑milk lift accrues across the producer base regardless of product mix; we treat that as the official view, and this article focuses on how the aggregate breaks down for fluid‑heavy herds.

Those are serious numbers worth respecting.

But here’s where it gets uncomfortable for mid‑size herds. In our reading of Capps’ product‑category breakdown, the bulk of the modeled benefit — likely the majority and possibly more than two‑thirds — comes from cheese, exports, and foodservice rather than fluid milk. (That’s Bullvine’s interpretation of the published category split, not a figure Capps or DMI publishes that way.)

Plant‑based brands quietly grabbed a good chunk of the cooler while that was happening. And dairy noticed too late. The Good Food Institute’s 2024 U.S. retail overview shows plant‑based milk now making up about 14% of total milk category dollar sales and around 13% of unit sales. Four in ten U.S. households purchased plant‑based milk at least once in 2024, and 76% of those households purchased it more than once. That growth didn’t come from better protein or lower price. It came from brands like Oatly and Chobani treating story as infrastructure — climate, identity, lactose‑free, “for people like us” — and funding it aggressively.

Oatly’s 2023 financials show selling, general, and administrative expenses of about $80.7 million in Q4 alone, with branding, advertising, and marketing called out as a significant focus in investor communications. Analyst commentary consistently describes Oatly as a marketing‑heavy business, with selling and marketing costs taking a larger share of revenue than you’d ever see in a typical commodity category.

Oatly markets an identity — climate, café culture, lactose‑free — and pays to keep that identity visible in coffee shops, barista training programs, and barista competitions. Dairy markets a product. Oatly markets a side, and pays to keep that side visible behind the espresso machine.

Dairy’s national system, by comparison, measures at 30,000 feet. It can model “pizza cheese plus exports” down to the milk‑fat equivalent and simulate all‑milk impacts. But it doesn’t track what happens when a young family in town follows a dairy farm on Instagram and decides not to grab oat milk this week.

That blind spot matters more than ever in a world where your blend price and policy risk are shaped by stories your farm didn’t write.

How This Plays Out on Real Farms

You don’t get a line on your milk cheque that says “penalty for losing the narrative.” You get a softer Class I basis and one more “for sale” sign down the road.

Central FMMO data shows a weighted average Class I utilization of 27.03% in 2022, down 3.76 percentage points from 2021, per the Central Order’s 2022 statistical bulletin. For decades, fluid’s share of the pool was much higher; now Class III dominates in many orders. Fluid milk has steadily lost share to bottled water, soft drinks, and plant‑based alternatives.

American Farm Bureau Federation analysis of the 2018 Farm Bill’s change to the Class I price formula — implemented in May 2019 — estimates that switching from the “higher of” to the “average of” Class III and IV produced a $403 million net loss in Class I value compared to the previous formula over the first 19 months, with much of that value flowing to processors rather than producers under the new formula.

Now think about what those policy and demand shifts cost in production terms — and what dairy’s voice is up against.

A Hoof GP video shot with a GoPro and a phone in a hoof‑trimming chute regularly draws viewer numbers in the hundreds of thousands to millions — comparable to or beyond the reach of many national TV spots — on a production budget that wouldn’t cover one corporate stylist. The funding from your checkoff for that kind of work is essentially zero.

Take a 400‑cow operation shipping about 112,000 cwt per year. At an illustrative $20/cwt gross, that’s roughly $2.24 million in milk revenue. If fluid demand erosion and policy tweaks combine to shave even 25¢/cwt across a multi‑year price cycle, you’re looking at:

  • 112,000 cwt × $0.25 = $28,000 in a year that hits the bottom edge of that cycle.

That’s a family’s living, or the room you thought you had for a piece of used equipment. And it’s the kind of squeeze that doesn’t make headlines. It just accumulates until you hit the “sell or massively expand” fork in the road.

Now layer on trust.

EIT Food’s Trust Report showed about two‑thirds of European consumers (67%) trust farmers, well ahead of manufacturers and government agencies. Same pattern from Canada’s CCFI and from Mintel’s sustainability work: farmers consistently top the list, while big food companies trail.

The irony is expensive. The people consumers already trust most are the least funded and least measured part of dairy’s communication strategy — and that gap shows up in lost Class I share, weaker pricing power, and policy battles dairy didn’t even know it had until it lost them.

What Exactly Are You Buying With 15¢/cwt?

Investment AreaNational Checkoff FocusFarm‑Level “Story” Focus
Primary GoalGeneric demand (cheese/export)Specific brand / social license
Key MetricAll‑milk price ROIDirect sales / retention / policy risk
Content StyleGeneric / brand‑level (DMI/USDEC)Farm‑level / first‑person (“Modern Day Farm Chick”)
Cost15¢/cwt (mandatory)~8¢/cwt (optional infrastructure)
Time Horizon5–10 years to attribute lift12–18 months to first measurable return

It’s fair to ask what your mandatory 15¢/cwt is actually purchasing — and what a farm‑level story budget would look like beside it.

USDA and DMI reports show the national assessment plus state and regional programs put the U.S. checkoff system well over $400 million a year in producer and importer money. The national piece funnels into these broad buckets:

  • Foodservice partnerships: Embedded food scientists and joint menu work with Domino’s, Pizza Hut, McDonald’s, Taco Bell, and others.
  • Exports: USDEC‑led market development, trade missions, technical support, and in‑market promotion.
  • Domestic marketing and health/nutrition: School programs, e‑commerce promotions, retail pilots, and some fluid innovation projects.
  • Reputation and sustainability: Industry‑level messaging on dairy’s environmental footprint and animal care.

Capps’ model says those investments buy you about $1/cwt in higher all‑milk price vs a world without the checkoff over 2009–2024. That’s real money. But on a per‑cwt checkoff ROI basis, our reading of Capps’ product‑category breakdown is that the dominant share of the modeled economic lift comes from expansion in cheese, exports, and foodservice — the pizza cheese and whey stream, not the jug in the dairy case. Fluid‑specific innovations — like new milk products or school pilots — account for a much smaller slice of the pie. Meanwhile, Wegner’s 200,000+ followers and The Hoof GP’s million‑view chute videos are doing trust‑building work for free that no national agency line item is buying.

“You don’t get a line on your milk cheque that says ‘penalty for losing the narrative.’ You get a softer Class I basis and one more ‘for sale’ sign down the road.”

For a large, high‑component herd shipping most milk into Class III/IV plants and export channels, the current allocation makes sense. You’re riding the rising tide.

For a 300–800 cow family herd with heavy Class I exposure, you’re funding the same system, but the benefits hit you at a distance. They filter through pool calculations and processor decisions. It’s hard to see — in your own ledger — how many cents of your 15¢ came back beyond “some.”

What the budget does not include, in any explicit way, is:

  • A line for farm‑level storytelling infrastructure: training, equipment grants, or production stipends for farmers who’ve already proven they can build trust at scale.
  • A metric for “incremental fluid gallons or retained dairy shoppers per 10,000 followers of a real farmer account.”

Right now, those sit in the “nice extras” column. Not something the national budget is built around.

How Much Does Waiting 30 Days on Your Story Actually Cost?

Let’s run the barn math on treating story like a feed additive.

Same 400‑cow herd, 112,000 cwt per year, grossing around $2.24 million at $20/cwt.

If you decide to allocate 0.4% of revenue to narrative infrastructure — basically a small line item alongside repairs and software — you’re talking:

  • 0.004 × $2.24M ≈ $8,960, call it $9,000/year.
  • Divide by 112,000 cwt, and it’s about 8¢/cwt.

What can $9,000 realistically buy?

  • Roughly $2,500 in one‑time gear: a decent camera, mic, tripod, phone gimbal, and editing apps.
  • About $2,000–3,000 for a local freelancer, ag communications grad, or small shop to define your audience and map a three‑month content plan tied to real goals (tours, beef, creamery partners).
  • Around $3,500 to pay a local student five hours a week at roughly $16–$20/hour for 35 weeks to film, edit, and post under your direction — which lines up with current Wisconsin student wage ranges.

Now give that investment 12–18 months and attach it to actual offers, not just pretty pictures. Promote two or three farm open days, beef box pre‑orders, or seasonal events. Build a simple email or text list to bring people back. Talk with a local grocer or small processor about a premium product with your farm’s name on it.

Say, conservatively, that by the end of the year you’ve:

  • Added $12,000 in extra on‑farm or direct‑to‑consumer sales (farm store, beef, events).
  • Secured a $1/cwt premium on just 10% of your milk through a local creamery or special program: 11,200 cwt × $1 = $11,200/year.

Even if you only credit half of that premium to your story and visibility — and the rest to product specs or timing — you’re at:

  • $12,000 + $5,600 = $17,600 in incremental value.

Against a $9,000 spend, that’s roughly a 2:1 return and about 16¢/cwt back on an 8¢/cwt investment.

Is it guaranteed? No. The data here is still thin and will vary farm to farm. But that’s the point. As soon as you write the numbers down, “story” stops being a fuzzy feelings project and becomes one more lever in your survival math.

The real cost of waiting 30 more days isn’t “losing the algorithm.” It’s one more month where your only story is the generic one being told about “big dairy” by people who’ve never scraped a pen.

Is Your Farm’s Story Still Treated Like PR — or Infrastructure?

On your farm, you already treat some things as non‑negotiable infrastructure.

You wouldn’t throw feed together without knowing the cost per cow per day. You wouldn’t sign a milk contract without reading the premium structure. Story rarely gets that respect.

Part of it is how the system trained you. Four decades of checkoff communications have framed the deal the same way for producers: you fund generic promotion, and DMI runs the marketing ROI on behalf of the industry. That framing puts story out there — in boardrooms, agency decks, and fast‑food test kitchens — not in your lane.

Part of it is time. Research on farmers who add agritourism, online marketing, or direct sales is pretty consistent: when it works, it can meaningfully boost income and spread risk. The biggest barriers are human capital — comfort on camera, basic marketing skills — and hours in a day that’s already full. Liability and regulation worries are real once you start inviting the public down the lane. For a 400‑cow herd already short on labor, “become a part‑time media company” can sound like a sick joke.

And yet, the Australian cotton industry shows what it looks like when a sector decides story is part of its license to operate, not a bonus.

Starting in 1991, cotton growers — through Cotton Australia and the Cotton Research and Development Corporation (CRDC) — commissioned independent environmental assessments of the entire Australian cotton industry. Those audits looked hard at water, pesticides, biodiversity, and community impacts. The most recent fourth assessment, completed in 2023–24, included 16 recommendations. The industry publicly accepted every one and laid out how it would respond.

Those audits aren’t PR pieces. They’re a backbone. They give brands and regulators confidence that Australian cotton can back up its “sustainable” story with data and continuous improvement. In return, cotton protects export access and earns premiums in markets where ESG metrics now decide who stays on the supplier list.

Dairy has similar science in its corner on efficiency and emissions per litre. What it hasn’t done — yet — is build that kind of sector‑wide audit and farm‑level storytelling backbone into its economic strategy. Wegner’s public work shows it’s possible from a phone. Hoof GP’s public work shows it’s possible from a chute. The question is whether the $431.8 million system will catch up to what farmers with cameras already figured out.

Options and Trade‑Offs for Farmers

You’re not going to fix the checkoff structure from your kitchen table. But you can decide whether your own story is just something your co‑op uses in a brochure or a piece of infrastructure you measure.

Here are four paths farms are using or seriously considering — with when they make sense, where they can backfire, and the first concrete step for each.

PathBest FitRealistic Annual SpendFirst 30-Day MoveBiggest Risk
Treat story as a line item200–1,120 cow herd with a premium/direct path5–10¢/cwt, roughly ,600–,200 on 112,000 cwtPut one specific offer or event on the calendarVanity metrics with no margin
Build a local narrative co-op3+ nearby dairies facing the same local pressure,000–,000 per farmSchedule a one-hour kitchen-table meetingPersonality clashes kill momentum
Push checkoff accountabilityHerds writing five-figure checkoff checks15¢/cwt already mandatory; ,800 on 112,000 cwtTotal 12 months of deductions and bring the number to a meetingGetting framed as rage, not reform
Stay commodity, protect social licenseEfficient commodity-focused farms avoiding side businessesLow cash cost, but consistent time requiredUpdate the farm Facebook cover photo and About sectionBecoming the faceless “bad actor” locally

Path 1: Treat Story Like a 0.25–0.5% Line Item (Start Within 30 Days)

When it makes sense: You’re a 200–1,120 cow herd with a reasonably stable core business, feeling margin pressure but not in active crisis, and you’ve got at least one realistic path to direct or premium revenue — a farm store, beef sales, on‑farm events, or a small local processor that cares about story.

What it requires:

  • Committing 0.25–0.5% of milk revenue (roughly 5–10¢/cwt) to narrative infrastructure for at least two to three years.
  • Picking 1–2 platforms where your buyers live (Facebook/Instagram for local families, TikTok/IG Reels for younger and wider audiences).
  • Posting 2–3 times per week with a simple ratio — like the public Wegner pattern: real‑life posts dominate, with the occasional educational ask.
  • This month: Put one specific offer or event on the calendar in the next 30 days. Not someday. An actual date. Then do the math afterward.

First step (today): Buy a $50 wireless lapel mic. Audio quality is roughly half of how viewers judge a video’s worth, and a phone plus a clip‑on mic out‑performs a $500 camera with bad sound every time.

Risks/limits: If nobody on the farm actually wants to be visible, it’ll feel forced and probably flop. If you never connect the posts to a specific ask — tours, beef, a premium product — you’ll rack up vanity metrics and no margin. And you have to be willing to shut it down or change tack after 18–24 months if the numbers don’t move.

Path 2: Build a Local “Narrative Co‑op” With Neighbors

When it makes sense: You’ve got three or more dairies within driving distance that see the same pressure from plant‑based chatter, local politics, or new environmental rules — and you’re willing to sit at a table together.

What it requires:

  • Each farm kicking in $2,000–3,000/year into a shared pot.
  • Hiring a local storyteller — a videographer, ag student, or small marketing shop — who actually understands farms.
  • Launching shared channels (e.g., a “Dairy in Our County” page) plus a simple website and email list.
  • Rotating features and events so each farm gets its turn being the face of dairy for local media and schools.

First step (this month): Pick up the phone and put three neighbors on the calendar for a one‑hour meeting at one of your kitchens. No agenda beyond: “Are we tired of having no voice locally?”

Risks/limits: You’ll need ground rules on what’s fair game on camera and what isn’t. Personality clashes can kill it; someone has to be the adult in the room. You’ll still be at the mercy of national policy, but you’ll be a lot harder to ignore locally.

Path 3: Push for Checkoff Accountability — With Numbers, Not Rage

When it makes sense: Your annual checkoff line and co‑op patronage are big enough to make you swallow hard, and you’re tired of hearing aggregate ROI numbers that don’t feel like they land on your milk cheque.

What it requires:

  • Knowing your own contribution: a 400‑cow herd at 112,000 cwt is sending around $16,800/year into national and state promotion at 15¢/cwt.
  • Showing up to meetings with specific, calm questions about per‑cwt benefit by region, fluid vs cheese/export attribution, and what percent of the budget directly supports farmer‑led storytelling.
  • Suggesting small but concrete changes, like carving out 2–3% of the budget as a pilot “farmer storyteller” fund with transparent metrics.

First step (this week): Pull your last 12 months of milk cheques, total the checkoff deductions, and write that exact number on a sticky note. That’s your seat at the table — and your first slide at the next board meeting.

Risks/limits: You’ll hit political resistance from folks who feel the checkoff is already under attack. You won’t flip the system overnight. But you may open the door to programs that don’t exist today. And if you go in guns blazing, you’ll be the story, not the solution.

Path 4: Stay in the Commodity Lane — Protect Your Social License

When it makes sense: You’ve decided your best shot at survival is to be ruthlessly efficient, stay in the commodity stream, and not build side businesses. You’re not interested in building a personal brand. But you still don’t want to wake up one morning and see your farm in a one‑sided activist video.

What it requires:

  • Saying yes to the basics: school tours, FFA/4‑H visits, local media when they call.
  • Keeping one simple public channel (even a basic Facebook page) updated with who you are, what you do, and some evidence you care about cows and community.
  • Understanding what your processor and co‑op are promising on sustainability and animal care so your practices match the story they’re telling with your milk.

First step (today): Update the cover photo and “About” section on your farm’s Facebook page. If a local reporter, regulator, or angry neighbor lands there tonight, what they see in 10 seconds is your social license.

Risks/limits: You won’t directly monetize story. That’s a choice you’re making with your eyes open. You’re still exposed to narrative‑driven policy and retailer decisions. But you’re far less likely to be the faceless “bad actor” when the local debate heats up.

Key Takeaways

  • If your checkoff contribution is north of roughly $10–20K/year, treat it like any other major spend: ask your board or rep for per‑cwt ROI broken out by fluid vs cheese/export, not just an all‑milk average.
  • If you can’t see a plausible path to turn 5–10¢/cwt of story budget into something like 15–20¢/cwt of added revenue or reduced risk within 2–3 years, start smaller and treat it as a test — don’t mortgage the farm to become an influencer.
  • If you already have a six‑figure follower base or a packed tour schedule without a budget, that’s a signal — it may be time to formalize a 0.25–0.5% revenue line item and run the math instead of treating it as unpaid overtime.
  • If three or more farms in your county are worried about the same plant‑based and policy chatter, stop fighting alone — a modest narrative co‑op budget can buy shared production help and more leverage with local media and retailers.
  • If you’d rather stay anonymous, at least protect your social license: be visible enough locally that people who vote and show up at hearings know there are real families and real cows behind the word “dairy.”

So What Does This Mean for Your Milk Cheque?

“Dairy markets a product. Oatly markets a side, and pays to keep that side visible behind the espresso machine.”

Plant‑based brands have already proven that measured narrative — backed by real money — can take roughly 14% of the U.S. milk category dollar share, where it sits as of 2024. You can’t flip a $431.8 million checkoff machine from one farm. You also don’t have to sit quietly while a system funded by your assessment concentrates returns in cheese and export categories that may not match your milk cheque.

Next time you look at your milk cheque, remember: You’re already paying for a story. Whether it’s one that actually helps you survive is now a choice.

What’s the first sticky‑note number you’d put in front of your co‑op board?

Complete references and supporting documentation are available upon request by contacting the editorial team at editor@thebullvine.com.

Learn More

  • Marketing Your Farm: Why Your Story is Your Greatest Asset — Arms you with the psychological tools to identify which parts of your farm life resonate most with urban consumers. Master the art of authentic connection to protect your social license without a corporate marketing budget.
  • The Dairy Industry in 2026: Trends to Watch — Exposes the looming economic shifts that will redefine milk checks and consumer expectations over the next decade. Positions your operation to capitalize on emerging trends before they become mandatory compliance hurdles in the global supply chain.
  • Niche Marketing: Is it the Answer for the Family Farm? — Dismantles the myth that commodity production is the only viable path for survival by analyzing successful niche-market case studies. Delivers the hard math on diversifying your income streams to insulate equity from extreme market volatility.

The Sunday Read Dairy Professionals Don’t Skip.

Every week, thousands of producers, breeders, and industry insiders open Bullvine Weekly for genetics insights, market shifts, and profit strategies they won’t find anywhere else. One email. Five minutes. Smarter decisions all week.
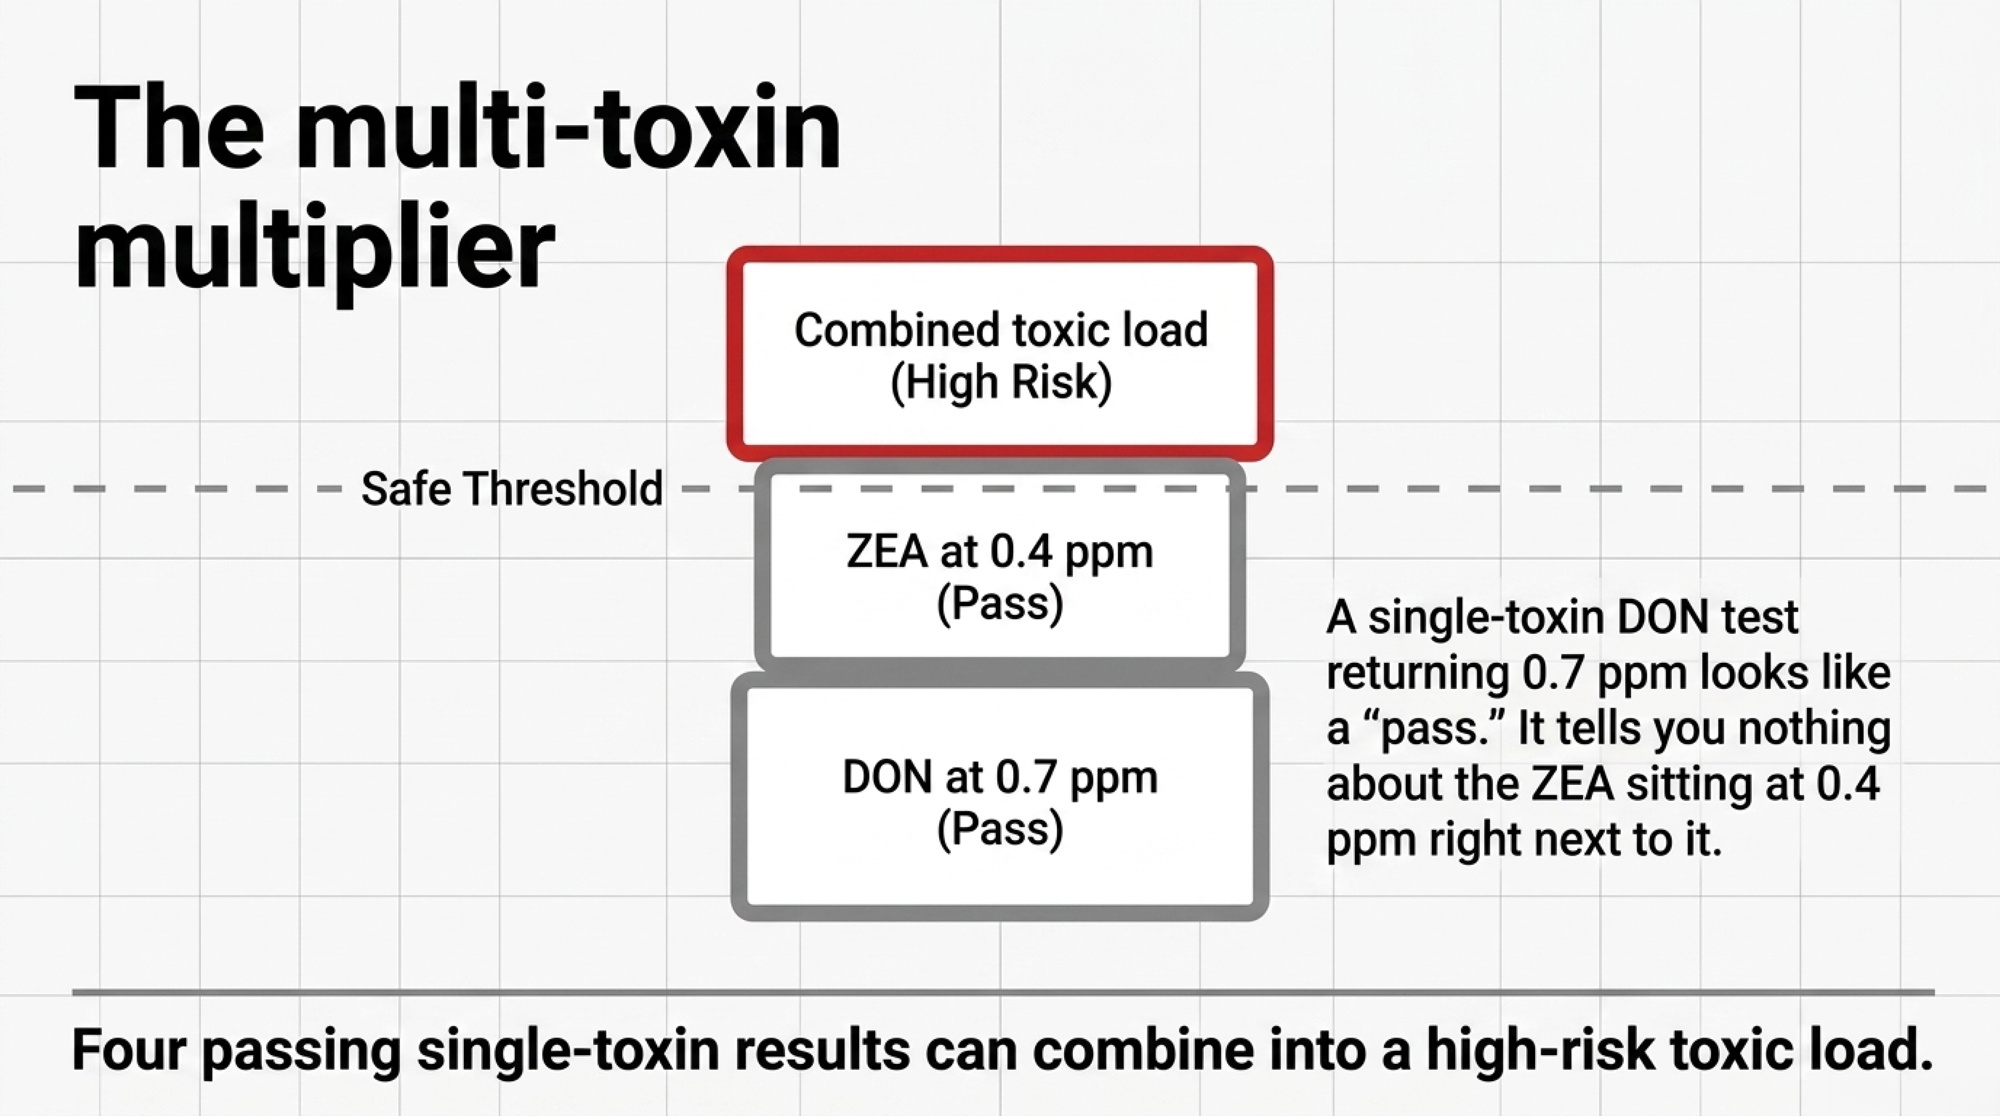
NewsSubscribe
First
Last
Consent

The $427,500 Diesel Hole McCarty Locks Shut Before January 1 

A 50¢ diesel move costs a 19,000-cow dairy roughly $427,500 a year. The McCartys book ~90% of next year’s gallons before Jan 1 — and treat beating the bottom as luck, not skill.

According to a May 8, 2026 report and an industry strategic-analysis brief, McCarty Family Farms aims to enter each fiscal year with roughly 90% of its diesel needs already booked for the next 12 to 18 months, working with Compeer Financial economist Dr. Megan Roberts on a layered procurement plan. Applied to a 45 gal/cow proxy at McCarty’s roughly 19,000-cow scale, a single 50-cent move on diesel would represent about $427,500 in annual exposure. That’s the kind of budget hole the McCarty hedging system is designed to prevent.

The system was built by four brothers — Mike, Clay, Dave, and Ken — who took a 15-cow Pennsylvania herd, moved it to western Kansas in 1999, and grew it into a roughly 19,000-cow operation across Kansas, Nebraska, and Ohio, with a workforce that has grown beyond the 130-plus head count cited in earlier coverage, and a long-term Danone milk contract. Right now, with U.S. retail on-highway diesel sitting at $5.64/gal as of May 12, 2026 per EIA’s weekly update — roughly a 61% jump from a year earlier — that discipline is the difference between funding the next generation and funding the pump.

📌 Editor’s Perspective: Where This Fits in the Bullvine Universe

This piece is the energy-risk leg of a margin story we’ve been mapping all month. Bullvine’s May 2026 Corridor Trap analysis pegged the annual drag at roughly $221,760 on a 600-cow Upper Midwest herd as basis slid from –$0.35 to –$0.85/cwt. The Corridor Trap is what happens to your milk check on the revenue side. The McCarty diesel rule is what locks down the cost side. Same farm. Same lender meeting. Different lever.

What’s Changing — and Why It Hits 24/7 Operations Hardest

Diesel isn’t a line item on a modern dairy. It’s the bloodstream. Feed delivery, manure hauling, milk hauling, cropping, generators, and third-party freight surcharges all move with the price of crude. Brownfield Ag News reported in early May 2026 that one dairy producer’s milk check was running close to .00/cwt while feed and fuel were eating the margin alive — part of a broader 2026 ag-economist warning from David Widmar’s April 28, 2026 Managing for Profitcolumn that energy-market volatility is now a primary 2026 cost-side risk.

For a 24/7 operation, a 50-cent move isn’t an inconvenience. It’s a quarterly-budget derailment. And it’s landing on top of the FMMO Make-Allowance 2025 update — effective June 1, 2025, per the USDA AMS final rule — which trimmed an estimated $0.85–$0.93/cwt off Class III–IV values, with Class III near $0.92/cwt. Stack those two numbers and you can see why lenders are starting to ask for a written energy-risk plan before they renew a line of credit.

The farms feeling it first are the ones running the most equipment hours per cow — large freestall operations with custom hauling contracts, long milk routes to a tightening number of plants, and irrigation. If that’s you, the math below isn’t theoretical.

How This Plays Out on Real Farms — The Energy Risk Management Math

Here’s the back-of-the-envelope every dairy CFO should run today. Using an industry proxy of roughly 45 gallons of diesel per cow per year — covering feeding, manure, and basic forage transport — a 500-cow herd burns about 22,500 gallons annually. A 50-cent spike costs that herd $11,250. A dollar move costs $22,500. At 5,000 cows, the same 50-cent move costs $112,500. At McCarty’s roughly 19,000-cow scale, illustrative math points to about $427,500 in exposure on that one move.

Herd SizeAnnual Diesel (gal)25¢ move50¢ move$1.00 move
500 cows22,500$5,625$11,250$22,500
1,000 cows45,000$11,250$22,500$45,000
5,000 cows225,000$56,250$112,500$225,000
McCarty (~19k)855,000$213,750$427,500$855,000
40,000 cows1,800,000$450,000$900,000$1,800,000

Source: 45 gal/cow/year industry proxy. Your actual intensity moves with cropping system, hauling distance, manure logistics, and how much fuel sits on a custom operator’s invoice rather than yours. Farms growing most of their own forage will run hotter than this proxy.

🎯 The Magic Number: $0.09/cwt

That’s the cost of a 50-cent diesel move on a 200-cow herd shipping 24,000 lbs/cow (9,000 gallons × $0.50 = $4,500; ÷ 48,000 cwt of milk ≈ $0.09/cwt). On its own, a rounding error. Stacked on the FMMO Make-Allowance 2025 drag of roughly $0.92/cwt and a basis slide, it can be the number that breaks the bank — and on a marginal book, the variable that tips a Debt Service Coverage Ratio below 1.25x.

The Mechanics: Three Pillars of the McCarty System

The McCarty system rests on three pillars: proactive layering, historical benchmarking, and mitigation over speculation. They don’t try to call the bottom — the McCartys are described as treating that as luck, not skill. As forward months become available, the team books physical gallons in increments — 20–25% at a time — smoothing what the Compeer team has publicly framed as the “fat tails” of the energy market.

Success isn’t beating the spot price. It’s landing in the bottom third or bottom half of the 5- to 10-year historical average — or simply staying consistent year over year — so milk margins can be calculated with precision before the cows ever produce them. Compeer’s Chief Risk Officer Bill Moore calls it “controlling the controllables.” Translation: lock down breakeven, watch the consensus, and stress-test what happens if ad-hoc government payments fall or Class III drops below $15/cwt.

The 18-month plan is a family-business mechanism for the McCarty brothers — Mike, Clay, Dave, and Ken — built on the same data discipline behind their genetics program, their 2012 Rexford milk condensing plant, and the long-term Danone partnership that anchors their revenue side. None of this is about the next quarter. It’s a question every multi-generational operation faces: whether the next generation inherits a balance sheet they can run, or one they have to dig out from under.

The Hidden Exposures a Hedge Doesn’t Cover

Worth saying out loud: a 90% fuel hedge is not a shield. Three exposures still run through the system the contracts can’t reach.

  • Hauling adjusters. Milk haulers and commodity deliverers run fuel surcharges that re-price weekly off the EIA index. Your tank is locked. Their truck isn’t.
  • The processing paradox. As regional plant capacity tightens, dairies get pushed to longer milk routes to find an accepting plant. Longer routes mean more surcharge surface area.
  • Embedded energy. Mineral premixes, plastic resin, distillers grains, equipment parts — all carry crude-oil cost inside the invoice. Lock the diesel; the inflation still leaks in.

That’s why the 90% target matters. Shrinking the surface area of the things you can’t control is the entire point.

How Much Does Skipping the Hedge Actually Cost You?

Run your own number. If you milk 500 cows and diesel moves $1.00 — and weekly EIA retail diesel did exactly that, climbing roughly $2.14/gal year-over-year through May 2026 — that’s $22,500 you didn’t budget for. On 1,000 cows, $45,000. That’s well above the USDA NASS national livestock-worker average of $17.51/hr for the October 2024 reference week, per the November 20, 2024 Farm Labor release — i.e., real wage money, regardless of region. It’s also more than seven times the bid on a single replacement heifer at the USDA AMS national average of $3,010/head, with USDA NASS’s January 30, 2026 Cattle Inventory printing 3.90 million dairy replacement heifers — the lowest since 1978, per Farm Progress’s February 16, 2026 reporting on the same release.

Every dollar you don’t lose to a fuel spike is a dollar that stays in the business — for cows, for people, for technology, for principal paydown.

Is Your Lender Already Asking About This? — The Energy Risk Management Conversation

In Bullvine’s May 2026 Corridor Trap analysis, a corridor-aware stress test pegs the annual drag at roughly $221,760 on a 600-cow Upper Midwest herd as basis slid from –$0.35 to –$0.85/cwt — and lenders increasingly want to see that same kind of stress test applied to your fuel budget. A documented energy-risk plan — even a one-pager showing how you forward-book diesel — improves your risk profile. In a corridor-aware stress test, an unhedged fuel budget can be the variable that tips a marginal Debt Service Coverage Ratio from acceptable to constrained.

If your bank hasn’t asked yet, your next renewal conversation is the right moment to bring the document yourself.

Options and Trade-Offs for Farmers — Including Dairy Margin Coverage Stacking

You don’t need a 19,000-cow footprint or a quant analyst on retainer to copy the discipline. You do need to pick a lane.

StrategyPrimary BenefitThe Price You PayBest-Fit DairyWatch This Metric
Lock fixed diesel priceBudget certainty before the fiscal year startsLose upside if spot diesel fallsAny dairy with predictable annual fuel useCoverage above 90% can leave no room for usage surprises
Layer 20% to 25% incrementsSmooths volatility across the buying cycleMore supplier calls and internal tracking500 to 5,000 cow dairies building disciplineGallons booked vs. actual 12-month use
Prepay forward gallonsGives lender visible cost controlTies up working capitalLarger dairies with strong liquidityCash tied up before milk revenue arrives
Pair fuel with DRP or LGM-DairyStabilizes more of the milk, feed, and fuel marginPremium cost plus more paperworkMargin-managed dairies with lender scrutinyNet margin after premium, not gross protection
Keep spot-market exposureMaximum upside if diesel fallsNo protection when the market jumpsOnly farms with low fuel intensity or strong cash reserves50¢ move exposure before Jan. 1
  • Co-op forward booking — the 500-cow blueprint. Work with your local fuel co-op to forward-contract gallons 12 months out. Lock 25% in September for Q1 delivery. Another 25% in December for Q2. And so on. By the time the calendar flips, you’ve layered four price points instead of betting on one. When it works: you’ve got working capital and a lender comfortable with prepaid inventory. Risk: if spot prices fall below your locked rate, you’ll pay more than the neighbor who didn’t hedge. You’re buying budget certainty, not the bottom of the market.
  • The “Jan 1, 90%” rule. Set a hard target to have 90% of next year’s diesel booked before the fiscal year starts. When it works: any size farm running an annual budget. Requires: 12 months of clean fuel-use data. Limit: leaves 10% open for genuine consumption surprises — herd expansion, new acreage, beef-on-dairy intensity.
  • 30-day on-ramp. This month, pull last year’s fuel invoices, calculate your gallons-per-cow, and call your fuel supplier to ask what forward-contract terms they offer. That’s the entire starting move. No working capital required to make the phone call.
  • Integrate fuel with milk and feed risk. Fuel hedging is one piece of a margin toolkit. Compeer’s published framework treats it alongside DRP for component-based revenue protection, LGM-Dairy for bundled feed risk, and Dairy Margin Coverage as a Tier 1 backstop that’s often too small for large herds. None of these tools work alone. Pair them.

The trade-off table — benefit vs. cost, plain English:

StrategyPrimary BenefitThe “Price” You Pay
Locking priceBudget certaintyLoss of “downside” opportunity if spot falls
Layering 25% incrementsCost averaging across the cycleIncreased admin and supplier time
Prepaying forward gallonsLender confidence in your risk planWorking capital tied up
Pairing with DRP / LGM-DairyMargin certainty across feed + milkPremium cost on the policy

Key Takeaways

  • If you can’t say what you paid per gallon over the last 12 months, you don’t have a fuel strategy — you have a fuel bill.
  • If your fuel exposure on a 50-cent move would change a hire, an expansion, or a debt payment, you have a hedging case. Run the test: gallons/cow × $0.50 × your herd size.
  • If you can hit 50% coverage by January 1, you’re ahead of the spot-market crowd. 90% is the McCarty benchmark, not the entry point.
  • If you book a layer, book another. One fixed price isn’t a strategy — three or four staggered layers is.
  • If you hedge fuel without hedging milk or feed, you’ve stabilized one leg of a three-legged stool. Pair it with DRP, LGM-Dairy, or a forward milk contract.
  • If your milk hauling, mineral premix, or replacement heifer bills are climbing faster than diesel, the embedded energy is leaking in. Track those line items separately.
  • If your next lender meeting is inside 90 days, bring a one-page energy-risk plan before they ask for it.

The Real Question

The next 50-cent diesel move is coming. The only question is whether your operation has decided in advance who it’s going to hurt — the market, or you. Where does your fuel coverage sit on January 1, and what would you have to change this month to get it closer to 90? The McCarty brothers built a 12–18 month answer to that question. Many multi-generational dairy families face the same calculus when planning for succession — and yours can do the same work at a smaller scale.

Try It Yourself · Free Tool

Reporting in this article is based on published trade-press coverage (Dairy Herd Management, Brownfield Ag News, Farm Progress, Bullvine archive), public Compeer Financial materials, USDA AMS and NASS data (USDA NASS Farm Labor 11/20/2024; USDA NASS Cattle 01/30/2026), EIA weekly retail diesel data, and an industry strategic-analysis brief. The Bullvine did not independently interview McCarty Family Farms or Compeer Financial for this piece. Diesel-cost figures are illustrative calculations using a 45 gal/cow industry proxy and will vary by farm.

Complete references and supporting documentation are available upon request by contacting the editorial team at editor@thebullvine.com.

Learn More

The Sunday Read Dairy Professionals Don’t Skip.

Every week, thousands of producers, breeders, and industry insiders open Bullvine Weekly for genetics insights, market shifts, and profit strategies they won’t find anywhere else. One email. Five minutes. Smarter decisions all week.
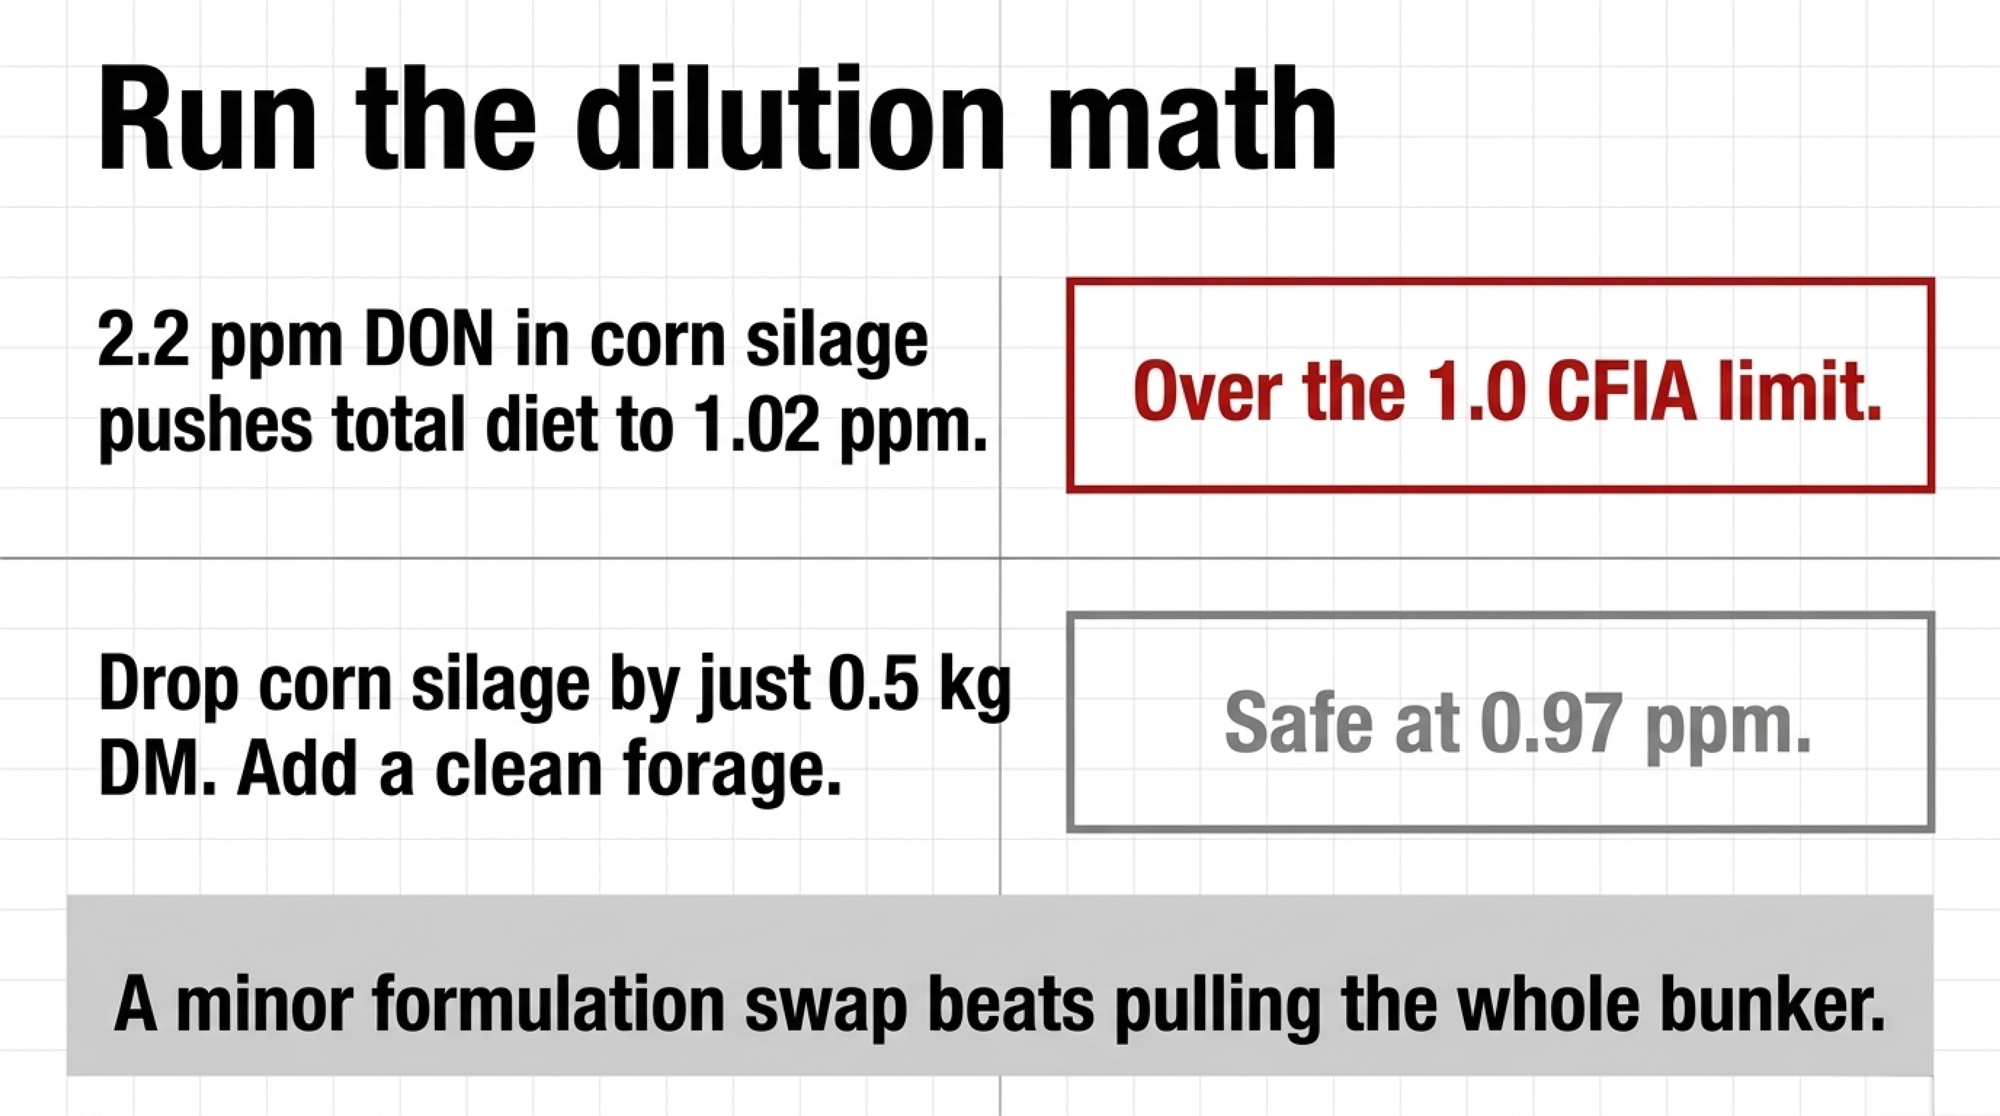
NewsSubscribe
First
Last
Consent

$80M on Her Land, $0 in Carbon Credits: Inside Curtis Creek’s RNG Trade

An $80M Sedron Varcor nutrient-recovery plant now sits on Curtis Creek ground, alongside the dairy’s separate anaerobic digester and RNG operation. The farm keeps about $250K/year in avoided costs — and a 20-year manure contract. The credit stack? Not theirs.

Correction (May 19, 2026): An earlier version of this article incorrectly stated that Sedron operates the anaerobic digesters and produces RNG at Curtis Creek. Sedron’s Varcor system processes digestate into dry fertilizer, liquid ammonium nitrate fertilizer, and clean water; the digester and RNG production are run by a separate party. The article has been updated accordingly.

Executive Summary: Curtis Creek Dairy… now hosts an $80M Sedron Varcor nutrient-recovery plant that processes digestate from the dairy’s separate anaerobic digester — and the developer, not the farm, owns the carbon credits. The 2,000‑cow herd (with publicly reported plans toward 3,200) puts up the manure and the land; The RNG developer (not Sedron) owns the LCFS and RIN credit stack tied to gas production. Sedron’s role is downstream nutrient recovery via Varcor. That stack is where the money lives: $3 base gas vs. $60–$90/MMBtu once 2025 LCFS credits ($57.77/ton avg, $40.75–$75.50 range, Stillwater) and D3 RINs (~$2.40 avg, EPA EMTS) are layered in. The farm’s payoff comes in avoided costs — modeled at roughly $250K/year, or about $50–$100/cow on the manure side alone — locked in against a 15–25‑year manure‑supply contract recorded against the property. Compare that to a hypothetical farm‑owned 2,500‑cow build at ~$3,400/cow capital with ~$525K/year net cash flow, and the trade‑off is obvious: stability and zero project debt, or upside and policy risk you carry yourself. With USDA’s REAP grant window paused in early 2026 and similar pitches landing in producer inboxes weekly, the 30‑day move is simple — get any draft term sheet in front of a lender and an attorney who’ve read manure‑to‑energy contracts before they get in front of a pen.

dairy RNG contract

Carl Ramsey doesn’t really manage a manure lagoon anymore. He carries the title Manager of Digester Operations at Curtis Creek Dairy in Newton County, Indiana — a role that started as Farm Manager back in 1999 and has since grown into oversight of a 7.5‑million‑gallon DVO plug‑flow digester and a 50,000-square-foot Sedron Varcor facility that processes digestate from the dairy’s digester into dry fertilizer, liquid ammonium nitrate fertilizer, and clean water. Curtis Creek is milking about 2,000 cows today, with publicly reported plans to grow toward 3,200, but the real story sits on the other side of the flush barn — an $80 million Sedron Varcor plant that recovers nutrients and water from digestate. The pipeline gas and California carbon credits come from the dairy’s separate digester/RNG project. “Their facility is going to use the manure from our cows for the basis of their feedstock,” Ramsey told Brownfield Ag News in May.

If you’re being courted for a digester or RNG project, this is the kind of deal that’s likely headed your way.

What’s Actually Changing Around the Manure Pit

For most of dairy’s history, manure has been a cost and a compliance headache. You scraped it, stored it, hauled it, and hoped the inspector didn’t show up the week after a big rain. Early digesters didn’t change that much. They knocked down odor and spun a generator, but the economics were usually thin — low power buy‑back rates, high maintenance, and more than a few farms quietly shutting them off after a rough run.

Curtis Creek represents a different era. Here, manure flows first to the dairy’s anaerobic digester, which produces RNG. The leftover digestate is then piped to Sedron’s Varcor plant for nutrient and water recovery, which is backed by private‑equity firm Ara Partners. Your cows and land become the steady input for a facility whose real profit centre is not the gas molecule itself, but the environmental “attributes” attached to it.

That’s where the money gets interesting. A million BTUs of methane might sell for roughly $3 at the city gate, but the credit stack on dairy RNG is where the real dollars sit. In 2025, D3 cellulosic RINs — the federal credits tied to dairy RNG — averaged about $2.40 per RIN, based on EPA EMTS data and trade press averages. California’s LCFS credit price averaged $57.77 per metric ton CO₂e that same year, with trades ranging from $40.75 to $75.50 and a credit‑clearance market price ceiling indexed up toward $275.39 per ton in 2026 (CARB and Stillwater Associates, 2025–26). When your project scores a deeply negative carbon intensity (often ‑250 to ‑270 g CO₂e/MJ for dairy manure RNG), those numbers stack fast.

Translation: this isn’t a milk‑cheque play. It’s a credit‑market play, and the policy math decides who eats.

Quick glossary for your boardroom brain

  • MMBtu: million British thermal units — the unit gas is sold in.
  • RIN (D3): Renewable Identification Number under the Renewable Fuel Standard, cellulosic biofuel category.
  • LCFS: California’s Low Carbon Fuel Standard credit; pays for displacing fossil fuel based on carbon intensity.
  • CI score: carbon intensity, in grams CO₂‑equivalent per megajoule. Dairy manure RNG often scores deeply negative.
  • DBOOM: Design‑Build‑Own‑Operate‑Maintain. The developer owns and runs the plant; you provide manure and site access.

How This Plays Out on a Real Farm

At Curtis Creek, manure handling is no longer just a herd‑side job — Ramsey’s title, Manager of Digester Operations, captures the shift. According to Sedron’s public materials, the site processes 200 million gallons of digestate a year, which means feedstock consistency, throughput, and biology are now operational priorities alongside the scraper schedule. The farm provides the cows, the manure, and the ground. Sedron provides the $80 million Varcor facility, the plant staff (about four full‑time employees on their payroll), and the contracts with the pipeline and credit markets.

That’s a real change in scope for a role that started as Farm Manager in 1999. The cows still come first, but on this site, the lagoon now functions as the feedstock source for an industrial process feeding the pipeline.

Sedron’s own materials describe Curtis Creek as a 200‑million‑gallon‑per‑year processing site and their flagship agricultural project. The Varcor system takes digestate and separates it into three product streams: clean, nearly pathogen‑free water; roughly 37,000 tons a year of dry organic fertilizer; and a liquid ammonium nitrate fertilizer, per Sedron’s Varcor product spec. The digester/Varcor complex sits alongside a 1.7 MW solar array that helps power the site and farm, supported by a 0,000 USDA REAP grant documented in USDA Rural Development’s 2024 Indiana Earth Day release. For a glimpse of where lower‑tech nutrient recovery is heading, it’s worth comparing this with the lower‑tech nutrient recovery bet one farm is making with worms instead of distillation.

In the forensic modeling for a Curtis Creek–scale setup, the avoided‑cost value comes in around $250,000 per year, conservatively — that’s lagoon dredging avoided, bedding replaced with dry solids (worth $20,000–$50,000 annually), water reuse, and solar‑offset energy. In other words, the dairy sees its manure problem shrink and some line items drop.

Now stack that against a farm‑owned version, using industry‑typical barn math instead of Curtis Creek’s internal books. A hypothetical 2,500‑cow digester, built and owned by the farm, takes on about $8.5 million in capital cost. Under conservative assumptions:

  • Gross revenue (gas plus credits): about $2.83 million/year
  • Operating cost: about $1.1 million/year
  • Debt service (7%, 10‑year term): about $1.21 million/year

You’re left with roughly $525,000 a year in net cash flow. That’s the upside. The downside: every swing in RIN and LCFS prices hits you directly.

At 45,000 MMBtu/year of gas output, a stacked value of per MMBtu means about .7 million in credit‑driven revenue before operating costs. That credit‑driven upside is a big part of why private capital is so interested in these projects. The real question is how much of that flow will ever reach your farm account.

How Much Money Actually Flows Back to Your Farm?

Short answer: in a typical developer‑owned deal, your gain shows up more in avoided costs than in a direct share of credit revenue.

In most DBOOM‑style deals, the developer’s profits come primarily from the credit stack, not the base gas price. On the farm side, the payoff usually shows up as avoided cost rather than a cheque tied to every RIN or LCFS credit. That’s still real money. But unless the contract ties your compensation to RIN or LCFS prices, your avoided‑cost benefit stays flat even if credit prices climb. We’ve dug into how carbon contracts are reshaping farm balance sheets if you want to see how this plays out beyond manure.

What kind of avoided cost are we talking about?

  • $50–$100 per cow per year in reduced lagoon dredging and handling.
  • Bedding savings using dry separated solids, modeled at $20,000–$50,000 a year on a Curtis Creek–size herd.
  • Distilled water reused for cows and irrigation instead of pumping new water.
  • Solar and digester heat offsetting roughly $139,850/year in farm electricity.
Benefit CategoryLow EstimateHigh EstimatePer-Cow Range (2,000 cows)Notes
Lagoon dredging avoided$50K/yr$100K/yr$25–$50/cowDepends on lagoon size and frequency
Dry solids bedding replacement$20K/yr$50K/yr$10–$25/cowReplaces purchased sand/straw
Water reuse (irrigation/cows)$10K/yr$30K/yr$5–$15/cowSite-specific; distilled effluent quality
Solar & digester heat offset~$140K/yr~$140K/yr~$70/cowBased on $139,850/yr REAP-supported array
Total avoided cost~$220K/yr~$320K/yr~$110–$160/cowArticle models ~$250K/yr mid-point

On a 2,000‑cow herd, that $50–$100/cow range is $100,000–$200,000 a year, before bedding and power savings. That’s meaningful — especially if your lagoon headaches are getting worse — but it’s also a capped upside. Your side doesn’t automatically rise with higher LCFS or RIN prices unless the contract says so.

And those credits move. In 2025, LCFS credits traded between about $40.75 and $75.50 per ton, with an average around $57.77 (Stillwater Associates LCFS data, 2025). That’s after sliding from earlier levels that pushed up close to the program’s price ceiling. Meanwhile, D3 RINs sat around $2.40 on average in 2025, with futures already pricing in some policy uncertainty. Terrain’s 2025 “Economic Sustainability of Dairy Digesters” report, prepared for the Farm Credit System, was blunt: the feasibility of dairy digesters producing RNG “hinges on the value of LCFS, RIN credits and tax incentives,” not just base gas value.

From a lender’s point of view, that means an RNG project is only as strong as the policy stack it sits on. Layer a 15–25‑year manure‑supply contract on top of that, recorded against your land, and they have to think hard about what happens to your debt‑service coverage and collateral if credit prices dip mid‑contract.

Is Your Land’s Future Tied Up for 25 Years?

For a lot of projects, it can be.

A typical RNG contract runs 15 to 25 years and is often recorded as an encumbrance against the property, which means it shows up in a title search. If you ever want to sell the farm, bring in a partner, or carve out land for development, a recorded manure‑supply obligation and a large industrial plant on site can narrow the pool of potential buyers and influence how they look at price.

The contract is usually built around a feedstock guarantee. You’re committing to:

  • A minimum volume of manure.
  • A certain solids content and methane potential.
  • Operating practices that won’t dilute or disrupt the feedstock.

That’s where flexibility can disappear. If the document says a change in bedding or ration that lowers gas yield brings “lost gas” penalties, you’re effectively treating your manure as a tightly specified feedstock. You need to decide whether living inside those limits for 20 years fits how you want to run the herd. Before you sign anything that touches feed, it’s also worth running through what a methane‑reducing additive actually costs per cow on your operation.

Force‑majeure language matters too. If H5N1 or another disease forces a depopulation, you want the supply guarantee clearly paused without penalties, not a lawyer arguing that “disease risk was foreseeable.” Those are the lines you want to see in black and white, not just implied in a brochure.

Contract Clause🔴 Red Flag Language🟢 Green Light Language
Credit ownership“All attributes, RINs, LCFS, and low-carbon premiums assigned to Developer”Farm retains or receives revenue share on RINs/LCFS above a price floor
Feedstock specificationPenalty triggered by bedding or ration changes that affect gas yieldReasonable tolerance range (+/–15%) with no penalty
Contract term20–25 years with no exit clause15-year base with mutual renewal options or buyout provisions
Title encumbranceAgreement recorded against fee title with no subordination clauseSubordinated to farm’s primary lender; carve-out for sale
Force majeureDisease risk listed as “foreseeable” or not listedExplicit coverage: disease depopulation, regulatory shutdown, Act of God
DecommissioningSilent on removal responsibilityDeveloper solely responsible for removal and site restoration
Expansion rightsDeveloper has right of first refusal on herd expansion manureFarm retains full rights over additional cows and future infrastructure

Options and Trade‑Offs for Farmers

Three main models are on the table for most dairies. Each trades a different mix of capital, control, and upside.

Farm‑owned digester

  • When it makes sense: Big herds with capital room, strong tax appetite, and the desire to own the upside.
  • What it requires: Comfort with policy risk, a solid O&M plan, real offtake agreements, and a lender fluent in RNG.
  • Risks/limits: Long payback if credits soften; potential to strain your balance sheet; a new operational discipline on top of your cows.

You put up the capital — roughly $3,400 per cow for a plug‑flow system without distillation, plus about $440/cow/yearin operating cost. You own the digesters, the gas upgrading, and usually the interconnect. You also own the credits, the downtime, and the policy risk.

30‑day action: if a developer sends you a proposal, ask them for a build‑cost estimate for a farm‑owned system and ask your lender for a term sheet. You don’t have to build it. You just need real numbers to compare. Then run that same capital against your next‑best options — pellet‑free robotics, spray drones, cow‑comfort work — using your own numbers and Bullvine’s ROI pieces as benchmarks. If $3,400/cow in digester capital can’t beat the return on a robotics or cow‑comfort upgrade on your farm, that’s a loud signal. The $36,740‑per‑200‑cows robotics math is a good starting comparison.

Developer‑owned (DBOOM)

  • When it makes sense: You want manure headaches reduced and you’re okay trading upside for stability.
  • What it requires: Comfort with a long‑term manure contract, clarity on title encumbrance, and trust in the developer’s staying power.
  • Risks/limits: Limited share in credit booms; dependence on a third party’s solvency; less flexibility in future herd or management changes.

Curtis Creek is the textbook example. Sedron designs, builds, owns, operates, and maintains the Varcor nutrient-recovery plant. The anaerobic digester and RNG facility are owned and operated separately by the developer under their own DBOOM-style arrangement. You put up no project capital, take on no project debt, and get paid in avoided costs and, sometimes, a modest lease or royalty.

The big trade‑off is control. A DBOOM contract will spell out how much manure you must supply, what you can and can’t do that might affect gas yield, and for how long. As of early 2026, USDA has halted new REAP grantapplications while it rewrites program rules and rescinds earlier funding notices, even as the guaranteed loan side of REAP remains open (USDA Rural Development; Brownfield Ag News; DTN, 2026). That means the grant layer that helped sharpen Curtis Creek’s solar economics may not be available in the same way for the next wave of projects.

Community hub

  • When it makes sense: Mid‑size farms in a cluster, or regions where a hub exists or is planned.
  • What it requires: Haulage or piping to the hub, coordination with neighbouring farms, and a clear tipping‑fee and revenue‑share formula.
  • Risks/limits: You’re one step removed from the credits; your economics depend on decisions made at the hub and policy levels you don’t control.

Think Fair Oaks: several dairies in a region truck or pipe manure to a central digester and RNG upgrading plant. You might pay a small hookup or haul fee and get a tipping fee or revenue share back. The key is the tipping‑fee math. What does it cost you per cow to get manure to the hub, and what do you get back per MMBtu or per ton? Put those numbers next to your lagoon, hauling, and nutrient‑plan costs, not just on a “feel” basis. If you’re weighing capital between manure and other operations, the 980‑acre breakeven on owned spray drones is another useful side‑by‑side.

MetricFarm-Owned DigesterDBOOM (Curtis Creek model)Community Hub
Capital cost (per cow)~$3,400/cow$0Low (haulage/hookup only)
Annual net cash flow~$525K/yr~$250K avoided costVaries (tipping fee + revenue share)
Owns RINs & LCFS creditsYesNo — developer keeps allPartial (hub-level split)
Contract lengthNegotiable15–25 years10–20 years typical
Title encumbrance riskLowHigh — recorded on propertyModerate
Policy price exposureFull (you carry all downside)ShieldedPartial
O&M responsibilityFullO&M responsibility (Varcor): Sedron, 4 FTEs on Sedron payroll. O&M responsibility (digester/RNG): separate developer.Hub operator
Best fitLarge herds, capital + tax appetiteFarmers prioritizing stabilityMid-size farms in a cluster

30‑day action: if an RNG pitch has landed in your inbox, get the draft term sheet — even a non‑binding one — into the hands of (1) an attorney who’s read manure‑to‑energy contracts before, and (2) your primary lender. Ask both of them one simple question: “What’s the worst‑case scenario for our farm in this deal?”

Key Takeaways

  • If your avoided‑cost benefit in a DBOOM offer comes out under about $80/cow/year on your numbers, you’re likely giving away too much of the manure value for too little return.
  • If the contract hands all “attributes” — RINs, LCFS credits, and any low‑carbon‑milk premiums — to the developer, assume you’ve sold your future green‑milk story along with your gas.
  • If a routine ration or bedding change would trigger “lost gas” penalties, you’re effectively signing up for a tightly specified feedstock supply role — decide if you can live with that for 20 years.
  • If decommissioning responsibilities aren’t clearly spelled out, assume that taking the plant off your land could become your problem down the road.
  • If $3,400/cow in digester capital can’t beat the ROI on robotics, drones, or cow‑comfort investments on your own farm, don’t let a “free money” pitch rush your decision.
  • If you’re a mid‑size herd, don’t write off digesters until you’ve checked whether a community hub option exists within hauling distance.
  • If your lender and lawyer haven’t seen an RNG agreement before, make sure they do — in full — before anyone at your farm touches a pen.

You don’t have to become an energy trader to milk cows in 2026. But if your manure is about to feed a multimillion‑dollar industrial plant, you do need to know whether you’re trading that manure for durable value or just getting cleaner lagoons while someone else rides the credit stack.

So, if a Sedron‑style pitch showed up on your phone tomorrow, which version of the deal would actually fit your balance sheet and your family’s plans — farm‑owned, developer‑owned, or a community hub? And just as important, what happens to that deal if the credits that make it all pencil don’t hold?

Run Your Numbers

Farm Benchmark Snap Check — Before you sign a 20‑year manure‑supply contract, pressure‑test the offer against your own herd. Plug in your cow numbers and avoided‑cost line items to see whether a DBOOM deal clears the $80/cow threshold — or quietly trades your manure value away.

Complete references and supporting documentation are available upon request by contacting the editorial team at editor@thebullvine.com.

Learn More

  • The Carbon Credit Conversation: What’s Really Happening on Dairy Farms Today — Secure your share of the upcoming $130-per-acre 45Z tax credit using proven farm-level methods. Real-world cash flow data from Midwest operations demonstrates exactly how targeted solar installations and feed additives rapidly defend operational margins.
  • The State of the Dairy Industry 2026: Policy, Markets & Change — Mandatory climate laws and Scope 3 reporting are transforming abstract environmental metrics into concrete business risks. Following the money on processor-level carbon insetting ensures your dairy remains competitive ahead of tightening milk supply contracts.
  • The $73-a-Cow Gap Hiding in Your 2027 Bovaer Contract — Breaks down the hidden math behind Bovaer feed additives to expose a $73-per-cow revenue shortfall. You can close this dangerous margin gap without adding another budget line item by deploying overlooked genomic selection tools instead.

The Sunday Read Dairy Professionals Don’t Skip.

Every week, thousands of producers, breeders, and industry insiders open Bullvine Weekly for genetics insights, market shifts, and profit strategies they won’t find anywhere else. One email. Five minutes. Smarter decisions all week.
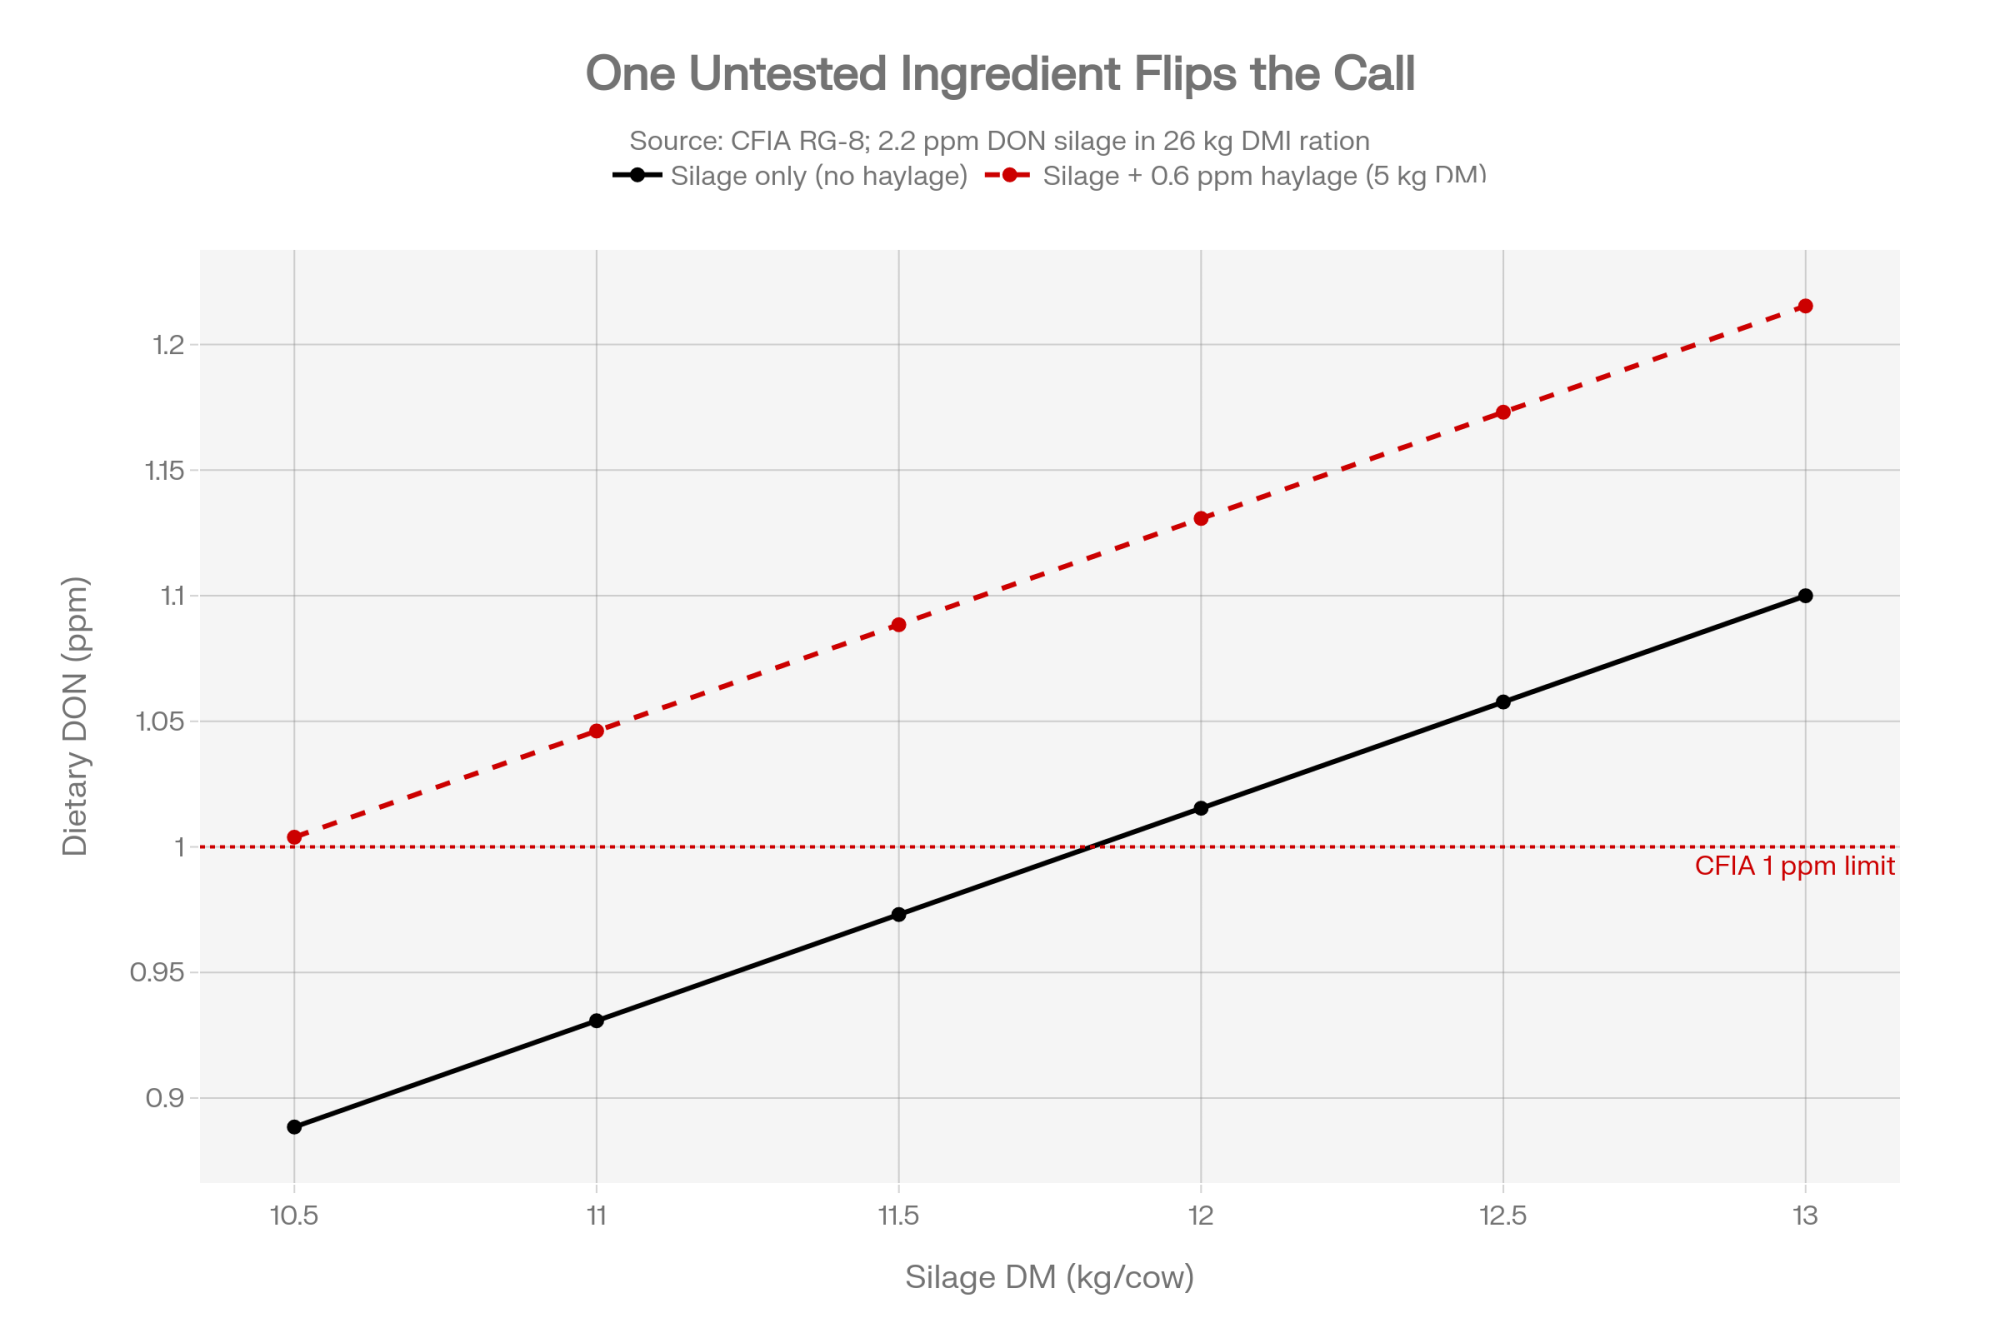
NewsSubscribe
First
Last
Consent

A $45 Test, A $149,840 Gap: Inside Kansas’s 700-Cow Genomic Trap

A 700-cow Kansas freestall tests 250 heifer calves at $45/head, files the report, and breeds the herd the same way it bred last year. The 2026 modeled gap: $149,840.

For U.S. commercial freestall dairies in the 500–1,500-cow band, it costs $2,651 to raise one Holstein heifer to calving, per Iowa State University Extension’s heifer cost of production work. The $45 line on your genomic testing invoice is the cheapest number in the stack. The expensive number is what that test didn’t change in the alley at 4:30 a.m.

Run that math on a 700-cow Kansas freestall that tests its full 2024 heifer crop and then keeps every heifer anyway, and the 2026 dairy economics of genomic testing produce a modeled 9,840 annual gap between testing spend and routing discipline. That figure is a scenario comparison against an enforced genomic-routing benchmark, built from a $45-per-head lab contract and published Iowa State Extension, CDCB, Lactanet, and Bullvine inputs. Not a P&L forecast.

Same test. Different decisions. Different milk checks.

Is Genomic Testing Worth It for Commercial Dairy Herds in 2026?

U.S. benchmark pricing on commercial genomic tests has held in the $40–$45/head range through 2024–2026. Reliability on Net Merit and Productive Life now runs 73–79%, with Daughter Pregnancy Rate around 74%, based on CDCB-published reliability tables cited in that same guide. Genetic gain in NM$ has accelerated to roughly per year under genomic selection, consistent with CDCB’s published national trend data reported in the Bullvine May 2025 guide.

TraitCDCB Reliability RangeWhat It Means in PracticeEnforcement Implication
Net Merit (NM$)73–79%High confidence — ranking is stable across re-runsSafe to print on breeding sheet as decision rule
Productive Life (PL)73–79%Longevity signal strong at this reliabilityBottom-quartile PL animals are real culling targets
Daughter Pregnancy Rate (DPR)~74%Solid — fertility signal actionable at farm levelUse to flag beef-routing candidates, not just sire selection
Fat Yield (PTA Fat)~78–82%*Highest reliability in the index post-2025 revision31.8% NM$ weight now makes this the dominant sort variable
Feed Saved~65–70%*Improving but widest confidence band in the indexUse directionally; don’t cull solely on Feed Saved at this stage

Layer in the 2025 NM$ revision. CDCB’s April 2025 NM$ formula revision moved PTA Fat near 31.8% relative emphasis and Feed Saved to roughly 14%, as reported in the May 2025 guide and anchored to the CDCB primary release linked there. On paper, the case writes itself.

Some commercial herds use genomic data primarily for sire selection and donor identification, where ROI capture doesn’t require the kind of cull-and-route discipline this article emphasizes. Those strategies have their own economics. The case below is built for the much larger commercial cohort that buys the test, files the report, and breeds the herd the way it bred last year.

For Canadian and other supply-managed readers, the cull-and-route economics shift under quota systems — the beef-cross premium and rearing-avoidance lines still apply, but the replacement-pressure math changes when quota expansion governs herd growth rather than market-priced milk volume. The thesis below is built for U.S. market-priced systems.

The recommended commercial playbook surfacing across major U.S. genomic test provider strategy guides and university extension materials The Bullvine has reviewed across 2024–2026 looks consistent: test the full heifer crop at the lab’s $40–$45 contract rate, cull the bottom 15–20% as calves, route the bottom cows to beef semen, pull donor candidates from the top 5%.

Plan on paper. Plan in practice: often barely touched.

What Does It Cost When a 700-Cow Herd Tests Every Heifer But Culls None?

The pattern The Bullvine has documented across commercial freestalls in 2024–2026 breaks one assumption flat. Everyone assumed genomic data and genomic decisions were the same thing. The 2024 barns say otherwise.

A run of transition wrecks tightens springer inventory. A load of heifers moves at a strong price right after calving and tightens it further. By the time the genomic reports land, the quiet decision has already been made in herds this size: keep every heifer, use the rankings to pick donors, move on.

In herds The Bullvine reviewed during 2024–2026 where genomic testing was paid for but routing wasn’t enforced on paper, the observable pattern is that breeding decisions often continue to follow visual and temperament cues rather than the genomic ranking. The ranking isn’t wrong. It just isn’t the rule. Where the ranking isn’t printed on the daily breeding sheet, it’s rarely the operative input at the tank. That’s an enforcement pattern, not a technician failing.

Three forces keep this pattern alive in 500–1,500-cow herds. Muscle memory beats spreadsheets when the tech is working in the dark. Visual bias defends favorite cow families against any ranking that contradicts them. Pay structures tie breeding staff to pregnancy rate and services-per-conception, not to whether the semen pulled matched the genomic tier.

Strategy without enforcement drifts into decoration. That’s what the testing line item is paying for when it pays for nothing else.

How the Execution Leak Happens — The Genomic Routing Funnel

Three Cash Flows That Move the Wrong Way

Against an enforced routing benchmark, three lines on the 700-cow Kansas scenario’s 2024 cash flow move in the wrong direction.

Rearing dollars not recaptured. Rearing dollars not recaptured. A $45 × 250-heifer test flags a clear bottom-quartile group — roughly 50 animals running below the top half on NM$ and components. Pull 30 as calves under a disciplined sort-and-cull plan modeled on The Bullvine’s February 2026 execution-leak work, and you avoid roughly 30 × $2,651 in rearing cost over the next 24 months. Pull three instead of 30, and the other 47 stay on feed, in pens, on the balance sheet.

Beef-cross revenue not captured. The beef-cross premium over a straight Holstein bull calf ran $350–$700 per head through late 2024 and into 2025, consistent with USDA AMS bull calf price ranges over the same period. That’s a national/trade-press benchmark; Kansas and Plains-region premiums vary, so cross-check against local sale barn or regional trade reporting before applying this range to your own math. At 450 cows bred in a cycle and an enforced top-half-dairy/bottom-half-beef rule — a framework consistent with routing discipline operators have described to The Bullvine in 2024–2026 interviews — 220–225 cows land in the beef-eligible bucket. When a herd this size books 95 beef-cross calves for the year, the modeled gap sits at roughly 125 additional cows not routed (rounded to 120 in the table below for arithmetic simplicity).

Stall value that ages poorly. A third- or fourth-lactation cow can carry genetics $250–$400 behind the 2023–2024-born heifers coming up behind her, derived from 85/year NM$ gain (CDCB national trend data). The Bullvine’s November 2025 Retention Payoff framework puts the three-year advantage of swapping a genetically lagging cow for a top-index replacement at roughly $1,350 per cow, with an approximate $233 per cow per year genetic opportunity cost derived from that same gain rate. Without genomic culling pressure, stalls age in the wrong direction.

Running the Numbers — Modeled Kansas Scenarios at 400, 700, and 1,000 Cows

This is a modeled comparison, not any single operation’s P&L. Inputs come from Iowa State Extension’s 2024 heifer cost work, CDCB trend figures, Lactanet 2024 inbreeding data, The Bullvine’s 2024–2025 reporting, and a $45/head lab contract. Convention: Year-1 gap = rearing avoided + beef premium captured + stall drag. Testing investment is shown separately as the ante. Beef-routing line uses 120 cows at the 700-cow scenario for table simplicity (exact math = 125).

Herd SizeTesting AnteRearing Avoided (24-mo)Beef Premium (Year 1)Stall Drag (Opportunity)Total Year-1 Gap
400 cows$6,525$47,718$31,500$9,320$88,538
700 cows (lead scenario)$11,250$79,530$54,000$16,310$149,840
1,000 cows$16,200$119,295$78,750$23,300$221,345

Inputs behind the table

  • Herd: 32% replacement rate, Kansas freestall, 2024 calf crop tested at $45/head.
  • Heifer raising cost: $2,651/head to calving (Iowa State Extension, 2024).
  • Beef-cross premium: $350–$700/head, $450 midpoint (USDA AMS, 2024–2025).
  • Stall drag: ~$233/cow/year, derived from 85/year NM$ gain (CDCB national trend data).
  • Rearing line is realized over 24 months; beef premium and stall drag are Year-1.
  • Cull depth and beef-eligible count move with your replacement strategy, not just your herd size.

Separate three-year frame (700-cow scenario)

  • Retention Payoff on 70 stall upgrades: 70 × $1,350 = $94,500 across three years, or roughly $31,500 per year amortized (Bullvine, November 2025). Don’t fold this into the Year-1 number. It’s a different horizon.

Plug in your own cull depth, routing rate, and beef premium midpoint. The range is directional.

Why the Testing Line Is the First Thing Lenders Ask About in 2026

The turn is showing up in Q4 lender meetings, not in the barn.

In The Bullvine’s 2025–2026 editorial conversations with commercial dairy operators in the 500–1,500-cow segment across the U.S. Midwest and Plains, multiple operators reported that their regional ag lenders raised a version of the same question at 2025 working capital renewals: the genomic testing line is up, where is it showing up on the milk check? Operators who can’t tie specific animals on the ranking report to specific routing decisions are finding those conversations harder to navigate than in prior cycles. That pattern aligns directionally with widely reported 2024–2025 ag-credit tightening across U.S. dairy.

EDITOR’S INSIGHT

In 2026, the milk check tells the story of your past decisions. The genomic report tells the story of your next ones.

One 2025 Lender Conversation, Illustrative and Anonymized

Read this as composite, not verbatim. The figures below are derived from the modeled 700-cow Kansas scenario above, not from any single operator’s records. It reflects the pattern operators have described to The Bullvine across the U.S. Midwest and Plains during 2025 renewal cycles, not any single exchange.

Lender: Your testing line went from $7,400 in 2023 to $11,250 in 2024. Walk me through what changed on the milk check.

Operator: We’re testing every heifer now.

Lender: I can see that. Your beef-cross calf count went from 82 to 95. Your springer inventory is up eleven head year-over-year. Which animals on the 2024 ranking report did you cull or route differently because of what the test said?

Operator: (pause) We’d have to pull the list.

That silence is the product. Not the $45 invoice.

A 2024 DSCR under 1.2 — the working-capital threshold widely used by U.S. ag lenders — sitting on the ledger next to a five-figure genomic testing bill and a ranking report whose bottom-quartile heifers are still in the springing pen answers the lender’s question for them. The test wasn’t the product. The decision rule was.

The other half of the pattern shows up at the barn level. The list wasn’t the rule, so the list wasn’t the input. Visual appraisal won because nothing in the daily workflow required anything else. That single dynamic explains most of the daylight The Bullvine has been documenting across commercial dairies reviewed in 2025–2026.

The 30/90/365-Day Playbook for Herds Testing Without a Rule

The fix isn’t more testing. It’s less freelancing. This playbook blends the restructured 2025–26 protocols The Bullvine has reviewed, the routing discipline operators have described, and the February 2026 execution-leak findings.

30 Days: Stopping the Bleed

  • Tag the bottom 20% so the alley can see them. Rank every heifer on hand by NM$ from your 2024 and 2025 genomic reports. Tag the bottom 20% with a physical signal — leg band, ear tag color, pen flag — within 30 days. Requires one morning with your genomicist and your software. Red-flag trigger: if your genomic testing spend is up year-over-year and your beef-cross calf count hasn’t moved, this is week one. Backfire watch: over-culling into a replacement shortage if your sexed semen program isn’t already creating surplus. Pull your 12-month projected heifer inventory before acting.
  • Print the ranking on the daily breeding sheet. Rewrite the daily breeding sheet with your AI tech. Every line prints with an assigned semen type — SEXED DAIRY, CONVENTIONAL DAIRY, or BEEF — derived from genomic tier, not tech discretion. Requires 2–3 hours in your herd management software (DairyComp, MPT, or equivalent). Trigger: if semen calls are being made at the tank rather than from a printed list, this is the highest-leverage 30-day fix.
  • Track tier compliance for one month. Target 95% by day 30, per The Bullvine’s editorial recommendation. Watch for excuses that start with “she looked good.”

90 Days: Systematizing the Rule

  • Install the one barn rule in writing. Band the breeding herd into top 30% sexed dairy only, middle 40% conventional or flex, bottom 30% beef only. Publish it in writing to everyone who touches the tank. Requires current genomic indexes on every eligible animal, a family meeting, and a plan for cultural pushback before it happens at 4:30 a.m. Threshold: if compliance runs below 90% in month two, the rule isn’t the rule yet. Backfire watch: resentment if you enforce without backing the tech when a well-presenting cow in the bottom band gets beef. The rule isn’t the rule until the tech has been backed up in front of the owner.
  • Pay for the rule, not just the pregnancy. Rewrite your breeding tech’s performance metric to include tier compliance alongside conception rate, tracked as paired numbers on the same weekly dashboard. Requires one conversation and one line change. Watch for gaming — compliance without conception progress isn’t the goal.
  • Audit inbreeding before the next mating cycle. Have your genomicist generate genomic inbreeding coefficients and Genomic Future Inbreeding scores for every breeding candidate. Flag any potential mating over 9% projected progeny inbreeding. Canadian Lactanet 2024 data points to roughly $60–$78 per cow per lactation of drag per additional 1% inbreeding. On a 300-cow herd, a 2-point reduction held across three lactations pencils to about 300 × 2 × $70 × 3 = $126,000 in avoided lifetime drag, using the $70 midpoint of the Lactanet $60–$78 range.

365 Days: Repositioning the Operation

  • Re-baseline the heifer pen around enforced culling. By end of year one, your heifer pen should be smaller, genetically stacked at the top, and funding a visible beef-cross calf revenue line on the cash flow your lender reviews. Requires one full breeding cycle under the rule. Opportunity signal: if your 2026 calf crop shows beef-cross count rising while springer projections hold within your 24-month replacement target, you have room to tighten the top tier further.
  • Run the donor program on index, not pedigree alone. Commercial IVF pregnancies typically run into the several-hundred-dollar range per confirmed pregnancy; confirm current rates with your provider before committing. The Bullvine’s editorial view on donor economics: the strongest pedigrees don’t always produce the strongest genomic profiles, and donor economics work best when the index decision leads the pedigree decision. For the legacy view of how disciplined index-led mating built famous breeding programs.
  • Rebuild sire selection around the 2025 NM$ weightings. Review sire selection through a component and inbreeding lens, not a top-10 list lens. Align your bull roster to the 2025 NM$ weightings and layer genomic relationship checks on top. Requires your mating software provider’s current release and a half-day with your genetics consultant.

What This Means for Your Operation

Testing isn’t the product. The rule is. That’s why the same $45 test lands as a six-figure decision on one farm and a line item on another.

The trade-off is plain. You gain margin by letting genomic ranks decide who gets raised, who gets bred dairy, who gets beef. You give up the comfort of family tradition, eye appraisal, and the peace of never arguing with your herdsman at 4:30 a.m. You also need a sexed semen program already doing real work. No surplus, no cull room. No cull room, no ROI on the test.

Across the commercial herds The Bullvine reviewed in 2025–2026 that installed a printed tier-routing rule, the editorial pattern has been beef-cross calf counts rising in the first full breeding cycle under the rule, testing spend holding roughly flat, and tier compliance converging on the 90–95% range within a quarter. The sample is the herd cohort described in the Behind the Numbers toggle below, not a national survey. October 2026 working capital reviews are five months out. The math is already moving on the herds that rewrote their breeding sheets this spring.

▶ RUN YOUR NUMBERS — Open the Genomic Testing ROI Calculator

The calculator walks you through your own herd’s test cost, cull depth, beef-routing rate, and replacement value in under ten minutes. Pull it up before your next breeding-sheet review.

Pull your 2024 and 2025 genomic reports. Answer one question honestly. Which specific animals did you actually treat differently — culled, routed to beef, moved out of the replacement pipeline — because of what the test said? Walk to the office. Find last week’s breeding sheet. Count the semen assignments that came from the genomic tier versus the tech’s judgment.

Key Takeaways

  • The $45 invoice isn’t the cost. The $149,840 modeled gap on a 700-cow Kansas freestall is what happens when the ranking lives in the office and the breeding sheet doesn’t change.
  • Genomic ROI shows up only when the rule is printed: top 30% sexed dairy, middle 40% conventional, bottom 30% beef — and the tech gets backed up the first time a well-presenting cow in the bottom band gets beef.
  • Tag the bottom 20% in 30 days, install the routing rule in writing in 90, and re-baseline the heifer pen by the 2026 calf crop. Your October 2026 working capital review is the deadline, not your next lab invoice.
  • If your testing line is up year-over-year and your beef-cross calf count hasn’t moved, your lender already knows the answer. Pull last week’s breeding sheet before they ask again.

What does your current breeding protocol actually say, on paper, about the bottom 30% — and when did it last change a single decision at the tank?

This article draws on The Bullvine’s 2024–2026 editorial review of commercial freestall dairies in the 500–1,500-cow segment, built from aggregated operator interviews and on-farm record reviews conducted across the U.S. Midwest and Plains during that window. The cohort referenced in the article reflects herds The Bullvine has reviewed in that segment during 2024–2026; specific herd counts are not disclosed to protect operator anonymity. The 700-cow Kansas scenario is modeled, not drawn from any single operation’s records.

The anonymized 2025 lender conversation is composite and illustrative, constructed from the pattern of exchanges operators described to The Bullvine during 2025 working capital renewal cycles. The dialogue’s specific figures are derived from the modeled 700-cow Kansas scenario inputs, not from any single operator’s ledger. No individual operator, herdsman, or lender is named or profiled. The DSCR-under-1.2 threshold reflects a working-capital line widely used by U.S. ag lenders and is cited as a common-practice benchmark, not as a specific institution’s policy.

Learn More

The Sunday Read Dairy Professionals Don’t Skip.

Every week, thousands of producers, breeders, and industry insiders open Bullvine Weekly for genetics insights, market shifts, and profit strategies they won’t find anywhere else. One email. Five minutes. Smarter decisions all week.
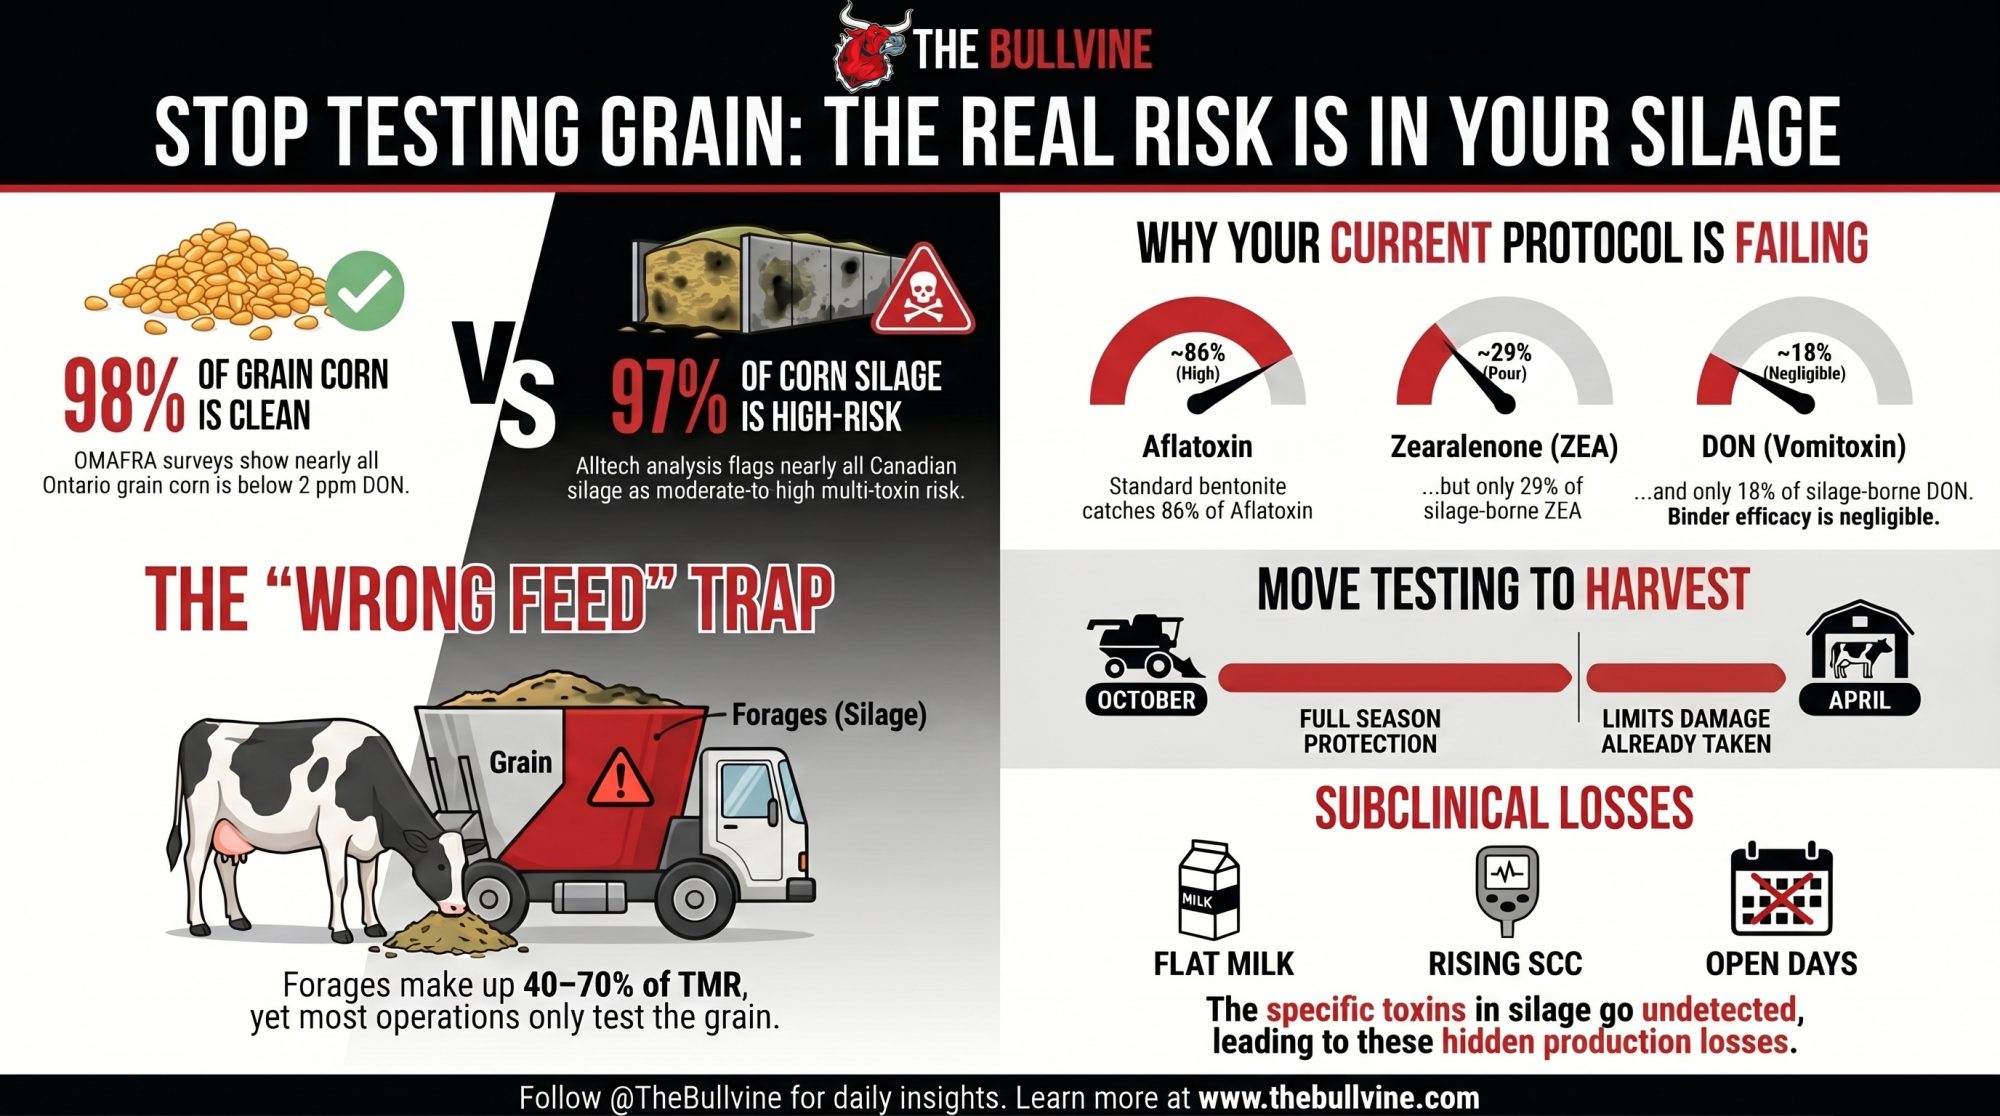
NewsSubscribe
First
Last
Consent

Canada’s 2025 Top Herds Share One Pattern. It Isn’t Their Milking System. 

A tie-stall pipeline just hit 978 HPI. The gap between Canada’s median and elite 2025 herds isn’t robots—it’s closed gates, 21-month AFCs, and culling cows costing you $640 in lost milk.

Executive Summary: A tie-stall pipeline barn just beat every robot in Canada to take the #1 spot on Lactanet’s 2025 Best Managed list with a 978 HPI. Sunrise Holsteins and the rest of the top four prove elite performance isn’t bought with new equipment—it’s built on the second 500 points of the index. They share a strict closed-herd discipline that systematically eliminates the chronic, high-SCC cows draining roughly $640 in milk revenue per lactation. With the recent CDC price hike and April’s Western Milk Pool component shift, herds relying on sheer volume are about to feel the squeeze. Meanwhile, top operations are pulling years of profit forward by hitting a 21.4-month age at first calving, three full months ahead of the national median. If you can’t immediately name the five cows costing you the most HPI points, your dairy software is just keeping history instead of making you money.

Lactanet 2025 Best Managed

A tie‑stall barn in Clarence Creek, Ontario just beat every robot herd in Canada. No automation. No free stall. No classifier on the property in years. Edgar Kaelin’s Sunrise Holsteins posted a 2025 Herd Performance Index of 978 — the highest score in the country, top of the 50 farms named to Lactanet’s 2025 Best Managed list — milking on a pipeline behind cows tied in stalls.

“I feel kind of like I went to the Olympics as a spectator and came home with a gold medal,” Kaelin told Farmtario on March 17, 2026. The line reads like modesty. A 978 HPI says it’s accurate self‑assessment.

That ranking should bother anybody selling you the idea that elite production requires expensive infrastructure. The 2025 Best Managed list keeps proving the gap between placing and disappearing isn’t equipment. It’s the second 500 points of the HPI — and the daily discipline that puts them on the board.

Canada’s Top 4 in 2025: Three Provinces, Three Systems, One Pattern

FarmLocationSystemHPINotable Stat
Sunrise HolsteinsClarence Creek, ONTie‑stall pipeline978#1 nationally; top tie‑stall
Alexerin DairyManotick, ONParlour974#1 parlour in Canada; top‑25 five years running
Lansi HolsteinSaint‑Albert, QCRobot972#1 robot in Canada; #1 in QC
West River FarmRosedale, BCRobot944#1 in BC; #2 robot in Canada

Sunrise and West River both operate closed herds with udder health as the central management priority, per Farmtario‘s March 17, 2026 coverage. Alexerin Dairy is CQM‑certified and runs structured biosecurity protocols, per The Bullvine’s earlier breeder profile of the operation. Different barns, different milking systems. Same discipline.

What’s Changing and Why

Lactanet’s HPI runs to 1,000 points across six indicators, split evenly between Milk Value and the management pillars that decide who places.

IndicatorPointsWhat it captures
Milk Value500Production × component value vs. herdmates
Udder Health150Bulk tank SCC + cow‑level Linear Score
Longevity100Productive life and adult survival
Age at First Calving100First‑lactation entry age vs. benchmark
Herd Efficiency100Days dry, days in milk, herd turnover balance
Calving Interval50Days between successive calvings

Top‑1% Canadian herds carry HPI scores in the 920–978 band, per Lactanet’s 2025 Top 1% release. The gap from there down to the median isn’t a robot. It isn’t a sire stack. It’s daily management discipline applied for years.

How Lactanet’s Herd Performance Index actually scores your herd.

What’s shifting now is the cost of not operating in that band. The Canadian Dairy Commission’s October 30, 2025 announcement put a 2.33% farmgate milk price increase into effect on February 1, 2026, while the P5 board moved to a new component structure on January 1, 2026 — putting $3/kg more on Tier 2 protein and pulling 18¢/kg off Tier 1 protein, with the sweet spot at an SNF:butterfat ratio of 2.2 (Dairy Farmers of Ontario). And on April 1, 2026, the Western Milk Pool moved from an 85/10/5 butterfat/protein/other‑solids ratio to 70/25/5. Herds built on tight sub‑indicator discipline absorb a payment‑structure change like this. Herds running on volume alone don’t.

Payment ComponentBeforeAfter (2026)ShiftWho Wins
Western Milk Pool
Butterfat allocation85%70%🔴 −15%Component-managed herds
Protein allocation10%25%🔴 +15%Herds optimizing protein yield
Other solids5%5%No change
P5 Protein Tiers
Tier 1 proteinBaseline−$0.18/kg🔴 DownVolume herds lose margin
Tier 2 proteinBaseline+$3.00/kg🔴 UpHigh-component herds gain
SNF:BF target ratioUnspecified2.2New targetPrecision feeding pays
CDC FarmgatePre-Feb 2026+2.33%UpAll herds (offsets costs only)

Why Your New Robot Won’t Fix Poor Discipline

Kaelin told Farmtario what sets Sunrise apart is a focus on udder health and a closed‑herd status that’s blocked the arrival of damaging infections. The Sunrise team doesn’t feed in the middle of the day or middle of the night. Cows are up while people are in the barn, lying down when they’re not. “It works with a tie‑stall,” Kaelin said.

About 40 minutes south, Ron, Judy, Todd and Erin Nixon’s Alexerin Dairy outside Manotick took the top parlour spot in Canada for 2025 with an HPI of 974 — second nationally overall, and ranked in Lactanet’s top 25 for five years running. “We’re really proud of our team — including Ron, Judy, Todd and Erin Nixon as well as four non‑family employees — for maintaining consistency to achieve reproductive success, maintain good production, and we’ve made good progress on improving our udder health this year,” Todd Nixon said in a video Lactanet released alongside the 2025 announcement. The Nixons run DairyComp for everyday management, with their vet and nutritionist working off the same data set.

West River Farm in Rosedale, B.C., placed #13 nationally, top in BC, and second among Canada’s robot herds with an HPI of 944. Sarah Sache, who manages the business at West River, told Farmtario the family has always managed for efficiency — historically feed efficiency and butterfat per cow, but increasingly protein production as the consumer marketplace evolves. “And profitability has always been a key metric for us,” she said. Lansi Holstein, owned by Nicolas and Frédéric Landry in Saint‑Albert, Quebec, took #1 robot in Canada and #1 overall in Quebec at 972.

The Barn Math on a Single Chronic Cow

A chronic high‑SCC cow in second lactation or older loses roughly 200 kg of milk per lactation for every Linear Score unit above 2 — that’s the conversion published in Lactanet’s Udder Health methodology. A cow sitting at LS 6 against a healthy LS 2 herdmate is short roughly 800 kg of milk over a 305‑day lactation. At an average Canadian quota blend price near $0.80/kg following the CDC’s February 1, 2026 farmgate adjustment, that works out to roughly $640 short on milk revenue alone — before you count premium‑program ineligibility, vet costs, or discarded milk days.

The Bottom Line: One LS 6 cow isn’t just a high‑SCC risk. She’s a $640 annual hole in your pocket before you even touch a vet bill. On a barn carrying 20 of those cows, the math compounds quickly.

The 200,000‑Cell Threshold Isn’t About Quality. It’s About Capacity.

Lactanet flags any cow above 200,000 cells/mL as a problem cow on its SCC reports — a threshold that captures roughly 85% of mastitis cases, clinical and subclinical. What that 200,000 line really marks is the point where the udder stops being a milk factory and starts being an immune battleground. Somatic cells are white blood cells. Once they crowd the alveoli, secretory tissue gets damaged or replaced with scar tissue, and production capacity drops — not just for that lactation, but across her productive life.

That’s why top‑1% herds don’t think of SCC as a milk‑quality metric. They think of it as a biological capacity ceilingthey refuse to let any cow stay above for long.

Go deeper: The hidden $1,400/cow cost killing dairy profits.

How Much Does Keeping One Chronic Cow Actually Cost You?

Pick one cow currently flagged on your Lactanet SCC report — anything above 200,000 cells/mL across her last three tests. Compare her last 305‑day production to a healthy herdmate of the same lactation number. Use Linear Score to make the math clean: every LS unit above 2, in second lactation or older, is roughly 200 kg of lost milk per lactation. Multiply by your component‑adjusted milk price.

Then ask whether your bulk tank would clear a premium‑quality threshold (typically <150,000 cells/mL across Canadian provincial structures) if she and a handful of her chronic peers left this month. The dollar value of that single threshold cross varies by board and shipper, but it’s almost always real money.

The Bottom Line: The hard part isn’t running the math. It’s being willing to look at it.

The Mechanics Behind the Outcomes

The reason most herds keep that cow is straightforward. She’s still milking. Replacement heifers in Quebec averaged $4,859 per head for conventional herds in Lactanet’s most recent rearing‑cost analysis, with a range from roughly $3,500 to over $7,000 depending on housing and feeding. Culling feels like loss.

The mechanics of the second 500 HPI points work like a system of compounding gears.

  • Udder Health drops, and Milk Value drops with it — high SCC suppresses production at the same time it costs you premiums. Double penalty.
  • Calving Interval stretches, and Herd Efficiency cracks because more dry and empty cows clog the system. Each extra day open costs an average of 2.40 kg of milk and 0.112 kg of fat per cow, per the foundational Journal of Dairy Science work on production losses from days open.
  • Age at First Calving drifts past 24 months when pre‑weaning growth is underpowered, calf disease sets heifers back, and breeding gets pushed. CDCB respiratory‑disease work shows a single recorded respiratory event in a heifer costs 121 kg of first‑lactation milk on its own.

Of the six HPI indicators, Udder Health typically moves first. Most herds see SCC shift inside one or two test cycles when they cull or treat aggressively. Calving Interval and Age at First Calving take a year or more to register on the report.

Go deeper: The $2,678 lifetime profit gap between top and bottom quartile classified cows.

Your Shopping Habit Is Why Your SCC Is High

The closed‑herd pattern at Sunrise and West River isn’t a coincidence. Staphylococcus aureus — the contagious mastitis pathogen most responsible for chronic SCC elevation — spreads cow‑to‑cow at milking and incubates subclinically in purchased animals that test fine on arrival. Bringing in live animals brings in their bacteria. Closing the gate doesn’t.

A closed herd doesn’t manage introduction risk. It eliminates it. Genetics still flow in — semen and embryos cross the gate. The disease pipeline is what’s being closed. Dairy Farmers of Canada’s proAction biosecurity guide makes the same recommendation in plainer language: limit purchase frequency, limit number of sources, and maintain a closed herd to the extent practicably possible.

Reality Check: You can’t buy your way into the top 1% of Best Managed herds. But you can absolutely buy your way out of it by bringing in one Staph aureus carrier.

Is Your Heifer Program Building a 23‑Month Calving Window or a 26‑Month One?

Average herds answer “what age do you breed at?” Top herds answer “what weight at 12 months are you tracking against?” Those aren’t the same question. Wardway Farms — featured in Lactanet’s published AFC case work — averages 21.4 months at first calving by breeding heifers on weight, not on the calendar.

A 24‑month AFC isn’t “good enough.” Lactanet’s 2025 Management Benchmarks put Canada’s national median at 24.6 months, with the 90th‑percentile band at 23.1 months or below. Wardway’s 21.4 months sits more than three months below the national median — and every one of those months is direct lifetime profit. Calving at 21–22 instead of 24–25 means an extra lactation across her productive life on the same depreciation schedule, fewer non‑producing days on feed, and a higher share of her HPI Age at First Calving 100 points captured. The gap is almost entirely about pre‑weaning nutrition, calf disease management, and whether breeding happens on weight or on the calendar.

Options and Trade‑Offs for Farmers

Most middle‑of‑the‑pack herds don’t need to copy a tie‑stall pipeline operation to move. They need to pick the levers that respond fastest and start.

Action PathHPI Points at StakeTime to Visible MoveDollar AnchorHard Trade-Off
🔴 Cull chronic SCC cows150 (Udder Health)1–2 test cycles🔴 $640/cow/lactationCull cost hits before premium recovery
Tighten repro protocol50 direct + drags on Efficiency & Milk Value6–9 months2.40 kg milk/day openCompliance slips under harvest pressure
Rebuild heifer pipeline100 (AFC) + Longevity18–24 months$4,859 avg rearing cost (QC)Payback delayed but compounding
Close the herd gateProtects Udder Health 150Immediate risk reduction1 Staph aureus intro = 5–15 cows × $640🔴 9.99% inbreeding floor to beat

Path 1 — Attack SCC and chronic cows in the next 30 days. Pull your Lactanet SCC Herd Summary this week. Flag every cow above 200,000 cells/mL across her last three tests, and check her Linear Score and lactation $ loss on the second page of the report. Assign each one a treatment plan, segregation order, early dry‑off, or cull date. Top herds make this list weekly, not annually. The cull cost lands before the premium gain — but the reclaim arrives within one or two test cycles, and the 150‑point HPI Udder Health component typically moves faster than any other lever on the report. Forward signal: with the April 1, 2026 WMP component shift rewarding tighter SNF management, the bulk‑tank SCC reclaim and the protein‑side payment improvement land in the same quarter.

Path 2 — Tighten repro discipline this breeding season. Define your voluntary waiting period in writing. Run a structured first‑service program (Double‑Ovsynch or G6G). Preg‑check at 32 days post‑AI, not 60. Each day open trimmed off your herd average is worth 2.40 kg of milk per cow per day across the rest of that lactation, per Journal of Dairy Science‘s days‑open work. The risk: protocol compliance under harvest pressure is exactly when discipline tends to slip. Forward signal: Calving Interval is only worth 50 of the 1,000 HPI points, but it’s the lever that drags Herd Efficiency and Milk Value with it when it moves.

Path 3 — Rebuild the heifer pipeline now for 2027 AFC. Colostrum within 1–2 hours, 2+ L, Brix‑tested. Aim to double birthweight by weaning. Track growth against mature‑cow targets, not the calendar. Wardway’s 21.4‑month average sits more than three months below the national median — and the gap is calf nutrition and disease management, not calendar discipline. Payback lands two years out. Every month you delay starting is a month added to your AFC drift.

Go deeper: Why raising your heifers just became profitable again.

Path 4 — Decide whether closing your herd is feasible. It’s binary. You either bring in zero outside live animals or you don’t get the biosecurity benefit. For operations not selling embryos or buying expansion cows, the 2026 economics tilt sharply toward closing. The trade‑off: slower genetic correction (closed herds depend on genomic semen rotation rather than purchased proven cows), and inbreeding management becomes a deliberate task. Lactanet’s August 2025 inbreeding update pegged Canadian Holstein heifers born in 2024 at 9.99% average inbreeding — a full point above 2014. Close the gate, and that’s the number you have to actively beat in your own mating reports.

Key Takeaways

  • If your bulk tank SCC sits above 150,000, pull your Lactanet udder health report this week and identify the 5–15 cows pulling the average up. Build a treatment, segregation, or cull date for each.
  • If your calving interval is above 400 days, audit your VWP and first‑service program with your vet inside the next 30 days. This single lever moves HPI faster than any other.
  • If you can’t pull a problem‑cow list in under five minutes — chronic SCC, repeat breeders, longest open — your herd software is a record‑keeper, not a management tool.
  • If you’re considering closing your herd, cost out one disease introduction event against your current purchase frequency before deciding.
  • If your AFC is above 24.6 months, the bottleneck is your heifer program, not your breeding calendar. Start with colostrum protocol and pre‑weaning ADG tracking.
  • If your expected mating inbreeding is running above 9.99%, your sire stack needs two or three outcross or lower‑inbreeding bulls before the next breeding cycle, per Lactanet’s August 2025 benchmark.
  • If you’re at the 50th percentile across multiple components, attack udder health and calving interval first. Milk Value and Longevity follow as side effects, not the other way around.

Sunrise. Alexerin. West River. Lansi. Four operations, four provinces, almost nothing else in common — except the discipline. Different barns, different milking systems, different cow families. What they share isn’t equipment. It’s the willingness to look at their own data and act on what it says, even when the action is unpopular or expensive in the short term.

So here’s the question worth sitting with this week. When you look at your last 12 months of test data, can you name the five cows costing you the most HPI points right now? And if you can’t, what would change if you could?

The full barn‑math on each HPI component — the SCC math, the calving‑interval economics, the heifer‑program rebuild — gets the calculator treatment in our companion piece The Math Behind Canada’s Best Managed Dairy Herds. That’s where the numbers live.

Operating details for the herds named here are drawn from Lactanet’s 2025 Best Managed announcement (March 9, 2026) and Top 1% release, the Lactanet 2025 Best Managed announcement video, the Ontario West Progress Report (April 22, 2026), and Farmtario’s March 17, 2026 coverage of the rankings. Component price detail draws from the Canadian Dairy Commission’s October 30, 2025 farmgate price announcement, and Farmtario’s February 10, 2026 coverage. None of the operators were interviewed directly for this piece.

Run Your Numbers

Component Value Tracker — Use the Component Value Tracker to translate today’s shifting milk pricing into herd-level component dollars. See what one-tenth of a point of fat or protein is actually worth in your milk check before you change your ration or sire stack.

Learn More

  • Why 150 Well-Managed Cows Beat 500 Poorly-Run Ones — Capture the $100,000 management differenceby driving operating costs below $18/cwt and optimizing SCC premiums. Focusing on these efficiency metrics allows 150-cow dairies to out-earn struggling 500-cow giants through superior component production and labor optimization.
  • Lactanet Unveils Canada’s Best Managed Herds for 2024 — Adopt the 984 HPI playbook used by Canada’s 2024 leaders to slash replacement costs by C$580 per cow. Benchmarking data reveals how genomic testing and longevity analytics create a high-margin “survival toolkit” for elite Canadian operations.
  • The Profit Index Paradox: Choosing Dollars Over Rankings — Master the genetic profit gap by choosing sire teams based on Net Merit and Pro$ instead of vanity rankings. High-LPI bulls often hide a 31st percentile fertility trap that arms you with expensive breeding delays rather than real-world margin.

The Sunday Read Dairy Professionals Don’t Skip.

Every week, thousands of producers, breeders, and industry insiders open Bullvine Weekly for genetics insights, market shifts, and profit strategies they won’t find anywhere else. One email. Five minutes. Smarter decisions all week.
NewsSubscribe
First
Last
Consent

Before You Sign the Methane Contract: The $54,750 Your Feed Bunk Is Already Burning

A $0.45/cow/day methane quote. A 1,000-cow herd stuck at 1.48 ECM/DMI. One 0.05-point bump is worth $54,750/yr — before you pay a cent for carbon in a bottle.

Executive Summary: A $0.45/cow/day methane additive works out to $164,250 a year on 1,000 cows, while a 0.05‑point bump in ECM/DMI is worth $36,500–$73,000/year with no new line item. The article shows how most herds sitting around 1.45–1.50 ECM/DMI are leaking money through bunk management, comfort, and forage drift long before additives or digesters enter the picture. You’ll see hard barn math on pit DM swings, lying time, and grouping, plus a simple ladder that puts barn basics, precision feeding, genetics, and methane tools in the right order. For a 500–3,000 cow operation, the same small efficiency gains that cut kg CO₂e/kg milk also trim feed cost per cwt and protect IOFC when milk or feed swings. If you’re being nudged to “do something on methane,” this piece helps you answer one question first: will a new product beat what you can pull out of your own feed bunk in the next 30 days?

feed efficiency vs methane additives

A commercial 1,000-cow herd in the Upper Midwest got the pitch last month. A feed rep walked in with a methane additive quoted at roughly $0.45 per cow per day. The manager had a processor letter on his desk asking for a sustainability update by Q3, and his herd was running about 1.48 ECM/DMI — Energy-Corrected Milk per pound of Dry Matter Intake, the single cleanest way to measure how efficiently your cows turn feed into milk. Nobody in the room was doing the math on what that efficiency gap was actually worth before signing anything.

That scenario is a composite, built from recent herd reviews across the region — names withheld at the operators’ request. The numbers are real, though, and they’re why feed efficiency — not methane in a bottle — is where your first sustainability dollar usually belongs. For most commercial herds still sitting south of 1.60 ECM/DMI, the cheapest tonnes of CO₂e and the best dollars of income over feed cost are still inside the barn, waiting.

The Math That Should Stop the Meeting

Start with the additive cost. It’s not a mystery:

1,000 cows × $0.45/cow/day × 365 days = $164,250/year.

That’s a six-figure line item, every year, before you see a single lab result. Now price the other direction. A 0.05-point bump in ECM/DMI — the kind of move that comes from tightening bunk management, fixing obvious refusals, and catching new silage pits the day they open — is worth roughly $0.10–$0.20 per cow per day in income over feed cost at 2026 feed-and-milk spreads, consistent with the Penn State Extension Dairy Outlook (April 2026 release) IOFC benchmarks at current spreads.

Here’s that math on one line each:

  • Current gap: 1.48 ECM/DMI vs. a 1.60 target
  • The opportunity: a 0.05-point move ≈ $0.15/cow/day in IOFC (midpoint of the $0.10–$0.20 range)
  • The reward: ~$54,750/year on 1,000 cows; full range $36,500–$73,000
  • The underlying change: about 2 lb more ECM/cow/day off roughly 44 lb [20 kg] of DMI

No new line item. No contract. No Q3 report needed. You’re just catching margin that’s already sitting in your bunk and stalls.

Stack the two and the picture gets uncomfortable. You’re looking at $164,250 out the door for emissions reductions you may or may not get paid for — versus $36,500–$73,000 captured from work your team can start this week. The additive isn’t the villain. The sequence is.

What 0.05 ECM/DMI Is Worth on Your Herd

Find your row. That number is what a “small” ECM/DMI improvement is actually worth before you buy a single gram of methane reducer.

Herd sizeDaily IOFC at $0.10/cow/dayDaily IOFC at $0.20/cow/dayAnnual range (365 days)
250 cows$25$50$9,125 – $18,250
500 cows$50$100$18,250 – $36,500
1,000 cows$100$200$36,500 – $73,000
2,500 cows$250$500$91,250 – $182,500

📊 FAST FACT BOX — Why Efficiency Is the Sustainability Lever

Sustainability gains on dairy farms have historically been a feed-efficiency story, not a product story:

  • U.S. dairy, 1944 → 2007: a gallon of milk in 2007 carried only 37% of the carbon footprint of 1944, using roughly a fifth of the cows and feed (Capper et al., 2009 J. Animal Science; summarized by Cornell). 
  • California, 1964 → 2014: a UC Davis 50-year analysis (Naranjo et al., 2020 JDS) showed dramatically less land, water, and GHG per litre of milk, driven mostly by higher per-cow yields and tighter rations. 
  • Canada, 2011 → 2021 (national scope — do not apply directly to U.S. herds): the national LCA puts the average farm-gate footprint at 0.94 kg CO₂e/litre, a 9% drop in a decade and well under half the FAO global average of 2.5 kg. 

None of that came from a single product. It came from genetics, forage quality, ration management, and more milk from fewer, more efficient cows.

What’s Really Driving “Sustainable” Milk in 2026

Processors have stopped talking about sustainability in the abstract. They’re tracking emissions intensity per litre of milk — a number that mostly rides on how efficiently your cows turn feed into milk and how long they last in the herd.

The money is moving with it. In the U.S., the FARM Environmental Stewardship program continues to push supplier-level footprint tracking across co-ops. Global buyers like Nestlé and Fonterra are wiring sustainability performance directly into supplier pricing — Fonterra’s Co-operative Difference top tiers translated to meaningful per-kg-MS premiums in the 2024–25 season for farms that document their emissions and nutrient footprints, with current reporting pegging realistic North American processor premium ranges in the dimes-per-cwt band. Herds that show better kg CO₂e per kg milk almost always have better ECM/DMI and fewer nutrient-management headaches. The biology doesn’t care what you call it. It cares how much feed and land it took to get the milk on the truck.

Picture the “dilution of maintenance” effect this way. Every cow carries a fixed feed bill just to stay alive before she gives you a drop of milk. Push more milk through that same overhead and emissions per litre drop automatically — that’s the whole story behind 80 years of quiet environmental progress in dairy, and it’s still the cheapest rung on the ladder for most commercial herds in North America.

How This Looks in a Real Barn Week

You’ve probably lived this week. The new corn silage pit opened Tuesday. Nobody pulled a DM sample that day. The mixer sheet is still running on numbers from the old pit, which was 4 points wetter. Cows are getting less dry matter than the software thinks they are. Milk slides 1–2 lb per cow, refusals wobble, and your nutritionist isn’t scheduled until the 15th.

Run that math. Take a representative –/cwt milk price using USDA’s early-2026 all-milk projections. A 1.5 lb milk slide across 1,000 cows for 30 days works out to:

🚨 ~$8,100 in lost milk revenue — from one untested pit face.

Stretch it across two pit changes and a summer heat event and you’ve burned more margin on silent forage drift than the entire cost of the feed-analysis and DM-testing program that would have caught it.

Here’s the awkward part: herds stuck at 1.45–1.50 ECM/DMI rarely have a ration formulation problem first. They have a feed-delivery problem (inconsistent DM and shrink), a comfort problem (overstocked, hot, sore cows), and a data problem (nobody owns yesterday’s DMI and refusals). A nutritionist who visits every two weeks can’t fix what nobody on farm is measuring in between.

What Actually Moves ECM/DMI (And How Fast)

Strip the emotion out and three barn-side levers move the needle, in roughly this order of speed.

1. Feed availability and bunk management (2–8 weeks). Keep feed in front of cows. Deliver on time after milking, push up properly, target refusals in the 1–5% range. Extension work from Miner Institute and land-grant universities routinely associates tight bunk management with roughly 4–8 lb more milk per cow per day compared with empty-bunk programs — consistent with Grant’s time-budget research summarized in Stocking Density and Time Budgets(WDMC).

2. Cow comfort and stocking (1–3 months). Rick Grant’s Miner Institute work pegs each extra hour of rest at roughly 2–3.5 lb more milk per cow per day in freestall Holstein herds. Watch the cows, not the spreadsheet: if more than a few are standing when they should be lying, you already have your answer. Once stall stocking pushes much past 120% and bunk space drops under about 24 in [≈61 cm] for milking cows, cows lose lying time and you lose milk. If fewer than 80% of cows are lying during peak rest between 11 a.m. and 2 p.m., your first sustainability investment is stalls, space, and air — not an additive.

3. DM and forage tracking (ongoing — protects the first two). Modeling work out of Ohio State (St-Pierre & Weiss) and Wisconsin shows that as herd size grows, the cost of sampling more often is tiny compared with the cost of flying blind. For a 1,500–1,600 cow herd, hitting forage DM checks ≈ every 4 days is a lot safer than once a month. Most big herds are nowhere close.

Genetics then layers on top. Selecting on Feed Saved, EcoFeed, or similar feed-efficiency indices means picking daughters that give the same output on less feed. GENEX ICC modeling suggests daughters of top ICC-ranked sires eat roughly 100 lb less DM per lactation than top NM$ daughters and ~165 lb less than top TPI daughters at comparable production. You won’t feel that in this quarter’s IOFC. You will feel it for the rest of that cow family’s life in your herd.

How Much Does Waiting 30 Days Actually Cost?

Every 0.05-point swing in ECM/DMI on a 1,000-cow herd is worth $36,500–$73,000 per year in IOFC at today’s spreads. A single silage pit changeover that goes 30 days without a DM test and a mixer-sheet update can easily burn $8,000 in lost milk on a 1.5 lb slide — and closer to $16,000 when DM drift compounds with more refusals, slug feeding, and a bit of summer heat.

Stretch that across a year on a herd running two corn silage pits, one haylage pile, and seasonal cutting changes. The difference between catching those shifts in a week versus a month is often bigger than the entire cost of a methane-additive program. Before you sign any sustainability product contract, the question has to be:

Will this product beat the $36,500 I could capture by tightening my own bunk, forage, and comfort protocols first?

For most 500–3,000 cow herds in 2026, the honest answer is still no — not yet.

Is Your Nutrition Program Built for Speed or for Monthly Meetings?

Most nutrition programs are still built around the consultant’s calendar: monthly or bi-weekly visits, monthly forage analyses, rations updated when the truck pulls in the yard. That worked when a nutritionist drove to three herds a week, every pit was opened in front of him, and a 4-point DM swing took weeks to matter because the bulk tank was 120 cows and a cooler. It doesn’t work on a 1,500-cow free-stall where two pits, a haylage pile, and three heifer pens move in the same week.

The “120-cow paper sheet” mindset is still embedded in a lot of programs — and it’s quietly expensive. If your SOP starts with “wait until the nutritionist calls,” you’ve already given up a week of silent margin every time a forage shifts. Modern herd size needs a split job:

  • The barn owns speed and data. Daily DM checks when pits change. Refusals weighed by pen for at least a couple of weeks every season. Bunk walks. A simple ECM/DMI dashboard by group that somebody actually looks at.
  • The consultant owns math and strategy. Ration design, long-term forage plans, additive screening, and genetic direction. They shouldn’t have to guess at yesterday’s DMI or whether a pit changed last Tuesday.

If your standard operating procedure doesn’t say, “When we open a new pit, we test DM that day and update the mixer sheet — no consultant call required,” your nutrition program isn’t built for modern herd size. It’s built for the herd your consultant walked into in 1995.

Options and Trade-Offs for Your 2026 Sustainability Budget

Rung / ToolTypical cost/cow/yrECM/DMI impact in 12 moPayoff speedPolicy / market risk
Barn basics (bunk, DM, comfort)$10–$250.05–0.10 ↑30–90 daysLow
Precision feeding & grouping$15–$300.05–0.12 ↑3–6 monthsLow–moderate
Genetic feed efficiency$5–$100.03–0.06 ↑3–5 yearsLow
Methane additives$1640.00–0.05 ↑ (variable)6–12 months+High

Here’s the ladder most margin-focused consultants use right now when you ask, “Where should my first sustainability dollar go?”

🪜 RUNG 1 — Fix Barn Basics First

Difficulty: Low | Impact: High | Timeline: 30-day action

When it makes sense: Always, and especially if you’re below 1.60 ECM/DMI.

What it requires:

  • Weigh refusals daily by pen for at least 2 weeks
  • DM-test every time a pit, bag, or cutting changes
  • Midday (11 a.m.–2 p.m.) lying-time spot check; aim for 80% of cows lying
  • Calculate ECM/DMI by group monthly with numbers you’re already recording

Risks/limits: It’s boring, and it needs someone on farm to own it every week — not just when the nutritionist is coming. Plenty of herds plan to do this and never quite start.

Forward signal: This is the path processors can actually verify with the data you already collect — which is exactly what their sustainability teams are starting to pay for.

🪜 RUNG 2 — Precision Feeding and Grouping

Difficulty: Moderate | Impact: High | Timeline: 3–6 months

When refusals, comfort, and forage data are under control, grouping becomes the next lever. Most herds discover the real obstacle isn’t the nutritionist — it’s the parlor schedule and pen design that make regrouping a pain. You need at least two lactating groups, some MUN tracking, and a nutritionist willing to trim crude protein and phosphorus toward requirements instead of sitting comfortably above them.

The Cannonsville Reservoir work in New York (Cerosaletti, Fox et al., 2004 JDS) showed that dropping dietary phosphorus from about 153% to 111% of requirement cut manure P excretion roughly 12 kg per cow per year and reduced whole-farm P balance by about half, without giving up milk. Wisconsin dynamic-grouping modeling (Kalantari & Cabrera, 2018) shows about 15 g/cow/day lower N intake when cows are grouped more tightly by stage and production.

Risks/limits: A sloppy precision program is worse than a well-run single-group TMR. You can save nutrients on paper and lose milk in the tank.

🪜 RUNG 3 — Genetic Feed Efficiency

Difficulty: Low | Impact: Compounding | Timeline: 5-year payoff

When it makes sense: Now — it costs nothing to start.

Add a minimum threshold for Feed Saved, EcoFeed, or similar indices on your sire list, and keep it when a hot young bull with no efficiency data shows up. GENEX’s ICC index bakes in a feed-efficiency component, and its modeling suggests top daughters eat noticeably less for the same output than top NM$ or TPI daughters.

You won’t feel it as a line item in 2026. This is slow, permanent money — cows calving in 2028–2030 will simply give more milk on fewer tonnes of feed.

Forward signal: CDCB and international partners are already folding sensor-derived and efficiency traits into routine proofs. The next decade of proofs will quietly reward cows that do more with less, whether processors talk about it or not.

🪜 RUNG 4 — Methane Additives and Digesters

Difficulty: Moderate | Impact: Conditional | Timeline: Policy-dependent

When it makes sense: Once you’re over 1.60 ECM/DMI, barn basics are working, and you have a real payer for the emissions reduction.

What it requires: A documented baseline, a clear IOFC trial plan, and either a processor premium or a carbon/credit market that moves the math from pure cost to net positive. Realistic processor sustainability premiums for verified performance currently live in roughly the $0.10–$0.30/cwt range, depending on processor and region. Well-designed digesters in strong-policy environments (California LCFS or RIN-eligible states) can add roughly $50–$150/cow/yearnet once grants and energy credits clear; in weak policy environments they’re mostly green theater.

Risks/limits: Meta-analyses of 3-NOP (Bovaer-type) trials show real methane reductions near 30%, but with diet sensitivity and variable DMI and milk responses across studies. Regulatory status varies by jurisdiction, so confirm approvals in your market before sourcing. The gas number looks good on paper, but IOFC and cow-level responses still live and die on your underlying ration and management. If you’re still leaking ECM/DMI because of bunk, comfort, or forage issues, an additive is a high-priced patch on a leaky system.

Your Next Management-Meeting Checklist

Print this. Take it to the barn. Answer each one before the next sustainability pitch lands on your desk.

  • ☐ Do I know my 12-month ECM/DMI by group, not just herd average? If not, fix the data before buying a product. 
  • ☐ Can I tell yesterday’s DMI within half a pound per cow? If not, weigh refusals by pen for two weeks before changing an ingredient.
  • ☐ Are 80% of cows lying during peak rest (11 a.m.–2 p.m.)? If not, fix comfort and stocking before funding an additive trial. 
  • ☐ Does my SOP require a same-day DM test whenever a pit, bag, or cutting changes? A 1,500-cow herd should be sampling closer to every 4 days than monthly. 
  • ☐ Does my sire list carry a Feed Saved or EcoFeed minimum? If not, add one this breeding cycle. Cows calving in 2028 will be eating money your competitor’s cows aren’t. 
  • ☐ If a feed rep quotes a $0.45/cow/day additive and I’m still at 1.48 ECM/DMI — do I open a spreadsheet or a contract first? Spreadsheet.
  • ☐ When I sit with my processor, am I bringing an ECM/DMI and emissions-per-litre trend — or a folder of product receipts? That trend is what unlocks premiums. 

The Real Question

What does your milk check look like if every tonne of feed you buy this year actually hits milk instead of the refusal alley or the lagoon? Not someday, when methane tools get cheaper or policy shifts your way. This year.

Most commercial herds still have meaningful feed efficiency sitting on the table, and processors are already starting to pay real money — in dimes per cwt — for the herds that can prove they’ve captured it.

Key Takeaways

  • If your herd is sitting south of 1.60 ECM/DMI, your first sustainability dollar belongs in bunk management, comfort, and DM testing — not a $164,250 methane contract.
  • A 0.05-point ECM/DMI bump is worth $36,500–$73,000/yr on 1,000 cows, and it’s the same work that lowers kg CO₂e per kg milk, so you get paid twice for the same effort.
  • Additives and digesters are Rung 4, not Rung 1 — use them once you’re over 1.60 ECM/DMI, barn basics are working, and you have a real payer (processor premium or LCFS/RIN credit).
  • Before your next sustainability pitch, walk the bunk at 1 p.m.: if fewer than 80% of cows are lying and nobody DM-tested the new pit, close the spreadsheet and fix that first.

Run Your Numbers

Forage Quality Value Calculator — Before you sign any methane contract, pressure-test the other side of the math: what a 4-point DM swing or a lower-energy pit is actually costing you in milk per cow and dollars per ton. Turns the “$8,100 untested pit” question into a real number for your herd.

Complete references and supporting documentation are available upon request by contacting the editorial team at editor@thebullvine.com.

Learn More

The Sunday Read Dairy Professionals Don’t Skip.

Every week, thousands of producers, breeders, and industry insiders open Bullvine Weekly for genetics insights, market shifts, and profit strategies they won’t find anywhere else. One email. Five minutes. Smarter decisions all week.
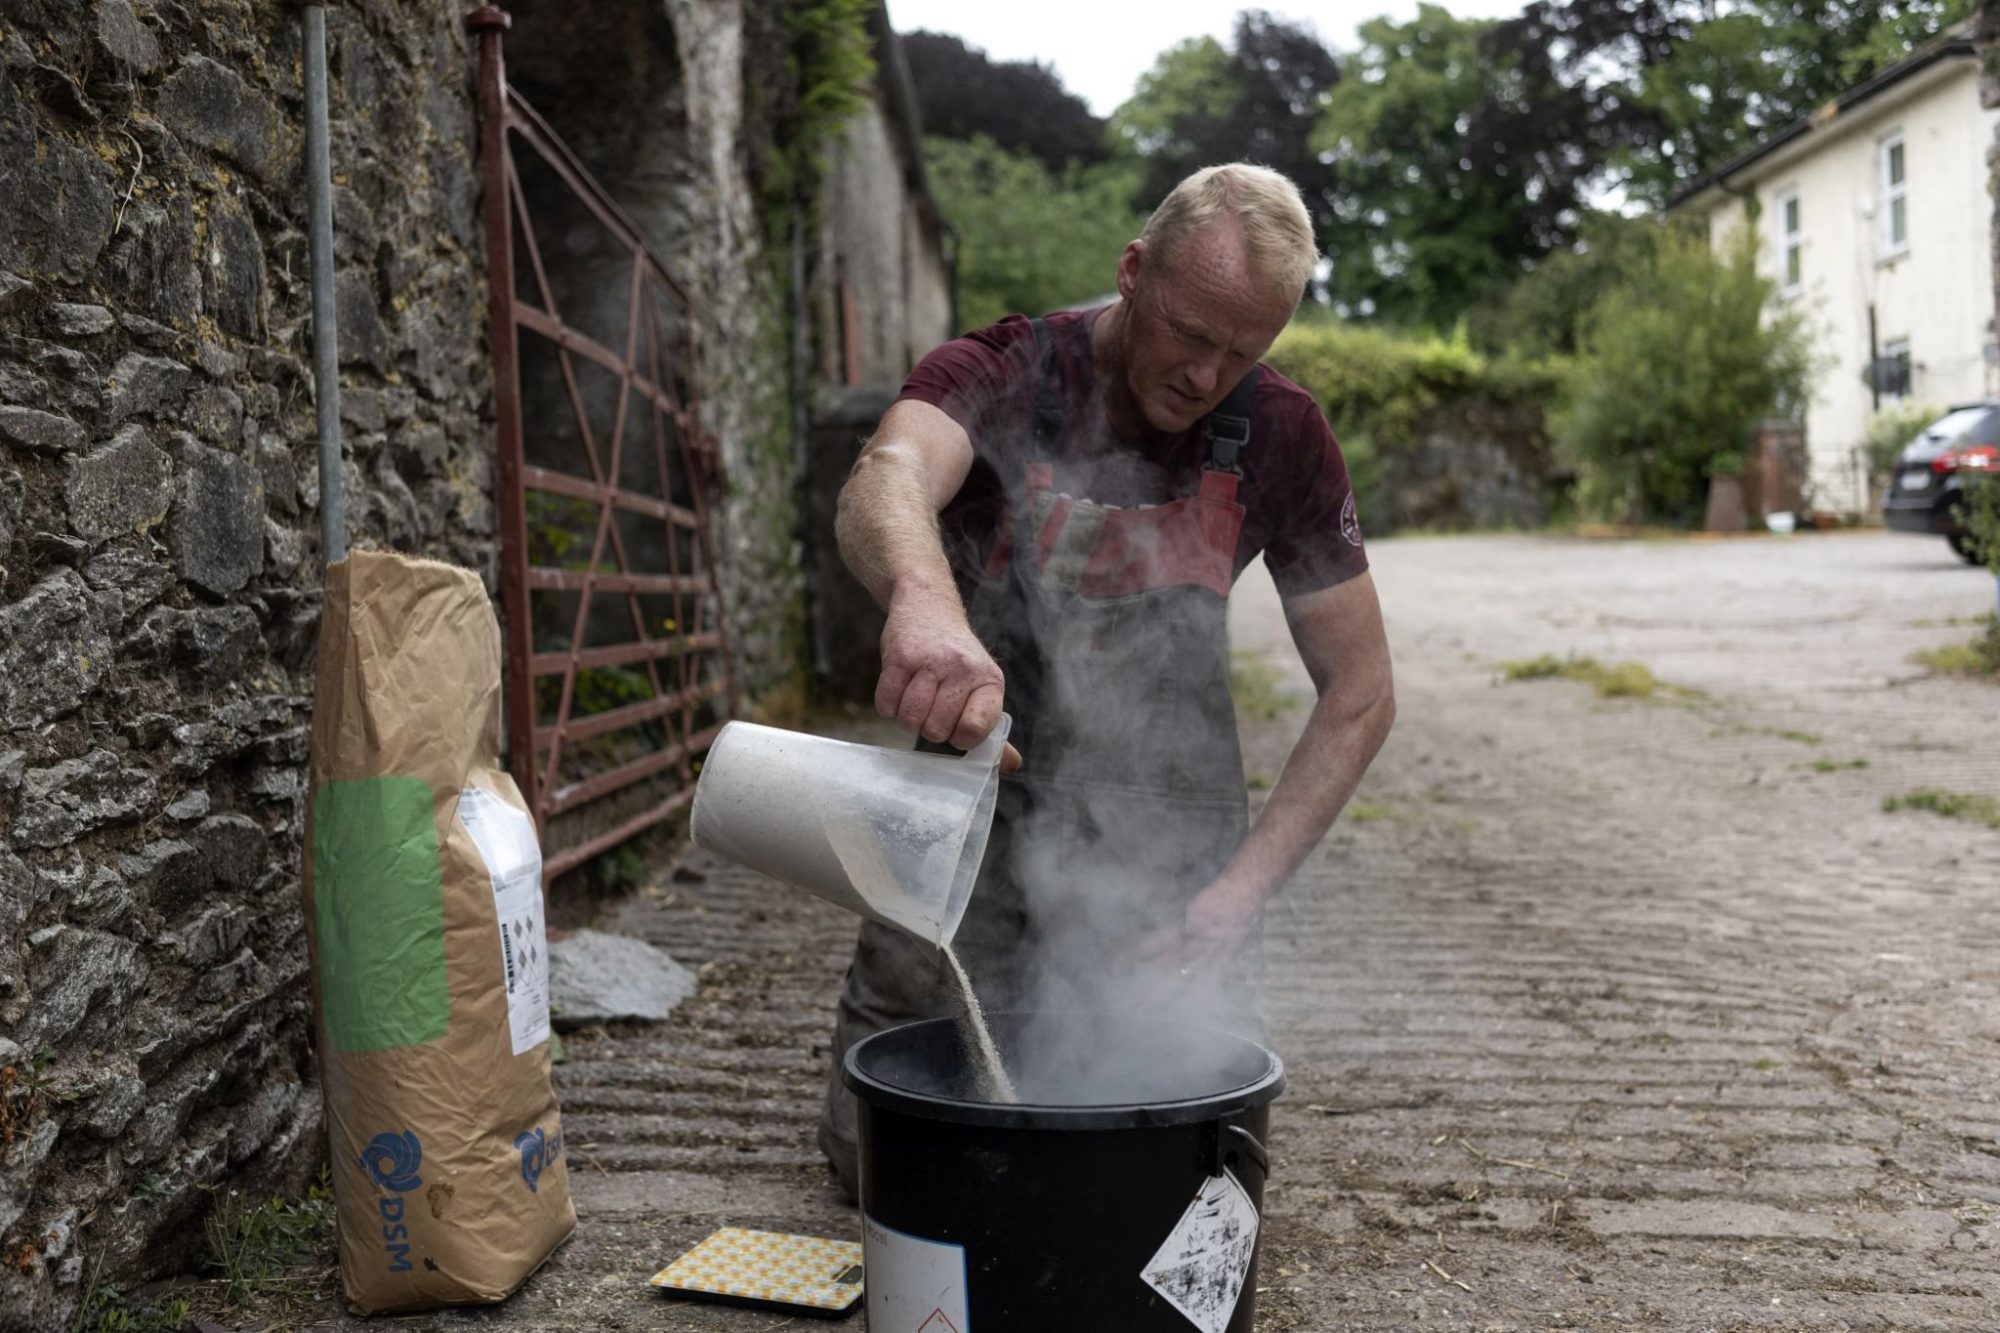
NewsSubscribe
First
Last
Consent

The Feedlot Already Knows: Your $1,400 Beef-on-Dairy Calf Is Telling On You

A 1,200-cow Wisconsin dairy banked every $1,400 calf cheque this spring — then pulled six months of records: 25% poor passive transfer, 0.75 kg/day ADG, 32% scours. The feedlot saw it first.

Executive Summary: Day-old beef-on-dairy bull calves are moving off US dairies at $1,350–$1,500 this spring — roughly $400–$600 above straight Holstein bulls per USDA-AMS weekly reporting — and that cheque is propping up margins while the North American heifer hangover drives replacement cost higher. But the same genetics are auditing calf programs in real time: Texas Tech Beef on Dairy Symposium data show crossbreds with scours lose roughly 21 lbs at weaning versus about 8 lbs for Holsteins, and a 0.75 kg/day pre-weaning ADG (vs. a realistic 1.05 kg target) leaves an 18-kg weaning-weight hole that costs the downstream chain $70–$87 per head in catch-up days alone. Stack treatment costs, extra days on feed, and a 10–20-point grid-discount hit on upper Choice and Prime, and the hidden bill runs $130–$225 per head — roughly $44,000 a year on 250 calves, $88,000 on 500. The dairy rarely sees it directly; it shows up as $50–$80 lighter bids the next auction, and USDA’s November 2024 ADT rule plus Source & Age Verification now make that reputation data permanent. Producers with under 40% of calves in “excellent” passive transfer (serum TP >6.2 g/dL, IgG >25 g/L per Lombard et al. 2020) or 60-day scours above 25% are funding elite genetics for someone else. The 30-day move is a serum-TP audit — Brix on every colostrum, blood on two days of calves a week — before the next SimAngus or terminal-sire order. If you can’t pull passive transfer, ADG split, and scours rate in one report by Monday, you don’t have a beef-on-dairy program — you have a hope.

Beef-on-dairy calf profit

Veterinarians working south-central Wisconsin’s mid-size dairies keep walking into the same story on farm after farm. What follows is a composite of three operations from one Upper Midwest practice — stitched together so no single farm is identifiable, but every number is a real number pulled from real records. On a 1,200-cow dairy in that group, day-old beef-on-dairy bull calves were moving off the property in the ,350–,500 range per head this spring, consistent with USDA-AMS weekly dairy calf and feeder cattle reporting showing beef-on-dairy day-old premiums running roughly 0–0 above straight Holstein bull calves through the first half of 2026. The milk cheque was thin. Beef-on-dairy revenue was doing the heavy lifting. “These crossbreds hardly ever get sick,” the owner told his vet.

Then they pulled six months of records. Passive transfer: 25% of calves in the “poor” category on serum total protein. Pre-weaning average daily gain on the beef-on-dairy calves: 0.75 kg/day — dead-even with his Holsteins. Scours treatments: 32% of calves hit at least once in the first 60 days. Every number he was proud of turned out to be a number he’d never actually pulled. That’s what beef-on-dairy does in 2026. It doesn’t just pay a premium. It audits your calf program whether you want it to or not.

The $1,400 Honeymoon Is Over

Beef semen on dairy cows isn’t a side hustle anymore. It’s a structural piece of the US dairy revenue model. NAAB year-end semen sales reports have tracked beef semen units sold for dairy use in the multi-million-unit range annually since 2021, and USDA reporting from 2022 onward has documented a steady climb in the share of US dairy cows bred to beef sires.

That’s the math that makes a $1,400 calf possible on the front step. And here’s the piece most dairies haven’t processed yet: the beef-on-dairy calf cheque is propping up margins because the North American heifer hangover — documented in USDA NASS January Cattle inventory reports and Rabobank Dairy Quarterly analysis through 2025 — is simultaneously driving replacement costs higher. You are more dependent on that crossbred revenue in 2026 than you were in 2023, not less.

When a Holstein bull calf was worth $200, sloppy colostrum was annoying. When he’s worth $1,400, the same sloppy colostrum is a direct hit to your second-largest revenue line. And the crossbreds themselves are unforgiving in a way Holsteins never were. Research presented through the Texas Tech Beef on Dairy Symposium series has reported that crossbred calves with scours lost roughly 21 lbs of weaning weight versus about 8 lbs for Holsteins hit with the same illness, a finding consistent with the Journal of Dairy Science work of Windeyer et al. (2014) on early-life disease effects on dairy calf weight gain. Higher ceiling. Steeper fall.

The herds most exposed aren’t the ones just starting out. They’re the ones that got comfortable. Mid-size dairies running beef-on-dairy for two or three seasons, still using colostrum and weaning protocols built for Holstein replacements, still weaning on a calendar instead of by starter intake. Those are the farms cashing calf cheques today and losing reputation battles in the feedlot six months from now.

How This Plays Out on Real Farms

On that 1,200-cow operation, the maternity routine hadn’t changed in a decade. Colostrum got fed “when we get to it.” Brix was measured sometimes. Serum total protein — the blood test that tells you whether the antibodies actually made it into the calf — was never pulled, ever. Scours treatments lived in a notebook in the vet’s truck, a pattern Ontario Veterinary College survey work has flagged as widespread: a large share of surveyed herds either don’t record individual calf treatments at all or record them in a format that can’t be analyzed after the fact.

The calf buyer had already noticed, even if the dairy hadn’t. Bids on the last two groups were running $50–$80 a head below what comparable neighbors with tighter calf numbers were getting out of the same auction barns that week. The owner blamed “the market.” The market wasn’t the problem.

The Hidden Bill, at a Glance

Loss CategoryEstimated Cost (per head)Root Cause
Direct treatment$20–$30Scours/BRD incidence
Additional days on feed$70–$105Poor weaning ADG / 21-lb weight gap
Carcass quality discount$40–$90Reduced marbling from early-life illness
Total value leak$130–$225Systemic management failure

Treatment-cost band draws on the Journal of Dairy Science calf-illness economic modeling published by Dubrovsky et al. (2020) and related USDA-ARS work. Days-on-feed costs assume Iowa State Extension’s 2024–2025 Ag Decision Maker custom calf-feeding and yardage surveys, which reported total daily cost of gain in the $3.00–$4.00/day range. The grid-discount band assumes upper Choice and Prime premiums in the $20–$35/cwt range reported through USDA AMS LM_CT155 National Weekly Direct Slaughter Cattle — Premiums and Discounts during 2024–2025.

On a 250-calf operation, the midpoint of that table is roughly $44,000 a year; on 500 beef-on-dairy calves, it’s roughly $88,000. The awkward part? The dairy never sees most of it directly. The feedlot eats the extra days on feed. The packer eats the lighter, lower-grading carcass. You get a $50–$80 lighter bid next round, tell yourself the buyers got cheap, and lose next year’s bid the same way.

Colostrum to Carcass: Where the 0.75 kg/day Gap Actually Costs You

Three things separate herds banking the beef-on-dairy premium from herds quietly leaking it, and none of them live on a genomic test.

Passive transfer is the foundation. USDA NAHMS Dairy 2014 found a substantial share of preweaned heifer calves failed to achieve adequate passive transfer, and Lombard et al. (2020) in the Journal of Dairy Science has since reclassified the targets. Calves with failed passive transfer carry 1.5–2× the risk of diarrhea and pneumonia. Industry guidelines used by Penn State Extension’s CalfCare program, Michigan State Extension, and the Dairy Calf & Heifer Association Gold Standards III now aim for at least 40% of calves in the “excellent” bucket — serum total protein above 6.2 g/dL, IgG above 25 g/L. Plenty of farms running “good Brix” colostrum still have 30–40% of calves sitting in fair or poor when you actually pull blood. Brix tells you about the liquid. Serum TP tells you whether the calf got what you think you gave her.

Passive Transfer CategorySerum TP (g/dL)IgG (g/L)Disease Risk vs Excellent% Farms Hitting 40%+ “Excellent” Target
Excellent>6.2>25Baseline<50% of US herds
Good5.8–6.218–251.2–1.4×Target threshold
Fair5.1–5.710–171.5–1.8×⚠ Common default
Poor<5.1<102.0–2.5×25% of article herd calves

Starter, not milk, drives weaning weight. The Quigley and Drackley line of Journal of Dairy Science research — Drackley (2008) and the Quigley starter-intake series — has shown for two decades that age at first starter intake and starter consumed by 21–28 days are among the strongest predictors of weaning weight. Elite beef-on-dairy programs target 0.9–1.1 kg/day pre-weaning ADG — realistic when calves are eating 0.3–0.5 kg/day of starter by the end of week three and pushing past 1.5 kg/day before the milk comes off.

Here’s what that gap actually costs. If your calves are gaining 0.75 kg/day instead of 1.05 kg/day, the weaning-weight gap over 60 days is (1.05 − 0.75) × 60 = 18 kg. At yardage and feed costs of $3.50/day, that 18-kg deficit takes roughly 20–25 days to close in the feedlot, costing the chain about $70 to $87 in catch-up time alone.

At yardage and feed costs of $3.50/day$3.50/day, that 18 kg deficit takes roughly 20–25 days to close in the feedlot, costing the chain about $70$70 to $87$87 in catch-up time alone. That recovery window assumes typical beef-on-dairy compensatory gain rates reported in Ohio State’s beef × Holstein vs straight Holstein feedlot work (Fluharty et al. and the subsequent OSU beef-on-dairy feedlot study series). The carcass side makes it worse. Ohio State’s growth-performance and carcass-traits data showed measurable advantages for crossbreds on gain, feed efficiency, and carcass value — but those advantages erode when calves arrive with poor early growth or lingering respiratory damage. Penn State extension work on bovine respiratory disease and lung consolidation has linked early BRD to reduced marbling and lower quality-grade outcomes. Lose 10–20 percentage points of calves out of upper Choice and Prime at current grid spreads and the expected-value hit across the lot runs roughly $40–$90 per head. Your day-old cheque looked the same. Your actual value to the chain did not.

The feedback loop is the permanent one. A feedlot typically needs one turn of your calves — 6 to 12 months — to decide whether you’re what your marketing said. They see arrival treatments, gain in the first 60–90 days, then the close-out at harvest. Feeder-cattle research out of Kansas State (Schroeder et al.), UW-Madison, and Superior Livestock tele-auction price analyses has shown consistently that buyers discount negative reputations faster than they reward positive ones — and they rarely tell sellers why.

Why Feedlots Remember — and How EID Makes It Permanent

The reputation problem isn’t anecdotal anymore. It’s digital.

USDA’s Animal Disease Traceability final rule, which made electronic identification mandatory for breeding cattle and bison moving interstate effective November 2024, has accelerated what commercial feedyards were already doing: matching arrival health, gain in the first 60–90 days, and carcass close-out data back to the source dairy through EID tags and lot paperwork. Source and Age Verification programs under USDA Process Verified Programs and equivalent certifications have made those audit trails saleable. A feedlot’s “problem lot” database used to live in a yard manager’s head. It now lives in a database with your farm name next to it.

You don’t get blacklisted with a phone call. You get blacklisted with a quieter bid and a skipped auction. By the time you notice the pattern, the data upstream has already decided for the buyers.

MetricWhat the Dairy ThinksWhat the Feedlot RecordsData Now Permanent Since
Passive transfer rate“We feed 4L colostrum”25% of calves in “poor” categoryNov 2024 (USDA ADT rule)
Pre-wean ADG“Crossbreds are growing great”0.75 kg/day — at Holstein floorPer-lot EID arrival data
60-day scours rate“We treat when needed”32% treated ≥ onceSource & Age Verification PVP
Calf health reputation“Buyers just got cheap”$50–$80/head bid discountLot history, digital & permanent
Carcass outcome“Not our problem after sale”10–20pt upper Choice/Prime lossUSDA AMS LM_CT155 grid data
Feedlot feedback“Nobody tells us anything”One turn = permanent source scoreKansas State/UW-Madison buyer research

How Much Is a 0.75 kg/day ADG Really Costing You?

Run the numbers on your own herd and the answer isn’t a rounding error. At 0.75 kg/day instead of 0.95–1.1 kg/day, you’re 15–20 kg light at weaning before you factor any post-weaning slump. Against 2026 calf values of $1,350–$1,500, the leak table above puts $130–$225 of value per calf at risk — a meaningful share of the premium the market is currently paying you for crossbred genetics. That math stays ugly whether corn is $4 or $5.

Is Your Calf Program Ready for $1,400 Genetics?

Beef-on-dairy calves were built to outperform. That’s why buyers pay for them. But the outperformance is conditional — on colostrum that actually gets into the calf, on starter that actually gets eaten, on weaning decisions that respect what the rumen is doing rather than what the calendar says.

The honest question isn’t whether your genetics rep sold you the right bull. It’s whether your maternity pen, your colostrum bucket, and your starter pail are holding up their end. A 25% “poor” passive transfer rate on a $200 Holstein bull calf was a rounding error. The same 25% on a $1,400 crossbred is a different conversation, and it’s one the feedlot is already having about you — just not with you.

Options and Trade-Offs for Producers

PathCore ActionTimelineCostRisk if IgnoredKey Metric
1 — Colostrum AuditBrix + serum TP protocol30 daysLow (~$3–8/calf)Continued value leak≥40% calves in “Excellent”
2 — Wean by Starter1.5 kg/day intake threshold60–90 daysLow (extra MR on slow calves)18-kg weaning-wt holeStarter intake Week 3–4
3 — Segment Breeding30–40% sexed dairy, 50–60% beefOngoingMedium (genomic testing)⚠ Heifer shortage by 2028Replacement rate vs cull rate
4 — Feedlot FeedbackAnnual data debrief with buyerAnnualNone (relationship cost)Permanent reputation damageArrival health + carcass grades

Path 1 — The “Stop Lying to Yourself” Colostrum Audit (do this within 30 days)

When it fits: any herd that can’t tell you, off the top of its head, the percentage of calves sitting in “excellent” passive transfer.

What it requires: Brix on every first-milking colostrum, a written SOP for volume and timing (4 L within 2 hours of birth, no exceptions), and a rolling serum TP check on a sample of calves at 24–48 hours of age. Pull blood on every calf born across two days a week and run the panel.

Risk and limit: it surfaces problems fast, which means someone has to own the fix. The refractometer is useless if nobody changes what happens between the cow and the calf.

Path 2 — Wean by Starter Intake, Not by Calendar

When it fits: any dairy still pulling milk on a fixed calendar — 42 days, 56 days — regardless of what calves are actually eating.

What it requires: starter in front of calves by day 3–4, buckets dumped and refreshed daily, and a simple rule the barn team can live by: no full milk removal until calves are eating roughly 1.5 kg/day of starter for three consecutive days.

Risk and limit: you’ll extend the milk window on some calves, which costs a few dollars in milk replacer per head in the short run. On $1,400 calves, that’s a bargain.

Path 3 — Segment Your Breeding Instead of Blanket-Beefing It

When it fits: herds using beef semen as a dumping ground for every “low” cow without a genomic plan behind the decision.

What it requires: a genomic framework that puts sexed dairy on roughly the top 30–40% of cows and beef on the bottom 50–60%, with clear calving-ease rules for heifers. Using Angus on first-calf heifers and reserving terminal breeds (Simmental, Charolais, Limousin) for mature cows isn’t a style choice — it’s dystocia management. Watch replacement inventory hard; the heifer hangover reshaping 2026 breeding plans came from over-beefing two and three years ago.

Risk and limit: if your replacement math is off, you’ll fix your calf revenue and break your cow supply at the same time.

Path 4 — Close the Feedlot Feedback Loop

When it fits: any dairy selling more than a truckload of beef-on-dairy calves a year and getting no carcass data back.

What it requires: one structured annual debrief with your primary calf buyer or receiving feedlot — arrival health, gain in the first 60 days, days on feed, carcass weights, grades. EID tagging at birth and BVD-PI ear-notching remove two of the biggest buyer objections at once.

Risk and limit: some buyers won’t share numbers. Sell to the ones who will. The data is worth more than a $20/head bid bump from someone who treats your calves as a black box.

Key Takeaways

  • If fewer than 40% of your last 30 calves land in “excellent” passive transfer on serum TP, your colostrum program is your first problem — regardless of what Brix says on the bucket.
  • If your beef-on-dairy pre-weaning ADG isn’t clearly ahead of your Holstein ADG, stop blaming genetics. The crossbreds give you a higher ceiling; management is what’s pinning you to the Holstein floor.
  • If your 60-day scours treatment rate is above 25%, treat it as a five-alarm fire. In the Texas Tech Beef on Dairy Symposium dataset, every case costs roughly triple the weaning-weight penalty a Holstein pays.
  • If your starter buckets are dusty, caked, or sorted tomorrow morning, your calves aren’t eating enough to hit elite ADG — no matter what the bag label promises.
  • If you’re still weaning on a calendar, switch to a 1.5 kg/day starter-intake threshold for three consecutive days before full milk removal.
  • If your primary calf buyer won’t share arrival health, days on feed, or carcass data once a year, assume the worst about how your calves are actually performing — and find a buyer who will.
  • If you can’t pull passive transfer, pre-weaning ADG split, and scours treatment percentage in the same report by next Monday, you don’t have a beef-on-dairy program. You have a hope.

Your Next Step

Don’t order your next batch of SimAngus or terminal-sire semen until you’ve audited your serum total protein.If you’re under 40% “excellent,” you aren’t ready for elite genetics — you’re funding them for someone else.

This week, put a refractometer, a serum TP kit, and a scale in the calf pens. Pull two days of blood and one week of starter intakes. Then decide whether your calf program deserves your breeding program.

Somewhere downstream, a feedlot is already building a picture of your calves from data you don’t see. The only move that fixes that is deciding to see it first. The week-by-week starter curve and the full colostrum-to-carcass cost model live in Bullvine Weekly and the next Tier 2 playbook — that’s the piece to read before your next sire order.

Run Your Numbers

Calf Feed ROI Tool — Before you pull another $50 off the calf program, run your colostrum, starter, and pre-weaning ADG through the Calf Feed ROI Tool and see whether the cheaper plan is actually funding that $1,400 crossbred — or quietly draining it.

Complete references and supporting documentation are available upon request by contacting the editorial team at editor@thebullvine.com.

Learn More

  • The $3,000 Heifer Hangover: How Beef-on-Dairy Emptied Your Pipeline and Left the U.S. 800,000 Head Short— Secure your 2027 herd capacity by exposing the 800,000-head replacement deficit currently hidden in national inventory data. Arms you with market intelligence to navigate $3,000 price tags before the supply window slams shut.
  • Beef-on-Dairy’s $6,215 Secret: Why 72% of Herds Are Playing It Wrong — Capture your share of the $6,215 monthly performance gap by revealing the reproductive guardrails top earners use. Delivers a blueprint for matching beef semen deployment to specific pregnancy rate tiers and genetic markers.
  • Boosting Dairy Farm Profits: Using Embryo Transfer and Male-Sexed Beef Semen — Accelerate genetic progress by dismantling the cost barriers of embryo transfer and male-sexed beef semen. Illustrates how leveraging hybrid vigor generates up to 200% higher premiums for your crossbred day-old calves.

The Sunday Read Dairy Professionals Don’t Skip.

Every week, thousands of producers, breeders, and industry insiders open Bullvine Weekly for genetics insights, market shifts, and profit strategies they won’t find anywhere else. One email. Five minutes. Smarter decisions all week.
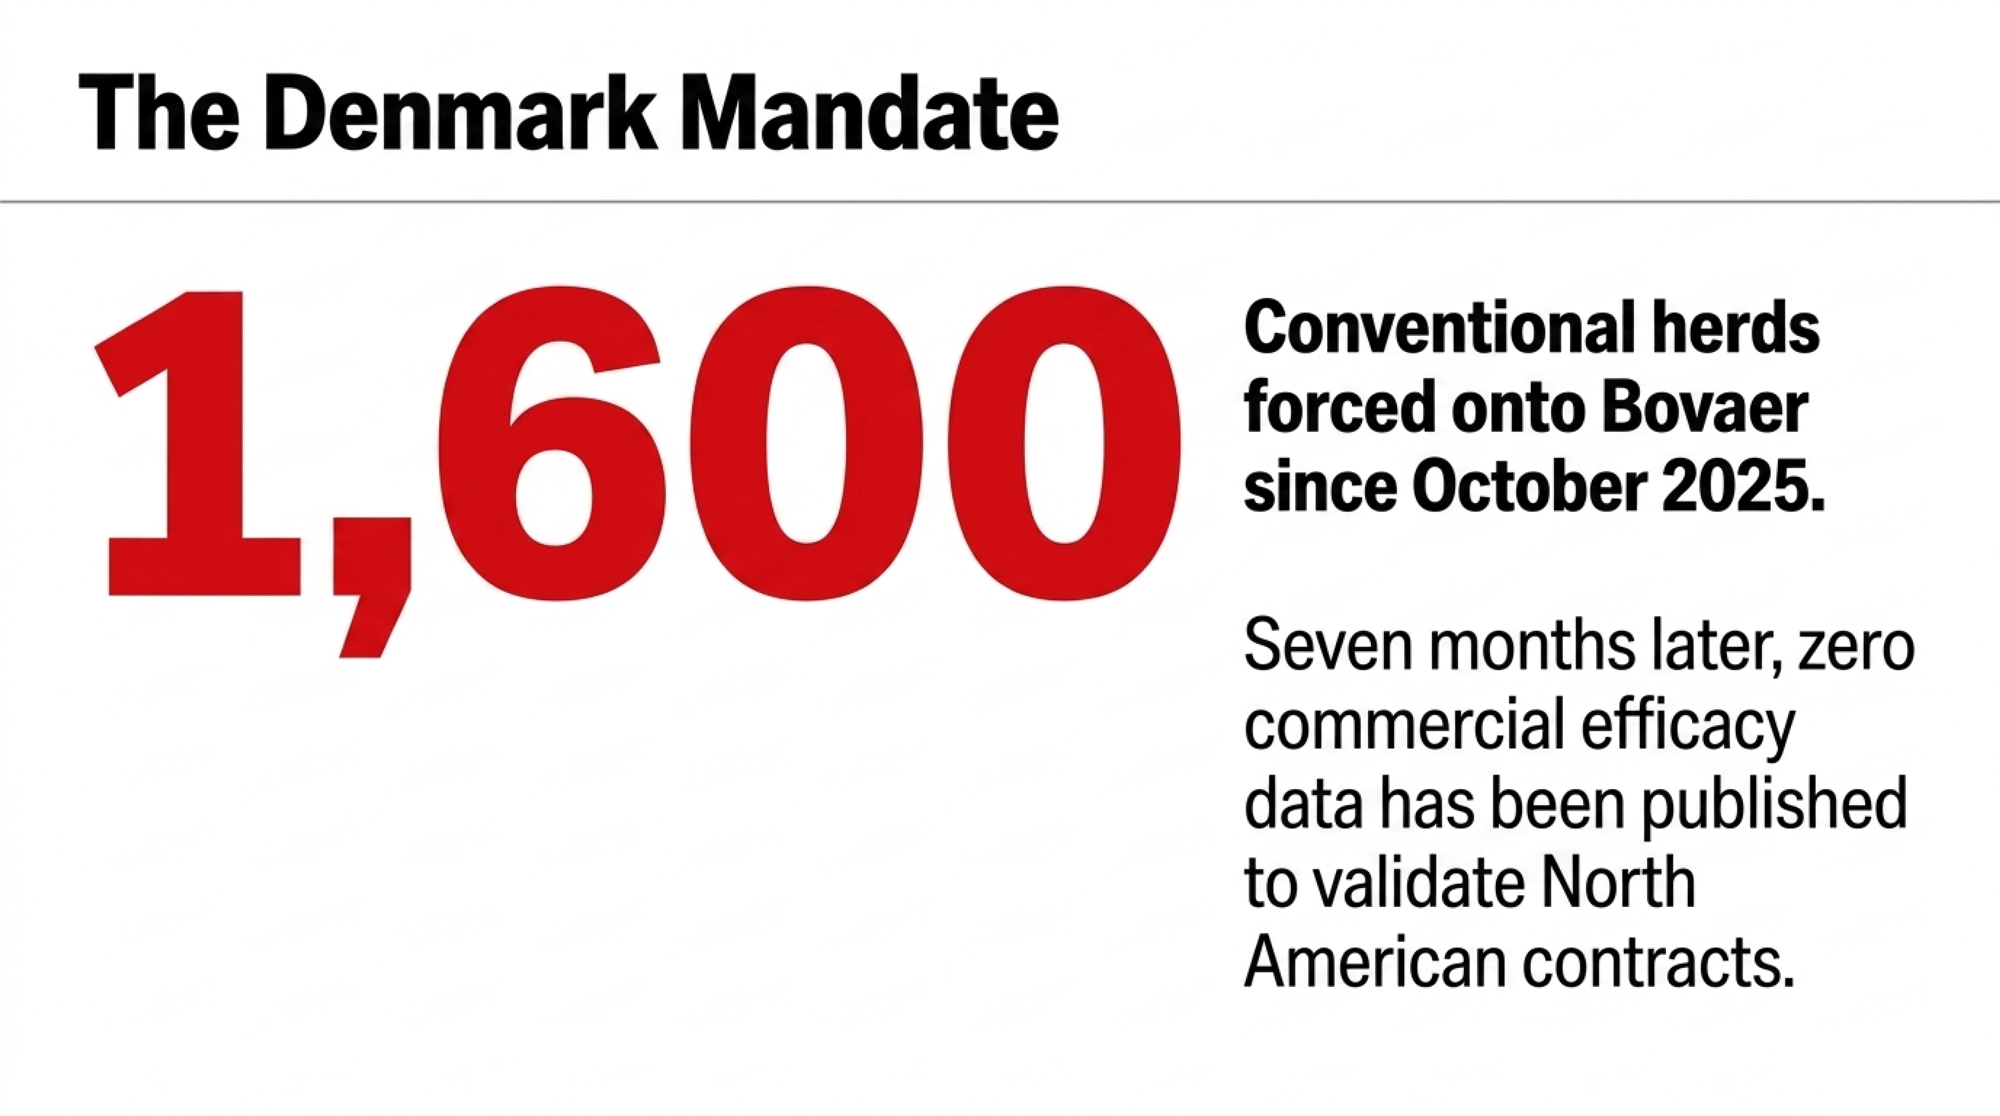
NewsSubscribe
First
Last
Consent

The $221,760 Corridor Trap Hitting 600‑Cow Upper Midwest Dairies in 2026

Same cows. Same management. A different corridor — and a $221,760 annual drag. Basis went from ‑$0.35 to ‑$0.85/cwt while the FMMO make‑allowance took another $0.92 off Class III. The herd report still looks clean.

On a 600‑cow Upper Midwest dairy we’ll call Maple Ridge, the all‑in basis on the milk check has moved from roughly ‑$0.35/cwt in 2024 to about ‑$0.85/cwt in early 2026. Same cows. Same management. A different corridor.

USDA ERS’s April 2026 Livestock, Dairy, and Poultry Outlook puts 2026 all‑milk near $20.40–$20.50/cwt, while CME Class III futures for mid‑2026 contracts have traded mostly in the mid‑$16s to upper‑$17s through early Q2 2026 sessions. That $2–$3/cwt gap is the budget anchor argument every dairy lender is now having. Maple Ridge’s gap isn’t on the screen. It’s on the milk check.

Maple Ridge is a composite operation drawn from Bullvine reporting and the Processing Paradox 2024–2026 dataset, used here so we can show real numbers without exposing a real farm’s milk check. The rule‑change inputs are verified against published USDA and Bullvine analysis. The herd‑level inputs are illustrative. Plug in your own.

A 2,000‑cow Western dairy we’ll call Dos Arroyos — also a composite, modeled on the kind of core‑supply contracts Bullvine has documented along the High Plains and I‑29 corridor — is staring at the same kind of basis pressure and adding 400 cows anyway. The processing capacity dairy 2026 question lives right in the gap between those two decisions.

This isn’t a story about milk per cow. It’s about whether your region’s plants want your next pound or not.

Bullvine Definition — Corridor Math (n.): The calculation of farm profitability based on regional processing capacity, hauling distance to marginal plants, and local basis, rather than national Class III averages. Two farms with identical herd reports can sit on opposite ends of Corridor Math if their plants, hauling lanes, and basis trends diverge.

Quick note for Ontario and Canadian readers: Corridor Math applies under supply management too. The levers change — base allocation, P5 pooling, plant access, CDC pricing signals — but the question is the same: does your buyer’s plant want your next hectolitre, and at what net mailbox price?

How Maple Ridge’s $221,760 Annual Drag Hid Inside a Clean Herd Report

Maple Ridge ships into a cheese‑heavy Upper Midwest milkshed inside Federal Order 30. Components are solid, somatic cell count is low, and debt per cow sits under the $3,500/cow “strong” threshold cited in Cornell PRO‑DAIRY Dairy Farm Business Summary–style benchmarks referenced in the Processing Paradox analysis (Cornell PRO‑DAIRY DFBS, 2024 edition). By the herd report, nothing’s wrong.

The corridor changed around them.

  • Bullvine’s Processing Paradox reporting — drawing on USDA AMS Dairy Market News and operator public statements — documented reduced weekend and overtime processing at several Upper Midwest cheese plants through 2024–2025, alongside tighter volume caps and base‑excess plan use. Operators cited labor and energy costs.
  • Regional herd consolidation in the same buyer’s draw radius tightened the local milk‑to‑capacity ratio over 2024, consistent with the relocation and consolidation patterns Bullvine has documented along the I‑29 corridor.
  • USDA AMS Dairy Market News reported Midwest spot Class III milk trading flat to as much as $7.00 under Class III during the spring 2025 flush cycle, with the deepest discounts in the week ending May 2, 2025 (USDA AMS DMN, April–May 2025 weekly issues).

Stack those forces and a 50¢/cwt basis slide isn’t a mystery. It’s the price tag on a corridor that quietly went long on milk.

The 2025 FMMO modernization sits on top of all this. Bullvine’s April 2026 analysis, The New FMMO Rule Costs a 500‑Cow Dairy $97,750 a Year, pegs the make‑allowance update at roughly $0.85–$0.93/cwt off Class II–IV values once fully phased in, with Class III near $0.92/cwt, based on USDA AMS, Final Rule on Amendments to Federal Milk Marketing Orders (January 2025) and the University of Wisconsin Extension review of the AMS final decision (2025). That’s before a single mile of freight. Before basis. Before a balancing fee.

Deep Dive → The New FMMO Rule Costs a 500‑Cow Dairy $97,750 a Year — Tier 3 pillar, April 2026.

What Does a 50¢/cwt Basis Slide Actually Cost a 600‑Cow Dairy in 2026?

This is where you stop talking corridors and run the numbers like your banker would.

The Maple Ridge 2026 Reality — 600 Cows, Upper Midwest, Illustrative Composite

Factor2024 Impact (per cwt)2026 Impact (per cwt)Annual Bottom‑Line Shift vs 2024
FMMO Make‑Allowance$0.00(‑$0.92)(‑$132,480)
Regional Basis(‑$0.35)(‑$0.85)(‑$72,000) on the 50¢/cwt move
Marginal Hauling (weighted)*$0.00(‑$0.12)(‑$17,280)
Total Drag vs 2024 Baseline(‑$0.35)(‑$1.89)(‑$221,760)

Weighted across marginal loads, assuming ~30% of volume moves as overflow at an extra $0.40/cwt above the $0.80/cwt core rate documented in the Processing Paradox dataset. At a 15% marginal share, the hauling line is closer to ‑$0.06/cwt, or about ‑$8,640/year.

How to read this table: The Regional Basis line shows the delta vs 2024 — the 50¢/cwt move, not the full 2026 basis cost. The Total Drag row sums the 2026 deltas against that 2024 baseline.

Running the Numbers — Maple Ridge, 600 Cows, Upper Midwest, 2024 vs 2026 (illustrative composite)

Verified inputs: USDA NASS Milk Production 2025 annual production averages; USDA AMS Final Rule on Amendments to FMMOs (January 2025); UW Extension AMS final‑decision review (2025); Bullvine April 2026 New FMMO Rule analysis; Bullvine Processing Paradox 2024–2026 dataset. Illustrative inputs: Maple Ridge’s herd‑level basis trend, marginal‑load share, and hauling differential. Plug in your own numbers and your own statements.

  • Herd: 600 milking cows, Upper Midwest, manufacturing‑heavy FMMO.
  • Production: ~24,000 lb/cow/year, in line with the 24,390 lb 2025 U.S. average from USDA NASS Milk Production (2025).
  • Annual shipped: 600 × 24,000 lb = 14.4 million lb = 144,000 cwt/year.

Industry rule‑change impact: 144,000 cwt × $0.92/cwt FMMO Class III hit = ~$132,480/year.

Corridor basis impact: $0.50/cwt move × 144,000 cwt = ~$72,000/year.

Marginal hauling drift (illustrative scenarios):

  • Scenario A — 15% marginal: 144,000 × 0.15 × $0.40 = ~$8,640/year.
  • Scenario B — 30% marginal: 144,000 × 0.30 × $0.40 = ~$17,280/year.

Combined drag range: ~$213,000–$222,000/year, against an operation that hasn’t changed cows, ration, or management since 2023.

Scale the basis‑only piece to your herd:

  • 400 cows shipping ~96,000 cwt: 50¢/cwt basis move = ~$48,000/year.
  • 1,000 cows shipping ~240,000 cwt: same move = ~$120,000/year.

The herd report didn’t flinch. The mailbox check did. That’s the gap most barn KPIs aren’t built to catch.

The Continental Divide: Rationing Space vs Pre‑Selling It

While the Upper Midwest is rationing space, the High Plains is pre‑selling it. The difference isn’t the cows. It’s the contract.

FactorMaple Ridge (Upper Midwest)Dos Arroyos (High Plains/I-29)
Herd size600 cows2,000 cows (+ 400 planned)
Federal OrderFO-30 (cheese-heavy)High Plains / non-pooled
2026 All-in Basis-$0.85/cwt~-$0.35/cwt (core supply)
FMMO Class III impact-$0.92/cwt (2025 rule)-$0.92/cwt (same rule)
Marginal hauling (overflow)$1.10–$1.20/cwt<$0.80/cwt within 60 mi
Plant capacity statusRationing / base-excessPre-sold / volume ramp
Core supply statusSwing/dispensableWritten core-supply contract
Total 2026 annual drag vs 2024-$221,760Largely offset by contract premiums
Robot/capex DSCR (corridor case)1.05–1.10× (yellow light)>1.25× (green)
Strategic pathPivot, exit, or repositionScale with concrete
Regional farm count trend-630 farms, 2022–2025Expansion corridor

Most producers can name the bull behind their best heifer. Few can name the closest plant project in their draw radius. Dos Arroyos can.

Their state, by the headline numbers in Processing Paradox 2024–2026 (USDA NASS state‑level Milk Production, 2014 vs 2024), looks bad. New Mexico shed roughly 2.2 billion pounds of annual milk and about 83,000 cows over that decade. California gave back more than 2.0 billion pounds and around 72,000 cows. The Ogallala Aquifer projection — up to 70% of the aquifer’s saturated thickness potentially unusable in the Texas Panhandle expansion zone within 20 years, per the Texas Tech and USGS‑linked aquifer research cited in Processing Paradox — isn’t a footnote.

Their corridor still tells a different story.

Dos Arroyos isn’t ahead because they’re better farmers. They’re ahead because they bought Processing Security in writing before they bought concrete. The era of producing milk and hoping for a check is over inside their basin.

The corridor’s public cheese build‑out — Hilmar (Lubbock, TX project announced 2021), Leprino (Lubbock, TX complex announced 2022), and Valley Queen (Milbank, SD expansion announced 2022) — sets the public context, per each operator’s project announcements and Processing Paradox.

The contract terms described below are a Bullvine composite of corridor practice, drawn from Processing Paradox. They are not attributable to Hilmar, Leprino, Valley Queen, or any other named processor.

  • Dos Arroyos’s milk feeds into the $1.6 billion High Plains and I‑29 cheese build‑out underway since 2020.
  • Their 2025 supply agreement, as composited from Processing Paradox, carries defined base‑excess terms, component premiums tied to plant product mix, and a written volume ramp.
  • That ramp is what makes the 400‑cow expansion pencil. In the composite, throughput is committed in writing before concrete is poured. The base‑excess clause prices growth pounds inside core‑supply terms for the duration of the ramp, not at swing‑load discounts.
  • Their marginal load travels under 60 miles to a plant still bidding for volume, not rationing it.

The assumption that “Western dairy is doomed” doesn’t survive a corridor‑level read. The assumption that Upper Midwest dairy is structurally safe because it’s always been there doesn’t either. The Upper Midwest lost roughly 630 farms between 2022 and 2025 while regional milk climbed to 43.2 billion pounds (Bullvine Processing Paradox, drawing on USDA NASS, 2024–2026). The volume stayed. The mid‑size families didn’t.

Must‑Read → The $11 Billion Dairy Rush: Growth Corridor or Dead Zone? — Tier 3 hidden gem.

Why Maple Ridge’s Owner Stopped Trusting the Old Lender Spreadsheet

The turn for Maple Ridge came in early 2026, in a robotic milking conversation with a regional ag lender.

The opening was familiar. Rolling 12‑month averages. A USDA‑style price near $20.40/cwt for 2026, pulled from ERS and WASDE ranges. A generic stress test at $15/cwt with a flat ‑$0.25/cwt basis. Ag operating loans in the mid‑7% range, consistent with the lender environment Federal Reserve district and Purdue Center for Commercial Agriculture outlooks have tracked through late 2025 and into early 2026.

On those numbers, robots penciled.

Maple Ridge’s owner put three different numbers on the table.

  • A real trailing 24‑month all‑in basis: ‑$0.85/cwt, not ‑$0.25/cwt.
  • Marginal hauling reality from this composite operator’s dispatch profile: about $1.10–$1.20/cwt on overflow loads, versus the $0.80/cwt core rate documented across Processing Paradox herds.
  • Post‑FMMO Class III math reflecting the ~$0.92/cwt make‑allowance hit per the UW Extension review and the Bullvine April 2026 analysis, instead of pre‑2025 class values.

Bullvine’s 2025–2026 lender reporting describes the same pattern in plainer terms. The binding constraint isn’t a lower headline price. It’s a lower effective floor once basis, hauling, and post‑FMMO Class values are layered in.

A robotic milking project at this herd profile typically carries roughly $360,000/year in annual debt service on the parlor and related infrastructure portion of the loan, drawn from Bullvine’s prior reporting on robotic ROI in the 300–600 cow range and standard amortization on 7%‑range term money. Re‑run with the corridor inputs above against that debt service, the project moved from comfortably above 1.25× DSCR into the 1.05–1.10× range under a $15/cwt corridor stress case — the “yellow light” zone Cornell DFBS‑style benchmarks (referenced in Processing Paradox) flag for tighter scrutiny.

The DSCR shift is illustrative. The inputs that drove it are real: the basis trend, the marginal hauling, the post‑FMMO Class values, and the debt service.

The robots didn’t become impossible. They became a different decision.

The question is no longer “how do we squeeze more milk out of this barn.” It’s “do we want to leverage 7%‑range money against a corridor that’s losing capacity, or use that equity to reposition?”

Deep Dive → Dairy Lending 2026: Why Your Banker Says No at 7% Money — prior Tier 3 economics analysis.

What Maple Ridge’s 24‑Month Basis Trend Means For Your Operation

Maple Ridge’s herd report stayed clean while its corridor quietly repriced every cwt. That’s the lesson worth carrying off this page: cost per cwt and milk per cow defend the milk check only as far as your buyer’s plant has room for your next pound. Corridor structure decides how much of any cost or component advantage you actually keep.

There are three honest paths from here, and you don’t get to skip the diagnosis to pick one.

  • Scale with a processor. Real only if your buyer puts core‑supply status, base terms, and component premiums in writing, and your corridor‑aware DSCR holds.
  • Pivot to a premium or niche channel. Smaller volume, higher complexity, slower onboarding, but partial escape from commodity basis.
  • Plan an orderly exit or relocation. Preserves equity in a structurally bad basin; forecloses generational continuity in the existing barn.

The trade‑off underneath all three: speed of decision versus depth of corridor diagnosis. Move too fast and you lock in the wrong path. Stall and the basis keeps deciding for you.

The 30/90/365‑Day Playbook for Herds Like Maple Ridge’s

Adapt the thresholds to your own statements and your own basin. Don’t copy them.

30‑Day Actions — urgent checks

  • Pull 24 months of milk checks and graph all‑in basis: mailbox − announced price, including hauling and any “marketing” or “balancing” adjustments.
    • Requires: bookkeeping time, statements, a spreadsheet.
    • Red‑flag trigger: basis widened by more than 25¢/cwt over 18 months without a corresponding national price move.
    • Backfire risk: averaging across very different months hides flush‑season pain. Look at flush separately.
  • Separate loads into core versus marginal. Calculate actual hauling cost per cwt on overflow loads.
    • Requires: dispatch tickets, co‑op statements, an hour of cross‑checking.
    • Red‑flag trigger: marginal‑load hauling 50% or more above your core rate.
    • Watch for: milk‑check formats that combine freight with basis or place it under “other,” making marginal hauling hard to isolate.
  • Confront your field rep with three direct questions, on the record. Are we core, swing, or dispensable supply over the next 5–10 years? Where do our marginal loads physically go, and at what discount, when milk is long? What plant additions or closures are in your 3–5‑year network plan?
    • Requires: one meeting, no spin in your own answers.
    • Red‑flag trigger: vague answers or “we’ll get back to you” on all three.
  • Escalate if your DSCR has been under 1.20× for three straight months on your lender’s or CPA’s standard method. This list moves to the top of the next 30 days.

90‑Day Actions — structural adjustments

InputStandard Lender ModelCorridor-Aware ModelDifference
All-milk price used$20.40–$20.50/cwt (USDA ERS 2026)$15.00/cwt (corridor floor)-$5.40–$5.50/cwt
Basis assumption-$0.25/cwt (generic flat)-$0.85/cwt (trailing 24-month actual)-$0.60/cwt
FMMO Class III valuesPre-2025 class valuesPost-rule: -$0.92/cwt make-allowance-$0.92/cwt
Marginal hauling %0% (core rate only)15–30% of volume at overflow rate+$0.06–$0.12/cwt
Effective floor (combined)~$20.15/cwt~$13.71/cwt-$6.44/cwt
Robot project DSCR result>1.25× ✓ (pencils)1.05–1.10× ✗ (yellow light)Crosses freeze threshold
Capex decisionProceedFreeze or resizeMaterial divergence
Risk to lender if national model usedLow (on paper)High (basis keeps widening)Model blind spot
  • Force a corridor‑aware stress test at your bank. Two scenarios, side by side.
    • National case: USDA‑style all‑milk price, flat basis, generic hauling.
    • Corridor case: post‑FMMO Class values reflecting the 2025 make‑allowance changes (per the UW Extension review and Bullvine’s April 2026 analysis), your trailing 12–24‑month basis minus another 25–50¢/cwt, and marginal‑load hauling on at least 15–30% of volume.
    • Requires: milk check history, dispatch records, current contract, lender model.
    • Threshold: corridor‑case DSCR below 1.20× should freeze any non‑essential capital project.
    • Backfire risk: if a lender won’t run the corridor case alongside the national case, factor that into your read of how flexible the relationship is likely to be when margins tighten.
  • Pressure‑test a “minus 10–15% intake” scenario. If your primary buyer cut your base by 10–15% tomorrow, where does that milk go, and at what discount?
    • Requires: honest conversations with two or three alternative buyers.
    • Threshold: if you can’t name a plant and a realistic price within two to three weeks, your marketing risk is bigger than your production risk.
    • Watch for: verbal interest that disappears when you ask for a number.
  • Revisit any contracted or planned capital project — robots, freestall expansion, parlor upgrade — against the corridor case, not the national case.
    • Requires: vendor flexibility, willingness to walk back announced plans.
    • Threshold: re‑size, re‑time, or shelve if the corridor case pushes DSCR below 1.20×.
    • Backfire risk: sunk‑cost thinking on deposits and engineering work.

Deep Dive → Robotic Milking ROI Under 500 Cows — Tier 2 management pillar.

365‑Day Moves — strategic positioning

  • Pick your lane on a written timeline: scale, pivot, or exit. Bullvine’s December 2025 piece, Squeezed Out? A 12‑Month Decision Guide for 300–1,000 Cow Dairies, lays out the logic.
    • Requires: a family or partnership meeting that ends with a decision, not another meeting.
    • Opportunity signal: if a buyer puts core‑supply status, base terms, and component premiums in writing, and your corridor‑aware DSCR stays above 1.25×, scaling is defensible.
    • Backfire risk: leveraging into hope without both a written commitment and a corridor‑aware model.
  • Condition any expansion on a written processor commitment. No contract, no concrete.
    • Requires: legal review of base‑excess and force‑majeure clauses.
    • Threshold: walk away if base‑excess deductions are deeper or longer than the plant’s own escape clauses.
  • Evaluate relocation or premium transition before equity erosion makes the call, if you sit in a legacy region with no new steel within reasonable hauling distance. Processing Paradox closure analysis documents a $15,000–$45,000/quarter equity erosion range across negative margin cycles (Bullvine, 2024–2026).
    • Requires: appraisals, tax planning, succession conversations 12–24 months before any move.
    • Opportunity signal: if a growth‑corridor buyer expresses written interest in backing a relocated supply, that timing window is real but short.
    • Watch for: emotional attachment overriding the math. This is where families lose the most.

Must‑Read → Squeezed Out? A 12‑Month Decision Guide for 300–1,000 Cow Dairies — Tier 3 pillar, December 2025.

From the human side → More Milk, Fewer Farms, $250K at Risk: The 2026 Numbers Every Dairy Needs to Run — what the corridor squeeze looks like at the kitchen‑table level.

What This Means On Your Next Statement

Maple Ridge’s 50¢/cwt basis slide didn’t show up in herd software, ration sheets, or somatic cell graphs. It showed up in 24 months of milk checks — and it turned a robot decision into a corridor decision. Dos Arroyos sees the same pressure on the horizon and is leaning into it because its composite contract and its plants give it room.

Your next pound of milk is worth what your corridor is willing to pay for it, less what hauling and base‑excess take on the way there.

Pull your current milk supply agreement and your last three milk checks tonight. Find the language that governs base‑excess, hauling, and any “marketing” or “balancing” adjustments. Match that language against the basis trend you’ve actually lived since 2024.

What does your current processor contract say about basis and base‑excess when your region’s milk goes long — and does that language describe the corridor you’re still in, or the one you used to be in?

Key Takeaways

  • A clean herd report won’t save you from a bad corridor. Maple Ridge’s 50¢/cwt basis slide plus the post‑2025 FMMO Class III hit stacks to ~$1.89/cwt — about $221,760/year on 600 cows shipping ~144,000 cwt.
  • Stress‑test on your real basis, not the USDA all‑milk price. If your lender won’t run a corridor case with trailing 24‑month basis and 15–30% marginal hauling, the spreadsheet that says robots pencil isn’t the one you should bet on.
  • The capex question changed shape. Below 1.20× DSCR on the corridor case, freeze any non‑essential project. Below 1.25× even with national‑case math, scaling isn’t defensible without a written core‑supply commitment.
  • Pick your lane on a written timeline — scale, pivot, or exit — inside 12 months. Stall, and the basis keeps deciding for you while $15K–$45K/quarter of equity quietly walks off the farm.

This analysis uses composite operator profiles (Maple Ridge, Dos Arroyos) drawn from Bullvine’s Processing Paradox dataset. Contract structures described are illustrative composites and do not describe the actual contracts of any named processor.

Learn More

The Sunday Read Dairy Professionals Don’t Skip.

Every week, thousands of producers, breeders, and industry insiders open Bullvine Weekly for genetics insights, market shifts, and profit strategies they won’t find anywhere else. One email. Five minutes. Smarter decisions all week.
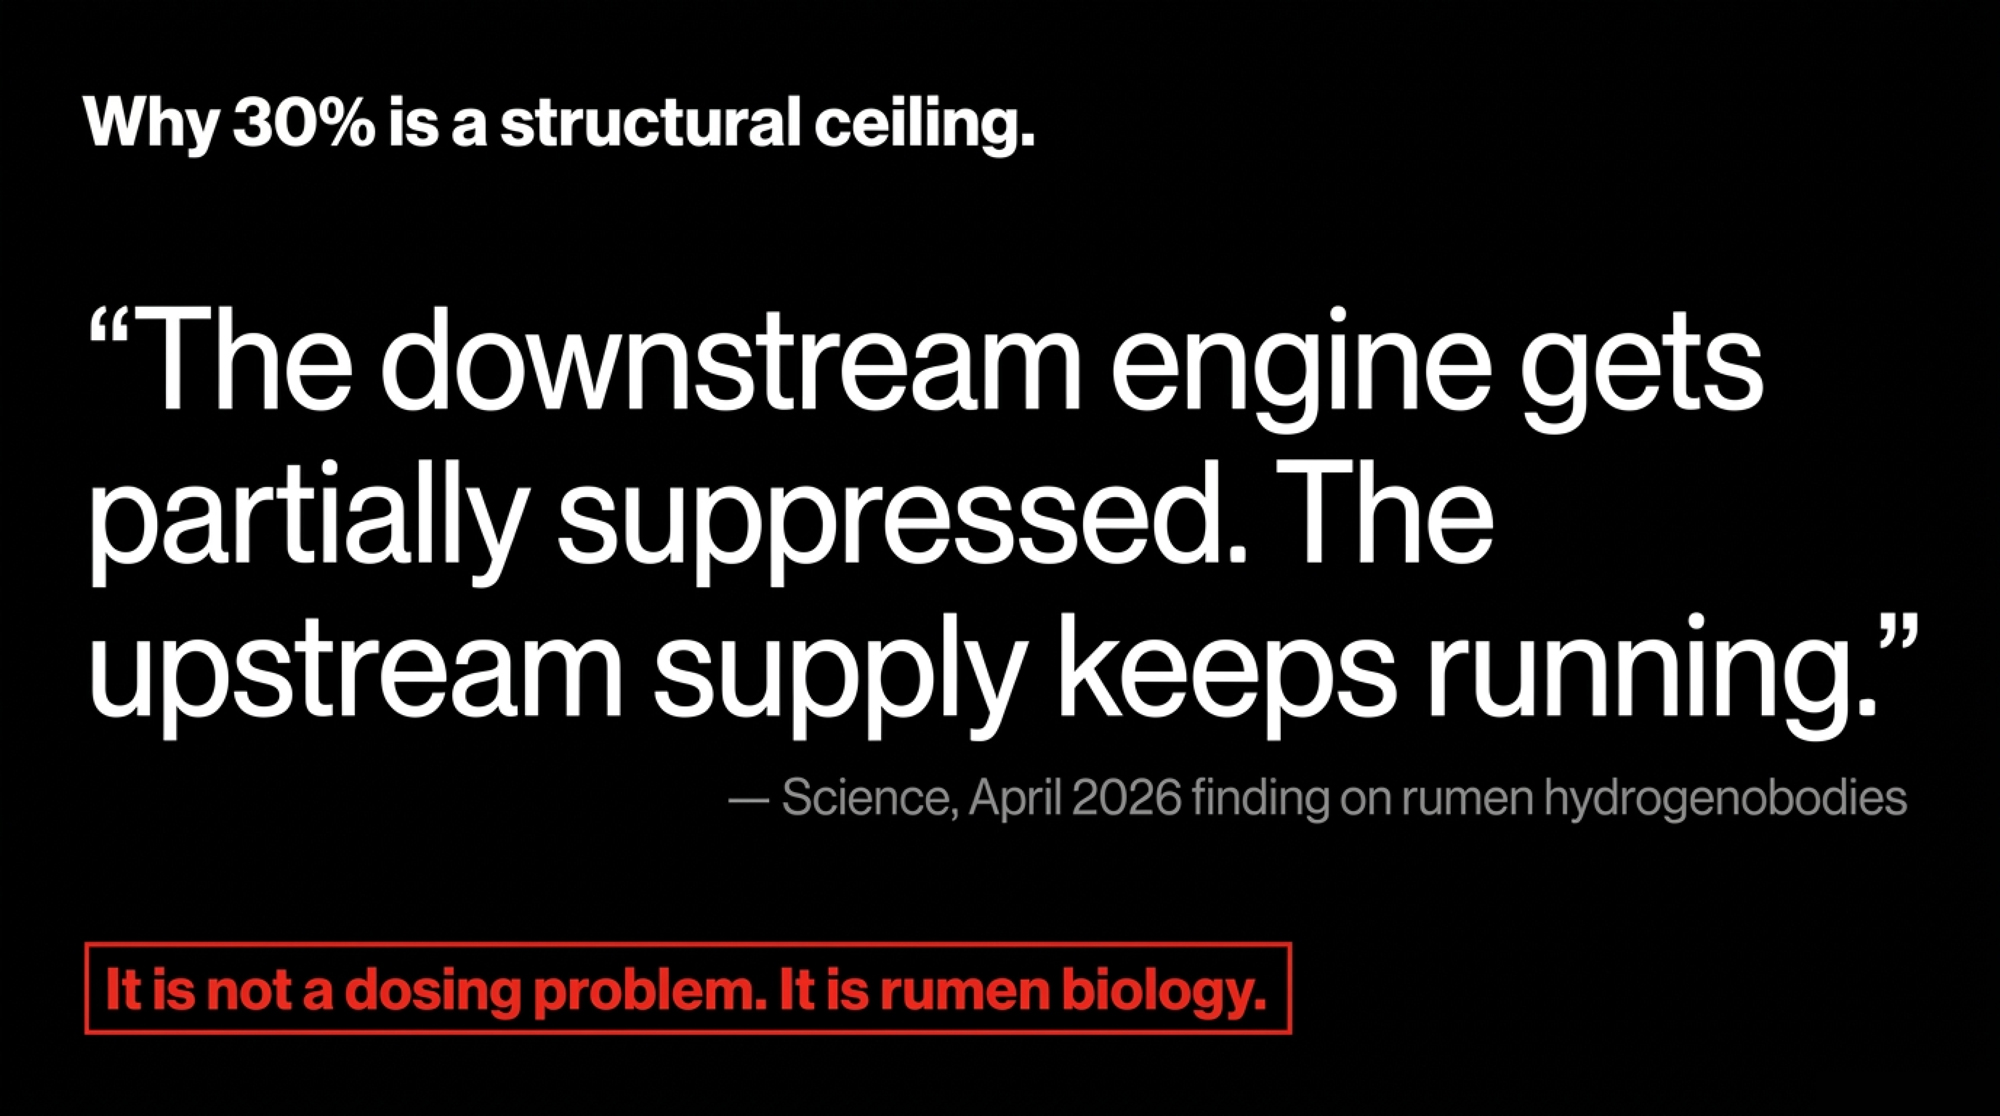
NewsSubscribe
First
Last
Consent

The $3,030 Pen Nobody Scored: Ohio State on Where Your Transition Really Starts

A nutritionist calls the high pen 3.3 and moves on. Ninety days later it’s costing $3,030 in SCK and DAs — and Ohio State says the wreck was locked in at 180 DIM, not the close-up pen.

A nutritionist walks the late-lactation pen on a cold Midwestern morning, eyes the cows, and calls the group 3.25 to 3.3. Ninety days later the same farm is chasing a subclinical ketosis rate that won’t quit, a couple of unexpected DAs, and first-service conception that feels off — all of it locked in by the pen walk nobody wrote down. That’s the gap Ohio State’s Anaclara Daudet and Lucas González-Chappe examined in the April 2026 Buckeye Dairy News: not a measurement problem, but an accountability problem hiding inside the comfortable illusion of an average.

BCS gets this treatment on most farms — a quick scan, a shared nod, no number written on a single animal. The herd manager agrees. The feeder nods. Everyone moves on to feed push-ups and the fresh-cow list, and the transition cycle three months out is quietly loaded while they work.

Quick Stats — The 0.375 Drift

  • ≥0.375 BCS units lost after calving → roughly 5× higher odds of pregnancy loss (Krogstad & Bradford, 2025 Journal of Dairy Science)
  • BCS below 2.75 postpartum → reported odds ratio of roughly 2.16 for culling
  • Calving at ≥3.75 BCS → 5.55× more likely to lose ≥0.75 units by first breeding (separate 2025 peer-reviewed analysis)
  • Calving at ≤3.5 BCS → 0.45× as likely to go subclinical ketotic
  • Herd setting: commercial Michigan dairy on automated milking, scored prepartum and postpartum

So What Does a 0.375-BCS Change Actually Cost You?

BCS ThresholdTimingConsequenceOdds Ratio / MagnitudeSource
≥0.375 BCS units lostPost-calvingPregnancy loss~5.0× higher oddsKrogstad & Bradford 2025 JDS
BCS <2.75 postpartum0–30 DIMCulling riskOR ~2.16Krogstad & Bradford 2025 JDS
Calving BCS ≥3.75At dry-off/calving≥0.75 BCS loss by 1st breed5.55× more likelySeparate 2025 peer-reviewed analysis
Calving BCS ≤3.5At calvingSubclinical ketosis0.45× as likely (protective)Separate 2025 peer-reviewed analysis
<0.5 BCS lostCalving to peak1st-service conception65% conception rateButler & Smith 1989 JDS
>1.0 BCS lostCalving to peak1st-service conception17% conception rateButler & Smith 1989 JDS
≥3.5 BCS at 150–220 DIMLate lactationFat-tail SCK loadingNo move = ~$2,030/pen cycleGohary & Overton 2016 JDS
≥3.75 BCS dry-offDry periodOver-conditioning, SCKStandard far-off ration insufficientDrackley lab / Alberta Ag extension

The OSU extension piece leans on a 2025 Journal of Dairy Science paper from Kirby Krogstad and Barry Bradford, whose recent transition-cow work is associated with Michigan State. The pair followed a commercial Michigan dairy running automated milking, scoring BCS prepartum and postpartum across multiple transition windows.

The headline numbers are worth taping to the office wall. Cows losing ≥0.375 BCS units after calving had roughly five-fold higher odds of pregnancy loss. Cows losing ≥0.75 units had significantly higher odds of leaving the herd. Thin postpartum cows — BCS under 2.75 — carried a reported odds ratio of roughly 2.16 for culling.

A separate 2025 peer-reviewed analysis on BCS at calving and subclinical ketosis sets the other bookend. Cows calving at ≥3.75 BCS were 5.55× more likely to lose ≥0.75 units by first breeding than cows calving at ≤3.5. Cows at ≤3.5 at calving were only 0.45× as likely to go subclinical ketotic.

None of this is radical. Butler and Smith’s 1989 JDS paper already showed first-service conception dropping from 65% in cows losing under 0.5 BCS units to 17% in cows losing more than 1.0. And older University of Kentucky extension work from Jeffrey Bewley, traceable to 2008, suggested only a small share of U.S. herd managers record individual BCS on a structured basis. The scoring card has been on every extension pamphlet since before most fresh-cow crews were born. The adoption number tells you what that’s worth in the barn.

Why Is Your Fresh-Cow List Uglier Than Your Feed Software Predicts?

Here’s the uncomfortable math on a “3.3 average” late-lactation pen. Picture 80 cows in the high group. The nutritionist eyeballs 3.3. Score every animal individually and that pen will almost never match the eyeball average. An illustrative distribution — 40 cows at 3.0–3.25, 20 at 2.5–2.75, 20 at 3.75–4.0 — still averages near 3.3. The average is also lying.

Run the barn math on the fat tail. Using Gohary and Overton’s 2016 JDS cost-of-SCK model on Canadian herds — roughly $203 per case, split across clinical disease, extra days open, extra culling, and lost milk — up to 10 extra cases in that 20-cow fat-tail cohort pencil out to roughly $2,030. Add two DAs at a commonly cited $500 each, a midrange within DA cost ranges of roughly $250 to $900+ per case in U.S. and Canadian extension literature, and the total lands near $3,030 in one pen, in one transition cycle, before any pregnancy losses are factored in — the same 60-to-90-day cascade that writes your fresh-cow bill, sitting under a number every one of them signed off on.

Note the currency and scope. The Gohary and Overton figure is Canadian, circa 2016. 2026 U.S. costs likely run higher given feed, treatment, and replacement inflation. The $3,030 is illustrative, not a bank statement.

Scale it to your operation. On a 500-cow herd, the proportional numbers drop by roughly two-thirds. On a 3,000-cow operation, the same fat-tail share can stack into five-figure annual transition losses once you count multiple pens and multiple calving cycles. Order-of-magnitude math, not a precise forecast — but no dashboard labeled “3.3 average” would have flagged any of it. Layer in even one early pregnancy loss — a 2019 South American analysis modelled the average hit at roughly $2,333 per event — and the cost of leaving the fat tail alone gets harder to wave off. That’s the real cost of a lost pregnancy, before anyone factors in the cull-cow ripple.

A second scenario, scaled up. A 1,500-cow herd running roughly 600 calvings a year (depending on calving distribution) with a 15% baseline SCK rate is carrying about 90 SCK cases annually. Shift the calving-BCS distribution down — fewer cows at ≥3.75, more at ≤3.5 — and the 2025 SCK paper’s 5.55× and 0.45× multipliers say a meaningful share of those cases come off the board. Even a conservative 20-case reduction at $203 per case pencils to roughly $4,060 in avoided cost, before any DA or pregnancy-loss savings. Conservative. Directional. Worth pulling your own SCK rate and running the same math against your real calving distribution.

The Status Quo vs. The Active Protocol

MetricThe “Average” Trap (3.3 Eyeball)The Active Protocol (Individual Sorting)
Pregnancy loss oddsBaseline risk hidden inside the pen averageRoughly 5× lower for cows that hold condition
SCK risk in the fat tailHidden, treated downstream at 7 DIMIdentified at 150–220 DIM and mitigated before dry-off
Decision owner“Everyone watches it” — nobody owns itNamed lead: herd manager, nutritionist, vet
Economic hit per pen / cycleAbout $3,030+ in avoidable SCK and DAAbout $30 milk traded per cow to save $200+ per SCK case
Tools driving the decisionPen-average dashboards, fresh-cow surveillanceIndividual scores, written triggers, 7-day move rule

The Accountability Vacuum Nobody Owns

Ask a 1,500-cow operation who owns reproduction. Instant answer. Who owns feeding? The nutritionist. Fresh cows? The vet and the fresh-cow crew.

Now ask who owns BCS strategy from 150 DIM through 30 DIM of the next lactation. The usual answer is silence, or some version of “we all keep an eye on it.” On paper, the feeder and nutritionist should own over-conditioning. The herd manager should own group moves. The vet should tie BCS back to disease risk. In the barn, it’s everyone’s problem and no one’s job. A 2020 UBC-affiliated study on transition-management barriers found farmers and veterinarians working on the same farms held meaningfully different views of what the transition window even covered.

Recent behavioural research makes that harder to dismiss. A peer-reviewed study on BCS adoption found producers often described scoring as difficult or unnecessary on their operations, despite nearly five decades of extension pushing it. The barrier wasn’t knowledge. It was structure, time pressure, and the lack of a clear payoff landing in the same week the scoring did.

The honest read from advisors who walk these barns: most herds don’t have a disagreement about whether BCS matters. They have a disagreement about whose calendar it lives on. And until that calendar question gets answered in writing, the score on the page changes nothing in the pen.

What a Composite Midwestern Herd Saw When It Finally Scored Every Cow

Picture a 1,200-cow Midwestern operation — an illustrative composite, not a real farm — drawn from patterns Bullvine has seen on multiple 1,000–1,500 cow herds. Good people, good facilities, proud of the tank. One far-off dry pen, no fat-dry group. The nutritionist eyeballed late lactation at 3.25 to 3.3, and everyone was comfortable.

A note on the case study: The 1,200-cow operation below is a composite drawn from patterns Bullvine has seen across multiple 1,000–1,500 cow herds. No real farm is named. Cost figures are illustrative and anchored to the cited research, not to any single dairy’s books.

Over one winter, fresh-cow SCK on weekly strips drifted from the mid-teens into the mid-twenties. DAs ticked up by one or two per month. First-service conception dipped. The whole team started chasing: close-up ration, DCAD, fresh-pen stocking density. Six months later, the vet finally pushed for one month of individual scoring on every dry cow. The average came back 3.6. Roughly a third of the dry pen was ≥3.75.

In the composite, the moment of seeing three pages of individual scores against an eyeball average held for two years is the structural rethink. The DAs and most of the SCK cases were clustered inside that 3.75+ tail.

That’s the “oh, damn” moment. The problem wasn’t in the three weeks the team had been obsessing over. It was in the 150–220 DIM window and the dry pen nobody had scored.

Fresh-Pen Myopia Is Counting Casualties

Tool / PracticeWindow It Operates InTypeWhat It Actually DetectsDecision Point It Can Change
BHB strips at 7 DIM0–14 DIM🔴 SurveillanceSCK after the factTreatment, not prevention
Rumination collarsFresh pen🔴 SurveillancePost-calving stress signalTreatment timing
Inline milk BHB analyzersFresh pen🔴 SurveillanceMetabolic status post-calvingTreatment, extended VWP
Manual BCS at 150–220 DIMLate lactation🟢 PreventionFat-tail loading in real timeGroup move within 7 days
Manual BCS at dry-offFar-off entry🟢 PreventionOver-conditioned cows before they crashFat-dry pen assignment
Written BCS trigger protocolAny stage🟢 Decision layerAccountability gapMoves, ration changes, vet flag
AI/overhead BCS cameraAny stage🟡 Depends on protocolIndividual scores at scaleOnly preventive if written trigger exists

Most “precision” transition programs aren’t managing transition risk. They’re surveilling fresh cows. BHB meters at 7 DIM, rumination collars, inline analyzers, chalk on the rump — all tracking consequences that got locked in 60 to 90 days earlier, when a cow drifted from 3.25 to 3.75 and nobody moved her. A BHB meter at 7 DIM is a coroner’s report, not a diagnosis.

Extension guidance from Penn State’s dairy team, including Virginia Ishler and Jud Heinrichs, is blunt: if cows are consistently calving above 3.75, late-lactation energy intakes are too high and the calving-interval problem has to be addressed. Two uncomfortable conversations — ration and repro — packaged as one BCS observation. Most operations would rather note the pen is “a touch heavy” and keep milking. That’s where the transition gap between your neighbour’s fresh cows and yours often starts.

Can Your BCS Protocol Actually Fit on One Page?

If a farm can’t write down, on a single page, what specific action each BCS threshold triggers and who owns it, then BCS isn’t actually integrated into transition management. It’s just another number collected.

Protocol TriggerThresholdTimingNamed Owner RequiredPass CriteriaCommon Fail Mode
Late-lac fat-cow moveBCS ≥3.5150–220 DIMHerd manager approves; feeder executesWritten, name on file, executed within 7 days“We watch the pen” — no move date, no name
Dry-off over-cond. groupBCS ≥3.75 at dry-offDry-off dayNutritionist adjusts receiving rationSeparate fat-dry pen or documented ration changeSingle dry-pen, no differentiation
Early-lac BCS-loss flag≥0.375 BCS units lostCalving to 14–30 DIMVet + repro lead review breeding planTagged in herd software; ketone screen mandatoryBred on standard timeline regardless of BCS loss
Values statement sign-off$30 milk traded vs. 0+ SCKOngoingFarm owner / managerWritten, signed, postedVerbal agreement only; quietly reversed under milk price pressure

Three non-negotiable lines for a 1,500-cow operation:

  • Trigger 1 — Late-lactation fat-cow move. Any pregnant cow at 150–220 DIM scoring ≥3.5 moves out of high group within seven days. Owner: herd manager approves, feeder executes, nutritionist adjusts the receiving pen’s ration by the next visit.
  • Trigger 2 — Dry-off “fat dry” decision. Any cow at ≥3.75 BCS at dry-off goes to an over-conditioned dry group on a controlled-energy, high-forage ration — the approach Jim Drackley’s Illinois lab has published on since the mid-2000s. The goal isn’t to crash-diet her. Alberta Agriculture extension guidance on BCS and energy balance is explicit that over-conditioned cows at dry-off should not be fed to lose condition. Prevent further gain. Soften the postpartum crash.
  • Trigger 3 — Early-lactation BCS loss red flag. Any cow losing ≥0.375 BCS units from calving to 14–30 DIM is tagged high-risk in herd software, gets mandatory ketone screening, and has her breeding plan reviewed by the vet and repro lead before first service.

None of that replaces ration design, close-up management, or heat abatement. It’s a trigger layer sitting on top of them. Where those fundamentals are already broken, BCS monitoring alone won’t fix them. If more than 20–25% of your dry cows score ≥3.75 consistently, the math on a second dry-cow pen starts to pencil against the labor and capex of building it.

The Fourth Line — The Values Statement

“We will pull profitable high-producers out of high group early if their BCS crosses 3.5 at 150–220 DIM.”

That’s not a protocol tweak. It’s a values statement. It says the farm will trade roughly $30 of late-lactation milk per cow — 5 lb/day lost across 30 days at a milk price near $0.20/lb, adjusted to your regional mailbox price before running the trade for your own herd — for a shot at avoiding a $200+ SCK bill, or a much larger pregnancy-loss hit, three months later.

Until someone with authority signs that line, the other three triggers get quietly neutered.

Before You Spend Six Figures on a BCS Camera

DeLaval, CattleEye, and Herd-i are among the vendors active in this space. The independent peer-reviewed validation base for overhead AI BCS systems on commercial AMS herds remains thin, particularly at the high and low ends of the BCS distribution. That’s where the highest-risk cows live — and that’s the part of the curve any farm weighing a six-figure install needs published evidence on.

A 2019 University of Kentucky validation study compared an automated 3D BCS system against manual scoring on a research herd; the published agreement statistics and the conditions under which agreement declined are available in the paper and should be read directly before any purchase conversation. DeLaval, CattleEye, and Herd-i were offered the opportunity to comment on the independent validation landscape ahead of publication; their responses, where received, are reflected in this section.

Before any camera — from any vendor — lands on a purchase order, request the underlying peer-reviewed validation studies and read them yourself. Pay attention to herd type (AMS vs. parlor), herd size, lighting conditions, and behaviour at the BCS extremes. The labor trade-off cuts the other way: a weekly manual scoring protocol on a 1,500-cow operation costs real herd-manager hours — predictable, cheaper than a six-figure install, and under your team’s control. A camera removes the labor. It doesn’t remove the harder problem.

That harder problem is the decision link. Sit across from the farm before any install and ask one question: “When this thing tells you 40% of your dry cows are over 3.5 next month, what changes on this farm by Friday?” The usual answers — calling the nutritionist, watching them closer, considering moves — signal the missing written link between data and action. Without that link, adding any camera is a more expensive way to confirm the same averages the farm has been ignoring. The tool isn’t the problem. The missing decision framework is.

What This Means for Your Operation

  • Can you name, by name, the person who owns BCS strategy from 150 DIM through 30 DIM of the next lactation? If the answer is “we all watch it,” nobody does.
  • Do you have the actual BCS distribution of your current dry pen — not the nutritionist’s eyeball average? Pull one pen this week and score every cow individually. Compare what you find to what you would have guessed.
  • What specific, written action triggers when an individual cow hits 3.5 at 180 DIM? If “we’ll catch her at dry-off” is still the plan, published dry-period data suggests that usually doesn’t work — over-conditioned cows tend to hold or keep drifting on a standard far-off ration.
  • Is your dry-cow program one pen or two? If it’s one, what happens to the 20–30% of cows who calve at ≥3.75 without a separate strategy?
  • When a cow loses ≥0.375 BCS in her first 30 DIM, does anything change in her breeding plan, or does she get bred on the same timeline as a cow that held condition? Krogstad and Bradford’s numbers say she shouldn’t.
  • What’s the shortest sentence your herd manager and nutritionist can both agree on that describes when a high-producing pregnant cow leaves high group? If that sentence doesn’t exist, neither does your protocol.
  • If a camera system lands tomorrow and flags 40% of your dry cows at ≥3.5, what exact action does that trigger by Friday? The answer needs to be shorter and more specific than you’d like.

Key Takeaways

  • If more than 10% of your 150–220 DIM cows are ≥3.5 BCS, per the cited research your transition risk is already loaded 60–90 days before calving — not at the close-up pen.
  • If dry-off BCS averages ≥3.5 across the herd and first-30-DIM subclinical ketosis sits above 15%, the cited research suggests those are almost certainly connected, not coincidental.
  • If your one-page protocol can’t fit on one page, it isn’t a protocol. It’s a philosophy.
  • If you can’t trade $30 of late-lactation milk per cow to avoid a $200+ SCK bill on the same cow, the economic problem isn’t BCS. It’s how your farm measures success.

What to Do in the Next 30 Days

This month, pull one pen — late lactation or dry — and score every cow individually. Write the distribution, not the average. If more than one in five cows is above 3.5 where you didn’t expect them, you’ve found the tail that’s quietly loading your next transition cycle.

Then sit down with your nutritionist, herd manager, and vet and answer one question in writing: Who owns what this data says, and what happens because of it, within seven days?

The 90-day test: pull fresh-cow SCK, DA, and metritis rates for the cohort calving after the protocol goes live and compare to the six months before. The 365-day test: decide whether the year-over-year change in disease rate and pregnancy loss justifies infrastructure changes — a fat-dry pen, a camera, a low-energy late-lactation group.

The Binary You’re Actually Deciding

The math isn’t just about biology. It’s about the integrity of your management system. A herd that refuses to manage the fat tail because it’s chasing the last five pounds of late-lactation milk isn’t being aggressive. It’s being reckless with its own future.

If you can’t see the individual cow through the fog of the pen average, you aren’t managing a transition program. You’re just waiting for the wreck to happen. So which pen will you score first — and whose name goes next to it on Monday?

All cost figures in this article are illustrative; no real farm is named in the case study. Research findings are attributed by author, paper, and year; readers wanting full statistical detail are directed to the cited primary sources.

Run Your Numbers

Herd Health ROI Calculator — Plug in your herd size, culling rate, mastitis incidence, and milk price to see what reducing SCK, premature culling, and transition disease is actually worth per cow — in real dollars, not extension estimates.

Learn More

The Sunday Read Dairy Professionals Don’t Skip.

Every week, thousands of producers, breeders, and industry insiders open Bullvine Weekly for genetics insights, market shifts, and profit strategies they won’t find anywhere else. One email. Five minutes. Smarter decisions all week.
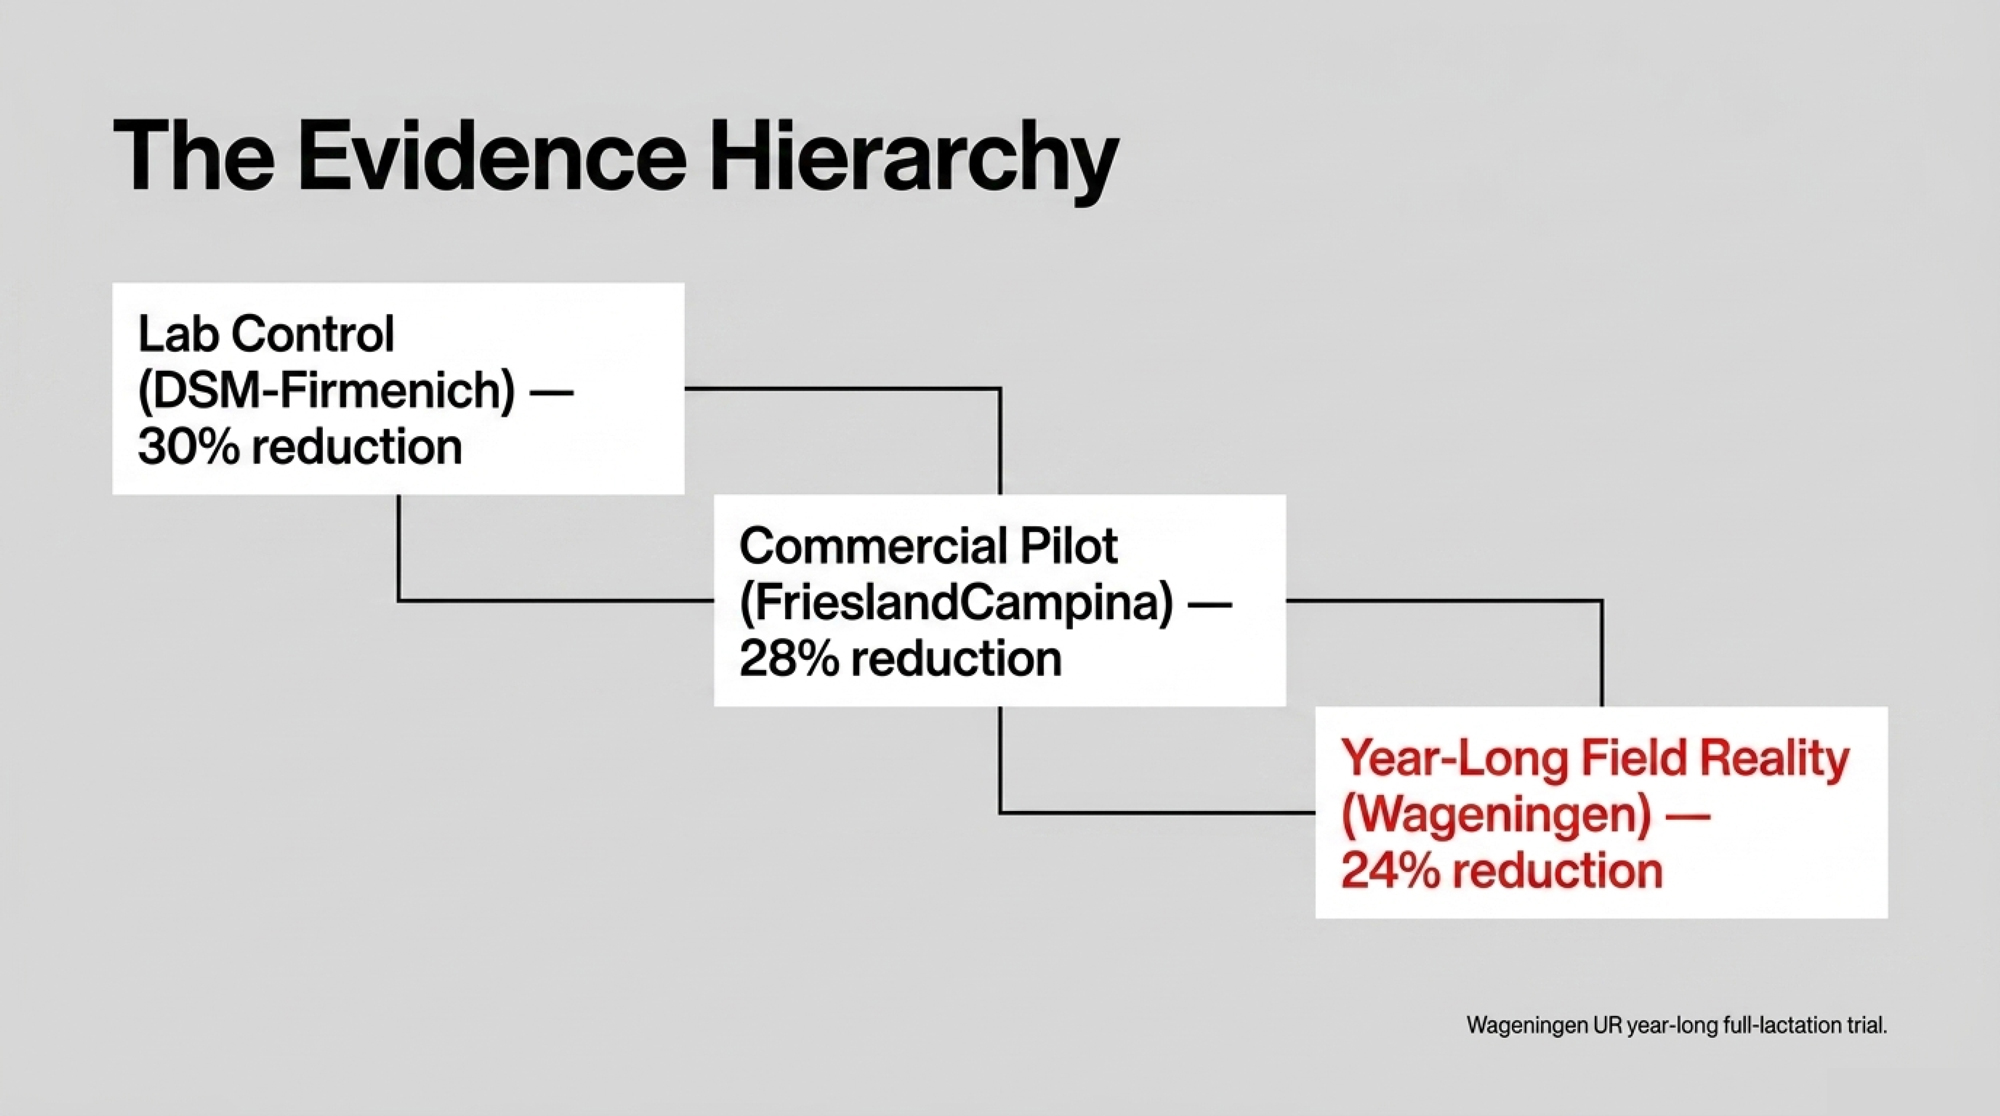
NewsSubscribe
First
Last
Consent

Estate Dairy Hit £26M on £5,000. Your 300-Cow Herd Can’t Copy That. 

Müller’s cheque cleared at 34.5ppl on 1 March. Your fully-loaded cost sits near 42ppl. On 3 million litres that’s –£210,000 a year — and no amount of glass bottles fixes that row.

Executive Summary: Müller GB cut its Advantage contract price to 34.5ppl from 1 March 2026, while Estate Dairy — the asset-light London brand that started with £5,000, a borrowed catering van and no cows of its own — just reported turnover of about £26M on Claridge’s, Ritz and Savoy tables. For a 300-cow Holstein herd shipping around 3M litres a year, that cheque at 34.5ppl against a typical fully-loaded cost of roughly 42ppl pencils out at –£210,000 annually, and at 45ppl it widens to –£300,000. AHDB’s October 2025 survey puts GB down to 7,010 producers (–2.6% YoY), so the pressure to “do an Estate Dairy” is real — but the Youngs’ edge was starting with no parlour debt and buying Jersey and Guernsey milk already suited to baristas, not flipping a Holstein herd. A disciplined 5%-of-the-tank premium experiment (150,000 L at a net 80ppl) could add about +£67,500 a year, enough to close the gap on the High-Efficiency row but nowhere near the Debt-Heavy row. The four paths worth costing this month: tighten under the contract, run a bounded 12-month premium edge experiment, plan a 3–5 year glide exit, or go big on premium only if most debt is secured against land. Read the full piece if you want the row-by-row barn math and the 30-day actions before the next Müller price letter lands.

UK dairy farm economics

Shaun and Rebecca Young built UK’s Estate Dairy from £5,000, a borrowed catering van and no cows of their own, and turned it over at about £26 million in its most recently reported financial year, with hospitality names like Claridge’s, The Ritz and the Savoy on the customer list, according to reporting in The Times. If you’re milking 300 cows in 2026, carrying more kit finance than you’d like and staring at a 34.5ppl Müller cheque from 1 March, that headline lands differently at your kitchen table than it does in a London Sunday supplement.

Estate Dairy is a real business with real cows’ worth of milk moving through it. The mirage isn’t whether the Youngs did it — it’s whether a 300-cow Holstein herd carrying parlour and shed finance can copy it. Let’s put the glossy version next to the one that actually matters — yours — and ask the quiet question nobody in the farm press wants to say out loud: are you really failing if you stay on the contract?

What the Estate Dairy UK Growth Story Really Proved

FactorEstate Dairy (Youngs)Your 300-Cow Holstein Herd
Starting capital£5,000 + borrowed van£800k–£2M in parlour, shed & kit finance
Herd ownershipNone — bought milk from othersOwned; replacement costs ~20–25%/yr
Milk breedJersey / Guernsey (high fat, high protein)Holstein (high yield, lower fat/protein)
Parlour debt£0 legacy debtTypically £200k–£600k outstanding
Annual turnover~£26M (FY 2025 reported)~£1.05M at 35ppl on 3M litres
Pre-tax profit~£1M (reported)–£90k to –£300k depending on cost tier
Customer baseClaridge’s, Ritz, Savoy, M&S, OcadoSingle processor contract (e.g., Müller)
Route to marketBuilt coffee/hospitality channels firstProcessor sets price; no direct market
Genetic pivot timelineN/A — sourced milk already suited to premium4–7 years to shift bulk tank profile via crossbreeding
Key replicable elementBrand building, channel relationshipsCost discipline, premium edge experiment (5% of tank)

Before the brand, the Youngs worked in London’s specialty coffee scene, not a parlour. Around 2015 they scraped together £5,000, sold a car, borrowed Rebecca’s mum’s catering van, and used a friend’s cold store as a first “plant.” They spent roughly a year driving between farms and cafés, looking for milk that would actually perform in a barista’s hands.

A few hard facts about that journey:

  • Founded 2016. The Estate Dairy brand launched that year.
  • Asset-light entry. No parlour, no robot, no slurry store, not an acre of their own — and no legacy dairy debt. That structural difference matters more than any branding lesson you could copy off them.
  • Bought the milk, didn’t breed it. Suppliers reported in Estate Dairy’s public origin story have included Brades Farm’s Jerseys in Lancashire’s Lune Valley and Bickfield Farm’s Guernseys in Somerset — higher fat, higher protein, that “gold top” look in a glass.
  • High-end customer base. As reported in early 2026, the customer list has included Claridge’s, The Ritz, the Savoy, plus retailers such as Sainsbury’s, Marks & Spencer, Ocado and Waitrose.
  • Profitable from the start. The Times reported turnover in the most recently reported financial year at around £26 million, with just under £1 million pre-tax profit.

Strip the Instagram glow off that and the proof is narrower than the headline suggests. Start with no herd and no farm debt. Buy milk already suited to premium channels. Build the coffee and hospitality relationships before you spend big on plant. Do those things in that order and you can build a profitable premium dairy brand that never lives or dies by a processor contract. None of that is the same as saying a 300-cow Holstein herd with parlour finance, shed loans and machinery leases should try to become The Estate Dairy 2.0.

What’s Actually Changing for Mid-Size UK Herds

Step away from Shoreditch cafés for a moment and look at the picture most readers are standing inside.

A fairly typical GB mid-size setup in 2026:

  • Around 300 Holstein-type cows in a higher-yield system.
  • Roughly 2.4–3.0 million litres/year, depending on litres per cow and days in milk — comfortably above the UK all-cow average of about 8,148 litres/cow/year in the 2023/24 milk year. [VERIFY: confirm exact litres/cow/year figure from latest Defra/AHDB milk utilisation release at sub-edit.]
  • A processor contract — say Müller — paying 34.5ppl for Advantage-eligible milk from 1 March 2026, down 1ppl from the 35.5ppl paid from 1 February, according to Müller GB’s own published 1 February 2026 and 1 March 2026 price announcements.

AHDB’s October 2025 milk buyer survey counted 7,010 GB dairy producers, down 2.6% year-on-year, and structural work on the industry shows GB farm numbers were roughly 25,000–30,000 in the mid-1990s. The sector has consolidated hard. Major GB processors have restructured supply pools over the past year, and UK farm trade press has reported termination or restructure notices involving cases at Müller and other buyers. Müller GB was approached for comment on this piece; any response received post-publication will be added as an update.

AHDB’s recent cost-of-production work shows dairy costs have climbed sharply since 2019, with feed, energy and finance squeezing margins even where milk prices lifted. Fully-loaded costs in many higher-input, debt-heavy systems can end up above 40ppl. AHDB’s 2024/25 cost banding places a meaningful minority of GB producers in the high-cost tier where contract price alone cannot close the gap.

Find Your Tier on One Page

Three illustrative scenarios, same 3.0M-litre herd, same 35ppl contract price. Find the cost band closest to your own books and read down.

Illustrative only — not a benchmark for any named farm. Before you scroll further, decide which of these three rows your last milk cheque actually puts you in.

ScenarioRevenue (3M L @ 35ppl)Cost (fully loaded)Annual Margin
High-Efficiency (38ppl cost, 3.0M L baseline)£1,050,000£1,140,000–£90,000
Typical Mid-Size (42ppl cost)£1,050,000£1,260,000–£210,000
Debt-Heavy (45ppl cost)£1,050,000£1,350,000–£300,000

The shape holds. The size changes. Higher-yielding 300-cow herds pushing 3.2–3.3M L should re-run the High-Efficiency row on their own litres before drawing conclusions. When you read the £26M Estate Dairy headline after looking at your own bank statement, the emotional math can feel worse than the financial math — and the first honest move is knowing which row you’re standing in.

How Does a 12-Month Premium “Experiment” Actually Hit Your Cashflow?

On paper, “go premium” almost always looks better than “stay commodity.” That’s what makes it dangerous.

Say your herd is in that 3.0M-litre zone and you decide not to go all-in. You’ll test the waters with 5% of your milk.

  • 5% of 3,000,000 L = 150,000 litres.
  • At contract, 150,000 × 35ppl = £52,500.
  • If you can move those 150,000 L at a net 80ppl after packaging, labour, fuel and extras — the kind of margin some UK glass-bottled premium lines report achieving, though published per-litre net margins from GB direct-sales operators remain thin and this figure should be read as illustrative — it brings in around £120,000.
  • Upside: roughly +£67,500/year on 5% of your milk.

The upside is real. The road to it isn’t free. You’re buying bottles, labels and crates, maybe a vending unit. You’re building delivery routes or paying someone to run them. And it all lands on top of the deficit rows in the table above.

The Soft Cost Nobody Puts on the Spreadsheet

Every direct-sales plan underestimates the same line item: your time. If even a day a week of your time goes to chasing café invoices and fixing the vending machine, who’s walking fresh cows? A premium margin can be eaten alive by a measurable drop in pregnancy rates — even a couple of percentage points — because the boss was busy being a delivery driver instead of managing the transition pen.

Even when the premium slice eventually works, total cashflow often gets worse before it gets better. If your real monthly gap is already around £17,500 (Typical Mid-Size row) or £25,000 (Debt-Heavy row), extra capex and learning curves can push that wider for a few months while new channels settle. The honest question isn’t “should you try premium?” It’s whether your balance sheet and your management bandwidth can fund 6–12 months of worse-before-better on top of the gap you already carry, without your lender losing patience or your herd losing performance.

Is Your Herd’s Milk Even What Premium Buyers Want?

Estate Dairy didn’t invent its supply story. It bought into one that already existed. Brades Farm’s Jerseys in Lancashire’s Lune Valley are known for rich, high-fat milk and barista-focused work, and Bickfield Farm’s Guernsey herd in Somerset produces the classic “gold top” milk that behaves differently in a glass or a flat white.

Those herds came with fat and protein that make better foam, butter and yoghurt — plus a story buyers can tell: long-established herds, grass-based systems, heritage breeds tied to a specific region. A lot of GB 300-cow herds are built on a different model: Holstein-heavy, often chasing 8,000–10,000+ litres/cow/year, with regular beef-on-dairy use to add calf and cull value, which limits dairy heifers if you suddenly want to pivot the whole herd.

You can shift the profile of your tank — crossbreeding, selection for fat and protein, changing feeding strategy. But with a GB replacement rate typically in the 20–25% range reported in AHDB benchmarking, you’re usually looking at 4–7 years before a new genetic strategy really shows up in the bulk tank.

If the story in your head is, “We’ll flip our Holstein herd into Jersey-type milk in a couple of years and then go premium,” you’re stacking two big bets. Bet one: you can fund the genetic transition while you’re still paid mostly on litres. Bet two: a premium buyer who cares about that new profile will be there at scale when you’re ready. Estate Dairy didn’t wait for genetics. They went and found the milk they needed. That difference matters when you decide how much of their path is even available to you.

Options and Trade-Offs for Farmers

Stop measuring yourself against someone else’s starting line and your choices sharpen. None of these paths are glamorous. All of them are real.

1. Tighten Under the Contract — and Drop the Guilt

When it makes sense:

  • You’re already losing money at today’s milk price.
  • You’re 12–24 months from contract renewal.
  • You don’t have six figures of spare cash for a gamble.

What it requires:

  • A blunt look at the books: which row of the table above you actually sit in, and which kit upgrades are habit rather than need.
  • A frank talk with your lender: “Here’s cost per litre. Here’s the gap. Here’s what we’re doing about it.”

Risks and limits:

  • You’re still exposed to processor cuts.
  • This is a “slow the bleed” strategy, not a growth story.

30-day action: print the last 12 months of bank statements and milk cheques. On a single sheet of paper, write down your average monthly gap at today’s price. If you can’t do that in an hour, that’s your first job.

Go deeper: our Tier 3 piece on what happened to GB farms that tried to ride out Müller’s 1ppl cut without changing anything else picks up where this path ends.

2. Try Premium at the Edges, Not the Whole Tank

When it makes sense:

  • You can name at least three realistic local buyers — a farm shop, a cluster of cafés, a gelato maker, a small cheese plant — who might pay more for what you already produce.
  • You have labour or capital you can risk without missing loan payments.

What it requires:

  • Treat it as a bounded experiment, not salvation. “We’ll put 5–10% of our milk and £X of capital into this. In 12–18 months we either have a clear profit or we shut it down.”
  • Honest costing of the soft stuff: bottling, cleaning, deliveries, invoice chasing — and whose attention shifts away from fertility, transition and feed while that happens.

Risks and limits:

  • Side projects creep. 5% can quietly become 20% if you don’t watch it.
  • A vending-machine side business that trims a couple of points off your pregnancy rate isn’t a win — it’s a distraction with a logo.

Barn-math example: shift 150,000 L (5% of 3.0M) from 35ppl to a net 80ppl after extra costs. That’s roughly +£67,500/year. On its own, it won’t fill the Typical Mid-Size –£210,000 row or the Debt-Heavy –£300,000 row. Paired with tight cost control, it can close most of the gap on the High-Efficiency row.

30-day action: write a short list of who within 30 miles would pick up the phone if you offered something different. If you can’t fill that list with real names, you’re not ready to spend on stainless.

Go deeper: our case study on how one GB farm kept 95% of its milk on contract and still made a vending machine pay in 12 months shows what a disciplined edge experiment actually looks like.

3. Plan a Controlled Glide Path Instead of a Crash

When it makes sense:

  • Age and family plans make a 10-year turnaround unlikely.
  • You care more about protecting equity and health than about the size of the herd on your funeral card.

What it requires:

  • A 3–5 year plan with your bank and your family: freeze non-essential capex, keep the unit tidy and saleable, pay down what you can, and pick a window to sell cows and machinery while they still hold value.
  • The guts to say “enough” before the lender says it for you.

Risks and limits:

  • Emotionally brutal. It can feel like walking away from generations of work.
  • Resist jumping back in when milk blips up for a few months.

Reframe what “winning” looks like. Exiting with your land, machinery and cow values substantially intact is not losing — it’s walking away with capital in hand. A forced liquidation by an administrator or a fire-sale dispersal under bank pressure typically turns far less equity into cash than a planned, well-timed exit on your own calendar. One path ends with something left to pass on. The other doesn’t.

Talk to enough GB 300-cow operators and you hear the same thing: hard work doesn’t scare them. Betting the kids’ future on a shiny new bottling line that may or may not pay? That’s what really weighs on them.

30-day action: book a two-hour session with your accountant and your bank manager in the same room. Walk them through your land vs kit-finance split, your cull and machinery values, and ask one question out loud: “If we chose to glide out over five years starting this autumn, what does the best-case exit balance sheet look like?”

4. Go Big on Premium — Only If the Runway Is Real

When it makes sense:

  • Most of your debt is secured against land, not short-term kit finance.
  • You have strong reserves or credible outside backing.
  • You can name specific buyers who need what you could produce — not a vague sense that “people will pay more.”

What it requires:

  • A phased plan, not a leap. Secure one or two anchor customers first — a cluster of independent cafés, a regional foodservice wholesaler. Size your first processing kit to those customers, not your entire herd. Consider retail only once you can move product consistently and stay on top of compliance.

Risks and limits:

  • Specialist coffee and high-end hospitality already have suppliers like Estate Dairy. You’re not filling an empty niche — you’re asking someone to switch.
  • A mis-timed plant investment can sink a business faster than a bad milk cheque.

30-day action: map your existing relationships — chefs, retailers, wholesalers — and ask, quietly: “If we built this, would you sign a contract, and for how much volume?” If the answers are vague, hit pause.

Key Takeaways

  • If your fully-loaded cost puts you in the Debt-Heavy row (–£300,000/year), a big premium pivot isn’t “bold” — it’s reckless. Tighten under the contract or plan a controlled exit instead.
  • If you’re in the High-Efficiency row (–£90,000/year), a +£67,500 edge experiment can credibly close most of the gap when paired with cost discipline — but only with hard limits on volume, capital and timeframe set before you start.
  • If most of your debt is tied to parlour, robots and sheds rather than land, your runway for a 6–12 month “worse-before-better” transition is short. The more repayments depend on today’s litres, the less room you have for a bet that temporarily reduces them.
  • If you can’t name three realistic local buyers within driving distance who would pay more for what you already produce, you’re not “behind” on premium — you just don’t have a market yet.
  • If your breeding and replacement plan means 4–7 years to shift your tank’s profile, don’t build a business model that assumes Jersey-style milk is two winters away.
  • If a planned 3–5 year glide path preserves more land, cow and machinery equity than a forced liquidation would, that’s a win in cash terms — not a defeat in identity terms.
Strategic PathBest-fit scenario12-month cash requirementBiggest hidden risk30-day action
Tighten under the contractCost sits near 38–40ppl; within 12–24 months of renewalMinimal capex; focus on cost cutsStill exposed to processor cuts; no upsidePrint 12 months of bank statements + milk cheques onto one sheet
Premium edge experiment (5% of tank)Can name ≥3 local buyers; 150,000 L available£15,000–£40,000 upfront (bottles, crates, labour)Management time drag drops pregnancy rates; side project creeps to 20%List real buyer names within 30 miles; no list = not ready
Controlled glide exit (3–5 yr)Age/succession makes 10-yr turnaround unlikely; land equity intactFreeze non-essential capex; no new debtEmotional — hardest path to hold when milk ticks up for a seasonTwo-hour session: accountant + bank manager, same room, exit balance sheet
Go big on premiumMost debt secured against land; credible outside backing; anchor customer committed£100,000–£300,000+ for processing kit and working capitalNiche already occupied by Estate Dairy et al.; mis-timed plant investment is terminalMap existing chef/retailer relationships; ask for a volume commitment in writing

You can’t control which dairy stories the business pages choose to spotlight. The Youngs’ £5,000-to-£26M arc was always going to make headlines. You can control which game you’re actually playing.

Pull the 12-month milk cheque total, the average ppl and your best estimate of fully-loaded cost, and put them on one page before the end of the week. Find your row in the table above. Then answer the question out loud, in front of the person whose name is also on the loan:

If your fully-loaded cost is 42ppl and the cheque clears at 34.5ppl, are you running a dairy — or quietly funding your processor’s margin with your own equity?

Run Your Numbers

Farm Benchmark Snap Check — Drop in your herd’s litres, ppl, and fully-loaded cost per litre and see which row you’re actually standing in — High-Efficiency, Typical Mid-Size, or Debt-Heavy — before you decide whether to tighten under the contract, experiment at the edges, glide out, or bet on premium.

Learn More

The Sunday Read Dairy Professionals Don’t Skip.

Every week, thousands of producers, breeders, and industry insiders open Bullvine Weekly for genetics insights, market shifts, and profit strategies they won’t find anywhere else. One email. Five minutes. Smarter decisions all week.
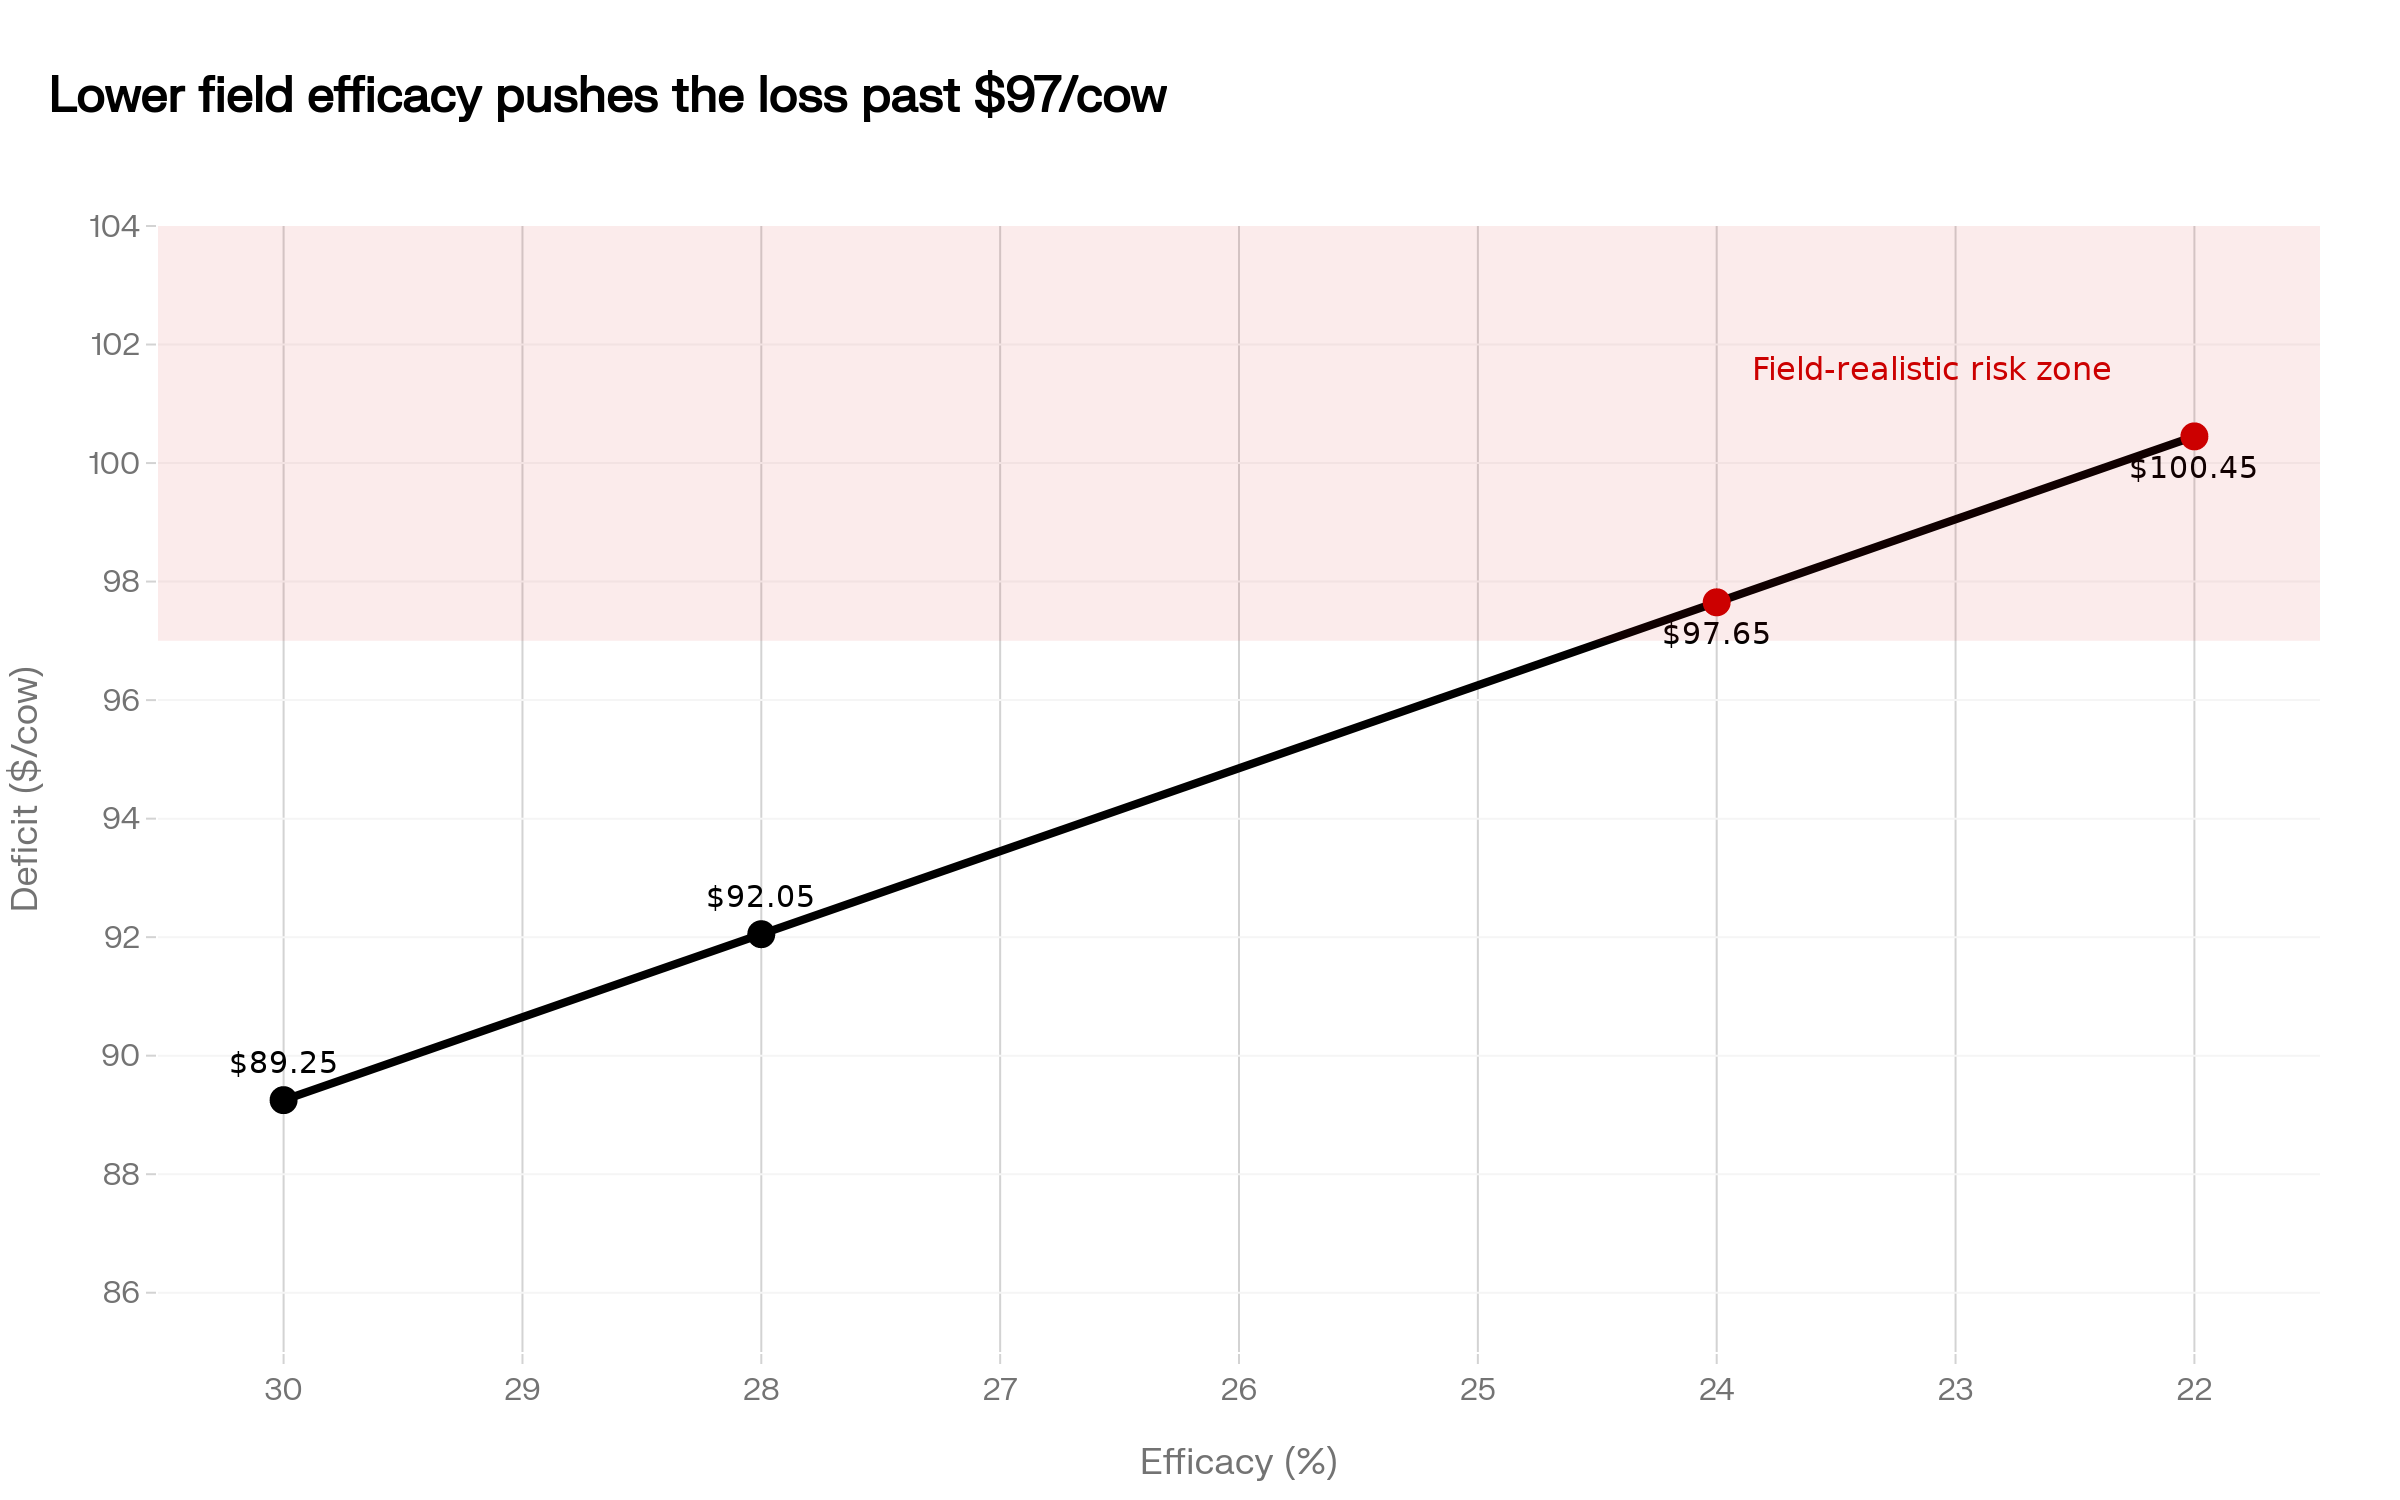
NewsSubscribe
First
Last
Consent

Wisconsin’s Prison Dairy Program Hits 88% Retention. Yours Runs at 38.8%.

Wisconsin’s Bureau of Correctional Enterprises has been training dairy workers since 2017. Internal program data reports roughly three times the retention of the industry’s standard hiring channel — and as of May 2026, no U.S. state dairy association has publicly announced a pipeline to use it.

Dairy worker retention

Tyson Gilbert cleared his first six months full-time on a Gippsland, Victoria dairy this spring after leaving Fulham Correctional Centre’s Nalu program. He hasn’t been interviewed by The Bullvine; this account draws on Dairy News Australia’s April 2026 reporting. Per that reporting, Gilbert described dairying as giving him structure, purpose and a trade, and said he hopes others follow the same path.

The bridge between his prison yard and his parlour was built by Victoria’s Demo Dairy Foundation, working alongside Gippsland operators who decided their labour problem wasn’t going to solve itself. The North American version of that bridge already exists inside Wisconsin’s Department of Corrections. As of May 2026, a review of publicly available materials from NMPF, Dairy Management Inc., Dairy Business Association, and a cross-section of state dairy organizations surfaced no announced equivalent pipeline.

The short version: Wisconsin’s Bureau of Correctional Enterprises reports 88% three-year retention on dairy graduates, against a U.S. industry turnover rate of 38.8% from the FARM Program’s Texas A&M analysis of 600-plus dairies. On a 500-cow crew, that’s about $153,000 a year in avoidable replacement cost. Graduates release monthly from four Wisconsin facilities with a Moraine Park credential in hand. Australia’s already plugged the same model in through Gippsland. As of May 2026, no U.S. state dairy association has publicly announced a comparable pipeline. The 30-day move: if you’re within 60 minutes of a Wisconsin minimum-security facility, have on-farm housing, and can name the herdsperson who’ll mentor the hire through the first 60 days, call Wisconsin DOC Communications this week.

What’s Actually Changing in Dairy Labor — and Why

Fulham’s Nalu program trains selected inmates for Dairy Australia–accredited certificates inside the facility. Live calves get trucked in. By the time a graduate walks out the gate, they know what a parlour smells like at 4 AM.

Wisconsin’s been running the equivalent since 2017. The Bureau of Correctional Enterprises (BCE), in partnership with Moraine Park Technical College, offers a Dairy Worker Training Certificate at the Waupun, Fox Lake, Oregon, and Green Bay correctional facilities. WUWM confirmed the program was active and expanding as of September 2022, and internal BCE reporting — as cited in Wisconsin corrections publications — places three-year post-release employment near 88% and non-recidivism near 75%. That’s roughly 15 percentage points better than the state’s general prison population on recidivism.

Now compare that against the 38.8% annual turnover rate for U.S. dairy labour — from the National Dairy FARM Program’s nationwide workforce survey, analyzed by Texas A&M across more than 600 U.S. dairies. Your crew walks out the door at a rate nearly three times higher than BCE graduates leave their first dairy job. The program’s there. Graduates are releasing every month. The credential’s accredited. What’s missing is the coordination layer Gippsland’s operators and Demo Dairy Foundation built together.

How This Plays Out on Real Farms

Here’s what the retention gap looks like with a payroll attached to it.

Run the numbers by herd size and the gap stops being abstract. Replacement-cost estimates vary by source: National Dairy FARM Program materials and Dairy Herd Management put entry-level parlour turnover at $3,000 to $25,000 per departure. Apply the standard 1.5× annual-salary-plus-recruitment HR framework to a typical $35,000–$40,000 parlour wage base and the figure pushes toward $55,000–$60,000 for a fully burdened departure.

The table below models the upper-bound figure ($56,925) against a 38.8% industry turnover rate versus BCE-equivalent retention — annualized at roughly 12% from the reported 88% three-year figure.

Herd SizeCrewStatus Quo: 38.8% TurnoverBCE Pipeline: ~12% AnnualizedAnnual Gap Per Farm
200 cows6$132,000$41,000~$91,000
500 cows10$221,000$68,310~$153,000
1,500 cows25$552,000$171,000~$381,000

Table uses the upper-bound fully-burdened figure from the 1.5× HR framework. Substitute $3,000–$25,000 per departure from the FARM Program range and the gap narrows proportionally — the Quick Math below gives the conservative version. Annualized BCE retention is derived from the reported 88% three-year figure; year-over-year variance unknown.

Quick math for your dairy: (Crew Size) × (Your Current Turnover %) × $25,000 conservative loss per hire = your annual leaking cash. On a 10-person crew at 38.8% turnover, that’s ~$97,000 a year even at the conservative end.

The federal Work Opportunity Tax Credit offered up to $2,400 per qualified ex-felon hire — roughly $4,800 in annual offset on two placements — under the authorization that expired December 31, 2025. Extension legislation has moved through congressional discussion in 2026; confirm current authorization status with your tax preparer before factoring the credit into hiring math. Even stripped of the credit, two full-time workers recovered every year on a single farm is the exposure that moves the annual-meeting conversation.

What We Couldn’t Confirm Before Print

Three items remain open as of publication: BCE’s 2026 operating status (last public confirmation September 2022), the current WOTC authorization status, and the employer-facing direct line for Wisconsin DOC’s Reentry Unit — which operators can request through Wisconsin DOC Communications at doc.wi.gov. Reader-facing transparency is part of why this article runs now rather than waiting. The retention gap doesn’t pause for verification cycles. Updated detail will appear in the Bullvine Weekly as confirmations close.

The Mechanics Behind the Numbers

Your default hiring channels weren’t built for retention. They were built for availability.

Estimates of immigrant dairy labour vary by scope. Texas A&M and the National Milk Producers Federation place the share around 51% of U.S. hired dairy labour. A 2023 UW-Madison School for Workers survey pegs the Wisconsin-specific figure at 70%, with more than 10,000 undocumented workers carrying the state’s dairy workload. Farms relying on immigrant workforces produce roughly 79% of U.S. milk either way.

That workforce is structurally transient by legal design. H-2A rules restrict dairy to seasonal work under a year, which pushes most year-round positions onto workers whose immigration status creates a permanent incentive to leave or hide. The June 2025 federal immigration enforcement action at Outlook Dairy in New Mexico, as reported by Cowsmo and covered previously by The Bullvine, reduced the farm’s workforce from 55 to 20 in a single morning. Recovery options under current H-2A rules are limited.

BCE graduates change that equation. Domestic residents with verified work history. Pre-screened at no cost — corrections staff and Moraine Park coordinators have already watched them handle live animals. They arrive with the credential in hand.

State dairy associations operate on member mandate, and publicly visible member priorities in 2026 centre on H-2A reform and federal immigration policy. Reentry pipelines require a different organizing constituency. The handshake that makes Fulham work isn’t the prison. It’s the industry body on the other end of the call.

BCE has the graduates, the dairy experience, and the Moraine Park credential. Based on publicly available program materials as of May 2026, the employer-facing process is self-initiated: operators contact BCE to request candidates, rather than the program matching candidates to operations proactively. No dedicated outbound coordinator matching graduates to specific dairies. Just a phone waiting to ring.

DimensionStandard Hiring ChannelBCE / Corrections PipelineEdge Goes To
3-Year Retention Rate~61% (inverse of 38.8% annual turnover)88%BCE
Pre-Screened SkillsResume only; unverifiedMoraine Park Dairy Worker Certificate; live animal handling confirmedBCE
Recruitment Cost$3,000–$56,925 per departure (FARM Program range)$0 pre-screening by corrections staff + Moraine Park coordinatorsBCE
Legal Work AuthorizationVariable; structural transience risk under H-2ADomestic residents; verified work historyBCE
Immigration Enforcement RiskHigh (WI: ~70% immigrant workforce; 10,000+ undocumented)NoneBCE
Release CadenceApplicant-driven, unpredictableMonthly from 4 WI facilitiesBCE
Coordination SupportNone (standard job posting)Self-service match; no outbound coordinatorTie (both limited)
WOTC Tax Credit (if active)Not applicableUp to $2,400/hire for qualified ex-felon; ~$4,800/2 placementsBCE
Non-Recidivism RateN/A~75% (15 pts above WI general prison population)BCE

How Much Does Waiting 30 Days Actually Cost You?

Run your own version using the Quick Math formula. Your gap lands somewhere in the $3,000–$56,925 per-departure span, depending on how you count the indirect losses. A 200-cow operation at $25,000 per departure and 38.8% turnover is sitting on roughly $58,000 a year in avoidable replacement cost. A 500-cow at the same conservative per-departure figure is closer to $97,000.

The 30-day action is short. If your operation has on-farm housing available, sits within 60 minutes of a Wisconsin minimum-security facility, and you can name the specific herdsperson who’d mentor a new hire, request placement in the BCE employer pool through Wisconsin DOC Communications this week. Operators can reach Wisconsin DOC through the department’s public-information channel at doc.wi.gov and ask to be routed to the Reentry Unit and BCE Transition Program. Making the call doesn’t obligate you to hire anyone. It puts your operation in the pool Gippsland farms have already been drawing from.

Is Your State Dairy Association Actually Doing Anything About This?

Fair question for the next board meeting. NMPF’s publicly visible 2025–2026 labour advocacy, per the federation’s published dairy-policy agenda and its testimony before the House Agriculture Committee during the 2025 farm-bill debate, centres on year-round H-2A eligibility and legal status protections for the existing immigrant workforce. That’s a distinct policy problem from building a new domestic hiring channel. Dairy Management Inc., operating under the federal dairy checkoff’s demand-promotion mandate, does not publicly report farm-level labour-supply coordination as part of its current work.

The Fulham/Gippsland model works because a regional industry body — Demo Dairy Foundation alongside local Gippsland operators — owns the coordination work. It takes the reputational risk. The public record to date shows no U.S. equivalent announced.

If you’re watching for who moves first, the New York dairy workforce focus group that convened in August 2025 — announced by WWNY in Watertown, tied into Cornell’s Dairy Specialist Apprenticeship expansion — is the most structurally Gippsland-equivalent body on the continent. New York’s ban-the-box hiring law reduces the political exposure a Wisconsin association would face championing the same program. Wisconsin’s infrastructure is stronger. But the Wisconsin politics right now are harder.

Governor Evers signed Wisconsin Act 240 in April 2026, addressing workforce authorization for DACA recipients and credentialed immigrant labour. The first Watertown board meeting on a corrections-to-dairy pipeline may happen before the first Madison one does.

Why the Mentor Is the Whole Ballgame

Path 1 lives or dies on one question: who on your crew will sit with this person through the first 60 days?

Reentry after a multi-year sentence isn’t just a housing and transportation problem. Graduates come out with parole appointments, court-ordered check-ins, sometimes continuing substance recovery, and the cognitive whiplash of making a dozen small decisions a day after years of having none to make. The first time a BCE graduate has to troubleshoot a pulsator at 5 AM with no supervisor in the barn, what they need isn’t another manual. It’s a phone number they can call without feeling like they’re failing.

That’s why the Gippsland model works and why a self-service BCE match tends to fail without preparation. Demo Dairy Foundation’s coordinators run 30/60/90-day check-ins. They handle the awkward first conversations between a graduate and a crew that didn’t ask for this hire. The early friction that would otherwise end the placement in week three gets absorbed by someone whose job it is to absorb it.

On a Wisconsin farm making this hire without Gippsland-style coordination, that work falls on one person. Not the owner. A specific herdsperson — someone who already mentors new hires, who runs the parlour rotation, and who the rest of the crew respects. If you can’t name that person before you call DOC, the placement will fail regardless of the candidate’s quality. That’s the single biggest predictor of whether the 88% retention number shows up on your farm or only on someone else’s data sheet.

Options and Trade-Offs for Farmers

PathActionBest FitTimelineAnnual Cost if You WaitKey Risk
1 — Direct BCE ContactContact Wisconsin DOC Reentry Unit via doc.wi.govWithin 60 min of WI min-security facility; on-farm housing available; mentor named30 days$97k–$221k+ (10-crew)No coordinator — you carry the relationship work
2 — County Reentry CoalitionContact regional Workforce Development Board before DOC200–500 cow ops in WDA 10 or Pathways Home 2 western counties60–90 days$58k–$132k (6-crew at $25k conservative)Coverage gap — outside designated counties, no post-release support
3 — Association PressureSend 88%-vs-38.8% math to state dairy association as financial exposure briefOperations with state-level influence; not positioned to hire directly1–3 years$221k/yraccumulates annually at 500-cow scaleSlowest path; depends on board mandate shift
4 — Status QuoContinue existing recruitment; wait for federal immigration reformN/AIndefinite$97k–$552k/yr depending on scaleFull exposure; no hedge against enforcement actions

Your next 90 days have four paths through this. They aren’t mutually exclusive.

Path 1 — Direct BCE employer contact (the 30-day move). If you’re within 60 minutes of a Wisconsin minimum-security facility and you have on-farm housing available, contact Wisconsin DOC’s Reentry Unit through doc.wi.gov and request pre-screened candidates with Dairy Worker Training Certificate credentials releasing to your county. When it works: open position, willing mentor named, housing ready inside 30 days. Risks: the program runs as a self-service match. You’re carrying the relationship work Gippsland coordinators handle in Australia. Without a named mentor, placements fail in the first 60 days regardless of candidate quality — see the section above.

Path 2 — County reentry coalition partnership. Wisconsin Pathways Home 4X, administered by the Workforce Development Board of South Central Wisconsin with U.S. Department of Labor funding, serves Columbia, Dane, Dodge, Jefferson, Marquette, and Sauk counties. Eligibility runs 20–270 days pre-release. A separate western footprint — Pathways Home 2 through the West Central Wisconsin Workforce Development Board — covers Barron, Chippewa, Clark, Dunn, Eau Claire, Pepin, Pierce, Polk, and St. Croix counties. When it works: 200–500 cow operations with one or two open positions and no dedicated HR function. Risks: milk outside those counties and you’re on your own for post-release support infrastructure.

Path 3 — Association pressure campaign. Send your state dairy association the 88%-versus-38.8% retention math. Not a program request. A financial exposure briefing. Works if you’re not positioned to hire directly but your operation has state-level influence and wants systemic movement. It’s the slowest of the four paths by years.

Path 4 — Status quo. Continue with existing recruitment channels and wait for federal immigration reform. The cost? The six-figure turnover gap, every year, until Washington moves. Cross-reference Bullvine’s earlier coverage of the Wisconsin operation that cut turnover below 1% — the kitchen-table math on that farm is the counterpoint to Path 4.

Key Takeaways

Decision thresholds, not a summary.

  • If your annual turnover is above 30% and your crew is 10 or more, run the per-departure formula against your last 36 months of turnover data. Your gap lands somewhere between $30,000 and $150,000-plus depending on which figure reflects your fully loaded cost.
  • If your operation sits within 60 minutes of a Wisconsin minimum-security facility AND you have on-farm housing available within 30 days AND you can name the mentor on your current crew, make the Wisconsin DOC call this week.
  • If your annual turnover cost is under $50,000 or your crew is under six, defer this model. The coordination investment doesn’t pay back at that scale.
  • If you’re in WDA 10 (Columbia, Dane, Dodge, Jefferson, Marquette, Sauk) or the Pathways Home 2 western counties, call your regional Workforce Development Board before you call DOC. Shared support infrastructure separates a 90-day failure from a three-year retention.
  • If your parlour starts at 4 AM, confirm any candidate’s parole reporting schedule before you make the offer. Normal question. Parole officers expect it.
  • If your first open position is parlour milker or calf care, a BCE graduate arrives with verified skills. Equipment management or independent judgment from week one? Wrong starting position.
  • If your state dairy association has never seen the 88%-versus-38.8% retention math, sending them that single data point is the highest-leverage move you can make this month.

Editorial View — The Question Worth Sitting With

The following reflects The Bullvine’s editorial view, not neutral reporting.

The public record to date shows no U.S. state dairy association has announced an evaluation of a BCE-style pipeline. That may change. The retention math lives in association members’ own FARM Program data, the Wisconsin infrastructure is documented, and the graduates are releasing every month. Boards that examine the exposure and choose against a pipeline for regulatory, liability, or political reasons will have a defensible position. Boards that don’t examine it will have a harder one.

Run Your Numbers

Snap Check — Plug your crew size, turnover rate, and wage base into Snap Check to put a real dollar figure on what your current hiring channel is costing you. It turns the 38.8% versus 88% retention gap into a number you can carry into your next board meeting or lender call.

Complete references and supporting documentation are available upon request by contacting the editorial team at editor@thebullvine.com.

Learn More

The Sunday Read Dairy Professionals Don’t Skip.

Every week, thousands of producers, breeders, and industry insiders open Bullvine Weekly for genetics insights, market shifts, and profit strategies they won’t find anywhere else. One email. Five minutes. Smarter decisions all week.
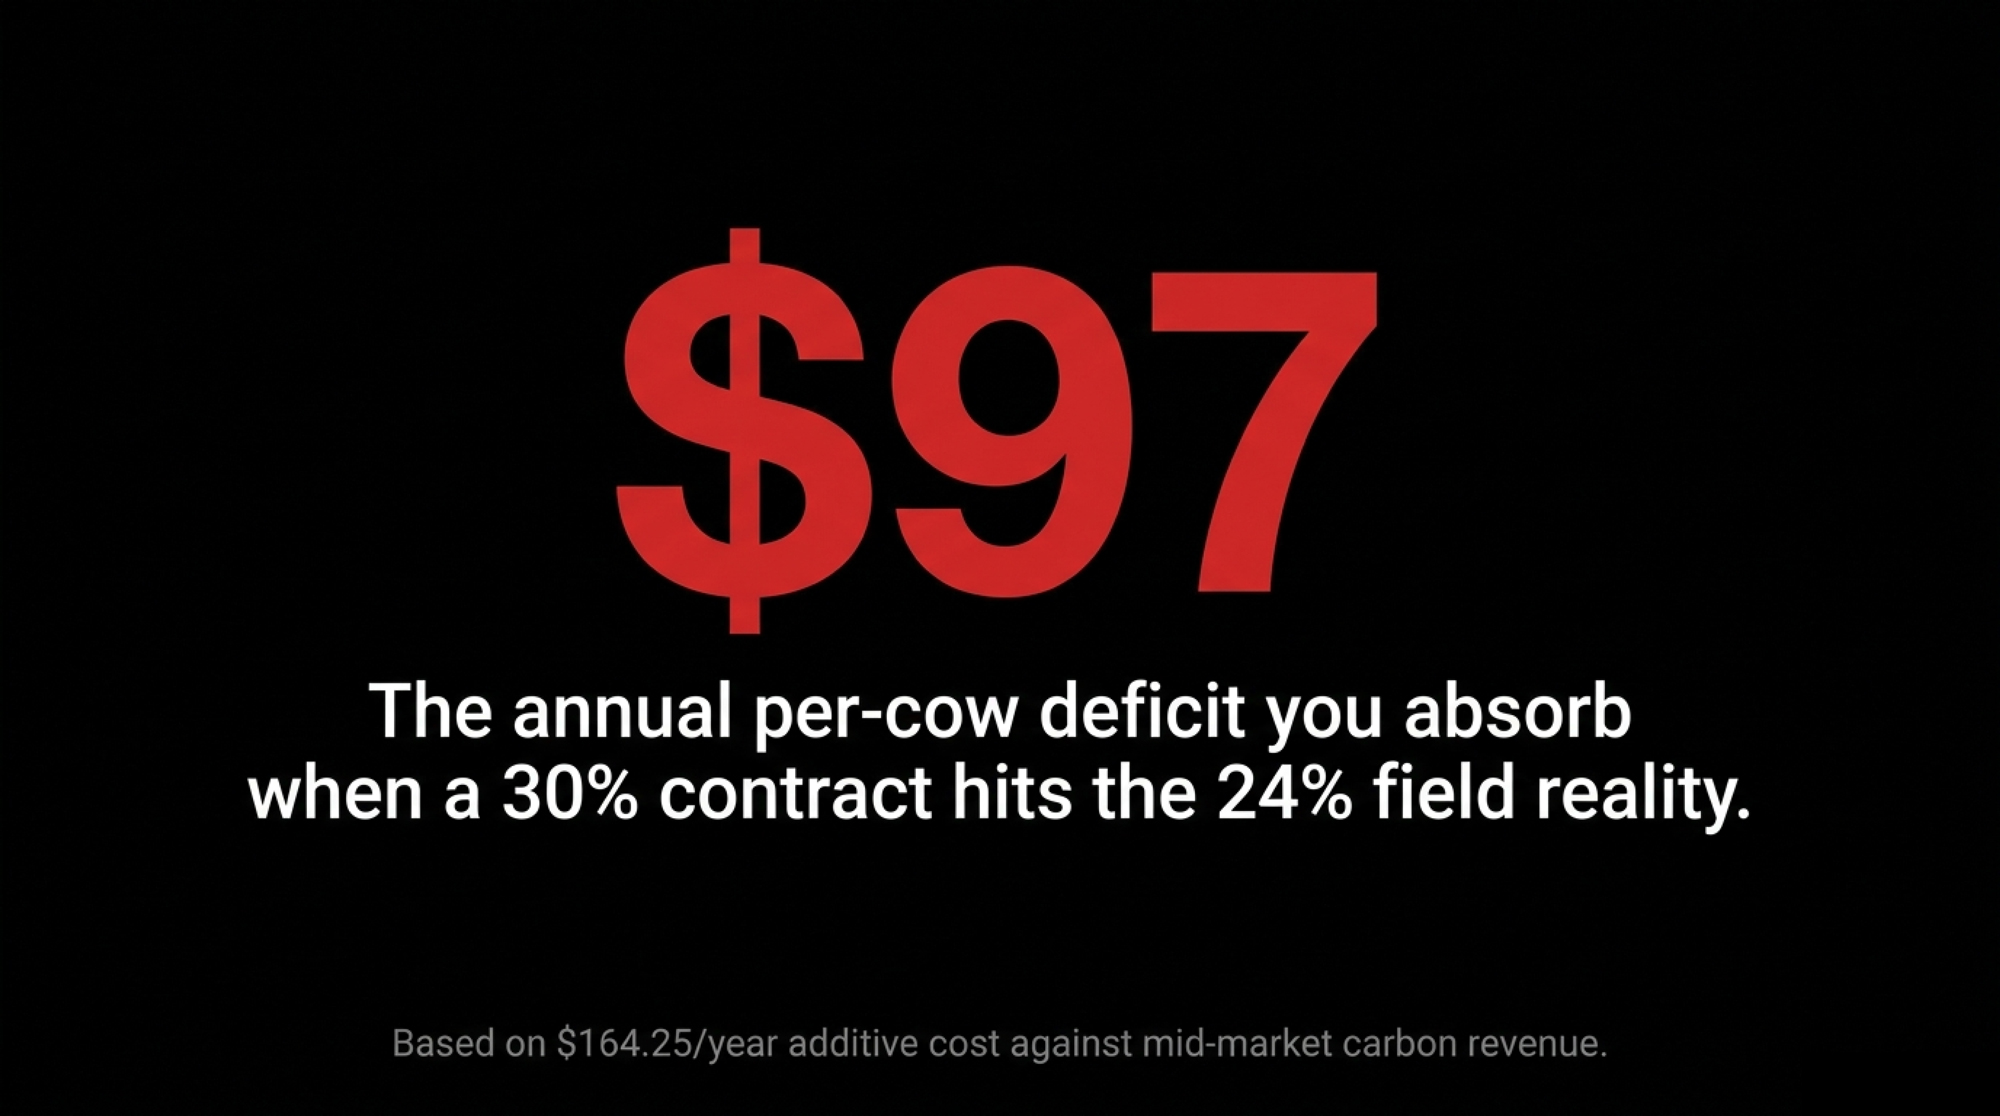
NewsSubscribe
First
Last
Consent

22 Tuesdays at 37% Beef: The $87,500 Hole in a 480-Cow Dairy’s 2027 Heifer Pen

22 Tuesdays. 540 services a year. At 37% beef-on-dairy through H1 2024, a composite 480-cow Upper Midwest herd is now 25 heifers short of its 154-head replacement need at $3,500/springer.

Executive Summary: Beef-on-dairy hit 32.8% of U.S. dairy services in NAAB’s 2025 report, and USDA NASS’s January 2026 inventory printed 3.905 million replacement heifers — the lowest in 48 years. For a composite 480-cow Upper Midwest herd that ran 37% beef through H1 2024, the math now shows a 4–25 head annual gap against a 154-head replacement need, translating to $30,000–$87,500/year in outside-springer liability at USDA AMS’s April 2026 prices ($3,010 national, $3,500–$4,500 Panhandle top pens). The CME Class III strip has $18.70–$19.15 milk on the board July–October 2026, so held cull cows finally ship — and the replacements aren’t in the calf barn. Lenders writing 24-month paper have moved projected 2027 fresh heifer count (at 0.79 calf-to-fresh, not 0.90) to page one of the dairy file. The rewrite — 25% beef cap, 35% sexed on top cows — costs roughly $71,500/year in foregone beef revenue on a 480-cow base, but produces ~60 surplus springers/year into a short market. Herds above 30% beef share with DSCR under 1.20 for two of the last three quarters should treat this as a balance-sheet problem this week, not a breeding-season one.

Beef-on-dairy heifer math

NAAB’s 2025 annual semen sales report put beef-on-dairy at 32.8% of U.S. dairy cow services — 8.1 million beef-on-dairy units against 10.6 million sexed dairy and 6.0 million conventional dairy, for 24.7 million total. USDA NASS’s January 2026 Cattle Inventory printed dairy replacement heifers 500+ lbs at 3.905 million head. Lowest in 48 years.

For a 400–600 cow Upper Midwest operation that rode the cheap-milk stretch hard, that national math is now a local problem: where do your 2027 replacement heifers come from, and what do they cost at $18+ milk?

Editor’s note: the sections below reference an illustrative 480-cow Upper Midwest operation. The region, herd size, and figures are a composite, not a specific farm. No individual producer, family, or private business is being described.

The Trade That Looked Airtight Through H1 2024

For much of the first half of 2024, USDA AMS Class III announced prices ran roughly $14–$16/cwt, with prints near $13 early in the year — before the late-2024 rally carried the board past $20 by September. The cheap-milk pressure that reshaped breeding sheets was H1 2024, not the year in aggregate. That’s the stretch this story is about.

University of Wisconsin Center for Dairy Profitability and Iowa State Ag Decision Maker cost-of-production work through 2024 put full costs north of $20/cwt on many Upper Midwest operations. At $13–$16 milk in H1 2024, that’s a $4–$7/cwt negative margin on base milk before the H2 2024 sign flip. You can only eat that kind of spread for so long before the semen order starts solving for cash flow instead of pipeline.

Beef-cross calves off dairy cows cleared $1,400–$1,600 at Upper Midwest sale barns through much of 2024, consistent with Wisconsin and Iowa extension weekly livestock auction summaries. At 150 beef-cross services a year on a 480-cow herd, that premium over a Holstein bull calf added $150,000–$180,000 in calf revenue. Real money when the milk check was underwater.

Producers who ran heavy beef-on-dairy through that stretch weren’t making a mistake. They were responding to a cash-flow crisis you could measure in the milk check. The problem isn’t the decision. It’s the decision stacked 22 Tuesdays deep.

What Everyone Assumed — And Why the Data Says the Opposite

The prevailing view heading into 2026 — including The Bullvine’s own January 2026 analysis — was that the rally would be capped by a wall of milk.

The data says the opposite. NAAB 2025: 8.1 million beef-on-dairy units. USDA January 2026: 3.905 million replacement heifers, the lowest since the late 1970s. ISU Extension’s weekly tracker showed federally inspected dairy cow slaughter below year-ago for 86 of 88 weeks through mid-May 2025, producing a retention overhang of roughly 600,000 cows into late 2025 as estimated in published Rabobank and CoBank Knowledge Exchange dairy commentary. Q1 2026 USDA AMS federally inspected slaughter data show dairy cull shipments flipping to roughly +40,000 head above year-ago.

The release has started. The rally isn’t getting capped by oversupply. It’s getting amplified by a supply hole built one Tuesday at a time.

Related Bullvine analysis: 2026 Dairy Rally Or Dead-Cat Bounce? The Risk and Margin Math Behind Today’s Wall of Milk — held-cull retention and the 2026 Class III futures curve.

What Does Beef-on-Dairy 2026 Actually Cost a 480-Cow Upper Midwest Herd?

Picture an illustrative 480-cow Upper Midwest herd that ran beef-on-dairy in the 35–40% range of services for nearly two years through early 2025. Each Tuesday, the decision felt sharp: a $1,400 calf check in nine months, or a dairy heifer that might or might not be milking 27 months out.

Twenty-two Tuesdays at 37% isn’t the same herd as twenty-two Tuesdays at 25%. It’s a heifer inventory the lender can see on the balance sheet and the next operator can count in the calf barn. The breeding sheet is balance-sheet construction, even when it feels like a cash decision.

That’s where the trap closes. The USDA AMS National Dairy Replacement Heifer Report showed springers averaging $3,010/head nationally in April 2026, with top pens clearing $3,500–$4,000. Panhandle and California auction reporting carried by USDA AMS regional summaries has shown quality springers at $3,500–$4,500 through April 2026 — a short market likely to persist into 2027.

Related Bullvine analysis: The Panhandle Springer Tax (April 21, 2026) — regional springer-price variance.

On the CME, the Class III futures strip as of late April 2026 crossed $18/cwt in June 2026 and ran in the $18.70–$19.15 band from July through October.

At $18+ milk, the math on a held cull cow flips. She ships. The replacement you were going to raise instead of buy is still 27 months out.

Running the Numbers

Illustrative — Composite 480-Cow Upper Midwest Herd, 2025 Breeding Season

Inputs (USDA AMS April 2026; NAAB 2025; heifer-rearing completion benchmarks consistent with University of Wisconsin Extension and Penn State Extension published work through 2024–2025):

MetricOld Plan (37% Beef)Sexed Crunch (12% Sexed)Rewritten Plan (25% Beef, 35% Sexed)
Total Services/Year540540540
Dairy Services340340405
Beef Services200200135
Weighted Female Share (Dairy)60%56%67%
Female Live Calves204190271
Fresh Heifers @ 0.79 Completion~161150~214
Gap vs. 154-Head Need+7−4+60
Annual Outside-Springer Liability @ $3,010$0$12,040$0
Annual Outside-Springer Liability @ $3,500$0$14,000$0
Foregone Beef Revenue vs. Old Plan$0~$71,500
Surplus Springers Available to Sell/Year~7 surplusDeficit~60 surplus
  • Milking herd: 480 cows; services per year: ~540.
  • Prior mix: 37% beef-on-dairy, 45% conventional dairy, 18% sexed dairy.
  • Cull rate: 32% (upper end of the 28–35% industry range).
  • Female live-calf share: ~49% on conventional; ~88% on sexed dairy.
  • Calf-to-fresh completion rate: 0.79 (within recent extension heifer-rearing benchmarks).
  • Beef calf net premium over Holstein bull calf: $1,000–$1,200/head (2024 Upper Midwest sale barn range).
  • Replacement springer cost: $3,010 national average; $3,500 top pen (USDA AMS, April 2026).

Method note: the model treats services as equivalent female-calf generators at their published female-share rates and doesn’t adjust for the typical 3–5 point conception gap between sexed and conventional. That’s the standard barn-math approach and is conservative for the deficit case.

Weighted female-share formula used throughout: Weighted female share on dairy services = (conventional share of dairy services × 49%) + (sexed share of dairy services × 88%).

Step 1 — Heifers Needed to Hold 480 Cows

  • Milking herd × cull rate: 480 × 32%
  • Result: 154 fresh heifers/year

The Bottom Line: 154 is the number the lender is comparing against. Everything else in this box either clears that bar or doesn’t.

Step 2 — The Production Reality at 37% Beef-on-Dairy

  • Dairy services: 540 × 63% = 340
  • Conventional share of dairy services: 45/63 = 71%; sexed share: 29%
  • Weighted female share: (0.71 × 49%) + (0.29 × 88%) = 60%
  • Female calves: 340 × 60% = 204
  • Fresh heifers at 0.79 completion: ~161

The Bottom Line: Under the 37% beef plan, you’re one bad pneumonia outbreak away from a replacement deficit. Zero margin for error.

Step 3 — The Sexed-Crunch Scenario

Pull sexed from 18% to 12% of all services (keep beef at 37%, conventional at 51%):

  • Dairy services: still 340
  • Conventional share rises to 81%; sexed drops to 19%
  • Weighted female share: (0.81 × 49%) + (0.19 × 88%) = 56%
  • Female calves: 340 × 56% = 190
  • Fresh heifers at 0.79 completion: ~150 — against a 154-head need

The Bottom Line: Cut sexed to preserve cash and the gap opens by a full semen order. A 4-head deficit at $3,010 national or $3,500 top-pen springers is $12,000–$14,000/year walking out the gate. Slip further, and you’re buying.

Step 4 — Outside-Replacement Liability When the Cushion Goes

For every 10-head annual shortfall against the 154-head need:

  • At $3,010 national avg: 10 × $3,010 = $30,100/year
  • At $3,500 top-pen: 10 × $3,500 = $35,000/year
  • Two-year exposure per 10-head gap: $60,200–$70,000

Herds that drifted deeper — 45% beef share, 10% sexed — widen the gap to 20–25 head/year. At $3,010, that’s $60,200–$75,250/year. At $3,500 top pen, $70,000–$87,500/year.

The Bottom Line: This is where the headline number lives. The $87,500/year is the top end of the drift case at the Panhandle springer price — not the central 480-cow composite. It’s what a 25-head gap costs at $3,500/head, full stop.

Step 5 — Rewriting the Plan: 25% Beef Cap, 35% Sexed on Top Cows, 40% Conventional

  • Dairy services: 540 × 75% = 405
  • Sexed share of dairy services: 35/75 = 47%; conventional: 53%
  • Weighted female share: (0.53 × 49%) + (0.47 × 88%) = 67%
  • Female calves: 405 × 67% = 271
  • Fresh heifers at 0.79 completion: ~214

That overshoots the 154-head target by ~60 head/year. The overshoot is the point — room to cull harder, sell surplus springers into a tight market, or bank replacements against a down year.

Step 6 — Cost of the Rewrite

Beef services drop from 540 × 37% = 200 to 540 × 25% = 135. That’s 65 fewer beef services/year. At a $1,100/head average net premium over Holstein bulls, foregone beef revenue ≈ $71,500/year.

The Bottom Line: Give up ~$71,500/year in calf revenue for 24 months to avoid $30,000–$87,500/year in outside-replacement liability, build a ~60-head/year springer surplus, and turn the 2028 herd into an asset instead of a gap. The beef check is cash this quarter. The heifer is inventory that compounds.

Scaling down to 300 cows: multiply Steps 1 through 6 by 0.625. A 300-cow herd at the same behavior needs ~96 fresh heifers/year, runs the same per-head economics on springers and beef calves, and faces foregone-beef trade-offs near $45,000/year to close a proportional gap.

Old Plan vs. Sexed Crunch vs. Rewritten Plan — 480-Cow Upper Midwest Composite

MetricOld Plan (37% beef)Sexed Crunch (12% sexed)Rewritten Plan (25% beef, 35% sexed)
Dairy services340340405
Weighted female share on dairy services60%56%67%
Female live calves204190271
Fresh heifers at 0.79 completion~161~150~214
Gap vs. 154-head need+7−4+60
Annual outside-replacement liability at $3,010 / $3,500$0 / $0$12,000 / $14,000$0 / $0
Foregone beef revenue vs. 37% plan$0~$71,500

Visual opportunity: horizontal bar graphic comparing “fresh heifers produced vs. 154-head need” across the three scenarios, with a pull-quote of the $30K–$87.5K liability range. Render for Instagram square, LinkedIn 1200×628, and newsletter header.

The Turn: Why This Stopped Being a Breeding Decision

The quandary two years ago pushed culling rates down. Those held cows have to ship eventually — and when they do, the replacements aren’t there. That’s the spine of what’s changed: 2024’s breeding decisions were often right cow-by-cow. The problem is what they stacked into herd-by-herd.

One ag lender reviewing dairy files in the first half of 2026, speaking on background, told The Bullvine that the projected 2027 fresh heifer count and the completion-rate assumption behind it is now the first question on every dairy file. A year ago, that question didn’t come up until page three of the package. That’s not a credit-policy memo — that’s a loan officer who’s tired of getting surprised at renewal.

That shift — from income statement to balance sheet as the first read — is the turn. Beef-on-dairy cash flow is an income-statement event. The replacement shortfall is a balance-sheet event. Lenders writing 24-month paper in 2026 are weighing both sides of that ledger, not just the cash one.

Related Bullvine coverage: The Dairy Succession Math — why the breeding sheet has become a succession document.

Why the Old Playbook Stopped Working

The old playbook was simple. Ride beef checks when milk is soft. Ride milk when it rallies. Figure out replacements when you have to. It worked in 2012. It worked in 2016. Arguably worked in 2020.

What changed between then and now is every input the old playbook depended on:

  • Replacement supply — Then: cheap springers available from neighbors rotating out. Now: 3.905 million dairy replacement heifers in USDA NASS’s January 2026 inventory, a 48-year low, with the short market already priced at $3,010 national / $3,500–$4,500 Panhandle top pens in April 2026 AMS reporting.
  • Completion rates — Then: 90% calf-to-fresh was a “good enough” spreadsheet assumption most herds could hit. Now: 0.79 is the honest number in recent University of Wisconsin and Penn State Extension heifer-rearing benchmarks — labor, feed, and respiratory pressure stacked into rearing economics.
  • Cull timing — Then: an open cow moved promptly because nothing else paid for her feed. Now: 86 of 88 weeks below year-ago slaughter through mid-May 2025 (ISU Extension) built an estimated 600,000-cow retention overhang; Q1 2026 is already unwinding at +40,000 head vs. year-ago in USDA AMS federally inspected slaughter.
  • Milk outlook — Then: a $17 print was a normal good year. Now: the CME Class III strip has $18–$19 milk on the board for H2 2026, so the held cull cow ships into a rally, not a trough.
  • Lender read — Then: DSCR and the milk check carried page one. Now: the projected 2027 fresh heifer count carries page one, per dairy files reviewed in the first half of 2026.
  • Succession backstop — Then: a neighbor’s dispersal was a cheap replacement option. Now: land-grant family-business research and USDA ERS farm-typology work consistently find multi-generational dairy transitions remain difficult, with debt structure and unwritten transition terms among commonly cited failure points.

When those six stack, “figure out replacements when you have to” becomes “write a six-figure check into an auction ring that’s already short.”

Where’s the 2027 Heifer Coming From at Your Barn?

That’s the question the rewrite has to answer. Not in theory. In writing.

The composite 480-cow herd doesn’t redesign its breeding sheet because someone yells at a webinar. It redesigns because someone at the operation runs the math at 0.79 calf-to-fresh completion — not the 0.90 figure that still shows up in a lot of parent-generation spreadsheets — and produces a number the lender can see.

On a herd already drifting short on replacements, another year of heavy beef-on-dairy checks doesn’t strengthen the credit. It deepens the pipeline liability on the balance sheet faster than it improves DSCR on the income statement. The cash looks fine until it doesn’t.

Related Bullvine coverage: The Tiered Breeding SOP — sexed-semen strategy and tiered breeding SOP discipline.

What Does the 2026 Pipeline Mean for 400–600 Cow Herds?

Depends on whether the pipeline is sized to the barn or to the bank account.

Herds that held beef-on-dairy around 20–25% through 2023–2024 and kept sexed dairy disciplined on top cows have room to capture calf-check upside without mortgaging their 2027 herd. Herds that drifted to 35–45% beef share through the H1 2024 cheap-milk stretch are staring at the outside-replacement math.

Regional variance matters. Panhandle and California operations face a short springer market and will likely see the $3,500–$4,500 top-pen band persist into 2027. Upper Midwest and Northeast herds with in-house rearing have more optionality but less room on feed and labor. Herds without a written breeding SOP carry a third risk — drift. That’s how 2023’s 25% beef share became 2024’s 37%. Nobody makes that decision on purpose. It happens anyway.

Canadian context: this piece is U.S.-scoped. Ontario and Quebec operators under supply management face different replacement dynamics — quota value, component premiums, and P5 mechanics change the math. The breeding-SOP discipline and the 0.79 completion benchmark still apply. The U.S. price signals don’t.

The U.S. signal to watch: your local springer premium over USDA’s $3,010 national average. Read this as an interpretive signal, not a published benchmark. Below $200 over = pipeline rebuilding. $500+ over = your region is still importing heifers that aren’t there.

The 30/90/365-Day Playbook for Herds Like the 480-Cow Composite

Starting points, not prescriptions. Match to your own records.

30-Day Actions — Urgent Checks

  • Pull your last three pregnancy check reports and calculate your actual beef-on-dairy share of services over the last 12 months. Trigger: above 30% and not adjusting → front of the to-do list. Requires: herd management software export, 20 minutes.
  • ⚠️ Backfire Watch: a single quarter can swing 5–7 points. Use the 12-month trailing number, not last week’s — a hot-weather conception dip can make the sheet look fine when the 12-month trend is already past 35%.
  • Run your 2026 and 2027 projected fresh heifer counts using a 0.79 calf-to-fresh completion rate, not 0.90. Compare to your replacement need at your current cull rate. Requires: your own herd records and a spreadsheet.
  • ⚠️ Backfire Watch: if you don’t separate sexed vs. conventional female share in the model, the gap will look smaller than it is. A 29% sexed share inside dairy services looks fine until you realize sexed is carrying 88% female while conventional drags the blended rate down.
  • Request written quotes from at least two heifer yards on Q4 2026 and Q1 2027 springer availability and price per head. Requires: phone calls, not emails. Put the numbers on paper.
  • ⚠️ Backfire Watch: verbal quotes from a short market don’t hold. In April 2026, the spread between the $3,010 national average and $3,500–$4,500 top-pen regional prints is wide enough that a handshake number at month-end can be $500/head light of the invoice at delivery.
  • Red-flag trigger: if term-debt coverage has been under 1.20 for two of the last three quarters per your lender’s or CPA’s method and your beef-on-dairy share is above 30%, move this to the top of the list this week. DSCR 1.20 is a common agricultural-lending benchmark; confirm the exact method your own lender uses.

90-Day Actions — Structural Adjustments

  • Write a one-page breeding SOP. Rank cows into three tiers. Hard-cap beef-on-dairy share (many herds in this position are landing at 20–25%). Name a quarterly review date. Sign it. Tape it to the milkhouse wall. Email it to your lender. Requires: a genomic or index-based cow ranking, buy-in from the person ordering semen, a written target for heifer calves born per year.
  • ⚠️ Backfire Watch: a cap set too tight on a cash-short herd can trip an operating line. Model the cash-flow impact — the rewrite gives up ~$71,500/year in beef revenue on a 480-cow base — before you sign. A 90-day phase-in beats a Day 1 hard cap if the milk check can’t absorb it.
  • Put capital structure on the table alongside the breeding plan if a successor or partner is in the conversation. Staged buy-ins, holding entities for land, step-down retirement draws — they belong in the same meeting as the semen order. Requires: an ag-law attorney and a CPA who has closed a dairy transition.
  • ⚠️ Backfire Watch: asking the next generation to rebuild the pipeline on top of a full-value buyout is how 2026 pipeline decisions become 2028 dispersals. If the breeding rewrite gives up calf-check cash for 24 months, the succession terms have to absorb that, not compound it.
  • Consider locking 30–40% of Q4 2026 and Q1 2027 milk against the CME Class III strip or DRP, with explicit attention to local basis. The futures curve says the $18–$19 window exists. Whether your specific milk check holds it depends on processor relationships and basis risk. Requires: a broker or DRP-qualified agent and a margin sub-account.
  • ⚠️ Backfire Watch: hedging more than your reliable milk volume invites margin calls in a rally. If Class III runs past $19.15 into Q4, a 50% hedge on shipments you can’t deliver to a processor turns a balance-sheet win into a cash-call loss.

365-Day Moves — Strategic Positioning

  • Pick a lane on purpose. Three legitimate Tier 3 strategies for 2026–2028:
    • Fortress pipeline: rebuild to ~200+ fresh heifers/year on a 480-cow base; requires a 25% beef cap and 35%+ sexed on top cows for 24 months.
    • Niche/component: negotiate reliability and component premiums — ranges reported in recent Upper Midwest processor contract coverage have run 30–50¢/cwt over base; requires a processor relationship willing to sign 24-month component terms.
    • Managed exit: structure a 24–36 month contraction with surplus springer sales into the tight market and debt paydown against a dispersal timeline.
  • ⚠️ Backfire Watch: drift is the fourth option, and it isn’t a strategy. A herd that tries to run fortress and niche simultaneously without a written cap usually ends up with neither — a half-built heifer pipeline and a processor contract that rewards a component profile the cull list can’t support.
  • Renegotiate processor and co-op terms on components and reliability premiums, not just base price. If the rewrite means breeding harder for heifers and tightening the cull, you need a milk check that rewards the quality you’re building. Requires: component history, a redacted competing offer if available, a signed NDA.
  • ⚠️ Backfire Watch: renegotiating from a pipeline-short position is renegotiating from weakness. Do this while the milk is still flowing on schedule — a processor that smells a volume shortfall at contract time will trade you a component bump for a reliability clause you can’t meet in 2027.
  • Opportunity signal: if your local springer premium over the USDA $3,010 benchmark narrows below $200 while your component premium holds steady and your margin over feed stays positive, you have room to expand sexed-dairy emphasis on the top tier and sell surplus springers into a market that’s still long on demand.

Herds that pick a lane in 2026 are the ones positioned to rebuild by 2028.

What This Means for Your Operation

The breeding sheet is now a succession document. Tuesday mornings stack. NAAB’s 32.8% national number is the aggregate of several million of those Tuesdays.

The trade-off is real and doesn’t get easier. Cash this quarter vs. optionality in 2028. The beef check vs. the heifer pen. The income statement vs. the balance sheet.

So before the next semen order goes in: what’s your projected 2027 fresh heifer count at a 0.79 completion rate — and does the person you’re handing this operation to agree with the number?

Key Takeaways

  • At 32.8% beef-on-dairy nationally and a 48-year low in replacement heifers, the 2026 rally isn’t getting capped by milk — it’s getting amplified by a supply hole built one Tuesday at a time.
  • For a 480-cow herd that ran 37% beef through H1 2024, the outside-replacement math runs $30,000–$87,500/year at April 2026 springer prices; run your own projection at 0.79 calf-to-fresh, not 0.90.
  • If your beef-on-dairy share is above 30% and DSCR has been under 1.20 for two of the last three quarters, the 2027 heifer count belongs on page one of your next lender meeting — not page three.
  • The trade is real: giving up ~$71,500/year in calf revenue on a 480-cow base to cap beef at 25% and run 35% sexed on top cows builds ~60 surplus springers into a short market and turns the 2028 herd into an asset.

Run Your Numbers

Bullvine Pipeline Index Calculator — Takes your milking herd size, heifer inventory, sexed semen rate, cull rate, replacement cost, and beef-on-dairy share and returns a 0–100 pipeline score across four weighted components. If your score is in the Yellow Zone, the article’s math already told you why.

Complete references and supporting documentation are available upon request by contacting the editorial team at editor@thebullvine.com.

Learn More

The Sunday Read Dairy Professionals Don’t Skip.

Every week, thousands of producers, breeders, and industry insiders open Bullvine Weekly for genetics insights, market shifts, and profit strategies they won’t find anywhere else. One email. Five minutes. Smarter decisions all week.
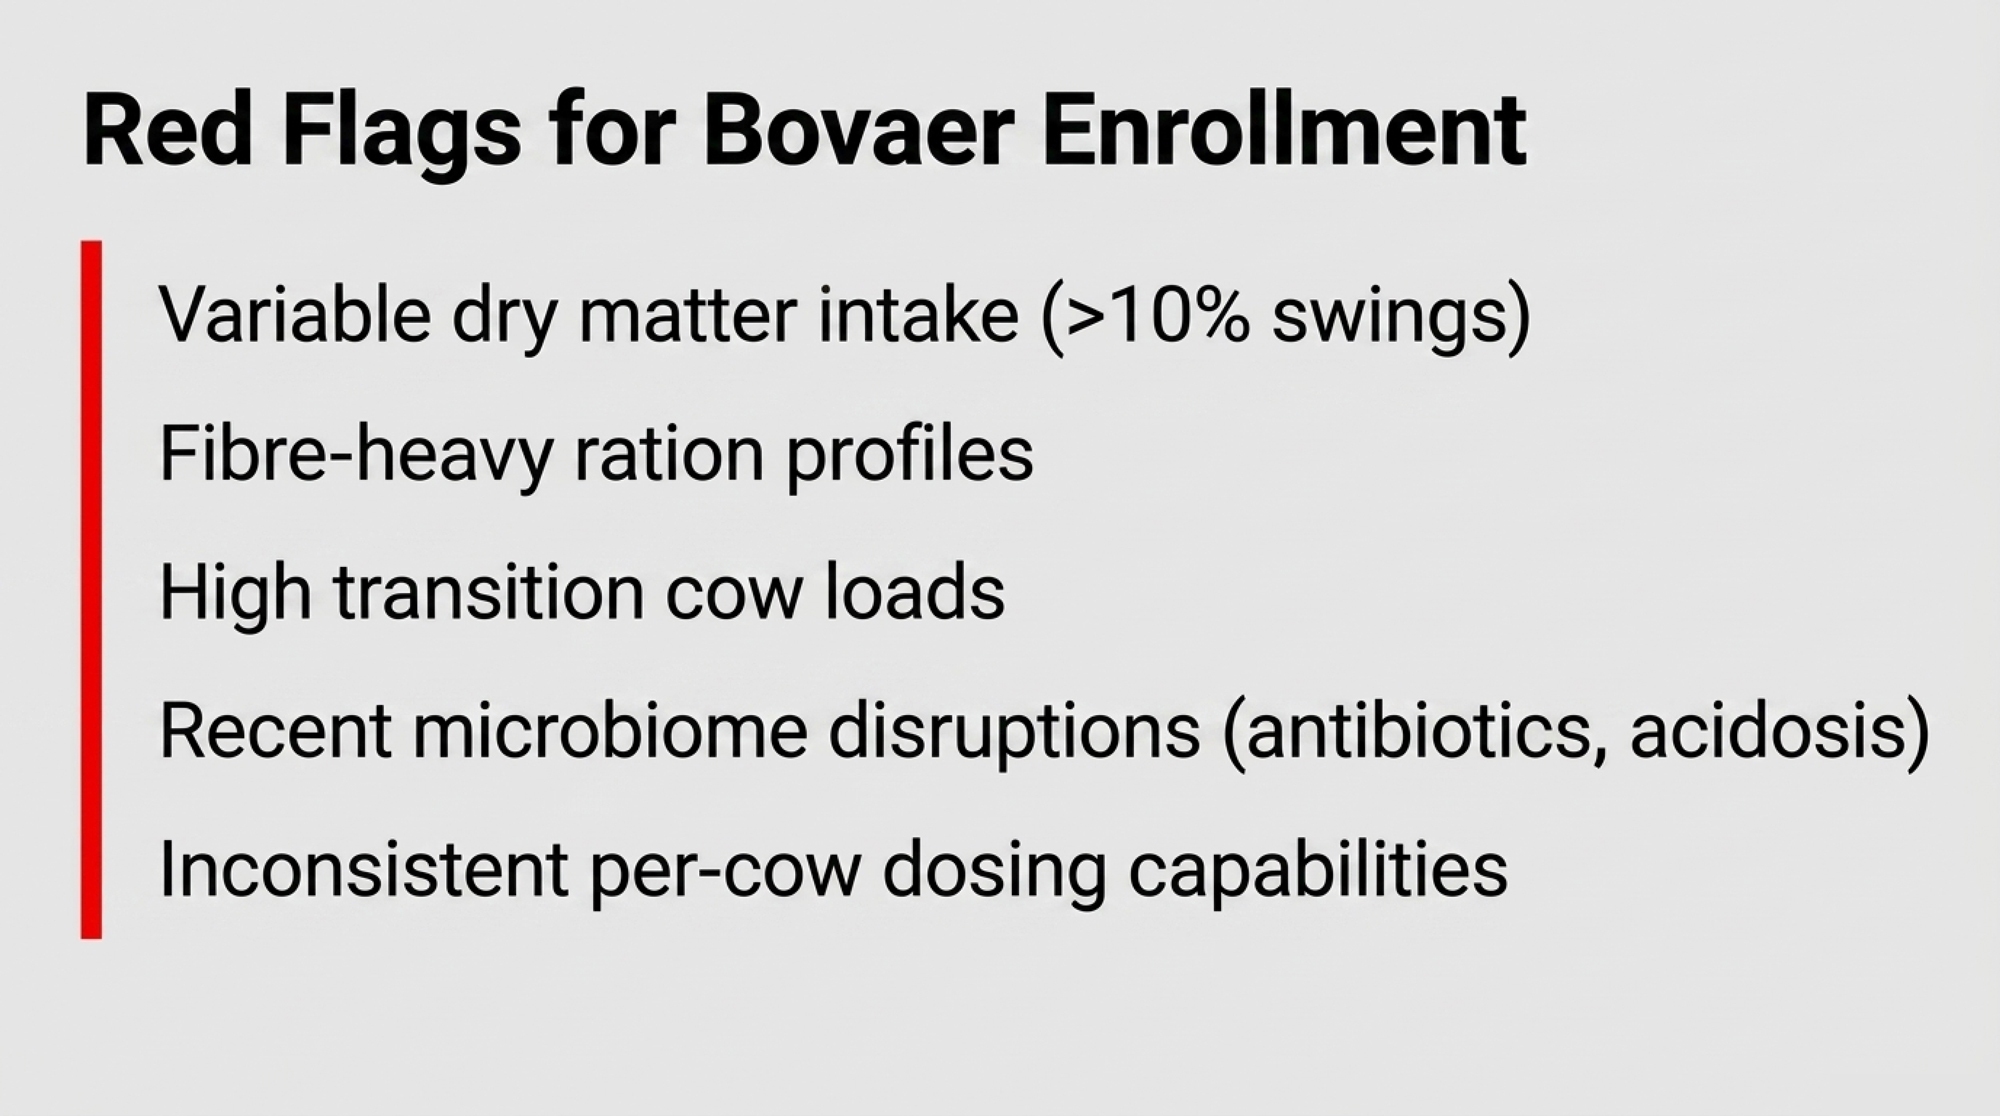
NewsSubscribe
First
Last
Consent
Send this to a friend