


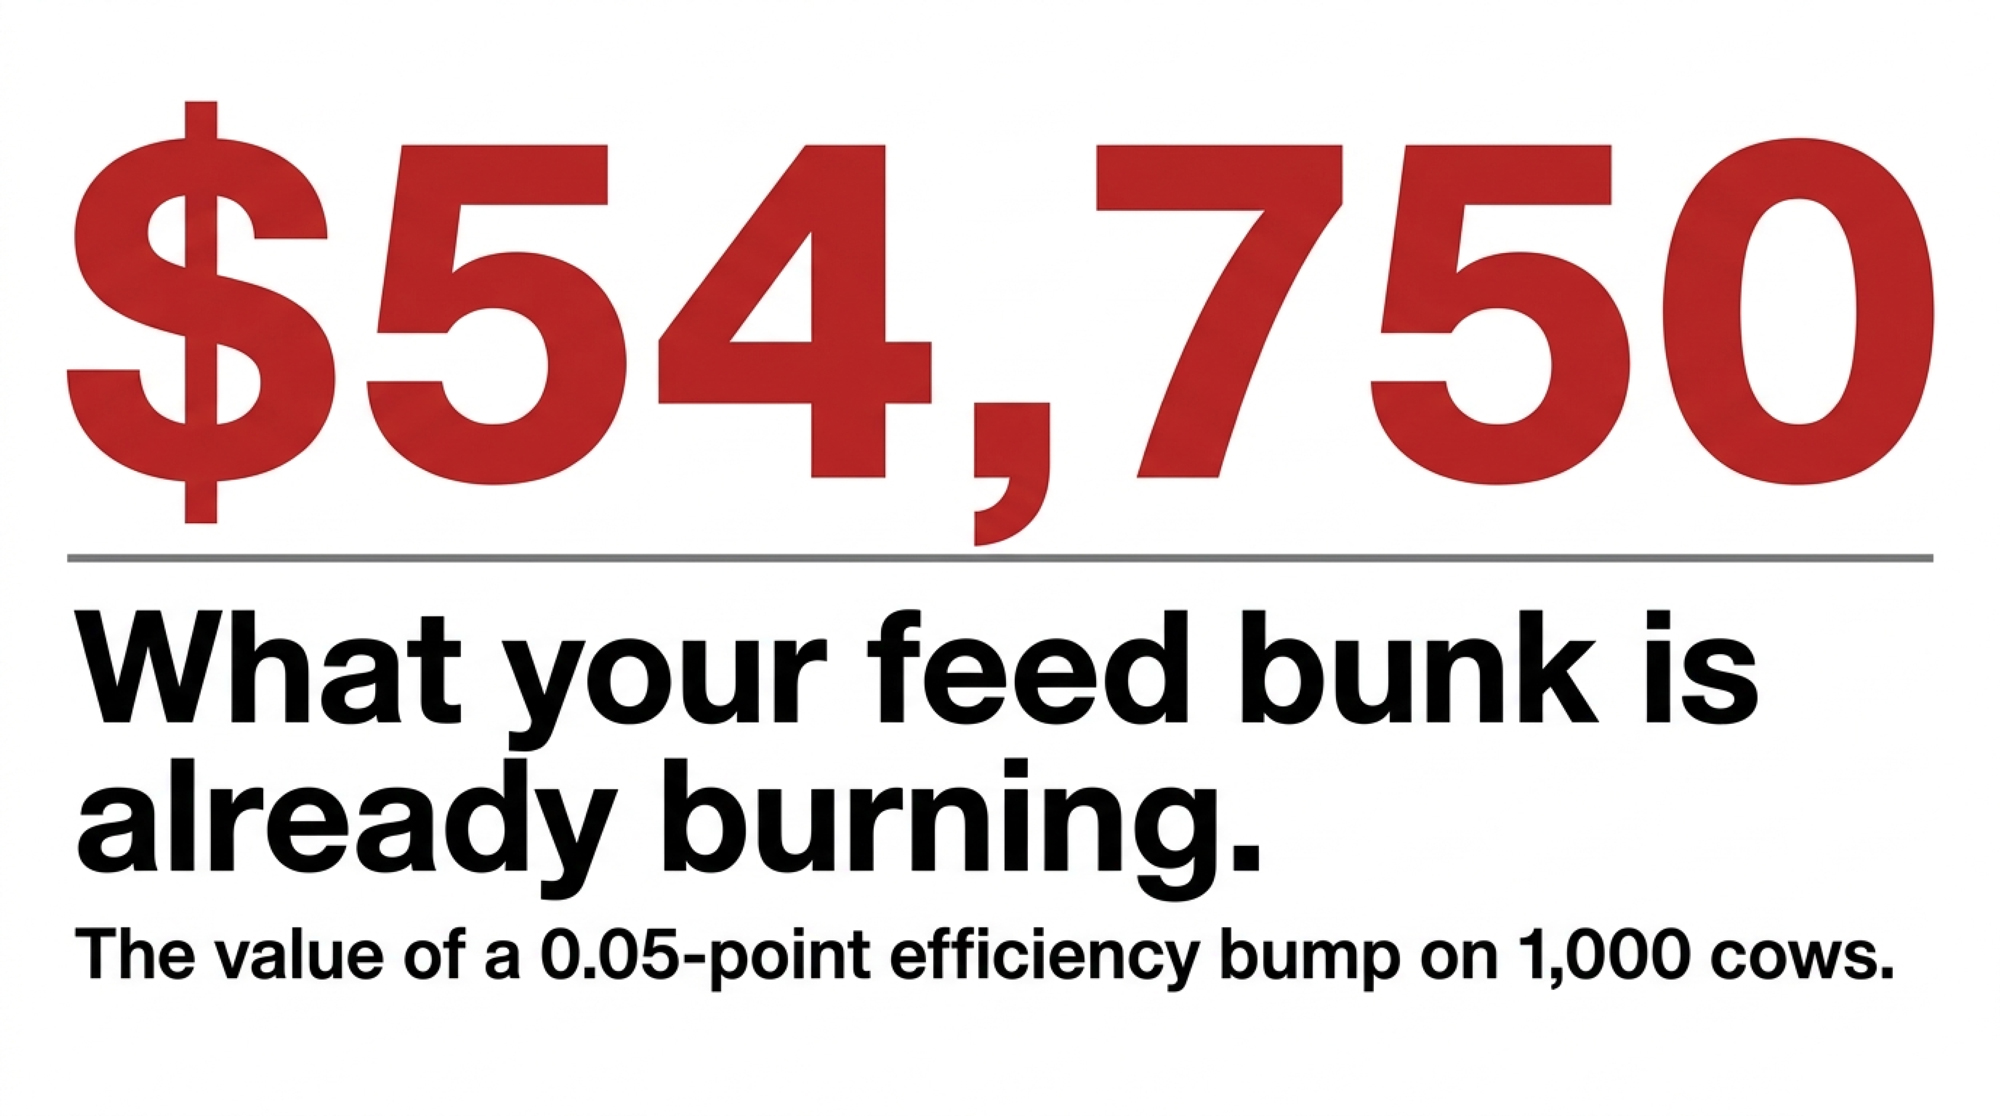
A $0.45/cow/day methane quote. A 1,000-cow herd stuck at 1.48 ECM/DMI. One 0.05-point bump is worth $54,750/yr — before you pay a cent for carbon in a bottle.
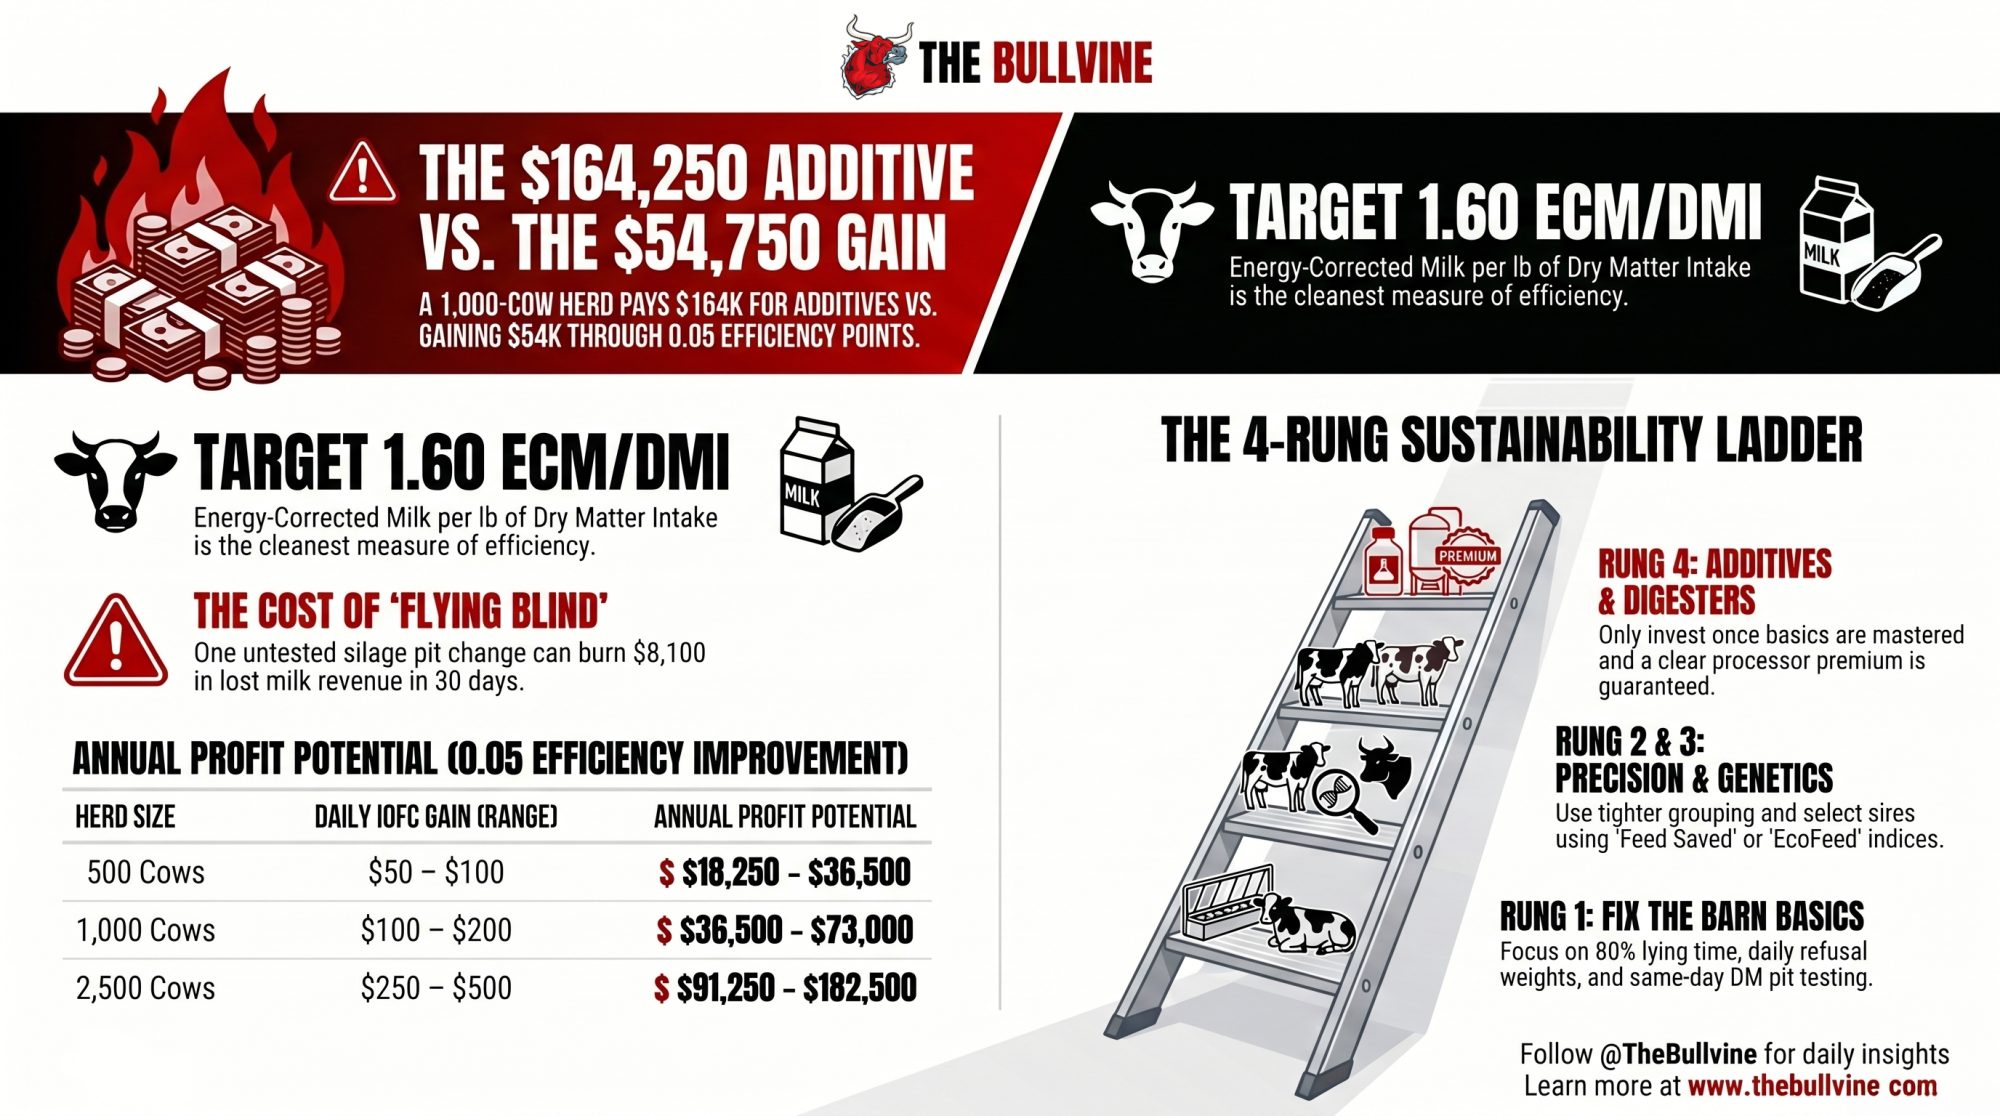
Executive Summary: A $0.45/cow/day methane additive works out to $164,250 a year on 1,000 cows, while a 0.05‑point bump in ECM/DMI is worth $36,500–$73,000/year with no new line item. The article shows how most herds sitting around 1.45–1.50 ECM/DMI are leaking money through bunk management, comfort, and forage drift long before additives or digesters enter the picture. You’ll see hard barn math on pit DM swings, lying time, and grouping, plus a simple ladder that puts barn basics, precision feeding, genetics, and methane tools in the right order. For a 500–3,000 cow operation, the same small efficiency gains that cut kg CO₂e/kg milk also trim feed cost per cwt and protect IOFC when milk or feed swings. If you’re being nudged to “do something on methane,” this piece helps you answer one question first: will a new product beat what you can pull out of your own feed bunk in the next 30 days?
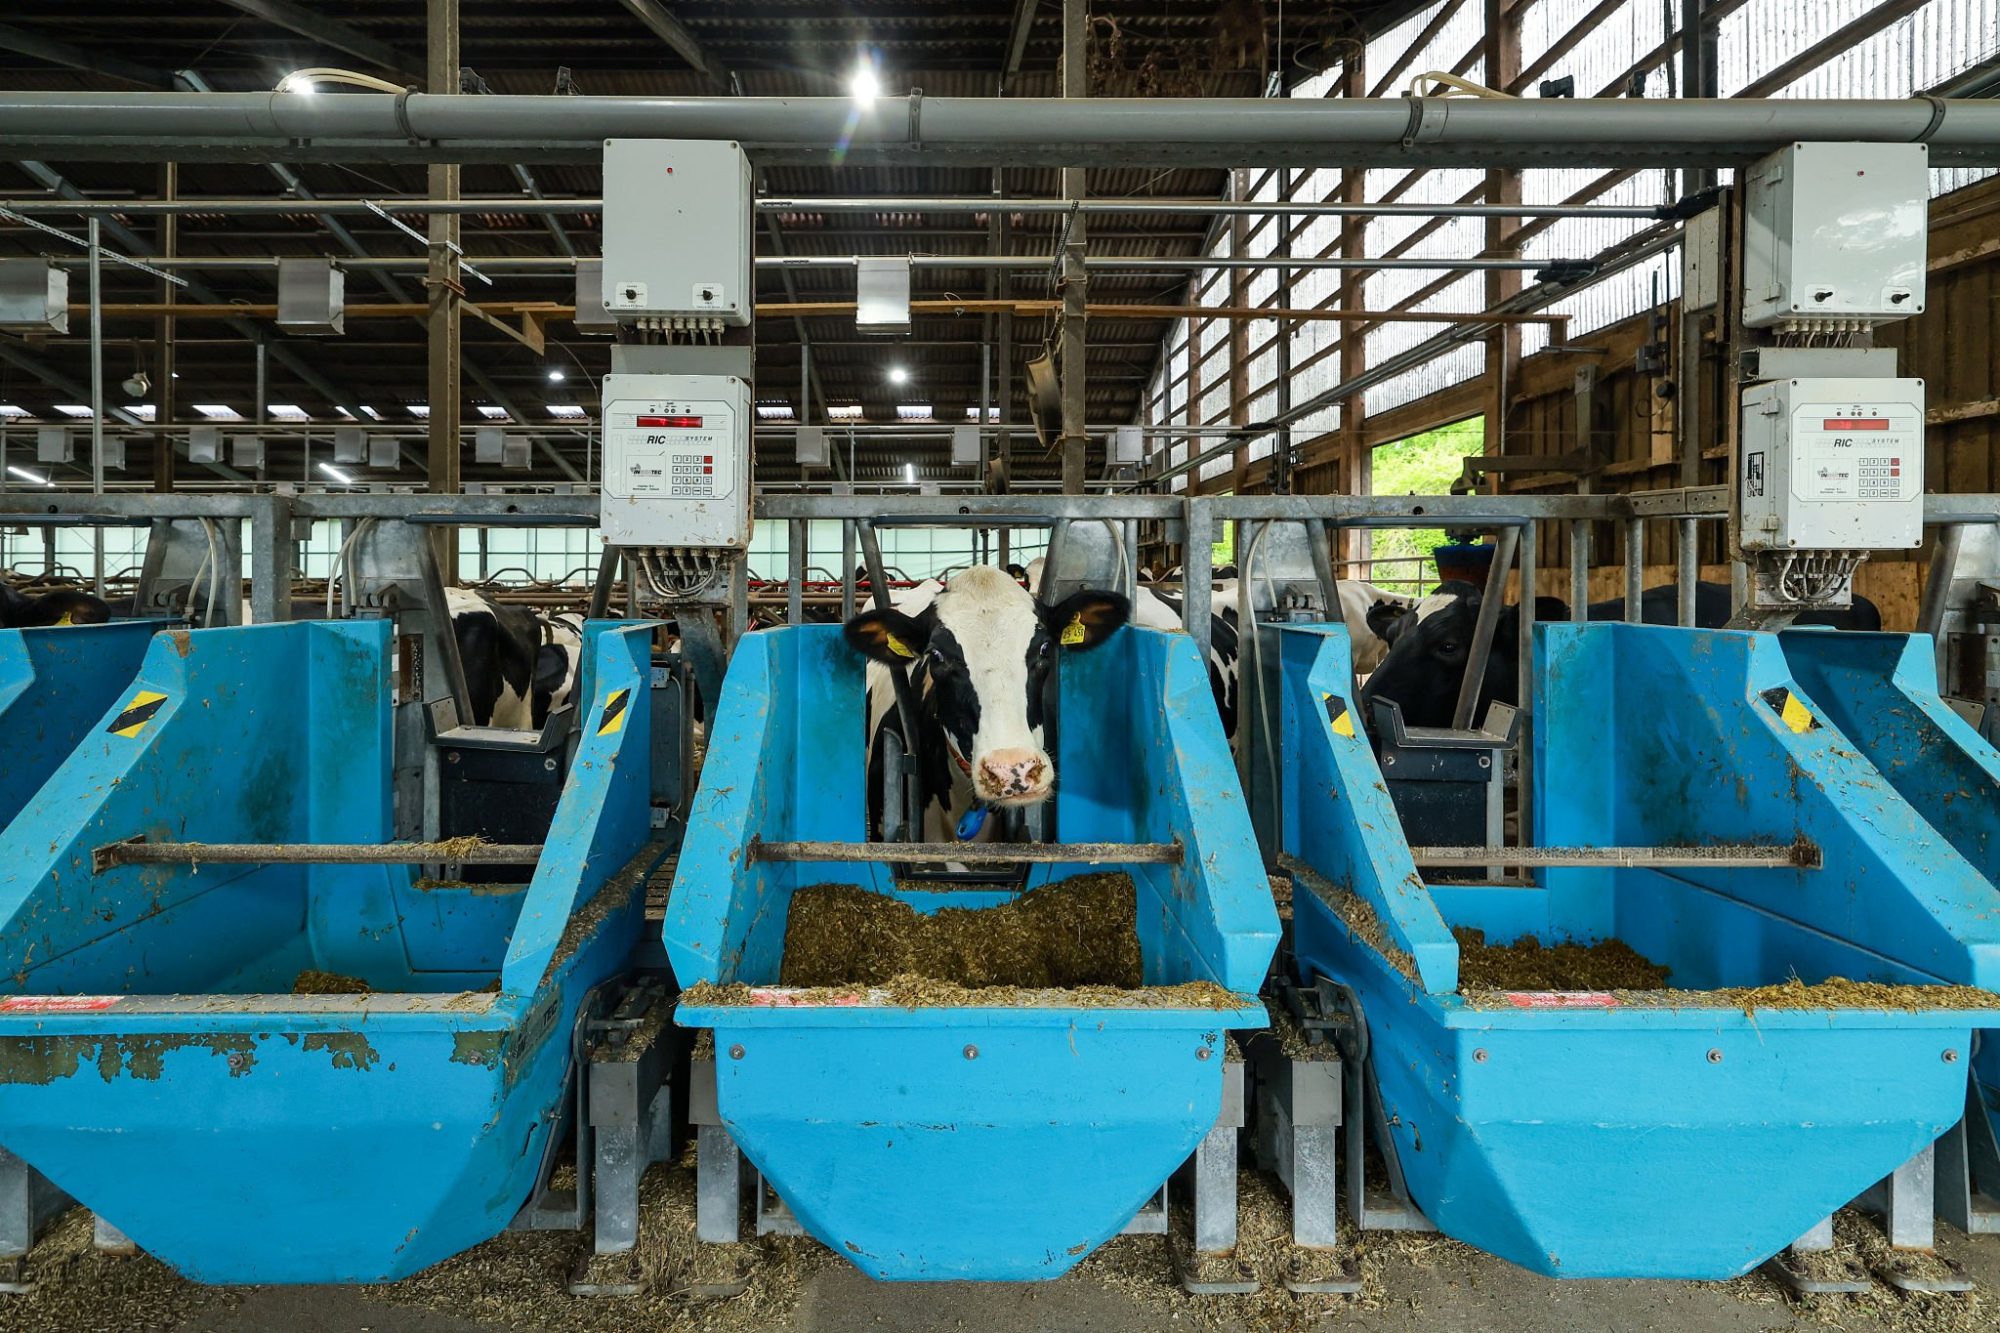
A commercial 1,000-cow herd in the Upper Midwest got the pitch last month. A feed rep walked in with a methane additive quoted at roughly $0.45 per cow per day. The manager had a processor letter on his desk asking for a sustainability update by Q3, and his herd was running about 1.48 ECM/DMI — Energy-Corrected Milk per pound of Dry Matter Intake, the single cleanest way to measure how efficiently your cows turn feed into milk. Nobody in the room was doing the math on what that efficiency gap was actually worth before signing anything.
That scenario is a composite, built from recent herd reviews across the region — names withheld at the operators’ request. The numbers are real, though, and they’re why feed efficiency — not methane in a bottle — is where your first sustainability dollar usually belongs. For most commercial herds still sitting south of 1.60 ECM/DMI, the cheapest tonnes of CO₂e and the best dollars of income over feed cost are still inside the barn, waiting.
The Math That Should Stop the Meeting
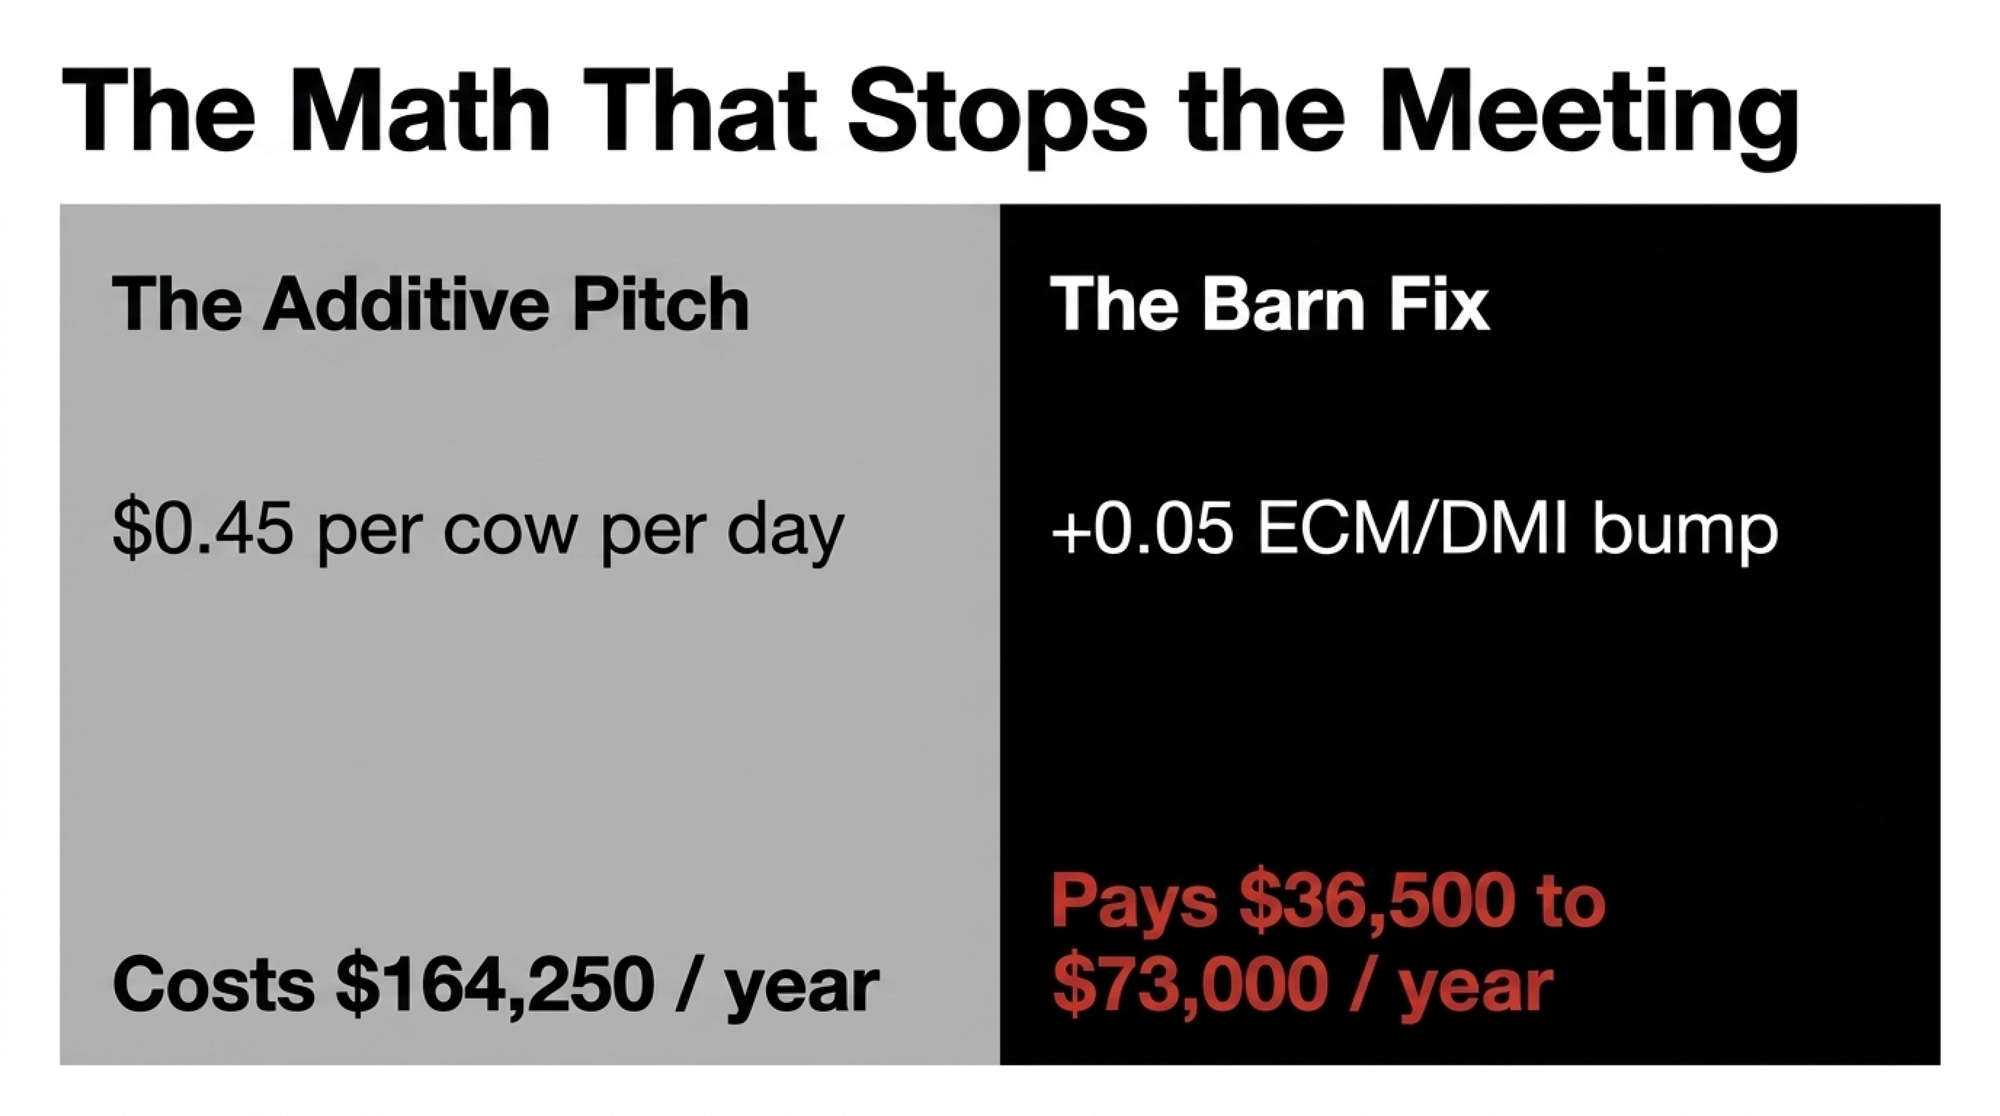
Start with the additive cost. It’s not a mystery:
1,000 cows × $0.45/cow/day × 365 days = $164,250/year.
That’s a six-figure line item, every year, before you see a single lab result. Now price the other direction. A 0.05-point bump in ECM/DMI — the kind of move that comes from tightening bunk management, fixing obvious refusals, and catching new silage pits the day they open — is worth roughly $0.10–$0.20 per cow per day in income over feed cost at 2026 feed-and-milk spreads, consistent with the Penn State Extension Dairy Outlook (April 2026 release) IOFC benchmarks at current spreads.
Here’s that math on one line each:
- Current gap: 1.48 ECM/DMI vs. a 1.60 target
- The opportunity: a 0.05-point move ≈ $0.15/cow/day in IOFC (midpoint of the $0.10–$0.20 range)
- The reward: ~$54,750/year on 1,000 cows; full range $36,500–$73,000
- The underlying change: about 2 lb more ECM/cow/day off roughly 44 lb [20 kg] of DMI
No new line item. No contract. No Q3 report needed. You’re just catching margin that’s already sitting in your bunk and stalls.
Stack the two and the picture gets uncomfortable. You’re looking at $164,250 out the door for emissions reductions you may or may not get paid for — versus $36,500–$73,000 captured from work your team can start this week. The additive isn’t the villain. The sequence is.
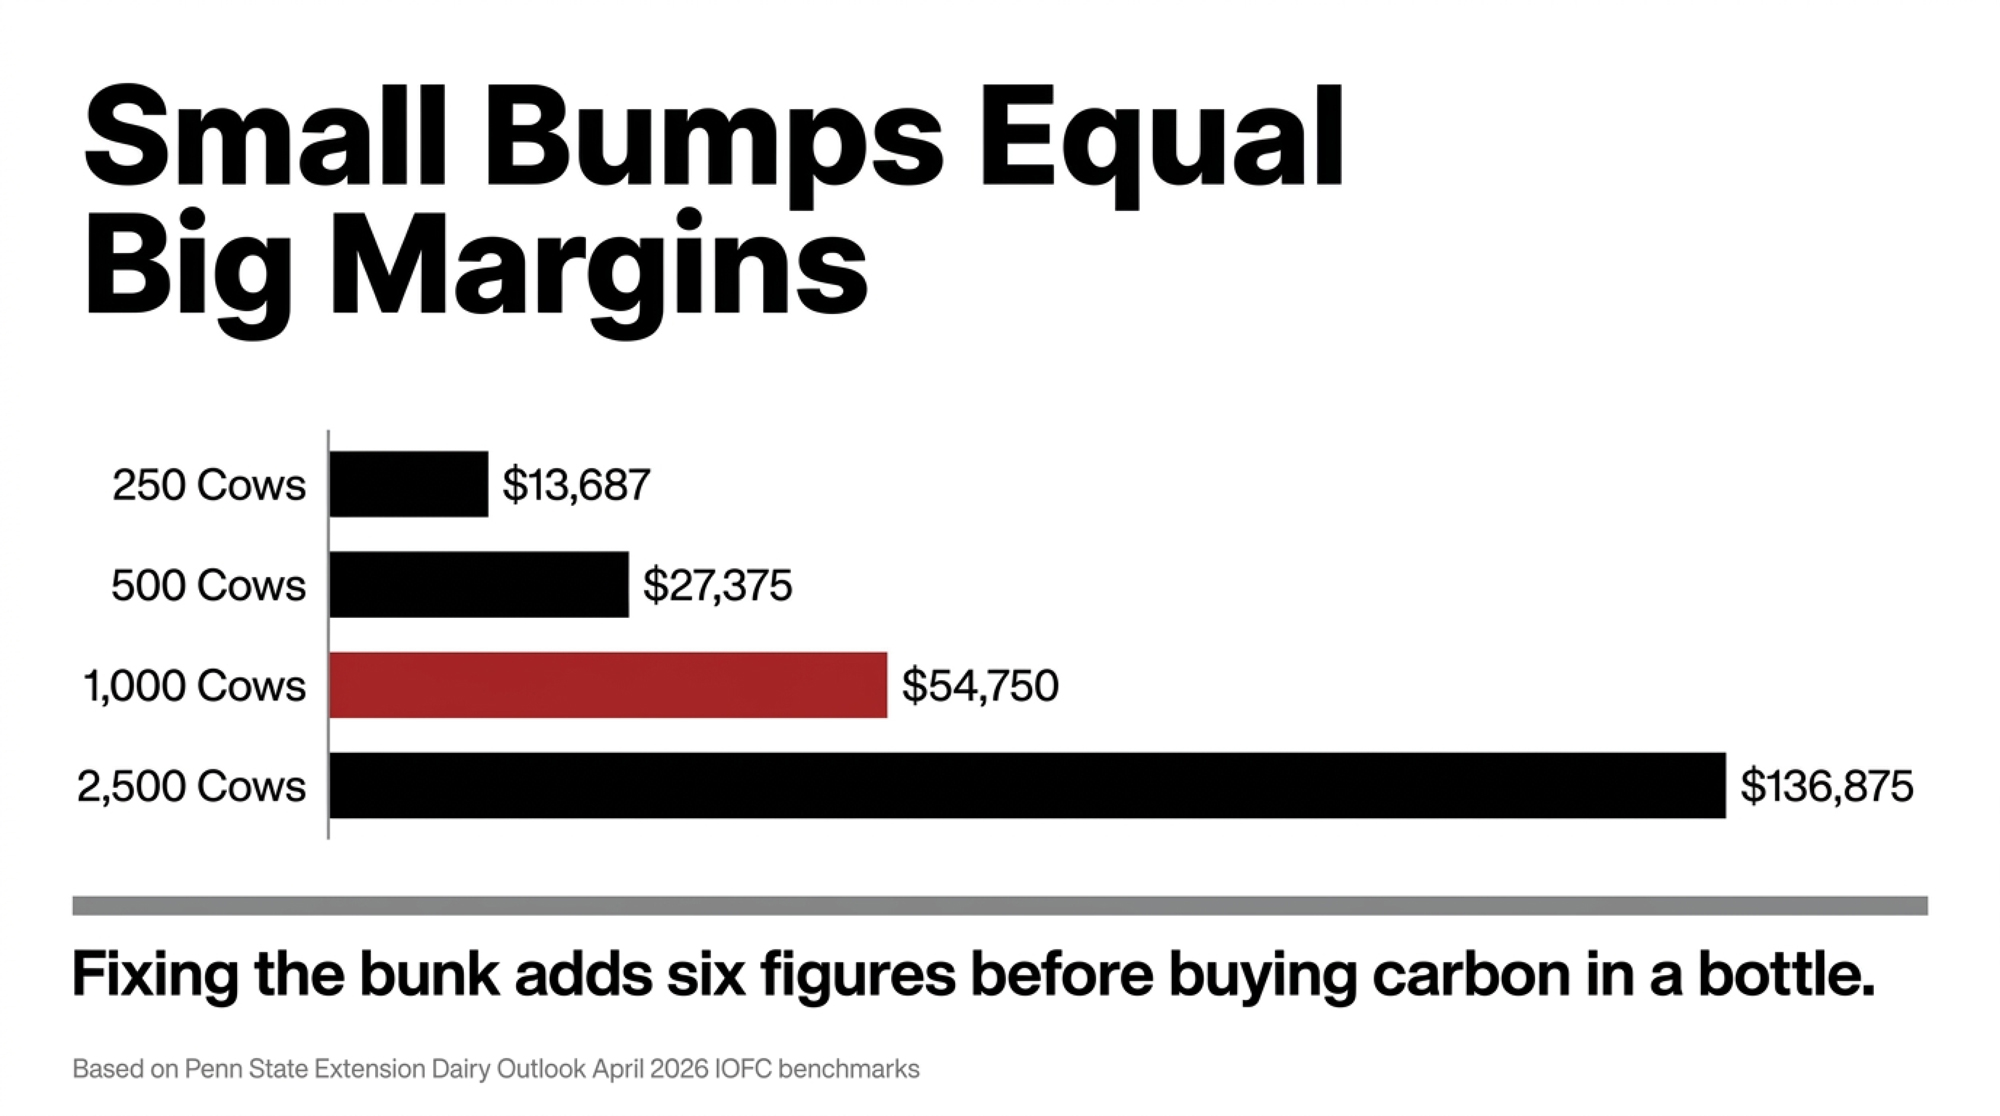
What 0.05 ECM/DMI Is Worth on Your Herd
Find your row. That number is what a “small” ECM/DMI improvement is actually worth before you buy a single gram of methane reducer.
| Herd size | Daily IOFC at $0.10/cow/day | Daily IOFC at $0.20/cow/day | Annual range (365 days) |
| 250 cows | $25 | $50 | $9,125 – $18,250 |
| 500 cows | $50 | $100 | $18,250 – $36,500 |
| 1,000 cows | $100 | $200 | $36,500 – $73,000 |
| 2,500 cows | $250 | $500 | $91,250 – $182,500 |
📊 FAST FACT BOX — Why Efficiency Is the Sustainability Lever
Sustainability gains on dairy farms have historically been a feed-efficiency story, not a product story:
- U.S. dairy, 1944 → 2007: a gallon of milk in 2007 carried only 37% of the carbon footprint of 1944, using roughly a fifth of the cows and feed (Capper et al., 2009 J. Animal Science; summarized by Cornell).
- California, 1964 → 2014: a UC Davis 50-year analysis (Naranjo et al., 2020 JDS) showed dramatically less land, water, and GHG per litre of milk, driven mostly by higher per-cow yields and tighter rations.
- Canada, 2011 → 2021 (national scope — do not apply directly to U.S. herds): the national LCA puts the average farm-gate footprint at 0.94 kg CO₂e/litre, a 9% drop in a decade and well under half the FAO global average of 2.5 kg.
None of that came from a single product. It came from genetics, forage quality, ration management, and more milk from fewer, more efficient cows.
What’s Really Driving “Sustainable” Milk in 2026
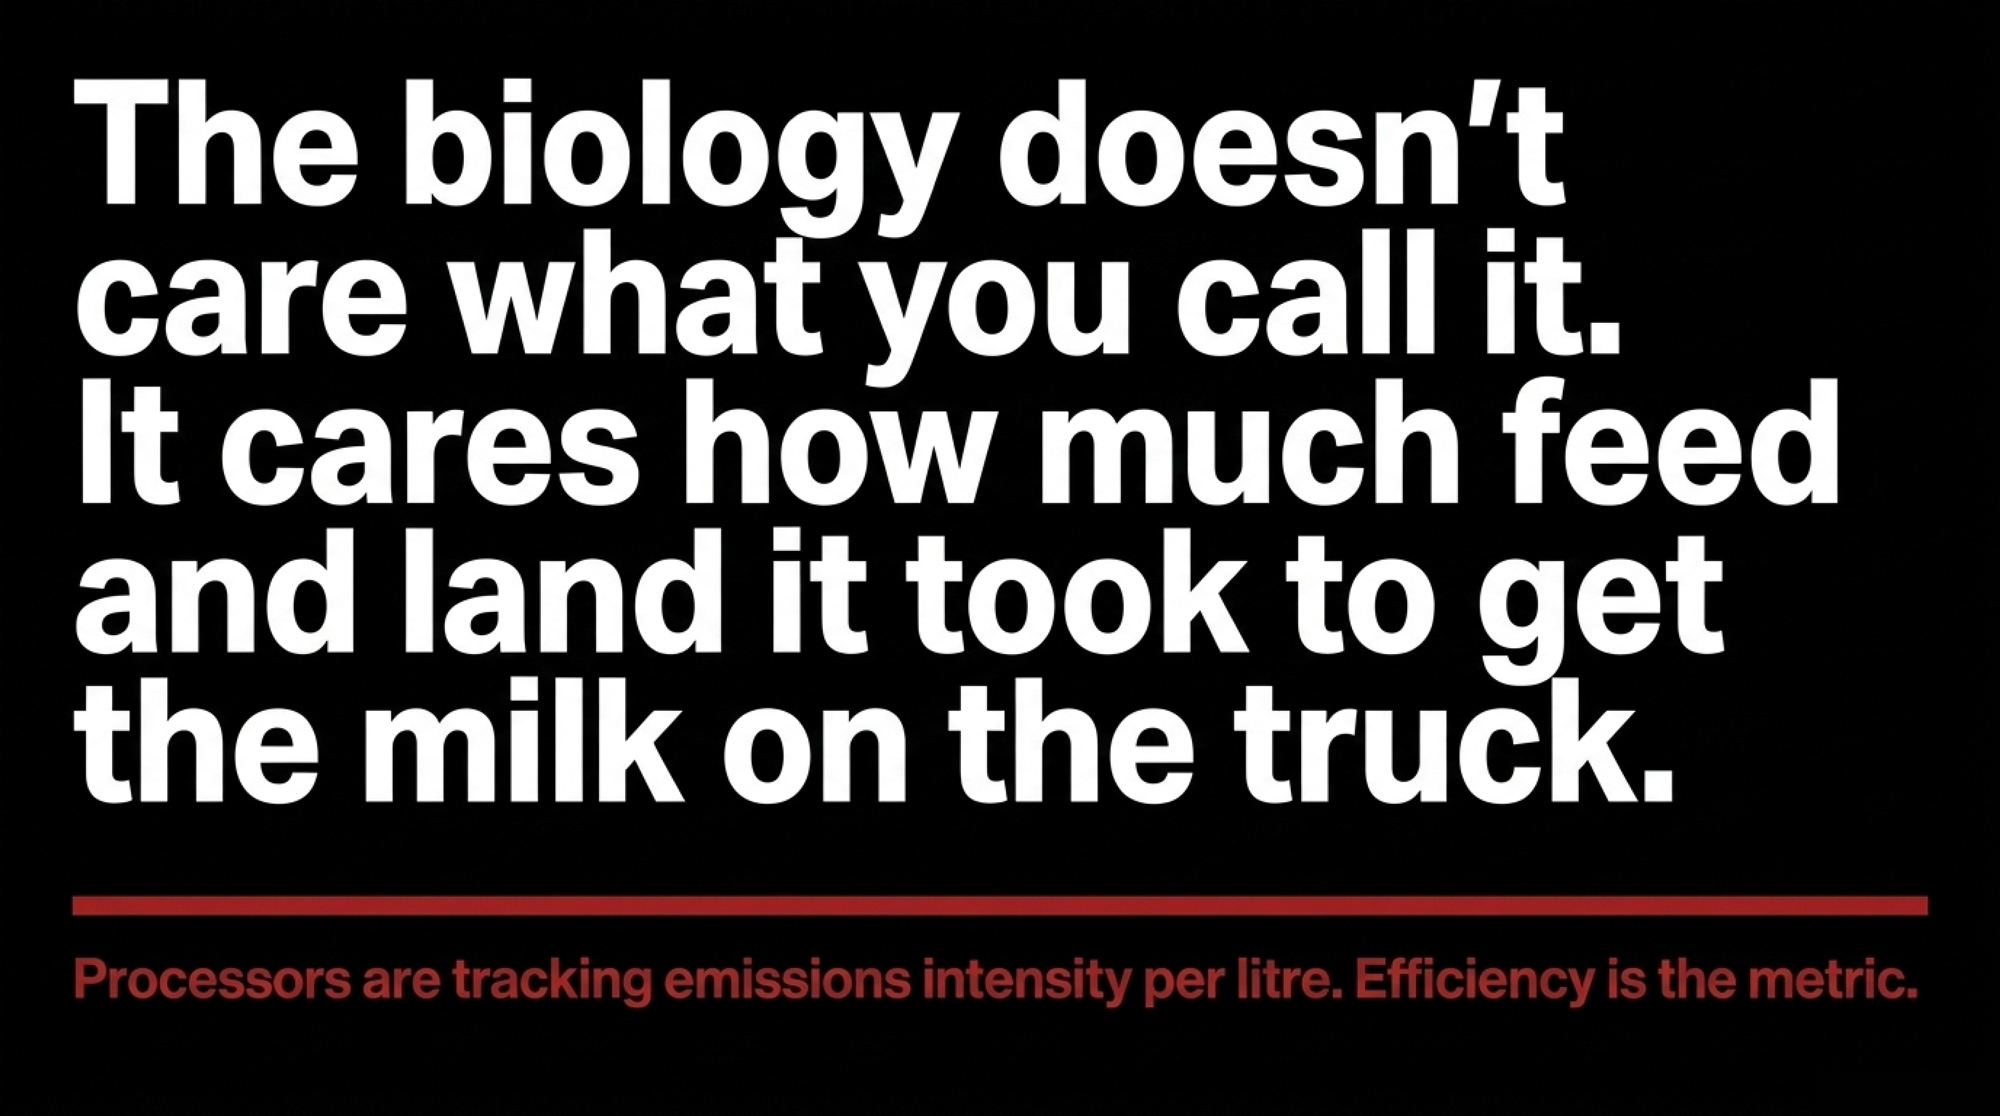
Processors have stopped talking about sustainability in the abstract. They’re tracking emissions intensity per litre of milk — a number that mostly rides on how efficiently your cows turn feed into milk and how long they last in the herd.
The money is moving with it. In the U.S., the FARM Environmental Stewardship program continues to push supplier-level footprint tracking across co-ops. Global buyers like Nestlé and Fonterra are wiring sustainability performance directly into supplier pricing — Fonterra’s Co-operative Difference top tiers translated to meaningful per-kg-MS premiums in the 2024–25 season for farms that document their emissions and nutrient footprints, with current reporting pegging realistic North American processor premium ranges in the dimes-per-cwt band. Herds that show better kg CO₂e per kg milk almost always have better ECM/DMI and fewer nutrient-management headaches. The biology doesn’t care what you call it. It cares how much feed and land it took to get the milk on the truck.
Picture the “dilution of maintenance” effect this way. Every cow carries a fixed feed bill just to stay alive before she gives you a drop of milk. Push more milk through that same overhead and emissions per litre drop automatically — that’s the whole story behind 80 years of quiet environmental progress in dairy, and it’s still the cheapest rung on the ladder for most commercial herds in North America.
How This Looks in a Real Barn Week
You’ve probably lived this week. The new corn silage pit opened Tuesday. Nobody pulled a DM sample that day. The mixer sheet is still running on numbers from the old pit, which was 4 points wetter. Cows are getting less dry matter than the software thinks they are. Milk slides 1–2 lb per cow, refusals wobble, and your nutritionist isn’t scheduled until the 15th.
Run that math. Take a representative –/cwt milk price using USDA’s early-2026 all-milk projections. A 1.5 lb milk slide across 1,000 cows for 30 days works out to:
🚨 ~$8,100 in lost milk revenue — from one untested pit face.
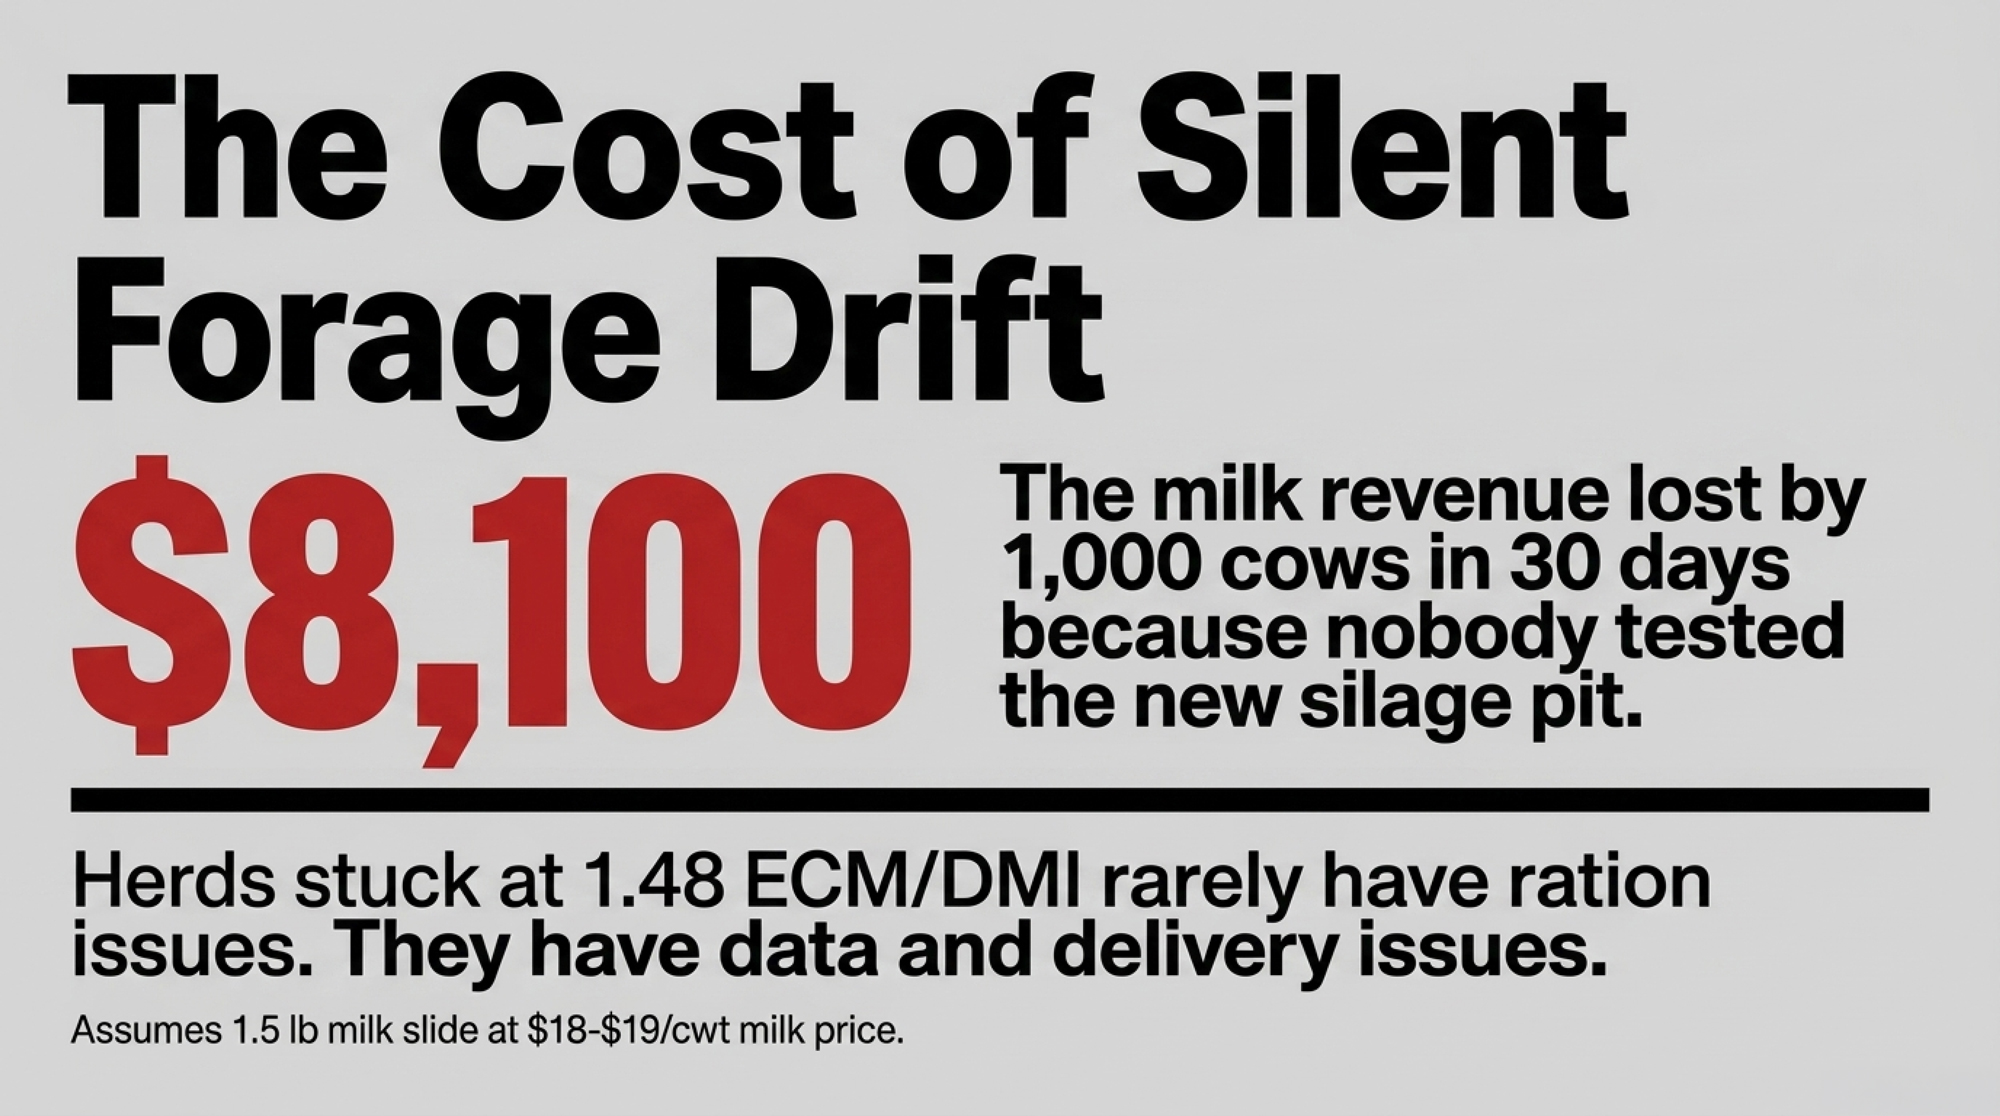
Stretch it across two pit changes and a summer heat event and you’ve burned more margin on silent forage drift than the entire cost of the feed-analysis and DM-testing program that would have caught it.
Here’s the awkward part: herds stuck at 1.45–1.50 ECM/DMI rarely have a ration formulation problem first. They have a feed-delivery problem (inconsistent DM and shrink), a comfort problem (overstocked, hot, sore cows), and a data problem (nobody owns yesterday’s DMI and refusals). A nutritionist who visits every two weeks can’t fix what nobody on farm is measuring in between.
What Actually Moves ECM/DMI (And How Fast)
Strip the emotion out and three barn-side levers move the needle, in roughly this order of speed.
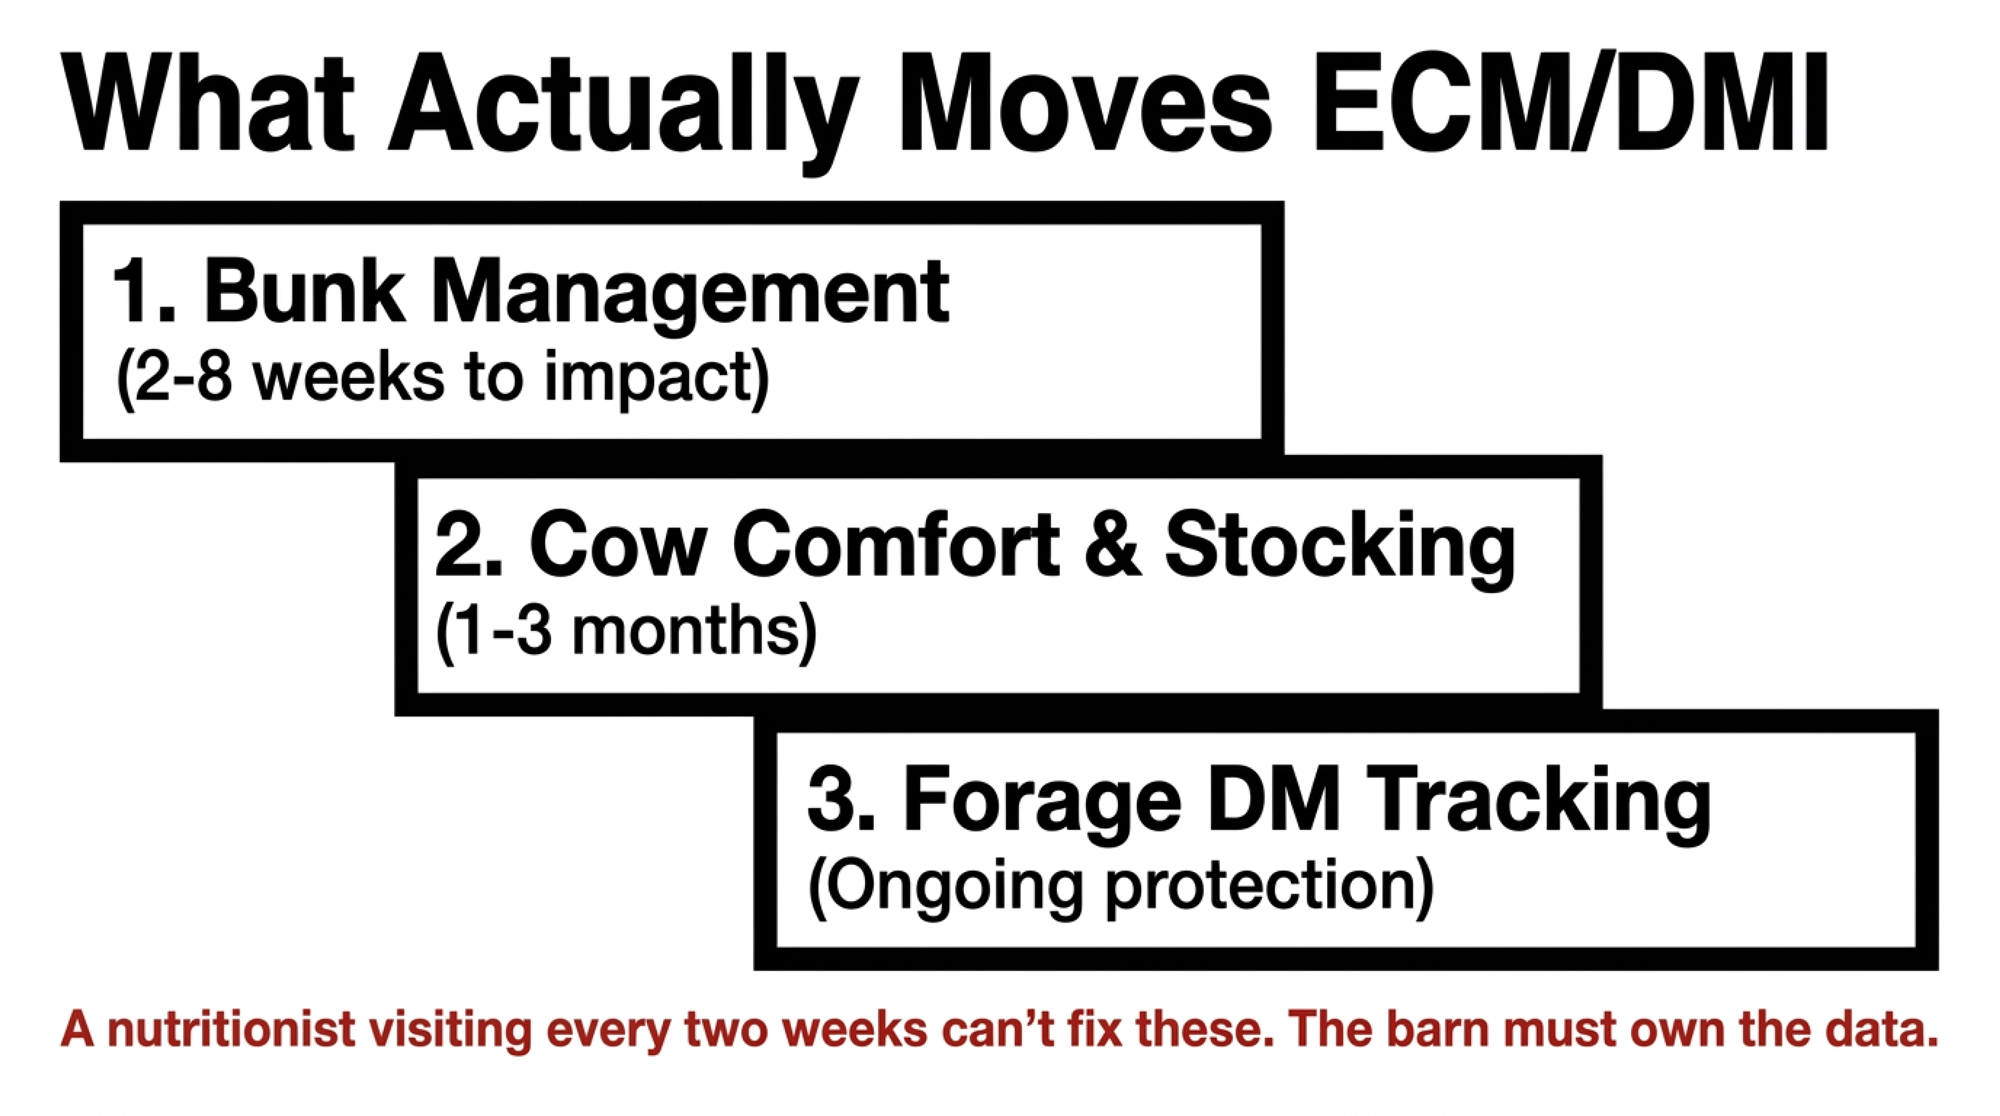
1. Feed availability and bunk management (2–8 weeks). Keep feed in front of cows. Deliver on time after milking, push up properly, target refusals in the 1–5% range. Extension work from Miner Institute and land-grant universities routinely associates tight bunk management with roughly 4–8 lb more milk per cow per day compared with empty-bunk programs — consistent with Grant’s time-budget research summarized in Stocking Density and Time Budgets(WDMC).
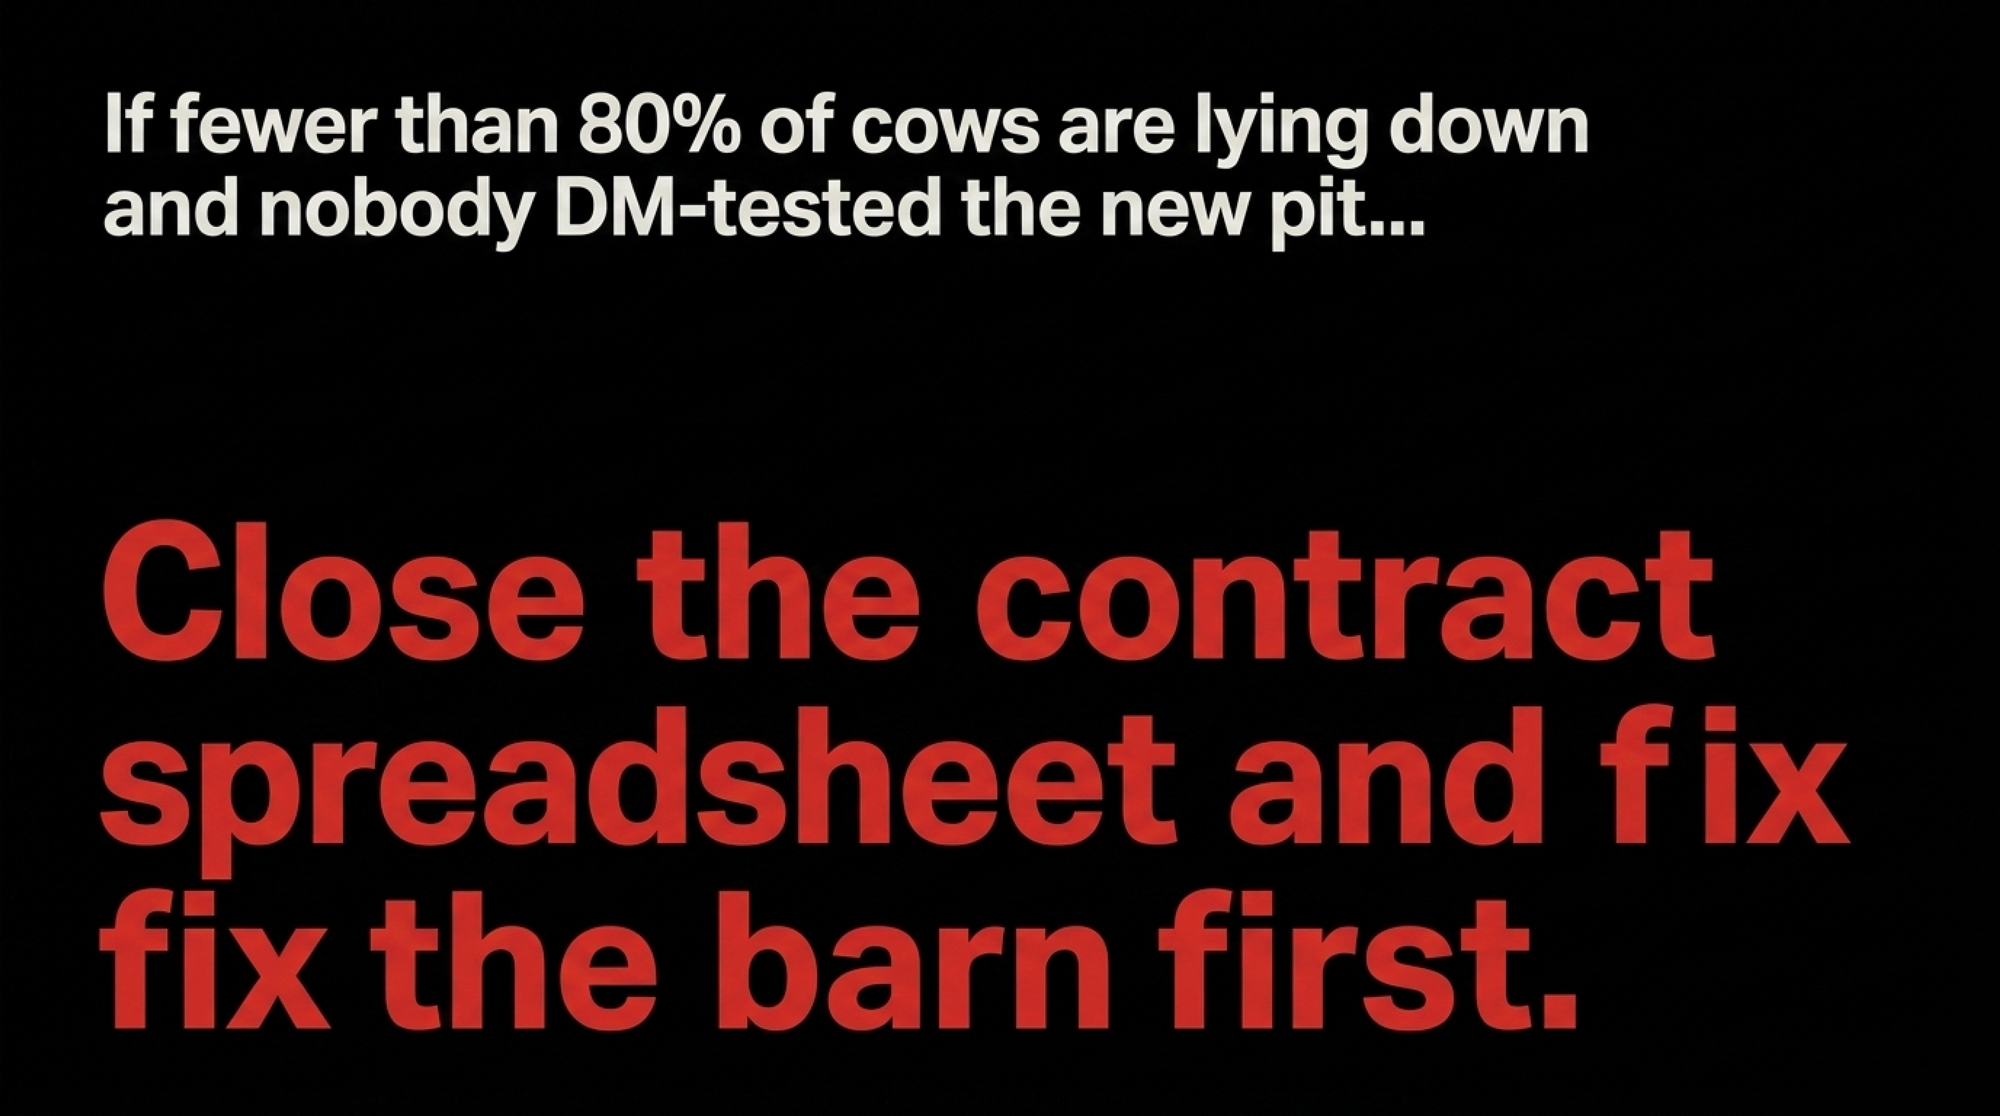
2. Cow comfort and stocking (1–3 months). Rick Grant’s Miner Institute work pegs each extra hour of rest at roughly 2–3.5 lb more milk per cow per day in freestall Holstein herds. Watch the cows, not the spreadsheet: if more than a few are standing when they should be lying, you already have your answer. Once stall stocking pushes much past 120% and bunk space drops under about 24 in [≈61 cm] for milking cows, cows lose lying time and you lose milk. If fewer than 80% of cows are lying during peak rest between 11 a.m. and 2 p.m., your first sustainability investment is stalls, space, and air — not an additive.
3. DM and forage tracking (ongoing — protects the first two). Modeling work out of Ohio State (St-Pierre & Weiss) and Wisconsin shows that as herd size grows, the cost of sampling more often is tiny compared with the cost of flying blind. For a 1,500–1,600 cow herd, hitting forage DM checks ≈ every 4 days is a lot safer than once a month. Most big herds are nowhere close.
Genetics then layers on top. Selecting on Feed Saved, EcoFeed, or similar feed-efficiency indices means picking daughters that give the same output on less feed. GENEX ICC modeling suggests daughters of top ICC-ranked sires eat roughly 100 lb less DM per lactation than top NM$ daughters and ~165 lb less than top TPI daughters at comparable production. You won’t feel that in this quarter’s IOFC. You will feel it for the rest of that cow family’s life in your herd.
How Much Does Waiting 30 Days Actually Cost?
Every 0.05-point swing in ECM/DMI on a 1,000-cow herd is worth $36,500–$73,000 per year in IOFC at today’s spreads. A single silage pit changeover that goes 30 days without a DM test and a mixer-sheet update can easily burn $8,000 in lost milk on a 1.5 lb slide — and closer to $16,000 when DM drift compounds with more refusals, slug feeding, and a bit of summer heat.
Stretch that across a year on a herd running two corn silage pits, one haylage pile, and seasonal cutting changes. The difference between catching those shifts in a week versus a month is often bigger than the entire cost of a methane-additive program. Before you sign any sustainability product contract, the question has to be:
Will this product beat the $36,500 I could capture by tightening my own bunk, forage, and comfort protocols first?
For most 500–3,000 cow herds in 2026, the honest answer is still no — not yet.
Is Your Nutrition Program Built for Speed or for Monthly Meetings?
Most nutrition programs are still built around the consultant’s calendar: monthly or bi-weekly visits, monthly forage analyses, rations updated when the truck pulls in the yard. That worked when a nutritionist drove to three herds a week, every pit was opened in front of him, and a 4-point DM swing took weeks to matter because the bulk tank was 120 cows and a cooler. It doesn’t work on a 1,500-cow free-stall where two pits, a haylage pile, and three heifer pens move in the same week.
The “120-cow paper sheet” mindset is still embedded in a lot of programs — and it’s quietly expensive. If your SOP starts with “wait until the nutritionist calls,” you’ve already given up a week of silent margin every time a forage shifts. Modern herd size needs a split job:
- The barn owns speed and data. Daily DM checks when pits change. Refusals weighed by pen for at least a couple of weeks every season. Bunk walks. A simple ECM/DMI dashboard by group that somebody actually looks at.
- The consultant owns math and strategy. Ration design, long-term forage plans, additive screening, and genetic direction. They shouldn’t have to guess at yesterday’s DMI or whether a pit changed last Tuesday.
If your standard operating procedure doesn’t say, “When we open a new pit, we test DM that day and update the mixer sheet — no consultant call required,” your nutrition program isn’t built for modern herd size. It’s built for the herd your consultant walked into in 1995.
Options and Trade-Offs for Your 2026 Sustainability Budget
| Rung / Tool | Typical cost/cow/yr | ECM/DMI impact in 12 mo | Payoff speed | Policy / market risk |
| Barn basics (bunk, DM, comfort) | $10–$25 | 0.05–0.10 ↑ | 30–90 days | Low |
| Precision feeding & grouping | $15–$30 | 0.05–0.12 ↑ | 3–6 months | Low–moderate |
| Genetic feed efficiency | $5–$10 | 0.03–0.06 ↑ | 3–5 years | Low |
| Methane additives | $164 | 0.00–0.05 ↑ (variable) | 6–12 months+ | High |
Here’s the ladder most margin-focused consultants use right now when you ask, “Where should my first sustainability dollar go?”
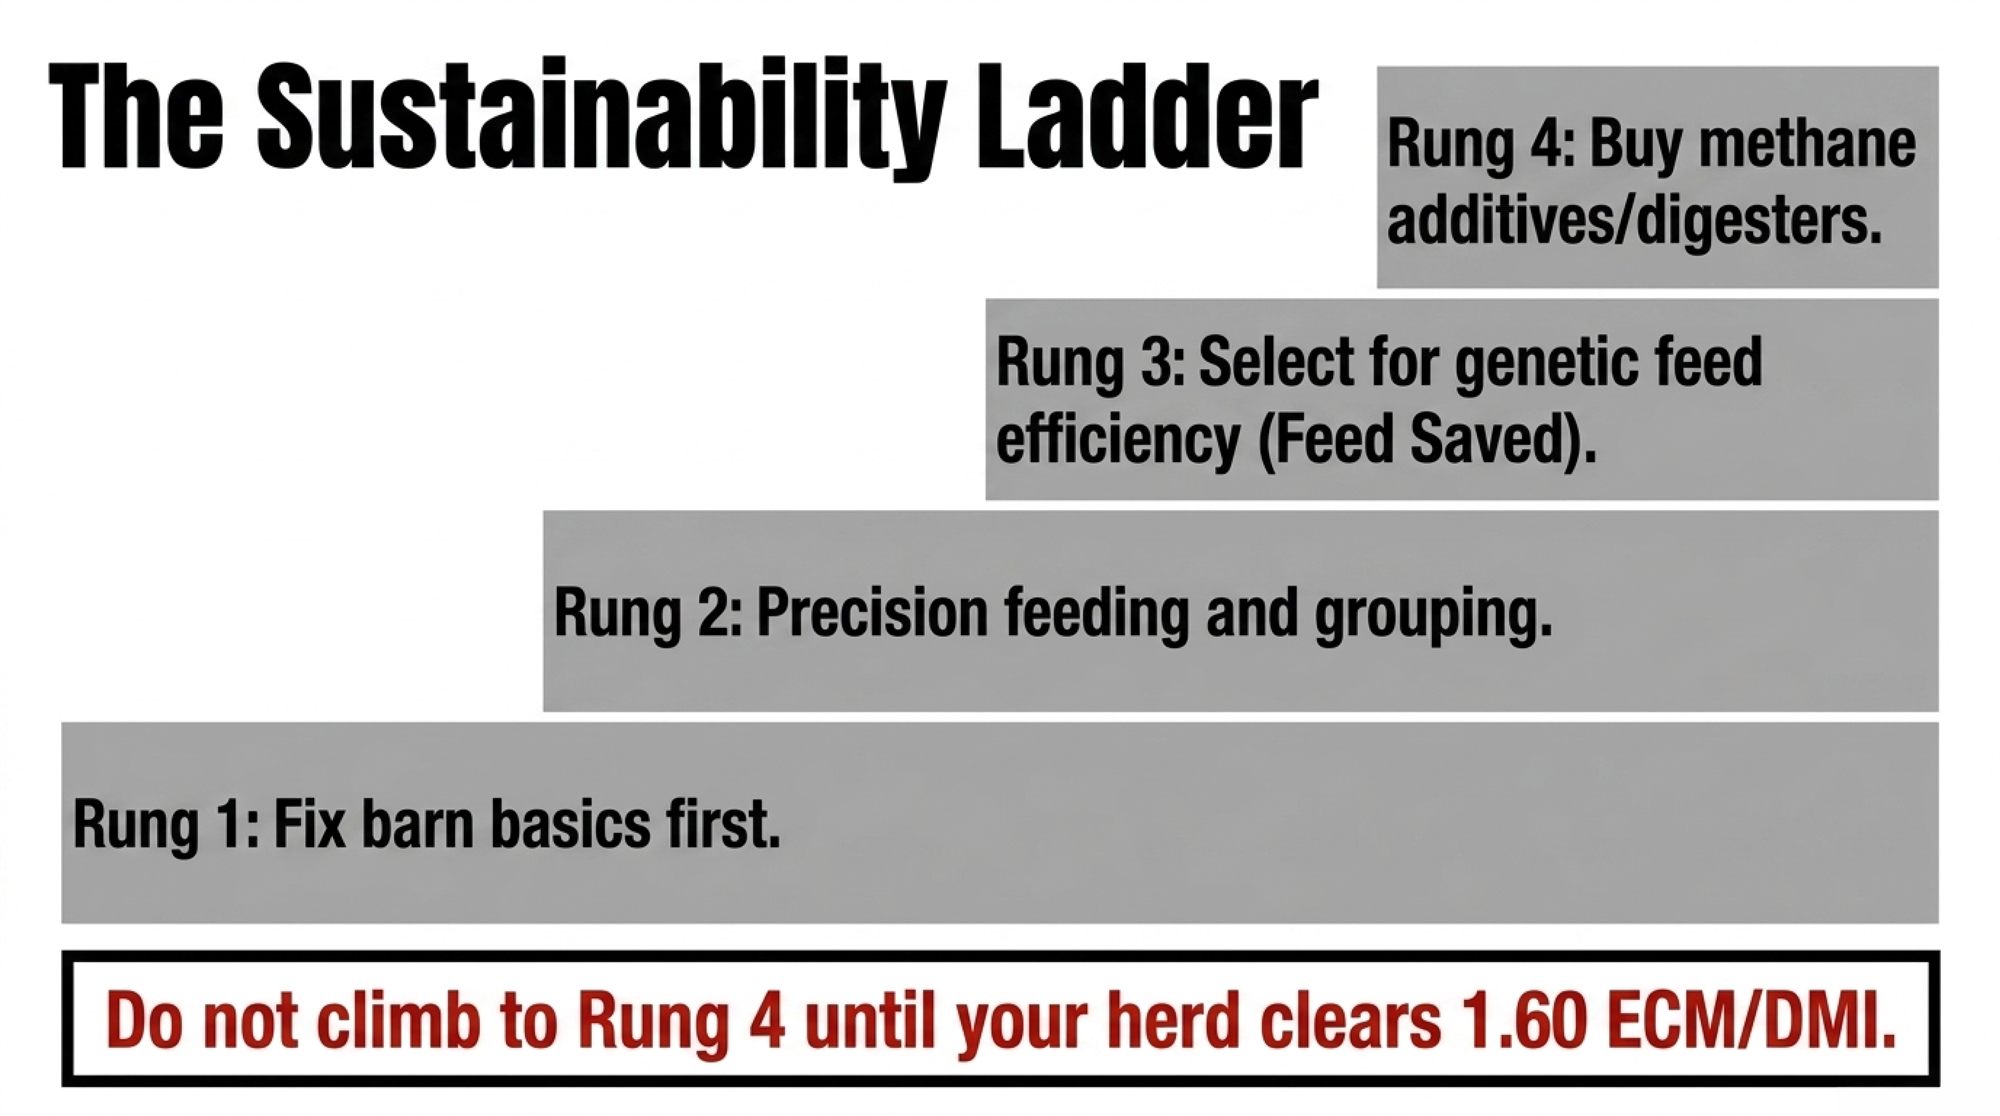
🪜 RUNG 1 — Fix Barn Basics First
Difficulty: Low | Impact: High | Timeline: 30-day action
When it makes sense: Always, and especially if you’re below 1.60 ECM/DMI.
What it requires:
- Weigh refusals daily by pen for at least 2 weeks
- DM-test every time a pit, bag, or cutting changes
- Midday (11 a.m.–2 p.m.) lying-time spot check; aim for 80% of cows lying
- Calculate ECM/DMI by group monthly with numbers you’re already recording
Risks/limits: It’s boring, and it needs someone on farm to own it every week — not just when the nutritionist is coming. Plenty of herds plan to do this and never quite start.
Forward signal: This is the path processors can actually verify with the data you already collect — which is exactly what their sustainability teams are starting to pay for.
🪜 RUNG 2 — Precision Feeding and Grouping
Difficulty: Moderate | Impact: High | Timeline: 3–6 months
When refusals, comfort, and forage data are under control, grouping becomes the next lever. Most herds discover the real obstacle isn’t the nutritionist — it’s the parlor schedule and pen design that make regrouping a pain. You need at least two lactating groups, some MUN tracking, and a nutritionist willing to trim crude protein and phosphorus toward requirements instead of sitting comfortably above them.
The Cannonsville Reservoir work in New York (Cerosaletti, Fox et al., 2004 JDS) showed that dropping dietary phosphorus from about 153% to 111% of requirement cut manure P excretion roughly 12 kg per cow per year and reduced whole-farm P balance by about half, without giving up milk. Wisconsin dynamic-grouping modeling (Kalantari & Cabrera, 2018) shows about 15 g/cow/day lower N intake when cows are grouped more tightly by stage and production.
Risks/limits: A sloppy precision program is worse than a well-run single-group TMR. You can save nutrients on paper and lose milk in the tank.
🪜 RUNG 3 — Genetic Feed Efficiency
Difficulty: Low | Impact: Compounding | Timeline: 5-year payoff
When it makes sense: Now — it costs nothing to start.
Add a minimum threshold for Feed Saved, EcoFeed, or similar indices on your sire list, and keep it when a hot young bull with no efficiency data shows up. GENEX’s ICC index bakes in a feed-efficiency component, and its modeling suggests top daughters eat noticeably less for the same output than top NM$ or TPI daughters.
You won’t feel it as a line item in 2026. This is slow, permanent money — cows calving in 2028–2030 will simply give more milk on fewer tonnes of feed.
Forward signal: CDCB and international partners are already folding sensor-derived and efficiency traits into routine proofs. The next decade of proofs will quietly reward cows that do more with less, whether processors talk about it or not.
🪜 RUNG 4 — Methane Additives and Digesters
Difficulty: Moderate | Impact: Conditional | Timeline: Policy-dependent
When it makes sense: Once you’re over 1.60 ECM/DMI, barn basics are working, and you have a real payer for the emissions reduction.
What it requires: A documented baseline, a clear IOFC trial plan, and either a processor premium or a carbon/credit market that moves the math from pure cost to net positive. Realistic processor sustainability premiums for verified performance currently live in roughly the $0.10–$0.30/cwt range, depending on processor and region. Well-designed digesters in strong-policy environments (California LCFS or RIN-eligible states) can add roughly $50–$150/cow/yearnet once grants and energy credits clear; in weak policy environments they’re mostly green theater.
Risks/limits: Meta-analyses of 3-NOP (Bovaer-type) trials show real methane reductions near 30%, but with diet sensitivity and variable DMI and milk responses across studies. Regulatory status varies by jurisdiction, so confirm approvals in your market before sourcing. The gas number looks good on paper, but IOFC and cow-level responses still live and die on your underlying ration and management. If you’re still leaking ECM/DMI because of bunk, comfort, or forage issues, an additive is a high-priced patch on a leaky system.
Your Next Management-Meeting Checklist
Print this. Take it to the barn. Answer each one before the next sustainability pitch lands on your desk.
- ☐ Do I know my 12-month ECM/DMI by group, not just herd average? If not, fix the data before buying a product.
- ☐ Can I tell yesterday’s DMI within half a pound per cow? If not, weigh refusals by pen for two weeks before changing an ingredient.
- ☐ Are 80% of cows lying during peak rest (11 a.m.–2 p.m.)? If not, fix comfort and stocking before funding an additive trial.
- ☐ Does my SOP require a same-day DM test whenever a pit, bag, or cutting changes? A 1,500-cow herd should be sampling closer to every 4 days than monthly.
- ☐ Does my sire list carry a Feed Saved or EcoFeed minimum? If not, add one this breeding cycle. Cows calving in 2028 will be eating money your competitor’s cows aren’t.
- ☐ If a feed rep quotes a $0.45/cow/day additive and I’m still at 1.48 ECM/DMI — do I open a spreadsheet or a contract first? Spreadsheet.
- ☐ When I sit with my processor, am I bringing an ECM/DMI and emissions-per-litre trend — or a folder of product receipts? That trend is what unlocks premiums.
The Real Question
What does your milk check look like if every tonne of feed you buy this year actually hits milk instead of the refusal alley or the lagoon? Not someday, when methane tools get cheaper or policy shifts your way. This year.
Most commercial herds still have meaningful feed efficiency sitting on the table, and processors are already starting to pay real money — in dimes per cwt — for the herds that can prove they’ve captured it.
Key Takeaways
- If your herd is sitting south of 1.60 ECM/DMI, your first sustainability dollar belongs in bunk management, comfort, and DM testing — not a $164,250 methane contract.
- A 0.05-point ECM/DMI bump is worth $36,500–$73,000/yr on 1,000 cows, and it’s the same work that lowers kg CO₂e per kg milk, so you get paid twice for the same effort.
- Additives and digesters are Rung 4, not Rung 1 — use them once you’re over 1.60 ECM/DMI, barn basics are working, and you have a real payer (processor premium or LCFS/RIN credit).
- Before your next sustainability pitch, walk the bunk at 1 p.m.: if fewer than 80% of cows are lying and nobody DM-tested the new pit, close the spreadsheet and fix that first.
Run Your Numbers
Forage Quality Value Calculator — Before you sign any methane contract, pressure-test the other side of the math: what a 4-point DM swing or a lower-energy pit is actually costing you in milk per cow and dollars per ton. Turns the “$8,100 untested pit” question into a real number for your herd.
Complete references and supporting documentation are available upon request by contacting the editorial team at editor@thebullvine.com.
Learn More
- The $73-a-Cow Gap Hiding in Your 2027 Bovaer Contract — Exposes the exact financial risk hiding inside 3-NOP additive contracts. Before financing processor sustainability goals out of your own pocket, use this math to calculate why a standard 300-cow herd still loses $73 per head under current premiums.
- 11 Proven Strategies to Lower Feed Costs and Boost Efficiency on Your Dairy — Secures your operational margins by tightening the feed conversion ratios draining your profits daily. Armed with targeted grouping tactics and preventative health protocols, producers can immediately block unseen feed waste before it hits the bottom line.
- Gene Editing in Dairy Cows: A Revolutionary Approach to Reducing Methane Emissions — Delivers a radical shift in tackling greenhouse gases by rewriting microbial DNA inside the rumen. Rather than paying daily additive costs, you deploy a one-time probiotic intervention designed to permanently slash 220 pounds of annual emissions at the source.
 The Sunday Read Dairy Professionals Don’t Skip.
 The Sunday Read Dairy Professionals Don’t Skip.
Every week, thousands of producers, breeders, and industry insiders open Bullvine Weekly for genetics insights, market shifts, and profit strategies they won’t find anywhere else. One email. Five minutes. Smarter decisions all week.
