


22 Tuesdays. 540 services a year. At 37% beef-on-dairy through H1 2024, a composite 480-cow Upper Midwest herd is now 25 heifers short of its 154-head replacement need at $3,500/springer.
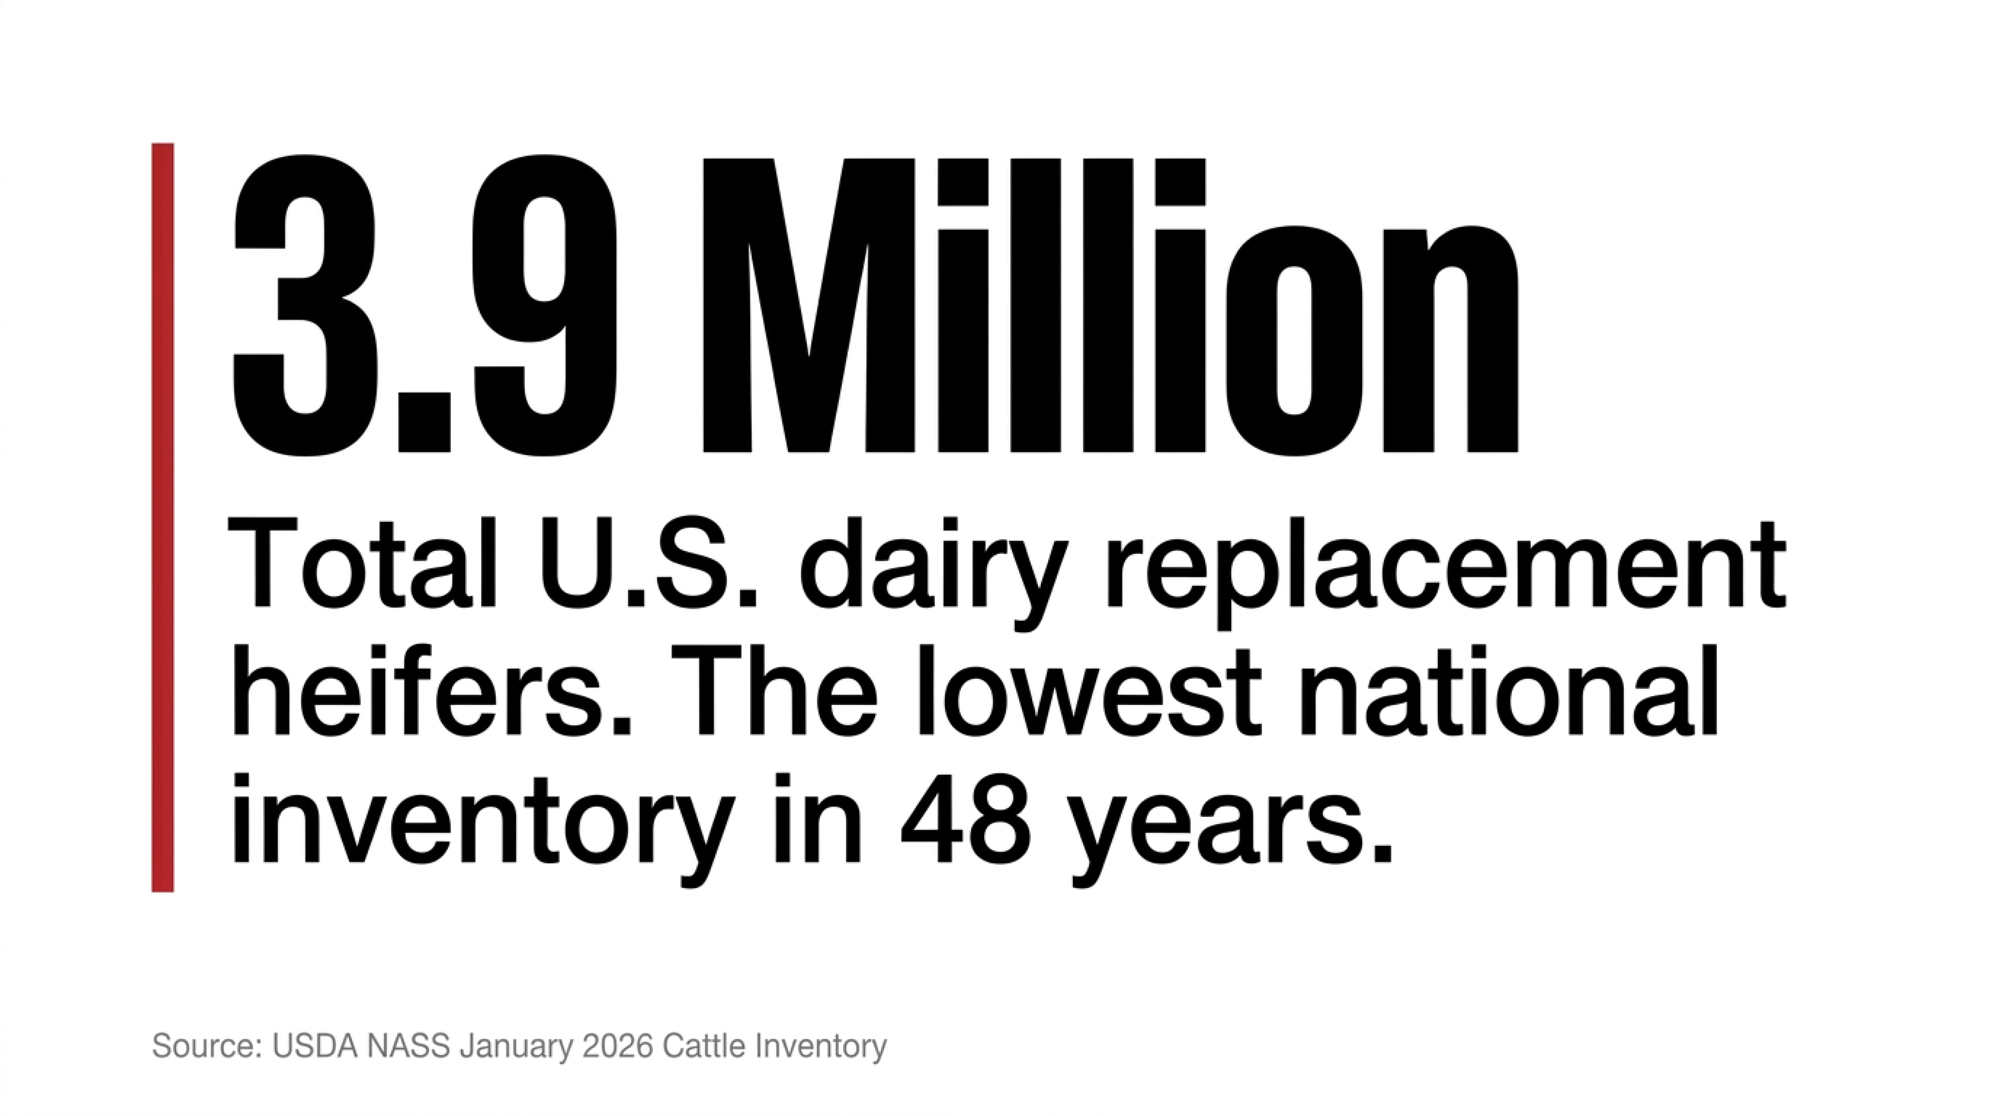
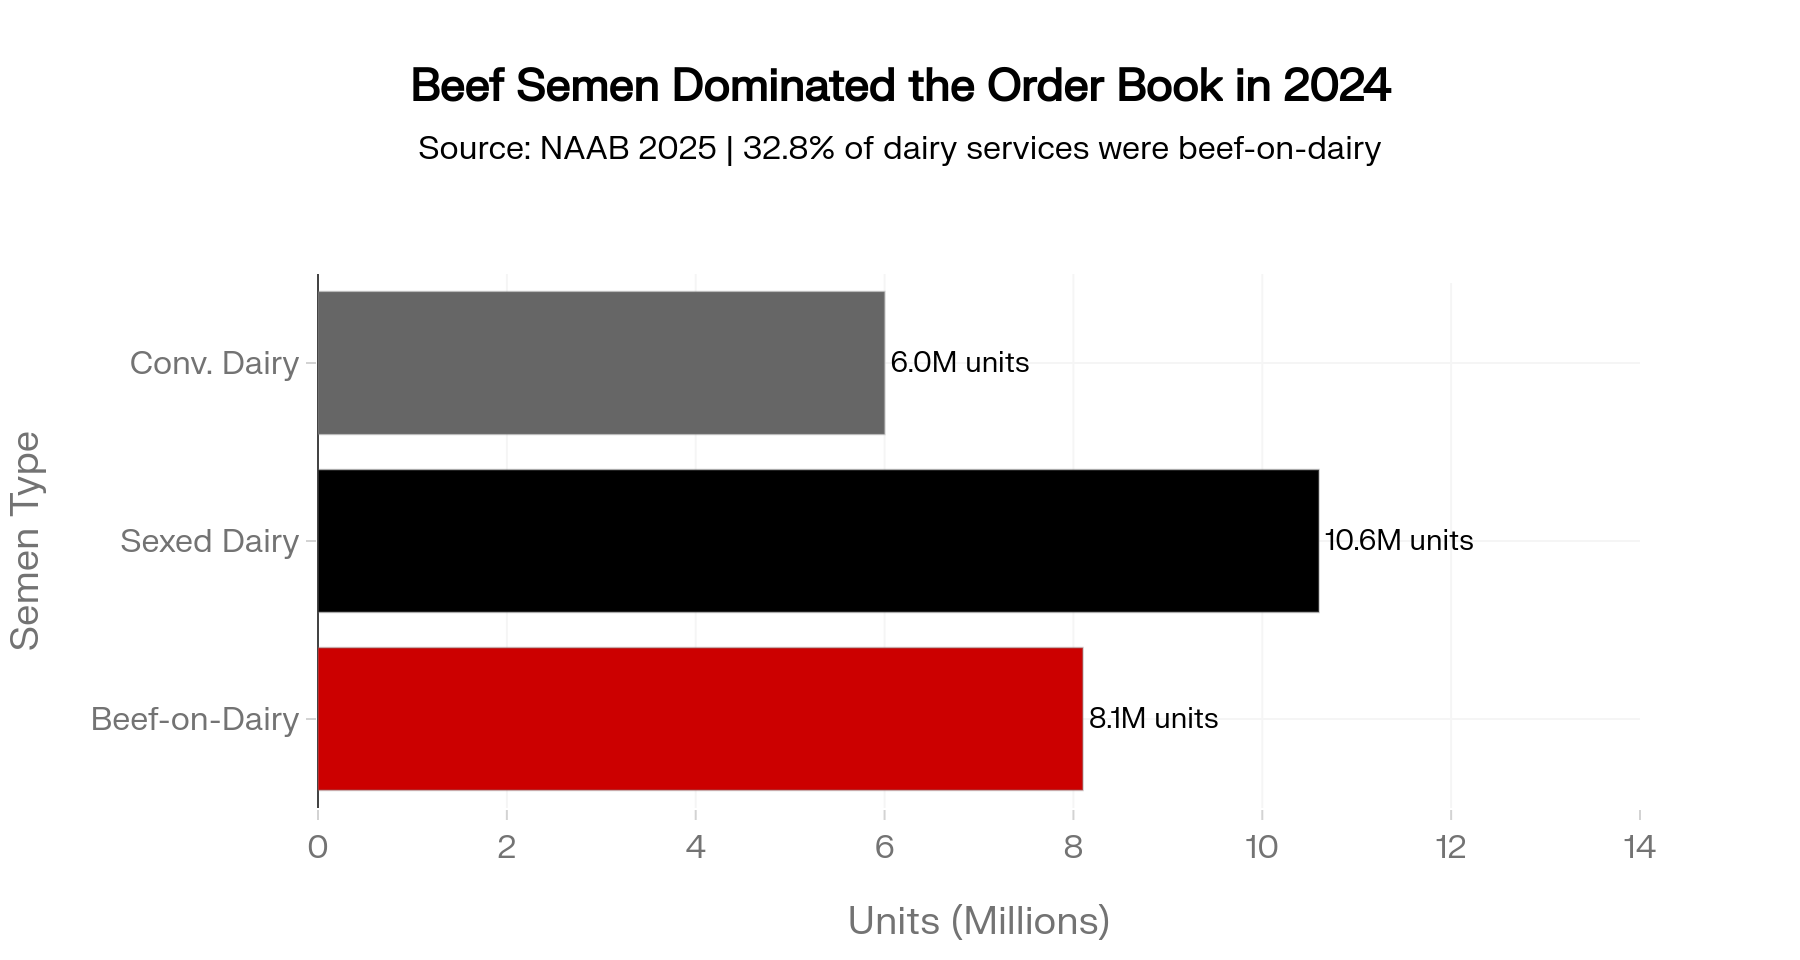
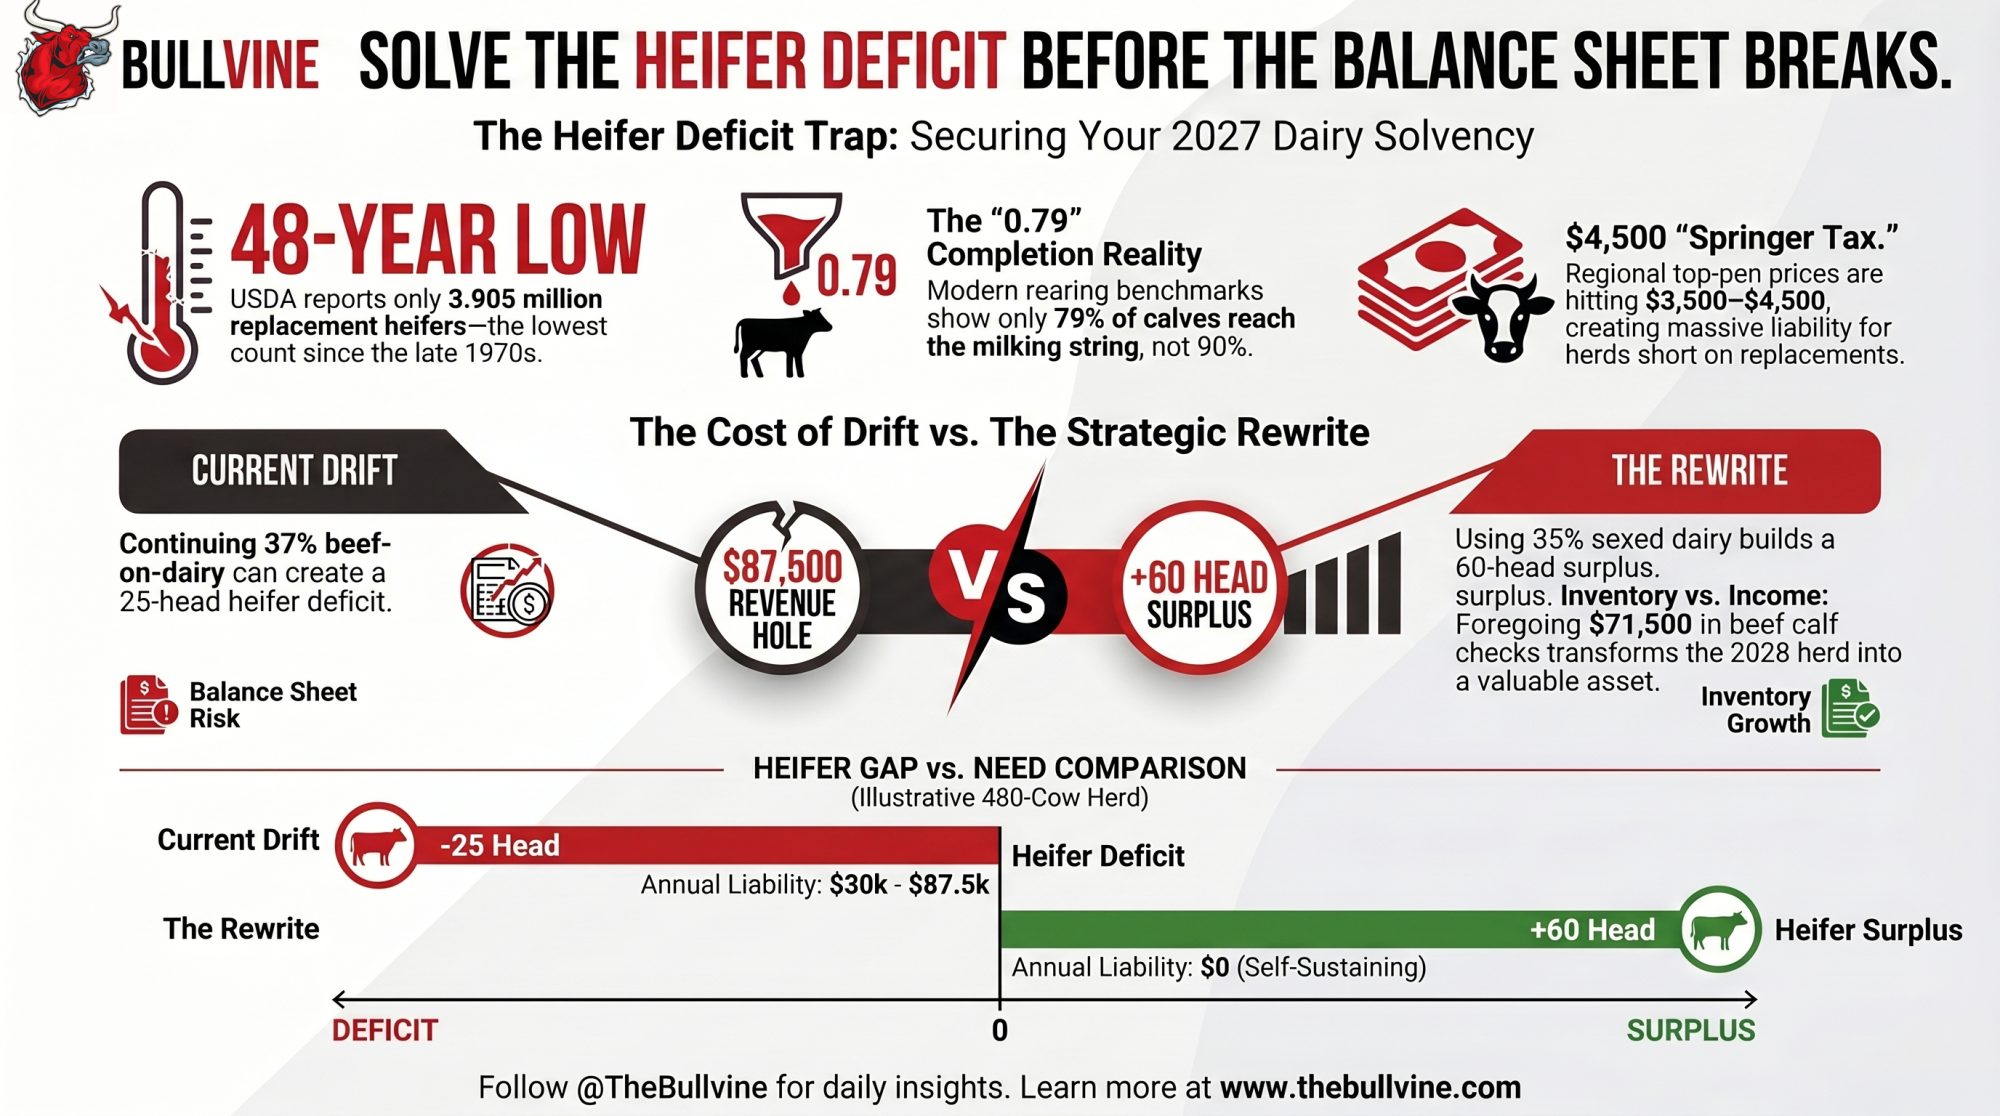
Executive Summary: Beef-on-dairy hit 32.8% of U.S. dairy services in NAAB’s 2025 report, and USDA NASS’s January 2026 inventory printed 3.905 million replacement heifers — the lowest in 48 years. For a composite 480-cow Upper Midwest herd that ran 37% beef through H1 2024, the math now shows a 4–25 head annual gap against a 154-head replacement need, translating to $30,000–$87,500/year in outside-springer liability at USDA AMS’s April 2026 prices ($3,010 national, $3,500–$4,500 Panhandle top pens). The CME Class III strip has $18.70–$19.15 milk on the board July–October 2026, so held cull cows finally ship — and the replacements aren’t in the calf barn. Lenders writing 24-month paper have moved projected 2027 fresh heifer count (at 0.79 calf-to-fresh, not 0.90) to page one of the dairy file. The rewrite — 25% beef cap, 35% sexed on top cows — costs roughly $71,500/year in foregone beef revenue on a 480-cow base, but produces ~60 surplus springers/year into a short market. Herds above 30% beef share with DSCR under 1.20 for two of the last three quarters should treat this as a balance-sheet problem this week, not a breeding-season one.
NAAB’s 2025 annual semen sales report put beef-on-dairy at 32.8% of U.S. dairy cow services — 8.1 million beef-on-dairy units against 10.6 million sexed dairy and 6.0 million conventional dairy, for 24.7 million total. USDA NASS’s January 2026 Cattle Inventory printed dairy replacement heifers 500+ lbs at 3.905 million head. Lowest in 48 years.
For a 400–600 cow Upper Midwest operation that rode the cheap-milk stretch hard, that national math is now a local problem: where do your 2027 replacement heifers come from, and what do they cost at $18+ milk?
Editor’s note: the sections below reference an illustrative 480-cow Upper Midwest operation. The region, herd size, and figures are a composite, not a specific farm. No individual producer, family, or private business is being described.
The Trade That Looked Airtight Through H1 2024
For much of the first half of 2024, USDA AMS Class III announced prices ran roughly $14–$16/cwt, with prints near $13 early in the year — before the late-2024 rally carried the board past $20 by September. The cheap-milk pressure that reshaped breeding sheets was H1 2024, not the year in aggregate. That’s the stretch this story is about.
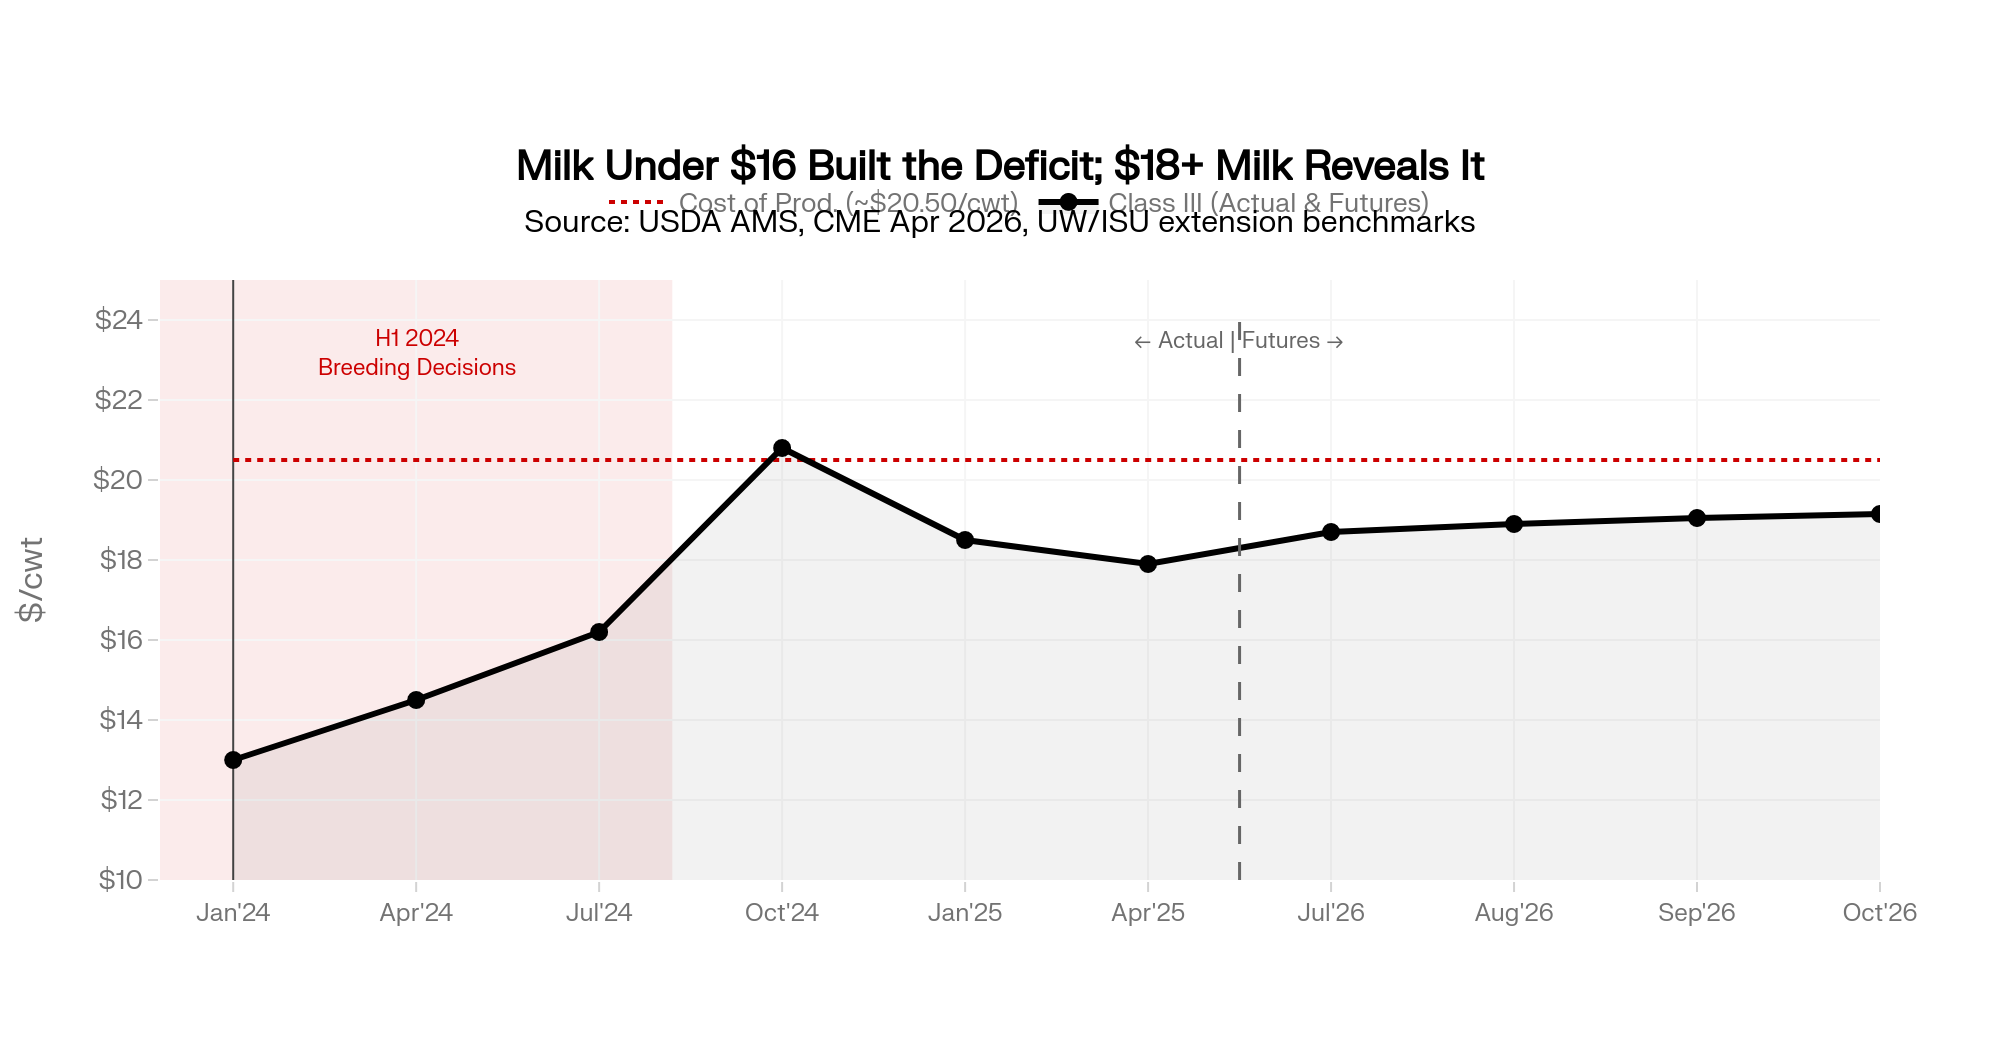
University of Wisconsin Center for Dairy Profitability and Iowa State Ag Decision Maker cost-of-production work through 2024 put full costs north of $20/cwt on many Upper Midwest operations. At $13–$16 milk in H1 2024, that’s a $4–$7/cwt negative margin on base milk before the H2 2024 sign flip. You can only eat that kind of spread for so long before the semen order starts solving for cash flow instead of pipeline.
Beef-cross calves off dairy cows cleared $1,400–$1,600 at Upper Midwest sale barns through much of 2024, consistent with Wisconsin and Iowa extension weekly livestock auction summaries. At 150 beef-cross services a year on a 480-cow herd, that premium over a Holstein bull calf added $150,000–$180,000 in calf revenue. Real money when the milk check was underwater.
Producers who ran heavy beef-on-dairy through that stretch weren’t making a mistake. They were responding to a cash-flow crisis you could measure in the milk check. The problem isn’t the decision. It’s the decision stacked 22 Tuesdays deep.
What Everyone Assumed — And Why the Data Says the Opposite
The prevailing view heading into 2026 — including The Bullvine’s own January 2026 analysis — was that the rally would be capped by a wall of milk.
The data says the opposite. NAAB 2025: 8.1 million beef-on-dairy units. USDA January 2026: 3.905 million replacement heifers, the lowest since the late 1970s. ISU Extension’s weekly tracker showed federally inspected dairy cow slaughter below year-ago for 86 of 88 weeks through mid-May 2025, producing a retention overhang of roughly 600,000 cows into late 2025 as estimated in published Rabobank and CoBank Knowledge Exchange dairy commentary. Q1 2026 USDA AMS federally inspected slaughter data show dairy cull shipments flipping to roughly +40,000 head above year-ago.
The release has started. The rally isn’t getting capped by oversupply. It’s getting amplified by a supply hole built one Tuesday at a time.
Related Bullvine analysis: 2026 Dairy Rally Or Dead-Cat Bounce? The Risk and Margin Math Behind Today’s Wall of Milk — held-cull retention and the 2026 Class III futures curve.
What Does Beef-on-Dairy 2026 Actually Cost a 480-Cow Upper Midwest Herd?
Picture an illustrative 480-cow Upper Midwest herd that ran beef-on-dairy in the 35–40% range of services for nearly two years through early 2025. Each Tuesday, the decision felt sharp: a $1,400 calf check in nine months, or a dairy heifer that might or might not be milking 27 months out.
Twenty-two Tuesdays at 37% isn’t the same herd as twenty-two Tuesdays at 25%. It’s a heifer inventory the lender can see on the balance sheet and the next operator can count in the calf barn. The breeding sheet is balance-sheet construction, even when it feels like a cash decision.
That’s where the trap closes. The USDA AMS National Dairy Replacement Heifer Report showed springers averaging $3,010/head nationally in April 2026, with top pens clearing $3,500–$4,000. Panhandle and California auction reporting carried by USDA AMS regional summaries has shown quality springers at $3,500–$4,500 through April 2026 — a short market likely to persist into 2027.
Related Bullvine analysis: The Panhandle Springer Tax (April 21, 2026) — regional springer-price variance.
On the CME, the Class III futures strip as of late April 2026 crossed $18/cwt in June 2026 and ran in the $18.70–$19.15 band from July through October.
At $18+ milk, the math on a held cull cow flips. She ships. The replacement you were going to raise instead of buy is still 27 months out.
Running the Numbers
Illustrative — Composite 480-Cow Upper Midwest Herd, 2025 Breeding Season
Inputs (USDA AMS April 2026; NAAB 2025; heifer-rearing completion benchmarks consistent with University of Wisconsin Extension and Penn State Extension published work through 2024–2025):
| Metric | Old Plan (37% Beef) | Sexed Crunch (12% Sexed) | Rewritten Plan (25% Beef, 35% Sexed) |
|---|---|---|---|
| Total Services/Year | 540 | 540 | 540 |
| Dairy Services | 340 | 340 | 405 |
| Beef Services | 200 | 200 | 135 |
| Weighted Female Share (Dairy) | 60% | 56% | 67% |
| Female Live Calves | 204 | 190 | 271 |
| Fresh Heifers @ 0.79 Completion | ~161 | ~214 | |
| Gap vs. 154-Head Need | +7 | −4 | +60 |
| Annual Outside-Springer Liability @ $3,010 | $0 | $12,040 | $0 |
| Annual Outside-Springer Liability @ $3,500 | $0 | $14,000 | $0 |
| Foregone Beef Revenue vs. Old Plan | — | $0 | ~$71,500 |
| Surplus Springers Available to Sell/Year | ~7 surplus | Deficit | ~60 surplus |
- Milking herd: 480 cows; services per year: ~540.
- Prior mix: 37% beef-on-dairy, 45% conventional dairy, 18% sexed dairy.
- Cull rate: 32% (upper end of the 28–35% industry range).
- Female live-calf share: ~49% on conventional; ~88% on sexed dairy.
- Calf-to-fresh completion rate: 0.79 (within recent extension heifer-rearing benchmarks).
- Beef calf net premium over Holstein bull calf: $1,000–$1,200/head (2024 Upper Midwest sale barn range).
- Replacement springer cost: $3,010 national average; $3,500 top pen (USDA AMS, April 2026).
Method note: the model treats services as equivalent female-calf generators at their published female-share rates and doesn’t adjust for the typical 3–5 point conception gap between sexed and conventional. That’s the standard barn-math approach and is conservative for the deficit case.
Weighted female-share formula used throughout: Weighted female share on dairy services = (conventional share of dairy services × 49%) + (sexed share of dairy services × 88%).
Step 1 — Heifers Needed to Hold 480 Cows
- Milking herd × cull rate: 480 × 32%
- Result: 154 fresh heifers/year
The Bottom Line: 154 is the number the lender is comparing against. Everything else in this box either clears that bar or doesn’t.
Step 2 — The Production Reality at 37% Beef-on-Dairy
- Dairy services: 540 × 63% = 340
- Conventional share of dairy services: 45/63 = 71%; sexed share: 29%
- Weighted female share: (0.71 × 49%) + (0.29 × 88%) = 60%
- Female calves: 340 × 60% = 204
- Fresh heifers at 0.79 completion: ~161
The Bottom Line: Under the 37% beef plan, you’re one bad pneumonia outbreak away from a replacement deficit. Zero margin for error.
Step 3 — The Sexed-Crunch Scenario
Pull sexed from 18% to 12% of all services (keep beef at 37%, conventional at 51%):
- Dairy services: still 340
- Conventional share rises to 81%; sexed drops to 19%
- Weighted female share: (0.81 × 49%) + (0.19 × 88%) = 56%
- Female calves: 340 × 56% = 190
- Fresh heifers at 0.79 completion: ~150 — against a 154-head need
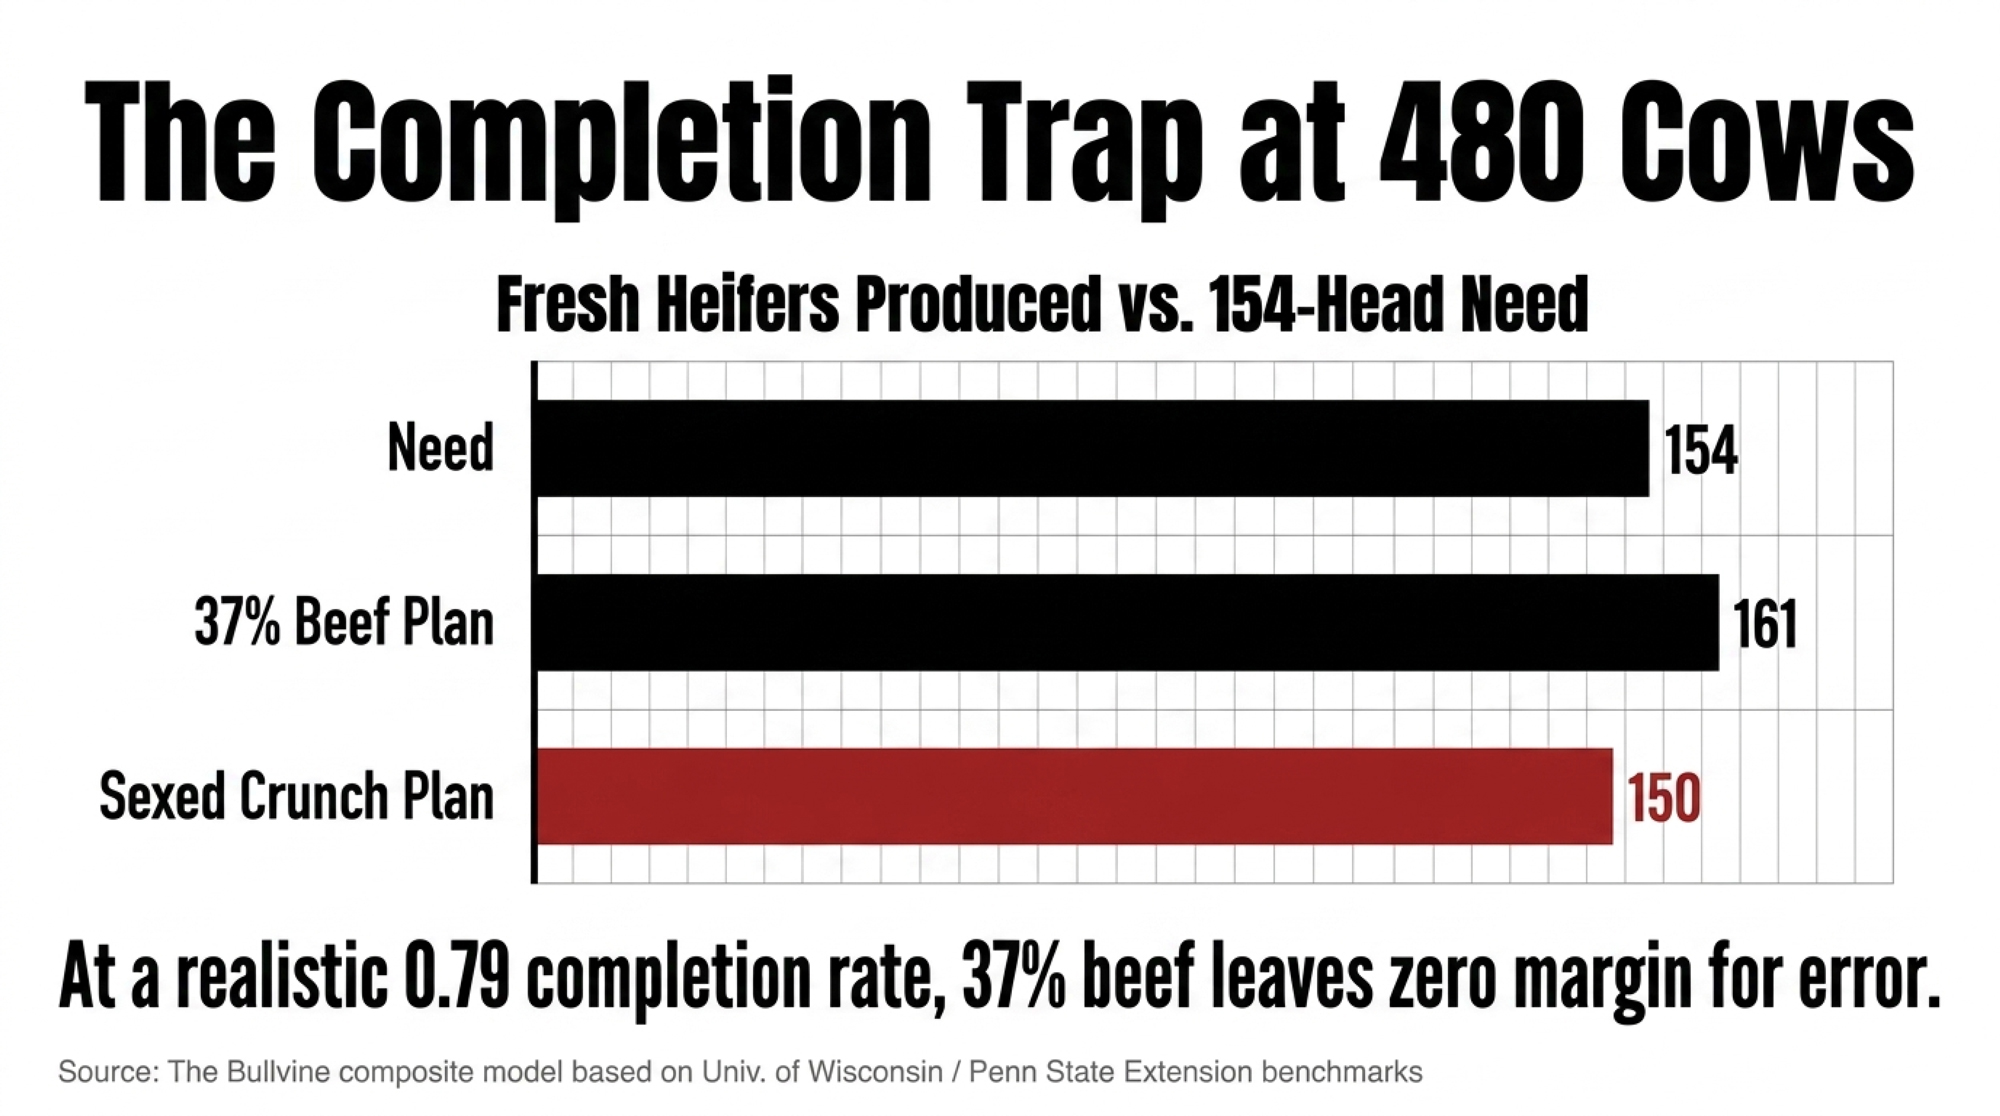
The Bottom Line: Cut sexed to preserve cash and the gap opens by a full semen order. A 4-head deficit at $3,010 national or $3,500 top-pen springers is $12,000–$14,000/year walking out the gate. Slip further, and you’re buying.
Step 4 — Outside-Replacement Liability When the Cushion Goes
For every 10-head annual shortfall against the 154-head need:
- At $3,010 national avg: 10 × $3,010 = $30,100/year
- At $3,500 top-pen: 10 × $3,500 = $35,000/year
- Two-year exposure per 10-head gap: $60,200–$70,000
Herds that drifted deeper — 45% beef share, 10% sexed — widen the gap to 20–25 head/year. At $3,010, that’s $60,200–$75,250/year. At $3,500 top pen, $70,000–$87,500/year.
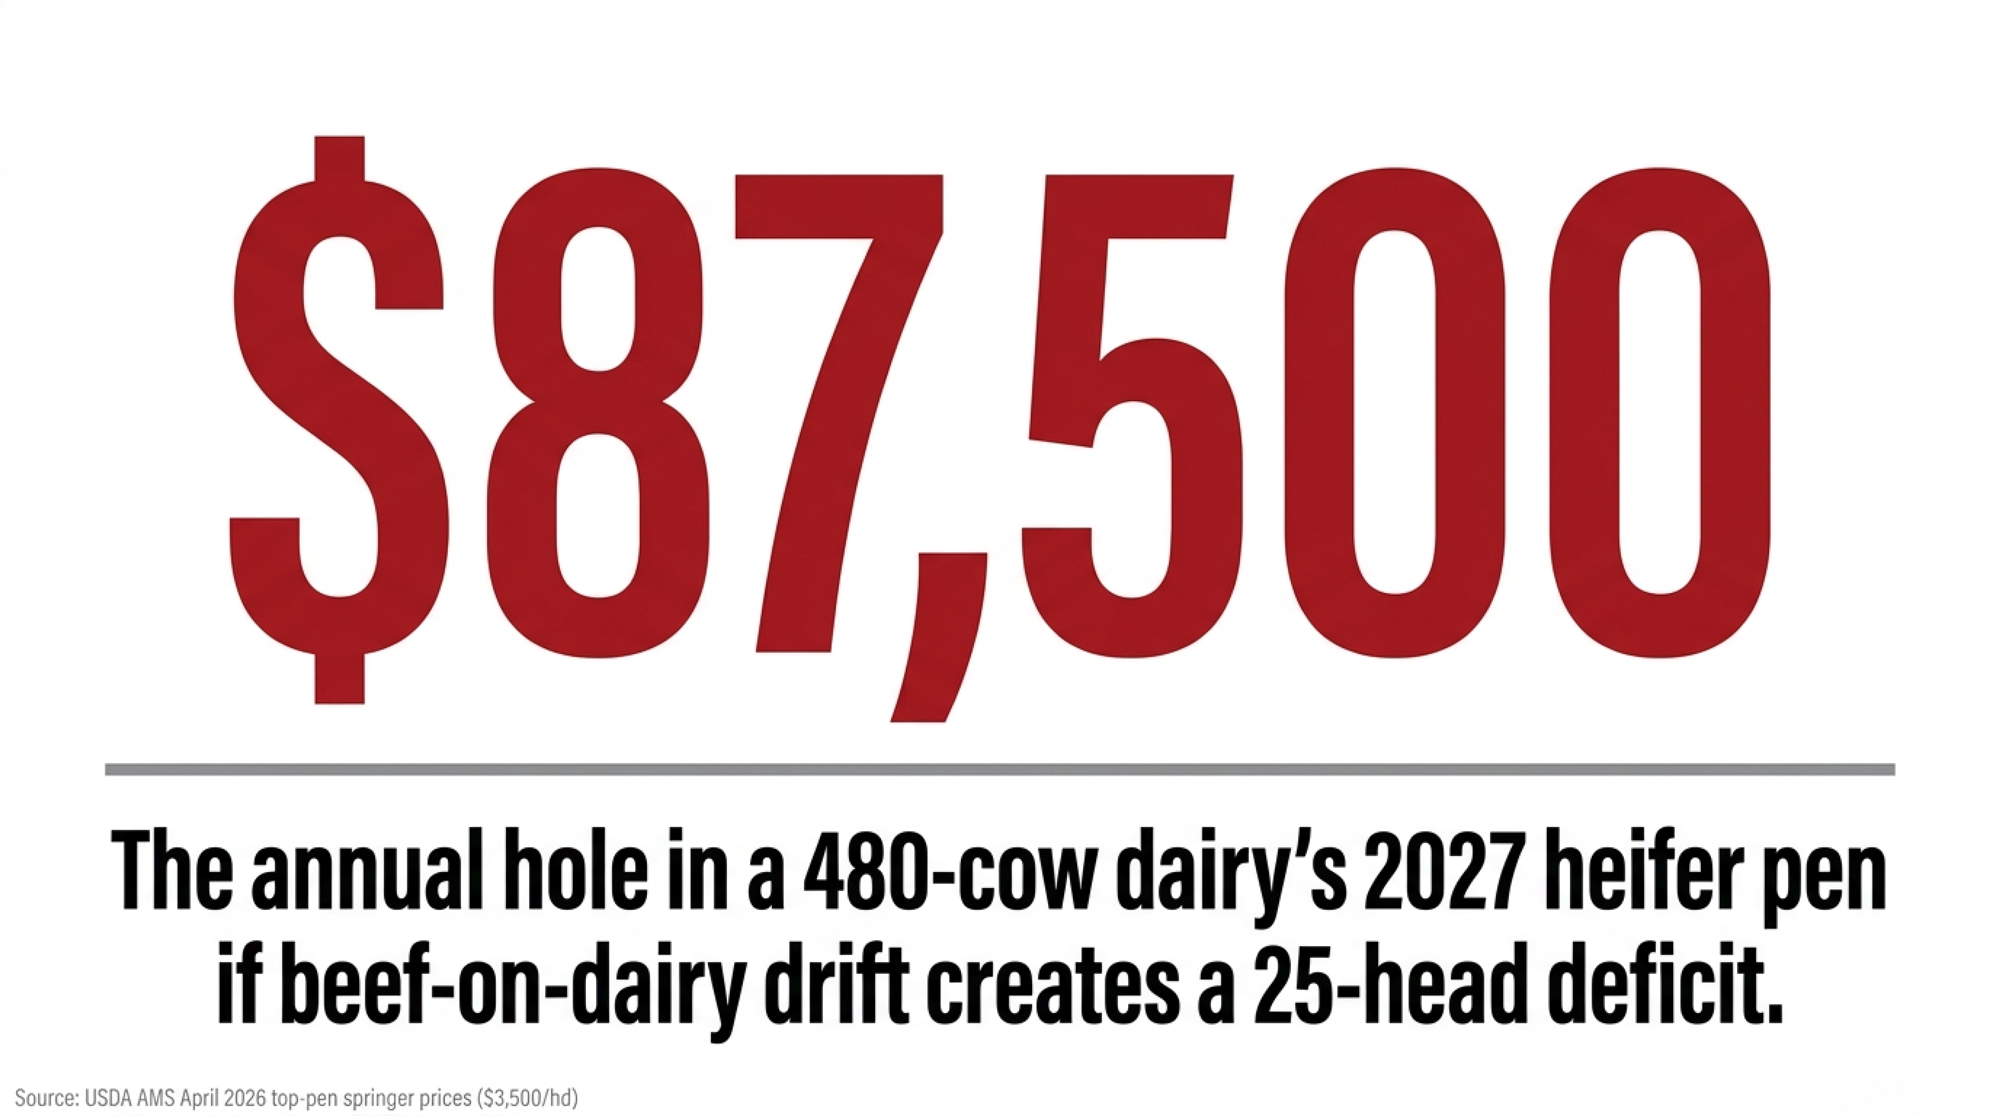
The Bottom Line: This is where the headline number lives. The $87,500/year is the top end of the drift case at the Panhandle springer price — not the central 480-cow composite. It’s what a 25-head gap costs at $3,500/head, full stop.
Step 5 — Rewriting the Plan: 25% Beef Cap, 35% Sexed on Top Cows, 40% Conventional
- Dairy services: 540 × 75% = 405
- Sexed share of dairy services: 35/75 = 47%; conventional: 53%
- Weighted female share: (0.53 × 49%) + (0.47 × 88%) = 67%
- Female calves: 405 × 67% = 271
- Fresh heifers at 0.79 completion: ~214
That overshoots the 154-head target by ~60 head/year. The overshoot is the point — room to cull harder, sell surplus springers into a tight market, or bank replacements against a down year.
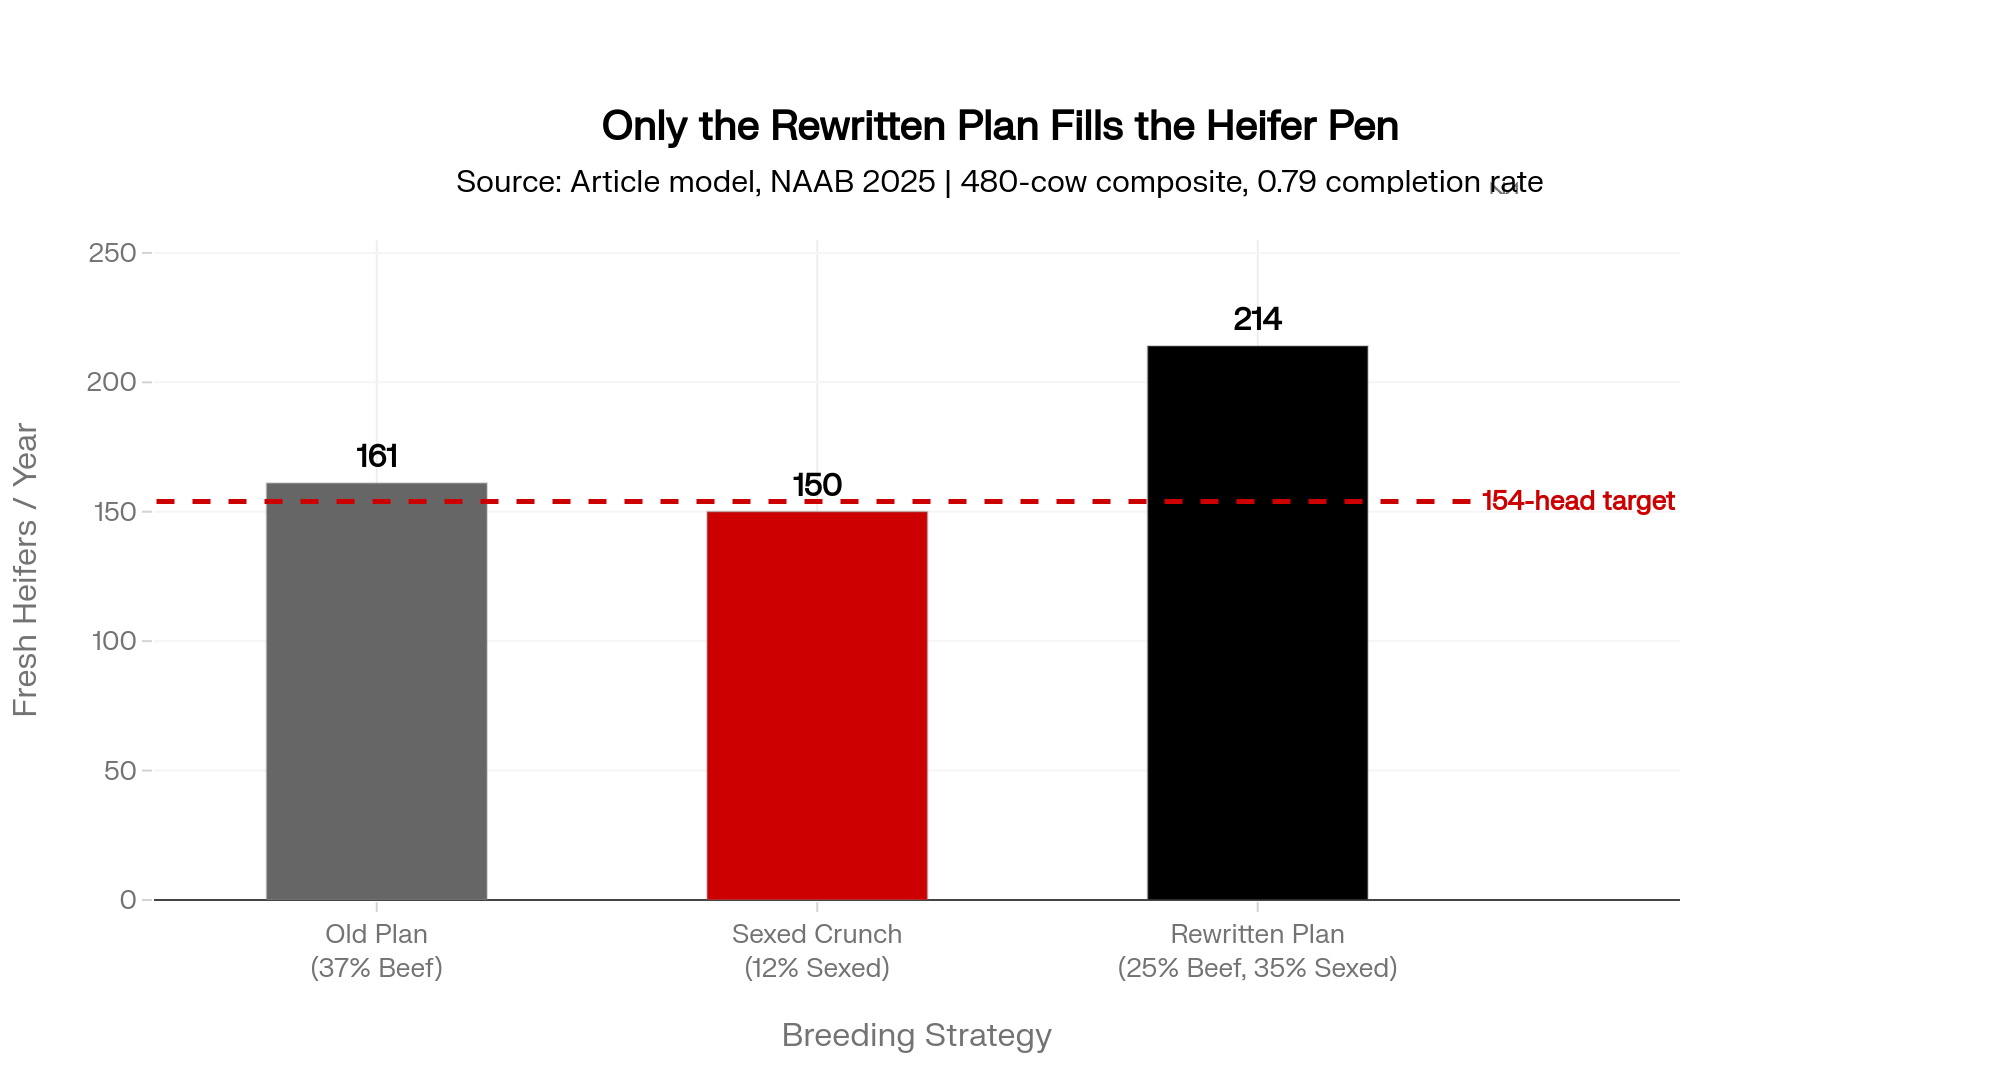
Step 6 — Cost of the Rewrite
Beef services drop from 540 × 37% = 200 to 540 × 25% = 135. That’s 65 fewer beef services/year. At a $1,100/head average net premium over Holstein bulls, foregone beef revenue ≈ $71,500/year.
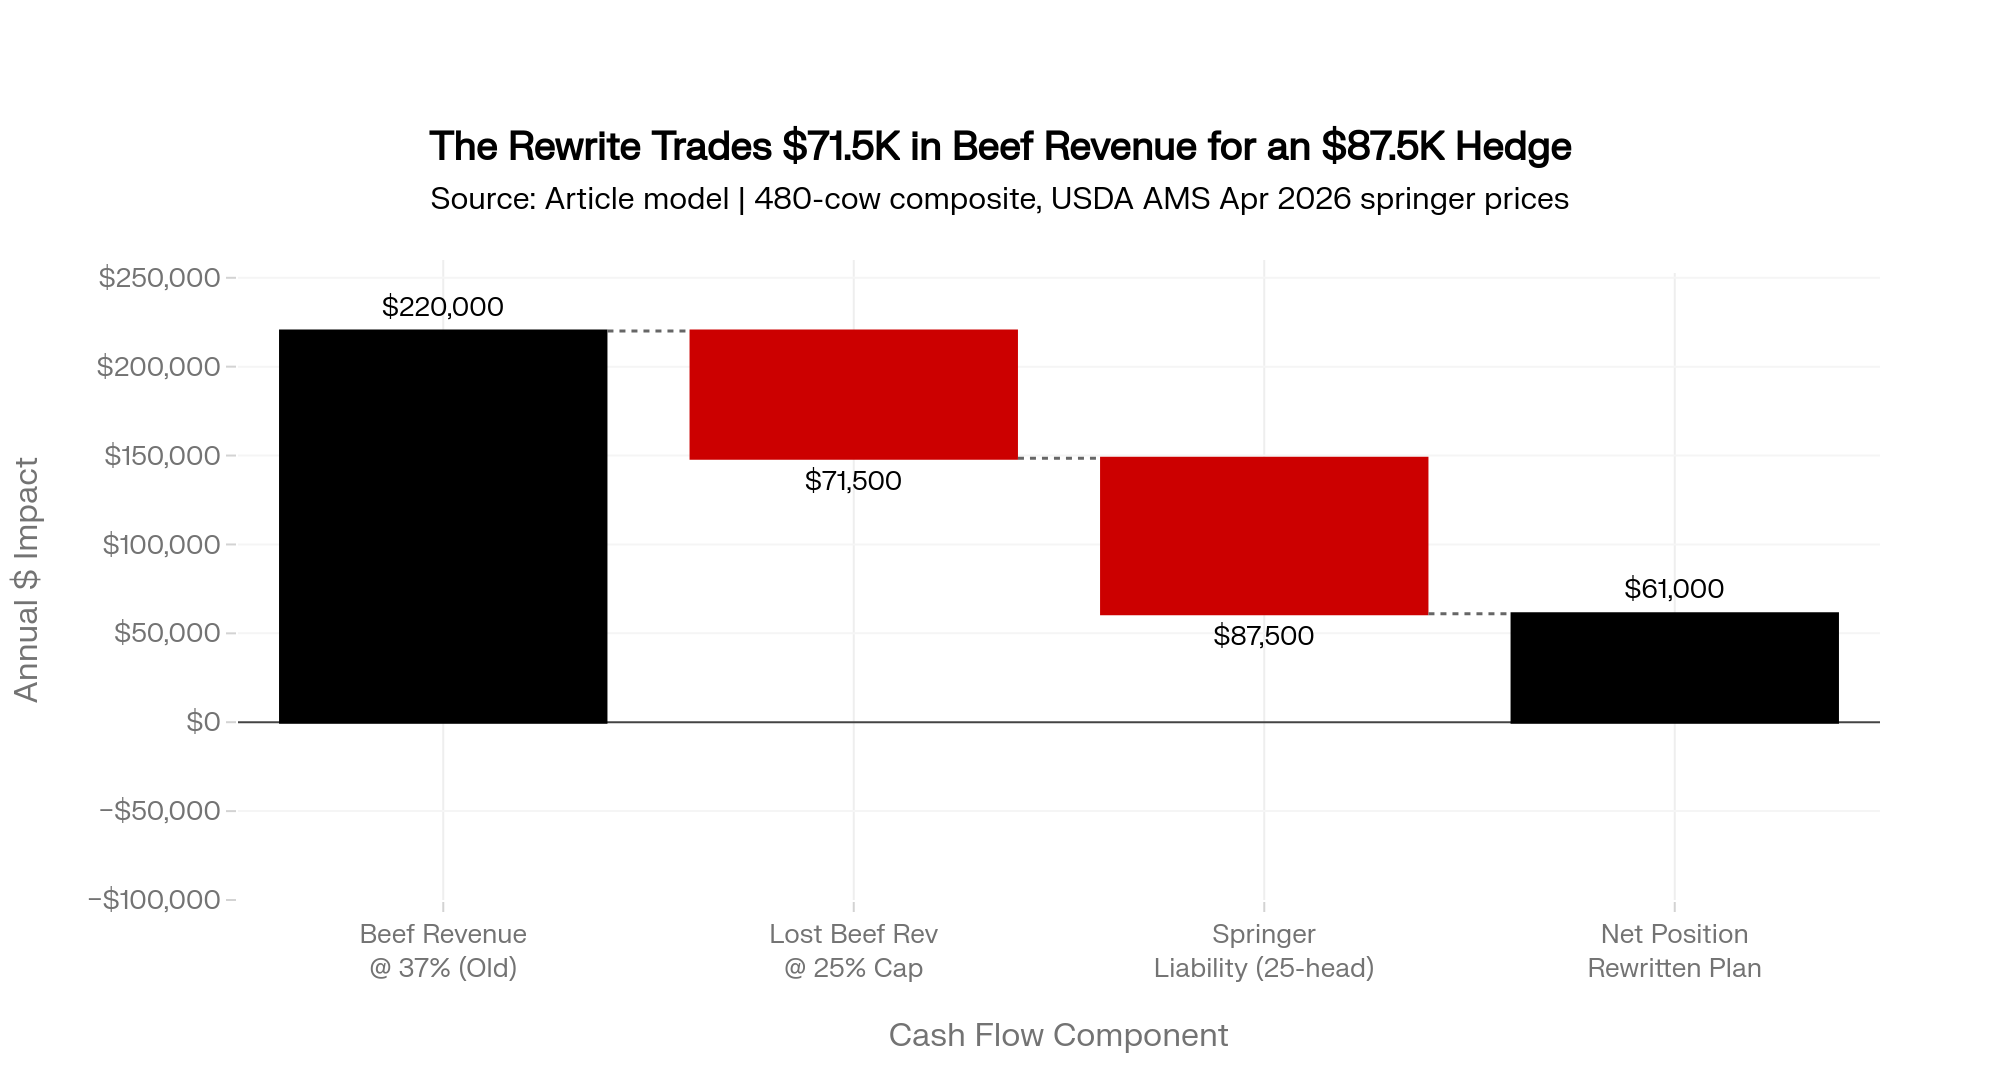
The Bottom Line: Give up ~$71,500/year in calf revenue for 24 months to avoid $30,000–$87,500/year in outside-replacement liability, build a ~60-head/year springer surplus, and turn the 2028 herd into an asset instead of a gap. The beef check is cash this quarter. The heifer is inventory that compounds.
Scaling down to 300 cows: multiply Steps 1 through 6 by 0.625. A 300-cow herd at the same behavior needs ~96 fresh heifers/year, runs the same per-head economics on springers and beef calves, and faces foregone-beef trade-offs near $45,000/year to close a proportional gap.
Old Plan vs. Sexed Crunch vs. Rewritten Plan — 480-Cow Upper Midwest Composite
| Metric | Old Plan (37% beef) | Sexed Crunch (12% sexed) | Rewritten Plan (25% beef, 35% sexed) |
| Dairy services | 340 | 340 | 405 |
| Weighted female share on dairy services | 60% | 56% | 67% |
| Female live calves | 204 | 190 | 271 |
| Fresh heifers at 0.79 completion | ~161 | ~150 | ~214 |
| Gap vs. 154-head need | +7 | −4 | +60 |
| Annual outside-replacement liability at $3,010 / $3,500 | $0 / $0 | $12,000 / $14,000 | $0 / $0 |
| Foregone beef revenue vs. 37% plan | — | $0 | ~$71,500 |
Visual opportunity: horizontal bar graphic comparing “fresh heifers produced vs. 154-head need” across the three scenarios, with a pull-quote of the $30K–$87.5K liability range. Render for Instagram square, LinkedIn 1200×628, and newsletter header.
The Turn: Why This Stopped Being a Breeding Decision
The quandary two years ago pushed culling rates down. Those held cows have to ship eventually — and when they do, the replacements aren’t there. That’s the spine of what’s changed: 2024’s breeding decisions were often right cow-by-cow. The problem is what they stacked into herd-by-herd.
One ag lender reviewing dairy files in the first half of 2026, speaking on background, told The Bullvine that the projected 2027 fresh heifer count and the completion-rate assumption behind it is now the first question on every dairy file. A year ago, that question didn’t come up until page three of the package. That’s not a credit-policy memo — that’s a loan officer who’s tired of getting surprised at renewal.
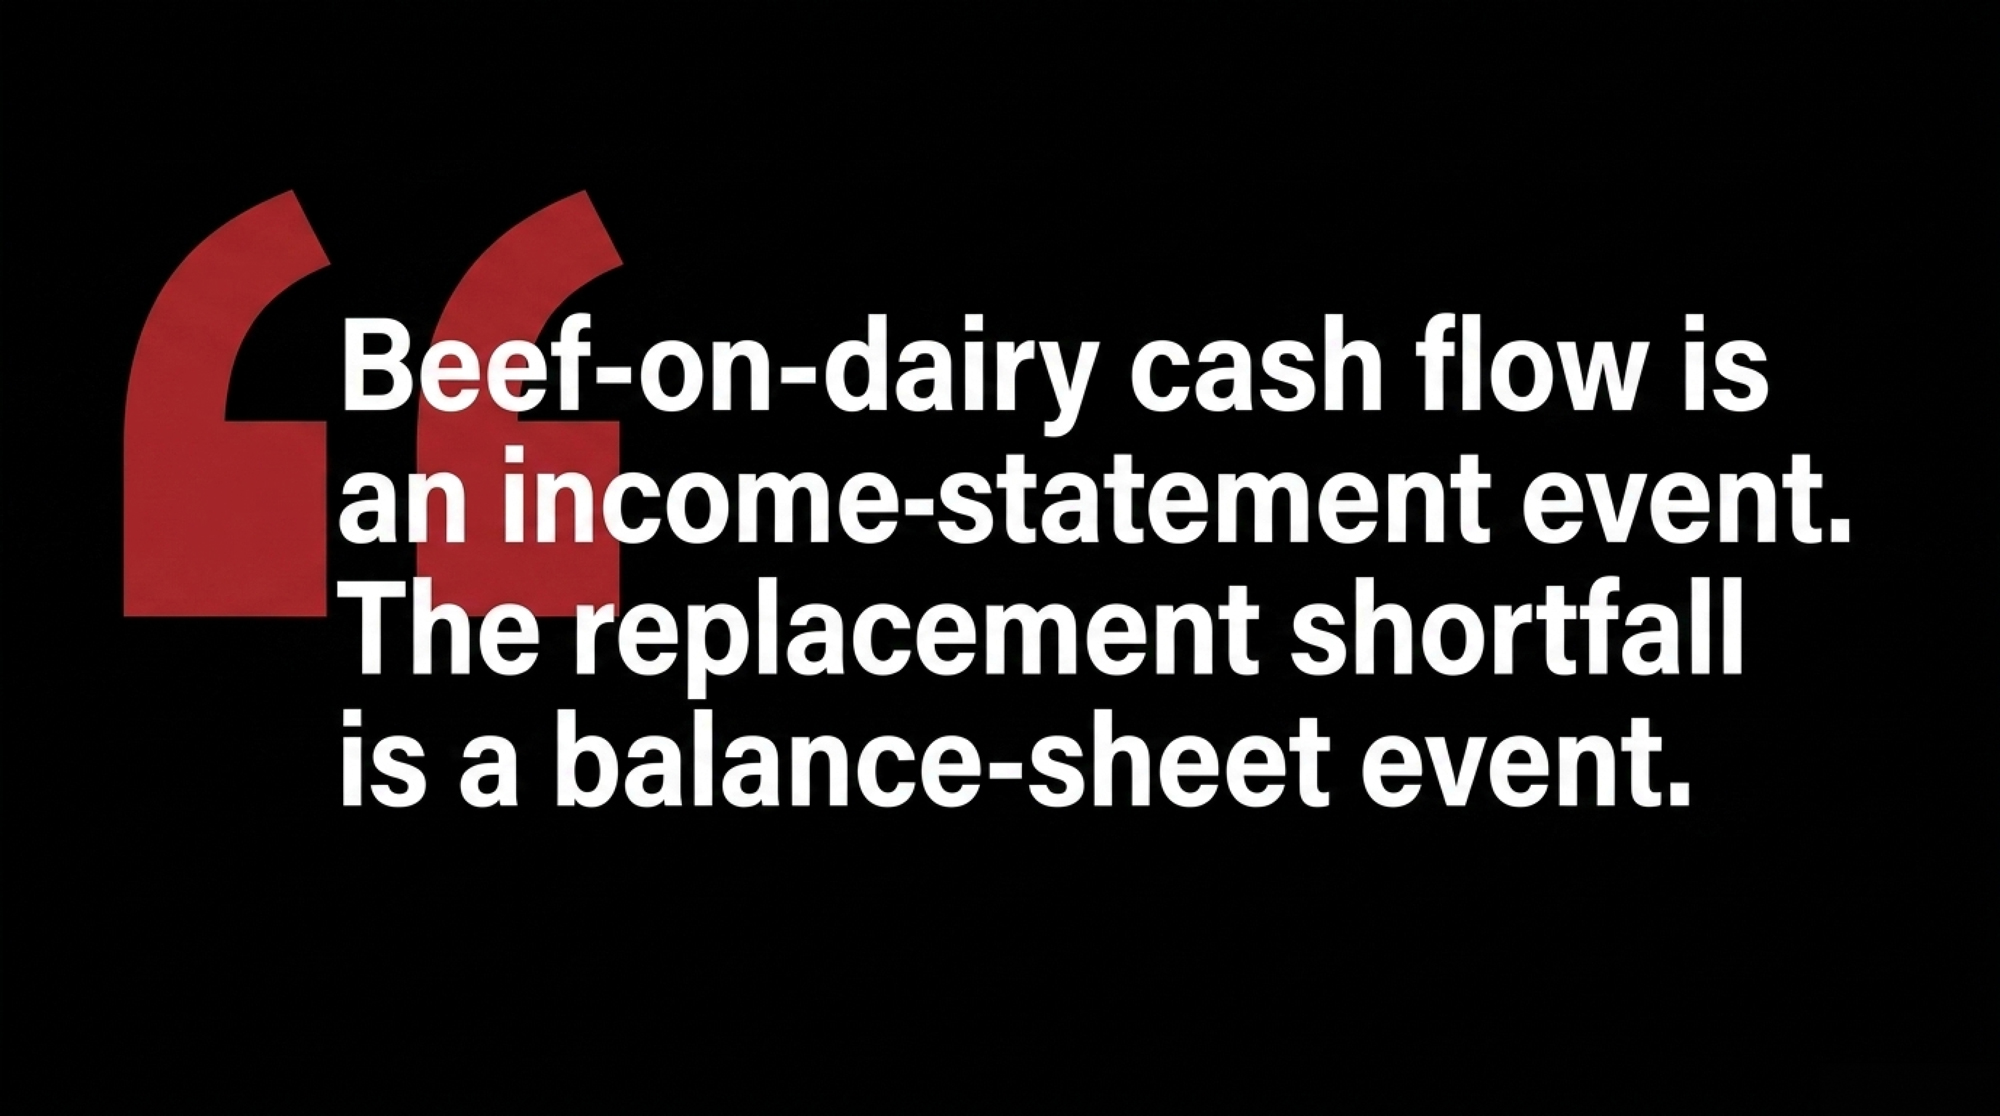
That shift — from income statement to balance sheet as the first read — is the turn. Beef-on-dairy cash flow is an income-statement event. The replacement shortfall is a balance-sheet event. Lenders writing 24-month paper in 2026 are weighing both sides of that ledger, not just the cash one.
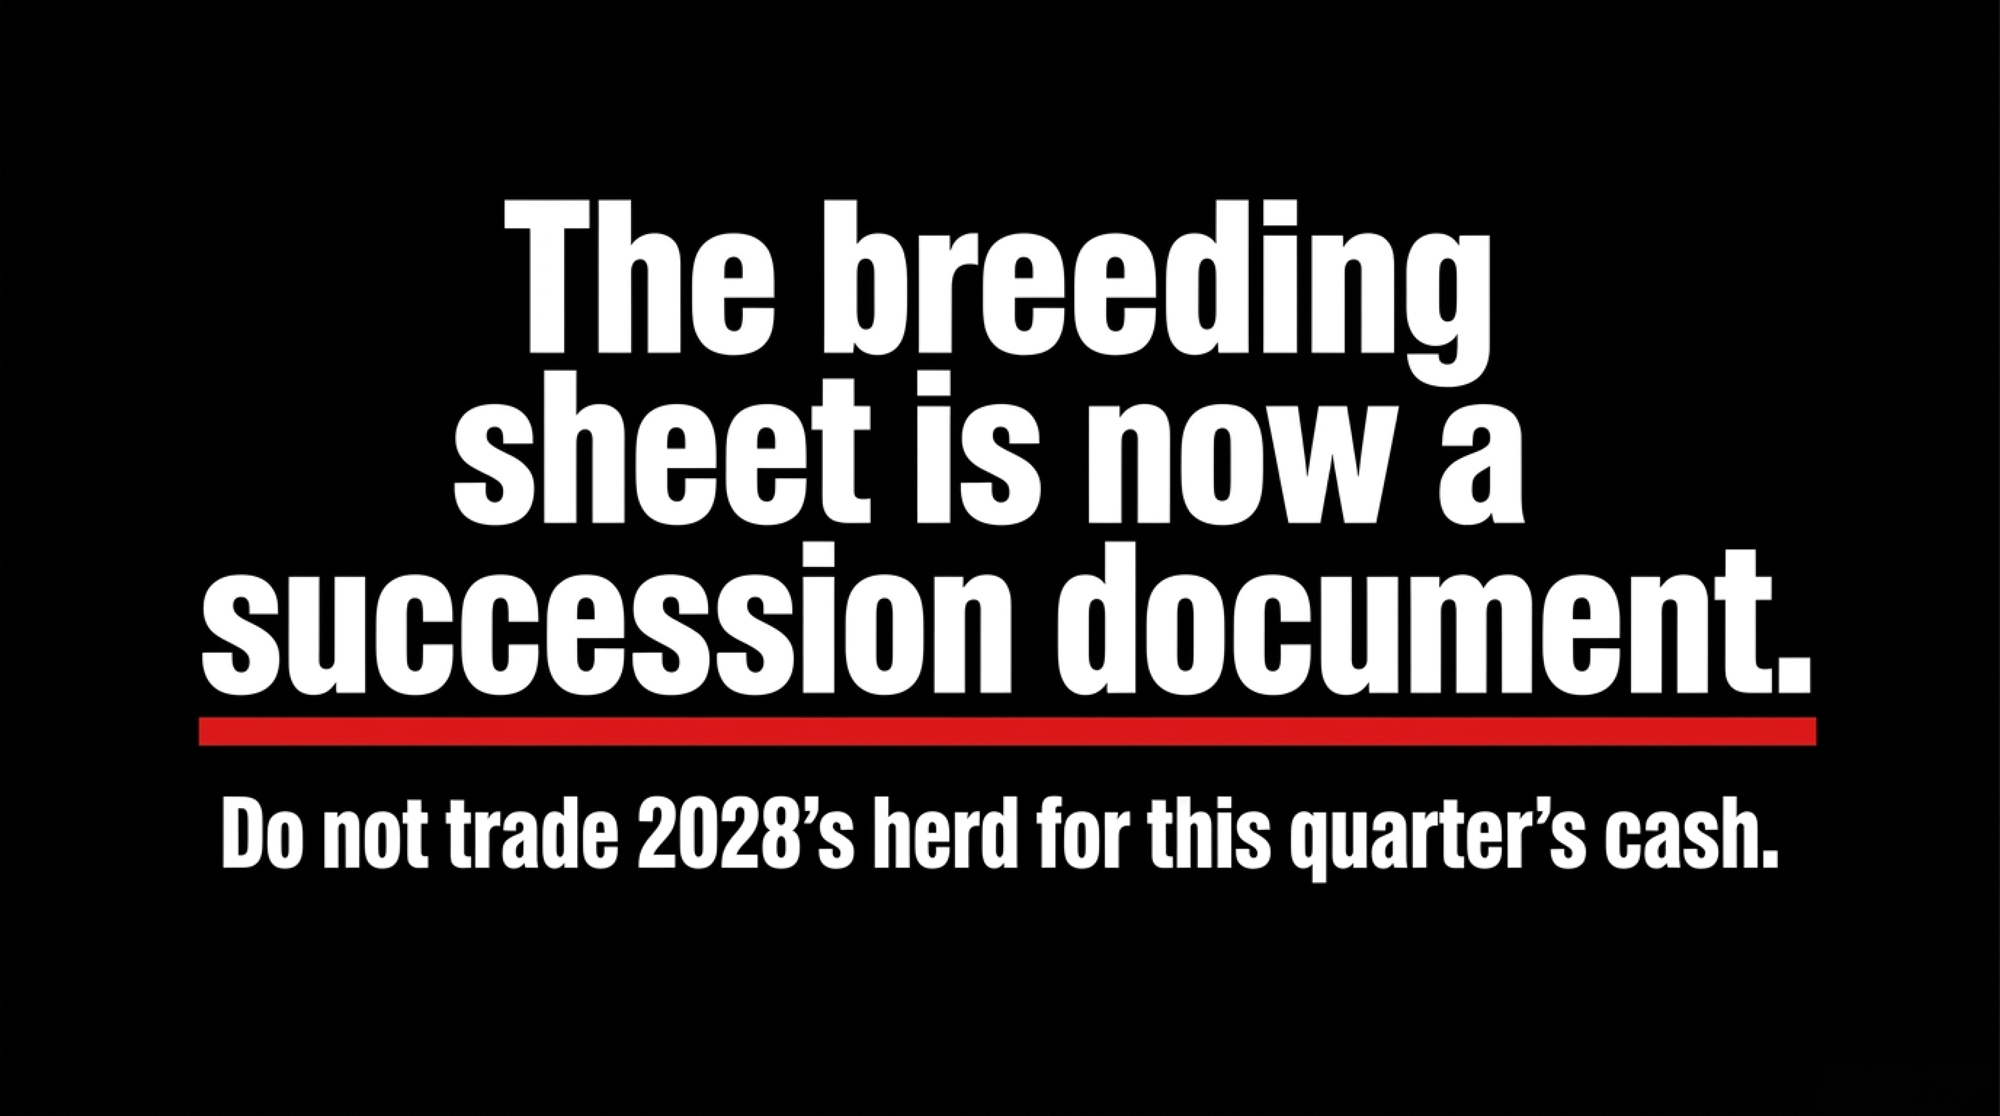
Related Bullvine coverage: The Dairy Succession Math — why the breeding sheet has become a succession document.
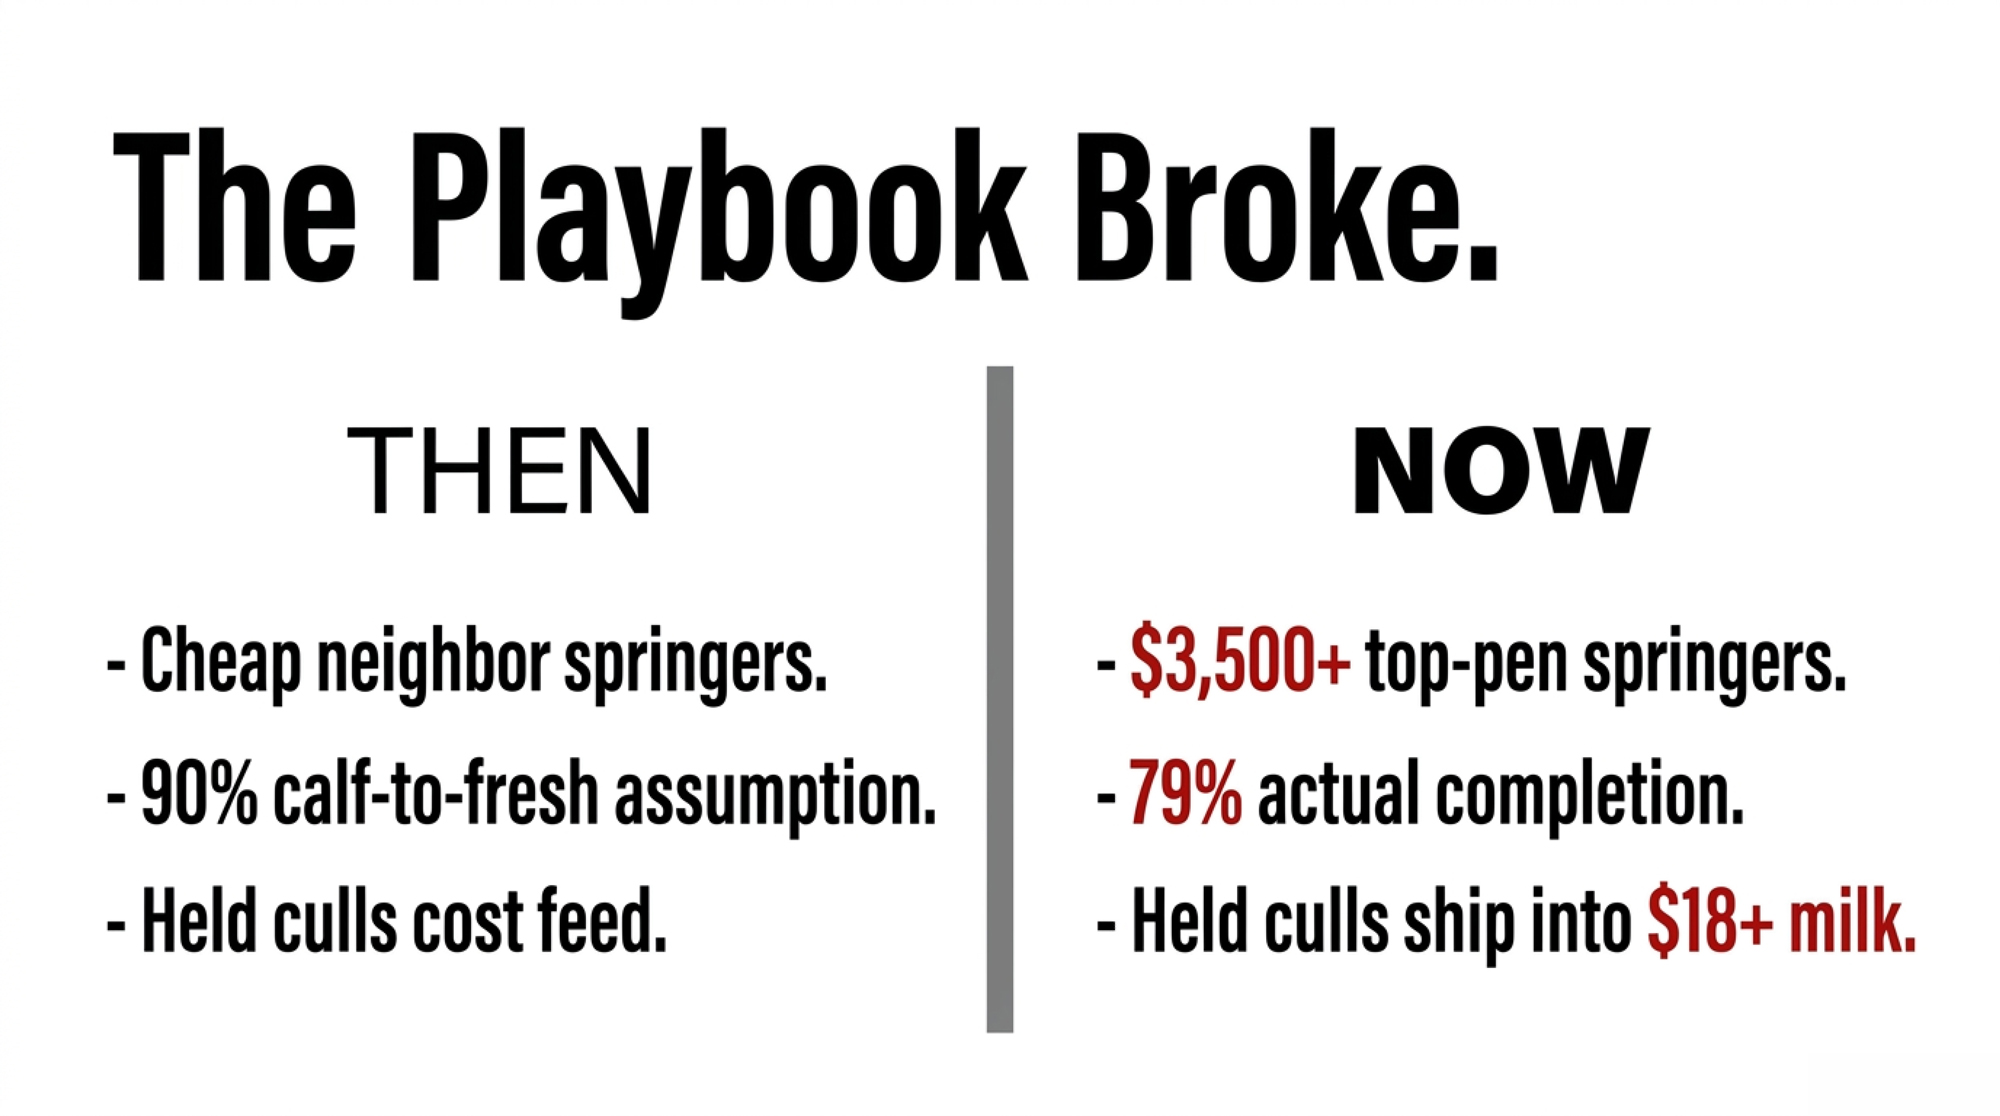
Why the Old Playbook Stopped Working
The old playbook was simple. Ride beef checks when milk is soft. Ride milk when it rallies. Figure out replacements when you have to. It worked in 2012. It worked in 2016. Arguably worked in 2020.
What changed between then and now is every input the old playbook depended on:
- Replacement supply — Then: cheap springers available from neighbors rotating out. Now: 3.905 million dairy replacement heifers in USDA NASS’s January 2026 inventory, a 48-year low, with the short market already priced at $3,010 national / $3,500–$4,500 Panhandle top pens in April 2026 AMS reporting.
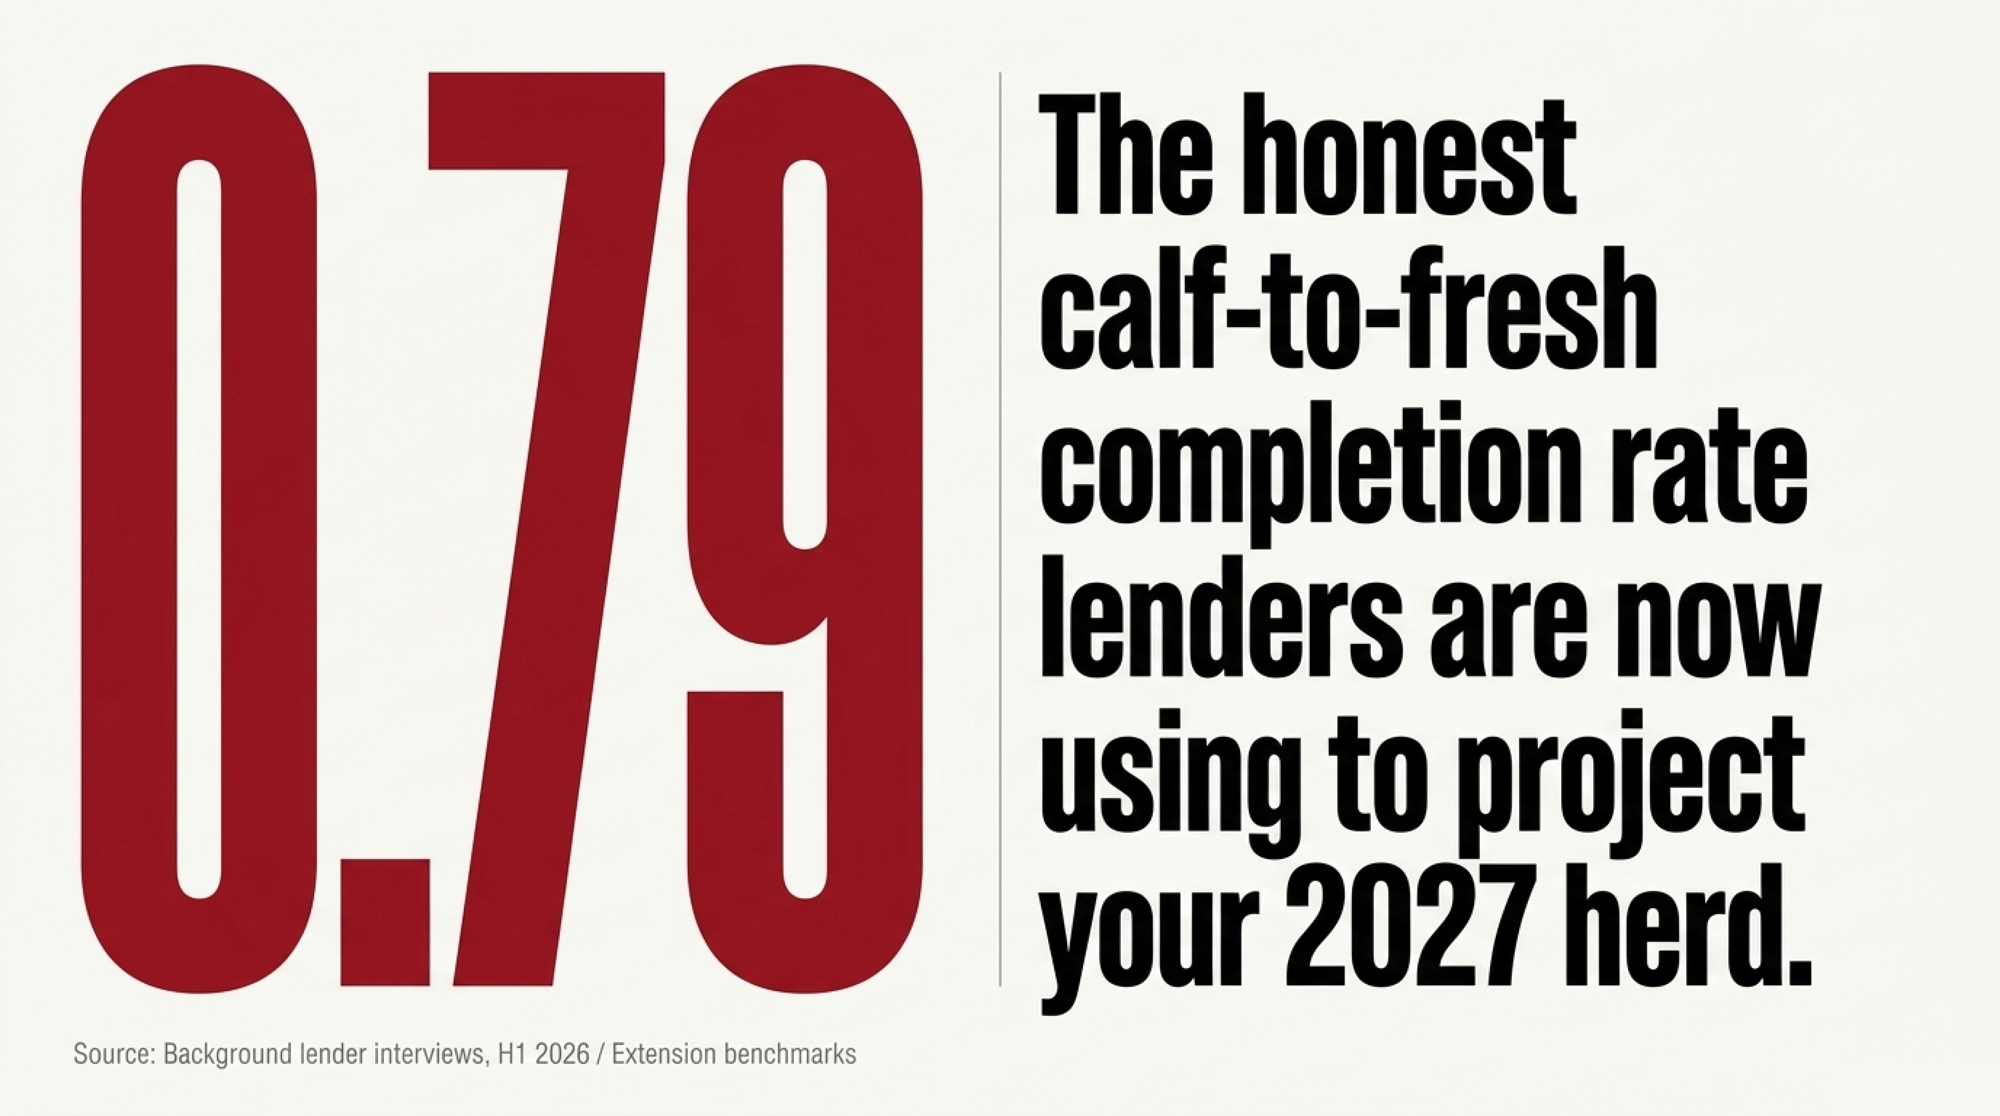
- Completion rates — Then: 90% calf-to-fresh was a “good enough” spreadsheet assumption most herds could hit. Now: 0.79 is the honest number in recent University of Wisconsin and Penn State Extension heifer-rearing benchmarks — labor, feed, and respiratory pressure stacked into rearing economics.
- Cull timing — Then: an open cow moved promptly because nothing else paid for her feed. Now: 86 of 88 weeks below year-ago slaughter through mid-May 2025 (ISU Extension) built an estimated 600,000-cow retention overhang; Q1 2026 is already unwinding at +40,000 head vs. year-ago in USDA AMS federally inspected slaughter.
- Milk outlook — Then: a $17 print was a normal good year. Now: the CME Class III strip has $18–$19 milk on the board for H2 2026, so the held cull cow ships into a rally, not a trough.
- Lender read — Then: DSCR and the milk check carried page one. Now: the projected 2027 fresh heifer count carries page one, per dairy files reviewed in the first half of 2026.
- Succession backstop — Then: a neighbor’s dispersal was a cheap replacement option. Now: land-grant family-business research and USDA ERS farm-typology work consistently find multi-generational dairy transitions remain difficult, with debt structure and unwritten transition terms among commonly cited failure points.
When those six stack, “figure out replacements when you have to” becomes “write a six-figure check into an auction ring that’s already short.”
Where’s the 2027 Heifer Coming From at Your Barn?
That’s the question the rewrite has to answer. Not in theory. In writing.
The composite 480-cow herd doesn’t redesign its breeding sheet because someone yells at a webinar. It redesigns because someone at the operation runs the math at 0.79 calf-to-fresh completion — not the 0.90 figure that still shows up in a lot of parent-generation spreadsheets — and produces a number the lender can see.
On a herd already drifting short on replacements, another year of heavy beef-on-dairy checks doesn’t strengthen the credit. It deepens the pipeline liability on the balance sheet faster than it improves DSCR on the income statement. The cash looks fine until it doesn’t.
Related Bullvine coverage: The Tiered Breeding SOP — sexed-semen strategy and tiered breeding SOP discipline.
What Does the 2026 Pipeline Mean for 400–600 Cow Herds?
Depends on whether the pipeline is sized to the barn or to the bank account.
Herds that held beef-on-dairy around 20–25% through 2023–2024 and kept sexed dairy disciplined on top cows have room to capture calf-check upside without mortgaging their 2027 herd. Herds that drifted to 35–45% beef share through the H1 2024 cheap-milk stretch are staring at the outside-replacement math.
Regional variance matters. Panhandle and California operations face a short springer market and will likely see the $3,500–$4,500 top-pen band persist into 2027. Upper Midwest and Northeast herds with in-house rearing have more optionality but less room on feed and labor. Herds without a written breeding SOP carry a third risk — drift. That’s how 2023’s 25% beef share became 2024’s 37%. Nobody makes that decision on purpose. It happens anyway.
Canadian context: this piece is U.S.-scoped. Ontario and Quebec operators under supply management face different replacement dynamics — quota value, component premiums, and P5 mechanics change the math. The breeding-SOP discipline and the 0.79 completion benchmark still apply. The U.S. price signals don’t.
The U.S. signal to watch: your local springer premium over USDA’s $3,010 national average. Read this as an interpretive signal, not a published benchmark. Below $200 over = pipeline rebuilding. $500+ over = your region is still importing heifers that aren’t there.
The 30/90/365-Day Playbook for Herds Like the 480-Cow Composite
Starting points, not prescriptions. Match to your own records.
30-Day Actions — Urgent Checks
- Pull your last three pregnancy check reports and calculate your actual beef-on-dairy share of services over the last 12 months. Trigger: above 30% and not adjusting → front of the to-do list. Requires: herd management software export, 20 minutes.
- ⚠️ Backfire Watch: a single quarter can swing 5–7 points. Use the 12-month trailing number, not last week’s — a hot-weather conception dip can make the sheet look fine when the 12-month trend is already past 35%.
- Run your 2026 and 2027 projected fresh heifer counts using a 0.79 calf-to-fresh completion rate, not 0.90. Compare to your replacement need at your current cull rate. Requires: your own herd records and a spreadsheet.
- ⚠️ Backfire Watch: if you don’t separate sexed vs. conventional female share in the model, the gap will look smaller than it is. A 29% sexed share inside dairy services looks fine until you realize sexed is carrying 88% female while conventional drags the blended rate down.
- Request written quotes from at least two heifer yards on Q4 2026 and Q1 2027 springer availability and price per head. Requires: phone calls, not emails. Put the numbers on paper.
- ⚠️ Backfire Watch: verbal quotes from a short market don’t hold. In April 2026, the spread between the $3,010 national average and $3,500–$4,500 top-pen regional prints is wide enough that a handshake number at month-end can be $500/head light of the invoice at delivery.
- Red-flag trigger: if term-debt coverage has been under 1.20 for two of the last three quarters per your lender’s or CPA’s method and your beef-on-dairy share is above 30%, move this to the top of the list this week. DSCR 1.20 is a common agricultural-lending benchmark; confirm the exact method your own lender uses.
90-Day Actions — Structural Adjustments
- Write a one-page breeding SOP. Rank cows into three tiers. Hard-cap beef-on-dairy share (many herds in this position are landing at 20–25%). Name a quarterly review date. Sign it. Tape it to the milkhouse wall. Email it to your lender. Requires: a genomic or index-based cow ranking, buy-in from the person ordering semen, a written target for heifer calves born per year.
- ⚠️ Backfire Watch: a cap set too tight on a cash-short herd can trip an operating line. Model the cash-flow impact — the rewrite gives up ~$71,500/year in beef revenue on a 480-cow base — before you sign. A 90-day phase-in beats a Day 1 hard cap if the milk check can’t absorb it.
- Put capital structure on the table alongside the breeding plan if a successor or partner is in the conversation. Staged buy-ins, holding entities for land, step-down retirement draws — they belong in the same meeting as the semen order. Requires: an ag-law attorney and a CPA who has closed a dairy transition.
- ⚠️ Backfire Watch: asking the next generation to rebuild the pipeline on top of a full-value buyout is how 2026 pipeline decisions become 2028 dispersals. If the breeding rewrite gives up calf-check cash for 24 months, the succession terms have to absorb that, not compound it.
- Consider locking 30–40% of Q4 2026 and Q1 2027 milk against the CME Class III strip or DRP, with explicit attention to local basis. The futures curve says the $18–$19 window exists. Whether your specific milk check holds it depends on processor relationships and basis risk. Requires: a broker or DRP-qualified agent and a margin sub-account.
- ⚠️ Backfire Watch: hedging more than your reliable milk volume invites margin calls in a rally. If Class III runs past $19.15 into Q4, a 50% hedge on shipments you can’t deliver to a processor turns a balance-sheet win into a cash-call loss.
365-Day Moves — Strategic Positioning
- Pick a lane on purpose. Three legitimate Tier 3 strategies for 2026–2028:
- Fortress pipeline: rebuild to ~200+ fresh heifers/year on a 480-cow base; requires a 25% beef cap and 35%+ sexed on top cows for 24 months.
- Niche/component: negotiate reliability and component premiums — ranges reported in recent Upper Midwest processor contract coverage have run 30–50¢/cwt over base; requires a processor relationship willing to sign 24-month component terms.
- Managed exit: structure a 24–36 month contraction with surplus springer sales into the tight market and debt paydown against a dispersal timeline.
- ⚠️ Backfire Watch: drift is the fourth option, and it isn’t a strategy. A herd that tries to run fortress and niche simultaneously without a written cap usually ends up with neither — a half-built heifer pipeline and a processor contract that rewards a component profile the cull list can’t support.
- Renegotiate processor and co-op terms on components and reliability premiums, not just base price. If the rewrite means breeding harder for heifers and tightening the cull, you need a milk check that rewards the quality you’re building. Requires: component history, a redacted competing offer if available, a signed NDA.
- ⚠️ Backfire Watch: renegotiating from a pipeline-short position is renegotiating from weakness. Do this while the milk is still flowing on schedule — a processor that smells a volume shortfall at contract time will trade you a component bump for a reliability clause you can’t meet in 2027.
- Opportunity signal: if your local springer premium over the USDA $3,010 benchmark narrows below $200 while your component premium holds steady and your margin over feed stays positive, you have room to expand sexed-dairy emphasis on the top tier and sell surplus springers into a market that’s still long on demand.
Herds that pick a lane in 2026 are the ones positioned to rebuild by 2028.
What This Means for Your Operation
The breeding sheet is now a succession document. Tuesday mornings stack. NAAB’s 32.8% national number is the aggregate of several million of those Tuesdays.
The trade-off is real and doesn’t get easier. Cash this quarter vs. optionality in 2028. The beef check vs. the heifer pen. The income statement vs. the balance sheet.
So before the next semen order goes in: what’s your projected 2027 fresh heifer count at a 0.79 completion rate — and does the person you’re handing this operation to agree with the number?
Key Takeaways
- At 32.8% beef-on-dairy nationally and a 48-year low in replacement heifers, the 2026 rally isn’t getting capped by milk — it’s getting amplified by a supply hole built one Tuesday at a time.
- For a 480-cow herd that ran 37% beef through H1 2024, the outside-replacement math runs $30,000–$87,500/year at April 2026 springer prices; run your own projection at 0.79 calf-to-fresh, not 0.90.
- If your beef-on-dairy share is above 30% and DSCR has been under 1.20 for two of the last three quarters, the 2027 heifer count belongs on page one of your next lender meeting — not page three.
- The trade is real: giving up ~$71,500/year in calf revenue on a 480-cow base to cap beef at 25% and run 35% sexed on top cows builds ~60 surplus springers into a short market and turns the 2028 herd into an asset.
Run Your Numbers
Bullvine Pipeline Index Calculator — Takes your milking herd size, heifer inventory, sexed semen rate, cull rate, replacement cost, and beef-on-dairy share and returns a 0–100 pipeline score across four weighted components. If your score is in the Yellow Zone, the article’s math already told you why.
Complete references and supporting documentation are available upon request by contacting the editorial team at editor@thebullvine.com.
Learn More
- Beef-on-Dairy’s $6,215 Secret: Why 72% of Herds Are Playing It Wrong — Arms you with rigid pregnancy-rate thresholds to protect your replacement pipeline. Breaks down the reproductive math separating profitable crossbreeding from costly deficits, detailing exactly when your operation can safely deploy terminal semen without choking supply.
- Did Genomics Really Deliver What We Think It Did? $238,000 Says Yes – If You Steer It Right — Follows the money on a $238,000 lifetime profit gap between herds wielding precision index data and those drifting. Quantifies the hidden penalties of stacked inbreeding while charting a five-year genetic roadmap to outpace rising feed expenses.
- Boosting Dairy Farm Profits: Using Embryo Transfer and Male-Sexed Beef Semen — Dismantles traditional breeding limits by merging terminal genetics with advanced embryo transfer. Reveals how aggressive deployment of targeted male semen rapidly shifts herd revenue toward premium crossbreds while driving 15% faster genetic progress in your replacements.
 The Sunday Read Dairy Professionals Don’t Skip.
 The Sunday Read Dairy Professionals Don’t Skip.
Every week, thousands of producers, breeders, and industry insiders open Bullvine Weekly for genetics insights, market shifts, and profit strategies they won’t find anywhere else. One email. Five minutes. Smarter decisions all week.
