Archive for feed efficiency dairy

Before You Sign the Methane Contract: The $54,750 Your Feed Bunk Is Already Burning

A $0.45/cow/day methane quote. A 1,000-cow herd stuck at 1.48 ECM/DMI. One 0.05-point bump is worth $54,750/yr — before you pay a cent for carbon in a bottle.

Executive Summary: A $0.45/cow/day methane additive works out to $164,250 a year on 1,000 cows, while a 0.05‑point bump in ECM/DMI is worth $36,500–$73,000/year with no new line item. The article shows how most herds sitting around 1.45–1.50 ECM/DMI are leaking money through bunk management, comfort, and forage drift long before additives or digesters enter the picture. You’ll see hard barn math on pit DM swings, lying time, and grouping, plus a simple ladder that puts barn basics, precision feeding, genetics, and methane tools in the right order. For a 500–3,000 cow operation, the same small efficiency gains that cut kg CO₂e/kg milk also trim feed cost per cwt and protect IOFC when milk or feed swings. If you’re being nudged to “do something on methane,” this piece helps you answer one question first: will a new product beat what you can pull out of your own feed bunk in the next 30 days?
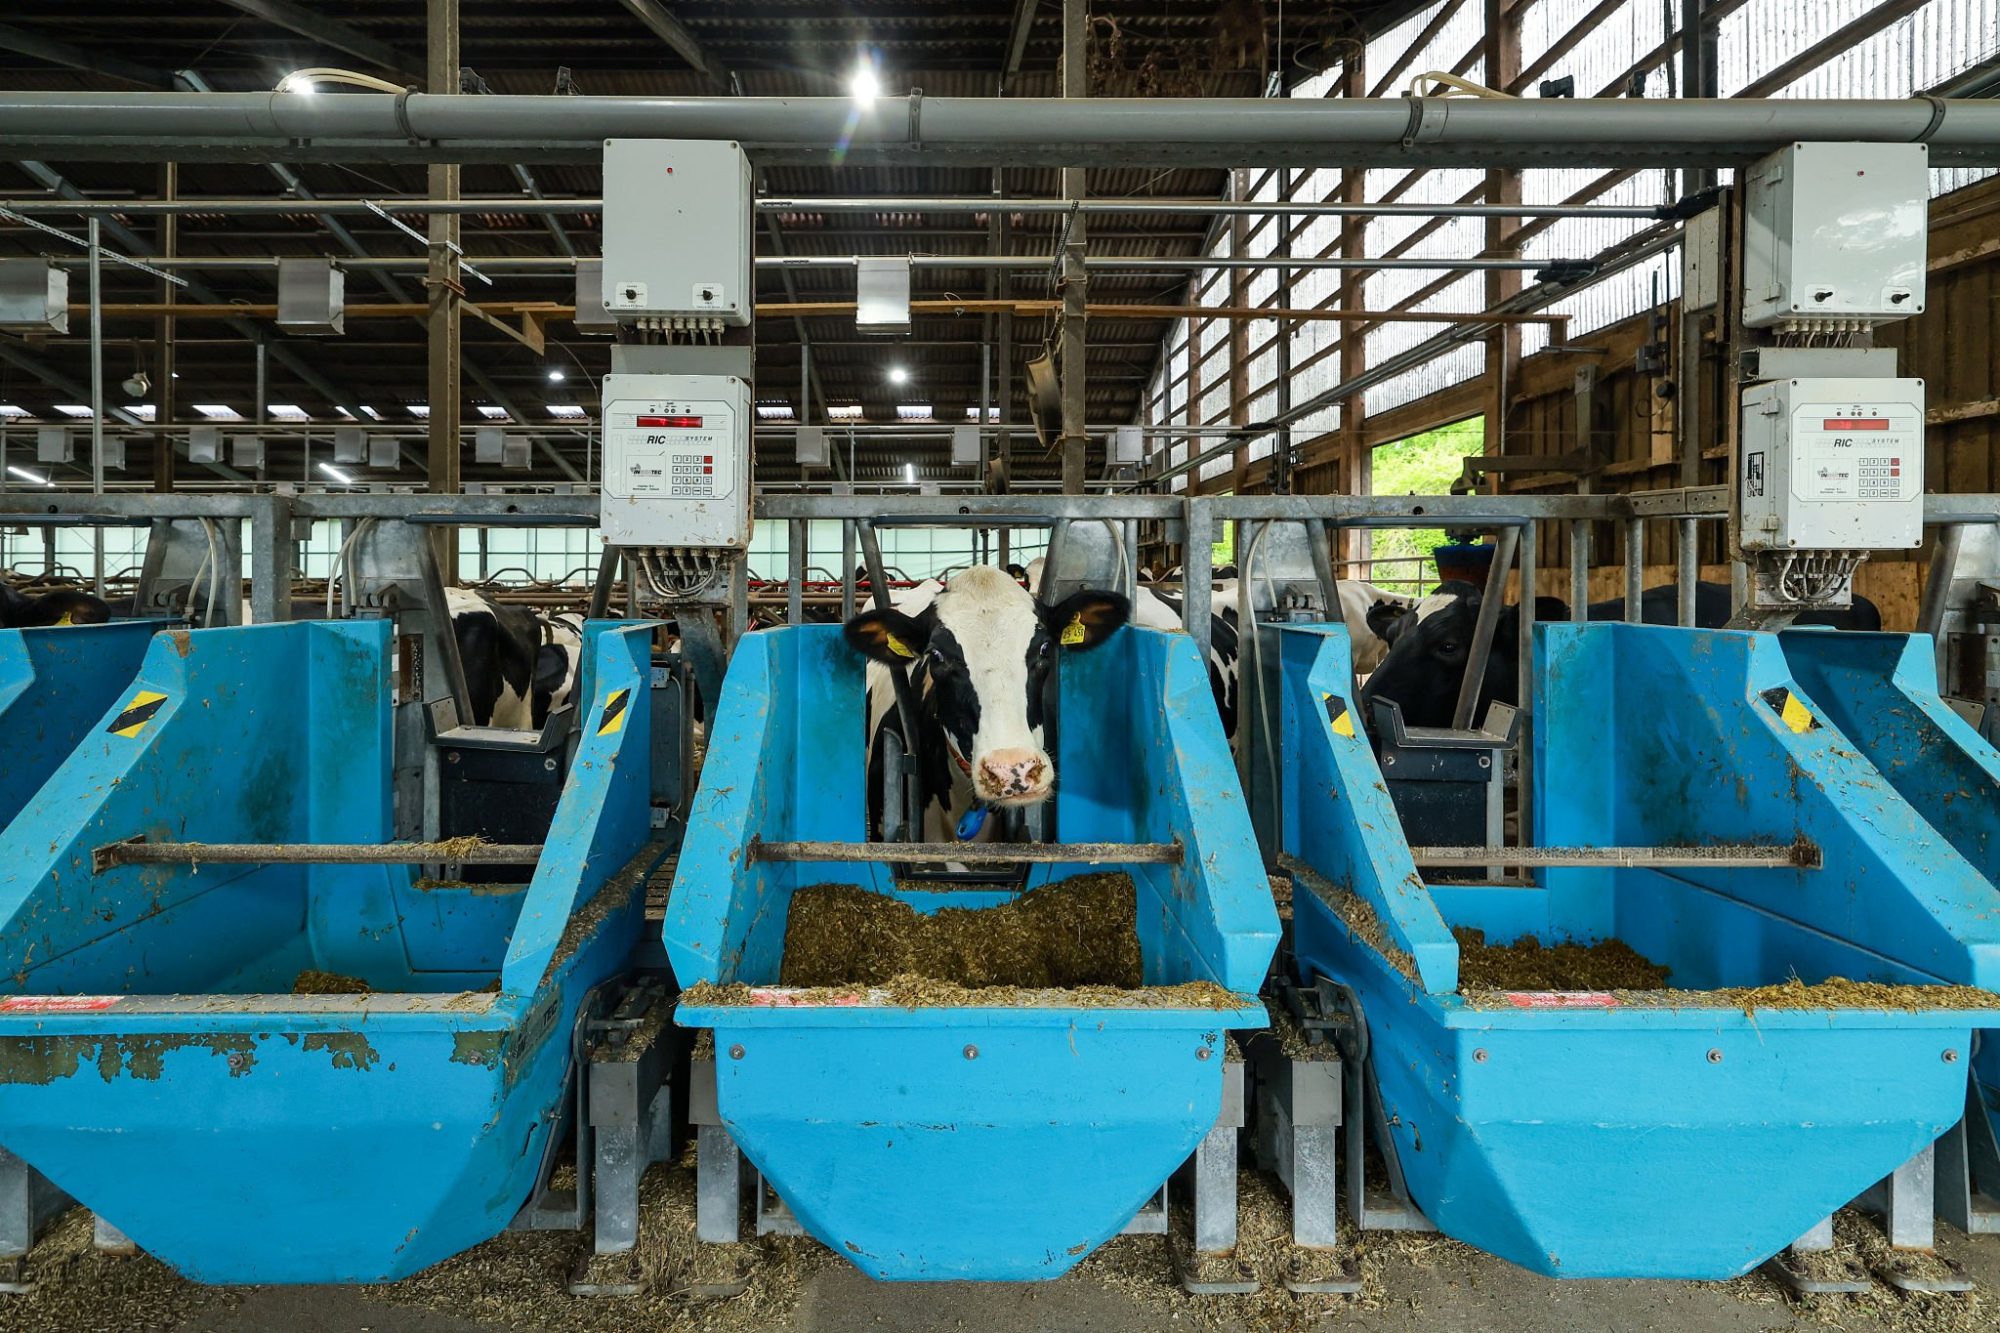
feed efficiency vs methane additives

A commercial 1,000-cow herd in the Upper Midwest got the pitch last month. A feed rep walked in with a methane additive quoted at roughly $0.45 per cow per day. The manager had a processor letter on his desk asking for a sustainability update by Q3, and his herd was running about 1.48 ECM/DMI — Energy-Corrected Milk per pound of Dry Matter Intake, the single cleanest way to measure how efficiently your cows turn feed into milk. Nobody in the room was doing the math on what that efficiency gap was actually worth before signing anything.

That scenario is a composite, built from recent herd reviews across the region — names withheld at the operators’ request. The numbers are real, though, and they’re why feed efficiency — not methane in a bottle — is where your first sustainability dollar usually belongs. For most commercial herds still sitting south of 1.60 ECM/DMI, the cheapest tonnes of CO₂e and the best dollars of income over feed cost are still inside the barn, waiting.

The Math That Should Stop the Meeting
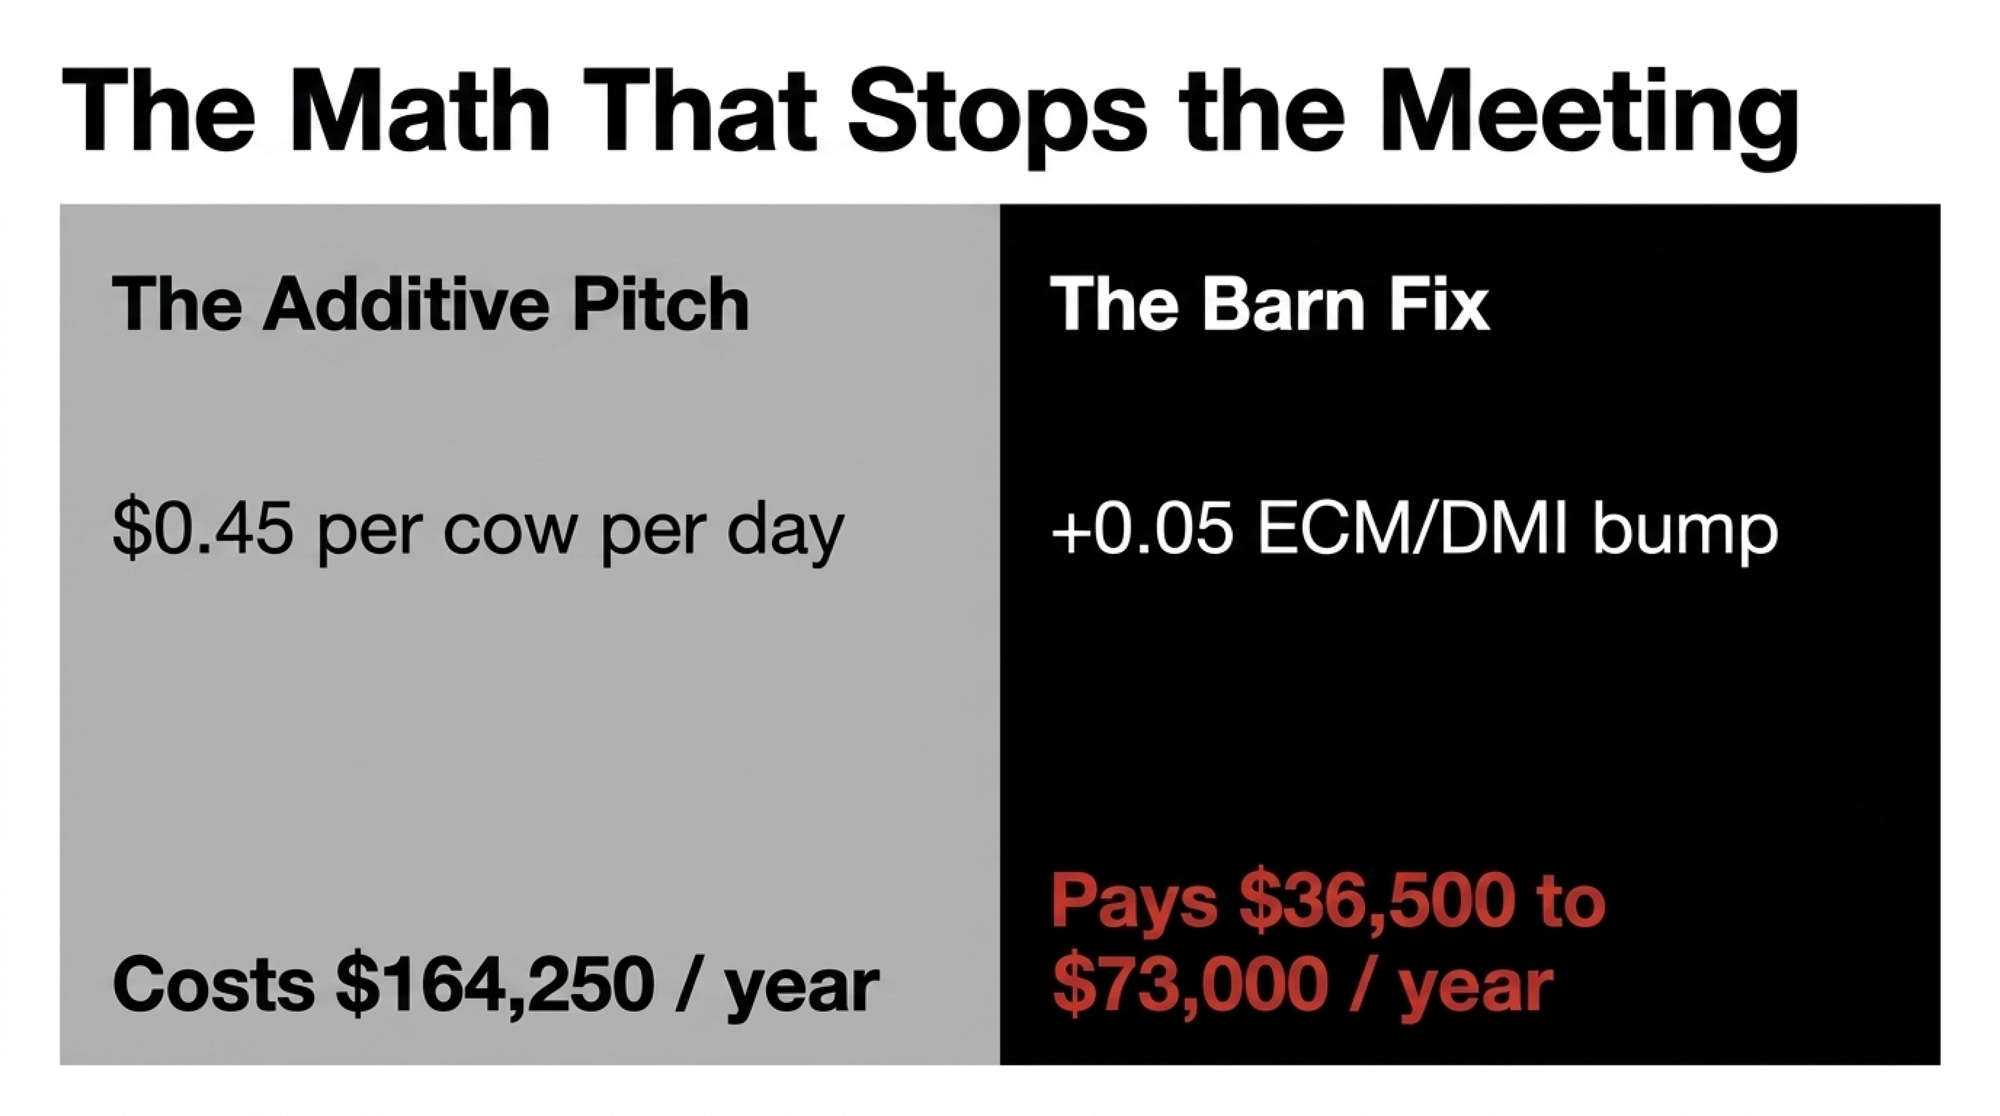
Start with the additive cost. It’s not a mystery:

1,000 cows × $0.45/cow/day × 365 days = $164,250/year.

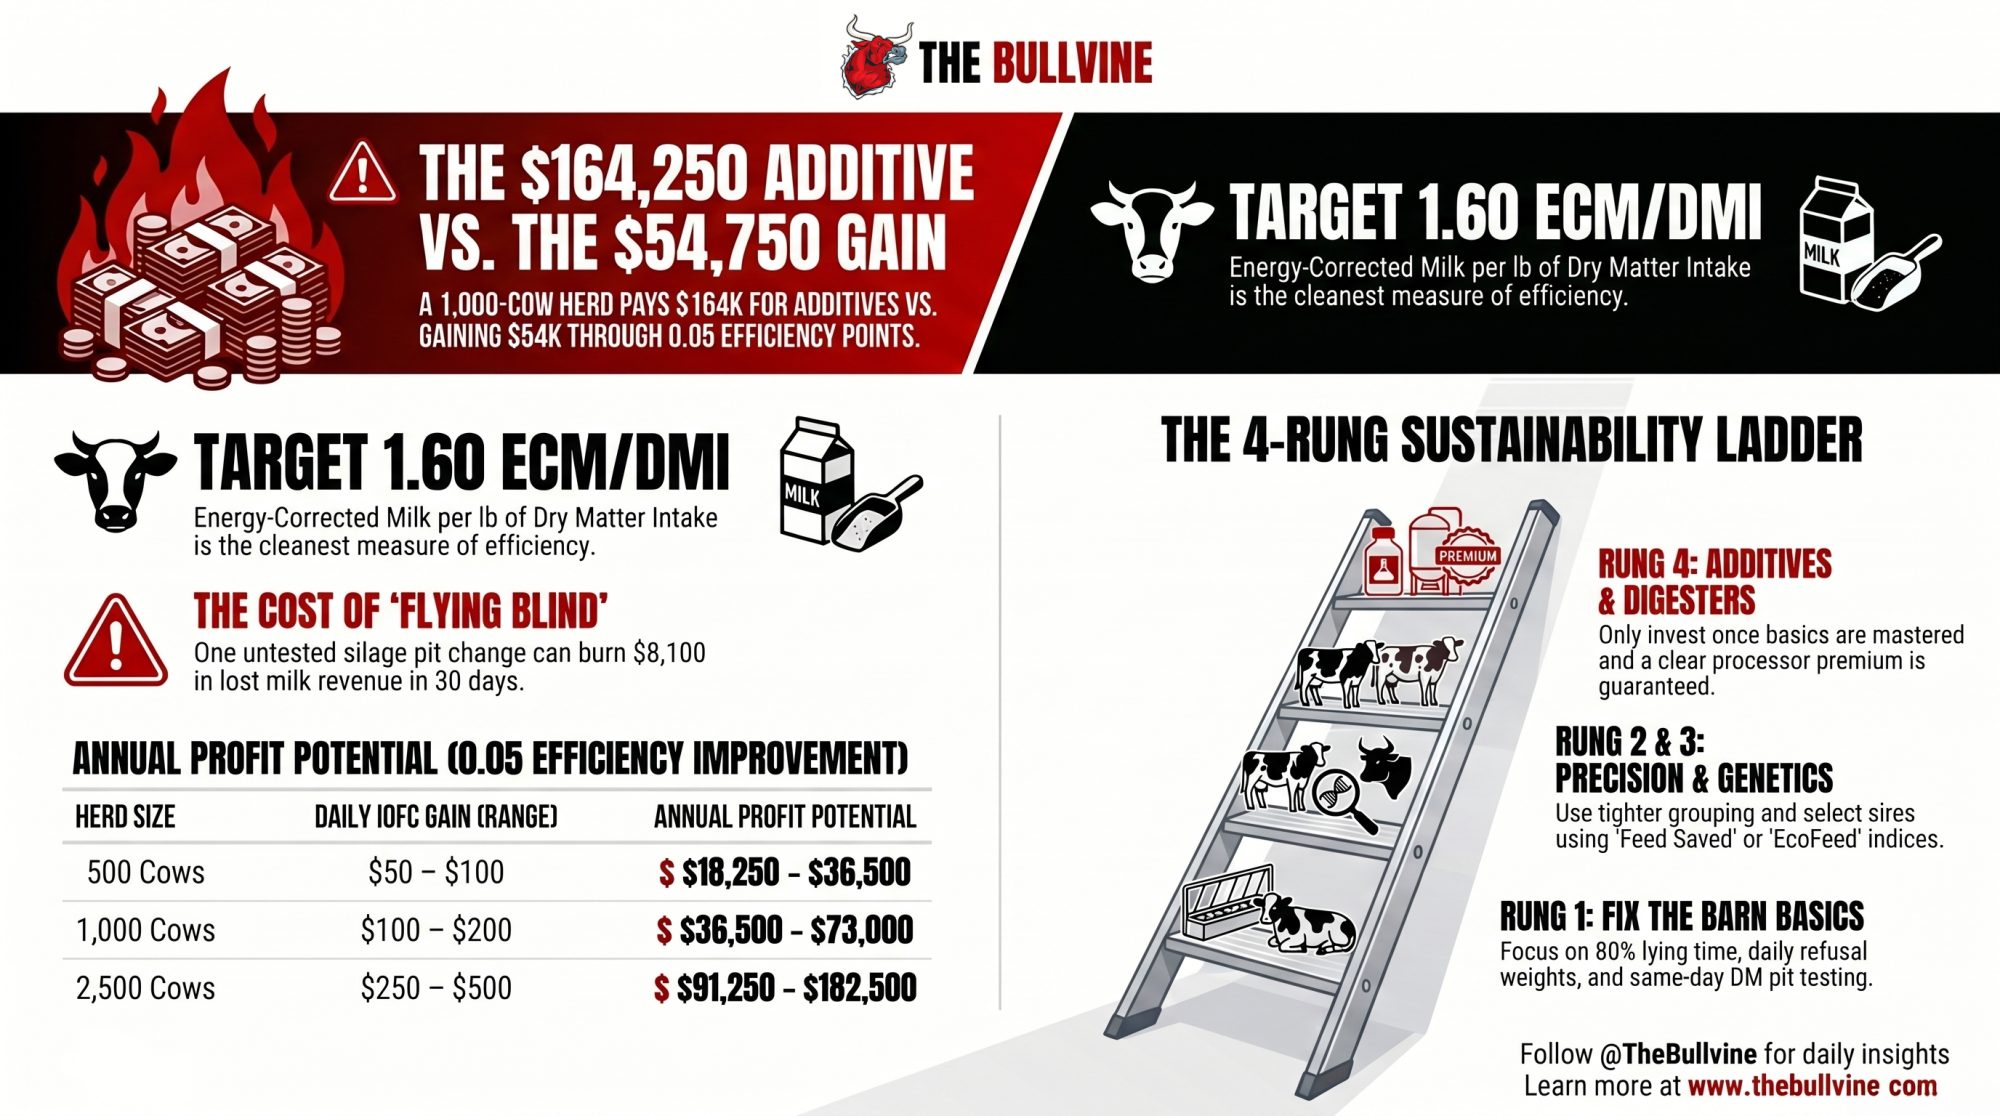
That’s a six-figure line item, every year, before you see a single lab result. Now price the other direction. A 0.05-point bump in ECM/DMI — the kind of move that comes from tightening bunk management, fixing obvious refusals, and catching new silage pits the day they open — is worth roughly $0.10–$0.20 per cow per day in income over feed cost at 2026 feed-and-milk spreads, consistent with the Penn State Extension Dairy Outlook (April 2026 release) IOFC benchmarks at current spreads.
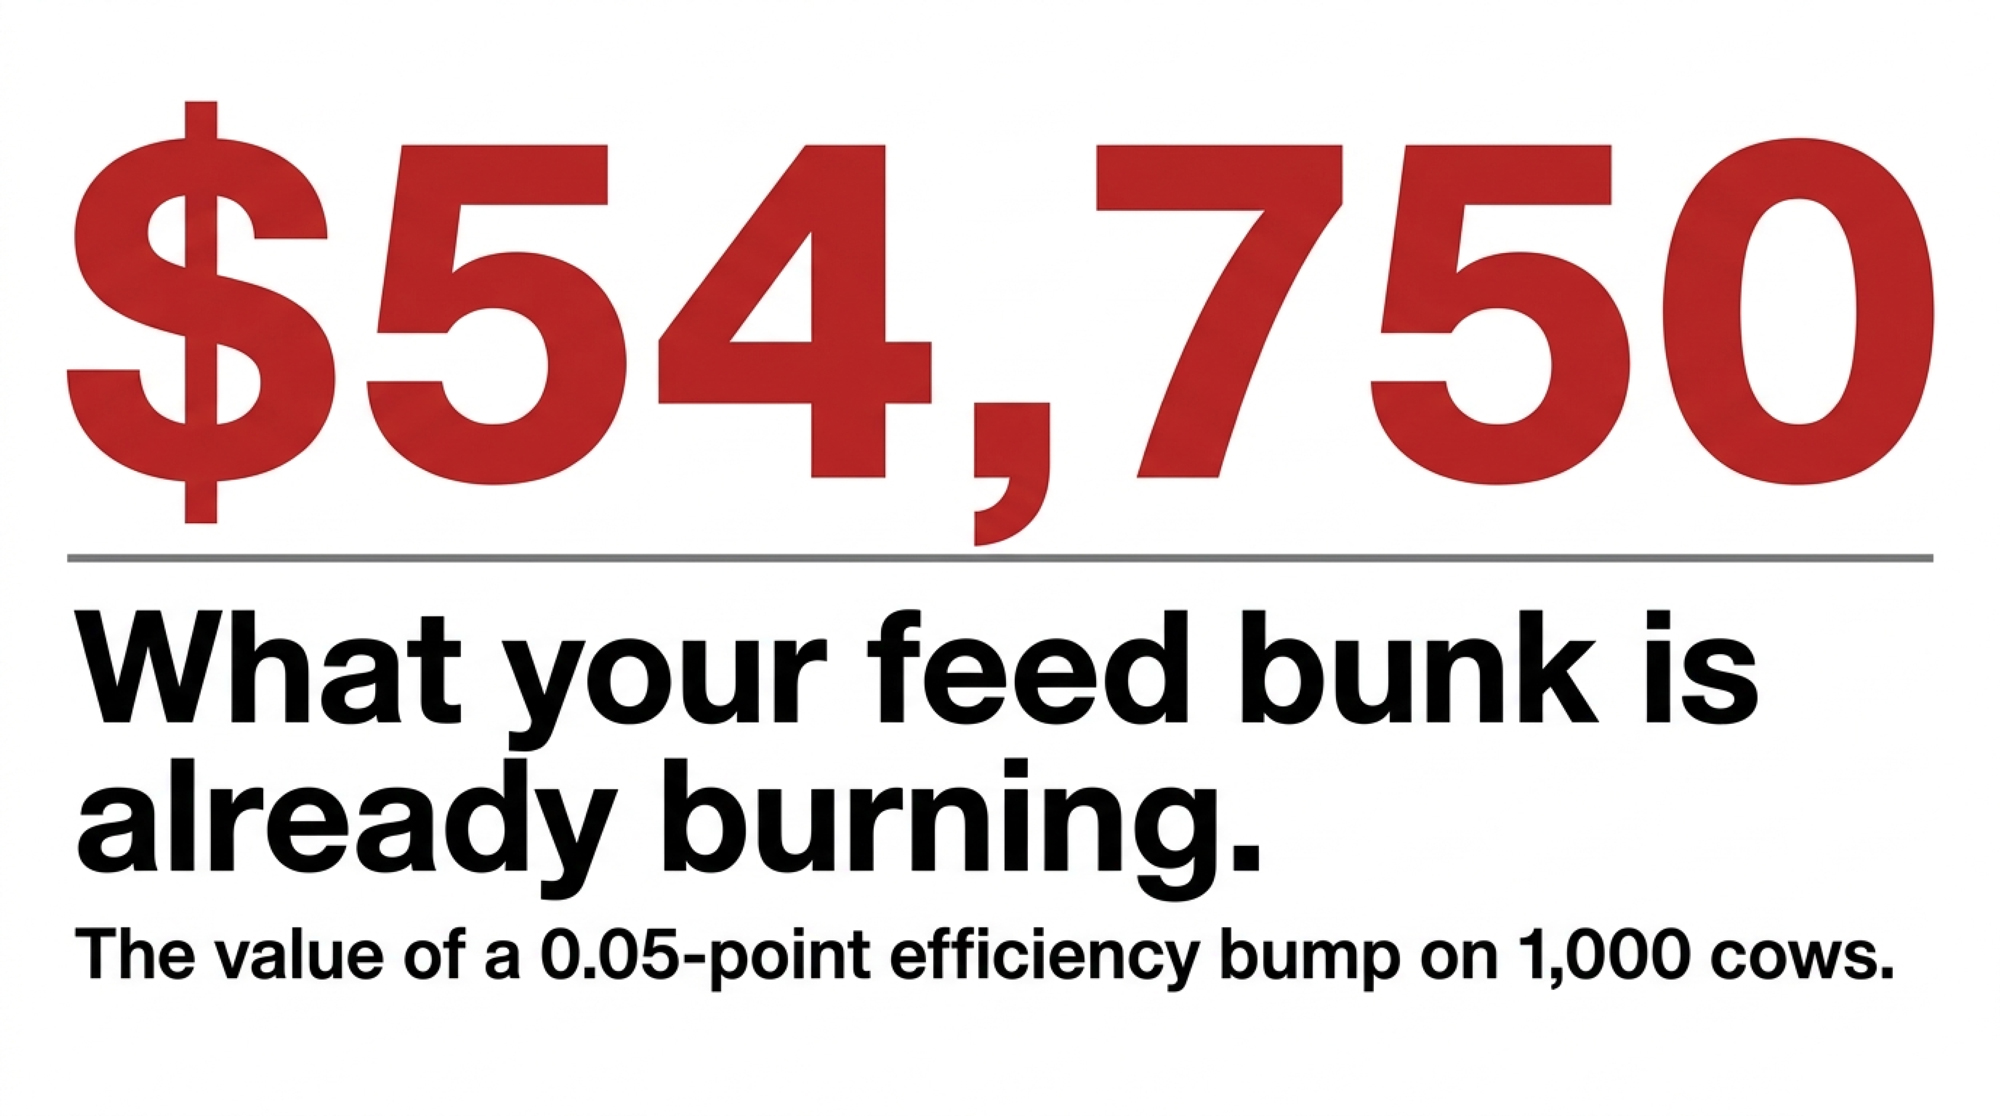
Here’s that math on one line each:

  • Current gap: 1.48 ECM/DMI vs. a 1.60 target
  • The opportunity: a 0.05-point move ≈ $0.15/cow/day in IOFC (midpoint of the $0.10–$0.20 range)
  • The reward: ~$54,750/year on 1,000 cows; full range $36,500–$73,000
  • The underlying change: about 2 lb more ECM/cow/day off roughly 44 lb [20 kg] of DMI

No new line item. No contract. No Q3 report needed. You’re just catching margin that’s already sitting in your bunk and stalls.
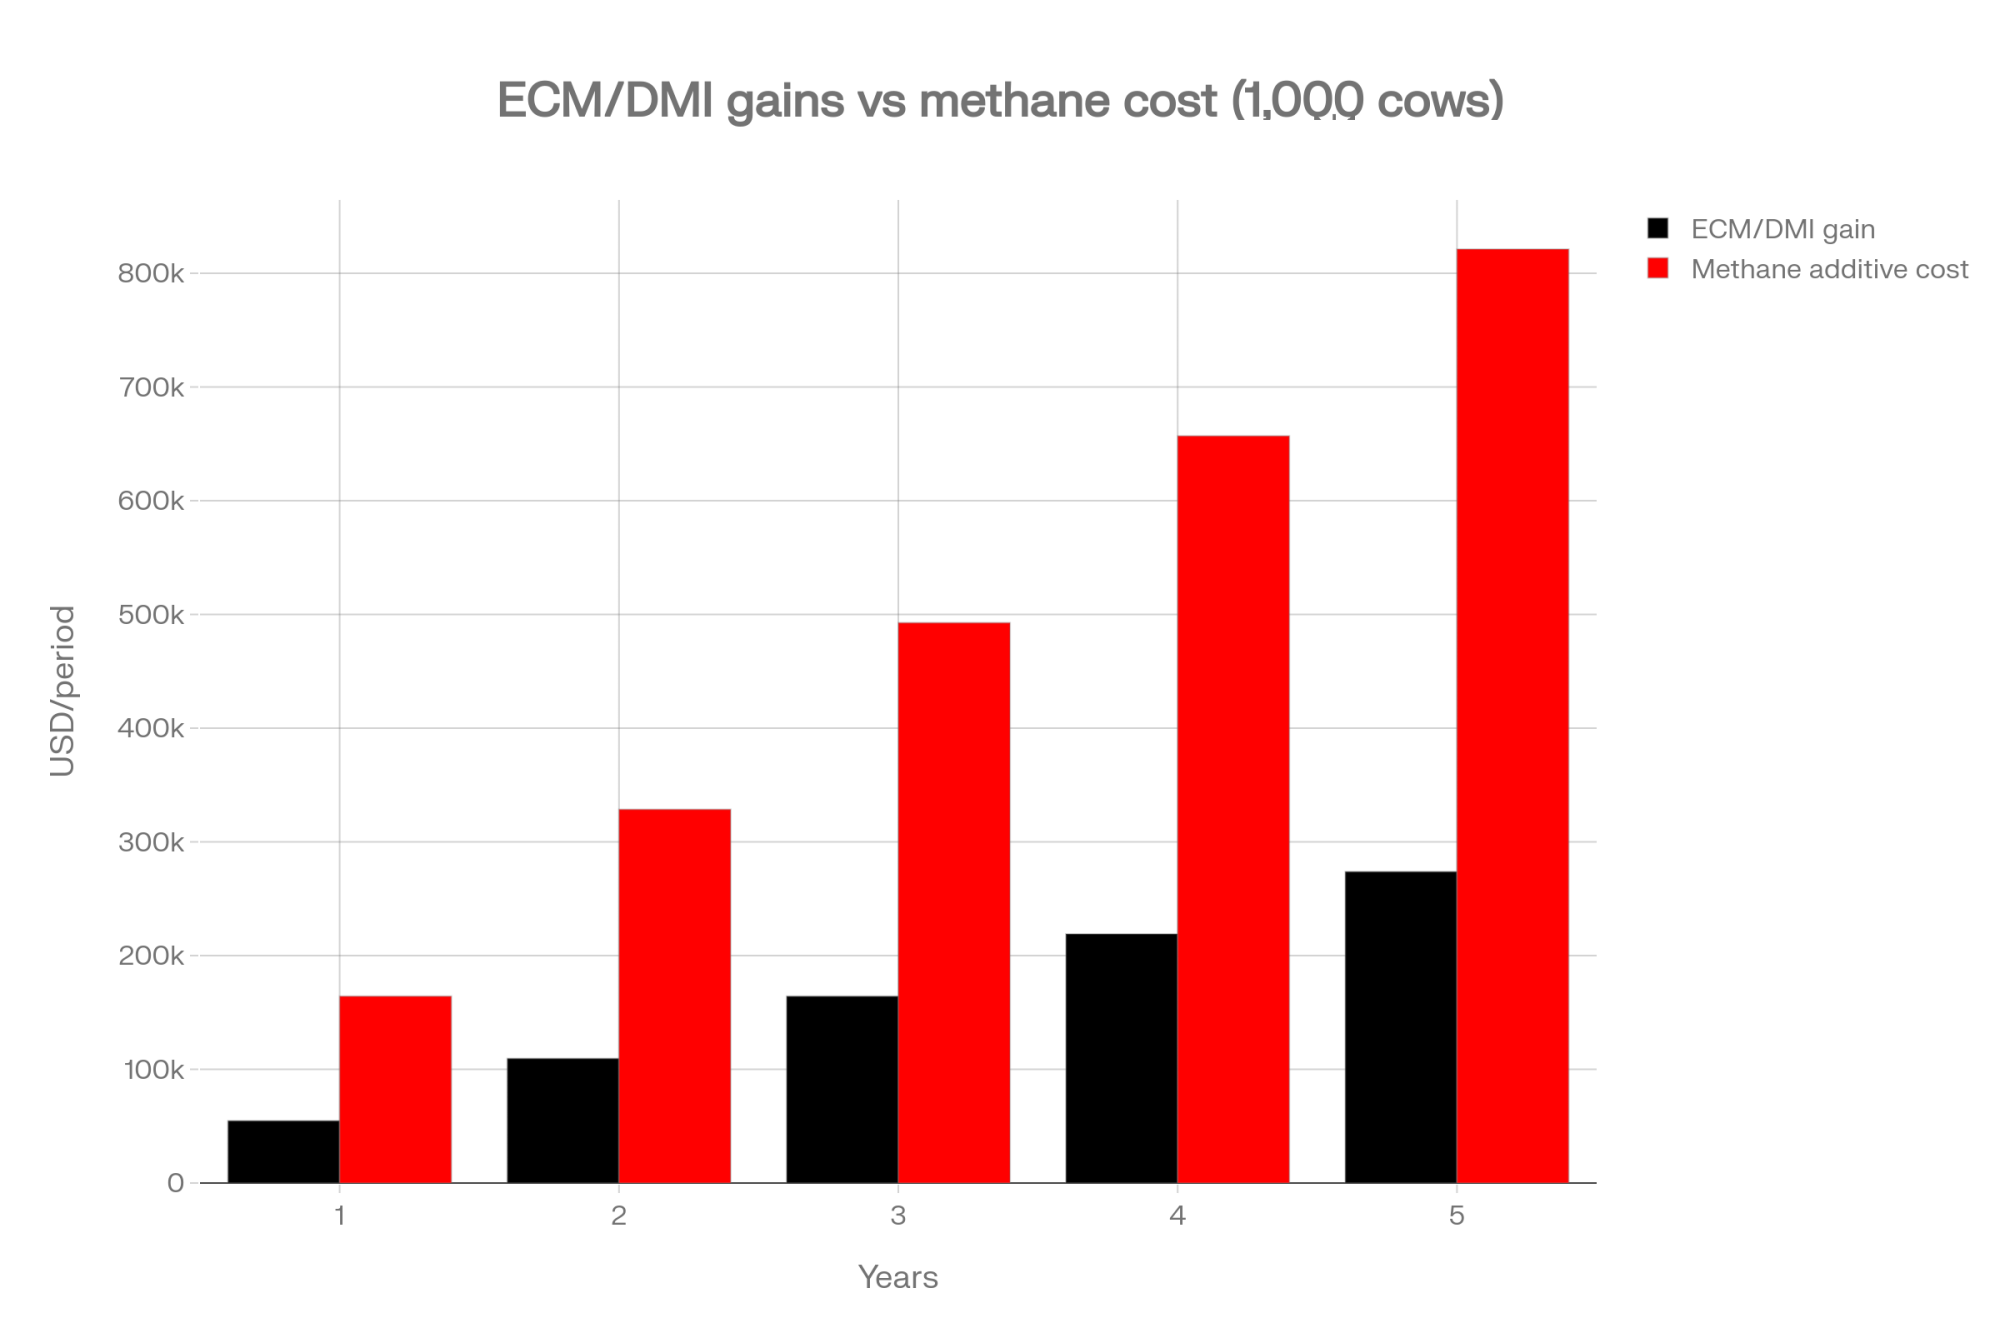
Stack the two and the picture gets uncomfortable. You’re looking at $164,250 out the door for emissions reductions you may or may not get paid for — versus $36,500–$73,000 captured from work your team can start this week. The additive isn’t the villain. The sequence is.
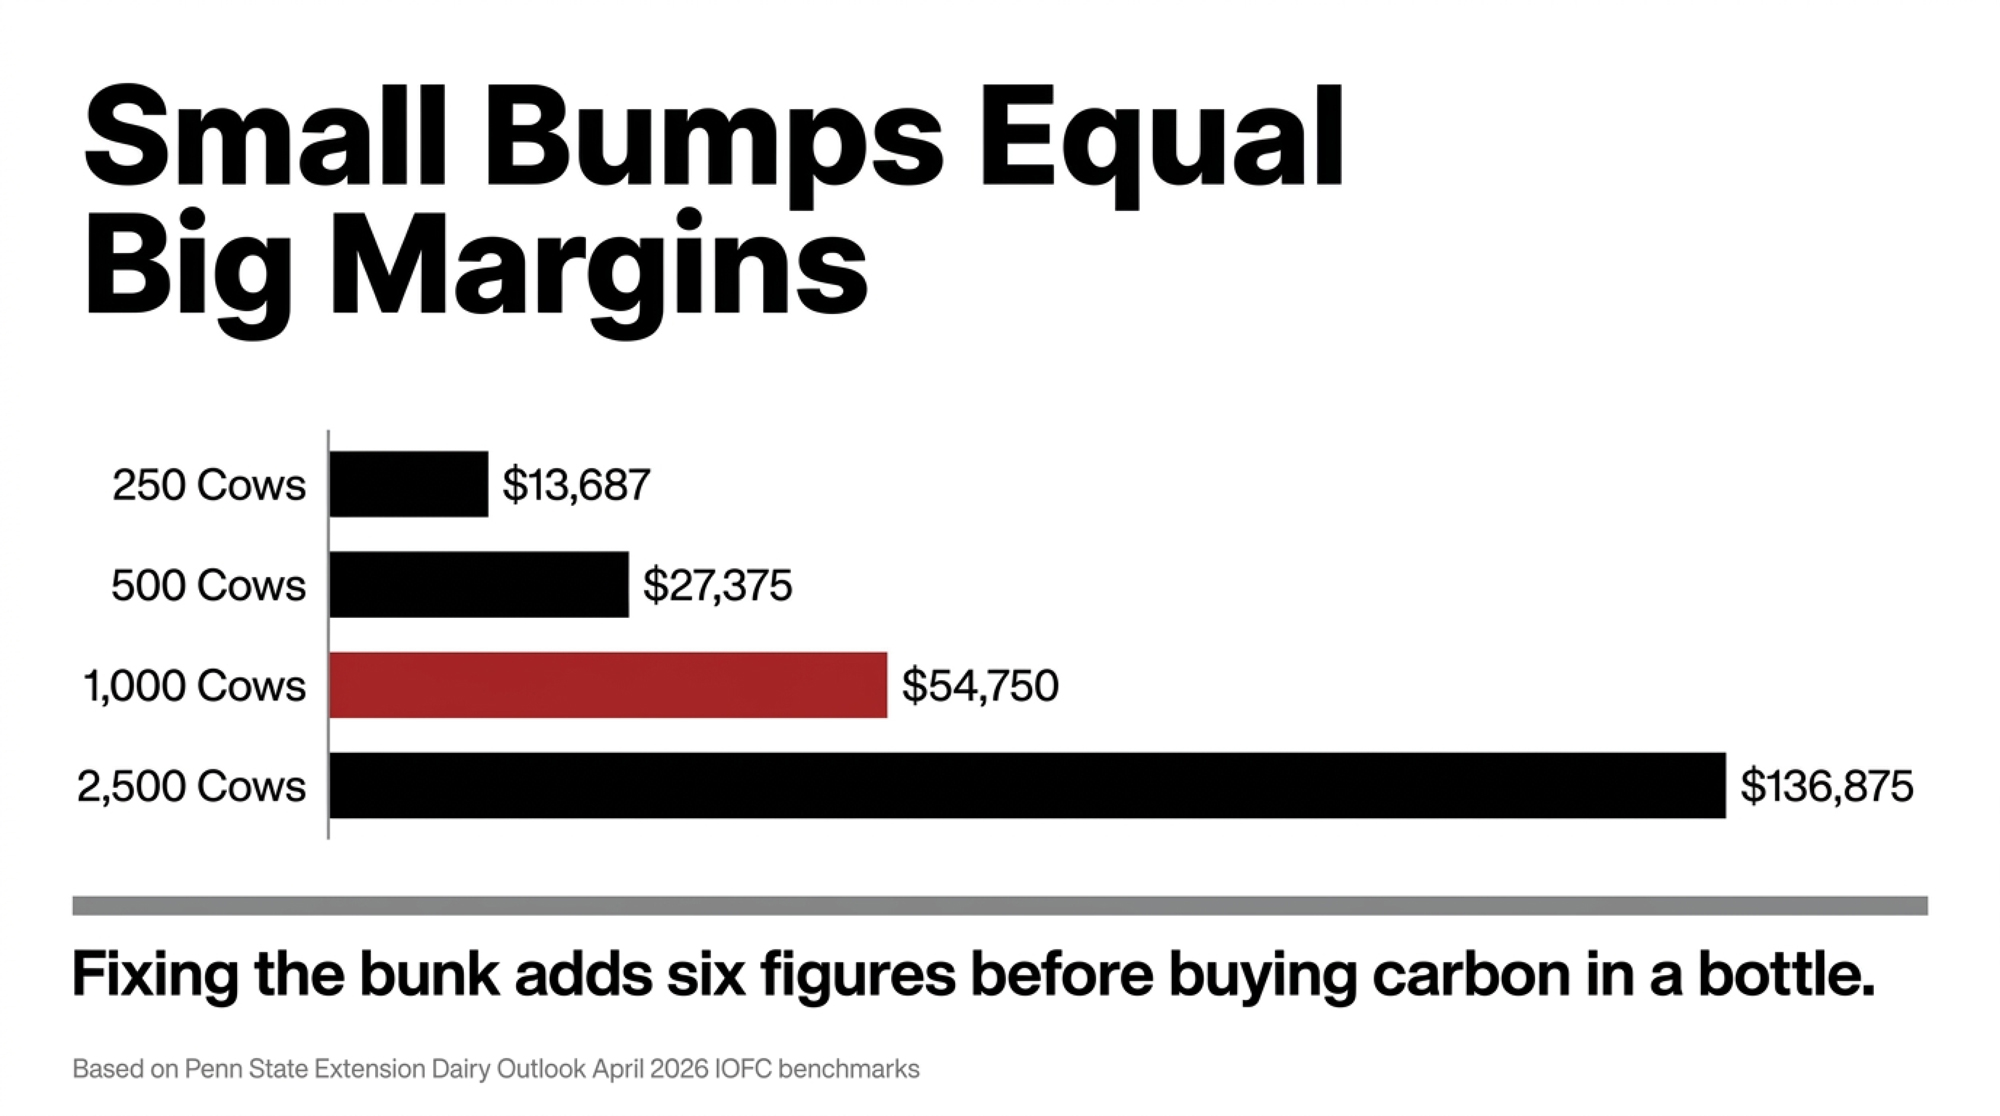
What 0.05 ECM/DMI Is Worth on Your Herd

Find your row. That number is what a “small” ECM/DMI improvement is actually worth before you buy a single gram of methane reducer.

Herd sizeDaily IOFC at $0.10/cow/dayDaily IOFC at $0.20/cow/dayAnnual range (365 days)
250 cows$25$50$9,125 – $18,250
500 cows$50$100$18,250 – $36,500
1,000 cows$100$200$36,500 – $73,000
2,500 cows$250$500$91,250 – $182,500

📊 FAST FACT BOX — Why Efficiency Is the Sustainability Lever

Sustainability gains on dairy farms have historically been a feed-efficiency story, not a product story:

  • U.S. dairy, 1944 → 2007: a gallon of milk in 2007 carried only 37% of the carbon footprint of 1944, using roughly a fifth of the cows and feed (Capper et al., 2009 J. Animal Science; summarized by Cornell). 
  • California, 1964 → 2014: a UC Davis 50-year analysis (Naranjo et al., 2020 JDS) showed dramatically less land, water, and GHG per litre of milk, driven mostly by higher per-cow yields and tighter rations. 
  • Canada, 2011 → 2021 (national scope — do not apply directly to U.S. herds): the national LCA puts the average farm-gate footprint at 0.94 kg CO₂e/litre, a 9% drop in a decade and well under half the FAO global average of 2.5 kg. 

None of that came from a single product. It came from genetics, forage quality, ration management, and more milk from fewer, more efficient cows.

What’s Really Driving “Sustainable” Milk in 2026

Processors have stopped talking about sustainability in the abstract. They’re tracking emissions intensity per litre of milk — a number that mostly rides on how efficiently your cows turn feed into milk and how long they last in the herd.

The money is moving with it. In the U.S., the FARM Environmental Stewardship program continues to push supplier-level footprint tracking across co-ops. Global buyers like Nestlé and Fonterra are wiring sustainability performance directly into supplier pricing — Fonterra’s Co-operative Difference top tiers translated to meaningful per-kg-MS premiums in the 2024–25 season for farms that document their emissions and nutrient footprints, with current reporting pegging realistic North American processor premium ranges in the dimes-per-cwt band. Herds that show better kg CO₂e per kg milk almost always have better ECM/DMI and fewer nutrient-management headaches. The biology doesn’t care what you call it. It cares how much feed and land it took to get the milk on the truck.
Picture the “dilution of maintenance” effect this way. Every cow carries a fixed feed bill just to stay alive before she gives you a drop of milk. Push more milk through that same overhead and emissions per litre drop automatically — that’s the whole story behind 80 years of quiet environmental progress in dairy, and it’s still the cheapest rung on the ladder for most commercial herds in North America.

How This Looks in a Real Barn Week

You’ve probably lived this week. The new corn silage pit opened Tuesday. Nobody pulled a DM sample that day. The mixer sheet is still running on numbers from the old pit, which was 4 points wetter. Cows are getting less dry matter than the software thinks they are. Milk slides 1–2 lb per cow, refusals wobble, and your nutritionist isn’t scheduled until the 15th.

Run that math. Take a representative –/cwt milk price using USDA’s early-2026 all-milk projections. A 1.5 lb milk slide across 1,000 cows for 30 days works out to:

🚨 ~$8,100 in lost milk revenue — from one untested pit face.
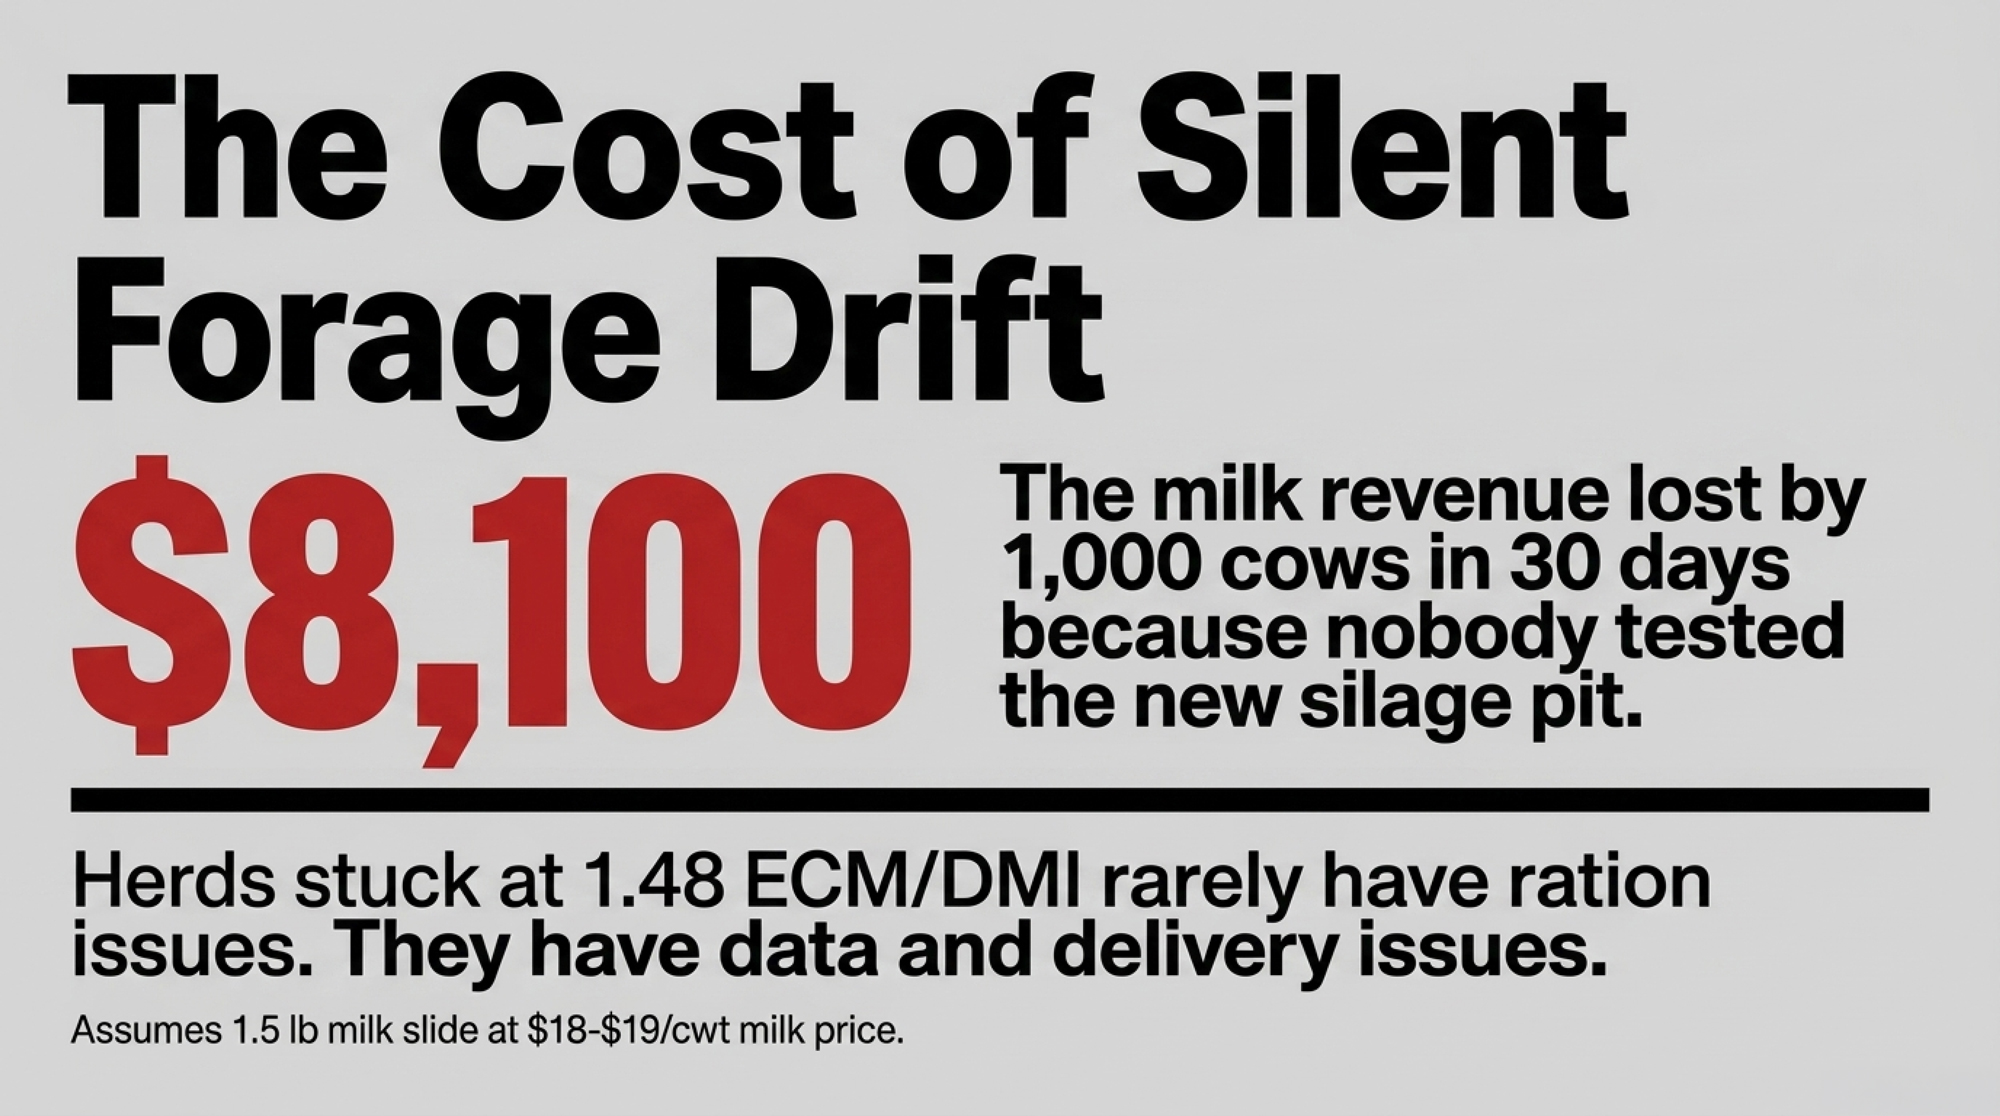
Stretch it across two pit changes and a summer heat event and you’ve burned more margin on silent forage drift than the entire cost of the feed-analysis and DM-testing program that would have caught it.

Here’s the awkward part: herds stuck at 1.45–1.50 ECM/DMI rarely have a ration formulation problem first. They have a feed-delivery problem (inconsistent DM and shrink), a comfort problem (overstocked, hot, sore cows), and a data problem (nobody owns yesterday’s DMI and refusals). A nutritionist who visits every two weeks can’t fix what nobody on farm is measuring in between.

What Actually Moves ECM/DMI (And How Fast)

Strip the emotion out and three barn-side levers move the needle, in roughly this order of speed.
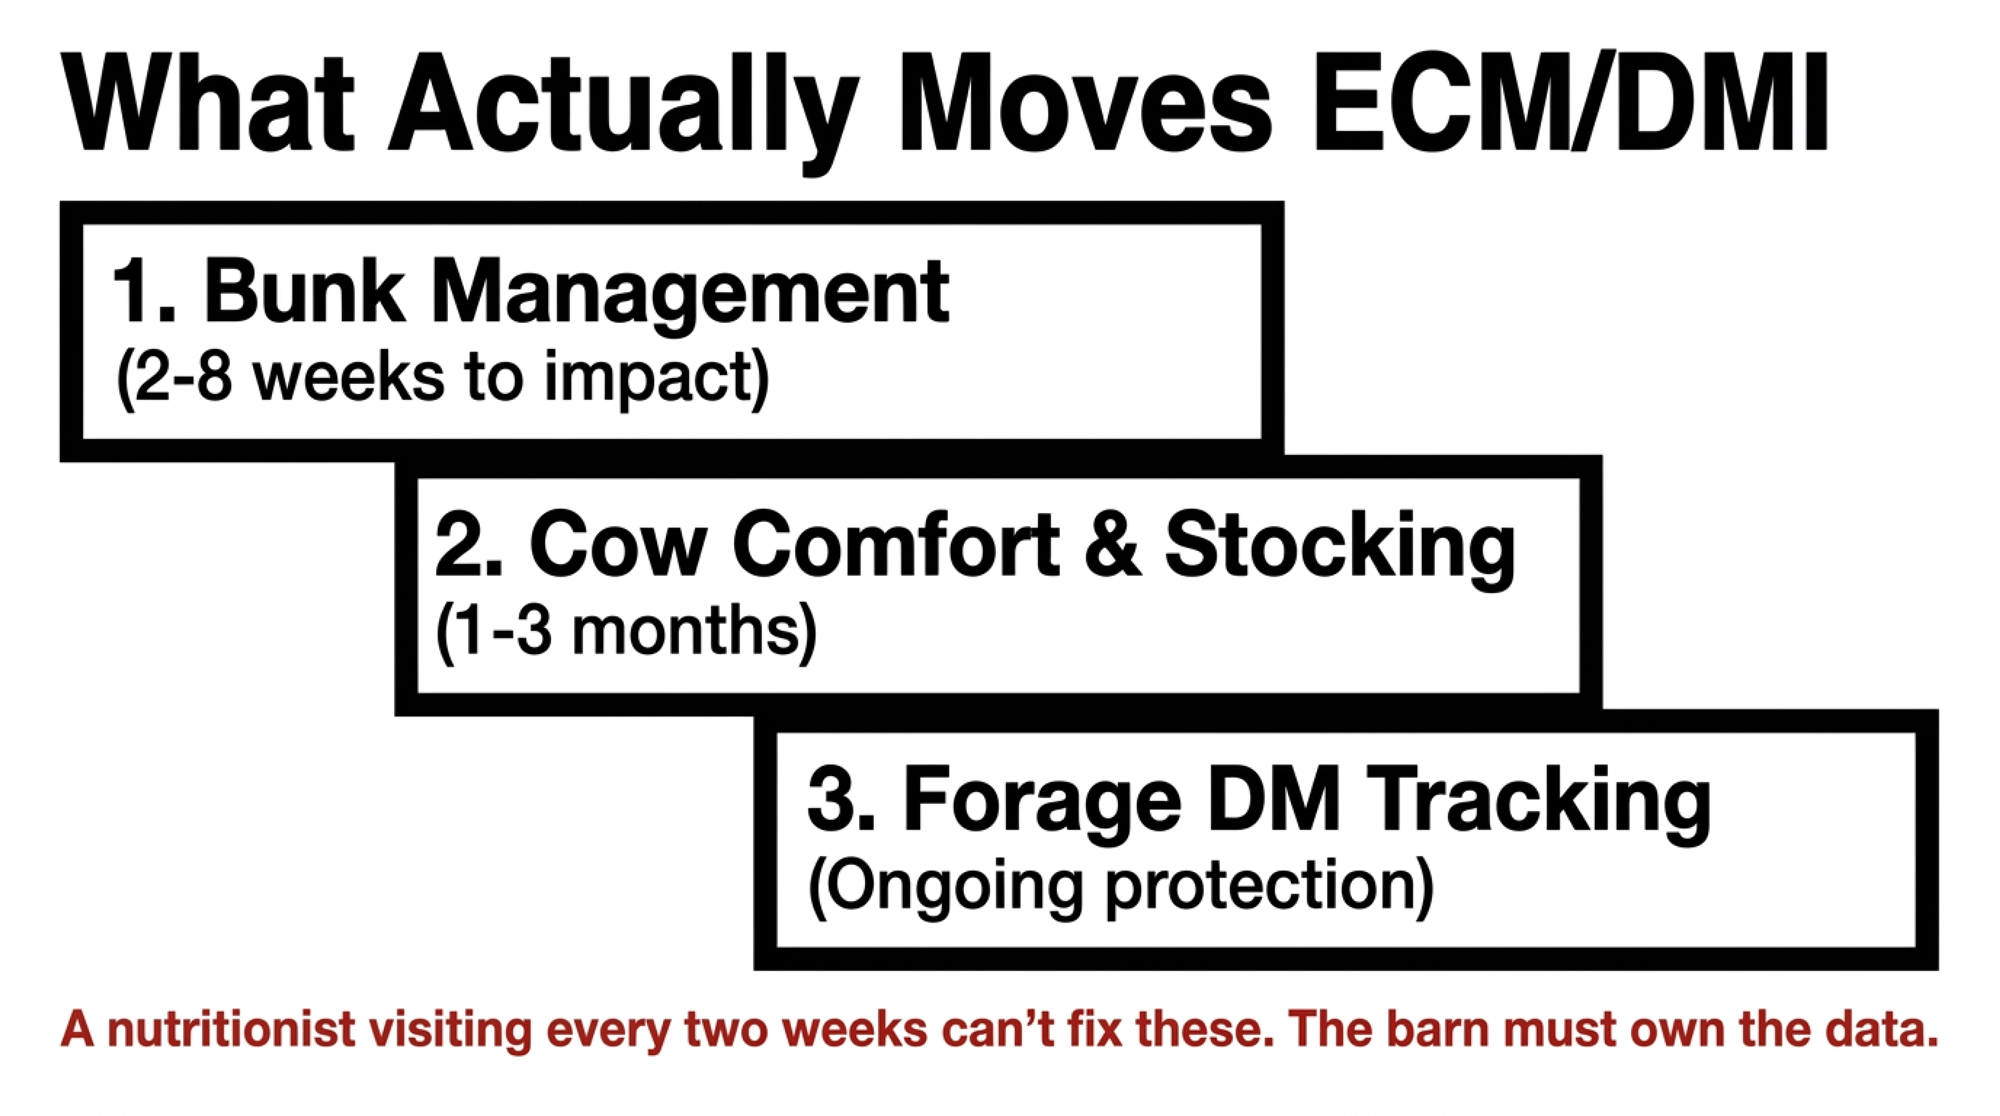
1. Feed availability and bunk management (2–8 weeks). Keep feed in front of cows. Deliver on time after milking, push up properly, target refusals in the 1–5% range. Extension work from Miner Institute and land-grant universities routinely associates tight bunk management with roughly 4–8 lb more milk per cow per day compared with empty-bunk programs — consistent with Grant’s time-budget research summarized in Stocking Density and Time Budgets(WDMC).

2. Cow comfort and stocking (1–3 months). Rick Grant’s Miner Institute work pegs each extra hour of rest at roughly 2–3.5 lb more milk per cow per day in freestall Holstein herds. Watch the cows, not the spreadsheet: if more than a few are standing when they should be lying, you already have your answer. Once stall stocking pushes much past 120% and bunk space drops under about 24 in [≈61 cm] for milking cows, cows lose lying time and you lose milk. If fewer than 80% of cows are lying during peak rest between 11 a.m. and 2 p.m., your first sustainability investment is stalls, space, and air — not an additive.

3. DM and forage tracking (ongoing — protects the first two). Modeling work out of Ohio State (St-Pierre & Weiss) and Wisconsin shows that as herd size grows, the cost of sampling more often is tiny compared with the cost of flying blind. For a 1,500–1,600 cow herd, hitting forage DM checks ≈ every 4 days is a lot safer than once a month. Most big herds are nowhere close.

Genetics then layers on top. Selecting on Feed Saved, EcoFeed, or similar feed-efficiency indices means picking daughters that give the same output on less feed. GENEX ICC modeling suggests daughters of top ICC-ranked sires eat roughly 100 lb less DM per lactation than top NM$ daughters and ~165 lb less than top TPI daughters at comparable production. You won’t feel that in this quarter’s IOFC. You will feel it for the rest of that cow family’s life in your herd.

How Much Does Waiting 30 Days Actually Cost?

Every 0.05-point swing in ECM/DMI on a 1,000-cow herd is worth $36,500–$73,000 per year in IOFC at today’s spreads. A single silage pit changeover that goes 30 days without a DM test and a mixer-sheet update can easily burn $8,000 in lost milk on a 1.5 lb slide — and closer to $16,000 when DM drift compounds with more refusals, slug feeding, and a bit of summer heat.

Stretch that across a year on a herd running two corn silage pits, one haylage pile, and seasonal cutting changes. The difference between catching those shifts in a week versus a month is often bigger than the entire cost of a methane-additive program. Before you sign any sustainability product contract, the question has to be:

Will this product beat the $36,500 I could capture by tightening my own bunk, forage, and comfort protocols first?

For most 500–3,000 cow herds in 2026, the honest answer is still no — not yet.

Is Your Nutrition Program Built for Speed or for Monthly Meetings?

Most nutrition programs are still built around the consultant’s calendar: monthly or bi-weekly visits, monthly forage analyses, rations updated when the truck pulls in the yard. That worked when a nutritionist drove to three herds a week, every pit was opened in front of him, and a 4-point DM swing took weeks to matter because the bulk tank was 120 cows and a cooler. It doesn’t work on a 1,500-cow free-stall where two pits, a haylage pile, and three heifer pens move in the same week.

The “120-cow paper sheet” mindset is still embedded in a lot of programs — and it’s quietly expensive. If your SOP starts with “wait until the nutritionist calls,” you’ve already given up a week of silent margin every time a forage shifts. Modern herd size needs a split job:

  • The barn owns speed and data. Daily DM checks when pits change. Refusals weighed by pen for at least a couple of weeks every season. Bunk walks. A simple ECM/DMI dashboard by group that somebody actually looks at.
  • The consultant owns math and strategy. Ration design, long-term forage plans, additive screening, and genetic direction. They shouldn’t have to guess at yesterday’s DMI or whether a pit changed last Tuesday.

If your standard operating procedure doesn’t say, “When we open a new pit, we test DM that day and update the mixer sheet — no consultant call required,” your nutrition program isn’t built for modern herd size. It’s built for the herd your consultant walked into in 1995.

Options and Trade-Offs for Your 2026 Sustainability Budget

Rung / ToolTypical cost/cow/yrECM/DMI impact in 12 moPayoff speedPolicy / market risk
Barn basics (bunk, DM, comfort)$10–$250.05–0.10 ↑30–90 daysLow
Precision feeding & grouping$15–$300.05–0.12 ↑3–6 monthsLow–moderate
Genetic feed efficiency$5–$100.03–0.06 ↑3–5 yearsLow
Methane additives$1640.00–0.05 ↑ (variable)6–12 months+High

Here’s the ladder most margin-focused consultants use right now when you ask, “Where should my first sustainability dollar go?”
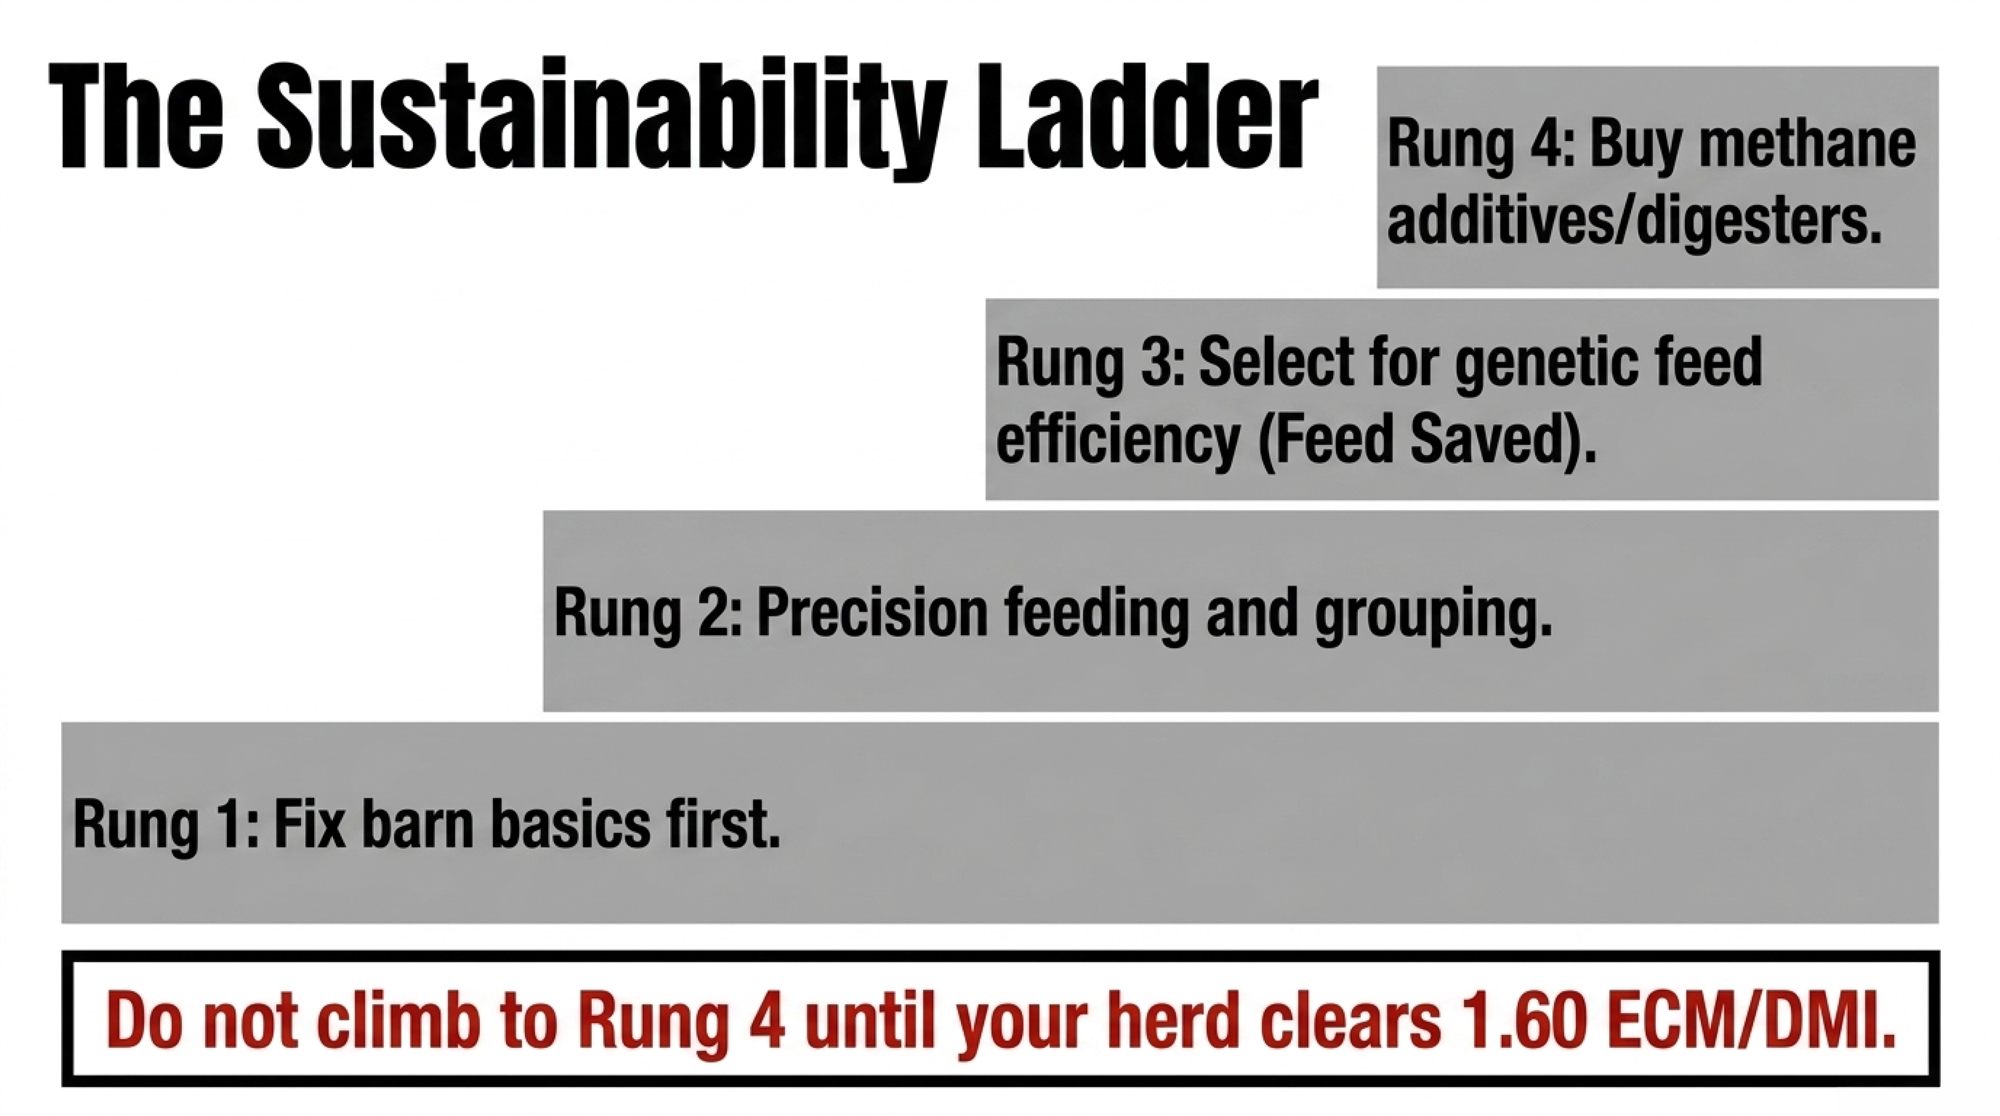
🪜 RUNG 1 — Fix Barn Basics First

Difficulty: Low | Impact: High | Timeline: 30-day action

When it makes sense: Always, and especially if you’re below 1.60 ECM/DMI.

What it requires:

  • Weigh refusals daily by pen for at least 2 weeks
  • DM-test every time a pit, bag, or cutting changes
  • Midday (11 a.m.–2 p.m.) lying-time spot check; aim for 80% of cows lying
  • Calculate ECM/DMI by group monthly with numbers you’re already recording

Risks/limits: It’s boring, and it needs someone on farm to own it every week — not just when the nutritionist is coming. Plenty of herds plan to do this and never quite start.

Forward signal: This is the path processors can actually verify with the data you already collect — which is exactly what their sustainability teams are starting to pay for.

🪜 RUNG 2 — Precision Feeding and Grouping

Difficulty: Moderate | Impact: High | Timeline: 3–6 months

When refusals, comfort, and forage data are under control, grouping becomes the next lever. Most herds discover the real obstacle isn’t the nutritionist — it’s the parlor schedule and pen design that make regrouping a pain. You need at least two lactating groups, some MUN tracking, and a nutritionist willing to trim crude protein and phosphorus toward requirements instead of sitting comfortably above them.

The Cannonsville Reservoir work in New York (Cerosaletti, Fox et al., 2004 JDS) showed that dropping dietary phosphorus from about 153% to 111% of requirement cut manure P excretion roughly 12 kg per cow per year and reduced whole-farm P balance by about half, without giving up milk. Wisconsin dynamic-grouping modeling (Kalantari & Cabrera, 2018) shows about 15 g/cow/day lower N intake when cows are grouped more tightly by stage and production.

Risks/limits: A sloppy precision program is worse than a well-run single-group TMR. You can save nutrients on paper and lose milk in the tank.

🪜 RUNG 3 — Genetic Feed Efficiency

Difficulty: Low | Impact: Compounding | Timeline: 5-year payoff

When it makes sense: Now — it costs nothing to start.

Add a minimum threshold for Feed Saved, EcoFeed, or similar indices on your sire list, and keep it when a hot young bull with no efficiency data shows up. GENEX’s ICC index bakes in a feed-efficiency component, and its modeling suggests top daughters eat noticeably less for the same output than top NM$ or TPI daughters.

You won’t feel it as a line item in 2026. This is slow, permanent money — cows calving in 2028–2030 will simply give more milk on fewer tonnes of feed.

Forward signal: CDCB and international partners are already folding sensor-derived and efficiency traits into routine proofs. The next decade of proofs will quietly reward cows that do more with less, whether processors talk about it or not.

🪜 RUNG 4 — Methane Additives and Digesters

Difficulty: Moderate | Impact: Conditional | Timeline: Policy-dependent

When it makes sense: Once you’re over 1.60 ECM/DMI, barn basics are working, and you have a real payer for the emissions reduction.

What it requires: A documented baseline, a clear IOFC trial plan, and either a processor premium or a carbon/credit market that moves the math from pure cost to net positive. Realistic processor sustainability premiums for verified performance currently live in roughly the $0.10–$0.30/cwt range, depending on processor and region. Well-designed digesters in strong-policy environments (California LCFS or RIN-eligible states) can add roughly $50–$150/cow/yearnet once grants and energy credits clear; in weak policy environments they’re mostly green theater.

Risks/limits: Meta-analyses of 3-NOP (Bovaer-type) trials show real methane reductions near 30%, but with diet sensitivity and variable DMI and milk responses across studies. Regulatory status varies by jurisdiction, so confirm approvals in your market before sourcing. The gas number looks good on paper, but IOFC and cow-level responses still live and die on your underlying ration and management. If you’re still leaking ECM/DMI because of bunk, comfort, or forage issues, an additive is a high-priced patch on a leaky system.

Your Next Management-Meeting Checklist

Print this. Take it to the barn. Answer each one before the next sustainability pitch lands on your desk.

  • ☐ Do I know my 12-month ECM/DMI by group, not just herd average? If not, fix the data before buying a product. 
  • ☐ Can I tell yesterday’s DMI within half a pound per cow? If not, weigh refusals by pen for two weeks before changing an ingredient.
  • ☐ Are 80% of cows lying during peak rest (11 a.m.–2 p.m.)? If not, fix comfort and stocking before funding an additive trial. 
  • ☐ Does my SOP require a same-day DM test whenever a pit, bag, or cutting changes? A 1,500-cow herd should be sampling closer to every 4 days than monthly. 
  • ☐ Does my sire list carry a Feed Saved or EcoFeed minimum? If not, add one this breeding cycle. Cows calving in 2028 will be eating money your competitor’s cows aren’t. 
  • ☐ If a feed rep quotes a $0.45/cow/day additive and I’m still at 1.48 ECM/DMI — do I open a spreadsheet or a contract first? Spreadsheet.
  • ☐ When I sit with my processor, am I bringing an ECM/DMI and emissions-per-litre trend — or a folder of product receipts? That trend is what unlocks premiums. 

The Real Question

What does your milk check look like if every tonne of feed you buy this year actually hits milk instead of the refusal alley or the lagoon? Not someday, when methane tools get cheaper or policy shifts your way. This year.

Most commercial herds still have meaningful feed efficiency sitting on the table, and processors are already starting to pay real money — in dimes per cwt — for the herds that can prove they’ve captured it.
Key Takeaways

  • If your herd is sitting south of 1.60 ECM/DMI, your first sustainability dollar belongs in bunk management, comfort, and DM testing — not a $164,250 methane contract.
  • A 0.05-point ECM/DMI bump is worth $36,500–$73,000/yr on 1,000 cows, and it’s the same work that lowers kg CO₂e per kg milk, so you get paid twice for the same effort.
  • Additives and digesters are Rung 4, not Rung 1 — use them once you’re over 1.60 ECM/DMI, barn basics are working, and you have a real payer (processor premium or LCFS/RIN credit).
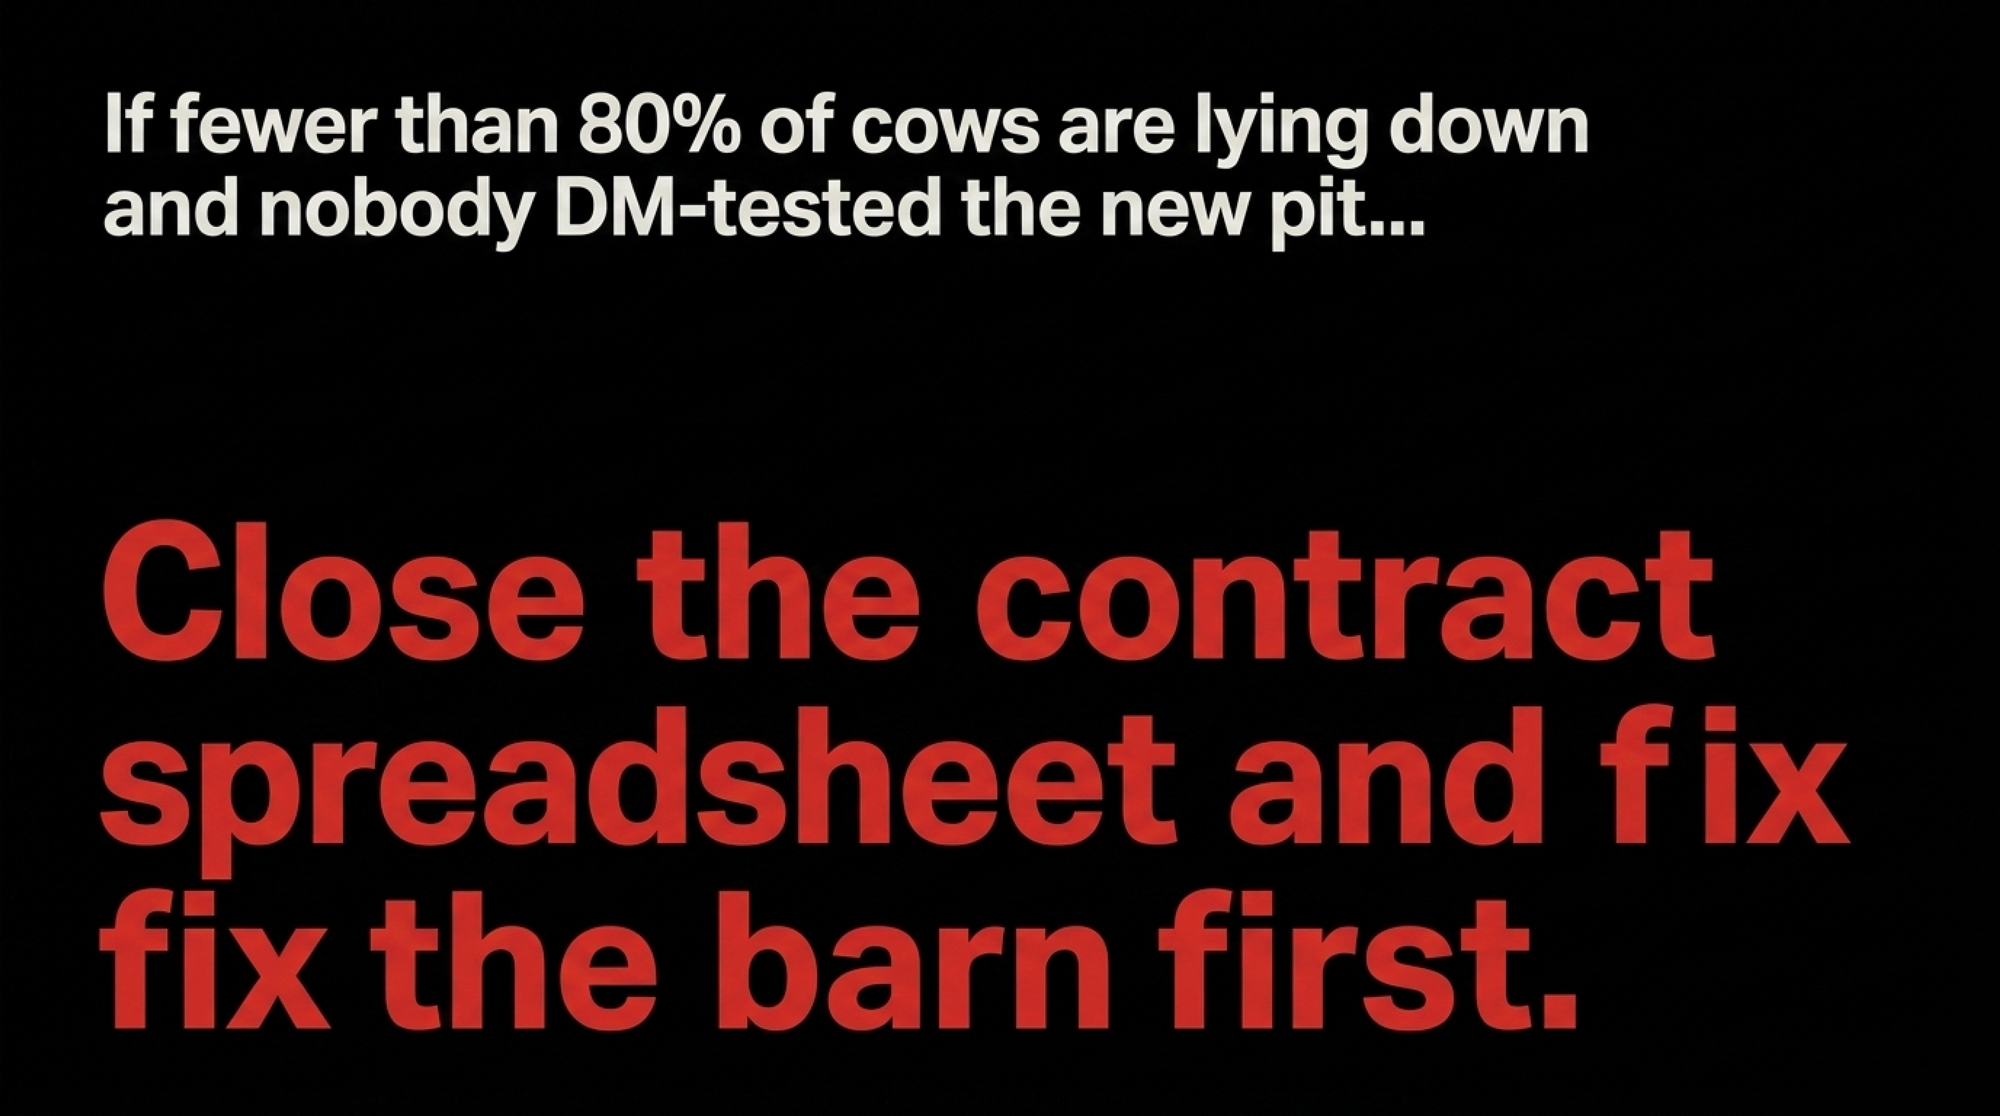
  • Before your next sustainability pitch, walk the bunk at 1 p.m.: if fewer than 80% of cows are lying and nobody DM-tested the new pit, close the spreadsheet and fix that first.
Run Your Numbers

Forage Quality Value Calculator — Before you sign any methane contract, pressure-test the other side of the math: what a 4-point DM swing or a lower-energy pit is actually costing you in milk per cow and dollars per ton. Turns the “$8,100 untested pit” question into a real number for your herd.

Complete references and supporting documentation are available upon request by contacting the editorial team at editor@thebullvine.com.

Learn More

The Sunday Read Dairy Professionals Don’t Skip.

Every week, thousands of producers, breeders, and industry insiders open Bullvine Weekly for genetics insights, market shifts, and profit strategies they won’t find anywhere else. One email. Five minutes. Smarter decisions all week.

NewsSubscribe
First
Last
Consent

Revolutionize Dairy Profits: How Microbes Could Boost Your Operation’s Performance by 30%

Stop chasing sterile milk. New microbiome research reveals 30% feed efficiency gains and $500/cow ROI for dairy operations.

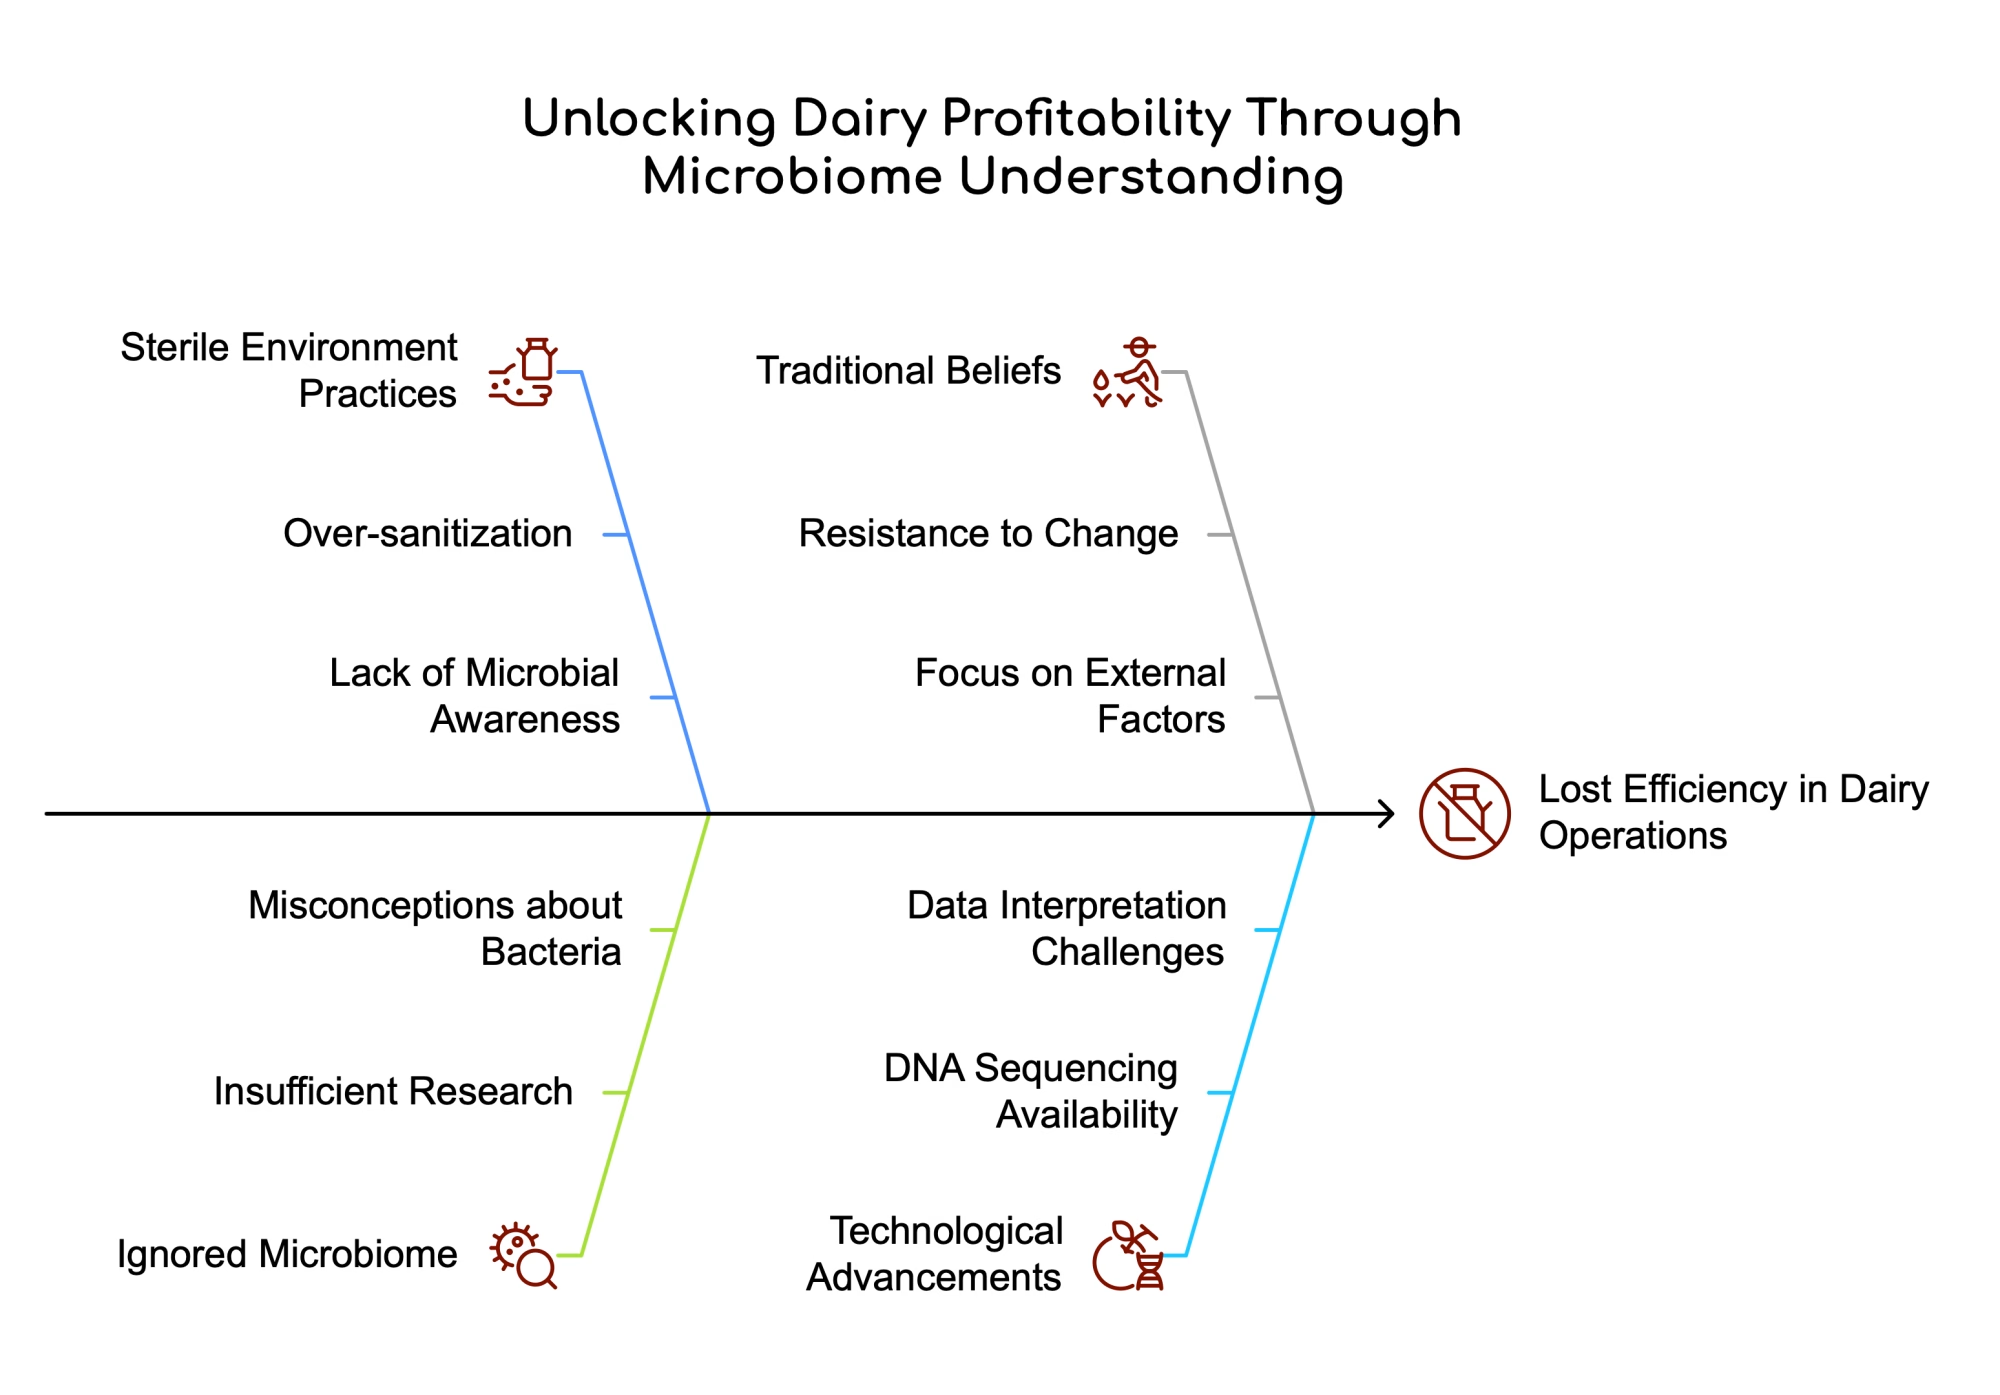
While you’ve been obsessing over genomic testing and precision feeding systems, trillions of microscopic workers inside your cows have been quietly determining whether your milk checks clear $18.57 per cwt or fall short of breakeven. The dairy industry’s next breakthrough isn’t coming from another genetic advancement or fancy robotic milker—it’s hiding in the gut bacteria that convert your expensive feed into profitable milk components. Early adopters are reporting 50% fewer reproductive problems, 4-6 liter daily milk increases, and feed conversion improvements that rival the best genomic gains—all by learning to work with nature’s smallest employees.

Here’s what nobody wants to tell you: you’ve been managing only half your operation. While you meticulously track TPI scores, monitor DMI through precision feeding systems, and analyze lactation curves down to the last kilogram, you’ve completely ignored the trillions of microorganisms that actually convert your expensive feed into the components that determine your milk check.

This isn’t some fringe science anymore. With USDA reporting 2025 U.S. milk production growth at a modest 0.5% annually and Class III prices at $18.57 per hundredweight as of May 2025, every efficiency gain matters more than ever. Universities across North America are proving that the bovine microbiome—the collection of bacteria, viruses, and fungi living in your cows—directly impacts everything from feed conversion ratios to somatic cell counts to reproductive success rates.

Why Are Your Cows’ Most Important Workers Getting Ignored?

Think of your rumen like a high-tech fermentation facility running 24/7. You wouldn’t operate a feed mill without understanding the machinery, yet most producers run their biological feed processing plant—the rumen microbiome—without any idea what’s happening inside. This sterile-world mentality has cost the average 100-cow dairy operation an estimated $25,000-40,000 annually in lost efficiency.

But here’s the controversial truth that challenges everything you’ve been taught: the dairy industry’s obsession with sterile environments is actually sabotaging your profitability. For decades, we’ve been told that good bacteria and bad bacteria don’t matter—just sanitize everything, and problems disappear. Recent research reveals this approach eliminates beneficial microbes that naturally suppress pathogens and optimize production.

Consider this analogy: managing dairy cows without understanding their microbiome is like trying to optimize a TMR mixer by only looking at the ingredients going in, never checking if the mixing paddles are working. You’ve optimized facilities, genetics, and nutrition, but the biological machinery that converts feed into milk has been operating without supervision.

What if everything you’ve been taught about cleanliness is costing you money? The breakthrough came when DNA sequencing technology finally allowed researchers to study entire microbial communities. What they discovered should fundamentally change how you approach cow health: healthy, high-producing cows aren’t bacteria-free—they’re teeming with beneficial microbes that actively promote optimal production.

Are You Throwing Money Away on Feed Efficiency?

Here’s a number that should wake you up: rumen microbiome composition alone can predict significant variation in feed efficiency between your animals. With feed representing 50-70% of production costs and current market pressures, even small efficiency improvements translate to massive profit increases.

Recent research from Washington State University reveals that 7% to 30% of microbes within the rumen microbial community had structural coefficients different from zero when analyzing feed efficiency traits. The efficient animals show higher abundances of specific bacterial families that excel at fermenting fiber and producing the volatile fatty acids that fuel milk production. Meanwhile, your inefficient cows carry microbial populations that essentially waste your expensive feed.

Why This Matters for Your Operation: If you spend $150,000 annually on feed for a 100-cow herd, a 25% efficiency improvement through microbiome optimization could save $37,500 annually. Even accounting for intervention costs, the net benefit could exceed $30,000 annually—that’s equivalent to adding 15-20 cows to your milking string without additional facilities.

Are you monitoring the right metrics to identify your most efficient animals? Most producers stop thinking about digestion at the rumen. Big mistake. Research from the University of Alberta shows that when cattle are more feed efficient, they actually have less diverse rumen microbiota and less microbial activity compared to cattle who are less feed efficient. This counterintuitive finding suggests that optimal efficiency comes from targeted microbial communities rather than maximum diversity.

A comprehensive study published in the Journal of Dairy Science found that models using both genome and microbiome data offer more accurate prediction of feed efficiency than genomic models alone. The holobiont effect—the joint effect of the host genome and rumen microbiome—was greater than the sum of individual effects, demonstrating the critical importance of considering microbial communities in management decisions.

Let’s examine a real-world scenario: Twin Holstein heifers from identical genetics and feeding programs. Heifer A consistently converts feed 22% more efficiently than Heifer B. Traditional analysis blames management or environmental factors. Microbiome analysis reveals that Heifer A carries optimal bacterial communities while Heifer B’s gut harbors inefficient microbial populations. Which approach would you rather use to identify your next herd sires’ mothers?

Feed Efficiency MetricTraditional ManagementMicrobiome-OptimizedImprovement
Feed Conversion Ratio1.8:11.4:122% better
Daily DMI (kg)24.522.12.4 kg less
Milk per kg DMI1.852.3527% more
Annual Feed Cost/Cow$1,500$1,125$375 savings

Is Your Mastitis Prevention Strategy Actually Making Things Worse?

Here’s something that might shock you: sterile milk is a myth, and chasing it might be hurting your udder health and somatic cell counts. This challenges one of the dairy industry’s most sacred beliefs, but the evidence is overwhelming. Research published in Frontiers in Microbiology shows that healthy mammary glands harbor bacterial loads of 10^4 to 10^5 bacterial cells per ml and that these communities may be crucial for maintaining udder health.

The research consistently shows that milk from healthy mammary glands has greater bacterial richness and diversity compared to milk from clinical mastitis cases. A critical study by Metzger et al. found that PCR amplification was actually higher in cisternal samples (83%) compared to conventional samples (40%), strongly suggesting that bacteria are indeed inside the mammary gland and do not get in the milk as a result of external contamination.

The pattern becomes clear when you examine SCC data through a microbiome lens. Canadian research on milk microbiome and mastitis shows that mastitis costs more than $600 per cow annually, with infections like Klebsiella pneumoniae causing a reduction in the diversity of the milk microbiome when infection occurs.

The economic implication? Irish dairy industry research demonstrates that when BMSCC increased from less than 100,000 to over 400,000 cells/mL, net farm profit decreased from €31,252 to €11,748 annually. The study found that reducing national BMSCC by just 10,000 cells/ml would lead to an estimated industry benefit of €6.6 million annually.

Your current mastitis prevention strategy might be eliminating the good bacteria that naturally suppress pathogens and maintain the premium milk quality that processors pay extra for.

Have you ever wondered why some cows never get mastitis while others are chronic offenders? Traditional explanations focus on teat end condition, milking routine, and environmental cleanliness. But what if the real difference lies in their mammary microbiome composition? Research shows that dairy environments harbor complex microbial communities with beneficial bacteria that could naturally prevent infections—if we stop eliminating them.

Reproductive Problems: The Hidden $300-Per-Case Microbiome Connection

Let’s talk about the elephant in the barn: reproductive failure. Every open day costs you $3-5, and with current market volatility, extended calving intervals destroy profitability faster than almost any other problem. But what if I told you that much of your reproductive trouble starts with microbial imbalances you’re not even monitoring?

University of Alberta researchers developed something revolutionary: a targeted probiotic that reduced post-calving uterine infections by 50% and increased milk yield by 4-6 liters per day in the first 50 days after calving. The product, called ProPreg™, consists of three bacterial strains found naturally in the reproductive tract of healthy cows.

The results from 10 years of testing weren’t just impressive—they were profit-changing. Beyond halving uterine infection rates, the probiotic also cut milk fever incidence in half and reduced placental retention. Even inflammation-related lameness decreased, demonstrating that reproductive tract microbiome health affects the entire cow.

Calculate this based on current market conditions: If you’re currently treating 20% of your herd for uterine infections at $300 per case, a 50% reduction saves you $30 per cow annually. Add the 4-6 liter daily increase for 50 days (250 extra liters at current milk prices = $125 per cow), and you’re looking at $155 in additional profit per cow per year. For a 100-cow herd, that’s $15,500 annually.

Why This Matters for Your Operation: Think of the reproductive tract microbiome like your breeding program—you can’t ignore it and expect optimal conception rates. Just as you wouldn’t use poor-quality semen, you shouldn’t ignore the microbial environment determining whether that $50 breeding investment results in a live calf.

Research on reproductive microbiota shows that endometritis has a major impact on fertility in postpartum dairy cows, and studies reveal clear associations between reproductive microbiota and perinatal disease. The research demonstrates that uterine and vaginal microbiota show a maximum of 20.1% shared amplicon sequence variants, indicating distinct microbial communities that require targeted management approaches.

Commercial Solutions: From University Labs to Your Feed Room

The transition from research to practical application is happening faster than most producers realize. University of Alberta’s ProPreg™ is already in small-scale commercial sales in the United States, with Canadian availability expected within two years. This isn’t another generic probiotic—it’s precision-engineered based on studying specific microbial imbalances.

But reproductive health is just the beginning. Researchers are developing precision probiotics targeting respiratory health, with multispecies formulations showing significant improvements in calf average daily gain while decreasing bovine respiratory disease by up to 40%. Since respiratory disease costs the average dairy operation $150-200 per affected calf, microbiome-based interventions could dramatically improve animal welfare and your bottom line.

Global Perspective: While North American producers are just beginning to adopt microbiome technologies, international competitors are already capturing advantages. Early adopters in major dairy regions are already capturing competitive advantages that late adopters will struggle to match.

Recent research identified that bovine respiratory disease often results from stress-induced dysbiosis, allowing commensal bacteria like Mannheimia haemolytica to proliferate and move from the upper respiratory tract to the lungs. This knowledge enables probiotic formulations that restore healthy microbial balance before disease develops—think preventive medicine rather than reactive treatment.

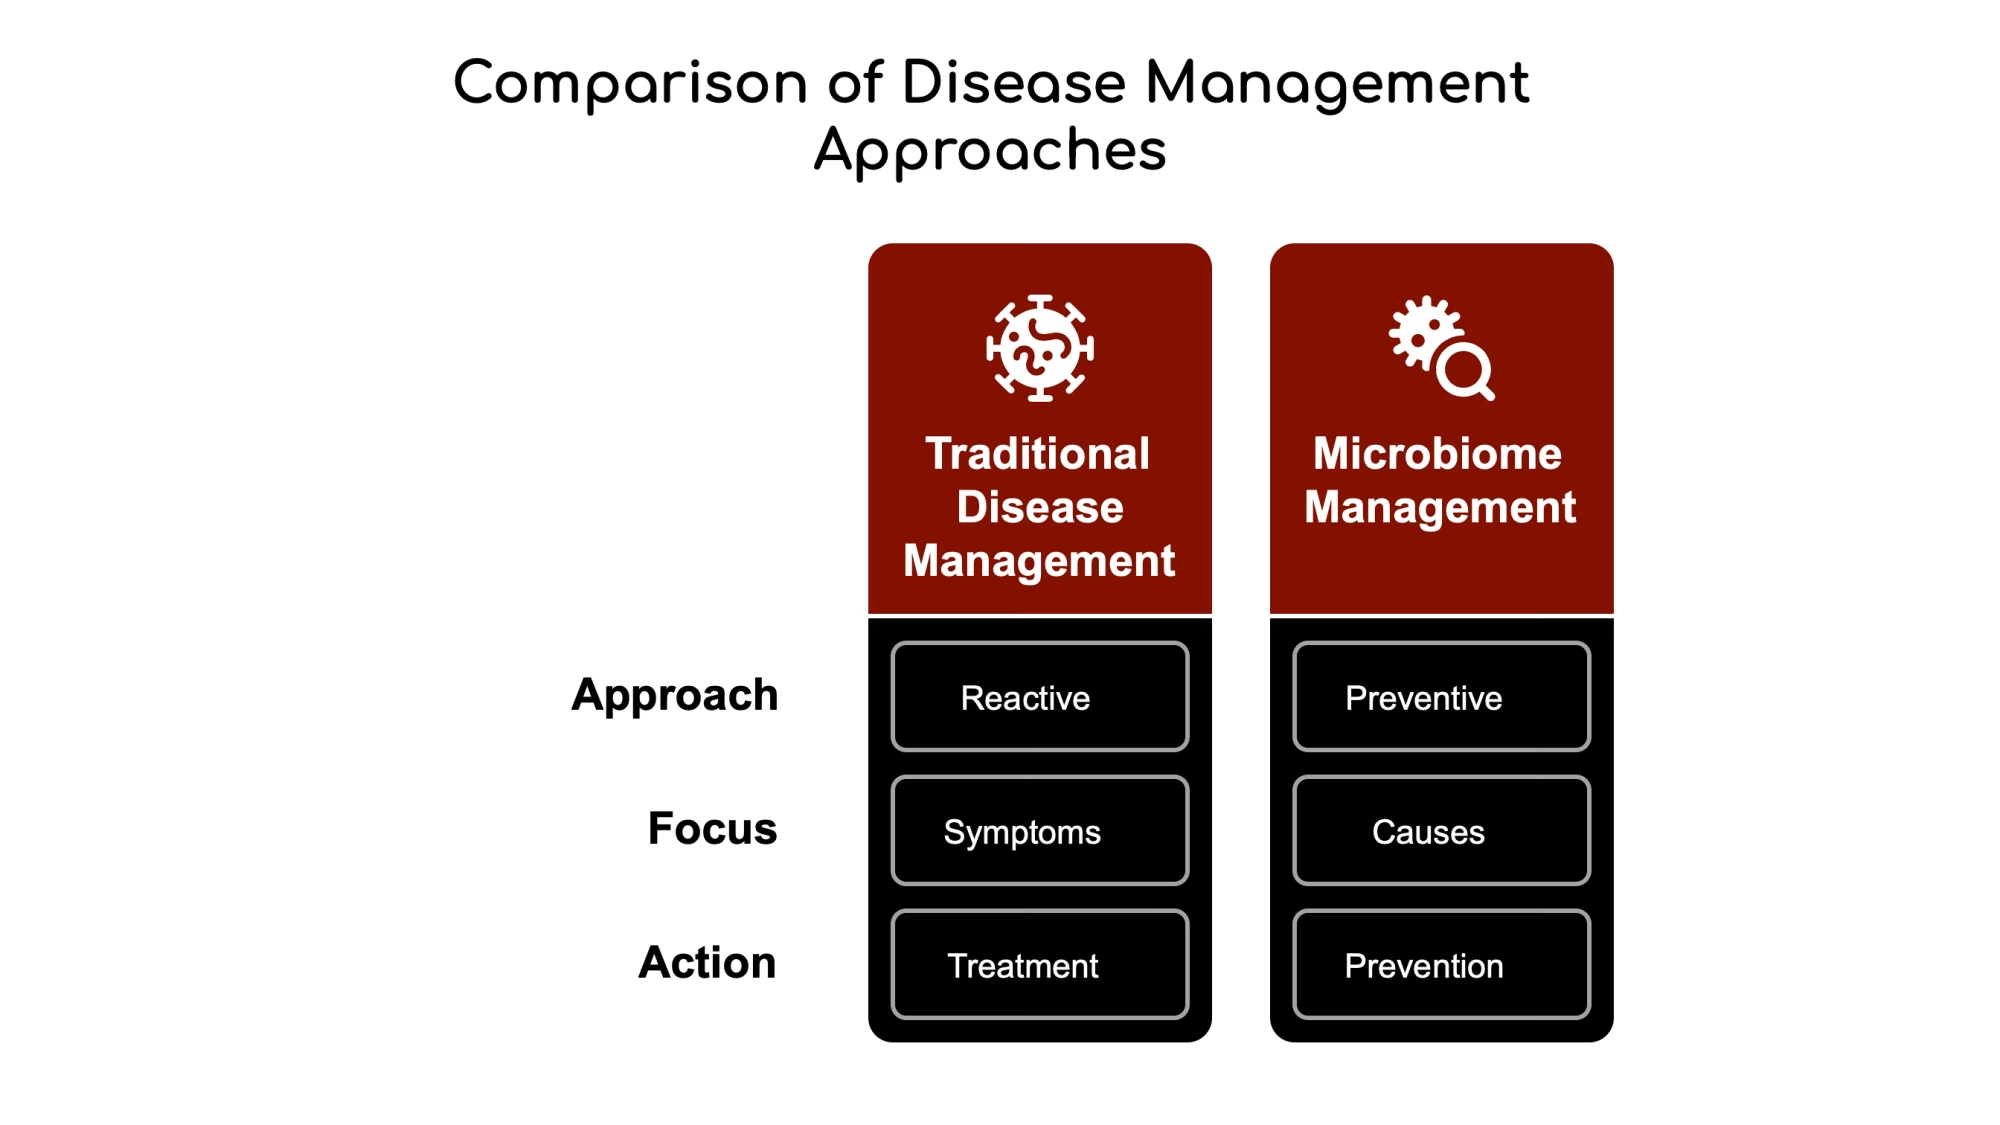
Are you still treating symptoms instead of causes? Traditional disease management waits for clinical signs and then applies expensive treatments. Microbiome management prevents problems by maintaining beneficial bacterial communities that naturally suppress pathogens.

Implementation Challenges: What Every Producer Must Know

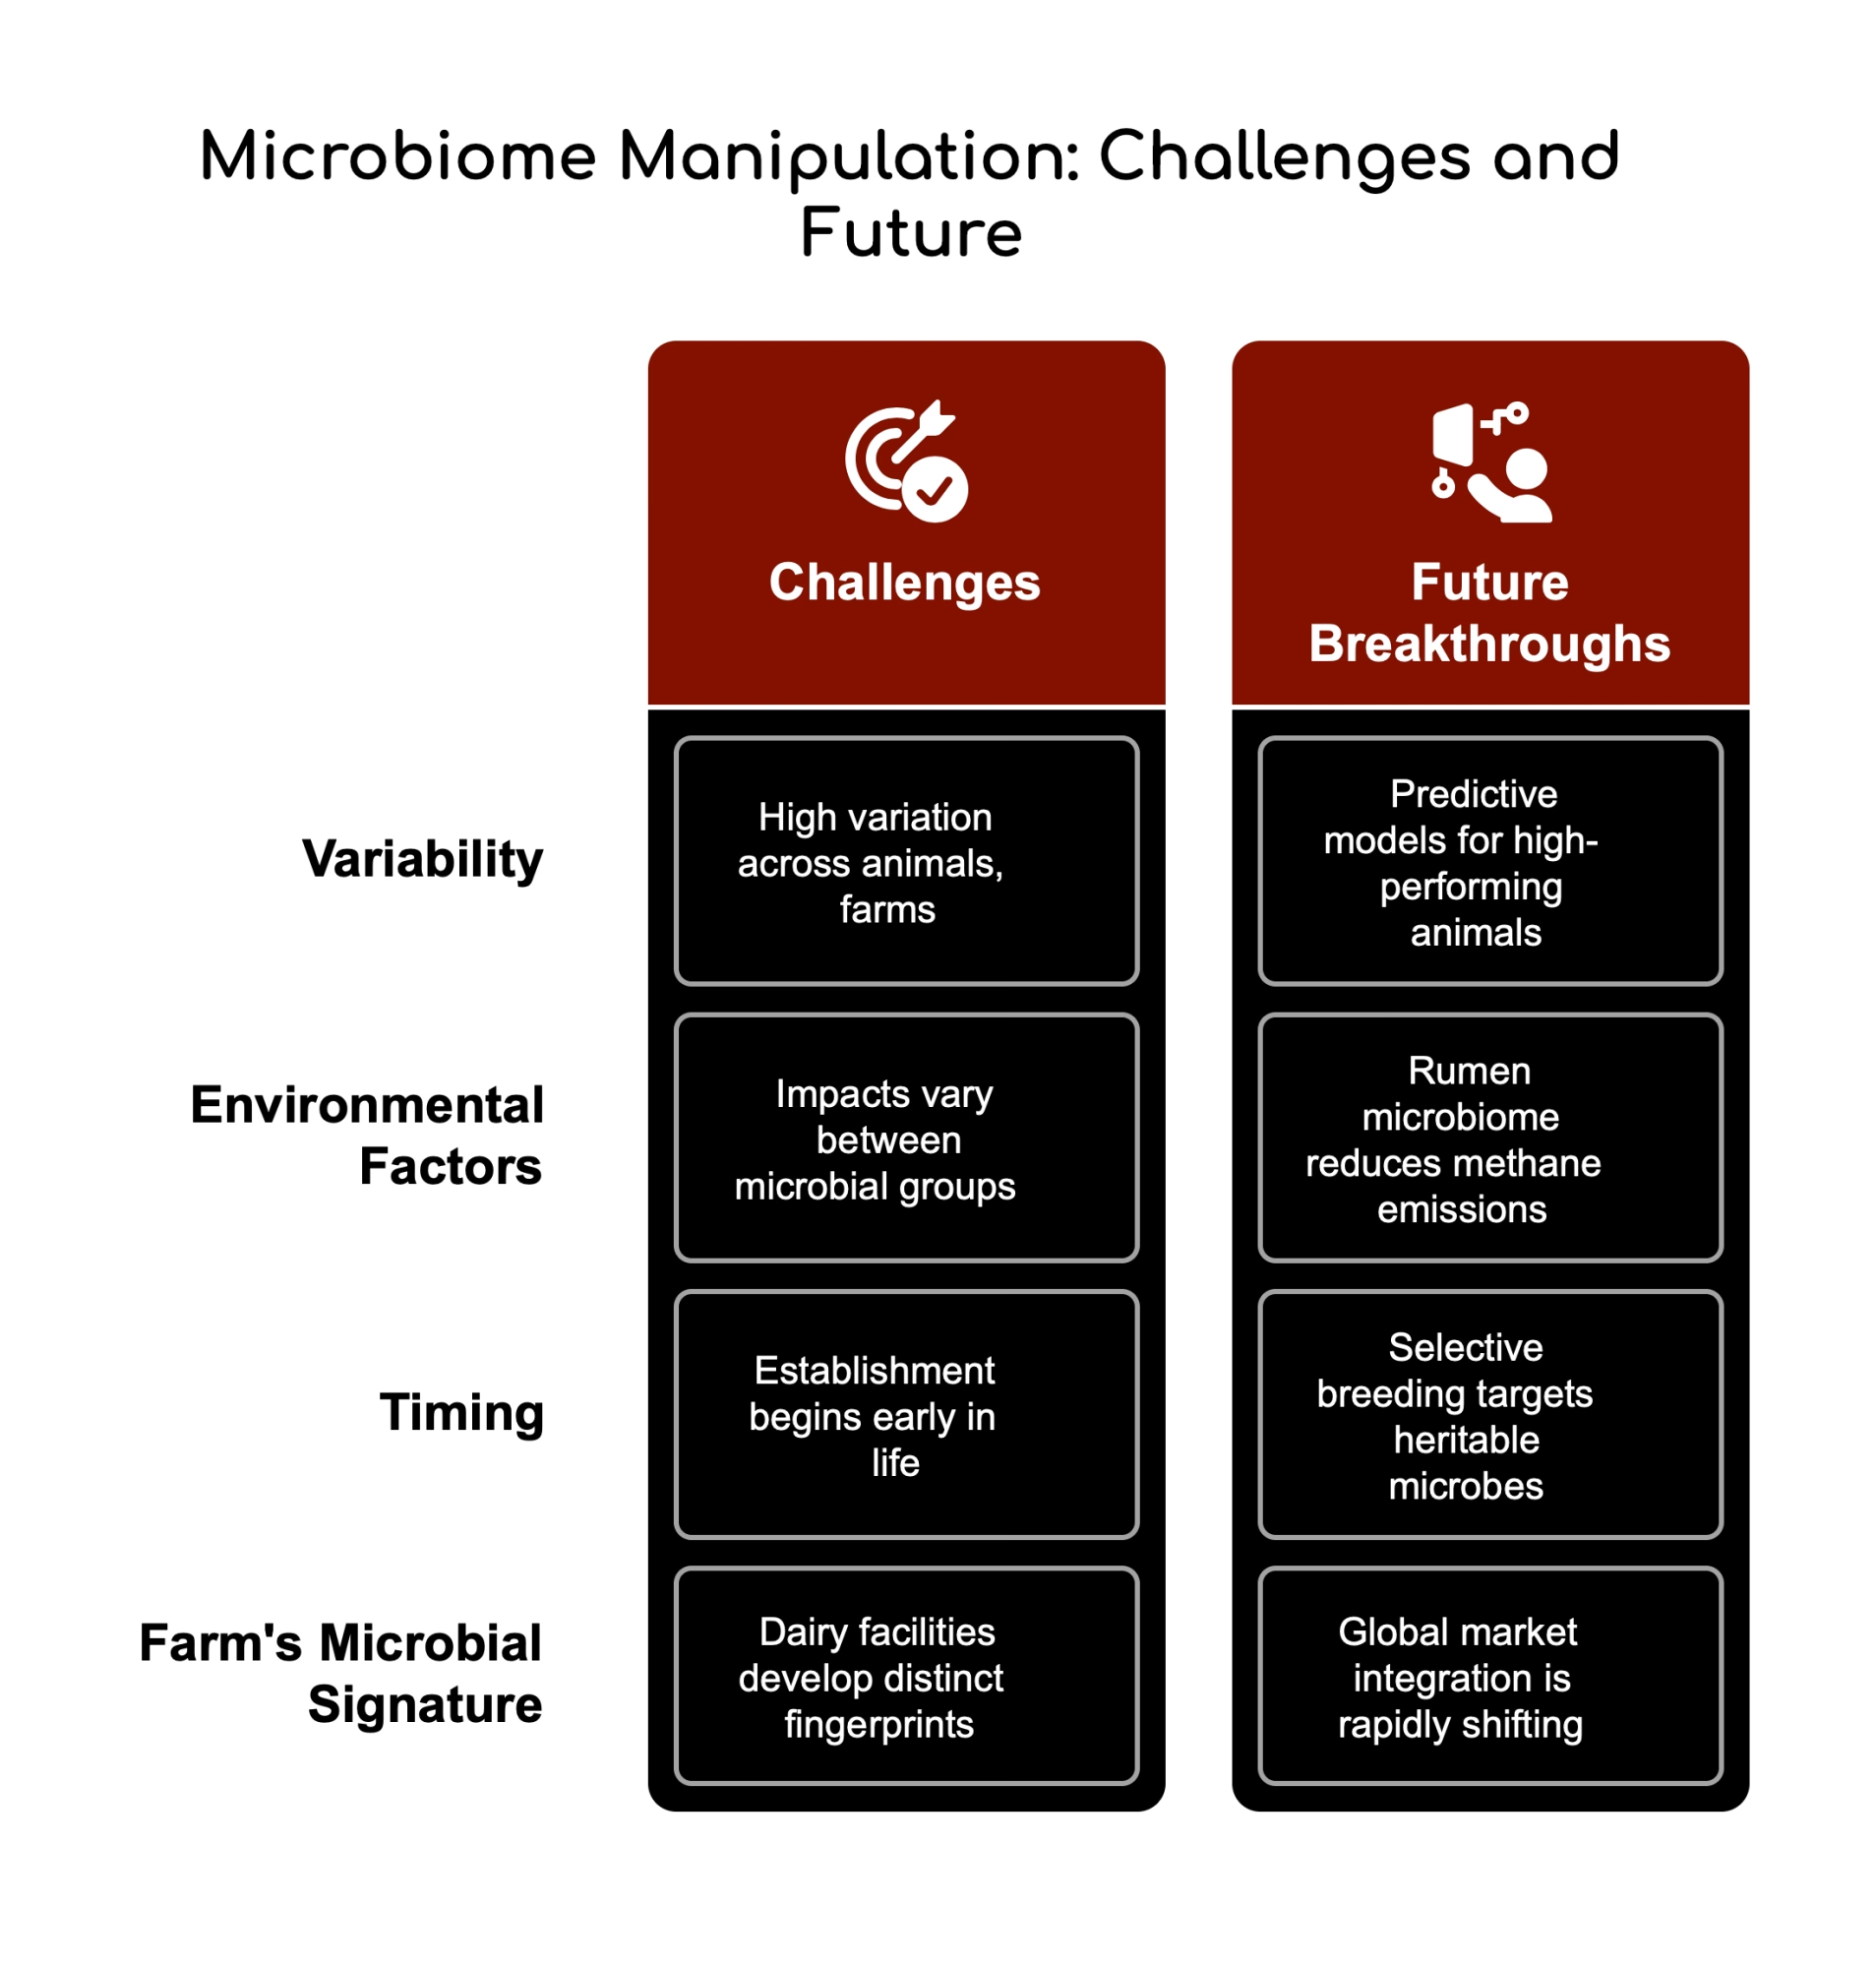
Despite the exciting potential, microbiome manipulation isn’t a silver bullet. The bovine microbiome varies significantly between individual animals, farms, and geographic regions. What works brilliantly on a Wisconsin free-stall operation might fail completely on a California dry lot or a New Zealand pasture-based system.

Environmental factors play huge roles in microbiome establishment and maintenance. Research from the University of Alberta shows that changes resulting from grazing environments varied between each microbial group, with different impacts on bacteria versus archaea populations. This means microbiome interventions must integrate with your overall management strategy rather than replace existing protocols.

Think of it like precision agriculture: you wouldn’t apply the same fertilizer rate across different soil types. Similarly, microbiome interventions require customization based on your operation’s unique characteristics—feed sources, housing system, genetics, and management style.

Timing presents another critical challenge. Microbiome establishment begins early in life, with maternal microbiota significantly influencing calf gut development. The most effective interventions might need to start during the pre-weaning period, requiring you to think about microbiome health across the entire production cycle—from colostrum management through first lactation.

What’s your farm’s microbial signature? Research shows that dairy facilities develop distinct microbial fingerprints that can be used for traceability. Understanding your operation’s unique microbiome could be key to optimizing interventions for maximum effectiveness.

Future Breakthroughs: What’s Coming in the Next Five Years

The microbiome revolution is accelerating, and early adopters will gain significant competitive advantages. Researchers are developing predictive models that can identify high-performing animals based on their microbial profiles, potentially revolutionizing genetic selection programs. Imagine predicting a heifer’s lifetime productivity by analyzing her rumen microbiome at weaning—more accurate than current genomic evaluations.

Research from Washington State University reveals that microbes can be classified into three groups for different uses in dairy farming: those with low heritability but significant causal effects (attractive for external interventions) and two groups with high heritability and significant causal effects that could be targeted through selective breeding.

Environmental sustainability represents another exciting frontier. University of Alberta research suggests that certain rumen microbiome compositions can reduce methane emissions, potentially helping your operation meet increasingly stringent environmental regulations while maintaining productivity. With carbon credit programs paying $15-25 per ton of CO2 equivalent, methane reduction could become a new revenue stream.

Global Market Integration: The competitive landscape is shifting rapidly—producers who don’t adapt risk being left behind as international operations implement microbiome-based improvements at scale.

Will your operation lead or follow this revolution? Today, technology is advancing to begin microbiome optimization. While competitors debate adoption, forward-thinking producers are already capturing measurable advantages.

Economic Reality: Calculate Your Microbiome ROI

Let’s talk about numbers that matter to your operation based on current market conditions. With Class III milk at $18.57 per cwt as of May 2025 and feed costs consuming 50-70% of gross milk income, every efficiency gain translates directly to profit.

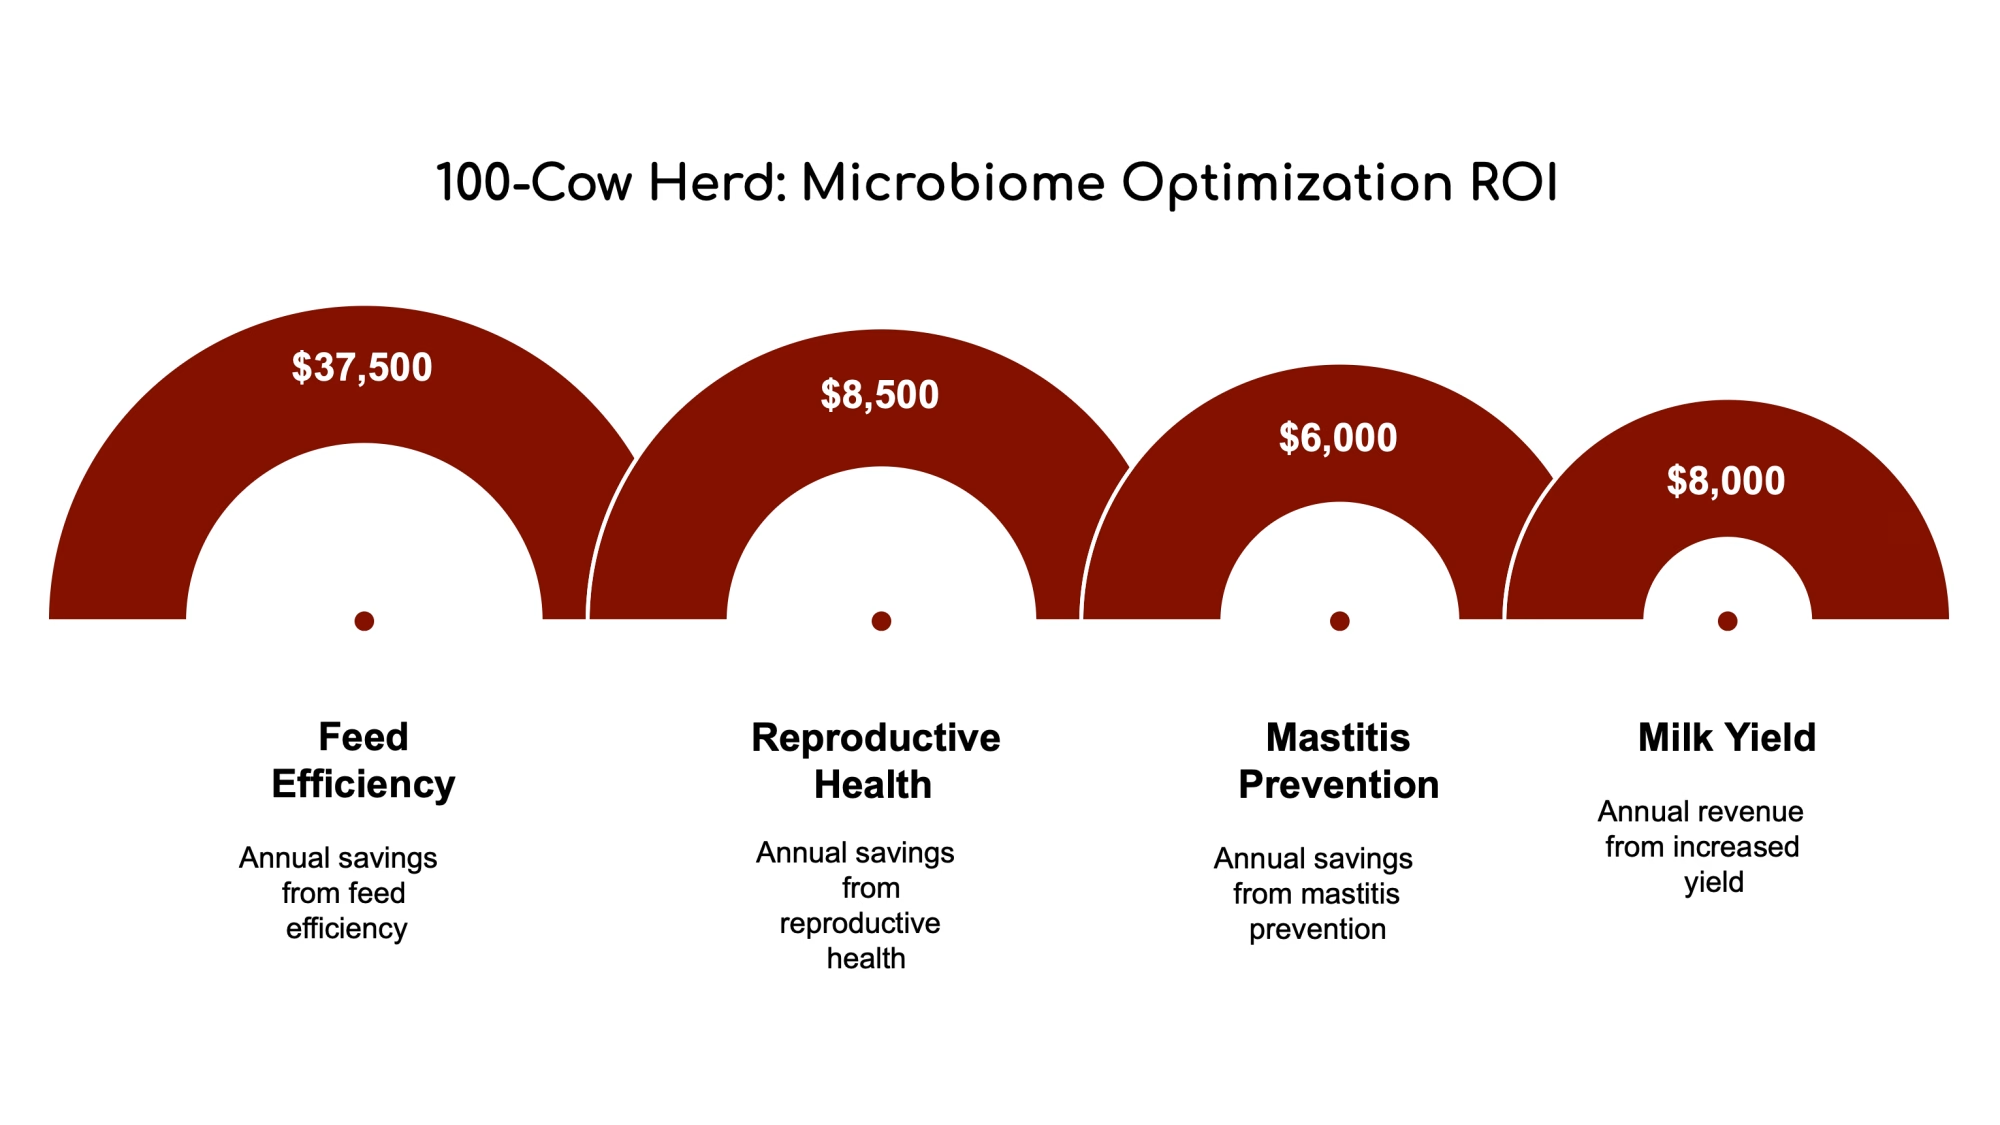
Feed efficiency improvements of 20-30% are achievable through microbiome optimization. On a 100-cow operation spending $150,000 annually on feed, a 25% efficiency improvement could save $37,500 per year. Even accounting for intervention costs, the net benefit could exceed $30,000 annually—equivalent to the profit from 15-20 additional cows.

Reproductive benefits show even more dramatic returns. University of Alberta research demonstrates that reducing uterine infections by 50% eliminates treatment costs (typically $200-300 per case) and prevents production losses from extended calving intervals. With the average dairy cow worth $1,800-2,200, preventing just one culling due to reproductive failure pays for substantial microbiome interventions.

ROI Calculation100-Cow HerdPer Cow ImpactAnnual Benefit
Feed Efficiency (25% improvement)$37,500$375High
Reproductive Health (50% reduction)$8,500$85High
Mastitis Prevention (30% reduction)$6,000$60Medium
Total Potential Benefit$52,000$520Very High

Milk yield increases of 4-6 liters per day for 50 days post-calving translate to 200-300 additional liters per cow. Currently, milk prices of approximately $0.40 per liter represent $80-120 in additional revenue per cow. Across a 100-cow herd, annual benefits could reach $8,000-12,000.

Strategic Implementation: Your 18-Month Roadmap

Ready to put these microscopic workers to work for your operation? Here’s a practical implementation roadmap based on successful adoption patterns from early-adopter farms.

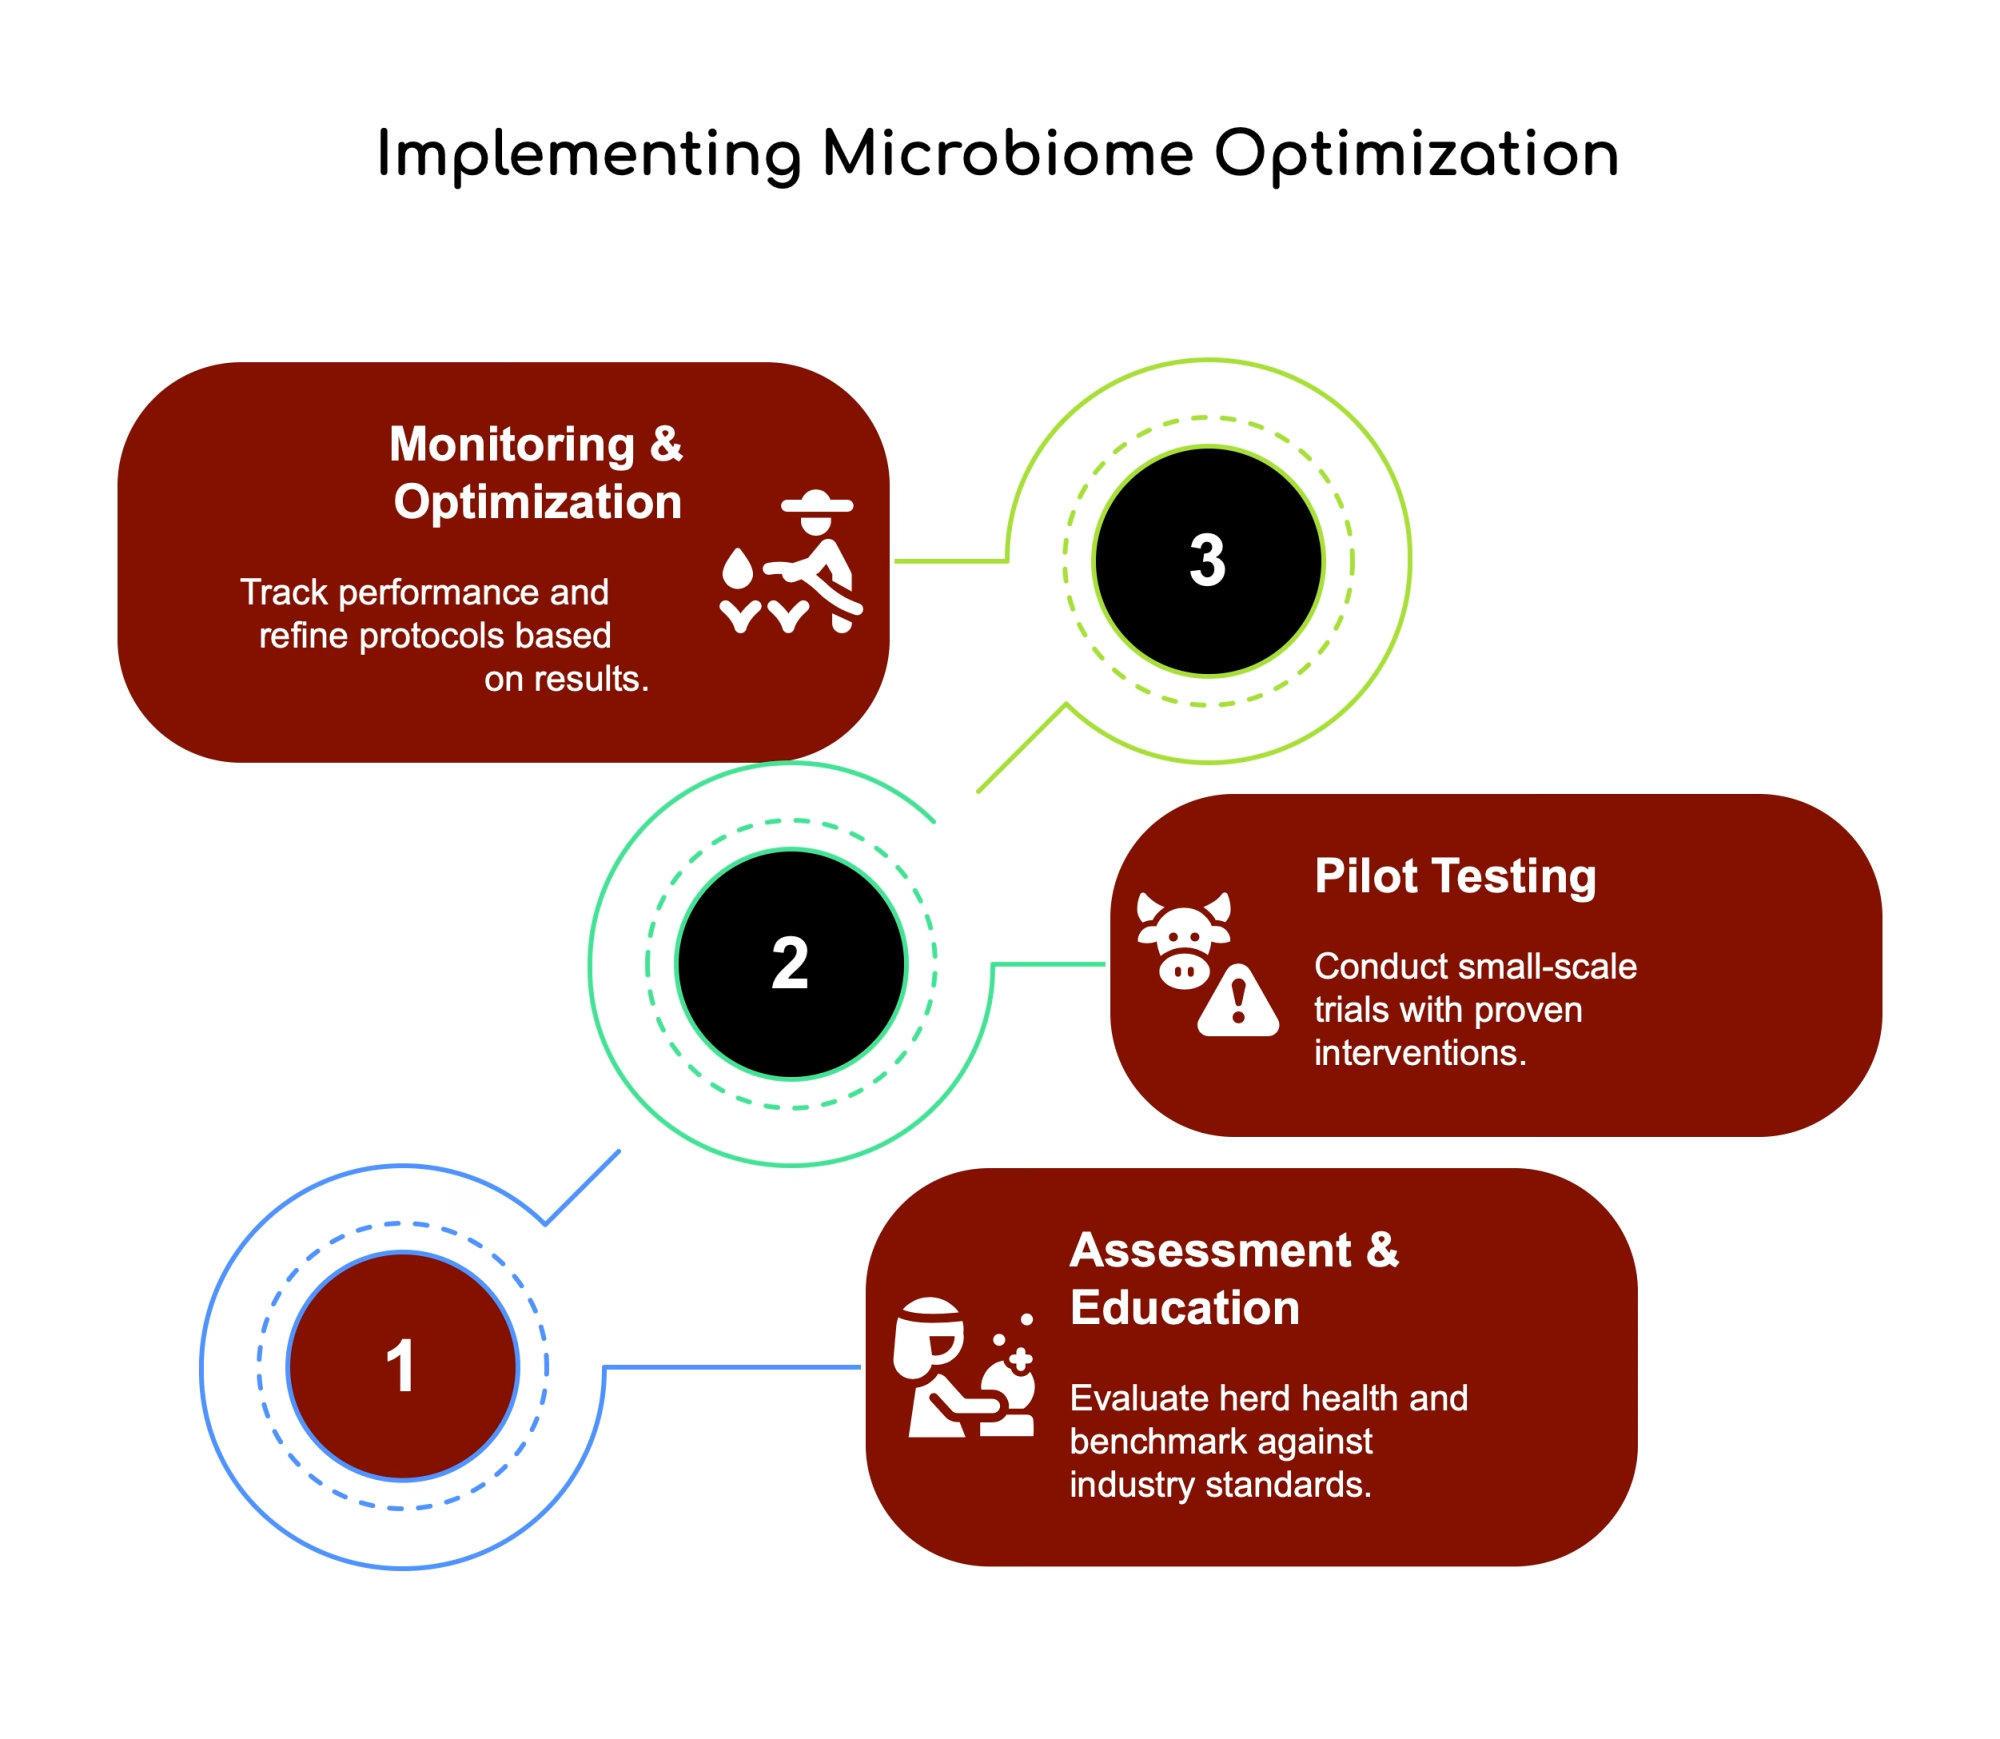
Phase 1: Assessment and Education (Months 1-3) Start by working with your veterinarian and nutritionist to assess current herd health status using existing data—SCC trends, reproductive performance, and feed conversion ratios. Focus on areas where you’re already seeing challenges. Cost: Minimal (existing advisor time)

Benchmark your operation against industry standards: USDA reports show modest growth patterns in 2025, with the January 1 dairy cow inventory at 9.349 million head, up 2,500 head from 2024. Microbiome optimization could offer a significant upside if you’re below average in efficiency metrics.

Phase 2: Pilot Testing (Months 4-9) Begin with small-scale trials of proven interventions. The University of Alberta’s reproductive probiotic represents the most commercially advanced option, with documented results from multiple research trials. Test with 25-50 animals while maintaining detailed records on key performance indicators.

Implementation costs: $15-25 per cow for proven probiotic interventions, with expected payback within 4-6 months based on documented performance improvements.

Phase 3: Monitoring and Optimization (Months 10-18) Track performance indicators and refine protocols based on results. To quantify benefits, monitor somatic cell counts, reproductive performance metrics, and feed efficiency data. Use precision agriculture tools—activity monitors, automated feed systems, milk meters—to capture detailed performance data.

Why This Matters for Your Operation: Think of this phase like fine-tuning a TMR ration. You wouldn’t change feed ingredients without monitoring production response—same principle applies to microbiome interventions.

Critical success factor: Research shows that dairy environments develop facility-specific microbial signatures. Your implementation strategy must account for your operation’s unique characteristics rather than applying generic protocols.

Technology Integration: Connecting Microbiomes to Precision Agriculture

The convergence of microbiome science and precision agriculture creates unprecedented optimization opportunities. Modern dairy operations already collect massive amounts of data—individual cow production, activity monitors, automated feeding systems, and environmental sensors. Adding microbiome data to this information ecosystem could improve predictive accuracy by 30-40%.

Consider how activity monitors currently predict estrus events. Adding reproductive tract microbiome data could improve conception rate predictions and optimize breeding timing—potentially increasing first-service conception rates from industry average of 35-40% to 50-55%.

Automated feeding systems provide another integration opportunity. Research suggests that precision feeding based on individual rumen microbiome composition could optimize nutrient utilization while reducing feed costs. Early research suggests this approach could improve feed conversion ratios by 15-25% while reducing nitrogen and phosphorus excretion.

Robotic milking systems generate detailed individual cow data that could guide microbiome interventions. Combining milk flow rates, conductivity measurements, and activity data with microbiome profiles could enable predictive health management—identifying problems before clinical symptoms appear.

What if your herd management software could predict mastitis, reproductive problems, and feed efficiency based on microbial data? The technology convergence is happening now—the question is whether you’ll be ready to capitalize on it.

Challenging Industry Sacred Cows: The Sterile Milk Myth

Let’s directly challenge one of the dairy industry’s most entrenched beliefs: the pursuit of sterile milk through aggressive sanitization protocols. This practice, while well-intentioned, may be undermining the very health outcomes we’re trying to achieve.

Recent microbiome mapping reveals that processing environments harbor complex beneficial bacterial communities that contribute to natural pathogen suppression. Our obsession with eliminating all bacteria destroys protective microbial ecosystems that have evolved over millennia.

Here’s the evidence that challenges conventional wisdom: Research consistently shows that healthy mammary glands don’t lack bacteria—they harbor diverse microbial communities that actively maintain udder health. The research demonstrates that milk from healthy glands has greater bacterial richness than milk from mastitis cases. We’ve been measuring the wrong thing: bacterial absence instead of bacterial balance.

This isn’t just academic theory. Practical implications include rethinking sanitization protocols, reconsidering antibiotic use patterns, and developing management systems that promote beneficial microbes rather than eliminating all microbes. Some progressive operations are already experimenting with “selective sanitization” that preserves beneficial bacteria while controlling pathogens.

Are you brave enough to challenge 50 years of industry dogma with evidence-based alternatives? The producers who question conventional practices and adopt microbiome-informed management will capture competitive advantages while competitors cling to outdated approaches.

The Bottom Line

The dairy industry stands at a pivotal moment. With volatile markets and rising production costs squeezing margins tighter than ever, competitive advantages that seemed incremental five years ago now determine survival. While your competitors focus on marginal genetic gains and equipment upgrades, the producers who embrace microbiome science now will gain competitive advantages that could last for decades.

The research is clear and verified through multiple university studies: microbiome optimization can improve feed efficiency, reduce reproductive problems by 50%, and increase milk production by 4-6 liters per day during peak lactation. These aren’t theoretical possibilities—they’re documented results from rigorous research trials with verified economic returns.

More importantly, this isn’t about adding another expensive technology to your operation. It’s about finally managing the biological workforce that’s already inside your cows. The microbes are there whether you pay attention to them or not. The question is whether you’ll put them to work boosting your profitability or continue letting them operate without supervision.

Global competitive pressures are intensifying rapidly. The producers who act on this information in the next 18 months will establish competitive advantages that their neighbors will struggle to match.

With verified ROI potential exceeding $500 per cow annually and implementation costs under $25 per cow, the economics of microbiome optimization are compelling for operations of all sizes. Your cows’ microscopic workforce is ready to revolutionize your operation’s performance.

Here’s your action plan: Start with the Phase 1 assessment this month. Work with your advisors to identify intervention opportunities. Begin pilot testing proven solutions within 90 days. The producers who move first will establish sustainable competitive advantages while others debate the science.

The only question remains whether you’ll lead or follow this revolution. Your cows—and your bank account—are waiting for your decision.

Take Action Today: Contact your veterinarian to discuss microbiome assessment opportunities. Review your current sanitization protocols with fresh eyes. Calculate your potential ROI using the frameworks provided. The microbiome revolution starts with a single producer willing to challenge conventional wisdom with evidence-based innovation.

Your future profitability may depend on microscopic workers you’ve never met. Isn’t it time you were properly introduced?

KEY TAKEAWAYS

  • Feed Conversion Revolution: Rumen microbiome composition predicts 32% of feed efficiency variation between animals, with optimization delivering 25% cost savings ($375 per cow annually on a $1,500 feed budget)
  • Reproductive Performance Breakthrough: Targeted probiotics cut post-calving uterine infections by 50% while increasing milk production 4-6 liters daily for 50 days, generating $155 additional profit per cow per lactation
  • Mastitis Prevention Paradigm Shift: Healthy mammary glands harbor beneficial bacteria 5-10 times more abundant than in high-SCC milk, challenging sterile milk protocols that eliminate protective microbial communities
  • Economic Implementation Reality: Total potential benefits exceed $52,000 annually for 100-cow herds through combined feed efficiency, reproductive health, and mastitis prevention improvements—with implementation costs under $2,500
  • Competitive Advantage Window: European operations lead North American adoption by three years, with early implementers capturing sustainable advantages while competitors cling to outdated sanitization practices that destroy beneficial microbes

EXECUTIVE SUMMARY

The dairy industry’s obsession with sterile environments is sabotaging your profitability—and the science proves it. University research reveals that healthy mammary glands harbor diverse bacterial communities, with microbiome-optimized operations achieving 20-30% feed efficiency improvements and $500 annual ROI per cow. University of Alberta’s breakthrough probiotic reduces uterine infections by 50% while boosting milk yield 4-6 liters daily, delivering $155 additional profit per cow annually. While North American producers debate adoption, European operations have captured three-year competitive advantages through microbiome management, with implementation costs under $25 per cow. Current Class III prices at $18.57/cwt and rising feed costs make every efficiency gain critical for survival. The microscopic workforce inside your cows is ready to revolutionize performance—the question is whether you’ll lead this revolution or follow it.

Learn More:

The Sunday Read Dairy Professionals Don’t Skip.

Every week, thousands of producers, breeders, and industry insiders open Bullvine Weekly for genetics insights, market shifts, and profit strategies they won’t find anywhere else. One email. Five minutes. Smarter decisions all week.

NewsSubscribe
First
Last
Consent
Send this to a friend