


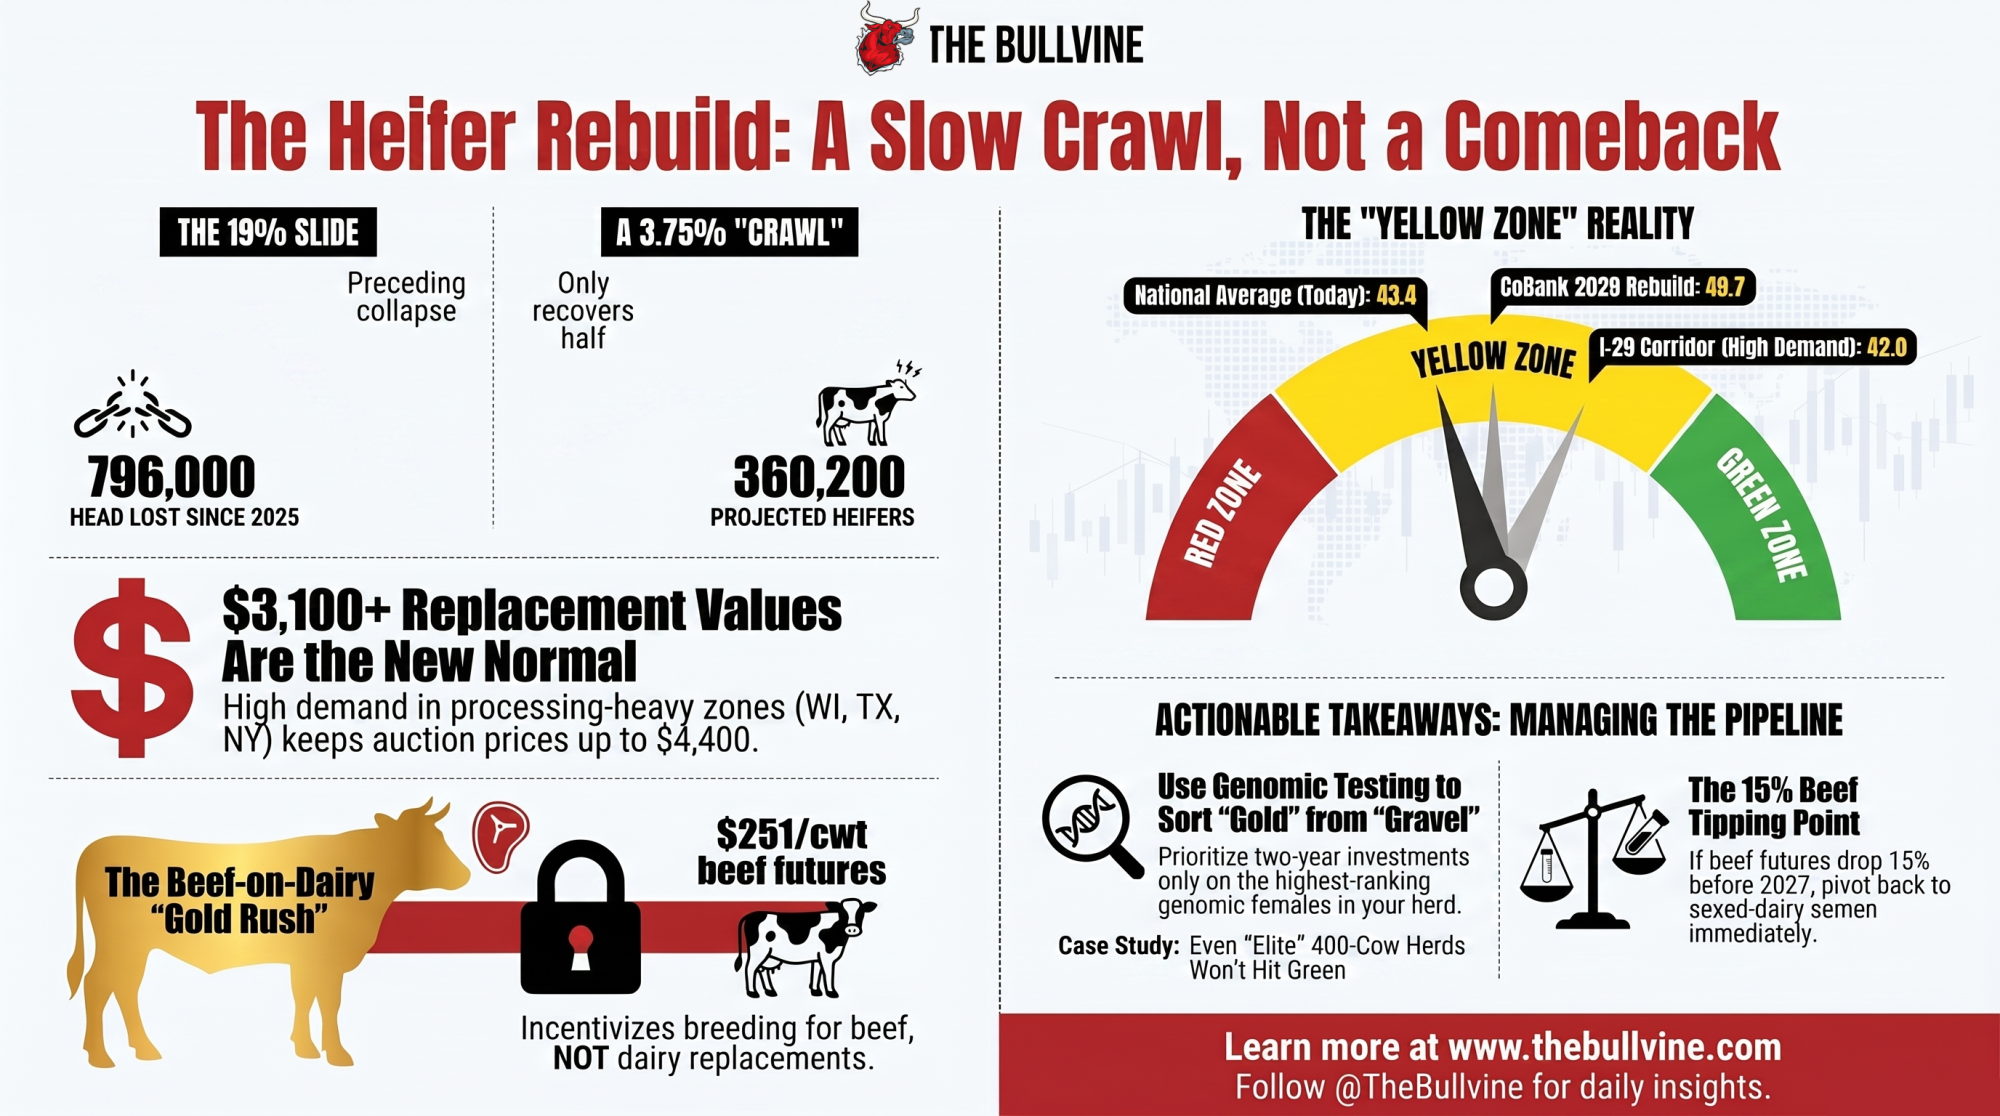
CoBank projects 360,200 more replacement heifers over 2027 and 2028 — just 3.75% of the national herd. Enough to stop the bleeding. Not enough to refill the pipeline. Here’s what it means for your breeding sheet this year.
Picture a 400-cow operation in central Wisconsin that’s been holding heifers like gold bars since 2024. The owner did everything CoBank’s models would applaud — genomic tested, sexed the top end, beef-bred the bottom. And he’s still staring at $3,100 replacement values and a pipeline that won’t feel “rebuilt” for years. If you’re milking cows anywhere in the U.S. right now, that’s your story, too.
The question isn’t whether replacements come back. It’s how little, how slow, and what you do about it in the meantime.
On June 18, 2026, CoBank’s Corey Geiger and Abbi Prins published their read on it: dairy replacements “should begin a slow rebuild in 2027 and 2028.” They’re right about the biology. They’re right about the timeline. But “rebuild” is a generous word for what the numbers actually deliver.
Disclosure: CoBank is a major agricultural lender to the U.S. dairy and livestock industries, so it has a commercial interest in how the dairy outlook is read. That’s a reason to check the numbers against independent data — not to assume bias. We did, and CoBank’s figures track USDA and NAAB reporting.
What CoBank Is Actually Saying
Give CoBank credit before you challenge them, because the framework is sound. Semen sales in a given year set replacement heifer availability roughly 30 months later — that biological lag doesn’t negotiate. Raising a dairy replacement from birth to maturity is a two-year investment, while a beef-on-dairy cross calf is “essentially an instant one-time revenue source,” as Geiger and Prins put it — and that timing gap is the whole story.
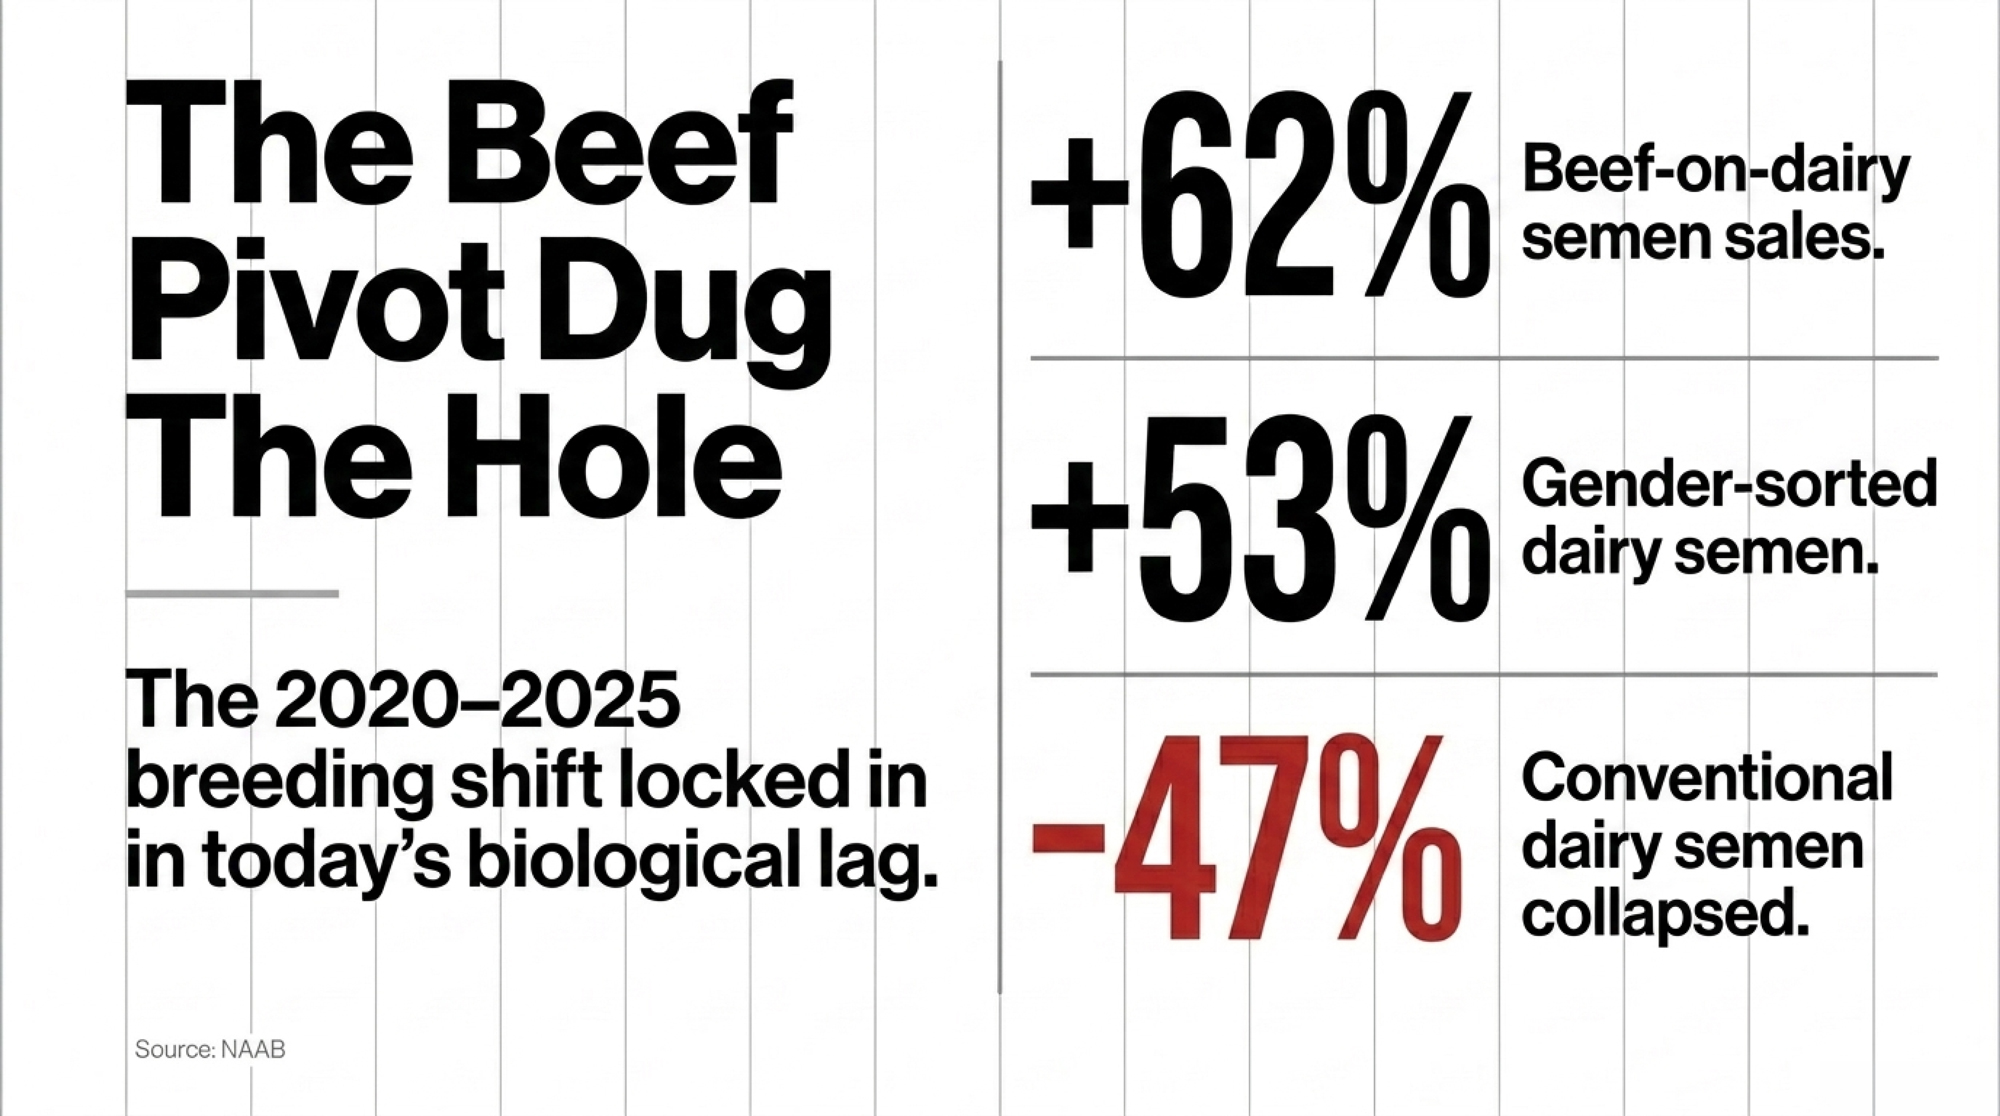
Their case rests on a few legs. The triple-play breeding shift — sexed dairy semen on elite cows, genomic testing to sort keepers, beef on the rest — has been reshaping the national mix since 2022. Retained dairy cows have plugged the gap, holding the milking herd above 9.6 million head, the highest in 30 years, even as replacement inventories fell to their lowest level since 1978. The beef pivot is what dug the hole, and it ran deep: beef-on-dairy semen sales grew 62% from 2020 to 2025, while gender-sorted dairy semen climbed 53.6% and conventional dairy semen collapsed 47.4% over the same window.
Here’s the headline number. Dairy replacements entering the milking herd shrink by a combined 796,000 head across 2025 and 2026, then rebuild by 360,200 head in 2027 and 2028. Call it 285,400 in 2027 and roughly 74,900 in 2028. CoBank’s read on geography holds up too — the wave of new dairy processing investment in New York, Texas, Wisconsin, Michigan, Idaho, and the I-29 corridor keeps replacement demand hotter in those zones than anywhere else.
The diagnosis is accurate. The fight is over what “rebuild” means once you run it forward — and over one thing CoBank’s own data quietly undercuts, which we’ll get to: beef isn’t going anywhere.
Where the Math Agrees With CoBank
Run CoBank’s numbers through The Bullvine’s BPI Index — the composite that scores a replacement pipeline on heifer supply, price signal, culling pressure, and semen mix momentum — and the early read matches CoBank almost exactly. The mid-2025 trough lines up with CoBank’s biology window. The beef-on-dairy surge of 2022–2023 locked in the 2025–2026 shortage before most producers felt it in their pens.
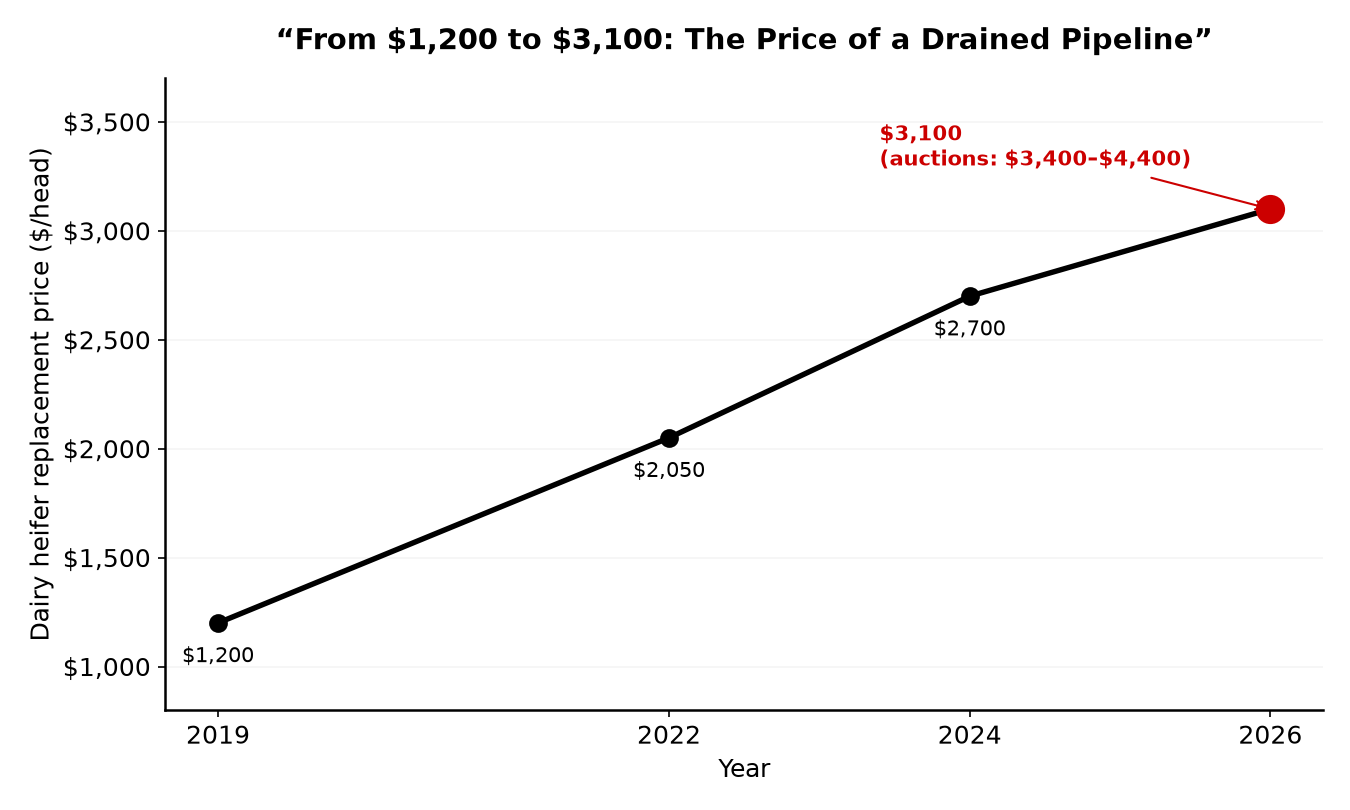
Price is where the agreement is tightest. CoBank’s own model puts dairy heifer replacement prices above $3,000 per head this year, driven by the ratio of dairy heifers expected to calve falling to 26.1% of the cow herd — down from above 30% as recently as 2022. And those USDA figures run conservative next to the auction barn: top-quality replacements cleared $3,400 to $4,400 in Minnesota and Wisconsin markets this spring. CoBank traces the whole arc — replacements ran $1,200 a head in 2019, when dairy heifers were worth more in a feedlot than a dairy barn, which is exactly what kicked off the beef-semen-on-dairy movement in the first place.
So the disagreement isn’t about today. It’s about what 360,200 head actually buys you.
Is CoBank’s “Rebuild” Big Enough to Move Your Replacement Costs?
Short answer: barely. Here’s the arithmetic, and you can map it to your own barn.
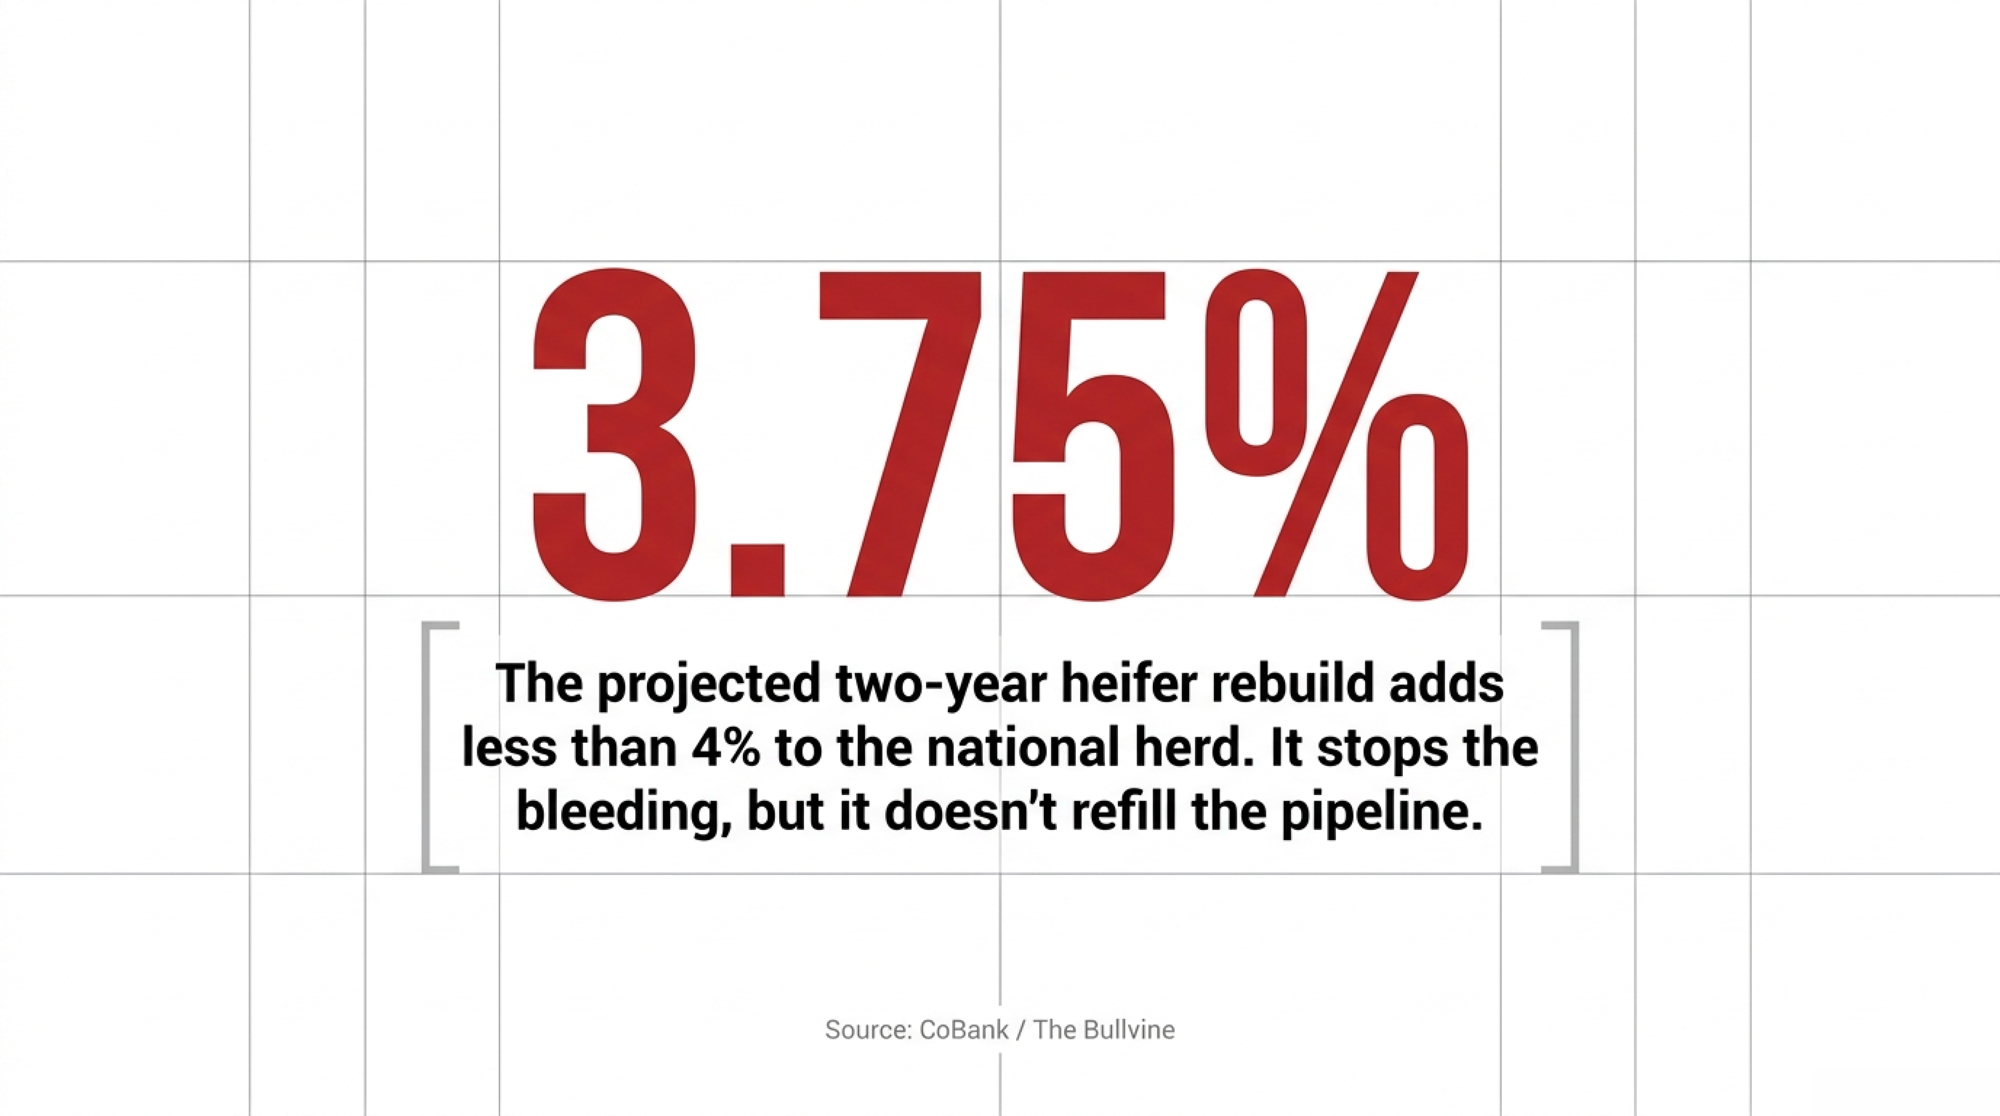
360,200 head ÷ 9.6 million cows = 3.75%. That’s the rebuild — two years of heifers entering the herd, measured against today’s 9.6-million-cow milking base. Now set it against the hole. The industry drained 796,000 replacements over 2025–2026. So the recovery gives back, over two years, less than half of what got pulled out in the prior two. You lost ground roughly twice as fast as you’re projected to win it back.
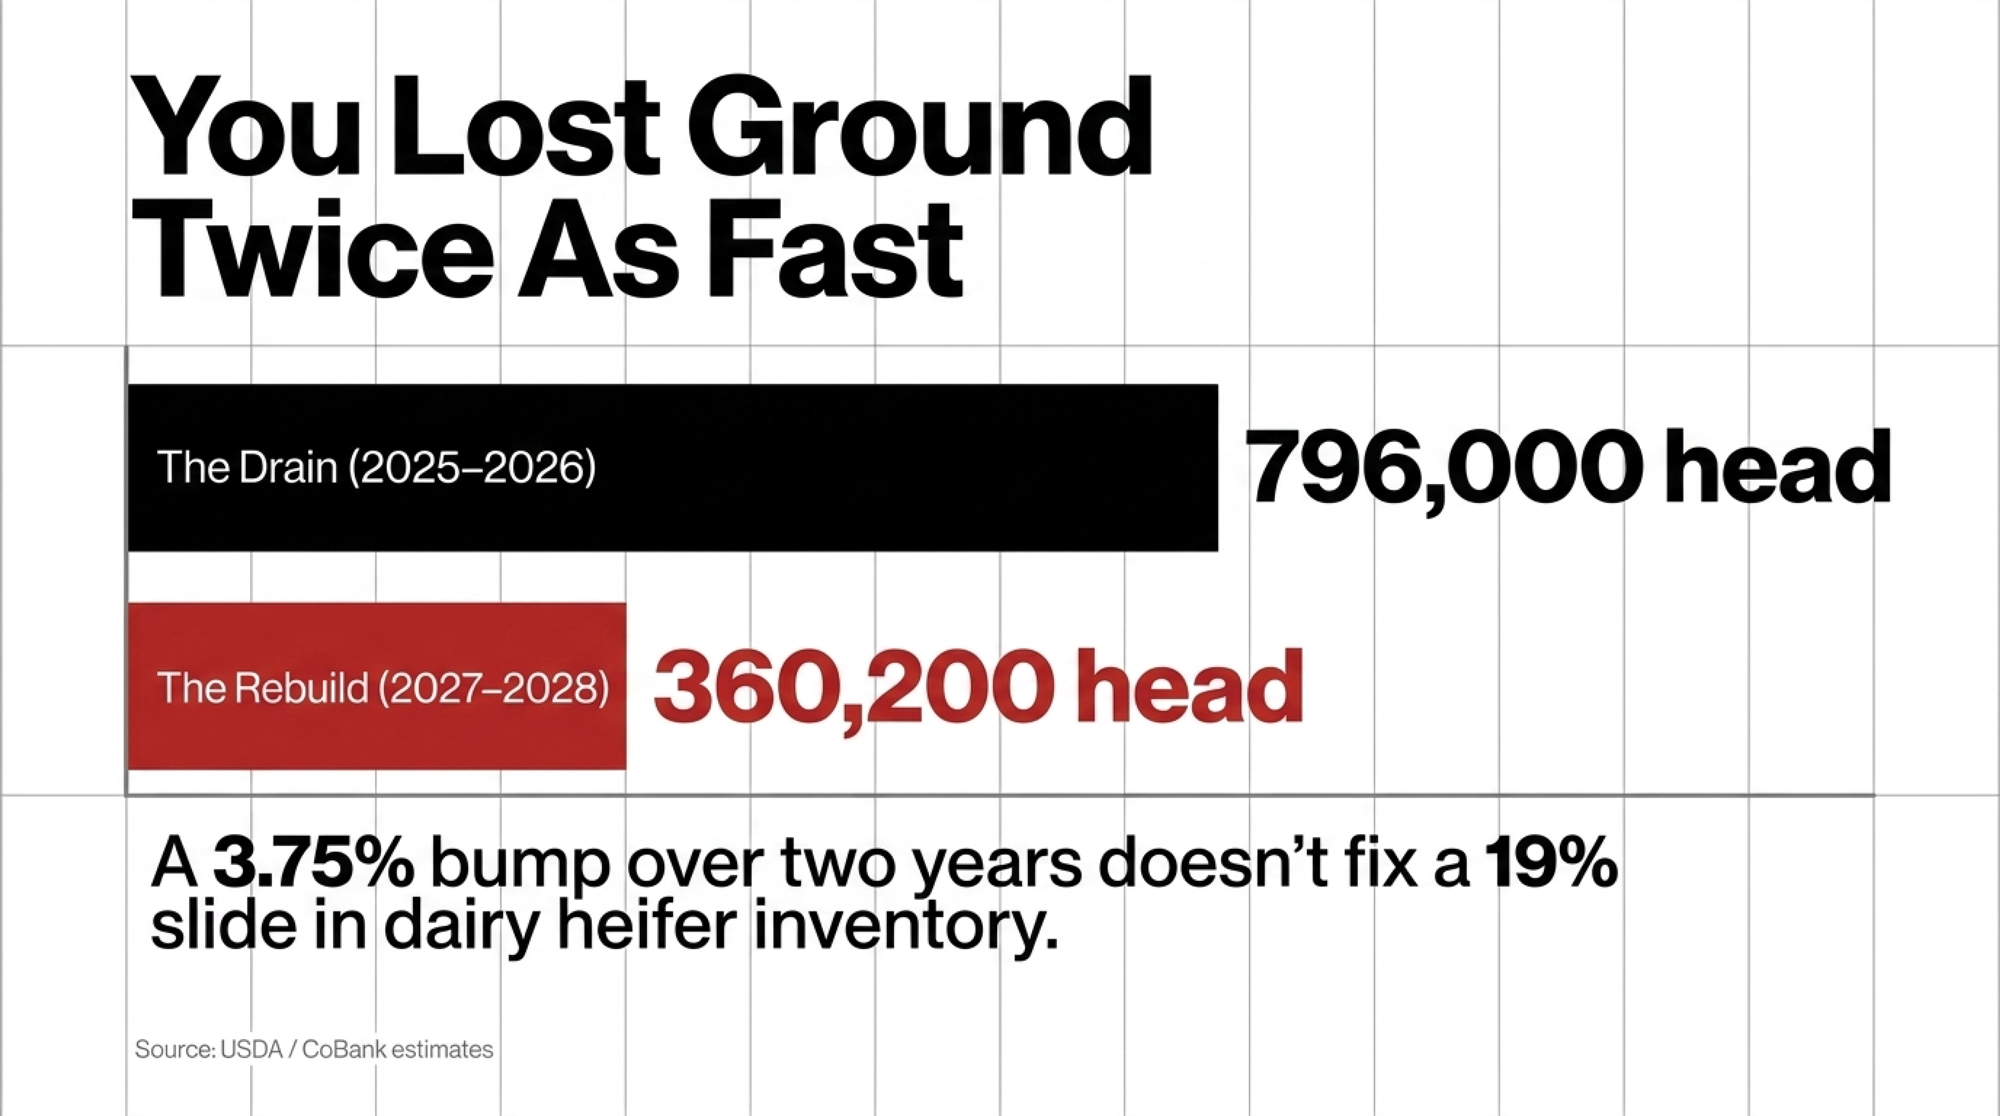
Zoom out, and it’s worse. CoBank pegs the inventory of dairy heifers 500 pounds and over as down 909,400 head — a 19% drop from 2016 to 2026. A 3.75% bump doesn’t undo a 19% slide. It dents it.
The BPI dial tells the same story. Plug CoBank’s 2028 assumptions into the national-average inputs, and the Index moves from 43.4 to 48.7 — a 5.3-point lift that never leaves the Yellow Zone. No scenario reaches Green. Here’s how the paths shake out:
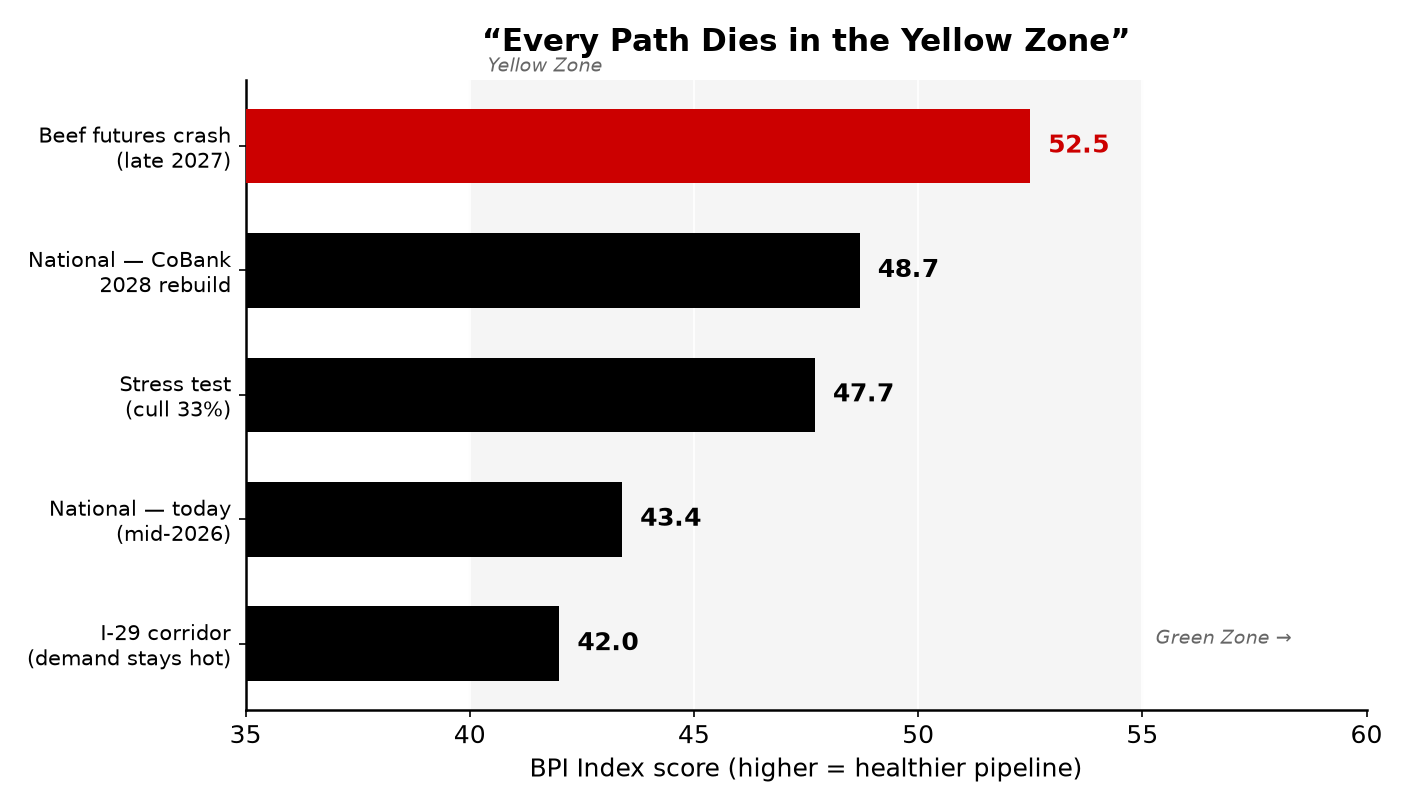
| Scenario | Heifer ratio | Cull % | Heifer cost | Sexed % | BoD % | BPI | Zone |
| National — today (mid-2026) | 0.42 | 29% | $3,100 | 52% | 31% | 43.4 | Yellow |
| National — CoBank 2028 rebuild | 0.45 | 32% | $2,800 | 55% | 32% | 48.7 | Yellow |
| Stress test — cull rate 33% | 0.45 | 33% | $2,800 | 55% | 32% | 47.7 | Yellow |
| I-29 corridor — demand stays hot | 0.45 | 32% | $3,200 | 55% | 32% | 42.0 | Yellow |
| Beef futures crash by late 2027 | 0.45 | 34% | $2,600 | 58% | 22% | 52.5 | Yellow |
The BPI is built around four levers, in order of weight: heifer supply carries the most, followed by culling pressure, then the price signal, then semen-mix momentum.
Here’s the part that should change how you read CoBank’s report. The rebuild is a quantity forecast — more heifers. But the price signal still moves the composite, and CoBank doesn’t forecast heifer prices at all. If demand stays hot in the processing-investment zones and prices hold near $3,100 instead of softening to the $2,800 CoBank’s math implies, the Index barely twitches — that’s the I-29 row sitting at 42.0. More water in the tank doesn’t help if the demand side keeps the price of that water high.
What Happens to the Math If Your Cull Rate Snaps Back?
This is the operational trap, and it’s already in motion. From August 2023 through August 2025, U.S. dairy farmers collectively retained more than 600,000 cows by sending fewer to slaughter — the pullback that pushed the national herd past 9.6 million head. Those retained cows are exactly what’s been holding the milking herd at a 30-year high.
But the drain is reopening. CoBank notes cull cow slaughter has risen in 35 of the last 38 weeks from mid-September through mid-June 2026 — a net 83,100 more dairy cows sent to slaughter, even if that’s still well off the 2022–2024 pace. Run it through the Index: take CoBank’s rebuilt 2028 heifer supply, then move the cull rate from today’s 29% retention mode back toward a more historical 33%, and the BPI drops a full point — 48.7 to 47.7. You’re filling the bathtub while someone reopens the drain. On your farm, the math runs the same direction, so want a faster read on where you sit?
Check your replacement-to-cull ratio with the RC Snapshot to see whether your heifer pipeline is short, tight, balanced, or long.
The Wild Card CoBank Doesn’t Model: Beef
The most interesting line in that table isn’t the rebuild. It’s the bottom row.
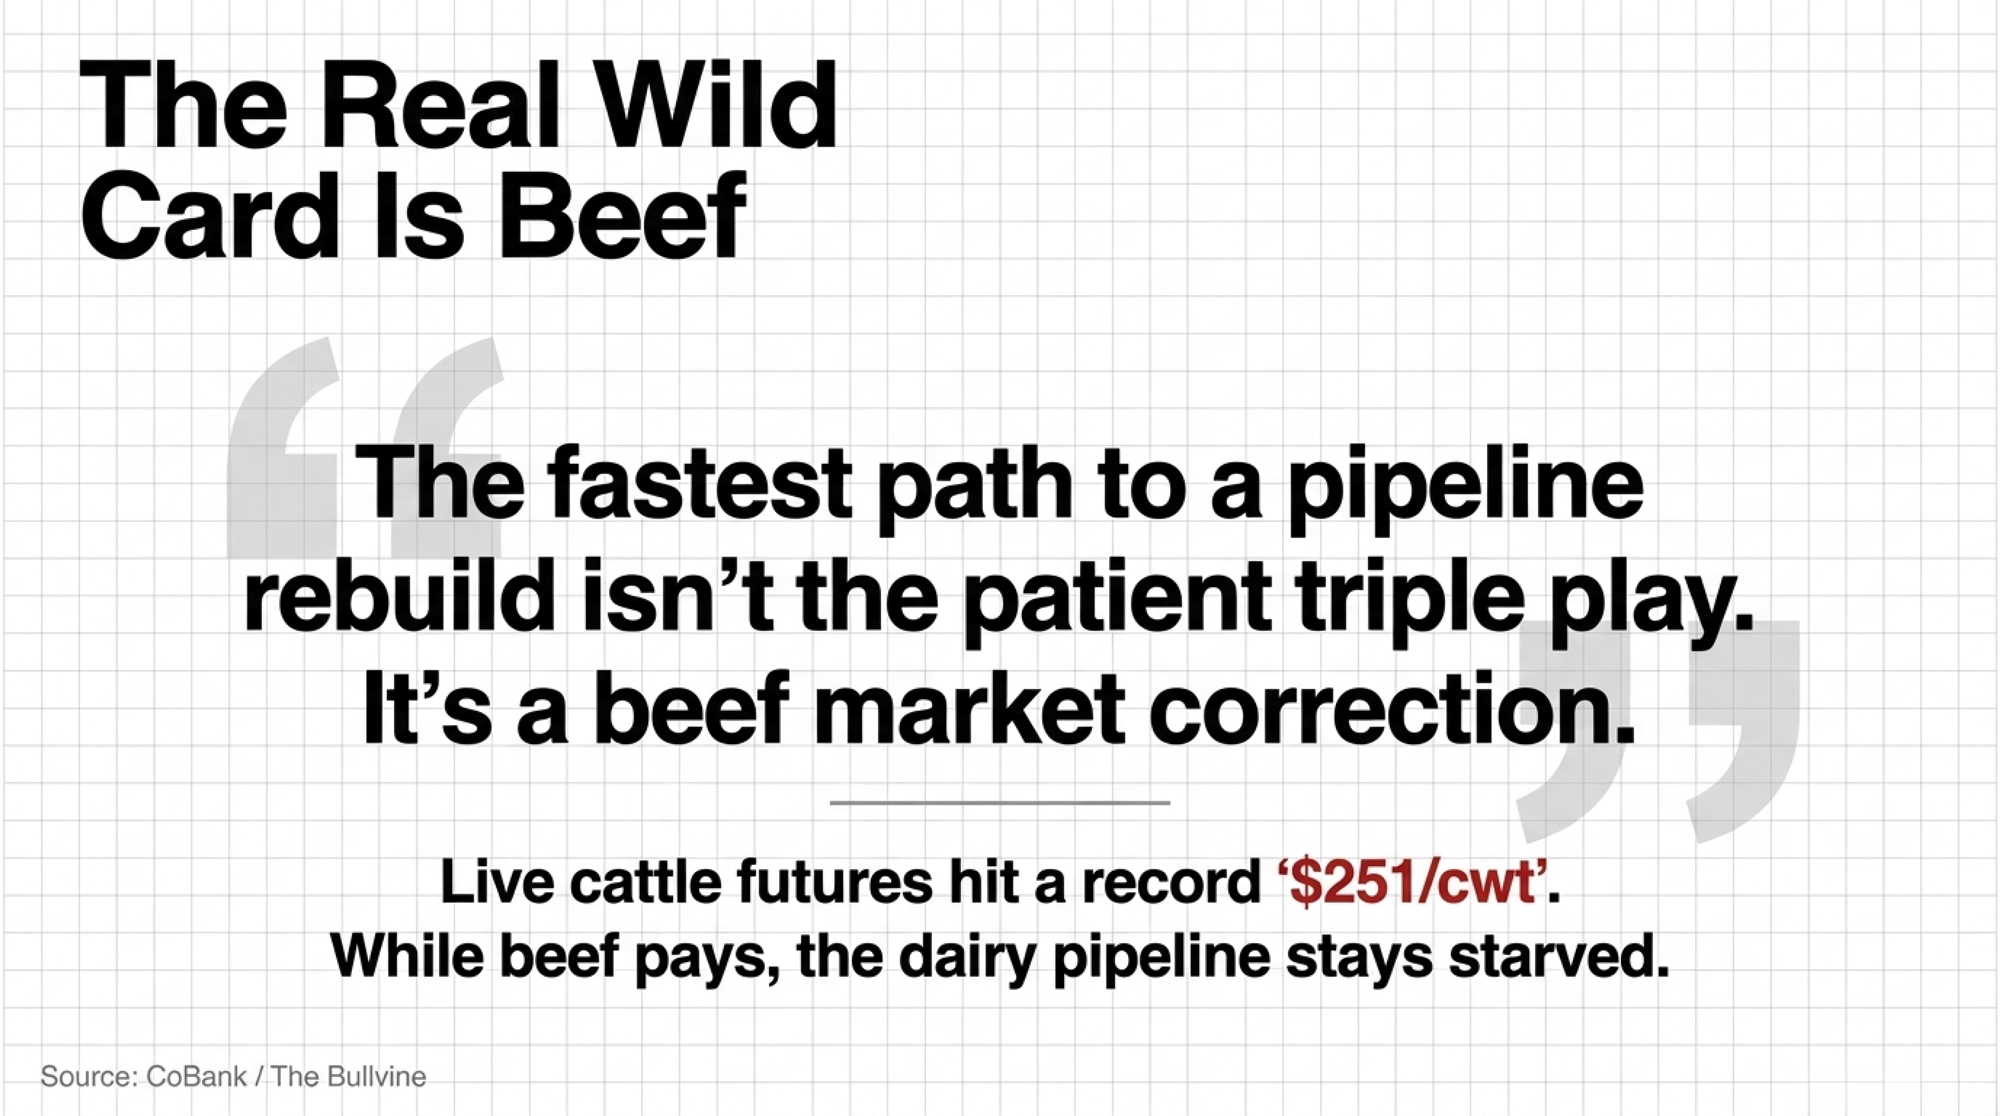
Live cattle futures hit a record $251 per cwt in May 2026, riding the smallest U.S. beef cattle herd in 75 years. As long as beef pays like that, dairy farmers keep beef-breeding the bottom of the herd — and the replacement pipeline stays starved. The beef check is now driving margins more than the milk check on many operations: five years ago, calf and cull sales accounted for about 5% of the dairy’s bottom line; today, they run 12–15%, with some operations near 20% on a per-hundredweight basis. No surprise the U.S. dairy herd has grown by 254,000 head since January 2025.
| Metric | 5 years ago (~2021) | Today (mid-2026) | What it signals |
| Calf + cull share of dairy bottom line | ~5% | 12–15% (up to 20%) | Beef now rivals milk as the margin driver |
| Live cattle futures | well below record | $251/cwt (record, May 2026) | Peak incentive to beef-breed the bottom |
| U.S. beef cattle herd | larger | smallest in 75 years | No relief on cattle prices coming |
| Beef heifers retained for herd growth | — | +1% vs. 2025 | Ranchers aren’t rebuilding — incentive holds |
| U.S. dairy herd vs. Jan 2025 | baseline | +254,000 head | Retained cows, not new heifers, fill the gap |
But if beef rolls over before 2027, the whole incentive structure flips. Push beef-on-dairy down from 31% to 22% of matings, let sexed dairy climb to 58%, and the BPI jumps to 52.5 — the highest of any scenario here. Sit with that. The fastest path to a pipeline rebuild isn’t the patient triple play. It’s a beef market correction that drags farmers back into making dairy replacements.
Now here’s what makes CoBank’s own data so revealing. The beef herd isn’t rebuilding — heifers retained for beef cow replacement are up just 1% from 2025. Ranchers aren’t holding back females to grow the herd, which keeps cattle prices sky-high and keeps the beef-on-dairy incentive locked in. CoBank’s forecast quietly assumes those beef economics hold through 2028, and their own numbers say that’s the likely case, which means the slow rebuild, not the fast one, is the base case. But the report never models the flip side, and that flip is the single biggest swing factor in whether your heifer costs ease in 2028 or stay stuck.
Barn Math: A 400-Cow Midwest Herd
Run the same logic on the Wisconsin operation from the top of the page. It starts ahead of the national average — disciplined breeding, strong calf care — but watch where CoBank’s rebuild leaves it.
- Today: 400 cows, replacement-to-cow ratio 0.70, 60% sexed, 30% cull rate, $3,100 heifer cost, 30% beef-on-dairy → BPI 61.8, Yellow Zone.
- Apply CoBank’s 2028 rebuild: ratio rises 3.75% to about 0.73; heifer cost softens to $2,800; cull rate normalizes to 33%, sexed bumps to 62% → BPI 65.9, Yellow Zone.
Net move: +4.1 points. Zone change: none. Even the well-run herd that started above average doesn’t reach Green by 2028 on CoBank’s numbers. The rebuild is real. It just doesn’t close the gap. The other lever the well-run herd can still pull is sorting — deciding which heifers are worth the two-year carry in the first place.
That’s where the Genomic Testing ROI Calculator earns its keep: it weighs testing cost against avoided poor replacements and beef-on-dairy premiums.
Methodology note: the BPI uses a herd-level replacement-to-cow inventory ratio in the farm example (0.70), which is a different measure than the national heifer-availability ratio in the scenario table (0.42–0.45). The calculator reproduces the published mid-2025 national trough within roughly 3.7 points using national-average inputs; the directional findings hold.
Options and Trade-Offs for Your Operation
Three real paths, depending on where you farm and how you read beef.
If you’re inside the processing-investment corridor — New York, Texas, Wisconsin, Michigan, Idaho, or the I-29 stretch through western Iowa, Minnesota, and South Dakota — processor demand is locking in replacement demand through 2028 and probably past it. Heifer prices in those markets likely won’t soften to CoBank’s implied $2,800, which keeps your local BPI down near 42 even after the national rebuild. What it requires: holding heifers and not selling into the peak. CoBank’s Ben Laine framed the scale of the squeeze plainly at World Dairy Expo last October — “We haven’t seen heifer supplies this tight since 1978.” The risk: the next window to add quality genetics at a sane price may not open until late 2028 at the earliest. Score your herd now so you know which animals are worth holding.
If you’re outside those zones, the rebuild may show up as modest price relief — but later than you’d like, more like 2028 or 2029, and only if culling doesn’t normalize faster than the pipeline recovers. What it requires: budgeting honestly. Don’t pencil in $3,000 heifers unwinding fast. Treat $2,600–$2,800 as the optimistic case, not the base case. The margin for error is thin, and the BPI math says so.
For everyone, beef futures are the variable to watch — and this is the 30-day move. Pull up the live cattle board this week and write down your tipping point. With futures at that May 2026 record of $251/cwt and the beef herd showing only a 1% heifer-retention bump, the incentive to beef-breed isn’t fading on its own. But if futures drop 15% or more before the end of Q1 2027, shifting more breeding weight to sexed dairy stops being a nice-to-have and becomes the play — that’s the path to BPI 52.5, the fastest recovery modeled. Decide your number now, while the market’s calm, so you’re not reacting in a panic later.
Key Takeaways
- If you farm in a processing-investment zone, don’t plan around softening heifer prices. Your local pipeline likely stays below BPI 45 through 2028 — hold heifers and score your herd this month.
- If your cull rate sits near 29% because you’re retaining cows, know that normalizing to 33% costs you roughly a full BPI point of recovery. Make that call deliberately, not by drift.
- If live cattle futures fall 15%+ from $251/cwt before Q1 2027, accelerate sexed-dairy matings. That single shift moves the pipeline faster than CoBank’s entire patient-rebuild scenario.
- If beef-heifer retention stays near +1%, plan for the slow rebuild, not the fast one. The cattle herd isn’t growing, so the beef-on-dairy incentive holds — and so does your replacement cost.
- If you’re budgeting replacements for 2027–2028, use $2,600–$2,800 as the optimistic case — not the number you bank on.
Where Does Your Pipeline Actually Sit?
CoBank’s biology is right and their timeline is probably right. But a 5.3-point BPI gain that keeps the national replacement pipeline in the Yellow Zone for another two-plus years isn’t a rebuild. It’s the end of the freefall — and honestly, that’s worth something. The freefall was the scary part.
So where does your barn land on that dial right now — green, yellow, or already flashing red? Run your herd through the BPI Index Calculator before you finalize a single 2027 breeding decision, because the national average is a story about everyone and nobody in particular.
If you want the backstory on how the pipeline got drained in the first place, the 800,000-Heifer Crisis pillar walks through the whole unwind. And for the full model behind these scenarios — the lever weights, the price-sensitivity curves, the regional adjustments — that’s where Bullvine Weekly digs in. Subscribe, and we’ll send the deeper math the week it drops.
Learn More
- NAAB’s $327.6 Million Semen Boom vs. $3,000 Heifers: The Beef-on-Dairy Math That Can Cost Your Herd $108,000 a Year — Delivers an operational stress-test checklist showing how pushing beef-on-dairy past 50% can trigger a quiet 36-heifer shortfall, costing your business $108,000 annually to purchase replacements.
- 211,000 More Dairy Cows. Bleeding Margins. The 2026 Math That Won’t Wait. — Exposes the strategic, long-term breakdown in traditional culling math where short-term $1,300 crossbred calf revenue traps low-margin, low-component cows in stalls that should be empty.
- $3,150 vs $30,000: The Whole‑Herd Genotyping Math on a 300‑Cow Herd — Demonstrates how a four-figure investment in data precision recaptures $30,000 to $45,000 in lost margin by replacing coin-flip parent averages with 70% genomic reliability on your breeding sheet.
 The Sunday Read Dairy Professionals Don’t Skip.
 The Sunday Read Dairy Professionals Don’t Skip.
Every week, thousands of producers, breeders, and industry insiders open Bullvine Weekly for genetics insights, market shifts, and profit strategies they won’t find anywhere else. One email. Five minutes. Smarter decisions all week.
