Archive for farm data ownership

$43 a Test, $160M for the Lab: Why Select Sires and ABS Are Quiet on the GeneSeek Close

One $43 test, one $160 million lab acquisition, and one Danone preferred-provider letter — and the cooperative system 75 years of dairy farmers built has months, not years, to answer for itself.

The next time URUS, ABS Global, Genex/CRI, ST Genetics, or your Select Sires / Semex -affiliated co-op holds a district meeting on your calendar, look at the slide deck the regional manager hands out. Then ask, out loud, in front of your neighbors: “What’s our plan for the GeneSeek close?”

If the room goes quiet, you already have your answer. The publicly announced 2026 dairy genetics stack — Clarifide Plus at $43 a head, the $160 million Zoetis–Neogen lab deal, Danone’s Partner for Growth letter naming Zoetis as preferred testing provider — is reshaping every AI cooperative’s negotiating position through 2030. As of May 1, 2026, none of the major cooperatives most exposed to that shift has published a strategy response.

Your seat at that table. Your kids’ equity in the co-op. The genotyping pipeline three generations of member-owners built. All of it is being decided right now, in rooms where the question hasn’t been asked out loud yet.

This article is built on published program terms, public corporate filings, CDCB evaluation data, NAAB’s 2025 year-end report, USDA NASS Milk Production data, and a peer-reviewed 2025 Journal of Dairy Science study.

What Zoetis Built While the Cooperatives Were Quiet

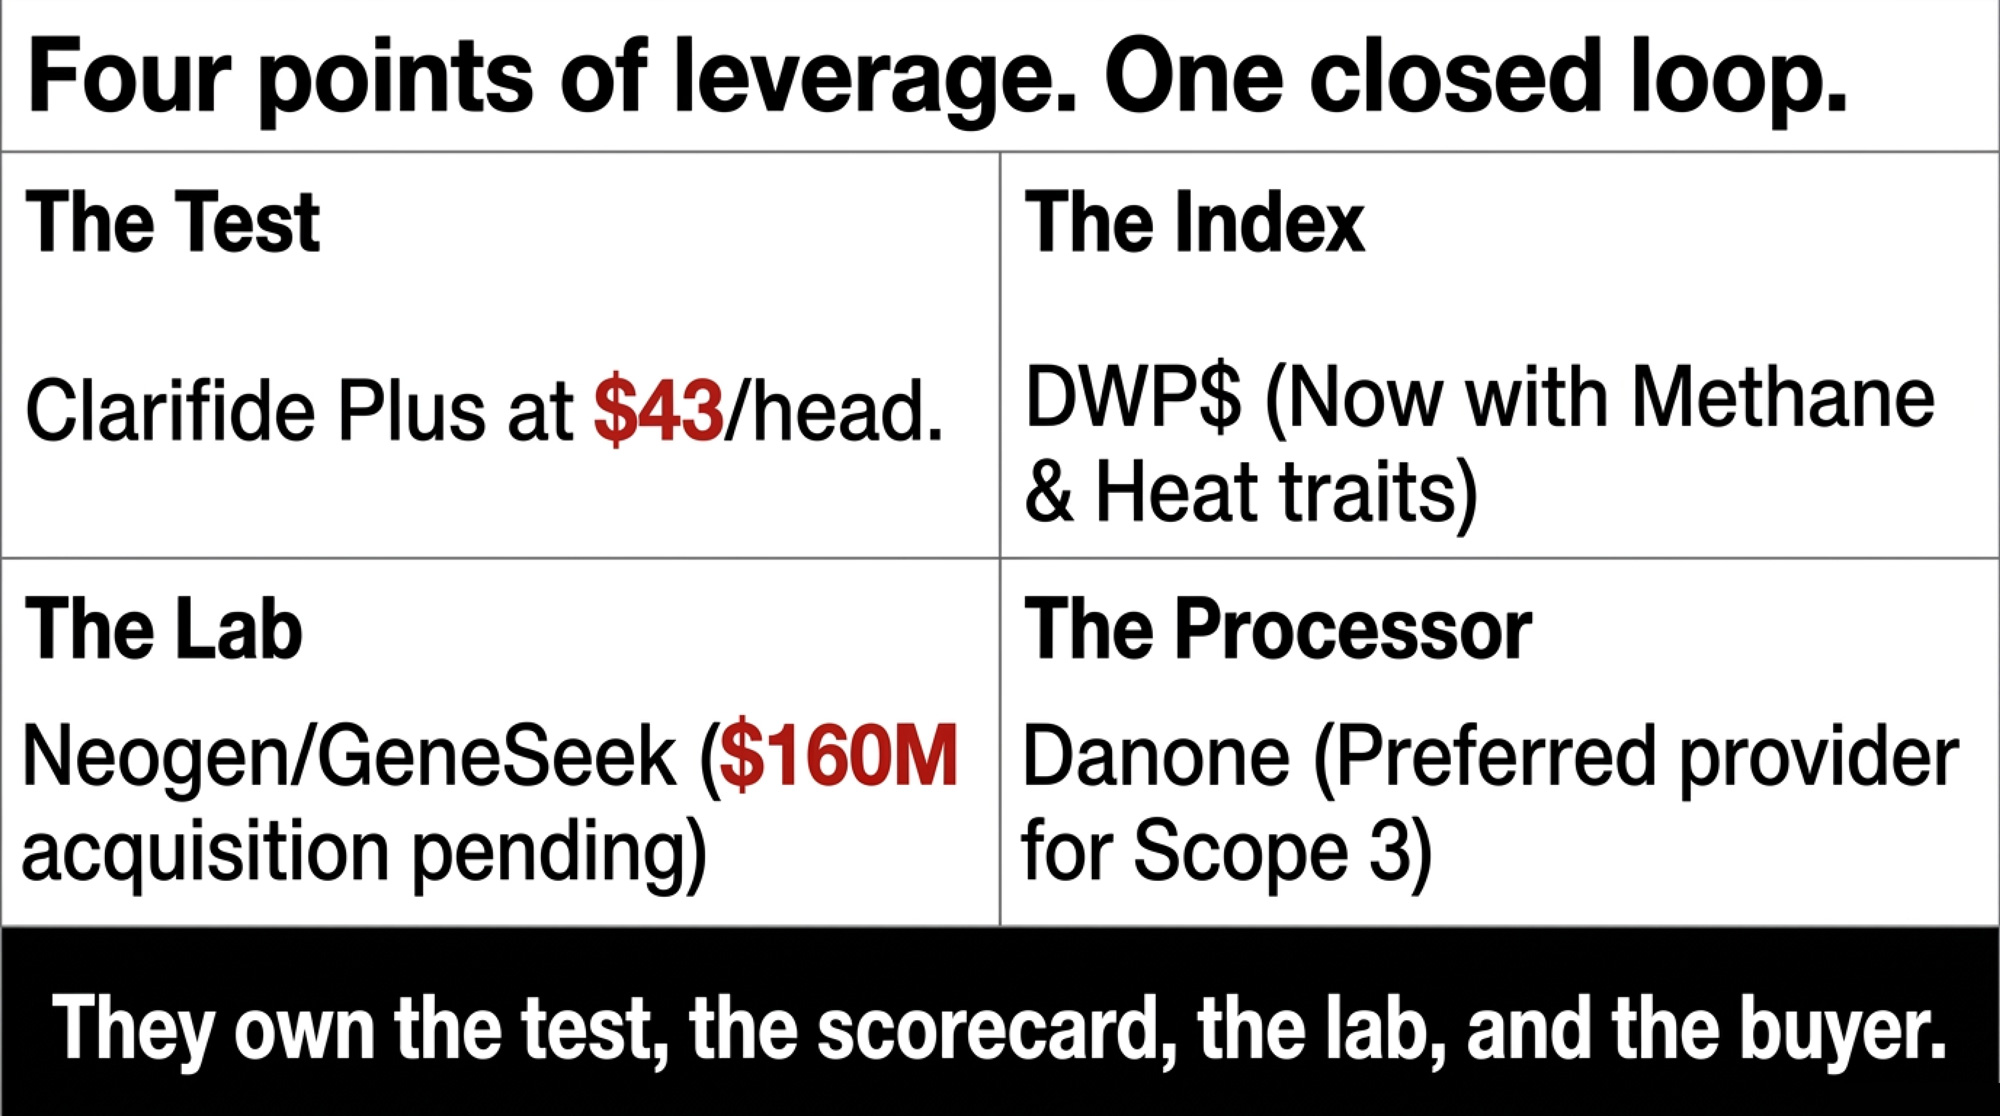
Zoetis doesn’t sell a single straw of semen. But it now sits at four points of leverage in the U.S. dairy genetics chain, and each one was announced publicly, in plain sight.

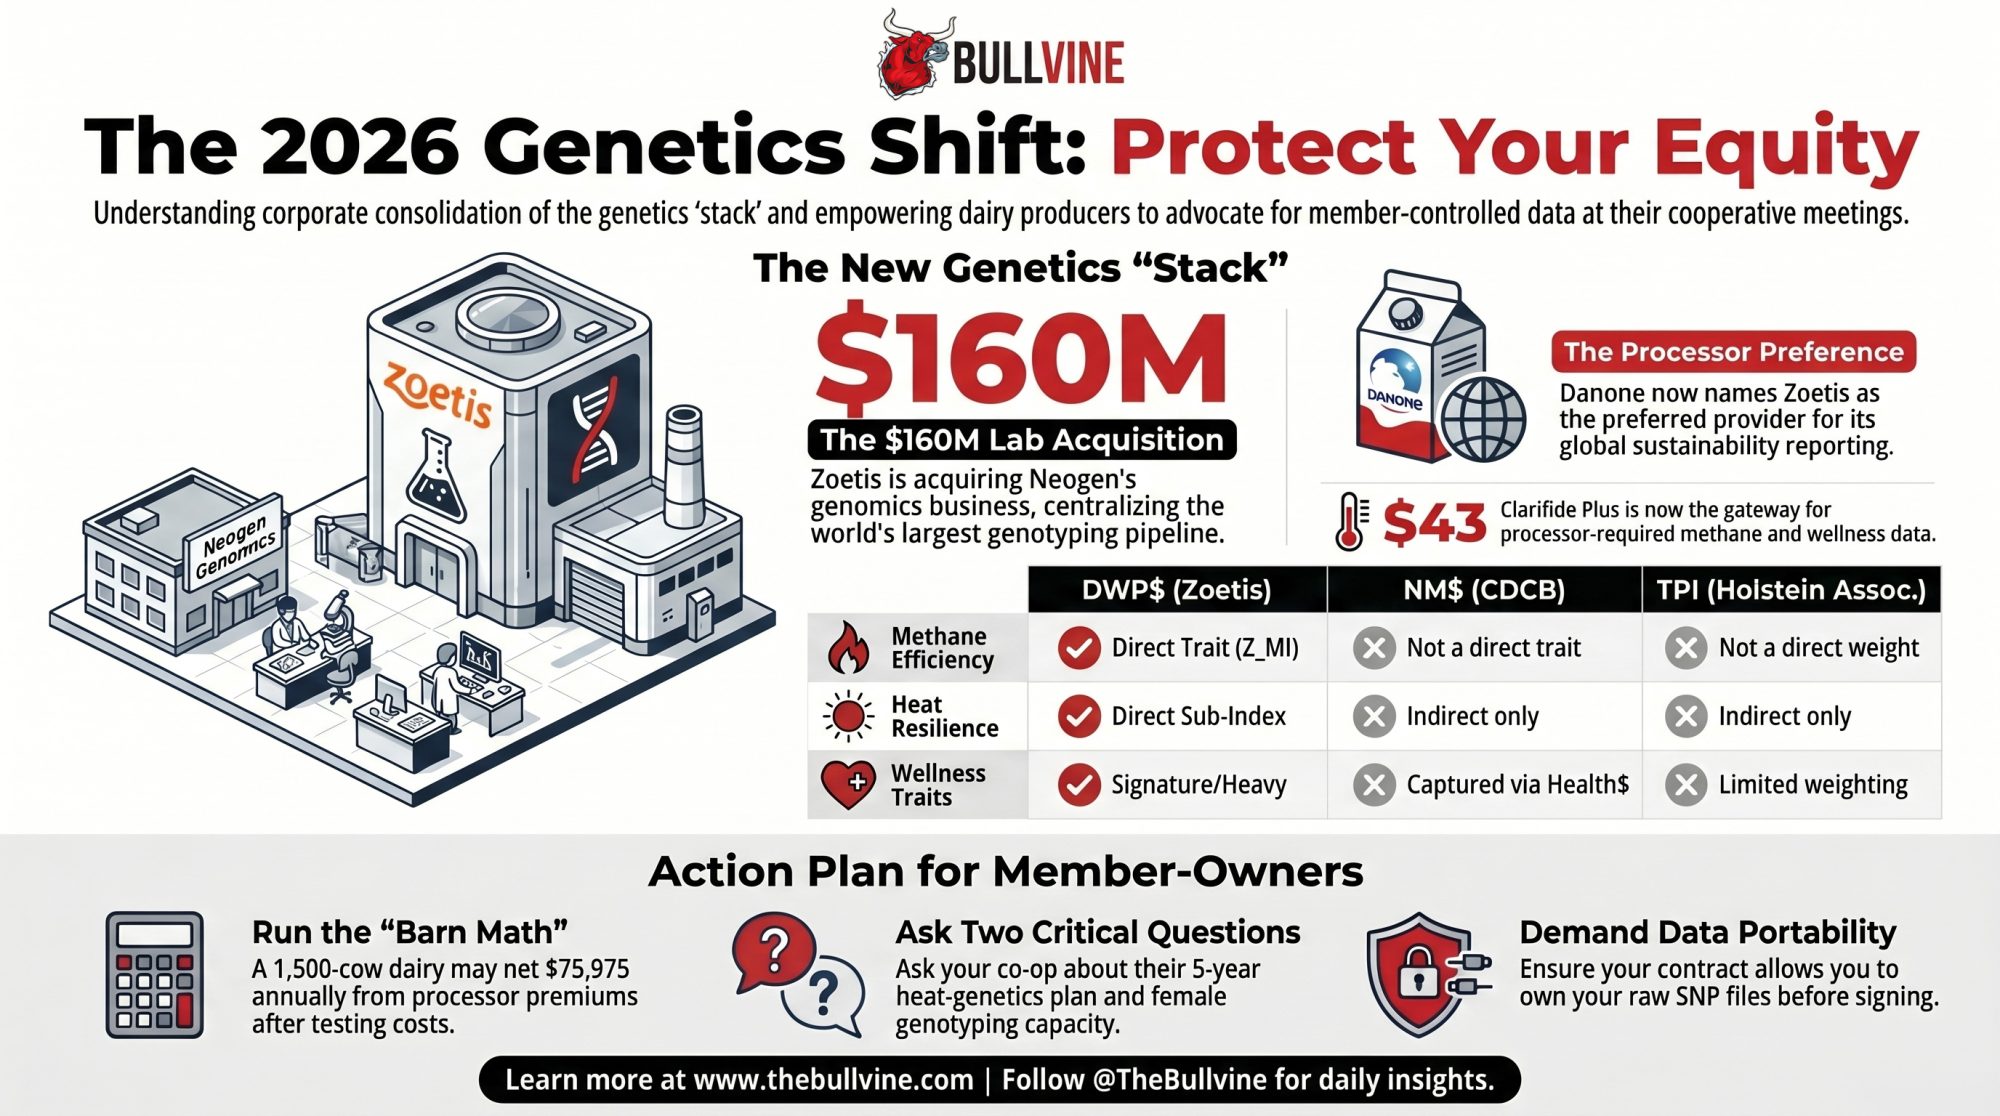
The test. Clarifide Plus runs $43 per Holstein head at Holstein Association USA’s published member rate, accessed May 1, 2026.¹ It’s already among the most widely used genomic tests in U.S. dairy.

The index. Zoetis owns DWP$, the Dairy Wellness Profit index. In April 2026, the company added Milk Methane Intensity (Z_MI) and a new sub-index called DWP$ Heat — built for herds experiencing heat stress 20% or more of the year, roughly 73 days. That’s Florida, Texas, Arizona, the southern San Joaquin, and increasingly the lower Midwest in late summer. For the back-story on how the index was assembled and what’s actually inside it, see our deeper piece on how Zoetis built the DWP$ index.

The lab. In March 2026, Zoetis announced it would acquire Neogen’s animal genomics business — including GeneSeek’s Igenity and GGP portfolios — for 0 million, subject to customary closing adjustments. That business runs roughly $90 million in annual genomics revenue, operates labs across the U.S., Brazil, Australia, China, and the U.K., and serves customers in more than 120 countries. Close is expected in the second half of 2026, pending regulatory approval.

The processor. Zoetis is the preferred genetic testing provider for Danone’s global Partner for Growth program, with DWP$ as the selection index. The two later expanded that partnership to scale testing across Danone’s supplier base for sustainability reporting — methane intensity, nitrogen efficiency, the metrics that feed scope 3 disclosures.

A company with no semen catalog is now the preferred testing provider for one of the world’s largest dairy processors, owns the index that ranks bulls inside that program, and is acquiring the lab that genotypes much of the rest of the industry. That’s the stack. On one page.

Leverage pointWhat it isKey figureStatus / trigger date
The testClarifide Plus genomic panel$43 / Holstein headHolstein Assn. USA member rate, May 1, 2026
The indexDWP$ (Dairy Wellness Profit$)Z_MI + DWP$ Heat sub-index addedApril 2026
The labNeogen animal genomics (GeneSeek, Igenity, GGP)$160M acquisition, ~$90M annual revenueClose expected H2 2026, pending regulatory approval
The processorDanone Partner for Growth preferred providerDWP$ as selection indexActive; expanded for scope 3 reporting

What 75 Years of Member-Owners Actually Built

Three generations of dairy farmers pooled capital, semen, risk, and bull power so no single member would have to face the genetics market alone. Genex/CRI. Semex. Select Sires-affiliated co-ops — different banners, same logic. Member-owned, member-governed, member-equity. The genotyping pipeline that feeds every NM$ proof you’ve ever read off a sire summary was built on that infrastructure. What’s at stake in the post-GeneSeek environment isn’t whether your cooperative survives. It’s whether the genotyping data, the female reference population your co-op contributes to, and the negotiating leverage your manager carries into a Danone or Saputo or Schreiber meeting — whether all of that stays member-controlled, or gets routed around inside 18 months. That’s not a Zoetis policy question. It’s a member-governance question. And it’s the one your district director almost certainly hasn’t been asked yet.

To be fair to the boards at the major cooperatives, they’re navigating something the cooperative system wasn’t built for. Corporate entities move at the speed of capital. Cooperatives move at the speed of consensus — that’s a feature, not a bug, and it’s the same governance model that built the negotiating leverage worth protecting in the first place. But in 2026, consensus is a luxury members can no longer afford to wait through quietly. The fairness is real. The clock is also real. Both can be true.

Two Questions to Bring to Your Next District Meeting

This is the action that matters most this month. Open the notes app on your phone. Type these two questions out. Read them aloud in front of the room when the floor opens for member questions:

“What’s our plan — capital commitment, timeline, named sourcing partners — for heat-tolerant genetics over the next five years?”

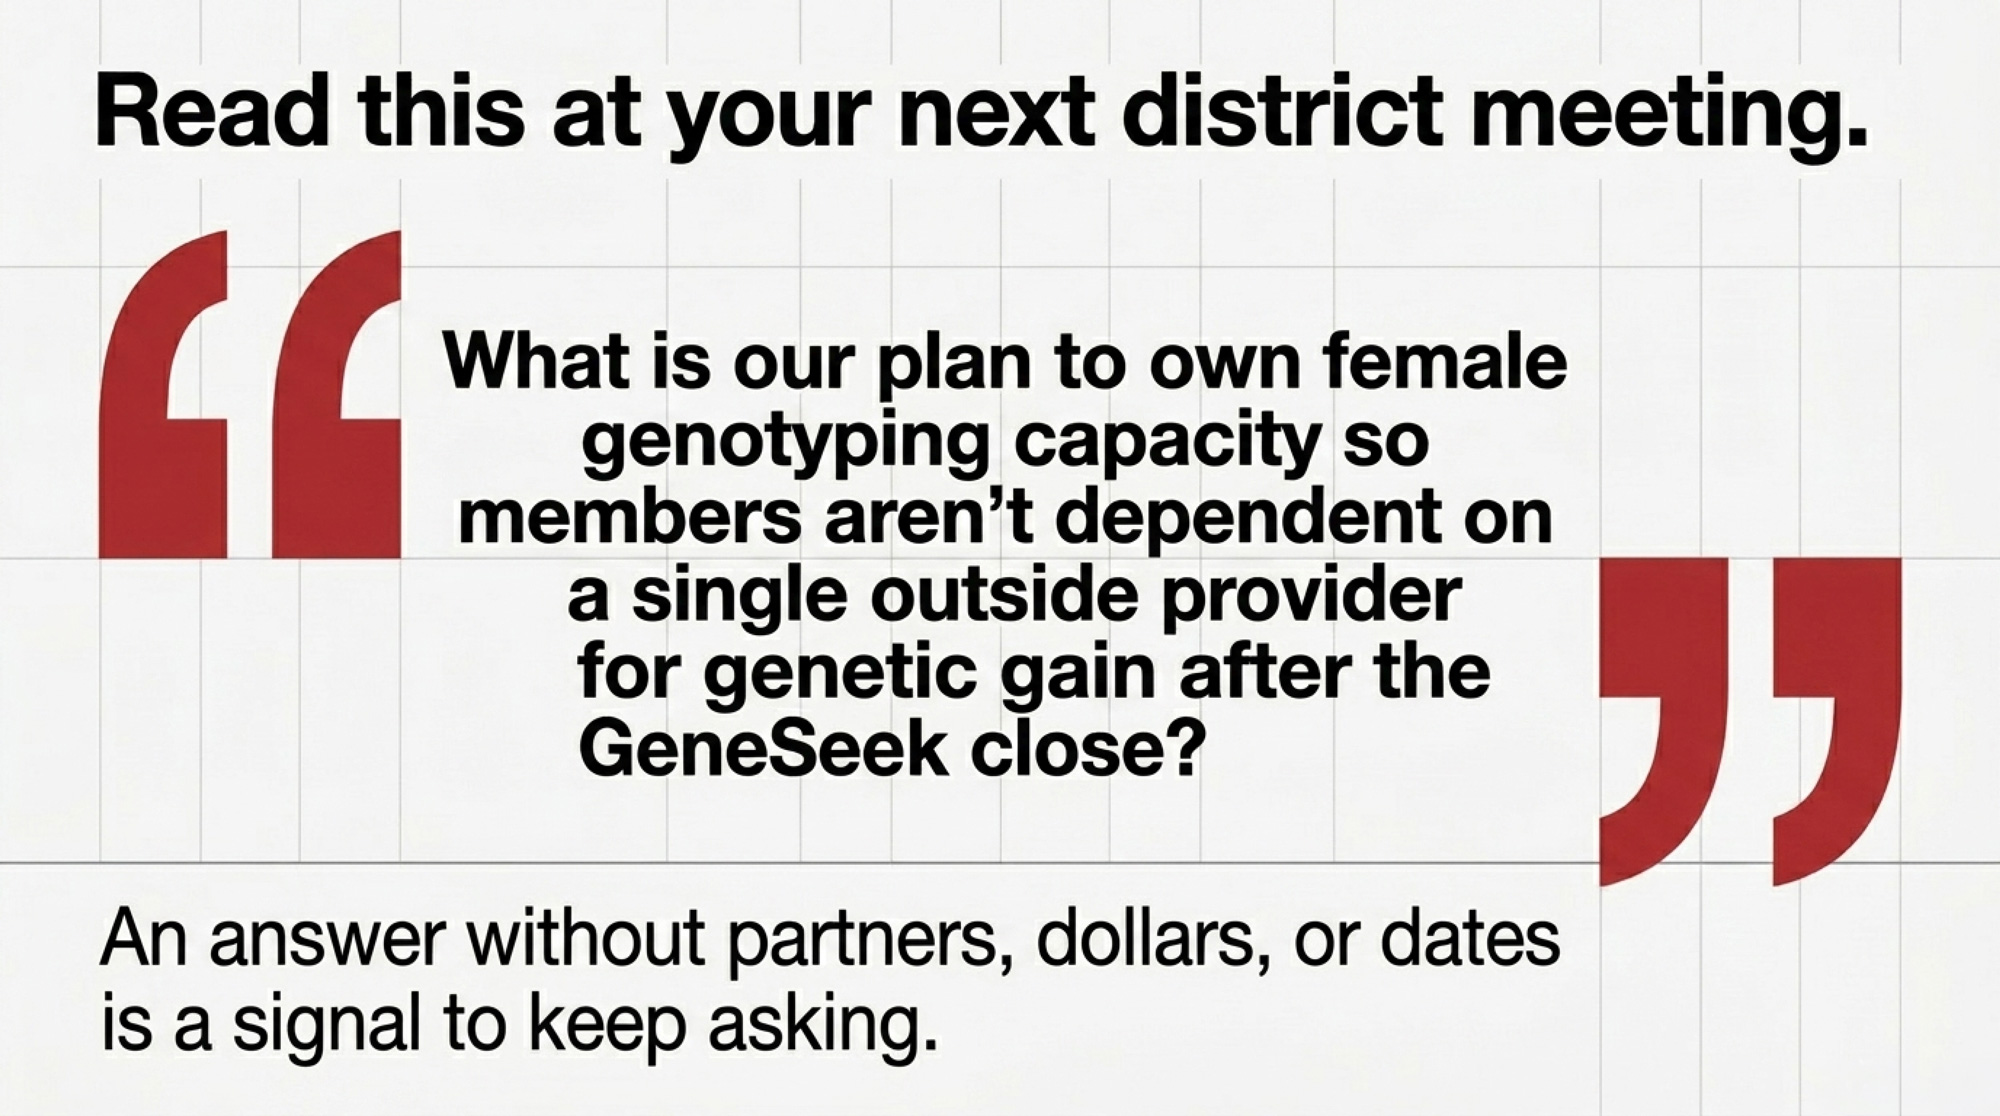
“What’s our plan to own or control female genotyping capacity so members aren’t dependent on a single outside provider for health and fertility genetic gain after the GeneSeek close?”

Write the answer down. Date it. A serious answer names specific partners — Embrapa, Trans Ova, a domestic IVF lab — with dollar commitments and timelines beating 2028. An answer without partners, dollars, or dates is a signal to keep asking. Re-raise in 90 days. Document each round.

Boards move when members raise issues. The question is whether you’re the member raising this one.

What Data Are Processors Actually Building Their Scope 3 Programs Around?

The farms most exposed are mid-to-large commercial dairies supplying Danone and the processors likely to follow.

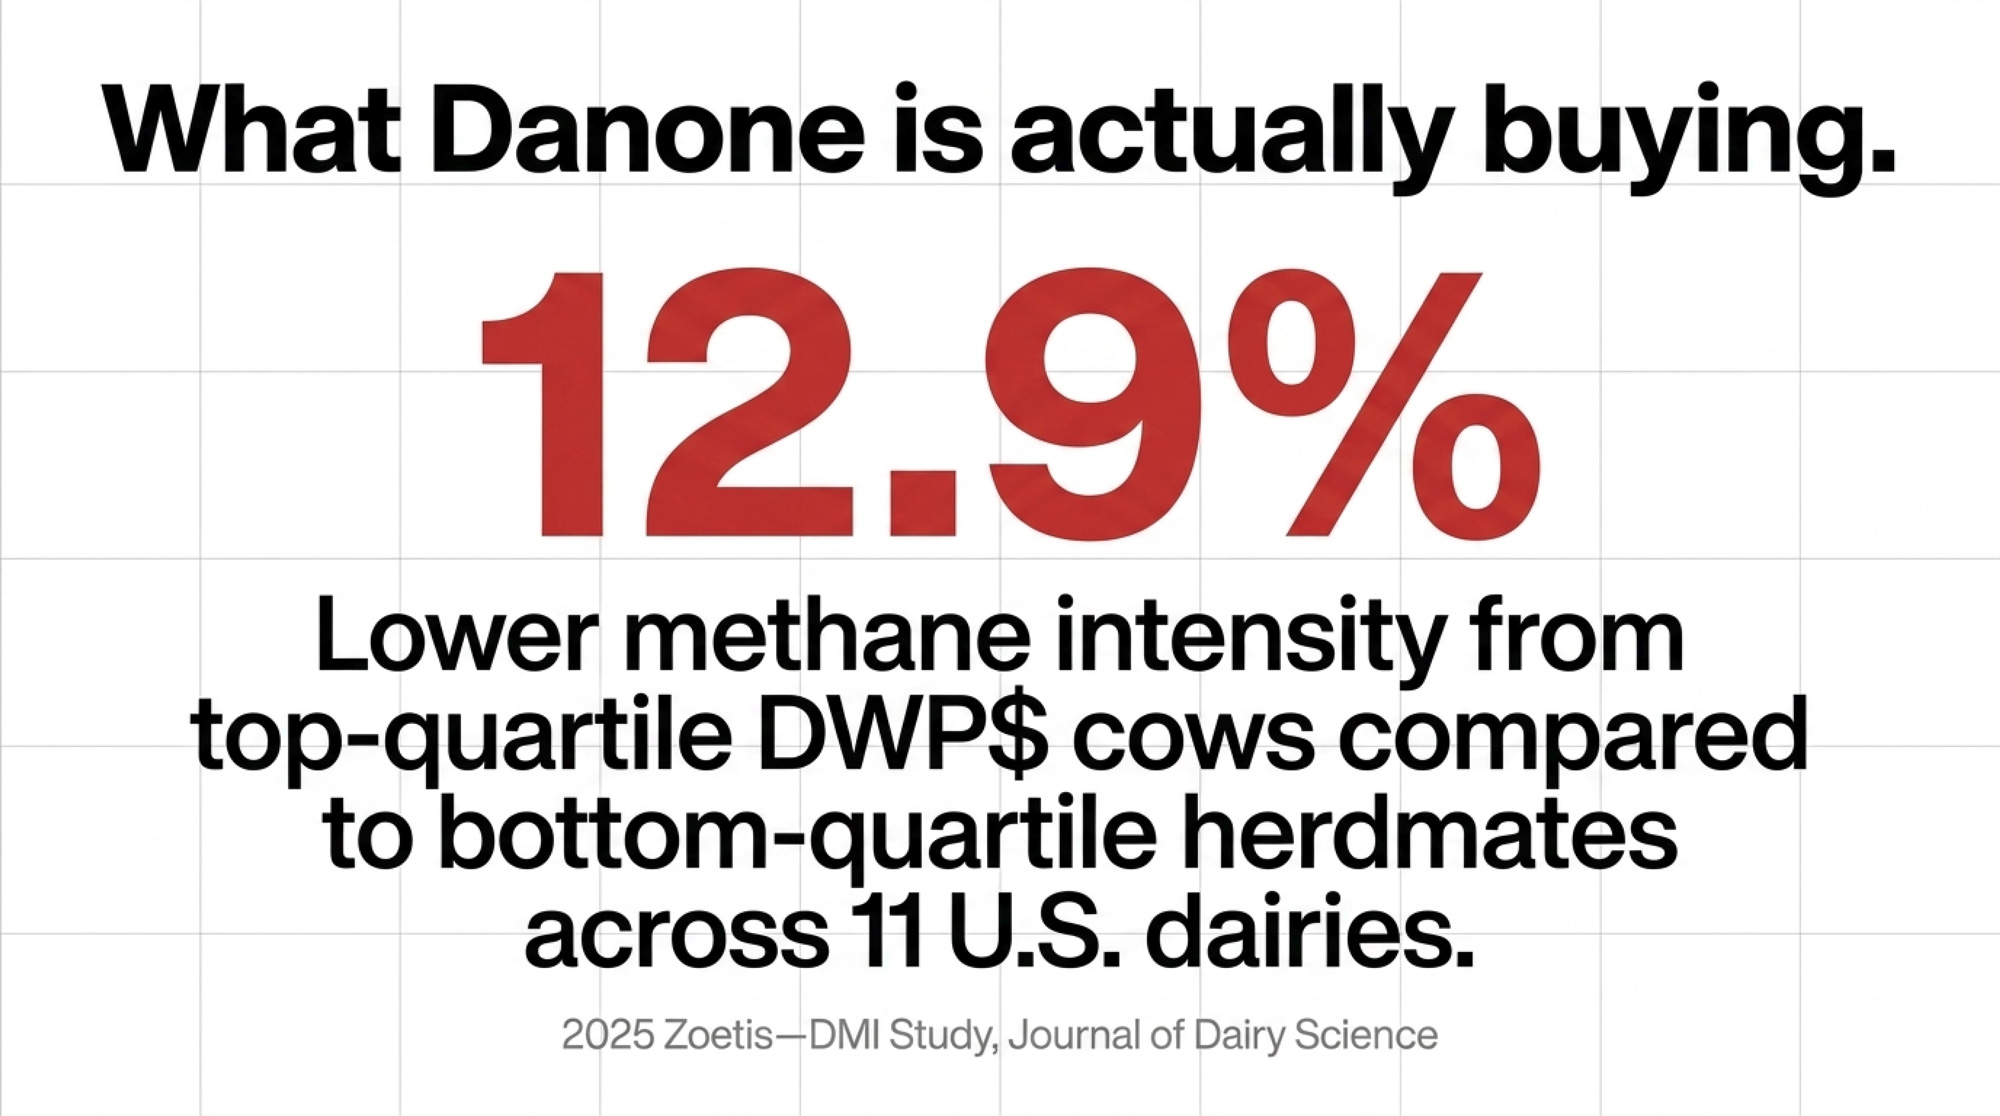
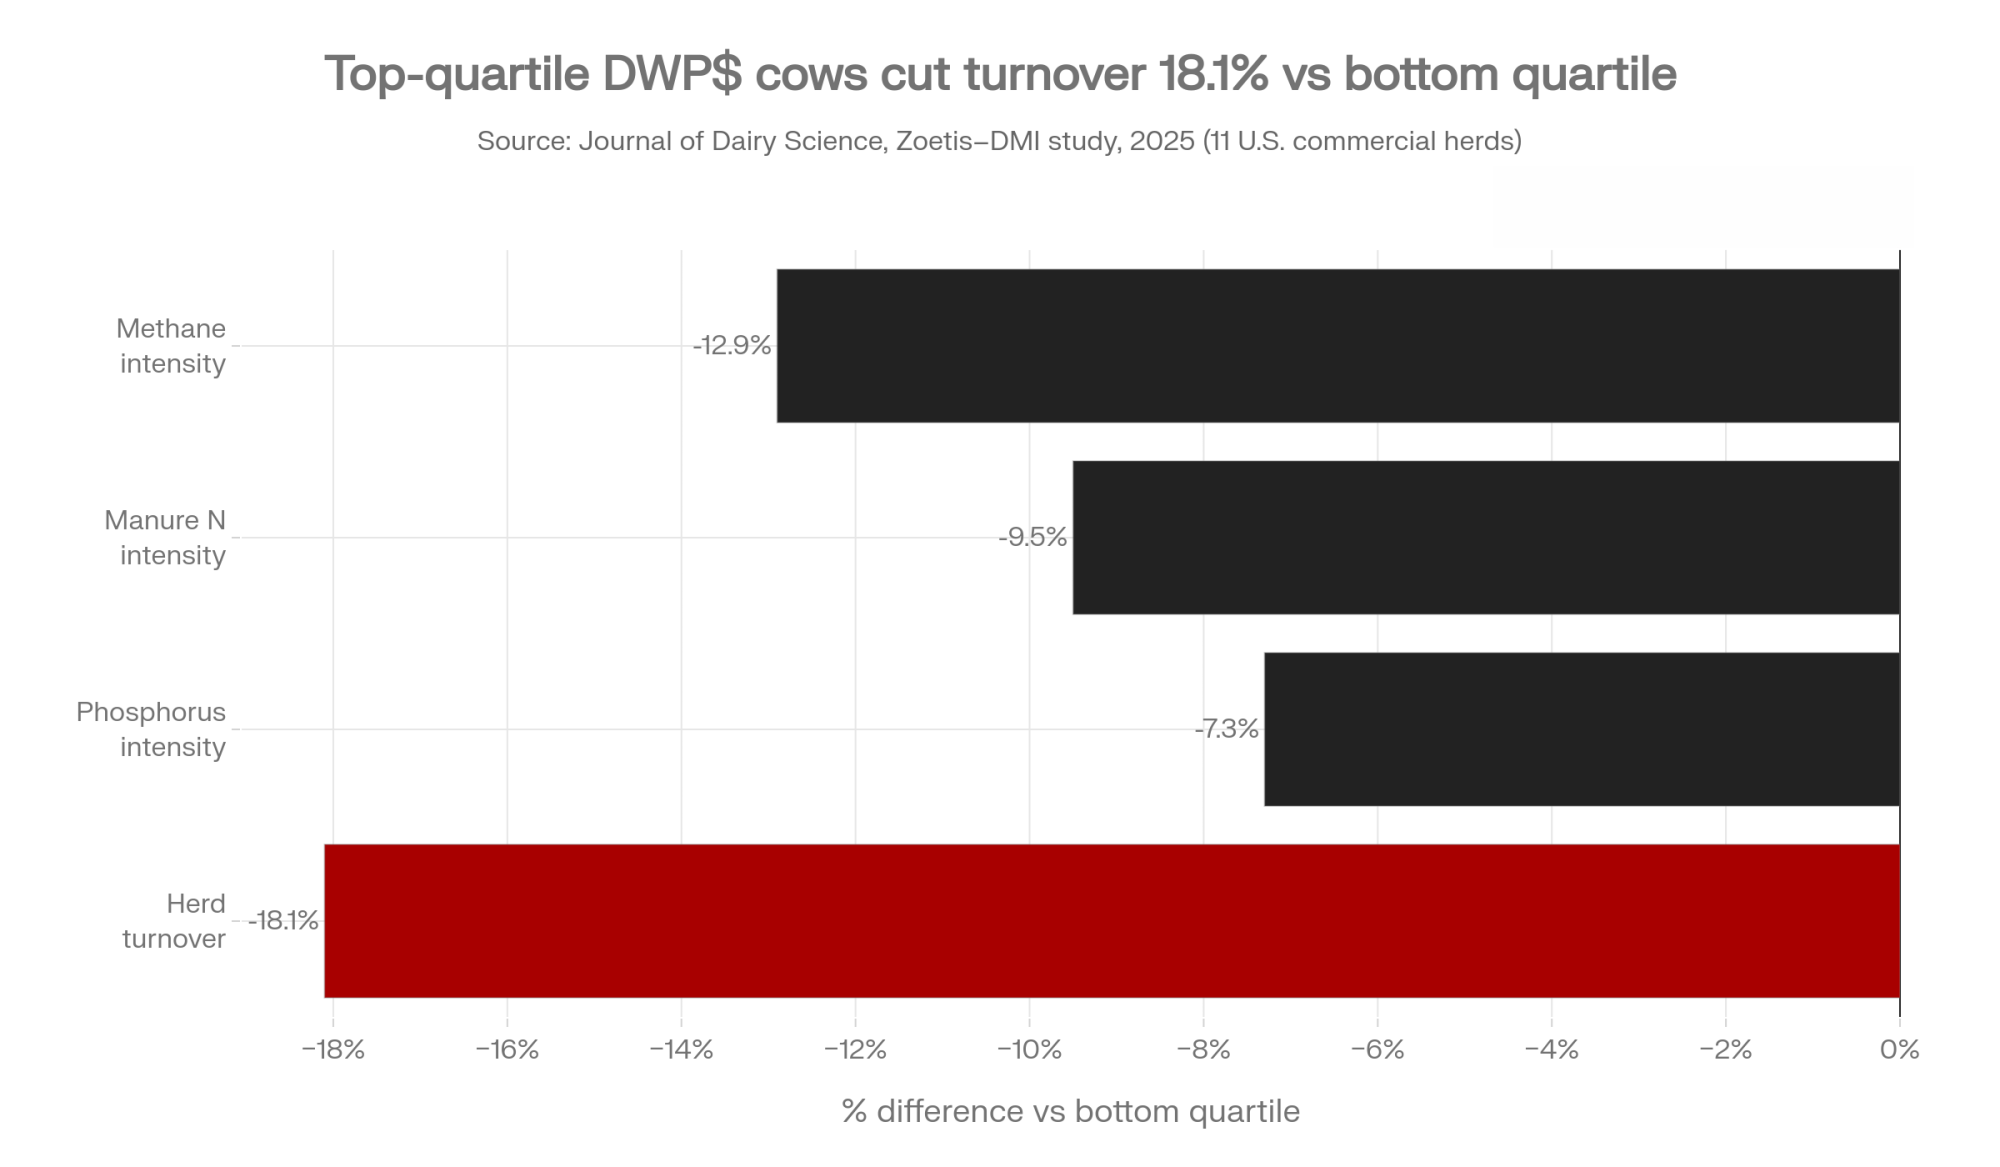
A 2025 Zoetis–Dairy Management Inc. study published in the Journal of Dairy Science — “Reduction of environmental effects through genetic selection” — analyzed cows from the top and bottom DWP$ quartiles across 11 U.S. commercial dairies. Top-quartile cows produced 12.9% lower methane intensity, 9.5% lower manure nitrogen intensity, 7.3% lower phosphorus intensity, and 18.1% lower herd turnover than bottom-quartile herdmates. That’s the dataset processors are now building scope 3 programs around.

Whether your milk check rewards those exact traits is a different question. Whether your cooperative has a counter-proof on the table is a third.

How DWP$, NM$ and TPI Differ on the Traits Processors Now Care About

Trait categoryDWP$ (Zoetis)NM$ (CDCB)TPI (Holstein Assn.)
Methane efficiencyDirect trait (Z_MI), added 2026Not a direct trait in 2025 NM$ revisionNot a direct trait weight
Heat resilienceDirect sub-index (DWP$ Heat), added 2026Indirect (fertility, livability)Indirect (fertility, longevity)
Wellness traitsSignature, heavy weightingCaptured via Health$ subindexLimited direct weighting
Components (fat, protein)Balanced vs wellness/longevitySubstantial weightHeaviest weight historically
Productive LifeStrong weightStrong weightStrong weight
Type / ConformationModest direct weightModest direct weightHeaviest of the three

Direction, not exact percentages. Each index answers a different question. Your milk check decides which one matters most. Your co-op’s catalog depth decides whether you have alternatives.

How Much Is the Processor Premium Really Worth on Your Operation?

Here’s the barn math. Plug your own herd into one of these and see where the net-out lands.

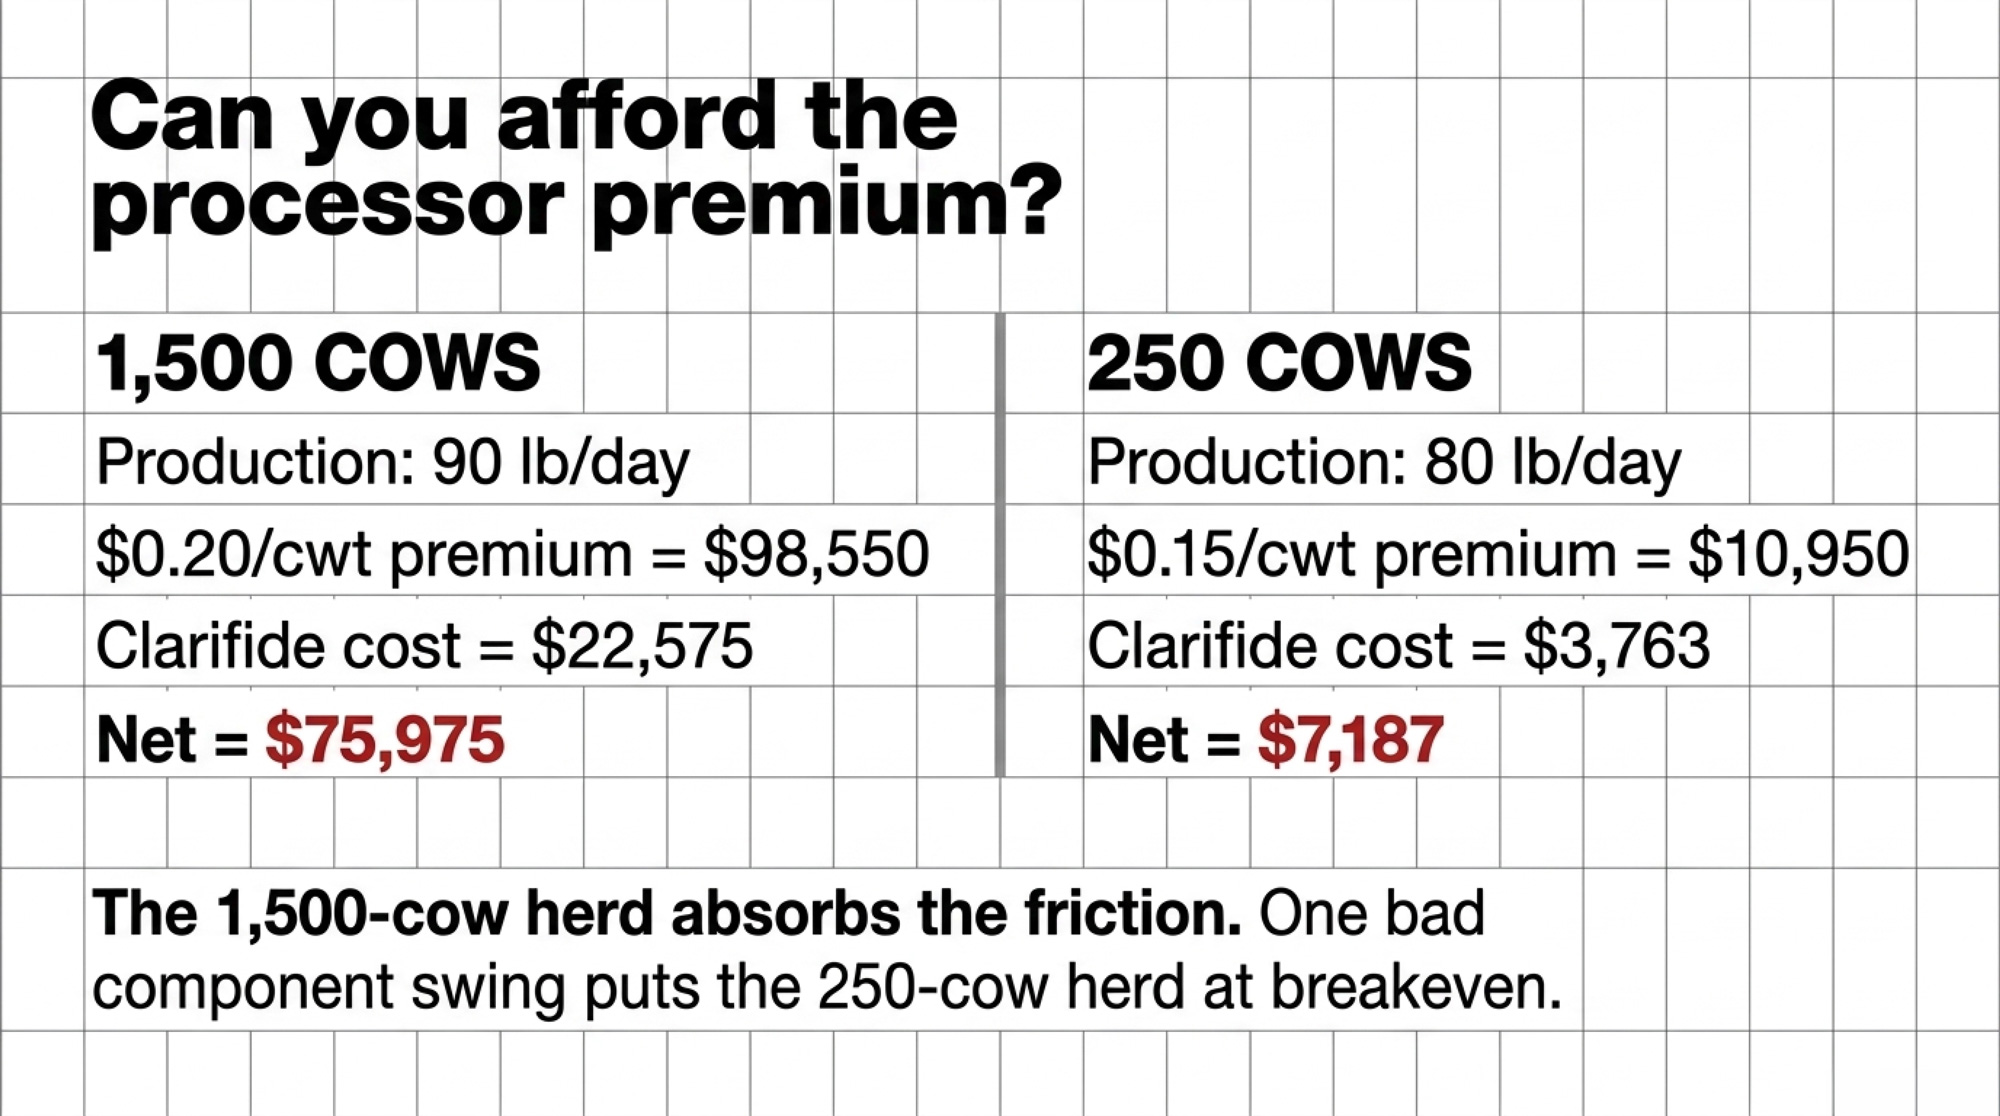
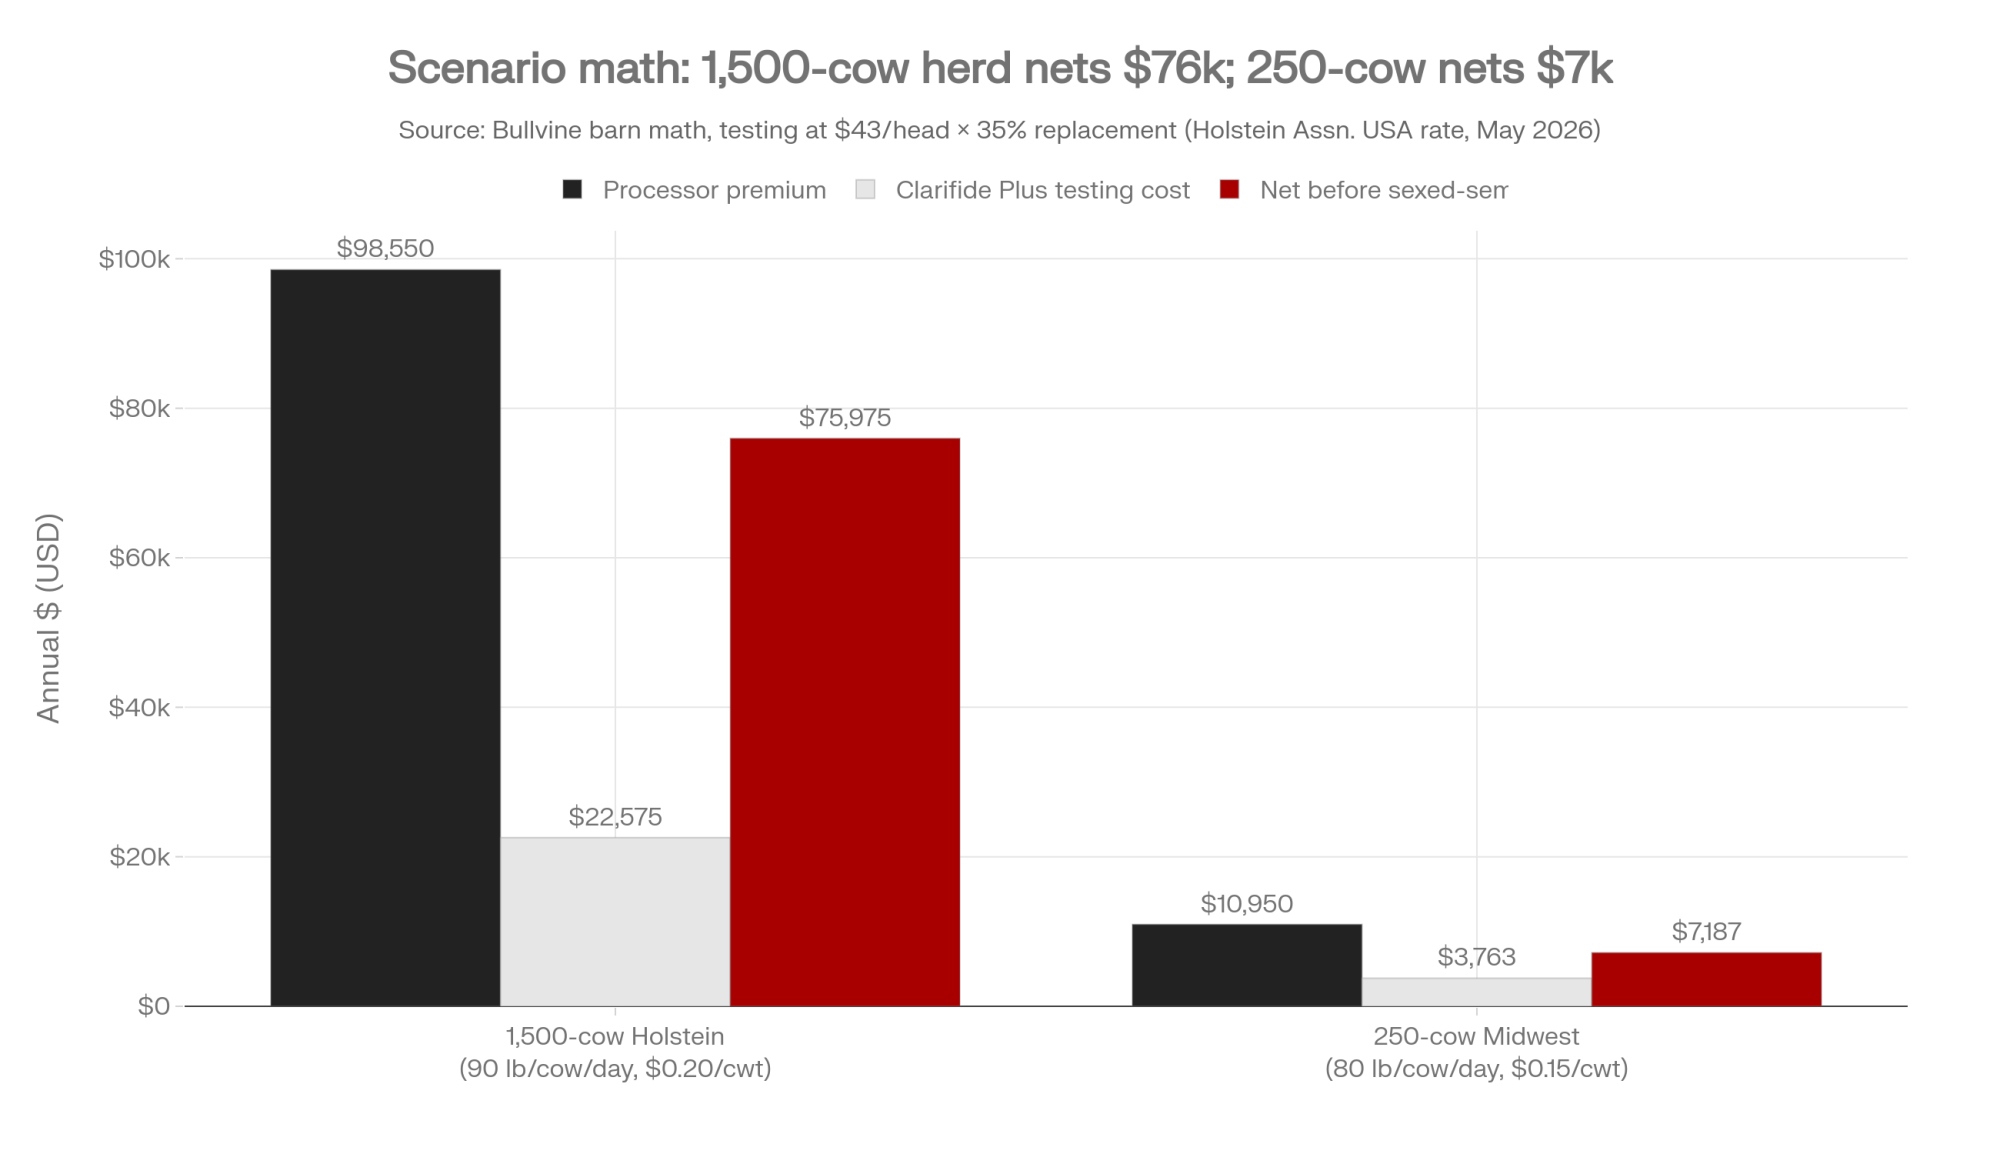
Scenario A — 1,500-cow Holstein operation, 90 lb/cow/day

InputValue
Cows in milk1,500
Daily production per cow90 lb (above the U.S. herd average of ~66–67 lb/day implied by USDA NASS Milk Production, late 2025)²
Total annual production49,275,000 lb = 492,750 cwt
Premium at $0.20/cwt$98,550
Annual Clarifide Plus testing (1,500 × 35% × $43)³~$22,575
Net at $0.20/cwt before sexed-semen differential~$75,975

Scenario B — 250-cow Midwest herd, 80 lb/cow/day

InputValue
Cows in milk250
Daily production per cow80 lb
Total annual production7,300,000 lb = 73,000 cwt
Premium at $0.15/cwt$10,950
Annual Clarifide Plus testing (250 × 35% × $43)³~$3,763
Net at $0.15/cwt before sexed-semen differential~$7,187

These are gross figures. Before the sexed-semen price differential. Before any component-yield drift if your contract pays butterfat and protein harder than DWP$ weights them. Before any year-one Danone signing subsidy.

The 1,500-cow operation has the volume to absorb the friction. The 250-cow operation is one bad component-pay swing from breakeven. If you’re a Wisconsin cheese-milk herd paid hard on components, or a Southern operation whose biggest profit leak is summer fertility — exactly the herds Zoetis is targeting with DWP$ Heat — DWP$ alignment may or may not match how your milk check actually gets built. Run your own math against your own contract before you renew.

Where Will Catalog Pressure Show Up First in Your AI Rep’s Order Sheet?

Indexes improve by consuming data. The one with preferred-provider testing across thousands of farms refines itself faster than one relying on voluntary contributions. Over five to seven years, in our analysis, DWP$ is on track to lead among major U.S. indexes on the traits processors care about — methane, feed efficiency, wellness — because of Zoetis’s vertically integrated testing-plus-index position. The 2025 JDS study is the first peer-reviewed proof point for that thesis.

The compounding runs downstream fast. More processors layer in Clarifide. Studs feel pressure to shift young-sire sampling toward DWP$-ranking bulls. Sampling slots are finite. A slot that doesn’t fit processor demand is a slot unlikely to recover cost.

That’s not Zoetis policy in any direct sense. It’s market dynamics responding to a structural shift. By April 2026, in our analysis of the public NAAB genomic young-sire list, the top tier of genomic Net Merit young bulls in the U.S. showed sharp concentration in a single stud’s NAAB code (methodology available on request). That’s the precedent for what catalog compression looks like when it works through to a published bull list.

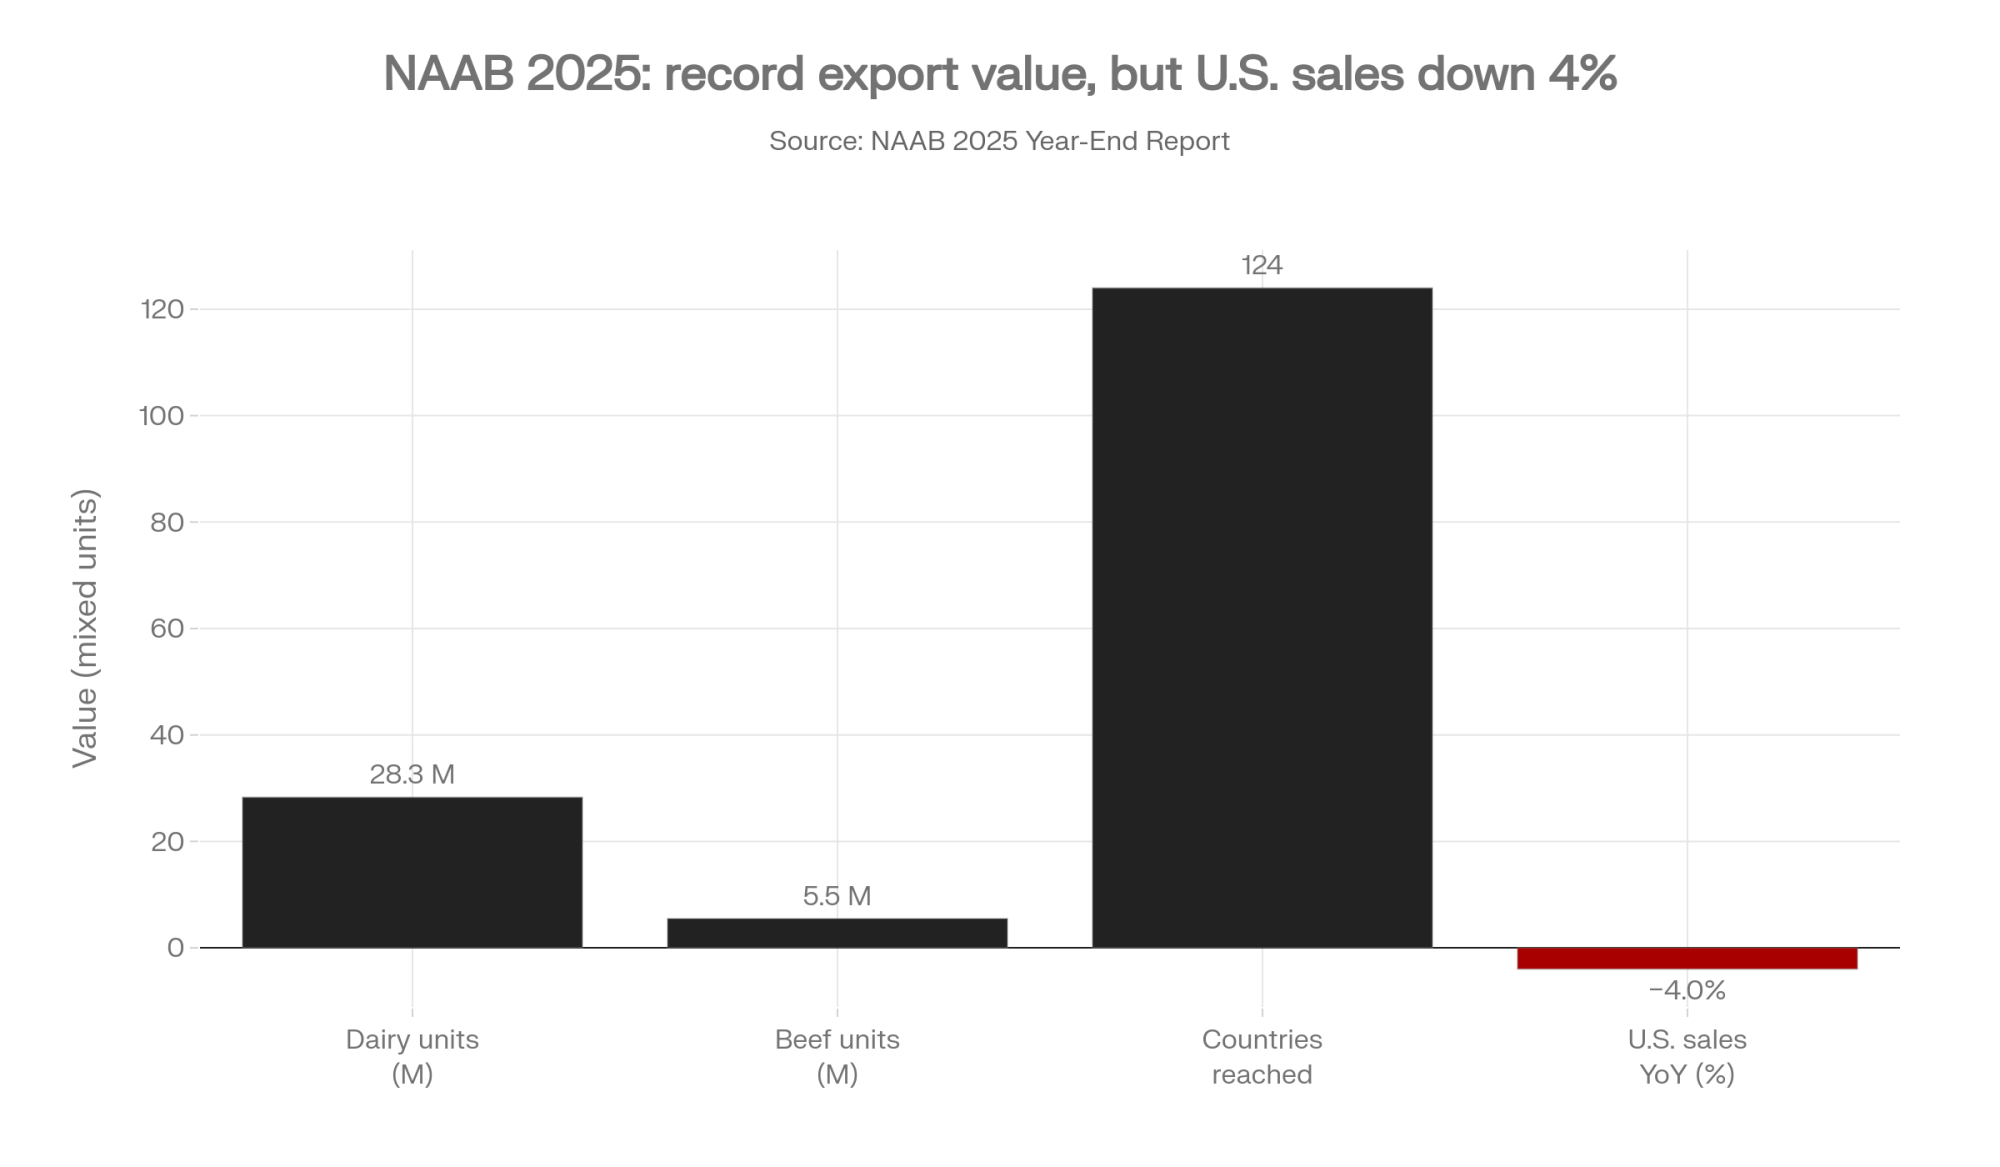
NAAB’s 2025 year-end report shows U.S. bovine semen sales down roughly 4% year-over-year. Export value reached a record $327.6 million even as total export units fell. China exited the U.S. market in early 2025. Dairy units exported settled at 28.3 million; beef exports rose to 5.5 million. U.S. genetics now reach 124 countries, up from 108 the prior year — and a clear majority of all dairy semen produced by NAAB members in 2025 left the country.

The structural pressure to watch is catalog compression outside the flagship top tier. The bulls most exposed in your cooperative’s next two catalogs are the slot 40–80 specialists: outcross health-trait sires, daughter-pregnancy-rate-leading bulls without methane-efficiency rank, show-type longevity sires whose proofs were built around classification rather than wellness data, A2A2-plus-component specialty sires for cheese-milk niches DWP$ doesn’t reward. That’s our read, not NAAB-confirmed sampling-mix data. Your cooperative’s next two catalogs will tell you if it’s right.

Pull slots 40–80 in the next catalog. Count what’s missing.

Options and Trade-Offs

Pick the path that fits how your milk check is built and how much room you’ve still got.

Path 1 — Participate with a parallel scorecard. Stay in Clarifide/DWP$ for processor compliance. Run your own mating logic underneath it, weighted to what your milk check actually pays for. Works when the processor premium is meaningful and your contract pays traits DWP$ underweights. Requires a breeding consultant or software workflow that shows DWP$ and NM$ rankings side by side. The risk: your AI rep’s default view is DWP$-framed. You have to actively ask for the second view every time.

Path 2 — Diversify your testing providers now, while you still can. Before you renew any testing contract, negotiate data-portability terms or split testing between Clarifide and an alternative — Neogen-GeneSeek pre-close, CDCB-based panels, a cooperative-run program. The H2 2026 close narrows the window on pre-close options. The risk: your nutrition software, vet platform, and mating program increasingly default to one data feed. Break one integration and three break with it.

The Switching-Cost Trap — read this before you sign anything.

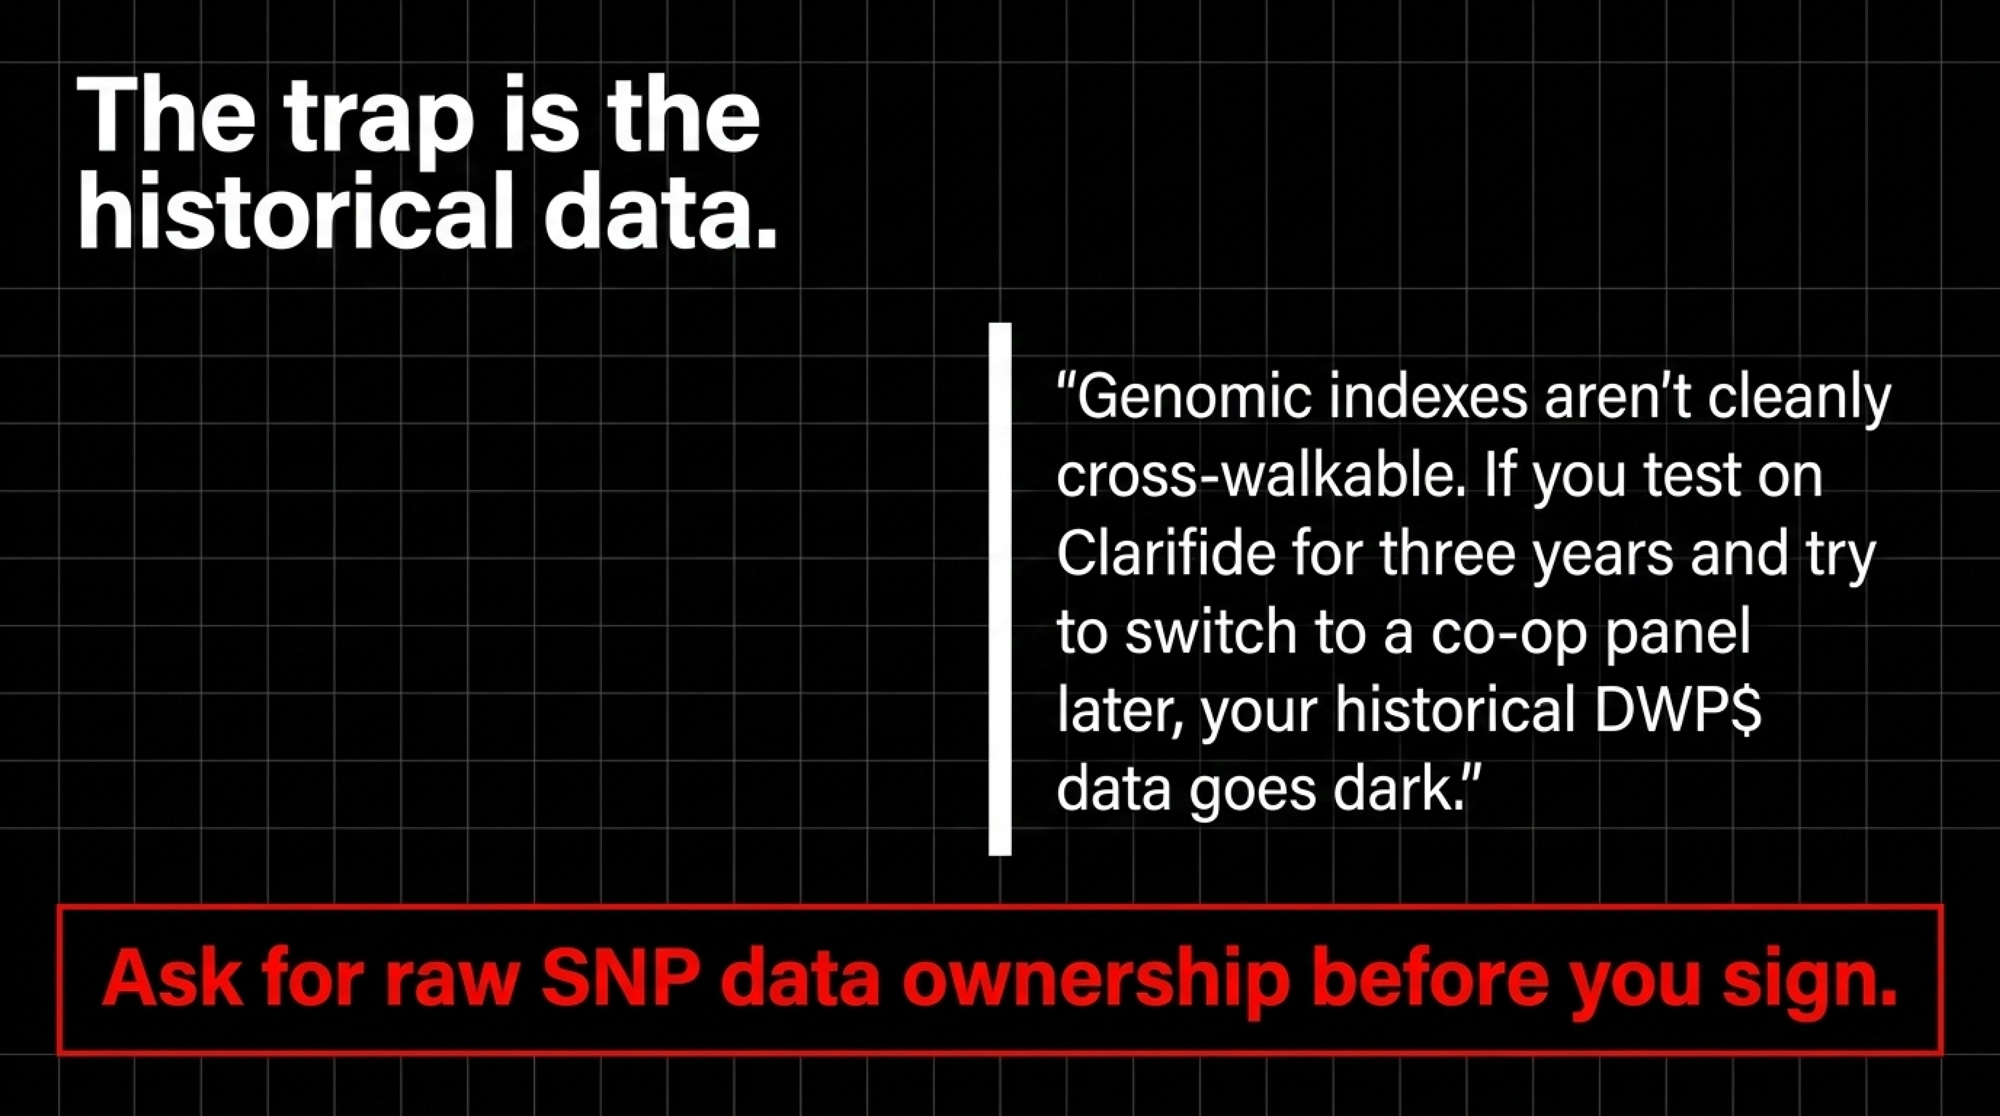
The harder cost in Path 2 isn’t the per-head test fee. It’s what happens to three years of historical rankings if you switch later.

Genomic indexes don’t translate cleanly across providers. The underlying SNP genotype usually does — once a genotype is on file with CDCB, it gets imputed to the same 80K-marker reference base regardless of which chip generated it. What doesn’t translate is the index ranking. DWP$ is Zoetis. NM$ is CDCB. TPI is Holstein Association. Each one weights traits differently, and a cow’s rank on one is not her rank on another.

So if you stay on Clarifide for three breeding crops and then want to move to a CDCB-based panel or a co-op program, the question isn’t whether to re-test the cattle. It’s whether your testing contract gives you export rights to the raw SNP file — and whether your genotypes were deposited with CDCB at the time of original testing. With those two boxes checked, a parallel evaluation costs a fraction of a re-test. Without them, you’re stuck either re-pulling samples or accepting that your historical DWP$ rankings and your forward-going scorecard live on different rulers.

Before you sign any testing contract this year, ask three questions in writing: Who owns the genotype file? Can you receive the raw SNP data, not just the index output? And can you re-run that data through a competing index without paying for a second test? Get the answers in the contract, not over the phone.

Path 3 — Source heat-tolerant genetics directly. If you’re in the South, parts of the West, or the lower Midwest, build a relationship with a Brazilian genetics supplier or a domestic IVF program working with Gyr-Holstein or SLICK-edited genetics. Trigger: summer THI in the upper-70s-to-low-80s range across an extended window — roughly where Zoetis itself recommends DWP$ Heat — and conception rates dropping by more than 5 percentage points across three consecutive summers. The risk: your traditional cooperative supplier probably can’t serve this need, creating a sourcing split you’ll need to manage.

Worth saying plainly as we head into the May–September heat window: DWP$ Heat is a software answer to a hardware problem. Genomic selection inside an existing Holstein population can shift what your daughters inherit at the margin. It cannot change what a Holstein is — a black-and-white animal selected over 75 years for cool-climate fluid-milk production, with body mass and coat type that limit how she dissipates heat at peak summer THI. Gyr-Holstein crosses and SLICK-edited cattle are a different physical platform: shorter coats, smaller body mass, sweat-gland density bred for the tropics. The honest question isn’t “is my DWP$ Heat score high enough?” It’s “do I need a different cow?” For most herds the answer is no — Holsteins still pay best where heat stress is occasional. For Florida, South Texas, Arizona, and the southern San Joaquin, where the answer is increasingly maybe, the Path 3 conversation isn’t optional anymore.

Path 4 — Stay loud at the cooperative. This is the 30-day action. The two questions earlier in this article aren’t a one-time ask. Walk them into the next district meeting on your calendar. Bring them on your phone. Read them aloud. Write the answer down, date it. Talk to two neighbors before the meeting and ask them to do the same. Re-raise in 90 days. Boards respond to repeated, specific, member-coordinated pressure. They do not respond to a single member raising an issue once. The cost is your time and a little social friction. The alternative is having the answer handed to you in 2028 by someone who wasn’t elected by your district.

The 30/90/365 Horizon

HorizonActionTrigger
30 daysRead data-ownership clauses (raw SNP file, portability, re-run rights); bring district-meeting questions; talk to two neighborsRenewal letter on file or expected within 12 months
90 daysNegotiate portability terms; open tropical-genetics conversation; re-raise at next district meetingTHI / fertility decline ORrenewal date inside H2 2026
365 daysTrack slots 40–80; commit to scorecard or diversification path; document board responsesNext two catalog cycles published

Key Takeaways

  • If your processor has mentioned Clarifide, sustainability testing, or scope 3 reporting in any conversation this year, assume a similar letter could land within 6 to 18 months. Negotiate data-portability terms — including raw SNP file access — before you sign, not after.
  • If DWP$ rankings on your last 30 sire selections diverge from your NM$ or TPI rankings by more than your milk-check structure can absorb, you’re breeding against a scorecard that doesn’t match how you get paid.
  • If your summer conception rate has dropped more than 5 points across three consecutive summers, the question isn’t whether to chase a higher DWP$ Heat score. It’s whether the Holstein is the right physical platform for your zip code at all. Put tropical, SLICK-edited, or DWP$ Heat-aligned genetics on your supplier conversations this quarter.
  • If your cooperative can’t name partners, dollar commitments, and timelines when asked the Path 4 questions, treat that as an unanswered question. Re-raise in 90 days. Keep asking.
  • If thinning shows up at slots 40–80 in your cooperative’s next two catalogs, that’s the leading indicator of R&D compression — visible 18 to 24 months before it shows up in flagship marketing.

What Kind of Cooperative Do You Want to Belong to in 2030?

Three generations of dairy farmers decided no member should face the genetics market alone. That decision built shared genotyping pipelines, member-owned data, and the negotiating leverage that has kept U.S. genetics competitive in 124 export markets and in your own barn. None of that is guaranteed to survive a structural shift it doesn’t see coming.

The cow-level economics — full DWP$-versus-NM$ math broken down by contract type and herd size — live in next week’s Bullvine Weekly. That’s where the spreadsheet sits: plug in your own components, your own premium, your own replacement rate, and see where the net-out lands.

But the question that actually matters this month isn’t the spreadsheet. It’s the one you bring to your next district meeting, in front of the neighbors whose kids might still be milking cows in 2050. What kind of cooperative do you want them to belong to?

Editorial note: This article reflects publicly available information as of May 1, 2026. Updates and any post-publication responses will be reflected in subsequent coverage.

¹ Holstein Association USA, Genomic Testing Services price schedule, accessed May 1, 2026: Clarifide Plus Medium-Density SNP Test + Dairy Wellness Traits & Polled at $43 per Holstein animal (member rate). Industry-wide practical costs typically run $40–$50 per head depending on volume and program tier.

² USDA NASS Milk Production monthly report, late-2025 release: U.S. average production per cow for the most recent reported month was 1,963 lb, putting annualized U.S. herd-average in the 24,000–24,400 lb/cow/year band, equivalent to roughly 66–67 lb/day on a steady-state basis.

³ 35% reflects a typical Holstein heifer-replacement rate; operations generally run 30–40% depending on cull rate. Figures rounded to the nearest dollar; testing-cost rows reflect 35% of milking herd as a straight multiplier. Adjust to your own heifer inventory before applying.

Disclaimer: The Zoetis–Neogen $160 million transaction is structural in scope, but individual outcomes vary by state, processor contract, regional milk pricing, herd size, and cooperative affiliation. The barn-math figures above are illustrative benchmarks, not universal forecasts. Run your own numbers against your own contract before any breeding, testing, or supplier decision.

Learn More

The Sunday Read Dairy Professionals Don’t Skip.

Every week, thousands of producers, breeders, and industry insiders open Bullvine Weekly for genetics insights, market shifts, and profit strategies they won’t find anywhere else. One email. Five minutes. Smarter decisions all week.
NewsSubscribe
First
Last
Consent

Your Data, Their Premium: The Sustainability Math Every Dairy Farmer Needs to See

Retailers get sustainability claims. Processors land premium contracts. Farmers get… a benchmarking report.

EXECUTIVE SUMMARY: Retailers want sustainability data. Processors are landing premium contracts. Farmers are doing the assessments—and asking a fair question: what’s coming back to the farm? The economics reveal a structural gap worth understanding. Programs like FARM Environmental Stewardship deliver genuine environmental progress, but while producers absorb the time investment and compliance costs, the marketing value and buyer relationships flow primarily upstream to cooperatives and processors. Technology economics follow a similar pattern: digesters can pay back in under five years for large operations in favorable policy states, but mid-size farms elsewhere often find lower-capital alternatives offer more practical returns. This analysis breaks down the real costs, maps where value flows, and provides a framework of questions to work through—helping farmers evaluate which sustainability opportunities actually make sense for their operation.

You know that feeling when your co-op asks you to complete another assessment, and you’re already behind on breeding decisions, that heifer pen needs attention, and you haven’t caught up on feed inventory in two weeks? You’re certainly not alone in feeling that tension.

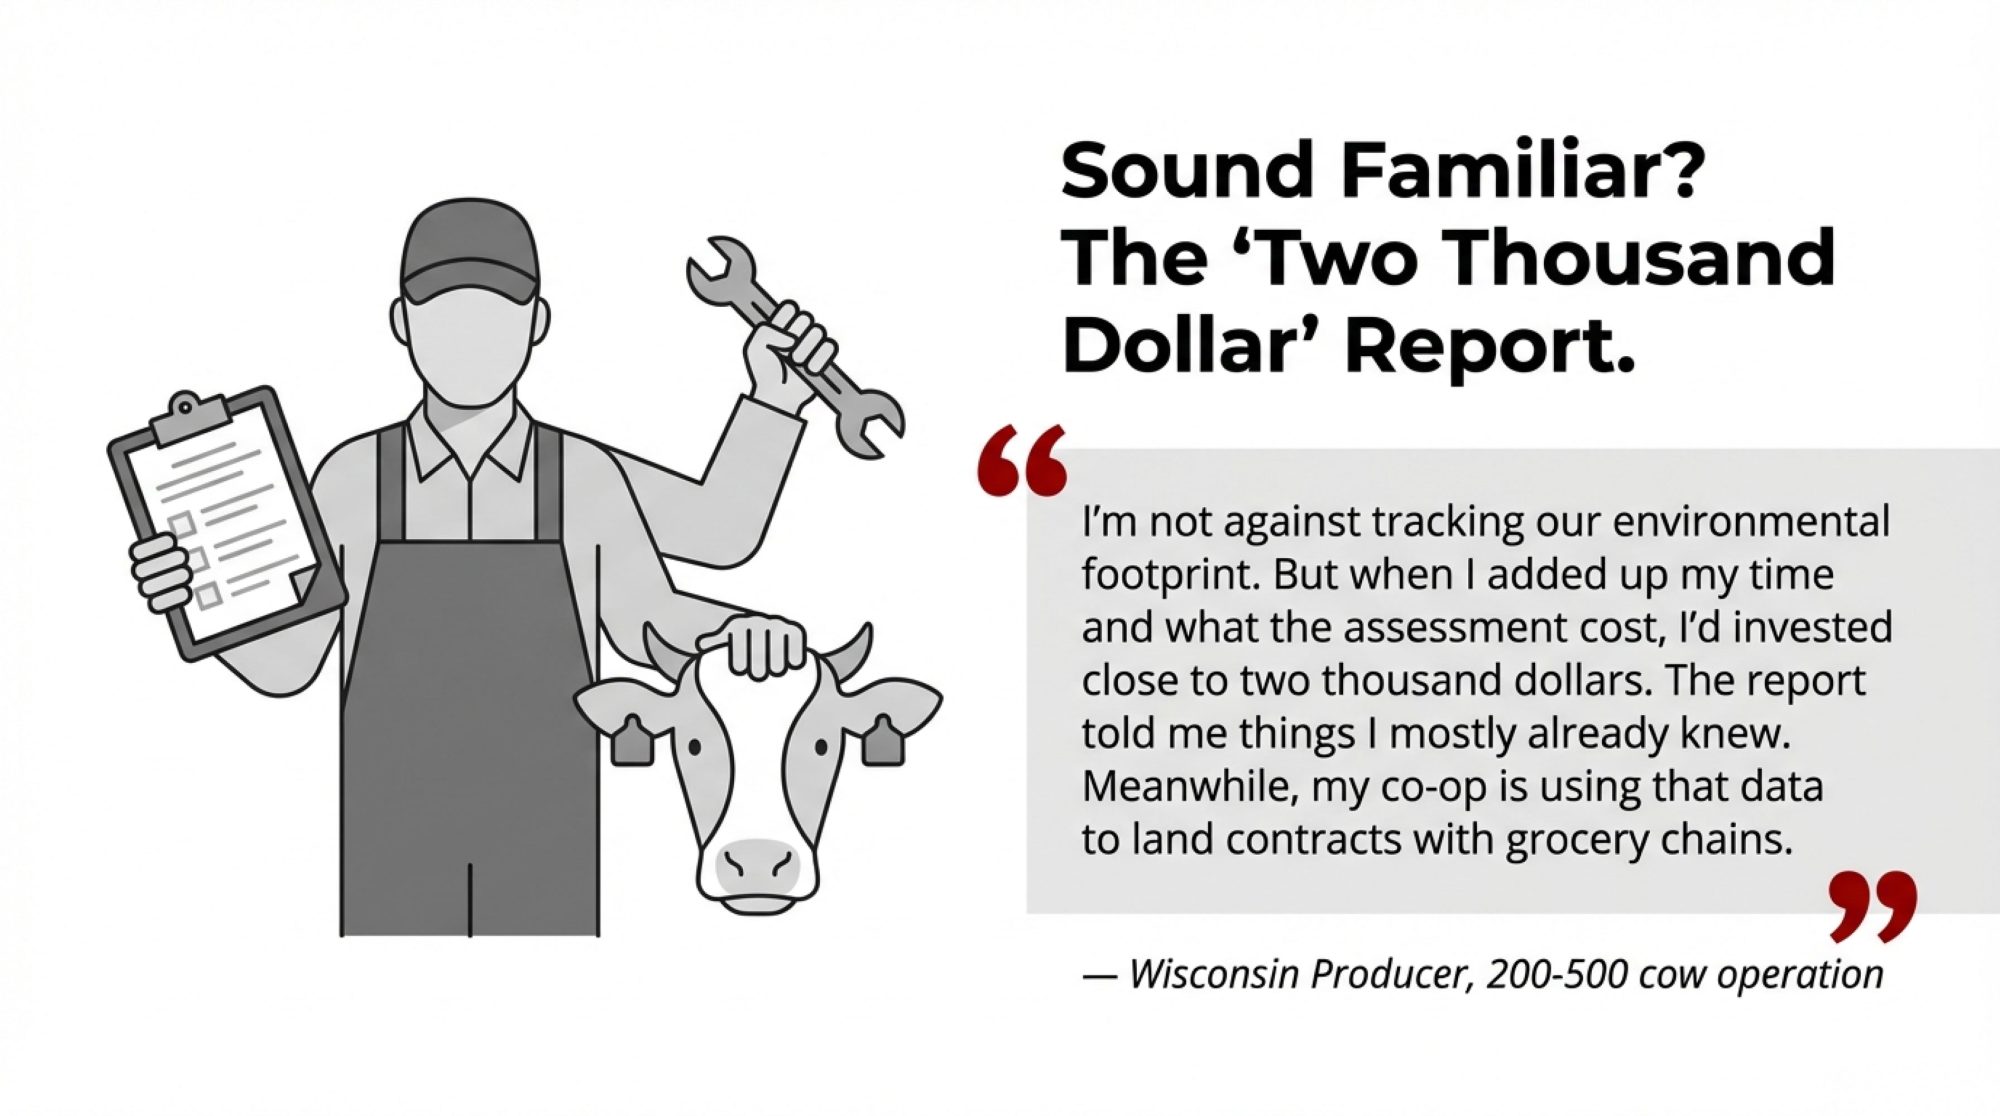
I’ve been talking with producers across the Midwest and Northeast who are running mid-size operations—the 200- to 500-cow range—and hearing remarkably similar stories. One Wisconsin producer I spoke with recently shared his experience: he spent the better part of three days pulling together feed records, energy bills, manure management documentation, and herd data for his cooperative’s sustainability assessment. His co-op got metrics to share with their retail partners. He got a benchmarking report and a request to do it again next year.

“I’m not against tracking our environmental footprint,” he told me. “But when I added up my time and what the assessment cost, I’d invested close to two thousand dollars. The report told me things I mostly already knew. Meanwhile, my co-op is using that data to land contracts with grocery chains.”

That’s the heart of the issue. These programs aren’t inherently problematic—many drive genuine environmental improvements that benefit the entire industry’s reputation. But the economics work differently than farmers sometimes expect. Retailers get sustainability claims for their marketing. Processors get preferred supplier status. And farmers get… a benchmarking report.

Understanding that dynamic matters when you’re making decisions about your operation.

The Real Cost of Participation

Let me walk you through what these programs actually cost when you add everything up—not just the line items that show up on invoices.

The FARM Environmental Stewardship program has completed more than 4,000 on-farm assessments across 42 states since it launched, with the broader FARM Animal Care program covering approximately 99% of U.S. milk production. That’s according to the National Dairy FARM Program’s 2023 Year in Review, which notes that assessments cover operations ranging from 10 to over 35,000 lactating cows. Direct assessment costs vary by region and evaluator, but producers I’ve spoken with report fees ranging from a few hundred dollars for basic assessments to well over a thousand for comprehensive lifecycle evaluations.

But here’s what often gets overlooked: the time investment.

Dr. Greg Thoma, who directs the Agricultural Modeling and Lifecycle Assessment program at Colorado State University’s AgNext initiative, has noted that comprehensive farm-level data collection requires significant farmer involvement. We’re not talking about clicking a few buttons. Initial assessments typically run from half a day to two full days of farmer time for data gathering, verification, and review—depending on how your record-keeping systems are organized.

What’s that time actually worth? If you value your management hours at fifty to seventy-five dollars—and honestly, that’s conservative for someone juggling fresh cow protocols, transition period monitoring, feed inventory, and labor scheduling—you’re looking at several hundred to over a thousand dollars in opportunity cost before counting direct fees.

A farm business consultant who works with dairy operations across the Upper Midwest put it plainly: “The assessment process is useful for industry positioning, but provides limited direct benefit for the farmer completing it.”

Who Captures the Value You Create?

This brings me to something worth understanding, regardless of how you feel about sustainability initiatives generally.

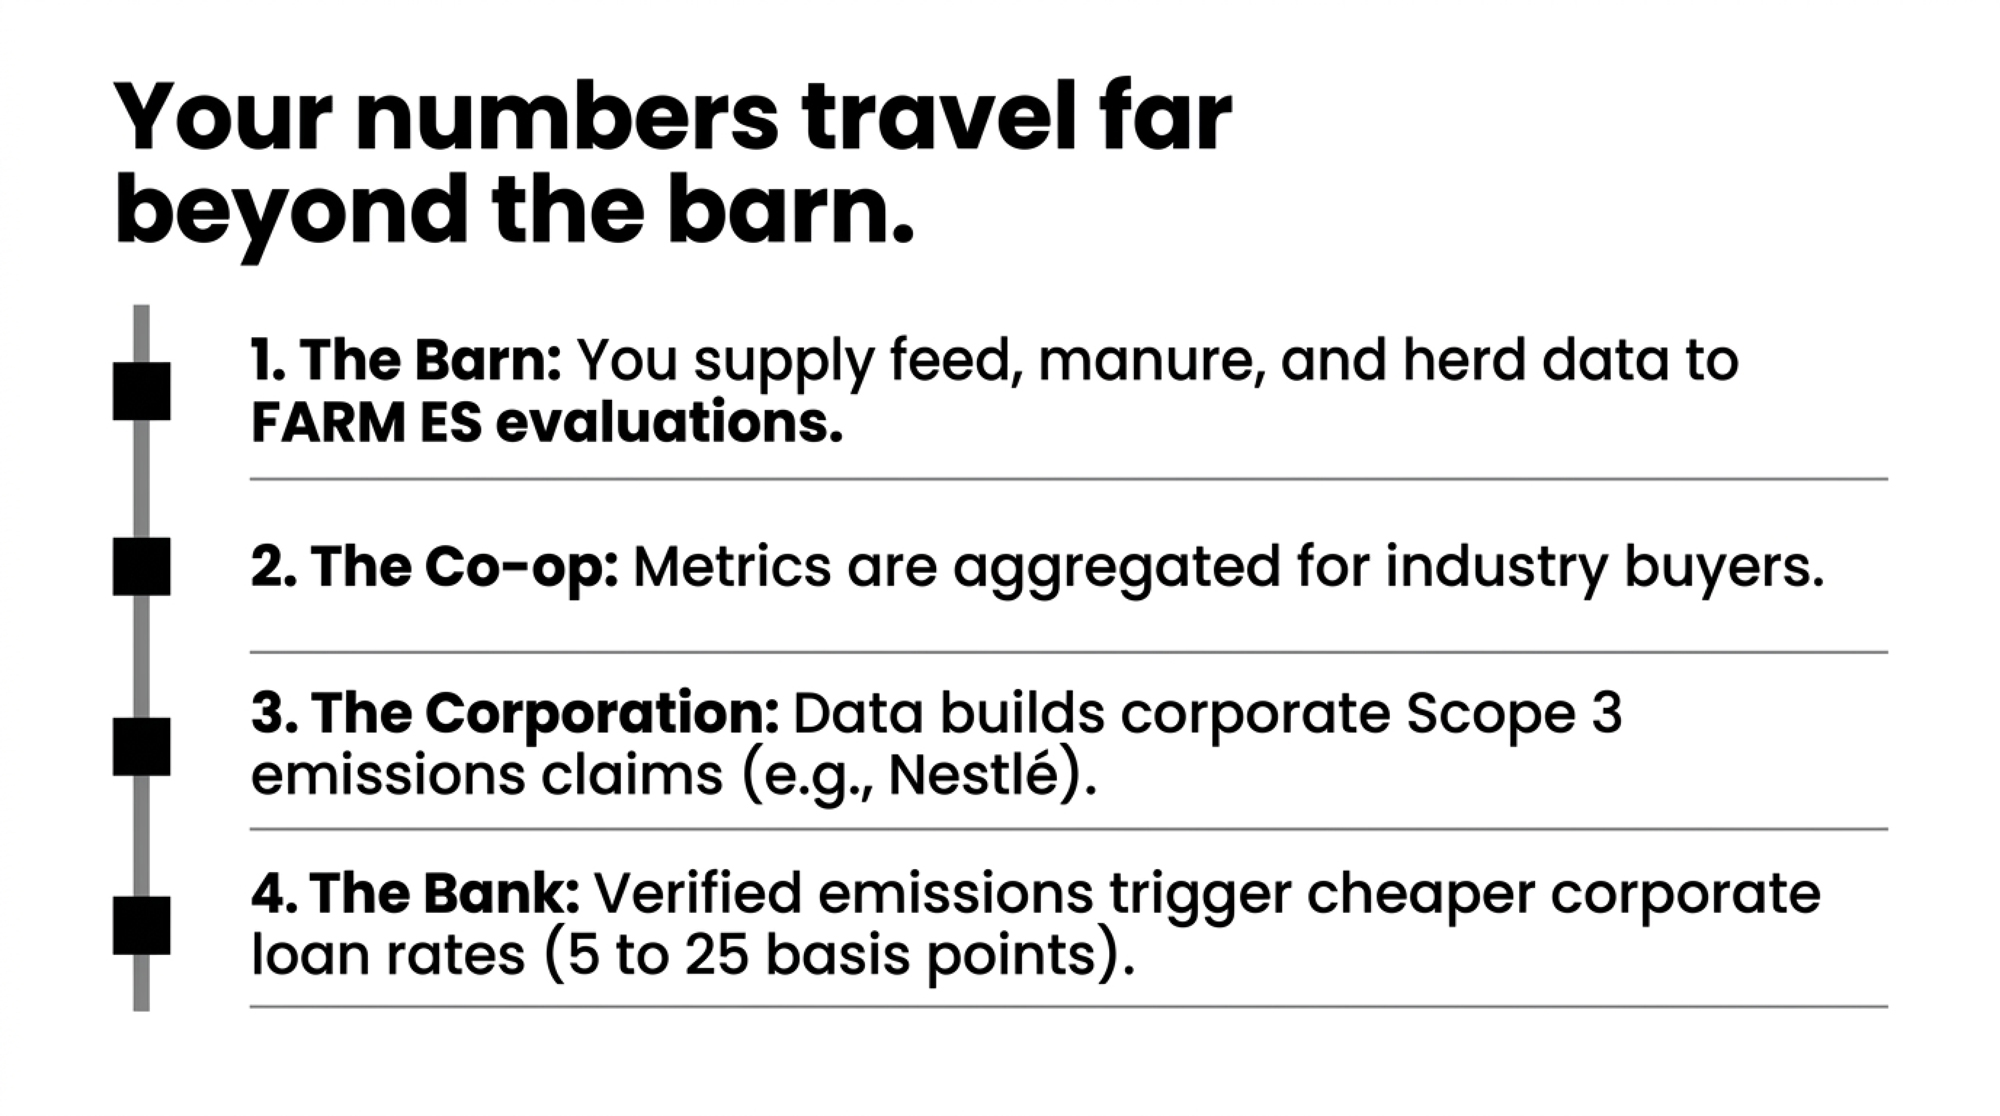
When a cooperative aggregates sustainability data from member farms, they create several distinct value streams. According to the FARM ES Program documentation, aggregated data helps “demonstrate dairy’s environmental benefits to customers and consumers” and supports “cooperative, processor and national level” sustainability claims.

Let’s be direct about what that means: your operational data—the information you spent days compiling between morning milking and dealing with that problem fresh cow—becomes raw material for marketing claims that help your processor land contracts with Walmart, Kroger, and institutional buyers. It feeds into ESG reports that satisfy institutional investors. It supports premium positioning that benefits everyone in the supply chain above you.

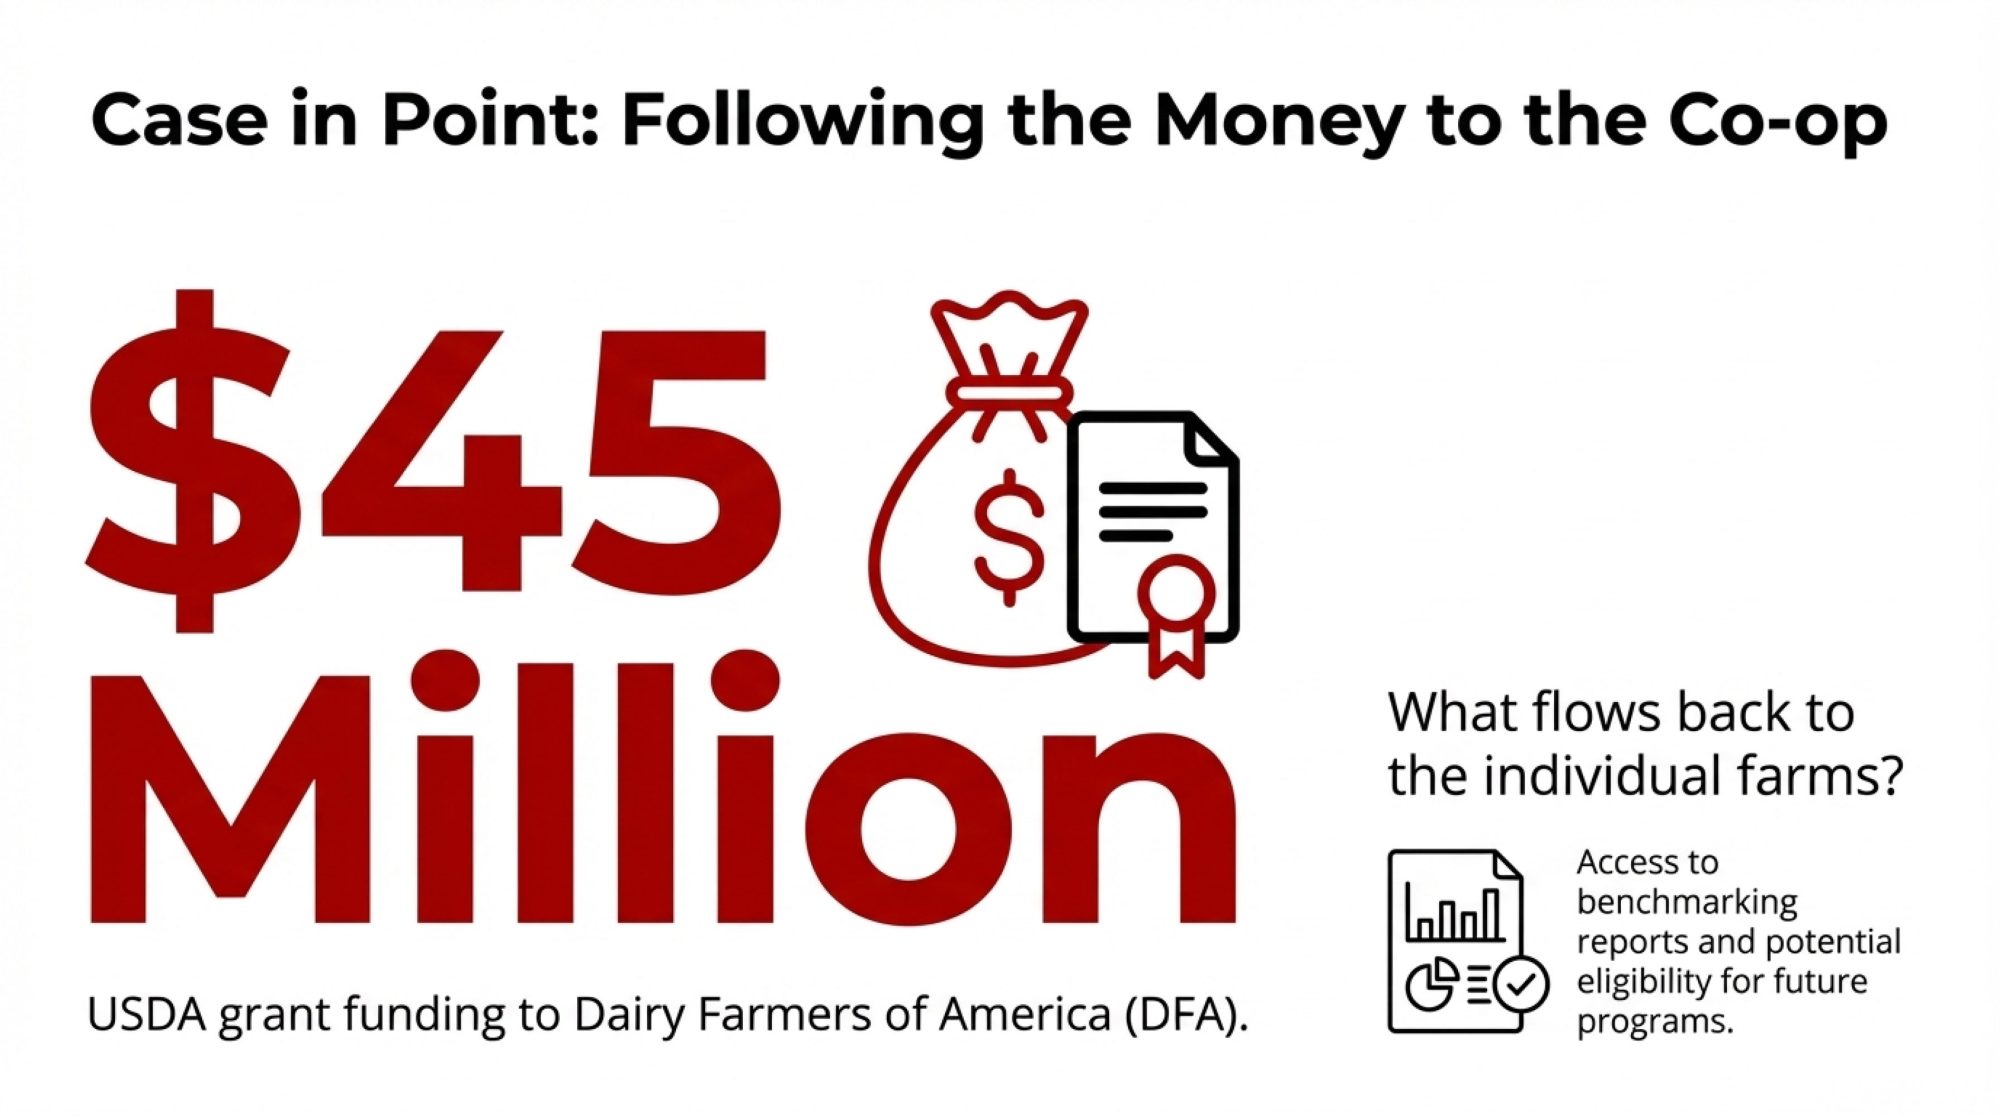
Here’s a concrete example. In August 2020, Dairy Farmers of America became the first U.S. dairy cooperative to have emissions targets validated by the Science Based Targets initiative. DFA is committed to reducing greenhouse gas emissions across its supply chain by 30% by 2030, relative to a 2018 baseline. That’s built on data from member farms. Then, in September 2022, DFA received up to $45 million in USDA grant funding through the Partnerships for Climate-Smart Commodities program.

That represents real industry progress. But $45 million flowed to the cooperative level. What flowed back to the farms that provided the data and implemented the practices? Access to benchmarking reports and potential eligibility for future incentive programs.

I should be fair here: cooperatives are responding to legitimate market pressures. Retailers have made sustainability documentation a condition of doing business, and someone has to aggregate and verify that data. The question isn’t whether this work should happen—it’s whether the current value distribution makes sense for farmers.

Technology Economics: Finding What Actually Pencils Out

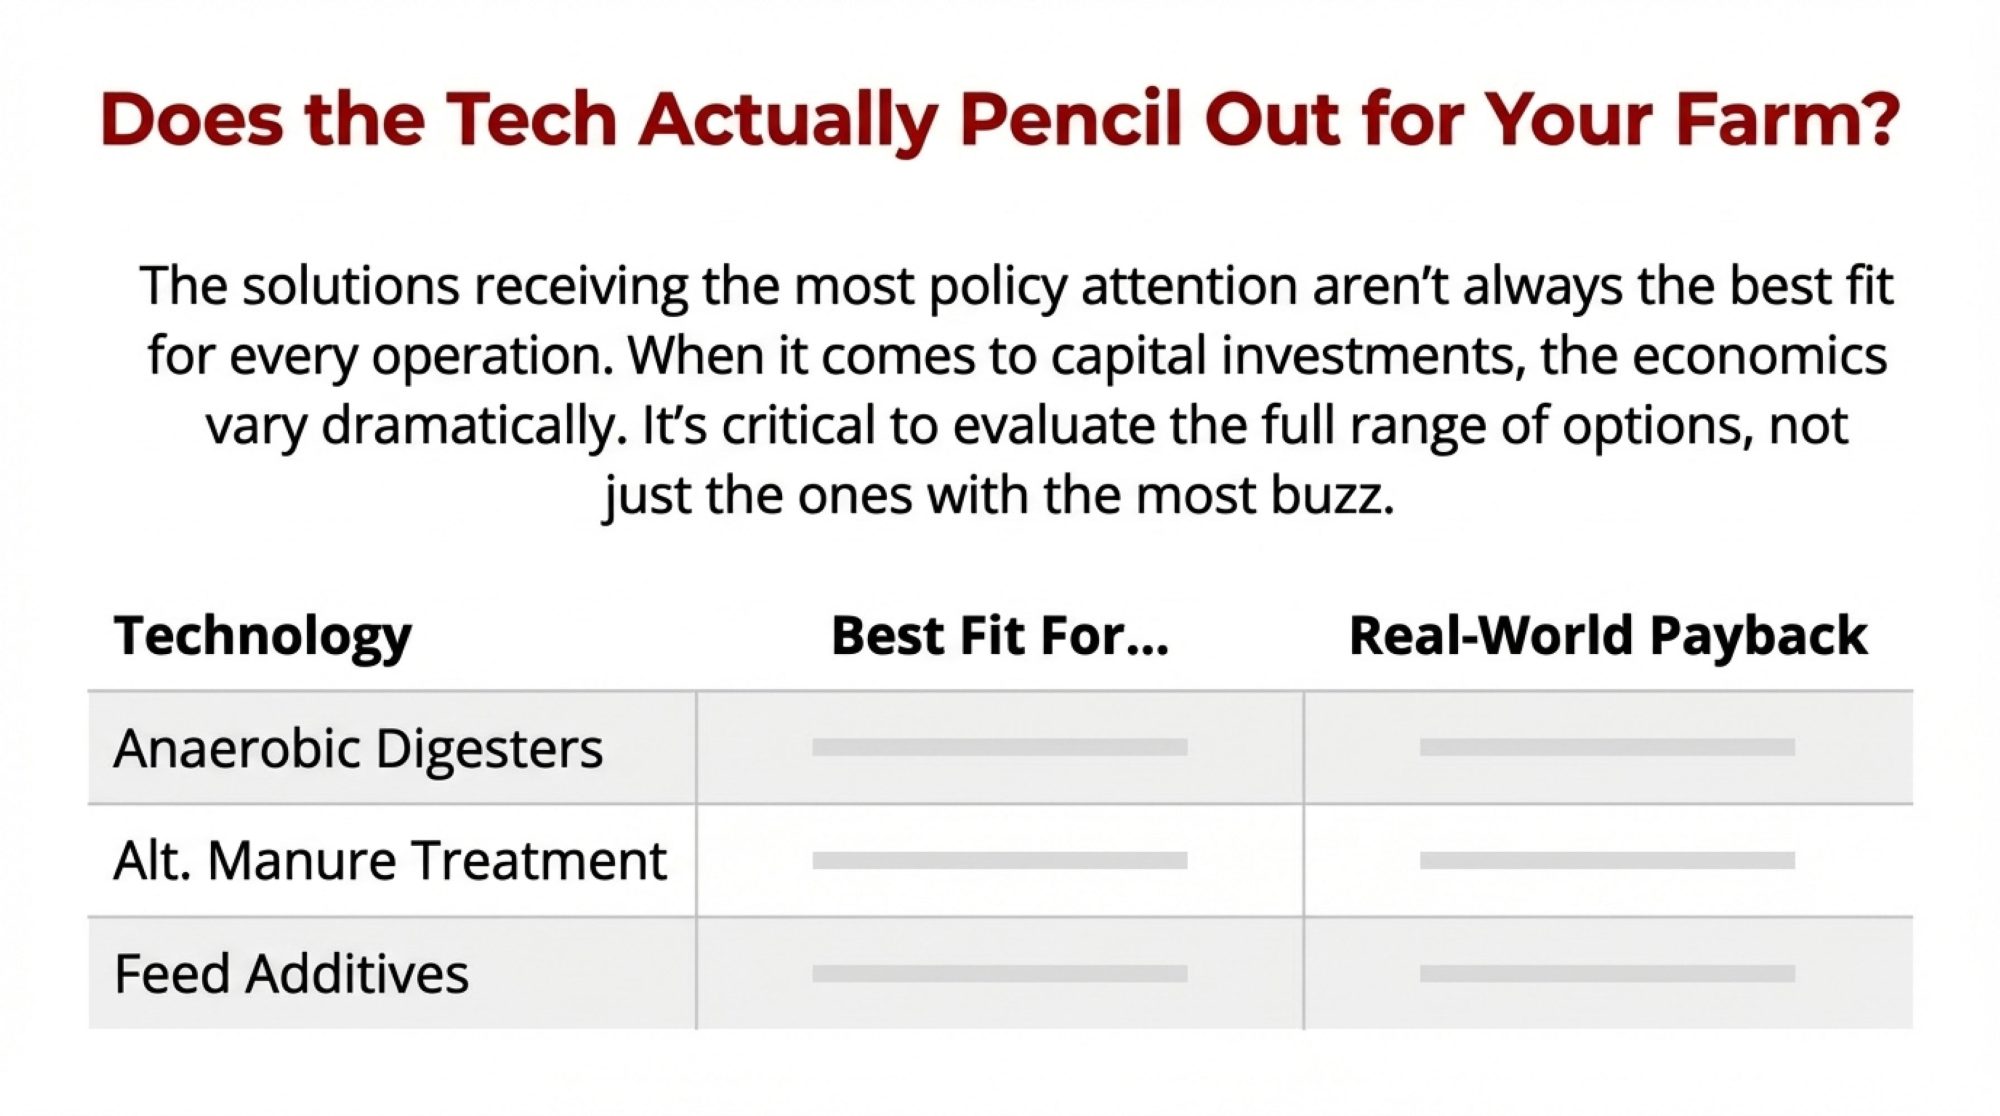
When it comes to capital investments for emissions reduction, the economics vary dramatically. And here’s what I’ve noticed: the solutions receiving the most policy attention aren’t always the best fit for every operation.

Technology Comparison at a Glance

Anaerobic Digesters

  • Capital: $2-5 million full-scale; $125K-500K mini systems
  • Operating: $20,000-51,000 annually
  • Methane reduction: 25-35% from storage
  • Payback without grants: Can exceed 22 years
  • Payback with full grants: Under 5 years possible
  • Best fit: 500+ cow operations in LCFS states

Alternative Manure Treatment Systems

  • Capital: Varies significantly; generally lower than digesters
  • Operating: Lower ongoing costs
  • Methane reduction: Up to 97-99% from treated streams
  • Payback without grants: Generally 4-7 years
  • Payback with grants: 3-5 years
  • Best fit: Various sizes, most regions

Feed Additives (3-NOP)

  • Capital: Minimal infrastructure
  • Operating: $40-60 per cow annually
  • Methane reduction: 25-30% enteric
  • Payback: Ongoing operational cost
  • Best fit: Any size, immediate impact

Sources: Penn State Extension, March 2025; Bioresource Technology Reports, June 2022

The Digester Reality Check

Digesters have dominated the sustainability technology conversation, and for good reason—they can generate meaningful revenue streams on the right operation. But the financial threshold is steeper than many producers initially realize.

Penn State Extension’s March 2025 analysis—titled “Enhancing Digester Profitability: Strategies for Farmers”—lays out the numbers clearly. Without grant funding, payback periods can stretch to 22 years or more. In challenging scenarios, payback could exceed 50 years. That’s longer than most of us plan to be milking cows.

With substantial grant funding, the picture changes dramatically. Payback can drop to under five years, and under optimal conditions with full grant coverage, Penn State documented payback periods as short as 1.3 years.

So the practical question becomes: can your operation access that level of grant funding? Farms in California benefit from Low Carbon Fuel Standard credits that create additional revenue streams. Operations in Wisconsin, New York, or Pennsylvania are working with a different policy landscape entirely.

The result is that digester economics work particularly well for larger operations—generally 500 cows or more—in favorable policy environments. For everyone else, the math often doesn’t work.

Looking at Economic Alternatives

This is where mid-size operations need to think creatively. Research published in Bioresource Technology Reports in June 2022 found that alternative manure treatment approaches—including biological systems—can achieve 97-99% methane reduction from treated streams at substantially lower capital requirements. The California Dairy Research Foundation has funded multiple demonstration projects through CDFA’s Alternative Manure Management Program with promising results.

Payback periods for these systems generally range from 4 to 7 years, often achievable without major subsidies.

The point isn’t that one technology is universally better than another—it’s that farmers should evaluate the full range of options rather than defaulting to whatever solution has the most policy momentum. For mid-size operations in states without LCFS programs, lower-capital alternatives may offer more practical economics. It’s worth exploring what actually fits your situation rather than what fits the policy conversation.

Government Support: Helpful, But Don’t Build Your Strategy Around It

Federal sustainability funding has expanded significantly. The Partnerships for Climate-Smart Commodities program allocated $2.8 billion across 70 projects, with USDA announcing support reaching more than 50,000 farms.

Those are meaningful numbers. But here’s the context that matters for individual operations.

Of that $2.8 billion, dairy-specific allocation represents roughly $500-600 million—the remainder flows to row crops, beef, specialty crops, and other commodities. Divide dairy funding across approximately 24,000 U.S. dairy farms (USDA NASS data), and you get a theoretical availability of around $22,000 per farm.

In practice, several factors reduce that figure. Program administration requires resources. Competition for applications means not every eligible farm accesses available support. And let’s be honest—grant-writing capacity matters. Larger operations with professional staff have real advantages in navigating application processes that 200-cow family operations simply don’t have.

Government support can help on the margins. But building your sustainability strategy around grant funding you may or may not receive is a risky proposition.

Corporate Partnerships: Read the Fine Print

Major food companies are investing substantial resources in the sustainability of the dairy supply chain. In February 2025, Mars announced a $27 million commitment over five years to support Fonterra’s farmer sustainability initiatives in New Zealand, with Nestlé backing additional incentive payments through the same partnership. The stated goal: reduce dairy-related emissions by 150,000 metric tons by 2030.

According to ESG News reporting, farmers who achieve significant emissions reductions—30% or more compared to the industry average—become eligible for per-kilogram incentive payments ranging from NZ$0.10 to NZ$0.25 per kgMS. That’s meaningful compensation for documented environmental improvements.

But there’s a structural element worth understanding. When these programs involve carbon “insetting”—where farmers sell their emissions reductions to their processor rather than on open markets—you permanently transfer that environmental attribute. You can’t sell the same carbon reduction to another buyer. You can’t use it to market your operation independently.

The processor gets to claim the carbon reduction in their corporate sustainability reports. You get a per-kilogram payment. Whether that’s a fair exchange depends on how the market develops—but it’s worth understanding before you sign.

What Happens When Corporate Priorities Shift

In August 2021, 89 organic dairy farmers across Maine, Vermont, New Hampshire, and parts of New York received termination letters from Horizon Organic, with their contracts set to end by August 2022. Around the same time, another 46 farms were dropped by Maple Hill Creamery—documented by Dairy Reporter and the Northeast Organic Dairy Producers Alliance.

These were established operations—multi-generational family farms that had invested substantially in organic certification, infrastructure changes, and the three-year transition period. They’d met all program requirements. They’d done everything asked of them.

When Danone decided to consolidate supply around fewer, larger operations closer to processing facilities, none of that mattered. The terminations reflected corporate supply chain optimization, not farmer performance.

What happened next offers an encouraging counterpoint. Organic Valley—the farmer-owned cooperative with more than 1,600 member farms producing over 30% of U.S. organic milk—stepped in. According to their reporting, 50 farms from the affected states joined as new members, with another 15 farms joining earlier that year.

Two lessons here. First, concentrated market relationships create real vulnerability. Second, farmer-controlled alternatives can provide meaningful options when corporate priorities shift.

Models Worth Understanding

Not every sustainability structure concentrates value away from farmers.

Organic Valley’s cooperative ownership structure shapes how they respond to challenges. When feed costs increased significantly during 2021-2023, they mobilized member support through task forces, deployed field staff for technical assistance, and invested in tools helping farmers maximize on-farm feed production. Their sustainability programs include farmer compensation for sequestration and avoided emissions, with farmer governance over program evolution.

In Europe, farmer-controlled data cooperatives offer another model. The JoinData approach in the Netherlands allows farmers to retain ownership of their operational data, authorize each use individually, and receive compensation when their data generates commercial value.

These aren’t the only valid approaches—conventional cooperative relationships and corporate partnerships provide real value for many operations. But knowing alternatives exist helps you evaluate what structure works best for your situation.

Questions to Work Through Before Signing

Based on conversations with producers who’ve navigated these decisions:

On costs and time:

  • What’s the total annual commitment—assessment fees, data platform costs, and your time at realistic hourly rates?
  • Does the potential return justify that investment?
  • How does timing align with your busiest seasons?

On value distribution:

  • Who captures the marketing value from your participation?
  • What specific benefits are guaranteed versus contingent on future development?
  • Are you comfortable with the exchange you’re making?

On data:

  • What do contract terms say about data ownership and use?
  • Can your data be aggregated for purposes beyond your direct benefit?
  • What compensation exists when your data supports others’ sustainability claims?

On technology:

  • Does the promoted solution match your operation’s scale and capital access?
  • What alternatives might offer better economics?
  • Does the investment make sense without grant funding?

On market relationships:

  • What notice period does your buyer have for relationship changes?
  • How dependent are you on a single market channel?
  • What options exist if current arrangements become unfavorable?

The Bottom Line

The dairy industry’s sustainability transformation is real and likely to continue. Consumer expectations, retailer requirements, and regulatory pressures create market dynamics that aren’t going away. Farms that can document and improve their environmental performance will generally have better positioning over time.

But how you participate matters enormously.

Right now, a lot of the sustainability conversation asks farmers to provide data, implement practices, and absorb costs—while the marketing value and premium positioning flow primarily to other parts of the supply chain. That’s not necessarily wrong, but it’s worth seeing clearly.

The producers who feel good about their sustainability investments share some common approaches. They understood the full economics before committing. They maintained diverse market relationships. They chose technologies that fit their scale and geography. And they asked direct questions about value distribution before signing anything.

That’s not cynicism—it’s the same analysis that characterizes good management decisions in any area of the operation. What does this cost? What do I receive? Who else benefits, and by how much?

The sustainability conversation doesn’t change those fundamentals. If anything, it makes asking them more important than ever.

Have experiences with sustainability programs that might help other producers? We’re interested in hearing what’s working—and what isn’t—across different operations and regions.

KEY TAKEAWAYS:

  • Know the exchange you’re making: Your data and compliance work enable sustainability claims that benefit the entire supply chain—be clear on what returns to your farm before committing
  • Technology economics are operation-specific: Digesters pay back quickly for 500+ cow farms in favorable policy states; mid-size operations elsewhere often find lower-capital alternatives pencil out better
  • Build strategy around economics, not grants: Federal programs are competitive and favor operations with professional staff—assume you won’t get funding and be pleasantly surprised if you do
  • Market concentration creates vulnerability: When Horizon and Maple Hill dropped 135 organic farms in 2021-2022, performance wasn’t the issue—farms with multiple buyer relationships recovered fastest
  • Programs deliver real value; distribution is the question: Sustainability initiatives drive genuine environmental progress—the issue worth examining is whether farmers share fairly in the value they help create

Complete references and supporting documentation are available upon request by contacting the editorial team at editor@thebullvine.com.

Learn More:

  • Profitability vs. Sustainability: Can You Have Both? – Challenges the assumption that environmental goals must come at the expense of your bottom line. This analysis breaks down strategies for aligning green initiatives with black ink, ensuring your operation remains financially viable while meeting modern market demands.
  • Feed Efficiency: The Single Greatest Opportunity to Improve Profitability and Sustainability – Moves beyond the hype to practical genetics. This guide demonstrates how selecting for feed efficiency reduces input costs and methane output simultaneously, offering a proven, low-capital tactic to improve your sustainability metrics without massive infrastructure investments.
  • Is Technology the Answer to the Labor Crisis? – Examines the ROI of automation beyond just milking cows. Learn how data-driven systems can reclaim the management hours lost to manual record-keeping—directly addressing the “opportunity cost” of time highlighted in our sustainability analysis.

The Sunday Read Dairy Professionals Don’t Skip.

Every week, thousands of producers, breeders, and industry insiders open Bullvine Weekly for genetics insights, market shifts, and profit strategies they won’t find anywhere else. One email. Five minutes. Smarter decisions all week.
NewsSubscribe
First
Last
Consent

The $30,000 Question: Who Really Owns Your Farm’s Digital DNA?

You paid half a million for the robots. The data they collect? That belongs to someone else.

Executive Summary: You paid $500,000 for robots, but the vendor owns your data—and wants $30,000 to give it back when you retire. This is the hidden crisis hitting Canadian dairy: producers discovering they don’t control the breeding records, health data, or management protocols they’ve built over decades. While the technology works brilliantly (saving 5+ hours weekly, catching mastitis days earlier), contracts grant vendors permanent rights to aggregate and sell your information back to feed companies and consultants. Mid-size farms (200-500 cows) face the worst squeeze—too big for simple systems, too small for automation economics, locked into 8-10 year paybacks they can’t escape. Before signing anything, get written answers on three things: exit costs, data access rights, and succession provisions. Your breeding data is generational wealth—don’t let fine print hold it hostage.

dairy farm data ownership

You know that moment when a producer realizes they’re not just passing a farm to their kids, but also a ransom note from their software provider? That’s what’s happening across Canada right now. The cost to unlock 20 years of breeding data for succession? I’ve heard figures as high as $28,000.

That’s not a typo. According to ag lending specialists at Farm Credit Canada and other major banks I’ve spoken with, data migration costs during farm transitions now range from $5,000 for basic exports to over $25,000 for complex system conversions. And when quota’s already at $24,000 per kilogram in Ontario, according to the November 2024 DFO Markets Report—with Western Milk Pool values creating massive barriers for young farmers out west—well, these unexpected data transfer costs really sting.

When Digital Integration Works (And When It Doesn’t)

Here’s the thing about the International Dairy Data Exchange Network, launched in late 2020 with Lactanet leading the charge. According to iDDEN’s own reporting, they’ve now got over 200,000 herds across fifteen countries connected. And you know what? The technology actually works pretty well.

University extension research consistently shows that we’re saving several hours per week on data management. Health monitoring systems? They’re catching issues days earlier than we’d spot them manually—especially mastitis, which anyone who’s dealt with knows is worth catching early. Farm management specialists in Western Canada have noted that producers using fully integrated platforms report significant time savings and substantial reductions in treatment costs based on 2024 Western Canadian veterinary fee schedules.

The system creates this common language so your DeLaval VMS can talk directly to Lactanet’s genetic evaluation system, which shares with your nutritionist’s software. According to industry announcements, the major equipment companies all formalized their iDDEN connections between late 2022 and 2023—DeLaval in March 2023, GEA in December 2022, and Lely in September 2023.

But here’s what gives me pause. DataGene mentioned in their recent documentation that consent management trials are still being evaluated through mid-2025. Think about that… we’re five years in, and they’re still figuring out how we control who sees our data.

Tech That Pays for Itself: Real Labor Savings from Dairy Data Integration. Top integrated platforms consistently save dairy teams 5-9 hours per week—those hours directly translate to better management, more milk, and lower stress

The Brutal Math of Scale

You probably already sense this, but the economics vary dramatically with herd size. The USDA Economic Research Service’s 2024 report shows precision dairy technology adoption at 72% for farms with 1,000 or more cows, 48% for farms with 200-999 cows, and just 31% for farms with fewer than 200 cows.

What I’m seeing in Eastern Ontario matches this exactly. Take a typical 650-cow operation investing $1.3 million in four robots plus automated feeding. First-year benefits? Around $400,000-450,000 when you add up labor redeployment, extra milk from more frequent milking, reduced vet bills, and feed efficiency improvements. They’re looking at five-year payback, maybe less if milk prices hold.

But a 350-cow operation making similar proportional investments—two robots for around half a million? The per-cow benefit drops significantly. Based on OMAFRA business analyses I’ve reviewed, these operations are looking at eight to ten years before seeing black ink. That’s a tough pill to swallow.

Why Herd Size Dictates Dairy Tech ROI. Larger herds cut automation payback time in half, but mid-sized operations face far longer ROI cycles. Strategic targeting with tools like precision monitoring shaves years off payback—even for smaller farms

Agricultural economists have long warned of what they call the “technology trap”—farms between 200-500 cows that are too big for simple systems but too small for full automation economics. And that’s a lot of Canadian dairy farms right there.

The Fine Print Nobody Reads Until It’s Too Late

What agricultural law experts reviewing dairy technology contracts have found is pretty concerning. The vast majority—we’re talking close to 90%—grant vendors what they call “perpetual, irrevocable, worldwide rights” to aggregate and analyze farm data, even after you’ve ended your contract.

Consider this typical scenario from Oxford County. A producer discovers their nutritionist has incredibly specific recommendations about metabolic issues in fresh cows in a particular barn. How’s an outside consultant know about location-specific problems? Well, it turns out that robotic milking data is aggregated by manufacturers, packaged with thousands of other farms’ data, and sold as “market intelligence” to feed companies. When producers try to limit third-party access through their system settings, they often find that it disables critical features like heat-detection alerts or even voids their service warranty.

It’s essentially holding your own operational data hostage.

What the Nordic Countries Got Right

Now this is interesting. Danish farmer cooperatives don’t just use their digital infrastructure—they own it outright. When Danish farmers share data through their systems, it flows through organizations where farmers hold the majority of board seats. That’s a completely different power dynamic.

EU Data Act vs Canada Dairy Rights

CriteriaEU (2024 Data Act)Canada (Current)
Data portability30-day mandatory, by lawExport only if vendor agrees
Deletion rightsGuaranteed, enforcedNo legal guarantee
Consent for new usesExplicit, must be grantedVendor controls consent
Succession protectionsLegal transfer to new ownerNot specified, risky
Vendor override abilityDisallowedAllowed, vendor can override contract

With the EU’s Data Act, which took effect January 11, 2024—not September, as some have reported—farmers there gained enforceable rights that override contract terms. The legislation guarantees data portability within 30 days, deletion rights that vendors must honor, and requires explicit consent for any new data uses. Plus, their cooperative structure means any revenue from data monetization flows back to member farms through dividends.

What’s particularly clever about their timing is that Nordic cattle exchanges began developing in 2013, before all the commercial fragmentation occurred. They set up farmer-favorable governance when nobody really knew how valuable this data would become.

Meanwhile, here in Canada? Bill C-27—our Digital Charter Implementation Act—just died on the order paper when Parliament was prorogued on January 6, 2025. That leaves us with PIPEDA rules from 2000 that never contemplated precision agriculture. As one MP on the Standing Committee on Agriculture put it to me, we’re essentially trying to regulate smartphones with rules written for rotary phones.

Fair enough—though it’s worth noting that some vendors are beginning to recognize these concerns. Several equipment manufacturers have recently introduced improved data portability features, though implementation varies widely and often still involves CSV export limitations.

The Succession Planning Nightmare

Here’s where it gets really challenging for farm families. I’ve been hearing similar stories across the country. Farms using software systems for 15-20 years accumulate incredibly detailed records—breeding decisions, health patterns, management protocols. When the next generation wants to use different technology, the costs are staggering.

One family I spoke with near New Hamburg had used the same herd management software for eighteen years, building detailed records on 450 cows. The son wanted to switch to a different system for better smartphone integration. The quote to export their historical data? Nearly $5,000. Converting it to work in the new system? Another $8,000-10,000. Training and setup? Add another few thousand. We’re talking $15,000-20,000 just to keep using their own information.

Ag lenders from TD, RBC, and FCC have all told me they now specifically assess software dependencies when reviewing succession financing. Several deals were delayed this year by data transfer complications, resulting in an average of over $20,000 in unexpected costs.

Data Migration Costs by Farm Size

Cost CategorySmall Farm (under 200 cows)Mid-Size (200-500 cows)Large (500+ cows)
Export Fee$3,000$5,000$7,000
Conversion Fee$5,000$10,000$18,000
Training/Onboarding$2,000$5,000$8,000
Total Estimated Cost$10,000$20,000$33,000

Out in Manitoba, producers at the fall dairy meeting were discussing similar challenges. One mentioned that data conversion alone would cost more than good used equipment. These aren’t small expenses when you’re already dealing with all the other succession costs.

Three Questions That Save Your Farm

Before you sign anything, get these answers in writing:

First, nail down exit costs: “If we change systems in three years, what’s the total cost—data export, format conversion, transition support?” If you get vague responses about “reasonable fees,” that’s a red flag. Get specific numbers.

Second, understand who accesses your data: “Which organizations see our operational data? For what purposes? How do we modify permissions?” Watch especially for words like “perpetual” and “irrevocable.”

Third, address ownership transitions upfront: “How does this contract handle business succession, merger, or if your company discontinues the system?”

Agricultural lawyers specializing in these contracts typically charge $800- $ 1,500 for a review. That’s nothing compared to discovering you can’t access your own data when you’re trying to retire.

Farmers Fighting Back

What’s encouraging is that mid-size operations are finding creative solutions. I’ve heard about Manitoba producers cutting their automation investment from $680,000 to under $400,000 through selective implementation—automating only milking while keeping conventional feeding, joining multi-farm software licensing groups. They’re capturing most of the efficiency gains at a fraction of the cost.

In Quebec’s St-Hyacinthe region, producer groups have formed to negotiate collectively with vendors. With their combined purchasing power—we’re talking thousands of cows—they’ve successfully negotiated data portability clauses into contracts with major vendors. As one coordinator told me, alone, they had no leverage, but together, vendors actually listened.

Organizations are starting to pay attention too. The Canadian Dairy Network Foundation has mentioned exploring standardized data governance frameworks, and Dairy Farmers of Ontario has been discussing digital agriculture issues at recent meetings.

Making It Work for Your Operation

Looking at research from major dairy universities and what Canadian producers are experiencing, here’s how the economics generally break down:

500-plus cows: Technology typically delivers reasonable returns at current milk prices. Focus your negotiation on succession provisions and avoid those perpetual licenses. DFO has contract-review resources on its website worth checking out.

200-500 cows: This is 40-something percent of Canadian dairy farms, according to recent statistics. You’ve got to look at complete costs—not just equipment but electrical upgrades (often $40,000-50,000 according to utility companies), first-year training, annual subscriptions running $4,000-8,000, plus succession planning. Group purchasing through cooperatives can knock 15-20% off costs.

Under 200 cows: University research suggests full automation won’t pencil out at current Canadian milk prices. But targeted tools can work—heat-detection monitors offer reasonable payback periods, and automated calf feeders can significantly reduce labor while improving consistency.

The Bottom Line

Recent research has documented real benefits for integrated herds—improved feed efficiency, better pregnancy rates, and reduced treatment costs. The technology itself works brilliantly.

But the contract structures? They heavily favor vendors over producers. And you know what? That’s not surprising—vendors need returns on their innovation investments. The issue is that the balance has tilted too far.

I keep thinking about what a long-time producer said at a recent county federation meeting: “We created supply management in the 1970s when individual farmers couldn’t negotiate fair prices with processors. Today’s data situation feels awfully similar.”

He’s got a point. The next year or two will likely determine whether Canadian dairy develops producer-favorable data governance or just accepts vendor terms. Parliament’s going to be reviewing digital agriculture when they’re back in session. Provincial organizations are mobilizing. Your voice matters here.

Stop signing contracts you haven’t read. Stop letting vendors treat your data like their property. Stop accepting “that’s just how it works” as an answer.

You own the cows. You own the quota. You damn well better own the data.

Get those three questions answered in writing before you sign anything. Join or form a producer group in your area if you can. Push your provincial organization to take this seriously.

Your breeding decisions, your management insights, your operational data—that’s generational wealth being held hostage by fine print. Time to take it back. 

Key Takeaways

  • Lock in control: require written exit costs, specific data-access permissions, and guaranteed succession transfers before you sign.
  • Budget realistically: set aside $15k–$30k for data export, conversion, and onboarding during succession or platform changes.
  • Fit tech to herd size: for 200–500 cows, prioritize targeted tools with verified ROI, pilot first, and use co-op/group purchasing to trim 15–20%.
  • Use proven guardrails: EU-style rights—30‑day portability, explicit consent for new uses, and deletion—are practical protections for farmers.
  • Time your leverage: ask the three questions during quotes/RFPs, capture answers in the contract, and coordinate with producer groups to secure portability.

Complete references and supporting documentation are available upon request by contacting the editorial team at editor@thebullvine.com.

Learn More:

The Sunday Read Dairy Professionals Don’t Skip.

Every week, thousands of producers, breeders, and industry insiders open Bullvine Weekly for genetics insights, market shifts, and profit strategies they won’t find anywhere else. One email. Five minutes. Smarter decisions all week.
NewsSubscribe
First
Last
Consent
Send this to a friend