







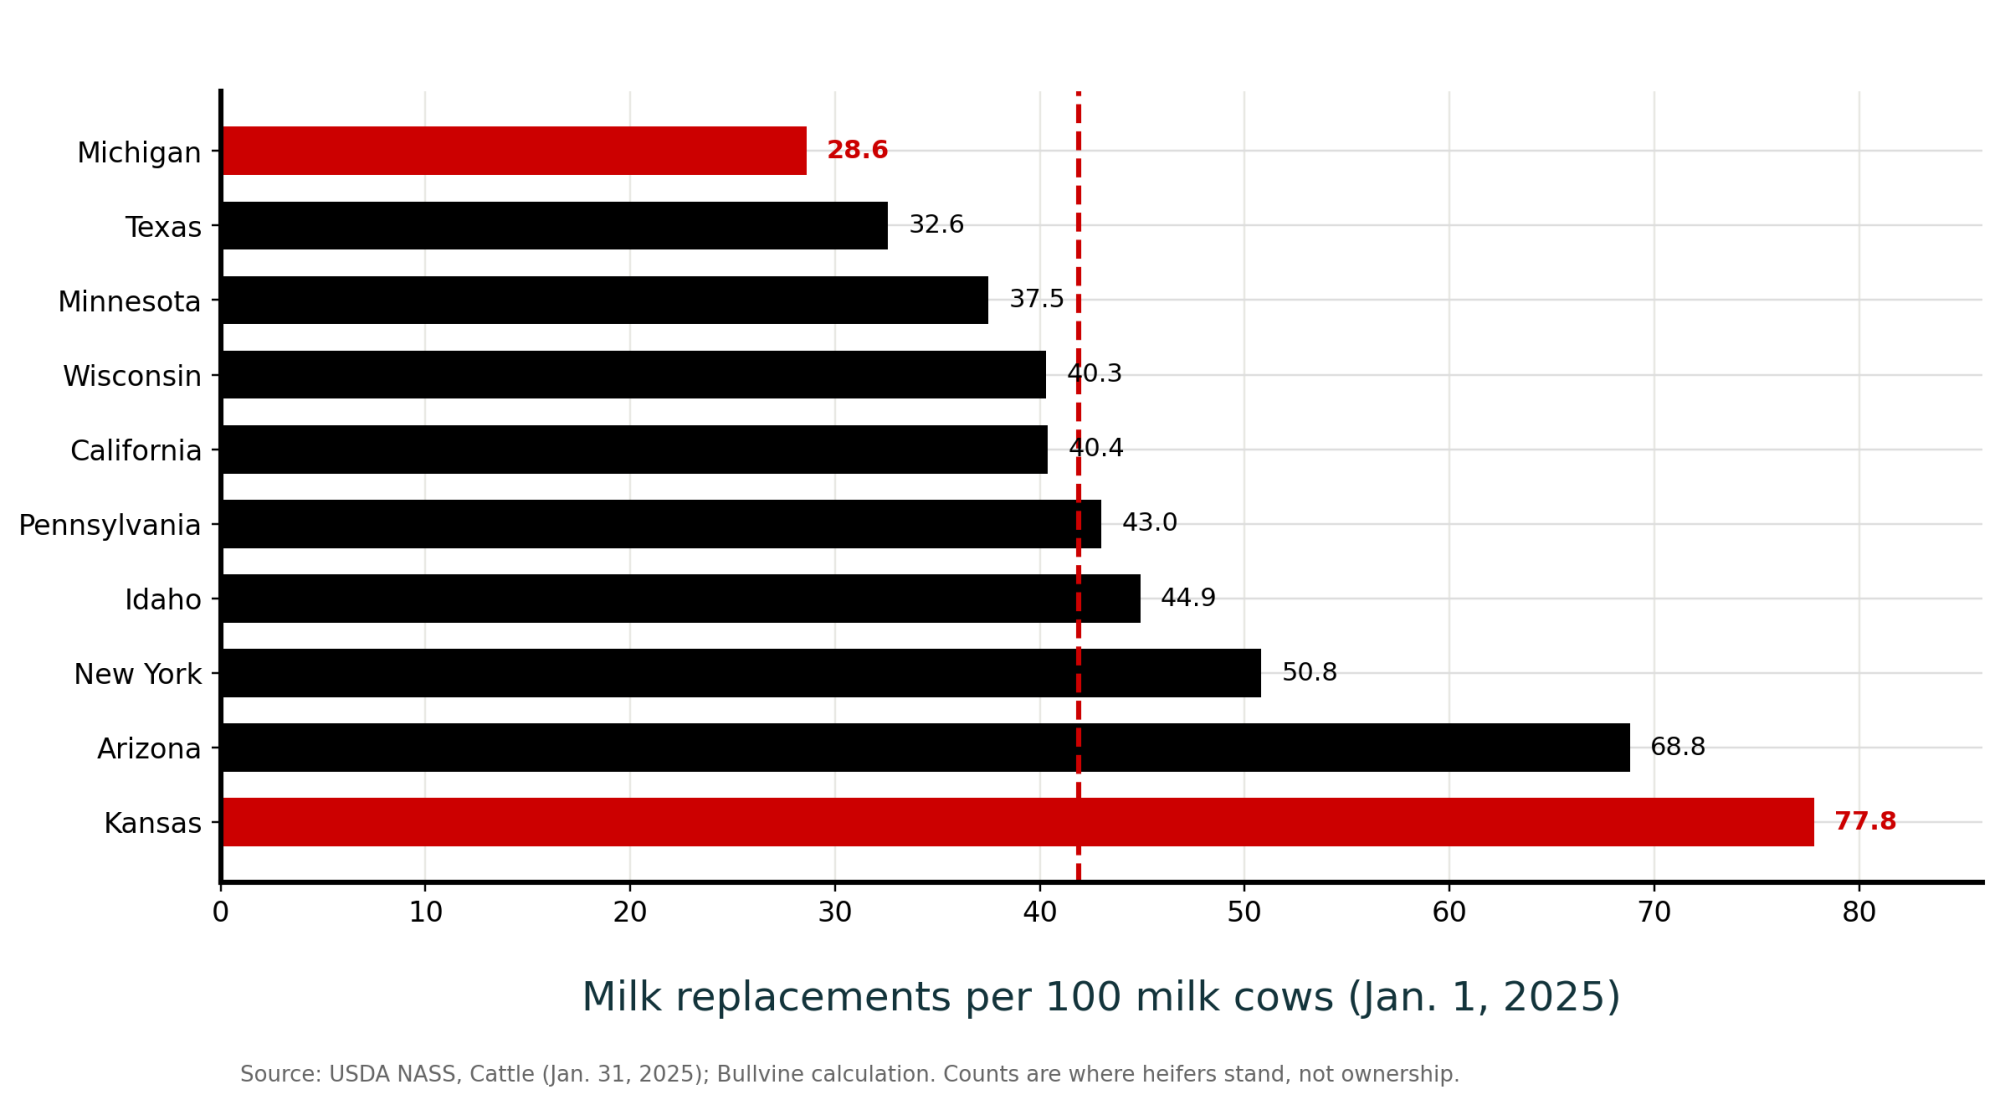
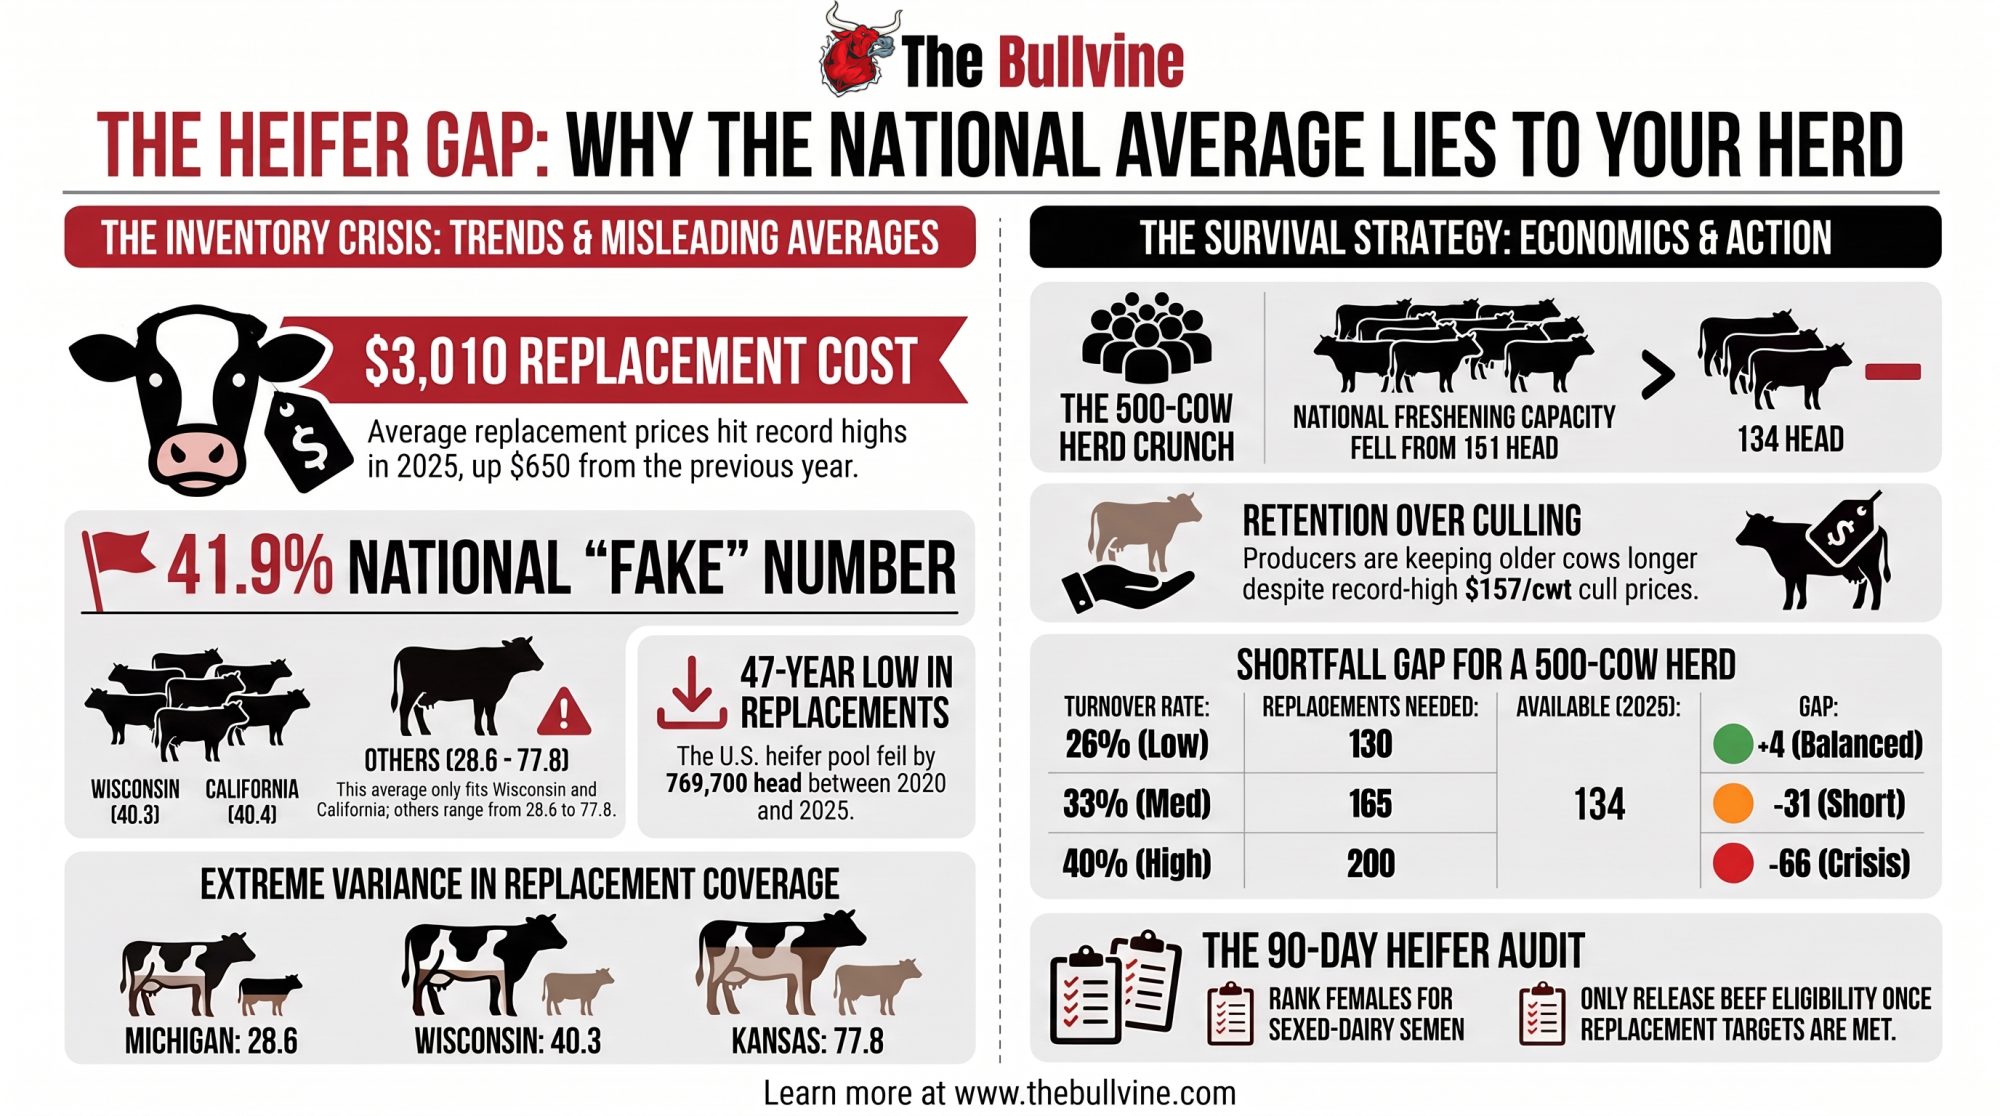
Wisconsin sits at 40.3 replacements per 100 cows. California at 40.4. National is 41.9 — so a third of the herd is fine using it, and everyone else has been quoting a stranger’s number.
Executive Summary: USDA’s replacement-heifer pool fell 769,700 head between 2020 and 2025 while the milk-cow herd held flat, and a DRMS analysis of continuously DHIA-tested Holstein herds shows third-and-later-lactation culling down 7.6 points across the same years — even as cull cows hit a record US$157.00 per cwt. Joining two USDA columns nobody had joined shows why: national freshening capacity for a 500-cow herd fell from 151 head to 134, leaving a 33%-turnover herd 31 short. State coverage runs 49 points wide, from 28.6 to 77.8.
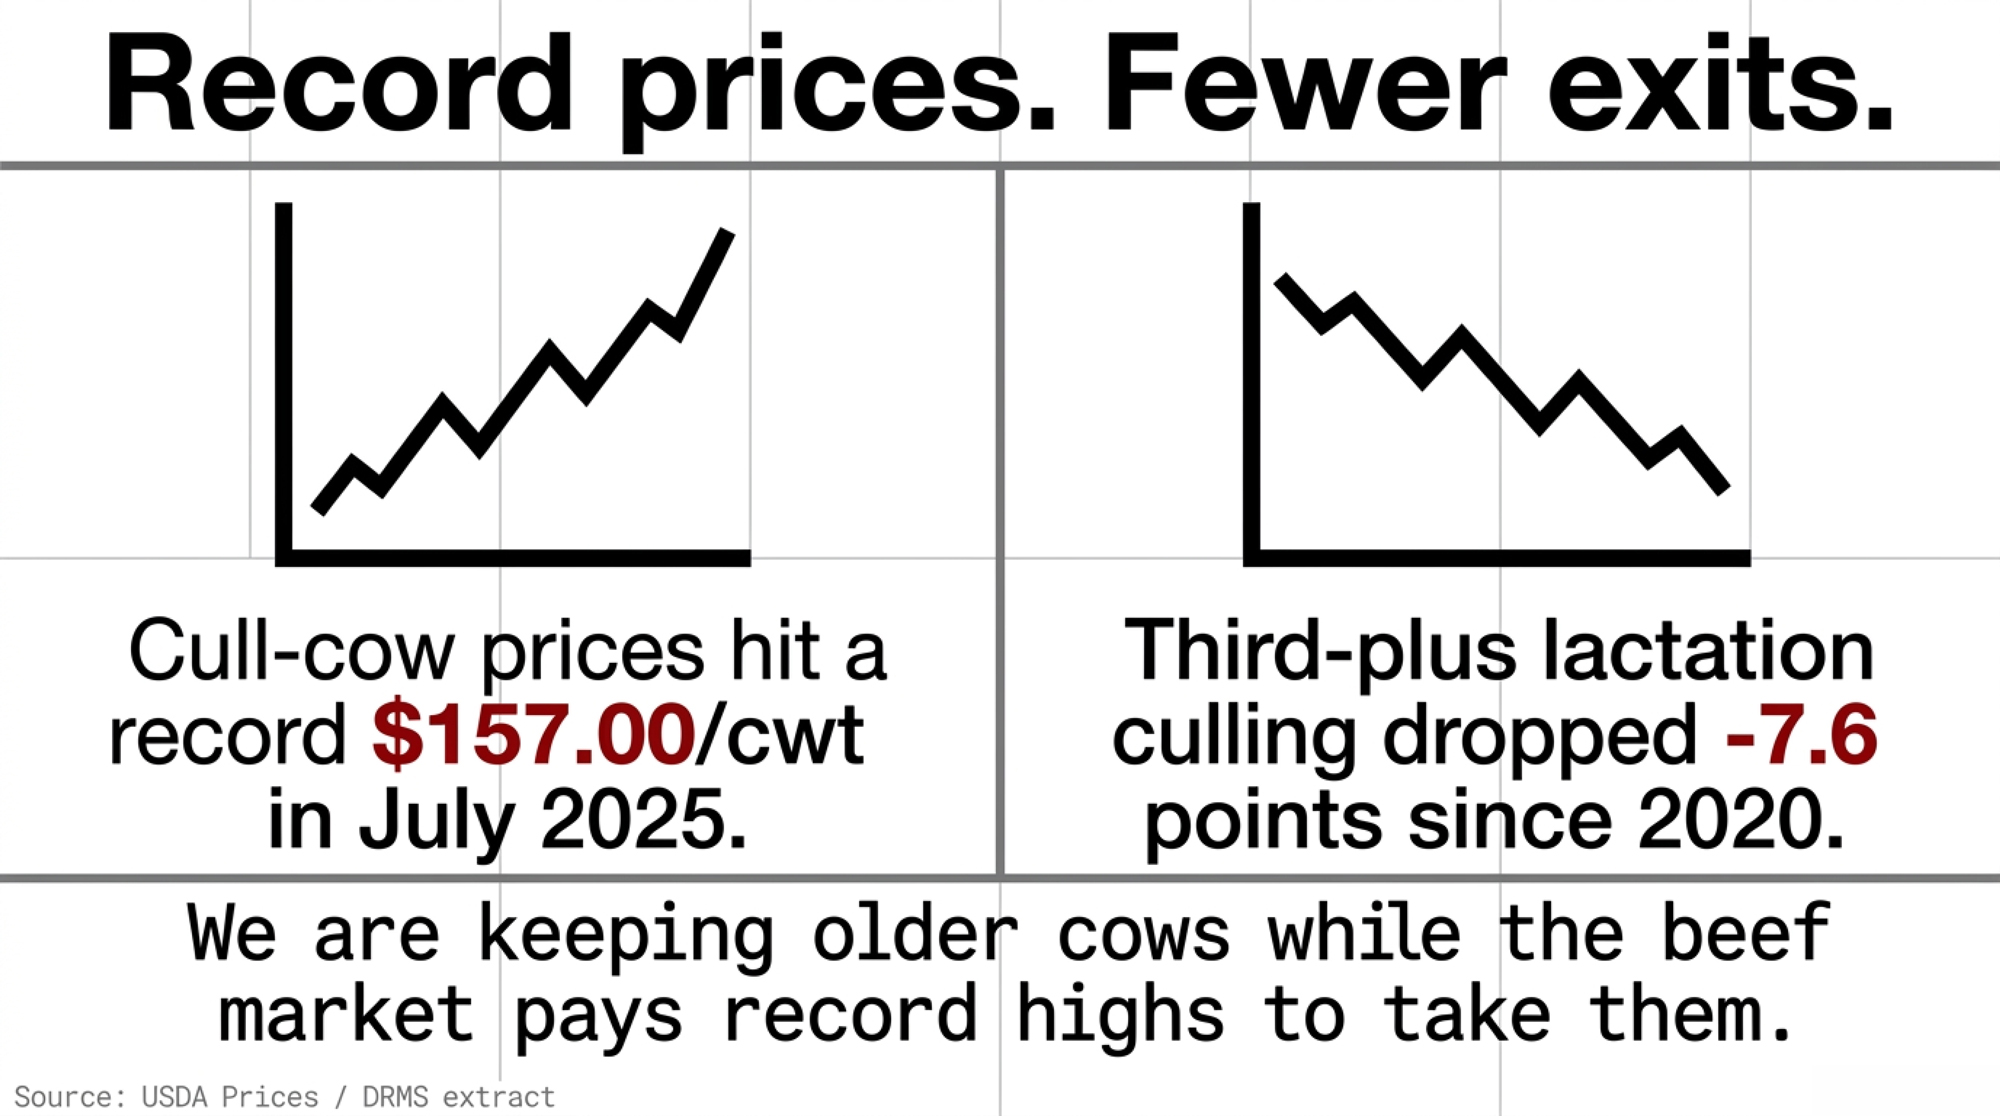
Cull-cow prices hit their highest monthly average on record in July 2025 and herds on DRMS records were culling less, not more. The average price received for cows, beef cows and cull dairy cows sold for slaughter reached US$157.00 per cwt that month, US$15.00 above July 2024. In the same year, a DRMS analysis of Holstein herds on continual DHIA test, shared publicly on LinkedIn by DRMS’s Dr. Robert Fourdraine, put third-and-later-lactation culling at 46.1%, down 7.6 points since 2020.
Behind that retention sits a supply problem. The dairy replacement heifer inventory reported by USDA’s National Agricultural Statistics Service fell 769,700 head between January 1, 2020 and January 1, 2025 on the agency’s revised figures, while the national milk-cow herd finished essentially unchanged. Replacement pressure contributed to lower culling. That is an inventory signal, not proof that beef semen caused it.
Where the culling actually went
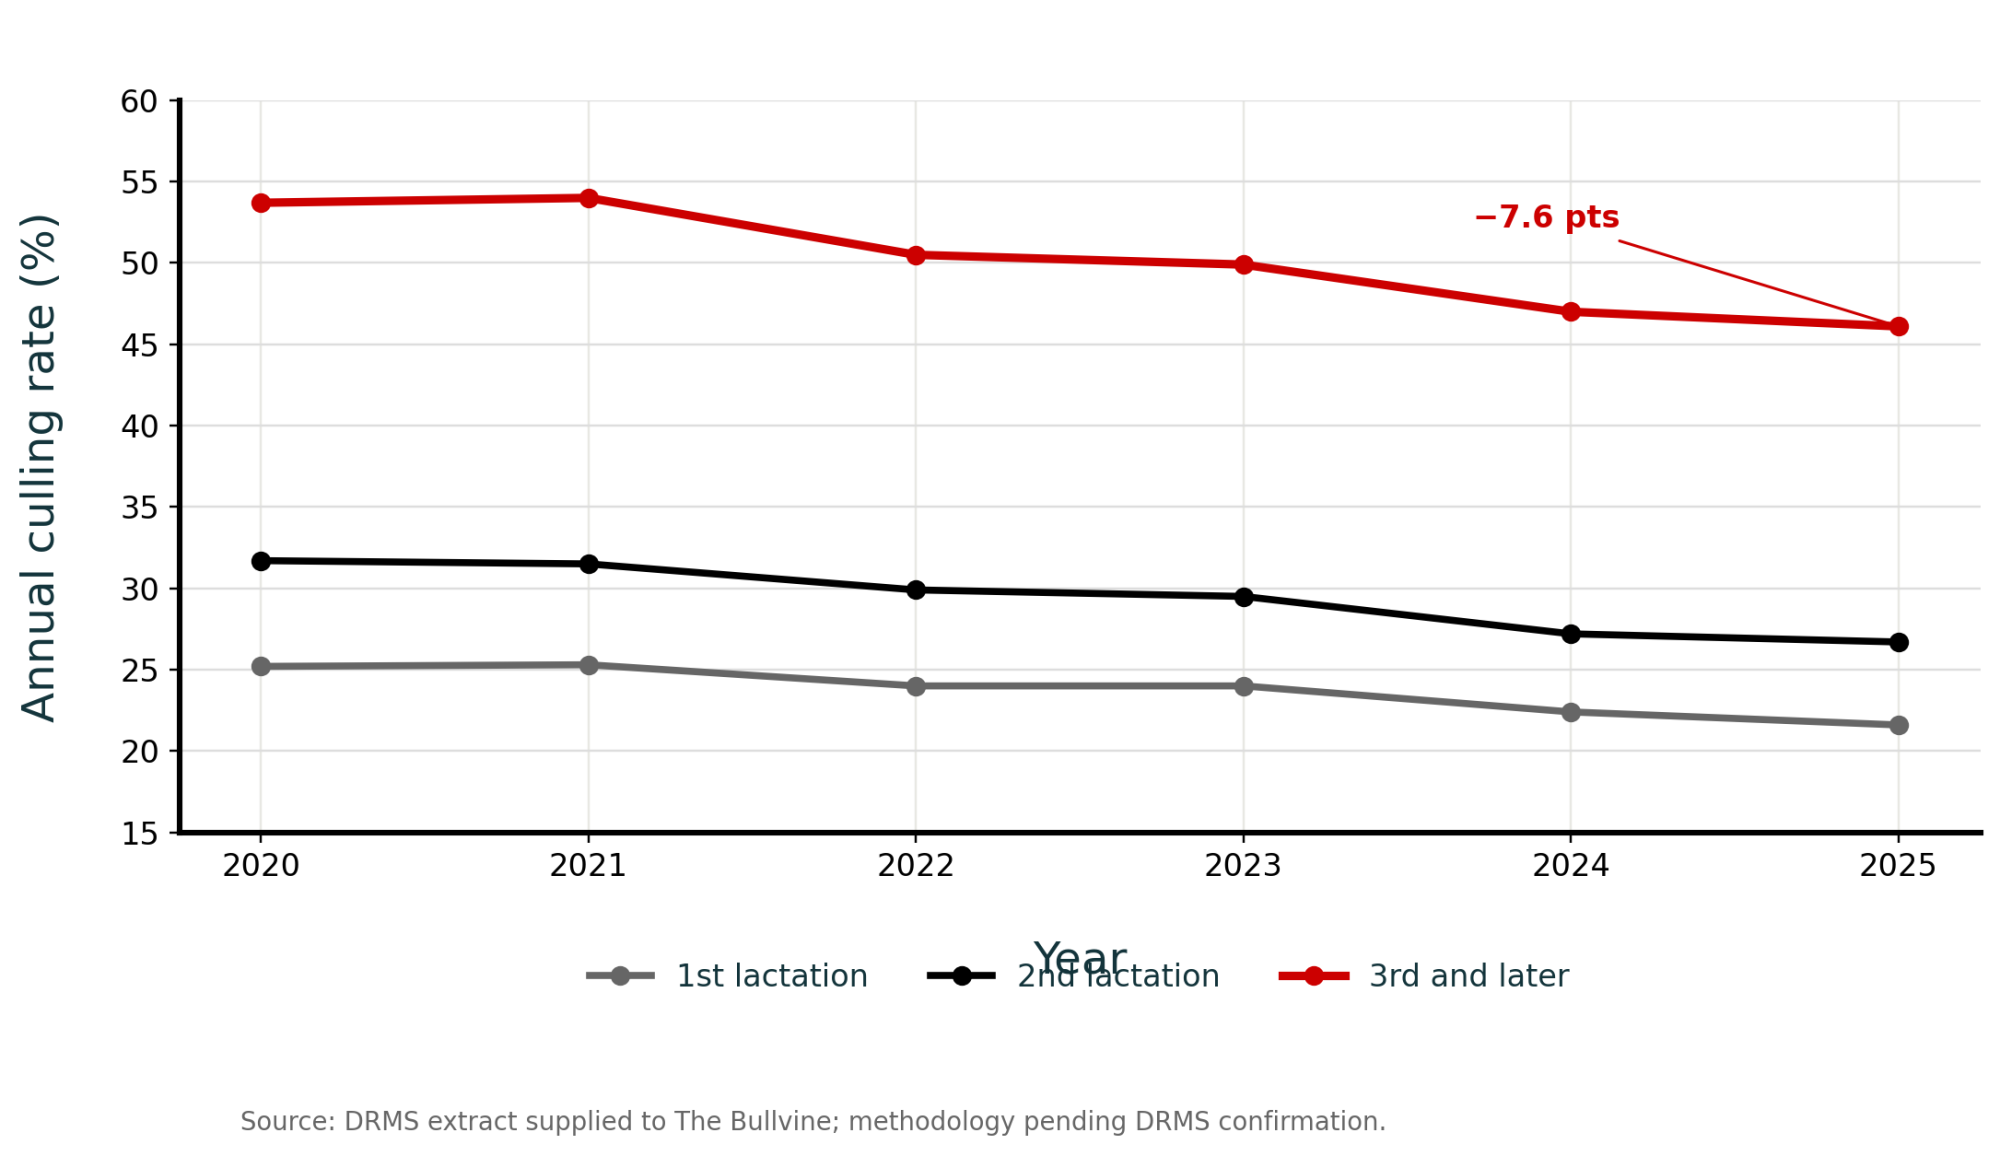
Nothing moved in 2021. First-lactation culling sat at 25.2% in 2020 and 25.3% in 2021. Second lactation went from 31.7% to 31.5%. Third-plus edged up from 53.7% to 54.0%.
The break starts in 2022 and holds through 2025 in all three groups — four consecutive declining years, not a two-point wobble.
| Lactation group | 2020 | 2021 | 2022 | 2023 | 2024 | 2025 | Change | Relative |
| 1st | 25.2% | 25.3% | 24.0% | 24.0% | 22.4% | 21.6% | -3.6 pts | -14.3% |
| 2nd | 31.7% | 31.5% | 29.9% | 29.5% | 27.2% | 26.7% | -5.0 pts | -15.8% |
| 3rd and later | 53.7% | 54.0% | 50.5% | 49.9% | 47.0% | 46.1% | -7.6 pts | -14.2% |
The 7.6-point move is the biggest in absolute terms. Look at the relative declines, though: 14.3%, 15.8%, 14.2%. Nearly identical. This isn’t only older cows getting a reprieve. Exits slowed across the whole productive herd, and the head-count effect landed hardest where turnover was always highest.
Run it on a 500-cow herd carrying 150 third-and-later-lactation cows. A 7.6-point drop is about 11 of those cows staying who would have left in 2020.
Does 41.9 mean anything in your state?
The national 41.9 is where every story about this shortage stops. For most herds, it’s also where it stops being useful.
The Bullvine Replacement Coverage Ratio divides milk-replacement heifers by milk cows and multiplies by 100. Both inputs come from the same NASS table each January. Run it on the state pages and coverage ranges from 28.6 replacements per 100 cows in Michigan to 77.8 in Kansas on January 1, 2025 — a 49-point spread the national number hides completely.
| State | Milk cows (1,000 head) | Milk replacements (1,000 head) | Replacements per 100 cows |
| Michigan | 440.0 | 126.0 | 28.6 |
| Texas | 675.0 | 220.0 | 32.6 |
| Minnesota | 440.0 | 165.0 | 37.5 |
| Wisconsin | 1,265.0 | 510.0 | 40.3 |
| California | 1,710.0 | 690.0 | 40.4 |
| Pennsylvania | 465.0 | 200.0 | 43.0 |
| Idaho | 680.0 | 305.0 | 44.9 |
| New York | 630.0 | 320.0 | 50.8 |
| Arizona | 189.0 | 130.0 | 68.8 |
| Kansas | 180.0 | 140.0 | 77.8 |
| United States | 9,349.3 | 3,914.3 | 41.9 |
Bullvine calculation. Published evidence: USDA NASS, Cattle, January 31, 2025, state tables, January 1, 2025 inventory, head. Bullvine math: state milk replacements ÷ state milk cows × 100. Ratios built on small cow bases move further on the same absolute change — Kansas and Arizona each carry under 200,000 milk cows against Wisconsin’s 1.27 million, so treat the extremes as directional rather than precise.
One caution before you locate yourself on that list. NASS counts heifers where they physically stand, not who owns them. Kansas at 77.8 and Arizona at 68.8 carry custom-raised animals destined for herds in other states, and the reverse holds too — a Michigan or Texas herd may own heifers growing out of state, which makes its real position better than 28.6 or 32.6 suggests. This is a location map, not an ownership ledger. Check your contracts before you treat a state number as your supply.
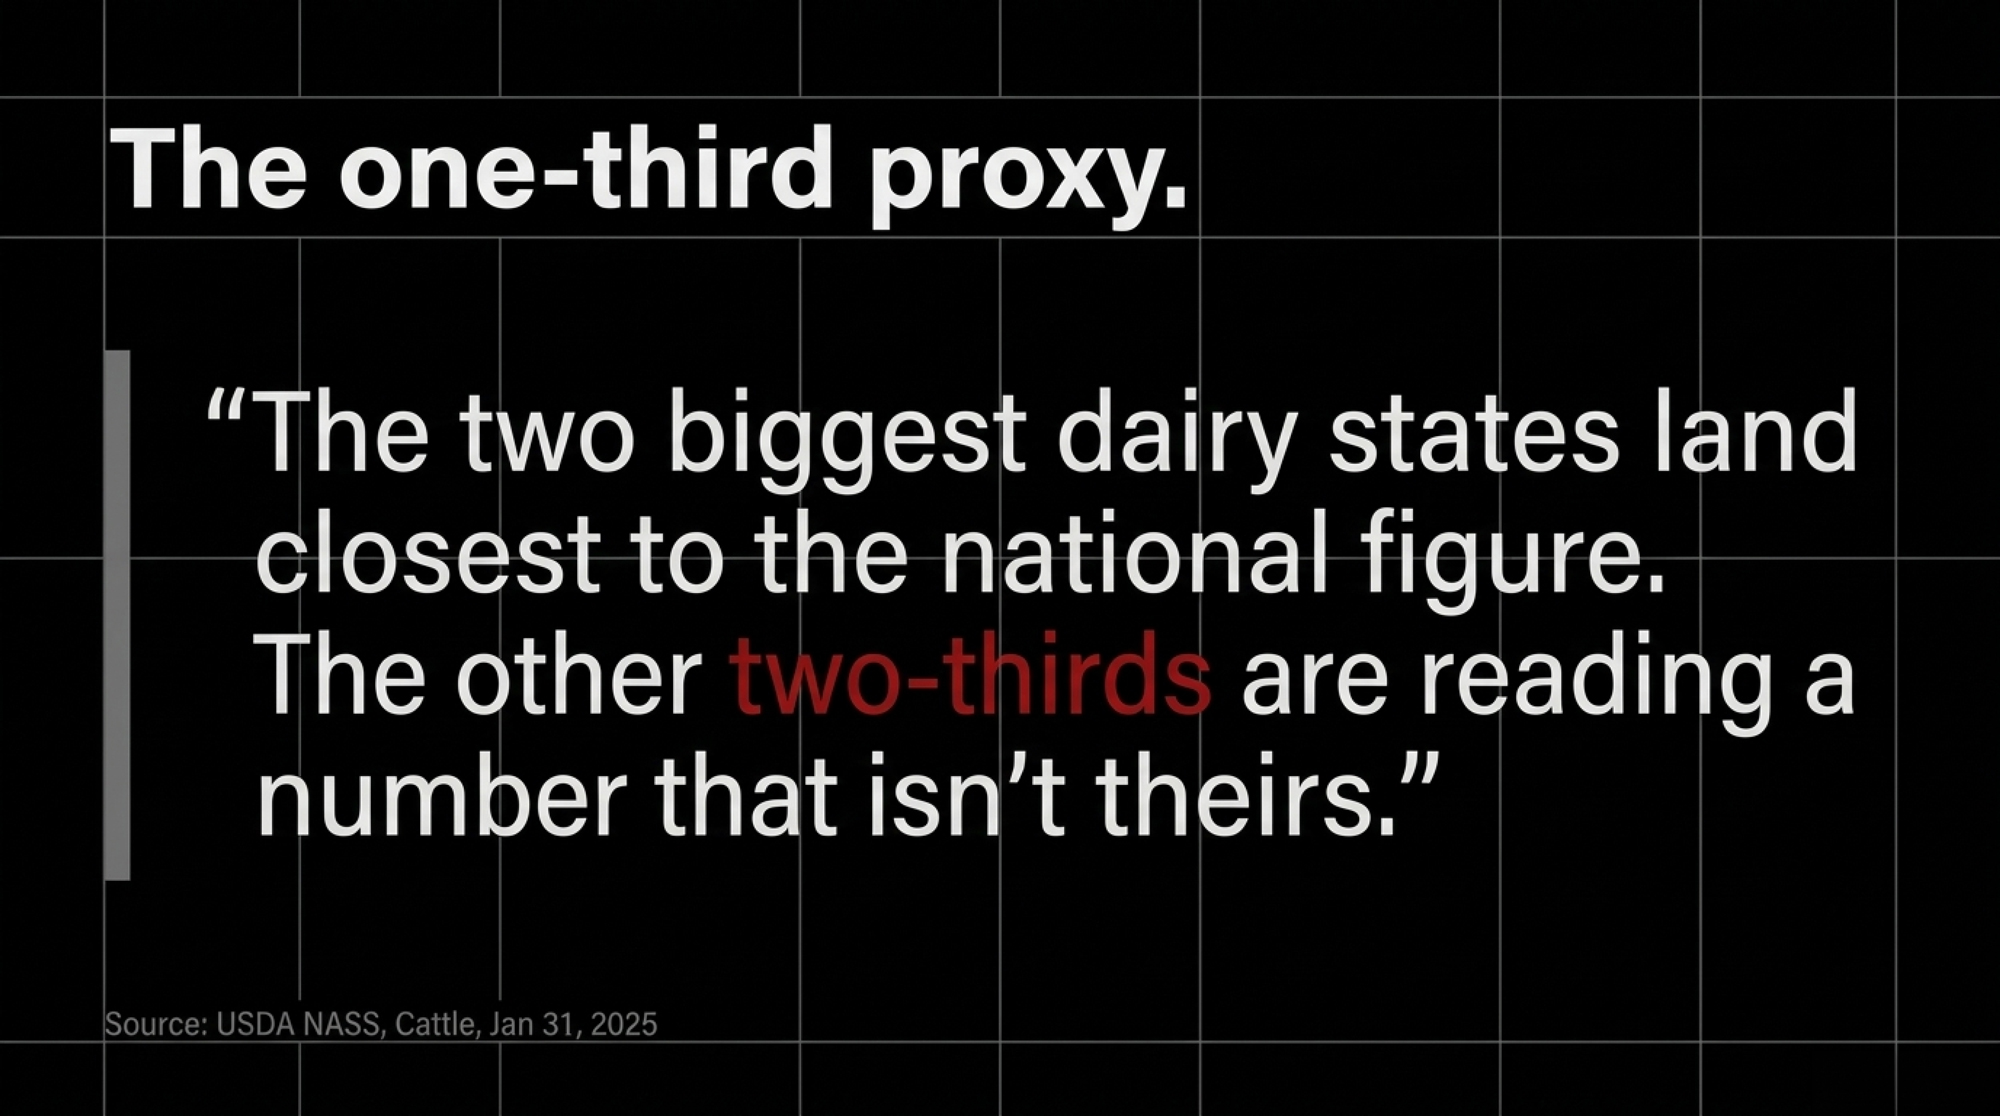
The two biggest dairy states land closest to the national figure — Wisconsin at 40.3 and California at 40.4, inside 1.6 points of 41.9. Together they hold roughly a third of the U.S. herd on that same table, so for that third the national number is a fair proxy. The other two-thirds are reading a number that isn’t theirs.
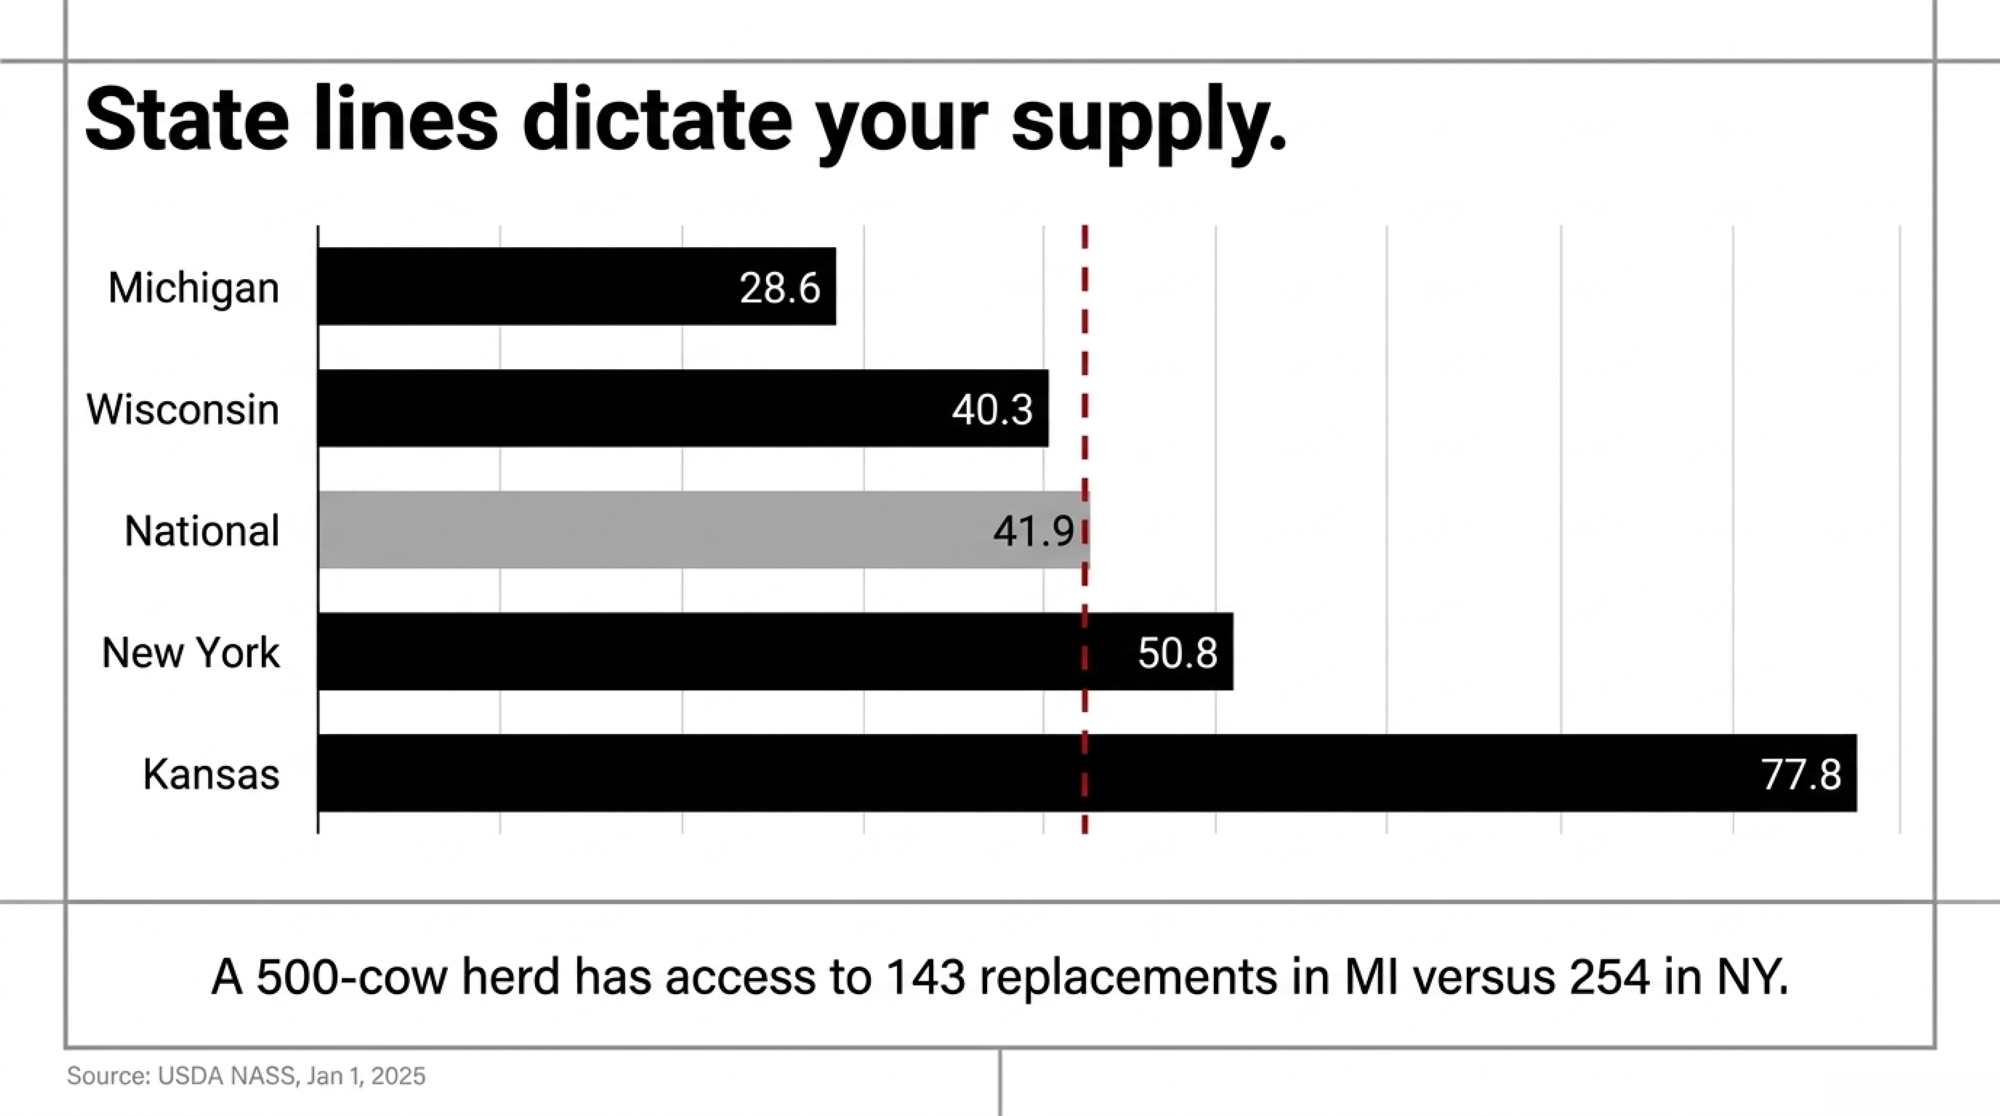
A 500-cow herd’s share of the state pool runs 143 head in Michigan, 163 in Texas, and 254 in New York. Same national headline, three different decisions.
Is the heifer pipeline really that tight?
The obvious response to a shrinking heifer supply is to buy replacements, not keep older cows. The national trend says why that stopped working.
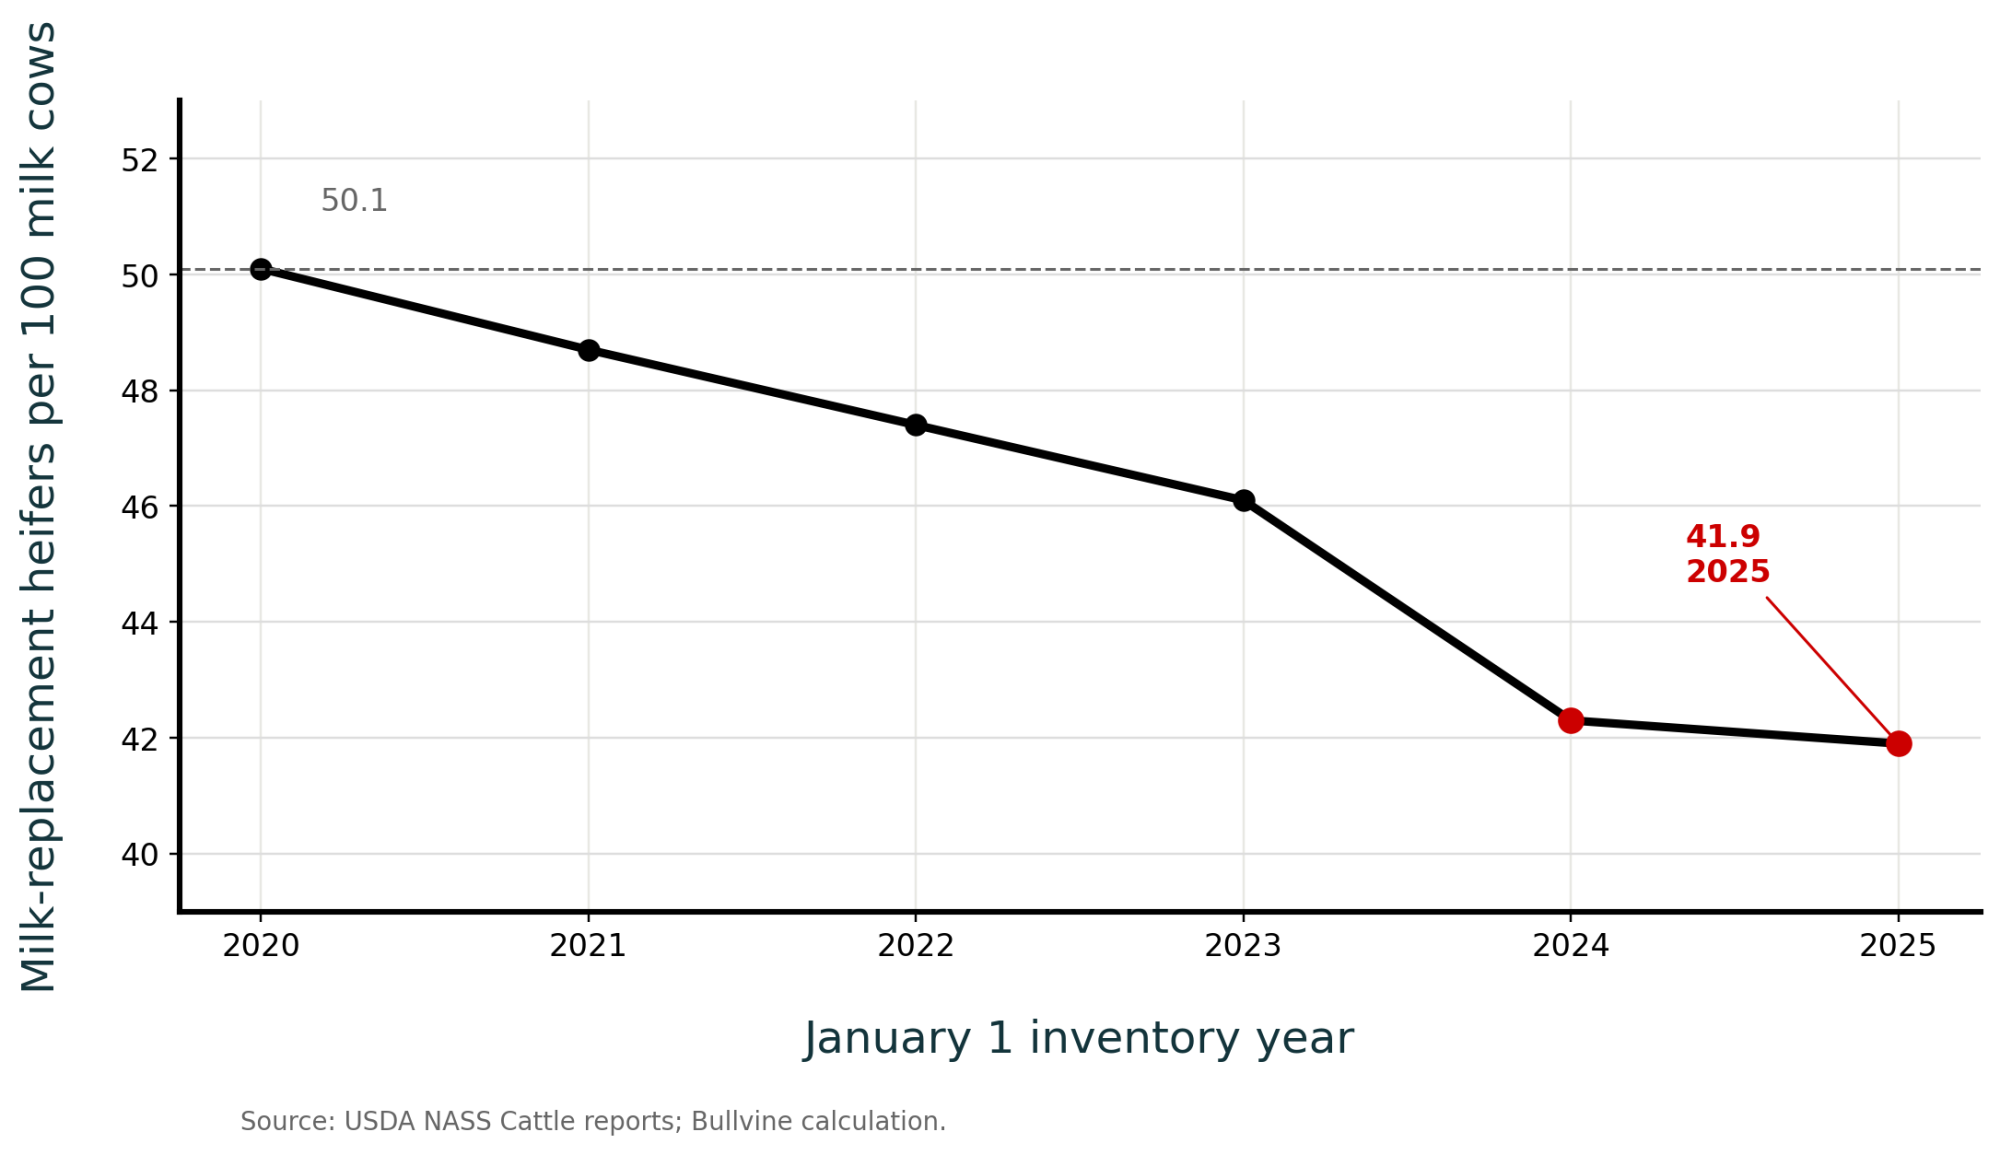
Most beef-on-dairy programs rest on one assumption: a shortfall can be bought out. That assumption holds when replacements are plentiful, and through 2021 the national pool held above 48 replacements per 100 cows. Both series turn in the same window — coverage drops below 48 in 2022, and the DRMS culling decline starts in 2022. Coverage is a January 1 inventory and culling an annual rate, so read the alignment as directional rather than same-day.
Replacement numbers haven’t been this low in absolute terms since 1978. The Bullvine put a price on that low in January: 800,000 missing heifers, and who pays the bill? What the 1978 framing misses is coverage — how many replacements stand behind each cow, year by year.
| January 1 | Milk-replacement heifers | Milk cows | Replacements per 100 cows |
| 2020 | 4.684 million (revised) | 9.3426 million | 50.1 |
| 2021 | 4.60 million | 9.44 million | 48.7 |
| 2022 | 4.4406 million | 9.3770 million | 47.4 |
| 2023 | 4.3372 million | 9.4025 million | 46.1 |
| 2024 | 3.9512 million | 9.3468 million | 42.3 |
| 2025 | 3.9143 million | 9.3493 million | 41.9 |
Bullvine calculation. Methodology Note — published evidence: USDA National Agricultural Statistics Service, Cattle, U.S. national, head, January 1 inventory. The 2020 and 2021 rows come from the January 29, 2021 release, the 2022 and 2023 rows from the January 31, 2023 release, and the 2024 and 2025 rows from the January 31, 2025 release, using revised figures where a later release supersedes an earlier one. The January 2020 release originally reported 4.64 million replacements; the January 2021 release revised that to 4.684 million, and the revised figure is used throughout. Stated assumption: milk-replacement heifers weighing 500 pounds and over represent the available replacement pool, which is broader than heifers expected to calve within the year. Bullvine math: heifers ÷ cows × 100. The 2021 row derives from figures published to three significant figures and is accurate to roughly ±0.2.
Coverage fell from 50.1 to 41.9 — about eight fewer replacements behind every hundred cows. The pool contracted 16.4%, while milk cows moved 6,700 head, a difference well inside the agency’s own revision range.
It hasn’t released either. The January 30, 2026 Cattle report put milk replacements at 3.90 million, down slightly again, while milk cows climbed 2% — about 220,000 head — to 9.57 million. We called this America’s worst replacement crisis in 47 years in August 2025, and the 2026 count didn’t soften it. More stalls, fewer heifers behind them.
What beef semen is and isn’t doing
A 2023 Journal of Dairy Science analysis of U.S. Holstein and Jersey females found sexed-dairy and beef-semen inseminations both rose from 2019 through 2021, allocated differently by parity and service number, with larger herds driving most of the increase. University of Wisconsin–Madison Extension reported that in 2020, 20% of Holstein females were bred with sexed semen while beef semen accounted for 23% of inseminations — two different bases, as the source expresses them.
That’s a deliberate two-job strategy. Replacements come from selected females, beef-cross value from the rest. It works when conception, calf survival, heifer growth, and freshening all land near plan.
It breaks when any one of four assumptions misses: pregnancy rate slips, heifer attrition rises, the herd expands, or cow exits run above what the breeding plan assumed.
The timing is what hurts. A beef mating pays a calf cheque in weeks. The missing replacement shows up two years later, long after the decision is made.
How many replacements does a 500-cow herd actually need?
Running the Numbers
Scope: 500-cow Holstein herd, U.S. national basis, 12-month window, head and USD. Herd size held flat, no purchased replacements.
NASS publishes a second line most coverage ignores: milk-replacement heifers expected to calve during the year. That removes any need to assume an entry rate.
| January 1 | Heifers expected to calve | Milk cows | Freshenings per 100 cows | Per 500-cow herd |
| 2022 | 2.8262 million | 9.3770 million | 30.1 | 151 |
| 2023 | 2.7694 million | 9.4025 million | 29.5 | 147 |
| 2024 | 2.5089 million | 9.3468 million | 26.8 | 134 |
| 2025 | 2.4998 million | 9.3493 million | 26.7 | 134 |
Bullvine calculation. Published evidence: the NASS Cattle releases linked above — 2022 and 2023 from the January 2023 report, 2024 and 2025 from the January 2025 report. Bullvine math: expected-to-calve ÷ milk cows × 100, then × 5 for a 500-cow herd. No entry-rate assumption is used anywhere in this box.
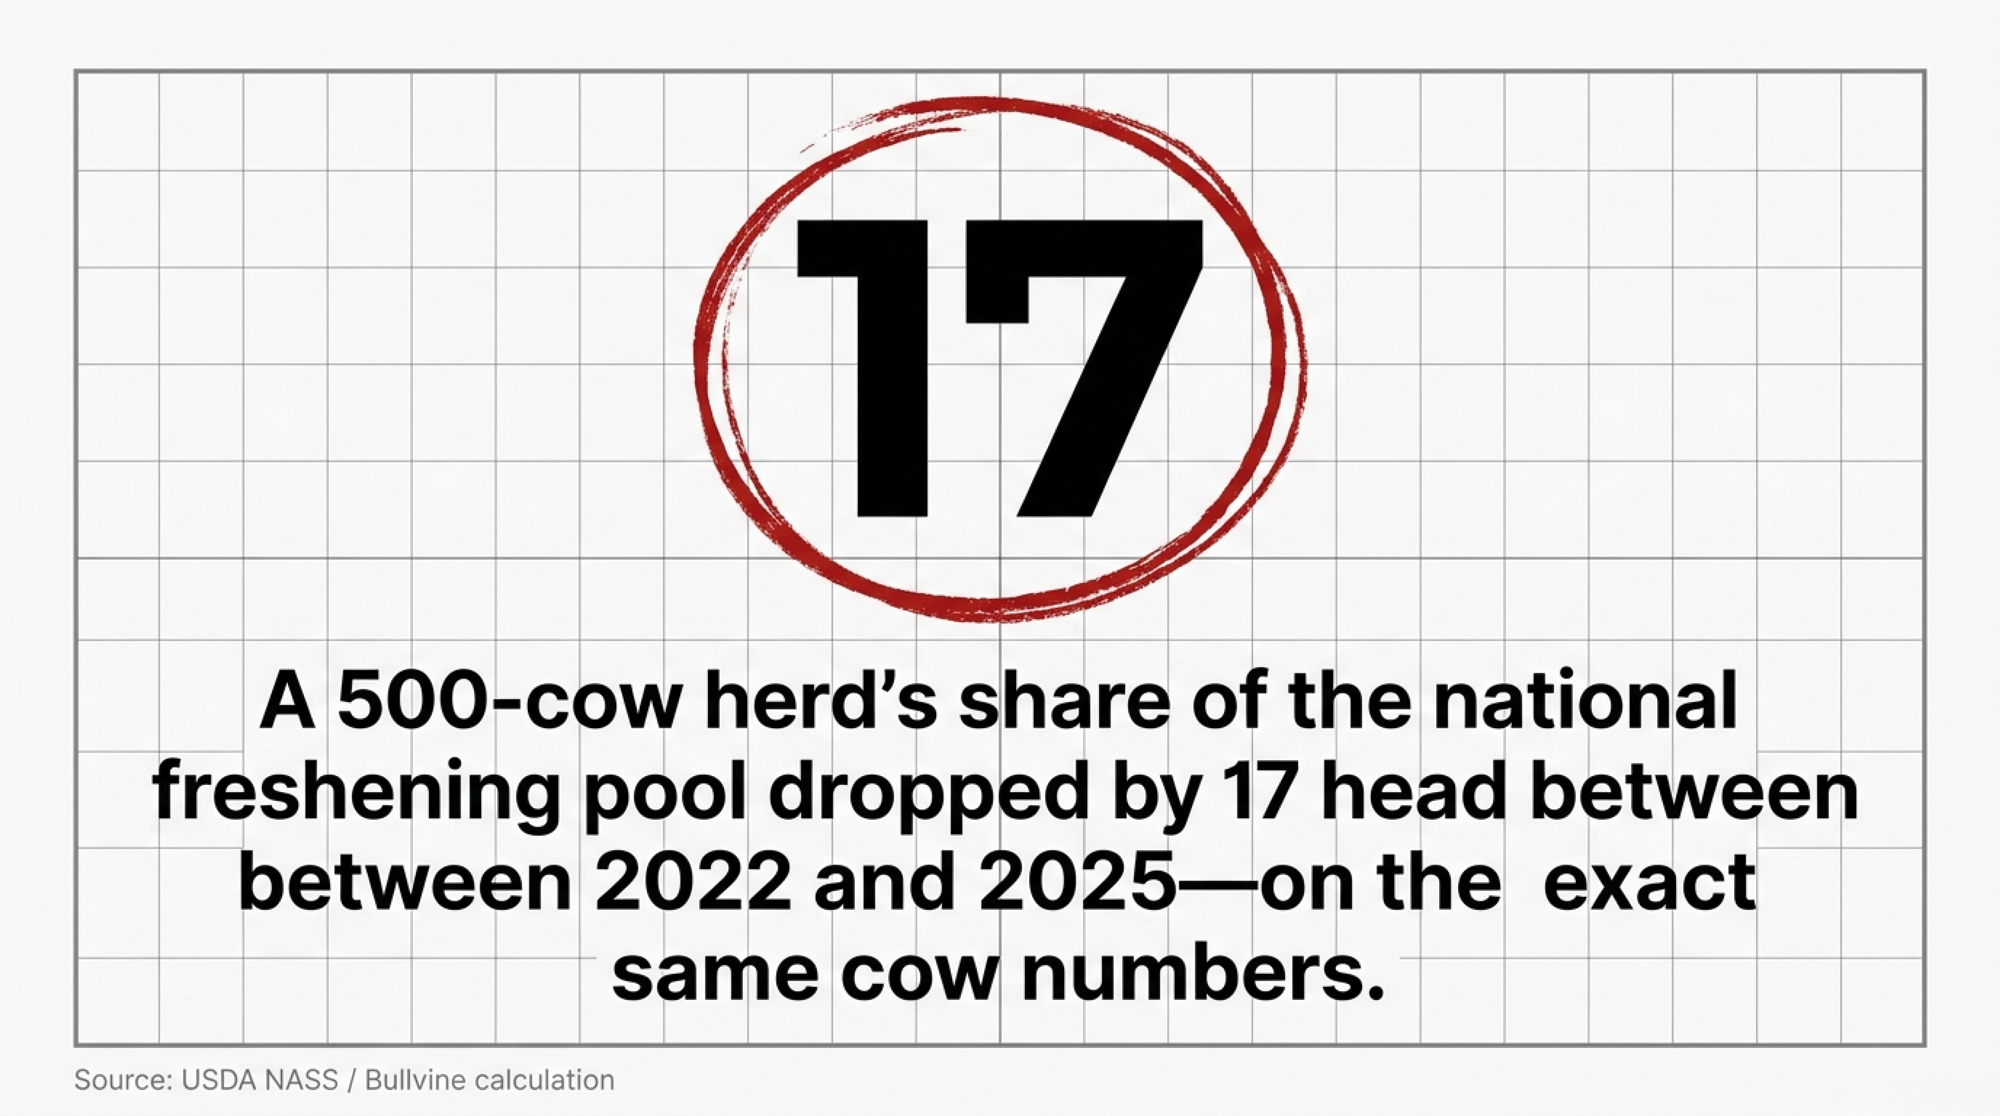
Layer 1 — sourced arithmetic. A 500-cow herd’s share of the national freshening pool fell from 151 head in 2022 to 134 in 2025.
Seventeen fewer fresh heifers a year, on the same cow numbers.
Layer 2 — demand against that supply. Turnover scenarios below are the Bullvine model, not a NASS figure.
| Turnover | Replacements needed | Available at 2025 coverage | Gap |
| 26% | 130 | 134 | +4 |
| 33% | 165 | 134 | -31 |
| 40% | 200 | 134 | -66 |
A low-turnover herd sits in balance. At 33% turnover, the herd is 31 head short, and at 40% it’s 66 short. The conservative figure the takeaways use is 31.
The NASS average price received for milk cows — animals sold for dairy herd replacement only, reported quarterly — hit US$3,010 per head in July 2025, up from US$2,360 in July 2024, per the August 29, 2025 Agricultural Prices release. Buying out of a 31-head gap at that price is roughly US$93,000. Buying back the 17-head decline in freshening capacity is roughly US$51,000. Both are model outputs conditional on the herd choosing to buy rather than retain, and neither is any farm’s books.
What this means for your operation
Next 30 days.
- Calculate replacement demand as herd size × your own annual turnover rate, using mean cow inventory as the denominator — the method the 2006 Journal of Dairy Science culling review recommends. Requires 12 months of exit records. Red-flag trigger: if you can’t produce a turnover rate from your own records, freeze beef-eligibility decisions until you can. Backfires when the denominator is inventory plus culls: that review’s worked example shows the same herd reading 25% instead of 34%, and 32% instead of 46%.
- Count heifers due to freshen in the same window, then deduct expected pregnancy loss, deaths, sales, and animals that won’t meet your entry standard. Threshold: projected freshenings under 90% of projected need moves this to the top of your list. Benchmark against your own state’s coverage, not the national 41.9.
- Pull your last three cull-cow settlements and check them against the US$157.00 per cwt July 2025 average. If your marginal cows are worth that and you’re still keeping them, name the reason out loud.
Next 90 days.
- Rank females for sexed-dairy semen and release beef eligibility only once the replacement target is covered. Requires current index or genomic ranking plus a reproduction forecast. Threshold: reset the ratio whenever pregnancy rate moves more than two points. Backfires if the ranking is done once and left, because the eligible pool shifts monthly.
- Where the gap is real, choose openly among four levers: fewer beef matings, fewer avoidable exits, purchased replacements, or a smaller expansion. Debt load decides this one more than herd size does — a heavily leveraged herd is buying replacements with borrowed money at US$3,010 a head, which makes retention and fewer beef matings the cheaper levers even when the cows are marginal. Keeping every marginal cow by default isn’t a fifth lever.
Running the retention number
The direction of this one confuses people, so run it rather than eyeball it. Keeping an older cow is not free. You give up her salvage cheque, and you accept a production and component gap against the heifer who would have replaced her. What you avoid is the purchase price.
Net cost of retention = salvage you gave up + the twelve-month cash margin gap against a fresh heifer − the purchase price you avoided. Positive means retention is the expensive choice.
Fill it with your own three numbers: your cull weight at US$157.00 per cwt live, your own cash milk and solids difference between her and a first-lactation animal over twelve months, and US$3,010 or your actual quote.
At a 1,400-pound cull weight, salvage runs about US$2,200 — roughly 73% of that July heifer price, which is why the margin gap usually decides this rather than the price spread. Run that gap on your own contract’s pay basis: a component-based milk cheque and a volume-based one weight solids and pounds differently, so the same two cows produce a different gap depending on how you get paid. Compute it from your statement, not from hundredweights.
One caveat: this is a twelve-month frame, and over multiple lactations the heifer’s longer remaining life and her own eventual salvage tilt it further toward replacement. Requires your own DHI records. We’re not supplying a margin figure because it moves too much by herd to model honestly.
Next 365 days.
- Rebuild the forecast quarterly on actual pregnancies, attrition, and exits. A plan built at 26% turnover misses badly at 40%.
- Opportunity signal: herds holding freshening coverage above the national 26.7 per 100 cows while running beef on the bottom end capture calf revenue and keep the option to sell springing heifers into a market that showed no sign of loosening in the January 2026 count. In a low-coverage state like Michigan at 28.6, that option is worth more.
- Before benchmarking your parity rates against this analysis, get your cow count in each lactation group. The 21.6%, 26.7%, and 46.1% figures answer three different parity questions and can’t be averaged unweighted into a herd number. And know that DRMS excludes cows sold for dairy from these rates — so if you calculate turnover on all exits, your figure will read higher and the two aren’t comparable. Strip dairy sales out of your own numerator first, or you’ll conclude you’re culling harder than you are.
- We’ve argued the flip side of the retention trade before: the longer a healthy cow keeps producing, the less exposed you are.
What the chart cannot tell you
The DRMS analysis is consistent with farms protecting cow inventory. It does not identify beef-semen exposure by herd, link any individual cow’s exit to projected heifer supply, or separate replacement pressure from better transition management, reproduction, udder health, facilities, labor, or planned expansion.
DRMS has now confirmed the methodology. The denominator is the average number of cows across all included herds in each year — the mean-inventory approach the 2006 Journal of Dairy Science review by Fetrow, Nordlund and Norman recommends. The numerator covers cows recorded as sold for feet and legs, low production, reproduction, injury, mastitis, disease, udder, reason not reported, and died. Cows sold for dairy — animals that go on milking in another herd — are excluded.
So this isn’t herd turnover rate. That same 2006 review defined culling to include dairy sale, slaughter or salvage, and death, and warned that dropping a destination distorts the comparison. Excluding dairy sales makes this a measure of exits that aren’t sales to other dairies — closer to what the industry means by involuntary culling than to total turnover, and lower than total turnover by the size of the dairy-sale category.
One more feature of the population worth knowing: these are herds that stayed on DHIA test for six straight years. Continuously enrolled herds aren’t a random sample of the national herd, and nothing in the analysis claims they are.
One counter-signal makes the retention read stronger. Culling fell in all three groups during 2025 — first lactation 22.4% to 21.6%, second 27.2% to 26.7%, third-plus 47.0% to 46.1% — in the same year that cow price series hit its record. Herds on DRMS records kept more cows while the beef market paid the most it ever had to take them away.
Proving beef-on-dairy changed cow-level exit decisions needs semen allocation, heifer inventory, and disposal records linked inside the same herds. DRMS says that linkage is possible but would take additional work, and it deferred two of our five questions — the cow count by lactation group, and whether herd-level beef-semen use can be tied to disposal records — to a World Dairy Expo session on October 1: Improving Calf Health: What the Data Shows and How New Traits Can Be Used, with Dr. Robert Fourdraine of DRMS and Katie Schmitt of the Council on Dairy Cattle Breeding, 11:30 a.m., Mendota 1. DRMS says that presentation will include Beef × Dairy calf numbers, herd size and replacement animals entering the herd. We’ve accepted an interview afterward and will report it.
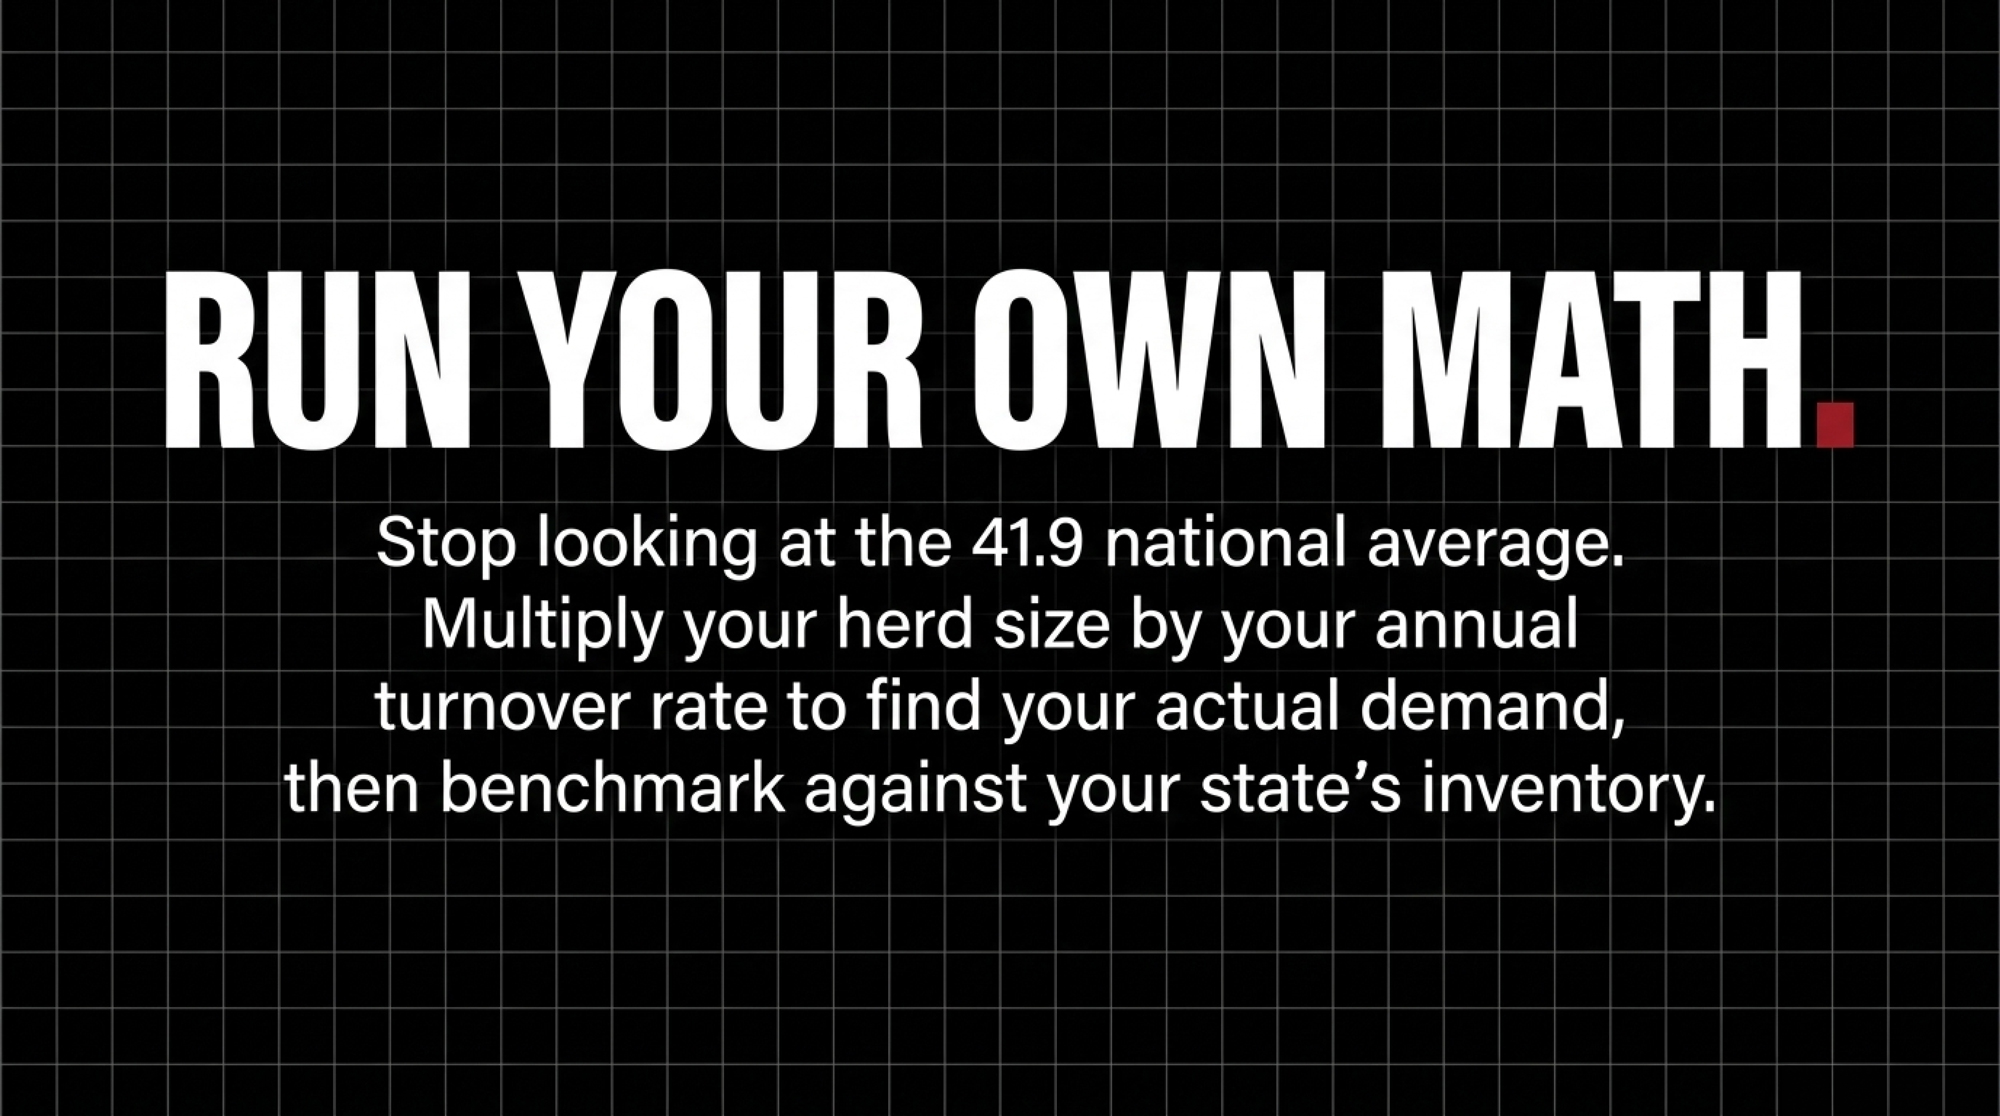
Which leaves one number worth more than any of these. Pull your heifer inventory report, count how many animals are due to freshen in the next twelve months, and compare that to the turnover rate your own exit records produced last year.
Key Takeaways
- The national 41.9 replacements per 100 cows fits Wisconsin and California almost exactly and almost nobody else — Michigan sits at 28.6, Kansas at 77.8, and state figures count where heifers stand, not who owns them.
- Joining USDA’s two heifer columns shows freshening capacity for a 500-cow herd fell from 151 head in 2022 to 134 in 2025. At 33% turnover, that’s 31 short; at 26% you’re fine.
- Retention isn’t the cheap default anymore. At US$3,010 a head, salvage recovers about 73% of a replacement’s cost, so the twelve-month margin gap decides the trade, not the price spread.
- Culling fell across every lactation group in the same year cull cows hit US$157.00 per cwt. Replacement pressure contributed to that — but nothing here proves beef semen caused it, and DRMS excludes dairy sales, so your own all-exits number won’t match these.
Heifer Supply & Retention Trade-off Calculator
Audit your pipeline deficit and test whether holding a marginal older cow beats taking the slaughter salvage check.
Cow Retention vs. Replacement Trade-Off
Your heifer pipeline falls short of expected exits. While retaining an older cow is currently cheaper than buying a replacement on the open market, verify if your margin gap includes somatic cell penalties and mastitis treatments.
UPDATE, September 18, 2026: DRMS has responded to our September 18 request and confirmed the methodology behind the culling figures. The analysis covers Holstein herds on continual DHIA test across six years from January 1, 2020; the denominator is the average number of cows across those herds each year; and the rates exclude cows sold for dairy. This article has been updated to reflect that, and to correct the description of how the figures reached us — they were shared publicly on LinkedIn by DRMS’s Dr. Robert Fourdraine, not supplied privately to The Bullvine. DRMS will present fuller herd trends, including Beef × Dairy calf numbers, herd size and replacement animals entering the herd, at World Dairy Expo on October 1, and has offered an interview afterward.
Methodology, limitations, and corrections. Inventory and price figures come from the USDA National Agricultural Statistics Service releases linked above, on U.S. national and state bases as labeled, in USD. Livestock prices are prices received on a live-weight basis. The Replacement Coverage, state coverage, and Freshening Coverage ratios and the 500-cow scenarios are Bullvine calculations on those published inputs; national averages will not match your region, herd size, or management system, and the turnover scenarios are a model rather than any farm’s books. The culling figures come from a DRMS analysis shared publicly on LinkedIn by Dr. Robert Fourdraine. DRMS confirmed the methodology to The Bullvine on September 18, 2026: Holstein herds on continual DHIA test across six years from January 1, 2020, with annual rates calculated against the average number of cows across those herds and cows sold for dairy excluded. Factual corrections: editor@thebullvine.com
Learn More
- $585 a Straw: What Every Beef Service Really Costs Your Next Heifer — Arms you with the exact breakeven formula to audit your breeding sheet this week, revealing how a $1,250 calf check quietly burns $585 in replacement value whenever springing heifers clear $3,100.
- Beef Tariff Waiver 2026: Dairy Has 90 Days to Find Out If Its Best Hedge Still Holds — Follows the money across a tightening policy window, mapping why 90% lean trim contracts held flat at $449 and how commercial dairies pulling 20% of revenue from beef can price LRP hedges through 2027.
- The $1,200 Heifer Paradox: Why Your Healthiest Cows May Produce Your Worst Replacements — Dismantles traditional parity culling wisdom with genomic data, showing why daughters of first-lactation dams outperform mature cows and how precision ranking saves 500-cow operations up to $147,000 in missed genetic gain.
 The Sunday Read Dairy Professionals Don’t Skip.
 The Sunday Read Dairy Professionals Don’t Skip.
Every week, thousands of producers, breeders, and industry insiders open Bullvine Weekly for genetics insights, market shifts, and profit strategies they won’t find anywhere else. One email. Five minutes. Smarter decisions all week.




