










DFA idles St. Albans August 17. New York’s building $2.8B in new capacity one state over. Three lines on your milk check can move — and only two are published anywhere.
Executive Summary: More than $11 billion is going into 50-plus new or expanded dairy plants across 19 states through 2028, per IDFA — and none of the 66 facilities is in New England. Vermont loses its fourth plant of the year when DFA idles St. Albans on August 17, three of the four in Franklin County. For rerouted shippers, the hauling deduct is the one moving check line with no federal formula behind it — a 19-cent shift runs $27,740 a year on a 500-cow herd.
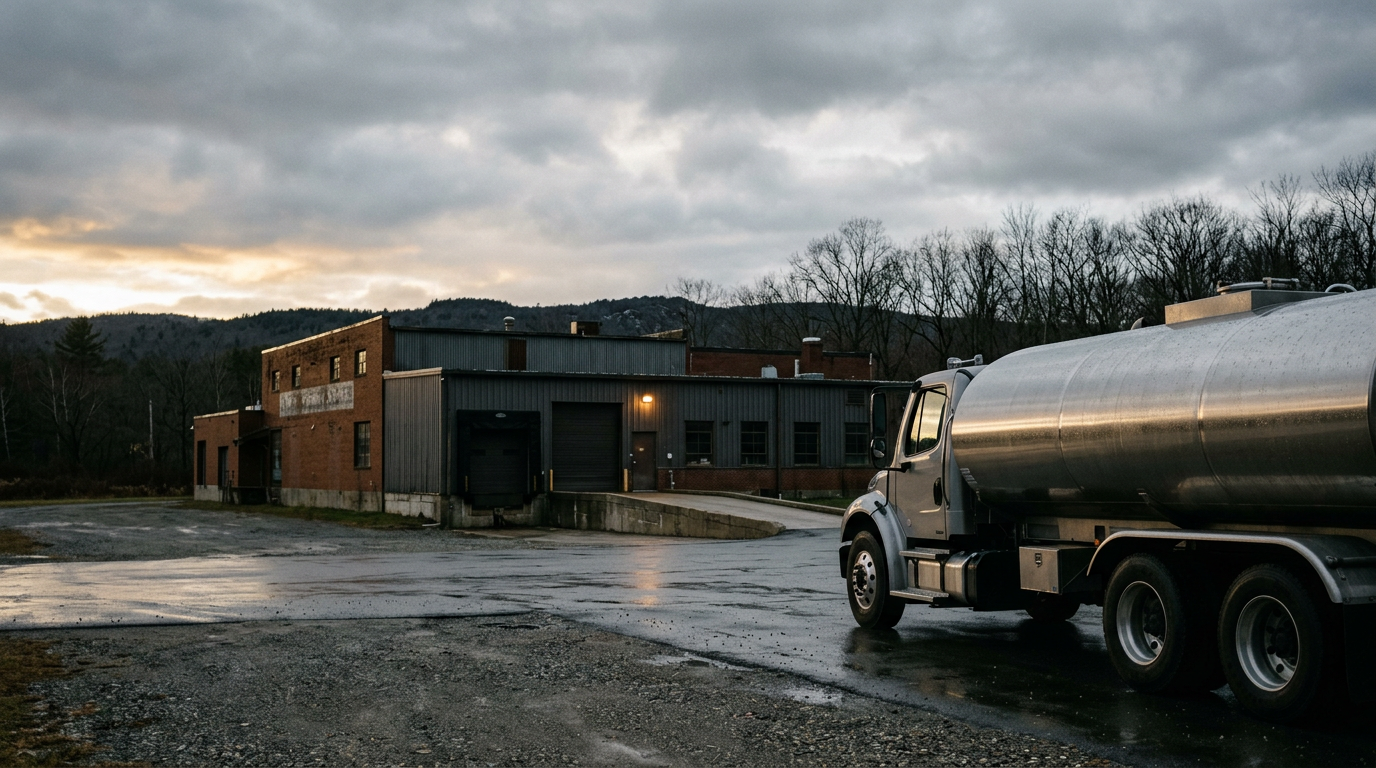
Curtis Clough, a plant worker, told VTDigger in June that employees “feel like they have supported DFA through the hard times, like Covid, and DFA is turning around and abandoning them.” He was talking about roughly 80 jobs going away when Dairy Farmers of America idles its St. Albans, Vermont facility on August 17. He’s one of about 390 people in Vermont who got that kind of news this year, and that number deserves saying on its own terms before anyone starts doing math about milk checks.
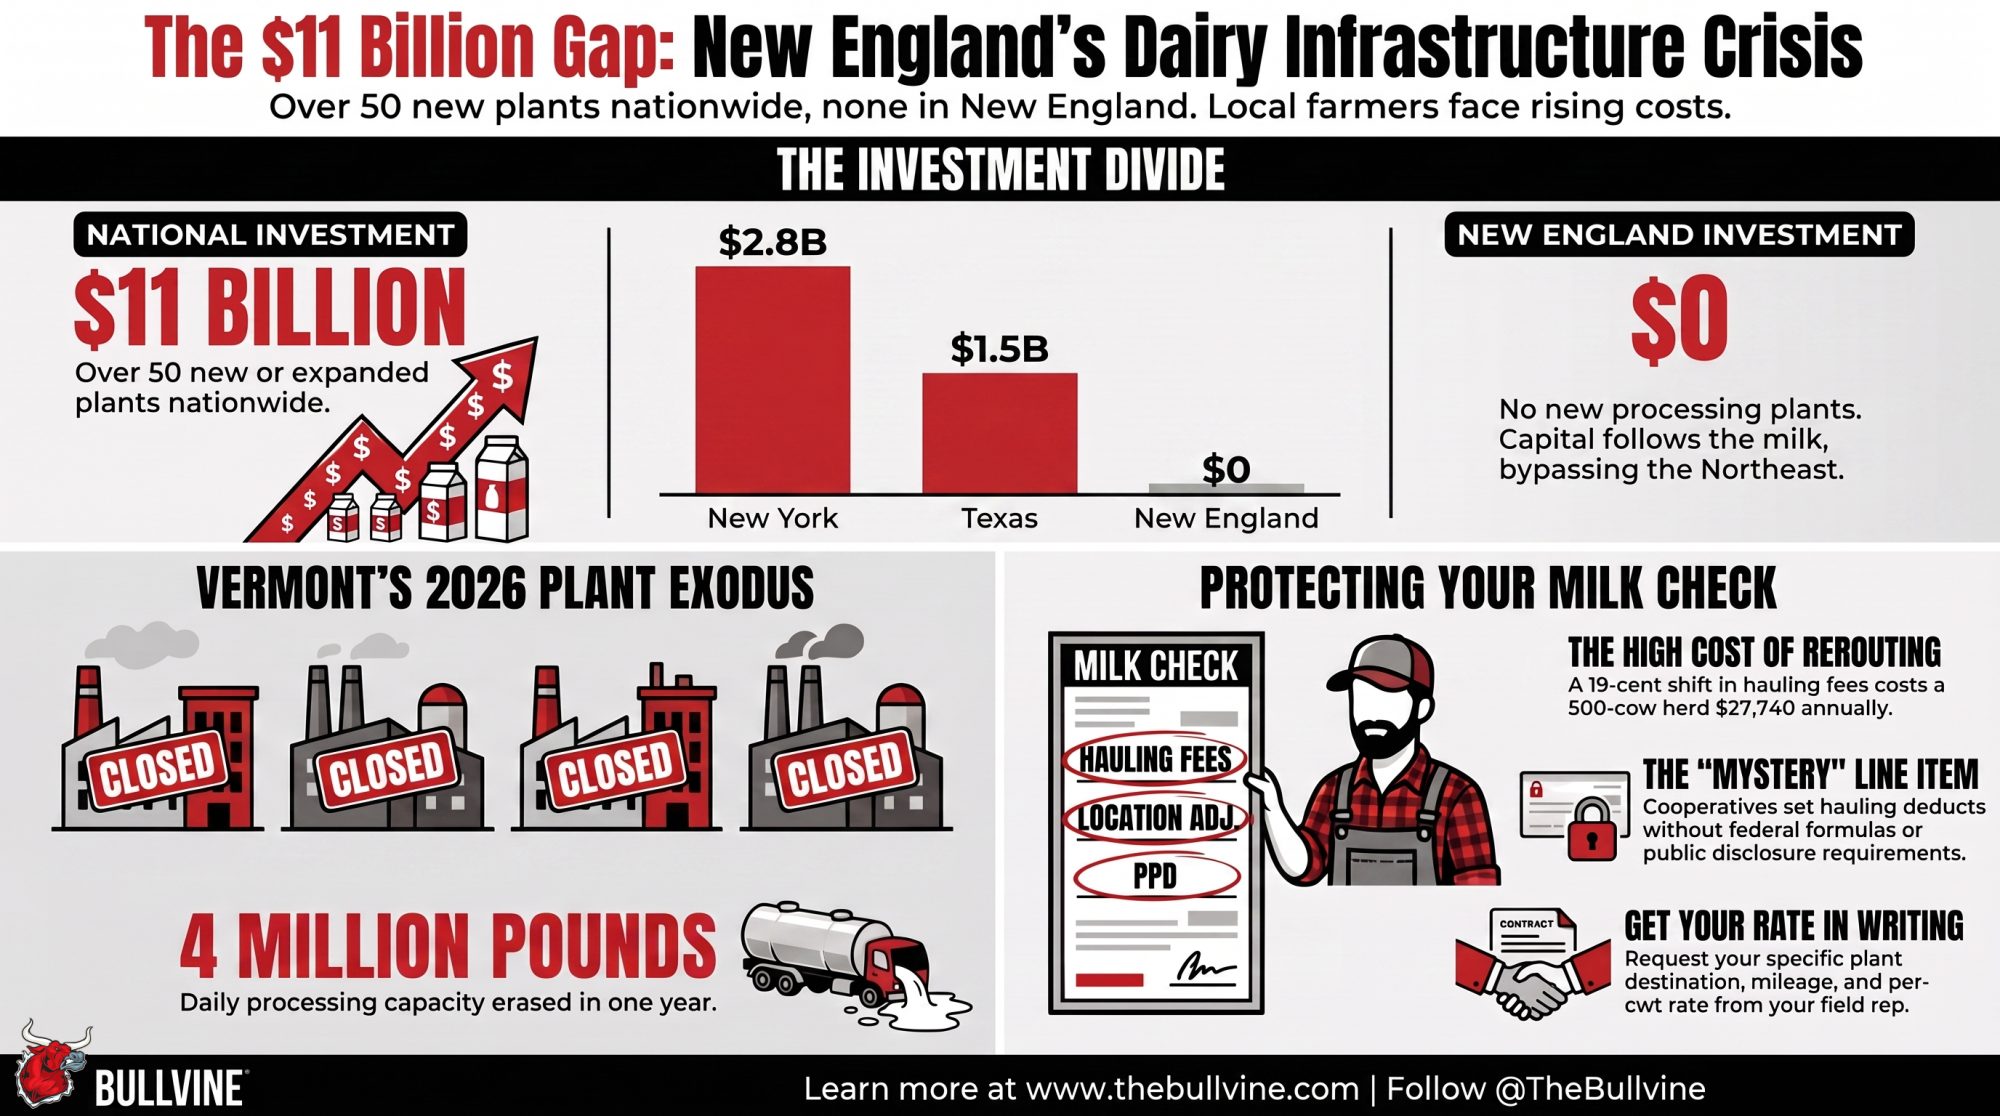
But this closure isn’t the usual consolidation story. American dairy processors are in the middle of a building boom — more than $11 billion committed to over 50 new or expanded plants across 19 states between 2025 and 2028, according to the International Dairy Foods Association’s October 2, 2025 announcement. New York alone is getting $2.8 billion of it, the largest share in the country. Texas is getting $1.5 billion, Wisconsin $1.1 billion, Idaho $720 million, Iowa $701 million.
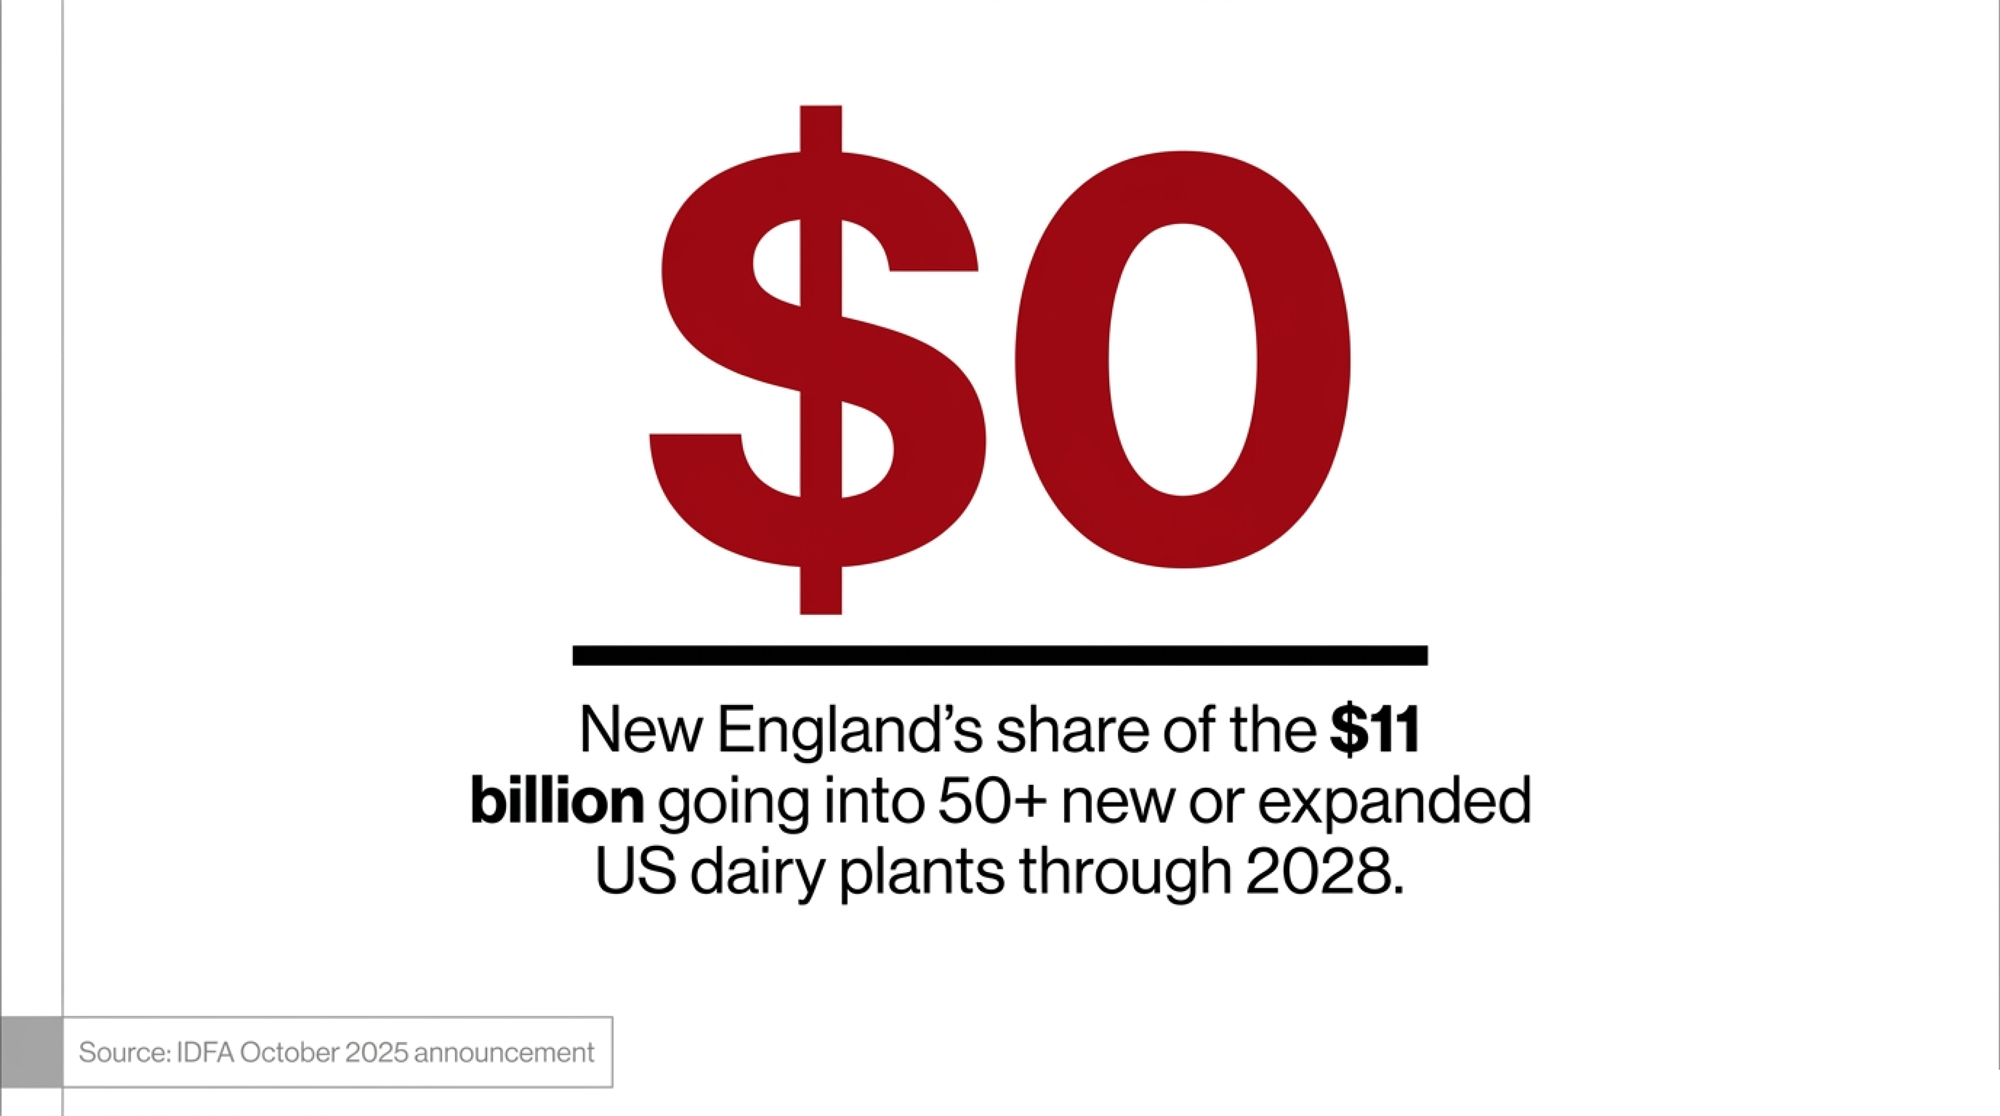
Of the 66 new plants underway or recently opened under that investment, VTDigger reported on July 12, 2026, that none are in New England. The money went to the state next door and kept going.
Four Plants, One Year, Three in One County
Vermont isn’t losing one plant. It’s losing four in 2026, and the Vermont Farm Bureau tallied the damage on July 16: roughly 4 million pounds of daily processing capacity and about 390 jobs, gone inside a single year. Three of the four sit in Franklin County.
Hood’s Booth Bros. facility in Barre took its last milk delivery in late March and closed April 1, after nearly 80 years — the plant opened in 1946, Hood bought it in 1997, and it was Vermont’s last commercial fluid bottler at more than 500,000 pounds a day. Perrigo ended production at its Georgia, Vermont infant formula plant on June 30, laying off 161 in phase one of a closure that ultimately affects about 420 people. Franklin Foods closed its Enosburg Falls plant July 31 after 125 years, cutting roughly 100 jobs. And St. Albans, the biggest of the four at over 3 million pounds a day, goes dark August 17 — a balancing plant, the facility that absorbs surplus milk when fluid demand dips, closing six years after a $30 million upgrade completed in 2020.
One of those four has a second act. The Enosburg Falls facility was sold and reopens September 1 as Franklin County Cheese, a new Vermont-based business, per Franklin Foods’ own June 16 announcement. Worth noting, because the trend line isn’t uniformly one direction and this piece shouldn’t pretend it is.
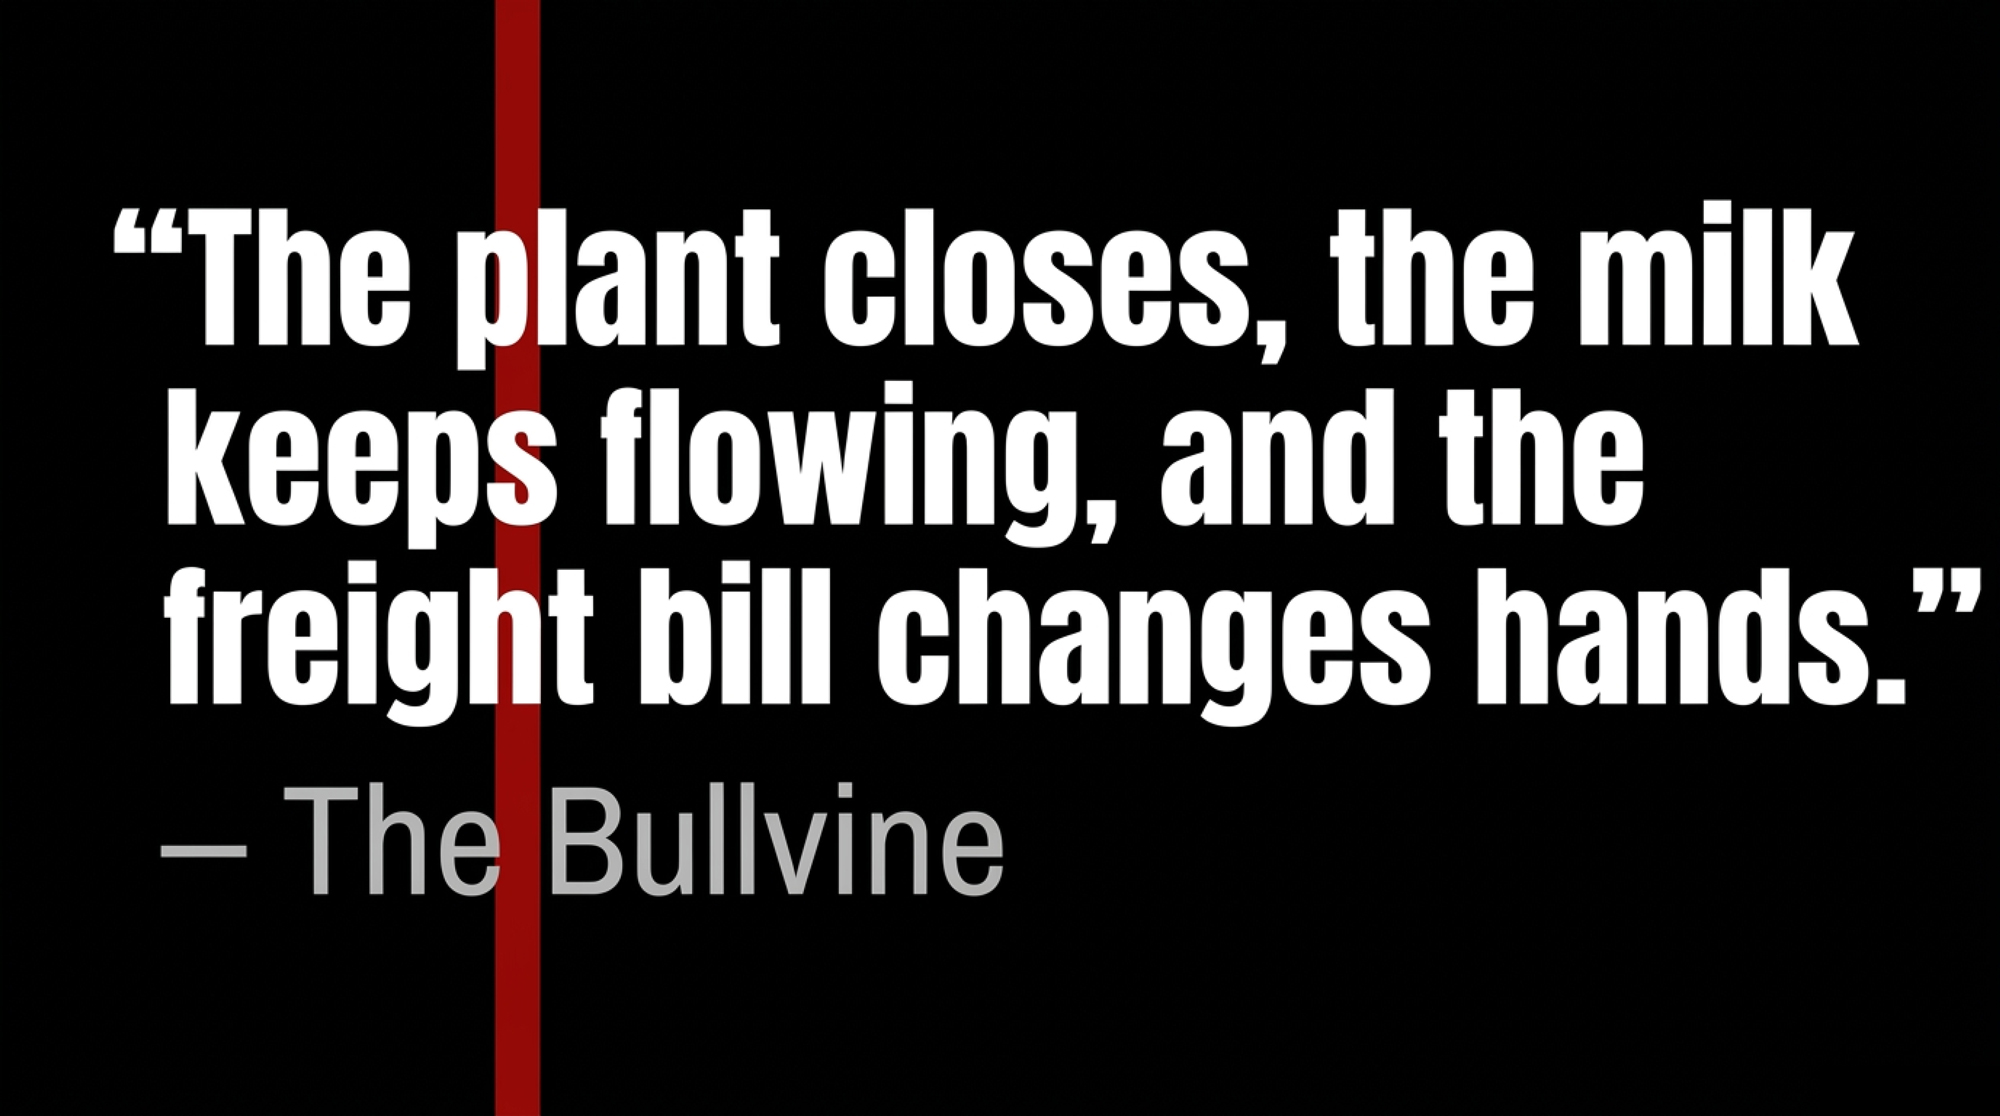
Watch what happened to the Booth Bros. milk, though, because that’s the tell. That volume now hauls to HP Hood in Concord, New Hampshire — and according to the Vermont Farm Bureau’s July 16, 2026 analysis, the added transportation cost landed on farm producers. The plant closes, the milk keeps flowing, and the freight bill changes hands.
DFA closed a Connecticut plant in May and opened a Michigan plant making whey protein powder, per Washington Post reporting on July 13, 2026. Read those two decisions together, and you get the same signal the investment map sends: capital isn’t leaving dairy, it’s following the milk — the same pattern as the last time a plant went dark without much warning.
Why the Money Skipped the Region
Claire Kelloway, food systems program manager at Open Markets, put it plainly on Vermont Public’s Vermont Editionon July 7, 2026. Consolidation has run for decades, she said, “and there’s a case to be made that the Northeast has been affected particularly acutely compared to other regions of the country.”
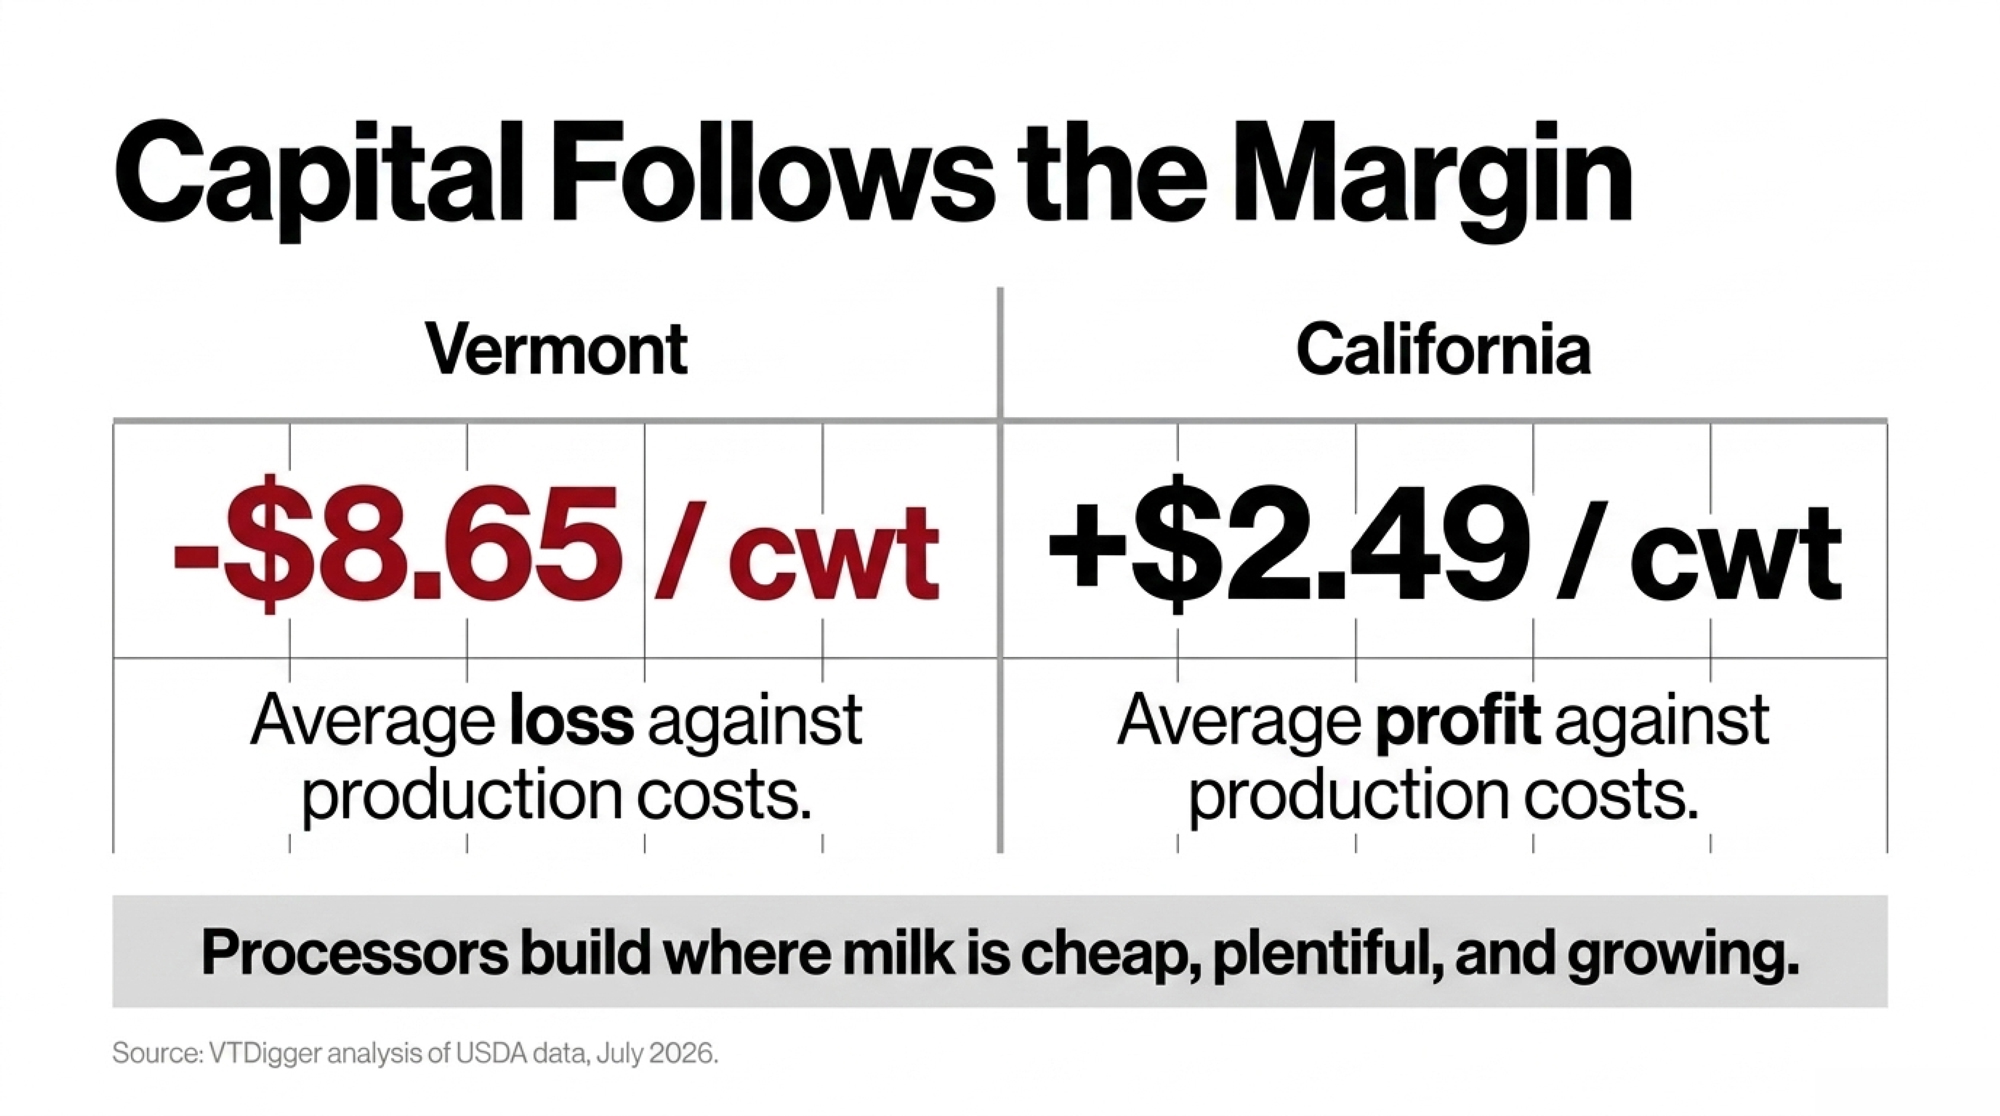
The underlying economics back her up, and they’re rough. VTDigger’s July 12, 2026 analysis of USDA data compared dairy production costs against milk sales across 19 states and found Vermont’s costs exceeded sales by the widest margin of any of them — an average loss of $8.65 per hundredweight. California farmers, by contrast, cleared $2.49 in profit on the same measure. One Vermont farmer told VTDigger overhead runs as high as $72,000 a month.
| State/Region | New Plant Investment (2025-2028) | Cost vs. Sales per cwt |
|---|---|---|
| New York | $2.8 billion | — |
| Texas | $1.5 billion | — |
| Wisconsin | $1.1 billion | — |
| California | — | +$2.49 profit/cwt |
| Vermont | $0 | -$8.65/cwt (widest loss margin in US) |
The farm count tracks the same curve. Vermont had 838 cow dairy farms in 2016. University of Vermont Extension’s February 2026 Dairy Update counts 427 locations producing milk, with the series running 636 in 2020, 583 in 2021, 550 in 2022, 503 in 2023, and 434 in 2024. Vermont Farm Bureau projects another 50 gone by year’s end and fewer than 200 by 2036 — which is roughly where the farm-count math is heading nationally, not just here.
Processors build where milk is cheap, plentiful, and growing. That’s the whole calculation, and it isn’t personal. New England is none of those three right now, and the $11 billion investment map is what that judgment looks like poured in concrete.
What Changes on Your Milk Check After a Plant Closure?
Kevin Kouri chairs the Vermont Dairy Producers Alliance and works as director of nutrition and sales at Phoenix Feeds & Nutrition — so he watches this from both sides of the fence. In the VDPA’s June 19 statement on the St. Albans closure, he said the loss “will directly increase processing and transportation costs.” A month later, he told VTDigger the worry runs past any one plant: “We potentially may continue to see an exodus of dairies from the state. And the trickle-down effect that that has not only to local communities and what these dairies bring in terms of employment opportunities in rural Vermont, but also the infrastructure and the allied businesses like mine.”
DFA says milk received at St. Albans “will continue to be processed,” ensuring “a market for regional dairy farmers and continued service to customers without disruption,” with volume rerouting to plants in Maine, Massachusetts, and New York. What the statement doesn’t say is what that costs. VTDigger put it plainly in July: farmers now pay to move milk out of Vermont to DFA facilities in nearby states, “adding an unknown sum of money to members’ hauling fees.” Unknown is the operative word, and it matters more than it sounds — for reasons that show up on the next statement.
Three lines can move when your milk gets rerouted. Two of them USDA publishes. The third one your cooperative sets — and that distinction runs opposite to what most people assume.
| Milk Check Line | Who Sets It | Published? | Farmer Can Verify Independently? |
|---|---|---|---|
| Location differential | USDA (Federal Milk Marketing Order) | Yes — public zone map | Yes |
| Producer price differential (PPD) | Northeast Market Administrator | Yes — monthly | Partially (pool-wide, not closure-specific) |
| Hauling deduct | Cooperative (no federal formula) | No — must ask | No — must request in writing |
Hauling deduct. Your co-op sets this. No federal formula, no publication requirement. University of Wisconsin Extension’s May 2026 walkthrough of milk check line items treats hauling as a market-determined adjustment, sitting alongside check-off and cooperative charges rather than among the regulated ones. The arithmetic is easy once you have the rate. Getting the rate is the work.
Location differential. Public — and it already moved for reasons that have nothing to do with St. Albans. The June 2025 changes to the Federal Milk Marketing Orders, the USDA system that sets minimum class prices, raised Boston’s Class I differential from $3.25 to $5.10 per cwt. That’s a $1.85 jump, the highest in the Northeast order. Boston is the base zone, and nearly every other Northeast county prices below it, so most producers now carry a larger negativelocation adjustment than a year ago. One detail matters more than the rest: the adjustment keys off where your milk is received and priced, not where your barn sits.
Producer price differential. The PPD is the pool-wide adjustment that reconciles your blend price against the class values, and the Northeast Market Administrator publishes it monthly. You can look it up any time. What you can’t do is isolate how much of a given month’s figure reflects this closure versus everything else moving through the pool.
The Barn Math You Can Run Today
Skip the mileage guessing. The calculation that matters is simpler: new hauling rate, minus old hauling rate, times your annual hundredweight.
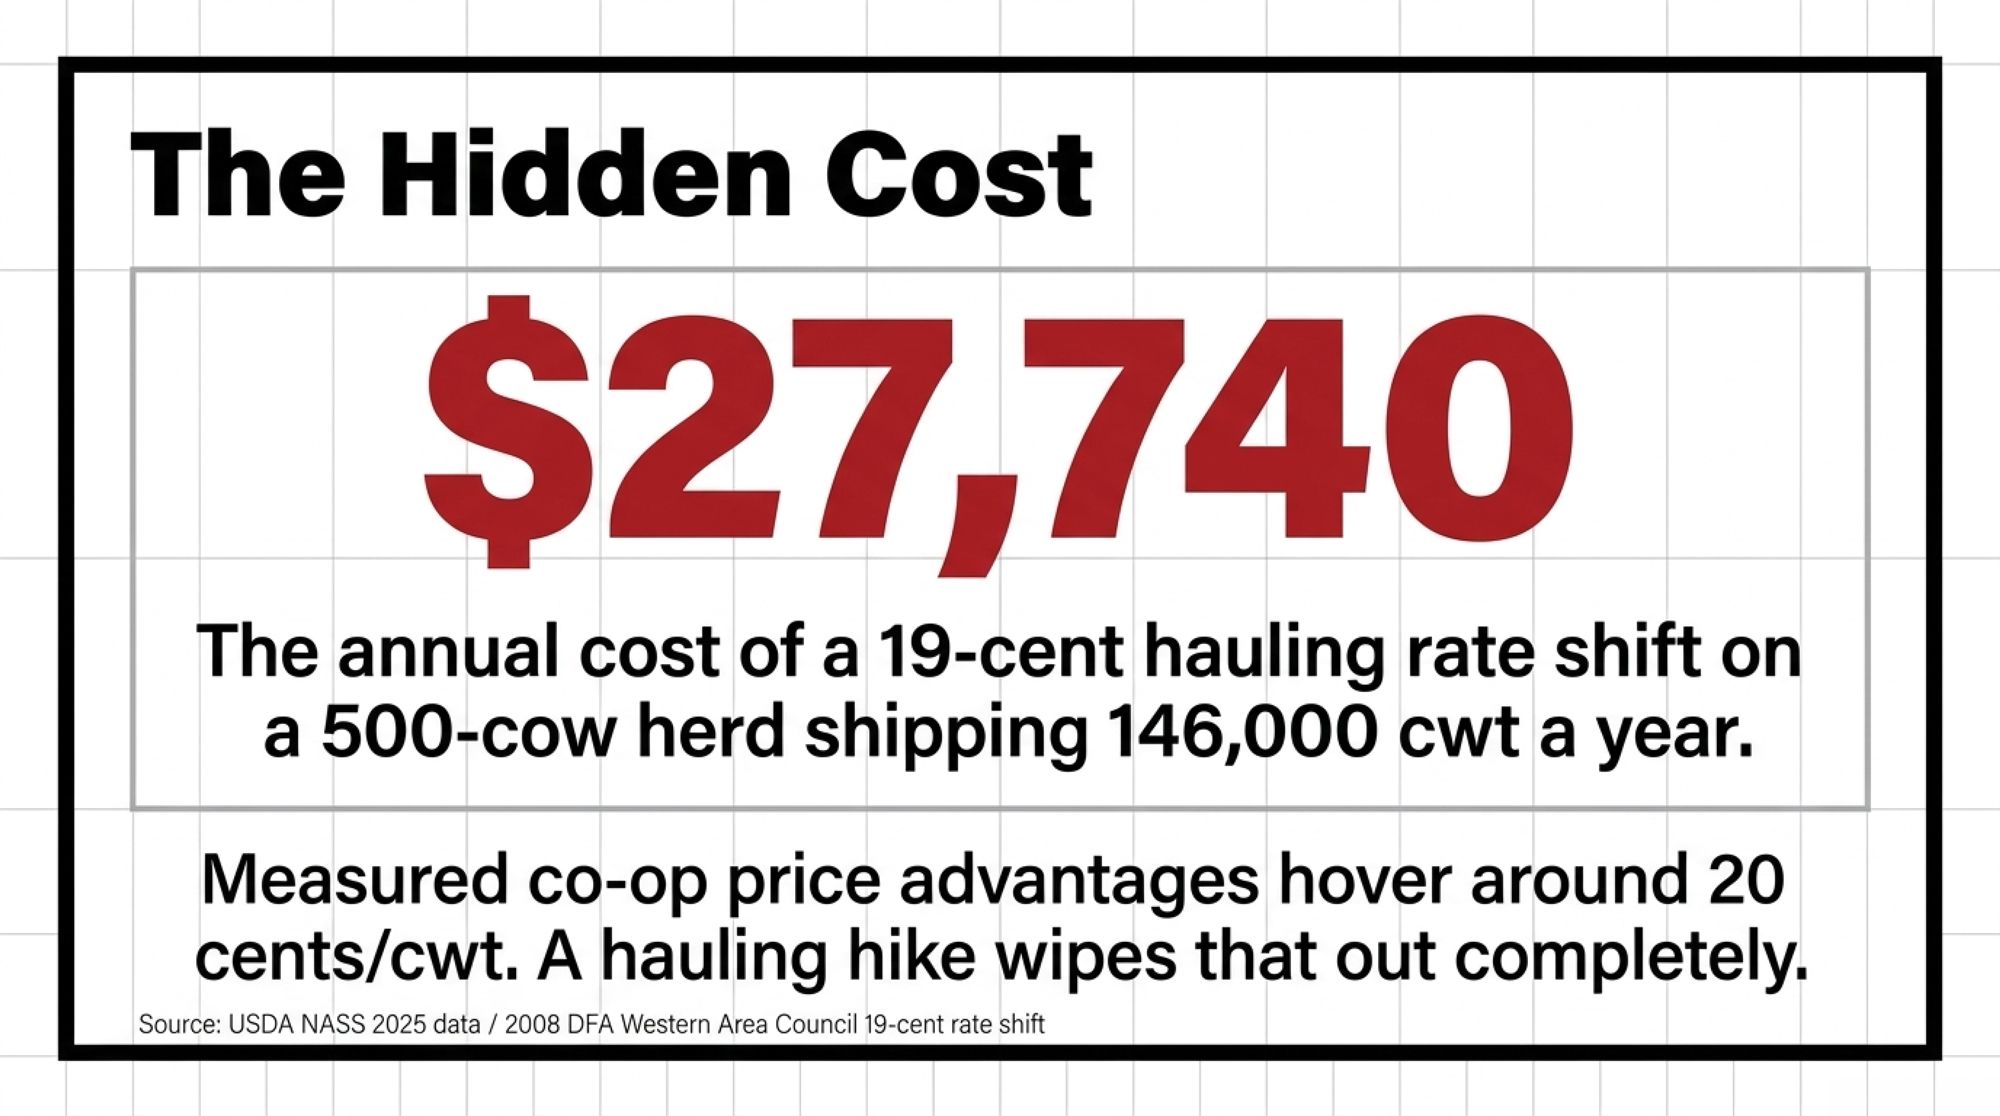
Take a 500-cow herd shipping 80 pounds per cow per day — about 146,000 cwt a year. Check that against your own figure, because it’s an above-average assumption. USDA NASS put 2025 national production at 24,390 pounds per cow, roughly 67 pounds a day. At 146,000 cwt, a dime of added hauling costs $14,600 a year. A quarter costs $36,500.
Is a quarter plausible? DFA’s Western Area Council moved its hauling charge from 6 cents to 25 cents per cwt inside a single year in 2008, per reporting on cooperative base-excess programs — a different region under different program rules, but the same cooperative. A 19-cent swing isn’t a thought experiment.
A note on method: our June estimate on this closure used a wider basis — total reroute impact of $0.85 to $3.15/cwt depending on destination. The calculator above isolates just the hauling line, which is the piece you can actually check against a rate somebody gives you.
Now hold that against what membership is worth on price. Research by Munch, Schmit and Severson, published through the NCERA-210 proceedings in 2020, found dairy farmers willing to accept about 2.3% lower compensation — roughly 45 cents per cwt — for the security of belonging to a co-op. But once every pricing component got counted, the same work found the net milk price advantage came to about 20 cents per cwt, roughly 1%. The authors noted the real value of membership likely comes from things other than price.
Twenty cents of measured price advantage, against a hauling line that has historically moved nineteen. That’s not an argument for leaving your co-op. It’s an honest read on how thin the cushion is.
Who Sets Your Hauling Rate, and How Do You Get It in Writing?
Your cooperative sets it, and you get it by asking. Four questions, one call. Which plant is my milk going to? What’s the new one-way mileage? What’s the per-cwt hauling rate, and when does it take effect? Can I have that in writing?
The plant name is the one people skip, and it’s the one that unlocks everything else. Without it, you can’t use the Northeast Order’s zone differential map, which means the location line stays a mystery. With it, you can pull the map from fmmone.com and the monthly PPD from the Market Administrator and reconcile two of the three yourself, at the kitchen table, in an evening.
If the answers come back specific and documented, say so out loud to your neighbors — clean execution deserves reporting as clean execution. If they come back vague, that’s not evidence anybody’s hiding anything. Field reps answer this stuff daily. It’s evidence that hauling sits outside the federally regulated part of your check — no federal provision we could locate requires advance written notice before a rate change lands. That gap in what gets published is its own kind of governance question, and it’s the same one that surfaces when 0.8% of members vote on a bylaw rewrite.
Options and Trade-Offs for Farmers
Path 1 — Get your rate in writing. Do this within 30 days. Plant name, mileage, per-cwt rate, effective date. When it makes sense: always, and urgently before the first post-closure statement. What it requires: one call and an email follow-up. Risk: none. Even a non-answer is information. This is the only route to the hauling number, since there’s no published fallback.
Path 2 — Reconcile the two lines you can source. Pull the monthly PPD and the zone differential map and check both against your stub. It takes about an hour a month once you’ve set it up the first time — the same kind of accounting discipline that shows up in the real math on where your hours and dollars actually go. Worth doing if margins are tight enough that you need the variance explained rather than just absorbed. The catch is that you’re verifying formula math on only two lines. The third still depends on a rate somebody has to hand you.
Path 3 — Review your Dairy Margin Coverage election. USDA’s Economic Research Service forecast $122.9 million in DMC payments for 2026 in its May 18, 2026 farm sector income forecast, a $176.3 million swing from 2025 when net activity ran negative. It’s worth a look as baseline protection on Tier I production, but understand what it won’t do. DMC triggers on a national margin, so it can’t see a hauling deduct or a location differential specific to your reroute. Different problem, different tool.
Path 4 — Track Section 1006, don’t budget around it. The House passed the Farm, Food, and National Security Act of 2026 on April 30 by a 224-200 vote, and the Senate Agriculture Committee released its own draft text in late June. Both versions carry mandatory biennial dairy processing cost surveys. But Munch has been clear that new data doesn’t automatically adjust anything — it still takes a full FMMO hearing, initiated by stakeholders, to change a make allowance. His floor is 2028. A realistic read lands closer to 2031. File comments, stay engaged with your state Farm Bureau, and treat passage as a clock starting rather than stopping.
Key Takeaways
- If you can’t get a written per-cwt hauling rate from your field rep, that’s your finding. Log the ask and the date.
- If you don’t know which plant your milk goes to, you can’t check your location differential — the published zone map is keyed to the receiving plant, not your barn. That’s the first call, not the last.
- If your hauling deduct rises more than 19 cents/cwt — the size of DFA’s 2008 Western adjustment — run the full-year number against your annual cwt before assuming you can carry it.
- If your location differential got worse sometime after June 2025, check the Boston base-zone change before blaming the reroute. Two separate events.
- If your operation sits within 20 to 45 cents per cwt of breakeven, the measured co-op price advantage is inside your margin of error. Know that before you renew anything.
- If your PPD line diverges from the published Order 1 figure without explanation, ask — the number is public, so the question is answerable.
- If all three lines come back clean and fully documented, tell your neighbors. That’s data too.
Barre. Georgia. Enosburg Falls. St. Albans. Four Vermont towns that had a plant in January and won’t have one by fall — though Enosburg Falls gets a new tenant on September 1, which is more than the other three can say. Somewhere in New York, meanwhile, a plant is going up in a town most Vermont farmers couldn’t find on a map. That’s what an $11 billion forecast looks like when people with capital at risk write it down.
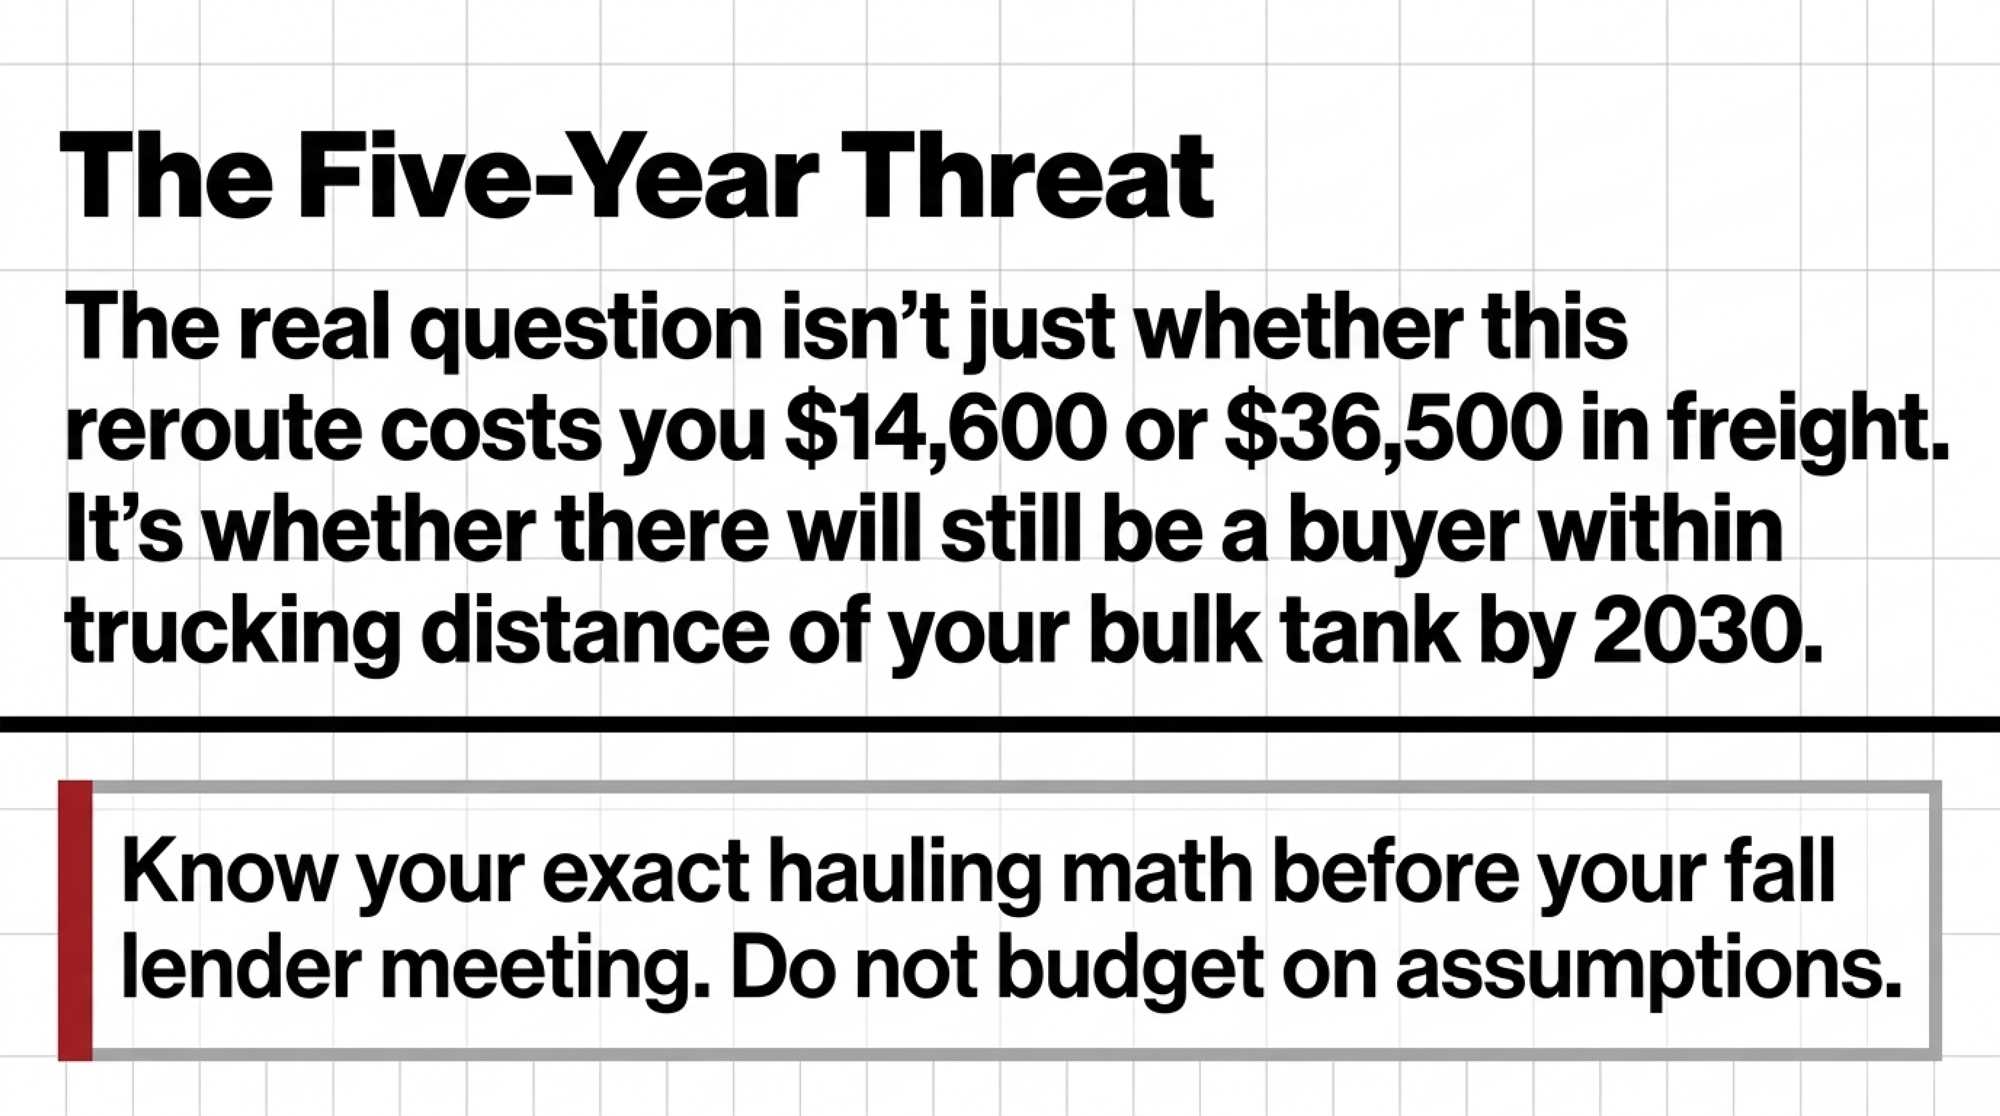
So the real question for any Northeast operation isn’t whether this reroute costs you $14,600 or $36,500. It’s whether there’s still a buyer within trucking distance of your bulk tank in five years — and when you last checked instead of assumed. We’re building the plant-by-plant location differential breakdown for Order 1 once the first post-closure statements land in September, paired with the New England capacity map set against that investment list. That’s the one to have in front of you before your fall lender meeting.
Complete references and supporting documentation are available upon request by contacting the editorial team at editor@thebullvine.com.
Learn More
- The Bullvine Dairy Curve: 15,000 U.S. Farms by 2035, and Under 10,000 by 2050 – Who’s Still Milking? — Exposes the brutal structural math behind national farm attrition, arming commercial dairies with five critical operational benchmarks required to survive the ongoing capital concentration shift.
- The 143-Hour Week at Clark Farms: The Real Math of On-Farm Creamery ROI and Your Time — Delivers an unvarnished audit of direct-to-consumer processing, detailing how one family calculated real labor inputs against capital risks before deciding whether to bypass regional plant consolidation.
- $51,000 a Day in Silence: AMPI’s Paynesville Plant Went Dark and Nobody Told You — Reveals the hidden financial cascade that hits producer milk checks when cooperative balancing facilities go dark without advance notice, tracing freight shifts directly to member margins.
The Sunday Read Dairy Professionals Don’t Skip.

Every week, thousands of producers, breeders, and industry insiders open Bullvine Weekly for genetics insights, market shifts, and profit strategies they won’t find anywhere else. One email. Five minutes. Smarter decisions all week.
