







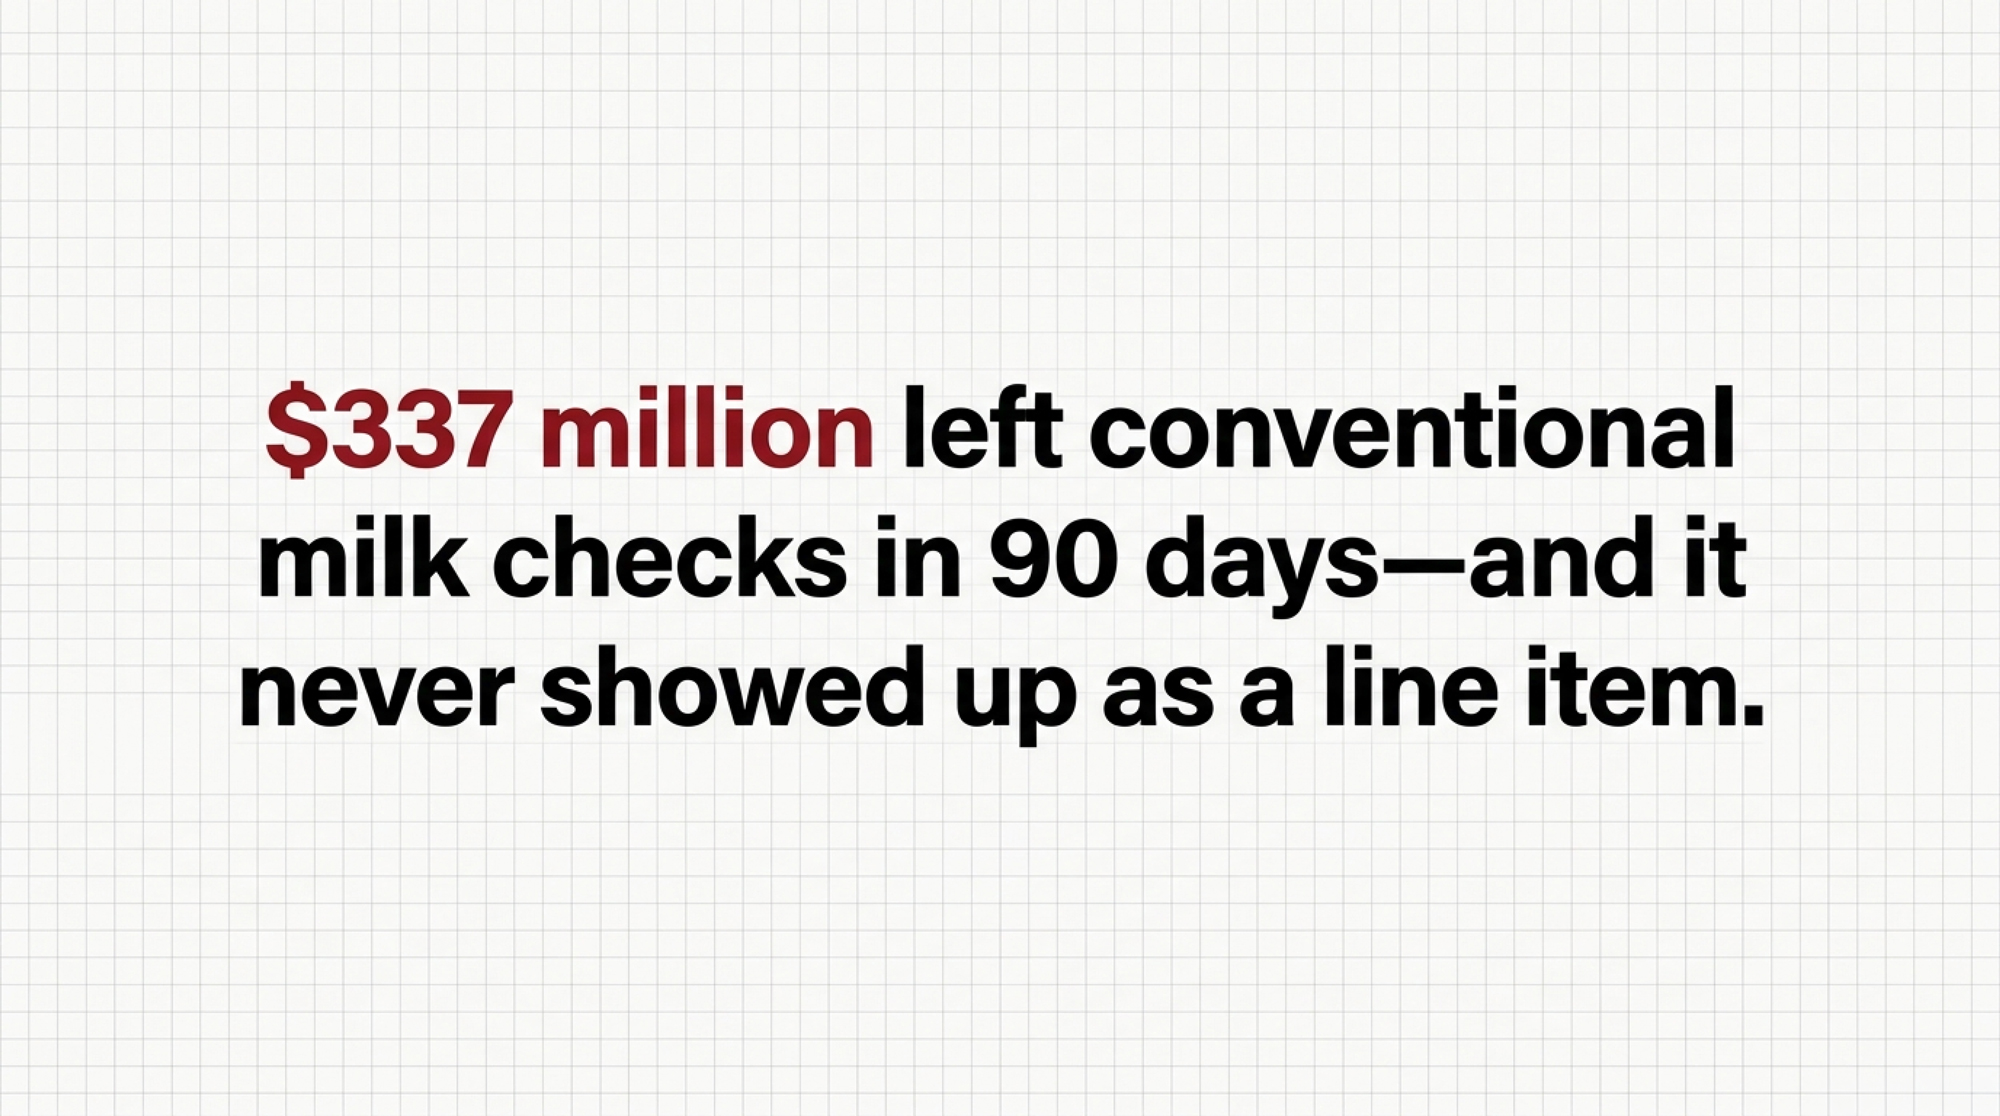
$337 million left conventional milk checks between June and August 2025. No lawsuit, no plaintiff, no line item — it was gone before your cheque cleared. Can you name your number?
Executive Summary: USDA’s June 2025 make-allowance hike quietly pulled about $0.92/cwt off your Class III check — and roughly $337 million out of producer pools in its first three months, per AFBF’s September 2025 numbers. It never showed up as a line item. On a 200-cow herd shipping 5.6 million pounds, that’s about $56,000 gone over 13 months; scale to 1,000 cows and you’re near $279,000, with six years of erosion running past $310,000 before any fix can land. Seven Organic Valley farmers, led by Abby Swan of Westfield, Wisconsin, sued over their share and can name a dollar figure — conventional producers lost far more and have no plaintiff, no courtroom, and nowhere obvious to point. The catch: the federal cost survey meant to check the math won’t collect data until 2027, and a fresh hearing could push real relief to 2031. Anyone shipping Class III or IV is exposed, and if your co-op also owns processing plants, the increase touched both sides of its books while only one side hit your cheque. Two moves this month — pull your co-op’s 2024 and 2025 audited financials, and price a floor with the 2026 all-milk forecast cut to $20.70/cwt — decide whether you’re looking at a market problem or a governance one.

Abby Swan, a dairy farmer from Westfield, Wisconsin, is the lead plaintiff on a federal lawsuit that says the milk-pricing system is quietly bleeding organic farmers. She and six other Organic Valley farmer-members filed a class-action takings claim — one of four organic dairy suits filed April 28 under the Coalition for Organic Dairy Exemption. Their argument: the Federal Milk Marketing Order forces organic producers to pay into a national pool for milk they never sell as commodity, and the class action seeks at least $60 million in compensation.
Here’s the part that should stop every conventional producer cold. That same pricing formula pulled an estimated $337 million out of producer pools between June and August 2025 — its first three months, according to the American Farm Bureau Federation’s September 2025 analysis. That money came off conventional milk cheques. And unlike the organic side, nobody filed anything — no lawsuit, no plaintiff, no headline with your name on it. It was gone before your cheque cleared.
What Changed on June 1, 2025
USDA updated the “make allowances” baked into all 11 Federal Milk Marketing Orders — the fixed deductions in the pricing formula that stand in for what it costs a processor to turn your raw milk into cheese, butter, or powder. They hadn’t been touched since 2008. In the January 2025 final rule, they climbed across the board: cheese to $0.2519 a pound, butter to $0.2272, nonfat dry milk to $0.2393, and dry whey to $0.2668, all effective June 1.
| Make-Allowance Category | Pre-June 2025 Rate ($/lb) | Post-June 2025 Rate ($/lb) | Change ($/lb) | Net Impact on Producer |
|---|---|---|---|---|
| Cheese | $0.2003 | $0.2519 | +$0.0516 | Largest Class III hit |
| Butter | $0.1715 | $0.2272 | +$0.0557 | Class IV exposure |
| Nonfat Dry Milk | $0.1678 | $0.2393 | +$0.0715 | Class IV + protein pools |
| Dry Whey | $0.1991 | $0.2668 | +$0.0677 | Class III whey component |
| Combined Class III Effect | — | — | ~-$0.92/cwt | Off your regulated minimum |
| First-Quarter Pool Damage | — | — | -$337M | Across all 11 FMMOs |
| Last Rate Update Before This | 2008 | — | 17-year gap | No inflation adjustment |
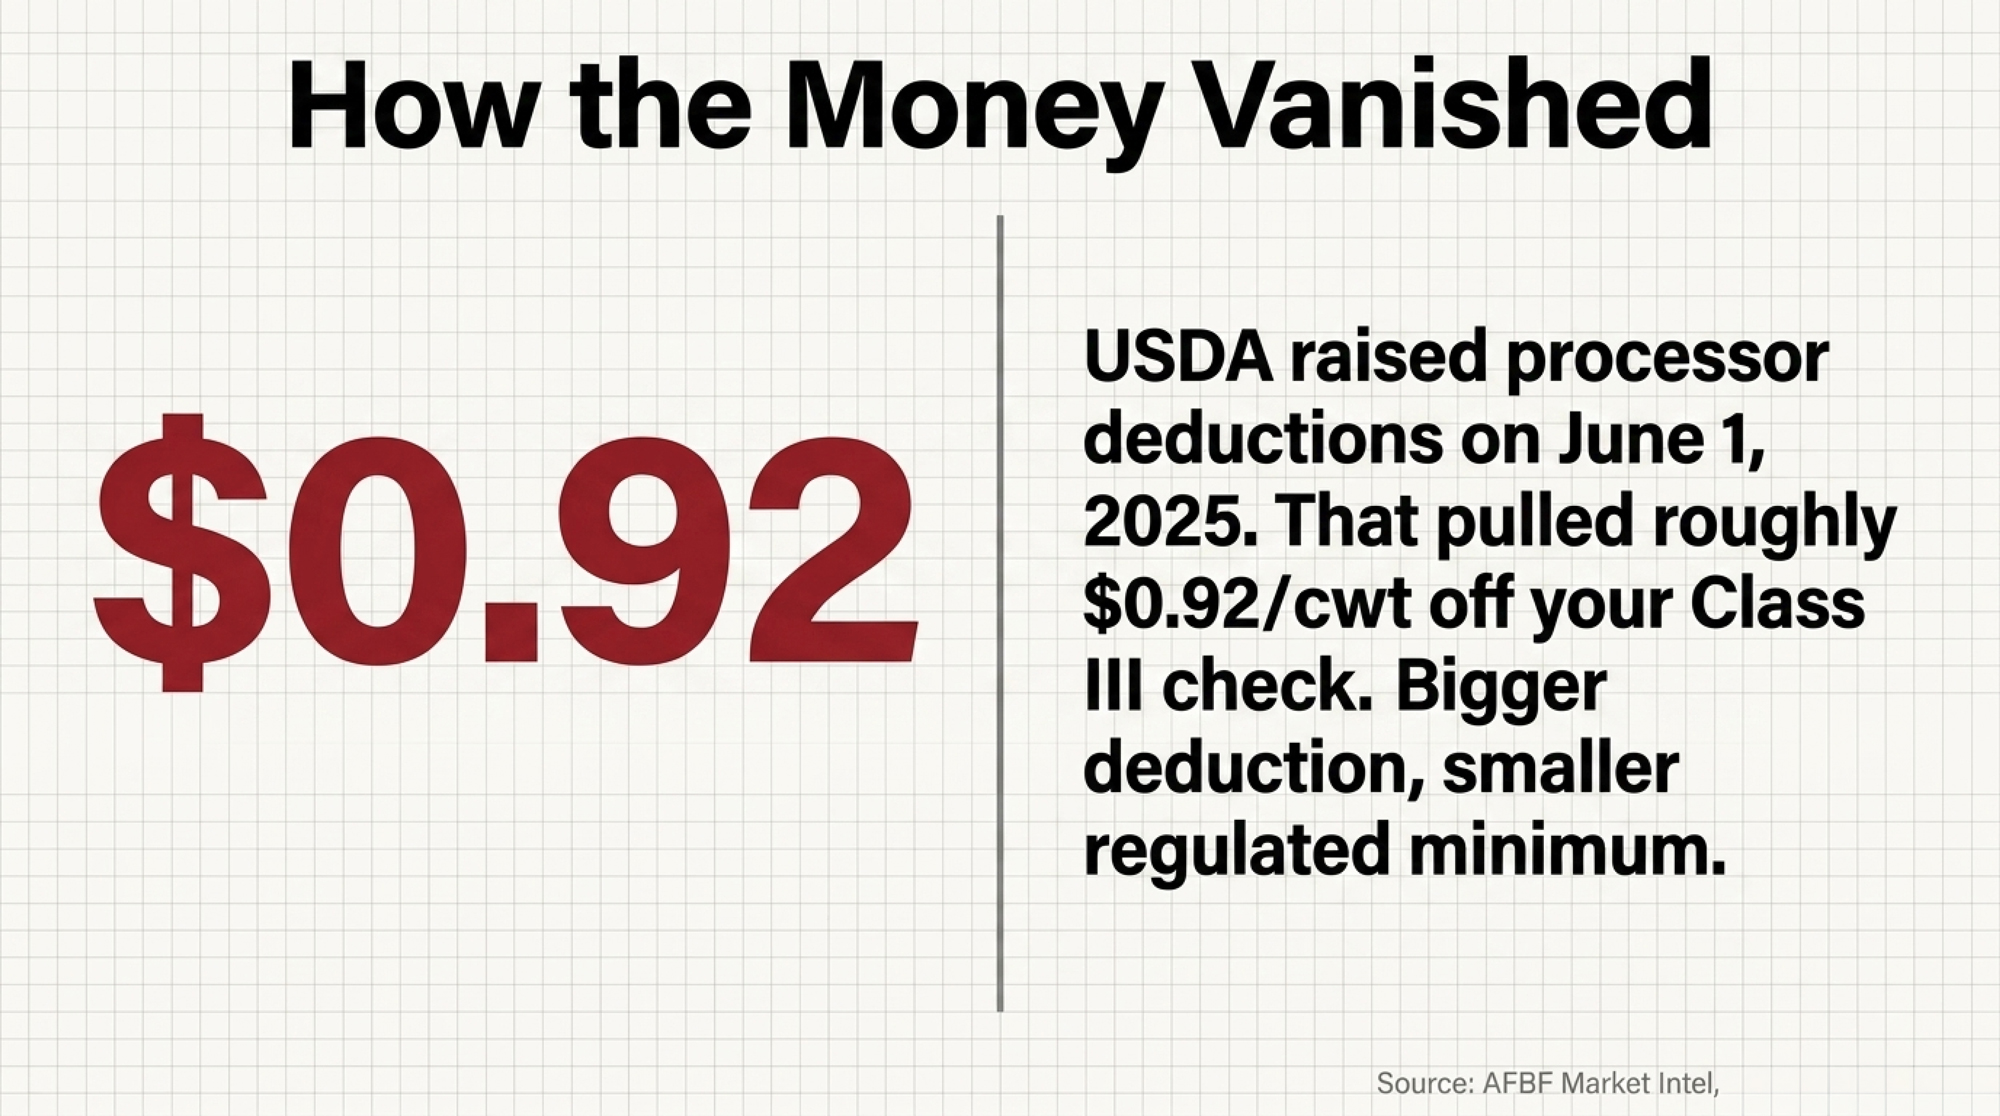
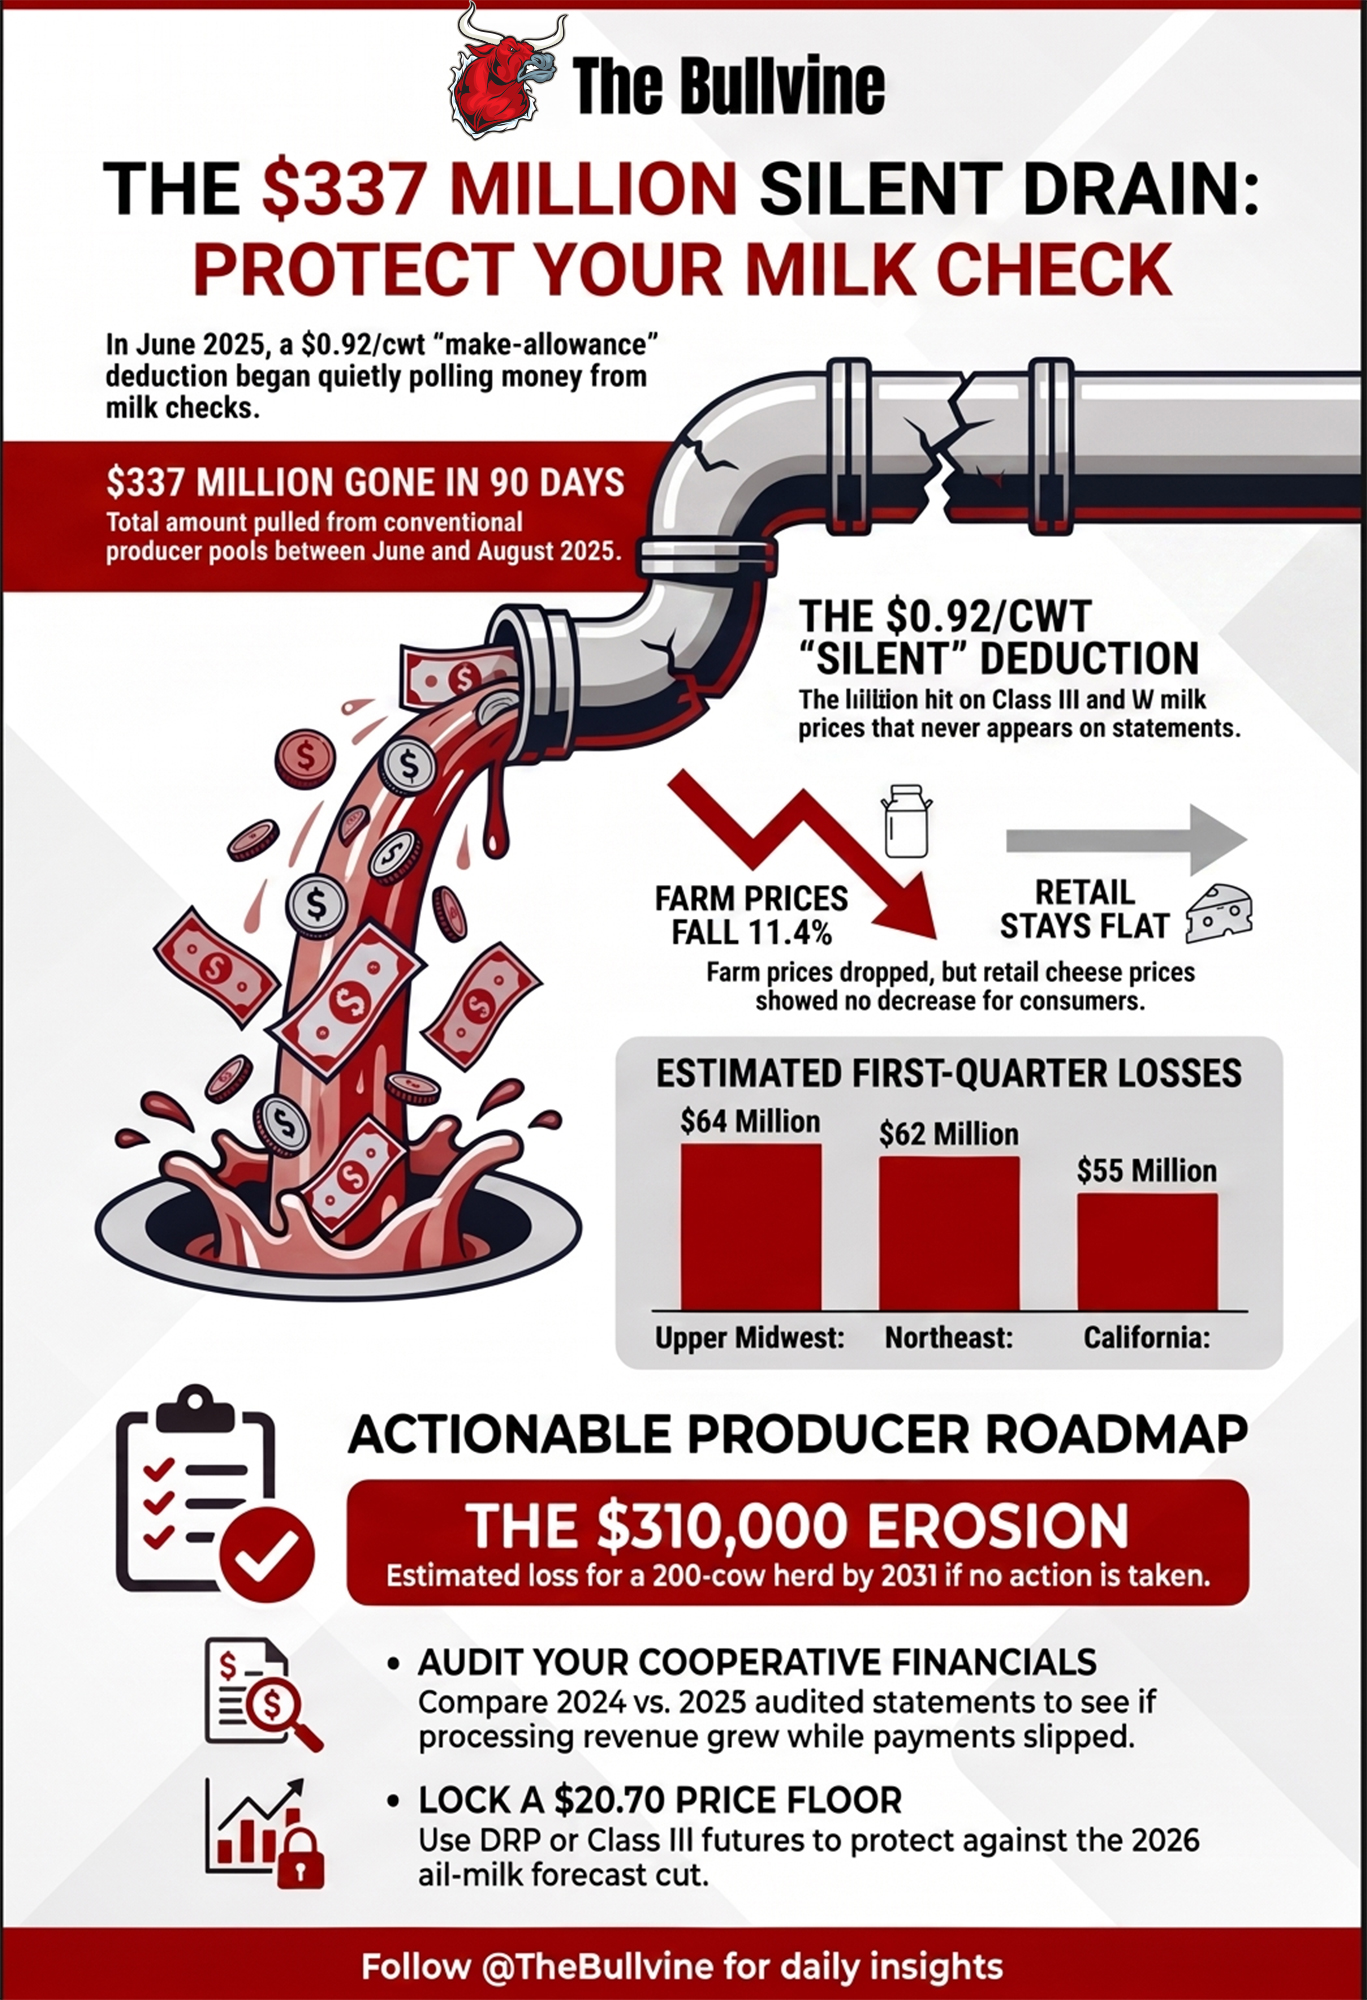
The mechanic is simple, and it doesn’t work in your favor. The make allowance gets subtracted from the product price before your milk gets priced. Bigger deduction, smaller regulated minimum. AFBF’s math put the Class III hit at about $0.92/cwt — money that now stays on the processor’s side of the ledger instead of flowing into the pool that pays you.
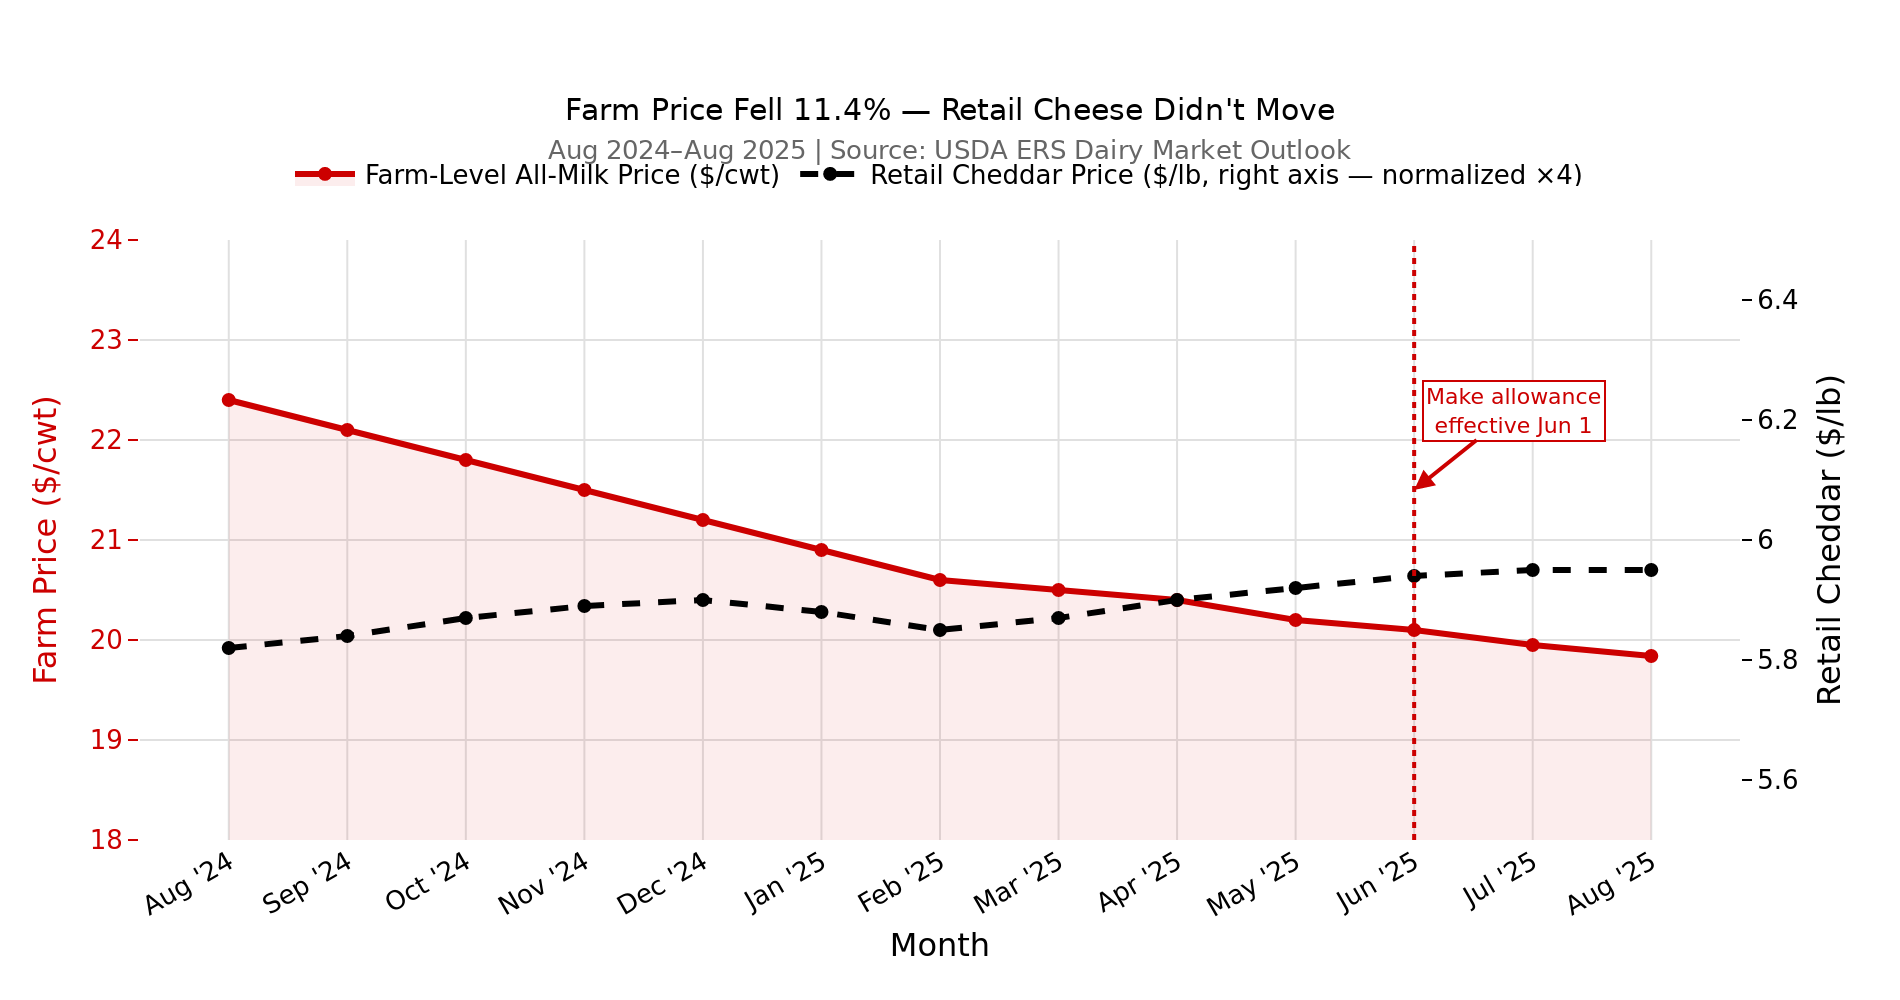
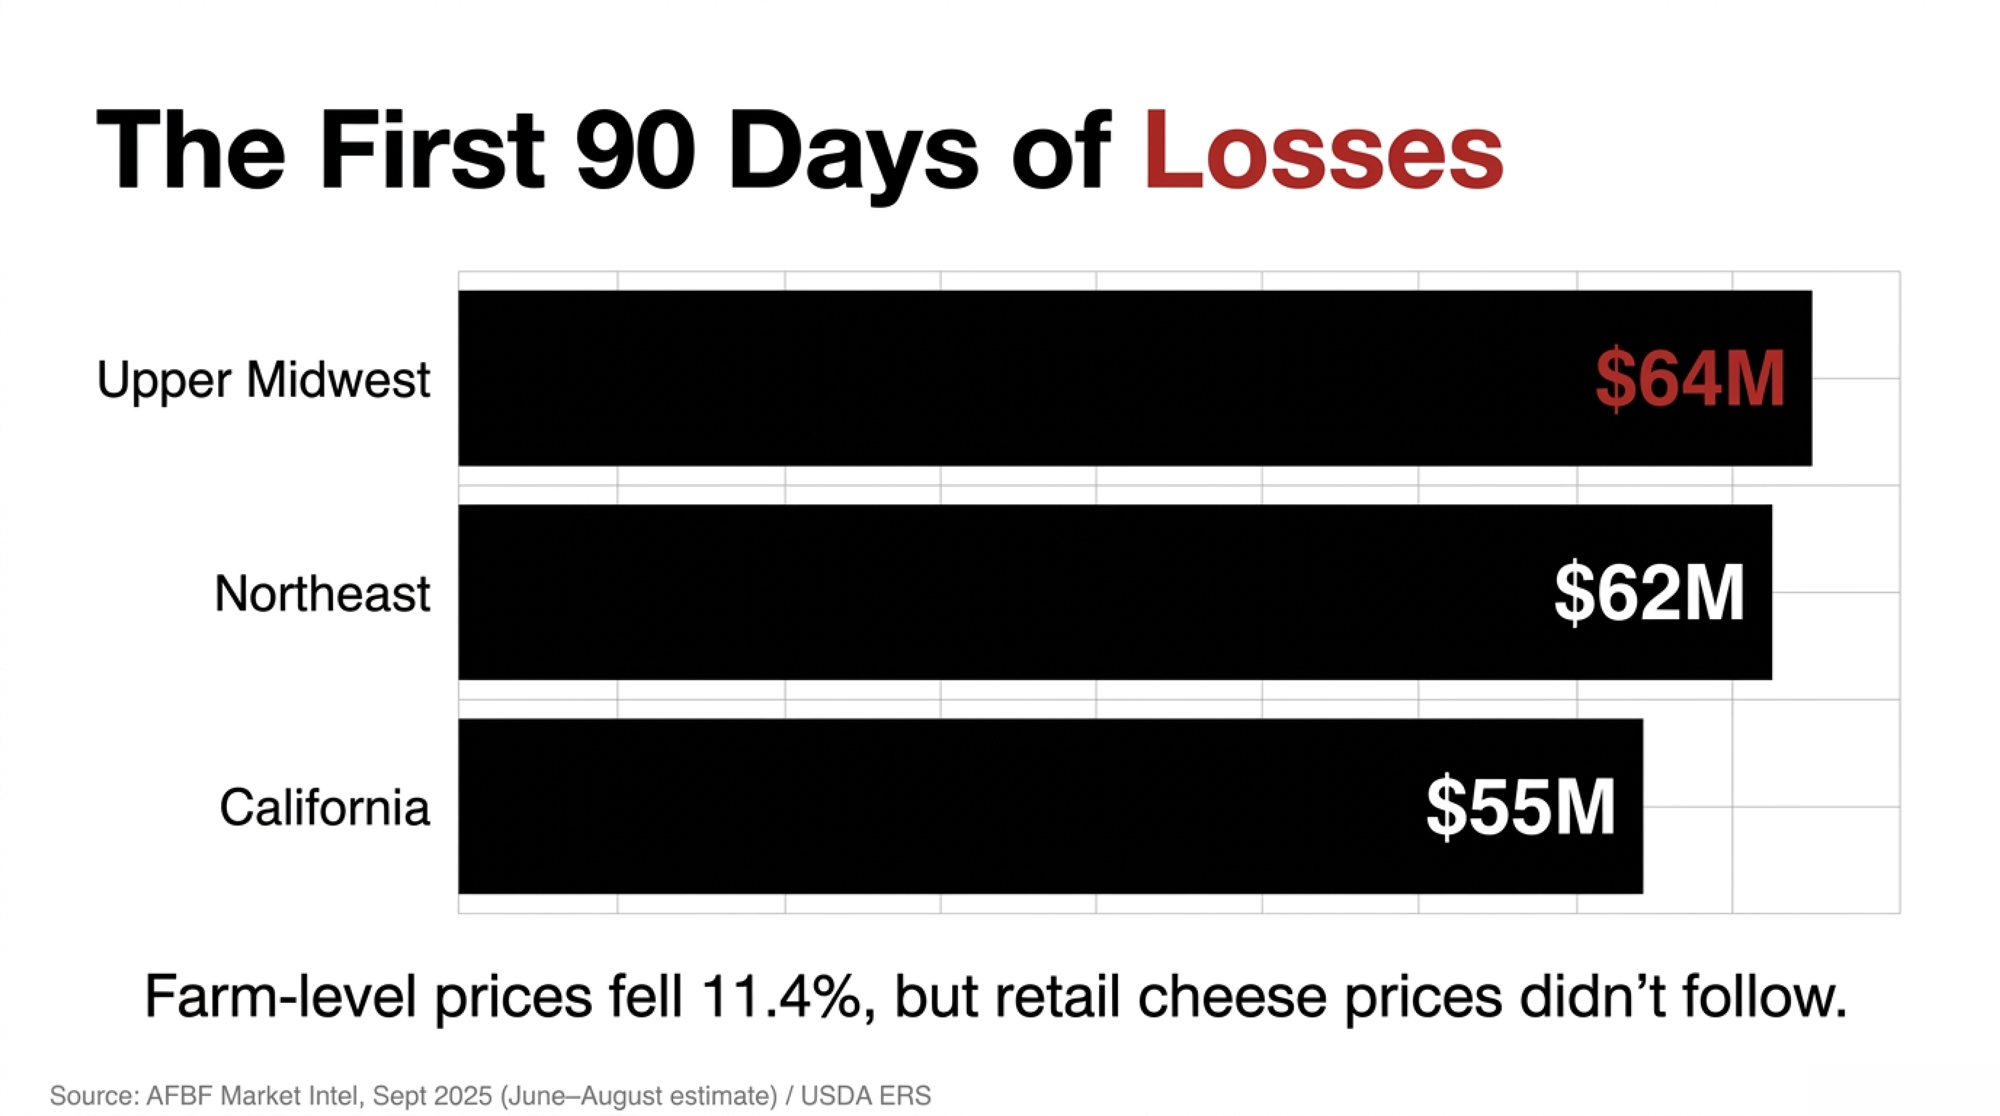
Who’s most exposed? Anyone shipping into Class III and IV, the manufacturing classes — which is most of the country. AFBF tallied the first-quarter damage at $64 million in the Upper Midwest, $62 million in the Northeast, and $55 million in California. (The Bullvine: the full $337 million breakdown by region) And here’s the tell: farm-level prices fell 11.4% between August 2024 and August 2025, but retail cheese prices didn’t follow. Whatever the lower regulated minimum saved on the processing side, it doesn’t appear to have reached the dairy case.
Where the First $337 Million Went Missing (June–August 2025)
| Region | First-Quarter Estimated Losses |
| Upper Midwest | $64 million |
| Northeast | $62 million |
| California | $55 million |
Source: American Farm Bureau Federation Market Intel, September 21, 2025. Figures cover the first three months under the amended make allowances.
How This Lands on a Real Farm
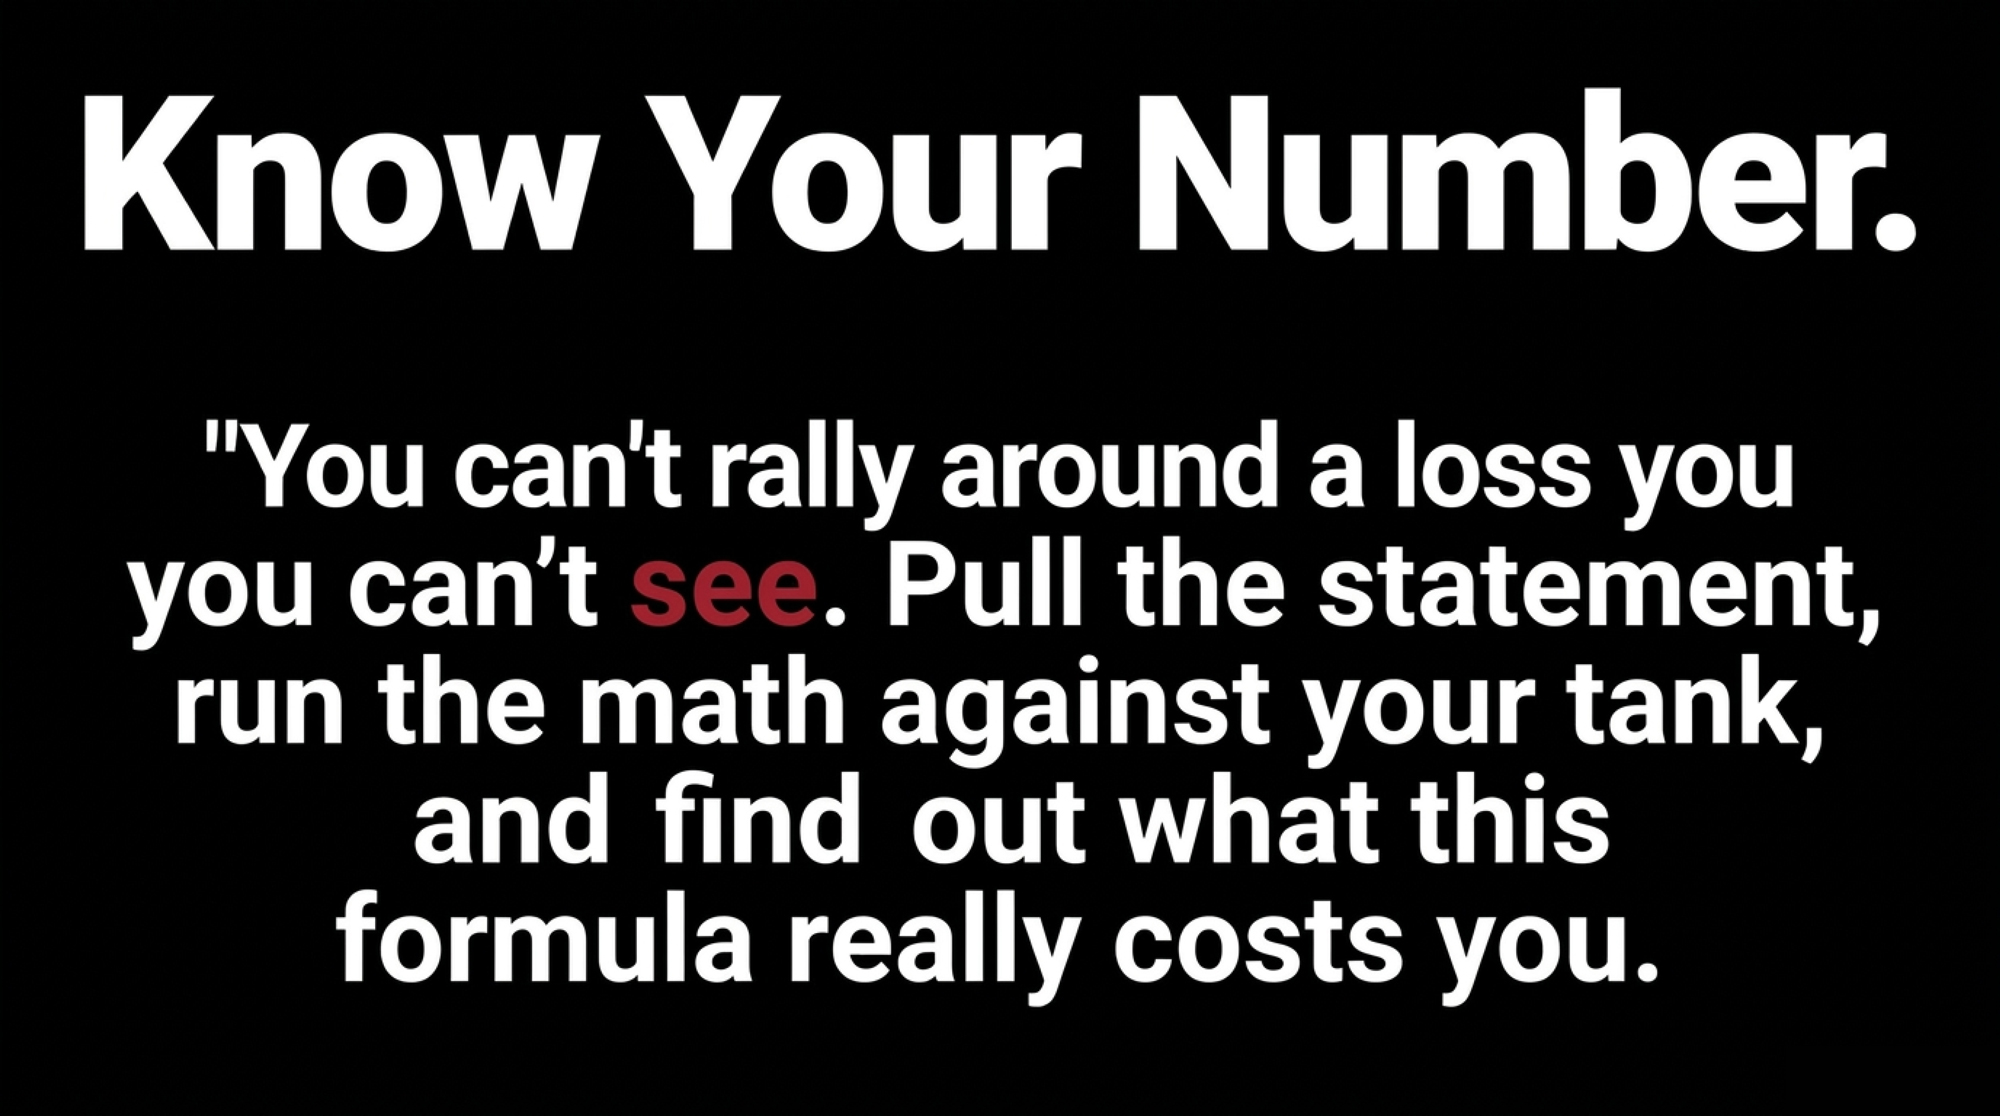
The $0.92 doesn’t knock on the door. It won’t show up on your statement as a line labeled “make allowance increase.” It’s just a slightly smaller number where a bigger one used to sit. That’s the whole trap — you can’t rally around a loss you can’t see.
Wisconsin farmer and Farmers Union leader Darin Von Ruden already put a face on that math. He ran the numbers on his own 300-cow operation and found the make-allowance change was pulling tens of thousands of dollars a year off his milk check — a hit he says arrived with no line item explaining it. He’s not an outlier. He’s just one of the few who bothered to calculate it.
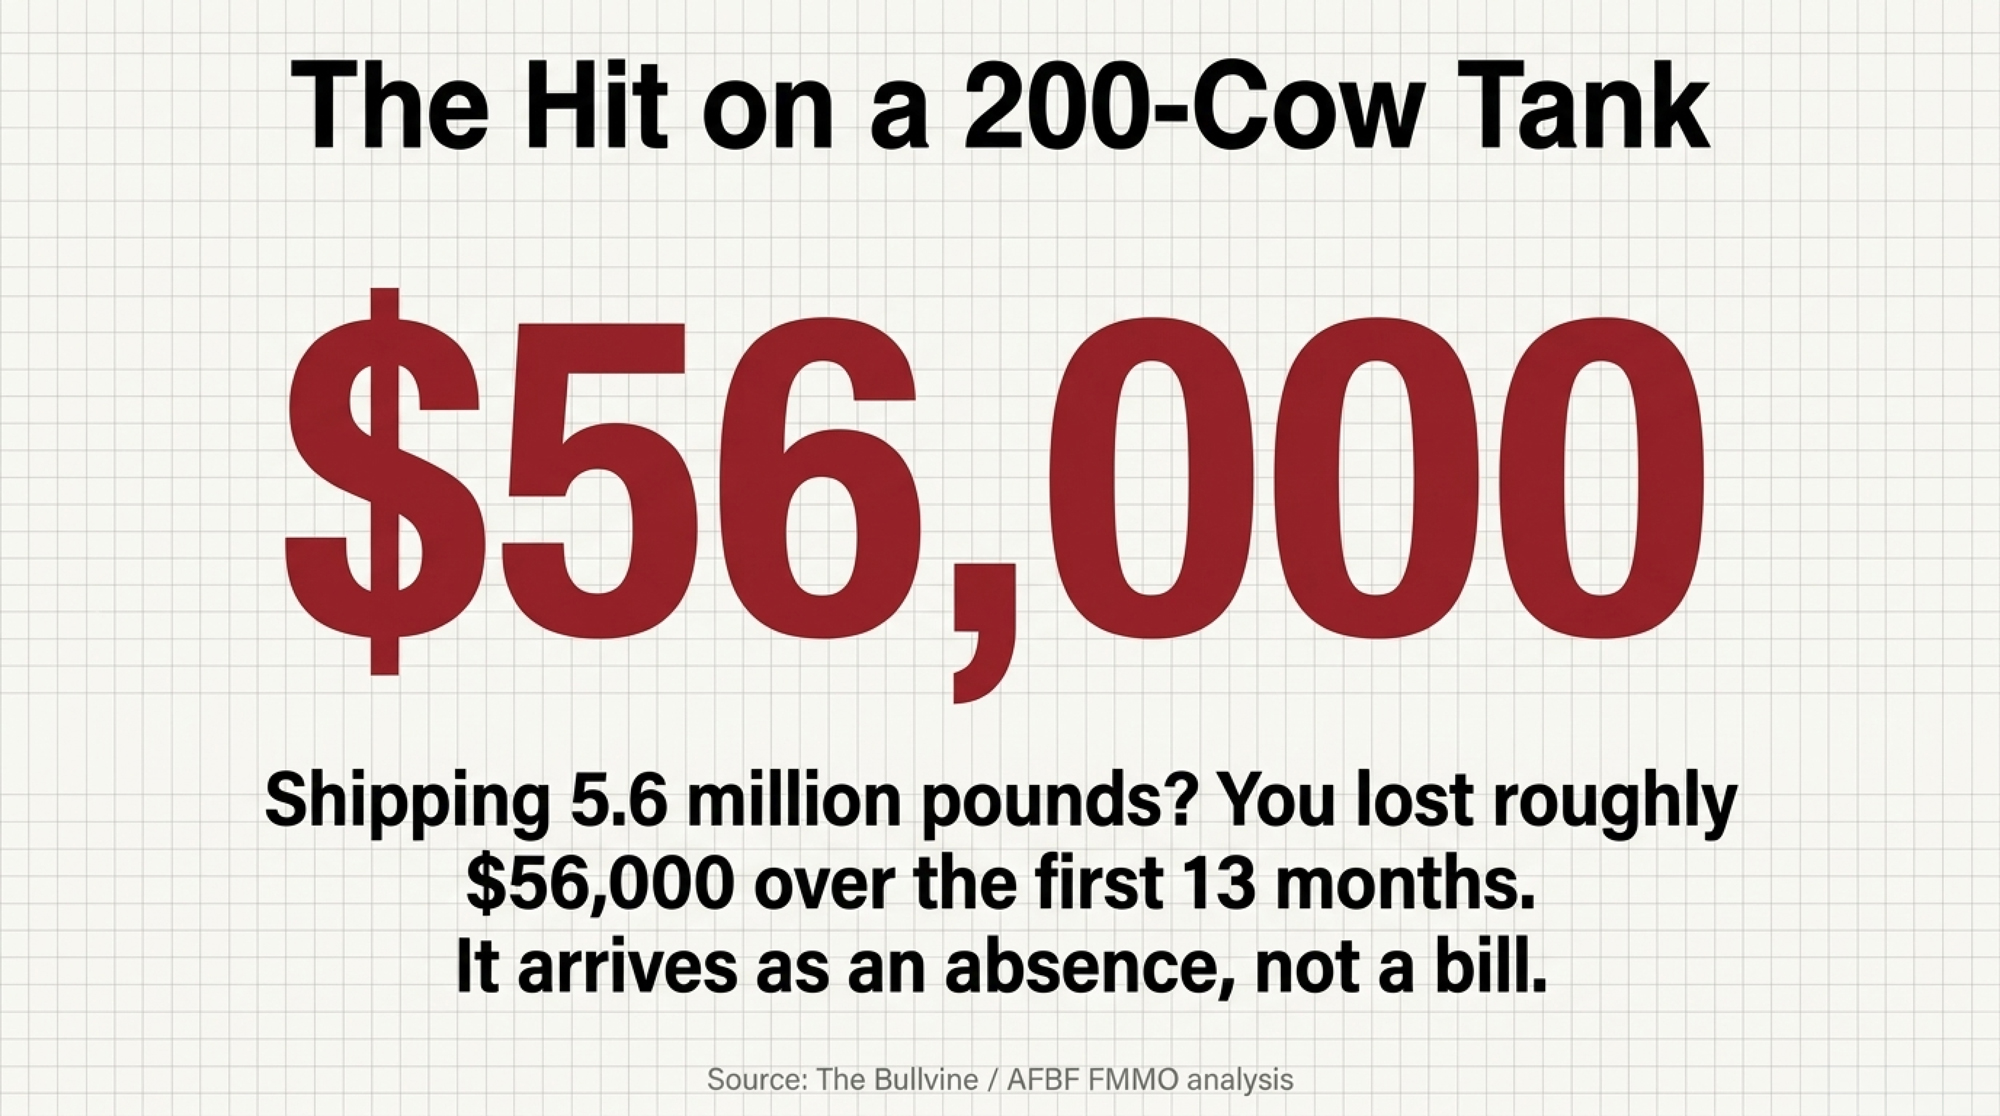
So run it on your own tank. Take a 200-cow herd shipping about 5.6 million pounds a year — that’s 56,000 hundredweight, or roughly 28,000 pounds a cow, so dial it to your own rolling herd average. At $0.92/cwt, that’s $51,520 a year, or about $56,000 across the 13 months since the change took effect. Neither number arrived as a bill. It arrived as absence, which is exactly why it’s gone unfought.
Now look at the contrast. The organic coalition can name its number: the class action puts a dollar figure on the harm and asks the court for at least $60 million back. The organic side has a figure, plaintiffs, and a courtroom. The conventional side has a lighter cheque and nowhere obvious to point.
| Dimension | Organic Producers (Organic Valley Plaintiffs) | Conventional Producers |
|---|---|---|
| Estimated Loss (first 3 months) | Portion of $60M+ claimed | $337M total [all FMMO regions] |
| Loss Visibility | Traceable — segregated milk pool | Invisible — absorbed into co-op pooling math |
| Legal Action | ✅ Class-action filed Apr 28, 2025 | ❌ No plaintiff, no filing |
| Dollar Figure Named | ≥ $60M in federal complaint | None on record |
| Pay Statement Transparency | Deductions itemized per organic program | Often catch-all “market adjustment” terms |
| Co-op Conflict of Interest Risk | Lower — OV is producer-owned, no processing assets | Higher — largest co-ops own processing plants |
| Path to Recovery | Federal court ruling (timeline TBD) | 2031 at earliest via new FMMO hearing |
| Action Required Now | Lawsuit proceeds; plaintiffs wait | Pull co-op financials; price a risk floor |
The Mechanics Behind the Split
Why aren’t the biggest conventional players fighting this the way the organic coalition did? Part of the answer is structural — some of them sit on both sides of the counter.
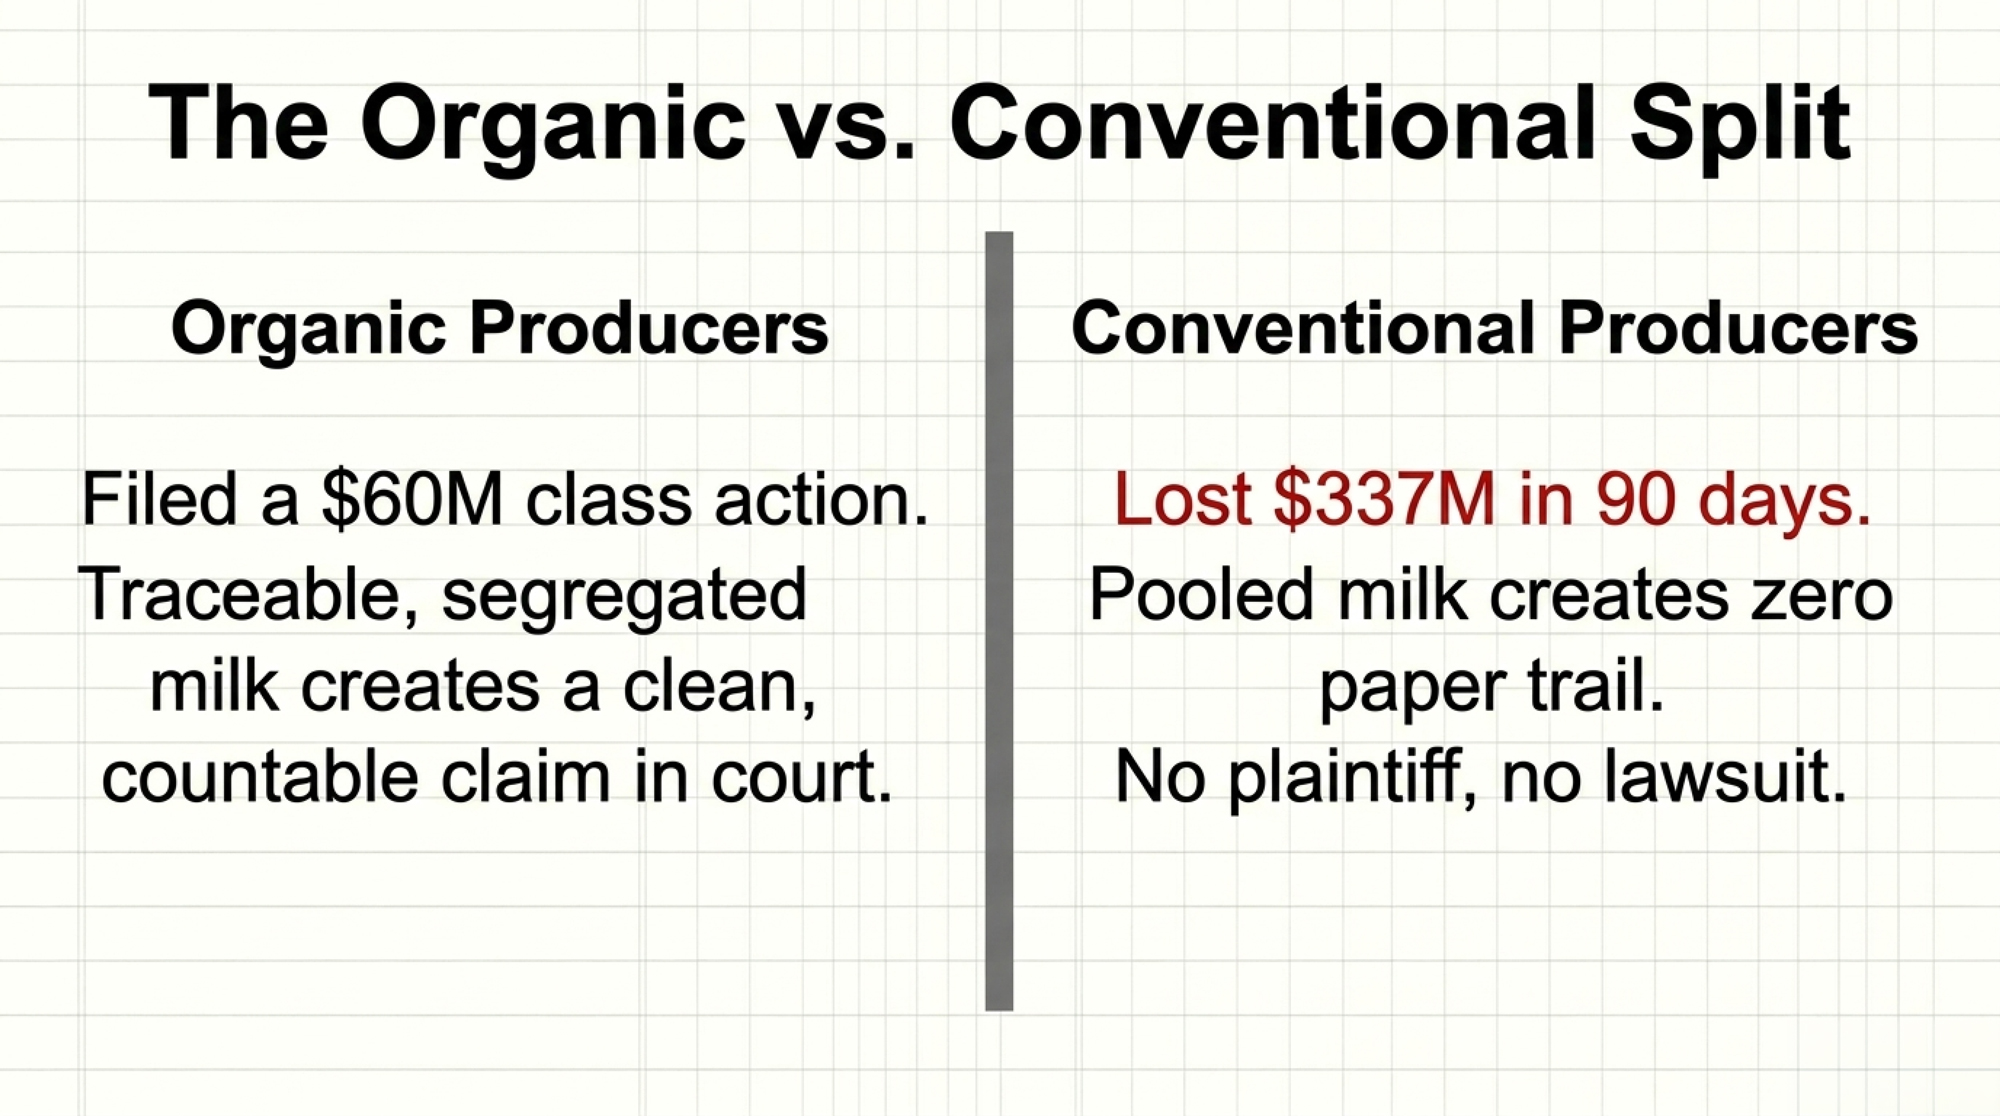
Organic producers like Swan and her co-plaintiffs can trace a defined block of segregated milk into the pool and calculate exactly what comes back — a clean, countable claim. A conventional producer never sees that math. Your cooperative handles the pooling, so the money never materializes on your side. And the paperwork doesn’t help you find it. The Bullvine’s reporting, citing a 2024 University of Wisconsin Extension analysis, found that many cooperative pay statements don’t fully explain deductions over $0.25/cwt — they lean on catch-all terms like “market adjustment” and leave it there. (The Bullvine: who speaks for your milk check?
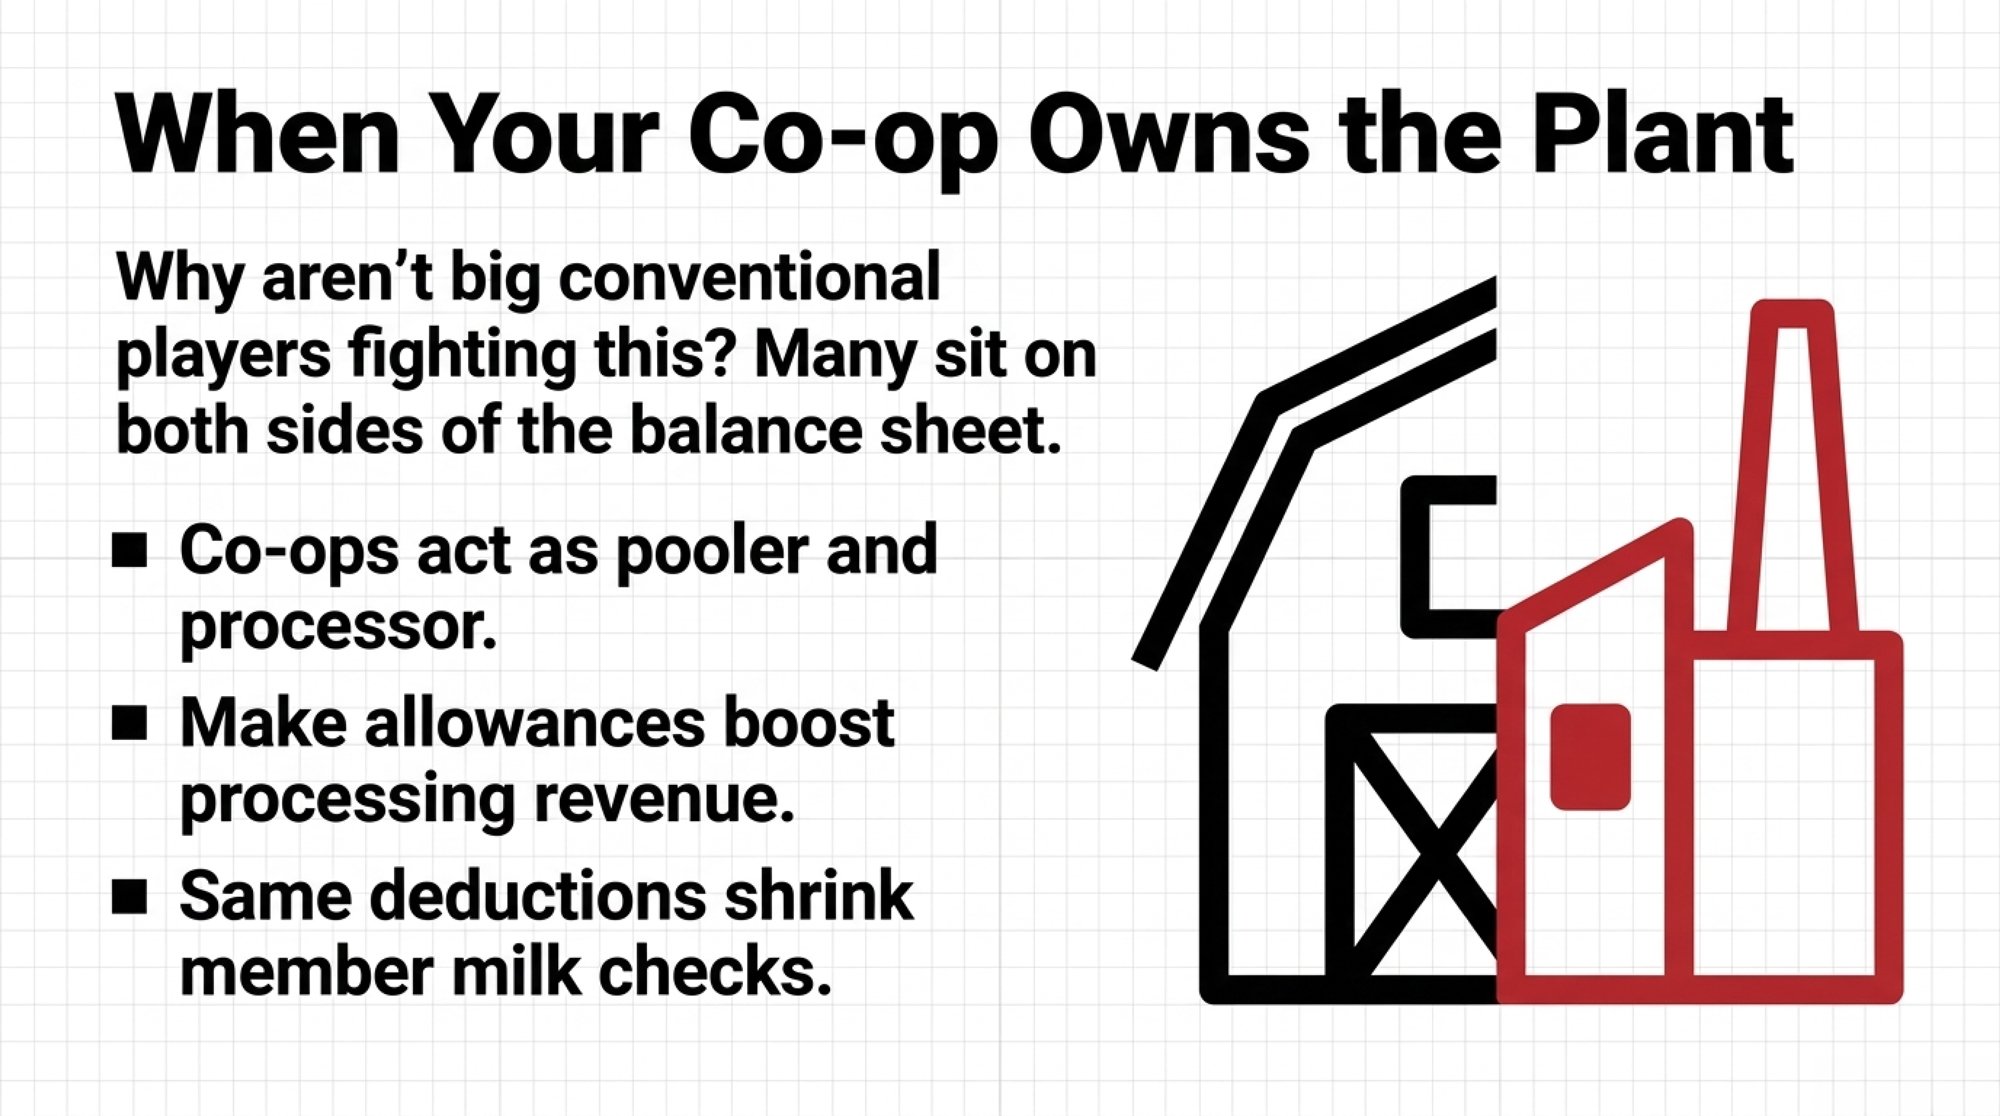
Here’s the structural wrinkle worth naming plainly. Several of the largest cooperatives also own processing assets, which means the make-allowance mechanic can cut in two directions inside one balance sheet. Dairy Farmers of America is the biggest example: net sales of $24.5 billion in 2022, a BBB credit rating, and 44 former Dean Foods plants absorbed out of bankruptcy in 2020. That dual role — cooperative and processor — has drawn scrutiny before. In a separate 2022 antitrust case in Vermont unrelated to make allowances, plaintiffs alleged a conflict between members’ interest in the highest milk price and a processor’s interest in the lowest; DFA spokesperson Kristen Coady called those allegations “baseless and completely without merit,” and no court has upheld them. Nothing in the public record connects DFA to the 2025 make-allowance decision. The point isn’t any one co-op’s conduct — it’s that the structure lets a single organization sit on both sides of the same price.
How Much Does Waiting on the “Fix” Actually Cost You?
Congress already passed the fix everyone points to. It’s slower than it sounds. The Carmel hearing that produced these increases was petitioned in May 2023 and took effect June 1, 2025 — 25 months from ask to paycheck. The mandatory processor cost survey meant to check that math was funded in July 2025, is still in the design stage as of the February 2026 rulemaking notice, and USDA doesn’t plan to begin collecting data until 2027.
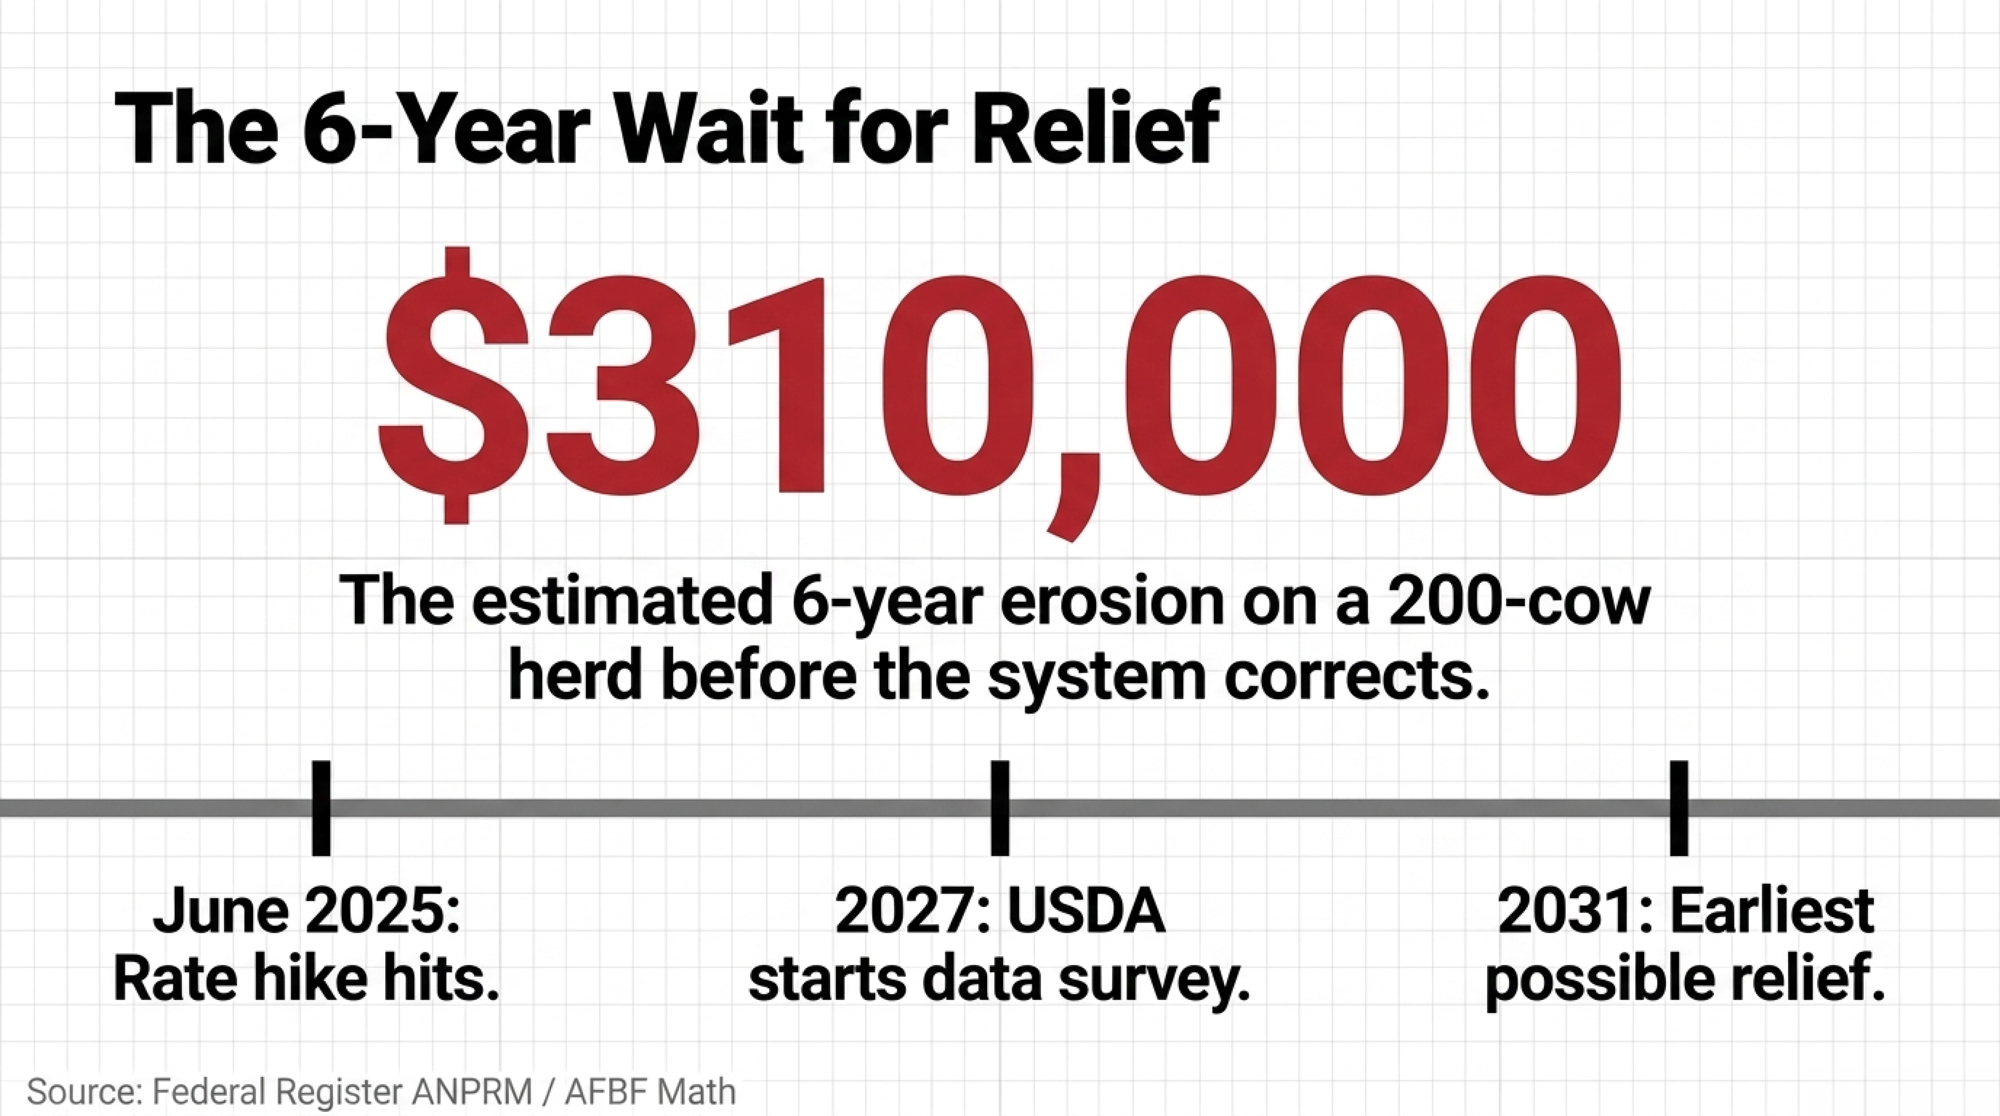
Stack the intervals from the last hearing on top of that, and relief lands no sooner than 2031 — six years after the cut started biting. For that same 200-cow herd, six years at today’s rate and volume runs to roughly $310,000 of erosion before the system can even theoretically correct. The increase arrived in 25 months. The audit on it takes six years. That gap isn’t a rumor. It’s arithmetic.
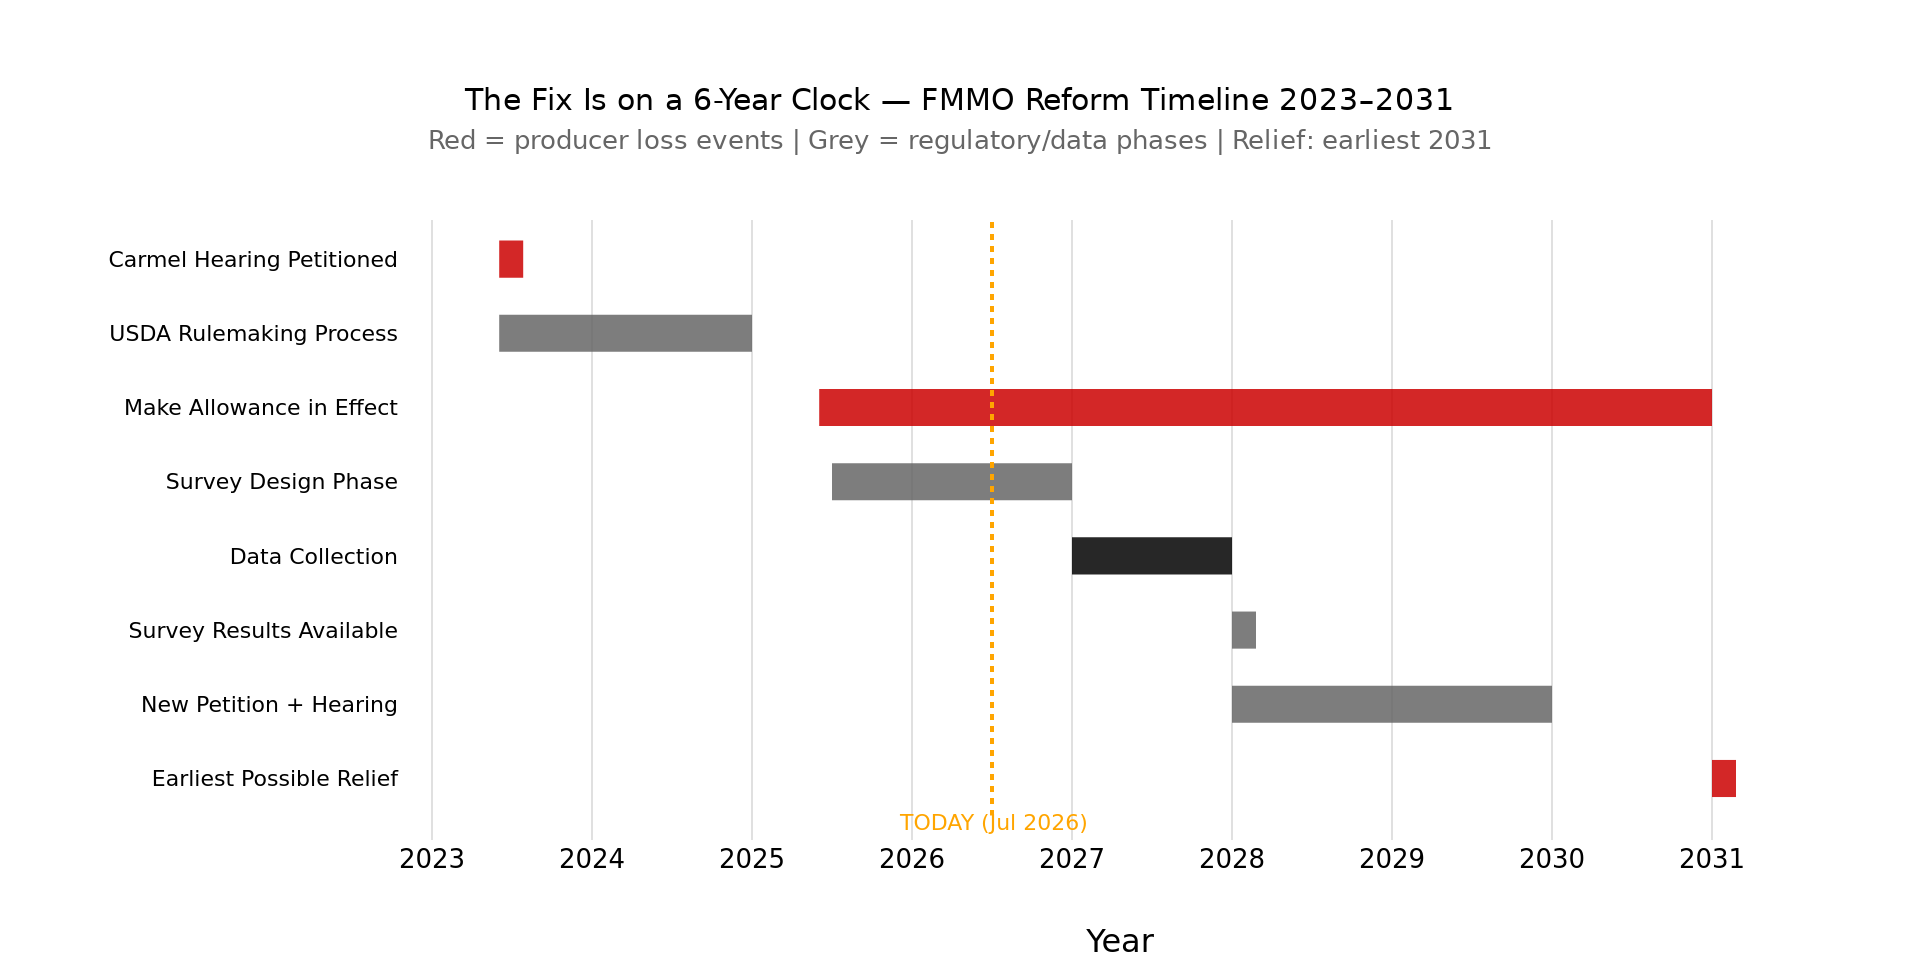
There’s a catch inside the catch, too. AFBF economist Danny Munch told Brownfield the survey changes nothing on its own: “You would still have to go through an FMMO hearing to change them.” New data doesn’t reset make allowances. It just gives somebody grounds to petition for another hearing — and start the 25-month clock over.
Is Your Own Cooperative’s Math Working For You or Around You?
This is the question the whole story lands on, and you don’t need a lawyer to answer it. If your cooperative owns processing assets, the make-allowance increase touched both sides of its books — and only one of those sides shows up on your milk cheque. You’re entitled to understand how it played out.
The goal here isn’t to hunt a villain in your co-op boardroom. Plenty of cooperatives passed the value through as cleanly as the formula allowed, and said so. But most producers can’t tell the difference right now — because they’ve never pulled the one document that would show them. Reading it turns a vague sense that something shifted into a number you can actually work with.
Options and Trade-Offs
The fix is on a six-year clock. Here’s where you actually have room to move before then.
Pull your cooperative’s audited financials this month. As a member, you have the right to your co-op’s audited annual financials — the exact terms are set out in your co-op’s bylaws and your state’s cooperative law, so check yours before you ask. Either way, requesting them costs you an afternoon. Set 2024 and 2025 side by side and watch a single thing: did processing revenue climb while member milk payments, as a share of total revenue, slipped? The statements won’t isolate the make-allowance effect for you — you’ll have to read them against the $0.92 yourself — but they’re the closest thing you’ve got to a receipt.
Don’t wait on the federal survey to bail you out. The One Big Beautiful Bill Act (H.R. 1, signed July 4, 2025) funded a mandatory, audited cost survey covering all reporting plants, replacing the old 61-plant voluntary sample — genuinely better data. But better data isn’t relief. There’s nothing before 2028, no automatic adjustment when it lands, and a hearing timeline that could push any actual change toward 2031. Treat it as a reason to stay engaged on policy, not a rescue you can budget around.
Lock a floor under the price you can still reach — this is the move that pays this year. With the 2026 all-milk forecast cut to $20.70/cwt in USDA’s June estimate and Class III soft, a lower regulated minimum is exactly when a risk floor earns its keep. If your breakeven sits anywhere near current prices, ask your advisor whether Dairy Revenue Protection (DRP), Class III futures, or Dairy Margin Coverage fits your class mix before the next contract window. Yes, coverage costs money and can cap your upside. You’re buying back the certainty the formula just took away — and right now that’s cheap insurance.
Back the groups building the paper trail. Edge Dairy Farmer Cooperative organized around exactly this governance-transparency gap, and if your own financials raise real questions, that’s where collective weight starts to matter. Fair warning: this one runs on the six-year clock, not the 30-day one.
Key Takeaways — Your Make-Allowance Checklist
✔ Run the $0.92. If you ship Class III or IV, assume roughly $0.92/cwt has come off your regulated price since June 2025. Multiply it by your annual hundredweight before you write it off as “just the market.”
✔ Pull the financials. If your cooperative owns plants, request the 2024 and 2025 audited statements this month. If processing revenue rose while your milk-payment share fell, that’s your question for the next meeting.
✔ Don’t bank on the survey. No data before 2028, no automatic adjustment, relief possibly not until 2031. It’s oversight, not a rescue.
✔ Price a floor if you’re close to breakeven. If your breakeven is within a dollar or two of $20.70/cwt, talk to your advisor about DRP or Class III coverage now — don’t wait on a regulated price to recover.
✔ Question vague deductions. If your pay statement carries deductions over $0.25/cwt with no line-item explanation, ask your co-op to itemize them.
The Question Worth Your Coffee Monday
Abby Swan knew her number well enough to put it in a federal complaint. Darin Von Ruden knew his well enough to run it on 300 cows and go public. So here’s the one to sit with: do you know yours? Not the regional estimate. Not the co-op average. Your operation’s actual exposure to a formula change that’s been quietly running for more than a year.
Pull the statements, run the $0.92 against your tank, and you’ll know whether you’re looking at a market problem or a governance problem — because those two need very different answers. We’re breaking down the full cost-per-cwt model by herd size, region, and class utilization in next week’s Bullvine Weekly. That’s where the real numbers live.
Run Your Numbers
Dairy Farm Corridor Score Calculator — This tool puts a dollar figure on the same drag this article tracks, folding FMMO make-allowance impact, hauling burden, and structural pressure into your milk revenue by state. Run your farm through it to see whether that $0.92/cwt is a market problem or a location problem you’re stuck paying.
Complete references and supporting documentation are available upon request by contacting the editorial team at editor@thebullvine.com.
Learn More
- The USDA Formula Change No Milk Check Explains — Arms you with a concrete risk-management checklist to offset formula losses, separating defensive, balanced, and aggressive strategies using Dairy Revenue Protection to shield your debt service cover ratio from structural price drops.
- You Bred for Butterfat. Make Allowances Took $337M – and Retailers Took the Provenance Premium. — Exposes how processing plants capture the value of record high-component milk, delivering an operational protocol to audit your own creamery contract and halt margin erosion before spring flush.
- Organic Valley Sued USDA Over $50M a Year — and Your Blend Price Is In It — Breaks down the underlying constitutional and pooling math driving the federal litigation, mapping out exactly how the legal battle impacts conventional blend prices across manufacturing heavy regions.
 The Sunday Read Dairy Professionals Don’t Skip.
 The Sunday Read Dairy Professionals Don’t Skip.
Every week, thousands of producers, breeders, and industry insiders open Bullvine Weekly for genetics insights, market shifts, and profit strategies they won’t find anywhere else. One email. Five minutes. Smarter decisions all week.
