










Ontario’s new formula went live April 1. Below a 2.14 SNF:butterfat ratio, your cheque is already smaller — about $2 per kilogram of quota. Do you know yours?
THE SHORT VERSION
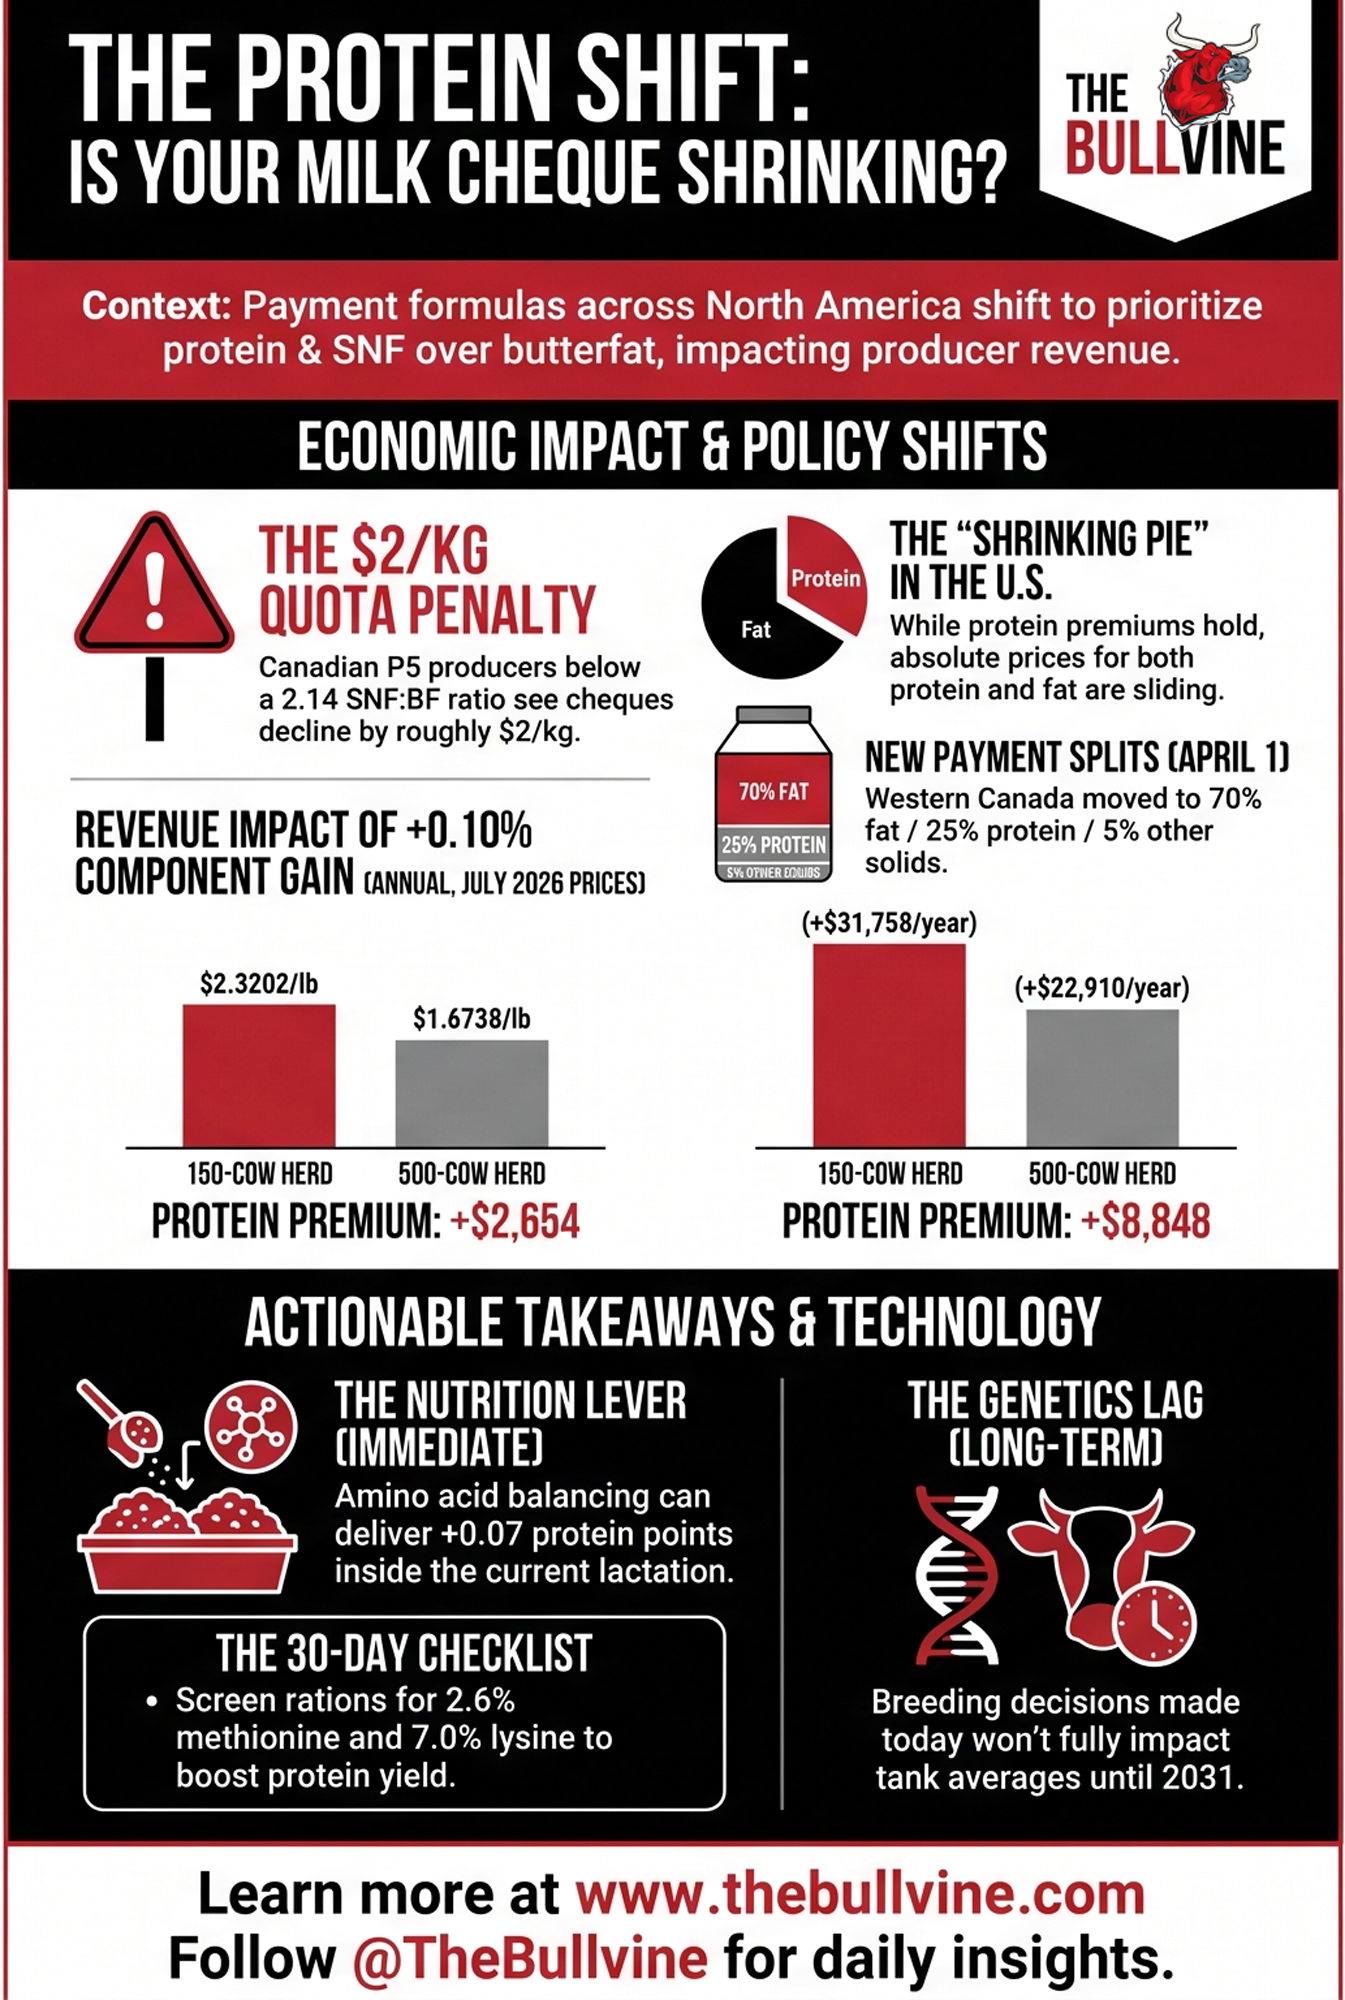
- Canada: P5 payment policy changed April 1. Holstein producers below a 2.14 SNF:BF ratio are seeing cheques decline — roughly $2 less per kilogram of quota owned for a farm at 2.1. Western Canada’s split moved to 70% butterfat / 25% protein / 5% other solids, from 85/10/5.
- United States: July protein paid $2.3202/lb against butterfat at $1.6738 — protein’s fourth straight month ahead. But TPI now weights protein at 24 while Net Merit weights it at 13, on the same cow population.
- The action: Genetics won’t reach your tank until 2029, herd average closer to 2031. Amino acid balancing delivers about 0.07 percentage points of true protein inside the current lactation — roughly $6,669 a year on 150 cows, without touching your forage base.
Component prices cited are USDA-announced figures through July 2026. August prices publish September 5.
In Canada, It’s Not a Signal Anymore. It’s the Formula.
While U.S. producers read price tea leaves, eastern Canada rewrote the pay sheet on April 1.
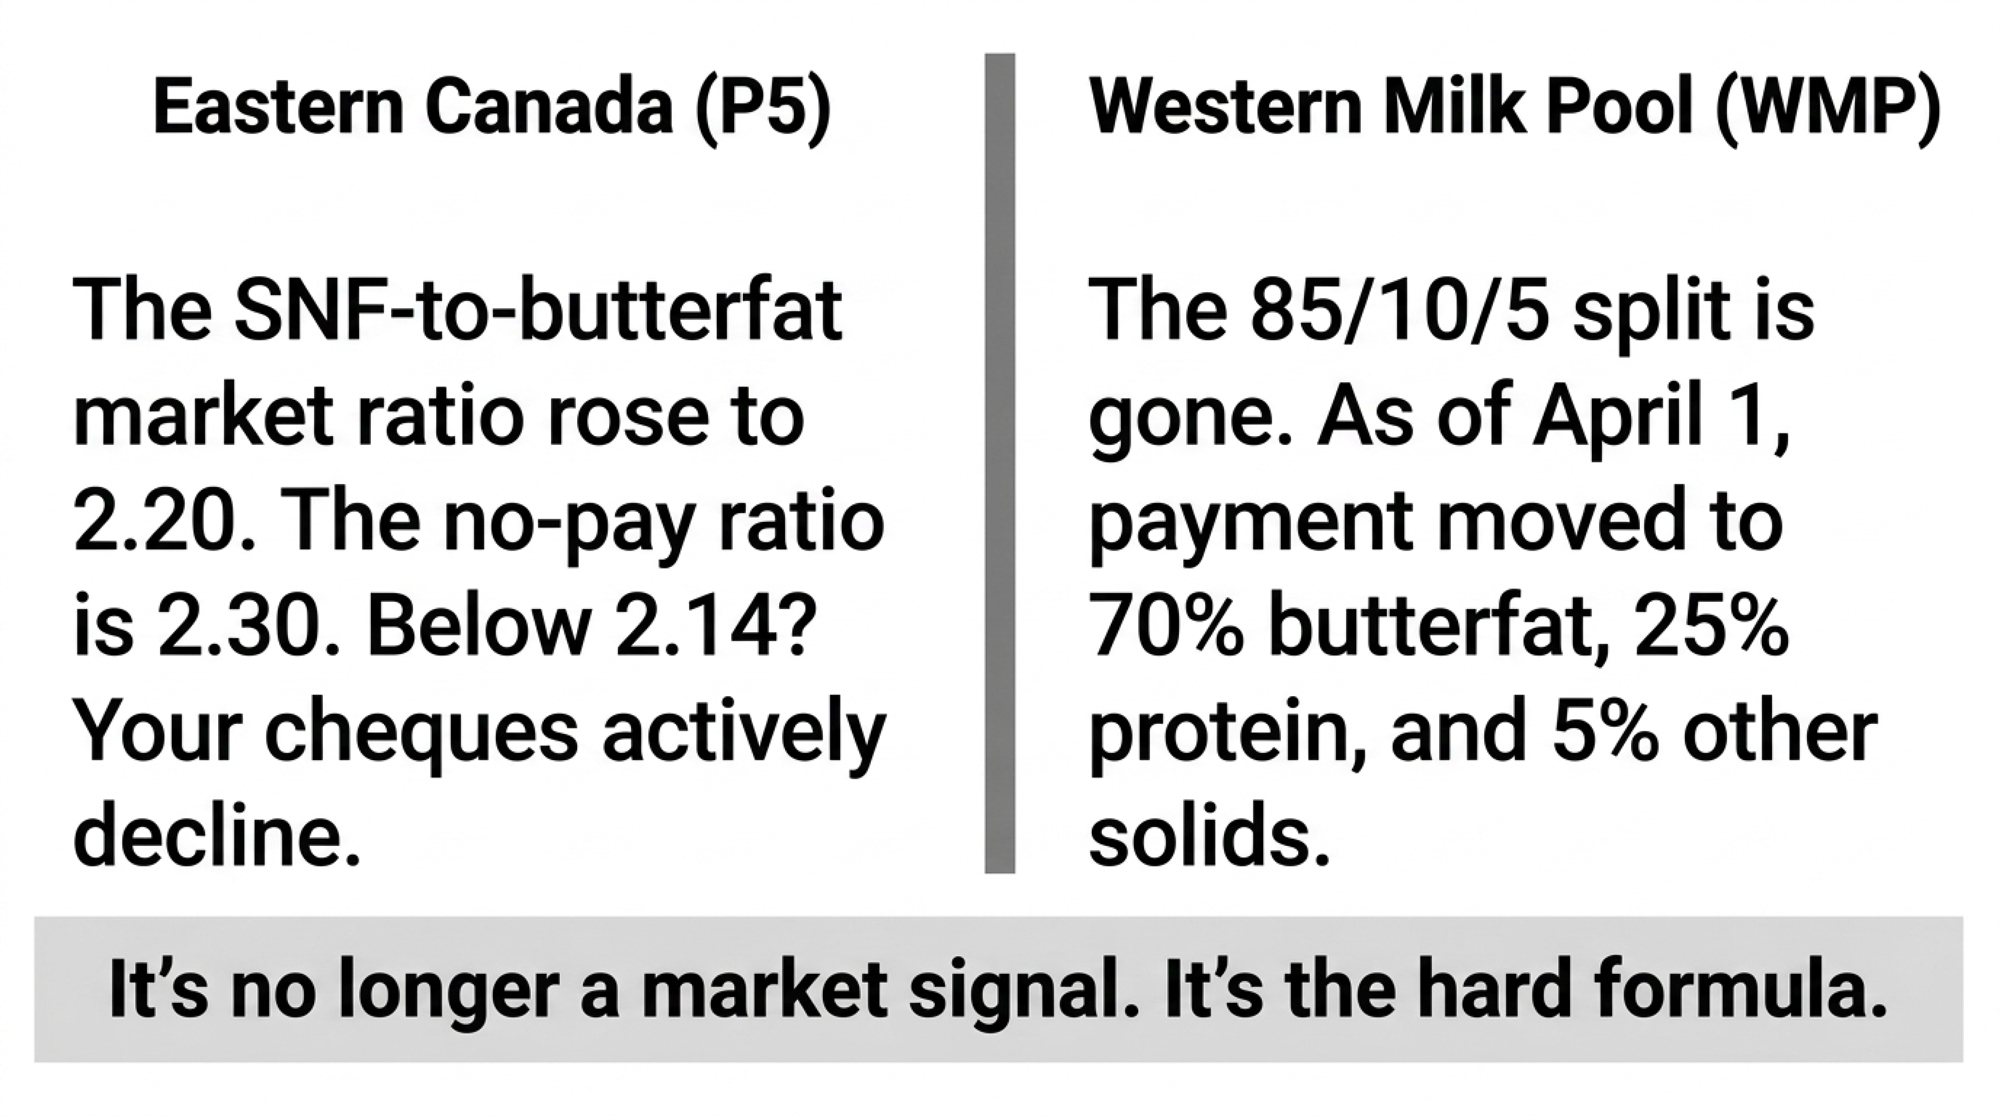
Dairy Farmers of Ontario’s February 2026 Dairynomics bulletin, “Changes in Solids-Non-Fat (SNF) Payment Policy – April 1, 2026,” sets out what the P5 Boards approved for Ontario, Quebec, New Brunswick, Prince Edward Island and Nova Scotia: the SNF-to-butterfat market ratio rises to 2.20, the no-pay ratio to 2.30, and residual other-solids revenue is redistributed 30% to butterfat and 70% to Tier 1 protein. On the cheque, that means Tier 1 protein jumped roughly $2.00 per kilogram while butterfat dropped about $1.80.
| Metric | Canada (P5 SNF:BF) | US/Global (Protein:Fat) |
|---|---|---|
| Threshold triggering pay cuts | Below 2.14 (cheque declines) | N/A — informational only |
| New market ratio (Apr 2026) | 2.20 | 0.80 (cheese-yield target) |
| No-pay / danger ratio | 2.30 | Below 0.80 — fortify or skim cream |
| Current US national average | Not applicable | 0.77 (down from 0.83 in 2015) |
| Farm-level example cited | 2.1 → −$2.00/kg quota | N/A |
Note on the math. These are two different ratios and they aren’t interchangeable. Canada’s P5 formula uses solids-non-fat to butterfat — SNF:BF — and the thresholds that matter are 2.14, 2.20 and 2.30. The cheese-yield figure quoted in U.S. and global coverage is true protein to butterfat, where 0.80 is the number cheesemakers want and the U.S. sits at 0.77. Same tank, different denominators. Don’t read one off the other.
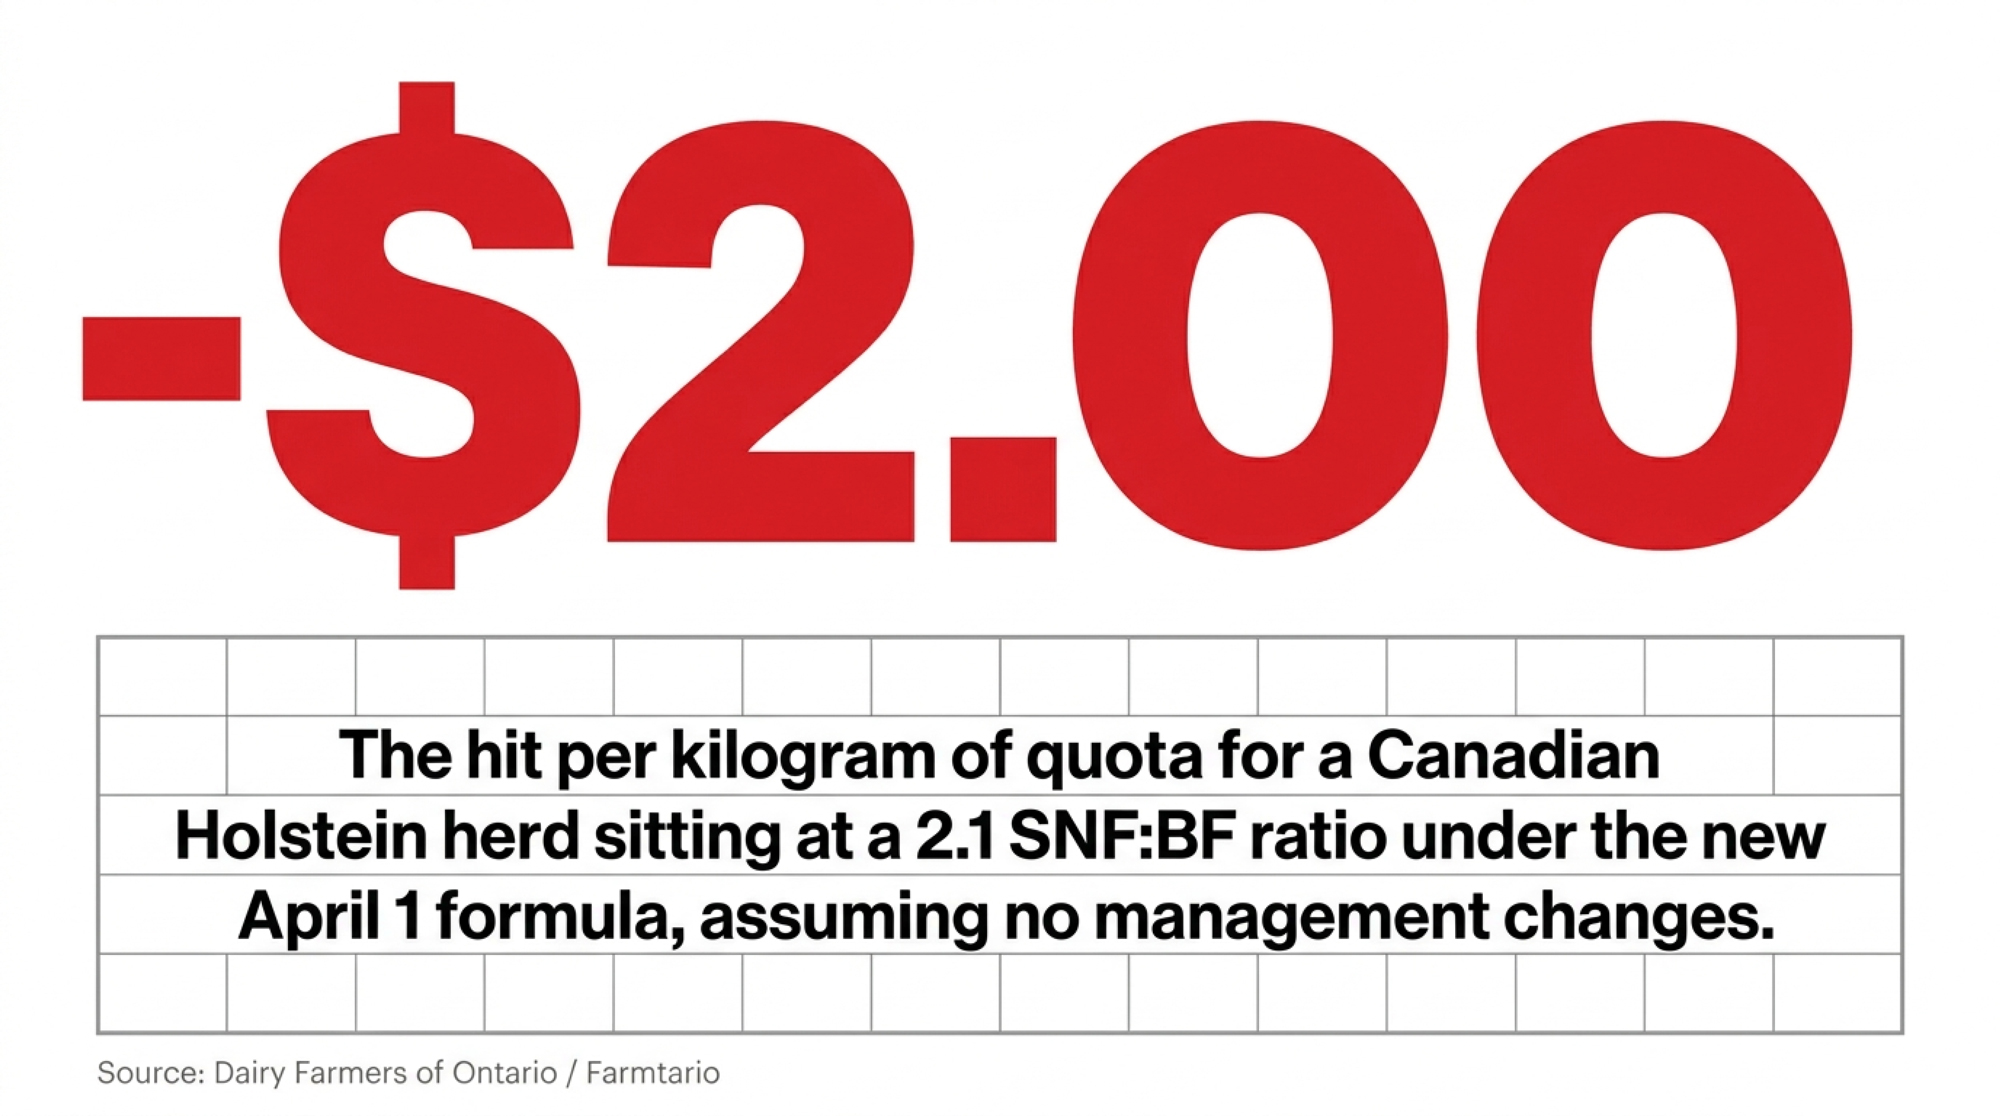
Here’s the part with teeth. Holstein producers running below a 2.14 SNF:BF ratio will see their milk cheques decline. A farm sitting at 2.1 that makes no management changes by April 1 receives roughly $2 less per kilogram of quota owned — DFO guidance, as reported by Farmtario in February.
Western Canada moved too. As of April 1, producers in the Western Milk Pool (WMP) are paid 70% on butterfat, 25% on protein and 5% on other solids, down from an 85/10/5 split set in 2017.
Farm Credit Canada’s 2026 Dairy Outlook, published February 4, runs the arithmetic on a western farm testing 4.5% butterfat and 3.4% protein. Push butterfat to 4.7% while holding protein flat and revenue falls 1.2%. Drop butterfat to 4.3% at the same protein and gross revenue rises 1.4%. FCC is a lender, so read its outlook accordingly — but that’s a farm getting paid less for more butterfat, which is the thing U.S. producers keep being told might happen someday.
Canada’s Regulator Said It Out Loud
The genetics side followed the money.
At the February 25, 2026 Open Industry Session, the Canadian Dairy Commission advised the industry to stop further improvement of butterfat content relative to protein. Lactanet reported the directive and added a caution: the adjustment “must be approached carefully to avoid overcorrection, with the objective of achieving a more balanced relationship between fat and protein.”
Six weeks later, Lactanet moved. Effective the April 2026 proof release, the LPI Production subindex shifts Holstein weightings from 60% fat/40% protein to 40F:60P, Jerseys from 50:50 to 33F:67P, and Ayrshires from 60:40 to 50:50. Lactanet’s Hannah Sweett notes the Holstein figure is a reversion — 40F:60P is where the subindex sat in 2015 — and expects “only minor reranking among top animals.”
If you’re milking in Canada, your April proofs re-sorted the bull list you were working from last fall, and your pay formula changed the same month. Worth checking whether your semen order noticed either.
The data behind the change is blunt. Using December 2025 records on registered Canadian females, Lactanet found Holstein genetic merit for Fat Yield reached roughly 56 kg in 2025 against 34 kg for Protein Yield, relative to the 2017–2019 base. Over five years, Holstein fat progress ran 20% ahead of protein. In Jerseys, closer to 40% ahead.
A Decade of Being Told the Opposite
None of this came out of nowhere, and U.S. producers are living the same arithmetic without the formula change.
Butterfat beat protein in 82 of the 128 months from January 2015 through August 2025, and when it did, the average spread ran 93 cents per hundredweight. That’s CoBank’s August 2026 component report — and CoBank is a dairy lender, so weigh its outlook accordingly.
Producers on both sides of the border did exactly what the check told them to do. National U.S. butterfat climbed from 3.75% in 2015 to 4.32% in 2025, per USDA-NASS figures cited in that report.
You can’t unwind ten years of selection in a season. And that’s before you get to the part where the two traits don’t separate cleanly no matter what you do.
Has the Protein Premium Actually Held?
Two things are happening in the U.S. numbers, and only one of them is good news.
The spread held. Protein beat butterfat by 16 cents in February, 65 cents in April, 77 cents in June, and 65 cents again in July.
The absolute price didn’t. Protein hit $2.75 in May, its high point across the months on record here, then slid to $2.46 in June and $2.32 in July. Butterfat fell too, from $1.69 in June to $1.6738 in July — its smallest value since January.
So you’re taking a bigger slice of a shrinking pie. August’s numbers publish by September 5, and the thing to watch isn’t whether protein wins again. It’s whether protein keeps sliding while butterfat steadies, because that closes the gap without a single farm changing a single thing.
The Barn Math on a Tenth
Find your herd size, then find the gap. Both columns assume 75 pounds a day — a Bullvine modeling assumption, so scale it to your own tank. The model holds milk volume constant, so it errs slightly low.
| Value of +0.10 percentage point | 150-cow herd (41,062 cwt/yr) | 500-cow herd (136,875 cwt/yr) |
| Protein at July 2026 ($2.3202/lb) | $9,527 | $31,758 |
| Butterfat at July 2026 ($1.6738/lb) | $6,873 | $22,910 |
| Spread, protein over fat | +$2,654 | +$8,848 |
| Protein at April 2026 ($2.5190/lb) | $10,344 | $34,479 |
| Swing, April to July | −$817 | −$2,721 |
The direction has been stable for four months. The dollar value moved almost three grand on a 500-cow herd in ninety days. Anyone building a five-year breeding plan off one month’s announcement is reading the wrong signal — we ran this same math at March prices back in May, and the tenth was worth less again.
Can You Actually Move Protein Before 2029?
Sixty-four percent, says Lactanet. Eighty percent, says CDCB. Both numbers describe how tightly fat and protein move together, and the two national bodies don’t agree.
Lactanet reports 64% between Fat Yield and Protein Yield in Canadian Holsteins, with heritability of 26% for both. CoBank cites CDCB at 80%. They may be measuring somewhat different things — yield versus composition — and neither has published a reconciliation.
What’s interesting is that Lactanet reads its own number as good news: a 64% correlation, they write, means “we can improve both traits simultaneously,” and “selecting for increased protein will also increase fat.” That’s the reverse of how the correlation gets framed in U.S. coverage, where it’s the reason you can’t fix your ratio. Which reading applies to you depends on whether you’re trying to raise protein or lower fat.
The calendar binds either way. Breed this fall and your heifer calf arrives around mid-2027, freshening at 22 to 24 months, so her first lactation lands in your tank in 2029. Lactanet puts the herd-level figure further out: breeding decisions made today “will not appear in a herd’s bulk tank for roughly 5 years or more, once daughters are born, raised, and enter the milking herd.”
First daughters in 2029. A real shift in your tank average closer to 2031. Which is a problem if your pay formula changed this April.
Four Indexes, Three Directions
If the lag is five years, the index you select on this fall matters more than the semen itself.
| Index | Owner | Current version | Protein | Fat | Points toward |
| TPI | Holstein Association USA | April 2026 evaluation | 24 (was 19) | 14 (was 19) | Protein |
| Net Merit (NM$) | CDCB | April 2025 revision | 13.0% (was 19.6%) | 31.8% (was 28.6%) | Fat |
| Cheese Merit (CM$) | CDCB | 2021 AGIL formulation | 20.9% | 27.2% | Protein, and penalizes milk at −2.2% |
| Fluid Merit (FM$) | CDCB | Published each run | Zero weight | — | Volume and fat |
| LPI Production, Holstein | Lactanet | April 2026 release | 60% (was 40%) | 40% (was 60%) | Protein |
Read the columns, not across the rows. TPI weights are points within a 100-point scale; Net Merit and Cheese Merit are relative economic emphasis; LPI Production is a within-subindex split. Different units. The CM$ figures come from the 2021 AGIL formulation, the last published side-by-side; current weightings aren’t available in comparable form. Bull-to-bull comparison across TPI, Net Merit, and LPI also requires an Interbull MACE conversion.
One thing the table can’t show you. CDCB’s 2025 revision moved Net Merit toward butterfat. Whether Cheese Merit’s weightings moved with it isn’t published in a form anyone outside CDCB can check — which is its own problem if you ship to a cheddar plant. What the 2021 figures do show is the structural difference: CM$ carries a −2.2% weighting on milk itself, docking carrier volume, where NM$ sits at +0.3%. Protein was 20.9% against 19.6% — a 1.3-point gap, not a transformation. Sort your battery both ways and look at what actually moves before you spend anything.
Holstein Association USA’s board approved its change at the March 26–27, 2026 meeting in Kansas City. No other trait weightings moved, and the Association reports a 0.9978 correlation between the revised and previous formula — a refinement, not an upheaval. CDCB explained its move plainly: “More emphasis on butterfat and less emphasis on protein due to recent price trends.”
Same national cow population, opposite instructions on the same trait pair. We ranked the exposure bull-by-bull before the April proofs dropped, and the reshuffling was real even at that correlation.
The 0.77 That Means Nothing in New Zealand
Here’s where the standard version of this story goes sideways.
The U.S. protein-to-fat ratio fell from 0.83 to 0.77 over the decade, per CoBank. Cheese makers generally want it above 0.80, and below that they’re either buying protein solids to fortify the vat or spinning cream off the front end.
New Zealand sits at 0.77 too. Has for ten years — 0.77 in 2015, 0.77 in 2025, according to DairyNZ and LIC figures cited by CoBank. No one in the New Zealand industry treats it as a problem.
The ratio isn’t the problem by itself. What the milk gets made into is. Only 15% of New Zealand’s whole milk solids go to cheese vats, based on Fonterra data. In the EU it’s 39%. A ratio that wrecks a cheddar plant’s economics is irrelevant to a whole-milk-powder operation.
So What’s the U.S. Number?
Nobody has settled it. CoBank’s report puts 49% of U.S. milk on a total solids basis going to cheese vats, credited to updated calculations by CoBank and dairy consultant Mike McCully. USDA metrics peg it at 42%.
Part of the answer may be that the two count different things. USDA’s Economic Research Service states in its August 2021 Amber Waves methodology that its figures are “based on these components in the final products, not the components used as inputs in the manufacturing process,” because some solids leave in the whey and some are lost in processing. ERS published how it counts; CoBank’s report doesn’t include the methodology behind its own figure.
Seven points apart, no way to reconcile them from outside. Don’t split the difference — an averaged number would be wrong twice.
What the Ration Can Do in One Lactation
Genetics runs on a five-year clock. The bunk runs on a lactation.
The best evidence is a meta-analysis by R.A. Patton in the Journal of Dairy Science, May 2010 — 35 studies, 75 dietary comparisons of rumen-protected methionine. Patton was with Nittany Dairy Nutrition, a private consultancy; the trials tested two commercial products, Mepron and Smartamine.
Adding rumen-protected methionine raised true milk protein by 0.07 percentage points and yield by 27 grams per day. Milk fat percentage went slightly down, dry matter intake dipped slightly, and milk production ticked slightly up. That fat decrease is a second benefit if your ratio is the problem — it nudges both ends the right way at once, which selection can’t do at either correlation figure. Those responses came from adding a supplement to existing diets, not from rebuilding the base ration — no forage or energy-density overhaul required.
Patton also found the protein response wasn’t related to how much product was added, or to the predicted amino acid deficiency of the base diet. More methionine didn’t mean more response. Worth raising with your nutritionist when you price a program.
One caution before you read your own numbers. Milk fat has an annual rhythm — University of Wisconsin–Madison Extension cites Salfer, Dechow and Harvatine (Journal of Dairy Science, 2019) showing national fat yield peaks around January and swings 0.15 to 0.30 percentage points across the year. That’s larger than the tenth this article is built on, which means one month’s test tells you nothing. Read twelve.
Where Your Ration Should Sit
University of Illinois extension guidance from Dr. Phil Cardoso (April 2020) gives workable targets.
| Diet | Methionine (% of MP) | Lysine (% of MP) | Other |
| Pre-fresh | 2.6% | 8.0% | MP not below 1,200 g/day |
| Fresh | 2.6% | 7.0% | LYS:MET ratio 2.6:1 to 2.8:1 |
| Patton meta-analysis average | 2.35% | 6.33% | Below Illinois fresh-cow targets on both |
Cardoso is direct that the ratio alone won’t carry a program: “adjusting only for the ratio between LYS:MET will not guarantee the success of your amino acid balancing.”
On cost, there’s no honest per-cow-per-day figure that applies to your ration. It moves with your base diet, your product, and your MP supply. Price the smallest program that hits the targets above.
Options and Trade-Offs for Farmers
Re-rank before you re-breed — your 30-day move. Ask your genetics rep to sort your current bull battery on Cheese Merit as well as Net Merit, and ask your fieldman what your plant’s cheese utilization actually runs. Two phone calls, no cost. Expect a tilt rather than an overhaul — the 2021 figures put the CM$ protein advantage at 1.3 points, with most of the difference in the milk penalty.
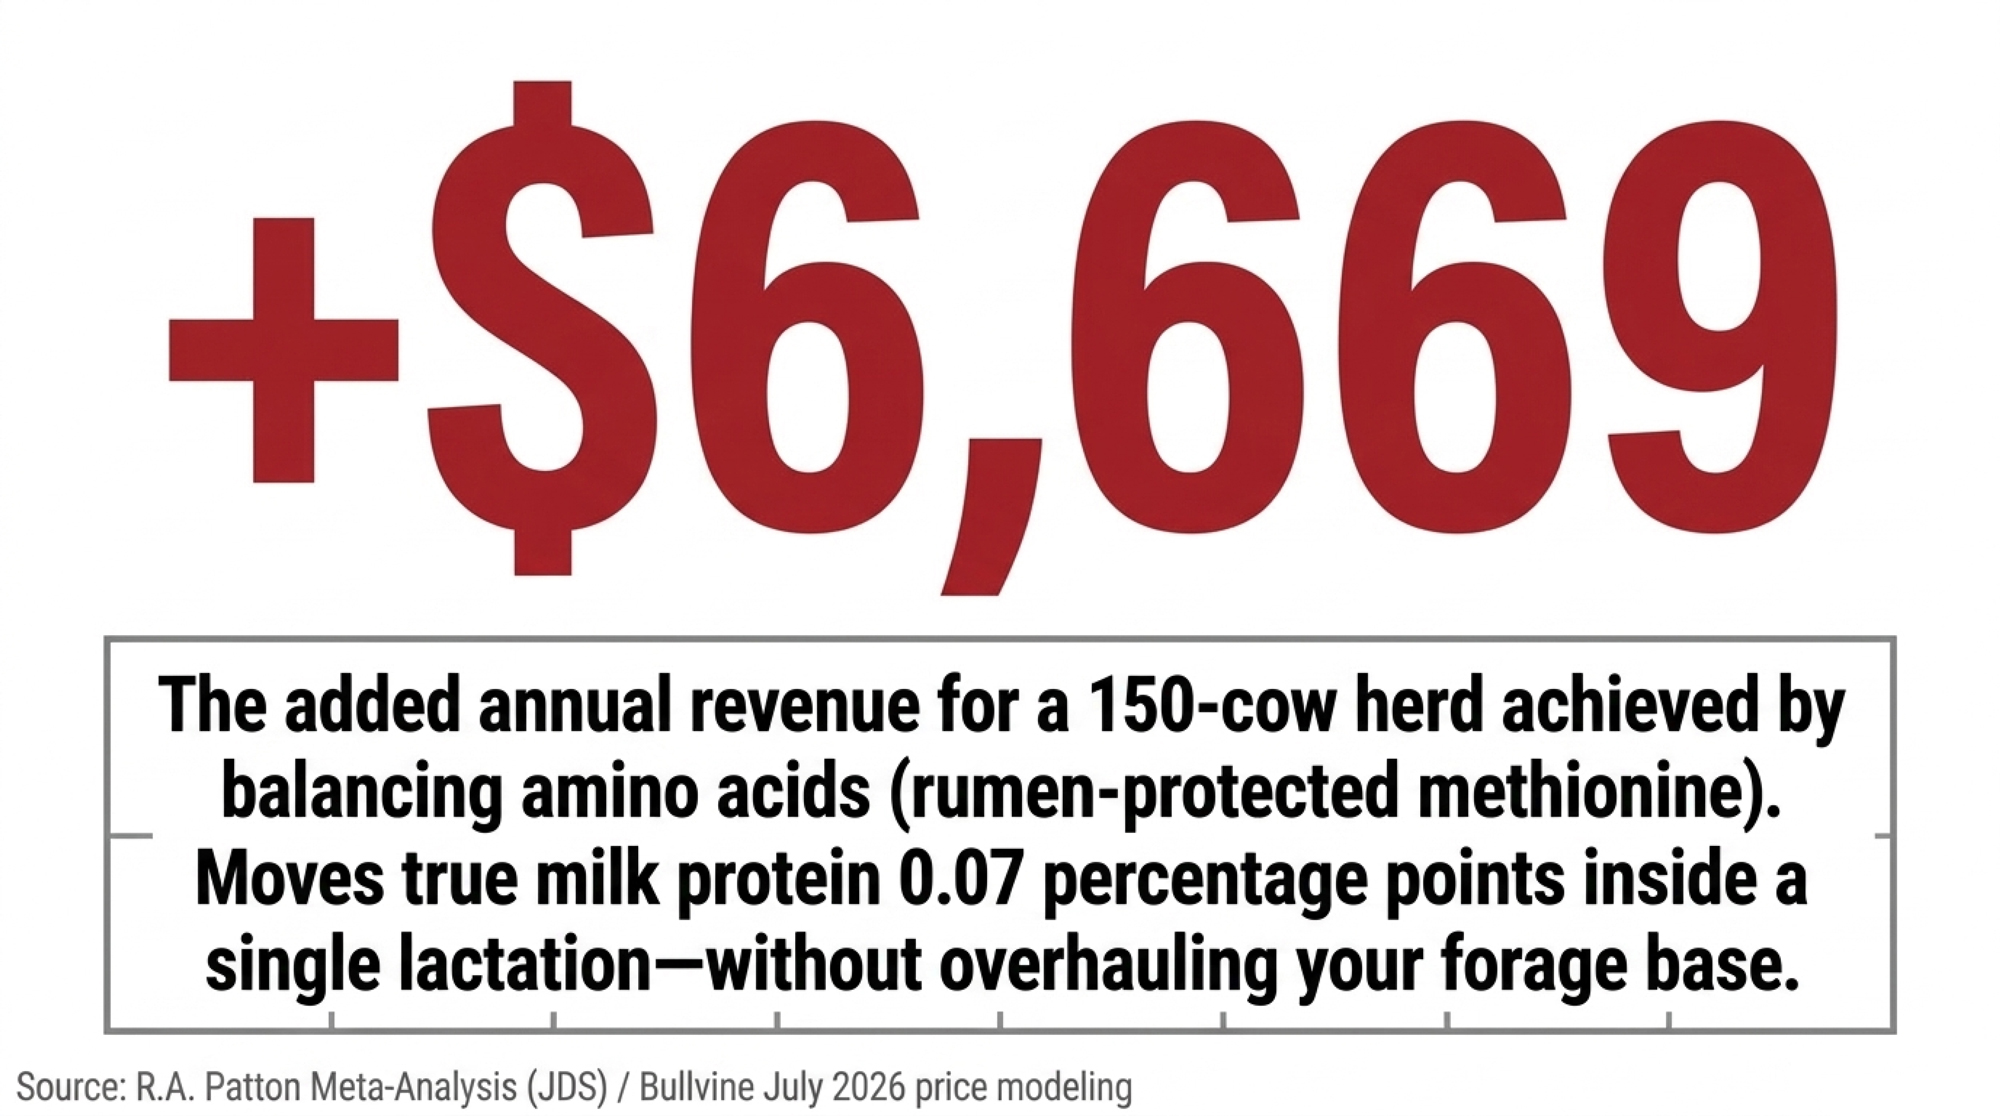
Balance amino acids. Ask your nutritionist what the fresh ration delivers for methionine and lysine as a percentage of MP. Under 2.6% and 7.0%? That’s a lever working inside one lactation instead of five years. Expect around seven hundredths of a point — on 150 cows, roughly $6,669 a year at July prices, before program cost.
Shift part of the fall battery. Pull twelve months of statements, divide protein test by fat test, and compare against the same months last year. Under 0.76 on a full-year basis and shipping to a cheese plant? Move a slice of your bull selection toward protein. Not the whole battery — you’d be betting five years on a four-month price pattern, and Lactanet’s own read is that protein selection lifts fat along with it.
Watch the export door. U.S. butterfat exports hit 196 million pounds in the first half of 2026, close to double all of calendar 2024, going mainly to MENA, Mexico, Central America and the Caribbean, and South Korea, per CoBank. That’s a concentrated buyer list. If global butter softens and those flows narrow, surplus fat comes home and farmgate fat value takes the hit — a different problem from the gap between what the pool pays you and what your fat actually sells for, but it lands in the same place on your statement.
Your Checklist, By Herd Type
The 0.80 cheese-yield threshold comes from CoBank. The 4.3% fat test, the 0.76 ratio, and the 25-cent trigger are Bullvine decision rules — useful, but ours, not the industry’s. The Canadian ratios are published P5 policy.
P5 producers — Ontario, Quebec, New Brunswick, PEI, Nova Scotia
- Find your SNF:BF ratio now. Below 2.14 and your cheque is already declining under the April 1 formula. A farm at 2.1 with no changes gives up about $2 per kilogram of quota owned.
- 2.20 is the market ratio; 2.30 is where extra protein stops paying. Know which side of that band you’re on.
- Re-examine your sire lineup under the April 2026 LPI Production formula — 40F:60P for Holsteins, 33F:67P for Jerseys, 50:50 for Ayrshires.
Western Milk Pool producers
- Your split moved to 70% butterfat, 25% protein, 5% other solids as of April 1. Run FCC’s arithmetic against your own tests before you assume more butterfat is still a win.
Cheese-market shippers, protein-to-fat ratio under 0.76 on a full-year basis
- Sort the fall sire battery on Cheese Merit and the April 2026 TPI, not just standard Net Merit. Before the semen order, not after.
- Get the plant’s actual cheese utilization from your fieldman. That single number decides whether the rest applies.
- Accept the timeline: first daughters in 2029, tank-average shift closer to 2031.
Balanced and high-component U.S. herds, protein-to-fat above 0.80 and fat under 4.3%
- Hold course. Don’t trade fat yield on a four-month market move.
- Watch September 5. If protein’s premium falls under 25 cents for two consecutive months, the flip is fading and sitting still was right.
Everyone, within 30 days
- Screen the fresh ration against Cardoso’s targets: 2.6% methionine, 7.0% lysine of MP, LYS:MET 2.6:1 to 2.8:1.
- A +0.07 percentage point protein response delivers roughly $6,669 a year on 150 cows at July prices — without changing your forage base.
- Pull twelve months of component tests, not one. Fat swings 0.15 to 0.30 points seasonally — bigger than the tenth you’re chasing.
Where Does Your Ratio Sit Across a Full Year?
Plenty of producers can recite their fat test from memory and have to go look up their protein. Ten years of the check telling you where to look.
So pull twelve months and do the division — then ask your fieldman the question he may not have fielded lately: what does this plant’s cheese utilization actually run? And if you’re in the P5, ask a harder one. Do you know your SNF:BF ratio, or are you finding out from your April cheque?
Run Your Numbers
Component Value Tracker — Drop in your herd size, bulk tank tests, and your own component prices. It calculates what 0.1 percentage point of butterfat or protein is worth on your farm per year, flags your P:F ratio status, and gives you the nutrition break-even before you commit to a program or a bull list.
Learn More
- Why Milk Components are the New Frontier in Dairy Profitability — Pinpoints immediate herd-level ration adjustments and bunk management protocols that lift solids yield per cow today, converting daily feed investment into direct component premiums across your next pay period.
- Breeding for Components: The High-Stakes Shift in Sire Selection — Arms herd owners with a disciplined mating blueprint to navigate diverging index weights, avoiding long-term production drags while securing high-ranking sires that protect bulk tank test through 2030.
- Is the Dairy Industry’s Butterfat Obsession Setting Up a Market Crash? — Dismantles the industry-wide assumption of perpetual fat premiums by following export flows and processing limits, exposing why unmanaged component swings risk stranding producers on the wrong side of processor demand.
The Sunday Read Dairy Professionals Don’t Skip.

Every week, thousands of producers, breeders, and industry insiders open Bullvine Weekly for genetics insights, market shifts, and profit strategies they won’t find anywhere else. One email. Five minutes. Smarter decisions all week.
