Archive for cull cow prices

Beef Tariff Waiver 2026: Dairy Has 90 Days to Find Out If Its Best Hedge Still Holds

NMPF flagged 20% of dairy income. The contract your culls actually compete in didn’t move a dollar. Here’s the barn math on a 90-day window nobody has signed yet.

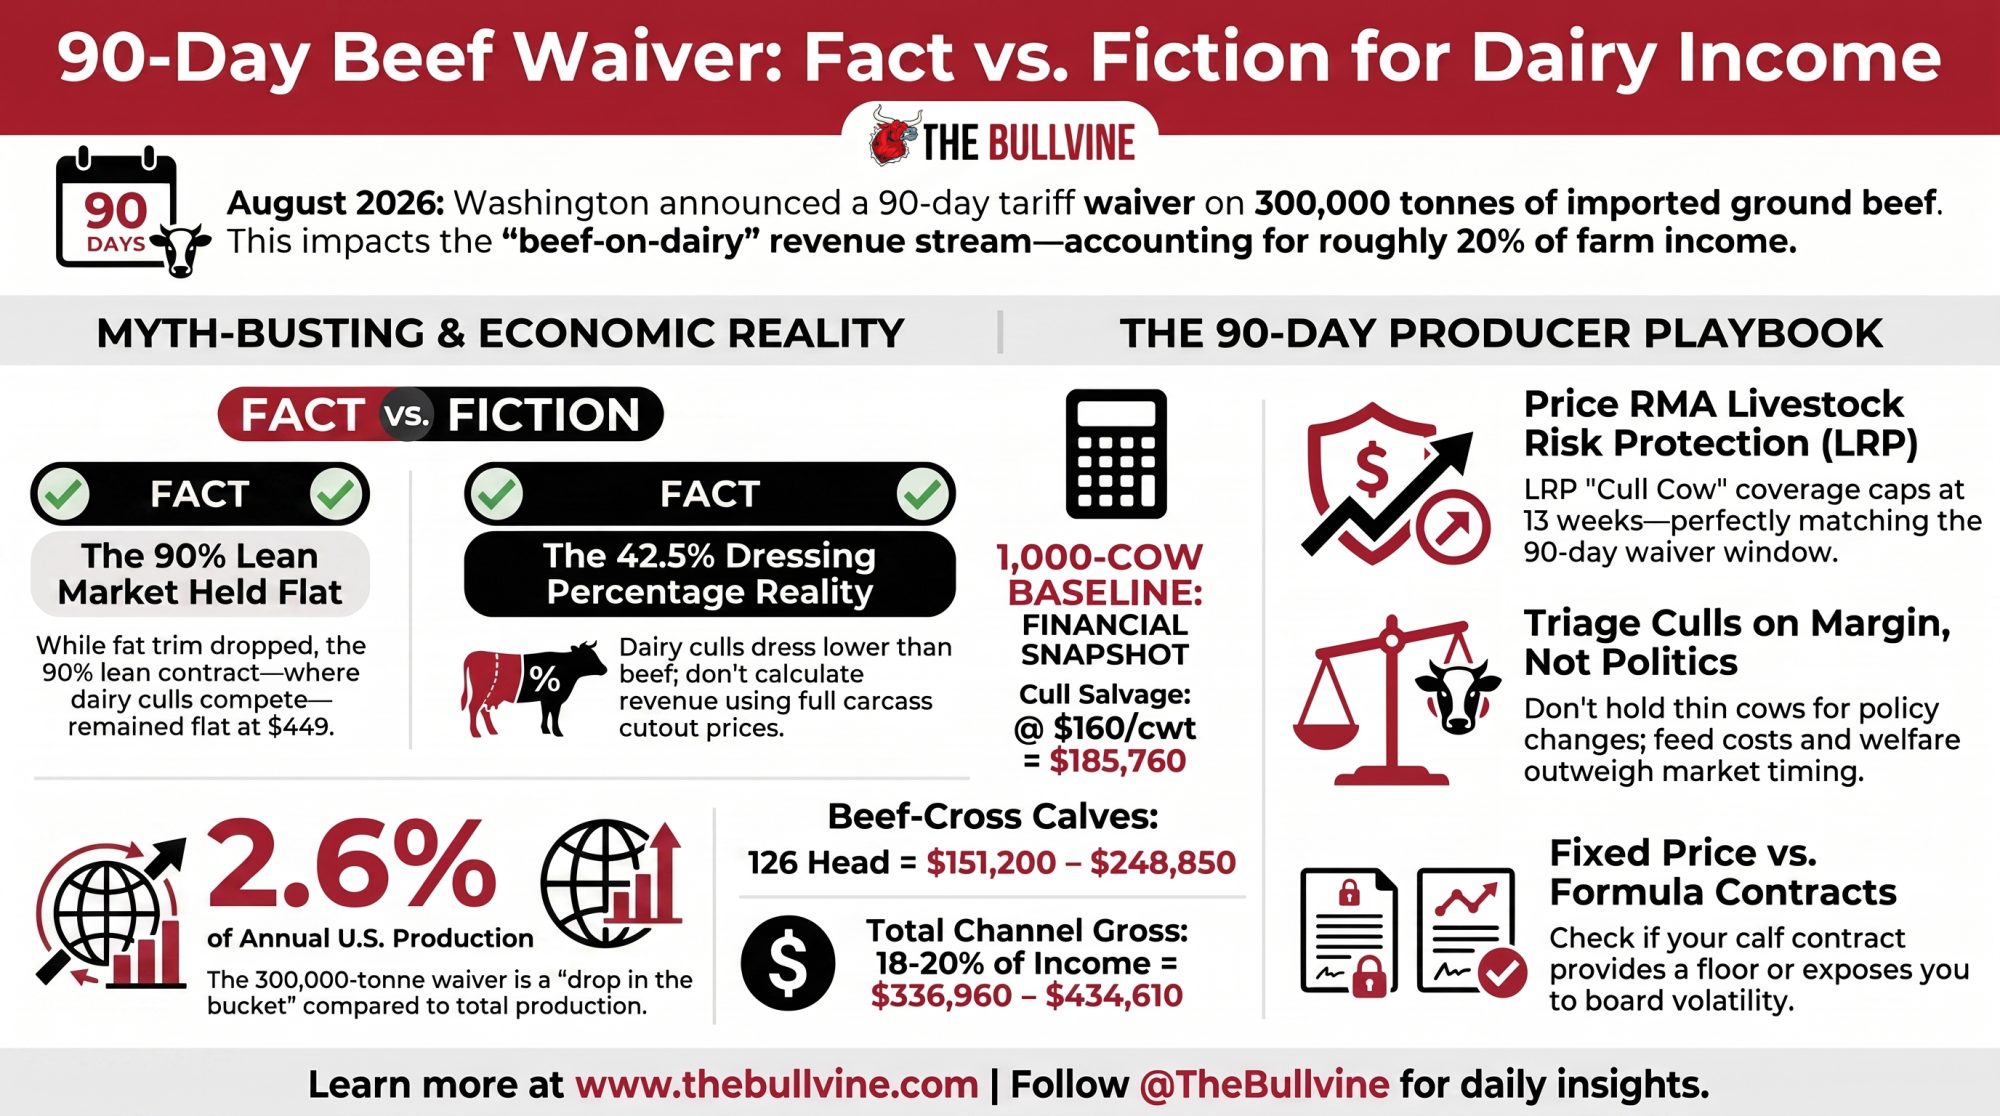
EXECUTIVE SUMMARY: The day Washington waived tariffs on 300,000 tonnes of imported ground beef, the 90% lean trim contract — the one your cull cows actually compete in — held dead flat at $449, while fat trim dropped $8. NMPF put dairy’s exposure at 20% of annual farm income in its August 24 statement, and the $13 billion figure that followed it through the trade press isn’t in that statement; independent reconstruction lands at $10.5 to $12.2 billion. On a 1,000-cow herd, roughly $337,000 to $435,000 of cull and beef-cross calf revenue moves through the 90-day window, with August auction trade running $160/cwt liveweight on culls and $1,200 to $1,975 a head on beef-cross calves. Cattle futures were already sliding well before August 21, so any softening in your cull check needs testing against the WASDE revision and the Tyson plant closures before you blame the waiver. Here’s the part almost nobody flagged: USDA’s Risk Management Agency built LRP coverage types specifically for beef-on-dairy calves and dairy cull cows, and the cull cow product caps at 13 weeks — 91 days against a 90-day waiver. A hedge at a fifth of your revenue isn’t a hedge anymore — it’s a second commodity position, priced by trade policy instead of by cheese.

beef tariff waiver dairy

If beef-cross calves and cull cows make up 20% of your gross revenue, a fifth of your dairy’s income statement was just exposed to a trade policy window you had no say in. On August 21, Washington opened a 90-day tariff waiver on 300,000 metric tonnes of imported ground beef. But before you panic-sell culls or cut beef semen services, look at the actual contract data.

That 20% figure comes from the National Milk Producers Federation’s August 24, 2026 statement, and it’s a national aggregate — your own share is knowable from your settlement sheets and probably isn’t 20%. The same Friday the waiver landed, USDA’s Oklahoma auction report showed slaughter cows selling $5.00 to $7.00 lower than the week before. Whether those two facts are connected is the question this piece exists to answer.

A White House official told reporters an executive order would follow within two weeks. No signed order has appeared in the Federal Register as of this morning, and the White House hasn’t published a supplier list or an enforcement mechanism for its stated commitment that the imported beef will sell 25% below current market prices.

Policy status and market prices reflect publicly available U.S. information as of the morning of August 26, 2026. Prices are U.S. national unless a region is specified.

Two Signed Orders, One That Never Got a Signature

The waiver isn’t the story. The repetition is.

Washington has reached for beef import relief three times since February. A signed presidential proclamation on February 6 raised the 2026 beef tariff-rate quota by 80,000 metric tonnes, allocated entirely to Argentina, restricted to lean beef trimmings by HTS line, released in four quarterly tranches — published in the Federal Register on February 13. In May, the administration prepared a 200-day suspension of beef tariff-rate quotas across all exporting nations; the Wall Street Journal reported on May 10 that the signing was delayed, and The Hill reported on August 20 that the plan was shelved after pushback from the president’s inner circle.

Then August 21.

Northern Ag Network’s August 21 reporting frames the current action as the second executive order aimed at beef prices, because May never produced one.

Why the product scope matters more than the count. February targeted lean beef trimmings specifically, by HTS line. August covers “product for ground beef” — a phrase the White House hasn’t defined. May would have suspended beef TRQs across the board. February hit lean trim directly. August almost certainly does, though the White House hasn’t said so in writing, and lean trim is the product your cull cows compete against in the grind. That’s why this waiver lands differently on a dairy than on a cow-calf operation, and it’s the thread worth pulling if you’ve built beef-on-dairy revenue into your operating budget.

Action DateVolume & ScopeProduct DefinitionLegal Status
Feb 6, 2026+80,000 t TRQ, Argentina only, 4 quarterly tranchesLean beef trimmings, specified by HTS lineSigned proclamation; Federal Register Feb 13
May 2026TRQ suspension, all exporting nations, 200 daysBeef TRQs across the boardSHELVED — never signed
Aug 21, 2026300,000 t waiver, 90 days“Product for ground beef” — undefined by White HouseAnnounced; no EO in Federal Register as of Aug 26
Late Nov 2026Expiry if signed on stated timelineLapse, extend, or become templateUnknown — lands inside fall culling

Running the Numbers: A 1,000-Cow Dairy’s 90-Day Beef Channel

Every figure in the middle column is either sourced or a labeled assumption. Fill the right column with your own, and the answer moves. The model assumes an even calving distribution across the year.

Metric1,000-Cow Baseline ModelYour Herd
Annual cull rate / 90-day culls35% (assumption) / 86 head 
Cull liveweight & farmgate price1,350 lb @ $160/cwt = $2,160/head 
90-day cull salvage gross$185,760 
Beef-semen share / calving rate60% / 85% (both assumptions) 
90-day crossbred calves126 head 
Calf realized value$1,200 – $1,975/head 
90-day calf revenue$151,200 – $248,850 
Total 90-day beef channel gross$336,960 – $434,610 
5–10% compression exposure$16,848 – $43,461 

On 300 cows, the same assumptions run roughly $101,000 to $130,000 through the channel. The percentage exposure is identical; the dollar figure isn’t.

Cull price is the midpoint of current national auction trade: USDA AMS National Daily Feeder and Stocker Summary, August 24, 2026, shows Boning 80-85% at $152.00–162.00 and Lean 85-90% at $143.00–146.00. Oklahoma National Stockyards on August 21 averaged $167.44 on Lean 85-90% and $166.75 on Breaker 75-80%.

Calf values reflect August 2026 beef-cross trade at Ohio auctions reported by Farm and Dairy: beef cross calves $1,200–$1,975/head, with top beef cross at $1,975, against dairy cross at $700–$1,175. Those are per-head prices on baby calves, not per-pound. If you sell by weight, that same report shows crossbreds by weight at $550–$700.

The compression range is a stress test, not a forecast. Nobody has isolated post-waiver farmgate movement from the decline already underway.

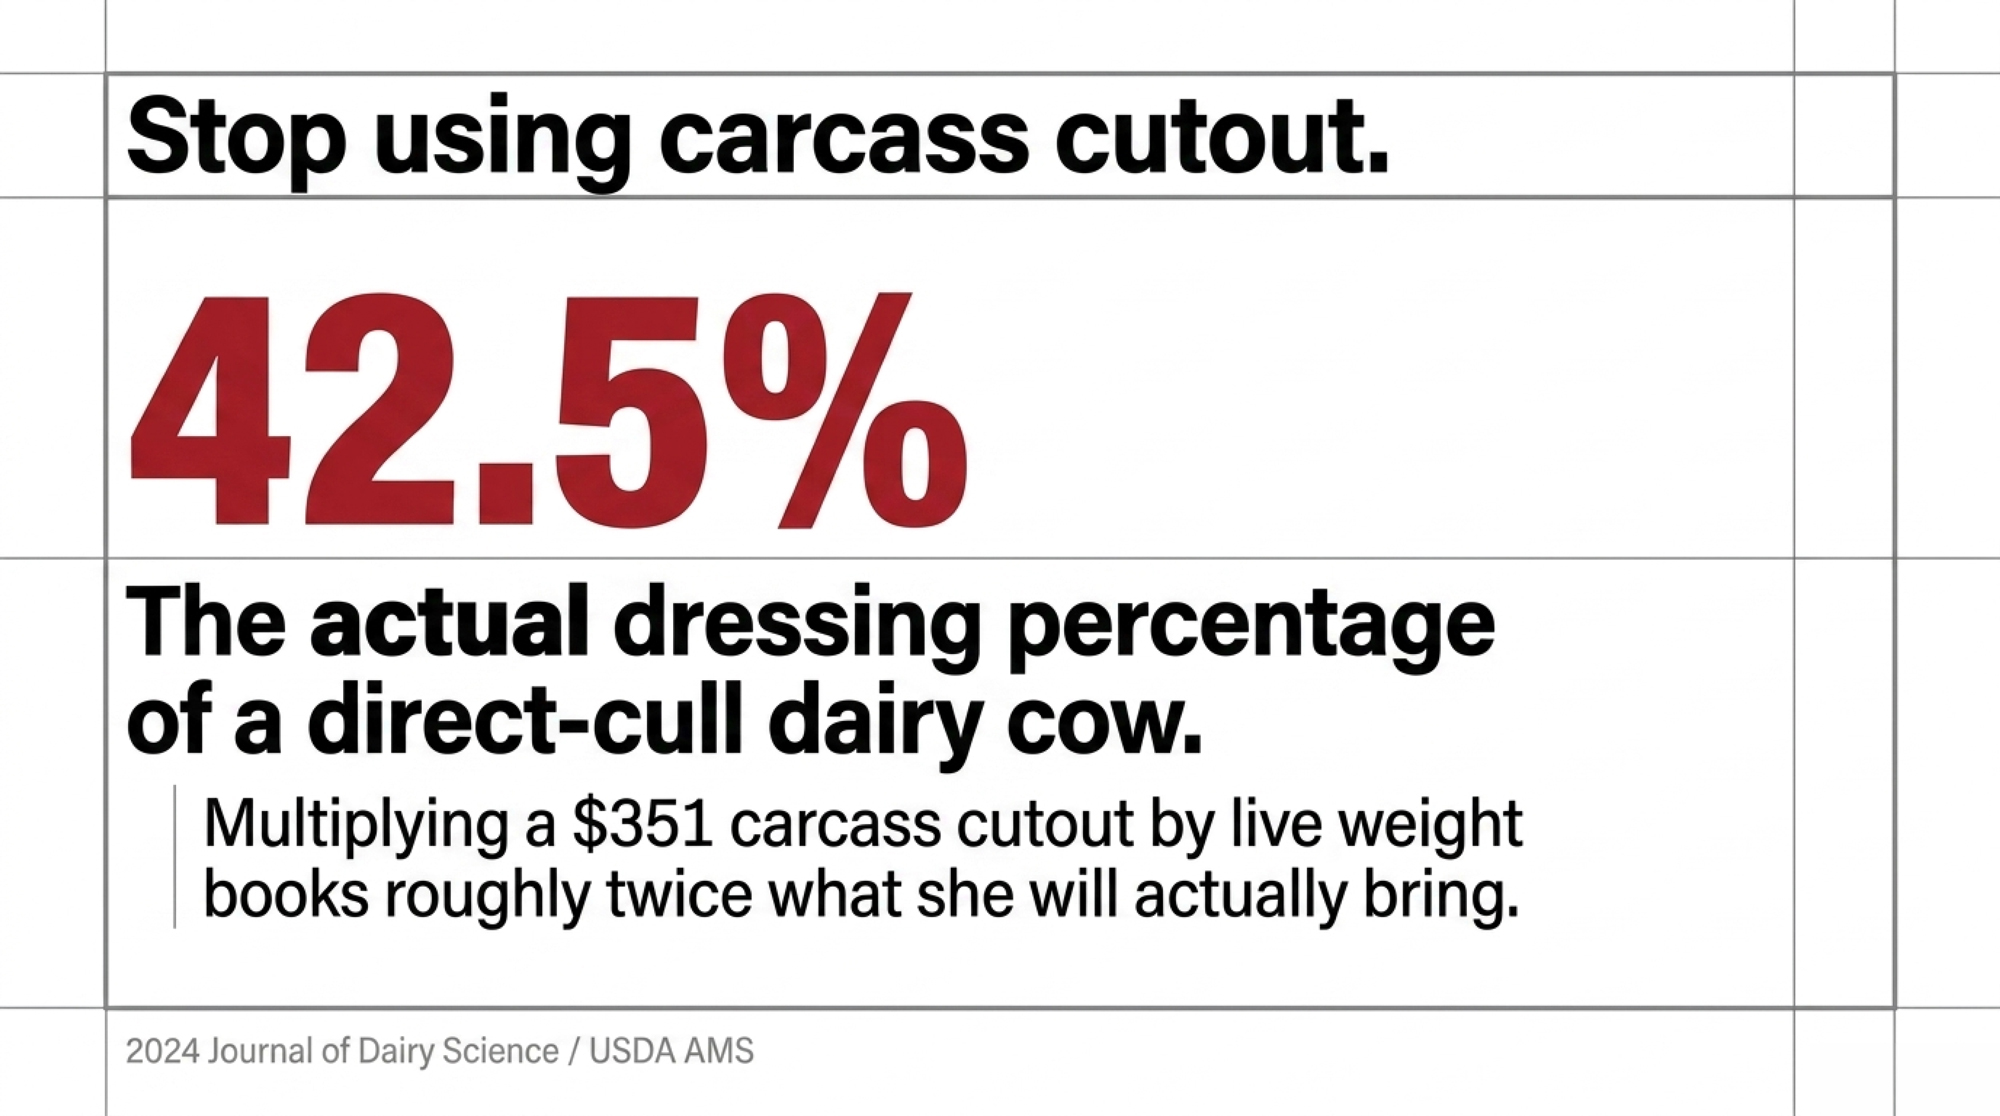
The pricing basis that trips up half the coverage. The national cutter cow carcass cutout ran $351.50/cwt on August 22, 2026 (USDA AMS Daily Cattle & Beef Summary). That’s a carcass value — and dairy culls don’t dress anywhere near their live weight. A 2024 Journal of Dairy Science study by Berdusco found direct-cull dairy cows averaged 42.5% dressing percentage, versus 49.1% for cows fed 60 days before slaughter. The broader literature puts dairy cow dressing percentage at 35% to 48% depending on gut fill, pregnancy status, udder weight, and trimmable defects. University of Maine Extension notes dairy cattle dress roughly 3% lower than beef cattle because of heavier bone and lighter muscling.

Run it: 1,350 lb at 42.5% is a 574 lb carcass. At $351.50/cwt, that’s $2,017 — in the neighborhood of the $2,160 liveweight figure, which is the point. Multiply cutout by live weight, and you’d book $4,745 a head. Plenty of coverage does exactly that.

Day-old calves run on a different clock than feeders. The $1,200–$1,975 range above is a per-head price on a wet newborn sold within days of birth. That’s a separate market from the feeder cattle futures dominating cattle headlines, with different buyers and different drivers. Feeder futures fell roughly 17% between May 1 and August 21, but no source has measured what that did to day-old values — so check your own last four settlement sheets against the range rather than assuming a matching decline.

Will Imported Ground Beef Actually Move Your Cull Cow Price?

The arithmetic runs cooler than the headlines, and the answer depends on your denominator.

300,000 metric tonnes converts to 661 million pounds. Against USDA’s 2026 beef production forecast of roughly 25.5 billion pounds, that’s 2.6% of annual U.S. beef production. On paper, a rounding error.

Annual is the wrong frame for a 90-day policy. Set the same volume against roughly one quarter’s production and it’s 10.4%. Against annual U.S. beef imports near 5.5 billion pounds, 12%. Analyst Scott Varilek pegged it at about 44 days of U.S. ground beef consumption, per AgWeb — the narrowest frame, and arguably the most honest, since ground beef is where this volume lands.

Small against all beef. Considerably larger against the 90-day lean-trim segment where your culls get priced. Independent trader Dan Norcini told Reuters on announcement day, “This is just a drop in the bucket. It really does nothing to fix the main issue which is a greatly reduced supply of cattle here in the U.S.”

The Trim Market Didn’t Believe It

Here’s the read almost nobody published, and it’s the most important number in this story.

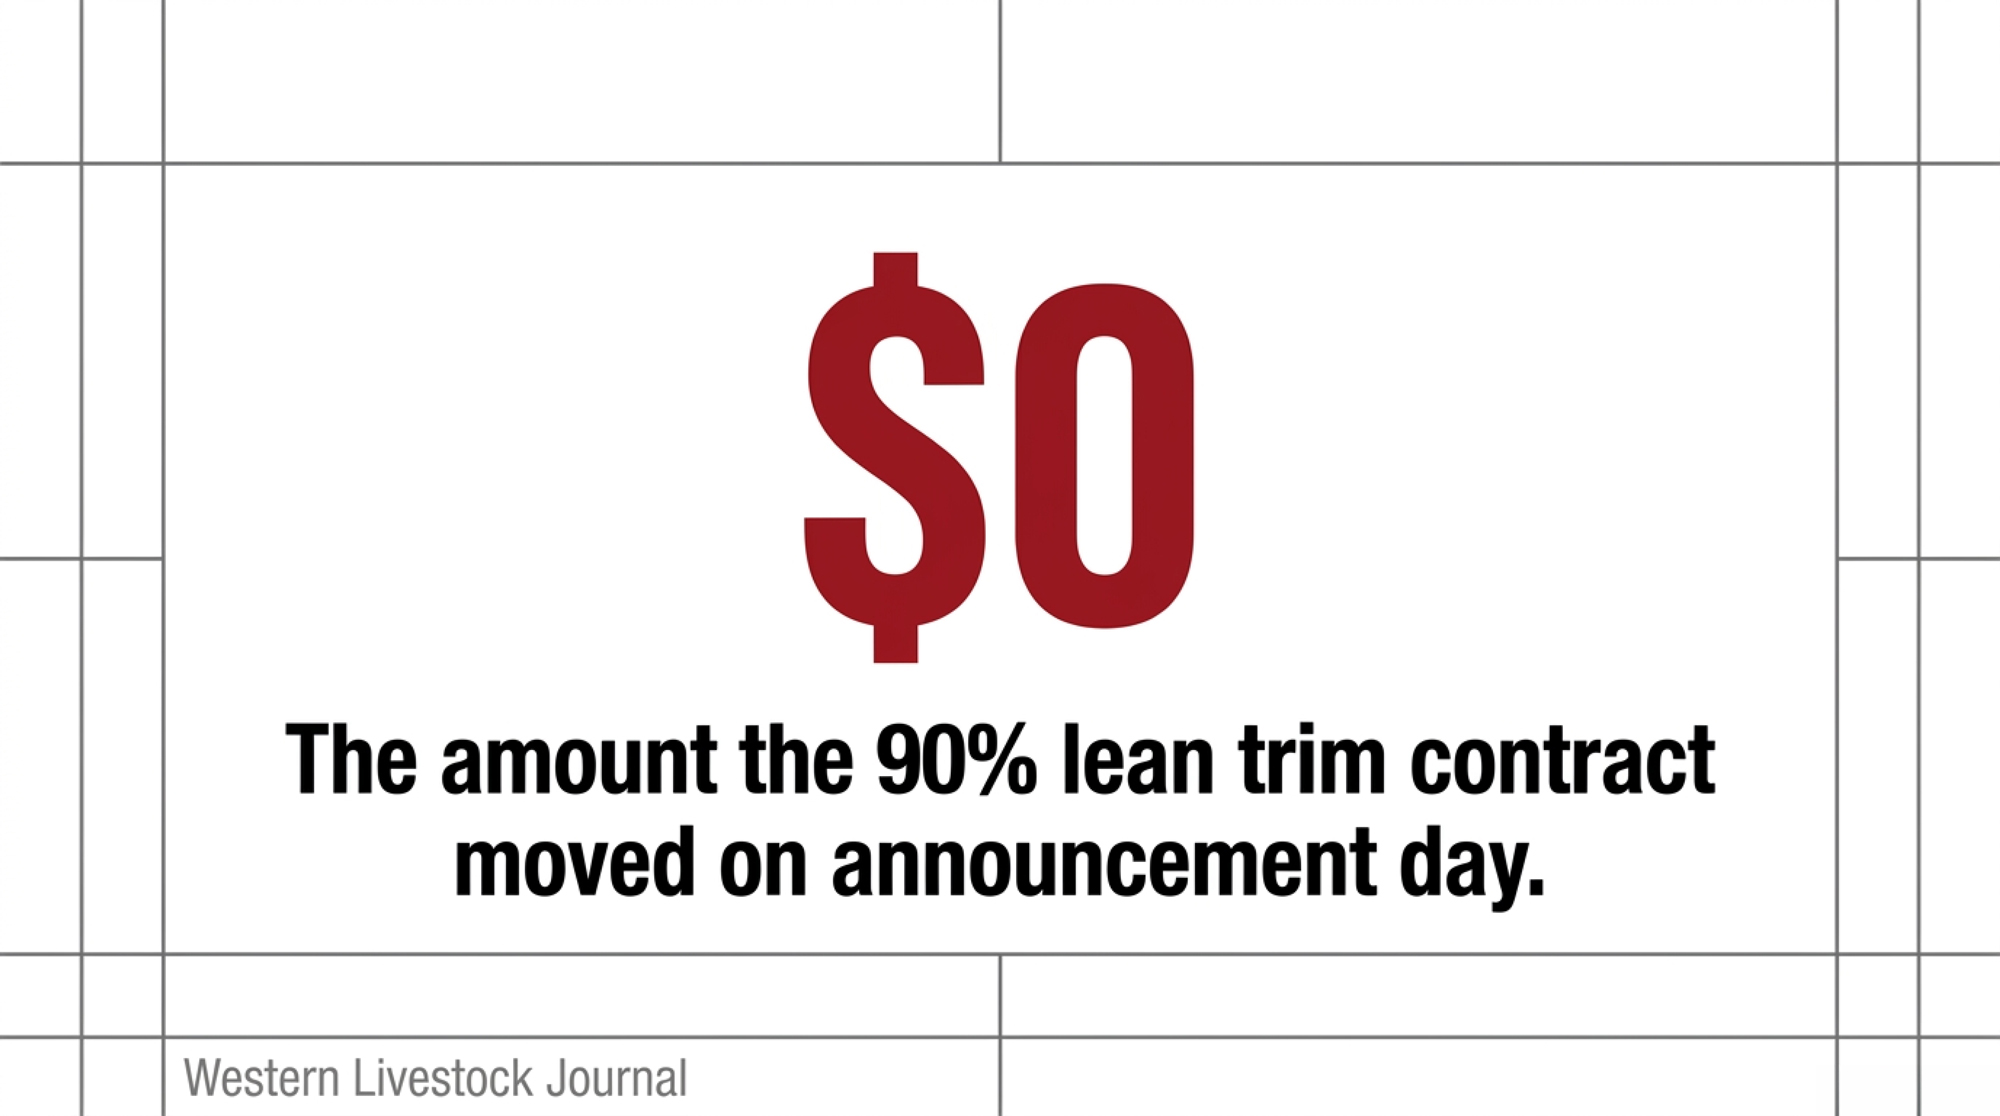
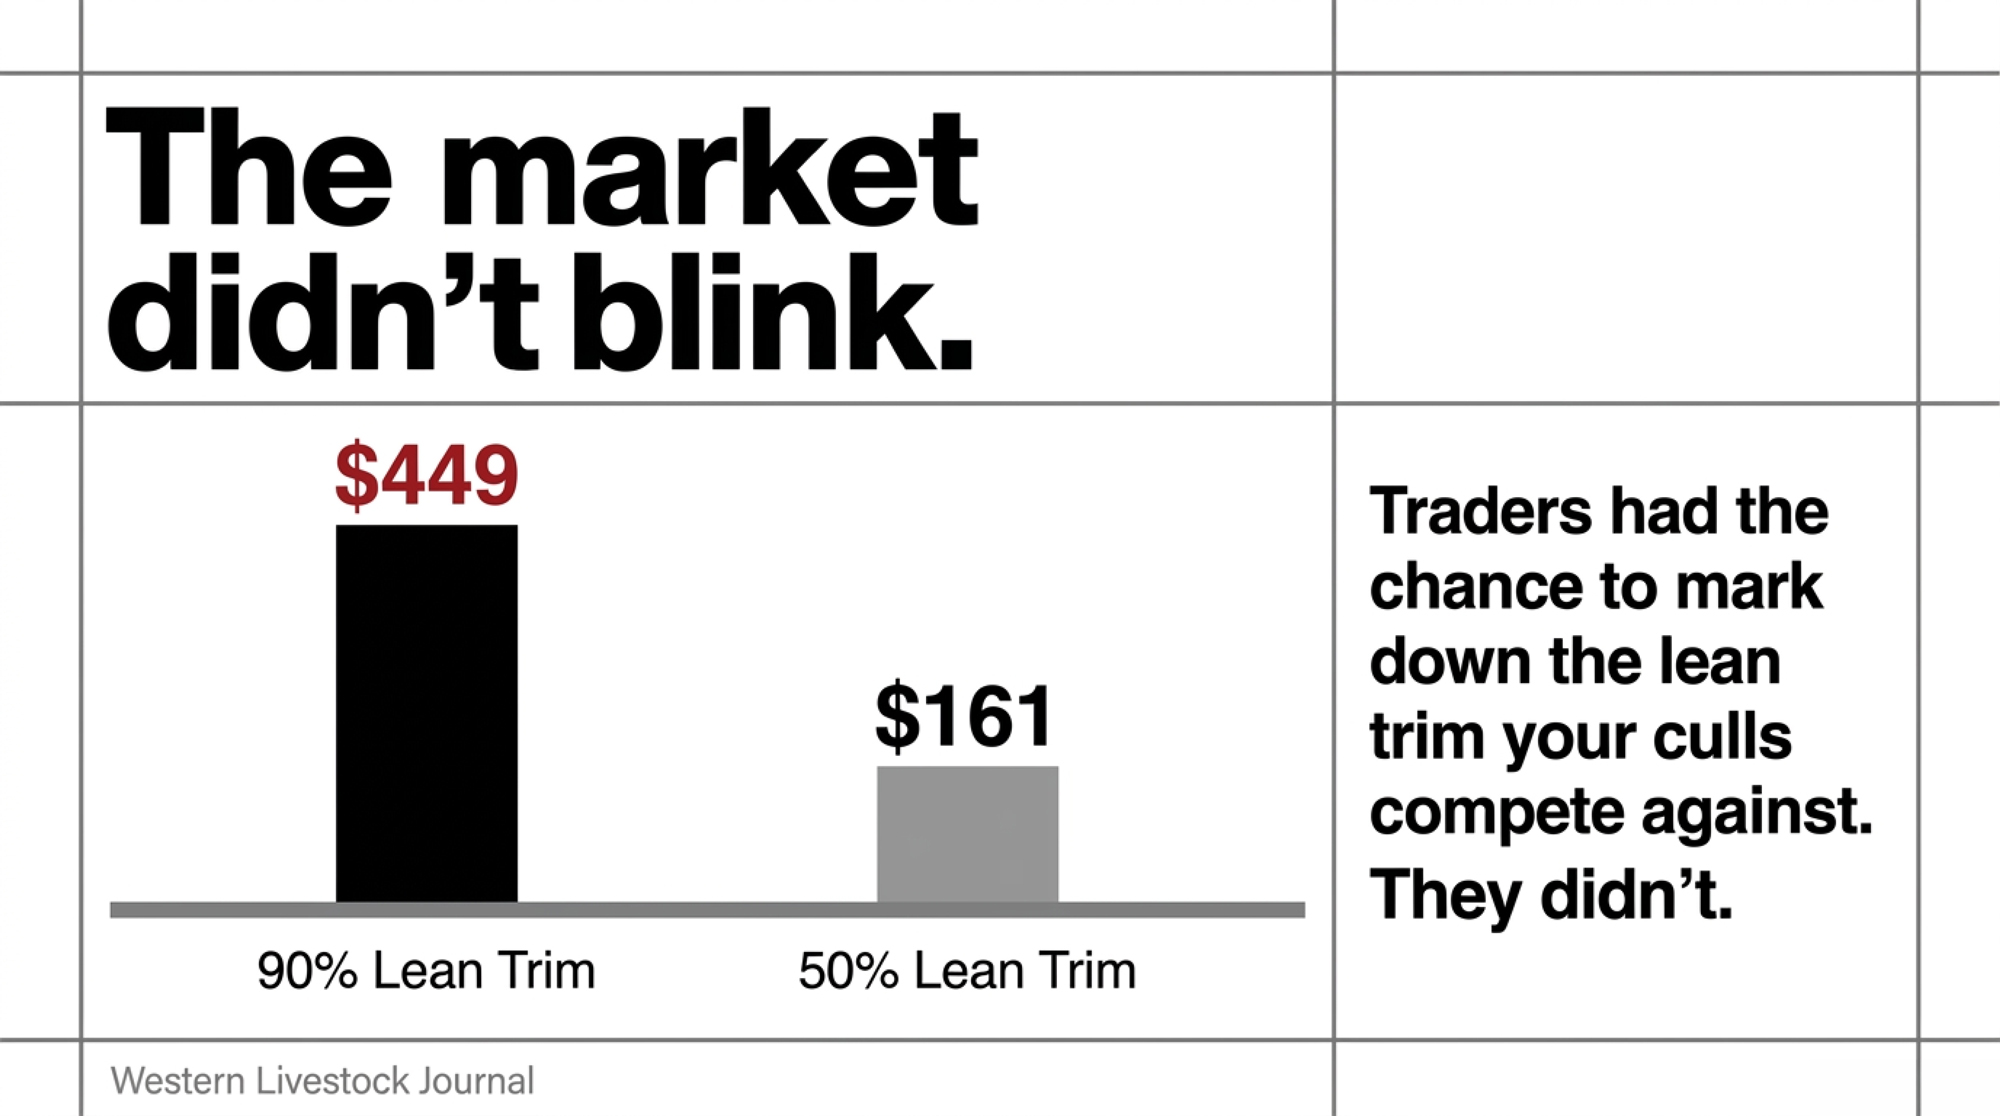
Per Western Livestock Journal, the 50% lean trim August contract lost $8 over the announcement week to close at $161, with September down $8 to $151. The 90% lean August contract held unchanged at $449. September gained $3.

That second contract is the one that matters to you. Cull cows are a primary source of 90% lean trimmings — the lean side of the grind, blended with fat trim to make ground beef, and the exact product category this waiver targets. Traders had every opportunity to mark it down on Friday. They didn’t move it.

Fat trim took the hit instead. Whatever the market priced on August 21, it wasn’t a lean-trim supply shock.

That’s the strongest evidence available that the alarm is running ahead of the arithmetic. One week of contract data from a single trade source isn’t a verdict — but it’s a direct market read on the specific product category NMPF flagged, and it points the other way.

Everyone Assumed August 21 Tanked the Cattle Market. Check the Dates.

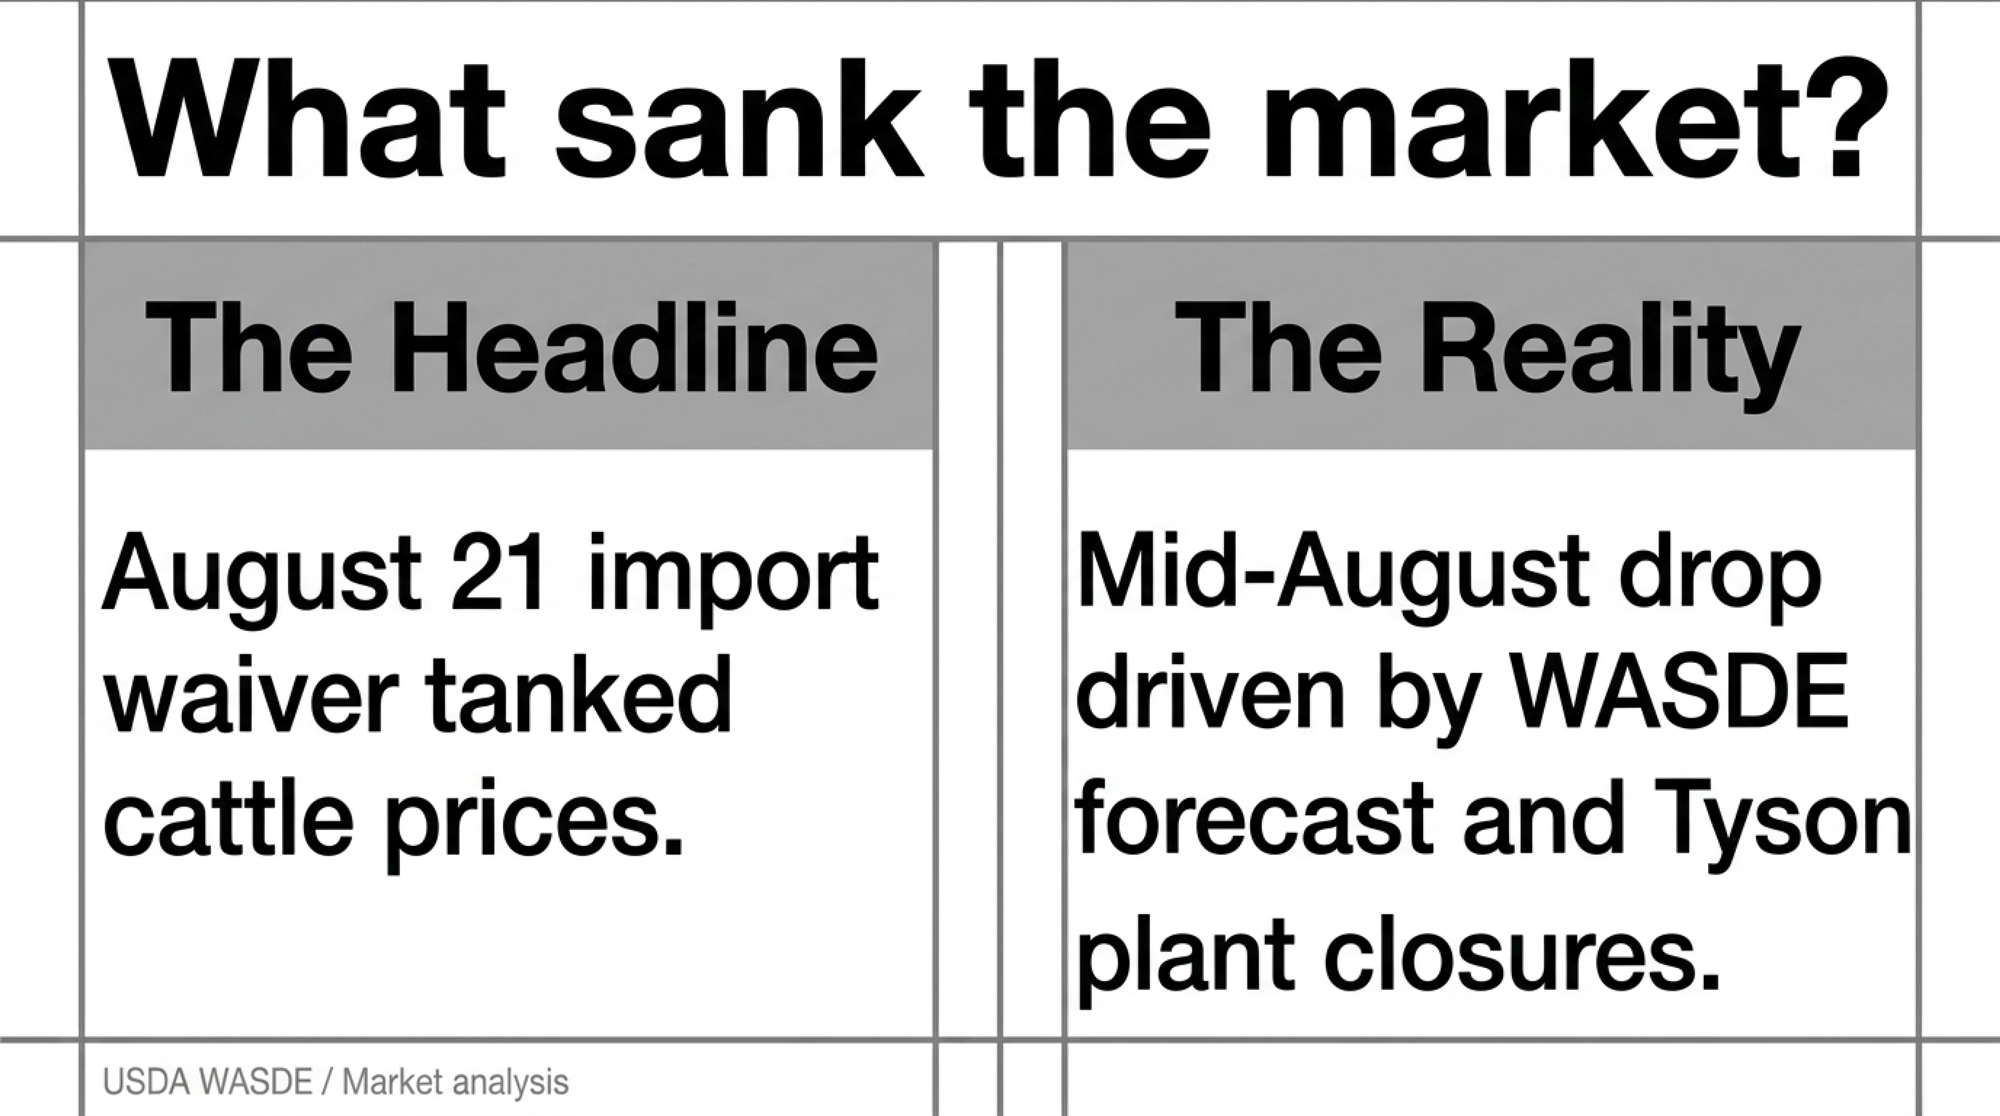
Live cattle futures fell 17.1% and feeders 16.9% from their May 1 highs to the August 21 low, per Barchart technical analysis published August 20 — a technical derivation rather than an exchange settlement figure.

The mid-August leg down had nothing to do with import policy. USDA’s August 12 WASDE cut its 2026 fed steer price forecast by $5.75/cwt. Tyson Foods’ announced closures at Joslin, Illinois, and Eagle Mountain, Utah, along with its stated intent to sell the Pasco, Washington plant, were cited by Andrew Griffith of the University of Tennessee and Tim Petry, livestock marketing specialist at North Dakota State University Extension, as contributing to the decline, per Agriculture.com’s August 17 report.

Announcement day itself is genuinely murky. The honest move is to show the disagreement rather than pick the loudest version. AgWeek reported August live cattle down 30 cents and August feeders down 55 cents. Reuters described futures “tumbling to eight-month lows.” AgWeb said they “gapped lower on the open.” Drovers reported both contracts “clawed back the morning’s losses” by the close — on the same morning USDA’s Cattle on Feed report came in bullish at 11.1 million head, up 2% year over year.

Feeder trade shows where the real pressure sat. Joplin Regional Stockyards sold feeder steers steady to $10 lower that week; Oklahoma National Stockyards saw feeder steers and heifers $5–15 lower and calves $10–20 lower. Those declines run deeper than anything in the cull cow trade — and feeder cattle aren’t what this waiver touches. We covered the broader cattle-market selloff separately; that piece tracks the whole complex, while this one isolates what lands on a dairy’s income statement.

Market SegmentAnnouncement-Week MoveWaiver ExposureWhat Actually Drove It
90% lean trim, Aug contract$0.00 — unchanged at $449Direct — this is the target productMarket declined to price a supply shock
Slaughter / cull cows (OK)−$5.00 to −$7.00/cwtDirect — cull salvage valueUnisolated from pre-existing decline
Feeder steers (OK National)−$5 to −$15/cwt; calves −$10 to −$20None — not a ground beef productAug 12 WASDE −$5.75/cwt; Tyson plant closures
Live cattle & feeder futures−17.1% / −16.9% from May 1 highsIndirect at mostDecline pre-dates Aug 21 by 16 weeks
Day-old beef-cross calvesUnmeasuredIndirect, via feeder boardNo source has quantified the pass-through

How a Percentage Became a $13 Billion Headline

NMPF quantified this exposure in percentages — 20% of farm income, 20% of beef production. No dollar total.

The $13 billion figure that’s followed the story since August 25, including in DairyHerd’s headline, isn’t in that statement. How a percentage becomes a dollar headline matters more than which outlet ran it first: the arithmetic requires a total-dairy-income denominator, and nobody publishing the number has shown one.

Two independent reconstructions get close without landing there. Working from a reported USDA-ERS February 2026 forecast of $42.5 billion in 2026 dairy cash receipts — down $6.2 billion from 2025, which back-solves 2025 milk receipts to roughly $48.7 billion — and treating beef as 20% of total farm income against milk’s 80%, the beef leg lands near $12.2 billion. A second method, applying HighGround Dairy’s estimate of roughly $4.50/cwt of beef income against 2026 milk production, comes out near $10.5 billion. That second figure is single-sourced commercial analysis, and the cull-versus-calf split inside it dates to 2022.

Both are forecasts and estimates, not audited baselines. They establish a range: $10.5 to $12.2 billion. The $13 billion figure sits above it. Not invented — a plausible estimate that rounds up, built on NMPF’s percentage by someone downstream, then repeated as though the trade group said it.

If that number is anywhere in your budget, replace it with your own percentage math.

NMPF represents dairy producers, so its statement is advocacy on their behalf. That’s its job. Worth noting once, since the percentages it cited hold up under independent reconstruction.

Is Your Beef Income Still a Hedge, or a Second Commodity?

Beef-on-dairy got sold as risk mitigation. Cross the bottom of the herd, capture a calf premium, cushion the milk check when Class III goes soft. It worked — calf values climbed from about $200 to more than $1,600 per head over five years, per the Center for Dairy Excellence in April 2026.

The herd grew right alongside it. USDA NASS reported 9.71 million U.S. milk cows in July 2026, up 199,000 head from July 2025, with production in the 24 major states up 2.3% year over year. ERS put 2026 all-milk at $19.85/cwt on August 19, revised down 15 cents. September 2026 Class III futures settled near $16.34 on August 26.

Stack those next to each other, and a loop appears. Beef income helped fund herd retention. That retention added milk. That added milk is part of what’s holding milk prices down — the exact problem beef income was supposed to buffer.

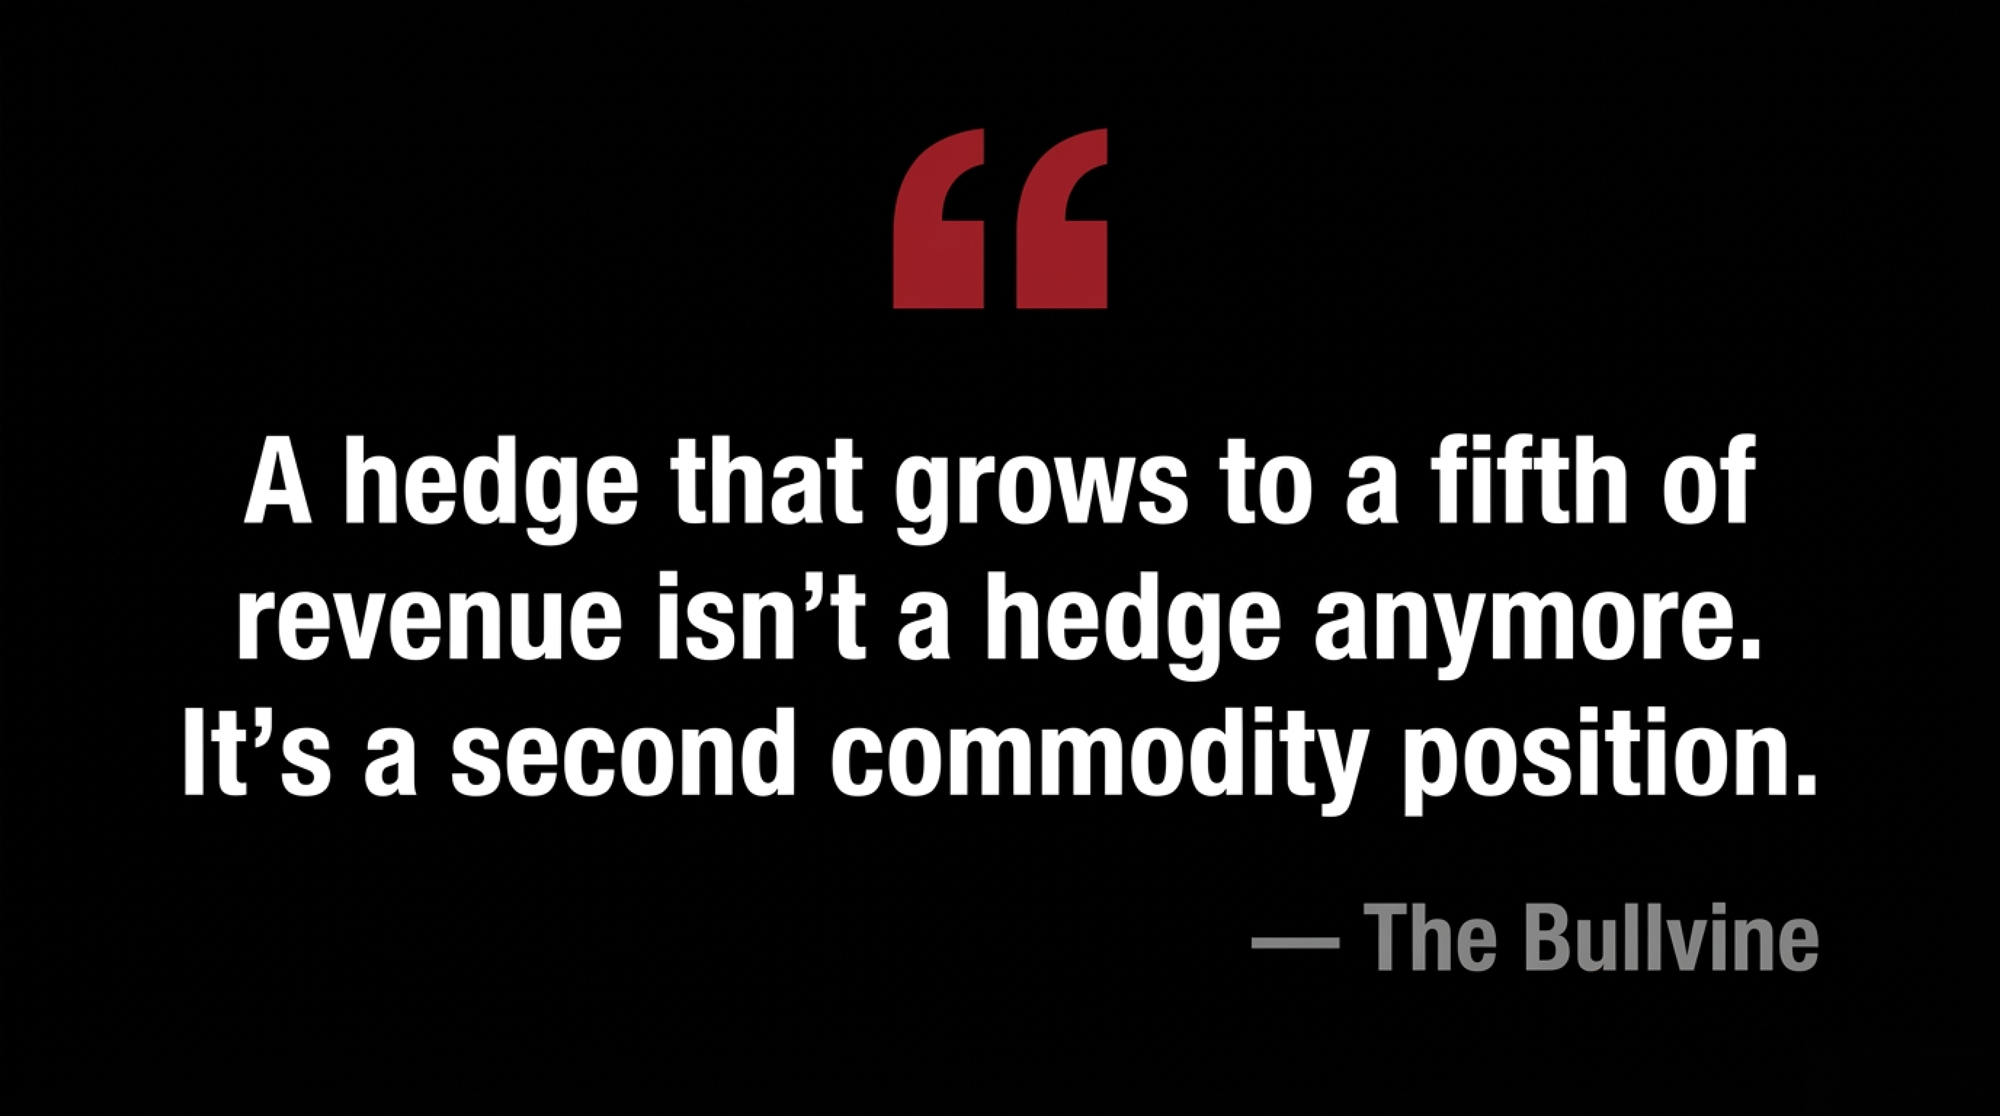
No single source states that chain. It’s the pattern that emerges when separately reported figures sit side by side, and it’s offered here as analysis, not as anyone’s published finding. The implication is still hard to unsee. A hedge that grows to a fifth of revenue isn’t a hedge anymore. It’s a second commodity position — and unlike your milk check, this one gets repriced by trade policy. Most operations built this revenue stream one calf at a time without ever underwriting it as a standalone position.

The 30/90/365-Day Playbook for Herds Carrying 20% Beef Revenue

30-Day: Price RMA Livestock Risk Protection on calves and culls

Action. USDA’s Risk Management Agency built coverage for exactly this exposure. Per RMA Product Management Bulletin PM-25-028, Livestock Risk Protection carries an Unborn Calves type covering beef and beef-on-dairy cross calves sold within two weeks of birth, target weight 60–99 lb, plus a separate Cull Cows type for dairy cull cows with a 13-week coverage limitation. Thirteen weeks is 91 days. The waiver runs 90.

Execution. Call a licensed crop insurance agent with your projected calf and cull volumes and pick a coverage level. Premium subsidies run 35% to 55% depending on level, with additional support for new and beginning producers. Coverage prices derive from CME feeder cattle futures; RMA updates them daily. Trigger: if your beef channel clears 18–20% of gross revenue, this stops being optional.

Risk. Premiums are cash out the door, and if prices hold, you bought coverage you didn’t need. Full dairy calves file under the predominantly-dairy type, not beef-cross — don’t let that get miscoded.

30-Day: Read the pricing clause in your calf contract

Action. Find out whether you’re on a fixed price or a formula tied to feeder cattle futures.

Execution. Pull the actual document, not your memory of it. Formula pricing means you inherited the board’s volatility — and feeders ran $5–15 lower at Oklahoma National the week of the announcement while cull cows moved $5–7.

Risk. A fixed floor gives up upside if the market firms into the fall run.

90-Day: Triage fall culling on welfare and margin, not the political calendar

Action. If the EO gets signed on the stated timeline, 90 days runs to roughly late November — putting expiry inside fall culling season. Sort your cull list by physical condition and production margin rather than by waiver dates.

Execution. Honest herd-health triage, and a hard read on which cows genuinely can’t wait. If a cow is thin enough to grade Lean or Light, the dressing-percentage discount is already working against you — per Oklahoma State Extension guidance, low-dressing cows are discounted $8 to $15/cwt against high-dressing cows, with the widest spreads on the thinnest grades.

Risk. A lame cow doesn’t wait for policy clarity. Holding her costs feed, risk, and eventually carcass value. Don’t turn a marketing call into a welfare problem.

90-Day: Recalculate beef-semen share against replacement cost

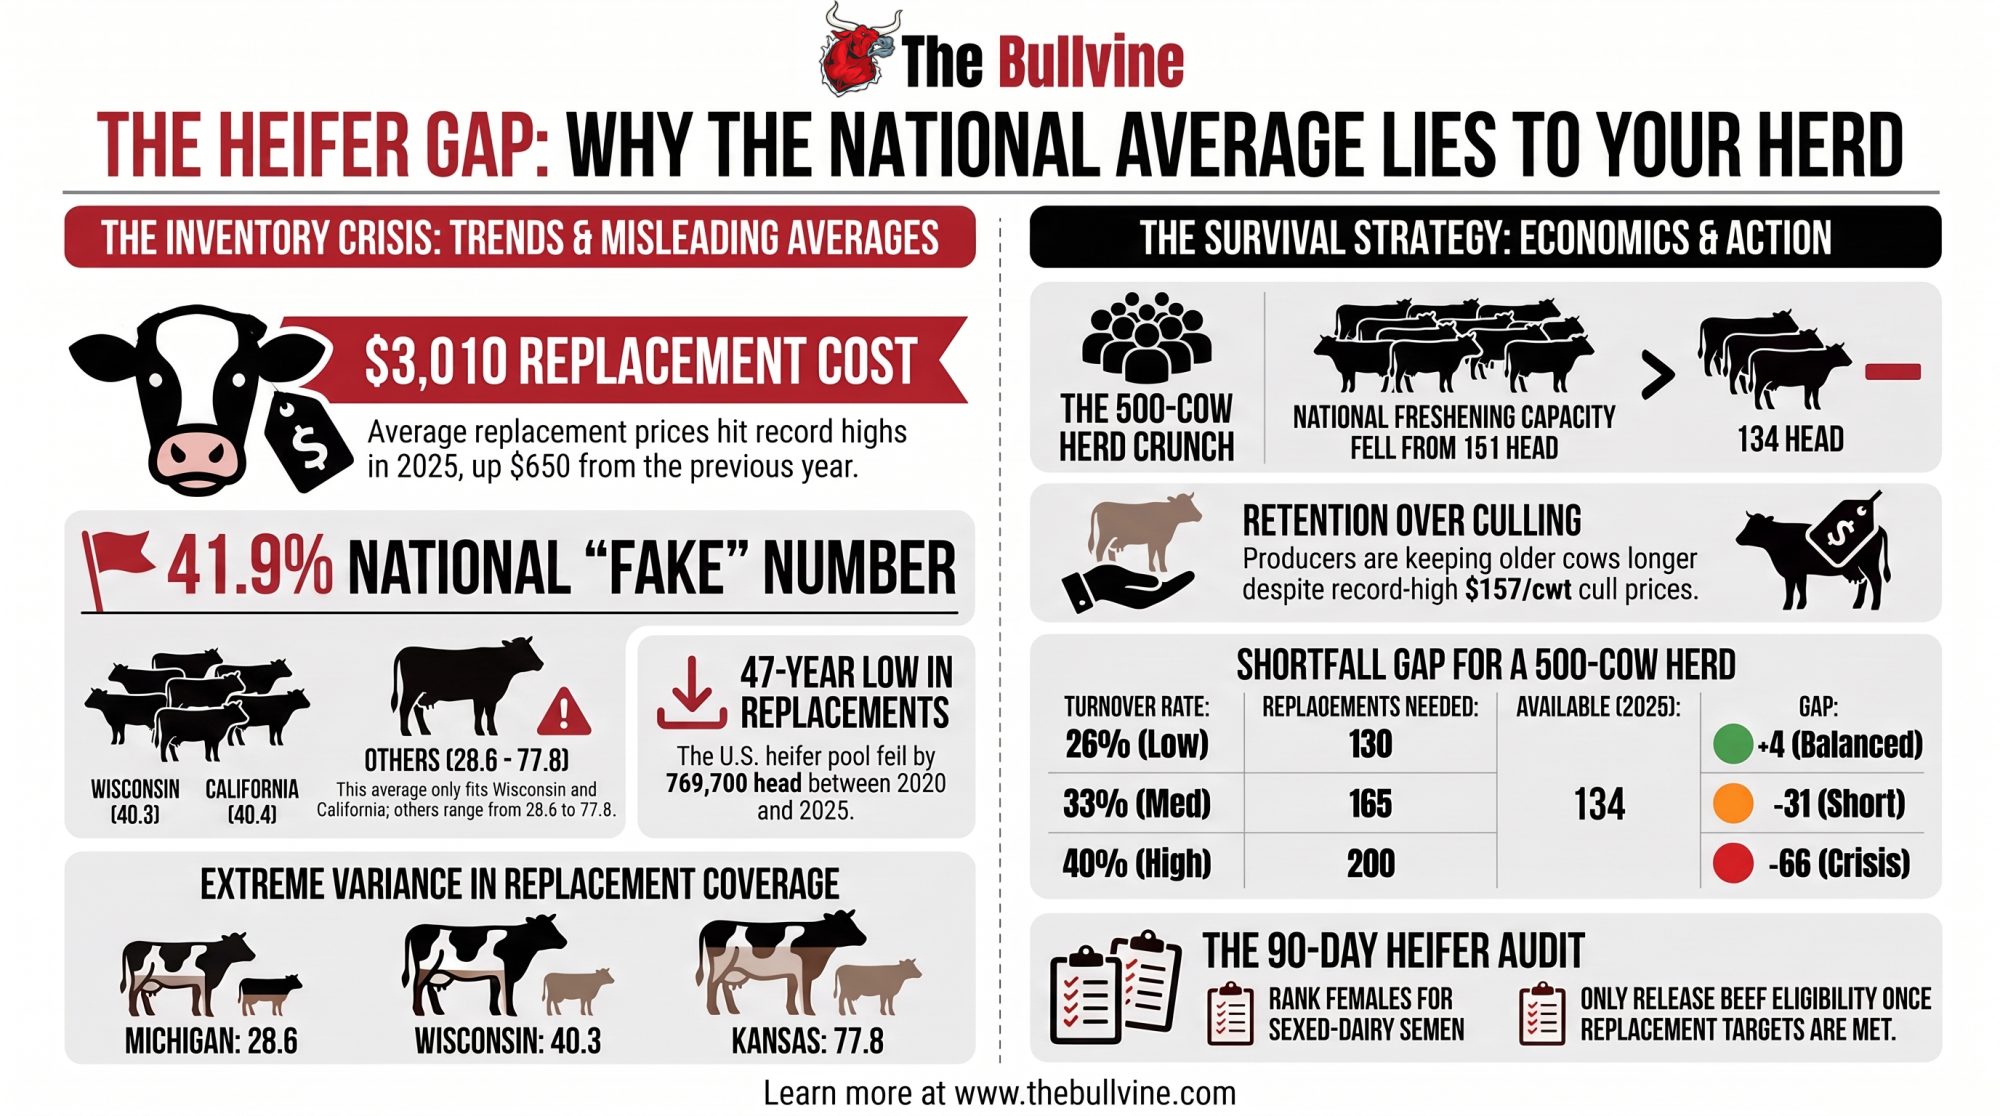
Action. Replacement dairy cows averaged $3,130 per head nationally in April 2026, up $270 from January, per USDA price reporting — a spread we broke down in our cull-cow replacement analysis.

Execution. Requires actual heifer inventory, projected cull rate, and a two-year forward view.

Risk. Cutting beef services to build heifers takes two years to show. You’d be making a 2028 herd decision on 2026 information, and the beef premium may well outlast this waiver.

365-Day: Separate salvage accounting from calf revenue

Action. Most operations track beef as one line. They’re two different exposures — imported lean trim hits salvage value directly, while calf values run off feeder futures and feedlot demand. Split them and track the ratio between what a cull brings and what her replacement costs.

Execution. A bookkeeping change and one conversation with whoever builds your financials. At $160/cwt liveweight on a 1,350 lb cull ($2,160/head) against $3,130 replacements, that ratio sits at 0.69. The 0.75 and 0.65 marks below are Bullvine working benchmarks, not industry standards — set your own against your actual replacement cost. Above roughly 0.75, with margin over feed holding, you have room to cull on production rather than defensively. Below 0.65, every cull decision becomes a capital decision.

Risk. The ratio moves on both numerator and denominator. A replacement-price spike can push you under 0.65 without cull prices falling at all — watch both sides.

365-Day: Consider whether feeding culls beats shipping them

Action. The same Berdusco work in the Journal of Dairy Science found 60 days of feeding before slaughter lifted hot carcass weight by 179 pounds and dressing percentage by 6.5 points over direct culls, with better marbling and tenderness.

Execution. Pen space, feed, and 60 days you’re not milking her. Run it against your own feed cost and the current Lean-to-Boning price spread before committing.

Risk. You’re feeding a cull cow at feedlot cost with no milk income against her. The spread has to cover the feed plus the opportunity cost of the stall, and a cow with a chronic problem may not finish.

365-Day: Watch the expiry harder than you watched the announcement

Three attempts in six months, two of them signed, none permanent. The repeat is the risk, not any single window.

What Happens When the 90 Days Run Out?

Three outcomes, and the record doesn’t tell you which. The waiver lapses and lean trim reverts to out-of-quota treatment. It extends, the way February staged tranches across a full year. Or it becomes a template — the tool this administration reaches for whenever retail beef prices make headlines.

That third one is worth pricing. February got signed. May got pulled. August got posted before it was drafted. You can’t forecast that pattern, but you can hedge it — which is why the LRP conversation matters more than the tariff conversation.

Key Takeaways

  • The 90% lean trim contract — where your culls actually get priced — held flat at $449 the day the waiver dropped, while fat trim fell $8. Whatever the market priced on August 21, it wasn’t a lean-trim shock.
  • Skip the $13 billion headline. NMPF said 20% of farm income, not a dollar figure, and independent reconstruction lands at $10.5 to $12.2 billion. Your own share comes off your settlement sheets, not a national average.
  • If your beef channel clears 18–20% of gross revenue, price LRP on both calves and culls this month. The cull cow coverage caps at 13 weeks — 91 days against a 90-day waiver, which is closer to a fit than anything else on offer.
  • Check whether you’re pricing culls off liveweight or somebody’s carcass cutout number. Dairy culls dress around 42.5% direct, so multiplying $351.50 cutout by live weight books roughly twice what she’ll bring.
  • February signed, May pulled, August posted before it was drafted. None permanent, all aimed at lean trim. Watch the late-November expiry harder than you watched the announcement.

The Trade-Off at the Center of This

The 90% lean trim contract didn’t move on announcement day, which tells you the market isn’t pricing this as the shock the headlines described. That’s the case for calm. The case for caution is that this is the third try in six months at the same product, and nothing about the pattern says it stops.

You built the beef line to protect the milk check, and it worked well enough to become a fifth of your revenue and a second exposure — priced by trade policy instead of Class III. You gained margin. You gave up control over where it comes from.

Pull your last four calf settlement sheets and your last cull cow check. Are you pricing culls off liveweight or off somebody’s carcass cutout number — and does your calf contract hand you a floor, or hand you the board?

Complete references and supporting documentation are available upon request by contacting the editorial team at editor@thebullvine.com.

Learn More

The Sunday Read Dairy Professionals Don’t Skip.

Every week, thousands of producers, breeders, and industry insiders open Bullvine Weekly for genetics insights, market shifts, and profit strategies they won’t find anywhere else. One email. Five minutes. Smarter decisions all week.
NewsSubscribe
First
Last
Consent

$2,000 Cull Cows Are Exposing Dairy’s Biggest Lie: Management Can’t Save You Anymore

Cull cow: $2,000. Daily milk profit: $2. You’re not failing – you’ve been lied to about what survival actually requires.

EXECUTIVE SUMMARY: The management myth just died. USDA’s October 2025 data confirms what the numbers have been screaming: your location now determines your profitability more than your skills ever will. Cull cows are fetching $2,000 as beef while daily milk margins scrape by at $2-3 per cow—and the smart money has noticed. Federal Milk Marketing Order data shows cheese-oriented regions pulling $1.00-1.50/cwt more than powder areas, handing some operations a $50,000+ annual advantage their neighbors can’t touch, no matter how hard they work. The heifer shortage—at 1970s lows—has flipped from crisis to cash flow, with producers breeding surplus heifers now banking $100,000+ annually. Billions in new processor investments are creating what analysts call “permanent regional stratification,” and lenders are already tightening credit windows. Strategic repositioning isn’t a five-year plan anymore—it’s a five-month decision. October’s culling data proves the reshuffling has already begun, and the producers who act now will be the ones still standing when the dust settles.

The USDA’s October 2025 Milk Production report confirms what we’ve all been feeling in our gut: The national herd is shrinking, but you know what? The reasons have fundamentally changed. This isn’t just about milk prices anymore—we’re watching a restructuring that’s making everything we thought we knew about good management seem… well, less relevant than it used to be.

Here’s the math we’re all looking at. October’s Class III milk was hovering in the mid-$16s per hundredweight, according to CME Group’s daily settlement data. Take your typical cow producing around 65 pounds daily—she’s bringing in maybe $11 in gross revenue. Feed costs? Using the USDA Farm Service Agency’s Dairy Margin Coverage calculations from October, we’re looking at roughly $8 to $9 daily per cow. That doesn’t leave much after labor, utilities, and keeping the lights on…

Meanwhile—and here’s what has everyone talking over morning coffee—that same cow is worth close to $2,000 as beef. USDA’s Agricultural Marketing Service weekly reports show cull cows bringing $1.60 to $1.70 per pound in some regions. A decent 1,200-pound cow? Do the math.

As one Extension economist down in Mississippi who tracks livestock markets put it to me, “When you’re looking at these beef prices, producers are asking themselves some pretty rational questions.”

But this goes deeper than just comparing milk checks to beef prices, doesn’t it? What October’s really showing us is the start of something bigger—where geography, genetics, and who you’re shipping to will matter more than ever. Management excellence? I hate to say it, but it’s becoming less relevant in the face of structural disadvantages.

The New Revenue Stream: Breeding for the Market, Not Just the Milking String

Here’s something clever that’s changing the entire breeding game—and I think more of us need to be talking about this. If you breed 20-25% more heifers than you need for replacements and sell the extras at these premium prices… well, as many of us have figured out, a 600-cow herd selling 30 surplus heifers at around $3,500 each? That’s roughly $100,000 in additional annual revenue. We’re talking about turning what most see as a constraint into a profit center.

USDA’s January 2025 Cattle inventory report shows dairy heifer numbers at historically low levels—we haven’t seen this level since the late ’70s. All those years of breeding for beef-on-dairy when milk prices were tough? Well, now we’re seeing the consequences—or maybe the opportunities.

Recent auction reports from key dairy states show good springers regularly trading above $3,000 per head, with top groups occasionally pushing past $4,000 per head. I spoke with an extension specialist at the University of Florida who’s been tracking this closely. “The consistency of these high prices,” he said, “that’s what’s remarkable. We’re not seeing the usual seasonal dips.”

A lending specialist at CoBank pointed out something fascinating—and think about this—the shortage that prevents you from expanding also prevents your competition from growing. Operations that might have expanded to grab market share? They simply can’t get the heifers at prices that make sense. It’s creating this forced discipline in the market that we haven’t seen before.

Smart producers are figuring out different ways to optimize. Can’t solve problems through expansion anymore—that playbook’s out the window. Instead, you’ve got to improve within your existing footprint. Genetic selection becomes crucial when you can’t add cows. I’m seeing more genomic testing than ever before.

I recently heard from a 480-cow operation in central Wisconsin that made the switch to component-based optimization last spring. They’re seeing an extra $3,800 monthly just from butterfat premiums alone, even with slightly lower volume. “We’re producing less milk but making more money,” the owner told me. “That’s not something I thought I’d ever say.”

How Geography Trumps Management

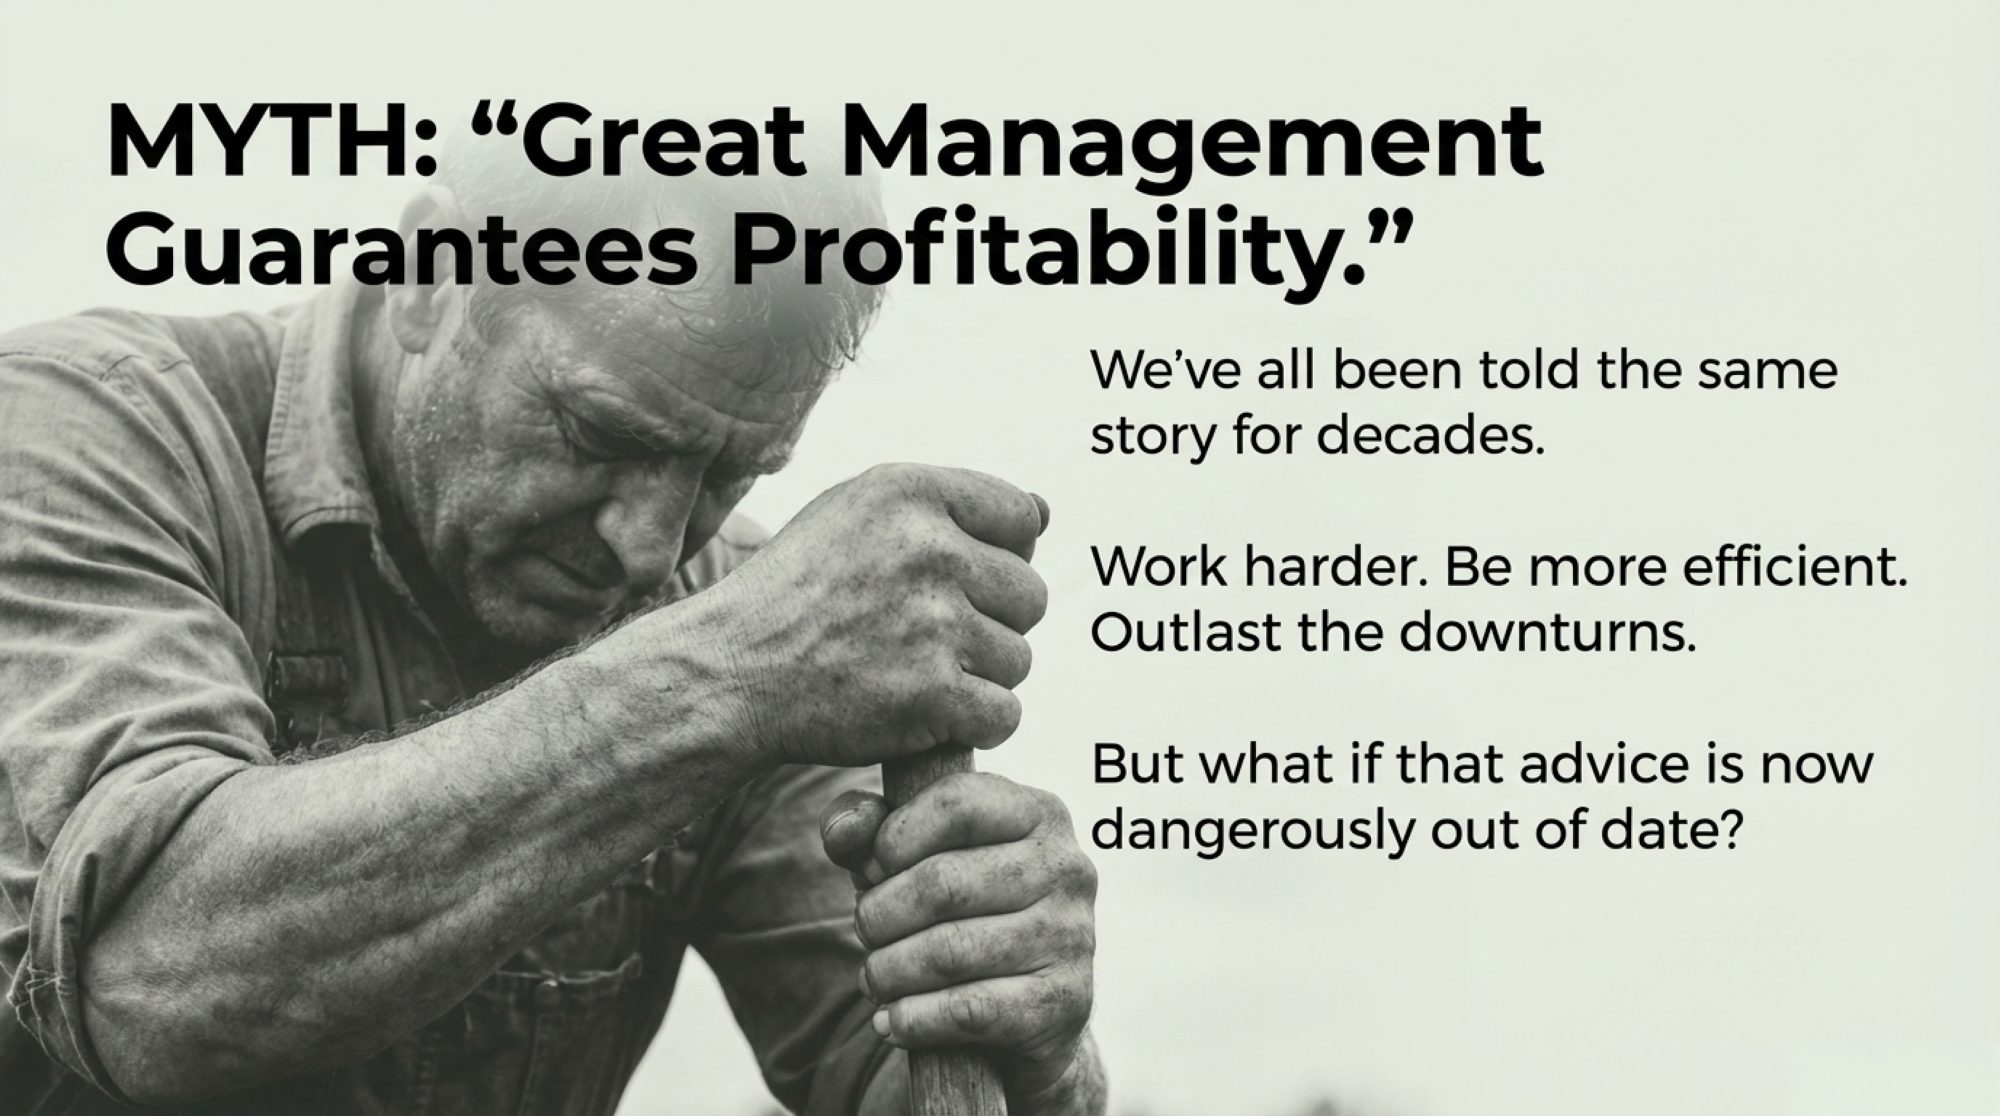
You know, the old wisdom was that efficient operations outlast downturns. We’ve all believed that, right? But what I’m seeing now challenges that thinking in ways most of us haven’t fully grasped yet.

Federal Milk Marketing Order data from October 2025 shows some cheese-oriented regions getting roughly $1.00 to $1.50 more per hundredweight than powder-oriented areas. Think about that for a minute—if you’re running a thousand cows, that gap could mean $50,000 or more annually. That’s not something you can just manage your way around, no matter how good you are at what you do.

And the driver behind these gaps? It’s these massive processor investments we’re seeing. The International Dairy Foods Association’s October 2025 capital investment tracking report shows billions in new and expanded dairy processing projects—dozens of facilities either under construction or recently announced across multiple states through the rest of this decade.

The concentration is what gets me. Texas is seeing major cheese facilities go in, including that big Leprino project near Lubbock everyone’s talking about. New York’s seeing major expansions in yogurt and premium milk. Idaho’s getting more cheese capacity around Twin Falls with Glanbia’s expansion. Wisconsin continues to add to its cheese infrastructure, with multiple expansion projects underway. Even the California Central Valley, despite its challenges, is seeing selective investment in specialized products.

What dairy economists at universities like Cornell and Wisconsin are telling me is this creates something like “permanent regional advantage.” Makes sense when you think about it. If you’re near these new cheese plants, you’re capturing premiums. If you’re shipping to butter and powder? Those challenges compound every month.

The producers in growth states—places like Idaho and Texas, where this new capacity promises good premiums—they culled selectively in October to upgrade genetics. Smart move.

But in other regions? Southwest dairy operations dealing with water restrictions, or Southeast producers managing not just heat stress but increasingly volatile feed costs and limited local grain production—that culling represented something different. Those folks are reducing exposure to what’s becoming a tougher competitive environment.

Building Your Bridge Through What’s Coming

For operations trying to navigate current challenges while positioning for better times, I’ve been collecting strategies from extension folks and producers who are making it work. From Southeast dairy operations dealing with heat stress and feed availability challenges to Upper Midwest producers managing seasonal variations, to California Central Valley farms wrestling with water costs.

First thing—and this is crucial—you need to understand your true economics beyond just that all-milk price everyone talks about. Several dairy economists at land-grant universities keep emphasizing this, and they’re right. With current component premiums, if you’re optimizing for volume rather than components, you could be leaving tens of thousands annually on the table, even for a modest-sized herd.

Component optimization matters more than ever. With butterfat premiums running anywhere from 50 cents to over a dollar per hundredweight above base in some areas—especially Upper Midwest operations shipping to cheese plants—if you’re still focusing on volume over components, you’re leaving serious money on the table.

Here’s what’s gaining traction based on my conversations:

You need to secure working capital lines now, while your operation still looks stable to lenders. Several ag lenders, including Farm Credit Services and regional banks, are telling me they expect to become more cautious about new working capital over the next year or so. Some are even talking about focusing more on financing acquisitions and restructurings if margins stay tight. That window? It’s narrowing faster than most folks realize.

The Dairy Margin Coverage program makes sense, too. According to the USDA’s Risk Management Agency, October 2025 updates, depending on your coverage level and production history, premiums often run from a few dimes to maybe 70 cents per hundredweight. But that cash flow protection when margins get really tight? Could make all the difference between weathering the storm and… well, not.

And here’s something livestock economists at universities like Kentucky and Kansas State are watching—CME feeder cattle futures have pulled back sharply since mid-October. Producers who locked in their beef-on-dairy calf values earlier are feeling pretty good right now. Consider hedging at least half your production to protect what’s become crucial revenue.

What’s interesting is that the operations doing these things aren’t expecting prosperity if milk prices drop to the $14-16 range that the USDA’s World Agricultural Supply and Demand Estimates suggest for next year. They’re building resilience to stay independent through what could be a tough stretch before things improve.

The Technology Factor and Labor Reality

The technology piece matters here too—and it’s changing the labor equation dramatically. Robotic milking systems, which can cost $150,000-250,000 per stall, are becoming more feasible for larger operations that can spread those fixed costs.

But here’s what’s interesting: these systems aren’t just about milking efficiency. They’re addressing the chronic labor shortage that’s hitting dairy farms nationwide.

One Pennsylvania producer running four robots told me, “We went from needing six milkers to basically one herd manager. In a market where finding reliable labor costs $18-22 per hour plus benefits, that math changes everything.”

For mid-sized farms, though, the capital requirements are creating another pressure point that’s accelerating consolidation decisions. And for those sub-300 cow operations? The technology investment rarely pencils out unless you’re adding significant value through on-farm processing or direct marketing.

Why Processors Keep Building While We’re Struggling

This apparent contradiction—processors pouring billions into new capacity while we’re dealing with tight margins—it makes more sense when you look at the longer game they’re playing.

Several outlooks from groups like Rabobank’s Q3 2025 Global Dairy Quarterly point to some interesting dynamics. The International Dairy Federation’s World Dairy Situation report is talking about potential gaps between global supply and demand later in the decade if trends continue.

Recent trade data from USDA’s Foreign Agricultural Service shows Chinese imports of cheese and whole milk powder running well ahead of year-ago levels. Countries like Indonesia are expanding school milk programs that could add meaningful demand over the coming years. And with EU production constrained by environmental regulations, the U.S. is positioned well as a growth supplier.

Gregg Doud, who served as U.S. chief agricultural trade negotiator and now works with Aimpoint Research, explained it well at the recent World Dairy Expo: “Processors aren’t building for today’s prices. They’re looking at where they think we’ll be in 2028, 2030. The current downturn? It actually helps their positioning by limiting competitive expansion.”

What’s less visible—and this is based on industry analysis from groups like CoBank and what I’m hearing through the grapevine—is that a large share of new processing capacity appears to be already tied up in multi-year arrangements with larger farms. Contracts negotiated when prices were recovering in ’23 and ’24, locking in supply regardless of current spot conditions. It’s creating this two-tier market that not everyone fully grasps yet.

The Information Gap That’s Hurting Smaller Operations

One challenge I keep hearing about from mid-sized operations is what university economists call “information asymmetry.” Basically, larger farms dealing directly with processors often see market shifts months before that information reaches smaller producers through traditional channels.

This gap shows up in several ways. Larger operations often have earlier visibility into processor needs and plans. They might subscribe to proprietary research from firms like Terrain or StoneX, which costs tens of thousands of dollars annually. Meanwhile, smaller operations rely on cooperative communications that, honestly, can lag market realities by quite a bit.

A Pennsylvania producer managing 600 cows—a fifth-generation dairy farmer—put it to me straight: “We thought October’s price drop was temporary. We didn’t realize how much had already been decided about where the industry’s headed. By the time we understood, our lender was already getting cautious about new credit.”

The practical impact? By the time many producers recognize these fundamental shifts, the window for smart positioning has already narrowed considerably.

Regional Winners and What’s Creating Lasting Advantages

The geographic distribution of new processing investment is creating what analysts at CoBank call “permanent regional stratification.” Strong words, but they’re not wrong.

Looking at Federal Milk Marketing Order data from October 2025 and processor announcements, here’s who’s seeing sustained advantages:

Idaho’s Magic Valley continues to benefit from expansions in cheese infrastructure. USDA National Agricultural Statistics Service data shows Idaho among the fastest-growing milk states, with many operations reporting solid annual gains. The Texas Panhandle’s seeing competitive pricing from multiple cheese plants.

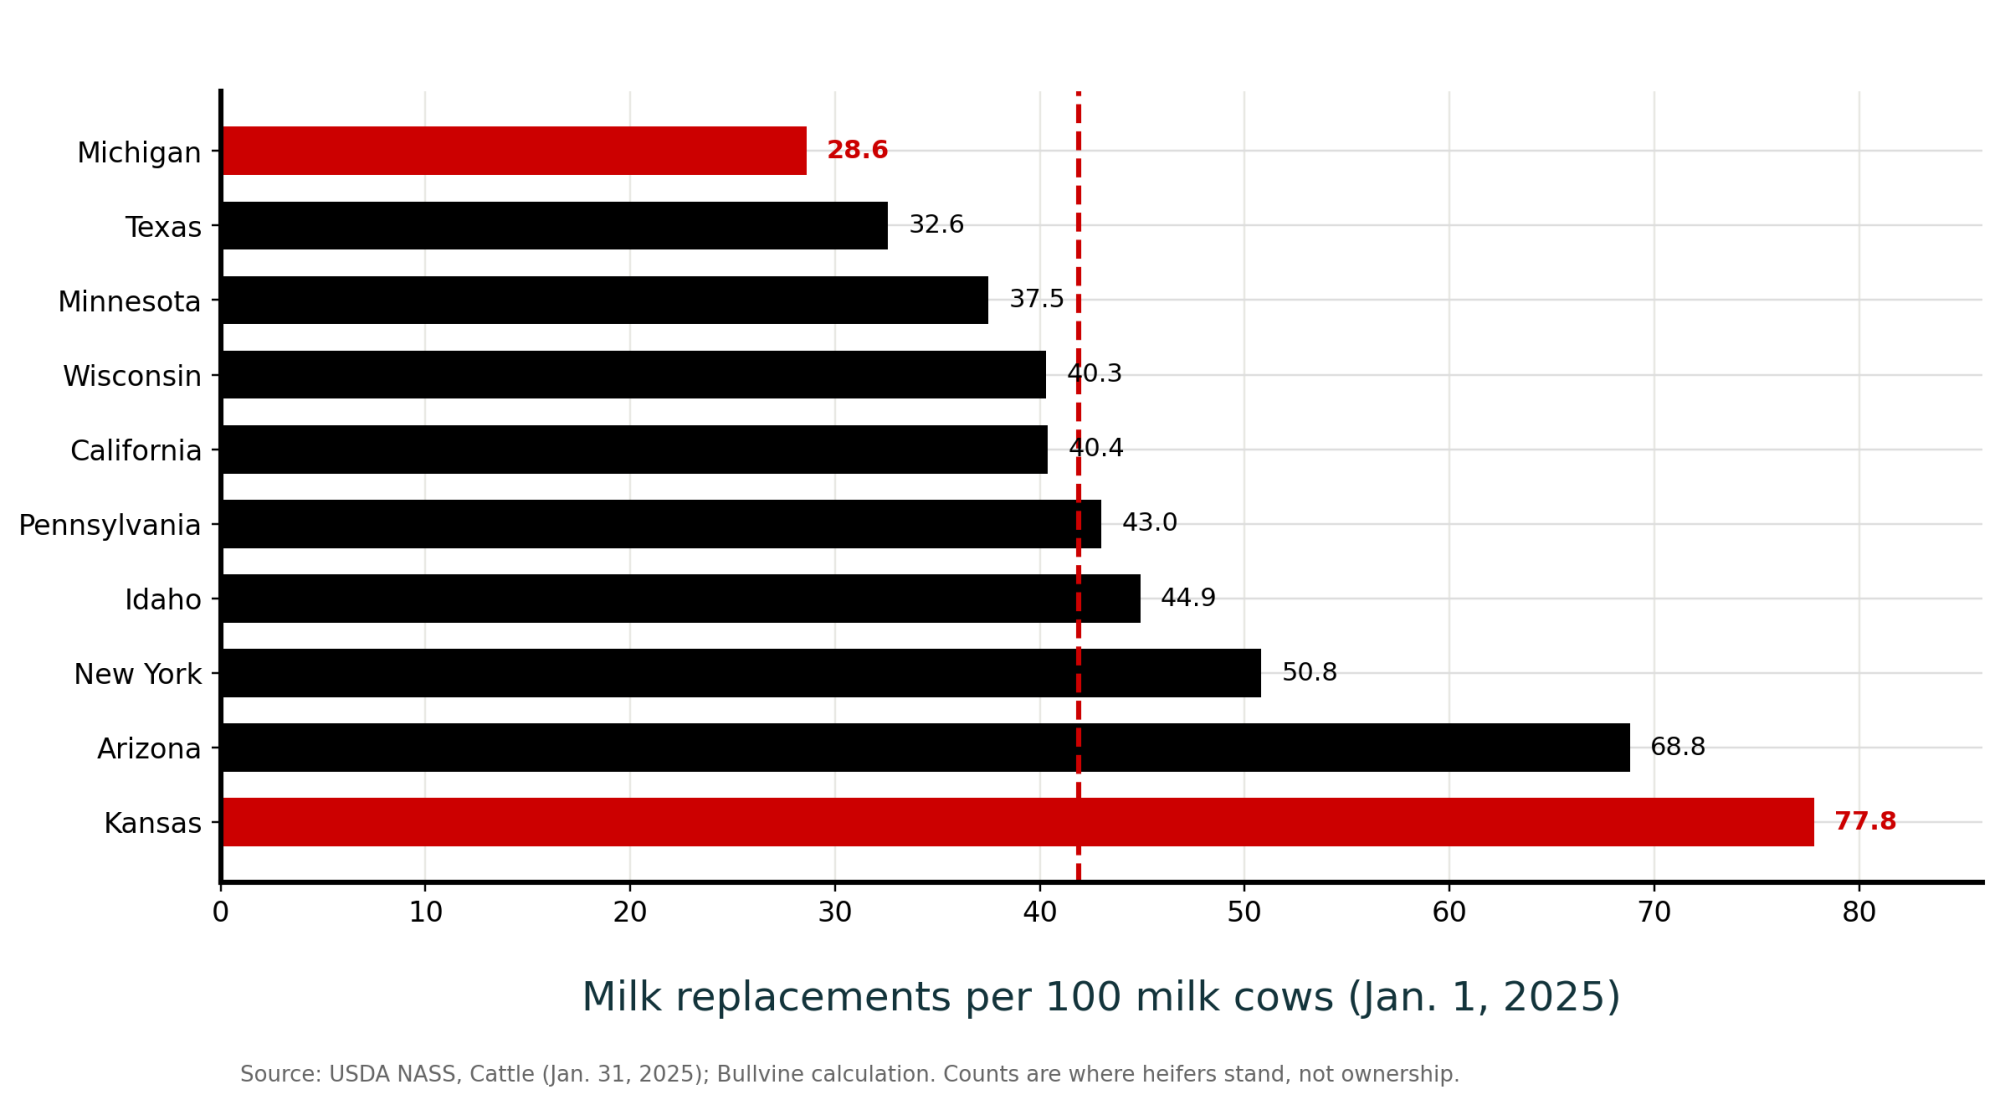
Kansas—and this surprised me—has emerged as a real growth story, with some of the strongest percentage gains in the country according to USDA data. Central New York’s premium milk and yogurt facilities are creating genuine competition for local supplies.

But then you’ve got regions facing structural challenges. The Pacific Northwest remains primarily powder-oriented with limited cheese processing. California’s Central Valley operations are dealing with both water costs and a commodity-focused product mix that limit pricing upside.

Southwest dairy producers face increasing water restrictions and rising costs for heat-stress management. Southeast operations are wrestling with not just heat stress but also limited local feed production and basis challenges that add $30-40 per ton to feed costs. The Upper Northeast faces geographic isolation that creates significant transportation penalties that can substantially erode margins.

The hard truth? And this is tough for many of us to accept—operational excellence can’t overcome a structural pricing gap of $1 or more per hundredweight by geography. That recognition is driving some of October’s herd adjustments.

Practical Steps Depending on Your Situation

Based on what’s emerging from October’s data and conversations with folks making it work, here’s what I’m seeing:

If You’re in a Growth Region:

Focus on genetic improvement within your existing herd rather than expansion. A Texas producer near one of the new cheese plants told me, “We’re genomic testing everything and being selective like never before.”

Work on developing direct processor relationships where possible. Several Idaho producers tell me they’re having success negotiating directly rather than relying only on their co-op. And consider partnerships with neighboring operations—achieve some scale advantages without individual expansion.

If You’re in a Challenged Region:

You need an honest evaluation of your long-term position given structural disadvantages. Run scenarios at different milk prices—$14, $16, $18—to really understand your breakevens. It’s sobering but necessary.

Look at diversification that reduces dependence on commodity pricing. I know Northeast producers are finding success with on-farm processing, agritourism—not for everyone, but worth considering. California Central Valley operations are exploring specialty milk products that command premiums despite the region’s challenges.

For those sub-300 cow operations, the math gets even tougher. But I’m seeing some find success through direct marketing, value-added products, or transitioning to organic, where premiums can offset scale disadvantages. Others are forming producer groups to share resources and negotiate collectively.

And assess whether relocating might work, though as one Wisconsin friend said, “The math on moving with current land and heifer prices? Brutal.”

Universal Strategies That Work:

Secure financial flexibility now while credit’s available. Every lender I’ve talked to expects standards to tighten over the next year.

Implement component-focused production aligned with how your processor actually pays. This means regular ration work, good DHI records.

And develop non-milk revenue streams. Despite some recent softening, beef-on-dairy remains profitable according to cattle market folks at the Chicago Mercantile Exchange. Every bit helps.

The Consolidation Already Underway

Let’s be honest about what’s happening here. Consolidation isn’t some future possibility—it’s here, right now. USDA’s 2022 Census of Agriculture shows dairy farm numbers in the mid-30,000s, and USDA Economic Research Service economists expect that to continue declining as the industry consolidates.

What’s driving this? ERS research consistently shows larger herds tend to have lower costs per hundredweight than smaller ones—often by several percentage points. Processors prefer fewer, larger suppliers to reduce complexity.

Technology adoption, especially robotic milking systems that can run $150,000-250,000 per stall, requires capital that favors bigger operations. The labor savings alone—reducing milking staff by 60-80% while addressing the chronic shortage of qualified dairy workers—makes automation almost mandatory for operations planning to survive long-term.

And the heifer shortage prevents smaller operations from achieving competitive scale, even if they wanted to.

Rather than viewing consolidation as failure—and this is important—many are recognizing it as evolution. As one university dairy economist at Wisconsin explained, “Operations that position strategically, whether through improvements, repositioning, or thoughtful exit timing, preserve more value than those forced into decisions.”

The Bottom Line

Several outlooks, including the Food and Agricultural Policy Research Institute’s baseline projections, suggest better price prospects later in the decade if global demand continues growing and herd size stays in check—though these are projections, not guarantees, as we all know.

Factors that could support recovery: The heifer shortage physically constrains expansion for a while. Global demand appears to be growing faster than supply, according to FAO data. Environmental regulations limit expansion in some major producing regions. And all this new processing capacity will need higher milk prices to generate returns.

But—and this matters—recovery probably won’t benefit everyone equally. Operations with secured processor relationships, geographic advantages, and superior genetics will likely capture premiums. Others might find that even recovered prices don’t fully offset their structural disadvantages.

What October’s Really Telling Us

After looking at the data and talking with folks across the industry, several lessons emerge pretty clearly.

Geography increasingly determines destiny. Those regional pricing gaps reflect structural realities that great management can’t overcome. If you’re in a disadvantaged region, that needs to factor into your planning—like it or not.

The heifer shortage creates both constraint and opportunity. Operations that optimize within their existing footprint while potentially monetizing excess production can turn the shortage to their advantage. Creative producers are making this work.

Information and relationships matter more than ever. Direct processor relationships and access to good market intelligence increasingly separate operations that thrive from those that struggle. Better information pays—literally.

Financial positioning can’t wait. Every lender emphasizes this—the window for securing working capital and risk management tools is months, not years. Wait until you need flexibility, and it might not be there.

Strategic positioning beats stubborn persistence. Whether improving for independence, positioning for acquisition on good terms, or planning an orderly exit, proactive decisions preserve more value than reactive ones. There’s no shame in strategic repositioning—it’s smart business.

We’ve weathered dramatic transitions before—from diversified farms to specialized operations, through technological changes and trade upheavals. This is another transition. What’s different is both the speed and the degree to which these advantages are becoming structural. Operations that recognize and adapt, rather than hope for a return to old patterns, are best positioned.

October’s strategic culling by forward-thinking producers shows something important: successful operations aren’t waiting for change to happen to them. They’re actively positioning for whatever comes next.

For those still evaluating, October’s message seems clear—the time for strategic decisions is now, while you’ve got options and can preserve value through thoughtful positioning.

The path forward won’t be identical for everyone—and that’s fine. But understanding the forces reshaping our industry helps inform decisions. In a world where change keeps accelerating, maybe the biggest risk is standing still.

For more specific information on programs mentioned, producers can check with their local USDA Service Center, university extension offices, or agricultural lenders.

KEY TAKEAWAYS 

  • Your zip code now outweighs your work ethic: Cheese regions earn $1.00-1.50/cwt more than powder areas—that’s $50,000+ annually, no amount of great management will ever close
  • The heifer shortage is now your profit center: Breeding 20-25% surplus heifers generates $100,000+ annually while locking competitors out of expansion at today’s prices
  • Your lender’s flexibility has an expiration date: Working capital windows slam shut by mid-2026—secure financing now, not when you desperately need it
  • This is a five-month decision, not a five-year plan: October’s culling data proves the reshuffling has begun—producers positioning now will be the ones still milking in 2027

Complete references and supporting documentation are available upon request by contacting the editorial team at editor@thebullvine.com.

Learn More:

The Sunday Read Dairy Professionals Don’t Skip.

Every week, thousands of producers, breeders, and industry insiders open Bullvine Weekly for genetics insights, market shifts, and profit strategies they won’t find anywhere else. One email. Five minutes. Smarter decisions all week.
NewsSubscribe
First
Last
Consent
Send this to a friend