


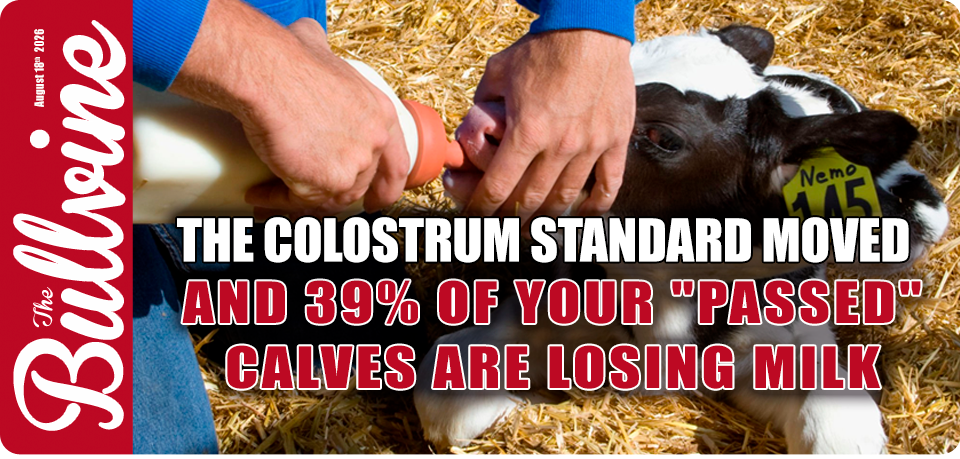








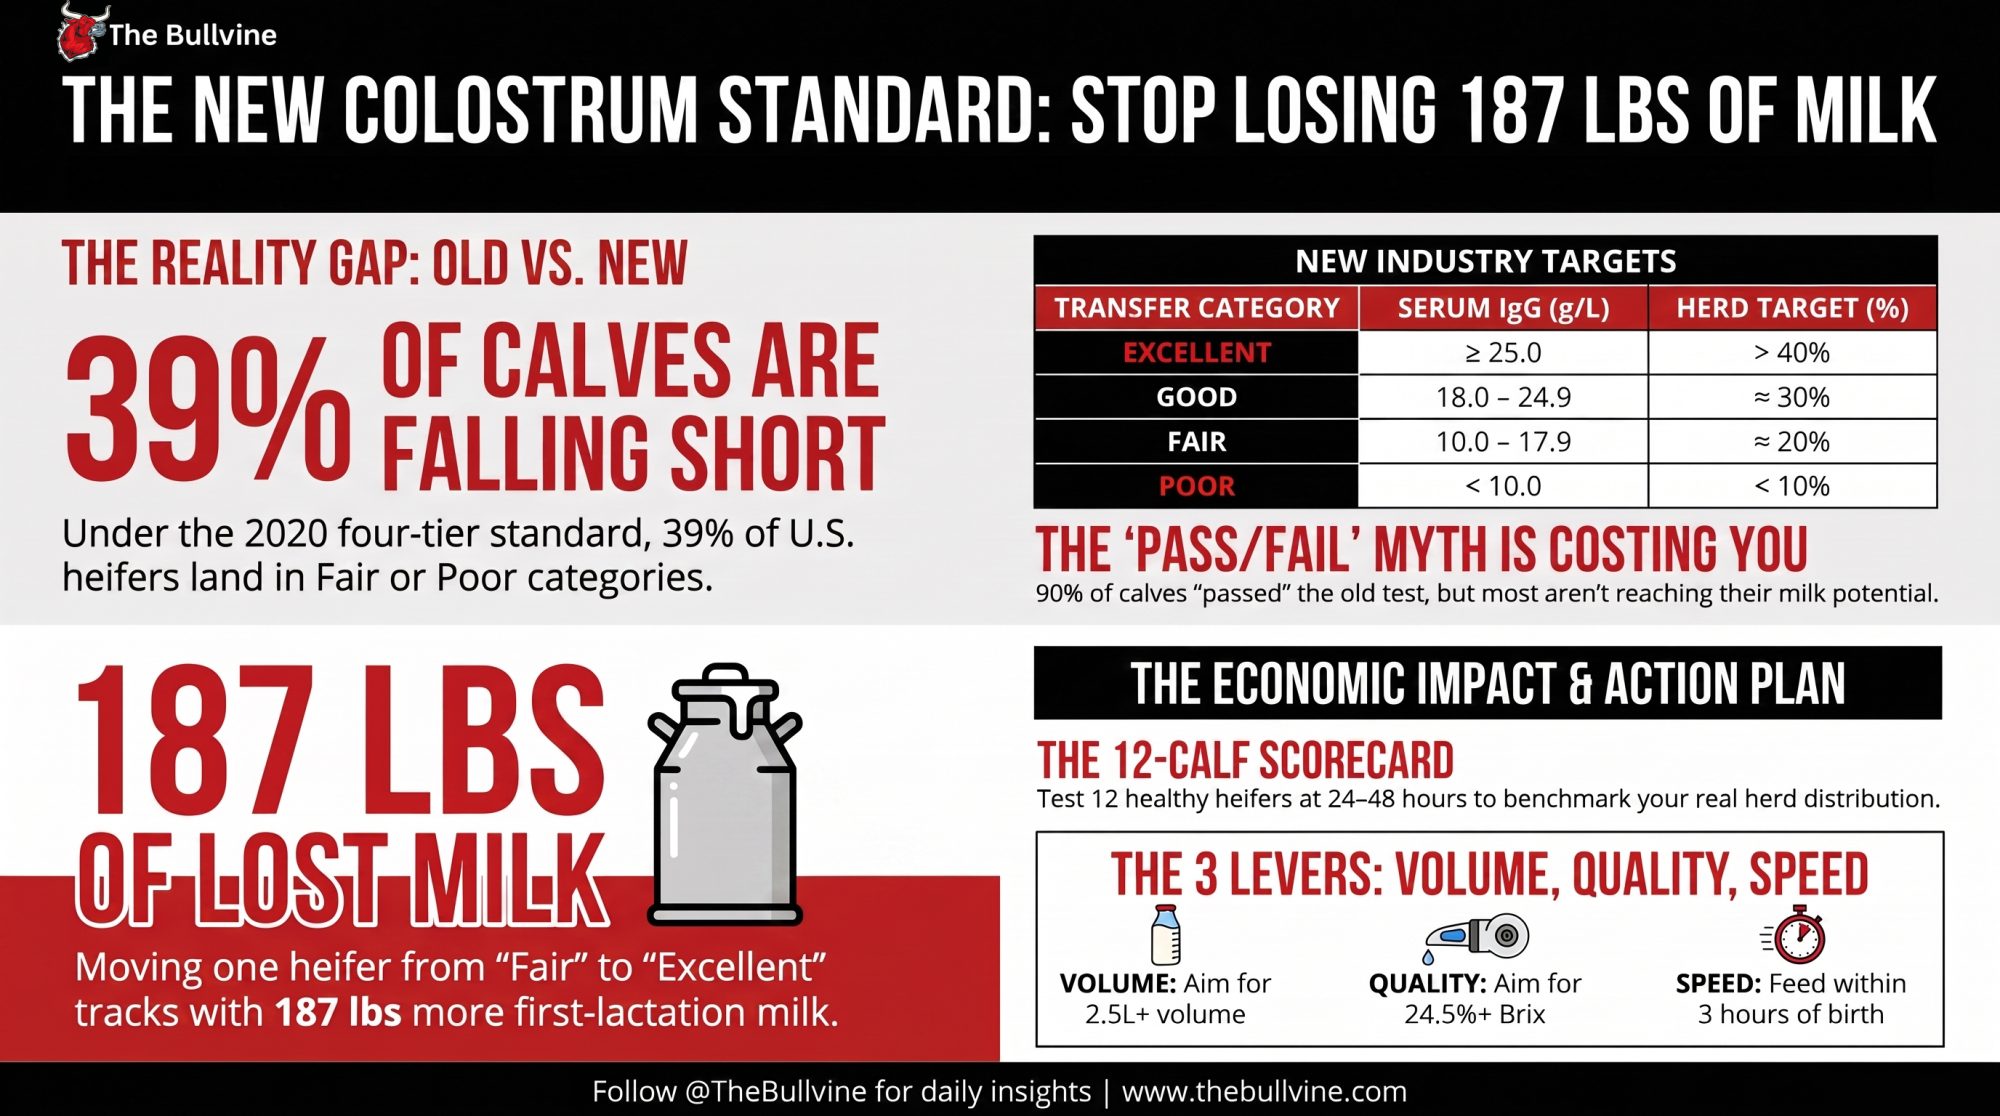
Reclassified under the four-tier standard, nearly 39% of U.S. heifer calves land in Fair or Poor — and the research suggests that gap follows them into first lactation.
The vet pulls blood from twelve healthy heifer calves, spins it, and runs each sample across a refractometer you already own. Nothing looks wrong. None of these calves are sick. They’re bright, they’re nursing, and they’d pass any eyeball test. Then the numbers come back — and the chart tells a different story than the calves do.
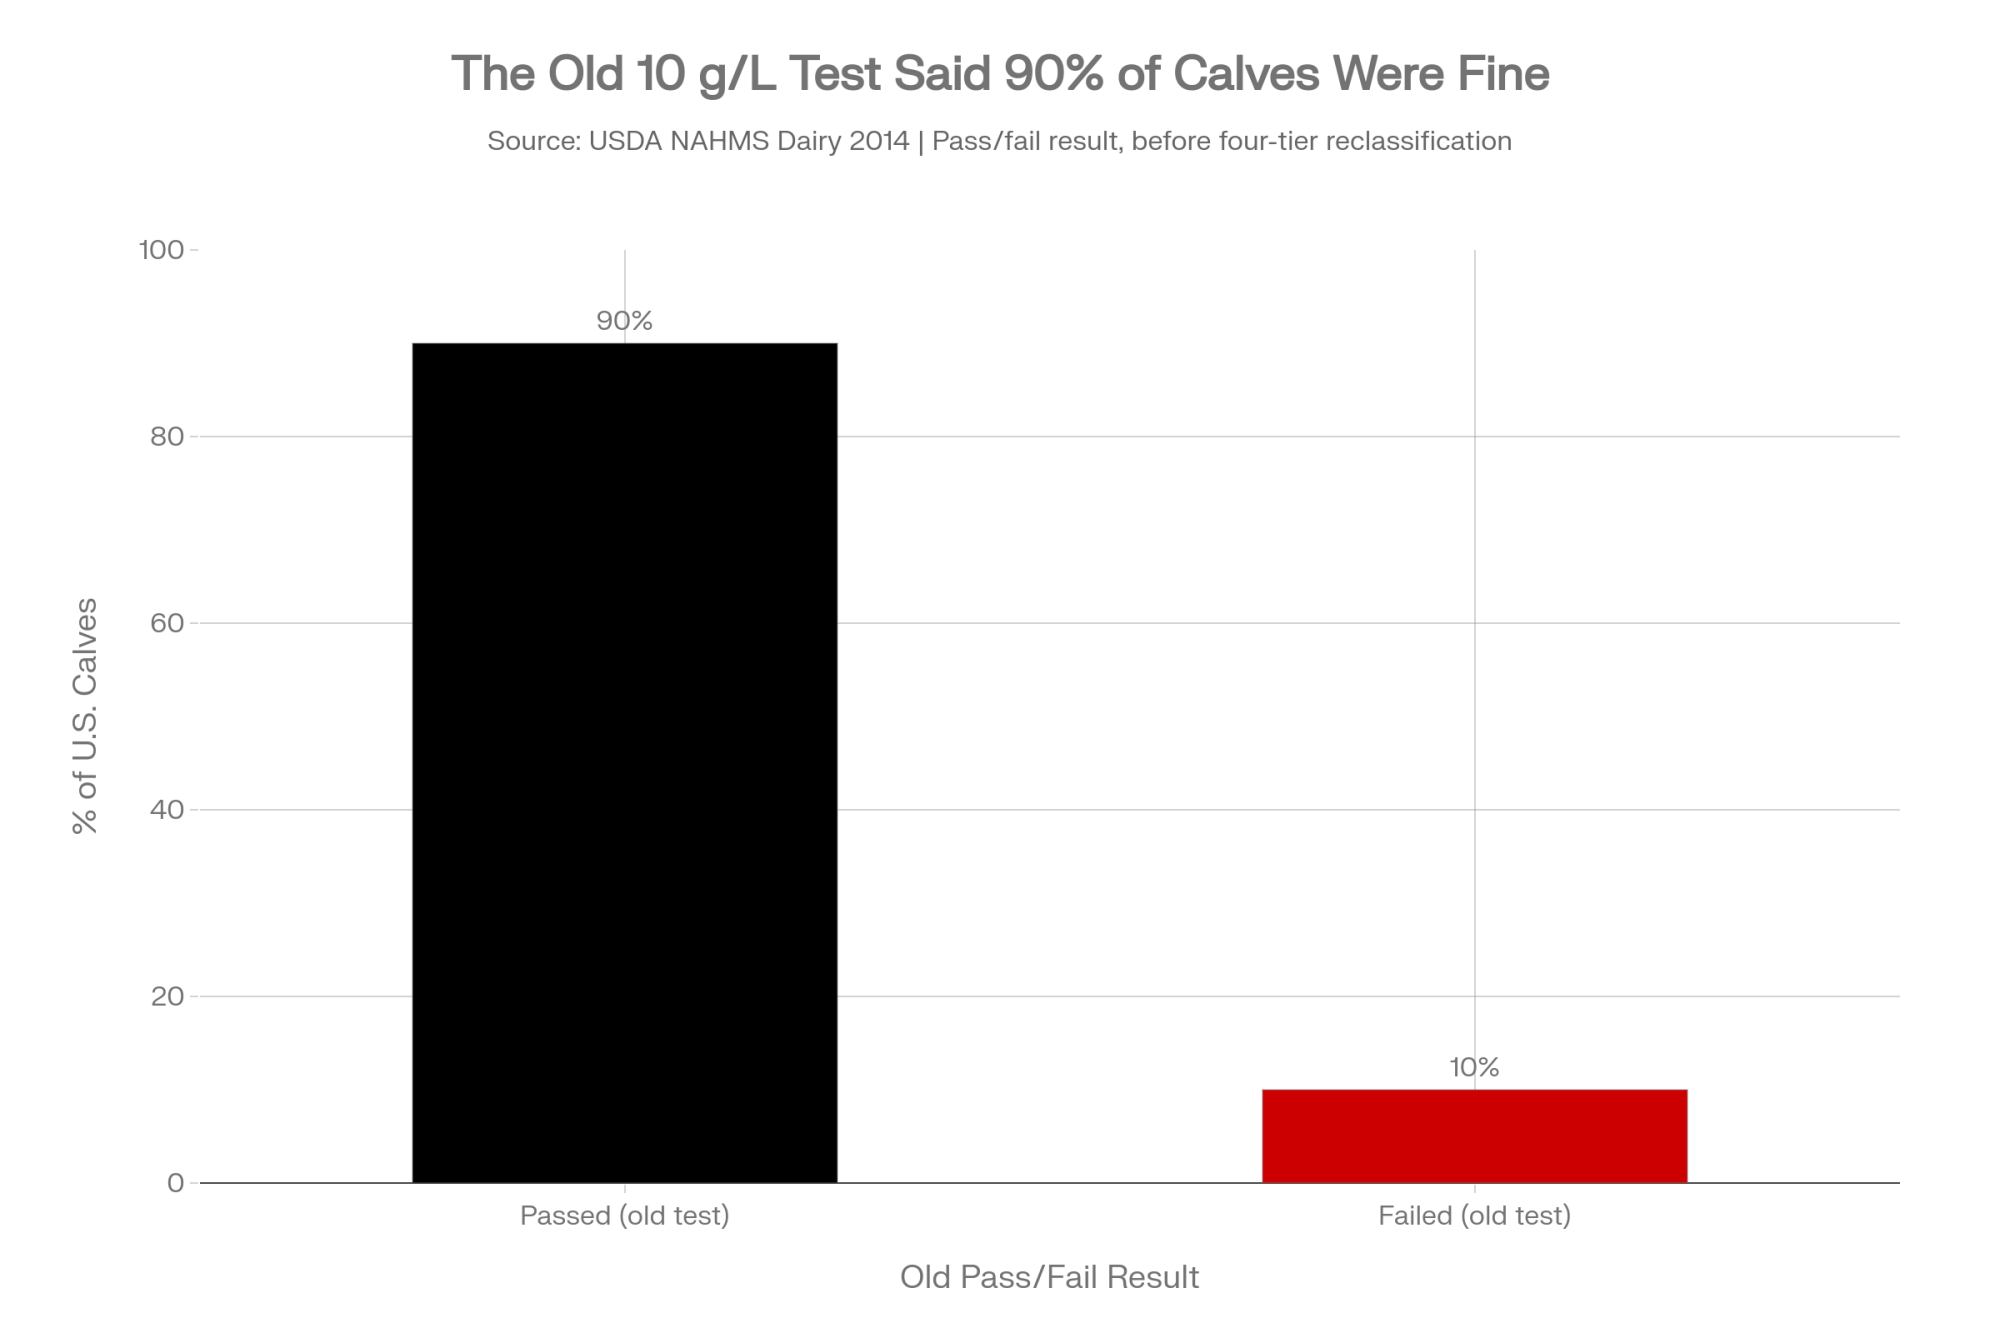
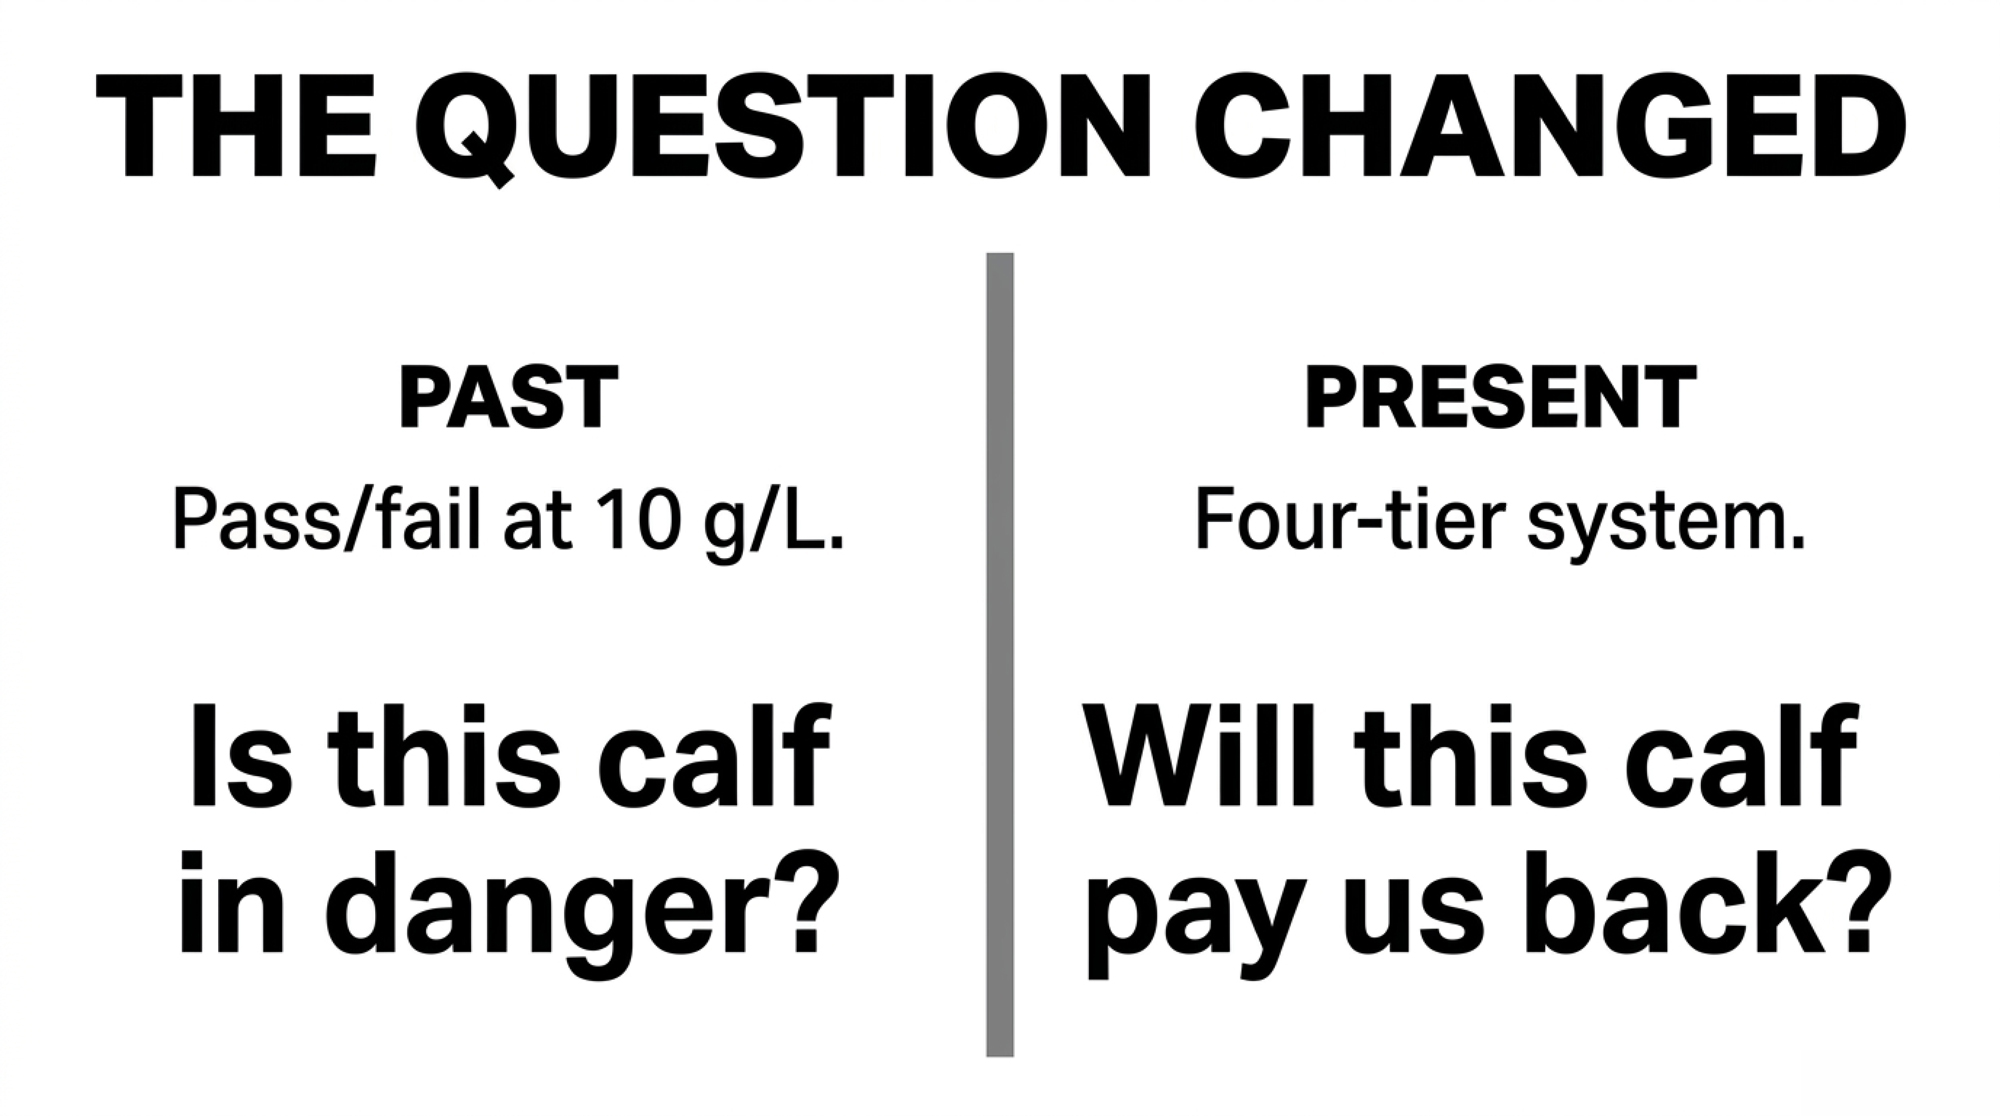
That’s the moment this whole thing turns. For twenty years, the standard said a calf either passed or failed at 10 g/L of serum IgG — and by that math, roughly 90% of calves in the USDA’s National Animal Health Monitoring System (NAHMS) Dairy 2014 study passed. A clean 90%. Sounds like a program that’s working. But it isn’t measuring what pays you back.
The Standard Quietly Changed, and Most Herds Didn’t Notice
In 2020, a group of calf experts led by Jason Lombard published consensus recommendations in the Journal of Dairy Science that retired the old pass/fail line. In its place: four tiers of passive transfer — Excellent, Good, Fair, and Poor — each with serum IgG, total protein, and Brix cut points you can read on-farm (Lombard et al., J. Dairy Sci.103:7611–7624, 2020, U.S. dairy calves).
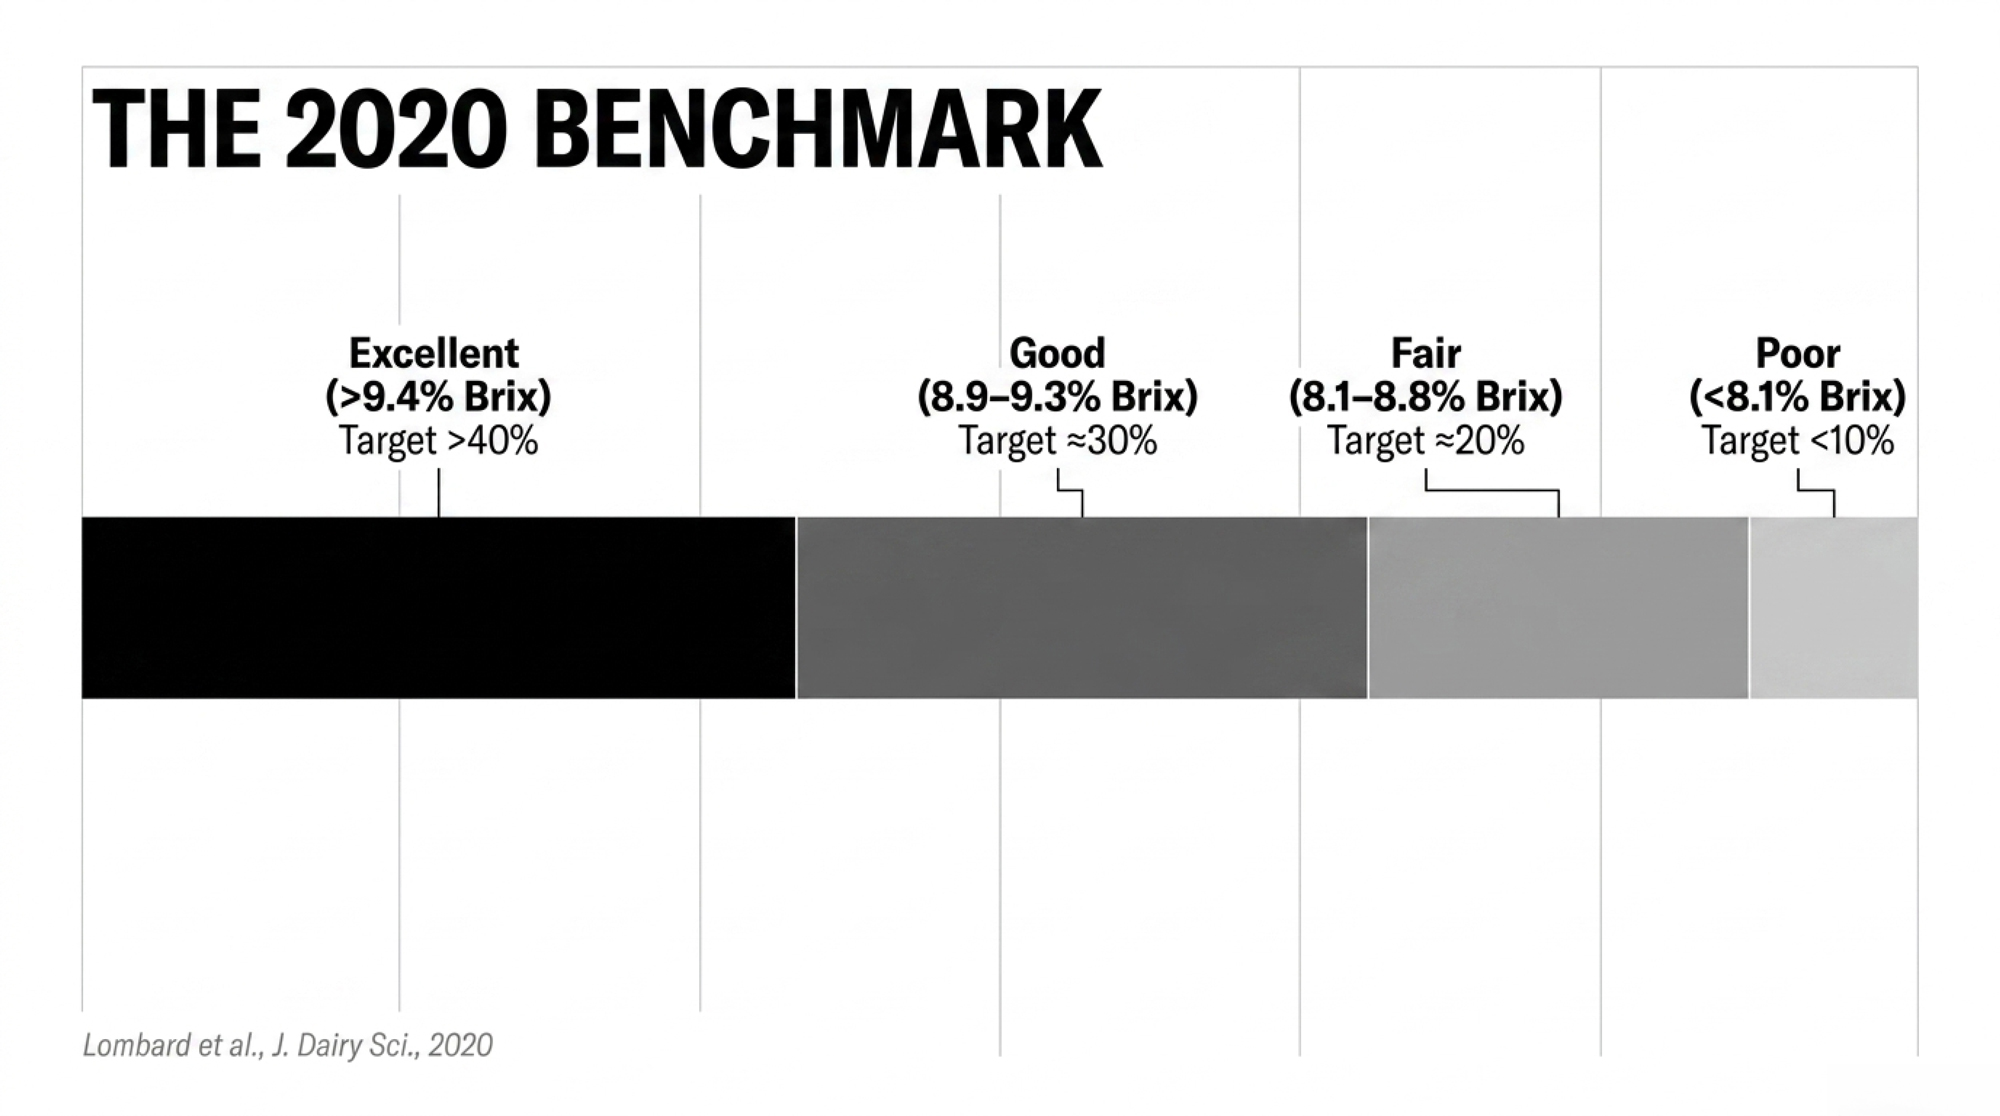
| Transfer category | Serum IgG (g/L) | Total protein (g/dL) | Brix (%) | Herd target (% of calves) |
| Excellent | ≥ 25.0 | ≥ 6.2 | ≥ 9.4% | > 40% |
| Good | 18.0 – 24.9 | 5.8 – 6.1 | 8.9% – 9.3% | ≈ 30% |
| Fair | 10.0 – 17.9 | 5.1 – 5.7 | 8.1% – 8.8% | ≈ 20% |
| Poor | < 10.0 | < 5.1 | < 8.1% | < 10% |
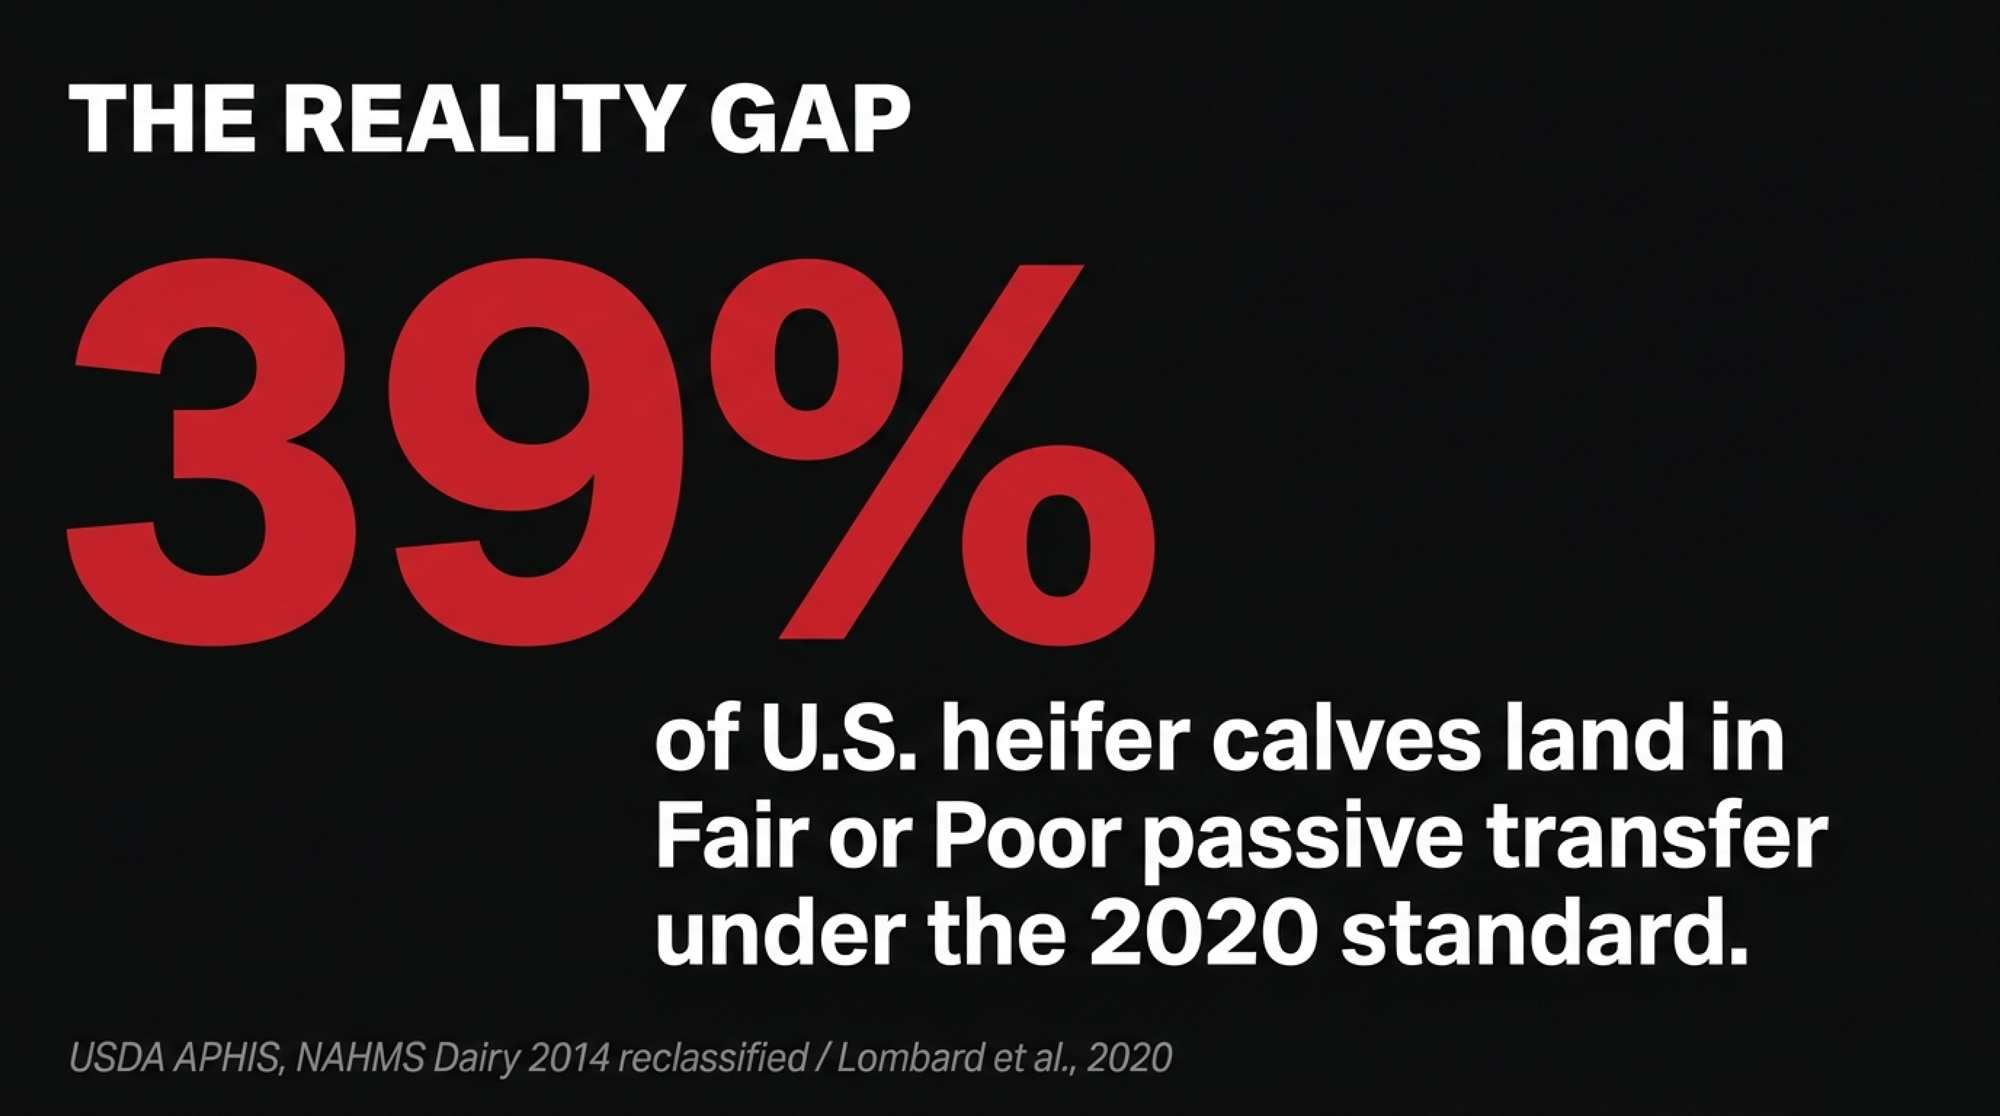
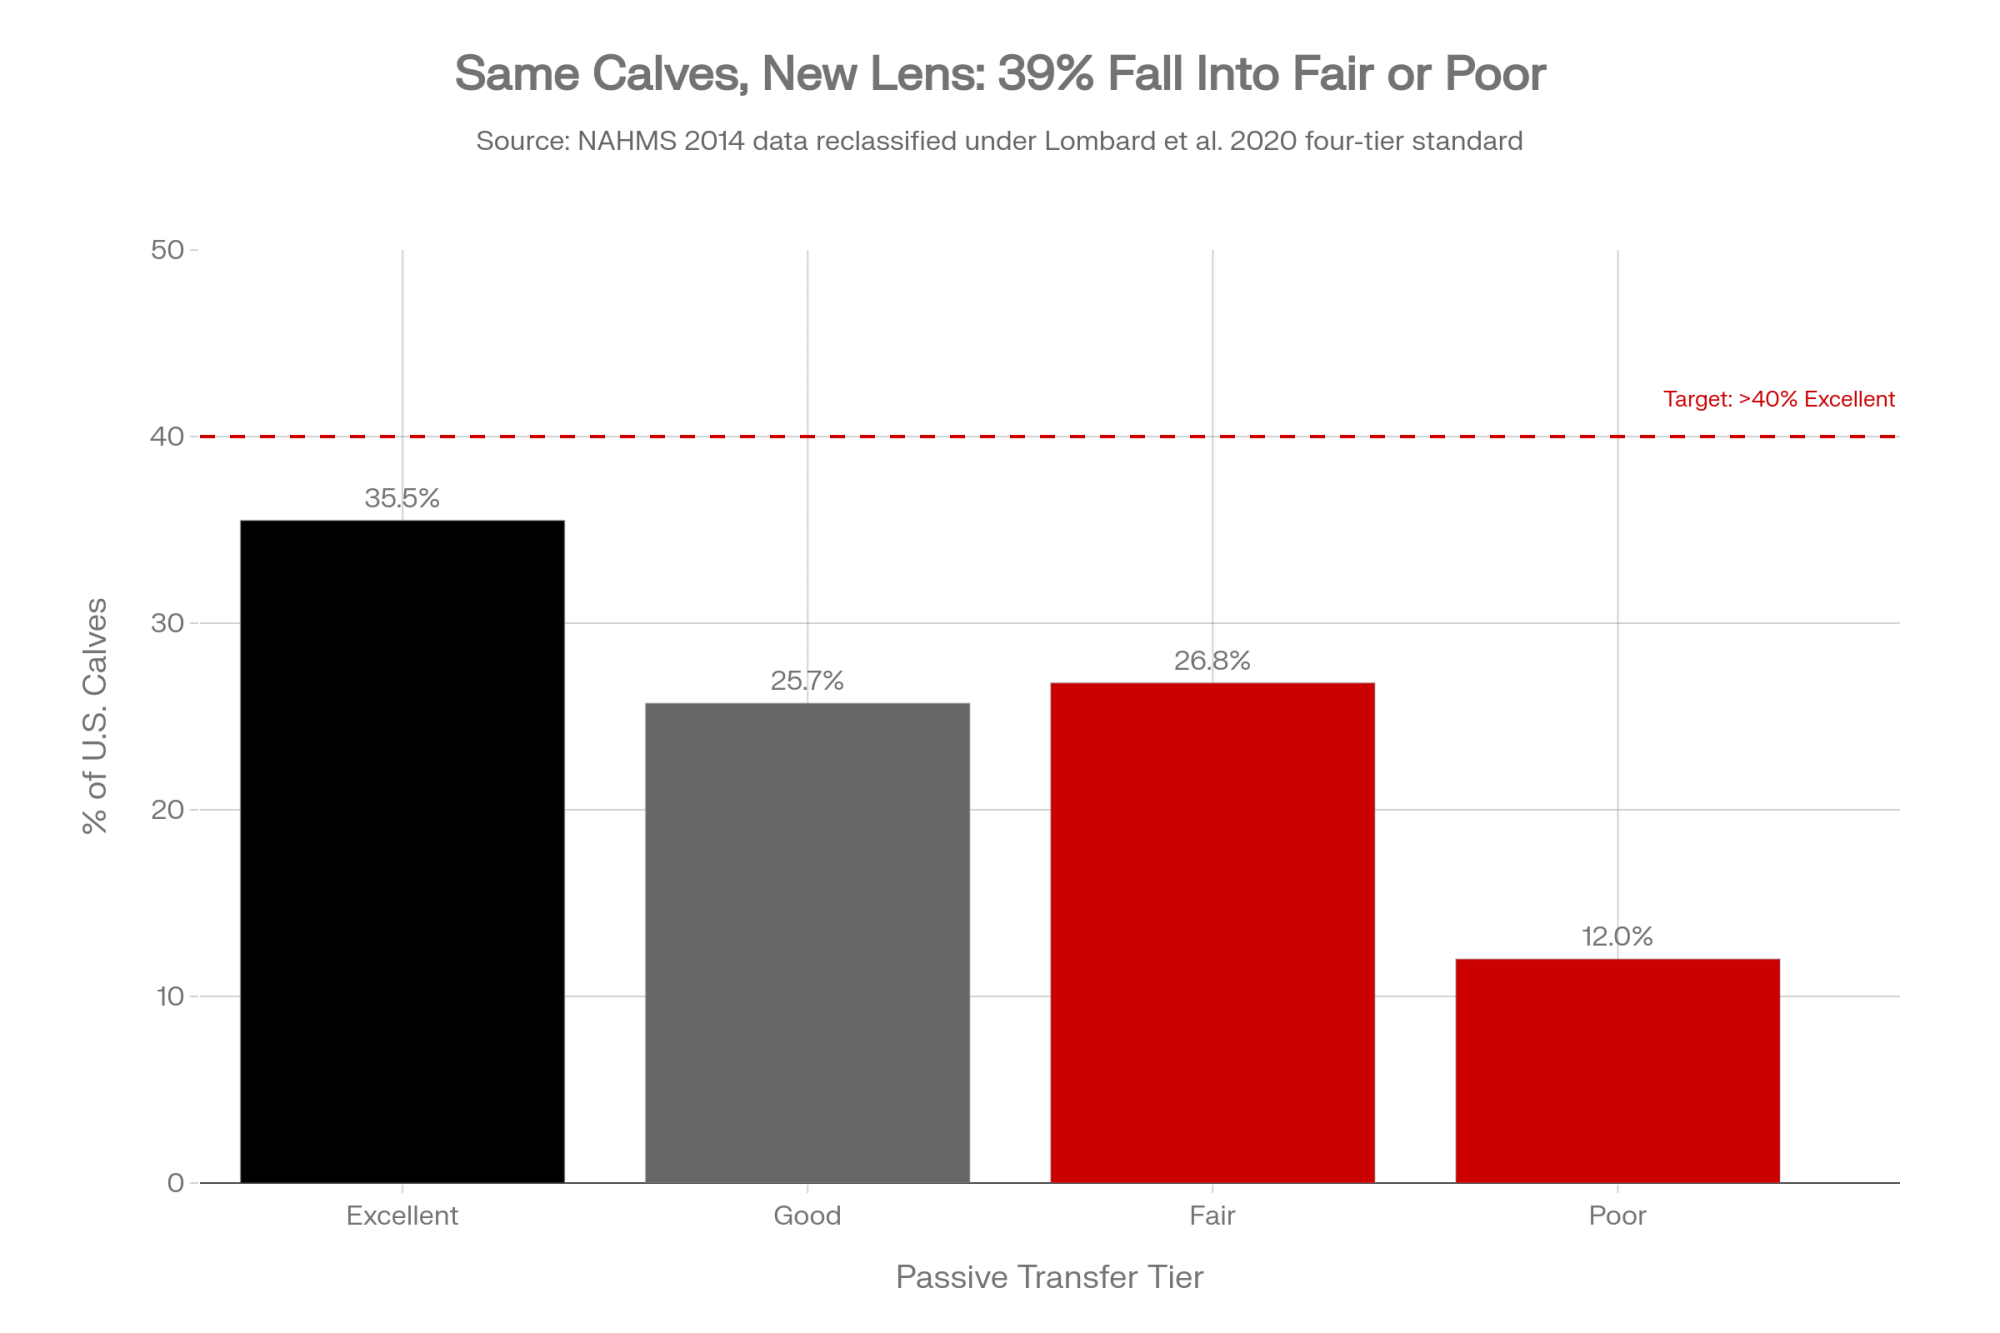
Now run the old NAHMS numbers through the new lens. When the Dairy 2014 data get reclassified into Lombard’s tiers, only about 35.5% of heifer calves land in Excellent, 25.7% in Good, 26.8% in Fair, and 12.0% in Poor (USDA APHIS, NAHMS Dairy 2014 info brief, U.S. national). It’s a decade-plus old, but it’s still the most recent USDA national passive-transfer survey we have. Same calves. Same blood. Nearly 39% of them are sitting in Fair or Poor.
The blood draw didn’t change. The question did. The old test asked, “Is this calf in danger?” The four-tier chart asks something harder: “Is this calf on track to pay back what she cost to raise?”
Why Is a Blood Value Really a Revenue Number?
Three separate studies point at the same target, and none of them are about scours.
Back in 1989, DeNise and colleagues followed roughly 1,000 Holstein heifers and found serum IgG measured shortly after birth was a real source of variation in first-lactation milk — a slope of 8.5 kg of mature-equivalent (ME) milk per 1 g/L of serum IgG (DeNise et al., J. Dairy Sci. 72:552–554, 1989). ME basis means the figure is standardized to a mature cow’s production, not a raw first-lactation tank weight. It’s an association from one cohort, not a guarantee. But it’s held up across the citations since, and it puts a number on a blood value most people file under “health.”
Then there’s growth. Soberon and colleagues reported that each 1 kg of preweaning average daily gain tracked with 850 kg more first-lactation milk in the Cornell herd, and 1,113 kg more in a commercial herd (Soberon et al., J. Dairy Sci.95:5254–5267, 2012). That early growth runs straight through the same colostrum window you’re testing.
And the cost of getting it wrong isn’t hypothetical. Raboisson’s 2016 meta-analysis pegged the mean total cost of a dairy calf with failure of passive transfer at about €60, with a prediction interval running to €109 (Raboisson et al., PLOS ONE, 2016). That’s before you count the milk you never make.
The Barn Math Nobody’s Running
Walk it through on one calf. Take a heifer sitting at 15 g/L — squarely mid-Fair, right where a big share of NAHMS calves live. Compare her to a herdmate at 25 g/L, the floor of Excellent. That’s a 10 g/L gap.
💸 The Leak on the Milk Check
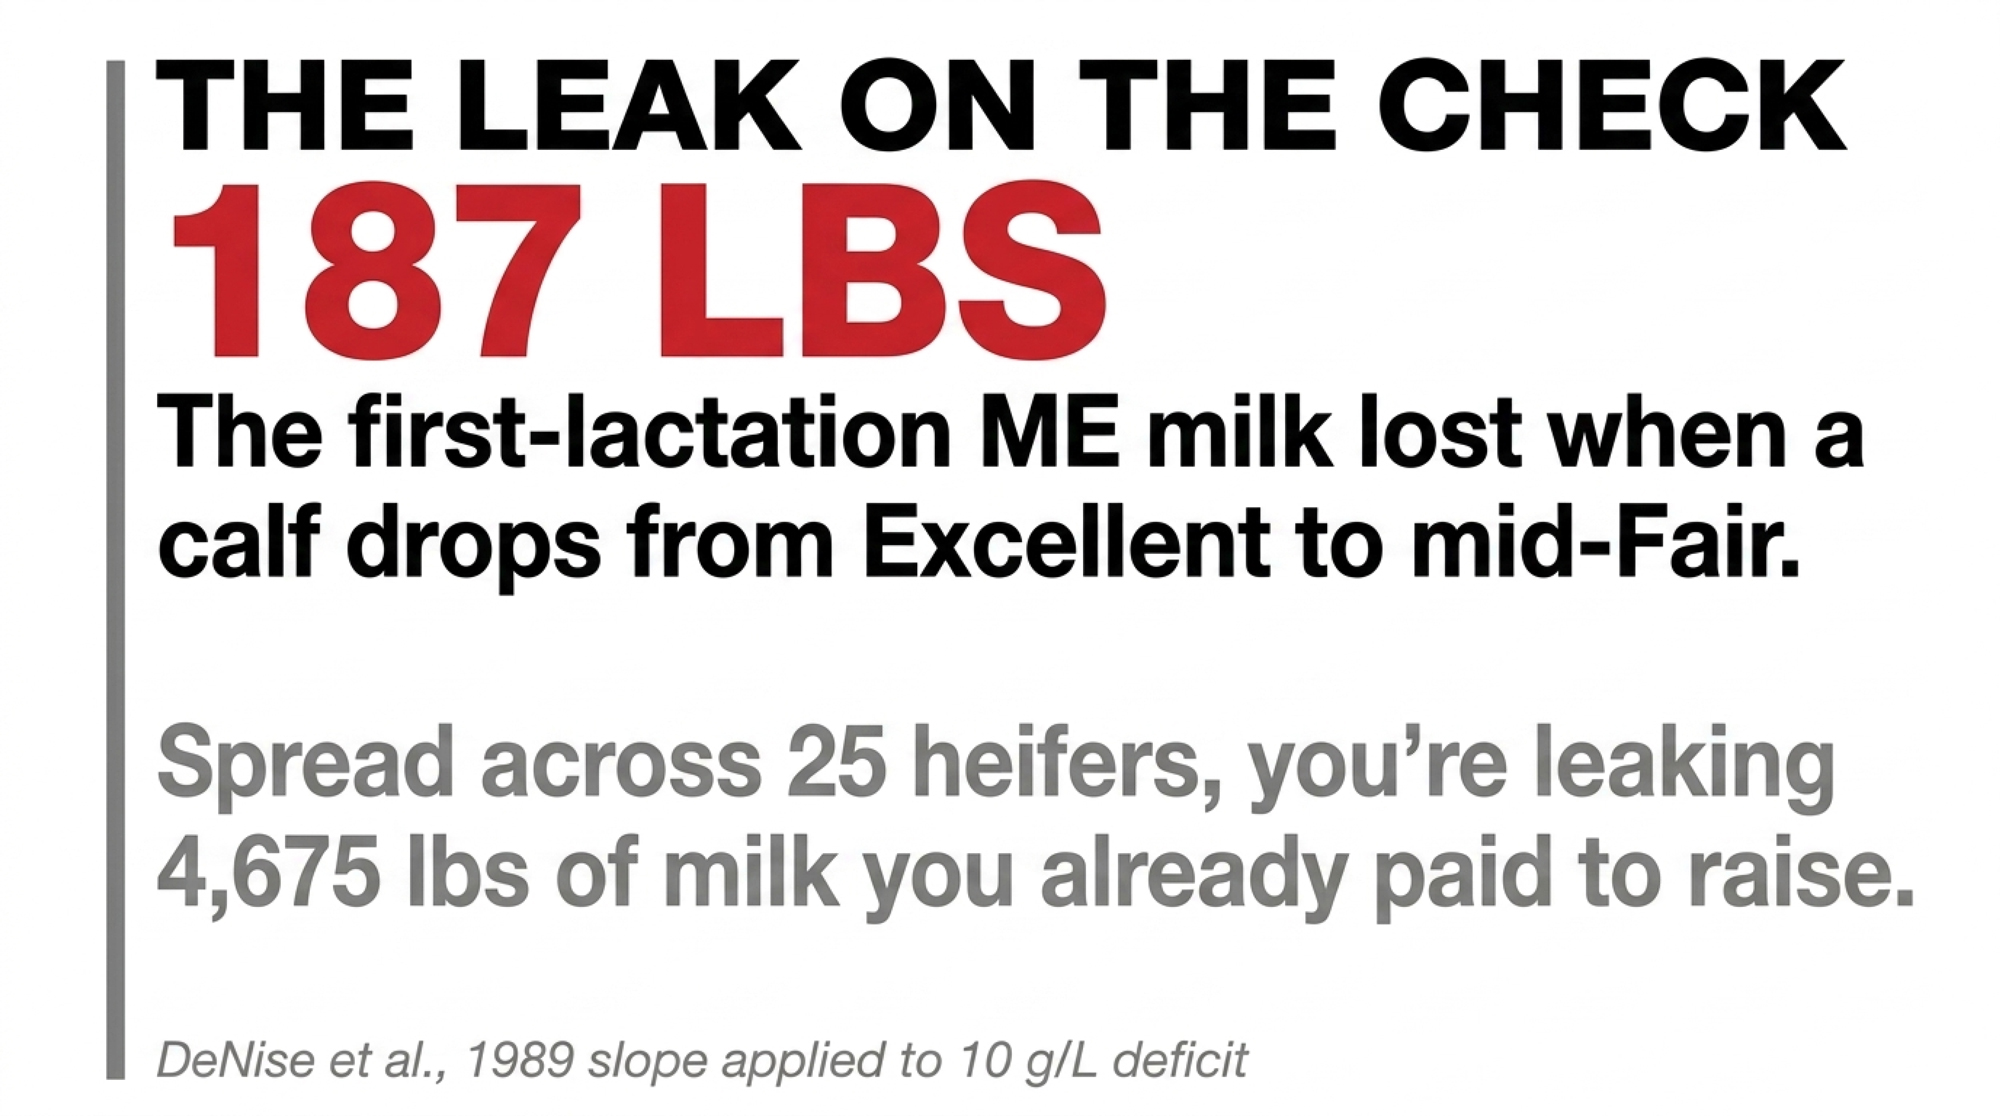
A calf in Fair (15 g/L) instead of Excellent (25 g/L) sits at a 10 g/L deficit.
On DeNise’s 1989 slope, that gap tracks with roughly 85 kg — about 187 lbs — of lost first-lactation milk per calf, mature-equivalent (ME) basis.
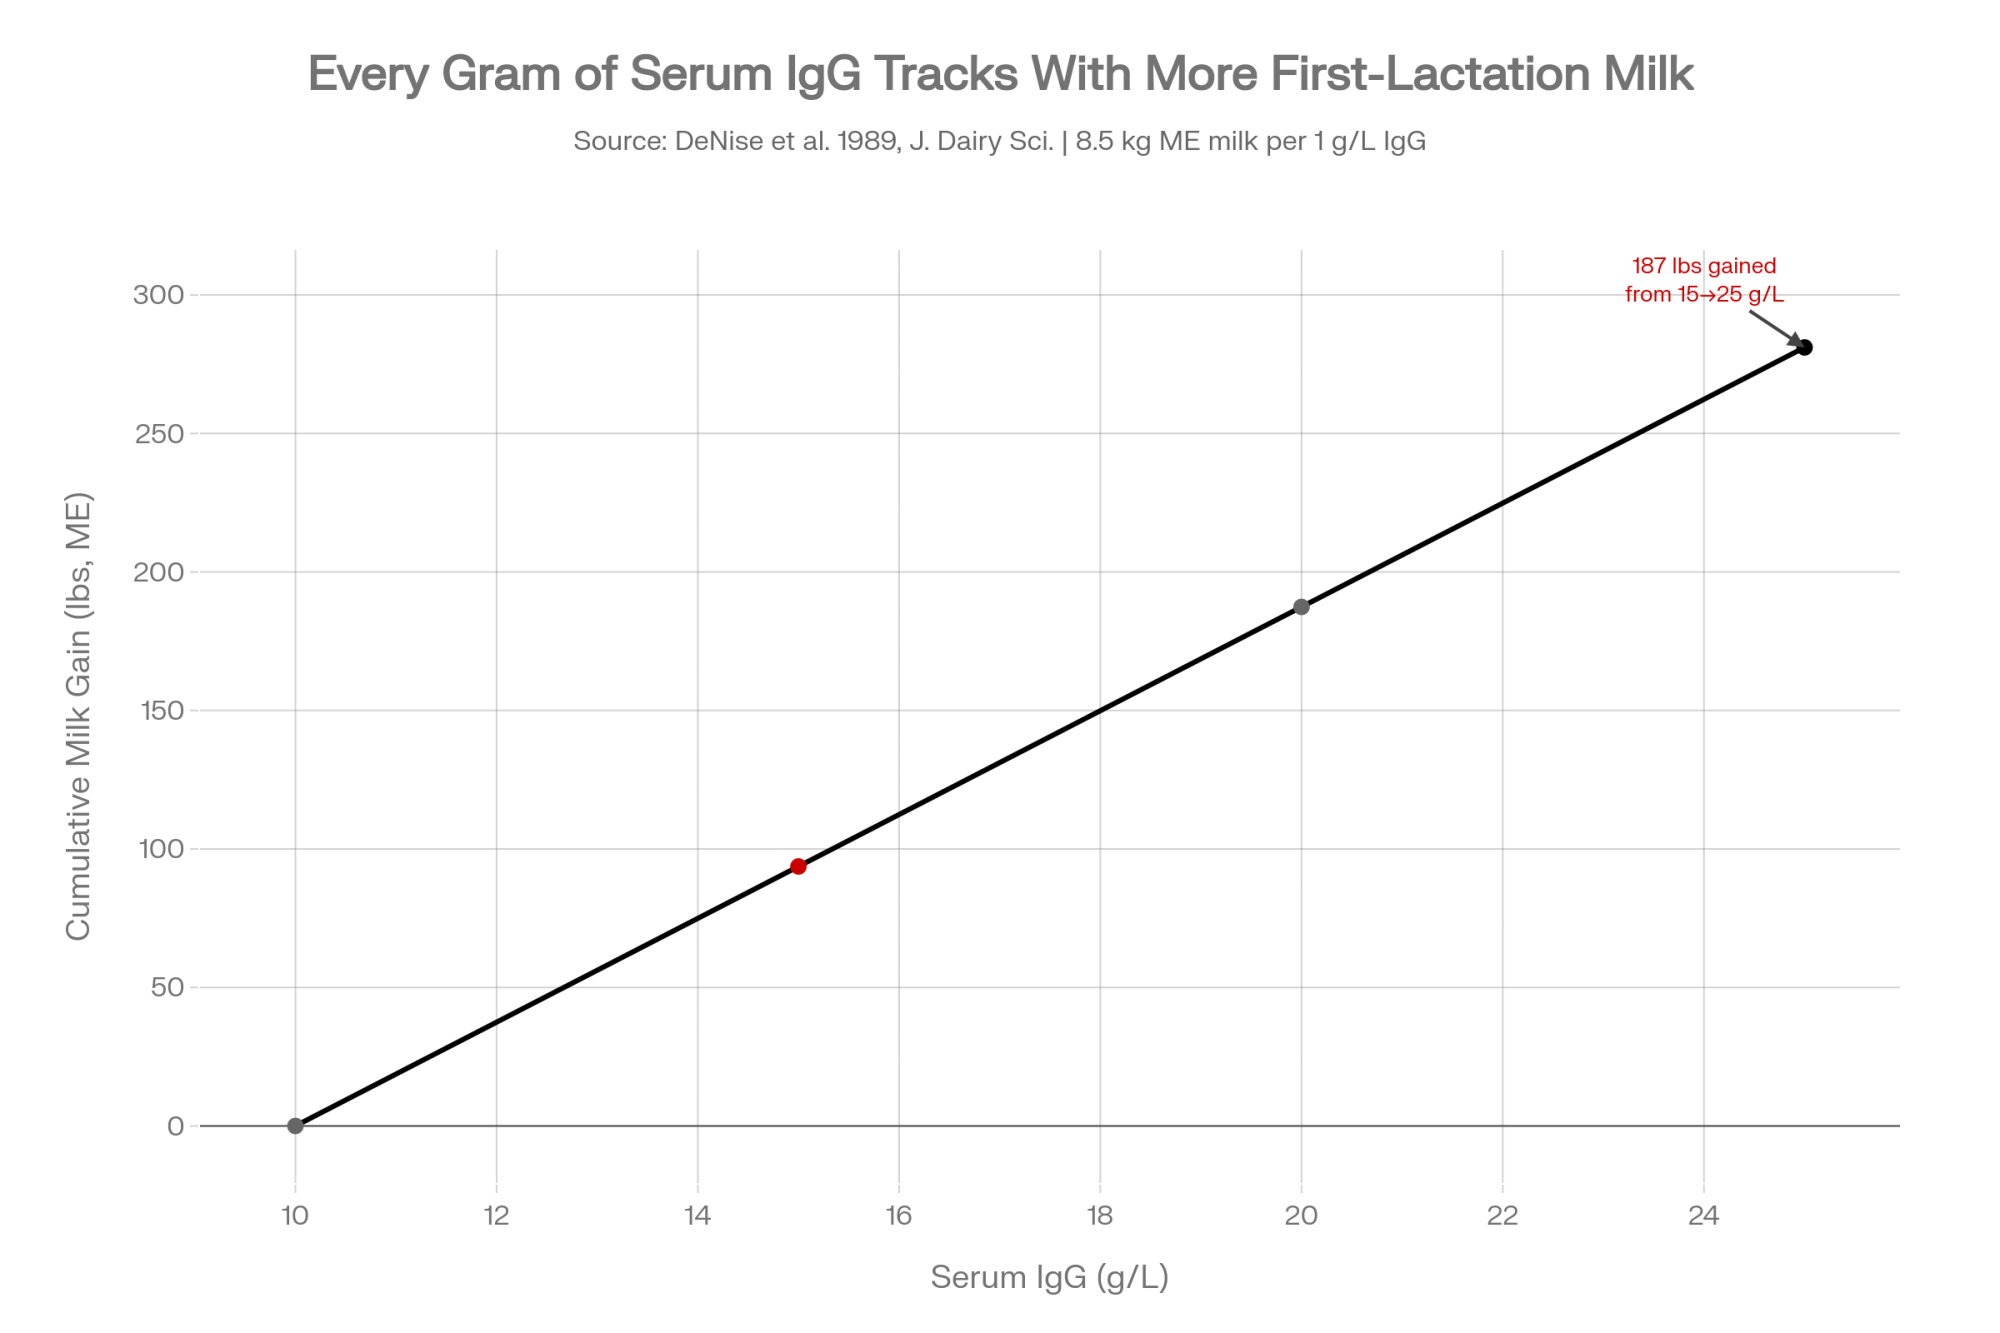
Scale it: for every 25 heifers stuck in Fair that could’ve reached Excellent, that’s roughly 4,675 lbs of ME first-lactation milk you’d already paid to raise.
This is an association from one cohort, not a guaranteed yield — but it’s the direction, and it’s real.
That’s the whole tension. The math has existed since 1989. The levers are known. And on most farms it’s still filed next to the scours rate instead of next to pregnancy rate and feed conversion. A leak spread across a quarter of the heifer crop never shows up as a disaster — it shows up as a herd that’s “doing fine.”
How Do You Actually Read the Herd? The 12-Calf Scorecard
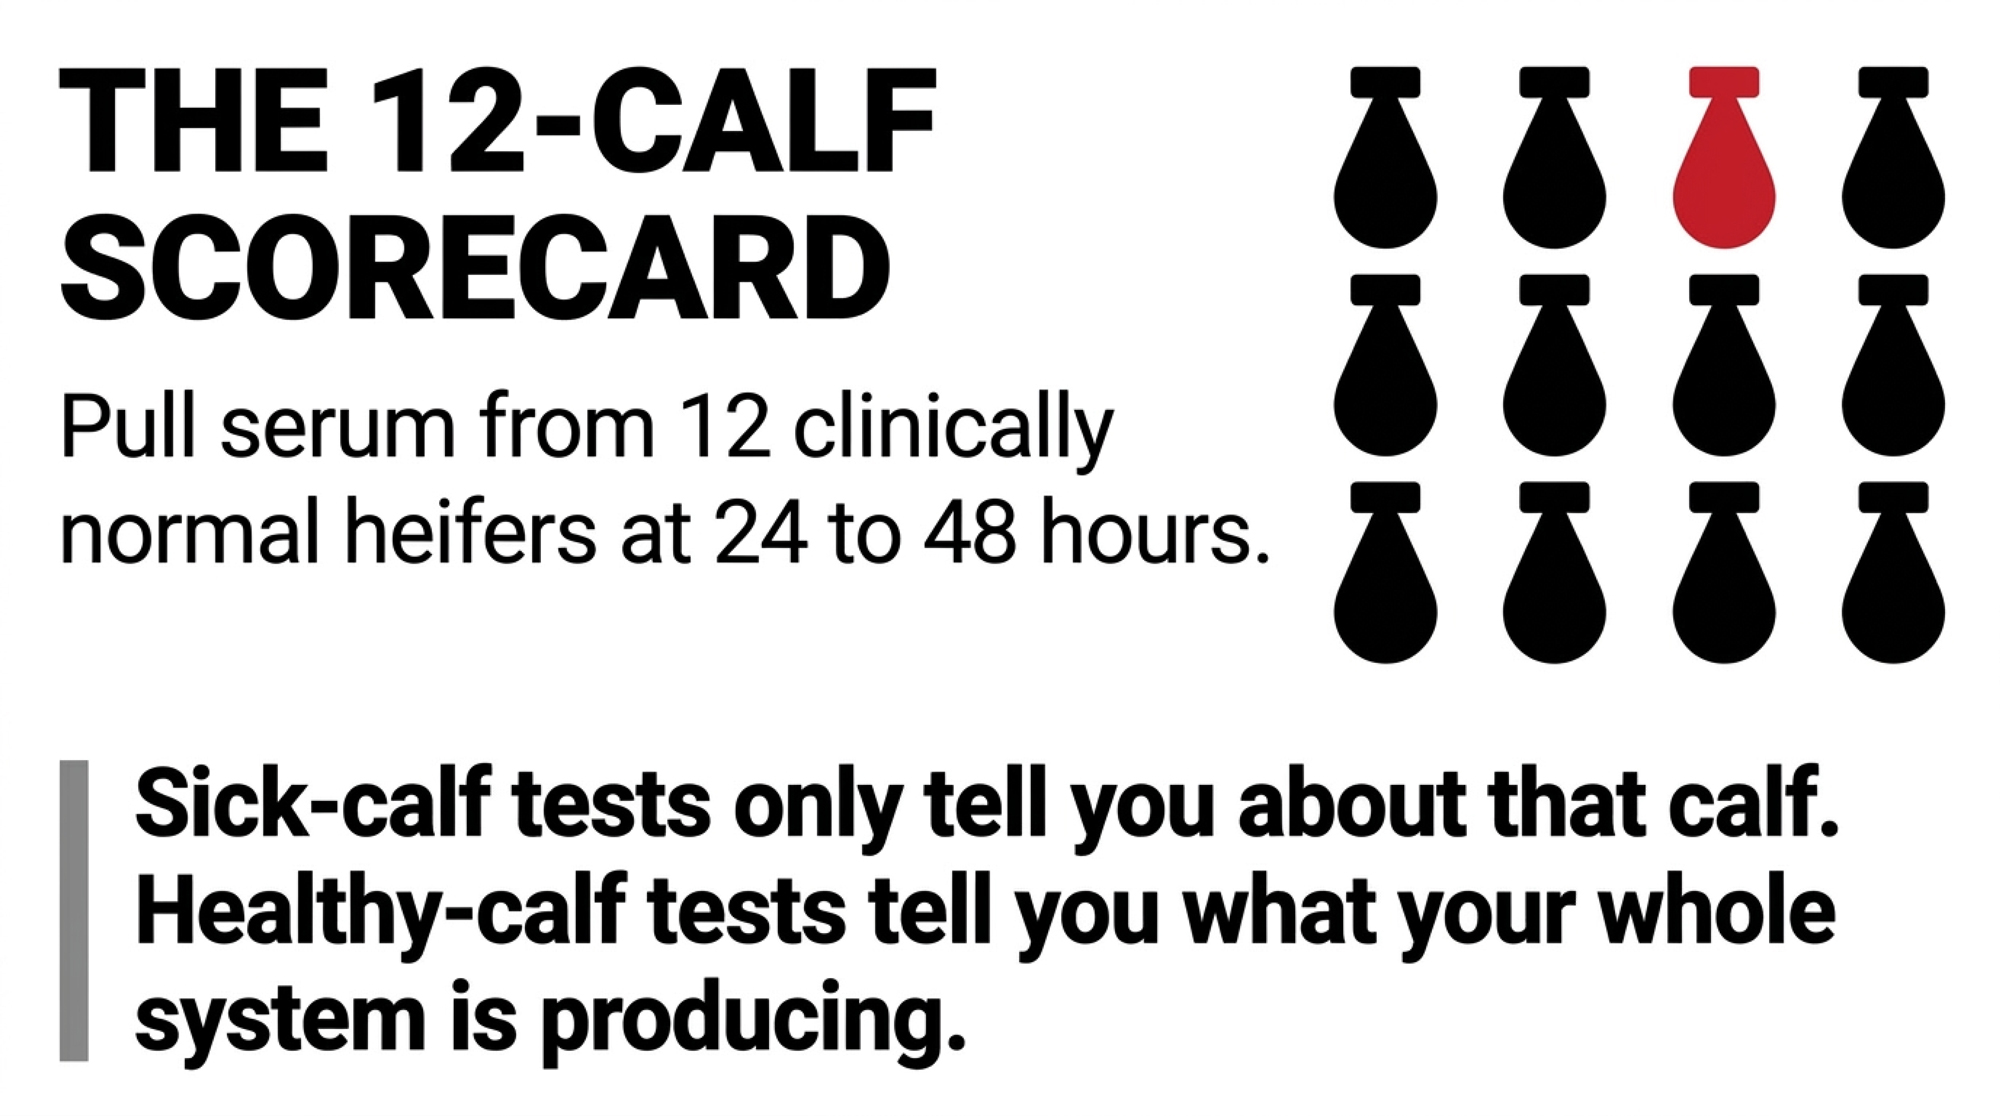
Here’s the tool. Have your vet pull serum from at least twelve clinically normal heifer calves at 24 to 48 hours of age — healthy ones, not the sick pen. Read each on a Brix or total-protein refractometer, the same one plenty of herds already use on colostrum. Sort them into the four tiers. Plot the distribution against the 40/30/20/10 target.
| Tier | Serum IgG (g/L) | Herd Target (%) | Morin Benchmark | Action If Below Target |
|---|---|---|---|---|
| Excellent | ≥25.0 | >40% | — | Protocol is working; maintain |
| Good | 18.0–24.9 | ≈30% | Combined Excellent+Good should exceed Morin’s 68% median | Check Brix consistency shift-to-shift |
| Fair | 10.0–17.9 | ≈20% | — | Audit first-feeding volume (target ≥2.5 L). |
| Poor | <10.0 | <10% | — | Trigger: audit volume, Brix, and timing on every calf for a month. |
Two things matter here. First, sample the calves that look good, because a sick-calf test only tells you about that calf — a healthy-calf sample tells you what your whole system is producing. Second, do it early, before dehydration or illness muddies the reading. Twelve is a floor, not a ceiling; more calves sharpen the picture.
The first time a herd runs this, the chart usually looks a lot like NAHMS 2014 — about a third Excellent, a quarter Good, the rest stuck in Fair and Poor — unless they’ve already put real work into colostrum. That’s the “oh” moment. And it goes one of two ways.
Sponsored Post
What Separates the Farms That Move From the Ones That File It Away
The difference isn’t knowledge. It’s ownership. And the fixable levers aren’t complicated — they’re things that happen in the first hours after a calf hits the ground.
Morin’s herd-level work in Québec makes the levers concrete. Across 144 herds, the prevalence of adequate transfer of passive immunity ranged from 24% to 100%, with a median of 68% (Morin et al., J. Dairy Sci. 104:1122–1135, 2021). In the final model, only two things stayed significantly tied to a herd hitting adequate transfer: how consistently calves got enough colostrum volume at the first meal, and how consistently they got it fast.
| Feature | Old Pass/Fail Standard (pre-2020) | Lombard Four-Tier Standard (2020) |
|---|---|---|
| Cut point | Single line at 10 g/L serum IgG | Four bands: <10, 10–17.9, 18–24.9, ≥25 g/L |
| % of NAHMS 2014 calves “adequate” | ~90% pass | 61.2% (Excellent + Good) |
| % flagged as a concern | ~10% fail | 38.8% (Fair + Poor) |
| What it actually predicts | Disease risk only | Disease risk AND first-lactation milk (ME) |
| Herd target | “Pass rate” — no upper tier goal | 40/30/20/10 distribution across tiers |
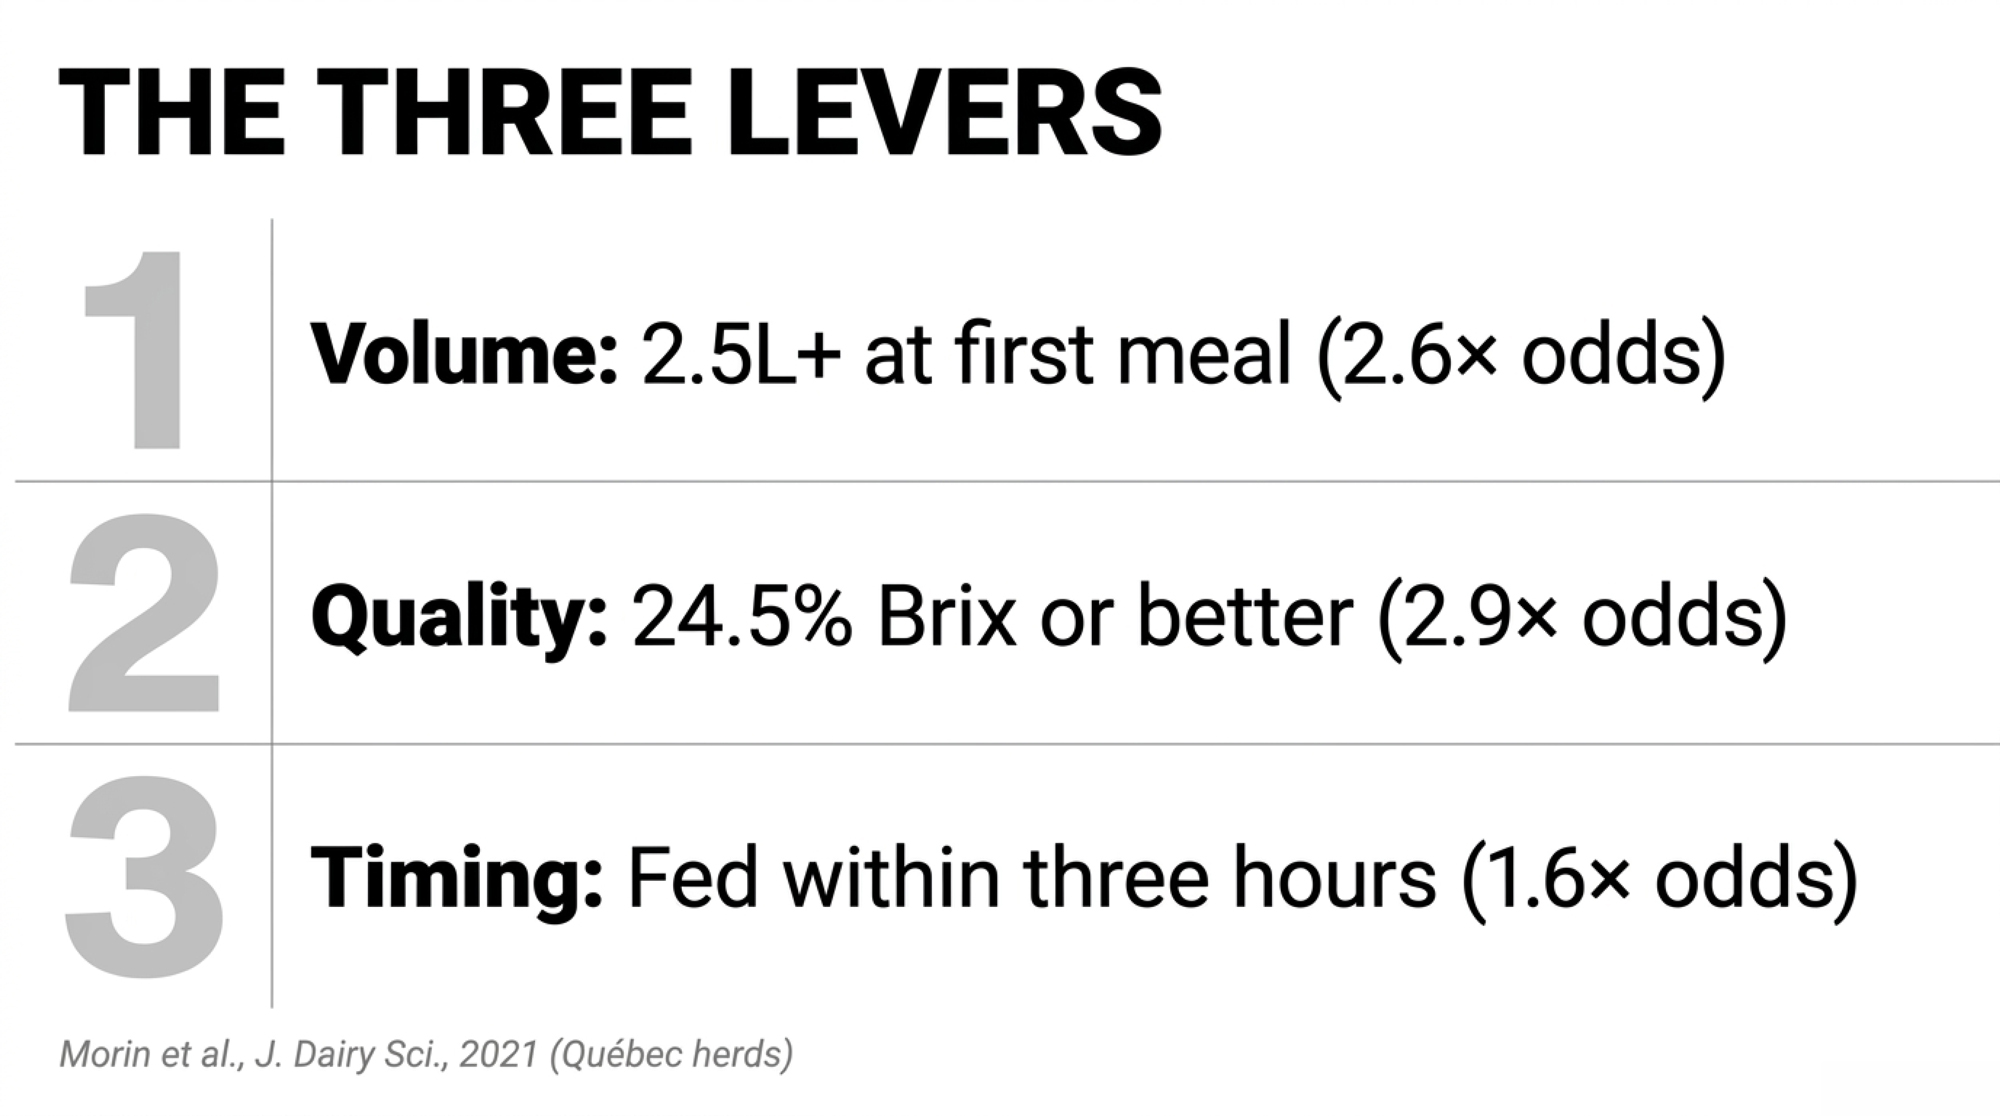
The companion calf-level study put odds on it. Calves had 2.6 times higher odds of adequate transfer when they got at least 2.5 L at the first feeding, 2.9 times higher odds with colostrum at 24.5% Brix or better, and 1.6 times higher odds when fed within three hours of birth (Morin et al., J. Dairy Sci. 104:4904–4918, 2021, Québec herds). Volume, quality, timing.
A 2025 European study drives home how much herds vary. Across 1,041 calves on 108 farms in six countries, an average of just 35.3% of calves hit Excellent — and only one country, Spain at 47.5%, cleared Lombard’s 40% bar. German herds in the study sat at 21.7% Excellent, French herds at 30.5%. Every extra liter of colostrum raised the odds of Excellent-instead-of-Poor by about 1.5 times (Fernandez-Novo et al., Front. Vet. Sci. 12:1515196, 2025; funded in part by Boehringer Ingelheim Vetmedica; per the paper’s disclosure, the funder was not involved in data analysis or interpretation). Same continent, same standard — a 26-point spread between the best and worst countries. The farms that don’t move tend to spread those levers across shifts and staff, with nobody owning the number.
Building the Dashboard: Owner, Target, Consequence
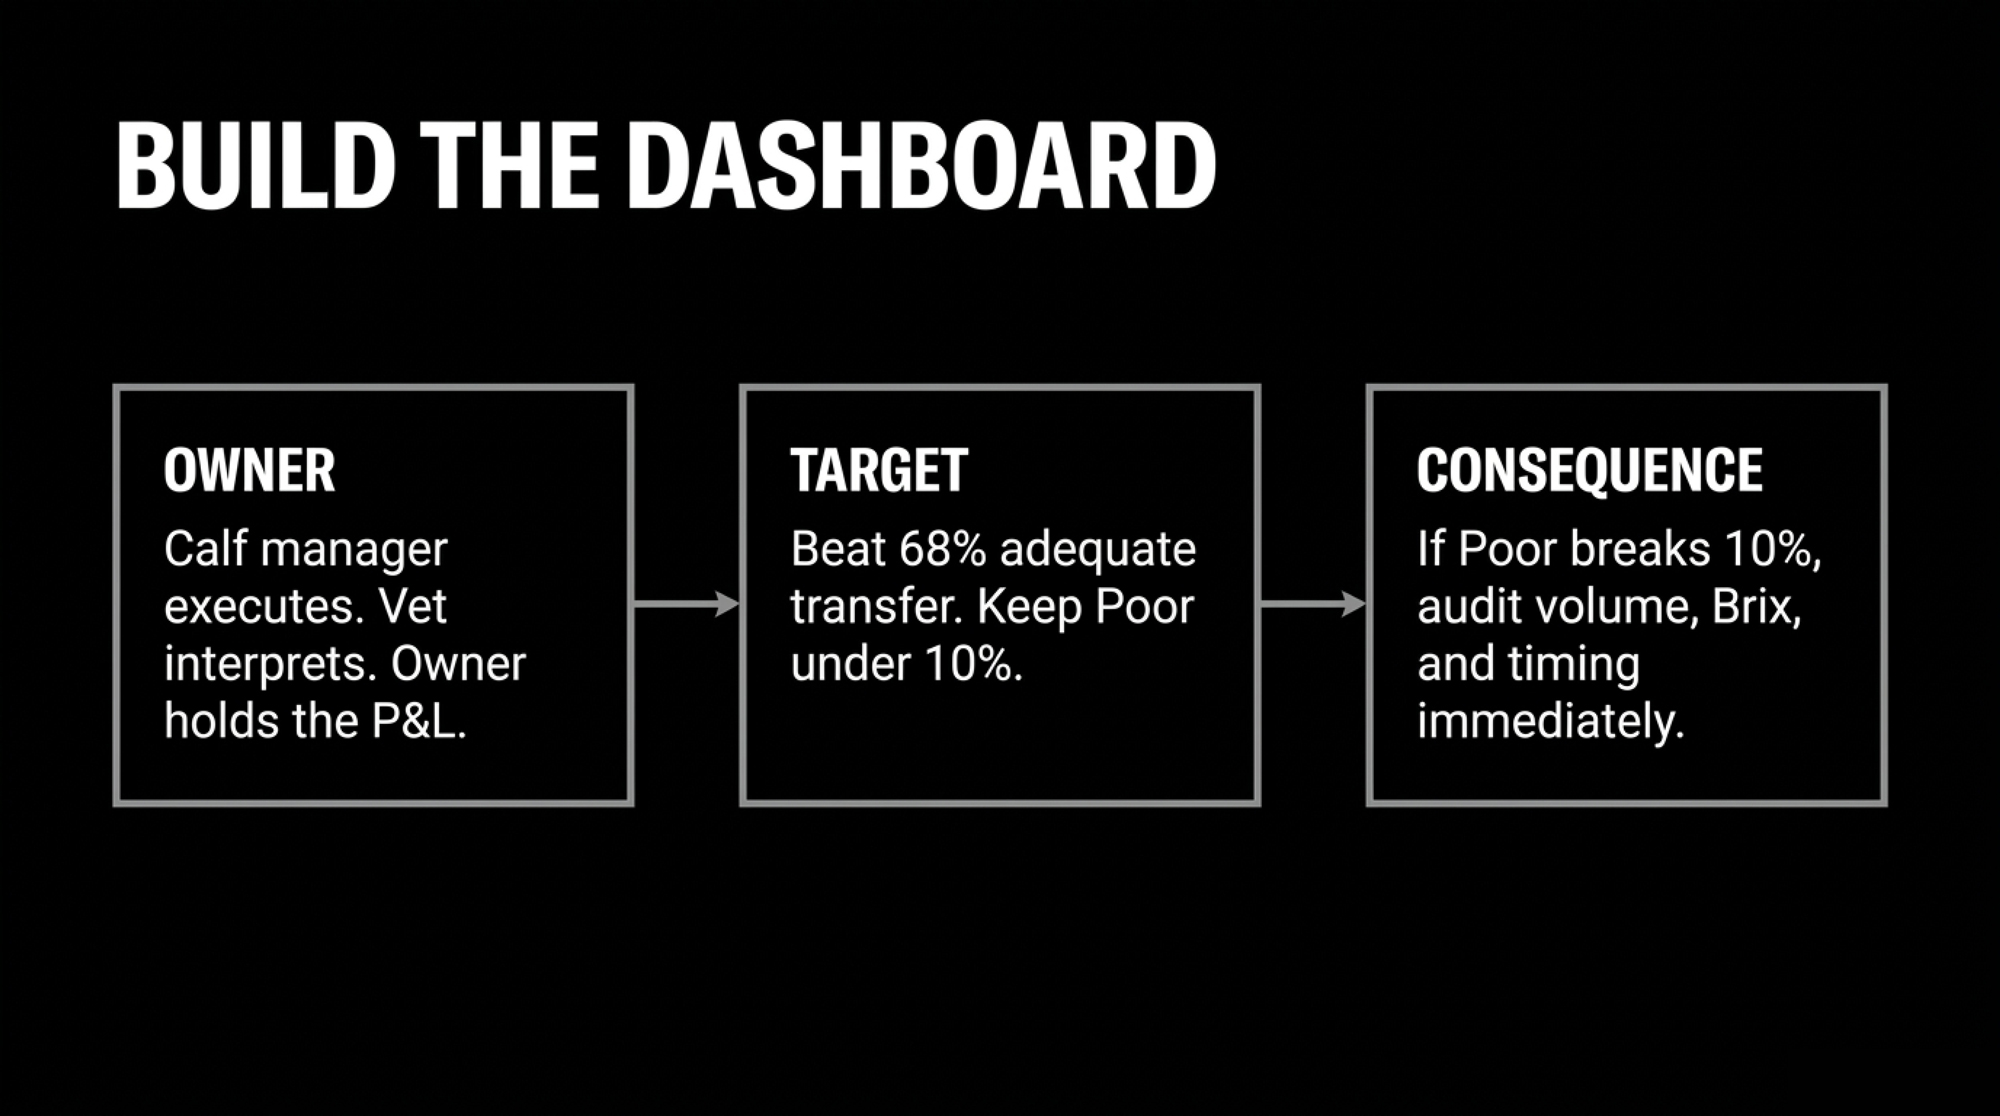
Pregnancy rate works because it has an owner, a target, and a consequence when it slips. Passive transfer distribution has none of that on most farms yet. You’d have to build it — and the science already hands you every piece.
The owner. The calf manager runs the twelve-calf sampling and the levers. The herd vet reads the chart against Lombard’s targets and connects it to health and growth. The owner owns the money side and decides what a drifting number is worth fixing.
The target. Short-term, beat Morin’s median of 68% adequate transfer, and keep Poor under 10%, Lombard’s herd standard. Medium-term, push the whole distribution toward more than 40% Excellent, around 30% Good, no more than 20% Fair.
The consequence. When Poor climbs past that 10% line, it isn’t just a health flag. Crannell and Abuelo’s retrospective cohort work found calves in the lower passive-immunity categories carried worse morbidity, mortality, and future performance than their better-transferred herdmates (Crannell & Abuelo, J. Dairy Sci. 106:2729–2738, 2023, single dairy herd). That’s your trigger to audit volume, Brix, and timing on every calf for a month.
None of this is new science. It’s a reshuffle — taking numbers that already exist and moving them into the room where the P&L conversation happens, instead of leaving them in the sick pen.
Options and Trade-Offs for Your Operation
Depending on where your herd sits, a few honest paths:
Option 1: Run the 12-Calf Scorecard This Month
- Best for: Any herd that has only ever tested sick calves.
- Requirement: One vet visit and about an hour of labor to pull serum from twelve clinically normal heifers at 24–48 hours, then classify each against the Lombard tiers.
- Risk: None — the only exposure is discovering where the distribution actually sits.
Option 2: Lock Down the Shift-to-Shift Protocols
- Best for: Herds where calf results swing depending on who worked the night shift.
- Requirement: Enforcing 2.5–3 L within two to three hours, at 24.5% Brix or better (Morin et al., 2021). No capital — protocol discipline and staff buy-in.
- Risk: Protocol fatigue if nobody is assigned direct ownership of the data; the chart won’t move and you’ll blame the wrong thing.
Option 3: Integrate Passive Transfer as a Boardroom KPI
- Best for: Herds already reviewing monthly management dashboards alongside pregnancy rate.
- Requirement: Percent Excellent-plus-Good and percent Poor on the dashboard, with a re-test schedule and a standing trigger to audit protocols whenever Poor exceeds 10%.
- Risk: Treating the chart as an interesting report rather than an operational trigger.
What This Means for Your Operation
- Have you ever tested passive transfer on healthy calves — or only the ones already in trouble?
- What share of your last twelve heifers would land in Fair or Poor if you plotted them today?
- Is your Poor category under 10%, and is your combined Excellent-plus-Good above Morin’s 68% median — the line between a working program and a coasting one?
- Who on your farm actually owns the passive transfer number the way someone owns pregnancy rate?
- Are your calves reliably getting 2.5–3 L of high-Brix colostrum inside the first two hours — on the night shift, not just the day shift?
- When was the last time a colostrum decision showed up in a budget conversation instead of a health one?
Key Takeaways
- If you’ve never sampled healthy calves, run the 12-calf scorecard this month — it’s the only way to see your real distribution instead of your assumed one.
- If your Poor tier is over 10% or Excellent-plus-Good is under about 68%, treat it as a trigger to audit volume, Brix, and timing — not as a number to file.
- If you can only fix one thing, fix first-feeding volume and speed: the European data showed each extra liter lifting the odds of Excellent by about 1.5 times.
- If nobody owns the number, the chart won’t move — assign it to the calf manager, with the vet on interpretation and the owner on the money.
The uncomfortable part isn’t that this is hard. It’s that it’s easy — a couple of levers, a couple of hours, one refractometer — and it still slips through because it’s filed under the wrong heading. So before your next heifer crop hits the ground: if a calf leaves the maternity pen in Fair when she could’ve been Excellent, and it costs you milk two lactations out, whose job was it to catch that — and does that person know it’s their job yet?
Run Your Numbers
Complete references and supporting documentation are available upon request by contacting the editorial team at editor@thebullvine.com.
Learn More
- Colostrum Management: The Foundation for Calf Health and Longevity — Breaks down on-farm storage, warming, and sanitation protocols to eliminate bacterial contamination that directly blocks immunoglobulin absorption during that critical first feeding.
- The High Cost of Raising Dairy Replacements — Exposes true per-heifer rearing costs and shows how early metabolic programming shortens the path to profitability by capturing more margin across the entire first lactation.
- Calf Rearing: Is Precision Nutrition the Key to Future Herd Performance? — Delivers an automated feeding blueprint that pairs real-time individual intake tracking with accelerated milk programs to lock in preweaning average daily gains.
 The Sunday Read Dairy Professionals Don’t Skip.
 The Sunday Read Dairy Professionals Don’t Skip.
Every week, thousands of producers, breeders, and industry insiders open Bullvine Weekly for genetics insights, market shifts, and profit strategies they won’t find anywhere else. One email. Five minutes. Smarter decisions all week.





