










Diesel set a record twice in two weeks. The only federal file measuring what you pay to haul milk was built on $3.44 diesel in May 2025 — and nothing newer exists.
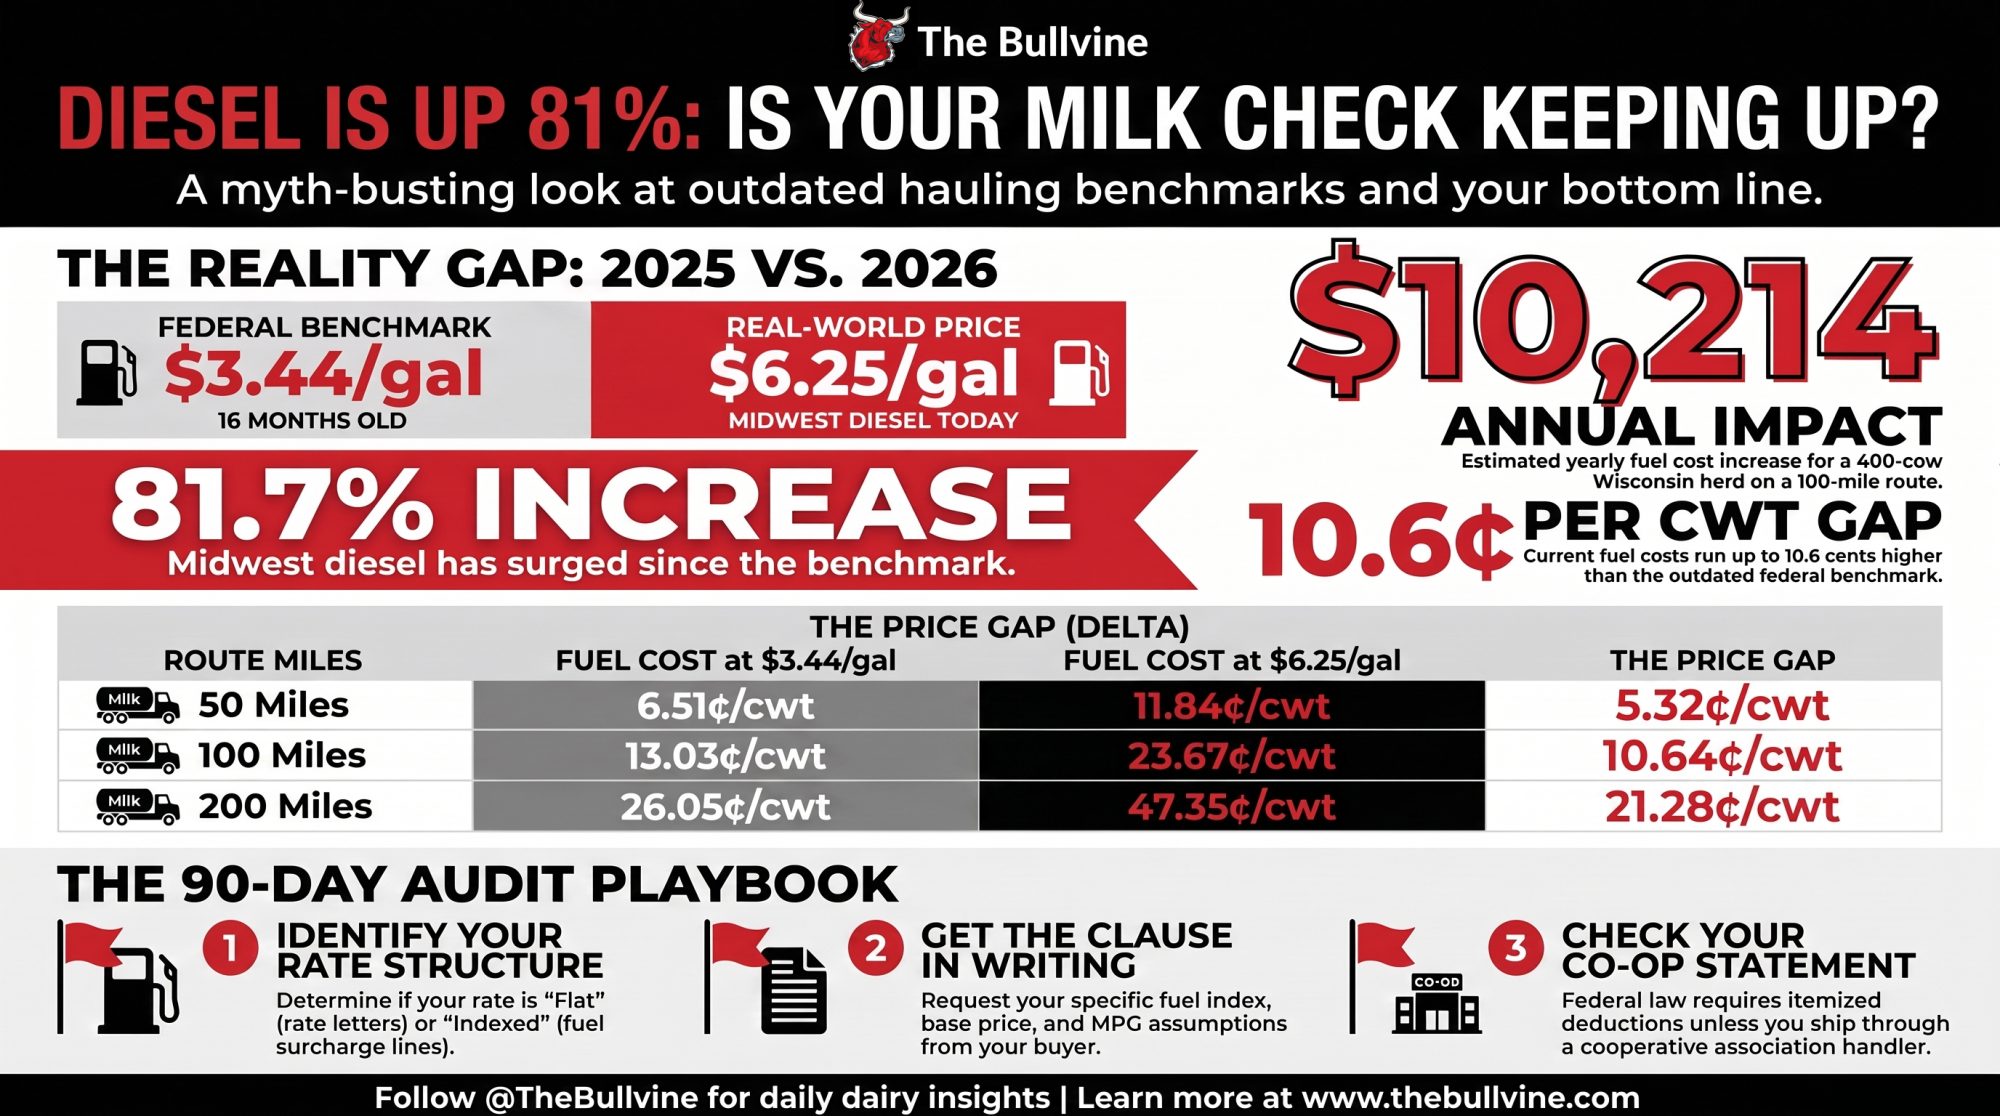
Executive Summary: Bullvine joined Federal Order 30’s May 2025 hauling file to this week’s EIA print: on a 100-mile route, fuel now runs 9.0 to 10.6 cents per hundredweight higher than the benchmark that file was built on — $8,650 to $10,214 a year on a 400-cow Wisconsin herd. Whether any of it reaches the milk check turns on whether the hauling charge is flat or indexed. Most Upper Midwest handlers use a flat value, which means the increase arrives as a rate letter, not a surcharge line. The federal data says handlers absorbed most of the last fuel spike. That record stops at May 2025.
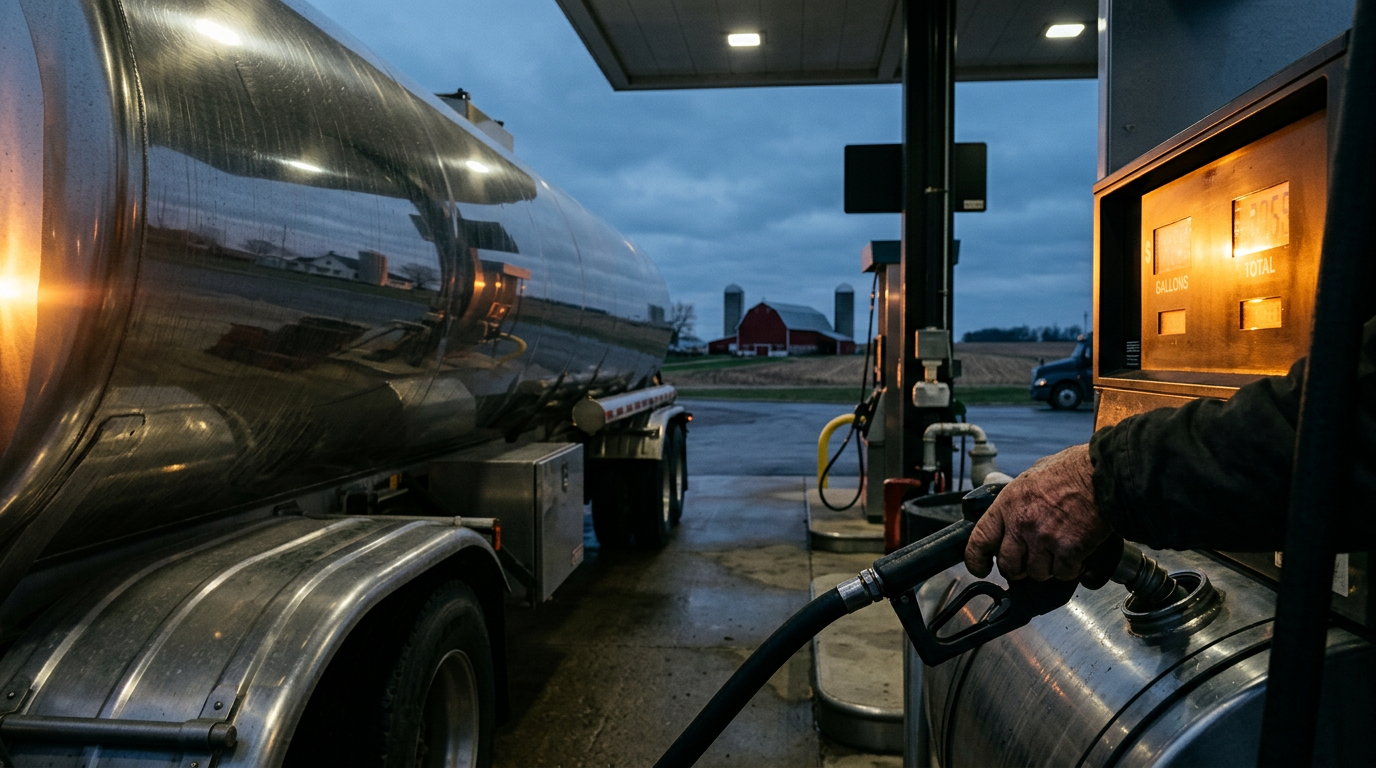
National on-highway diesel crossed $6 a gallon for the first time in the week ending September 14, 2026, printing $6.285, with Midwest at $6.250. The U.S. Energy Information Administration’s previous weekly record was $5.810, set in June 2022; the series broke it a week earlier at $5.967, then cleared $6 seven days later. A year ago the same series read about $3.71. Reuters, Forbes and TIME all attribute the run to supply disruption from the U.S.–Iran conflict and Ukrainian strikes on Russian refineries.
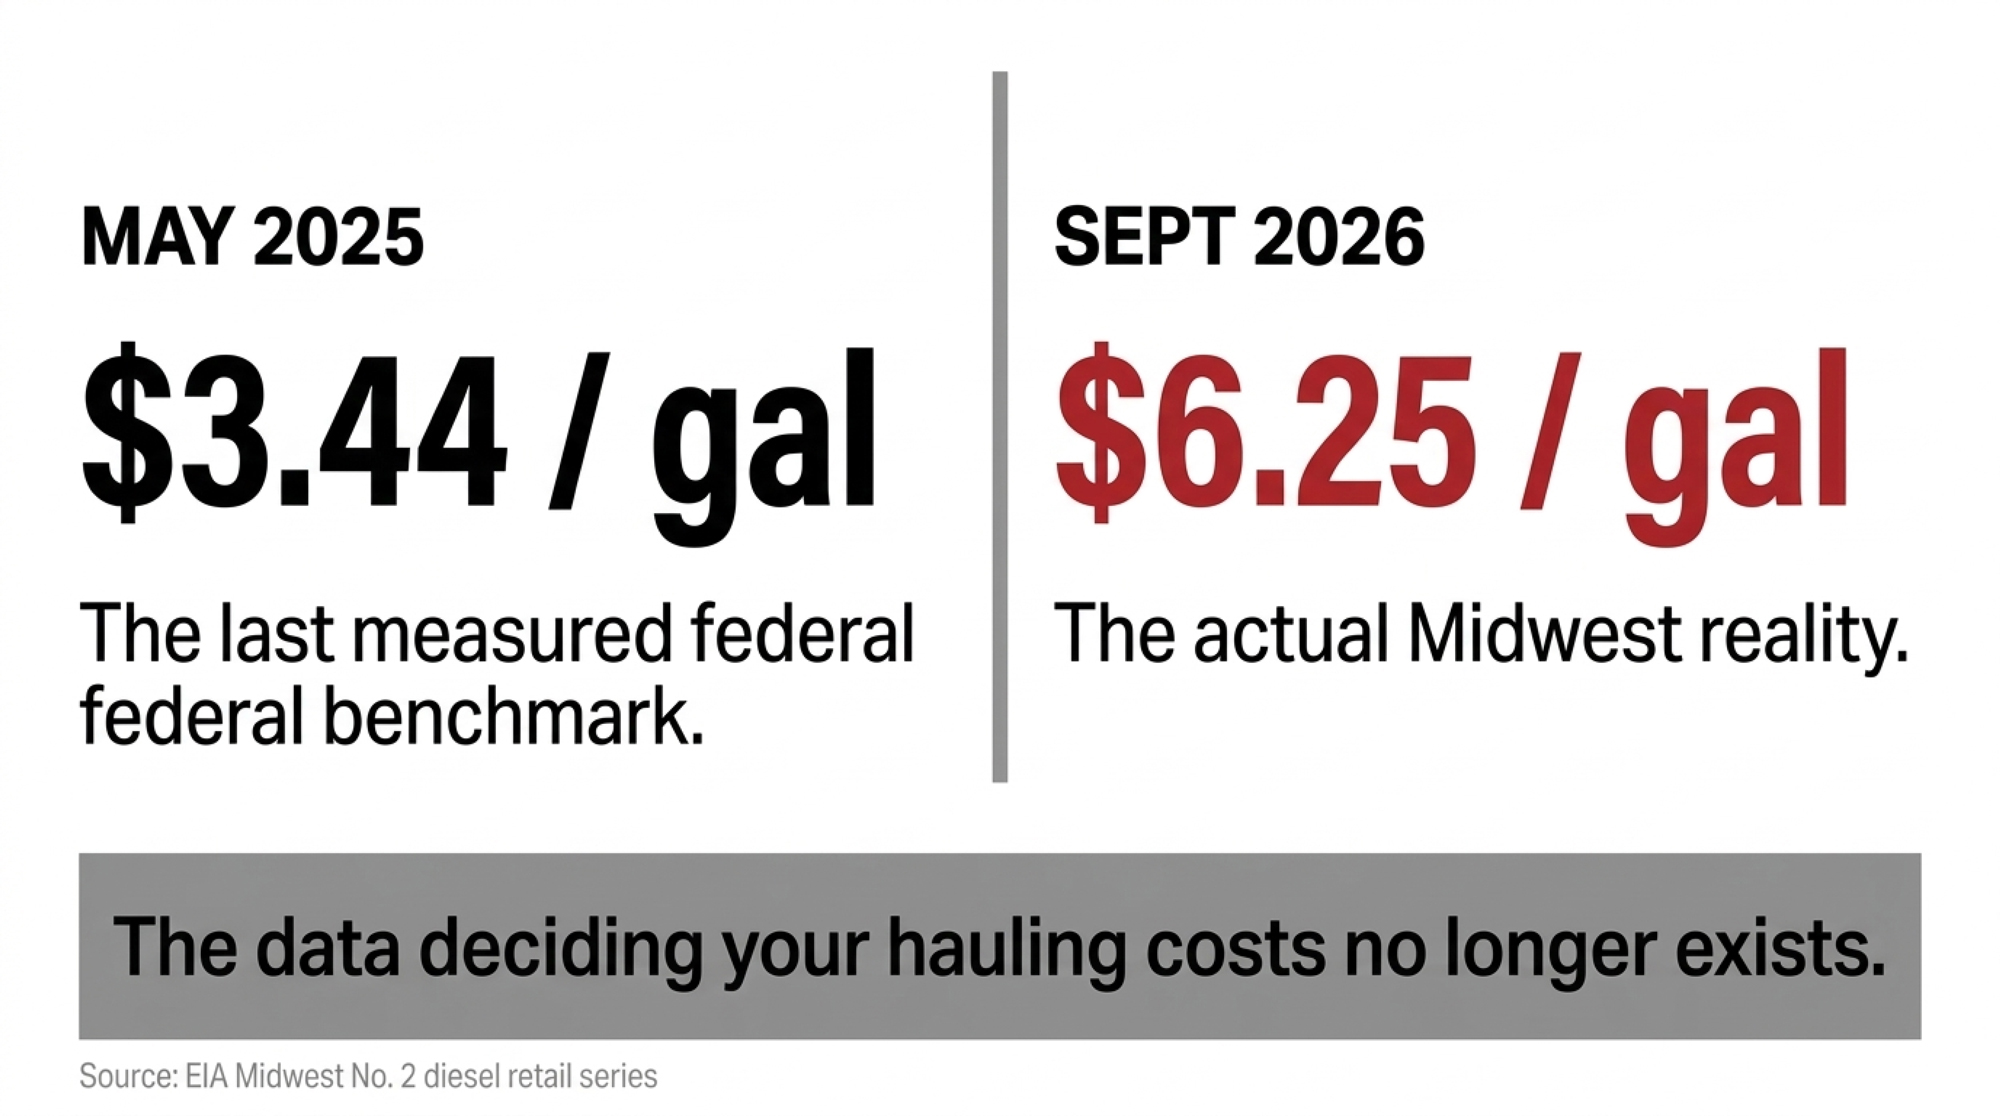
The last time a federal file measured what producers actually pay to move milk, diesel was $3.439. That was May 2025, 16 months ago, and no newer number exists.
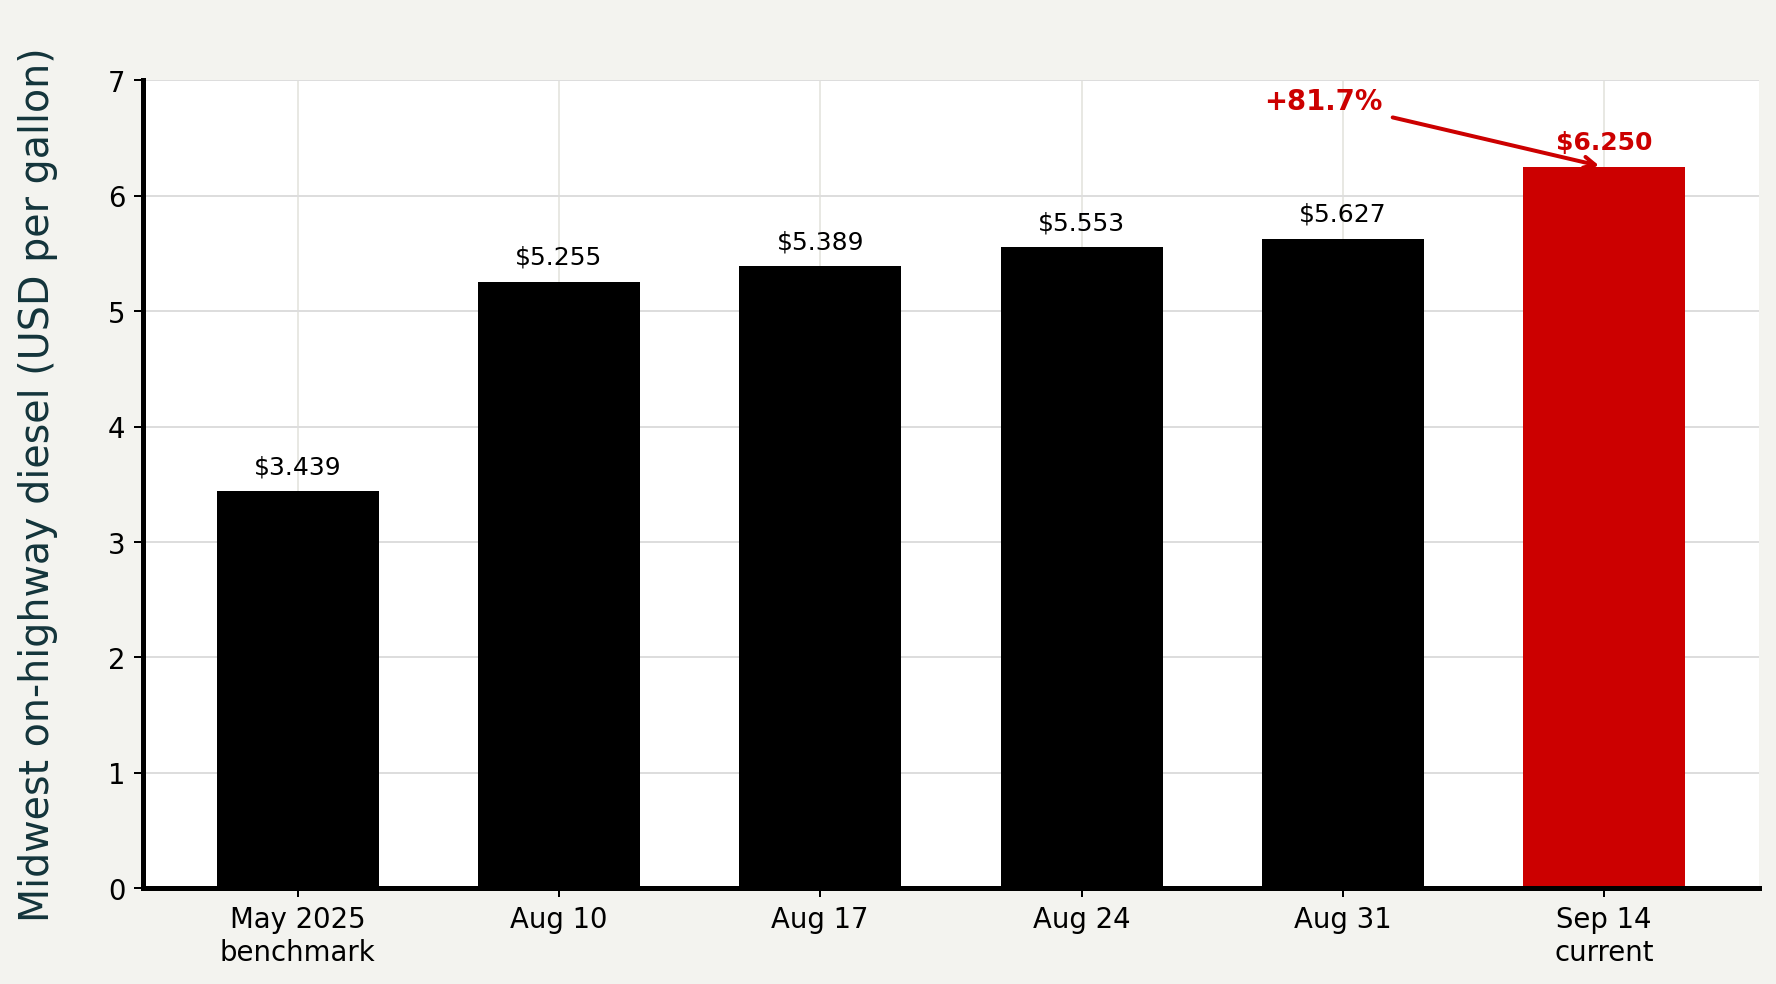
The Upper Midwest Federal Milk Marketing Order 30 Market Administrator measured May 2025 hauling charges against that $3.439 Midwest benchmark. Midwest diesel is up $2.811 a gallon since then, or 81.7%.
On a 100-mile route, the fuel inside one load now costs 9.0 to 10.6 cents per hundredweight more than at that benchmark, depending on whether the clause assumes 6.5 or 5.5 miles per gallon. No source we could locate joins those two figures. The contract, not the pump, decides who absorbs the difference — and the same federal paper recorded what happened the last time fuel moved like this.
9.0 to 10.6¢ per cwt. $8,650 to $10,214 a year on 400 cows.
Bullvine model on stated assumptions — full inputs at the foot of this article.
What the hauling file actually says about pass-through
Staff Paper 25-03, written by Dr. Areerat Kichkha of the Market Administrator’s Minneapolis office, examined payroll data for 7,805 producers and reported a weighted-average hauling charge of $0.5087 per cwt for May 2025, up from $0.5033 for May 2024. Total hauling charges came to $23,591,329.54 on 4,637,343,232 pounds of producer deliveries.
Its Table 4 sets May Midwest diesel against May hauling charges across eleven years, using a longer-run hauling series calculated on the pre-2011 methodology — $0.7902 per cwt for May 2025 against $0.7969 for May 2024. That series is not the $0.5087 figure, and the two should never be added or compared.
What Table 4 shows is the pass-through record, measured rather than modeled. In May 2022, the fuel price rose 68.35% year over year while the average hauling charge rose 21.43%. In May 2024, fuel fell 2.79% while hauling charges rose 29.85%. The paper’s conclusion is blunt: “Given the handlers’ tendency to subsidize hauling charges, this smaller volatility indicates a strong tendency to resist passing through the increased hauling costs,” and its summary states that the order’s weighted average hauling charges “show handlers passed on little of the recent changes in fuel costs to farmers.”
That finding runs through May 2025 and stops there. It does not predict what happens to your September 2026 statement, and the paper makes no such claim.
How much does milk hauling cost per hundredweight in 2026?
Cross a state line and the same decision costs differently. Staff Paper 25-03’s Table 3 puts Wisconsin’s weighted average at $0.4711 per cwt, Illinois at $0.8038, Iowa at $0.7036, North Dakota at $0.7027, Michigan’s Upper Peninsula at $0.6951, South Dakota at $0.5543, and Minnesota at $0.4585. Every figure here is Upper Midwest — producers under other federal orders, provincial boards, or quota systems face the same clause questions on different numbers.
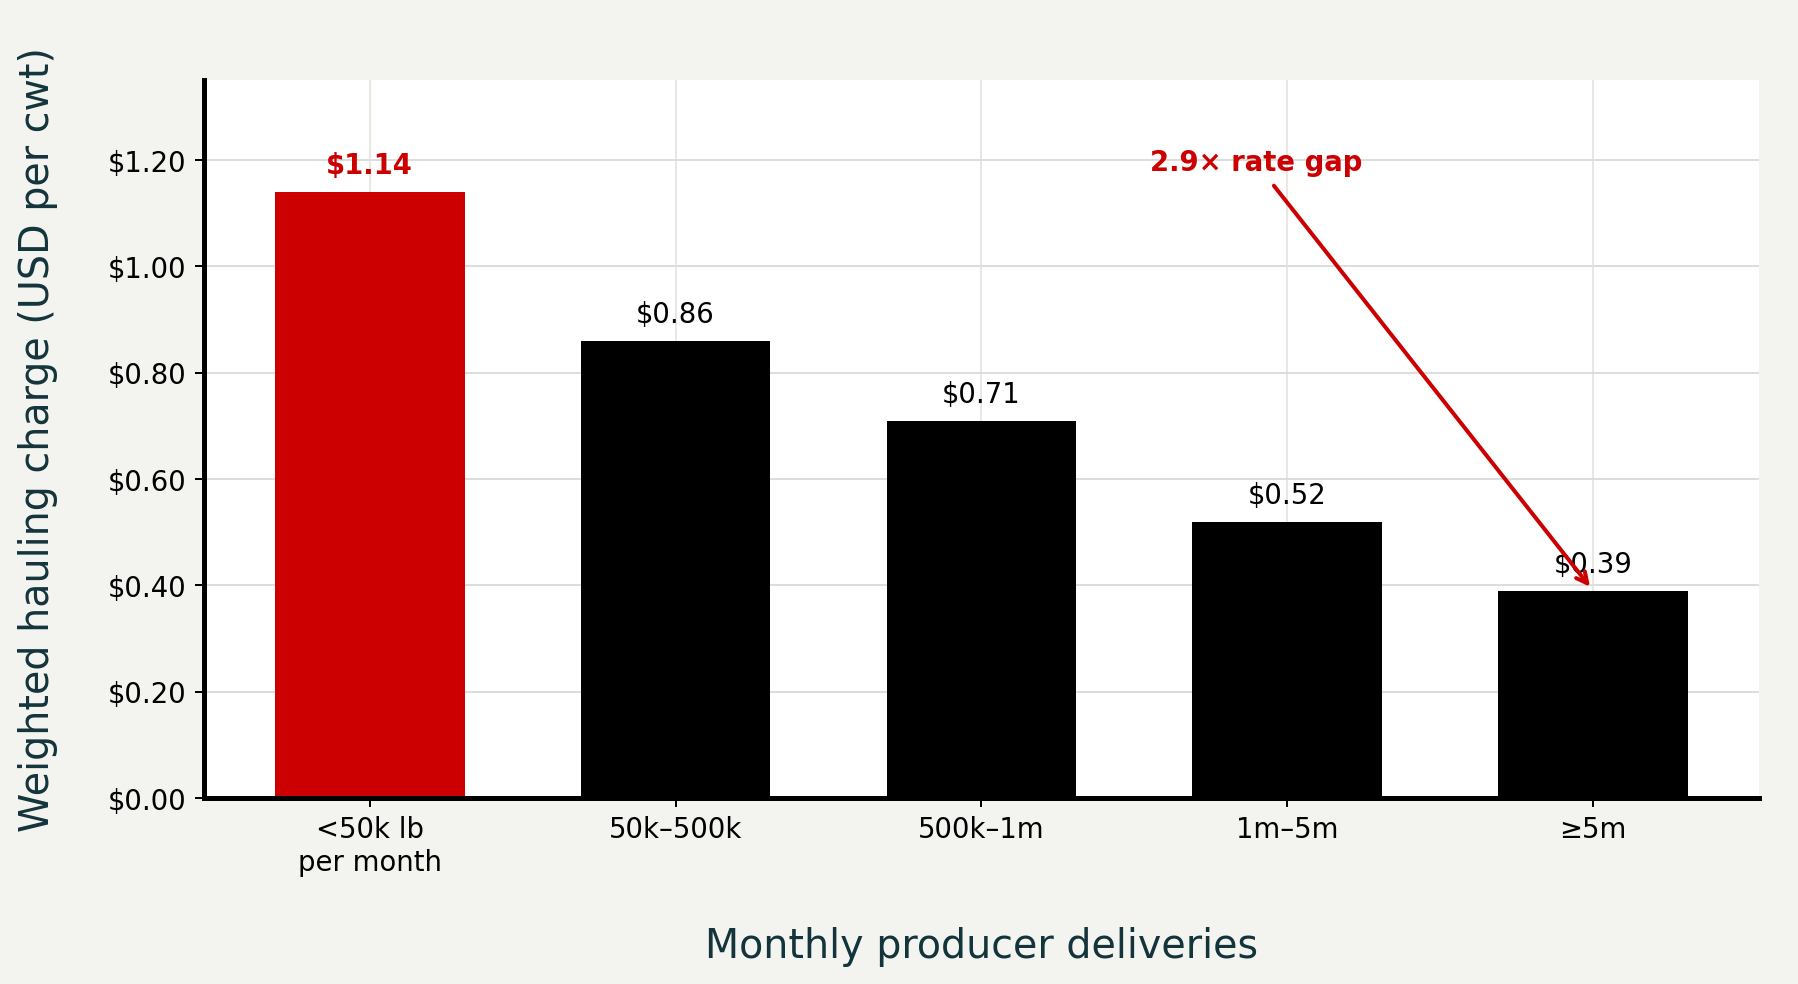
Herd size moves it harder. The smallest bracket, shipping under 50,000 pounds a month, paid about $1.14 per cwt weighted; the largest, at 5 million pounds or more, paid 39 cents. Inside Wisconsin, the same spread runs $1.04 down to 33 cents. Scale does the rest: 9% of farms produced 63.3% of the milk and paid 54% of total hauling charges.
At the county level, the appendix runs from about 44 cents a hundredweight in Clark County, Wisconsin, to $1.29 in Juneau — the spread Bullvine mapped against thinning farm density earlier this month.
On the truck’s side of the ledger, the American Transportation Research Institute put the 2025 average operating cost at $2.336 per mile, fuel at roughly $0.482 and non-fuel costs at a record $1.854, up 4.2%, with tank carriers averaging 4.0% operating margins. ATRI surveyed general freight carriers, not milk assembly fleets.
One more line in the file matters before you compare your own deduction to any of it. Strip out the 410 farms reporting no hauling deduction — 915,980,511 pounds — and the order-wide figure rises from 50.9 cents to 63.4 cents, with Wisconsin at 60.1 cents. The paper is careful about why those zeros exist: waiving the charge as a procurement tool, hauling self-funded outside the handler, or a third-party hauler not captured in payroll records. It says substantial anecdotal evidence indicates the latter two account for nearly all of them.
What the diesel move costs per hundredweight
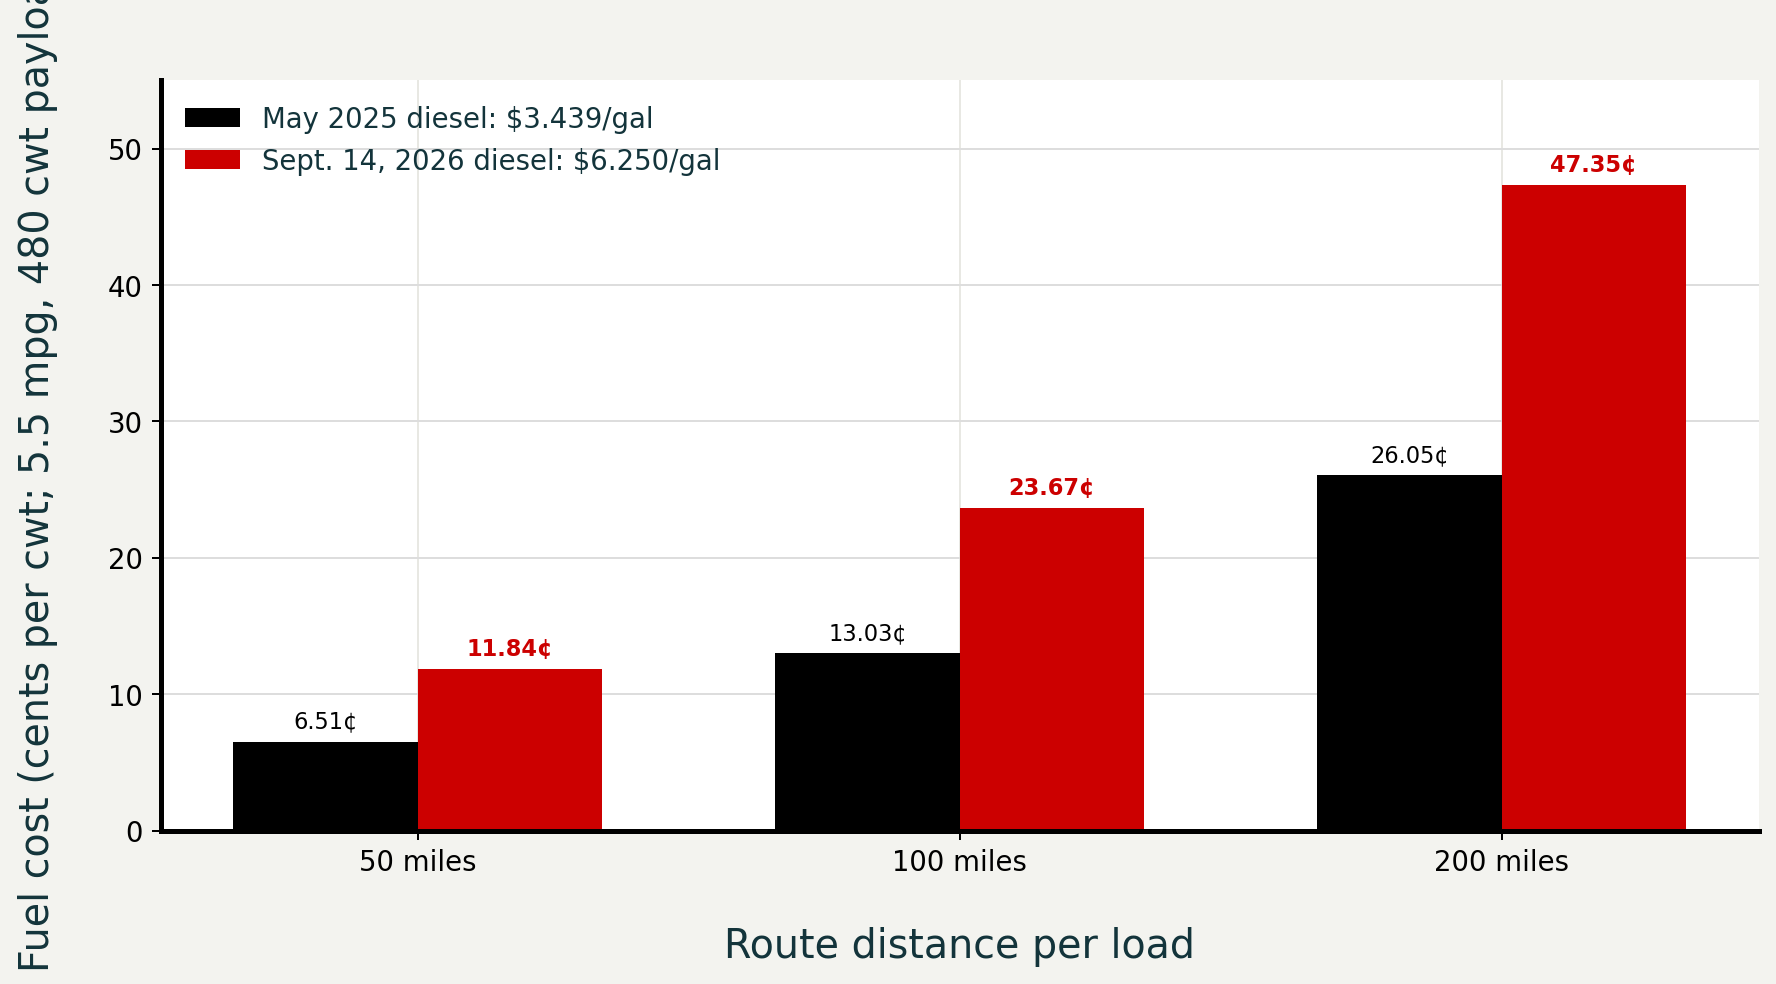
Running the Numbers — Bullvine calculation. Fuel cost inside a milk route: (diesel price ÷ mpg) × route miles ÷ payload cwt. Diesel moves from the $3.439 May 2025 benchmark in Staff Paper 25-03 Table 4 to EIA’s $6.250 Midwest print for the week ending September 14, 2026.
Route length, at 5.5 mpg and 480 cwt
| Route distance per load | Fuel cost at $3.439 diesel | Fuel cost at $6.250 diesel | Fuel-only increase |
| 50 miles | 6.51¢/cwt | 11.84¢/cwt | 5.32¢/cwt |
| 100 miles | 13.03¢/cwt | 23.67¢/cwt | 10.64¢/cwt |
| 200 miles | 26.05¢/cwt | 47.35¢/cwt | 21.28¢/cwt |
| 100 miles at 6.5 mpg | 11.03¢/cwt | 20.04¢/cwt | 9.01¢/cwt |
| 100 miles, 300-cwt payload | 20.85¢/cwt | 37.88¢/cwt | 17.04¢/cwt |
Sensitivity, per hundredweight
| Variable | Scenario | Per cwt |
| Fuel economy, 100 mi | 6.5 mpg vs 5.5 mpg | 9.01¢ vs 10.64¢ |
| Payload, 100 mi at 5.5 mpg | 480 cwt vs 300 cwt | 10.64¢ vs 17.04¢ |
| One-week index lag | Off the Sept 7 print of $5.946 | 1.15¢ |
| Monthly index lag | Off the Aug 10–31 average of $5.456 | 3.01¢ |
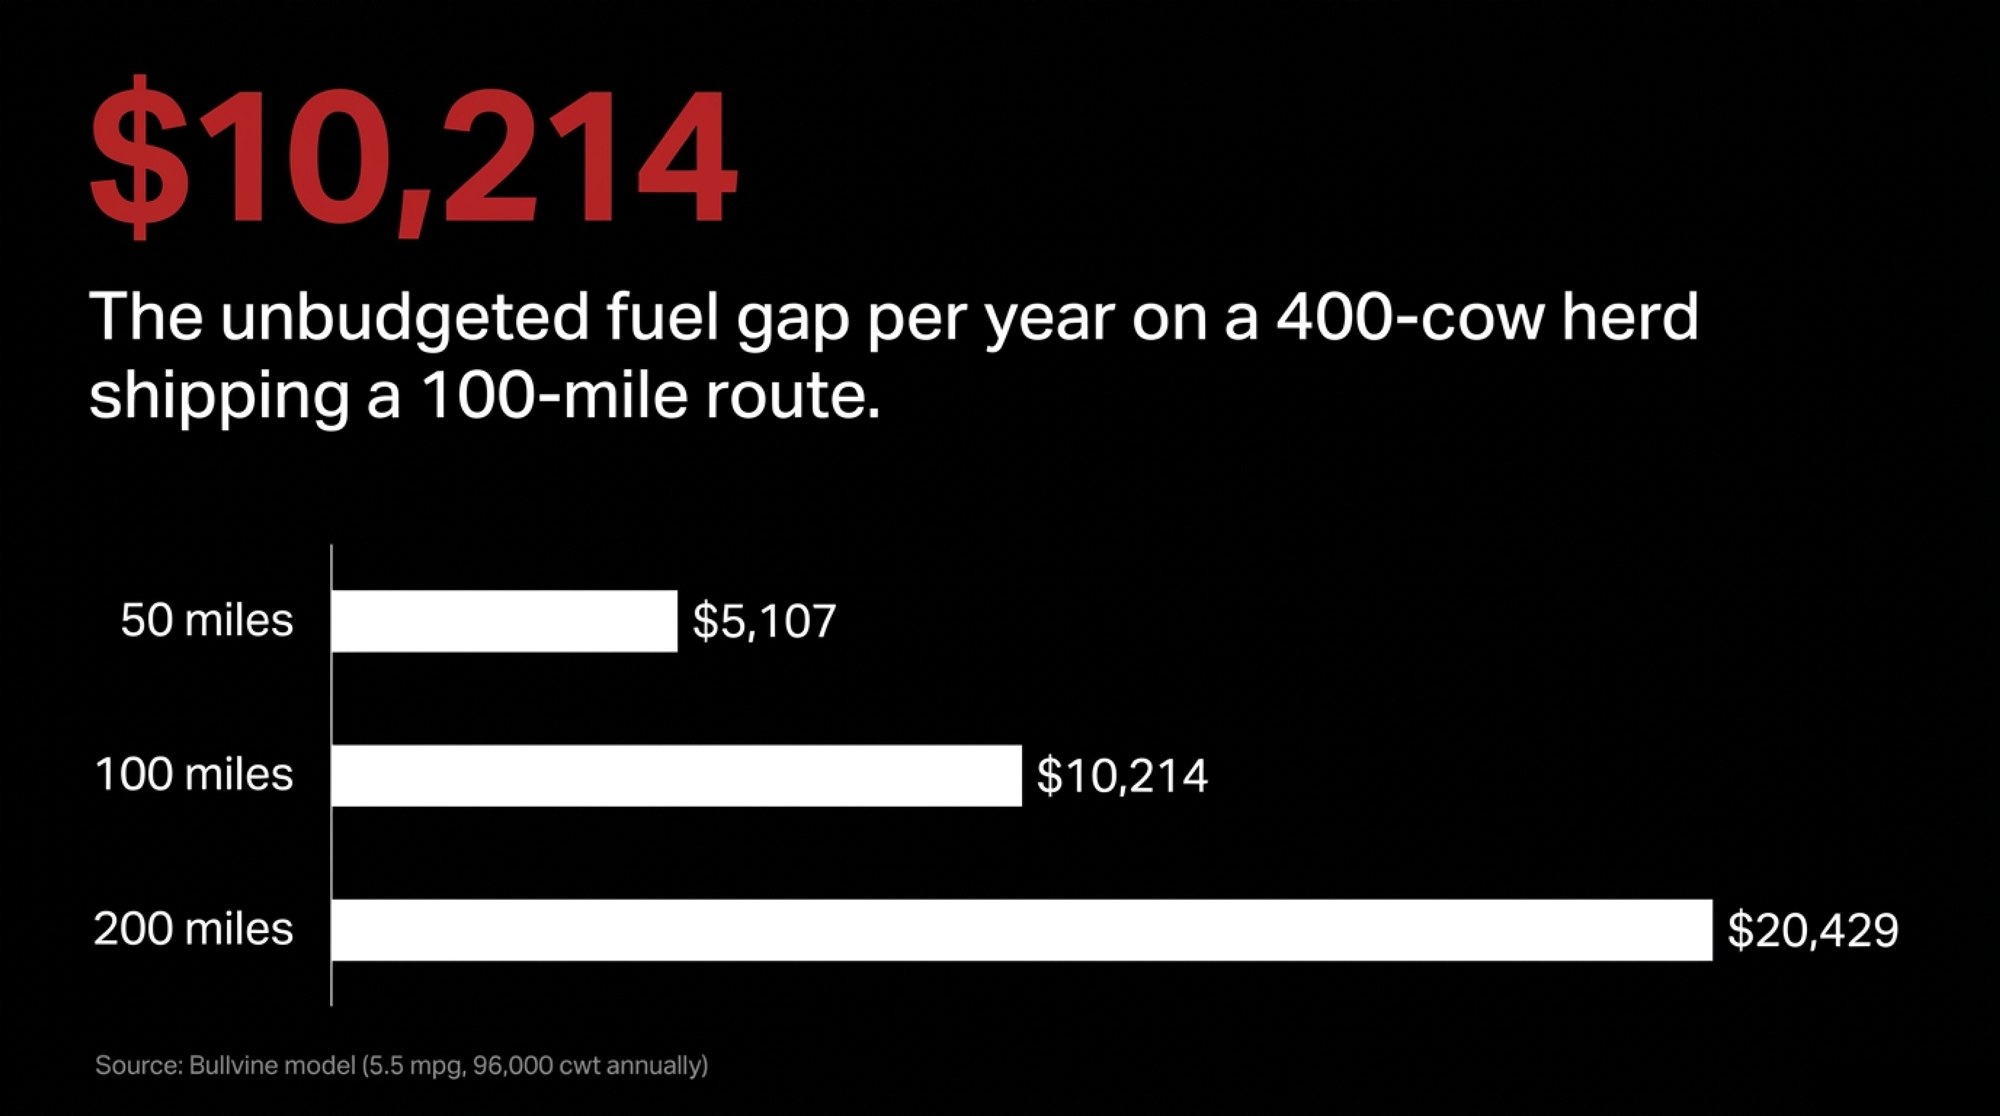
What that is in herd dollars. On a 400-cow Wisconsin herd shipping 96,000 cwt a year over a 100-mile route, the fuel delta runs $8,650 to $10,214 a year, or $25.54 per cow. Shorten the route to 50 miles, and it’s $5,107; stretch it to 200, and it’s $20,429. Per load, the incremental fuel on 100 miles at 5.5 mpg is $51.11. On a monthly-reset clause, roughly $433 a month per route goes unfunded at the current spread.
Every figure in this section is a Bullvine model on the stated assumptions, not a measured cost. Full inputs, exclusions, and the monthly-versus-weekly basis note are at the foot of this article.
Who eats the increase, your hauler, your co-op, or you?
Start with the structure the paper documents: “the vast majority of handlers on this market charge producers a flat hauling value, regardless of the size or volume of milk being marketed.” A flat charge has no fuel term in it. Diesel can run to $6.250, and that producer’s deduction does not move until somebody reopens the rate.
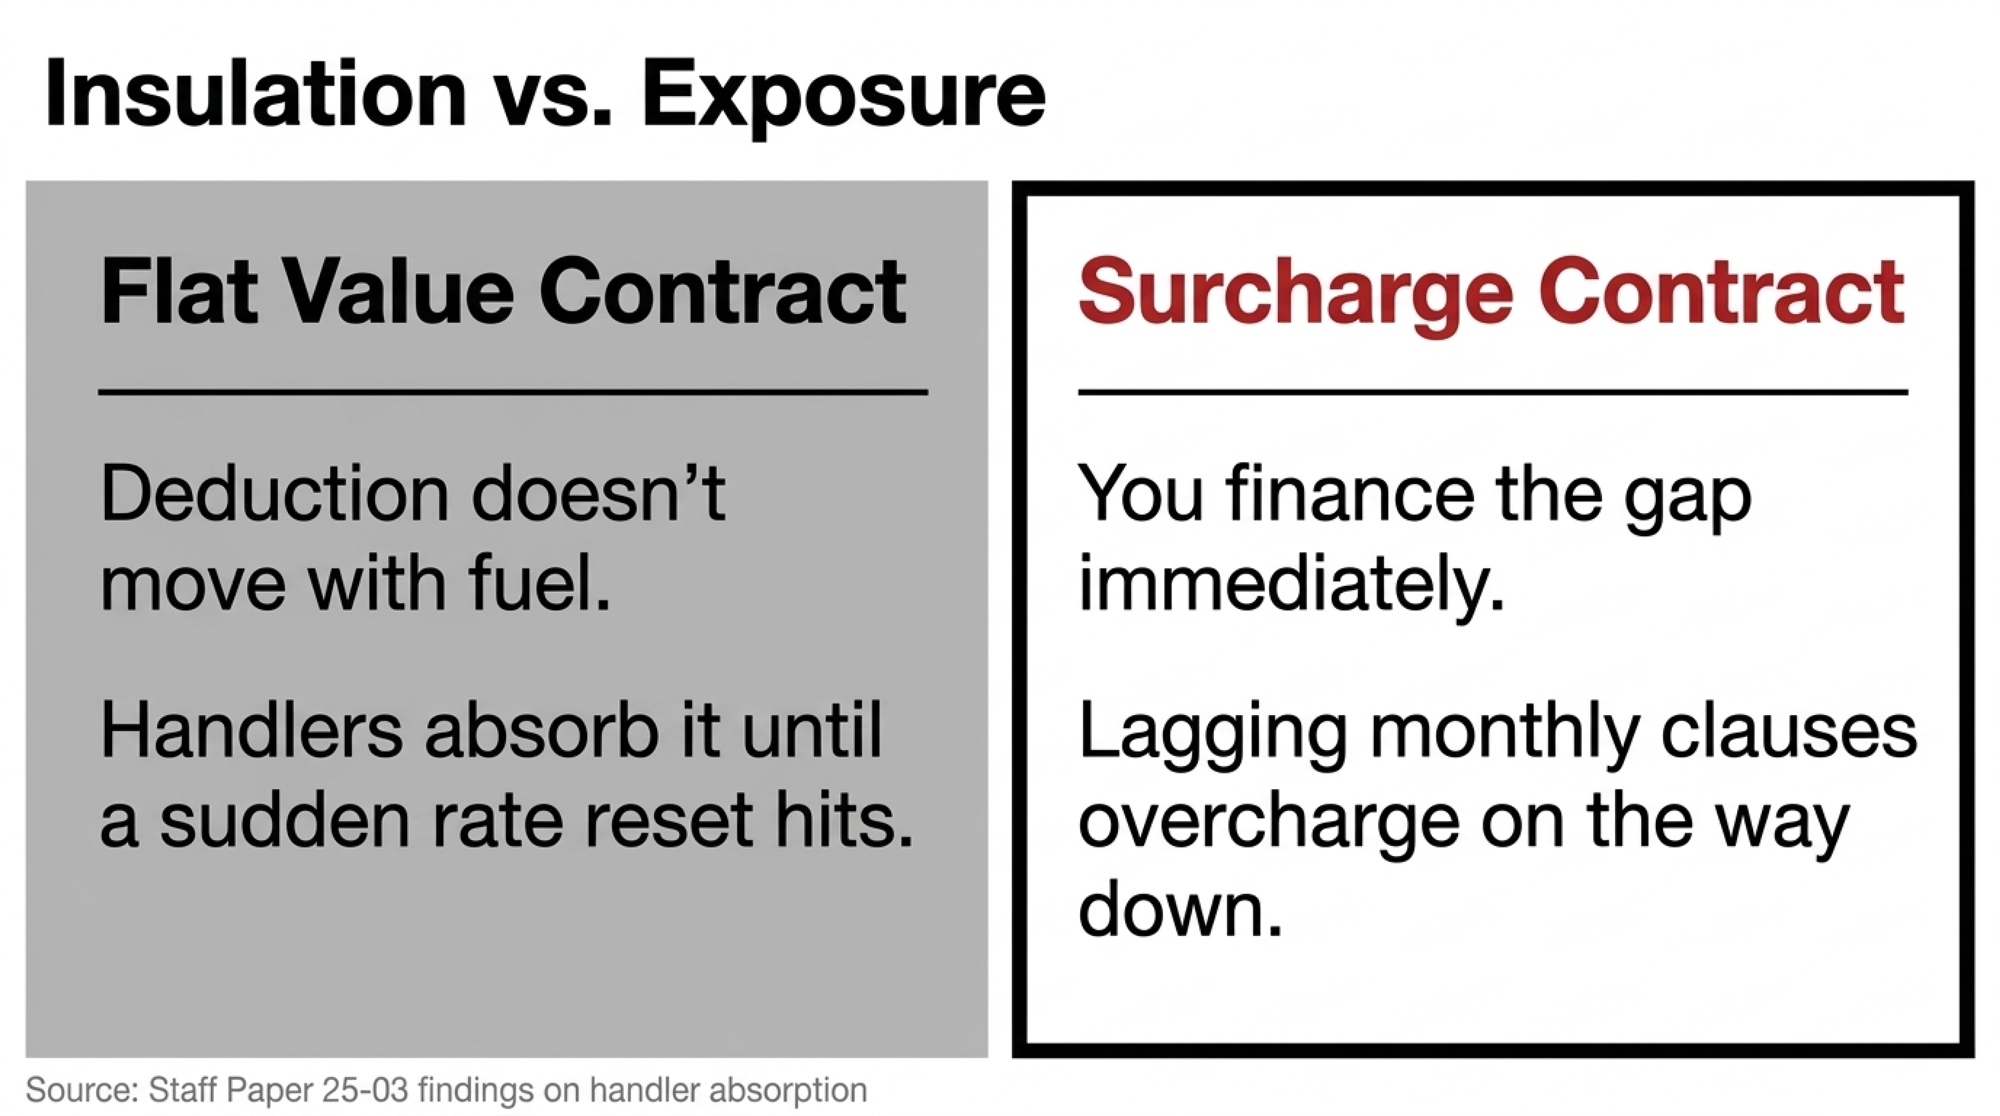
A flat rate through an 81.7% diesel move is not insulation. Table 4 shows the adjustment arriving unevenly. Fuel rose 68.35% in 2022, and the hauling average moved 21.43% the same year. Hauling then slipped 0.66% in 2023, before rising 29.85% in 2024 — a year fuel fell 2.79%.
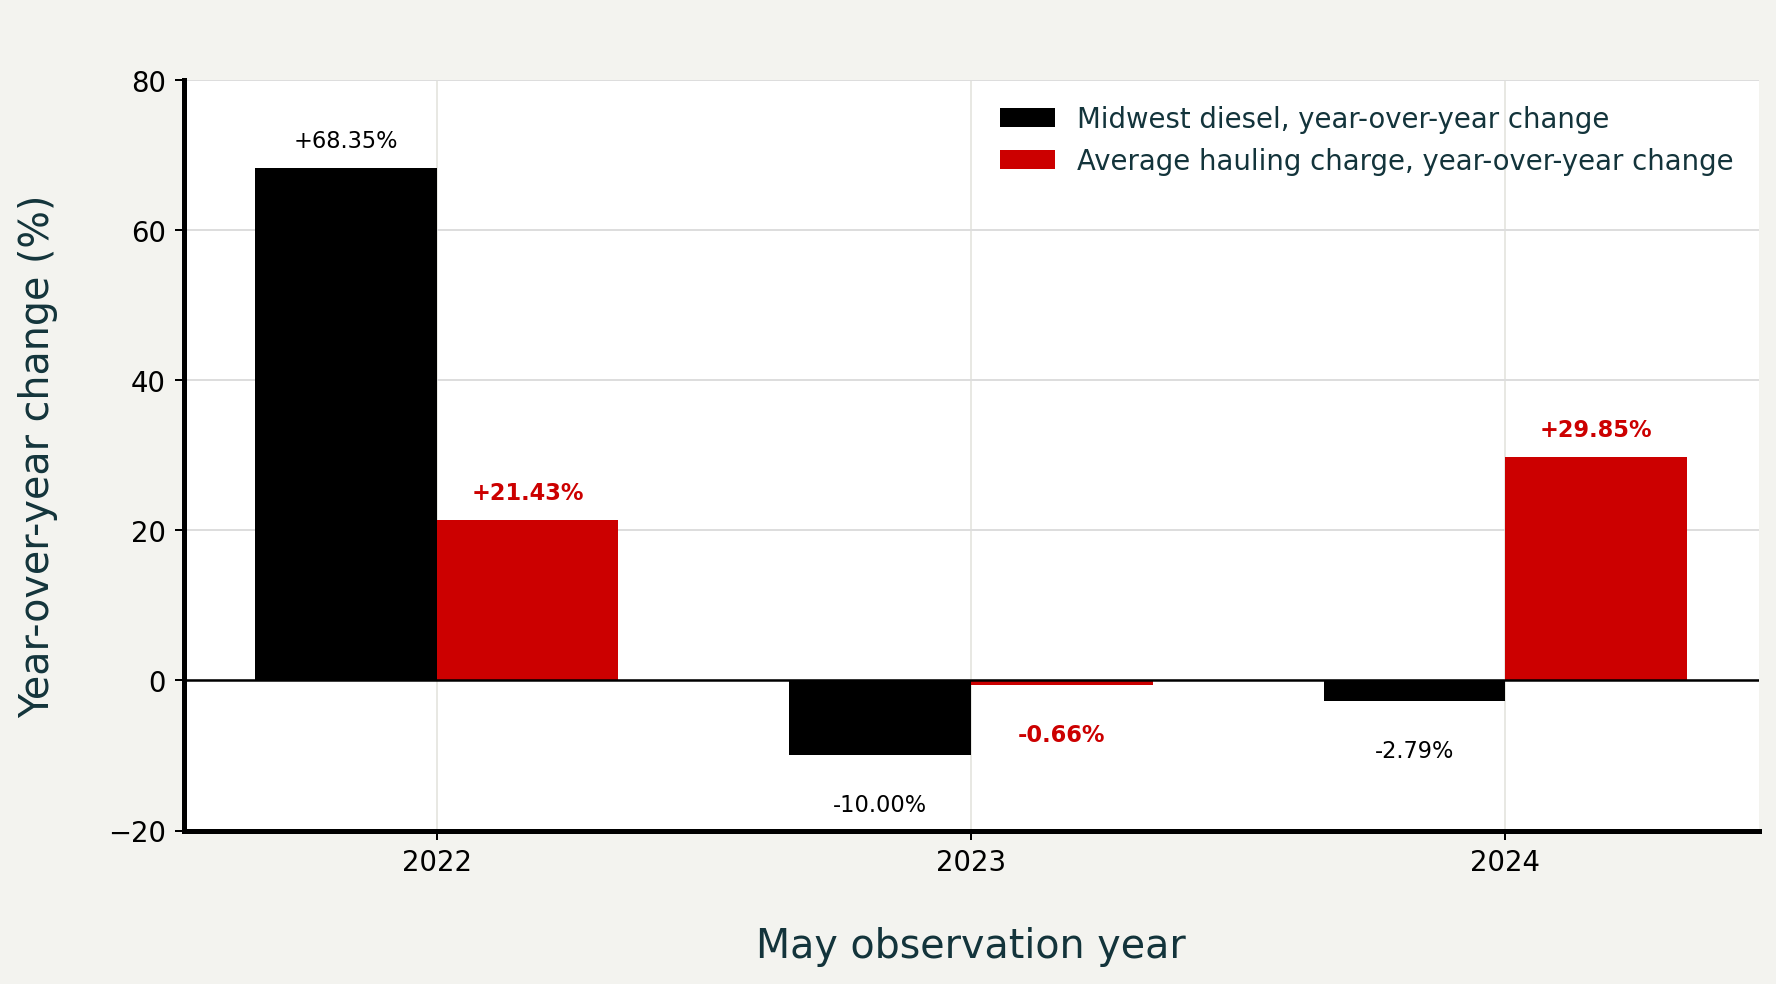
That 2024 line is the one to sit with. The paper does not attribute the rise to any single cost, and non-fuel operating costs have been climbing on their own: ATRI put them at a record $1.854 per mile in 2025, up 4.2%. Fuel is one candidate for what moves a hauling rate. It is not the only one, which is why the clause matters more than the pump price.
When a fuel term exists, the reset schedule determines who finances the gap. AAA Cooper Transportation’s published schedule sets its surcharge off the national weekly diesel average, with the new rate effective the Wednesday after Monday’s index. That is a documented one-week lag in general freight, not milk, and it is the clearest public illustration of the mechanic your clause may or may not share.
Six terms decide the rest, and they sit in the agreement rather than on the statement.
- Benchmark index. National, a regional series, or a local rack price. Gulf Coast diesel ran $5.754 the week of September 7 while the West Coast ran $6.987, a spread of $1.233, or 21.4%.
- Base fuel price. Sets the surcharge’s level. Under a linear formula, it does not change the cost of the next dollar of diesel.
- Contract mpg. 6.5 mpg yields 9.01¢ per cwt on 100 miles against the May 2025 benchmark; 5.5 mpg yields 10.64¢.
- Eligible miles. At $6.250 and 5.5 mpg, 20 uncounted miles burn $22.73 of fuel per load, of which $10.22 is the increase above the $3.439 benchmark — 2.13¢ per cwt at 480 cwt. A nine-cent difference between two regional indexes moves the same route 0.34¢.
- Payload rule. Actual hundredweights, a standard load, or rated capacity. Thin routes get expensive when the formula assumes a full tank.
- Cadence and symmetry. Weekly, monthly, or quarterly reset. A true-up decides who finally pays it, and the downward language decides whether the charge retreats when diesel does.
Tim Neubauer, listed as chair of the Wisconsin Milk Haulers Association and owner of Tim Neubauer Trucking in Sparta, told Wisconsin Public Radio on March 31, 2026, that spring road bans push milk trucks into more trips and “with the high diesel price, that’s costing a lot more money.” The association represents haulers, and that is published commentary rather than a disclosed contract term.
Why your statement can’t answer the question
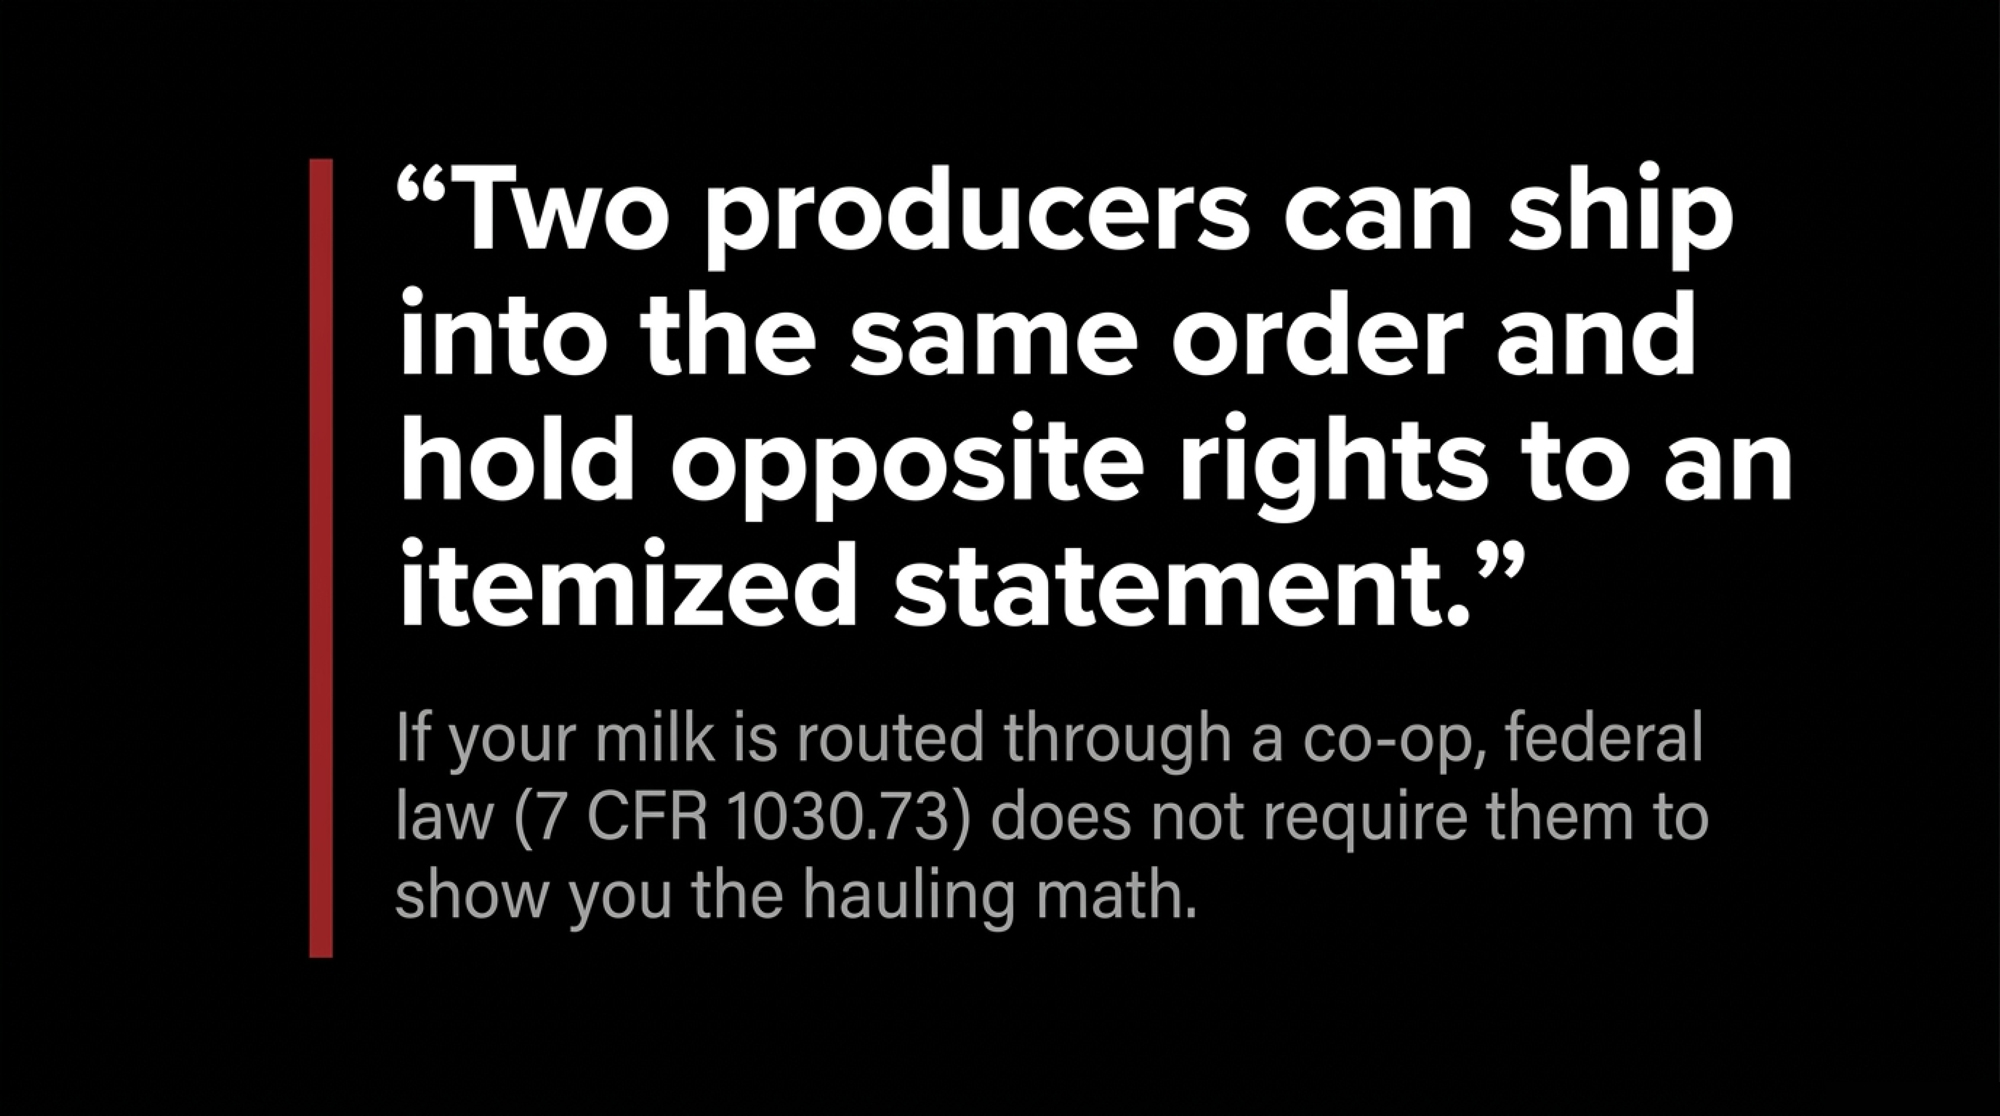
Two producers can ship into the same order and hold opposite rights to an itemized federal statement. That is not a co-op practice. It is written into the order.
Under 7 CFR 1030.73(f)(7), a handler paying you directly must furnish a supporting statement showing “the amount, or rate per hundredweight, or rate per pound of component, and the nature of each deduction claimed by the handler,” alongside pounds, components, somatic cell count, and the rates used. Ship to a regulated plant that pays you, and the itemization is required under the order.
The same subsection then carves out the other route. The obligation runs to each producer “except a producer whose milk was received from a cooperative association handler described in § 1000.9(a) or (c).” If your milk reaches the plant through a cooperative association handler, that federal itemization requirement does not reach you. Many co-ops itemize anyway, but no rule in that subsection compels it.
The federal aggregate has the same problem from the other end. The Market Administrator’s own reporting field accepts a single hauling line that “can include, but is not limited to, stop charges, fuel charges, or a flat fee,” with some handlers using a combination — which is why even the order-wide average cannot be decomposed into fuel, stops, and base rate. What reaches your statement is governed separately by (f)(7), if it reaches you at all. Itemizing an amount is not the same as publishing the index, base price, mpg, eligible-mile definition, and payload rule behind it. Your statement hands you the answer to a calculation you cannot independently run — the co-op exemption Bullvine traced to a single line of federal code in August.
Two reporting notes belong in the open. As of September 17, 2026, no 2026 member notice from a named co-op changing a hauling deduction or fuel-surcharge formula could be located in public sources, and the newest federal hauling paper remains the May 2025 file.
The 90-Day Playbook for herds shipping under a hauling deduction
The thresholds below use the Order 30 figures. The questions transfer to any order, board, or quota system; only the numbers change.
30 days
1. Pull four statements.
- Action: June through September 2026. Record hauling rate per cwt, any separate fuel line, stop charges, and cwt shipped for each month.
- Requires: Four statements, 20 minutes.
- Threshold: A month-over-month move above 3.8¢ per cwt on a 100-mile route exceeds what a $1.00 diesel change explains at 5.5 mpg, and 3.2¢ at 6.5 mpg. Above that, ask for the calculation.
- Backfire: Volume and component swings move per-cwt math too. Divide by shipped cwt every time.
2. Establish flat or indexed — before anything else.
- Action: Ask your buyer which structure your charge uses.
- Requires: One question.
- Threshold: If it is flat, stop watching for a surcharge line. Start watching for a rate-reset letter, because that is how any cost increase will reach you.
- Backfire: An unchanged flat rate is not evidence you are insulated. Staff Paper 25-03 says most Upper Midwest handlers use a flat value, and Table 4 shows those rates moving in steps rather than with the pump.
3. Get the clause in writing.
- Action: Request the fuel clause and current rate schedule from your field rep or hauler.
- Requires: One email.
- Threshold: If nobody can name the index, base price, mpg, eligible miles, and reset date, the charge is not auditable.
- Backfire: Some terms are genuinely confidential. Ask for the formula, not another producer’s rate.
4. Settle the mileage question.
- Action: Ask whether the surcharge pays loaded miles or every mile the truck runs for your pickup.
- Requires: One question, same email.
- Threshold: 20 uncounted miles is $22.73 of fuel per load at current prices.
- Backfire: Excluded empty miles may already sit inside the base rate. Get the whole structure before deciding anyone is short.
5. Red-flag trigger — debt service.
- Action: Divide your hauling deduction by net mailbox pay for each of the last six months.
- Requires: Six milk statements, fifteen minutes.
- Threshold: Order 30’s weighted average is 50.9 cents against a Wisconsin all-milk price north of $21 — roughly 2.4% of gross. If yours is running above 4%, route geometry or load size is the cause, not the diesel price, and the fix is in the schedule rather than the clause.
- Backfire: Rate pressure has limits. ATRI put tank-carrier operating margins at 4.0% in 2025 — general freight rather than milk assembly, but the direction holds. Push a hauler on rate without offering route efficiency or flexible pickup timing and you can lose the slot.
90 days
6. Reconcile one month end to end.
- Action: Match the clause against the month’s shipped cwt, route mileage, and the buyer’s calculation.
- Requires: The clause, the statement, your route miles.
- Threshold: Any variance above one rounding increment goes back in writing before the next statement closes.
- Backfire: You may find your handler absorbed part of it, which is what the federal data says handlers have historically done. That changes how you open the conversation.
7. Price the reset cadence.
- Action: Find the observation period and effective date in the clause.
- Requires: The clause, ten minutes.
- Threshold: A monthly reset on a rising series leaves roughly $433 per route per month unfunded at the current spread.
- Backfire: A lagging clause overcharges on the way down unless it adjusts both directions. Ask for the downward language in the same request.
8. Test route density against the payload assumption.
- Action: Compare your actual average load to the payload the formula assumes.
- Requires: Pickup frequency, tank size, actual average load.
- Threshold: Average loads near 300 cwt against a 480-cwt assumption run 60% higher per cwt.
- Backfire: Fewer, fuller pickups extend standing time and shift quality risk onto you.
365 days
9. Put hauling in the annual contract review.
- Action: Review it beside base price and premiums, not after them.
- Requires: The agreement, notice periods, every rate notice received this year filed by date.
- Threshold: Any notice that changed a rate without a stated formula goes to your accountant before renewal.
- Backfire: Opening the hauling schedule can reopen the base rate. Know your route economics first.
10. Opportunity signal — route density.
- Action: Price a fuller load or a shared route with a neighboring shipper.
- Requires: Volume projections, a willing partner, your co-op’s route consent.
- Threshold: Within Wisconsin, Staff Paper 25-03 records $0.3326 per cwt in the largest size bracket against $1.0433 in the smallest. That gap is the return on density — and plant geography moves it too, as the 24 extra one-way miles after the St. Albans idle showed. Model it before adding cows, because the pickup schedule sets the ceiling, not the parlor.
- Backfire: Consolidation strands you if the partner farm exits.
Federal data says handlers absorbed most of the last fuel spike through May 2025, and Table 4 above shows the catch-up arriving in steps rather than with the pump. Midwest diesel is now $2.811 a gallon above the benchmark that file used, and no newer federal number exists. Pull your September statement and your hauling agreement tonight, and find three things: whether your charge is flat or indexed, what the base price is, and which miles count.
Key Takeaways
- The federal number everyone cites for milk hauling is measuring a diesel market that no longer exists. Staff Paper 25-03 priced May 2025 at $3.439 a gallon; EIA printed $6.285 for the week ending September 14.
- Bullvine’s join of those two figures puts the fuel gap at 9.0 to 10.6 cents per cwt on a 100-mile route, or $8,650 to $10,214 a year on a 400-cow herd — before anyone decides who absorbs it.
- Flat or indexed is the first question, and it changes everything after it. Most Upper Midwest handlers use a flat value, which means the increase arrives as a rate letter rather than a surcharge line.
- Two producers shipping into the same order can hold opposite rights to an itemized statement. Under 7 CFR 1030.73(f)(7), a handler paying you directly must itemize every deduction. Milk routed through a cooperative association handler is carved out.
Milk Hauling Fuel Delta Calculator
Calculate your unhedged fuel exposure: benchmarked against Staff Paper 25-03 ($3.439/gal) vs. Current Diesel ($6.250/gal).
Methodology and what we excluded
Diesel, current: EIA weekly retail on-highway, national and PADD 2, weeks ending August 10 to September 14, 2026, USD per gallon. The August figure used in the lag row is the mean of the four verified weekly prints — August 10, 17, 24, and 31 — at $5.456; the August 3 print is excluded because it was not confirmed against the release, so this is not the full-month average. Records cited are nominal, not inflation-adjusted, and refer to the EIA weekly series — AAA’s daily average and GasBuddy’s index crossed $6 several days earlier on different methodologies.
Diesel, benchmark: the $3.439 May 2025 figure published in Staff Paper 25-03 Table 4, which the paper’s footnote 3 sources to EIA’s monthly Midwest No. 2 diesel retail series, EMD_EPD2D_PTE_R20_DPG. Same agency, same region, different frequencies — $3.439 is a monthly average, $6.250 a single weekly observation — so read the delta as a level comparison rather than a like-for-like series change.
Fuel economy and payload: USDA AMS stated assumptions from the Federal Register of September 13, 2006 — 20 years old, sensitivity-tested above, not a measured 2026 fleet average. Herd scenario: stated assumption, 400 cows, Wisconsin, 96,000 cwt shipped annually.
Fuel only. Driver wages, equipment, insurance, maintenance, tires, wash, sampling, and stop-and-wait time are excluded, so this is not a hauling rate. Deadhead is excluded unless counted in route miles. Published evidence, stated assumptions, and Bullvine math stay visibly separate throughout, and a 400-cow illustration is nobody’s books.
Learn More
- Milk check transparency: the co-op exemption in FMMO — Arms you with a four-step audit protocol to cross-examine non-itemized deductions, exposing the legal loophole under 7 CFR 1030.73(f) that shields cooperative pay formulas from federal disclosure.
- DFA St. Albans closure: who pays the 24-mile freight — Follows the money on regional plant consolidation, demonstrating how just 24 added one-way route miles quietly siphons 1% of gross milk revenue—draining $42,106 annually from a 400-cow dairy.
- Wisconsin milk hauling: 44¢ in Clark, $1.29 in Juneau — Dismantles the myth of uniform hauling rates by mapping how thinning cow density creates an 85¢/cwt county-to-county penalty, proving farm concentration dictates freight exposure long before diesel price resets hit.
The Sunday Read Dairy Professionals Don’t Skip.

Every week, thousands of producers, breeders, and industry insiders open Bullvine Weekly for genetics insights, market shifts, and profit strategies they won’t find anywhere else. One email. Five minutes. Smarter decisions all week.






