



Archive for milk hauling cost

Clark County Has 609 Dairy Herds and Pays 44¢/cwt to Haul Milk. Juneau County Has 36 and Pays $1.29.

Wisconsin fell below 5,000 licensed herds on August 1. Federal payroll data shows what that thinning costs on a 120-cow milk check — and it depends on which county line you farm inside.

Wisconsin milk hauling
Aerial shot of a milk tanker driving along a road between dairy farms, collecting milk in the evening.

Clark County, Wisconsin had 609 licensed dairy herds on August 1, 2026 — more than any county in the state, according to USDA’s National Agricultural Statistics Service working from the Wisconsin DATCP producer license list. The average Clark producer paid 44¢ per hundredweight to move milk.

In Juneau County, 36 herds were left. The average Juneau producer paid $1.2898.

Same state. Same month. Same federal study. On a 120-cow herd shipping 70 pounds a day, that’s roughly $26,000 a year in difference — before anyone makes a single decision about feed, labor, or debt.

Statewide, the count just crossed a line few expected this decade: 4,991 licensed dairy herds on August 1, down from 5,222 twelve months earlier, and the first time on record below 5,000.

The Milk Stayed. The Farms Didn’t.

Run the division and each of Wisconsin’s 4,991 remaining herds now moves about 6.6 million pounds of milk a year. That’s our own arithmetic — cow inventory times yield, divided by herd count — not something NASS or DATCP publishes. They report the three series separately.

The drop underneath it is well documented. Wisconsin had 7,292 licensed herds in January 2020. It has 4,991 now — a 31.6% decline in six and a half years while cow numbers held near 1.29 million and average production climbed to 25,599 pounds per cow.

The cows didn’t leave with the farms. The trucks just have fewer driveways to spread a load across — and that’s where the hauling math starts.

Two Auctions, and What the Record Actually Says

On September 30, 2025, the Downing family of Wonewoc sold their dairy cattle. The Gavin Bros Auctioneers listing says it flatly: they’d “sold their dairy cattle and are quitting farming.” Seven months earlier, Winkel Highland Dairy Farm near Elkhart Lake closed out its equipment in a retirement auction dated April 8, 2025.

That’s the whole public record on both. Farms exit for retirement, succession, health, a good offer, a son or daughter who wants something else — none of which makes it onto an auction bill. We don’t know why either family stopped milking, and neither does anyone else outside those two kitchens.

Geography put them in different positions, though, and that part is documented. Wonewoc sits in Juneau County, where the average producer paid $1.2898/cwt. Elkhart Lake sits in northwestern Sheboygan County — 78 licensed herds, but an average hauling charge of just 48¢, well under the state average. Whether either number had anything to do with either decision, the record doesn’t say.

Not Everyone’s Leaving

Miltrim Farms went the other direction. The Athens operation in Marathon County milks 3,100 cows and crops 5,100 acres solely for the dairy — split between 1,800 cows on 30 Lely A5 robots and the balance through a conventional double-24 herringbone parlor. Eighteen robots went in during 2019; twelve more followed in 2023.

The farm was established in 1988 by Scott Trimner, Tom Mueller and Martin Mueller, and now sits with the third generation — David Trimner and his wife Jessica Pralle-Trimner, who manages the dairy, alongside Andy and Jenny Miller. They bought it from the previous generation in summer 2024.

Co-owner David Trimner put the logic plainly to Xcel Energy in January 2026: “We don’t get to decide what we sell our milk for. It’s kind of based on the general market. And so you have to be very efficient with everything that you do.” That’s a long way from a 150-cow tiestall. It shows where capital’s flowing, not a template you can lift.

Statewide, the financial pressure has sharpened. Wisconsin’s Chapter 12 farm bankruptcy filings went from two in 2023 and two in 2024 to 16 in 2025, per U.S. Courts data reported by Wisconsin Public Radio. Nationally, Chapter 12 filings rose 46% that year with the Midwest leading. Those are 16 specific cases with court files behind them. For operations weighing the decision now, the timing gap between a planned dispersal and a forced one gets decided years ahead of the auction.

What Do Wisconsin Counties Actually Pay to Haul Milk?

There are two ways to average a county, and the difference matters more than you’d think. The simple average treats every farm equally; the study’s own footnote says it “increases the likelihood that it approximates a typical dairy farmer’s average hauling charge.” The weighted average weights by pounds shipped, so a couple of large farms can drag a county’s number way down. If you’re mid-size, the simple average is the one that looks like your milk check.

CountyLicensed herdsSimple avgWeighted avgAnnual, 120 cows
Clark609$0.4401$0.3037$13,493
Marathon324$0.4942$0.3178$15,152
Grant222$0.6180$0.5788$18,948
Sheboygan78$0.4786$0.4081$14,674
Juneau36$1.2898$0.9629$39,545
Bayfield7$1.2412$1.2569$38,055
Wisconsin4,991$0.7038$0.4711$21,579

Herd counts: USDA NASS, Wisconsin Dairy Producer License list, August 1, 2026. Hauling: Federal Milk Market Administrator Staff Paper 25-03, May 2025. Annual figures assume 70 lbs/cow/day — that assumption is ours.

Sheboygan is the honest complication. Only 78 herds, but 48¢ — because it sits close to processing and population, and the study lists distance to plants and handler competition right alongside farm concentration. Density isn’t the only variable. It’s just the one that changes when your neighbors quit.

THE DENSITY EQUATION

The five factors the federal study says set your rate:

  • Producer pounds
  • Distance to plants
  • Distance to population centers
  • Competition among handlers
  • Concentration of dairy farms in the local market

What that looks like on the ground:

HerdsRateCounty
60944¢Clark
7848¢Sheboygan — few herds, but close to processing
36$1.29Juneau

Wisconsin pays the lowest weighted hauling charge on the Upper Midwest order: 47.1¢, against 50.9¢ order-wide, 70.4¢ in Iowa and 80.4¢ in Illinois. The study credits the state’s “high number of farms generally in close proximity to high demand areas.”

That advantage rests on farm count and proximity to processing. One of those fell by 231 in twelve months.

Why Fewer Neighbors Can Raise Your Deduct

Here’s what happens when your neighbor sells. The truck still runs the route. It just fills slower, and the study doesn’t hedge on who carries that: “hauling costs are higher for smaller farms, given the increased number of stops in order to fill out a load.” Most Upper Midwest handlers charge a flat hauling fee regardless of volume. Fewer pounds, same fee, higher cost per hundredweight.

You can see it in Wisconsin’s size brackets. Producers shipping under 50,000 pounds a month paid $1.0433/cwt in May 2025. Producers shipping 5 million pounds or more paid 33.3¢ — right around a third of that. Distance is the other half of the equation, and we’ve watched what happens to a route when a plant closes and the milk suddenly has to travel.

Where the plants get built decides who has leverage, which is why processor investment patterns matter as much as herd counts.

Then there’s fuel, which behaves oddly here. Midwest diesel fell 7.68% between May 2024 and May 2025, while average hauling charges moved just −0.84% over the same stretch. Fuel is one input among several — labor, equipment, and insurance all move too — and the study doesn’t pin that gap on any single cause. Worth asking your co-op about anyway.

Is Your Herd Size Even the Right Benchmark?

Wisconsin’s average herd is around 260 cows. Milking 120 or 200, it’s easy to read that as falling behind.

Don’t. The 2022 Census of Agriculture puts the median Wisconsin dairy farm in the 50-to-99-cow bracket, where the bracket average was 67 cows — against a state average of 203 that same year. The average sat roughly three times higher than the midpoint of the bracket the median farm falls in. A handful of very large operations drag it up: 61.8% of Wisconsin dairy farms milked fewer than 100 cows in 2022, and together they held 12.9% of the state’s milk cows. The 217 farms above 1,000 head — 3.5% of operations — held 36.2%.

So at 120 or 200 cows, you’re not behind the typical Wisconsin dairy farm. You’re well ahead of it. (One caveat: the Census counts farms with milk cow inventory, a slightly different universe than DATCP’s licensed-producer list, so the two counts don’t line up exactly.)

Metric50–99 cow bracket (median farm)State average
Herd size67 cows203 cows
Share of WI dairy farms61.8% (farms <100 cows)—
Share of WI milk cows held12.9%100%
Monthly lbs shipped (70 lbs/cow/day)~143,000 lbs—
Hauling rate bracket$0.604/cwt (100k–249k lb bracket)$0.4711/cwt weighted
Extra annual hauling cost vs. state weighted avg+$2,280/yearbaseline

That loops straight back to the truck. A 67-cow herd at 70 lbs/day ships about 143,000 pounds a month, landing in the 100,000–249,999 bracket at 60.4¢/cwt — roughly 28% above the state weighted average. On 17,200 cwt a year, that’s about $2,280 more than the state-average farm pays for the same service. The median Wisconsin dairy farm is already sitting on the wrong side of the hauling curve.

Three Things to Run Before Your Next Budget Meeting

Action 1 — Audit your milk check against your county. Do this within 30 days.

What to do: Pull Staff Paper 25-03, free at fmma30.com. Find your county in the Wisconsin table. Use the simple-average column. Compare it against the hauling deduct on your last milk check.

What it tells you: Whether you’re paying a typical rate for your area or an outlier rate. If you’re materially above your county’s simple average, that’s a specific question for your field rep backed by federal data — a data point, not a complaint.

The limit: Counties with fewer than three producers are restricted from the data entirely. And where simple and weighted diverge sharply, one large farm is doing the work — Adams County reads $0.9173 simple against $0.0671 weighted.

Action 2 — Find the volume cliff nearest you.

What to do: Calculate your monthly pounds shipped. A 250-cow herd at 70 lbs/day ships roughly 532,000 lbs a month — just under the 600,000 lb line where Wisconsin’s rate drops from 63.2¢ to 53.2¢/cwt.

The math: Add about 32 cows and you cross it. Total annual hauling falls from roughly $40,400 to $38,400 — while shipping more milk.

The limit: Not a reason to expand on its own. But it’s a real line most expansion pro formas leave out entirely, and it can move a marginal project.

Action 3 — Stress-test new debt against your region’s ceiling.

What to do: Financing a barn or robots? Run the pro forma at $1.29/cwt alongside your current rate.

The math: Against Wisconsin’s all-milk price of $17.70/cwt in February 2026 — the most recent state figure NASS has published — Clark’s 44¢ is 2.5% of gross, the state simple average of 70¢ is 4.0%, and Juneau’s $1.29 is 7.3%. Prices have recovered since; the U.S. all-milk price was $21.10/cwt in June 2026, pulling those shares to 2.1%, 3.3%, and 6.1%.

The trade-off: This can make a sound project look worse on paper. It also means you find the sensitivity before your lender does. While you’re at it, price the permit timeline in before you finance the barn.

And three more lines belong in that same pro forma. Hauling isn’t the only cost that behaves differently at your scale, and if you’re already running the sensitivities, run these alongside it.

The first is labor, which doesn’t shrink with effort. USDA Economic Research Service puts total labor — hired plus unpaid family — at $13.18/cwt for herds of 10–49 cows, $5.12/cwt at 100–199 cows, and $1.85/cwt on farms with 2,000 or more (ERR-274, MacDonald, Law and Mosheim, 2020, ARMS 2016 data, national scope). Note the vintage — directionally solid, but not 2026 dollars. The full breakdown by herd-size band is here.

The second is the zero-deduct farms that skew every average you’ll read. 327 Wisconsin and Michigan UP farms showed no hauling deduction on handler payroll in May 2025, usually because they self-haul or use a third party outside the payroll system. Strip those out and Wisconsin’s weighted average jumps from 47.1¢ to 60.1¢/cwt. If you pay a deduct, the higher number is closer to your world.

The third only matters if exit is genuinely on the table inside five years — but if it is, start the tax and succession conversation now. The equity difference between a planned dispersal and a forced one gets decided years ahead of the auction, not weeks.

Key Takeaways

  • Can’t recall your hauling deduct? That’s this week’s phone call, not next quarter’s.
  • County herd count dropped since 2024? Treat hauling as a variable cost in this year’s budget, not a fixed one. The NASS county table publishes annually and it’s free.
  • Comparing yourself to a county average? Use the simple-average column. The weighted column describes the county’s biggest shippers, not you.
  • Two neighbors gone off your route since 2024? Run your annual cwt against both your current rate and your county’s simple average. That difference is your exposure.
  • Milking 50 to 99 cows? You’re the median Wisconsin dairy farm — and the median already pays roughly 28% above the state’s weighted average.
  • Shipping just under 600,000 lbs a month? Price out what crossing that line does to your total hauling bill before you rule out expansion on cost alone.
  • Would 44¢ to $1.29/cwt break your debt service? Hauling isn’t the problem. The margin structure is, and you’ve got more options now than you will later.

Go Count the Farms on Your Road

Count how many are still shipping within ten miles of your driveway, then count how many were there five years ago.

That number tells you more about next year’s milk check than the state herd count ever will. Wisconsin’s cheap hauling is built on farm density and processor competition, and both are moving. The question worth raising at the next co-op meeting isn’t whether the state count keeps falling — it’s what your route looks like when it does.

We’re testing the density-versus-cost relationship across all seven Order 30 states, with the outliers explained instead of smoothed over, for an upcoming Bullvine Weekly. That’s where the full county tables and the sensitivity model will live.

Run Your Numbers

Dairy Profit Projector — That 85¢ spread between Clark and Juneau is a margin-per-cwt problem. Drop in your herd size, milk, and ration, and the Projector returns your breakeven milk price and 12-month margin per cwt — so you can see what a hauling swing actually does to the year.

Methodology note: County herd counts come from “Wisconsin Milk Cow Herds by Type of Milk Produced, Number and Percent by County, August 1, 2026,” USDA National Agricultural Statistics Service, based on the Dairy Producer License list, Division of Food Safety, Wisconsin DATCP. Herd-size distribution comes from the 2022 Census of Agriculture, Wisconsin, Table 17, USDA NASS; the median is derived by cumulative farm count across published brackets and falls within the 50–99 cow class — NASS does not publish a median. Hauling charges come from “Milk Hauling Charges in the Upper Midwest Marketing Area, May 2025” (Staff Paper 25-03), by Dr. Areerat Kichkha, Agricultural Economist, Federal Milk Market Administrator’s Office, Minneapolis, September 2025, covering 7,805 producers, 5,073 of them in Wisconsin. Herd-count and hauling datasets are fifteen months apart. Milk-per-herd figures are The Bullvine’s own calculation. Labor figures are USDA ERS ERR-274 (MacDonald, Law and Mosheim, 2020), ARMS 2016 data, national scope. Wisconsin all-milk price from USDA NASS Agricultural Prices via the DATCP Wisconsin Farm Reporter. Miltrim Farms details come from the farm’s own published history, American Dairy XPO 2026 speaker materials, Farm Progress (2023), and a January 2026 Xcel Energy feature. The auction records referenced are public listings; they state no reason for either exit, and no financial circumstances of either family are known to us or asserted here. Herd-size equivalents assume 70 lbs/cow/day and are ours. Counties with fewer than three producers are restricted in the federal data and excluded here. All figures USD. Corrections and farm-specific data welcome.

Learn More

The Sunday Read Dairy Professionals Don’t Skip.

Every week, thousands of producers, breeders, and industry insiders open Bullvine Weekly for genetics insights, market shifts, and profit strategies they won’t find anywhere else. One email. Five minutes. Smarter decisions all week.
NewsSubscribe
First
Last
Consent

Chobani Needs 8.2 Million Pounds a Day. Don’t Pour Concrete Until You See the Paper.

It’s fall. Springing heifers are $3,400–$4,400, Allentown doesn’t take milk until 2027, and Chobani’s CEO just said there’s “still work to do.” What exactly are you borrowing against?

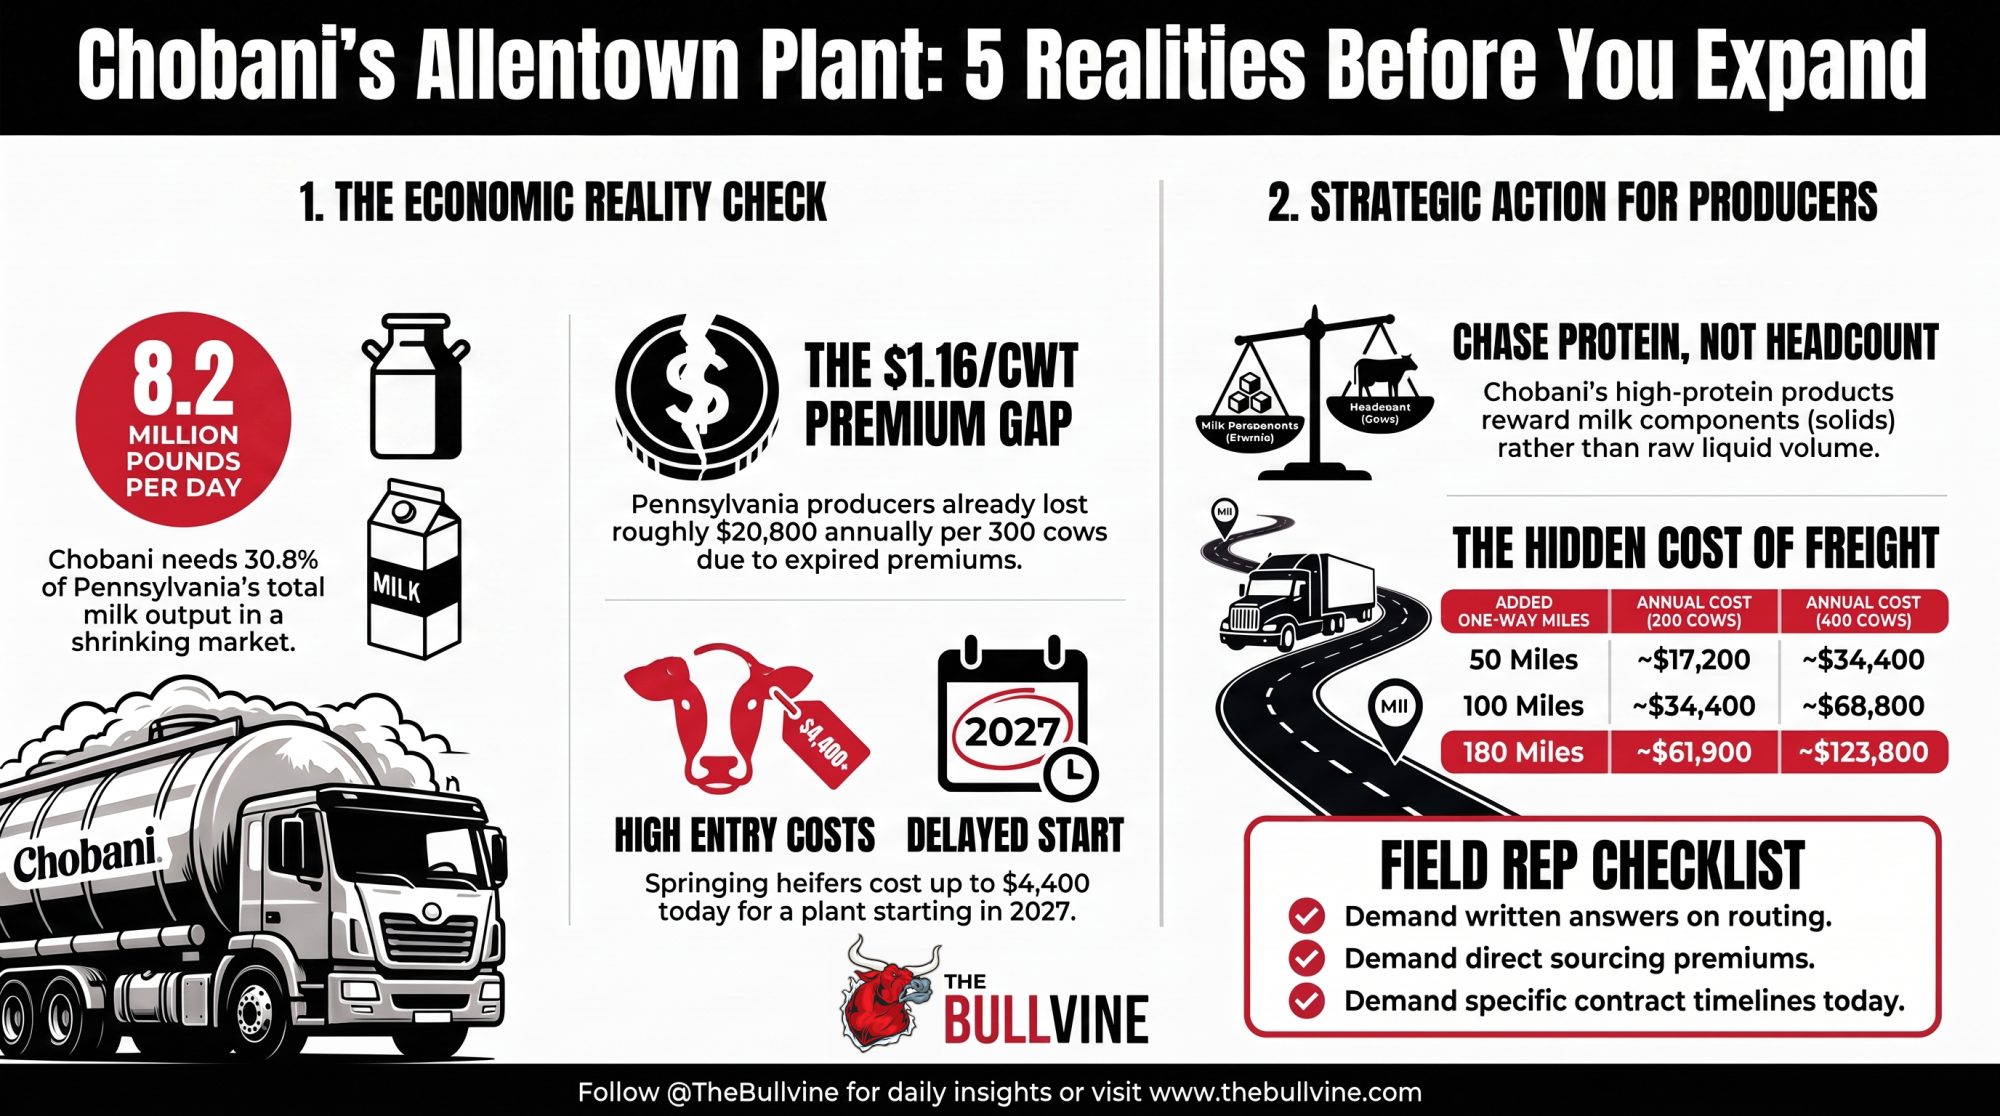
Executive Summary: Chobani’s Allentown plant will need 8.2 million pounds of milk a day at full run — 30.8% of everything Pennsylvania produces, in a state that’s shrunk output five years running to 9.737 billion pounds. The $1.2 billion is real and the Keurig Dr Pepper deal is signed, but no supply contract with any Pennsylvania producer has surfaced publicly, and CEO Hamdi Ulukaya said at a Schnecksville farm on September 1 that “the trust and the confidence is very high, but we still have some work to do.” Production doesn’t start until 2027, while springing heifers are already clearing $3,400 to $4,400 against a replacement inventory at its lowest heifers-per-100-cows ratio since 1991. Meanwhile you’ve already lost $1.16/cwt — the Milk Board deadlocked in June and let the over-order premium and fuel adjuster expire, which on a 300-cow herd at 28.27% Class I utilization runs about $20,800 a year. Freight cuts the same way in either direction: at USDA’s $0.00814 mileage factor, 50 added one-way miles costs a 200-cow herd roughly $17,200 annually, and a plant opening reshuffles routes exactly like the DFA St. Albans closure did. The play for a 150-to-500-cow operation isn’t buying cows against an announcement — it’s pushing true protein on the herd you own and getting freight deductions, component premiums, and destination clauses in writing before anyone signs anything. The article closes with eight questions to send your field rep this week and a decision rule for 150-to-500-cow operations.

Chobani Pennsylvania plant

Chobani just announced a $1.2 billion processing plant in Lehigh County that will eventually pull 3 billion pounds of milk a year. Every general outlet ran the investment total and the governor’s talking points.

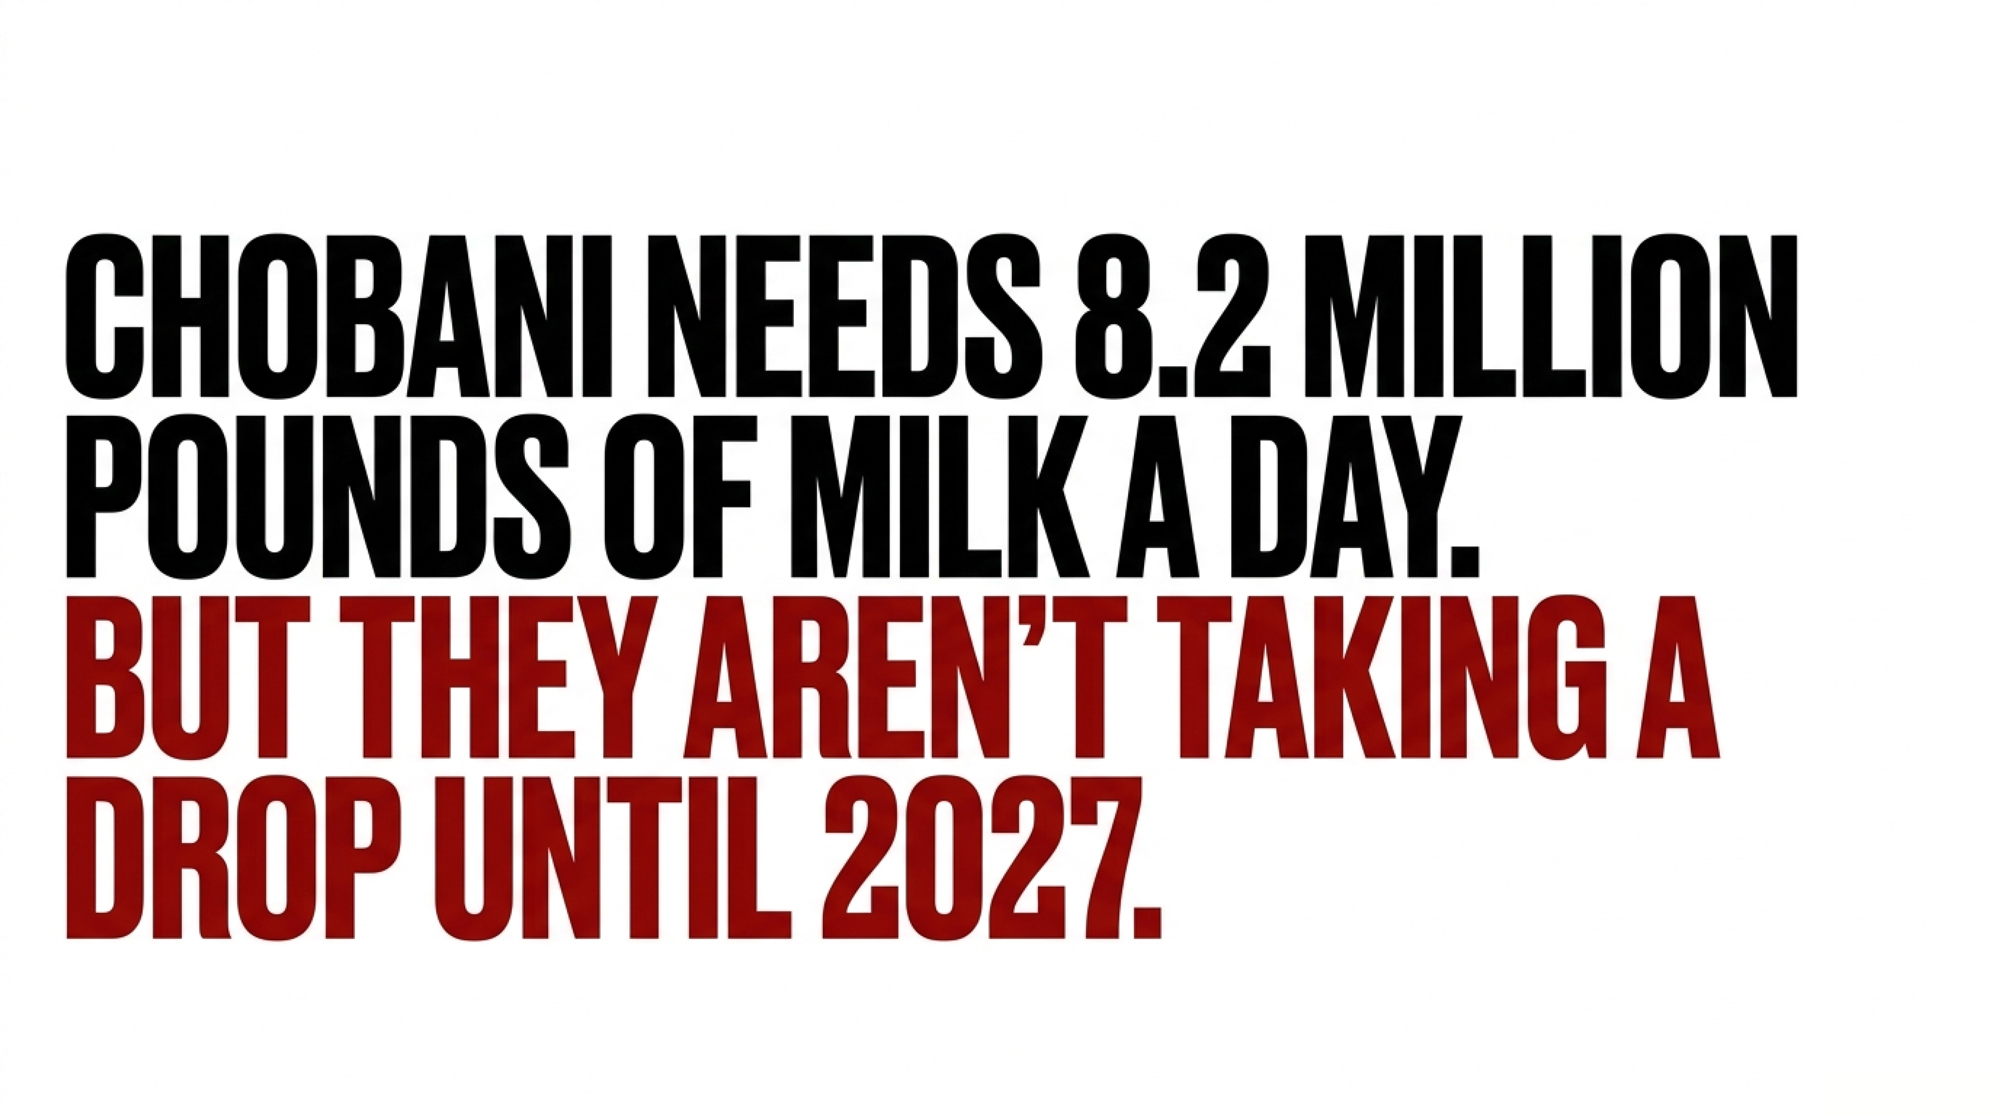
What none of them ran is the number that decides whether any of this reaches your barn: 8.2 million pounds of milk a day.

That’s roughly 30.8% of Pennsylvania’s entire annual production landing on a state dairy herd that has contracted for five consecutive years. But before you call your lender or order concrete, write down what sixth-generation Vermont dairyman Harold Howrigan — who also sits on Dairy Farmers of America’s board — told the Boston Globe when DFA moved to idle its St. Albans plant. Higher returns from farther-away plants do get passed back to farmers, he said. But “it’s not all gravy,” because the farmers themselves will have to pay for the increased transportation costs.

Production in Upper Macungie doesn’t start until 2027. The building purchase from Keurig Dr Pepper hasn’t closed. And no direct supply contract with a Pennsylvania producer has surfaced publicly.

You Already Lost $1.16 This Summer

Before any of that, there’s a cut that already landed. Two months before the Chobani announcement, Pennsylvania producers took a hit that got almost no coverage.

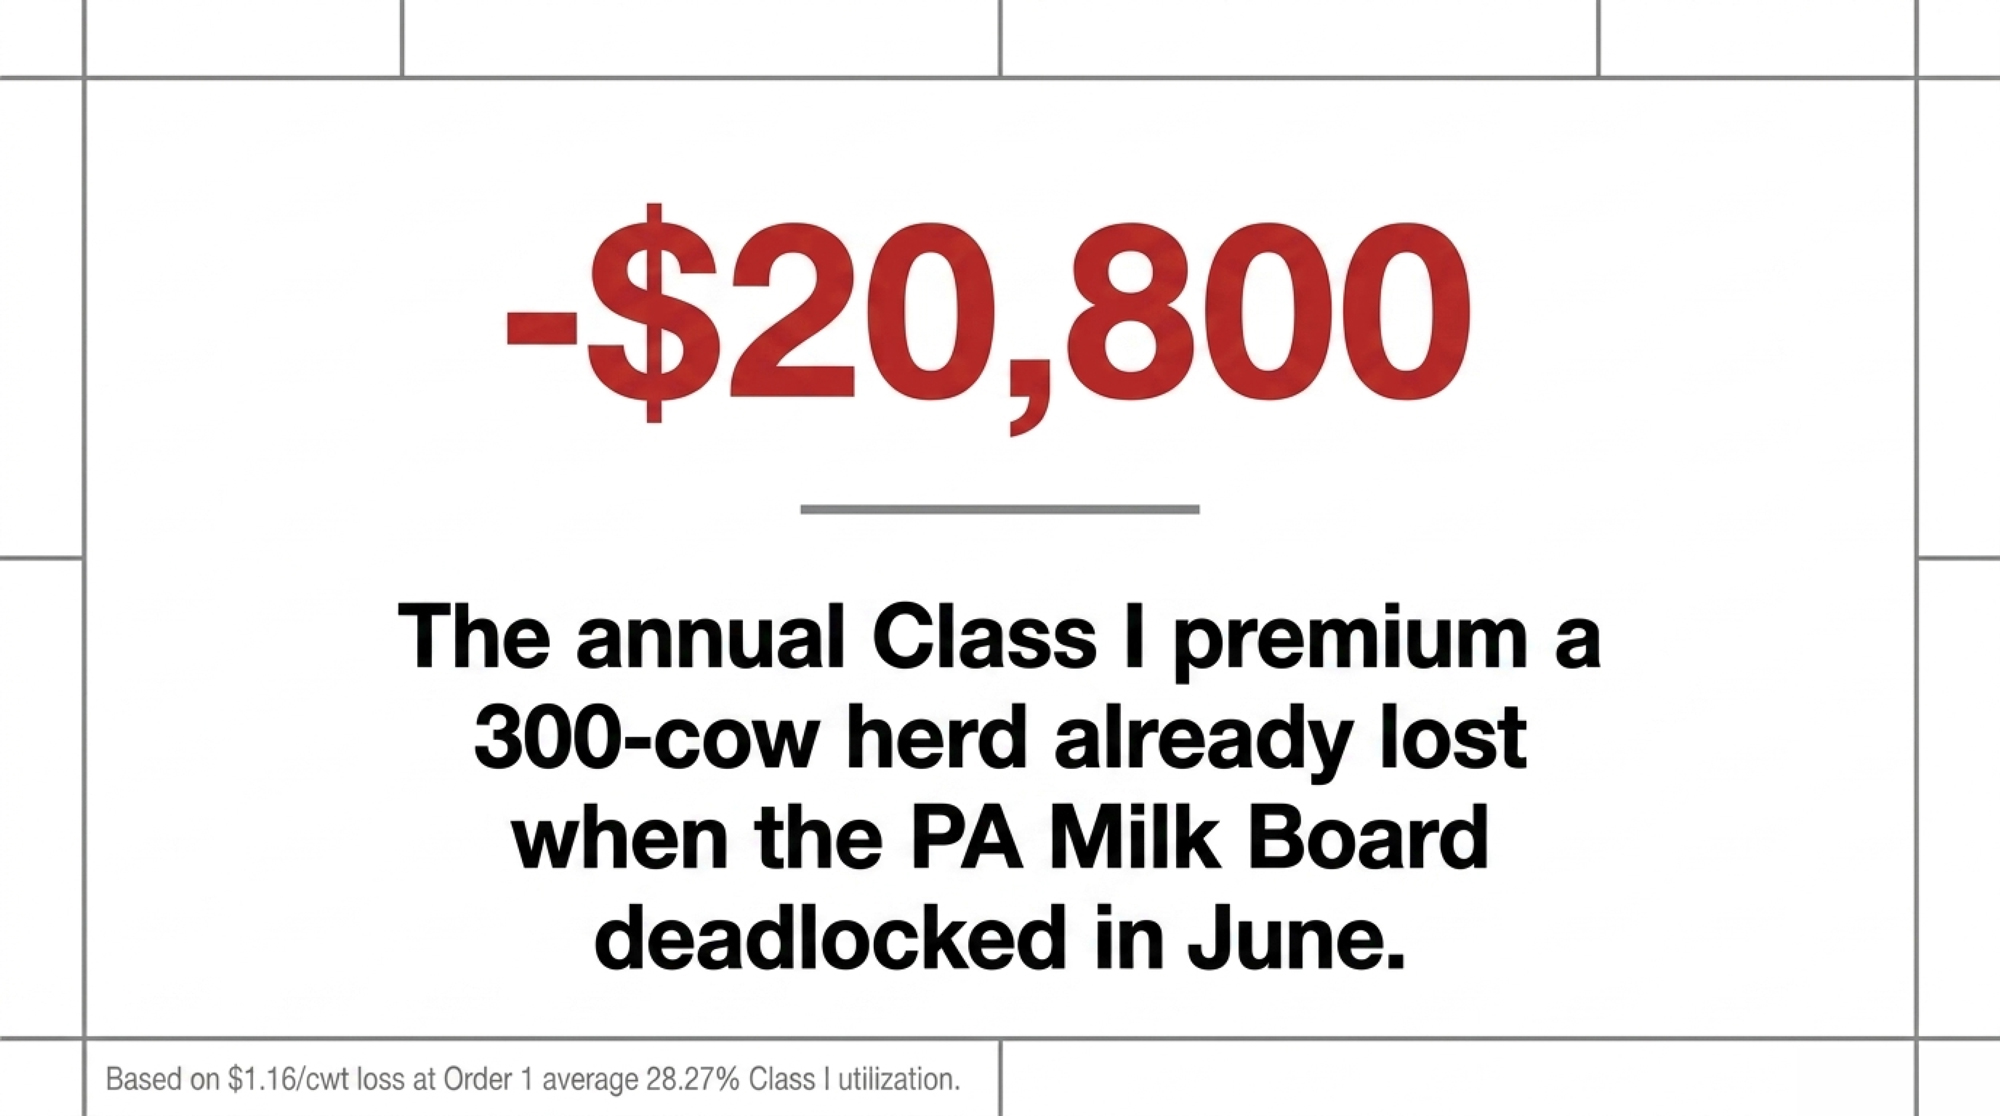
The Pennsylvania Milk Board deadlocked and issued no over-order premium order for July through December 2026 — Lancaster Farming reported the deadlock on June 12, and Farmshine confirmed on June 19 that no order had been issued. The premium in force was 50 cents per hundredweight, already the first sub-dollar rate since 2021 under General Order A-1022, plus a 66-cent fuel adjuster. Both expired at midnight on June 30. That’s $1.16/cwt gone, ending a 38-year-old program.

Put it against a 300-cow herd. At Pennsylvania’s average 21,121 pounds per cow, you’re shipping 63,363 cwt a year. Not all of that prices as Class I. Order 1 Class I utilization has run 28.27% year-to-date through April, per USDA AMS — so roughly 17,900 cwt of that milk priced Class I. At $1.16/cwt, that’s about $20,800 a year, gone before anybody said the word Allentown.

That assumes your milk pools at the order-average Class I utilization, which is how blend pricing works for a pooled producer. Your own figure moves with your handler’s mix.

ComponentRate/ValueAnnual Impact (300-cow herd)
Over-order premium (expired June 30)$0.50/cwtIncluded below
Fuel adjuster (expired June 30)$0.66/cwtIncluded below
Combined lost premium$1.16/cwt~$20,800/year
Class I utilization (Order 1, YTD Apr)28.27%~17,900 cwt priced Class I
Program duration before expiration38 yearsEnded with no replacement order

So when you hear about a plant creating new demand, that’s the baseline it’s landing on. Not a neutral one. The full breakdown of that expiration is here.

What Chobani’s CEO Actually Said

Chobani announced the project on September 1, 2026: approximately $1.2 billion over five years for a 1.5-million-square-foot manufacturing and warehouse campus at 7356 Industrial Blvd. in Upper Macungie Township, creating more than 900 jobs. The plant first opened for production in 2021 under Keurig Dr Pepper. KDP will keep some current employees there in corporate functions; the rest are being offered jobs with Chobani.

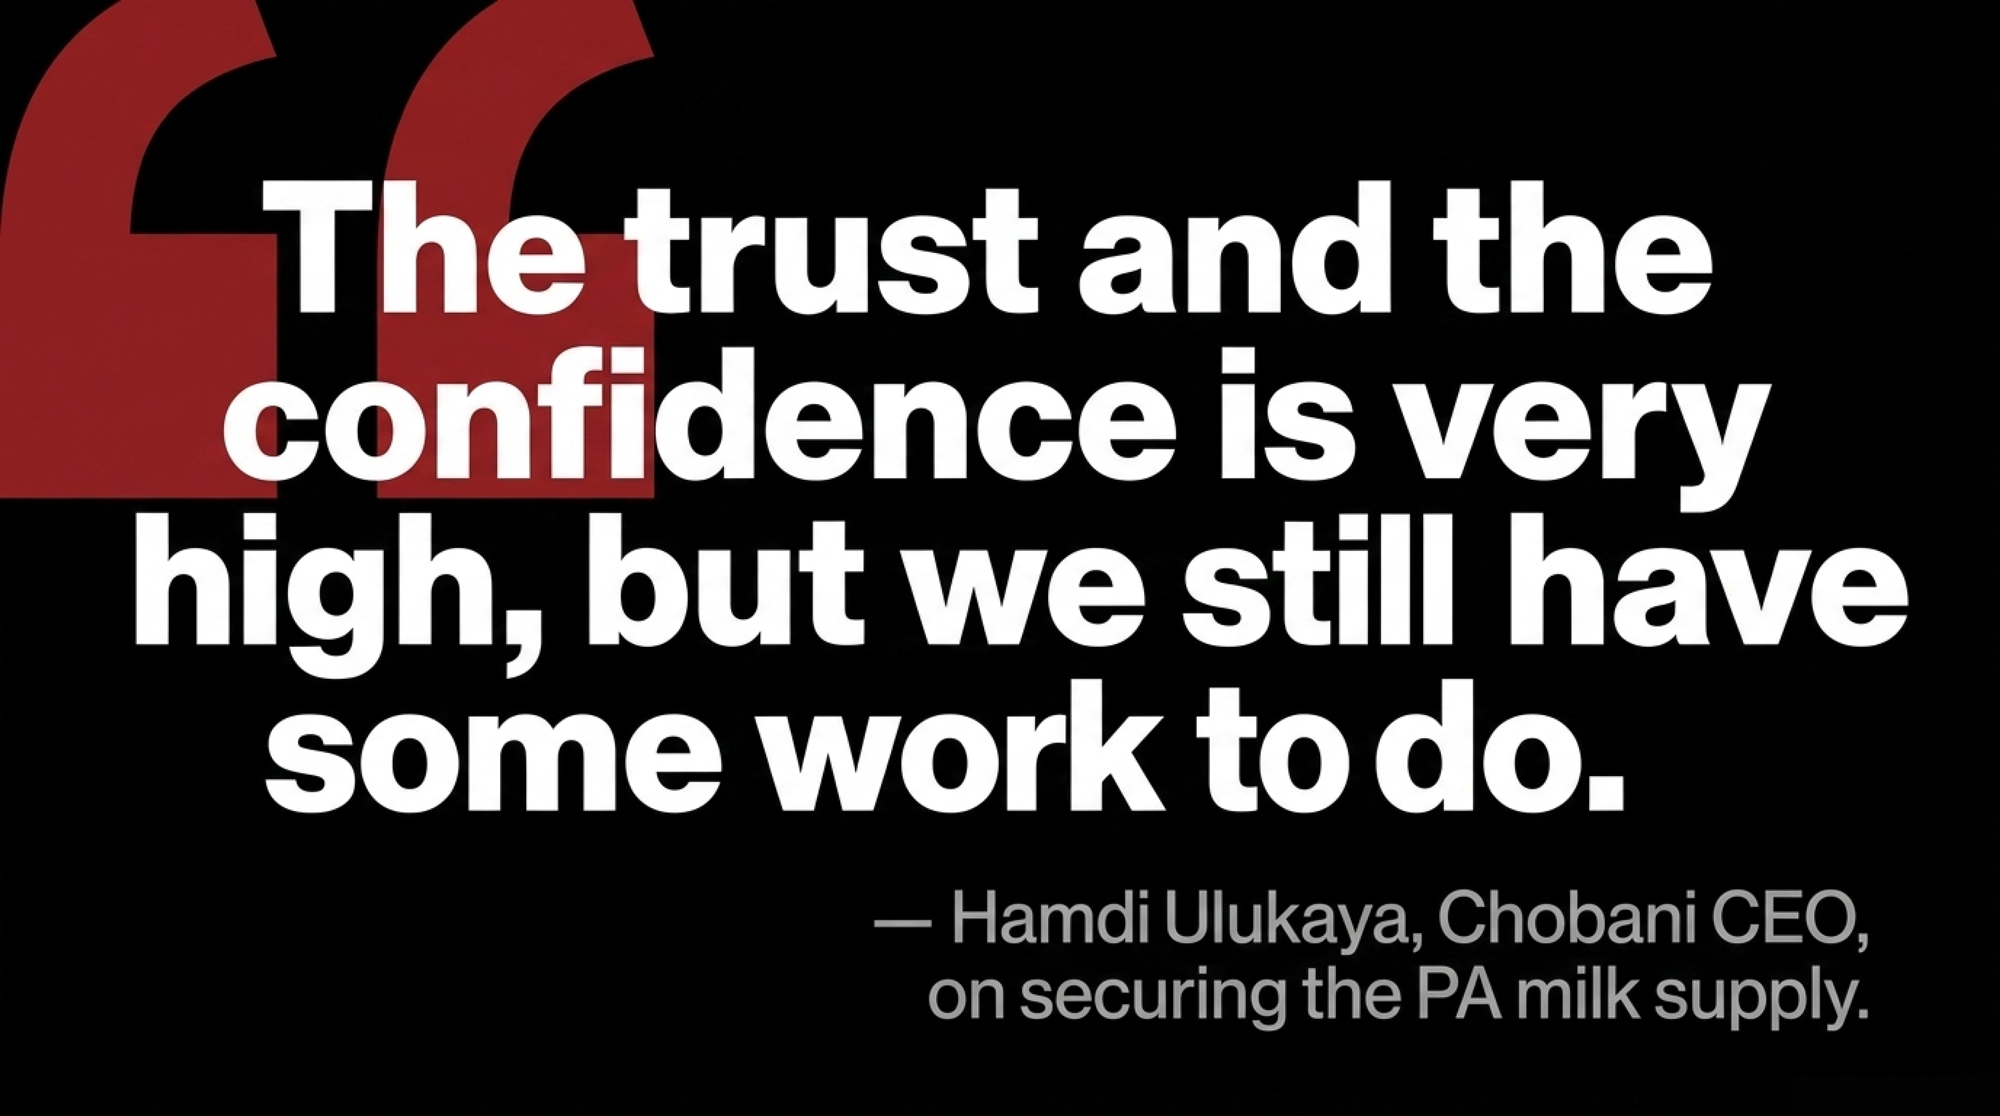
The next day, Chobani CEO Hamdi Ulukaya stood at Crystal Spring Farm near Schnecksville, a Land O’Lakes member operation, and told reporters he wants the plant to eventually draw 3 billion pounds of milk a year, all of it produced in Pennsylvania. He said he hadn’t previously seen a state commit to helping its farmers increase production the way Pennsylvania is. Then he added the line worth holding onto: “The trust and the confidence is very high, but we still have some work to do.”

Read that as what it is — the buyer saying the supply side isn’t settled. Not a warning, not a retreat. Just an accurate description of where things stand between an announcement and a signed agreement.

Pennsylvania Agriculture Secretary Russell Redding, speaking at the same event, framed the open question directly: “The discussion here has been about ‘how do you keep as many of these 4,300 farms as you can?’ How do you get the co-ops to really work with them to get herd-level improvements and efficiencies? How do you help them get expansions if they want to?”

Those are the right questions. None of them have been answered yet.

The Deal Is Real. The Contract Hasn’t Surfaced.

Keurig Dr Pepper has a definitive agreement to sell its full equity stake in Chobani back to the company for $800 million, plus roughly $125 million for the Allentown facility itself — lease, equipment, and operations included. That piece is locked down in writing.

The $1.2 billion works differently. It’s Chobani’s five-year capital plan, and Allentown is one piece of what the company describes as a broader commitment of more than $4 billion across its U.S. manufacturing network. Chobani is privately held, so there’s no filing behind the Allentown figure and no binding commitment you could show a lender. That’s not a knock on Chobani — that’s how every economic development announcement in America works. It matters because the state stacked $50 million in PA SITES grants and loans on Chobani’s side of the ledger.

ItemStatusDetail
KDP equity buybackConfirmed in writing$800 million definitive agreement
Allentown facility purchaseConfirmed in writing~$125 million, lease/equipment/operations included
PA SITES grants to ChobaniConfirmed in writing$50 million state package
Farmer supply contractNo public agreementZero signed contracts with any PA producer surfaced
$127M farmer loan/grant fundExisting programs, not newDCED says it will “drive out” existing capacity
Production start dateCommitted2027, not before

On the farmer side, Governor Shapiro said the state is providing up to $127 million in loans and grants to help dairy farmers expand herds, buy equipment, and meet the new milk demand. The Department of Community and Economic Development’s own wording is that the Commonwealth will “continue to drive out” that money — existing capacity pointed at a new purpose, not a new Chobani-specific fund with its own eligibility rules. Call the Bureau of Market Development at the Pennsylvania Department of Agriculture and expect the answer to depend on which existing program you land in.

Does the 30% Claim Actually Hold Up?

Yes. And checking it tells you something the announcement didn’t.

Pennsylvania produced 9.737 billion pounds of milk in 2025 from 461,000 cows, averaging 21,121 pounds per cow, according to the Center for Dairy Excellence’s state dairy overview drawing on USDA NASS data. Three billion against 9.737 billion is 30.8%. The state’s number is honest.

But look underneath it. That 9.737 billion was down about 45 million pounds from 2024 — the fifth consecutive year Pennsylvania’s production declined. The state also lost 11.7% of its dairy farms during 2025 alone, which Farmshine’s analysis of USDA data pegged at 41% of all U.S. dairy exits that year. Chobani’s target is measured against today’s output. Today’s output has been shrinking for half a decade.

So the real question isn’t whether Pennsylvania can supply 30%. It’s whether that 30% comes from new cows or from milk already in a tanker headed somewhere else.

The Value Is in the Solids, Not the Tanker

Here’s the distinction that should change what you do next. Chobani says Allentown will produce milk with more protein and less sugar than conventional milk, feeding into products including high-protein shakes. That’s a plant built around one component in particular.

Chobani hasn’t published how it will pay Pennsylvania producers. But under Federal Order pricing, manufactured-class milk is paid on components. So a plant built for high-protein products is a plant whose value runs through what’s dissolved in the tanker, not its raw volume.

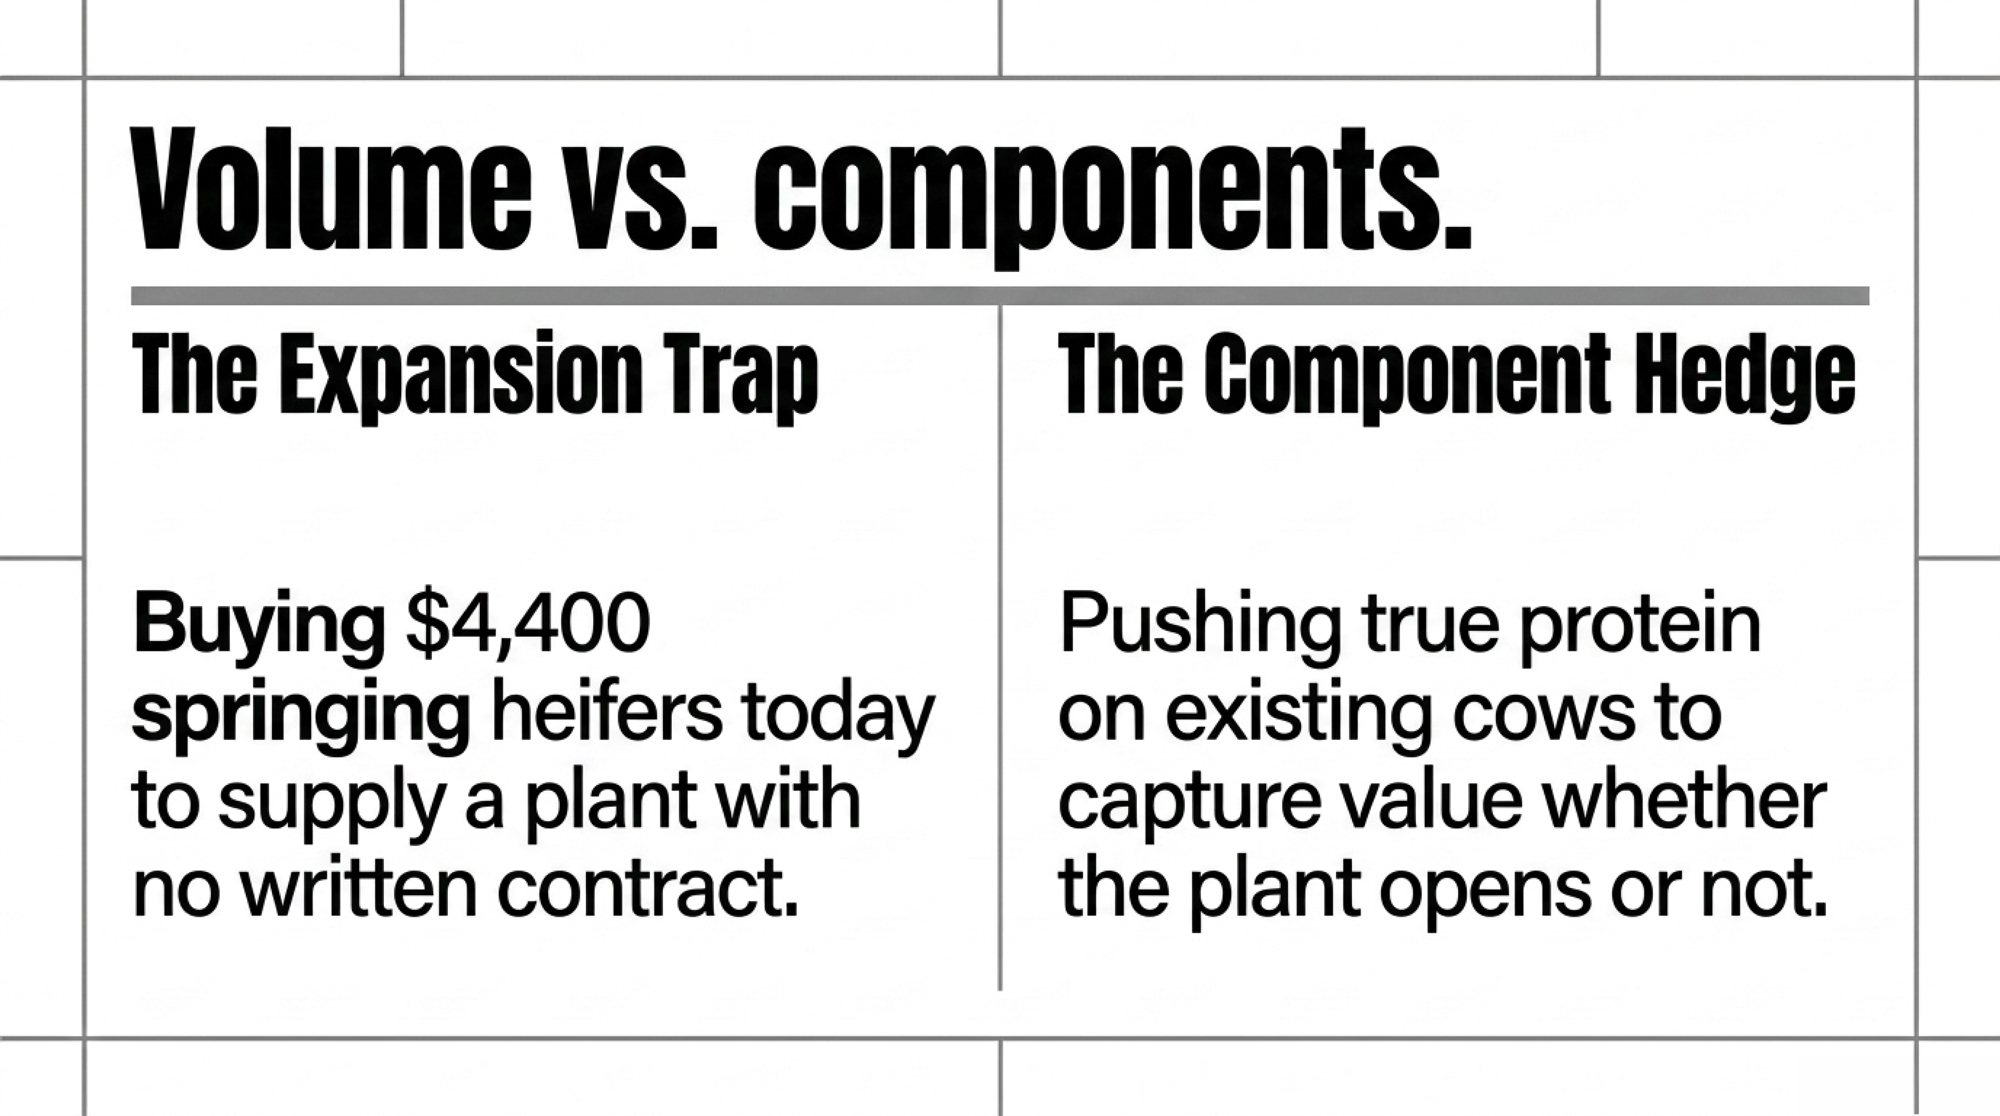
That reframes the expansion question. The producer who improves true protein per cow is positioned to capture that value without buying a single head — assuming component premiums are available on your contract, which is worth confirming before you invest in the ration to get there. Meanwhile, the producer who adds 100 cows at industry-average components has taken on debt to deliver more of what the market is least short of. U.S. milk production hit a record 232 billion pounds in 2025, up 2.6% from 2024 per USDA NASS. Nobody is short of volume.

The genetic and ration work behind components is slow — you don’t move a component test in a quarter. But it’s the only response to this announcement that pays off whether Allentown opens on time, opens late, or never buys a pound from your farm. Butterfat still drives your Class III value regardless of who ends up with your milk. Component work isn’t a bet on Chobani. It’s a hedge against everybody.

Ask your nutritionist and your genetics rep the same question this month: where are my components against the herds you work with, and what’s the twelve-month path to moving them?

Will This Volume Reach Your Check, or Just the Pool?

This is the question almost nobody is asking, and it determines whether any of the above matters to you personally.

Northeast milk marketing runs heavily through cooperatives, which market members’ milk collectively and pay out on a blended basis. A new plant buying 3 billion pounds can strengthen the whole pool without a single individual farm seeing a distinct line item for it. That’s not a criticism of how co-ops operate — it’s the structure they operate inside. But it means “Chobani is coming” and “my milk check goes up” are two separate claims, and only the first one has been announced.

So put it to your board delegate directly, in writing: will volume associated with the Allentown plant be blended across the pool, or will there be direct farm-to-plant sourcing premiums for members who ship to it? If the answer is blended, your expansion math shouldn’t assume a farm-specific premium that doesn’t exist. If it’s direct premiums, ask what qualifies a farm — location, volume, components, or all three.

You’re entitled to ask before you borrow, not after.

The Freight Math

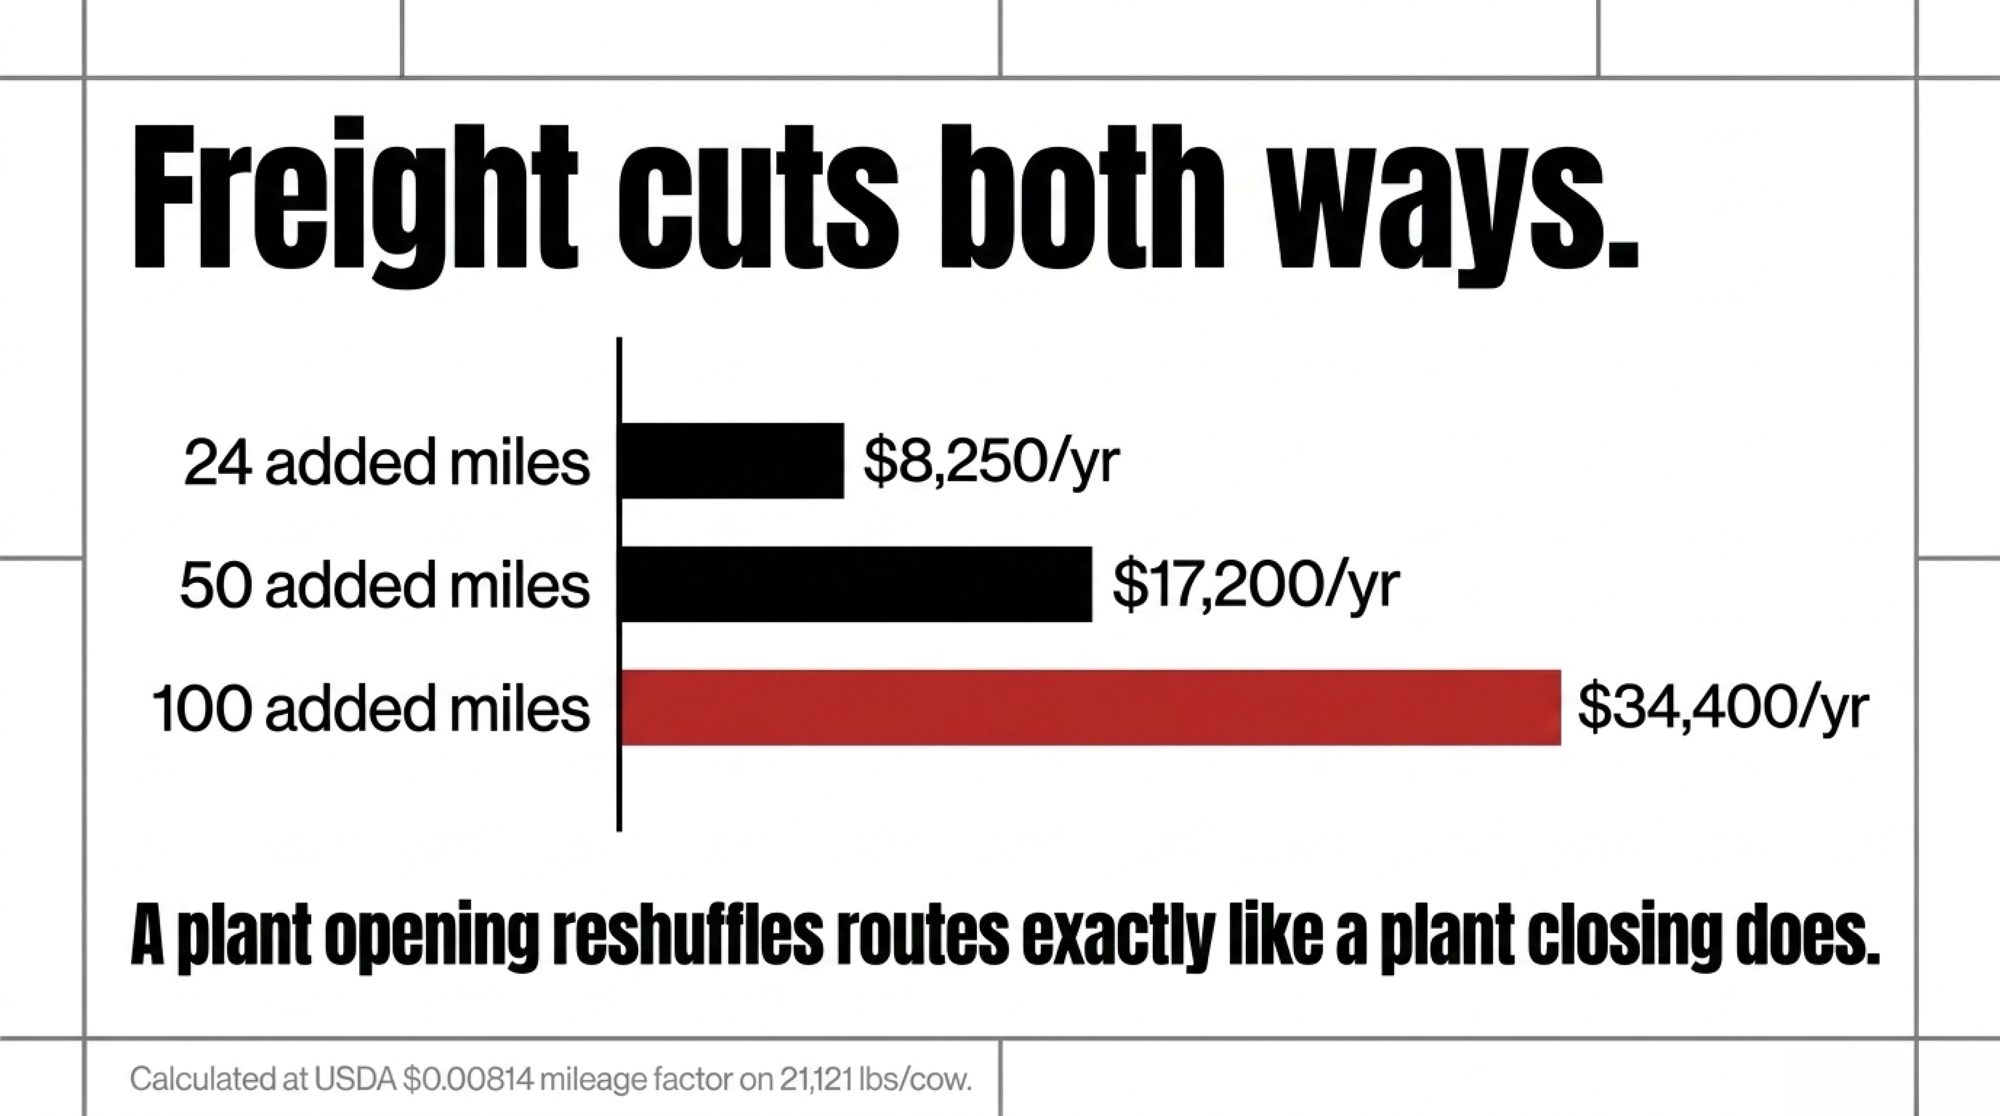
Freight is the channel you can measure. USDA’s Agricultural Marketing Service sets the Federal Order 1 mileage rate factor at $0.00814 per hundredweight per mile, effective March 1, 2024, under Final Rule 88 FR 84038. Applied to Pennsylvania’s state-average 21,121 pounds per cow:

Added one-way milesHauling cost per cwtAnnual cost, 200 cowsAnnual cost, 400 cows
24 miles$0.195~$8,250~$16,500
50 miles$0.407~$17,200~$34,400
100 miles$0.814~$34,400~$68,800
180 miles$1.465~$61,900~$123,800

Assumes 42,242 cwt annually at 200 cows and 84,484 cwt at 400 cows, using Pennsylvania’s 2025 state average of 21,121 lbs/cow.

As Vermont Public put it covering the St. Albans fallout, transportation costs show up as a deduction on farmers’ monthly milk checks. That’s where this lands. We ran the mileage math farm by farm after St. Albans closed — the pattern holds in either direction, because a plant opening reshuffles routes the same way a plant closing does.

Your Class III price already carries a second deduction most producers never see broken out. It’s the make allowance — the processing cost USDA subtracts before your milk gets priced. The final rule amending the Federal Milk Marketing Orders, issued January 2025 and effective June 1, 2025, raised all four: cheese from $0.2003 to $0.2519 per pound, butter from $0.1715 to $0.2272, nonfat dry milk from $0.1678 to $0.2393, dry whey from $0.1991 to $0.2668. Butterfat recovery in the Class III formula moved from 90% to 91%. When the allowance goes up, the regulated minimum comes down.

Then there’s what you’re allowed to see. Private handlers must itemize deductions under FMMO rules; cooperatives are exempt from that requirement. That’s a structural difference in what members can see, not a claim about any particular co-op’s practices. If your route changes and your deduction changes with it, ask how the number was built.

What the Math Looks Like on a 300-Cow Farm

This is a constructed scenario, not a real farm. Swap in your own numbers.

Say you’re milking 300 in Berks or Northampton County with barn room to push to 400. A hundred added cows at Pennsylvania’s average 21,121 pounds is 21,121 cwt of new milk a year. At August 2026’s announced Class III price of $16.64/cwt, that’s roughly $351,000 in added gross — before feed, labor, interest, or a single mile of freight.

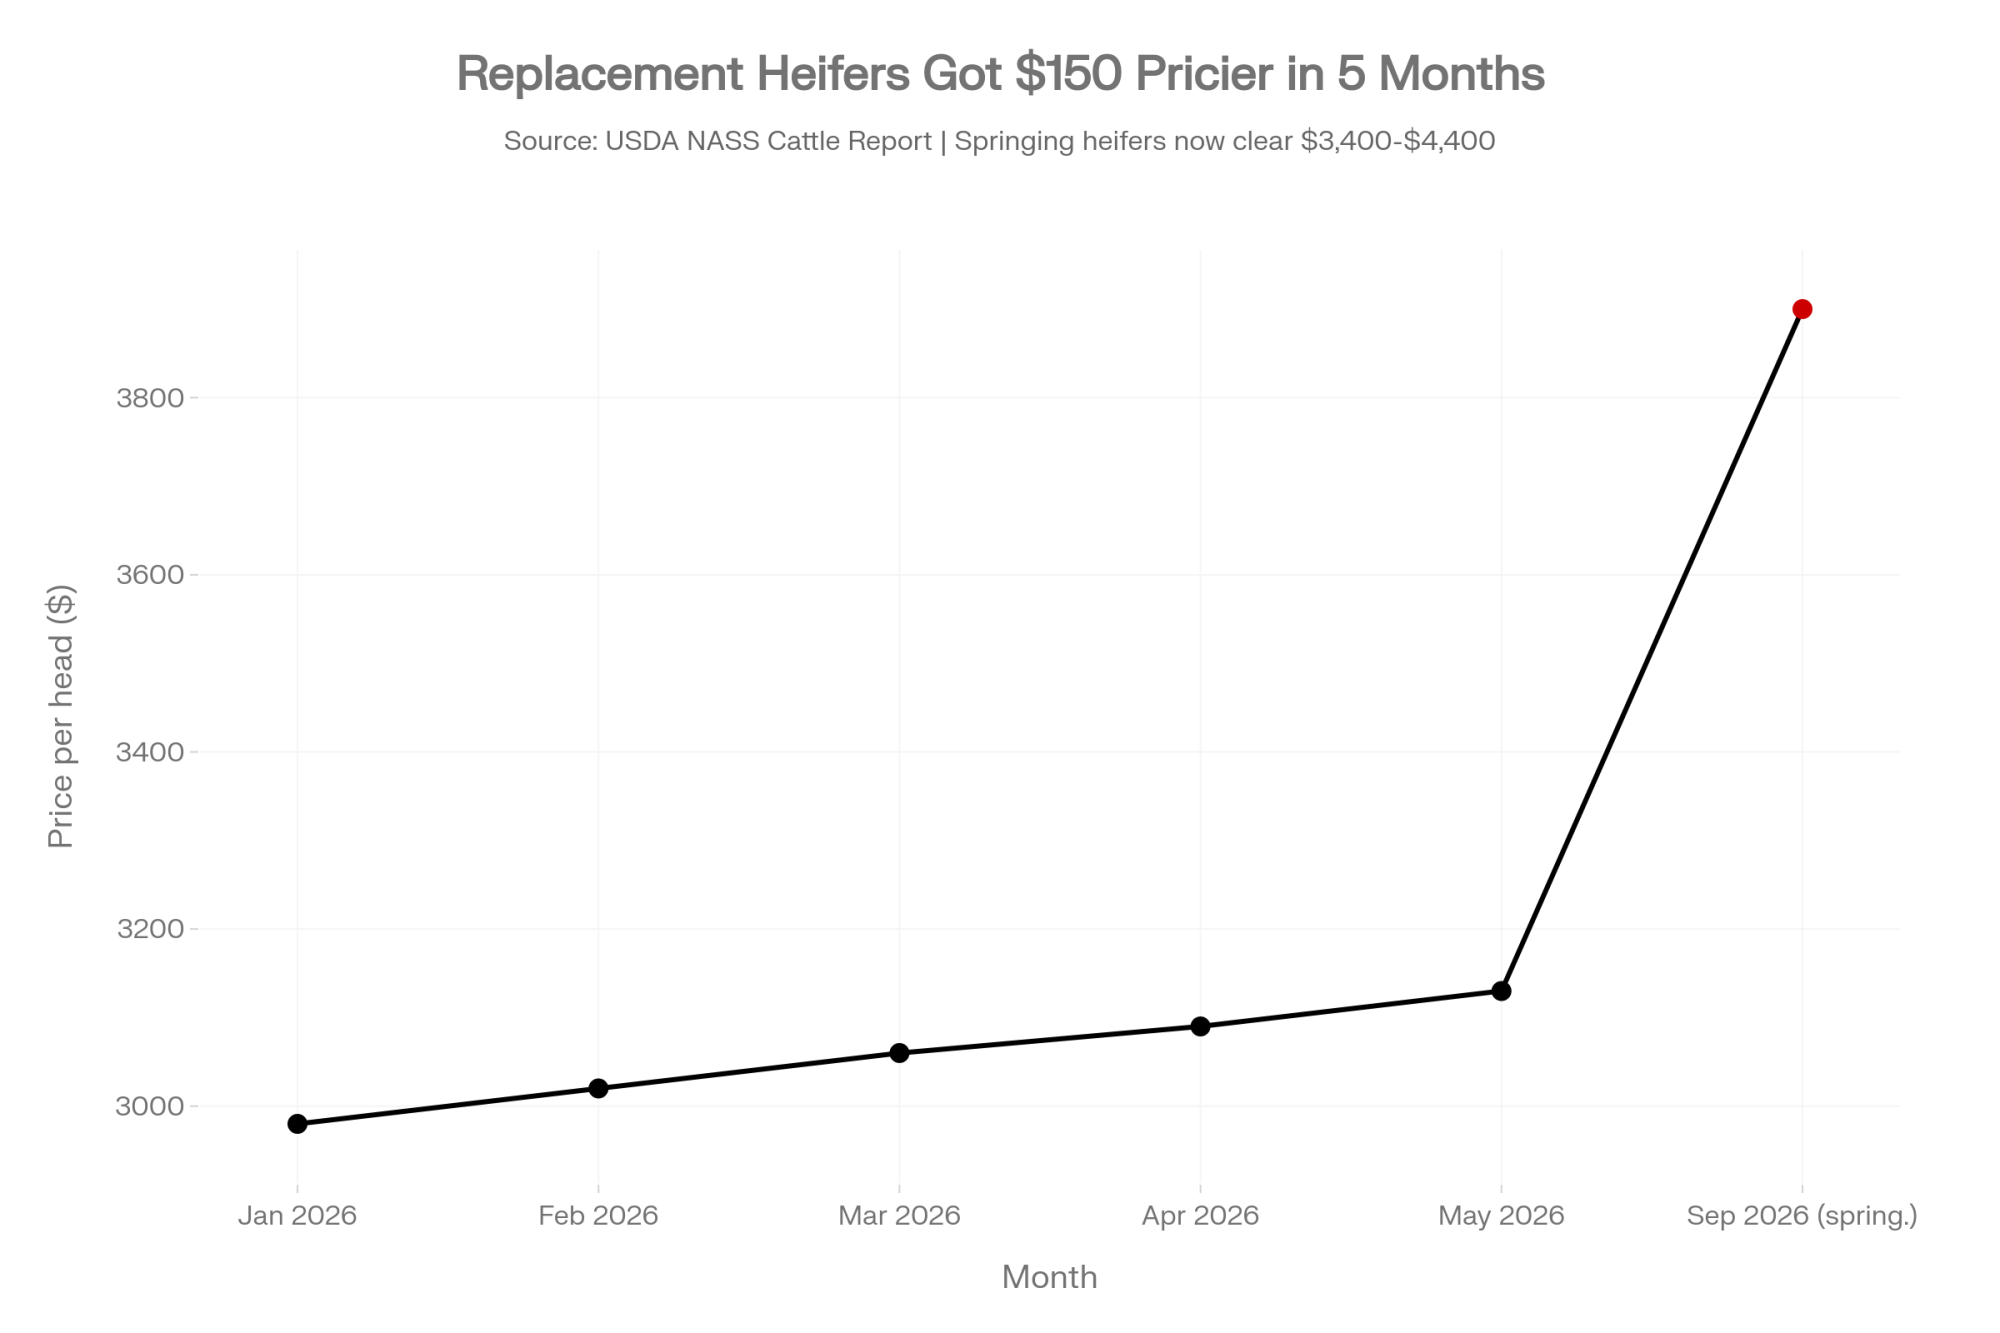
Now the other side. USDA quarterly estimates put replacement dairy cows at $2,980 per head in January 2026, rising to $3,130 by May. Top-quality springing heifers were clearing $3,400 to $4,400 this spring. Buy 25 head at $3,900 and you’ve spent $97,500 before you pour a foundation.

The supply behind those prices isn’t loosening. USDA’s January 1, 2026 Cattle report counted 3.90 million dairy replacement heifers, and USDA’s own Dairy Outlook notes that heifers per 100 milk cows sat at their lowest percentage since 1991 — with producers expecting 0.3% fewer heifers to calve this year despite a larger national herd. You’d be buying into a tight market to serve a buyer whose CEO just said there’s still work to do.

How Much Does Waiting 30 Days Actually Cost You?

Honestly? Not much. That’s the uncomfortable answer for anyone feeling urgency right now.

The plant isn’t taking milk before 2027. A heifer you buy in October doesn’t freshen and hit peak in time to matter for a 2027 startup anyway. What waiting costs is position in a tight replacement market where prices climbed $150 a head between January and May. That’s the honest trade — the animals get more expensive while you wait, but the buyer stays hypothetical. Where does your breakeven sit if replacements run another 5% higher next spring and there’s still no contract on the table?

Is Your Operation Actually Inside the Milk-Shed?

Being close to Allentown isn’t the same as having access to Allentown. A plant drawing 30 million cwt a year competes hardest inside roughly a 75-to-100-mile radius before freight economics eat what it can offer — which from Upper Macungie Township reaches into Berks, Bucks, Montgomery, Northampton, and Schuylkill counties, and possibly into Warren and Hunterdon counties in New Jersey. That’s a modeled radius built on standard hauling thresholds, not a Chobani sourcing map.

Here’s the threshold worth knowing. USDA’s 2026 all-milk price forecast sits at $19.85/cwt. At that price, about 24 extra one-way miles is where added freight starts eating 1% of your gross. Drop the milk price and the threshold tightens — measured against August’s $16.64 Class III, you hit 1% closer to 20 miles. That percentage holds whether you milk 120 cows or 500.

Do you know your actual haul distance and rate, or roughly? Roughly isn’t good enough when you’re deciding whether a new plant changes your basis.

Options and Trade-Offs

Wait for paper. Hold capital until a written supply agreement exists. Makes sense for nearly any operation without spare borrowing room. Processors building new capacity typically secure a supply base ahead of startup, so ask how early agreements for this plant are expected to be finalized and whether herd size factors into the sequence. Redding’s own question — how do you help farms expand if they want to — hasn’t been answered with a mechanism yet.

Expand only to demand you already have. Add cows to the level your current buyer wants today, and treat Chobani as upside rather than justification. Works if your handler has already signaled it wants more volume. You leave some potential upside on the table. That’s what the certainty costs.

Build components instead of headcount. Covered above, and it’s the path with the widest margin for error. It pays whether or not this plant ever buys from you.

StrategyUpfront CostPayoff If Plant Delays/Falls ThroughPayoff If Plant Delivers
Buy 25 heifers now ($3,900 avg)$97,500Sunk cost, no returnDelayed revenue, uncertain premium
Wait for written supply contract$0No loss, full flexibilitySlightly delayed entry only
Build true protein/component premiumsNutritionist/genetics costStill pays via Class III/component pricingCaptures premium without new debt

Do this within 30 days. Send the checklist below. Not a phone call you’ll half-remember — an email you can file.

Worth knowing where this sits nationally: more than $11 billion has gone into new dairy plants across 19 states, and the map has clear winners and losers. Pennsylvania just landed on the right side of it. That doesn’t automatically mean your farm did.

The Co-Op Director Checklist

Copy these into an email to your co-op director. Send it this week. Keep the reply.

On the contract:

  1. Does a written supply agreement tied to the Allentown plant exist for our region, or is one under negotiation? If yes, what’s the timeline for member offers?
  2. If an agreement is offered, will it specify committed volume, price basis, contract term, and what happens if the plant’s start date moves past 2027?

On the pool:

  • Will volume associated with the Allentown plant be blended across the pool, or will there be direct farm-to-plant sourcing premiums for members who ship to it?
  • If direct premiums exist, what qualifies a farm — location, volume, component levels, or a combination?

On freight:

  • What is my farm’s projected routing for the next twelve months: receiving plant, one-way miles, hauling rate per cwt, and location differential?
  • If my routing changes, how and when will I be notified, and how is the new hauling deduction calculated?

On components:

  • Where do my butterfat and true protein tests sit against the co-op average, and what component premiums are currently available to me?

On the state money:

  • Which specific Pennsylvania loan or grant program would my operation qualify under, and what are the eligibility and repayment terms? (If they can’t answer, call the Bureau of Market Development at the Pennsylvania Department of Agriculture directly.)

Anything you get verbally, ask for in writing. A field rep’s optimism isn’t a commitment, and neither is a governor’s press conference.

The Verdict

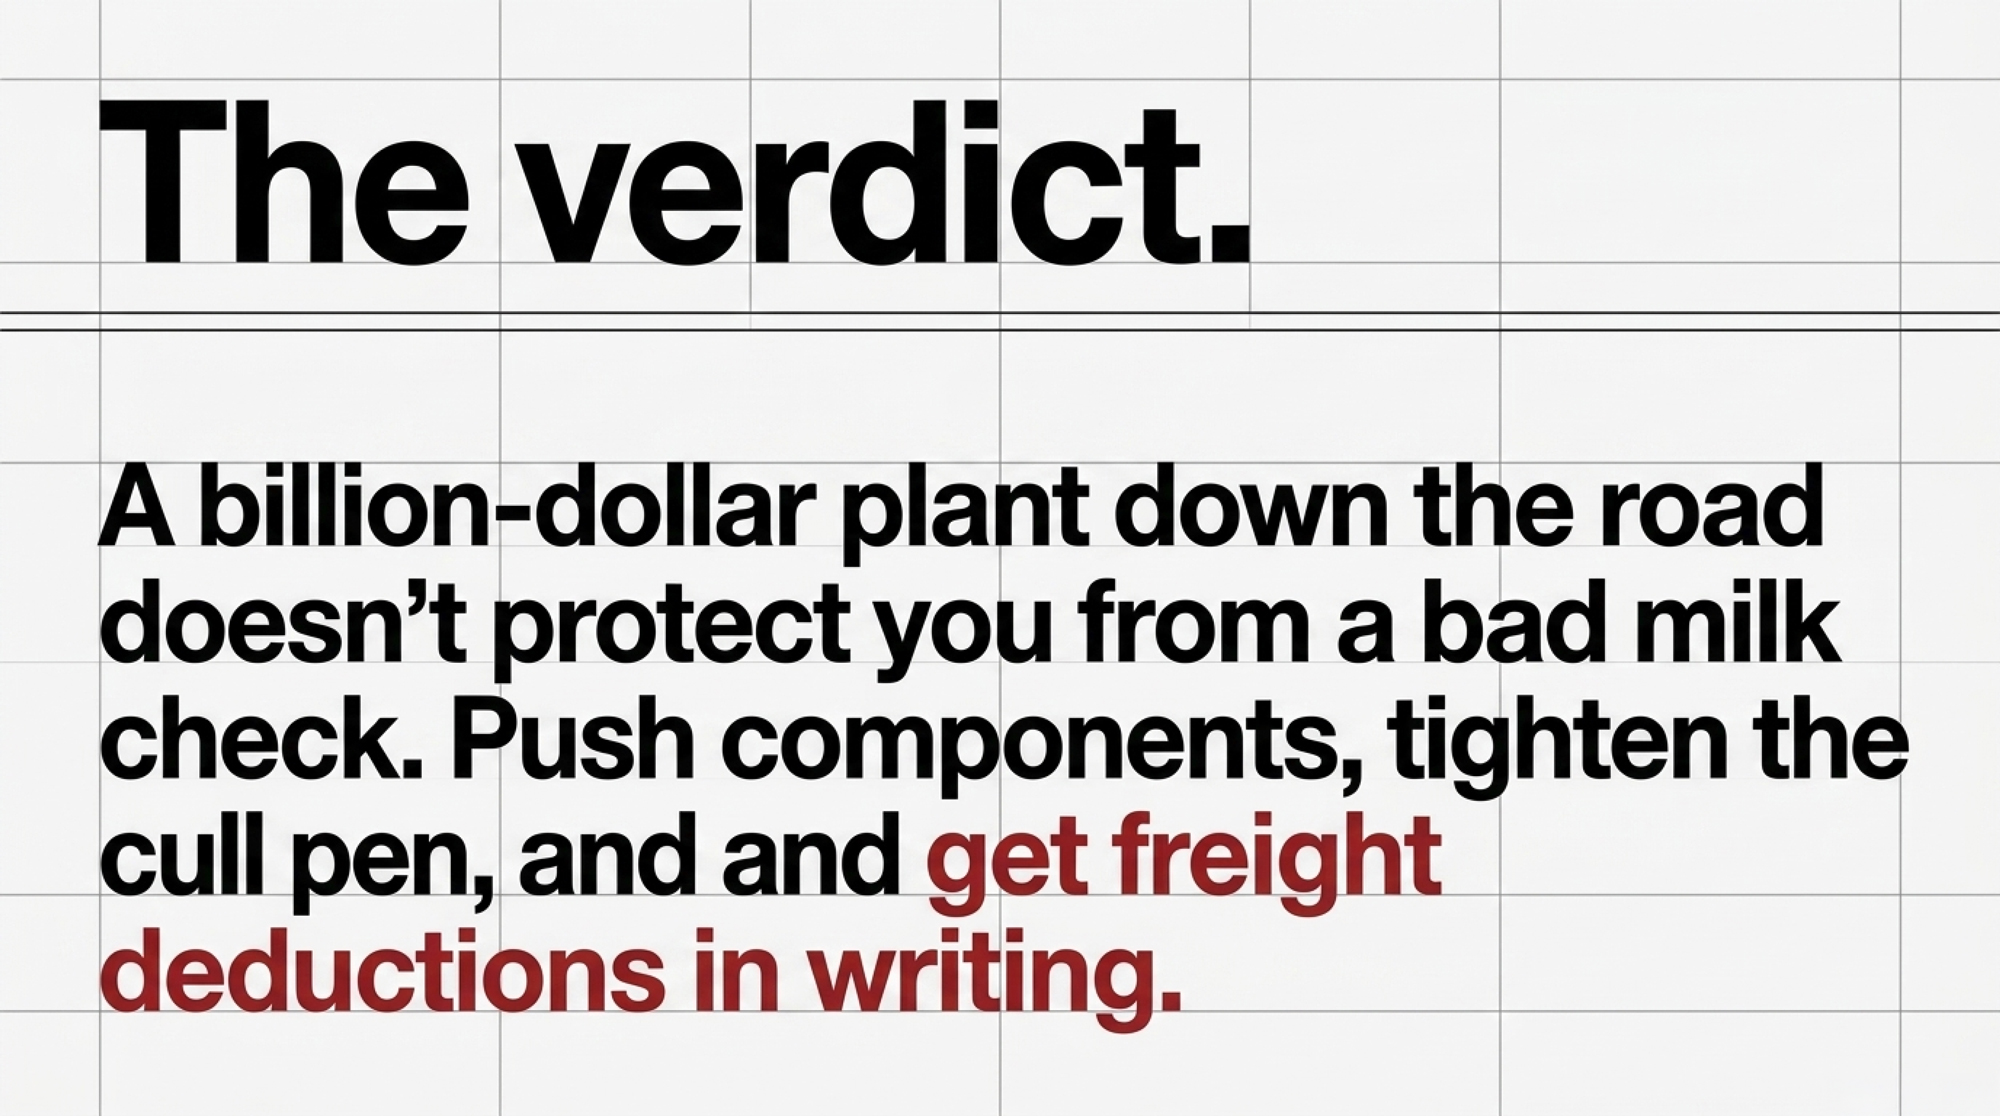
Let the operations that can absorb a miss take the risk on $4,400 springing heifers. If you’re running 150 to 500 cows, your play isn’t expansion — it’s efficiency. Push components on the cows you already own, tighten what leaves in the cull pen, and if a regional demand squeeze does materialize as the plant ramps, be positioned to negotiate a better basis from the handler you already ship to. That’s how a mid-sized operation captures value from a plant it doesn’t have a contract with.

A billion-dollar plant down the road doesn’t protect you from a bad milk check. The producers who win when Allentown opens won’t be the ones who gambled their balance sheets on $4,400 heifers. They’ll be the ones who forced their co-ops to put freight deductions, component premiums, and destination clauses in writing today.

So send the email. Then check what your neighbors get back — because if their answers differ from yours, that tells you something about how this pool actually works.

Key Takeaways

  • The $1.16/cwt over-order premium expired June 30 with no replacement order. On a 300-cow herd at Order 1’s 28.27% Class I utilization, that’s about $20,800 a year already gone — recalculate your Class I revenue before you model anything Chobani-related.
  • Allentown doesn’t take milk until 2027, but springing heifers were clearing $3,400 to $4,400 this spring. Buying replacements now against a plant with no public supply contract means carrying that cost through a start date nobody has committed to in writing.
  • Chase protein instead of headcount. A plant built for high-protein products pays through components, and component work holds its value whether or not your milk ever reaches Upper Macungie.
  • Get the routing answer in writing this week: which plant, how many miles, what rate per cwt. At USDA’s $0.00814 mileage factor, 50 added one-way miles costs a 200-cow herd roughly $17,200 a year — and a plant opening moves routes the same way St. Albans closing did.

The full milk-shed derivation, the county-level radius map, and the 300-cow break-even model — including what happens if the 2027 start slips — are coming in Bullvine Weekly. That’s where the numbers behind the decision live.

The Sunday Read Dairy Professionals Don’t Skip.

Every week, thousands of producers, breeders, and industry insiders open Bullvine Weekly for genetics insights, market shifts, and profit strategies they won’t find anywhere else. One email. Five minutes. Smarter decisions all week.
NewsSubscribe
First
Last
Consent

Complete references and supporting documentation are available upon request by contacting the editorial team at editor@thebullvine.com.

Learn More

Send this to a friend