Archive for Wisconsin dairy farms

Clark County Has 609 Dairy Herds and Pays 44¢/cwt to Haul Milk. Juneau County Has 36 and Pays $1.29.

Wisconsin fell below 5,000 licensed herds on August 1. Federal payroll data shows what that thinning costs on a 120-cow milk check — and it depends on which county line you farm inside.

Wisconsin milk hauling
Aerial shot of a milk tanker driving along a road between dairy farms, collecting milk in the evening.

Clark County, Wisconsin had 609 licensed dairy herds on August 1, 2026 — more than any county in the state, according to USDA’s National Agricultural Statistics Service working from the Wisconsin DATCP producer license list. The average Clark producer paid 44¢ per hundredweight to move milk.

In Juneau County, 36 herds were left. The average Juneau producer paid $1.2898.

Same state. Same month. Same federal study. On a 120-cow herd shipping 70 pounds a day, that’s roughly $26,000 a year in difference — before anyone makes a single decision about feed, labor, or debt.

Statewide, the count just crossed a line few expected this decade: 4,991 licensed dairy herds on August 1, down from 5,222 twelve months earlier, and the first time on record below 5,000.

The Milk Stayed. The Farms Didn’t.

Run the division and each of Wisconsin’s 4,991 remaining herds now moves about 6.6 million pounds of milk a year. That’s our own arithmetic — cow inventory times yield, divided by herd count — not something NASS or DATCP publishes. They report the three series separately.

The drop underneath it is well documented. Wisconsin had 7,292 licensed herds in January 2020. It has 4,991 now — a 31.6% decline in six and a half years while cow numbers held near 1.29 million and average production climbed to 25,599 pounds per cow.

The cows didn’t leave with the farms. The trucks just have fewer driveways to spread a load across — and that’s where the hauling math starts.

Two Auctions, and What the Record Actually Says

On September 30, 2025, the Downing family of Wonewoc sold their dairy cattle. The Gavin Bros Auctioneers listing says it flatly: they’d “sold their dairy cattle and are quitting farming.” Seven months earlier, Winkel Highland Dairy Farm near Elkhart Lake closed out its equipment in a retirement auction dated April 8, 2025.

That’s the whole public record on both. Farms exit for retirement, succession, health, a good offer, a son or daughter who wants something else — none of which makes it onto an auction bill. We don’t know why either family stopped milking, and neither does anyone else outside those two kitchens.

Geography put them in different positions, though, and that part is documented. Wonewoc sits in Juneau County, where the average producer paid $1.2898/cwt. Elkhart Lake sits in northwestern Sheboygan County — 78 licensed herds, but an average hauling charge of just 48¢, well under the state average. Whether either number had anything to do with either decision, the record doesn’t say.

Not Everyone’s Leaving

Miltrim Farms went the other direction. The Athens operation in Marathon County milks 3,100 cows and crops 5,100 acres solely for the dairy — split between 1,800 cows on 30 Lely A5 robots and the balance through a conventional double-24 herringbone parlor. Eighteen robots went in during 2019; twelve more followed in 2023.

The farm was established in 1988 by Scott Trimner, Tom Mueller and Martin Mueller, and now sits with the third generation — David Trimner and his wife Jessica Pralle-Trimner, who manages the dairy, alongside Andy and Jenny Miller. They bought it from the previous generation in summer 2024.

Co-owner David Trimner put the logic plainly to Xcel Energy in January 2026: “We don’t get to decide what we sell our milk for. It’s kind of based on the general market. And so you have to be very efficient with everything that you do.” That’s a long way from a 150-cow tiestall. It shows where capital’s flowing, not a template you can lift.

Statewide, the financial pressure has sharpened. Wisconsin’s Chapter 12 farm bankruptcy filings went from two in 2023 and two in 2024 to 16 in 2025, per U.S. Courts data reported by Wisconsin Public Radio. Nationally, Chapter 12 filings rose 46% that year with the Midwest leading. Those are 16 specific cases with court files behind them. For operations weighing the decision now, the timing gap between a planned dispersal and a forced one gets decided years ahead of the auction.

What Do Wisconsin Counties Actually Pay to Haul Milk?

There are two ways to average a county, and the difference matters more than you’d think. The simple average treats every farm equally; the study’s own footnote says it “increases the likelihood that it approximates a typical dairy farmer’s average hauling charge.” The weighted average weights by pounds shipped, so a couple of large farms can drag a county’s number way down. If you’re mid-size, the simple average is the one that looks like your milk check.

CountyLicensed herdsSimple avgWeighted avgAnnual, 120 cows
Clark609$0.4401$0.3037$13,493
Marathon324$0.4942$0.3178$15,152
Grant222$0.6180$0.5788$18,948
Sheboygan78$0.4786$0.4081$14,674
Juneau36$1.2898$0.9629$39,545
Bayfield7$1.2412$1.2569$38,055
Wisconsin4,991$0.7038$0.4711$21,579

Herd counts: USDA NASS, Wisconsin Dairy Producer License list, August 1, 2026. Hauling: Federal Milk Market Administrator Staff Paper 25-03, May 2025. Annual figures assume 70 lbs/cow/day — that assumption is ours.

Sheboygan is the honest complication. Only 78 herds, but 48¢ — because it sits close to processing and population, and the study lists distance to plants and handler competition right alongside farm concentration. Density isn’t the only variable. It’s just the one that changes when your neighbors quit.

THE DENSITY EQUATION

The five factors the federal study says set your rate:

  • Producer pounds
  • Distance to plants
  • Distance to population centers
  • Competition among handlers
  • Concentration of dairy farms in the local market

What that looks like on the ground:

HerdsRateCounty
60944¢Clark
7848¢Sheboygan — few herds, but close to processing
36$1.29Juneau

Wisconsin pays the lowest weighted hauling charge on the Upper Midwest order: 47.1¢, against 50.9¢ order-wide, 70.4¢ in Iowa and 80.4¢ in Illinois. The study credits the state’s “high number of farms generally in close proximity to high demand areas.”

That advantage rests on farm count and proximity to processing. One of those fell by 231 in twelve months.

Why Fewer Neighbors Can Raise Your Deduct

Here’s what happens when your neighbor sells. The truck still runs the route. It just fills slower, and the study doesn’t hedge on who carries that: “hauling costs are higher for smaller farms, given the increased number of stops in order to fill out a load.” Most Upper Midwest handlers charge a flat hauling fee regardless of volume. Fewer pounds, same fee, higher cost per hundredweight.

You can see it in Wisconsin’s size brackets. Producers shipping under 50,000 pounds a month paid $1.0433/cwt in May 2025. Producers shipping 5 million pounds or more paid 33.3¢ — right around a third of that. Distance is the other half of the equation, and we’ve watched what happens to a route when a plant closes and the milk suddenly has to travel.

Where the plants get built decides who has leverage, which is why processor investment patterns matter as much as herd counts.

Then there’s fuel, which behaves oddly here. Midwest diesel fell 7.68% between May 2024 and May 2025, while average hauling charges moved just −0.84% over the same stretch. Fuel is one input among several — labor, equipment, and insurance all move too — and the study doesn’t pin that gap on any single cause. Worth asking your co-op about anyway.

Is Your Herd Size Even the Right Benchmark?

Wisconsin’s average herd is around 260 cows. Milking 120 or 200, it’s easy to read that as falling behind.

Don’t. The 2022 Census of Agriculture puts the median Wisconsin dairy farm in the 50-to-99-cow bracket, where the bracket average was 67 cows — against a state average of 203 that same year. The average sat roughly three times higher than the midpoint of the bracket the median farm falls in. A handful of very large operations drag it up: 61.8% of Wisconsin dairy farms milked fewer than 100 cows in 2022, and together they held 12.9% of the state’s milk cows. The 217 farms above 1,000 head — 3.5% of operations — held 36.2%.

So at 120 or 200 cows, you’re not behind the typical Wisconsin dairy farm. You’re well ahead of it. (One caveat: the Census counts farms with milk cow inventory, a slightly different universe than DATCP’s licensed-producer list, so the two counts don’t line up exactly.)

Metric50–99 cow bracket (median farm)State average
Herd size67 cows203 cows
Share of WI dairy farms61.8% (farms <100 cows)
Share of WI milk cows held12.9%100%
Monthly lbs shipped (70 lbs/cow/day)~143,000 lbs
Hauling rate bracket$0.604/cwt (100k–249k lb bracket)$0.4711/cwt weighted
Extra annual hauling cost vs. state weighted avg+$2,280/yearbaseline

That loops straight back to the truck. A 67-cow herd at 70 lbs/day ships about 143,000 pounds a month, landing in the 100,000–249,999 bracket at 60.4¢/cwt — roughly 28% above the state weighted average. On 17,200 cwt a year, that’s about $2,280 more than the state-average farm pays for the same service. The median Wisconsin dairy farm is already sitting on the wrong side of the hauling curve.

Three Things to Run Before Your Next Budget Meeting

Action 1 — Audit your milk check against your county. Do this within 30 days.

What to do: Pull Staff Paper 25-03, free at fmma30.com. Find your county in the Wisconsin table. Use the simple-average column. Compare it against the hauling deduct on your last milk check.

What it tells you: Whether you’re paying a typical rate for your area or an outlier rate. If you’re materially above your county’s simple average, that’s a specific question for your field rep backed by federal data — a data point, not a complaint.

The limit: Counties with fewer than three producers are restricted from the data entirely. And where simple and weighted diverge sharply, one large farm is doing the work — Adams County reads $0.9173 simple against $0.0671 weighted.

Action 2 — Find the volume cliff nearest you.

What to do: Calculate your monthly pounds shipped. A 250-cow herd at 70 lbs/day ships roughly 532,000 lbs a month — just under the 600,000 lb line where Wisconsin’s rate drops from 63.2¢ to 53.2¢/cwt.

The math: Add about 32 cows and you cross it. Total annual hauling falls from roughly $40,400 to $38,400 — while shipping more milk.

The limit: Not a reason to expand on its own. But it’s a real line most expansion pro formas leave out entirely, and it can move a marginal project.

Action 3 — Stress-test new debt against your region’s ceiling.

What to do: Financing a barn or robots? Run the pro forma at $1.29/cwt alongside your current rate.

The math: Against Wisconsin’s all-milk price of $17.70/cwt in February 2026 — the most recent state figure NASS has published — Clark’s 44¢ is 2.5% of gross, the state simple average of 70¢ is 4.0%, and Juneau’s $1.29 is 7.3%. Prices have recovered since; the U.S. all-milk price was $21.10/cwt in June 2026, pulling those shares to 2.1%, 3.3%, and 6.1%.

The trade-off: This can make a sound project look worse on paper. It also means you find the sensitivity before your lender does. While you’re at it, price the permit timeline in before you finance the barn.

And three more lines belong in that same pro forma. Hauling isn’t the only cost that behaves differently at your scale, and if you’re already running the sensitivities, run these alongside it.

The first is labor, which doesn’t shrink with effort. USDA Economic Research Service puts total labor — hired plus unpaid family — at $13.18/cwt for herds of 10–49 cows, $5.12/cwt at 100–199 cows, and $1.85/cwt on farms with 2,000 or more (ERR-274, MacDonald, Law and Mosheim, 2020, ARMS 2016 data, national scope). Note the vintage — directionally solid, but not 2026 dollars. The full breakdown by herd-size band is here.

The second is the zero-deduct farms that skew every average you’ll read. 327 Wisconsin and Michigan UP farms showed no hauling deduction on handler payroll in May 2025, usually because they self-haul or use a third party outside the payroll system. Strip those out and Wisconsin’s weighted average jumps from 47.1¢ to 60.1¢/cwt. If you pay a deduct, the higher number is closer to your world.

The third only matters if exit is genuinely on the table inside five years — but if it is, start the tax and succession conversation now. The equity difference between a planned dispersal and a forced one gets decided years ahead of the auction, not weeks.

Key Takeaways

  • Can’t recall your hauling deduct? That’s this week’s phone call, not next quarter’s.
  • County herd count dropped since 2024? Treat hauling as a variable cost in this year’s budget, not a fixed one. The NASS county table publishes annually and it’s free.
  • Comparing yourself to a county average? Use the simple-average column. The weighted column describes the county’s biggest shippers, not you.
  • Two neighbors gone off your route since 2024? Run your annual cwt against both your current rate and your county’s simple average. That difference is your exposure.
  • Milking 50 to 99 cows? You’re the median Wisconsin dairy farm — and the median already pays roughly 28% above the state’s weighted average.
  • Shipping just under 600,000 lbs a month? Price out what crossing that line does to your total hauling bill before you rule out expansion on cost alone.
  • Would 44¢ to $1.29/cwt break your debt service? Hauling isn’t the problem. The margin structure is, and you’ve got more options now than you will later.

Go Count the Farms on Your Road

Count how many are still shipping within ten miles of your driveway, then count how many were there five years ago.

That number tells you more about next year’s milk check than the state herd count ever will. Wisconsin’s cheap hauling is built on farm density and processor competition, and both are moving. The question worth raising at the next co-op meeting isn’t whether the state count keeps falling — it’s what your route looks like when it does.

We’re testing the density-versus-cost relationship across all seven Order 30 states, with the outliers explained instead of smoothed over, for an upcoming Bullvine Weekly. That’s where the full county tables and the sensitivity model will live.

Run Your Numbers

Dairy Profit Projector — That 85¢ spread between Clark and Juneau is a margin-per-cwt problem. Drop in your herd size, milk, and ration, and the Projector returns your breakeven milk price and 12-month margin per cwt — so you can see what a hauling swing actually does to the year.

Methodology note: County herd counts come from “Wisconsin Milk Cow Herds by Type of Milk Produced, Number and Percent by County, August 1, 2026,” USDA National Agricultural Statistics Service, based on the Dairy Producer License list, Division of Food Safety, Wisconsin DATCP. Herd-size distribution comes from the 2022 Census of Agriculture, Wisconsin, Table 17, USDA NASS; the median is derived by cumulative farm count across published brackets and falls within the 50–99 cow class — NASS does not publish a median. Hauling charges come from “Milk Hauling Charges in the Upper Midwest Marketing Area, May 2025” (Staff Paper 25-03), by Dr. Areerat Kichkha, Agricultural Economist, Federal Milk Market Administrator’s Office, Minneapolis, September 2025, covering 7,805 producers, 5,073 of them in Wisconsin. Herd-count and hauling datasets are fifteen months apart. Milk-per-herd figures are The Bullvine’s own calculation. Labor figures are USDA ERS ERR-274 (MacDonald, Law and Mosheim, 2020), ARMS 2016 data, national scope. Wisconsin all-milk price from USDA NASS Agricultural Prices via the DATCP Wisconsin Farm Reporter. Miltrim Farms details come from the farm’s own published history, American Dairy XPO 2026 speaker materials, Farm Progress (2023), and a January 2026 Xcel Energy feature. The auction records referenced are public listings; they state no reason for either exit, and no financial circumstances of either family are known to us or asserted here. Herd-size equivalents assume 70 lbs/cow/day and are ours. Counties with fewer than three producers are restricted in the federal data and excluded here. All figures USD. Corrections and farm-specific data welcome.

Learn More

The Sunday Read Dairy Professionals Don’t Skip.

Every week, thousands of producers, breeders, and industry insiders open Bullvine Weekly for genetics insights, market shifts, and profit strategies they won’t find anywhere else. One email. Five minutes. Smarter decisions all week.

NewsSubscribe
First
Last
Consent

Kevin Spahn Won a National Title. Coming Home to 180 Cows Is the Harder Game. 

A Wisconsin farm kid anchored UW-River Falls to a historic Division III championship — and heads home this spring to a dairy where the succession math will define what happens next.

On January 4, 2026, UW-River Falls beat North Central College 24–14 at Tom Benson Hall of Fame Stadium in Canton, Ohio — capturing the program’s first-ever NCAA Division III national championship and capping a historic 14-1 season. Kevin Spahn, a 6-foot-3, 282-pound senior center out of Middleton, Wisconsin, was on that offensive line. So was the work ethic he’d built on his family’s dairy.

“It was really surreal,” Spahn told Dairy Star. “Growing up, you always dream of being able to play at a big stadium…Walking out and playing on that field at night, it was such a surreal moment that most of us on the team dreamed about since we were kids.”

He’s expected to graduate this spring with a bachelor’s degree in dairy science, management option. The trophy goes on a shelf. The question now is whether the family operation — Spahn Dairy, approximately 180 cows milked through a double-12 herringbone parlor near Middleton — can build a path that brings him back.

Kevin Spahn holds the Stagg Bowl trophy in the UW-River Falls locker room after the Falcons’ 2025 NCAA Division III football title. It’s the high point of a career built on early mornings in the barn — and the moment before the harder decision starts: what comes after football for a farm kid weeks from a dairy science degree.

The Season Nobody Saw Coming

UW-River Falls hadn’t made the playoffs since 1996. This team went 14-1, knocked off defending national champion North Central College — who had won 29 straight games — and did it on the biggest stage Division III football has. In the semifinal against Johns Hopkins, Blaha threw for 520 yards and five touchdowns in a 48-41 shootout that racked up 632 total yards for the Falcons. The championship was more controlled but no less dominant.

Quarterback Kaleb Blaha finished that title game with 419 total yards and three touchdowns, and broke the NCAA single-season total scrimmage yards record at 6,189 — surpassing the mark Joe Burrow set at LSU in 2019. Spahn didn’t throw any of those passes. He’s the guy who made sure nobody got to the guy who did.

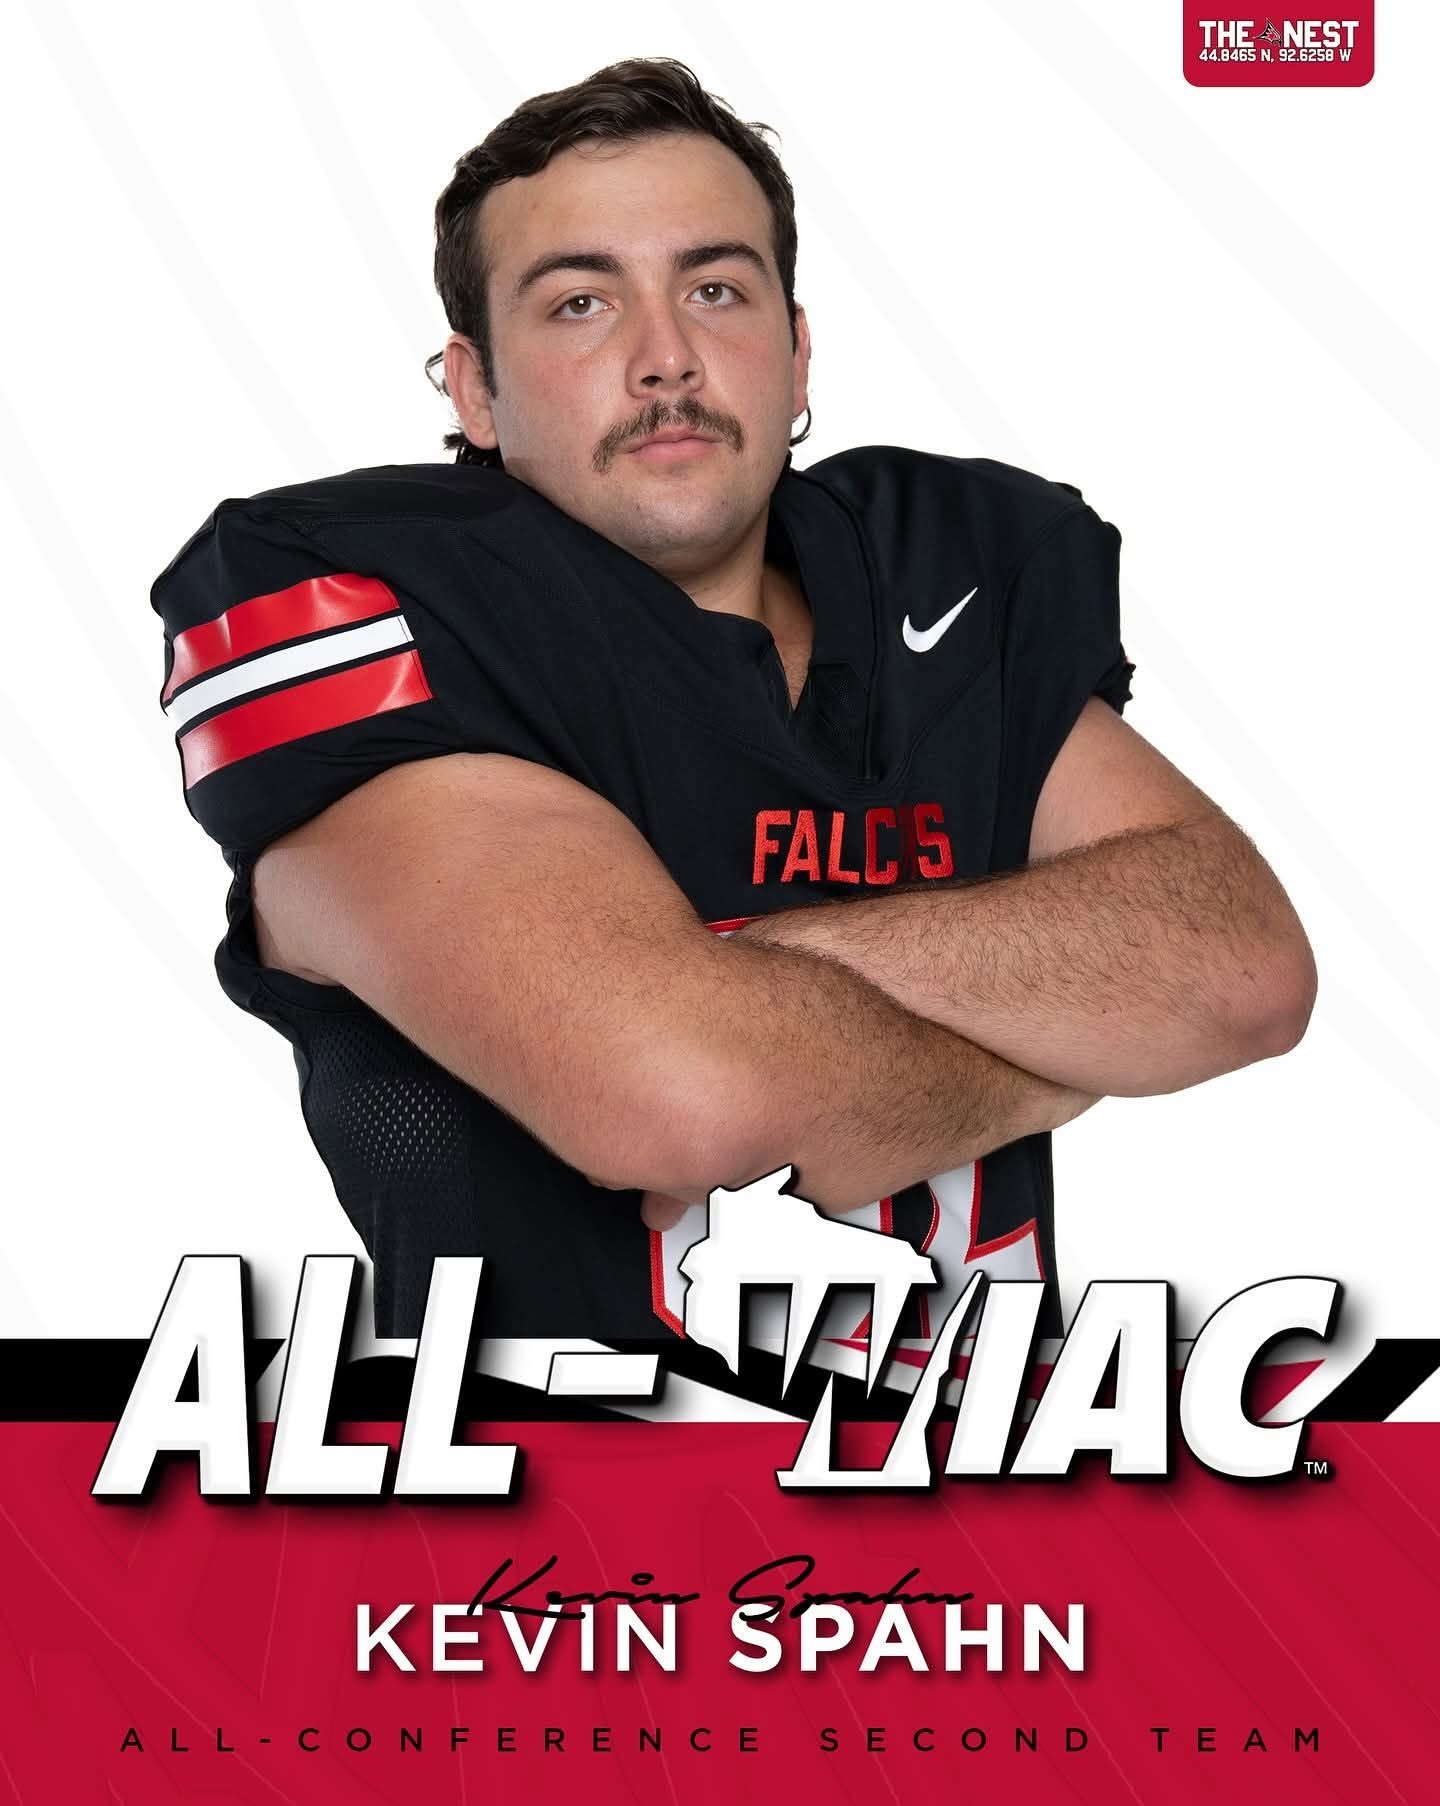
UW-River Falls recognized Kevin Spahn as an All-WIAC second-team offensive lineman, the conference honor that capped his role on a national-title team. The discipline behind it — graduating to college ball after early mornings in the parlor — is the same trait every dairy succession plan is quietly betting on.

Offensive linemen don’t make highlight reels. They make everything else possible. That tracks pretty cleanly with how dairy farms work, too.

“Growing up as a farm kid, it’s embedded to do things that aren’t going to come easy,” Spahn told Dairy Star. “That doesn’t mean you need to quit. Stay with it…You may not be better than everybody, but you can outwork everybody because hard work can beat talent if you just put your head down to work.”

What Kevin’s Dad Made Possible

Kevin Spahn (left) and his father, Joe, on the field in Canton, Ohio, after UW-River Falls captured the 2025 NCAA Division III football national championship at the Stagg Bowl. Joe runs the family’s 180-cow dairy near Middleton, Wisconsin — the operation that raised the lineman now weighing whether he can ever come home to milk it.

Here’s what doesn’t show up in the box score.

A 180-cow dairy near Middleton doesn’t run itself. Kevin balanced summer workouts, a job near River Falls, and academics during the school year. He returned home to help on the farm during breaks — but not during football season. That means Joe Spahn, Kevin’s father, shouldered the full operation through fall practices, road games, and a playoff run nobody planned for in September.

Joe traveled to Canton for the championship game — one of the few times he’d left the farm for more than a day, according to the Dairy Star profile. Kevin described his father as someone he couldn’t remember ever taking a full day off.

“I always offered [to help],” Kevin told Dairy Star. “But my dad said no, I didn’t need to rush home to help with chores and [that I should] enjoy it [school and football] a bit.”

That one line tells a bigger story than it looks like on first read. Kevin’s account, as reported by Dairy Star, describes a father who consistently prioritized his son’s development over his own convenience — on an operation where every pair of hands matters. The labor gap was real. Joe absorbed it. Whether that dynamic translates into a workable succession plan — a question the family hasn’t addressed publicly — is the chapter that matters most.

Can Your Kid Afford to Come Home?

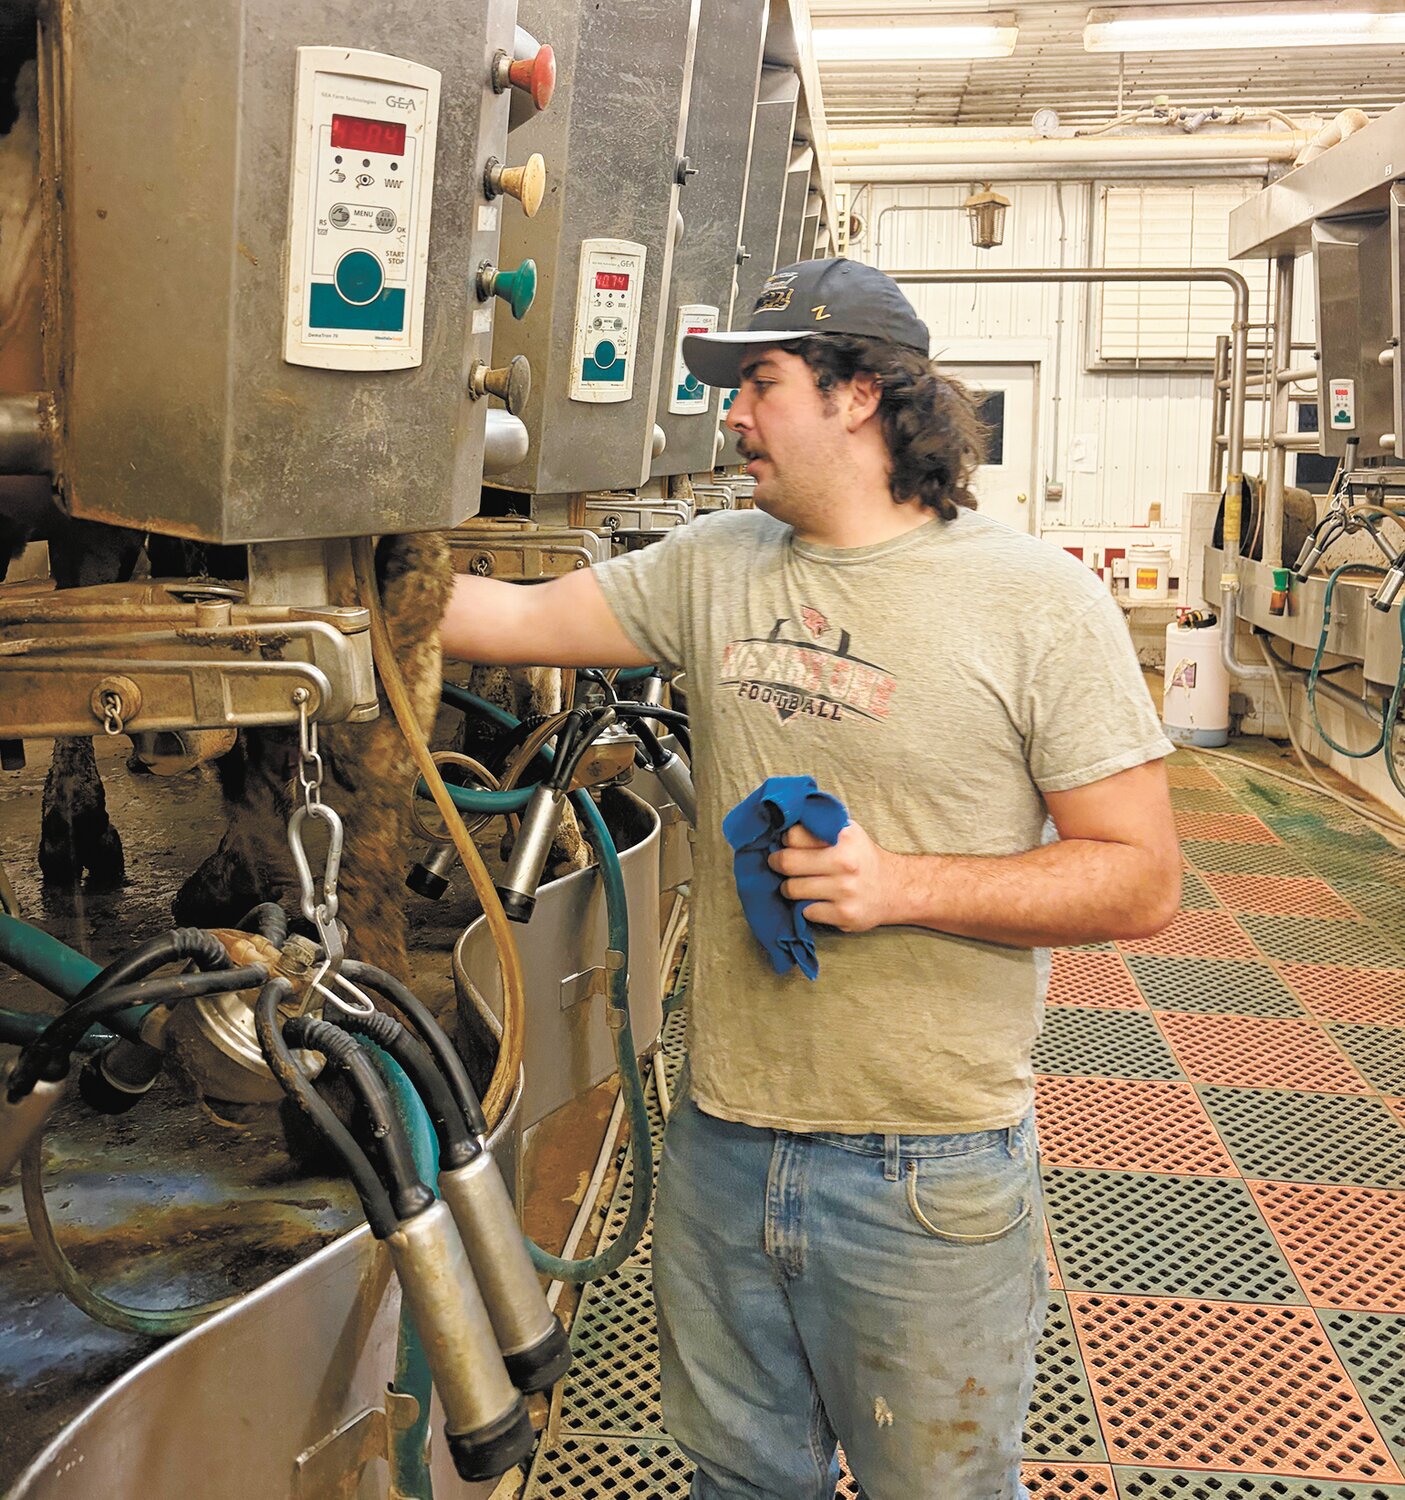
Weeks after winning a national title, Kevin Spahn cleans a cluster in the double-12 herringbone parlor at Spahn Dairy near Middleton, Wisconsin, milking the family’s roughly 180 cows over winter break Jan. 13. He graduates this spring with a dairy science degree — and the same question facing thousands of farm kids: whether the math will ever let him come home for good.

This is where the Spahn story becomes every dairy family’s story. And the math is blunt.

Dane County — where the Spahns farm near Middleton — saw agricultural land average $7,401 per acre in 2024 based on actual sales data (UW Extension Farm Management Program). But that average masks an enormous range: parcels traded for as little as $546/acre on marginal ground and as high as $15,440 where Madison’s suburban growth pushes prices. Near Middleton, where development pressure meets dairy country, usable farmland likely trades well above the county average.

Grab a napkin: 200 acres × $7,401 = $1,480,200. Land only. No cows. No parlor. No feed storage. No equipment.

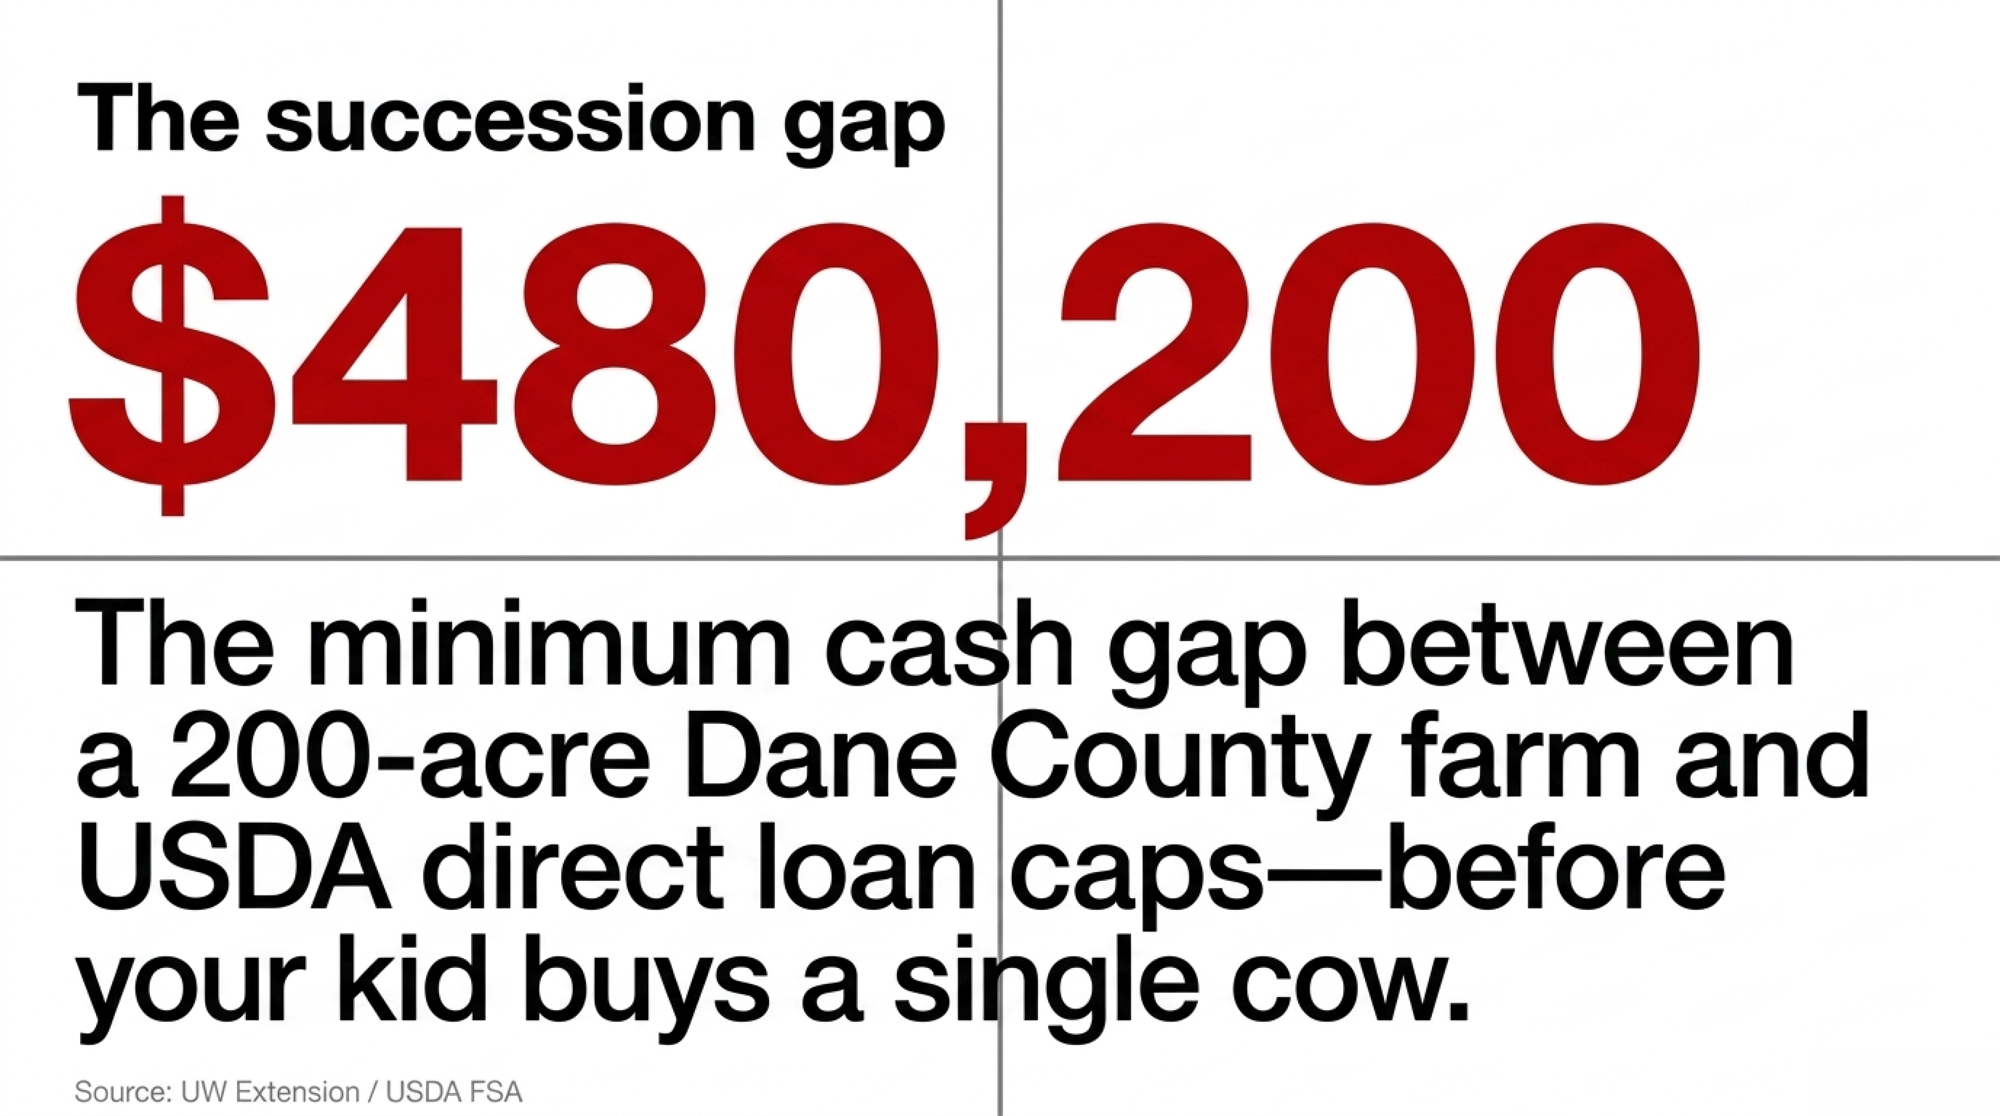
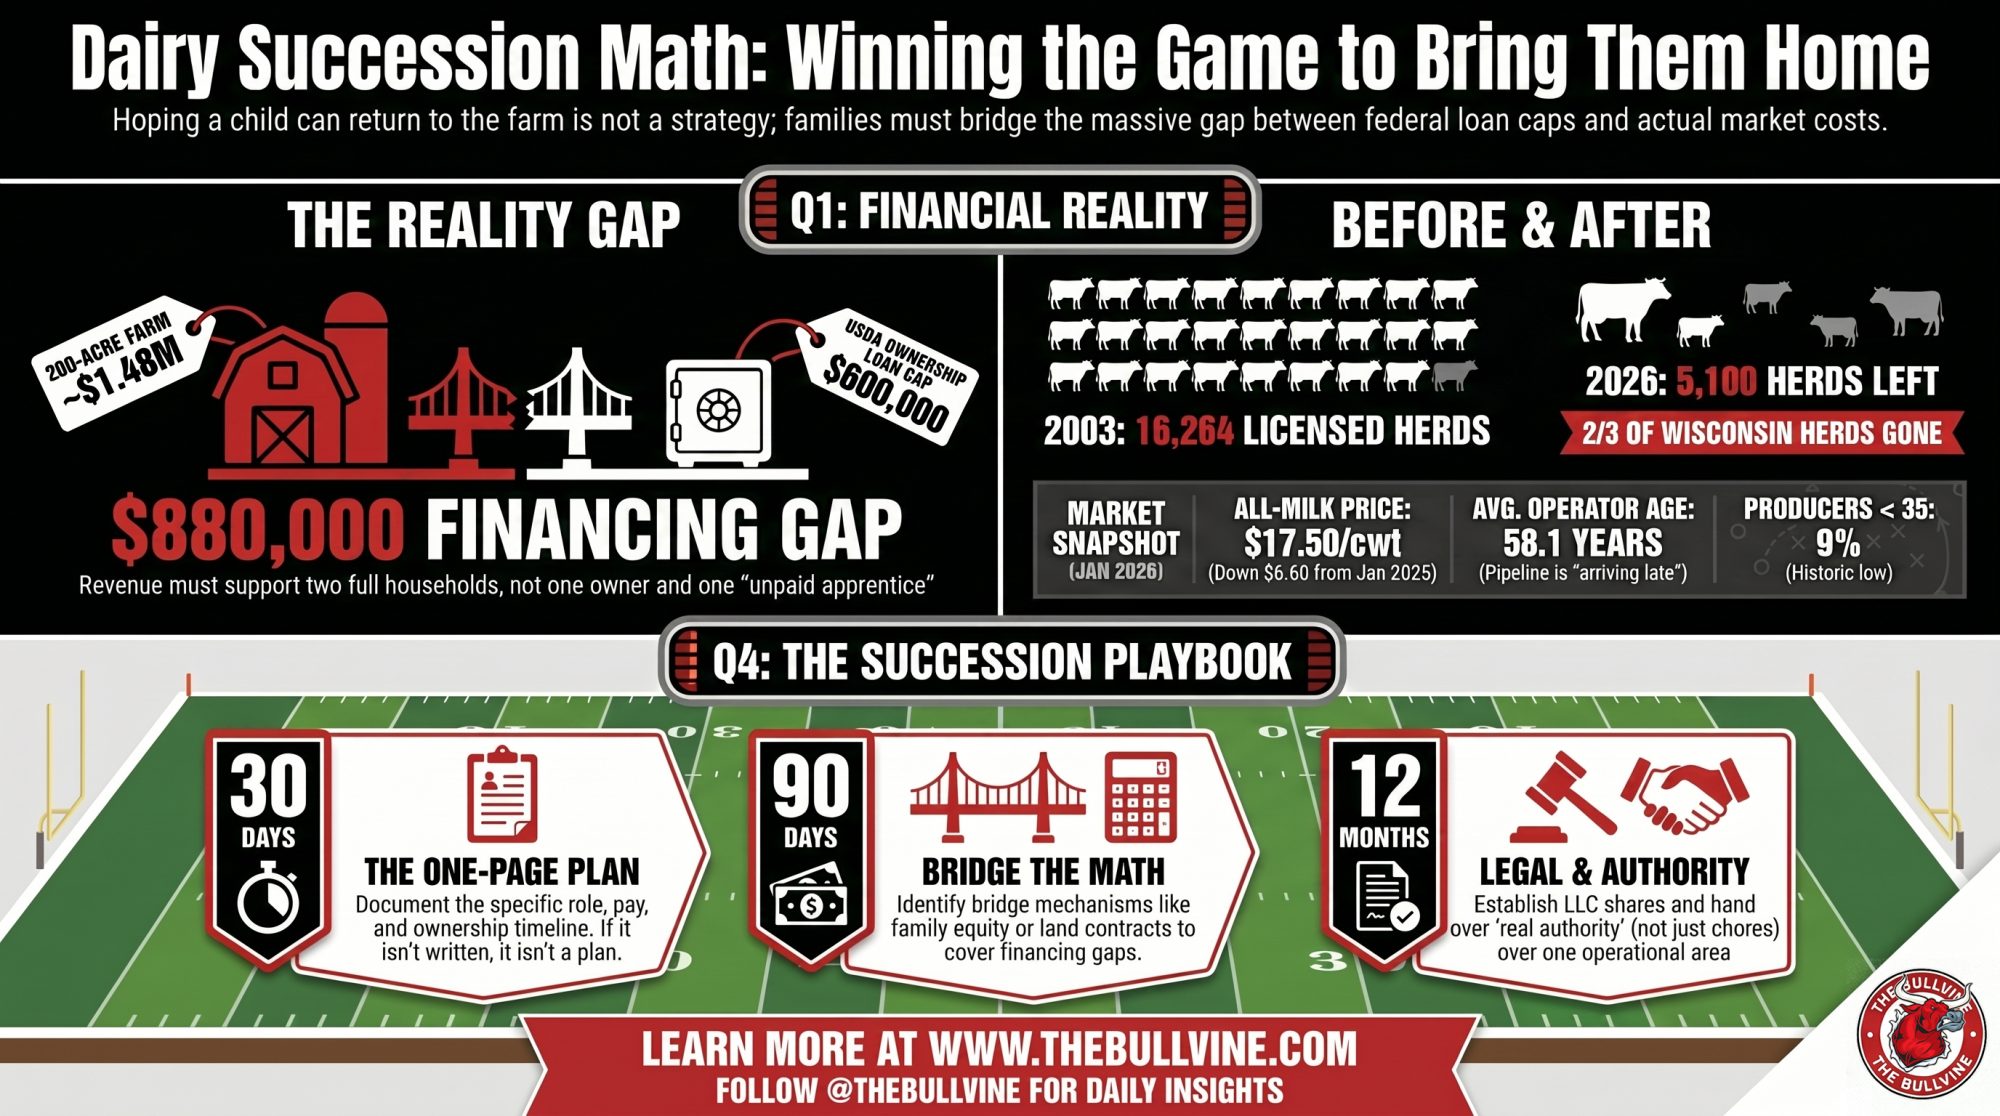
Now stack that against the available financing. USDA’s Farm Service Agency offers two direct loan programs — ownership loans for buying land and buildings (capped at $600,000) and operating loans for livestock, equipment, and feed (capped at $400,000). Combined ceiling on direct loans: $1 million. Guaranteed loans through a cooperating lender can go higher, but the borrower still needs the down payment and cash flow to qualify. The gap on direct financing alone — $480,200 before your kid buys a single cow — is where succession plans go to die.

And those numbers assume the county average. If you’re looking at parcels closer to Middleton at $10,000–$15,000/acre, the gap widens fast. Wisconsin’s statewide average runs about $6,363/acre (UW Extension, 2024 sales data), but the math doesn’t get friendlier in most active dairy counties. Revenue from 180 cows has to cover two households once the next generation arrives. Not one household and an unpaid apprentice.

Family equity, co-signing arrangements, graduated buy-in formulas, and land contracts aren’t optional workarounds. For most families without outside wealth, they’re the only way the numbers close.

MechanismHow It WorksBest ForKey RiskTypical Gap Coverage
Family Equity TransferParents gift/transfer equity stake at below-market valueEquity-rich operations with strong parent-child trustTax exposure; sibling conflictUp to 40–60% of gap
Land Contract / Installment SaleParents “hold the mortgage” directly; buyer pays over timeFamilies where parents want income stream in retirementRequires parent liquidity reservesFull gap, if structured well
FSA Guaranteed Loan (lender-backed)USDA guarantees up to 95% of loan; lender sets termsReturning farmer with some equity but no bank relationshipHigher total interest; still needs down paymentUp to ~$2.1M (2026 limits)
Co-Signing ArrangementParent co-signs commercial loan; kid qualifies for larger noteFamilies where kid has income history but limited collateralParent’s retirement assets at risk if operation failsDepends on lender terms
Graduated Buy-In (sweat equity)Kid earns ownership % annually via labor contributionOperations where cash is tight but labor is the real constraintNo legal structure = no protection for either partySlow; 10–15 year horizon
Outside Investor / Custom FarmingThird party provides capital; family retains operating controlLarge-scale operations; families comfortable with shared controlLoss of autonomy; exit clauses can be punishingPartial; covers capital, not land

5,100 Herds Left. Who’s Next?

Kevin Spahn wants to stay in dairy. He told Dairy Star he hopes to remain involved in working with dairy farms after graduation. But hoping and affording are two different problems — and the state-level data doesn’t make them any easier.

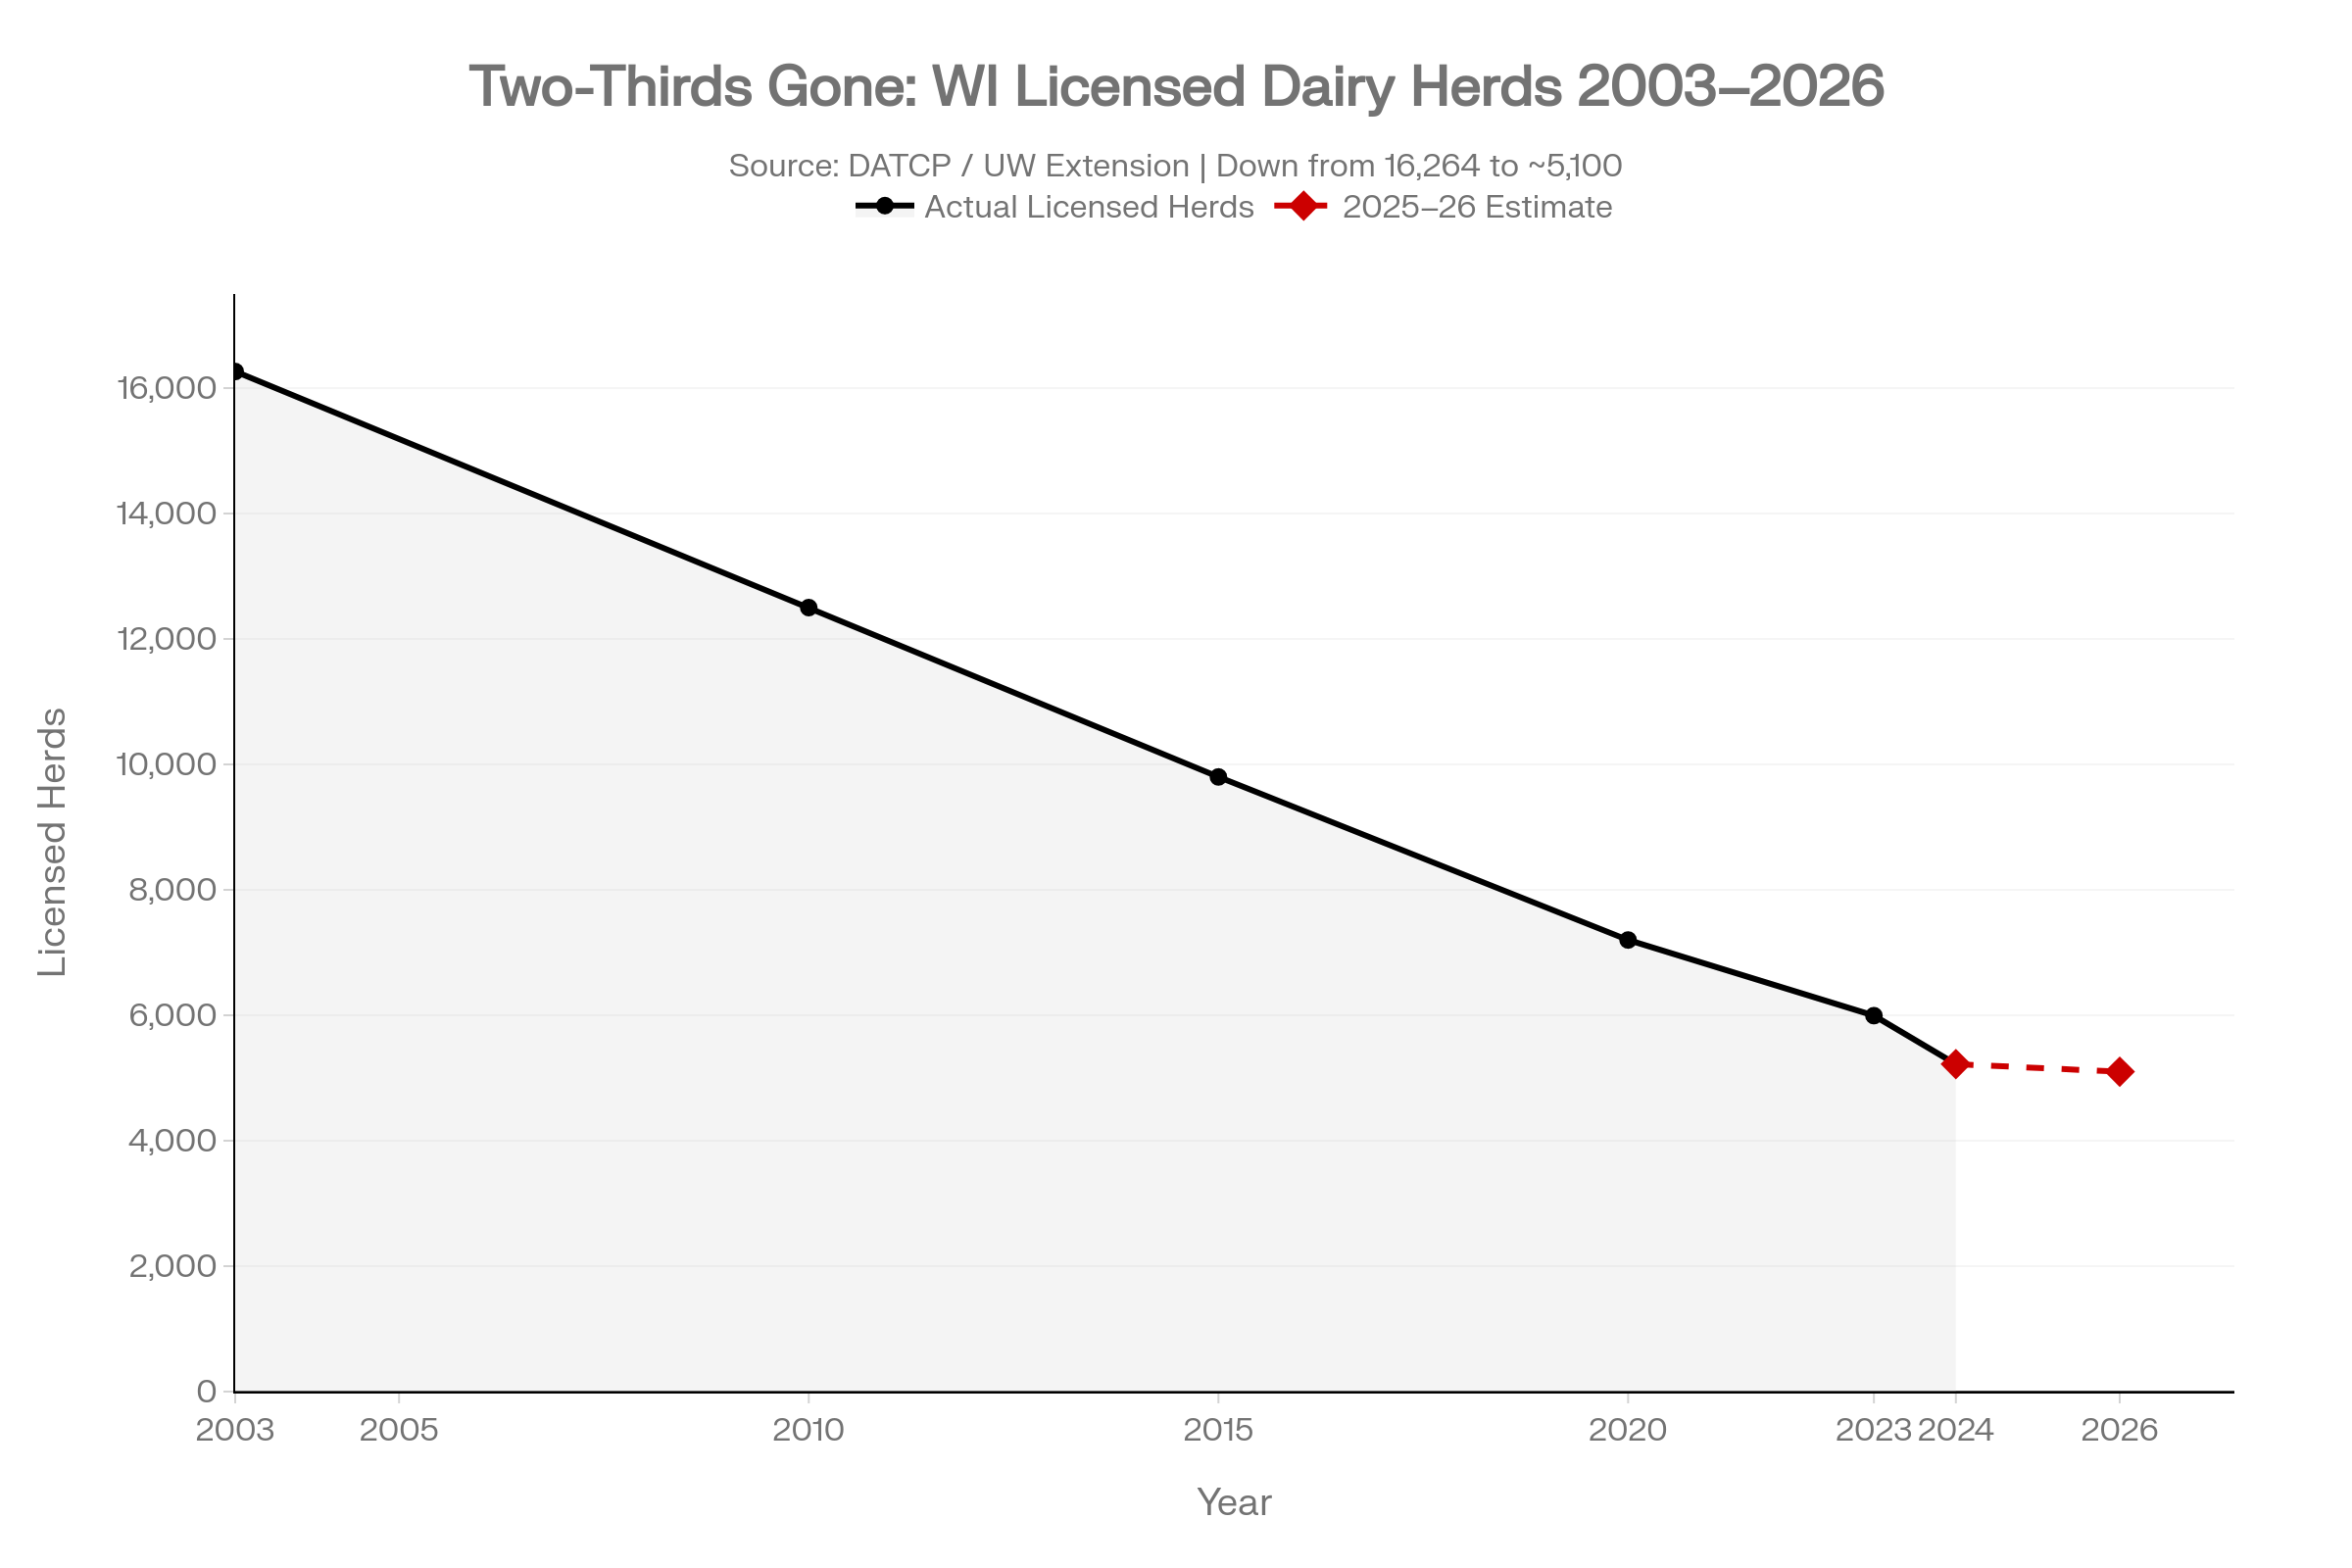
Wisconsin entered 2026 with roughly 5,100 licensed dairy herds. The state lost 455 herds in 2023 alone — a 7% decline that year (DATCP). By August 2025, the count sat at 5,222, down from 5,895 at the start of 2024. The pace has moderated, but the direction hasn’t changed. For perspective: Wisconsin had 16,264 licensed herds in August 2003. Two-thirds of the state’s dairies are gone in barely two decades.

At the current attrition rate, the question for families like the Spahns isn’t whether the decline continues — it’s who’s still milking by 2035.

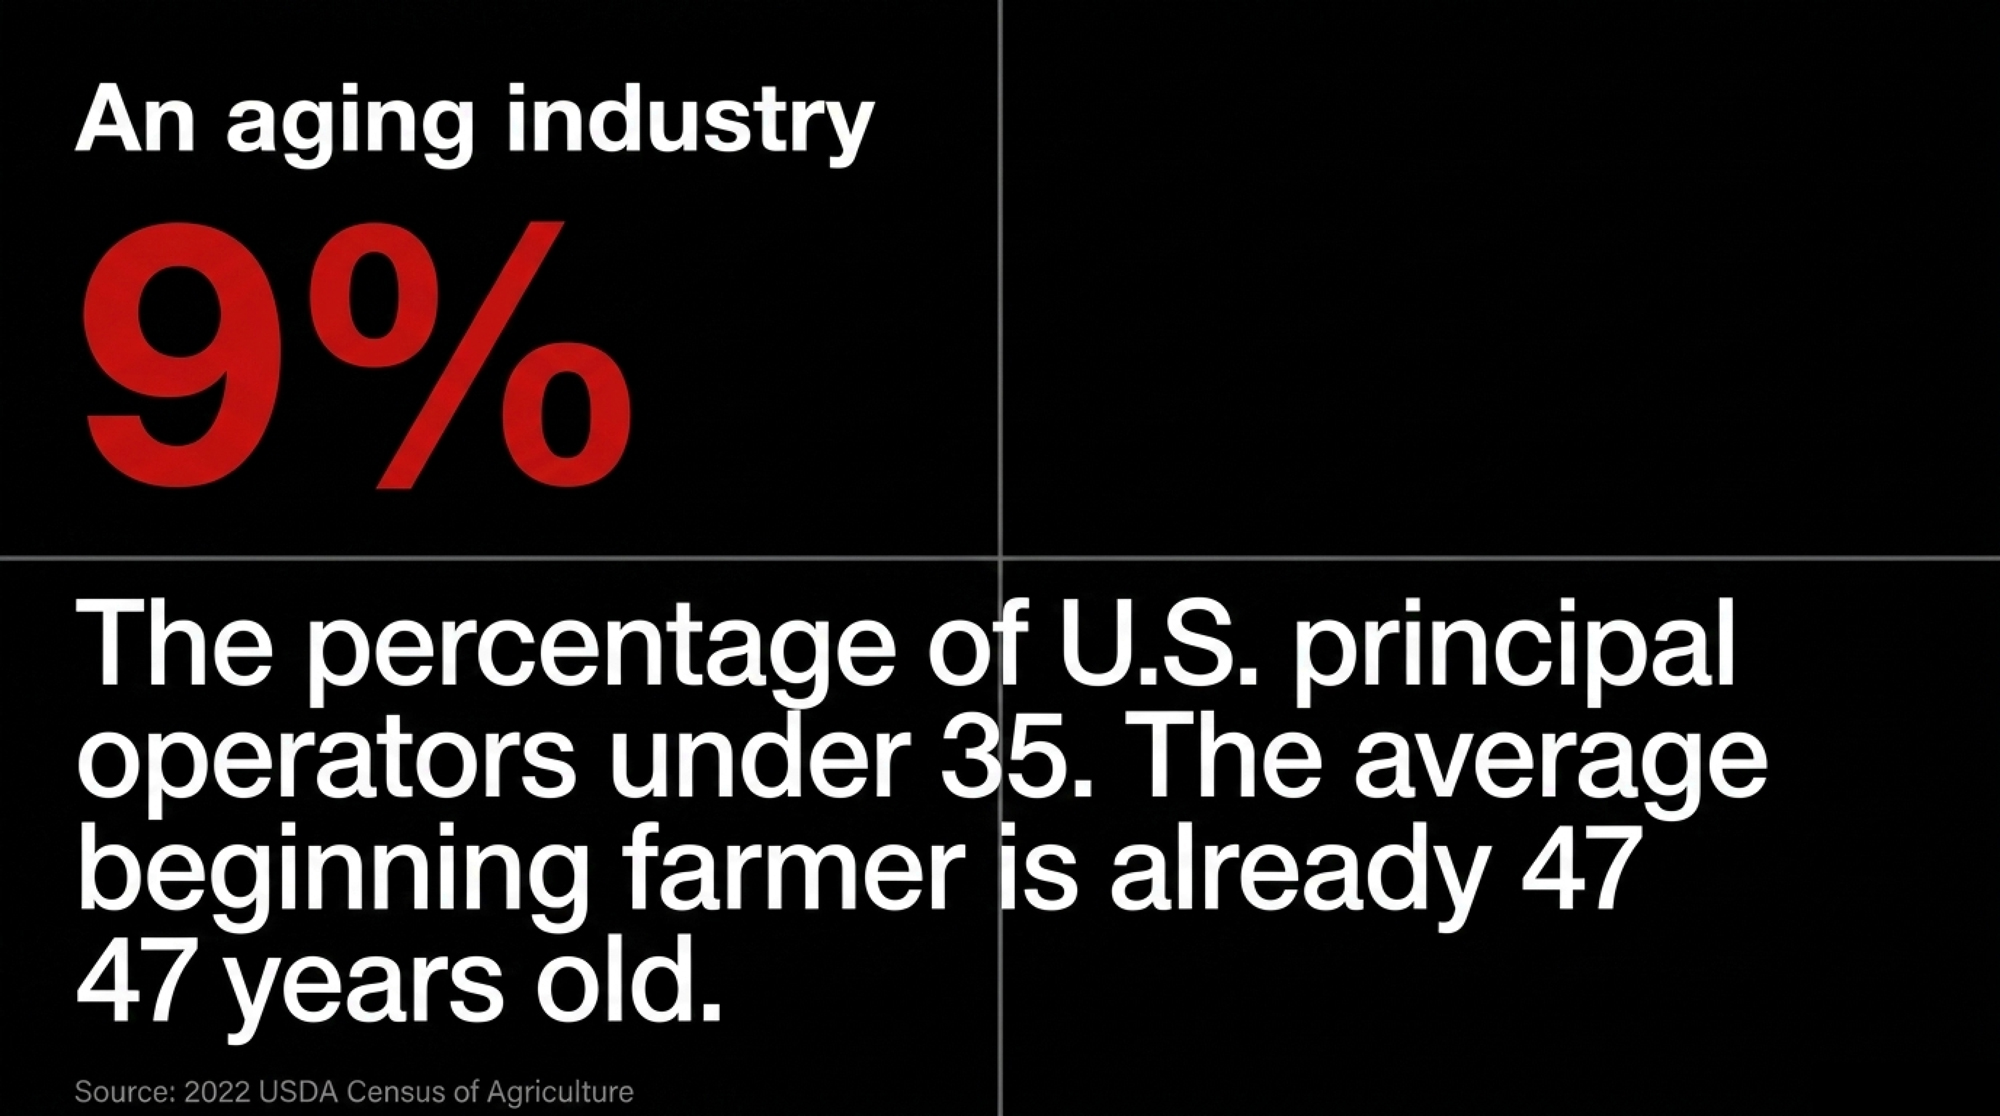
The 2022 USDA Census of Agriculture — still the most recent — pegs the average age of U.S. principal operators at 58.1. Only 9% of all producers are under 35. Beginning farmers average 47.1 years old, which means most people the USDA classifies as “new” to farming are already middle-aged. The pipeline isn’t empty. But it’s arriving late, underfunded, and walking into an industry where the price of entry keeps climbing.

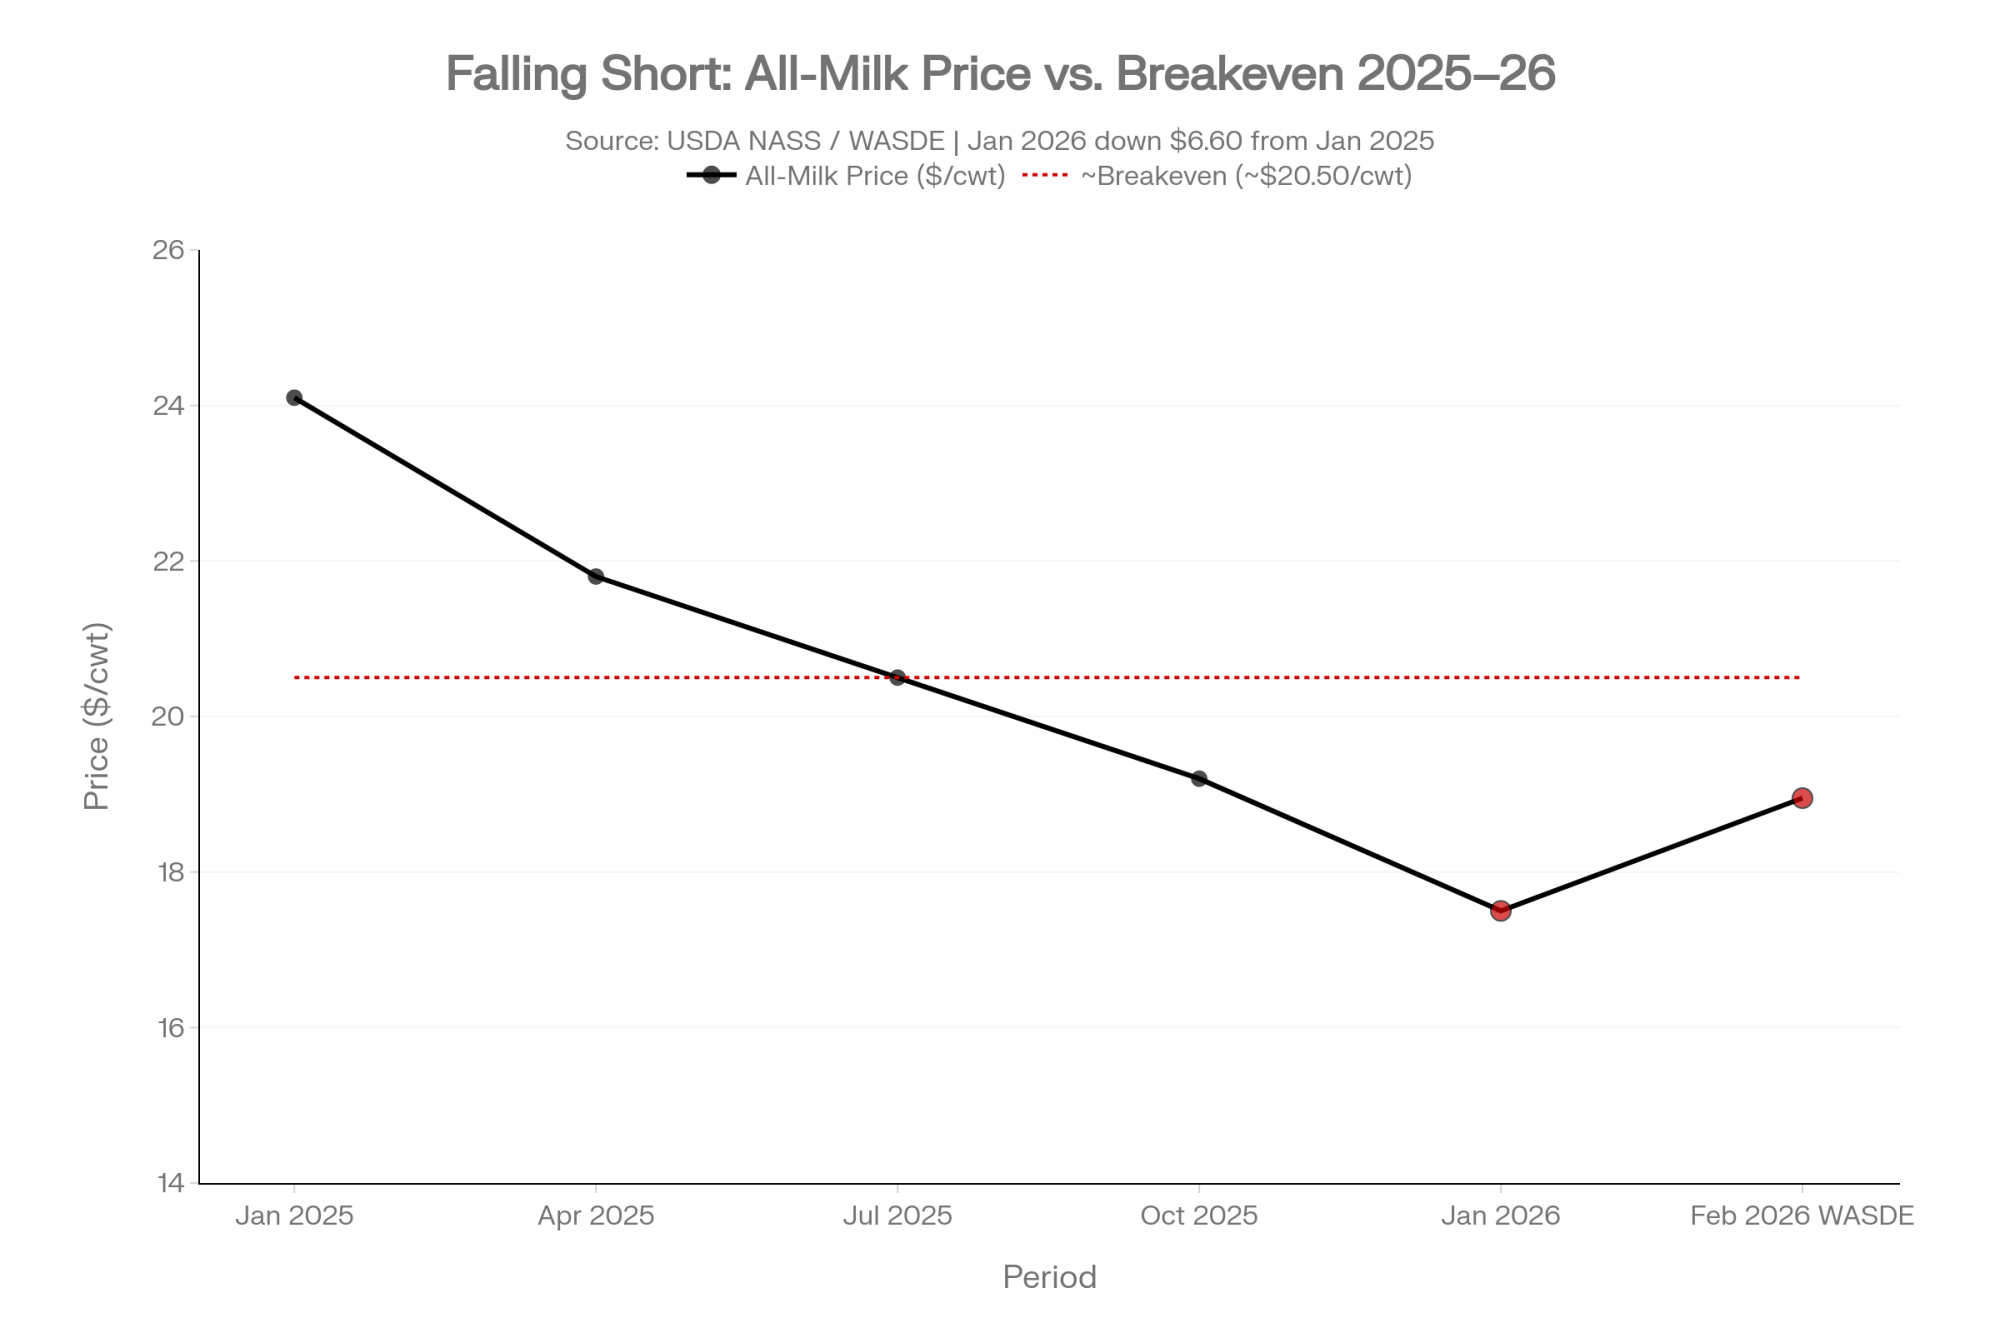
USDA’s February WASDE projects 2026 all-milk at $18.95/cwt. January’s actual all-milk price already came in at $17.50/cwt (USDA NASS, February 27, 2026) — down $6.60 from January 2025 and well below what most operations need. USDA’s own numbers suggest the 2026 all-milk forecast still leaves the average dairy in the red. Not a great backdrop for asking the next generation to buy in.

A Packers Legend Started on a 70-Cow Dairy. The Herd Didn’t Survive.

Wisconsin has seen this intersection of dairy and football before. Different era, different ending.

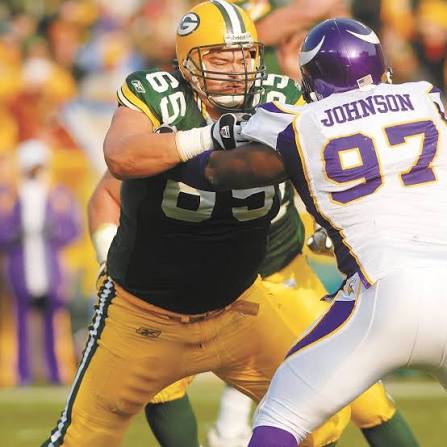
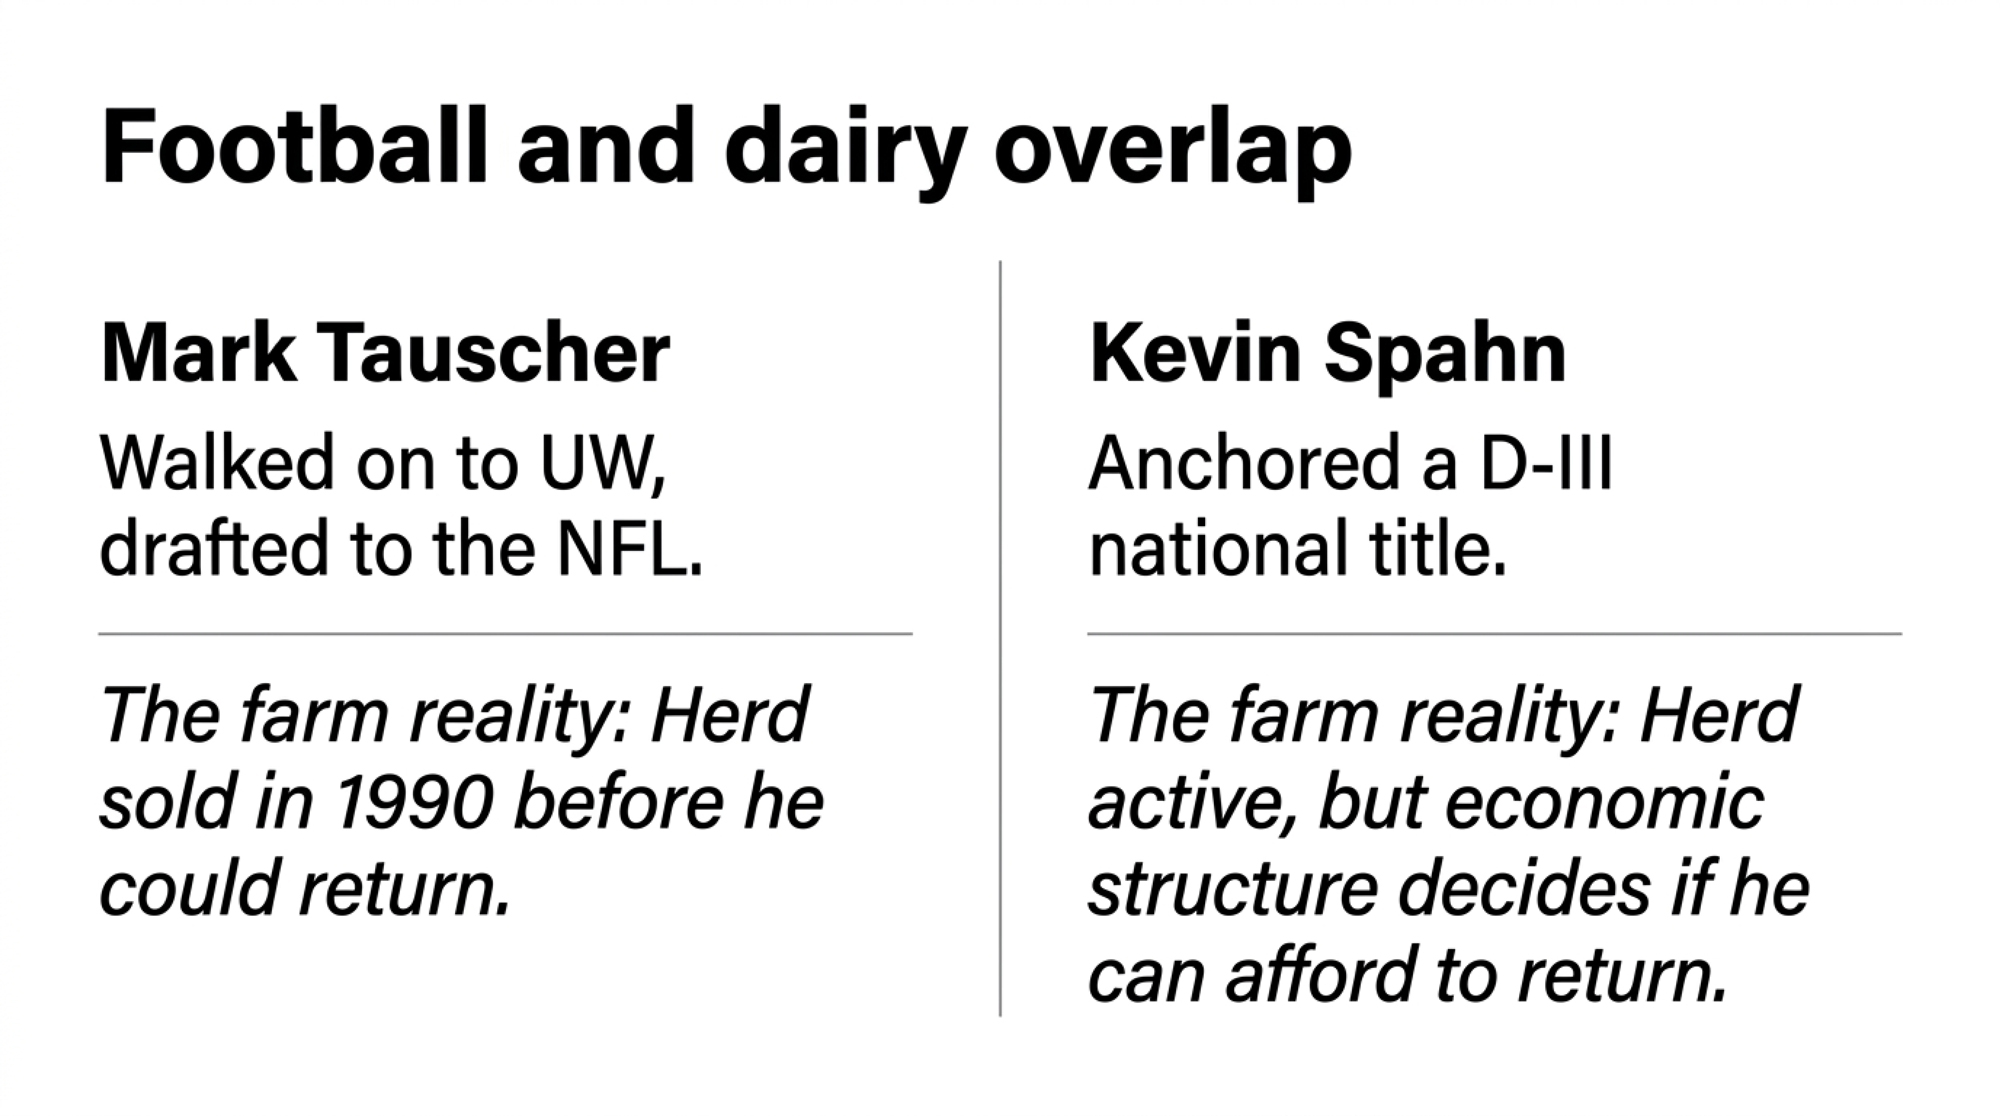
Mark Tauscher grew up on a roughly 70-cow dairy near Milladore, in Wood County. He walked on at UW-Madison after a Badger recruiting coordinator spotted him at the 1995 state basketball tournament. “Two weeks later, they asked me to walk on, and I decided to take it,” Tauscher recalled in a recent Dairy Star profile. That long shot turned into a seventh-round NFL Draft pick, 11 seasons with the Green Bay Packers, and a Super Bowl XLV ring. But the Tauscher family’s herd had been sold in 1990, while Mark was still a kid.

Growing up on his family’s dairy farm, Mark Tauscher never dreamed he would one day cap off an 11-year career with the Green Bay Packers, part of a team that brought the coveted Lombardi Trophy home to Wisconsin.

The dairy built the player. Tauscher told Dairy Star he was assigned to watch the barn cleaner chute at the age of 5. He recalled complaining to his dad about unloading hay on his birthday. His father’s response: “He told me the cows probably didn’t care it was my birthday, that you just have to go about doing your business every day.”

The work ethic carried Tauscher to the NFL. It didn’t carry him back to dairy. There was nothing to come back to — the herd was gone before he ever left home. That’s not about desire. It’s about timing and structure. And it’s the pattern that repeats across Wisconsin dairy country when the economics don’t leave anything for the next generation to return to.

The Bullvine previously covered a family that chose 5:30 AM chores over an NHL draft opportunity — a parallel story where the farm’s pull competed with elite athletics, and the outcome hinged not on the kid’s desire but on whether the family had built something financially viable to come back to.

Kevin Spahn has something Tauscher didn’t — a living herd, a father still milking, and a dairy science degree. His story doesn’t have to follow the same arc. But it won’t diverge by accident. The distance between those two outcomes isn’t talent or desire — it’s whether the family builds a structure that gives the next generation a reason to return and a way to afford it.

Options and Trade-Offs for Your Operation

If you’ve got a kid in college, playing a sport, working off-farm, or still figuring things out — and you want them to have a genuine option to come back — here’s what the economic math demands.

Within 30 days: Write a one-page return plan. Not a vague conversation. A document. What’s the role? What’s the pay? What decisions does the returning generation own? What’s the timeline to real equity? If you can’t fill one page, you’re not ready to have the conversation. This works whether you milk 80 cows or 800.

Within 90 days: Run the transition math. What does the operation need to generate to support two households, not two people, two households? If your county’s land runs anywhere near Dane County’s $7,401/acre average and FSA direct ownership loans cap at $600,000, your kid needs a bridge. Family equity, co-signing, graduated buy-in, or land contracts.

Pull up your county’s numbers from the UW Extension land price data and calculate the gap yourself. If your kid looks at the financials and sees 15 years of labor before any ownership stake, you’ve answered the succession question for them. They just haven’t told you yet.

Within 12 months: Build the legal structure. LLC or partnership shares. A buy-in formula. An exit clause for both sides. And at least one operational area — youngstock, cropping, parlor management, whatever fits — handed off with real decision-making authority. Not “help me with” authority. Actual authority over outcomes and accountability.

If signals shift — commodity prices crater, your kid picks a different path, health changes the timeline — revisit the plan. Families that survive transition treat it as a living document, not a one-time event. Families that wait too long to formalize these structures often find that consolidation decides for them.

One more thing worth sitting with. Kevin Spahn’s dad modeled something that doesn’t show up in any financial plan: he gave his kid room to build something outside the barn, then kept the lights on while he did it. On a 180-cow operation with no taxi squad, that’s a real sacrifice. And it may be the part of succession that determines whether the next generation comes home because they want to, or doesn’t come home at all.

Key Takeaways

  • If your succession plan is a conversation but not a document, it’s not a plan. Write the one-pager this month.
  • If FSA’s $600,000 direct ownership loan cap doesn’t cover your county’s land prices — and in most active dairy counties, it won’t — you need a bridge mechanism (family equity, co-signing, graduated buy-in, or land contracts) identified before your kid graduates.
  • If the operation can’t cash-flow two households at current milk prices, the financial structure needs to change before the next generation arrives — not after.
  • If your kid sees no path to ownership within 5–7 years of returning, they will find one elsewhere. Timeline matters as much as the dollar figure.

The Harder Game Starts This Spring

Succession FactorGreen Flag ✓Red Flag ✗
Documented return planWritten 1-page role/pay/equity doc existsSuccession is “understood” but unwritten
Land financing gapFSA + family equity covers 80%+ of land costGap exceeds $500K with no bridge identified
Two-household cash flowOperation generates $180K+ net at current milk priceSingle household barely cash-flows at $18–19/cwt
Equity timelineReturning gen reaches 25%+ ownership within 7 yearsNo ownership stake projected before year 10+
Legal structureLLC or partnership in place with buy-in formulaFarm is sole proprietorship with no succession docs
Decision authorityReturning gen owns at least one operational area outrightAll decisions still run through the senior generation
Milk price stress testOperation cash-flows at $17/cwt all-milkBreakeven requires $20+/cwt with no margin buffer
Operator age gapSenior operator under 62 with 5+ active years aheadOperator 65+ with no formal transition timeline

Kevin Spahn graduates this spring. He told Dairy Star he wants to stay in dairy. His family milks 180 cows near one of the most expensive land markets in Wisconsin. The championship is over. The harder game — the one where a 22-year-old with a dairy science degree tries to build a career in an industry that’s lost two-thirds of its Wisconsin herds in 20 years — is just starting.

So here’s the question for your operation: if your kid came home tomorrow, could you hand them a one-page document outlining the role, pay, equity path, and timeline? If you can’t, the Spahns’ story isn’t just their story. It’s yours.

Learn More

The Sunday Read Dairy Professionals Don’t Skip.

Every week, thousands of producers, breeders, and industry insiders open Bullvine Weekly for genetics insights, market shifts, and profit strategies they won’t find anywhere else. One email. Five minutes. Smarter decisions all week.

NewsSubscribe
First
Last
Consent

$1.6B to Texas and Kansas, 76% of Wisconsin Farms Gone: Scale Up, Go Premium, or Get Out

Hilmar, Leprino, and Valley Queen are pulling milk toward new regions. For producers in traditional dairy states, the math has changed—and so have the breeding goals.

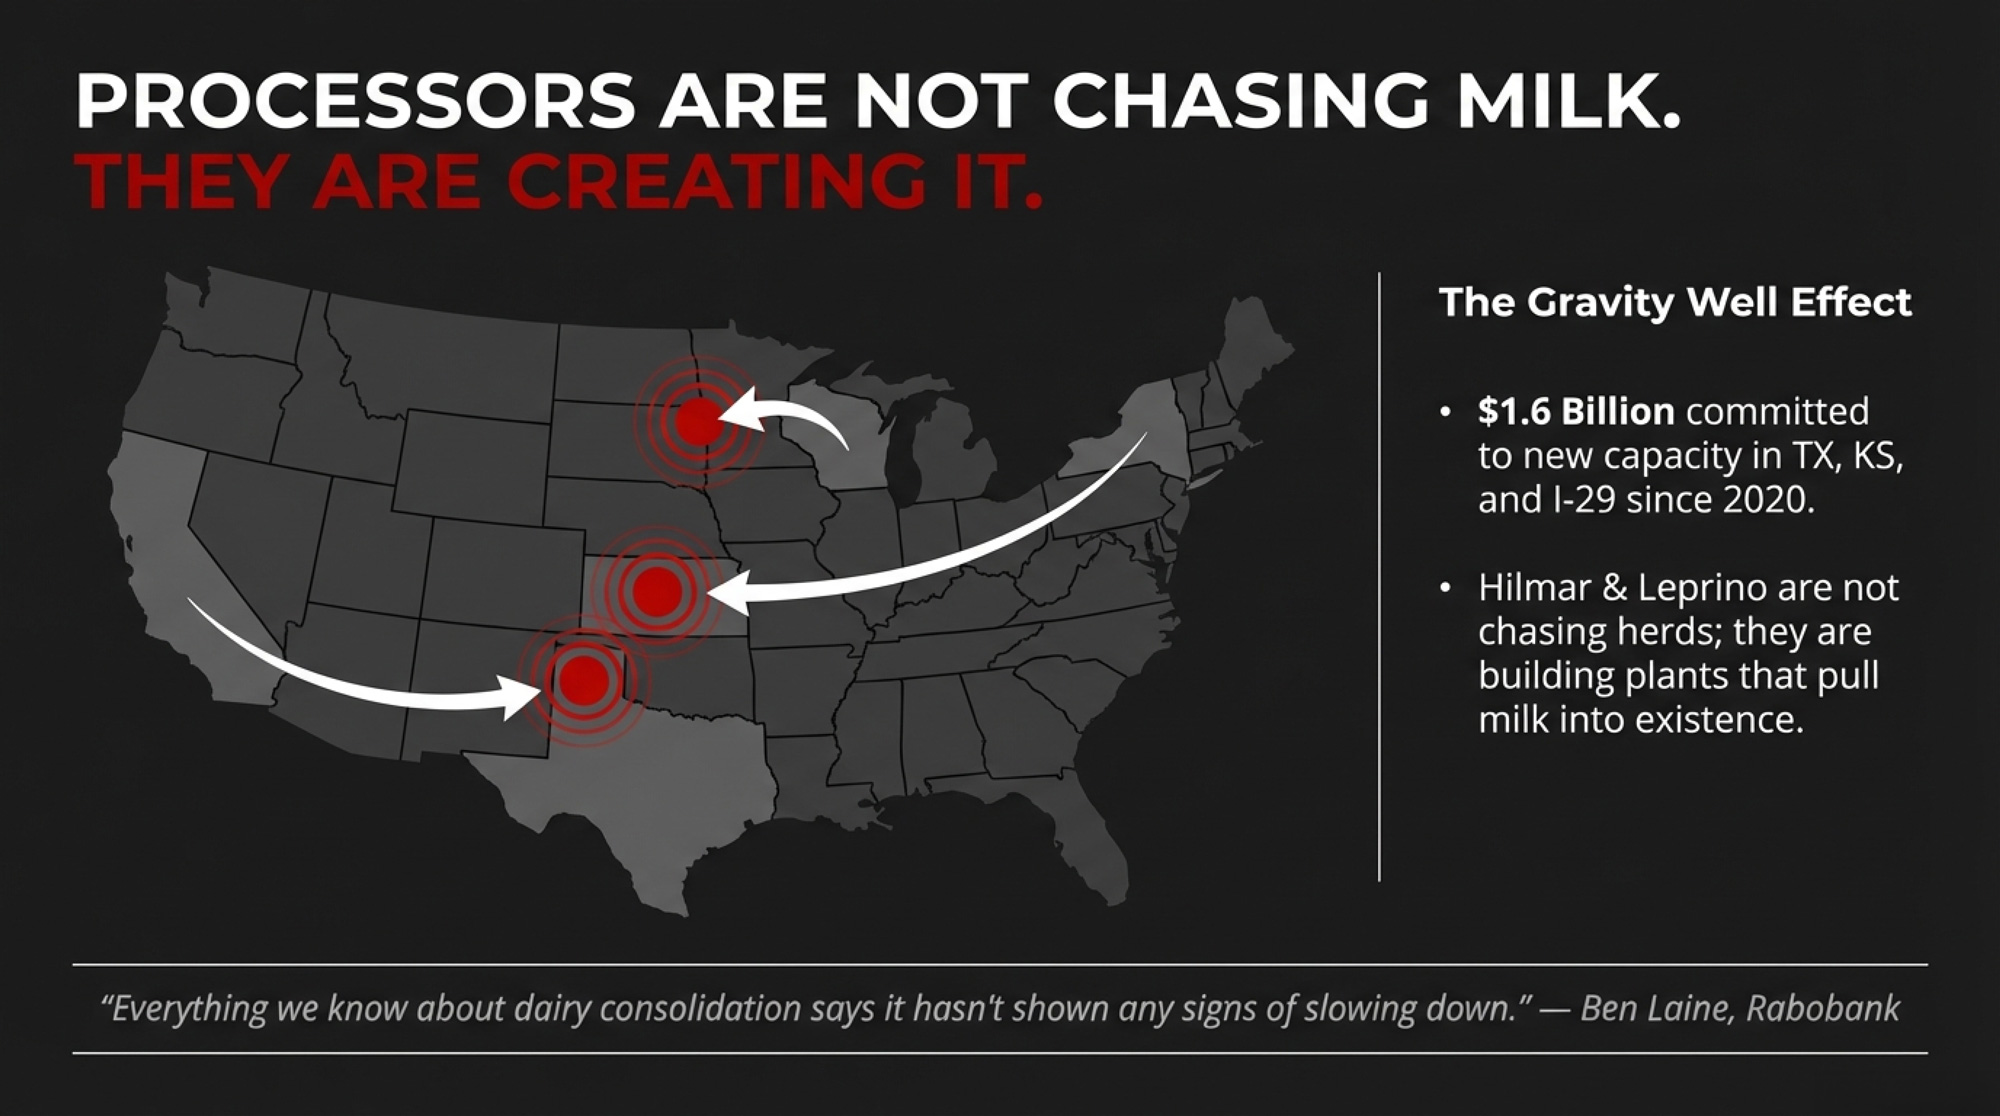
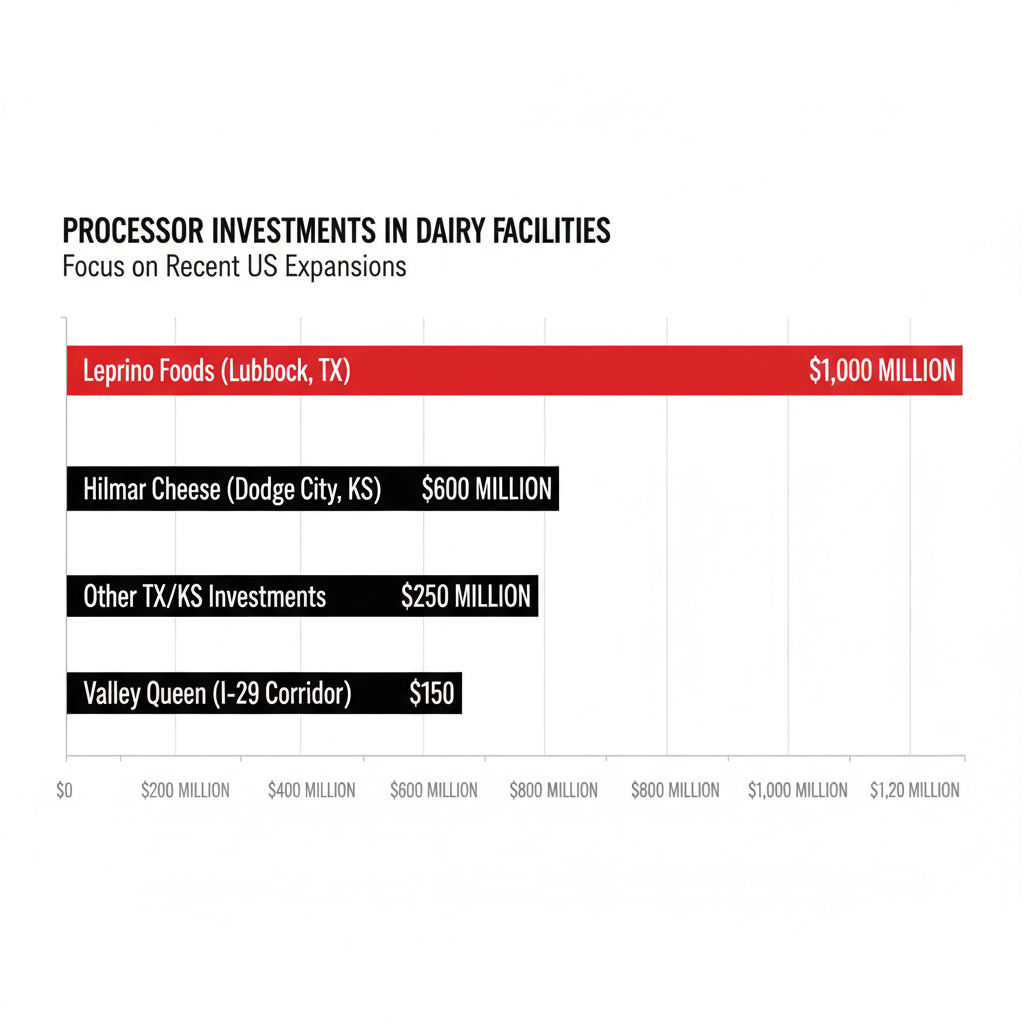
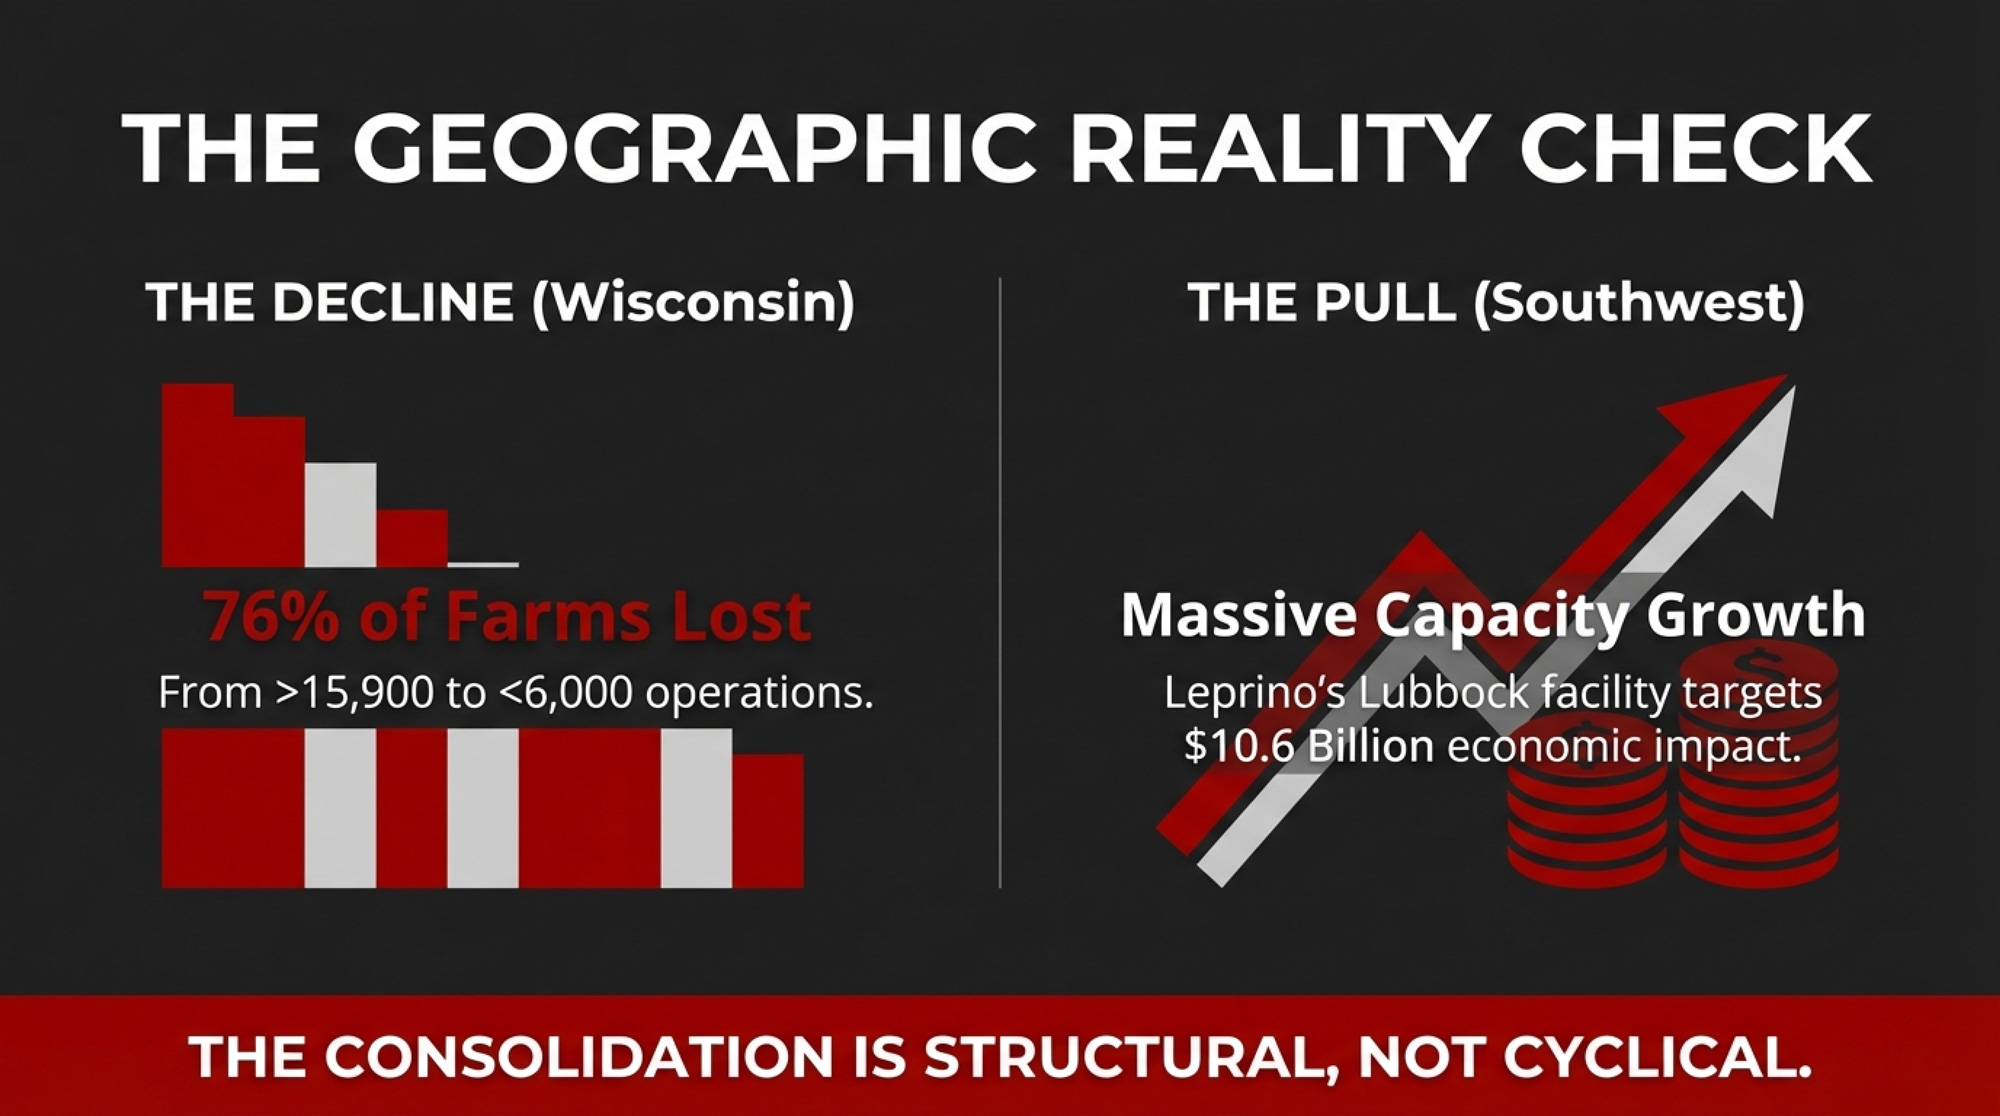
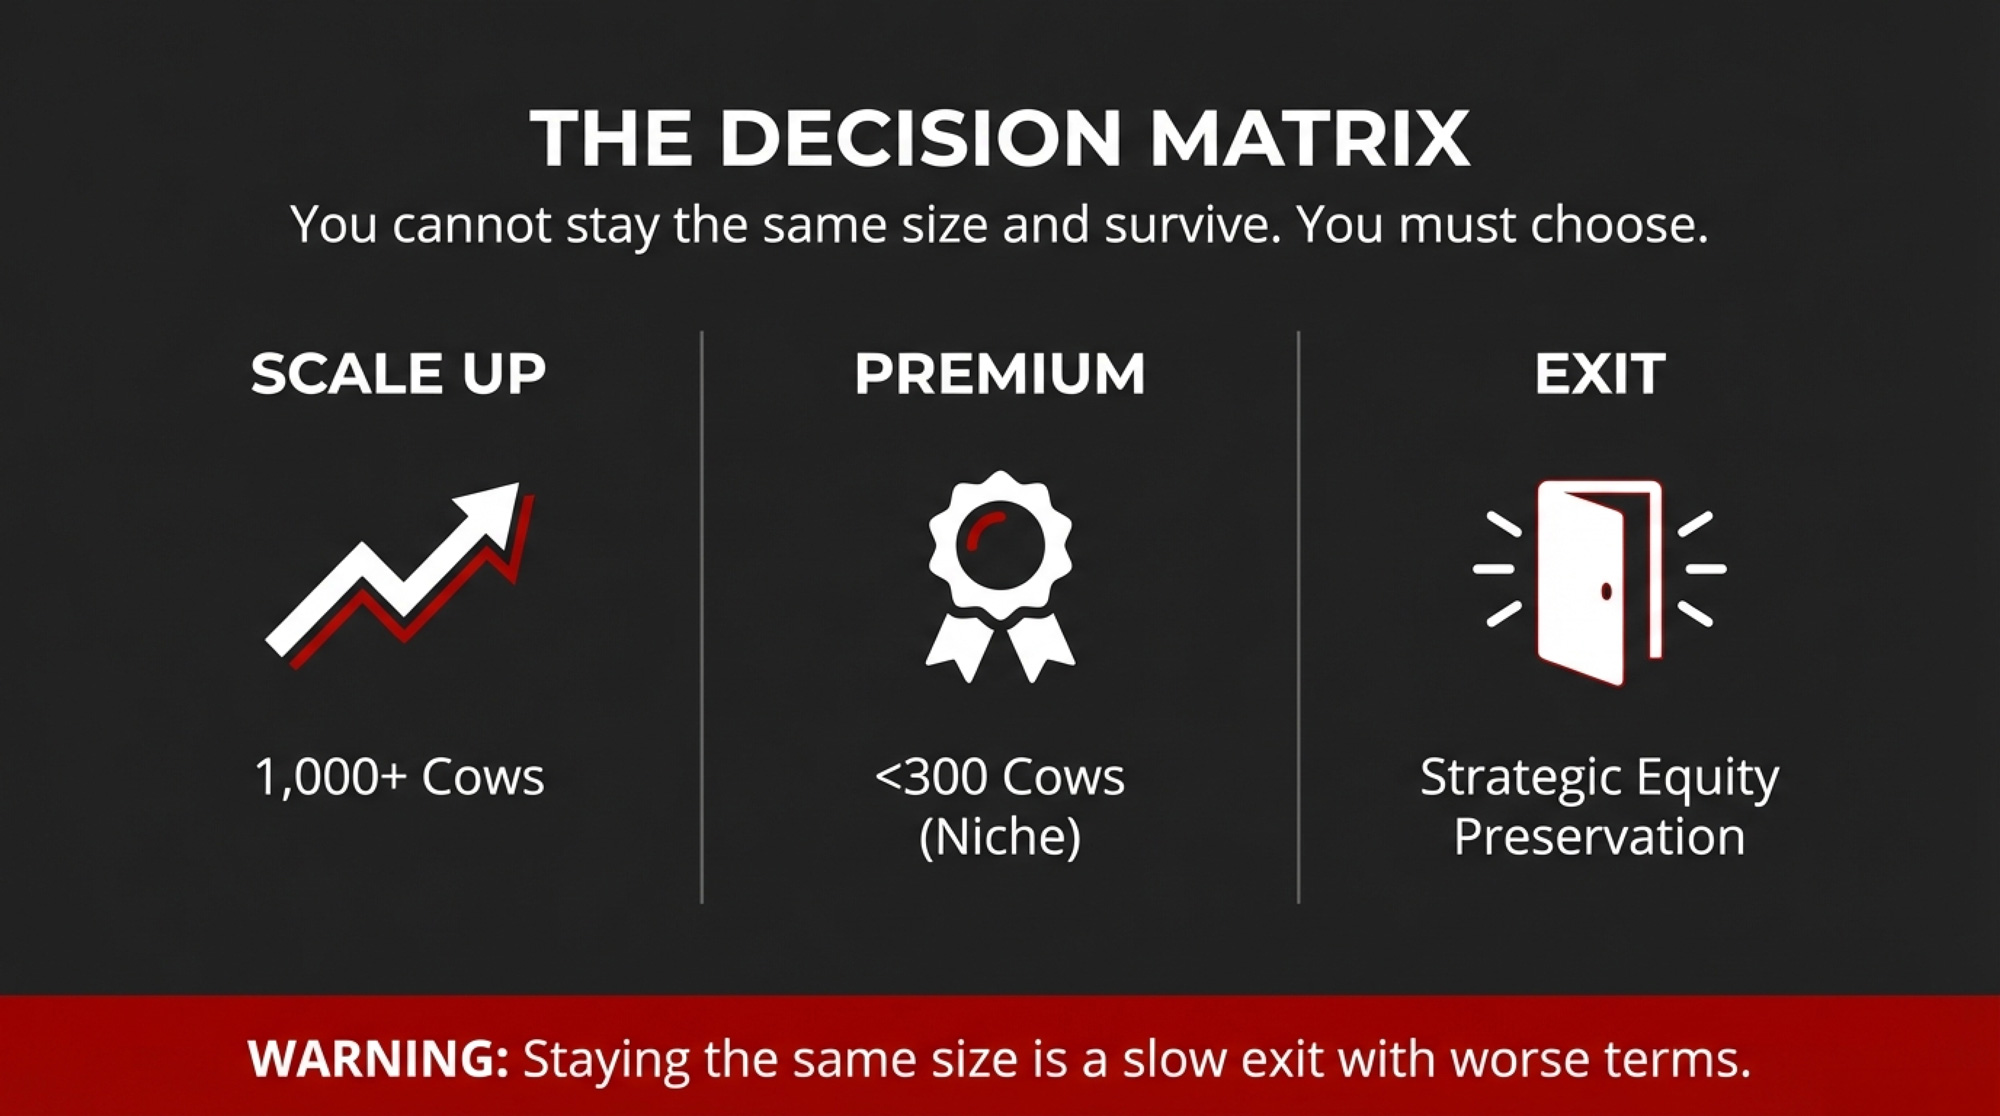
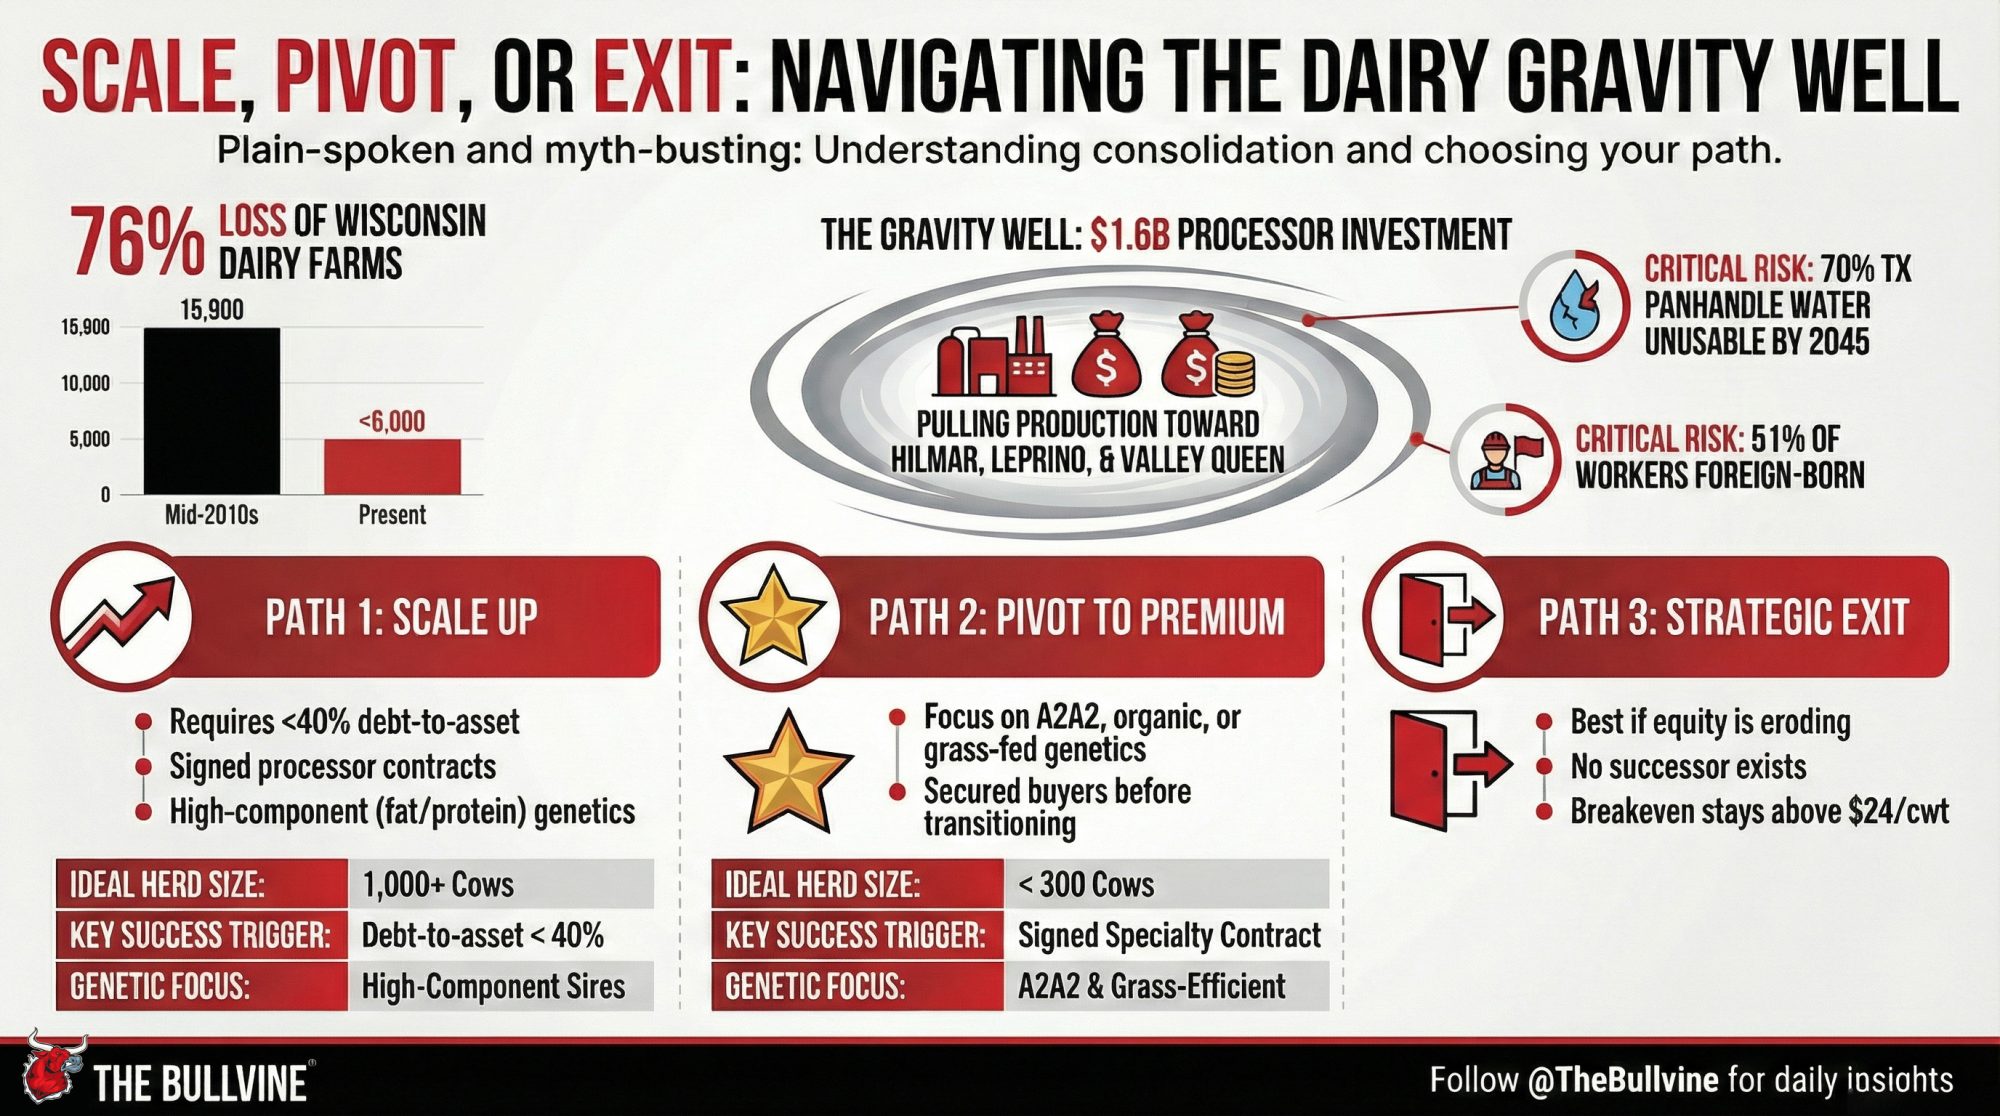
Executive Summary: Since 2020, Hilmar, Leprino, and Valley Queen have committed $1.6 billion to cheese plants in Texas, Kansas, and the I-29 corridor—not chasing existing milk, but creating the conditions that pull production toward them. Wisconsin has lost 76% of its dairy farms since the mid-2010s, from over 15,900 operations to fewer than 6,000. You now face a three-path decision: scale to 1,000+ cows with a processor contract and debt-to-asset below 40%; pivot to premium markets (A2A2, organic, grass-fed) at under 300 cows with a buyer secured before transition; or execute a strategic exit while equity holds. The structural risks driving this migration—70% of the Texas Panhandle’s Ogallala aquifer potentially unusable by 2045, 51% of U.S. dairy workers foreign-born—are risks processors can diversify away from but you cannot. As Rabobank analyst Ben Laine notes: “Everything we know about dairy consolidation says it hasn’t shown any signs of slowing down.” Your genetics program must match your market destination: component sires for cheese contracts, A2A2 and grazing genetics for premium paths.

dairy processing gravity wells

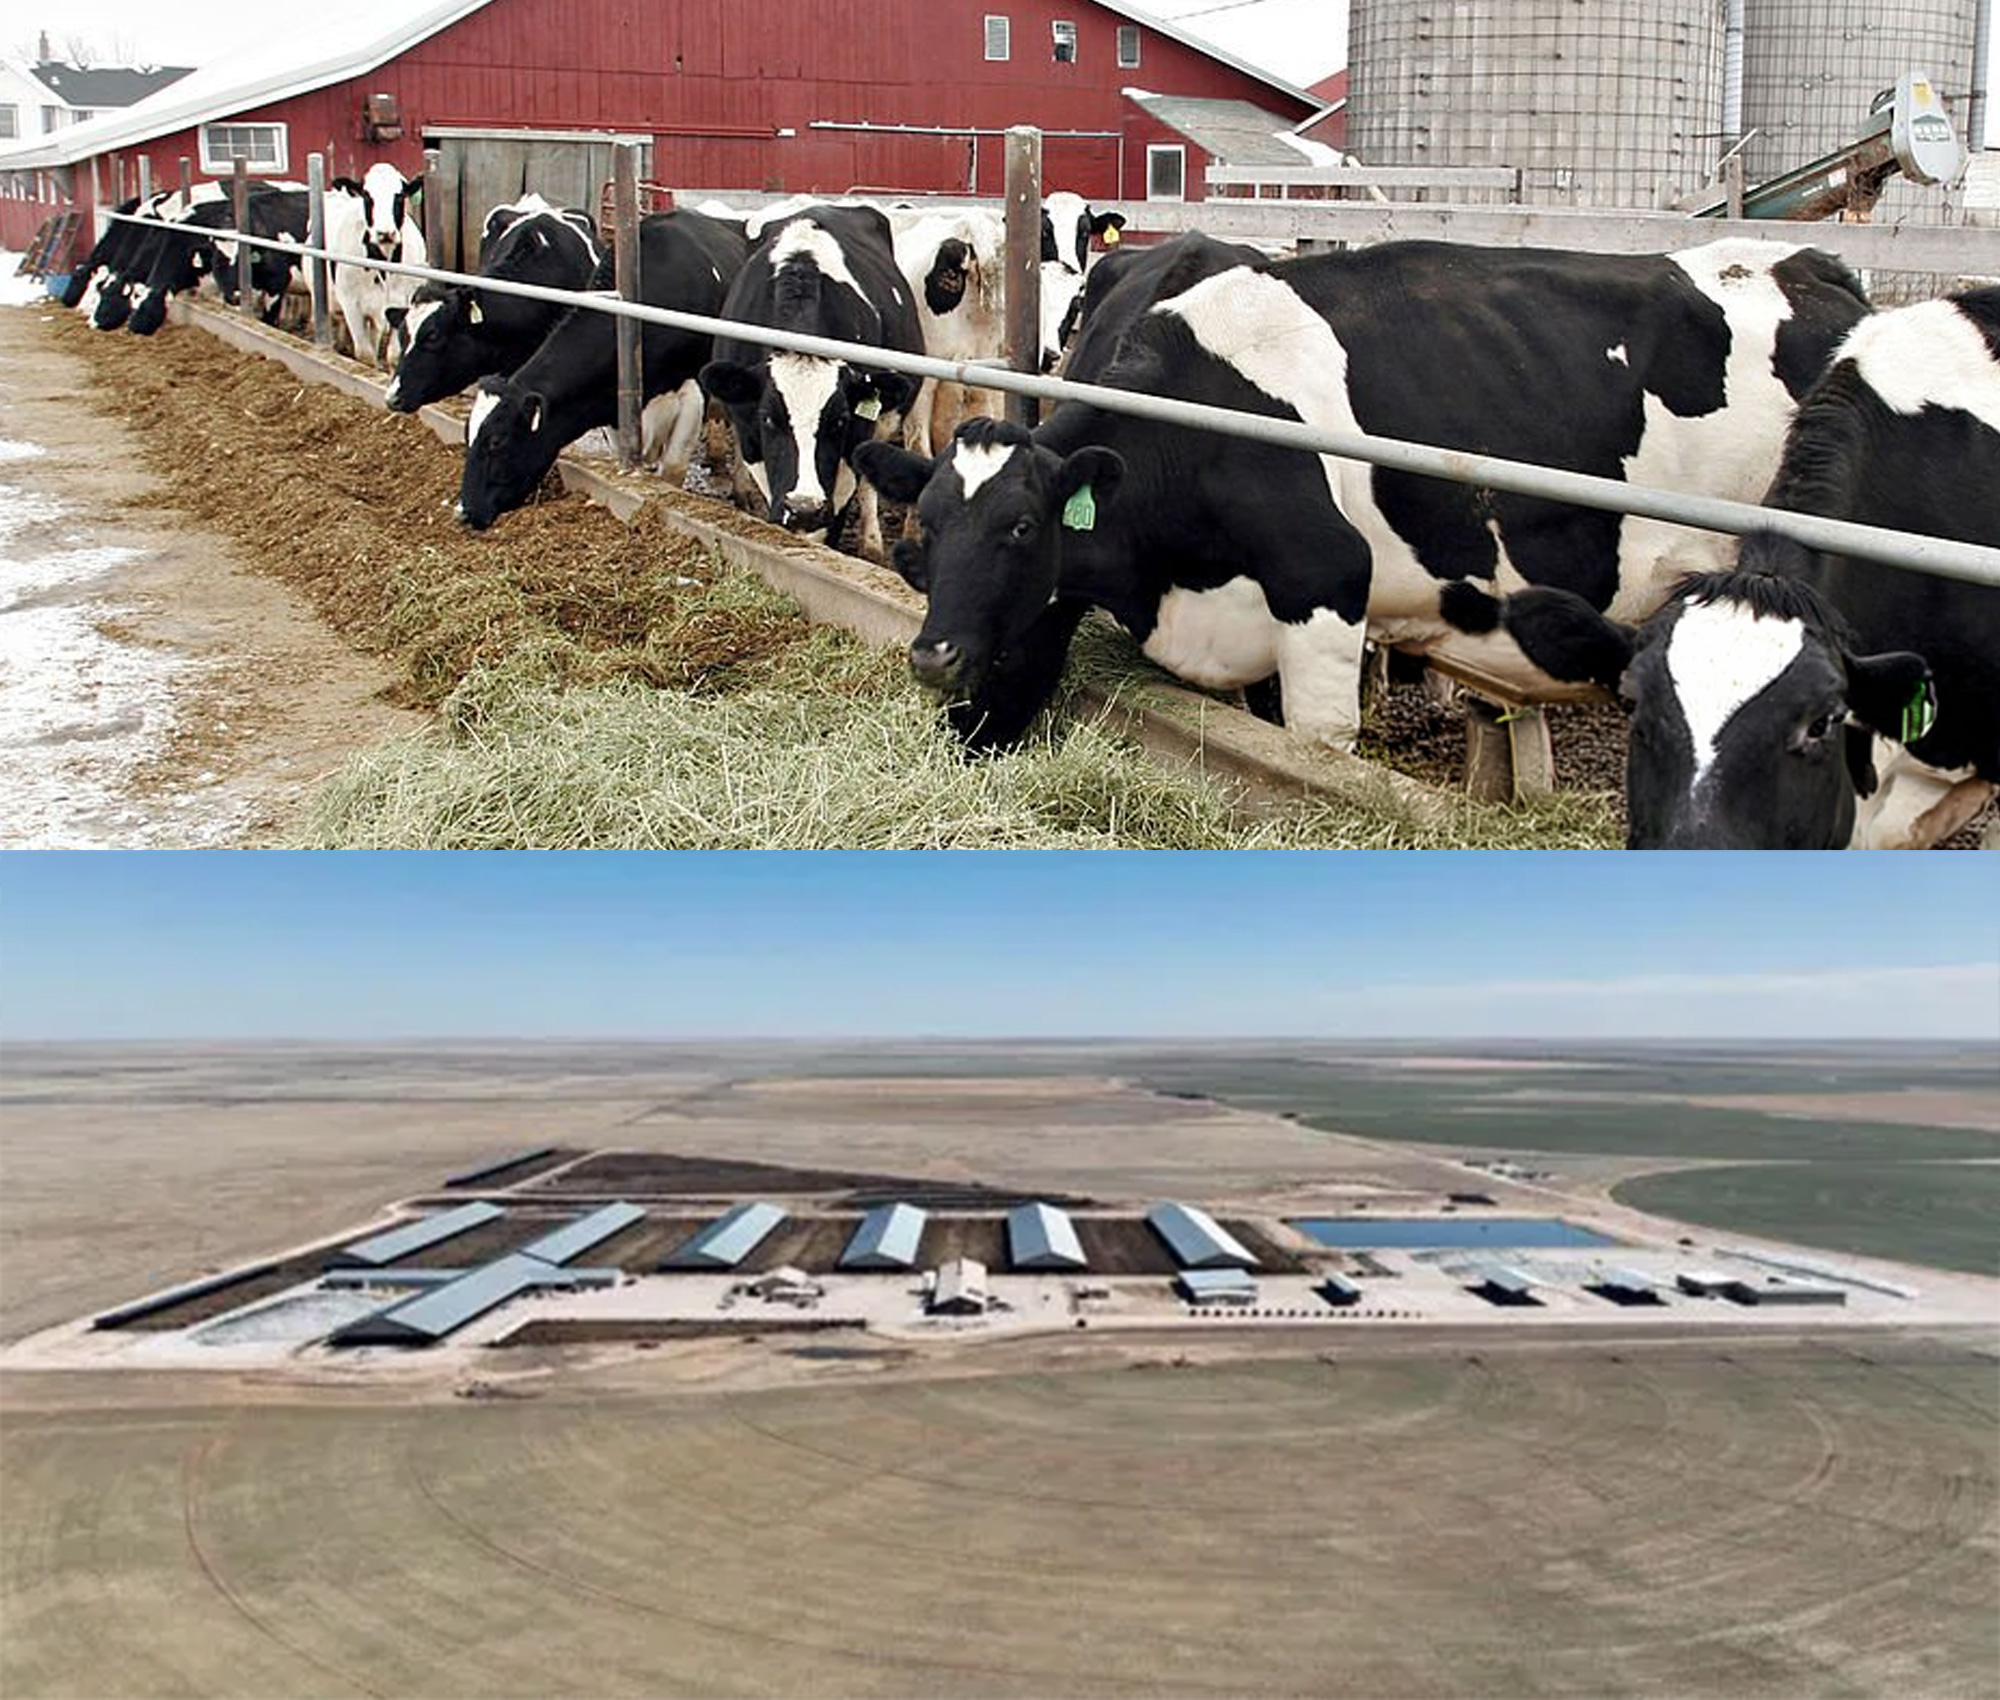
When Hilmar Cheese Company broke ground in Dalhart, Texas, in 2006, dairy consolidation was already reshaping American milk production. But nobody expected what came next. The surrounding region had a modest dairy presence. By 2014, the area’s herd had grown more than tenfold—not because producers chose Texas first, but because Hilmar created the conditions that pulled them in.

That pattern is repeating at scale. Since 2020, major processors have announced billions in new capacity across Texas, Kansas, and South Dakota—including Hilmar’s $600 million Dodge City facility and Leprino Foods’ $1 billion Lubbock complex.

If you’re weighing expansion in a growth state—or wondering how long to hold on where you are—the economics have shifted. Here’s the decision framework.

76% of Wisconsin’s dairy farms have disappeared since the mid-2010s—from over 15,900 operations to fewer than 6,000 today.

Processors Chose First. Producers Followed.

The conventional narrative frames this geographic shift as producer-driven: families chasing lower costs and friendlier regulations. The timeline tells a different story.

Hilmar’s CEO, John Jeter, explained the Dalhart decision by citing “a growing milk supply and a stable regulatory environment.” Note the word “growing”—not “large.” The company bet on the future supply it planned to create, betting that it would create the market for it.

When Hilmar announced the Dodge City plant in 2021, Kansas Dairy CEO Janet Bailey said it would “help the state’s industry expand” and “create incentives for producers to be innovative.” That’s future tense. The plant pulls production into existence rather than chasing milk that’s already there.

Leprino’s Lubbock facility follows the same script, with phases coming online through 2026. Industry analysts estimate the company targets $10.6 billion in economic impact for Texas over the next decade.

Processors aren’t following milk. They’re building gravity wells—and milk is flowing toward them.

The I-29 Corridor: A Third Path

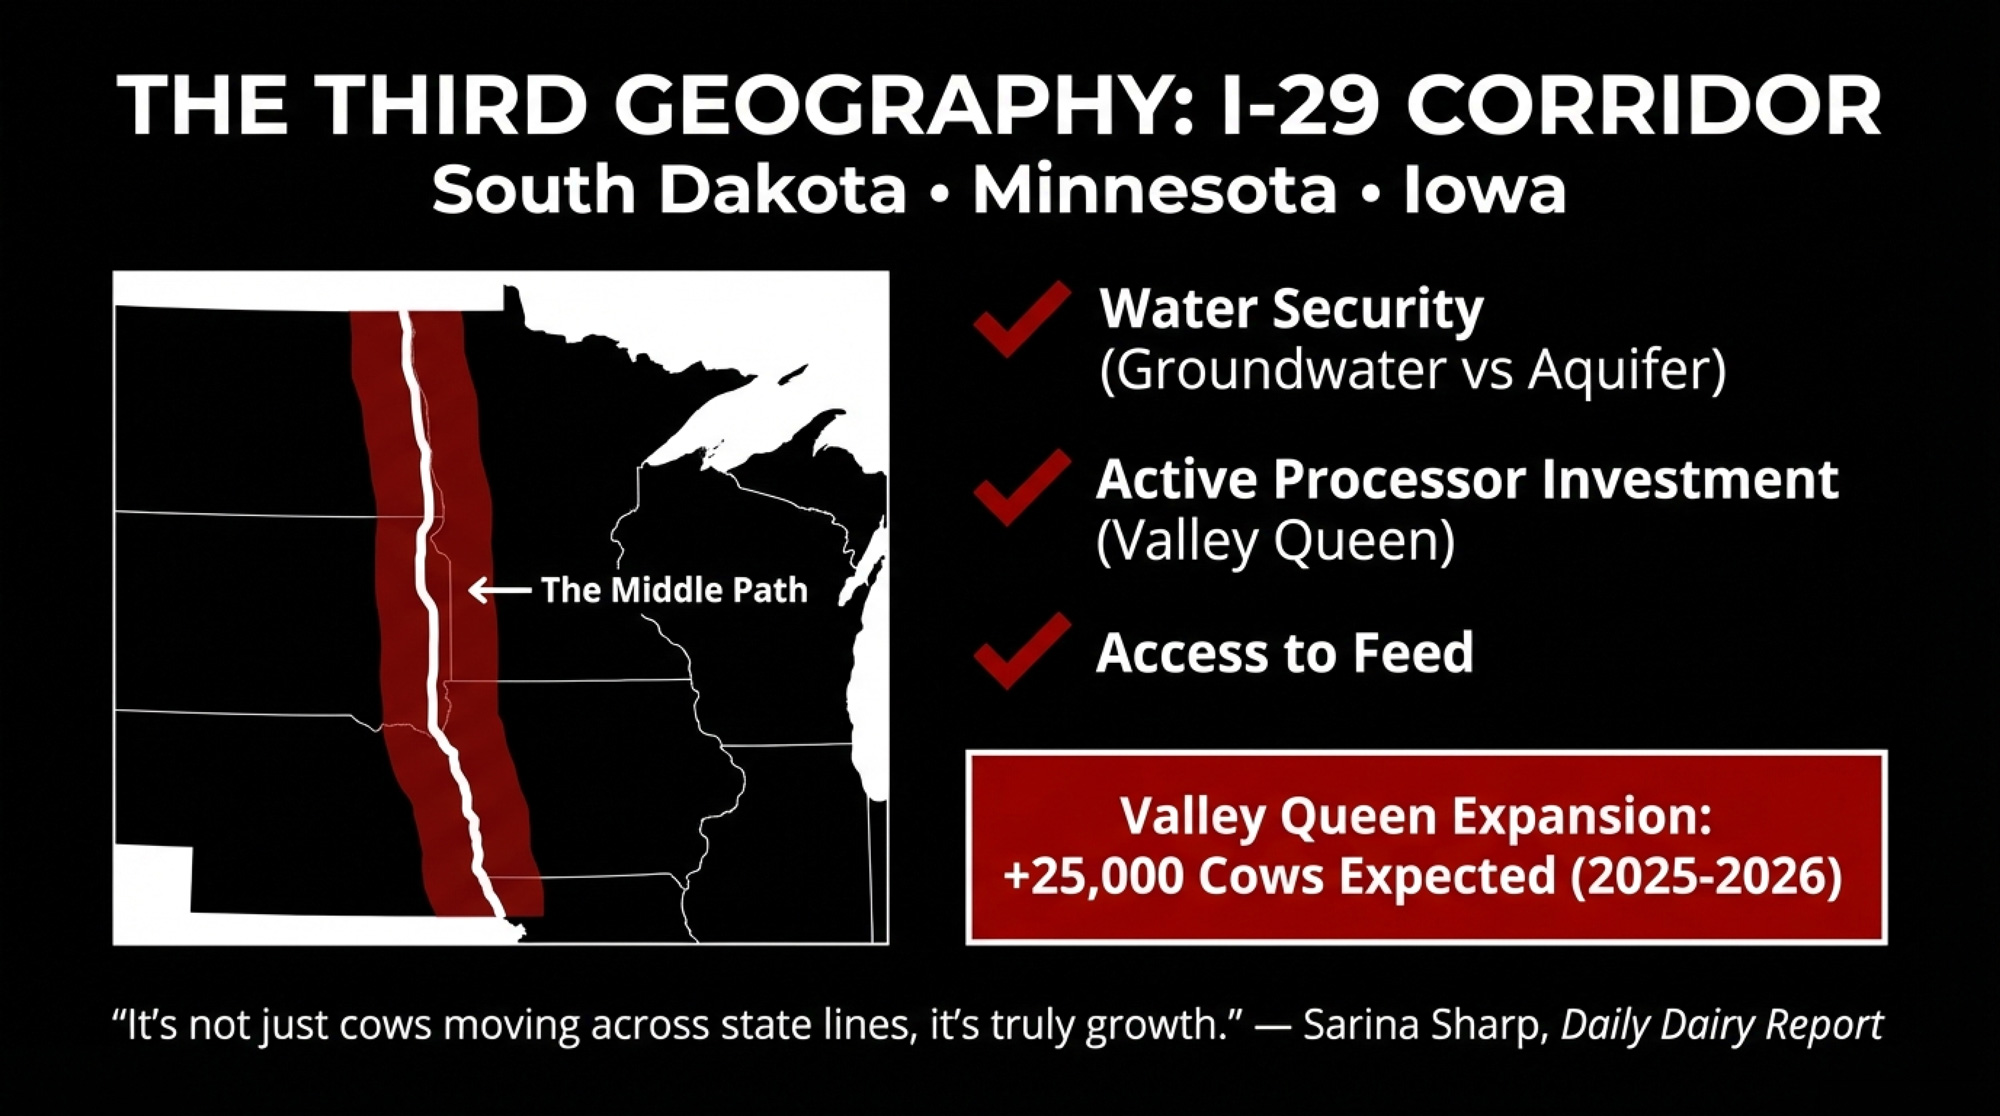
Not all dairy expansion is heading to the Southwest. The I-29 corridor—running through South Dakota, Minnesota, and Iowa—has quietly become the fastest-growing dairy region in the country on a percentage basis.

“So that is Iowa, South Dakota, and Minnesota—there they are growing milk production, and they are growing processing capacity,” notes Sarina Sharp in the Daily Dairy Report. “New dairies are coming in, and it’s not just cows moving across state lines, it’s truly growth.”

Valley Queen’s expansion project expects approximately 25,000 additional cows in 2025 and 2026 alone. Evan Grong, Valley Queen’s sales manager, identifies three key drivers: “We attribute the current and projected growth in the I-29 region primarily to access to feed production, abundant groundwater, and dairy processing investments.”

Unlike the Ogallala-dependent Panhandle, the I-29 corridor offers better long-term water security. Unlike Wisconsin, it has processor capacity actively seeking milk. It’s a middle path—if you can get in.

The Growth-State Assumption Is Cracking

Here’s the story everyone tells: growth states offer competitive advantages that traditional regions can’t match. Lower costs, friendlier regulations, room to expand.

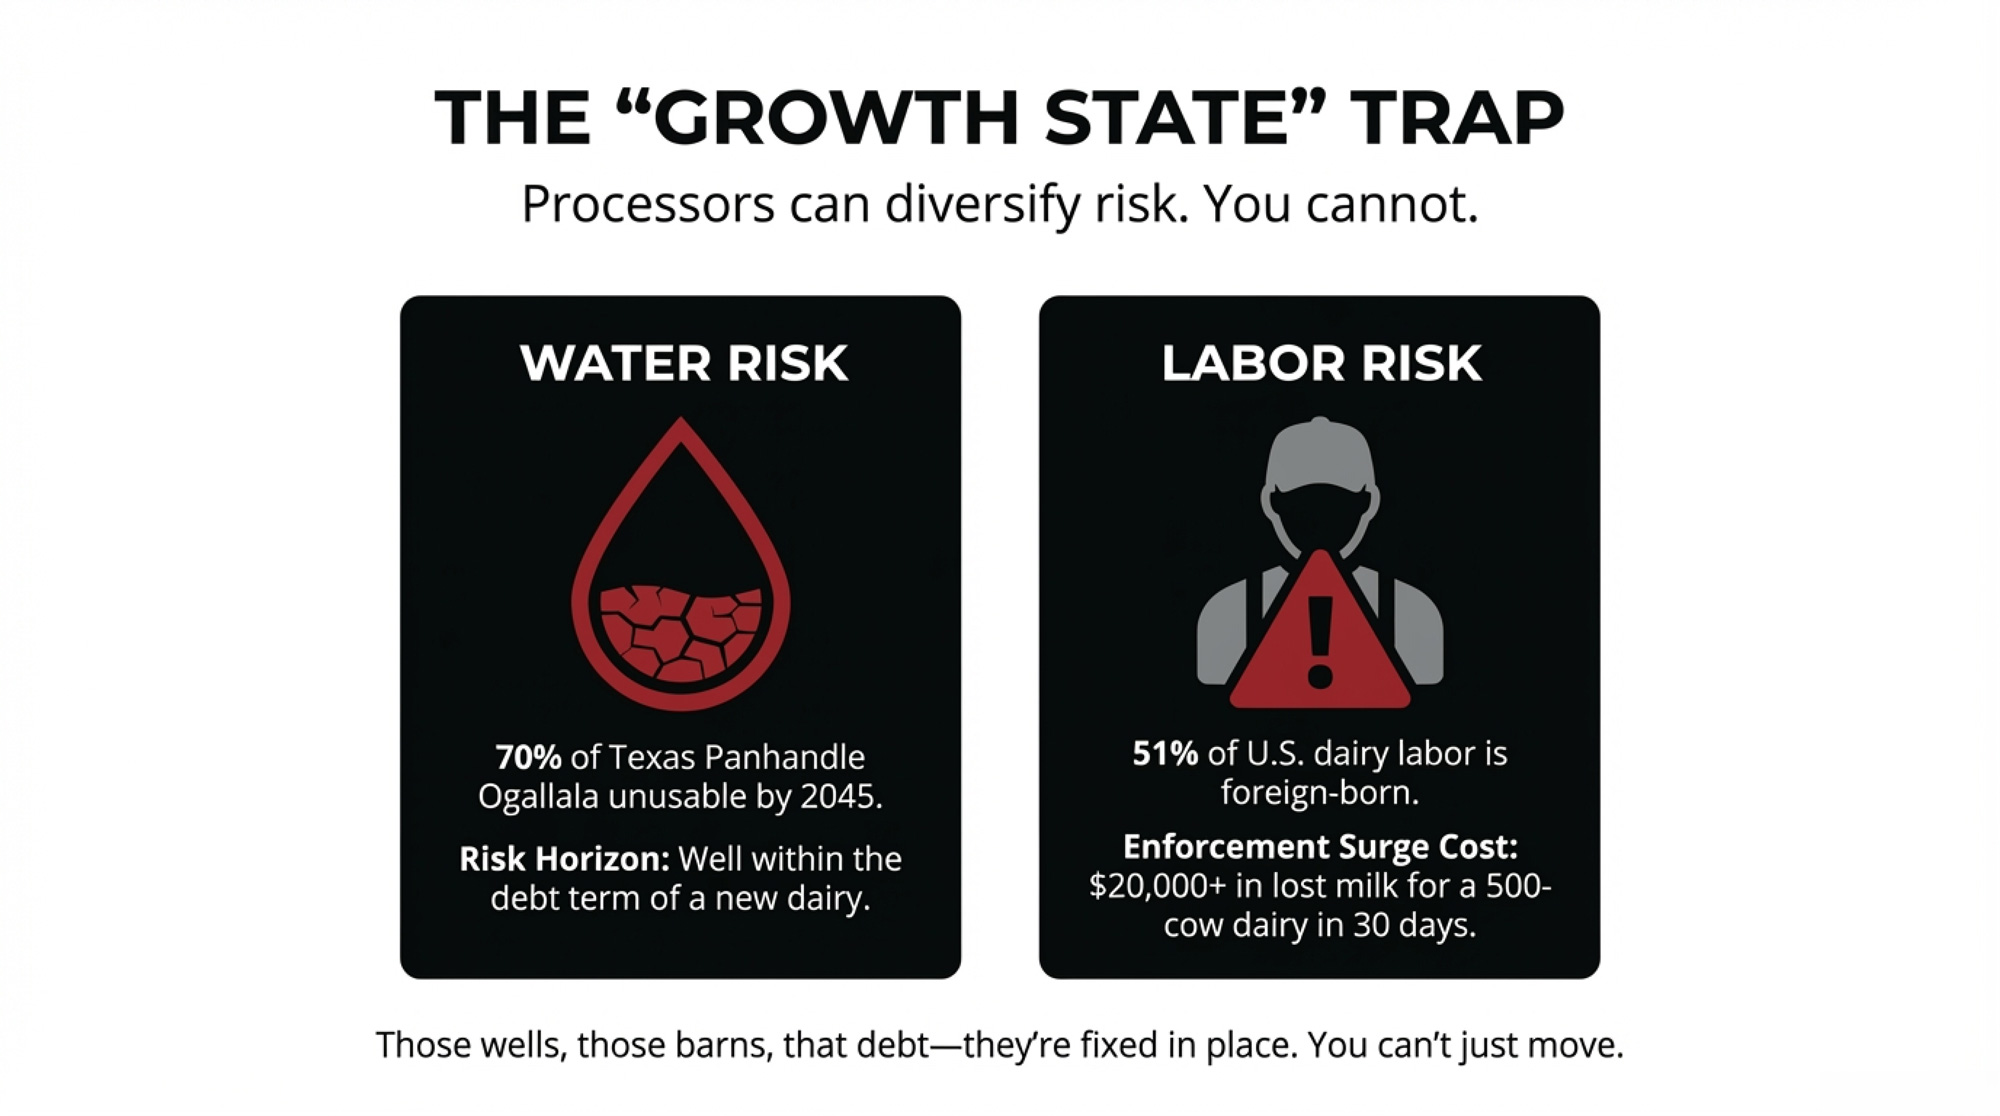
Here’s the problem: the two pillars holding up that story—water and labor—are shakier than most people realize.

The water math is brutal. The Ogallala Aquifer underlies the Texas Panhandle and western Kansas dairy expansion zones. According to USGS and Texas Water Development Board data, Texas accounts for 62% of total Ogallala depletion despite covering a fraction of the aquifer’s footprint.

A University of Texas Bureau of Economic Geology projection suggests up to 70% of the Texas Panhandle’s section could become unusable within 20 years at current pumping rates. That’s potentially mid-2040s—well within the debt horizon of a dairy built today.

The labor math is worse. According to NMPF research:

  • 51% of all hired U.S. dairy workers are immigrants
  • Farms employing immigrant labor produce 79% of the national milk supply
  • When NMPF surveyed 1,223 dairy farms, 80% reported “low or medium” confidence in employment documents

In Wisconsin alone, a UW-Madison School for Workers survey found more than 10,000 undocumented workers perform about 70% of the state’s dairy labor.

Wisconsin’s Governor Tony Evers put it plainly: “If suddenly those people disappear, I don’t know who the hell is going to milk the cows.”

The Risk Sits Differently for You Than for Them

Leprino runs facilities across Colorado, California, Michigan, New Mexico, and now Texas. Hilmar has operations in California and Texas, with Kansas coming online. If water constraints or labor enforcement hits one region hard, they can shift volume elsewhere or exit with a write-down that stings but doesn’t kill the company.

A 4,000-cow dairy built in the Panhandle to supply a processor contract? Those wells, those barns, that debt—they’re all fixed in place.

Risk FactorTexas PanhandleKansas (Western)I-29 Corridor (SD/MN/IA)
Ogallala Depletion70% potentially unusable by 2045 (red)Moderate-to-high stress, caps tightening (red)Not Ogallala-dependent (better water security)
Labor Dependency51% immigrant workers nationally (red)51% immigrant workers nationally51% immigrant workers nationally
Processor DiversificationHilmar (CA, TX, KS), Leprino (CO, CA, MI, NM, TX)Hilmar, Leprino multi-stateValley Queen, regional processors
Producer Risk ExitFixed assets, debt horizon 15-25 yearsFixed assets, debt horizon 15-25 yearsFixed assets, debt horizon 15-25 years

NMPF modeling shows what a full labor disruption would mean nationally:

  • Over 7,000 dairy farms closed
  • 2.1 million cows culled
  • 48.4 billion pounds of milk lost
  • Retail prices are nearly doubling

For a 500-cow operation that loses 40% of its crew during a 30-day enforcement surge, the hit could run $20,000 or more in lost milk alone.

The Genetics Angle: Components Are King

Here’s what most geographic-shift analyses miss: where you farm increasingly determines what genetics you need.

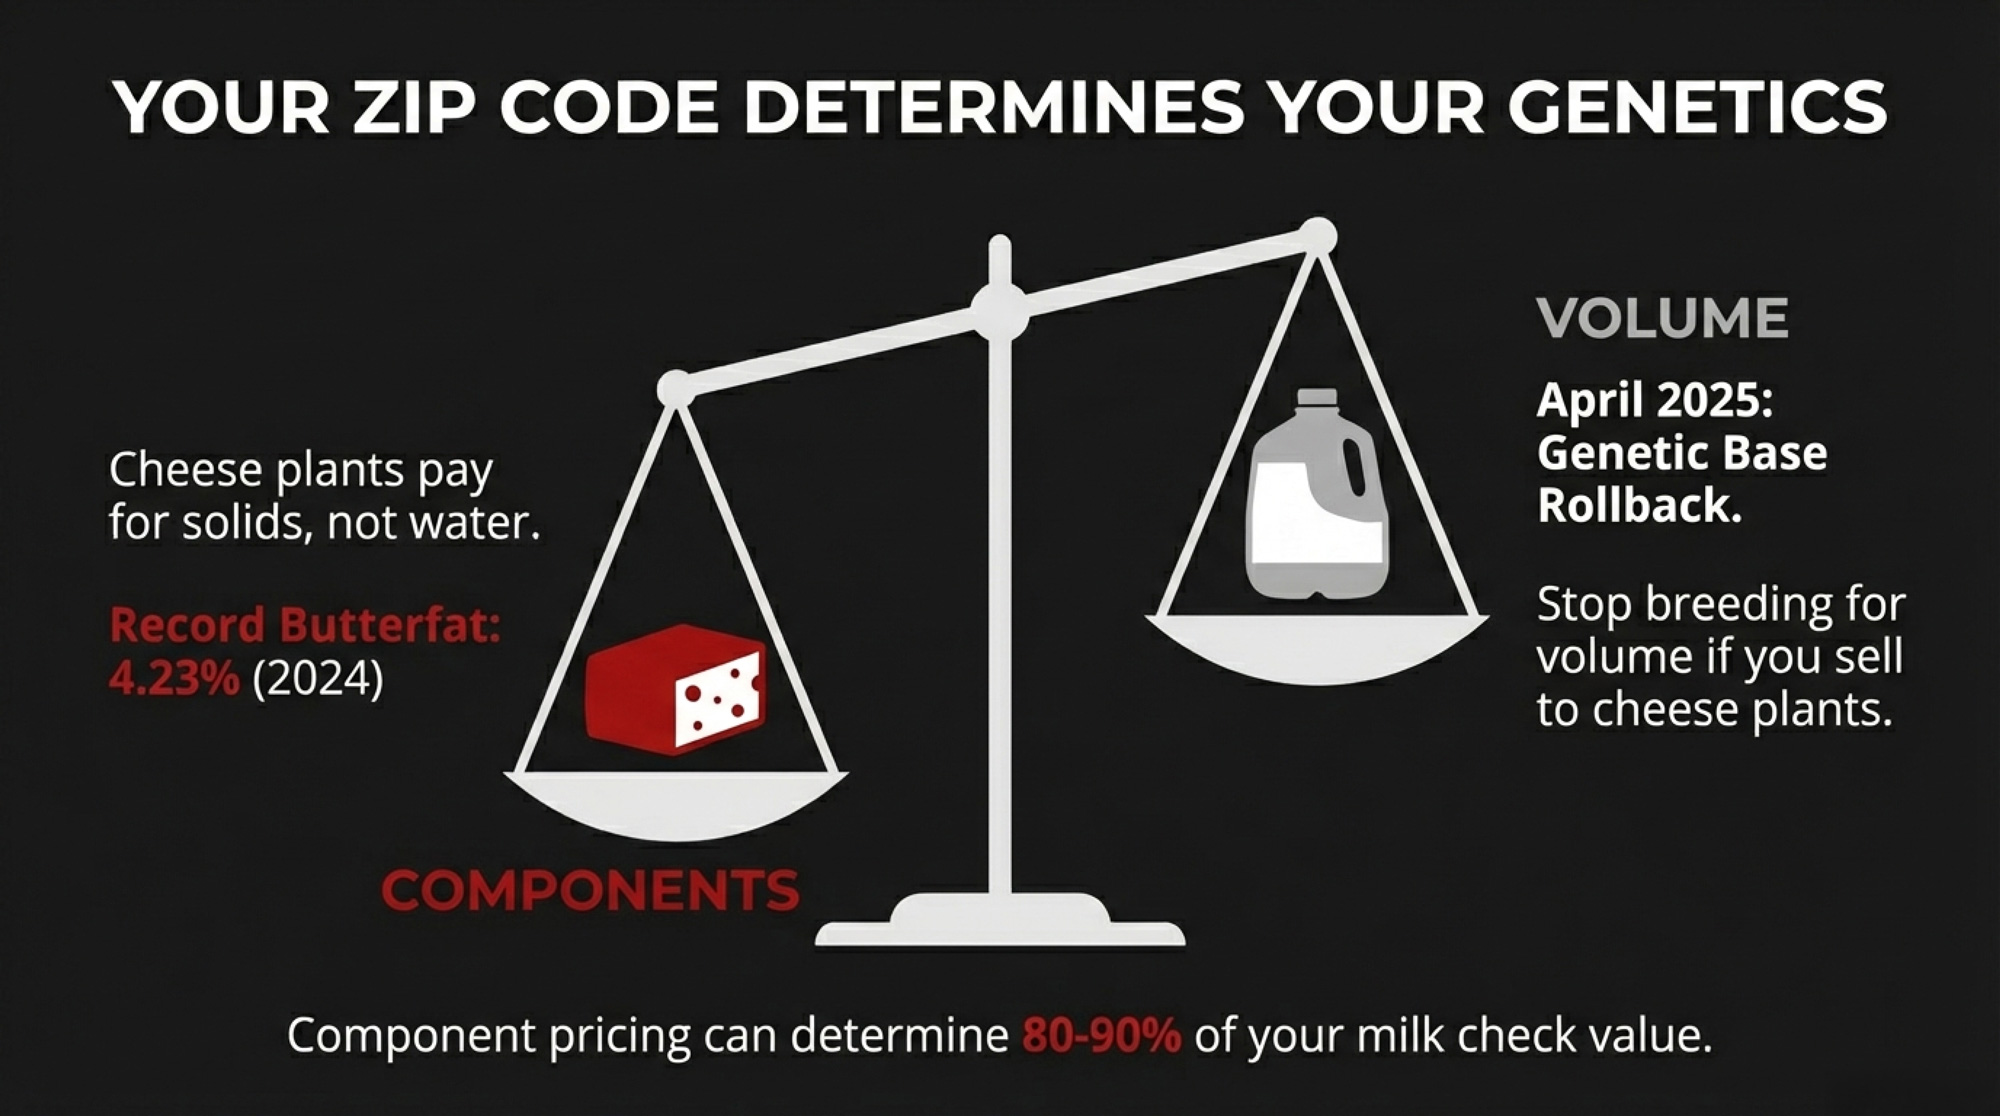
These “gravity well” dairies feeding Hilmar and Leprino cheese plants are breeding hard for components—not volume. According to a March 2025 CoBank report, U.S. butterfat reached a record 4.23% nationwide in 2024, while protein reached 3.29%.

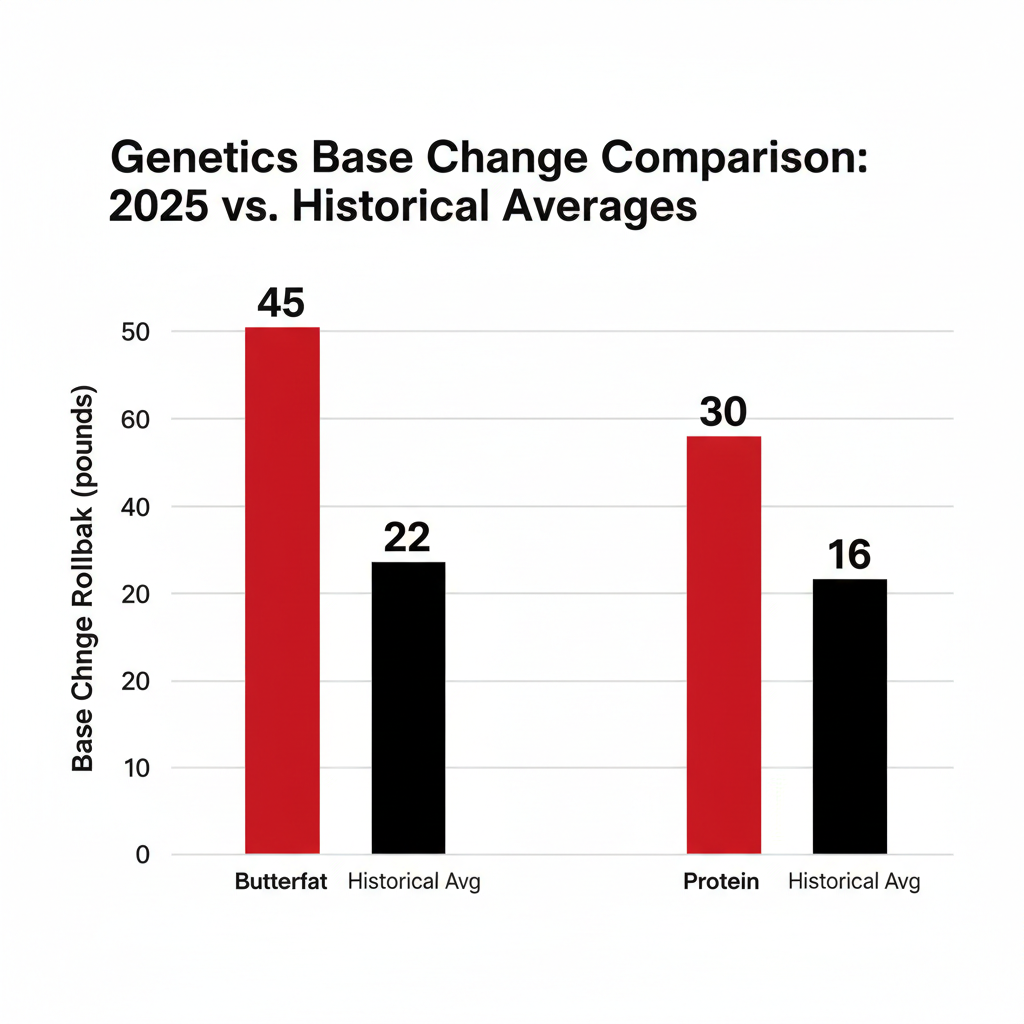
The April 2025 Holstein genetic evaluations saw the largest base change in history—a 45-pound rollback on butterfatand a 30-pound rollback on protein. Corey Geiger with CoBank explains: “That butterfat number’s almost double any number that’s taken place in the past.”

Why the shift? In cheese-focused markets, component pricing programs can place 80-90% of the milk check value on butterfat and protein—though this varies by Federal Order and utilization. Cheese plants pay for solids, not water.

For Wisconsin’s “premium path” operations, the genetics conversation looks different. A2A2 genetics, grass-fed programs, and high-type show cattle can command premiums in specialty markets. MilkHaus Dairy in Fennimore, Wisconsin, tests about 100 of their 360-head Holstein herd for A2 genetics, housing them separately to produce 12 cheese varieties sold nationwide.

The bottom line: Your sire selection should match your market destination.

Three Paths: Scale, Premium, or Exit

If you’re in a traditional region—or evaluating whether to build in a growth state—your decision comes down to three paths.

StrategyBest ForKey TriggerPrimary Risk
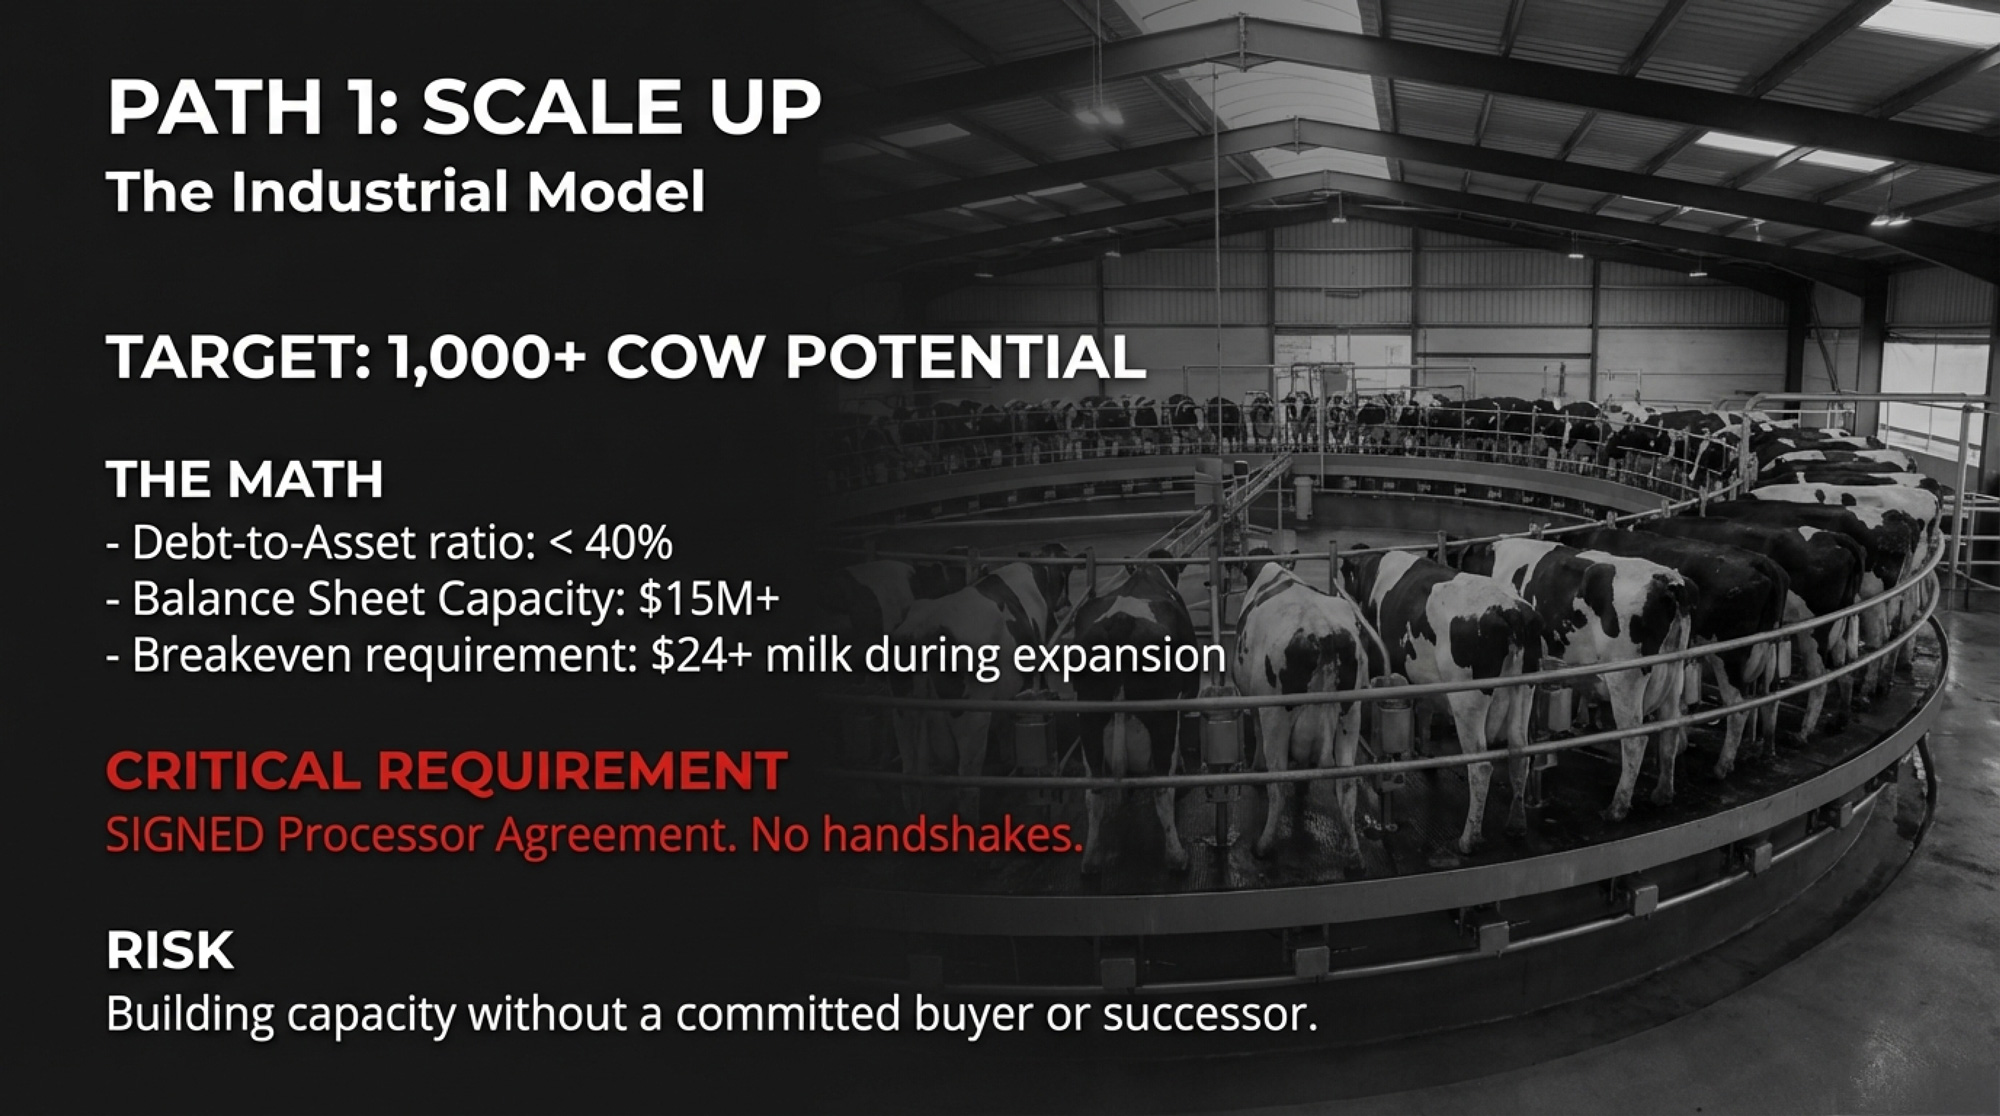
Scale Up1,000+ cow potentialDebt-to-asset < 40%, signed processor agreement$24+ breakeven, no successor
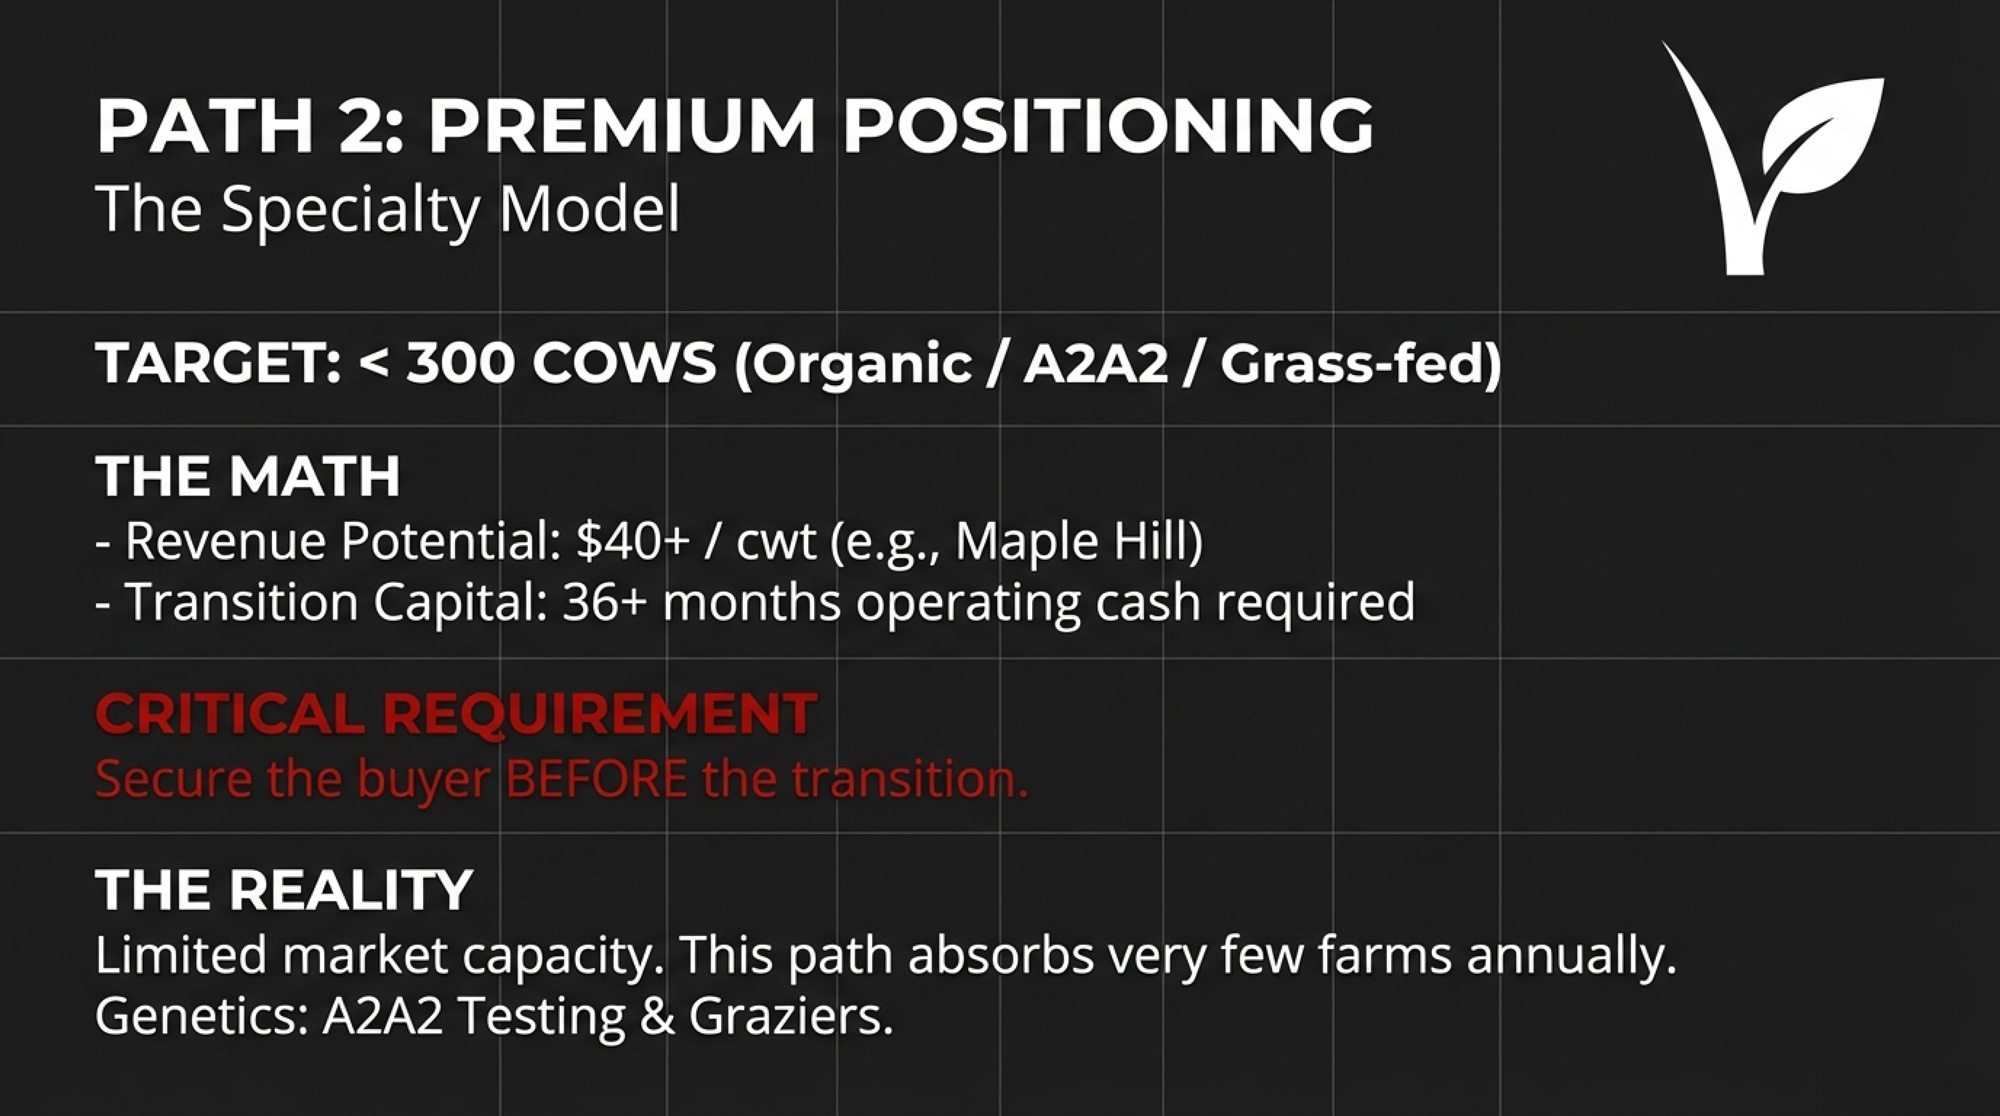
Premium< 300 cowsSigned specialty contract before transitionLimited market capacity
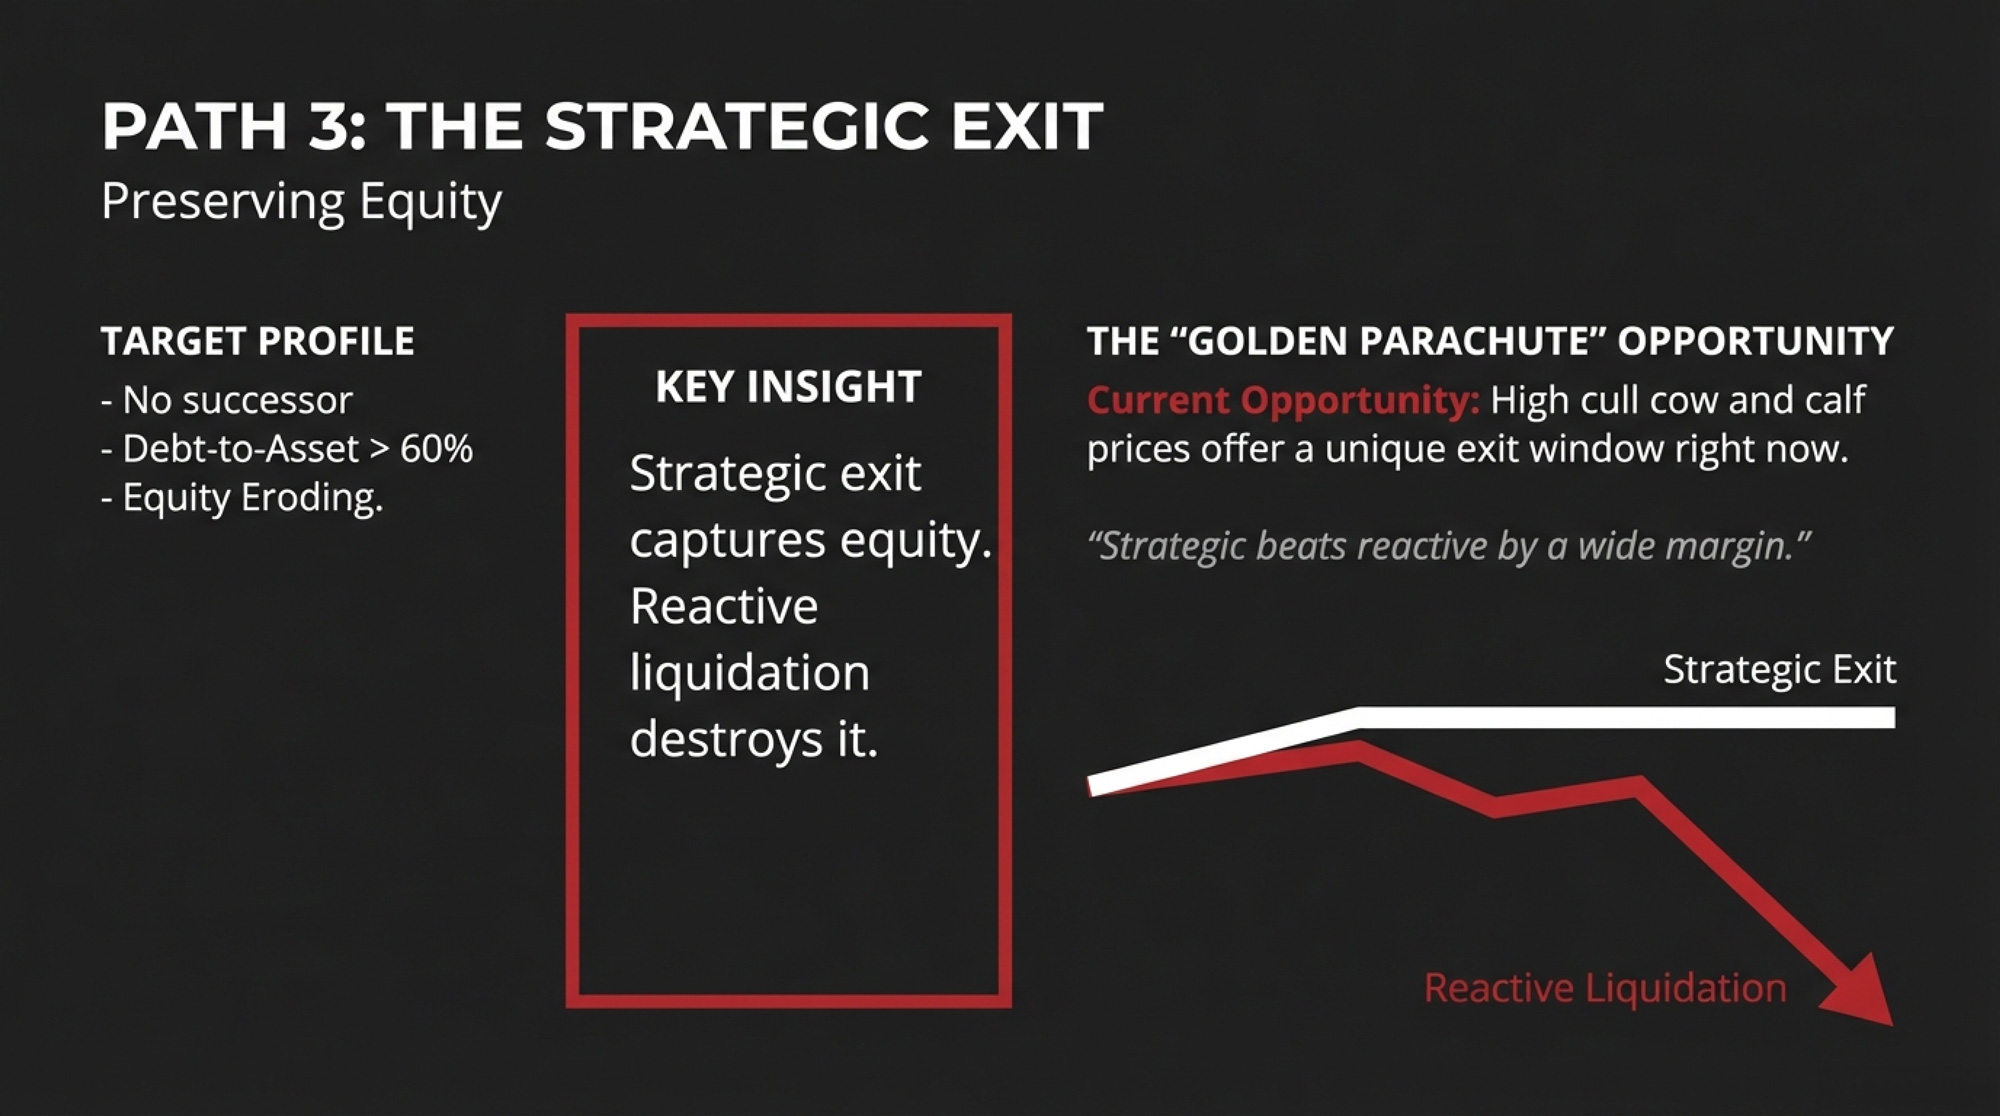
Strategic ExitNo successorEquity eroding 3+ yearsForced liquidation timing

Path 1: Scale Up

Decision triggers:

  • You’re at 500+ cows with a realistic path to 1,000+
  • Debt-to-asset sits below 40%
  • You’re under 55 with a committed successor
  • You have a signed processor agreement—not a handshake

It requires significant balance-sheet capacity—often $15 million or more — for a 500-to-1,000-cow build-out. Plan for 24-36 months of tight margins during ramp-up.

Genetics focus: High-component sires. The cheese plants driving this expansion reward butterfat and protein, not volume. While butterfat has driven the recent surge, CoBank’s September 2025 report noted excessive butterfat levels can impact cheese quality – keep an eye on protein-focused sires as processors adjust.

Where it breaks: Your expansion needs $24+ milk to pencil out. You don’t have a written processor commitment. No one’s willing to run the expanded operation after you.

Path 2: Premium Positioning

Decision triggers:

  • Your herd is under 300 cows—ideally under 200
  • You’ve got pasture access at 2+ acres per cow
  • You can secure a processor contract before starting the transition
  • Someone in your operation wants to do the marketing work

It demands 36+ months of operating capital for organic transition. Maple Hill was moving to $40.86/cwt base by July 2025, with quality premiums pushing total pay toward $45/cwt for qualifying producers.

Genetics focus: A2A2 testing and segregation, Jerseys or crossbreeding for components, grass-efficient genetics. Most Holsteins run 50-60% A2 naturally—testing your herd first tells you how much work the transition requires.

Where it breaks: Premium markets absorb perhaps a few hundred operations annually at most. Wisconsin alone loses 400-500 farms per year, according to USDA data.

Path 3: Strategic Exit

Decision triggers:

  • You’re past 55 with no committed successor
  • Breakeven sits above $24/cwt with no clear path down
  • Equity has eroded three years running
  • Debt-to-asset has crossed 60% and keeps climbing

The gap between a well-planned exit and a forced sale can be substantial—potentially several hundred thousand dollars in recovered equity. Cull cow prices have been running strong in recent months.

One DFA executive put it this way: “For farms without succession plans, strong calf and cull prices offer a timely opportunity to exit the industry without incurring losses from prolonged milk prices.”

Signals Worth Watching

  • Immigration reform is moving. The Farm Workforce Modernization Act was reintroduced in May 2025 with bipartisan support. Senate Ag Chair John Boozman recently said: “We said we could not do reform because the border was not secure… it is secure now, then through visa programs you control the flow, but it’s time to do that.” If year-round ag visas open up by 2027-2028, the labor advantage in growth states shrinks.
  • Groundwater districts are tightening. Texas and Kansas conservation districts can implement pumping caps faster than the aquifer models update. Watch Dallam, Hartley, and Moore Counties in Texas, plus western Kansas districts.
  • Watch the processor contract terms. Are supply agreements getting shorter? Quality specs tightening? Water-efficiency clauses appearing? That tells you how processors are pricing in structural risk.
  • Component premiums may shift. CoBank’s September 2025 report noted that butterfat growth has significantly outpaced protein growth and that excessive butterfat levels can impact cheese quality. Protein may command higher premiums than fat.

What This Means for Your Operation

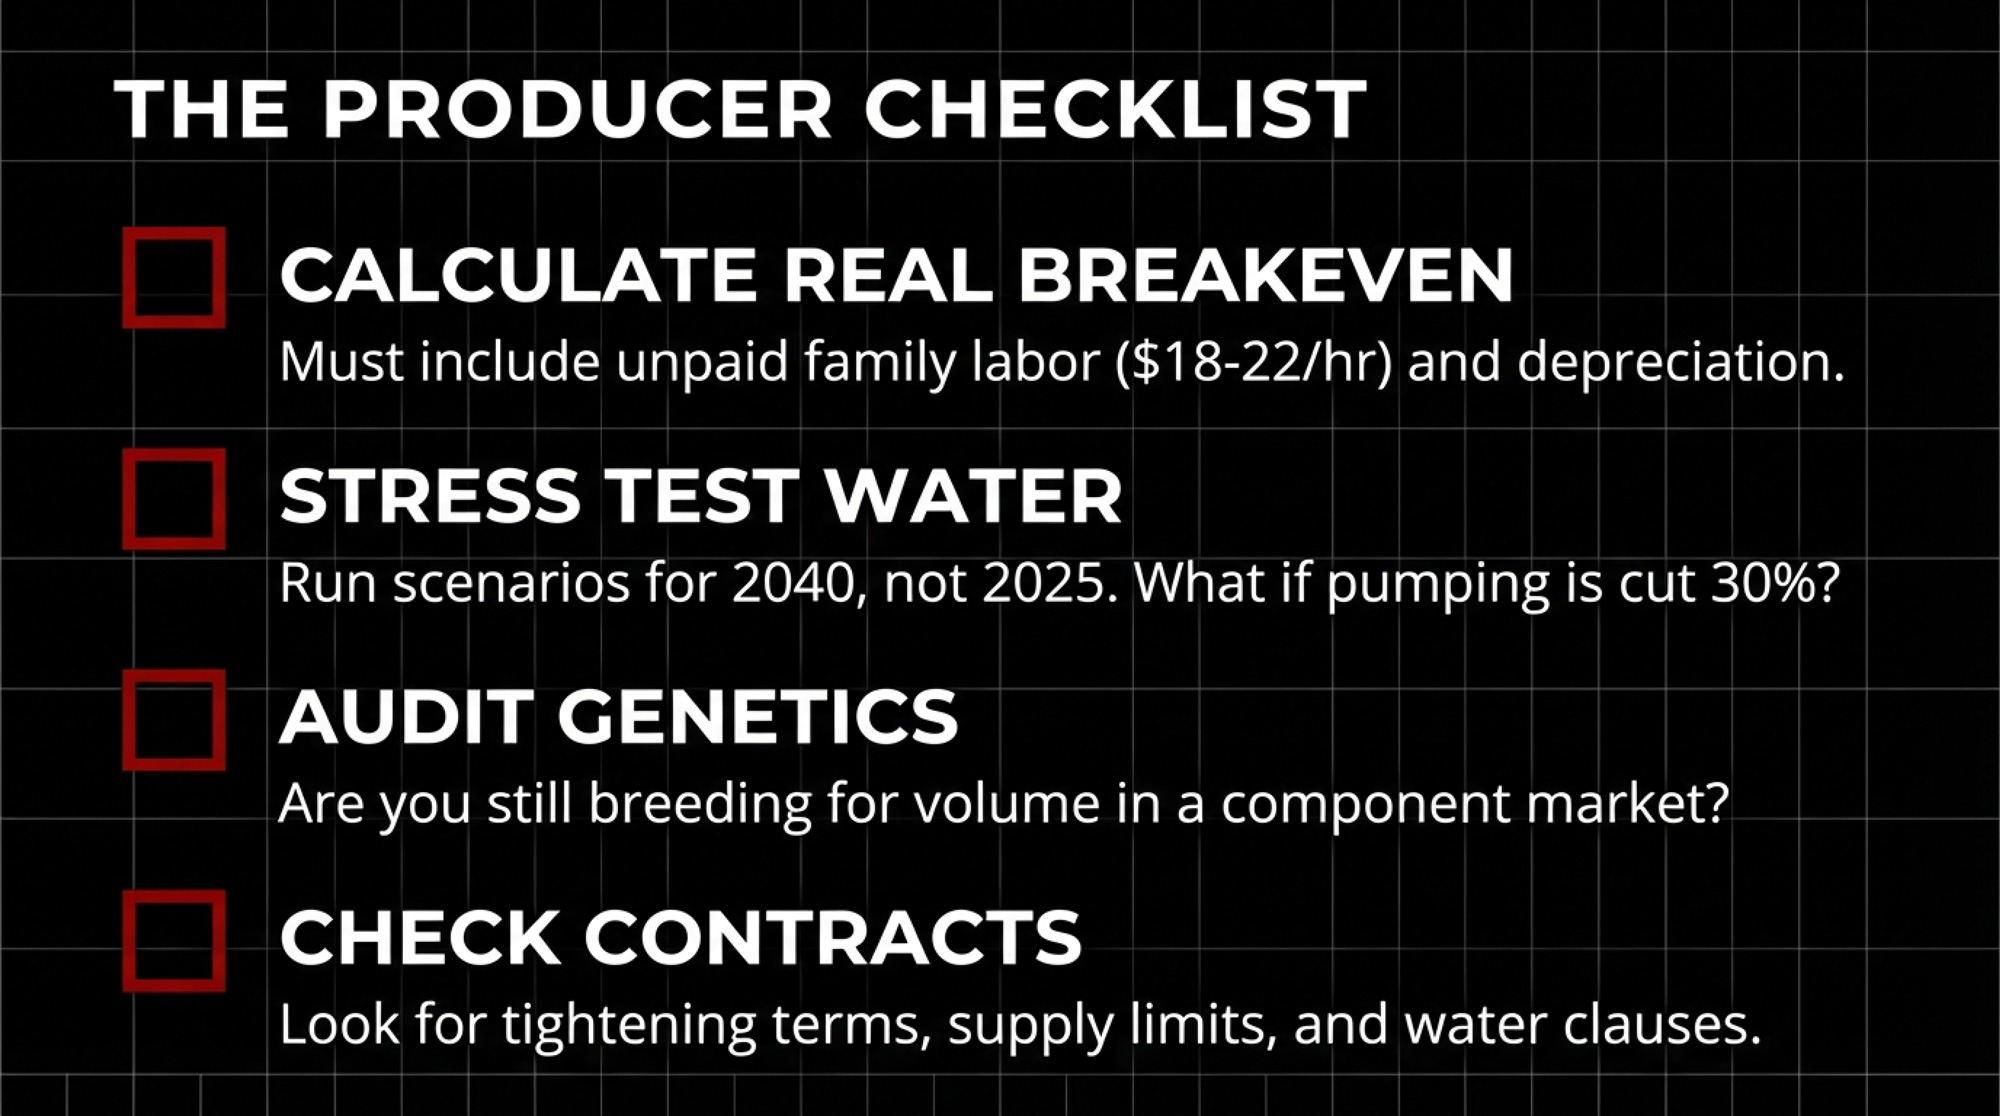
  • Know your real breakeven. Include unpaid family labor at $18-22/hour, depreciation at replacement cost, and management compensation. For most 300-500 cow herds, that number lands between $22-26/cwt.
  • If you’re looking at growth states: Run your water scenario for 2040, not today. What happens if pumping gets cut by 30-40%? Consider the I-29 corridor as an alternative with better water security.
  • If you’re eyeing premium markets, don’t start an organic transition without a signed contract. Test your herd’s A2A2 genetics first.
  • Audit your genetics program. Are you still breeding for volume while processors pay for components? The April 2025 base change proves the industry has moved.
  • If exit makes sense: Strategic beats reactive by a wide margin. That’s the difference between selling genetics as genetics versus a fire sale.
  • Red flag: Your 18-month cash flow shows cumulative losses exceeding 15% of equity.
  • Green light: You’re under 250 cows, have pasture, and a processor has put interest in writing at premium terms.
Herd SizeReal Breakeven (incl. unpaid labor)Current Milk Price RangeDecision Trigger
100-200 cows$25-28/cwt (red)$20-22/cwtConsider premium pivot or strategic exit (red)
300-500 cows$22-26/cwt (red)$20-22/cwtMarginal viability; efficiency gains or exit (red)
500-1,000 cows$20-23/cwt$20-22/cwtViable if debt-to-asset < 50%; consider scale-up
1,000+ cows$18-21/cwt$20-22/cwtProfitable; focus on component optimization

The Bottom Line

Processor confidence doesn’t validate producer expansion. Their bets pay off under scenarios where yours might not—they have optionality you don’t.

The three-path decision isn’t optional. Scale, premium, or exit. Staying the same size, doing the same things, hoping prices improve—that’s not a strategy. It’s a slow exit with worse terms.

Water, labor, and genetics are structural, not cyclical. These aren’t problems that fix themselves in the next price rally. Build them into your 10-year planning.

Chad Vincent of Dairy Farmers of Wisconsin captured the human weight of all this: “I think Wisconsin dairy is as strong today as it’s ever been, although it is sad to see the next generation not come back.”

Rabobank analyst Ben Laine summed up the trajectory: “Everything that we know about dairy consolidation says it hasn’t shown any signs of slowing down… I don’t see that changing.”

Wisconsin’s farm count peaked above 100,000 in the mid-20th century. Today, fewer than 6,000 remain—and production has nearly doubled. The milk keeps flowing. The communities that make it look nothing like they used to.

Where does your operation sit on that curve? And who’s making the call—you, or the next milk check?

Complete references and supporting documentation are available upon request by contacting the editorial team at editor@thebullvine.com.

Learn More

The Sunday Read Dairy Professionals Don’t Skip.

Every week, thousands of producers, breeders, and industry insiders open Bullvine Weekly for genetics insights, market shifts, and profit strategies they won’t find anywhere else. One email. Five minutes. Smarter decisions all week.
NewsSubscribe
First
Last
Consent
Send this to a friend