Four of the world’s ten largest dairy companies are farmer-owned. All four are running the same playbook Lactalis has been running — and the fine print is where members find out what that costs.
EXECUTIVE SUMMARY
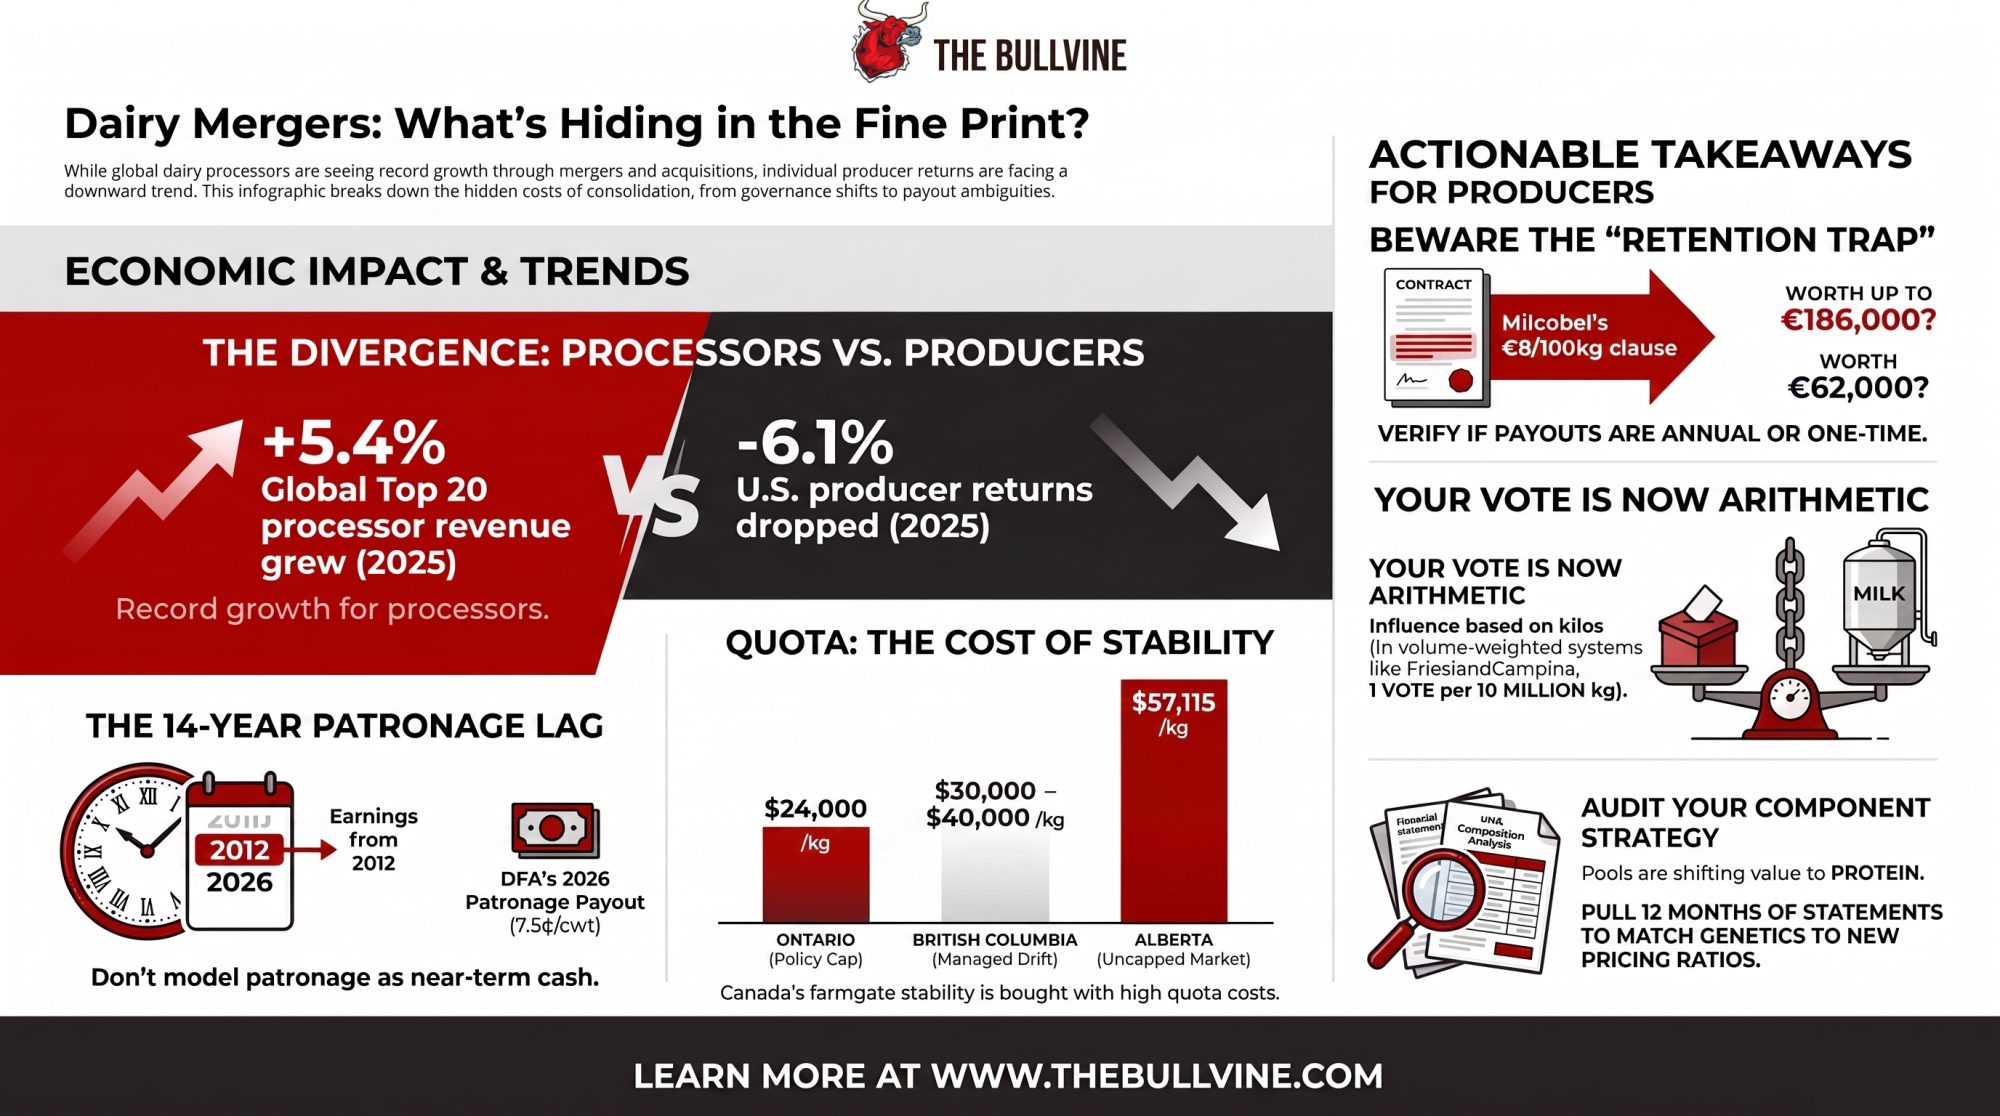
- The €8 clause nobody has defined. Milcobel’s merger proposal pays €8 per 100 kilograms to members who stay three years with FrieslandCampina. Nine months after the deal closed, no public document says whether that lands once or annually — on 760,000 litres, roughly €62,000 versus about €186,000 across the term. It also isn’t clear whether a one-time payment would be calculated on one year’s volume or on cumulative supply, which would close the gap entirely.
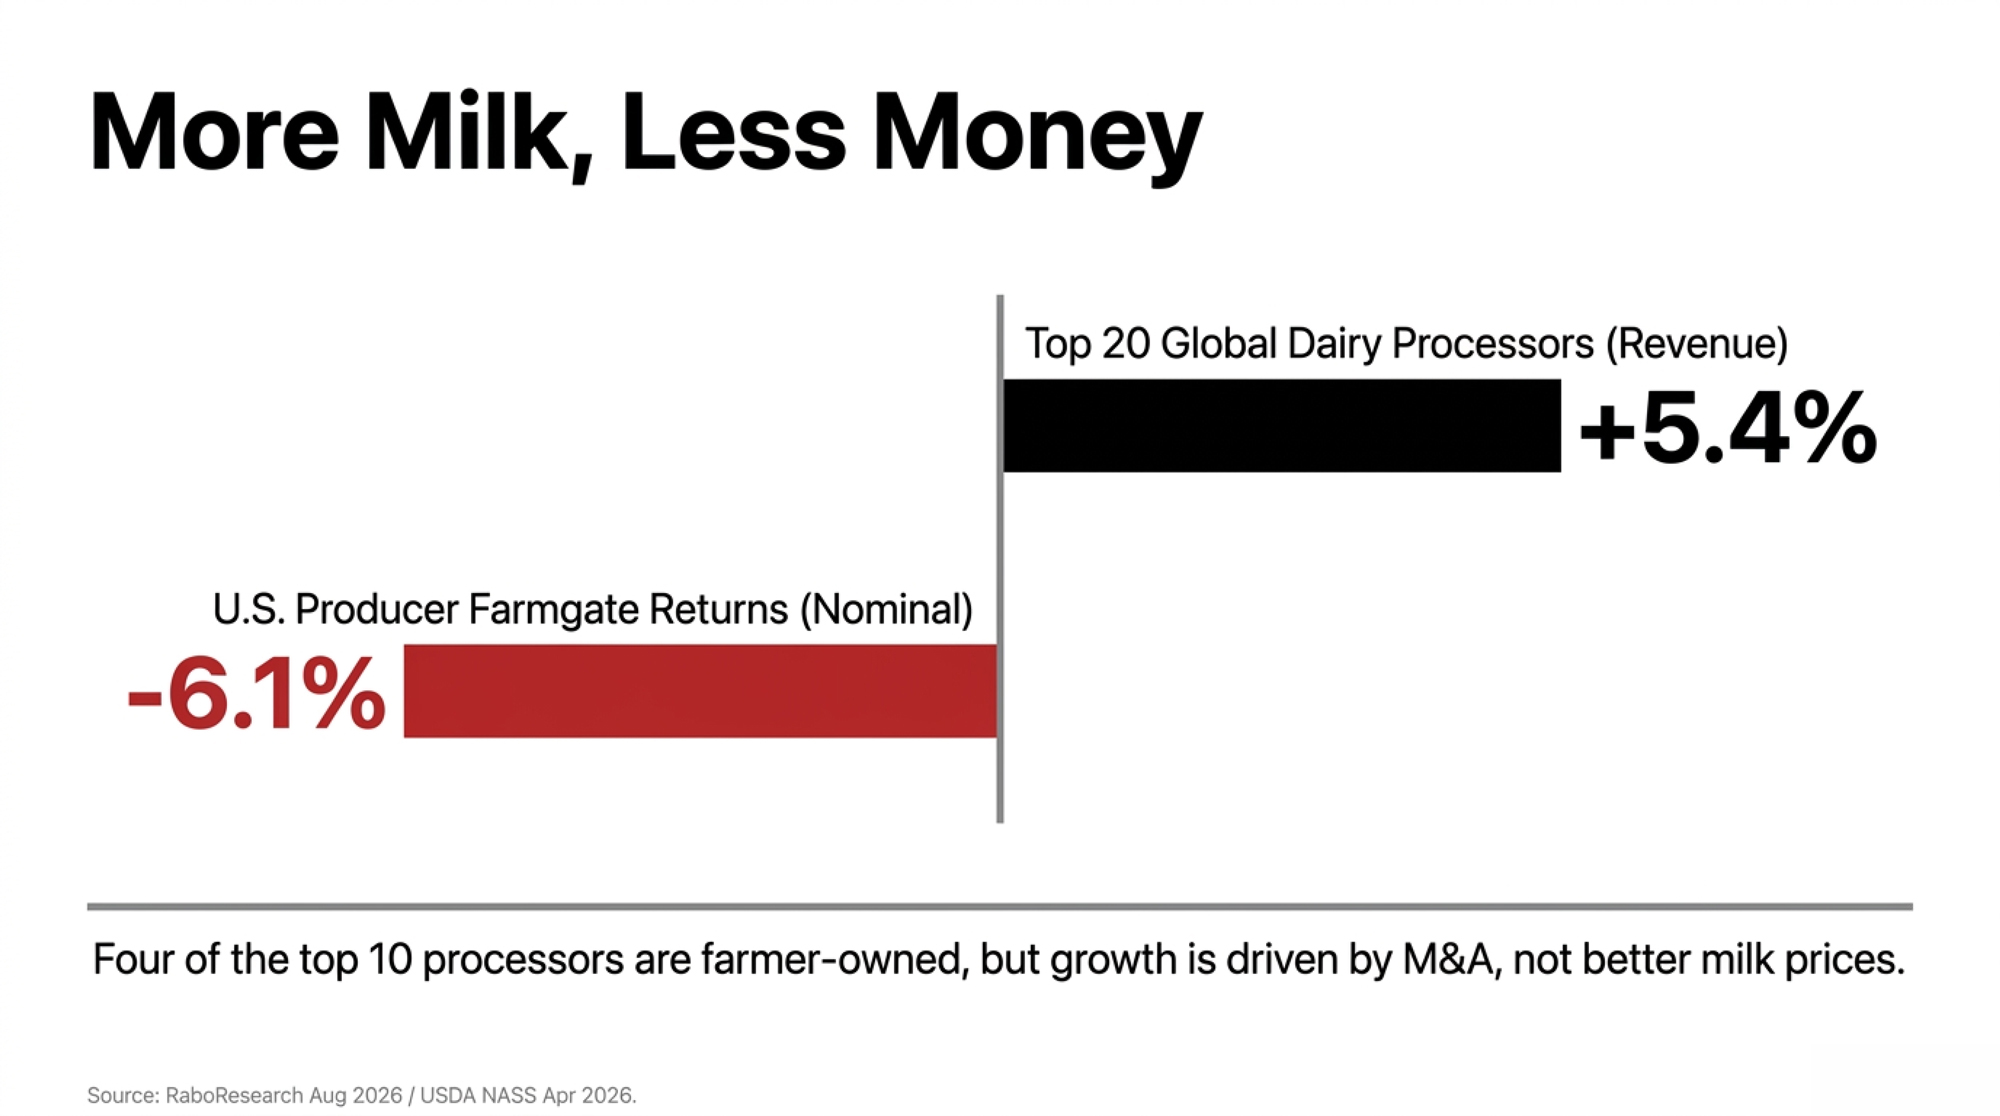
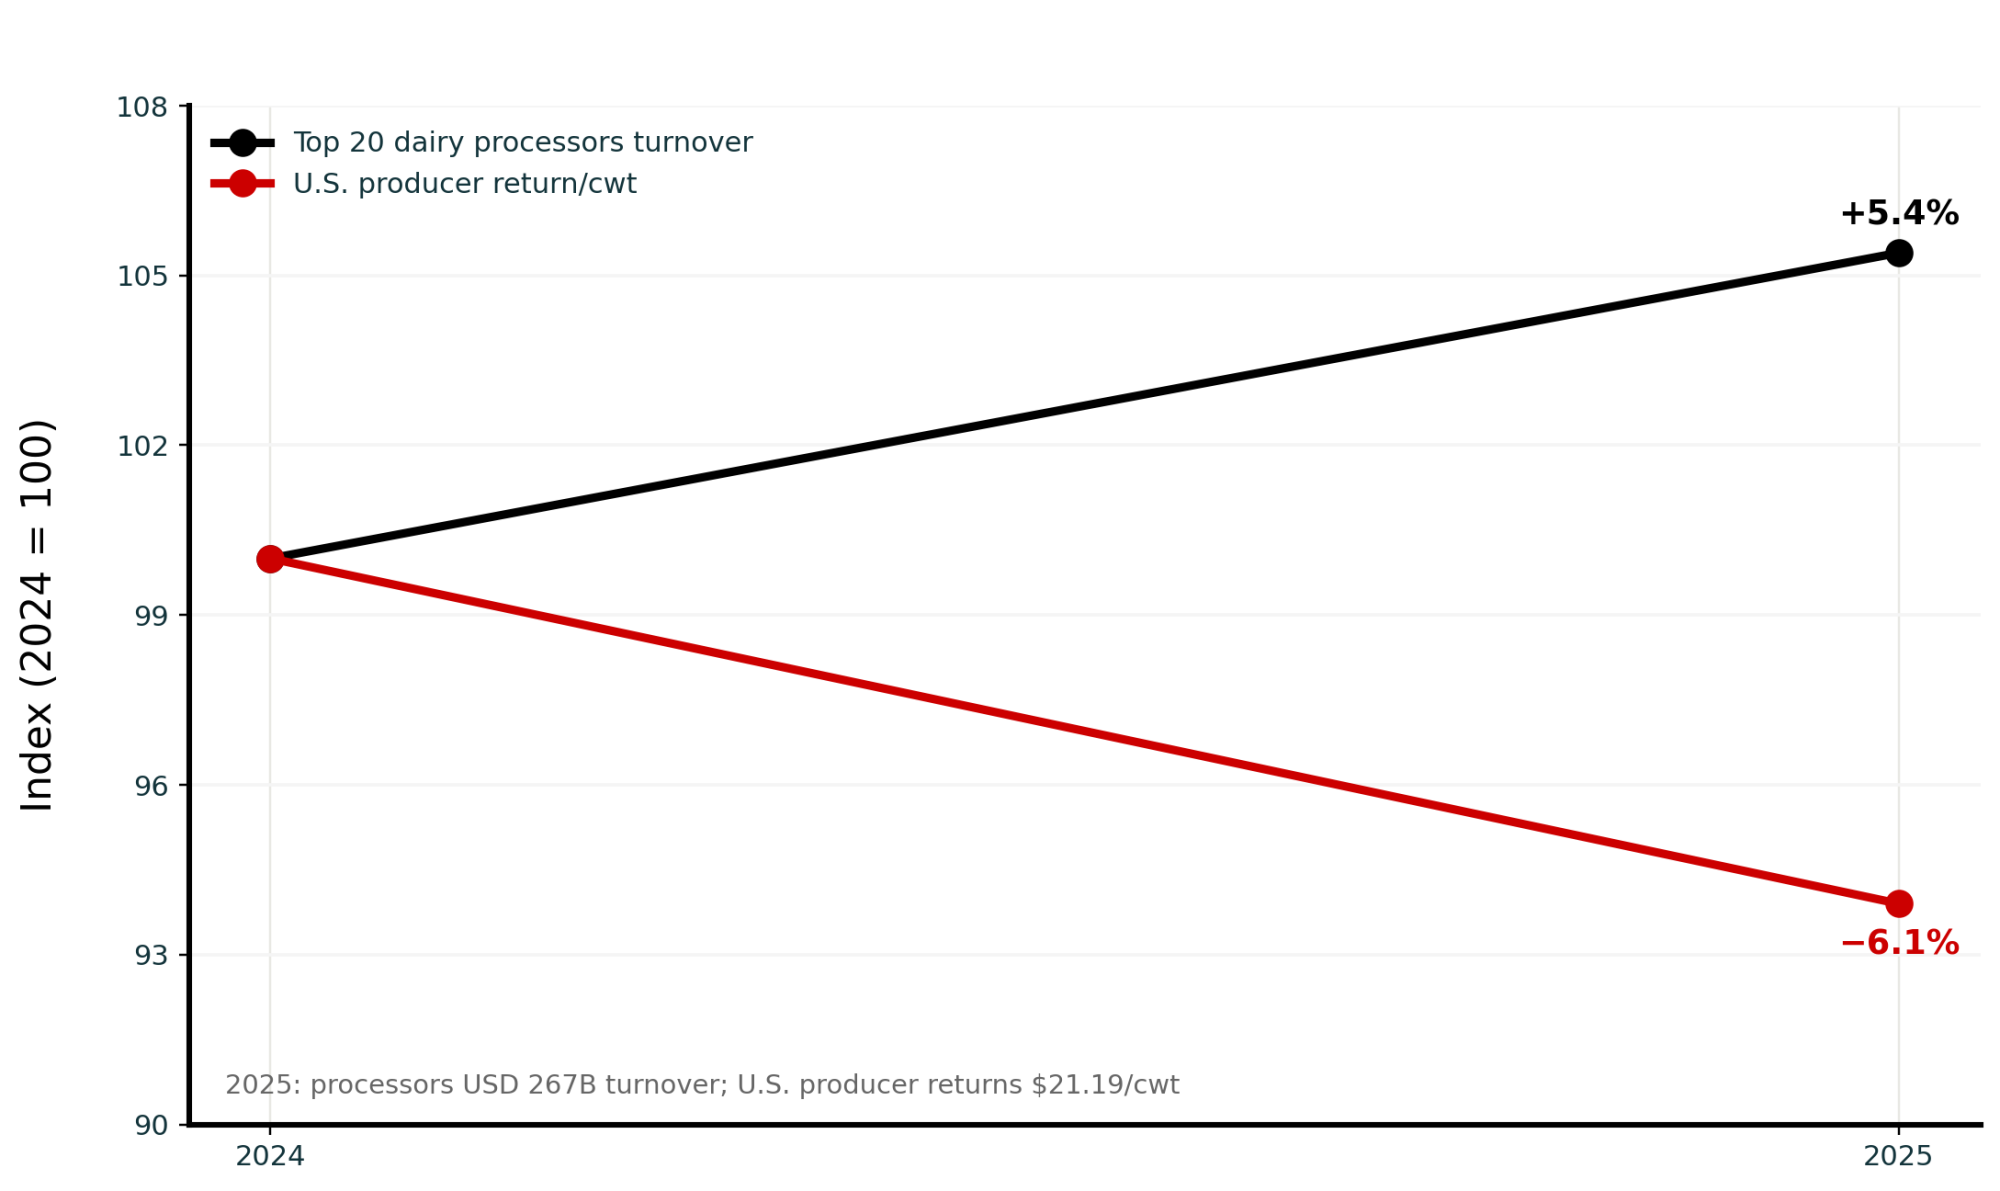
- The macro split. The world’s 20 largest dairy companies turned over USD 267 billion in 2025, up 5.4%. USDA NASS put U.S. producer returns at $21.19/cwt — down 6.1% nominal and 8.5% real. On 400 cows at the national 24,390-lb average, that’s about $133,657 off the top line.
- Governance moved with the money. FrieslandCampina’s Members’ Council votes one vote per ten million kilos of district milk, and its district count has gone 21 to 14 to 16 since 2009. Milcobel’s merger passed unanimously among 70 delegates; FrieslandCampina’s percentage has never been published. In June, the ICA circulated draft language inserting “normally” into one-member-one-vote.
- The 14-year capital lag. DFA’s board issued $29.6 million in patronage on September 3, 2026 — 7.5¢/cwt, or roughly $7,317 on that same 400-cow herd. It covered 2012 earnings. If you’re modelling patronage into cash flow, model the delay with it.
€8 per 100 kilograms, for three years, to members who stay. That’s Milcobel’s retention clause, and nine months into the merged cooperative nobody has published whether it pays once or annually. On a 760,000-litre operation, one reading is worth roughly €62,000 and the other nearly three times that. If you ship to DFA, Land O’Lakes, Agropur or any co-op that’s merged in the last decade, the same question sits in your own agreement — and 2025 was the year U.S. producer returns fell 6.1% while the world’s biggest dairy companies grew 5.4%.
A long-standing Milcobel member described that calculation to The Bullvine last December, a week before the vote that folded her Belgian cooperative into Dutch giant FrieslandCampina. A second member, in West Flanders, ran it from the other end.
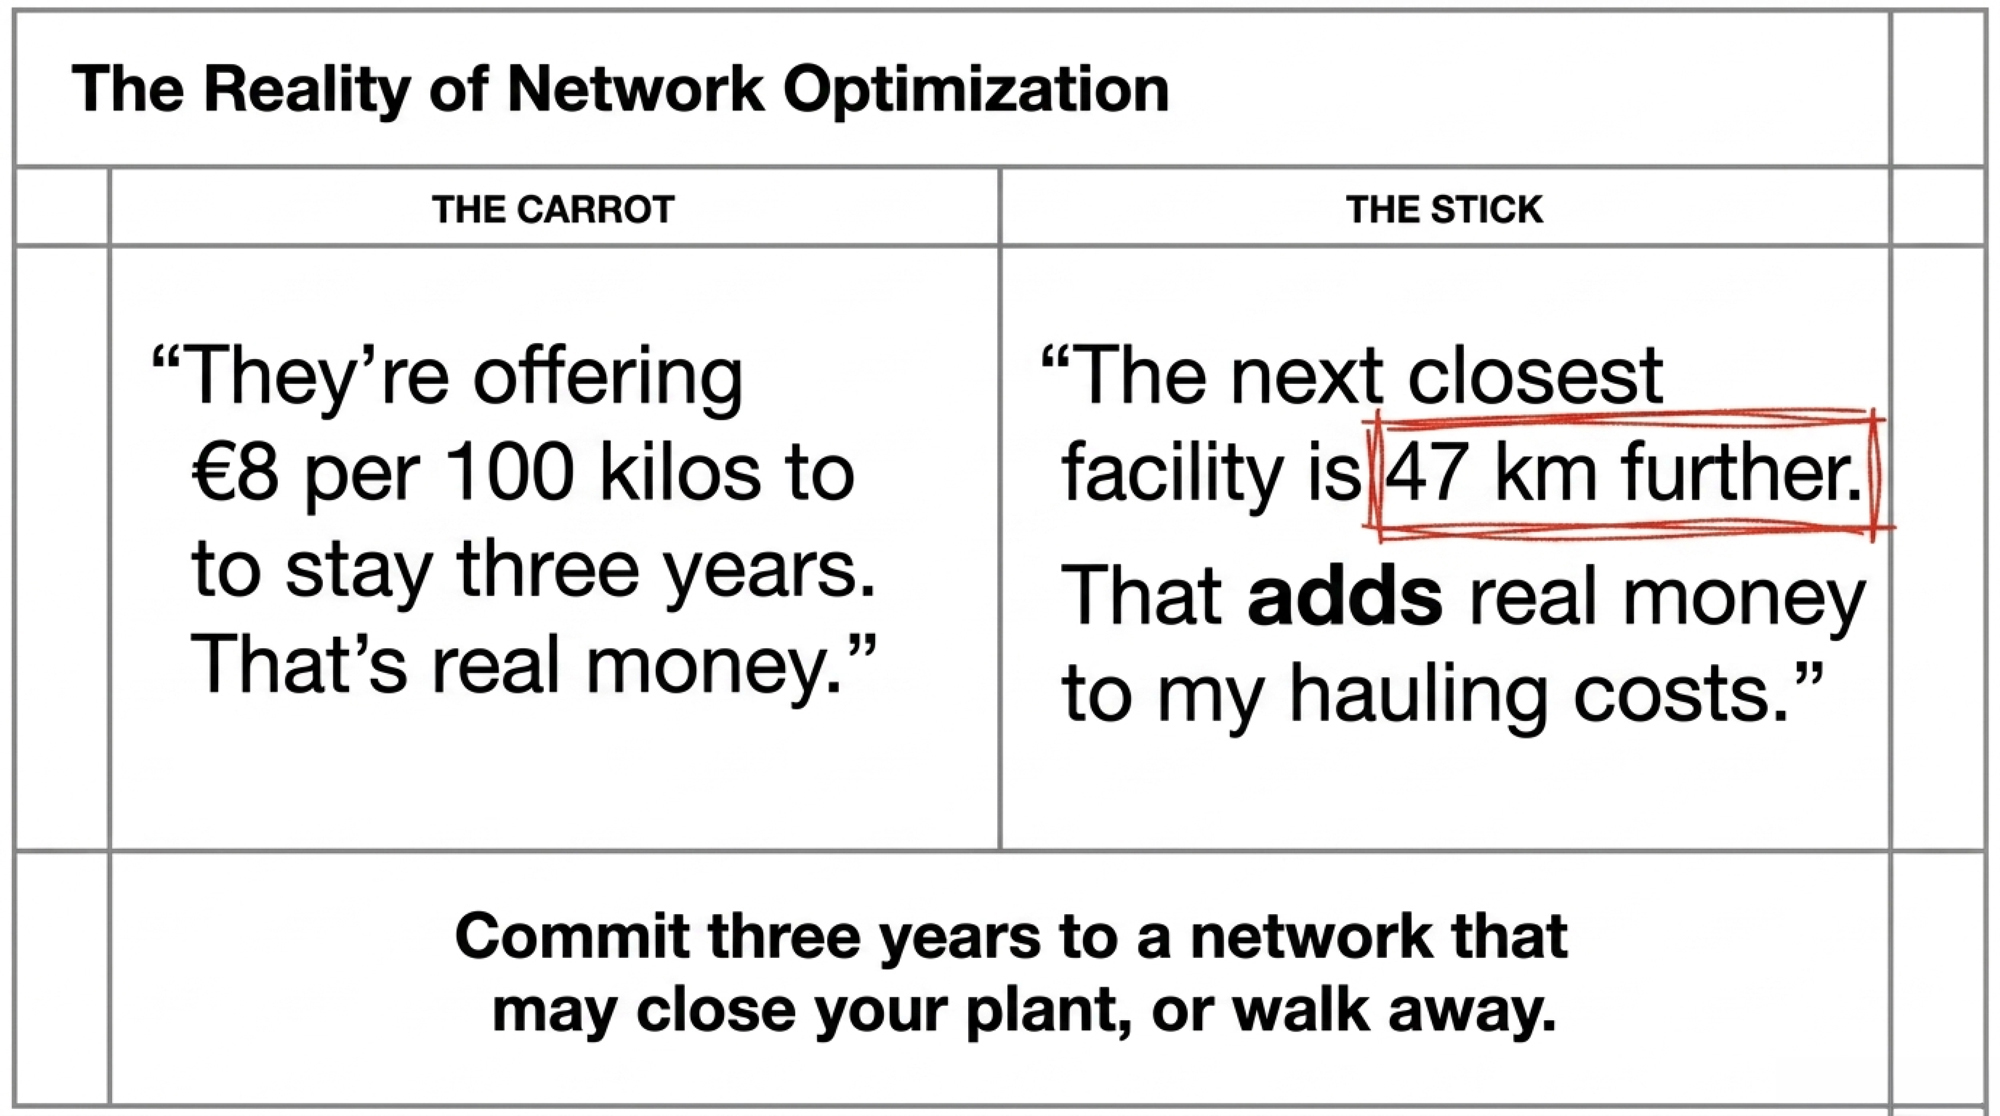
“They’re offering us €8 per hundred kilos to stay three years,” the first said. “That’s real money. But my nearest plant is on the closure list.”
“The next closest facility is 47 kilometers further,” the second said. “That’s going to add real money to my hauling costs every year.”
There’s the trap. Commit three years to a processing network that may not include your plant, or walk away from the payment. Both members asked not to be named. Both were describing their own operations.
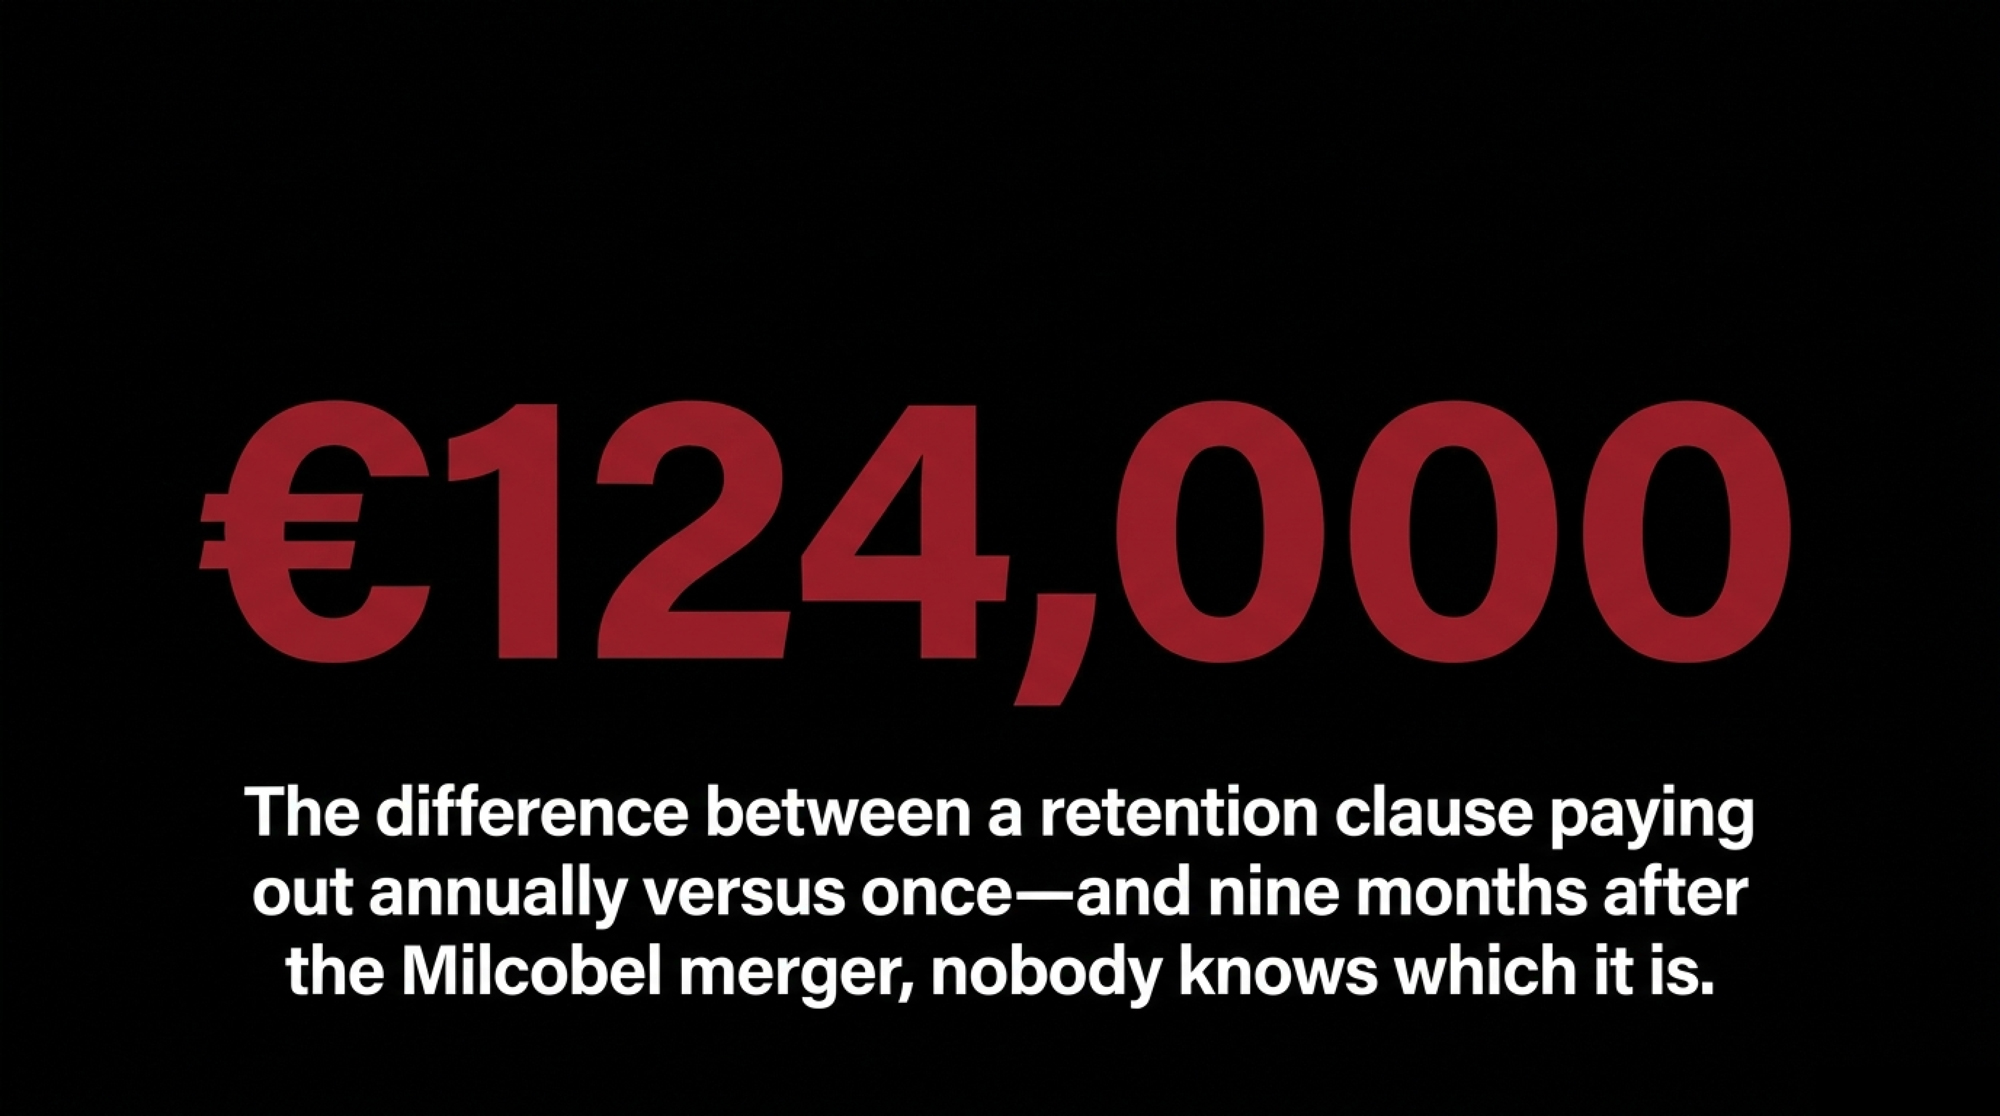
What We Could and Couldn’t Verify: The €8 rate and the three-year condition come from the published merger proposal. Whether the payment is made once or annually is not established in any public document — the whole reason it leads this story — and neither is the volume basis it would be calculated on. We found no documented instance of a Milcobel or FrieslandCampina member facing consequences for speaking publicly, and no published plant-closure list. The cooperative has used the language of network optimization rather than announcing closures. The closure-list characterization is the member’s own reading of her situation. Nestlé’s Top 20 turnover figure is carried by dairy trade press covering the RaboResearch release and isn’t independently cross-confirmed. DFA’s $23.1 billion comes from the Dairy Foods Top 100, a separate North American ranking, not RaboResearch’s own line item. The ICA’s June 2026 draft revision is quoted verbatim below. We haven’t established what prompted the change, and the draft doesn’t mention dairy.
The Divergence in One Table
| Metric (2024 → 2025) | Top 20 Global Dairy Processors | U.S. Producer Farmgate |
| Topline movement | +5.4% — USD 267B combined turnover (RaboResearch, Aug 2026) | −3.7% — $48.9B gross cash receipts (USDA NASS, Apr 30, 2026) |
| Price / return realization | No group margin published; growth driven by M&A and a stated pivot to protein, functional nutrition and high-value ingredients | −6.1% — $21.19/cwt nominal; −8.5% real on BLS CPI-U (313.7 → 321.9) |
| Output volume | Not reported as a group figure; Arla–DMK–DOC alone carries a pro forma pool of 19.4B kg | +2.6% — 232B lbs produced; 24,390 lbs per cow, up 218 lbs |
Two things worth naming before the analysis. Revenue growth isn’t profit growth, and a good chunk of that 5.4% comes from mergers stacking two companies’ revenue under one banner rather than anyone selling milk at a better price. And U.S. output rose while returns fell — more milk, less money per hundredweight.
Running the Numbers: Your Herd Against That Table
Every input below is sourced so you can run it against your own statements.
Sourced inputs — USDA NASS, Milk Production, Disposition, and Income 2025 Summary, released April 30, 2026, U.S. national:
- Producer returns, 2025: $21.19/cwt, 6.1% below 2024 (NASS wording)
- Implied 2024 figure: roughly $22.56/cwt — a decline of about $1.37/cwt
- Rate per cow, 2025: 24,390 lbs
- Deflator: BLS CPI-U annual averages, 313.7 → 321.9, +2.6%
- Real 2025 return in 2024 dollars: $21.19 ÷ 1.026 = $20.65
Scenario — 400 cows at the NASS national per-cow average:
- 400 × 24,390 lbs = 9,756,000 lbs
- ÷ 100 = 97,560 cwt marketed
- 97,560 cwt × $1.37 = $133,657
Swap in your own cow count, production average, and regional basis, and the figure moves. The direction won’t.
Now put the Belgian arithmetic beside it. The West Flanders member’s 47 kilometres is a permanent cost added to every load, running against a payment that stops after three years even on the most generous reading. Whatever her hauling rate is per kilometre, multiply it by two for the round trip, then by her annual load count, then by three. That’s what the €8 has to beat if the payment recurs annually — and roughly three times what it has to beat if it’s paid once on a single year’s volume. She can’t finish that calculation either, because nobody has published which one it is.
Why Canada’s Farmgate Went the Other Way — And What It Costs to Get In
Not every system moved the same direction in that window. The Canadian Dairy Commission’s National Pricing Formula produced a 2.3255% farmgate increase effective February 1, 2026, following a 0.0237% decrease the prior year. The mechanism is the whole difference: supply management prices milk off a national cost-of-production formula — the CDC calculated 2024 cost of production, indexed to the three months ending August 2025, at $92.82 per hectolitre — rather than off global commodity markets. That insulates Canadian farmgate returns from the swing the table above shows.
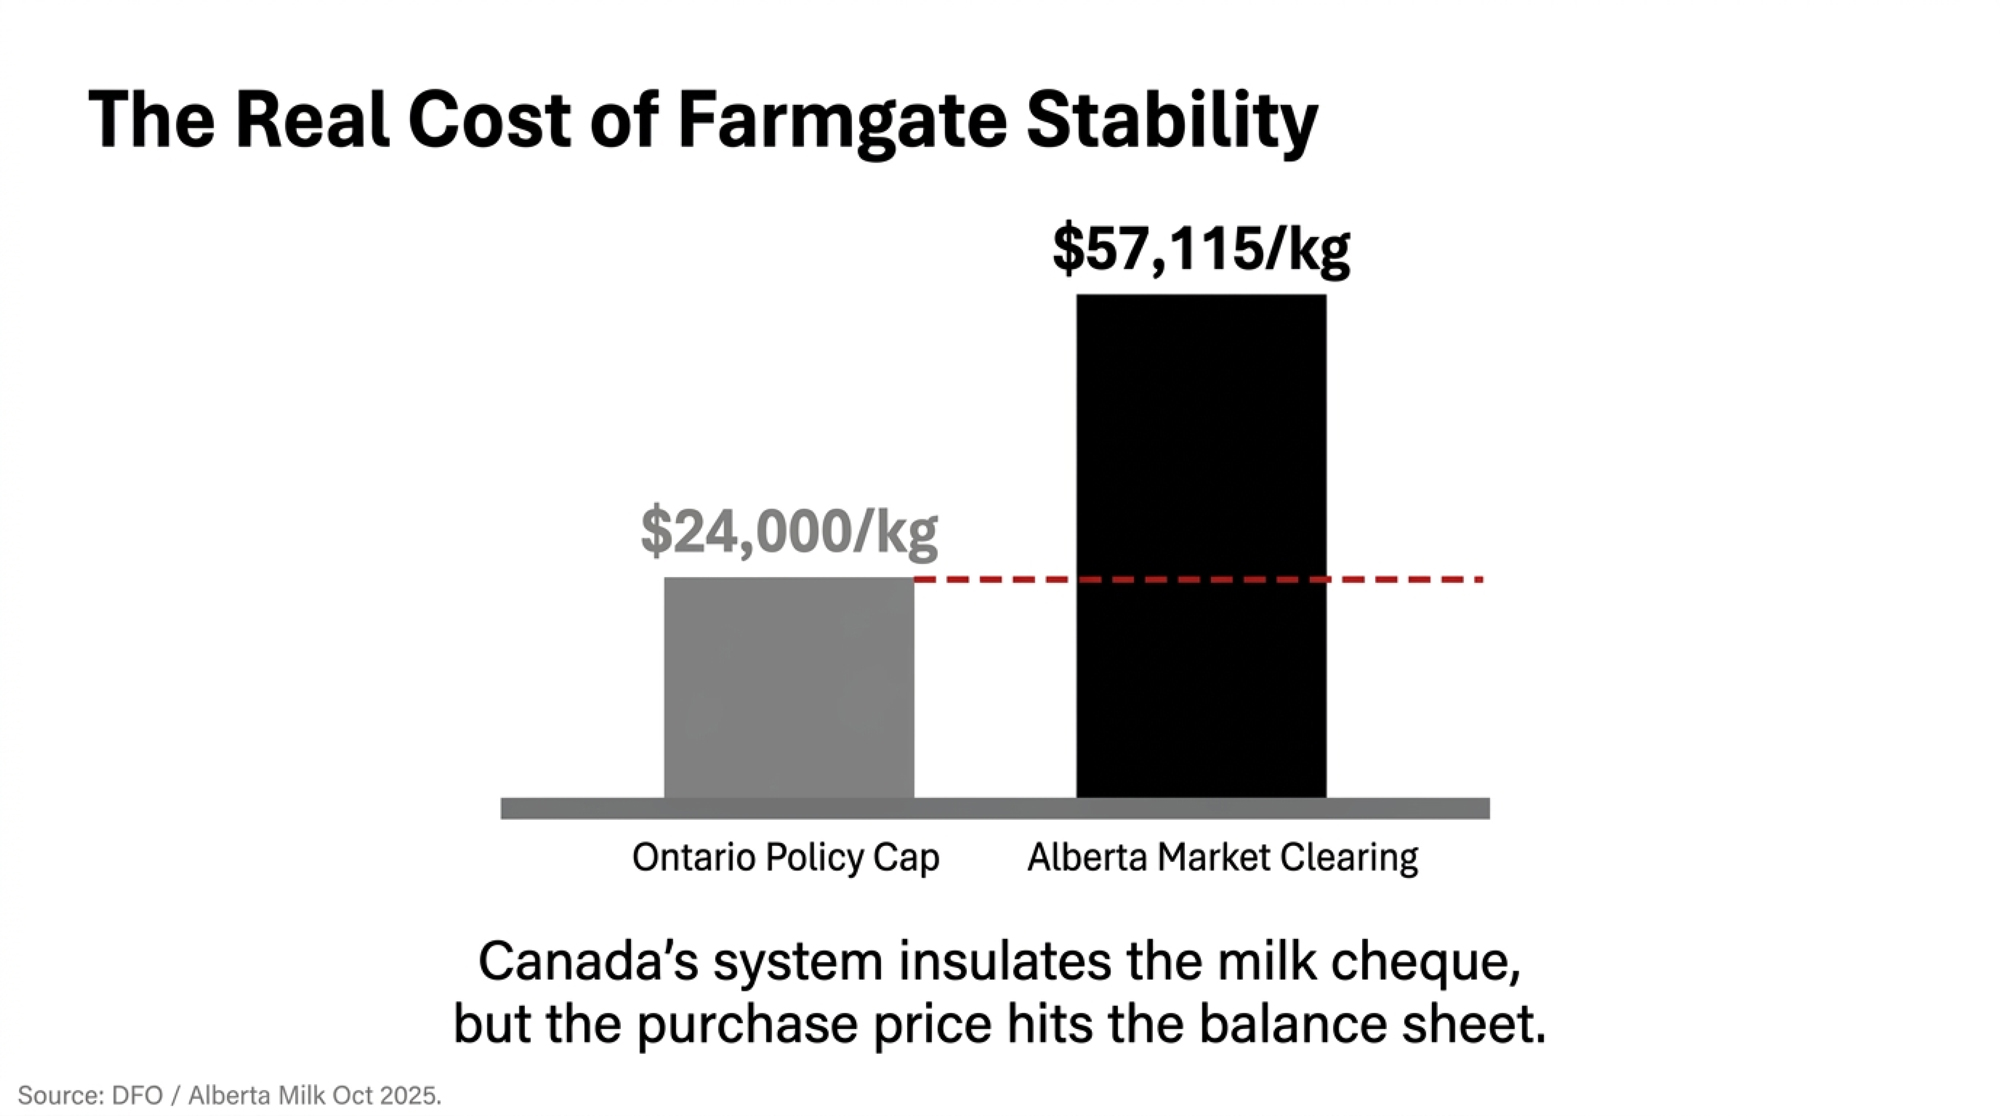
It prices entry instead. Ontario quota sits at a policy cap of $24,000 per kilogram of butterfat per day, the same ceiling in force in Quebec, New Brunswick, Nova Scotia and Prince Edward Island. Alberta and Saskatchewan don’t cap at all.
| Province | Mechanism | Price / kg Butterfat / Day |
| Ontario / P5 | Policy cap | $24,000 |
| Alberta | Uncapped market clearing (Oct 2025) | $57,115 |
Sources: Dairy Farmers of Ontario quota exchange summaries; Alberta Milk October 2025 exchange summary.
Watch what happens when you remove the ceiling. Alberta Milk’s October 2025 exchange cleared at $57,115/kg, with 23 successful bids between $58,200 and $60,900 and 30 successful offers between $54,000 and $56,030. That’s roughly 2.4 times Ontario’s capped price for the same asset — the clearest available read on what the cap is holding back.
British Columbia runs a third model worth knowing about, because it’s neither of those. The BC Milk Marketing Board manages a market-clearing price inside a core range of $30,000 to $40,000 per kilogram, with the price permitted to move no more than $1,000 in any month while it sits inside that band — rules that took effect for exchanges from January 1, 2025. Managed drift, not a hard ceiling.
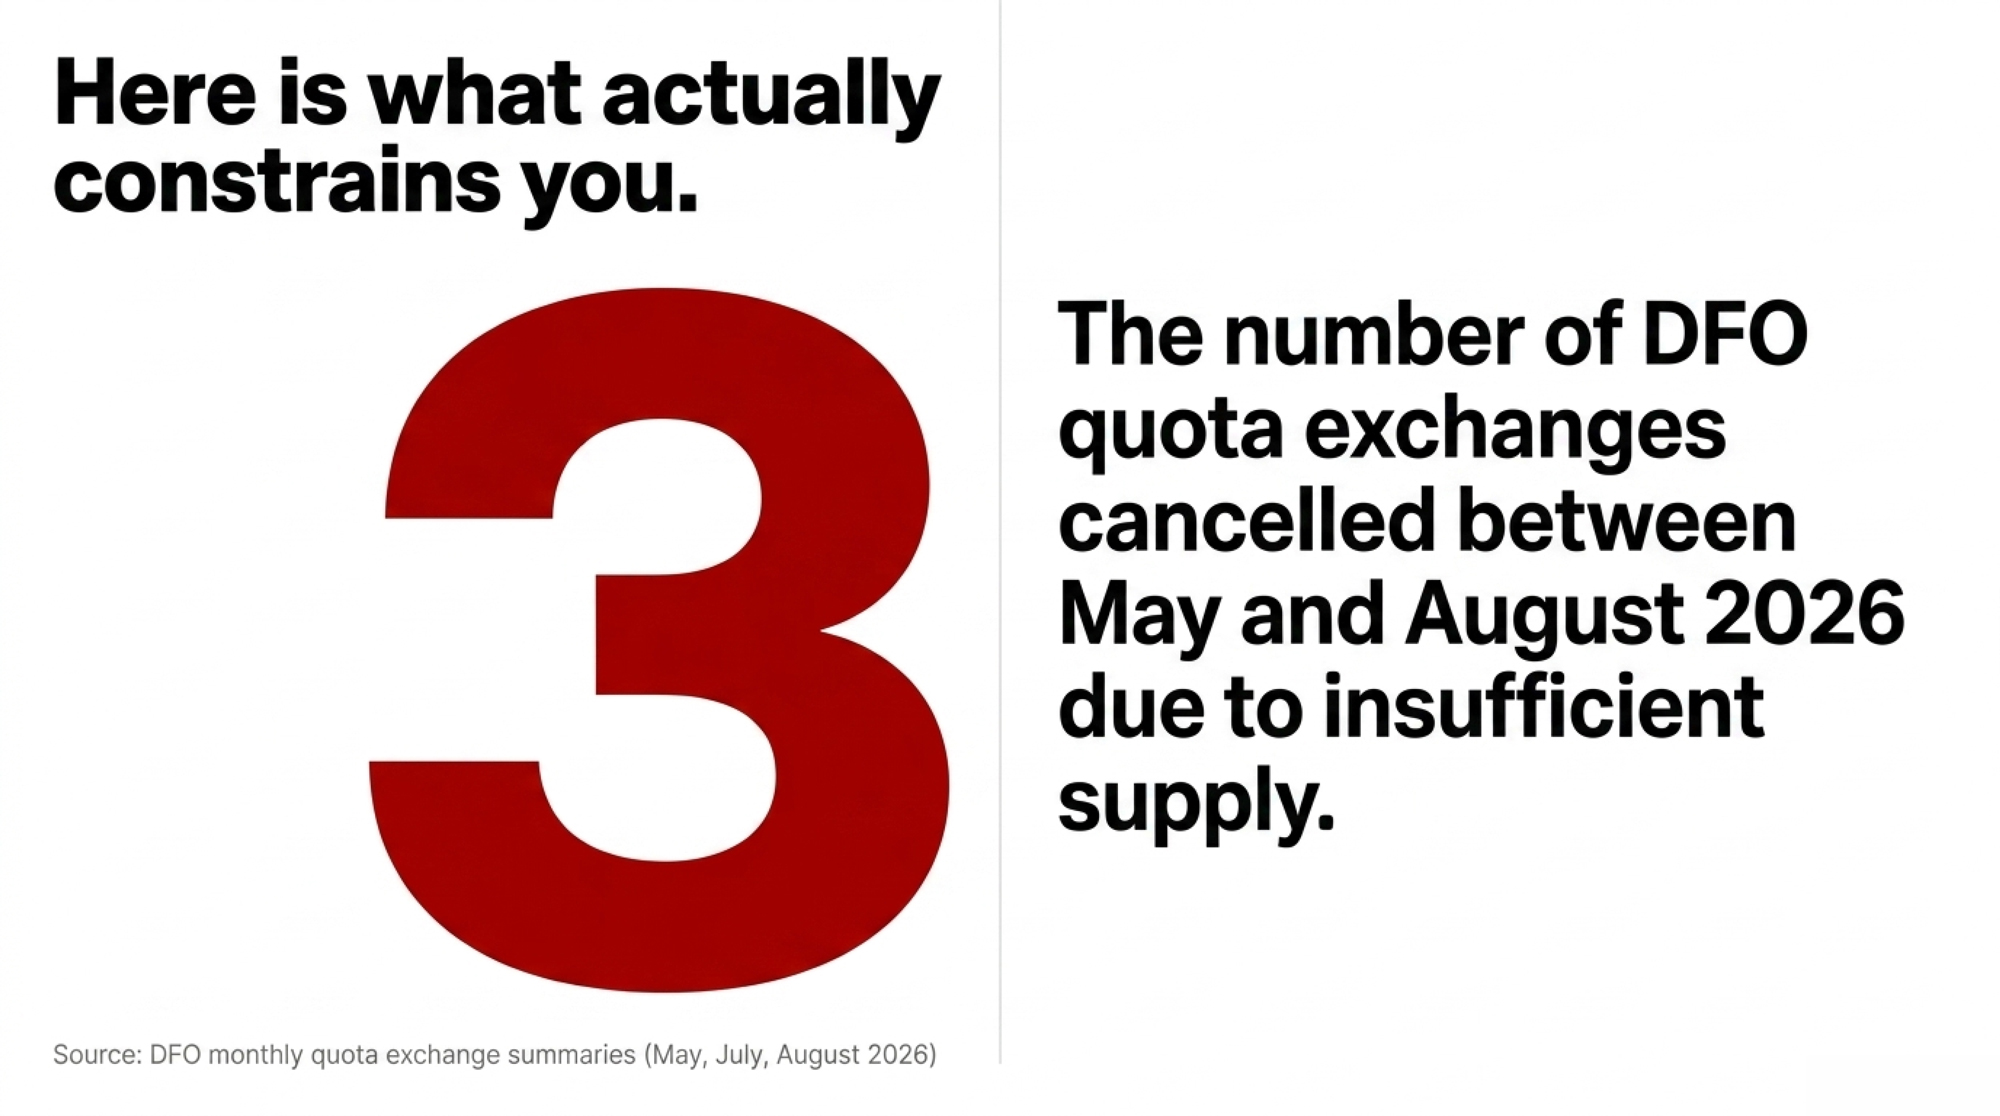
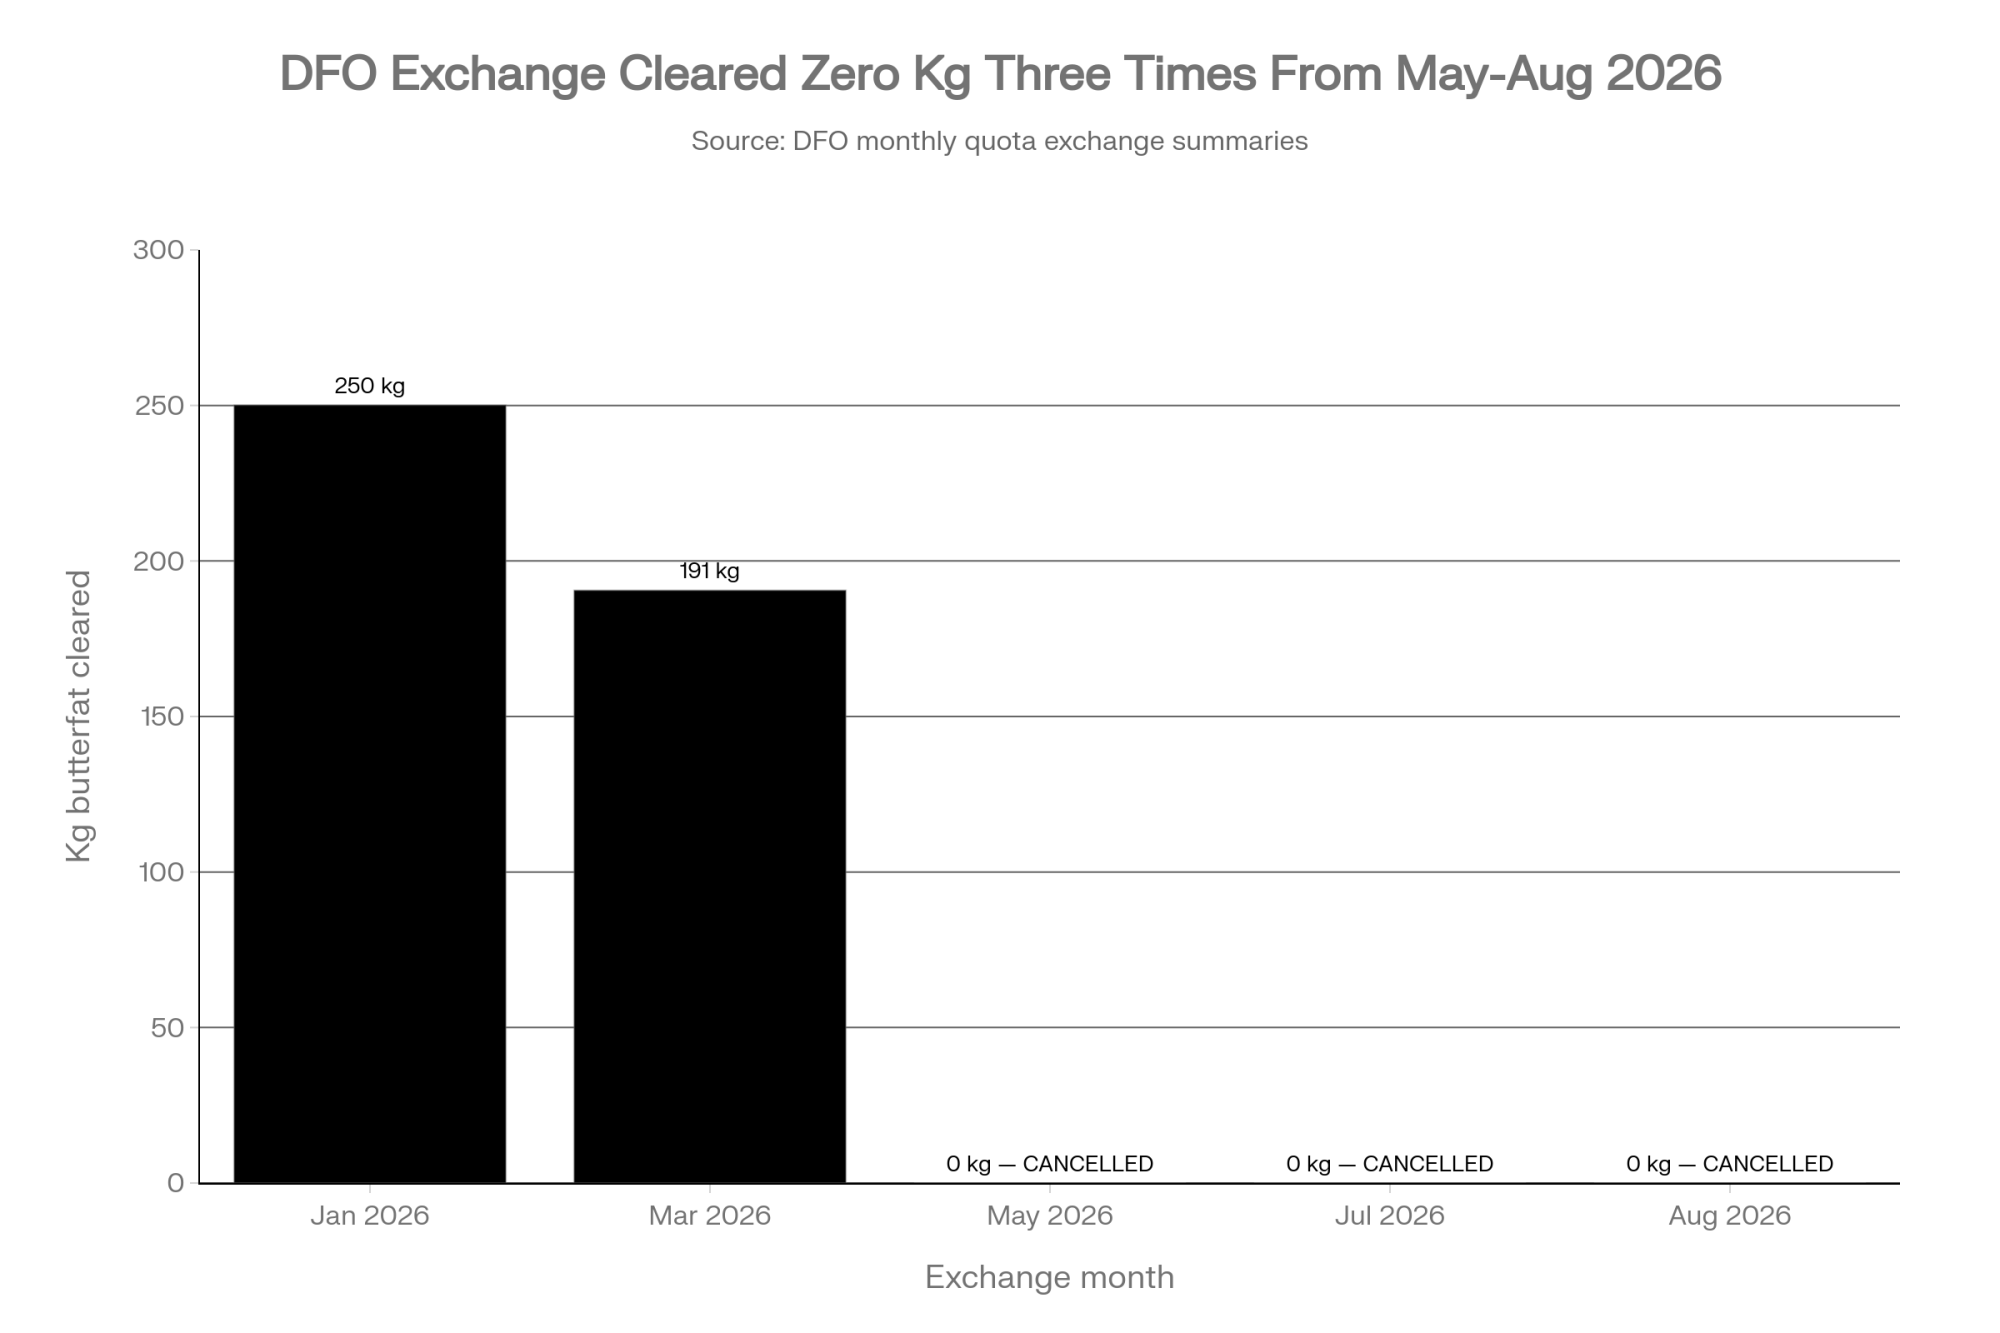
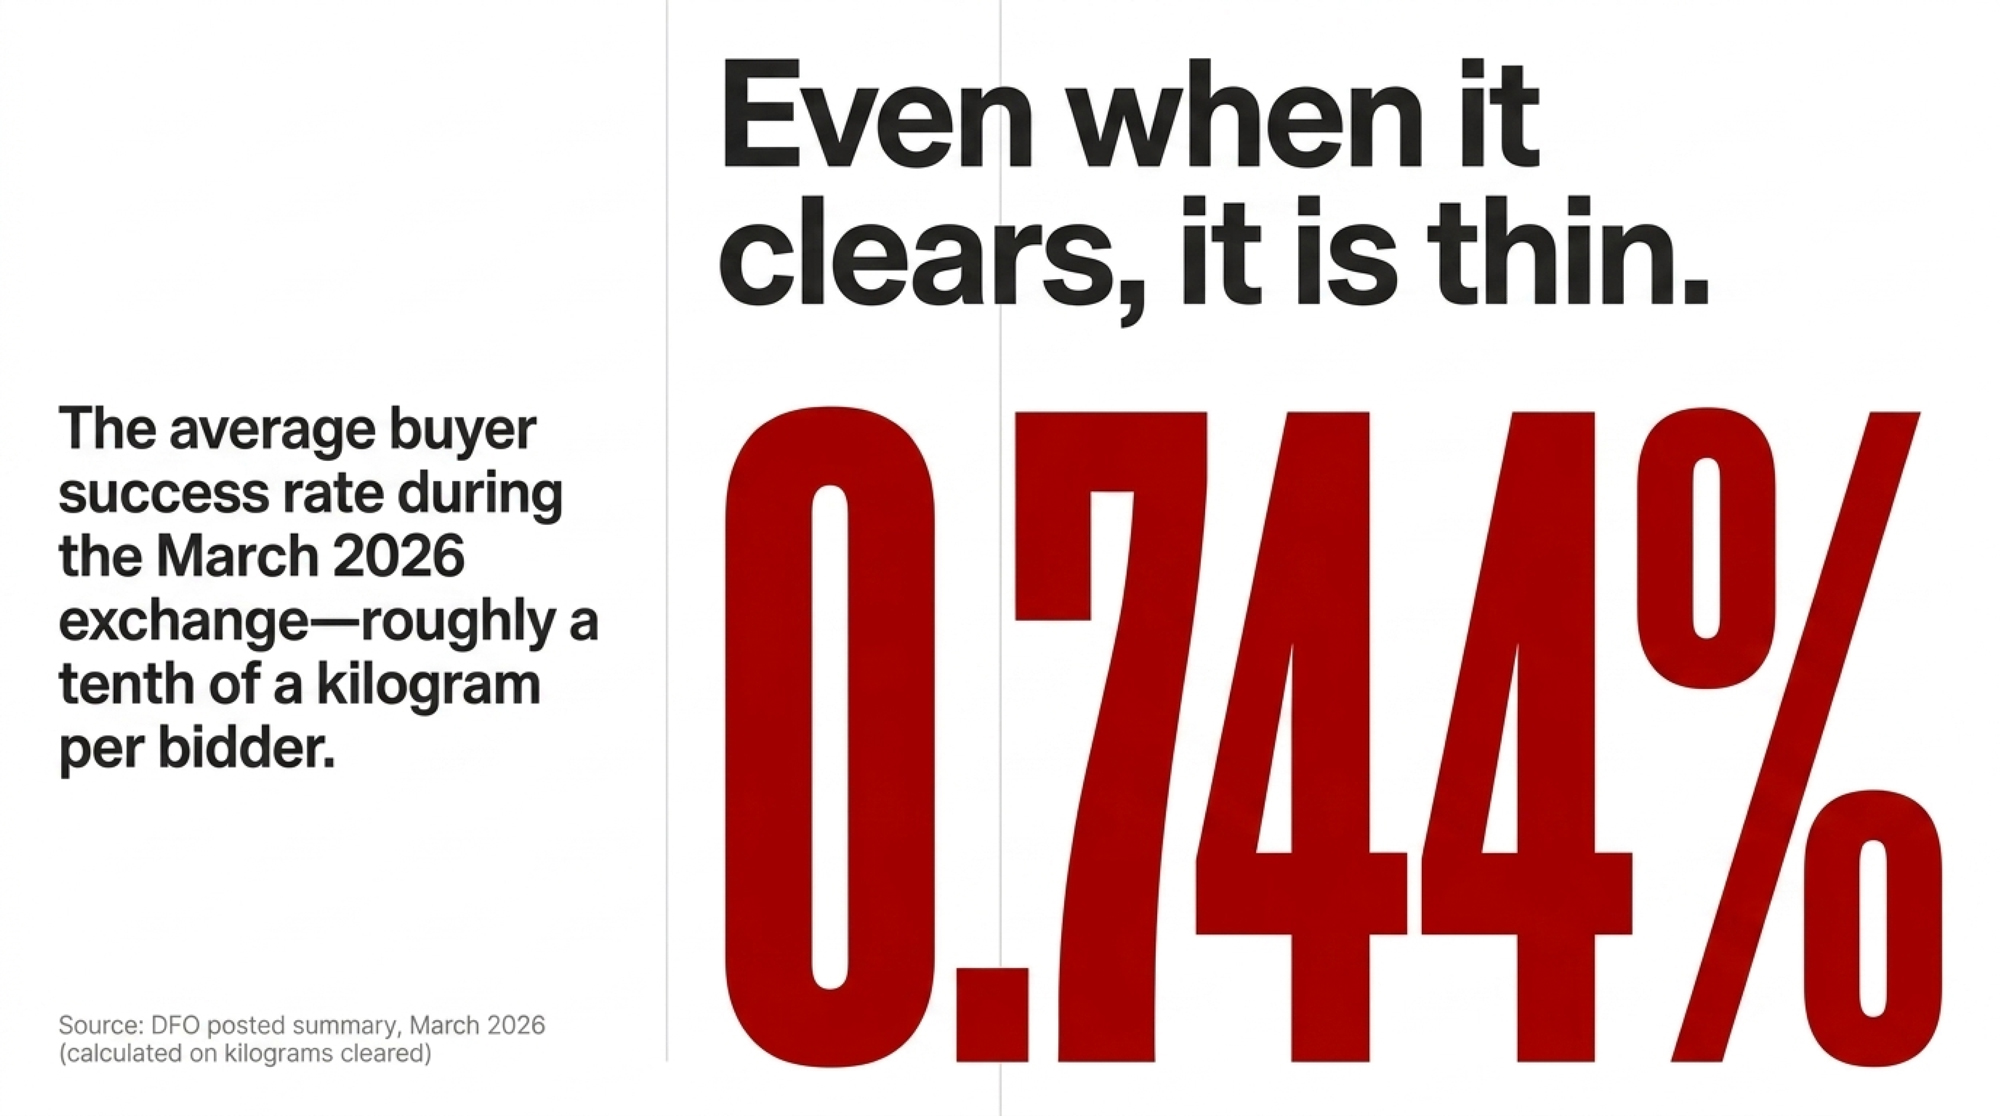
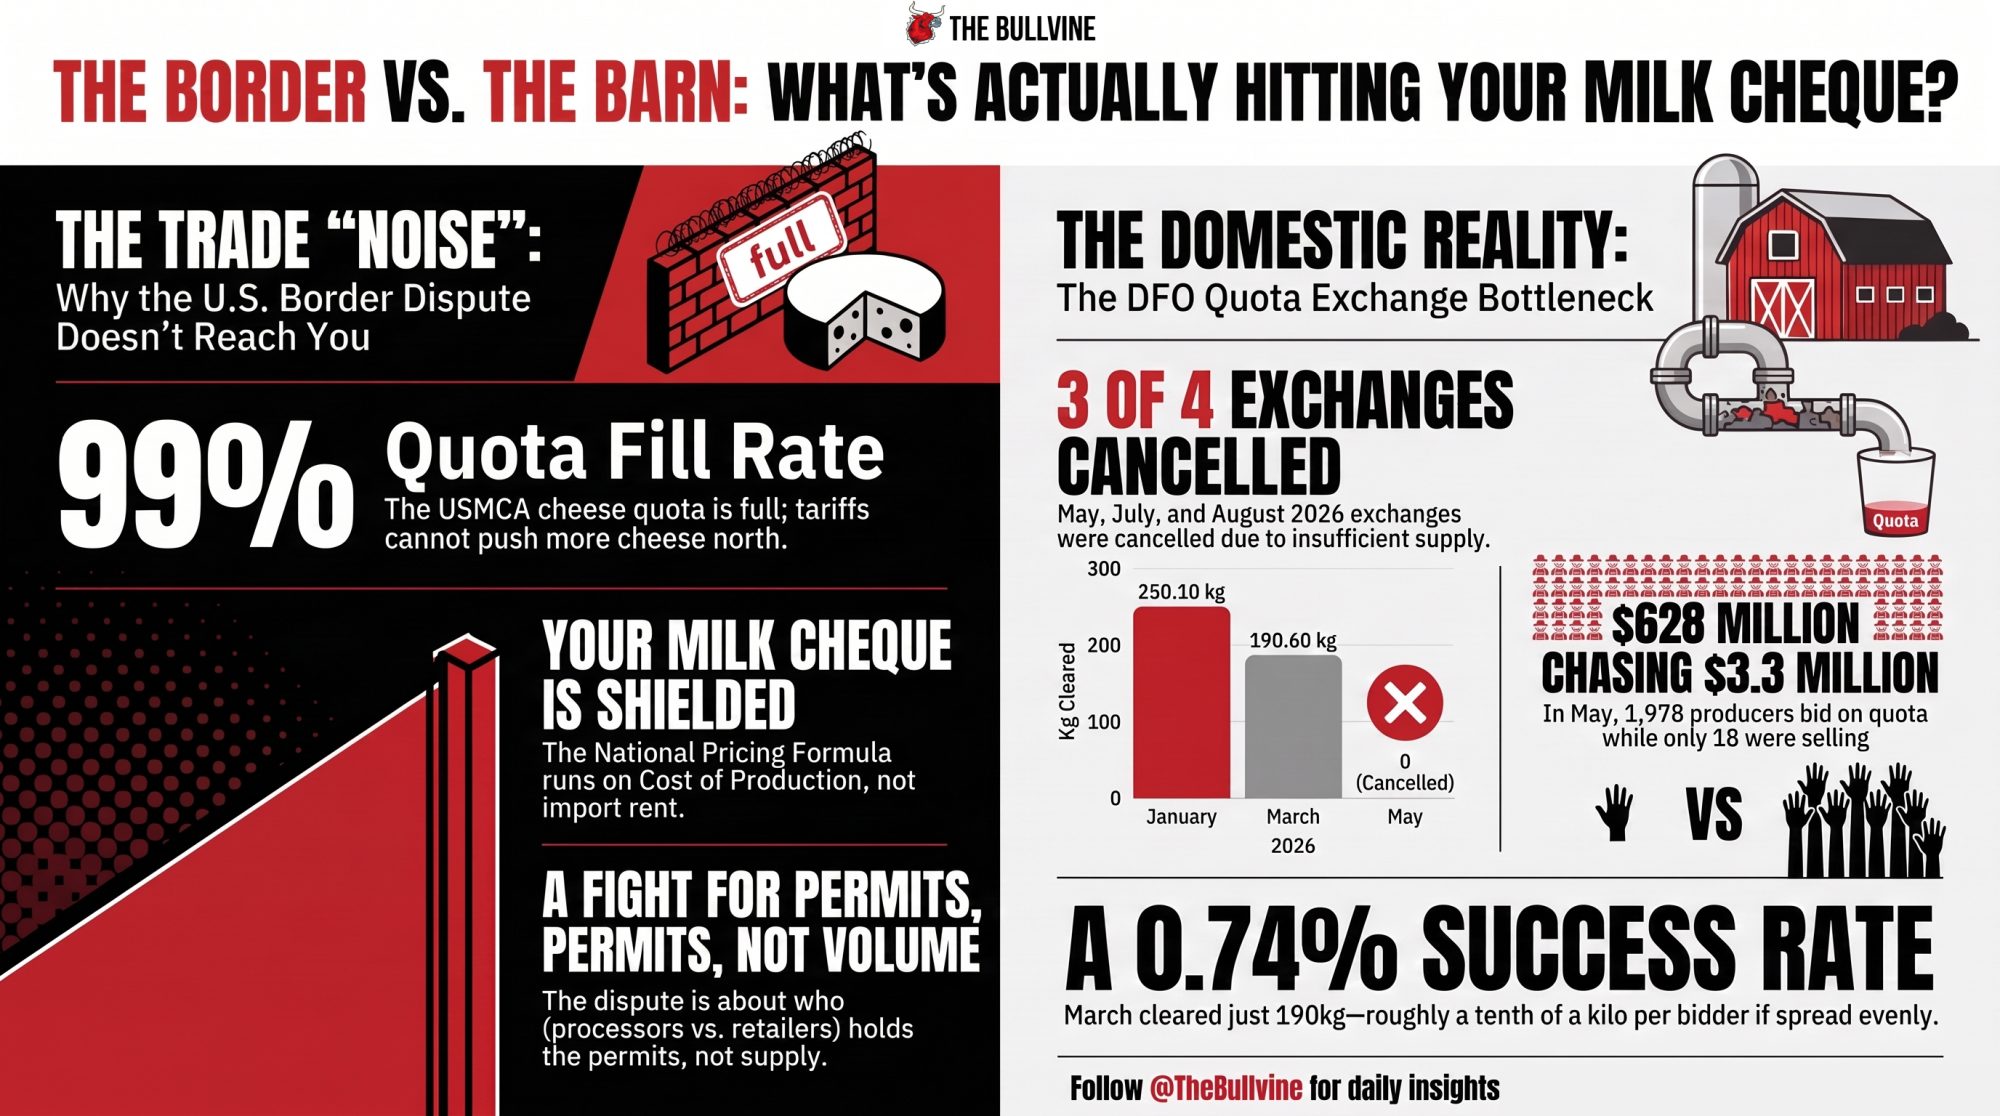
The cap doesn’t make quota cheap; it makes it scarce. Dairy Farmers of Ontario’s March 2026 exchange drew bids from 1,908 producers against 190.60 kg traded, all of it at the ceiling. The November 2025 exchange was cancelled. So was August 2026. Run the ceiling against your own barn and the barrier gets concrete fast: at $24,000/kg, every kilogram of daily butterfat you’d need to add is a $24,000 cheque — assuming an exchange clears at all.
That’s a capital barrier no U.S. or EU producer carries. EU quotas ended in 2015; the U.S. never had them. Canadian farmgate stability is bought, and the purchase price hits the balance sheet instead of the milk cheque.
Our breakdown of why financed Ontario quota at 6% bleeds cash every year runs the servicing math per kilogram — at 6%, every financed kilogram gave back $586 a year.
What Everyone Assumed About Farmer-Owned Processing
Own the plant, control the milk, capture the margin. That’s the founding logic of the cooperative model, and it isn’t wrong — it’s been renegotiated in bylaws while most members were watching milk prices instead.
Here’s the part that breaks the usual framing. That Top 20 list isn’t investor-owned giants circling farmer co-ops. Dairy Farmers of America sits at No. 3 at USD 23.1 billion, just behind Nestlé at USD 23.7 billion. Arla Foods moved to No. 4, passing Danone. FrieslandCampina landed at No. 7 after absorbing Milcobel. Fonterra slipped from 7th to 10th after selling Anchor, Mainland and Kāpiti to Lactalis for NZ$4.22 billion.
Four of the global top ten answer to farmers. And they’re running the same playbook Lactalis has been running — cross-border M&A, exiting commodity categories, and chasing protein and high-value ingredients. RaboResearch’s report frames scale as “a prerequisite for long-term competitiveness,” a line trade coverage attributes to analyst Emma Fuess.
The Arla Number That Doesn’t Say What It Appears To
Worth stopping on Arla, because the calendar complicates the ranking. Arla’s audited 2025 revenue was EUR 15.1 billion, up 9.4% from EUR 13.8 billion in 2024. The merger with Germany’s DMK Group and the Dutch cooperative DOC received unconditional EU Commission approval on May 28, 2026, and took effect June 1, 2026 — after the calendar year the ranking measures. Arla’s own release puts the merged entity at roughly 11,200 farmers, 28,800 employees, local roots in seven countries, and pro forma revenue above EUR 20 billion. In Arla’s H1 2026 results, DMK contributed EUR 409 million — for the single month of June.
So the No. 4 placement rests on a transaction that closed months after the turnover year closed. Pro forma treatment is standard practice, not a methodology complaint. It’s a caution for anyone reading the table as a 2025 snapshot.
The same caution applies to the co-op share of that $267 billion. Publicly available turnover for DFA, Amul, and Fonterra comes to roughly $46 billion — about 17% — and even that floor mixes accounting periods, since the Fonterra component is a 2024-basis figure. Add reasonable proxies for Arla and FrieslandCampina and the share probably sits in the 35–40% range. Probably. Nobody can calculate it precisely without RaboResearch’s full 20-line table on a consistent FX basis, which isn’t public.
What Does Your Co-op Membership Still Buy You?
The economic core hasn’t moved. USDA Rural Development’s framework is blunt: “cooperatives are businesses established for users and do not serve the interests of non-user investors.” Surplus returns as patronage proportional to milk shipped, not shares held. Cooperative earnings get taxed once, not twice.
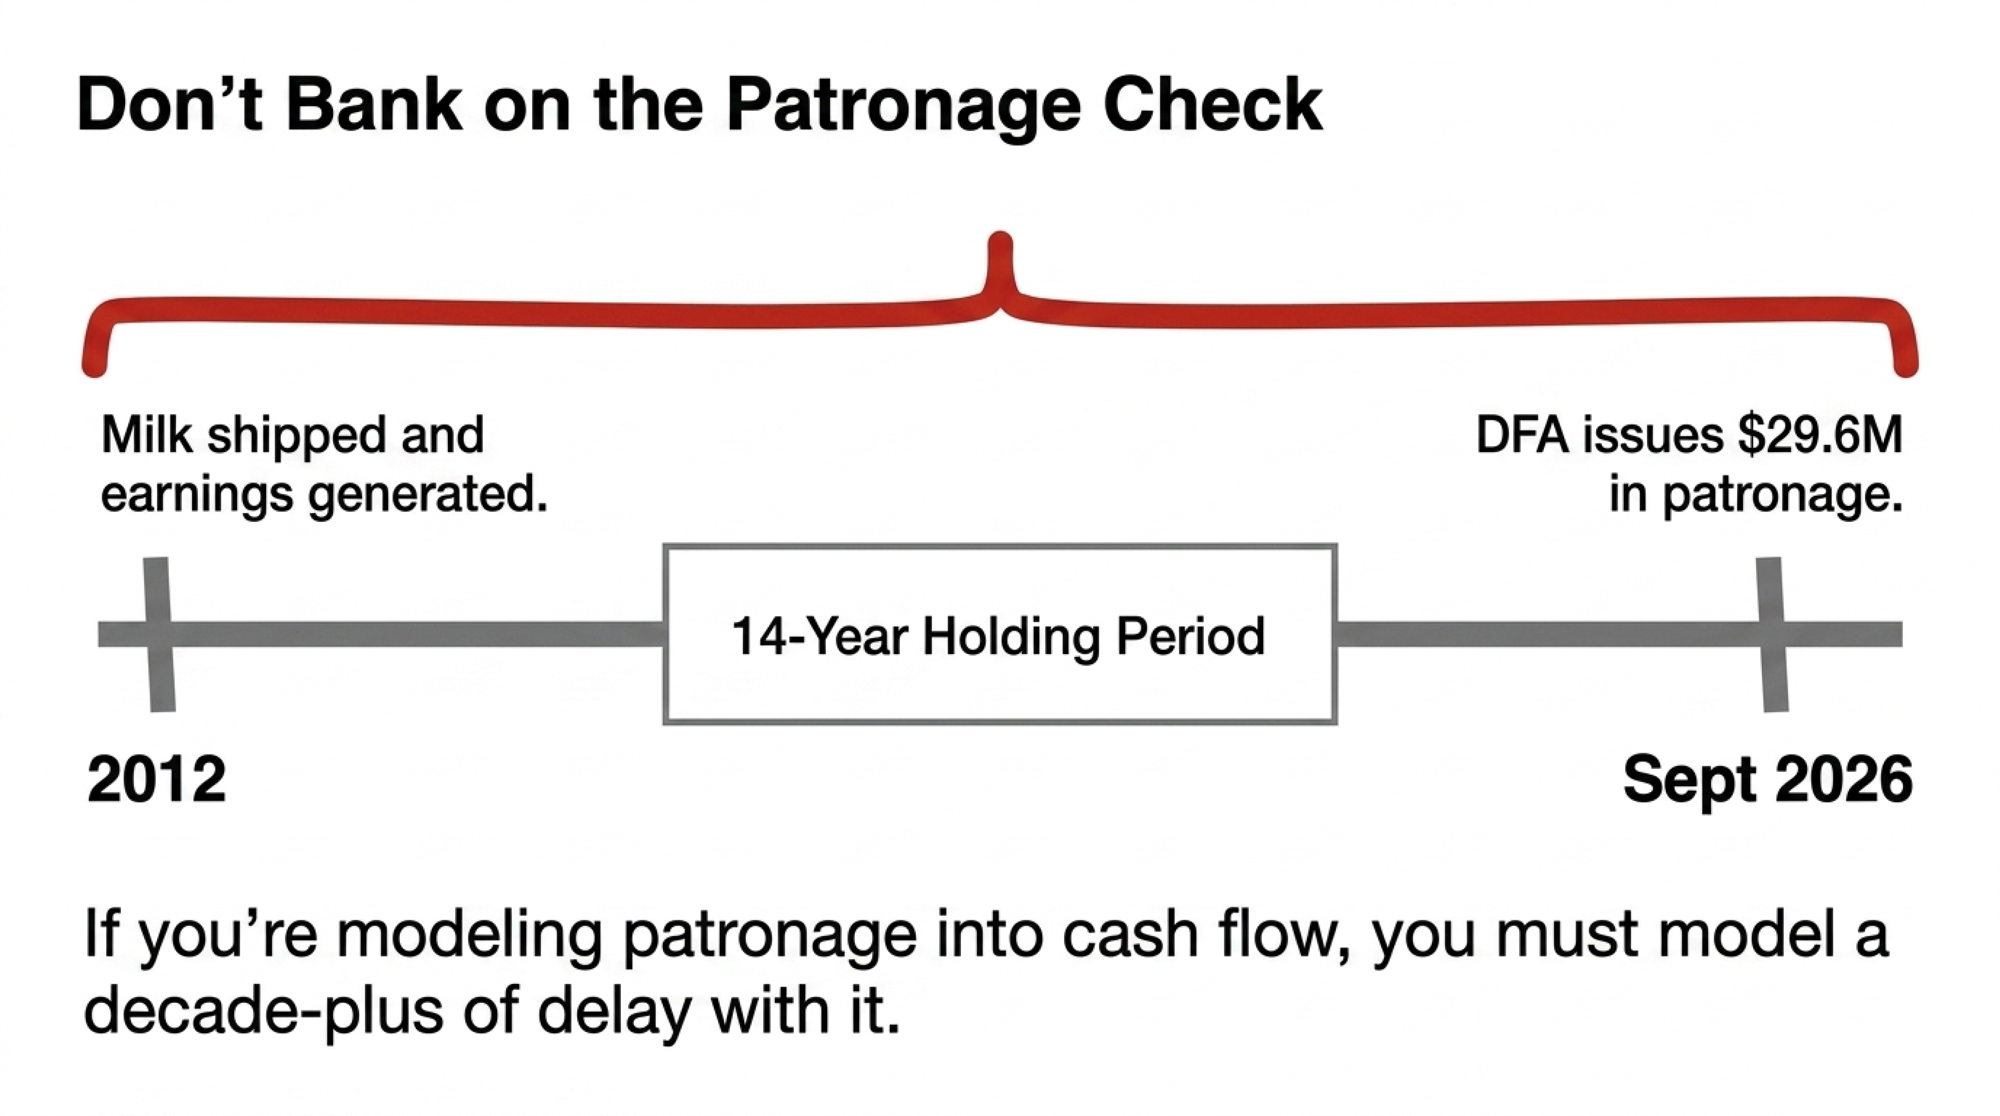
That machinery still runs. On September 3, 2026, DFA’s board issued $29.6 million in patronage earnings — 7.5 cents per hundredweight — to members who marketed milk through the cooperative in 2012.
Run it on the same 400-cow scenario: 97,560 cwt × $0.075 = $7,317. Hold that beside the $133,657 price swing as a matter of scale, not as a ratio — one is a 2012 earnings allocation, the other a 2024–25 price move, and comparing them as a percentage would flatter neither. It arrives because you shipped milk, not because you bought equity. No investor-owned processor writes that cheque.
Note the lag. A September 2026 allocation covering 2012 earnings. If you’re modelling patronage into cash flow, model fourteen years of delay with it.
Where the Renegotiation Actually Happened
Governance is the piece that changed, and it changed in public. Bylaws, not backrooms.
FrieslandCampina publishes its own formula: members of the Members’ Council “have one vote for every ten million kg of milk that their district supplied to the company during the most recent financial year.” Volume-weighted, at district level. Your influence runs through your district’s aggregate kilos, then through your district’s elected representatives. The Milcobel merger created two new Belgian districts — Milcobel-West (District 15), chaired by Bram Maes, and Milcobel-East (District 16), chaired by Vanessa Tindemans-Van Eynde — each with eight to ten elected farmers.
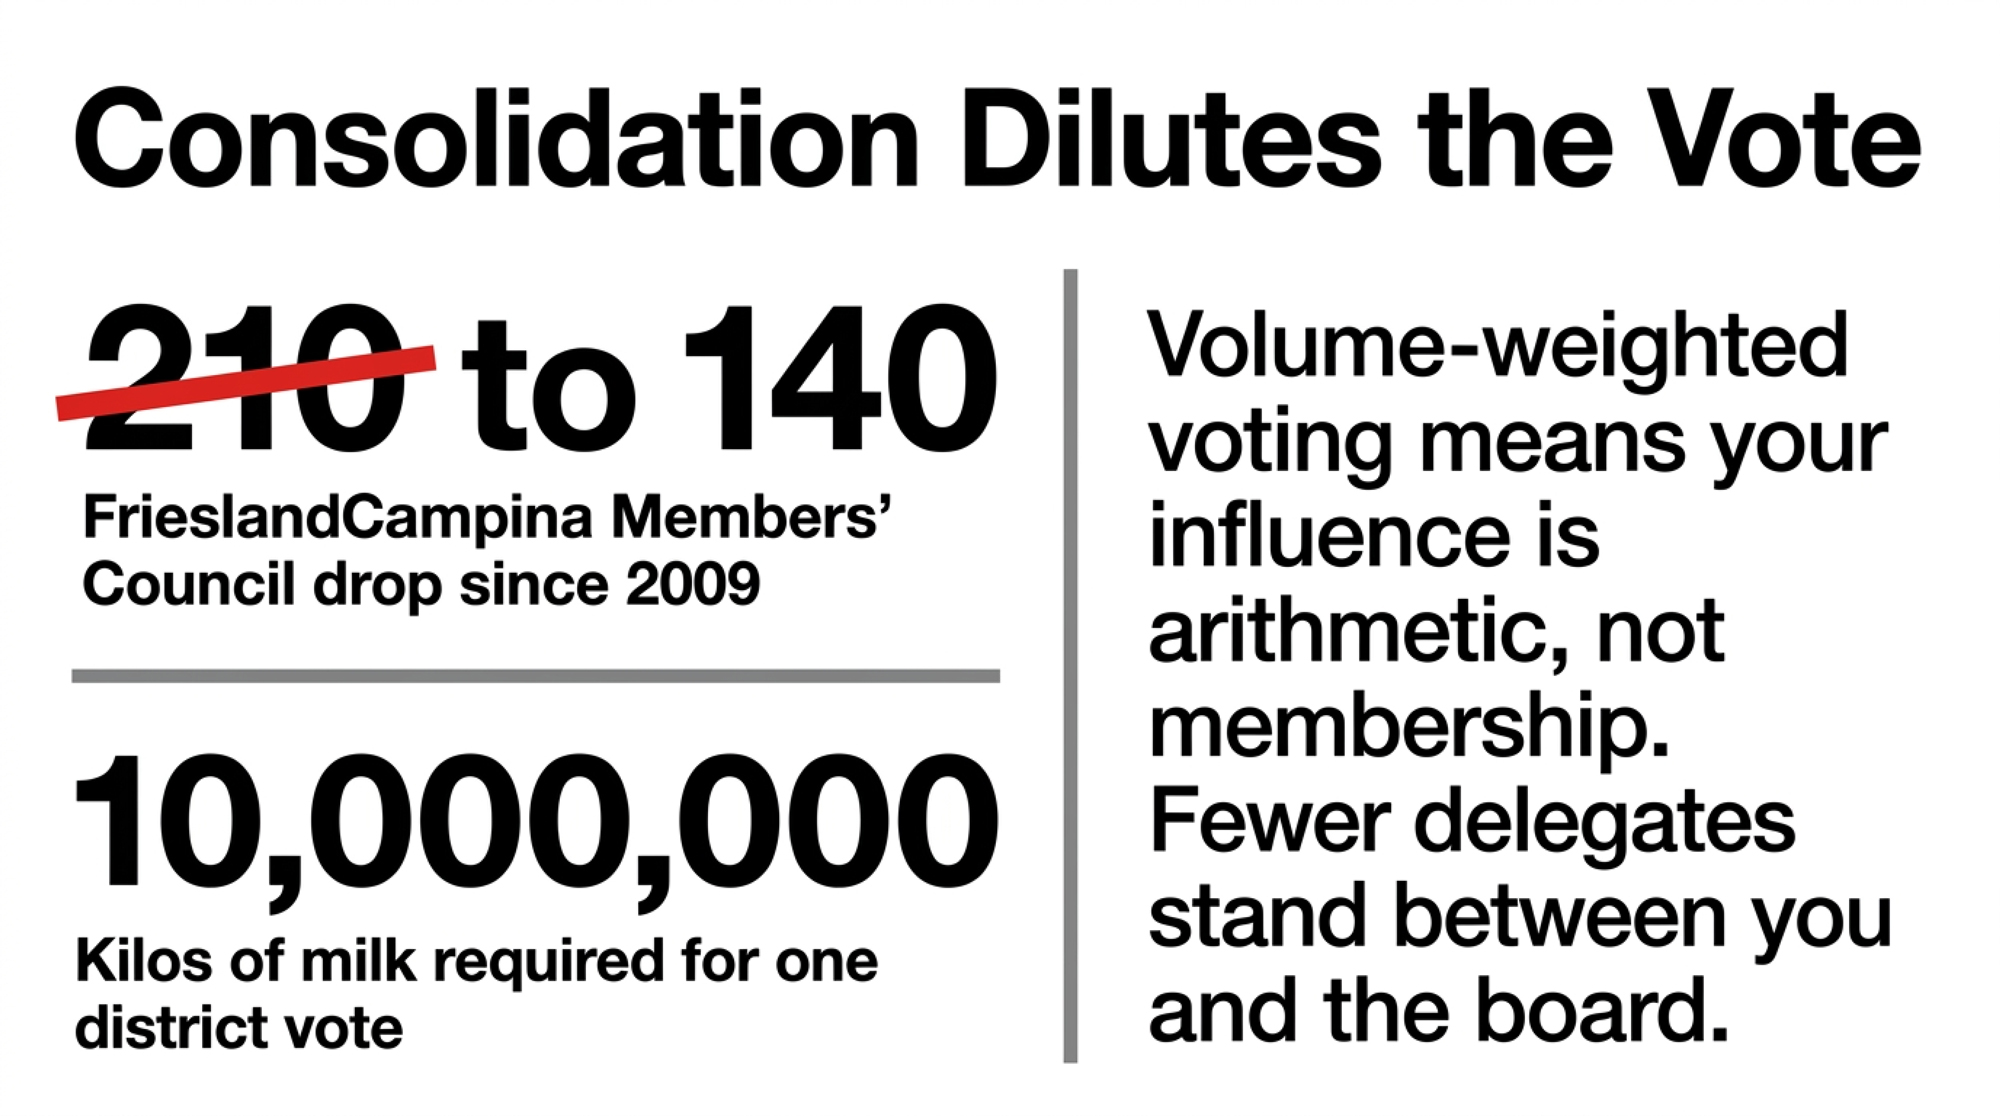
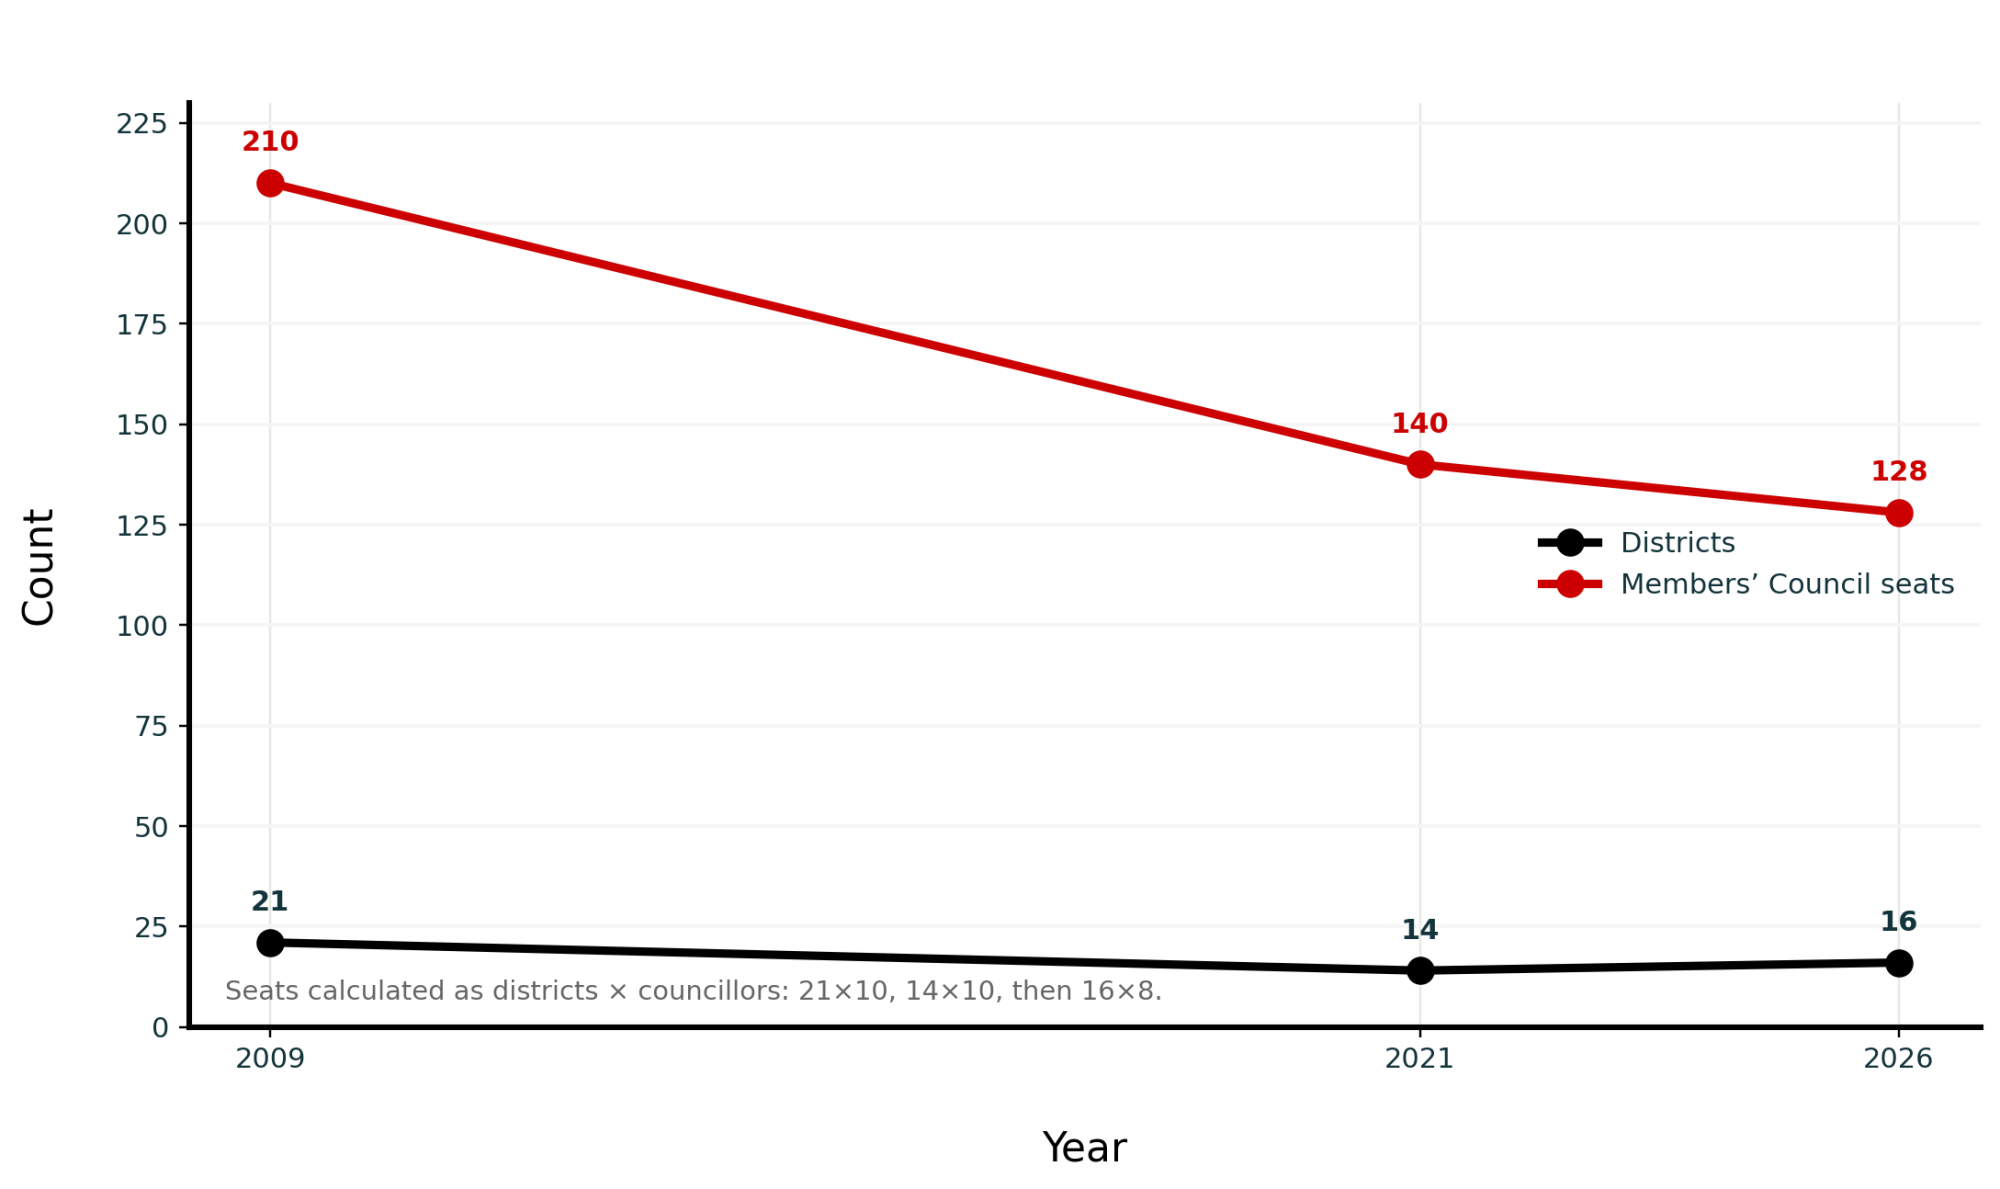
Watch the district count over time. It tells the story better than any single vote. FrieslandCampina ran 21 districts with ten councillors each as recently as 2009 — a 210-member Members’ Council. A 2021 Members’ Council decision cut districts from 21 to 14, producing a 140-member council. Post-Milcobel, the co-op describes 16 districts with eight councillors each. Fewer, larger districts mean fewer people standing between an individual member and the board.
Fonterra shows the same trajectory over a longer runway, through a New Zealand-specific structure with no direct U.S. equivalent. Trading Among Farmers passed with 66.45% support in June 2012. Flexible Shareholding passed with 85.16% in December 2021, on 82.65% participation, widening the shareholding range from 33% to as much as 400% of the production requirement. The Lactalis brand sale passed with 88.47% in October 2025, on 80.59% participation by milk solids.
Those aren’t close calls. Members voted for this, repeatedly, by wide margins. Any honest reading has to sit with that.
The U.S. Government Accountability Office flagged the mechanism in 2019, six years before either merger closed: as co-ops consolidate, “farmers… can have different expectations,” and voting structures “can create power imbalances based on farm size.”
Turnout is its own variable — when Holstein Canada rewrote its governance, the rewrite passed with 0.8% of members voting.
The Turn: 70 Delegates and One Unpublished Percentage
Here’s the data point that reframes everything above.
Milcobel’s Extraordinary General Meeting approved the merger unanimously — among 70 representative member dairy farmers in attendance. FrieslandCampina’s Members’ Council approved it “by a large majority.” No percentage appears in the joint release, in any subsequent coverage, or anywhere else in the public record. Approval thresholds were reported as two-thirds at FrieslandCampina and three-quarters at Milcobel. The merger took effect January 1, 2026, after EU Commission clearance in October 2025.
Unanimous among 70 delegates isn’t the same measurement as consensus among roughly 16,000 members. No farm-size breakdown of any of these votes is public — not at Fonterra, not at FrieslandCampina — so nobody outside those boardrooms can say which members’ preferences carried the day.
Two members isn’t a pattern, and we’re not calling it one. But it’s a fair question for any co-op to be able to answer:
Can a member raise a costed operational concern under their own name without weighing what it costs them?
Which is why the Fonterra landslides don’t settle anything. An 85% or 88% result measures agreement inside the electorate that earlier votes built. Weight the ballot by kilos and capital, and the room answers to whoever ships and finances the most milk.
Is the Cooperative Principle Itself Being Rewritten?
Here’s what almost nobody in the barn has seen yet. The International Cooperative Alliance’s 1995 Statement on the Cooperative Identity — the document that defines what a cooperative is — sets out Democratic Member Control as the second principle: “In primary co-operatives members have equal voting rights (one member, one vote) and co-operatives at other levels are also organised in a democratic manner.”
Note the escape hatch that’s been in the text since 1995. Federated and secondary cooperatives aren’t held to one-member-one-vote; they need only be “organised in a democratic manner.”
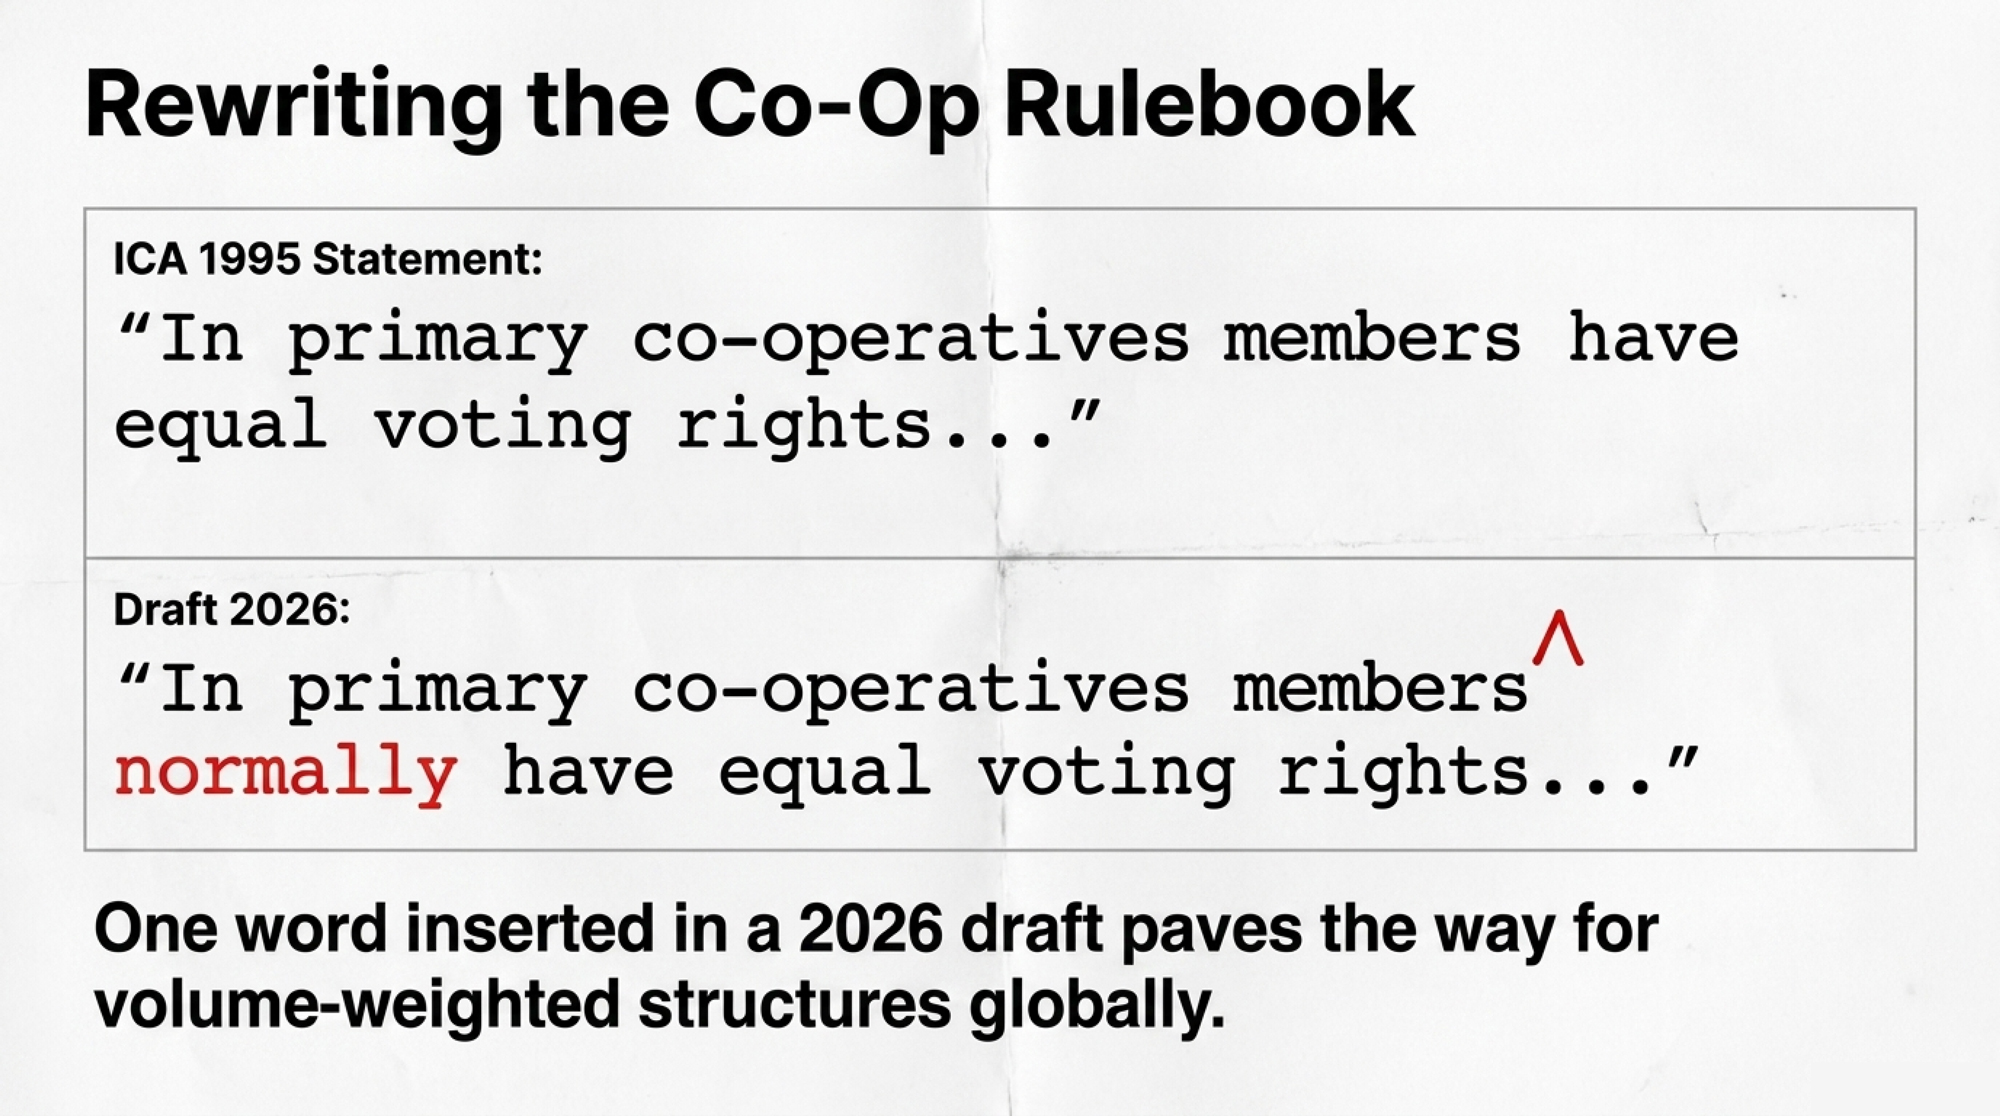
Now look at what the ICA circulated in a revised discussion draft dated June 9, 2026. The second principle becomes: “In primary co-operatives, members normally have equal voting rights (one member, one vote). Cooperatives at other levels and those with discrete classes of members are organised on a suitable democratic basis determined by their members.” (Emphasis added on “normally.”)
One word inserted. One clause added for “those with discrete classes of members.” If adopted, the wording would sit more comfortably alongside the volume-weighted structures FrieslandCampina and Fonterra already run. It’s a discussion draft, not adopted text. Worth watching.
The check still comes by the kilo. What changed is how loud your kilo talks in the room where the next merger gets decided.
Is Your Milk Price Statement Telling You What You Think It Is?
FrieslandCampina publishes a monthly integral milk price, and three consecutive months of 2026 show why any single month tells you very little. June: guaranteed price €41.50/100kg, integral price €45.21. July: guaranteed €41.25, integral €44.96. August: guaranteed €42.50, integral €46.21.
The mechanics matter more than the month. FrieslandCampina calculates monthly payment from the value of protein and fat in a fixed 5:4 ratio, referenced at 3.57% protein and 4.49% fat, excluding VAT. In August, the protein value rose to €593.41 per 100kg from €575.96 in July, and the fat value to €474.73 from €460.77. The integral figure then adds sustainability and quantum surcharges, plus a monthly seasonal bonus or discount set for the calendar year, which is why you can’t simply add a guaranteed price to a headline premium and expect to land on the published number.
Two things to carry to your own statement, whatever co-op you ship to. Separate the guaranteed or base price from the conditional premium. Then subtract the deductions that apply regardless of your score.
And check what you actually earn against the advertised ceiling. FrieslandCampina’s average Foqus planet sustainability premium paid was €2.63/100kg for the 2023 performance year, against a €3.50 maximum at the time — members captured 75% of the ceiling on average in 2023. The maximum has since risen to €4.00. We don’t have a current-year average to compare it to, so we can’t say whether that capture rate has improved or slipped.
Canadian producers are running the same exercise on a reweighting with a date on it. Farm Credit Canada’s 2026 Dairy Outlook puts it plainly: beginning in 2026, in both the P5 in eastern Canada and the Western Milk Pool, a greater dollar amount is placed on protein components. The Western boards have published their ratio — BC Milk, Alberta Milk, SaskMilk and Dairy Farmers of Manitoba move to 70% butterfat, 25% protein and 5% other solids effective April 1, 2026, up from 10% protein. FCC also notes Ontario butterfat composition has risen about 0.9% a year over the last six years. A decade of breeding toward fat, meeting a pool that’s rebalancing toward protein.
Processor network decisions land fast when they land — our reporting on what happened when AMPI’s Paynesville plant went dark is the closest North American parallel to what those two Belgian members described.
The 30/90/365-Day Playbook for Members Facing a Co-op Vote
30 Days — Urgent Checks
Pin Down Whether the Retention Payment Is Annual or One-Time
- The Trap: €8/100kg for staying three years reads one way to a member and another way on a balance sheet. On 760,000 litres, that’s roughly €62,000 — or about €186,000 if it recurs annually.
- Action: Written request to member relations asking for the payment clause verbatim. Look for two things: the words “annually” or “one-time,” and the volume basis the calculation runs on.
- Trigger: You’ve already booked a loyalty or retention payment into a cash-flow projection without seeing that clause in writing.
- Risk: Verbal confirmation from a field rep isn’t a contract term and won’t survive a dispute. And a one-time payment struck on cumulative three-year supply is a different number again from one struck on a single year.
Calculate Your Voting Weight in Kilograms
- The Trap: Volume-weighted voting means your influence is arithmetic, not membership.
- Action: Divide annual kilos shipped by your co-op’s per-vote threshold. FrieslandCampina’s is ten million kg at district level; Fonterra’s Share Standard runs one share per kg of milk solids.
- Trigger: The threshold isn’t findable in published bylaws — that absence is your first phone call.
- Risk: Your own figure may look small enough to dismiss. The point isn’t your weight; it’s which farm sizes the structure favours.
Run Your Butterfat-to-Protein Ratio Against the April 1 Reweighting
- The Trap: If you ship into the Western Milk Pool and your last twelve months of components lean harder on fat than the new 70/25/5 split rewards, the change is a pay cut you can see coming.
- Action: Pull your component averages from twelve months of statements. Compare your fat and protein percentages against your co-op’s current and post-April-1 weightings.
- Trigger: Your protein percentage sitting flat or declining while butterfat climbs — the pattern FCC reports at roughly 0.9% a year in Ontario.
- Risk: One year of data can hide seasonal swing. Use twelve months, not three.
90 Days — Structural Adjustments
Price Hauling Impact Against Plant Consolidation
- The Trap: A 47-km reroute is a permanent deduction running against a temporary retention bonus.
- Action: Multiply [round-trip km] × [hauling rate/km] × [loads/year] × 3. That’s the three-year figure the payment has to beat if it’s annual — triple it if the payment is one-time on a single year’s volume.
- Net it out before you compare offers: Subtract that hauling total from the gross retention payment first. The number left over is what you’re actually being paid to stay — and it’s the only figure worth setting against a competing processor’s bid.
- Trigger: Co-op communications citing “network optimization” or asset rationalization.
- Risk: No public FrieslandCampina closure list was located, and co-ops rarely release them early. Model the worst-case distance now and rebuild when something official publishes.
Split Twelve Months of Statements Into Three Buckets
- The Trap: A single blended milk price hides which portion you actually control.
- Action: Separate base or guaranteed price, premiums you genuinely earned, and deductions taken regardless of performance. One year of statements, about an hour.
- Trigger: Realized premium capture below 75% of the advertised maximum — the benchmark FrieslandCampina members hit in 2023.
- Risk: Premium structures reset annually, so this is a yearly job, not a one-off.
Confirm Your Patronage Lag Before You Bank On It
- The Trap: Patronage is real money on an unreal timeline.
- Action: Ask member services when the last allocation was issued and which earnings year it covered.
- Trigger: DFA’s September 2026 allocation covered 2012. A lag longer than you assumed means patronage doesn’t belong in near-term projections.
- Risk: Allocation timing is a board decision, not a schedule. Don’t model it as recurring income.
365 Days — Strategic Positioning
Track Where New Capacity Lands Relative to Your Farm
- The Signal: Announced capacity in your hauling radius, concentrated in a category your components already suit, is leverage in a supply conversation.
- Action: Map announced projects against your shipping distance. IDFA reports more than $11 billion in U.S. capacity investment across 2025–2028 — cheese leading at $3.2 billion, yogurt and cultured at $2.81 billion, butter and powders at $1.6 billion.
- Trigger: A new facility inside your current hauling radius serving a category you can hit on components.
- Risk: Announced isn’t built. Industrial Info Resources counts 499 projects worth over $14.5 billion using a different methodology — don’t stack the two totals. Neither dataset separates co-op from investor-owned from foreign-owned.
Match Your Component Strategy to Where the Pool Is Moving
- The Signal: The Top 20 is pivoting to protein, functional nutrition, and high-value ingredients. FrieslandCampina’s own formula already prices protein above fat at a fixed 5:4 ratio, and FCC reports both the P5 and the Western Milk Pool putting more dollars on protein beginning in 2026.
- Action: Take your component averages and your co-op’s published strategy to your genetics conversation. Decide whether your sire selection points where the premium is heading.
- Trigger: A component pricing ratio change with an effective date, or a public category commitment from your co-op.
- Risk: Strategies rarely outlast breeding cycles. Build in the possibility of a pivot before you commit a sire lineup to it.
Decide Where You Want to Be Standing When the Farm Count Settles
- The Signal: Consolidation trajectory and co-op governance math are two halves of the same question about your next decade.
- Action: Read our projection on who’s still milking by 2035 against your own succession horizon.
- Trigger: A succession decision, a major capital commitment, or a merger vote inside the next five years.
- Risk: Projections are projections. Treat the direction as information and the dates as arguable.
What This Means for Your Operation
Four of the world’s ten biggest dairy companies answer to farmers, and scale genuinely strengthened those cooperatives’ balance sheets. S&P upgraded DFA to BBB+ in April 2026. A co-op with capital can build plants instead of stranding member milk behind an undercapitalized one, and that’s not a small thing to hold onto.
You gain that. What you give up is measured in voting weight and in multi-year commitments attached to payments whose structure isn’t publicly documented. Neither side of that trade is illegitimate. But only one side shows up on your milk cheque, and it isn’t the governance side.
Nine months after the merger took effect, no public document clarifies whether the €8 arrives once or three times, or what volume it’s struck on. If your co-op is currently courting a merger partner, don’t wait nine months past the vote to find out what the fine print meant.
So pull your own agreements this week. What do your co-op’s bylaws actually say about your voting weight if a merger doubles the milk pool around you — and does the retention or loyalty payment in your own contract specify “per year,” or just a number?
Key Takeaways
- Get your retention clause in writing before you model a euro of it. Milcobel’s €8/100kg reads as roughly €62,000 on 760,000 litres — or about €186,000 if it recurs. Nobody’s published which, or what volume it’s struck on.
- If your co-op weights votes by volume, your influence is arithmetic. FrieslandCampina runs one vote per ten million kilos of district milk, and the district count has gone 21 to 14 to 16 since 2009. Do the division on your own kilos.
- Producer returns fell to $21.19/cwt while the Top 20 grew 5.4%. On 400 cows at the national 24,390-lb average, that’s about $133,657 — and DFA’s 7.5¢/cwt patronage covered 2012 earnings, so don’t book patronage as near-term cash.
- Canada bought farmgate stability and pays for it on the balance sheet. Ontario quota caps at $24,000/kg while uncapped Alberta cleared $57,115, and DFO cancelled two exchanges in nine months.
- Both Canadian pools are putting more money on protein starting in 2026, and the Western boards move to 25% protein weighting on April 1. If you’ve bred toward fat, pull twelve months of components before then.
Complete references and supporting documentation are available upon request by contacting the editorial team at editor@thebullvine.com.
Learn More
- The $586-per-Kilo Dairy Quota Trap: Why New Ontario Quota at 6% Bleeds Cash Every Year — Breaks down the exact debt-servicing arithmetic eating cash flow, arming operators with concrete cost models before signing loan agreements on capped quota exchanges.
- The Bullvine Dairy Curve: 15,000 U.S. Farms by 2035 and Under 10,000 by 2050 – Who’s Still Milking? — Forecasts the structural shakeout confronting family operations over the next decade, mapping the herd-size thresholds and capital requirements demanded to survive national processing consolidation.
- Holstein Canada’s Governance Rewrite Passed: 0.8% of Members Voted — Exposes how disengaged delegate bodies and sub-one-percent voter turnout hand boardroom control to concentrated voting blocks, dismantling the myth of grassroots producer influence.
The Sunday Read Dairy Professionals Don’t Skip.

Every week, thousands of producers, breeders, and industry insiders open Bullvine Weekly for genetics insights, market shifts, and profit strategies they won’t find anywhere else. One email. Five minutes. Smarter decisions all week.