Archive for milk price risk management

Cheddar’s Record 6.6% Crash Exposes Dairy’s Broken Recovery Plan: 90 Days to Act

I felt sick watching today’s GDT results. Not the WMP decline—the 6.6% cheddar crash. That was supposed to be our safety net. Now what?

EXECUTIVE SUMMARY: The November 4 GDT auction revealed the harsh truth: cheddar’s record 6.6% crash signals that dairy’s Plan B—pivoting from powder to cheese—has failed spectacularly. China won’t rescue us; they’re now 85% self-sufficient, with 40% fewer babies needing formula. The math is unforgiving: typical 500-cow operations are burning $101,000 per month, with 20 months of equity facing a 24-30-month downturn. CME futures at $16, versus USDA’s fantasy $19 forecast, show who’s been paying attention. Three paths remain viable: premium markets (requires location and a $400K investment), massive scale (minimum 2,000 cows), or a strategic exit before equity evaporates. Bottom line: decisions made in the next 90 days determine who survives 2027.

Dairy Market Strategy

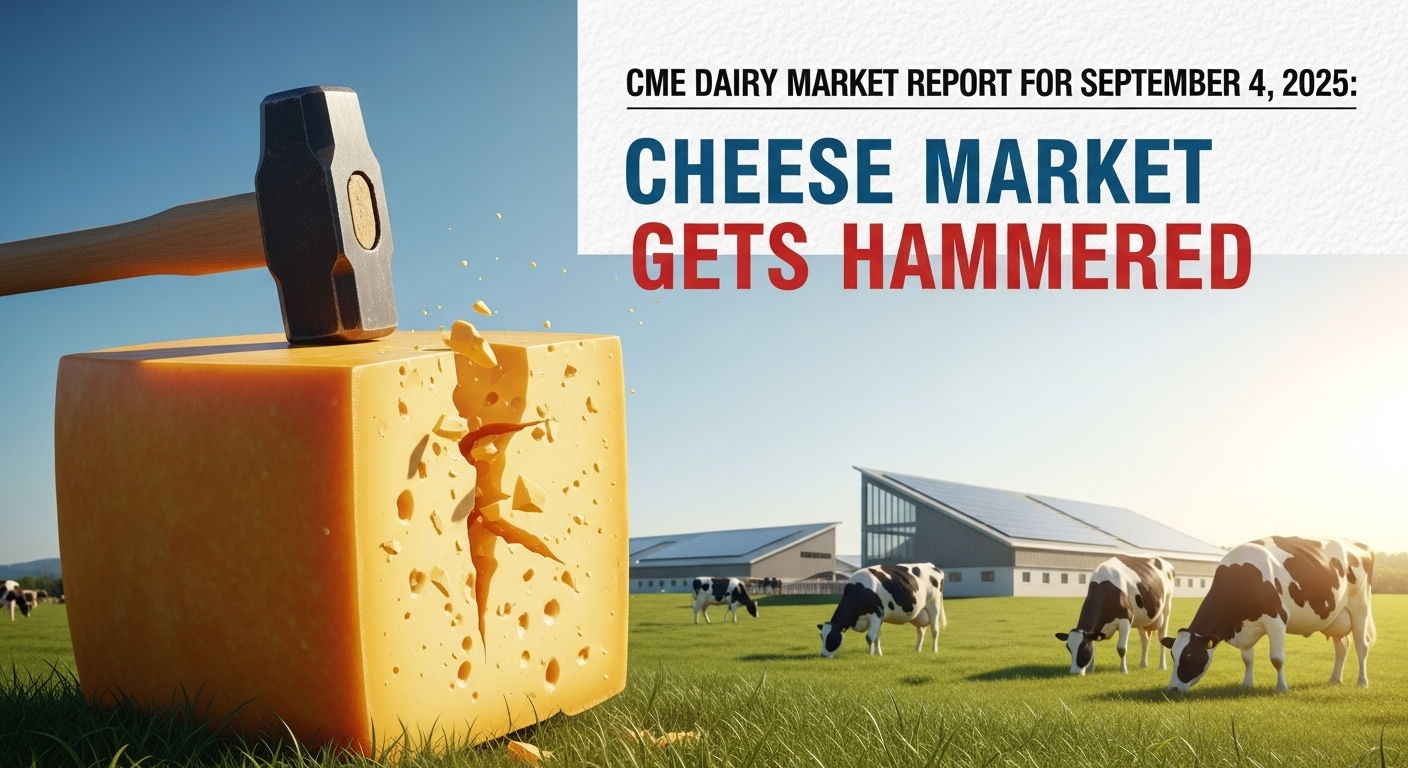
So here we are again, checking those GDT results from November 4, 2025, and honestly, I felt that familiar knot in my stomach watching Whole Milk Powder drop another 2.7%. That’s six straight declines since early August, according to the latest GDT data. But here’s what really caught my attention—and I think this is what we all need to be talking about—cheddar cheese absolutely tanked, down 6.6% to $3,864 per metric ton. That’s the biggest single-category drop we’ve seen in recent memory, and it changes everything we thought we knew about where this market’s headed.

You know, I’ve been watching these markets for over two decades now, and what’s happening today feels fundamentally different. It’s not just China backing away from powder imports (though that’s huge), or these productivity gains that keep milk flowing despite terrible economics, or even CME Class III futures sitting $2.50 to $3.00 below what USDA keeps telling us we’ll get. It’s all of it together. And if you’re still running your operation like this, is just another down cycle… well, we need to talk.

The November 4 GDT auction delivered a devastating 6.6% cheddar crash—the largest single-category drop in recent memory—confirming that dairy’s Plan B (pivoting from powder to cheese) has failed spectacularly

Quick Market Reality Check

Key Numbers from November 4:

  • GDT Index: Down 2.4% to 1,135 (lowest since August)
  • Whole Milk Powder: -2.7% to $3,503/MT
  • Cheddar: -6.6% to $3,864/MT (largest single decline)
  • Butter: -4.3% to $5,533/MT
  • Winners: Only mozzarella (+1.6%) and buttermilk powder (+1.0%)

What Makes This Time Different

Looking at those November 4 numbers more closely, the overall GDT Price Index fell 2.4% to 1,135—that’s our lowest point since August, based on the Event 391 summary. Since that tiny 1.1% bump we got back on July 15, it’s been pretty much straight down. Reminds me of 2015-16, except… well, except for everything else that’s different this time around.

Here’s the breakdown that matters: Whole Milk Powder hit $3,503 per metric ton. Skim milk powder? Flat. Butter dropped 4.3% to $5,533. But that cheddar number—down 6.6%—that’s what keeps me up at night. See, cheese was supposed to be our safety valve, right? The product that would soak up all that displaced WMP demand as China shifts gears. When your backup plan crashes harder than your original problem… that’s when you know you’re in trouble.

The only bright spots were mozzarella (up 1.6%) and buttermilk powder (up 1.0%). But let’s be real here—those are niche products. They can’t carry the weight that WMP used to handle.

I was talking with a Wisconsin producer last week—a third-generation operation with about 280 cows—and he put it perfectly: “I’ve never seen such a gap between what the government says and what my milk check actually shows.” USDA’s forecasting $19 milk, but his co-op’s already warning members to budget for $16 through spring. That’s a massive difference when you’re trying to plan feed purchases or, heaven forbid, thinking about expansion.

CME Class III futures trade $2.50-$3.00 per hundredweight below USDA’s optimistic $19.10 forecast—a reality gap that represents $1.25-1.5 million in lost revenue expectations for a typical 500-cow operation over 24 months, and proof that markets saw this crash coming while bureaucrats kept pushing rosy scenarios

Out in California, the larger operations—we’re talking 1,800 cows and up—are seeing processors cut quality premiums in half. Used to be you’d get 40 cents extra for really low somatic cell counts. Now? Twenty cents if you’re lucky. Every penny counts when margins are this tight.

Meanwhile, in the Northeast, smaller operations are feeling it differently. A Vermont producer with 120 cows told me their processor just extended payment terms from 15 to 30 days. That’s an extra full pay period of float you have to cover. These little changes add up fast.

The China Reality We Need to Accept

China achieved 85% dairy self-sufficiency by 2025 while infant formula imports crashed 35% from their 2019 peak—a permanent structural shift driven by plummeting birth rates (down 40%) and massive domestic production investment that’s fundamentally rewriting global dairy trade dynamics

Alright, let’s address the elephant in the room: China isn’t coming back to buy powder the way they used to. Period.

According to the USDA’s Foreign Agricultural Service report from May 2025, China successfully boosted their domestic milk production by 10 million metric tons between 2018 and 2025. They actually hit their target two years early. Think about that—they went from 70% self-sufficient to about 85%. And here’s what really matters: their economy grew 5% in the first half of 2025 according to Chinese government statistics, yet powder imports stayed flat. Economic recovery isn’t bringing back that demand.

The demographics make it even more permanent. China’s Statistics Bureau shows the birth rate dropped from 10.48% in 2019 to 6.39% in 2023. The number of kids aged 0-3—your core infant formula market—fell from 47.2 million to 28.2 million. That’s not a temporary dip, folks. That’s a 40% structural reduction in the exact demographic that drives WMP consumption.

Industry contacts at the major export companies tell me they’ve basically written off any return to 2021-22 WMP levels. Everyone’s pivoting to cheese and butter production, which sounds great until you realize… yeah, everyone’s doing exactly that. Hence, the cheese price crash we just witnessed.

How Smart Operators Are Adapting Right Now

What I’m seeing from the operations that are navigating this successfully is that they’re not waiting around, hoping for a miracle. They’re making hard decisions today while they still have options.

The Culling Math Nobody Wants to Do (But should)

With beef prices around $145 per hundredweight—USDA Agricultural Marketing Service confirmed this in late October—the economics of culling have completely shifted. Let me walk you through the actual numbers here.

Say you’re running 500 cows. Your bottom 20%—that’s 100 head—are probably giving you about 55 pounds a day, while your top girls are at 75 pounds. At $16.50 milk, those bottom cows generate roughly $2,768 in annual revenue. But here’s the kicker: they’re costing you at least $4,200 in feed, labor, vet work, and utilities. You’re losing $1,432 per cow per year just keeping them around.

Now, if you ship those 100 cows at an average of 1,400 pounds and $145 per hundred, that’s $203,000 cash in hand. Real money you can use today.

I know several Idaho operations that pulled the trigger on this in September. They culled their bottom 15%, used half the money to pay down debt, and half to upgrade their feed systems. What’s interesting is that their remaining cows are actually producing more total pounds now. Better feed efficiency, less competition at the bunk—sometimes less really is more.

Getting Smart About Feed Costs

December corn futures are around $4.10 per bushel, and soybean meal is at $274.50 per ton, based on CME data from early November. That’s actually manageable—if you lock it in now. University of Wisconsin calculations show income-over-feed margins at about $7.80 per hundredweight. Barely breakeven for good operations, but it’s workable if you’re on top of things.

The regional differences are huge, though. Texas producers with local grain access are doing okay. But if you’re in the Upper Midwest, dealing with basis issues and trucking costs? That’s a different story. Nutritionists I work with tell me operations keeping milk-to-feed ratios above 2.35 are surviving. Below that? They’re hemorrhaging cash.

And California… don’t get me started. Between water issues and hay prices that swing $50 a ton depending on the week, feed costs can vary $2-3 per hundredweight just based on timing. Feed dealers in the Central Valley tell me they’ve never seen such demand for almond hulls and other byproducts—everyone’s scrambling to cut costs wherever possible.

Southeast operations have their own challenges. With the costs of humidity- and heat-stress management, they’re spending an extra $1.50-2.00 per hundredweight just on cooling compared to northern states. A Georgia producer with 600 cows said his electric bill alone runs $8,000 per month in summer.

The Timeline Nobody Wants to Hear (But Needs To)

CME Class III futures paint a pretty clear picture if you’re willing to look. November 2025 contracts at $16.17, December at $16.39, and the first quarter of 2026 at an average of just $16.35, according to daily settlements. Meanwhile, USDA keeps saying we’ll average $19.10 for 2025. That $2.50 to $3.00 gap? That’s the market telling you the government’s being way too optimistic.

I lived through the 2015-16 crisis, and it took about 15-18 months — from peak oversupply to decent prices again — according to USDA historical data. But we had some natural circuit breakers then that we don’t have now:

China came back once they worked through inventory—Rabobank documented this in their 2016 reports. La Niña hit and naturally reduced New Zealand’s production. We had various government programs that provided at least some relief.

This time? New Zealand just reported milk collection in August 2025 at 1.68 billion liters, up 14.6% from last year, according to the Dairy Companies Association. U.S. production is up 1.6% despite everything, per the USDA’s latest report. And the weather’s been perfect for grass growth pretty much everywhere. No natural brakes this time around.

The Productivity Problem That’s Breaking Everything

Here’s something that should blow your mind: According to data compiled by Cornell’s dairy economists from USDA records, average U.S. butterfat went from 3.95% in 2020 to 4.218% by November 2024. Protein jumped from 3.181% to 3.309%.

What’s that mean in real terms? Despite losing 557,000 cows from the national herd in 2024, total milk solids production actually increased by 1.345%. We’re making more cheese and butter with fewer cows. Great for efficiency, terrible for market balance.

The genetics have gotten so good that we’ve essentially broken the old supply-demand correction mechanism. Herds shrink, but production stays flat or even grows. It’s remarkable from a technical standpoint, but it means this oversupply problem isn’t going away naturally like it used to.

New Zealand shows this even more starkly—they reduced cow slaughter rates by 18.4% according to their Ministry for Primary Industries, even while WMP prices crashed for six straight auctions. Why? Because each cow today produces so much more than five years ago that farmers literally can’t afford to cull heavily. They’d lose too much capacity.

Three Paths Forward (And Why You Need to Pick One Soon)

Based on everything I’m seeing and hearing from producers who’ve survived multiple cycles, there are really only three strategies that make sense right now.

The Premium Route (Maybe 20-25% of You Can Do This)

If you’re within a reasonable distance of a city and can tell a good story, direct sales can get you 50-75% premiums. Vermont producers doing this successfully report $32-38 per hundredweight equivalent. That’s basically double commodity prices.

But—and this is a big but—it requires serious investment. We’re talking $400,000 minimum in processing equipment, dedicated marketing staff, and probably 20+ hours a week of your time on social media and customer management. It’s not dairy farming anymore; it’s running a specialty food business. Some folks love it. Others find it exhausting.

The organic market’s another option. USDA data shows the Organic Pay Price averaged $38.69 in September 2025. But that three-year transition period is brutal, and you better have contracts locked before you start.

Scale and Efficiency (Works for 30-35% of Producers)

The Texas model shows how this works. Average Panhandle dairy runs about 4,000 cows according to the Texas Association of Dairymen. With new plants from Cacique Foods in Amarillo, Great Lakes Cheese in Abilene, and Leprino in Lubbock, there’s demand for big, efficient suppliers.

But you need serious scale—minimum 1,000 cows, probably more like 2,000+. And the capital requirements for automation and upgrades… well, if you’re a 300-cow operation in Wisconsin, this probably isn’t your path. I wish it were different, but that’s reality.

The co-ops are adjusting, too. Industry reports show DFA consolidating smaller farms’ milk into bigger pools to maintain negotiating power. Land O’Lakes is pushing component improvement hard—offering bonuses for consistently hitting protein targets. It’s all about efficiency now.

Strategic Exit (The Hardest but Sometimes Smartest Choice)

Nobody wants to talk about this, but for operations caught between premium and scale, getting out while you still have equity might be the smartest move.

Chapter 12 bankruptcy—the farmer-friendly option—can get you reorganized in about 100 days, according to ag bankruptcy attorneys. It lets you restructure debt while keeping the farm running. But timing is everything. Act before you default, and you have options. Wait until you’re behind on payments, and those options evaporate fast.

The generational piece makes this even tougher. I know young farmers looking at these projections for the next two years and thinking maybe that agronomy job in town makes more sense right now. Can’t say I blame them.

Why The Cheddar Crash Changes Everything

Let’s circle back to that 6.6% cheddar price collapse, because this is crucial. Cheese was supposed to be our growth story, right? China’s cheese imports rose 13.5% through September 2025, according to its customs data. Processors globally have invested billions in cheese capacity.

But if cheese is crashing harder than powder, it means the pivot everyone’s counting on is already overcrowded. Instead of 18-24 months to rebalance, we might be looking at 24-30 months or longer.

California processors I talk with say they’re getting squeezed on every product now. Can’t make money on powder, and cheese margins are evaporating too. Something’s got to give, and it’s probably going to be at the farm level.

The Financial Reality Check

Let me paint you the picture for a typical 500-cow operation at current prices. You’re looking at about $101,000 in monthly losses. Over a 24-month downturn—which is what futures markets suggest—that’s $2.4 million in red ink.

Most farms I know started this downturn with maybe $2 million in equity if they were lucky. Do the math. You run out around month 20, just before the projected recovery. That’s the cruel joke here—operations that survive 80% of the downturn still fail because they can’t bridge those last few months.

Operations with $2M in starting equity face complete depletion at month 20—just four months before projected recovery begins at month 24—meaning 80% of the struggle buys you nothing if you can’t bridge the final cruel gap, making the next 90 days of strategic decisions literally the difference between survival and bankruptcy

We’re currently in months 4-5 of what could be a 24-30 month adjustment. Decisions you make right now have completely different outcomes than those same decisions in March or April when equity’s gone and options have narrowed to basically nothing.

The Human Side We Can’t Ignore

Behind those 259 bankruptcy filings in Q1 2025—up 55% from last year, according to federal court statistics—are real families watching everything disappear.

The Journal of Rural Mental Health published research showing farmers face suicide rates 3.5 times higher than the general population. Mental health professionals describe this pattern where chronic stress builds for months until hitting what psychotherapist Lauren Van Ewyk calls a “quick flip”—that breaking point where you can’t think straight anymore.

I bring this up because recognizing the stress early and getting help—whether it’s financial advice, operational changes, or just someone to talk to—that preserves way more options than waiting until you’re in crisis mode. We need to look out for each other right now.

What You Should Be Doing Right Now

Next 30 Days: Figure out your real equity runway. Not the optimistic version—the actual number of months you can sustain these losses. If it’s less than 24 months, you need to act now, not later.

Lock in feed prices while you can. That $4.10 corn won’t last forever. Take a hard look at your bottom 20% for culling while beef prices are still strong. And call your processor about contract opportunities—they’re making deals right now.

Next 90 Days: Stress-test everything against a 24-30 month downturn. Can you survive it? Be honest. If you’re in the right location, explore premium markets, but be realistic about what it takes.

Technology that actually reduces costs—robotic milkers if you’re big enough, better feed systems, genetic improvements—these aren’t luxuries anymore. They’re survival tools. And if refinancing is in your future, talk to your lender now while you’re still current on your payments.

What to Watch: The late November GDT auction will tell us if this cheese crash was a one-off or a trend. If CME Class III futures for Q2 2026 start climbing above $17.50, maybe recovery comes sooner. China’s Q4 import data will confirm if this structural shift is as permanent as it looks. And keep an eye on processor announcements—they’re reshaping regional opportunities as we speak.

Where We Go from Here

The November 4 GDT results confirm what many of us suspected but didn’t want to admit: this isn’t your typical dairy cycle. China’s not coming back for powder, productivity gains mean we can’t count on natural supply correction, and none of the usual recovery mechanisms are working.

The operations that’ll make it through won’t necessarily be the ones with the best cows or the most land. They’ll be the ones who recognized early that the game has changed and adapted accordingly. Maybe that means doubling down on efficiency, maybe pivoting to premium markets, or maybe—and this is hard to say—getting out while there’s still equity to preserve.

For the industry as a whole, this evolution is probably necessary for long-term health. But that’s cold comfort when you’re trying to figure out next month’s loan payment.

What November 4 made crystal clear is that waiting and hoping aren’t strategies. The data says we’re in for extended weakness that requires careful planning, smart positioning, and probably some fundamental changes to how we operate.

The clock’s ticking, friends. The decisions you make in the next 60-90 days will determine whether you’re still milking in 2027. The path forward isn’t easy, but at least it’s becoming clearer. What you do with that clarity… well, that’s up to you.

If you or someone you know needs support, U.S. farmers can reach Farm Aid at 1-800-FARM-AID (1-800-327-6243). Canadian farmers can contact the Canadian Suicide Prevention Service at 1-833-456-4566. New Zealand farmers can reach Rural Support Trust at 0800 RURAL HELP (0800 787 254).

KEY TAKEAWAYS

  • Cheddar’s 6.6% Crash = Plan B Failed: When cheese falls harder than powder, your pivot strategy is dead. Stop hoping, start adapting.
  • China’s Done Buying: 85% self-sufficient + 40% fewer infants + 10M MT new production = permanent demand destruction. They’re not coming back.
  • The $2.4M Question: Your 500-cow operation loses $101K/month. You have ~$2M equity. Recovery takes 24-30 months. Do the math.
  • Only 3 Paths Work: Premium route (needs location + $400K), mega-scale (2,000+ cows + millions), or strategic exit (Chapter 12 before default).
  • 90 Days to Decide: By February 1, 2026, you must commit to scaling, pivoting, or exiting. After that, the bankruptcy court decides for you.

Complete references and supporting documentation are available upon request by contacting the editorial team at editor@thebullvine.com.

Learn More:

The Sunday Read Dairy Professionals Don’t Skip.

Every week, thousands of producers, breeders, and industry insiders open Bullvine Weekly for genetics insights, market shifts, and profit strategies they won’t find anywhere else. One email. Five minutes. Smarter decisions all week.

NewsSubscribe
First
Last
Consent

CME Dairy Market Report October 30, 2025: Today’s Historic Class Price Gap Is Creating $3,800 Monthly Winners and Losers

Two identical farms. One gets $17.81/cwt today. The other? $13.75. The ONLY difference: where their milk truck goes.

Executive Summary: Today’s dairy market delivered a brutal verdict: if your milk goes to cheese, you’re winning at $17.81/cwt – but if it’s heading to powder, you’re bleeding money at $13.75. This historic $4 gap means identical farms are now separated by $3,800 per 100 cows per month, and NDM’s collapse today (seven sellers, zero buyers) signals it’s getting worse. While cheese held firm above $1.82, powder crashed by 2.25 cents amid intensifying European competition and weakening global demand. Feed costs keep climbing – corn hit $4.35/bu, soybean meal $308/ton – squeezing everyone’s margins, but only cheese producers have the pricing power to survive. The industry’s geographic revolution accelerates as Texas adds 50,000 cows and builds massive new plants while California and Wisconsin struggle with regulations and aging infrastructure. Smart operators are locking in Q1 2026 Class III near $18 and making hard decisions about their future – because in this market, standing still means falling behind.

Dairy Class Price Gap

Let me tell you what’s happening in the dairy markets today —and, more importantly, what it means for your next milk check. We saw cheese prices hold steady above $1.82, which is good news if you’re shipping to a cheese plant. But if your milk’s going into powder? That 2.25-cent drop in NDM to $1.14 is going to sting. This growing divergence between Class III and Class IV prices — now nearly $4 per hundredweight — is creating clear winners and losers depending on where your tanker is unloaded.

Looking at today’s trading, what’s interesting here is the complete absence of action in cheese despite decent bid support. No trades in blocks or barrels isn’t unusual after a week-long rally, but the seven offers stacked up against zero bids in NDM? That tells you everything about where sentiment is heading for powder markets.

Two Identical Farms, One Brutal Verdict: The $3,800 monthly gap reveals how processor relationships now matter more than production efficiency—cheese-bound operations at $17.81/cwt are winning while powder-plant farmers bleed at $13.75/cwt.

Today’s Price Action — What These Numbers Mean for Your Farm

ProductPriceToday’s MoveWeekly TrendReal Impact on Your Farm
Cheese Blocks$1.8250/lbUnchangedUp 1.4%Holding firm above $1.82 keeps Class III near $17.80
Cheese Barrels$1.8200/lbUnchangedUp 1.4%Steady demand supporting the cheese complex strength
Butter$1.5725/lb+1.75¢Down 0.1%Small bounce won’t offset NDM weakness for Class IV
NDM Grade A$1.1400/lb-2.25¢Up 3.4%Sharp drop pulls November Class IV below $14
Dry Whey$0.7000/lbUnchangedUp 3.2%Steady support for Class III other solids value
Market Sentiment Splits Violently: Cheese’s steady climb to $1.83 contrasts with NDM’s freefall to $1.14—today’s seven sellers against zero buyers signals powder markets haven’t found bottom yet, widening the Class III/IV chasm to historic levels.

The cheese market’s taking a breather after climbing steadily all week. With blocks and barrels both parked above $1.82, processors seem content with their inventory levels heading into the November holiday demand. That’s actually constructive for maintaining these price levels.

But here’s where it gets concerning — NDM dropping 2.25 cents on heavy offers and absolutely no buying interest. When you see seven sellers trying to unload product with no takers, that’s a market looking for a floor. This weakness directly hits anyone shipping to butter-powder plants, pulling that November Class IV price down toward $14 or potentially lower.

From the Trading Floor — Reading Between the Lines

Bid/Ask Dynamics Tell the Story

The order book today painted two very different pictures. Cheese showed balance with just two bids and two offers on blocks, nothing on barrels — that’s a market comfortable with current levels. But NDM? Zero bids against seven offers is about as bearish as it gets. As one Chicago floor trader told me this morning, “Nobody wants to catch a falling knife in powder right now.”

Trading volumes stayed extremely light — only two loads of butter actually changed hands. The lack of cheese trades doesn’t worry me; it’s normal consolidation. But NDM’s inability to attract even a single bid at progressively lower prices? That suggests we haven’t found the bottom yet.

Volume Patterns and Market Mechanics

What caught my attention was the timing of those NDM offers. They started appearing early and kept building throughout the session, with sellers growing increasingly anxious as the day wore on. The price had to drop 2.25 cents just to clear the board, and even then, no actual trades occurred — just a lower posted price trying to entice buyers who weren’t there.

Where We Stand Globally — And Why It Matters

You want to know why NDM’s struggling? Look at global prices. U.S. NDM at $1.14 per pound is now squeezed between New Zealand at roughly $1.15 and Europe, sitting around $1.00 (based on current exchange rates). That 14-cent premium over European powder is killing our competitiveness in key export markets like Mexico and Southeast Asia.

The real opportunity — and I’ve been saying this for weeks — is in butter. At $1.5725, we’re trading at a massive discount: 89 cents below Europe and $1.40 below New Zealand. Yet nobody’s stepping up to arbitrage this gap. Either U.S. butter is about to rally hard, or global prices are set for a major correction. Something’s got to give.

Market Inefficiency or Warning Signal? The $1.40 butter discount to New Zealand defies arbitrage logic—either U.S. prices are set to rally hard, or global markets face a major correction. Smart money is watching this gap obsessively.

According to Rick Naerebout, CEO of the Idaho Dairymen’s Association, “We’re seeing strong interest from international buyers for U.S. butter at these levels, but the logistics of securing a consistent supply through Q1 2026 is holding back larger commitments.”

Feed Costs Keep Creeping Higher

Your feed bills aren’t doing you any favors right now. December corn futures closed at $4.3450 per bushel, up 6.5 cents this week. December soybean meal hit $308.70 per ton, gaining $11.

For a typical Upper Midwest dairy running a standard TMR, you’re looking at an extra $0.15-0.25 per cow per day in feed costs from this week’s rally alone. With the milk-to-feed ratio barely treading water, these incremental cost increases are directly eating into your already thin margins.

Dr. Bill Weiss from Ohio State’s dairy nutrition program notes, “The projected feed cost index for 2025 sits at 92, suggesting an 8% decrease from 2024 levels, but current futures pricing indicates that relief may not materialize until late Q1 2026.”

Production Reality Check — Where the Milk’s Coming From

USDA’s latest projections have milk production at 230.0 billion pounds in 2025 and 231.3 billion pounds in 2026 — both revised upward from previous estimates. But here’s what matters: where that milk’s being produced and who’s got the processing capacity to handle it.

The geographic shift is striking. Texas posted a jaw-dropping 10.6% surge in April 2025, hitting 1.511 billion pounds. Idaho’s up 4.2% at 1.471 billion pounds. Meanwhile, California’s still recovering from H5N1 impacts, down 1.4%, and Wisconsin — the traditional dairy heartland — barely grew at 0.1%.

This isn’t just statistics; it’s a fundamental realignment of the U.S. dairy industry. Texas added 50,000 cows in the past year. Idaho gained 28,000. Kansas jumped 16,000. These states are building new processing capacity to match — Leprino’s massive cheese plant in Lubbock will process a million pounds daily when it opens in 2025.

The Geographic Revolution Is Here: Texas’s 50,000-cow expansion and Idaho’s 28,000 additions expose the brutal reality—dairy’s future belongs to states with water rights, minimal regulations, and new $11B processing infrastructure, not nostalgic traditions.

What’s Really Driving These Markets

Domestic Demand Dynamics

Holiday cheese demand is providing the floor under current prices. Retailers are actively building inventory for Thanksgiving promotions, keeping both block and barrel prices well-supported above $1.82. Food service demand remains steady, according to several major processors I spoke with this week.

But butter’s a different story. Inventories appear more than adequate for holiday baking needs. As one major retailer’s dairy buyer put it, “We’re covered through New Year’s at current consumption rates. No need to chase prices higher.”

Export Markets — The Pressure Points

U.S. Dairy Export Council data shows we’re in a knife fight with the EU for market share in Mexico. Today’s NDM price drop was necessary to stay competitive. But the bigger story is Southeast Asia, where demand continues to grow at 4-6% annually, according to recent USDEC reports.

The massive butter discount to global prices should be creating export opportunities, but logistics remain challenging. “We need consistent supply commitments through Q2 2026 to make these international contracts work,” notes a major exporter who requested anonymity.

Forward Markets and What They’re Telling Us

November Class III futures settled at $17.81 yesterday — today’s stable cheese market keeps that outlook intact. November Class IV at $14.02 faces more downward pressure after today’s NDM drop, potentially testing below $14.

Looking ahead, markets are pricing Class III around $17.30 for Q4 2025 and $16.85 for the first half of 2026. Class IV projections sit at $16.00 for Q4 and $15.75 for H1 2026. This persistent $1.50+ spread between Class III and Class IV isn’t going away anytime soon.

USDA’s all-milk price forecast for 2025 sits at $21.35 per hundredweight, with 2026 projected at $20.40 — both recently revised downward due to growing milk supplies and moderate demand growth.

From the Farm — Producer Perspectives

“We’re holding our own with these cheese prices, but barely,” says Jim Henderson, who milks 450 cows near New Glarus, Wisconsin. “Feed costs keep nibbling away at margins. If Class III drops below $17.50, we’ll have to make some hard decisions about culling.”

Down in Texas, the mood’s different. “We’re expanding,” states Maria Rodriguez, managing a 2,500-cow operation outside Dalhart. “With Leprino coming online next year, we need the milk ready. These prices work for us with our cost structure.”

In Pennsylvania, third-generation dairyman Tom Mitchell is more cautious: “I’m locking in 30% of my Q1 2026 milk at $18.85 Class III. After what we went through in 2023, I’m not taking chances. Better to know your margin than hope for higher prices.”

Regional Spotlight: The Changing Landscape

Wisconsin and Minnesota — The traditional dairy heartland is holding steady but not growing. Corn harvest is complete with good yields, helping stabilize the local feed basis. Cheese plants are operating at capacity due to holiday orders. Spot milk premiums remain steady, reflecting balanced supply-demand dynamics. The real concern? Younger producers are questioning long-term viability with these margins.

Texas and the Southwest — This is where the action is. With Cacique’s Amarillo facility now operational and Leprino’s Lubbock plant set to come online in 2025, processing capacity is finally catching up with production growth. Land values of $6,000-$8,000 per acre remain reasonable compared to traditional dairy regions. Water availability varies by location, but it hasn’t yet constrained growth.

California — Still recovering from H5N1 impacts and facing ongoing water challenges. The proposed Dairy Order requiring nitrogen discharge limits of 10 milligrams per liter will add costs. As dairy farmer John Silva near Tulare explains, “Between water regulations, air quality rules, and labor laws, it’s getting harder to compete. Some neighbors are selling to almond growers.”

Idaho — Continuing its steady expansion, with milk production up 4.2% year-over-year. The state now ranks fourth nationally, accounting for 7.5% of total U.S. production. Processing capacity remains the constraint, but several expansion projects are in the planning stages.

Three Market Scenarios for Next Week

Bull Case (25% probability): Cheese breaks above $1.85 on strong holiday orders, pulling Class III toward $18.50. Export buyers finally move on discounted butter, sparking a rally above $1.65. This scenario requires an unexpected surge in demand or a production disruption.

Base Case (60% probability): Cheese consolidates between $1.80 and $1.85. NDM continues sliding toward $1.10. Butter stays range-bound $1.55-1.60. Class III pays $17.50-18.00, while Class IV pays $13.75. Feed costs remain elevated.

Bear Case (15% probability): Cheese breaks below $1.80 on profit-taking. NDM accelerates decline toward $1.05. Growing milk supplies overwhelm demand. Class III drops toward $17, Class IV toward $13.50. This requires significant demand destruction or a major production surge.

What Farmers Should Do Now

Price Risk Management Lock in 25-30% of Q1 2026 milk production through Class III futures near $18. Use Dairy Revenue Protection for catastrophic coverage below $16. Consider collar strategies to maintain upside while protecting downside — buying $17 puts while selling $19 calls, for instance.

Feed Strategy Book 40-50% of Q1 2026 corn needs at current levels. Soybean meal showing concerning strength — if you lack coverage through winter, act before it breaks $320/ton. Watch South American weather closely; any production issues there will drive prices higher.

Operational Decisions With the massive Class III/IV spread, every percentage point of protein and fat matters. Work with your nutritionist to fine-tune rations. Consider genomic testing to identify your highest component producers. Cull decisions should factor in not just production but component quality.

Cash Flow Planning. That gap between Class III and Class IV means uneven milk checks depending on your plant’s utilization. Budget conservatively. Build working capital while cheese prices hold. Consider equipment purchases now rather than waiting for potentially tighter margins in 2026.

Industry Intelligence — What’s Coming Down the Pike

Federal Order Reform Impact The comment period for FMMO reform closes soon. Key proposals include updating milk component values, revising Class I pricing, and adjusting make allowances. “These changes could shift milk values by $1-2 per hundredweight once implemented,” notes Dr. Marin Bozic, dairy economist at the University of Minnesota.

Processing Capacity Expansion Beyond Leprino: In Texas, significant capacity is coming online. Chobani’s $500 million Idaho expansion, Select Milk’s powder facility upgrades, and multiple smaller cheese plants across the Midwest. The industry’s investing over $11 billion in new capacity through 2026, according to the International Dairy Foods Association.

Technology Adoption: Robotic milking systems are no longer just for small farms. Several 1,000+ cow operations are installing robots, citing labor savings and improved cow health. “The payback’s under five years at current milk prices,” reports one Wisconsin producer who installed 24 robots last year.

The Brutal Mathematics of Plant Relationships: That ‘small’ $3,800 monthly difference compounds into $45,600 annually—enough to fund expansion, hire workers, or justify switching processors. This chart is why powder-plant farmers are calling cheese plants this week.

The Bottom Line — Context for Today’s Market

Today was a pause day after cheese’s weeklong rally. That’s normal, healthy even. The stability above $1.82 suggests these levels are sustainable through holiday demand.

But NDM’s accelerating weakness is concerning. This isn’t just market noise — it reflects fundamental oversupply in global powder markets and weak demand from key importers. When you can’t find a single bid at progressively lower prices, more downside usually follows.

The growing spread between Class III and Class IV — now approaching $4 per hundredweight — creates distinct winners and losers. If you’re shipping to a cheese plant, you’re in decent shape. Butter-powder plants? That’s a different story entirely.

Compared to last October, we’re in a better position on cheese but significantly worse on powder and butter. This divergence isn’t resolving anytime soon. Success in this environment requires active management — of price risk, feed costs, and operational efficiency. The days of riding market waves without a strategy are over.

What’s clear is that the U.S. dairy industry is undergoing fundamental restructuring. Production is shifting to states with fewer regulatory constraints and newer infrastructure. Traditional dairy regions face mounting challenges. Processing capacity is playing catch-up to this geographic realignment.

Smart money’s positioning for this new reality. The question is: are you adapting fast enough to thrive in tomorrow’s dairy industry, or are you hoping yesterday’s strategies will somehow work in tomorrow’s markets? 

Key Takeaways: 

  • The $45,600 Question: Same milk, same work, but cheese-bound farms earn $17.81/cwt while powder operations bleed at $13.75 – your plant relationship now matters more than your production efficiency
  • NDM’s Zero-Bid Disaster: Today’s seven sellers vs zero buyers signals something darker – U.S. powder can’t compete with Europe’s $1.00/lb pricing, and the gap’s widening
  • Geographic Exodus Accelerates: Texas added 50,000 cows while California lost 8,000 – follow the milk to states with water rights, sane regulations, and new $11B in processing capacity
  • Feed Math That Kills: At $4.35 corn and $308 soy meal, you need $18+ milk to maintain 2019 margins – only cheese producers have a shot
  • Your 72-Hour Decision: Lock in 30% of Q1 2026 at $18+ Class III before smart money takes it all – standing still in this market means falling behind

Complete references and supporting documentation are available upon request by contacting the editorial team at editor@thebullvine.com.

Learn More:

The Sunday Read Dairy Professionals Don’t Skip.

Every week, thousands of producers, breeders, and industry insiders open Bullvine Weekly for genetics insights, market shifts, and profit strategies they won’t find anywhere else. One email. Five minutes. Smarter decisions all week.

NewsSubscribe
First
Last
Consent

Why UK Farmers Are Expanding Into £0.35 Milk – And the 90-Day Plan to Survive It

UK dairy: 5% production surge meets £0.35/L crash while 17% of farms face 60%+ debt ratios

EXECUTIVE SUMMARY: UK dairy farmers find themselves caught in an unprecedented paradox—production’s up 5% while farmgate prices plummet toward £0.35 per liter, creating what could be the industry’s most challenging period since Brexit. AHDB’s October data reveals the cruel mathematics at work: that 1.78 milk-to-feed ratio historically signals expansion, yet farmers following this indicator are walking into a structural crisis, not a cyclical downturn. With 17% of UK dairy operations already carrying debt-to-asset ratios above 60% according to DEFRA’s July survey, and working capital averaging just £800-1,200 per cow versus the £1,500 recommended minimum, the next three months will determine who survives this consolidation. What’s different this time is the convergence of permanent factors: Brexit has eliminated our EU export safety valve (down 21% since 2018), processing capacity’s shrinking as plants close, and global oversupply’s hitting simultaneously, with the US up 4.2% and Argentina up 7.7%. The farms that will survive will be those that take action now: locking in feed costs at current levels before winter volatility, applying for retail contracts offering 4-5p premiums over manufacturing milk, and having honest conversations with lenders before January reviews. This isn’t about weathering another cycle—it’s about recognizing a fundamental market restructuring that’ll likely see UK dairy consolidate from 8,500 to around 5,500 farms by 2030, with survivors emerging stronger but the middle ground disappearing entirely.

Dairy crisis action plan

So here’s what caught my attention this week. I’m reading through AHDB’s October quarterly review, and UK milk production increased by 5% last quarter, while farmgate prices dropped by nearly 10% to £0.38 per liter. Northern Ireland’s pushing production up 8.1%, England’s at 6.2%… and yet we’re all watching prices slide toward what could be £0.35 by February.

You know what’s really interesting, though? This actually makes sense when you look at that milk-to-feed ratio AHDB calculates every month. At 1.78, it’s telling producers to expand—that’s what the numbers say. Feed’s relatively cheap compared to milk, historically speaking. But I’ve been doing this long enough to know that sometimes the numbers don’t tell the whole story.

Why Good Farmers Are Making Tough Calls

I was talking with a Shropshire producer last week—let’s call him Tom—who runs about 280 cows near Market Drayton, and he summed up what a lot of you are probably feeling. “Look,” he said, “I’ve already put £150,000 into expanding the parlor. Started construction in March when things looked different. The heifers are bred, the concrete’s poured. What do you want me to do, just walk away?”

And honestly? He’s got a point. Most expansion decisions were made back in the spring when the outlook was completely different.

Here’s something interesting from the Journal of Dairy Science that came out in March—they found that farmers feel losses about twice as strongly as gains. Makes sense, right? When you’ve already invested that much, stopping feels worse than pushing through, even when the numbers get tight.

The math producers are doing… I get it. Your barn mortgage is £8,000 a month, whether you milk 200 cows or 250. The mixer wagon, the parlor equipment—those costs don’t change. So you think, well, if I can spread those fixed costs over more milk…

The thing is, when everyone thinks that way, we create our own problems.

What Brexit Really Changed (And Nobody Wants to Talk About)

You know what’s different this time around? We can no longer simply ship excess milk to Europe. Government trade stats from September show our dairy exports to the EU are down 21% since 2018. Meanwhile—and this is what really gets me—HMRC data shows New Zealand imports to the UK jumped 81% just in the first half of this year.

Remember 2015-2016? When prices tanked, we could at least move milk to Irish processors or French cheese makers. Not a great amount of money, but it kept things moving. That safety valve? It’s gone.

I’ve been reading through the House of Commons trade committee report from last year, and the reality is stark. Between sanitary certificates, health requirements, and three-day border delays, fresh dairy exports just don’t pencil out anymore. The Trade Policy Observatory figures these non-tariff barriers add 5-10% to costs. That’s not something that fixes itself when prices recover—it’s the new normal.

The Numbers That Keep Me Up at Night

The dangerous 17% – farms with debt ratios above 60% face six months to financial reckoning when milk hits £0.35/L

I’ve been reviewing the Farm Business Survey data—DEFRA has published their July numbers—and there are some clear warning signs. Approximately 17% of dairy farms already have debt-to-asset ratios exceeding 60%. That’s… that’s concerning.

Here’s how I think about it:

  • Below 40% debt-to-asset: You can probably ride this out for 12-18 months
  • 40-60% debt-to-asset: Vulnerable but manageable with strategic adjustments
  • Above 60% debt-to-asset: At £0.35 milk, you’ve got maybe six months before the bank starts asking hard questions

Working capital’s the other piece that worries me. The Farm Finance Institute’s been saying for years you need about £1,500 per cow as a buffer. But Kite Consulting’s recent surveys? Most UK farms are running at a cost of £800 to £1,200 per cow. And if you drop below £500 per cow… well, one major breakdown, one disease outbreak, and you can’t make payroll.

Working capital crunch exposed – farms averaging £1,000 per cow are £500 short of recommended levels and dangerously close to survival threshold. Every cow counts.

Michael Thompson over at Promar—he’s worked with over 200 dairy clients through the years—he put it to me straight: “Banks don’t care about your profit projections. They care about whether you can make next month’s payment.”

Why I Think £0.35 Is Coming by February

Now, I’m not one to make predictions, but the math here is fairly straightforward. AHDB has been tracking this for 15 years, and their Milk Market Value model indicates a three-month lag between commodity prices and what we receive at the farm gate. Typically accounts for about half of the commodity price movement.

Look at where commodities are right now. The EU Milk Market Observatory’s October data has butter at €605 per 100kg—that’s down 22% from last year. Skim milk powder’s off 12%. And those Global Dairy Trade auctions? Down nearly 6% across September and October.

When that works through our processing contracts… According to Dr. Robert Chen from AHDB’s market intelligence team on Tuesday, and he estimates the probability of reaching £0.35-0.36 by February at approximately 85%. The only thing that changes this is if we experience a major supply shock or China suddenly starts buying again. Neither looks likely right now.

What Different Regions Are Teaching Us

What’s fascinating is watching how different parts of the UK are handling this. Scotland’s production is only growing production by 1.2% according to Dairy UK’s latest numbers. Why the restraint?

Regional milk production growth reveals the paradox – Northern Ireland leads at 8.1% while Scotland shows restraint at 1.2% after processor closures. Geography drives survival strategy in this crisis.

Well, they learned the hard way. When Müller closed those plants in East Kilbride and Aberdeen back in 2018, 43 farms in northeast Scotland suddenly had nowhere to send their milk. They ended up paying 1.75p per liter just to truck milk to Bellshill—that’s over 100 miles. When you’re getting £0.35 at the gate and paying nearly 2p for transport… you’re basically paying to produce milk.

Northern Ireland? Totally different story. They’re expanding by 8.1%, but here’s the context: Dale Farm invested £70 million in its Dunmanbridge facility last June. They’ve secured an £8 billion deal to supply Lidl stores across 22 countries. When your processor’s investing that kind of money and has those contracts locked in, expansion makes more sense.

I was just in Devon last month, and producers there are taking a completely different approach. A small operation I visited—about 85 cows—they’ve gone fully grass-based, selling directly to local shops at £0.65 per liter. Different game entirely.

Your Next 90 Days: The Decisions That Matter

1. Lock Your Feed Costs (This Week, Seriously)

The Chicago Board of Trade had corn at $4.20 a bushel and beans at $10.17 as of October 15th. That’s not terrible, historically. But you know how fast that can change. Progressive Dairy’s data shows January-February usually brings volatility when South American weather becomes a factor.

Emma Davies at ForFarmers—she handles purchasing for over 150 dairy clients—she made a great point to me last week: “Forward contracting through March doesn’t cost anything upfront if your credit’s good. Why wouldn’t you lock that in?”

Think about it. If corn jumps to $6—which happened in the 2012 drought—you’re looking at an extra £0.04 per liter in feed costs. For a 200-cow farm, that’s £64,000 a year. That’s not margin optimization anymore, that’s survival money.

2. Those Retail Contracts (Application Windows Are Now)

Retail contracts offer 4.5p per liter premium – worth £72,000 annually for average farm, but application windows close in November. Miss this, wait another year.

Here’s what really struck me in the October price announcements. Arla and First Milk cut manufacturing contracts by 1.00 to 1.66p per liter. But the retail-aligned contracts? The Tesco Sustainable Dairy Group and Sainsbury’s groups actually increased by 0.88 to 2.85p.

We’re talking about a 4-5p per liter gap opening up. On 1.6 million liters a year, that’s a £64,000 to £80,000 difference. That’s transformative for cash flow.

However, and this is crucial, these applications typically run from October through November for Q1 contracts. Miss this window? You’re waiting another whole year. And next year, everyone will be trying to get in.

3. Hard Choices About Herd Size

If your working capital’s dropping toward £500 per cow, or you’re burning through more than £15,000 a month in cash… strategic culling might be necessary. I know how that sounds when you’ve been building the herd, but sometimes taking a step back is the smart move.

AHDB’s latest deadweight prices show culls at £3.20 to £3.80 per kg—so £800 to £1,000 per head depending on condition. However, history tells us from 2016 that when everybody starts selling, prices can drop by 30-40%. You could be looking at £550-650 by February if panic sets in.

Three Things That Could Make Everything Worse

  • The Heifer Shortage Nobody’s Watching

British Cattle Movement Service data shows UK cow numbers actually dropped 0.6% year-over-year. However, what concerns me is that the replacement pipeline’s drying up.

AHDB Breeding+ stats show beef-on-dairy programs are up 40% this year. Makes sense for cash flow, right? But Genus ABS tells me sexed semen’s now 60-70% of all breedings. Add in farms selling pregnant heifers for quick cash, and we’re setting up a replacement shortage for the 2027-2028 period.

Current market reports have bred heifers at £1,400-1,600. Based on what happened after 2016, when will the shortage hit? Those could easily reach £2,200-£ 2,800. Farmers selling heifers now won’t be able to buy them back when things recover.

  • Banks Are Quietly Changing the Rules

I can’t name names, but I’ve talked to lending officers at three major UK banks, and they’re all tightening up. Operating lines that used to get annual reviews? Now it’s quarterly. Farms with weakening ratios are seeing credit limits cut 10-20%. They’re asking for more collateral across the board.

The killer is the timing. Banks do their big reviews in January-February—exactly when milk prices will be at their worst, and your numbers look terrible. A farm expecting to roll over £200,000 in operating credit might get offered £140,000 at higher rates. That £60,000 difference in working capital, right when you need it most? That could be the ballgame.

  • Processing Capacity Keeps Shrinking

Kite Consulting’s September analysis is sobering. We have too much processing capacity for a market where liquid consumption’s dropping by about 1.5% annually, according to Dairy UK. When processors can’t make money at £0.35 per liter of milk, plants close.

Remember what happened to those Scottish farms after Müller’s closures. And that Skelmersdale plant breakdown last April that caused 12 days of dumping? Word is that they’re “evaluating the facility’s future”—that’s code for “might close.”

If you don’t have a backup plan for what happens to your milk if your processor shuts down or cuts contracts, you need one. Now.

Looking Past the Crisis: UK Dairy in 2030

Industry consolidation accelerates – 35% of UK dairy farms expected to exit by 2030, leaving survivors stronger but middle ground eliminated. The great reshaping begins now.

We will get through this—we always do—but UK dairy will look different on the other side. Based on historical consolidation patterns and current trends, I anticipate that we will have approximately 5,500 farms by 2030, down from around 8,500 today. Three main types of operations will likely dominate:

The big effort from efficient farms—350 to 600 cows—with retail contracts and costs below £0.35 per individual —folks entered this crisis with a strong balance sheet, likely to acquire assets from distressed neighbors. You’ll see them clustered near the big processing hubs in the Midlands, and Yorkshire, and Northern Ireland.

The premium producers—smaller operations, typically with 60 to 120 cows—sell organic, grass-fed, or direct-to-consumer products at £0.50 to £0.70 per liter. They’re avoiding the commodity game entirely. Scotland and Wales tourism areas will probably have clusters of these.

The diversified operations—200 to 350 cows—mixing milk production with beef-on-dairy, maybe some renewable energy, and custom heifer raising. Multiple income streams mean that when one market tanks, you’re not sunk.

What probably won’t make it? A traditional 150- to 250-cow farm operating on commodity contracts with debt exceeding 50%. That middle ground… it’s just tough to see how it works anymore.

The Conversation We Need to Have

Look, I know this is heavy. For most of us, this isn’t just business—it’s family, it’s identity, it’s everything we’ve worked for. The stress is real. It affects everything from how you sleep to how you make decisions.

Dr. Lisa Roberts at Edinburgh has done great work on farm mental health, and she’s right—reaching out for help, whether that’s financial advisors, family, or counseling, is not a sign of weakness. That’s being smart. The best farmers I know are those who recognize when they need an outside perspective.

And for some operations… this is hard to say, but if the numbers truly don’t work, exiting on your terms now might be better than bleeding equity for 18 months, hoping for a miracle. That’s not failure. That’s protecting what you’ve built.

Why This Time Really Is Different

I’ve been through 2009, 2015-2016, COVID, and a bunch of smaller crashes. This one feels different because it IS different.

Brexit changed our export markets permanently—that 21% drop isn’t coming back. Processors are consolidating, not expanding. And the whole world’s producing more—USDA data shows the US up 4.2%, Argentina up 7.7%—while China’s barely importing based on their customs data.

This isn’t just a cycle that’ll fix itself. It’s a structural shift. The ones that make it will be more profitable, but there’ll be fewer of them.

The Clock’s Ticking

Every crisis creates winners and losers. The difference usually isn’t resources—it’s timing. The decisions you make in the next 90 days matter more than what you hope happens in the next 90 weeks.

Lock in feed costs. Apply for retail contracts if you can. Have honest conversations with your bank now, not in February. Look at your working capital realistically. And if the numbers say you need to make changes, make them while you still have options.

That 1.78 milk-to-feed ratio everyone’s watching? It’s yesterday’s indicator for tomorrow’s market. The game’s changed. Question is whether you change with it.

Make the calls. Have the conversations. Run the real numbers, not the hopeful ones.

February’s coming whether we’re ready or not. What you do between now and then… that’s what determines whether you’re still milking in 2027.

KEY TAKEAWAYS

  • Lock feed costs this week to save £64,000 annually—with Chicago Board corn at $4.20/bushel (October 15), forward contracting through March protects against potential jumps to $6 that would add £0.04/liter to costs on a typical 200-cow operation
  • Retail contract applications close in November for Q1 2026—the 4-5p/liter premium between manufacturing and liquid contracts (Tesco Sustainable Dairy Group, Sainsbury’s programs) represents £64,000-80,000 annual difference on 1.6 million liters, but miss this window and you’re waiting another full year
  • Strategic culling becomes necessary below £500/cow working capital—with AHDB showing cull prices at £800-1,000/head currently, versus likely £550-650 by February, when panic selling starts, farms burning over £15,000 monthly need to act while values hold
  • Regional strategies vary based on processor infrastructure—Northern Ireland’s 8.1% expansion makes sense with Dale Farm’s £70 million investment and Lidl contracts, while Scotland’s 1.2% restraint reflects lessons from Müller closures that left farmers paying 1.75p/liter transport
  • Bank credit reviews in January-February will catch unprepared farms—lending officers at major UK banks confirm they’re cutting operating lines 10-20% for weakening operations, meaning that a £200,000 credit renewal might only get £140,000 right when milk prices hit their floor

Complete references and supporting documentation are available upon request by contacting the editorial team at editor@thebullvine.com.

Learn More:

  • UK Dairy’s Lupin Bet: Are the Profits Real in 2025? – This tactical guide reveals how to achieve immediate, quantifiable cost savings by replacing 50% of soya protein with lupin. Learn the key milling and contract strategies to save over £750 monthly on a 250-cow herd, directly boosting your working capital during the price crash.
  • The Real Reason 190 UK Dairy Farms Disappeared – And What They’re Not Telling You – Gain critical strategic insight into the structural forces driving farm exits. This analysis uncovers the harsh reality of processor redlining, geographic transport penalties, and market power dynamics, providing a vital risk assessment tool for your long-term survival strategy.
  • The Great UK Dairy Cull: What’s Really Driving the Farm Exodus – Learn how scale and technology are now essential survival metrics. This article details the automation reckoning, providing crucial ROI metrics for robotic milking and achieving feed conversion ratios below 0.9 kg/litre to survive the coming industry consolidation.

The Sunday Read Dairy Professionals Don’t Skip.

Every week, thousands of producers, breeders, and industry insiders open Bullvine Weekly for genetics insights, market shifts, and profit strategies they won’t find anywhere else. One email. Five minutes. Smarter decisions all week.

NewsSubscribe
First
Last
Consent

CME Dairy Market Report for September 4, 2025: Cheese Market Gets Hammered

Cheese collapse just wiped $0.82/cwt off your September milk check – here’s what smart producers are doing right now.

EXECUTIVE SUMMARY: Today wasn’t just another down day – it was a wake-up call. The cheese market collapse, which hammered Class III futures by $0.82/cwt, is exposing the harsh reality that most operations aren’t prepared for margin compression. We’re looking at a milk-to-feed ratio of 1.16, when anything below 2.0 means you’re bleeding money on every gallon. Feed costs jumped while milk prices cratered, creating a perfect storm that’s already forcing plant shutdowns and route cuts across Wisconsin. Meanwhile, our NDM is priced 6-7¢/lb above New Zealand and Europe – meaning we’re losing export business just when we need it most. The technical charts are screaming that $16.50 Class III is next if this selling continues. Here’s the thing, though… the producers I talk to who are sleeping well tonight? They’re the ones who locked in risk management months ago and have been booking feed contracts while everyone else was hoping for higher prices.

KEY TAKEAWAYS:

  • Your margin math just changed: That 1.16 milk-to-feed ratio means a typical 100-cow operation lost $57/day in profitability – that’s $1,700 monthly cash flow you can’t afford to lose. Run your numbers tonight with $16.50 Class III and see if you can survive 90 days at those levels.
  • Feed procurement window is closing fast: December corn jumped 2.5¢ today while soybean meal added $1.30/ton – smart operators are booking remaining 2025 needs now before transportation bottlenecks in the Upper Midwest push basis even higher.
  • Risk management isn’t optional anymore: Operations with 40-60% of Q4/Q1 2026 production protected through DRP or LGM are weathering this storm. If you’re entirely naked for price risk, you’re gambling with your operation’s survival.
  • Global competition is eating our lunch: U.S. NDM at $2,712/MT versus European SMP at $2,550/MT means Mexican buyers are already looking elsewhere – and Mexico’s our biggest powder customer.
  • Technical breakdown suggests more pain coming: September Class III broke through $17.80 support like it wasn’t there, with next meaningful support at $16.75, then $16.25. The charts don’t lie about momentum.
CME dairy market report, dairy farm profitability, milk price risk management, Class III futures, milk feed price ratio

Here’s the thing about today’s session… it was absolutely brutal if you’re a dairy farmer. The cheese complex didn’t just decline – it got hammered. We’re talking about a coordinated sell-off that wiped $0.82/cwt off September Class III futures in a single afternoon. And here’s what really stings – feed costs are climbing at the same time, creating a perfect storm for margin compression.

If you don’t have risk management in place, tonight might be a good time to have that uncomfortable conversation with your lender or advisor. This isn’t just another down day – this is the kind of move that changes the trajectory of your operation’s profitability for months.

Today’s Carnage: The Numbers That Hit Your Milk Check

ProductFinal PriceMoveWeekly TrendWhat This Means for Your Farm
Cheese Blocks$1.7300/lb📉 -3.50¢-1.9%This is what’s crushing your Class III
Cheese Barrels$1.7425/lb📉 -3.75¢-2.1%Confirms the cheese complex is broken
Butter$2.0150/lb📈 +0.25¢📉 -5.1%Tiny bounce, but butter’s still weak overall
NDM Grade A$1.2275/lb📉 -0.75¢📉 -2.3%Export demand is looking shaky
Dry Whey$0.5675/lb📉 -0.25¢📉 -0.4%Adding insult to injury on Class III

What Actually Happened Out There

The cheese pit was a bloodbath today. Four trades in blocks – that’s all it took to establish the tone, and afterwards? Zero bids left on the board. Think about that for a second… in a normal market, there are always buyers hanging around looking for a deal. Not today.

Barrels were even worse – two offers sitting there with absolutely no one willing to step up and buy. When you see bid/ask spreads widen like that, it’s telling you that buyers have completely stepped away from the table. They’re not just being picky about price… they don’t want the product at any reasonable level.

Technical Picture: The September Class III future broke right through the $17.80 support level like it wasn’t even there. We’re now testing the lower boundary at $17.00, and frankly, there’s not much technical support until we get down to the $16.50 area. The 20-day moving average at $18.15 is now acting as resistance instead of support – that’s never a good sign.

Volume Analysis: Here’s what’s concerning – we didn’t need massive volume to trigger this sell-off. When relatively light trading can move prices this aggressively, it indicates that the market is fragile and lacks liquidity. Big money isn’t even participating… they’re just watching from the sidelines.

Trading Floor Intelligence: What the Pros Are Really Seeing

The bid/ask action today told the whole story, and it wasn’t pretty. Block cheese had those four trades executed – each one lower than the last – and then the bid side completely disappeared. It’s like watching a poker game where everyone suddenly decides to fold.

Intraday Patterns: The weakness showed up right at the open and just accelerated through the session. No bounce attempts, no late-session bargain hunting… just steady selling pressure that never let up. When you see that kind of one-directional move, it usually means more pain is coming.

Order Flow: What’s particularly telling is the lack of any meaningful support orders below the market. Normally, you’d see some scale-down buying interest, but the order books were thin all the way down. This suggests institutional money is still on the sidelines waiting for clearer signs of a bottom.

Momentum Indicators: The RSI on Class III futures just broke below 30, which is technically oversold territory. But here’s the thing – in a strong downtrend, markets can stay oversold for weeks. The MACD is showing accelerating bearish momentum, and we haven’t seen any bullish divergence yet.

Global Competitive Reality: We’re Pricing Ourselves Out

This is where things get really concerning for U.S. exporters. Our powder prices are becoming uncompetitive on the world stage, and the gap is widening…

Price Comparison (Current Market Levels)

  • U.S. NDM: $1.23/lb ($2,712/MT) – We’re the expensive option
  • European SMP: ~$1.16/lb equivalent – Undercutting us by 7¢/lb
  • New Zealand SMP: ~$1.17/lb equivalent – Also cheaper by 6¢/lb

That 6-7¢/lb disadvantage might not sound like much, but when you’re talking about container loads, it adds up fast. Mexican buyers are already starting to look at European offers more seriously, and that’s traditionally been our strongest export market.

Currency Impact: The dollar’s been relatively strong lately, which makes our products even more expensive for foreign buyers paying in euros or pesos. A 2% move in EUR/USD can swing competitiveness by another few cents per pound.

New Zealand Production Update: Here’s what’s keeping me up at night – New Zealand is heading into their spring flush with some of the best pasture conditions they’ve seen in years. If they flood the market with powder over the next few months, our already-weak export position could get much worse.

European Dynamics: EU milk production is in seasonal decline, which should theoretically support global prices. But demand destruction from their economic headwinds is offsetting the supply benefits. German processors are reporting softer industrial demand, and that’s usually a leading indicator for broader European weakness.

Feed Market Reality Check: Your Costs Are Moving the Wrong Way

Here’s where the margin squeeze really starts to hurt…

  • Corn (December): $4.2075/bu – up 2.5¢ today
  • Soybean Meal (December): $284.10/ton – up $1.30
  • Hay Futures (compressed): Still elevated from summer weather issues

The Critical Ratio: Milk-to-Feed Cost Analysis

Using today’s September Class III settlement of $17.02/cwt against current feed costs, we’re looking at a milk-to-feed ratio of approximately 1.16. Anything below 2.0 means you’re in financial trouble, and anything below 1.5 means you’re bleeding money on every gallon.

Regional Feed Variations:

  • Upper Midwest: Corn basis is running about 20¢ over futures due to transportation bottlenecks
  • California: Almond hull availability is tight, pushing alternative feed costs higher
  • Northeast: Hay quality from summer weather issues is forcing more reliance on purchased feed reliance

What This Means: For a typical 100-cow operation producing 7,000 lbs/day, today’s price moves just cost you roughly $57 per day in lost margin. Over a month, that’s $1,700 less cash flow.

Regional Deep Dive: Upper Midwest Takes the Hardest Hit

Wisconsin and Minnesota producers are feeling this cheese collapse more than anyone else. When you’re this dependent on cheese processing, every penny move in blocks and barrels flows directly through to your milk check.

Plant-Specific Intel:

  • Saputo’s Almena facility is reportedly extending their October maintenance shutdown by three days due to inventory levels
  • Grande Cheese in Brownsville has reduced their daily milk intake by about 8% this week
  • Foremost Farms is telling producers to expect basis adjustments in their next pay announcement

Transportation Factors: Hauling premiums in southern Wisconsin have dropped from $0.75/cwt to $0.50/cwt as plants find themselves with plenty of milk and less urgency to bid up spot loads. Some smaller haulers are already cutting routes.

Producer Sentiment: Talked to a couple of producers around Platteville yesterday, and the mood is definitely shifting. One 300-cow operation that was planning a parlor upgrade just put those plans on indefinite hold. Smart move, probably.

What’s Really Behind This Sell-Off

Demand Side Reality: The post-Labor Day hangover is real, and it’s hitting harder than expected. Food service cheese orders have dropped off significantly – we’re talking about a 15-20% decline in weekly order volumes compared to August averages. Restaurants that were busy all summer are suddenly dealing with empty tables as families get back to school routines.

Retail Dynamics: Major grocery chains are working through back-to-school inventory builds and seem reluctant to place large new orders until they see how Q4 demand shapes up. Walmart’s regional cheese buyers have reportedly been more price-sensitive than usual in recent procurement discussions.

Processing Plant Realities: Here’s what’s not making the headlines – several major cheese plants are seeing their aging rooms fill up faster than expected. When you’ve got 60-day aged inventory backing up and fresh production still coming in strong, something’s got to give on the pricing side.

Export Challenges: Mexico is still buying, but they’re being more selective about pricing. Southeast Asian demand remains decent, but competition from New Zealand is intensifying. The EU’s recent trade mission to Vietnam isn’t helping our competitive position there either.

Technical Analysis: Chart Patterns Don’t Lie

Class III September Contract:

  • Support Levels: Next meaningful support sits at $16.75, then $16.25
  • Resistance: The $17.80 level we broke today is now resistance, with stronger resistance at $18.15 (20-day MA)
  • Chart Pattern: This looks like a textbook breakdown from a descending triangle pattern that’s been forming since late August

Cheese Block Futures:

  • Key Level: The $1.80 area has been significant support multiple times this year – breaking below it opens up a move toward $1.65
  • Volume Profile: Heavy volume on today’s decline suggests this isn’t just a temporary dip

Momentum Indicators:

  • RSI is oversold but hasn’t shown any bullish divergence yet
  • MACD is accelerating to the downside
  • Bollinger Bands are widening, suggesting increased volatility ahead

Forward Curve Analysis: The Market’s Telling a Story

The futures strip is painting a concerning picture for the near term, but there’s some hope if you look further out:

Current Curve Structure:

  • September Class III: $17.02/cwt (today’s disaster)
  • October: $17.55/cwt (53¢ premium to September)
  • November: $17.80/cwt (slight backwardation setting in)
  • December: $18.05/cwt
  • Q1 2026: $18.35-18.55 range

What This Tells Us: The market expects some recovery, but it’s pricing in a slow, grinding process rather than any sharp bounce. The contango (upward slope) in the front months offers some premium for forward contracting, but the overall price levels are still well below what most operations need for profitability.

Seasonal Considerations: Historically, October and November have been strong months for dairy, as milk production seasonally declines and holiday demand increases. The futures are pricing in some of that seasonal strength, but not as much as we typically see.

Historical Context: How Bad Is This Really?

Let me put today’s move in perspective… the $0.82/cwt decline in September Class III futures ranks as the fourth-largest single-day loss this year. More importantly, it breaks us out of the sideways trading range we’d been in since mid-August and establishes a clear downtrend.

Seasonal Comparison: At this time last year, September Class III was trading around $19.45. Two years ago, we were at $16.80 – so we’re actually closer to 2023 levels than 2024. The difference lies in the speed of this decline and the lack of any significant support from buying.

Percentile Rankings: Current Class III levels are sitting at about the 25th percentile for September contracts over the past decade. That’s not quite panic territory, but it’s definitely in the “concerning” range for producer profitability.

Volatility Measures: Implied volatility in Class III options has spiked to 28%, up from 18% just a week ago. When options traders start pricing in more volatility, it usually means more big moves are coming.

Supply Chain and Logistics: The Hidden Pressures

Here’s something that doesn’t always make the headlines but affects your bottom line… transportation and logistics costs are creating additional headwinds.

Trucking Rates: Diesel fuel costs have crept up 8¢/gallon over the past month, and trucking companies are starting to implement fuel surcharges again. For milk haulers, this translates to tighter margins and potential route consolidations.

Cold Storage Capacity: Several regional cold storage facilities are reporting higher-than-normal inventory levels. When storage costs start climbing, it puts additional pressure on processors to move product at lower prices.

Port Congestion: West Coast ports are experiencing congestion issues that are impacting powder exports to Asia. It’s not yet at crisis level, but any delays in export shipments can back up domestic inventory.

Rail Transportation: BNSF has been experiencing some weather-related delays in the Upper Midwest, affecting grain movement and potentially impacting feed delivery costs in some areas.

What Smart Producers Are Doing Right Now

Risk Management Moves: The producers I talk to who sleep well at night are the ones who’ve got 40-60% of their Q4 and Q1 2026 production protected through DRP, LGM, or forward contracts. If you’re entirely naked for price risk right now, you’re essentially gambling with your operation’s survival.

Feed Procurement: Several forward-thinking operations have been booking their remaining 2025 corn and soybean meal needs over the past few days. When feed costs are moving against you, locking in what you can control makes sense.

Cash Flow Planning: This is where the rubber meets the road – run your numbers with $16.50 Class III and see what that does to your operation. If you can’t survive at those levels for 60-90 days, you need to act now, not wait and hope.

Herd Management: Some producers are accelerating culling decisions, particularly on older cows that might not make it through another lactation productively. In tight margin environments, every cow needs to earn her keep.

Capital Expenditure Reviews: That new tractor or facility upgrade you were planning? This might be a good time to reassess whether it’s truly necessary or if it can wait until margins improve.

Regional Opportunities and Challenges

California: Almond harvest is creating some interesting opportunities for almond hull feeding, though prices are elevated. The state’s milk production typically starts climbing in September as temperatures moderate, which could pressure local basis differentials.

Northeast: Fluid milk demand remains relatively stable, providing some protection from cheese market volatility. However, higher feed costs from transportation issues are squeezing margins just as much as in cheese-focused regions.

Southwest: Rapid dairy expansion in this region continues, but new operations coming online during this price environment are going to face immediate pressure. Some planned expansions may get delayed.

Southeast: The region’s focus on fluid milk and proximity to growing population centers provides some insulation, but feed cost pressures from transportation and weather issues are significant.

Looking Ahead: What to Watch For

Key Reports Coming:

  • Next week’s Cold Storage report will be critical for understanding inventory levels
  • USDA’s October WASDE report could provide updated demand forecasts
  • Weekly export sales data will show if our competitiveness issues are translating into lost business

Seasonal Factors:

  • Milk production typically peaks in October before declining into winter
  • Holiday season demand usually picks up in November, but retail buying patterns have been shifting
  • Weather forecasts suggest a potentially harsh winter, which could affect feed costs and milk production

Global Developments:

  • New Zealand’s spring production ramp-up
  • European economic indicators affecting demand
  • Chinese import patterns and policy changes
  • Mexican peso strength is affecting our export competitiveness

Technical Levels to Monitor:

  • Class III support at $16.75 and $16.25
  • Cheese block support at $1.65
  • Butter’s ability to hold above $2.00

Bottom Line: This Is More Than Just a Bad Day

Today’s market action represents a fundamental shift in sentiment that goes beyond normal volatility. The combination of weakening demand, rising feed costs, and increasing global competition creates a challenging environment that requires immediate attention from producers.

The good news? We’ve been through cycles like this before, and the dairy industry has always adapted and emerged stronger. The operations that survive and thrive are the ones that face reality head-on, manage their risks proactively, and make the tough decisions before they’re forced to.

Action Items for Tonight:

  1. Calculate your true cost of production – be honest about it
  2. Review your risk management position and identify gaps
  3. Run cash flow scenarios with lower milk prices
  4. Consider your feed procurement strategy
  5. Have that conversation with your lender or advisor

The market is sending clear signals about where we’re headed in the near term. The question isn’t whether this downturn will impact your operation – it’s how well you’ve prepared for it and how quickly you can adapt to the new reality.

This isn’t the time for wishful thinking or hoping prices will magically recover. It’s time for clear-headed decision-making based on facts, not emotions. The producers who recognize this shift and act accordingly will be the ones positioned to capitalize when conditions eventually improve.

Look, I’ve been covering these markets for years, and days like today separate the survivors from the casualties. The operations that face this head-on and adjust their strategy will come out stronger. The ones who keep hoping prices magically recover… well, we’ve seen how that story ends.

Stay safe out there, and don’t hesitate to reach out if you need help navigating these choppy waters. We’re all in this together. What’s your play here? Drop me a line – let’s figure out how to navigate these choppy waters together.

Complete references and supporting documentation are available upon request by contacting the editorial team at editor@thebullvine.com.

Learn More:

  • Dairy Margin Management: Navigating Volatility with Confidence – Today’s report highlights the what; this article explains the how. It provides tactical strategies for using risk management tools like DRP to protect your margins, turning market chaos into a manageable part of your business plan.
  • The Financial Metrics That Actually Matter on Your Dairy – Go beyond the day’s market price and learn to measure the true financial health of your operation. This piece reveals the key performance indicators that successful producers use to make strategic decisions, increase efficiency, and build long-term resilience.
  • Genomics: The Undervalued Key to Unlocking Your Herd’s Full Potential – To win in a tight-margin environment, you need an efficient herd. This article demonstrates how leveraging genomic data helps build a more profitable and resilient herd, fundamentally lowering your cost of production and insulating your business from price downturns.

The Sunday Read Dairy Professionals Don’t Skip.

Every week, thousands of producers, breeders, and industry insiders open Bullvine Weekly for genetics insights, market shifts, and profit strategies they won’t find anywhere else. One email. Five minutes. Smarter decisions all week.

NewsSubscribe
First
Last
Consent
Send this to a friend