Archive for farm financial management

$368 Insurance, −$1,830 from Farming: What Actually Keeps One Iowa Dairy Alive

When enhanced ACA subsidies expired at the end of 2025, one Iowa dairy family’s monthly insurance cost nearly doubled — and exposed the financial arithmetic most dairy households already live but rarely put on paper.

Executive Summary: USDA’s 2024 data says the median U.S. farm household lost ,830 farming and earned ,900 off the farm — and when enhanced ACA subsidies expired in December 2025, families like Meghan Palmer’s in northeastern Iowa watched their monthly health insurance bill nearly double to 8.18, exposing exactly how much of a dairy’s real margin comes from the spouse’s W-2. On a 200-cow herd shipping 75 lbs/day at USDA’s current .50/cwt all-milk forecast, gross revenue runs about .12 million — but with average total production costs near .56/cwt, net margin is razor-thin or negative before you account for insurance, equipment, or anything else. Factor in that more than 40% of dairy farmers lack health insurance entirely, and that 27% of the ag workforce buys coverage on the individual marketplace at four times the national rate, and you’ve got a structural vulnerability most operations have never formally addressed. A spouse’s ,000 salary plus employer health benefits and retirement match adds up to ,000–,000 in total compensation — yet that income stream rarely appears on the farm‘s loan documents, succession plan, or cash-flow projections. This piece walks through the barn math, the governance gap, and four decision paths — including a 30-day action any operator can take with last year’s tax return and a W-2. If the off-farm number is bigger than the Schedule F net, the conversation about who really funds the dairy needs to happen now.

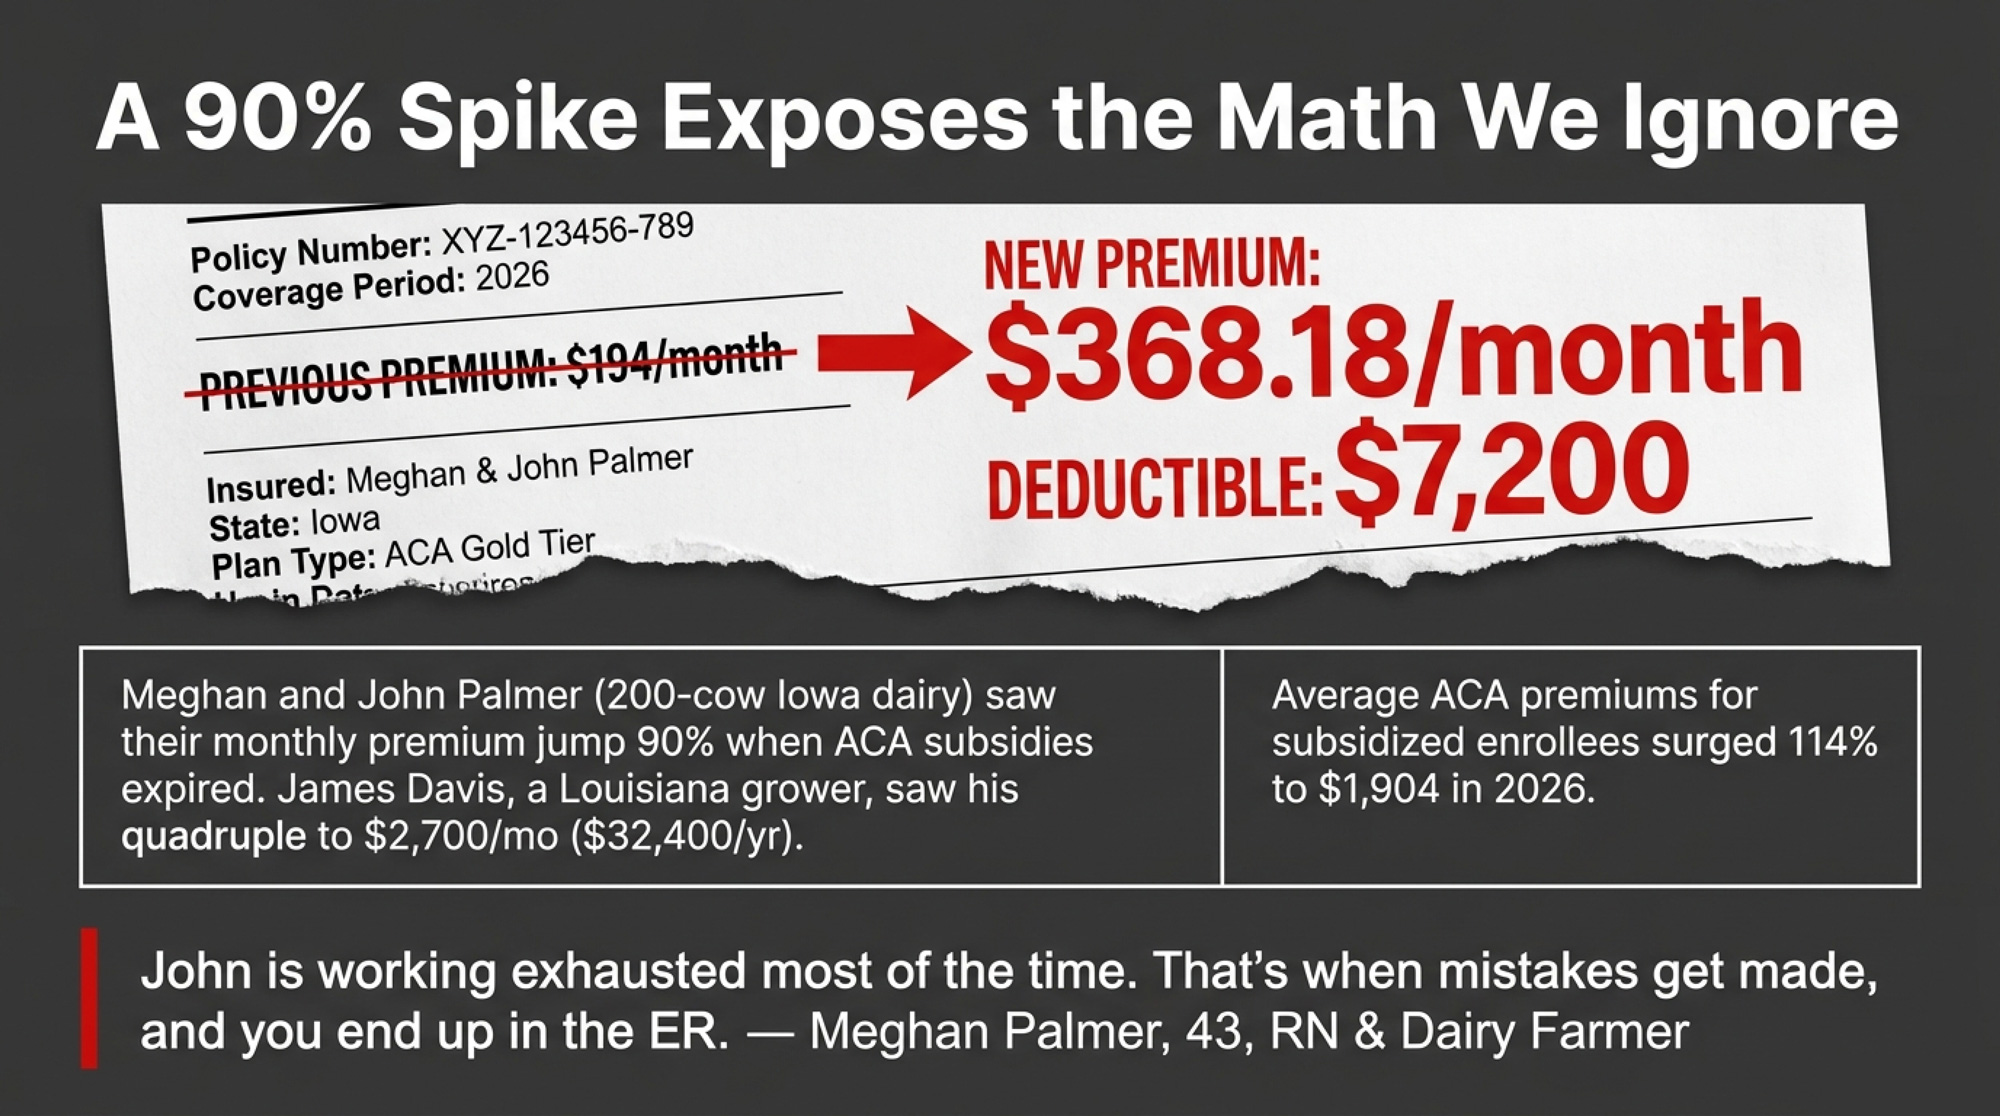
Meghan Palmer is 43, a registered nurse, and runs a dairy farm in northeastern Iowa with her husband, John. Their family’s monthly health insurance cost nearly doubled at the start of 2026 — climbing more than 90%, to $368.18 — after enhanced ACA premium subsidies expired. At $368 a month, that’s roughly $4,400 a year in premiums alone, nearly twice what they paid before the subsidies lapsed. Their total deductible for 2026: $7,200, as reported by KFF Health News in January 2026.

Palmer picks up nursing shifts as needed, giving her flexibility to prioritize the farm. But she’s now searching for a job with employer-sponsored health benefits — and she told KFF Health News she worries a job that doesn’t let her keep up with farm work will create a bigger burden for John.

“John is working exhausted most of the time,” she said. “That’s when mistakes get made, and you end up in the ER.”

Their situation isn’t unusual. It’s just more visible than most.

The Number Nobody Puts on the Whiteboard

USDA’s Economic Research Service tracks what farm households actually earn — not what they earn from farming, but what they earn total. The 2024 figures tell a story that anyone married to a dairy farmer already knows.

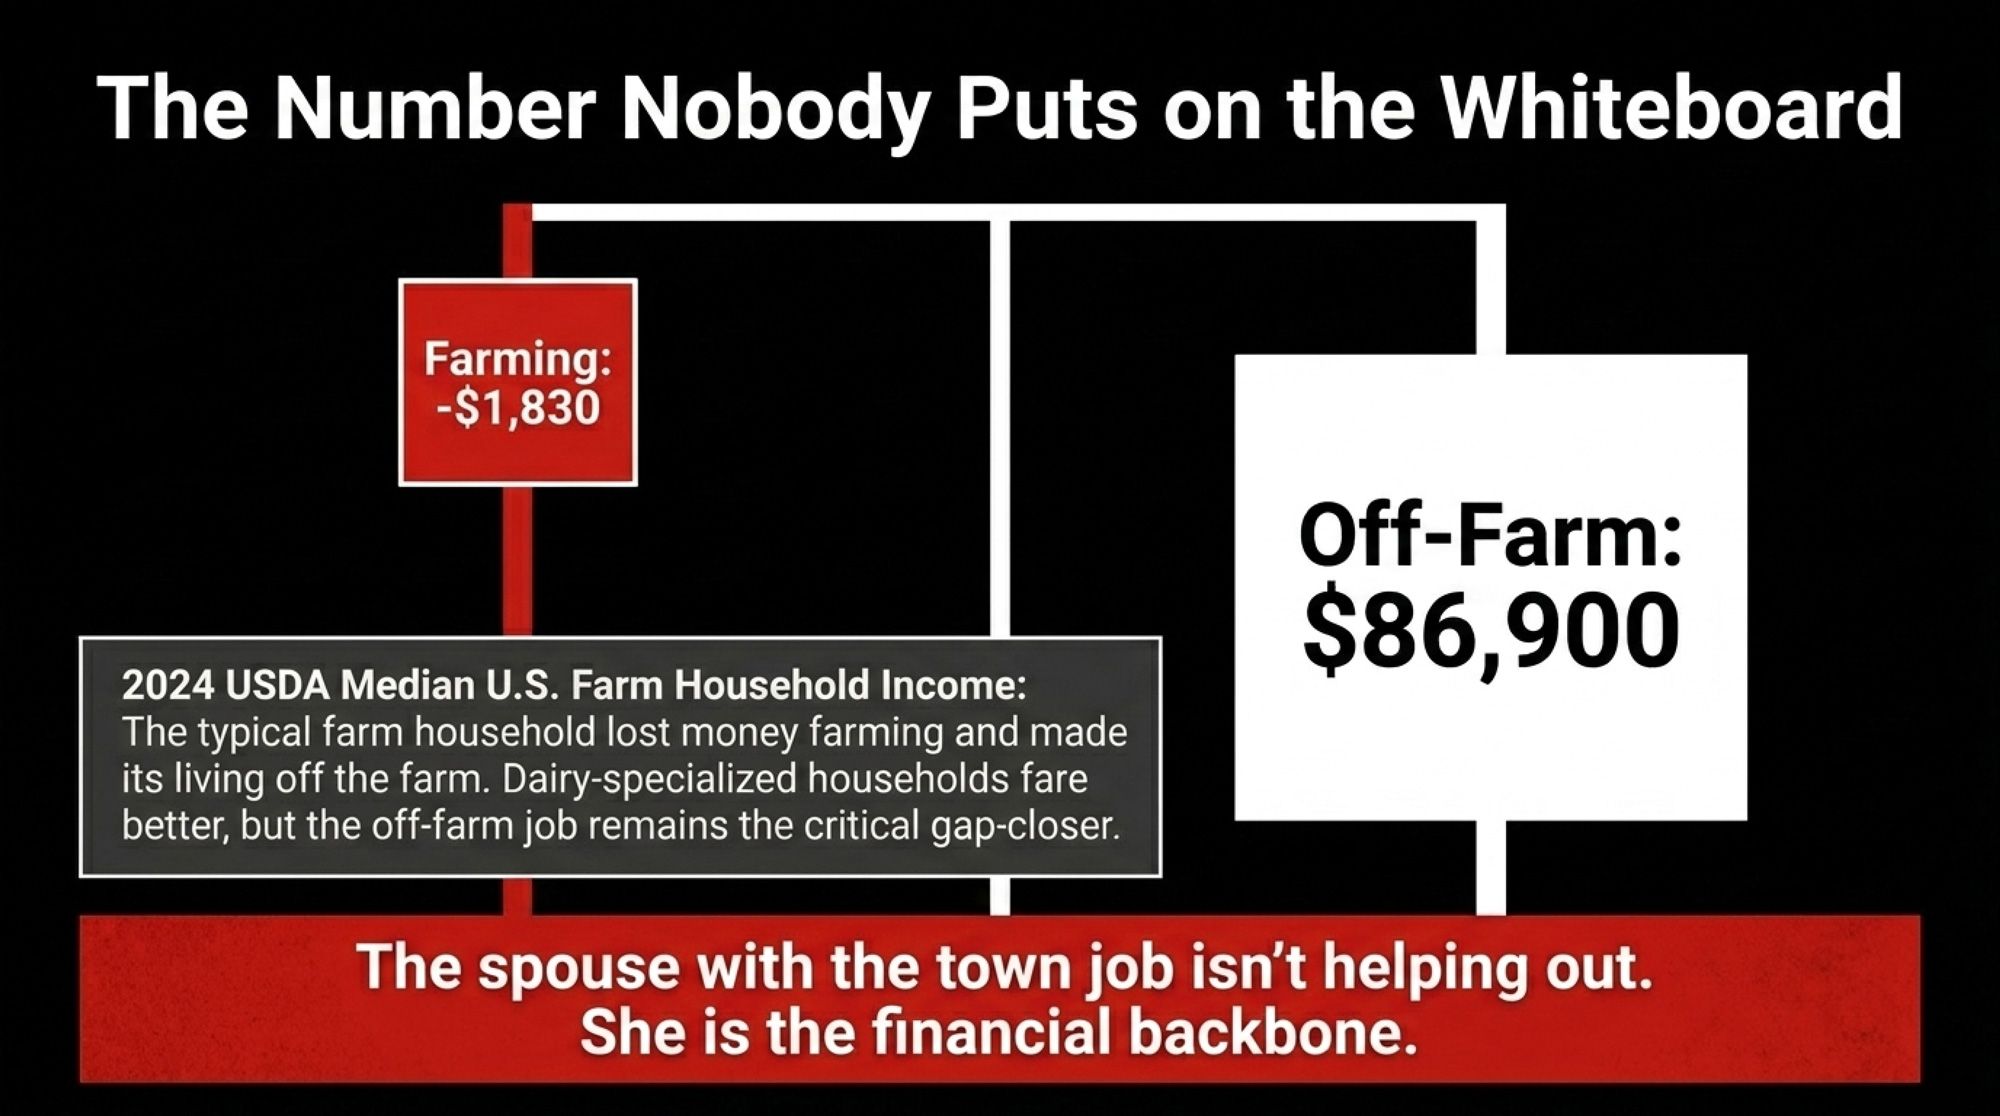
Median household income from farming in 2024: negative $1,830. Median off-farm income: $86,900. Total median farm household income: $102,748, according to ERS’s Farm Household Income Estimates. The typical American farm household lost money farming and made its living off the farm.

Dairy-specialized households do better than that all-farm median. ERS’s commodity-specialization data show dairy households earned a median of $100,493 from farming, with a total median household income of $146,964 (2023 reference year, from the December 2024 chart—the most recent dairy-specific breakdown available at publication). That’s real money from the cows. But even in dairy, off-farm income closes the gap between getting by and getting ahead — and for smaller operations, it’s often the gap between staying and leaving.

The point isn’t that farming doesn’t pay. For commercial-scale dairies, it often does. The point is that on a huge share of operations, the spouse with the town job isn’t “helping out.” She’s the financial backbone — and nobody’s accounting for it that way.

What Does the Town Job Actually Cover?

Here’s where most farm families undercount what the off-farm job is worth.

A $55,000 nursing or accounting salary doesn’t just bring home $55,000. It carries employer-paid health insurance — and that piece alone is bigger than most people realize. KFF’s 2024 Employer Health Benefits Survey puts the average employer contribution at about $7,500 a year for single coverage and nearly $19,300 for a family plan. Then there’s a 3%–6% salary match. Social Security credits that self-employment income alone often can’t match. Disability and life coverage are usually bundled at no extra cost.

Add the employer’s premium share and the retirement match to that $55,000, and you’re looking at $65,000 to $77,000 in total compensation — depending on whether you’re on single or family coverage. Now stack that against the milk check.

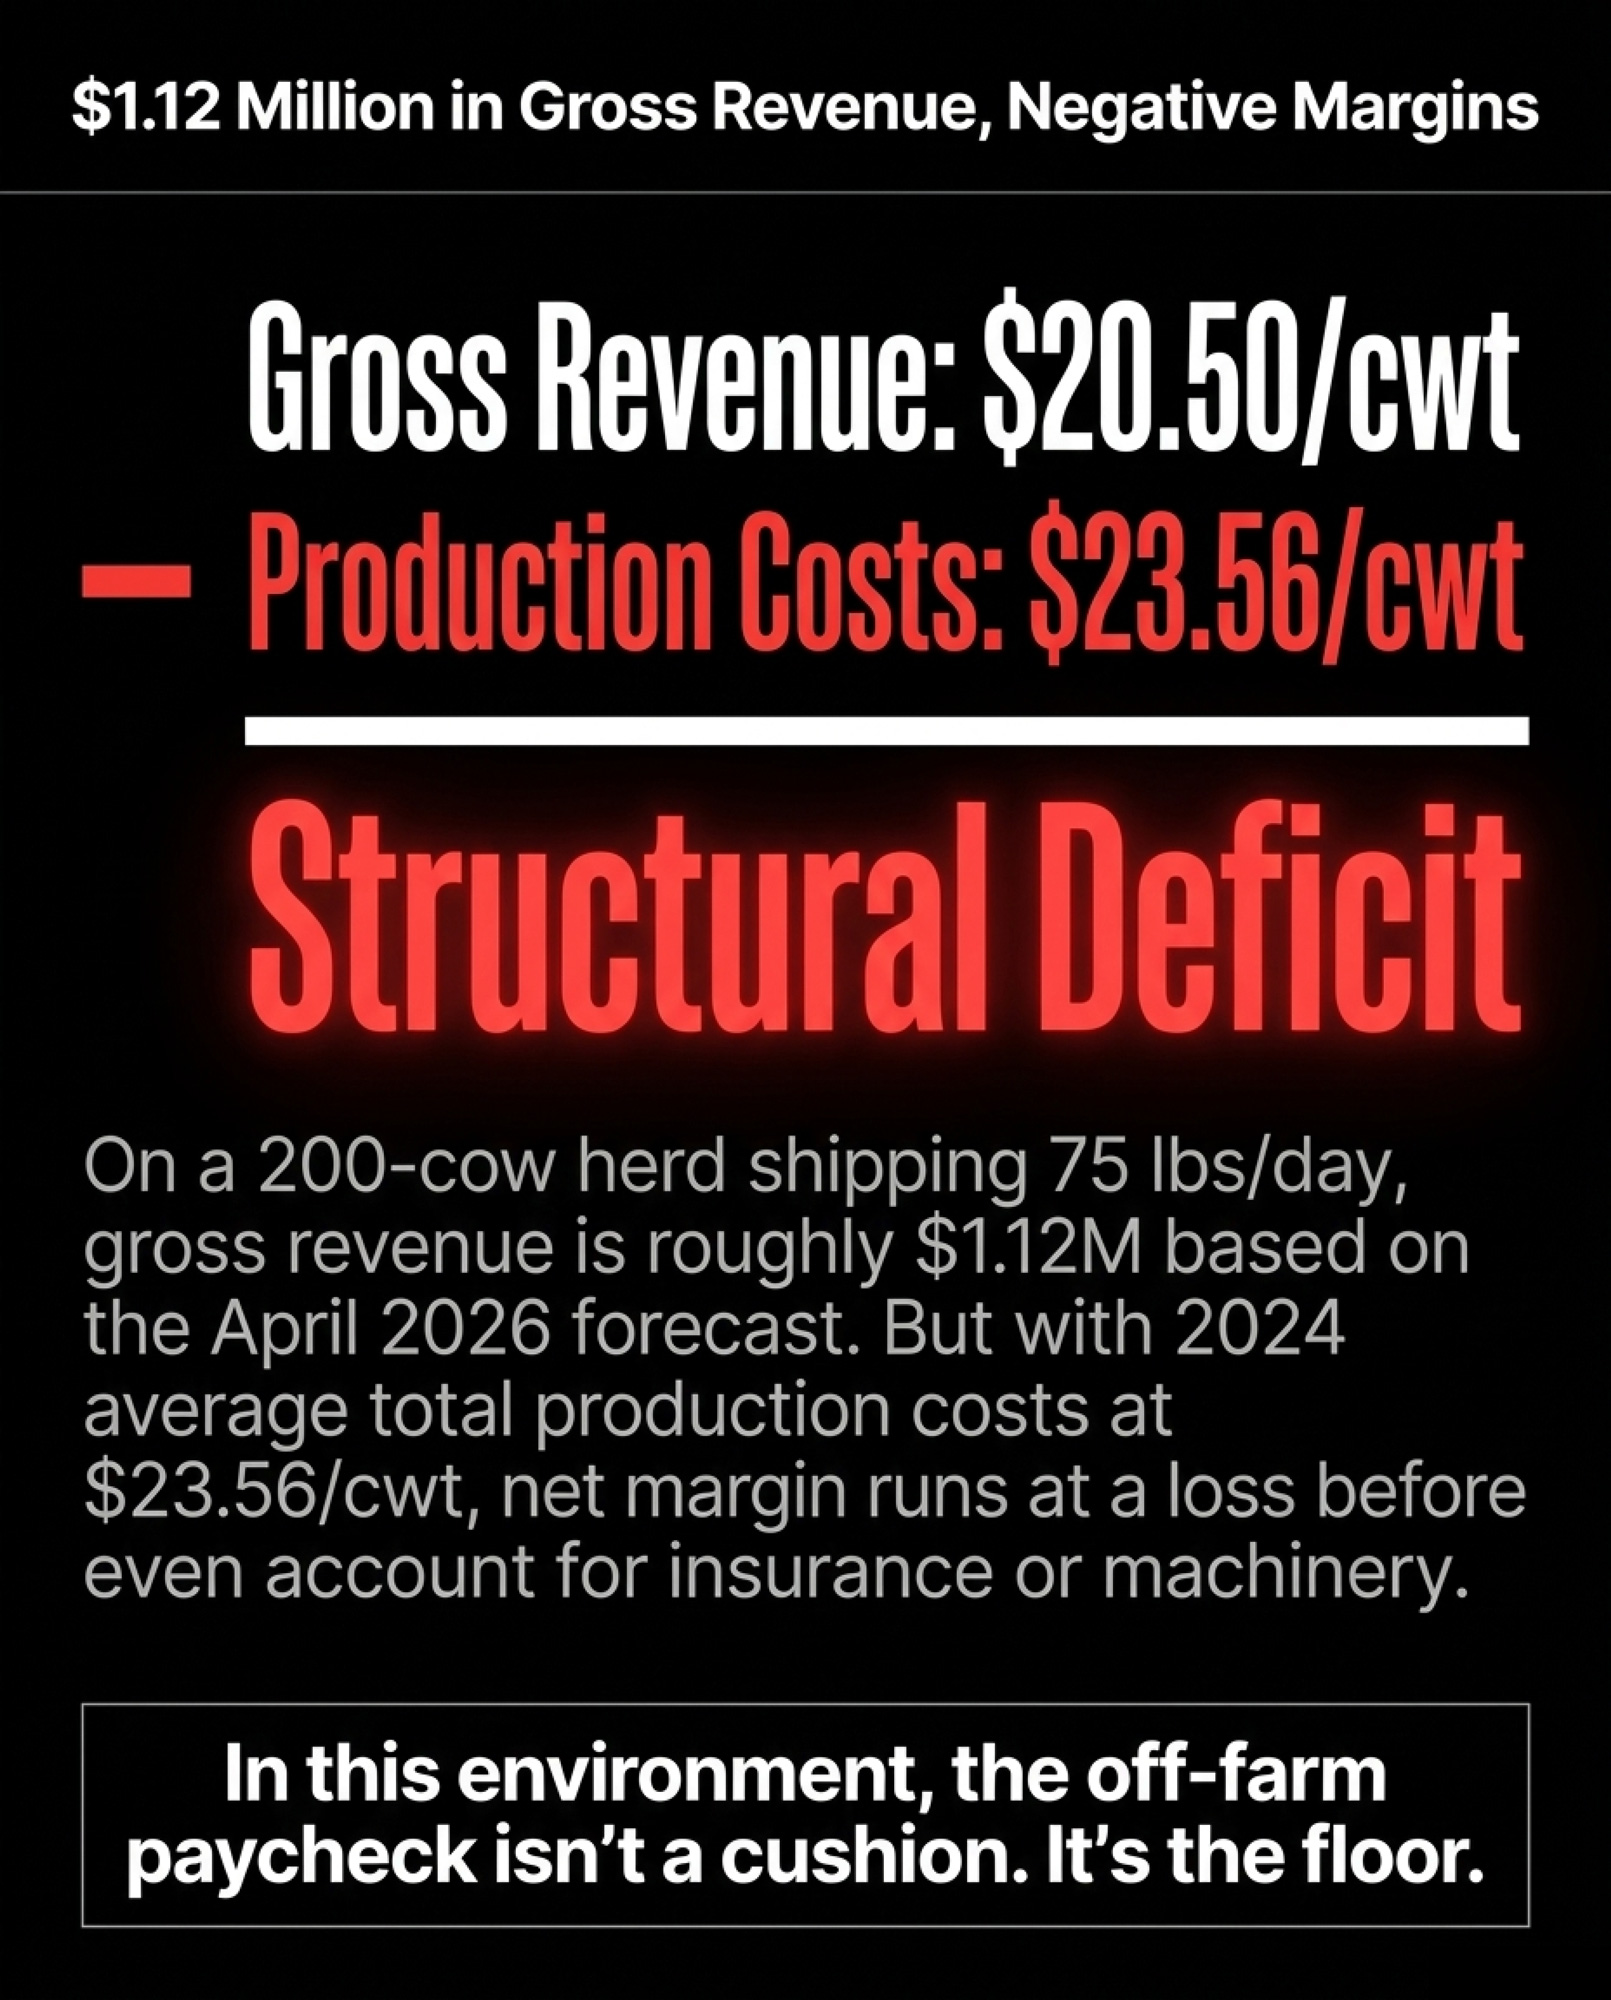
On a 200-cow herd shipping 75 lbs/day at USDA’s April 2026 forecast of .50/cwt all-milk price, gross milk revenue runs roughly .12 million a year. But your net? After feed, labor, depreciation, debt service, and the rest — USDA’s own full-economic-cost estimates run above $19/cwt for the largest operations, and a Bullvine analysis of 2024 data put average total production costs at about $23.56/cwt — the net might pencil out in the low single digits in a decent year. For mid-size and smaller herds, it runs at a loss.

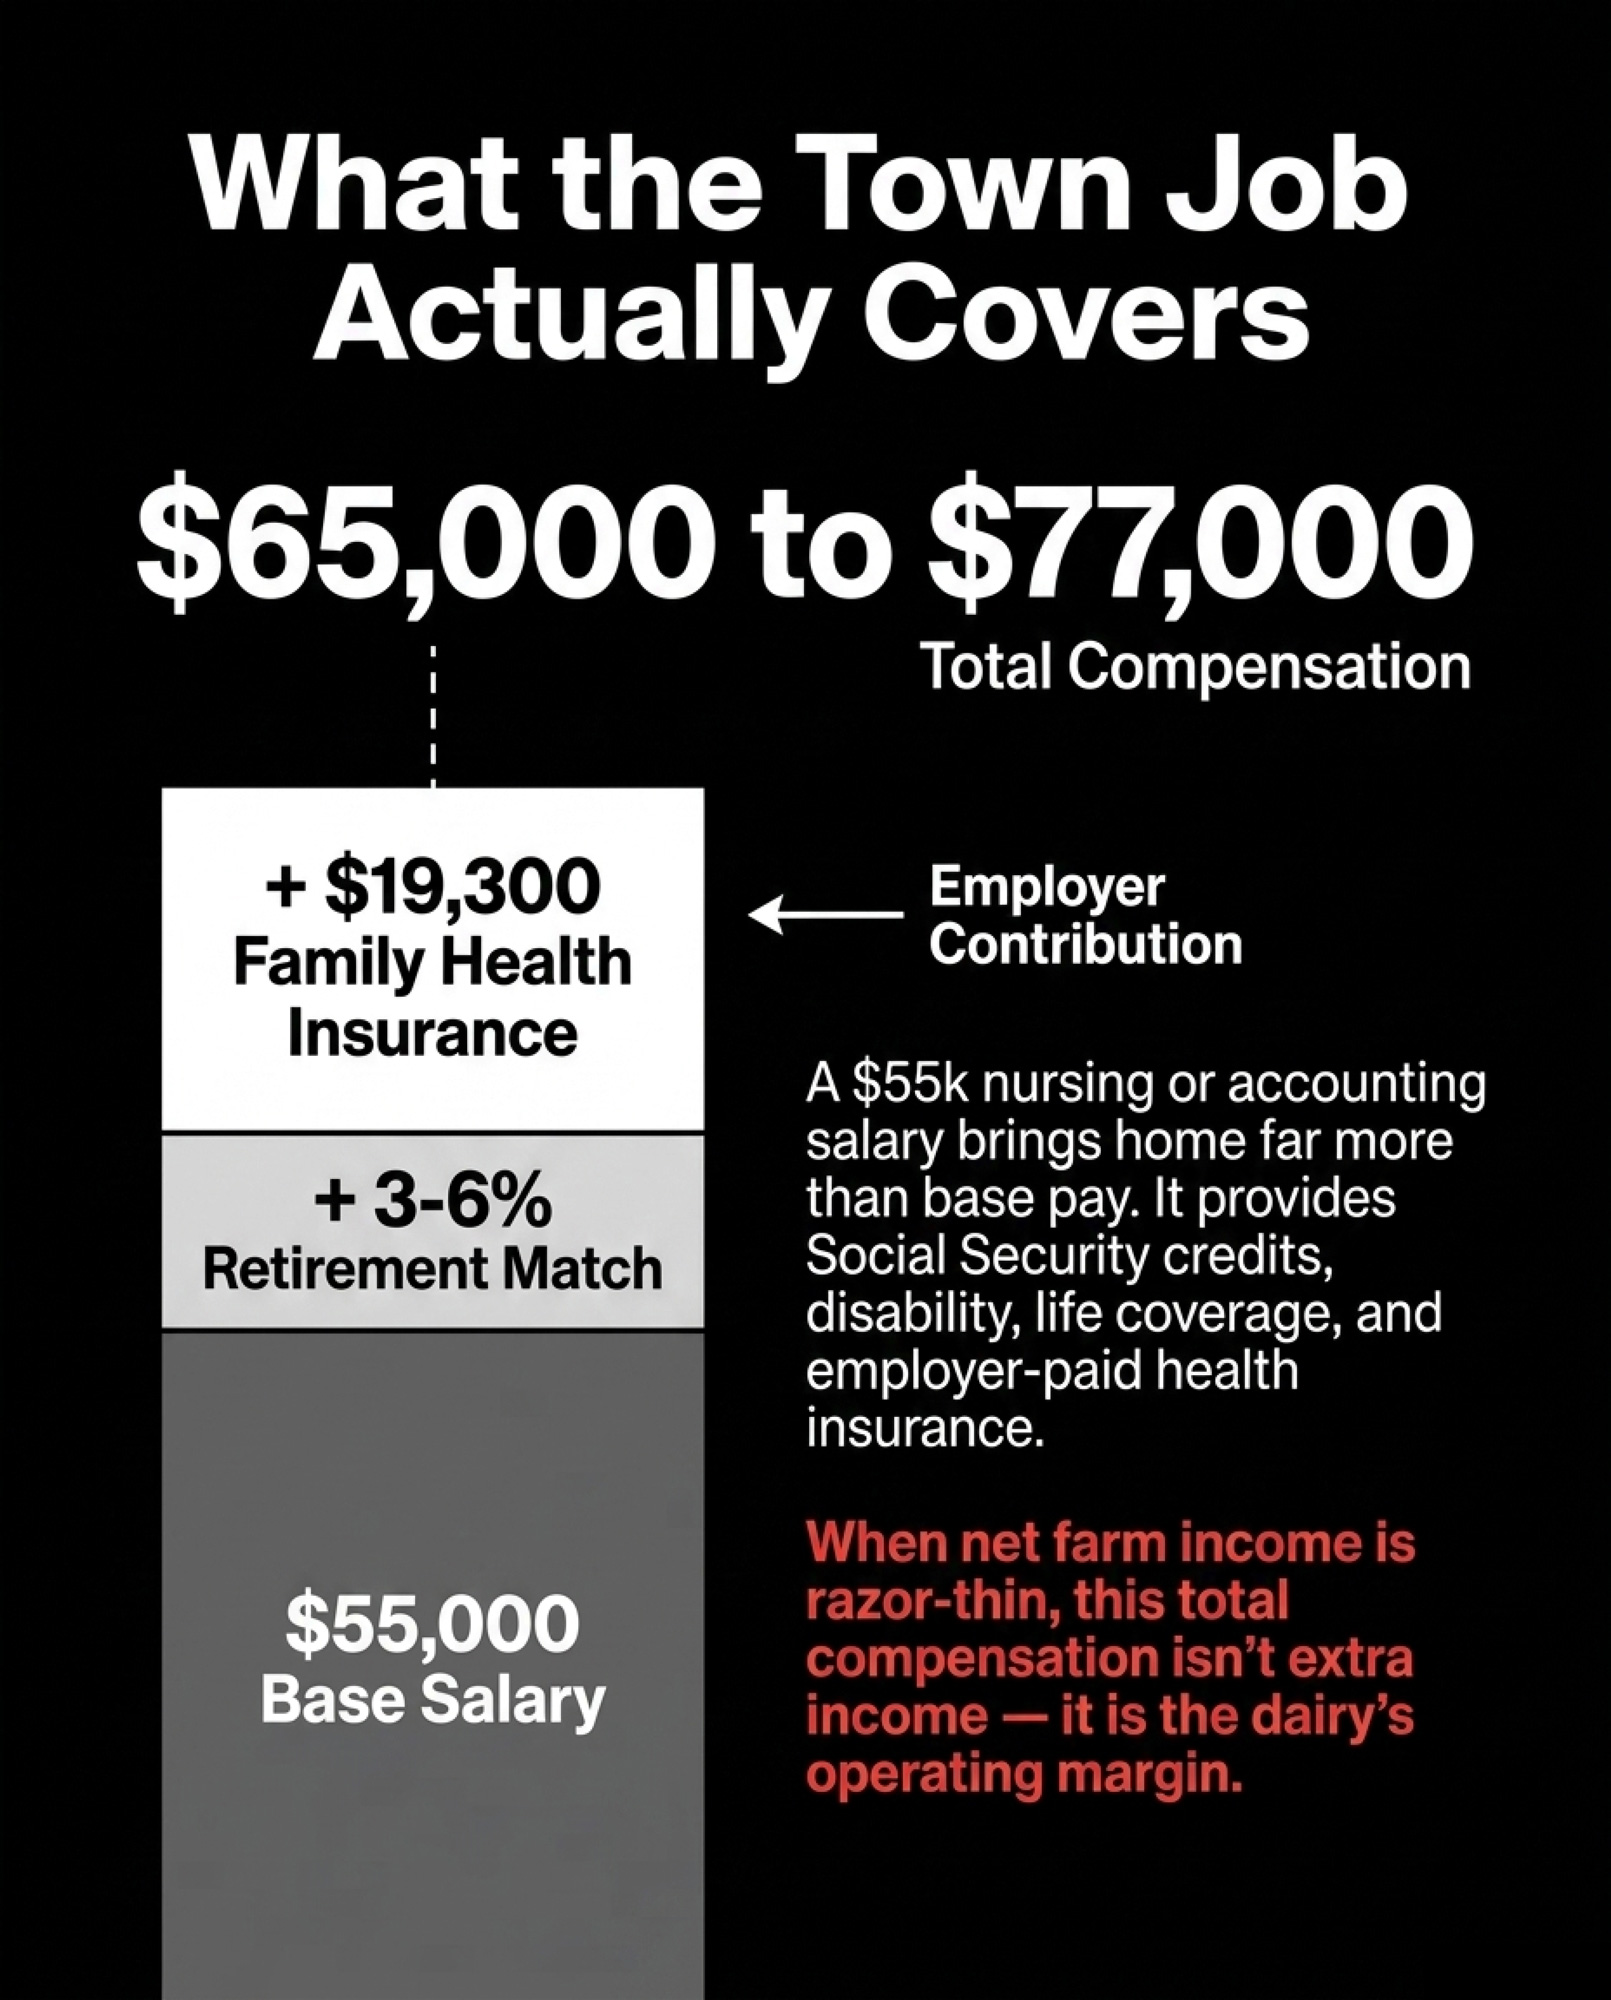
That $65,000–$77,000 in total off-farm compensation doesn’t look like “extra income” when you run those numbers. It looks like the operating margin.

Is the Spouse’s Off-Farm Income in Your Farm’s Business Plan?

This is the governance question that the forces pushing mid-size operations to restructure or exit make unavoidable. If the town job is propping up the farm financially, is the person earning it actually part of the farm’s financial structure?

In many operations, the answer is no. The spouse with the W-2 isn’t on the operating loan. It isn’t on the farm’s bank accounts. It isn’t named in the succession plan. Isn’t at the table when the lender comes for the annual review.

That’s a big governance gap. You’ve built a dairy that depends on a single off-farm income stream, and the person generating it has no formal role in the business it supports. If that person gets hurt, burns out, or quits, there’s no Plan B — because nobody wrote Plan A down.

Your lender already factors this in. They’re looking at your whole household, not just your cows — total household cash flow, not just milk revenue — when they assess repayment capacity. The town job is already part of your credit picture. It should be part of your management picture too.

What Happens When the Insurance Math Changes?

The Palmer family’s 90% premium spike isn’t an outlier. KFF projected that ACA marketplace premium payments for subsidized enrollees would more than double once enhanced subsidies expired — from an average of $888 in 2025 to $1,904 in 2026, a 114% increase. That subsidy loss landed on top of underlying insurer premium increases — a median of about 18% nationally, per KFF’s analysis of 312 insurer filings, with the average closer to 20%. For farm families with incomes that fluctuate above and below subsidy thresholds from year to year, the whiplash is sharper still.

And it’s not just dairy. James Davis, 55, who grows cotton, soybeans, and corn in northern Louisiana, told KFF Health News that his family’s insurance premium quadrupled for 2026, to about $2,700 a month. That’s $32,400 a year in premiums alone, before a single deductible dollar kicks in. “You can’t afford it,” Davis said. “Bottom line. There’s nothing to discuss. You can’t afford it without the subsidies.”

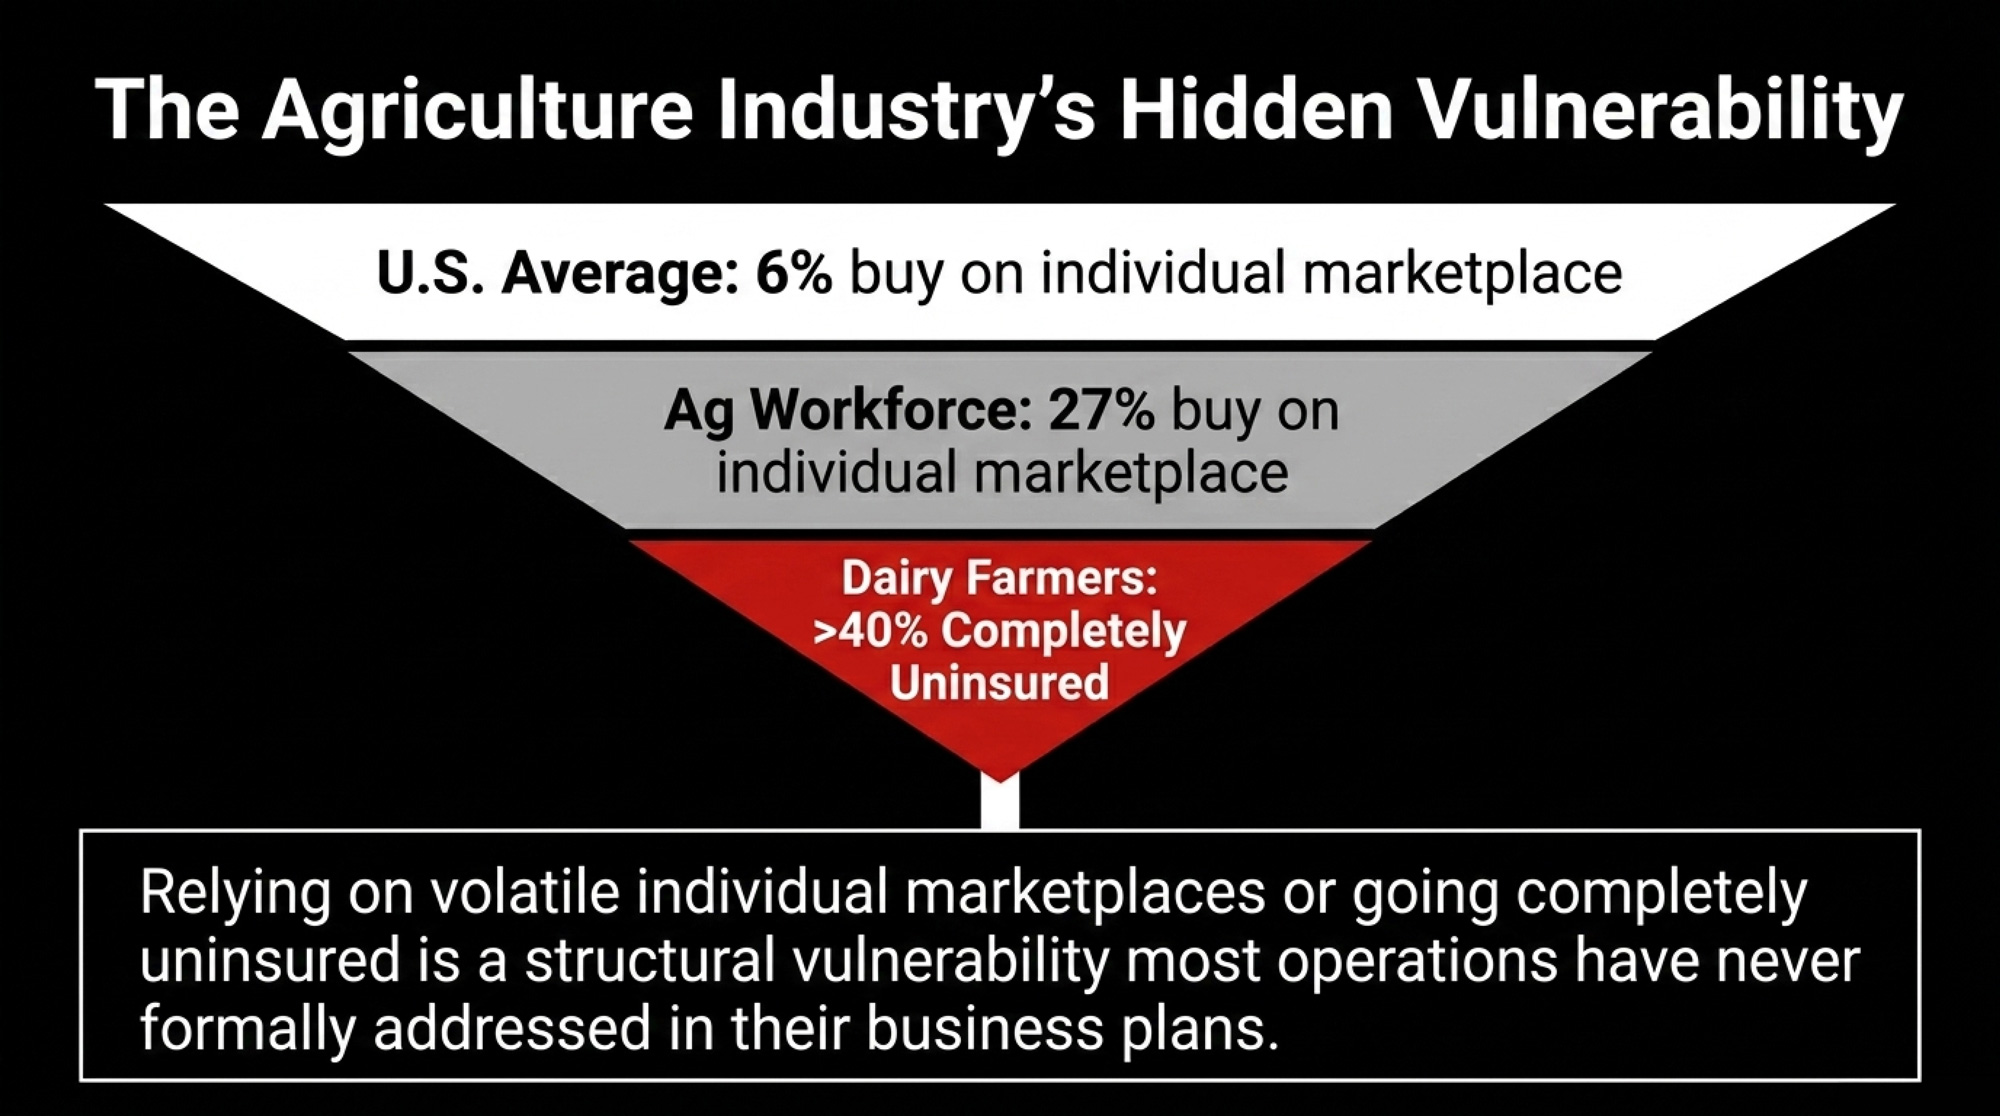
More than a quarter of the agricultural workforce — 27% — purchases health insurance through the individual marketplace, per KFF. That’s more than four times the 6% rate for U.S. adults overall. And among dairy farmers specifically, more than 40% lack health insurance entirely — one of the highest uninsured rates across all agricultural sectors, according to KFF Health News.

Now layer the milk-price outlook on top. USDA’s February 2026 forecast projected dairy cash receipts would fall by $6.2 billion to $42.5 billion in 2026 — a 12.8% decline from 2025. Subsequent WASDE updates have lifted the all-milk forecast to $20.50/cwt as of April, which may narrow that gap. But on that same 200-cow herd, even $20.50 pencils out to about $1.12 million gross — and when average total production costs ran $23.56/cwt in 2024, you’re operating on tight margins before you think about insurance, machinery, or your kid’s braces.

In that environment, the off-farm paycheck isn’t a cushion. It’s the floor.

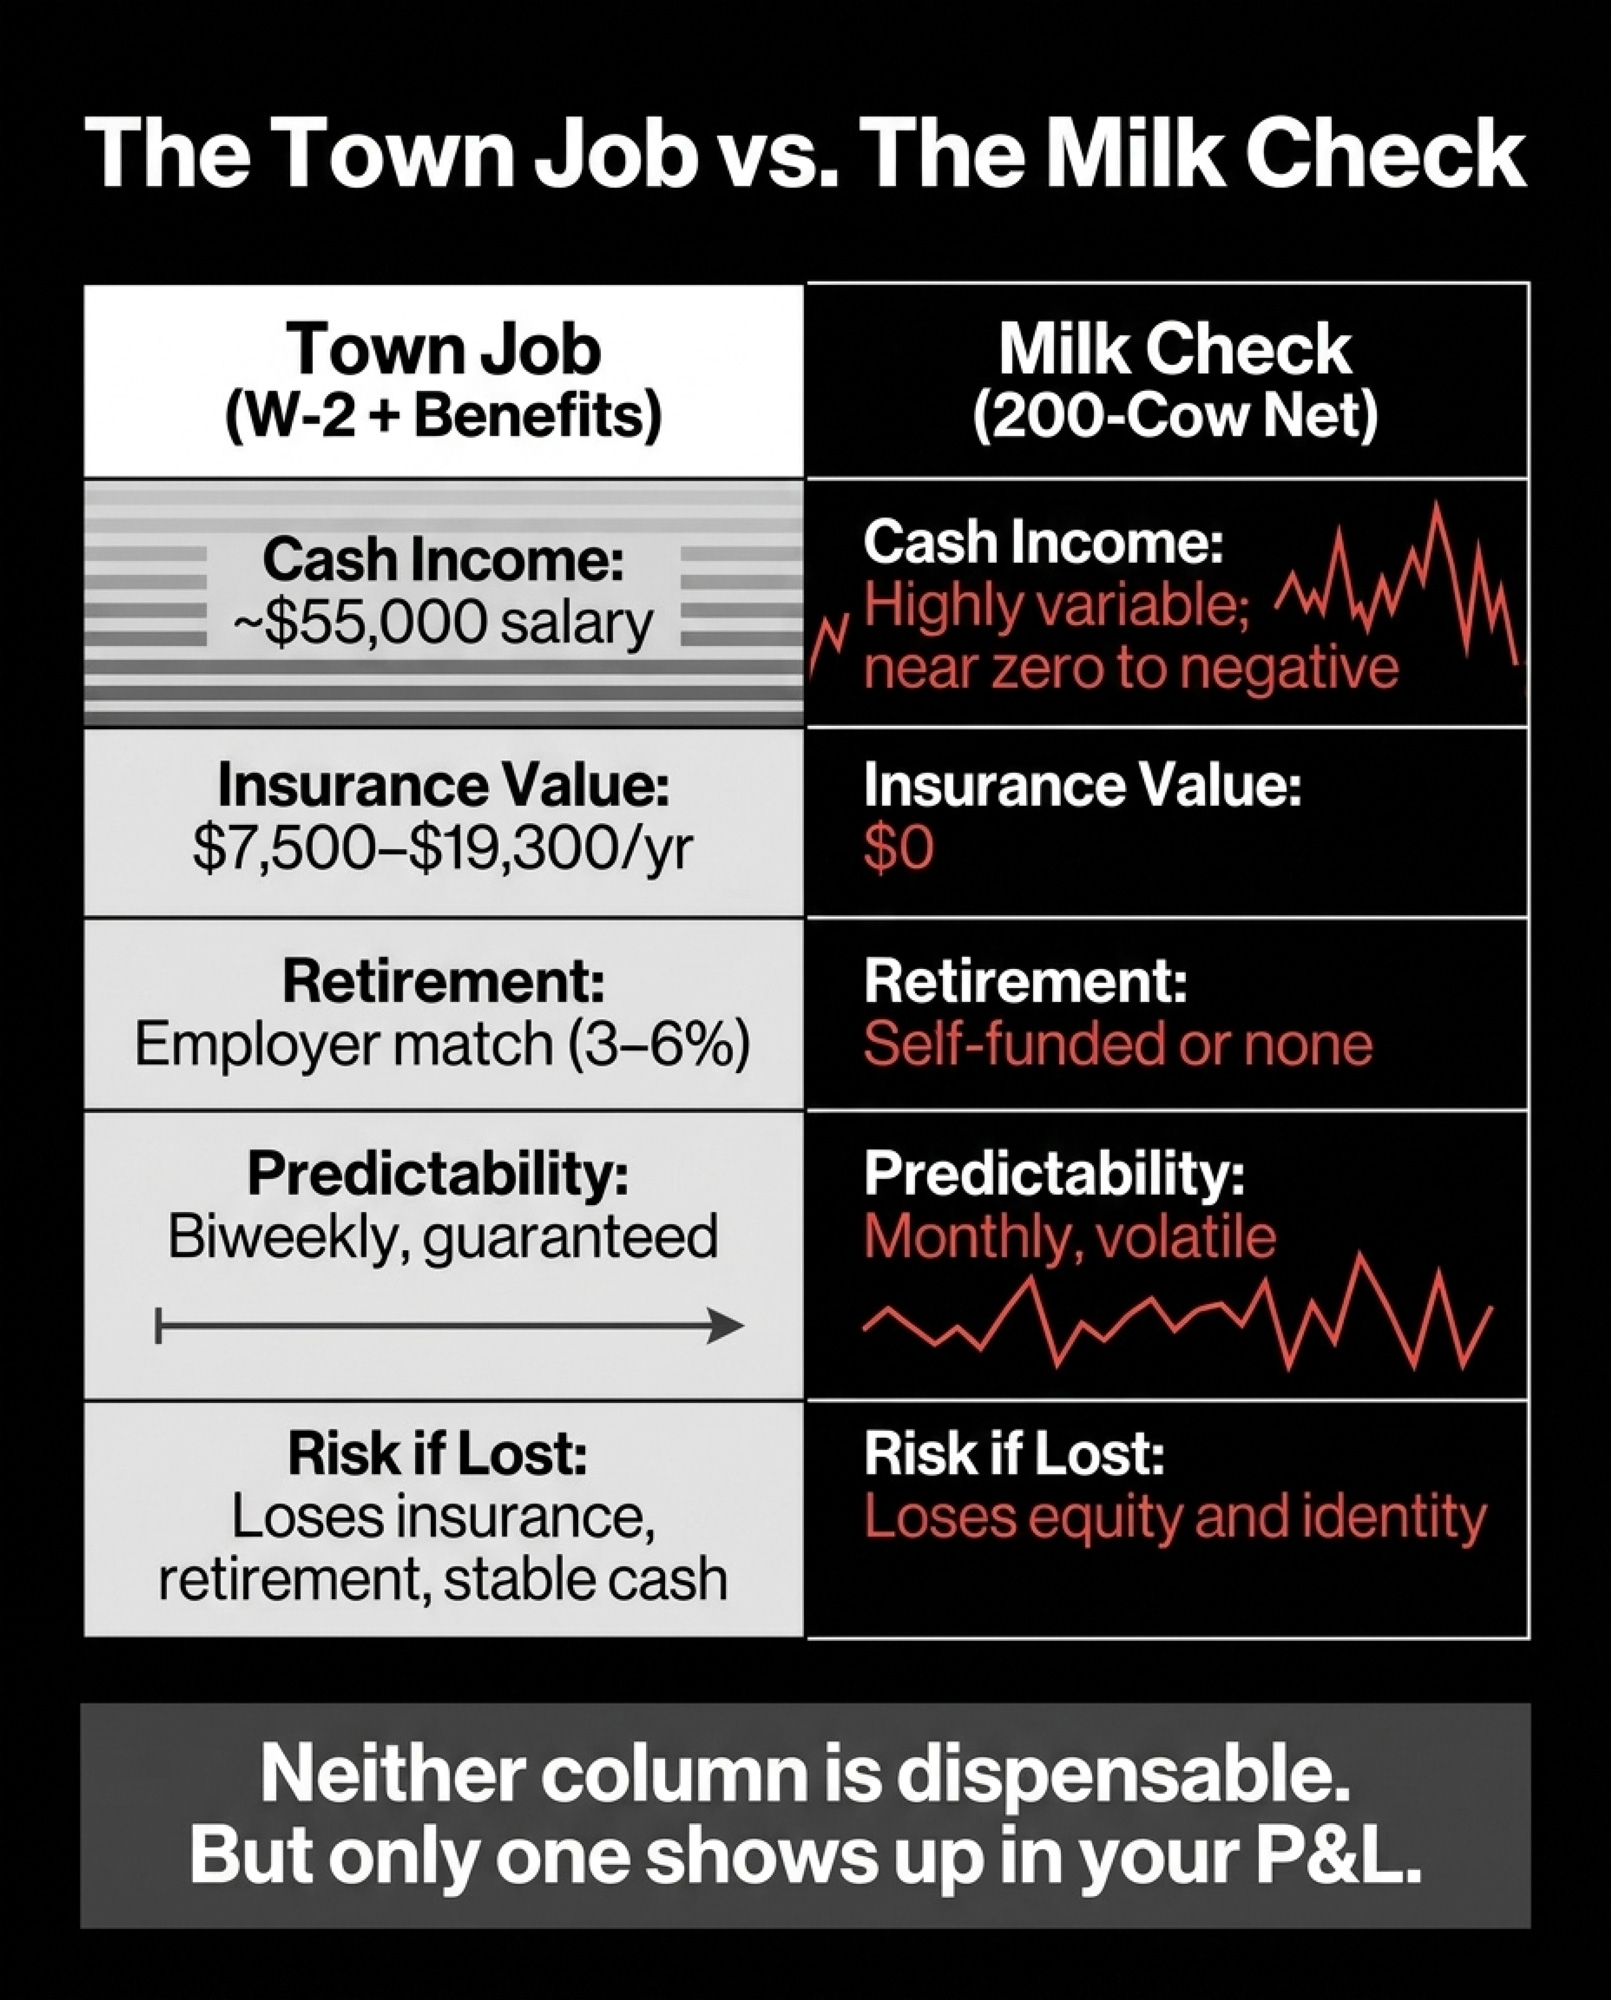
The Town Job vs. the Milk Check

Here’s how the math stacks up side by side for a typical dual-income dairy household:

DimensionTown Job (W-2 + Benefits)Milk Check (200-cow net)
Base Cash Income~$55,000 salaryVariable; near $0 to negative in tight years
Health Insurance Value$7,500–$19,300/yr employer share (KFF 2024)$0 unless self-purchased
Retirement ContributionEmployer match 3–6% (~$1,650–$3,300/yr)Self-funded or none
Total Comp Value$65,000–$77,000Razor-thin at $20.50/cwt vs. $23.56/cwt cost
Payment PredictabilityBiweekly, guaranteedMonthly, highly volatile
2026 Insurance ExposureEmployer-covered<span style=”color:red”>40%+ of dairy farmers fully uninsured</span>
Appears in Farm P&L?❌ No✅ Yes
Risk if LostHousehold loses insurance, retirement, stabilityHousehold loses equity and identity

Neither column is dispensable. But only one shows up in your farm’s P&L.

Options and Trade-Offs for Dairy Families

Path 1: Protect and formalize the town job — your 30-day action. If the off-farm W-2 plus benefits exceed one-third of total household income — and, for most dairy households, they do — treat it like any other critical business input. Put the earning spouse on the farm’s bank accounts and loan documents. Include off-farm income explicitly in cash-flow projections. Build the succession plan around two incomes, not one.

Here’s the 30-day move: pull your most recent tax return and your spouse’s latest W-2. Add the salary, the employer insurance contribution, and the retirement match. Compare that total to your net farm income on the Schedule F. If the off-farm number is larger — and don’t be surprised when it is — you’ve got a concentration-risk problem worth addressing this month, with your spouse, your lender, and your accountant.

Palmer herself faces exactly this calculus. She told KFF Health News that farmers “can be reluctant to acknowledge that they rely on government-subsidized insurance.” And she added: “We’re not handout-takers.” But the math doesn’t care about pride.

Path 2: Reduce dependence on a single W-2. If the town job disappears — layoff, injury, burnout — what happens to your operation? Diversifying off-farm sources (a second part-time income, custom work, or rental income) or building on-farm revenue reduces risk. But the real math of on-farm diversification is worth studying before you commit. Every diversification path costs time, and time is the scarcest input on a dairy. You gain resilience, but stretch management thinner.

Path 3: Restructure the dairy so it stands on its own. Some operations can realistically reach a cost structure where the milk check covers the bills without off-farm support. That usually means significant scale, premium marketing channels (organic, A2, processor quality bonuses), or radical cost reduction — low debt, paid-for facilities, minimal hired labor. This is the multi-year play, and it only works if you’re honest about your breakeven. Average total production costs ran about $23.56/cwt in 2024, per USDA data analyzed by The Bullvine. Even at the improved .50/cwt all-milk price, that gap doesn’t close in 12 months through genetic progress or feed tweaks alone.

Path 4: Plan the exit with eyes open. If the off-farm income is clearly the household’s real earning power, and the dairy is consuming equity rather than building it, an intentional transition — renting the land, selling quota (in Canada), shifting to beef, or exiting production — may be the strongest financial move. The hardest part isn’t the math. It’s the identity. But when financial stress piles up, management decisions suffer first, and the cost of delayed exits compounds every month. (If financial stress is affecting you or someone on your operation, the 988 Suicide & Crisis Lifeline and the Farm Aid hotline — 1-800-FARM-AID — are free, confidential resources.)

Key Takeaways

  • If your spouse’s W-2 plus employer benefits exceed your net farm income, the town job is your primary business — treat it accordingly in governance, lending conversations, and succession planning.
  • If a single off-farm income accounts for more than one-third of household cash flow, that’s a concentration risk. Assess it the same way you’d assess dependence on a single milk buyer.
  • Pull your 2024 tax return and your spouse’s W-2 this month. Add salary + employer health premium + retirement match. If that total is larger than your Schedule F net, the conversation about the farm’s real financial structure needs to happen now — not next year.
  • If your all-in production cost sits above $20.50/cwt — and with 2024 averages near $23.56/cwt for many operations, it likely does — your milk check still isn’t covering the full cost of producing it. The off-farm income isn’t supplemental. It’s subsidizing the operation.

Meghan Palmer’s $368 insurance bill isn’t really about insurance. It’s about what happens when the financial structure holding a dairy together takes a 90% jolt — and nobody had written down how much of the load that structure was carrying.

You know what your milk price is. You probably know your feed cost per cow. But do you actually know — down to the dollar — what your spouse’s off-farm job is worth to your operation? Not just the paycheck. The insurance. The retirement. The stability.

Pull the numbers. Then have the conversation.

Complete references and supporting documentation are available upon request by contacting the editorial team at editor@thebullvine.com.

Learn More

The Sunday Read Dairy Professionals Don’t Skip.

Every week, thousands of producers, breeders, and industry insiders open Bullvine Weekly for genetics insights, market shifts, and profit strategies they won’t find anywhere else. One email. Five minutes. Smarter decisions all week.

NewsSubscribe
First
Last
Consent

Taiwan Deal Requires 100,000 Pounds Monthly – Here’s What That Really Means for Your Farm

Taiwan imports $600M+ dairy annually but requires 100K pounds monthly—shutting out 85% of U.S. farms

EXECUTIVE SUMMARY: What farmers are discovering about the Taiwan dairy memorandum of understanding is that access requires scale, which most operations simply don’t have—a minimum of 100,000 pounds monthly is required just to qualify for export programs. USDA data confirms that Taiwan imports over $600 million in dairy products annually, with domestic production covering less than a third of its needs. However, there’s a catch: New Zealand already dominates with tariff-free access, while U.S. dairy faces 15-20% duties plus three weeks longer shipping times. For the 2,000-head operations that can absorb certification costs and manage 60-90 day payment terms, Taiwan represents a genuine opportunity and a gateway to Southeast Asia’s rapidly expanding markets. Yet for mid-size dairies—the backbone of many rural communities—the economics suggest focusing on regional institutional buyers, value-added production, or collaborative export ventures might deliver better returns without the complexity. The most successful path forward depends on honestly matching your operation’s capabilities to market requirements, not chasing opportunities designed for different scales. Your cooperative needs to hear from members about developing tiered programs that recognize these realities—because the future of rural dairy depends on strategies that work for more than just the most significant operations.

dairy export profitability

You know, when USDEC and NMPF announced their memorandum of understanding with Taiwan’s Dairy Association, it really got people talking. Now, let me clarify something upfront—an MOU isn’t a binding trade agreement. It’s essentially a framework for cooperation, a statement of intent to work together on market development. Unlike a formal trade deal that might reduce tariffs or guarantee market access, this MOU signals that both sides want to explore opportunities. Think of it as laying groundwork rather than breaking ground.

There’s good reason to pay attention—USDA Foreign Agricultural Service data show that Taiwan imports over $600 million in dairy products annually, with its domestic production covering less than a third of its needs. That’s a substantial opportunity by any measure.

However, what’s interesting as we delve deeper into the requirements and market dynamics is that this opportunity unfolds very differently depending on your operation’s capabilities. Let me share what the data’s revealing.

Understanding Taiwan’s Market Position

Taiwan’s dairy market has been steadily expanding, and federal trade reports confirm that they’re importing more than half a billion dollars’ worth of dairy products each year—a figure that continues to trend upward. This builds on broader Asian dietary shifts that we’ve been watching for the past decade, where dairy consumption continues to grow as incomes rise and dietary preferences evolve.

What’s particularly noteworthy is their institutional demand through school milk programs. You probably know this already, but these kinds of programs typically provide stable, predictable volume—something we all value in today’s volatile markets. And Taiwan’s infrastructure? They’ve invested heavily in cold chain capabilities that rival what you’d find in Wisconsin or California.

The strategic piece that’s worth considering… Taiwan’s position potentially makes them a gateway to Southeast Asian markets. FAO statistics show that the region has the fastest-growing dairy consumption globally. So we’re not just talking about one island market here—we’re looking at potential access to something much broader.

TAIWAN EXPORT REQUIREMENTS AT A GLANCE:

  • Volume: 100,000+ pounds monthly minimum
  • Components: 4.2%+ butterfat, 3.3%+ protein
  • Payment: 60-90 day terms standard
  • Competition: New Zealand tariff-free access

The Reality of Export Requirements

Now, when you look at what the major cooperatives require for export programs—and DFA, Land O’Lakes, and others have been pretty consistent about this—there are some significant thresholds to meet.

Volume commitments typically begin at a minimum of two truckloads per month. That’s roughly 100,000 pounds, give or take. For perspective, if you’re running 500 head that produce around 12 million pounds annually, you’re generating about one truckload per month. See where this is going?

Why does this matter? Fixed costs for export certification, enhanced testing protocols, and documentation systems need to be spread across your total volume. A 2,000-head operation can absorb these costs much more efficiently. Basic math, but the impact on your bottom line is profound.

Then there’s the component specifications. Export buyers consistently want butterfat above 4.2% and protein exceeding 3.3%. Jersey herds naturally tend to hit these levels more easily—that’s just breed characteristics at work. Holstein operations often require significant ration adjustments or long-term genetic selection strategies. And changing your herd’s component profile… that’s not something that happens overnight.

New Zealand’s Built-In Advantages

Here’s something that really shifts the competitive landscape: New Zealand achieved complete tariff elimination with Taiwan through their Economic Cooperation Agreement. Meanwhile, we’re still facing duties ranging from 15% to 20%, depending on the item being shipped. That’s documented in Taiwan’s customs schedules and various trade analyses.

Think about what this means practically. New Zealand can deliver to Taiwan in under a week from their ports. From our West Coast? We’re looking at a minimum of three to four weeks. When you combine zero tariffs with shorter shipping times and lower freight costs, their delivered price advantage becomes significant.

Trade data shows New Zealand already captures the largest share of Taiwan’s dairy imports, and with these structural advantages locked in through trade agreements, that position seems secure. Though U.S. dairy often commands quality premiums that can partially offset some disadvantages, particularly for specialized products where our consistency really shines.

Cash Flow and Operational Realities

One aspect that is not discussed enough is the impact of exports on working capital. Domestic milk payments typically arrive in your account within two to three weeks. But export contracts? Industry-standard terms typically run 60 to 90 days, sometimes longer.

For operations already managing tight cash flow—and let’s be honest, that describes many of us these days—that extended payment period creates real challenges. You’re still paying feed bills monthly, covering payroll every two weeks, but waiting two to three months for that milk check. The premium might look good on paper, but cash flow is what keeps the lights on.

Export-qualified milk typically receives priority scheduling for pickup to ensure that quality specifications are maintained. Makes perfect sense from a logistics standpoint, right? But farms not participating in export programs might see their pickup windows shift to less optimal times. Your milk sits in the tank longer, potentially affecting domestic quality premiums. Small things add up.

Community and Consolidation Impacts

What university extension programs have documented—and what many of us are seeing firsthand—is how consolidation patterns affect entire rural economies. Each mid-sized dairy operation supports a whole network of local businesses, including veterinary practices, feed suppliers, equipment dealers, local banks, and schools.

When smaller operations exit and their production is absorbed by larger farms (often located in different areas), the economic activity shifts accordingly. The local vet might lose enough business to cut back hours. The equipment dealer might close their satellite location. School enrollment drops. These ripple effects are real and lasting.

This isn’t an argument against efficiency—we all need to stay competitive. However, it’s worth understanding these broader impacts as we consider how export opportunities might accelerate existing trends.

Alternative Strategies for Premium Capture

Not every premium opportunity requires access to export markets. What’s encouraging is seeing different approaches work across various regions.

Institutional buyers—such as hospitals, schools, and corporate food service operations—have increasingly paid premiums for locally sourced dairy products. These arrangements often involve simpler logistics and much faster payment terms than export programs. When you factor in reduced complexity and faster cash flow, the net return can be comparable or even better.

Value-added production continues to show promise as well. Small-scale processing—whether it’s farmstead cheese, yogurt, or bottled milk—can capture retail premiums that rival export opportunities. Yes, it requires learning new skills and developing marketing channels. But you maintain control over your product and pricing in ways commodity markets never allow.

Producer collaborations are gaining traction, where multiple farms pool resources to meet export volume requirements while sharing certification costs. When economics get divided among several operations, they become more manageable—though it requires significant coordination and trust among participants.

Examining operations in Texas and Idaho, where large-scale dairies already predominate, we’re seeing interesting hybrid approaches. Some are partnering with smaller neighbors to aggregate volume while maintaining individual farm identity for certain premium markets. It’s a model worth watching.

The Cooperative Perspective—And Your Role in It

You know, cooperatives face genuine challenges here. They need to stay competitive in global markets while serving members ranging from 50 to 5,000 cows. Export program development represents one path toward accessing growing markets and potentially improving returns for all members.

Cooperative governance increasingly reflects the perspectives of larger operations. Not through conspiracy—it’s a practical reality. Larger farms typically have more resources to participate in leadership, attend meetings, and serve on committees. That naturally influences how programs get structured and priorities get set.

However, here’s the thing: if you’re not satisfied with how your cooperative is managing export opportunities or any other programs, sitting on the sidelines won’t make a difference. When’s the last time you attended your co-op’s annual meeting? Reviewed the board election slate? Actually read those governance proposals?

The question we should be asking our cooperatives: Can you develop tiered programs that recognize different member capabilities? Some co-ops are already experimenting with this—offering different service levels and cost structures based on volume and participation. If your cooperative isn’t exploring these options, bring it up at the next member meeting. Get it on the board’s agenda. Find other members who share your concerns and present a unified voice.

Your cooperative is only as responsive as its members are engaged. If export programs feel designed for operations three times your size, that’s feedback your board needs to hear—repeatedly and from multiple members.

Making the Right Decision for Your Operation

So, where does all this leave us with the Taiwan opportunity? The market is real, the demand is growing, and for operations with appropriate capabilities, the returns could be meaningful.

If you’re running a business with over 2,000 employees and strong component genetics, along with solid banking relationships, these export programs may align well with your business model. The premiums can justify the investment, and accessing growing Asian markets provides important diversification.

However, if you’re managing a mid-sized operation—particularly one already facing margin pressure—the requirements create hurdles that may be difficult to overcome profitably. And that’s okay. Not every opportunity needs to be your opportunity.

What seems to be working for many mid-size operations is focusing on regional markets. Building relationships with local institutions. Exploring value-added possibilities. Finding niche markets that value specific attributes—whether that’s grass-fed, local, family farm, or sustainable practices. These strategies might not generate headlines, but they’re delivering solid returns.

Looking Ahead

This Taiwan MOU illuminates broader dynamics in today’s dairy industry. Opportunities are increasingly differentiated by capability and resources, and understanding where your operation fits—along with what alternatives exist—is becoming crucial for long-term success.

Recent volatility has taught us that resilience comes from matching strategy to capabilities. Large operations might find their advantage in export markets and global supply chains. Mid-size farms often succeed through regional focus and differentiation. Smaller operations increasingly thrive through direct marketing and value-added strategies.

The most successful producers share common traits. They honestly assess their strengths and limitations. They understand market requirements thoroughly. They choose strategies aligned with their operational realities rather than chasing every opportunity that comes along.

As we head into another year of uncertainty, with milk prices volatile and input costs unpredictable, these strategic choices matter more than ever. The Taiwan opportunity offers a valuable perspective for examining our individual positions and options.

What’s working in your region? Because ultimately, that’s what makes our industry strong—sharing knowledge, learning from each other’s experiences, and finding paths forward that work for our individual operations while strengthening the broader dairy community. The Taiwan MOU is just one piece of a much larger puzzle we’re all working to solve together.

Key Takeaways:

  • Component and cash flow impacts: Achieving 4.2% butterfat and 3.3% protein specifications often requires feed cost increases of $0.50-1.00/cwt, while 60-90 day export payment terms versus 15-20 day domestic payments can strain working capital by $40,000-60,000 for mid-size operations
  • Regional alternatives delivering results: Direct institutional sales to hospitals and schools are capturing $0.50-1.00/cwt premiums with simpler logistics, while producer collaborations pooling volume among 6-8 farms are successfully accessing export premiums through shared certification costs
  • Cooperative engagement opportunity: Members should actively push boards to develop tiered export programs, recognizing different scales—attend meetings, join committees, and build coalitions, because governance increasingly reflects large-farm perspectives unless smaller operations organize
  • Strategic decision framework: Match your operation’s strengths to appropriate markets: 2,000+ head farms can justify export infrastructure, 500-1,000 head operations often maximize returns through regional differentiation, while smaller dairies thrive with direct marketing and value-added strategies

Complete references and supporting documentation are available upon request by contacting the editorial team at editor@thebullvine.com.

Learn More:

The Sunday Read Dairy Professionals Don’t Skip.

Every week, thousands of producers, breeders, and industry insiders open Bullvine Weekly for genetics insights, market shifts, and profit strategies they won’t find anywhere else. One email. Five minutes. Smarter decisions all week.

NewsSubscribe
First
Last
Consent

The Fed Rate Cut Reality: What Every Dairy Farmer Needs to Understand

Think the Fed rate cut’s good news? We’ve got data that says otherwise. Your dairy needs to hear this…

EXECUTIVE SUMMARY: At The Bullvine, we’re seeing the Fed’s upcoming rate cut as more caution flag than celebration. The real story isn’t cheaper money—it’s what drives the Fed to cut rates when unemployment claims hit 263,000. USDA data shows that every 1% unemployment rise slashes dairy consumption by 3%, hitting premium products hardest. Meanwhile, we’ve lost 15,221 farms since 2017 while production held steady through consolidation and tech advances. Robotic milking delivers 5-8 year ROI for 1,000+ cow operations, but smaller herds face tougher economics (Cornell Extension). Milk fat levels climbing to 4.2% nationally create premium opportunities—but mainly for operations with capital to invest in genetics and nutrition programs. The trend’s clear: scale advantages keep compounding while mid-size farms get squeezed. We’re telling progressive producers to think strategically about debt, master their costs, and build unique market positions before the storm hits harder.

KEY TAKEAWAYS

  • Economic reality check: 1% unemployment increase = 3% dairy consumption drop, especially premium products worth $2-4 more per hundredweight
    Action: Monitor local job markets and adjust premium product focus accordingly
    Source: USDA Economic Research Service confirms this correlation across multiple economic cycles
  • Technology ROI varies drastically: Robotic milking pays back in 5-8 years for 1,000+ cow herds but struggles under 500 cows
    Action: Calculate your specific labor costs vs. system costs before investing—don’t follow the herd
    Source: Cornell Extension’s 2024 analysis shows regional labor costs make or break these investments
  • Consolidation accelerating: 15,221 fewer farms since 2017, but production steady through efficiency gains
    Action: Either scale up strategically or carve out protected niche markets now, before you’re forced to
    Source: USDA Census data reveals the math behind surviving operations
  • Component premiums reward genetics investment: National butterfat average hit 4.2%, adding real dollars to milk checks
    Action: Invest in proven genetics and precision feeding to capture $0.15-0.30/cwt component premiums
    Source: Journal of Dairy Science tracking shows a consistent upward trend worth real money
  • Network participation trade-offs: Upfront costs often exceed $150K while reducing operational control
    Action: Evaluate governance structures carefully—know what decisions you’re giving up before signing
    Source: Industry reports show mixed results depending on network structure and farmer involvement
dairy farm profitability, dairy industry trends, farm financial management, milk pricing, agricultural economics

Look, everyone’s talking about the Federal Reserve cutting rates like it’s Christmas morning. Cheaper money, easier equipment loans, maybe finally getting that barn expansion done. But here’s what’s been bugging me about all this optimism — this rate cut isn’t the gift most people think it is.

The market’s putting about 90% odds on a quarter-point cut this September. Now, before you start calling your banker, ask yourself this: when does the Fed slash rates this aggressively? Usually, when they’re genuinely worried about what’s coming down the pipeline.

The Unemployment Warning

SignalRecent jobless claims hit 263,000 — and that number should grab every dairy farmer’s attention. When folks lose paychecks, they don’t just cut back on restaurants. They switch from your premium Greek yogurt to a store brand. From organic milk to whatever’s cheapest on the shelf.

The USDA’s Economic Research Service has been tracking this correlation for years. Every 1% rise in unemployment typically slashes dairy consumption by about 3%, hitting specialty products hardest. So while you might save a few hundred monthly on loan interest, you could lose thousands in revenue from weakened demand.

That math doesn’t pencil out in our favor.

Scale Advantages Keep Compounding

Here’s what gets under my skin — industry analysts report that large dairy operations access substantially larger credit facilities than smaller farms, often enabling volume purchasing advantages that we simply cannot match. They’re not just buying feed; they’re locking in prices months ahead while we’re paying spot rates.

Technology tells the same story. Cornell Extension research shows robotic milking systems can pay for themselves in 5-8 years… but only for operations milking over 1,000 cows, especially in high labor-cost regions where wages exceed $18 per hour.

For a 400-cow operation in Wisconsin? The numbers get pretty challenging pretty fast.

What’s Really Happening Out There

The USDA’s 2022 Census confirms what most of us already know in our gut — we lost 15,221 dairy farms between 2017 and 2022, yet total production barely budged. Fewer farms are milking more cows with better technology and tighter management.

Industry reports indicate that acquired operations often experience significant production gains through facility upgrades and improved management practices. It’s becoming the norm, not the exception.

The Network Promise Reality

Dairy networks are being pitched as the great equalizer, but proceed with your eyes wide open. Industry observations suggest network participation often involves substantial upfront financial commitments, with some arrangements requiring significant investments.

More importantly, industry data indicate that some network participants report concerns about reduced day-to-day operational control. You might hold title to the land and cows, but strategic decisions increasingly get made by professional management teams.

The Component Silver Lining

There is legitimate good news in the milk quality story. Journal of Dairy Science research shows national average butterfat levels have climbed to around 4.2%, creating real value through component premiums.

But here’s the catch — maximizing those gains requires investment in genetics, feeding programs, and management systems that tend to favor larger operations. Once again, scale matters.

What This Means for Your Operation

If you’re milking anywhere from 200 to 800 cows, here’s my take:

  • Don’t get seduced by cheap money. Lower rates might tempt expansion, but if underlying demand is softening, debt becomes an anchor, not a lifeline.
  • Track every expense like your survival depends on it. Know your cost per hundredweight down to the penny. Margins are razor-thin across all farm sizes.
  • Double down on your story. Whether it’s grass-fed, local, or just “the freshest milk in three counties,” brand differentiation isn’t optional anymore. Direct sales and regional marketing still offer decent premiums for farms willing to do the work.
  • Get politically engaged locally. County commissioners decide zoning. State legislators write environmental regulations. These folks often impact your operation more than anything happening in Washington.

The Bottom Line

This isn’t about weathering another economic cycle. We’re watching structural changes that are redefining what dairy farming looks like. The advantages of scale have compounded dramatically, creating gaps that can’t be bridged through efficiency alone.

Rate cuts might provide some breathing room on financing costs, but they’re signaling broader economic challenges that could reshape dairy demand patterns. Success requires understanding these dynamics and positioning strategically rather than just hoping for the best.

The operations that survive won’t be those celebrating cheaper loans. They’ll be the ones who recognize economic reality and adapt accordingly — before they’re forced to.

Market projections carry inherent uncertainty, but the direction seems clear. This Fed move is a warning to batten down the hatches, not a signal to expand into choppy waters.

We dig deeper into the data so you can make smarter decisions. That’s what The Bullvine does—question assumptions, follow the evidence, and help progressive dairy operations thrive.

Complete references and supporting documentation are available upon request by contacting the editorial team at editor@thebullvine.com.

Learn More:

  • 5 Technologies That Will Make or Break Your Dairy Farm in 2025 – The main article touches on tech, but this piece dives deep into specific innovations like smart calf monitoring and advanced genetics. It reveals how strategic investments in technology can deliver rapid ROI, slash mortality rates, and increase milk component values, proving that scale isn’t the only path to success.
  • 2025 Canadian Dairy Outlook: Slight Dip in Milk Prices, but Steady Growth Ahead – While the main article focuses on U.S. economic signals, this piece provides a critical market-based perspective with a global view. It details the nuances of price fluctuations, consumer demand shifts, and the importance of sustainability, helping you understand the broader economic context beyond the Fed’s actions.
  • Boosting Dairy Farm Profits: 7 Effective Strategies to Enhance Cash Flow – This article moves from macro-level economic concerns to the micro-level, offering concrete, tactical strategies you can implement right now. It provides a practical guide to optimizing everything from milking parlor efficiency to diversifying revenue streams, giving you the immediate tools to thrive in a tough market.

The Sunday Read Dairy Professionals Don’t Skip.

Every week, thousands of producers, breeders, and industry insiders open Bullvine Weekly for genetics insights, market shifts, and profit strategies they won’t find anywhere else. One email. Five minutes. Smarter decisions all week.

NewsSubscribe
First
Last
Consent

Market ‘Balance’ or Farmer Trap? Why This Cattle Price Plateau Could Cost You Big

Think the market’s stable? Think again — this plateau might be a trap!

EXECUTIVE SUMMARY: Look, I’ve been watching this industry long enough to know when something doesn’t smell right. Everyone’s talking about market “balance,” but history shows these calm periods usually end badly. Debt levels are climbing — many producers are sitting above 40% debt-to-asset ratios — while replacement heifers have skyrocketed from $1,600 to over $4,000 in just 18 months. Meanwhile, processing capacity is expanding faster than the milk supply can keep up, creating pockets of oversupply that could drive down local prices. Dr. Nicholson’s economic models at Wisconsin aren’t pretty — they show potential milk price drops of $1.90 per hundredweight and export losses hitting $22 billion. Here’s the thing: smart producers aren’t waiting around to see what happens. They’re tightening their belts, building cash reserves, and hedging their bets right now.

KEY TAKEAWAYS:

  • Debt management is critical — keep your debt-to-asset ratio below 35% to avoid getting squeezed when markets turn
  • Build liquidity like your business depends on it — aim for six months of operating reserves because cash creates options when others are forced into crisis decisions
  • Start hedging now while you can — use Class III futures or feed cost hedging to lock in margins before volatility hits
  • Diversify your buyer relationships — don’t put all your eggs in one processor’s basket, especially with new capacity coming online everywhere
  • Focus on operational efficiency ruthlessly — every dollar you save on feed conversion or labor costs today becomes margin protection when prices drop

The chatter in the dairy industry is all about “market balance.” Prices have plateaued, and many believe this stability will last. But here’s the thing — this perceived comfort might just be setting you up for a devastating fall.

History is littered with periods where seemingly stable prices plunged unexpectedly, catching producers completely off guard. Think back to the early 2000s and the 2014-2015 cycles — long stretches of steady pricing that lulled producers into aggressive expansion and debt accumulation. When the market suddenly shifted, those who had leveraged too heavily saw their equity vanish overnight.

Current Warning Signs Are Flashing Red

Today, multiple vulnerability indicators are blinking simultaneously, and frankly, they’re being ignored by too many operators who’ve bought into the “balanced market” narrative.

Debt levels are rising across the industry, with many producers carrying debt-to-asset ratios exceeding 40% — a historically critical stress marker that has preceded major financial casualties in previous downturns. Cash flows are being squeezed by stubbornly high feed and input costs that refuse to come down despite commodity corrections.

Interest rates are hovering near 5% for qualified operations, making expansion financing and debt refinancing particularly costly propositions. Add persistent policy uncertainties — from potential trade disruptions to shifting immigration and labor regulations — and you’ve got a perfect storm brewing beneath the surface calm.

The Economic Modeling Says It All

Crucially, recent economic modeling from Dr. Charles Nicholson at the University of Wisconsin-Madison isn’t speculative forecasting — it’s hard data analysis. His research reveals specific scenarios where various trade and policy shifts could result in milk price reductions of up to $1.90 per hundredweight and cumulative U.S. dairy export value decreases of $22 billion over a four-year period.

That’s not a theoretical risk — that’s economic modeling based on current market structure and realistic policy trajectories.

The replacement cattle market tells an even more dramatic story. Replacement heifers have surged from around $1,600 per head in mid-2023 to over $4,000 by late 2024 — a 150% spike driven by inventory scarcity and the beef-on-dairy trend. When input costs are exploding while revenue streams remain stagnant, that’s a classic vulnerability setup.

Meanwhile, dairy processing capacity has been expanding aggressively, with new mega-plants coming online across multiple regions. But milk production growth isn’t keeping pace uniformly, creating potential pockets of oversupply that could hammer local pricing.

Are You on This List? Identifying the Most Vulnerable Operations

Are the operations walking the tightrope right now? Those who expanded aggressively during recent favorable periods, especially in high-cost regions where water, feed, and regulatory pressures add operational complexity. Small to mid-size operations with thin margins and limited cash reserves are particularly exposed.

The highest-risk profiles include:

  • Operations with debt-to-asset ratios above 40% and debt service coverage below 1.25
  • Producers dependent on single-buyer relationships or concentrated market exposure
  • Facilities in regions facing water restrictions, increased regulatory pressure, or limited processing alternatives
  • Operations that banked on continued export market stability without downside protection

Here’s what really concerns me: the early warning signs I’m seeing mirror patterns from previous market corrections. The disconnect between soaring replacement costs and stagnant milk premiums? That’s a classic vulnerability indicator that preceded past crashes.

Your Defensive Playbook: Strategic Protection Plan

Market turbulence isn’t a question of if — it’s when. Smart operators aren’t sitting around hoping this plateau continues. They’re actively building defensive positions while opportunities still exist.

Diversification isn’t optional anymore. Don’t put your operation’s future on a single buyer or market channel. I’m seeing forward-thinking producers develop relationships with multiple processors, exploring emerging opportunities in specialty markets and value-added product streams.

Risk management tools deserve serious consideration. Whether through Class III milk futures, options contracts, or cross-hedging strategies for feed costs, you need downside protection. Recent analysis shows that effective hedging strategies can significantly manage margin risk during volatile periods.

Cash reserves aren’t a luxury — they’re survival insurance. Target at least six months of operating reserves. Operations with strong liquidity positions will have options when others are forced into crisis decisions.

Financial discipline matters more than ever. Aim for debt-to-asset ratios below 35% and debt service coverage ratios above 1.25. These aren’t arbitrary benchmarks — they’re financial stress indicators that historically separate survivors from casualties.

Take Action Now — Your 4-Step Priority Plan

If I were making decisions on your operation tomorrow, here’s my immediate action checklist:

1. Get a Real-Time Financial Snapshot. Immediately calculate your actual debt-to-asset ratio and debt service coverage. If you’re above 40% and below 1.25, respectively, you need a deleveraging plan now, while milk prices still provide some flexibility.

2. Lock In Your Risk Management. Don’t gamble with your operation’s future. Whether it’s forward pricing a portion of your production, establishing feed cost hedges, or negotiating flexible supply agreements with multiple buyers, your goal is to minimize as much uncertainty as possible from your profit and loss (P&L) statement.

3. Hunt for Efficiencies Ruthlessly. Every dollar you save in feed conversion, labor productivity, or operational costs today becomes a dollar of margin protection when the market turns. This requires disciplined focus on measurable improvements.

4. Hoard Cash Like Your Business Depends on It. If that means pausing expansion plans or selling non-core assets to build liquidity reserves, do it. In a downturn, cash creates options, and options are the difference between survival and failure.

The Bottom Line

Don’t be lulled into complacency by the current price plateau. This “market balance” narrative is dangerous precisely because it breeds the kind of strategic inaction that destroys operations when cycles inevitably turn.

The dairy industry’s current stability might be real, but it’s also fragile. External shocks — whether from trade policy changes, weather events, disease outbreaks, or broader economic disruption — could unravel today’s equilibrium faster than most producers realize.

The next market cycle isn’t coming someday — it’s building momentum right now, beneath the surface of this apparent calm. The question isn’t whether it will arrive, but whether your operation will be positioned to weather it when it does.

Will you be ready?

Complete references and supporting documentation are available upon request by contacting the editorial team at editor@thebullvine.com.

Learn More:

The Sunday Read Dairy Professionals Don’t Skip.

Every week, thousands of producers, breeders, and industry insiders open Bullvine Weekly for genetics insights, market shifts, and profit strategies they won’t find anywhere else. One email. Five minutes. Smarter decisions all week.

NewsSubscribe
First
Last
Consent
Send this to a friend