







When enhanced ACA subsidies expired at the end of 2025, one Iowa dairy family’s monthly insurance cost nearly doubled — and exposed the financial arithmetic most dairy households already live but rarely put on paper.
Executive Summary: USDA’s 2024 data says the median U.S. farm household lost ,830 farming and earned ,900 off the farm — and when enhanced ACA subsidies expired in December 2025, families like Meghan Palmer’s in northeastern Iowa watched their monthly health insurance bill nearly double to 8.18, exposing exactly how much of a dairy’s real margin comes from the spouse’s W-2. On a 200-cow herd shipping 75 lbs/day at USDA’s current .50/cwt all-milk forecast, gross revenue runs about .12 million — but with average total production costs near .56/cwt, net margin is razor-thin or negative before you account for insurance, equipment, or anything else. Factor in that more than 40% of dairy farmers lack health insurance entirely, and that 27% of the ag workforce buys coverage on the individual marketplace at four times the national rate, and you’ve got a structural vulnerability most operations have never formally addressed. A spouse’s ,000 salary plus employer health benefits and retirement match adds up to ,000–,000 in total compensation — yet that income stream rarely appears on the farm‘s loan documents, succession plan, or cash-flow projections. This piece walks through the barn math, the governance gap, and four decision paths — including a 30-day action any operator can take with last year’s tax return and a W-2. If the off-farm number is bigger than the Schedule F net, the conversation about who really funds the dairy needs to happen now.
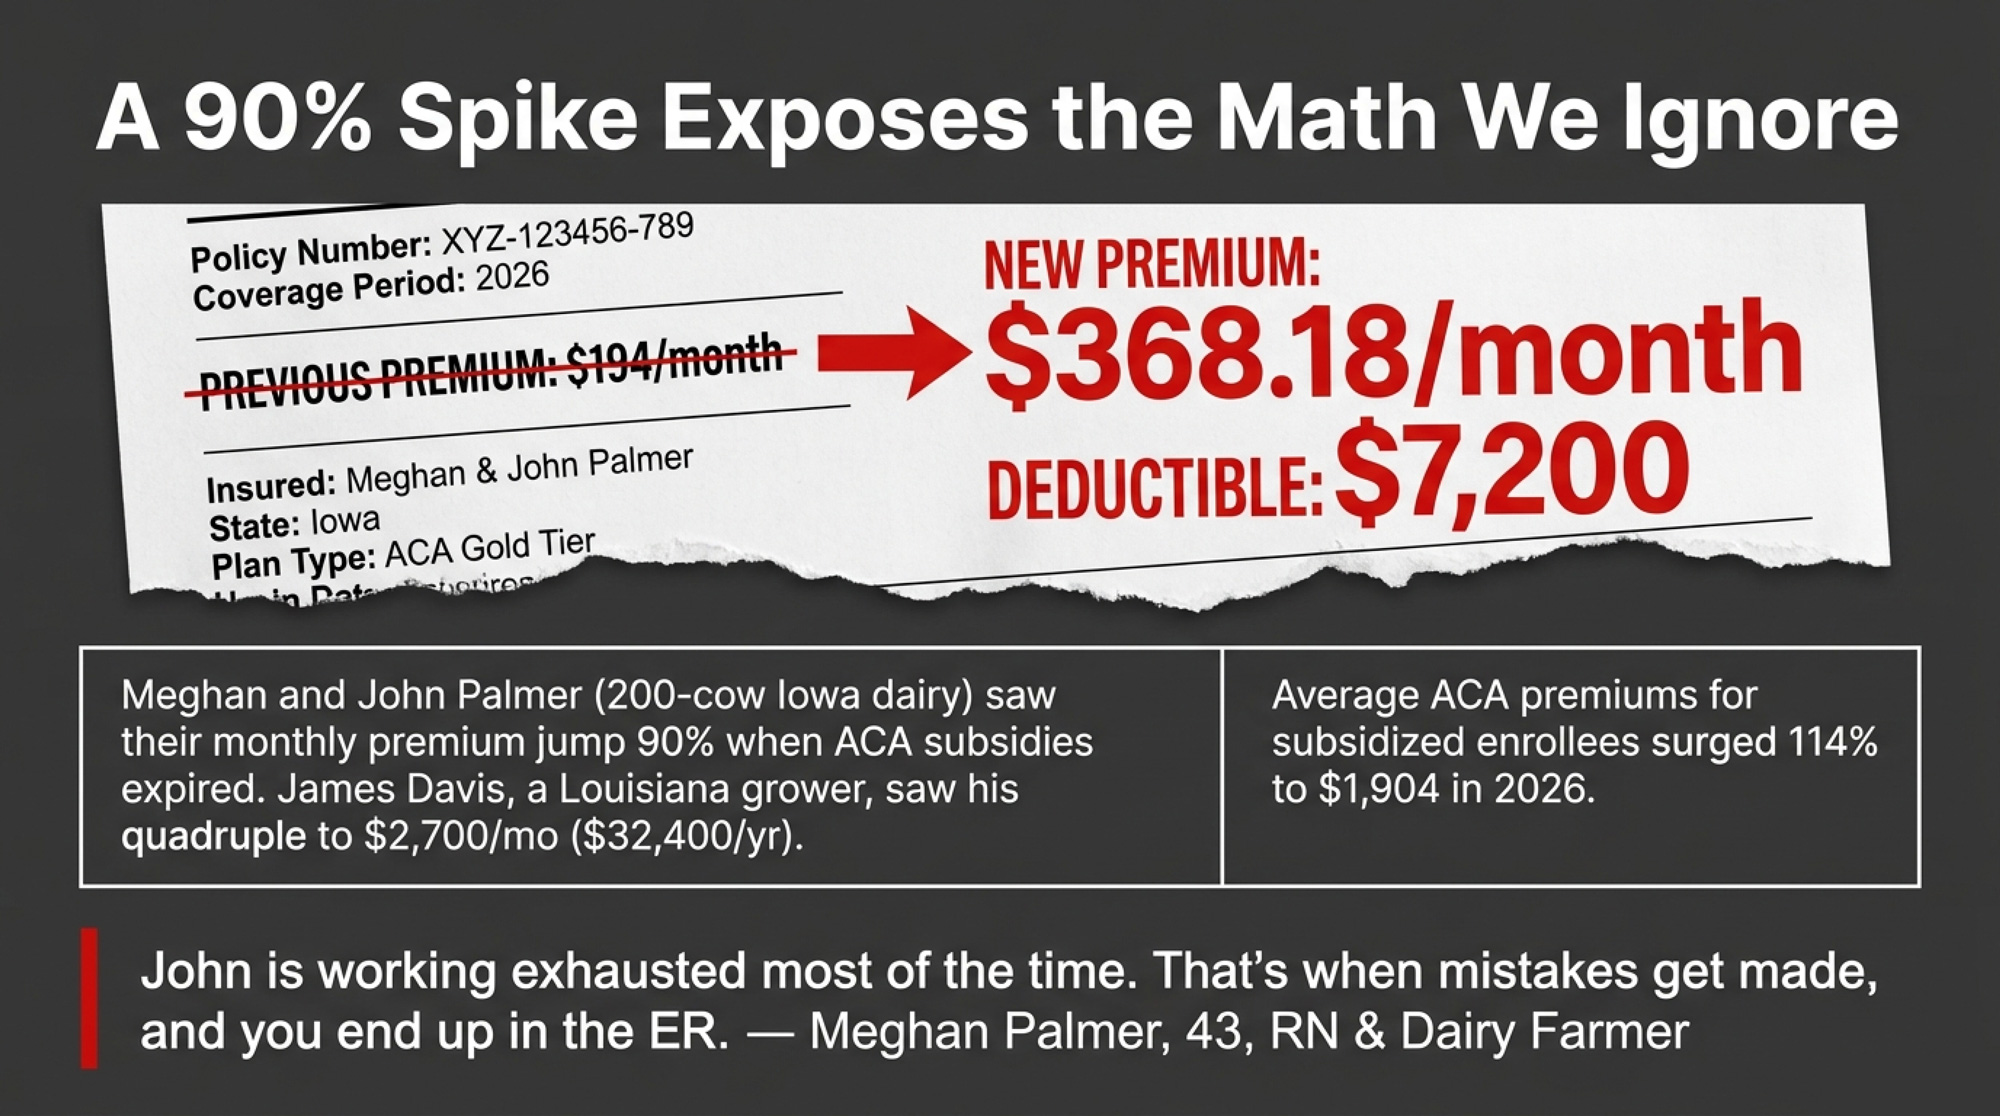
Meghan Palmer is 43, a registered nurse, and runs a dairy farm in northeastern Iowa with her husband, John. Their family’s monthly health insurance cost nearly doubled at the start of 2026 — climbing more than 90%, to $368.18 — after enhanced ACA premium subsidies expired. At $368 a month, that’s roughly $4,400 a year in premiums alone, nearly twice what they paid before the subsidies lapsed. Their total deductible for 2026: $7,200, as reported by KFF Health News in January 2026.
Palmer picks up nursing shifts as needed, giving her flexibility to prioritize the farm. But she’s now searching for a job with employer-sponsored health benefits — and she told KFF Health News she worries a job that doesn’t let her keep up with farm work will create a bigger burden for John.
“John is working exhausted most of the time,” she said. “That’s when mistakes get made, and you end up in the ER.”
Their situation isn’t unusual. It’s just more visible than most.
The Number Nobody Puts on the Whiteboard
USDA’s Economic Research Service tracks what farm households actually earn — not what they earn from farming, but what they earn total. The 2024 figures tell a story that anyone married to a dairy farmer already knows.
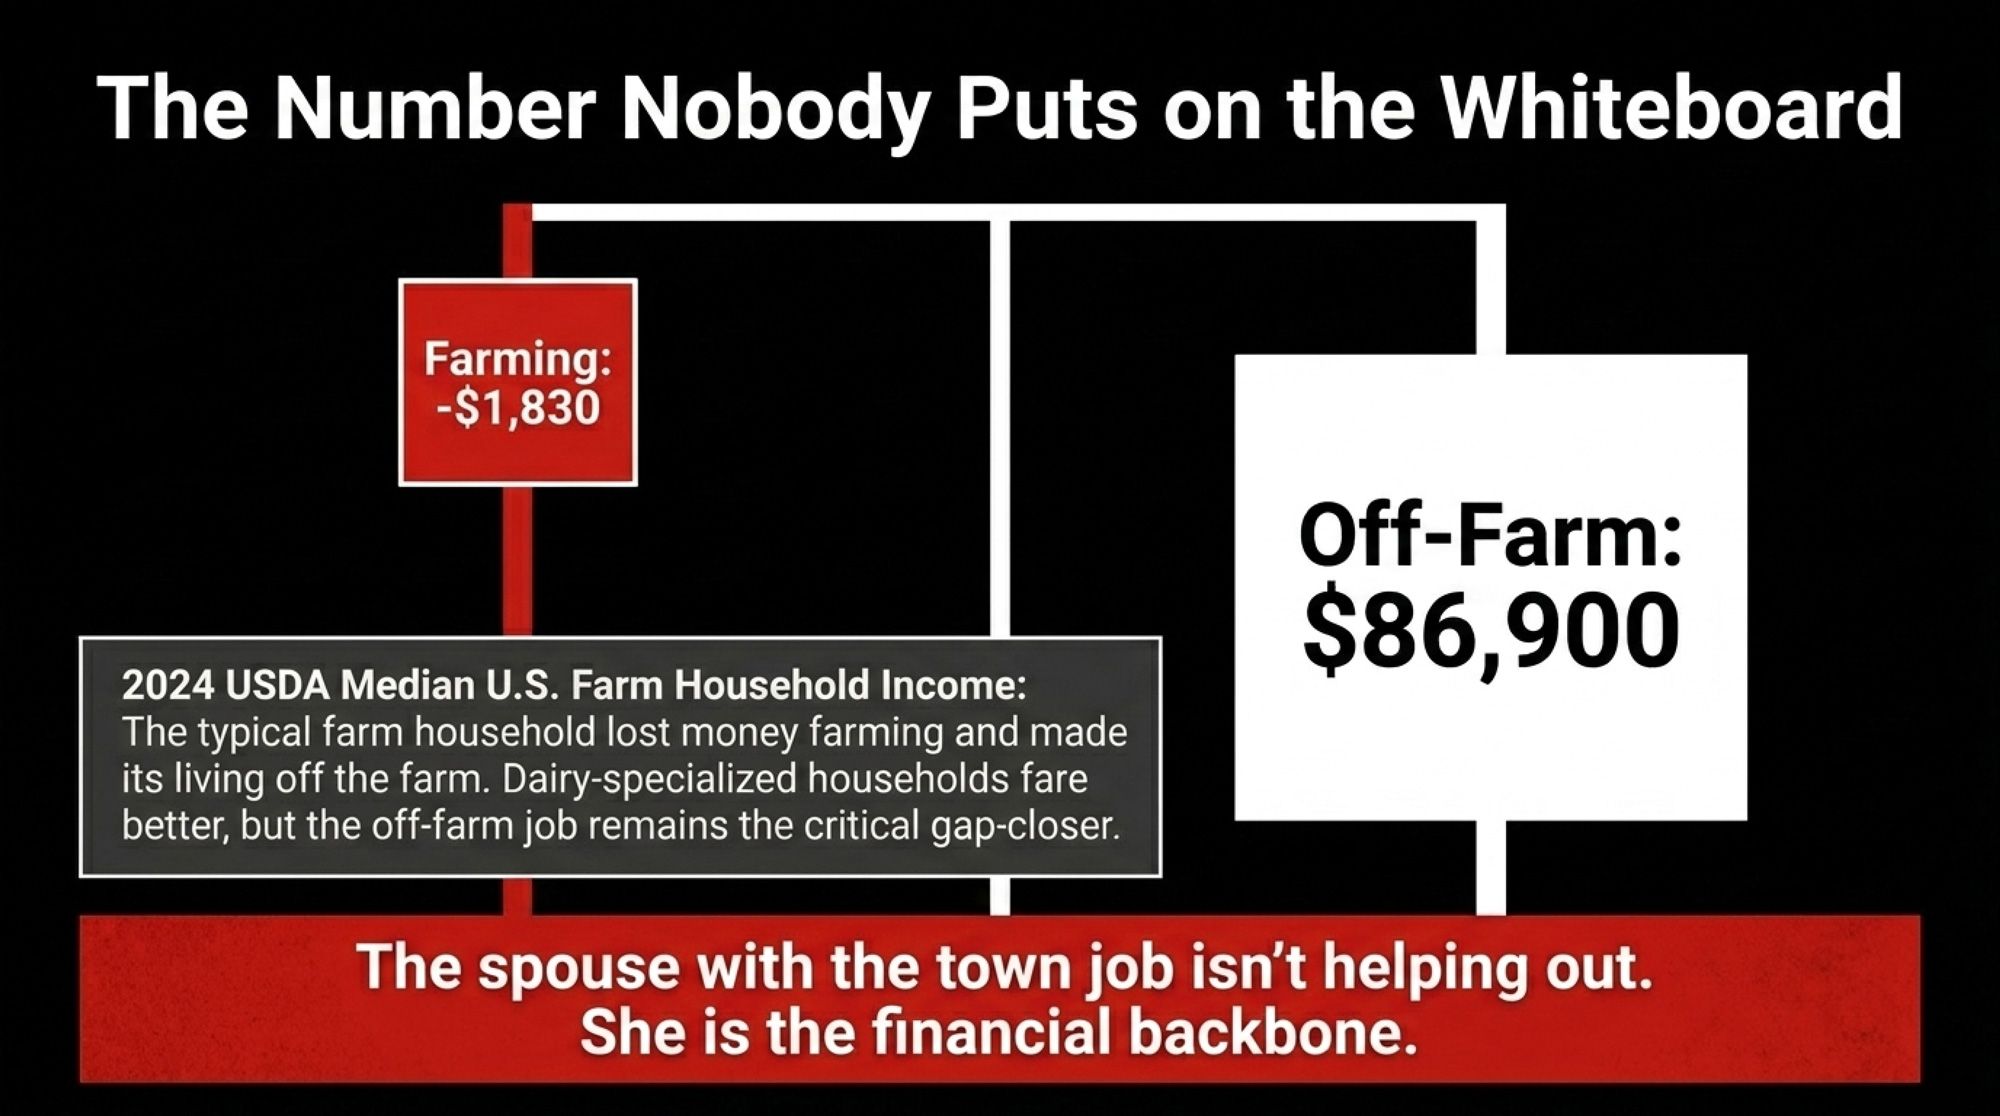
Median household income from farming in 2024: negative $1,830. Median off-farm income: $86,900. Total median farm household income: $102,748, according to ERS’s Farm Household Income Estimates. The typical American farm household lost money farming and made its living off the farm.
Dairy-specialized households do better than that all-farm median. ERS’s commodity-specialization data show dairy households earned a median of $100,493 from farming, with a total median household income of $146,964 (2023 reference year, from the December 2024 chart—the most recent dairy-specific breakdown available at publication). That’s real money from the cows. But even in dairy, off-farm income closes the gap between getting by and getting ahead — and for smaller operations, it’s often the gap between staying and leaving.
The point isn’t that farming doesn’t pay. For commercial-scale dairies, it often does. The point is that on a huge share of operations, the spouse with the town job isn’t “helping out.” She’s the financial backbone — and nobody’s accounting for it that way.
What Does the Town Job Actually Cover?
Here’s where most farm families undercount what the off-farm job is worth.
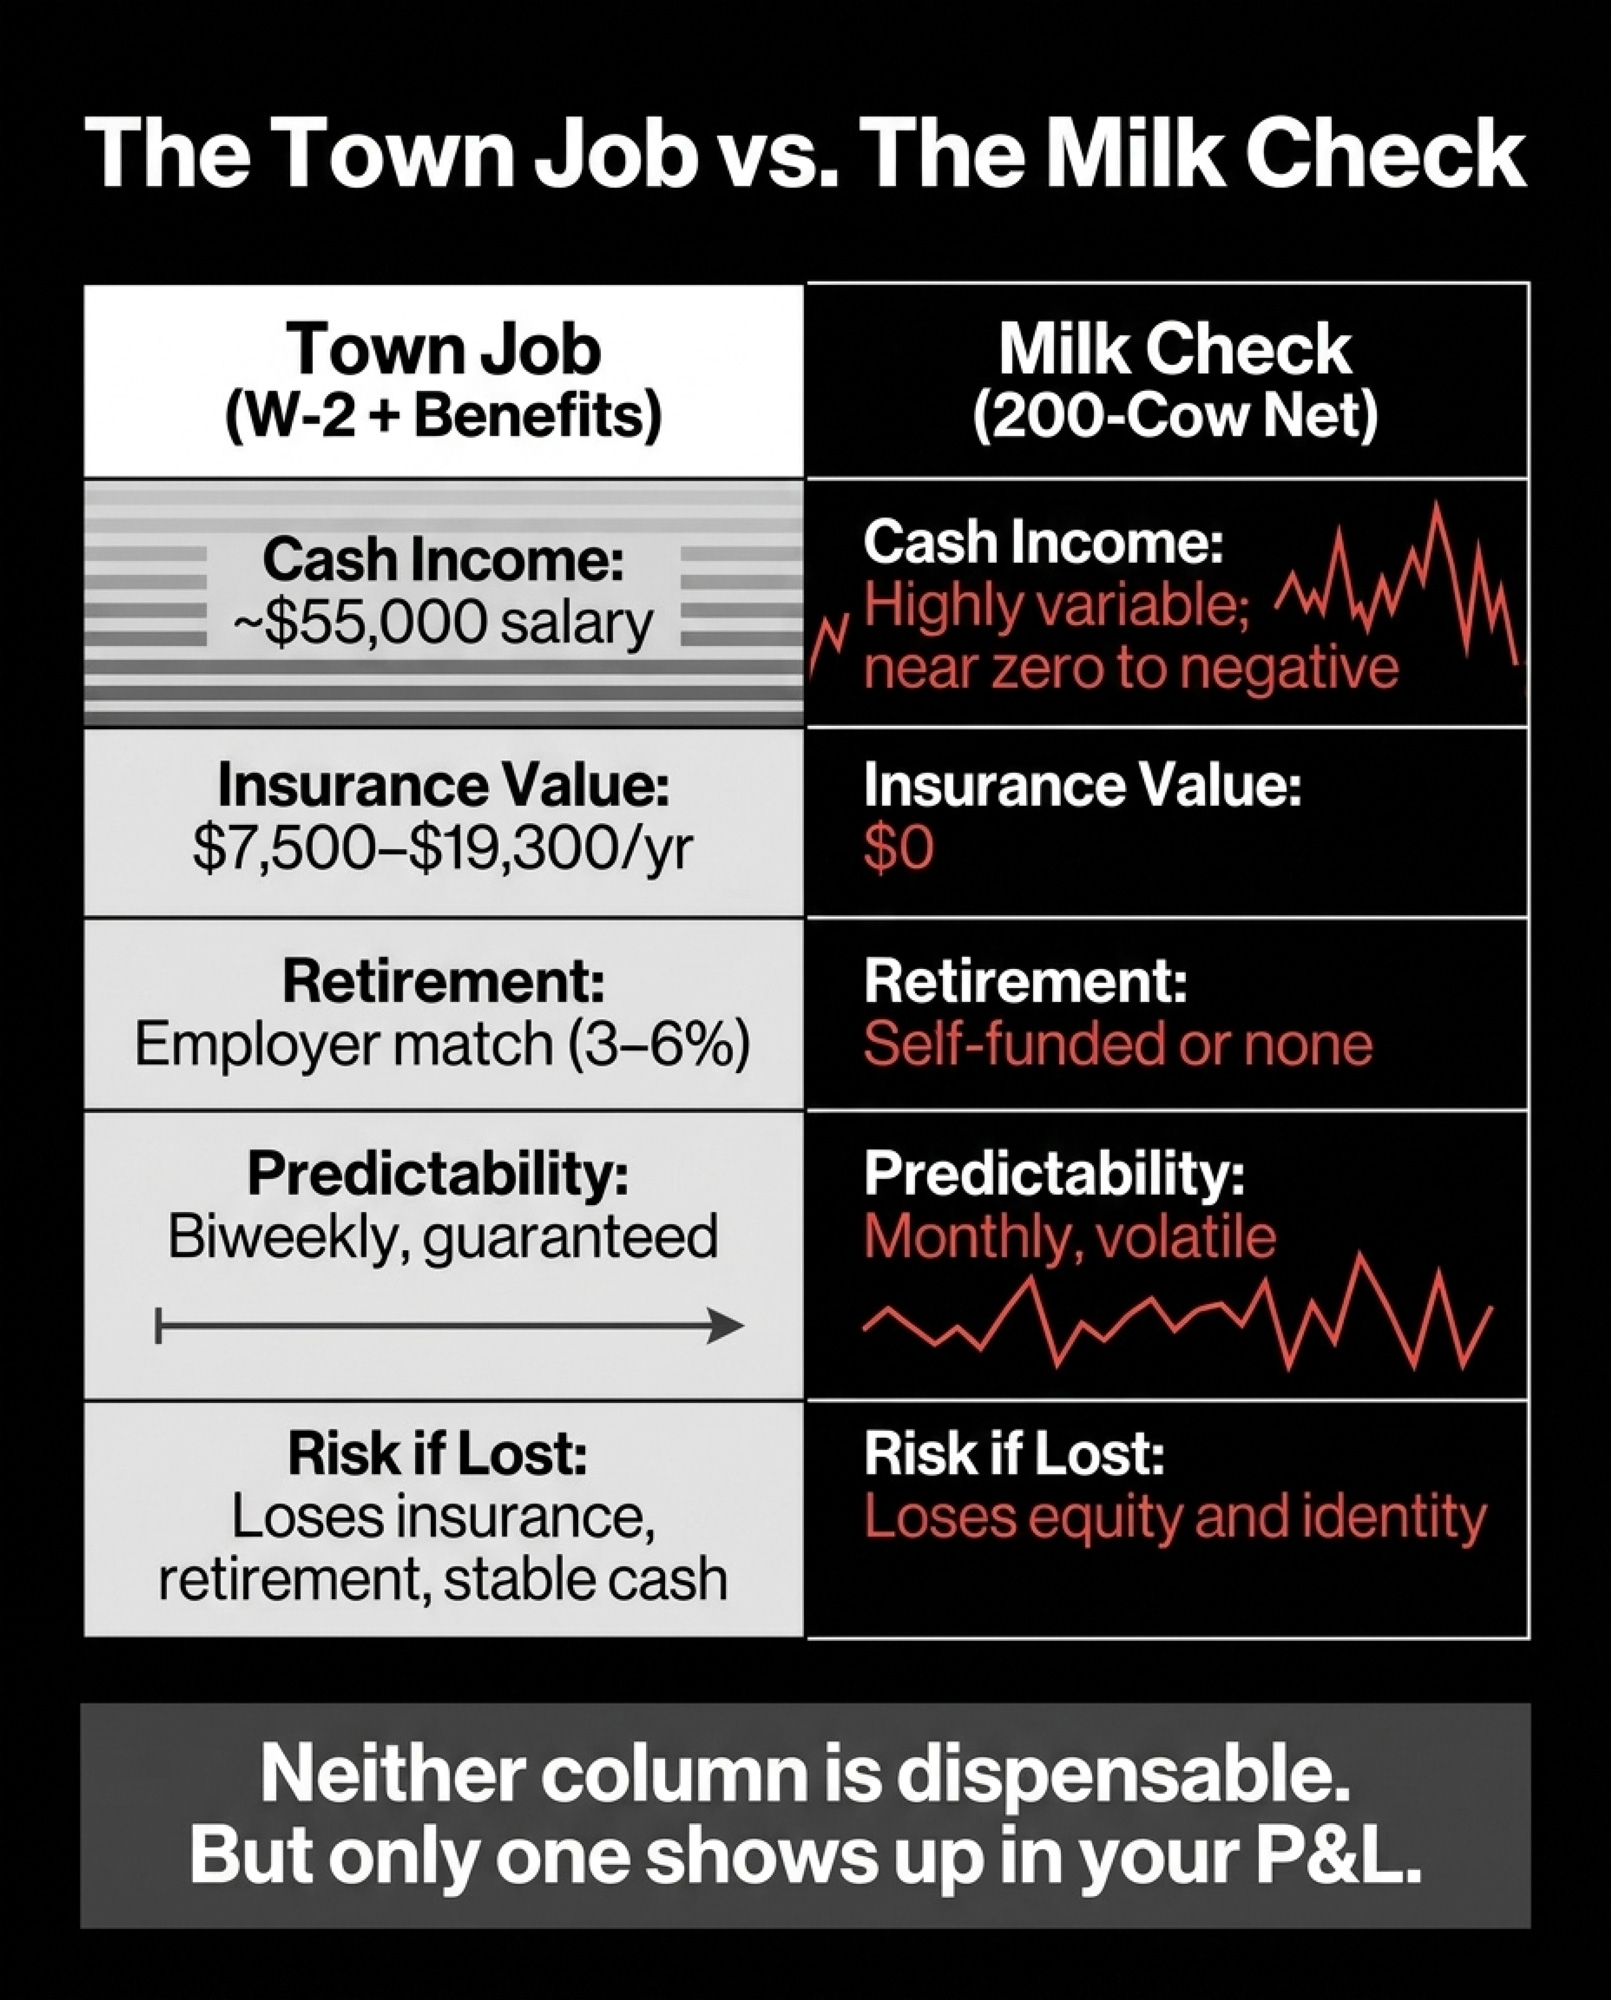
A $55,000 nursing or accounting salary doesn’t just bring home $55,000. It carries employer-paid health insurance — and that piece alone is bigger than most people realize. KFF’s 2024 Employer Health Benefits Survey puts the average employer contribution at about $7,500 a year for single coverage and nearly $19,300 for a family plan. Then there’s a 3%–6% salary match. Social Security credits that self-employment income alone often can’t match. Disability and life coverage are usually bundled at no extra cost.
Add the employer’s premium share and the retirement match to that $55,000, and you’re looking at $65,000 to $77,000 in total compensation — depending on whether you’re on single or family coverage. Now stack that against the milk check.
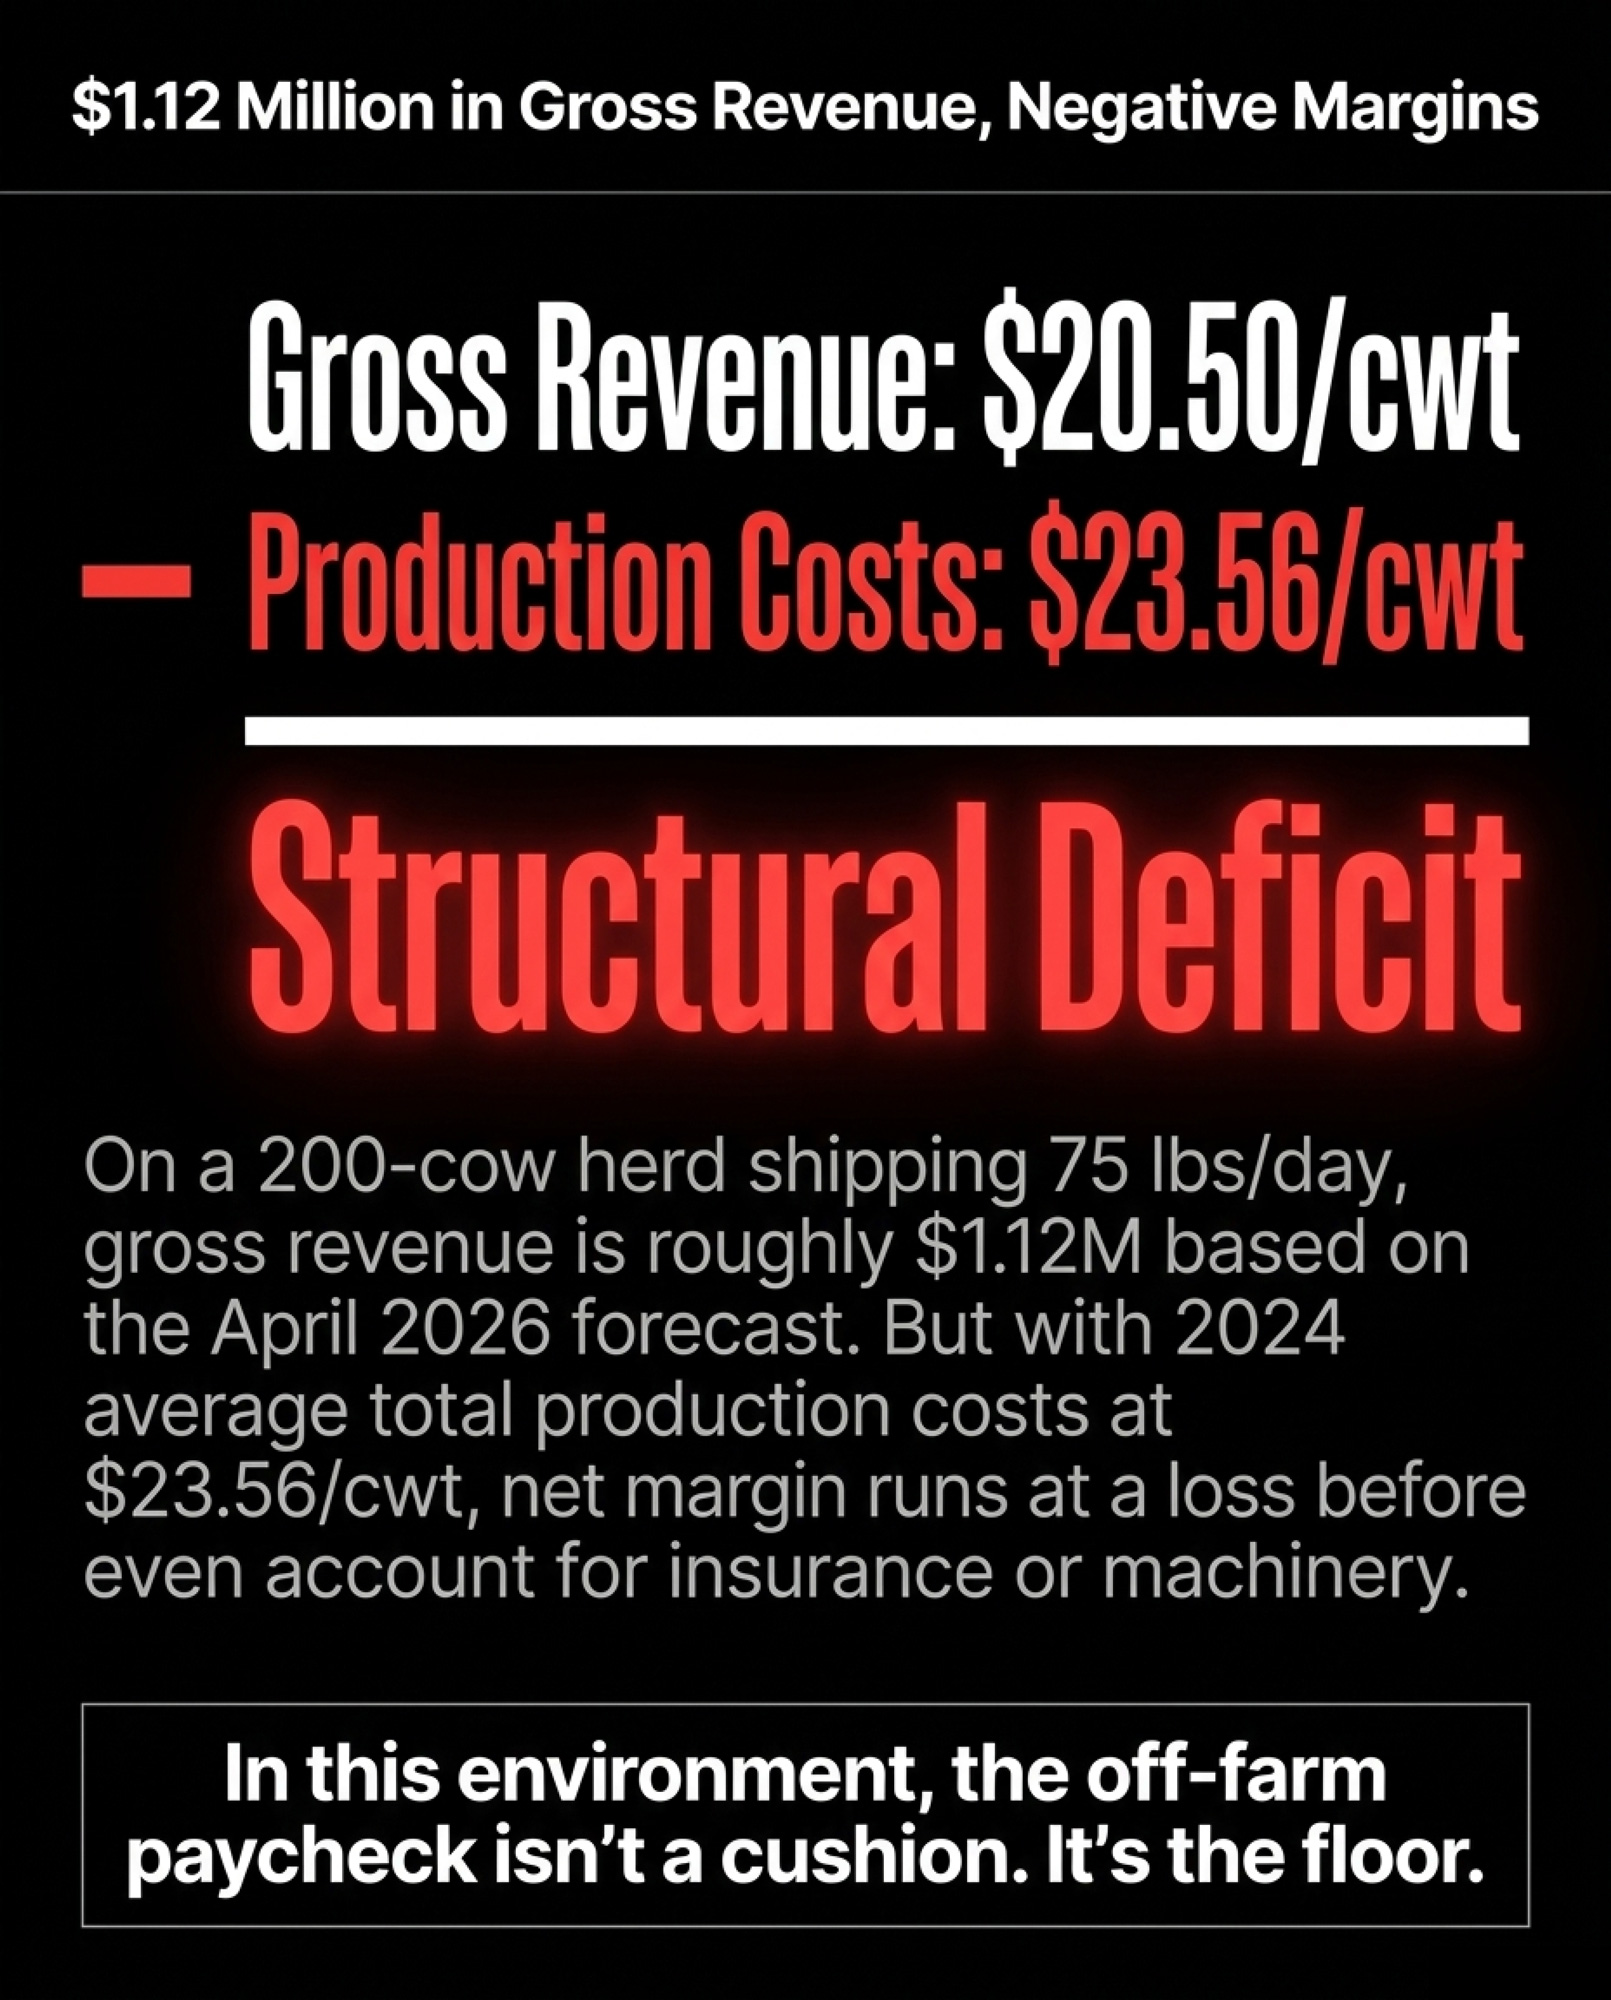
On a 200-cow herd shipping 75 lbs/day at USDA’s April 2026 forecast of .50/cwt all-milk price, gross milk revenue runs roughly .12 million a year. But your net? After feed, labor, depreciation, debt service, and the rest — USDA’s own full-economic-cost estimates run above $19/cwt for the largest operations, and a Bullvine analysis of 2024 data put average total production costs at about $23.56/cwt — the net might pencil out in the low single digits in a decent year. For mid-size and smaller herds, it runs at a loss.
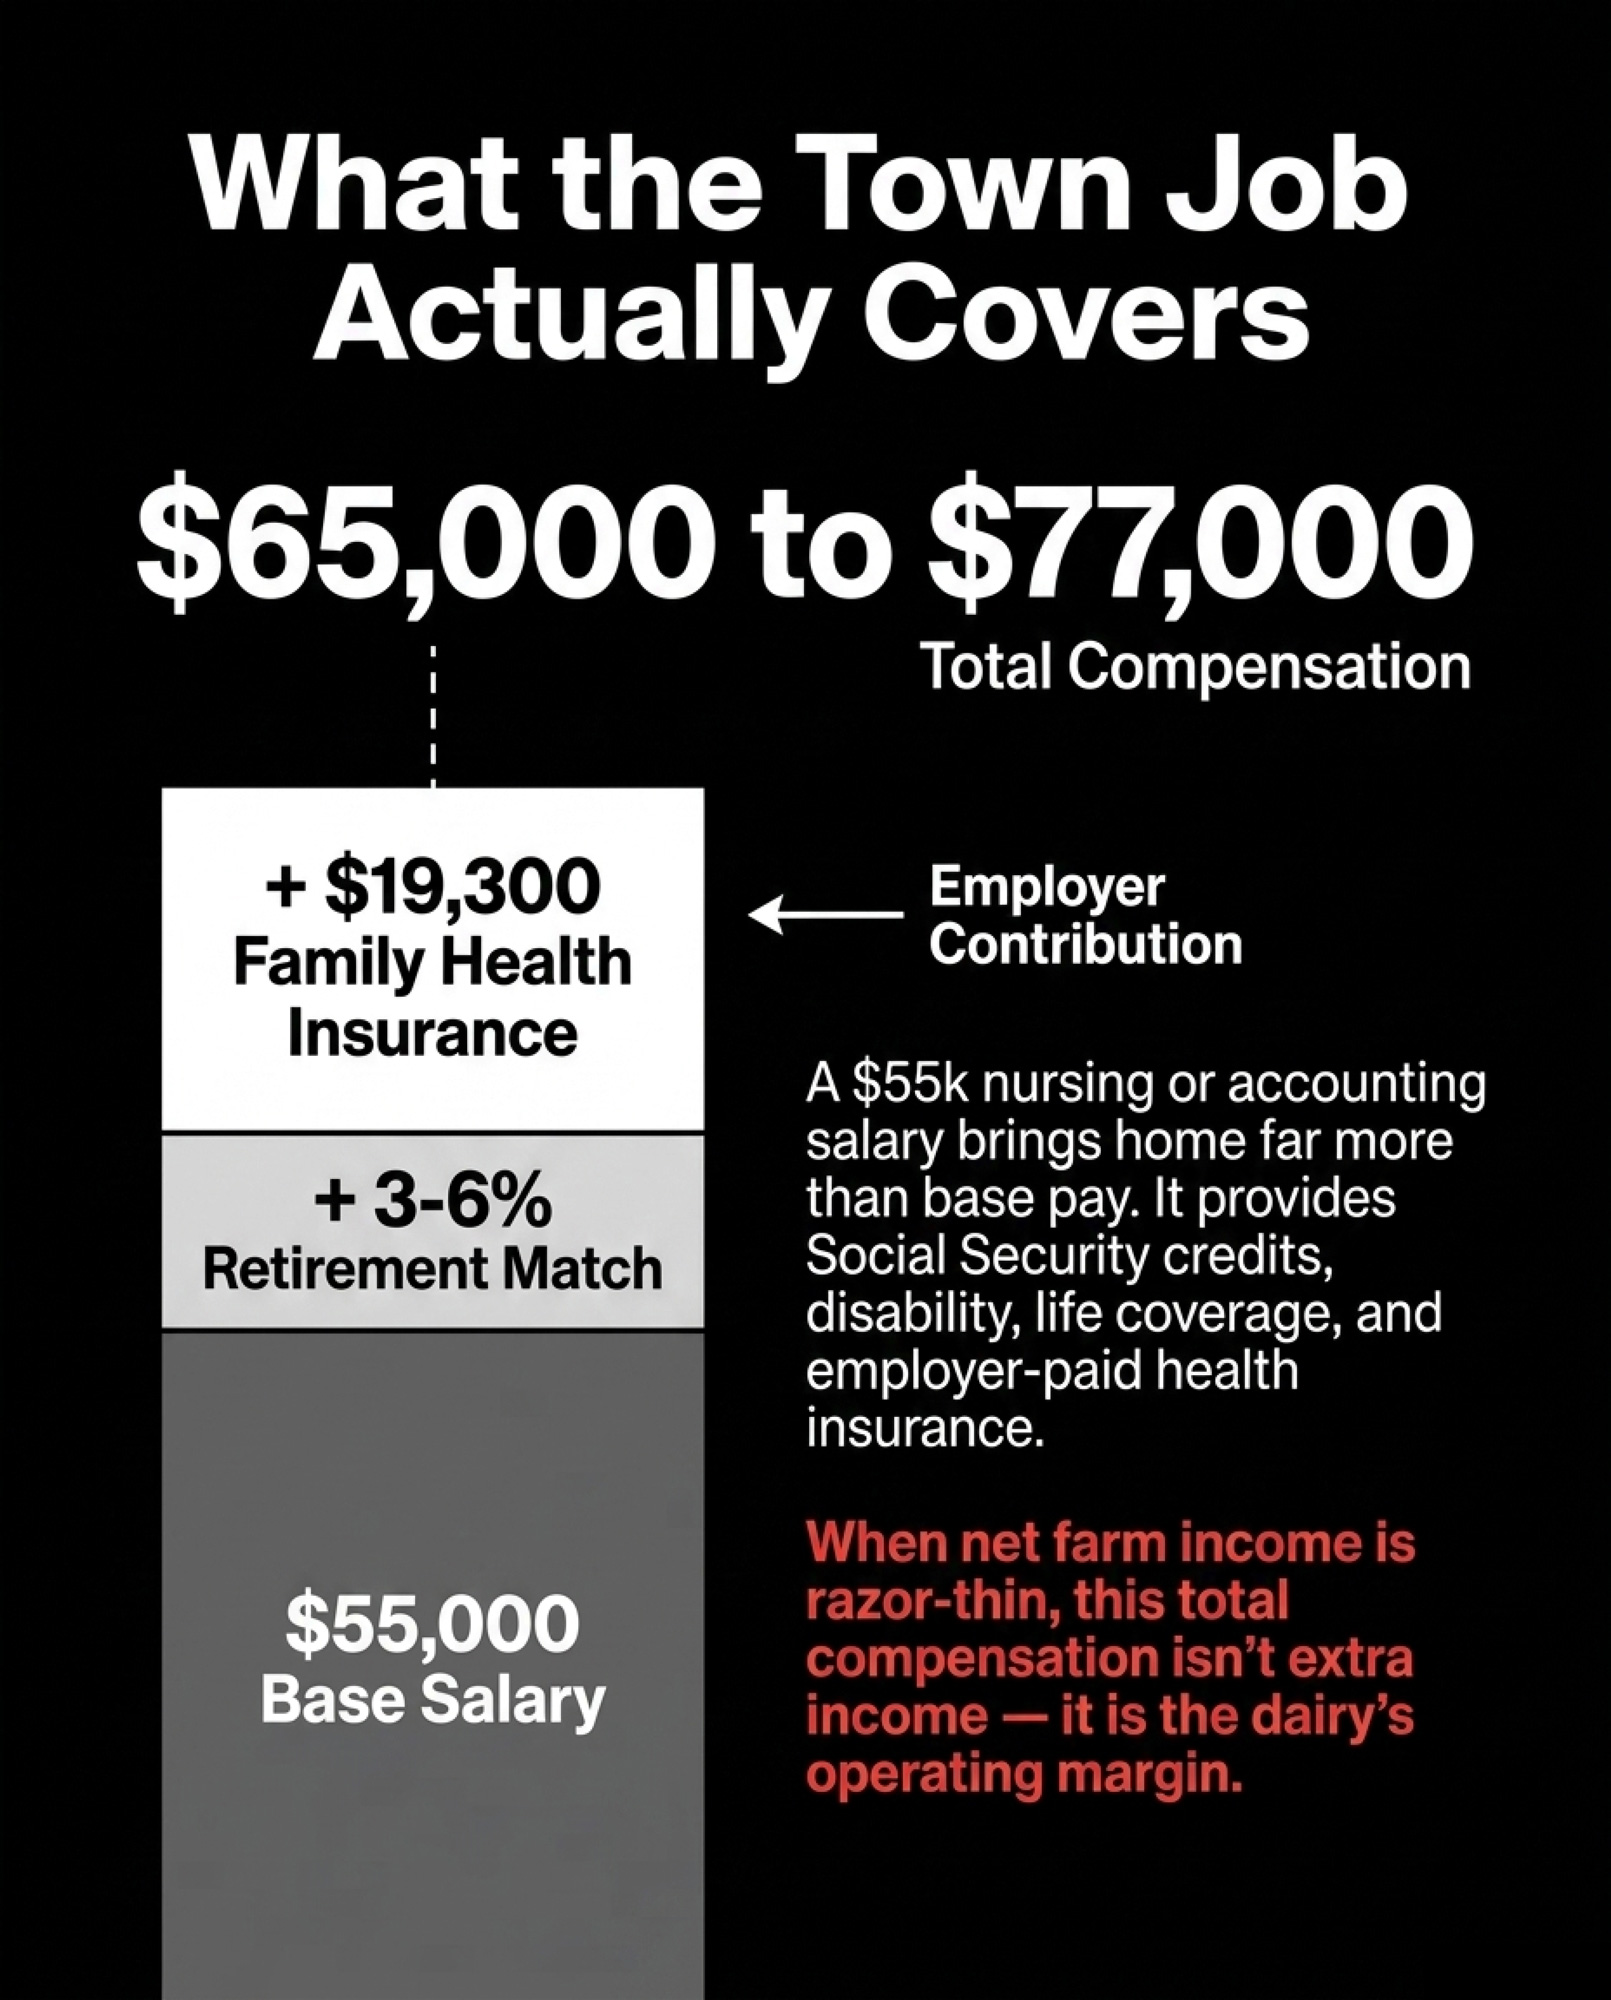
That $65,000–$77,000 in total off-farm compensation doesn’t look like “extra income” when you run those numbers. It looks like the operating margin.
Is the Spouse’s Off-Farm Income in Your Farm’s Business Plan?
This is the governance question that the forces pushing mid-size operations to restructure or exit make unavoidable. If the town job is propping up the farm financially, is the person earning it actually part of the farm’s financial structure?
In many operations, the answer is no. The spouse with the W-2 isn’t on the operating loan. It isn’t on the farm’s bank accounts. It isn’t named in the succession plan. Isn’t at the table when the lender comes for the annual review.
That’s a big governance gap. You’ve built a dairy that depends on a single off-farm income stream, and the person generating it has no formal role in the business it supports. If that person gets hurt, burns out, or quits, there’s no Plan B — because nobody wrote Plan A down.
Your lender already factors this in. They’re looking at your whole household, not just your cows — total household cash flow, not just milk revenue — when they assess repayment capacity. The town job is already part of your credit picture. It should be part of your management picture too.
What Happens When the Insurance Math Changes?
The Palmer family’s 90% premium spike isn’t an outlier. KFF projected that ACA marketplace premium payments for subsidized enrollees would more than double once enhanced subsidies expired — from an average of $888 in 2025 to $1,904 in 2026, a 114% increase. That subsidy loss landed on top of underlying insurer premium increases — a median of about 18% nationally, per KFF’s analysis of 312 insurer filings, with the average closer to 20%. For farm families with incomes that fluctuate above and below subsidy thresholds from year to year, the whiplash is sharper still.
And it’s not just dairy. James Davis, 55, who grows cotton, soybeans, and corn in northern Louisiana, told KFF Health News that his family’s insurance premium quadrupled for 2026, to about $2,700 a month. That’s $32,400 a year in premiums alone, before a single deductible dollar kicks in. “You can’t afford it,” Davis said. “Bottom line. There’s nothing to discuss. You can’t afford it without the subsidies.”
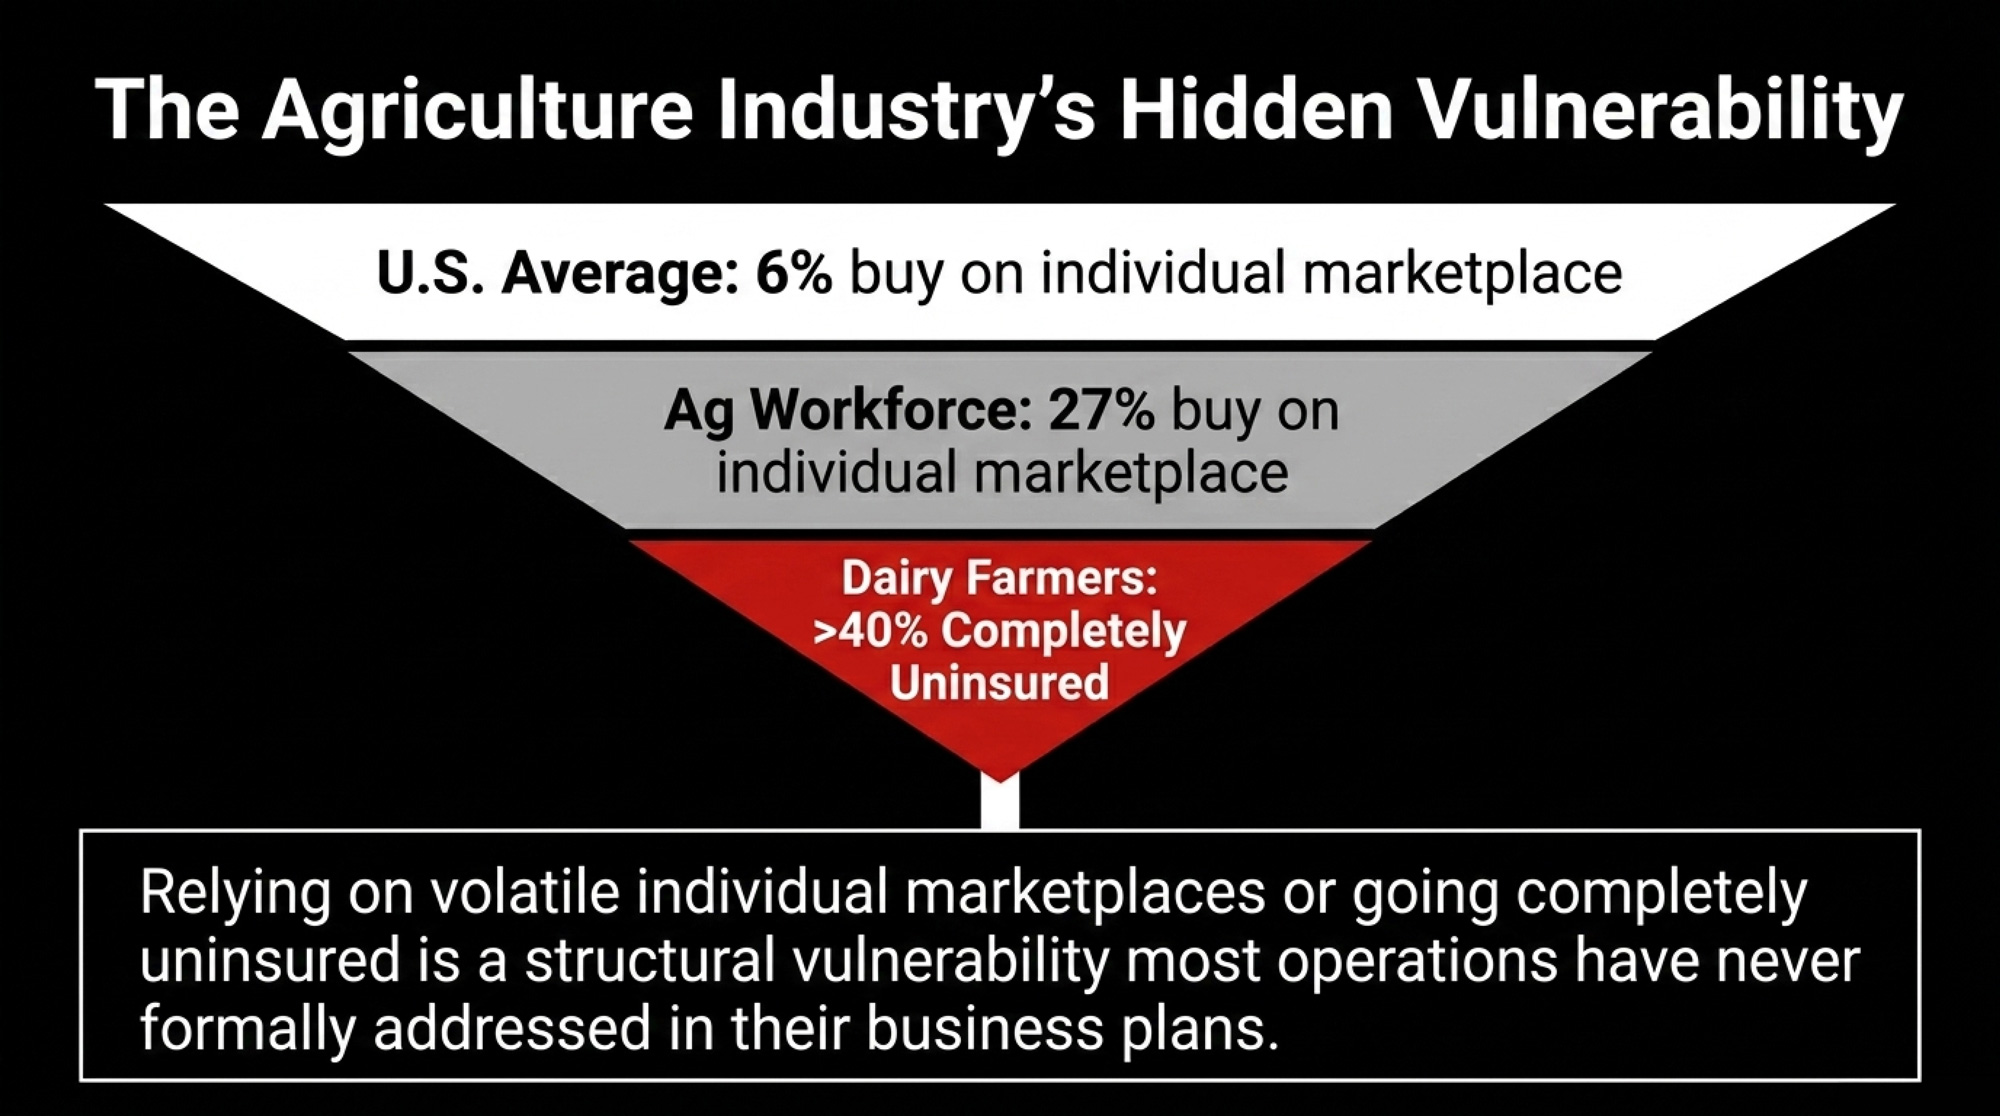
More than a quarter of the agricultural workforce — 27% — purchases health insurance through the individual marketplace, per KFF. That’s more than four times the 6% rate for U.S. adults overall. And among dairy farmers specifically, more than 40% lack health insurance entirely — one of the highest uninsured rates across all agricultural sectors, according to KFF Health News.
Now layer the milk-price outlook on top. USDA’s February 2026 forecast projected dairy cash receipts would fall by $6.2 billion to $42.5 billion in 2026 — a 12.8% decline from 2025. Subsequent WASDE updates have lifted the all-milk forecast to $20.50/cwt as of April, which may narrow that gap. But on that same 200-cow herd, even $20.50 pencils out to about $1.12 million gross — and when average total production costs ran $23.56/cwt in 2024, you’re operating on tight margins before you think about insurance, machinery, or your kid’s braces.
In that environment, the off-farm paycheck isn’t a cushion. It’s the floor.
The Town Job vs. the Milk Check
Here’s how the math stacks up side by side for a typical dual-income dairy household:
| Dimension | Town Job (W-2 + Benefits) | Milk Check (200-cow net) |
|---|---|---|
| Base Cash Income | ~$55,000 salary | Variable; near $0 to negative in tight years |
| Health Insurance Value | $7,500–$19,300/yr employer share (KFF 2024) | $0 unless self-purchased |
| Retirement Contribution | Employer match 3–6% (~$1,650–$3,300/yr) | Self-funded or none |
| Total Comp Value | $65,000–$77,000 | Razor-thin at $20.50/cwt vs. $23.56/cwt cost |
| Payment Predictability | Biweekly, guaranteed | Monthly, highly volatile |
| 2026 Insurance Exposure | Employer-covered | <span style=”color:red”>40%+ of dairy farmers fully uninsured</span> |
| Appears in Farm P&L? | ❌ No | ✅ Yes |
| Risk if Lost | Household loses insurance, retirement, stability | Household loses equity and identity |
Neither column is dispensable. But only one shows up in your farm’s P&L.
Options and Trade-Offs for Dairy Families
Path 1: Protect and formalize the town job — your 30-day action. If the off-farm W-2 plus benefits exceed one-third of total household income — and, for most dairy households, they do — treat it like any other critical business input. Put the earning spouse on the farm’s bank accounts and loan documents. Include off-farm income explicitly in cash-flow projections. Build the succession plan around two incomes, not one.
Here’s the 30-day move: pull your most recent tax return and your spouse’s latest W-2. Add the salary, the employer insurance contribution, and the retirement match. Compare that total to your net farm income on the Schedule F. If the off-farm number is larger — and don’t be surprised when it is — you’ve got a concentration-risk problem worth addressing this month, with your spouse, your lender, and your accountant.
Palmer herself faces exactly this calculus. She told KFF Health News that farmers “can be reluctant to acknowledge that they rely on government-subsidized insurance.” And she added: “We’re not handout-takers.” But the math doesn’t care about pride.
Path 2: Reduce dependence on a single W-2. If the town job disappears — layoff, injury, burnout — what happens to your operation? Diversifying off-farm sources (a second part-time income, custom work, or rental income) or building on-farm revenue reduces risk. But the real math of on-farm diversification is worth studying before you commit. Every diversification path costs time, and time is the scarcest input on a dairy. You gain resilience, but stretch management thinner.
Path 3: Restructure the dairy so it stands on its own. Some operations can realistically reach a cost structure where the milk check covers the bills without off-farm support. That usually means significant scale, premium marketing channels (organic, A2, processor quality bonuses), or radical cost reduction — low debt, paid-for facilities, minimal hired labor. This is the multi-year play, and it only works if you’re honest about your breakeven. Average total production costs ran about $23.56/cwt in 2024, per USDA data analyzed by The Bullvine. Even at the improved .50/cwt all-milk price, that gap doesn’t close in 12 months through genetic progress or feed tweaks alone.
Path 4: Plan the exit with eyes open. If the off-farm income is clearly the household’s real earning power, and the dairy is consuming equity rather than building it, an intentional transition — renting the land, selling quota (in Canada), shifting to beef, or exiting production — may be the strongest financial move. The hardest part isn’t the math. It’s the identity. But when financial stress piles up, management decisions suffer first, and the cost of delayed exits compounds every month. (If financial stress is affecting you or someone on your operation, the 988 Suicide & Crisis Lifeline and the Farm Aid hotline — 1-800-FARM-AID — are free, confidential resources.)
Key Takeaways
- If your spouse’s W-2 plus employer benefits exceed your net farm income, the town job is your primary business — treat it accordingly in governance, lending conversations, and succession planning.
- If a single off-farm income accounts for more than one-third of household cash flow, that’s a concentration risk. Assess it the same way you’d assess dependence on a single milk buyer.
- Pull your 2024 tax return and your spouse’s W-2 this month. Add salary + employer health premium + retirement match. If that total is larger than your Schedule F net, the conversation about the farm’s real financial structure needs to happen now — not next year.
- If your all-in production cost sits above $20.50/cwt — and with 2024 averages near $23.56/cwt for many operations, it likely does — your milk check still isn’t covering the full cost of producing it. The off-farm income isn’t supplemental. It’s subsidizing the operation.
Meghan Palmer’s $368 insurance bill isn’t really about insurance. It’s about what happens when the financial structure holding a dairy together takes a 90% jolt — and nobody had written down how much of the load that structure was carrying.
You know what your milk price is. You probably know your feed cost per cow. But do you actually know — down to the dollar — what your spouse’s off-farm job is worth to your operation? Not just the paycheck. The insurance. The retirement. The stability.
Pull the numbers. Then have the conversation.
Complete references and supporting documentation are available upon request by contacting the editorial team at editor@thebullvine.com.
Learn More
- 211,000 More Dairy Cows. Bleeding Margins. The 2026 Math That Won’t Wait. – Arms you with a 2026 survival playbook, exposing the $2/cwt gap between cash and real breakeven. Reveals how to turn genetic losers into cash-flow winners via beef-on-dairy premiums before your lender starts asking hard questions.
- Cheap Milk Is Breaking the Farm: What’s Really Hollowing Out Dairy’s Middle Class – Exposes the structural vise crushing mid-sized operations and reveals why “improving” margins are often a decoy for deeper consolidation. This analysis delivers the benchmarks you need to evaluate your operation’s 3-to-5-year survival odds.
- Bred for Fat, Paying for Protein: The $180,000 Trap Locked into Western Cheese Herds Until 2029 – Breaks down the 2026 component whiplash and identifies the massive profit trap hidden in traditional breeding programs. Gains an immediate competitive advantage by realigning your genetics with protein-heavy markets before the current fat-boom officially evaporates.
 The Sunday Read Dairy Professionals Don’t Skip.
 The Sunday Read Dairy Professionals Don’t Skip.
Every week, thousands of producers, breeders, and industry insiders open Bullvine Weekly for genetics insights, market shifts, and profit strategies they won’t find anywhere else. One email. Five minutes. Smarter decisions all week.
 Join the Revolution!