Archive for Dairy Markets – Page 2

Men’s Hockey Gold Medal Game vs Dairy’s Real Faceoff: $24,000 Quota, 1,434 Lost Herds in Canada–USA Farming

While Canada and the U.S. fight for men’s hockey gold, 1,434 dairy herds are gone, and quotas are at $24,000/kg. Where does your balance sheet land in this faceoff?
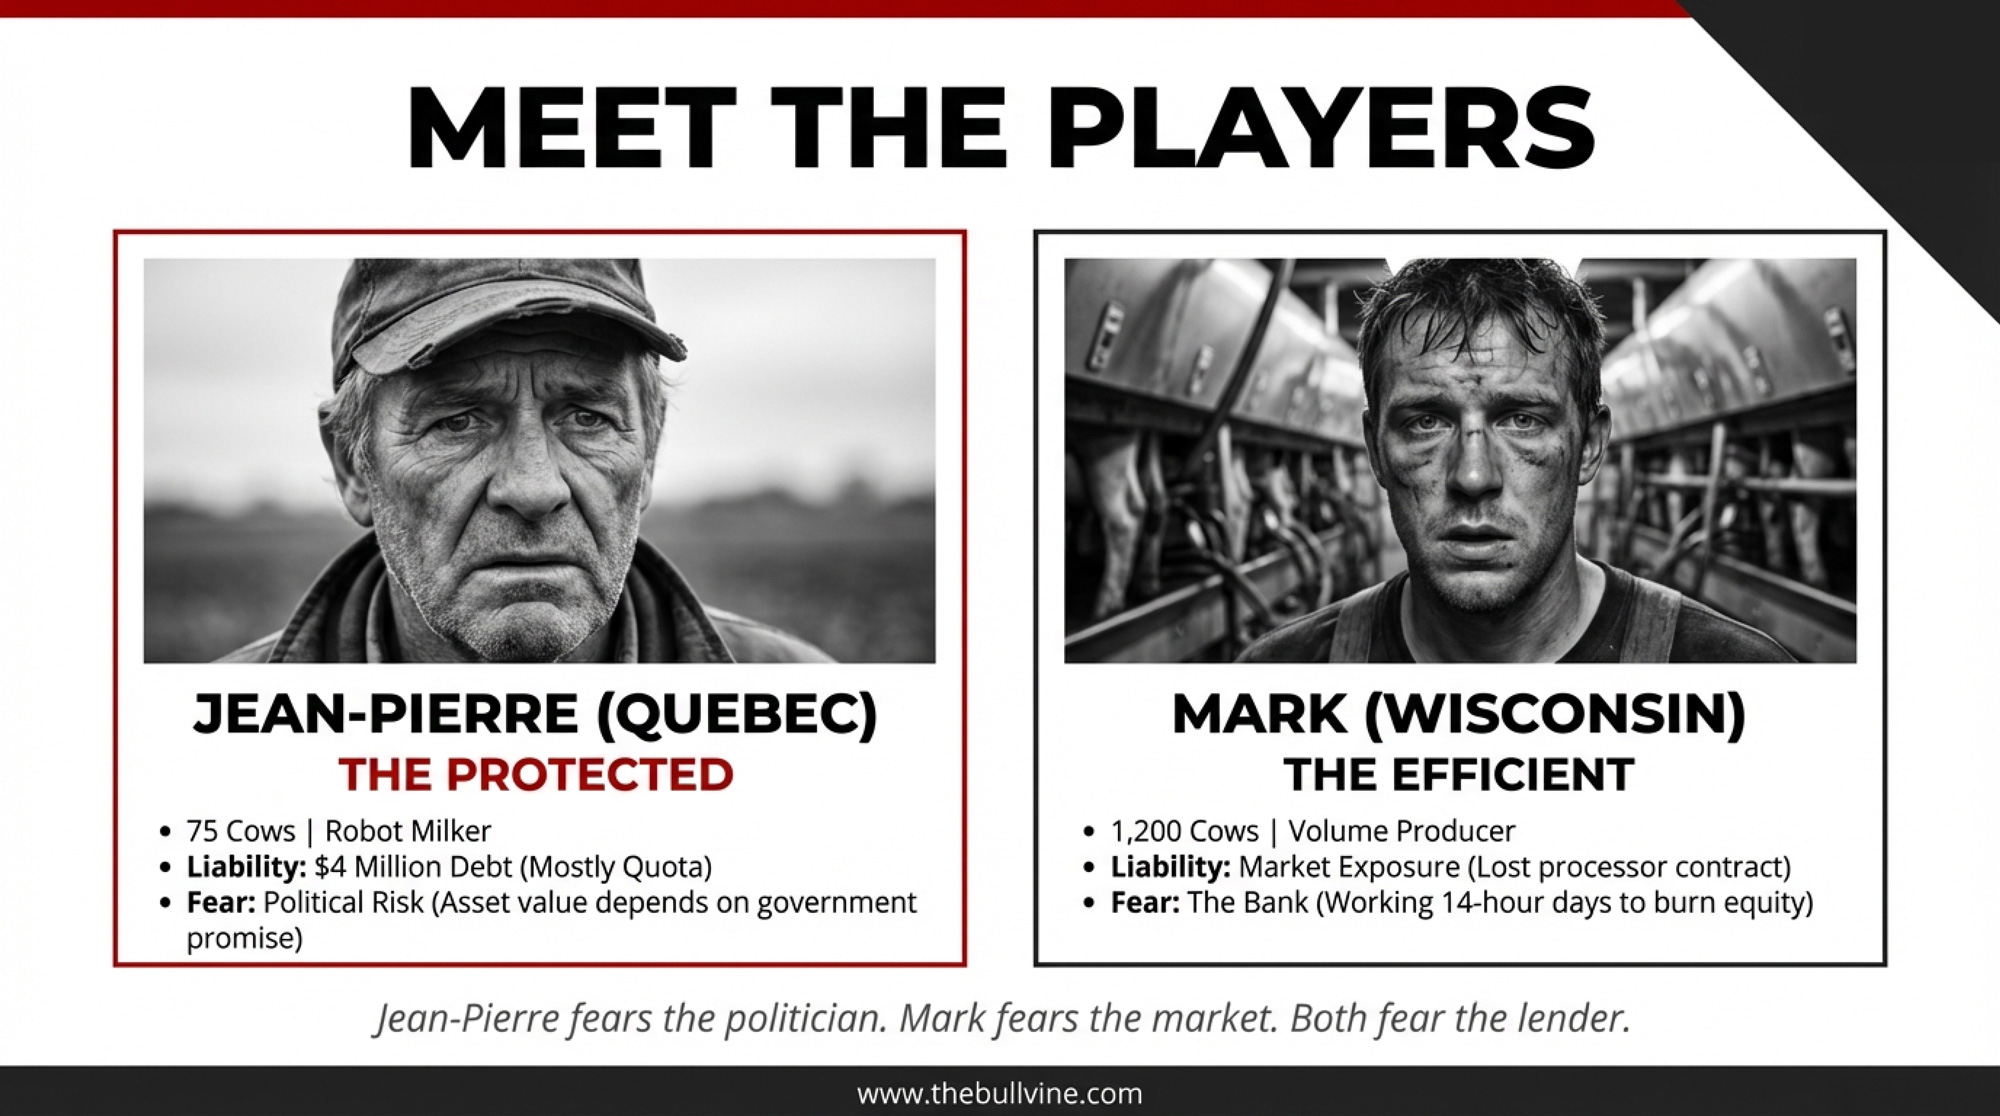
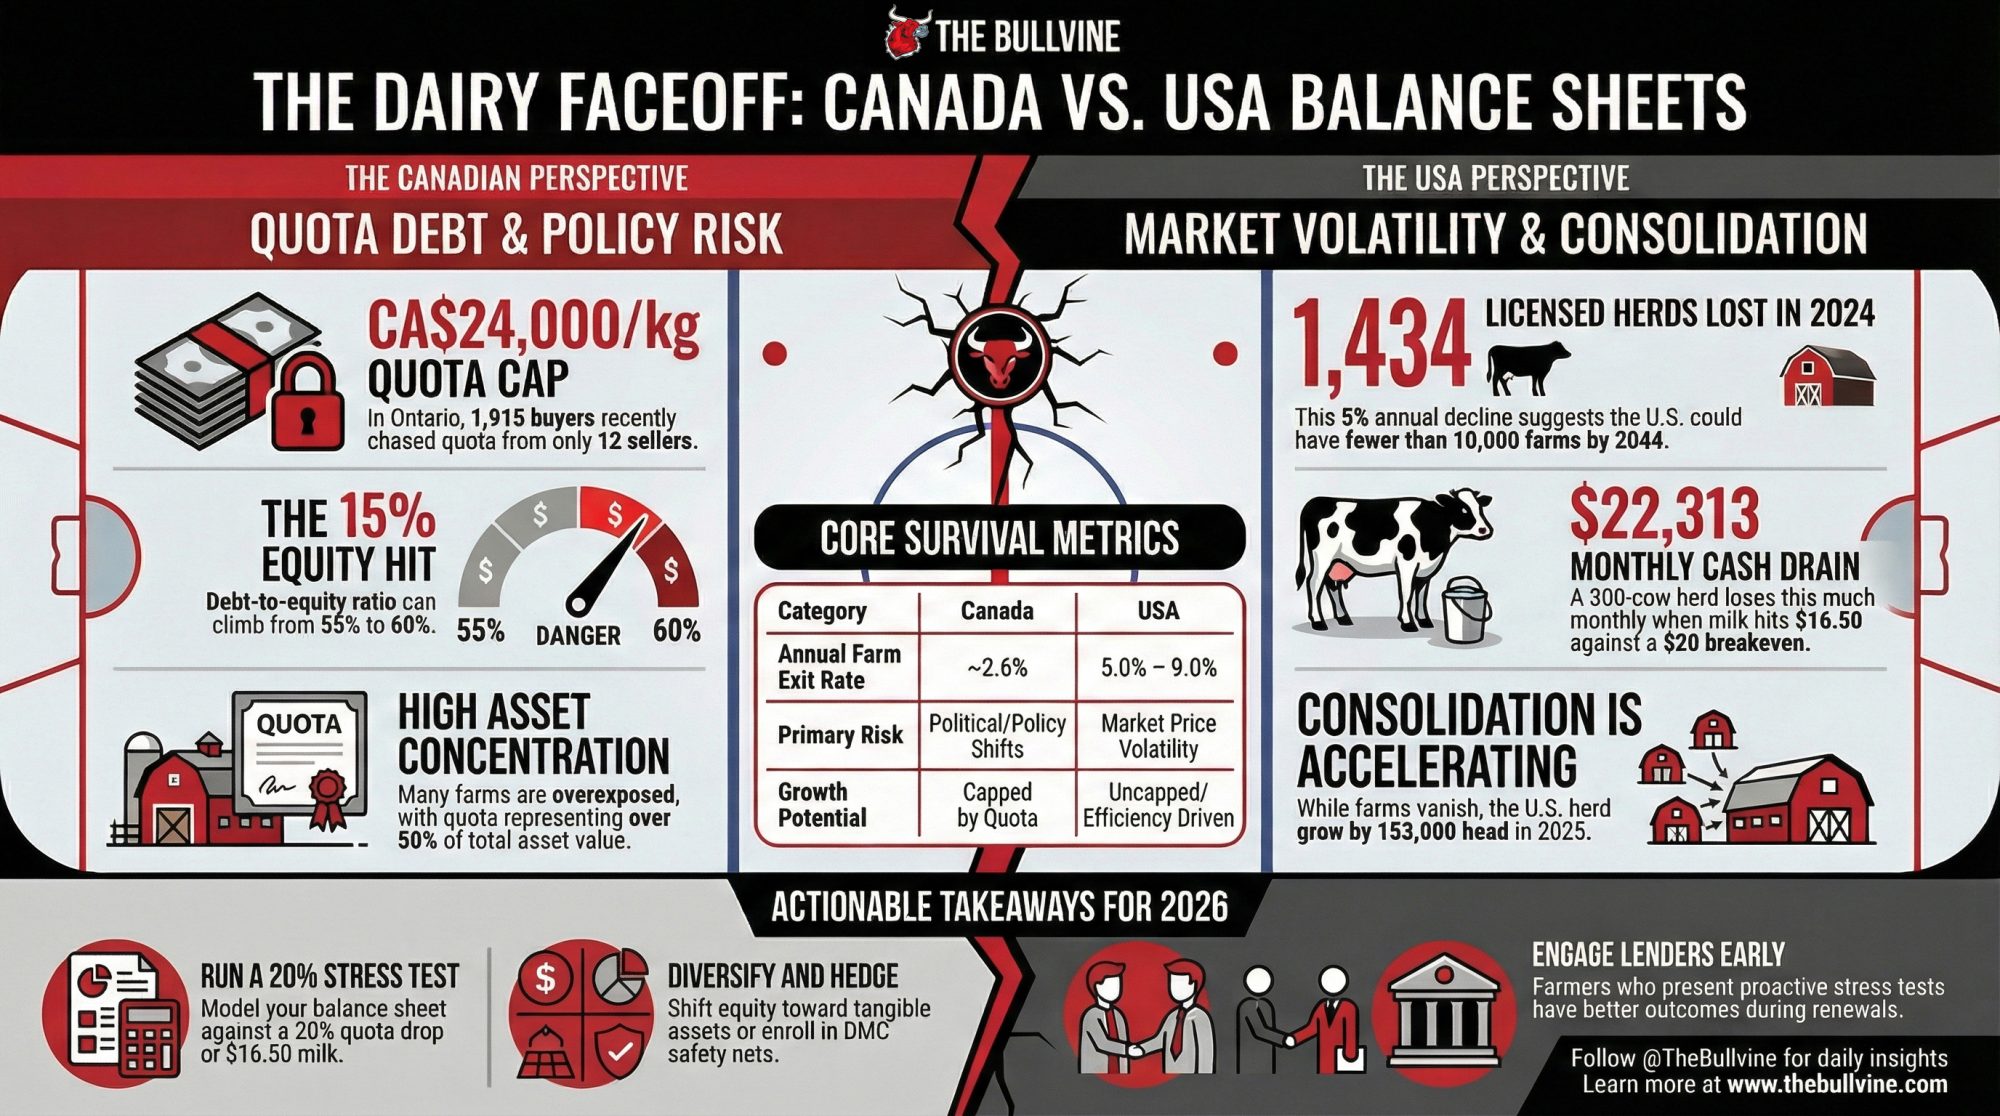
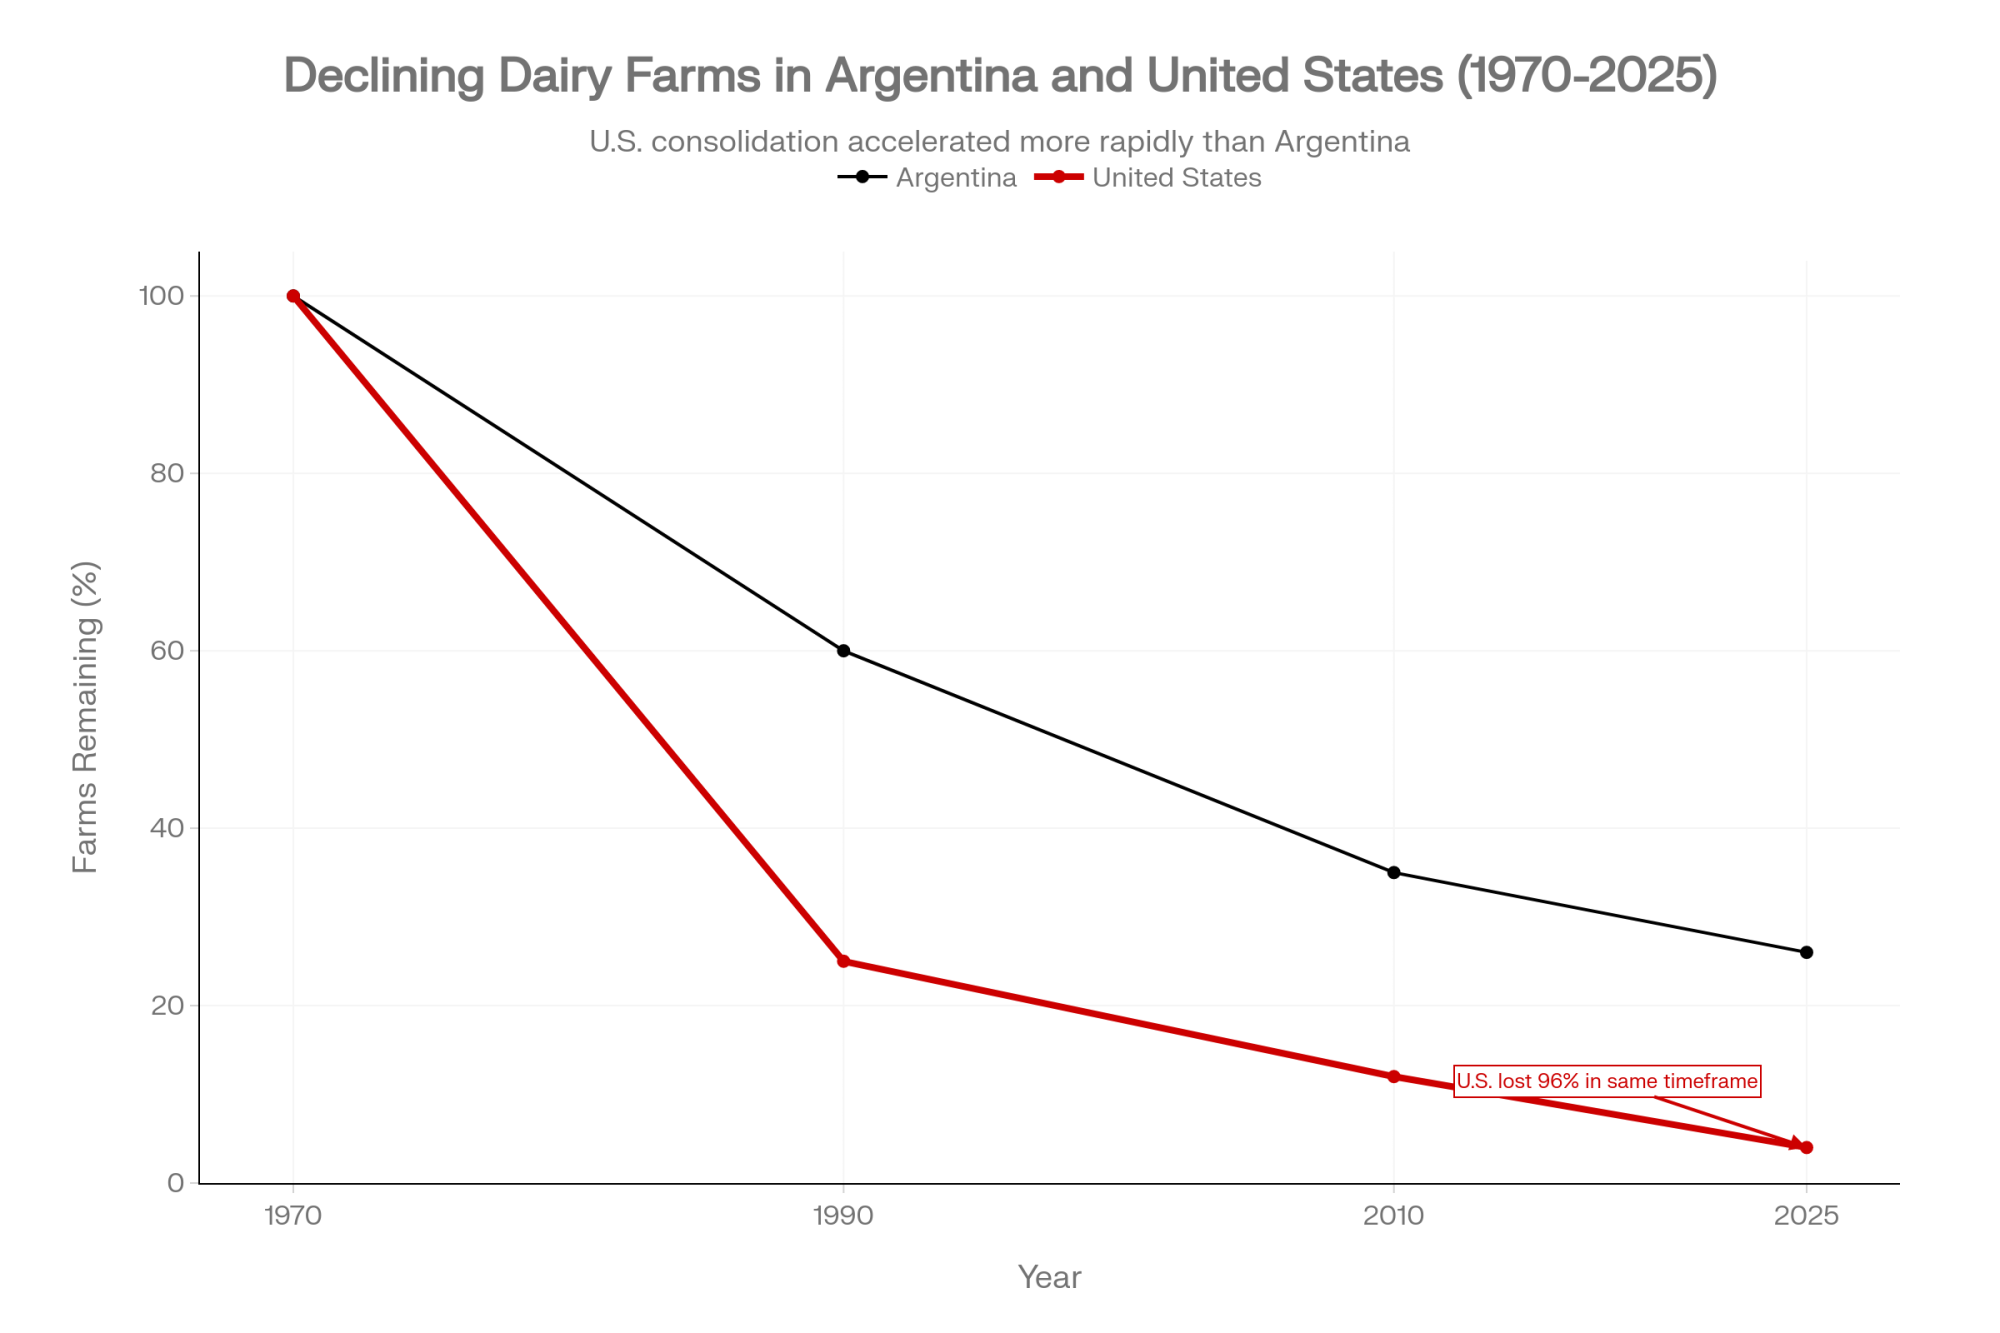
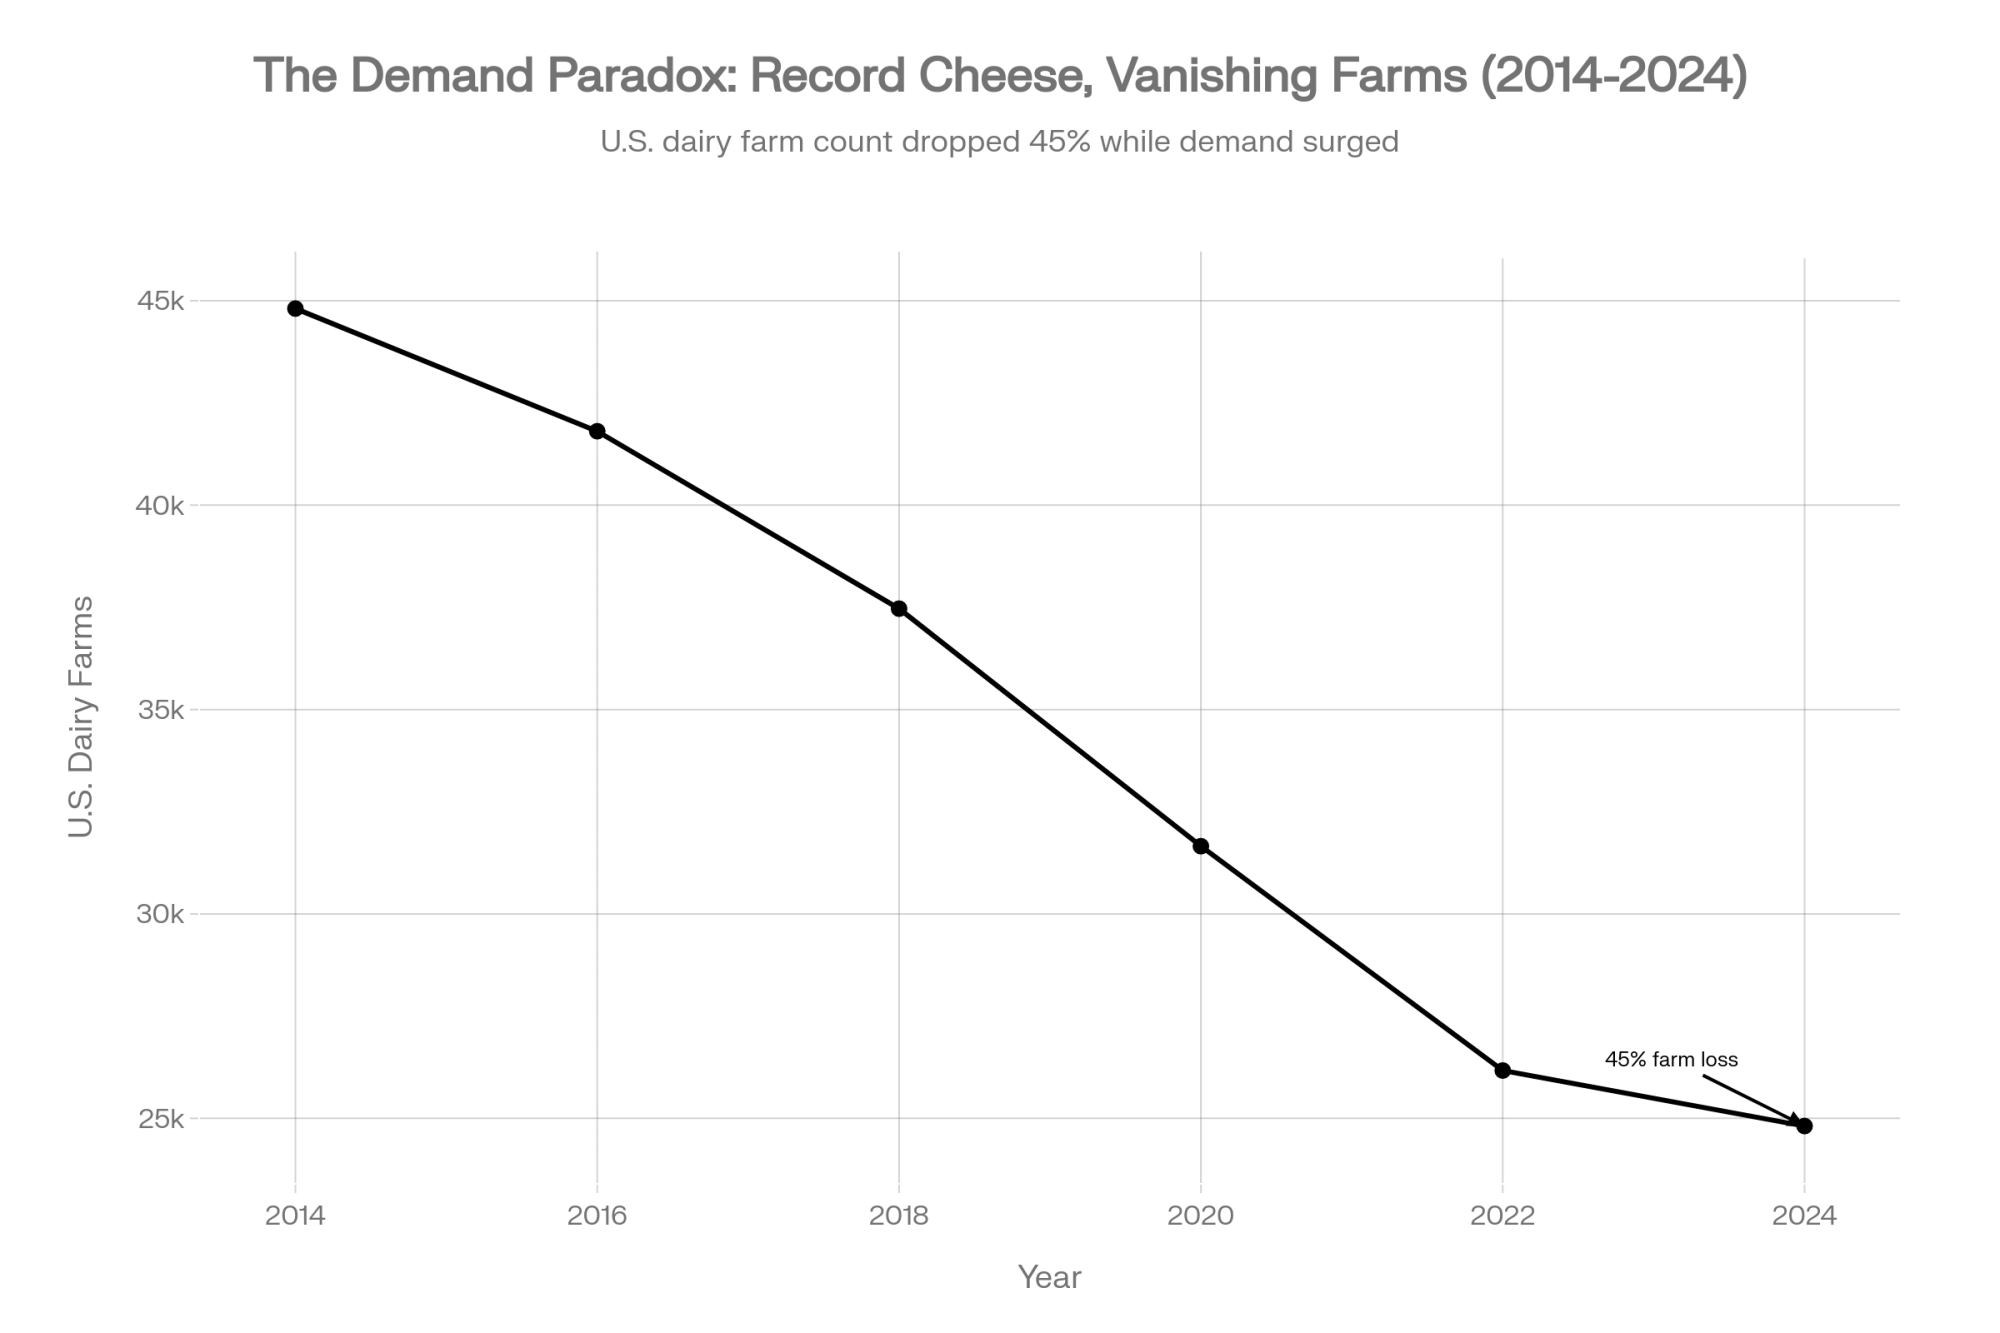
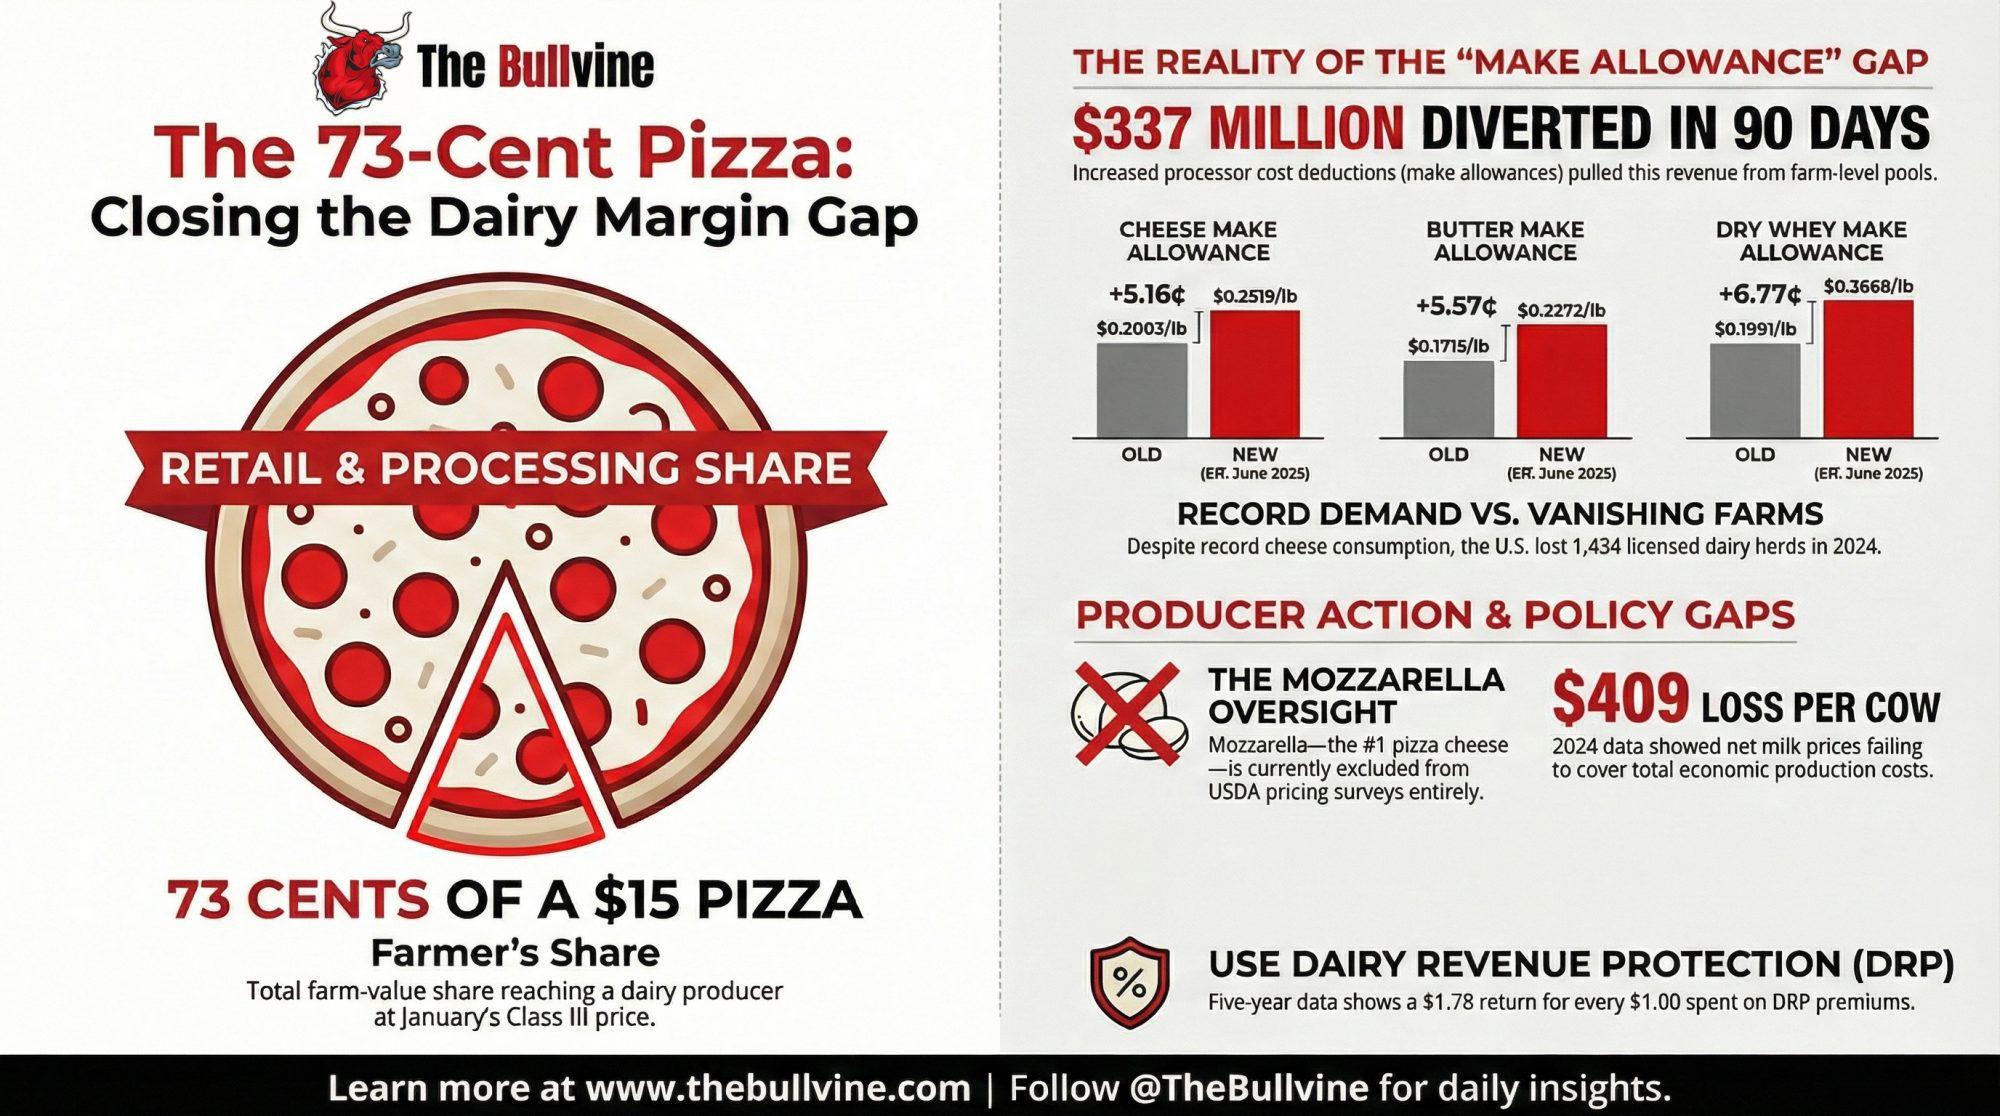
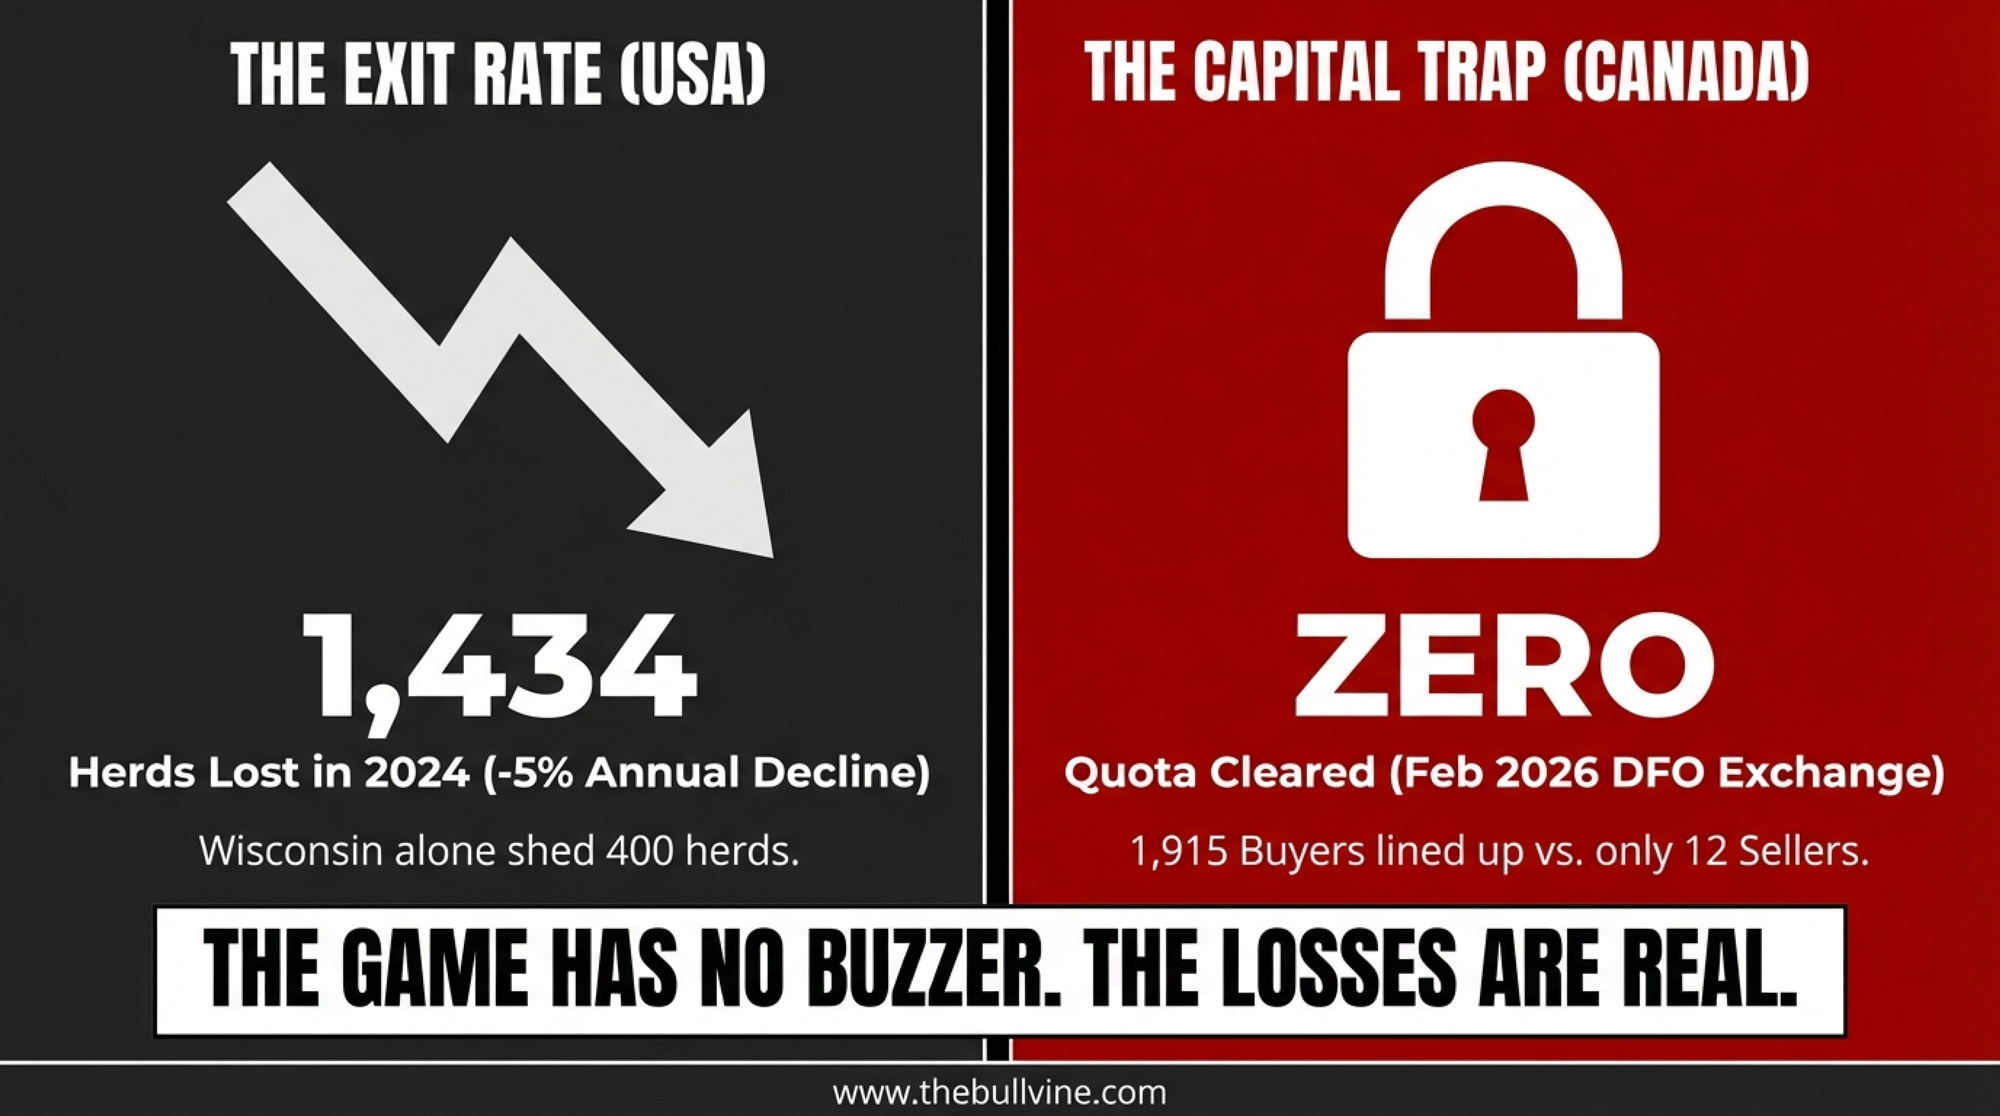
The U.S. lost 1,434 licensed dairy herds in 2024 — a 5% annual decline that dragged the national total to 24,811 operations, with Wisconsin alone shedding 400. At this rate, the country falls below 10,000 dairy farms before 2044. Across the border, Dairy Farmers of Ontario cancelled its February 2026 quota exchange entirely: 1,915 buyers lined up, 12 sellers offered quota, but the system couldn’t clear a single allotment round at the CA$24,000-per-kilogram butterfat cap. 

Year5% Decline Scenario7.5% Decline Scenario
202424,81124,811
202721,00019,800
203018,40015,800
203513,2009,200
20409,5005,300
20447,8003,100

Tomorrow morning, Canada and the U.S. face off for Olympic hockey gold at Milano Santagiulia — 8:10 a.m. ET on NBC. That game lasts sixty minutes. The dairy version of this rivalry has no final buzzer, and the July 1, 2026,USMCA sunset review could rewrite both rule books. 
Five months from the most significant dairy trade reset in a generation, neither system is as healthy as its politicians claim. If you haven’t stress-tested your balance sheet against a 15% equity hit, you’re not being an optimist. You’re a spectator.

Two Rule Books, Same Rink

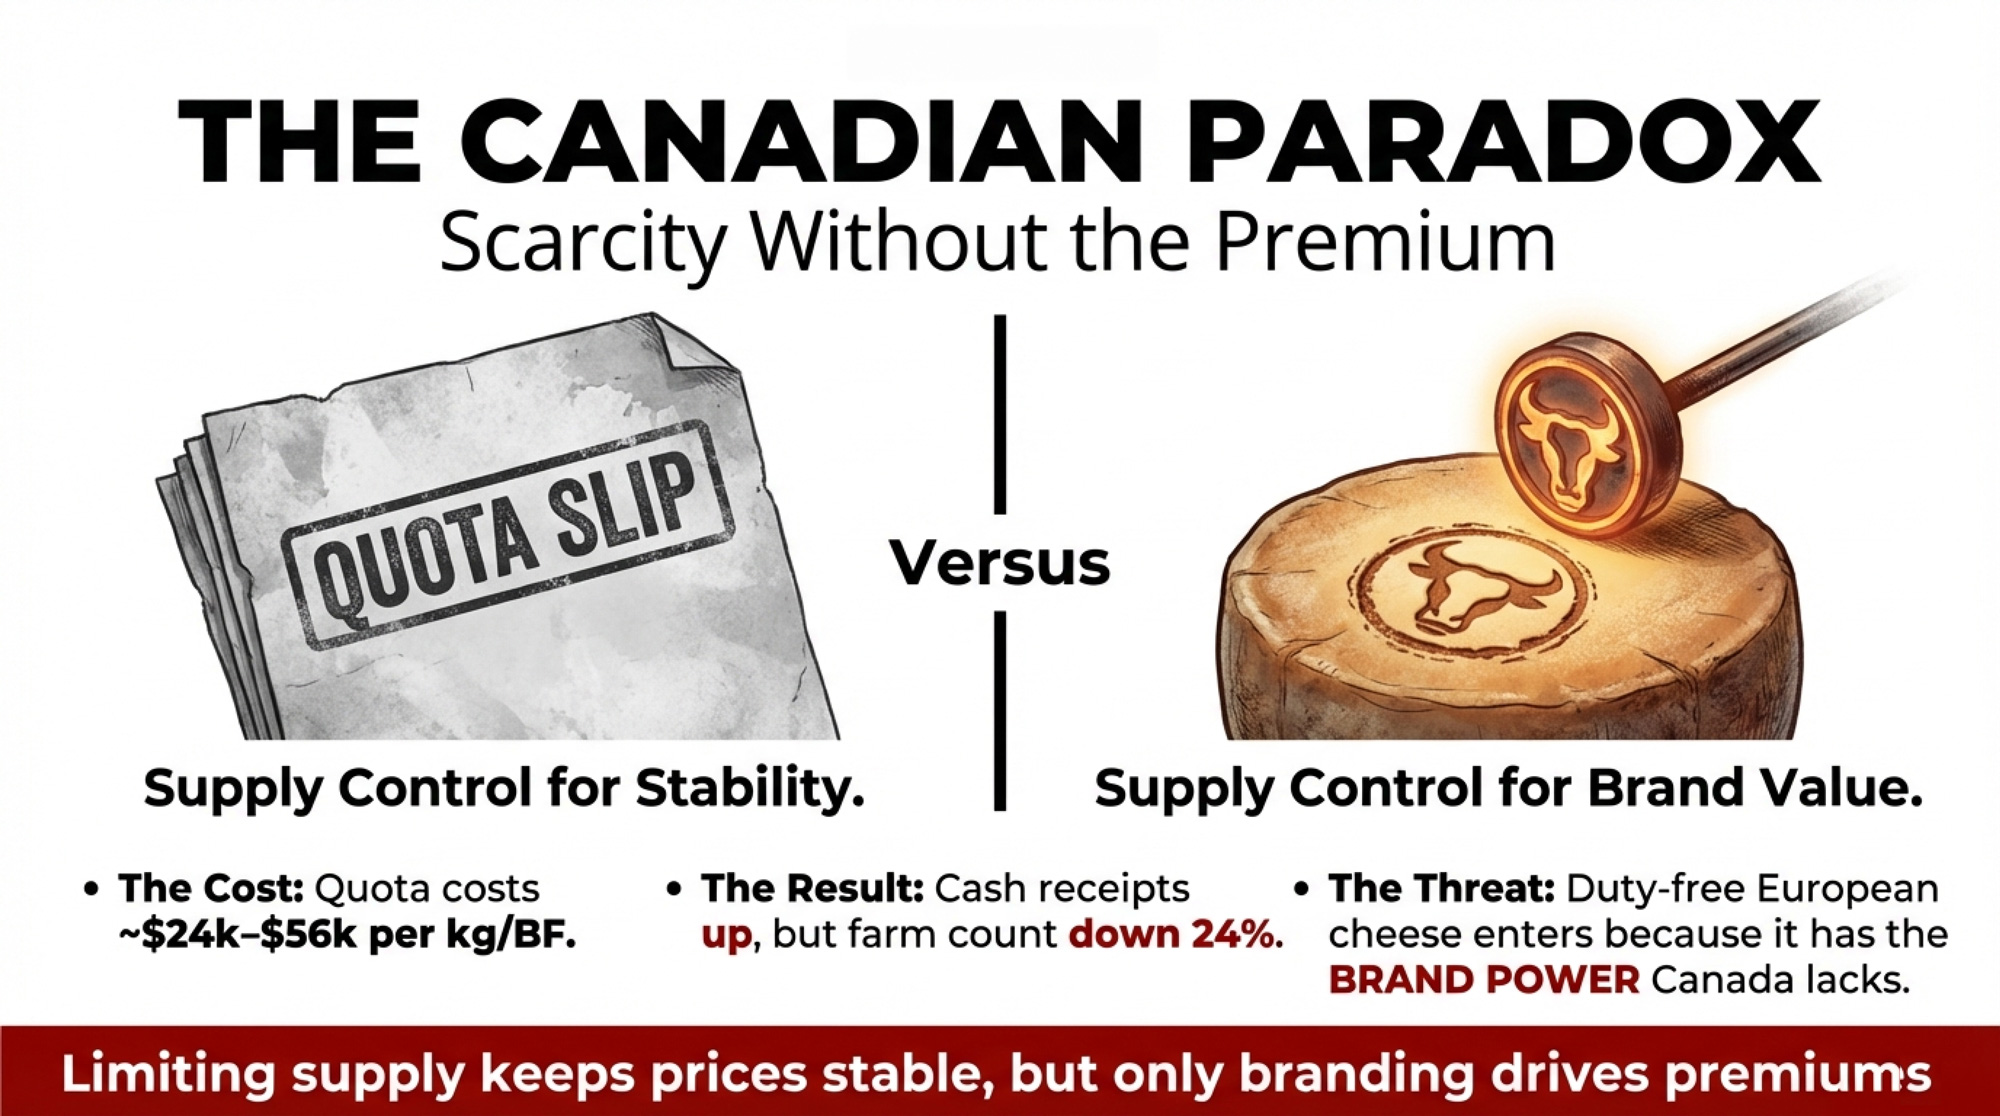
You know the basics, so we’ll keep this tight. Canada runs supply management: production quotas, cost-of-production pricing through the CDC, and import tariffs of 200% to 315%. Your milk cheque is predictable. Your growth is capped. 

The U.S. runs an open market with federal safety nets. Dairy Margin Coverage catches you — partially — when margins collapse. But volume is uncapped. That’s freedom. Until DMC margins crash from $15.57/cwt in September 2024 to $10.04/cwt by November 2025. That’s how fast the floor moves. 

Two operations will carry this story.

In Quebec, call him Jean-Pierre. Seventy-five cows, a modern robot, and CA$4 million in debt — most of it for the quota he bought to bring his son into the business. His milk cheque is high, but the bank takes most of it. One policy change could blow up his balance sheet, because his CA$3 million in quota value isn’t backed by concrete or genetics. A political promise backs it.

In Wisconsin, call him Mark. Twelve hundred cows. An efficiency machine who just lost a processor contract because the plant switched to “dedicated suppliers” from even larger farms. He’s selling milk on the spot market at a loss, hoping DMC payments and a friendly lender bridge the gap. He has freedom — including the freedom to go broke while working 14-hour days.

Jean-Pierre fears the politician. Mark fears the market. Both fear the bank.

MetricJean-Pierre (Quebec)Mark (Wisconsin)
Herd Size75 cows (robot)1,200 cows
Total DebtCA$4.0M (75% for quota)$2.8M (land, equipment, cattle)
Quota Asset ValueCA$3.0M @ CA$24,000/kgN/A
Milk Price StabilityHigh (cost-of-production formula)Volatile ($16.50–$24/cwt swings)
Growth ConstraintCapped by quota availabilityUncapped (if capital/market allow)
Primary RiskUSMCA concessions erode quota valueProcessor consolidation + spot market collapse
Breaking Point15% quota drop → 60%+ debt-to-equity → bank review6 months @ $16.50 milk → $134K equity burn → DSCR < 1.0
Safety NetOttawa compensation (CA$320K over 10 years)DMC Tier I (covers 65% of output)

How Many Farms Are Actually Surviving?

USDA NASS data confirms 24,811 licensed U.S. dairy herds at the end of 2024, down 1,434 (about 5%) from the prior year. Eighty-six percent of those losses hit the Midwest and East — Wisconsin dropped 400 herds, Minnesota and New York combined for another 315, and Pennsylvania lost 90. Rabobank’s North American dairy outlook projected roughly 2,800 U.S. dairy closures for 2025 — a 7–9% annual exit rate through 2027. For context, Agriculture Secretary Brooke Rollins was talking about a “golden age” for dairy that same week. 

The cows aren’t disappearing. They’re consolidating. The February 20, 2026, USDA Milk Production report shows the U.S. averaged 9.50 million head in 2025, up 153,000 from 2024, with average herd size nationally at 377 cows. More milk from fewer farms. The engine doesn’t have a brake pedal. 

Canada’s exit rate runs slower. Agriculture and Agri-Food Canada’s Dairy Sector Profile puts the count at 12,007 farms in 2014 and 9,256 in 2024 — an average annual decline of approximately 2.6%. National average herd size has climbed to 150 cows. But Dalhousie University food economist Sylvain Charlebois co-authored a 2020 report with the University of Guelph’s Simon Somogyi warning that Canada could lose half its dairy farms by 2030 without fundamental supply management reform  — a warning he reiterated in May 2025. The DFO exchange cancellation tells the same story from inside the system: when 1,915 producers want to buy quota, and 12 want to sell, the system isn’t just “protective.” It’s a capital trap with a waiting list

What Does a 15% Quota Drop Mean for Your Balance Sheet?

Here’s where the numbers get personal. Grab a pencil.

The Canadian stress test. Take Jean-Pierre’s 100-cow equivalent Ontario operation. At DFO’s CA$24,000/kg butterfat cap  and approximately 1.25 kg BF daily allocation per cow, his quota represents roughly CA$3 million in asset value. That quota is collateral for the operating line, the land, the robot, and his parents’ retirement. 

Model a USMCA concession that triggers a 15% decline in quota values:

  • Quota asset value drops: CA$3.0M → CA$2.55M (CA$450,000 paper loss)
  • Total farm assets: CA$5.0M → CA$4.55M
  • Total debt: CA$2.75M (unchanged)
  • Equity drops: CA$2.25M → CA$1.80M
  • Debt-to-equity ratio jumps: 55% → 60.4%
  • That crosses Farm Credit Canada’s comfort threshold for operating renewals
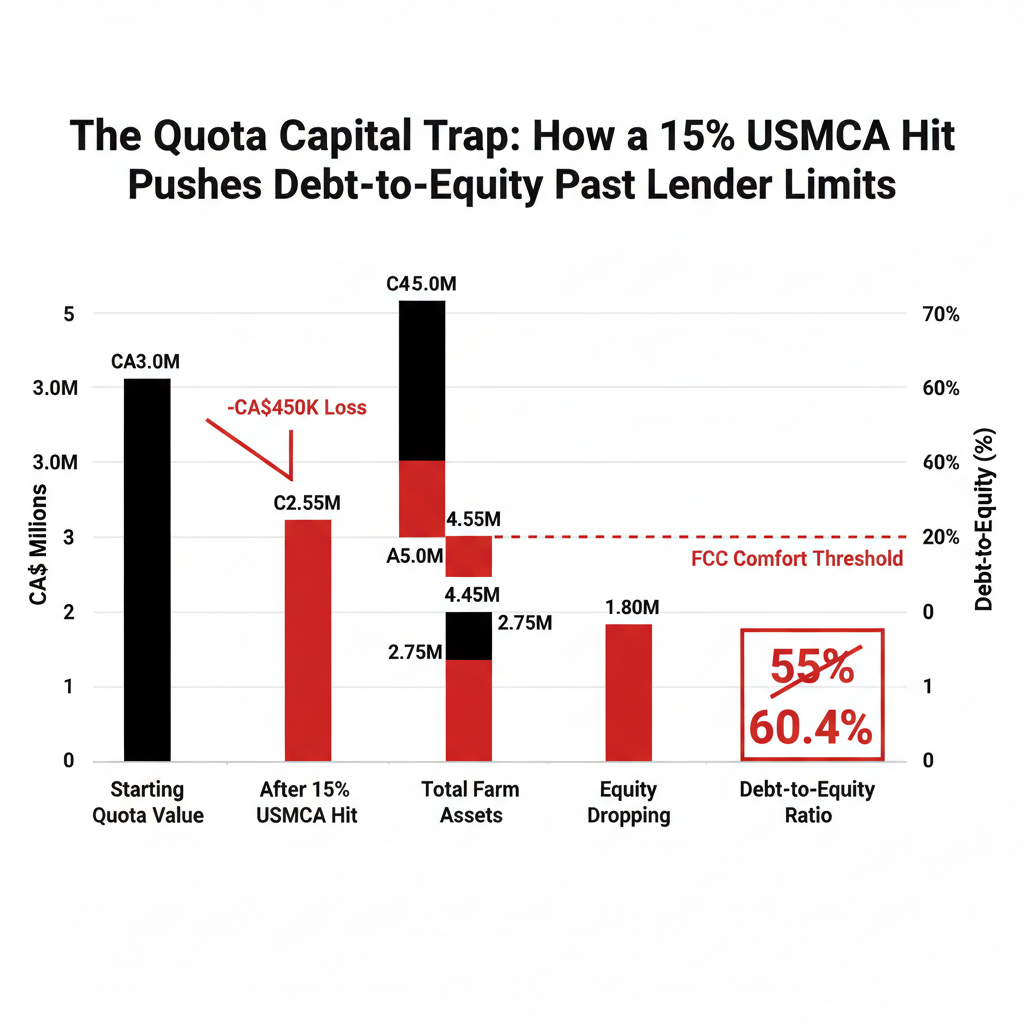
Nobody can assign a probability to this scenario. But if Jean-Pierre hasn’t run it, his lender already has. There’s no futures market for Canadian quota — the succession math just broke, and you can’t hedge against it.
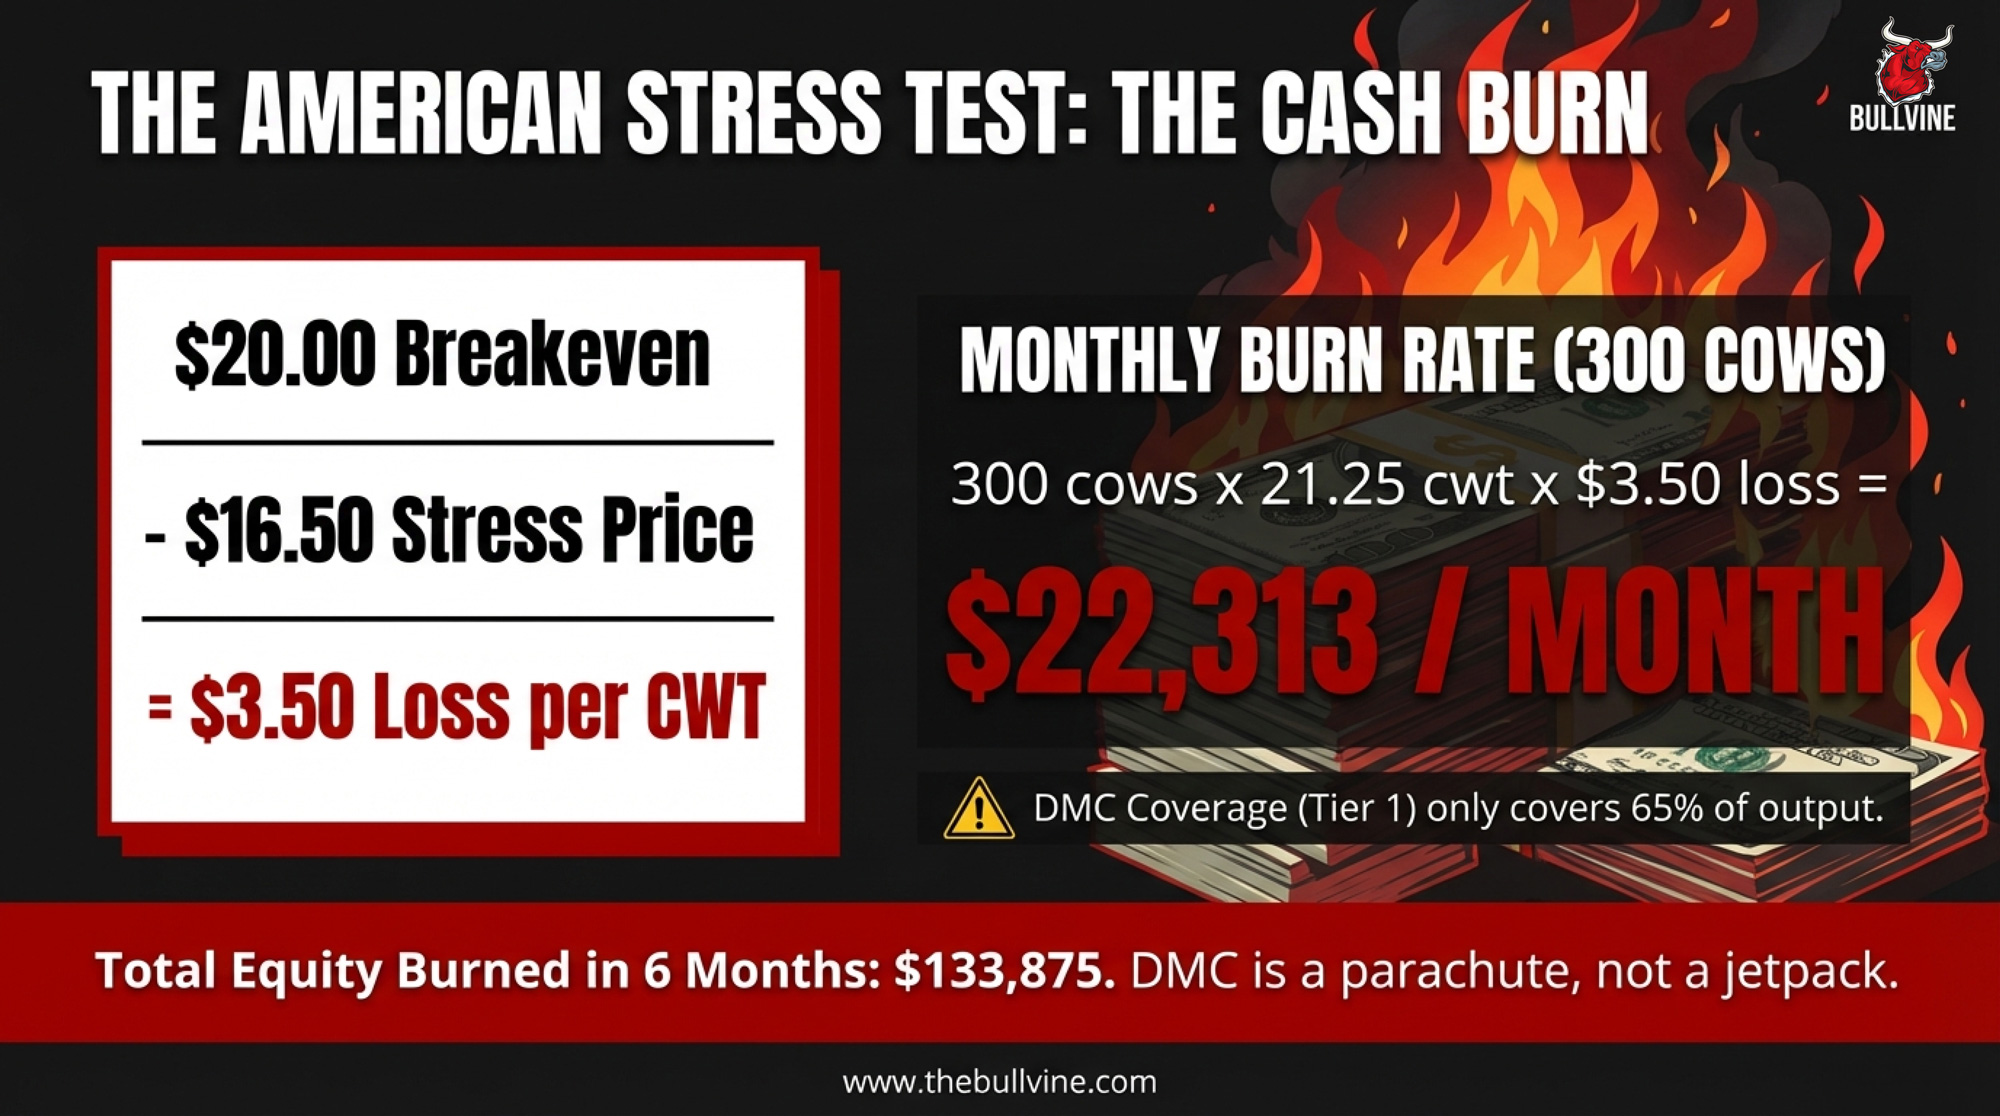
The American stress test. Take Mark’s 300-cow equivalent herd. USDA puts Wisconsin’s average at roughly 25,493 lbs/cow annually  — call it 2,125 lbs/cow per month, or 21.25 cwt. The University of Wisconsin–Madison Extension’s July 2025 dairy enterprise budget puts the cost of production in the range of $18.68 to $21.50/cwt. Midpoint: ~$20/cwt. Now stress at $16.50 milk: 

  • 300 cows × 21.25 cwt/month = 6,375 cwt monthly output
  • $20.00 breakeven − $16.50 = $3.50/cwt gap
  • 6,375 × $3.50 = $22,313/month cash drain
  • DMC Tier I at 5M lbs covers ~4,167 cwt/month — 65% of Mark’s output
  • Remaining 2,208 cwt fully exposed: $7,728/month uncovered loss
  • Six months at the full rate burns $133,875 in equity
MonthMonthly Cash DrainCumulative Equity Loss
1$22,313$22,313
2$22,313$44,626
3$22,313$66,939
4$22,313$89,252
5$22,313$111,565
6$22,313$133,878

Mark’s lender is already running these numbers. If his DSCR falls below 1.0, the conversation shifts from “renewal” to “exit planning.”

Your turn: [your herd size] × [your cwt/cow/month] × [gap between your breakeven and stress price] = monthly cash exposure. If six months of it exceeds your liquid reserves, you’ve got a decision to make before the market makes it for you.

What Does USMCA 2026 Mean for Your Milk Cheque?

When Idaho dairyman Ted Vander Schaaf told the U.S. Senate Finance Committee on February 12 that the USMCA’s foundation depends on Canada following through on its dairy commitments, Jean-Pierre wasn’t watching C-SPAN. He was doing morning chores. But the testimony was about his CA$3 million. 
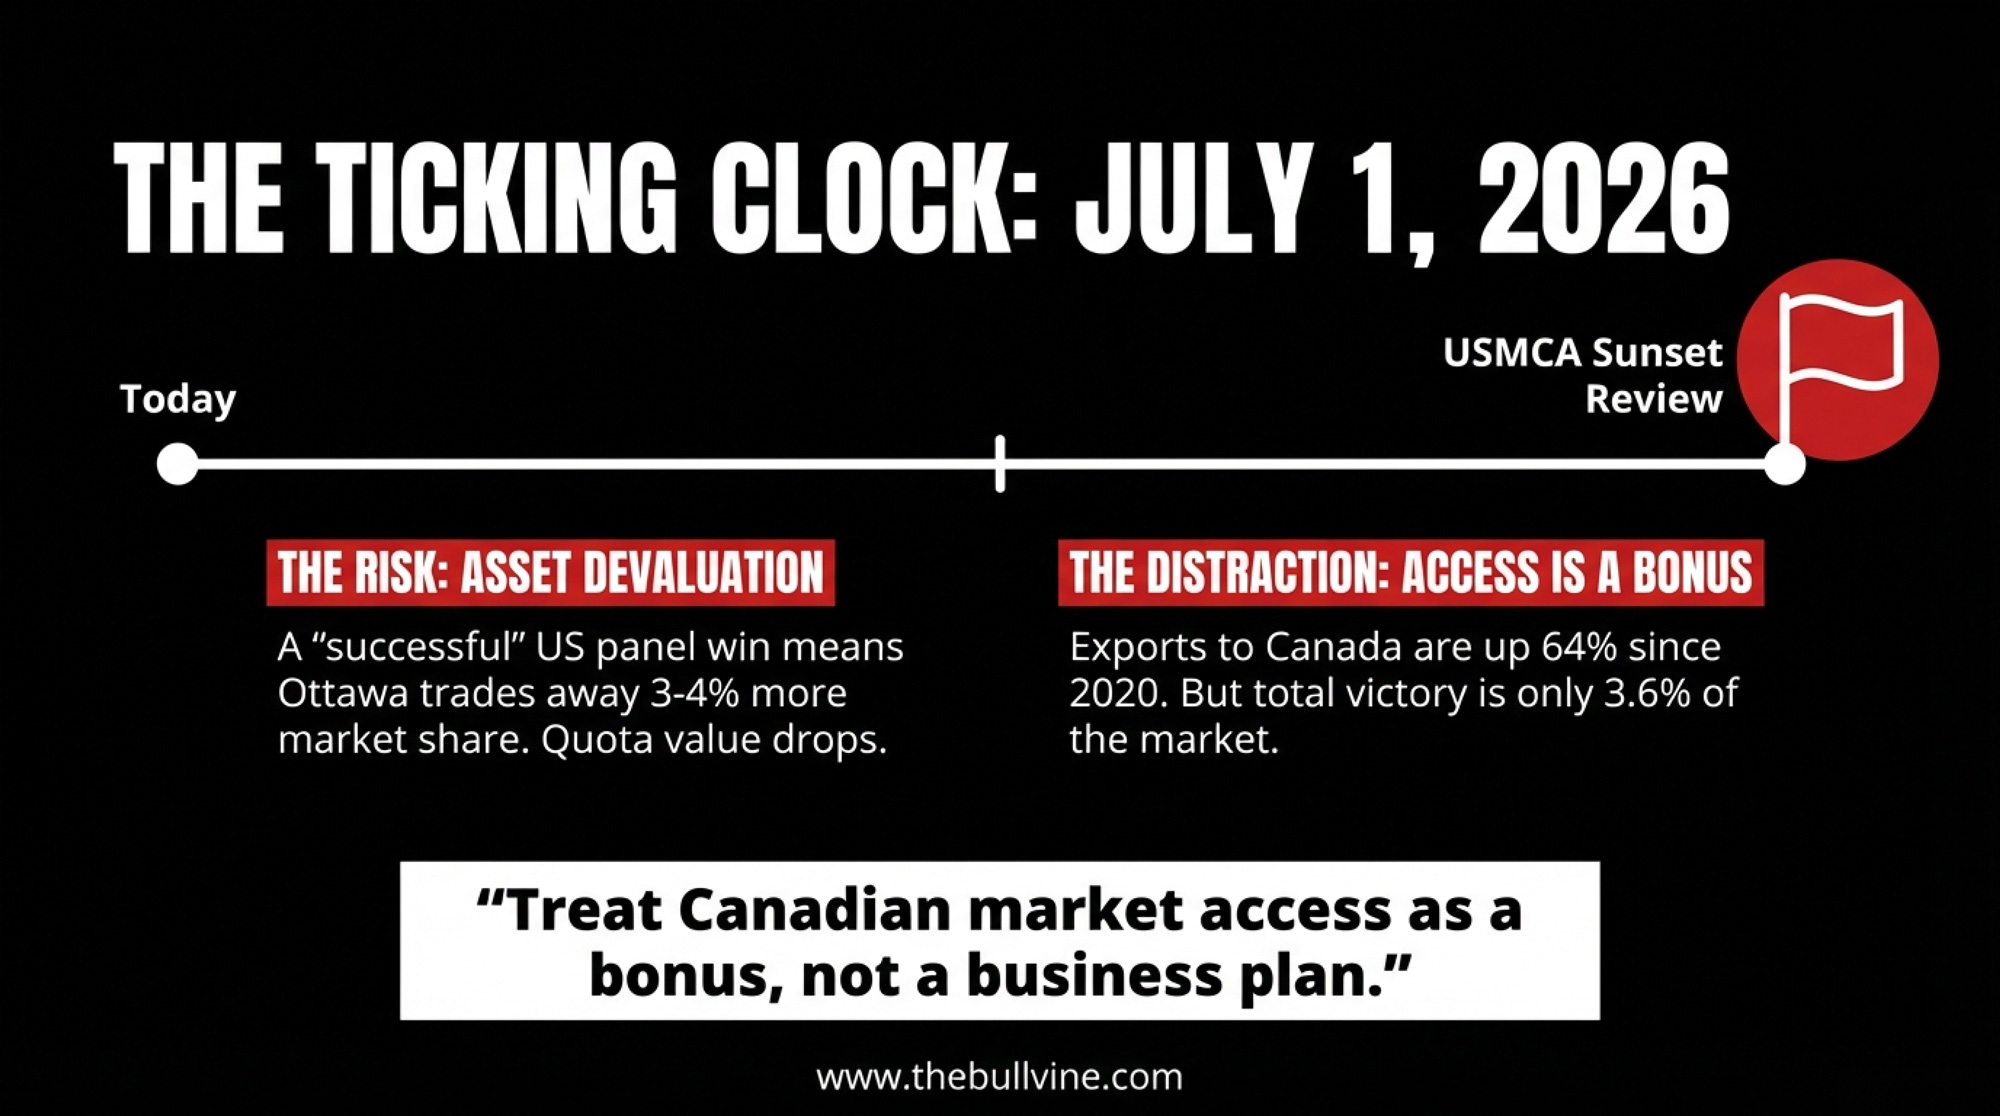
Here’s what the trade data shows. U.S. dairy exports to Canada topped $1.2 billion through the first 11 months of 2025 — up 11% from 2024 and 64% higher than 2020. America is already selling plenty of dairy into Canada, despite the rhetoric. The central U.S. complaint: Canada allocates 85–100% of its tariff-rate quotas to Canadian processors—the companies with the least incentive to import American competition. Average TRQ fill rates: just 42% across key categories. 

Congressional pressure is bipartisan and escalating. In December 2025, Rep. Jim Costa led 74 members of Congress in pushing USTR to hold Canada accountable. On February 5, USDEC and NMPF co-launched the Agricultural Coalition for USMCA. 

Every percentage point of additional access erodes the structural guarantee that makes Jean-Pierre’s quota valuable. DFC president Pierre Lampron called the original USMCA signing “a dark day in the history of dairy farming in Canada” on November 30, 2018. Since then, Ottawa has committed CA$2.95 billion in direct compensation to dairy producers — CA$1.75 billion for concessions under CETA and CPTPP (disbursed between 2019–20 and 2022–23) and CA$1.2 billion for CUSMA (being disbursed from 2023–24 through 2028–29), according to Agriculture and Agri-Food Canada’s Dairy Direct Payment Program. That works out to roughly CA$320,000 per farm spread over a decade. It was an admission that concessions cause real financial damage. The question for 2026 isn’t whether more damage is coming. It’s how much, and whether the next round covers the gap between what Jean-Pierre’s quota was worth on June 30 and what it’s worth on July 2. 

For Jean‑Pierre, a “successful” U.S. panel win looks like Ottawa trading away 3–4% more of his home market so Mark can ship more powder north — and his banker quietly repricing that CA$3 million quota.

For Mark, more Canadian access is a bonus, not a lifeline. Even if U.S. negotiators win everything they want, 3.6% of the Canadian market is a small number against 225.9 billion pounds of domestic production. Don’t build a business plan around it. 

The Invisible Cost Neither System Budgets For

Dr. Andria Jones-Bitton’s survey of 1,132 Canadian farmers, conducted in 2015–16 and published in Social Psychiatry and Psychiatric Epidemiology in 2020, found 45% reported high stress, 57% met criteria for anxiety classification, and 35% for depression — all far above the general population. Her pandemic follow-up found every metric worsened. Jean-Pierre’s stress is capital-weighted — a multi-million-dollar asset controlled by politicians he can’t lobby. Mark’s is market-weighted — chronic price swings and the knowledge that 1,434 operations vanished last year. Neither system budgets for this, but both pay for it — in burnout, in broken families, in farms that go dark. 

If you’re struggling: Farm Aid 1-800-FARM-AID | 988 Suicide & Crisis Lifeline | Do More Ag Foundation (Canada)

Canada vs USA Dairy Farming: Which System Wins?
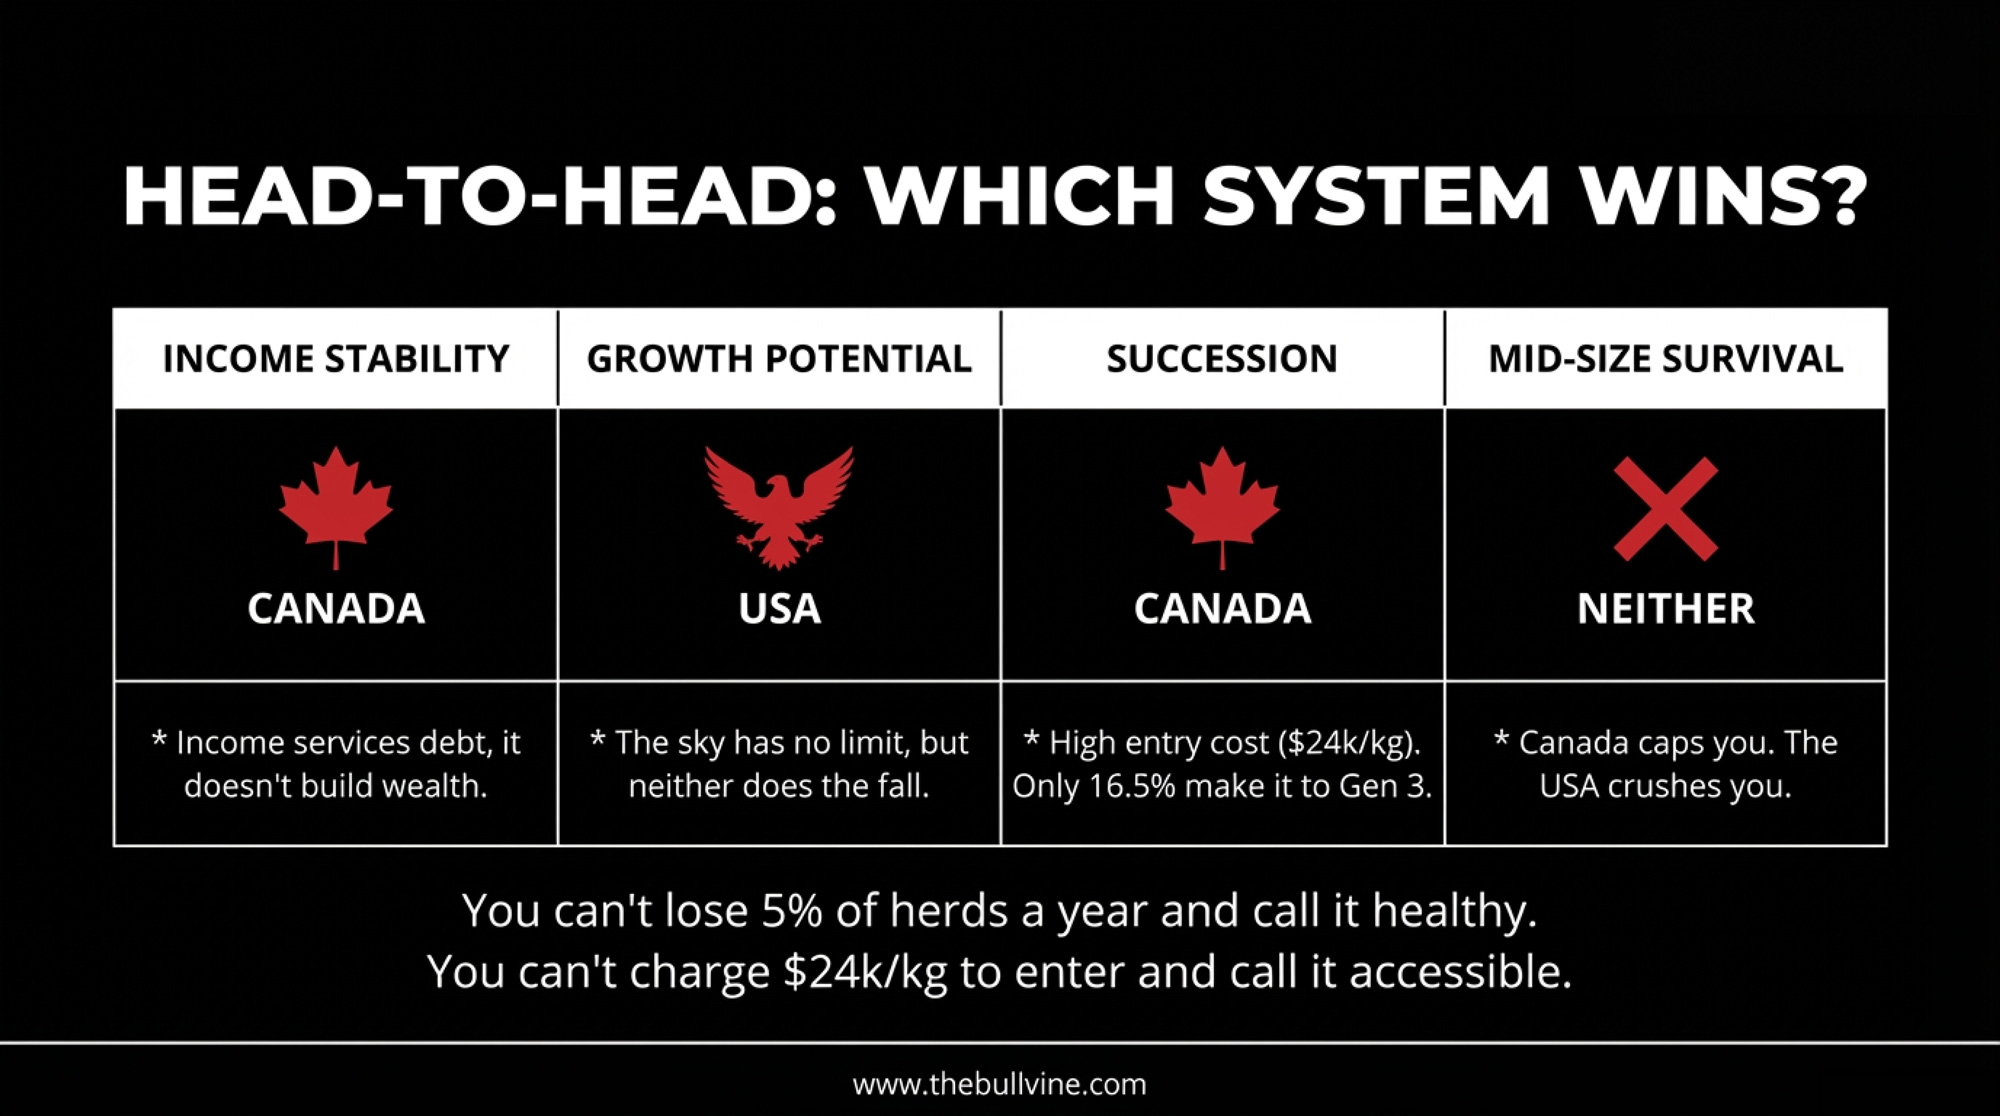
If Jean-Pierre and Mark sat down with this table, here’s what each would circle first:

CategoryEdgeThe Asterisk
Income StabilityCanadaJean-Pierre’s “stable income” services CA$24,000/kg debt — it doesn’t build wealth 
Growth PotentialU.S.Mark’s sky has no limit. Neither does the fall  
Entry for Young FarmersU.S.No quota to buy. But you’re entering a market, losing 5–9% of participants per year  
SuccessionCanada98% of Canadian dairy farms are family-owned and operated, per DFC’s 2025 pre-budget submission. But 88% lack a formal written succession plan, and only about 16.5% of family farms make it to a third generation  
Trade Policy RiskU.S.(lower)Mark’s operation isn’t collateralized on a political construct.
Mid-Size SurvivalNeitherCanada caps you. The U.S. crushes you. Both bleed the middle.

The Canadian system is arguably superior for preserving a mid-sized family farm that already exists. It creates a stable, middle-class existence for 9,256 families. The U.S. system is superior for the entrepreneur who can stomach the casino. 

But you can’t lose 5% of your farms every year and call it “healthy”. And you can’t charge CA$24,000 per kilogram for the right to milk a cow and call it “accessible”. Both systems are aging out — just at different speeds and for different reasons. 

What This Means for Your Operation

If you milk in Canada (Jean-Pierre’s playbook):

  • 30 days: Run three balance-sheet scenarios through FCC’s calculator — current quota value, minus 10%, minus 20%. If the minus-20% scenario pushes your debt-to-equity above 0.60, you need a contingency plan before Ottawa sits down at the table.
  • 90 days: If the quota represents more than 50% of your total asset base, you’re overexposed to a single political construct. Start shifting equity toward land, equipment, or off-farm investments. The trade-off is real: diversification capital competes with quota debt service. But the concentration risk is worse.
  • 365 days: Get involved in producer organizations ahead of the USMCA talks. Don’t let the November 2023 panel victory create complacency. The sunset clause is a reset button, not a renewal.

If you milk in the U.S. (Mark’s playbook):

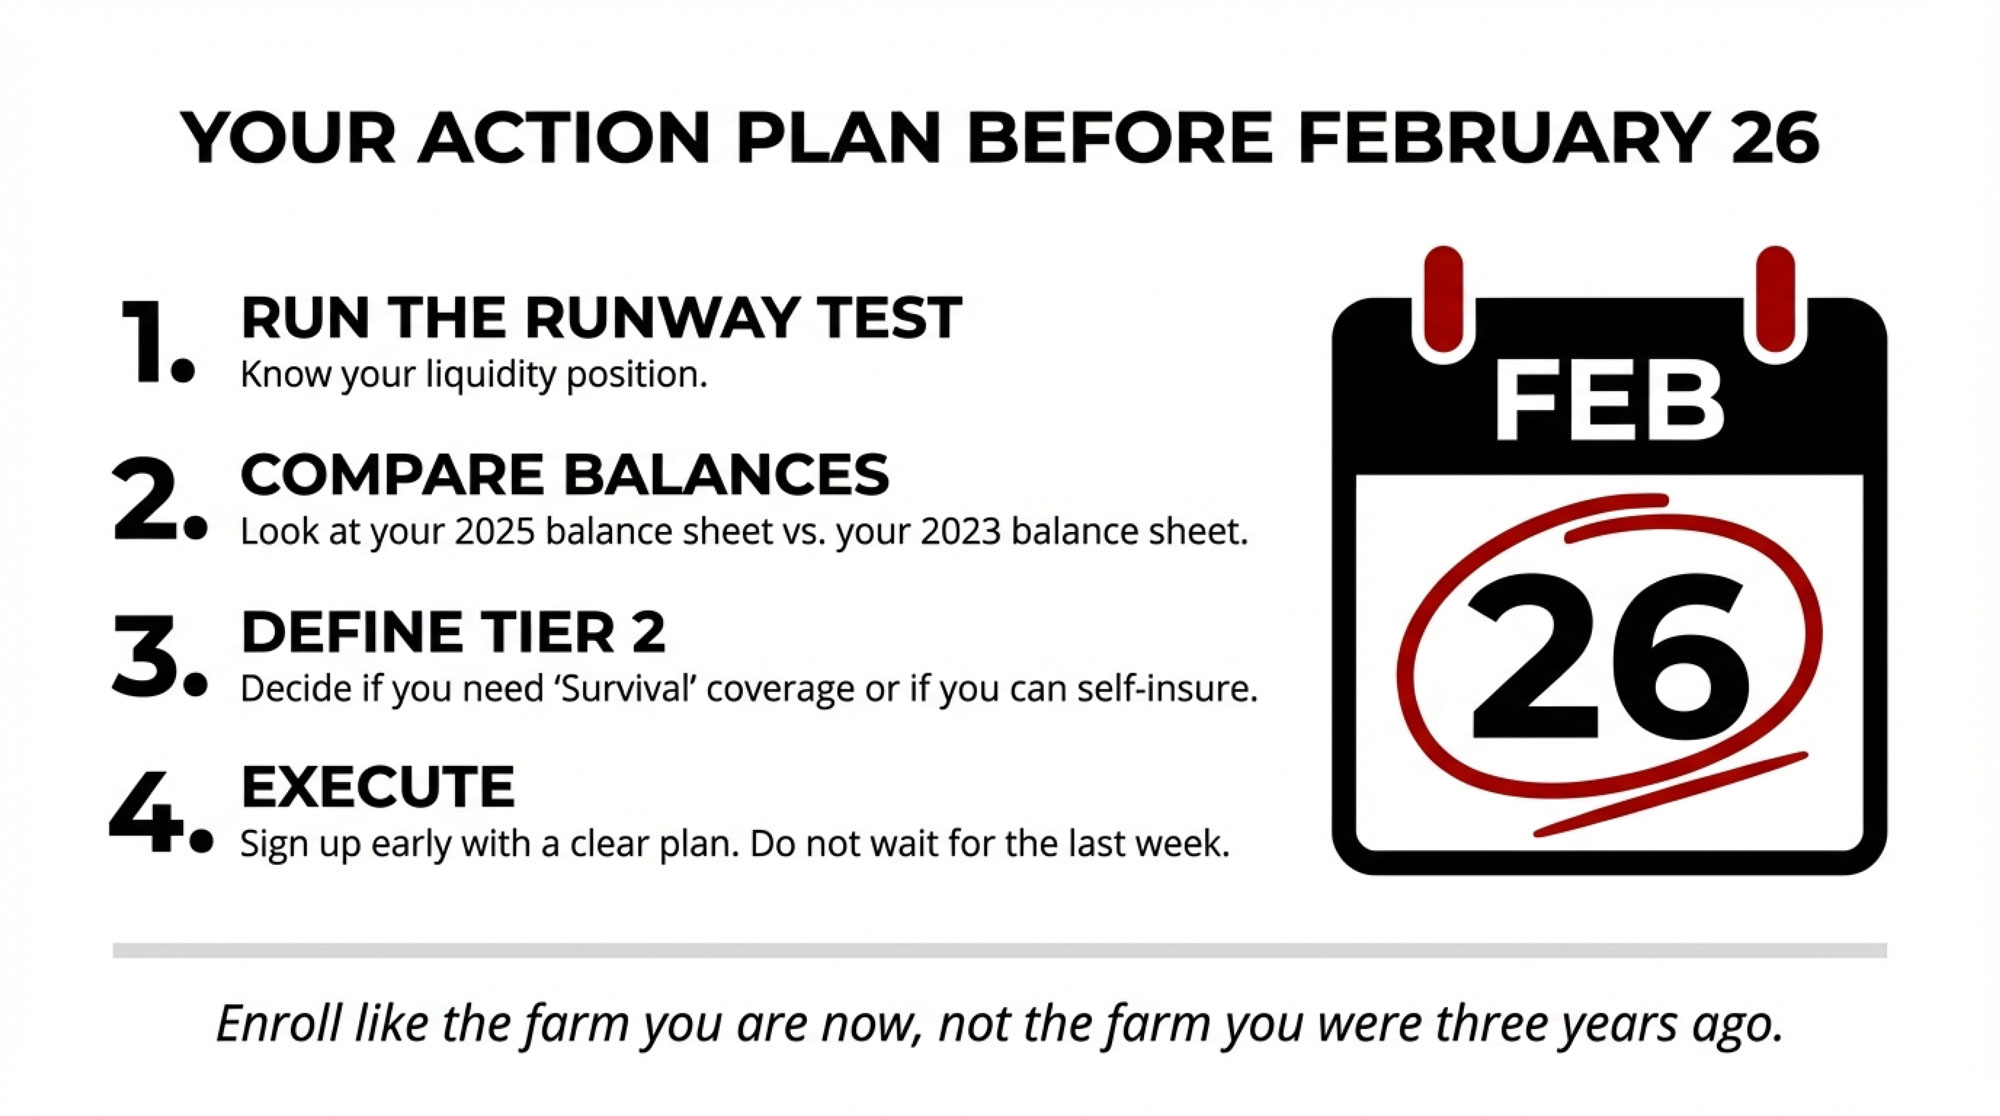
  • 30 days: Enroll in DMC by February 26. The production history reset and higher Tier I cap change the math for every herd under 350 cows. The trade-off: Tier II coverage gets expensive for larger herds, and the 5M-lb Tier I cap still leaves Mark’s remaining output exposed. Model it anyway. 
  • 90 days: If your all-in cost of production exceeds $20/cwt and your DSCR sits below 1.15, you’re one 90-day price dip from an exit conversation. Run the number now. Review processor contract renewal terms — if yours expires before December, negotiate before July 1, as leverage dynamics change. 
  • 365 days: Treat Canadian market access as a bonus, not a business plan. Invest in what you can control: efficiency, milk quality, risk management, and genetics aimed at the component premiums processors are chasing.

If you milk on either side:

  • Watch the ITC report on Canadian dairy protein — expected March 2026, four months before the USMCA decision. It sets the tone. 
  • Talk to your lender. Now. Not when you’re in trouble. The farmer who walks in with a stress test gets a different conversation than the one who gets called in.
TimeframeIf You Milk in Canada 🇨🇦If You Milk in USA 🇺🇸Both Systems
30 DaysRun 3 balance-sheet scenarios (current, −10%, −20% quota value). If −20% pushes debt-to-equity >60%, you need a plan nowEnroll in DMC by Feb 26. Model Tier I production history reset vs costStress-test your actual breakeven. Stop guessing.
90 DaysIf quota = >50% of total assets, you’re overexposed to a political construct. Start shifting equity to land/equipment/off-farmIf cost of production >$20/cwt and DSCR <1.15, you’re one 90-day price dip from exitTalk to your lender NOW—before you’re in trouble
90 DaysGet involved in producer orgs before USMCA talks. Panel victory ≠ complacencyReview processor contract terms if yours expires before Dec. Negotiate before July 1Watch the March ITC report on Canadian dairy protein—it sets the tone
365 DaysDiversification capital competes with quota debt service, but concentration risk is worseTreat Canadian access as bonus, not business plan. Invest in efficiency, quality, geneticsNeither government has your back. Plan accordingly.
365 DaysDon’t let July 1 sunset clause sneak up on you—USMCA is a reset button, not auto-renewalProcessors are chasing component premiums—breed for what they’ll pay for, not what they paid forThe rules change July 1. Your balance sheet needs to work on July 2.

Key Takeaways

  • If you’re in Canada, a 10–15% quota value hit in the 2026 USMCA review can push your debt‑to‑equity from the mid‑50s into the 60s fast — run those scenarios now.
  • If you’re in the U.S., six months of $16.50 milk on a $20/cwt breakeven can burn well over $100,000 in equity on a 300‑cow herd, even with DMC — your DSCR needs to be safely above 1.15.
  • When the quota is more than 50% of your total assets, or your lender already flags leverage, you’re overexposed to forces you don’t control on either side of the border.
  • Treat extra Canadian market access as found money, not a business plan, and treat current quota values as political, not permanent — both systems reward those who stress‑test and adjust early.
  • The men’s hockey gold medal game ends Sunday; the real Canada–USA faceoff is whether your balance sheet still works on July 2 if the rules or the milk price move against you.

The Real Gold Medal

The jerseys come off tomorrow. The medals get boxed. The hashtags fade.

But Jean-Pierre will still walk into his Quebec barn at 4:30 a.m. on Monday, servicing CA$4 million in debt on a political promise that expires in 131 days. And Mark will still be milking 1,200 cows in Wisconsin on the spot market, watching his equity burn at $22,313 a month while waiting for a rally that may not come before his lender’s patience runs out.

Both are betting entire family histories on systems that haven’t been tuned since the last time the border was this tense. The real win isn’t a gold medal. It’s making sure there are still farm families on both sides with enough skin in the game when the next generation drops the puck.

Start with your own balance sheet. What’s your actual debt-to-equity ratio today — and what does it look like on July 2 if quota drops 15% or milk hits $16.50 for six months?

Executive Summary: 

The U.S. lost 1,434 dairy herds in 2024, while Ontario’s February 2026 quota exchange was cancelled after 1,915 buyers chased quota from just 12 sellers at CA$24,000/kg. This article uses the men’s hockey gold medal game as the backdrop to show the real Canada–USA faceoff: quota‑backed stability with capital risk versus open‑market upside with a 5–9% annual farm exit rate. For Canadian producers, it shows how a 10–15% quota value hit in the 2026 USMCA review could push debt‑to‑equity ratios past lender comfort levels. For U.S. herds, it shows what six months of $16.50 milk does to a 300‑cow balance sheet, even with DMC, and why more access to Canada is a bonus, not a business plan. You get step‑by‑step barn math to plug in your own herd size, breakeven, and equity, plus a 30/90/365‑day checklist for both systems. If you’re milking on either side of the border, this is your game tape before July 1 — because when the gold medals are boxed away, your balance sheet is still on the ice.

Complete references and supporting documentation are available upon request by contacting the editorial team at editor@thebullvine.com.

Learn More

The Sunday Read Dairy Professionals Don’t Skip.

Every week, thousands of producers, breeders, and industry insiders open Bullvine Weekly for genetics insights, market shifts, and profit strategies they won’t find anywhere else. One email. Five minutes. Smarter decisions all week.
NewsSubscribe
First
Last
Consent

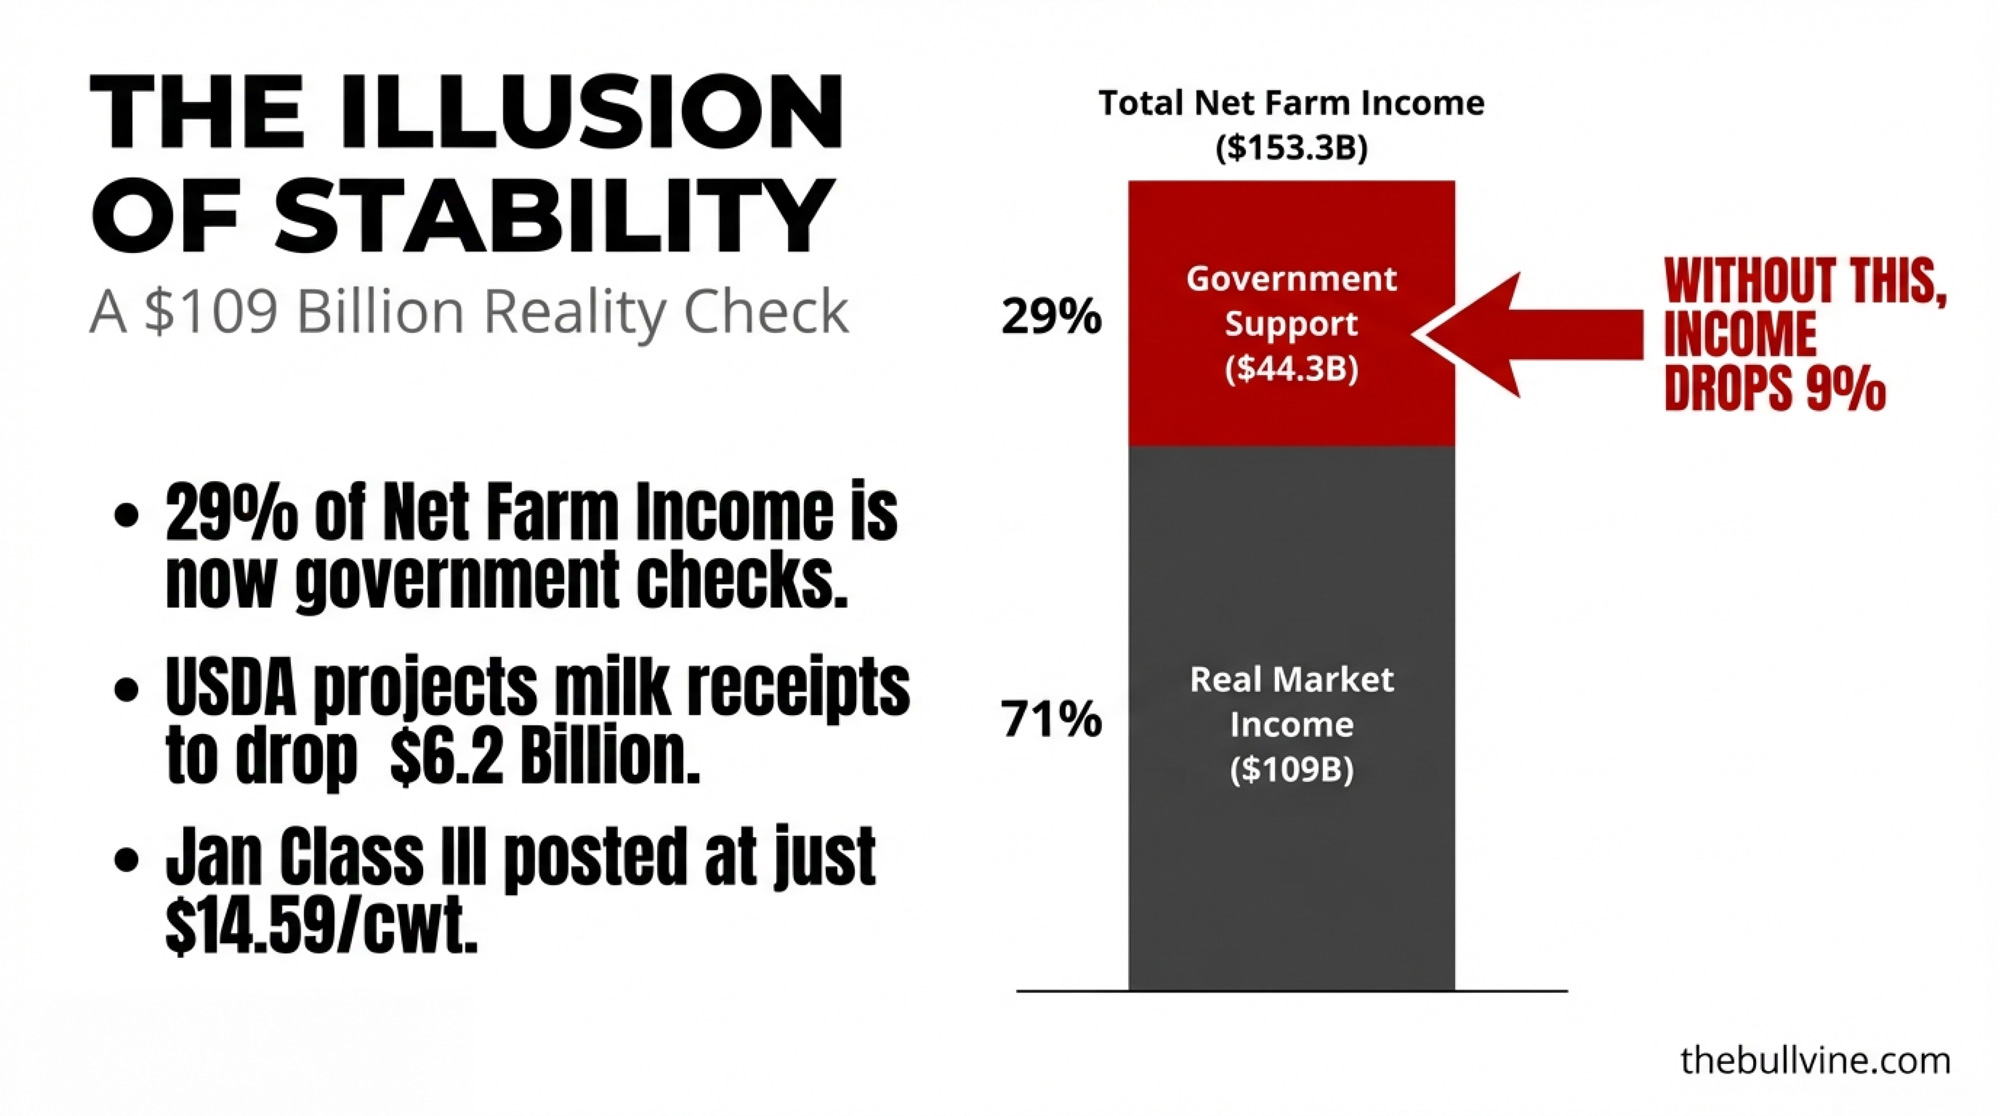
The Calf-Check Paradox: $14.59 Milk, 14,000 Extra Cows, and a 550-Cow Dairy Staring at an 11-Week Runway

When a day‑old calf pays better than the milk check, the rules change. The question isn’t volume anymore. It’s survival math.

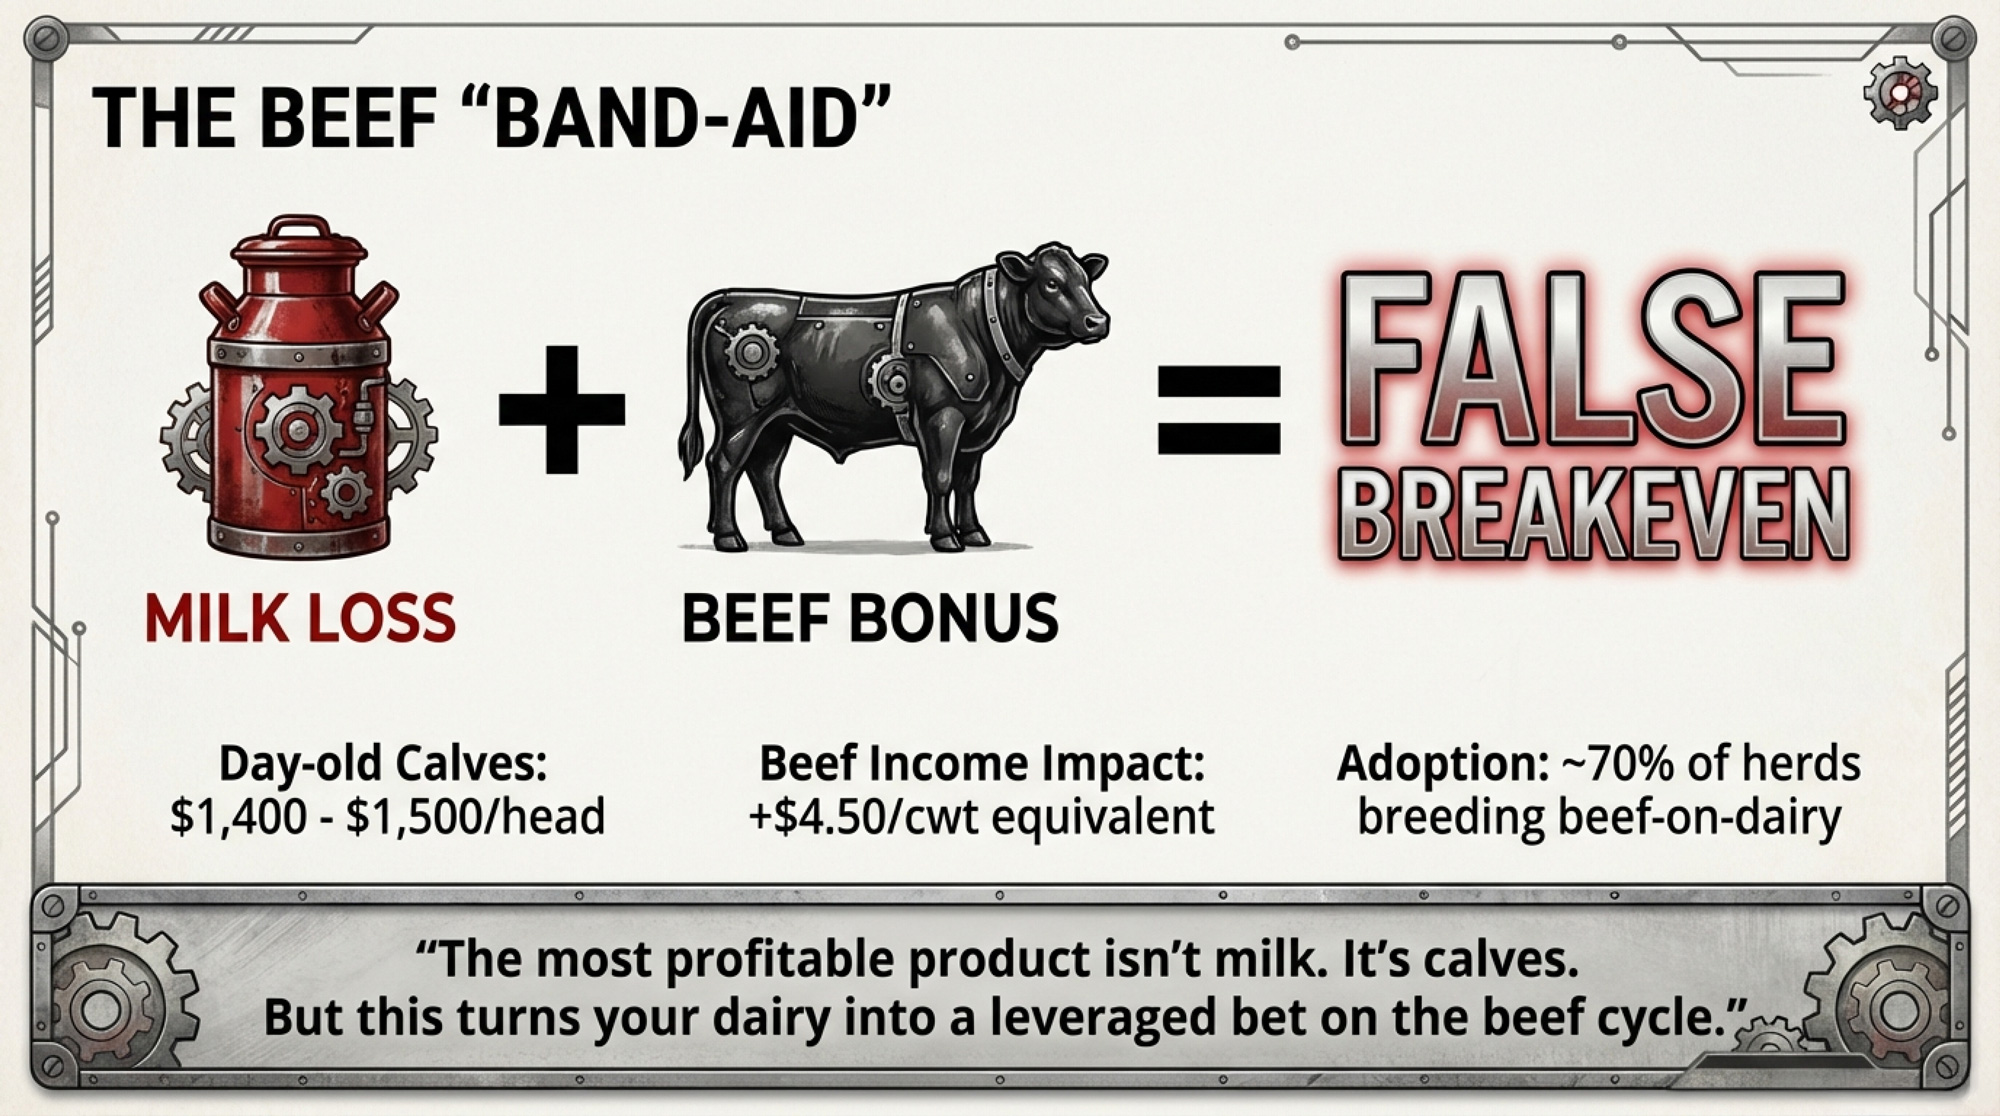
Executive Summary: January’s USDA report exposed a deep disconnect in U.S. dairy economics: milk prices are collapsing while cow numbers and output still climb. Production was up 3.2% year‑over‑year with 14,000 more cows on line, even as Class III fell to $14.59/cwt and Class IV to $13.55/cwt against full costs that often sit near $18–$19/cwt. The missing margin is coming from cattle, with beef‑on‑dairy calf and cull checks routinely adding $3–$4.50/cwt, but that turns your dairy into a leveraged bet on the beef cycle. Using USDA and CoBank numbers, a 300‑cow herd faces roughly a $153,000 drop in milk revenue for 2026, and closer to $261,700 when you layer in a realistic 35% correction in calf values. At the same time, replacement heifers are at a 20‑year low, trading around $3,010–$3,360 per head, even as more than $11 billion in new processing capacity comes online and demands more milk. One 550‑cow Midwest dairy that thought it had six months of cash discovered it had just eleven weeks, then bought time by culling its worst converters and restructuring debt inside 48 hours. For your operation, the takeaway is blunt: treat calf income as volatile bonus money, know your real cost of production to the penny, and set 30‑, 90‑, and 365‑day plans that assume milk and beef could both move against you at the same time.

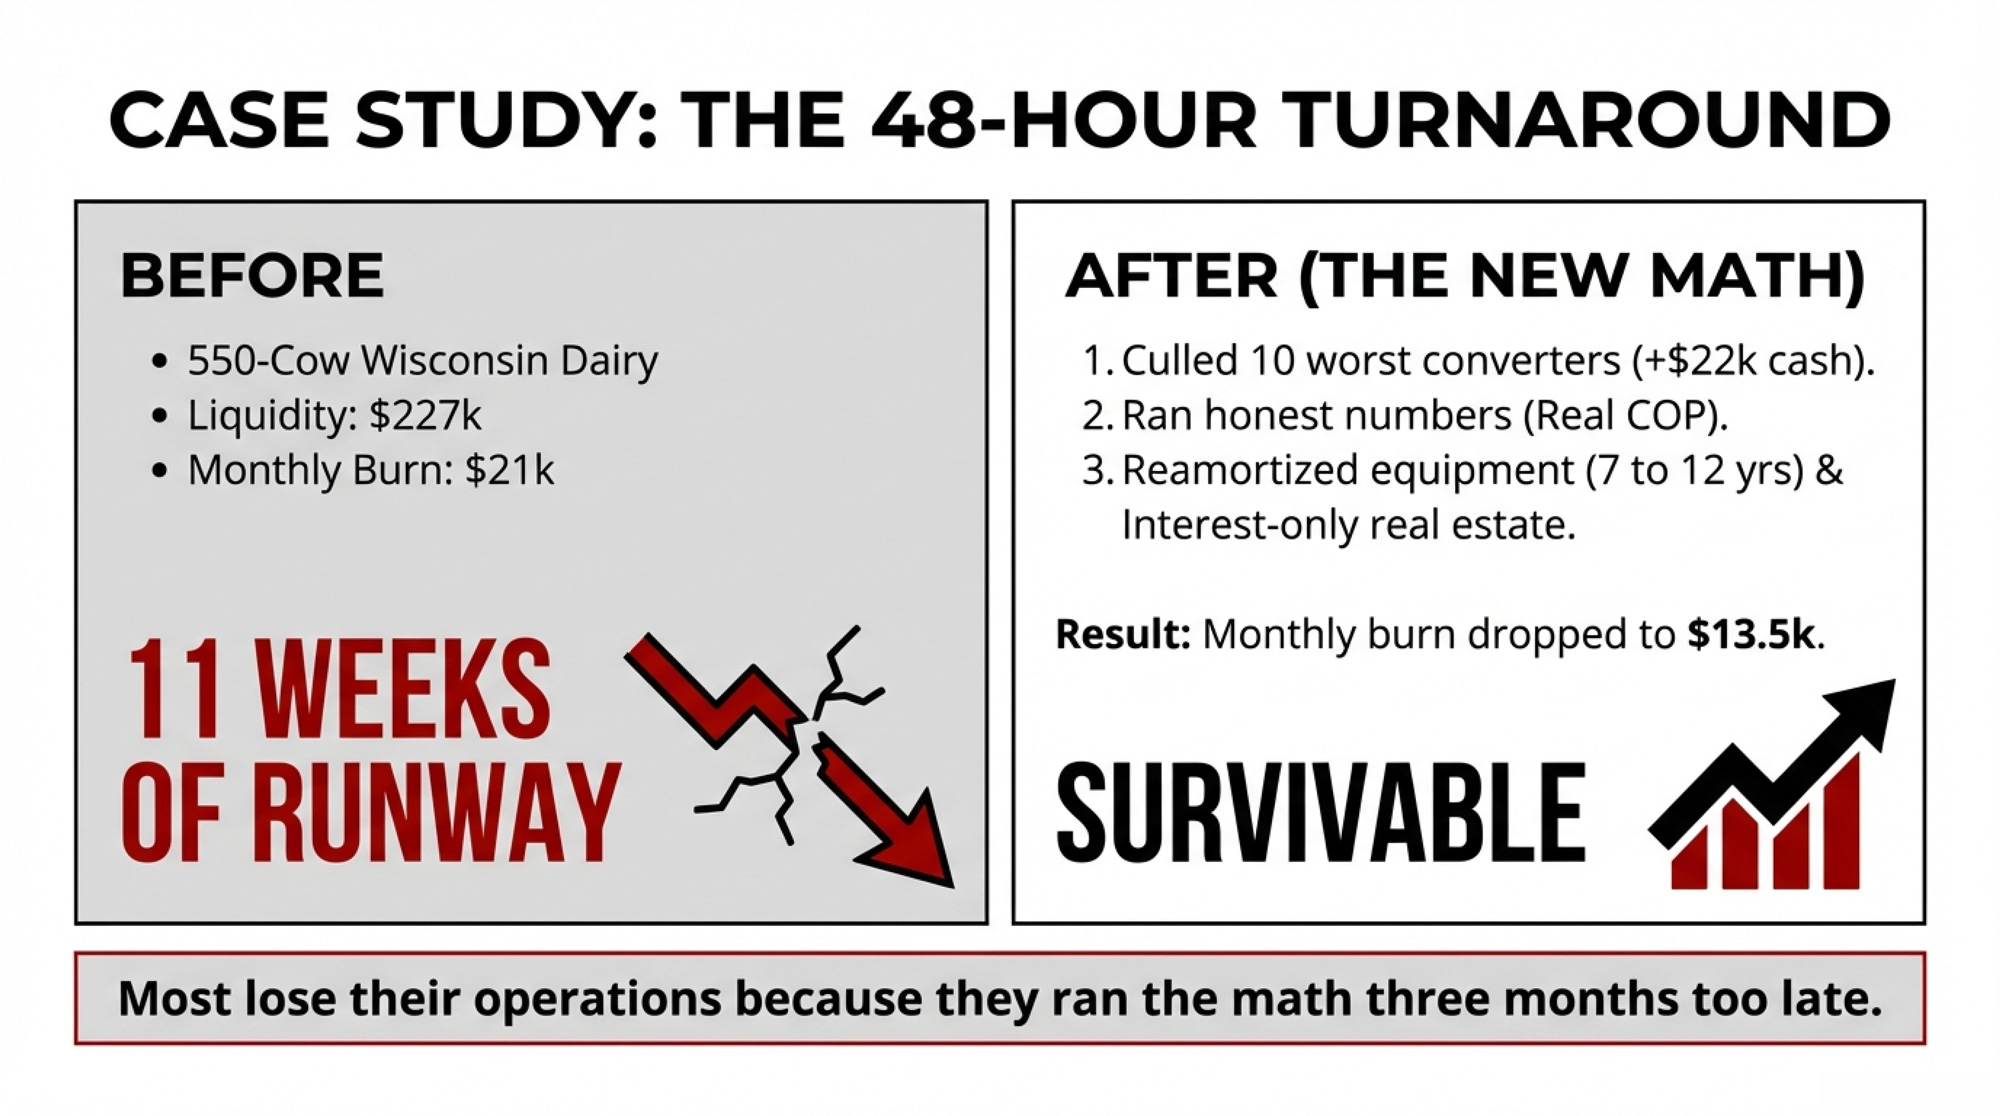
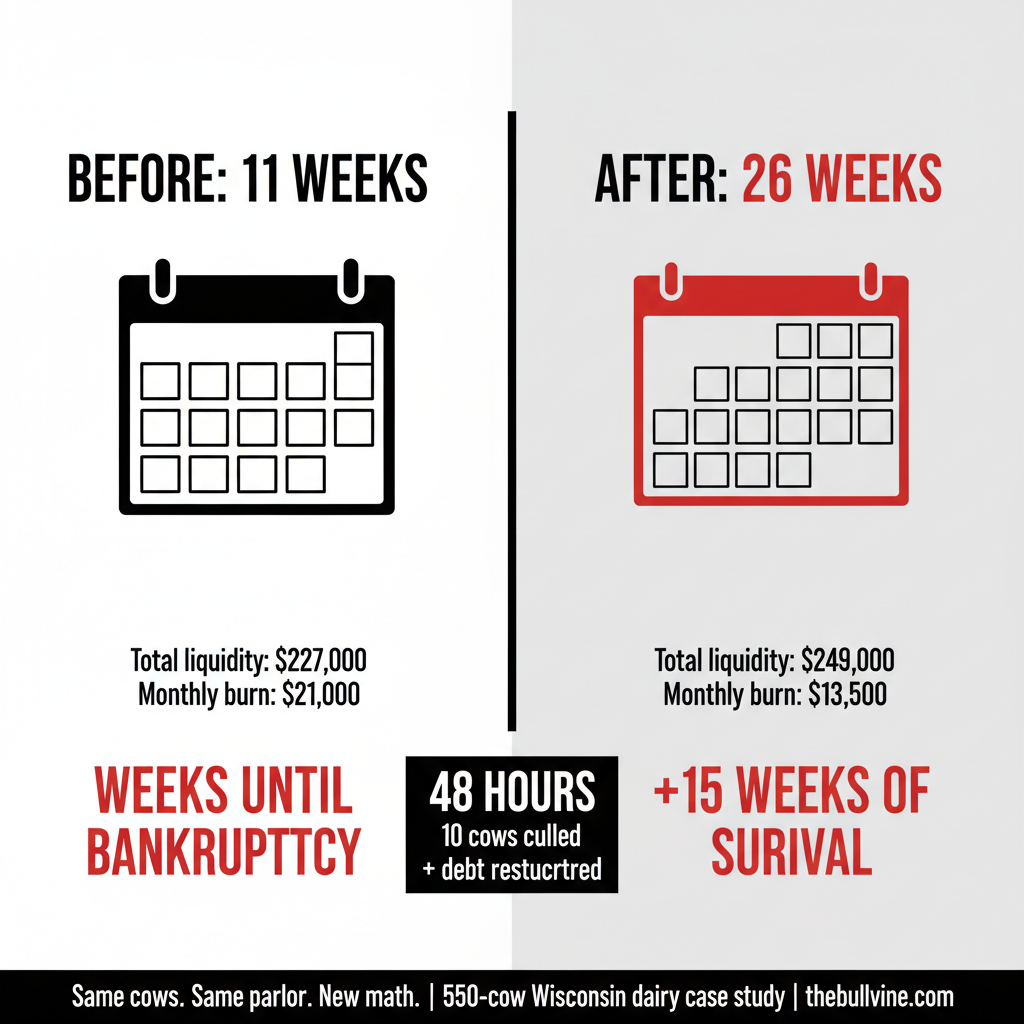
A 550-cow Wisconsin dairy sat down with a farm financial counselor earlier this month and pulled a full cost-of-production analysis. The producer thought his all-in cost was around $17.25/cwt. When the spreadsheet included market-rate family labor, real depreciation, current interest on all repriced debt, and health insurance, the number came back at $18.75/cwt — right in line with UW Extension’s cost-of-production benchmarks, which put average COP at $18–$19/cwt for mid-size Midwest dairies. Then he checked his liquidity: $227,000 total. Net weekly cash drain at current prices: about $21,000. That’s roughly eleven weeks of runway — not the five or six months he’d been carrying in his head. 

Cost CategoryNapkin MathMarket-Rate RealityDelta
Feed & Nutrition$7.50$7.80+$0.30
Labor (Family = $0)$2.00$3.10+$1.10 (red text)
Veterinary & Health$0.85$1.05+$0.20
Depreciation (Book)$1.80$2.20+$0.40
Interest (Pre-2022 Rates)$1.10$1.75+$0.65 (red text)
Utilities & Fuel$0.90$0.95+$0.05
Repairs & Maintenance$1.20$1.30+$0.10
Insurance & Taxes$0.60$0.90+$0.30
Miscellaneous$1.30$1.45+$0.15
TOTAL COP$17.25$18.75+$1.50 (red text, bold)

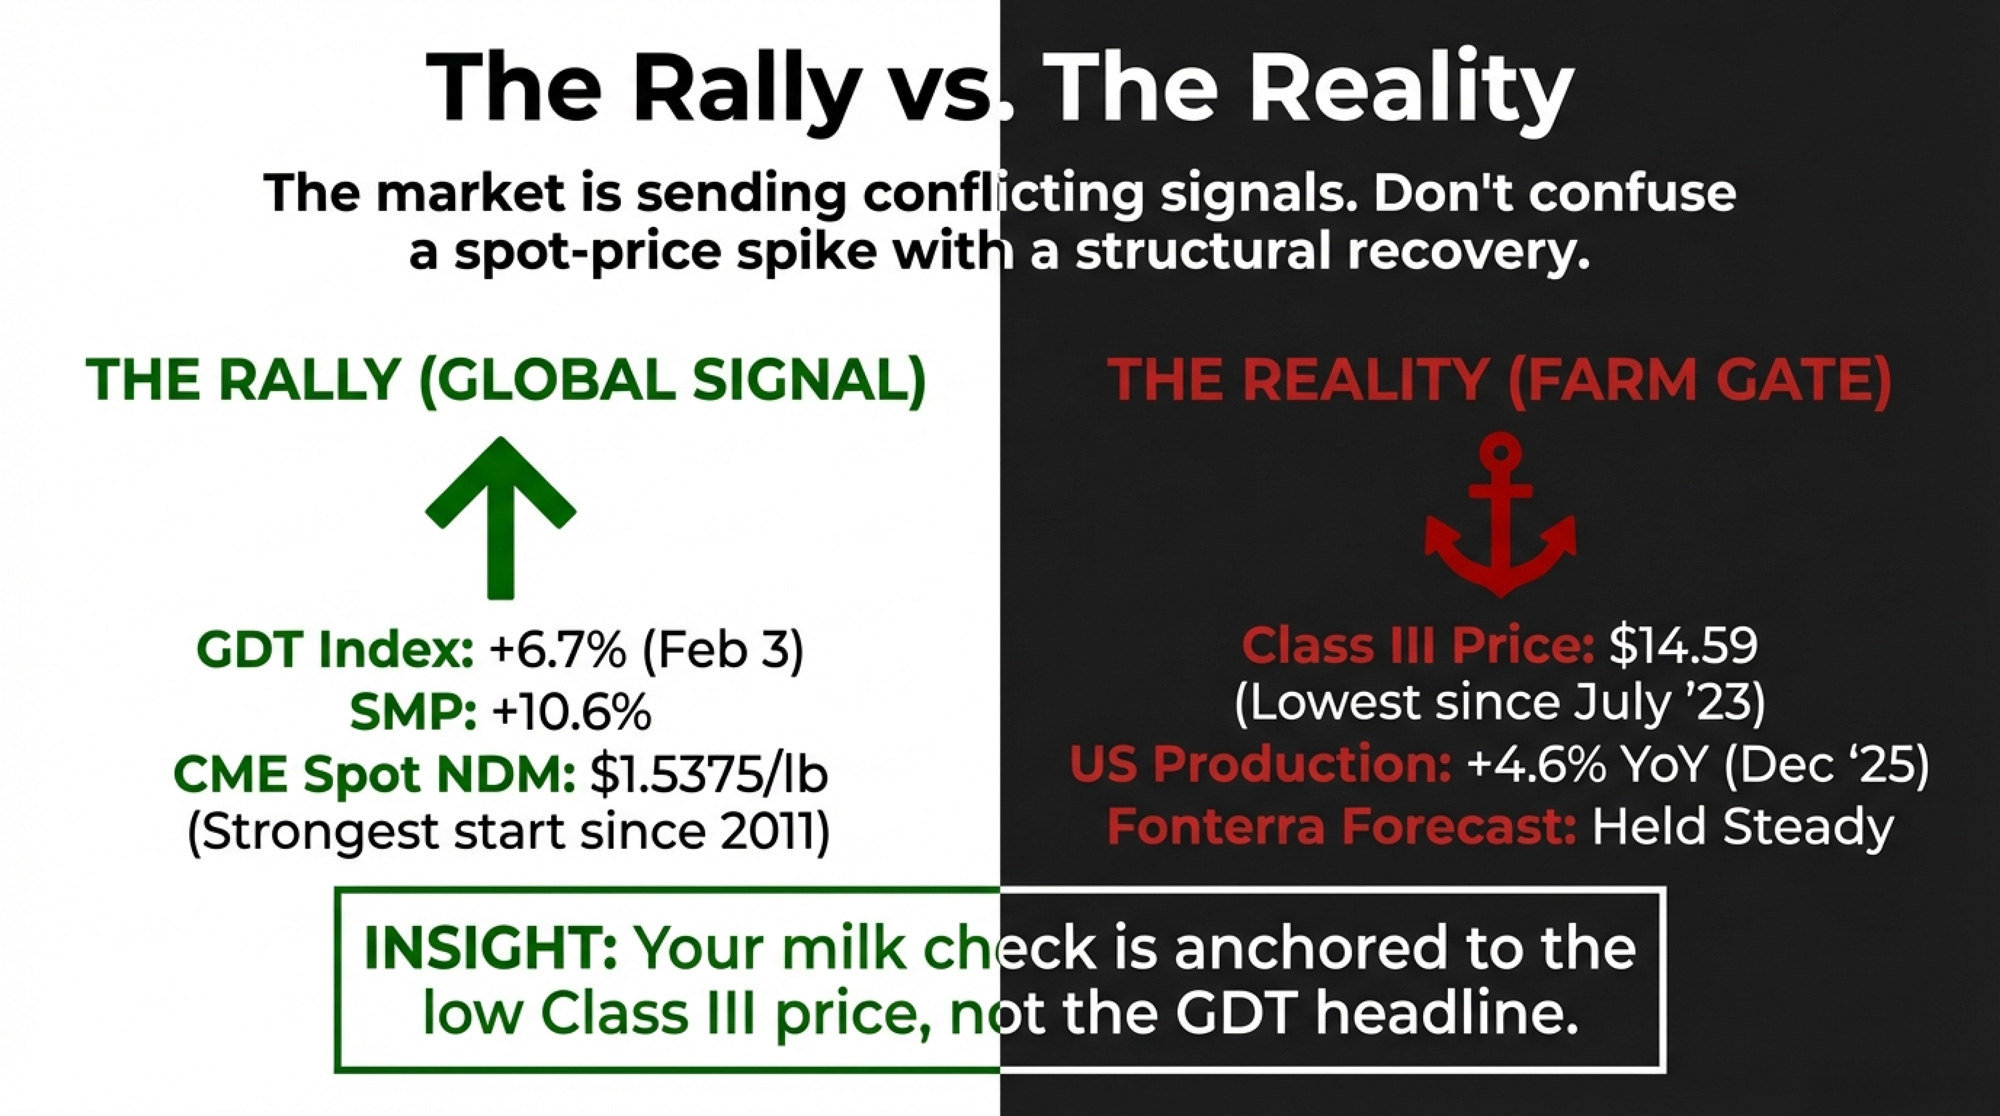
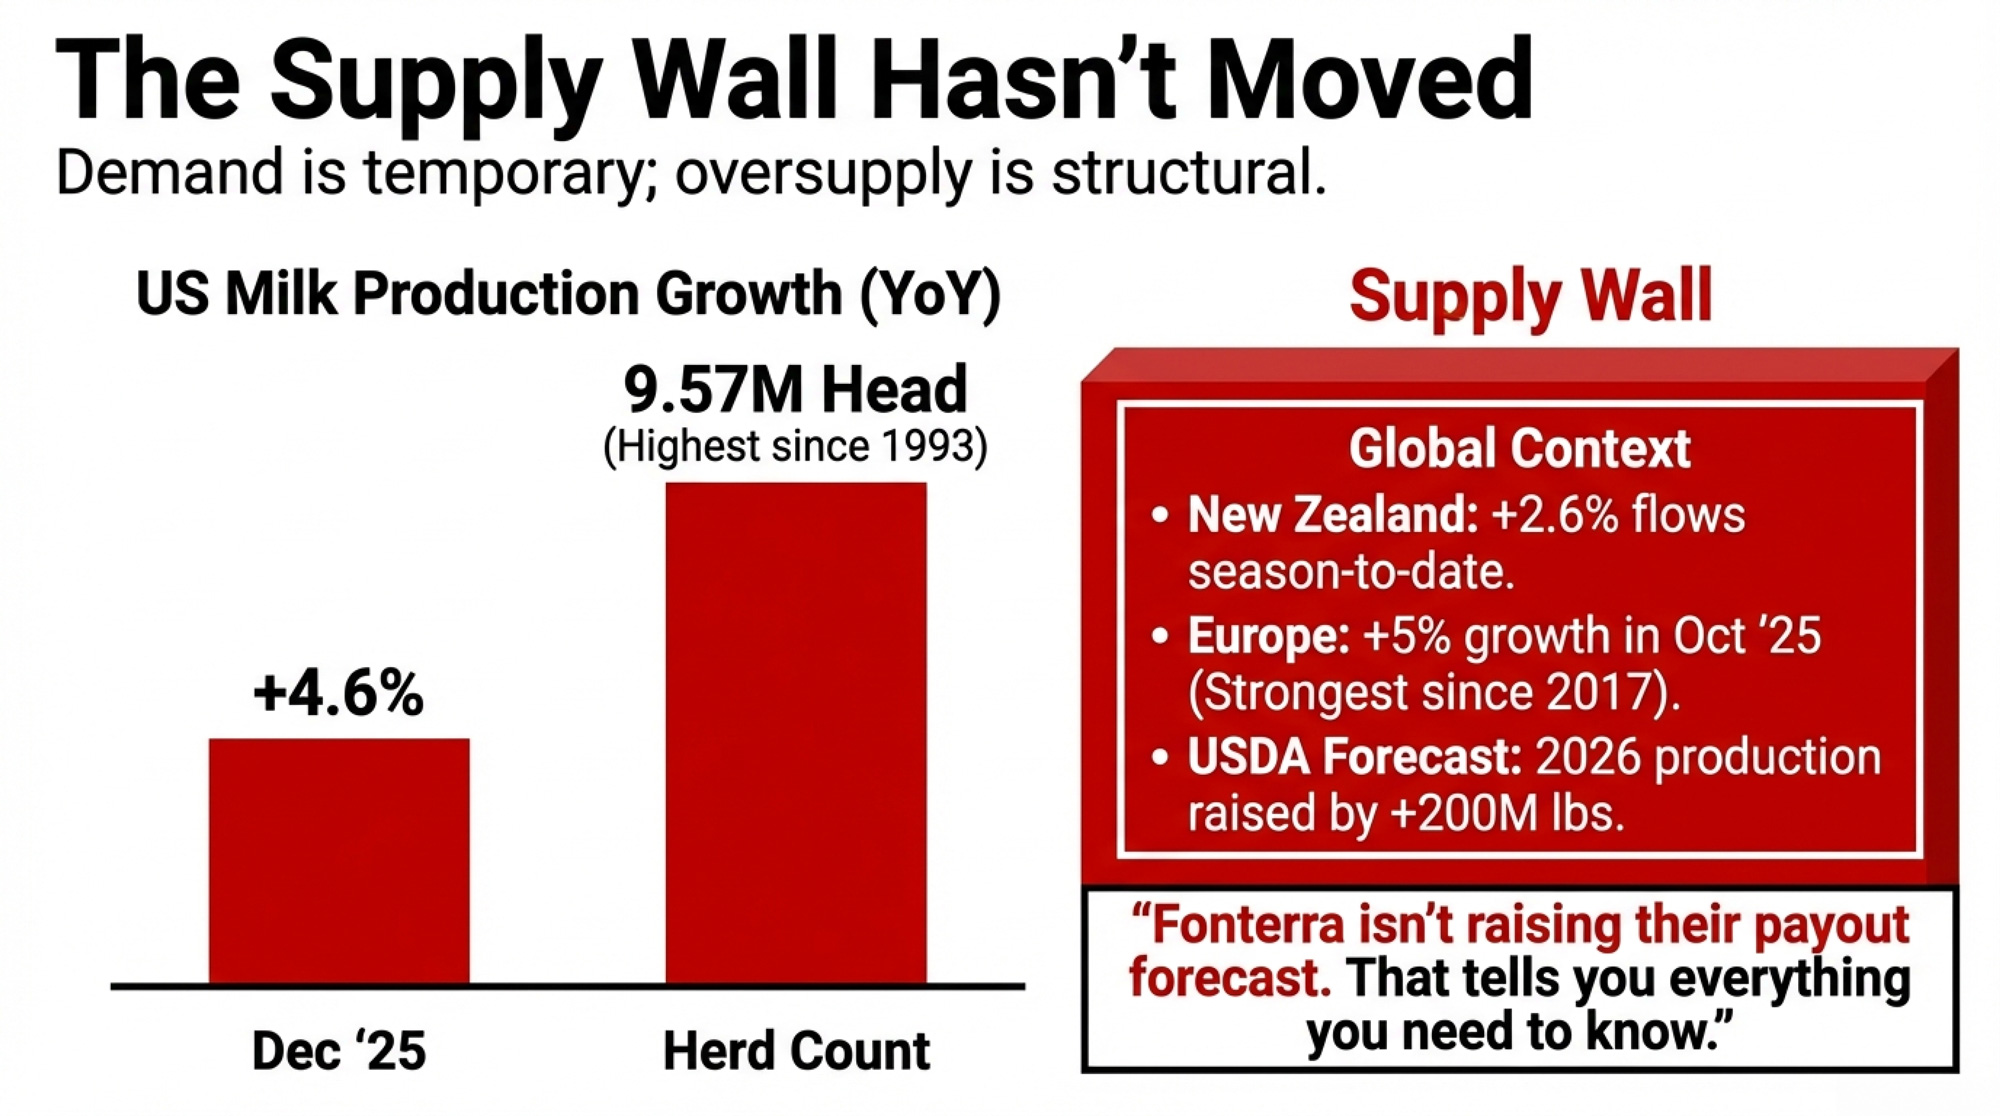
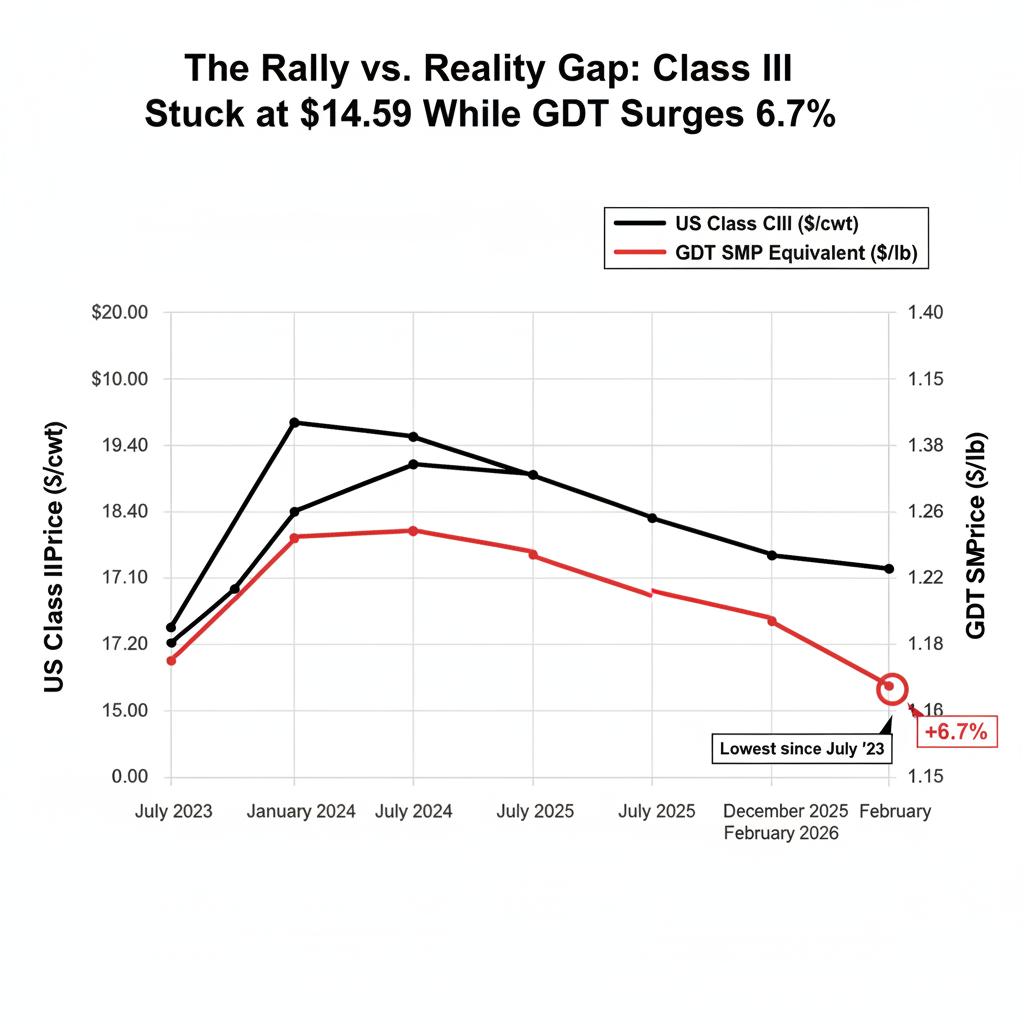
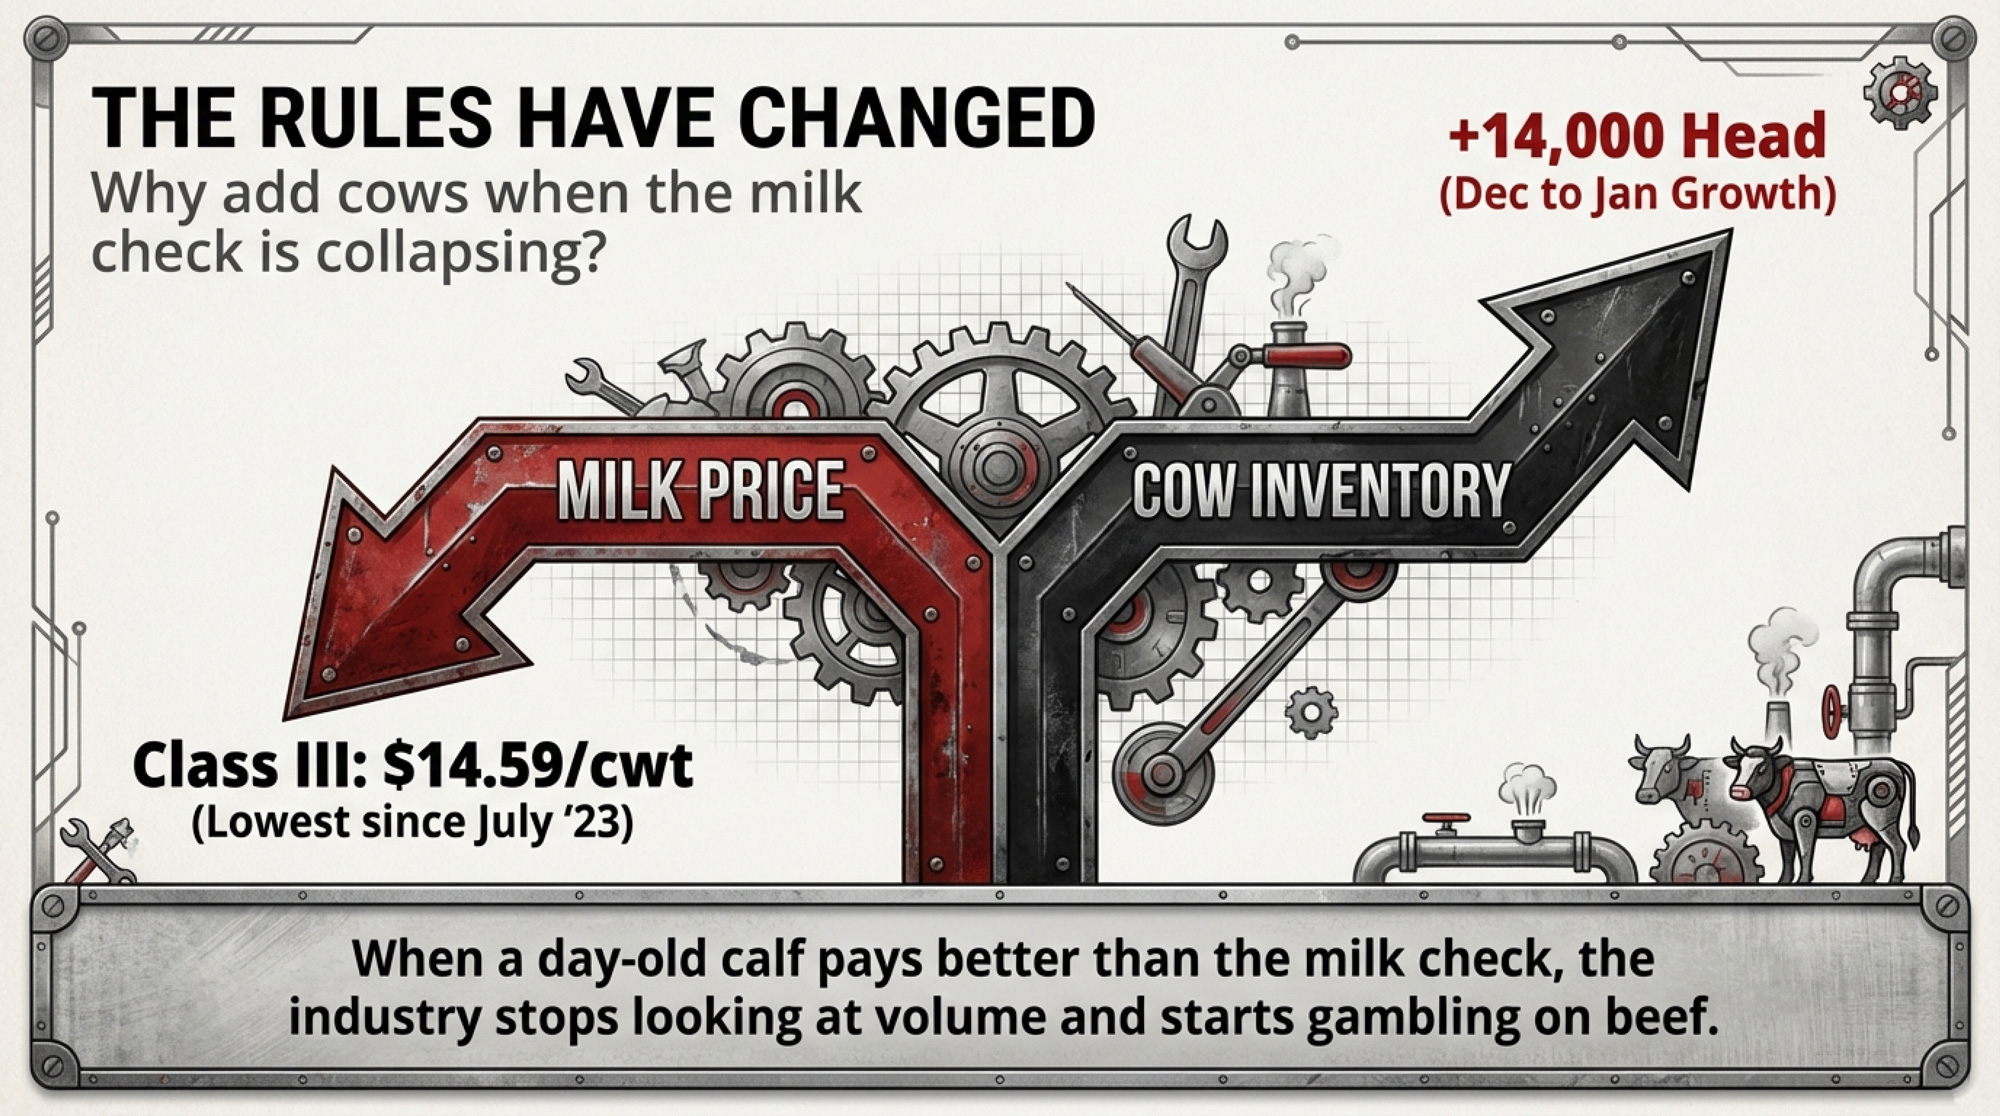
That producer’s math collided with today’s USDA NASS report. U.S. milk production came in at 19.81 billion poundsfor January — up 3.2% year-over-year but a clean miss against the +3.8% that StoneX had penciled in. January’s Class III price printed at $14.59/cwt, the lowest since July 2023, and $5.75 below a year ago. Class IV was even uglier: $13.55/cwt, the lowest in nearly five years, per the AMS announcement. And yet USDA says farmers added 14,000 head between December and January, pushing the national herd to 9.58 million — up 2.0% from last year. StoneX had modeled roughly 9,000 head of growth; the actual came in about 5,000 head hotter. 

When your milk check is falling that fast, and your cow numbers are still climbing, something other than milk economics is driving the bus.

Where Did 14,000 Cows Come From?

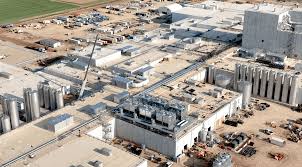
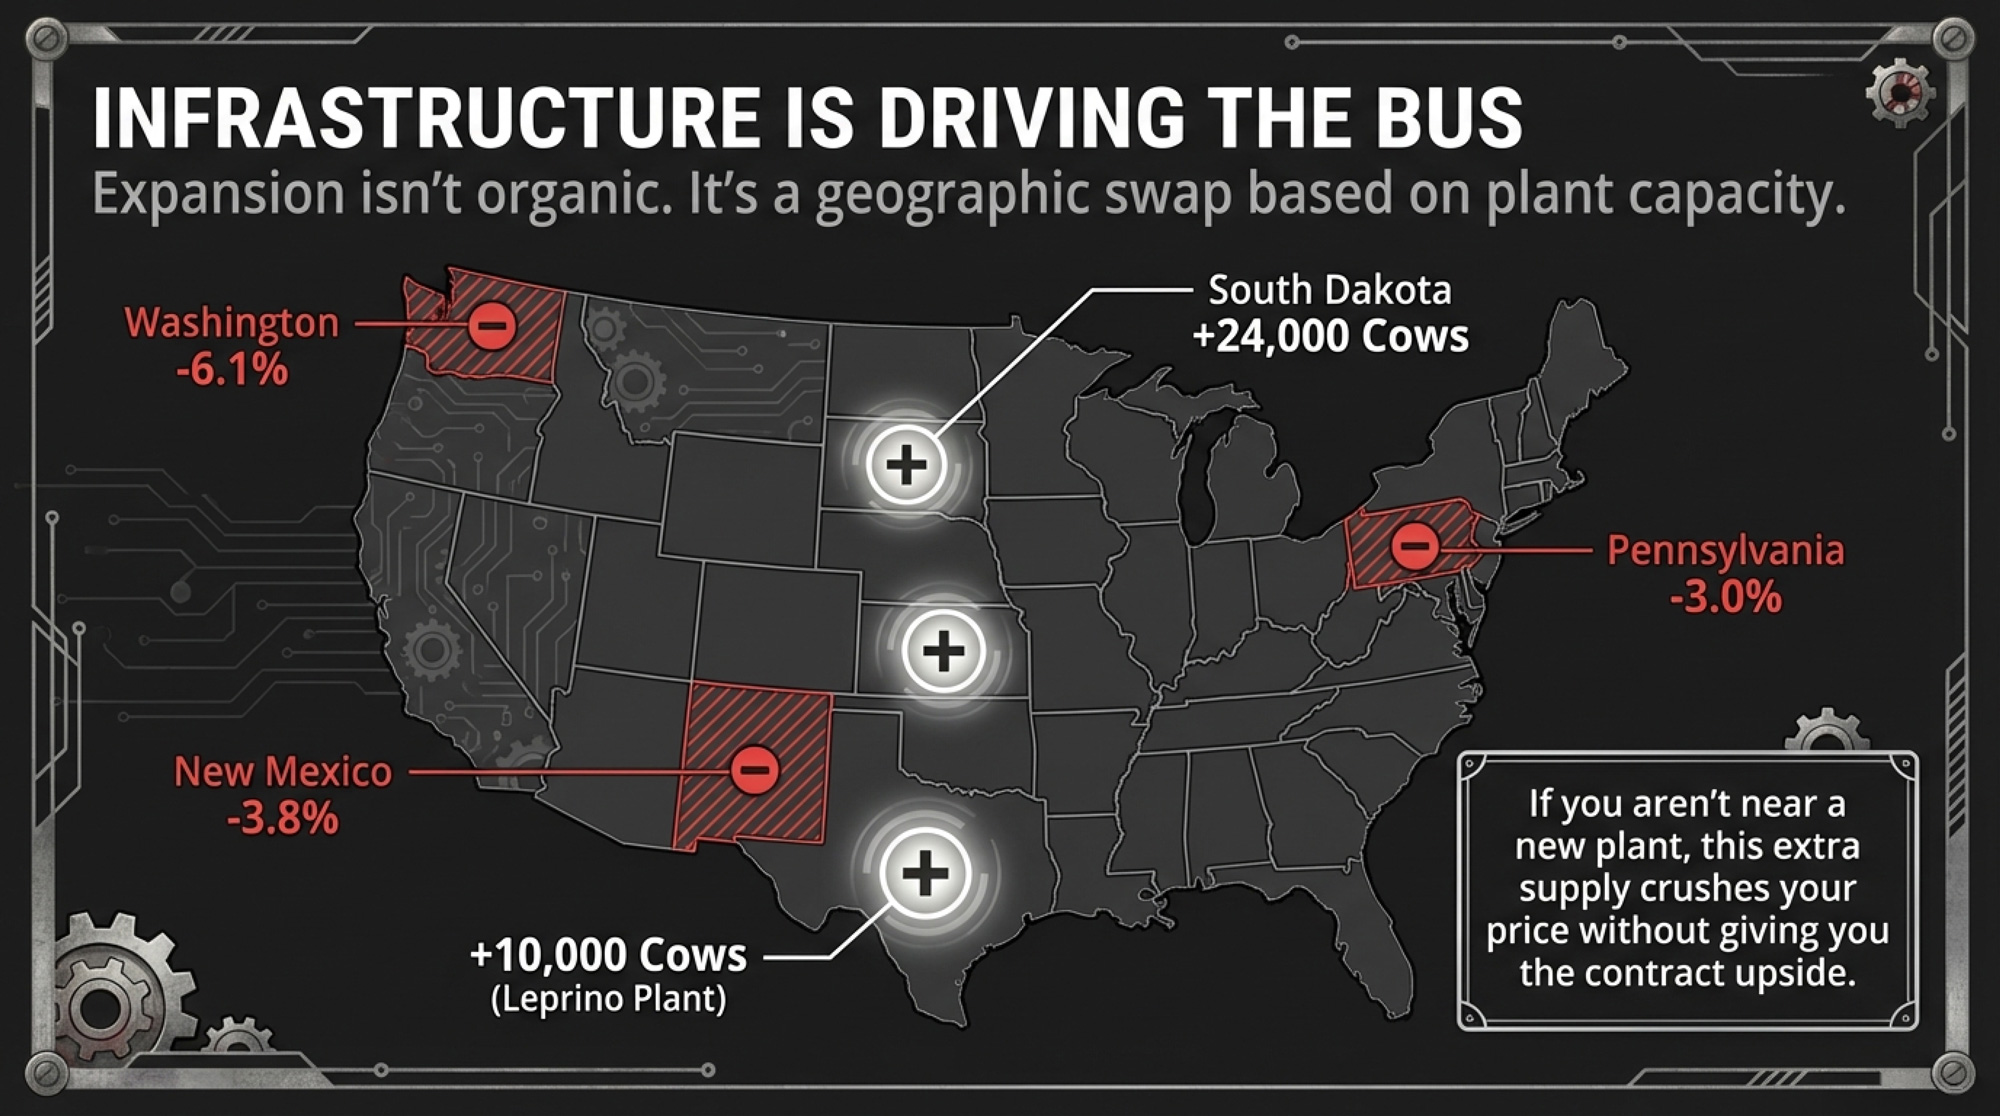
Of that 14,000-head surprise, about 10,000 appeared in Texas. The state’s inventory hit 715,000 head, and production jumped 7.6% year over year to 1.598 billion pounds. That’s not organic growth — it’s a direct response to Leprino Foods’ mozzarella facility in Lubbock. Phase 1 of the 850,000-square-foot plant began production in January 2025, with its formal opening ceremony in March. Phase 2 is slated for completion in early 2026. At full capacity, the facility is designed to handle roughly 200 milk trucks per day. 

Kansas tells an even bigger story. Production exploded 26.1% year-over-year — the largest jump of any state — on 45,000 additional head since January 2025. Hilmar’s $600 million Dodge City cheese plant is pulling milk into existence across the High Plains. South Dakota added 24,000 cows and saw production rise 10.9%. 

But flip to the other column. Washington dropped 6.1%. New Mexico fell 3.8%. Pennsylvania slipped 3.0%. The expansion isn’t national — it’s a geographic swap. And if you’re not near a new processing asset, this extra supply pushes your price down without giving you any contract upside. 

What Does $14.59 Class III Mean for a 300-Cow Dairy?

Here’s the barn math that should be taped to every office wall right now.

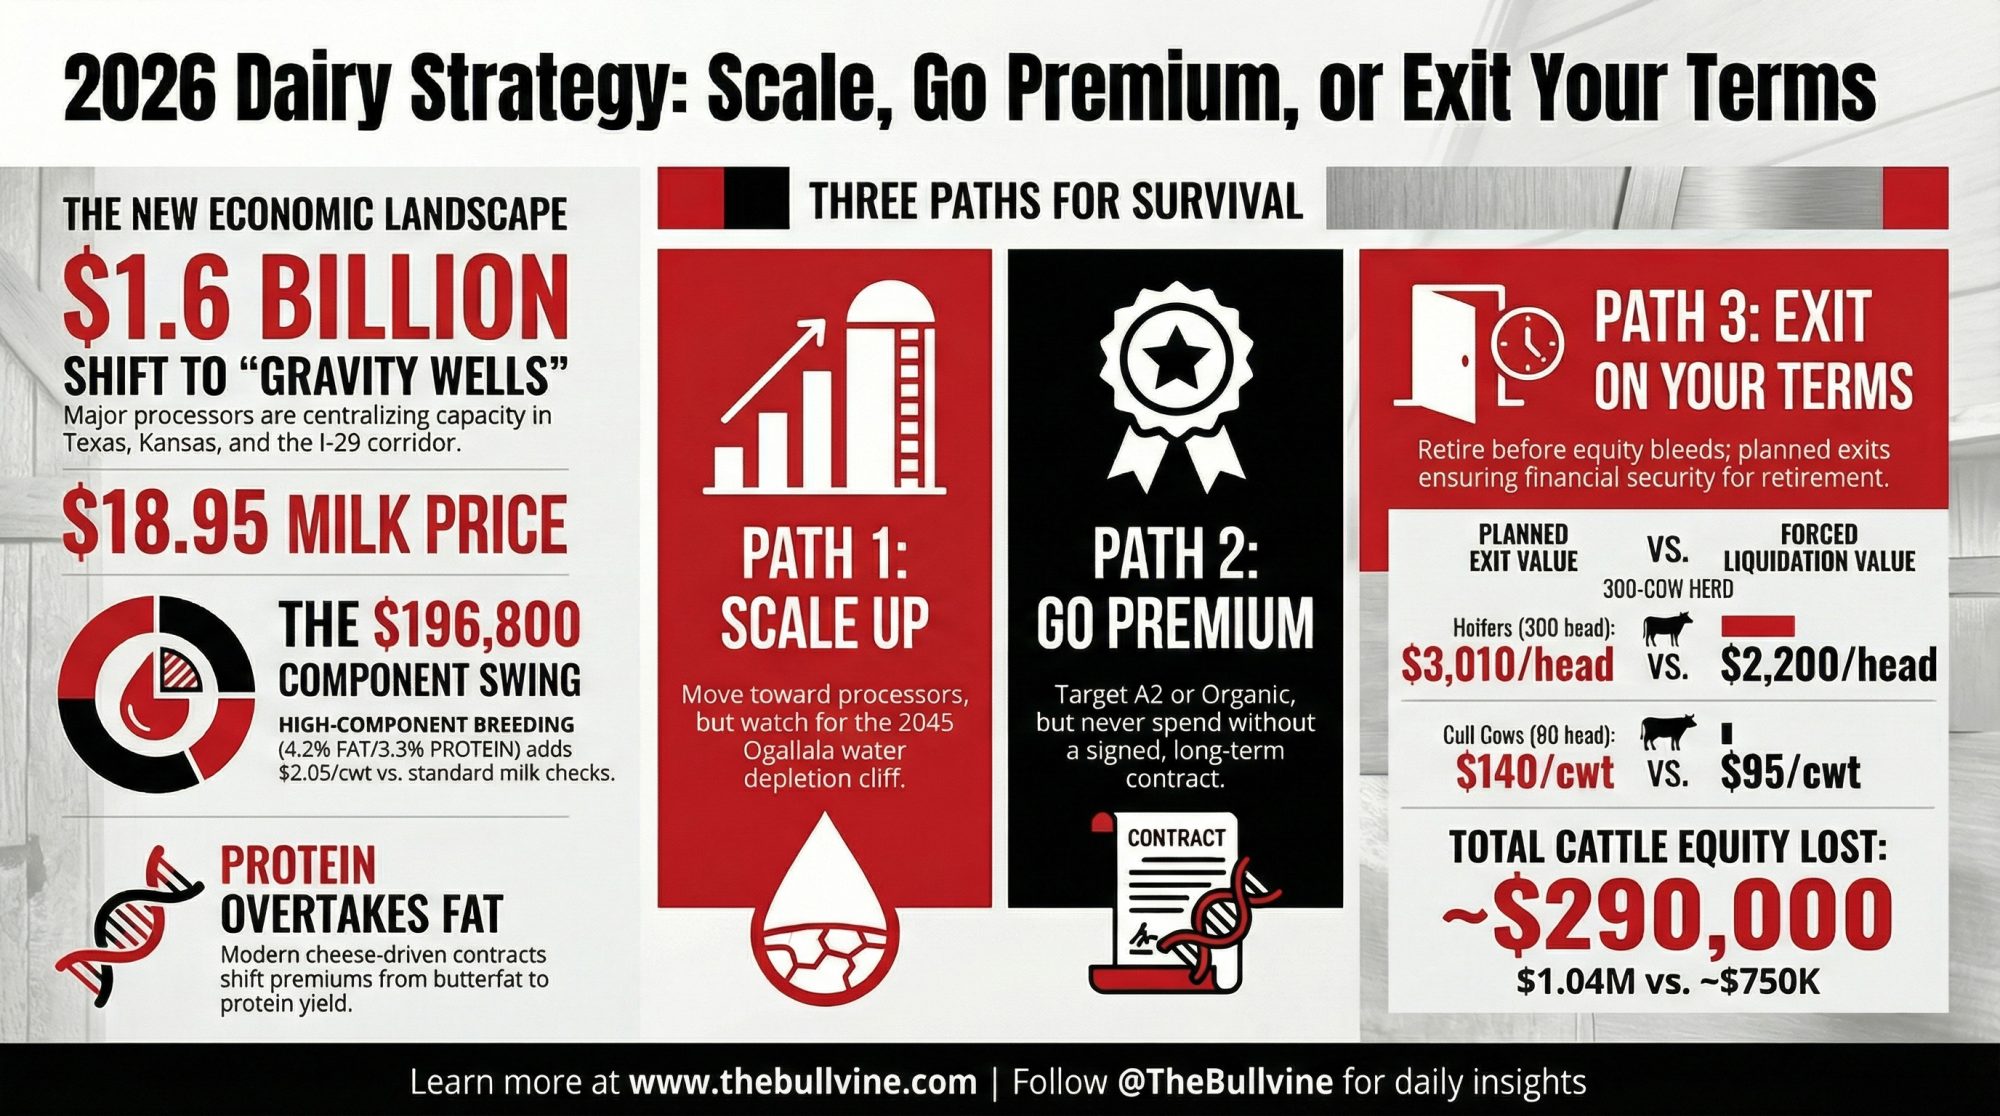
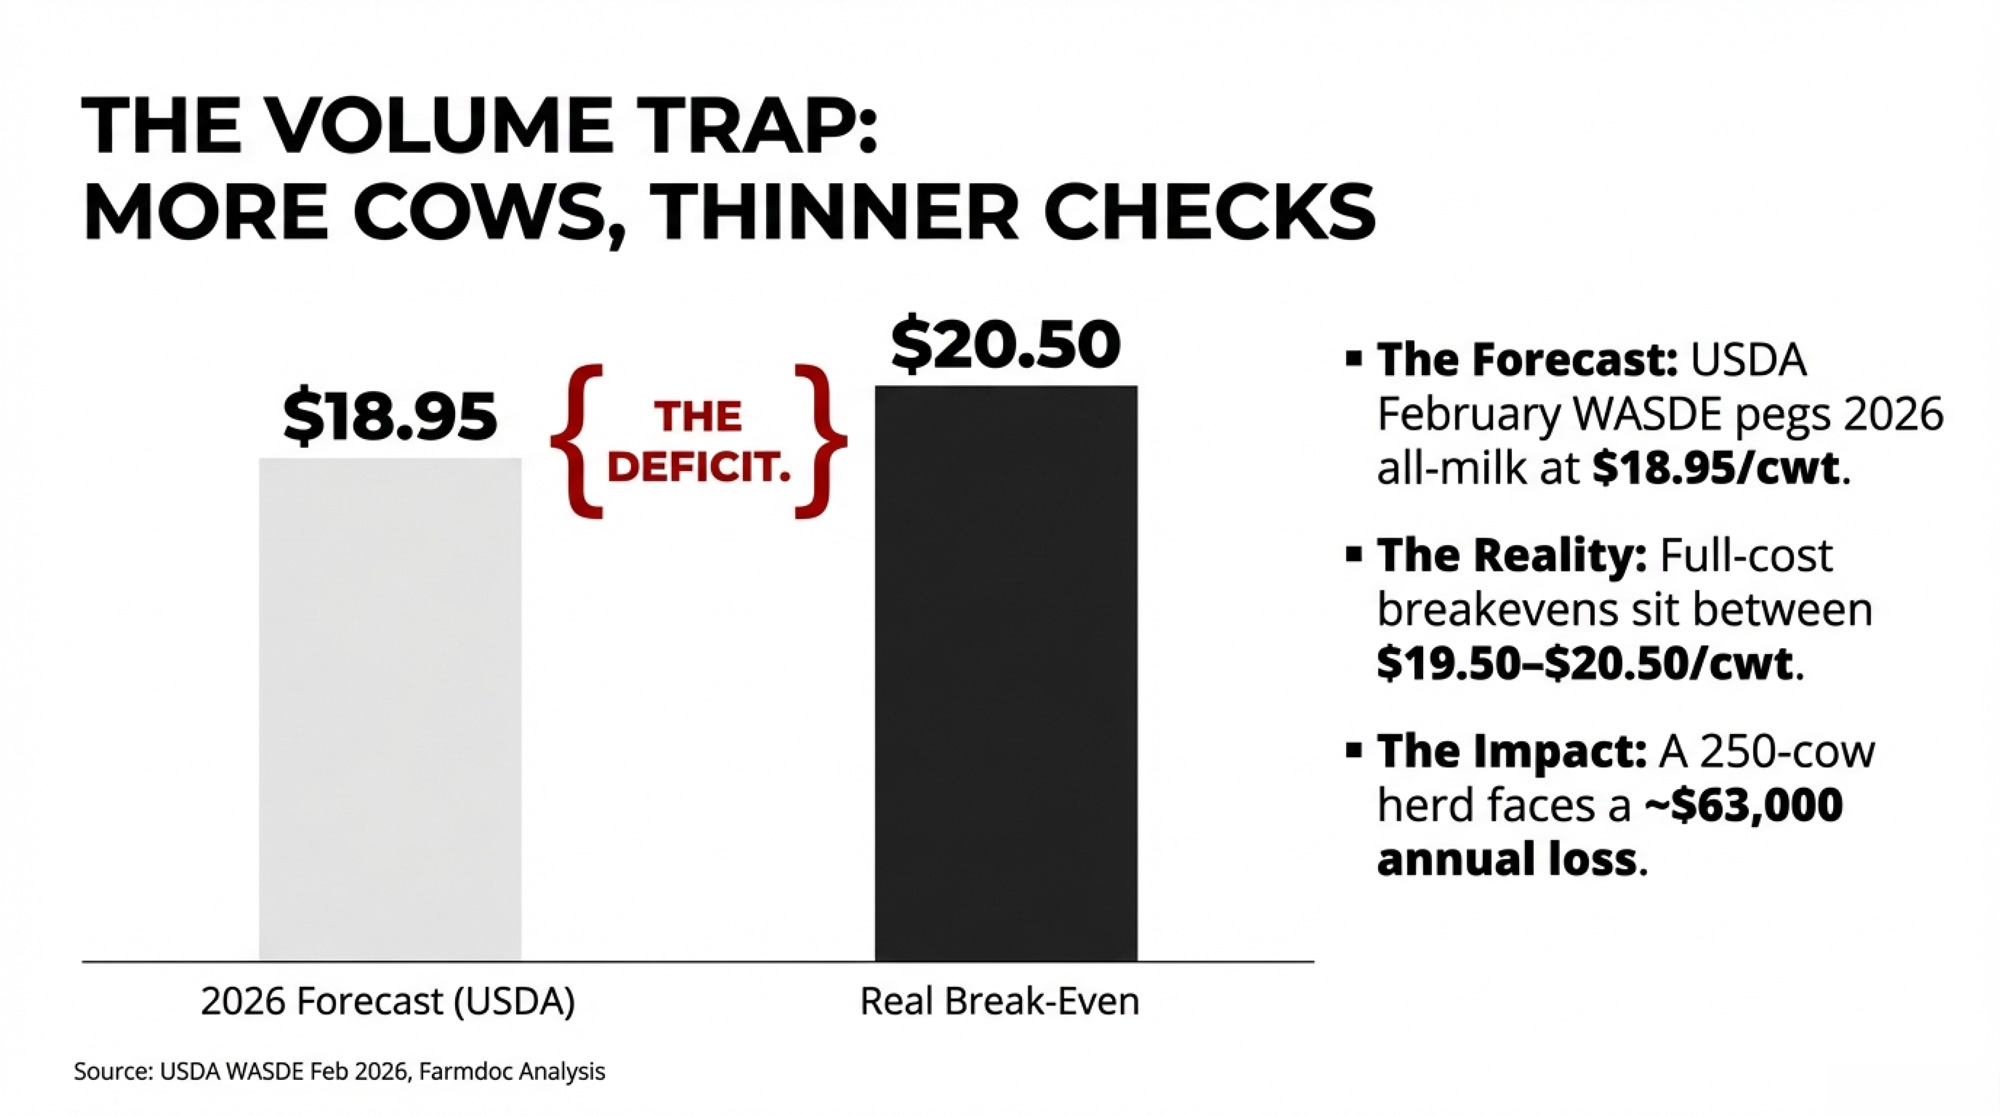
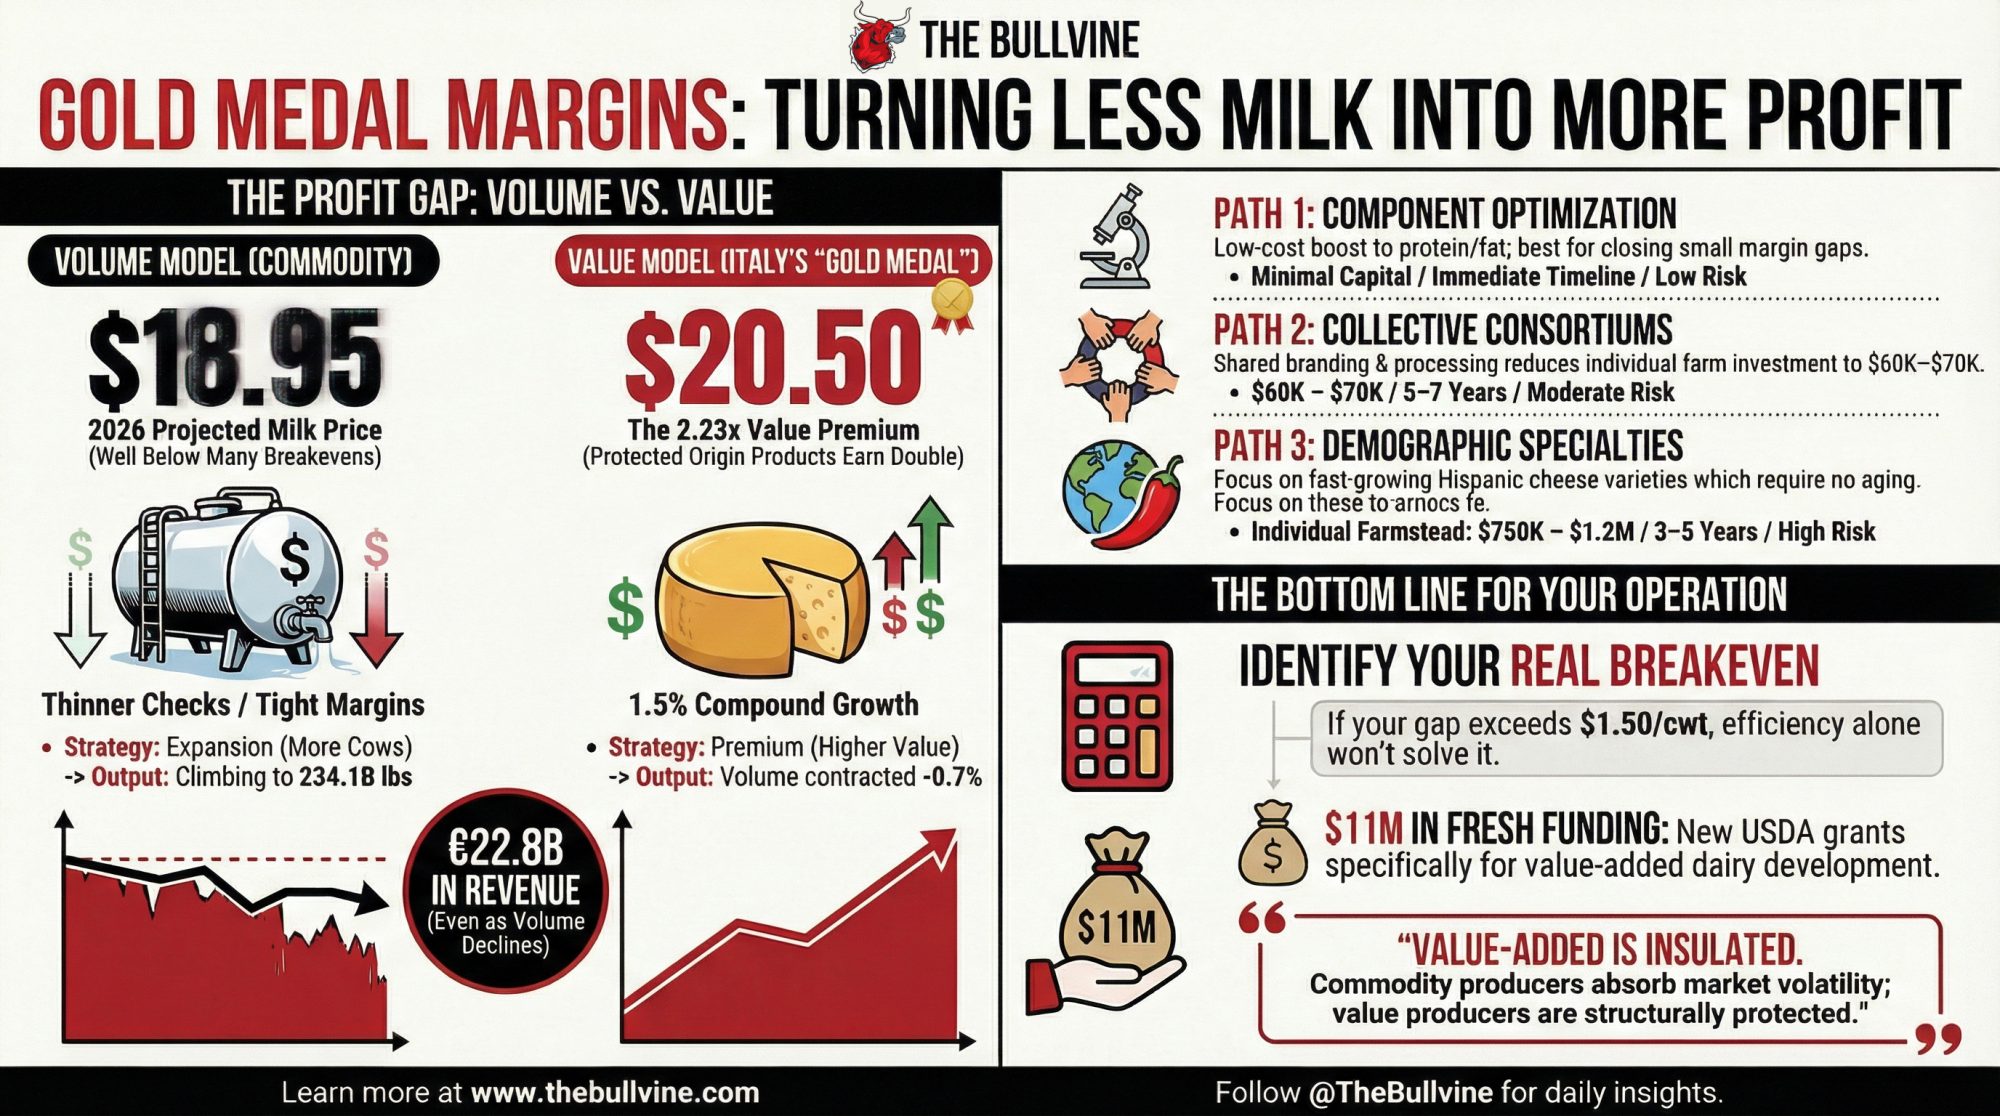
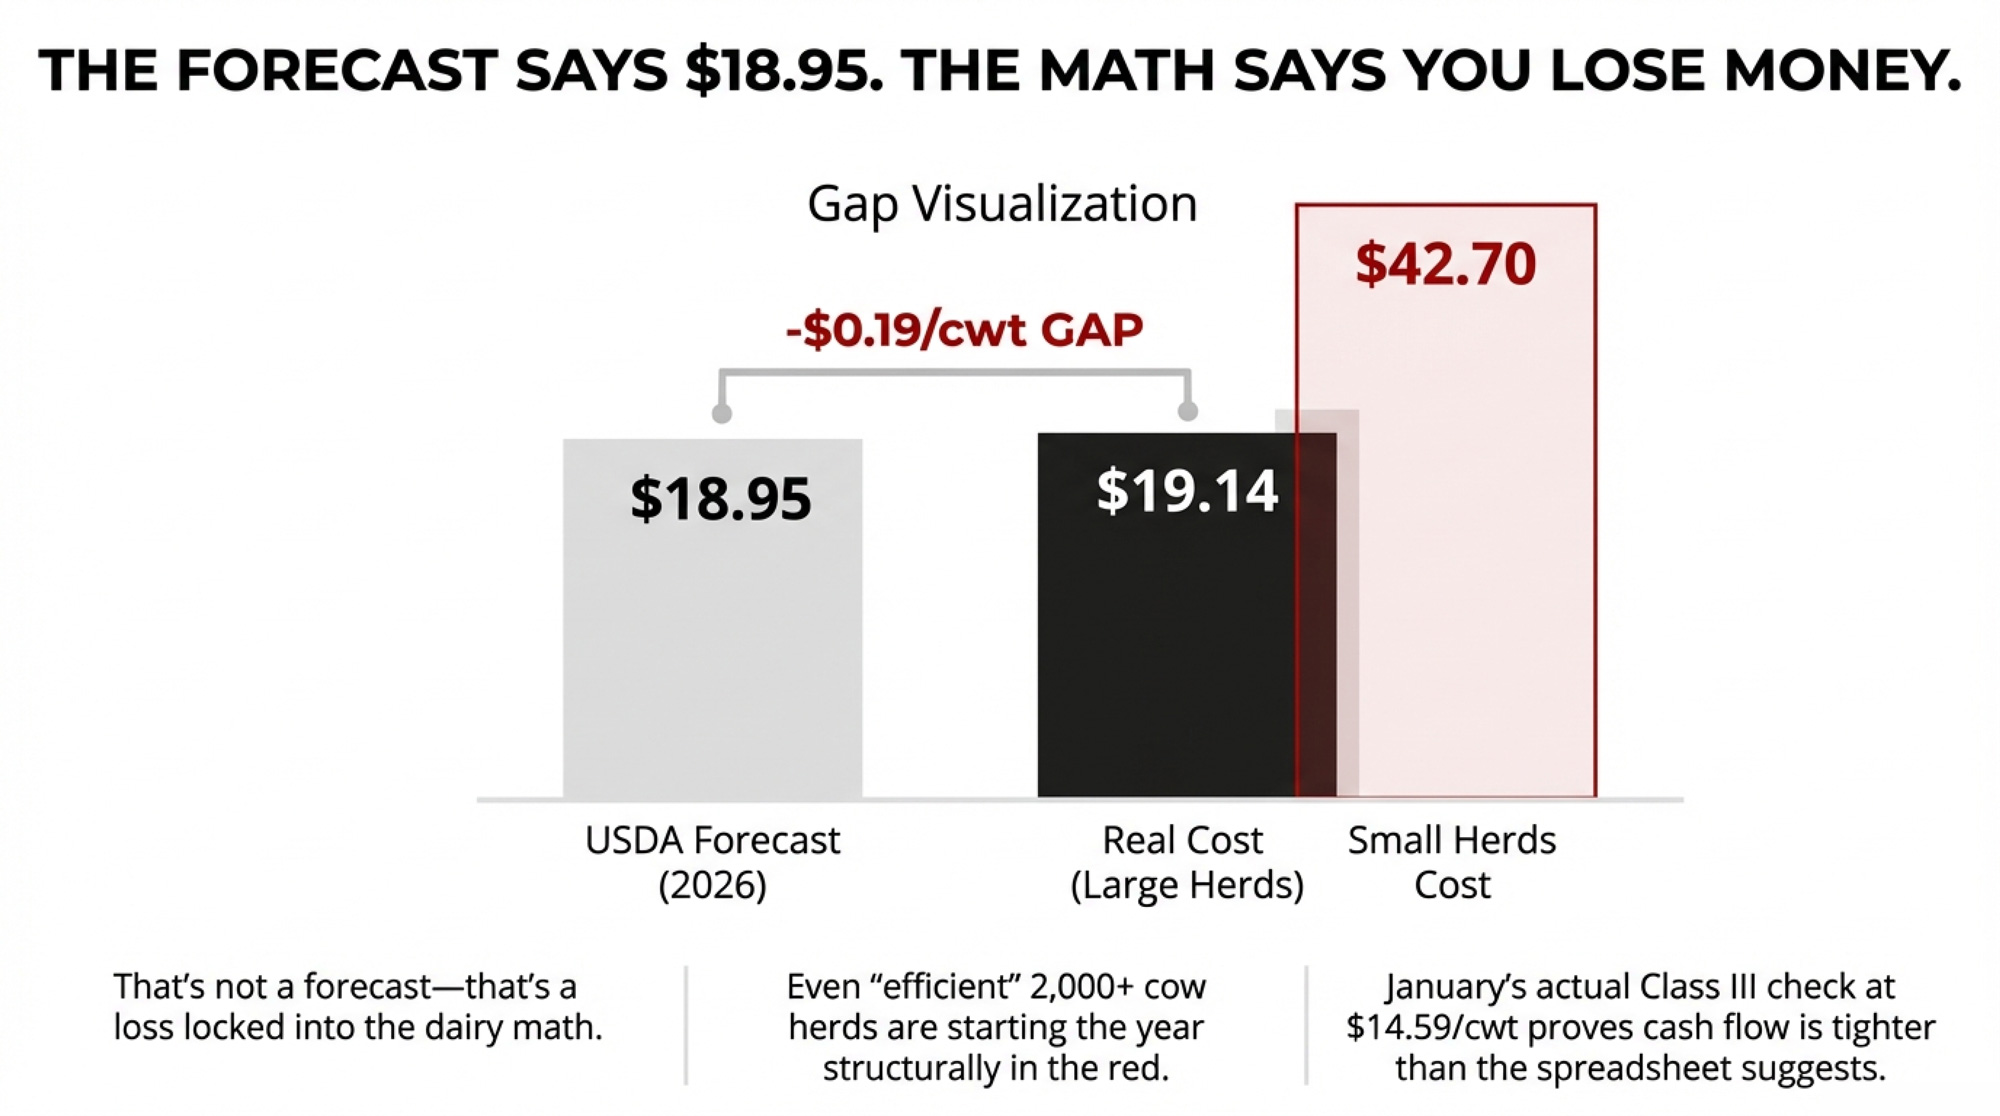
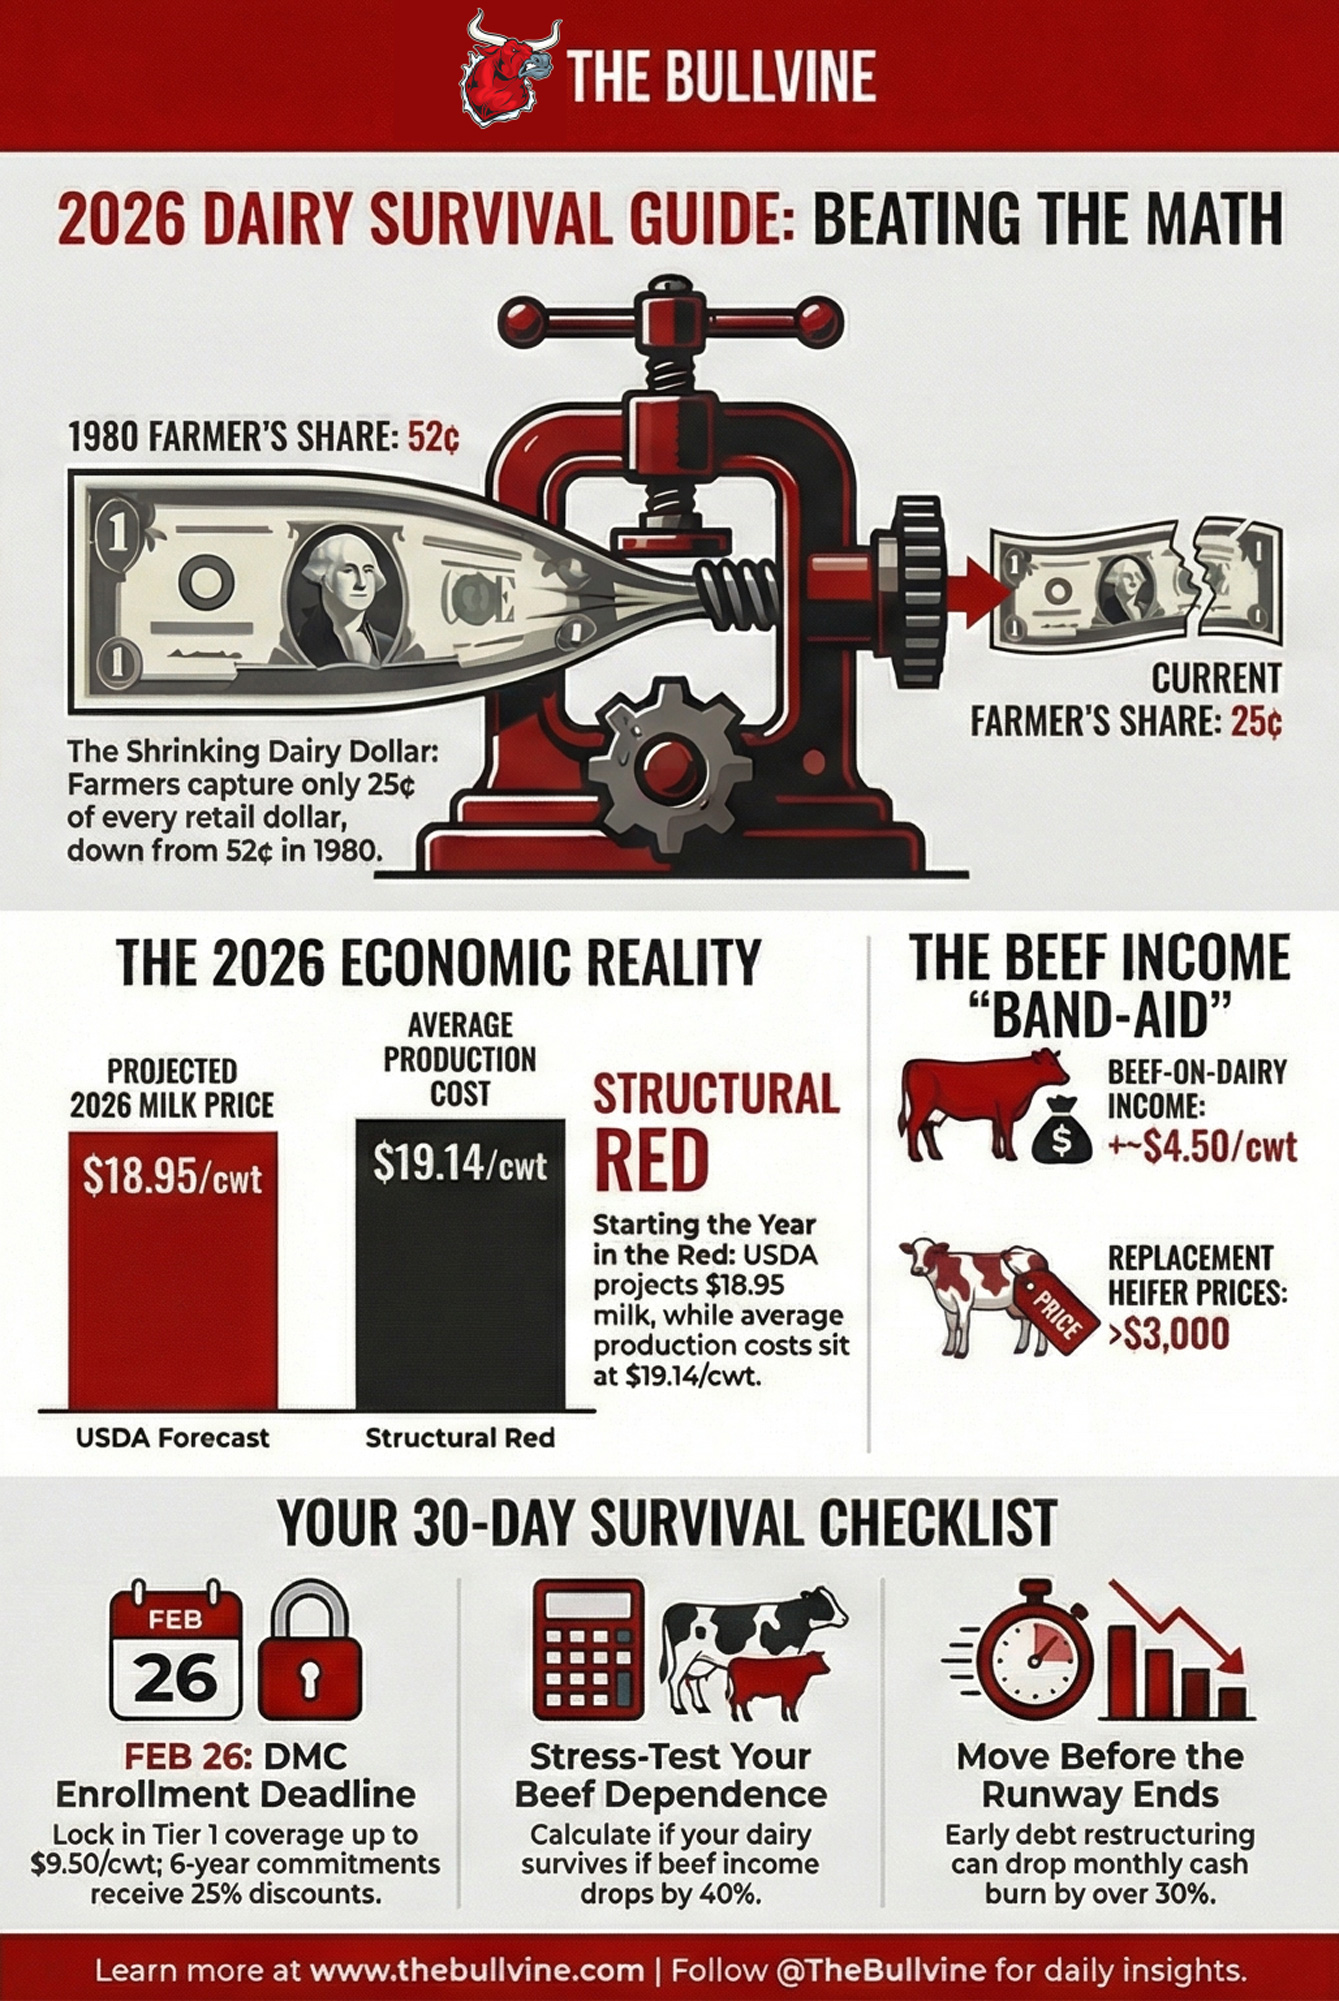
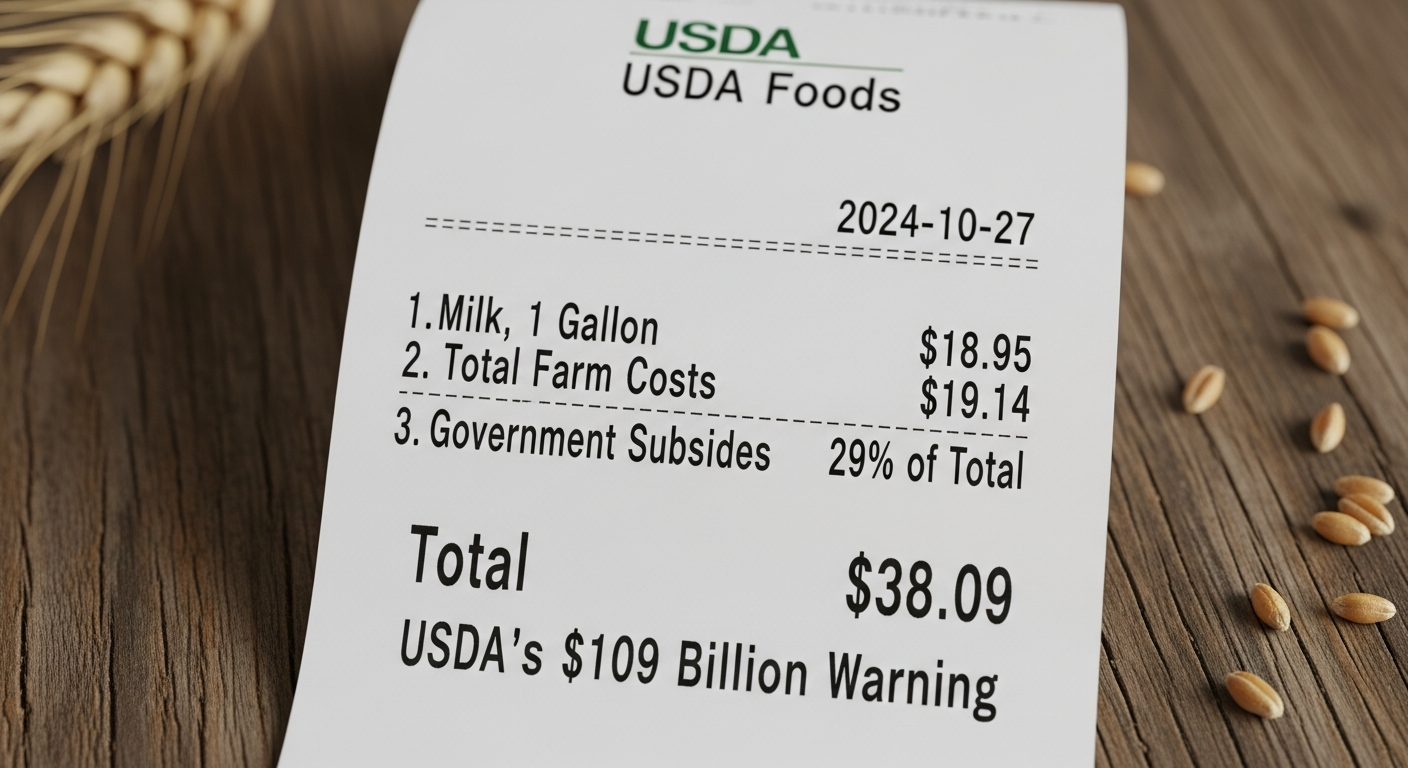
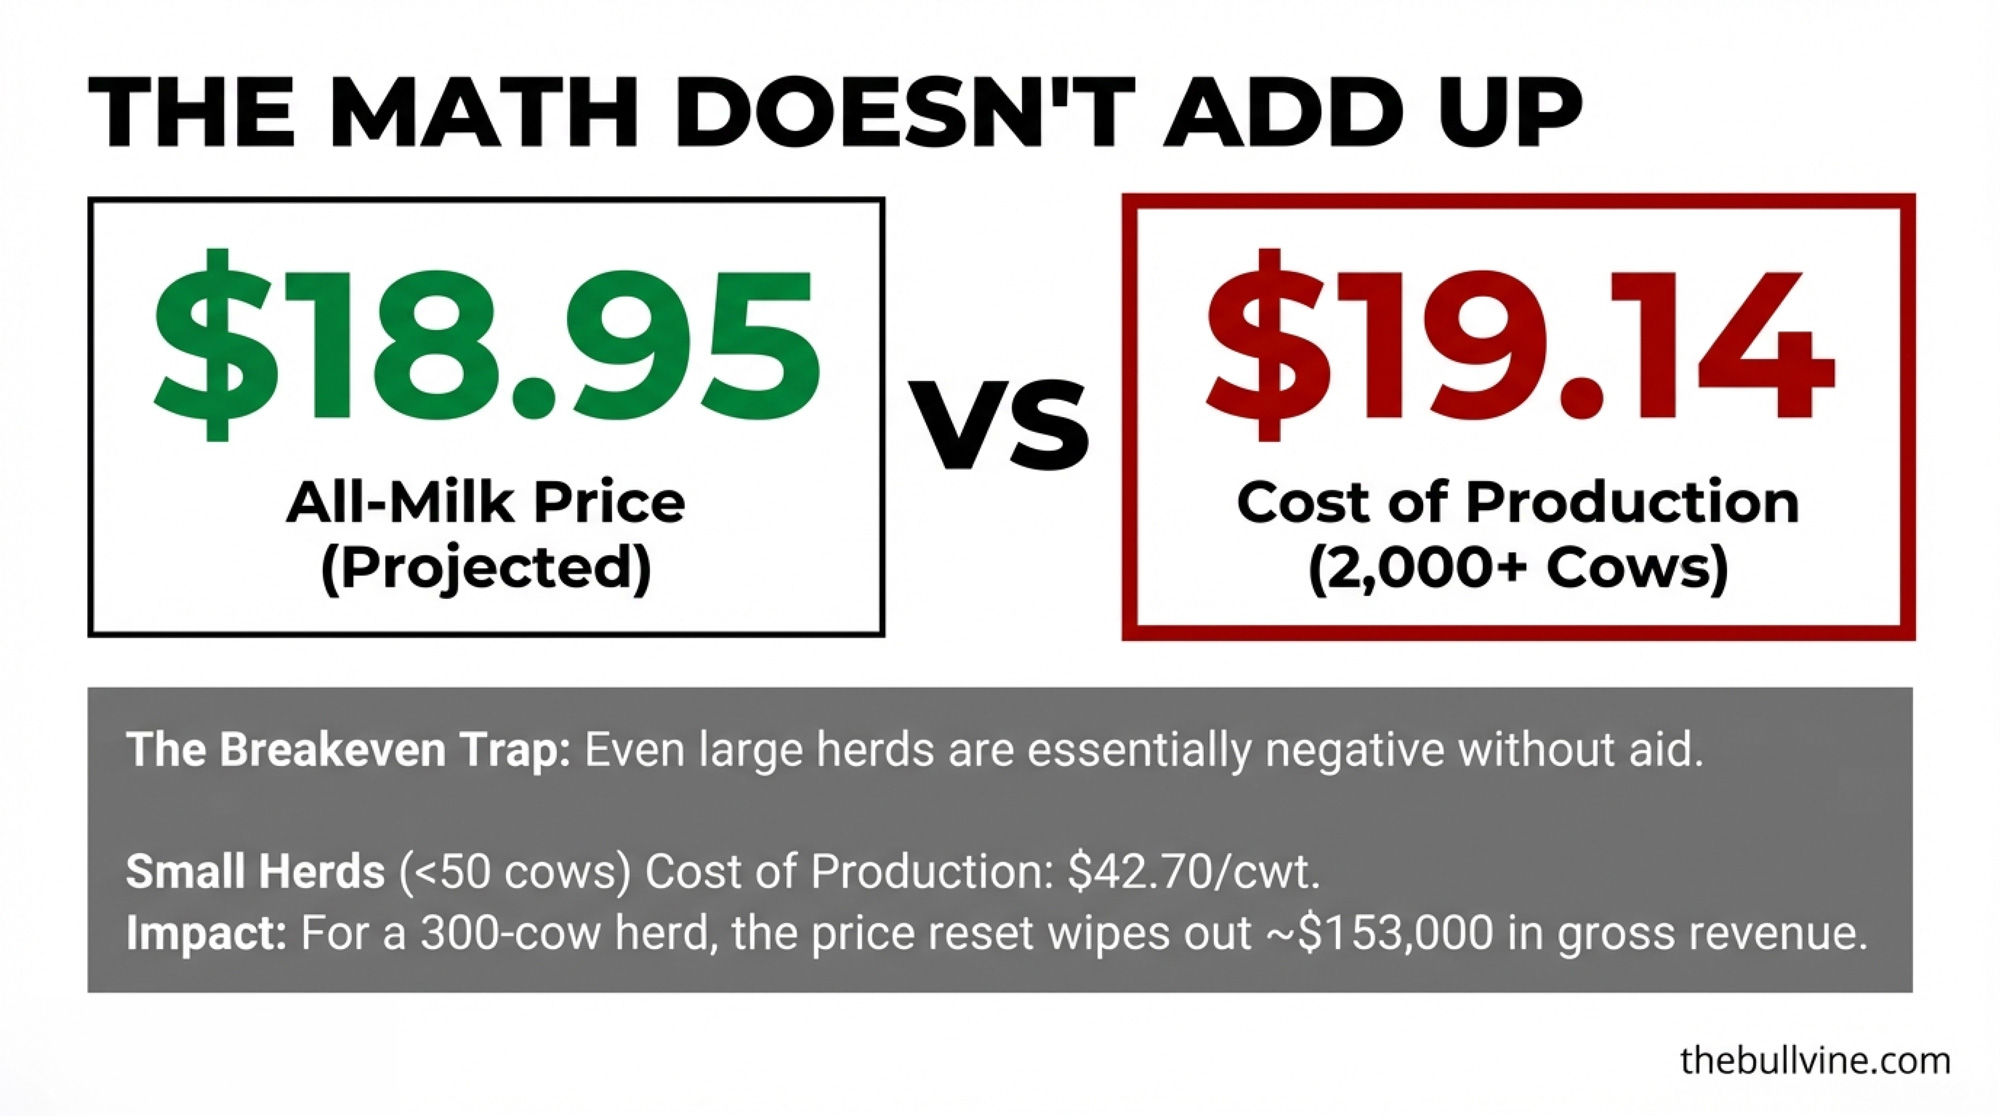
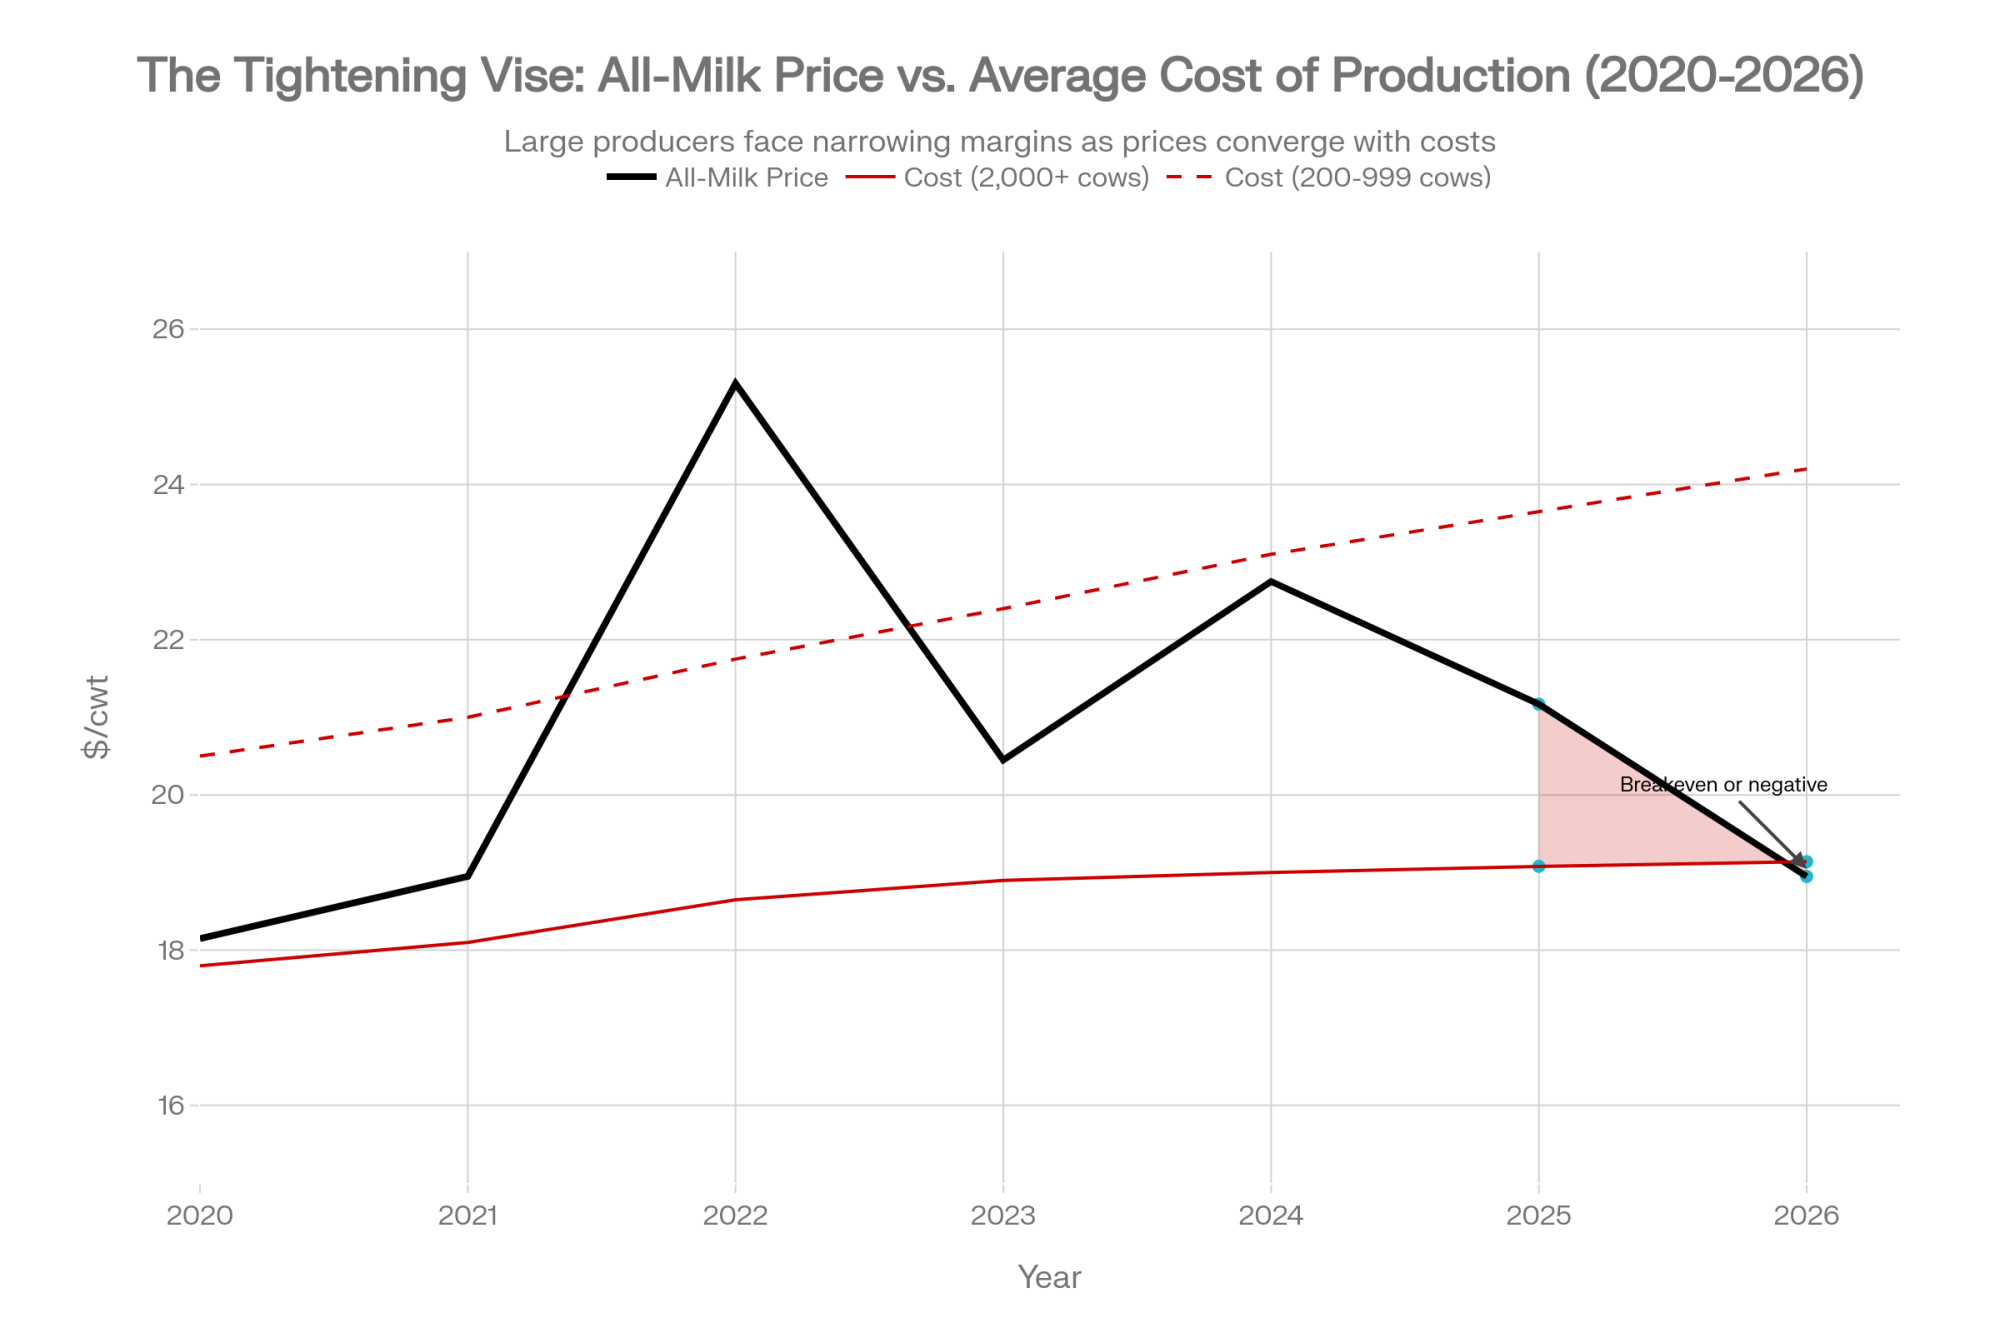
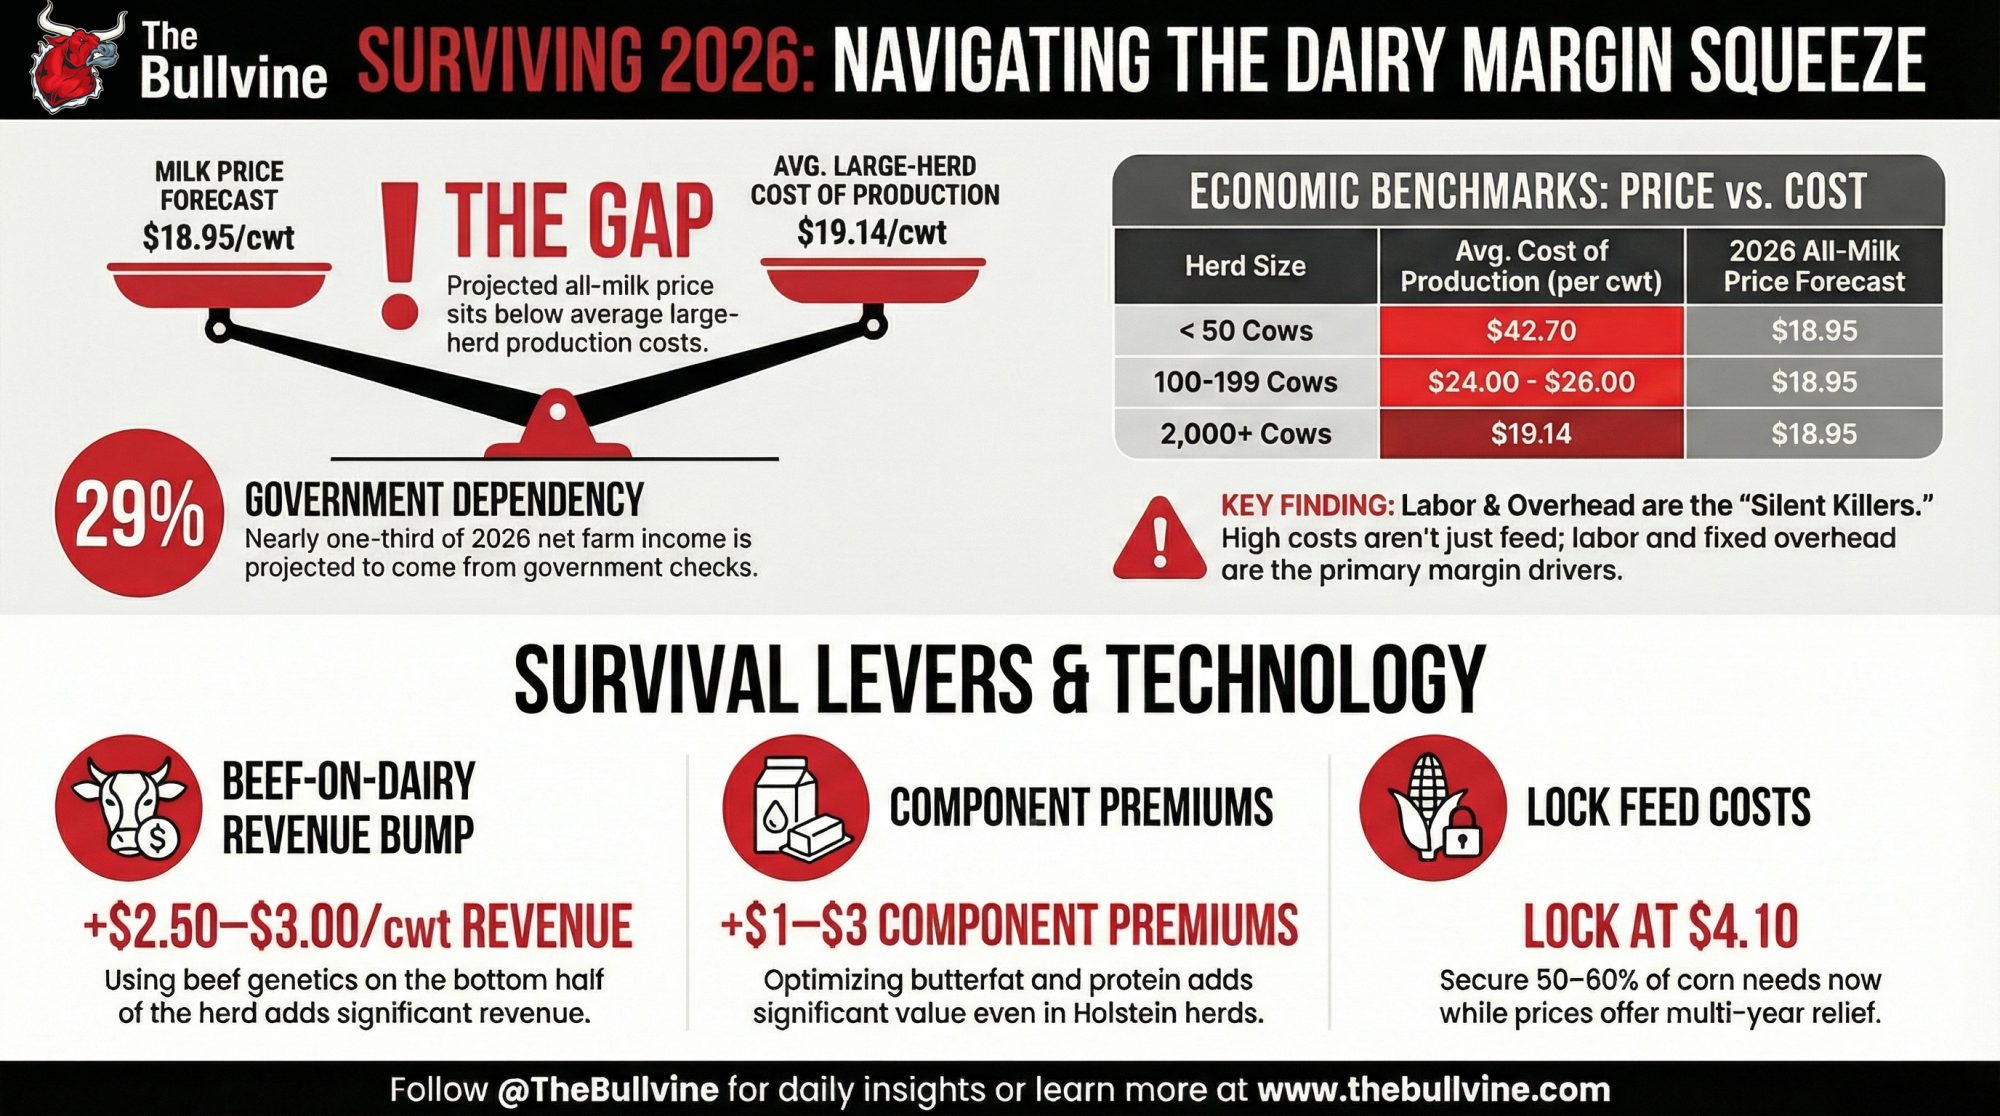
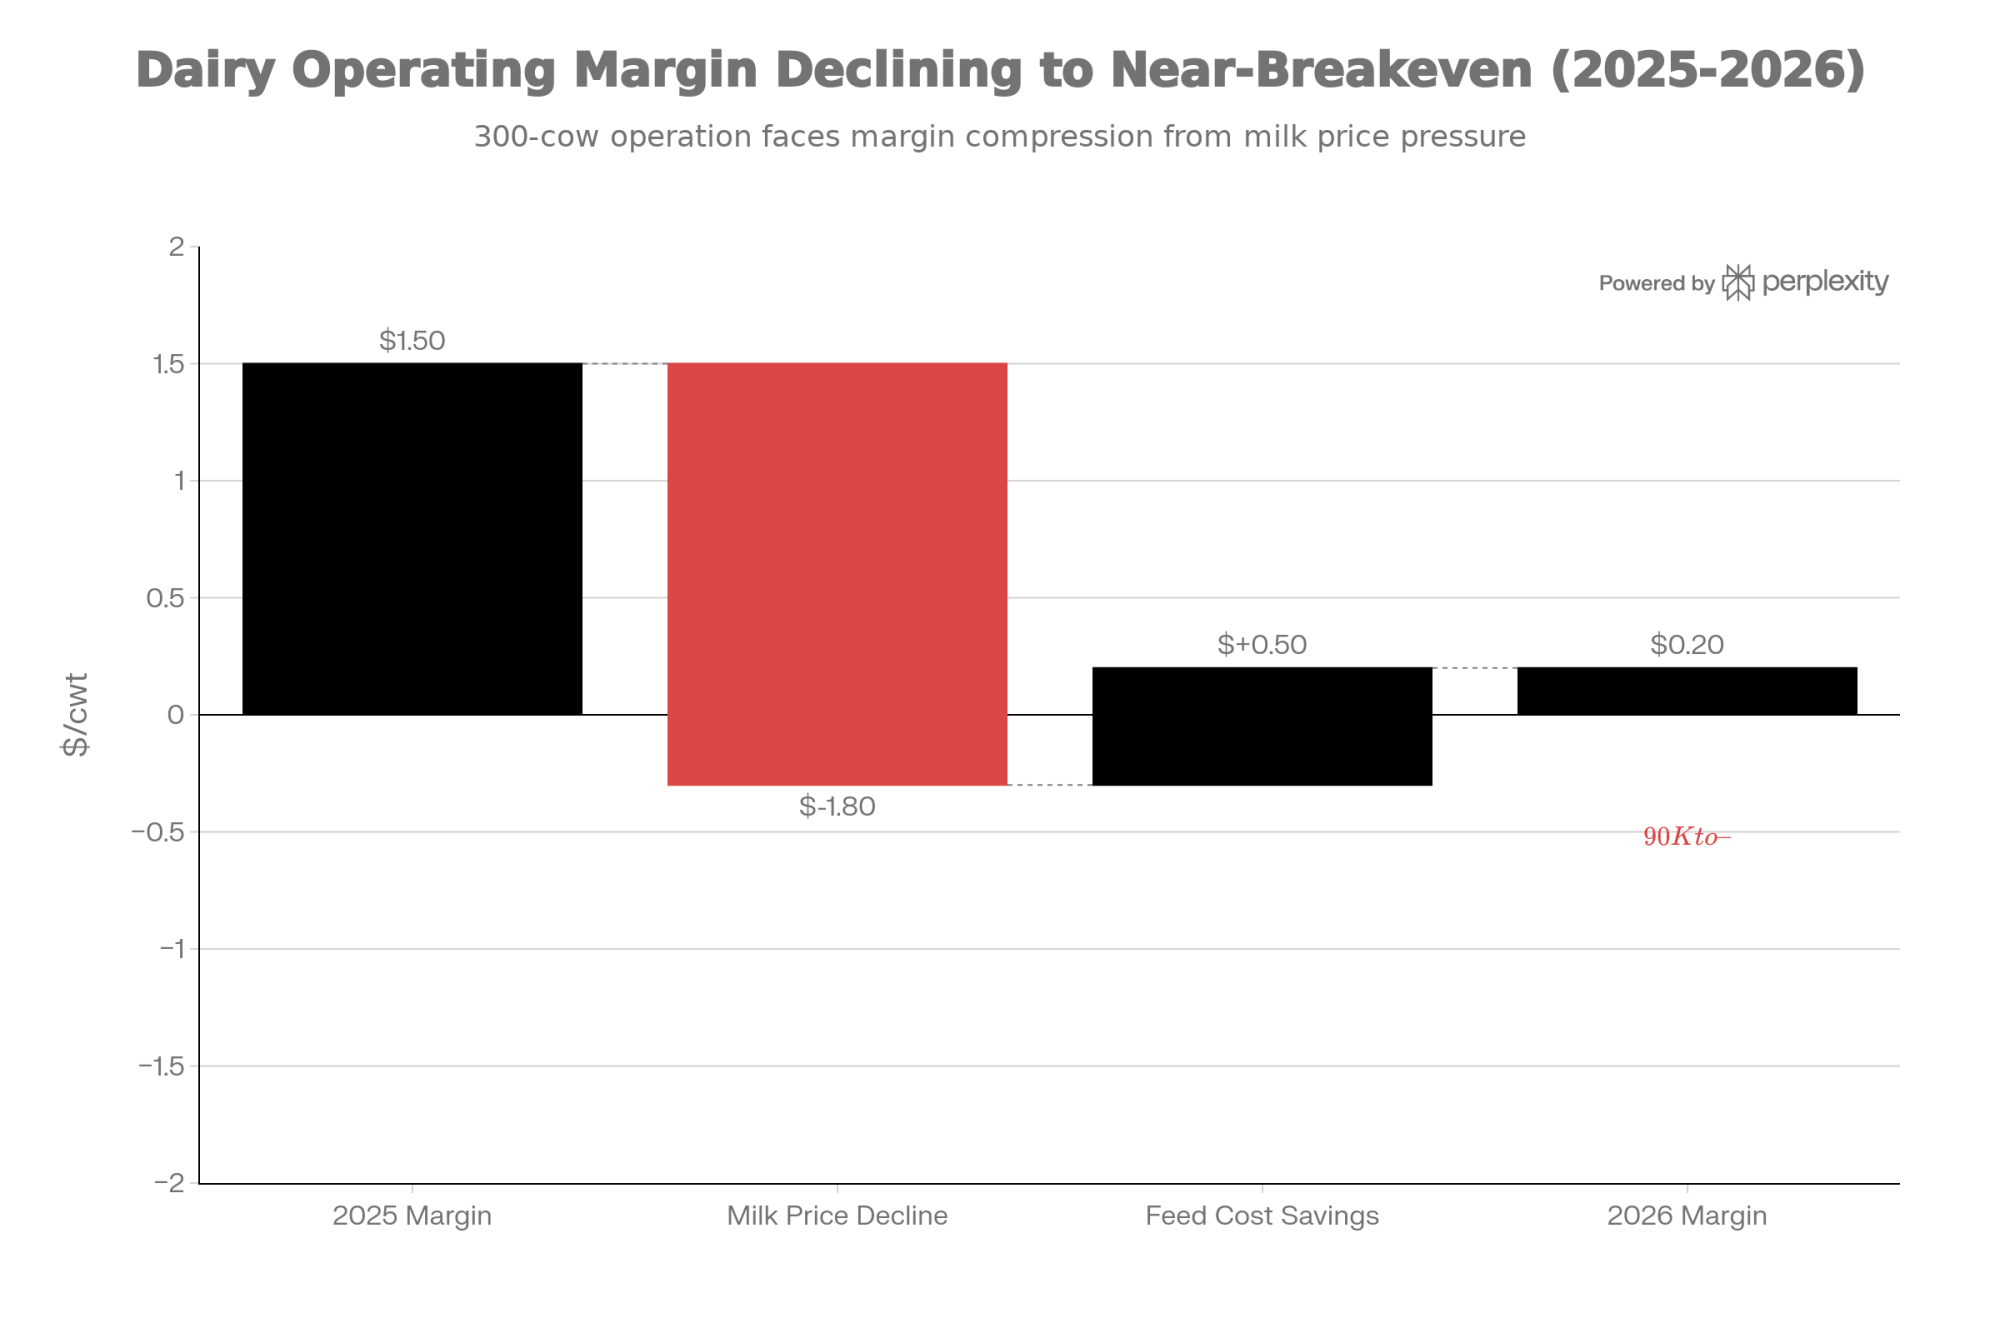
USDA’s February 10 WASDE projects the 2026 all-milk price at $18.95/cwt. That’s down $2.22/cwt from the revised 2025 average of $21.17/cwt. If the back half doesn’t rally, that number won’t hold. 

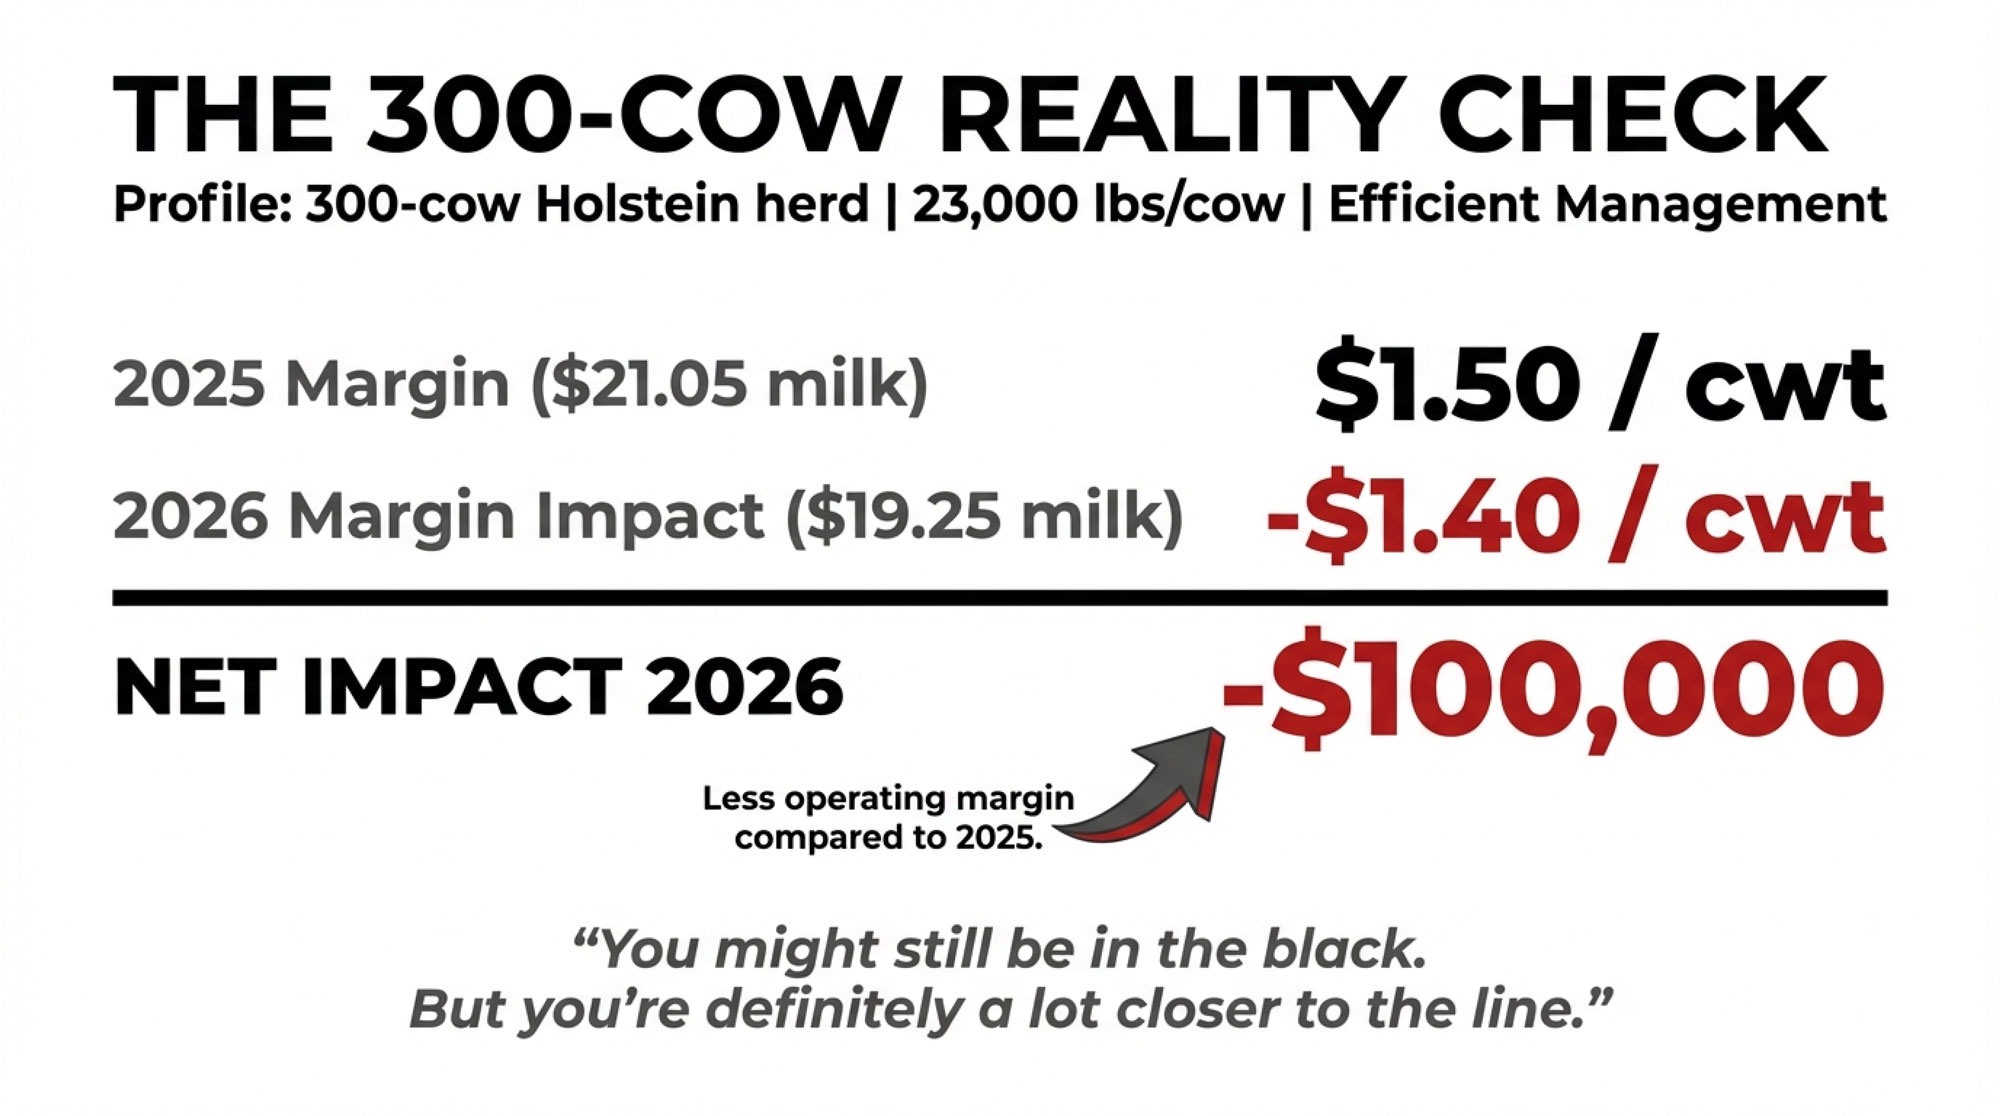
Take a 300-cow herd shipping roughly 69,000 cwt annually (at about 23,000 lbs/cow — below the national average of 24,390, which gets skewed upward by the largest herds): 

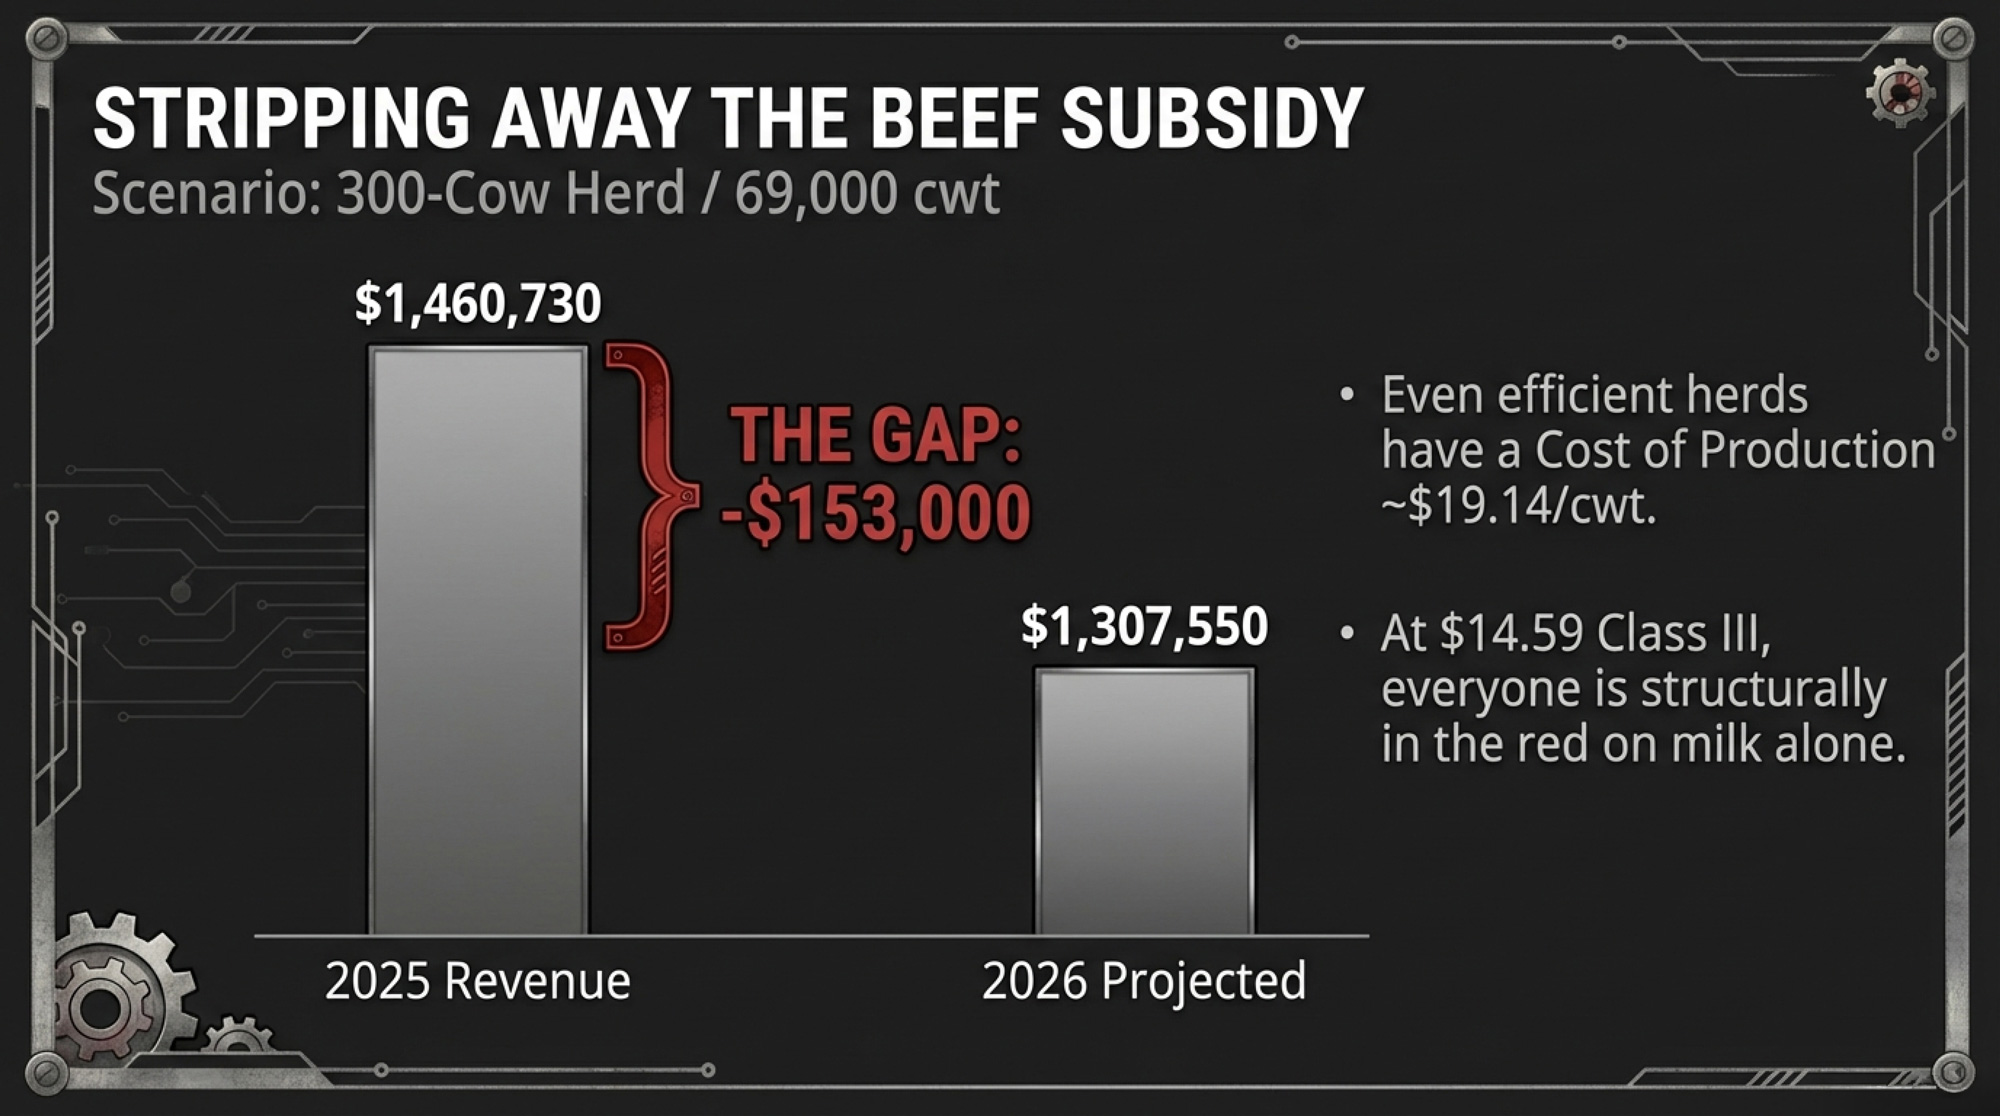
  • 2025 gross milk revenue (at $21.17/cwt): ~$1,460,730
  • 2026 gross milk revenue (at $18.95/cwt WASDE forecast): ~$1,307,550
  • The gap: roughly $153,000 in lost gross milk revenue

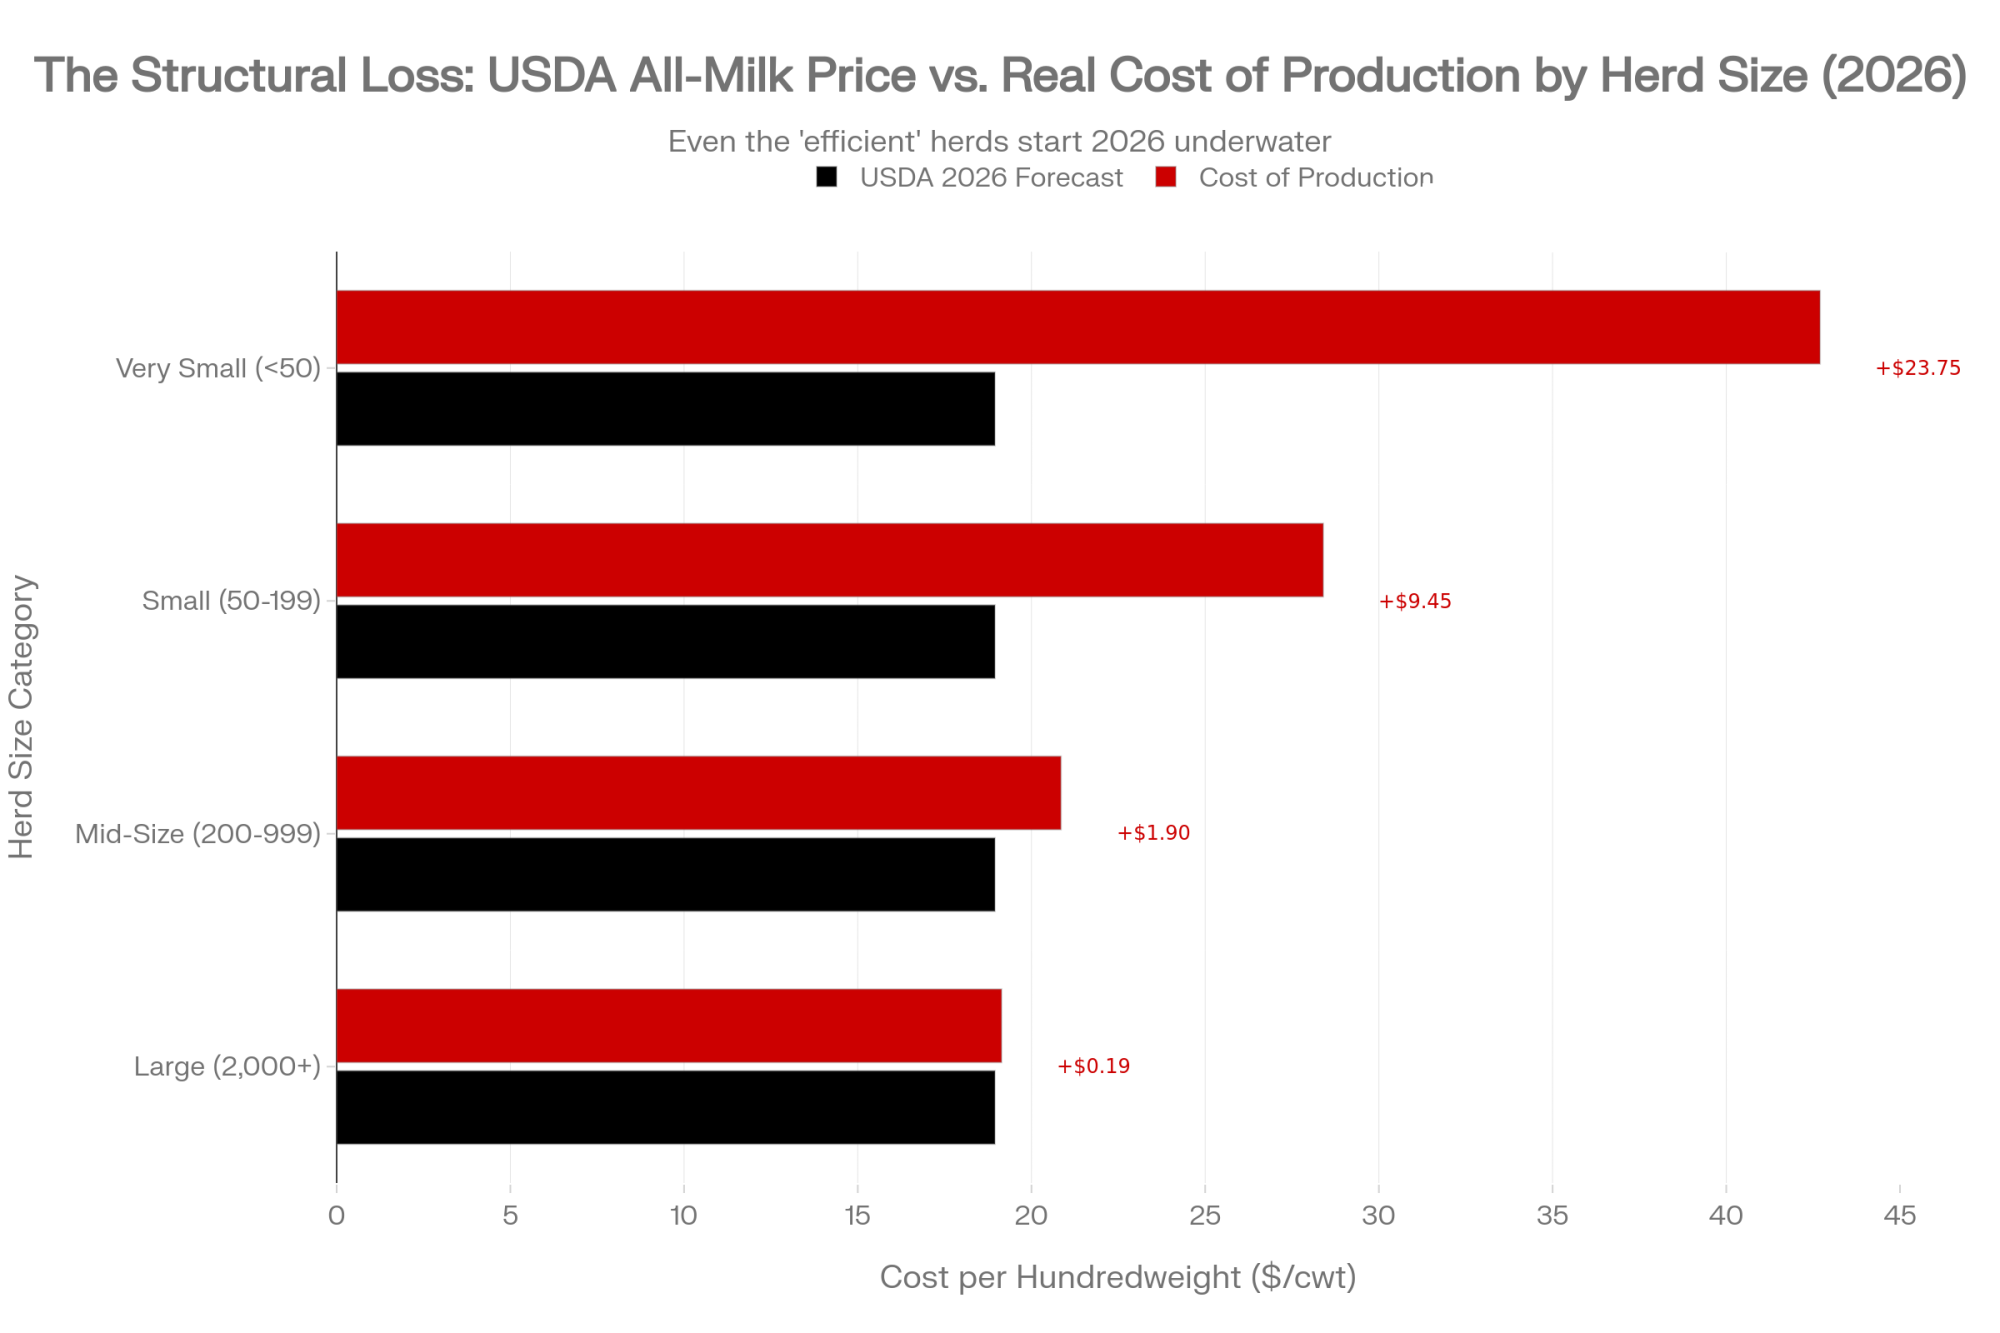
That’s before feed, labor, or debt service. ERS cost-of-production data puts a 2,000-plus-cow operation at $19.14/cwt— which means even the largest, most efficient herds are structurally in the red on a full-cost basis at current spot prices. That Wisconsin producer’s $18.75/cwt looked tight against $21 milk. Against $14.59 Class III, it looks like a countdown. 

As of mid-February, CME Class III futures had March at roughly $16.68 and April around $17.24, with the curve reaching $18 by November. There’s a path to USDA’s annual average, but it requires a back-half rally that hasn’t started yet. 

Why Per-Cow Output Missed — and Why Ration Cuts Are the Real Story

Nationally, per-cow production averaged 2,068 pounds in January — 10 pounds below StoneX’s 2,078 forecast. That 1.2% year-over-year gain is a real downshift from the stronger increases through mid-2025. 

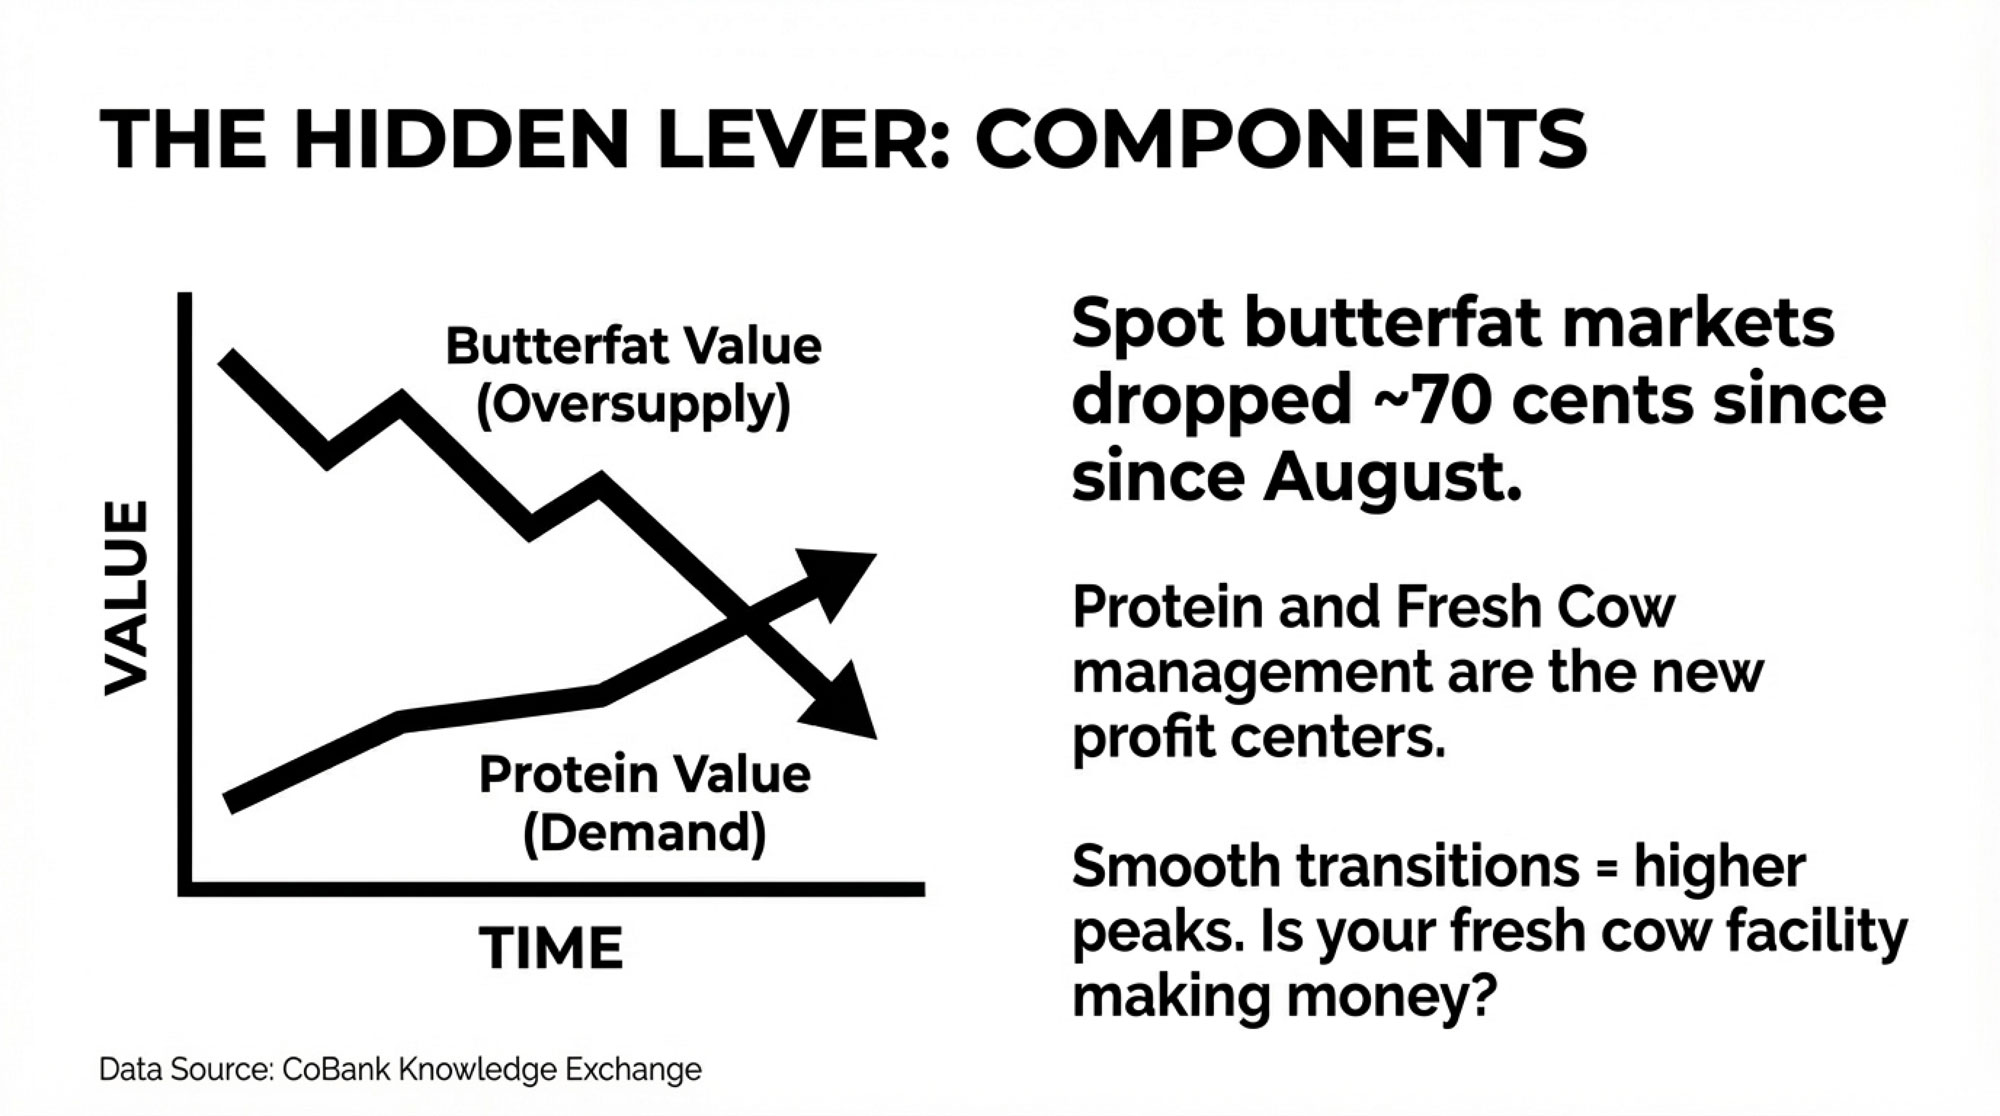
The explanation is ration economics. When your December Class III drops to $15.86 — down $2.76 from the prior year  — you cut feed intensity. StoneX’s analysis notes these adjustments have “probably cut the fat content in the milk and slowed the growth in milk production per cow”. Component-adjusted production still rose 4.2%, with butterfat at 4.50% and protein at 3.45%, but the year-over-year gains are narrowing. 

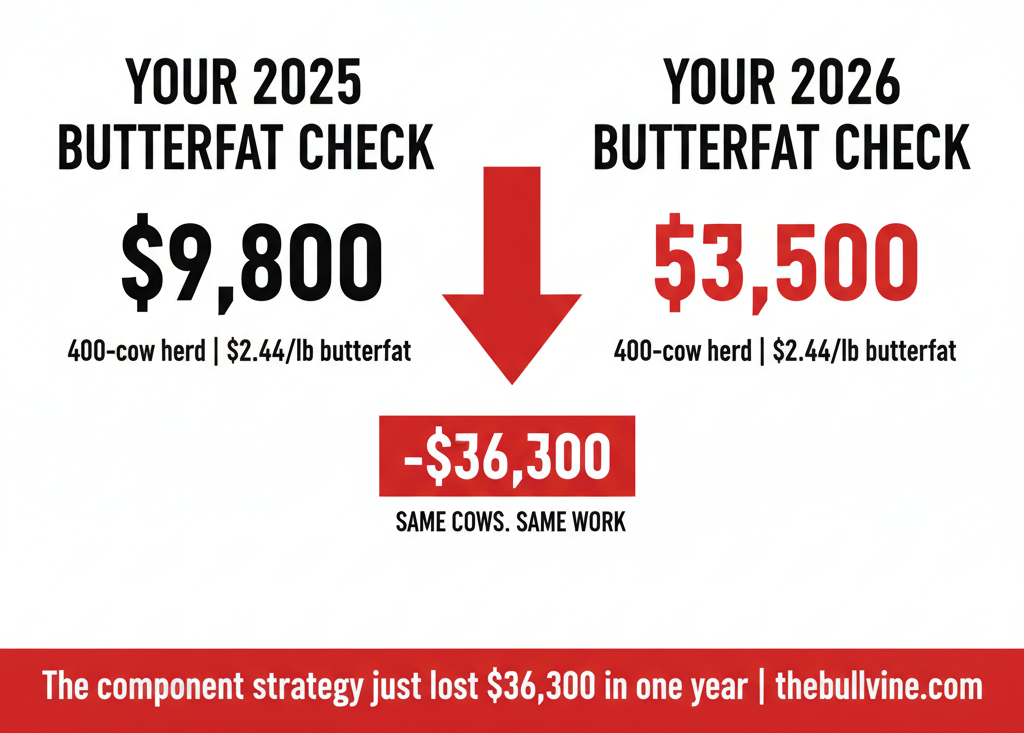
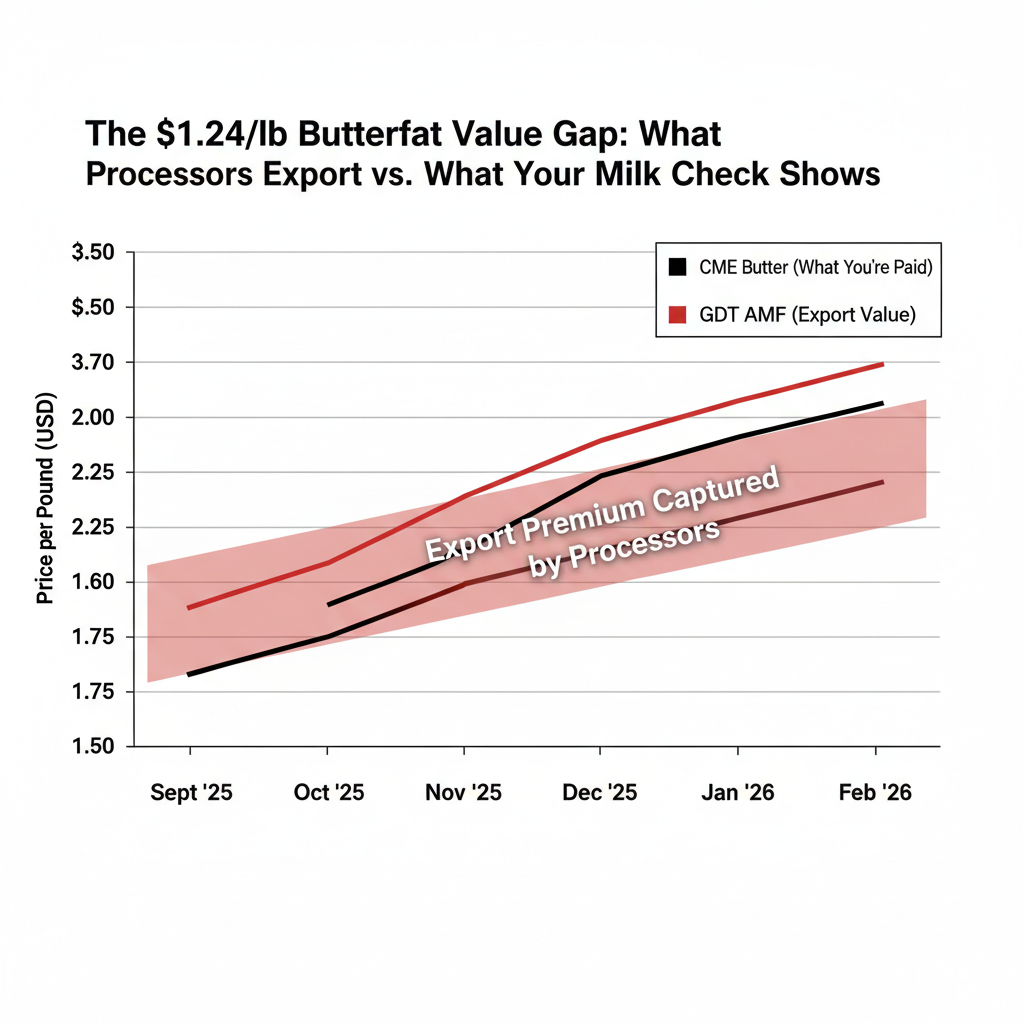
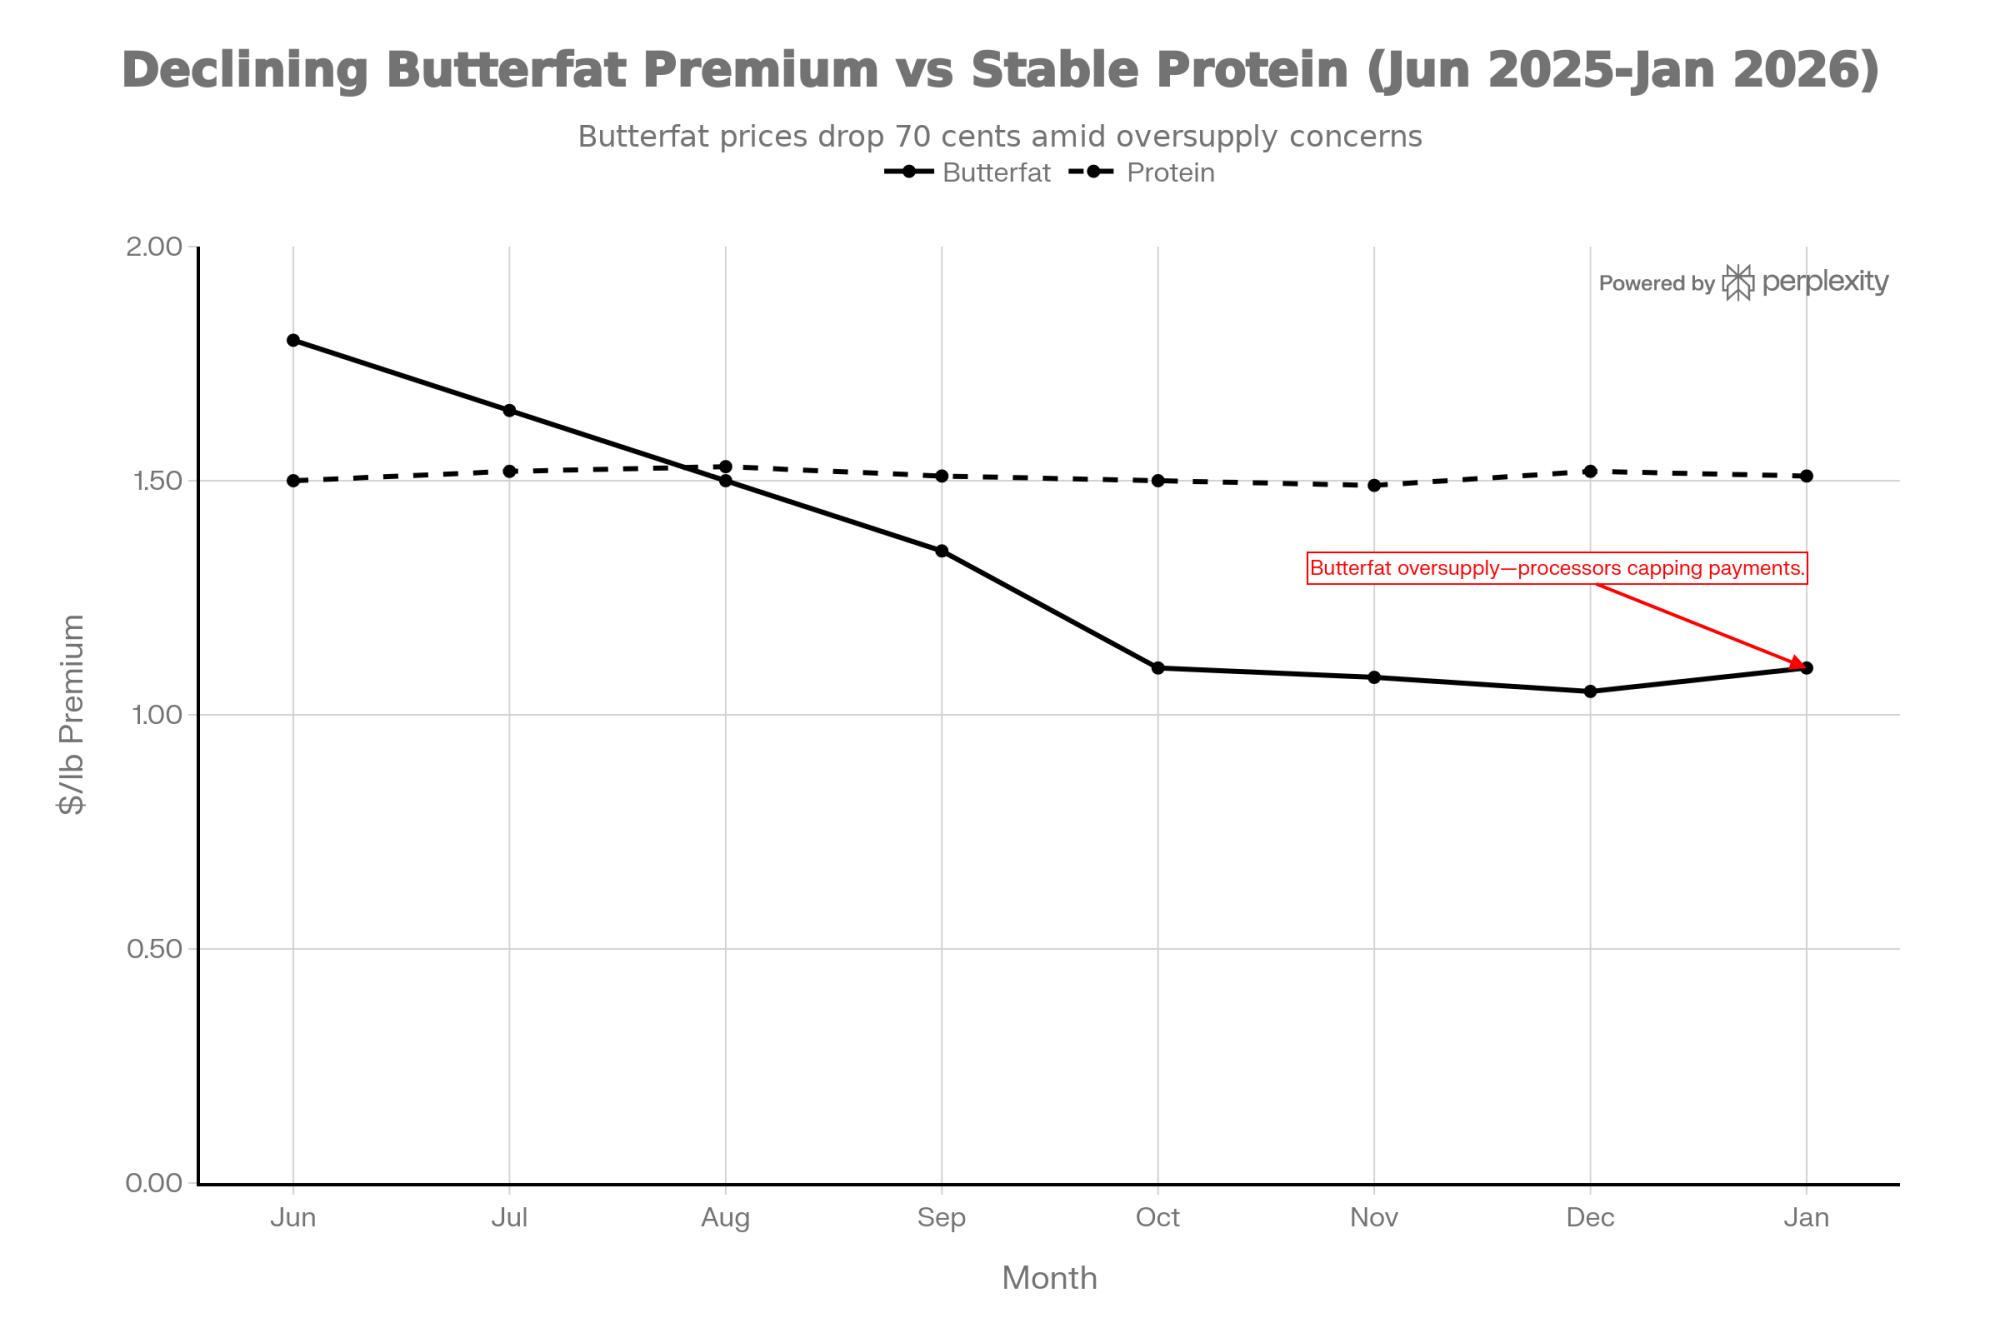
January’s FMMO butterfat price came in at $1.4525/lb  — roughly 40% below the 2025 average of about $2.44/lb. Chasing components at those returns is a different proposition than it was a year ago. 

Dairy economist Bill Brooks of Stoneheart Consulting puts 2026 milk income over feed costs at $10.14/cwt — still above the $8/cwt threshold generally needed to maintain production, but $2.30/cwt below 2025. The cushion is thinning. 

The Real Profit Center: Calves, Not Milk

This is the paradox at the heart of today’s report. Milk prices are terrible. Farmers keep adding cows anyway.

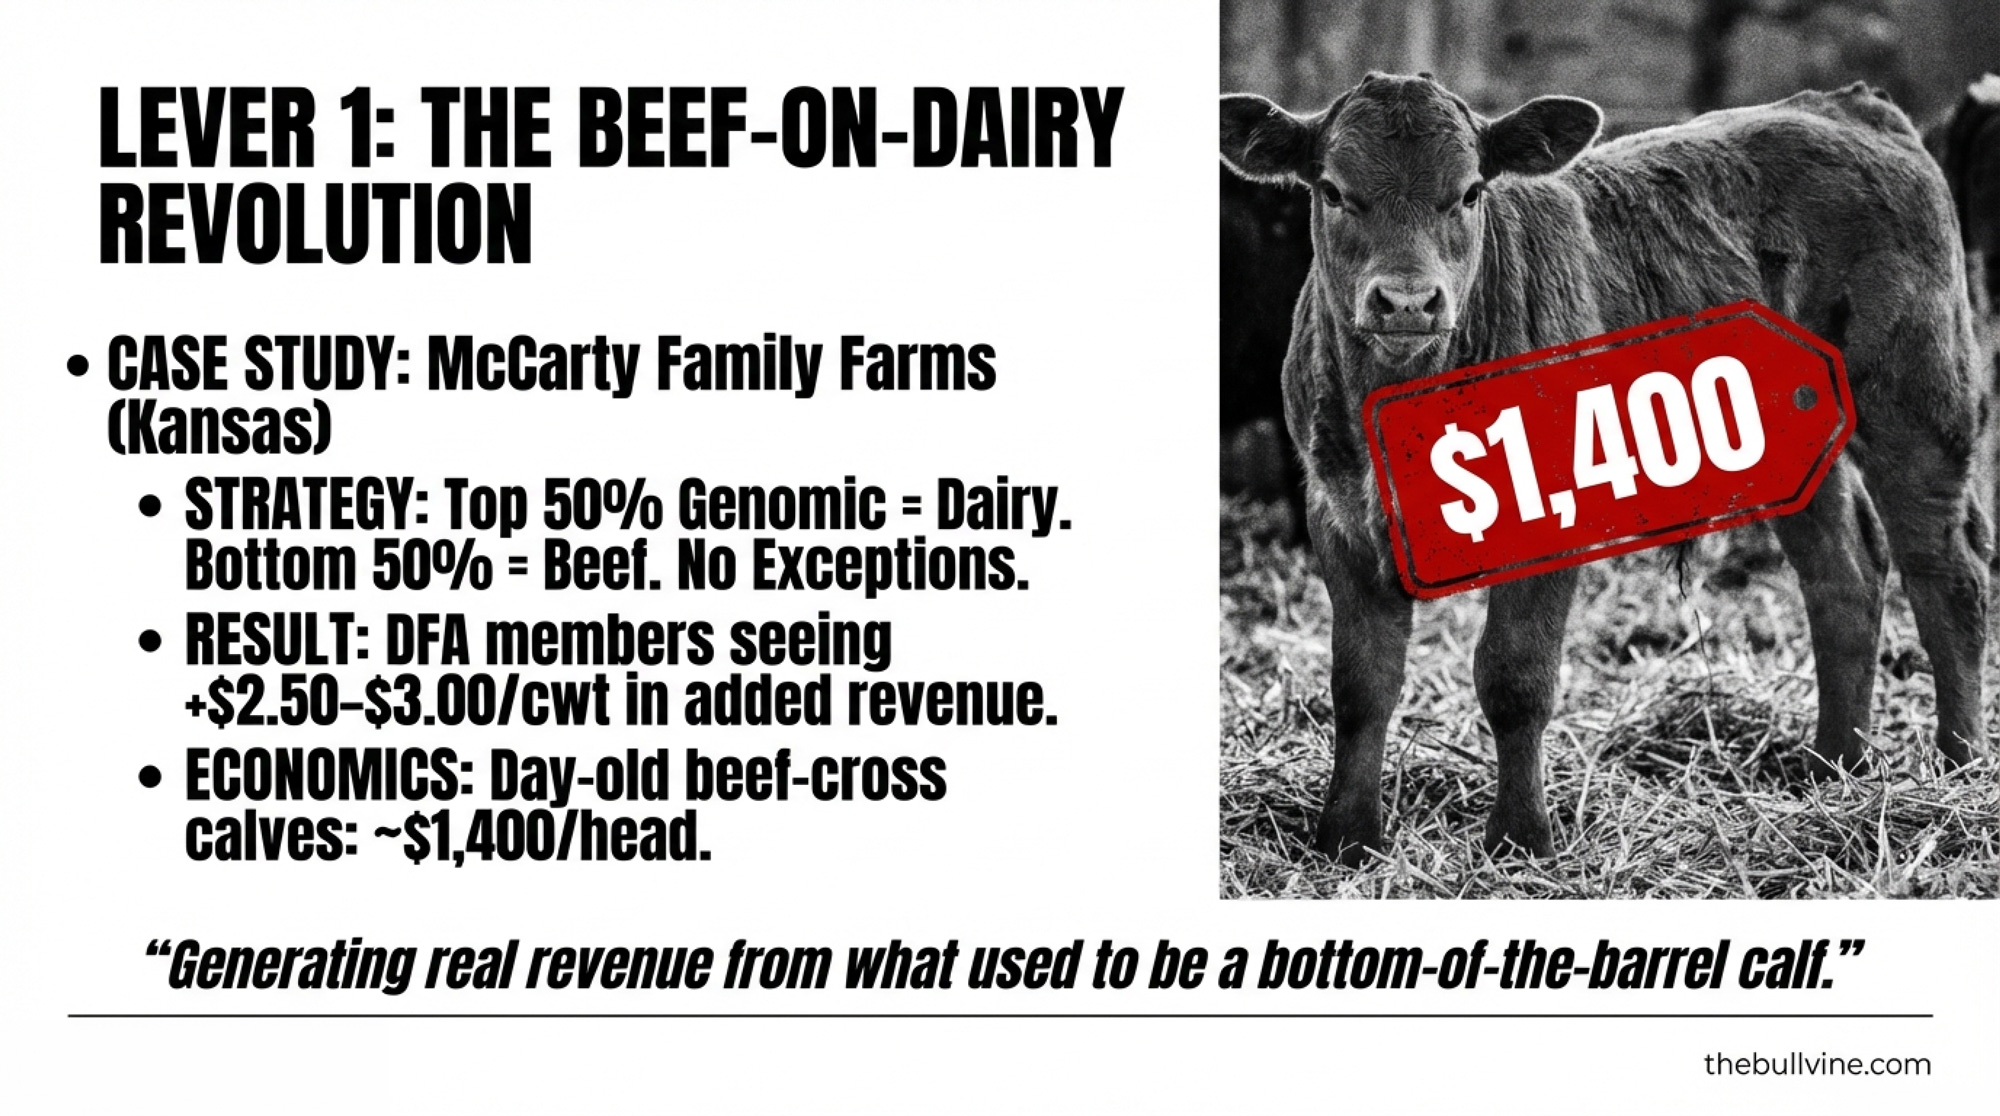
The answer walks out the barn door on four legs. Nationally, day-old beef-on-dairy calves are bringing $1,400 to $1,500 per head — up from roughly $650 just three years ago. High Ground Dairy’s modeling shows that beef-on-dairy calf values surged by more than 533% between August 2022 and August 2025. In strong Wisconsin markets, premiums push that figure higher still. 

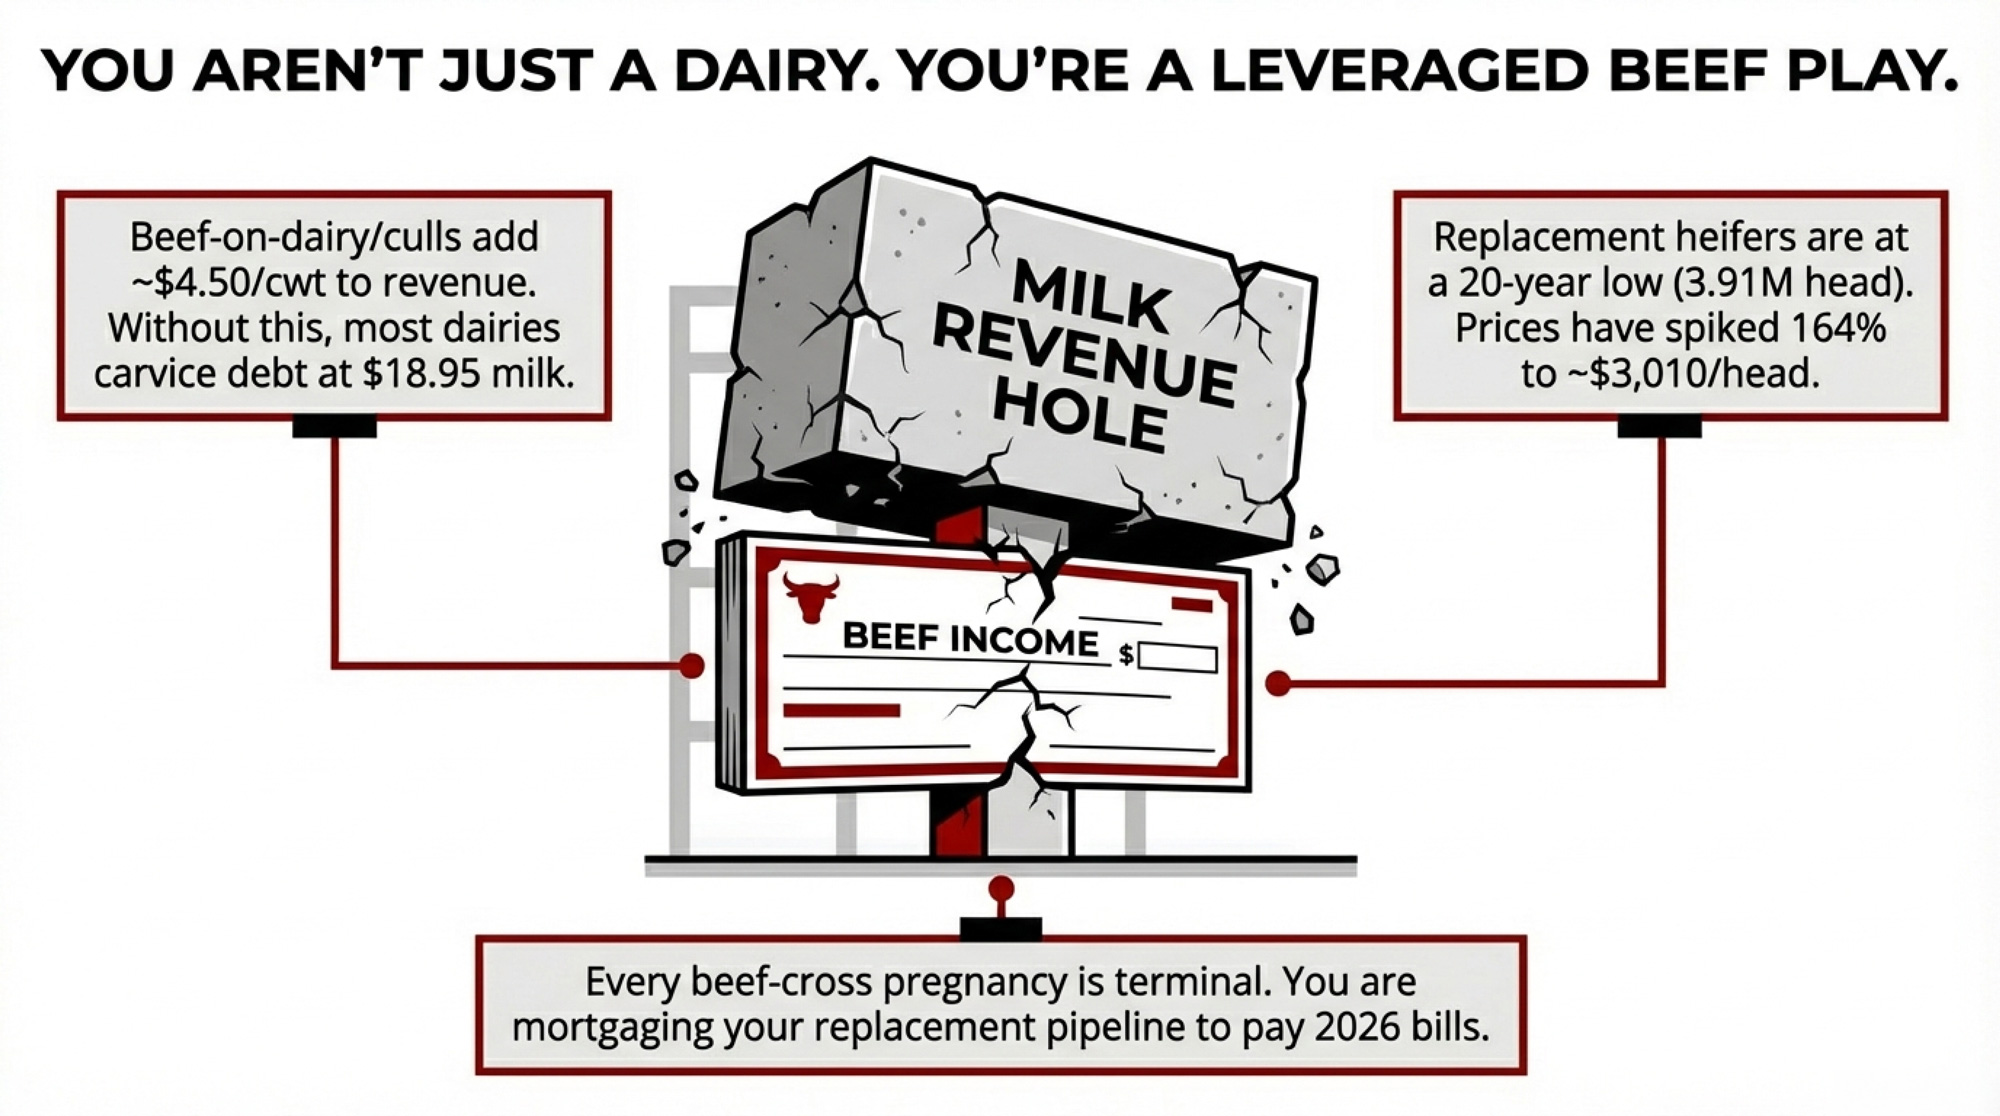
DFA’s Corey Gillins, the co-op’s chief milk marketing officer, estimates that about 70% of DFA’s dairy farmer members are now engaged in beef-on-dairy breeding, adding roughly $2.50 to $3.00/cwt in calf revenue alone. That’s a DFA membership estimate, not an independent industry audit, but it tracks with NAAB semen sales data. High Ground Dairy’s October 2025 modeling on a 1,000-cow operation (55% bred to beef, 28% annual cull rate) pegs total beef-related income — calves plus cull premiums — north of $4.50/cwt of milk shipped. 

On a 300-cow dairy shipping 69,000 cwt, that’s roughly $310,000 a year coming from the cattle market, not the milk market.

CattleFax’s outlook at CattleCon 2026 in Nashville forecast the average 2026 fed steer price at $224/cwt, roughly steady with 2025, and utility cows around $155/cwt. That suggests beef could stay supportive through 2026. But that’s not an excuse to skip the stress test. 

What If Beef and Milk Prices Drop at the Same Time?

Walk through it step by step for that same 300-cow herd:

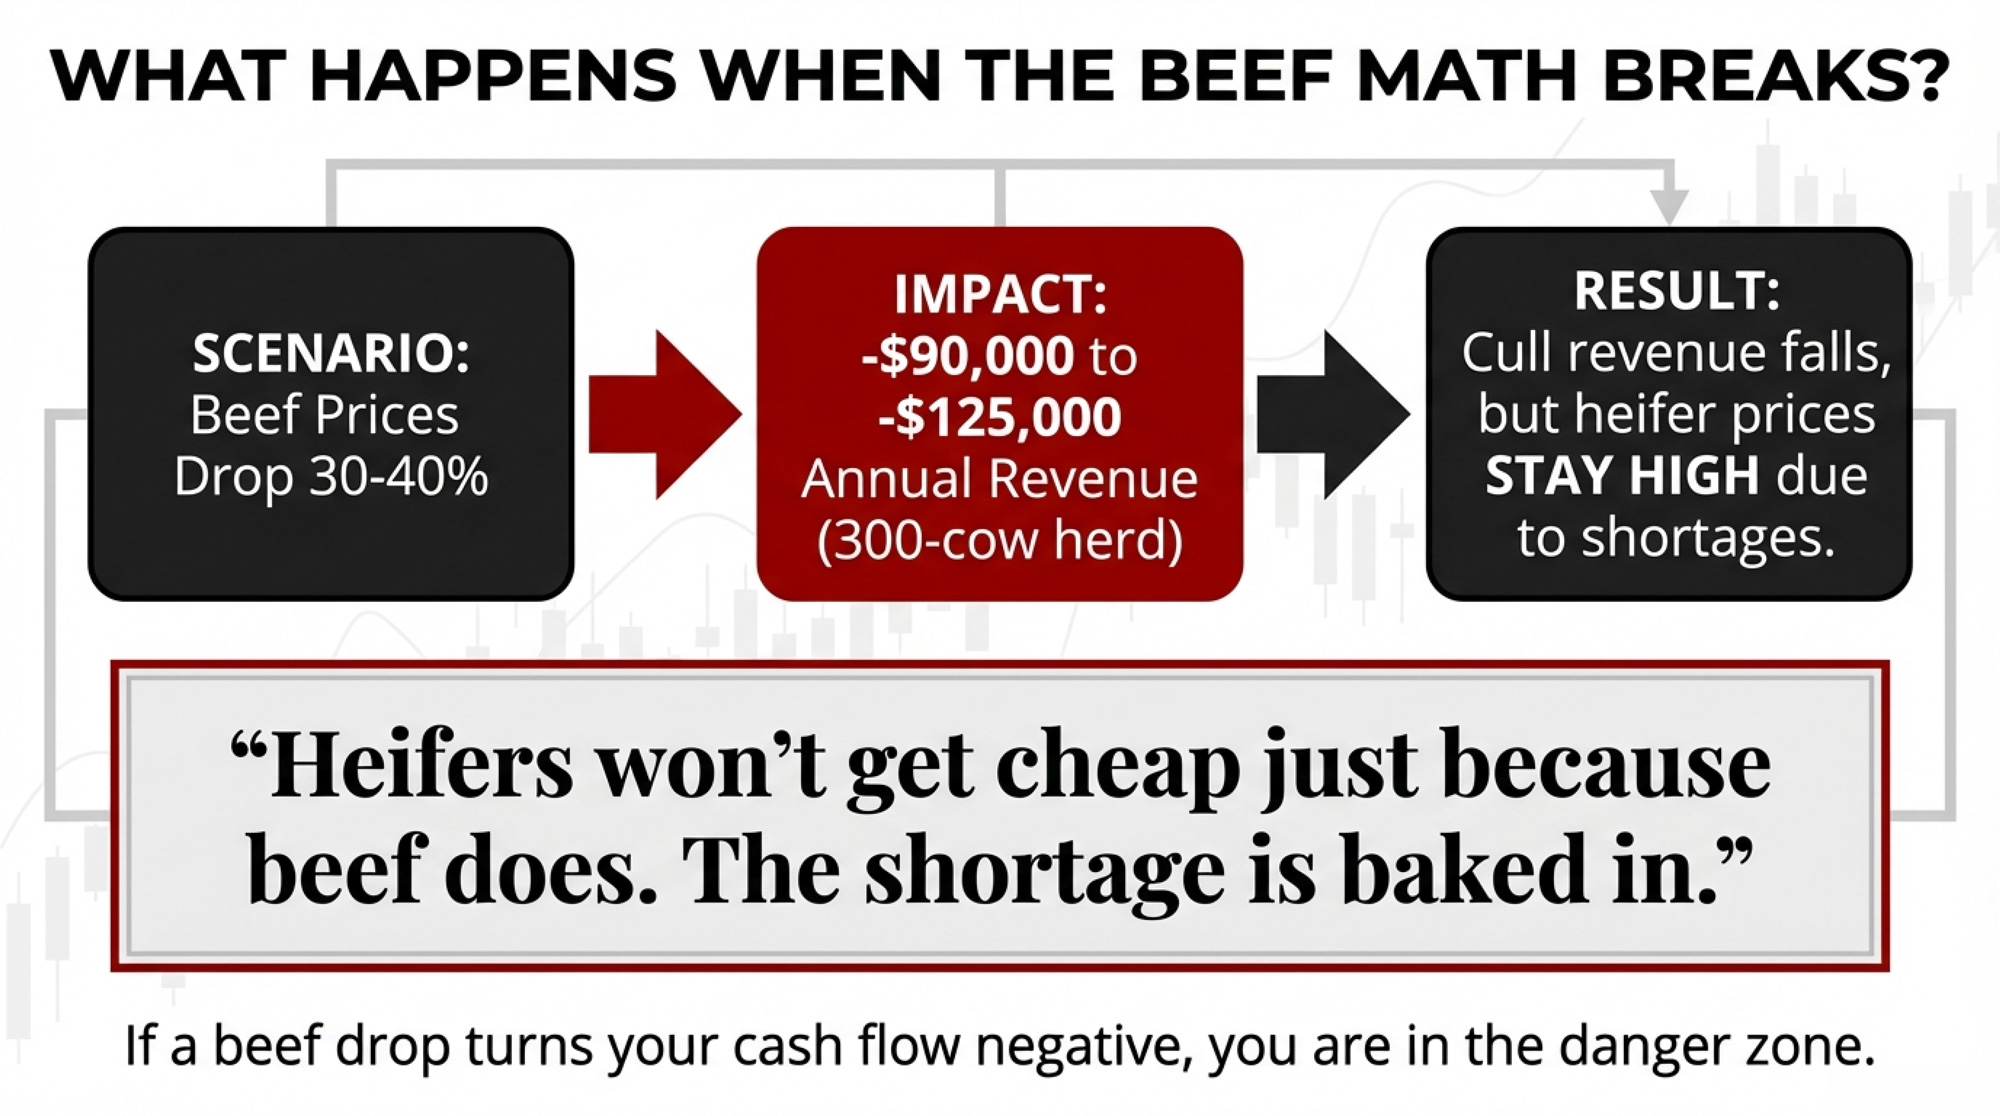
  • 2025 total gross revenue: ~$1,460,730 (milk) + $310,000 (beef) = ~$1,770,730
  • 2026 if WASDE holds + beef holds: ~$1,307,550 + $310,000 = ~$1,617,550 — down ~$153,000
  • 2026 if WASDE holds + beef corrects 35%: ~$1,307,550 + ~$201,500 = ~$1,509,050 — down ~$261,700

That 35% correction in beef isn’t extreme — it’s within range for a normal cattle cycle turn. And the hit compounds because roughly $108,500 of your beef income disappears on top of the $153,000 milk gap you were already absorbing. If your total annual debt service is anywhere near $200,000, that second scenario puts you in the danger zone.

CoBank’s August 2025 analysis estimated that dairy producers held back roughly 611,600 cows from slaughter between Labor Day 2023 and mid-2025. But the dam is starting to crack. USDA data shows December 2025 dairy cow slaughter hit 248,400 head — up 10.6% from December 2024. And the uptick continued into January, with the week ending January 10 logging 60,300 head, up 8.8% year-over-year. If beef softens enough that everyone ships at once, those cows hit the rail together — and the cull market falls harder than the correction alone would suggest. 

The Heifer Cliff Behind the Beef Check

There’s a price for breeding the bulk of your herd to beef genetics.

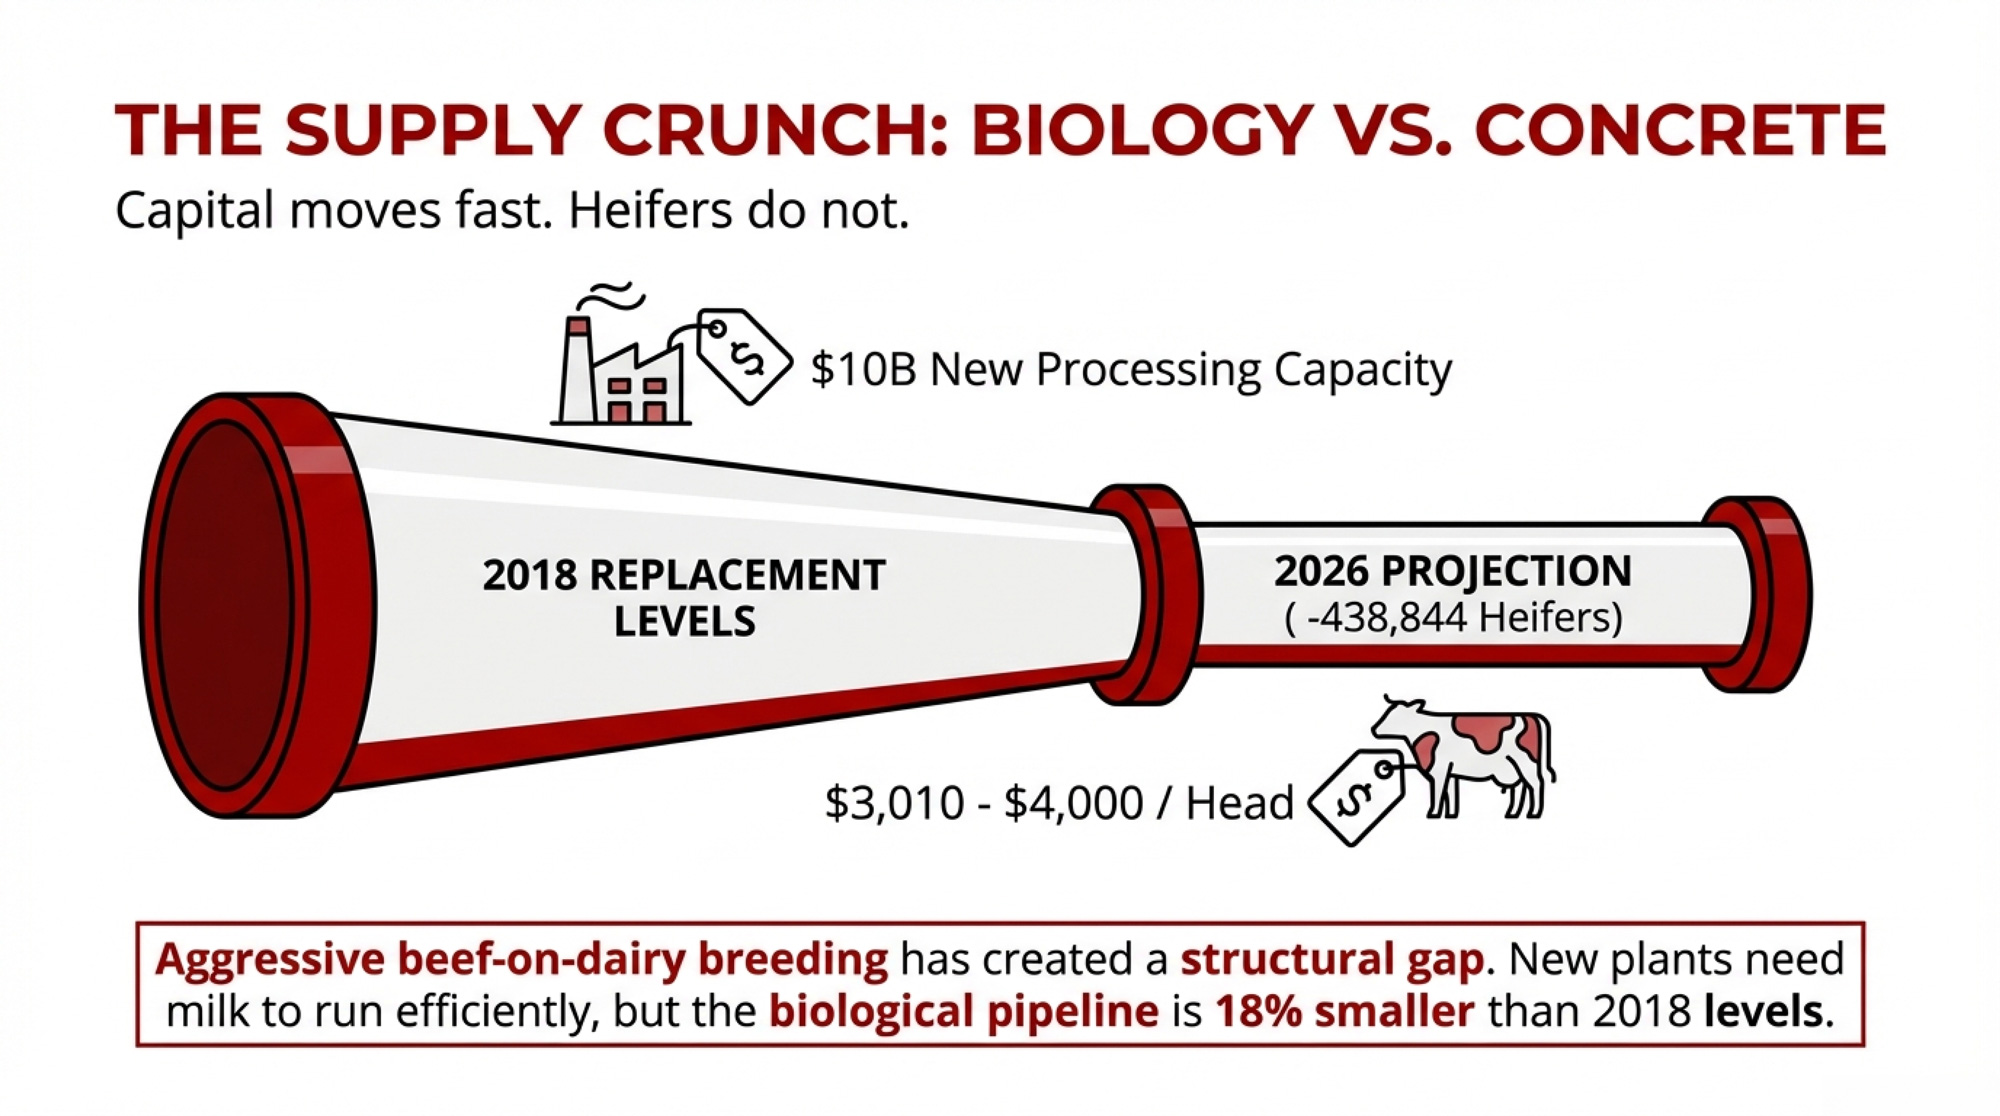
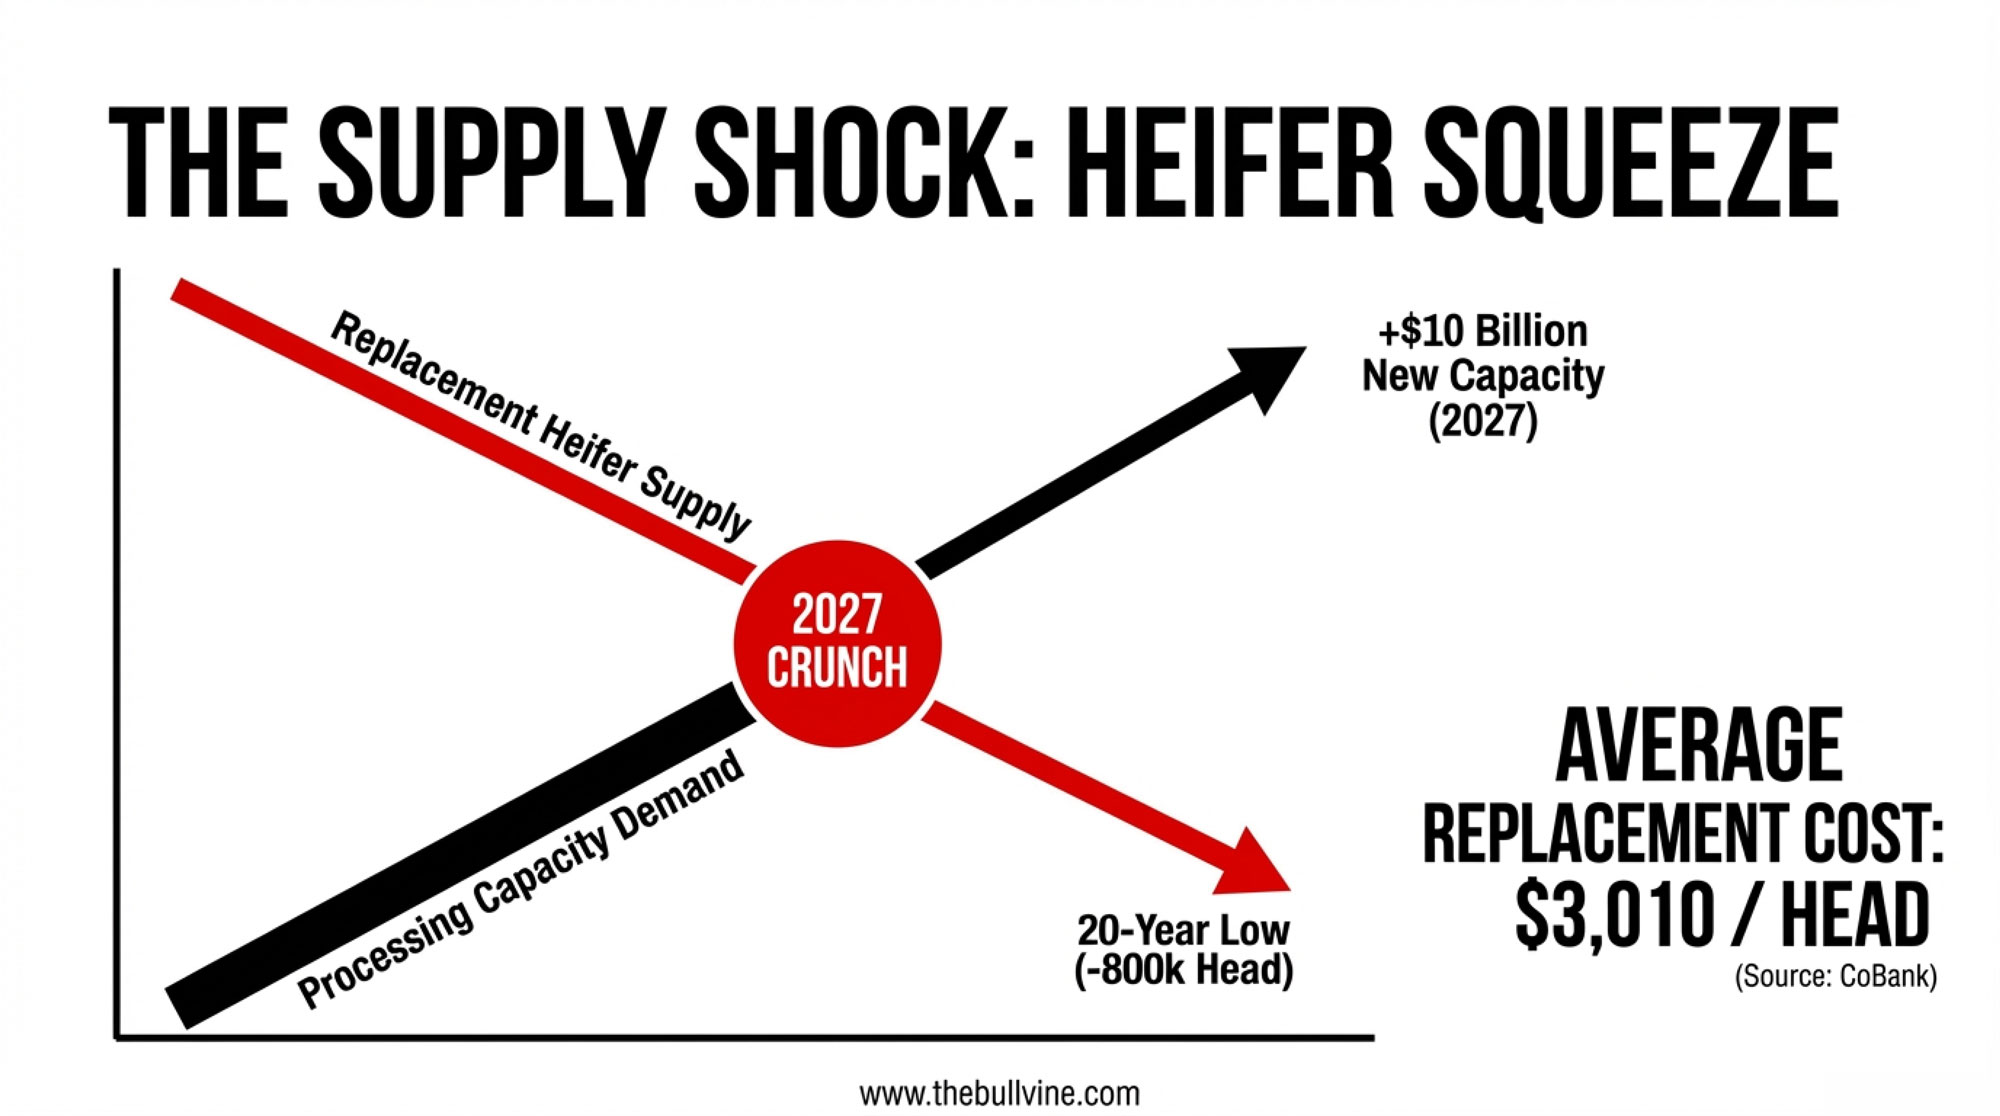
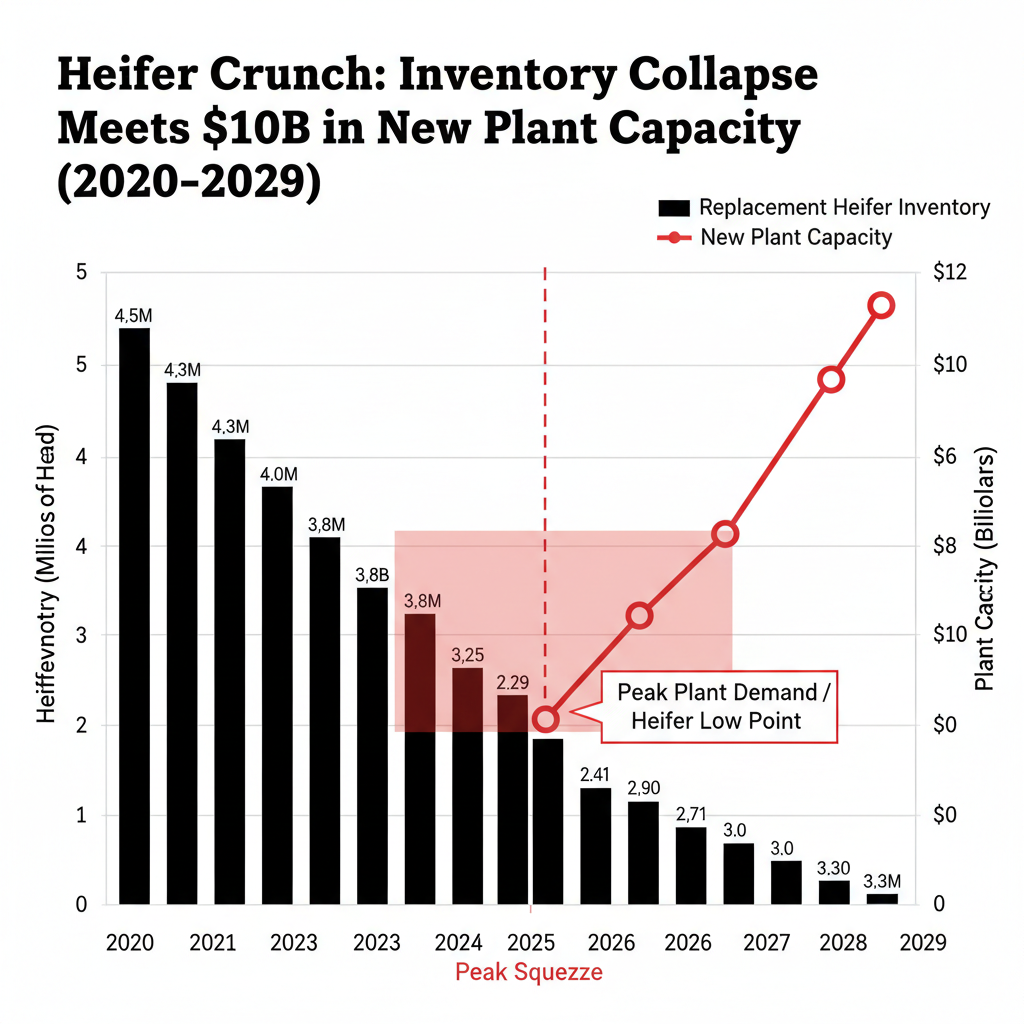
The U.S. now has its lowest dairy heifer replacement inventory in more than two decades — about 3.9 million head as of January 1, 2026. CoBank’s Corey Geiger, in a September 2025 report, projected 300,000 fewer dairy animals entering the milking stream in 2025 and nearly 438,000 fewer in 2026 — the year we’re living through. A rebound of about 285,000 isn’t expected until 2027, but that comes after a cumulative 800,000-head deficit. 

YearHeifers Entering StreamChange vs. BaselineCumulative DeficitReplacement Cost/Head
2023~900,000 (baseline)~$2,100
2024~850,000–50,000–50,000~$2,400
2025~600,000–300,000 (red)–350,000 (red)$2,600–$2,850
2026~462,000–438,000 (red, bold)–788,000 (red, bold)$3,010–$3,360 (red)
2027(proj.)~615,000–285,000–1,073,000 (red)$3,200–$3,500 (est.)
2028(proj.)~775,000–125,000–1,198,000TBD

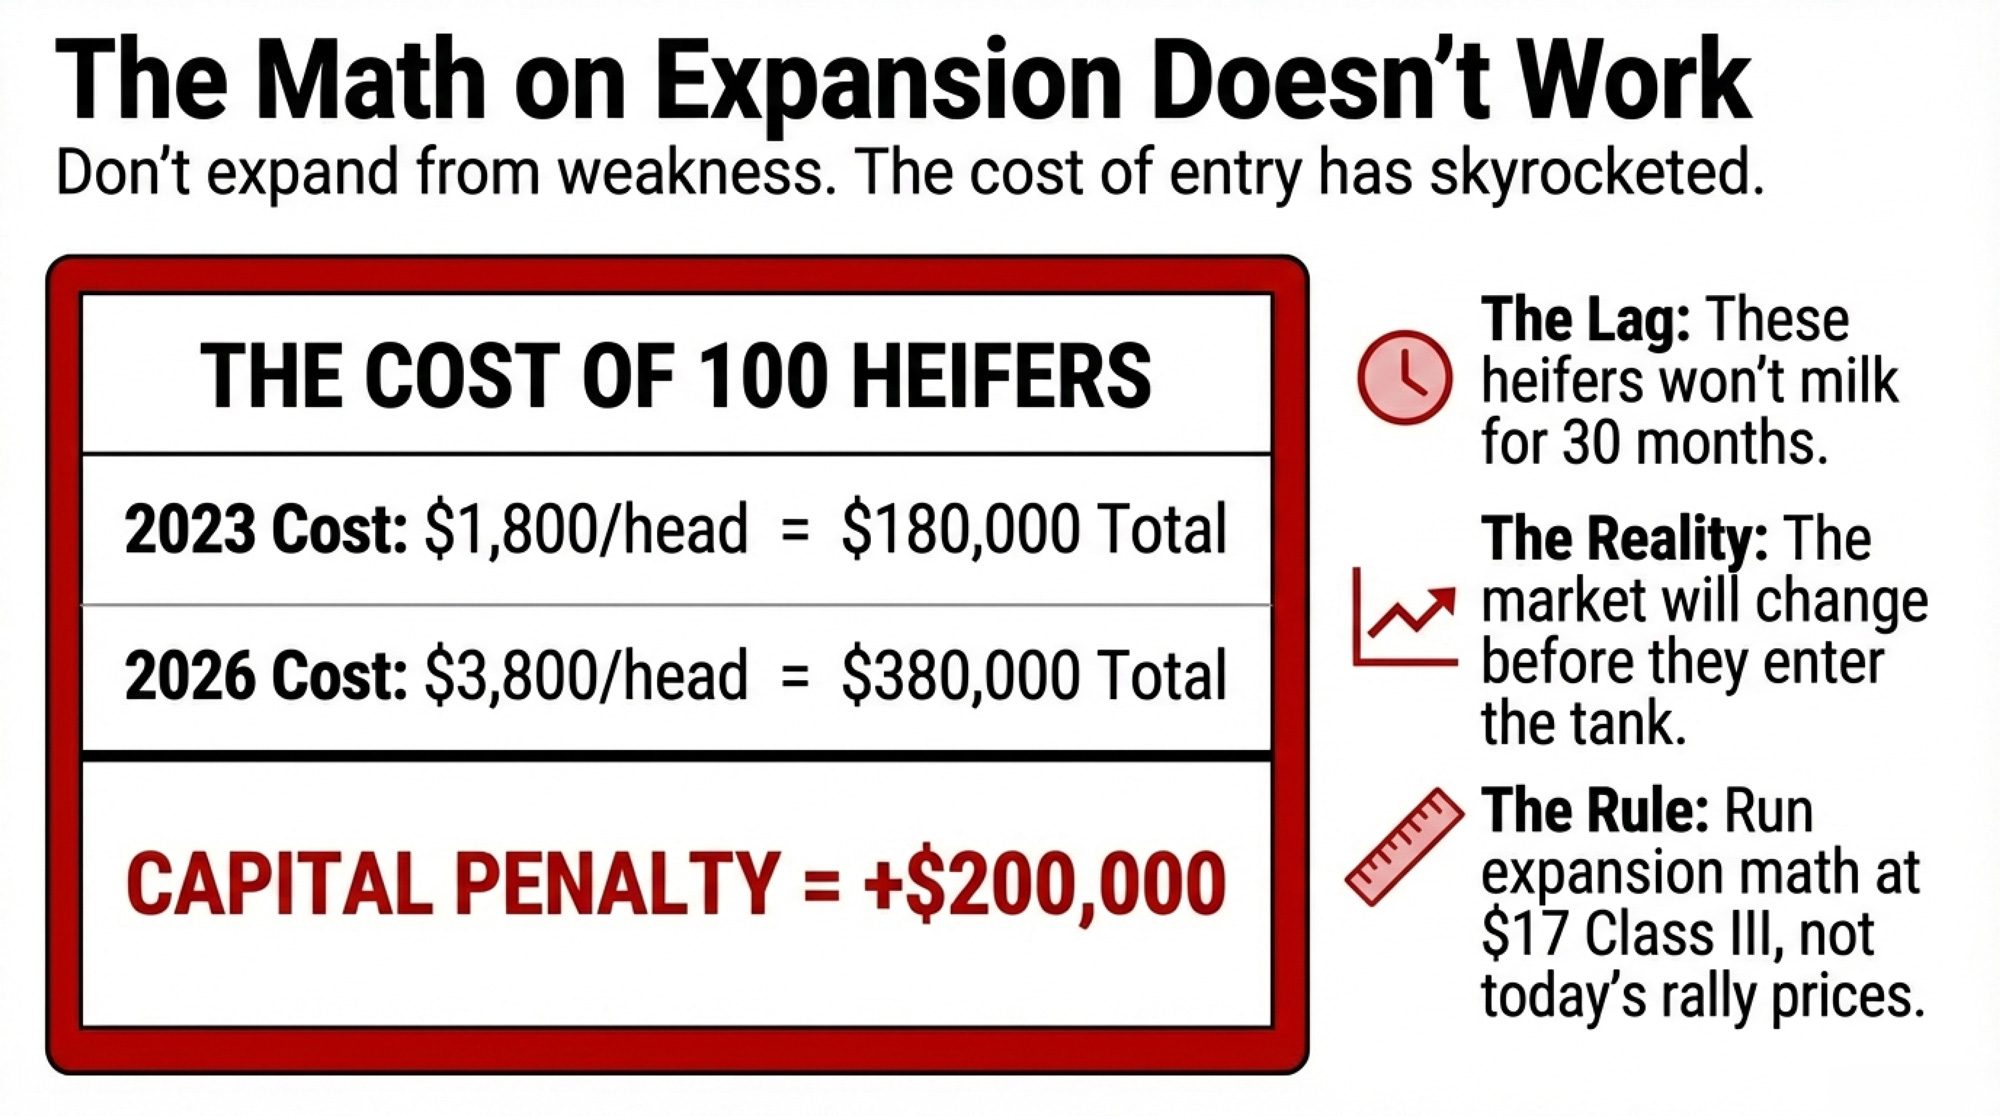
USDA’s January 2026 cattle inventory report pegs replacement heifer costs in the range of $3,010 to $3,360 per head. Wisconsin sits at the top of that range. These prices are up roughly 20–30% from a year ago, and the pipeline isn’t getting any fatter. 

More than $11 billion in new dairy processing capacity is scheduled to come online through 2028 (much of it in Texas and the High Plains). Every breeding decision you make this month has a two-year tail — and the replacement pipeline can’t deliver what those new plants need. 

The 48-Hour Playbook: What the Wisconsin Dairy Did

Remember that 550-cow operation with eleven weeks of cash? Here’s what happened next. 

Within 48 hours, the producer culled his 10 worst feed-to-milk converters, bringing in roughly $22,000 in cash and cutting daily feed costs by about $85. He walked into his lender’s office with a 12-month projection of $18/cwt milk and a real cost-of-production sheet—not the optimistic version, but the one with market-rate labor and repriced debt. Then he negotiated reamortization of equipment debt (from seven to twelve years) and four months of interest-only on real estate.

Weekly burn dropped from $21,000 to roughly $13,500. Same cows. Same parlor. New math. His runway went from eleven weeks to something survivable.

That’s what saved him. Not a magic ration. Not a unicorn contract. Just running the real numbers, believing what they told him, and moving before the runway disappeared.

What $14.59 Class III and $1,500 Calves Mean for Your 2026 Budget

In the next 30 days:

  • Pull your real cost of production — market-rate family labor, depreciation, repriced interest, and insurance. If your COP exceeds $18/cwt and your Class III check is printing $14–$16, you need to know your actual weekly burn and your runway in weeks, not months. That Wisconsin producer’s eleven-week wake-up call could be yours.
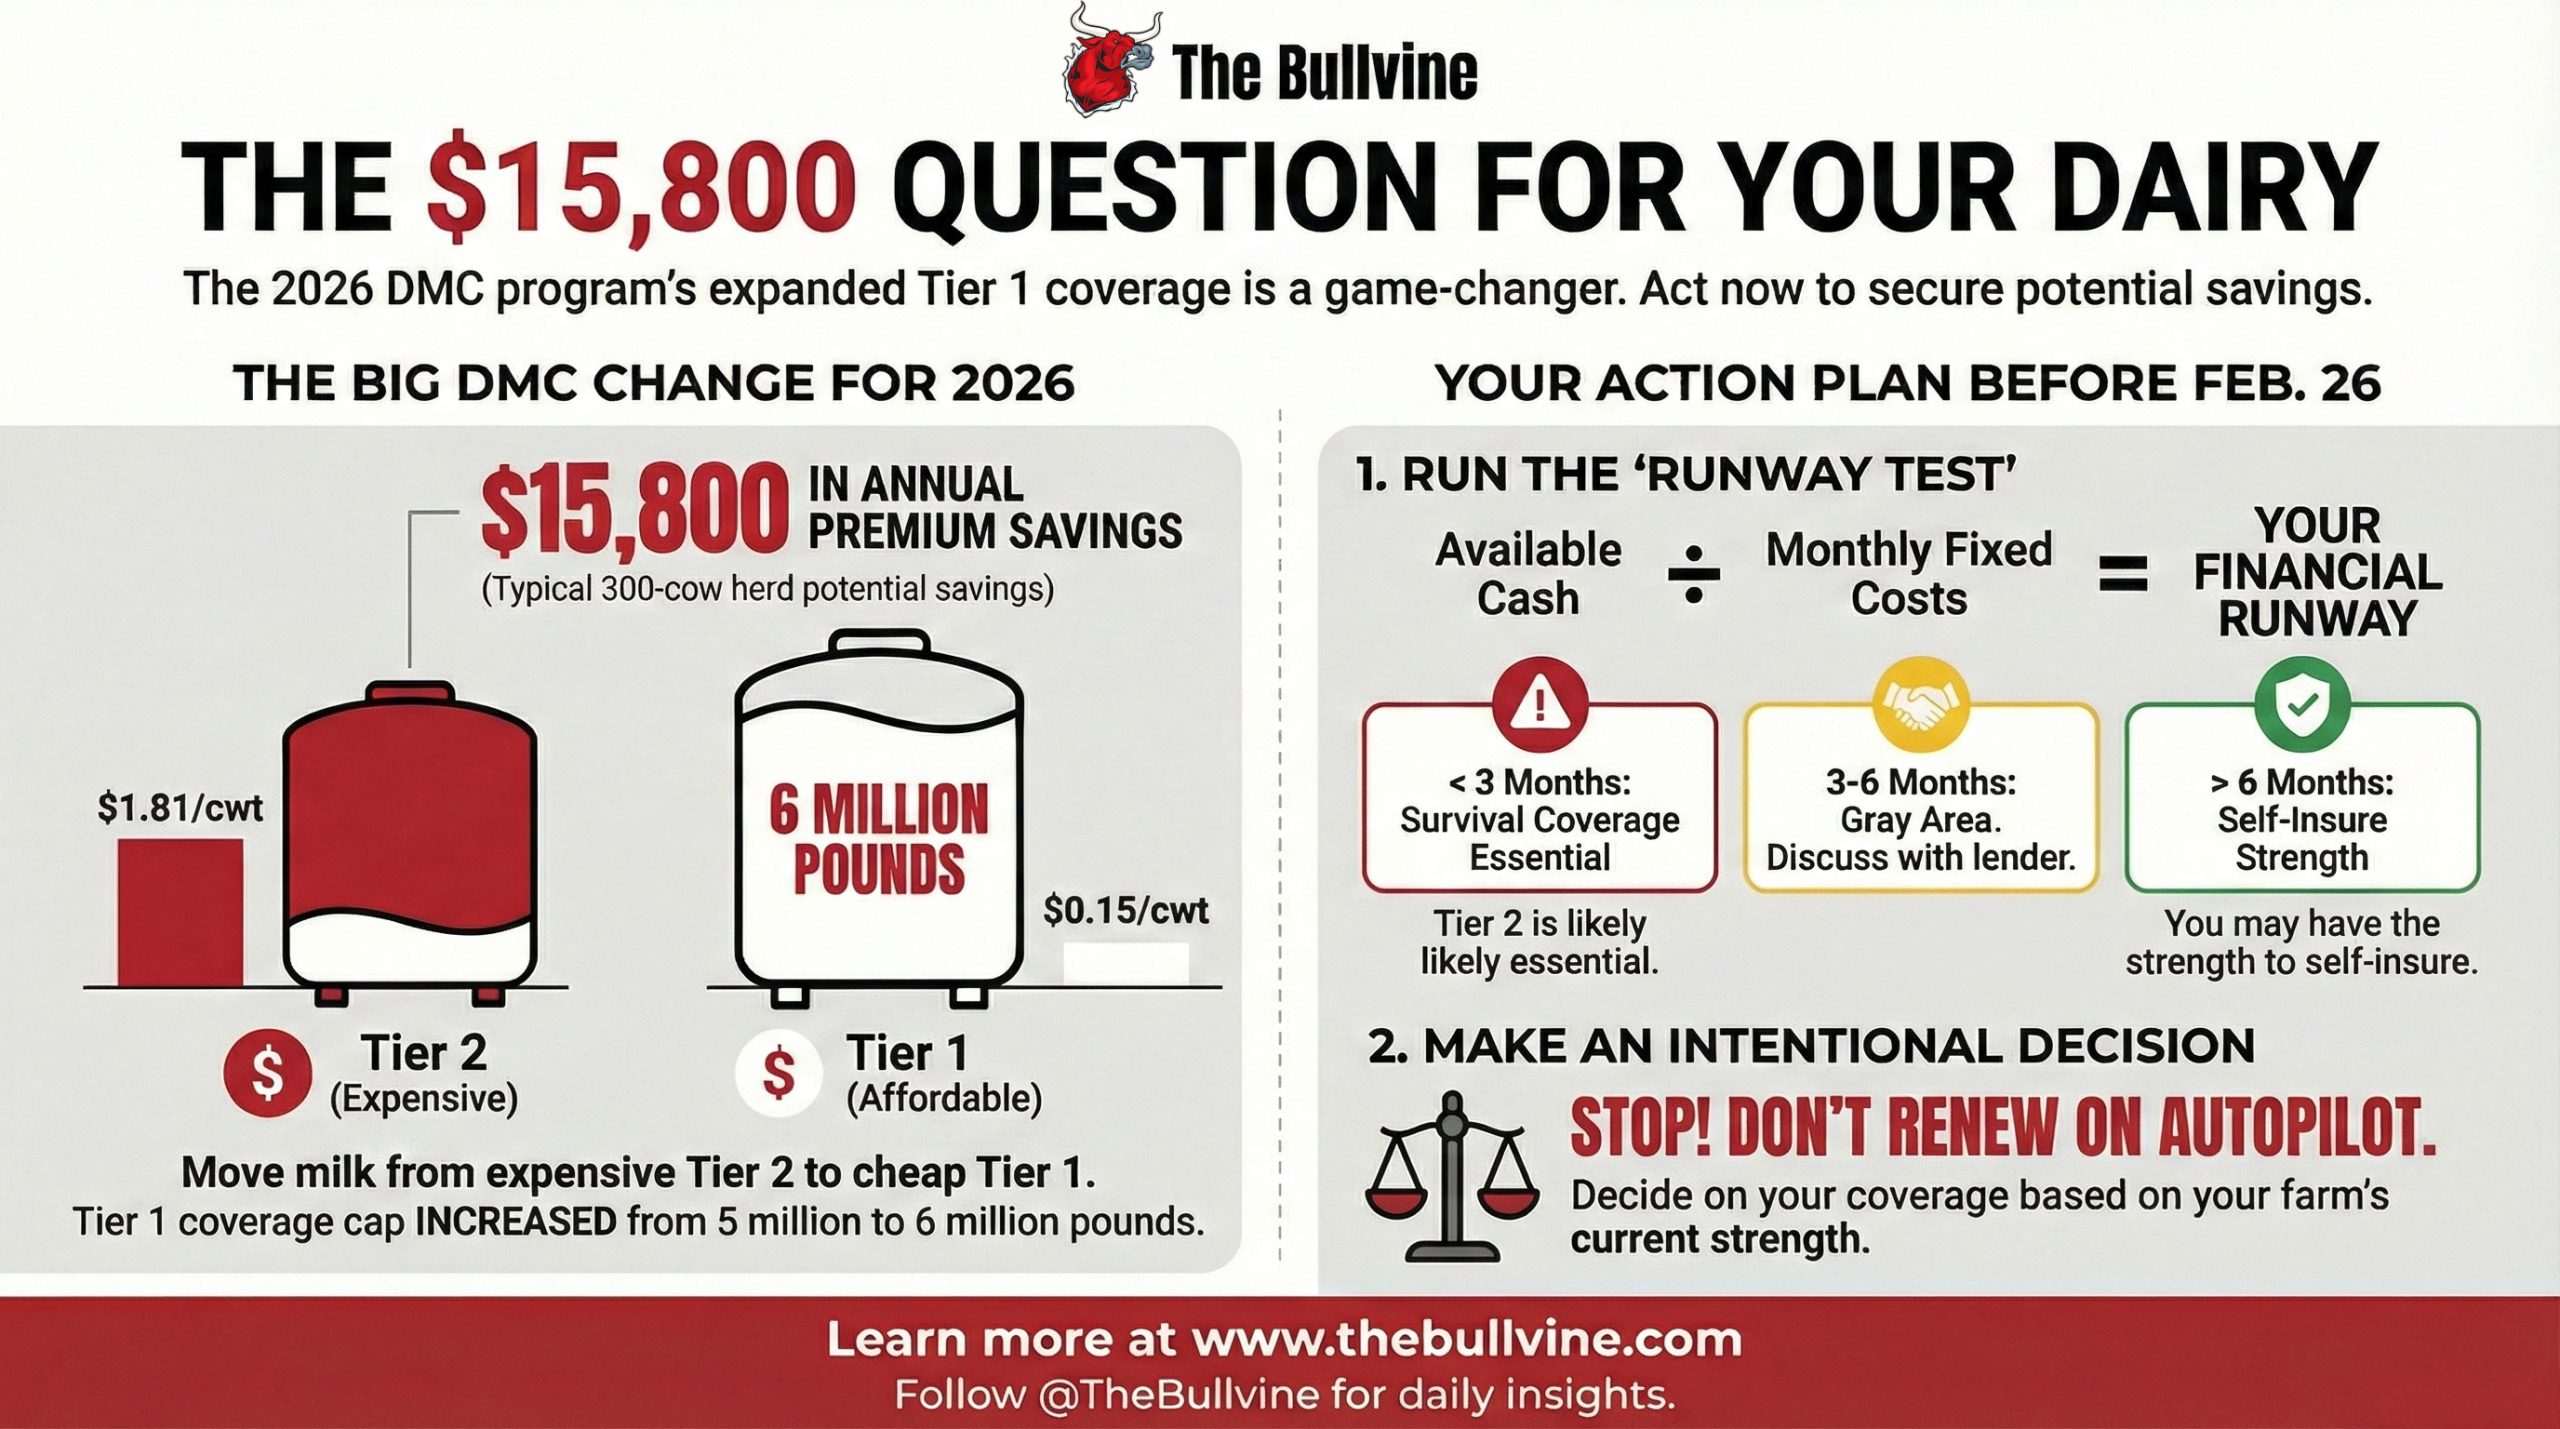
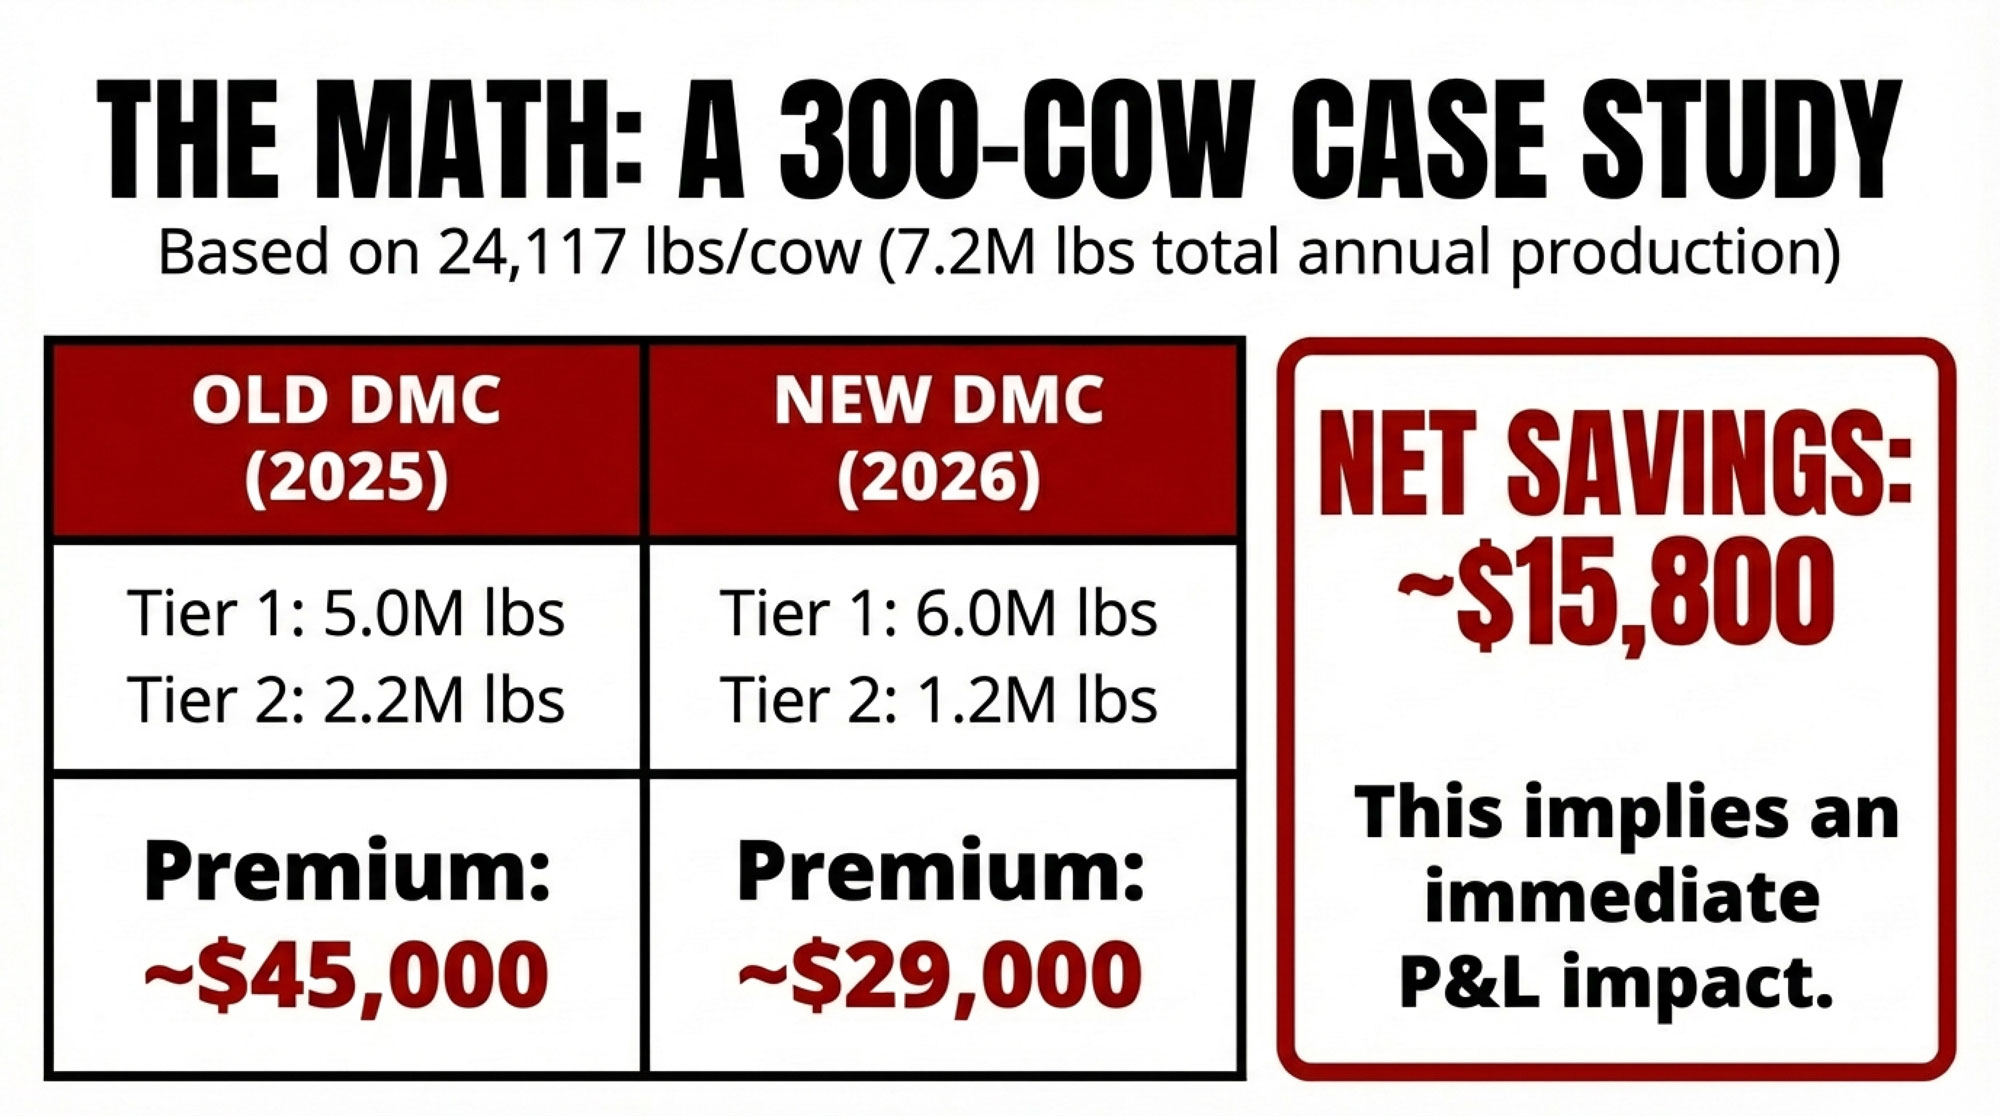
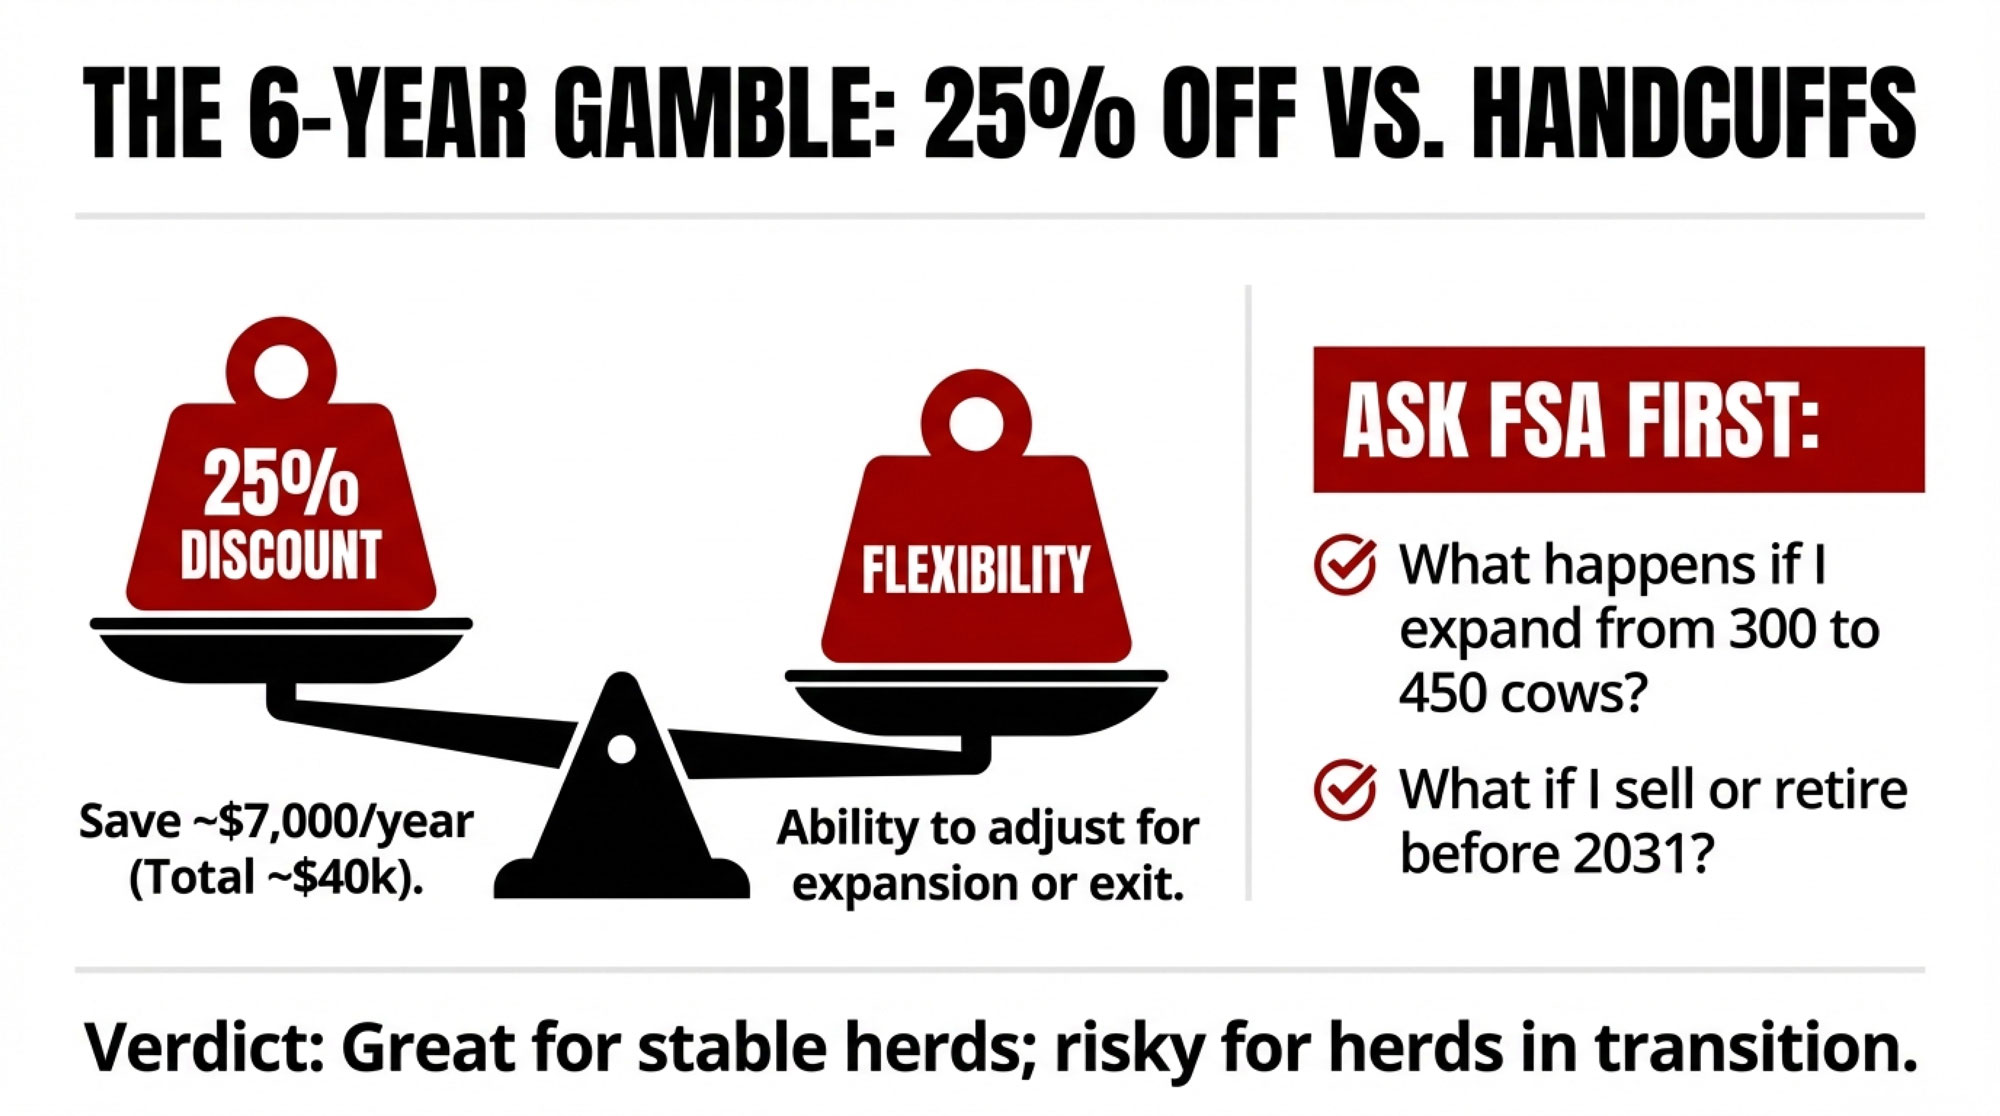
  • Enroll in DMC before February 26 if you’re eligible. At $9.50/cwt, Tier 1 on 6 million pounds is cheap margin insurance on the feed side. And if you commit to the full 2026–2031 enrollment window, OBBBA gives you a 25% premium discount — though that’s a six-year lock-in, so weigh it against your planning horizon. Keep in mind DMC covers milk-over-feed margin, not the milk price itself. If your problem is the milk price and feed costs are already low, DMC alone won’t bridge the gap. 
  • Stress-test your beef income. Take your last 12 months of calf and cull revenue per cwt. Knock it down 35%. If that single change swings your operation from positive to negative cash flow, you’re not just a dairy — you’re a leveraged beef play.

In the next 90 days:

  • Lock heifer grower contracts before the planting season, as feed and land compete for replacement heifers — replacements at $3,010-plus aren’t getting cheaper with 438,000 fewer heifers entering the pipeline this year.
  • Decide your fall AI breeding percentage. At current calf prices, the temptation is to beef at 70%+ or more. But every point above 50% further mortgages your replacement supply.
  • If your cash flow requires a lender conversation, have it now—with a full COP sheet and a 12-month projection at $18.95 all-milk, not $21. Early conversations are get restructuring. Late ones get foreclosure.

Over the next 12 months:

  • Reassess herd size against 2027 heifer availability and processor volume commitments. If you’re contracted to deliver a volume you can only hit by adding cows, price those cows at $3,010–$3,360 and run the payback against $16–$17 Class III.
  • If you’re a sub-200-cow operation without a succession plan, strong calf and cull values offer a historically good exit window. Phil Plourd of Ever.Ag Insights frames the question directly: will high beef prices keep producers in — keep the quasi-cow-calf thing going — or will they push them out, using high cattle prices to pave the exit ramp?  Put hard numbers on “stay” versus “go” before the market decides for you. 

Key Takeaways

  • If your operating costs exceed $17/cwt and you aren’t generating $4+/cwt in beef-related income, January’s $14.59 Class III puts you in cash-burn territory. Run the numbers before planting season locks in your feed costs.
  • The 14,000-head January herd expansion is processor-driven, not price-driven. Texas and Kansas accounted for the lion’s share. If you’re not near a new processing asset, this expansion adds supply that pressures your mailbox price without giving you contract upside. 
  • A 35% beef correction on top of the ~$153K milk revenue gap costs a 300-cow herd roughly $261,700 in total gross. That math is within normal cattle-cycle range. Check your debt service against that number.
  • Geiger’s CoBank modeling says 438,000 fewer replacement heifers enter the milking stream this year. Every breeding decision you make this month has a two-year tail — and replacements above $3,000 aren’t getting cheaper. 

The Bottom Line

The most profitable product on a lot of U.S. dairy farms right now isn’t milk. It’s calves. A Wisconsin producer with 550 cows and eleven weeks of runway learned that survival isn’t about which product pays best — it’s about knowing your real numbers and moving before the math moves you. Where does your operation sit if the cattle market and the milk check both soften in the same quarter?

Complete references and supporting documentation are available upon request by contacting the editorial team at editor@thebullvine.com.

The Sunday Read Dairy Professionals Don’t Skip.

Every week, thousands of producers, breeders, and industry insiders open Bullvine Weekly for genetics insights, market shifts, and profit strategies they won’t find anywhere else. One email. Five minutes. Smarter decisions all week.
NewsSubscribe
First
Last
Consent

USDA’s $148 Million Section 32 Dairy Purchase, Zero Dollars Guaranteed: What It Actually Means for Your Milk Check

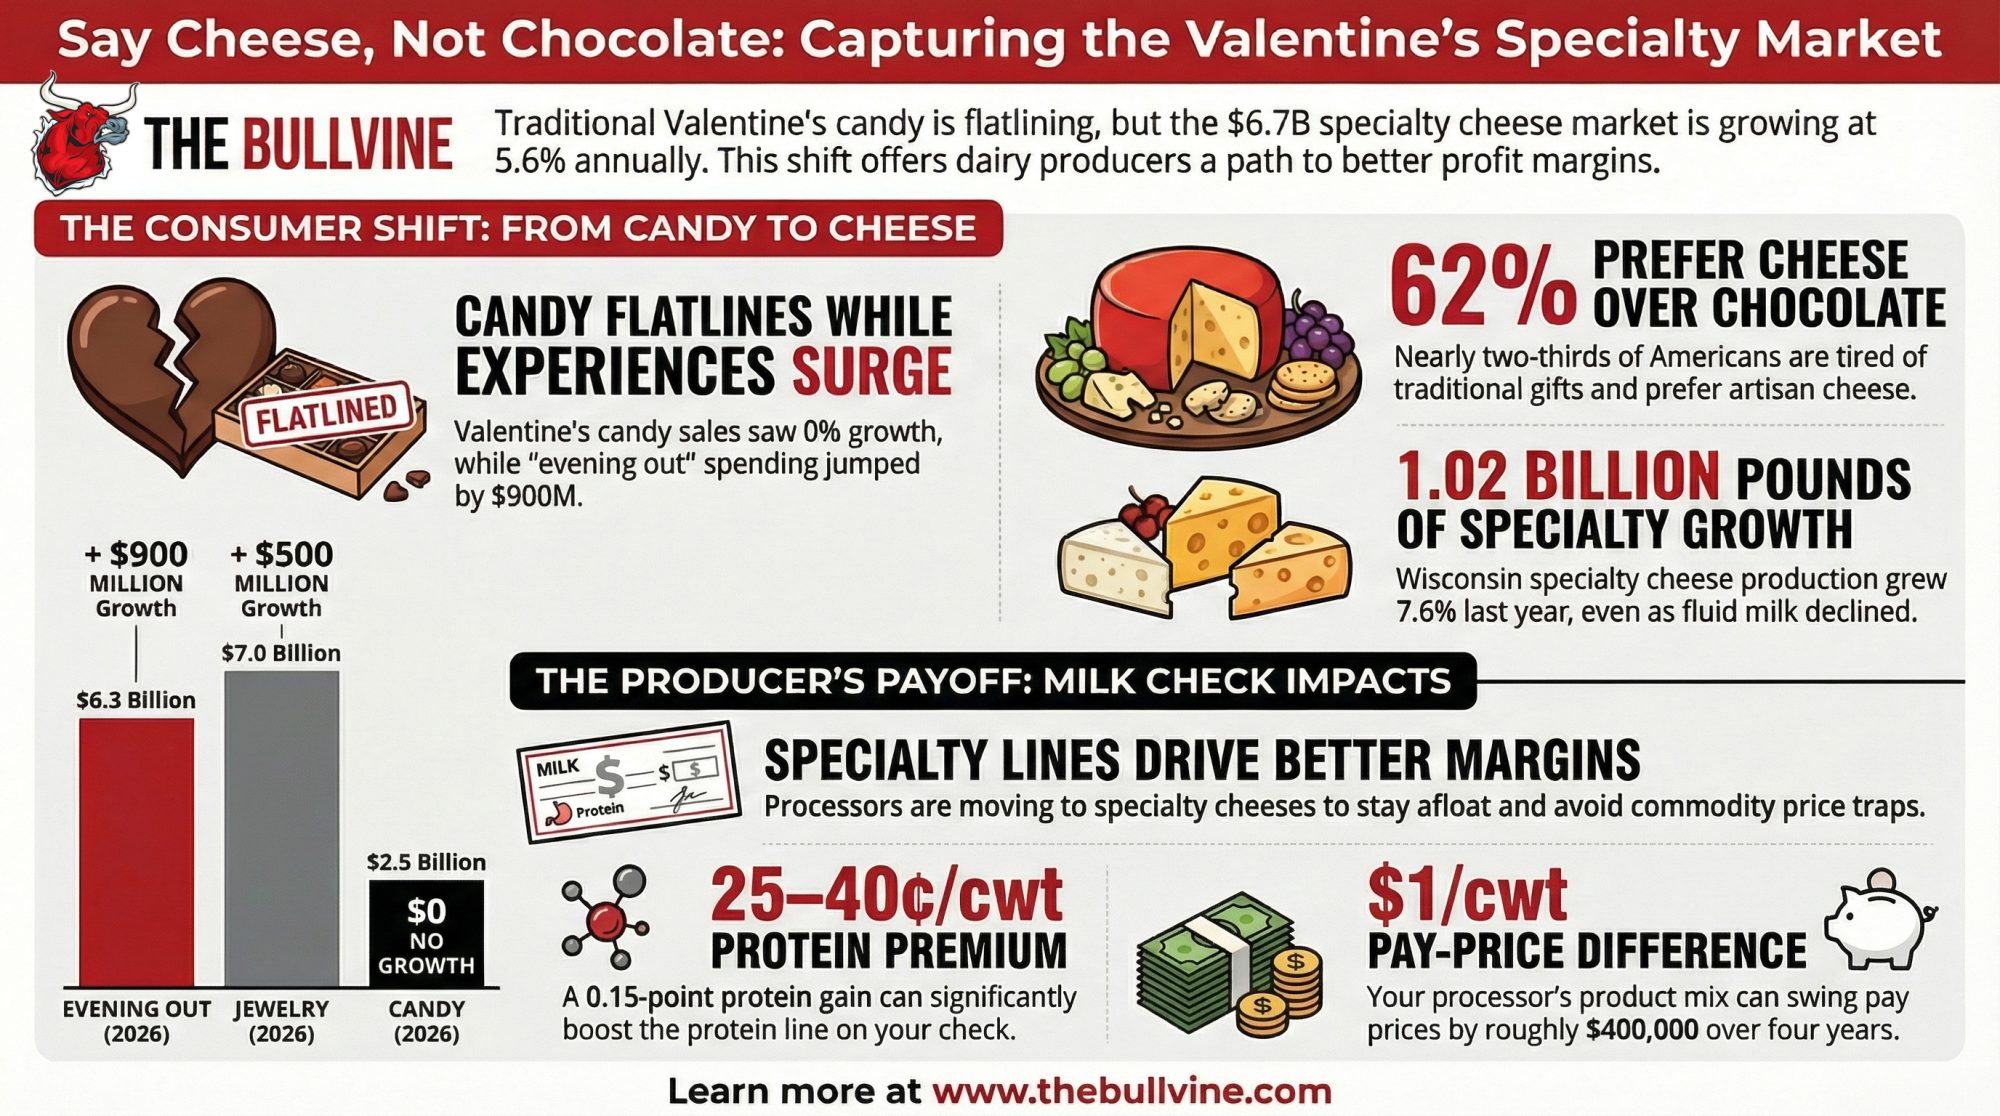
NMPF asked USDA for exactly $148 million in dairy purchases last November. On February 19, USDA delivered — to the dollar. That’s not luck. That’s the advocacy pipeline working. Who benefits?

Executive Summary: USDA has approved $263 million in Section 32 food purchases, including $148 million for dairy — the exact figure NMPF asked for last November and the largest dairy round since the COVID programs. That money goes to processors for butter, cheese, and milk, not directly to farms, so any benefit shows up only if it lifts CME prices enough to move FMMO component values on your milk check. Butter is the main story: $75 million at current prices pulls roughly 40 million pounds — about 20% of a typical month of U.S. butter output — out of the commercial market, and CME butter already jumped $0.165/lb during the announcement week. The $32.5 million cheddar buy, by comparison, removes only about 1.7% of a month’s cheese production, so it’s unlikely to change protein checks on its own materially. For high‑butterfat herds, a sustained $0.10/lb increase in butterfat value can add more than $1,500/month per 200 cows, but only if the rally holds and your co‑op’s component premiums pass that value through. The article breaks down that barn math, compares this purchase to earlier Section 32 and COVID‑era interventions, and provides a 30/90/365‑day playbook so you can track CME butter, scrutinize your component statement, and adjust your risk‑management strategy in response to this one‑time demand boost.

$148 million. That’s the dairy industry’s share of USDA’s $263 million Section 32 purchase announced on February 19, 2026 — and it’s the exact figure the National Milk Producers Federation requested in a letter to USDA last November. Not one dollar more. Not one dollar less. 

Every ag newswire ran the number. Secretary Brooke Rollins called it “delivering wholesome, real food to Americans while injecting critical dollars into local economies”. NMPF President and CEO Gregg Doud said the purchases “will provide important relief to producers who will benefit from the additional demand”. The International Dairy Foods Association applauded. Headlines everywhere. 

But here’s what nobody’s explaining: Section 32 doesn’t write checks to dairy farmers. It buys finished products from processors. Between that $148 million announcement and your milk check, there are five steps, at least three middlemen, and zero guaranteed dollars. Let’s walk through what this purchase actually buys, who actually gets paid, and what it could — could — mean for the price of your milk.

What USDA Is Actually Buying

The $148 million breaks down into five commodity categories, and the allocation tells you exactly where USDA sees the deepest surplus problem: 

  • Butter: $75 million (50.7% of dairy total)
  • Cheddar cheese: $32.5 million (22.0%)
  • Fresh fluid milk: $20.5 million (13.9%)
  • Swiss cheese: $10 million (6.8%)
  • UHT (shelf-stable) milk: $10 million (6.8%)

Butter dominates. That’s not random — it’s where the price crash has been worst. NMPF specifically noted that these are “the first major butter purchases in five years.” The remaining $115 million in the broader announcement covers non-dairy commodities: dried beans ($25 million), split peas ($24 million), fresh pears ($15 million), walnuts ($15 million), lentils ($14 million), chickpeas ($12 million), and pecans ($10 million). 

Dairy got the single largest allocation of any category. That matters.

How $148 Million Became the Number

This wasn’t a surprise. NMPF sent USDA a letter last November requesting exactly $148 million in dairy purchases. What followed, in NMPF’s own words, were “extensive conversations and further official communication with USDA”. When the announcement dropped on February 19, it matched the request to the dollar. 

Gregg Doud — NMPF’s president and CEO since September 2023, a former Chief Agricultural Negotiator under President Trump’s first term, and a Kansas farm kid who still runs cattle — framed it as demand support: “Dairy farmers have shared in the struggles faced throughout the agricultural economy.” 

That’s the advocacy pipeline working. NMPF identified the surplus problem, built the case with USDA, and delivered a specific ask. Whether you’re an NMPF member co-op shipper or not, this is what organized lobbying looks like when it produces results. The question is whether those results reach your bulk tank. 

If you ship to an NMPF member co‑op, this is your dues at work; if you don’t, you’re still riding the same CME prices, just without the direct contract upside.

What Is a Section 32 Purchase and How Does It Work?

Section 32 of the Agricultural Adjustment Act of 1935 authorizes the USDA to buy surplus U.S.-produced agricultural products for two purposes: stabilize farm markets and supply food to federal nutrition assistance programs. 

Here’s the mechanism, step by step:

  1. USDA’s Agricultural Marketing Service issues Purchase Program Announcements.
  2. Approved vendors — processors, not farmers — submit bids.
  3. USDA awards contracts to winning bidders.
  4. Processors deliver products to food banks and nutrition programs.
  5. The purchased volume exits the commercial market, reducing available supply.

That fifth step is where farm‑level impact starts, in theory. Removing surplus from the market tightens supply, which supports commodity prices on the CME, which flows through FMMO formulas into component pricing, which eventually — weeks to months later — appears on your milk check.

Five steps. None of them is “USDA writes a check to a dairy farmer.” This is a market-support mechanism, not a direct payment. That distinction matters.

The Per-Cow Reality Check: Why $15.46 Is a Meaningless Number

You’ll see this math on social media: $148 million ÷ 9.57 million U.S. dairy cows = $15.46 per cow. Sounds underwhelming, right?

It’s also completely irrelevant. Section 32 doesn’t distribute money per cow. It removes the product from the market. The $15.46 figure tells you nothing about the actual price-support effect, which depends on how much volume gets pulled, from which markets, at what prices, and how CME traders respond.

The per-cow math is a useful headline killer, though. And that’s the point: $148 million sounds massive until you spread it across the national herd. The real impact isn’t in the division. It’s in the market math.

Butter vs. Cheese: One Big Lever, One Tiny One

This is where the numbers get interesting. The $75 million butter purchase is the headline within the headline. Here’s why.

Butter math: At CME cash butter prices of $1.8700/lb on Friday, February 20, 2026, $75 million buys roughly 40 million pounds of butter. December 2025 U.S. butter production was 204 million pounds, according to USDA NASS’s Dairy Products report released on February 5, 2026. Full-year 2025 butter output hit 2.36 billion pounds — an average of about 197 million pounds per month. That $75 million purchase removes roughly 20% of one month’s productionfrom the commercial market. 

MetricButterCheddar Cheese
Purchase Amount$75 million$32.5 million
Pounds Purchased~40 million lbs~21.7 million lbs
Typical Monthly Production~197 million lbs~1.28 billion lbs
% of Monthly Output Removed20.3%1.7%
Likely CME Price Impact$0.10–0.15/lb$0.01–0.02/lb

Twenty percent is significant. It’s not catastrophic-surplus territory, but it’s enough to tighten the market meaningfully — especially with butter already climbing. CME cash butter opened the announcement week at $1.7050 on Tuesday and closed Friday at $1.8700, a $0.165/lb gain in four trading sessions. That’s not all Section 32 — other factors are in play — but the timing is hard to ignore. 

Cheese math: The $32.5 million cheddar purchase at roughly $1.50/lb buys about 21.7 million pounds. December 2025 total cheese production was 1.28 billion pounds. That’s barely 1.7% of one month’s output. Meaningful for cheddar specifically, but a rounding error for the broader cheese market. 

The takeaway: If you’re a high-butterfat herd, this purchase tilts in your favor. If your income depends more on protein and cheese prices, the direct effect is minimal. Butter is the big lever here. Cheese is noise.

How Much Will This Actually Affect Milk Prices?

Now for the barn math that connects the announcement to your component statement.

Start with butter. If the Section 32 purchase contributes even $0.10/lb to sustained butter price support — and the $0.165/lb rally this week suggests that’s conservative — here’s what it means at the farm level:

The Class IV butterfat price is derived directly from CME butter. A $0.10/lb butter increase translates to roughly $0.10/lb on your butterfat component price. For a 200-cow herd shipping 23,000 lbs/cow/year at 4.1% butterfat:

  • Monthly milk shipped: ~383,333 lbs
  • Monthly butterfat lbs: ~15,717 lbs
  • Value of $0.10/lb BF increase: ~$1,572/month, or $18,860 annualized

For a 400-cow herd at the same test? Double it: roughly $3,144/month.

That’s real money — if the butter rally holds and if your co-op’s component premiums reflect it. Two big ifs.

Now cheese. A $32.5 million purchase removing 1.7% of monthly production might support block prices by $0.01–0.02/lb at best. On your protein check, that’s almost invisible.

Bottom line: This purchase is a butterfat story. Your Class IV components — butterfat specifically — are where the action is. If your herd tests 3.6% fat, the impact is noticeably smaller than at 4.2%. Run it with your own numbers.

Why Now — and How Does This Compare?

Butter prices crashed from roughly $2.50/lb in mid-2025 to around $1.50/lb by January 2026 — a 40% decline in six months. CME cheese blocks were sitting at $1.45/lb before the announcement week. Global milk production — what analysts have called the “wall of milk” — has been pressuring commodity prices across the board. 

NMPF called this the first major butter purchase in five years. That’s significant context. For comparison: 

  • 2020 COVID-era: USDA purchased roughly $1.33 billion in dairy products across multiple programs, including about $100 million/month in Section 32 alone. That removed an estimated 238 million pounds of cheese and 64 million pounds of butter over the year. 
  • 2020 Section 32 specifically: A $120 million cheese-and-butter purchase removed about 23 million pounds of cheese and 3.6 million pounds of butter per month. 
  • January 2026: USDA bought $80 million in specialty crops under Section 32 — no dairy in that round. 

At $148 million, this is the largest single-round Section 32 dairy purchase outside of COVID emergency spending. It’s substantial. It’s also one-time, not recurring. The 2020 program ran for months. This is a single injection.

The Market Already Moved

Here’s what happened on the CME the week of the announcement: 

CommodityTue 2/17Wed 2/18Thu 2/19 (Announcement)Fri 2/20Weekly Change
Butter ($/lb)$1.7050$1.7050$1.7800$1.8700+$0.1650
Blocks ($/lb)$1.4500$1.5000$1.5100$1.4975+$0.0475
Barrels ($/lb)$1.4500$1.4700$1.4700$1.4900+$0.0400
NFDM ($/lb)$1.5900$1.5975$1.6225$1.6850+$0.0950

Butter jumped $0.075/lb on announcement day alone and added another $0.09 on Friday. That’s a two-day move of $0.165/lb — the kind of swing that moves component checks. Blocks and barrels gained modestly. NFDM surged nearly a dime on the week.

The market is pricing in the volume removal. Whether it holds through March and April — when the actual Purchase Program Announcements are issued, and contracts are awarded — is the open question.

What $148 Million in Section 32 Purchases Means for Your Component Check

  • Check your butterfat test. This purchase overwhelmingly favors high-BF herds. At 4.0%+ test, the butter rally has meaningful upside for your Class IV components. At 3.5%, the effect is roughly half as large.
  • Watch CME butter through March. If butter sustains above $1.85/lb through mid-March, the Section 32 volume removal is working as intended. If it fades back below $1.70, the purchase wasn’t enough to absorb the surplus.
  • Don’t expect cheese miracles. The $32.5 million cheddar purchase is too small relative to monthly production (1.28 billion pounds in December alone ) to meaningfully move block or barrel prices. Your protein check won’t feel this. 
  • Know the timeline. USDA hasn’t issued the Purchase Program Announcements yet. Approved vendors still need to bid. Contracts need awarding. Product needs to ship. The actual volume won’t leave the commercial market for weeks, possibly months. 
  • Ask your co-op. Does your cooperative supply USDA commodity programs? If so, this purchase directly increases demand for your co-op’s output. If not, you’re relying entirely on the indirect price-support effect.
  • Review your risk coverage. DRP (Dairy Revenue Protection) is available for purchase on any business day when prices are published on RMA’s website — there’s no fixed quarterly enrollment window. If butter holds its rally, Class IV DRP coverage premiums will rise as expected revenue increases. Locking in current premium levels sooner rather than later may make sense for Q2 and Q3 2026 quarters. Separately, DMC enrollment for 2026 closed February 26  — if you missed it, DRP is your remaining federal safety-net option. 

Your 30/90/365-Day Playbook

TimelineWhat to TrackKey ThresholdAction If Threshold Met/Missed
This WeekUSDA AMS Purchase Program AnnouncementAnnouncement postedRead for delivery windows, product specs, quantity breakdowns
30 DaysCME butter & cheese block pricesButter holds above $1.85/lbPrice support working; below = surplus bigger than $75M can fix
90 DaysYour co-op component statement (April/May)BF premium reflects butter rallyIf butter held but BF premium flat = question for co-op field rep
365 DaysTotal 2026 Section 32 dairy purchases vs. 2024/2025Second round announcedSignals structural surplus, not seasonal—NMPF pipeline now recurring

This week: Read the USDA AMS Purchase Program Announcement when it posts. It will specify exact product forms, quantities, and delivery windows. That’s when you’ll know whether this is a 60-day buy or a 6-month program. 

30 days: Track CME butter and cheese block prices. The $1.85/lb butter threshold is your marker. Above it, the purchase is supporting prices. Below it, the surplus is bigger than $75 million can fix.

90 days: Pull your co-op component statement for April or May. Compare your butterfat premium to January and February. If butter held above $1.85 through March and your BF premium didn’t move, that’s a question for your co-op field rep.

365 days: Compare the total 2026 Section 32 dairy purchases to 2025 and 2024. If USDA comes back for a second round, it signals the surplus problem is structural, not seasonal — and that NMPF’s advocacy pipeline is becoming a recurring feature of dairy price support.

Key Takeaways

  • USDA’s $148 million dairy allocation under Section 32 is exactly what NMPF asked for last November and marks the largest non‑COVID dairy purchase in five years.
  • None of that money arrives as a farm check — it pays processors, and the only way you see it is if it pushes CME prices high enough to lift FMMO component values on your milk check.
  • Butter is where it bites: $75 million pulls roughly 40 million pounds — about 20% of a typical month of U.S. butter output —, and CME butter already moved $0.165/lb higher during the announcement week.
  • The cheddar piece is small by comparison: $32.5 million removes only about 1.7% of a month’s cheese production, so don’t expect a big protein or Class III bump from this round alone. ​
  • If your herd ships 4%‑plus butterfat, a sustained $0.10/lb increase in butterfat value can add more than $1,500/month per 200 cows, which makes watching butter hold above roughly $1.85/lb and checking how your co‑op adjusts component premiums a key decision point.

The Bottom Line

$148 million isn’t a rescue. It’s a market lever—and specifically, a butter lever. NMPF asked for it, USDA delivered it, and the CME responded with a $0.165/lb butter rally in 48 hours. Whether that holds depends on what happens when the actual contracts hit and the product starts moving. 

Pull your last component statement. Find the butterfat line. Now add $0.10/lb and multiply by your monthly butterfat pounds. That’s the upside scenario from this purchase — not $148 million divided by your herd size, but butter price × your components × time.

Complete references and supporting documentation are available upon request by contacting the editorial team at editor@thebullvine.com.

Learn More

The Sunday Read Dairy Professionals Don’t Skip.

Every week, thousands of producers, breeders, and industry insiders open Bullvine Weekly for genetics insights, market shifts, and profit strategies they won’t find anywhere else. One email. Five minutes. Smarter decisions all week.
NewsSubscribe
First
Last
Consent

The $17,500 Dairy Margin Coverage Gamble: The 6‑Year Lock‑In Decision Most Farms Haven’t Run the Numbers On Yet

USDA’s 25% premium discount only pays off if margins stay compressed five of the next six years. That’s never happened.

Executive Summary: Wisconsin dairies are a week from the 2026 Dairy Margin Coverage deadline, and 68% still aren’t enrolled even though January’s projected DMC margin of $7.52/cwt would generate about $1,564 per million pounds — enough to cover a full year of Tier 1 premiums at $9.50. The article breaks down how the new 6‑year lock‑in, with its 25% premium discount, only comes out ahead if you’d enroll in at least five of the next six years, and how locking in anyway can turn into a $17,500 premium drag for a 200‑cow herd when margins stay strong in four of those years. ⚡ But that analysis comes with an important caveat: at $0.15/cwt, the enrollment hurdle is low enough that a rational producer looking at futures would likely have enrolled in most years — which makes the lock‑in more defensible than it first appears.  The article walks through full barn math for 200‑ and 500‑cow operations, shows how the 6‑million‑pound Tier 1 cap leaves half the milk on a 500‑cow herd uncovered, and puts 2023’s record $1.27 billion in DMC payouts — $63,633 per enrolled Wisconsin dairy — in context as the benchmark for what this program delivers when margins compress. Instead of generic advice, you get four specific paths — annual DMC, 6‑year lock‑in, lower‑tier coverage, or skipping DMC and leaning on DRP/LGM for the rest of your milk — with clear trade‑offs spelled out for each. The playbook is simple: pull your 2021–2023 milk marketings, run the USDA DMC calculator with your actual cwt, and call FSA by February 24, so you know exactly what you’re betting before you sign a contract that runs through 2031.

January 2026 Class III settled at $14.59/cwt — the weakest month since early 2024. And as of February 17, roughly 3,500 Wisconsin dairy operations still hadn’t enrolled in Dairy Margin Coverage for 2026. Katie Detra at Wisconsin’s Farm Service Agency shared that just 1,616 producers had completed DMC signup — only 31.5% of the state’s 5,116 licensed dairy farms. The deadline is February 26.

DMC doesn’t use Class III directly. The program’s margin formula takes the national All-Milk price and subtracts a standardized feed cost. But the pressure is running in the same direction. As of February 2, the Center for Dairy Excellence projected the January 2026 DMC margin at $7.52/cwt. At $9.50 coverage, that’s a $1.98/cwt indemnity — and CDE noted that January alone would produce “about $1,564 on a million pounds of production covered under Tier 1, which would cover premium costs” for the entire year.

One month’s payment covers your annual premium. For 2026, the enrollment decision is close to automatic. The six-year lock-in checkbox sitting next to it on the form? That’s a different conversation entirely—and nobody’s walking producers through the math.

From 80% to 31% — What Happened in Wisconsin?

Here’s the part that doesn’t add up. As of early 2024, 80 percent of Wisconsin dairy farmers were enrolled in DMC — the highest participation rate in the country, per Wisconsin Farm Bureau Federation. WFBF President Brad Olson called it “a critical farm safety net program during tough times.”

Fair warning on the comparison: that 80% figure was a final-year enrollment count. The current 31.5% is a mid-signup snapshot with six days left. Deadline rushes always close the gap. But even so, the pace is way off.

Some of the lag is structural. Wisconsin lost 545 dairy operations between January 2024 and today — down from 5,661 to 5,116. Some of those lost farms were DMC enrollees. Others are mid-transition, selling cows or passing the herd to the next generation, and a six-year commitment is the last thing they want. Still others have built hedging programs around Dairy Revenue Protection and see DMC as redundant on their first 6 million pounds.

But the margin picture has shifted underneath all of them. December 2025’s DMC margin came in at $9.42/cwt — just barely triggering the year’s first and only payment, a thin $0.08/cwt. That was the warm-up act. CDE’s January 14 outlook projects the full-year 2026 average margin at $8.51/cwt, starting at $7.37 in January and not climbing above $9.50 until November. If that forecast holds, ten months trigger payments — a total net indemnity of $8,300 per million pounds of Tier 1 covered production, after premiums but before sequestration.

Katie Burgess, director of risk management at Ever.Ag, projected “payouts of more than $1 per hundredweight for January through April, and then some smaller payments for May through July as well.” Mike North, also at Ever.Ag, as been blunt with producers: just “get it.” 

They’re right about 2026. The harder question is whether you should lock your elections through 2031.

What 2023 Should Remind Every Producer About DMC

Before digging into the lock-in math, it’s worth anchoring on what DMC actually delivers when margins compress hard — because the numbers aren’t theoretical.

In 2023, DMC triggered payments in 11 of 12 months at $9.The 50 coverage. At the level of average enrolled dairy, received indemnity payments of $2.80/cwt per month. Through the first nine months alone, total program payouts reached $1.27 billion — surpassing the previous annual record of $1.187 billion set in 2021. Wisconsin led all states at $272.2 million, averaging $63,633 per enrolled operation.

July 2023 hit the floor: a $3.52/cwt margin, the lowest in DMC history. At $9.50 coverage, that was a $5.98/cwt indemnity in a single month.

Put that in barn math for a 200-cow herd at 95% Tier 1: one month at $5.98/cwt on 3,800 covered cwt = roughly $22,724 from one month of milk. The annual premium was about $6,840. One July check covered three years of premiums.

Here’s the full payout history at $9.50 Tier 1 coverage:

YearMonths TriggeredTotal PayoutsAvg Per Enrolled Dairy
20197 of 12$451.6M$19,306
20205 of 12$234.0M$17,324
202111 of 12$1.187B$62,214
20222 of 12$83.7M$4,656
202311 of 12$1.27B+$74,553
2024~5 of 12$36.9M est.$2,356 est.
20251 of 12Minimal~$0.08/cwt (Dec only)

Two things jump out. First, the big-payment years are massive — 2021 and 2023 alone combined for roughly $2.46 billion in indemnities. A single year of compression can dwarf a decade of premiums. Second, the non-payment years (2022, 2024, 2025) are real. At $0.15/cwt, you’re not losing much in those years — but you are paying premiums for coverage that didn’t trigger.

That second point matters for the lock-in question. More on that below.

What Changed Under the New Law

The One Big Beautiful Bill Act, signed July 4, 2025, reauthorized DMC through 2031 with three changes that shift the math.

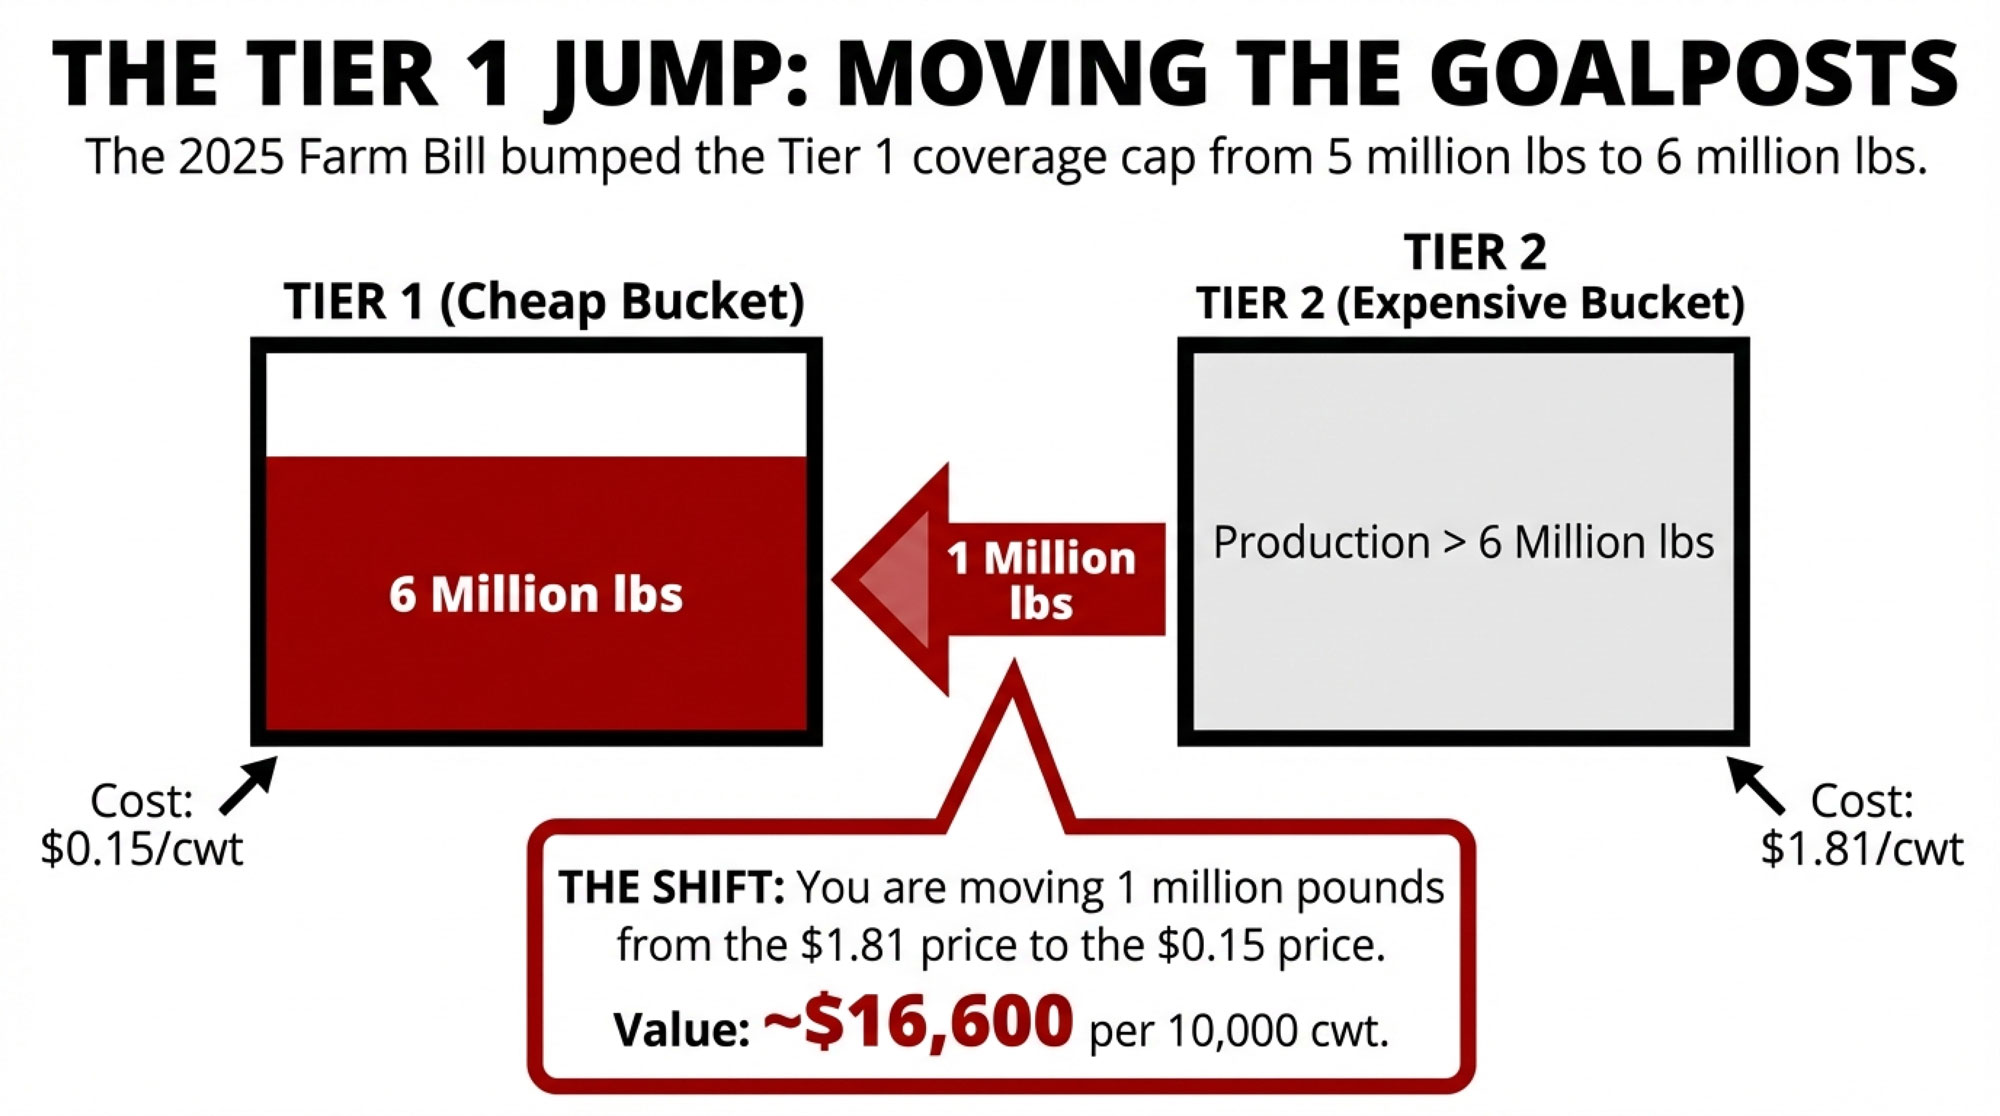
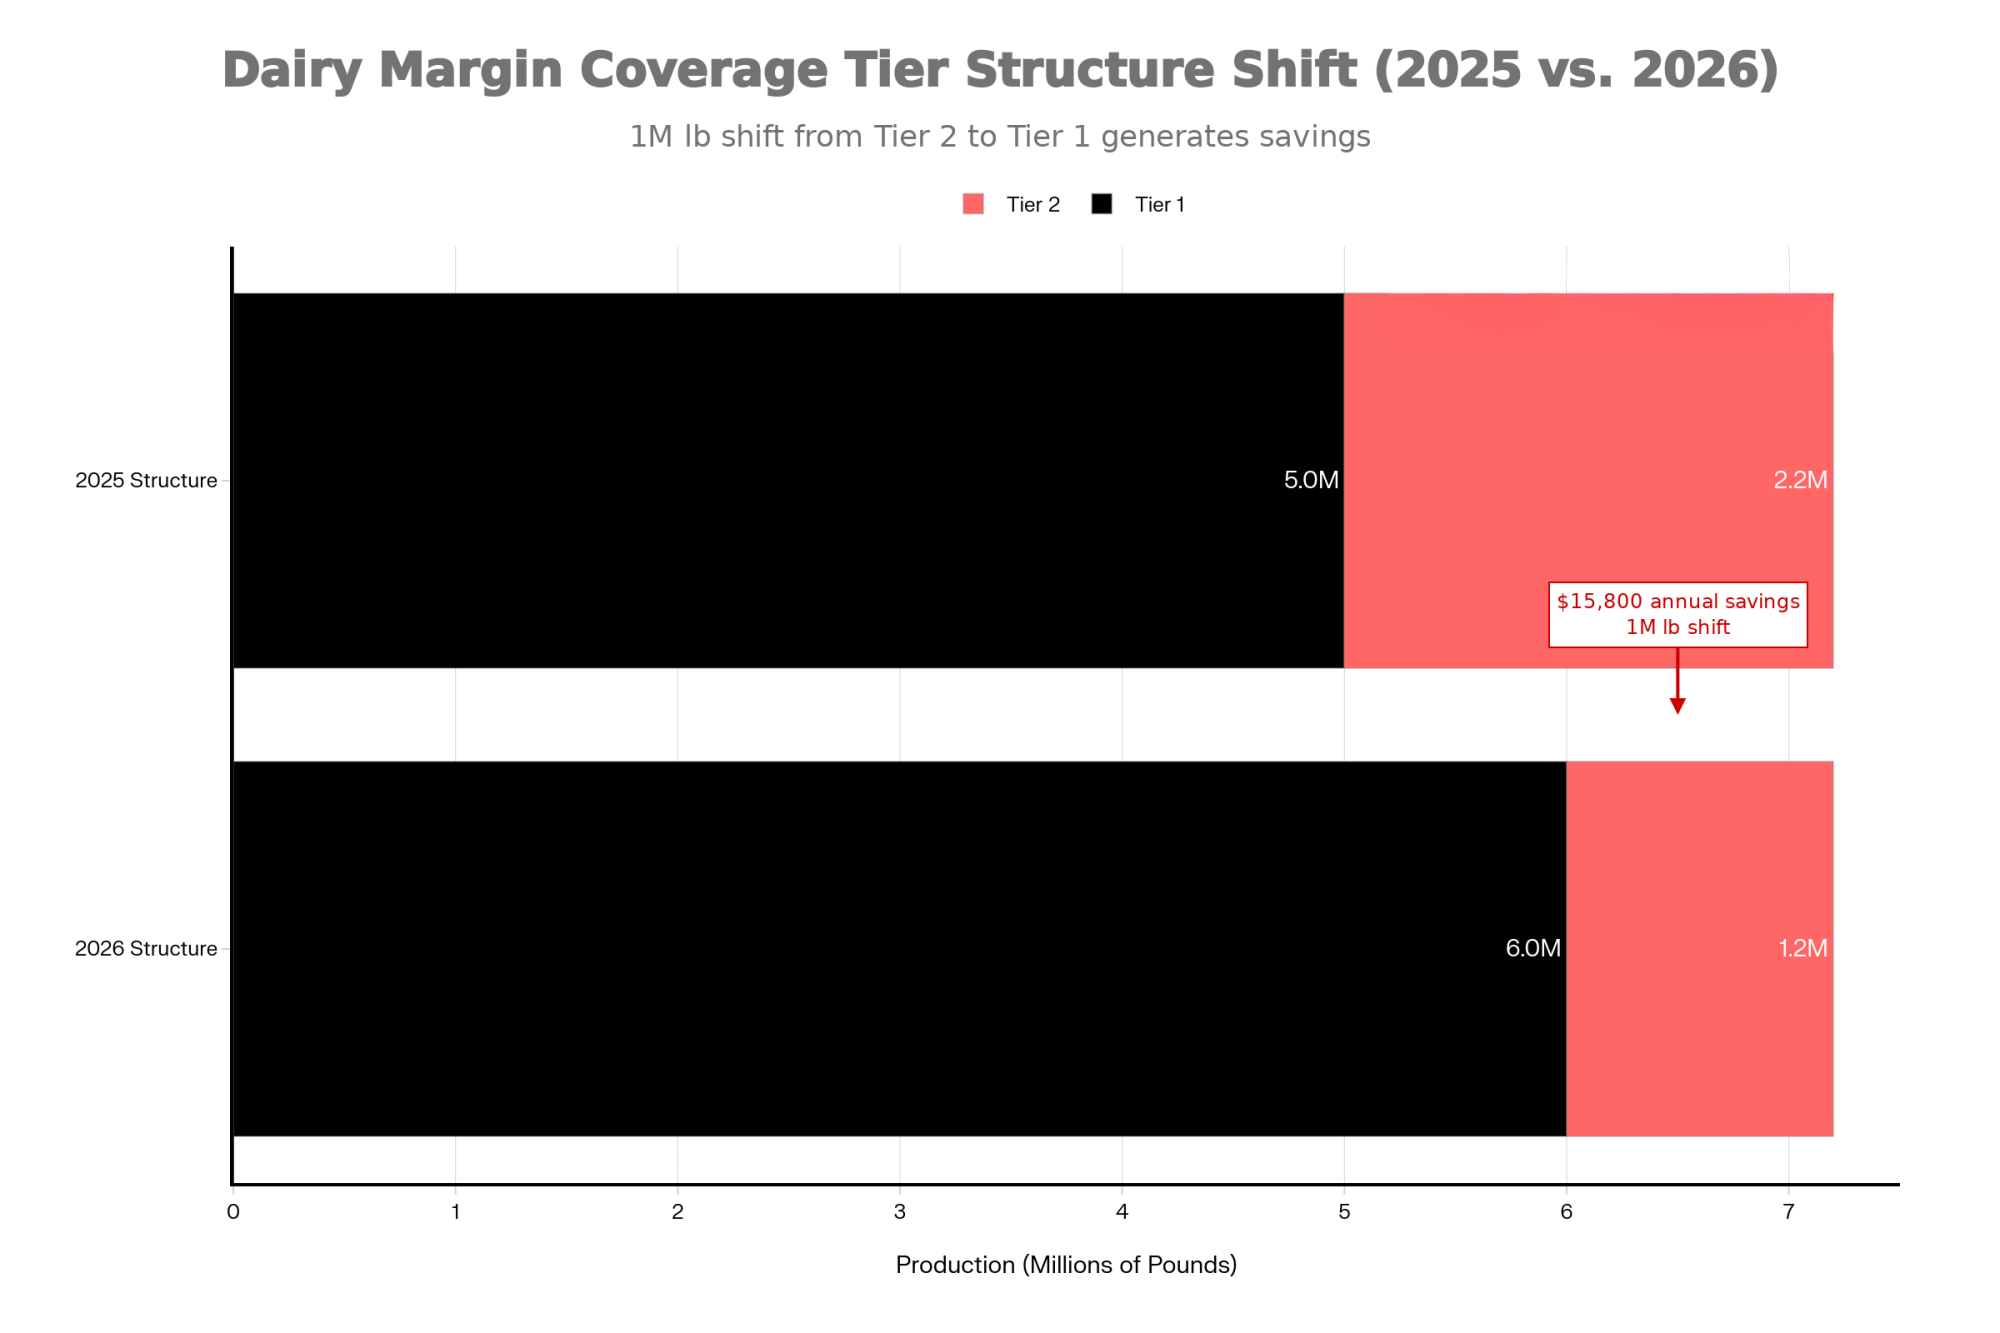
Tier 1 coverage went from 5 million to 6 million pounds. A 250-cow herd shipping 24,000 lbs/cow now fits entirely inside Tier 1. Every operation gets a fresh production history based on the highest annual marketings from 2021, 2022, or 2023. And the new wrinkle: lock your elections for all six years and get a 25% premium discount.

FSA program manager Doug Kilgore confirmed this lock-in is a one-time election — available only during 2026 enrollment. Skip it now, and it’s gone for the life of the program.

Sandy Chalmers, Wisconsin’s FSA State Executive Director, outlined the base case on February 17: “At $0.15 per hundredweight for $9.50 coverage, risk protection through Dairy Margin Coverage is a cost-effective tool to manage risk and provide added financial security for your operations.”

At fifteen cents a hundredweight, she’s right. That’s the easy part.

How Much Does DMC Actually Pay a 200‑Cow Dairy?

A 200-cow operation averaging 24,000 lbs/cow ships 4.8 million pounds — comfortably inside the 6-million-pound Tier 1 cap. At $9.50 coverage and 95% enrollment, the premium is $0.15/cwt.

Annual enrollment:

  • 4,800,000 lbs × 95% = 4,560,000 lbs = 45,600 cwt covered
  • 45,600 cwt × $0.15 = $6,840 + $100 admin fee = $6,940/year
  • You choose each year whether to re-enroll.

Six-year lock-in:

  • 45,600 cwt × $0.1125 (25% discount) = $5,130 + $100 = $5,230/year
  • Locked through 2031. No exit.

Annual savings from the lock-in: $1,710/year, or $10,260 over six years.

Now look at January alone. CDE’s $1.98/cwt projected indemnity on that 200-cow herd: 3,800 cwt of monthly covered production × $1.98 = roughly $7,524 on one month’s milk. That single payment exceeds the entire annual premium.

If margins track CDE’s January 14 forecast for the full year, total net indemnity on 4.56 million covered pounds would land around $37,800 for 2026. That’s a projection, not a guarantee — forecasts shift month to month. But it shows the scale of what’s sitting on the table.

And on a 500‑Cow Operation?

Scale up, but know where the wall is. A 500-cow dairy at 24,000 lbs/cow produces 12 million pounds. Tier 1 caps at 6 million. Half of your milk is unprotected.

Annual: 57,000 cwt × $0.15 = $8,550 + $100 = $8,650/year

Lock-in: 57,000 cwt × $0.1125 = $6,412.50 + $100 = $6,512.50/year — saving $2,137.50/year

January’s projected indemnity: 4,750 monthly cwt × $1.98 = $9,405. One month covers the premium. Scale CDE’s full-year projection the same way — $8,300 per million covered pounds × 5.7 million — and you’re looking at roughly$47,310 in net indemnity for 2026 on the Tier 1 portion alone.

But the other 6 million pounds? Nothing. Tier 2 premiums jump to a maximum of $8.00 coverage with rates running dramatically higher — that’s why most advisors treat DMC as a Tier 1 play and layer DRP on top for the rest.

William Loux, senior vice president of global economic affairs at the National Milk Producers Federation, put it this way: “The uncertainty in dairy markets is not going away anytime soon. So DMC, DRP — these are great programs to utilize.”

Should You Lock In DMC for 6 Years?

This is where the 25% discount starts to get complicated. Leonard Polzin, dairy markets and policy specialist at UW–Madison Extension, ran the margin history, and his numbers frame the decision.

The lock-in only beats annual enrollment if you’d sign up in at least 5 of the 6 years. Here’s what that looks like for a 200-cow dairy:

ScenarioLock-In Cost (6 yrs)Annual CostDifferencefor 
Enroll all 6 years$31,380$41,640Lock-in saves $10,260
Enroll 5 of 6$31,380$34,700Lock-in saves $3,320
Enroll 3 of 6$31,380$20,820Annual savings are $10,560
Enroll 2 of 6$31,380$13,880Annual saves $17,500

That bottom row. You’ve paid $17,500 in premiums for coverage that barely triggered.

So how often do margins actually compress for five or six straight years? Polzin checked. From 2019 through 2025, 39 of 84 months fell below $9.50. Payment runs averaged 4.88 months. Non-payment runs averaged 4.33 months. As his analysis notes, “margins tend to move in episodes rather than in isolated one-month shocks” — and “the relevant risk is frequently the duration of tight margins and the associated working-capital strain, not only whether a single-month payment occurs.”

The margin oscillates. It doesn’t stack up in neat multi-year compression streaks.

But Here’s the Honest Counterpoint: What Did Futures Show at Decision Time?

The table above assumes you’d skip enrollment in years when margins ended up running above $9.50. That’s hindsight. You don’t have hindsight at enrollment time — you have futures.

And here’s what producers actually knew at each deadline:

Enrollment YearDeadline WindowMarket Signal at SignupWould a Rational Producer Enroll?Actual Result
2019Early 2019Tight margins expectedYes7 months triggered; $19,306/op
2020Late 2019Uncertain; premium cheapProbably5 months; $17,324/op
2021Early 2021Feed costs risingYes11 months; $62,214/op
2022Late 2021Milk recovering, feed highUncertain — but $0.15/cwt is cheap insurance2 months; $4,656/op
2023Extended to January 31, 2023FSA Administrator: “early projections indicate payments are likely for the first eight months”Absolutely11 months; $74,553/op
2024February 28 – April 29, 2024Jan margin hit $8.48, first payment triggered before enrollment openedProbably~5 months; $2,356/op
2025January 29 – March 31, 2025Futures projected ~$12.50/cwt average marginsMaybe skip — but premium is just $0.15/cwt1 month; ~$0.08/cwt

At $0.15/cwt, the enrollment hurdle is remarkably low. A 200-cow herd pays $6,940 for a full year of $9.50 coverage. In 2023, that $6,940 returned roughly $63,000. Even in the weakest year on record — 2022 — the premium amounted to about $1.44/cow/year. Most producers would enroll on cheap-insurance logic alone in all but the most obviously strong-margin years.

Look at that column honestly: a rational producer reviewing futures at each enrollment deadline would likely have enrolled in five or six of the last seven years. Only 2025 gave a clear “skip” signal — and even then, some producers enrolled because the premium was effectively a rounding error against downside protection.

That changes the lock-in math. If you’re the kind of operator who enrolls most years anyway — and the historical enrollment rate of 73–80% of eligible dairies suggests most producers are — the lock-in’s $10,260 in savings over six years is real money you’d leave on the table by staying annual.

The lock-in loses when you’re disciplined enough actually to skip enrollment in good-margin years. Polzin’s data shows that the years 2022, 2024, and 2025 all had weak or zero payouts. But the question isn’t whether good-margin years exist. It’s whether you’d actually sit out when the premium is $0.15/cwt and the downside is missing a 2023-style year.

Loux captured the tension: “It’s good that DMC is paying out, but it’s almost always better for prices, and better for dairy farmers, if they don’t.”

What Happens When Your Herd Outgrows Your History?

Lock in for six years, and your production history freezes at your best year between 2021 and 2023. Your herd doesn’t.

Say your best history year was 170 cows. You’re milking 200 now. That history — 4,080,000 lbs at 95% enrollment — gives you 3,876,000 covered pounds. Here’s the part that trips people up: the dollars don’t change as you grow. The premium stays the same. The indemnity payment stays the same. You’re buying coverage on a fixed number of pounds — same check out, same check in, regardless of what’s happening with your actual herd size.

What does change is the share of your total production that has margin protection underneath it:

YearActual ProductionCovered Lbs% CoveredAnnual PremiumIndemnity per $1/cwt Trigger
20264,800,000 (200 cows)3,876,00080.8%$5,914$38,760
20285,198,000 (217 cows)3,876,00074.6%$5,914$38,760
20315,845,000 (244 cows)3,876,00066.3%$5,914$38,760

Notice the last two columns — they’re identical every row. The DMC math on your covered pounds doesn’t erode. You pay the same premium. You get the same indemnity. The ROI on the covered portion is unchanged whether you’re milking 200 cows or 244.

The real issue is what’s growing outside that coverage. By 2031, a third of your actual production has zero margin protection. That milk generates revenue in good months and unprotected losses in bad ones. It’s not that DMC got worse — it’s that your unprotected exposure got bigger, and you need to manage it separately.

For a 500-cow herd, this gap exists from day one. You’re producing 12 million pounds and covering 6 million — half your milk is already outside DMC, regardless of herd growth.

The practical question isn’t “is my DMC eroding?” — it’s “what am I doing about the growing share of milk that DMC was never designed to cover?” That’s where DRP, LGM, or self-insurance need to enter the conversation. Kilgore confirmed: locked-in operations must pay premiums annually and certify they’re commercially marketing milk every year. There’s no pause button and no off-ramp — but the coverage you’re paying for delivers the same dollar protection it always did.

Four Paths Before February 26

Path 1: Annual enrollment at $9.50, Tier 1. No lock-in. Best for growing herds, operations expecting margin recovery within 2–3 years, or anyone facing a major change before 2031. Cost: $6,940/year (200-cow) or $8,650/year (500-cow), paid only in the years you choose. You sacrifice $1,710–$2,137/year in premium savings. You keep full flexibility.

Path 2: The stable-herd lock-in. Fits operations that closely match their 2021–2023 history, plan to milk through 2031, and would realistically enroll most years anyway, which the enrollment history suggests is most producers. Savings: $10,260–$12,825 total. But it can’t be reversed. Premiums are due by September each year, regardless of conditions. If 2028 turns out to be a $12 margin year, you’re still writing that check. ⚡ 

Think you’ll weigh the lock-in decision next year? You won’t have the option. This election is only available during the 2026 enrollment. Miss it, and it’s gone permanently.

Path 3: Enroll at a lower coverage tier. Dropping from $9.50 to $8.00 cuts your Tier 1 premium and reduces your exposure if margins recover faster than expected. But it also slashes your indemnity in the months that matter most. Run both scenarios at dmc.dairymarkets.org with your actual production numbers before deciding.

Path 4: Skip DMC entirely. Only makes sense if you’re running active DRP or LGM hedging and are comfortable walking away from the cheapest margin protection available on your first 6 million pounds. Note: operations with unpaid 2025 premiums can’t get a 2026 contract until the balance clears.

Minnesota producers — one more variable. Your state’s DAIRI program requires a 6-year DMC commitment to qualify for state-level dairy assistance. That alone could tip the math.

What This Means for Your Operation

  • Pull your 2021–2023 milk marketings now. Your production history is the highest of those three years. If it sits well below current output, know that your DMC coverage on those pounds still delivers the same dollar protection — but you’ll need DRP or LGM for the uncovered portion. ⚡
  • Run the USDA DMC decision tool with your actual numbers: dmc.dairymarkets.org. Polzin’s full historical margin analysis is at UW–Madison’s farm management site.
  • Be honest about your enrollment behavior. How many of the last seven years would you have enrolled? Not in hindsight — looking at what futures showed at each enrollment deadline. At $0.15/cwt, most producers enrolled in five or six of seven. If that’s you, the lock-in’s $10,260 in savings is real. If you’re disciplined enough to skip when futures signal strong margins, annual gives you that optionality. 
  • Remember what 2023 delivered. Wisconsin dairies enrolled in the program averaged $63,633 in indemnity payments. Those that weren’t? Zero. At $0.15/cwt, the annual cost of not being covered in a compression year dwarfs a decade of premiums. 
  • Call your local FSA office by February 24—not the 26th. Phone lines jam on deadline day. Paperwork takes longer than you expect. Find your office at farmers.gov/service-locator.
  • DMC payments are taxable income and are subject to a 5.7% sequestration, per OMB’s FY2026 report. On a $1.98/cwt January indemnity, that shaves roughly $0.11/cwt before the check hits your account. Plan with your accountant.
  • Within 3–5 years of a transition? A six-year commitment may outlast your timeline. Annual enrollment preserves every option.

Key Takeaways

  • If you’d realistically enroll most years anyway — and at $0.15/cwt, the enrollment history suggests most producers would — the lock-in saves $10,260 on a 200-cow herd. The 25% discount represents genuine savings if your enrollment behavior aligns with historical norms. 
  • If you’re disciplined enough to skip enrollment when futures signal strong margins, annual enrollment preserves that optionality. Polzin’s data shows margins ran above $9.50 for all or most of 2022, 2024, and 2025 — skipping those years saves more than the lock-in discount. 
  • Growing herds don’t lose DMC value on covered pounds — same premium, same indemnity, same ROI. But the uncovered share of your total production continues to grow each year. If current production exceeds your 2021–2023 high by more than 15%, layer DRP or LGM on the exposed portion now. 
  • If your debt-service coverage ratio sits below 1.3, the lock-in’s predictable cost may matter more to your lender than flexibility. Have that conversation before the 26th.
  • The six-year election disappears after 2026 enrollment. Annual is the default. After February 26, the option is permanently gone.

The Bottom Line

Pull your milk statements. Plug your numbers into the USDA calculator — yours, not the ones in this article. And before you check that lock-in box, answer one question honestly: in the last seven years, how many times would you have sat out enrollment at $0.15/cwt? 

If the answer is one or two, the lock-in probably makes sense. If you’d have skipped three or more annual wins.

Make the call before February 24. When January’s official DMC margin drops, you’ll know exactly what your decision was worth.

We’ll have that scorecard next month.

Complete references and supporting documentation are available upon request by contacting the editorial team at editor@thebullvine.com.

Learn More

The Sunday Read Dairy Professionals Don’t Skip.

Every week, thousands of producers, breeders, and industry insiders open Bullvine Weekly for genetics insights, market shifts, and profit strategies they won’t find anywhere else. One email. Five minutes. Smarter decisions all week.
NewsSubscribe
First
Last
Consent

$18.95 Milk, $1.6B in Cheese Plants: Why 2026 Forces Mid-Size Dairies to Scale, Go Premium, or Exit

Processors just bet $1.6B you’ll chase their cheese plants. At $18.95 milk, mid-size dairies really face only three choices: scale, go premium, or exit.

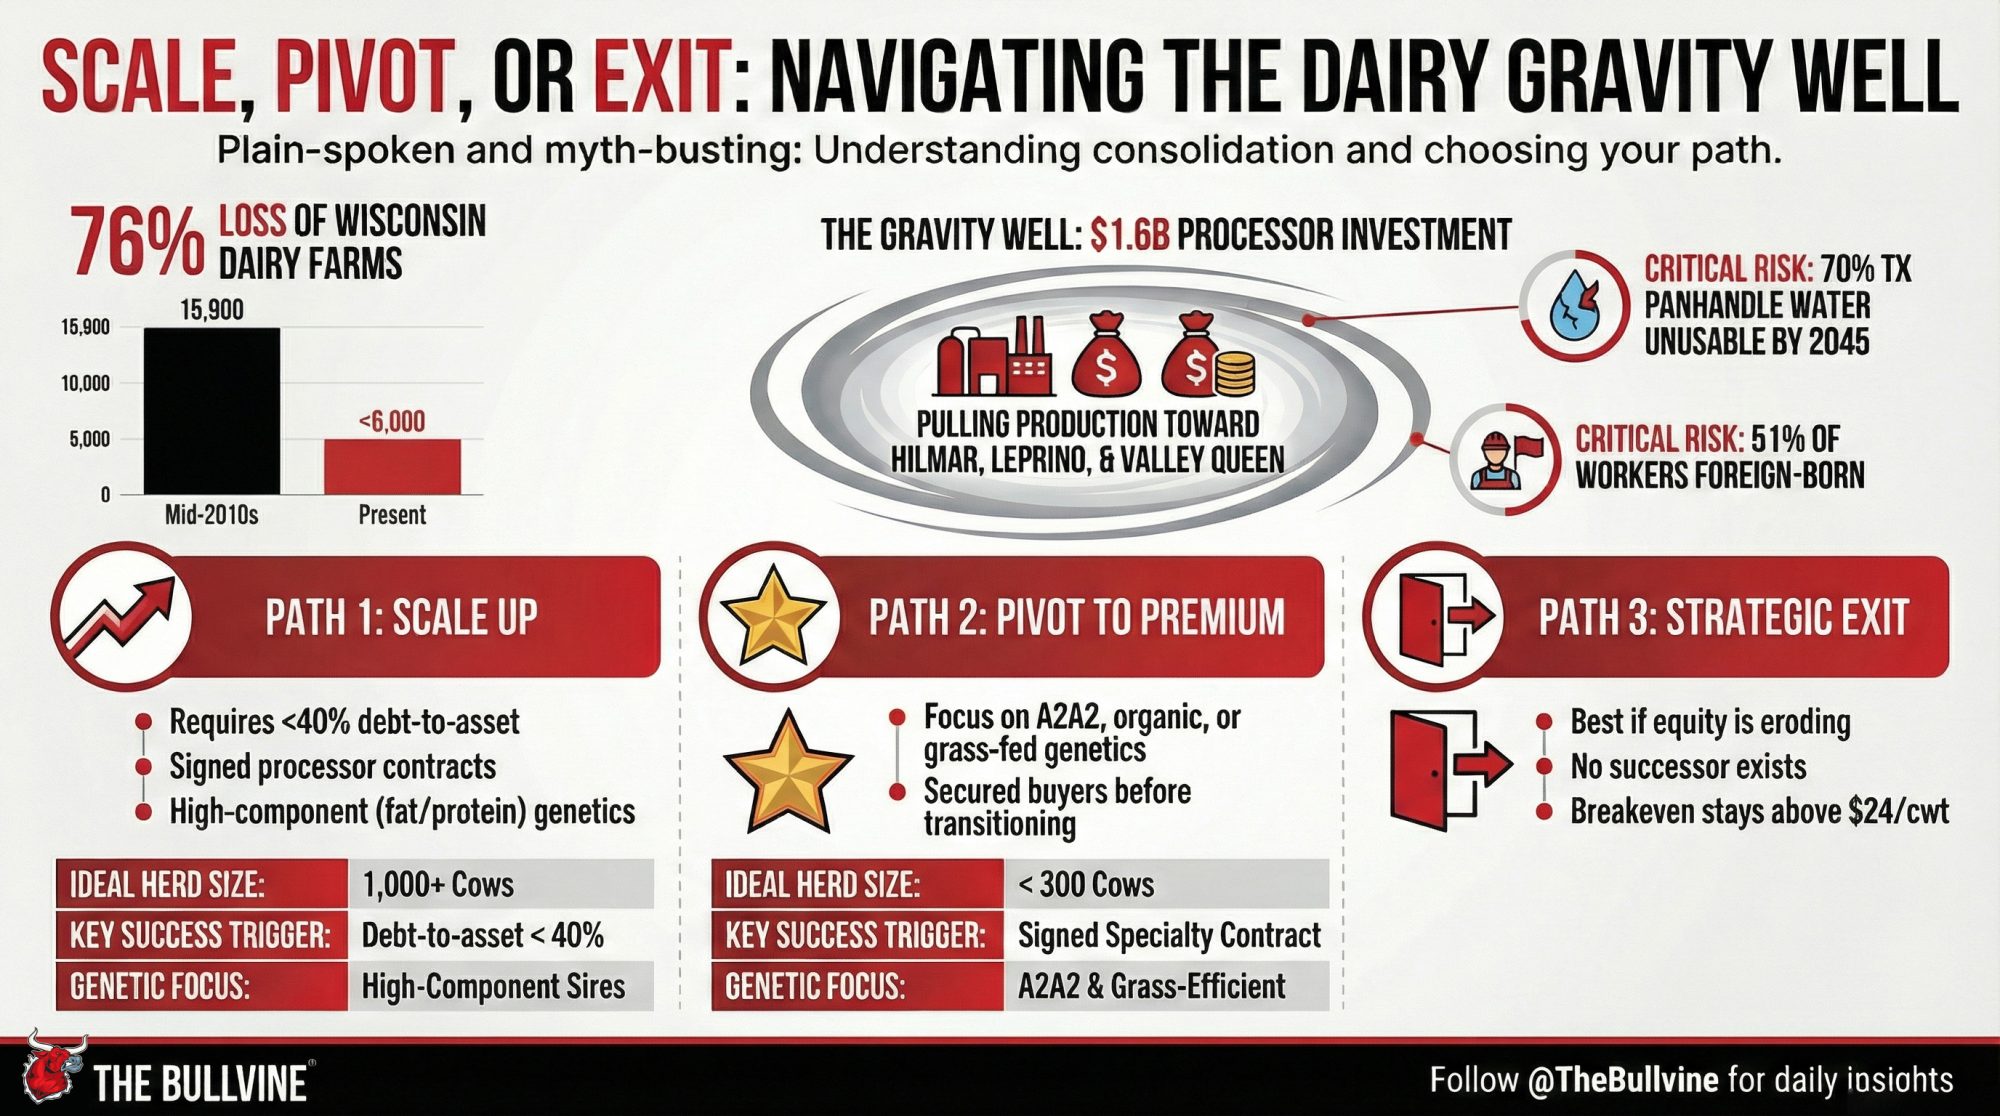
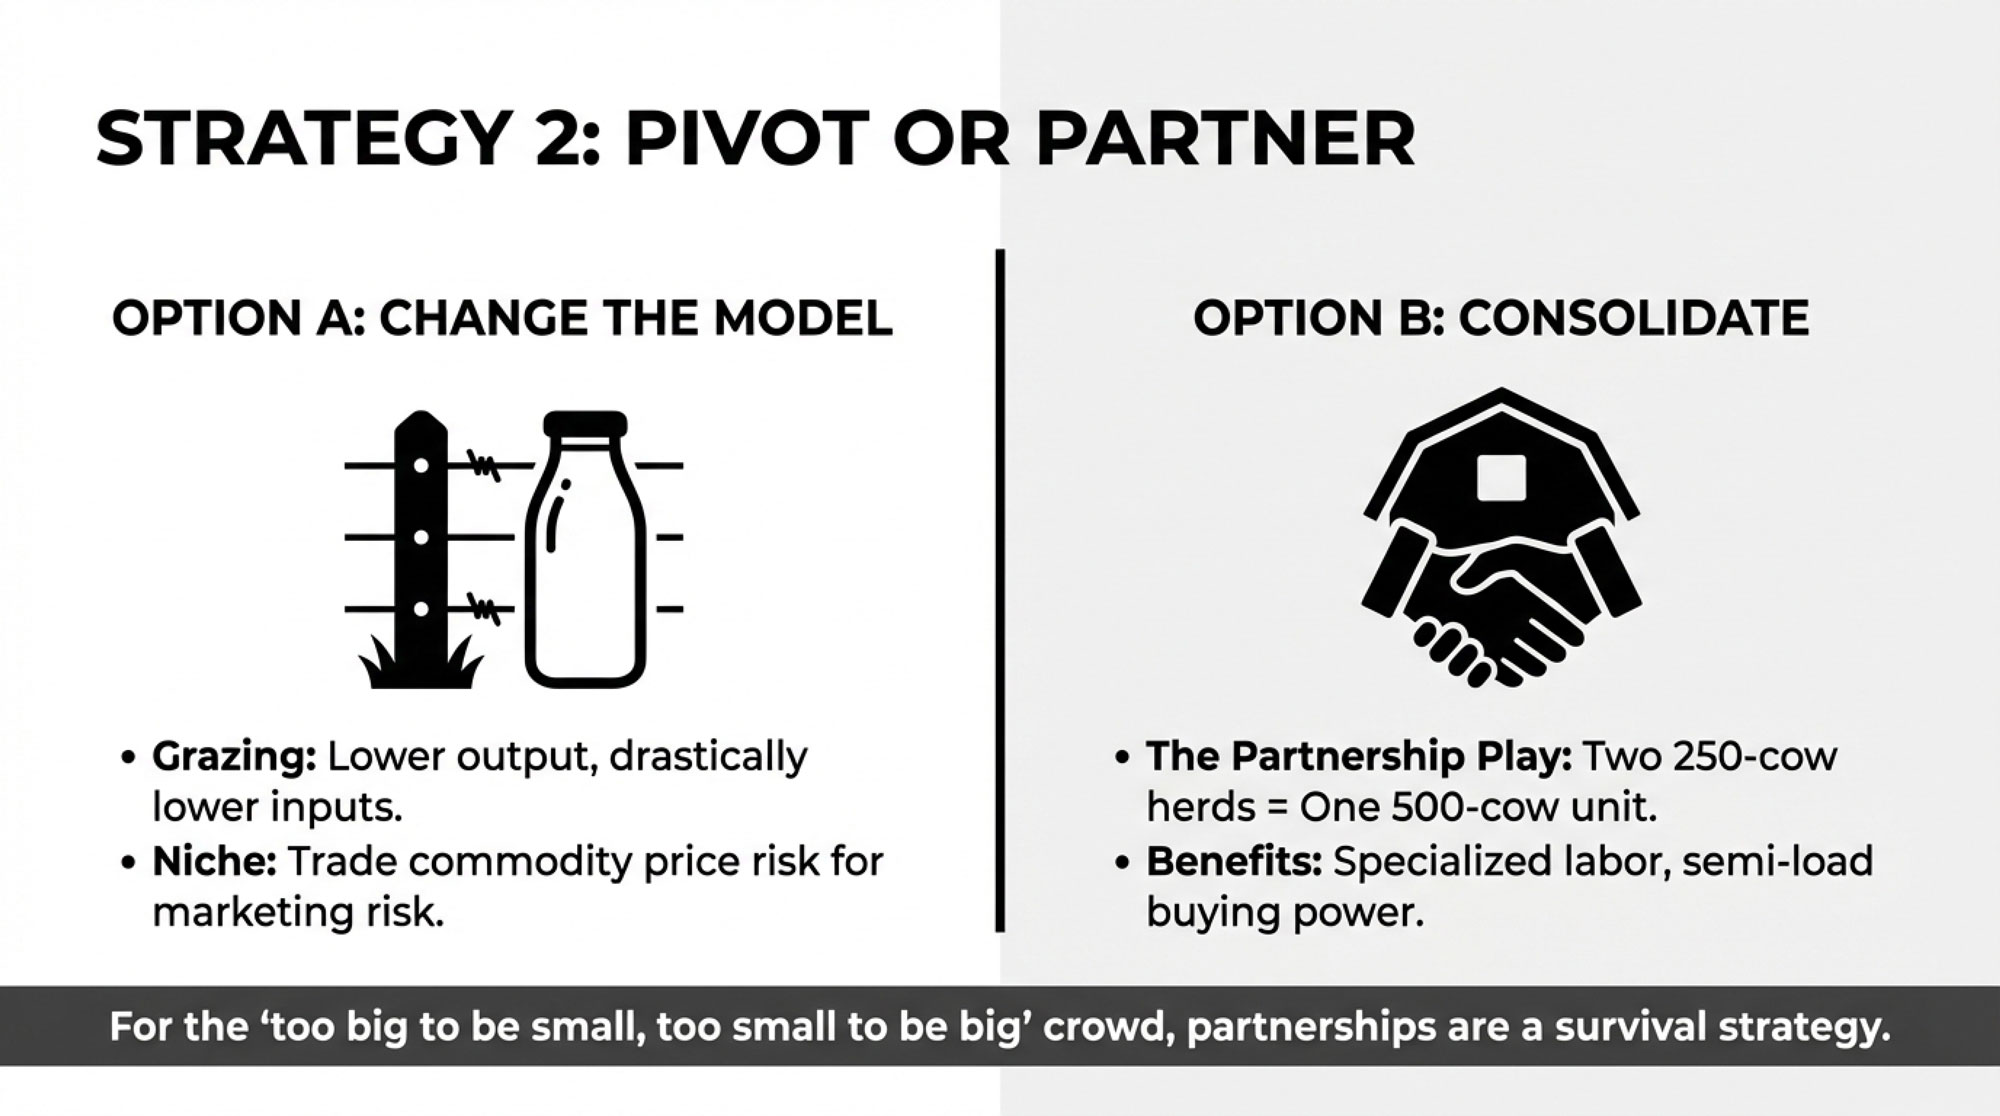
Executive Summary: Processors have poured about $1.6 billion into new cheese plants in Texas, Kansas, and the I‑29 corridor, just as Wisconsin has lost roughly 76% of its dairy farms since the mid‑2010s. At $18.95/cwt all‑milk, many 300–500 cow herds are staring at $100,000–$300,000 in annual losses once you put realistic labor and depreciation into the breakeven. This analysis shows how a 400‑cow herd can swing nearly $200,000/year on the same milk simply by shifting into component‑driven contracts that reward 4.2% fat and 3.3% protein. It then walks through the only three paths that really remain for most mid‑size dairies in 2026: scale up around gravity‑well cheese plants, lock in a premium contract (organic/A2) before spending, or exit on your own terms before equity disappears. Water limits on the Ogallala, heavy reliance on immigrant labor, and a looming shift from butterfat to protein premiums all tilt the table in different ways depending on your zip code. If you own or manage a mid‑size herd, this piece gives you the barn math, contract questions, and risk signals you need to decide whether your future is scale, premium, or a controlled exit.

Dairy Markets

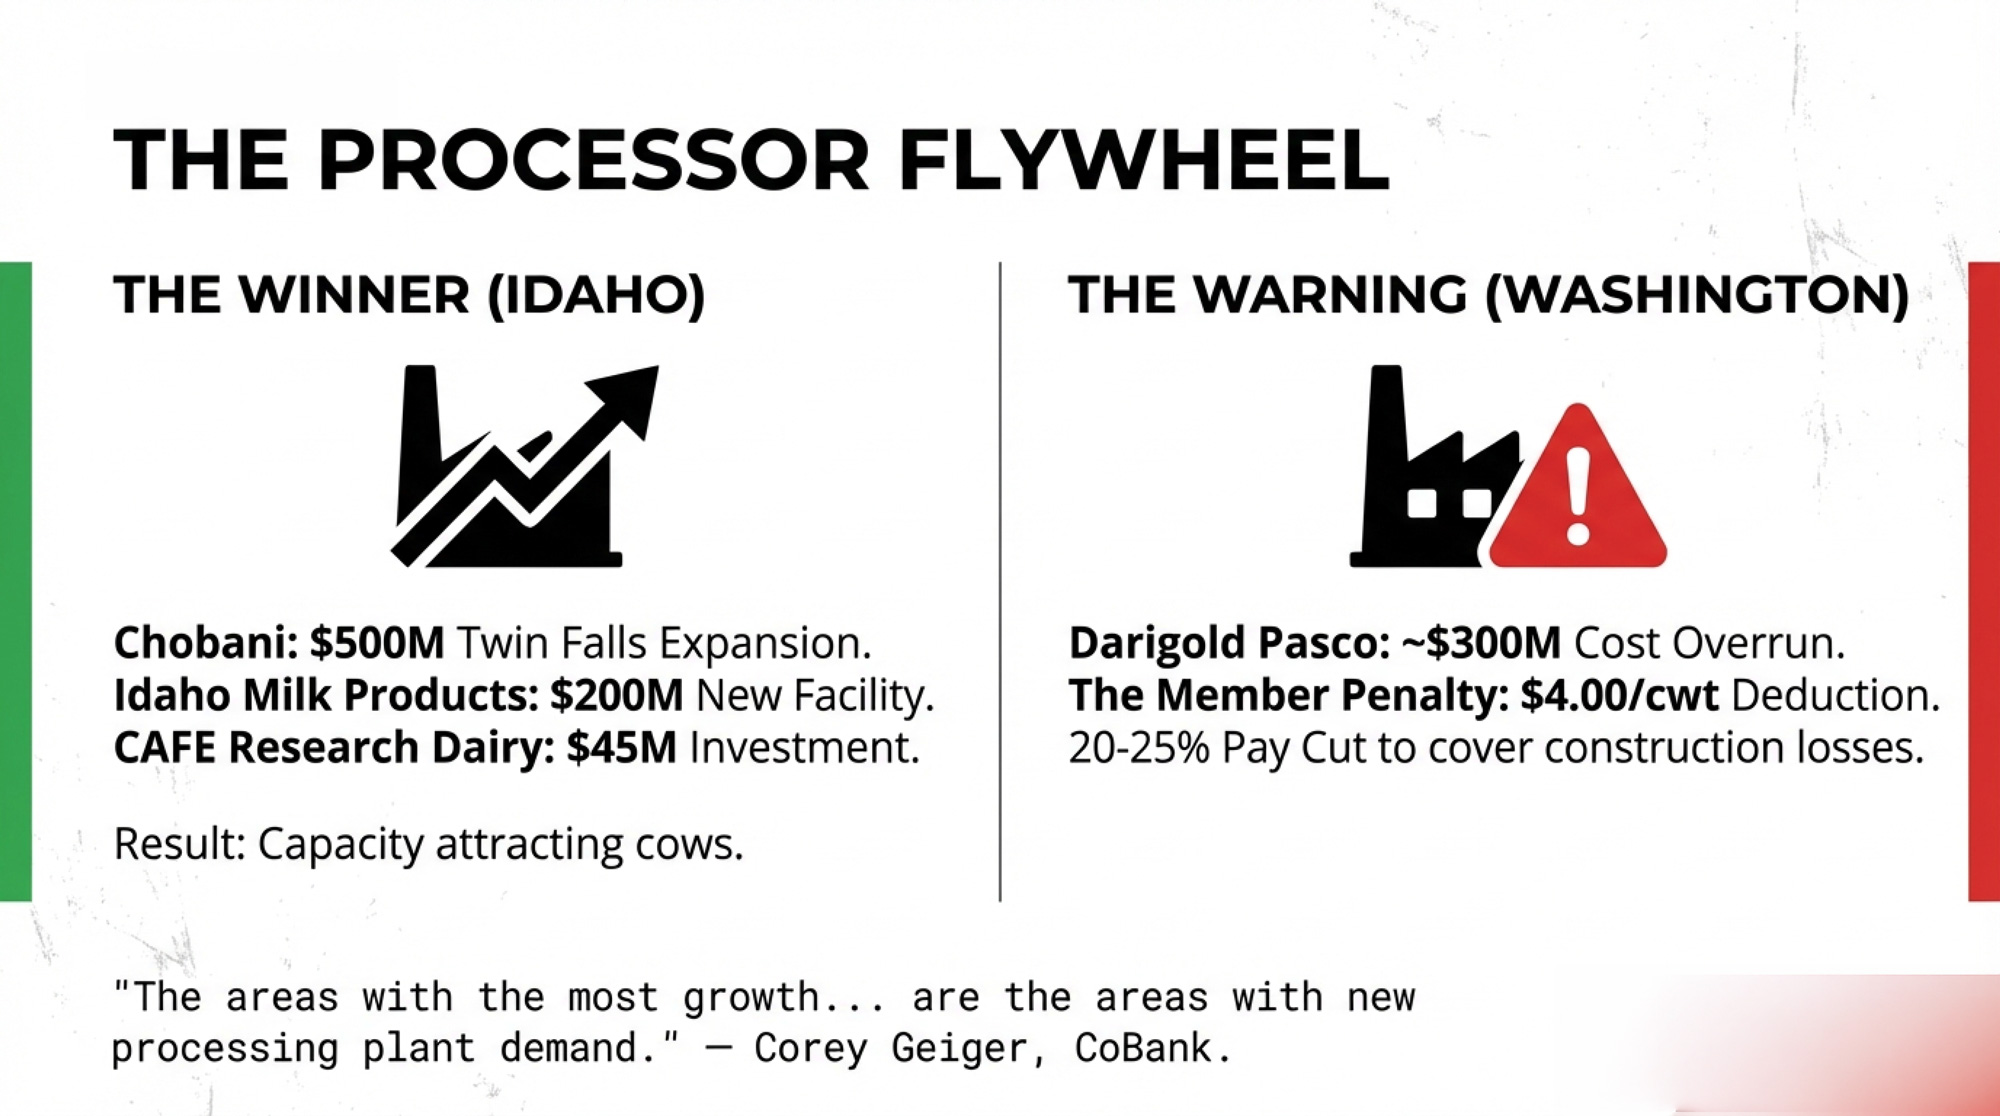
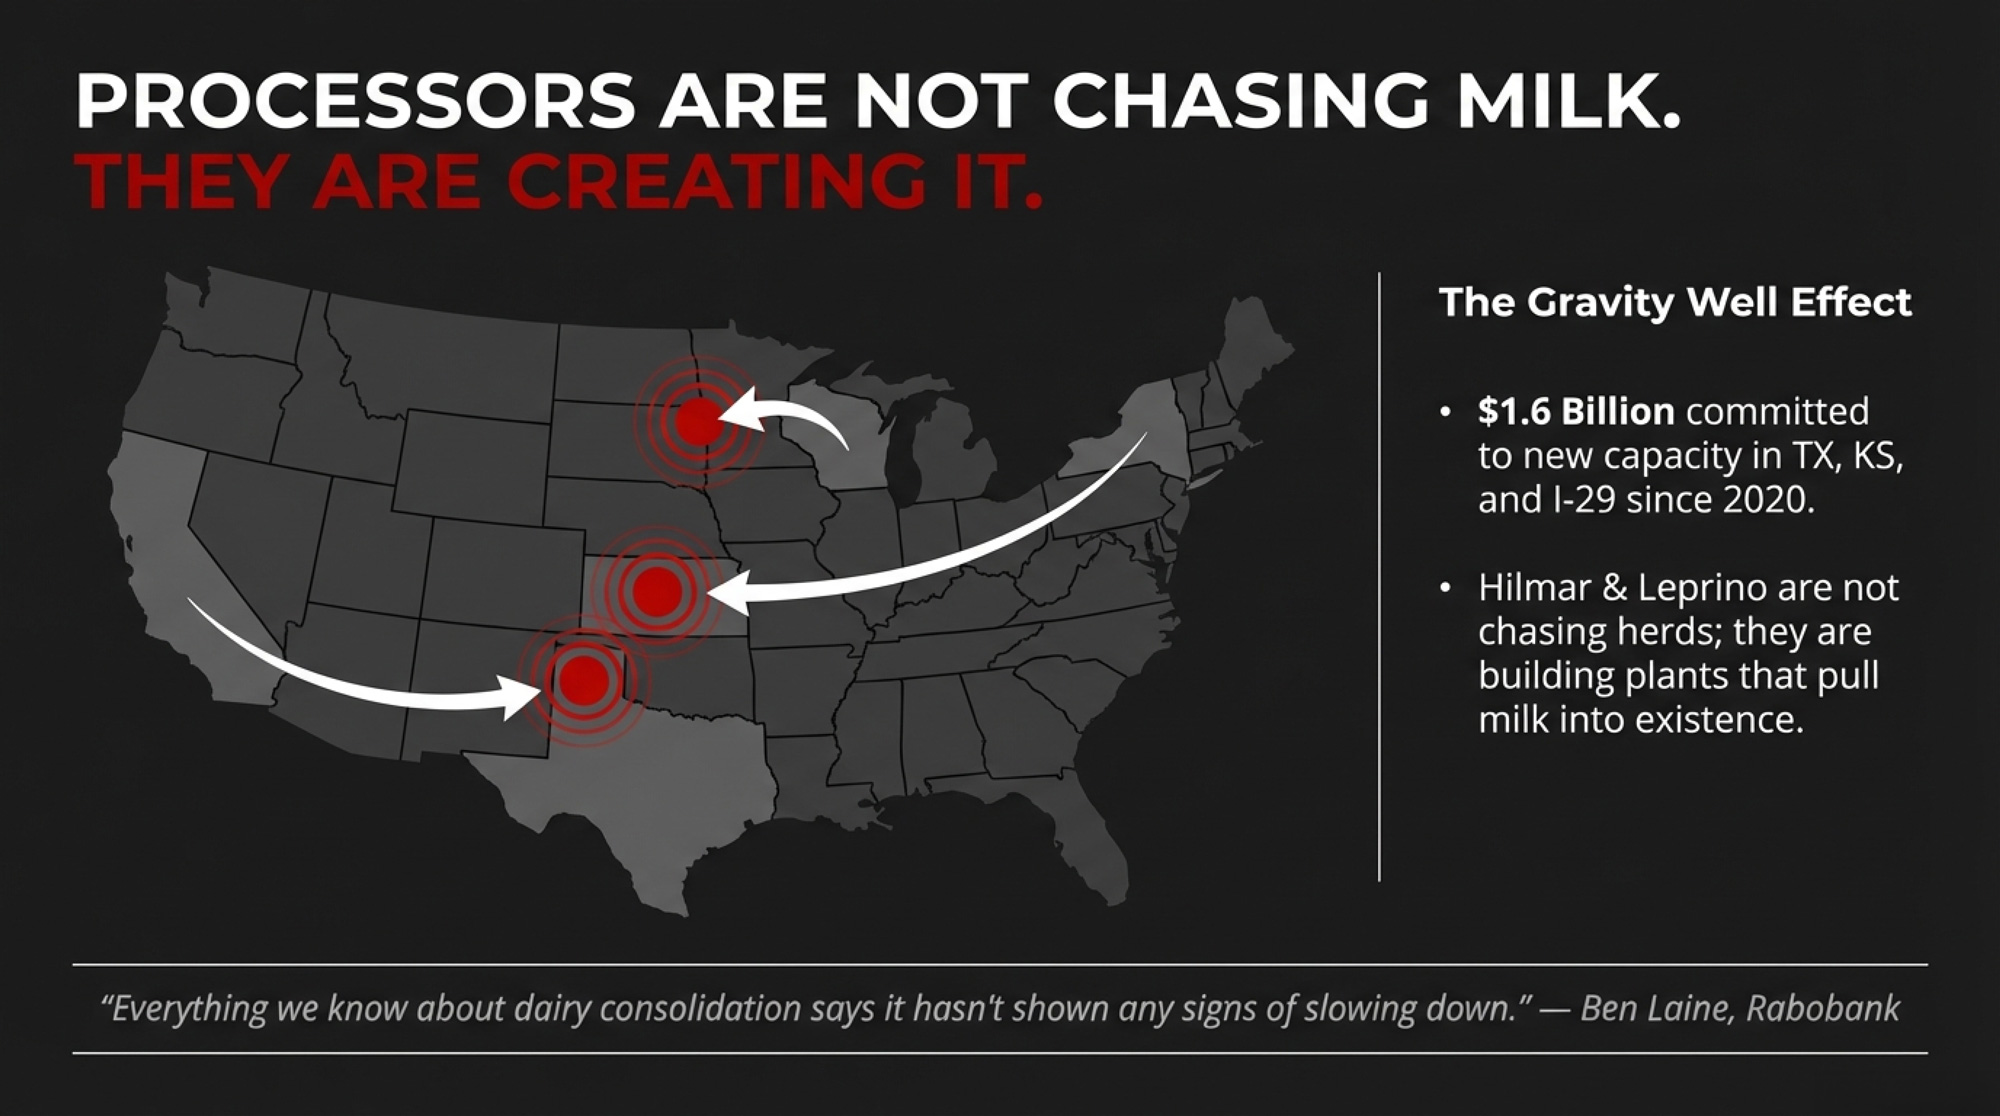
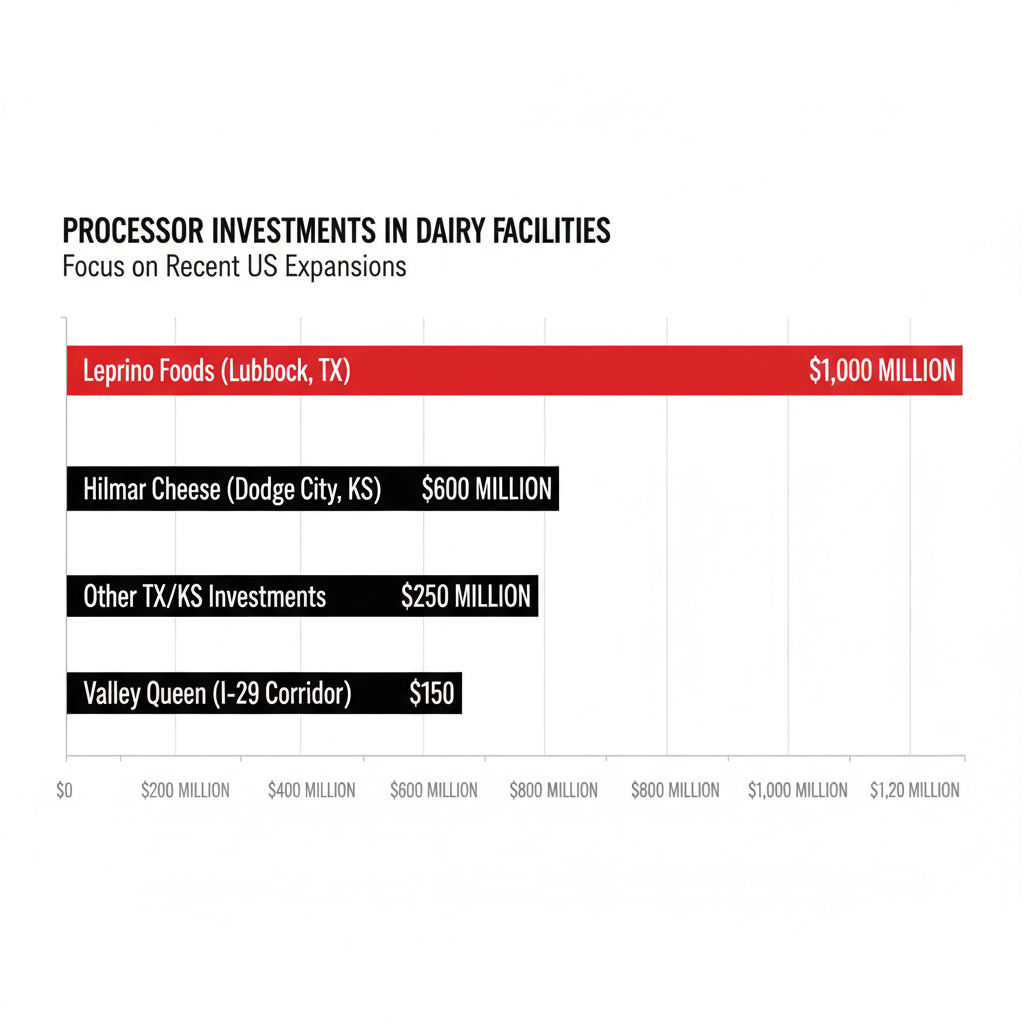
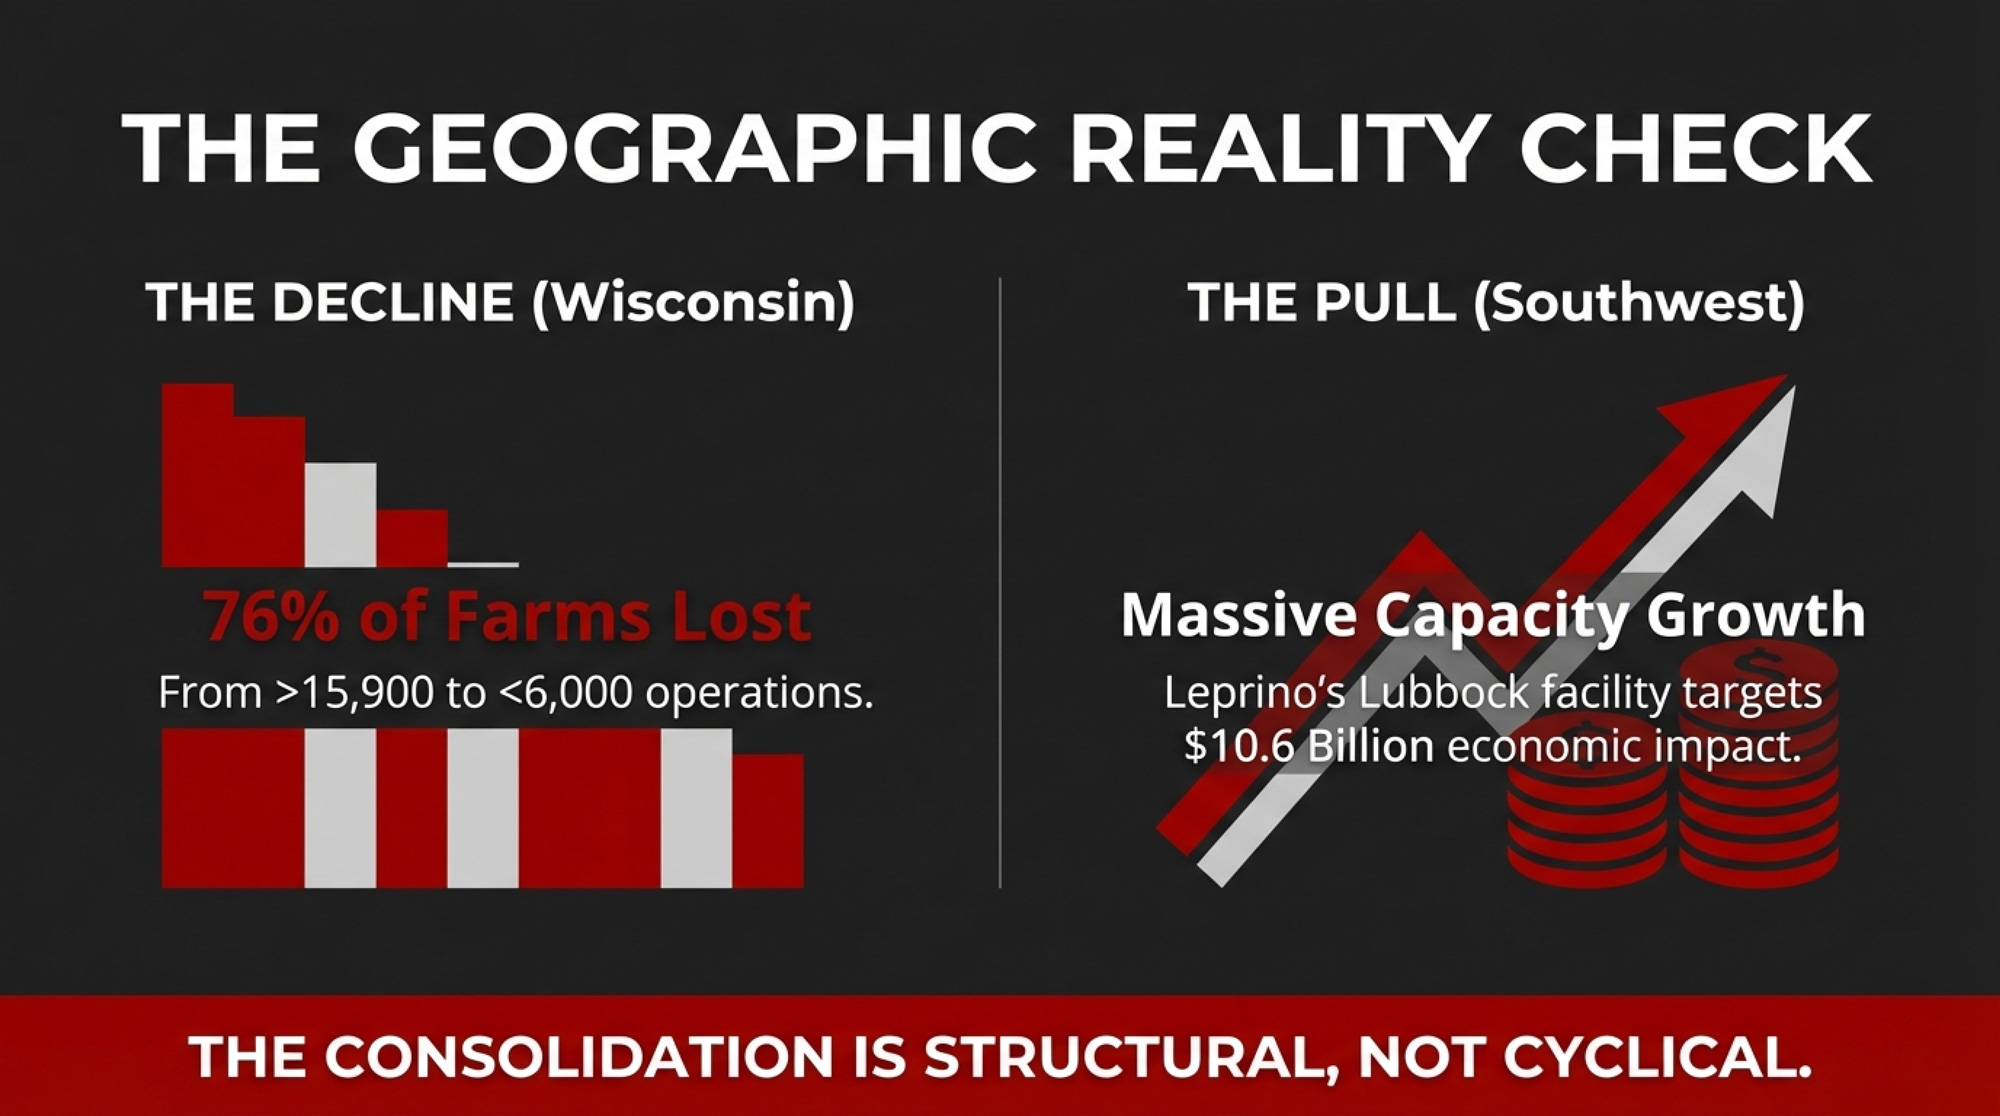
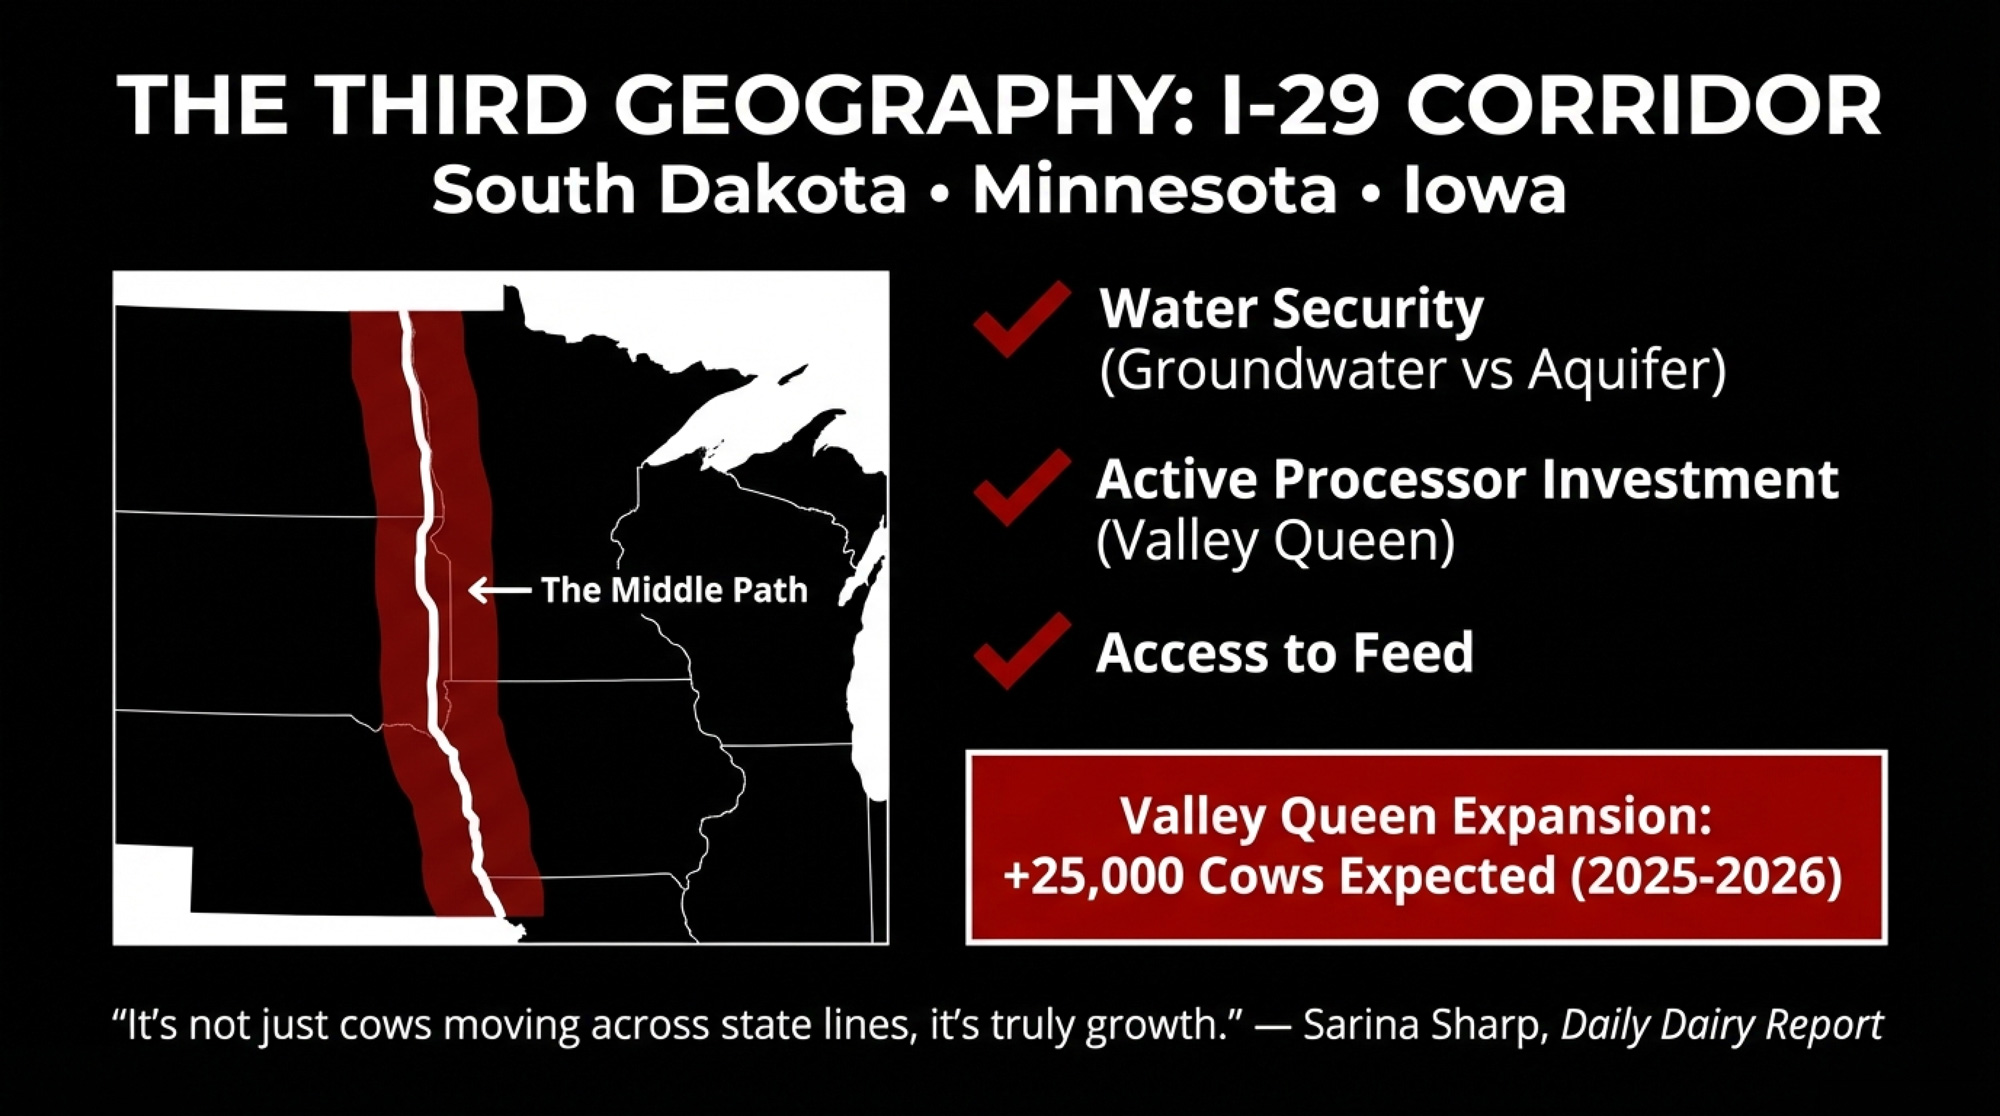
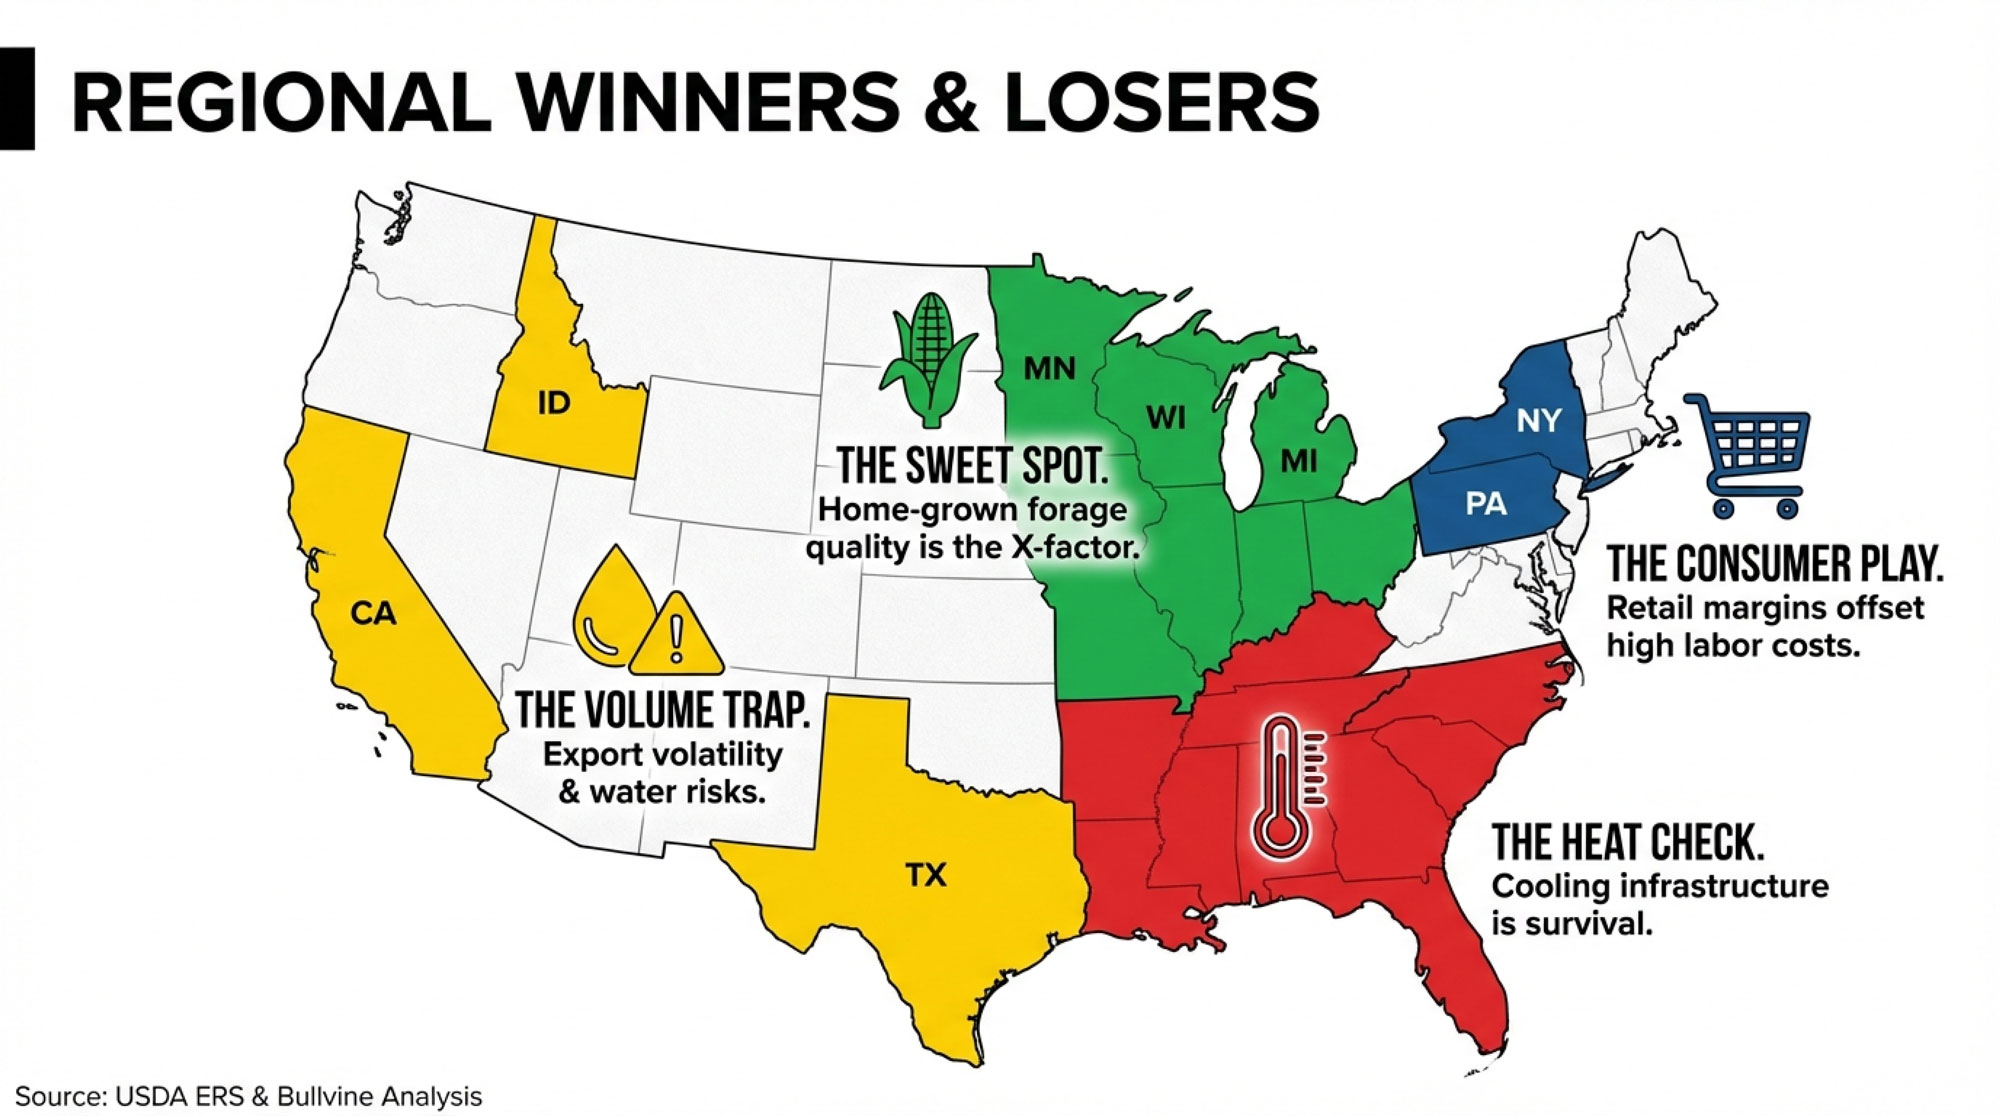
For mid-size dairies, the numbers are brutal. Since 2020, three processors have committed roughly $1.6 billion to cheese capacity in Texas, Kansas, and the I-29 corridor, while Wisconsin has lost about 76% of its dairy farms since the mid-2010s, dropping from over 15,900 operations to fewer than 6,000.  USDA’s February 2026 WASDE pegs the all-milk price at $18.95/cwt, down $2.22 from last year’s revised average of $21.17.  Those two curves — processor expansion and farm attrition — are not random. 

Ben Laine, now senior dairy analyst at Terrain, shared, “If you’re building new cheese plants and you need to fill them with milk, you’re going to pay what it takes to get the milk in there… It’s going to be a bit more of a seller’s market for milk. So, producers might be able to negotiate and move around, and that’s not something they’ve had in a long time.”

That’s the optimistic read. The cautious one is simple: those plants will fight hard for milk from the most reliable, scalable suppliers. If your breakeven sits above $20–$22/cwt, you’re not automatically at the front of that line.

Processors Chose First. You Followed.

The usual story says producers drove the geographic shift — families chasing cheaper land and gentler regulations. The timeline says the plants made the first move.

Hilmar Cheese didn’t go to Dalhart, Texas, because there was an ocean of milk sitting there in 2006.  The region’s dairy presence was modest when they broke ground. By 2014, the local herd had grown more than tenfold. Former CEO John Jeter described Dalhart as having a growing milk supply and a stable regulatory environment — not a huge supply, a growing one.  Hilmar bet on the future milk it knew would follow its stainless steel. 

The same pattern shows up in Kansas. When Hilmar announced its $600 million Dodge City, Kansas, cheese plant in 2021, Kansas Dairy CEO Janet Bailey said the facility would help the state’s dairy industry expand and encourage producers to be innovative.  Future tense again. Leprino Foods’ roughly $1 billion Lubbock, Texas, complex follows the same script, with phases coming online through 2026 and an estimated $10.6 billion in economic impact for Texas over the next decade. 

Here’s the processor scorecard:

FacilityInvestmentProjected Cow AdditionsKey Risk Factor
Leprino Foods (Lubbock, TX)$1,000 million~40,000+ head (est.)Ogallala: 70% unusable by ~2045
Hilmar Cheese (Dodge City, KS)$600 million~25,000+ head (est.)Moderate Ogallala stress
Other TX/KS cheese investments$250 million~15,000+ head (est.)Water + 51% immigrant labor
Valley Queen (I-29 Corridor)$150 million~25,000 head (2025–26)Slots filling fast; low milk prices

They aren’t following milk. They’re building gravity wells. And milk — and producers — move toward gravity.

Why the I-29 Corridor Is Suddenly a Growth Magnet

Not every dollar is heading southwest. Along the I-29 corridor — South Dakota, Minnesota, Iowa — the dairy map is being redrawn just as quietly.

Evan Grong, Valley Queen’s sales manager for dairy ingredients, told Dairy Herd in May 2023: “We attribute the current and projected growth in the I-29 region primarily to access to feed production, abundant groundwater, and dairy processing investments.”  Valley Queen’s expansion alone expects approximately 25,000 additional cows in 2025 and 2026. 

Sarina Sharp, with the Daily Dairy Report, told Brownfield Ag News in October 2022: “So that is Iowa, South Dakota, and Minnesota — there they are growing milk production, and they are growing processing capacity. New dairies are coming in, and it’s not just cows moving across state lines, it’s truly growth.” 

The contrast is sharp:

  • Unlike the Ogallala-dependent Panhandle, the I-29 region isn’t sitting on a rapidly draining aquifer. 
  • Unlike Wisconsin, the corridor has processors actively courting volume rather than telling farms there’s no room on the route. 

If you’re looking at a relocation or expansion, it can feel like a “get in while there’s room” middle path. But as Sharp herself noted in February 2026, most major expansions that coincided with new processing plant growth have already been completed, and low December/January milk prices are making producers “think twice” about putting money down for a big expansion. 

[INTERNAL LINK: news/1-6b-to-texas-and-kansas-76-of-wisconsin-farms-gone-scale-up-go-premium-or-get-out] → Suggested anchor text: “Our original breakdown of $1.6B to Texas/Kansas and the 76% drop in Wisconsin farm numbers digs deeper into how we got here.”

The Growth-State Trap: Water, Labor, and Asymmetry

On paper, growth states look unbeatable. Cheaper ground. Warmer winters. New cheese plants are hungry for milk. But two of the pillars under that advantage — water and labor — are much shakier than the investment headlines suggest.

Water: The Ogallala Clock Is Ticking

The Ogallala Aquifer underlies the Texas Panhandle and western Kansas — exactly where a lot of the new stainless steel has landed or is landing.  Texas accounts for roughly 62% of total Ogallala depletion despite sitting on only part of the aquifer’s footprint, according to USGS and Texas Water Development Board data.  A University of Texas Bureau of Economic Geology projection suggests that up to 70% of the Panhandle’s Ogallala section could become unusable within about 20 years at current pumping rates. 

If you break ground on a new 4,000-cow unit in 2026 on that footprint, that 20-year horizon takes you to the mid-2040s — right inside the lifespan of your wells, your loans, and your next generation’s mortgage.

Labor: 51% of the Workforce, 80% of the Milk

The labor math is just as stark. A 2015 NMPF-commissioned study conducted by Texas A&M AgriLife Research found that about 51% of dairy farm workers nationwide were immigrants, and that farms employing immigrant labor accounted for roughly 80% of U.S. milk production.  Texas A&M’s economic modeling suggested that a complete loss of immigrant labor would mean a $32 billion hit to the U.S. economy, 208,000 fewer jobs, and retail milk prices potentially doubling to around $6.40 per gallon.

An earlier 2009 version of the study, using a smaller industry base, projected 4,532 farm closures and a 61% increase in retail milk prices if immigrant labor disappeared.  The dependence hasn’t gone down since; if anything, consolidation has concentrated that risk.

In Wisconsin, a 2023 UW-Madison School for Workers survey estimated that immigrant labor accounts for roughly 70% of the state’s dairy workforce.  Governor Tony Evers told Wisconsin news outlet WLUK: “If suddenly those people disappear, I don’t know who the hell is going to milk the cows.” 

The Asymmetry That Matters

Processors can spread their risk. Leprino runs facilities across multiple states. Hilmar operates in California, Texas, and soon Kansas.  If water regulation tightens or labor enforcement ramps up in one region, they shift volume elsewhere or take a write-down. 

You can’t move a 4,000-cow Panhandle dairy built to service one contract. The wells, the manure system, the concrete: fixed. The contract term? Usually not as long as the debt.

Risk FactorTexas PanhandleWestern KansasI-29 Corridor
Ogallala depletionUp to 70% potentially unusable by ~2045  Moderate-to-high stress Not Ogallala-dependent 
Labor dependency51% immigrant nationallySame national exposureSame national exposure
Processor diversificationMulti-state (Hilmar, Leprino)  SameRegional (Valley Queen) 
Producer riskFixed assets, 15–25 yr debt  SameSame

That doesn’t mean “Don’t go.” It means go in with both eyes open, and don’t let a processor’s confidence substitute for your own risk math.

[INTERNAL LINK: news/dairy-cows-bleeding-margins-the-2026-math] → Suggested anchor text: “For a deeper dive on how water and labor risk are showing up in 2026 margins, see ‘Dairy Cows, Bleeding Margins: The 2026 Math.'”

Your Zip Code Now Dictates Your Genetics

Where you farm increasingly determines what genetics you need, because it determines how your milk check is built.

Gravity-well dairies feeding Hilmar and Leprino cheese plants are breeding hard for components, not sheer volume. CoBank’s March 2025 Knowledge Exchange report, “Unprecedented Genetic Gains Are Driving Record Milk Components,” by lead dairy economist Corey Geiger and analyst Abby Prins, documented that U.S. butterfat reached a record 4.23% in 2024, while protein was 3.29%.  The April 2025 Holstein base change was the biggest in history. Geiger told Brownfield Ag News: “Butterfat in Holsteins will shift by 45 pounds, and protein by 30 pounds, and that butterfat number’s almost double any number that’s taken place in the past.” brownfieldagnews

For component-priced milk, the message was clear: cows are fatter on paper than they used to be. Future dollars will chase the next increment of fat and protein, not the old base.

As Geiger put it in that same CoBank report: “There’s a clear financial incentive for producers given that multiple component pricing programs place nearly 90% of the milk check value on butterfat and protein.”  DFA’s Corey Gillins reports that rising component values are currently adding about $1–$3/cwt across their membership, depending on region and plant. 

In that world, solids are the product. Water is freight.

Premium-channel operations feel this differently. MilkHaus Dairy in Fennimore, Wisconsin, for example, tests about 100 of their 360 Holsteins for A2 genetics, housing them separately to produce multiple cheese varieties sold in more than 180 Hy-Vee stores and through their own channels.  Components still matter — but the contract is driven by A2, local story, and branded cheese, not just fat and protein yield.

What Does $18.95 Milk Really Mean for a 400-Cow Wisconsin Herd?

USDA’s Economic Research Service released detailed cost-of-production estimates in August 2024, based on 2021 ARMS dairy survey data.  For herds in the 200–999 cow bracket, the national average total cost landed around $16.90/cwt — but that average is heavily weighted toward larger, more efficient herds at the top end of the bracket.

Hoard’s Dairyman, working off the same dataset, found that low-cost producers in the 100–199 cow class came in around $19.76/cwt, essentially matching the average 2,000-cow operation at $19.14/cwt.  In other words, a lean 150-cow herd can run with a typical 2,000-cow unit on cost — but that’s the low-cost subset, not the median neighbor down the road.

So where does that leave a realistic 400-cow Wisconsin herd that values family labor at $20/hour and books depreciation at replacement cost instead of whatever’s left on the last accountant’s worksheet? Most honest budgets put full-economic breakeven in the $20–$22/cwt range.

Let’s walk it:

  • Herd size: 400 cows
  • Annual production: 240 cwt/cow/year (roughly 24,000 lbs)
  • Total cwt: 96,000 cwt/year
  • All-milk price: $18.95/cwt

At a $20/cwt breakeven: margin = −$1.05/cwt, or −$100,800/year

At a $22/cwt breakeven: margin = −$3.05/cwt, or −$292,800/year

That’s six figures of red ink either way.

How Components Flip the Math

Now say that same 400-cow herd ships to a cheese plant, paying aggressively for components. They’ve been breeding for solids, and the herd averages 4.2% butterfat and 3.3% protein — achievable with a focused component strategy in Holsteins in 2026. 

DFA’s Corey Gillins reports that component premiums are currently lifting checks by roughly $1–$3/cwt across their membership.  Split the difference: $2.05/cwt as a realistic mid-range premium for a high-component herd.

  • Base all-milk: $18.95/cwt
  • Component premium: +$2.05/cwt
  • Effective price: $21.00/cwt

At a $20/cwt breakeven: margin = +$1.00/cwt, or +$96,000/year

At a $22/cwt breakeven: margin = −$1.00/cwt, or −$96,000/year

The component swing here is $2.05/cwt — exactly $196,800/year on 96,000 cwt.

Same cows. Same parlor. Same weather. Just a different milk check structure and a genetics program that lines up with it.

Three Real Paths: Scale Up, Go Premium, or Exit On Your Terms

Most mid-size herds staring at $18.95 milk are not really looking at 10 options. The road narrows to three.

Path 1: Scale Up — If the Balance Sheet Can Carry It

This is for you if you’re already at 500+ cows with a credible path to 1,000+, your debt-to-asset ratio is below 40%, you’re under about 55 with a committed successor, and you can secure a signed processor agreement.

The capital is serious. A Bullvine analysis of expansion economics (May 2025) found that even a 250-cow expansion — land at the national average of $5,570/acre, facilities, and cattle at recent replacement heifer prices of $2,660–$4,000/head — stacked to $4+ million before a single new cow was milked.  UW Extension’s 2022 building cost estimates put freestall barn costs at $3,000–$3,500/stall and robot milking facilities at $14,000–$15,000/stall.  With construction bids running 25–40% above pre-2022 benchmarks, according to Progressive Dairy’s contractor survey, a 500-to-1,000-cow greenfield build-out realistically starts north of $10 million once you add land, milking center, manure storage, and cattle. 

And there’s a genetics wrinkle. CoBank’s September 2025 Knowledge Exchange report, “While U.S. Leads Milk Component Growth, Butterfat May Be Growing Too Fast,” warned that cheesemakers strive for a protein-to-fat ratio near 0.80, and anything significantly lower “can reduce cheese quality and compromise production yields.”  Geiger told Brownfield in October 2025: “Eight of the last ten years, butterfat led milk checks. We are going to see a reversal of that this fall. Protein will take over the pole position on milk checks because we need more of it.” 

30-day check: Secure a letter of intent from your target plant that spells out the base price, component premiums, and volume expectations.

90-day check: Stress-test your cash flow at $18/cwt for 12 months. January 2026 Class III settled around $14.59, so that downside isn’t hypothetical.

Path 2: Go Premium — If You Can Lock the Contract First

This path works best with 300 cows or fewer2+ acres of pasture per cow, and a premium contract locked in beforeyou start spending.

On the organic/grass-fed side, the numbers can get eye-popping. Maple Hill Creamery raised its base to about $40.86/cwt by July 2025, with quality premiums pushing checks toward $45/cwt for farms over 30,000 lbs monthly volume, according to NODPA’s Ed Maltby.  Horizon Organic has offered up to $45/cwt in New York, with signing bonuses layered on.

Those checks are real. But so are the costs. NODPA’s Ed Maltby told Dairy Reporter in 2022 that organic production costs in the Northeast were averaging around $37/cwt, with purchased feed running at least 40% higher than conventional, and a three-year transition period that creates a significant income gap before premium checks start flowing.  At $40–$45/cwt on the revenue side, today’s premiums finally pencil for qualifying farms — but the slots are limited, the standards are rigid, and the transition window is expensive. 

30-day check: Pull your latest genomic or A2 test results. If your herd’s A2A2 frequency is below 40%, a full A2 push might not pencil within the contract window.

90-day check: Model the full transition timeline (12–36 months for organic), including lost conventional premiums during transition, feed cost increases of 40%+, and the lag before premium checks show up. 

365-day check: If you don’t have a signed contract by then, stop spending for that premium channel.

Path 3: Exit On Your Terms — Before the Equity Bleeds Out

This is the path nobody wants to talk about at the coffee shop. But it’s where more mid-size herds are quietly ending up.

It fits when you’re past 55 with no committed successor, your breakeven is above $24/cwt and not trending down, and your debt-to-asset ratio has climbed past 60%

The difference between a planned exit and a forced one is measured in equity:

AssetPlanned ExitForced ExitEquity Gap
Heifers (300 head)$3,010/head≈$2,200/head−$243,000
Culls (80 head, 1,300 lbs)$140/cwt$95/cwt−$46,800
Combined  ≈$290,000

That’s nearly $290,000 gone — on cattle alone — if you sell into a weaker market or under duress.

Red flag: If your 18-month cash flow projection shows cumulative losses exceeding 15% of equity, you’re already in the danger band where lenders start quietly moving you from “client” to “risk.” 

365-day check: If you’ve crossed that 15% threshold and have no successor, your default path is already Path 3. The only question is whether you control the timing.

PathIf This Is You30-Day Check90-Day Check365-Day Check
Path 1: Scale Up500+ cows, debt-to-asset <40%, under 55, committed successorSecure letter of intent from target plant (base + component premiums)Stress-test cash flow at $18/cwt for 12 monthsIf breakeven >$24/cwt with no improvement, Path 1 isn’t yours
Path 2: Go Premium300 or fewer cows, 2+ acres pasture per cowPull genomic/A2 test results. If A2 frequency <40%, stopModel full transition: 12–36 months, feed costs +40%, lag before premium checksNo signed contract by day 365? Stop spending for that channel
Path 3: Exit On TermsPast 55, no successor, breakeven >$24/cwt, debt-to-asset >60%Pull 18-month cash flow projectionCheck equity burn. Losses >15% of equity? You’re in the danger bandIf you’ve crossed 15% threshold, default path is already exit
Capital Reality CheckAll paths500→1,000 cow expansion: $10M+ greenfieldOrganic transition: $37/cwt costs, 40% higher feedPlanned vs. forced exit: $290K equity gap on 300-cow herd

What Signals Should Dairy Producers Watch in 2026?

There are a few signals worth tracking closely before you commit hard to any of these three paths.

  • Immigration reform has real momentum. Senate Agriculture Committee Chairman John Boozman (R-AR) told AgWeb in January 2026: “We said we could not do reform because the border was not secure, and it wasn’t.”  He indicated that with the border situation changed, visa program reform is now on the table.  If year-round ag visas open by 2027–2028, the labor cost gap between regions shrinks. 
  • Groundwater rules are tightening. Watch counties like Dallam, Hartley, and Moore in Texas, plus western Kansas groundwater districts.  If pumping caps or metering requirements tighten on new wells, your 2026 expansion penciling may not hold in 2036. 
  • Contract language is drifting. Shorter contract terms, stricter quality specs, or new water-efficiency clauses are not paperwork details. They’re how processors quietly move more structural risk onto you.
  • Protein is taking over from fat. CoBank’s Geiger was explicit in October 2025: “Protein will take over the pole position on milk checks because we need more of it.”  If your herd’s protein is weak relative to fat, that premium shift matters. 
  • Spring flush will pressure prices. The national herd was up about 202,000 head year-over-year in Q4 2025, pushing more milk into the system.  January’s DMC margin clocked in at $7.57/cwt, which is $1.93 under the $9.50 top-tier trigger.  Those checks help, but they don’t fix a structural cost problem.

What This Means for Your Operation

You don’t control Hilmar, Leprino, or Valley Queen. You do control how honestly you read your own numbers.

  • Pin down your real breakeven. Don’t benchmark off the national $16.90/cwt average for 200–999 cow herds — that’s production-weighted toward bigger units.  Use your own books with family labor at $18–22/hour and depreciation at replacement value. If your full-economic breakeven is north of $22/cwt, Path 1 (Scale) probably isn’t yours.
  • Test your component readiness. Pull your latest DHIA test. If you’re nowhere near 4.2% fat and 3.3% protein, you’re not positioned to grab a $2.05/cwt component lift tomorrow. Above 4.0/3.2? You’re in the conversation. Below that? Plan on 18–24 months of genetics and management work to climb.
  • Model your operation at $18/cwt for six months. If that scenario puts you past a 15% equity burn or pushes your debt-service coverage ratio below your lender’s requirements, the current structure isn’t sustainable without changes. 
  • If you’re flirting with growth states, run the 2040 water scenario. Don’t just ask, “Can I pump today?” Ask, “What happens if my allocation is cut 30–40% halfway through the loan?”
  • If you’re eyeing a premium contract, don’t spend a dollar without a signed agreement. Maple Hill and Horizon are paying $38–$45/cwt in some regions  — but organic production costs average around $37/cwt in the Northeast, and the three-year transition means years of conventional-priced milk before premium checks start. 
  • If you’re over 55 and have no successor, set a date for your exit. Look at cattle prices, heifer values, land comps, and your loan schedule. The planned vs. forced gap on a 300-cow herd is roughly $290,000 in cattle equity alone.
  • Use DMC to buy time, not to hide from reality. January’s $7.57 DMC margin will send checks to those enrolled at the $9.50 level.  That’s breathing room, not a business model.

Key Takeaways

  • The $2.05/cwt component swing on a 400-cow, 96,000-cwt herd equals about $196,800/year. If you ship to a cheese plant and aren’t breeding for solids, you’re leaving a six-figure line item on the table.
  • If your breakeven sits above $24/cwt with no clear plan to get it back under $22, the exit math is already running in the background. On a 300-cow herd, the difference between a planned and forced exit is roughly $290,000 in cattle equity alone.
  • Processor confidence doesn’t validate your expansion. Hilmar, Leprino, and Valley Queen can diversify across regions. A new 2,000-cow unit tied to a single plant in a single stressed aquifer can’t.
  • Protein is about to overtake fat on your milk check. CoBank’s Geiger says it’s already happening this fall.  If your breeding plan hasn’t caught up, your milk check will tell you. 
  • Water, labor, and genetics are structural, not cyclical. They won’t fix themselves in the next price rally. If your five-year plan doesn’t account for them, it’s not really a plan.

The Bottom Line

Pull your latest DHIA test, your actual debt-to-asset, and your processor contract terms. Those three numbers tell you which path is still open.

Complete references and supporting documentation are available upon request by contacting the editorial team at editor@thebullvine.com.

Learn More

  • The $212,000 Bulk Tank Lie Hitting Upper Midwest Dairies – Arms you with a step-by-step playbook to stress-test your component revenue against the latest FMMO reforms. This breakdown reveals why chasing high test percentages could be costing your operation six figures in lost component pounds.
  • Beyond Efficiency: Three Dairy Models Built to Survive $14 Milk in 2026 – Delivers a strategic roadmap for the next three to five years by exposing the structural shift toward mega-scale and premium diversification. It helps you position your operation to survive a permanent low-margin landscape.
  • Breeding Into a Moving Market: What Butterfat’s Crash Reveals About Dairy’s Genetic Timing Problem – Exposes the dangerous “timing gap” between today’s genetic selection and tomorrow’s market reality. This analysis delivers the insight needed to stop chasing yesterday’s premiums and start breeding for the 2030 component demand.

The Sunday Read Dairy Professionals Don’t Skip.

Every week, thousands of producers, breeders, and industry insiders open Bullvine Weekly for genetics insights, market shifts, and profit strategies they won’t find anywhere else. One email. Five minutes. Smarter decisions all week.
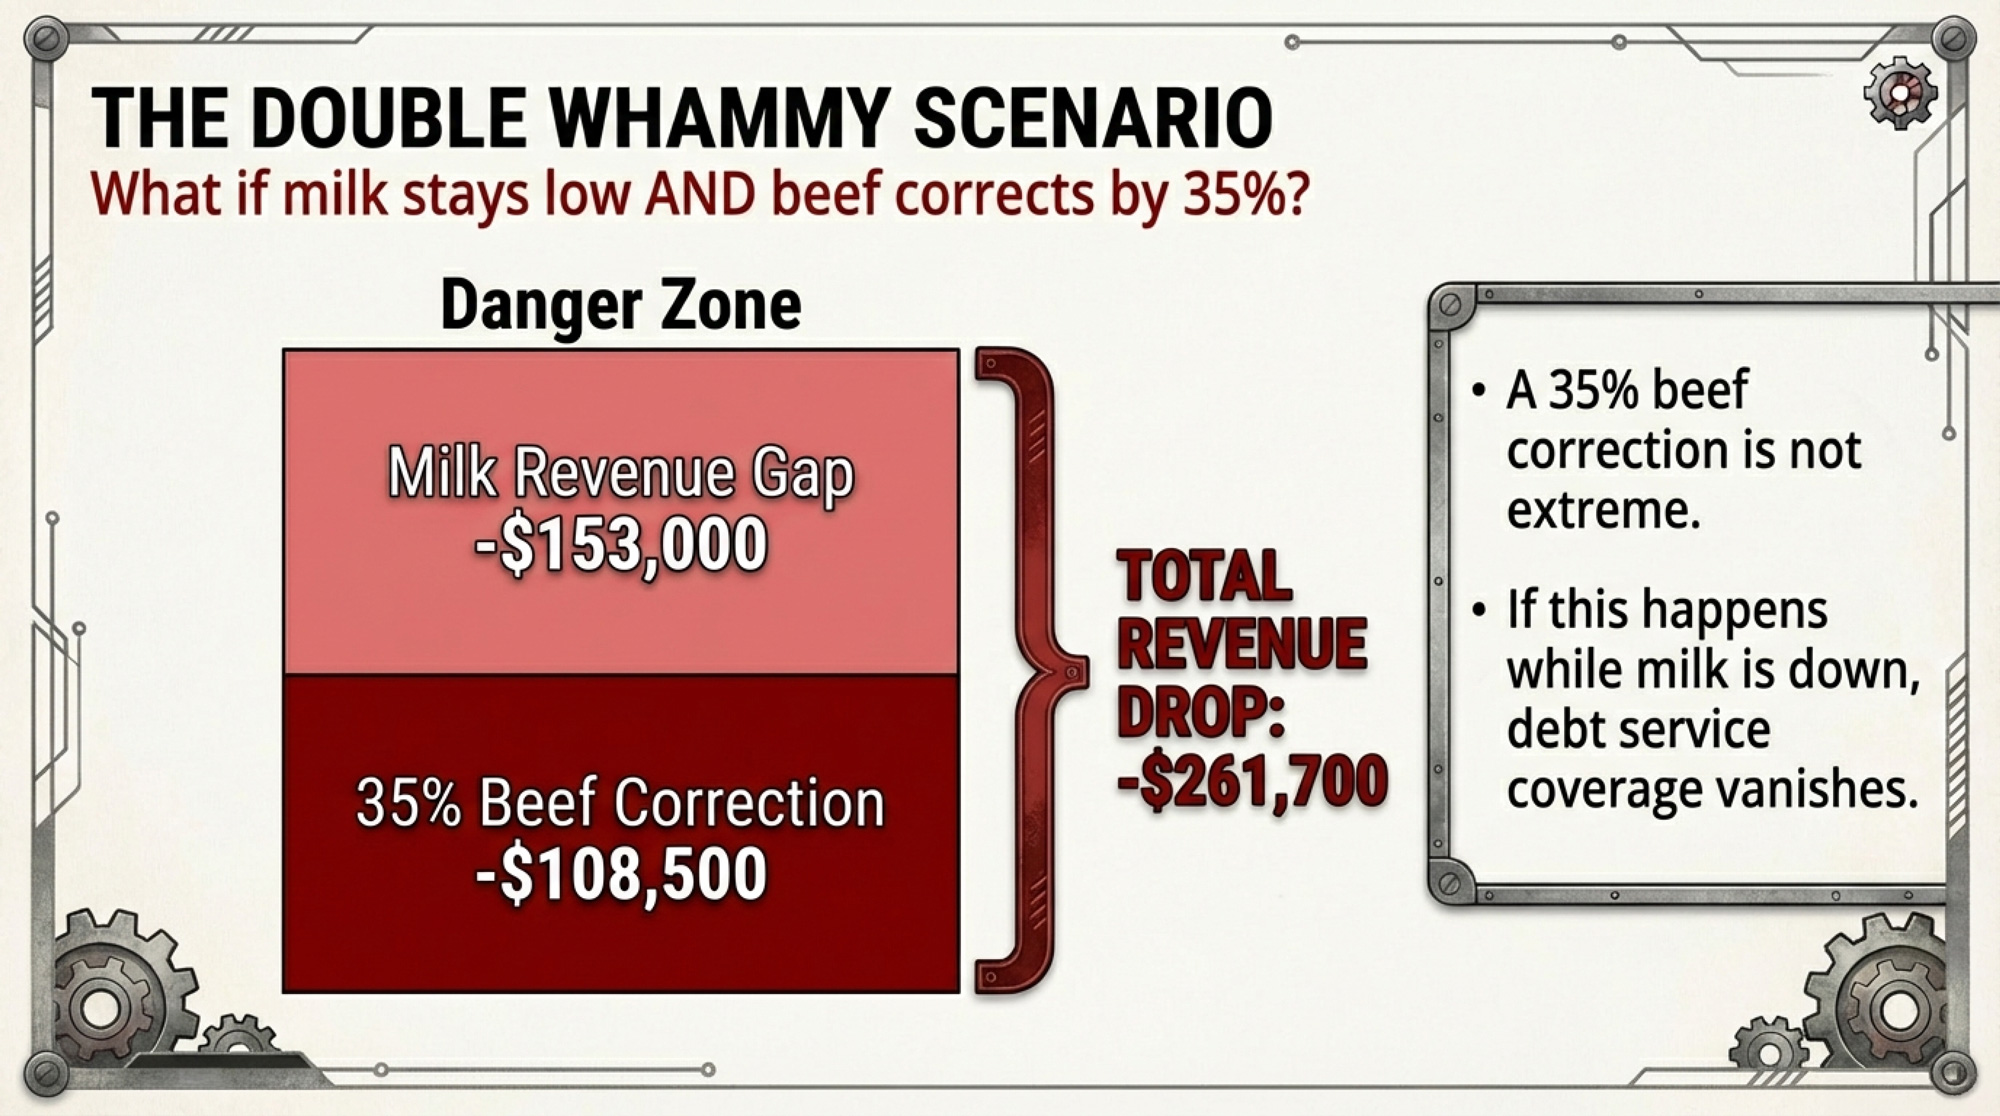
NewsSubscribe
First
Last
Consent

Dairy Management’s $165 Million Checkoff Bet: $1.75 Billion Cottage Cheese Boom, $3.01/cwt Class II Drop

Your 15¢/cwt helped sell $1.75B of cottage cheese. Your Class II price went down $3.01/cwt. Explain that.

Executive Summary: Dairy farmers are still paying 15¢/cwt into a national checkoff that now bets big on TikTok creators and retail algorithms, even as the 2025 Class II price fell $3.01/cwt to $18.33 during the strongest cottage cheese demand year on record. The story opens in Andy and Sarah Lenkaitis’ Illinois barn, where influencers filmed cows and robots while milk from that 75‑cow herd headed to a plant making cottage cheese, a TikTok-helped category that’s now worth $1.75 billion. From there, it follows the money through Dairy Management Inc.’s $165.7 million 2024 budget and into campaigns DMI says returned $15.60 in retail dairy sales for every checkoff dollar, set against USDA data showing fluid milk finally up 0.8% while Class II sagged. Along the way, you get barn‑math you can actually use — from a 300‑cow herd’s roughly $12,319/year checkoff bill to a $484‑per‑cow protein price swing you can compare to your own component check. It all leads to one blunt question: if your money helped create the demand and your milk made the product, are you seeing enough of that margin in your mailbox price to call this checkoff bet a win?

Starbucks launched its Protein Lattes and Protein Cold Foam nationwide on September 29, 2025, delivering 15 to 36 grams of protein per grande. Every cup is classified as Class I milk under federal orders — priced at $21.47/cwt in 2025, a $3.14 premium over the $18.33 Class II price on cottage cheese. For your blend price, every latte beats every yogurt cup.

One day in early December 2024, parenting blogger Aneta Linko and her family walked into Andy and Sarah Lenkaitis’s dairy barn in Campton Hills, Illinois — one of three dairy farms left in all of Kane County. The Lenkaitis family milks about 75 Holsteins with robots, grows their own feed, and gives tours to the subdivision neighbors who now surround them on two sides. That day, though, the visitors weren’t neighbors. They were content creators, and the cameras were rolling.

Midwest Dairy had arranged the visit. The resulting posts — Linko highlighting the family’s animal care, the robotic milking system, the quiet daily rhythms of a working farm 40 miles from downtown Chicago — generated 255,048 impressions and 55,981 engagements. One farm. One day. Quarter-million eyeballs. And every dollar that funded it came from the same place: your checkoff.

The strategy behind that visit didn’t originate in Campton Hills. It came from Barb O’Brien, President and CEO of Dairy Management Inc. On the Your Dairy Checkoff Podcast, O’Brien told producers the organization had fundamentally changed course. “We’re spending fewer dollars directly to consumer ourselves,” she said. “We’re asking farmers to sort of take that shift with us to look to third parties, who we think can bring more visibility, more credibility, and ultimately more sales.”

Food Network star and checkoff partner Molly Yeh — a New York Times bestselling author who lives on a sugar beet farm near the Minnesota–North Dakota border — was one of the influencers Midwest Dairy tapped for its late-2024 “Cheesy Season” campaign, which generated 10.1 million impressions. Her cookbook Sweet Farm! is built around dairy-heavy recipes from her farm kitchen. The question this article asks: does that kind of reach show up on your milk check?

Those third parties are TikTok creators, Instagram food influencers, and names like Molly Yeh and Faith Enokian. DMI’s 2024 audited financials, filed by Ernst & Young on May 8, 2025, show the scale of the shift: $165.7 million in total expenses, $127.1 million directed toward domestic marketing programs, and $76.6 million specifically in promotional and professional services. Those figures come straight from the Ernst & Young audit — confirmed to the penny in DMI’s public filings at dairycheckoff.com.

The question isn’t whether these campaigns get eyeballs. They do. It’s whether those eyeballs translate into something you can measure at the farm gate.

Why Did DMI Abandon Billboards for TikTok?

You don’t blow up a marketing playbook that worked for decades unless you’re scared. And the fluid milk numbers were scary enough.

USDA’s Economic Research Service reported in June 2022 that U.S. per capita fluid milk consumption has been falling for over seven decades. But the 2010s accelerated the damage: daily per capita consumption dropped 20.7%, from 0.62 cups in 2010 to just 0.49 cups by 2019. Analysis of USDA data (August 2025), per capita milk sales fell 28% between 2011 and 2023, averaging a 2.2% decline annually — more than four times the pre-2010 rate.

USDA noted that plant-based milk alternatives explain “some, but not all” of that decline. The bigger problem was cultural: an entire generation grew up without dairy as a default part of their day. (For a deeper dive into the decade-long decline in fluid milk consumption, The Bullvine covered the trend and its implications last year.)

DMI and the regional checkoff organizations watched those trendlines and made a bet. And the economics of the shift made it easy to justify. A TikTok ad typically runs $6 to $10 CPM (cost per thousand impressions), according to DriftLead’s 2025 digital advertising analysis. Broadcast television primetime? Anywhere from $28 to $45 CPM, depending on network and daypart, per industry planning benchmarks.

Even at the conservative end of that range, every checkoff dollar buys roughly three to five times as many eyeballs on TikTok as it would have during a primetime “Got Milk?” spot — which means DMI’s $165.7 million stretches a lot further in the digital world than it ever could have on cable. The reach is real. Whether reach translates to revenue is a different question.

What Does $12,319 a Year Buy on TikTok?

If you’re running a 300-cow herd shipping 75 lbs/day — roughly the Lenkaitis operation scaled up four times — your annual checkoff contribution at $0.15 per hundredweight works out to roughly $12,319 per year. Of that, about $0.05/cwt goes to the National Dairy Board, which funds DMI directly. The remaining $0.10/cwt can be directed to qualified state and regional programs, such as Midwest Dairy or the American Dairy Association North East. The money splits — but it all feeds the same promotional machine.

“If you think about it, some of our food service partners are spending billions of dollars,” O’Brien said on the same podcast. “But it’s a shift. We’re asking farmers to sort of take that shift with us.”

What does that machine produce? Midwest Dairy’s 2024 annual report reads less like a dairy promotion document and more like a social media agency’s pitch deck. In late 2024, the organization launched a holiday campaign it branded “Cheesy Season,” partnering with influencers Faith Enokian, Molly Yeh, and content creators Jay and Channing to produce cheese-forward recipe videos for Instagram and TikTok. The result: 10.1 million impressions, 2.3 million of them organic, and a 5.74% average organic engagement rate that Midwest Dairy says surpassed industry benchmarks.

That wasn’t their only play. Midwest Dairy also ran a broader TikTok push, collaborating with 34 influencers to create 39 videos about dairy farming, cow care, and sustainability. Those videos generated more than 5.2 million impressions, comfortably exceeding the original 4-million target. A brand-lift study found an 11-point increase in viewers’ perception that dairy animals are treated humanely and a 5-point increase in the view of dairy farmers as environmentally responsible.

DMI reported another metric from its annual meeting in October 2024: an e-commerce strategy conducted with 14 state and regional checkoff organizations — running campaigns on Instacart, Walmart, and Dollar General — delivered a return of $15.60 in retail dairy sales for every dollar invested by the checkoff. But here’s the translator’s note on that number: $15.60 in retail sales is not $15.60 back to you.

If most of that margin stays with Walmart and the processor — and right now, nobody’s publishing the downstream split — then the gap between that $15.60 and what actually reaches your bulk tank could be a lot wider than that number suggests. It’s the right metric to start with. It’s just not the metric that answers the question producers are actually asking.

Did a TikTok Dance Actually Sell $1.75 Billion in Cottage Cheese?

The cottage cheese story is the one that makes the whole strategy look like genius—or at least very good timing.

U.S. cottage cheese retail sales had actually declined in 2021, according to Circana data reported by CNN in July 2025. Then TikTok creators discovered it as a high-protein, low-effort substitute for everything from ice cream to pizza dough. The sales response was rapid and sustained: 11% growth in 2022, roughly 17% in both 2023 and 2024, and a 20% surge in the 52-week period ending June 15, 2025.

For the 52 weeks ending February 23, 2025, cottage cheese hit $1.75 billion in total U.S. dollar sales — an 18% year-over-year increase — with unit sales up 13% to 558 million, per Circana data reported by Dairy Foods (May 2025).

The growth wasn’t limited to one brand. Good Culture, the Irvine, California-based challenger brand co-founded by Jesse Merrill, saw dollar sales jump 75% to $187 million. Daisy Brand’s cottage cheese line surged 32% to $352 million. And private label led the way overall at $612 million, up 14% year-over-year.

The feedback loop that made it self-sustaining was simple: creators chased engagement with cottage cheese hacks → brands and checkoff-funded programs amplified the best-performing content → more viewers saw cottage cheese as the default protein ingredient → more creators made cottage cheese content. Storyful’s narrative analysis found cottage cheese content generating around 4 million engagements in just a few weeks, turning what they called a “boring” 1970s diet food into a global trend.

It looks organic. And some of it genuinely was. But DMI’s own strategy explicitly calls for leveraging third-party voices rather than running direct-to-consumer campaigns. The line between an authentic TikTok trend and a checkoff-amplified one is blurrier than you’d think.

What Does a Protein Latte in Seattle Mean for a Farmer in Wisconsin?

The cottage cheese story is about cultured dairy, but the fluid milk side of this equation matters just as much — maybe more, given those decades of declining consumption.

Starbucks launched its Protein Lattes and Protein Cold Foam nationwide on September 29, 2025, delivering 15 to 36 grams of protein per grande. Every cup is classified as Class I milk under federal orders — priced at $21.47/cwt in 2025, a $3.14 premium over the $18.33 Class II price on cottage cheese. For your blend price, every latte beats every yogurt cup.

In September 2025, Starbucks rolled out Protein Lattes and Protein Cold Foam drinks built on protein-enriched milk. A grande Protein Latte delivers 27-36 grams of protein. The protein cold foam alone adds 15 to 18 grams per beverage, depending on flavor, according to Starbucks’ own nutrition data. Customers can swap protein-boosted 2% milk into any hot or iced drink on the menu.

Here’s why that matters to your blend price. Standard milk in a latte — every grande, every venti, every carton in the grab-and-go cooler — is classified as Class I under the federal order system. In 2025, the Class I price averaged $21.47 per hundredweight across all federal orders, according to dairy market analyst William Pollock’s calculation from USDA advance pricing data. Class II — the category covering cottage cheese, yogurt, and other soft-manufactured products — averaged just $18.33/cwt for the full year, per USDA Agricultural Marketing Service data released February 4, 2026.

That’s a $3.14 gap per hundredweight. Every gallon of milk that flows across a Starbucks counter instead of into a cottage cheese vat is priced higher, pushing the blend price up for every producer pooled on that order. When the checkoff helps position dairy as a protein-forward performance beverage, it’s not just brand-building—it’s nudging milk toward the highest-value utilization class.

Milk Utilization Class2025 Avg Price ($/cwt)Premium vs. Class II
Class I (Fluid Milk)$21.47+$3.14/cwt
Class II (Cottage Cheese, Yogurt, Ice Cream)$18.33baseline
Class III (Cheese)$19.68+$1.35/cwt
Class IV (Butter, Powder)$19.21+$0.88/cwt

And there’s reason to think the broader fluid momentum is real. USDA data show total U.S. fluid milk sales were up about 0.8% in 2024 from the year prior — the first year-over-year gain since 2009, ending a 14-year streak of annual declines, according to the National Milk Producers Federation. Midwest Dairy board chair Charles Krause confirmed the significance in the organization’s spring 2025 newsletter: “For the first time since 2009, fluid milk consumption has shown a slight increase.”

That’s a genuine milestone. But one year of 0.8% growth doesn’t erase seven decades of structural decline — and Starbucks’ protein lattes launched too recently to have influenced 2024 numbers. They’re a forward-looking bet, not a proven demand driver yet. If protein-forward dairy gains traction in café and quick-service channels, the 2024 uptick could strengthen. That’s a big “if.”

Is Any of This Actually Reaching the Bulk Tank?

Now for the uncomfortable part.

The demand signals are undeniably strong. Cottage cheese is a $1.75 billion category growing at 18% annually. Starbucks is building protein milk into its core menu. DMI’s 2024 annual report states that consumer spending and volume sales increased across all domestic dairy categories — cheese, milk, yogurt, ice cream, frozen novelties, and butter. Every single one.

But look at this number. Cottage cheese is a Class II product under the Federal Milk Marketing Order system. And the average Class II price in 2024 was $21.34 per hundredweight, according to USDA’s Agricultural Marketing Service — a figure independently verified against Cheese Reporter’s monthly Class price data. In 2025 — while cottage cheese sales were surging 20% — the full-year average Class II price fell to $18.33 per hundredweight, per USDA AMS data released February 4, 2026. That’s a decline of $3.01/cwt during the single strongest cottage cheese growth year on record.

Metric20242025
Cottage Cheese Retail Sales$1.48 billion$1.75 billion
Year-Over-Year Retail Growth+17%+18%
Cottage Cheese Unit Sales477 million558 million
Average Class II Price ($/cwt)$21.34$18.33
Class II Price Change ($/cwt)–$3.01
DMI Marketing Expenses$165.7 million(not yet reported)

Think about what that means for the Lenkaitis farm specifically. Andy Lenkaitis told the DuPage County Farm Bureau that their milk ships to a plant in Rockford, Illinois, “where it’s made into cottage cheese and sour cream.” That plant — formerly Dean Foods, now operated by Dairy Farmers of America after DFA acquired 44 Dean facilities for $433 million in May 2020 — is still certified for cottage cheese and sour cream production today.

The Lenkaitis family’s checkoff dollars helped fund the influencer visit to their own barn. The resulting content drove a quarter-million impressions, telling consumers to trust dairy and buy dairy. Consumers apparently listened — cottage cheese sales are up 20%. And the Class II price on the product made from their own milk went down three bucks.

Run the quick math on protein, and the picture changes—but it’s still mixed. The federal order protein price averaged $1.8961 per pound in 2024 and rose to $2.4495 per pound for full-year 2025 — a 29% increase, per USDA AMS data. On a 300-cow herd shipping 75 lbs/day at 3.2% protein, that shift in protein price alone represents roughly $145,000 more in annual revenue, or about $484 per cow. But protein prices are driven by cheese commodity values and the FMMO pricing formulas, not directly by cottage cheese retail sales or TikTok impressions. (For a deep look at how FMMO component prices actually move your check, our March 2025 analysis breaks down the mechanics.)

MonthProtein Price ($/lb)Cottage Cheese Sales Growth (% YoY)
Jan 2024$1.85+12%
Apr 2024$1.92+14%
Jul 2024$1.98+16%
Oct 2024$2.12+17%
Jan 2025$2.28+18%
Apr 2025$2.41+19%
Jul 2025$2.47+20%
Oct 2025$2.52+19%
Dec 2025$2.49+18%

The connection between a viral recipe and your component check runs through layers of commodity pricing, processor margins, and utilization formulas that can muffle, delay, or redirect the demand signal entirely. Consumer demand for dairy products is stronger than it’s been in years. Possibly decades. But the distance between a $7.99 tub of Good Culture cottage cheese and your mailbox price is long, and much of the margin lives somewhere in between.

Options and Trade-Offs for Producers

Know what your checkoff is buying — within the next 30 days. Pull up your regional checkoff’s annual report. Midwest Dairy publishes theirs online. So do most others. Look at how contributions are split between influencer marketing, foodservice partnerships, nutrition education, and export.

DMI’s 2024 audited financials are public at dairycheckoff.com — $76.6 million went to “promotional and professional services” alone. You’re paying into this system. You should know what it’s producing, and you have every right to ask your regional board for specific ROI metrics, not just impression counts. The $15.60-per-dollar return DMI reported on its e-commerce campaigns is the kind of number you want to see across every major initiative — and remember, that’s a retail-sales metric. Push for data on what happens between the cash register and your bulk tank.

Track whether consumer demand is showing up in your component premiums. Compare your protein and butterfat premiums over the next 90 days against the 12-month trailing average. The federal protein price jumped from a $1.90/lb average in 2024 to $2.45/lb in 2025 — but that’s largely a cheese-price story, not a cottage-cheese-TikTok story. If your premiums are tracking commodity markets but not reflecting the surge in retail demand, that’s a conversation worth having with your processor or co-op: who’s capturing the margin between $1.75 billion in retail sales and what’s flowing back to your farm?

If you’re considering a direct-to-consumer approach, proceed with caution. Cottage cheese and artisan butter are the two cultured-dairy categories with the strongest consumer demand right now. If you’re within driving distance of a metro area and have the appetite for on-farm processing, the demand environment hasn’t been this favorable in years. But direct-to-consumer requires capital, permits, a completely different skill set, and patience.

The Clark family — five generations on Elk Creek Road in Delhi, New York — beside the delivery van that carried “The Cream of the Catskills” to dozens of local accounts. On January 28, 2026, owner Kyle Clark shut the creamery down, citing 143-hour weeks and a staff of six doing the work of ten. The cows are still milking. Demand wasn’t the problem. Read More

Clark Farms in Delhi, New York, ran a creamery for six years with dozens of local accounts — then shut down the processing side in January 2026 while keeping the cows milking, because 143-hour weeks stopped making sense. Their story is a real-world case study in what on-farm processing actually costs and what it returns. Build your business plan around five-year demand projections, not this year’s trending hashtag.

Over the next 12 months, watch the fluid milk data closely if you’re in a heavy Class I order. Fluid milk sales grew 0.8% in 2024 — the first gain since 2009. And that $3.14/cwt gap between Class I and Class II in 2025 means every gallon that shifts from manufactured products back to fluid beverages carries real blend-price weight.

If the Starbucks protein-milk play gains traction across café and quick-service channels, it could nudge Class I utilization rates up in ways that haven’t been on the table since the fluid decline accelerated. Track the USDA monthly data. And if your FMMO is under review or reform discussion, factor these demand shifts into your analysis of pooling changes.

Key Takeaways

  • If your regional checkoff can’t show you ROI data from their influencer campaigns — not just impressions, but traceable sales lift — ask why. Midwest Dairy publishes theirs. DMI’s audited financials are available at dairycheckoff.com. The $15.60 return on e-commerce dollars is a starting benchmark—but demand to know how much of that $15.60 actually reaches milk checks.
  • If cottage cheese is growing at 18–20% annually while Class II prices dropped $3.01/cwt from $21.34 (2024) to $18.33 (2025), the margin is being captured between the retail shelf and your bulk tank. Find out where.
  • If protein premiums are up 29% year-over-year ($1.90/lb to $2.45/lb), verify whether that’s reaching your check — or whether it’s a commodity-driven move unrelated to the consumer trends the checkoff is funding. On a 300-cow herd, that gap represents roughly $484 per cow per year.
  • If fluid milk’s 0.8% uptick holds, the $3.14/cwt Class I premium over Class II means demand shifting back to beverages (think Starbucks protein lattes) carries real blend-price upside — especially in heavy Class I orders. Watch the monthly USDA data.
  • If you’re evaluating on-farm processing, cottage cheese and butter have the demand. But Clark Farms proved that demand alone doesn’t make the business case. Run real capital, labor, and regulatory numbers before committing.

The Bottom Line

Fourteen years of fluid milk decline. Then 2024 broke the streak — barely, at 0.8%, but it broke it. And somewhere in Campton Hills, Illinois, Andy and Sarah Lenkaitis are still milking their Holsteins with robots, still giving tours, still shipping milk to a DFA plant in Rockford that turns it into cottage cheese — the same product TikTok creators turned into a $1.75 billion category. Their checkoff dollars helped fund the influencer visit that brought a quarter-million eyeballs to their barn. Consumer demand for dairy, measured in retail dollars, has never been stronger.

What hasn’t been answered — and what no annual report, brand-lift study, or TikTok impression count can settle — is whether $12,319 a year from a 300-cow herd is money well spent if the demand it helps create flows to processors and retailers instead of the bulk tank. Your checkoff, your question. Pull up the numbers and decide.

Complete references and supporting documentation are available upon request by contacting the editorial team at editor@thebullvine.com.

Learn More

The Sunday Read Dairy Professionals Don’t Skip.

Every week, thousands of producers, breeders, and industry insiders open Bullvine Weekly for genetics insights, market shifts, and profit strategies they won’t find anywhere else. One email. Five minutes. Smarter decisions all week.
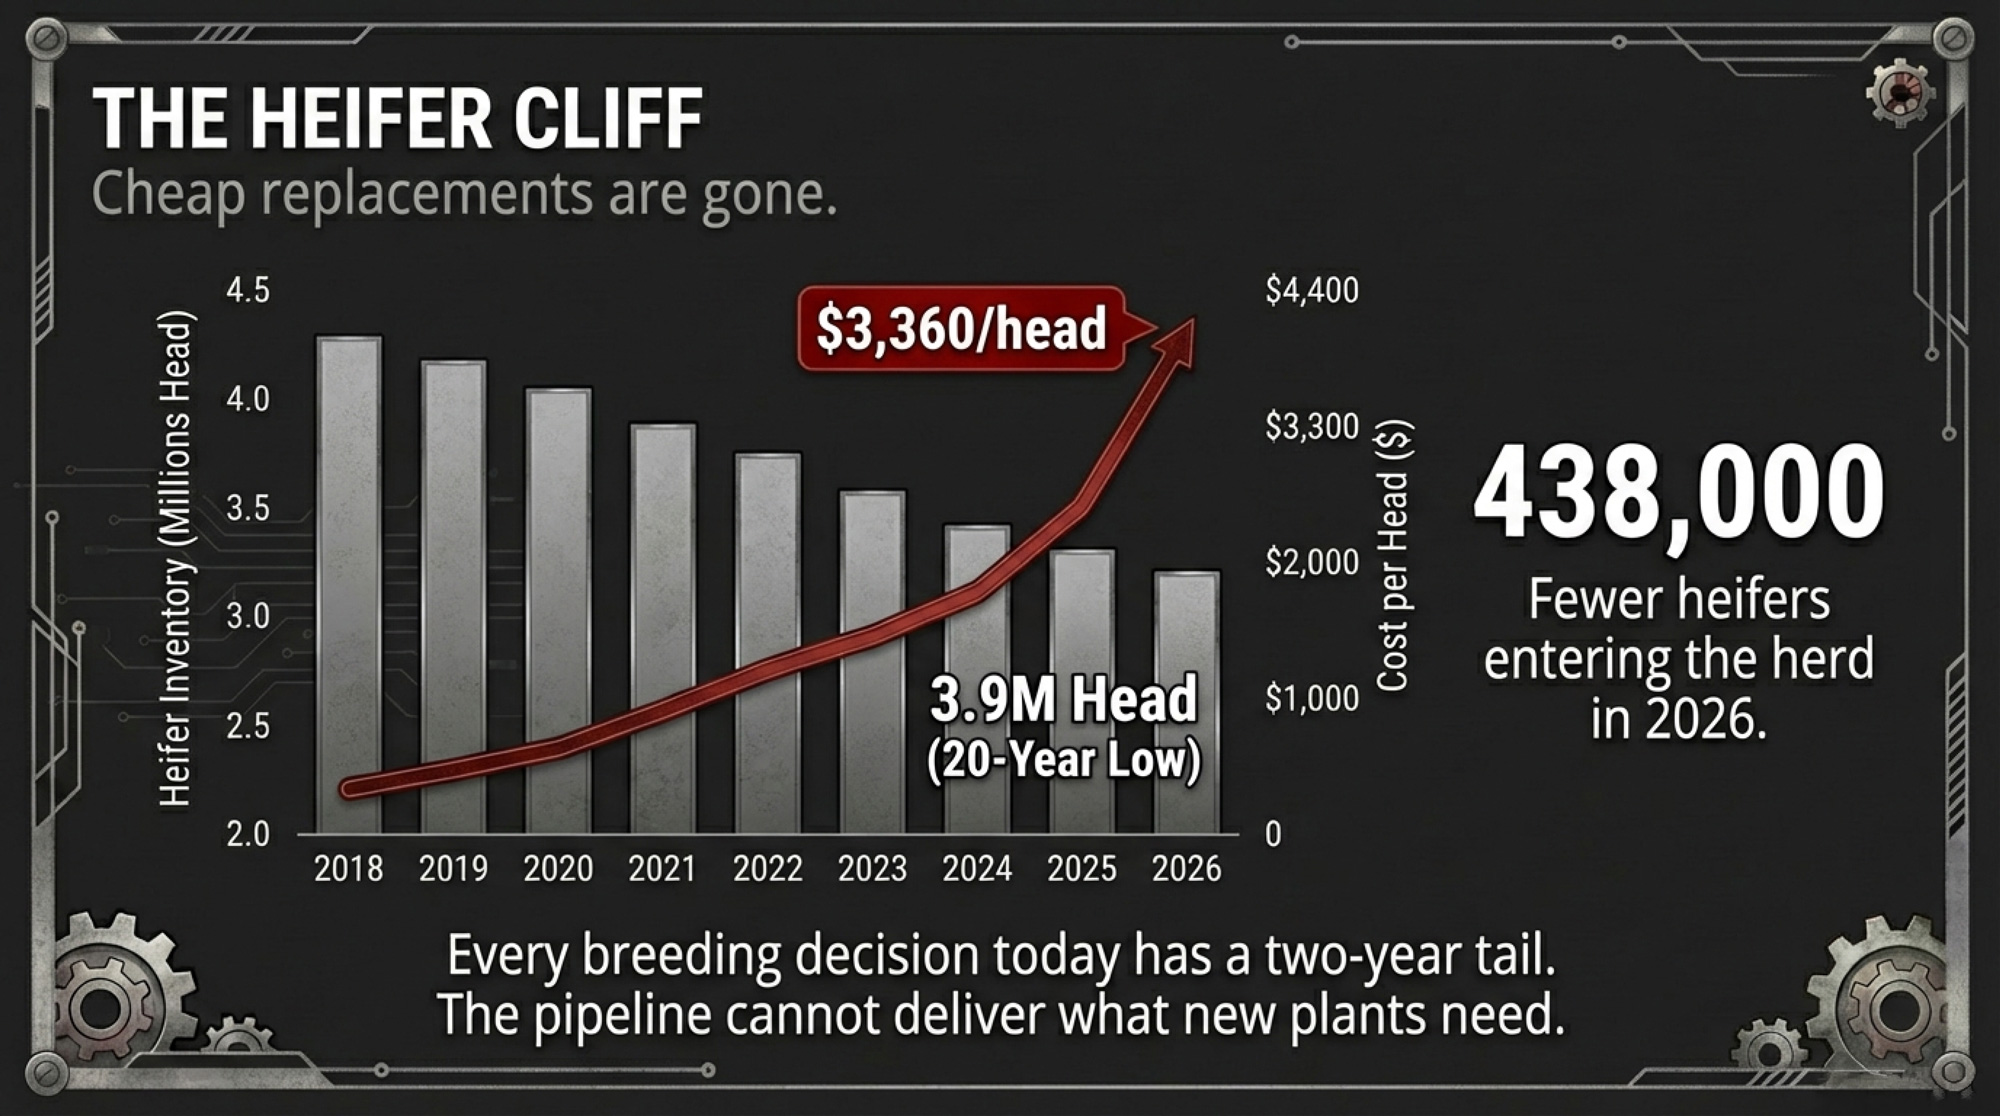
NewsSubscribe
First
Last
Consent

Butter’s 113-Trade Week: 25% Domestic Demand Drop, Export Surge – and What It Means for Your Milk Check

Butter demand fell 25% and 113 loads still traded. The demand didn’t die — it moved overseas. Has your Q2 plan caught up with that math yet?

Executive Summary: U.S. butter looked bearish on the surface this week — November domestic disappearance fell 24.8% year over year and every CME dairy commodity finished lower — but 113 butter loads still traded and the price slipped just 0.5¢ to $1.7050/lb. The reason is redistribution, not collapse: ERS shows domestic butter use down sharply while USDEC data shows butter exports up 245% and anhydrous milkfat up 184%, so demand has shifted channels rather than vanished. Cheese followed the same pattern of misleading headlines, with an 8.5¢ block drop translating to only about $0.18/cwt on Class III once a flat barrel market is factored in — roughly $73/day, or $2,200/month, for a 500‑cow herd shipping 80 lb. In contrast, NDM near $1.60/lb and a roughly 34¢ gap over NDPSR averages have pushed U.S. powder about 23% above world prices, making $1.50 a critical spring flush line for whether Class IV at $18.10 proves rich or cheap. Dry whey at 72¢ quietly adds about $3.06/cwt to Class III, while USDA’s latest WASDE lifts the 2026 all‑milk price forecast to $18.95/cwt even as western snowpack sits at just 32–83% of normal, putting forage risk squarely on the 2026 balance sheet. Taken together, this week’s math argues for three concrete moves: stress‑test your Q2 hedge at $16.45 Class III against your true COP, set feed-buy alerts around $4.00 corn and $290 meal, and build a forage plan that assumes the West stays dry longer than anyone would like.

Dairy Market Risk Management

Every CME spot dairy commodity finished in the red for the week ending February 13, 2026. The simple read is bearish: butter down 0.5¢ to $1.7050/lb, blocks down 8.5¢ to $1.3875/lb, NDM down  to $1.6000/lb, dry whey down a penny to $0.7200/lb.

But that simple read is incomplete. USDA’s Economic Research Service published its updated “U.S. Dairy Situation at a Glance” on February 11, and the numbers tell a story the spot market can’t: domestic butter disappearance cratered 24.8% year over year in November — from 235.45 million pounds in November 2024, per the prior ERS release, to 177.15 million pounds.

That same month, butter exports surged 245% and anhydrous milkfat shipments jumped 184%, according to USDEC November 2025 U.S. Dairy Export Trade Data. The butter didn’t vanish. It went overseas. And that redistribution — demand shifting channels rather than evaporating — is the thread running through every commodity this week.

CommodityFriday Close ($/lb)Weekly Change (¢)Loads TradedMarket Signal
Butter$1.7050-0.5113High volume = real price discovery
Block Cheddar$1.3875-8.510Headline overstates true Class III hit
Barrel Cheddar$1.4400NC0No trades = flat barrel saves protein
Nonfat Dry Milk$1.6000-4.01734¢ above NDPSR = export kill zone
Dry Whey$0.7200-1.01Quiet floor holding $3.06/cwt to Class III

Source: CME Cash Dairy / USDA Dairy Market News, week of Feb. 9–13, 2026

March Class III futures settled Thursday at $16.45/cwt; March Class IV landed at $18.10/cwt.

Butter: 113 Trades, Thin Stocks, and a Demand Map That’s Been Redrawn

Monday opened with a thud — down 8.5¢ to $1.6250/lb. Tuesday clawed back a penny. Wednesday added 1.75¢. Thursday blew the doors off with an 8.25¢ surge to $1.7350/lb, before Friday shaved 3¢ to close at $1.7050/lb. Half a cent lower on the week. A hundred and thirteen trades to get there.

Supply doesn’t look tight on the surface. Dairy Market News reports cream “widely available” and churns running strong. December 2025 butter production totaled 203.85 million pounds, up 2% from December 2024’s 199.75 million pounds, per ERS. But cold storage tells a different story: 199.3 million pounds on December 31, down 5% from November and 7% below year-ago levels.

The demand picture is where the “butter is in trouble” narrative falls apart. Domestic disappearance collapsed in November: 177.15 million pounds, down 24.8% from the year-ago 235.45 million pounds, per ERS. That’s the kind of number that should crater a market.

Except the same month saw butter exports up 245% and total U.S. dairy export value climb 14% to $801.7 million, per USDEC. November cheese exports rose 28%. The butter went overseas.

Retail sales in the East “continue to exceed last year,” according to DMN, supported by a 3.4% year-over-year decline in the butter CPI in December 2025, per ERS. Central retail is steady. Western retail is softer as buyers pulled back after the price run-up. Export demand for 82% butterfat product remains “tight” in the Central and Western regions.

As William Loux, senior vice president of global economic affairs at the National Milk Producers Federation, put it in January: butter and cheese prices “are the products that have the biggest influence on the milk check.” He’s right. And right now, butter is the hardest of those products to read — because the demand isn’t weak. It’s just somewhere else.

Cheese: The 8.5¢ Headline That Overstates the Damage

If butter’s story is demand moving overseas, cheese’s story is demand shifting from foodservice to retail and exports, with the headline overstating the hit.

Cheddar blocks stepped down every session Monday through Thursday before steadying on Friday. Close: $1.3875/lb, down 8.5¢ on 10 loads. Barrels didn’t flinch — $1.4400/lb all week, zero trades.

That barrel hold matters. Class III protein pricing uses the block–barrel average. Blocks fell 8.5¢; barrels held flat. The actual impact on the average: about 4.25¢, not 8.5¢. Through the protein formula, that’s roughly $0.18/cwt.

Run the barn math. A 500-cow herd shipping 80 lbs/cow/day moves 400 cwt daily. At $0.18/cwt, that’s about $73/day— roughly $2,200 over a month. Real money, but a different decision context than a panicked 8.5¢ headline suggests.

March Class III at $16.45/cwt puts gross milk revenue at about $13.16/cow/day at 80 lbs. With March corn at $4.3175/bu and soybean meal at $309.30/ton, purchased feed runs roughly $2.78/cow/day before forage, labor, and debt. There’s margin — but not much room for error. Jenny Wackershouser, a dairy marketing advisor with Ever.Ag, warned late last year that domestic demand hasn’t kept pace with the increased U.S. capacity to make more dairy products, and that cheese may need to price “sub-$1.30 to win” export business against European competition that has fallen to around $1.50/lb. At $1.3875, blocks aren’t there yet — but they’re closer than most producers would like.

Line ItemUnitValueNotes / Context
March Class III Price$/cwt$16.45CME futures close Feb 13, 2026
Gross Milk Revenue$/cow/day$13.16Based on 80 lb/cow/day production
Purchased Feed Cost$/cow/day$2.78Corn $4.32/bu, SBM $309/ton (concentrates only)
Net Margin Before Forage/Labor/Debt$/cow/day$10.38Tight cushion = hedge decision point
Monthly Margin (500-Cow Herd)$/month$155,700$10.38/cow/day × 500 cows × 30 days

ERS shows November 2025 American cheese disappearance at 462.89 million pounds, up 5.4% year over year. Total cheese disappearance rose about 4.8% year over year.

But Loux’s observation about foodservice cuts deep: cheese “does better at food service than it does at home.” DMN backs that up — foodservice demand is “light” in the Central region and “weaker to start 2026” in the West.

So where’s the 4.8% growth coming from? Retail and exports. At $1.3875/lb, U.S. block Cheddar undercuts GDT Cheddar near the low $2.20s/lb — a competitive edge driving volume. November cheese exports were up 28% year over year, per USDEC. December production hit 1.28 billion pounds (American + other-than-American combined), up 6.7% year over year, while cold storage ended the year at 1.35 billion pounds — up just 1%. Balanced, not burdensome.

NDM at $1.60: Where the Redistribution Story Breaks Down

NDM is where the “demand is moving, not dying” narrative hits a wall. At $1.60/lb, U.S. powder isn’t being redistributed to new buyers — it’s being priced out of the global market entirely.

Monday dropped 3.5¢ to $1.6050/lb, followed by half-cent declines Tuesday and Wednesday, then quarter-cent recoveries Thursday and Friday. Close: $1.6000/lb, down  on 17 loads. The weekly average of $1.5995 is the highest CME spot weekly average since mid-2022, when NDM was still elevated from the post-pandemic rally.

The global math is brutal. GDT Event 397 on February 3 saw skim milk powder average $2,874/MT — roughly $1.30/lb. At $1.60, U.S. NDM carries about a 30¢/lb premium, a 23% markup over world price. DMN notes “higher prices are contributing to lighter export demand,” with Mexican buyer interest softer.

The Ever.Ag Insights team put it plainly in their February 2026 outlook: “The current rally has roots in real supply issues, as cheese plants and other avenues for skim solids keep milk out of dryers.” But they warned: “We will likely see more drying activity seasonally in the weeks ahead, and U.S. marketers will struggle to win exports at prevailing prices.”

Here’s the twist your check cares about. The NDPSR average for the week ending February 7 was $1.2604/lb — more than 33¢ below the CME close. Class IV futures reflect expectations the NDPSR hasn’t yet caught up to that reality.

Dryers aren’t running flat out. In the East, some plants operate at just 25–50% of capacity as skim gets diverted to bottling, ultrafiltered milk, and higher-value uses. December 2025 dry skim milk product output came in at 171.10 million pounds, down from 182.30 million pounds in December 2024 — a 6.1% decline, per ERS.

Spring flush is six to eight weeks away. If NDM can’t hold $1.50/lb through the flush, March Class IV at $18.10 will look expensive in hindsight. If it holds above $1.50, powder is genuinely tight, and component values stay supported. That $1.50 line is your main powder signal.

Dry Whey at 72¢: Quiet but Load-Bearing

Whey gave up a single penny on Tuesday and held — $0.7200/lb, one load. Don’t confuse quiet with irrelevant. At 72¢, whey contributes roughly $3.06/cwt to Class III through the other solids component. That’s quietly holding your check together while cheese protein drags it down.

DMN reports WPC and isolate lines running full, keeping dry whey supply limited. As long as consumer protein demand stays insatiable — and nothing suggests it’s slowing — tight raw whey supplies should keep propping up this floor.

Will Western Snow Drought Hit Your 2026 Feed Budget?

USDA’s February WASDE left the soybean balance sheet unchanged and raised Brazilian soybean output to a massive 180 million metric tons. The season-average corn price received by producers was held at $4.10 per bushel, and the soybean price stayed at $10.20 per bushel. On the dairy page, USDA raised all four product price forecasts for 2026 — cheese, butter, NDM, and whey — on recent prices, lifting the 2026 all-milk price forecast to $18.95/cwt.

Katie Burgess, director of risk management at Ever.Ag, set the margin context in January: milk prices are “quite low to kick off the year,” with DMC payouts projected above $1/cwt for January through April. For a lot of operations, that safety net matters.

The real wildcard is water in the West. NIDIS’s February 5 update shows record-low snowpack in Colorado and Utah, most basins below 60% of median snow water equivalent, and five Wyoming monitoring sites at record lows. A February 12 update puts the Humboldt Basin at just 32% of median and the Upper Colorado at its lowest since 1986.

Gary Stone, extension crops educator at the University of Nebraska–Lincoln, reported in early February that North Platte River reservoirs are at 32% to 53% capacity. Normal headwater runoff averages about 800,000 acre-feet — roughly matching irrigation demand — and Stone warned reduced water allocations are possible for 2026.

His UNL colleague Aaron Berger, extension beef educator in Kimball, Nebraska, isn’t sugarcoating the comparison. “That year was eerily similar,” Berger said, drawing a line to 2002, which devastated spring yields. “Then we had a very dry spring. It was terrible.” He pointed to late-season storms in 2023 that dropped over 10 inches in April and May as a reason to hope—but hope isn’t a forage plan.

AgWest Farm Credit’s February 2026 drought report noted snow water equivalent at just 53% to 83% across Idaho — the state’s third-largest dairy region — calling it a “snow drought.” If you’re running cows in the West, your back-half 2026 forage budget is at risk.

What This Means for Your Operation

This week’s price declines hit unevenly: butter barely moved, the cheese headline overstated the hit, NDM pulled back from export-killing highs, and whey held the floor. The real risk isn’t what happened on the spot board this week. It’s whether spring flush overwhelms an export-dependent demand structure while western water dries up underneath it.

Next 30 days:

  • Audit your Q2 hedge coverage. March Class III at $16.45 and Class IV at $18.10 aren’t disaster prices, but they don’t leave room for margin erosion. If those numbers cover your all-in cost of production, lock in at least part of your spring output. If your COP is above $17.00, the March Class III means you’re underwater before components.
  • Run your own cheese math. Blocks fell 8.5¢, but barrels held flat — the real protein hit is about $0.18/cwt. Know your number, not the headline.
  • Set feed price alerts. Corn below $4.00/bu or meal below $290/ton is a reasonable trigger to layer in fall/winter 2026 coverage.

Next 90 days:

  • Watch $1.50 NDM as your spring flush signal. Above $1.50 into the flush says dryers can’t keep up, and Class IV holds together. Below $1.50 by May says spring milk is overwhelming dryers. Track the NDPSR-to-CME gap ($1.26 vs. $1.60) — once it closes, the price action hits your check.
  • Reassess forage contracts if the western snowpack doesn’t improve by April. North Platte reservoirs at 32–53% full and Idaho at 53–83% median SWE aren’t forecasts. They’re current conditions.

Next 12 months:

  • Western producers: build your 2026 forage budget with a drought scenario. Price out emergency hay and alternative forages now, while sellers aren’t panicking.
  • Layer in feed coverage opportunistically. Brazil at 180 MMT of soybeans means the meal could soften. Having alerts in place lets you move when the market gives you an opening.

Key Takeaways

  • A 24.8% drop in November domestic butter disappearance didn’t kill demand; USDEC data shows butter and AMF exports jumped, so the product shifted overseas rather than disappearing at home.
  • The 8.5¢ block Cheddar slide translated to only about $0.18/cwt on Class III once flat barrels were averaged in — roughly $73/day, or $2,200/month, for a 500‑cow herd shipping 80 lb, so you need to run the block‑barrel math before reacting.
  • NDM near $1.60/lb and a roughly 34¢ gap over NDPSR averages put U.S. powder about 23% above world prices, making $1.50/lb your key spring flush trigger for whether $18.10 Class IV is worth locking in.
  • Dry whey at 72¢ is quietly adding about $3.06/cwt to Class III, which means your check is leaning heavily on other solids while cheese underperforms.
  • With USDA’s 2026 all‑milk forecast at $18.95/cwt and western snowpack stuck near 32–83% of normal, you should be stress‑testing Q2 hedges against a dry‑year forage budget, not just the board price.

The Bottom Line

The trade-off on all of this: locking in Q2 at $16.45/$18.10 buys certainty but surrenders upside if the flush disappoints and prices rebound. That’s the call you make with your own cost structure.

Pull up your March coverage next to your all-in COP. Does the math still work — and have you priced in a drought scenario for your forage line?

Complete references and supporting documentation are available upon request by contacting the editorial team at editor@thebullvine.com.

Learn More

The Sunday Read Dairy Professionals Don’t Skip.

Every week, thousands of producers, breeders, and industry insiders open Bullvine Weekly for genetics insights, market shifts, and profit strategies they won’t find anywhere else. One email. Five minutes. Smarter decisions all week.
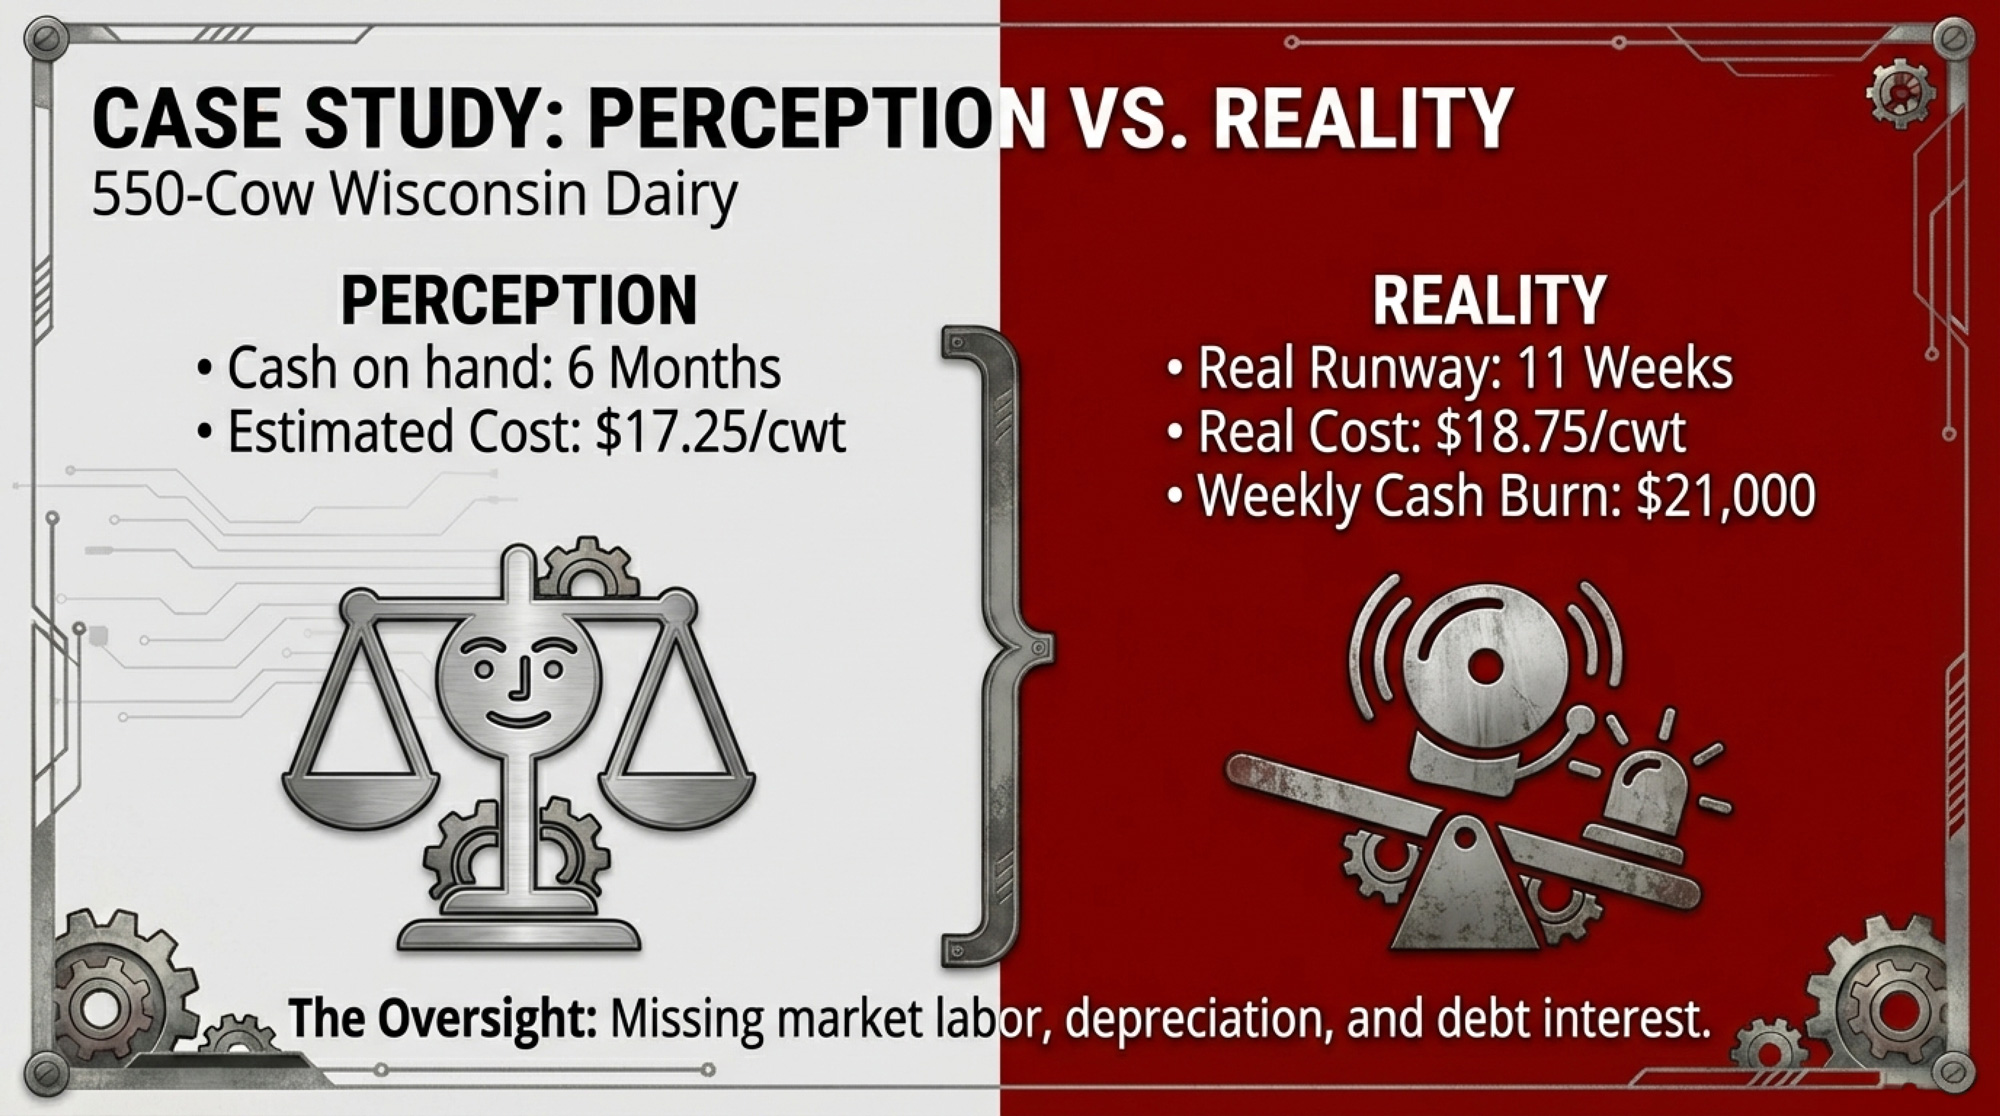
NewsSubscribe
First
Last
Consent

62% Want Cheese, Not Chocolate This Valentine’s  – How Much of the $6.7 Billion Specialty Cheese Market Reaches Your Milk Check?

62% of Americans now prefer cheese to chocolate for Valentine’s. The $6.7B question: does any of that reach your milk check?

Executive Summary: Americans are on track to spend a record $29.1 billion on Valentine’s Day in 2026, but candy — at $2.5 billion — is the only major category that hasn’t grown at all. A Wakefield Research survey for Wisconsin Cheese shows 62% of Americans are tired of traditional gifts and 64% would trade roses for wedges of artisan cheese, while the US specialty cheese market has climbed to $6.67 billion and is growing 5.6% a year. Wisconsin now produces 1.02 billion pounds of specialty cheese — 53% of the US total — and is testing the Valentine’s opportunity with farmstead boards from Crave Brothers and a $100 Wedges of Love bouquet from Wisconsin Cheese. The catch is that processors like Klondike openly admit that specialty cheese keeps their business afloat, yet there’s no clean public data showing how much of that premium flows back as component bonuses on your milk check. Bullvine’s own component grid math shows a 0.15-point protein gain can add 25–40¢/cwt, and processor product mix can swing pay price by about $1/cwt over time. This feature walks through the numbers, the farmstead vs. coalition paths, and the seasonal risk so you can decide if and where Valentine’s specialty cheese fits in your own herd strategy.

Americans are spending a record $29.1 billion on Valentine’s Day this year — $199.78 per celebrating shopper — according to the National Retail Federation and Prosper Insights & Analytics annual survey of 7,791 adult consumers conducted January 2–8, 2026. That’s up from $27.5 billion in 2025, which itself broke the previous record of $27.4 billion set in 2020. And for the first time, there’s hard consumer data suggesting specialty cheese wants a piece of that.

A Wakefield Research poll of 1,000 nationally representative US adults, conducted December 12–16, 2025 — commissioned by Wisconsin Cheese, the promotional arm of Dairy Farmers of Wisconsin — found that 62% of Americans are tired of traditional Valentine’s gifts like chocolates, flowers, and teddy bears. Sixty-six percent said cheese is their “love language.” Sixty-four percent would trade a dozen roses for a dozen wedges. The methodology is credible. The sponsorship still matters. But those numbers are hard to ignore.

The US specialty cheese market hit $6.67 billion in 2024, according to Grand View Research, and is projected to reach $9.2 billion by 2030 at a 5.6% compound annual growth rate. Flavored cheese is the fastest-expanding segment. Meanwhile, total US fluid milk sales barely ticked up 0.5% in 2024 — the first increase since 2009, per USDA Agricultural Marketing Service data — and that growth came almost entirely from whole milk (up 1.6%), organic (up nearly 7%), and value-added products like fairlife, not traditional skim and reduced-fat, which continued to decline.

Where the $29.1 Billion Goes

Category2025 ($B)2026 ($B)Change
Jewelry$6.5$7.0+$0.5B
Evening Out$5.4$6.3+$0.9B
Clothing$3.2$3.5+$0.3B
Flowers$2.9$3.1+$0.2B
Candy$2.5$2.5$0.0B

Not all Valentine’s dollars matter equally for dairy. Here’s where NRF says the money landed in 2026, with 2025 comparisons:

  • 💍 Jewelry: $7.0 billion, up from $6.5B in 2025 (25% of shoppers, up from 22%)
  • 🍽️ Evening Out: $6.3 billion, up from $5.4B in 2025 (39% of shoppers, up from 35% — the fastest-growing category, jumping $900 million in a single year)
  • 👗 Clothing: $3.5 billion
  • 🌹 Flowers: $3.1 billion, up from $2.9B in 2025 (41% of shoppers, up from 40%)
  • 🍫 Candy: $2.5 billion both years (56% participation — the only major category with zero growth)
  • 🧀 Specialty Cheese: No Valentine’s-specific figure exists yet — that’s the opportunity gap. The US market is growing at 5.6% annually.

The story is clear. Candy flat-lined. Experience spending surged. That $900 million jump in “evening out” tells you consumers are spending more on shared experiences — and cheese boards positioned as a date-night-at-home experience tap directly into that shift.

Two Wisconsin Plays Worth Watching

Play #1: The Farmstead Coalition Board

Crave Brothers Farmstead Cheese, based in Waterloo, Wisconsin, launched a “Better Together” Valentine’s campaign in late January — four curated cheese boards, each matched to a relationship stage. “These boards highlight how local cheeses can be the centerpiece of any celebration, while supporting the farmers and producers behind them,” Roseanne Crave, the family’s sales and marketing manager, told Perishable News.

The boards feature products from at least nine other Wisconsin makers: Sartori, Carr Valley, Widmer’s, Henning, Marieke, Ellsworth Cooperative Creamery, Buholzer Brothers, Renard’s, and Pine River. That’s coalition marketing — pooling reach instead of one brand shouldering the cost. The Crave family farms 2,500 acres in south-central Wisconsin, running a herd of over 2,000 Holsteins with a biodigester for energy and water recycling across the operation. Their cheeses are farmstead — the milk comes from their own cows. To celebrate the month of love, they’re also donating 5% of all proceeds from their online store during February to the American Heart Association.

Play #2: The $100 Cheese Bouquet

Dairy Farmers of Wisconsin went bigger. On National Cheese Lovers Day (January 20), Wisconsin Cheese launched Wedges of Love — a bouquet-style gift box featuring nine award-winning artisan cheeses arranged like a floral bouquet. Retail price: $100 with free overnight shipping. It includes four stainless steel knives, a personalized poem, and pairing guides.

The lineup: Carr Valley Cranberry Chipotle Cheddar, Deer Creek Carawaybou, Hoard’s Dairyman Farm Creamery Belaire, Landmark Creamery Tallgrass Reserve, Marieke Fenugreek Gouda, Roelli Cheese Haus Dunbarton Blue, Roth Grand Cru Reserve, Sartori SarVecchio, and Uplands Cheese Company Pleasant Ridge Reserve. Limited drops sold on January 20, January 27, and February 3. Demand was strong enough that Parade ran a story headlined “It’s Almost Sold Out.”

“The Wedges of Love box provides a delectable glimpse, showcasing a variety of tastes and styles from farmstead producers and cheesemakers of all sizes,” said Suzanne Fanning, chief marketing officer for Wisconsin Cheese.

Here’s what connects both plays to the broader supply chain: Wisconsin produced a record 1.02 billion pounds of specialty cheese in 2024 — up 7.6% from 2023 — according to the USDA’s National Agricultural Statistics Service. That’s 28.3% of the state’s total cheese output of 3.59 billion pounds, and more than 53% of all specialty cheese produced in the United States. Ninety-three of Wisconsin’s 116 cheese plants manufactured at least one specialty variety. Production has increased twelvefold since the USDA started collecting data in 1993.

The Honest Scale Problem

Let’s be direct about the gap. Valentine’s candy flat-lined at $2.5 billion. A $100 cheese bouquet and a set of board recipes aren’t competing at that scale. Not yet.

But specialty cheese has a structural tailwind that fluid milk doesn’t. A 5.6% CAGR doesn’t sound dramatic until you stack it against fluid milk’s 13-year decline. Reduced-fat milk dropped another 4.4% in 2024. Meanwhile, Wisconsin specialty cheese output grew 7.6% in a single year. The premium and commodity ends of dairy are diverging, and Valentine’s Day is one of the clearest seasonal moments to capture premium demand.

The smart play isn’t to unseat chocolate. It’s to sit beside it on the board and quietly capture more of the basket every February.

Does Any of This Reach Your Milk Check?

Here’s the question every producer reading this is actually asking.

The answer starts at the processor level, and it’s blunt. “The whole reason we went into specialty cheeses is because they do have better profit margins, so we can keep the business afloat,” Luke Buholzer, vice president of sales at Klondike Cheese Company, told Wisconsin Watch in October 2025. Klondike produced about 38 million pounds of cheese last year — nearly double their output from a decade ago — and every pound is specialty. They phased out commodity cheeses entirely.

John Lucey, director of the Wisconsin Center for Dairy Research at UW-Madison, told Cheese Market News the shift was driven from the plant floor up: “Cheesemakers at smaller plants started to become more flexible, entrepreneurial, and willing to take on some risk. They got fed up with the low cheese prices and trying to compete with commodity plants.”

That margin advantage at the processor level is real. But how much flows back to your bulk tank? That’s where the data gets thin. No public source we found connects specialty cheese market growth directly to measurable premium increases for individual farms.

Here’s what we do know. On a typical Upper Midwest Class III–based component grid, a 0.15-point protein gain can be worth 25–40¢/cwt on the protein line alone, with cheese yield bonuses adding another 10–20¢/cwt. And as we’ve covered before, where your processor sends your milk — pizza cheese and specialty yogurt versus commodity powder and private-label fluid — can mean a steady $1/cwt pay-price difference, worth roughly $400,000 in equity over four years for a 400-cow herd. Specialty cheese growth widens that gap.

ScenarioComponent/Product Mix ImpactPremium (¢/cwt)Annual Impact*4-Year Equity Gain
BaselineStandard components, commodity channel$0.00$0$0
Protein Gain+0.15 protein points (3.15% → 3.30%)+25–40¢$27,375–$43,800$109,500–$175,200
Product MixMilk allocated to specialty cheese vs. powder+$1.00$109,500$438,000
CombinedProtein gain + specialty channel access+$1.25–$1.40$136,875–$153,300$547,500–$613,200

Chad Vincent, CEO of Dairy Farmers of Wisconsin, framed the farmer’s stake this way in a December 2025 piece for Professional Dairy Producers of Wisconsin: “Your milk is the foundation for innovation far beyond the vat. As processors continue to explore new uses for dairy byproducts, farms supplying consistently high-quality milk will remain critical partners.”

That’s the right direction. But “critical partners” and “a line item on your milk check” aren’t the same thing. If your milk ships to a plant with an artisan line and your components are strong, bring one question to your next field-rep visit: What butterfat and protein specs does your specialty cheese require, and does meeting them earn me a premium? If they can’t answer, the answer is probably no. And that’s worth knowing.

Farmstead vs. Coalition: Two Ways In

If you’re evaluating how to connect your operation to this channel, there are two models on the table:

 Farmstead Path (Crave Brothers model)Coalition Marketing Path (Wedges of Love model)
Investment$218,500–$553,000 startup (general industry estimates, BusinessPlanKit.com, March 2025 — not a university source; UW-Madison’s Center for Dairy Research may have region-specific benchmarks); equipment is 40–50% of totalMarketing contribution only — split across partners
Timeline12–24 months to first product; years to brand recognitionCan launch a seasonal campaign in weeks if the cheese already exists
ControlFull — you own the product, the brand, and the marginShared — you’re one cheese among many
RiskHigh licensing, cold chain, seasonal inventory if Valentine’s demand disappointsLow to moderate — reputational risk if the campaign flops, but no capital at stake
MarginHighest per unit — farmstead commands premium retail pricingModerate — depends on wholesale terms with the promotional partner
Best fitOperations already exploring DTC or on-farm processingAny producer whose milk goes into cheese that could be part of a curated offering

Neither path is right for every operation. For many dairy farms, the honest answer is that neither applies today. That’s fine. But if 7.6% annual growth in Wisconsin specialty production continues to compound, the channel will need more milk. Knowing where you sit when that call comes is worth something.

What This Means for Your Operation

Ask your processor one question. Does your plant have a specialty or artisan cheese line—and does seasonal Valentine’s demand create any pull on component volumes or pricing? Wisconsin specialty cheese output hit a record 1.02 billion pounds in 2024, up 7.6% year-over-year. Somebody is capturing that margin.

If you’re farmstead-curious, Valentine’s is a natural first test. One limited-edition SKU — heart-shaped, gift-boxed, paired with a local chocolatier — before committing to year-round production. But know the capital: $218,500–$553,000 for a small-scale cheese operation. Run the numbers before the dream.

Think experience, not commodity. The $199.78-per-shopper Valentine’s budget isn’t going toward a random wedge in the dairy case. Wisconsin Cheese proved there’s a $100 price point that moves for a curated box with the right packaging and story.

Don’t fight chocolate — partner with it. Crave Brothers’ Chocolate Mascarpone is the template. Their “Udderly in Love” gift box pairs it with Heart-Shaped Mozzarella and custom Valentine’s cow portraits. Become chocolate’s co-star, not its replacement.

Coalition marketing lowers the barrier. Both Wisconsin campaigns feature products from multiple cheesemakers — 10 in Crave Brothers’ campaign and 9 in the Wedges of Love bouquet. Pooling spend builds a category story bigger than one brand can tell alone.

Watch the experience-spending surge. “Evening out” jumped from 35% to 39% — and from $5.4 billion to $6.3 billion — in a single year. That $900 million increase is the largest dollar jump of any Valentine’s category. At-home food experiences are reshaping how consumers spend on dairy.

Be honest about the seasonal risk. Valentine’s is a one-week window. For farmstead operations, gearing production to that spike means holding inventory that may not move if demand disappoints. Coalition marketing avoids this — the cheese already exists; you’re just merchandising it differently.

A Note for Canadian Readers

Most of the market data in this piece is US-specific, and supply management changes the economics of specialty cheese north of the border. But the channel isn’t closed. Dairy Farmers of Ontario has operated an Artisan Cheese Programsince April 2006, setting aside 3 million litres designated as “Artisan Cheese Milk” — available to qualifying new processors at up to 300,000 litres per applicant annually. The program covers small-batch, hand-produced specialty cheeses (excluding cheddar and mozzarella) and operates alongside the Canadian Dairy Commission’s Domestic Dairy Product Innovation Program. If you’re a Canadian producer interested in the specialty channel, these programs are worth understanding — the demand trends are crossing the border, even if the supply structure doesn’t.

Key Takeaways

  1. 62% of Americans are tired of traditional Valentine’s gifts, and 64% would trade roses for cheese wedges (Wakefield Research for Wisconsin Cheese, 1,000 US adults, Dec 2025). Consumer pull backed by credible methodology — from a survey commissioned by the state’s cheese promotional organization.
  2. Wisconsin produced a record 1.02 billion pounds of specialty cheese in 2024, up 7.6% from 2023, accounting for 53% of all US specialty cheese (USDA NASS). That growth — in an industry where fluid milk declined for 13 straight years — tells you where the premium is heading.
  3. Valentine’s spending hit $29.1 billion in 2026, up from $27.5 billion in 2025 (NRF). Candy was the only major category with zero-dollar growth ($2.5B in both years). “Evening out” surged to $900 million, bringing the total to $6.3 billion. Experience spending is climbing. Boxed-gift spending isn’t.
  4. Two Wisconsin operations proved the Valentine’s model. Crave Brothers built a farmstead coalition board with nine partner cheesemakers and tied it to an American Heart Association donation. Wisconsin Cheese’s $100 Wedges of Love bouquet drew enough demand across three limited drops to near sell-out. Different models. Both replicable.
  5. The farm-level bridge is real but incomplete. Specialty cheese processors are clear about why they’re there — better margins. A 0.15-point protein gain can be worth 25–40¢/cwt on Class III grids, and where your milk lands in the value chain can mean a $1/cwt difference. But whether Valentine’s-specific demand moves your check depends on your processor relationship. Ask the question.

The Bottom Line

Your best move this Valentine’s Day is to make sure that when someone spends $199.78 on the person they love, cheese shows up alongside the truffles—not as an afterthought in the grocery cart. The Crave family and Wisconsin Cheese already made that bet. What’s your operation’s play?

Editor’s Note: Valentine’s spending data comes from the National Retail Federation and Prosper Insights & Analytics (7,791 adult consumers, Jan 2–8, 2026; and 8,020 adult consumers, Jan 2–7, 2025). Consumer sentiment on cheese gifting comes from Wakefield Research, commissioned by Wisconsin Cheese / Dairy Farmers of Wisconsin (1,000 nationally representative US adults, Dec 12–16, 2025). Specialty cheese market figures are from Grand View Research (2024 base year, US scope). Wisconsin specialty cheese production data are from USDA NASS as reported by Cheese Reporter (June 2025) and Wisconsin Watch (Oct 2025). Wisconsin industry quotes are from Wisconsin Watch (Oct 9, 2025) and Professional Dairy Producers of Wisconsin (Dec 2025). Fluid milk trends are from USDA AMS data as reported by High Ground Dairy (Feb 2025). Premium component data are from The Bullvine’s analyses in “The Protein Premium” (Jan 2026) and “Same Milk, Different Payday” (Jan 2026). Startup cost ranges are general industry estimates from BusinessPlanKit.com and may vary by region, scale, and regulatory environment. Canadian program details are from Dairy Farmers of Ontario. We welcome producer feedback and case studies for future coverage.

Learn More

  • $19.14 Costs vs. $18.95 Milk: Is Your Barn Tech Paying the Difference? – Stop bleeding margin on Monday by auditing the 90% of your existing tech you aren’t using. This 30-day “tech tune-up” reveals how integrating current herd software and activity collars claws back $20,000–$45,000 in immediate health-related savings.
  • More Milk, Fewer Farms, $250K at Risk: The 2026 Numbers Every Dairy Needs to Run – Exposes the brutal math of the $250,000 margin gap facing mid-size dairies in 2026. This strategic analysis arms you with the cost-per-hundredweight benchmarks needed to decide if your operation should grow, hold, or exit before the market chooses.
  • PDO cheese premiums – Delivers the “Jasper Hill” blueprint for achieving a 2.23x milk price multiplier through collective regional branding. This disruptor report breaks down the capital required to exit the commodity race and secure $50+/cwt premiums through organized, PDO-style consortiums.

The Sunday Read Dairy Professionals Don’t Skip.

Every week, thousands of producers, breeders, and industry insiders open Bullvine Weekly for genetics insights, market shifts, and profit strategies they won’t find anywhere else. One email. Five minutes. Smarter decisions all week.
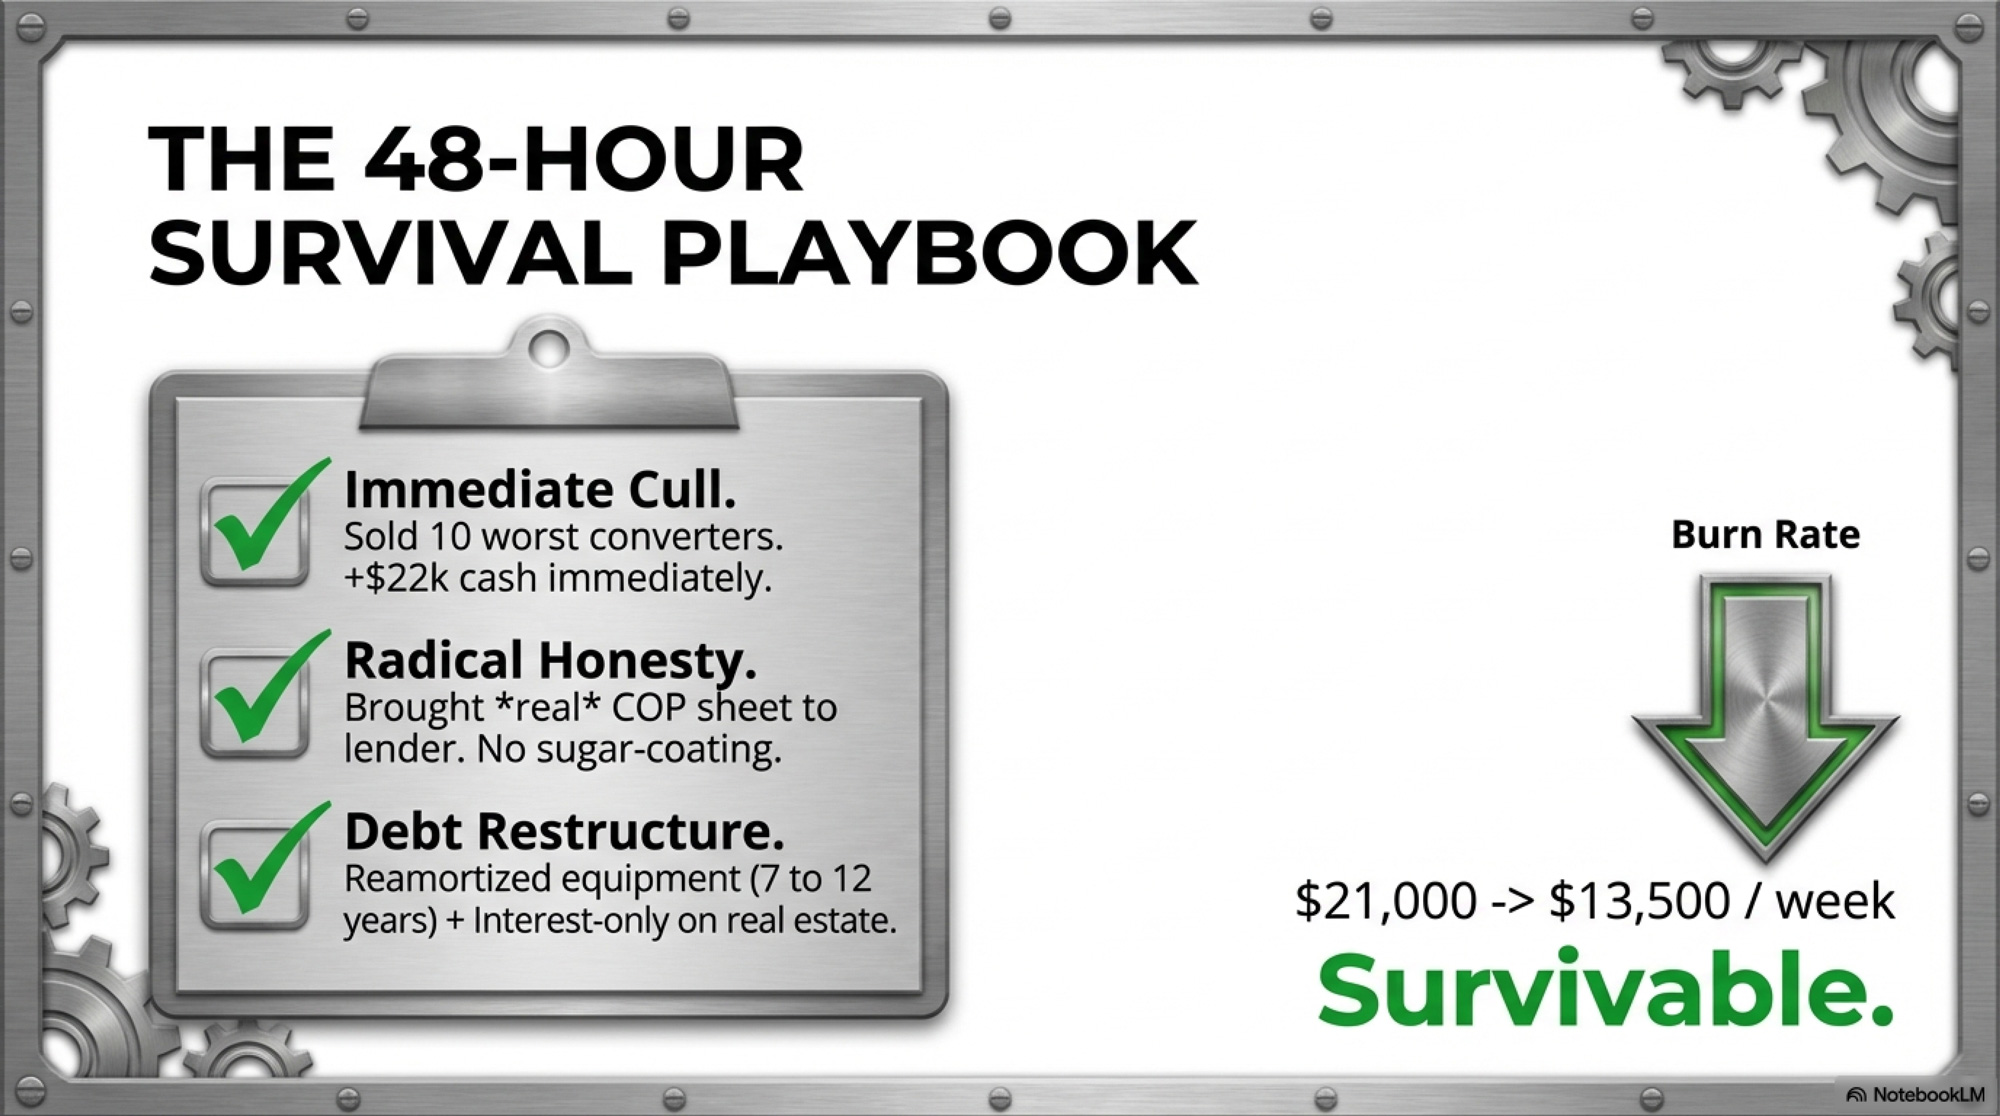
NewsSubscribe
First
Last
Consent

Gold Medal Margins: Italy Turns Less Milk into €22.8B. You’re Stuck at $18.95.

As Milano-Cortina chases medals, Italy’s dairies pull €22.8B from less milk. If your 2026 outlook starts with $18.95, you need to see how they did it.

Where does your real break-even sit — family labor honestly valued, principal payments included, living expenses accounted for? Bullvine analysis pegs a mid-size herd’s full-cost break-even in the range of $19.50–$20.50/cwt, depending on region, debt load, and unpaid family labor assumptions — consistent with farmdoc’s 2024 analysis, which places full costs in the low $20s/cwt. USDA’s outlook has been a moving target: the all-milk price for 2026 fell from $19.25 in November to $18.75 in December to $18.25 in January — then bounced to $18.95/cwt in the February 2026 WASDE, released yesterday. Even with the uptick, a 250-cow operation at the midpoint of that break-even range faces a projected annual loss of roughly $63,000. That gap has whipsawed $70,000 in four months of USDA revisions — and the direction isn’t settled.

Now consider the country hosting this month’s Winter Olympics, where dairy producers are doing the opposite: generating €22.8 billion in industry revenue while their milk production declines year over year. The value-added dairy production model behind that number isn’t a European curiosity. It’s a functioning alternative to the volume-first strategy that’s compressing margins across North American herds in 2026 right now.

Two Industries, Two Scorecards: Volume vs. Value in 2026

The U.S. dairy herd expanded by an estimated 211,000 cows in 2025 while margins deteriorated. More cows. Thinner checks. USDA projects output climbing to 234.1 billion pounds in 2026, and income-over-feed-cost margins are tightening toward roughly $11.40/cwt. Meanwhile, USDA-ERS cost-of-production data show even the lowest-cost tier — operations with 2,000-plus cows — averages $19.14/cwt on a full economic basis, essentially breakeven at $18.95 milk.

Italy went the other direction. The number of Italian dairy businesses actually increased over the past five years, reaching roughly 4,043 operations (IBISWorld, 2025 data). An industry gaining participants while losing volume only happens when per-unit returns make smaller-scale production pay. Industry revenue grew at a positive 1.5% CAGR over 2020–2025, while milk volume contracted at approximately –0.7% CAGR. Revenue up. Volume down.

EU-wide, the pattern holds. Milk production dropped an estimated 0.2% to 149.4 million metric tons in 2025, while cheese production rose 0.6% to 10.8 million metric tons (USDA FAS data). Germany and France shed 2.3% and 1.8% of milk output, respectively, while Dutch cooperatives lost 14% of members since 2023. The full picture is in our earlier analysis: EU production is declining while cheese output is rising.

The Parmigiano-Reggiano production zone — which extends from Parma north into Lombardy — overlaps with the broader Milano-Cortina Olympic region. The athletes and the cheesemakers are competing in the same territory this month. Only one group has figured out how to turn less into more.

What the Premium Actually Looks Like

Parmigiano-Reggiano, the world’s top-selling PDO (Protected Designation of Origin) cheese, generated €3.2 billion in turnover at consumption in 2024 — a record, up 4.9% from €3.05 billion in 2023 — from approximately 4 million wheels, according to consortium data reported at its April 2025 annual press conference in Milan. Total sales volume rose 9.2%, with domestic sales up 5.2% and exports surging 13.7%. Producer prices for 12-month matured wheels reached €11.0/kg in 2024, up 9% year-over-year. By mid-2025, wholesale hit €13.30/kg. A 21% gain.

The export math is where it gets pointed. Italian cheese exports in the first half of 2025: volume up 2.2%, value up 20.4%. Two percent more product out the door, twenty percent more revenue back. Exports now account for 48.7% of Parmigiano’s total sales volume — closing in on overtaking domestic consumption. As consortium president Nicola Bertinelli put it: “2024 was a challenging year for Parmigiano Reggiano, yet it ended with record results.” The U.S. alone absorbed over 16,000 tons in 2024, up 13.4%.

On this side of the Atlantic, Mateo Kehler’s Jasper Hill Farm in Greensboro, Vermont — population roughly 800 — generates multi-million-dollar annual revenue and pays partner farms roughly three times the commodity milk price, according to figures shared with The Bullvine. Kehler has observed that a Vermont family can make a good living with 25 to 30 cows, provided they make high-end cheese. By the operation’s own accounting, the vast majority of profits stay in-state.

But Jasper Hill is entirely debt-financed, took two decades to reach its current scale, and recently watched its Canadian export market collapse after tariff-driven boycotts. Kehler has had to buy 11 properties to house employees in a town with Vermont’s highest second-home ownership rate. Even successful premium transitions create new problems. In Wisconsin, Uplands Cheese Company — two neighboring families in Dodgeville’s Driftless Region — milks roughly 150 cows (Holsteins, Jerseys, and Brown Swiss) and produces just two cheeses: Pleasant Ridge Reserve during summer pasture months and Rush Creek Reserve in fall. At peak production, a day’s run yields up to 78 ten-pound wheels. When the cheese was launched, wholesale pricing was roughly 4 times commodity cheddar — about $10/lb versus $2.50/lb. Multiple Best of Show wins at the American Cheese Society competition. Strategic scarcity is built into the production calendar.

Why the Italian Premium Sticks

The Italian premium isn’t about Mediterranean mystique or tourist spending. It’s three structural mechanisms—and the first two are replicable.

Geographic designations create enforceable scarcity. PDO rules require all production within a defined region. A 2012 study by AND-International for the European Commission’s DG Agriculture — covering GI products across EU member states — found that the “value premium rate” for PDO/PGI products averaged 2.23 times that of comparable non-GI products. A separate, more detailed 2014 study by Areté srl for the Commission confirmed that PDO/PGI products were generally more profitable than their comparators, though with significant variation across products and regions. Export prices run roughly 11.5% higher even in international markets where consumers have no cultural attachment to the origin.

Consortium structures align producers with collective brand value. The Parmigiano Consortium operates on a projected €51.5 million budget for 2025 — including a €1.5 million crisis fund for price stabilization. Individual farms don’t need their own marketing. The consortium is the marketing.

Farmgate prices link directly to end-product value. When Parmigiano prices rise, supplying farms get paid more — Italian spot milk quotations ran €0.425–€0.4575/kg even during recent downturns. North America’s FMMO system deliberately severs that link through pooling. Under the USDA Final Rule published in January 2025, the FMMO make allowance for cheese increases to $0.2519/lb effective June 1, 2025 — locking in a higher guaranteed margin for processors before your milk check is calculated. Your milk check reflects pool averages, not what your specific milk became.

MetricU.S. Commodity BaselinePDO 2.23× MultiplierJasper Hill (VT)Parmigiano (Italy)
Base milk price$18.95/cwt (Feb 2026 WASDE)$18.95/cwt$18.95/cwt$18.95/cwt (equiv.)
Value multiplier1.0×2.23× (EU study avg.)~3.0× (est.)2.23× (applied)
Premium farmgate equivalent$18.95/cwt$42.26/cwt$56.85/cwt$42.26/cwt
Annual revenue (250-cow herd)¹$455,400$1,015,548$1,365,900$1,015,548
Revenue gain vs. commodity+$560,148+$910,500+$560,148

In France, the Comté PDO tells the same story. Data from French agricultural statistics (SCEES), compiled by Origin-GI, show Comté-zone farms achieved a 32% profitability premium over non-PDO dairy farms in the same Franche-Comté region. A February 2022 analysis by the French Ministry of Agriculture’s Centre for Studies and Strategic Foresight confirmed the pattern, finding Franche-Comté PDO farms earned a surplus of approximately €22,000 per agricultural worker unit compared to non-GI farms in surrounding areas. Farmgate milk ran 14% above baseline. Between 1988 and 2000, PDO-area farms lost 36% of their operations — a painful but non-PDO farm loss in the same area was 57%. The designation didn’t prevent consolidation, but it meaningfully slowed it.

These systems aren’t risk-free. Long aging cycles tie up capital for months or years, concentrated brands can suffer when export demand softens, and inventory exposure during downturns is real. But the studies suggest that, over time, farms inside well-run GI systems have had more room to absorb shocks than their commodity neighbors. For more on how geographic indications are reshaping global dairy trade, including the U.S. industry’s pushback, see our earlier analysis.

Four Paths Forward — and What Each One Costs

Not every operation can or should pursue the same route. Your scale, your balance sheet, and how much transition risk your family can absorb determine which path makes sense.

PathUpfront CapitalTimeline to PremiumRisk LevelBest Fit
1. Component optimizationMinimalImmediateLowAny herd with protein below 3.4%
2. Individual farmstead cheese$750K–$1.2M3–5 yearsHighOperations with strong local market access
3. Collective regional consortium$60K–$70K per farm5–7 yearsModerate3+ neighboring herds facing shared margin pressure
4. Demographic-driven specialtyModerate1–3 yearsModerateHerds near growing Hispanic or urban markets

Path 1: Component optimization. Under FMMO reforms effective June 1, 2025, moving from 3.1% to 3.4% protein could generate approximately $8,640 annually for a 200-cow herd based on current component pricing — no infrastructure change required. At the February WASDE’s $18.95/cwt outlook, a herd with a $19.50 break-even faces a $0.55/cwt gap — component optimization (including butterfat and quality adjustments) could plausibly close that. At a $20.50 break-even, you’re staring at a $1.55/cwt hole, and $8,640 on 48,000 cwt is only $0.18/cwt in protein gains alone. Path 1 is a margin patch, not a margin strategy. But if your gap is under roughly $1.00/cwt, components might be enough.

PathUpfront CapitalTimeline to PremiumRisk LevelBest FitEst. $/cwt Gain
1. Component OptimizationMinimal (<$10K)Immediate (0–6 mo)LowAny herd with protein <3.4%, gap <$1.00/cwt$0.15–$0.50/cwt
2. Individual Farmstead Cheese$750K–$1.2M3–5 yearsHighStrong local market access, $150K+ working capital$5–$15/cwt
3. Collective Regional Consortium$60K–$70K/farm5–7 yearsModerate3+ neighboring herds, shared margin pressure$3–$8/cwt
4. Demographic-Driven Specialty$150K–$400K1–3 yearsModerateNear Hispanic/urban markets, no aging required$2–$5/cwt

Path 2: Individual farmstead cheese. A 2014 study by Bouma et al., published in the Journal of Dairy Science, found that startup costs for artisan cheese processing and aging facilities ranged from $267,248 to $623,874 for annual production volumes of 7,500 to 60,000 pounds. Bullvine’s own financial modeling — which extrapolates Bouma et al.’s capital benchmarks to current prices and adds working capital, a broader product mix, and aging capacity — puts total investment for a 250-cow operation diverting 40% of milk to artisan cheese at roughly $750,000 to $1.2 million. Annual cheese operating costs add approximately $456,000. The model shows cumulative returns turning positive around Year 4 at $18/lb artisan retail pricing. Kehler’s experience suggests the model works from roughly 25 cows up, but the capital structure looks completely different at 25 versus 250.

Uplands Cheese proves the premium is real — four times commodity cheddar at wholesale — but the operation runs on 150 cows making just two cheeses, and only during months when pasture conditions are ideal. And here’s the sobering counterweight: the American Cheese Society’s 2022 biennial industry survey — funded by the American Cheese Education Foundation, based on responses from more than 200 artisan and specialty cheesemakers (published June 2023) — found 24% of U.S. artisan cheesemakers gross under $50,000 annually. Premium pricing is not automatic. As Paul Scharfman told the Wisconsin Dairy Task Force 2.0, “many specialty cheesemakers are fighting for the same four-foot section in a grocery store.”

Path 3: Collective regional consortium. Twenty farms sharing infrastructure brings individual exposure to roughly $60,000–$70,000 per farm. A consortium modeled on France’s Comté CIGC — shared aging infrastructure, collective branding under a USPTO certification mark, codified production standards that naturally constrain supply — addresses the capital and distribution barriers that kill individual producers. The trade-off is real: Parmigiano producers subordinate their individual farm identity entirely to the regional brand. You gain collective pricing power. You give up the option to differentiate on your own terms. John Umhoefer of the Wisconsin Cheese Makers Association identified “money, licensing, regulations, and liability” as the obstacles when the Wisconsin Dairy Task Force explored exactly this concept. DATCP had $200,000 in total processor grant funding. Parmigiano’s consortium operates on €51.5 million. That funding gap tells you everything about institutional commitment.

Path 4: Demographic-driven specialty. Hispanic cheese varieties are growing at more than three times the rate of the broader cheese category, according to DFA’s Ken Orf, citing Circana data from early 2024. The latest 52-week MULO+ data (ending December 29, 2024) confirms the acceleration, with Hispanic cheeses growing at 2× to 27× faster than mainstream counterparts in comparable applications. DFA’s acquisition of W&W Dairy in Wisconsin was targeted directly at this segment. No aging caves required, no geographic branding necessary — you need to understand which consumer populations are expanding near you and produce for them.

The Demand Signal Is Already There

A nationally representative survey of 583 U.S. supermarket shoppers — commissioned by Supermarket Perimeter and conducted by Cypress Research (Kansas City, Mo.) with fieldwork in March 2023 — found 64% of Americans purchased specialty cheese in the prior three months. Gen Z led at 71%. And 56% of specialty cheese buyers actively seek seals of authenticity or origin, even though there is no North American GI system.

Market data from Circana supports it. Over the most recent 52-week tracking period in 2025, deli specialty cheese sales rose 8% in both dollars and volume, led by Hispanic and Italian cheese types. American cheese — the commodity benchmark — fell nearly 5% over the same stretch. Rachel Shemirani, senior vice president of Poway, California-based Barons Market, described Gen Z consumers gaining “visual access to different types of specialty cheeses” through TikTok, driving discovery that once took generations to build. The Milano-Cortina Games this month will put Italian food production on a global screen for two weeks, but the domestic demand signals suggest North American consumers don’t need the reminder.

California’s Real California Milk seal — a regional origin certification, not a formal PDO — already delivers a measurable 6.3 percentage point sales spread over non-origin-branded specialty cheese in the same stores (Circana/IRI data, 52 weeks ending May 2023: volume up 3.3% with seal, down 3.0% without). “Domestic origin labeling, and even more so local connotations, carry our customers’ trust in their quality and value,” said the California Milk Advisory Board’s Katelyn Harmon.

On the institutional side, USDA announced $11 million in new Dairy Business Innovation Initiative grants on January 20, 2026. Wisconsin and Vermont each received $3.45 million — explicitly earmarked for value-added development in small and mid-size dairy operations. That comes on top of the $11 billion in new processing capacity coming online through 2028, almost all of it commodity-oriented. The question is whether any of the new stainless includes specialty or aged-cheese capacity—and whether premium returns would flow back through your milk check.

The Canadian Paradox: You Already Have Organized Scarcity — Without the Premium

Here’s the part that should frustrate Canadian producers most: you’re already operating inside a managed-supply system. Quota limits production. Tariffs block imports. The Canadian Dairy Commission sets prices. Supply management has shaped the structure of the Canadian dairy industry since 1972. That’s organized scarcity—the same foundational principle behind every PDO consortium in Europe.

And yet the economic outcomes aren’t even close.

System FeatureParmigiano Consortium (Italy)Canadian Supply ManagementResult
Quota systemYes – tied to brand protectionYes – tied to domestic demand matchingBoth manage scarcity
Annual brand investment€51.5M (2025 budget)$350M CETA compensation (couldn’t measure impact)Italy builds value; Canada maintains floor
Farmgate price mechanismContractually linked to wheel pricesRegulated floor price, pooledItaly: price rises with product; Canada: static regulation
Premium to farmers (vs. commodity)2.23× average (EU study)Minimal to noneItaly captures value; Canada captures stability
Producer count trend (recent)+4,043 operations (growing)–24% farms (2012–2022)Italy adds participants; Canada consolidates
Export competitiveness48.7% of sales, growing 13.7%/yrFaces 16,000 MT duty-free EU cheese importsItaly wins globally; Canada defends domestically
Price volatilityLow (brand-buffered)Low (quota-regulated)Both stable—but only Italy delivers premium

The Parmigiano Consortium also assigns production quotas directly to farmers, with financial contributions required from anyone who exceeds their allocation—a system the Italian Ministry of Agriculture formally approved for the 2020–2022 cycle and has renewed since. Both countries manage supply. But Italy’s quotas exist to protect the brand value of a €3.2 billion product and flow premium returns back to the farms that produce the milk. Canada’s quotas exist to match domestic supply to domestic demand at a regulated floor price. One system creates scarcity, driving up the value of the end product. The other creates scarcity that maintains stability, which is a different thing entirely. For many Canadian farms, that stability has been the point, and it’s delivered real income predictability that U.S. producers riding the WASDE rollercoaster don’t have. But it hasn’t translated into a structural price premium the way PDO status has in Europe.

The numbers bear it out. Canadian dairy cash receipts rose from $5.9 billion to $8.2 billion between 2012 and 2022 — a 39% increase (AAFC evaluation, 2024). But the number of farms dropped from 12,762 to 9,739 over the same period, a 24% decline. Production went up 18%. Fewer farms, more milk, higher gross receipts — and yet, as McGill University’s 2023 policy analysis concluded, the system “limits producers’ ability to set the price and quantity of their products” and “prevents farms from achieving economies of scale.” Quota costs in Ontario sit at roughly $24,000 per kilogram of butterfat per day; in other provinces, recent transactions have exceeded $44,000 and even $56,000 per kg/BF/day (Agriculture Canada, 2025 monthly quota trade reports). That capital buys you the right to produce milk at a regulated price. It doesn’t, on its own, create a premium brand.

Agriculture Canada’s own evaluation of the $350 million CETA compensation programs (DFIP and DPIF) was blunt: the department “is unable to determine whether either program mitigated anticipated future growth losses” from increased European cheese imports. Meanwhile, CETA opened the door to 16,000 metric tonnes of duty-free EU cheese annually — about 4% of Canadian consumption. The irony is hard to miss: European PDO cheese is entering the Canadian market because it commands a premium, while Canadian producers inside a managed-supply system have no structural mechanism to build comparable brand value with their own milk.

It’s not impossible to break through. Gunn’s Hill Artisan Cheese in Oxford County, Ontario — Canada’s self-described Dairy Capital — demonstrates at least a partial path. Owner Shep Ysselstein trained in the Swiss Alps, then returned to build a small artisan cheese plant using milk from his family’s neighboring dairy farm, Friesvale Farms. Today, Gunn’s Hill produces Swiss-style artisan cheeses sold in over 300 retail locations across Ontario. And as of this week, dairy farmer organizations across Canada are changing how farmers get paid for milk to meet growing demand for protein — cottage cheese alone grew 32% — which at least signals the system can adapt when market pull is strong enough.

But Gunn’s Hill is small, regional, and essentially operating around the edges of supply management rather than through it. What’s missing isn’t the production discipline — Canadian dairy already has that in spades. What’s missing is the brand architecture, the collective marketing investment, and the legal framework that turns managed scarcity into managed premium. Italy devotes €51.5 million a year to one consortium’s brand. Canada spent $350 million across the sector — and AAFC couldn’t determine whether those investments protected future growth.

What This Means for Your Operation

Before your next capital decision, these are worth working through:

  • Where does your real break-even point sit? Not cash break-even — real break-even, with family labor, principal, and living expenses honestly accounted for. Farmdoc’s 2024 analysis pegs full costs in the low $20s/cwt. USDA-ERS data show even the largest herds (2,000+ cows) average $19.14/cwt on a full economic basis. The February WASDE raised the 2026 all-milk outlook to $18.95/cwt — up from $18.25 in January — but a 250-cow herd at a $20.00 break-even still faces a $1.05/cwt structural gap, or roughly $63,000 annually. If your gap exceeds $1.50/cwt, component optimization alone won’t close it. That’s a structural problem, not an efficiency problem.
  • How many years of operating losses can your balance sheet absorb? The farmstead cheese model shows a 42-month ramp to positive cash flow. If your current debt service doesn’t leave room for three-plus years of additional operating costs, Path 2 isn’t viable without outside capital — whether that’s DBI grants, USDA Rural Development financing, or equity partners.
  • Is there a specialty processor within 100 miles who could use your milk at a premium? Jasper Hill pays partner farms at a rate triple the commodity rate. Operations like this cluster across Vermont, Wisconsin, Oregon, and upstate New York. The conversation costs nothing.
  • Are three or more neighboring operations facing similar margin pressure? If each operation’s gap exceeds $1.50/cwt, the cost of a collective exploration of shared processing infrastructure is less than one farm’s annual component premium — and the DBI grants specifically fund this kind of feasibility work.
  • Has your cooperative discussed value-added returns to producers? The $11 billion in new U.S. processing capacity coming online through 2028 is almost entirely commodity-oriented. Ask whether any of it includes specialty or aged-cheese capacity — and whether premium returns would flow back through your milk check.
  • Does your state dairy association have a position on geographic indication development? NMPF and USDEC have identified GI protections as trade barriers in 34 markets, opposing them on stated grounds that GIs function as non-tariff barriers. As USDEC’s Krysta Harden put it in our Global Cheese Wars analysis: “Europe’s misuse of geographical indications is nothing more than a trade barrier dressed up as intellectual property protection.” The organizations representing you nationally may oppose the legal framework that underpins Italy’s pricing power. It’s a question worth raising at your next member meeting.

Key Takeaways

  • Italy generates €22.8 billion in dairy revenue while production volume shrinks — driven by PDO-protected cheese commanding 2.23 times the value premium of comparable non-GI products, according to AND-International’s 2012 study for the European Commission.
  • North American consumer demand for premium cheese is well established: 64% of U.S. shoppers buy specialty cheese regularly, with Gen Z leading at 71%, and 56% of buyers actively seek origin seals (Cypress Research for Supermarket Perimeter, March 2023).
  • A collective consortium approach reduces per-farm investment from $750K–$1.2M to roughly $60K–$70K — and $11 million in fresh USDA DBI funding is available now.
  • USDA’s 2026 all-milk outlook has whipsawed from $19.25 (November) to $18.25 (January) to $18.95 (February WASDE). That volatility itself is the point: commodity producers absorb every revision; value-added producers are structurally insulated from it.
  • Canada already has organized scarcity through supply management — the same foundational principle Italy uses — but hasn’t built the brand premium layer on top of it. The structure is there. The premium isn’t.
  • The realistic timeline is 5–7 years to meaningful premium returns for individual operations, potentially faster for organized collective efforts. Comté’s 32% profitability premium over neighboring farms — confirmed by both Origin-GI analysis and the French Ministry of Agriculture’s 2022 study — took 15–20 years to fully mature, but the divergence from the commodity market began almost immediately.

The Bottom Line

Italy didn’t build a €22.8 billion dairy industry by expanding herds. It organized producers into consortiums that turned commodity milk into protected brands — then enforced the quality and scarcity that hold price. The USDA outlook bounced 70 cents in one month. Next month, it could drop again. Value-added producers don’t spend February wondering which direction the revision goes. Where does your operation sit on that question?

Complete references and supporting documentation are available upon request by contacting the editorial team at editor@thebullvine.com.

Learn More

The Sunday Read Dairy Professionals Don’t Skip.

Every week, thousands of producers, breeders, and industry insiders open Bullvine Weekly for genetics insights, market shifts, and profit strategies they won’t find anywhere else. One email. Five minutes. Smarter decisions all week.
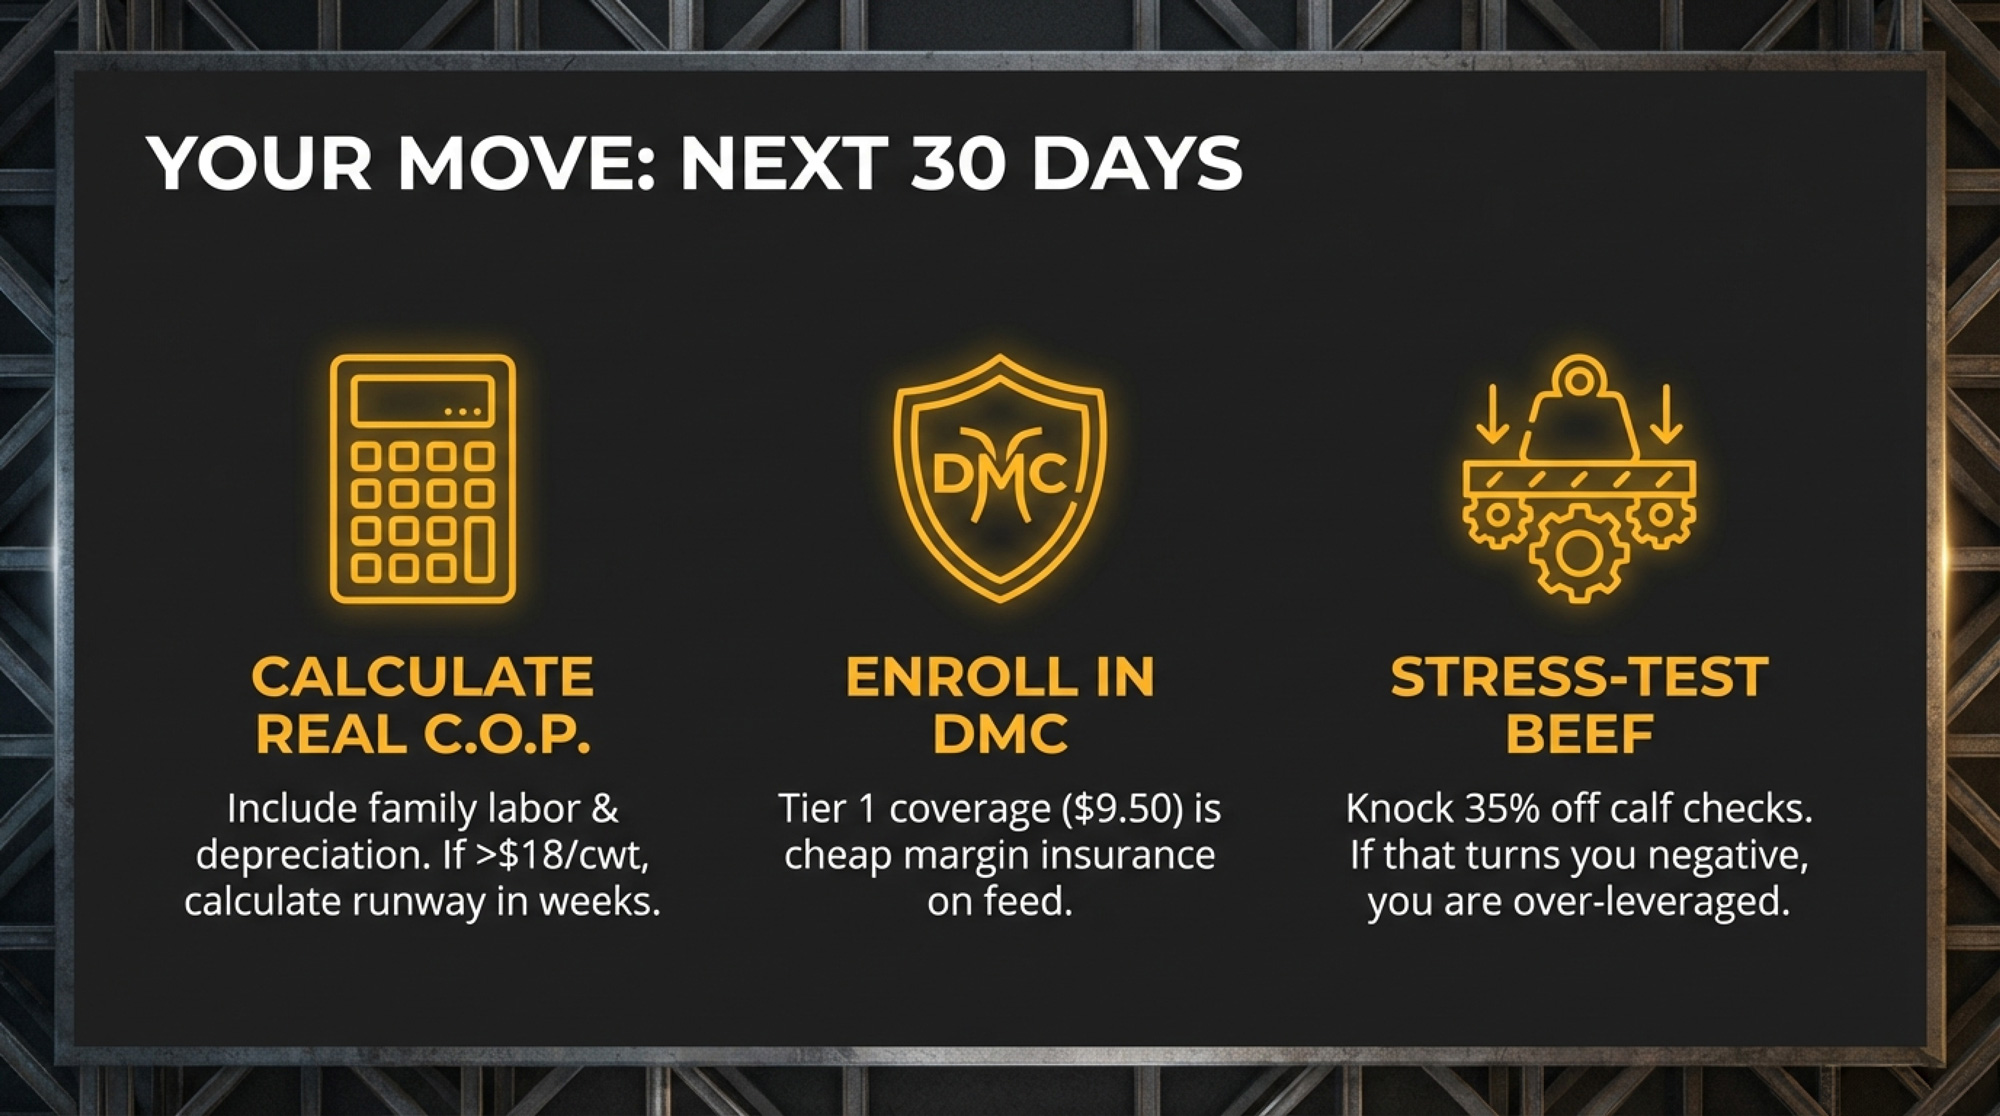
NewsSubscribe
First
Last
Consent

600 Argentine Dairy Families, One New Buyer, Zero Warning: Saputo’s $630M Sell‑Off and Your Processor Contract Risk

Your milk goes to one processor. Overnight, they sell 80% to a stranger. That’s not a what‑if — it’s what 600 Argentine dairy families woke up to today.

Executive Summary: Saputo is selling 80% of its Argentine dairy division to Peru’s Gloria Foods in a deal that values the business at C$855 million (about US$630 million), while keeping a 20% stake. Overnight, control of Argentina’s largest milk processor — 11.6% of the nation’s industrial milk and collections from more than 600 farms — shifts to a buyer that’s been sued for abusing its power with producers in Chile, fined in Colombia for adding whey to “whole” milk, and accused of monopolistic practices in Peru. Farmers shipping to Saputo’s Rafaela and Tío Pujio plants learned about the deal from a press release instead of a phone call, and they still don’t know if Gloria will keep their contracts, prices, and pickup schedules intact. They’re dealing with that gut punch in a sector where SanCor has just entered creditor protection and co‑ops’ share of Argentina’s milk has collapsed from roughly 34% to about 3%, leaving most producers tied closely to a single processor. Add in Gloria’s aggressive acquisition run and rising debt‑service costs at its Peruvian holding company, and you have a new owner that’s highly motivated to manage margins hard once the ink dries. This article walks you through what’s happening to those 600 Argentine dairy families — and gives you a concrete playbook to check whether your own processor contract would protect you if the company you ship to sold tomorrow without warning.

Saputo Inc. announced today that it’s selling 80% of its Argentine dairy division to Gloria Foods — the dairy arm of Peru’s Grupo Gloria — for an enterprise value of C$855 million. That works out to roughly US$630 million, including assumed debt, though Peruvian business media report the equity purchase price closer to US$500 million. Saputo expects net proceeds after tax of approximately C$543 million (US$400 million). The company keeps a 20% minority stake. The deal covers two processing plants, the La Paulina, Ricrem, and Molfino brands, and a milk collection network serving more than 600 dairy farms across Santa Fe and Córdoba provinces, according to Argentine agricultural media, including LA17 and Bichos de Campo.

This is what dairy processor consolidation risk looks like in practice. Those 600 families weren’t part of the conversation — and the company taking over has a record across Latin America that every producer, Argentine or not, ought to understand before this deal closes around mid-2026.

If you read nothing else this month, pair this with our recent piece on the four questions every dairy producer should ask about processor dependency. What’s happening in Argentina right now is a textbook case of what that audit is designed to prevent.

How Saputo Built Argentina’s Top Dairy Operation — Then Walked Away

Saputo entered Argentina in November 2003 by acquiring Molfino Hermanos S.A. from Molinos Río de la Plata for US$50.8 million. At the time, Molfino was the country’s third-largest processor — two plants, roughly 850 employees, about US$90 million in annual revenue. Over 23 years, Saputo turned that into the country’s number-one operation.

The OCLA 2023/24 industry ranking — based on reported and estimated daily milk reception by industrial processors, published annually — had Saputo processing an average of 3,650,288 liters per day, or 12.5% of national industrial milk volume. By the most recent OCLA 2024/25 ranking (published July 2025), that figure had dropped to 3.53 million liters daily, or 11.6% of the national total. Still number one, ahead of Mastellone (La Serenísima) at 3.15 million liters and 10.8%, but the decline hints at the pressures behind Saputo’s decision to sell. In the last four quarters, the Argentine operation generated approximately C$1.2 billion in revenue — about 7% of Saputo’s consolidated total.

When SanCor — once Argentina’s cooperative giant — entered a deep financial crisis beginning in 2017 (as SanCor put it in its February 2025 court filing), Saputo moved quickly. The company absorbed the freed-up milk supply and routinely offered prices better than competitors’. Producers followed the money. You would have too.

And then SanCor’s story got worse. On February 2, 2025 — just ten days before today’s Gloria announcement — SanCor formally filed for concurso preventivo de acreedores (creditor protection proceedings) at the Commercial Court in Rafaela, Santa Fe, carrying approximately US$400 million in debt. SanCor now processes just 409,163 liters daily, barely 1.4% of national production, down from its peak of 1.2 million. The region’s dairy infrastructure isn’t just shifting; it’s transforming. It’s being completely restructured.

Saputo’s dominance also created structural dependency. The practical effect was that Saputo’s price signals shaped the broader regional market — when the biggest buyer in the milkshed moved, everyone else followed. That arrangement works fine. Right up until the company at the center decides to leave.

CEO Carl Colizza’s press release language was corporate but clear: “This divestiture enhances our financial flexibility and supports targeted reinvestment in platforms that offer the highest growth opportunities.” Translation: take a roughly 12-fold return on a 23-year investment (US$630M enterprise value on a US$50.8M entry) and redeploy capital somewhere with fewer currency crises.

600 Families, No Advance Notice

Here’s what we know about how this landed on the ground. As of publication — hours after the announcement — there’s been no reported communication from Gloria Foods to Argentine producers. No new contract terms. No timeline for meetings. No word on whether existing payment schedules, quality premiums, or pickup logistics will change. Infocampo described the news as a “sacudón” — a jolt — to the Argentine dairy chain.

Several cooperatives sit squarely in Saputo’s milkshed. Cooperativa Tambera Central Unida in San Guillermo, Santa Fe — managed by Javier Clemente — delivers milk to five processing companies, including Saputo. Clemente has spoken publicly about producer autonomy in the region: “The one who decides where their production goes is the member, because the milk belongs to whoever produces it.” He made those remarks before the Gloria deal was announced. His cooperative is now directly affected, and whether that principle holds when a Peruvian conglomerate replaces a Canadian one is the question nobody can answer yet.

Cooperativa Agrícola Santa Rosa, also near San Guillermo and managed by Martín Guruceaga, works with approximately 60 farms across a 40-kilometer radius. Guruceaga has described the area simply as “una zona tambera” — a dairy zone where the community and the industry are one and the same. UNCOGA, a federation of nine cooperatives spanning central-west Santa Fe and central-east Córdoba, operates across the heart of Saputo’s collection territory.

These cooperatives are the closest thing to a collective voice that affected producers have. But the cooperative system itself has been hollowed out. Cooperative share of Argentine milk reception dropped from 34% in 1995 to roughly 3%today, according to the OCLA 2024/25 industry ranking. That means most of those 600-plus farms negotiate individually with their processor. When that processor changes without warning, individual leverage is essentially zero.

“The dairy sector and the country will only grow when the producer grows, because the producer is the one who carries the activity in their blood.” — Daniel Oggero, APLA executive committee, El Litoral, July 2015

Oggero made that statement during a blockade of Saputo’s Rafaela plant by western Santa Fe dairy farmers protesting milk price cuts. Those words land differently today, when the producer’s voice in the transaction was exactly zero.

Why Saputo Sold — And What Gloria’s Track Record Shows

Understanding both sides of this deal matters if you’re trying to figure out what comes next.

Why Saputo left: This isn’t a distressed sale. Through FY26, Saputo’s efficiency program has been delivering: Q1 operating cash flow hit C$317 million (up 66% year-over-year), adjusted EBITDA reached C$417 million (up 12.7%), and the company has been buying back shares aggressively. Saputo reported net losses of C$250 million through the nine months ended December 2024, driven largely by writedowns and hyperinflation accounting adjustments tied to Argentina — but the underlying business is profitable and improving. Saputo chose to leave. That tells you how the company views Argentine risk-reward going forward.

Who Gloria is: Gloria Foods is the dairy platform of Grupo Gloria, a Peruvian conglomerate with more than 7,000 employees across Peru, Chile, Bolivia, Argentina, Colombia, and Ecuador. President Claudio Rodriguez called the Saputo acquisition “a milestone within the strategy of sustained growth in Latin America.” The expansion has been rapid: Soprole in Chile from Fonterra for approximately US$644 million (completed April 2023), Ecuajugos from Nestlé in Ecuador (2024), and now Saputo Argentina.

But that growth has come with a trail of regulatory actions and producer-relations disputes. Not one-offs. A pattern across multiple countries.

In Peru, former AGALEP (national dairy farmers’ association) president Javier Valera publicly described Gloria’s market behavior as monopolistic. His successor, Nivia Vargas, accused the company of offering infrastructure only to larger-volume farms — deliberately fragmenting producer associations and undermining collective bargaining. Gloria has also fought a Peruvian government decree requiring evaporated milk be made from fresh milk. AGALEP leadership says that regulation underpins demand from an estimated 450,000 Peruvian dairy farmers.

In Chile, Gloria’s subsidiary Prolesur faces a lawsuit admitted by the national competition tribunal (TDLC) on January 30, 2025. Plaintiff Chilterra S.A. alleged abuse of dominant position, specifically that Prolesur imposed “unjustified prices through arbitrary and unverifiable criteria”—a system plaintiff Ricardo Ríos described as designed to create total producer dependence.

In Colombia, the Superintendencia de Industria y Comercio fined Gloria, along with Lactalis, Hacienda San Mateo, and Sabanalac in February 2025 for adding whey protein (lactosuero) to products labeled as whole pasteurized milk. The basis: INVIMA laboratory studies from 2019–2020 detected elevated caseinomacropeptide levels — a marker indicating whey protein had been added to a product labeled as pure milk. Gloria’s penalty was US$2.2 million. The company has appealed.

CountryAction / DisputeYearStatus / Penalty
PeruFormer AGALEP president accused Gloria of monopolistic behavior; producers claim infrastructure access limited to large farms, fragmenting associationsOngoingNo formal penalty; producer relations remain strained
ChileProlesur (Gloria subsidiary) sued for abuse of dominant position—”unjustified prices through arbitrary criteria” designed to create producer dependence2025Lawsuit admitted by TDLC competition tribunal Jan 2025; pending resolution
ColombiaFined for adding whey protein to “whole” milk; INVIMA labs detected elevated caseinomacropeptide (adulteration marker)2025US$2.2 million fine; Gloria appealed
Puerto RicoExited market entirely after regulatory challenges made operations “unworkable”2025–26Complete market withdrawal

Gloria reports investing approximately S/718 million — roughly US$190 million (S/ refers to Peruvian soles) — between 2012 and 2023 in a farmer development program. That figure comes from Gloria itself and hasn’t been independently audited, but the investment claim is on the record. In Puerto Rico, the company exited the market entirely in 2025–2026 after what it described as regulatory challenges that made operations unworkable.

Does any of this predict what happens in Argentina? Not necessarily. Different market, different regulations, different competitive dynamics. But the holding-level financial picture adds context. Holding Alimentario del Perú reported net losses of S/124.9 million (roughly US$33 million) in 2023 and S/62.2 million (~US$16 million) through nine months of 2024, according to Peruvian securities filings. Financial expenses surged from S/123.7 million in 2022 to S/399.5 million in 2023. A company whose debt-service costs tripled in one year is under pressure, even if the core dairy business is profitable.

Nobody’s saying assume the worst. But you’d be wise to ask very specific questions before closing day.

What This Means for Your Operation

This section is about dairy processor risk — and it applies whether you’re milking cows in Córdoba or Ontario or Wisconsin.

Contract ProtectionWhat It DoesArgentine StatusYour Action This Week
Ownership-change clauseRequires new buyer to honor existing contract terms or provides renegotiation windowMissing for most producersPull your supply agreement; search for “assignment,” “change of control,” or “transfer” clauses
Minimum notice periodGuarantees 30–90 days’ written notice before contract termination or major changesMissing for most producersCheck termination section; if absent, negotiate 60-day minimum before any ownership transfer
Payment guaranteeEnsures payment terms (price, schedule, penalties) survive ownership changeUnknown—producers waiting for Gloria communicationVerify whether your agreement specifies payment continuity; if not, add it
Secondary buyer relationshipDiversifies risk by routing 10–30% of production to alternative processorNot common in concentrated marketsIdentify regional cheese makers or co-ops; formalize even small-volume backup contract
Collective bargaining vehicleCooperative or producer association negotiates on behalf of groupExists (UNCOGA, cooperatives) but weakened by 3% co-op market shareJoin or re-engage with local co-op; coordinate questions for new buyer through group
Regulatory review triggerLarge acquisitions require competition-authority approval, sometimes with producer-protection conditionsPending—Argentine CNDC reviewing dealMonitor CNDC decision; if conditions imposed, ensure enforcement mechanisms exist

If you’re in Saputo’s Argentine collection zone: Your contract is the document that matters now. Does it include an ownership-change clause? A minimum notice period? A payment guarantee? If yes, those terms should carry over. If not — or if you don’t have a written agreement at all — you’re negotiating from scratch with a company you’ve never dealt with. Contact your cooperative this week. The latest SIGLEA data (December 2025) shows Argentine farm-gate milk prices averaging AR$476.60 per liter — up only about 8% year-over-year in nominal terms, while costs have continued to rise, putting margins under pressure. Any disruption in payment terms during a processor transition hits harder when margins are already thin.

If you’re a North American Saputo supplier: This looks like an emerging-market exit, not a signal about Saputo’s core North American business. The company is investing in U.S. capacity and showing improving domestic margins. Your situation is structurally different. But the underlying lesson is universal — if your supply agreement doesn’t survive a processor sale, you’re carrying the same risk these Argentine families just discovered. You just haven’t been tested yet.

If you sell to any dominant processor, anywhere: Here’s the math that matters. If one company handles more than 60% of your milk and your agreement has no ownership-change clause, you’re structurally identical to those 600 Argentine families. Geography doesn’t change that equation. What changes it is your contract.

The trend behind this deal — processor consolidation reshaping producer relationships globally — isn’t slowing down. In the past three years, Fonterra sold Soprole to Gloria, Nestlé sold Ecuador operations to Gloria, Savencia acquired Williner in Argentina, and Lactalis bought Dairy Partners Americas. Every transaction meant producers discovering, after the fact, that their buyer had changed.

Four Moves Before Closing Day

1. Pull your supply agreement and read it this week. Look for three things: the termination notice period, the ownership-change transfer provision, and the payment guarantee. If any are missing, that’s your negotiating priority before the new owner takes over. Not after.

2. Engage through your cooperative — and accept the trade-off. UNCOGA, Productores Unidos de Rafaela, and the San Guillermo cooperatives are the existing vehicles for collective action. A unified set of questions to Gloria about contracts, payment terms, and collection schedules carries more weight than 600 separate phone calls. Yes, coordinated engagement could be perceived as adversarial before the relationship starts. Move forward anyway. Silence is worse than friction.

3. Explore a second buyer relationship. Around Córdoba and Santa Fe, small and medium cheese makers (PyMEs queseras) have historically offered competitive raw-milk prices. Diversifying even a portion of production reduces concentration risk. The trade-off is real: approaching alternative buyers pre-closing could signal distrust to Gloria, and logistics with smaller processors are more complex. But having options is always the right strategy. And here’s your trigger — if Gloria hasn’t communicated directly with producers within 60 days of closing, that’s your signal to formalize a secondary buyer relationship. Not explore one. Formalize it.

4. Watch Gloria’s first 90 days after closing. Do they communicate directly with producers? Honor existing terms? Provide timeline certainty? Those are positive signals. Prolonged silence — producers still waiting for a phone call weeks after operational control transfers — tells a different story. What Gloria actually does will matter more than anything in a press release.

Three Signals Between Now and Mid-2026

Argentine regulatory review. This deal requires approval from Argentine authorities. At 11.6% of the national industrial milk volume, the competition authority (CNDC) could attach conditions. Any requirements imposed on Gloria regarding producer terms or pricing would be of enormous importance.

Gloria’s outreach to producers. The single most revealing signal. The company knows 600-plus families are waiting. Whether Gloria reaches out proactively or waits for producers to come to them will tell you which version of Gloria is showing up in Argentina.

Payment performance. SIGLEA reported Argentine farm-gate milk prices at AR$476.60 per liter in December 2025 — up only about 8% year-over-year in nominal terms, while production costs have continued climbing, according to OCLA. Gloria’s ability and willingness to maintain competitive pricing after closing will be the metric that matters most to every producer in the collection zone. Everything else is words on paper.

The broader context here — what processor consolidation means for producer survival — was one of the defining themes of 2025 dairy coverage.

Your Processor Risk Checklist

  • Audit your contract this week. No ownership-change clause, no defined termination notice, no payment guarantee means you’re carrying processor risk whether you’re in Córdoba or Ontario, or Wisconsin.
  • Know your single-buyer number. Over 60% of your milk to one processor without contractual protections? You’re in the same structural position as those Argentine families. The difference is timing — you can fix it before the press release drops.
  • Research your processor’s parent company. Financial pressure at the holding level — like debt-service costs tripling in a year — eventually filters down to producer terms. This applies to your processor too.
  • Don’t wait for the phone call. If you’re in Saputo’s Argentine collection zone: contact UNCOGA, your regional cooperative, or APLA (headquartered in Suardi, Santa Fe) this week. Ask collectively about contract continuity, payment schedules, and collection logistics. A coordinated ask is harder to ignore.
  • For North American Saputo suppliers wondering if you’re next: The evidence points to an emerging-market exit driven by Argentine macro conditions, not a systemic pullback. Saputo’s domestic numbers are moving in the right direction. But read your contract. Know what survives a sale.
  • If you know Argentine producers, share this. If you’ve toured dairy operations in Santa Fe or met producers from the Rafaela corridor at genetics events, connect them with this information. The more that circulates, the better everyone’s decisions get.

The Bottom Line

Guruceaga calls his part of Santa Fe “una zona tambera.” A dairy zone. It sounds simple until you sit with what it means: the cows and the community are the same thing. When the processor changes, the community changes with it.

The hardest part of what happened today isn’t the deal. It’s the sequence. A press release in Montreal. A wire story picked up in Lima. A notification on a phone in a milking parlor somewhere between Rafaela and Tío Pujio. And then the question that 600-plus families are asking right now — the same question every producer who depends on a single buyer should be asking before their turn comes:

Does my contract survive this?

If you don’t know the answer, you already know what to do this week.

Key Takeaways

  • Saputo is selling 80% of its Argentine dairy division to Gloria Foods for a C$855 million (≈US$630 million) enterprise value, keeping a 20% minority stake.
  • That puts Argentina’s largest processor — 11.6% of industrial milk and collections from 600‑plus farms — in the hands of a buyer that’s been sued for abuse of dominance in Chile, fined in Colombia over adulterated “whole” milk, and accused of monopolistic behavior in Peru.
  • Farmers supplying Saputo’s Rafaela and Tío Pujio plants learned of the sale from the media, not from their processor, and, as of today, have no firm answer on whether Gloria will honor their current contracts, prices, or pickup schedules.
  • With SanCor in creditor protection and co‑ops’ share of Argentina’s milk shrinking from roughly 34% to about 3%, most producers are now highly dependent on a single buyer when decisions like this drop.
  • If more than 60% of your milk goes to one processor and your contract is silent on ownership changes, you’re carrying the same processor‑risk those 600 Argentine families just discovered — and you should be auditing that agreement this week, before your own “press‑release moment” arrives.

Complete references and supporting documentation are available upon request by contacting the editorial team at editor@thebullvine.com.

Learn More

The Sunday Read Dairy Professionals Don’t Skip.

Every week, thousands of producers, breeders, and industry insiders open Bullvine Weekly for genetics insights, market shifts, and profit strategies they won’t find anywhere else. One email. Five minutes. Smarter decisions all week.
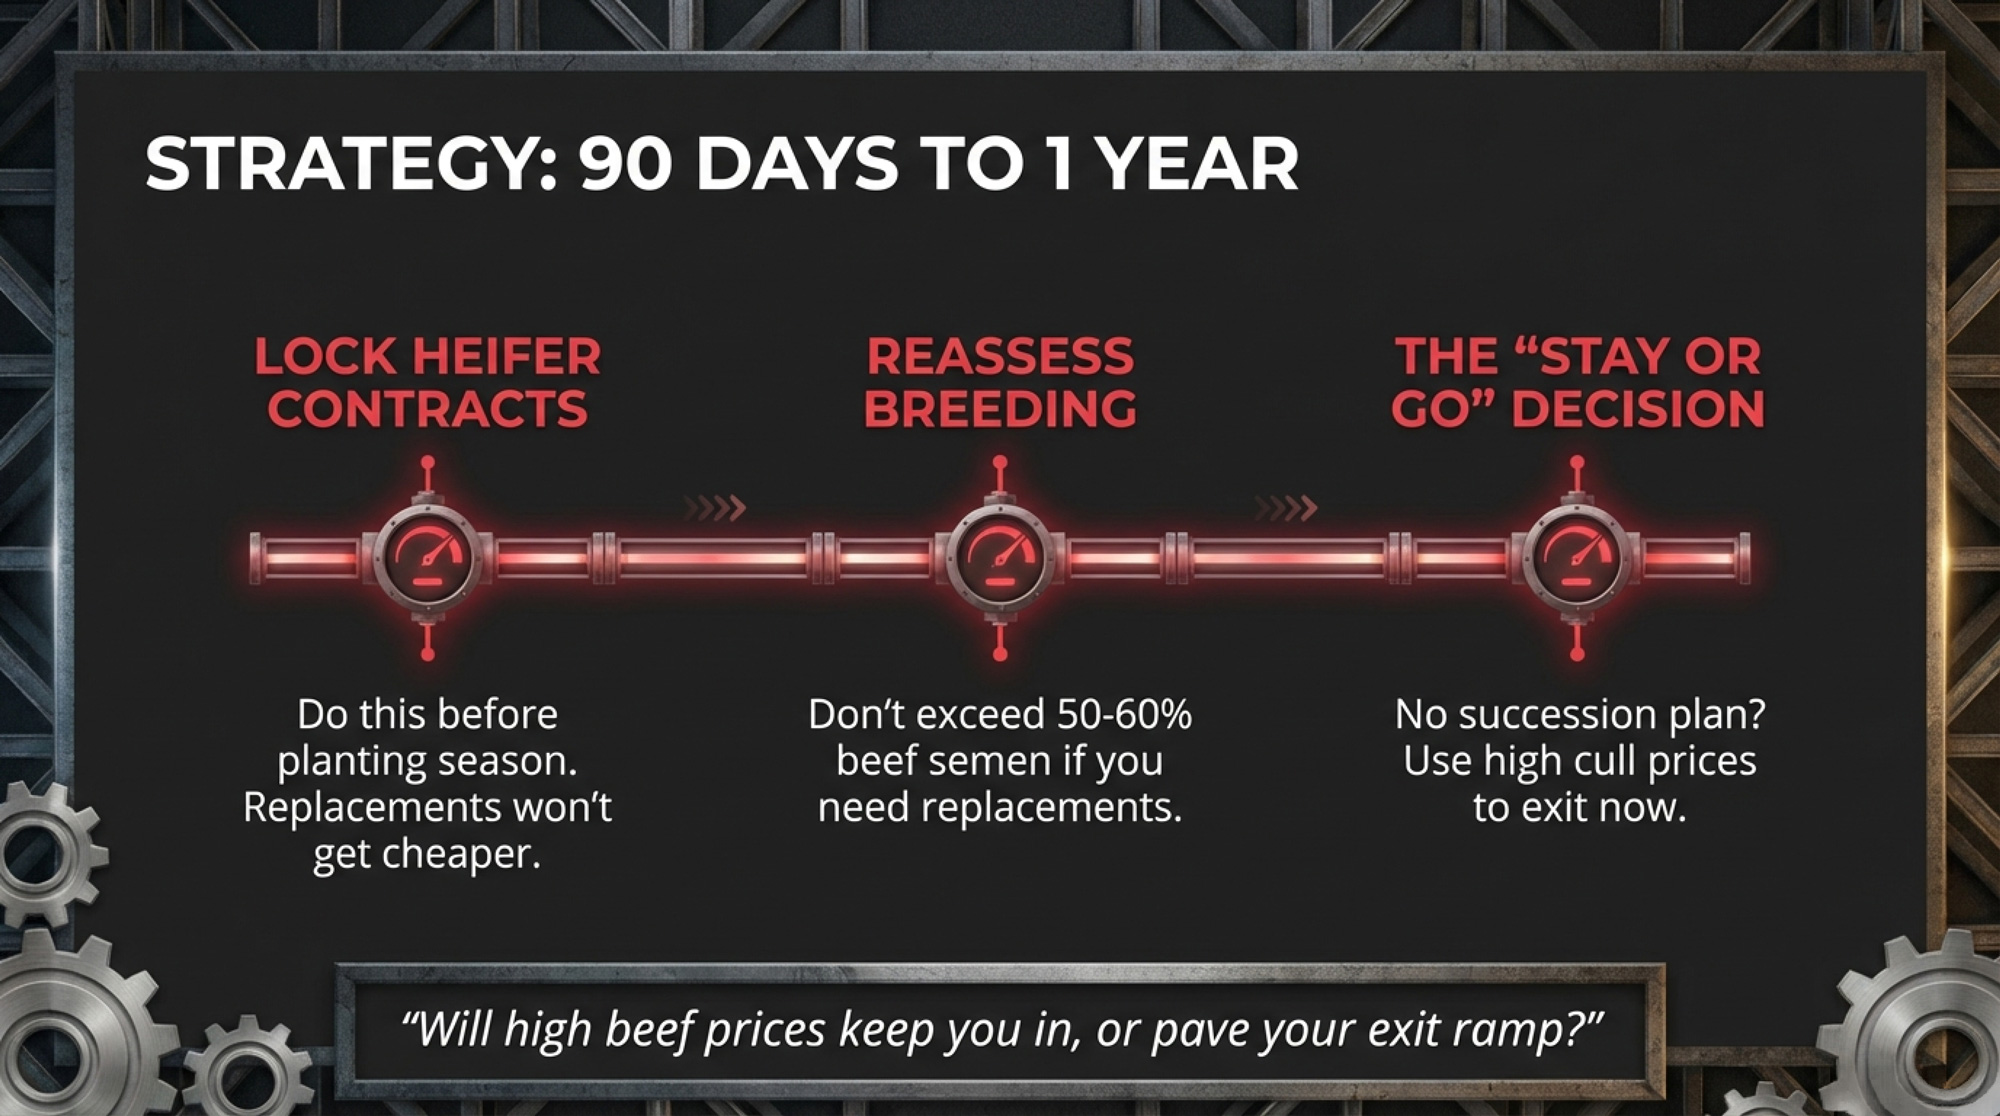
NewsSubscribe
First
Last
Consent

From 1,810 Dairy Farms to 18: How North Dakota’s Processing Collapse Cornered the Holle Family – and Could Corner You

You can’t breed your way to cheaper diesel.” North Dakota did the math, lost 1,792 dairies, and left one 1,000‑cow family asking what to do next.

Northern Lights Dairy sits about 12 miles south of Mandan, North Dakota — a 1,000‑cow Holstein operation run by the Holle family. Over the past 30 months, the Holles have been forced to find a new market for their milk twice. Not because of anything they did wrong, but because every processing facility in their state either closed or stopped taking raw milk. They now ship to a Bongards plant in Perham, Minnesota—a haul that runs about 5 hours one way, several times a day.

According to the Holle family, there are now just 18 Grade A dairy farms left in North Dakota as of early 2026. In 1987, there were 1,810. That’s a dairy farm collapse of more than 99% in less than four decades — the steepest of any state in modern American history, according to USDA Census of Agriculture data and the North Dakota Milk Marketing Board. If you’re milking in Wisconsin, Minnesota, Pennsylvania, or Vermont, North Dakota isn’t someone else’s cautionary tale. It’s a diagnostic tool for your own operation.

The Numbers: 1,810 to 18

North Dakota’s dairy collapse was both a slow grind and a sudden implosion. USDA Census data tells the story in five‑year snapshots:

YearDairy FarmsMilk CowsAvg. Herd Size
19871,810Not specified~30
19921,92574,88539
19971,19053,83545
200263334,50555
200740226,47966
201715616,470106
202210714,191133
2025~23–25~8,700–10,000~400
Early 202618

Note: Farm counts vary by source and methodology. Deputy Agriculture Commissioner Tom Bodine testified in March 2025 that 23 permitted dairy farms remained, with one not operating and “about 8,700 cows.” Dairy Star reported 25 regular‑milk dairies and 10,000 cows in June 2025. USDA NASS and NDSU Extension list approximately 10,000 cows for 2025. The Holle family at Northern Lights Dairy reports 18 Grade A dairy farms remaining as of early 2026.

From 107 farms in 2022 to 18 by early 2026. That’s not attrition. That’s a system breaking.

For comparison, Wisconsin went from 5,661 licensed herds in January 2024 to 5,348 by January 2025 — a loss of 313 farms, or 5.5%. By January 2026, state figures showed roughly 5,100 active dairy herds. A decade ago, Wisconsin had 10,081 dairy farms. Nearly half are gone. The rate is steadier and slower than North Dakota’s implosion. But the physics are the same. When processing density thins and routes stretch, the math turns hostile for everyone on the wrong end of the haul.

Two Plant Closures That Broke a State

Your dairy is only as viable as your ability to get raw milk onto a truck and into a plant at a cost that leaves a margin. When that chain breaks, everything you do inside the fence — genetics, feed efficiency, cow comfort — stops mattering.

North Dakota’s chain broke in two stages.

In September 2023, Prairie Farms Dairy closed its processing facility in Bismarck and converted it to distribution only. That plant had been the primary Class I destination for central and western North Dakota. Agriculture Commissioner Doug Goehring didn’t mince words: “With no other processors nearby, those dairies will likely pay for shipping longer distances that will be deducted from their milk checks. This will have a dramatic impact on their bottom line.” He was right. One producer about 50 miles northwest of Bismarck — identified in Dairy Star’s September 2023 reporting as Henke — saw his milk rerouted 151 miles to a DFA facility in Pollock, South Dakota, at an immediate freight surcharge of $0.55 per hundredweight. He also had to invest in an additional bulk tank to store two days’ worth of milk between every‑other‑day pickups. “That is going to be more important all the time,” Henke told Dairy Star.

Then, DFA closed the Pollock plant effective August 30, 2024, displacing 33 full‑time and four part‑time employees. That eliminated the backup destination. Suddenly, milk wasn’t traveling dozens of miles. It was traveling hundreds — into Minnesota plants that had no particular reason to pay a premium for distant, hard‑to‑route volume. Today, the only milk plant still operating in North Dakota is Cass‑Clay’s facility in Fargo, pressed against the Minnesota border. For smaller herds west of the Missouri, those added miles wiped out whatever thin margin remained.

Who Survived — and Why It Matters

The farms still milking aren’t random survivors. They sort into three models, and each tells you something about what works — and what doesn’t — when regional infrastructure collapses.

The scaled conventional — hanging on by the freight bill. Northern Lights Dairy’s permit allows up to 1,275 milking cows, and the Holles are currently milking about 1,000. That’s enough volume to keep haulers coming — but not enough to make a five‑hour haul one way, multiple times a day, feel anything but brutal. “The cost of trucking our milk 5 hours one way, multiple times a day, is really, really hard,” the family told The Bullvine in early 2026. “Dairying is really hard right now… we’re praying for the milk price to rebound, but the year looks bleak.”

The numbers back them up. The January 2026 Class III price landed at $14.59 per hundredweight (USDA AMS) — the lowest since April 2021. Strip the Holles’ massive freight costs off that already‑depressed price, and you can see why the family describes this as the toughest stretch they’ve faced.

In March 2025, Dawson Holle told the North Dakota House Agriculture Committee that the family had been researching on‑farm processing — a logical response after being forced to switch milk markets twice. But a year later, the family told The Bullvine they aren’t sure they’re in a financial position to build, that it’s “extremely expensive,” and that state funding may not be a realistic option. When asked directly about their plans, the answer was blunt: “We don’t know what we are going to do.”

Sit with that for a second. A 1,000‑cow operation. Fifth‑generation family. Fiber‑connected monitoring technology. A state legislator in the family. And the honest answer about the future is we don’t know. That’s not a failure of management or planning. That’s what it sounds like when every option outside the fence has been stripped away and the ones that remain are either unaffordable or uncertain.

The Holle family — Jennifer, Andrew, and their four children — at Northern Lights Dairy near Mandan, North Dakota. Behind them: the barns, the equipment, and a 1,000‑cow operation that now depends on a five‑hour milk haul to Minnesota just to stay in business. (Photo courtesy of Northern Lights Dairy)

Jennifer Holle, who serves as calving manager and oversees an average of three to four births a day — sometimes up to 15 — has described the farm’s monitoring technology as critical to managing individual cow care at that scale. Inside the fence, they’re running a tight, modern operation. Outside the fence, the system offers them no good answers.

The industrial entrant. Riverview LLP, based in Morris, Minnesota, is developing two massive projects in eastern North Dakota: a 25,000‑head facility in Traill County and a 12,500‑head facility in Richland County. An NDSU Extension analysis from December 2025 estimated the two dairies would inject approximately $270 million in initial investment and generate gross annual revenue ranging from $122 to $227 million. Both sites sit near the Minnesota border and the I‑29 processing corridor. North Dakota may stay on the map for total cow numbers. But these aren’t family farms — they’re industrial production units built for integration with large‑scale processing.

The direct‑to‑consumer niche. Twenty‑three farms sell raw milk directly to consumers under HB 1515, which legalized those sales effective August 1, 2023. These aren’t necessarily the same 23 farms Bodine referenced as permitted dairies — there’s overlap, but some raw‑milk sellers may not hold conventional permits and vice versa. Dawson Holle, who co‑sponsored HB 1515, told Dairy Star that “more are poised to come on board” as the 2025 legislature expanded sales to include raw milk products. “This also gives consumers in some of those 50‑person towns the chance to buy local, fresh milk,” he said. By capturing a far larger share of the retail dollar, these farms sidestep FMMO pricing and long‑haul freight entirely.

Here’s the tension worth sitting with: North Dakota will likely remain a dairy state in cow numbers. But the era of family‑scale dairy as a widespread enterprise there is over — unless someone can rebuild the processing link on terms the math can support. Right now, even the families best positioned to try can’t make it pencil.

Three Forces That Grind Margins to Zero

Plant closures pulled the trigger. But three deeper forces had been weakening the foundation for years.

Basis and the geography penalty. Basis — the gap between what you actually get paid and the CME benchmark — is shaped by how far your milk travels and how badly the nearest plant needs it. As processing consolidated along the I‑29 corridor, North Dakota producers saw their basis turn persistently negative with no local plant competition to bid it back up. You took what was offered, or you quit.

Federal Order 30 hauling data makes the geography penalty concrete. The weighted average milk hauling charge across the Upper Midwest jumped from $0.6137 per cwt in 2023 to $0.7969 in 2024 — a 30% increase — and North Dakota carries the highest average hauling charge of any state in the order. For an operation like Northern Lights, those averages understate reality. They’re hauling roughly 5 hours one way, several times a day, and describing the freight bill as “really, really hard” to carry, even though headline Class III is already at $14.59.

Make allowances: the quiet regulatory hit. In November 2024, USDA issued its final decision on FMMO pricing amendments—the most significant since 2000. The referendum passed in all 11 FMMOs in January 2025, with changes effective June 1, 2025. The cheese make allowance rose from $0.2003 to $0.2519 per pound (25.8%). Butter: $0.1715 to $0.2272 (32.5%). Nonfat dry milk: $0.1678 to $0.2393 (42.6%). Dry whey: $0.1991 to $0.2668 (34.0%).

The American Farm Bureau Federation estimated that if these increases had been in place from 2019 to 2023, they’d have reduced Class III prices by an average of $0.90 per hundredweight and cut annual pool values by over $91 million beyond the $1.26 billion decline already projected. On paper, that hits every farm equally. In practice? Producers in dense processing regions sometimes claw back some of the premium through higher prices. Producers in remote areas with one buyer and long hauls take it dollar‑for‑dollar on a check that was already thin.

The scale gap. USDA Economic Research Service data from the 2021 Agricultural Resource Management Survey, published in August 2024, found the average total production cost was $42.70 per cwt for herds under 50 cowscompared with $19.14 per cwt for herds of 2,000 or more — a cost gap of $23.56 per hundredweight. That gap is wider than many producers’ entire margin. Illinois Farm Business Farm Management data for 2024 reinforces the pattern: across all herd sizes, the average dairy posted a net economic return of negative $409 per cow, and returns haven’t exceeded total economic costs in any of the last ten years.

Our own internal benchmarking puts it in profitability terms: roughly 89% of operations milking 1,000+ cows report positive returns in typical conditions, compared with about 31% at 300 cows and roughly 11% at 100 cows or fewer. (Specific breakpoints vary significantly by region, management, and debt level.)

And that brings us to the distinction that matters most in this entire story: inside the fence versus outside the fence.Feed efficiency, reproduction, labor protocols — those live inside the fence, and improving them compounds over time. Basis, plant closures, make‑allowance hikes, route economics — those live outside it. If you’ve become top‑10% at everything inside the fence and your three‑to‑five‑year average still shows red, North Dakota’s lesson is blunt. The problem is structural, not operational. You can’t breed your way to cheaper diesel.

FactorInside the Fence (You Control)Outside the Fence (You Don’t Control)
Feed EfficiencyRation formulation, feed additives, bunk managementCommodity prices, regional drought, tariffs
ReproductionHeat detection, semen selection, protocol timingBull stud consolidation, semen price inflation
LaborTraining, retention, shift structureRegional wage competition, immigration policy
Milk QualityParlor hygiene, milking routine, mastitis protocolsProcessor quality premiums (or lack thereof)
BasisHerd size, contracts, buyer relationshipsPlant density, regional supply/demand, co-op pricing
FreightBulk tank size, pickup frequency negotiationHauling distance, route economics, plant closures
RegulatoryCompliance, record-keepingMake allowances, FMMO rules, environmental regs

The National Numbers Say You’re Next

The forces that dismantled North Dakota aren’t slowing down. Nationally, the U.S. lost roughly 15,866 dairy farms between 2017 and 2022, according to the USDA Census of Agriculture, followed by an estimated 8,400 more between 2022 and 2025. The average age of U.S. farm producers reached 58.1 years in the 2022 Census (USDA NASS), up from 57.5 in 2017. Producers over 65 grew by 12%, while the 35‑to‑64 bracket shrank by 9%. Widely cited family‑business research puts the third‑generation survival rate at roughly 12%, and dairy’s capital intensity makes it especially exposed.

Then there’s depooling. When the spread between Class III and Class IV prices gets wide enough, processors opt out of the federal pool, destabilizing pricing for everyone who stays in. By late October 2025, The Bullvine’s own CME market data showed the Class III–Class IV spread hitting $4.06 per hundredweight — Class III at $17.81, Class IV at $13.75 — creating a gap of roughly $3,800 per month per 100 cows between cheese‑plant shippers and butter‑powder shippers . The producers who get hurt the worst are in regions with limited local Class I demand and no bargaining power.

And 2026 offers no relief. USDA’s January 2026 WASDE projects the all‑milk price at roughly $18.25 per cwt, but Class III futures are hovering in the mid‑$16s with some contracts dipping toward the mid‑$15s. Capital Press reported in December 2025 that Class III is expected to average $17.05 in 2026 — down 7.3% from 2025 — while Class IV is forecast at $14.40, a 17% drop. The February 2026 Base Class I price fell to $14.70 — down $1.65 from January. The pricing environment is the most restrictive in half a decade. For producers already absorbing long hauls and thin basis, 2026 may be the year the structural math becomes undeniable.

What This Means for Your Operation

North Dakota’s lesson isn’t “work harder.” It’s “know whether your business model is structurally viable — and act on the answer before someone else makes the decision for you.”

The core diagnostic is one number: your true all‑in cost of production per hundredweight — including family labor at a realistic market wage, full debt service, and capital replacement — minus your three‑to‑five‑year average mailbox price after hauling, co‑op fees, and deductions. If that gap is consistently negative, you’re not in a bad year. You’re in the same structural position that killed 1,792 North Dakota dairies.

From that single number, everything else follows:

  • Know your freight exposure. What’s the hauling distance to your second‑nearest plant? If your current processor closes and your milk has to travel an additional 100 miles, what does that do to your net margin? If you effectively have only one buyer within practical distance, your vulnerability mirrors that of pre‑collapse North Dakota.
  • Track your basis monthly. Compare your actual mailbox price to the relevant CME Class price over 12 to 36 months. A persistently negative basis with no offsetting premium is a structural warning, not noise.
  • Stress‑test your debt service coverage. A DSCR consistently below 1.25 in average milk‑price years — or one that drops below 1.0 with a $1.50/cwt price dip — signals structural vulnerability.
  • Sort your problems: inside or outside the fence? If you’ve become top‑10% at feed, repro, and labor, and your multi‑year average still shows red, the problem is structural. You need a strategic pivot, not better protocols.
  • Have the succession conversation with a date attached. Not “someday.” If no committed successor exists, use that clarity to design a deliberate exit while you still have options.
  • Ask your processor one direct question: What’s your five‑year plan for this plant?

Four Paths Forward — and What Each Costs

If you recognize pieces of this pattern in your own operation, four strategic paths emerge. None is universally right.

Path 1: Scale toward the efficiency band. If you can credibly reach 1,000 to 1,500 cows, have strong plant relationships, and sit in a geography where processing is growing, the USDA ERS cost data says the math favors you. But scaling in a region with thinning plant density is a different bet than scaling near an I‑29 corridor. If your second‑nearest plant is more than 150 miles away and you don’t have a direct contract, bigger might just mean a bigger version of the same trap.

Path 2: Build a defensible niche. Organic, grass‑fed, A2, farmstead cheese, direct‑to‑consumer — these can work, but only with real margins. The threshold: your niche needs to deliver roughly $8 or more per hundredweight above commodity after all added costs — certification, labor, marketing, packaging. North Dakota’s 23 raw‑milk sellers prove the model. But they depend on location and customer base, not just good intentions.

Path 3: Own or invest in processing — but be honest about what it actually takes. On paper, producer‑owned processing is the logical answer to a processing desert. In practice, it’s “extremely expensive,” as the Holles put it, and state grant programs may not bridge the gap. North Dakota’s SB 2342, sponsored by Sen. Paul Thomas (R‑Velva), offers grants of 5% of processing plant construction costs, capped at $10 million. “Dairy without processing is going to be really tough to kick back in,” Thomas told the House Agriculture Committee. He’s right. But the Holles — a 1,000‑cow, fifth‑generation operation with a state legislator in the family and every reason to make this work — looked at the numbers and told The Bullvine flatly: “We don’t know what we are going to do.” If they can’t pencil it, that tells you something about the gap between policy intent and farm‑level reality. Cooperative models like Idaho’s Glanbia and Wisconsin’s Foremost Farms show producer‑aligned processing can work at scale — but organizing those structures requires volume, capital, and regional density that places like central North Dakota no longer have.

Path 4: Plan a profitable, deliberate exit. If your structural math is negative over a multi‑year average, no successor is committed, and major capital expenditures loom, the most rational move may be to sell cows and equipment while they still command reasonable prices, keep the land, and redeploy capital. In North Dakota, hundreds of families waited until plant closures and exhausted equity forced distressed exits. The families who got out earlier kept more of what they’d built.

One trade‑off nobody talks about openly: in tight‑knit dairy communities, exiting early carries real social stigma. That pressure keeps people milking past the point of economic sense. Acknowledging it doesn’t make the math any friendlier.

The Choice That Sits Heaviest

There’s a moment every producer in a structurally challenged region eventually faces. The morning you realize you’re no longer fighting to save the dairy, you’re deciding whether to fight to preserve the family and the land.

In North Dakota, too many families reached that moment after the plant closed, when equity was burned and options had narrowed to a distressed sale. The ones who came through with something to show — whether they’re still milking or whether they pivoted to cropping and kept the ground — ran the numbers honestly, believed what the math told them, and moved while they still had choices.

Your job isn’t to save dairy as a concept. It’s to decide — clearly, honestly, and soon enough to matter — whether this business, in this form, can support your family for another generation. If the answer is yes, invest accordingly and fight like hell. If it’s no, preserve what you’ve built and redirect it before the route, the regulator, or the bank makes the call for you.

If the financial and emotional weight of these decisions feels overwhelming, resources are available. The Farm Aid hotline (1‑800‑FARM‑AID) connects producers with local support services, and most state extension programs offer confidential financial counseling for farm families.

Key Takeaways

  • North Dakota’s crash from 1,810 dairies to 18 is your warning label for what happens when processing deserts, long hauls, and weak basis stack up.
  • The Holle family’s 1,000‑cow Northern Lights Dairy — hauling milk five hours one way and saying, “We don’t know what we are going to do” — shows how structural risk can corner even well‑run herds.
  • National and Upper Midwest data confirm the math: small and remote herds often face >$23/cwt higher production costs than 2,000‑cow farms, plus roughly 30% higher hauling charges in just one year.
  • You need to run the six diagnostics in this article to sort your problems into “inside the fence” (feed, repro, labor) versus “outside the fence” (basis, plants, freight, policy).
  • If your three‑ to five‑year average mailbox price sits under your true all‑in cost, your job isn’t to work harder — it’s to choose one of the four paths laid out here before the route, the regulator, or the bank chooses for you.

The Bottom Line

Northern Lights Dairy is still milking today, still hauling to Minnesota on a five‑hour route, still doing everything they can to keep the lights on. When we asked about the future, the family didn’t offer a polished plan or a confident prediction. They said, “We don’t know what we are going to do.” Honestly? That might be the most important sentence in this entire article. Because if a 1,000‑cow, fifth‑generation operation with every advantage inside the fence can’t see a clear path forward, the structural crisis isn’t coming. It’s here.

Complete references and supporting documentation are available upon request by contacting the editorial team at editor@thebullvine.com.

Learn More

The Sunday Read Dairy Professionals Don’t Skip.

Every week, thousands of producers, breeders, and industry insiders open Bullvine Weekly for genetics insights, market shifts, and profit strategies they won’t find anywhere else. One email. Five minutes. Smarter decisions all week.
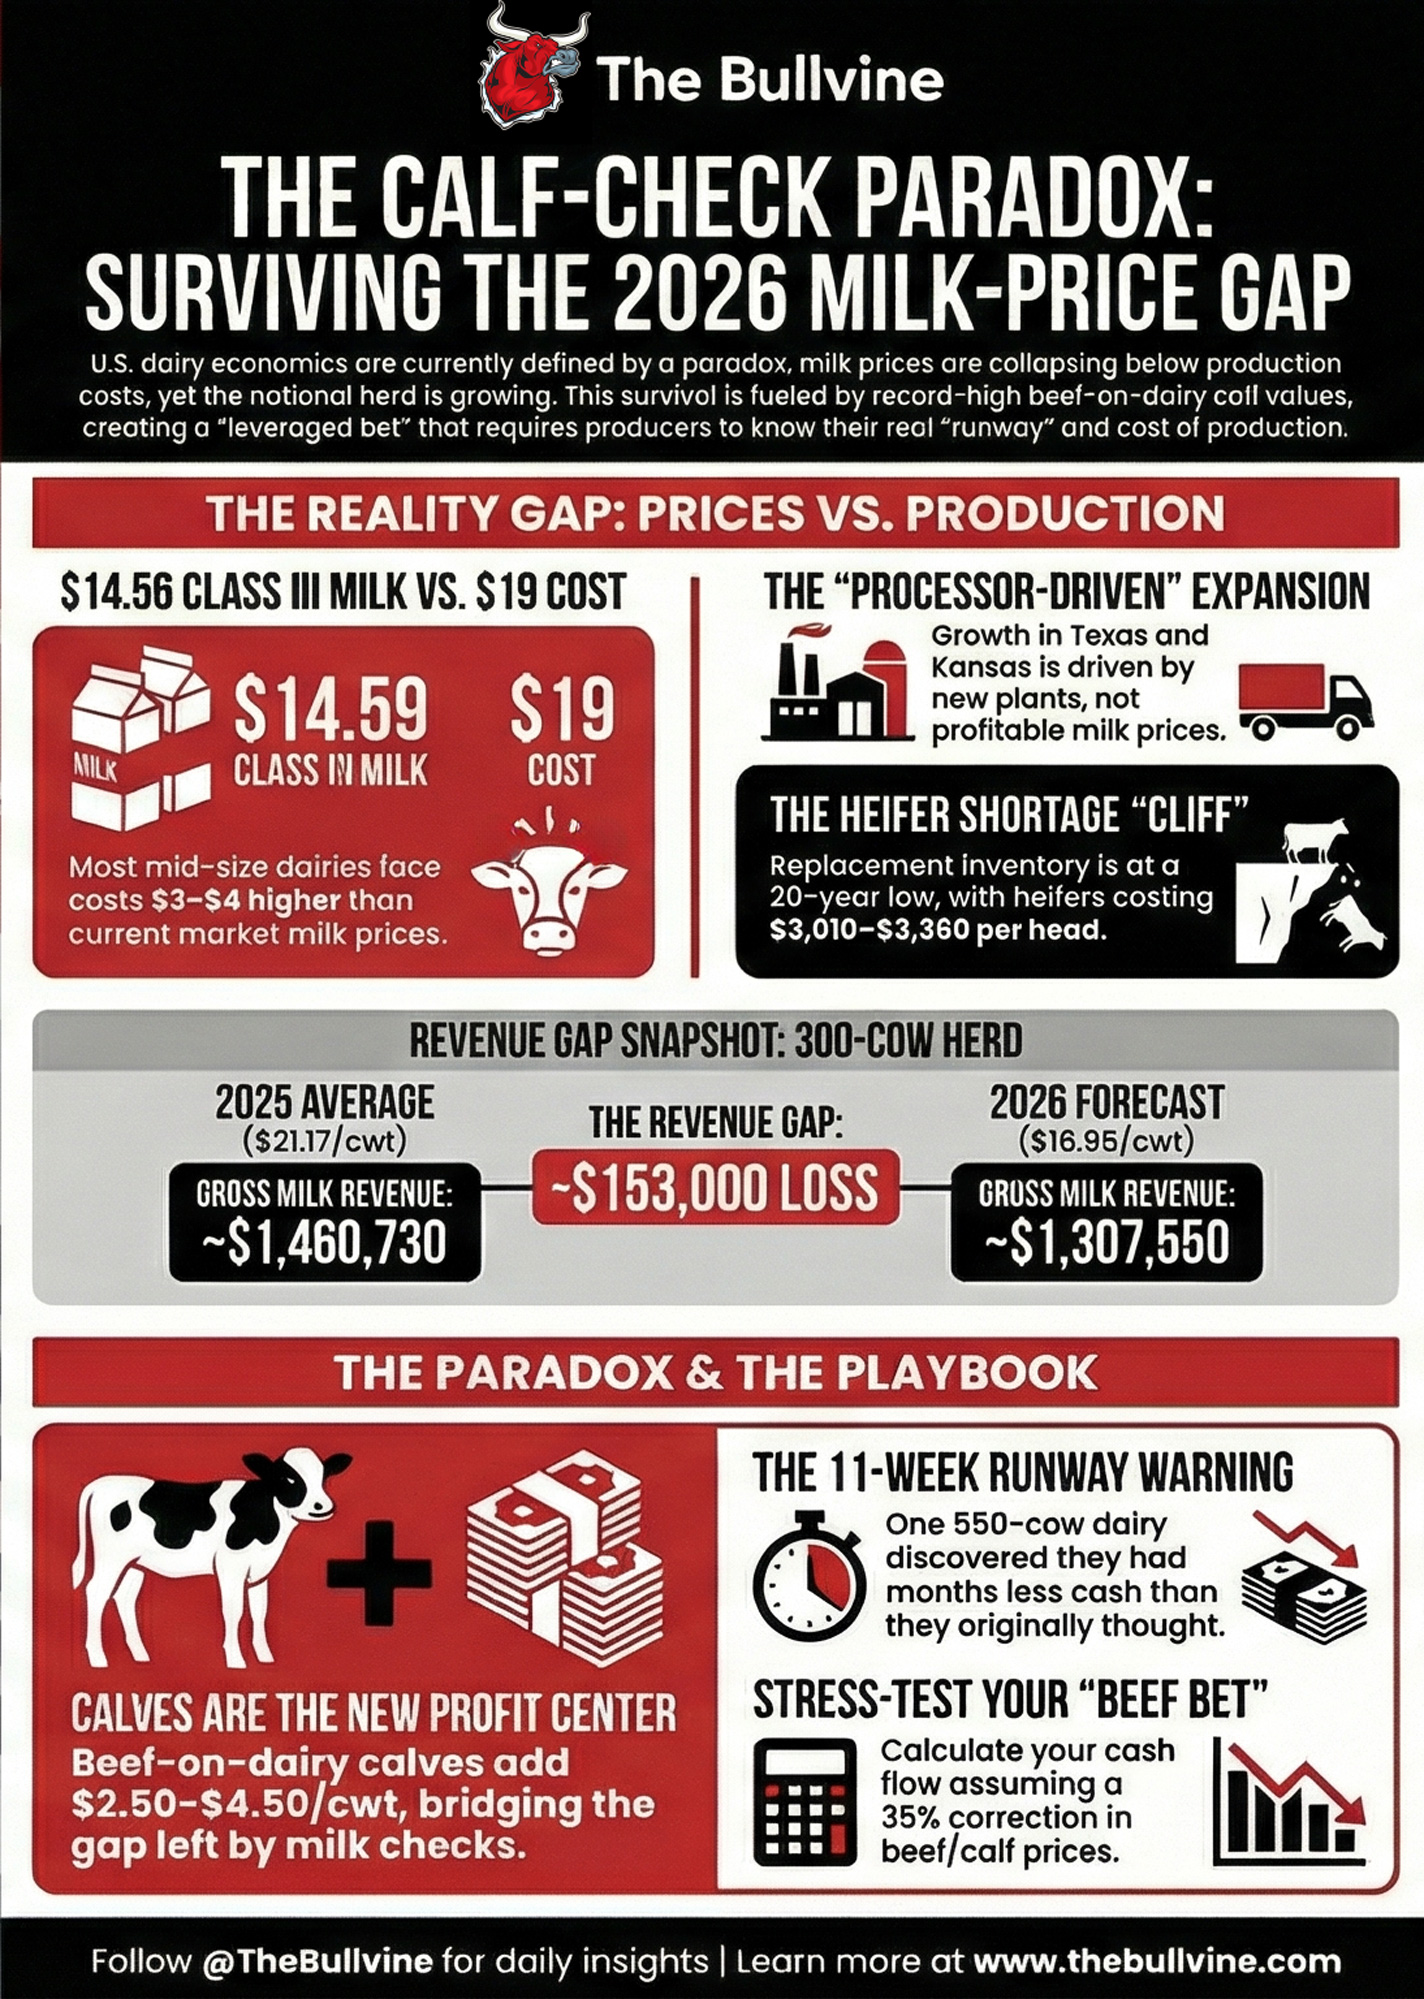
NewsSubscribe
First
Last
Consent

The $100 Springer Gap: Dairy Farm Relocation Is Moving America’s Milk Map to I-29

$225K from beef‑on‑dairy, $6M digesters in the red, and 10-year permits on offer. This isn’t theory — it’s where herds are actually moving.

Executive Summary: South Dakota has become dairy’s new magnet, adding 25,000 cows in a year to hit 240,000 head by January 2026, while California Dairies Inc. shut a 99‑year‑old plant in Los Banos. The piece shows how that kind of dairy farm relocation is being driven by 10‑year CAFO permits, nine‑figure cheese investments, and genetics built for component pricing on the I‑29 corridor — and by rising water, labor, and methane‑rule friction in the West. It puts real faces on the shift: David Lemstra leaving California after 40 years to build Dakota Line Dairy in South Dakota, and California producers like Jared Fernandes and Simon Vander Woude staying put but flipping genetics, forage use, and beef‑on‑dairy strategy to make the math work. On the income side, beef‑on‑dairy crosses that bring $80–90 a head over Holsteins can add about $225,000 a year to a 2,000‑cow herd; on the cost side, $6‑million digesters and LCFS credits falling from $200 to ~$60/ton have turned many “green” projects into long‑shot paybacks. From there, it lays out three concrete paths — relocate, stay and adapt, or cash out — backed by specific rules of thumb like a $0.75/cwt 3‑year basis trigger, a 7–10‑year relocation payback window, and a 20% 21‑day pregnancy rate threshold for sexed‑on‑top/beef‑on‑bottom programs. The takeaway for 2026 is blunt: sitting in the middle — too big for niche, too small for true scale, stuck in a high‑friction state — is a choice, and probably the riskiest one on the table.

In January 2026, a load of Holstein springers from a top-tier herd — impeccable records, sexed-semen confirmation, premier genetics — sold for $3,300 a head. Two loads of heifers from custom raisers, with no birthdates, no records, and bred to natural-service Black Angus bulls, cleared $3,400. Jake Bettencourt of TLAY Dairy Video Sales, who witnessed the sale, put it plainly: “The main trend currently is, ‘What calf is a springer carrying?'”

That $100 gap is a small number with a big message. This dairy migration — the relocation of dairy farms at an industrial scale — isn’t just about geography. It’s about which regions built systems where every piece of the profit equation works together, and which ones quietly stacked friction until producers started loading trucks.

88,000 Cows in Five Years — and 25,000 More Right Behind Them

The I-29 and I-90 corridors running through South Dakota, Minnesota, Iowa, and Nebraska have become the primary growth engine for U.S. milk production. The reason isn’t abstract. It’s stainless steel.

Three processor expansions tell the story. Agropur invested $252 million to nearly triple capacity at its Lake Norden, South Dakota, plant, going from 3.3 million to 9.3 million pounds of milk per day. Valley Queen Cheese in Milbank broke ground on what was originally announced in 2022 as a $195 million expansion, its largest in 93 years. That project came in at $230 million and by late 2025 was handling 8 million pounds of milk daily. Bel Brands launched its Brookings facility, adding still more demand. 

The cows came — fast. South Dakota’s milk cow population reached 215,000 as of January 1, 2025 — more than doubling in a decade, a gain of 117% that leads the nation. Some 88,000 of those cows arrived in just five years, a 69% jump. Then it kept going. USDA NASS confirms the state’s dairy herd reached 240,000 head as of January 1, 2026  — exactly the 25,000 additional cows Valley Queen’s Evan Grong had projected. South Dakota’s December 2025 milk production ran more than 11% above the prior year, the biggest increase among the 24 major dairy states — in a national herd of 9.57 million, South Dakota punched well above its weight. 

Tom Peterson, executive director of South Dakota Dairy Producers, describes a deliberate effort: “About 20 years ago, South Dakota leaders and stakeholders came together with farmers and milk processors to develop a plan to not only ensure dairy industry survival in the state, but with aspirations of creating a dairy destination”. GOED Commissioner Chris Schilken estimated in early 2024 that the economic impact of 118,000 additional cows was “nearly $4 billion annually”. With 25,000 more since then, that number has only climbed. 

A Genetics Gap Is Emerging

Here’s a dimension of this migration that gets overlooked: the cows moving east aren’t just changing zip codes. They’re changing what gets selected for.

The Upper Midwest model is built around cheese vats. Valley Queen, Agropur, Bel Brands: component-driven processors. That means the genetics flowing into the I-29 corridor increasingly prioritize high-butterfat, high-component cattle that fit Cheese Merit profiles — and component pricing rewards them for it. The April 2025 Net Merit revision tells the same story nationally: CDCB bumped butterfat emphasis to 31.8% (up from 28.6%) while dropping protein from 19.6% to 13.0%, and pushed Feed Saved to 17.8%. Holstein butterfat hit a national average of 4.23% in 2024, per CoBank’s Corey Geiger. Under the revised NM$ weightings, a cow with top-decile butterfat and Feed Saved genetics delivers meaningfully more lifetime profit than a volume-only counterpart — the exact dollar advantage varies by herd and market, but the directional shift is unmistakable.  

For I‑29 shippers, CM$ often beats NM$ as your main index, because plants like Valley Queen and Agropur pay you on components, not volume.

The Western model may need a different genetic profile entirely. Jared Fernandes at Legacy Ranches in Tulare County made that call: he switched from Holsteins to Jerseys, cutting forage consumption by 30% and reducing water use on a 4,500-cow operation facing tight water supplies. In Merced County, Simon Vander Woude took a different approach: genomic testing since 2012, beef-on-dairy crosses on 60% of calvings, cull rate around 30%, and average lactations pushed to 2.7 — up from 2.2 when he started. “We are creating more milk with fewer cows, more components in the milk with fewer cows,” Vander Woude said. “That’s fewer mouths eating, fewer heifers”. 

Dairy Migration: Two Systems, Two Sets of Friction

California’s December 2024 milk production fell 6.8% year over year — the state’s steepest monthly drop in roughly 20 years, heavily amplified by HPAI, which hit 747 of approximately 950 dairy farms. California recovered by mid-2025 — production up 2.7% in June versus 2024  —, but the episode exposed structural vulnerabilities that predate the outbreak. Idaho’s Rick Naerebout reported the cost of production “above $18.50 per hundredweight and still around $20 for many.” Oregon’s John Van Dam: “staying above water but not going anywhere”. 

 Upper Midwest (I-29 Corridor)Western U.S. (CA, ID, OR, WA)
CAFO Permits10-year state permits (SD DANR)  5-year federal NPDES cycle; annual state layers
Processing$700M+ invested 2019–2025; coordinated with cow growth  CDI closed Artesia (2020) and Los Banos (Oct. 2024) — two plants in four years  
WaterAbundant groundwater; no pumping restrictionsSGMA projected to fallow 388,000 acres, cut dairy output $2.2B by 2040  
Methane RulesMinimal state mandates$300–$675M/year in projected losses under direct regulation  
Digester EconomicsN/A (not required)$6M+ per unit; LCFS credits crashed from $200 to ~$60/MT (2021–2024)  
LaborStandard ag labor rulesCA/WA: highest minimum wages + ag overtime mandates
LegislativePro-dairy incentive programs (GOED)  25 anti-dairy bills killed cumulatively through 2023  
GeneticsComponent-driven (CM$); fits cheese processingUnder pressure to shift — Fernandes (Jersey pivot) and Vander Woude (genomic efficiency) lead 

The LCFS column deserves a closer look. Digester construction averages over $6 million per unit. Those investments were supposed to pencil on strong carbon credit revenue. Instead, the green dream turned into a red-ink reality for many Western digesters. UC Berkeley professor Aaron Smith found dairy digester developers need approximately 10 years to achieve ROI on avoided methane credits  — and that’s if credit values hold, which they haven’t. Anja Raudabaugh, CEO of Western United Dairies, noted that producers face “years of delay for approval and additional years of waiting for the actual money to show up”. 

ERA Economics’ February 2023 analysis projects a 130,000-head reduction in California’s herd by 2040 under SGMA. A separate ERA report from September 2024 estimates 20–25% of small dairies could exit under direct methane regulation. These aren’t one-time hits. They compound annually — and they fall hardest on mid-sized commodity operations too large for niche premiums and too small to absorb six- and seven-figure regulatory overhead. 

The Beef-on-Dairy Premium: A Profit Engine That Follows the Truck

The $100 springer gap Bettencourt described is the visible edge of a much larger shift. Kansas State University researchers, analyzing 14,075 feeder steer lots through Superior Livestock (2020–2021), found beef-on-dairy crosses at 550–600 pounds bringing roughly $80–90 per head more than straight Holstein steers. UF dairy economist Albert De Vries found that when 21-day pregnancy rates exceed 20%, a sexed-on-top, beef-on-bottom strategy maximizes calf income while still generating enough replacements. Below that threshold, you may not be making enough heifers to sustain the replacement pipeline. 

Scale it: a 2,000-cow herd producing roughly 1,500 beef-cross calves annually at a conservative $150/head advantageworks out to $225,000 per year in extra calf revenue. That premium is location-sensitive — regions with established feedlots and packers set up for beef-on-dairy pay more consistently. The I-29 corridor has that infrastructure. And with the U.S. beef cattle inventory at a 75-year low of 86.2 million head as of January 2026, those premiums have structural support. But cattle cycles turn. 

Three Paths Forward — and What Each One Costs

Path A: Move the cows to fit the system. David Lemstra did exactly this. After more than 40 years in central California, he spent nearly a decade researching alternatives before building Dakota Line Dairy in Humboldt, South Dakota. Today, the Lemstras milk 4,000 cows and ship to Agropur’s Lake Norden plant. Feed, permits, and processing” drove the move. He described leaving California as “death by 1,000 cuts”. Compare your 10-year “stay” cost to building in a growth corridor after selling your current assets. If the payback falls within 7–10 years, it pencils out. The risk: capital-intensive, and the best processor relationships won’t wait. 

Path B: Change the model to fit the ground. Fernandes built a digester, went deep on regenerative ag, and made the genetic pivot to Jerseys. “We do a lot of things that you don’t hear about, that I think are sustainable,” he said at the 2025 California Dairy Sustainability Summit. Vander Woude kept Holsteins but used genomics to push average lactations from 2.2 to 2.7 while running 60% beef-on-dairy — more milk and more valuable calves from fewer animals. ERA Economics notes that digester revenue-share agreements typically provide $50–100 per cow per year, which is meaningful if volatile. The risk: heavy capital and regulatory tolerance required; niching down means brand-premium volatility. 

Path C: Monetize the asset base. For operations where neither moving nor reinventing pencils, the honest option may be selling while assets still command value. ERA projects 388,000 acres could be fallowed in the San Joaquin Valley under SGMA. Selling from strength is a different negotiation than selling from distress. 

PathA: Relocate to Growth CorridorB: Reinvent In PlaceC: Monetize & Exit
DescriptionMove cows to I-29 corridor; build on 10-yr permits, processor contractsDigester + genetics pivot (Jersey/genomic efficiency) + regen agSell assets while value remains; avoid distressed sale
Capital Required$7–10M+ (new facility, herd move, infrastructure)$6M+ digester + genetics transition + brand/regen investmentMinimal (brokerage, legal, transition planning)
Payback Window7–10 years (basis advantage + calf premium + water/compliance savings)10+ years (digester ROI alone ~10 yrs; genetics 3–5 yrs to see full shift)Immediate liquidity; capital preservation
Key RisksCapital-intensive; best processor relationships won’t wait; market timingHeavy regulatory tolerance required; LCFS/SGMA volatility; brand-premium niche riskTiming matters—asset values eroding as Western processing consolidates
Best Fit For…2,000+ cow herds with equity, rolling 3-yr basis drag >$0.75/cwt, appetite for scaleEstablished Western herds with strong brand access, regen ag commitment, high reproductive efficiencyMid-size commodity herds: too big for niche, too small for scale, stuck in high-friction state

Your 90-Day Decision Checklist

  • Run your 10-year “stay” scenario. Pull your rolling 3-year basis versus the best alternative region. Add actual water and compliance cost trends. If the cumulative drag exceeds $400,000–$500,000 per year, relocation deserves a serious model.
  • Test your basis trigger. A rolling 3-year disadvantage exceeding $0.75/cwt means $225,000 annually on a 2,000-cow herd shipping 300,000 cwt/year. Before water, compliance, or calf value.
  • Audit your genetic alignment. Are you selecting for CM$ or NM$ to match your actual processor contract? The April 2025 NM$ revision puts butterfat at 31.8% — if you’re shipping into a fluid market, that may not be your index. 
  • Check your 21-day pregnancy rate against the De Vries threshold. Below 20%, a sexed-on-top/beef-on-bottom program may not generate enough replacement heifers. 
  • Scout destination regions before you need them. Lemstra spent nearly a decade researching before he moved. The best sites and processor relationships go to producers who are already known. 
  • Don’t assume your current asset values are permanent. CDI closed two California plants in four years — Artesia in 2020  and Los Banos in October 2024. If processors are consolidating around you, your land’s dairy-use premium may already be eroding. 

Key Takeaways

  • South Dakota’s dairy herd hit 240,000 cows as of January 1, 2026, adding 25,000 head in a single year  — exactly matching Grong’s projection, built on 10-year CAFO permits, reinvestment incentives, and nine-figure processor expansions. 
  • The $100 springer premium for beef-cross calves signals that calf revenue belongs in the same strategic column as milk price, basis, and water cost. Beef herd at a 75-year low supports that premium  — but cattle cycles turn. 
  • A genetics gap is emerging between component-driven Midwest herds (butterfat now 31.8% of NM$) and Western herds pivoting toward longevity and efficiency. Fernandes’s Jersey switch and Vander Woude’s genomic program show what that pivot looks like. 
  • Western producers face compounding threats: $2.2 billion in projected SGMA losses by 2040; $300–$675 million per year in methane regulation; LCFS credits crashing from $200 to $60; and CDI closing two plants in four years. 
  • Watch in 2026–2027: SGMA implementation deadlines, Midwest processor capacity utilization, and beef-cycle signals that could compress cross-calf premiums.

The Bottom Line

The middle ground — too big for niche, too small for scale, stuck in a high-friction state with genetics optimized for a pricing structure that’s shifting underneath you — is the most dangerous place to be in 2026. The producers hauling cattle east on I-90 have run the numbers long enough to know it. The ones staying, like Fernandes and Vander Woude, are reinventing their operations from the genetics up. Both are making active choices with their eyes open. The only losing move is standing still and hoping the spreadsheet doesn’t notice.

Complete references and supporting documentation are available upon request by contacting the editorial team at editor@thebullvine.com.

Learn More

The Sunday Read Dairy Professionals Don’t Skip.

Every week, thousands of producers, breeders, and industry insiders open Bullvine Weekly for genetics insights, market shifts, and profit strategies they won’t find anywhere else. One email. Five minutes. Smarter decisions all week.

NewsSubscribe
First
Last
Consent

USDA’s $109 Billion Warning: $18.95 Milk, $19.14 Costs, and 29% of Farm Income from Government Checks

$18.95 milk, $19.14 costs, 29% of income from government checks. If any one of those moves against you, what happens to your dairy?

Executive Summary: USDA’s February outlook has 29% of U.S. net farm income coming from government checks in 2026, with $44.3 billion in payments propping up a farm economy that would otherwise drop to about $109 billion in net income. At the same time, the February WASDE raised the 2026 all‑milk price to $18.95/cwt, while USDA‑ERS cost‑of‑production data put average 2,000‑plus cow herds at $19.14/cwt and the smallest herds near $42.70/cwt. For a 300‑cow, 23,000‑lb herd, that price reset from $21.17 to $18.95 still means roughly $153,000 less gross milk revenue before you even count feed, labor, and debt. This article walks the math by herd size, then lays out four real levers you can pull — beef‑on‑dairy, component premiums, feed cost protection, and risk‑management tools like DMC — with the upsides and trade‑offs spelled out in plain language. It uses real operations and named analysts to show how those choices are playing out on the ground, from McCarty Family Farms’ genomic beef‑on‑dairy strategy to DFA’s $2.50–$3.00/cwt revenue bump and Ever.Ag’s “street fight” warning. It finishes with concrete thresholds and questions for sub‑200, 200–999, and 1,000‑plus cow herds so you can see whether you’re running a market‑based margin, a subsidy‑dependent margin, or whether it’s time to use today’s strong cattle markets to exit on your own terms.

USDA dairy market outlook

Twenty-nine cents of every dollar of U.S. net farm income now comes from government payments. For dairy, those numbers hit even harder. USDA’s February 4 forecast projects $44.3 billion in direct payments for 2026 — up 45% from roughly $30.5 billion in 2025, according to USDA-ERS data analyzed by the American Farm Bureau Federation. Strip those payments out, and net farm income drops to approximately $109 billion, representing a roughly 9% real decline from 2025’s non-government income, per Econbrowser’s analysis.

The headline — $158.5 billion in net cash farm income — looks stable. Almost comfortable. But USDA forecasts dairy milk receipts dropping $6.2 billion (12.8%) this year. And while today’s February WASDE raised the 2026 all-milk price to $18.95/cwt — up 70 cents from January’s projection — January’s actual Class III still posted at just $14.59/cwt. The forecast improved. The checks haven’t caught up yet.

The $25 Billion Revision Nobody Expected

Start with what happened to 2025. USDA cut last year’s net farm income estimate by $25 billion, from $179.8 billion projected in September, down to $154.6 billion. Production expenses got revised up to $473.1 billion. Government payments came in about $10 billion below earlier projections, at $30.5 billion versus a September estimate near $40.5 billion.

AFBF’s Danny Munch, co-author of the Farm Bureau’s Market Intel analysis, called this “a generational downturn rather than a temporary slowdown.” Total farm debt is projected at $624.7 billion for 2026, up $30.8 billion (5.2%), with the debt-to-asset ratio climbing from 13.49% to 13.75%.

Where are those aid dollars going? Purdue University’s Ag Economy Barometer found that a majority of farmers report using government payments primarily to pay down existing debt — not to reinvest.

Dairy’s Revenue Problem — Even After Today’s WASDE Bump

Today’s February WASDE brought some relief. USDA raised all 2026 dairy product price forecasts — cheese up 2 cents to $1.6050/lb, butter up 7 cents to $1.68/lb, NDM up 11 cents to $1.3150/lb, and whey up 2 cents to $0.69/lb. The result:

  • All-milk price: Raised to $18.95/cwt for 2026, up 70 cents from January’s $18.25 projection. That’s still down $2.22/cwt from the revised 2025 average of $21.17. Better than last month. Still a significant revenue hit.
  • Class III: Raised to $16.65/cwt, up 30 cents from $16.35. Class IV got the bigger bump — up $1.25 to $15.70/cwt — largely on stronger NDM and butter price assumptions. But January’s actual Class III of $14.59 and December’s $15.86 are both well below the new annual average, meaning the back half of 2026 needs to do a lot of heavy lifting for your budgets.
  • Milk production: Raised to 234.5 billion pounds, up 200 million from January’s estimate. The national herd was up 202,000 head year over year in Q4 2025, with December production running 4.6% above the prior year. RFD-TV noted output “driven by the largest milk cow herd in decades and higher per-cow productivity.”
  • DMC margins: January’s Dairy Margin Coverage margin is projected at $7.57/cwt — a full $1.93 below the $9.50 trigger. That’s the first meaningful DMC payout since December 2025 and signals the kind of margin compression producers should plan for, not just hope for.
MonthAll-Milk Price ($/cwt)Feed Cost ($/cwt)Actual Margin ($/cwt)DMC Payout at $9.50 Coverage
Dec 2025$14.59$6.02$8.57$0.93
Jan 2026$14.35$6.78$7.57$1.93
Feb 2026 (proj)$15.10$6.85$8.25$1.25
Mar 2026 (proj)$15.80$6.90$8.90$0.60
Apr 2026 (proj)$16.20$7.00$9.20$0.30
May 2026 (proj)$17.00$7.15$9.85$0.00
Jun 2026 (proj)$17.50$7.20$10.30$0.00

Munch told Brownfield Ag News the receipts decline “would put dairy down about 35% over five years.” CoBank’s Corey Geiger noted butterfat production was running 5–6% above year-ago levels heading into 2026, volume even strong demand can’t easily absorb. The February WASDE’s butter price raise to $1.68/lb signals USDA sees some floor forming, but that’s still well below 2024 peaks.

Mark Stephenson at UW-Madison put it plainly in an April 2025 Bullvine interview: “Operations with weaker financial positions or higher production costs could face heightened pressure, potentially leading to further consolidation within the sector.”

The $23.56 Cost-of-Production Gap — And Why Feed Isn’t the Problem

USDA’s Economic Research Service published updated cost-of-production estimates by herd size in August 2024, based on the 2021 ARMS dairy survey. The spread: $42.70/cwt for herds under 50 cows. $19.14/cwt for operations with 2,000 or more. A $23.56 gap. And at $18.95 all-milk, even the lowest-cost tier is essentially breakeven on a full economic basis.

The instinct is to blame the feed. But feed costs account for a surprisingly small share—roughly $3/cwt or less. USDA’s own report to Congress showed feed differing by less than $1/cwt between mid-size and the largest herds. Agri-benchmark’s international analysis (using 2016 ARMS data, directionally consistent with the 2021 update) confirmed the pattern: feed and other direct costs differ by only about 28% across size classes. The real drivers sit elsewhere.

Cost Category<50 cows50-99 cows100-199 cows200-999 cows2,000+ cows
Labor$12.00$8.50$5.20$3.10$2.20
Feed$3.50$3.40$3.20$3.00$2.90
Overhead$15.20$10.80$7.60$4.50$3.10
Other Direct$5.00$4.30$3.80$3.20$2.80
Opportunity Cost (Land, Capital)$7.00$5.50$4.20$3.10$2.44
TOTAL ($/cwt)$42.70$32.50$24.00$16.90$19.14

Labor eats the biggest piece. Small herds carry roughly $12/cwt in labor costs — mostly imputed value of unpaid family hours. Large operations run about $2.20/cwt. Nearly $10 of the gap is from one line item. And larger farms generally pay higher cash wages. NASS Farm Labor data shows livestock worker wages rising roughly 7% per year in both 2021 and 2022, reaching $16.52/hr by October 2022. The cost advantage comes from output per labor dollar—not lower pay.

Overhead is the silent killer. Barns, parlors, mixers, insurance — a 50-cow dairy needs roughly the same equipment categories as a 2,000-cow operation. But the big barn spreads those fixed costs across 40 times as much milk. Agri-benchmark found that overhead costs decrease approximately fivefold from the smallest to the largest herds.

Productivity per cow compounds everything. A 2,000-cow herd pushing 24,000–25,000 lbs/cow generates 30–40% more milk per stall, per parlor turn, per dollar of overhead than a 50-cow herd at 15,000–16,000 lbs. That compounds every other cost advantage.

These are national averages. Regional differences matter for a lot of herds: Western large-herd operations in Idaho, the Texas panhandle, or California’s Central Valley face different overhead structures — water, environmental compliance, land prices — than Upper Midwest grazing operations in Wisconsin or proximity-to-market herds in the Northeast. Top-quartile producers within each size class typically run $3–$5/cwt below these averages, per the ARMS data.

The Finding That Cuts Both Ways

Here’s where the data gets genuinely interesting. Hoard’s Dairyman’s analysis of the 2021 ARMS data (Table 9) found that low-cost producers in the 100–199 cow range operate at $19.76/cwt. High-cost producers in the 2,000-plus range run $19.63/cwt. Essentially identical.

The best-managed 150-cow dairy can match the average cost structure of a 2,000-cow operation. So the question isn’t whether you’re big enough. It’s whether you’re sharp enough.

Ask a Wisconsin 150-cow operator who benchmarks through Farm Business Management whether size is destiny, and you’ll get a different answer than the national averages suggest. But flip it around: the average 100–199 cow herd runs closer to $24–$26/cwt. Even with today’s bump to $18.95 milk, the distance between “best in class” and “average” in that cohort is the difference between a thin margin and a steady cash drain. Bradley Zwilling at the University of Illinois Farm Business Farm Management Association confirmed this in January 2026: Illinois operations can “squeak out a profit margin” on a cash basis, he told Brownfield Ag News, but “from an economics standpoint, we’ve got lots of negative numbers.”

For many operations, that gap — between cash-basis survival and full economic viability — is a significant part of the 29% government payment dependency measured at the national level.

How One Kansas Operation Reads the Numbers

When Ken McCarty looked at the cost-of-production math, the direction was clear long before the latest USDA revision. McCarty Family Farms, a roughly 20,000-cow operation in Colby, Kansas, has genomically tested more than 75,000 females since 2018. Their rule is simple: the top half by genomic index gets dairy semen; the bottom half gets beef — no exceptions.

That discipline matters when you see the $2.50–$3.00/cwt in added non-milk revenue that DFA’s chief milk marketing officer Corey Gillins says beef-on-dairy is generating across about 70% of their membership. McCarty markets beef-cross calves as day-olds — eliminating the feed and labor burden rather than retaining ownership. According to Laurence Williams, Purina’s dairy-beef cross development lead, day-old beef-on-dairy calves now average roughly $1,400 per head, up from about $650 three years ago — and Hoard’s Dairyman confirmed in March 2025 that dairy-beef calf prices “continued to skyrocket, reaching historical highs” nationally.

“The value of genomic testing has evolved over time,” McCarty has said — a characteristically understated way of describing a system that generates real revenue from what used to be a bottom-of-the-barrel calf. Farm Journal named McCarty Family Farms the 2025 Leader in Technology for exactly this kind of integration.

Four Margin Levers — And What Each One Costs You

Beef-on-dairy. The McCarty model works, but it demands investment: genomic tests run about $40–$50 per calfthrough providers like Zoetis or Neogen for medium-density panels, per The Bullvine’s November 2025 analysis. Lower-density tests start as low as $15–$38, but commercial dairies optimizing beef-on-dairy splits typically need the fuller panels. The trade-off: overcommit to beef sires and you risk a replacement shortage — with dairy replacement heifers at $3,010 per head nationally as of July 2025 per USDA, that’s an expensive gamble. Wrong sire selection on calving ease creates problems that erase the revenue gain entirely.

Component premiums. Gillins notes rising component values are adding $1–$3/cwt to milk checks, even in Holstein herds. Today’s WASDE bump in cheese (+2¢/lb), butter (+7¢/lb), and NDM (+11¢/lb) supports that thesis short-term. The trade-off: component improvement requires consistent nutrition programs and genetic changes that take 2–3 lactations to express. Medium-term play, not a quick fix.

Feed cost protection. Corn at $4.10/bushel (USDA’s January WASDE season-average farm price) remains genuine multi-year relief — and today’s February WASDE raised corn exports to a record 3.3 billion bushels without materially moving price forecasts. Locking 50–60% of Q2–Q3 needs now protects against upside risk. The trade-off: if grain falls further, you forgo additional savings. But at current levels, the floor matters more than the ceiling for cash flow.

Risk management enrollment. DMC enrollment for 2026 is open. With January’s margin projected at $7.57/cwt — $1.93 below the $9.50 trigger — the program is already paying. The February WASDE price bump may narrow DMC payouts in later months, but margins remain tight enough to justify coverage. The trade-off: premium costs are real, and DRP basis risk varies by plant and FMMO class.

The Consolidation Math Keeps Running

The 2022 Census of Agriculture recorded roughly 24,000 dairy operations — down 39% from 2017. DFA projects just 5,100 member farms by 2030. Cows from exiting operations are absorbed by expanding members in growth regions — Idaho, southwest Kansas, Michigan, and, increasingly, southern Georgia and northern Florida.

Ever.Ag Insights president Phil Plourd doesn’t sugarcoat what’s ahead. “It is a street fight, in terms of figuring out ways to stay relevant, to get more productive, to stay ahead of the curve, to manage risk better.” And the beef market adds a wild card: “Will high beef prices make producers stay — keep the quasi cow-calf thing going — or will they make them go, use high cattle prices to pave the exit ramp? There’s no way to know for sure.”

Hanging over everything: baseline projections from FAPRI at the University of Missouri show total government payments potentially falling from about $53 billion in FY25 to $32 billion by FY27 as temporary programs expire. FAPRI director Pat Westhoff confirmed in the institute’s April 2025 baseline that the longer-term outlook “shows a return to a downward trajectory in 2026,” and Terrain’s John Newton separately told Brownfield in May 2025 that 2025 incomes are “being propped up by over $30 billion dollars in government subsidies and disaster relief” with “no relief packages factored in the 2026 projections.”

CBO’s own February 2026 farm programs baseline shows dramatically higher near-term spending on crop programs — underscoring the cliff that forms when ad hoc payments expire. A $21 billion drop.

Signals to Watch This Quarter

  • February WASDE follow-through — USDA raised all 2026 dairy prices today, with all-milk up 70 cents to $18.95. But January’s actual Class III of $14.59 and December’s $15.86 are both well below even the old annual forecast. The question for your budgets: can the second half of 2026 actually deliver the recovery USDA’s annual average implies?
  • Spring Class III/IV divergence — Class IV got the biggest WASDE bump (+$1.25 to $15.70), while Class III moved only 30 cents to $16.65. Watch whether that spread continues widening, because it shifts risk for operations on Class III-heavy pay plans.
  • NASS March Milk Production report — will confirm whether herd expansion is accelerating past 202,000 head or plateauing. USDA raised 2026 production to 234.5 billion pounds today. RFD-TV notes that higher slaughter rates suggest some adjustment has begun, but beef-on-dairy revenues are softening the immediate exit signal.
  • DFA and regional co-op component premium announcements — any reductions signal processors repricing the butterfat surplus Geiger flagged.

What This Means for Your Operation

If you run fewer than 200 cows: Your most important number right now is full economic cost of production — including family labor, depreciation, and return on capital. Compare it to the USDA-ERS benchmarks from the 2021 ARMS. If you’re above $25/cwt, the gap to $18.95 milk is still over $6/cwt — roughly $140/cow annually on a 20,000-lb herd. Today’s WASDE bump helps at the margins, but it doesn’t close that gap. The Hoard’s data shows the best operators in your size class run below $20—where does yours sit? And if your dairy is part of a diversified operation, the COP threshold shifts — but the question of whether the dairy enterprise stands on its own economics still matters for long-term capital allocation.

If you run 200–999 cows: A 300-cow herd averaging 23,000 lbs/cow produces roughly 69,000 cwt annually. The updated all-milk price decline from $21.17 to $18.95 — a $2.22/cwt drop — means approximately $153,000 in gross lost milk revenue versus 2025. Component premiums and marketed volume adjustments may reduce the net hit to $100,000–$130,000 for many operations, but the math is still unforgiving. Beef-on-dairy, component optimization, and feed cost protection are your most accessible near-term levers. Run the numbers before spring breeding decisions lock in.

If you run 1,000-plus cows: Your cost structure likely generates some market-based margin at $18.95 milk — the 2,000+ average of $19.14 is now just 19 cents above the all-milk price. Razor-thin. Stress-test against $16.65 Class III— where the February WASDE now projects the 2026 average — and check your debt service coverage ratio at that level. If DSCR is thinning toward 1.25 or below, talk to your lender now, not after a bad quarter forces the conversation.

Key Takeaways

  • Pull your full economic cost of production this month. Compare honestly to the $18.95 milk, the new February WASDE all-milk figure. That single comparison tells you whether your operation generates market-based margin or subsidy-dependent margin.
  • Calculate your government payment share of the 2025 net income. If it’s approaching 25–30%, model what your books look like if payments fall by a third, which FAPRI baseline projections and CBO’s February 2026 farm programs baseline both suggest could happen as ad-hoc programs expire.
  • Evaluate beef-on-dairy economics. At $2.50–$3.00/cwt added revenue across DFA’s membership, the entry cost ($40–$50/head genomic testing through Zoetis or Neogen, plus sexed semen) has a short payback — but only if you have the heifer pipeline to support it. With replacements at $3,010/head nationally as of July 2025, every breeding decision carries more weight than it used to.
  • Lock feed costs while corn sits near $4.10. It won’t close a revenue gap alone, but it protects cash flow against the one input you can actually control right now.
  • If your margin is structurally negative even at $18.95 milk and with feed relief, model exit timing now. Replacement heifers hit $3,010/head nationally in July 2025, up from $2,660 in January 2025 and $1,720 in April 2023, per USDA data. Strong cull cow prices mean a planned dispersal captures far more value than a forced one later. The risk: if you sell alongside a wave of other exits, buyer fatigue compresses values before you close. Planning beats reacting.
  • Track USDA’s quarterly replacement heifer prices. If the national average drops back below $2,500, it’s a signal the exit window may be narrowing faster than it looks on paper.
Asset/Income SourcePlanned Exit (2026)Forced Exit (2027-28 Scenario)Value Difference
Replacement Heifer Price$3,010/head$2,200/head-$810/head
Cull Cow Price$140/cwt (1,300 lb)$95/cwt (1,300 lb)-$585/head
Dairy Equipment (% of replacement)75-85%45-60%-25-30%
Herd Sale (300 cows)~$903,000 (replacements)~$660,000 (replacements)-$243,000
Cull Value (80 culls/yr)~$145,600~$98,800-$46,800
Land (if owned, $/acre premium)Strong farmland demandSoftening as exits increase-10-15%

The Bottom Line

The 29% is a national average. Your number is the one that matters. Today’s WASDE brought the all-milk forecast up 70 cents — welcome news, but not a rescue. And if you haven’t compared your full economic COP to your neighbor’s in the last twelve months, spring 2026 — with DMC paying, feed at multi-year lows, and breeding decisions ahead — is the time to do it honestly.

Complete references and supporting documentation are available upon request by contacting the editorial team at editor@thebullvine.com.

Learn More

The Sunday Read Dairy Professionals Don’t Skip.

Every week, thousands of producers, breeders, and industry insiders open Bullvine Weekly for genetics insights, market shifts, and profit strategies they won’t find anywhere else. One email. Five minutes. Smarter decisions all week.
NewsSubscribe
First
Last
Consent

$60 Million in Unpaid Milk, 150 Families Wrecked: The 4-Question Processor Risk Audit Every Dairy Needs

If more than half your milk goes to one plant and you don’t have a 72-hour Plan B, this story is about you.

Executive Summary: An Argentine processor, Lácteos Verónica, collapsed in 2025–26, leaving about 150 dairy families with roughly $60 million in unpaid milk and 3,843 bounced checks, while one small tambo that switched buyers early limited its losses. That story, paired with Dean Foods’ 2018 contract terminations, shows how even strong herds get wrecked when most of their milk goes to a single buyer, and the money stops. The article backs this up with current data on Argentina’s consolidation, rising U.S. Chapter 12 filings, roughly 1,420 U.S. dairy farms lost in 2024, and Wisconsin’s drop to about 5,100 herds, arguing that processor risk—not imports—is the real fault line under 2024–2026 margins. For your farm, it boils processor risk into a four-question audit: how concentrated your milk check is, how many days of true cash runway you have, whether you’d act on early warning signs, and who can take your milk within 72 hours if your current buyer fails. It offers practical markers—like targeting 90 days of operating reserves and keeping any one buyer below 50% of your volume, where the market allows—while being honest that some regions have only one realistic plant. The piece finishes by tying the math back to legacy, contrasting families who waited for “patience” with those who moved while they still had choices, and leaves you with a simple challenge: if your processor stumbled tomorrow, would you be Sedrán—or her neighbors?

Dairy Processor Risk

In April 2025, an Argentine dairy processor started falling behind on payments to its farmers. By mid-year, the checks weren’t just late—they were bouncing. Within months, Lácteos Verónica owed roughly $60 million to about 150 dairy families across Santa Fe province, according to reports from iProfesional and AgroLatam in January 2026. Whether it’s a dairy processor payment default in South America or a contract termination in the Midwest, the math doesn’t change — if you’re shipping most of your milk to one buyer right now, this is a case study in processor risk that could play out anywhere.

Here’s the question worth sitting with: if your processor stopped paying next month, would you have 90 days of oxygen and a Plan B—or would you be feeding cows for free while waiting on lawyers?

April 2025: When Lácteos Verónica Went Silent

Producer Cecilia Sedrán works 60 hectares and runs a small tambo (dairy farm) near San Genaro, Santa Fe. Her family produces about 1,500 liters of milk a day and had been shipping to Lácteos Verónica since 2011, as she described in interviews with both TN Campo (December 2025) and Bichos de Campo (November 2025). No off-farm income. No government backstop.

“Somos dos familias las que vivimos de esto. Lo que generamos todos los días es lo que reinvertimos. No tenemos otro ingreso.”

(“We’re two families that live off this. What we generate every day is what we reinvest. We have no other income.”) — Cecilia Sedrán to TN Campo, December 2025

In mid-2025, Lácteos Verónica’s checks started bouncing — and didn’t stop. Records from Argentina’s central bank, the BCRA, show exactly 3,843 checks to producers rejected by banks. Trucks still rolled. Milk was still left on the farm. Money didn’t show up.

Sedrán’s family switched processors by July 2025 — months before many of their neighbors acted, according to Bichos de Campo. That move limited their exposure to roughly one month of unpaid milk. Other tambos around San Genaro stayed on the route, hoping things would turn. TN Campo reported in December 2025 that some farms now carry unpaid balances above 100 million pesos — around $100,000 USD at early-2026 parallel-market rates (Argentina maintains official and parallel currency markets; the parallel rate, used here, is the rate most commercial transactions actually reference) — and several have already closed or stand on the brink.

“Lo único que nos dicen es que tengamos paciencia.”

(“The only thing they tell us is to have patience.”) — as reported by TN Campo, December 2025

Dean Foods Did This in 2018 — Without the Bounced Checks

Argentina can feel like a world away from Wisconsin or Pennsylvania. But the underlying risk is the same.

Sedrán’s farm isn’t a hobby. Two families depend on it, as she told TN Campo. When Lácteos Verónica stopped paying, there was no Chapter 12 bankruptcy protection, no Dairy Margin Coverage, no FSA disaster loan to bridge the gap. Just a brutally simple choice: keep feeding cows and hope the processor catches up, or find another buyer before cash and credit run dry.

U.S. producers faced a softer-packaged version of the same thing when Dean Foods — then the largest milk processor in the country — terminated contracts with more than 100 farms across Indiana, Kentucky, Pennsylvania, Ohio, New York, Tennessee, North Carolina, and South Carolina in early 2018. As Jayne Sebright, executive director of Pennsylvania’s Center for Dairy Excellence, told Farm and Dairy at the time, the cancelled suppliers were  “excellent family farms” — including “young dairy families that have really invested in their farms.”

They weren’t bad operators. They were good dairies tied to the wrong buyer at the wrong time.

The real difference? U.S. farms at least had a structured legal path and some federal program options. Sedrán’s neighbors had bounced checks and a processor literally telling them to “have patience.”

The Comparison: Why This Matters to You

You might think Argentina’s economy is a special case of chaos. But look at the mechanics of the failure. It’s the same plumbing, just a different leak.

Risk FactorArgentina — Lácteos Verónica (2025–26)United States — Dean Foods (2018)
The Warning3,843 bounced checks (BCRA data)Sudden contract termination notices
The Fallout≈$60 million USD in unpaid milk across ~150 tambos; 3 plants paralyzed (Suardi, Lehmann, Totoras); ~700 workers at risk (per AgroLatam, Jan 2026)100+ farms across 8 states forced to find new buyers within ~90 days; multiple plants closed or sold
The Safety NetIneffective — legal processes exist but take years while inflation erodes value; producers are told to “have patience.”Chapter 12 bankruptcy protection, Dairy Margin Coverage, FSA disaster loans

Lácteos Verónica defaulted on payments already owed — milk that had already left the farm. Dean Foods cut ties going forward—devastating, but a different kind of pain. Both left producers scrambling for somewhere to ship milk within days.

The Reality Check: On a 300-cow herd shipping 90 lbs/cow at $18/cwt, a 30-day payment failure is a $145,800 hole in your balance sheet. That isn’t a “bad month” — for many, that’s the end of the road.

Herd SizeDaily ProductionMilk PriceMonthly Production Value30-Day Payment Hole
100 cows75 lbs/cow$18.00/cwt$40,500$40,500
300 cows90 lbs/cow$18.00/cwt$145,800$145,800
500 cows85 lbs/cow$18.00/cwt$229,500$229,500
750 cows88 lbs/cow$18.00/cwt$356,400$356,400
1,000 cows90 lbs/cow$18.00/cwt$486,000$486,000

Roberto Perracino, president of Santa Fe’s Meprosafe producer group, told LT9 radio in late December 2025: “El año empezó muy bien, con buenos precios y rentabilidad que permitían pensar en invertir. Pero desde mitad de año todo se desmoronó.” (“The year started very well, with good prices and profitability that allowed you to think about investing. But from mid-year, everything collapsed.”)

He added that while annual inflation ran about 30%, milk prices recovered only 8%, while feed, fuel, and silage costs jumped by 25% to 70%.

You’ve seen that movie. Think 2014 highs sliding into the 2015–16 gut punch, or the optimism of late 2022 crashing into 2023’s margin squeeze. The difference in this Argentine case is the snap: solid margins in Q1, followed by a processor meltdown before year’s end. No slow fade. A cliff.

Argentina’s Processor Crisis Is America’s Preview

Argentina has already sprinted decades down the consolidation road the U.S. is still running on. Perracino himself put it plainly on LT9: the country went from 35,000 tambos in the 1970s to fewer than 9,000 today.

MetricArgentinaUnited States
Peak dairy farms~35,000 tambos (1970s, per Meprosafe/Perracino)648,000 farms with dairy cows (1970, USDA ERS)
Current farms9,013 tambos (end of 2025, OCLA/SENASA)~24,470 dairy operations (2022 Ag Census)
Decline from peak~74%~96%
Avg cows/farm (Argentina)~166 cows in 2025, up from ~162 in 2024Similar “bigger survivors” pattern

OCLA data show that just 6.3% of Argentine farms now hold 27.6% of the cows and produce more than a third of the country’s milk. When that much volume is concentrated in a handful of big units, one decision in a boardroom reshapes an entire region’s milk market. And the mid-sized family tambos? They’re negotiating from the weak side of the table every single time.

Wisconsin knows the feeling. The state starts 2026 with about 5,100 licensed dairy herds — 5,115 to be exact, according to USDA NASS data based on Wisconsin DATCP’s Dairy Producer License list as of January 1, 2026. That’s down from more than 15,000 in the early 2000s. The Hartwig family is one example among many. When low prices nearly forced them to sell their Wisconsin herd in 2019, a local banker helped them restructure and survive, as the Milwaukee Journal Sentinel reported. Not every family gets that kind of lifeline.

Farm bankruptcy filings have climbed hard across the sector. American Farm Bureau Federation analysis of U.S. district court data shows 216 Chapter 12 farm bankruptcy filings in 2024 — up 55% from 2023. In 2025, that number hit 315, up another 46%. These are all-farm filings, not dairy-specific, but 120 of the 2024 cases were in the 24 major dairy states — and the Midwest dairy belt saw the steepest increases. Meanwhile, USDA data put 2024 dairy farm losses at around 1,420 licensed herds nationally — roughly a 5% drop in a single year.

Same pattern everywhere: mid-sized family dairies getting squeezed between thin farmgate margins and concentrated buyers who have options when you don’t.

Legacy at Risk: When the Tambo Is More Than a Business

Strip this down to dollars, and you miss the deeper loss.

Argentine coverage of the Lácteos Verónica crisis doesn’t just talk about pesos and liters. It talks about legacy. Many Santa Fe tambos have been in the same families since the 1960s and 1970s, often tracing back to Italian and Spanish immigrant settlers. As TN Campo reported in December 2025: “Para muchas familias, el tambo es un legado de generaciones. Hoy, sin ingresos y con deudas en aumento, varios deben abandonar la actividad.” (“For many families, the dairy farm is a generational legacy. Today, without income and with debts mounting, many must abandon the activity.”)

That kind of loss can’t be captured in a spreadsheet. And it plays out the same way in Wisconsin, Pennsylvania, or anywhere else a family’s identity is tied to land and livestock.

This Wasn’t an Import Story

You’ll hear folks pin Argentina’s dairy pain on “cheap imports.” The numbers don’t support that.

Argentina is a net dairy exporter. Argentine Agriculture Ministry data show 2025 dairy export value at $1.69 billion — the strongest performance in 12 years — with roughly 27% of total milk production going to export markets. Imports of milk powder and other dairy products remain small relative to what Argentina ships out.

The damage in this story came from inside the chain:

  • A major processor overextended and ran out of cash, racking up 3,843 bounced checks and tens of millions in unpaid milk.
  • Payments to farmers stopped while plants tried to keep running on fumes.
  • Smaller and mid-sized suppliers with no financial buffer absorbed the losses first.

That’s not a trade-war tale. It’s a processor-risk tale. And it’s worth separating the two, because U.S. dairies sit on the exact same fault line: a small number of large processors, thin margins, and no guarantee the company taking your milk today will still be solvent in three years.

Trade agreements like the EU–Mercosur deal and newer U.S.–Argentina frameworks do change long-term competitive dynamics. But in Sedrán’s case, the crisis didn’t start with someone else’s powder. It started with her own buyer’s balance sheet blowing up.

What This Means for Your Operation

This is where the story stops being about Argentina and becomes a planning session for your own farm. Four questions. Write down your honest answers.

Risk FactorThe QuestionHigh Risk 🚨Lower Risk ✓
Buyer ConcentrationWhat % of your milk goes to one processor?> 50% to single buyer< 50%; multiple outlets
Cash RunwayHow many days of operating expenses do you have in reserves?< 30 days liquid cash≥ 90 days accessible reserves
Early Warning SystemWould you act on warning signs—or wait and hope?“We’ll give them time”Written response plan; quarterly processor health check
72-Hour Plan BWho can take your milk within 3 days if your buyer fails?No answer / “I’d have to call around”Written list: alt plants, haulers, pricing

1. How exposed are you to one processor?

Pull your last 90 days of milk checks. If more than 50% of your volume went to a single buyer for that entire stretch, you’re effectively single-sourced.

In some regions, that’s just reality — one major plant within hauling range. But calling it “normal” instead of “high-risk” is exactly how good farms end up in the same spot as Sedrán’s neighbors.

If your number is north of 50%, start thinking about secondary outlets (co-ops, smaller plants, direct-to-consumer channels), contract terms that give you at least some flexibility, and how fast you could actually re-route part of your volume if you needed to. The goal isn’t to blow up a good relationship. It’s to stop pretending concentration doesn’t change the risk math.

2. What’s your cash runway?

Sedrán limited the damage because she had enough cash and credit to stop shipping while she found another buyer. Many of her neighbors didn’t, so they kept feeding cows for free.

Aim for at least 90 days of operating expenses in accessible reserves. On a 500-cow herd, that often means something like $250–$300 per cow in cash or near-cash, depending on your cost structure. Not a magic number — a starting point.

If you’re sitting at 20–30 days right now, don’t beat yourself up. Set a concrete goal to add 5–10 days of cushion each quarter for the next 18–24 months. Slow, boring progress beats “we’re fine” right up until you’re not.

3. Would you see the warning signs — and act?

Sedrán’s neighbors all saw signs: payment dates slipping, checks clearing more slowly, and local media reporting on the company’s financial troubles. Some took action. Others waited, hoping things would turn. You know which group came out ahead.

On your farm, warning signs might include payment schedules being “restructured,” vague responses when you ask about plant capacity, or rumors that your buyer is closing facilities in other states.

Pro-Tip: Watch the “Smoke” If your processor is a private company, ask your lender if they have seen a change in the speed of deposits from that specific entity. Bankers often see the “smoke” (slower clearing times) months before the “fire” (bounced checks).

Once a year, sit down with your lender, accountant, or advisor for a “processor health check.” Pull whatever public data you can — annual reports, credit ratings, news on plant expansions or closures. Ask the blunt question: is this buyer growing, stable, or shrinking? And what would we do if they suddenly “restructured” procurement?

4. What’s your 72-hour Plan B?

If your processor stopped paying tomorrow, who could realistically take your milk in 72 hours? Not six months. Three days.

Write it down: names of alternate plants or co-ops, haulers who could move milk there, rough price expectations in a distressed situation, and how many days you could afford to dump or divert before the bleeding matters.

Put that one-page plan in the same drawer as your emergency vet contacts and power-outage protocol. Make sure at least one other person on the farm knows it exists and where to find it.

Sedrán had enough runway and local options to move quickly. Her neighbors are now pursuing legal claims for their unpaid milk, according to Argentine press reports.

Your Processor Risk Checklist

Print this. Stick it on the office wall. Do the homework before you need to.

  • [ ] Identify your exposure: Is more than 50% of your milk going to one buyer? Pull 90 days of milk checks and find out.
  • [ ] Calculate your runway: Do you have 90 days of operating expenses in accessible cash or credit? If not, what’s the gap — and what’s your quarterly plan to close it?
  • [ ] Monitor the vibe: Are payments slowing down? Is communication getting vague? Schedule an annual “processor health check” with your lender or advisor.
  • [ ] Draft your 72-hour Plan B: Who gets the milk if the gate stays locked tomorrow? Write down names, haulers, and timelines. One page. Keep it where someone else can find it.

Key Takeaways

  • Processor failure is not abstract: Lácteos Verónica’s collapse left about 150 Argentine dairy families with roughly $60 million in unpaid milk and 3,843 bounced checks, while one family that switched early limited its loss to about a month.
  • The same pattern is already on your doorstep, with Dean Foods’ 2018 cuts, rising Chapter 12 filings, roughly 1,420 U.S. dairy farms gone in 2024, and Wisconsin down to about 5,100 herds showing how fast good operations can be stranded when most of their milk goes to one buyer.
  • For your farm, processor risk boils down to four questions: how concentrated your milk check is, how many days of true cash runway you have, whether you’ll move on warning signs, and who can take your milk within 72 hours if your current buyer stops paying.
  • The practical targets in this piece are simple but hard to ignore: aim for at least 90 days of operating reserves, keep any single buyer under 50% of your volume where markets allow, and put a written 72‑hour Plan B in the same drawer as your emergency vet numbers.
  • In the end, the difference between still milking and fighting over unpaid checks wasn’t luck or genetics—it was whether a family treated processor risk as a real threat and acted before hope was their only plan.

The Bottom Line

Cecilia Sedrán didn’t wait to find out how that bet would play out. She moved while she still had choices.

Do you?

Complete references and supporting documentation are available upon request by contacting the editorial team at editor@thebullvine.com.

Learn More

The Sunday Read Dairy Professionals Don’t Skip.

Every week, thousands of producers, breeders, and industry insiders open Bullvine Weekly for genetics insights, market shifts, and profit strategies they won’t find anywhere else. One email. Five minutes. Smarter decisions all week.
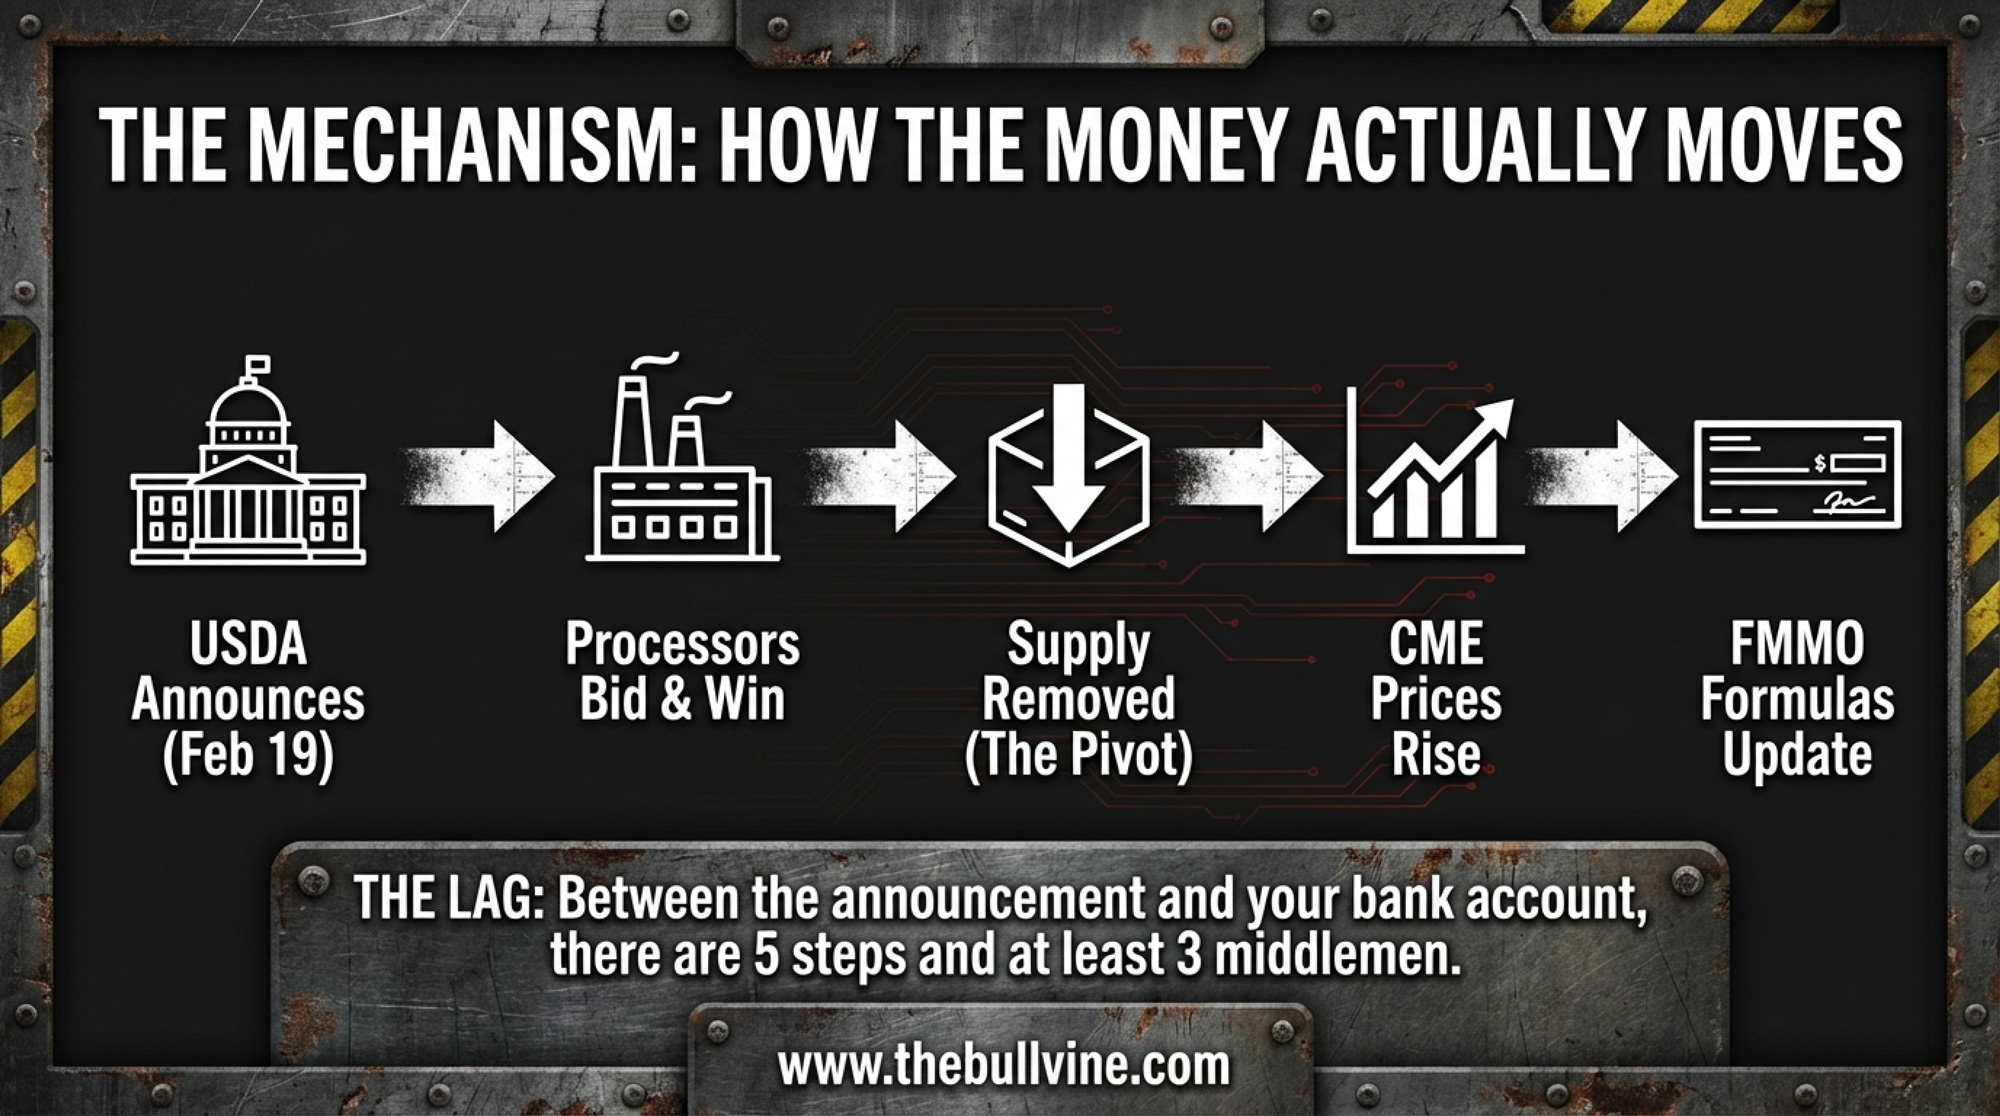
NewsSubscribe
First
Last
Consent

GDT surged 6.7%, and U.S. powder output hit a 12-year low – but your DMC window closes in 17 days.

17 days to the DMC deadline. Class IV is $1.50/cwt above Class III. If your DRP is weighted heavily on III, you’re insuring a check that doesn’t exist.

Executive Summary: NDM hit $1.64/lb on Friday — its best week since 2007 — putting milk powder 16.75¢ above Cheddar blocks. That’s not a blip. U.S. dryers produced just 2.143 billion pounds of NDM/SMP in 2025, the weakest since 2013, while the industry poured $11 billion into cheese plants that need more milk but don’t make powder. GDT confirmed the global story on February 3: the index surged 6.7%, SMP jumped 10.6%, and all seven product categories gained. The Class III/IV spread now sits at roughly $1.50/cwt—and every month you don’t restructure your DRP or optimize components, you’re subsidizing that spread from your own check. DMC enrollment closes February 26. Below: 4 moves before the deadline, the three structural constraints keeping powder tight, and the single production number that tells you whether this rally is real.

Class III/IV Spread

Nonfat dry milk surged 18¢ in a single week to settle at $1.64/lb on Friday, February 6 — the highest CME spot price since August 2022 and the strongest weekly gain since May 2007. That puts milk powder a full 16.75¢ above Cheddar blocks and within pennies of butter. For the first time in years, the product that the U.S. processing sector largely ignored is outpricing the one the entire industry was built around.


By Friday, MAR26 Class III futures were trading above $17/cwt through year-end, while Class IV — emboldened by surging NDM — was in the high $18s/cwt. DMC enrollment closes February 26. Just 17 days from today. Spring flush is six to eight weeks out.

Kevin Krentz, president of the Wisconsin Farm Bureau and a roughly 600-cow operator near Berlin, WI, knows what pool disadvantage feels like. He testified at the USDA Federal Milk Marketing Order hearing on August 31, 2023, that negative PPDs reached $9/cwt, costing his operation nearly $200,000 during the PPD crisis. The current Class III/IV spread is opening a similar gap — and the decisions you make about DRP coverage, component targets, and handler alignment right now determine which side of it you land on. 

GDT Surges 6.7%: Powder and Mozzarella Lead a Clean Sweep

The Global Dairy Trade auction (TE397) on February 3 delivered a 6.7% jump in the price index — the third consecutive gain — with the average winning price firming to $3,830/MT across 24,034 tonnes sold and 175 bidders participating. SMP leapt 10.6% to $2,874/MT, and mozzarella matched it at +10.6% to $3,694/MT. Those two categories matter most for U.S. powder and cheese pricing.

Butter surged 8.8% to $5,773/MT, with Solarec’s Belgian C2 butter hitting $4,950 — up 9.6% from two weeks ago. AMF gained 5.0% to $6,524, WMP rose 5.3% to $3,614, cheddar added 3.8% to $4,772, and lactose ticked up 1.5% to $1,410. Trade commentary attributed part of the rally to Chinese restocking ahead of the Lunar New Year and seasonal MENA demand ahead of Ramadan, though GDT doesn’t disclose buyer-country data.

Phil Plourd, president of Ever.Ag Insights, framed the broader landscape bluntly in a report on industry consolidation trends: “It is a street fight, in terms of figuring out ways to stay relevant, to get more productive, to stay ahead of the curve, to manage risk better, because it’s never been an easy business. It’s not going to be an easy business anytime soon”. 

EEX and SGX Confirm the Bid: 16,631 Tonnes Traded

The rally wasn’t just a GDT event. On EEX, 5,365 tonnes (1,073 lots) traded last week, with butter futures firming 10.7% on the Feb26–Sep26 strip to an average of €4,730 and SMP jumping 9.4% to €2,605. Only whey pulled back — down 1.8% to €1,019.

SGX told the same story: 11,266 lots traded, with WMP up 8.6% to $3,791 and SMP up 11.0% to $3,298 on their Jan26–Aug26 curves. AMF settled at $6,281 (+6.3%) and butter at $5,664 (+7.3%). The NZX milk price futures contract moved 1,763 lots — 10,578,000 kgMS — suggesting New Zealand producers are actively pricing forward at these levels. Powders led the rally on both exchanges. That confirms the GDT signal isn’t isolated.

European Market Snapshot: Powder Rallies, Butter, and Cheese Correct

European spot and futures markets pulled in opposite directions last week — and that divergence is the story worth watching.

ProductCurrent IndexWeekly ChgY/Y Chg
Butter€3,933−0.9%−46.6%
SMP€2,247+4.4%−10.6%
Whey€999Flat+12.5%
WMP€3,065−0.3%−30.0%
Cheddar Curd€3,222−1.4%−33.1%
Mild Cheddar€3,248−0.1%−31.9%
Young Gouda€3,059+1.1%−29.0%
Mozzarella€3,098+2.6%−24.0%

EU Weekly Quotation, 4 February 2026. Country splits tell the story: German butter unchanged at €4,050; Dutch butter +€50 to €3,950; French butter −€160 to €3,800. SMP: German +€90 to €2,250; French +€70 to €2,200; Dutch +€120 to €2,290.

That 46.6% year-over-year drop in EU butter tells you how inflated 2025 prices were — not how weak 2026 prices are. SMP moving in the opposite direction, with all three country quotations gaining, mirrors the global powder bid.

Every cheese index sits 24% to 33% below year-ago levels. That’s a massive compression European processors are still absorbing — and it’s keeping EU cheese competitively priced on global markets.

Global Supply: Butter Growing, Powder Capacity Isn’t

European and Irish butter supplies are expanding. Powder capacity outside the U.S. isn’t growing fast enough to fill the gap that GDT just priced in.

Ireland’s provisional December collections came in at 267kt, down 3.0% y/y — the second consecutive monthly contraction. But full-year 2025 totalled 9.10 million tonnes, up 5.0% y/y, with milksolids up 5.5% on stronger fat (4.93%) and protein (3.85%). Irish butter production for 2025 hit 286kt, up 7.1%.

Spain posted a decent December at 624kt (+1.8% y/y), but the full-year picture is flat — down 0.2%. UK butter production jumped 6.6% in December to 15.4kt, and total cheese production rose 3.4% to 42.4kt. Full-year butter hit 199kt (+2.1%), and cheese reached 513kt (+2.9%).

China’s farmgate price edged to 3.04 Yuan/kg in late January — up just 0.2% month-over-month and still 2.8% below last year. The Ministry noted that collections growth was driven by per-cow productivity, not herd expansion, with less productive cows culled. With Lunar New Year stocking mostly behind us, the question now is whether post-holiday Chinese buying holds — or if TE397 was the peak.

$11 Billion Went to Cheese. Now, Powder Is Short.

Powder got scarce because the industry was built for cheese, not because the world suddenly needed more milk powder.

U.S. dairy processors have committed more than $11 billion in new and expanded capacity across more than 50 projects in 19 states between 2025 and early 2028 — overwhelmingly targeting cheese and whey protein, not drying, according to data released by the International Dairy Foods Association on October 2, 2025. UW Extension dairy economist Leonard Polzin described “more than eight billion dollars’ worth of stainless steel” being invested in new and expanded dairy processing in January 2025 — before several major announcements pushed the total higher. CoBank analyst Corey Geiger flagged the tension directly: those plants will need more milk and “many more dairy heifer calves in future years to bring the national herd back to historic levels.” 

Ken Heiman knows the margins from the inside. The certified Master Cheesemaker runs Nasonville Dairy in Marshfield, WI, processing up to 1.8 million pounds of milk per day. He’s blunt about the economics: cheese alone just about breaks even — it’s the whey protein stream that makes the operation work. “We ought to be thanking people who are buying whey protein at Aldi’s,” Heiman told the New York Times on July 16, 2025. “It definitely enhances the bottom line”. That math explains why plants keep expanding cheese capacity even when cheese margins are thin. The whey subsidizes the vat. 

Meanwhile, USDA’s Dairy Products report (February 5, 2026) confirmed that combined U.S. NDM and SMP output in December totalled just 170.3 million pounds — down 6.2% year-over-year. Full-year 2025 powder production: 2.143 billion pounds. The weakest annual total since 2013.

U.S. Cheese Hits 1.28B Pounds in December — But Butter’s the Tighter Market

December cheese production hit 1.279 billion pounds, up 6.7% y/y, with Cheddar surging 9% and Italian varieties climbing 7.4%. Mozzarella grew 5.9%, even as foodservice channels continue pulling back. Hoard’s Dairyman reported in March 2025 that “food service has seen the biggest pullback in cheese demand” and that the pullback “shows little sign of any significant rebound”. Domino’s confirmed the trend firsthand, reporting a 0.5% decline in U.S. same-store sales in Q1 2025. 

Butter production expanded a more modest 2% to 203.8 million pounds. But the spot market doesn’t feel oversupplied — CME butter jumped 13¢ last week to $1.71/lb, including a 10.25¢ leap on Thursday alone, with dozens of unfilled bids remaining at Friday’s close. USDA’s Agricultural Prices report pinned the national average fat test at 4.51% in December, up 0.05 percentage points y/y. More fat entering the system, and buyers still can’t get enough.

Cheddar blocks rose 11¢ to $1.4725/lb on 51 loads — competitively priced for global buyers. Dry whey was the lone loser, dipping 2¢ to 73¢/lb. But the whey complex is structurally shifting: December whey protein isolate production surged 11.7% to 20.6 million pounds, and WPC (50–89.9% protein) rose 9%, while lower-protein WPC (25–49.9%) fell 12.8%. Ask Ken Heiman — plants keep making cheese because the whey stream pays the bills.

Three Constraints Stacking: Heifers, Dryers, and Feed

The powder squeeze has staying power because three structural constraints are converging—and none resolves quickly.

Heifers. USDA’s January 2025 estimate pegged dairy replacement heifers (500 lbs+) at 3.914 million head — the lowest since 1978. CoBank’s Abbi Prins projected the shortfall won’t begin recovering until 2027 at the earliest. With beef-on-dairy breeding running at elevated levels, the pipeline keeps shrinking even as processors need more cows. 

Dryers. The $11 billion investment wave went to cheese and whey protein, not powder. No major drying plant expansions have been announced. If Q1 2026 NDM/SMP production stays below 180 million pounds monthly despite record milk supply, drying capacity isn’t just tight — it’s structurally insufficient. 

Feed. MAR26 soybean meal settled at $303.60/ton on Thursday, with further gains on Friday. MAR26 corn hit $4.35/bu before giving back ground. On February 4, Trump stated that China was considering purchasing 20 million metric tons of U.S. soybeans this season, following what he called “very positive” talks with President Xi. On February 8, USDA confirmed an additional 264,000 MT of China soybean sale. This follows China’s completion in January of its initial 12 million MT commitment from the October 2025 Trump-Xi agreement, as confirmed by Treasury Secretary Scott Bessent at Davos. That buying pressure boosted soybean and soybean meal values heading into the week. Higher feed costs don’t make DMC optional. They make it essential. 

4 Moves Before February 26

1. Restructure your DRP to match actual pool exposure. If your co-op runs 60% cheese and 40% butter/powder, but your DRP is weighted 80% Class III, you’re insuring a milk check that doesn’t exist. High-component herds generally benefit from the Component Pricing option; average-component herds from Class Pricing with accurate III/IV weighting. Get a current quote — premiums fluctuate with volatility.

Your Pool MixYour DRP WeightingClass III/IV SpreadMonthly Exposure (500 cows)Risk Level
60% Cheese / 40% Powder80% Class III / 20% Class IV$1.50/cwt-$10,000 to -$15,000HIGH
60% Cheese / 40% Powder60% Class III / 40% Class IV$1.50/cwt-$3,000 to -$5,000MODERATE
40% Cheese / 60% Powder60% Class III / 40% IV$1.50/cwt+$4,000 to +$6,000LOW
70% Cheese / 30% Powder70% Class III / 30% Class IV$1.50/cwt-$5,000 to -$8,000MODERATE-HIGH

2. Stack DMC before the deadline. Tier 1 now covers up to 6 million pounds — up from 5 million — giving medium-sized operations an extra million pounds of protection. You must establish a new production history based on your highest marketings from 2021, 2022, or 2023. The six-year lock-in (2026–2031) saves 25% on premiums but surrenders annual flexibility. Run the math both ways. 

3. Audit your milk check. AFBF economist Danny Munch, speaking at ADC’s Dairy Hot Topics session during World Dairy Expo on October 2, 2025, urged producers to share milk check stubs with ADC, their state Farm Bureau, or their market administrator. He flagged instances — particularly in Wisconsin — where independent handlers weren’t meeting existing disclosure requirements. 

Foremost Farms patrons already know the pain: the cooperative announced a $0.90/cwt market adjustment deduction from member payments, citing “a significant difference between Class III milk costs and the revenue generated from cheese and whey product sales”. The FMMO pricing formula changes implemented on June 1 resulted in decreases “up to $0.90 per cwt” for producers in the Upper Midwest, Central, and Mideast FMMOs. Look for months where your PPD went sharply negative while Class IV traded at a premium. Cost: one uncomfortable phone call. Potential payback: significant. 

4. Run your component economics. As of January 2026, FMMO component prices ($1.4595/lb butterfat, $2.1768/lb protein): every tenth of a percent in butterfat translates to roughly $0.15–$0.35/cwt in additional revenue. A herd testing 4.3% fat and 3.3% protein versus one at 3.8% and 3.0% holds a cumulative advantage of roughly $1.00–$1.50/cwt. On 1,000 cows averaging 75 lbs/day, even the low end is approximately $22,000/month. Protected fat supplements typically run $0.30–$0.55/cow/day — University of Illinois dairy nutritionist Mike Hutjens has pegged rumen-protected choline alone at roughly 30¢/cow/day, with calcium salt fat supplements adding cost above that depending on inclusion rate. Genetic gains through sire selection take 6–24 months to hit the tank. Ask your nutritionist for the breakeven component test at current premiums. 

Herd ProfileButterfat %Protein %Premium Value ($/cwt)Monthly Revenue (1000 cows, 75 lb/day)Annual Advantage
High-Component Herd4.3%3.3%+$1.25+$28,125+$337,500
Average Herd3.8%3.0%BaselineBaselineBaseline
Gap+0.5%+0.3%$1.00-$1.50$22,500-$33,750$270,000-$405,000

What to Watch at TE398 on February 17

The next GDT auction will be the first real test of whether TE397’s 6.7% surge was panic buying or a structural repricing. Rabobank’s Q4 update (“Global Dairy Supply Surpasses Demand,” published January 7, 2026, via AHDB) estimated Big-7 milk production finished 2025 up 2.2% y/y, with 2026 growth moderating to 0.6%. If SMP holds above $2,800/MT at TE398, the floor is real. If it retreats below $2,600, the rally may have been seasonal restocking ahead of Ramadan and Lunar New Year.

On the domestic side, the March USDA Dairy Products report — covering January production — is the single most important data point. If NDM/SMP output stays below 180 million pounds, drying capacity is confirmed insufficient. Above 195 million, the system may be self-correcting.

What This Means for Your Operation

  • If you ship to a cheese-heavy co-op like Foremost Farms and your DRP is weighted more than 60% Class III, you’re likely insuring the wrong revenue stream. Pull your current DRP parameters this week and request a requote before the February 17 GDT gives the market its next signal.
  • If you’re considering forward contracting at current NDM-driven Class IV levels, talk to your risk management advisor now. DRP covers revenue; DMC covers margin. Neither locks in today’s spot price, but structuring both before February 26 gives you the cheapest available hedge against the spread narrowing or feed costs widening.
  • If you’re in the Southwest — near Hilmar’s Dodge City plant or Leprino’s Lubbock facility — your handler’s plant mix may already capture more Class IV value. DFA is even seeing milk production growth in areas like southern Georgia and northern Florida. Know where your milk goes before you assume the spread hits you the same way it hits a Wisconsin cheese-pool shipper. 
  • If your herd averages below 4.0% butterfat and 3.1% protein, you’re leaving an estimated $1.00+/cwt on the table relative to component-optimized herds in the same pool. That’s roughly $22,000/month on 1,000 cows at the low end.
  • If your PPD went negative in any month since October 2025, ask your co-op directly whether Class IV milk was depooled. Danny Munch at AFBF has flagged handlers not following existing disclosure rules. 
  • Counter-signal: If Q1 NDM/SMP production rebounds above 195 million pounds monthly, the scarcity thesis weakens, and the Class III/IV spread narrows. The March Dairy Products report is the first real test.

Key Takeaways

  • The Gap: NDM at $1.64 sits 16.75¢ above Cheddar and within pennies of butter. For cheese-pool herds, that translates to a Class III/IV spread costing real money every month — The Bullvine’s October 2025 paired-herd analysis pegged it at $10,000–$15,000/month on 500 cows. 
  • Why It Lasts: 2025 powder output fell to 2.143 billion pounds — weakest since 2013 — while $11 billion in new capacity went to cheese and whey. Heifer replacements are at a generational low of 3.914 million head, constraining even the milk supply. 
  • Your Biggest Lever: Components plus DRP alignment. Moving from average to high components is worth $1.00–$1.50/cwt, but only if your DRP weighting and handler actually capture that value. Fix both before February 26.
  • The Cost of Waiting: Rolling into spring with a cheese-heavy pool, a Class III-heavy DRP, and average components is a bet that the Class IV premium disappears before your cash does.

The Bottom Line

The February 26 DMC deadline isn’t the end of the conversation — it’s the last clean entry point before spring flush reprices everything. Where does your breakeven sit if Class III stays in the low $17s through summer?

To enroll in the 2026 DMC, contact your local USDA Farm Service Agency office or visit farmers.gov/service-center-locator. The deadline is February 26, 2026.

Complete references and supporting documentation are available upon request by contacting the editorial team at editor@thebullvine.com.

Learn More

The Sunday Read Dairy Professionals Don’t Skip.

Every week, thousands of producers, breeders, and industry insiders open Bullvine Weekly for genetics insights, market shifts, and profit strategies they won’t find anywhere else. One email. Five minutes. Smarter decisions all week.
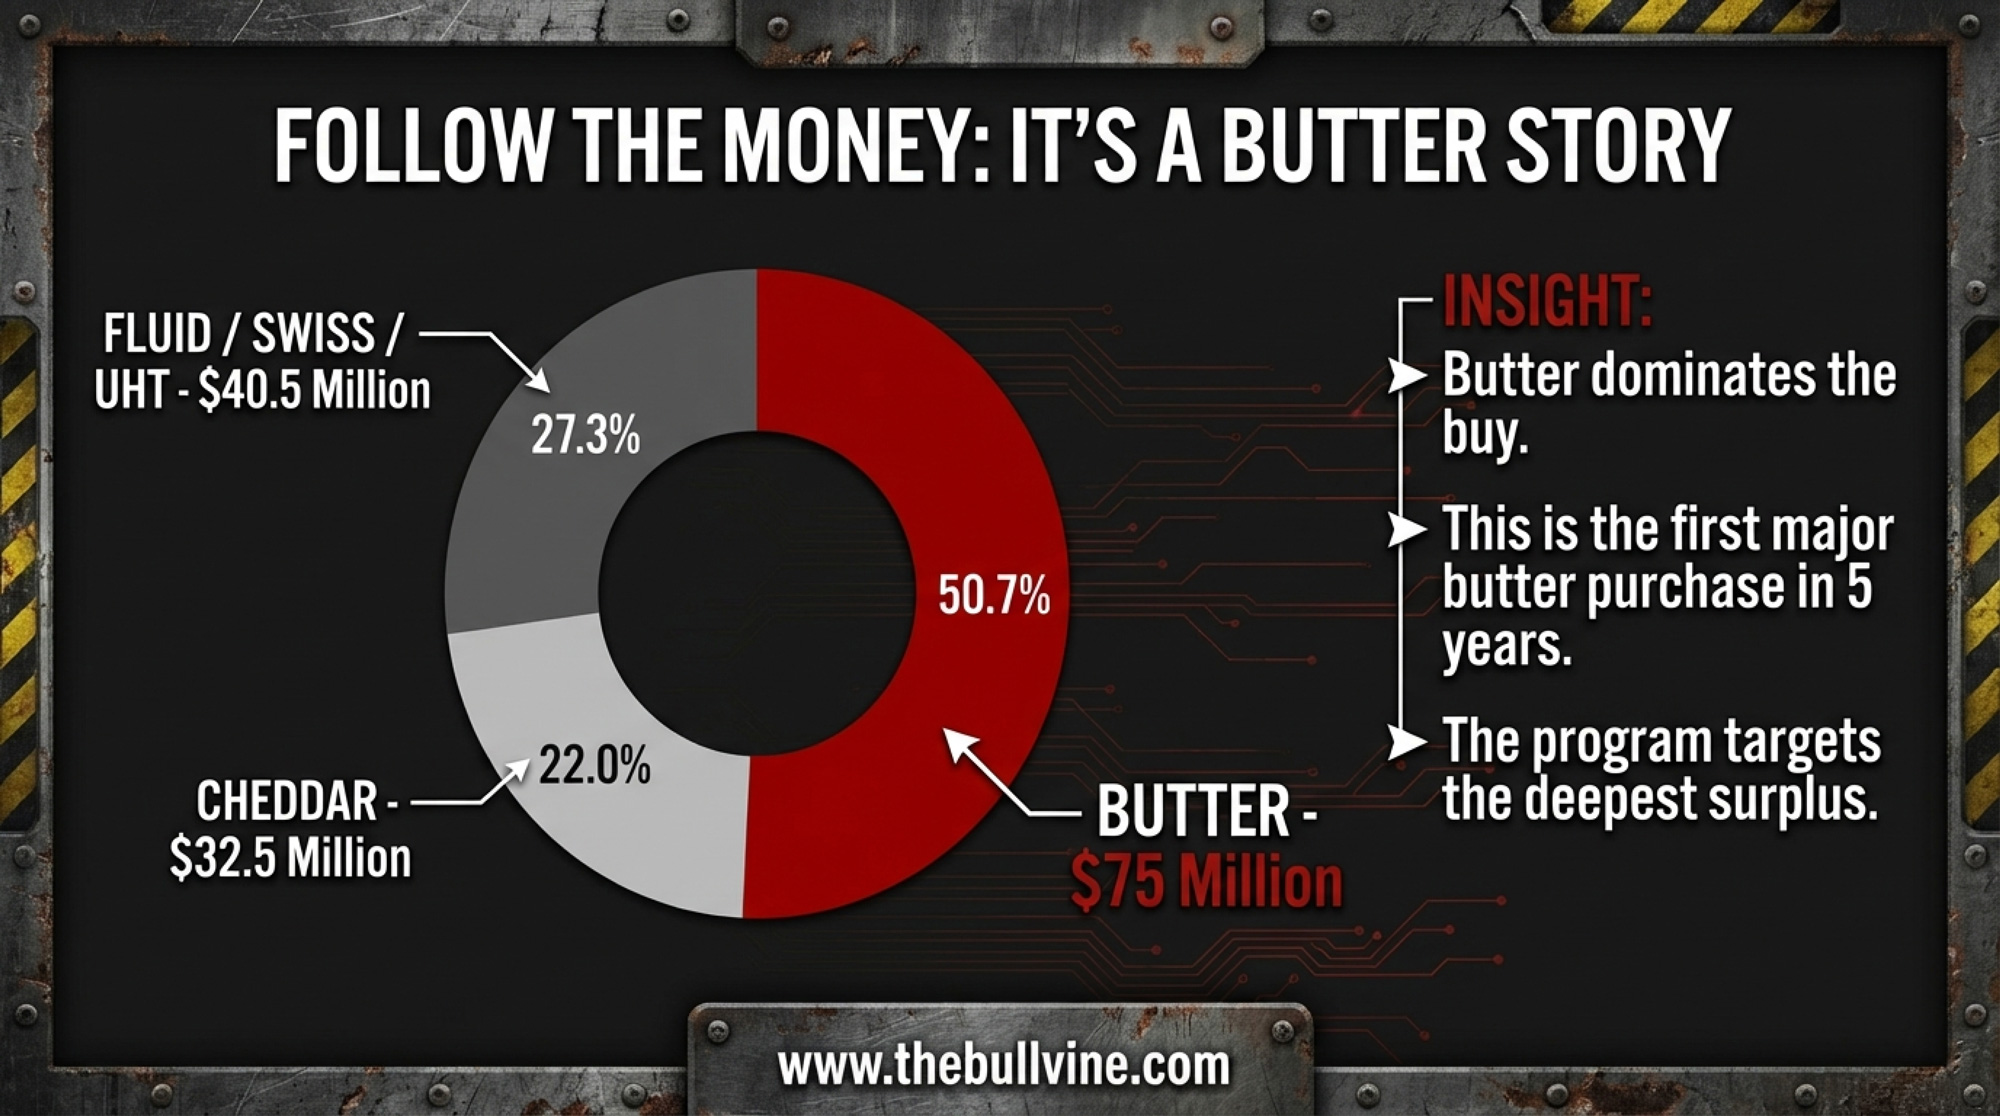
NewsSubscribe
First
Last
Consent

Your Milk Check Just Split in Two: NDM’s Best Week Since 2007 Blows the Class IV Spread to $1.40

The forward Class IV/III gap is now worth $11,000–$16,000/month on a 500-cow herd — and DMC enrollment closes in 17 days.

Executive Summary: NDM jumped 18¢ in a single week to $1.64/lb — the biggest move since 2007 —, and it dragged the entire global dairy complex with it. The GDT index surged 6.7% with every product higher, EEX butter futures ripped 10.7%, and forward Class IV is now running $1.40+/cwt above Class III through year-end. On a 500-cow herd, that spread alone is worth $11,000–$16,000 a month. EU spot butter tells the flip side: down 46.6% year-over-year, a reminder that last year’s overproduction hasn’t cleared, even as dry whey slipped to become the week’s only loser. The scarcity behind this powder rally isn’t going away — 2025 NDM/SMP output was the weakest since 2013, while $11 billion in new US processing capacity went to cheese, not dryers. DMC enrollment closes February 26, Ever.Ag is projecting payouts above $1/cwt through April, and if you haven’t run the numbers on your Class III/IV exposure this week, you’re already behind.

Class IV milk price spread

Nonfat dry milk surged 18¢ in a single week to settle at $1.64/lb on Friday — its highest CME spot price since August 2022 and the strongest weekly dairy market gain since May 2007. By Friday, Class IV futures from March through December 2026 were trading in the high $18s/cwt while Class III sat just above $17/cwt. That’s a spread north of $1.40/cwt, and on a 500-cow herd producing roughly 11,250 cwt/month, it works out to $11,000–$16,000/monthdepending on your component tests and pool structure. NDM is now 16.75¢ above Cheddar blocks — and within pennies of butter. 

Herd Size (cows)Monthly Production (cwt)At $0.50 SpreadAt $1.00 SpreadAt $1.40 Spread (Current)
2505,625$2,813$5,625$7,875
50011,250$5,625$11,250$15,750
75016,875$8,438$16,875$23,625
1,00022,500$11,250$22,500$31,500

USDA’s own weekly NDM report for February 2–6 spells it out: “Tight inventories are the primary factor driving prices higher, as some manufacturers have limited or no spot loads available in the near term.” Katie Burgess, director of risk management at Ever.Ag, put the margin picture in sharper terms — her models show DMC payouts of “more than $1 per hundredweight for January through April, and then some smaller payments for May through July as well.” That was modeled before this week’s powder rally reshaped the Class IV curve.

This Week at a Glance

MarketKey PriceWeekly MoveYoY
US NDM (CME spot, Feb 6)$1.64/lb+18¢
US Cheddar Blocks (CME spot)$1.4725/lb+11¢
US Butter (CME spot)$1.71/lb+13¢
GDT Index (TE397, Feb 3)+6.7%
GDT SMP$2,874/MT+10.6%
EEX Butter (Feb–Sep 26 strip)€4,730/MT+10.7%
EU Butter Index (spot, Feb 4)€3,933/MT-0.9%-46.6%
EU Whey Index (spot, Feb 4)€999/MTFlat+12.5%

GDT TE397: Every Product Up — Short Squeeze or Real Demand?

The February 3 auction was all green. SMP and Mozzarella led at +10.6% each. Butter jumped 8.8% to $5,773/MT. WMP gained 5.3% to $3,614. Even Cheddar — the laggard — posted 3.8% to $4,772.

SellerProductC2 Pricevs Prior GDT
FonterraWMP Regular$3,590+$205 (+6.1%)
FonterraSMP Medium Heat (NZ)$2,920+$275 (+10.4%)
ArlaSMP Medium Heat (EU)$2,800+12.4%
SolarecSMP (Belgian)$2,875+12.5%
SolarecButter$4,950+9.6%

CZ App’s February 8 analysis describes the rally as partly a short squeeze — traders who’d sold forward at lower levels were forced to cover as stops triggered. But the demand side has real teeth too. Strong participation from Asia and the Middle East, with pre-Ramadan and pre-Easter purchasing piling on. Algeria’s ONIL tendered for 56,000 tonnes of WMP — more than double expectations — which tightened supply quickly.

The total volume of 24,034 tonnes wasn’t unusually high. This was a demand-driven move on limited supply, amplified by positioning — not processors dumping product. The February 17 GDT will show whether the squeeze has run its course or genuine scarcity is sustaining these levels.

Global Futures: EEX and SGX Both Surge — Whey the Exception

On EEX, 5,365 tonnes (1,073 lots) traded last week. Thursday alone accounted for 1,805 tonnes — the busiest single session.

ExchangeProductAvg PriceWeekly Move
EEXButter (Feb–Sep 26)€4,730/MT+10.7%
EEXSMP (Feb–Sep 26)€2,605/MT+9.4%
EEXWhey (Feb–Sep 26)€1,019/MT-1.8%
SGXWMP (Jan–Aug 26)$3,791/MT+8.6%
SGXSMP (Jan–Aug 26)$3,298/MT+11.0%
SGXAMF (Jan–Aug 26)$6,281/MT+6.3%
SGXButter (Jan–Aug 26)$5,664/MT+7.3%

SGX SMP’s 11.0% weekly gain actually outpaced EEX — this isn’t just a European story. SGX traded 11,266 lots for the week, more than double EEX volume. The NZX milk price futures contract moved 1,763 lots (10,578,000 kgMS).

The outlier? EEX Whey, down 1.8%. Spot demand is migrating toward higher-protein concentrates and isolates, leaving standard whey behind. CZ App’s February 8 report also flagged quality concerns in the infant formula segment as a factor pushing WPC80 and specialty ingredient demand higher, with whey protein prices up more than 25% in both the EU and New Zealand. Same protein-shift story stateside.

EU Spot Prices: The -46.6% YoY Butter Collapse Nobody’s Talking About

The EU weekly quotations from February 4 paint a more complicated picture than the futures. Week-on-week, SMP gained 4.4%, and Mozzarella rose 2.6%. Zoom out year-over-year, and it’s brutal.

Index€/MTWeeklyYoY
Butter€3,933-0.9%-46.6%
SMP€2,247+4.4%-10.6%
WMP€3,065-0.3%-30.0%
Whey€999Flat+12.5%
Cheddar Curd€3,222-1.4%-33.1%
Mild Cheddar€3,248-0.1%-31.9%
Young Gouda€3,059+1.1%-29.0%
Mozzarella€3,098+2.6%-24.0%

Butter’s collapse — down €3,433/MT from a year ago — is the legacy of 2025’s European production surge. French butter fell €160 (-4.0%) to €3,800, German held at €4,050, and Dutch rose €50 to €3,950. That’s a €250/MT spreadbetween France and Germany. European butter isn’t one market anymore. It’s three markets wearing one index.

Whey remains the lone EU bright spot year-over-year at +12.5% — same protein-demand shift driving the US whey complex.

US Market: The $1.64 NDM Price and the Math Behind the Class IV/III Gap

NDM rose every trading day from Tuesday through Friday. At $1.64/lb, it’s 16.75¢ above Cheddar blocks and closing in on butter at $1.71. US dryers produced just 2.143 billion pounds of NDM/SMP in 2025 — the weakest annual output since 2013, according to the USDA’s Dairy Products report. Combined December output was 170.3 million pounds, down 6.2% year-over-year.

But positioning is part of this story too. CZ App’s analysis points to a rumored US short squeeze in the SMP/NFDM market, with traders forced to cover forward sales at sharply higher prices. Whether you call it scarcity or a squeeze, the practical effect on your milk check is the same.

Why is powder so scarce when milk is abundant? Because the $11 billion in new processing capacity that IDFA highlighted on October 2, 2025 — 50-plus projects across 19 states — went overwhelmingly toward cheese and protein, not dryers. IDFA CEO Michael Dykes said the investment “reflects the confidence dairy companies have in the future of American agriculture.” The industry bet on cheese. The market is punishing that bet through the Class IV/III spread.

Despite the GDT’s 10.6% SMP surge, the GDT-priced product still holds roughly a 25¢/lb advantage over CME NDM after correcting for protein levels. That’s choking US export competitiveness and keeping domestic availability tight.

Cheese gained 11¢ on 51 loads to $1.4725/lb — cheap enough globally that US shipments keep running at a record pace. USDEC reported that November 2025 was the seventh consecutive month above 50,000 MT, volume up 28% year-over-year. But December output hit 1.279 billion pounds (+6.7% YoY), with Cheddar alone up 9%. Production isn’t slowing down.

Butter rose 13¢ to $1.71/lb, including a 10.25¢ jump on Thursday. Twenty-one loads traded, but dozens of unfilled bids stayed on the board. December production grew a modest 2% YoY to 203.8 million pounds. The average US fat test hit 4.51% in December per USDA’s Agricultural Prices report — up 0.05 percentage points from a year ago.

Dry whey was the lone loser, down 2¢ to 73¢/lb. Whey protein isolate production surged 11.7% YoY to 20.6 million pounds in December, while lower-protein WPC (25–49.9%) fell 12.8%. The market is telling processors where the money is.

Milk futures: Class III from March through year-end above $17/cwt. Class IV, driven by NDM, in the high $18s/cwt. That forward spread — not the announced January prices — is the defining number in US dairy right now.

Global Production: Where the Supply Pressure Lives

CountryPeriodVolumeYoYKey Detail
IrelandDec 2025267kt-3.0%Full-year: 9.10M tonnes (+5.0%); butter 286kt (+7.1%)
UKDec 202515.4kt butter+6.6%Full-year cheese: 513kt (+2.9%)
SpainDec 2025624kt+1.8%Full-year flat (-0.2%); milksolids +3.4%
ChinaJan 2026-2.8% farmgate YoY3.03 Yuan/kg; cull cycle ongoing

Don’t confuse Ireland’s December contraction (-3.0%) with structural decline — full-year 2025 collections hit 9.10 million tonnes, up 5.0%. Irish butter production reached 286kt for the year, up 7.1%, and the UK added 6.6% more butter in December. More product hitting export channels. One more reason the EU butter index keeps falling year-over-year, even as powder attempts to stabilize.

China’s ongoing cull cycle — the Ministry of Agriculture confirmed less productive cows are being destocked, with growth driven by yield per cow — could keep Chinese import demand firm through Q2.

Grains and IOFC: $11/cwt Keeps the Lights On, Nothing More

March 2026 soybean meal settled at $303.20/ton on Thursday; March corn at $4.35/bu before giving back ground Friday. South American weather and Trump administration comments about expanding Chinese soybean purchases drove the rally.

At $17/cwt Class III and current grain prices, income over feed cost sits around $11/cwt — consistent with Cattlytics’ January 29 projection of ~$11.40/cwt for 2026. They described it as “not a year that forgives loose management.” Class IV shippers look better on the forward curves. That spread between the two classes isn’t an abstract futures curve — it’s the difference between treading water and building equity.

What This Means for Your Operation

Before anything else, answer three questions your lender will eventually ask:

  1. What’s your handler’s cheese-to-powder plant split?
  2. What’s your current DRP Class III/IV weighting?
  3. What’s your rolling 12-month butterfat test?

If you can’t answer all three, that’s your first move this week.

  • Cheese-dominant shippers, check your DRP weighting. The forward Class IV/III spread is real money — potentially off your check. By Friday, Class IV futures were running $1.40+/cwt above Class III from March through December. On a 500-cow herd, that’s $11,000–$16,000/month in potential value difference. Pull your DRP parameters and check whether your III/IV weighting reflects the forward curve, not last year’s relationship. 
  • Below 4.0% butterfat and 3.1% protein? Run your breakeven now. As of January 2026, FMMO component prices ($1.4525/lb butterfat, $2.1768/lb protein): each 0.1% increase in butterfat translates to roughly $0.15–$0.35/cwt. Moving from average to high-component tests is worth $1.00–$1.50/cwt — roughly $22,000–$34,000 per month on 1,000 cows. Ask your nutritionist for the breakeven test level before the spring flush dilutes components.
  • DMC enrollment closes February 26 — 17 days out. The One Big Beautiful Bill Act reauthorized DMC through 2031 with expanded Tier 1 coverage up to 6 million pounds (up from 5 million). NMPF reported the predicted December 2025 margin at $9.19/cwt — generating a $0.31/cwt payment at $9.50 coverage, the only DMC payout for 2025. But 2026 looks different. Ever.Ag’s Burgess projects payouts exceeding $1/cwt January through April. NMPF’s William Loux confirmed he “would certainly expect to see some DMC payments here through the first quarter and probably through the first half of the year.” At 15¢/cwt for Tier 1 enrollment, Burgess calls DMC “the best risk management coverage you can buy right now.” The six-year lock-in (2026–2031) saves 25% on premiums but sacrifices annual flexibility. Run the math against your feed cost trajectory.
  • Consider locking 30–40% of forward powder exposure before the February 17 GDT. The Feb26–Sep26 EEX SMP strip at €2,605 and the CME Class IV near $18.50/cwt offer a window. But CZ App flags short-squeeze dynamics in this rally. If the squeeze unwinds, prices give back a chunk fast. If genuine scarcity persists, unhedged operations fall further behind. Neither outcome is wrong — being completely unhedged is.
  • Canadian producers: your export-class economics just improved. The CDC’s 2.3255% farm-gate price increase took effect on February 1, with carrying charges rising to $0.0254/kg of butter from $0.0137/kg. But your CEM allocation and export-class shipments are priced off these same global benchmarks. This GDT rally directly supports Class 5 (export) pricing. If GDT SMP holds above $2,800 at TE398, P5 pool returns should reflect it in the next provincial board pricing announcement — watch for the butter-to-SMP ratio shift.
  • Two signals to watch over the next 30 days. (1) If NDM/SMP output stays below 180 million pounds in the USDA’s next Dairy Products report, the scarcity thesis holds. (2) A second consecutive strong GDT auction on February 17 (TE398) confirms this isn’t just short-covering. If prices retreat sharply, the squeeze narrative wins, and you want downside protection in place.

The Bottom Line

The hard choice this week isn’t whether the rally is real — the data says it is, even if short-covering is turbocharging the move. The hard choice is whether you position for it to continue or protect against it reversing. Producers who locked in forward coverage three weeks ago are sitting pretty. The ones who waited are chasing. What does your plan for February 17 look like?

Complete references and supporting documentation are available upon request by contacting the editorial team at editor@thebullvine.com.

Learn More

The Sunday Read Dairy Professionals Don’t Skip.

Every week, thousands of producers, breeders, and industry insiders open Bullvine Weekly for genetics insights, market shifts, and profit strategies they won’t find anywhere else. One email. Five minutes. Smarter decisions all week.
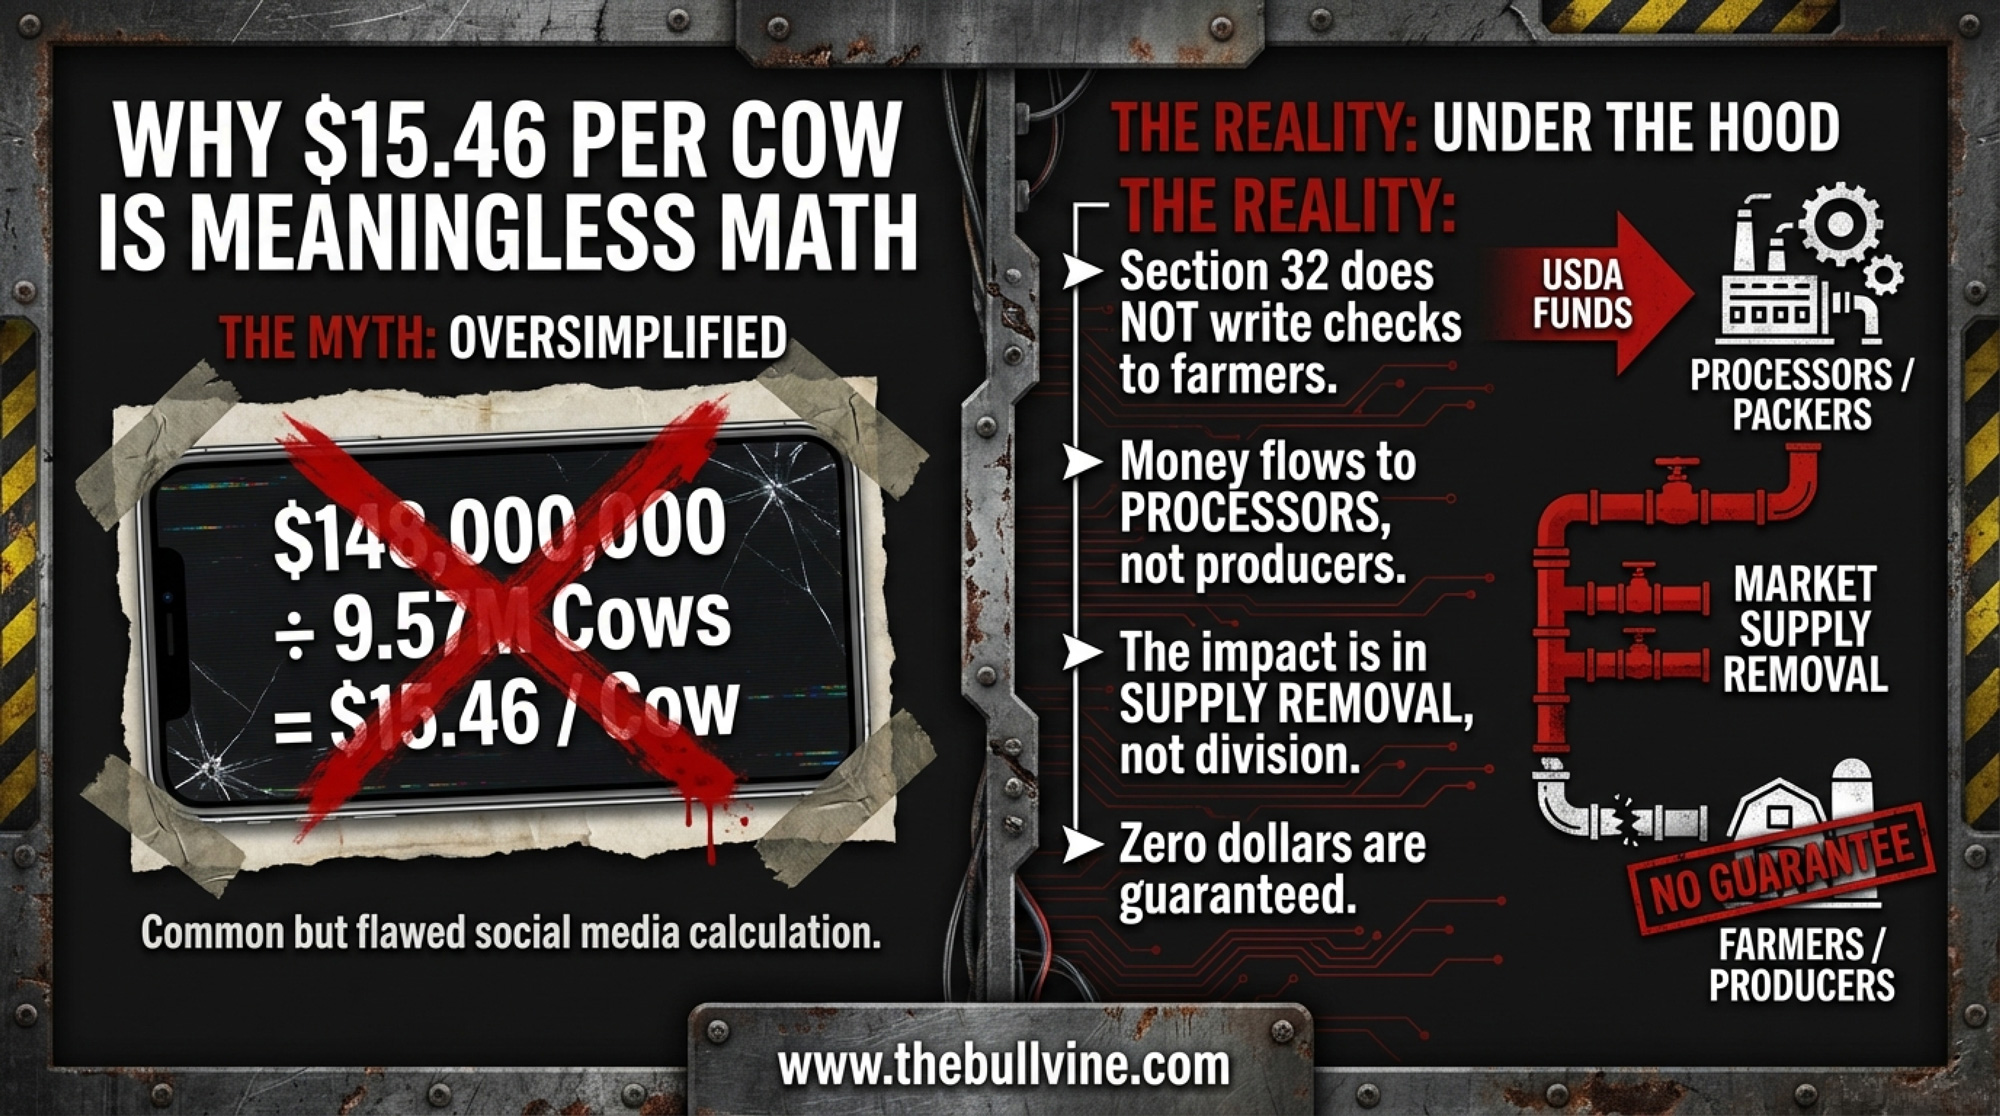
NewsSubscribe
First
Last
Consent

$15 Pizza. 73-Cent Milk Check. The Real Super Bowl Score for Dairy Farmers.

America eats 29 million pounds of cheese today — and the FMMO make allowance ensures your share keeps shrinking.

EXECUTIVE SUMMARY: Americans are tearing into an estimated 29 million pounds of cheese today — six times normal daily volume — and the dairy farmer’s cut of a $15 Super Bowl pizza is 73 cents at January’s Class III price of $14.59/cwt. USDA’s June 2025 make allowance increases widened that gap, diverting an additional 85–93 cents per hundredweight from producer pools to processors and pulling $337 million from farm-level revenue in the first 90 days alone, per the American Farm Bureau Federation’s analysis. The demand story is real; the margin story isn’t. Illinois FBFM data shows dairy operations lost $409 per cow in 2024 on a total economic cost basis — even with per capita cheese consumption hovering near all-time highs. Wisconsin producer Mike Yager calculated the make allowance hit on his 275-cow Mineral Point operation at roughly $55,868 per year in value that now stays with the processor, and says no new premiums have materialized to offset it. If your cash costs are above $17.50/cwt and your order’s blend is anywhere near Class III, your working capital is eroding monthly — and tonight’s pizza binge won’t change that.  The lever that matters now: ensuring USDA’s mandatory biennial processor cost surveys — authorized under the One Big Beautiful Bill Act signed July 4, 2025 — launch on a concrete timeline and include mozzarella, the dominant Super Bowl cheese, which is currently excluded entirely from USDA pricing surveys.”

Right about now, Americans are tearing into an estimated 29 million pounds of cheese. That’s the number Dairy Farmers of Wisconsin — the checkoff-funded marketing organization funded by farmers themselves — projects for Super Bowl Sunday, roughly six times what the country consumes on a normal day. Enough mozzarella, cheddar, pepper jack, and queso to top 12.5 million pizzas, fill millions of nacho platters, and anchor every cheese board from Seattle to Miami. Instacart’s 2026 Super Bowl data shows just how dairy-heavy the day has become: queso orders surged 196% and buffalo sauce — the stuff that goes on wings destined for ranch and blue cheese dip — jumped 201% during game week. 

Here’s the kicker: the same farmers who pay into that checkoff fund to promote cheese are getting about $0.73 of farm value on a $15 pizza when January’s Class III sits at $14.59 per hundredweight. If February futures hold near $15.92, that climbs to about 80 cents. Either way, the delivery driver’s tip is almost certainly larger. The FMMO formula is supposed to connect consumer demand with farm-gate value. Super Bowl Sunday is Exhibit A for why it doesn’t. 

The Demand Is Real — the Margin Isn’t

That volume translates to real dollars at retail — just not at the farm gate. Wells Fargo’s Agri-Food Institute pegs the average 10-person Super Bowl party spread at about $140 in 2026, up just 1.6% from last year — below the 2.4% food-at-home CPI. Frozen pizza prices actually fell 0.6% year over year. For consumers, dairy-heavy game-day food is a bargain. 

Those party-spread prices reflect a deeper pattern. Per capita total cheese consumption hit a record 40.54 pounds in 2023 — the third straight record year, according to USDA ERS data published in late 2024. Then, in 2024, it slipped to the lowest level since 2021, per the ERS’s January 2026 update — the first year-over-year decline since at least 2013. Even at record or near-record consumption, the economics at the farm gate keep tightening. 

A note on the 29-million-pound figure: this is a promotional estimate from a checkoff-funded organization, not an independently audited figure. It’s been used for at least the 2024 and 2025 Super Bowls; no 2026-specific update had been published at the time of writing. Treat it as a credible industry estimate, not a USDA-verified statistic.

Following 73 Cents from the Pizza Box to the Bulk Tank

A standard large pizza uses roughly half a pound of mozzarella. Industry yield runs about 10 pounds of milk per pound of cheese. One pizza, therefore, requires approximately 5 pounds of milk — or 0.05 hundredweight.

0.05 cwt × $14.59/cwt (January 2026 Class III, USDA AMS) = $0.73

At 2024’s all-milk price of $22.55 per hundredweight (USDA ERS annual data), that same pizza returned about $1.13 to the farm — still under 8% of the retail price. As of January 2026, Class III levels are barely 5%. 

USDA ERS published its 2024 farm-to-retail price spread data in June 2025. Nationally, the farm-value share of the dairy product basket was 25 percent, up from 23 percent in 2023. For cheddar specifically, the farm value was $1.80 per pound against a retail price of $5.66 — a 32 percent farm share. Butter fared better at 57 percent. But cheese — which is what’s disappearing tonight — sits squarely in that one-quarter-to-one-third zone. 

The farmer’s share of a $15 Super Bowl pizza: 73 cents. The delivery driver’s tip is almost certainly larger.

PeriodFarm Value ($)Processor/Retail ($)Class III ($/cwt)
Jan 20260.7314.2714.59
Feb 2026 Futures0.8014.2015.92
2024 Average1.1313.8722.55

That’s what happens when the formula pays everyone else first and hands you what’s left

How the FMMO Make Allowance Sets Your Price Before Game Day

On June 1, 2025, USDA raised the make allowances embedded in all 11 Federal Milk Marketing Orders—the first update since the FMMO system was consolidated in January 2000. These are the processing cost deductions that come off wholesale commodity prices before any value reaches producers. 

The American Farm Bureau Federation’s Danny Munch calculated the early damage: class price reductions ranging from 85 to 93 cents per hundredweight, pulling roughly $337 million out of combined producer pool values in just the first 90 days (AFBF Market Intel, September 21, 2025). As Munch told RFD-TV: “Dairy farmers were most concerned about the impact of increased make allowances because they reduce the price farmers receive, and were based on incomplete data during the hearing process”. 

ProductOld Make Allowance ($/lb)New Make Allowance ($/lb)Increase (¢/lb)Impact
Cheese$0.2003$0.25195.16¢Directly hits Super Bowl cheese
Butter$0.1715$0.22725.57¢Record high costs
Nonfat Dry Milk$0.1678$0.23937.15¢Highest increase
Dry Whey$0.1991$0.26686.77¢Wings & dip tax

Source: USDA Final Rule on FMMO Amendments, effective June 1, 2025

Take cheese at $1.60 per pound on the CME. Under the old formula, $1.3997 per pound flowed into Class III component values ($1.60 minus $0.2003). Under the new formula, only $1.3481 does ($1.60 minus $0.2519). That extra 5.16 cents per pound never hits the pool—it stays with the processor as cost recovery.

Here’s a detail that should land hard on Super Bowl Sunday: mozzarella — the single most consumed cheese in America, the cheese on every one of those 12.5 million pizzas tonight — is currently excluded from USDA’s pricing surveys and formula pricing entirely. The cheese-making allowance was set using cheddar processing cost data. Processors testified during the FMMO hearing that mozzarella processing costs differ from cheddar, yet the USDA doesn’t track them separately. The dominant game-day cheese is priced off a formula that doesn’t account for how it’s actually made. 

Processor costs are genuinely higher than they were in 2000 — energy, labor, and packaging all climbed. But AFBF argues the adjustments “must be grounded in comprehensive, mandatory and independently audited surveys” and warns there is “some likelihood that USDA’s changes will unfairly penalize dairy farmers by overstating processing costs”. The data the USDA used were self-selected and self-reported by processors and were not independently verified. 

So when 29 million pounds of cheese disappear tonight, every pound carries that larger deduction. And every hundredweight behind it pays the farmer less than it did a year ago — even if the block price on the CME hasn’t moved.

How Pizza Chains Lock In Their Price While You Ride the Cycle

Domino’s, Pizza Hut, and the major frozen pizza brands don’t buy mozzarella on the spot market in February. They negotiate supply contracts months in advance — typically locking prices or establishing cost-plus formulas that insulate them from short-term CME volatility. 

Tonight’s Super Bowl surge was priced into processor order books weeks or months ago. The demand spike is real, but it doesn’t create upward spot-market pressure that would flow back through Class III into your milk check. By the time 29 million pounds of cheese hits the coffee table, the price was already set. And by the time Americans order those 12.5 million pizzas tonight, Yager’s January milk check was already settled.

You’re selling milk into a Class III formula that resets monthly based on USDA commodity surveys. If CME blocks rally in February, you might see a modest lift in your March check. If they don’t, you won’t — regardless of how many pizzas Americans ordered tonight.

Record Cheese, Vanishing Farms: The Demand Paradox

Americans have never eaten more cheese over a sustained period than they did from 2021 through 2023 — three consecutive record years, peaking at 40.54 pounds per capita in 2023. And yet U.S. dairy farms keep closing at an accelerating rate.

The numbers are stark. USDA NASS data shows the U.S. lost 1,434 licensed dairy herds in 2024 alone — a 5.5% decline in a single year, bringing the national total to 24,811 farms. That’s down from 44,809 just a decade earlier — a 45% loss since 2014. And 86% of the 2024 decline was concentrated in the Midwest and Eastern states: Wisconsin lost 400 herds, Minnesota and New York shed a combined 315, and Pennsylvania dropped another 90. 

RegionFarms Lost (2024)% of National LossImpact
Wisconsin40027.9%Worst hit
Minnesota18012.5%Severe
New York1359.4%Severe
Pennsylvania906.3%Major
Other Midwest/East42929.9%Critical belt
Western States20014.0%Growing regions
Total U.S.1,434100.0%5.5% decline

The Bullvine reported in October 2025 that 1,420 American dairy farms had exited in the prior year. If that pace continued or accelerated, The Bullvine estimated the 2025 total could approach 2,800 closures — though the actual figure depends on how many operations secured financing versus being forced out. Cornell’s Dr. Andrew Novakovic put it bluntly: “What took ten years then is happening in two or three now” (The Bullvine, November 2025). 

Processing capacity, meanwhile, is expanding in the opposite direction. Hilmar Cheese opened a $600 million facility in Dodge City, Kansas, in March 2025, specializing in American-style cheese in 40-pound commercial blocks and employing nearly 250 people. Great Lakes Cheese announced a $185 million expansion in Abilene, Texas, in 2024. These plants are designed to run for decades. And every one of them operates under the wider make allowances that took effect last June. 

The View from Two Federal Orders

Mike Yager milks 275 Holsteins and grows feed crops near Mineral Point, Wisconsin — squarely in Federal Order 30, the Upper Midwest. When the make allowance increases hit last June, he did his own calculation: that additional 90 cents per hundredweight amounts to roughly $55,868 per year for an average-sized Wisconsin dairy in value that now stays with the processor instead of reaching the bulk tank. To estimate your own hit: multiply your total hundredweight shipped per year by $0.90. A 500-cow herd shipping around 110,000 cwt annually loses roughly $99,000 in pool value. 

Herd SizeAnnual Shipment (cwt)Annual Loss from Make AllowanceMonthly Impact
Mike Yager (275 cows)62,076$55,868$4,656
Average WI (500 cows)110,000$99,000$8,250
Large (1,000 cows)220,000$198,000$16,500
Mega (5,000 cows)1,100,000$990,000$82,500

“We as dairy farmers don’t see it on our milk checks. But via the new make allowances, we are losing out on 90 cents per hundredweight additional money that the processors are now receiving.” — Mike Yager, Brownfield Ag News, November 2025 

For his operation, that deficit is roughly equivalent to an employee’s salary. And so far, he says, no added premiums have materialized to offset the loss. 

The regional numbers vary, but no federal order escaped the hit. In the Northeast, the Milk Dealers and Distributors Industry Association warned during FMMO hearings that reduced minimum prices would be “particularly problematic” amid “widespread and accelerating exit of Northeast dairy farmers” — and could push the milkshed past a point of no return. Calvin Covington estimated Southeast orders will see the largest net benefit from updated Class I differentials — an average $1.42/cwt increase, but only on Class I volume. For Upper Midwest producers like Yager, where the blend skews heavily toward Class III, the make allowance hit lands harder, and the Class I differential cushion is thinner. 

Illinois Farm Business Farm Management data tells the broader story. The 2024 numbers showed an average net milk price of $21.63 per hundredweight against total economic costs of $23.56 — a loss of $1.93/cwt, or negative $409 per cow for the year. Feed costs averaged $11.64/cwt, and nonfeed costs hit a record $11.92/cwt. SDA ERS’s January 2026 Livestock, Dairy, and Poultry Outlook forecasts the 2026 all-milk price at $18.25 per hundredweight, down from $21.15 in 2025 — a decline of nearly $3.00/cwt, or roughly 14% ​. That’s a wider drop than feed cost savings can absorb.” This is the single most important factual correction in this draft.

If you’re on a component order running 4.0% butterfat and 3.3% protein, there is a premium above the Class III floor — but it’s thinner than you might assume. At January 2026 component prices (butterfat at $1.4525/lb, protein at $2.1768/lb, other solids at $0.4448/lb — per USDA AMS), a hundredweight at those test levels returns roughly $15.53in component value (assuming 5.7% other solids, standard for Holstein herds), about $0.94 above the $14.59 Class III. That’s real money. But the make allowance still comes off the top of every component calculation before those prices are set. High components help. They don’t fix the formula. 

What This Means for Your Operation

This isn’t a guilt trip. It’s a math problem — and the math has specific levers you can pull.

  • Pull your last 12 months of milk checks and calculate your true net effective price — not the blend, not the gross, but what actually hit your account after deductions, hauling, and co-op assessments. USDA ERS data shows the national dairy farm-value share was 25% of the retail dollar in 2024. If your net is more than $1.50 below the FMMO blend minimum published by your order, you need to understand why. 
  • Know your breakeven in Class III terms. Illinois FBFM data pegged total economic costs at $23.56/cwt for 2024, with feed and cash operating costs at $17.43/cwt. Your costs vary by region, herd size, and feed situation — but if your cash costs are above $17.50/cwt and January’s $14.59 Class III is anywhere near your order’s blend, your working capital is eroding monthly. That’s the conversation to have with your lender this month, not in May. 
  • Talk to your crop insurance agent about Dairy Revenue Protection for Q2 and Q3 2026. HighGround Dairy’s five-year analysis found that for every $1.00 spent on DRP premiums, producers received $1.78 in return on average — a net benefit of $0.23/cwt after premiums. Coverage booked three quarters out returned the highest average net benefit at $0.30/cwt, despite higher premiums. With February 2026 advanced cheese prices at $1.4078/lb and butter at $1.4201/lb (USDA AMS, February 4, 2026), markets are signaling continued softness — exactly the environment where DRP has historically paid off. The trade-off is real: DRP premiums are a cash cost that hits quarterly, whether you need the coverage or not, and if milk rallies above coverage levels, you’ve paid for protection you didn’t use. But at current futures, the odds favor the buyer. If you haven’t locked Q3 2026 yet, that window is still open. 
  • Push USDA to launch mandatory processor cost surveys—and include mozzarella. Congress has already acted: the One Big Beautiful Bill Act, signed July 4, 2025, mandates biennial cost-of-production surveys covering cheese, butter, and nonfat dry milk processors, with $9 million appropriated for the program. But AFBF’s Danny Munch warns the timeline remains unclear. “They’re going to have to set up a methodology. They’re going to have to have staff and researchers set aside for this,” Munch told Brownfield Ag News at World Dairy Expo. “I don’t expect it to happen anytime soon”. And even when data comes in, there’s no automatic adjustment — a full FMMO hearing would still be required to change make allowances. The gap to push on: the survey covers cheese, butter, and NFDM, but does not explicitly name mozzarella — the single largest-volume cheese in America and the backbone of tonight’s pizza consumption. Push your co-op and trade organization to demand that mozzarella be included in the USDA’s survey methodology before it’s finalized. USDA’s FMMO modernization referendum was approved across all 11 orders in January 2025, with pricing amendments effective June 1, 2025.
  • Request one competitive price comparison from an alternative buyer. If you ship to a large co-op, call an independent or a smaller cooperative and ask what they’d pay for your components. Yager’s experience is telling: the fear of being dropped keeps many farmers from asking tough questions about premiums. You don’t have to switch — switching carries real risk, including loss of hauling routes, potential basis penalties during transition, and relationship capital that’s hard to rebuild. But knowing you have options strengthens every negotiation you stay in. And if you’re exploring farmstead cheese or on-farm retail, start with no more than 10–20% of your production; the capital and compliance costs catch more operations than the margins do. 

The Three Numbers That Matter Monday Morning

  • 73 cents — the farm share of a $15 Super Bowl pizza at January’s Class III. Your actual loss from the make allowance increase scales with production: multiply your annual hundredweight shipped by $0.90. Nationally, the farm-value share of all dairy products at retail was 25% in 2024. 
  • 29 million pounds of cheese was priced into processor contracts weeks ago. Game-day demand doesn’t create spot-market pressure that flows back to your bulk tank. The consumption is real; the price signal to producers is at best muted.
  • Mozzarella — tonight’s dominant cheese — isn’t even in the USDA pricing survey. The make allowance was set on cheddar data. Until the survey includes the cheeses that actually drive demand, the formula will keep underpricing your contribution to the products consumers want most. 

Beyond the Final Whistle

Seventy-three cents on a fifteen-dollar pizza. That’s the current system’s answer to record demand. It matters that dairy farmers built what’s on every table in America tonight — and it matters more that the pricing formula doesn’t reflect it.

Yager’s math is blunt: the make allowance increase alone costs an average-sized Wisconsin dairy enough to fund a full-time employee — and so far, no premiums have shown up to replace it. In the Northeast, state industry groups have warned that continued milkshed contraction threatens the infrastructure supporting all small-scale agriculture in rural New England. Novakovic says the consolidation cycle is compressing a decade into two or three years. Whether the system changes fast enough to slow that compression is the open question — and 2,800 farms may not get to wait for the answer. 

Pull your numbers this week. If your net effective price is more than $1.50 below the published FMMO blend, call your field rep before March—and then call the people who claim to speak for you and ask one specific question: what are they doing to ensure USDA’s mandatory processor cost surveys include mozzarella and launch before the next make-allowance fight. The gap between what consumers pay and what you receive won’t close on its own.

Complete references and supporting documentation are available upon request by contacting the editorial team at editor@thebullvine.com.

Learn More

The Sunday Read Dairy Professionals Don’t Skip.

Every week, thousands of producers, breeders, and industry insiders open Bullvine Weekly for genetics insights, market shifts, and profit strategies they won’t find anywhere else. One email. Five minutes. Smarter decisions all week.
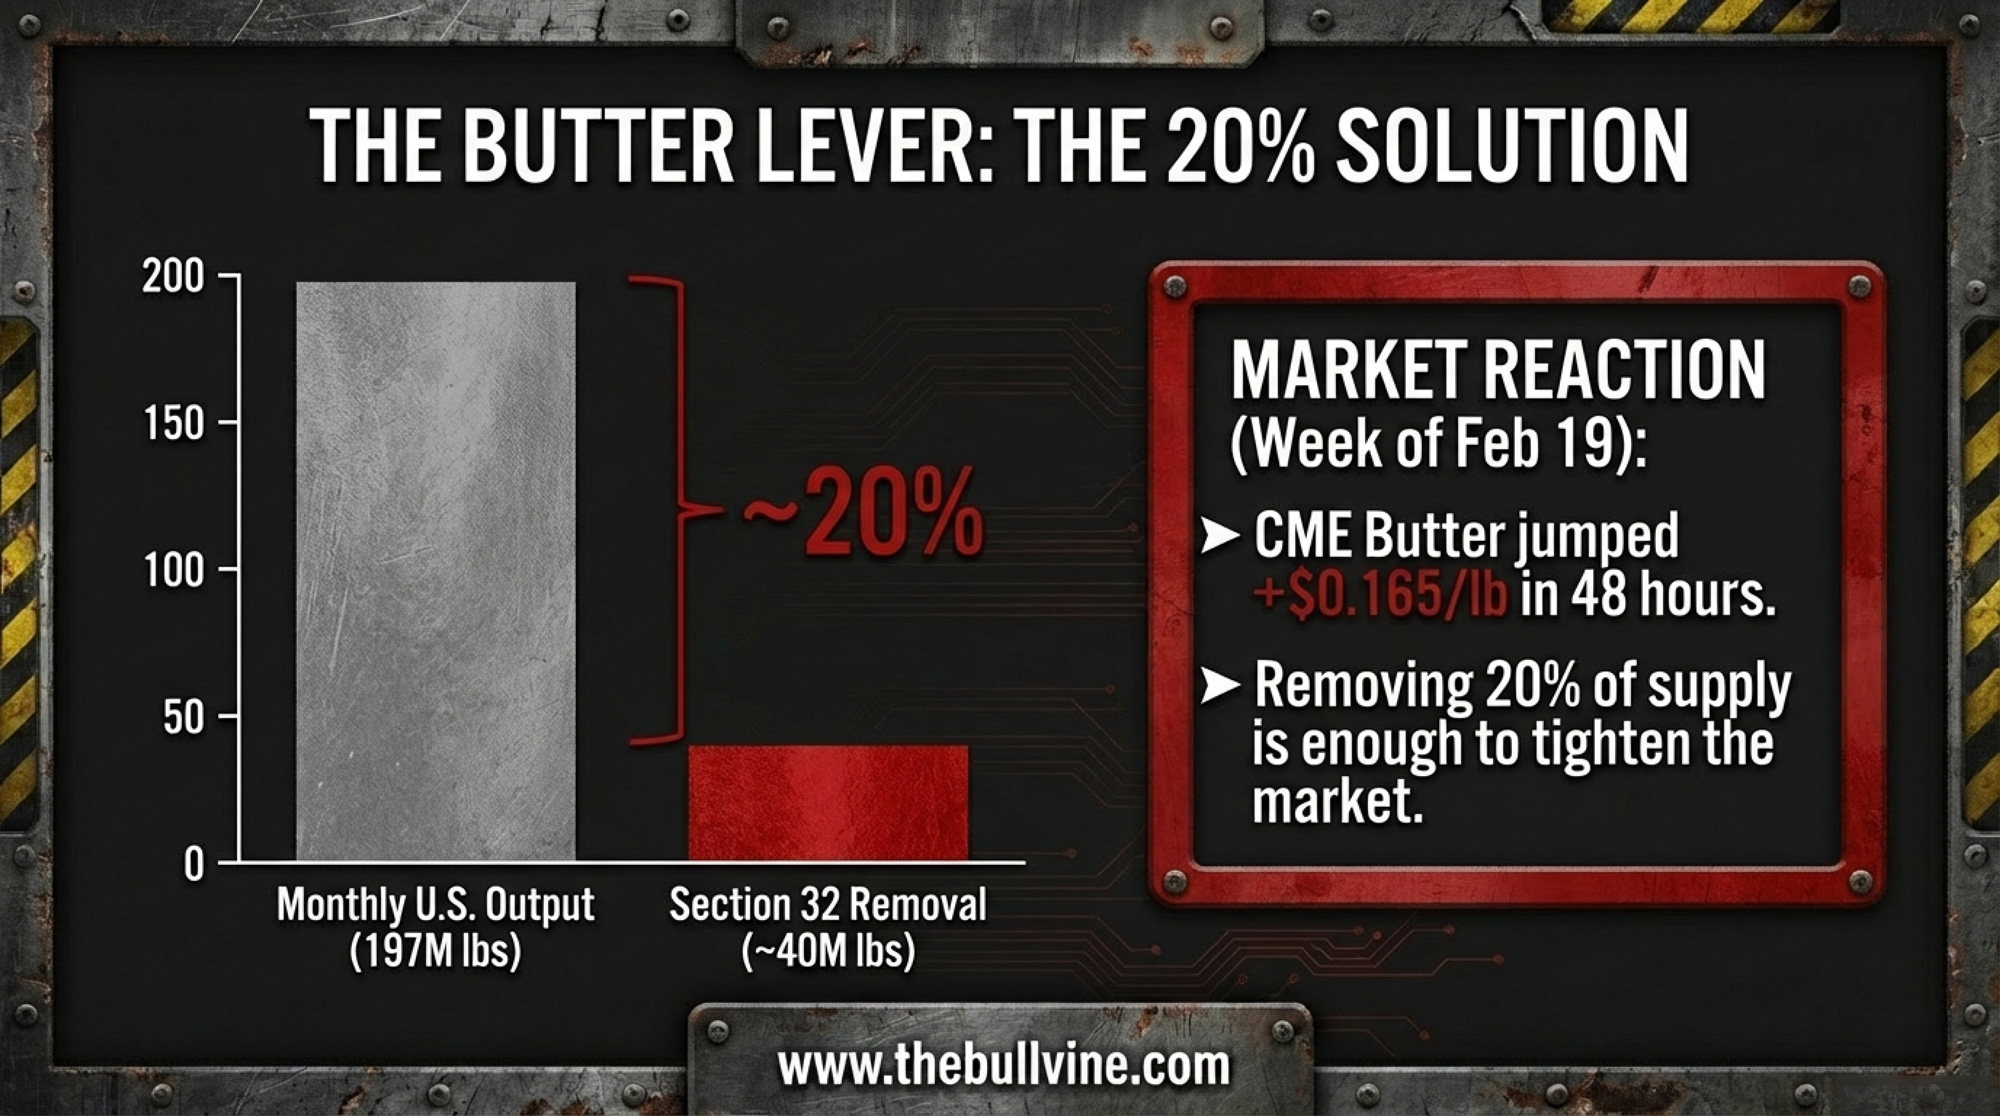
NewsSubscribe
First
Last
Consent

Powder Just Outpriced Cheddar: The $15,000/Month Gap Reshaping Your 2026 Milk Check

NDM’s best week since 2007 exposed a Class III/IV spread that’s costing cheese-pool herds $10,000–$15,000/month. Four moves before spring flush.

Executive Summary: If you’re shipping to a cheese-dominant handler, the Class III/IV spread is costing your operation $10,000 to $15,000 a month on 500 cows. NDM surged 18¢ this week to $1.64/lb — its strongest weekly gain since May 2007 — while Cheddar settled at $1.4725 and Class IV futures pushed into the high $18s versus Class III in the low $17s. The structural driver: U.S. powder output in 2025 fell to its weakest level since 2013 while over $11 billion in new processing capacity flowed to cheese and whey, not dryers. That imbalance has staying power. DMC enrollment closes in 52 days, and four moves — DRP restructuring, DMC stacking, component optimization worth $1.00–$1.50/cwt, and a hard look at your handler alignment — can narrow this gap before spring flush closes the window.

Nonfat dry milk surged 18¢ in a single week to settle at $1.64/lb on Friday, February 6, 2026 — the highest CME spot price since August 2022 and the strongest weekly gain since May 2007, per Jacoby & Associates. That puts powder a full 16.75¢ above Cheddar blocks and within pennies of butter. For the first time in years, milk powder is outpricing the product that the entire U.S. processing sector was built around. 

For producers shipping to cheese-dominant handlers — where Class III drives the blend — the revenue gap is specific and measurable. The Bullvine’s October 2025 analysis of two identical 500-cow herds — same genetics, same production, same components, different pool structures — found a monthly revenue disparity of $10,000 to $15,000, with the cheese-heavy operation on the losing end. DMC enrollment closes March 31. Spring flush is six to eight weeks out. The decisions you make about DRP coverage, component targets, and handler alignment in the next 90 days determine which side of that gap you land on. 

MonthClass III Pool (Black Line)Class IV Pool (Red Line)Gap
Sep 2025$310,000$315,000$5,000
Oct 2025$305,000$314,000$9,000
Nov 2025$302,000$314,500$12,500
Dec 2025$298,000$313,000$15,000
Jan 2026$295,000$310,000$15,000
Feb 2026$292,000$307,000$15,000

What $1.64 NDM and $1.47 Cheddar Look Like on Your Check

The week’s CME scoreboard tells a lopsided story. NDM at $1.64/lb. Cheddar blocks up 11¢ to $1.4725/lb on 51 loads — one of the busiest trading weeks in recent memory. Butter jumping 13¢ to $1.71/lb, with dozens of unfilled bids still on the board at Friday’s close. By Friday, MAR26 Class IV was trading in the high $18s to near $20/cwt — well above Class III in the low-to-mid $17s. That spread hits your check directly if you’re in a cheese-heavy pool. 

ProductFeb 6, 2026 CloseWeekly ChangeYOY ChangeTrading Volume (loads)
Nonfat Dry Milk$1.64/lb+18.0¢+42.6%38
Cheddar Blocks$1.4725/lb+11.0¢+8.4%51
Butter$1.71/lb+13.0¢+15.5%42
Class IV Futures (MAR26)~$19.00/cwt+$1.50/cwt+12.2%
Class III Futures (MAR26)~$17.25/cwt+$0.50/cwt+4.1%

Behind those numbers sits twelve months of compounding imbalance. USDA’s Dairy Products report, released February 5, confirmed that combined U.S. NDM and skim milk powder output in December totaled just 170.3 million pounds — down 6.2% year-over-year. Full-year 2025 powder production: 2.143 billion pounds. The weakest annual total since 2013. 

Cheese, meanwhile, has never been higher. December output hit 1.279 billion pounds, up 6.7% year-over-year, with Cheddar surging 9%. Milk production grew 4.6% in December across the 24 major states. More milk than ever is flowing through the system. It’s going into cheese vats, not dryers. 

Where Did All the Dryers Go?

Powder got scarce because the industry was built for cheese, not because the world suddenly needed more milk powder.

IDFA reported in October 2025 that U.S. dairy processors have committed over $11 billion in new and expanded processing capacity across more than 50 projects in 19 states between 2025 and early 2028 — overwhelmingly targeting cheese and whey protein, not drying. IDFA CEO Michael Dykes framed it as a response to “unprecedented demand for American-made dairy products, especially cheese and whey protein”. That investment wave is a supply-side explanation for the powder squeeze—and it suggests the scarcity has staying power. 

Inside the Plant Where Cheese Barely Breaks Even

Ken Heiman lives this math daily. The CEO and co-owner of Nasonville Dairy in Marshfield, Wisconsin — a certified Master Cheesemaker who got his license at 16 — processes 1.8 million pounds of milk daily from roughly 190 Wisconsin farm families, turning out more than 150,000 pounds of cheese every day. By his own account, the operation “just breaks even” on most of the cheese. What keeps Nasonville profitable is whey protein. “We ought to be thanking people who are buying whey protein at Aldi’s,” Heiman told the New York Times last July. “It definitely enhances the bottom line.” 

That’s not an outlier — it’s the new economics of processing. December USDA data shows whey protein isolate production at 20.6 million pounds, up 11.7% year-over-year, while lower-protein WPC (25–49.9%) fell 12.8%. Plants keep making cheese — even at thin margins — because the whey stream subsidizes the operation. More cheese keeps Class III supply elevated, which holds down the blend price for every farm shipping to a cheese-dominant handler. Phil Plourd at Ever.Ag framed it bluntly: “It is a street fight, in terms of figuring out ways to stay relevant, to get more productive, to stay ahead of the curve, to manage risk better.” 

What the FMMO Reforms Actually Did to Your Check

Kevin Krentz knows the cost of pool imbalances firsthand. The Wisconsin Farm Bureau President — who milks about 600 cows with his wife, Holly, near Berlin, in Waushara County — testified before USDA in August 2023 that negative PPDs reached $9/cwt, costing his operation nearly $200,000. Those losses accumulated during a PPD crisis that began when the “average-of” Class I mover took effect in May 2019 and persisted through at least 2023. 

The June 2025 FMMO reforms addressed that specific formula — reverting to the “higher-of” Class I mover, with all 11 federal orders voting to accept it. But the reforms also raised make allowances by 5¢ to 7¢ per pound across all four pricing products. In three months, that wiped $337 million from pool values nationally, per AFBF economist Danny Munch, with the Upper Midwest absorbing $64 million of the hit. Class prices dropped 85 to 93 cents per hundredweight, even with make allowances alone. 

UW–Madison extension specialist Leonard Polzin noted that make allowances are “embedded in the federal pricing formulas rather than itemized”—they don’t show up as a line on your check like a hauling charge. Roughly 90% of the component-priced milk check sits on butterfat and protein, per CoBank analyst Corey Geiger. With the spread running this wide, that concentration means your check swings harder on butterfat and protein than on volume — and the structural dynamics driving today’s Class III/IV divergence share some of the same characteristics as the crisis Krentz lived through. 

Component Premiums — Run Your Own Numbers

The gap between high-component and volume-focused herds is calculable from the USDA’s monthly announcements. In January 2026, FMMO component prices were $1.4595/lb for butterfat and $2.1768/lb for protein. The Bullvine’s June and July 2025 market reports estimated that each 0.1% increase in butterfat translates to roughly $0.15–$0.35/cwt in additional revenue, depending on the month. For a farm testing 4.3% fat and 3.3% protein versus one at 3.8% and 3.0%, that cumulative advantage runs $1.00–$1.50/cwt

On a 1,000-cow herd averaging 75 pounds per day, even the low end means roughly $22,000 per month. The high end: $34,000 — over $400,000 annually. This lever works regardless of your pool or handler — as long as component premiums hold. And that’s not guaranteed. Protected fat supplements run $0.35 to $0.55 per cow per day in the Upper Midwest. Genetic gains through sire selection take 6–24 months to show up in the tank. Ask your nutritionist for the breakeven component test level at current premiums.

Component TestButterfat (%)Protein (%)Monthly Revenue Advantage (1,000 cows)Annual Revenue Advantage
Low Components3.6%2.9%
Average Components3.8%3.0%+$8,000+$96,000
Mid-High Components4.1%3.2%+$18,000+$216,000
High Components4.3%3.3%+$28,000+$336,000

Four Moves Before Spring Flush — and What Each Costs

  • Restructure DRP to match actual pool exposure. If your co-op runs 60% cheese and 40% butter/powder but your DRP is weighted 80% Class III, you’re insuring a milk check that doesn’t exist. High-component herds generally benefit from the Component Pricing option; average-component herds from Class Pricing with accurate III/IV weighting. RMA premium subsidies range from 44% at 95% coverage to 55% at 70%. Compeer Financial’s 2020–2023 analysis found average DRP premiums of $0.31/cwt; HighGround Dairy’s five-year review showed an average net benefit of $0.23/cwt. Get a current quote — premiums fluctuate with volatility. The trade-off:premiums are sunk cost if the spread narrows. That premium stacks against a monthly gap exposure of $10,000–$15,000 on 500 cows. 
  • Stack DMC before March 31. Tier 1 now covers up to 6 million pounds — up from 5 million — giving medium-sized operations an extra million pounds of coverage. You must establish a new production history based on your highest marketings from 2021, 2022, or 2023. For operations with a longer risk horizon, DMC offers a six-year lock-in (2026–2031) with a 25% premium discount — but you give up annual flexibility, and if milk prices surge above $24/cwt, you’re locked into coverage you don’t need. With MAR26 soybean meal at $303.60/ton and corn at $4.30/bu, the feed-cost squeeze is real. DMC covers cost; DRP covers revenue. 
  • Audit your milk check. AFBF economist Danny Munch, at ADC’s Dairy Hot Topics session during World Dairy Expo last October, urged farmers to share milk check stubs with ADC, their state Farm Bureau, or their market administrator. Munch found instances — particularly in Wisconsin — where independent handlers weren’t following existing disclosure requirements. Look for months where your PPD went sharply negative while Class IV traded at a premium. Cost: one uncomfortable phone call. Potential payback: significant. 
  • Explore handler options in competitive milk sheds. In parts of Wisconsin, Idaho, and the Upper Midwest, producers with high-component milk may have leverage to find handlers whose plant mix better captures Class IV value. The trade-off is real: equity stakes in your current co-op, hauling logistics, and relationship costs. But when pool assignment can swing $10,000–$15,000 monthly on 500 cows, the conversation may be worth having.
Coverage ScenarioQuarterly DRP Premium ($/cwt)Monthly Premium Cost (9,000 cwt/month)Monthly Uninsured Pool Gap Exposure
Low Coverage (70%)~$0.05/cwt~$450$10,000–$15,000
Mid Coverage (85%)~$0.20/cwt~$1,800$10,000–$15,000
High Coverage (95%)~$0.40/cwt~$3,600$10,000–$15,000

Running the Numbers: DRP Coverage (500-cow herd, ~9,000 cwt/month)

 Low EstimateHigh Estimate
Quarterly DRP premium (per cwt)~5¢~40¢
Monthly premium cost~$450~$3,600
Monthly Class III/IV pool gap exposure~$10,000~$15,000
Net monthly uninsured risk~$9,550~$11,400

Compeer Financial 2020–2023 avg: $0.31/cwt. HighGround Dairy five-year avg net benefit: $0.23/cwt. RMA subsidies: 44% (95% coverage) to 55% (70% coverage). Gap: Bullvine analysis, Oct 2025. Get a current quote for your operation.

Four Signals That Separate Noise from Structure

  • Q1 2026 powder production (USDA reports, March and April). If NDM/SMP output remains negative year-over-year despite record milk production, drying capacity is confirmed to be insufficient— not just seasonally tight. Monthly sales below 180 million pounds would be historically abnormal. Above 195 million pounds would suggest the system is self-correcting. This is the single most important data point for validating or killing the thesis.
  • Monthly cheese exports to Mexico (USDEC data, ~6-week lag). Mexico accounted for 38% of all U.S. cheese exports through November 2024 — 392 million pounds — per Hoard’s Dairyman, with full-year 2024 volumes reaching 424 million pounds. If monthly volumes drop below 30,000 metric tons for two consecutive months, alternative markets can’t absorb the displacement. 
  • Class III/IV spread duration. A two-month spread is noise. One that persists through six months signals a structural change that even processing allocations will eventually follow. Last July, The Bullvine reported the Class IV premium hit $1.71/cwt over Class III. If the gap holds above $1.00/cwt through June 2026, that would mark the longest sustained Class IV premium driven by powder scarcity in modern FMMO history. 
  • Cheese inventories. USDA’s December 31, 2025, Cold Storage report showed 1.35 billion pounds of natural cheese in warehouses, up 1% year-over-year. Two consecutive months above 1.40 billion pounds would signal the export safety valve is failing — and that cheese is backing up faster than the market can clear it. 

Your Next Moves

Start with three questions: What’s your handler’s cheese-to-powder plant utilization split? What’s your current DRP Class III/IV weighting? What’s your rolling 12-month average butterfat test? If you don’t know all three, that’s your first move.

  • If your DRP is weighted more than 60% Class III but your handler runs significant butter or powder volume, you’re likely insuring the wrong revenue stream. Pull your current parameters this week.
  • DMC enrollment closes on March 31 — 52 days from now. Tier 1 covers 6 million pounds for 2026. Six-year lock-in (2026–2031) saves 25% on premiums but sacrifices annual flexibility. With soybean meal above $303/ton, this is the cheapest margin backstop available. 
  • If your herd averages below 4.0% butterfat and 3.1% protein, you’re leaving an estimated $1.00+/cwt on the table relative to component-optimized herds in the same pool. 
  • If your PPD went negative in any month since October 2025, ask your co-op directly whether Class IV milk was depooled. Danny Munch at AFBF has flagged handlers — particularly in Wisconsin — not following existing disclosure rules. 
  • Run your cash flow at Class III, averaging $16.50/cwt for the next 18 months with current feed costs. If that doesn’t work on your spreadsheet, waiting costs more than acting.
  • Counter-signal: If Q1 NDM/SMP production rebounds above 195 million pounds monthly, the scarcity thesis weakens. The March Dairy Products report is the first real test.

Key Takeaways

  • The Gap: Today’s NDM–Cheddar spread is already costing a 500-cow cheese-pool herd $10,000–$15,000/month compared with the same cows in a more Class IV-exposed pool.
  • Why It Lasts: 2025 powder output fell to its weakest level since 2013 while more than $11 billion in new capacity went to cheese and whey, not dryers — a setup that keeps Class IV firm and cheese-led pools behind.
  • Your Biggest Lever: At current component prices, moving from “average” to high components is worth roughly $1.00–$1.50/cwt — about $22,000–$34,000/month on 1,000 cows — but only if your DRP mix and handler capture that value.
  • The 52-Day Deadline: DMC enrollment closes in 52 days, giving you one tight window to line up DMC coverage, DRP weighting, and component targets with the actual market you’re in before spring flush hits.
  • The Cost of Waiting: Rolling into spring with a cheese-heavy pool, a Class III-heavy DRP, and “good enough” components is a bet that the Class IV premium disappears before your cash does.

Complete references and supporting documentation are available upon request by contacting the editorial team at editor@thebullvine.com.

Learn More

The Sunday Read Dairy Professionals Don’t Skip.

Every week, thousands of producers, breeders, and industry insiders open Bullvine Weekly for genetics insights, market shifts, and profit strategies they won’t find anywhere else. One email. Five minutes. Smarter decisions all week.
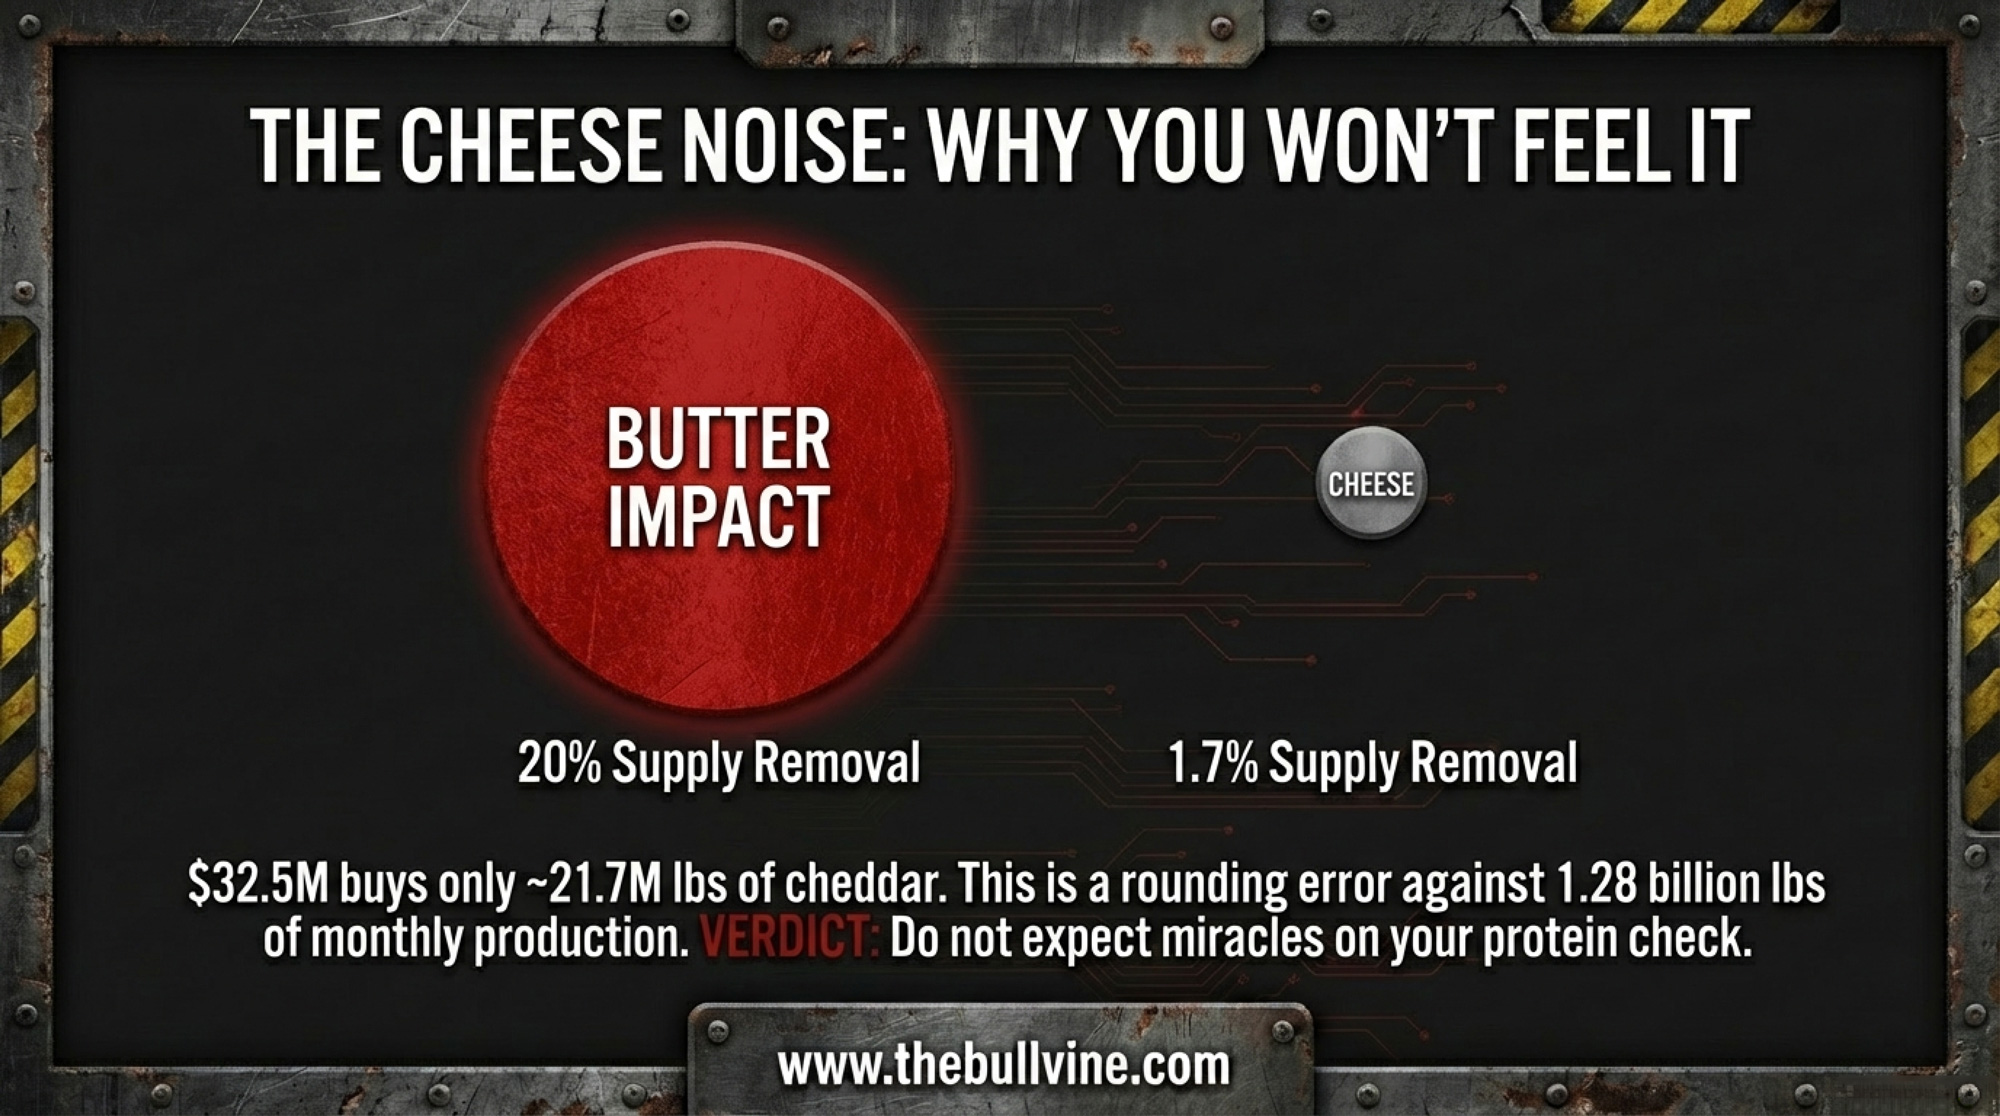
NewsSubscribe
First
Last
Consent

Idaho’s $3.87 Billion Edge: Why Geography Is Beating Management in the West Coast Dairy Wars

The Reynolds family bet half their Idaho farm on dairy. An Oregon neighbor did everything “right” and still bleeds cash. The gap? Up to $600,000 a year in geography, not effort.

Executive Summary: You’re not imagining it — Idaho’s dairy families aren’t just getting lucky, they’re starting every year about $600,000 ahead of similar herds in Oregon and Washington because of feed, labor, and plant math they don’t control. Through the Reynolds family’s R 7 Dairy and the Kircher/Bansen Forest Glen operations, you see how cheap hay, no ag overtime, and billion-dollar-class processing investments in Idaho created a structural edge of $3.10–$4.25/cwt, while Darigold’s $300 million Pasco overrun and $4.00/cwt deductions pushed many Washington members into survival mode. Even a 2,200-cow organic A2 Jersey herd with grazing, a digester, and strong contracts can’t fully outrun a bad zip code once organic feed, overtime rules, and processor margins stack up. This piece doesn’t stop at sympathy; it gives you three concrete paths in a high-cost state — spend millions on robots and automation, pivot hard into ultra-premium contracts, or plan a relocation/exit on your terms instead of the bank’s. It also shows how CDCB’s 2025 Net Merit update — more weight on Feed Saved and fat, less on protein — quietly shifts sire selection from “nice to have” traits to survival filters if you’re fighting high costs. In plain language, it explains why geography now sets your floor, why management and genetics still decide your ceiling, and what decisions you actually have left if your zip code is working against you.

Idaho Dairy Edge

Dave Reynolds didn’t come from dairy. He came from row crops — 2,200 acres of sweet corn seed, silage, wheat, barley, sugar beets, and alfalfa near Kuna, Idaho. He was, by his own admission, “less comfortable with animals.” But his son Tyler took dairy science courses at the University of Idaho and saw what his father couldn’t: the crops they already grew were essentially a dairy ration in the ground. The cows were the missing piece.

When a small dairy nearby went to auction in 2012, every established operator in the valley passed. “For the big dairymen, it was way too old, way too little,” Dave told Capital Press (May 28, 2025). Tyler convinced his father to buy in anyway. They named the dairy R 7 — for the seven members of the Reynolds family.

Today, R 7 Dairy milks more than 700 cows, and dairy accounts for “over half of our business,” Tyler said. “If you include the byproduct beef calves off of it, it’s stronger than that.”

Three hundred miles west in Dayton, Oregon, Robert Kircher and farm owner Dan Bansen run Forest Glen Farms — 2,200 Jersey cows across two operations, certified organic since 1997, shipping specialty milk to Nancy’s Probiotic Foods and Costco’s A2 program. They manage over 1,000 acres of irrigated pasture and 2,000 acres of organic cropland. A 370-kilowatt anaerobic digester generates 3.1 million kilowatt-hours a year for Portland General Electric. By every operational measure, Forest Glen is a textbook.

Here’s what Kircher told Capital Press: “It’s been pretty tough. We’re getting near to what we were seeing pricewise in 2014. But 10 years ago, all your costs were a lot lower.”

The gap between these two operations isn’t inside the parlor. It’s everything outside it.

Idaho’s $3.87 Billion Flywheel

Idaho generated $3.87 billion in dairy farm-gate receipts in 2024 — up 12% from $3.46 billion the year before, according to USDA data cited by the Idaho Farm Bureau (September 2025). Idaho produced 17 billion pounds of milk from 671,000 cows, averaging 25,375 pounds per head — roughly 1,200 pounds above the national per-cow average of 24,178 pounds. Through the first half of 2025, Idaho milk output ran about 7% ahead of the prior year, according to the Idaho Dairymen’s Association.

Texas edged past Idaho for the #3 national production slot in 2024. Rick Naerebout, CEO of the Idaho Dairymen’s Association, told Capital Press he’s confident Idaho will reclaim it — pointing to water constraints already limiting Texas expansion.

The West Coast tells a different story. California’s production dipped in 2024, partly from H5N1 disruptions. Oregon’s output fell 4% to 2.5 billion pounds, cow numbers dropped to 117,000, and the state’s milk value sat at $596 million. U.S. total production was 225.9 billion pounds — down 2% — even as total milk value rose 11% to $50.9 billion.

The Feed Gap No Nutritionist Can Close

You already know feed is your biggest cost. What you might not know is how wide the regional spread has gotten.

National alfalfa hay averaged about $172 per ton in September 2024 (Hoard’s Dairyman, December 2024). The USDA Direct Hay Report showed Good-quality Idaho alfalfa at $190 per ton FOB in late 2025 (USDA AMS, January 4, 2026). For context, NASS reported the 2024 Idaho alfalfa average at $153 per ton — the $190 spot price reflects seasonal and quality variations in the January market. At the Wolgemuth Hay Auction in Leola, Pennsylvania, premium alfalfa/grass mix sold at $320 to $405 per ton — averaging $366 — while premium straight alfalfa brought $305 to $330 (USDA AMS Hay Auction Report #1725, January 14, 2026).

 Idaho (Magic Valley)Pennsylvania (East)Gap
Alfalfa hay, $/ton$190 FOB$305–$405 (avg $366)$115–$215/ton
SourceUSDA AMS Direct Hay, January 4, 2026USDA AMS Auction #1725, January 14, 2026 
Hay cost impact per cwt milk (DMC formula: 0.0137 tons alfalfa/cwt)~$2.60~$5.01$2.50–$3.00/cwt
Annual cost, 1,000-cow herd (at Idaho avg 25,375 lbs/cow)~$660,000~$1,270,000>$600,000/year

Run that spread through the DMC formula — corn at 1.0728 bushels, soybean meal at 0.00735 hundredweight, alfalfa at 0.0137 tons per hundredweight of milk — and the hay component alone creates a feed cost gap of $2.50 to $3.00 per cwt.

For a 1,000-cow dairy producing at Idaho averages (253,750 cwt annually), that translates to north of $600,000 in additional feed costs for the same operation parked in the wrong geography.

University of Illinois dairy scientist Mike Hutjens has benchmarked the value of pushing feed efficiency from 1.4 to 1.5 pounds of milk per pound of dry matter — a genuinely elite gain — at about $0.51 per cow per day, or $186 per cow per year. Real money. Also, less than a third of the per-cow geographic penalty. You can run the tightest ration in Oregon and still lose on feed to an average operation in Jerome.

Labor Law: The Advantage You Can’t Out-Manage

Idaho’s agricultural workers are exempt from overtime under the federal Fair Labor Standards Act, and Idaho imposes no state-level overtime mandate.

That’s not the case next door. California has required ag overtime after 40 hours per week since 2022 for large operations under AB 1066. Washington requires ag overtime after 40 hours — dairy workers have been covered since the state Supreme Court’s Martinez-Cuevas v. DeRuyter Brothers Dairy ruling in November 2020, and all other ag workers since January 2024 under ESSB 5172. Oregon’s House Bill 4002, signed in 2022, currently sets the threshold at 48 hours, dropping to 40 in January 2027 (Oregon Bureau of Labor and Industries).

On a dairy where most employees work 50- to 55-hour weeks, the differential adds roughly $0.60 to $1.25 per cwt. That range is consistent with a Washington-focused study published in Choices (AAEA), which found that dairy farm total wages increased by more than 7% under a 48-hour threshold and by 12% under a 40-hour threshold. Cornell’s Dairy Farm Business Summary documented total labor cost at $3.08/cwt after New York’s 60-hour overtime threshold took effect in 2020, with total wages up 15.9% due to combined minimum wage increases and overtime costs (EB2021-06, October 2021). For Jason and Eric Vander Kooy, milking 1,400 cows near Mount Vernon, Washington, the overtime differential on 50-hour workweeks translates to tens of thousands of dollars annually that an identical Idaho operation simply doesn’t pay. That’s a policy gap, not an efficiency gap.

Worth watching: the federal Fairness for Farm Workers Act has been reintroduced in multiple Congresses (2019, 2021, 2023) to eliminate the FLSA ag overtime exemption. It has failed to advance each time. Moving the other direction, the Protect Local Farms Act (H.R. 240), introduced in January 2025, would pre-empt any state overtime law below 60 hours for ag workers. Neither has passed. For now, the advantage holds.

Stack feed on top of labor. Combined structural disadvantage for the wrong geography:

The Geographic Penalty

Hay component gap: $2.50–$3.00 per cwt

Labor mandate gap: $0.60–$1.25 per cwt

Total structural disadvantage: $3.10–$4.25 per cwt

Before you’ve touched a management lever, hired a consultant, or upgraded a single piece of equipment.

Cost FactorIdahoPacific NorthwestGap (PNW Penalty)
Alfalfa hay, $/ton$190 FOB$305–$405 (avg $366)+$115–$215/ton
Ag overtime rulesExempt (federal)Required after 40–48 hrs+$0.60–$1.25/cwt
Feed cost impact, $/cwt~$2.60~$5.01+$2.50–$3.00/cwt
Total structural penalty, $/cwtBaseline+$3.10–$4.25/cwt
Annual cost, 1,000-cow herdBaseline+$600,000–$800,000/yr

When Processors Pick Your State

Cheap feed and favorable labor law attracted cows to Idaho. Cows attracted processors. Processors attracted more cows. That flywheel now spins at a pace no other Western region can match.

Chobani’s $500 million Twin Falls expansion, announced in March 2025, increases plant capacity by 50% — adding over 500,000 square feet to bring the facility to 1.6 million square feet with 24 production lines. Idaho Milk Products is building a $200 million facility in Jerome. High Desert Milk invested $50 million in 2021. And the University of Idaho’s $45 million CAFE research dairy — billed as the nation’s largest — occupies 640 acres near Rupert in Minidoka County and began milking its first cows in early 2026, with a rotary parlor built to handle up to 4,000 head and plans to ramp to 2,000–2,500 long-term.

Corey Geiger with CoBank put it plainly in July 2025: “The big growth has been coming in Texas, Idaho, Kansas, and South Dakota. That’s most of the growth areas with new dairy processing assets coming online.” The areas with the most growth in milk production aren’t the areas with the highest milk prices — they’re the areas with new processing plant demand.

Now flip the flywheel.

The Darigold Wreck

Darigold’s Pasco, Washington, plant was budgeted at $600 million when the cooperative broke ground in September 2022, promising to “preserve the legacy of nearly 350 multigenerational farms” (Darigold/NDA press release, July 2021). It didn’t go that way. Capital Press reported the plant ran approximately $300 million over budget, citing people familiar with the matter (May 1, 2025). The Chronline characterized the total investment at $900 million (June 4, 2025). Darigold acknowledged cost overruns, blaming inflation, supply-chain issues, changes to building codes, and project complexity.

To cover the shortfall, Darigold imposed a $4.00/cwt deduction on member milk checks — a 20% to 25% cut — for its roughly 250 current members across Washington, Oregon, Idaho, and Montana, down from the nearly 350 cited at the time of the groundbreaking. The breakdown: $2.50 per cwt for construction costs and $1.50 for operating losses, beginning with an initial $1.50 reduction at the end of 2023.

The damage to individual operations has been severe. Dan DeRuyter, milking in Yakima County, Washington, told Capital Press the deductions cost his operation “almost $5 million in the past two years.” John DeJong, whose family shipped to Darigold for 75 years, said it “eliminated investment” and put his dairy in “survival mode.” Jason Vander Kooy laid out his three options: “It’s either we go organic, go on our own, or close the doors” (Capital Press, May 28, 2025).

The 500,000-square-foot plant started taking milk in early June 2025 and began producing powdered milk and butter by August, with a second dryer slated for year’s end. It can process up to 8 million pounds of milk a day. Some of the operations that financed the overrun won’t be around to ship to it.

The Organic Shield — and Its Limits

Forest Glen represents the supposed answer for high-cost regions. Premium products. Contracted buyers. Revenue above the commodity floor.

Organic pay prices vary widely by buyer and program. The Northeast Organic Dairy Producers Alliance reported 2025 farm-gate pay prices ranging from $33 to $45 per cwt for grain-and-pasture-fed dairies, with grass-fed certified operations pulling $36 to $50 per cwt and spot organic loads exceeding $50 per cwt in tight markets. That’s well above the conventional all-milk price — USDA’s ERS Livestock, Dairy, and Poultry Outlook projected the 2026 all-milk average at $18.25 per cwt (January 16, 2026), while the January 2026 WASDE pegged 2026 Class III at $16.35 per cwt, down 70 cents from the prior month’s estimate. Nancy’s Probiotic Foods, based at Springfield Creamery in Springfield, Oregon — a family operation since 1960 — gives Forest Glen a contracted home for organic Jersey milk. The Costco A2 program taps into a market Grand View Research valued at $4 billion in 2024, and projects will reach $11.2 billion by 2030.

So why has the last decade been “pretty tough”?

Because premium pay doesn’t eliminate costs. Organic feed costs more. Three thousand acres of organic cropland take intensive management. Oregon’s overtime rules apply to organic dairies the same as to conventional ones. And the processor captures the bulk of the retail premium — organic farm-gate prices typically land at less than a third of what consumers pay at the shelf. With national organic retail whole milk cresting above $5.00 per half gallon for the first time in April 2025, even a $45/cwt farm-gate check captures a fraction of what the product is worth at the register.

The Kirchers and Bansen make it work because they started nearly 30 years ago, run 2,200 cows to spread overhead, and stack revenue streams beyond milk: registered Jersey genetics, digester electricity, and composted fiber sold to Willamette Valley vineyards as mulch. That’s not a model you replicate from a standing start in 2026.

Revenue/Cost ItemConventional (PNW)Organic (PNW)Net Advantage
Milk price, $/cwt$18.25 (2026 proj.)$45.00 (high-end)+$26.75/cwt
Organic feed premium, $/cwtBaseline+$8.00–$12.00–$8.00–$12.00/cwt
Overtime labor penalty, $/cwt+$0.60–$1.25+$0.60–$1.25No change
Geographic penalty (vs. Idaho), $/cwt+$3.10–$4.25+$3.10–$4.25No change
Beef-on-dairy calf revenue, per head~$1,400~$1,400No change
Net organic advantage after penalties+$6.50–$15.15/cwt

Beef-on-Dairy: Real Revenue, Real Ceiling

Tyler Reynolds told Capital Press that including beef byproduct makes dairy’s share of his revenue “stronger than” half. Stewart Kircher was equally direct: “The impact on the beef market is huge from dairies.”

Day-old beef-on-dairy crossbred calves averaged about $1,400 per head in 2025, according to Laurence Williams, dairy-beef cross development lead at Purina — up from roughly $650 three years earlier (Dairy Herd Management, September 2025). Phil Plourd, president of Ever.Ag Insights, expects financial incentives to “continue to lean toward beef-on-dairy activity, even if it’s not quite as lucrative as today.”

That revenue is real. It’s also cyclical. Budget for it. Don’t build a survival plan around it.

Geography Sets the Floor. Management Sets the Ceiling.

A fair objection to this piece: if geography is the whole game, why do some Idaho dairies fail while some Oregon dairies survive?

Because geography doesn’t replace management — it determines where management has room to work. Tyler Reynolds didn’t just happen to sit on cheap hay. He recognized the dairy ration built into his family’s crop rotation, bought into a facility every big operator passed on, and built a beef-on-dairy revenue stream that pushes his dairy share past 50%. The structural advantage gave him the floor. His decisions were built on top of it.

The same is true on the genetics side. CDCB’s April 2025 Net Merit update increased emphasis on Feed Saved from 12.0% to 17.8% and boosted butterfat from 28.6% to 31.8%, while protein dropped from 19.6% to 13.0%. In high-cost regions where every cent per cwt matters, that shift isn’t academic — it’s survival math. Producers who can’t win on geography are increasingly breeding for components and feed efficiency to close the gap from the cow side, selecting bulls for traits that directly address the structural disadvantage their zip code creates.

But here’s the honest truth: even with elite genetics and Net Merit optimization, the cost gap narrows by hundreds of dollars per cow. The geographic penalty runs into the thousands. Management and genetics are the ceiling. Geography is the floor. And when the floor is $3.10 to $4.25 per cwt below your neighbor’s, the ceiling starts a lot higher, too.

What This Means for Your Operation

If you’re milking in Oregon, Washington, or another region where the structural math works against you, the data points to three paths. None is painless.

Automate and stay. Robotic milking and precision feeding can tighten the gap — current systems run $200,000–$300,000 per unit, each handling 50–80 cows. For a 1,000-cow herd, that’s $3–$5 million in capital. Even in the best-case, automation roughly closes a third to half of the $3.00–$4.00/cwt structural gap. Automation buys time. It doesn’t change the zip code.

Pivot to premium. Organic, A2, grass-fed — they all pay more. Forest Glen proves it works at scale with the right starting conditions: established certification, Jersey genetics, contracted buyers, stacked revenue. If you don’t already have most of that infrastructure, the three-year organic transition means three years of organic-level costs on conventional-level checks. Run that math to the penny before you commit.

Evaluate dairy relocation — seriously. Current asset markets favor sellers. USDA’s July 2025 data puts the national average replacement dairy cow at $3,010 per head, with Idaho at $3,050 and Wisconsin at $3,290. Mike North of Ever.ag told Brownfield in January 2025 that Pacific Northwest animals were moving at “north of $4,000 an animal.” But Idaho farmland in the Magic Valley runs $12,000–$18,000 per acre, with cash rent at $300–$390 in top dairy counties (NASS, 2022). You’re not moving into bargain country. If you’re seriously weighing dairy relocation, run the full capital budget — land, facilities, permits, disruption costs — not just the per-cwt savings on feed and labor.

Whatever path fits, do these things now:

  • Run your actual cost of production per cwt. Include depreciation, family labor at market rates, and the opportunity cost of equity. USDA ERS’s January 2026 outlook projects 2026 all-milk at $18.25/cwt, but Class III futures have slid to $16.35, and CME block cheddar just hit $1.2825 — its lowest since May 2020. If your all-in cost exceeds $18.25, you’re farming upside down. If it exceeds $16.35, the market is telling you something louder.
  • Ask your processor one question—and get it in writing. Will they commit to your volume in 2027 at a price that covers your production costs? Tyler Reynolds is “hoping to expand, but the creamery hasn’t committed.” If the answer is vague, it’s an answer.
  • Run the exit math even if you never use it. Every year you farm at a loss, you’re spending a six-figure piece of your family’s net worth on the choice to keep milking in a place the economics have moved past. That might be the right call. It should be a deliberate one.
  • Factor in the next generation before you commit capital. Rick Naerebout shared that Idaho loses about 10% of its dairy membership a year, often because “the next generation, they see the parents struggling, so they’re not going to continue with farming.” That’s true everywhere. If your kids aren’t in, an expansion note is a bet with no one to carry it.
ScenarioAnnual Operating Loss5-Year Net Worth ImpactExit Option: Sale Value (Today)Expansion Option: Debt + Loss
Baseline (break-even)$0$0
Survival mode–$100,000/year–$500,000Preserve equity, redeploy–$500K equity + $0 debt
Structural disadvantage–$200,000/year–$1,000,000Preserve equity, redeploy–$1M equity + $3–$5M expansion debt
Darigold scenario–$300,000/year–$1,500,000Preserve equity, redeploy–$1.5M equity + $3–$5M expansion debt

The Gap That Isn’t Going Away

What separates the Reynolds family’s trajectory from the Kirchers’ decade of tough economics isn’t effort, intelligence, or cow quality. It’s the cost of hay, the labor code, and the processing flywheel — three forces no individual farmer chose but every individual farmer lives with.

That’s the real driver behind dairy consolidation in the West — the gap between regions now exceeds the gap between the best and worst operators within a region. As far back as 2019, Rick Naerebout wrote in Hoard’s Dairyman that Idaho’s 10 largest owners/partnerships milked 32% of the state’s cows, and the top 20 milked 47%. Those shares have almost certainly grown since. The farms that survive and the farms that grow aren’t necessarily the best-managed ones. They’re the ones sitting on the right side of the structural math.

The numbers don’t care about legacy.

Jason Vander Kooy, watching what he estimates as a decline from around 80 dairy farms in Skagit Valley to roughly 10 over the past two decades, put it in terms that cut through any spreadsheet: “We can trace back dairy farming in our family before Christopher Columbus in Europe. I don’t want to be the last generation, so we’re going to make a go of it” (Capital Press, May 28, 2025).

The families who make their next move based on where the structural math is going — not where their grandfather’s fence line sits — are the ones who’ll still be milking in 2035.

Dig in, pivot, or move. But whatever you do, do it on purpose.

Key Takeaways

  • Where you milk now matters as much as how you milk: Idaho’s cheap hay and no ag overtime create a $3.10–$4.25/cwt advantage — over $600,000/year on a 1,000-cow herd in feed and labor alone.
  • Processors are picking winners and losers: Idaho adds capacity with Chobani, Idaho Milk Products, High Desert Milk, and CAFE, while Darigold’s $300 million Pasco overrun and $4.00/cwt deductions pushed many Washington members into survival mode.
  • Premium doesn’t erase geography; Forest Glen’s 2,200-cow organic A2 Jersey herd with grazing, contracts, and a digester still fights 2014-level milk prices under 2026-level costs.
  • If you’re in a high-cost region, your real choices are to invest heavily in automation, double down on ultra-premium contracts, or design a relocation/exit plan now instead of letting the bank decide later.
  • Genetics is no longer a side note: CDCB’s 2025 Net Merit shift toward Feed Saved and fat turns sire selection into a survival tool for high-cost herds, not just a way to chase show-ring banners.

Complete references and supporting documentation are available upon request by contacting the editorial team at editor@thebullvine.com.

Learn More

The Sunday Read Dairy Professionals Don’t Skip.

Every week, thousands of producers, breeders, and industry insiders open Bullvine Weekly for genetics insights, market shifts, and profit strategies they won’t find anywhere else. One email. Five minutes. Smarter decisions all week.
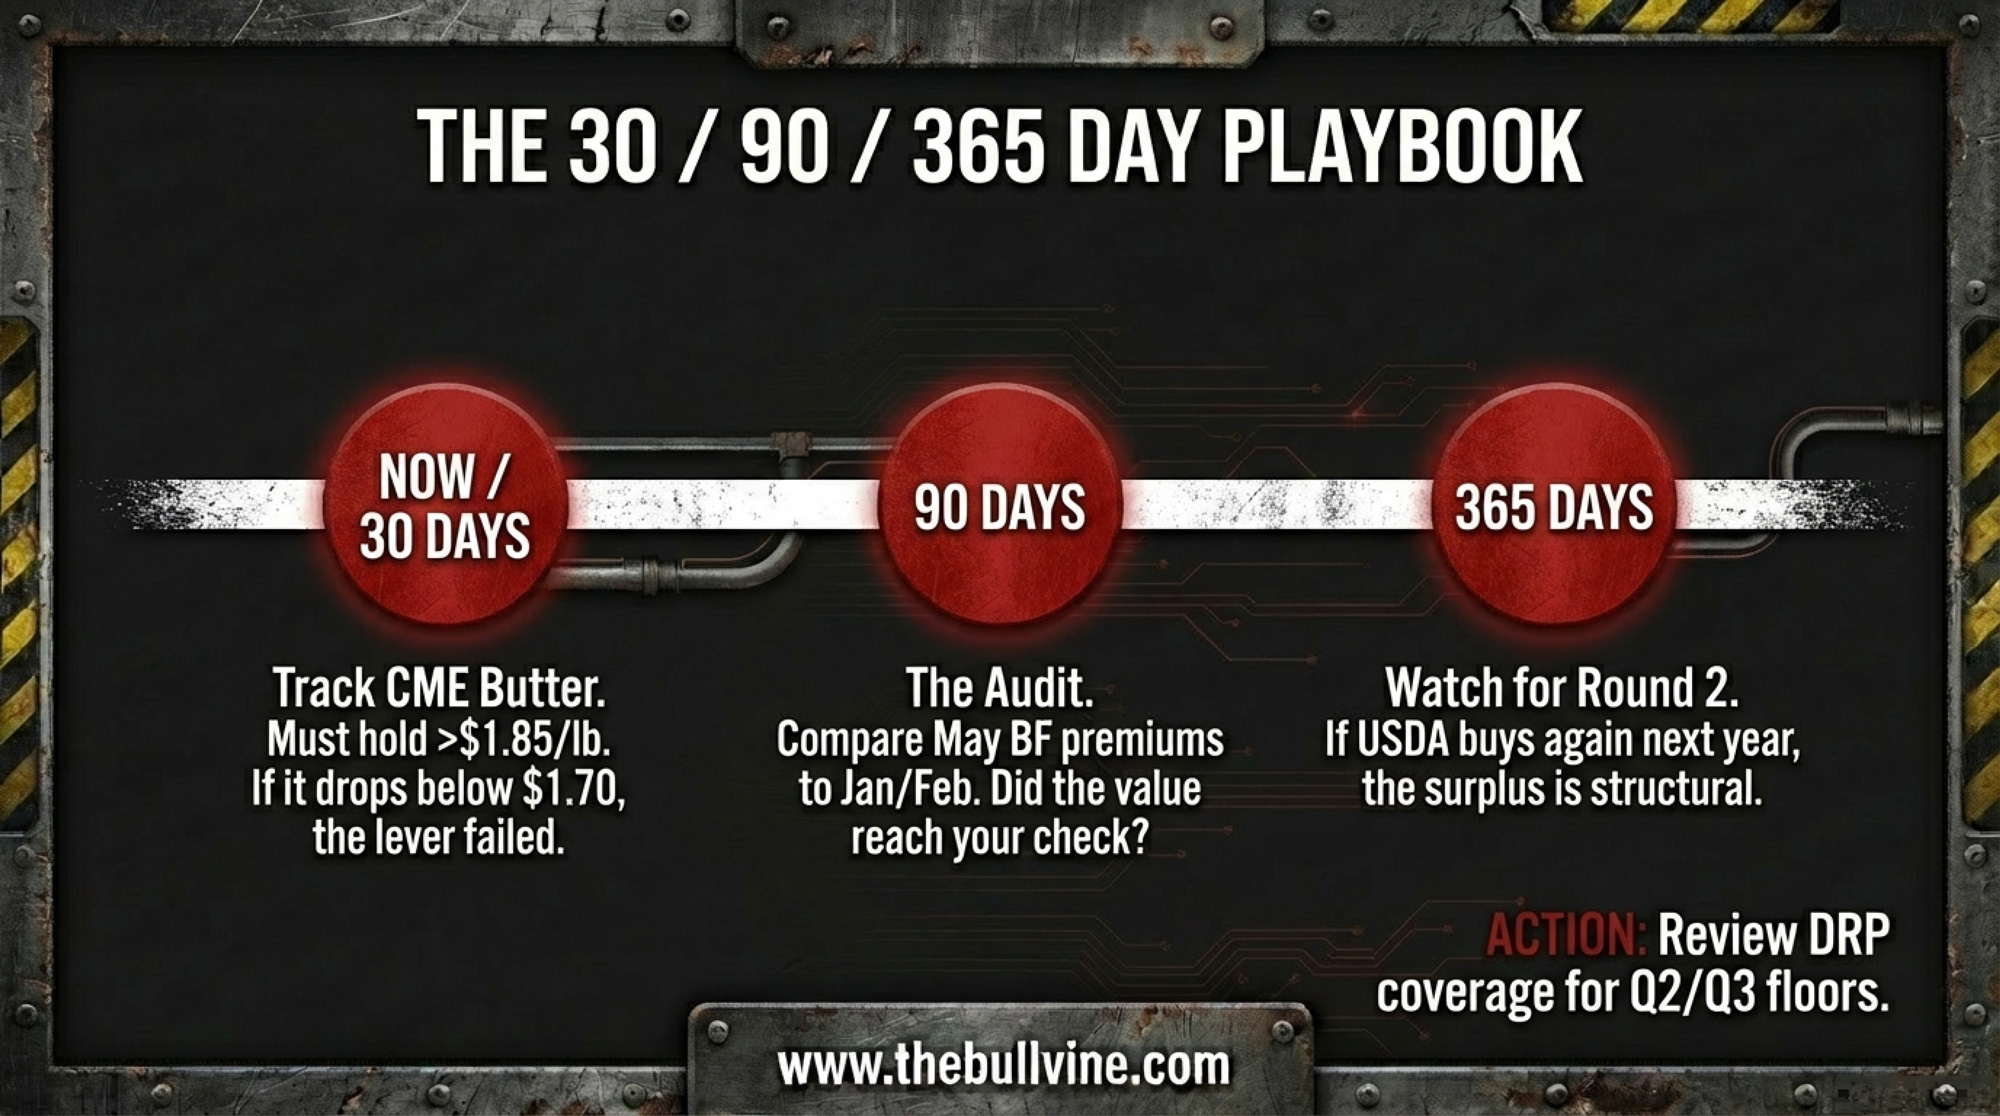
NewsSubscribe
First
Last
Consent

FMMO Pays $1.71/lb for Butterfat Worth $2.95: What USDA’s December Report Tells You About Your Milk Check in 2026

Processors are exporting your butterfat at roughly $2.95/lb while the FMMO pays you based on ~$1.71. Here’s how that gap formed — and what you need to lock in before spring flush closes the window.

EXECUTIVE SUMMARY: Your butterfat is worth $2.95/lb on the global market. The FMMO pays you based on $1.71. That $1.24/lb gap — exposed in USDA’s December 2025 report — flows to processors exporting record butter and AMF volumes, not to the producers making the components. June’s FMMO modernization widened the divide: raised make allowances cut Class III by $0.92/cwt handing plants a bigger slice while yours shrank. Supply pressure is building from the other direction — CoBank projects 438,844 fewer replacement heifers by 2026, with prices at $3,010–$4,000/head, just as $10 billion in new processing capacity needs milk. Component-focused operations in deficit regions have roughly 60 days before the spring flush to convert handshake deals into written terms. After that, the leverage shifts.

Cheese blew past expectations. Butter missed — again. NFDM production fell, but stocks climbed anyway. When USDA dropped the December 2025 Dairy Products report on February 5, 2026, futures barely flinched. Everything traded flat except powder, which caught immediate sell-side pressure.

The headline numbers look simple enough: total cheese at 1.28 billion pounds (+6.7% year over year), butter at 204 million pounds (+2.0%), nonfat dry milk at 127 million pounds (down 2.7%), per USDA NASS. But underneath those percentages sits a widening disconnect between the global value of your components and what actually shows up on your milk check — a gap that should be front-of-mind for every component-focused operation heading into spring 2026.

For the component-focused operations tracking their butterfat premium against the blend, December’s milk check told a familiar story: the premium was up, but not nearly as much as the export math suggested it should be. The rest of the value? It left the country.

Cheese: $10 Billion in Capacity, and the Export Machine Is Absorbing It

Cheddar alone hit 340,350 thousand pounds in December — up 9.0% from a year ago. Not a one-month blip. Full-year 2025 cheddar finished 5.3% above 2024, and total cheese came in 2.9% higher. Italian types weren’t far behind: mozzarella up 5.9%, Parmesan up a striking 22.9%.

Announced U.S. dairy processing investments total roughly $10 billion through 2027, according to CoBank. The industry braced for a glut that would crush the board.

It hasn’t happened — because export demand ate through the extra volume. USDEC’s January 2026 trade summary puts November 2025 cheese exports at 50,775 metric tons, up 28% year over year. That’s the seventh consecutive month above 50,000 MT — a threshold never breached before 2025. Volume rose significantly to Mexico and South Korea, which USDEC says is “poised to set an annual record for U.S. cheese purchasing.” Southeast Asia cheese exports surged 92%.

MonthU.S. Cheese Exports (MT)YoY Change (%)Status vs. 50k MT Threshold
May 202551,240+18%✓ Above
June 202552,890+22%✓ Above
July 202553,470+24%✓ Above
Aug 202551,920+21%✓ Above
Sept 202554,110+26%✓ Above
Oct 202552,650+23%✓ Above
Nov 202550,775+28%✓ Above

But 28% export growth isn’t a number you can bank on forever. Here’s the threshold worth watching: if monthly cheese exports drop below 45,000 MT for two consecutive months while new plants keep ramping, domestic inventories will build faster than the market can clear. That’s not a prediction. It’s a trip wire.

Butter: Your Fat Leaves the Country at ~$2.95. Your Check Reflects ~$1.71.

Butter production came in at 203,848 thousand pounds, just 2.0% above December 2024. Full-year 2025 butter was up 5.7% — not a collapse — but December fell well short of private forecasts for the second straight month. USDA’s January 23 Milk Production report showed December output in the 24 major states at 18.8 billion pounds, up 4.6%year over year, with 222,000 more cows and 42 more pounds per cow generating plenty of cream.

So where’d all the butter go? Overseas. Where the margins are.

Per the CME cash dairy trade the week of February 3 (prices as of February 5, 2026), spot butter closed at approximately $1.71/lb, up from around $1.58 earlier in the week. GDT futures for February 2026 delivery had butter at roughly $2.64/lb and anhydrous milk fat at roughly $2.95/lb, per the Daily Dairy Report. That’s a spread of about $0.93/lb between CME and GDT butter — and $1.24/lb between CME butter and GDT AMF.

USDEC confirms processors are leaning hard into that spread. November butter exports surged 245% year over year. AMF shipments jumped 184%. USDEC called it the highest single month on a milk-fat basis for U.S. dairy exports — total butterfat exports reached 15,308 metric tons.

Now stack FMMO math on top. The June 2025 Federal Order modernization raised the butter make allowance from $0.1715/lb to $0.2272/lb — a 32.5% increase, per the USDA final rule published January 17, 2025. The changes “lowered the value of producer milk,” with the new cheese make allowances alone reducing the Class III price by $0.92/cwt.

The formula changes gave plants a bigger slice of the value pie. Your slice got smaller.

You produce the butterfat. Your plant converts it to 82% butter or AMF and sells it into an export channel, priced off GDT. Your milk check stays anchored to CME butter minus a bigger make allowance. The FMMO has no mechanism to pass that export premium back to you. Not through your blend price. Not through your component premium.

Product / MetricCME Price ($/lb)GDT Price ($/lb)Spread ($/lb)Value Gap per Tanker
Butter (82% fat)$1.71$2.64+$0.93~$5,580
Anhydrous Milk Fat$1.71*$2.95+$1.24~$7,440
Your Butterfat (3.7% test)Based on $1.71 CMEActual export value $2.95+$1.24~$7,440
Per Cwt Impact (80 lb/cwt @ 3.7% BF)Paid ~$5.06/cwt BFWorth ~$8.74/cwt BF-$3.68/cwt-$221/tanker

One partial exception worth investigating: if you’re a co-op member, your cooperative may return a share of export value through patronage dividends or retained earnings. Pull your co-op’s annual financial statement. Ask the question directly at your next member meeting. You might not like the answer — but you deserve to know it.

NFDM: Production Down, Stocks Up — Powder Took the Only Futures Hit

This is where the December report sent its clearest signal, and the one place futures actually listened.

December NFDM production came in at 127,190 thousand pounds, down 2.7% year over year. Skim milk powder dropped even harder — down 15.2%. If you only saw the production side, you’d assume a tightening powder complex.

CategoryDec 2024Dec 2025Change
Production130,700127,190-2.7% ↓
End-Month Stocks202,548213,981+5.6% ↑
Shipments115,004115,119+0.1% →

End-of-month manufacturer stocks told a different story: 213,981 thousand pounds, up 5.6% from 202,548 a year ago. NFDM shipments were essentially flat at 115,119 thousand pounds (+0.1%). USDEC’s trade data through three quarters showed total export volume up only 1.7% through September, while powder shipments to Mexico and Southeast Asia posted year-over-year declines. USDEC directly noted that “a decline in exportable supplies of milk powder from the U.S., combined with tepid demand from SEA, has caused volumes into the region to fall.”

November did bring a rebound in Southeast Asian powder shipments — NFDM/SMP to the region jumped 23%, driven almost entirely by Indonesia — but year-to-date milk powder exports to Southeast Asia were still down 20% through November.

Falling production. Rising stocks. Flat-to-weak exports. That’s a demand problem, not a supply story.

The Quiet Whey Shift: Putting a Floor Under Class III

One number buried in this report deserves your attention. Whey protein isolate production jumped 11.7% year over year to 20,644 thousand pounds, while WPI stocks fell 5.4%. Consumer demand for high-protein products is pulling whey streams into higher-value WPI — human dry whey was up only 4.0% despite 6.7% more cheese generating more liquid whey.

Because dry whey feeds the Class III formula, that structural pull is quietly supporting one of the inputs that determines your Class III price. If you’re on Class III, your dry whey component isn’t eroding the way the powder side is. Small bright spot in a complicated picture.

438,000 Fewer Heifers vs. $10 Billion in Hungry Plants

Every capacity story runs into the same wall. Biology doesn’t move at the speed of capital.

CoBank’s Corey Geiger projected in August 2025 that U.S. dairy heifer inventories would shrink by 438,844 head between 2025 and 2026, driven by beef-on-dairy breeding decisions that sent skyrocketing volumes of beef semen into dairy herds — 7.9 million units in 2024 alone, per NAAB data. Over two years, CoBank estimates the total decline could reach roughly 800,000 fewer replacement heifers, with a rebound starting in 2027. USDA’s January 2025 Cattle report showed 3.914 million dairy replacements — 18% fewer than in 2018.

YearHeifer Inventory (million)Cumulative Capacity Investment ($B)
20243.91$2.5
20253.69$5.8
20263.47$8.5
20273.58 (projected rebound starts)$10.0

December 2025 milk production still looked strong — up 4.6% in the 24 major states with 222,000 more cows and 42 more pounds per cow. But USDA’s January 2026 WASDE pegs 2026 production at 234.3 billion pounds, up roughly 1.4% from 2025, as a thinning replacement pipeline starts to constrain herd expansion.

Geiger didn’t sugarcoat it: “The short answer is that it will be tight. Those dairy plants will require more annual milk and component production, largely butterfat and protein. And it will take many more dairy heifer calves in future years to bring the national herd back to historic levels.”

Heifer prices already reflect the squeeze, from $1,720/head in April 2023 to roughly $3,010 by mid-2025 per the USDA’s July 2025 Agricultural Prices report. Top dairy heifers in California and Minnesota auction barns were bringing upwards of $4,000 per head by mid-year 2025, according to CoBank.

Why Flat Futures Don’t Mean the Fundamentals Are Wrong

If all this tension is real, why did cheese and butter futures trade flat on report day?

Near-term data wasn’t wildly off expectations. Cheese was already strong in November. Butter’s miss fit the ongoing “tight but not panicked” narrative. NFDM was the exception because rising stocks directly contradicted the bullish price story—a signal even a thin market could quickly process.

The deeper issue is structural. Dairy futures trade at a fraction of the open interest depth seen in cattle or hog contracts. That’s not a market that can efficiently price a two-year heifer decline or a multi-year butterfat export arbitrage. The flat response isn’t the market disagreeing with the fundamentals. It’s the market admitting it can’t fully express them.

And that gap between what futures say and what the fundamentals show? That’s where the opportunity sits for producers paying close attention.

What This Means for Your Operation

  • Your butterfat is underpriced relative to global value. As of February 5, 2026: GDT AMF at roughly $2.95/lb; CME butter at approximately $1.71/lb. Your Class IV price is anchored to CME plus a bigger make allowance. Component optimization still pays inside the system, but the extra export margin sits on the processor’s ledger. The spread to watch: if CME stays below $1.80 while GDT holds above $2.50, processors have no incentive to redirect cream to domestic channels, and your Class IV component value stays compressed. Pull your last three milk checks. Compare your butterfat premium per hundredweight to the CME butter price on those settlement dates. The gap between what you’re getting and what GDT says your fat is worth — that’s the number this article is about.
  • If you’re in a deficit region, your leverage is real — but it has a shelf life. Processors in short areas are paying to secure a supply right now. That urgency fades as cooperatives formalize long-haul logistics and spring flush arrives in April–May. The most important move in the next 60 days isn’t a hedge — it’s getting written terms on component premiums, hauling, and volume commitments while plants still feel short. Twelve-to eighteen-month agreements balance security with flexibility. The trade-off: if spot premiums spike higher than your locked rate during peak shortage, you’ll watch neighbors on handshake deals get paid more. But you’ll also sleep through the months when premiums collapse post-flush.
  • Watch NFDM stocks, not price. If manufacturer stocks hold above 210 million pounds through the March report while exports stay flat, that’s your signal to layer in Class IV put protection before spring flush. DRP Q2 2026 endorsements (April–June milk) are mostly written in the late-January to March window, outside of USDA report release days when sales are suspended. You want protection in place before April, not after.
  • Run the heifer math before you bid. At $3,500/head (midpoint of the $3,010–$4,000 range CoBank reported) and current carrying costs — Penn State Extension’s most recent data puts total rearing costs at roughly $1.60–$2.82 per head per day depending on operation type and region — a heifer needs to enter your string within about 24 months to break even against buying a fresh cow. But retaining heifers ties up capital and bunk space for 22+ months before they generate a dollar of milk revenue. Buying springers costs more per head but puts milk in the tank within weeks. Your cash flow position — not just the per-head price — should drive this call.
  • Check your Federal Order’s Class IV exposure. If you’re in Order 5 (Appalachian) running high Class I utilization, the differential increases from the June 2025 reforms may partially offset the make allowance pain — analysis found Orders 1, 5, 7, and 33 gained value under the new structure, while Order 30 (Upper Midwest) lost value. Run your margin-over-feed calculation against current component values to see where your breakeven actually sits under the new formulas.
Federal Milk Marketing OrderOrder #Value ImpactPrimary Driver
Northeast1Gained ValueHigher Class I differentials offset make allowance increases
Appalachian5Gained ValueHigh Class I utilization + differential increases
Southeast7Gained ValueClass I differential structure favorable
Upper Midwest30Lost ValueHeavy Class III/IV exposure + make allowance cuts hit hard
Mideast33Gained ValueClass I differential gains exceeded component losses

Key Takeaways

  • Cheese is running hot but roughly in balance thanks to record exports — November was the seventh straight month above 50,000 MT. The risk trigger: monthly exports below 45,000 MT for 2 consecutive months while new plants keep coming online.
  • Butterfat is where the value gap is widest. CME butter at ~$1.71/lb vs. GDT AMF at ~$2.95/lb as of February 5, 2026, represents a $1.24/lb spread that FMMO pricing doesn’t capture for producers. Co-op members: ask what share, if any, flows back through patronage.
  • NFDM sent the clearest warning in this report. Stocks up 5.6% while production fell 2.7%, and year-to-date powder exports to Southeast Asia were down 20% through November — that’s the pattern that precedes price weakness, not strength.
  • The heifer shortage is real and has come at a bad time. It won’t choke production in 2026, but by 2027 — when new plants need to run full — the math stops working without more replacements than the pipeline can deliver.
  • Check your DRP windows. Q2 2026 endorsements are mostly written in the late-January to March window. If NFDM stocks stay elevated and spring flush hits Class IV values, you want coverage locked before April.

The Bottom Line

The next two months aren’t about whether exports stay strong or heifers tick up another $200. They’re about whether you’ll have written terms — or still be on a handshake — when your plant decides who to lock in for the next cycle. And whether the terms you’re milking under today reflect even a fraction of what your components are actually worth on the global market.

Complete references and supporting documentation are available upon request by contacting the editorial team at editor@thebullvine.com.

Learn More

The Sunday Read Dairy Professionals Don’t Skip.

Every week, thousands of producers, breeders, and industry insiders open Bullvine Weekly for genetics insights, market shifts, and profit strategies they won’t find anywhere else. One email. Five minutes. Smarter decisions all week.
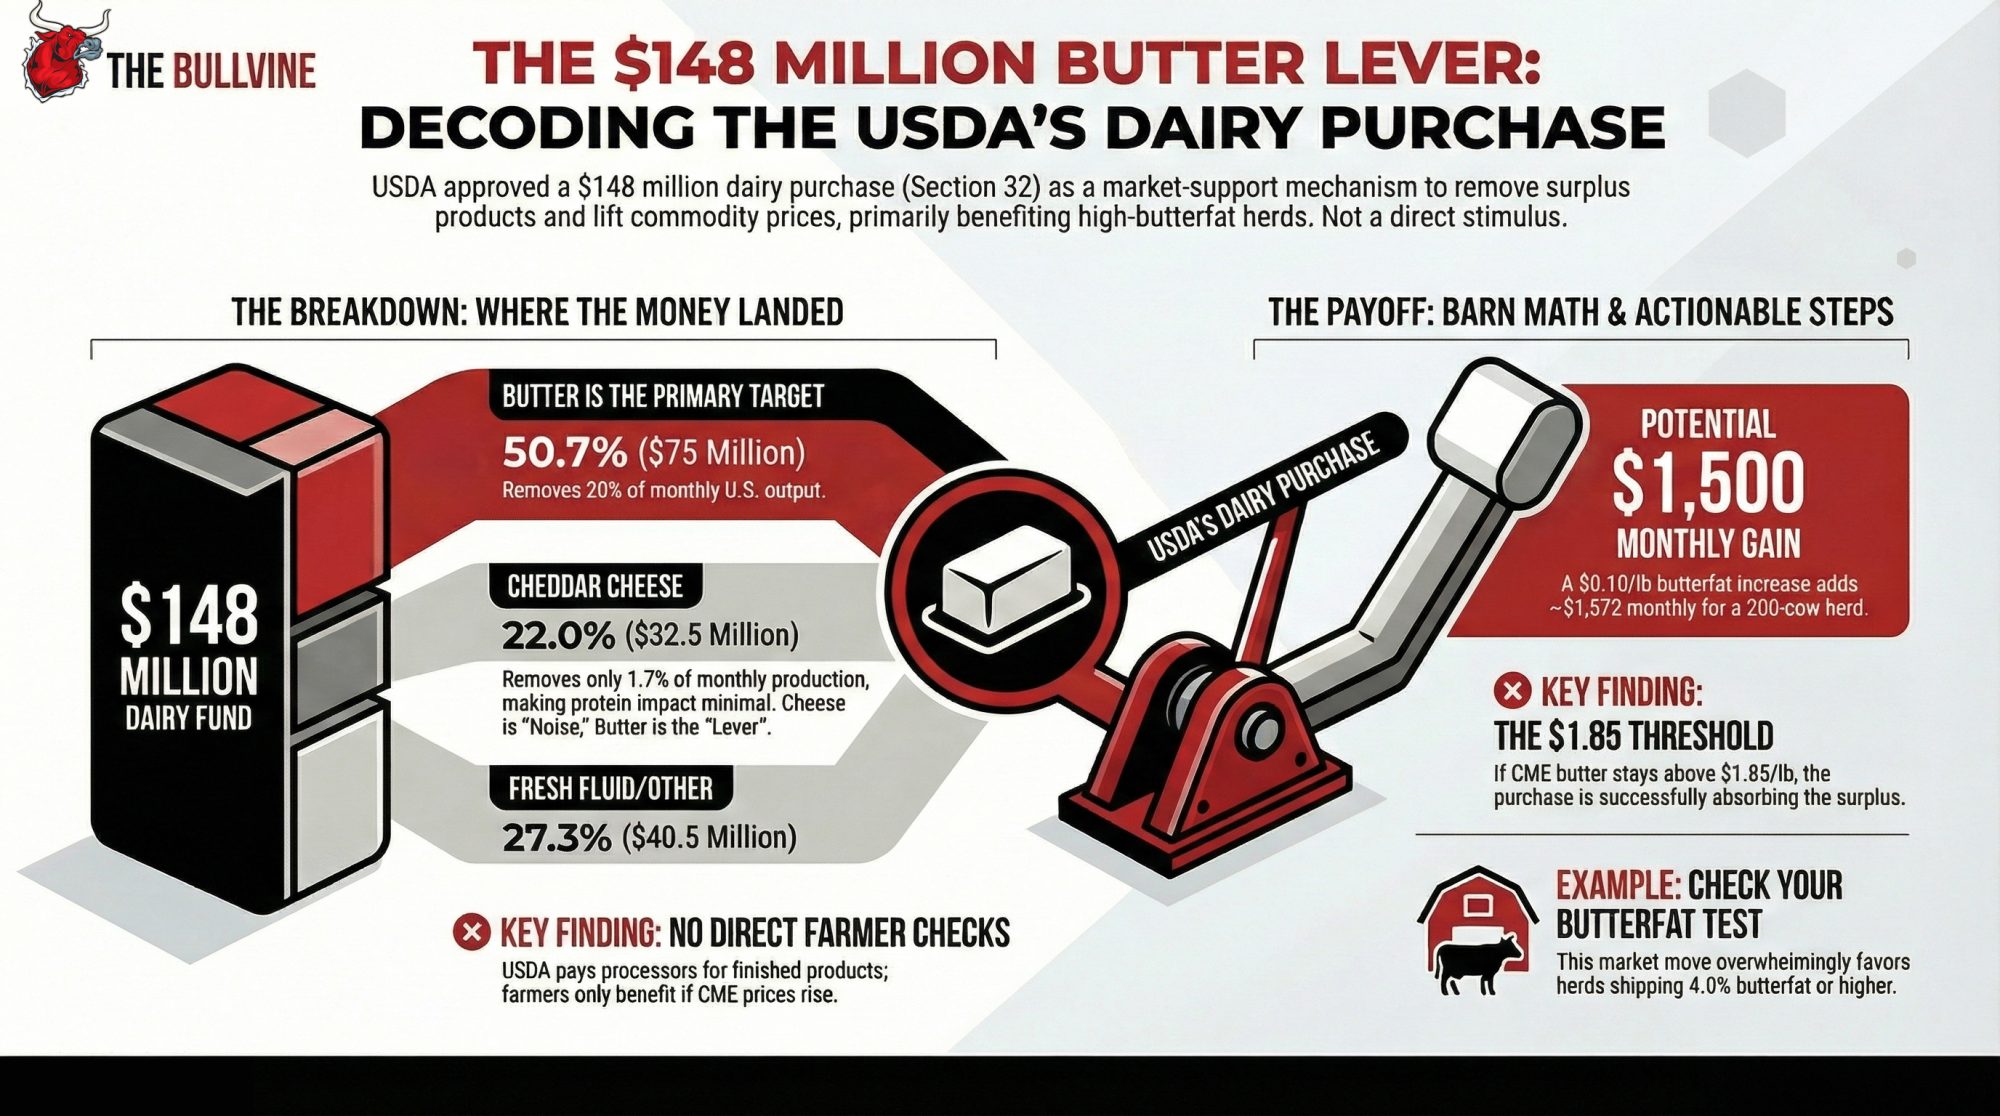
NewsSubscribe
First
Last
Consent

$1.6B to Texas and Kansas, 76% of Wisconsin Farms Gone: Scale Up, Go Premium, or Get Out

Hilmar, Leprino, and Valley Queen are pulling milk toward new regions. For producers in traditional dairy states, the math has changed—and so have the breeding goals.

Executive Summary: Since 2020, Hilmar, Leprino, and Valley Queen have committed $1.6 billion to cheese plants in Texas, Kansas, and the I-29 corridor—not chasing existing milk, but creating the conditions that pull production toward them. Wisconsin has lost 76% of its dairy farms since the mid-2010s, from over 15,900 operations to fewer than 6,000. You now face a three-path decision: scale to 1,000+ cows with a processor contract and debt-to-asset below 40%; pivot to premium markets (A2A2, organic, grass-fed) at under 300 cows with a buyer secured before transition; or execute a strategic exit while equity holds. The structural risks driving this migration—70% of the Texas Panhandle’s Ogallala aquifer potentially unusable by 2045, 51% of U.S. dairy workers foreign-born—are risks processors can diversify away from but you cannot. As Rabobank analyst Ben Laine notes: “Everything we know about dairy consolidation says it hasn’t shown any signs of slowing down.” Your genetics program must match your market destination: component sires for cheese contracts, A2A2 and grazing genetics for premium paths.

dairy processing gravity wells

When Hilmar Cheese Company broke ground in Dalhart, Texas, in 2006, dairy consolidation was already reshaping American milk production. But nobody expected what came next. The surrounding region had a modest dairy presence. By 2014, the area’s herd had grown more than tenfold—not because producers chose Texas first, but because Hilmar created the conditions that pulled them in.

That pattern is repeating at scale. Since 2020, major processors have announced billions in new capacity across Texas, Kansas, and South Dakota—including Hilmar’s $600 million Dodge City facility and Leprino Foods’ $1 billion Lubbock complex.

If you’re weighing expansion in a growth state—or wondering how long to hold on where you are—the economics have shifted. Here’s the decision framework.

76% of Wisconsin’s dairy farms have disappeared since the mid-2010s—from over 15,900 operations to fewer than 6,000 today.

Processors Chose First. Producers Followed.

The conventional narrative frames this geographic shift as producer-driven: families chasing lower costs and friendlier regulations. The timeline tells a different story.

Hilmar’s CEO, John Jeter, explained the Dalhart decision by citing “a growing milk supply and a stable regulatory environment.” Note the word “growing”—not “large.” The company bet on the future supply it planned to create, betting that it would create the market for it.

When Hilmar announced the Dodge City plant in 2021, Kansas Dairy CEO Janet Bailey said it would “help the state’s industry expand” and “create incentives for producers to be innovative.” That’s future tense. The plant pulls production into existence rather than chasing milk that’s already there.

Leprino’s Lubbock facility follows the same script, with phases coming online through 2026. Industry analysts estimate the company targets $10.6 billion in economic impact for Texas over the next decade.

Processors aren’t following milk. They’re building gravity wells—and milk is flowing toward them.

The I-29 Corridor: A Third Path

Not all dairy expansion is heading to the Southwest. The I-29 corridor—running through South Dakota, Minnesota, and Iowa—has quietly become the fastest-growing dairy region in the country on a percentage basis.

“So that is Iowa, South Dakota, and Minnesota—there they are growing milk production, and they are growing processing capacity,” notes Sarina Sharp in the Daily Dairy Report. “New dairies are coming in, and it’s not just cows moving across state lines, it’s truly growth.”

Valley Queen’s expansion project expects approximately 25,000 additional cows in 2025 and 2026 alone. Evan Grong, Valley Queen’s sales manager, identifies three key drivers: “We attribute the current and projected growth in the I-29 region primarily to access to feed production, abundant groundwater, and dairy processing investments.”

Unlike the Ogallala-dependent Panhandle, the I-29 corridor offers better long-term water security. Unlike Wisconsin, it has processor capacity actively seeking milk. It’s a middle path—if you can get in.

The Growth-State Assumption Is Cracking

Here’s the story everyone tells: growth states offer competitive advantages that traditional regions can’t match. Lower costs, friendlier regulations, room to expand.

Here’s the problem: the two pillars holding up that story—water and labor—are shakier than most people realize.

The water math is brutal. The Ogallala Aquifer underlies the Texas Panhandle and western Kansas dairy expansion zones. According to USGS and Texas Water Development Board data, Texas accounts for 62% of total Ogallala depletion despite covering a fraction of the aquifer’s footprint.

A University of Texas Bureau of Economic Geology projection suggests up to 70% of the Texas Panhandle’s section could become unusable within 20 years at current pumping rates. That’s potentially mid-2040s—well within the debt horizon of a dairy built today.

The labor math is worse. According to NMPF research:

  • 51% of all hired U.S. dairy workers are immigrants
  • Farms employing immigrant labor produce 79% of the national milk supply
  • When NMPF surveyed 1,223 dairy farms, 80% reported “low or medium” confidence in employment documents

In Wisconsin alone, a UW-Madison School for Workers survey found more than 10,000 undocumented workers perform about 70% of the state’s dairy labor.

Wisconsin’s Governor Tony Evers put it plainly: “If suddenly those people disappear, I don’t know who the hell is going to milk the cows.”

The Risk Sits Differently for You Than for Them

Leprino runs facilities across Colorado, California, Michigan, New Mexico, and now Texas. Hilmar has operations in California and Texas, with Kansas coming online. If water constraints or labor enforcement hits one region hard, they can shift volume elsewhere or exit with a write-down that stings but doesn’t kill the company.

A 4,000-cow dairy built in the Panhandle to supply a processor contract? Those wells, those barns, that debt—they’re all fixed in place.

Risk FactorTexas PanhandleKansas (Western)I-29 Corridor (SD/MN/IA)
Ogallala Depletion70% potentially unusable by 2045 (red)Moderate-to-high stress, caps tightening (red)Not Ogallala-dependent (better water security)
Labor Dependency51% immigrant workers nationally (red)51% immigrant workers nationally51% immigrant workers nationally
Processor DiversificationHilmar (CA, TX, KS), Leprino (CO, CA, MI, NM, TX)Hilmar, Leprino multi-stateValley Queen, regional processors
Producer Risk ExitFixed assets, debt horizon 15-25 yearsFixed assets, debt horizon 15-25 yearsFixed assets, debt horizon 15-25 years

NMPF modeling shows what a full labor disruption would mean nationally:

  • Over 7,000 dairy farms closed
  • 2.1 million cows culled
  • 48.4 billion pounds of milk lost
  • Retail prices are nearly doubling

For a 500-cow operation that loses 40% of its crew during a 30-day enforcement surge, the hit could run $20,000 or more in lost milk alone.

The Genetics Angle: Components Are King

Here’s what most geographic-shift analyses miss: where you farm increasingly determines what genetics you need.

These “gravity well” dairies feeding Hilmar and Leprino cheese plants are breeding hard for components—not volume. According to a March 2025 CoBank report, U.S. butterfat reached a record 4.23% nationwide in 2024, while protein reached 3.29%.

The April 2025 Holstein genetic evaluations saw the largest base change in history—a 45-pound rollback on butterfatand a 30-pound rollback on protein. Corey Geiger with CoBank explains: “That butterfat number’s almost double any number that’s taken place in the past.”

Why the shift? In cheese-focused markets, component pricing programs can place 80-90% of the milk check value on butterfat and protein—though this varies by Federal Order and utilization. Cheese plants pay for solids, not water.

For Wisconsin’s “premium path” operations, the genetics conversation looks different. A2A2 genetics, grass-fed programs, and high-type show cattle can command premiums in specialty markets. MilkHaus Dairy in Fennimore, Wisconsin, tests about 100 of their 360-head Holstein herd for A2 genetics, housing them separately to produce 12 cheese varieties sold nationwide.

The bottom line: Your sire selection should match your market destination.

Three Paths: Scale, Premium, or Exit

If you’re in a traditional region—or evaluating whether to build in a growth state—your decision comes down to three paths.

StrategyBest ForKey TriggerPrimary Risk
Scale Up1,000+ cow potentialDebt-to-asset < 40%, signed processor agreement$24+ breakeven, no successor
Premium< 300 cowsSigned specialty contract before transitionLimited market capacity
Strategic ExitNo successorEquity eroding 3+ yearsForced liquidation timing

Path 1: Scale Up

Decision triggers:

  • You’re at 500+ cows with a realistic path to 1,000+
  • Debt-to-asset sits below 40%
  • You’re under 55 with a committed successor
  • You have a signed processor agreement—not a handshake

It requires significant balance-sheet capacity—often $15 million or more — for a 500-to-1,000-cow build-out. Plan for 24-36 months of tight margins during ramp-up.

Genetics focus: High-component sires. The cheese plants driving this expansion reward butterfat and protein, not volume. While butterfat has driven the recent surge, CoBank’s September 2025 report noted excessive butterfat levels can impact cheese quality – keep an eye on protein-focused sires as processors adjust.

Where it breaks: Your expansion needs $24+ milk to pencil out. You don’t have a written processor commitment. No one’s willing to run the expanded operation after you.

Path 2: Premium Positioning

Decision triggers:

  • Your herd is under 300 cows—ideally under 200
  • You’ve got pasture access at 2+ acres per cow
  • You can secure a processor contract before starting the transition
  • Someone in your operation wants to do the marketing work

It demands 36+ months of operating capital for organic transition. Maple Hill was moving to $40.86/cwt base by July 2025, with quality premiums pushing total pay toward $45/cwt for qualifying producers.

Genetics focus: A2A2 testing and segregation, Jerseys or crossbreeding for components, grass-efficient genetics. Most Holsteins run 50-60% A2 naturally—testing your herd first tells you how much work the transition requires.

Where it breaks: Premium markets absorb perhaps a few hundred operations annually at most. Wisconsin alone loses 400-500 farms per year, according to USDA data.

Path 3: Strategic Exit

Decision triggers:

  • You’re past 55 with no committed successor
  • Breakeven sits above $24/cwt with no clear path down
  • Equity has eroded three years running
  • Debt-to-asset has crossed 60% and keeps climbing

The gap between a well-planned exit and a forced sale can be substantial—potentially several hundred thousand dollars in recovered equity. Cull cow prices have been running strong in recent months.

One DFA executive put it this way: “For farms without succession plans, strong calf and cull prices offer a timely opportunity to exit the industry without incurring losses from prolonged milk prices.”

Signals Worth Watching

  • Immigration reform is moving. The Farm Workforce Modernization Act was reintroduced in May 2025 with bipartisan support. Senate Ag Chair John Boozman recently said: “We said we could not do reform because the border was not secure… it is secure now, then through visa programs you control the flow, but it’s time to do that.” If year-round ag visas open up by 2027-2028, the labor advantage in growth states shrinks.
  • Groundwater districts are tightening. Texas and Kansas conservation districts can implement pumping caps faster than the aquifer models update. Watch Dallam, Hartley, and Moore Counties in Texas, plus western Kansas districts.
  • Watch the processor contract terms. Are supply agreements getting shorter? Quality specs tightening? Water-efficiency clauses appearing? That tells you how processors are pricing in structural risk.
  • Component premiums may shift. CoBank’s September 2025 report noted that butterfat growth has significantly outpaced protein growth and that excessive butterfat levels can impact cheese quality. Protein may command higher premiums than fat.

What This Means for Your Operation

  • Know your real breakeven. Include unpaid family labor at $18-22/hour, depreciation at replacement cost, and management compensation. For most 300-500 cow herds, that number lands between $22-26/cwt.
  • If you’re looking at growth states: Run your water scenario for 2040, not today. What happens if pumping gets cut by 30-40%? Consider the I-29 corridor as an alternative with better water security.
  • If you’re eyeing premium markets, don’t start an organic transition without a signed contract. Test your herd’s A2A2 genetics first.
  • Audit your genetics program. Are you still breeding for volume while processors pay for components? The April 2025 base change proves the industry has moved.
  • If exit makes sense: Strategic beats reactive by a wide margin. That’s the difference between selling genetics as genetics versus a fire sale.
  • Red flag: Your 18-month cash flow shows cumulative losses exceeding 15% of equity.
  • Green light: You’re under 250 cows, have pasture, and a processor has put interest in writing at premium terms.
Herd SizeReal Breakeven (incl. unpaid labor)Current Milk Price RangeDecision Trigger
100-200 cows$25-28/cwt (red)$20-22/cwtConsider premium pivot or strategic exit (red)
300-500 cows$22-26/cwt (red)$20-22/cwtMarginal viability; efficiency gains or exit (red)
500-1,000 cows$20-23/cwt$20-22/cwtViable if debt-to-asset < 50%; consider scale-up
1,000+ cows$18-21/cwt$20-22/cwtProfitable; focus on component optimization

The Bottom Line

Processor confidence doesn’t validate producer expansion. Their bets pay off under scenarios where yours might not—they have optionality you don’t.

The three-path decision isn’t optional. Scale, premium, or exit. Staying the same size, doing the same things, hoping prices improve—that’s not a strategy. It’s a slow exit with worse terms.

Water, labor, and genetics are structural, not cyclical. These aren’t problems that fix themselves in the next price rally. Build them into your 10-year planning.

Chad Vincent of Dairy Farmers of Wisconsin captured the human weight of all this: “I think Wisconsin dairy is as strong today as it’s ever been, although it is sad to see the next generation not come back.”

Rabobank analyst Ben Laine summed up the trajectory: “Everything that we know about dairy consolidation says it hasn’t shown any signs of slowing down… I don’t see that changing.”

Wisconsin’s farm count peaked above 100,000 in the mid-20th century. Today, fewer than 6,000 remain—and production has nearly doubled. The milk keeps flowing. The communities that make it look nothing like they used to.

Where does your operation sit on that curve? And who’s making the call—you, or the next milk check?

Complete references and supporting documentation are available upon request by contacting the editorial team at editor@thebullvine.com.

Learn More

The Sunday Read Dairy Professionals Don’t Skip.

Every week, thousands of producers, breeders, and industry insiders open Bullvine Weekly for genetics insights, market shifts, and profit strategies they won’t find anywhere else. One email. Five minutes. Smarter decisions all week.
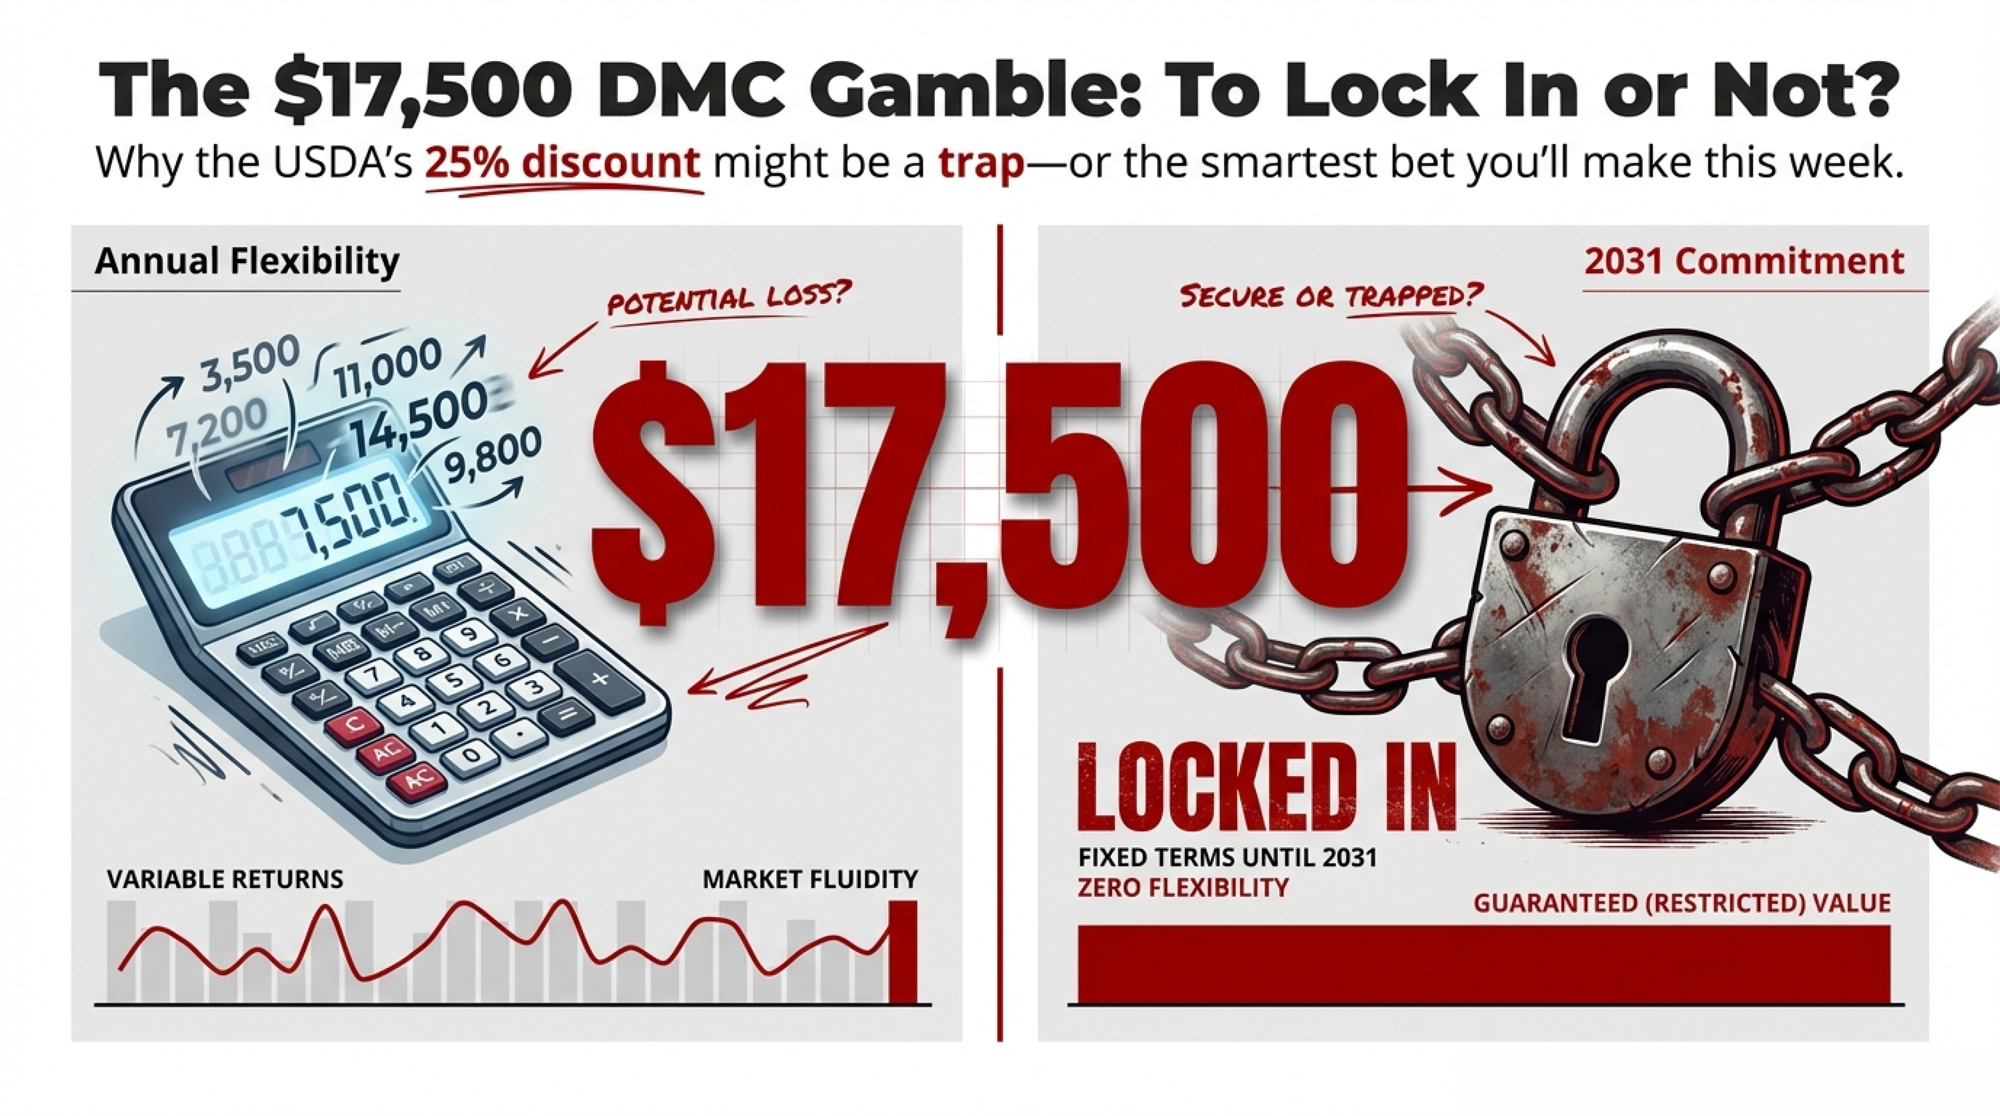
NewsSubscribe
First
Last
Consent

GDT’s 6.7% Rally, $14.59 Class III: Head-Fake? Your Call Before April

GDT up 6.7%, Class III stuck at $14.59. Is this rally real—or a head-fake you’ll regret chasing before April?

Executive Summary: The early 2026 GDT rally looks impressive—up 6.7% on February 3 with SMP surging 10.6%—but your milk check is still anchored to $14.59 Class III, the lowest since July 2023. At the same time, US milk production is running about 4.6% above a year ago, and New Zealand and EU collections are also climbing, so the supply wall hasn’t gone away. The buying burst from China, the Middle East, and Algeria is largely seasonal, tied to Ramadan and Easter, which means it can mask the underlying imbalance for a few auctions without actually fixing it. Powders look closest to a genuine reset after dropping to value territory late in 2025, while butterfat’s 8.8% bounce is a small blip against a 35–40% price break and a decade of genetically driven fat growth that’s still flooding the system. In this environment, your safest 90‑day play is to treat the rally as a potential head-fake: secure DMC coverage before the February 26 deadline, push Q2–Q3 Class III hedge coverage toward roughly 60–70% if you’re light, and build working capital toward about $500/cow before committing to major capital projects. Any expansion math should be run at $17 Class III, not today’s bounce, and held until the April 7 and 21 GDT auctions show whether prices can hold once holiday demand fades. Those two April sales, along with US milk growth, CME NDM holding above $1.40, and whether Fonterra nudges its forecast higher, are the signals that’ll tell you if this rally has real legs or was just a very expensive head-fake.

GDT Market Rally

Three consecutive Global Dairy Trade gains to open 2026 have producers asking the same question: Is this the recovery we’ve been waiting for, or a seasonal head-fake that punishes anyone who bets on its continuation?

For operations staring at January milk checks based on $14.59 Class III—the lowest since July 2023—the answer shapes every decision over the next 90 days. The February 3 GDT auction delivered a 6.7% index jump, with skim milk powder surging 10.6% to $1.39/lb on an NDM-equivalent basis. CME spot NDM hit $1.5375/lb the same day, its strongest start since 2011, and up 31% year-to-date.

Here’s the tension: US milk production grew 4.6% year-over-year in December, according to USDA; the dairy herd sits at 9.57 million head (the highest since 1993); and Fonterra held its farmgate forecast at NZ$8.50-$9.50/kgMS despite the rally. The supply side isn’t confirming what demand is signaling.

The Head-Fake Setup: Who’s Buying and Why

The demand shift between December and February was dramatic. Three buyer groups drove the surge:

  • Middle East: Reportedly doubled GDT participation from approximately 11% to 21%, according to analyst estimates—their highest share in two years—driven by Ramadan preparation beginning late February.
  • China: Returned as active purchasers after months of cautious observation, accounting for an estimated 44% of volume sold at the January 6 auction based on analyst tracking.
  • Algeria: The ONIL tender in January moved significant volumes of WMP and SMP, re-establishing global price benchmarks after weeks of volatility.

Katie Burgess of Ever.ag captured the core dynamic: global milk powder prices remain “very highly correlated,” so what happens at GDT in New Zealand directly influences US pricing. That correlation is holding. CME spot NDM now trades at roughly a 10% premium to GDT SMP equivalent, suggesting both domestic and export demand are active simultaneously. USDA’s weekly Dairy Market News confirms “tight spot inventories” and “strong international interest.”

But Fonterra’s decision to hold—not raise—its price forecast tells you what the largest dairy exporter sees in its collection data. New Zealand season-to-date milk flows are running 2.6% above last year, and their full-season forecast was raised to 1,545 million kgMS in November. The supply wall that drove nine consecutive GDT declines through late 2025 hasn’t disappeared. It’s temporarily obscured by compressed seasonal demand.

Why This Head-Fake Looks Different: The Supply Collision

The conventional read on this rally goes something like: “Prices found a floor, buyers returned, the market is rebalancing.”

That assumes supply and demand are moving toward equilibrium. The data says otherwise.

US milk production grew 4.5-4.6% year-over-year in both November and December 2025, per USDA. The January WASDE raised the 2026 production forecast by 200 million pounds to 234.3 billion—up 3.2 billion pounds from 2025. EU milk output posted its strongest growth since 2017 in October 2025, running 5% above year-ago levels according to Eurostat. Rabobank analyst Michael Harvey noted that what made the late-2025 decline unusual wasn’t weak demand—GDT bidder participation stayed above 150—but a “supply collision” where multiple exporting regions flooded the market simultaneously.

What’s happening now isn’t rebalancing. It’s seasonal demand compression meeting a temporary shift in buyer psychology. Purchasers who depleted inventories waiting for the bottom are scrambling to cover positions before Ramadan and Easter. When that seasonal window closes in April, supply fundamentals reassert themselves.

Head-Fake Math: Margins, Heifers, and Timing Traps

The immediate margin picture remains tough despite the GDT rally. USDA’s December 2025 All-Milk Price came in at $19/cwt, down 70¢ from November. January erodes by another $1/cwt-plus because Class III ($14.59) and Class IV ($13.55) prices are the lowest since July 2023 and February 2021, respectively. For operations in the Upper Midwest and similar regions—where many herds break even in the mid-$16/cwt range based on regional benchmarking data—Q1 2026 milk checks are already underwater.

The futures market sees improvement ahead, with Class III contracts trading in the $17-18/cwt range for Q2-Q3 2026 on CME. But here’s where the timing trap for expansion kicks in.

Replacement heifers currently run $3,000-$4,000/head according to USDA livestock data, versus $1,800 in 2023. A 100-heifer expansion now costs $120,000-$220,000 more in heifer costs alone than it would have two years ago—and those heifers won’t hit the milking string for 27-30 months. Market conditions will shift multiple times before the genetics purchased today reach the bulk tank. Producers running that heifer math are finding the rally looks different than it feels.

A December 2025 Bullvine analysis examined the expansion timing gap: operations expanding at 80% barn capacity with intact working capital face dramatically better outcomes than those expanding at 95% capacity with depleted reserves. This rally creates exactly the psychological conditions that lead producers to expand from weakness rather than strength.

Cost Category2023 Cost (100-Head)2026 Cost (100-Head)Cost Increase
Replacement Heifers$180,000 ($1,800/hd)$350,000 ($3,500/hd)+$170,000
Feed Costs (27-mo to freshening)$81,000 ($810/hd)$95,000 ($950/hd)+$14,000
Facility/Equipment Allocation$125,000$160,000+$35,000
Interest Carry (2-yr avg on capex)$18,000 (5.5% rate)$28,000 (7.2% rate)+$10,000
TOTAL EXPANSION COST$404,000$633,000+$229,000 (+57%)

The Butterfat Head-Fake: Why Components Tell a Different Story

Product category behavior reveals which segments are genuinely rebalancing versus catching temporary bids. At the February 3 GDT auction, SMP led at +10.6% while butter rose 8.8% to $5,773/MT. That might look like broad-based strength. Context says otherwise: butter dropped roughly 35-40% from its May 2025 peak to December’s lows on GDT. The 8.8% bounce doesn’t erase that collapse.

The structural problem for butterfat is genetic. US butterfat production grew approximately 30% from 2011 to 2024, outpacing overall milk production growth. Corey Geiger of CoBank put it directly: “This isn’t a demand issue. It’s clearly a ‘We’re supplying way too much.'” Holsteins averaged a 45-lb butterfat rollback in the April 2025 CDCB evaluation—significantly higher than 2020 levels. The cows producing today’s oversupply are already in herds, and some geneticists project genetic selection could push average butterfat content toward 5% within the decade.

SMP tells a different story. Prices genuinely reached value territory at late-2025 lows ($1.18/lb equivalent on GDT), triggering buying that appears more structural than seasonal. Both CME and GDT powder markets are moving in sync, domestic inventories remain tight, and the US has regained export competitiveness after losing Asia market share to New Zealand in 2023-2024.

For hedging decisions, this divergence matters. Butter exposure carries a higher reversal risk post-Easter; powder positions have better structural support—though still vulnerable to the production surge.

Four Paths If This Is a Head-Fake

DMC Enrollment (Deadline: February 26, 2026)

USDA’s Tier 1 coverage was expanded to 6 million pounds for 2026, and analysts expect payments early this year amid current margin compression. The multi-year commitment option (2026-2031) locks in a 25% premium discount per FSA program terms.

Trade-off: You’re paying premiums through 2031 even if margins recover strongly. But current signals don’t support betting on a rapid recovery. Use the University of Tennessee DMC calculator to optimize coverage level for your production history.

Hedging Coverage

Risk management advisors often suggest 60-70% coverage at elevated premium levels for Class III, keeping 25-30% open for potential upside. Options (puts/put spreads) preserve participation if the rally extends, versus futures that lock you out of gains. Lock feed costs through Q2—corn near $3.90/bu on CME represents favorable input pricing regardless of milk price direction.

Trade-off: Over-hedging costs you if this rally proves structural; under-hedging hurts if April auctions give back Q1 gains.

Capital Allocation

Lender reports indicate many producers are prioritizing paying down loans and building working capital over expansion. That’s the right read for this environment. Many advisors suggest targeting working capital at $500-550/cow before committing to expansion. Defer major capital projects until post-April GDT results confirm whether the rally has structural support.

Expansion Timing

Wait for post-holiday GDT auctions (April 7 and April 21) before committing. Test project economics at $17/cwt Class III, not current rally prices. Don’t expand from a position where depleted reserves require the rally to continue.

Four Indicators: Head-Fake or Real Recovery?

Indicator“Recovery Has Legs”“Head-Fake Confirmed”
GDT Post-Holiday (Apr 7, 21)Prices hold within 3% of March highsDrop 6%+ from March levels
US Milk ProductionGrowth moderates to <2.5% YoY by the March reportContinues at 4%+ YoY
CME Spot NDMHolds above $1.40/lb through AprilFalls below $1.25/lb
Fonterra ForecastRaises above NZ$9.50Holds or cuts below $8.50

The April 7 and April 21 auctions are the critical test per GDT’s published calendar. That’s when Ramadan and Easter demand releases. If prices hold, it’s fundamentals. If they crash, the head-fake is confirmed.

What This Means for Your Operation

  • Enroll in DMC by February 26. The expanded Tier 1 coverage and current margin compression make this a defensive baseline regardless of rally outlook.
  • If you’re hedged below 50% for Q2-Q3, the current rally provides an opportunity to add coverage. Target 60-70% total to balance protection with upside participation.
  • If you’re considering expansion, run your economics at $17/cwt Class III—not current futures—and don’t commit until April GDT results confirm or deny structural support.
  • The critical threshold: working capital around $500/cow before any major capital deployment. Below this, use the rally to strengthen reserves rather than expand commitments.
  • If you’ve been assuming the supply surge would self-correct through lower prices driving exits, check whether your region is actually seeing herd contraction. National USDA data shows the opposite.
  • Red flag: Any expansion plan that requires Class III to stay above $18/cwt carries an elevated risk given the current production trajectory.

Key Takeaways

  • The rally is real, but likely a seasonal head fake. Three consecutive GDT gains driven by Ramadan/Easter buying and inventory restocking—not structural rebalancing of a 4.6% US production surge.
  • April auctions are your decision point. The post-holiday GDT events (April 7 and 21) will reveal whether demand can absorb the supply wall. Don’t make irreversible commitments before then.
  • Butterfat and powder are telling different stories. SMP shows signs of genuine value buying; butter’s 8.8% bounce doesn’t offset a 35-40% collapse driven by structural genetic oversupply.
  • Use the rally to strengthen the position, not bet on continuation. Build working capital, add hedging coverage, pay down debt. The producers who maintain optionality will outperform those who commit prematurely.

The Bottom Line

The producers who navigate the next 90 days successfully won’t be the ones who correctly called the market’s direction. They’ll be the ones who kept their options open while others locked themselves into bets they couldn’t afford to lose.

Every cycle looks obvious in hindsight. Where does your operation sit on the spectrum between building reserves and betting on continuation?

Complete references and supporting documentation are available upon request by contacting the editorial team at editor@thebullvine.com.

Learn More

The Sunday Read Dairy Professionals Don’t Skip.

Every week, thousands of producers, breeders, and industry insiders open Bullvine Weekly for genetics insights, market shifts, and profit strategies they won’t find anywhere else. One email. Five minutes. Smarter decisions all week.
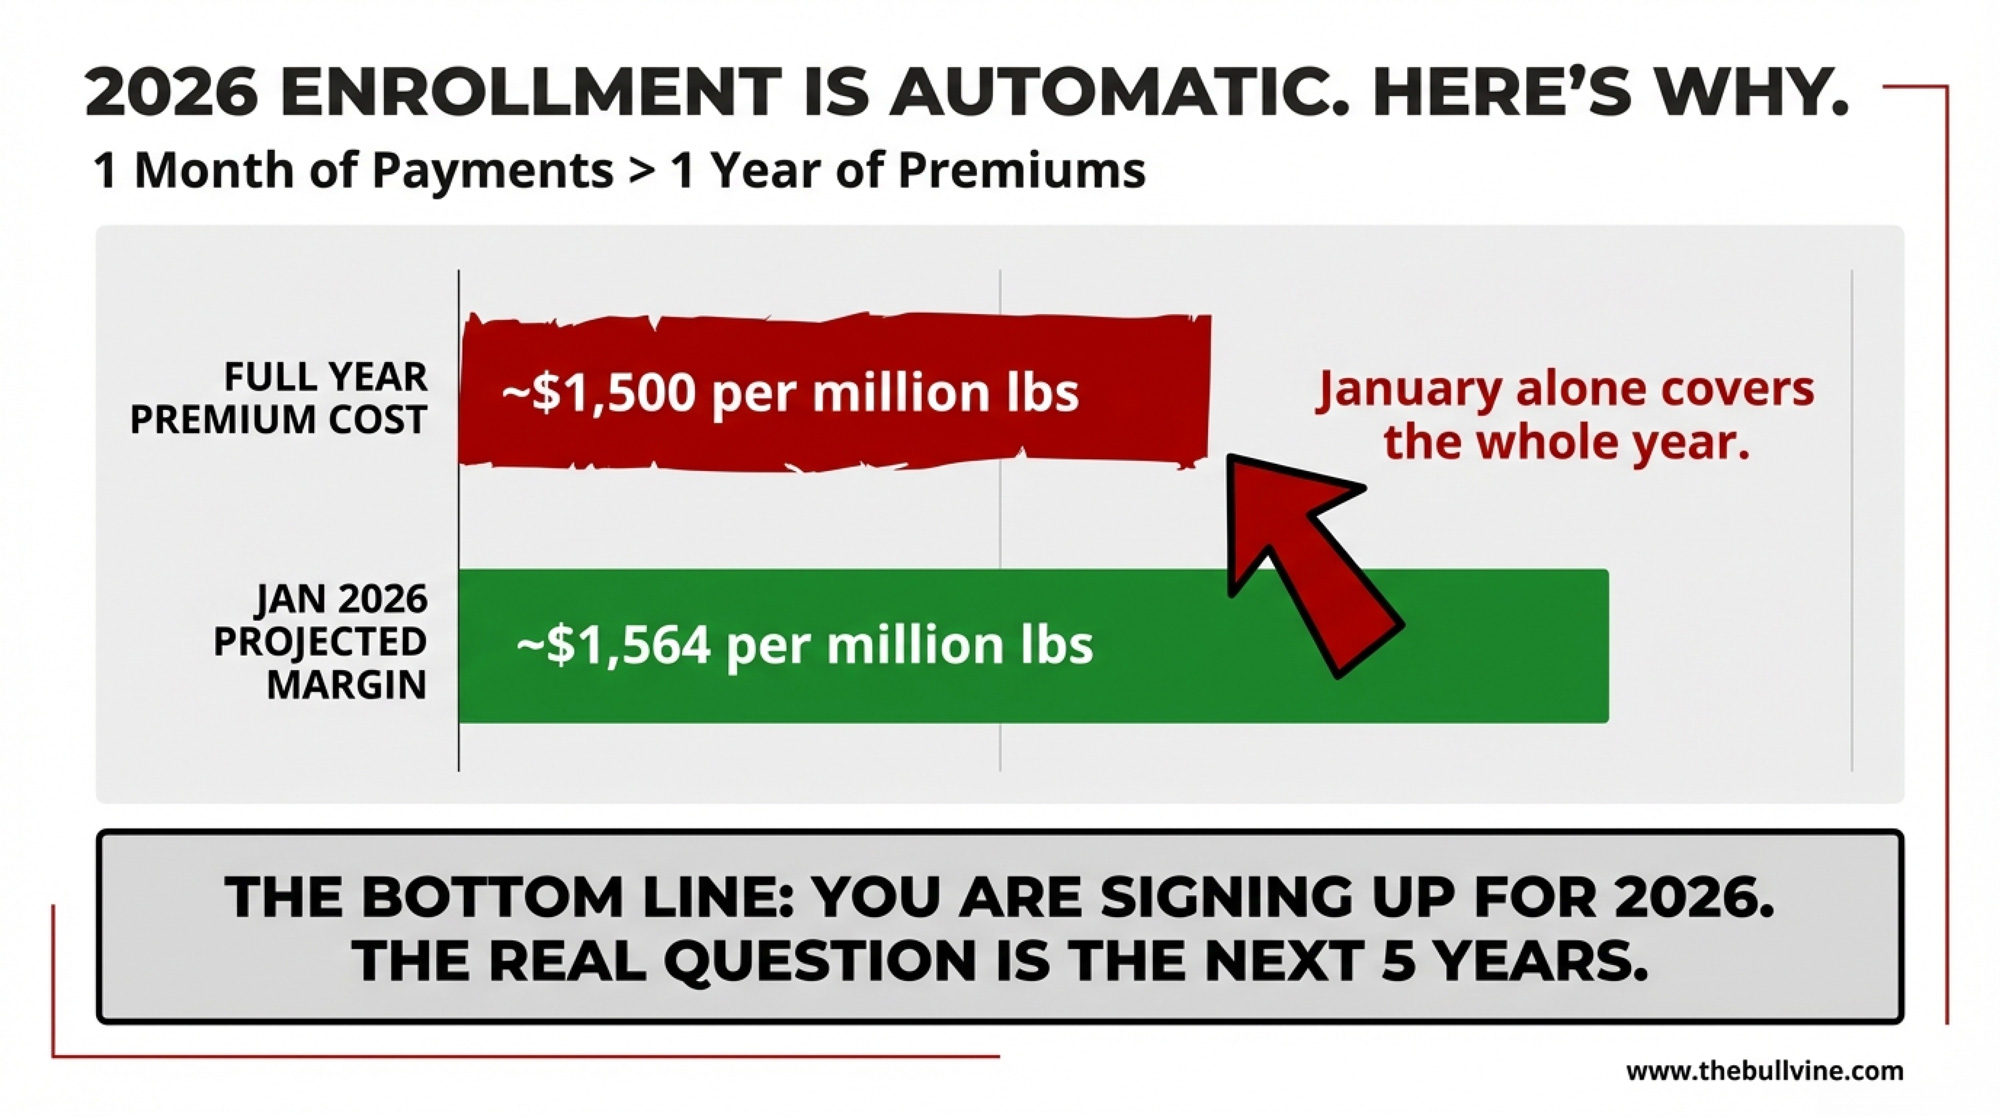
NewsSubscribe
First
Last
Consent

Record Exports, Reeking Checks: How a 34% Hidden Tax Costs You $5.85/Cwt

U.S. dairy exported $801M in November. Your butterfat paid $5.85/cwt less. The missing money isn’t magic — it’s a 34% ‘hidden tax.

Executive Summary: November 2025 U.S. dairy exports hit $801.7 million, but many producers watched their butterfat pay $5.85/cwt less than late 2024. This piece unpacks that paradox and shows how exports surged because U.S. butterfat got cheap, not because buyers paid premiums. It brings the June 2025 FMMO reforms front and center, explaining how a 34% jump in the butter make allowance acts like a “hidden tax” on high‑component herds by pulling more value out before it ever reaches your milk check. Real‑world examples from Wisconsin and Minnesota walk through how wide Class III/IV spreads, depooling, and $180,000 in locked-up co‑op equity shift risk and revenue off the farm. From there, the article lays out four concrete paths — demand co‑op transparency, measure your mailbox vs. uniform gap, honestly assess switching costs, and tighten DMC/forward‑pricing coverage. It gives you specific triggers to watch, like a $0.50/cwt mailbox gap and a $2.00–$2.50 Class III/IV spread, so you can decide whether your current marketing channel is earning its share — or just taking it.

“If exports are so great, why don’t I feel it?”

That’s what one Wisconsin producer said when he opened his December milk statement after weeks of headlines celebrating record U.S. dairy exports. It’s the right question.

November 2025 delivered $801.7 million in U.S. dairy export value — up 14% from the prior year, according to USDEC data released in January 2026. Butter shipments surged 245%. Total butterfat exports reached 15,308 metric tons, the highest single-month total ever recorded. Yet Class IV checks arrived at $13.89 per hundredweight, and butterfat component values had dropped roughly $5.85 per cwt compared to late 2024.

We’re feeding the world on a discount, and the only ones not invited to the feast are the people milking the cows.

That gap between headline and mailbox isn’t random. It’s structural. And understanding why — plus what you can do about it — matters more now than it has in years.

The Hidden Tax on Your Efficiency

Before we get to export mechanics, here’s the piece most producers miss entirely.

The Federal Milk Marketing Order reforms that took effect in June 2025 included increases in make allowances across product categories. According to USDA Agricultural Marketing Service data, butter’s make allowance rose 34% to $0.2272 per pound. These allowances get deducted before class prices and producer payments are calculated.

ComponentBefore June ’25After June ’25% Increase
Butter$0.1694/lb$0.2272/lb+34%
Cheese (Cheddar)$0.2003/lb$0.2367/lb+18%
Dry Whey$0.1991/lb$0.2210/lb+11%
Nonfat Dry Milk$0.1678/lb$0.1889/lb+13%
Avg. Impact on Class III-$0.91/cwt
Avg. Impact on Class IV-$0.85/cwt

Think about that: you invested in genetics, management, and components. Your herd is testing 4.3% butterfat — roughly 23% above the 3.5% baseline FMMO pricing assumes. And now a larger slice of that value gets carved out before it ever reaches your check.

American Farm Bureau Federation analysis estimated the FMMO changes reduced Class III prices by approximately $0.91 per cwt and Class IV by $0.85.

That’s not market forces. That’s policy. And it happened while everyone was watching export numbers.

Why Exports Surge When Prices Fall

Here’s the assumption most of us carry: strong export demand drives prices up, rising prices lift milk checks. November 2025 proved that the opposite can happen.

What actually drove the export boom? U.S. butterfat got cheap.

When domestic butter prices fell from nearly $2.89 per pound in late 2024 to roughly $1.53 by late 2025, American product became the discount option. Global buyers noticed. According to USDEC’s January 2026 analysis, butterfat imports from the U.S. to the Middle East and North Africa topped 4,000 metric tons in November alone. Bahrain and Saudi Arabia led the surge ahead of Ramadan buying.

South Korea emerged as a standout cheese market too, with November shipments jumping 136% year-over-year — mozzarella and cream cheese for foodservice driving those gains.

But here’s the thing: these weren’t premium buyers paying top dollar for American quality. They were price-sensitive markets taking advantage of a cheap supply.

When exports function as a release valve for surplus — moving product that would otherwise crash domestic prices further — they provide real value. That value shows up as market stabilization, though. Not enhanced producer premiums.

November’s export surge prevented worse. It didn’t create better.

Where the Dollars Disappear

That Wisconsin producer ships to a Class IV-heavy cooperative focused on butter and powder. In theory, a record butterfat export month should benefit operations in that channel.

The math didn’t work that way.

  • First, those export sales happened at prices reflecting the domestic collapse, not premiums above it. When butter trades at $1.53 domestically, export sales at competitive global prices don’t generate a margin to pass back to domestic customers. They generate volume movement that keeps plants running.
  • Second, cooperatives operate with their own cost structures — debt service, equity retention, and balancing costs. Large co-ops with recent processing investments may be servicing significant debt before member payments hit your account.

The Wisconsin producer put it bluntly: “So when they say exports are good for dairy farmers, they don’t actually know if that’s true?”

Not at the individual level. The system doesn’t track it.

The Pricing Mechanics Absorbing Your Margin

The 4.3% vs. 3.5% Problem

Federal order pricing assumes a 3.5% butterfat baseline. Actual farm tests have been running around 4.3% nationally—roughly 23% higher than that.

When butterfat prices are strong, high-component herds benefit. When prices collapse, those same herds have greater downside exposure.

Here’s the math: A producer shipping 4.3% butterfat saw component value drop from approximately $12.43 per cwt in late 2024 to $6.58 in late 2025. That’s $5.85 driven entirely by commodity price movement — same cows, same management, same milk.

The $3.29 Spread

November 2025’s gap between Class III ($17.18) and Class IV ($13.89) was $3.29 per hundredweight — the widest since April 2024.

Wide spreads create depooling incentives. Under federal order rules, milk can be pooled or depooled at the handler’s discretion — this is a permitted structural feature, not a violation. When one class commands a significantly higher price than the blend, handlers can pull that milk out and capture the full value.

When milk is depooled, the higher-value revenue exits the system. Producers remaining in the pool absorb the cost through negative PPDs.

If your PPD went sharply negative in a month with a wide class spread, someone’s milk was depooled. It might not have been yours, but you paid for it.

When Equity Becomes a Barrier

One Minnesota producer calculated he had roughly $180,000 in retained equity with his cooperative. When he explored switching, he discovered leaving would mean waiting 12+ years to access that money — and the bylaws allowed offsets for “losses attributable to departing members.”

He stayed. Not because he was satisfied. Because $180,000 was more than he could walk away from.

His situation illustrates a common barrier, though specific equity positions and terms vary by cooperative and tenure. Retention policies for 15-20-year revolving schedules are standard across much of the industry.

What Works Differently

Not every cooperative operates the same way.

Organic Valley (CROPP Cooperative) pays 8% interest on retained member equity — treating members as capital partners, not just milk suppliers. Their pay prices have historically run several dollars per cwt above conventional, with organic premiums in the $8-10 range during favorable periods. That gap narrows when organic supply exceeds demand, but the structure rewards member investment differently than most commodity co-ops.

FrieslandCampina in the Netherlands paid €245 million in documented sustainability premiums to member farmers in 2023, according to the cooperative’s annual report. Transparent indicator systems show exactly what farmers earn for meeting specific targets.

FeatureTypical U.S. Commodity Co-opOrganic Valley (CROPP)FrieslandCampina
Interest on retained equity0% – 2%8%Variable, disclosed
Premium above conventional$0 – $0.50/cwt$8 – $10/cwt€0.02 – €0.05/kg
Sustainability premiumsRare, undisclosedDisclosed, integrated€245M (2023, documented)
Transparency on export revenueMinimal to noneMember reportsAnnual public reporting
Equity recovery timeline12 – 20 years7 – 10 years5 – 7 years
Member decision-makingBoard-driven, limited inputStrong member voiceIndicator-based, transparent targets

These examples prove the mechanics can work differently. But they represent a small fraction of U.S. production.

Four Paths Forward

Path 1: Demand Transparency

The most accessible option is better information from your current cooperative.

Three Questions to Send Before the Annual Meeting Season

Send these in writing — responses aren’t guaranteed, but asking creates a record:

  1. “What was our cooperative’s gross export revenue in 2025, and what net amount reached member pay prices after all costs?”
  2. “For months when the Class III/IV spread exceeded $2.00, what was our pooling policy?”
  3. “How did our member mailbox prices compare to the FMMO statistical uniform price?”

One producer asking gets brushed off. Five people sending the same letter gets a board agenda item.

Path 2: Know Your Numbers

This week: Pull your milk checks from the last 12 months. Calculate your actual mailbox price — total dollars received divided by total hundredweights, after every deduction.

ScenarioAnnual Production (lbs)FMMO Uniform ($/cwt)Mailbox ($/cwt)Annual Gap
Small herd, commodity co-op850,000$18.25$17.45-$6,800
Mid-size, high-component1,400,000$18.25$17.50-$10,500
Large herd, Class IV heavy3,200,000$18.25$17.70-$17,600
Regional co-op, transparent1,400,000$18.25$18.15-$1,400

Then compare to the statistical uniform price for your federal order.

If your mailbox trails the uniform by more than $0.50 per cwt consistently, that gap warrants investigation. On a 200-cow herd shipping 1.4 million pounds annually, a $0.75 gap is roughly $10,500 per year.

Path 3: Evaluate Switching — Honestly

The barriers are real: retained equity that takes 10-15 years to recover, 12-18 month notice periods, geographic constraints on handlers, and social pressure in tight-knit communities.

But understanding your options provides context for negotiation. A producer who knows their alternatives negotiates differently.

Path 4: Strengthen Risk Management

  • Dairy Margin Coverage remains cheap insurance. December 2025 was the only month triggering a DMC payment all year — but with margins now compressing toward the $9.50 trigger, payments appear increasingly likely in 2026. The enrollment period runs through February 26, and the One Big Beautiful Bill Act expanded Tier 1 coverage to 6 million pounds.
  • Forward contracting through the Dairy Forward Pricing Program allows locks through September 2028. You trade upside for certainty — appropriate for tight debt service, less so if you can absorb volatility.

What to Watch Through Q2 2026

Class III/IV spreads: When they exceed $2.00, depooling pressure builds. Past $2.50, it’s likely affecting your check.

Your PPD trend: Sustained negative PPDs during wide-spread months signal pooling decisions that aren’t serving you.

Co-op annual meetings: Q2 is your window to ask questions with other members present.

What This Means for Your Operation

  • Calculate your mailbox-to-uniform comparison this week. More than $0.50 below consistently? You need to understand why.
  • Send the three questions in writing before your annual meeting. See what answers you get — and how long they take.
  • Know your equity position and departure terms now. Not because you’re leaving, but because understanding constraints lets you evaluate options clearly.
  • Connect with two or three producers in your cooperative. Compare mailbox prices. Collective inquiry creates dynamics different from those of individual complaints.
  • Review your DMC enrollment before February 26. With margins tightening and December’s payment fresh, coverage costs are minimal compared to downside protection.
  • Watch the spread monthly. Past $2.00, pay attention. Past $2.50, act.

Key Takeaways

  • Export records don’t equal premium checks. November’s $801 million was due to U.S. prices collapsing. The surge prevented worse; it didn’t create better.
  • The 34% make allowance hike is a hidden tax on your efficiency. You bred for components. Policy changes are capturing more of that value before it reaches your check.
  • The $5.85/cwt butterfat drop hit high-component herds hardest. The same genetics that boosted 2024 revenue also increased 2025 exposure.
  • $3.29 spreads create depooling that costs you. If you don’t know your co-op’s pooling policy, you can’t evaluate whether it’s working for you.
  • Your mailbox vs. the uniform price is the comparison that matters. A consistent $0.50+ gap means your channel is extracting more than it’s adding.

The Bottom Line

That Wisconsin producer figured something out after digging into the mechanics: the opacity isn’t inevitable. Some cooperatives operate transparently. Some structures actually return a value to members.

The difference is whether you know enough to ask — and whether you’ll ask alongside others who are tired of the same answer.

Where does your mailbox sit relative to the uniform?

Complete references and supporting documentation are available upon request by contacting the editorial team at editor@thebullvine.com.

Learn More

The Sunday Read Dairy Professionals Don’t Skip.

Every week, thousands of producers, breeders, and industry insiders open Bullvine Weekly for genetics insights, market shifts, and profit strategies they won’t find anywhere else. One email. Five minutes. Smarter decisions all week.
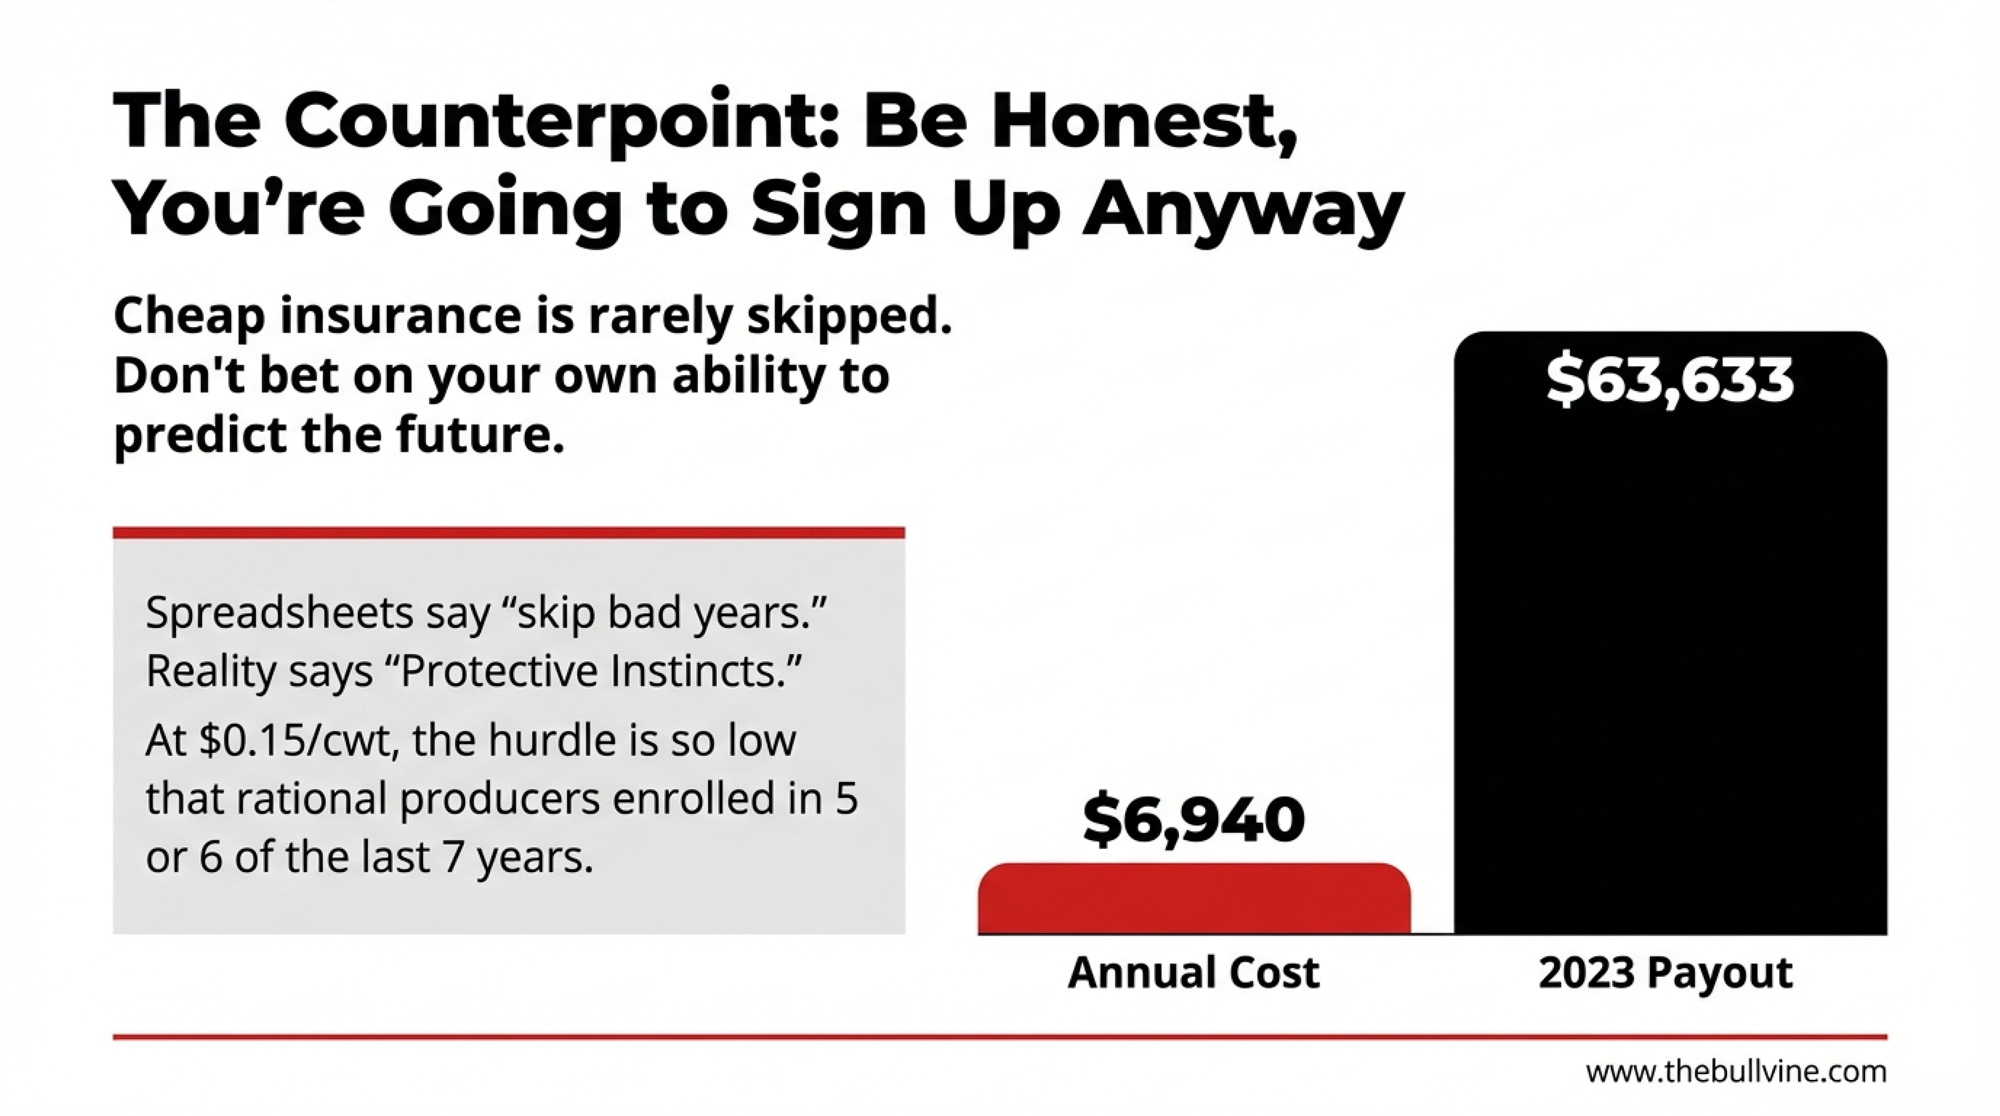
NewsSubscribe
First
Last
Consent

£187,500 Apart: The Contract Clause Deciding Which UK Dairies Survive 2026

When milk is worth 34.5ppl, and it costs close to 49ppl to produce, your contract decides whether you survive this squeeze or bleed cash until the bank decides for you.

EXECUTIVE SUMMARY: Two farms. Same county. Same herd size. One loses £187,500 more this year—the only difference is the contract. UK milk sits at 34.5ppl while production costs hit 49ppl (FAS Scotland, January 2026), leaving farmers on processor-discretionary deals 14-15ppl underwater on every litre. AHDB forecasts no relief until H2 2026 at the earliest. Seven contract clauses are doing the damage—from indemnification language that pins processor-facility contamination on you, to volume traps that trigger clawbacks when drought cuts your output. The UK’s Fair Dealing regulations gave farmers a complaints process, but in ASCA’s first twelve months, not one producer filed formally; nine called in confidence, then went silent. For non-aligned operations with less than six months of cash, the decision window isn’t approaching—it’s here.

Dairy Milk Contracts

Two farms. Same county. Same herd size. Same brutal market.

One loses close to £190,000 more this year than the other.

The difference isn’t just Müller’s March 2026 price cut to 34.5ppl. It’s not only the record milk glut or the butter crash. It’s what’s written in the contract—specifically, which operation bears the downside when processors slash farmgate prices, and which has terms that track costs and provide a floor.

Aligned retail contracts held steady in January 2026. Processor-discretionary deals dropped 1-4ppl. Meanwhile, The Dairy Group—reporting through Scotland’s Farm Advisory Service in January 2026—put the average cost of production at 48.5ppl for 2024/25, with a forecast of 49.2ppl for 2025/26. That means many non-aligned farms are now producing milk for roughly 14–15ppl more than they’re being paid.

On a 500-cow operation producing 1.25 million litres annually, that 14–15ppl gap represents roughly £175,000–£187,500 per year in lost margin compared with a neighbour on a cost-of-production-linked contract facing the same market.

Farm ParameterFarm A (Non-Aligned)Farm B (Aligned Retail)Difference
Herd Size500 cows500 cows
Annual Production1.25M litres1.25M litres
Milk Price (Early 2026)34.5 ppl48.5 ppl+14.0 ppl
Cost of Production49.2 ppl49.2 ppl
Margin per Litre-14.7 ppl-0.7 ppl+14.0 ppl
Annual Loss/Profit-£183,750-£8,750£175,000

“Prices are falling fast while costs remain high,” said Bruce Mackie, chair of NFU Scotland’s Milk Committee, in December 2025. “Processors must communicate clearly and fairly with suppliers.”

The UK now has regulatory teeth—the Fair Dealing Obligations (Milk) Regulations 2024 and the Agricultural Supply Chain Adjudicator to enforce them. But in ASCA’s first 12 months, not a single formal complaint landed across the entire industry. Nine farmers rang up in confidence. None followed through.

Is the regulation toothless, or are farmers too terrified of their milk buyer to bite back?

The Market Numbers You’re Up Against

UK dairy entered 2026 drowning in milk. December 2025 deliveries averaged around 35.6 million litres daily—4.8% above the prior year, according to AHDB. Total GB production for 2025/26 is forecast at a record 13.05 billion litres. Spring flush 2025 peaked at 39.02 million litres on May 4—the highest single-day volume ever recorded.

Wholesale markets buckled. Bulk cream cratered to £1,185 per tonne in January 2026, down 10% from December, per AHDB. UK wholesale butter averaged £3,600 per tonne for the month—AHDB notes it “has now lost over half of its value since the peak.” European butter slid below €4,000 per tonne in late January, down from over €7,000 at the 2022 high.

AHDB’s January 2026 outlook didn’t mince words: milk prices are “set to stay under pressure through the first half of 2026” with only “modest improvement” expected later. Rabobank’s Q4 2025 update pegs global supply growth at just 0.12% for 2026, with actual decline not expected until the first half of 2027.

FAS Scotland confirms it plainly: milk price was below the cost of production for most of 2025 and remains so heading into spring.

If your contract amplifies downturns, you’re staring down at least six more months of pain with no structural relief on the horizon.

A Global Problem, Not Just a UK One

While this analysis focuses on UK contracts and FDOM regulations, producers across the globe are fighting the same battle between discretionary and formula-based pricing.

In the US, the gap between Federal Milk Marketing Order Class III prices and actual processor pay has sparked renewed debate about order reform—with some co-ops offering cost-plus contracts while others stick to commodity-based formulas. EU producers face similar tensions as intervention prices sit well below production costs in many member states. The contract structures differ, but the fundamental question is identical: who absorbs the pain when markets turn?

UK farmers have FDOM. American producers have FMMO reform debates. EU farmers have CAP negotiations. None of these frameworks have yet solved the core imbalance: processors can pass risk down; farmers can only absorb it or exit.

Where the Money Actually Lands

The split between contract types has become stark.

Sainsbury’s Sustainable Dairy Development Group suppliers operate under cost-of-production models that flex with input costs. When feed and energy prices spike, the farmgate price rises. When wholesale markets collapse, the formula cushions the fall. These suppliers saw modest price bumps in early 2026.

Farmers locked into processor-discretionary deals—where pricing follows wholesale swings or processor margin targets—caught the full blow:

ProcessorContract TypeEarly 2026 Price
Müller AdvantageManufacturing (March)34.5ppl
First MilkManufacturing (February)30.25ppl
ArlaLiquid (February, GB conventional)32.57ppl

Set those against a cost of production near 49ppl, and many non-aligned producers are losing 14–19ppl on every litre.

MetricNon-Aligned (Red)Aligned Retail (Black)
Annual Milk Revenue£431,250£606,250
Annual Profit/Loss-£183,750-£8,750
Cash Available for Debt Service-£50,000+£40,000
Months of Liquidity Remaining4.2 months18+ months

On 1.25 million litres, a farm stuck at 34.5ppl instead of cost-linked pricing is effectively giving up £175,000–£187,500per year compared with a neighbour whose contract moves with costs. At 1.5 million litres and a 14ppl loss, you’re looking at roughly £210,000 in negative margin before you pay a penny on capital or debt.

Switching sounds nice. But with synchronized cuts across processors, alternatives aren’t materially better for most farms right now. And FDOM’s 12-month notice requirement means any move you make today won’t take effect until 2027.

Producers from Southwest England to Yorkshire are living the same reality: identical market conditions, wildly different cheques depending on what they signed 12–24 months ago.

Seven Clauses That Shift Risk Onto Your Back

What separates a protective contract from a loaded gun isn’t the headline price. It’s the fine print.

ClauseThe “Red Flag”Risk Level
Indemnification“Regardless of origin.”High
Quality DiscretionProcessor-controlled manualsHigh
Volume TrapsClawbacks on total deliveryHigh
Delayed PaymentsLoyalty bonuses forfeited on exitMedium
ConfidentialityNo carve-outs for advisorsMedium
Notice Period12-month asymmetrical locksMedium
Dispute ResolutionMultiple steps before external reviewMedium

Indemnification scope is where real damage hides. Standard language covers losses from your breach or negligence—fair enough. Expanded versions using “regardless of origin” or “arising from or related to the milk supplied” can pin liability for contamination at processor facilities squarely on your operation.

Agricultural attorney Ross Janzen, dissecting US contracts for Progressive Dairy in 2018, flagged this pattern: direct-buy contracts may hold producers “directly liable, not only for their own milk, but milk from other producers or the entire plant.” The mechanics apply similarly to UK contracts.

Quality standard discretion creates similar exposure. If your contract defines requirements by referencing a “Quality Manual,” the processor can rewrite whenever they like, and your pricing can shift mid-term without triggering any formal amendment clause.

Volume commitment traps bite hardest during downturns. What happens when you fall short? Some contracts treat under-delivery—even from drought or disease—as a material breach, triggering price clawbacks on all milk delivered.

Contract ClauseThe “Red Flag” LanguageRisk LevelWhat It Means When Prices Fall
Indemnification Scope“Regardless of origin” or “arising from or related to”HIGHYou’re liable for contamination at processor facilities—not just your milk, potentially entire plant batches. Legal exposure can exceed annual revenue.
Quality Discretion“As defined in Quality Manual” (processor-controlled)HIGHProcessor can rewrite quality standards mid-contract, triggering price penalties or rejection without contract amendment. Zero farmer input.
Volume TrapsClawbacks or penalties on “total delivery” if minimums missedHIGHMiss volume targets (drought, disease, market exit)? Processor claws back pricing on all milk delivered, not just shortfall.
Delayed PaymentsLoyalty bonuses or “end-of-year” payments tied to contract completionMEDIUMWalk away mid-contract? You forfeit 6–12 months of accrued payments—effectively a financial hostage clause.
ConfidentialityNo carve-outs for “advisors,” “legal counsel,” or “lenders”MEDIUMCan’t share terms with solicitor, accountant, or bank without breach. Makes informed decision-making nearly impossible.
Notice Period Asymmetry12-month producer notice, 30–90 day processor noticeMEDIUMYou’re locked in for a year; they can exit or cut pricing in 90 days. Risk runs one direction.
Dispute Resolution Barriers“Escalation process” requiring processor internal review firstMEDIUMMultiple hoops before external adjudication. Designed to exhaust you before you reach ASCA or legal remedy.

Your Contract Audit Checklist

Before your next contract conversation, nail down these eight items:

  • [ ] Indemnification scope: Does the clause include “regardless of origin” or similarly broad language?
  • [ ] Quality standards: Defined in the contract, or in external manuals, that the processor controls?
  • [ ] Volume commitment remedies: What happens if you miss minimums due to factors outside your control?
  • [ ] Payment timing: What chunk of your stated price depends on future behaviour?
  • [ ] Notice period symmetry: How much warning do you owe versus what they owe you?
  • [ ] Title transfer point: When does ownership move, and who carries risk during haulage?
  • [ ] Confidentiality carve-outs: Can you share terms with your solicitor, accountant, and lender?
  • [ ] Dispute resolution path: How many hoops between “I have a problem” and external review?

Four Realistic Paths Forward

You’re not going to strong-arm better terms out of your processor. Academic research on dairy supply chains shows that farmers’ bargaining power is well below that of processors. A 500-cow unit doesn’t rewrite standard contract language.

So what can you actually do?

Path 1: Audit for Intelligence

Contract auditing isn’t about renegotiating—it’s about knowing your exposure before the next price cut lands. Map how clauses interact. What happens if you trip the quality threshold while also missing the volume threshold?

Best for: Anyone who hasn’t done this in the last 12–18 months. Requires: 2–3 hours with your contract and a calculator. Downside: None—this is baseline due diligence

Path 2: Find Your Exit Number

Your exit price isn’t simply the cost of production. Cornell economists have shown the rational exit threshold often sits below variable cost because of “option value”—the potential gain from hanging on and catching a recovery. But debt changes that math fast.

The number that matters: At what milk price does cash flow go negative, including debt service? That’s your hard line.

Best for: Non-aligned contract holders carrying significant debt. Requires: Honest cash flow work with your accountant. Downside: Waiting for “confirmation” while cash drains out

Path 3: Position Without Committing

There’s groundwork you can lay before triggering any notice clock:

  • Talk to other processors. Exploring alternatives doesn’t breach exclusivity—shipping milk elsewhere does. Options are thin in early 2026. But knowing that is intelligence.
  • Run lender scenarios. “What happens if prices stay here through Q3?” Their answer tells you how much runway you actually have.
  • Compress costs strategically. NFU Scotland, in a November 2025 advisory, encouraged farmers to “reduce output slightly—selling poorer performing cows while cull prices remain high” to ease cost pressure. But don’t just sell cows—sell your bottom 10% genetically to protect future recovery. When margins turn negative, the embryo budget and top-tier semen are often the first casualties. Make culling decisions that preserve your genetic trajectory, not just your tank space.

Best for: Producers with 6–12 months of cash left. Requires: Uncomfortable conversations with lenders. Downside:Cut too deep, and you hobble your recovery capacity

Path 4: Build a Paper Trail

If pricing looks opaque or inconsistent, document everything. Under FDOM, processors must respond to pricing queries within 7 working days. If they don’t, that’s something concrete for ASCA.

Best for: Anyone who suspects their contract breaches FDOM rules. Requires: Systematic logging of every price notification and query. Downside: The confidential route may produce no visible outcome; the formal route puts you on their radar

Signals to Watch Through Q3 2026

  • Bulk cream leads the farmgate by 2–3 months. January’s £1,185/tonne—down 10% month-on-month—signals near-term pressure continues. AHDB sees “positive movements” starting but warns fats remain under “severe pressure.”
  • SMP and cheddar show early stabilisation. AHDB reports SMP up £80 (5%) to £1,810/tonne in January; cheddar recovered £30 to hit £2,860/tonne. But AHDB cautions that “stabilisation should not be mistaken for recovery.”
  • Milk deliveries versus year-ago gauge supply-side pressure. With volumes running nearly 5% above the prior year heading into spring flush, processing capacity stays strained through May.
  • ASCA activity tells you whether the regulator has any bite. If formal complaints stay in single digits through April while prices sit below the cost of production, the framework isn’t working as Parliament intended.

Why Nobody’s Talking

Here’s the part that doesn’t show up in market reports: why you’re not hearing individual farmers’ stories.

The producers getting hit hardest—the ones sliding toward exit—are the least likely to speak publicly. In farming culture, financial distress still feels like personal failure. Going on record about contract pressure invites lender scrutiny, community judgement, and processor retaliation.

As NFU Scotland’s Bruce Mackie put it in December 2025: “The dairy supply chain depends on farmers being able to plan and invest with confidence. Sudden, unjustified price drops damage that confidence and threaten not just individual businesses but the resilience of Scotland’s rural economy and food security.”

ASCA built confidential channels precisely because farmers fear reprisals. That’s the right protection—but it also keeps the pain invisible. Processors see aggregate data across their supplier network. Individual farmers see only their own situation and wonder if they’re alone.

You’re not. The aggregate numbers—nearly 5% oversupply, butter down more than half, costs near 49ppl against prices in the low-to-mid 30s—represent thousands of operations running the same brutal calculations.

What This Means for Your Operation

If you’re on an aligned retail contract: Your immediate exposure is limited. Don’t waste the breathing room. Build cash reserves and pay down debt—the cushion you create now determines your options when conditions shift.

If you’re not aligned with 6+ months of cash, you’ve got time to watch. Track these triggers:

  • Bulk cream dropping toward £1,000/tonne signals more farmgate pressure
  • UK deliveries staying 5%+ above year-ago into spring signals capacity strain
  • AHDB language shifting from “pressure” to “recovery” signals inflection

Book your lender scenario conversation before April 1.

If you’re non-aligned and have less than 6 months of cash on hand, the math is unforgiving. Run your exit threshold calculation this week. Have the lender conversation now. If two warning signs fire together—cash flow negative, cream still sliding, deliveries elevated—your decision window is closing fast.

Key Takeaways

  • At current price and cost levels, the gap between aligned and non-aligned contracts can reach 14–15ppl—roughly £175,000–£187,500 a year for a 500-cow, 1.25M-litre operation.
  • Contract auditing is intelligence, not leverage. You may not change the terms, but you can understand where the landmines are.
  • Risk is shifted onto your books across seven areas: indemnification, quality discretion, volume penalties, delayed payments, confidentiality, notice asymmetry, and dispute barriers.
  • Exit decisions come with a 12-month lag under FDOM notice rules. Staging preparation preserves options without starting the clock.
  • Every credible forecast points to H2 2026 at the earliest for meaningful recovery. AHDB: stabilisation “should not be mistaken for recovery.”
  • When culling to compress costs, cull genetically—not just economically. Protect your herd’s trajectory for the recovery.
  • Cash runway is the bottom line. Under six months at current prices means fundamentally different choices.

Your contract didn’t create this oversupply. It didn’t crash butter prices. But it decides which side of that £175,000–£187,500 divide you’re standing on while you wait for conditions to turn.

Pull out your contract this week. Work through the checklist.

Which side of the gap are you on?

Complete references and supporting documentation are available upon request by contacting the editorial team at editor@thebullvine.com.

Learn More

The Sunday Read Dairy Professionals Don’t Skip.

Every week, thousands of producers, breeders, and industry insiders open Bullvine Weekly for genetics insights, market shifts, and profit strategies they won’t find anywhere else. One email. Five minutes. Smarter decisions all week.
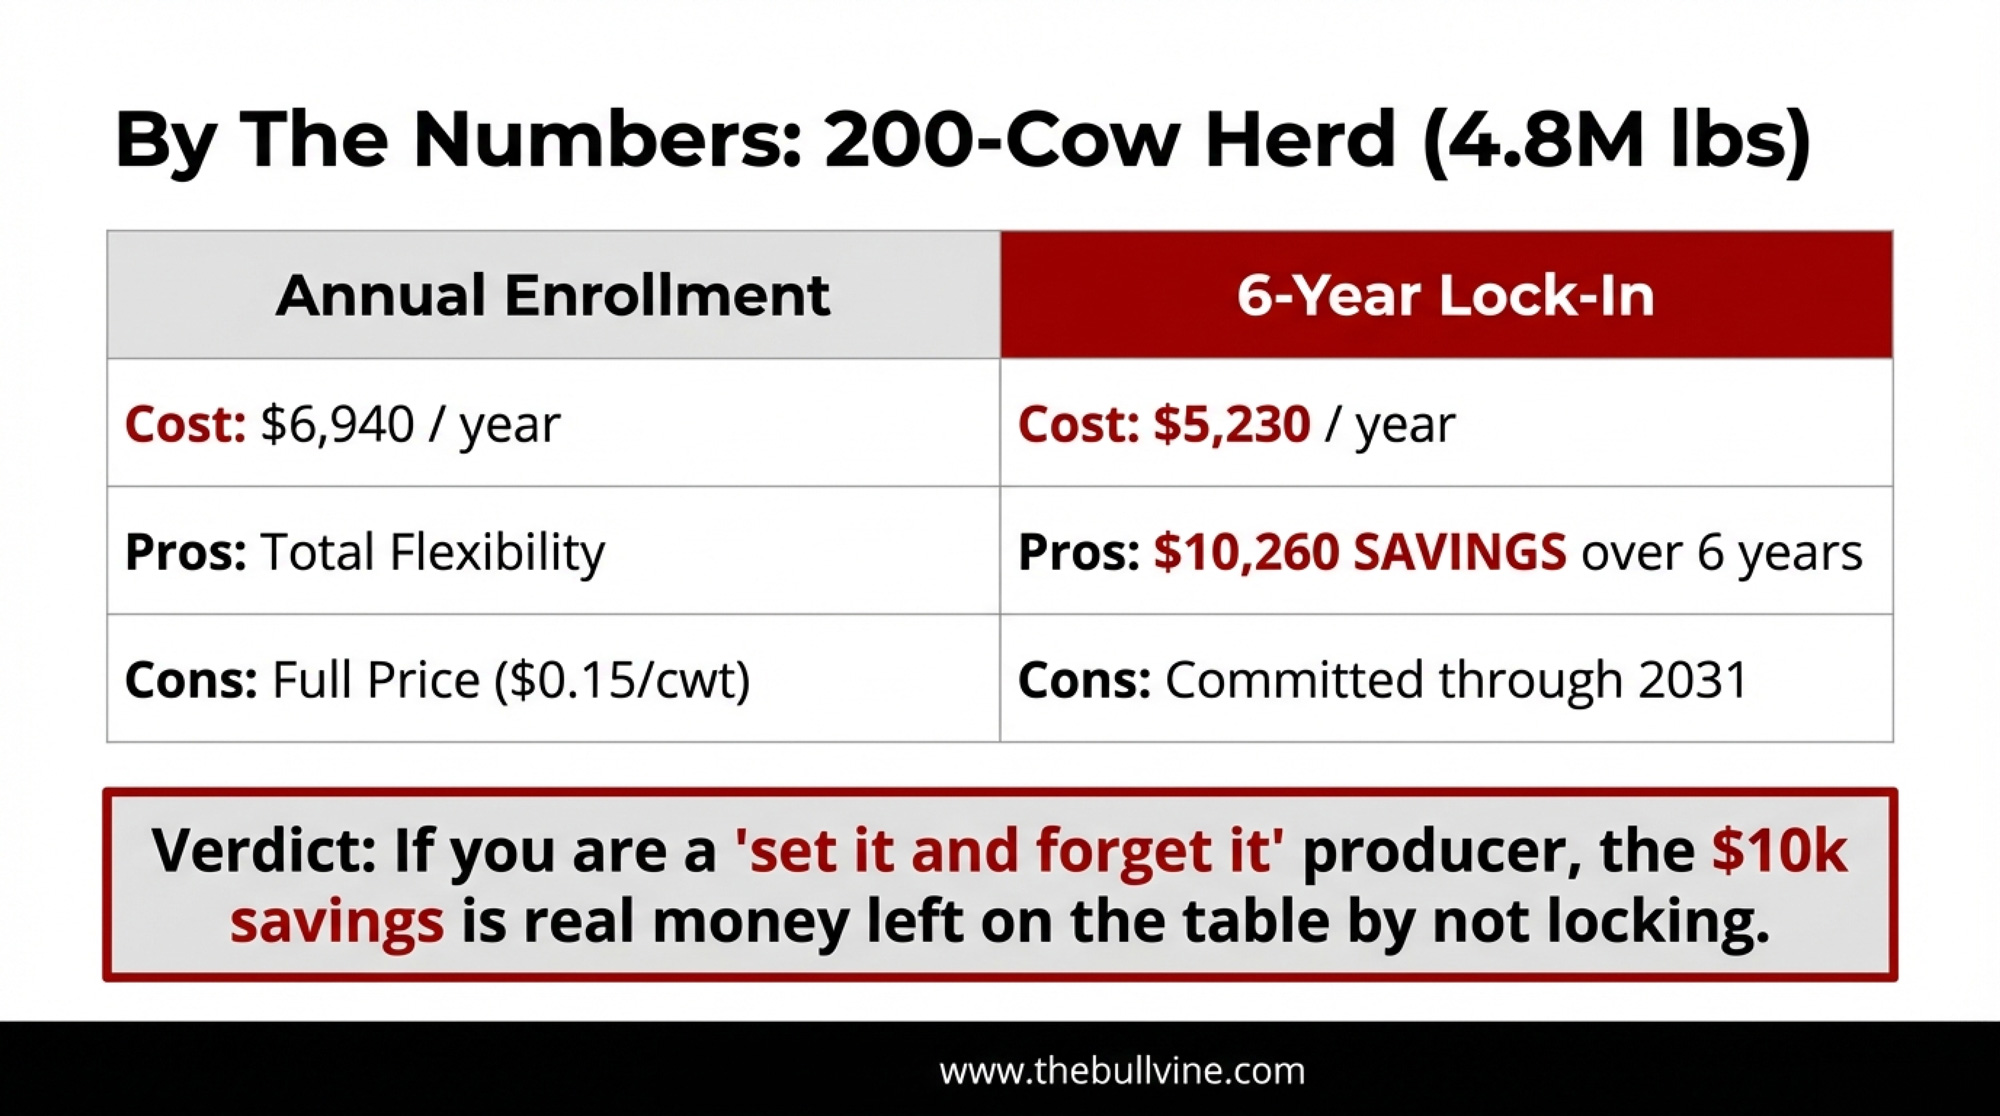
NewsSubscribe
First
Last
Consent

The $0.90/Cwt FMMO Hit: Reset Your Breakeven, DMC Coverage, and Heifer Strategy for 2026

A 90¢/cwt FMMO cut, $3,010 heifers, and DMC at $9.50. Are your 2026 plans actually built for this math?

Executive Summary: USDA’s June 2025 FMMO changes cut 85–93¢/cwt from class prices and $337 million from producer pool revenues in 90 days, effectively shifting many herds’ breakevens into the $18.75–$19.00/cwt range. For a 300‑cow, 7,500‑lb herd, that’s roughly $19,000–$21,000 gone from annual milk income before feed or futures even enter the conversation. CoBank’s latest work adds another pressure point: replacement heifer inventories at a 20‑year low, projected to shrink by 800,000 head while $10 billion in new processing capacity comes online and average replacements hit about $3,010/head. U.S. cheese and butter exports are booming only because they’re cheap—cheddar 40–60¢/lb under the EU and butter $1.09/lb lower—so that “good news” can flip fast if spreads close. This article lays out four hard‑nosed moves: rebuild your breakeven off 2025 milk checks, use $9.50 Tier 1 DMC as a structural margin tool, close 2027 replacement gaps before pushing more beef semen, and stress‑test your buyer and export exposure before basis and premiums do it for you.

If your milk check feels lighter than your markets suggest, you’re not imagining it. The problem isn’t just price volatility anymore. It’s the formula.

June 2025 didn’t just tweak how milk prices are calculated. It pulled 85–93 cents per hundredweight out of U.S. class prices in the first three months under the new Federal Milk Marketing Order rules, cutting about $337 million from nationwide pool revenues for farms shipping into U.S. FMMOs, according to American Farm Bureau Federation Market Intel’s “Three Months In: Early Impacts of FMMO Amendments” (September 21, 2025). For a 300‑cow herd averaging 7,500 pounds per cow per year—about 22,500 cwt—that single structural shift works out to roughly $19,125–$20,925 less annual revenue.

One 350‑cow Wisconsin herd that sat down with their advisor and two stacks of milk checks—January through May vs. July through December—watched their effective breakeven move from about $17.90 to $18.80/cwt. Same Class III levels on paper. Nearly a dollar less landing in the tank. If you haven’t rerun your own numbers since the June 1 change, you’re planning off a milk check that no longer exists.

What Changed in June 2025 FMMO Pricing

For the first time since 2000, USDA’s Agricultural Marketing Service raised the make allowances used to calculate Class III and IV prices in all 11 U.S. FMMOs. These are the built‑in processing cost deductions that come off wholesale product prices before any value flows back into the pool.

Under USDA’s final decision, effective June 1, 2025, the key make allowances moved from:

  • Cheese: $0.2003/lb → $0.2519/lb (+5.16¢)
  • Butter: $0.1715/lb → $0.2272/lb (+5.57¢)
  • Nonfat dry milk: $0.1678/lb → $0.2393/lb (+7.15¢)
  • Dry whey: $0.1991/lb → $0.2668/lb (+6.77¢)

Take cheese at $1.60/lb CME blocks as a simple example:

  • Old formula: $1.60 − $0.2003 = $1.3997 flows into Class III component values.
  • New formula: $1.60 − $0.2519 = $1.3481 flows in.
ProductOld Make Allowance ($/lb)New Make Allowance ($/lb)Increase (¢/lb)Impact on Class Prices
Cheese$0.2003$0.2519+5.16¢Class III down ~$0.92/cwt
Butter$0.1715$0.2272+5.57¢Class IV down ~$0.85/cwt
Nonfat Dry Milk$0.1678$0.2393+7.15¢Class IV down ~$0.85/cwt
Dry Whey$0.1991$0.2668+6.77¢Class III down ~$0.92/cwt
Combined Impact5–7¢/lb avg−$0.85–$0.93/cwt

That extra 5.16 cents per pound of cheese never hits the pool. It stays with the plant as cost recovery.

AFBF’s early‑impacts analysis of June–August 2025 found:

  • Average Class I prices were $0.89/cwt lower.
  • Class II down $0.85/cwt.
  • Class III down $0.92/cwt.
  • Class IV down $0.85/cwt.

That’s roughly a 4–5% drop in class prices driven solely by higher make allowances, pulling about $337 million out of combined pool revenues in just three months. The largest dollar losses occurred in the Upper Midwest ($64M), the Northeast ($62M), and California ($55M), where more milk runs through manufacturing classes. 

If your local Class III and IV prices in late 2025 look a lot like early 2025, but your milk check is down close to a dollar per cwt, that’s not bad luck. That’s the formula change doing what it was designed to do.

How the New Formulas Show Up in DMC

Dairy Margin Coverage was built as disaster insurance. You bought it for the years when milk cratered or feed blew up. Higher make allowances are slowly turning it into something else.

AFBF’s math shows the new formulas alone lowered class prices by 85–93¢/cwt in the first three months after June 1. That structural gap sits on top of whatever the market throws at you. fb

USDA FSA’s DMC margin series for 2024 shows several months where the national margin came uncomfortably close to $9.50/cwt, even without a full‑blown crisis. Now imagine one of those months under the new formulas:

  • All‑Milk price not far below $19/cwt.
  • Feed cost index near $9.50/cwt.
  • DMC margin scraping around $9.50/cwt.

If you take that 85–93¢/cwt impact and simply “add it back” to see what things might have looked like under the old make allowances, you’d be looking at a margin over $10/cwt in that same environment—comfortably above the Tier 1 trigger. That’s back‑of‑the‑envelope, not an official USDA series, but it tells you something important:

DMC is now catching structurally thinner “normal” years as well as train‑wreck years.

Katie Burgess, dairy analyst at Ever.Ag, expects real payouts in 2026: “Our model right now is showing payouts of more than $1 per hundredweight for January through April, and then some smaller payments for May through July as well.” William Loux at NMPF “certainly expect[s] to see some DMC payments here through the first quarter and probably through the first half of the year.”

For a lot of Tier 1‑eligible herds, $9.50 coverage is drifting from “catastrophe coverage” toward baseline margin backstop.

Rerunning Your Breakeven with 2025 Milk Checks

If your 2026–2028 plan still assumes $18/cwt is a safe breakeven because that used to work, you’re flying on old instruments.

You don’t need a fancy model to fix that. You need your milk checks and 20 minutes.

Step 1 – Two windows of checks

  • January–May 2025: pre‑reform.
  • July–December 2025: fully under the new formulas.

For each window, figure out:

  • Average net pay price per cwt (after hauling, co‑op fees, assessments).
  • Average Class III and/or IV values (USDA announced prices).

Step 2 – Compare like for like

Pick months where Class III/IV levels are similar before and after June. Then ask: how much lower is my net pay in the post‑June window?

If your Class III/IV values match but your net is 80–90¢/cwt lower, that’s the policy shift, not just “a bad month,” and lines up with AFBF’s 85–93¢/cwt range. 

On herds that have walked through this math with their advisors, the pattern often looks something like this:

  • A pre‑June “safe” breakeven around $18.00/cwt.
  • A post‑June reality that needs closer to $18.75–$19.00/cwt to land the same margin once you factor in the structural hit.

For that 300‑cow, 7,500‑lb/cow example:

  • Annual production: about 22,500 cwt.
  • Structural shift: $0.85–$0.93/cwt.
  • Annual revenue loss: $19,125–$20,925.
Herd Size (cows)Avg Production per Cow (lbs/year)Total Production (cwt/year)FMMO Revenue Loss @ $0.85/cwtFMMO Revenue Loss @ $0.93/cwt
1007,5007,500−$6,375−$6,975
3007,50022,500−$19,125−$20,925
5007,50037,500−$31,875−$34,875
7507,50056,250−$47,813−$52,313
1,0007,50075,000−$63,750−$69,750

You don’t have to like that number. You do have to plan off it—on budgets, on debt service, and on any expansion or robot that depends on your next five years of milk checks.

A 20‑Year‑Low Heifer Inventory Colliding with $10B in New Plants

While the FMMO formulas were changing, semen guns were rewriting the supply side.

CoBank’s August 27, 2025, analysis, Dairy heifer inventories to shrink further before rebounding in 2027, puts the U.S. replacement heifer supply at a 20‑year low. They project inventories will shrink by about 800,000 head over the next two years and only start to rebound in 2027 as breeding strategies adjust. 

At the same time, CoBank flags a $10 billion wave of new U.S. dairy processing investment, much of it scheduled to be running at full speed by 2027. As CoBank senior dairy economist Corey Geiger puts it: “The short answer is that it will be tight. Those dairy plants will require more annual milk and component production, largely butterfat and protein. And it will take many more dairy heifer calves in future years to bring the national herd back to historic levels.” 

Driving the heifer squeeze:

  • Strong beef prices pulled more beef semen into dairy herds.
  • Straight dairy heifer calves often didn’t pencil when bred heifers were cheap, and rearing costs were high.
  • Sexed dairy semen focused replacements on the top genetics but didn’t fully replace the volume lost to beef‑on‑dairy.

That logic made sense when beef‑on‑dairy calves were hot and USDA “Ag Prices” showed average replacement values in the neighborhood of $1,700/head, with many bred heifers trading somewhere in the $1,500–$2,000 range in local markets. 

It looks a lot riskier in a world where CoBank shows average replacement prices climbing to about $3,010/head and warns they could go “well above $3,000 per head” in a tight market. 

And the biology doesn’t care about your budget:

  • Breed a heifer in early 2025 → she freshens in 2027.
  • Those decisions are locked in.

The heifers that will fill the 2027 plant capacity are already on feed, or they were left as beef‑cross calves. You can still fix your 2028 and 2029 pipeline. You can’t go back and create 2027 heifers that were never conceived.

Why U.S. Cheese and Butter Are Moving—and Vulnerable

Exports have been the good‑news line on a lot of market calls. It’s worth looking under the hood. U.S. cheese and butter are moving because they’re cheaper than EU and New Zealand product. Using USDEC and USDA data, they show: 

  • U.S. cheese exports through October 2024 hit about 941 million pounds, and were on pace to surpass the previous annual export record. 
  • Butterfat exports reached 80 million pounds through October, up 18.6% (about 13 million pounds) year‑over‑year. 

The price spreads are doing the heavy lifting:

  • In January and March 2024, U.S. cheddar was roughly 40–50¢/lb cheaper than EU and New Zealand cheese. 
  • By November–December, that spread widened to about 45–60¢/lb
  • In early December, EU butter sat around $3.62/lb, while U.S. butter had slipped to about $2.53/lb—a $1.09/lbU.S. price advantage. 

That’s great for exports. It’s also fragile.

If U.S. prices rally 15–20% on domestic factors while EU/Oceania values sit still—or if EU/NZ soften while U.S. prices hold—those spreads can shrink fast. As discounts narrow, importers in Mexico, Asia, and the Middle East have less reason to choose U.S. products.

At that point:

  • Cheese meant for export stays domestic.
  • American‑type cheese inventories—which Hoard’s noted were already elevated relative to where many traders thought prices should be—could build further. 
  • U.S. prices may have to drop enough to re‑open the export valve.

One simple rule‑of‑thumb some risk‑managers use for export‑exposed herds: when the U.S.–EU cheddar discount shrinks below about 25¢/lb for more than a month, it’s a yellow light to start paying closer attention to what that means for your plant’s export book and your basis.

MonthU.S. Cheddar ($/lb)EU/NZ Cheddar ($/lb)U.S. Butter ($/lb)EU Butter ($/lb)
Jan 2024$1.55$2.05$2.45$3.50
Mar 2024$1.58$2.10$2.50$3.55
Jun 2024$1.62$2.15$2.60$3.65
Sep 2024$1.70$2.25$2.68$3.70
Nov 2024$1.75$2.30$2.55$3.60
Dec 2024$1.78$2.38$2.53$3.62
Feb 2025 (hypothetical tightening)$1.95$2.20$2.85$3.15
Avg Spread (2024)45–60¢/lb U.S. discount$1.05–$1.15/lb U.S. discount

Export “strength” built on deep price discounts is a useful buffer. It isn’t a guarantee.

Four Concrete Moves in a $0.90/Cwt World

You can’t change Washington’s formulas or CoBank’s heifer math. You can change how your own numbers line up.

1. Reset Breakeven Off Your 2025 Checks

This one applies to every U.S. herd shipping into an FMMO.

  • Pull your milk checks for January–May 2025 and July–December 2025.
  • For each period, calculate average net pay per cwt and average Class III/IV prices from the USDA.
  • Match months where Class III/IV were similar before and after June.
  • The gap in net pay is your structural hit from the new rules, in the same ballpark as AFBF’s 85–93¢/cwt estimate. 

If that math shows your realistic breakeven has climbed $0.75–$1.00/cwt compared with pre‑June, that’s the number you should plug into 2026–2028 cash‑flow plans, debt‑service conversations, and any capital decisions on barns, robots, or land.

2. Treat $9.50 DMC as a Structural Margin Tool

Best fit: herds under the Tier 1 pound cap, especially in cheese‑heavy or basis‑noisy orders.

Tier 1 DMC covers a capped chunk of your production history—and for 2026, that cap jumped from 5 million to 6 million lbs per year under recent farm‑bill changes. At the $9.50/cwt coverage level, Tier 1 premiums run $0.15 per cwt, according to USDA FSA’s current premium schedule. Enrollment for 2026 coverage closes February 26, 2026, and producers who lock in coverage through 2031 receive a 25% premium discount

If your updated breakeven is $18.75–$19.00/cwt and the margin outlook hangs close to $9.50, then $9.50 Tier 1 isn’t a lottery ticket; it’s a structural margin backstop.

The trade‑off is straightforward: in fat years, premiums feel like a waste; in thin structural years, DMC payments won’t erase the 85–93¢/cwt hit—but they can plug a meaningful slice of the gap.

3. Check Your 2027 Replacement Gap Before More Beef Semen

Best fit: herds where a majority of services are going to beef semen.

Step 1 – Inventory your pipeline: cows in milk by lactation, bred heifers with due dates, open heifers by age class, and heifer calves on the ground.

Step 2 – Run 2027 replacement math: target annual replacements = herd size × target cull rate (many herds land between 30–38%). Estimate how many heifers will freshen in 2027 based on current pregnancies and heifer numbers. Compare projected 2027 fresh heifers to replacement needs. 

If your projection is more than roughly 10–15% short, you’ve got a built‑in problem that most lenders and advisers would flag sooner rather than later.

Step 3 – Adjust semen mix, not just cull rate: problem cows and bottom genetics → beef semen; middle group → conventional dairy; top cows and heifers → sexed dairy.

If your records show 60+ percent of services going to beef semen, it may be worth dialing that back to a 30–40% banduntil your 2027 replacement gap closes. You give up some real beef‑cross calf cash now. In return, you reduce the odds of buying replacements “well above $3,000 per head” in a tight market or shrinking faster than you planned because you simply run out of heifers. 

4. Stress‑Test Your Plant and Export Exposure

Best fit: herds shipping into export‑oriented cheese and butter plants in the Southwest, Pacific Northwest, Upper Midwest, or similar regions.

Ask yourself three questions:

  1. How much of my milk check depends on my buyer’s export book?
  2. What happens to my basis and premiums if U.S. cheese and butter lose a big part of their discount to the EU and Oceania?
  3. Do I have more than one serious buyer, or am I effectively captive to a single plant?

Practical moves:

  • Track U.S. vs EU/New Zealand butter and cheddar price spreads monthly using public series from USDEC, USDA, and market summaries. 
  • Use DRP, forward contracts, and basis tools anchored to your updated breakeven, not the old one.
  • If you have multiple buyers, don’t wait for a crisis—start talking now about 2026–2027 volumes and premiums. When heifers and milk are both tight, plants don’t treat all suppliers the same.

What This Means for Your Operation

You don’t control FMMO formulas, CoBank’s heifer math, or EU butter prices. You do control how honestly your own numbers line up with them.

  • Rebuild your breakeven using pre‑ and post‑June 2025 checks. If that exercise shows your true breakeven has crept into the $18.75–$19.00/cwt range and you’re still planning off $18.00, that’s a silent risk your lender will spot before you do.
  • Look at Dairy Margin Coverage as a structural tool, not a Hail Mary. If your costs sit near $19/cwt and the national margin now scrapes $9.50/cwt more often, Tier 1 coverage at $9.50—now up to 6 million lbs with a $0.15/cwt premium in 2026—belongs in the core of your risk toolkit, not the “maybe” pile. Enrollment closes February 26, 2026.
  • Run a 2027 replacement gap check before another heavy beef‑on‑dairy year. If your math shows a deficit of more than 10–15% on 2027 replacements and you’re running high beef semen percentages, pulling back now may be cheaper than buying very expensive bred heifers or losing scale later in a 20‑year‑low heifer environment. 
  • Watch spreads and plant behavior, not just export headlines. Record exports driven by big discounts can flip fast. Pay more attention to U.S.–EU/NZ spreads and what your plant does with premiums and basis than to national export tonnage alone. hoards
  • Monitor these signals going forward: U.S.–EU cheddar spreads narrowing below 25¢/lb for more than a month; bred heifer prices pushing past $3,200–$3,500/head in your region; and any DMC margin prints below $9.00/cwt that would trigger larger payouts than current projections. 
  • If you have a strong heifer pipeline and more than one serious buyer, you’re in rare company. That’s a chance to play offense: negotiate better premiums, selectively expand, or lean harder into components while other herds are stuck just hanging on.

Key Takeaways

  • The 85–93¢/cwt hit from the new FMMO make allowances is structural until policy changes again. It’s built into the formulas and shows up even when CME prices look “normal,” with an estimated $337M pulled from pools in the first three months alone (AFBF, Sept. 2025). 
  • Dairy Margin Coverage is drifting from disaster insurance toward a structural margin backstop. With class prices permanently trimmed and margins regularly near $9.50/cwt, DMC is more likely to trigger in tight but “normal” years, not just in blow‑ups.
  • Replacement heifers are at a 20‑year low and projected to shrink by another ~800,000 head before rebounding in 2027 (CoBank, Aug. 2025). That makes your replacement strategy and semen mix real risk‑management levers, not just breeding preferences. 
  • U.S. export “strength” in cheese and butter is running on price discounts. Hoard’s and USDEC data show U.S. cheese and butter winning business because they’re 40–60¢/lb and more than $1/lb cheaper, not because demand is bulletproof. 

The Bottom Line

The rules changed faster than most budgets, breeding plans, and risk strategies. You can either recalibrate now while you still have choices—or wait until your milk check, your heifer buyer, or your plant forces the decision for you.

Where does your post‑June breakeven actually sit?

Complete references and supporting documentation are available upon request by contacting the editorial team at editor@thebullvine.com.

Learn More

The Sunday Read Dairy Professionals Don’t Skip.

Every week, thousands of producers, breeders, and industry insiders open Bullvine Weekly for genetics insights, market shifts, and profit strategies they won’t find anywhere else. One email. Five minutes. Smarter decisions all week.
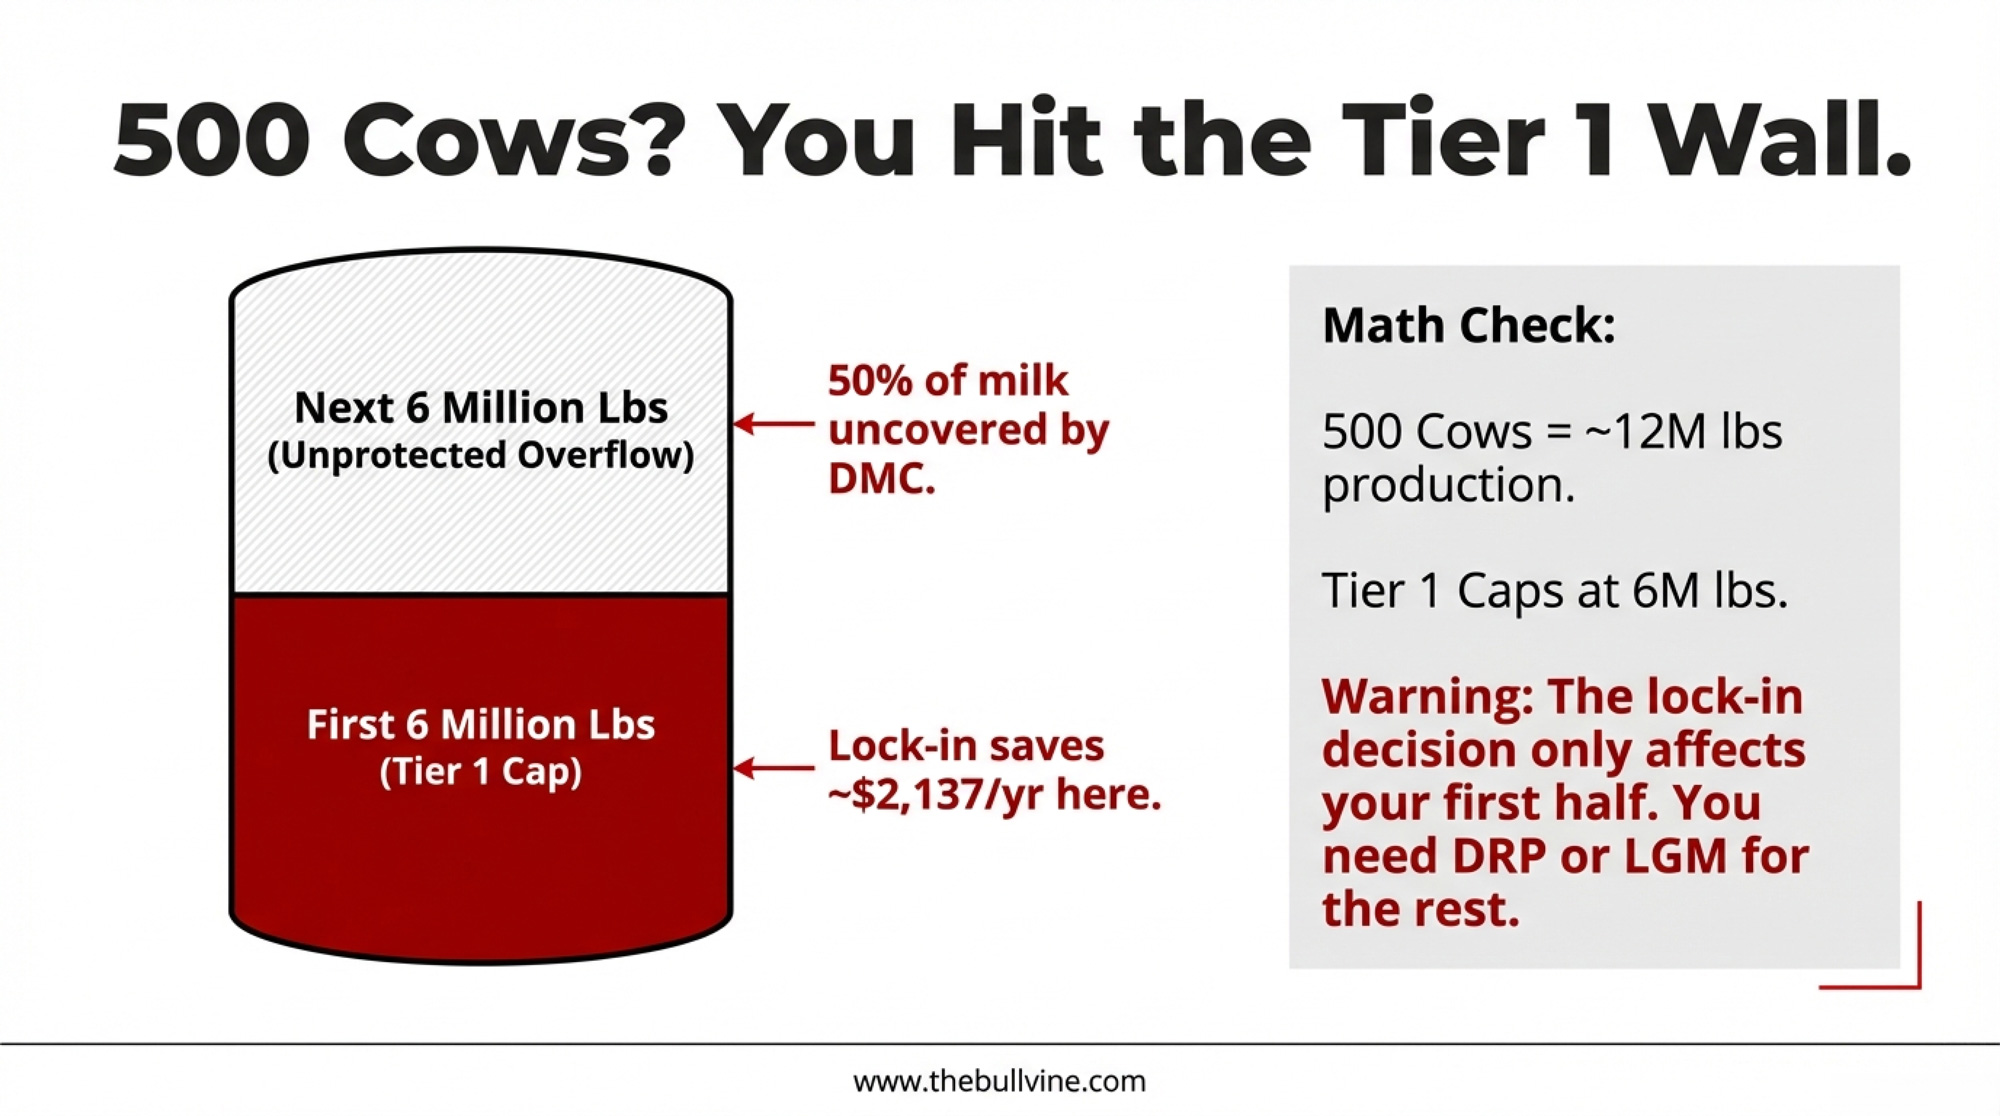
NewsSubscribe
First
Last
Consent

3 Ways the USDA School Meal Rules Can Move Your School Milk and Cheese Premiums – and Decide Which Herds Keep Their Contracts

Three changes in the 2024 USDA school meal rules could swing your school milk and cheese premiums by dimes per cwt. Have you run your numbers yet?

Executive Summary: The 2024 USDA school meal rules just turned school milk and cheese specs into real money — and real contract risk — for U.S. herds. By capping added sugars in school-flavored milk at 10 g per 8‑oz and yogurt at 12 g per 6‑oz, and requiring a 10–15% sodium cut in school menus by 2027–28, the rule effectively decides which milk is easy to use and which is always fighting formulation. In a U.S. industry that has seen licensed herds fall from 70,375 to 26,290 since 2003 while production climbed to 226.4 billion lb, processors now have the leverage to favor herds whose protein, casein, P:F ratio, and SCC make spec‑sensitive products simple to run — and quietly step back from the rest. For co‑ops like MMPA, that alignment already shows up as millions of dollars in quality and incentive premiums, with NDQA‑caliber farms capturing a disproportionate share of more than $23 million in producer incentives and roughly $15.3 million in quality payouts. This article gives you a simple 12‑month P:F gut check, a way to measure how much of your available quality premium you’re actually capturing, three pointed questions to take to your buyer, and four realistic paths — optimize, reposition, diversify, or transition — depending on where your numbers land. It also cuts through the noise on κ‑casein, A2, and FMMO reform so you can see where genetics and policy actually move your margins over the next 3–10 years, instead of chasing buzzwords or waiting for the next rule to hit.

USDA school meal rule

If you’re shipping into cheese plants or school milk contracts, USDA’s 2024 school meal rule isn’t just nutrition policy — it’s a spec and premium story that can move your milk check by a few dimes per cwt either way. For a mid‑sized herd, that’s easily a few thousand dollars a year swinging on whether your milk makes life easier or harder for a spec‑sensitive plant.

At the same time, USDA numbers show U.S. milk output climbing to about 226.4 billion lb in 2023 while the number of licensed herds collapsed from 70,375 in 2003 to 26,290 in 2023 — a 63% reduction over 20 years. Fewer herds, more milk, and more leverage for processors who can now pick and choose which farms help them win school and cheese business, and which farms they can live without. 

Why the USDA School Meal Rule Suddenly Matters to Your Milk Check

Here’s what’s really going on. In April 2024, USDA’s Food and Nutrition Service finalized new nutrition standards for school meals. Those rules lock in product‑specific caps on added sugars and a single sodium cut for school breakfasts and lunches that kicks in for the 2027–28 school year

According to the FNS comparison chart and a 2024 Congressional Research Service summary, the final rule does three big things that matter to you:

  • Starting in the 2025–26 school year, flavored milk in schools is capped at 10 g of added sugars per 8‑oz serving, and yogurt at 12 g per 6‑oz serving
  • From July 1, 2027, schools must cut average sodium on lunch menus by 15% and on breakfast menus by 10%from current limits — essentially locking in the old “Target 2” sodium standards from the 2012 rule. 
  • By 2027–28, added sugars across the whole weekly menu must average less than 10% of calories. 

That’s national. Every district in the National School Lunch and School Breakfast Programs lives under those numbers. They don’t stay in Washington. They show up as spec lines in bid documents, in what processors have to promise, and in how your co‑op or plant looks at its supply base.

Three Spec Shifts You Can’t Ignore

Let’s strip the policy talk down to the three shifts that hit your farm.

Spec ShiftWhat Changes (U.S. Schools)Where It Hits YouWhat to Watch in Your Herd
Sodium limitsOne‑time 15% sodium cut at lunch and 10% at breakfast vs current limits, effective SY 2027–28. Cheese plants have a smaller sodium “budget” on school menus; they need cheese that performs with less salt.P:F ratio, protein %, κ‑casein, SCC, vat performance.
Added‑sugar capsFrom SY 2025–26, flavored milk ≤10 g added sugars/8 oz; yogurt ≤12 g/6 oz. Plants need body and flavor with less sugar cover, especially in flavored milk and yogurt.Solids‑not‑fat, protein stability, bacteria counts, flavor consistency.
Contract specsThese limits move from “goals” to hard specs in bids and processor contracts.Premiums and base shift toward “spec‑friendly” herds; marginal herds risk weaker terms or less secure pickup.Your buyer’s school/cheese exposure, quality‑premium capture, and contract language.

You don’t see “10 g added sugars” printed on your milk check. You see new premium grids, new quality letters, more talk about “alignment,” and, in the worst cases, contracts that quietly get scaled back or not renewed.

Sodium: Why Cheesemakers Are Suddenly Obsessed With Your Casein

Sodium cuts mean school menu planners have less room for salty items, including cheese. Typical numbers: a 1‑oz slice of Cheddar runs around 180 mg of sodium, and part‑skim mozzarella usually lands in the 150–180 mg range depending on the formulation. If the menu sodium budget is tight, every slice of cheese eats up more of the allowance. 

Now, salt isn’t just window dressing in cheese. Cheese science work — including U.S. school‑meal nutrition research in Nutrients — highlights salt’s role in moisture control, whey expulsion, pH and texture, pathogen control, and flavor and shelf life. Processors can’t simply “use less salt” and expect cheese to make weight, slice clean, and sit in a school district’s cooler for weeks without issues. Something else has to carry more of the load. 

That “something” is your milk:

  • Casein and κ‑casein. Dairy science studies show that a higher casein-to-total-protein ratio improves curd formation and cheese yield. Multiple papers across breeds report that κ‑casein BB milk tends to coagulate faster and form firmer curd than κ‑casein AA milk, which often translates into better yield and more predictable vat performance when everything else is equal. 
  • Somatic cell count (SCC). Elevated SCC is consistently tied to lower cheese yield and more defects; NDQA scoring and co‑op quality programs bake that reality into their metrics. 

Here’s the bottom line: under tighter sodium specs, cheesemakers want milk that yields strong curd, clean drainage, and a low defect risk, even if they pull back a notch on the salt. That’s good news if your herd is already built around solid protein, casein, and NDQA‑level quality. It’s a big warning sign if you’ve been living with “good enough” SCC and protein.

A Simple P:F Ratio Gut Check

You don’t need a PhD to see if your herd is swimming with or against where cheese plants are heading. You just need your last 12 months of milk checks.

12-Month P:F RatioWhat It Usually SignalsCheese Plant ViewYour Next Move
Below ~0.77Light on protein relative to fat; rations, transition, or fresh cow issues likely⚠️ “We can use your milk, but you’re not making our life easier”🚨 RED FLAG: Call nutritionist + vet this month. Focus on fresh cow health, forage quality, one ration trial targeting 0.77+
0.77–0.80Middle-of-the-pack for Holstein cheese herds; serviceable but unremarkable“Standard supply—we’ll keep you as long as we need volume”⚠️ YELLOW LIGHT: Assess upside. Can you push toward 0.80+ with better transition management? Check if premium grid rewards the climb.
Above 0.80Strong cheese-merit profile if butterfat and SCC are also solid✅ “Exactly what we want for school cheese under tight sodium specs”✅ GREEN LIGHT: Protect this position. Ask your buyer if you’re capturing full quality premium. Consider genetics that lock in casein advantage long-term.

Do this once a year:

  1. Add up your total protein pounds shipped in the last 12 months.
  2. Add up your total butterfat pounds shipped in the same period.
  3. Divide protein by fat. That’s your 12‑month P:F ratio.

Here’s how a lot of field reps and nutritionists in cheese country use that number — purely as a rule‑of‑thumb, not a regulation:

The Breed Caveat: While the 0.77–0.81 band is the standard “North American Holstein” benchmark, remember that breed matters. Jerseys and Brown Swiss naturally carry higher components; for these herds, a ratio below 0.80 often means you are leaving significant cheese-merit dollars on the table despite having “high” test numbers. If you aren’t hitting the upper end of the scale with a high-component breed, your butterfat is likely out-pacing your protein synthesis.

These aren’t USDA lines. They’re countryside benchmarks. You still have to weigh them against your actual pay schedule, your herd’s health, and your feed and forage reality. But if you’re shipping to a cheese plant with a P:F under about 0.77, that’s not a “maybe later” project — it’s a “get your nutritionist and vet around the table this month” project.

On the flip side, if you’re above 0.80 with solid butterfat and low SCC, that’s exactly when you should be asking whether your buyer’s paying for that profile — or whether you’re subsidizing other milk in the pool.

Sugar Caps: School Milk and Yogurt Need Better Milk, Not Just Less Sugar

The sugar rules are just as blunt. Starting in SY 2025–26, flavored milk in schools is capped at 10 g of added sugars per 8‑oz serving, and yogurt at 12 g per 6‑oz serving. Then, in 2027–28, weekly calories from added sugars across the menu have to come in under 10%. 

The dairy side saw this coming. Under the International Dairy Foods Association’s Healthy School Milk Commitment, 37 processors representing more than 90% of school milk volume agreed to cap added sugars in school flavored milk at that same 10 g per 8‑oz, cutting about 7 g from the average flavored school milk back in 2006–07. Processors have already cut average added sugars in school-flavored milk roughly in half, down to about 8.2 g per serving

Public health voices aren’t done. The American Medical Association has argued flavored milk should be removed from school meals entirely and, if not, endorses tighter options. Other groups call the final rule “fair but still improvable.” That tells you the spotlight on sugar isn’t going away. 

For you, the practical takeaway is simple: processors need milk they can turn into low‑added‑sugar flavored milk and yogurt that still have body, flavor, and shelf life. Less sugar means less room to hide off‑flavors or thin mouthfeel.

What they’re quietly shopping for in their supply base is:

  • Component consistency. Under tight sugar caps, they lean harder on solids‑not‑fat and protein to keep flavored milk and yogurt from feeling like colored water. Herds that deliver steady components month in, month out are cheaper to formulate around.
  • High‑end quality. With less sugar to mask issues, low SCC and low bacteria counts matter even more for flavor stability and shelf life. That’s exactly where NDQA‑level herds stand out — and get paid for it.

Where Specs Actually Bite: Contracts, Co‑ops, and FMMOs

Let’s be honest: you don’t feel “Target 2 sodium” or “10 g added sugars” directly. You feel contracts, premiums, and pooling.

WHO and USDA set the nutrition guardrails. School districts and processors turn them into bids that say “must meet these sodium and added‑sugar limits.” For plants that ship a lot of cheese, yogurt, or fluid milk into school channels, those contracts are big enough to decide how hard the plant runs — and how secure your pickup feels.

On your side, specs usually show up in three ways:

  • new or revised premium sheet that pays more for protein, SCC, or quality — or quietly tightens the thresholds.
  • Conversations about base, hauling, or “alignment with plant needs.” When you hear “alignment” more often, that’s a clue that specs are driving talk behind the scenes.
  • In tighter markets, a contract that gets scaled back, or simply doesn’t reappear on your kitchen table when it’s up for renewal.

Edge Dairy Farmer Cooperative has been out front on this. Their CEO, Tim Trotter, and others at Edge have publicly pushed for stronger, more transparent processor contracts so farmers have at least some predictability about price and pickup, rather than hoping they’re still on the “keep” list when plants reshuffle supply. That fight tells you how much contract power has shifted as herd numbers dropped and plants consolidated.

Where FMMO Reform Fits

Layered over all this is the slow grind on Federal Milk Marketing Order (FMMO) reform. American Farm Bureau Federation’s Market Intel work does a good job explaining how FMMOs govern pricing and pooling across classes and regions, and how proposals on make allowances, the Class I mover, and pooling rules would directly change mailbox prices. 

Specs and FMMOs aren’t the same fight, but they intersect in a pretty simple way:

  • Specs change who your plant wants to pick up from and which products they chase.
  • FMMO rules change how much of the value of those products actually shows up on your check.

If you’re in a cheese‑heavy order, lining your herd up with cheese yield and quality — and the sodium realities in school cheese — gives you a better shot at being “core” supply when plants restructure or when FMMO tweaks change the cheese vs Class I balance. If you’re in a fluid‑oriented order, being the herd that makes low‑sugar school milk and ESL products easy to execute can matter just as much when your plant decides whose milk is non‑negotiable.

The Dollars Behind Being “Spec‑Aligned”

Talking about “spec alignment” only matters if it shows up in your milk check. In co‑ops with strong quality programs, it absolutely does.

MMPA is one of the best public examples. In the 2021 NDQA results, 21 MMPA farms were among 47 National Dairy Quality Award winners — nearly half the list. That kind of dominance doesn’t happen by accident. It reflects a culture of low SCC, tight routines, and serious field support.

Farms like Crandall Dairy Farms in Battle Creek, Michigan — run by Brad, Mark, and Larry Crandall — have earned NDQA recognition year after year, including Platinum in 2022 and Gold or Silver in multiple other cycles. That’s not a one‑time fluke; it’s the kind of sustained performance that spec‑sensitive buyers fight to keep on their routes. More recently, Schultz Dairy LLC in Sandusky took home Platinum in the January 2026 NDQA awards — one of only six farms in the U.S. and Canada to earn that honor this year.

Those results sit on top of serious money. MMPA reports that in fiscal 2021, total producer incentive premiums, including quality, totaled $23.6 million. Separate coverage notes that in another year, the co‑op paid about $15.3 million specifically in quality premiums. That’s not coffee money — that’s a major re‑allocation of value inside the co‑op from “base” milk to higher‑spec milk. 

When you look at numbers like that and how typical premium grids are structured, it’s realistic in strong quality programs for top‑tier SCC and bacteria performance to be worth on the order of a few dimes per cwt more than base milk, especially once you stack co‑op premiums on top of how quality plays into the federal order price. The exact spread depends heavily on your grid and your year, but the magnitude is real.

Let’s run one grounded example, just so the math isn’t abstract:

  • 450‑cow herd.
  • 23,000 lb shipped per cow per year.
  • That’s about 10,000 cwt of milk a year (23,000 × 450 ÷ 100).

If that herd shifted quality far enough to pick up an extra $0.40/cwt in quality premiums compared to where they sit today, that’s:

  • 0.40 × 10,000 cwt = $4,000 per year in additional revenue.

That 40¢ is just a placeholder — you need to pull out your own premium sheet, look at where your SCC/bacteria performance has sat for the last 12 months, and calculate the actual difference between your performance and the next tier up. In some programs, that gap might be only 15–20¢; in others, it might be more than 50¢. The point is simple: there’s real money on the table, and spec alignment decides who gets it.

Cheese‑Heavy vs Fluid‑Heavy: Same Pressure, Different Rules

These spec fights don’t land the same way in every region.

In cheese‑heavy regions — think Wisconsin, Idaho, parts of New York, Quebec — spec pressure shows up mainly through casein, P:F ratio, and total cheese yield. Plants there are already asking which herds make their Cheddar, mozzarella, and process cheese perform inside tighter sodium windows without breaking yield or texture.

In more fluid‑oriented regions — parts of the Southeast, states like Florida — the big school milk and ESL players care a little less about cheese yield and more about consistent components, shelf life, and flavor under sugar caps. You still feel the same consolidation math, but it shows up first in which flavored milks and nutrition drinks pass spec, and which herds make those products easy to run.

Across the U.S., the structural backdrop is the same. Summary of USDA data shows that from 2003 to 2023, U.S. milk production climbed from about 170.3 billion lb to 226.4 billion lb — roughly a 33% increase — while licensed herds dropped from 70,375 to 26,290, a 63% decline. Fewer, larger herds with more technology and lower per‑unit costs. That gives processors and co‑ops a lot more freedom to say, “We’re going to lean into these 300 farms that fit our specs — and we’re going to quietly back away from those 50 that don’t.” 

Genetics: When κ‑Casein and A2 Actually Belong in Your Plan

Any time specs tighten, genetics buzzwords start floating around: κ‑casein, A2, cheese merit, specialty labels. They all sound good on paper. The real question is where they belong in your actual strategy.

In κ‑casein, multiple dairy science studies across breeds report that BB milk tends to coagulate faster and form firmer curd than AA milk, and can deliver higher cheese yields and better fat recovery in many systems. European extension work and on‑farm trials back up faster clotting and, in some cases, better yields in BB cows — as long as you remember that solids, lactation stage, and management can mute or magnify that edge. 

On A2, a 2016 paper in Nutrients found that some milk‑intolerant individuals had fewer gastrointestinal symptoms when drinking A2 milk compared to conventional milk. That’s a marketing and demand story, not a yield bump. It matters if your buyer is actively branding A2‑only products and paying a premium for them. If not, it’s a “nice to have” that sits behind fertility, health, and core components. 

Genetics FocusWhen It MattersWhen It Doesn’tThe Bullvine Take
κ-Casein BB– You’re 10+ years from retirement
– Shipping to cheese-heavy plant
– Bulls otherwise similar on main index
– Within 3–5 years of major transition
– Buyer isn’t cheese-focused
– Core fertility/health traits still need work
Use as tie-breaker when sires are equal on your main priorities. Multiple dairy science studies show BB milk tends to coagulate faster, form firmer curd, and can deliver higher cheese yields—but only if solids, SCC, and management are already dialed in.
🔴 A2 Genetics–  Buyer is actively branding and paying premiums for A2 products
– You have written contract language specifying A2 pricing
– Buyer mentions A2 as “nice to have” but offers no premium
– You’re chasing it for generic “marketability”
🔴 This is a demand story, not a yield story. 2016 Nutrients research found some intolerant individuals had fewer GI symptoms with A2 milk—but that’s meaningless to your bottom line unless your buyer is writing checks for it. Keep fertility, health, and core components front and center.
✅ Protein/Fat/Health Traits–  Always.No exceptions. Every herd, every year.–  Never.These are neversecondary.If you’re debating κ-casein or A2 before you’ve maxed out fertility, daughter pregnancy rate, SCC genetics, and component consistency, you’re optimizing the wrong end of the curve. Fix the base. Then fine-tune.

Here’s where genetics really fits in a spec‑tightening world:

  • If you’re within 3–5 years of retirement or major succession decisions, the big returns don’t live in chasing κ‑casein or A2. They live in quality, fresh cow management, cost per cwt, and a clean transition plan.
  • If you’re thinking 10+ years out in a cheese‑oriented market, it’s reasonable to treat κ‑casein BB as a tie‑breaker when bulls are otherwise similar on your main index — especially if your plant leans hard into cheese.
  • A2 should only move up your sire priority list when your buyer is explicitly marketing A2 products and putting real money on the table. Otherwise, keep fertility, health traits, and protein/fat front and center.

What This Means for Your Operation

Here’s where this stops being a policy story and turns into decisions at your kitchen table.

1. Run a 12‑Month Spec Health Check

Once a year — after year‑end or after you file taxes — sit down with your last 12 months of milk checks and your current premium schedule and answer two blunt questions:

  • What’s my 12‑month P:F ratio, and does it put me below ~0.77, between 0.77–0.80, or above 0.80?
  • Over those 12 months, what percentage of the maximum quality premium my program offers did I actually capture?

If your P:F is below roughly 0.77 in a cheese‑oriented system, that’s a flashing yellow light. Get your nutritionist and vet around the table and talk fresh cow performance, transition, and forage quality — then commit to at least one ration trial or forage test specifically aimed at nudging P:F towards that 0.77–0.80 band.

If your quality‑premium capture sits in roughly the 60–70% or less range of what’s available, you’ve got real money sitting in SCC, bacteria, and milking routines. That’s exactly where NDQA‑level herds make their living.

2. Ask Your Buyer Three Straightforward Questions

In the next week or two, call a field rep, board member, or plant manager you trust and ask:

  1. Roughly what share of your total volume is tied to school milk, cheese, or yogurt that has to meet these sodium and added‑sugar specs?
  2. Do you expect your component pricing or quality standards to change over the next 2–3 years because of those specs — and if so, how?
  3. What do your most spec‑aligned herds tend to look like on protein, butterfat performance, SCC, and overall quality?

If they tell you a third or more of their business is spec‑sensitive school and cheese channels, your spec alignment isn’t a side topic — it needs to move up your strategic list.

3. Be Honest About Which Path You’re On

Looking at your numbers and what you just heard from your buyer, which of these paths are you really on — not the one you wish you were on?

  • Optimize. You’re capturing most of the quality premiums — say, north of 80% as a rough benchmark — your P:F is above 0.80 in a cheese plant, debt is manageable, and your buyer wants more milk like yours. Your job is to protect that position and keep sharpening at the margins.
  • Reposition. The herd is fundamentally sound, but P:F, SCC, or cost per cwt are holding you back. Your focus is better forage, tighter fresh cow and transition programs, more consistent milking routines, and getting P:F into at least the 0.77–0.80 band while climbing the premium ladder.
  • Diversify. You’ve got the scale and risk tolerance for digesters, renewable gas, or modest on‑farm processing — after your base milk is competitive on specs. You gain margin and new revenue streams, but you give up simplicity and take on new market and execution risk.
  • Transition. Between debt, distance to plant, and family plans, the smart move may be a managed exit, downsizing, or a simpler setup while equity is still strong. Families who do best here start the conversation early, not after the bank starts it for them.
PathYour 12-Month ProfileWhat It MeansFocus AreasRisk/Reward
✅ Optimize– Quality premium capture >80%
– P:F ratio >0.80 (cheese)
– Buyer says “we want more milk like yours”
You’re already in the “keep” pile—protect that position and sharpen at marginsMaintain SCC/bacteria performance, lock in casein genetics, ask if you’re capturing full available premiumLow risk, steady reward. Your job: don’t slip.
⚠️ Reposition– P:F ratio 0.75–0.79
– Quality premium capture 60–75%
– Fundamentals sound but held back by specs
You’re serviceable but not standout—one ration trial and tighter fresh cow work can move you up a tierBetter forage quality, transition cow protocols, consistent milking routines, target P:F ≥0.77, climb quality ladderModerate risk, high reward. You can win this.
🚀 Diversify– Already “optimize” on base milk
– Scale and risk tolerance for new revenue
– Willing to trade simplicity for margin
You add digesters, renewable gas, or modest on-farm processing after base milk is competitiveNew revenue streams, environmental story, margin stacking—but requires capital, management bandwidth, market executionHigher risk, higher reward.Don’t diversify fromweakness.
🚨 Transition–  Debt load high
–  Distance to plant a problem
– Family/succession unclear
–  Specs feel out of reach
Smart move may be managed exit, downsizing, or simpler setup while equity is still strongStart the conversation NOW—before the bank or buyer starts it for you; plan transition with dignity and controlIgnoring this path is the highest risk of all.

None of those paths is “right” for everyone. The danger is pretending you’re on one path when your numbers say you’re on another.

Key Takeaways

  • Specs — not just blend price — are deciding who keeps school milk and cheese contracts. The 2024 USDA school meal rule locks in sodium and added‑sugar limits that push processors toward milk with stronger protein, casein, and quality — and away from herds that make those specs harder to hit. 
  • Your 12‑month P:F ratio is a cheap early warning light. If you’re shipping into cheese and sitting below about 0.77, that’s a “now” conversation with your nutritionist and vet about fresh cows, rations, and forage quality — not a “someday” project.
  • Quality and component premiums are real money, not a rounding error. Co‑ops like MMPA have paid more than $23 million in producer incentive premiums in a single year, with about $15.3 million in quality premiums in another. Spec‑aligned, NDQA‑caliber herds capture a disproportionate share of that pool. 
  • FMMO reform and specs will collide in your mailbox price. Any changes to make allowances, Class I movers, or pooling rules will hit differently depending on whether your milk helps processors win and service spec‑sensitive school and cheese business. 

The Bottom Line

You don’t control the rule. You don’t control the pool. But you do control whether your herd looks like the easiest milk to keep when processors decide who fits their 2027–2031 book of business — or the milk they can live without when specs and margins get tight. The question is simple: when you pull your last 12 months of milk checks, does your P:F ratio, your quality performance, and your premium capture put you in the “optimize” band — or in the pile that needs to catch up before the next round of contracts goes out?

Complete references and supporting documentation are available upon request by contacting the editorial team at editor@thebullvine.com.

Learn More

The Sunday Read Dairy Professionals Don’t Skip.

Every week, thousands of producers, breeders, and industry insiders open Bullvine Weekly for genetics insights, market shifts, and profit strategies they won’t find anywhere else. One email. Five minutes. Smarter decisions all week.
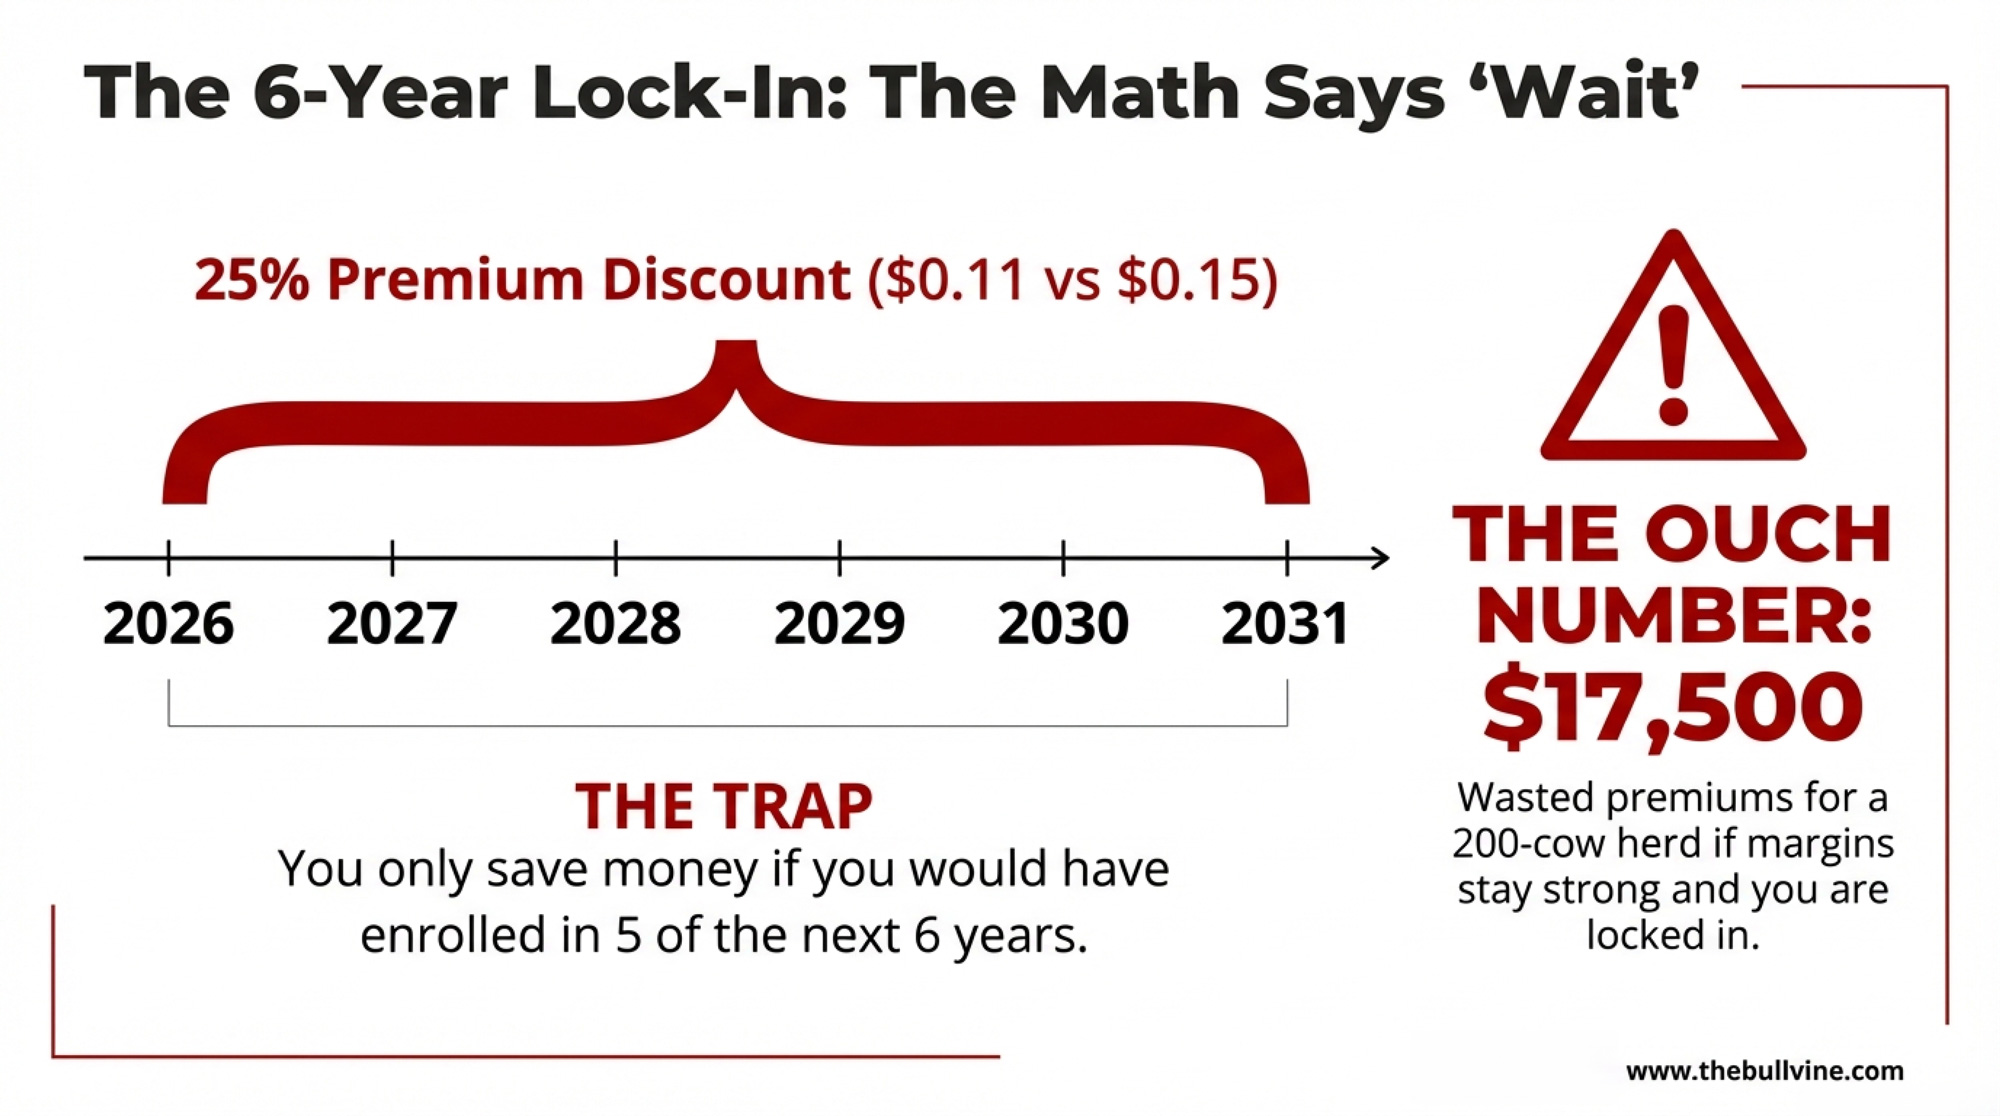
NewsSubscribe
First
Last
Consent

Same Cows, $15,000 Apart: Class III Milk Price, DRP, and Your Spring 2026 Risk Plan

Same cows, same milk, $15,000 apart. This spring, Class III won’t decide your future—your DRP and risk plan will.

Executive Summary: Class III and Class IV price swings are quietly putting five‑figure gaps between herds that look almost identical on paper. Using current USDA class prices and the latest 2026 milk production forecast, this piece shows how the same 500‑cow herd can end up roughly $10,000–$15,000 apart in a month, just on pooling and price exposure.It then sorts risk management into three simple lanes—defensive, balanced, and aggressive—with practical DRP and Class III options ideas, suggested coverage ranges, and clear cheese/Class III triggers for when to act. The article also walks through five numbers you’ll want on paper before you call your DRP agent: production, components, basis, utilization mix, and break‑even. If you’re planning for Spring 2026, it’s built to help you move from watching Class III to running a risk plan that actually fits your herd.

You know that feeling when Class III is up on the screen, but your milk check sure doesn’t look like it got the memo? You’re not alone. A lot of 400–800 cow herds are finding that when the Class III/Class IV spread opens up, two 500‑cow dairies with very similar cows, butterfat levels, and fresh cow management can still end up thousands of dollars apart each month, just because their milk is pooled and used differently.

What I want to walk through here is a simple, practical playbook for Spring 2026: three risk “lanes,” five numbers you need in front of you, and some Dairy Revenue Protection (DRP) timing and price triggers that actually help you decide, not just worry.

How the Class III/Class IV Spread Quietly Moves Your Milk Check

Let’s start with what the numbers really look like. USDA’s own class price reports make it pretty clear the spread between Class III and Class IV moves around more than most of us would like. For example, in February 2025, the USDA reported Class III and Class IV milk prices of 20.18 and 19.90 dollars per hundredweight, respectively. So in that month, Class III had a small edge. 

By October 2025, those class prices had shifted again. USDA’s Announcement of Class and Component Prices shows a Class III price of 16.02 dollars per hundredweight and a Class IV price of 14.30 dollars per hundredweight, giving Class III about a 1.72‑dollar advantage. So the story isn’t “Class IV always wins” or “Class III always wins.” The point is that the relationship between the two can change within a year, and your pay price rides on how your milk is used. 

Here’s an easy way to picture it. Say you’ve got a 500‑cow Holstein herd averaging about 60 pounds per cow per day. That’s roughly:

  • 500 cows × 60 lb = 30,000 lb per day
  • 30,000 lb × 30 days ≈ 900,000 lb per month
  • 900,000 lb ÷ 100 = 9,000 cwt per month

Now imagine two different pools:

  • One is effectively 70% cheese (Class III) and 30% butter‑powder (Class IV).
  • The other is closer to 25% Class III and 75% Class IV.

If Class III is a couple of dollars higher than Class IV for a stretch, that cheese‑heavy pool is going to capture a lot more of that value. A 2‑dollar spread on 9,000 cwt is 18,000 dollars on paper. Even if only part of that makes it into your final mailbox price because of pooling and adjustments, you can see why it’s realistic for two similar 500‑cow herds, sitting in two different utilization situations, to be ten‑plus thousand dollars apart in some months. The cows don’t know it, but the blend sure does.

Uniform prices tell the same story in a different way. USDA’s 2025 uniform milk price tables show that the monthly uniform price at 3.5% butterfat can differ by more than a dollar per hundredweight between some Federal Orders, depending on class utilization and the month. Industry coverage of those uniform prices in late 2025 noted that when class prices fell together, all 11 orders saw lower uniform prices, but the actual level on the milk check still varied by order and utilization mix. On 9,000 cwt, a 1‑dollar uniform price gap is 9,000 dollars before you even talk about premiums or penalties. 

And here’s something that’s easy to miss: the FMMO numbers are useful, but they’re still averages. Your co‑op’s monthly statement will often show how your specific pool and plant mix are behaving, and that’s the document you really want to study alongside the federal reports.

The bottom line: you don’t control the spread. You don’t control how your co‑op pools. But you do control how much of your business is exposed to that spread, and that’s where this risk “lane” idea comes in.

Three Risk Lanes: Which One Looks Most Like You?

What I’ve found, sitting at kitchen tables in Wisconsin and the Northeast, is that most herds don’t need a PhD in futures. They need an honest look at their balance sheet and a simple way to decide how much downside they can live with. When you do that, most 400–1,000 cow dairies fall into one of three lanes:

  • Defensive: “We really can’t afford a bad quarter.”
  • Balanced: “Let’s protect the downside, but don’t cap all the upside.”
  • Aggressive: “Feed’s lined up, equity’s good, we’ll ride more risk.”

Here’s an illustrative snapshot for that 500‑cow, 2.7‑million‑lb‑per‑quarter herd:

StrategyProduction CoveredPremium Commitment*Floor StrengthUpside ExposureBest Fits
Defensive65–70%HigherNear sustainable break‑even~30–35%Tight cash, higher leverage
Balanced40–50%ModerateGood, but not maximum~50–55%Moderate leverage, modest reserves
Aggressive20–25%LowDisaster‑only~75–80%Strong equity, feed locked, higher risk

*Premium commitment here is total premiums over several months as a rough share of gross milk revenue, not a quote.

A quick way to check your lane:

  • Defensive herds have less than 6 months of cash cushion, debt-to-asset ratios around 50–60%, and a genuinely scary outlook if one quarter goes badly.
  • Balanced herds have six to twelve months of operating cushion, manageable debt, and enough breathing room to absorb a tough quarter without the banker reaching for the restructuring file.
  • Aggressive herds have strong equity, feed covered through the next harvest at tolerable prices, and enough cash flow to ride out a bad quarter or two without forced cow sales.

What’s interesting is that no lane is “right” or “wrong.” They just come with different trade‑offs. More coverage buys stability but trims upside. Less coverage keeps upside but magnifies the swings. In many cases, producers I work with aim to keep at least 15–20% of production covered with something—DRP, deep out‑of‑the‑money puts, or a mix—just as catastrophic protection. It’s the rest of the milk where the lane really shows up.

If You’re Defensive: “We Can’t Afford a Bad Quarter”

Let’s talk about the herd that’s built new facilities, maybe added robots, and is carrying more debt than they’re comfortable with. If one really bad quarter would have your lender asking hard questions, you’re in the defensive lane, whether you feel like a risk‑taker or not.

You probably recognize yourself if:

  • Your cash cushion is under six months of expenses.
  • Debt‑to‑asset is 50–60% or more.
  • Your sustainable break‑even is at least in the mid‑15‑dollar range, once you account for all costs.
  • A quarter of low prices isn’t just “tight,” it’s a survival issue.

In this lane, it generally makes sense to cover about 65–70% of your projected production. For that 500‑cow herd producing about 2.7 million pounds a quarter, that’s roughly 1.8–1.9 million pounds insured in some way.

A practical defensive toolkit often includes:

  • DRP at around 90% coverage using Class Pricing that leans toward Class III if your plant is largely cheese‑focused. 
  • At‑the‑money or slightly out‑of‑the‑money Class III put options on part of that same milk to pull your effective floor closer to your sustainable break‑even once you factor in basis and component premiums.

The catch with going defensive:

  • DRP coverage is more expensive, net, at higher coverage levels because subsidy percentages are smaller.
  • You’re deliberately giving up some upside in exchange for a tighter floor.
  • You’ll feel the premium cost in a good year—but you’ll sleep better in a bad one.

What DRP materials and risk‑management guides consistently show is that premium subsidies are relatively larger at lower coverage levels and smaller at higher coverage levels, so an 80% policy usually has a larger subsidy share than a 95% policy. That’s why your out‑of‑pocket cost per insured hundredweight rises as you push coverage closer to 95%. 

What I’ve seen in many Wisconsin and Minnesota operations is that herds who accept the premium cost and stick to a consistent DRP and options plan tend to have calmer conversations at the bank when cheese and class prices fall than those who keep riding everything on the cash market. The year might still be tough, but the floor does its job.

If that sounds like you, here’s what this means in practical terms:

  • Your main question isn’t, “Where’s Class III going?” It’s, “What’s the lowest mailbox price we can live with and still pay the bills and keep the lender comfortable?”
  • If your sustainable break‑even is around 16 dollars per hundredweight and a quarter, and a 14‑dollar Class III would put you in real trouble, then your structures need to focus on keeping realized prices above that danger zone, not chasing every rally.
  • Once Q2 Class III futures sit 1.50–2.00 dollars above your sustainable break‑even for a while, you can justify easing off new coverage on part of your milk and letting some upside run. Until then, your priority is staying in business, not maximizing upside.

If You’re Balanced: “Protect the Downside, Don’t Miss the Rally”

A lot of progressive herds fall into this middle lane. You’ve tightened costs, you know your numbers, and your debt and cash position give you room, but you’re not interested in gambling.

You’re probably here if:

  • You’ve got six to twelve months of operating cushion.
  • Debt service fits comfortably into your cash flow most years.
  • You accept that you won’t call the top or the bottom.
  • You want real downside protection, but also want to participate when Class III runs.

In this lane, covering about 40–50% of your projected production often makes sense. For that same 500‑cow example, that’s roughly 1.1–1.4 million pounds hedged, with 1.3–1.6 million pounds left open.

The balanced toolkit usually has two pieces:

  • Slightly out‑of‑the‑money Class III puts—say, in the mid‑15 to low‑16‑dollar range if Q2 futures are in the mid‑16s—on around one‑third to two‑fifths of your milk. That way, a 1.50–2.00‑dollar slide in Class III starts to trigger protection, but you still fully enjoy a strong rally.
  • DRP at 80–85% coverage on another slice of milk as a safety net. Because DRP subsidies are generally more generous at these coverage levels than at 90–95%, the net cost per hundredweight on that insured volume is more manageable. 

In this setup, the options tend to do the heavy lifting for routine price swings, while DRP is there for the really ugly quarters.

For your herd, this lane means:

  • You’re trading moderate premiums for a decent floor and lots of upside.
  • A bad quarter still hurts, but it doesn’t put the whole operation at risk.
  • It helps to define a couple of simple triggers, so you’re not guessing in the heat of the moment:
    • If CME block cheddar sits under roughly 1.30–1.35 dollars per pound for several trading sessions, that’s usually a sign the cheese market is under real stress. In that situation, many balanced or aggressive herds add another 15–25% coverage via DRP or puts. 
    • If front‑month Class III slips under about 15.00 dollars per hundredweight, that’s a reasonable point to shift your posture a little more defensive and protect more of your production.

If You’re Aggressive: “Feed’s Locked, We’ll Ride It”

Then there are the herds that have built equity and efficiency over time and are in a position to withstand more volatility. In these dairies, feed is often locked at a decent price, the cows are producing well, and the balance sheet can take a punch without panic.

You’re in this camp if:

  • Your equity position is strong, and leverage is modest.
  • Feed costs are locked in through the next crop year at levels that still leave a margin.
  • You can live through a bad quarter or two without emergency financing, forced cow sales, or putting off critical maintenance.
  • You genuinely think the current weakness in cheese and Class III is overdone and want more upside exposure.

In this lane, you’re often only covering about 20–25% of projected production, leaving 75–80% to float with the market. For our 500‑cow example, that’s around 500,000–700,000 pounds covered and 2 million pounds uncovered.

The typical aggressive toolkit:

  • A modest DRP policy at 80% coverage on a slice of milk as “disaster insurance.” Because this is the lowest coverage level, it tends to carry a smaller net premium per hundredweight and still gives you something if prices collapse. 
  • Deep out‑of‑the‑money Class III puts—maybe around 14.50–15.00 dollars per hundredweight—that don’t cost much and only kick in if we get a serious wreck.

The trade‑off is pretty straightforward. You’re spending less on premiums, you’ve got maximum upside, but you’re also accepting that a routine 1‑dollar slide in Class III will hit you harder. That only works if your equity, cash flow, and feed position can legitimately handle that risk.

So it’s worth being blunt here: if your balance sheet isn’t genuinely strong, this lane isn’t a badge of honor, it’s just unnecessary risk. Plenty of good operators have gotten hurt by trying to be aggressive when the books said they should’ve been balanced or defensive.

If you are in a position to ride in this lane, it really pays to write down your “I’m wrong” lines:

  • Maybe you decide that if block cheese breaks 1.35 dollars per pound and stays below there for a week, you immediately add 20–25% more coverage.
  • Or you say that if front‑month Class III trades under 15.00 dollars per hundredweight, you’ll move yourself back toward a balanced posture and start building floors.

What’s encouraging is that when aggressive herds set those lines in advance and stick to them, they’re not just guessing. They’re managing risk, even if it’s a higher‑octane version.

DRP and Class III Options: Different Tools, Same Job

It’s easy to get stuck in debates about DRP versus futures and options, almost like it’s a philosophical choice. In practice, they’re just two tools in the same box. The real question is which mix fits your risk lane and your comfort level.

Dairy Revenue Protection is a USDA‑backed insurance program that lets you insure quarterly milk revenue. You pick a coverage level—anywhere from 80% to 95%—and choose between Class Pricing and Component Pricing. Under Class Pricing, your guarantee is based on a mix of Class III and Class IV futures, as you choose. Under Component Pricing, it’s based on futures‑derived butterfat and protein values and your declared component levels. 

Those guarantees are settled against published quarterly revenue indexes specific to your state or region. And because DRP is a federal program, premiums are partially subsidized. The key thing the program documents and industry overviews agree on is that subsidy percentages are higher at lower coverage levels and smaller at higher coverage levels, which is why an 80% policy usually has a lower net cost per insured hundredweight than a 95% policy. 

Class III put options are different. When you buy a put, you’re buying the right (but not the obligation) to sell Class III futures at your chosen strike. There’s no subsidy, and you need a futures/options account, plus some discipline around margin and position management. But the flexibility is hard to beat: you pick the strike, you pick the months, and on that hedged milk you keep all the upside above your floor.

So in many Midwestern dairies, the practical split looks like this:

  • Use DRP—particularly at 80–85% coverage—as relatively simple, subsidized, disaster‑style coverage on at least part of your milk.
  • Layer in Class III puts for the portion where you want a clear floor but don’t want to give up upside, especially in the balanced and aggressive lanes.

Five Numbers You Really Want in Front of You

Here’s something you probably know already from dealing with lenders and nutritionists: the better your numbers, the better the advice you get. Risk management’s no different. Before you call your DRP agent or broker, having these five numbers written down changes the conversation.

1. Projected Quarterly Production

Look back at the last three to six milk checks and average your monthly pounds shipped. Multiply by three to get a starting point for the next quarter. Then adjust for what’s actually happening on your farm:

  • Are you freshening more heifers?
  • Did you change your transition period management?
  • Are you switching to or from a dry lot system?
  • Is a new robotic box coming online?

You don’t need to be exact, but you do need an honest estimate.

2. Butterfat and Protein Averages

Pull your last several milk checks or DHIA tests and take the average butterfat and protein levels. If you’re considering DRP Component Pricing, those declared component levels should reflect the milk you actually ship. DRP resources make it clear that indemnities under Component Pricing are based on futures‑derived component values and your declared quantities, so over‑declaring components can come back to bite you if you don’t hit those numbers in the tank. 

High‑component herds that consistently run above the regional average often like Component Pricing because it lets them insure the value they’re producing. Herds with more variable components often lean toward Class Pricing because they’re not betting on precise tests every quarter.

3. Basis to Class III or Class IV

Basis is one of those words that makes people’s eyes glaze over, but it’s just the difference between the futures‑based price (Class III or IV) and your mailbox price.

For each of the last few months:

  • Take your net milk pay and divide by pounds shipped, then divide by 100 to get your mailbox price per hundredweight.
  • Look up the USDA Class III and Class IV prices for that month. 
  • Subtract Class III (or IV) from your mailbox price.

If your mailbox price has been running, say, about 0.30 dollars per hundredweight over Class III, and you buy puts with a 16.00‑dollar strike, your “real” floor before premiums and fees is closer to 16.30 dollars. That basis number helps you judge whether the protection you’re buying lines up with your actual risk.

4. Class III/Class IV Utilization Mix

This one’s easy to overlook, but it matters. In the U.S. marketing orders, different plants and co‑ops have different utilization mixes—some are heavily cheese‑weighted, others lean more toward butter‑powder. Federal Order documents and policy briefs on current and proposed marketing order reforms spell out just how different those mixes can be between areas. 

A simple call to your co‑op or plant rep with a question like, “Roughly what percentage of our pooled milk ends up in Class III products versus Class IV?” can give you a ballpark figure. And just as important, take a good look at your co‑op’s own monthly statement; that’s often the clearest picture of how your actual milk is being used and paid for, beyond the FMMO averages.

If your herd is effectively 65% Class III‑driven and you structure DRP as if you were a 50/50 Class III/Class IV herd, the policy won’t track your milk check as well as it could.

5. Break‑Even Milk Price

Finally, you need at least a rough survival break‑even and a sustainable break‑even.

  • Survival break‑even covers feed, power, essential repairs, and the minimum debt service to keep the doors open.
  • Sustainable break‑even adds in full debt service, family living, and enough capital replacement that the operation can keep going long term.
Herd ScenarioSustainable Break-Even ($/cwt)$1.00/cwt Drop = Monthly Loss$2.00/cwt Drop = Monthly Loss$3.00/cwt Drop = Monthly Loss
300-cow herd, 36 lbs/cow/day$16.25 (RED)$16,200/month$32,400/month (RED)$48,600/month
500-cow herd, 60 lbs/cow/day$15.75 (RED)$27,000/month$54,000/month (RED)$81,000/month
800-cow herd, 68 lbs/cow/day$15.00$36,480/month$72,960/month$109,440/month
Industry Median Break-Even (2024 USDA ERS)$15.50$25,920/month$51,840/month$77,760/month

A quick back‑of‑the‑envelope calculation is to total your annual cash costs and divide by your annual production (in cwt). It’s not perfect, but if it shows your sustainable break‑even is around 16 dollars per hundredweight, you now know that a 14‑dollar Class III “floor” isn’t really protection. It’s just a more predictable way to lose money.

In DRP and risk management meetings across the Midwest, it’s common to hear agents say that the producers who walk in with these five numbers tend to walk out with coverage structures that fit their lane. The ones who don’t bring numbers usually end up talking about feelings, not risk.

Timing and Triggers: Managing Spring 2026 Without Staring at the Screen All Day

If there’s one thing many of us have learned the hard way, it’s that risk management is as much about timing as it is about tools. You don’t have to watch the market all day. But you do want a few dates and signals written down so you can act on your plan, not your emotions.

How DRP Sales Windows Actually Work

DRP isn’t like corn insurance, where you have one big sales closing date. According to the 2026 DRP Basic Provisions, coverage is sold during specific “sales periods,” and sales are suspended on days when major USDA reports, such as Milk Production and Cold Storage, are released. That means you can buy coverage at multiple points, but not every single day. 

Practically speaking:

  • Q2 2026 endorsements (April–June milk) will mostly be written in the late‑January to March window, outside of those report days. 
  • Q3 2026 endorsements (July–September milk) will mostly be written in the April–June window, again avoiding report days.

So instead of waiting for a single “deadline,” you’re better off deciding in January and April what your lane is, how much milk you want covered, and what coverage levels make sense. Then it’s just a matter of working with your agent during an open sales period.

Watching USDA Production and Stocks

It’s worth noting that USDA’s January 2026 WASDE forecast bumped expected 2026 U.S. milk production up to about 234.3 billion pounds, roughly 3.2 billion pounds more than 2025, which works out to about 1.4% growth. On paper, that doesn’t sound huge, but as many of us have seen, an extra 1–2% milk floating around in a flat demand environment can put real pressure on prices. 

When you pair that with the monthly Milk Production report and the Cold Storage report—especially for cheese and butter inventories—you get a reasonable sense of whether the market is starting to back up or tighten. That can help you decide when to be more defensive and when you can afford to lighten up.

Simple Price Triggers That Help You Act

Most of the herds I talk to don’t want a complicated market model. They just want a few lines in the sand that tell them when it’s time to add coverage or lock in more upside. Here are three that can work as a starting point:

Signal / TriggerLevel (Approx.)Market ConditionDEFENSIVE Lane ActionBALANCED / AGGRESSIVE Lane Action
CME Block Cheddar< $1.30–$1.35/lb for 3+ sessionsCheese market in real stressADD 15–25% coverage immediately via DRP or Class III puts. Do not wait.Monitor closely; consider 10–15% extra coverage if sustained below $1.33/lb.
Front-Month Class III Futures< $15.00/cwtCash market under heavy pressureSHIFT POSTURE DEFENSIVE on 20–30% of unprotected milk.Add DRP or puts without delay.Tighten stops; add 15–25% coverage. This is your warning line.
Front-Month Class III Futures> $18.00/cwt for 2+ weeksRally is real and sustainedMonitor for profit-taking. Keep current coverage. Let upside run.Lock in a slice of gains; protect half your upside with tight stops or modest puts. Consider locking 10–15% at high prices.
USDA Milk Production Forecast1.5%+ YoY growth; cheese stocks risingOversupply buildingAssume downside risk increases Q2–Q3; add 20–30% coverage now while prices near seasonal highs.Add 10–15% defensive coverage on forward Q3 milk. Plan for lower Q3 prices.

These aren’t magic numbers. They’re practical guardrails. The real key is writing down, ahead of time, what each of those triggers will mean for you so you’re not trying to invent a plan on a bad Monday morning.

So What Does This Actually Mean for Your Dairy?

USDA’s current outlook, as summarized in late‑January 2026, is a year with a bit more milk and lower average prices than 2025. At the same time, the official class price series shows that the Class III/Class IV relationship can swing enough within a year to move your milk check by meaningful amounts, especially if your herd is tied heavily to cheese or butter‑powder. 

You don’t get to choose whether that spread exists. But you do get to choose how much of your herd’s future you leave riding on it.

If you’re in the defensive lane, your job this spring is to:

  • Get those five numbers—production, components, basis, utilization mix, and break‑even—on paper.
  • Work with your DRP agent to price 85–90% coverage on 60–70% of your Q2 milk, using Class Pricing that matches your actual exposure.
  • Layer in near‑the‑money Class III puts on part of that volume, so your effective floor comes closer to your sustainable break‑even.

If you’re in the balanced lane, your focus is to:

  • Use DRP at 80–85% coverage on 20–25% of your production as disaster coverage.
  • Use slightly out‑of‑the‑money Class III puts on another 20–30%, so you’ve got a reasonable floor with upside.
  • Put your cheese and Class III price triggers in writing and decide, ahead of time, how much extra coverage you’ll add when those lines get crossed.

If you’re in the aggressive lane and your numbers truly support it, you can:

  • Keep coverage lighter—say 20–25% of production with DRP at 80% or deep out‑of‑the‑money puts—to guard against a real crash.
  • Be honest about your “I’m wrong” lines on cheese and Class III and commit—with your family or business partners—to changing lanes if those lines are crossed.
  • And just as important, make sure your balance sheet is strong enough that you’re not turning your livelihood into a bet you can’t afford to lose.

And there’s one more step that’s worth taking this week, no matter which lane you’re in:

  • Pull your last six months of milk checks and calculate your basic basis and break‑even.
  • Put a ten‑minute weekly price check (cheese, Class III, Class IV) on your calendar.
  • Talk through your lane with whoever else has a stake in the dairy—family, partners, key employees—so everyone understands the plan.

In a 2025–26 world where USDA expects higher milk production and lower prices, and where the Class III/Class IV spread can change direction more than once a year, hoping the market behaves isn’t a strategy. Your balance sheet—not your opinion of cheese—is what should pick your lane. 

The goal isn’t to guess exactly where Class III will be in June. It’s to decide what you can live with now, set your floors accordingly, and make sure the market doesn’t get the final say on whether your dairy makes it through the next year.

Key Takeaways

  • Same cows, big gap: Class III/IV spread and pooling differences alone can put two similar 500‑cow herds $10,000–$15,000 apart in a single month.
  • Pick your lane: defensive herds should cover 65–70% of production, balanced herds 40–50%, and aggressive herds 20–25%—based on cash, leverage, and risk tolerance, not feelings.
  • DRP at 80–85% coverage offers the best subsidy‑to‑protection trade‑off for most operations; add Class III puts when you want a tighter floor with upside intact.
  • Know your numbers: projected production, component averages, basis, utilization mix, and break‑even should be on paper before you call your DRP agent.
  • Set triggers, not hopes: decide now what cheese price and Class III levels will make you add protection—so you’re acting on a plan, not reacting to a bad Monday.

Complete references and supporting documentation are available upon request by contacting the editorial team at editor@thebullvine.com.

Learn More

The Sunday Read Dairy Professionals Don’t Skip.

Every week, thousands of producers, breeders, and industry insiders open Bullvine Weekly for genetics insights, market shifts, and profit strategies they won’t find anywhere else. One email. Five minutes. Smarter decisions all week.
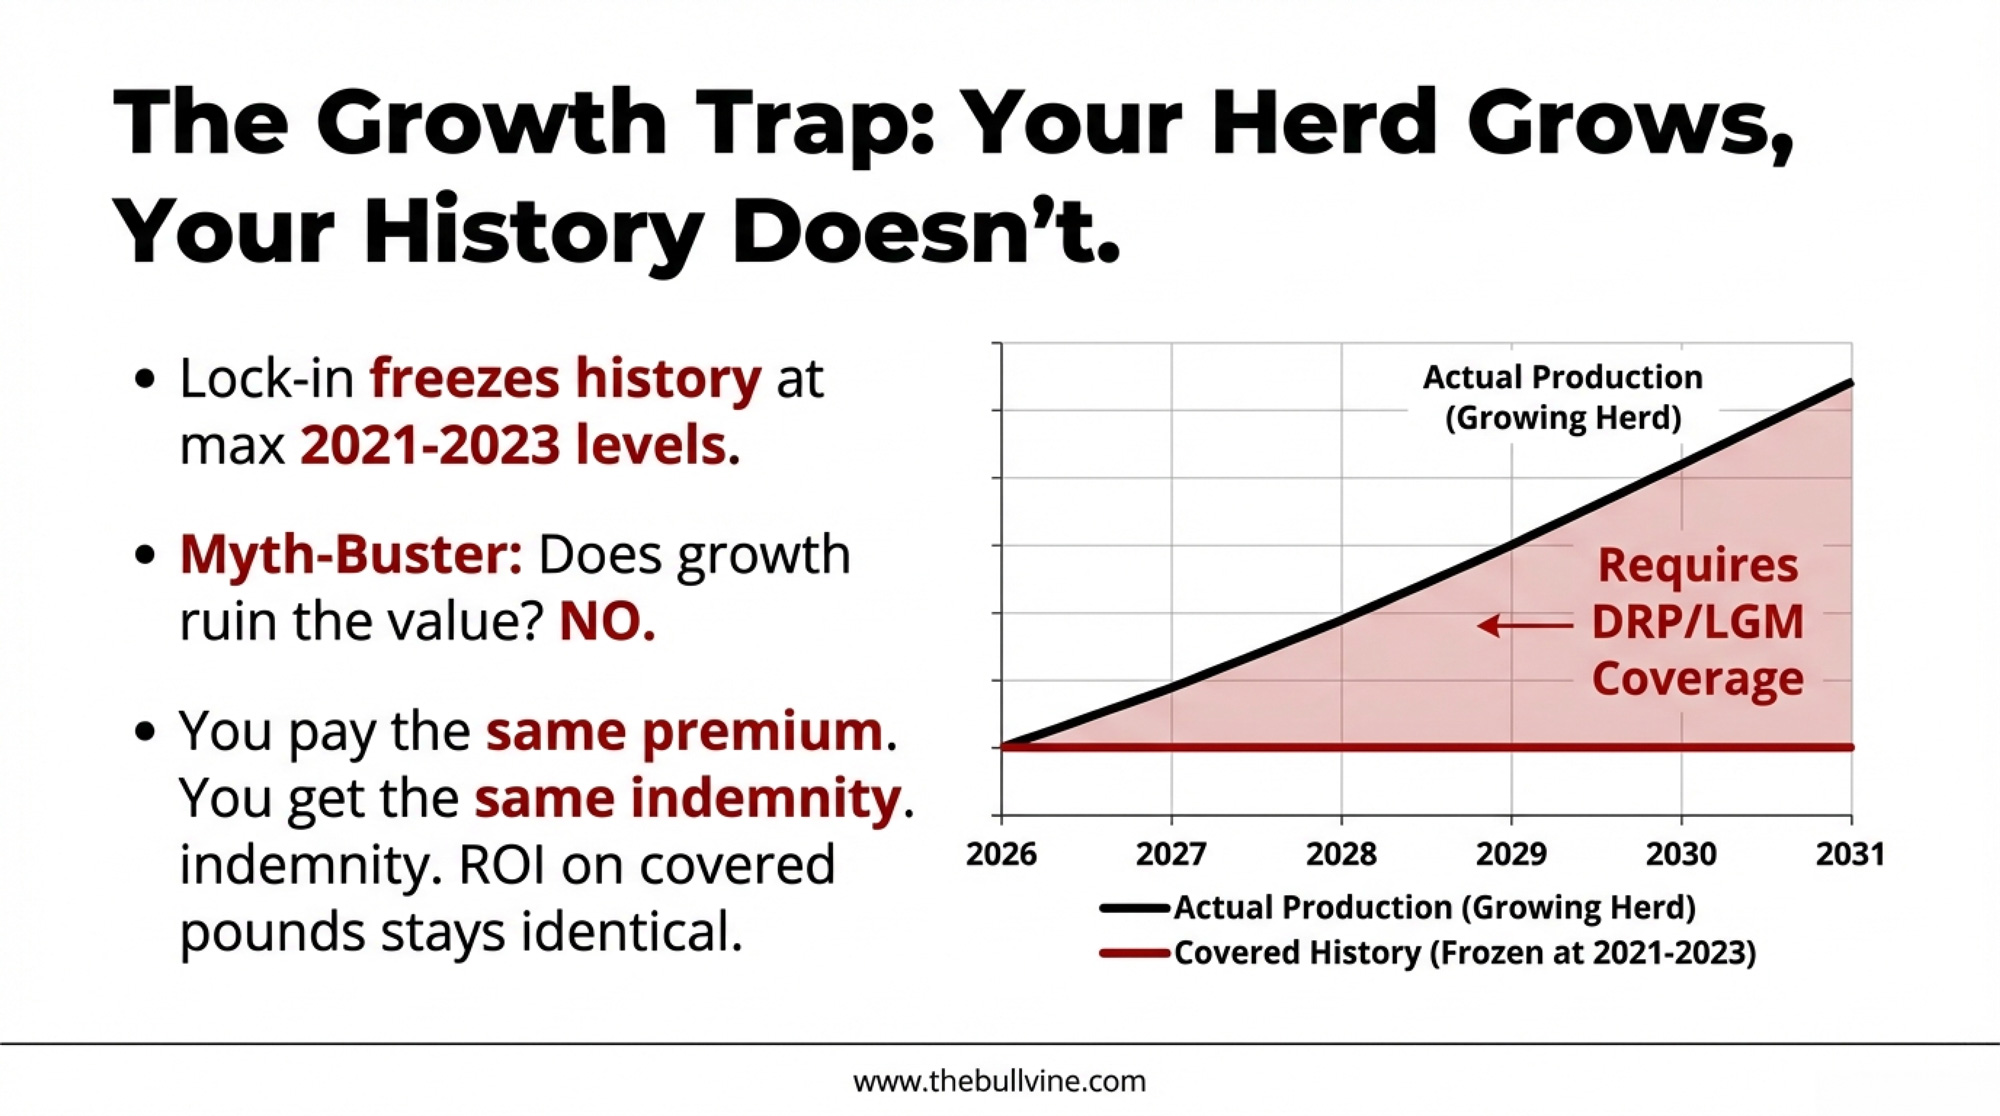
NewsSubscribe
First
Last
Consent

2026 Dairy Rally Or Dead-Cat Bounce? The Risk and Margin Math Behind Today’s Wall of Milk

Milk prices are up, but the world’s awash in milk. Have you actually run the 2026 risk math on your own herd yet?

Executive Summary: Early‑2026 dairy markets finally show some life, with GDT and CME prices moving higher, but global milk production is still expanding in the US, EU, New Zealand, and South America. That leaves us in a classic “relief rally” sitting on top of a wall of milk, as USDA forecasts more US output in 2026 and European and South American exports keep pressure on world prices. Cheaper feed has helped, yet many herds remain just one dollar per hundredweight away from losing—or gaining—six‑figure income, especially at 400–600 cows. This feature turns that big‑picture tension into simple margin math and walks you through what to do next: how much milk to lock in, how to rethink your cull list, and why components and fresh cow management matter more than ever. It doesn’t promise a magic fix; instead, it gives owners and managers a realistic playbook to de‑risk 2026 while keeping long‑term genetics and herd strategy in mind. If you want to stop guessing and start making deliberate moves in this rally, this is the article you read before your next marketing and herd meeting.

2026 dairy market rally

You know that feeling when the market finally throws you a bone, and you’re not sure whether to trust it? That’s exactly where dairy is sitting as we get into 2026.

The Global Dairy Trade (GDT) index has just put together back‑to‑back gains. At the January 20, 2026, auction, market reports from Trading Economics show the GDT Price Index up 1.5%, with the average winning price around 3,615 US dollars per tonne, building on a 6.3% jump at the previous event.  CME spot prices have turned green as well, with recent coverage highlighting higher butter, nonfat dry milk, and cheddar block values compared to late 2025. 

RegionJan 2025Apr 2025Jul 2025Oct 2025Jan 2026 (Forecast)Apr 2026 (Forecast)Jul 2026 (Forecast)Oct 2026 (Forecast)
US19,20019,60020,10020,40020,70021,00021,40021,600
EU8,1008,2008,3008,2508,3008,3508,4008,380
New Zealand2,8002,9502,7502,6002,6802,8502,9002,750
South America1,4001,4501,4801,5101,5501,6001,6301,660

What’s interesting here is that this little rally is showing up while both USDA and global analysts are still talking about milk supply outpacing demand through at least early 2026. USDA’s January outlook, as reported by Dairy Star, puts 2026 US milk production at about 234.3 billion pounds—roughly 1.4% above 2025.  A summary of global conditions bluntly warned that milk supply is set to outpace demand in early 2026, echoing similar concerns in other industry outlooks. 

So the real question a lot of you are quietly asking—whether it’s in a freestall in Wisconsin or a tie‑stall barn in Quebec—is simple: is this a real turn, or just a dead‑cat bounce in a still‑oversupplied world?

Let’s frame the stakes. On a 500‑cow herd, a one‑dollar‑per‑hundredweight swing in milk price moves annual revenue by roughly 100,000 dollars. That simple math comes straight from basic revenue calculations: price times hundredweight sold. It’s the kind of back‑of‑the‑envelope number that dairy economists and extension folks often use when they talk about income risk per herd.  That’s why getting this call even roughly right matters a lot more than just the color on your market screen. 

A Quick Snapshot Of Where We’re At

Looking at the latest numbers:

At that January 20 GDT event, official summaries show whole milk powder up about 1%, skim milk powder up roughly 2.2%, butter gaining about 2.1%, and anhydrous milkfat (AMF) up around 3%. Total volume sold was just under 28,000 tonnes, with more than 160 bidders active.  That’s a decent mix of product strength and participation. 

On the supply side, USDA and industry outlets like Dairy Star report that US milk output has been trending higher into late 2025, and the 2026 production forecast of 234.3 billion pounds confirms that they expect more, not less, milk in the system.  Coverage of Europe and Oceania points to year‑on‑year growth in milk collections in many key exporting regions, too. 

And then there’s storage. Reports that at the end of 2025, butter stocks sat around 199.3 million pounds in US cold storage—roughly 7% lower than a year earlier—but cheese inventories were higher than mid‑year levels, reflecting strong production but also resilient export demand. 

So yes, prices are better than they were in late 2025. But the wall of milk hasn’t magically disappeared.

ProductLate 2025 LowJan 20, 2026 (GDT)2024 Average% Gain (Late 2025 → Jan 2026)
Butter ($/tonne)3,4003,6704,200+7.9%
Skim Milk Powder ($/tonne)2,1002,1502,850+2.4%
Cheddar ($/lb)1.621.681.95+3.7%

GDT’s “Less Product, Higher Price” Moment

What farmers are finding is that the tone at GDT finally feels different than it did in the second half of 2025. A Cheese Reporter summary notes that the January 20 auction saw the GDT Price Index rise 1.5%, with fats and powders mostly stronger.  Earlier coverage flagged a shift in late 2025 toward fewer products offered at auction, which often puts upward pressure on prices even if underlying demand is only steady. 

Here’s what I think is worth noting: this isn’t just buyers suddenly waking up hungry. Put it plainly in a feature called “Global Dairy Trade: Less Product, Higher Price”—exporters have been trimming offer volumes and tightening how much skim they dry into powders.  That supply‑side adjustment is a big part of what’s lifting GDT, alongside stable—rather than booming—demand. 

Rabobank’s global dairy commentary, summarized in several industry interviews and articles, has been consistent: they see global supply still running slightly ahead of demand through at least mid‑2026, particularly in the US and EU, which limits the upside of these early‑year price moves.  So the rally is real, but it’s growing on a pretty thin root system. 

Futures: Hope With A Side Of Caution

If you look at how people are betting with real money, European and Singapore futures markets tell a similar story. Reporting in Dairy Global and other trade outlets notes that SMP and WMP strips on European and Oceania exchanges have firmed several percent for the first half of 2026, while butter values have been slower to move or even softened slightly in some contract periods. 

To me, this development suggests two things at once:

  • Markets are willing to pay a bit more for powder and fat into mid‑2026 than they were in late 2025.
  • At the same time, the more muted response in butter curves underscores that traders don’t believe the oversupply problem is solved.

For those of you whose milk cheques are influenced by European or Oceania references—either directly or through export pools—those curves are an early warning light. They’re signaling opportunity, but they are not signaling “party like it’s 2014.”

Europe: Cheaper Butter, Plenty Of Milk

Looking at this trend in Europe, price and volume aren’t exactly moving in the same direction.

Reports show that European butter prices were heading toward or even dipping below 4,000 euros per tonne as 2025 wound down and 2026 began, a sharp drop from the higher levels seen a year earlier.  Skim milk powder prices have stabilized somewhat from their lows but remain notably lower than 2024 values. Cheese values in Europe—cheddar, gouda, and mozzarella—have also been trading at discounts to year‑ago levels, according to EU market summaries and price transmission studies on the UK dairy market. 

On the volume side, AHDB and EU‑focused market reports show that milk deliveries across Western Europe, including key producers like the Netherlands and the UK, have been running ahead of 2024 levels, helped by relatively favorable weather and stable herd sizes.  An AHDB beef market update also notes a forecast of tighter Irish cattle numbers down the road, which reflects some structural shifts, but doesn’t suggest a dramatic collapse in dairy cow numbers in the short term. 

In plain terms, Europe is still putting a lot of milk through butter and cheese plants even as prices have eased. That cheap European cheese and butter is exactly the kind of competition that caps how far US and Oceania values can go before buyers in import regions switch to a different origin.

US, NZ, South America, Australia: Where The Milk Is Coming From

United States: More Cows, More Milk

On the US side, USDA and market summaries make it pretty clear: milk production has been trending higher into 2025, and the 2026 forecast of 234.3 billion pounds reflects an expectation of continued growth. Coverage of monthly production reports show repeated year‑over‑year gains in milk output through late 2025. 

It’s worth noting that USDA commentary captured in pieces like “USDA Expects More Cows, More Milk, More Dairy Products” points to both herd expansion and strong yield per cow as drivers of that growth.  That aligns with what many of us have seen visiting freestalls in the Midwest—more cows per site, better genetics and management, and higher pounds. 

At the same time, milk supply is on track to outpace demand in early 2026, which suggests that, collectively, we haven’t cut hard enough to rebalance.  Cull cow data and packer commentary through 2024 suggest slaughter has not spiked the way it did in some earlier margin squeezes, in part because strong beef prices have helped cash flow and encouraged some herds to hang on to marginal cows a bit longer. 

From what I’ve seen sitting at kitchen tables in Wisconsin and New York, it’s that emotional tug—“give her one more lactation”—that often keeps the bottom of the herd fatter than the balance sheet can support.

New Zealand: Solid Season, Tight Margins

Down in the New Zealand market, trend coverage shows that national milk collections were running a couple of percent ahead of the previous season as 2025 wrapped up, with both volume and milk solids up year-on-year. 

At the same time, Fonterra has updated its 2025/26 farmgate milk price forecast range more than once. In a September 2025 agribusiness note, Rabobank’s Australia/New Zealand team referenced Fonterra’s mid‑range forecast near 9.00 NZ$/kgMS after some adjustments. Reuters and other market outlets have also reported a revised forecast band around 8.50–9.50 NZ$/kgMS in late 2025.

What producers are finding in pasture‑based systems—whether that’s Canterbury or Taranaki—is that this mix of slightly higher production and a decent but not spectacular payout puts more pressure on butterfat performance, pasture utilisation, and fresh cow management. University of Waikato and DairyNZ extension pieces have shown that smart grouping, effective transition period management, and mitigating heat stress can increase milk solids per hectare without massive capital investment. 

South America: Quiet But Growing

In South America, Argentina is a good example of a region that’s not huge on its own but matters at the margins. A 2025 summary from Tridge, based on Argentina’s official dairy statistics, shows milk production up roughly 10–11% in early 2025 compared with the same period a year earlier, with especially strong growth in March.  Dairy Global has similarly reported improved performance in Argentina’s dairy sector, driven by better margins and stronger management. 

Uruguay has been posting sustained increases in milk production as pasture conditions improved and prices encouraged expansion.  All of that adds another flow of competitively priced solids into the world powder and cheese markets. 

Australia: Modest Recovery, No Surge

Australia, as Rabobank and FCC’s dairy outlook work emphasize, has not recovered to its historical production peaks.  Years of drought, high water costs, and herd reduction have shrunk the base. Current forecasts see only modest growth into 2026—more of a crawl upward than a surge. 

Australia still matters in certain niches, especially for some cheese and ingredient trade into Asia, but it’s no longer large enough to be the swing producer that rebalances the global market on its own.

China: Resilient Demand, But Not A Bottomless Sink

No matter where you milk cows, China is still a critical piece of your milk cheque.

Reports show that China has cut back on some categories of dairy imports in recent years, especially lower-value powders, as domestic production increased, but has continued to bring in substantial volumes of butter, cheese, whey, and other high‑value products.  A 2023 study on China’s milk and import markets in Cogent Economics & Finance also showed that rising imports of milk powders and dairy ingredients have significant impacts on domestic price dynamics, underlining how intertwined China is with world dairy markets. 

USDA and AHDB estimates place Chinese raw milk production in the low‑40‑million‑tonne range in recent years—up sharply from a decade ago as they’ve invested heavily in domestic herd expansion and modernisation.  So China remains a big, important buyer, but it’s no longer the bottomless sink it once seemed when domestic production was far smaller. 

On the policy side, industry news through 2024–2025 has highlighted growing trade friction between China and several trading partners, including the EU, across a range of ag products.  Some coverage has raised the possibility of additional duties on certain dairy categories, although precise tariff levels and timing remain uncertain. If those duties materialize, buyers may pivot more toward Oceania, the US, and South America, while EU exporters push more cheese and fats into other markets. 

For producers under quota in Ontario or Quebec, the take‑home isn’t “ship more litres because China’s there.” It’s to keep a close eye on butterfat and protein tests, over‑quota penalties, transport charges, and any changes to pooling as processors juggle export and domestic opportunities in response to this shifting trade landscape.

US Spot Markets: Butter Leads, Powders Catch Up

Back in Chicago, CME spot markets finally gave producers something positive to look at in early 2026. Market watchers reported that butter moved sharply higher in early January, with nonfat dry milk and cheddar blocks also gaining ground from late‑2025 lows. 

Cold storage coverage shows that at the end of 2025, US butter stocks sat around 199.3 million pounds, about 7% lower than in December 2024.  That’s not an emergency, but it does mean the butter pipeline isn’t bloated. When stocks are relatively lean, a bit of extra domestic retail demand or export buying can push prices around in a hurry. 

On the powder side, US production data indicate that nonfat dry milk and skim milk powder output has been somewhat lighter than in some past years, as more skim is diverted into cheese and higher‑value protein products.  That tighter dryer balance is one of the reasons NDM can rise even as national milk production grows. 

Cheese stocks, according to the same cold storage reports, ended 2025 higher than mid‑year levels but not at record extremes.  Solid US cheese exports to markets like Mexico have helped offset softer domestic foodservice demand.  So cheese isn’t tight, but it’s not disastrously long either. 

Margins: Cheaper Feed, But Not Enough Milk Price

Here’s where things get uncomfortable.

Feed costs are, thankfully, not where they were in 2021–2022. Corn and soybean meal prices have come off their peaks, a trend highlighted in several 2023–2025 dairy outlooks from FCC.  Many of you in the Midwest have told me that ration costs feel “manageable again” compared to a couple of years ago. 

The problem is that milk prices haven’t risen enough to turn those cheaper inputs into healthy margins for most operations. FCC’s dairy sector outlook and US‑focused extensions of that thinking suggest that many herds are still operating near breakeven once full costs—labor, interest, repairs, and a reasonable return on capital—are factored in.  USDA projections point to all‑milk prices in 2026 that are better than the worst of 2023 but still not generous. 

To make that more concrete, let’s walk through some simple example of math. Take a 200‑cow freestall averaging 24,000 pounds per cow. That’s 4.8 million pounds, or 48,000 hundredweight, of milk sold. At 18.50 dollars per hundredweight, you’re looking at about 888,000 dollars in milk revenue. If your true cost is 19.00—including feed, labor, interest, repairs, and basic reinvestment—that turns into roughly a 24,000‑dollar loss before family labor or any return on equity.

Now scale that up to 500 cows, and a one‑dollar‑per‑hundredweight gap can easily translate into a six‑figure swing in annual income. That’s the kind of gap you don’t fix by squeezing another kilo of milk out of the bottom tail of the herd.

Margin risk remains real even as headline prices improve.  That’s why risk tools like Dairy Margin Coverage (for smaller US herds), Dairy Revenue Protection, and forward contracting are still front‑of‑mind in a lot of conversations with producers and advisors. 

Herd SizeMilk PriceAnnual Milk Output (lbs)Gross Revenue
200 cows @ 24k lbs/cow
$17.50/cwt4,800,000$840,000
$18.50/cwt4,800,000$888,000
$19.50/cwt4,800,000$936,000
350 cows @ 24.5k lbs/cow
$17.50/cwt8,575,000$1,500,625
$18.50/cwt8,575,000$1,586,375
$19.50/cwt8,575,000$1,672,125
500 cows @ 25k lbs/cow
$17.50/cwt12,500,000$2,187,500
$18.50/cwt12,500,000$2,312,500
$19.50/cwt12,500,000$2,437,500

The Playbook: How To Use This Rally Before It Turns On You

So what do you actually do with all of this? Let’s get practical.

1. Use The Rally To Take Some Risk Off The Table

Right now, you’ve got:

  • A couple of GDT events are showing higher prices across key commodities. 
  • CME spot markets that have climbed off their lows in butter, NDM, and cheddar. 
  • A global outlook from the USDA are still warning that supply could outpace demand in early to mid-2026. 

So instead of asking “how high can this go?”, the more profitable question might be “how much of my risk can I reasonably take off the table here?”

That often looks like:

  • Sitting down with your buyer or risk advisor and discussing whether to lock in 20–30% of your expected spring and summer milk at today’s levels if the basis works for you. This is the kind of partial coverage that FCC and extension economists often recommend when margins are fragile but not catastrophic. 
  • If your milk cheque is heavily influenced by Class IV, using this stronger butter and NDM environment to revisit DRP coverage or processor contracts that give you some downside protection. 
  • For quota herds, watching over‑quota penalties and transport charges just as closely as headline pay price, since those can erase the benefit of chasing a rally with extra volume.

The goal isn’t to guess the top. It’s to make sure you won’t be exposed if this turns out to be a bounce, not a bull run.

2. Be Brutally Honest About Your Herd List

I’ve noticed that in just about every downcycle, there’s a point where the spreadsheets say “ship some cows,” but the heart says “she’s been good to us, one more lactation.” That’s human. But the current margin environment doesn’t have a lot of room for sentiment at the very bottom of the list.

Analysts tracking slaughter and coverage from beef and dairy outlets suggest that culling has been lighter than some past squeezes, even as milk output keeps growing.  That’s exactly the behavior that makes supply‑demand imbalances linger. 

Metric2023 (Normal Cycle)2025 (Actual)2026 (Supply-Balanced Target)
Starting Inventory (Jan)9.35M9.42M9.42M
Cows Needed for Production9.10M9.20M8.95M
Surplus (Over-herd)0.25M0.22M0.47M
Actual Culls (year)0.18M0.15M
Culls Needed (Supply Balance)0.20M0.27M0.47M
Culling Shortfall-0.02M-0.12M

So it’s worth sitting down with your vet, nutritionist, or trusted advisor and asking some pointed questions:

  • Which cows actually generate a positive margin once we charge them for feed, labor, stall space, and the opportunity cost of not having a younger cow in that spot?
  • Which fresh cows aren’t hitting their targets for milk and components, even with good fresh cow management in transition?
  • Is the bottom 10–15% of the herd dragging down average butterfat and protein enough to cost you more in lost premiums than they bring in on gross volume?

A 2024 systematic review in the journal Dairy on milk quality and economic sustainability underscored how subclinical mastitis, lameness, and other health issues hit both yield and component quality, and how strongly that feeds into farm profitability.  Another 2024 paper on mastitis risk modeling reinforced the importance of key transition-period management to prevent costly hits.  You don’t need those papers to tell you what you already know—but they confirm that this isn’t just a “nice to have” detail. It’s real money. 

Every system—tie‑stall, freestall, robotic milking setups, dry lot systems—will make different decisions about which cows stay and which ones go. But the global picture shows that, at a macro level, we’ve collectively kept more cows than the market wants.

Bulk Tank ProfileButterfat %Protein %Monthly Milk Cheque (Est. 300-cow, 72k lbs/month)
Below Average3.5%2.85%$18,720
Average (Regional Benchmark)3.7%3.0%$19,440
Above Average3.9%3.15%$20,808
Premium (Top 15%)4.1%3.25%$22,176
Bulk Tank ProfileMonthly $ vs. AverageAnnual $ vs. Average
Below Average-$720-$8,640/year
Average$0$0
Above Average+$1,368+$16,416/year
Premium+$2,736+$32,832/year

3. Follow The Protein Story, Not Just Butter Headlines

Butter tends to get all the attention. But what’s been growing for years is demand for dairy protein—whey, milk protein, and specialty fractions—both in sports nutrition and in the healthy aging markets. Reviews on protein markets and functional dairy ingredients, along with industry investment in membrane and fractionation facilities, confirm that trend. 

For your farm, that usually shows up in three ways:

  • Component‑based payment structures that put more dollars on protein and fat, not simply volume. That evolution has been documented in price transmission research on the UK and other markets, as well as in economic analyses of milk quality. 
  • Genomic proofs and breeding strategies that place more emphasis on components, health, and fertility traits (Net Merit, Pro$, LPI-type indexes) that better reflect long‑term profitability than just raw milk yield. 
  • The realisation that diseases like subclinical mastitis and lameness don’t just nick your bulk tank—they hit the more valuable parts of the cheque.

What I’ve found is that one of the most useful reality checks is simply tracking kilograms or pounds of protein sold per cow per day and comparing that to extension or milk board benchmarks for your region. If you’re below the pack, the fix isn’t always “buy more expensive feed.” Sometimes it’s cow comfort, stall design, milking routine, or getting more aggressive about removing chronic low‑component cows from the herd.

So…Is This Rally Real Or Not?

Here’s my straight answer.

The rally is real in the sense that prices at GDT, CME, and on the futures boards are higher than they were in the second half of 2025. What’s encouraging is that demand, especially for higher‑value fats and proteins, has held up reasonably well despite all the economic noise. 

At the same time, USDA and most media are all singing from roughly the same choirbook on one big point: unless something changes, milk supply is likely to outpace demand into early‑to‑mid 2026.  That doesn’t mean disaster, but it does mean the room for error is small. 

From where I sit, this looks and feels like a relief rally, not the start of a multi‑year bull run. That doesn’t make it any less useful—if you use it.

In the last few cycles—2009, 2016, 2020—the herds that came out stronger weren’t the ones that magically picked the top of the market. They were the ones that:

  • Used every rally to take a bit of price risk off the table.
  • Used every downturn to get more honest about their cow list, cost structure, and genetics strategy.

As we head into spring flush, your job isn’t to predict the exact GDT index three months from now. It’s to make sure you’re not naked if this bounce runs out of steam.

That means knowing your breakeven to the penny. It means deciding how much milk you’re willing to lock in if the market gives you a shot. And it means making a conscious decision on herd size and culling based on math and long‑term strategy, not habit or pride.

The wall of milk is still there. But the market is at least starting to respect good product again. You can’t control what Europe does, or how many containers China books this quarter. You can control how exposed your farm is if this rally turns out to be shorter than we’d all like.

And in 2026, that might be the most profitable decision you make.

Key Takeaways

  • Rally is real, but fragile: GDT and CME prices are up in early 2026, yet global milk supply keeps growing—analysts call this a relief rally sitting on a wall of milk.
  • Supply isn’t slowing: USDA forecasts US milk output up 1.4% in 2026; EU, NZ, and South America are all still adding volume to world markets.
  • Margins are razor-thin: A 1 dollar per cwt swing moves roughly 100,000 dollars on a 500-cow herd—there’s almost no room for error.
  • De-risk now, not later: Lock in 20–30% of expected production, revisit Class IV coverage, and audit your cull list before spring flush hits.
  • Components beat volume: Shift breeding and management toward protein and butterfat performance—that’s where processor money is heading long-term.

Complete references and supporting documentation are available upon request by contacting the editorial team at editor@thebullvine.com.

Learn More

The Sunday Read Dairy Professionals Don’t Skip.

Every week, thousands of producers, breeders, and industry insiders open Bullvine Weekly for genetics insights, market shifts, and profit strategies they won’t find anywhere else. One email. Five minutes. Smarter decisions all week.
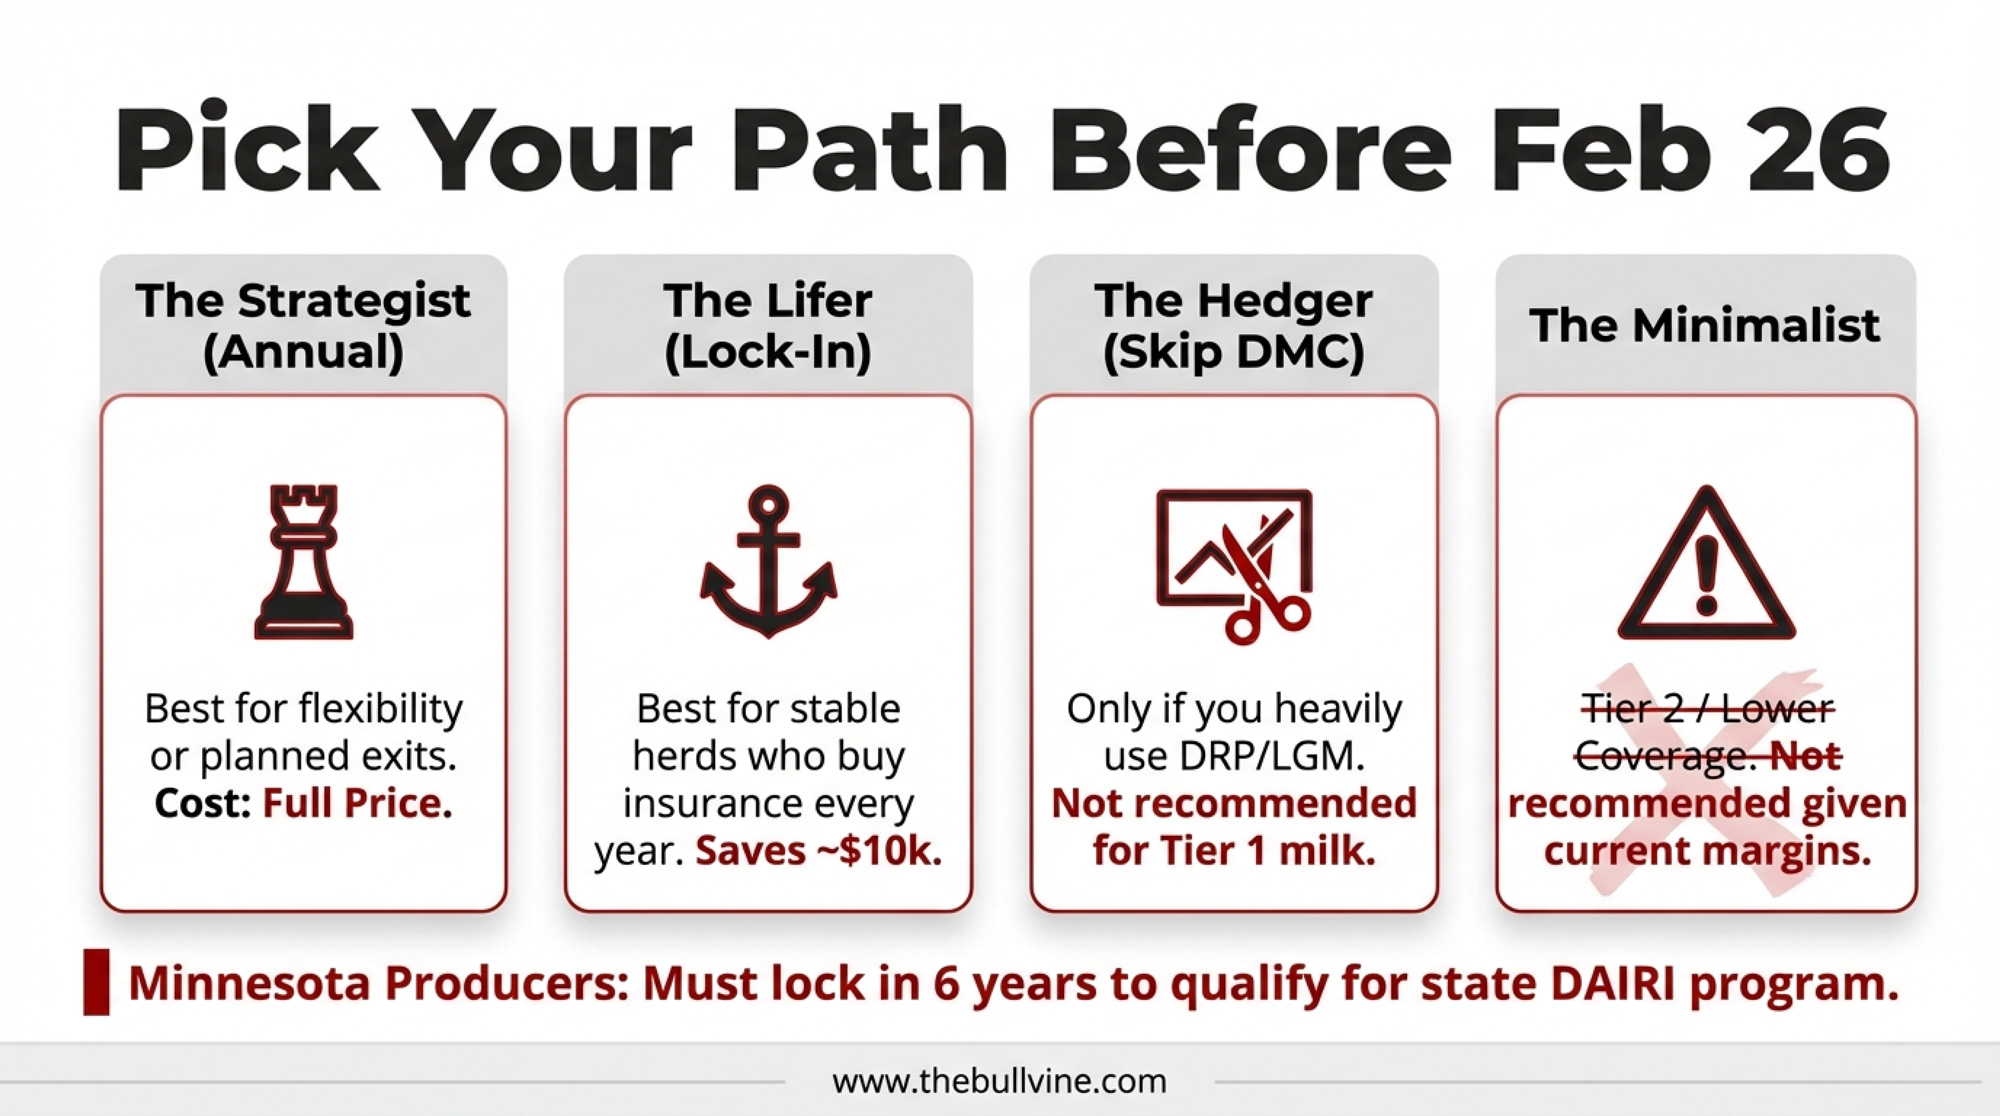
NewsSubscribe
First
Last
Consent

$90K Less Margin, 214K More Cows: Beef‑on‑Dairy, Calf Checks and Your 2026 Survival Playbook

Class III in the mid‑$16s, feed cheap, margins tight. The real test in 2026 is whether calf checks and components close your gap.

2026 dairy market outlook

Executive Summary: USDA’s latest Milk Production report shows November 2025 output up 4.7% in the 24 major states, with 214,000 more cows on line, even as 2026 all‑milk prices are forecast about $1.80/cwt lower—leaving a typical 300‑cow herd roughly $90,000–$100,000 short on milk income. This article explains why that expansion still pencils out for many farms once you put $1,400 beef‑on‑dairy calves, strong cull checks, and record U.S. cheese and butterfat exports into the equation. It shows how calf checks, better butterfat and protein performance, and DMC’s new 6‑million‑pound Tier 1 coverage can add $2–$3/cwt back into margins on efficient herds, while highlighting why high‑cost or heavily leveraged operations—especially in the Southeast, New England, and some Western dry‑lot systems—are under far more stress. From there, you get a straight‑talk 2026 playbook: know your true breakeven, use beef‑on‑dairy and components intentionally, lock in smart DMC/DRP protection, and be honest about scale, succession, and exit timing while calf and cull values are still on your side. It closes with three simple markers—Class III futures, cheese export volumes, and national cow numbers—to help you decide when this downcycle is finally turning instead of guessing from headlines.

Component2025 (at $21.05/cwt)2026 Forecast (at $19.25/cwt)Year-Over-Year Change
Gross Milk Revenue$1,452,450$1,328,250–$124,200
Beef-on-Dairy/Cull Income (est.)$32,000$42,000+$10,000
Net Revenue After Offsets$1,484,450$1,370,250–$114,200

You know, here’s what doesn’t quite add up when you look at where we’re starting 2026.

Most mid‑size herds are staring at roughly $90,000 to $100,000 less operating margin this year than they had in 2025, based on USDA’s all‑milk price forecasts and some pretty basic herd‑level math. USDA’s November 2025 Milk Production report put output in the 24 major states at 18.1 billion pounds, up 4.7% from November 2024, with total U.S. production at 18.8 billion pounds, up 4.5% year‑over‑year. That same report shows the milking herd in those 24 states at 9.13 million cows—214,000 more than a year earlier and even 1,000 head more than October.

So milk keeps coming, even as margins tighten to levels a lot of us haven’t had to stomach for a while.

On the face of it, that feels backward. But once you dig into the beef‑on‑dairy economics, the regional realities, and the way risk management and exports are behaving, the picture starts to come into focus.

Beef‑on‑Dairy: The Calf Check That’s Quietly Rewriting the Math

Looking at this trend, what farmers are finding is that beef‑on‑dairy has quietly become a major stabilizer in an otherwise stressful year.

Laurence Williams, who leads dairy‑beef cross development at Purina, reported in late 2025 that day‑old beef‑on‑dairy calves are now commonly bringing around $1,400 a head, compared to roughly $650 just three years earlier. Analysts ran the numbers and found that the combination of beef‑on‑dairy calves, cull cows, and related cattle sales has added $3.00 or more per hundredweight to the bottom line on many participating herds.

Revenue Stream2022 (Before B×D Surge)2025 (Beef-on-Dairy Established)Dollar Increase% of Total Revenue
Milk Revenue (Gross)$1,452,450$1,452,45087%
Beef-on-Dairy Calf Income$8,000 (dairy calves @ $650 ea)$35,000 (B×D @ $1,400 ea)+$27,0002.1%
Cull Cow Sales$18,000$22,000+$4,0001.3%
Component Premiums (fat/protein)$15,000$28,000+$13,0001.7%
TOTAL REVENUE$1,493,450$1,537,450+$44,000100%

That’s not a nice little bonus. That’s often the difference between red ink and black ink.

In barn after barn, what I’ve noticed is that producers are increasingly thinking of each cow as a two‑part enterprise: milk plus calf. If her butterfat performance and protein hold up reasonably well and she throws a high‑value beef cross calf, the calculus for one more lactation shifts. It’s no longer just, “Is she paying for her feed on milk alone?” It becomes, “Does her milk plus calf check more than cover her costs?”

CattleFax analysts have been pointing out that the U.S. beef cow herd is at its lowest level since the 1960s. That’s a structural shortage in the beef pipeline, not just a one‑season hiccup. In recent outlook presentations, CattleFax has said they expect beef and dairy‑beef calf prices to stay historically strong through 2026 and likely into the first half of 2027, because the beef herd just isn’t rebuilding quickly.

So when someone asks, “Why aren’t we seeing deeper herd cuts with these milk prices?” one honest answer is: because the calf checks and cull checks are doing a lot of heavy lifting right now, especially on farms that have leaned into beef‑on‑dairy in a disciplined way.

Global Milk Supply: Everyone Turned on the Taps at Once

Now, zooming out, here’s where it gets tricky. The U.S. isn’t expanding in a vacuum.

USDA’s Foreign Agricultural Service outlooks for 2025–2026 suggest that European Union milk production is holding near the high‑140‑million‑tonne range. Cow numbers in several EU countries are slowly declining, but productivity per cow continues to climb thanks to advances in genetics, feeding, and management documented in recent European dairy research. So you’ve still got a lot of European milk behind a very export‑oriented processing system.

In New Zealand, Fonterra cut its farmgate milk price forecast to around NZ$9.50 per kilogram of milk solids for the 2025–26 season. DairyNZ’s economic trackers show that at that level, many Kiwi farms are running on slender margins. But Fonterra’s seasonal updates have still shown collections heading into the Southern Hemisphere spring flush running ahead of the previous year across much of the country.

In South America, USDA attaché reports dindicate thatArgentina and Uruguay pare osting meaningful production gains over 2024 levels. While they’re smaller players than the EU or New Zealand, they add to the global pool of exportable milk solids and keep price presthe sure on whole milk powder amilk powder nd skim markets.

Australia is the one major exporter clearly constrained, with drought and water allocation issues limiting out,put in key dairy regions according to Australian government and industry reports. But Australia’s volumes by themselves aren’t big enough to offset Europe, New Zealand, and South America all pushing harder at once.

The bottom line on global supply is straightforward: multiple major exporting regions turned the taps up in the second half of 2025, and they’re all chasing a limited set of buyers. In that kind of environment, it doesn’t take much extra milk to lean hard on world prices.

Spot Markets and GDT: Trying to Find a Floor, Not a Rocket Ship

What’s interesting is that even in this heavy‑supply environment, the markets aren’t behaving like they d,id in some past downturns where everything fell off a cliff at once.

Take butter. USDA’s Cold Storage report released in late January 2026 shows U.S. butter inventories at the end of 2025 running about 7% below the year‑earlier level. That’s not wh,at most of us would expect given all the extra milk. But when you add in strong domestic demand for fat through the holiday season and the fact that U.S. butter has often been priced below European and New Zealand butter, it starts to add up.

Traders have responded to that combination with a firmer butter market than many had penciled in. That doesn’t mean prices are great, but it does mean there’s a recognizable floor.

Skim‑side products have been more volatile, but there ar,e some positive signs there too. At the Global Dairy Trade auctions in early January 2026, the overall price index climbed 6.3% at the first event of the year and another 1.5% at the next. Skim milk powder rose a little over 2% at the most recent auction, with butter and anhydrous milk fat also moving higher. Whole milk powder gained about 1%.

Analysts at AHDB in the U.K. and other market trackers have noted that these gains were broad‑based rather than driven by a single dominant buyer. Middle Eastern importers stepped up their participation to the highest share in roughly two years, and Chinese buyers returned to the platform more actively than they had in late 2024, even as China continues pushing its own domestic dairy expansion.

So are prices “back”? No. But they might be trying to carve out a base instead of sliding endlessly lower, and that’s worth watching.

U.S. Cheese Exports: The Quiet Workhorse in the Background

If there’s one bright spot that doesn’t get enough credit, it’s cheese exports.

The U.S. Dairy Export Council’s November 2025 report highlighted that August cheese exports hit 54,110 metric tons, up 28% year‑over‑year and the highest monthly cheese volume the U.S. has ever shipped. August was also the fourth straight month where U.S. cheese exports topped 50,000 metric tons—a milestone that had never been reached before May 2025.

Analysts pointed out that South Korea’s cheese imports from the U.S. were up 84% compared to the previous year. Mexico, Central America, Japan, and Australia all booked sizable gains as well. Butterfat exports nearly tripled year‑over‑year, with butter and anhydrous milkfat shipments up close to 190–200% in some categories, as foreign buyers took advantage of relatively cheap U.S. fat.

A big driver is price. USDEC and several commodity risk firms have noted that U.S. cheese—especially cheddar and mozzarella‑type products—has been priced below comparable European and Oceania offerings for much of 2025. That discount, combined with new cheese plants in the central U.S., has given buyers reasons to shift more volume to U.S. suppliers.

Without that export engine—in both cheese and butterfat—we’d likely be staring at much bigger inventories and even lower domestic prices.

Feed Costs: A Tailwind That Still Can’t Outrun the Headwinds

Now, let’s slide over to the cost side of the ledger.

USDA crop reports for 2025 confirmed a big U.S. corn harvest and solid soybean production. That’s kept corn futures trading in the low‑to‑mid $4 per bushel range and soybean meal at relatively manageable levels compared to the spike years we all remember too well. When you plug these feed prices into the Dairy Margin Coverage formula, the feed‑cost component drops to some of the lowest levels we’ve seen since late 2020.

Land‑grant economists and extension dairy specialists have been pointing out that, at least on paper, this should be a “feed‑friendly” year.

But here’s where the math still bites: USDA’s outlook, as summarized by Southeast Ag Net and other ag media, has the 2026 all‑milk price averaging around $19.25 per hundredweight, down from about $21.05 in 2025. That’s a drop of roughly $1.80 per hundredweight. So even if feed costs trim 35 to 50 cents per hundredweight off your expense line, the net margin still narrows uncomfortably.

I’ve seen some herds with exceptionally strong forage programs and careful fresh cow management insulate themselves a bit more—they’re getting more milk per unit of feed, which helps. But nobody’s describing this as an “easy‑money” year.

How the 2026 Margin Squeeze Lands on Different Farms

Let’s put some real numbers to this.

Region / Herd ProfileTypical Herd SizeFull-Cost Breakeven ($/cwt)2026 Forecast Price ($/cwt)Margin/(Loss) at ForecastKey Headwinds
Upper Midwest (WI, MN)300–500$16.50–$17.00$19.25+$2.25–$2.75None acute; feed-friendly; strong components help
Texas Panhandle2,000–5,000$17.00–$18.00$19.25+$1.25–$2.25High debt from recent expansion; interest rate exposure
California Central Valley2,000–8,000$16.50–$17.50$19.25+$1.75–$2.75Water restrictions; regulatory costs; high land value
Southeast (Federal Order 7)150–300$19.00–$20.50$19.25–$0.25 to +$0.25Class I premium erosion; heat stress; long hauls to plant
New England100–250$20.00–$21.50$19.25–$0.75 to –$2.25High land, labor, & regulatory costs; insufficient scale
Upper Midwest (< 100 cows)40–100$22.00–$25.00$19.25–$2.75 to –$5.75Can’t spread fixed costs; limited premium market access
Mid-Size Growth (500–1,000)500–1,000$17.50–$18.50$19.25+$0.75–$1.75Debt servicing; succession clarity required

Imagine a 300‑cow herd shipping about 23,000 pounds per cow annually—roughly 69,000 hundredweight per year. At a $1.80 per hundredweight drop in milk price, you’re looking at about $124,000 less top‑line milk revenue. If beef‑on‑dairy calves and components are adding extra income, that might bring the net hit closer to that $90,000 to $100,000 range, but it still stings.

USDA’s Economic Research Service breaks milk cost of production down by herd size, and while the exact numbers vary year to year, the pattern is consistent. Small herds under 50 cows often end up with total economic costs—once you price in family labor, depreciation, and interest—well over $40 per hundredweight. Mid‑size herds from 100 to 500 cows commonly sit somewhere in the low‑to‑mid twenties. Large herds, especially those above 2,000 cows with efficient layouts and strong management, can get their full costs into the upper teens or around $20.

In Wisconsin and much of the Upper Midwest, extension educators tell me that herds with a true full‑cost breakeven under about $16 per hundredweight are generally okay at these forecasted prices, especially if they’re capturing strong component premiums and calf/cull income. Once that breakeven climbs into the $18–20 range, the stress shows up quickly in lender meetings.

In California’s Central Valley and the Texas Panhandle, a lot of the big modern facilities have very competitive operating costs on a per‑hundredweight basis but also carry significant debt from recent expansions. When interest rates sit where they are and all‑milk prices back up, those principal and interest payments can start to drive decisions just as much as feed bills.

The Southeast is fighting a different battle. Federal Order 7, along with Order 5 in parts of the Appalachian region, has long relied on Class I fluid milk premiums to keep blend prices workable. University of Kentucky and other regional economists have been documenting how declining beverage milk consumption reduces Class I utilization and erodes that premium. Combine that with higher heat‑stress mitigation costs, more challenging forage conditions, and long hauls to processing plants, and many Southeast producers describe 2025–2026 as one of the toughest stretches they’ve faced.

In New England, the story centers on high land values, strict environmental regulations, and costly labor. Even with excellent butterfat performance and strong protein, some mid‑size herds simply can’t spread those fixed costs across enough hundredweight to make the numbers work at a sub‑$20 all‑milk price.

So when you look at the national average projections, it’s worth reminding yourself: there really is no single “U.S. dairy market.” Your reality depends on your region, your herd size, your debt structure, and how you manage forage, cows, and risk.

What DMC and Risk Management Can—and Can’t—Do This Year

Given all that, it makes sense that Dairy Margin Coverage is back on a lot of producers’ radar.

For the 2026 program year, USDA’s Farm Service Agency expanded Tier 1 coverage from 5 million to 6 million pounds of milk. That’s a big deal for herds in the 250–300‑cow range, because more of their production now fits under the lower Tier 1 premium schedule. Penn State Extension, Texas Farm Bureau, and several other groups have all been reminding producers that enrollment opened January 12 and runs through February 26, 2026.

Risk‑management specialists like Katie Burgess, director of risk management at Ever.Ag, has been quoted as saying that their models point to DMC payments exceeding $1 per hundredweight for at least the first few months of 2026, with smaller payments likely into mid‑year if current price and feed forecasts hold. That lines up with what many margin calculators were showing as we came into January.

It’s worth noting that DMC is designed as a margin program, not a price program. So it’s the combination of feed cost and milk price that matters. In a year like this, where feed is relatively cheap but milk has dropped more, it can still provide meaningful support.

Beyond DMC, Dairy Revenue Protection (DRP) and Livestock Gross Margin for Dairy (LGM) remain important tools. Extension economists at universities like Wisconsin, Minnesota, and Cornell keep stressing a simple point: the farms that seem to manage volatility best are the ones that decide ahead of time what prices they’ll lock in and how much volume they’ll protect, rather than trying to chase the market in real time.

Practical Playbook: Questions to Take to Your Lender and Nutritionist

If we were sitting at your kitchen table with a pot of coffee and your last 12 months of milk statements, here are the areas I’d want to talk through.

1. Know Your Real Breakeven, Not Just a Guess

You probably know this already, but in a year like 2026, guessing at your cost of production is dangerous.

That means:

  • Putting real numbers on family labor (what you’d have to pay someone else to do those jobs)
  • Including depreciation on equipment and facilities, not just current payments
  • Accounting for land costs honestly, whether you own or rent

Once you’ve got that full‑cost breakeven per hundredweight, compare it to what you can reasonably expect for the next 12 months, using both the USDA all‑milk forecast and current Class III/IV futures as guides. If your breakeven is $17 and you can add a couple of dollars from beef‑on‑dairy calves and solid components, you’re in a very different position than if your breakeven is $22 and you’re light on calf income.

2. Use Beef‑on‑Dairy as a Strategy, Not Just a Trend

Beef‑on‑dairy works best when it’s planned, not just sprinkled around.

The herds making it pay are typically:

  • Using sexed dairy semen on their best cows and heifers to generate high‑quality replacements
  • Breeding the bottom half—or more—of the herd to carefully chosen beef sires to maximize calf value
  • Building relationships with buyers, feedlots, or finishers who know how to handle dairy‑beef crosses

Several auction reports have all documented beef‑on‑dairy calves bringing $800–$1,000 per head in many markets, with some sales reporting over $1,600 for particularly strong day‑old crossbreds. When those prices are combined with the right breeding plan, you’re not just “having fun with a fad”—you’re rewiring your revenue model.

3. Treat Butterfat and Protein as Margin Levers

In a lot of federal orders and cooperative pay schedules, components are where the real action is.

Risk‑management columns from organizations like the Center for Dairy Excellence and multiple land‑grant extension dairy programs have shown that moving from, say, 3.7% fat and 3.0% protein toward something closer to 3.9% fat and 3.2% protein can often add 30–50 cents per hundredweight to the milk check in strong component markets. Across a 300‑cow herd shipping 23,000 pounds per cow, that can easily translate to $20,000–$30,000 per year.

Getting there usually isn’t about one magic bullet. It’s the combination of:

  • Consistent, high‑quality forages
  • Attention to detail in the transition period so fresh cows hit lactation strong
  • Careful ration balancing with your nutritionist
  • Stable cow comfort and feed access, especially in hot weather

As many of us have seen, the herds that are fanatical about feed delivery, bunk management, and minimizing up‑and‑down swings in dry matter intake tend to be the same herds that quietly add 0.1–0.2% fat and a bit more protein without spending much extra per cow.

4. Decide What “Scale” Means for Your Family, Not Just Your Neighbors

This is the hardest part of the conversation, but it’s one we can’t dodge.

If you’re under 500 cows and don’t have a clear edge—either by being ultra‑efficient, having reliable premium markets, or running a strong direct‑to‑consumer business—the structural headwinds have been intensifying for a decade. Consolidation in the U.S. dairy sector is well documented in USDA and industry analyses.

That doesn’t mean small and mid‑size herds are doomed. It does mean that, in many regions, they need one or more of the following to thrive:

  • A truly low cost of production and low debt load
  • A solid premium market (organics, grass‑fed, A2, or strong local brand)
  • An intentional plan to partner, merge, or exit before pressure forces a fire sale

The one thing that’s clear from both economic data and real farm stories is that making the tough calls while calf and cull prices are still strong usually works out better than waiting until lender pressure makes the decision for you.

What Could Actually Turn This Market Around?

So, with all of that on the table, what would it take for 2027 to feel meaningfully better than 2026?

1. A Real Supply Response

USDA’s late‑2025 Livestock, Dairy, and Poultry outlook pointed to ongoing herd expansion through much of 2025. For margins to really heal, we eventually need either stronger demand or slower growth in milk.

A meaningful supply response would look like:

  • National cow numbers falling 1–2% from their recent peaks
  • Noticeable herd dispersals in high‑cost regions
  • Replacement heifer prices easing as fewer people expand

Right now, beef‑on‑dairy is slowing that process because cull and calf values are so attractive. But if milk stays soft long enough, history says the herd will respond.

2. Sustained Export Strength

Export performance has a huge say in how quickly things improve at home.

If U.S. cheese exports can consistently stay in that 50,000‑metric‑ton‑plus range month after month, and butterfat exports hold onto their recent gains, that continues to siphon product off the domestic market and support both Class III and Class IV values. USDEC’s 2025 reports make it clear that strong export demand is the reason we’ve been able to move record volumes of cheese without drowning in inventory.

Watching Global Dairy Trade auctions, USDEC’s monthly updates, and export coverage is a good way to sense whether that engine is still running or starting to sputter.

3. Class III and All‑Milk Prices Converging on Something Livable

One simple rule of thumb several risk‑management folks use is this: if Class III futures can hold above about $16.50 for several consecutive contract months and you simultaneously see herd contraction, the worst of the downcycle is probably behind you.

Right now, USDA’s all‑milk forecast sits in the $19s for 2026, while Class III futures tend to be in the mid‑$15s to mid‑$16s in many months, based on early‑January price sheets. That gap is a big reason analysts keep warning producers to build budgets off realistic Class III/Class IV numbers, not just the all‑milk headline.

Three Markers Worth Checking Every Month in 2026

If we boil everything down, here are three things I’d personally watch as the year unfolds:

  1. Class III Futures: Are several 2026 contracts holding above roughly $16.50, or are they stuck in the mid‑$15s?
  2. Cheese Exports: Are U.S. cheese exports still at or above 50,000 metric tons per month, or have they slipped back? USDEC’s monthly summaries are a good quick read here.
  3. Herd Size: Are national cow numbers finally dropping 1–2% from a year earlier, as reflected in USDA’s Milk Production reports, or are we still adding cows?

If, by late summer, we can honestly say “yes” to at least two of those being in the “improving” camp, there’s a good chance 2027 looks more forgiving than 2026.

Signal / Metric2026 Breakeven TargetCurrent Status (Jan 2026)What “Improving” Looks LikeYour Action
Class III FuturesHold >$16.50 for 3+ consecutive contract monthsMid-$15s to $16.20 rangeSeveral 2026 contracts trending toward $16.50+Monitor CME futures daily; lock protection at $16.50+
U.S. Cheese ExportsSustain 50,000+ MT per monthAugust peak 54,110 MT; December ~50,700 MT; still strongConsistent 50K+ MT/month through Q2 2026Check USDEC monthly reports; if slipping below 48K MT, watch for domestic price weakness
National Cow NumbersDown 1–2% from year-earlier levelUp 214,000 cows YoY (9.13M in 24 states)Herd numbers plateau or decline 1–2% in Milk Production reportsIf two of three signals are improving by late summer, cycle is likely turning; consider less aggressive risk management in 2027
DECISION POINT (Late Summer 2026)Two of three signals in “improving” columnTBD – Check back August 2026If YES → 2027 likely more forgiving; if NO → Tighten controls furtherRevisit break-even, debt, and succession plans with lender & advisor

Bringing It Back to Your Farm

At the end of the day, the big charts and global data are useful, but they’re just the backdrop. The real work is in your own ledger, your own barns, your own conversations with family and lenders.

If there’s one thing this cycle is forcing on all of us, it’s clarity. Clarity about what our true costs are. Clarity about which cows and acres are really paying their way. Clarity about how much risk we’re willing to carry—and for how long.

The farms that come through this stretch in good shape tend to:

  • Know their cost of production down to a realistic dollars‑per‑hundredweight number
  • Use tools like DMC, DRP, and LGM on purpose—not as an afterthought
  • Treat beef‑on‑dairy and components as serious margin levers, not side projects
  • Keep fresh cow management and the transition period tight, so they’re not quietly bleeding money on sick cows and lost milk
  • Are honest about scale, succession, and what “success” looks like for their family

If 2026 feels tight for you, you’re not alone. Many of us are staring at the same spreadsheets and having the same conversations.

What’s encouraging is that the long‑term demand story for dairy still looks solid. USDEC data shows U.S. dairy exports hitting record volumes. USDA consumption statistics show Americans eating more cheese and using more dairy ingredients than ever. There’s been billions of dollars invested in new processing capacity across the country in the past few years—companies don’t make those bets if they think the category is dying.

The trick is getting from here to there without burning through more financial and emotional capital than you can afford.

And that’s where open, honest conversations—at meetings, in vet trucks, over coffee at the kitchen table—about the real math on our farms might be one of the most valuable tools we’ve got in 2026.

Key Takeaways 

  • $90K–$100K less milk income for a 300‑cow herd: USDA’s 2026 all‑milk price is forecast $1.80/cwt below 2025. At 69,000 cwt shipped, that’s a six‑figure revenue gap before calf and cull checks help close it.
  • Beef‑on‑dairy is why cow numbers keep climbing: $1,400 day‑old crossbred calves (vs. $650 three years ago) plus strong cull values add $3+/cwt to participating herds, according analysts, enough to justify keeping cows that would’ve been culled in 2022.
  • Record exports are quietly backstopping the market: August 2025 cheese exports hit 54,110 MT (+28% YoY); butterfat exports nearly tripled. Without that demand pulling product offshore, domestic prices would be far uglier.
  • DMC Tier 1 now covers 6M lbs—enrollment closes Feb 26: That fits a 250–300‑cow herd. Analysts project payouts above $1/cwt early in 2026. If you haven’t enrolled, you’re leaving real money on the table.
  • Know your breakeven, use components as a margin lever, and watch three signals: Herds under $16/cwt full cost and capturing strong butterfat/protein premiums are in far better shape. Track Class III futures (>$16.50), cheese exports (50K+ MT/month), and national cow numbers (down 1–2% YoY)—when two of three turn positive, the cycle is likely shifting.

Editor’s Note: The numbers in this article draw on USDA’s November 2025 Milk Production report, USDA Economic Research Service cost-of-production data, USDA Farm Service Agency announcements on Dairy Margin Coverage, CME Group market reports, Global Dairy Trade auction results, and industry analysis from the U.S. Dairy Export Council, and land‑grant university extension programs. Comments on beef‑on‑dairy and export trends reflect 2024–2025 data and interviews with credentialed industry experts, including analysts at CattleFax and risk‑management professionals working with dairy producers.

Learn More

The Sunday Read Dairy Professionals Don’t Skip.

Every week, thousands of producers, breeders, and industry insiders open Bullvine Weekly for genetics insights, market shifts, and profit strategies they won’t find anywhere else. One email. Five minutes. Smarter decisions all week.
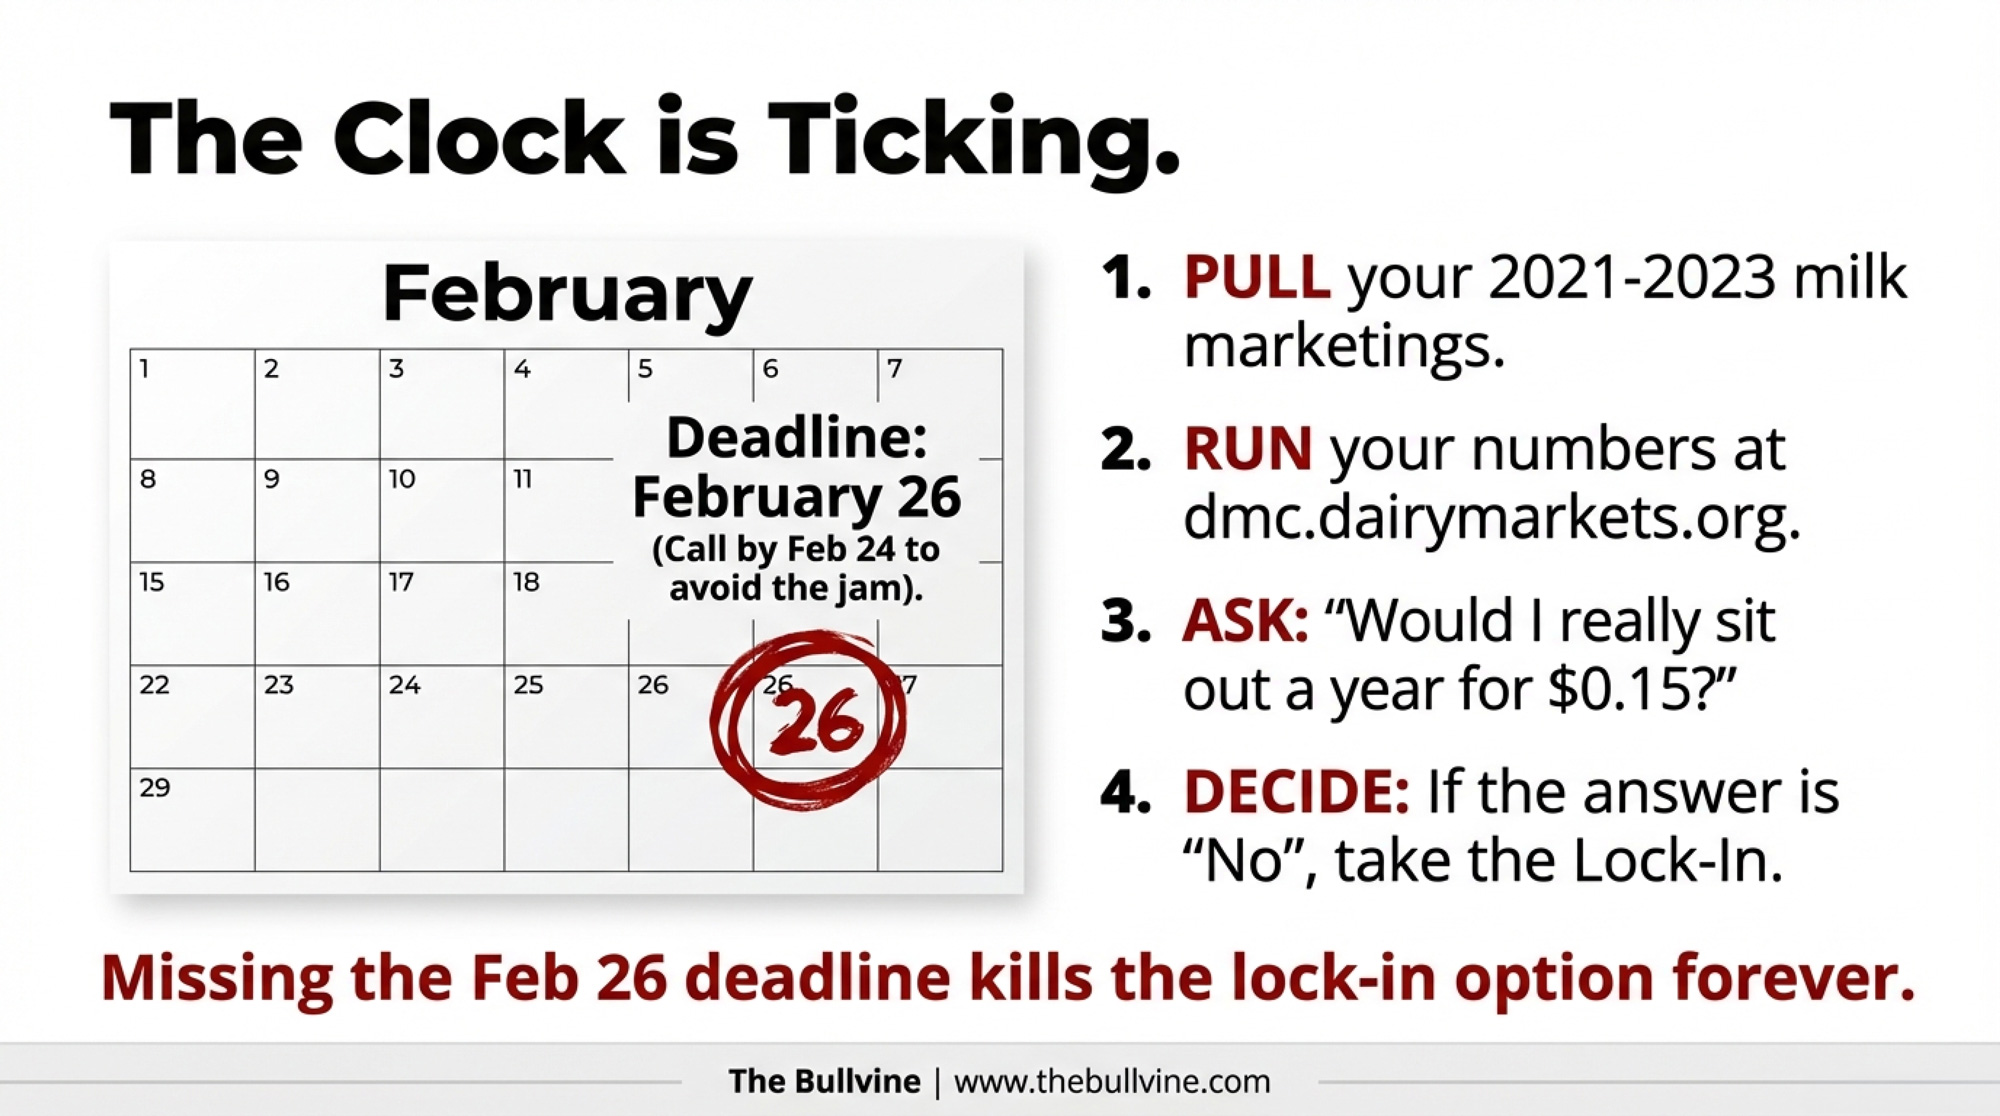
NewsSubscribe
First
Last
Consent

More Milk, Fewer Farms, $250K at Risk: The 2026 Numbers Every Dairy Needs to Run

500-cow dairy. $17 Class III. $250,000 negative margin. That’s 2026 math for farms still budgeting at USDA’s $19 forecast. The gap is real. Is your plan?

Executive Summary: For 2026, the core math is brutal: many 500‑cow dairies face up to a $250,000 annual margin gap between their full cost of production and what 2026 Class III futures will actually pay. USDA projects U.S. milk output climbing to about 231.4 billion pounds in 2025 and 234.1 billion pounds in 2026, even as licensed dairy herds keep dropping, confirming we’re in a “more milk, fewer farms” era, not a supply crunch. Rabobank’s Q4 Big‑7 analysis shows global exporters finished 2025 around 2.2 percent ahead of 2024 on a milk‑solids basis, so the world is long on milk and short on comfortable margins. Using farmdoc’s detailed cost work, the article walks through how full costs in the low‑$20s per hundredweight collide with $16–17 futures and what that means in dollars per farm, not just theory. A 600‑cow Wisconsin case study then illustrates how tightening heifer programs, sharpening culling, and revisiting land and lease costs can pull breakeven closer to realistic price levels. The piece closes with a concrete 2026 playbook—know your true cost, map your position in your processor’s supply network, stress‑test technology and expansion plans, and decide whether to grow, hold, or exit before the market decides for you.

If you sit down with the latest milk report and a cup of coffee, one thing really jumps out: we’re producing more milk than ever, but fewer farms are doing the work. USDA’s latest Livestock, Dairy, and Poultry Outlook puts U.S. milk production at about 231.4 billion pounds in 2025 and roughly 234.1 billion pounds in 2026, driven by higher yields per cow and modest herd growth in key dairy regions like the Upper Midwest, High Plains, and West. It’s worth noting that these gains come on top of already high production, not a rebound from a crash. 

What’s interesting is what happens when you overlay that with herd numbers. USDA and its Economic Research Service have shown that licensed U.S. dairy herds fell from just over 70,000 in 2003 to around 34,000 by 2019—a drop of more than 50 percent—while total milk output hit record levels. More recent compilations of USDA data suggest the national dairy herd still averaged about 9.34 million cows in 2024, very close to recent years. So the story isn’t “less milk.” It’s “fewer farms producing more milk.” 

What farmers are finding is that 2026 isn’t just another down year in the usual cycle. It’s part of a broader reset in who produces milk, where it gets produced, and what kind of financial structure sits under the barns and dry lot systems that do the work. Let’s walk through that together, the way we’d talk it through at a producer meeting or over coffee at the kitchen table.

MonthUSDA ForecastCME Class III Futures$ Gap (500-cow herd @ 12.5M lbs/yr)
Jan 2025$21.50$17.25$259,375
Apr 2025$21.00$16.75$265,625
Jul 2025$20.50$16.50$250,000
Oct 2025$19.75$16.25$218,750
Jan 2026$19.25$17.00$140,625
Apr 2026$19.00$16.75$156,250
Jul 2026$18.75$16.50$140,625
Oct 2026$18.50$16.25$140,625

Looking at This Trend: More Milk, Softer Prices, Heavier Surplus

Looking at this trend from altitude, the first thing to square is production versus price.

USDA’s economists, in their December 2025 and January 2026 outlooks, raised milk production forecasts but trimmed price expectations. Their latest numbers put the 2025 U.S. all‑milk price a little above $21 per hundredweight, and the 2026 all‑milk forecast in the high‑$19 range, after cutting it by more than a dollar from earlier in 2025 as production estimates came up. At the same time, CME markets have often priced 2026 Class III futures in the mid‑$16 to low‑$17 range, something that’s been highlighted in market columns and Bullvine analysis as a significant gap between what you can actually hedge and what older headline forecasts implied. 

On the global side, Rabobank’s Q4 2025 dairy report—summarized by AHDB—estimated that combined milk production from the “Big 7” exporters (EU, UK, U.S., New Zealand, Australia, Brazil, and Argentina/Uruguay) finished 2025 about 2.2 percent ahead of 2024 on a milk solids basis. Rabobank’s analysts noted that all the major exporters were expected to remain in growth at least through early 2026, and that this strong supply, coupled with fragile demand in some markets, was likely to keep dairy commodity prices under pressure into 2026. Reports following the Global Dairy Trade auctions in late 2025 back this up, showing butter and powder prices struggling to sustain rallies whenever stock levels and new-season milk flow signal ample supply. 

So the data suggests we’re not in a world where “there isn’t enough milk.” We’re in a world where there’s plenty of milk, and the question is who is producing it and at what margin.

Structurally, the long‑term pattern hasn’t changed. USDA’s consolidation work and independent reporting show licensed dairy herds cut roughly in half between 2003 and 2019, while national production increased. 2024 statistics, based on USDA numbers, put average cow numbers around 9.34 million head, confirming that cow numbers remain near recent levels while farm numbers keep sliding. The Bullvine’s own projection, simply extending those herd-loss trends forward, estimates the U.S. could be down to about 15,000 licensed dairies by the mid‑2030s and fewer than 10,000 by mid‑century if closure rates don’t slow. That’s our math, not USDA’s, but it aligns closely with the direction of the underlying data. 

YearLicensed DairiesTotal Milk Production (B lbs)Avg Herd Size (cows)
200370,00017095
200852,000191147
201341,000200183
201934,000215250
2024~16,500231.41,400
2026 (proj)~15,000234.11,560

The Expansion Squeeze: When Yesterday’s Good Plan Meets Today’s Math

Now let’s pull this down from the global and national level to something many of you have lived through: expansions that looked safe at $22–23 milk and 3–4 percent money.

In 2022, the U.S. all‑milk price averaged in the mid‑$25s per hundredweight, setting a new record and surpassing the previous peak from 2014. Butterfat performance was heavily rewarded in many pay programs, and farms with strong components were seeing exceptional checks. Feed costs were high, but by late 2023, USDA and market economists were already projecting some relief in corn and soybean meal prices as supply caught up. 

So a lot of 300‑ to 700‑cow herds—especially in regions like Wisconsin, New York, Ontario, and parts of the West—made expansion decisions that looked very reasonable on paper:

  • Grow from 300 to 500 or 600 cows by adding a new freestall barn or expanding a dry lot system.
  • Install or update manure storage to match the new scale.
  • Run the numbers at 25,000–26,000 pounds per cow per year, shipping 12–15 million pounds annually.

In many budgets, operating costs (feed, labor, vet and breeding, fuel, repairs, bedding, utilities) are penciled in at $12–13 per hundredweight, and term debt service at 3–4 percent, adding another $2–3 per hundredweight. At $22–23 milk, the pro formas left room for family living and reinvestment. Extension enterprise budgets from Midwestern and Northeastern universities show similar cost structures for well‑managed freestall herds in that size range. 

Then the conditions moved.

USDA’s updated outlooks have since trimmed price expectations. All‑milk is now projected at a bit above $21 for 2025 and high‑$19s for 2026. Futures markets have often only offered $16–17 for Class III futures in 2026. And interest costs—the piece many of us took for granted when rates were near historical lows—have roughly doubled on new and repriced loans. Farm finance reports and Federal Reserve district surveys show a clear shift toward mid‑single- and even high-single-digit rates for operating lines and floating‑rate term loans. 

The farmdoc daily “Economic Review of Milk Costs in 2024 and Projections for 2025 and 2026” is helpful here. That work found that:

  • Average total costs of production in 2024—including feed, non‑feed, and ownership costs—ran about $23.56 per hundredweight, while average milk price received was $21.63, implying negative economic returns. 
  • Cash costs (feed plus non‑feed operating) alone were around $17.43 per hundredweight
  • Projections for 2025 and 2026 show lower milk prices and only modest cost relief, suggesting continuing pressure on margins. 

So, in many cases, the full cost of production for mid‑size herds (including a realistic family draw and depreciation) lands somewhere in the upper‑teens to low‑20s per hundredweight. If your cost is, say, $18.50 and the futures market is offering $17, you’re looking at a $1.50 gap. On a 500‑cow herd shipping 12.5 million pounds a year (125,000 hundredweight), that’s roughly $187,500 in annual negative margin. At a $2 gap, it’s around $250,000.

What I’ve noticed, visiting farms and looking at DHIA and processor data, is that in many barns, the cows are actually doing well. Butterfat performance is often better than it was a decade ago. Fresh cow management during the transition period has improved, with more consistent protocols and monitoring. Reproductive programs are tighter. The stress is coming from the financial side of the ledger, not a sudden collapse in cow performance.

When a Dairy Quits: Where Cows, Land, and Steel Actually End Up

AssetPrimary BuyerSecondary MarketTypical Recovery (% of replacement cost)
Dairy cows (top-end)Larger regional herds (1,000–3,000 cows); growing dairies in ID, SD, TXDairy-beef cross, cull market85–95% (live animal value retained)
Dairy cows (lower-tier)Livestock dealers, dairy-beef operationsCull market40–65% (depends on age, health)
Land & forage acresNeighboring dairies, crop farms, investor fundsResidential/commercial development (near urban areas)100–120% (farmland appreciation in many regions)
Infrastructure (parlor, barns, lagoons)Limited—some buyers; mostly demolition/salvageScrap metal, reclaimed equipment dealers15–35% (substantial write-down; parlors rarely reused)
Equipment (TMR, tractors, loaders)Used equipment dealers, export channels, neighboring farmsOnline auctions (Machinery Values, etc.)50–75% (depends on age, condition)

We don’t enjoy talking about dispersals, but if we’re honest, they show us where the industry is really going.

On the cow side, the pattern is pretty similar across regions:

  • Larger neighboring herds—say 1,000–3,000 cows—often line up early to purchase the top end of the herd, either privately or on sale day. They’re after younger cows with strong components and healthy records, they can drop straight into their freestalls or dry lot systems.
  • Growing areas like South Dakota, Idaho, western Kansas, and parts of Texas have been bringing in cows from other regions to fill new or expanded facilities. USDA‑NASS and trade coverage show double‑digit herd growth in some of these states over the past decade. 
  • Livestock dealers purchase whole herds, sort animals into different quality groups, and send better cows into herds that are still expanding while moving lower‑tier animals into dairy‑beef and cull markets. 

Recent data from Wisconsin Extension indicates that total U.S. cow numbers have remained in the 9.3–9.5 million head range, even as herd numbers have continued to fall. That shows what many of us see: the cows are staying in the system, just on fewer farms. 

On the land side:

  • Neighboring dairies and crop farms frequently step in to buy ground for forage, grain, and manure application. This is especially common in the Upper Midwest, Ontario, and parts of the West, where land is still predominantly agricultural. 
  • In areas on the edge of urban growth—think parts of the Northeast, Ontario’s Golden Horseshoe, or near mid‑sized cities in the Midwest—developers sometimes buy former dairy land for residential or commercial use. Once that happens, that acreage is effectively gone from the production base.
  • Farmland investment funds and family offices have become a notable presence, purchasing land and leasing it back to operators. Rabobank and USDA research on farmland markets have pointed out that institutional investors are attracted to farmland’s inflation‑hedging properties and targeted rental yields in the four to five percent range. 

I’ve noticed a fairly consistent pattern in conversations: a family decides to exit, an investor group buys the land, and a larger local dairy leases it. The exiting family converts land equity into cash and steps out of day‑to‑day production; the remaining operator expands access to acres without tying up more capital.

The infrastructure—parlors, barns, lagoons—is often the hardest part to repurpose. Older parlors designed for 150–300 cows don’t always match the layout that a 2,000‑cow freestall or dry lot system wants today. Extension engineers and consultants sometimes point out that the salvage value is mainly in pumps, gates, and some steel, with much of the rest written down. Tractors, TMR mixers, loaders, and manure equipment generally move at a discount, but there’s more of a market for them, and export channels help in some cases. 

So, in many cases, cows and land get absorbed into the next phase of the industry. The mid‑size dairy footprint doesn’t always.

What Farmers Are Finding About Processor and Co‑op Strategies

Looking at this trend from the processor side fills in the rest of the picture.

Over the last several years, we’ve seen significant new cheese and whey capacity come online or announced in states like Michigan, Texas, Kansas, Idaho, and South Dakota. Industry outlets and USDA outlooks describe these plants as handling very large daily intakes—often in the millions of pounds—with high levels of automation and the flexibility to switch product mix as markets move. They are typically located in areas with strong concentrations of large herds and room for further growth. 

At the same time, smaller or older plants in areas with declining milk supplies or many small suppliers have been targets for rationalization, mergers, or closure. Examples have appeared in parts of the Northeast and Upper Midwest, as well as in the UK and Europe, where processors are consolidating into fewer, larger sites to improve efficiency. 

From a cost standpoint, the logic is hard to argue:

  • Hauling 200,000 pounds a day from a handful of large stops costs less than collecting the same volume from dozens of small herds.
  • Plants closer to full capacity spread fixed costs over more pounds, improving processing margins.
  • Regions with larger, more consolidated herds provide a more predictable supply.

USDA structural reports and co‑op communications both reflect the same reality: co‑ops and processors are losing farm suppliers faster than they’re losing milk volume. Many have said some version of “we’re losing members, but we’re not losing milk,” especially in boardroom and annual meeting contexts. The data backs that up. 

This development suggests that supply chains are being built around a smaller number of larger anchor herds, with smaller and mid‑size operations fitting in where they align with route plans, quality needs, and regional strategy. It doesn’t mean the end of 60‑ or 200‑cow farms—especially those tied to niche markets or local processing—but it does change the economic current they’re swimming against.

The “Optimism Gap”: USDA Forecasts vs. What You Can Actually Hedge

Now let’s look at something that quietly drives a lot of stress: the difference between official price forecasts and the numbers you can actually put on a hedge or forward contract.

USDA’s all‑milk price projections, as published in WASDE and the Livestock, Dairy, and Poultry Outlook, are built from models that connect anticipated production, stocks, exports, and domestic use. For late 2025 and into 2026, those projections cluster around $ 21+ in 2025 and the high $19s in 2026

On the other side, the CME Class III futures curve has, for much of late 2025 and early 2026, priced many 2026 contracts in the mid‑$16 to low‑$17 band. Dairy market writers and analysts have noted that this is a substantial and persistent gap, especially as processors remain cautious about forward contracting at higher levels. 

Economists at Cornell and Illinois who evaluate USDA forecast performance and farm-level decision tools have emphasized that futures prices tend to adjust more quickly to new information, while institutional forecasts can lag a bit or smooth volatility. In extension meetings, their message to producers has generally been: “Use USDA and co‑op forecasts as scenarios, but build your cash flow around what you can realistically hedge.” 

That’s the essence of what The Bullvine highlighted in its own “USDA Says $18, Futures Say $16” analysis—if your plan assumes $19–20 milk but the market will only let you lock in $17, the difference on a 500‑ or 600‑cow herd is often $200,000–$250,000 a year in gross revenue. That can be the difference between staying ahead of your principal and tapping the operating line to get through the year. 

So a practical approach for 2026 is to:

  • Treat the hedgable futures price (plus your realistic basis and component premiums) as your conservative planning number.
  • Use USDA all‑milk projections as higher‑price scenarios to test what happens if things break your way.
  • Be honest about whether your current business model only works at the top of the range, or also works at the conservative end.

A 600‑Cow Wisconsin Case: Turning Data into Decisions

To make this less abstract, let’s look at a composite case based on several real herds in central Wisconsin.

This farm:

  • Milks 600 Holsteins in a freestall setup with a double‑12 parlor.
  • Averages around 26,000 pounds per cow per year.
  • Maintains butterfat performance near 4.1 percent and protein about 3.2 percent, with strong emphasis on fresh cow management and the transition period.
  • Expanded from 400 to 600 cows in 2022, financing a new barn and lagoon at just under 4 percent interest.

In late 2025, their lender suggested a “stress test” for 2026 and 2027, given the revised USDA forecasts and the futures strip. Working with a dairy business specialist from extension, they pulled their last two years of numbers and calculated:

  • Cash cost per hundredweight (feed, labor—including unpaid family labor at a fair rate—vet and breeding, fuel, repairs, bedding, insurance, interest, property taxes).
  • Full cost per hundredweight after adding depreciation and a realistic family living draw.

Their full cost landed in the high‑$18s per hundredweight, very close to the range highlighted by the farmdoc 2024 cost study for similar Midwestern herds. 

Then they ran three simple price cases:

  • Forecast case: all‑milk equivalent of about $19.25 per hundredweight.
  • Market case: Class III‑based price of $17, adjusted for their herd’s typical basis and component premiums.
  • Stress case: $16 milk for half the year, plus a 10 percent bump in purchased feed costs.

At $19.25, they could service debt, cover family living, and maintain a modest cash buffer. At $17, they were hovering near breakeven—some months slightly positive, some slightly negative—depending on how tight they ran repairs and how well cows performed. At $16 plus higher feed, they would burn through most of their working capital inside about 12–15 months if nothing changed.

Instead of ignoring that, they made several specific adjustments:

  • Tightened their heifer program by raising fewer replacements and using more beef semen on lower‑tier cows, reducing heifer raising costs while capturing dairy‑beef value on calves.
  • Renegotiated a high cash‑rent land lease, bringing it closer to local averages and lowering their per‑cwt land cost.
  • Became more disciplined about culling cows with chronic health issues or consistent component underperformance, even if daily milk looked decent.

Those changes didn’t drop their cost by $3, but they shaved an estimated 50–75 cents per hundredweight. That pulled the $17 scenario from marginal into manageable. Their lender, seeing that they were budgeting off conservative price assumptions and actively adjusting, was more comfortable working with them on amortization and covenant flexibility.

The point isn’t that this particular mix of moves is right for every farm. It’s that using the numbers honestly can shift you from “hoping things turn” to actively managing risk.

Practical Questions for 2026: What to Ask Before You Decide Your Next Move

What farmers are finding is that the most important work in 2026 isn’t guessing the exact milk price—it’s asking the right questions about their own operations. Here are four sets of questions that keep coming up in conversations with producers, lenders, and advisors.

1. What’s our true cost of production—and where’s our red line?

You probably know this already, but in a tighter environment, it’s crucial to get beyond ballpark guesses:

  • What is our cash cost per hundredweight?
  • When we add depreciation and a realistic family living draw, what is our full cost per hundredweight?
  • At what milk price do we cover all that? At what price do we start eroding equity, and how long can we keep doing so before we reach a level we’re not willing to cross?

Tools from land‑grant universities and farm business programs can help you calculate this accurately, drawing on your actual records rather than averages. Knowing that threshold doesn’t solve the problem, but it gives you a clear frame for every other decision. 

2. Where do we sit in our regional supply network?

In California, a 1,500‑cow freestall near a major cheese or powder plant is in a very different situation than a 200‑cow tie‑stall in rural Vermont that’s at the end of a route. In eastern South Dakota or western Kansas, where new plants are coming online, and herd numbers have grown quickly, a 700‑cow herd might be seen as a stable core supplier. In other regions with shrinking cow numbers and plant closures, a similar herd might feel much more exposed. 

Questions worth asking include:

  • Are we one of the larger suppliers on our milk route, or one of the smallest?
  • Has our pickup frequency changed in recent years, and what does that signal about our fit in the logistics plan?
  • Are processors investing in our area, or consolidating capacity elsewhere and stretching routes to reach us?

Understanding your position doesn’t force you into one path, but it should influence whether your strategic focus is on careful growth, diversification (like on‑farm processing or specialty components), or planning a transition while you still have strong equity.

3. How do we feel about partnerships and outside capital?

In recent years, more dairy families have explored models where they don’t own every acre and every building themselves. That might look like:

  • Selling some or all land and leasing it back from an investor, freeing up capital while staying in production.
  • Entering a joint venture with a processor, co‑op, or private investors to build new facilities, with the family managing cows and staff.
  • Having the next generation step into a management role on a larger, investor‑backed freestall or dry lot operation with opportunities for equity over time.

Rabobank’s farmland and agribusiness work, and USDA financial analyses, note growing interest in these structures, especially in areas where land prices outpace what dairy cash flow alone can support. They are not right for everyone, but for some families, they offer a way to stay in dairy without carrying all the capital risk. 

The key is to:

  • Use advisors who understand both dairy and finance.
  • Carefully review contracts (with ag‑savvy legal counsel) and model returns under conservative milk prices.
  • Make sure everyone in the family understands what’s being traded: more external capital and potentially more stability, in exchange for sharing control.

4. Do our “efficiency” investments really reduce cost per cwt at today’s prices?

Robotic milking, automated feeding, in‑line sensors, and cow‑level health and activity monitors are becoming standard in many herds—from Ontario robotic barns to European pasture‑based systems. Research in journals like Frontiers in Veterinary Science and extension trials show that well‑managed robotic milking systems can maintain or improve milk yield, udder health, and cow longevity, and often reduce reliance on parlor labor. 

What’s important is not whether the technology can work—it often does—but whether it lowers your cost of production under realistic price and herd-size scenarios.

Before committing to a major system, it’s wise to:

  • Run a multi‑year partial budget with your lender and advisor, including capital cost, maintenance, software, and realistic labor savings.
  • Test cost per cwt at $16–17 milk, not just at $20–22.
  • Ask how the economics change if you end up milking fewer cows than planned or if labor markets ease.

If the numbers still work under those conditions, the investment can be a strategic advantage. If they only work under best‑case assumptions, it may be better to wait.

Strategic PathBest If…Capital RequiredRisk Level & Key Success Factors
GROW (Expand herd & facilities)You’re already one of the larger suppliers on your route; processor/co-op signaled support; you have 1,500+ cows in mind; management is scalable$3–5M for 300-cow addition (barns, parlor, lagoons); assume 4–5% interestHIGH RISK — Requires lowest cost structure, strong operator-to-cow ratio, processor loyalty; vulnerable to price drops and refinancing pressure if rates stay elevated
HOLD (Stay at current size, tighten costs)Your herd is 300–600 cows; you’re well-positioned on milk routes; you can cut 50–75¢/cwt via heifer & culling discipline; cash flow is adequateMinimal capital(operational improvements only); $0–200K for facility upgradesMODERATE RISK — Requires disciplined management, willingness to make tough culling/staffing decisions; protects equity while riding out cycle
EXIT (Planned dispersal, preserve equity)Your debt is aging; you have young family members not joining the farm; land value is strong; you want to exit while equity is highNone (in fact, generates cash); selling costs ~5–8% of asset valueLOW CAPITAL RISK, HIGH EMOTIONAL RISK — Requires family alignment, tax planning, and post-farm vision; timing is critical (sooner better before margins compress further)
PIVOT (Niche/value-added, on-farm processing, or partnership model)You’re in high-population area (Northeast, Ontario) with direct-to-consumer or specialty market access; or seeking joint venture with processor/investor$500K–$2M (depends on model: direct-sales infrastructure vs. co-packing partnership)MODERATE-HIGH RISK — Requires new skill sets (marketing, regulatory, finance), smaller volumes compensated by higher margins; longer payback window

The Bottom Line: Choosing Your Path, Not Having It Chosen for You

So where does this leave you in 2026?

The data from USDA, Rabobank, and farm-level cost studies all point in the same direction: there’s plenty of milk in the system, both in the U.S. and globally. Production is expected to grow, even as farm numbers continue to decline. Futures markets are less optimistic about price than some earlier official forecasts, and interest costs remain a real weight on expansion-era debt. That combination creates real pressure, especially for mid‑size family operations that expanded in 2022–2023. 

What’s encouraging is that the situation doesn’t dictate a single outcome. Some farms will choose to grow into the new scale with eyes wide open, focusing on cost control, strong relationships with processors, and careful use of risk‑management tools. Others will hold their size and trim costs and wait for clarity. Some will decide that an orderly exit, with strong equity preserved for the next generation—whether in dairy or another sector—is the right move.

What I’ve noticed, looking back over multiple cycles, is that the farms that come through in the best shape aren’t always the largest or the most automated. They’re the ones that:

  • Know their true cost of production at realistic price levels.
  • Understand their place in their regional supply chain.
  • Are honest with themselves and their families about how much risk they’re willing to carry.
  • And make deliberate choices early, rather than waiting for lenders, processors, or circumstances to make the choice for you.

As you think about the next 12–24 months, the most valuable step might not be a new piece of equipment or another pen of cows. It might be a quiet evening with your numbers, a futures chart, and a notepad—asking, “Where are we at $17 milk? How long can we live there? And what do we want our story to look like five years from now?”

That kind of clarity won’t make 2026 easy. But it can make it yours.

KEY TAKEAWAYS

  • $250,000 margin gap: USDA forecasts $19+ milk; futures offer $16–17. For a 500-cow dairy, that’s a quarter-million dollars a year on the line.
  • More milk, fewer farms: U.S. output heads toward 234 billion pounds in 2026. The cows aren’t leaving; the farms are.
  • Many breakevens are already underwater: Farmdoc’s 2024 analysis shows full costs in the low-$20s/cwt. At $17 Class III, that’s negative margin math.
  • 50–75¢/cwt is within reach: A 600-cow Wisconsin case shows targeted cuts to heifer programs, culling lag, and lease costs can close the gap—no expansion required.
  • Decide before 2026 decides for you: Know your true cost at $17 milk, map your processor position, and choose your path—grow, hold, or exit—while you still can.

Complete references and supporting documentation are available upon request by contacting the editorial team at editor@thebullvine.com.

Learn More

The Sunday Read Dairy Professionals Don’t Skip.

Every week, thousands of producers, breeders, and industry insiders open Bullvine Weekly for genetics insights, market shifts, and profit strategies they won’t find anywhere else. One email. Five minutes. Smarter decisions all week.
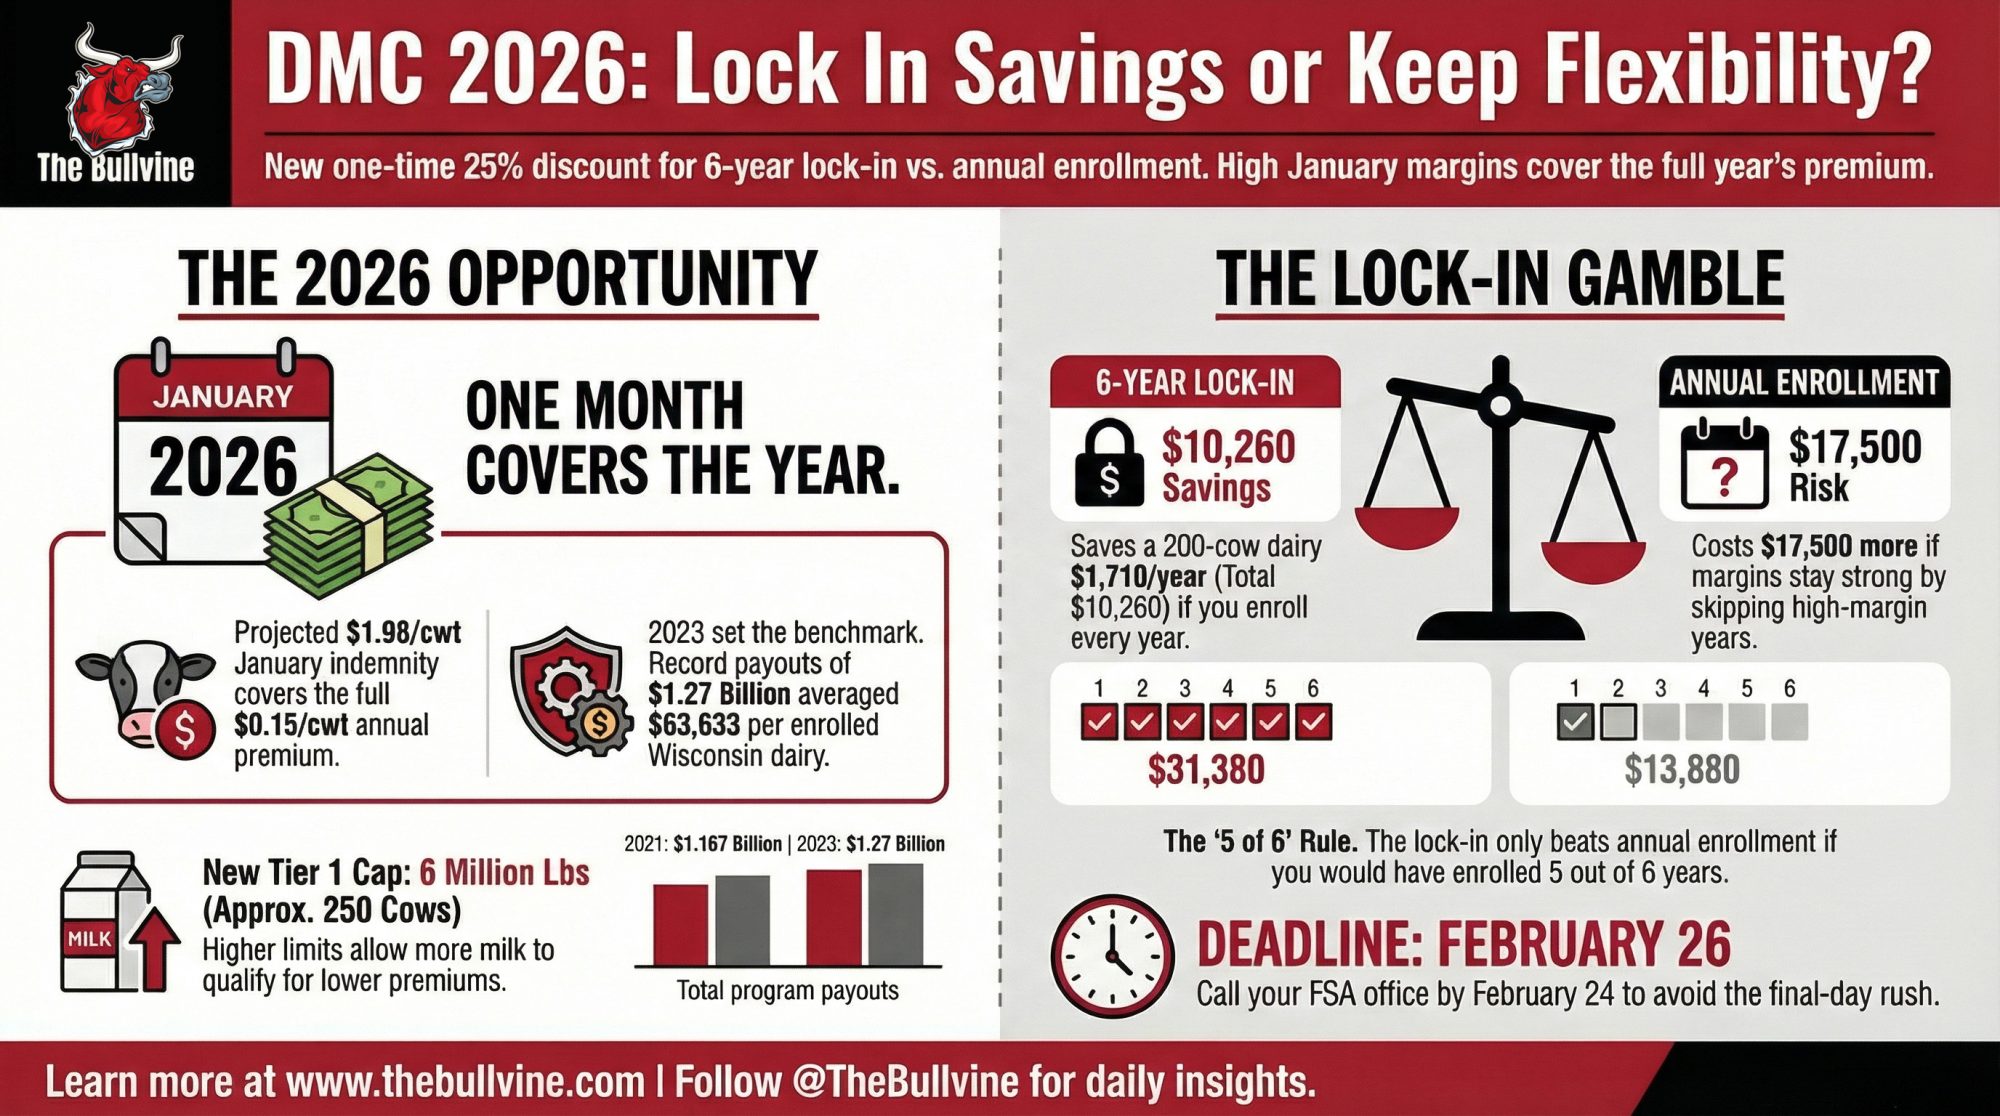
NewsSubscribe
First
Last
Consent

US$8 Billion in Whey Plants: Is Your Co‑op Letting Any Protein Money Reach Your Milk Cheque?

US$8B in whey plants is coming online. Will any of that protein cash ever reach your milk cheque?

Executive Summary: Processors are spending about US$8 billion on new cheese and whey plants because GLP‑1 drugs and protein‑driven diets are pushing global whey demand to record levels. Yet most milk cheques still key off commodity dry whey prices, while the real “protein money” sits in higher‑value ingredients like WPC‑80 and WPI, inside co‑op balance sheets and patronage systems. This article shows, in plain language, how that gap forms—and then uses simple math (like turning a 30¢/cwt whey margin into roughly US$40 per cow per year) to show what it could mean on your farm. From there, it gives you a clear playbook: how to read your equity statement, how to benchmark your all‑in price, and the three questions to ask at your next co‑op meeting about project financing, whey division reporting, and cash vs retained patronage. It also compares what this whey boom means if you ship to an ingredient‑heavy plant in the Texas Panhandle or Upper Midwest, a more commodity‑focused co‑op in the East, or a quota system in Canada. In short, it’s a guide to turning the whey boom from a stainless‑steel story into a milk‑cheque strategy.

dairy whey protein investments

You know how every winter meeting seems to have the same slide deck these days? Somebody from a processor or a bank stands up, talks about protein, GLP‑1 weight‑loss drugs, and this “massive opportunity in whey,” and then you’re driving home thinking, “OK, but where does that show up in my milk cheque?”

What’s interesting here is that this time, the stainless is real. University of Wisconsin–Madison Extension dairy economist Leonard Polzin told Brownfield Ag News that more than eight billion dollars’ worth of stainless steel is being invested in new and expanded dairy processing in various parts of the U.S., with a few plants starting in February and more coming online “in 2025 and in future years,” across a range of products from cheese to fluid and other dairy categories. About US$8billion in new U.S. dairy processing investment through 2026, with a big share of that going into cheese and whey capacity. 

And this isn’t just a Wisconsin or South Dakota story anymore. New cheese plants in Wisconsin, South Dakota, and Texas are expected to add roughly 360 million pounds of cheese annually by the end of 2025, and industry coverage points to big new facilities in the Texas Panhandle and eastern New Mexico, designed specifically to turn High Plains milk into cheese and high‑value whey ingredients.  So while the Upper Midwest still matters, a lot of the newest “stainless” is actually being welded out West. 

RegionEstimated New Capacity (2024–2026)Primary Product FocusKey New FacilitiesCo-op / Processor TypeWhey Ingredient Emphasis
Upper Midwest (WI, MI, MN)~$2.5–3.0BCheese + WheyEstablished complexes + expansionsIngredient-heavy co-ops (e.g., AMPI)High (WPC-80, WPI, export)
Upper Plains (SD, ND)~$1.5–2.0BCheese + WheyRegional & private plantsMixed (co-op + private)Medium–High
Texas Panhandle + E. New Mexico~$2.0–2.5BCheese + WheyNew-build, High Plains focusedPrivate processors + regional co-opsHigh (WPC-80, sports nutrition)
Idaho + Pacific NW~$1.0–1.5BCheese + Whey + SpecialtyExisting + niche biorefineryIngredient specialists (co-op + private)Very High (niche isolates, clinical)
Northeast + Southeast~$0.5–1.0BFluid + Cheese (commodity focus)Limited new buildsCommodity-focused regional co-opsLow–Medium
Western Canada (QC, ON under quota)~$0.5B (capacity additions under supply management)Cheese + Specialty WheyQuebec + Ontario expansionsProcessor cooperativesMedium (regulated pricing)

So here’s the real question many of us are asking: with all that stainless going into cheese and whey, how much of that value actually flows back to your farm—and how much stays inside the plant and on the co‑op balance sheet?

Let’s walk through that together, like we would over coffee.

Looking at This Trend: Why Whey Is Suddenly Center Stage

Looking at this trend from a distance, three big forces are pushing whey into the spotlight:

  • GLP‑1 weight‑loss drugs are changing how some people eat.
  • A long boom in sports and active nutrition.
  • A serious build‑out of processing capacity tied to cheese and whey.

GLP‑1 drugs are changing what some customers put in their carts

You’ve probably heard about Ozempic, Wegovy, and other GLP‑1 medications from TV ads or from your doctor. They started as diabetes drugs, but they’ve quickly turned into a major weight‑management tool. An economic evaluation in JAMA Network Open found that U.S. spending on GLP‑1 receptor agonists among adults jumped from about 13.7 billion dollars in 2018 to 71.7 billion dollars in 2023, more than a five‑fold increase in five years.  That tells you right away this isn’t a niche anymore. 

Retail analytics firm Circana has been digging into what that means at the grocery store. Their 2025 work, covered by food‑industry media, shows that households with at least one GLP‑1 user already make up around 23% of U.S. households and are projected to account for about 35% of all food and beverage sales by 2030. Those households don’t just buy less food; they tend to shift toward more nutrient‑dense, higher‑protein items. 

In a 2025 industry report on GLP‑1 and dairy, they reported on a poll of GLP‑1 users showing that people in that sample cut their daily calorie intake by roughly 20%—about 800 kilocalories—and favoured lean proteins over fatty, salty, sugary, or highly processed foods. For our sector, they described a clear divide: pure proteins like skim milk and whey have “immense potential,” while more indulgent, high‑fat, high‑sugar dairy products such as certain cheese dips and frozen desserts face more headwinds.

Nutrition guidelines back this up. Clinical nutrition and obesity guidelines generally stress that when calories go down, protein and micronutrient density must increase, especially in older adults and people with chronic conditions. Dietitians and GLP‑1 programs are steered towards lean meats, Greek yogurt, cottage cheese, and protein shakes as tools to help keep weight off. 

You can see where whey fits in that pattern: very concentrated, highly digestible protein in a small serving.

Sports and active nutrition aren’t niche anymore

On top of the GLP‑1 story, sports and active‑nutrition products have moved from the specialty aisle right into the heart of the store.

Market research from MarkNtel Advisors estimates that the global whey protein market was worth about 6.5 billion U.S. dollars in 2023 and is projected to reach roughly 19.2 billion dollars by 2030, growing at around 9% per year from 2024 through 2030. That’s a big leap for something that used to be a byproduct we hauled away or spread on fields. 

Tanner Ehmke, lead dairy economist with CoBank, has explained in reports that whey used to be dumped or land‑spread, but by 2021 had reached almost 5 billion dollars in global market value, and that demand for whey protein concentrate has been growing for more than 25 years, driven mainly by export demand. He also notes that U.S. cheese production capacity is expected to expand by about 10% over a five‑year window, and that processors need state‑of‑the‑art technology to meet global whey needs, especially in Asia. 

On the shelf, many of us have noticed the same thing: more ready‑to‑drink protein shakes, high‑protein yogurts, and fortified bars in Costco, farm stores, and even truck stops. The International Dairy Foods Association’s president, Michael Dykes, a veterinarian by training and long‑time dairy policy leader, told Dairy Forum attendees that most of the “protein‑added” products consumers see today are still built on dairy‑derived proteins, especially whey from cheese plants.

There’s growing clinical evidence backing whey’s role in health, too. A 2024 meta‑analysis in Clinical Nutrition ESPEN looked at randomized trials in older adults with sarcopenia (age‑related muscle loss) and found that whey protein supplementation, especially when combined with resistance training, improved lean mass and functional performance compared with control groups.  Industry reports have summarized research on inflammatory bowel disease, showing that participants receiving whey‑based nutrition supplements alongside exercise gained more muscle mass and strength than those who exercised without whey.  That kind of evidence gives doctors and dietitians a reason to keep whey‑based products in their toolbox. 

So when you put all of that together—GLP‑1 users cutting calories but chasing protein, mainstream shoppers grabbing RTD protein drinks, and clinicians using whey to help protect muscle—it makes sense that whey demand looks strong.

And the stainless is really going into cheese and whey

Now, back to that eight‑billion‑dollar pile of stainless.

In a interview, Leonard Polzin lays out that more than eight billion dollars’ worth of stainless steel is being installed in new and expanded dairy processing plants across the U.S., with some plants starting in early 2025 and others coming online over the following years, covering cheese, fluid, soft, and hard dairy products. 

Corey Geiger’s view from CoBank is that about eight billion dollars in new U.S. dairy processing investment is expected through 2026, and industry reports indicate that a large share of that is going into cheese and whey capacity.  Dykes told Dairy Forum in 2024 that more than $7 billion in dairy processing expansions were underway, and later coverage has raised that figure to over $11 billion when you extend the horizon a few more years and count additional projects. He links that investment directly to the protein opportunity. 

What I’ve found is that when you step back, you see three layers stacking:

  • Demand: GLP‑1 and protein‑focused diets plus sports and clinical nutrition.
  • Processing: a wave of new cheese and whey plants and expansions worth roughly eight billion dollars in this cycle.
  • Ingredients: continued shift from whey as a waste stream to whey as a core protein ingredient.

That’s a pretty big structural shift. The question is how much of it was built with your equity, and how much of it comes back as farm‑level pay price.

The Big Disconnect in the Milk Check

This is usually where the meeting room goes quiet: the space between whey’s ingredient value and what shows up in your milk cheque.

Most of the tools that touch your pay price—Class III formulas, many component programs, and a lot of co‑op base prices—are still built around commodity dry whey. USDA’s Dairy Market News for the Central region shows that through 2024, dry whey for human food often traded within a band from about 40 to 60 cents per pound, with “mostly” values often in the mid‑50s at times. Dry whey for animal feed typically sat lower, often in the high‑30s to low‑40s per pound. 

Those dry whey numbers feed directly into the Class III formula. That’s the part your milk cheque “sees.”

But in a lot of bigger cheese and whey plants—especially in those new Western facilities and in long‑standing ingredient complexes in Idaho and the Upper Midwest—the whey stream doesn’t stop at dry powder. Potable whey is being:

  • Concentrated into whey protein concentrates (like WPC‑80),
  • Further refined into whey protein isolates (WPI),
  • Sometimes split into more specialized fractions for infant formula, sports, and medical nutrition.
Ingredient / FormTypical Price Range (2024)What’s Included in Your Class III Formula?Market Margin vs. Commodity Dry Whey
Commodity Dry Whey (Human Food)$0.45–$0.60/lb✓ Yes—directlyBaseline (this is the “standard”)
Commodity Dry Whey (Animal Feed)$0.38–$0.42/lbLimited−12 to −18¢/lb vs. human food
Whey Protein Concentrate (WPC-80)$1.80–$2.40/lb✗ No—stays internal+$1.20–$1.80/lb over commodity dry
Whey Protein Isolate (WPI)$3.20–$4.50/lb✗ No—stays internal+$2.60–$3.90/lb over commodity dry
Specialized Fractions (infant formula, clinical)$4.00–$6.50/lb✗ No—not in formula+$3.40–$5.90/lb over commodity dry

Those ingredients sell at much higher per‑pound prices than bulk dry whey. Market research from MarkNtel and ingredient trade coverage show that high‑grade whey proteins typically command a multiple of whey powder prices, especially when export and sports demand are strong. 

Obviously, there are extra costs—membranes, energy, drying, quality systems, and marketing. But even after that, the margin between the dry whey value that goes into your formula and the finished ingredient values can be significant.

So the real question isn’t whether whey has value. It’s this:

  • When your co‑op or processor turns your whey into higher‑value ingredients, how much of that extra value comes back to you—and how much stays inside the plant and on the balance sheet?

That’s where co‑op finance and governance make all the difference.

How Co‑op Finance Shapes Who Wins in the Whey Boom

In many dairy co‑ops, the year‑end pattern looks something like this:

  1. The co‑op calculates its earnings and declares patronage refunds based on the volume or value of milk you delivered.
  2. A portion of those refunds is paid out in cash.
  3. The rest is retained as allocated member equity in your capital account.

Oklahoma State University Extension’s bulletin “Valuing the Cooperative Firm” lays this out neatly. In their sample, cash patronage ranged from about 21% to 70% of total patronage, with the rest retained as equity, and at least one co‑op paid as little as 15% in cash and 85% in equity.  In dairy, because plants are so capital‑intensive, it’s common—and OSU’s data supports this pattern—to see something in the ballpark of 20–30% of patronage paid as cash and 70–80% retained in some co‑ops, but there is no single standard. Policies vary widely by co‑op and over time. 

On top of that, most co‑ops use revolving equity. That means your retained patronage from a given year is supposed to be redeemed at some point in the future—either on a revolving schedule (oldest years first), at retirement, or a combination of both. USDA and extension guides emphasize that revolving timelines can range from a few years to decades, depending on each co‑op’s rules, performance, and board decisions. 

So when a board approves a major whey or cheese expansion, the financing stack often looks like this:

  • A chunk of debt from banks or bond markets.
  • A big share of retained member equity that’s already on the books.
  • Sometimes, new per‑unit retains or special capital assessments on current milk.

From a board’s perspective, this can be perfectly rational. They’re trying to keep the co‑op’s equity‑to‑debt ratio strong enough to make lenders comfortable, while leaving room for future projects.

From your perspective, sitting at the kitchen table with your lender, a few fair questions pop up:

  • If my retained equity helped build this plant, when does that investment realistically come back to my farm as cash?
  • When the whey and ingredients division has a strong year, does that show up as better cash patronage or faster equity redemption, or mostly as accelerated debt pay‑down and a stronger co‑op balance sheet?
  • Can I actually see how the whey and ingredients business is performing as its own line, or is it lumped into one big profit number?

It’s worth noting something simple that often gets glossed over: every dollar the co‑op retains is a dollar you can’t use this year to pay down your operating line, improve fresh cow facilities, or tweak ventilation and cow flow to protect butterfat performance in summer.

Research on European dairy co‑ops in specialty cheese and ingredient markets, summarized in global dairy sector reviews, has found that co‑ops with clear segment reporting and active member participation tend to maintain member trust and perform more steadily across market cycles than those with opaque structures.  Members in those systems may not love every decision, but they can see whether the whey or ingredients division is doing what it was supposed to do and how that performance connects to patronage and equity. 

Key takeaway for co‑op finance:
If whey and ingredient projects are funded heavily with member equity and the performance of those divisions isn’t clearly reported or tied to cash patronage and equity redemption, it’s very easy for ingredient value to get “stuck” at the co‑op level instead of showing up in your milk cheque.

That’s why transparency and structure matter just as much as stainless steel and membranes.

Whey Investments Can Pay Off—But Not Automatically

A fair question at this point is, “Do these whey investments actually pay back fast, or is that just a nice line in a PowerPoint?”

Several techno‑economic and “dairy biorefinery” studies have worked through the numbers on whey valorization—turning whey into higher‑value products instead of low‑value powder or waste. Reviews in journals like Foods and Journal of Environmental Management have concluded that whey is a promising feedstock for higher‑value ingredients and bioproducts and that, under favorable conditions—strong demand, good utilization, reasonable energy costs—those projects can deliver relatively fast payback compared with some other dairy investments. 

On the ground, I’ve noticed a pattern that fits that. Plants that bolt modern whey lines onto existing cheese operations often go through a bumpy “transition period”—membrane fouling, staffing issues, quality glitches. But once they settle in and run near design capacity, that whey-and-ingredients side often becomes one of the more attractive contributors to plant margins, especially when WPC‑80 and WPI exports are strong. 

But there are some real “ifs” here:

  • If energy is expensive in your region, it can eat into those margins fast.
  • If multiple plants in a region all add similar whey capacity at the same time, ingredient prices can soften just as everyone’s ramping up.
  • If milk supply is flat or constrained by environmental rules, permits, or cow numbers, it’s harder to hit the utilization rates the original models assumed.

So yes, whey projects can pay back relatively quickly when they’re sized well, run well, and markets cooperate. But they’re not automatic winners. And even when they do pay off at the plant level, it’s still an open question how that success is shared between the co‑op’s books and your farm’s balance sheet.

Where You Sit Depends on Who You Ship To

What farmers are finding is that their place in this whey story depends a lot on who they ship to and which region they’re in.

Ingredient‑heavy co‑ops and processors

In Wisconsin, Idaho, parts of Michigan and South Dakota, and now in the Texas Panhandle and eastern New Mexico, quite a few producers ship to co‑ops and private processors running big cheese and whey complexes. Those plants:

  • Turn a lot of milk into cheese.
  • Run modern whey lines making WPC‑80, WPI, and sometimes more specialized ingredients.
  • Sell into sports, clinical, and active‑nutrition markets that are still growing.

CoBank’s outlook suggests U.S. cheese capacity will grow by around 10% over a five‑year period, with whey processing expanding alongside it.  That means farms shipping into these systems—from the Upper Midwest to the High Plains—are sitting right on top of where much of the new ingredient value is being created. 

In those regions, the coffee‑shop conversation often sounds like, “I’m glad our co‑op is serious about ingredients and not stuck in 1985. I just wish I could see where that whey plant shows up in my patronage and equity.”

If that’s you, some smart questions include:

  • Does our co‑op report whey and ingredients as their own division with at least basic volume, revenue, and margin information?
  • In strong whey years, do we actually see that reflected in cash patronage or faster equity revolvement, or does most of the gain show up as lower debt and a stronger balance sheet?
  • Once the project has essentially hit the payback window we were shown, is there a plan to adjust patronage or redemption policies so more of the ongoing margin flows back to members?

More commodity‑ and fluid‑focused systems

In parts of the Northeast and Southeast, and in some smaller regional co‑ops, the product line is still heavily weighted toward fluid milk, butter, and nonfat dry milk. Whey may be in the mix as a commodity powder, but it’s not a big branded-ingredient business.

For those farms, the whey story sounds different:

  • Some co‑ops simply don’t have the scale or balance sheet to build and run their own WPC/WPI plants.
  • They may sell whey as basic dry whey, or explore joint ventures and toll-processing arrangements with ingredient specialists.
  • The strategic question becomes: do we move up the whey value chain, or do we double down on being a lean, low‑cost commodity producer?

In those systems, it’s worth watching:

  • Whether your co‑op is actively exploring partnerships that let members participate in some ingredient value without carrying all the risk.
  • Whether being a “commodity‑lean” co‑op is a conscious strategy with clear economics, or just the default because big ingredient projects feel too risky.

Quota systems, like in Canada

Under Canada’s supply‑managed system, milk is produced under quota, and national and provincial boards determine farm‑gate prices. That changes how the whey value shows up.

Canadian processors still capture value from cheese and whey ingredients, especially in export and specialty product niches. But farm revenue is much less tied to spot commodity swings and much more to regulated prices and pooled returns. In that context, whey value tends to affect processor health, competition, and long‑term investment capacity more than you see in day‑to‑day cheques.

So for many Canadian producers, the whey question sounds more like:

  • Are processors capturing enough ingredient value to stay financially healthy and keep investing in plants and products?
  • Is competition between processors strong enough to reward farms that invest in components, cow comfort, and better housing—whether that’s freestalls, tie‑stalls, or dry lot systems?

In places like New Zealand and parts of Europe, the picture is further shaped by emissions rules, subsidy structures, and trade agreements. But the core issue is the same: who gets the whey margin, and does the farm see enough of it to justify continuing to invest?

Questions That Actually Move the Needle in Co‑op Meetings

So what do you do with all this when you’re one member in a district meeting, trying to decide whether to stand up?

What I’ve found is that one or two well‑aimed, respectful questions will do more than a long speech. Here are three that line up well with what co‑op finance specialists and extension folks suggest.

Question to AskWhat It RevealsWeak Answer (Red Flag)Strong Answer (Green Light)Your Follow-Up Move
“How is this whey project being financed?”Mix of debt vs. member equity; equity leverage risk“We’re financing it the normal way” or vague numbers“60% bank debt, 40% member equity retained over 3 years; target debt-to-equity 50:50 post-payback”Ask: “When equity is fully retired, does the patronage policy change?”
“Will whey and ingredients be reported as their own division?”Transparency; whether co-op sees whey as core profit driver or afterthought“It’s in the consolidated number” or “We don’t break that out”“Yes—volume in tonnes, revenue, EBITDA margin, and narrative explaining performance vs. plan, starting next annual report”Follow-up: “What was last year’s volume and margin?” (tests if they have real data)
“What’s our patronage approach for higher-margin businesses?”Whether co-op evolves policies as projects mature; whether members benefit from success“We have a standard patronage policy; everybody gets the same”“We’re targeting 30% cash payout on whey division within 2 years of payback; board will revisit if equity targets are hit”Challenge: “Show me in writing how that ties to whey margin, not just total co-op earnings”

1. “How is this whey project being financed?”

Instead of “this feels risky,” you might ask:

  • Roughly what share of the capital is funded with debt from banks or bond investors?
  • How much is coming from retained member equity that’s already on the books?
  • Are there any new per‑unit retains or special capital assessments tied specifically to this project?
  • Once the plant is online, what equity‑to‑debt ratio is the board aiming for?

OSU Extension’s co‑op work stresses that you can’t really understand risk and return without knowing how much is coming from lenders versus members. If a project leans heavily on member equity, it’s natural to ask what the plan is for that equity to work back in your favour over time. 

2. “Will whey and ingredients be reported as their own business?”

More producers are starting to ask for segment reporting, not just a single, blended profit number.

That might look like:

  • A line in the annual report for “whey and proteins” or “ingredients.”
  • Simple, high‑level metrics: tonnes sold (or equivalent), revenue, and a margin range.
  • A short narrative each year explaining whether that division performed above or below expectations and why.

Studies of European dairy co‑ops suggest that groups with clearer divisional reporting and stronger member engagement tend to maintain trust and ride out downturns more smoothly.  When whey is clearly reported, members can see whether the business is working as promised. 

And I’ll say this as gently as possible: if your co‑op consistently refuses to share even basic performance information about a big new division like whey and ingredients, that’s telling you something about how it views member‑owners.

3. “What’s our patronage approach for higher‑margin businesses like whey?”

Lots of co‑op patronage policies were written in a world dominated by commodity milk, butter, and powder. Higher‑margin, capital‑intensive businesses like whey can behave very differently.

Good questions here include:

  • In years when whey and ingredients do especially well, is there room—within our financial targets—to increase the cash portion of patronage tied to that division?
  • Once the project has effectively paid for itself, has the board considered accelerating equity revolvement or increasing the cash share from that business, as long as equity and debt ratios stay healthy?
  • Could the board walk through a simple, realistic example of how a strong whey year would show up for a 200‑cow or 400‑cow member, both in cash and in equity?
Farm SizeAnnual Milk VolumeScenario A: Co-op Retains 100% (Zero Cash)Scenario B: Co-op Shares 50% of Whey Margin as Cash Patronage (+15¢/cwt)Scenario B Impact: Dollars Per Cow Per YearFarm-Level Decision Question
100-Cow Herd27,000 cwt/yr$0 additional cash+$4,050 annual cash+$40.50/cowWorth 3–4 parlour upgrades or a genetics consultant annual fee
250-Cow Herd67,500 cwt/yr$0 additional cash+$10,125 annual cash+$40.50/cowWorth deferring a major repair vs. doing it now; offsets half a veterinary rotation
500-Cow Herd135,000 cwt/yr$0 additional cash+$20,250 annual cash+$40.50/cowWorth a part-time employee’s wages for one season; meaningful debt service relief

To give that some scale, here’s an example you can scribble in your notebook:

  • Suppose the whey and ingredients division lifts overall co‑op margins by 30 cents per hundredweight in a given year.
  • If the board decides to pass half of that—15 cents per cwt—through as extra cash patronage:
    • A farm shipping 10,000 cwt/year would see about 1,500 dollars in additional cash.
    • A farm shipping 20,000 cwt/year would see about 3,000 dollars in additional cash.
  • At around 270 cwt per cow per year (about 27,000 pounds), that 15¢/cwt adds up to roughly 40 dollars per cow per year. On a 250‑cow herd, that’s in the neighborhood of 10,000 dollars.

That’s not going to buy a whole new parlour, but it might be the difference between putting off a key repair and finally doing it—or between feeling forced to stretch your line of credit and sleeping a little better.

Seeing It from the Board’s Side Too

To keep this fair, it helps to slide into the board chair for a minute and think about what directors and managers are juggling.

They’re dealing with:

  • Lender expectations. Co‑op lenders want to see strong equity and comfortable coverage ratios, especially when whey, cheese, and powder prices are volatile. 
  • Price and demand swings. CoBank’s work on whey markets has highlighted that strong demand periods can be followed by softer prices, especially when new capacity floods the market. 
  • Utilization risk. A plant designed for 90% utilization looks fantastic on the spreadsheet; at 65–70%, especially in regions where cow numbers are flat or environmental rules are tight, the economics change quickly. 
  • Future capital needs. Even if this whey project goes well, there are always other needs coming—dryer upgrades, cheese‑line modernization, wastewater and energy projects.

So when boards decide to retain a larger share of patronage during the early years of a big whey project, they’re often trying to keep the co‑op solid and bankable, not trying to short‑change members.

The tension comes when:

  • Retention policies don’t seem to evolve even after a plant appears to be past its payback window, or
  • Members don’t get enough information to judge whether their equity is being used well.

That’s why those three questions—about financing mix, segment reporting, and patronage for higher‑margin businesses—are so important. They help shift the conversation from frustration to shared problem‑solving.

Practical Moves for Your Farm Before the Next Wave of Stainless

With everything else on your plate—fresh cow management, labour, feed, keeping barns or dry lot systems in shape—it’s easy to shrug and say, “That’s co‑op stuff. I don’t have time for it.” But there are a few manageable steps that can put you in a much better spot without turning you into a full‑time analyst.

1. Really look at your co‑op equity statement

Start by grabbing your latest capital account statement:

  • How much total retained equity do you have?
  • How much of that has built up over roughly the last decade, during this wave of processing expansion?
  • Which patronage years are being revolved now, and what does the stated policy say about future revolvement?

Then sit down with your lender or adviser and look at that equity alongside your debt, age, and plans. OSU’s co‑op work points out that the value of co‑op equity depends heavily on your time horizon and the co‑op’s actual redemption practices.  For a 35‑year‑old with 400 cows, a strong equity balance with predictable revolvementcan look like an asset. For a 60‑year‑old with 100 cows, a big equity number with no clear path to redemption may feel more like trapped capital. 

2. Benchmark your all‑in price

Every year or so, it’s worth asking, “How do we actually compare?”

  • Calculate your average pay price per cwt (or per 100 litres) over the last 12–24 months, including both the cheque and any cash patronage you actually received.
  • Compare that with USDA mailbox prices or provincial benchmarks for your region. 
  • Quietly compare notes with one or two trusted neighbours who ship to other buyers, adjusting for components, quality, and hauling.

You’re not reacting to every ten‑cent blip. You’re looking for patterns. If, over time, your all‑in price is consistently 25–50¢/cwt behind similar herds, that’s 2,500–5,000 dollars on 10,000 cwt and 5,000–10,000 dollars on 20,000 cwt.That’s enough to matter when you’re trying to catch up on deferred maintenance or manage your operating line.

3. Take one or two good questions into your next meeting

You don’t have to take over the microphone. One or two clear questions can change the tone of a district meeting:

  • “Could the board give a simple overview of how our whey or ingredients division performed last year—rough volume, revenue, and whether it was on track with what we were told when we approved the project?”
  • “When we first discussed this whey plant, what kind of payback window were we shown, and based on what you’re seeing now, are we roughly in that range?”
  • “As this project matures and we hit the equity and debt ratios we’ve targeted, has the board discussed changing the cash portion of patronage tied to that division?”

Those are owner‑level questions. They show you’re engaged and thinking like an investor, not just a supplier.

4. Use the experts who already work for dairy farmers

There’s a lot of good help already in the system:

  • Ask your university or provincial extension folks if they’ll run a winter session on whey markets, co‑op financials, and how processing investments connect to milk pricing. 
  • Encourage your co‑op to invite its primary lender or a co‑op finance specialist to member meetings to explain how they look at equity, debt, and project risk around cheese and whey plants.
  • If your region has a co‑op development center or a similar organization, consider bringing together a small group of members to sit down with them and discuss governance tools and best practices.

These people see multiple co‑ops and processors. They know what “normal” looks like and where the outliers are, and they can help translate that into plain language.

The Bottom Line

So why spend this much energy thinking about whey when you’ve got cows to breed, feed to buy, and a to‑do list that never seems to shrink?

Because this isn’t just another short‑term price swing. The combination of:

  • GLP‑1 weight‑loss drugs are pushing a significant share of consumers toward fewer calories but more protein‑dense foods
  • Strong, still‑growing global demand for whey protein, with the market projected to nearly triple from 6.5 billion dollars in 2023 to 19.2 billion by 2030
  • And solid clinical evidence that whey helps older and medically vulnerable people maintain muscle and function

…all point toward durable demand for high‑quality dairy protein.

At the same time:

  • The spread between commodity dry whey and higher‑value whey proteins is large enough to change plant economics materially.
  • More than eight billion dollars in new processing capacity—a big chunk of it in cheese and whey, including major builds in the Texas–New Mexico corridor and the Upper Midwest—is being built or expanded in this cycle. 
  • And both techno‑economic research and real plant experience suggest that, when they’re sized and run well, whey investments can be among the quicker‑paying projects in a processor’s portfolio.

Those are the big structural forces. What’s still very much in our hands, as producers and co‑op members, is how those whey projects are financed, how their performance is reported, how patronage is structured, and how actively we choose to engage in those decisions.

There’s no one right answer. A 2,000‑cow dry lot in the Texas Panhandle, a 600‑cow freestall in Ontario, and a 120‑cow tie‑stall in Vermont are going to make different calls on risk, equity, and time horizon. But producers who:

  • Understand their co‑op’s equity structure,
  • Know where their all‑in price sits relative to neighbours and benchmarks,
  • And are willing to ask a few focused questions in the right rooms,

They are in a much stronger position to decide what this whey boom means for their own operation.

What’s encouraging is that we’re not starting from scratch. We’ve got solid data, extension specialists who understand both cows and co‑ops, lenders who will explain their thinking if we ask, and real‑world examples—here and overseas—of co‑ops and processors that have handled big investments in ways that kept both plants and farms healthy.

The opportunity now is to bring that same level of clarity and shared purpose to this “whey moment,” so that ten years from now we’re not just proud of the shiny stainless on plant tours—we’re also standing in barns and dry lot systems we’re proud to hand on to the next generation.

Key Takeaways:

  • US$8B in stainless, coming fast: New cheese and whey plants from Wisconsin to the Texas Panhandle are adding ~360 million pounds of cheese capacity by the end of 2025—with whey protein lines riding alongside.
  • Whey demand is structural, not hype: GLP-1 drugs and protein-obsessed consumers are pushing the global whey market from US$6.5B (2023) toward US$19.2B by 2030—a near tripling in seven years.
  • Your formula doesn’t capture the real value: Class III still prices whey at commodity dry whey levels (40–60¢/lb), while WPC-80 and WPI sell at multiples of that.
  • Co-op structure determines whether you ever see that margin: cash patronage splits range from 15–70%; equity can take years or decades to turn. If whey isn’t reported or tied to patronage, the value often stays parked on the co-op balance sheet.
  • Bring three questions to your next meeting: (1) How is this project financed—debt vs. member equity? (2) Will whey be reported as its own division? (3) When whey margins are strong, does cash patronage or redemption actually improve?

Complete references and supporting documentation are available upon request by contacting the editorial team at editor@thebullvine.com.

Learn More

The Sunday Read Dairy Professionals Don’t Skip.

Every week, thousands of producers, breeders, and industry insiders open Bullvine Weekly for genetics insights, market shifts, and profit strategies they won’t find anywhere else. One email. Five minutes. Smarter decisions all week.
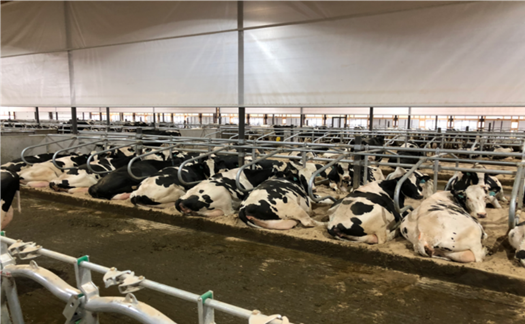
NewsSubscribe
First
Last
Consent

Tariffs Cost Dairy Farmers $2.6 Billion Last Time. You’ve Got 60 Days Before It Hits Again.

Tariffs stripped $2.6B from dairy farms last time. Use the next 60 days—or your milk check will make the decision for you.

Executive Summary: Tariffs stripped an estimated 2.6 billion dollars from U.S. dairy farms during the last China trade war, and today Mexico alone buys about 29 percent of all U.S. dairy exports while relying on the U.S. for more than 80 percent of its imported dairy. Using current data from USDA‑FAS, USDEC and CoBank, the article shows how that dependence on a few big buyers turns Washington’s tariff tools into direct Class III and milk‑check risk for every herd tied to cheese, powder, and whey markets. China’s experience—export value dropping to 377 million dollars and whey shipments collapsing 69 percent after retaliatory tariffs—illustrates how fast demand can vanish and how slowly it comes back once buyers switch to competitors like the EU. Against that backdrop, the piece lays out a plain‑spoken 60‑day decision window: put two price scenarios on paper, meet once with your co‑op and once with your lender, and use USDA/extension guidance to decide how DMC, LRP‑Dairy, and succession timing fit your risk tolerance. Written in a peer‑to‑peer, “over coffee” voice, it gives progressive dairy producers a clear, credible playbook to manage tariff risk before their milk check makes the decisions for them.

You know, if we were sitting down over coffee at World Dairy Expo or at a winter meeting in Ontario, with producers from Wisconsin freestalls, New York tiestalls, and California dry lot systems all at the table, I’d probably start with this: all the talk about presidential “emergency” tariff powers might sound like it belongs in Washington, but the impact doesn’t stay there. It flows through export channels and, sooner than most of us would like, it shows up in the milk check you’re depositing at home.

In early 2025, President Donald Trump signed executive orders imposing 25 percent tariffs on most goods from Mexico and Canada and 10 percent on goods from China, creating fresh uncertainty for U.S. dairy exporters and the farms that ultimately depend on those markets. Cornell University’s Charles Nicholson, Ph.D., an adjunct associate professor in the Charles H. Dyson School of Applied Economics and Management, told the Dyson Agricultural and Food Business Outlook conference that “if you pick a trade fight with our major export destinations… that has some substantive negative implications for dairy farms and processors”. What really made people sit up was his estimate that Chinese retaliatory tariffs alone cost U.S. dairy farms about 2.6 billion dollars in lost revenue from 2019 through 2021. 

What’s interesting here is that this isn’t just a policy debate. It’s about timing, concentration risk, and how much room you’ve got to maneuver before that next shock hits your milk price.

Let’s walk through what the data actually shows.

Looking Back: What 2018–2019 Really Taught Us

Looking at this trend, the 2018–2019 tariff period remains the clearest case study we’ve got on how quickly things can change.

On the Mexico side, USDA’s Foreign Agricultural Service published a GAIN report in June 2018 showing that Mexico responded to U.S. steel and aluminum tariffs with retaliatory tariffs on a range of U.S. products, including multiple cheese tariff lines. That report laid out how certain U.S. cheese categories were hit with new tariff rates starting June 5, 2018, and then increased again on July 5, with some lines moving into the 20–25 percent range depending on the specific HS code. That shift happened in a matter of weeks, not years. 

On the China side, the U.S. Dairy Export Council tracked the fallout as Beijing rolled out its own retaliatory measures. Cheese Reporter, summarizing USDEC’s January 2020 export review, noted that for the 12 months from December 2018 through November 2019, the value of U.S. dairy exports to China totaled about 377 million dollars—a roughly 47 percent decline from the prior 12‑month period. That’s a big haircut on a single key market. 

In an April 2025, after China imposed a 20 percent retaliatory tariff on U.S. dry whey in 2018, U.S. dry whey exports to China dropped 69 percent from their April 2018 peak to their February 2020 low, measured on a 12‑month rolling basis. That’s not just noise; that’s a major demand hole for a key by‑product that helps pay the bills in a lot of cheese and whey plants. 

As many of us have seen, once those kinds of volumes start moving, they don’t necessarily come back quickly. And if you wait to react until your milk check clearly reflects the problem, you’ve already given up most of your best options.

Mexico: Our Best Customer… and a Big Point of Exposure

You probably know this already, but the more recent numbers really drive home how central Mexico has become to U.S. dairy.

Citing USDA‑FAS data, it was reported that by September 2024, Mexico’s purchases accounted for 29 percent of all U.S. dairy product exports on a value basis. That same piece noted that the United States supplied Mexico with over 80 percent of its imported dairy products in 2024. So from Mexico’s side, the U.S. is the dominant supplier. From the U.S. side, Mexico accounts for close to a third of dairy export value. 

CoBank’s December 2024 report, “Mexico Has Become America’s Most Reliable Customer for U.S. Dairy Exports,” put it into milk terms. Their analysts calculated that Mexico purchases the equivalent of about 4.5 percent of total U.S. milk production through imported dairy products and ingredients. Corey Geiger, CoBank’s lead dairy economist, noted that Mexico runs a dairy product deficit of roughly 25–30 percent each year, and that the U.S. supplies over 80 percent of that shortfall. 

USDA‑FAS projections reinforce the idea that this isn’t going away overnight. In its May 2025 “Dairy and Products Semi‑annual – Mexico” report, FAS forecast Mexico’s fluid milk production to increase about 1 percent to 13.9 million metric tons in 2025 and projected similar modest growth in consumption. That same report highlighted that processors are expected to increase milk powder imports as they continue to favor lower‑cost raw materials for manufacturing. 

What the data suggests is an asymmetric relationship:

  • For Mexico, U.S. dairy is the dominant source of imports, but those imports sit on top of a large and growing domestic production base. 
  • For the U.S., Mexico is the single largest export destination—accounting for around 29 percent of total dairy export value and a major share of cheese, powder, and other products. 

So when CoBank calls Mexico “America’s most reliable customer” for U.S. dairy exports, they’re leaning on hard numbers. But Nicholson’s warning comes back into focus too: if trade tools get used aggressively and provoke retaliation in a market that important, the downside for U.S. dairy farms and processors is substantial. 

Key Numbers Worth Knowing

Looking at the numbers pulled together by USDA‑FAS, USDEC, and CoBank, a few datapoints really frame the risk:

  • Mexico’s share of U.S. dairy exports: about 29 percent by September 2024, based on USDA‑FAS trade data. 
  • U.S. share of Mexico’s dairy imports: over 80 percent of imported dairy products in 2024, per USDA‑FAS data reported by CoBank. 
  • Share of U.S. milk exported to Mexico: roughly 4.5 percent of U.S. milk production equivalent, according to CoBank’s 2024 analysis. 
  • U.S. dairy export value to China (Dec 2018–Nov 2019): about 377 million dollars, a 47 percent decline from the prior 12‑month period, per USDEC numbers reported by Cheese Reporter. 
  • Dry whey exports to China: a 69 percent drop from the April 2018 peak to the February 2020 low on a 12‑month rolling basis after China imposed a 20 percent retaliatory tariff, as documented by Hoard’s Dairyman. 
  • Estimated U.S. dairy farm revenue loss from China tariffs (2019–2021): about 2.6 billion dollars, according to Nicholson’s analysis cited by Cornell. 

Those numbers alone explain why tariff talk matters to your bottom line, even if all your cows are standing in a barn thousands of miles from the border.

China’s Lesson: When Demand Doesn’t Fully Come Back

Now let’s swing back to China, because what happened there is a warning about long‑term demand, not just short‑term pain.

USDEC’s review, as quoted in Cheese Reporter’s 2018–2019 tariff lessons column, showed that by 2017–2018, China had grown into a key destination for U.S. dairy—especially whey and other ingredients. Then the retaliatory tariffs hit. As mentioned earlier, USDEC’s tally showed the value of U.S. dairy exports to China fell to about $ 377 million in the 12 months from December 2018 through November 2019, a 47 percent drop from the previous year. 

2025 whey analysis dug deeper into the ingredient side. With a 20 percent retaliatory tariff on U.S. dry whey, exports to China dropped 69 percent from that April 2018 peak to a February 2020 low, using a rolling 12‑month comparison. During that period, it was noted that Chinese buyers shifted toward more EU dry whey, which wasn’t facing the same tariff penalty. 

Nicholson and other trade economists have pointed out that once buyers qualify alternative suppliers and re‑tool supply chains, not all of that business returns when tariffs ease or exemptions appear. A two‑ or three‑year disruption can change the growth path of a market for much longer than that. 

For U.S. producers, the key lesson is simple: when tariffs push a major buyer to diversify, some of that lost demand can become permanent.

So, Where Does This Leave Your Farm?

So, with all of that in mind, what does this actually mean when you walk back into your parlor or robot room?

First, it means export exposure is real, whether you’ve ever thought of yourself as an “export farm” or not. If your milk goes to a cooperative or processor that makes cheese, nonfat dry milk, whey, or other export‑oriented products, then pieces of your check are indirectly tied to people buying pizza in Mexico City or feed products in Asia. The concentration numbers—Mexico taking 29 percent of U.S. dairy export value and importing the equivalent of 4.5 percent of U.S. milk output—make that pretty clear. 

Second, it means that when tariffs and trade headlines start moving from talk to action, you don’t have unlimited time to react. The 2018–2019 episode showed that retaliatory moves can go from announcement to significantly lower export values in less than a year, and in the case of whey, the effect on shipments was both steep and persistent. That’s why thinking in terms of a “window” makes sense—there’s a period where you can still get ahead of it. 

Third, it means that planning and conversations matter as much as any single policy announcement. And that part’s under your control.

Questions to Bring to Your Co‑op or Buyer

Looking at this trend, one of the healthiest shifts in the last few years is that more producers are asking pointed, respectful questions about how their milk buyer is positioned.

For co‑op members in the Upper Midwest, for example, where a lot of milk heads into cheese vats, it’s worth asking your board or management:

  • Roughly what share of our milk is going into export‑oriented products like cheese, skim milk powder, and whey, given the national export patterns CoBank and USDEC have outlined? 
  • During the 2018–2019 tariff period, how did our average pay price compare to other buyers in our federal order—were we generally ahead, behind, or about in the pack?
  • What kinds of tools does the co‑op use today—hedging, product diversification, long‑term contracts—to buffer members from sudden export demand shocks?

If you’re shipping to a proprietary plant in Idaho or California that sells into both domestic and export markets, the questions are similar. You’re not trying to tell them how to run the business; you’re trying to understand how your farm fits into their risk picture.

Industry groups like the Wisconsin Cheese Makers Association have recently highlighted how trade tensions and export barriers shape decisions at cheese and whey plants, including product mix and market focus. Those kinds of articles make good conversation starters and show that processors are thinking about this, too. 

And I’ve noticed that when producers come to meetings with numbers and questions rather than just frustration, the conversation usually improves for everyone.

Sitting Down With Your Lender Before There’s a Fire

What many lenders have said in interviews with dairy media and farm‑management educators is pretty consistent: the best conversations happen before there’s a cash‑flow emergency. 

You don’t need perfect forecasts to have a useful meeting. What you do need are a few grounded scenarios you can walk through together:

  • One based on today’s outlook, using current futures and your local basis.
  • One that assumes a noticeable softening in prices for six to twelve months—something that would squeeze margins but not necessarily be catastrophic.

You might not know all your ratios off the top of your head, but you can bring a simple printout or spreadsheet with you:

  • Herd size and average production per cow.
  • Your recent butterfat performance and component levels.
  • Rough cost per hundredweight from your last farm financial review.
  • Current term debt schedule and operating line limits.

Then you can ask very practical questions:

  • “If prices moved into this softer scenario for half a year, what would you want to see from us to stay comfortable with our operating line?”
  • “Are there any term loans we could look at restructuring in advance to give us more breathing room on cash flow if things get choppy?”

Farm Credit associations and other ag lenders often publish their own dairy outlooks and risk‑management articles, and university extension programs pick them up and discuss them. Skimming one or two of those ahead of time can help you frame what your lender is already worrying about. 

What’s encouraging is that lenders generally don’t expect perfection. They expect awareness and a plan.

Thinking About Risk Tools Without the Sales Pitch

Programs like Dairy Margin Coverage and Livestock Risk Protection are designed for exactly the kind of volatility we’re talking about.

USDA’s Farm Service Agency has documented how DMC payments supported participating farms during the margin collapses of 2020, especially for operations that chose higher coverage levels up to the Tier I cap of 5 million pounds per year at 9.50 dollars per hundredweight. USDA’s Risk Management Agency, in its LRP‑Dairy materials, explains how producers can buy coverage on expected milk prices for specific months, with indemnities paid when actual index values fall below the coverage level, allowing smaller‑volume coverage than traditional futures or options. 

The data and case examples shared by land‑grant extension programs—like those from UW–Madison, Penn State, and Ohio State—suggest these tools tend to work best when they’re part of a thought‑out risk plan rather than a last‑minute scramble. Extension economists and dairy business management specialists have walked through examples of aligning DMC coverage with the cost of production and using LRP‑Dairy selectively on a portion of milk to cover the riskiest months. 

So instead of treating these programs as “nice extras” or something you only look at when prices are already ugly, it’s worth asking yourself:

  • “Given my cost structure and butterfat performance, how much downside can I realistically ride out on my own?”
  • “Beyond that point, what portion of my milk do I want to insure, and with what mix of tools that I actually understand?”

Your local extension educator, FSA staff, and crop insurance agent can help you look at USDA summaries of past payouts and current premium tables so you’re making decisions based on numbers, not anecdotes.

If Exit Is on the Horizon, Timing Still Matters

This is a tough topic, but it’s part of the real conversation on a lot of farms, especially in regions like the Northeast and Upper Midwest, where farm numbers have been under pressure for years.

In some operations—where the next generation is unsure about taking over or where the main operators are dealing with health issues—the question isn’t just “how do we ride out another tough year?” It’s also “if we’re going to be done sometime in the next five to ten years, when and how do we want that to happen?”

Cull cow and bred heifer prices have gone through stronger periods recently, supported in part by tighter beef supplies and the growing use of beef‑on‑dairy genetics, which can improve the value of crossbred calves and cull animals. Farm‑management articles and extension transition resources from universities in Wisconsin, Pennsylvania, and Ontario have noted that planned dispersals in reasonably firm cattle markets often preserve more equity than forced liquidations after prolonged low‑margin periods and mounting debt, based on farm case studies and lender feedback. 

The exact dollars will vary herd by herd. But the pattern is consistent enough that it’s worth a kitchen‑table discussion if you’re in that stage:

  • “If we did decide to exit in the next few years, what conditions—milk price, cattle price, debt level—would make that feel like a planned move rather than a last‑ditch sale?”
  • “What level of equity do we want to protect for the family, whether that’s land, retirement savings, or off‑farm investments?”

Extension farm‑transition specialists have checklists and meeting templates that can help you structure those conversations and bring everyone into the loop before circumstances force decisions. 

It Might Not Be 2018–2019 All Over Again… But It’s Worth Being Ready

It’s worth noting that not every tariff scare becomes a full‑blown crisis.

USDA‑FAS’s 2025 outlook for Mexico shows continued growth in domestic dairy production and ongoing demand for imported powders and cheese, even in the face of broader trade tension. CoBank’s analysis frames Mexico as a structurally reliable customer for U.S. dairy, given its persistent deficit and heavy reliance on the U.S. supply. Trade press coverage has also highlighted that some announced tariff measures end up delayed, modified, or partially offset by exemptions and side deals, which can soften the blow for agriculture.

What’s encouraging is that the U.S. dairy sector has adapted to shocks before. Exporters have shifted product mixes and markets, processors have invested in new capabilities, and producers have improved fresh cow management, feed efficiency, and overall cost control in response to tough years. That doesn’t mean it’s easy; it means it’s possible. 

At the same time, the data from the last tariff cycle—and Nicholson’s 2.6‑billion‑dollar loss estimate—are a reminder that when major markets pull back, the financial damage can be both large and long‑lasting. That’s why this isn’t about predicting doom; it’s about deciding how you want to be positioned if the road gets rough. 

A Simple 60‑Day Framework You Can Actually Use

MetricCurrent OutlookSofter Scenario (6–12 mo)Change
Class III Milk Price ($/cwt)$18.50$16.00–$2.50
Butterfat Premium ($/lb)$2.10$1.85–$0.25
Feed Cost per Cow/Day$9.25$9.50+$0.25
Est. Margin per Cow/Day$3.20$1.15 ⚠️ RED–$2.05

So, over the next couple of months, here’s a straightforward way to put all this into practice without turning it into a full‑time project.

  1. Put two price scenarios on paper.
    Use your own numbers—your butterfat performance, average production per cow, and local basis. Start with something close to today’s outlook based on current futures. Then sketch a second scenario in which prices are meaningfully softer for 6 to 12 months. You don’t need to be perfect; you just need to see roughly where cash flow turns from positive to negative and what that looks like in dollars per month.
  2. Take those scenarios to one meeting with your co‑op or buyer.
    At a member meeting in Wisconsin, a one‑on‑one with a field rep in New York, or a call with a plant in the West, use the Mexico and China numbers as a backdrop and ask: “If export markets got choppy like they did in 2018–2019, how would that likely show up in our pay price, and what options would you have beyond just dropping the check?” Co-op and processor leaders have been talking publicly about trade risk and export barriers in venues like the Wisconsin Cheese Makers Association and national dairy policy forums—referencing those discussions shows you’re paying attention. 
  3. Take the same scenarios to one meeting with your lender.
    Sit down with your banker or Farm Credit officer and say: “Here’s what our cash flow looks like at these two price levels. If the softer scenario showed up for half a year, what would you want to see from us to stay comfortable? Are there things we could adjust now to give both of us more confidence?” Dairy‑focused lenders interviewed by farm media and extension often point to debt‑service coverage, working capital, and equity as the main gauges they watch. Ask them which ones they’re watching on your operation. 
  4. Ask good questions about risk tools.
    With your extension educator, FSA office, or insurance agent, walk through how DMC and LRP‑Dairy actually performed in 2020 and other recent years for farms your size, using USDA and extension summaries as your guide. You’re not committing on the spot; you’re making sure you understand what they can realistically do for your operation and the costs involved. 
  5. If succession or retirement is a live topic, name the “trip wires.”
    If the family’s talked about being “done at some point,” put rough thresholds on paper—maybe a certain milk price, debt‑to‑asset ratio, or cattle value—and discuss at what point a planned exit might be better than pushing through at any cost. Extension farm‑transition specialists and case studies from Wisconsin, Pennsylvania, and Ontario can give you examples of how other families have navigated those choices. 

None of this requires you to guess which tariff will be announced next or how Mexico or China will respond. It just puts you in a better position to decide, rather than react.

Closing Thoughts: Deciding While You Still Have Room

As many of us have learned, nobody—whether it’s USDA, USDEC, your co‑op, or your lender—has quite the same focus on your farm’s future as you do. They all bring tools and information to the table, but they’re looking across hundreds or thousands of farms, not just yours. 

What’s encouraging is that you don’t need to control court decisions, trade negotiations, or election outcomes to tilt the odds a bit more in your favor. You can use this “60‑day window” idea as a reminder: there is a period between policy talk and milk‑check pain where you still have room to adjust your plan.

If things stay relatively calm, you’ll have invested some time in understanding your operation better and strengthening relationships with the people who help finance and market your milk. If tariffs and trade disputes start biting into exports again, you’ll be glad you didn’t wait for your milk statement to tell you there was a problem.

Because once the damage is printed on that check, you’re not really deciding anymore. You’re reacting.

Right now, you still have room to decide.

Key Takeaways

  • $2.6 billion lost: Chinese retaliatory tariffs alone cost U.S. dairy farms an estimated $2.6B in revenue from 2019–2021, per Cornell economist Charles Nicholson. ​
  • 29% in one market: Mexico buys about 29% of all U.S. dairy exports and relies on the U.S. for over 80% of its imported dairy—one trade dispute could ripple through the entire sector. ​
  • Demand doesn’t snap back: After China imposed 20% tariffs on U.S. dry whey, exports dropped 69% and buyers shifted to the EU; much of that volume never fully returned. ​
  • You have a 60-day window: From tariff announcement to milk-check impact is roughly 60–90 days—enough time to run price scenarios, schedule one meeting each with your co-op and lender, and review your DMC/LRP position.
  • Decide now or your check decides later: Farms that act in the window keep their options open; farms that wait until the damage prints are already reacting instead of choosing.

Complete references and supporting documentation are available upon request by contacting the editorial team at editor@thebullvine.com.

Learn More

The Sunday Read Dairy Professionals Don’t Skip.

Every week, thousands of producers, breeders, and industry insiders open Bullvine Weekly for genetics insights, market shifts, and profit strategies they won’t find anywhere else. One email. Five minutes. Smarter decisions all week.
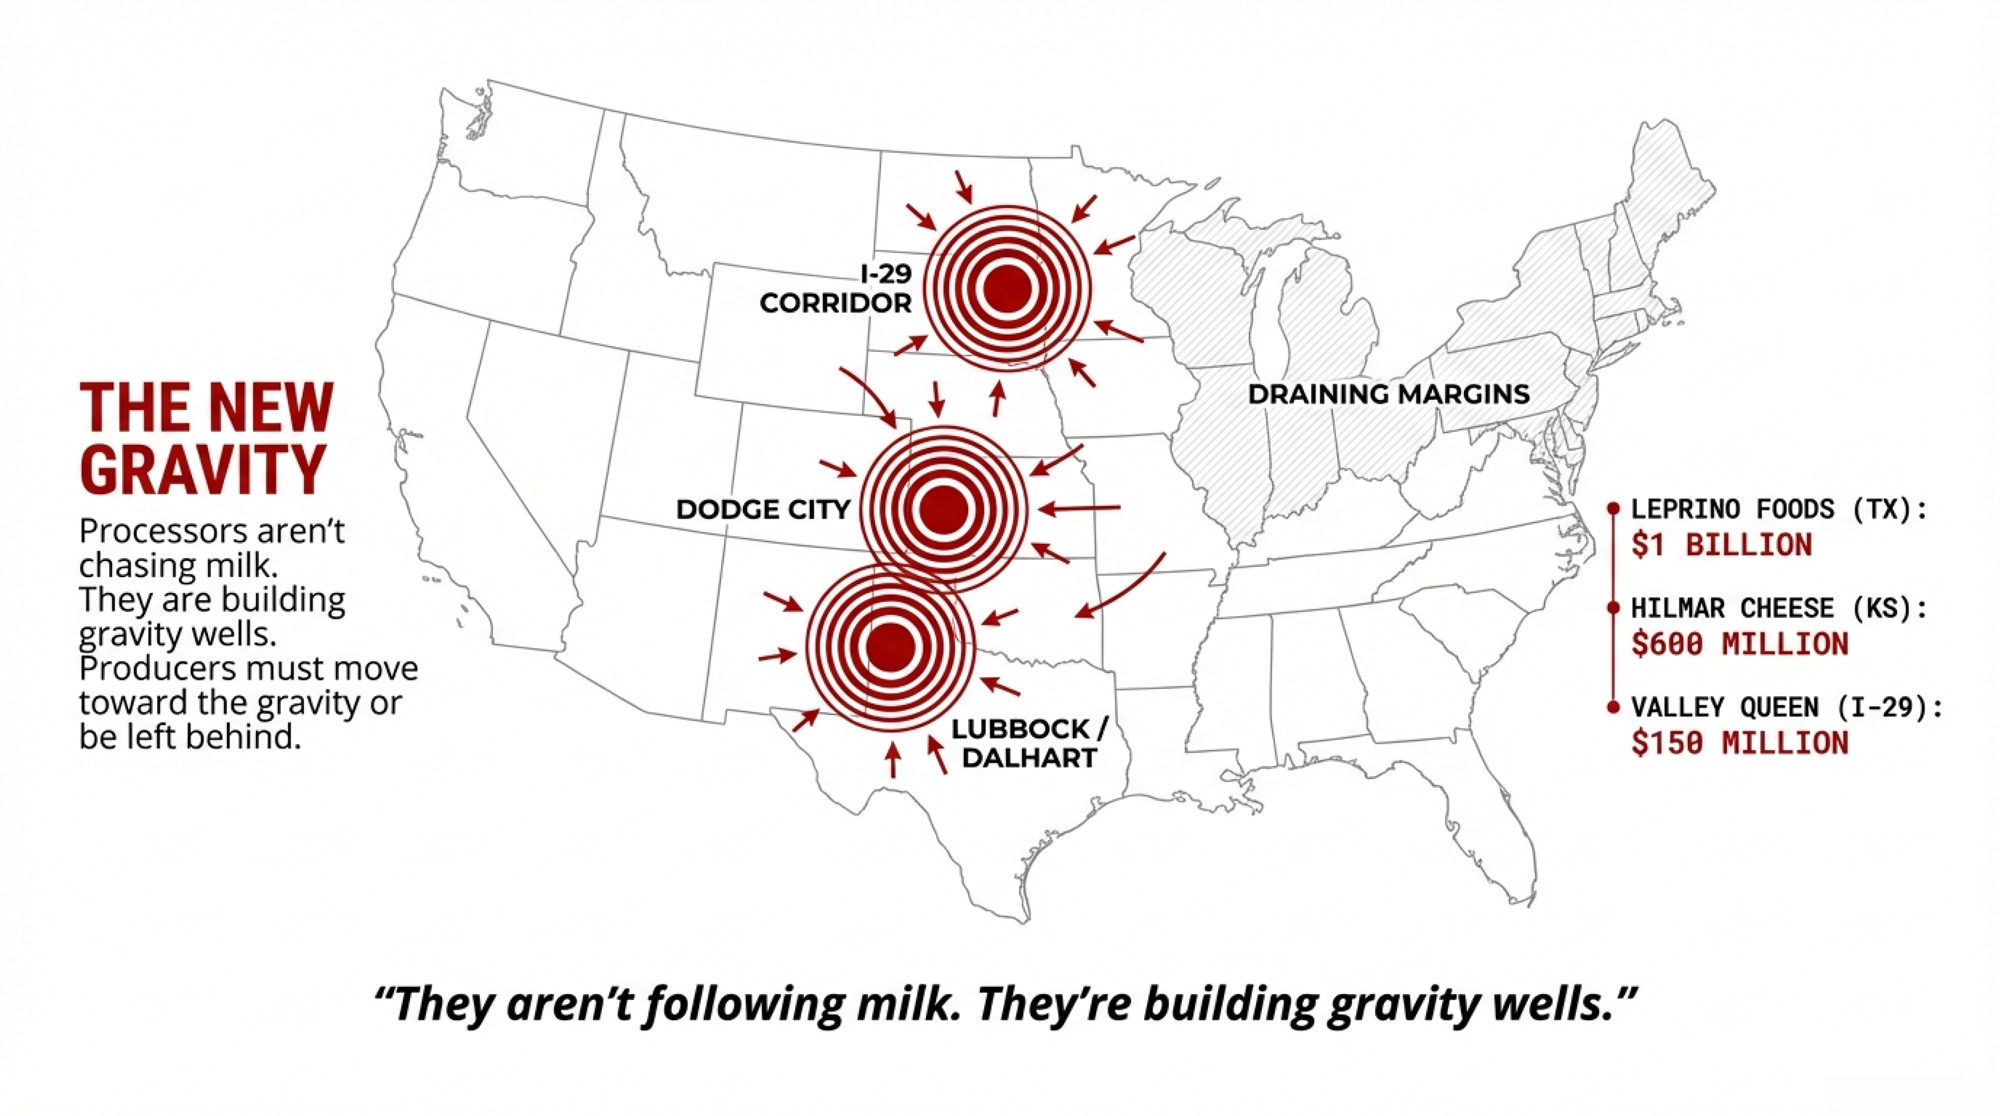
NewsSubscribe
First
Last
Consent

6% Milk at Costco, 4.0% in Your Tank: Who’s Getting the $50,000 Butterfat Premium – You or Your Processor?

Costco is selling 6% milk. Your tank’s butterfat is over 4.0%. So who’s actually getting the $50,000 premium—your farm, or your processor?

Executive Summary: In 2024, U.S. bulk‑tank butterfat is on track to clear 4.0% every single month, according to USDA data showing annual averages rising from about 3.7% a decade ago to over 4.1% today. At the same time, component markets now pull close to 60% of milk check income from butterfat, per‑capita butter consumption has climbed to a record 6.8 lb, and organic fluid milk volumes have grown nearly 70% since 2010—all strong signs that the market will pay for fat when it’s packaged and positioned properly. This article uses Amul’s new 6% milk at Costco and Alexandre Family Farm’s 6% regenerative organic A2 milk to show how processors and brands are already turning rich milk into high‑margin products. For a 120‑cow herd averaging 80 lb at 4.2% fat, the math is straightforward: moving just 5% of your volume into the right premium channel can conservatively add about $50,000 a year, or roughly $400 per cow, if you control the story and the contract. From there, the piece lays out a clear playbook—component income audits, smarter conversations with co‑ops about where your milk really goes, tightly scoped premium milk trials, and breeding/feeding plans aligned with realistic markets—for small, mid‑size, and large herds. The core takeaway is uncomfortable and straightforward: in a 4.0% butterfat world, the question isn’t whether rich milk will sell, it’s whether the butterfat premium ends up on your milk check or on someone else’s.

You know that feeling when you walk past the milk case, and something just doesn’t look like the “usual” gallon? That’s been happening a lot lately with one particular jug: Amul Gold – 6% butterfat milk – sitting in U.S. Costco coolers.In March 2024, Michigan Milk Producers Association (MMPA) inked a deal with Gujarat Cooperative Milk Marketing Federation (GCMMF), the massive Indian co‑op behind the Amul brand, to supply Amul‑branded fresh milk in the U.S., with MMPA providing the milk and processing and Amul handling the marketing and brand. In MMPA’s own Milk Messenger article “The Taste of Home,” the co‑op lays out the product line: Amul Gold at 6% milkfat, Shakti at 4.5%, Taaza at 3.25%, and Slim ‘n’ Trim at 2%, all bottled at Superior Dairy in Canton, Ohio, which MMPA acquired through its 2021 purchase of Superior’s parent company to expand extended‑shelf‑life and value‑added capacity.

Indian coverage, including the Times of India and GCMMF’s own press release, describes how Amul Gold’s U.S. launch in 2024 put 3.78‑liter (1‑gallon) jugs of 6% milk into Costco stores on the East Coast, with plans to expand into hundreds of warehouses. You can see the product yourself in Costco’s same‑day grocery listings as “Amul Gold 6% Fat Milk 1 Gal.”

On the surface, it’s just another SKU. What’s interesting here is that this high‑fat jug showed up right as three big forces were already shifting under your feet: your cows’ butterfat performance, consumer demand for milkfat, and school milk policy.

Your Butterfat Has Quietly Gone to the Next Level

If you look back a decade, you’ve probably felt it in your own bulk tank: butterfat is not what it used to be. USDA component data showed that from 1966 through 2010, the national average butterfat held within a narrow 3.65–3.69% band. Starting in 2011, things began to change. From 2011 to the present, U.S. bulk‑tank butterfat has increased from 3.70% to 4.15% annually, reaching 4.06% in 2022 and 4.15% in 2023—each year a new record. They described it as U.S. dairy finally earning a “4.0‑plus GPA” on butterfat.

The seasonal detail is important. In 2022 and 2023, some warm‑weather months still dipped just under 4.0%; July 2023, for example, averaged 3.99% fat. In 2024, that last “holdout” disappeared when July came in at 4.07% butterfat. Reports showed that 2024 isn’t fully “in the books” yet, but based on long‑term seasonal patterns, the 4.07% in July is likely the low point, meaning every month of 2024 lands at or above 4.0% for the first time on record.

You see the same pattern up close in regional data. In the Mideast Federal Order (FO 33), covering Ohio and parts of surrounding states, the January 2024 bulletin shows 2023 producer milk averaging 4.06% butterfat and 3.22% protein, with monthly butterfat ranging from 3.91% in July to 4.25% in December. Regional butterfat variation shows several orders in the Upper Midwest and Pacific Northwest now averaging over 4.0% butterfat on an annual basis, not just in the cool months.

On the ground, that lines up with what many of us hear in barns and on service calls. In Wisconsin operations and other Upper Midwest freestall herds, it’s become pretty normal to see Holstein bulk tank butterfat in the low 4% range and protein just above 3.2% when fresh cow management, the transition period, and cow comfort are all dialed in. Those numbers match the Federal Order averages. Out west and in the Pacific Northwest, extension and breed statistics often show Jersey herds averaging in the high 4s for butterfat, and field reports from Jersey and Jersey‑cross dry lot systems and grazing herds in California and the PNW frequently mention herd tests in that high 4% range when rations and dry cow programs are tuned for components.

Genetics are pushing in the same direction. In its April 2025 update, the Council on Dairy Cattle Breeding (CDCB) adjusted the Net Merit index to place greater emphasis on fat yield and slightly less on protein yield, while increasing the weight on health and efficiency traits such as productive life and disease resistance. CDCB and USDA’s Animal Genomics and Improvement Laboratory outlined these changes as part of the 2025 index revision, and analysts summaries made it clear that solids as a whole still drive the index, but the tilt has moved more toward butterfat to reflect current price relationships.

So, what farmers are finding is that butterfat performance has already moved up a full notch. Between genetics, better fresh cow management, improved transition protocols, and more attention to cow comfort in freestalls, robots, and even dry lot systems, your bulk tank is richer than it was ten years ago. Amul Gold just happens to be one of the first big retail labels to shout “6%” from the cooler.

Why Plants Keep Skimming Cream Instead of Bottling 6%

Now, if you flip the cap around and look at this from inside the processing plant, some of the decisions that frustrate us on the farm side start to make more sense.

Most fluid plants are built around standardization. Milk comes in at whatever butterfat level your cows produce that day—often north of 4.0%. The plant uses separators and blenders to standardize “whole milk” to 3.25% butterfat, set 2% and 1% at their proper levels, and strip out the excess cream. That cream becomes butter, whipping cream, and other fat‑rich products that flow through established channels.

From a processor’s standpoint, there are some solid reasons to stick to that routine:

  • Labeling and consistency. Keeping whole milk at 3.25% keeps labeling consistent and straightforward across huge volumes.
  • Cream as a revenue stream. As bulk‑tank butterfat levels rise, that “extra” cream is not just a by‑product; it’s a major source of income. U.S. butter production hit 2.15 billion pounds in 2020, the highest on record at the time, and, through November 2024, had already reached 2.20 billion pounds, setting up 2024 as the new record year once December numbers are in. They also emphasized that from January to November 2024, the U.S. imported a record 204.4 million pounds of butter and milkfat, up 27% from 2023 and roughly 10 times the 2013 level, underscoring just how strong demand for milkfat has become.
  • Risk management. Butter and nonfat dry milk prices feed into the Class IV formula, and co‑ops have long‑established hedging tools and risk strategies built around those commodities. A 5–6% fluid milk SKU doesn’t slot neatly into those existing tools.

Retailers add another layer. Fluid milk has long been treated in grocery research as a “known value item”—one of those core products, like bread and eggs, that shoppers use to judge whether a store is “expensive.” Category managers are very sensitive to shelf prices on those items. They know that if a gallon looks high, it can hurt the store’s price image out of proportion to the profit on that gallon.

Put that all together, and it’s not surprising that plants and co‑ops tend to standardize most fluid milk to fixed butterfat levels and capture the majority of butterfat value through cream and butter sold into manufacturing and retail channels. The Amul–MMPA venture doesn’t tear up that playbook, but it does show that with the right plant capacity, a strong brand, and a clear target audience, processors can occasionally step outside of it and get paid for richer milk in the jug.

What the Nutrition Science Actually Says About Dairy Fat

For years, much of what happened to fluid milk fat levels was driven less by economics than by nutrition policy. So it’s worth taking a quick look at where the science stands today.

You probably remember that earlier versions of the Dietary Guidelines for Americans strongly pushed low‑fat and fat‑free dairy. That was based on a broad concern about saturated fats in general. Over the last decade, though, the evidence has become more nuanced regarding dairy fat.

In 2021, a PLOS Medicine study led by Kathy Trieu used odd‑chain saturated fatty acids—15:0 and 17:0—as biomarkers of dairy fat intake in a large Swedish cohort and then pooled results from 18 similar prospective studies worldwide. That research team found that higher levels of these dairy fat biomarkers were associated with a lower risk of cardiovascular disease in the pooled analyses.

A 2020 review in the journal Advances in Nutrition, led by Jean‑Philippe Drouin‑Chartier of Université Laval, took a broader look at dairy fat and cardiometabolic health. They concluded that, within typical intake ranges and in the context of overall dietary patterns, current evidence doesn’t support a clear harmful association between consuming most full‑fat dairy products and cardiovascular disease risk in the general population.

Now, that doesn’t mean more saturated fat is always better. Some controlled feeding trials still show LDL cholesterol rising when people eat diets heavily loaded with saturated‑fat‑rich dairy foods, and a 2024 review in Foods discussed how altering cow diets and processing can shift the fatty acid profile of milk and potentially change its health effects. But taken together, these studies have pushed the conversation away from “full‑fat dairy is bad” toward “it depends on the food, the overall diet, and the person.”

Policy is slowly catching up. USDA and HHS have repeatedly said that the 2025–2030 Dietary Guidelines will emphasize overall dietary patterns over single nutrients. Recent USDA communications around school meals and nutrition suggest that full‑fat dairy can fit within healthy patterns when it’s part of a balanced diet, not the only source of saturated fat.

The clearest sign of that shift on your farm is the Whole Milk for Healthy Kids Act that was recently signed by President Donald Trump, allowing schools in the National School Lunch Program and related child nutrition programs to once again offer whole and 2% milk alongside 1% and fat‑free options, including flavored and unflavored, conventional and organic. USDA’s Economic Research Service and school nutrition associations note that the NSLP typically serves close to 30 million students per day across roughly 95,000 schools and institutions.

To make that concrete, schools and child care centers in federal programs can now serve:

  • Flavored or unflavored whole milk
  • Flavored or unflavored 2% (reduced‑fat) milk
  • 1% and fat‑free milks
  • Approved non‑dairy alternatives meeting nutrition standards

That change doesn’t mean every district will rush to whole milk, but it does remove a big legal barrier that kept fuller‑fat milk out of cafeterias for years.

What Consumers Are Actually Buying: Butter, Organic, and Cottage Cheese

While the scientific and policy debates have been shifting, shoppers haven’t been waiting around for permission to eat fat.

On the butter side consumption hits new all-time high in 2024″ reports that per‑capita butter consumption reached 6.8 pounds in 2024, a 0.3‑pound increase from 2023 and about 2.3 pounds higher than in 2000. The International Dairy Foods Association, using USDA Economic Research Service data, has also highlighted that butter consumption hit 6.8 pounds per person in 2024, surpassing all previous records. Butter market analysis shows 2020 holding the butter production record at 2.15 billion pounds, and that by November 2024 production had already hit 2.20 billion pounds, putting 2024 on pace to be the new record year once all months are counted. At the same time, as noted earlier, butter and milkfat imports are up 27% from 2023 and nearly tenfold compared to 2013.

YearU.S. Butter Production (B lb)Butter & Milkfat Imports (M lb)Per-Capita Consumption (lb/person)
20131.65215.5
20151.72355.8
20181.89686.1
20202.151126.4
20222.101686.6
20232.181786.7
20242.20 (est. Nov.)204 (Jan–Nov)6.8 (projected)

That combination—record domestic production plus record imports—only happens when demand is strong, and margins are there. This development suggests that there’s no shortage of homes for milkfat, even if much of that value is captured beyond the farm gate.

Organic fluid milk tells another part of the story. RaboResearch’s 2025 report on U.S. organic milk found that from 2010 to 2024, organic fluid milk sales grew 67.7%, while conventional fluid milk sales fell 21.3%. Over that period, organic’s share of total fluid milk more than doubled, from 3.3% to 7.1%, with organic accounting for 7.6% of all fluid milk sales in July 2024. Rabobank senior dairy analyst Lucas Fuess noted that this growth is driven both by conventional decline and real organic volume growth, supported by dedicated organic supply chains and long‑term contracts.

Retail price data back up what many of you have seen. USDA retail milk reports and chain pricing snapshots show organic whole milk in major metro markets often selling in the $4.50–$6.50 per half‑gallon range, while conventional store brands typically sit closer to $2.50–$3.50. That roughly 2‑to‑1 gap can only persist if consumers buy into the story and are willing to pay for the combination of fat, production practices, and brand.

Then there’s the cottage cheese story. In 2024, cottage cheese was the third-fastest-growing edible dairy segment in the U.S., with 11.7% brand growth and 5.7% private label growth according to Circana, and that, in the year to May 19, 2024, volumes were up 13.5% and prices up 16%. Circana’s senior vice president of client insights for dairy, John Crawford, shared that this wasn’t just a pricing effect—usage and social media‑driven recipes have driven real volume growth, and he expected the category to stay in positive territory rather than fall off a cliff.

CNN and other business outlets later reported that cottage cheese sales jumped around 20% in the 52 weeks through June 15, 2025, following roughly 17% annual growth in both 2023 and 2024 and an 11% rise in 2022, marking a clear turnaround after declines in 2021. Brands like Good Culture and Daisy have responded by expanding production to keep up.

So, if you step back for a second, the pattern is pretty clear: butterfat‑rich products—whether that’s butter, organic whole milk, or high‑protein cottage cheese—are not scaring consumers off. They’re pulling them in.

A Homegrown 6% Example: Alexandre Family Farm

Before we circle back to your own operation, it’s worth looking at a U.S. example that’s already turned 6% milk into a premium story.

Alexandre Family Farm on California’s North Coast is recognized as America’s first certified regenerative organic dairy. Their program combines organic certification, regenerative practices, and A2/A2 genetics. They market a 6% whole milk as part of their lineup, positioned as richer, grass‑based, and easier to digest for some consumers.

If you check the online store for Bristol Farms, a California specialty grocer, you’ll see “Alexandre Family Farm Certified Regenerative A2/A2 6% Whole Milk 12 oz” priced at about $4.29. That’s roughly $0.36 per ounce, or about $17–18 on a gallon‑equivalent basis—orders of magnitude above commodity fluid prices.

In early 2024, children’s nutrition brand Once Upon a Farm entered the dairy space with organic A2 whole milk shakes and smoothies using organic A2 milk from Alexandre Family Farm. Their leadership emphasized Alexandre’s status as a fifth‑generation, regenerative organic dairy and stressed that the A2, grass‑fed profile fit the nutritional and environmental message they wanted to deliver to parents.

Most of us aren’t going to flip overnight to regenerative organic A2/A2 production. That’s a specific, demanding lane. But this example shows that when strong butterfat performance, credible production claims, and the right partners come together, 6% milk can command a price that has nothing to do with the commodity Class I mover.

Where the Butterfat Money Actually Goes

So, let’s bring this back to your milk check, because that’s where the rubber meets the road.

Most producers in the U.S. are paid under some version of the Federal Milk Marketing Order. In simple terms, that means:

  • Class III prices are based mainly on cheese and whey values.
  • Class IV prices are based on butter and nonfat dry milk values.
  • Class I fluid prices are derived from Class III and IV using the Class I mover formula.
  • Component pricing in many orders pays you separately for butterfat, protein, and sometimes other solids, with additional premiums (for quality, volume, special programs) and deductions (hauling, balancing) layered on.

That structure absolutely pays you for butterfat. It’s why Net Merit, Cheese Merit, and other indices have leaned heavily into solids, and it’s why your co‑op has invested in butter churns, powder towers, and cheese plants over the years.

But here’s the hard truth I’ve noticed when looking at this value chain end‑to‑end: the system does a very good job of capturing milkfat value somewhere in the chain. It’s just not always clear how much of that value is being shared back to the farm, especially when butterfat ends up in premium fluid products or branded products rather than commodity butter or cheese.

Processors have to keep plants full, balance fluid, cheese, butter, and powder, and meet retailer demands for sharp pricing on “known value” items like gallons. Understandably, they default to standardizing fluid milk and building most of their butterfat strategy around butter and cream, where the market tools are familiar.

The myth that “the market just pays what butterfat is worth” glosses over many decisions made in plants and boardrooms, not at the CME screen. If you don’t know how much of your milk ends up in higher‑margin channels, you’re effectively letting someone else quietly decide what your butterfat is really worth.

The Big Math: What Premium Butterfat Could Mean for Your Herd

Let’s put some numbers to this, because that’s where decisions get real.

Herd SizeHerd CountMilk/Cow/Day (lb)Butterfat %Annual Production (lb)5% Volume into Premium (lb)Premium/GalGross Annual PremiumTypical Costs (Labor, Delivery, Marketing)Net Annual PremiumPer-Cow Value
Small120804.2%~3.5M~175K (20K gal)$2.50$50,000~$8,000~$42,000$350
Mid-Size400754.1%~11M~550K (65K gal)$2.50$162,500~$20,000~$142,500$356
Large2,000754.0%~54.75M~2.74M (325K gal)$2.50$812,500~$60,000~$752,500$376

Small herds – under about 200 cows

If you’re milking 80–150 cows in places like New York, Wisconsin, Ontario, or the Pacific Northwest, your strength usually isn’t volume. It’s flexibility and your connection to your community.

Here’s a small piece of “big math” that tends to focus the mind. Say you’ve got:

FactorValue
Herd size120 cows
Daily production80 lb/cow/day
Butterfat test4.2%
Annual production~3.5 million lb
5% of volume~175,000 lb (~20,000 gal)
Premium per gallon$2.50
Annual premium potential$50,000
Per-cow value~$400/cow/year

For many small herds, that’s the kind of number that could cover a tractor payment, help with a parlor upgrade, or give you some breathing room on repairs.

There are practical constraints:

  • Co‑op or processor contracts may limit diversions or set rules about branding and markets.
  • Regulations require Grade A facilities, inspections, and proper labeling.
  • Labor is tight; adding marketing and delivery is a real strain.

That’s why many smaller herds that are experimenting with premium milk treat it as a structured trial, not an identity shift. They partner with a licensed plant to co‑pack a few hundred gallons a week, place product in one or two outlets they know well—a farm store, farmers’ markets, a local café, or an independent grocer—and then run it for 60–90 days. During that time, they track:

  • How quickly the product actually sells.
  • What net margin remains after every cost.
  • What does it does to their workload and stress level.

If the numbers don’t work, they scale back without having bet the whole farm on a brand experiment. If the numbers dowork, they have real data to bring to family discussions, lenders, and co‑op leadership.

For Canadian quota herds: The math is framed differently, but the questions are similar. Butterfat levels directly influence how efficiently you use quota and participate in pooled returns, and some processors in provinces like Ontario and Quebec are exploring higher‑fat or specialty fluid products. The concept of moving a small share of milk into a higher‑value use still applies; the trick is to do it within the rules of the quota system and processor agreements.

Mid‑size herds – roughly 200 to 800 cows

If you’re milking 300–600 cows in freestalls in the Upper Midwest or Northeast, or running 200–400 cows under Canadian quota, you’re big enough that a tiny farm‑store play won’t move the needle, but you may feel too small to have huge leverage on your own.

In that bracket, what I’ve seen pay off is clarity plus conversation.

Step one is a component income audit. Take the last 12 months of milk checks and total:

  • Dollars from butterfat.
  • Dollars from protein.
  • Dollars from all premiums (quality, volume, programs).
  • Dollars lost to hauling, balancing, and other deductions.

Once you know those numbers, you can approach your co‑op or plant rep with a different conversation. Instead of asking, “How are prices this month?” you can ask:

  • Roughly where does my milk usually go—what share into fluid, cheese, butter, powder, and branded or specialty products?
  • How much of your overall supply is going into higher‑margin or branded products, and how is that value shared with members or suppliers?
  • Are there current or potential programs that pay differently for higher butterfat, A2 milk, organic, grass‑fed, or other traits?

Those questions signal that you understand they have a business to run, but you also want transparency about how your butterfat is being used.

From there, it’s smart to pull your nutritionist and genetics adviser into the conversation. We know from Hoard’s and FMMO data that average butterfat still has some room to climb in many herds. Ask them:

  • Realistically, what would it take in sire selection and ration adjustments to add 0.15–0.25 points of butterfat over the next few years?
  • Under our current pay program, what is each additional 0.1 point of butterfat worth per cow per year?
  • If our co‑op or processors launch richer or specialty lines, what kind of component profile are they likely to want, and how close are we already?

Larger herds – 1,000 cows and up

If you’re running 1,000–5,000 cows in places like Idaho, Texas, New Mexico, or California’s Central Valley, your context looks different again. A handful of branded jugs won’t change your P&L, and your biggest levers tend to be efficiency, contracts, and positioning.

At this scale, the butterfat strategy is usually about three things:

  • Component efficiency. A 0.05–0.10 point bump in butterfat across tens of millions of pounds of milk can translate into serious dollars, especially when combined with strong protein and low SCC. That makes fresh cow management, transition cow programs, ration design, and cow comfort in freestall or drylot systems central to your butterfat playbook.
  • Contract terms. Many large herds ship under supply agreements that specify butterfat, protein, quality thresholds, and, sometimes, sustainability metrics. Knowing exactly how you’re rewarded (or penalized) for component changes is critical before you aim for higher fat.
  • Strategic positioning. Even if most of your milk ends up in cheese or powder, being known as a high‑component, reliable supplier with a strong stewardship story matters when processors and retailers choose farms for higher‑margin or branded programs.

When you see stories like Amul Gold at Costco or Alexandre’s 6% in natural food stores, the takeaway for big herds isn’t “copy this.” It’s that brands looking to push richer or more specialized fluid products will need reliable pools of high‑butterfat milk. Being one of the herds already hitting strong butterfat performance, with good cow health and consistent supply, puts you at the front of the line if those programs come to your region.

Your Playbook for the Next 12–24 Months

Let’s pull this into something you can act on.

In the next 30 days: Audit your component income.

Grab your last 12 months of milk checks. Put numbers on:

  • Total dollars from butterfat.
  • Total dollars from protein.
  • Total premiums and total deductions.

That’s your baseline. Without it, you’re flying blind on what butterfat is really worth to you.

In the next 90 days: Have the tough but necessary conversation with your buyer.

Go to your co‑op or plant rep with those numbers and ask:

  • Where does my milk usually go—what share to fluid, cheese, butter, powder, and branded lines?
  • How much of your total milk ends up in higher‑margin products like branded fluid, specialty cheeses, or premium cultured dairy, and how is that value shared?
  • Are there current or developing programs that reward higher butterfat, A2 milk, organic, grass‑fed, or other traits?

If you’re in a Canadian quota system, make sure you also ask how butterfat levels affect your quota utilization and your ability to participate in any specialty programs.

Over the next year: Consider a tightly scoped premium trial if your situation allows.

If your contracts and local regulations give you some room, test moving a small share of your milk—say 5%—into a richer or differentiated product. Do it with a licensed processor, keep volumes modest, and commit to tracking:

  • Net margin compared with your regular milk check.
  • Additional labor, stress, and logistics.
  • Retailer and consumer response.

Let the hard numbers and lived experience decide whether you scale up, tweak, or step back.

Over the next 12–24 months: Align breeding and feeding with the markets you can realistically serve.

Take what you learn from your milk check, your buyer, and your own herd data and plug it into your breeding and feeding plans. Ask:

  • Under our current pay program, what’s the marginal value of another 0.1 point of butterfat per cow per year, and how does that compare with gains in protein, fertility, or health?
  • If premium opportunities (like richer fluid milk, A2, organic, grass‑fed) emerge where we are, what milk profile will those programs likely require, and how far are we from that?

With Net Merit now placing more emphasis on fat and health, and with markets rewarding fat across multiple product categories, it makes sense to ensure your sire selection and ration design are calibrated to where the money is likely to be, not just where it used to be.

Keep watching the small signals.

Monitor:

  • USDA and ERS reports on trends in whole, reduced‑fat, and skim milk consumption and organic share.
  • Co‑op and processor announcements about ESL capacity, A2 launches, organic and grass‑fed programs, and partnerships like Once Upon a Farm–Alexandre or MMPA–Amul.
  • What’s actually on your local shelves: more high‑fat fluid options, more organic, more A2 and regenerative labels—or less?

These details often tell you where butterfat value might move before it shows up in the pay formula.

The Bottom Line: Who Really Gets Paid for Your Butterfat?

When you step back from the day‑to‑day and look at the full picture—Amul Gold’s 6% jug at Costco, the steady climb of U.S. bulk‑tank butterfat past 4.0%, record per‑capita butter consumption, the surge in organic fluid milk, the cottage cheese boom, shifts in dairy fat science, full‑fat milk returning to school menus—it’s hard to miss the pattern.

You and your cows have already turned butterfat into one of your herd’s biggest assets. Genetics, better fresh cow management and transition programs, and improved cow comfort have pushed butterfat performance to record levels. Consumers are not shy about eating fat when it comes in the form of butter, organic whole milk, and high‑protein cultured dairy. Policy has backed off fighting full‑fat milk as hard. Processors and brands are starting to bottle richer milk when they see a clear story and a receptive audience.

What’s encouraging is that, for once, genetics, consumer demand, and policy are roughly aligned. The part that still needs your attention is everything between your bulk tank and the retail shelf: the contracts, the plant decisions, and the product mix.

Staying on autopilot means your butterfat keeps rising while your share of the value may not. Leaning in—even a little—means you start steering where those extra dollars land.

Audit your component income. Ask where your milk really goes. Run small, smart experiments where they make sense. And make sure your breeding and feeding plans reflect the markets you’re in, not the ones you left behind ten years ago.

Because the real question behind that 6% jug at Costco isn’t “Will rich milk sell?” The data says it already does. The real question is: when your cows put that extra butterfat in the tank, are you capturing the premium—or is someone else?

Key Takeaways 

  • Your tank just hit 4.0%—finally. U.S. butterfat averaged over 4.15% in 2023, and 2024 is on track to be the first year every single month clears 4.0%.
  • Consumers are all in on fat. Record 6.8 lb per-capita butter consumption in 2024. Organic whole milk up nearly 70% since 2010. Cottage cheese posting double-digit growth three years running.
  • Processors are already capturing the premium. Amul’s 6% milk at Costco and Alexandre’s $17/gallon regenerative A2 milk prove high-butterfat products sell—and sell well.
  • The math: $50,000 from 5% of your milk. On a 120-cow herd at 4.2% fat, shifting just 5% of volume into a premium channel can add roughly $400 per cow per year.
  • Your move: audit, ask, test, align. Know your component income. Press your co-op on where your milk really goes. Run a small premium trial. Match genetics and feeding to markets you can actually reach.

Complete references and supporting documentation are available upon request by contacting the editorial team at editor@thebullvine.com.

Learn More

The Sunday Read Dairy Professionals Don’t Skip.

Every week, thousands of producers, breeders, and industry insiders open Bullvine Weekly for genetics insights, market shifts, and profit strategies they won’t find anywhere else. One email. Five minutes. Smarter decisions all week.
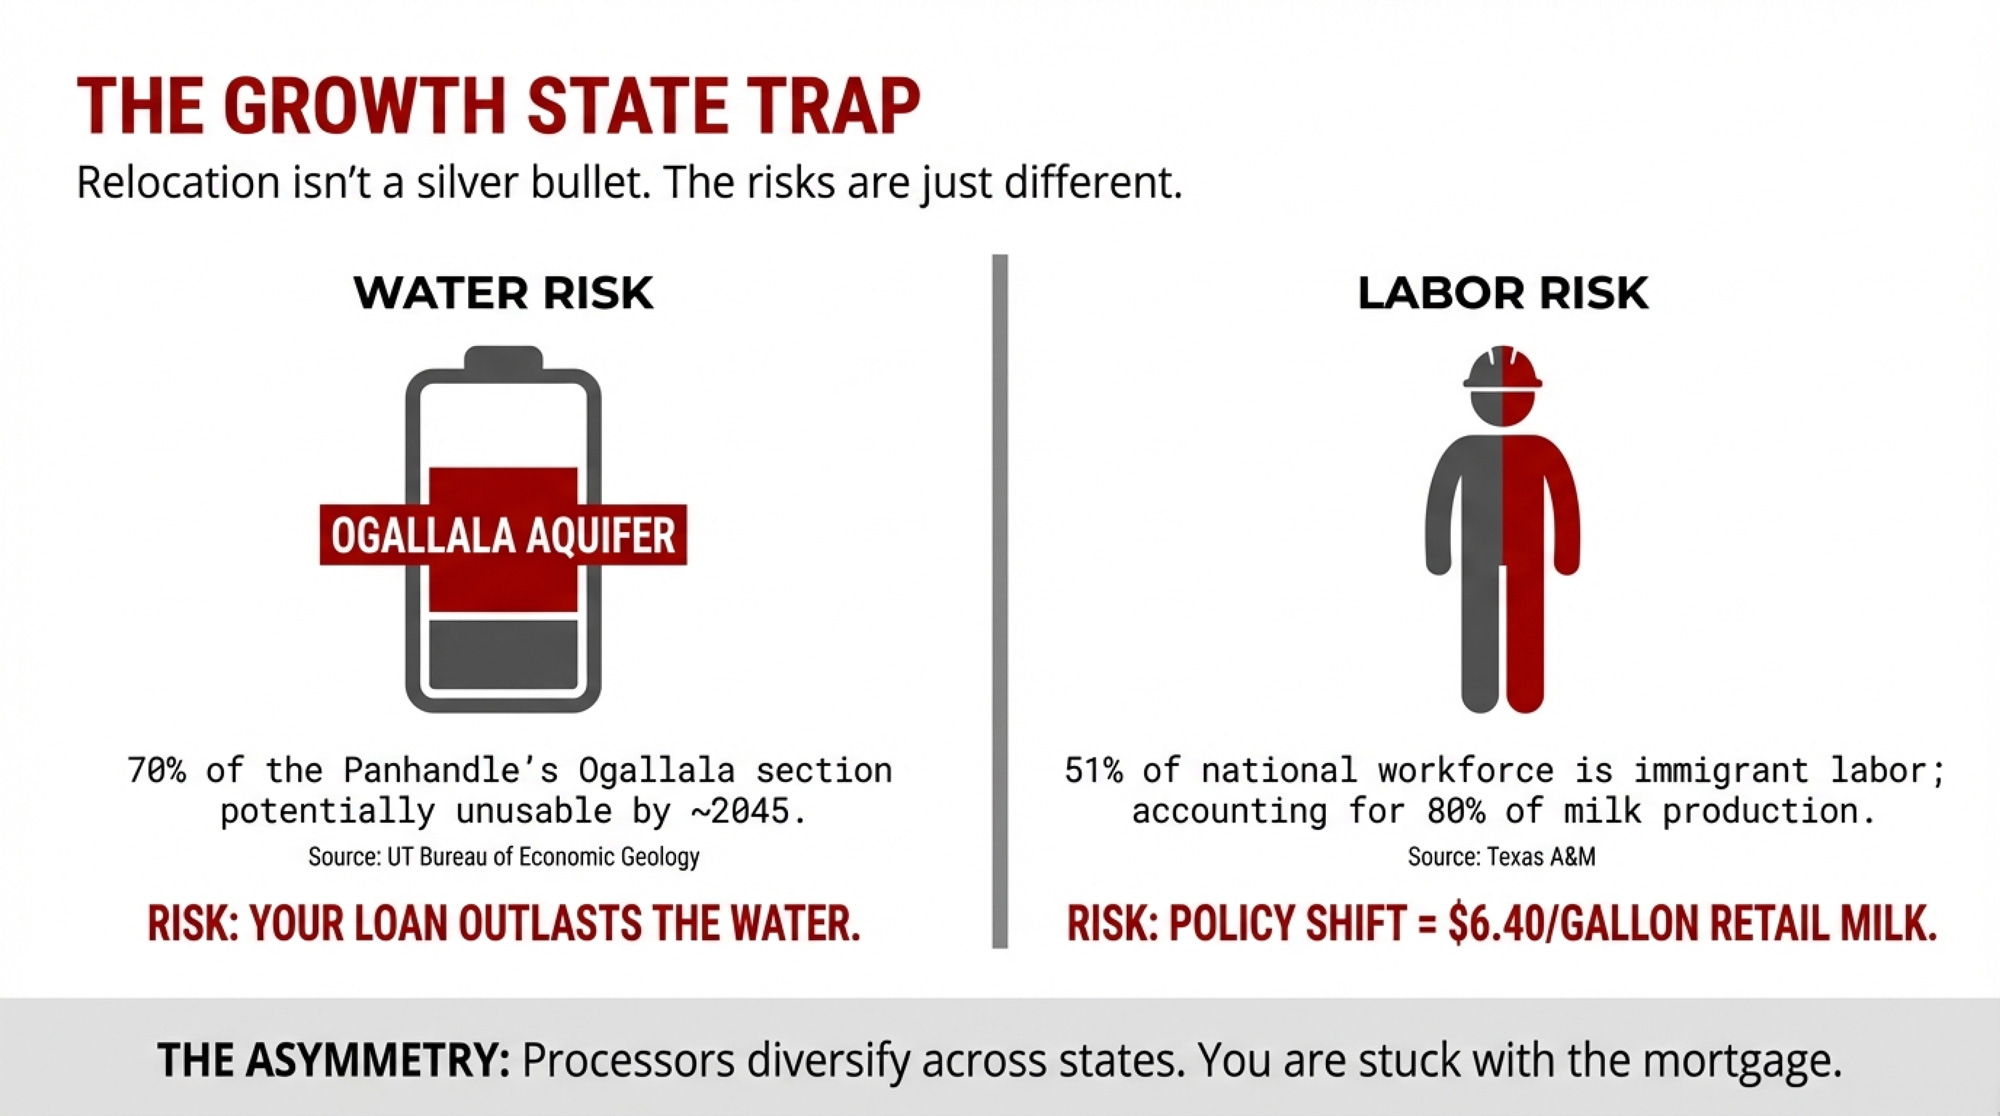
NewsSubscribe
First
Last
Consent

$14 Milk, $4 Corn, and the Cows Nobody Will Cull: This Week’s Global Dairy Reckoning

Cheap feed is a trap. Every cow that should’ve been culled is still milking—and $14 Class III is the price we’re all paying.

Global dairy market reckoning

EXECUTIVE SUMMARY: Class III is testing $14. EU butter crashed 43% year-over-year. Cheddar blocks hit $1.29—their lowest since May 2020. Welcome to synchronized oversupply: EU-27+UK November milk surged 4.6%, the U.S. dairy herd is near a 30-year high, and cull rates are at historic lows because $4.25 corn makes even marginal cows cash-flow positive. That’s the trap—cheap feed was supposed to ease the pain, but it’s keeping underperforming cows in barns across the industry and delaying the correction prices desperately need. GDT Pulse finally showed signs of life Sunday (WMP +1.0%, SMP +2.1%), but until someone starts culling, $14 milk isn’t going anywhere.

Futures Markets: Still Searching for a Floor

The futures boards told a grim story last week—and frankly, nobody’s quite sure where the bottom is yet.

EEX European Futures moved 4,550 tonnes (910 lots), with Wednesday posting the busiest session at 1,905 tonnes. Butter futures took the worst of it. The Jan26-Aug26 strip dropped 4.5% to average €4,199. SMP held up better, down just 0.2% to €2,200, while whey slipped 0.7% to €1,021.

Over on the SGX Asia-Pacific exchange, volume ran heavier at 15,116 lots—dominated by WMP at 12,287 lots. The Jan26-Aug26 curves tell you pretty much everything about current sentiment:

ProductAverage PriceWeekly Change
WMP$3,359–1.2%
SMP$2,703–0.8%
AMF$5,821–1.4%
Butter$5,278–0.1%

What’s particularly notable on the CME is how Class III futures tested sub-$14 territory multiple times last week. January through May contracts all notched life-of-contract lows before bouncing slightly Friday. February settled at $15.05—down a dime on the week. Class IV fared worse, with February closing at a brutal $13.86, down a nickel.

For producers who don’t actively trade futures, here’s why those life-of-contract lows matter: they signal that professional traders—people who make a living betting on where milk prices are headed—see no near-term catalyst for recovery. When the market establishes new lows across multiple contract months simultaneously, it’s pricing in an extended period of pain.

What this means for your operation: If you’re not already penciling out cash flow at $15 Class III and $14 Class IV through mid-year, you’re planning with the wrong numbers. DMC payments look increasingly likely for January through at least April, according to analysts at Ever.Ag.

European Quotations: The Butter Collapse Continues

The weekly EU quotations released January 14 painted a picture of a market still trying to find its footing after months of oversupply pressure.

Butter took another beating. The index dropped €171 (–3.9%) to €4,237. French butter got hit hardest—down €513 (–10.6%) to €4,310 in a single week. German and Dutch butter held steadier at €4,300 and €4,100 respectively.

Here’s the number that should grab your attention: EU butter is now down €3,176 (–42.8%) year-over-year. That’s not a correction. That’s a fundamental repricing of European milkfat. I’ve been covering dairy markets for years, and you rarely see a commodity give back nearly half its value in twelve months without some structural shift underneath.

SMP actually showed some strength—climbing €38 (+1.9%) to €2,085. German SMP rose €45 to €2,085, Dutch jumped €100 to €2,100, while French slipped €30 to €2,070. Still, SMP sits 17.3% below year-ago levels, so “strength” is relative here.

Whey eased €5 (–0.5%) to €996, though it’s actually up €123 (+14.1%) year-over-year. That makes whey one of the few genuine bright spots in European dairy commodity markets right now.

Cheese indices were mixed:

CommodityCurrent PriceWeekly ΔY/Y ΔMarket StatusStrategic Note
EU Butter€4,237/100kg–3.9%🔴 –42.8%CRISISDemand collapse
Class III (CME)$13.95/cwt–0.7%🔴 –32.0%CRISISLife-of-contract lows
Cheddar Block$1.29/lb–1.9%🔴 –27.5%WEAKMulti-year lows
SMP (EU)€2,085/100kg+1.9%🟡 –17.3%WEAKAlgeria returning
WMP (GDT)$3,359/MT–1.2%🟡 –18.5%WEAKPulse bounce +1.0%
Nonfat Dry Milk$1.255/lb–0.8%🟡 –14.2%STABLEMexico demand OK
Whey (CME)73.5¢/lb+4.8%🟢 +14.1%STRENGTHProtein demand high
Milk Price (U.S. avg)$14.05/cwt–0.7%🔴 –30.5%CRISISFeed savings insufficient
Corn (March)$4.25/bu–4.5%🟢 –52.0%STRENGTHRecord crop relief

USDA’s Dairy Market News describes European conditions as “orderly” and “measured”—values are cautiously higher to start the year after what can only be called the bloodbath of Q4 2025.

GDT Pulse: Finally, a Sign of Life

Sunday’s GDT Pulse Auction (PA098) delivered the first meaningful uptick we’ve seen in months (Global Dairy Trade, January 18, 2026).

Fonterra Regular C2 WMP won at $3,395—up $35 (+1.0%) from the last full GDT event and up $240 (+9.0%) from the previous pulse auction. That’s a real move, not just noise.

Fonterra SMP Medium Heat – NZ came in at $2,660, up $55 (+2.1%) from the last GDT and up $165 (+8.4%) from pulse.

Arla SMP Medium Heat – EU hit $2,485, up $95 (+4.0%) from the last GDT.

Total volume was modest at 2,358 tonnes with 54 bidders participating. The question everyone’s asking: genuine trend change, or dead cat bounce?

Tomorrow’s GDT Event TE396 will be the real test. Fonterra’s offered volumes:

ProductVolume (MT)
WMP15,588
SMP5,630
Butter1,920
AMF2,680
Cheddar540

Butter and AMF volumes were adjusted for Cream Group Flex at 15% applied to C1 and C2, while total milkfat supplied remains unchanged on the forecast. What I’ll be watching closely is whether the buying interest that showed up Sunday sticks around when larger volumes hit the auction block.

U.S. Spot Markets: Whey Holds While Everything Else Sinks

CME spot trading told a mixed story last week.

  • Butter bounced off multi-year lows, climbing 5.5¢ to $1.355 per pound. That’s still near the basement, but at least the bleeding stopped for now.
  • Cheddar blocks kept sinking, down 2.5¢ to $1.29—a level we haven’t seen since May 2020. Twenty loads traded, bringing the YTD total to 63 loads—a record for early January. When you see that kind of spot volume combined with falling prices, people are desperate to move product. That’s not a healthy market dynamic.
  • Nonfat dry milk slipped a penny to $1.255. Demand from Mexico is improving, and inventories are “tight” according to USDA’s Dairy Market News, but it wasn’t enough to hold the line.
  • Whey was the standout, rallying 3.5¢ to 73.5¢. Strong demand for whey protein concentrates is driving this—Dairy Market News reports some cheese processors are actually ramping up production “ultimately to produce more whey as prices and demand of whey protein concentrates remain high.”

Let that sink in for a moment: they’re making cheese not because cheese demand is strong, but because they need the whey. That’s a complete inversion of traditional dairy economics, and it tells you something important about where the real demand growth is happening right now.

The Culling Connection: Why Cheap Feed Is Delaying Recovery

Cheap corn isn’t just helping your margins—it’s keeping marginal cows in the herd longer and delaying the supply correction that would help prices recover.

The numbers are stark. Dairy cow culling dropped to historic lows through the first half of 2025, down 7.3% from the same period in 2024 (Southern Ag Today, January 13, 2026). The seven-month total through July was the lowest since 2008 (eDairy News, August 2025). Even as milk prices slid through the fall, weekly dairy cow slaughter through the last four weeks of 2025 was only slightly above year-earlier levels (USDA Livestock, Dairy, and Poultry Outlook, January 2026).

Why aren’t producers culling more aggressively?

Two factors, and they’re both working against a price recovery:

  • First, cheap feed makes borderline cows profitable enough to keep. When corn was running $6+, and soybean meal was north of $400, that seven-year-old cow giving 60 pounds was bleeding money. At $4.25 corn and $290 meal, she’s suddenly cash-flow positive—barely. So she stays. Multiply that decision across thousands of operations, and you’ve got an oversupply situation that won’t self-correct.
  • Second, the heifer shortage makes replacement expensive. Beef-on-dairy economics have drained the replacement pipeline. Springer heifer prices are at or near records, and with 800,000+ fewer dairy heifers in the system (Dairy Herd Management, November 2025), producers can’t easily replace culled cows even if they wanted to. Cull rates dropped to 29.6% in 2024—well below the typical 35-37% turnover that supports strategic herd improvement (Dairy Herd Management, August 2025).

The U.S. dairy herd now sits at approximately 9.49 million head—near the highest level since the early 1990s. USDA’s January Livestock, Dairy, and Poultry Outlook revised the annual dairy cow inventory to 9.490 million head and projects the herd will remain large well into 2026.

What’s interesting here is the game theory at play. Every individual producer benefits from keeping their cows in milk when feed is cheap. But collectively, those decisions are extending the timeline for everyone’s price recovery. It’s a classic tragedy of the commons, playing out in real-time across American dairy barns.

The strategic response some progressive operations are taking: Rather than culling primarily based on age or reproductive metrics, they’re calculating income over feed cost (IOFC) for each cow and moving out animals consistently below $1.50 per cow per day (The Bullvine, December 2025). That’s the math-based approach that makes sense when feed is cheap, but margins are thin.

Cow ProfileProd’n (lbs)BF/ProteinDaily RevenueDaily FeedDaily IOFCDecision
Cow A: 4yr, 75# prime753.8% / 3.2%$10.50$8.20$2.30✅ KEEP
Cow B: 6yr, 65# good653.7% / 3.1%$9.10$7.80$1.30🔶 BORDERLINE
Cow C: 7yr, 55# fading553.6% / 3.0%$7.70$7.40$0.30🔴 CULL
Cow D: 5yr, 70# solid703.8% / 3.2%$9.80$8.00$1.80✅ KEEP
Cow E: 8yr, 48# poor483.5% / 2.9%$6.72$7.10–$0.38🔴 CULL
Cow F: 3yr, 82# premium823.9% / 3.3%$11.48$8.40$3.08✅ KEEP

Don’t expect a supply-side correction to rescue prices anytime soon. The cows that would have been on trucks six months ago, when feed was expensive, are still in stalls today. That’s good for individual cash flow in the short term, but it’s extending the pain for everyone.

The Production Surge: Why This Is Happening

November milk collections confirm what the futures already priced in—global oversupply is real and accelerating.

European Production Explosion

EU-27+UK pumped out 12.94 million tonnes in November, up 4.6% year-over-year. To put that in perspective, that’s nearly 1.2 billion pounds more milk than November 2024—equivalent to adding all of Michigan’s November production to the global supply, plus change.

CountryNov 2025 Production (kt)Y/Y GrowthKey Signal
Germany2,643+7.5%🔴 Highest absolute growth
France1,954+5.9%Steady surge
UK1,329+5.6%Post-Brexit stabilization
Netherlands1,145+7.3%🔴 Second-highest % growth
Poland1,089+5.3%Eastern EU leading
Belgium375+10.1%🔴 Highest % growth—warning sign
Denmark449+0.7%Only modest growth
EU-27+UK TOTAL12,940+4.6%1.2B lbs MORE than Nov 2024

Cumulative EU-27+UK production through November hit 150.75 million tonnes, up 1.9% year-over-year after adjusting for the leap year. Milksolid collections were up 5.2% in November alone, which tells you butterfat and protein content are running strong across European herds.

French milksolids jumped 6.6% in November, with cumulative 2025 collections at 1.63 million tonnes (+1.5% y/y). French butter production hit 28.3kt in November (+0.8% y/y), with YTD production up 5.2% to 337.6kt.

Danish milksolids were up 1.5% in November, with cumulative collections at 431kt (+2.7% y/y).

What I find notable is how broadly based this European production surge is. It’s not just one country driving the numbers—Germany, France, the Netherlands, Poland, and the UK are all posting substantial gains. That kind of synchronized growth is rare, and it explains why European commodity prices have fallen so hard.

U.S. Production Outlook

USDA kept their 2025 forecast unchanged at 115.70 million tonnes in the January WASDE—a 2.4% increase over 2024. But they raised the 2026 forecast, citing “higher production per cow” as the primary driver (USDA WASDE, January 2026). If realized, that’s another 1.3% increase on top of an already elevated base.

Spot milk loads traded as much as $4 under Class III last week (Dairy Market News). When processors are paying that far below class price for spot loads, it tells you they have all the contracted milk they need—and then some.

Where’s the Demand? Following the Money

The good news: low prices are finally attracting buyers. The bad news: it’s not enough yet.

Algeria is back in the market. ONIL, their national dairy purchase program, is bidding for milk powder again. That’s significant—Algeria is historically one of the world’s largest SMP importers, and their return to active purchasing is exactly what you’d expect when global prices fall this far.

Chinese buyers are consistently attending GDT auctions. Chinese SMP inventories dropped to a one-year low in November, so merchants may need to step up purchases even though domestic consumption remains soft. It’s worth noting that Chinese dairy demand has been disappointing for nearly two years now, so I’d want to see sustained buying before getting too optimistic.

EU exports surged 12.3% in November:

ProductY/Y ChangeKey Destinations
SMP+39.6%Algeria, Egypt, Saudi Arabia, Morocco
Butter+14.9%Most destinations except S. Korea, China
Cheese+8.9%Japan, Korea, and China improved
WMP+33.2%
Casein+66.8%

U.S. exports are holding firm. The U.S. is currently the least-expensive global supplier for cheese and butter, shipping enough product abroad to keep inventories in check despite record output (Dairy Market News). For cheese, domestic demand is “solid,” and export demand is “strengthening.” For butter, Dairy Market News reports that “interest from international buyers is keeping domestic bulk butter spot loads tight.”

This is actually one of the more encouraging aspects of the current market. Demand isn’t collapsing—it’s growing. The problem is that production is growing faste than it isr.

Feed Markets: The One Bright Spot

USDA’s January WASDE dropped a bombshell on corn markets (USDA WASDE, January 13, 2026).

Corn yield came in at a record-shattering 186.5 bushels per acre—half a bushel higher than December estimates. Total production hit 17.021 billion bushels, smashing the previous record by 11%.

Ending stocks jumped to 2.227 billion bushels, on par with stockpiles from 2016-2019 when corn averaged roughly $3.50 per bushel. That historical comparison gives you a sense of where corn prices might be headed if demand doesn’t materialize.

March corn dropped 20¢ on the week to settle at $4.25 (CME Group). March soybean meal closed at $290 per ton, down $13.70.

What this means for your operation: Feed costs are genuinely cheap—the lowest since October 2020 on a DMC basis (Ever.Ag). But here’s the math problem that keeps coming up: milk prices are dropping faster than feed costs are falling. A 35-50¢ per cwt feed savings doesn’t offset a $1.80 drop in the all-milk price.

The record corn crop is a real relief for your feed bill. But if you’re counting on cheap feed to save your margins while milk stays at $14-15, rerun those numbers.

ProductSunday Pulse PA098Previous GDTY/Y (Jan 2025)TE396 Watch
WMP (C2)$3,395 (+1.0%)$3,360$3,155 (+7.6% y/y)Needs to hold $3,350+
SMP (MH)$2,660 (+2.1%)$2,605$2,495 (+6.6% y/y)Needs to hold $2,600+
Butter$5,395 (est.)$5,150$5,820 (–7.3% y/y)Watch for $5,200 support
Cheddar$3,270 (est.)$3,310$3,760 (–13.0% y/y)Critical: Hold above $3,200

The Week Ahead: What to Watch

Tuesday, January 20: GDT Event TE396 results. This is the auction that matters. If WMP and SMP can hold or extend Sunday’s gains with larger volumes on offer, we might actually be seeing a floor form. If they give it all back, buckle up for more pain.

The GDT Floor Test — What to Look For on Tuesday, Jan 21

🔴 FLOOR FAILURE SCENARIO:
• WMP falls below $3,350 (gives back Sun gain + more)
• SMP drops below $2,600 (momentum breaks)
• Volume is weak (less than 2,000 MT total)
→ Result: Expect further selling; $14 milk locks in

🟢 FLOOR HOLDING SCENARIO:
• WMP holds $3,350–$3,400 (sustains Pulse momentum)
• SMP holds $2,600–$2,650 (shows buying interest)
• Volume is healthy (2,500+ MT; strong participation)
→ Result: Floor forming; recovery narrative begins

🟡 CRITICAL THRESHOLD:
If Butter holds $5,200–$5,300 on larger volumes (TE396
has 1,920 MT offered), that signals structural demand
at lower price levels—a genuine floor signal.

Key data releases this week:

  • New Zealand December milk collections — Will signal if Fonterra’s production growth is moderating heading into the back half of their season
  • U.S. December milk collections — Confirms whether the herd expansion continued through year-end
  • Chinese December dairy imports — Tests whether inventory drawdowns are translating to actual purchases

The Bullvine Bottom Line

Tomorrow’s GDT auction is the market’s next referendum. If WMP and SMP hold Sunday’s gains, we might have found a floor. If they give it back, prepare for $14 Class III to stick around through spring.

Here’s the uncomfortable reality that this week’s data makes clear: cheap feed is keeping this market oversupplied longer than it otherwise would be. Every producer making the individually rational decision to keep marginal cows in milk is collectively extending everyone’s price recovery timeline. It’s nobody’s fault exactly, but it’s everybody’s problem.

The strategic question for your operation isn’t whether to keep milking—it’s whether you’re keeping the right cows milking. Run those IOFC calculations. That seven-year-old giving 45 pounds might be cash-flow positive at $4.25 corn, but she’s dragging down your herd average and, in a small way, dragging down everyone’s milk price too.

Watch the GDT numbers on Tuesday. And if you haven’t maxed out your DMC coverage at $9.50 for 2026, the enrollment deadline is February 26. Based on where futures are trading, those payments are looking increasingly likely through at least mid-year.

Key Takeaways

  • Pandemic-level prices are back: Class III testing $14. Cheddar blocks at $1.29. EU butter down 43% y/y. This is what three continents overproducing at once looks like.
  • Cheap corn is the problem, not the solution: At $4.25/bu, even marginal cows stay cash-flow positive. Every cow that should’ve been culled months ago is still milking—and that’s delaying the correction we all need.
  • The herd won’t shrink on its own: U.S. dairy cows near a 30-year high. Cull rates are at historic lows. Springer heifers are too expensive to replace aggressively. Until that changes, oversupply persists.
  • GDT finally has a pulse: WMP +1.0%, SMP +2.1% on Sunday’s Pulse auction. Tomorrow’s TE396 is the real test—if it holds, we might have found a floor.
  • Your move: Budget $15 Class III through Q2. Max out DMC at $9.50 before the Feb 26 deadline. And calculate IOFC on every cow in your barn—because $4 corn doesn’t make a 45-lb cow worth her stall.

Complete references and supporting documentation are available upon request by contacting the editorial team at editor@thebullvine.com.

Learn More

The Sunday Read Dairy Professionals Don’t Skip.

Every week, thousands of producers, breeders, and industry insiders open Bullvine Weekly for genetics insights, market shifts, and profit strategies they won’t find anywhere else. One email. Five minutes. Smarter decisions all week.
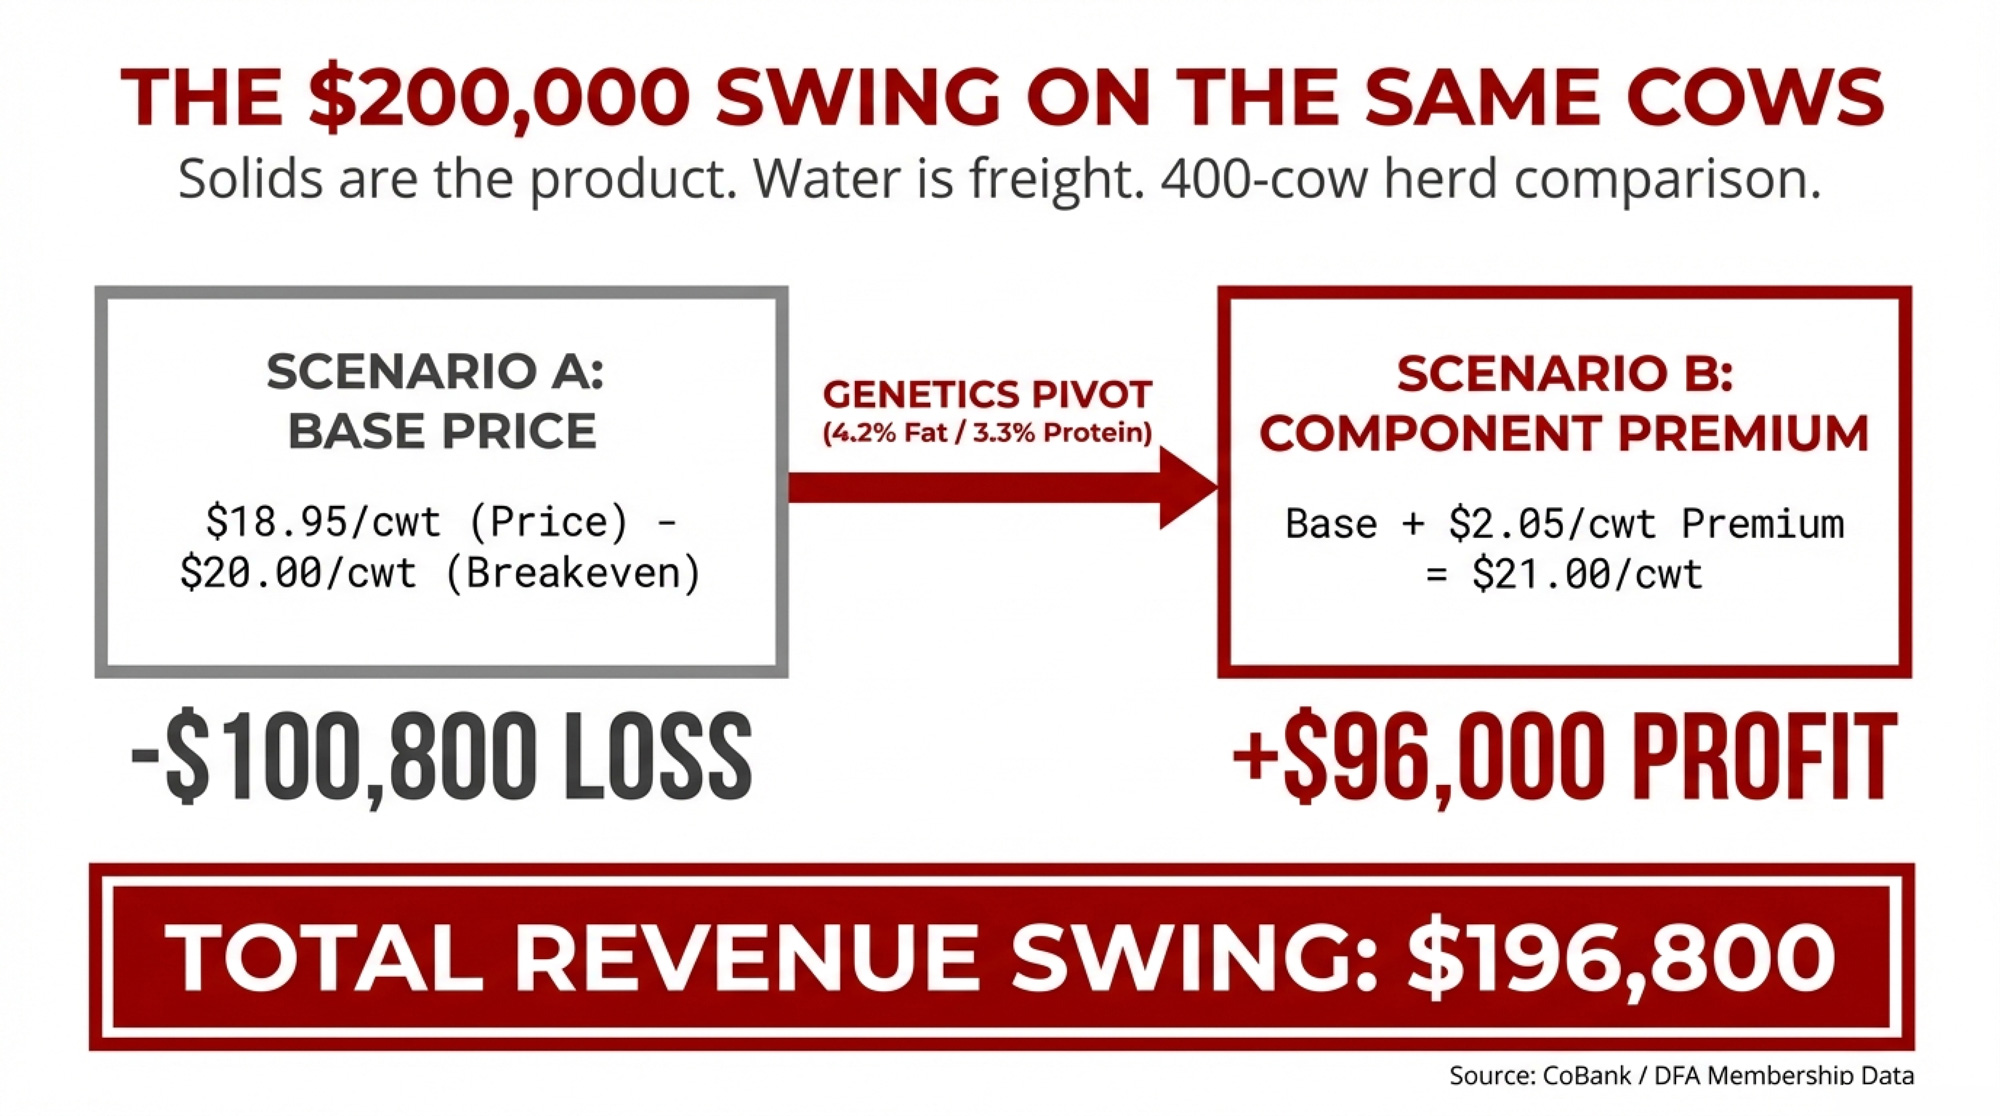
NewsSubscribe
First
Last
Consent

USDA Says $18, Futures Say $16: The $150K Gap That’s Rewriting 2026 Dairy Budgets

Is a $2 milk misread hiding a $150,000 hole in your 2026 budget? This is why USDA and futures don’t agree.

Executive Summary: USDA’s latest outlook has 2026 all‑milk in the high‑$18s, while Class III futures sit closer to the mid‑$16s—a $2–$3/cwt gap that can wreck a budget if you pick the wrong anchor. For a 300‑cow herd shipping about 75,000 cwt, that difference is a $150,000–$225,000 swing in annual revenue. At the same time, U.S. cheese and butterfat exports are hitting records only because we’re pricing below Europe and New Zealand, so strong export volume doesn’t automatically mean strong farm‑gate prices. Long‑term shifts in butterfat performance, protein levels, and roughly $10 billion in new processing capacity are changing what kind of milk plants want and how they reward components. Layer on 7–8% interest rates and tougher lender stress tests, and 2026 becomes a year where you can’t afford optimistic milk guesses or loose capital math. This feature gives you a five‑step playbook to budget off the right signals, lock in sensible feed margins, demand $17‑milk payback from new projects, tune components to your plant, and use risk tools that actually fit your herd size and region. ​

There’s a point every winter when you sit down with the books, look at that cash‑flow sheet, and think, “Alright… what does this year really look like?” Heading into 2026, that question carries a little more weight than usual.

What’s interesting here is that, for a 300‑cow herd shipping roughly 7.5 million pounds a year—about 25,000 pounds per cow—that question isn’t theoretical at all. Turn that into hundredweights, and you’re sitting near 75,000 cwt. If one version of your plan leans on a mid‑$16 Class III milk check and another counts on something closer to a high‑$18 all‑milk average, you’re staring at roughly a $150,000 to $225,000 swing in annual revenue just from a $2–$3 per cwt difference in price. 

For a family dairy—whether that’s in Grey‑Bruce, the St. Lawrence Valley, or central Wisconsin—that’s the difference between “we can finally fix some stuff” and “we’re just keeping the lights on.” So let’s walk through why the signals are so far apart, and more importantly, how to plan in a way that doesn’t bet the farm on any one forecast.

Looking at This Trend: USDA vs. the Futures Screen

On one side of the ledger, you’ve got USDA’s official outlooks. In the January 2026 World Agricultural Supply and Demand Estimates (WASDE), USDA pegs the 2025 all‑milk price at about $21.15 per cwt and the 2026 all‑milk price closer to $18.25 per cwt, tying that downgrade to softer cheese prices and slightly higher per‑cow production and overall output. Most analysts sum that picture up as higher milk supplies and somewhat softer prices by 2026. 

At the same time, USDA’s Livestock, Dairy, and Poultry Outlook projects U.S. milk production around 230.0 billion pounds in 2025 and 231.3 billion pounds in 2026, with modest gains in milk per cow pushing total output higher. That production path is part of why USDA trimmed its Class III and IV expectations later in 2025. 

On the other side of your phone, you’ve got what buyers and sellers are actually trading.

MonthUSDA All-MilkClass III FuturesSpread (USDA – Futures)
January$18.25$15.85+$2.40
February$18.25$15.92+$2.33
March$18.25$16.10+$2.15
April$18.25$16.25+$2.00
May$18.25$16.15+$2.10
June$18.25$16.00+$2.25
July$18.25$15.95+$2.30
August$18.25$16.05+$2.20
September$18.25$16.20+$2.05
October$18.25$16.30+$1.95
November$18.25$16.15+$2.10
December$18.25$16.05+$2.20

If you pull up USDA Dairy Market News’ weekly report from early January 2026, you see Class III futures for many 2026 months hovering in the mid‑$16s, with some contracts slipping toward the mid‑$15s and others flirting with the upper‑$16s. In the same report, spot cheddar blocks are described in the low‑$1.30s per pound, a long way from the $2‑plus levels that showed up briefly in 2022. 

So you’ve got two honest but different stories:

  • USDA’s forecast world says: “Given our assumptions, all‑milk should average in the high‑$18 to low‑$20range in 2026.” 
  • The futures world says: “Given what participants are willing to lock in today, Class III looks more like the mid‑$16s, with plenty of caution baked in.” 

Once you plug in your local basis and your butterfat performance and protein, that’s where the $2–$3 per cwt planning gap really shows up.

In barn after barn I walk through—from east coast tie‑stalls to Wisconsin freestalls and dry lot systems out west—I’m seeing a quiet but important shift. More conservative farms are starting to let the Class III strip anchor their budgetsand treat USDA’s all‑milk numbers as possible upside, not the default assumption. The bank account, after all, settles off cheques tied to real markets and pooling, not the top end of a forecast chart. 

Exports on Fire: The Cheese and Butterfat Paradox

Now let’s slide over to exports, because they’re doing a lot of heavy lifting right now.

The U.S. Dairy Export Council (USDEC) reports that in August 2025, U.S. cheese exports were 28% higher than a year earlier, making it a record August for cheese shipments. Cheddar exports jumped roughly 140% compared to August 2024, helped by new cheese capacity and aggressive pricing. Every major region except Canada bought more U.S. cheese, with South Korea particularly strong. 

Butterfat performance in exports has been even more dramatic. USDEC and Brownfield data show that:

  • Butter exports were up about 190% year‑over‑year in August 2025.
  • Anhydrous milkfat (AMF) exports climbed roughly 198% over the same period. 
  • Overall butterfat exports nearly tripled, with strong growth across Asia and the Middle East. 

Total U.S. dairy export volume in August 2025 was up around 3%, while export value climbed about 17% to roughly $831.5 million

In that Brownfield piece, William Loux, vice president of global trade analysis at USDEC, said, “We are in for probably almost certainly a record cheese year again here in 2025. We had a record year in 2024, we had a record year in 2022, so basically three out of the last four years we’ve set new records.” Hoard’s Dairyman and USDEC export reviews reinforce that U.S. cheese exports have surpassed 1 billion pounds in multiple recent years, underscoring our role as a long‑term global cheese supplier. 

From one angle, that all looks fantastic. The catch is the price tag attached to those wins.

Farm Credit East’s 2025–26 dairy outlook notes that U.S. butter prices have often been discounted compared to EU and New Zealand butter, which draws buyers but keeps domestic butter prices on a shorter leash. CoBank’s dairy export commentary adds that U.S. cheese has likewise tended to trade below comparable EU and Oceania cheeses to capture and hold certain markets. 

Corey Geiger, lead dairy economist for CoBank, explained that when European cheddar prices eased toward the equivalent of about $1.50 per pound in 2025, U.S. exporters often needed cheddar closer to $1.30 per pound to stay competitive in some export tenders. It’s not a fixed rule for every sale, but it captures the general spread.

So the export paradox looks like this: U.S. cheese and butterfat are setting volume records and keeping plants busy, but much of that demand is being bought at discount pricing, not at rich premiums. Great for clearing product and avoiding butter or powder mountains. Less great if you’re counting on exports alone to pull Class III into the high teens. 

ProductYoY Volume IncreasePrice vs. EU BaselinePrice vs. NZ Baseline
Cheese+28%87% (€1.30 vs €1.50)90% (€1.30 vs €1.44)
Butter+190%85% ($1.42 vs $1.67)88% ($1.42 vs $1.61)
AMF+198%83% ($1.38 vs $1.66)86% ($1.38 vs $1.61)
Powder+12%91% ($0.88 vs $0.97)92% ($0.88 vs $0.96)

Butterfat Performance, Protein, and What’s Really Changing in the Tank

Now let’s step out of the export office and back into the milkhouse.

Looking at this trend over time, the component story on U.S. farms has been remarkable. Analysts’ pooled data show that from 2010 to 2024, total U.S. milk production in pounds grew by about 15.9%, while total butterfat pounds climbed by about 30.6%. Average butterfat tests moved from roughly 3.80% into the low‑4% range during that period.

By early 2025, butterfat production was running 3–4% higher year‑over‑year, even though total milk volume was up less than 1%. That’s a huge butterfat performance story.

CoBank’s report “While U.S. Leads Milk Component Growth, Butterfat May Be Growing Too Fast” adds a global lens. It notes that over about a decade, U.S. butterfat levels increased roughly 13%, while comparable gains in the EU and New Zealand were closer to 2–3%. Over the same period, U.S. protein rose from just over 3.1% to about 3.29%, roughly a 6% bump. 

The U.S. is growing components faster than many of our global competitors, and those components are increasingly what matter in dairy markets. That’s a genuine advantage for cheese, butter, and protein ingredients. 

Here’s where it gets more complicated. CoBank points out that butterfat has led the milk check in eight of the last 10 years, creating what they call a “tremendous butterfat boom.” Genetics, nutrition, and even fresh cow managementhave been tuned to push fat as far as possible because, most years, it paid. 

Now, CoBank and others are asking whether we might have overshot in some systems. Their report warns that if butterfat and protein keep growing at current rates, processors will face rising costs to either back extra fat out or add protein to meet cheese and ingredient specs, which “ultimately reduces competitiveness on the export front.” Geiger noted that in some markets “we’ve just got a little bit too much extra supply of butterfat,” which has helped pull butter prices down, even though consumption is still solid. 

If you’re still breeding and feeding like butterfat is the only game in town, your plant’s pay grid and the export reality might be telling you a different story. 

Our own genetics features and CoBank’s component work both highlight herds that are now selecting more for pounds of fat and protein, total solids, and better protein‑to‑fat ratios, especially where plants pay on cheese yield and casein‑related traits. In those systems, the winning milk isn’t just high‑fat; it’s balanced for yield and specs. 

Academic work backs that up. An economic study from Brazil on milk pricing found that under component‑based payment systems, protein often carries greater marginal economic weight than fat because of its role in cheese yield and solids content. A 2024 review in Foods (MDPI) on “Emerging Parameters Justifying a Revised Quality Concept for Cow Milk” argues that modern milk quality needs to account much more for functional properties—especially protein fractions—than in the past. 

On the ground, what many herds are finding is that in cheese markets, shifting from something like 4.1% fat and just over 3.0% protein toward a more balanced 3.8–3.9% fat and 3.2%+ protein can produce better checks when plants truly pay on solids and yield. In those systems, you often see meaningful gains in revenue per hundredweight, because protein is better rewarded and excess fat isn’t discounted as heavily. 

Getting there usually means:

  • Working with your nutritionist on amino acid balance, not just crude protein.
  • Investing in forage quality and consistency, so cows can express both butterfat and protein potential.
  • Tightening fresh cow management and the transition period, so cows hit high intakes fast without metabolic wrecks.

On the genetics side, more herds are using genomic tools to line up sire selection with processor needs—whether that’s cheese yield, powder specs, or value‑added fluid. In Upper Midwest and Northeast cheese sheds, some producers are building custom indexes that place greater weight on protein pounds and cheese yield traits, rather than on total milk or butterfat percent. 

If you’re in a quota system like Canada, the pricing grid and quota rules are a bit different, but the core idea still holds: aligning your component profile—both fat and protein—with what your board and processors value is one of the cleanest ways to grow revenue without adding cows.

Herd ProfileButterfat %Protein %Milk Check $/cwtAnnual Revenue (75,000 cwt)Competitive Edge
Current: Butterfat-Maximized4.10%3.00%$16.50$1,237,500Commodity baseline; excess fat discounted by plants
Optimized: Balanced for Cheese Yield3.85%3.25%$17.20$1,290,000✅ +$52,500/year

How to Get There (No Capital, No Extra Cows):

ActionOwnerTimelineImpact
Optimize fresh cow transition (energy, amino acids)Nutritionist + Herd ManagerOngoing, 60 daysPeak milk intake faster; protein support
Improve forage quality (digestibility, consistency)NutritionistNext forage chopSupports protein expression, balances fat
Shift sire selection to cheese-yield genomicsGenetics team + ManagerBreedings starting nowNext 18 months; gradual shift in offspring profile
Work with processor on pay grid alignmentCo-op/BuyerQ1 2026Confirm premiums for balanced profile; lock terms

Global Supply: No Built‑In Shortage Riding to the Rescue

Now let’s zoom out to the world map.

USDA’s 2025–26 Livestock, Dairy, and Poultry Outlook and coverage on The Dairy Site indicate that U.S. milk output is projected at about 230.0 billion pounds for 2025 and 231.3 billion pounds in 2026, up slightly as milk per cow continues to creep higher. That extra milk is part of why the agency trimmed its Class III and IV expectations heading into late 2025. 

Global summaries suggest a similar pattern among major exporters:

  • EU milk production is generally steady to modestly higher, constrained by environmental policies but supported by improved margins in some regions. 
  • New Zealand and Australia have seen output rebound amid better weather and more favorable cost structures.
  • South America—especially Argentina and Brazil—has pockets of growth tied to currency and feed dynamics.

There are always local headaches, but nothing that looks like a synchronized global production crash. From a price standpoint, that means there isn’t an obvious global shortage brewing to “save” the market for us. Any stronger price story in 2026 is more likely to come from demand growth and product mix than from the world suddenly running short of milk.

Processing Capacity: New Stainless, New Rules of the Game

Looking at this trend on the processing side, it’s clear that a lot of serious money still believes in the long‑term North American dairy story.

CoBank estimates that roughly $10 billion in new or expanded dairy processing capacity is slated to come online through about 2027, with a heavy emphasis on cheese, butter, whey, and other protein ingredients. In a late‑2024 interview, Geiger said more than $8 billion of that investment is expected to be operating by 2026, with over half targeted at cheese and whey. 

You can see that on the ground:

  • In Wisconsin and Minnesota, new and expanded cheddar and mozzarella plants are chasing domestic pizza demand and export markets. 
  • In the Texas Panhandle and High Plains, big complexes built around freestalls and dry lot systems in Texas, Kansas, and eastern New Mexico are designed to run high‑component milk into large cheese and ingredient plants.
  • In the Northeast, investments like the Fairlife ultra‑filtered milk plant in Webster, New York, and expansions in yogurt and value‑added fluid plants that need consistent, high‑component milk.
  • In Idaho and California, continued investments in cheese and powder position those states as key suppliers to both domestic and export buyers. 

CoBank notes that we don’t yet have enough cows to max out all this new stainless, and that’s intentional—plants are being built for where the industry is going, not where it was five years ago. Their analysis also emphasizes that the next efficiency gains won’t just be about scale, but about getting the protein‑to‑fat ratio right for the products being made. 

Locally, that creates split realities:

  • If you ship into a newer or aggressively expanding plant that pays on components or cheese yield, you may see stronger over‑order premiums, solids incentives, and long‑term supply agreements. Farm Credit East reports that in parts of the Northeast, over‑order premiums of $0.75 to $1.50 per cwt have been common where plants are pulling hard for high‑component milk.
  • If you ship to a plant with limited capacity growth or a narrower product mix, you may feel more of the overall supply pressure and less of that premium pull.

From a distance, this wave of investment is a huge vote of confidence in the future of North American milk. At the farm gate, it also means that if demand doesn’t keep pace, processors will push utilization and volume, which can lean on commodity prices even while local premiums improve for the “right” kind of milk.

Looking ahead a bit beyond 2026, it’s also worth keeping an eye on FMMO modernization debates and evolving component pay structures, because those policy and pricing shifts will sit atop the same stainless and component dynamics we’re discussing today. 

Credit Tightening: Planning in an 8% Money World

Now bring the lender back into the kitchen conversation.

Ag credit reports from the Chicago Federal Reserve show that by late 2023 and into 2024, average farm operating loan rates in that district had climbed to about 8.5% at their peak and then eased slightly to just over 8%, while farm real estate loan rates sat roughly in the mid‑7% range. Purdue ag finance updates and related summaries note that these are the highest farm borrowing costs since the mid‑2000s.

CoBank’s financial statements shows higher provisions for credit losses in 2025 compared to the very low levels of 2021–2022, which is another way of saying lenders are paying much closer attention to risk again. Nobody is slamming the door on dairy, but the days of cheap money and easy approvals are over for now.

On many dairies—from 60‑cow parlors in New England to 2,000‑cow freestalls in Idaho—the lender conversation now revolves around three questions:

  • What if milk averages mid‑$16s instead of high‑$18s for the next 12–18 months? 
  • Does this capital project still pencil at 7–8% interest and realistic feed and labor costs?
  • What’s the plan if 2026 turns out “just okay” instead of strong?

For a 300‑cow operation carrying $4–5 million in total debt, moving from roughly 4% to 7–8% interest can add tens of thousands of dollars in interest expense each year, depending on amortization and structure. That’s money that used to be available for principal, repairs, or family living.

I’ve heard more than one banker say their informal stress test now is: “Would you still be comfortable at $16 milk for 18 months?” It’s not a forecast; it’s a guardrail. In a year where USDA and the futures board don’t agree, and exports are strong but price‑sensitive, that kind of discipline matters.

If milk spends half the year at your budget price, do you have anything in place to prevent it from crushing cash flow? 

Planning in a $17‑ish World: Five Strategies That Are Working

So with all those moving pieces—USDA vs. futures, record exports at discount prices, big component shifts, new stainless, and 8% money—the practical question is: what do you actually do when you sit down with your 2026 plan?

Here are five strategies that are working on real farms right now.

1. Let the Class III curve anchor your budget

One approach that’s gaining traction is straightforward: build your base budget off the Class III futures strip, and treat USDA’s all‑milk forecast as upside.

If the average of the next 6–12 Class III contracts is sitting in the mid‑$16s, you can:

  • Use that futures‑based number as your core milk price in the plan, then apply your historical mailbox basis and component performance. 
  • Build a second scenario using something closer to USDA’s high‑$18 to low‑$20 all‑milk range and ask, “If we actually see that, what would we change about capital and risk decisions?” 

In a 150‑cow family tie‑stall in Ontario or Vermont, that upside scenario might be where a parlor retrofit or bunk upgrade moves ahead. In a 1,200‑cow freestall in Wisconsin or New York, it might be where the next phase of stall renovation or manure handling upgrades makes sense.

Either way, the survival plan—the one your lender sees first—is built around the futures‑anchored price, not the rosiest forecast on the page.

2. Take advantage of a friendlier feed market—without getting greedy

The good news is that feed isn’t the villain it was a couple of years ago.

Corn has generally traded in the high‑$3 to low‑$4 per bushel range, and soybean meal in the high‑$200s to low‑$300s per ton, a long way from the spikes of 2022. USDA’s Dairy Margin Coverage calculations show that by late 2025, the feed‑cost portion of the DMC margin had improved to its best levels since about 2020 as grain and protein prices eased. 

That gives you a window to lock in some feed at workable prices.

A middle‑ground approach many herds are using looks like this:

  • Lock in 60–75% of core purchased feed—corn, soybean meal, key by‑products—for the next 6–9 months.
  • Keep 25–40% open to allow for ration tweaks, herd-size adjustments, or price improvements.
  • Avoid locking 100% for a full year unless your operation is very stable, and you’re comfortable with that risk.

For smaller and mid‑size herds, DMC remains a valuable safety net. USDA and extension analyses show that higher coverage levels on the first 5 million pounds have paid out in multiple low‑margin years since the 2019 redesign. For larger herds, Livestock Gross Margin for Dairy (LGM‑Dairy) offers a subsidized way to insure a futures‑based milk‑over‑feed margin.

Research from universities like Wisconsin and Kansas State shows that herds using a rules‑based margin strategy—consistent use of DMC, LGM‑Dairy, futures, and options around target margins—tend to see less income volatility than herds that act only when markets get scary. You’re not trying to pick the exact bottom; you’re trying to avoid being naked when both milk and feed move against you.

3. Make every capital project pass a $17 milk test

In an 8% money world, every barn, parlor, and piece of iron has to earn its keep.

A simple rule that works well is: if a project can’t pay for itself at about $17 milk and today’s interest rates within 5–7 years, it probably belongs on the “later” list.

Project TypeCapital CostCash Flow @ $16/cwtCash Flow @ $18/cwtPayback @ $17 (yrs)Recommendation
Parlor upgrade (60 cows/hr to 90)$280,000$22,400$38,5005.2PROCEED—labor payoff in peak season; health spillover
New VMS (50-cow system)$450,000-$8,200$12,600>10DEFER—milking labor gains don’t offset cost at $16 milk
Freestall renovation + new bedding$165,000$18,900$28,4004.6PROCEED—cow comfort drives milk/reproduction ROI
Manure handling (solid separator + storage)$220,000$14,200$22,1005.8PROCEED—compliance + nutrient value; essential
New feed mill automation$95,000$11,500$16,8003.1PROCEED NOW—fastest payback; ration consistency ROI
Robotic feed pusher (2 units)$180,000$3,400$8,2008.1DEFER—marginal labor benefit; wait for $18+ milk

For 100–250‑cow family herds, that tends to move projects that protect daily performance and cow health to the front:

  • Milking system reliability and throughput
  • Manure handling that keeps you compliant and efficient
  • Ventilation, bedding, and stall comfort
  • Functional fresh cow and transition facilities

“Nice‑to‑have” projects that don’t clearly move milk, health, or labor safety can wait.

For 500–1,500‑cow freestall or dry lot systems, the numbers are bigger, but the logic is the same:

  • Use mid‑$16–$17 milk in your cash‑flow, not $19 or $20.
  • Plug in realistic feed, labor, and 7–8% interest from your lender.
  • Sit with your lender and run a $16 milk stress test for 12–18 months before you sign.

Lenders are more eager to support capital when they see conservative assumptions and honest downside modeling, not just best‑case spreadsheets.

Letting Components – and Fresh Cows – Carry More of the Load

Components are a lever you can pull without adding cows or concrete.

Butterfat pounds have grown about 30.6% since 2010, compared with 15.9% growth in total milk, and that butterfat output was running 3–4% higher year‑over‑year in early 2025 while milk barely budged. We also know from CoBank that butterfat has accounted for most milk checks over the last decade, driving a butterfat boom, and that protein has risen about 6% in the same period. 

At the same time, CoBank, Geiger, and academic work on milk quality argue that processors—especially cheese plants—need a more balanced protein‑to‑fat ratio to optimize yields and manage standardization cost. So the farms that do best are often those that produce strong but not extreme butterfat with rising protein, not just the highest fat test in the county.

On the cow side, that typically means:

  • Investing in fresh cow management and the transition period so cows hit peak intake without a wreck.
  • Tuning amino acid balance instead of endlessly raising crude protein.
  • Focusing on forage quality and consistency so you’re not fighting the ration every week.

On the genetics side, CoBank’s report and Bullvine’s own component‑ratio work highlight herds using genomic tools and custom indexes that weight butterfat, protein, total solids, and cheese-yield traits, especially where plants pay on solids and yield. 

If you’re under Canadian supply management, the pricing grid and quota rules are a bit different, but the same principle applies: match your component profile to what your board and processors value most.

Using Risk Tools That Fit Your Scale

Month2023 High2023 Low2023 Close2024 High2024 Low2024 Close2025 YTD High2025 YTD Low2025 YTD Close
Jan$18.20$16.80$17.10$17.50$15.80$16.40$16.80$15.20$15.65
Feb$18.60$17.20$17.50$17.80$16.10$16.70
Mar$18.90$17.60$18.20$18.10$16.40$17.10

Most producers don’t want to live on a futures screen, and they don’t need to. But in a year when USDA and the board are a couple of bucks apart, and interest is high, having no risk plan is a risk in itself.

A practical, scale‑friendly approach looks like this:

  • Once a month, glance at Class III and IV futures and ask whether things are better, worse, or about the same as when you built your plan. 
  • Talk with your co‑op or buyer about forward‑pricing pools or risk programs where they handle the hedging, and you commit a portion of your milk. 
  • If you’re in the 1,000‑cow‑plus range, consider working with a risk adviser who uses rules and target margins, not just hunches.

University extension work on dairy risk management consistently shows that herds using structured, rules‑based programs with DMC, LGM‑Dairy, futures, and options have smoother income over time than herds reacting sporadically when markets look scary.

The key is to pick tools that fit your scale, comfort level, and co‑op structure, not to copy whichever strategy your neighbor talks about the loudest.

Different Farms, Different Realities

As you know, the same Class III price can feel very different two roads over.

For 100–250‑cow family herds in regions like New England, Maine, Wisconsin, New York, and Pennsylvania, the biggest pain points are usually cash flow, debt service, and family labor. Conservative price assumptions, sensible feed coverage, and smart use of DMC (or quota‑aligned tools in Canada) often do more good than chasing every 20‑cent move. On‑farm processing or direct marketing can be powerful for some, but only where there’s real local demand and labor capacity.

For 250–800‑cow operations across the Upper Midwest, Northeast, and parts of the West, working capital, component income, and labor efficiency tend to move the needle fastest. Lenders in these regions often say they’re most comfortable when they see:

  • Budgets run at $16–$17 milk
  • At least some margin protection in place
  • A capital program paced for 7–8% money, not cheap‑money days

For 1,000‑cow‑plus herds—multi‑site freestalls, big dry lot systems in the West and Southwest—processors care a lot about consistency, quality, and risk profile. Multi‑year supply deals, basis arrangements, and structured hedge programs can smooth income if they’re built around realistic margins and checked regularly.

Across all sizes, the farms that tend to come out of tight cycles with options left are usually the ones that:

  • Know their true cost of production
  • Are honest with themselves and their lenders about leverage
  • Make small, early adjustments when margins pinch instead of waiting for a crisis

The Short Version

If we were at a winter meeting in Listowel or Tulare and you slid your coffee across the table and said, “Alright, just give me the quick list,” here’s how I’d boil it down:

  • Plan off the futures strip, not the prettiest forecast. Use the 6–12‑month Class III average—roughly the mid‑$16s right now—as your base and treat USDA’s higher all‑milk projections as upside, not your starting point. 
  • Lock in some feed while it’s reasonable. With corn and soybean meal back in more manageable ranges and DMC margins much better than in 2022, it makes sense to protect part of your feed so a spike doesn’t wreck your year. 
  • Make capital prove it works at $17 milk and 8% interest. Any barn, parlor, or equipment upgrade that doesn’t pencil at about $17 milk and current rates within 5–7 years needs a tough second look before you sign.
  • Let components and fresh cow management do more of the lifting. Butterfat performance is strong, and protein’s value is rising in many pay systems. Align your ration, fresh cow management, and genetics with the component blend your plant or board actually pays for. 
  • Have the hard conversations early. Sit down now—with your lender, co‑op, nutritionist, and family—while there’s still time to tweak the plan instead of scrambling later.

The Bottom Line

The encouraging part of all this is that the long‑term demand story for North American dairy remains strong. USDEC numbers and Bullvine coverage show record or near‑record cheese and butterfat exports, and through three quarters of 2025, U.S. butterfat exports were up triple digits in volume, with butter export value surpassing prior full‑year records. CoBank’s $10‑billion stainless estimate—and the plants you can actually drive past—show processors still betting big on future milk. 

You don’t have to operate like milk will stay at $16 forever—but you can’t afford to build a 2026 plan that only works at $20, either.

Before March, sit down with: (1) your lender, with a $16–17 milk stress‑tested budget; (2) your nutritionist, with explicit butterfat and protein targets; and (3) your co‑op or buyer, with a specific risk‑tool and contract conversation. If the last couple of decades have taught anything, it’s that the better stretch does come back around. The herds still standing when it does are the ones that took years like 2026 seriously, planned conservatively, and kept just enough powder dry to move when the wind finally shifted in their favor. 

Key Takeaways

  • Mind the $150K gap: USDA forecasts 2026 all‑milk near $18.25/cwt; Class III futures sit in the mid‑$16s. For a 300‑cow herd, budgeting off the wrong number is a $150,000+ mistake. ​
  • Record exports, discount prices: U.S. cheese exports jumped 28% and butterfat nearly tripled in August 2025—but we’re winning volume by pricing below the EU and New Zealand, not by earning premiums. ​
  • Protein is catching up to fat: Butterfat led the check 8 of 10 years, but cheese plants now want balanced protein‑to‑fat ratios. Herds shifting to 3.8–3.9% fat with 3.2%+ protein are seeing better component checks. ​
  • $17 milk is the new capital test: At 7–8% interest and lenders stress‑testing at $16 milk, any project that doesn’t pay back at ~$17 milk within 5–7 years belongs on the “later” list.
  • Act before March: Budget off futures (not USDA), lock 60–75% of feed for 6–9 months, stress‑test every capital decision, align components with your plant’s pay grid, and put risk tools in place that match your scale. ​

Complete references and supporting documentation are available upon request by contacting the editorial team at editor@thebullvine.com.

Learn More

The Sunday Read Dairy Professionals Don’t Skip.

Every week, thousands of producers, breeders, and industry insiders open Bullvine Weekly for genetics insights, market shifts, and profit strategies they won’t find anywhere else. One email. Five minutes. Smarter decisions all week.
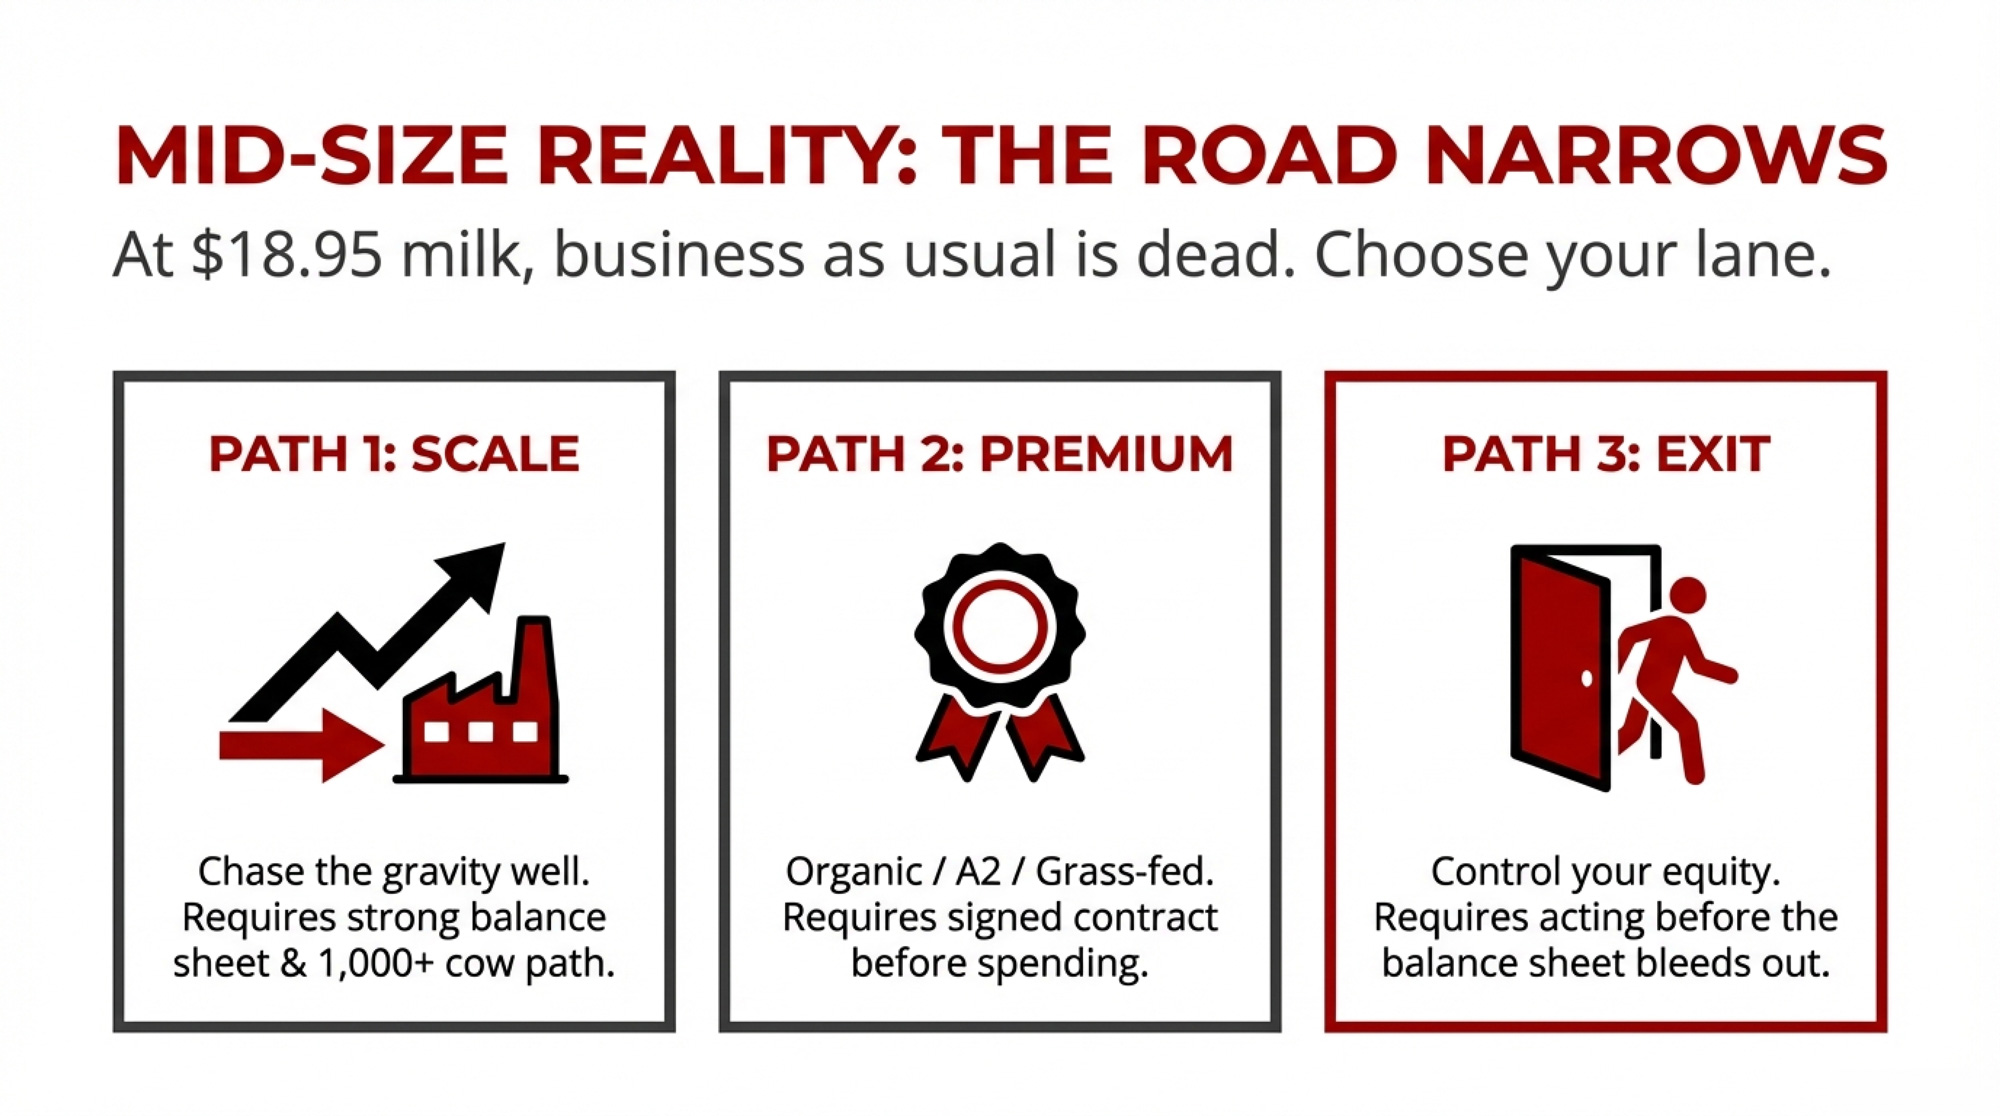
NewsSubscribe
First
Last
Consent

The $15,800 DMC Decision Every Dairy Needs to Make Before February 26

DMC averaged $74K per farm in 2023. In 2026, it got $15,800 better for 300-cow herds. Claim it by February 26—or miss it.

Executive Summary: DMC’s Tier 1 cap just jumped from 5 million to 6 million pounds. For a 300-cow dairy, that single change is worth roughly $15,800 in annual premium savings—money most producers will leave on the table because they’ll renew the way they always have. Before the February 26 deadline, you need to answer one question: Is Tier 2 coverage (about $70/cow, or $20,000/year) still survival insurance, or has your balance sheet improved enough since 2023 that it’s become expensive peace of mind? A quick runway test—available cash divided by monthly fixed costs—tells you where you stand. If you’ve rebuilt working capital and your operation is stronger than it was three years ago, your DMC strategy should reflect that. The $15,800 is there. The only question is whether you’ll claim it.

You know how it goes. You swing by the FSA office, renew your Dairy Margin Coverage more or less on autopilot, and get back to what actually matters—watching fresh cow performance, keeping an eye on butterfat levels, and making sure the transition period isn’t causing problems. In most years, that routine hasn’t hurt too badly.

This year’s different, though.

For the 2026 coverage year, FSA has bumped the Tier 1 coverage limit from 5 million pounds up to 6 million pounds. That’s straight from USDA’s official DMC program page, and they announced it at the Farm Bureau convention earlier this month. The expansion came through in the 2025 farm bill—the “One Big Beautiful Bill,” as it’s been called in the trade press—which also extended DMC through 2031.

Here’s what’s interesting about that change. The folks at Adams Brown, who spend their days running dairy financials, put out an article back in November showing what happens when you shift an extra million pounds from Tier 2 into Tier 1. For a lot of 250- to 350-cow herds, we’re talking premium savings solidly in the five-figure range.

So this year, doing “what we’ve always done” really is a decision. Not just a formality.

What Actually Changed in DMC for 2026?

Let me walk through this piece by piece, because the structure matters.

Starting in 2026, that first 6 million pounds of your production history qualifies for Tier 1 coverage. You can pick coverage levels from $4.00 up to $9.50 per hundredweight, in half-dollar increments. And here’s the part that makes Tier 1 so attractive—at the $9.50 level, you’re paying just $0.15 per cwt. That’s from UW-Madison’s DMC policy updates, and the 2026 DMC premium rates haven’t changed on the Tier 1 side from previous years.

Everything above 6 million falls into Tier 2. The coverage there tops out at $8.00 per cwt, and the premium at that level runs about $1.81 per cwt according to the same UW tables.

So any hundredweight you can move from Tier 2 down into Tier 1? You’re trading a $1.81 premium for a $0.15 premium. That’s roughly $1.66 per cwt difference.

Over a million pounds—10,000 cwt—that works out to around $16,600 in potential premium savings. Real money.

One more thing worth noting: FSA is also requiring all operations enrolling for 2026 to establish a new production history using the highest annual production from 2021, 2022, or 2023. That’s on FSA’s program page and confirmed in Adams Brown’s farm bill summary. If your herd has grown since you last updated, this could work in your favor.

Putting This in Cow Terms

It helps to anchor this in actual herds rather than abstract numbers.

The average U.S. milk production in 2023 came in at 24,117 pounds per cow, up about 30 pounds from 2022. Using that benchmark, 300 cows at average production gives you roughly 7.2 million pounds annually. That’s a pretty common profile in freestall operations across the Midwest and Northeast.

YearTier 1 (Lbs)Tier 1 Premium/cwtTier 2 (Lbs)Tier 2 Premium/cwt
20255.0M$0.152.2M$1.81
20266.0M$0.151.2M$1.81

Under the old DMC structure, that 300-cow herd had 5 million pounds in Tier 1 and 2.2 million in Tier 2. Under the 2026 rules, it’s 6 million in Tier 1 and only 1.2 million in Tier 2.

Run those volumes through current FSA premium rates at 95% coverage, and here’s what you get:

The old structure cost that herd roughly $45,000 a year in premiums—about $7,100 for Tier 1, nearly $38,000 for Tier 2. The new structure? Roughly $29,000—around $8,500 for Tier 1, about $20,700 for Tier 2.

MetricOld DMC (2025)New DMC (2026)
Tier 1 Cap5.0 Million Lbs6.0 Million Lbs
Tier 1 Premium ($9.50)$0.15 / cwt$0.15 / cwt
Tier 2 Premium ($8.00)$1.81 / cwt$1.81 / cwt
Annual Premium (300 Cows)~$45,000~$29,000
Net Savings$15,800

That’s approximately $15,800 in annual premium savings. Just because more milk now qualifies for the cheaper coverage tier.

Adams Brown’s worked examples hit the same ballpark when they model what happens as production shifts from Tier 2 to Tier 1. This isn’t a cosmetic tweak—it genuinely moves the needle.

Herd Size (Cows)Annual Production (Lbs)2025 Premiums2026 PremiumsSavings
2004.8M~$32,500~$20,800~$11,700
3007.2M~$45,000~$29,000~$16,000
4009.6M~$57,500~$37,000~$20,500
50012.0M~$70,000~$45,000~$25,000
60014.4M~$82,500~$53,000~$29,500

What 2023 Taught Us About DMC

You probably remember 2023 without needing much prompting. But it’s worth looking at what DMC actually did that year, because it shapes how a lot of us think about coverage now.

UW-Madison’s 2024 program review showed that DMC margins fell below the $9.50 coverage threshold in 11 out of 12 months during 2023. Several months landed in the mid-$4 to low-$5 per cwt range—some of the weakest margins we’d seen since the program started.

MonthAll Milk Margin ($/cwt)Tier 1 Payment @ $9.50 Coverage ($/cwt)
Jan$4.80$4.70
Feb$5.20$4.30
Mar$4.50$5.00
Apr$5.80$3.70
May$6.20$3.30
Jun$6.50$3.00
Jul$6.10$3.40
Aug$5.90$3.60
Sep$5.40$4.10
Oct$4.70$4.80
Nov$4.30$5.20
Dec$4.60$4.90

On the payment side, UW-Madison reported that total indemnity payments for 2023 topped $1.27 billion across about 17,059 enrolled operations. That worked out to an average of roughly $74,453 per farm, with about 74.5% of eligible dairies participating.

For producers at the $9.50 coverage level, monthly payments often exceeded $2 per cwt during the worst stretches. Dairy Herd Management described 2023 as a year when DMC was “in the money” almost continuously for herds with higher Tier 1 coverage.

When USDA first rolled out the DMC decision tool in 2019, it partnered with UW-Madison on its development. At the time, Mark Stephenson—then Director of Dairy Policy Analysis at UW—said DMC “offers very appealing options for all dairy farmers to reduce their net income risk due to volatility in milk or feed prices.”

That sounded promising then. 2023 showed what it looks like in real dollars.

So when producers say they’re not going through another margin crash without full coverage, that’s not paranoia. It’s memory. Those DMC payments kept operating loans current, and feed mills paid on a lot of farms.

What’s easy to miss, though—and this is where the 2026 DMC calculation gets interesting—is that many herds used the stronger margins of late 2023 and 2024 to rebuild. Working capital came back. Debt got paid down. Break-even costs dropped.

The Farm You Were vs. The Farm You Are Now

Here’s what I’ve noticed working through this with producers over the past few months.

Going into 2023, a lot of mid-size herds—the 250- to 350-cow operations—were carrying tight balance sheets. Farm-management reports and lender dashboards commonly showed working cash in the $50,000 to $100,000 range, debt service coverage ratios hovering around 1.1 to 1.25, debt-to-asset ratios in the mid-40% to low-50% band, and break-even milk prices pushing toward $19 or $20 per cwt in higher-cost regions.

University finance specialists had been flagging that profile as vulnerable for a while. Any combination of lower milk prices, poor forage quality, or spiking feed costs could push those farms into serious stress.

Fast forward to now, and the picture often looks different. The herds that stayed in business—especially those that collected DMC payments and caught the firmer milk prices of 2024—often rebuilt working capital into the $200,000 to $300,000 range or higher. Debt service coverage ratios improved into the 1.4 to 1.6 band. Debt-to-asset ratios drifted back toward the high 30s or low 40s. Break-even prices fell into the $17 to $18 range, with better forage and tighter overhead.

When you put the last few years of financials side by side, the “farm we were in 2022” and the “farm we are in 2025” can look quite different—even if your gut still feels like it’s living in 2023.

So, before you check those boxes at FSA, are you setting up DMC for the farm you were, or the farm you are now?

What Job Is Tier 2 Actually Doing?

This is where conversations tend to get interesting.

In my experience, Tier 2 ends up playing one of two roles. It’s either survival coverage or peace-of-mind coverage. Both are legitimate. The key is knowing which job it’s doing for you this year.

IndicatorTier 2 = Survival CoverageTier 2 = Peace-of-Mind Coverage
Working Capital (Days of Expenses)<60 days>120 days
Debt Service Coverage Ratio<1.25>1.40
Debt-to-Asset Ratio>50%<40%
Break-Even Milk Price>$19/cwt<$18/cwt
Tier 2 Annual Cost (300-cow herd)~$20,000–$21,000 (Critical)~$20,000–$21,000 (Discretionary)
DecisionMust Keep Tier 2Can Scale Back or Self-Insure

When Tier 2 is survival coverage

Tier 2 belongs in the “must-have” column when a farm is financially fragile. Extension finance programs and lenders typically flag farms with working capital covering less than 60 days of expenses, debt service coverage consistently below 1.25, debt-to-asset ratios above 50%, or break-even milk prices creeping toward $19 or higher.

As many of us have seen in Wisconsin freestalls and Western dry lot systems alike, it doesn’t take much to chew through limited cash when you’re that tight. A weather-damaged corn silage crop. Protein prices jumping. A dip in the milk check. On those farms, Tier 2 payments can literally be the difference between riding out a rough stretch and falling behind on bills you can’t afford to miss.

When Tier 2 becomes peace-of-mind coverage

On stronger farms, Tier 2 plays a different role.

When working capital covers 120 days or more of fixed costs, when debt service coverage holds comfortably above 1.4, when leverage sits under 40%, and when break-even prices have moved down into the $17 to $18 range—a farm can shoulder more of its own margin risk without immediately threatening survival.

In that situation, Tier 2 becomes more about smoothing income and reducing stress than about keeping the doors open. The protection is real, but the farm isn’t dependent on those checks to stay solvent.

What Tier 2 actually costs

Back to our 300-cow example. That extra 1.2 million pounds above the Tier 1 cap falls into Tier 2.

Using FSA’s premium table at $8.00 coverage and 95% coverage percentage, premiums on that Tier 2 slice run about $20,000 to $21,000 per year. Spread across the herd’s total production, you’re looking at roughly 28 to 29 cents per cwt, or about $70 per cow per year.

Some operations look at that $70 and say, “That’s a cheap price for peace of mind.” Others—particularly those with longer runway and stronger cash flow—start asking whether that money might work harder paying down principal, upgrading cow comfort, or buying targeted Dairy Revenue Protection for specific high-risk quarters.

A Kitchen-Table Runway Test

So how do you figure out where you actually stand without building a massive spreadsheet?

A lot of university educators and lenders have gravitated toward a simple runway test. It’s not perfect, but it’s surprisingly useful for getting your bearings.

  • Step one: Grab your most recent bank statement showing your operating account and any short-term savings. Pull your latest term-debt statement with the monthly principal and interest. Have a recent milk check handy.
  • Step two: Estimate your monthly fixed “burn.” Start with your total monthly term-debt payments, then add the costs that don’t disappear when margins drop—insurance, utilities, property taxes averaged over the year, core payroll for people you realistically can’t cut. Farm-business programs in Wisconsin, Minnesota, and New York commonly see 250- to 350-cow dairies with monthly burns in the $18,000 to $22,000 range, though it varies by region and setup.
  • Step three: Divide your available cash by that monthly burn.

That gives you your runway—the number of months you can keep essential bills paid if margins drop and stay ugly.

Extension risk-management materials generally talk about 3 to 6 months of working capital as a minimum target, with more than 6 months representing a strong buffer.

In practice:

  • Less than 3 months: Tier 2 is probably still survival coverage for your operation.
  • 3 to 6 months: Gray area—time for a careful conversation with your lender.
  • More than 6 months: There’s room to discuss self-insuring part of that Tier 2 risk.

What’s encouraging is that many Midwest operations running this exercise over the past year have been surprised to find their runway longer than they expected. Not everyone, but enough that it’s changed the tone of the Tier 2 conversation.

Months of RunwayFinancial StatusTier 2 Coverage Decision
<3 monthsTight. Vulnerable to margin shocks.KEEP TIER 2 — Survival coverage; margin failures = serious stress
3–6 monthsGray area. Stronger than tightest farms, not yet confident.CONSULT YOUR LENDER — Decision depends on debt structure & farm trajectory
>6 monthsStrong. Solid buffer.YOU HAVE OPTIONS — Can max Tier 1, skip/scale Tier 2, test self-insurance

How Bigger Herds Layer Their Risk Tools

For larger operations—500 cows, 1,000 cows, and up—the DMC discussion usually sits inside a broader risk-management framework.

UW-Madison’s 2025 DMC update explicitly notes that “DMC may be combined with DRP or LGM-Dairy to form a more comprehensive risk management framework.” And that’s exactly what we’re seeing in practice.

The pattern in a lot of Wisconsin freestalls and Western systems looks something like this: Use Tier 1 DMC at $9.50 for the first 5 to 6 million pounds as a base safety net. Add Dairy Revenue Protection on a portion of remaining production to lock in revenue floors for specific quarters, especially when futures markets and local basis look shaky. Use Livestock Gross Margin-Dairy selectively when feed cost risk is particularly high.

Risk Management Agency materials show that DRP adoption has been ramping up among larger herds since its 2018 launch. DMC serves as the first layer; DRP and LGM target more specific risks for volumes above Tier 1.

For bigger operations, Tier 2 is one option among several for covering extra production—and the decision about how much to buy sits alongside questions about DRP quarters and feed hedging.

The Six-Year Lock-In: Discount or Commitment?

Now let’s talk about the multi-year option, because it deserves a careful look.

The discount

Under the 2025 farm bill changes, producers can enroll in DMC for a six-year period—2026 through 2031—and receive a 25% discount on premiums throughout. That’s confirmed on FSA’s official program page and in Adams Brown’s farm-bill breakdown.

For our 300-cow example, where annual premiums under the new structure run about $29,000, a 25% discount brings that down to roughly $22,000 per year. That’s around $7,000 in annual savings, or more than $40,000 across six years.

The commitment

The catch—and it’s worth thinking through—is that multi-year enrollment isn’t designed as a “sign now, adjust freely later” arrangement.

USDA describes it as providing stability for both producers and the program. The detailed rules around mid-stream changes are best confirmed with your local FSA office, but the general idea is clear: you’re trading some future flexibility for a lower bill today.

Questions worth asking before you sign

If you’re considering the multi-year option, here are the conversations to have at FSA:

  • “If we expect to grow from 300 cows to 450 cows over the next six years, how does our coverage and premium obligation evolve?”
  • “If we sell, retire, or transfer the operation before 2031, what happens to the remaining years?”
  • “If our risk tolerance changes and we want to adjust Tier 2 coverage after a couple of years, what are our options?”

For stable herds with clear long-term plans, the multi-year discount can be a very good fit. For farms facing major transitions—expansion, succession, shifts in business model—staying year-to-year and letting coverage evolve with the operation might make more sense.

The main thing is asking these questions before you sign.

Why February 26 Should Be the Finish Line, Not the Starting Gun

According to FSA, the 2026 DMC enrollment deadline is February 26. Enrollment opened January 12.

What I’ve noticed is that the farms getting the most from DMC treat that deadline as the last day to finalize paperwork on a decision they’ve already worked through—not the day they first start asking what changed.

By mid-January, most dairies are already deep into year-end review. You’re looking at your 2025 income statement and balance sheet. You know how forage turned out. You’ve got a feel for where feed and milk markets might be headed. That’s exactly when DMC strategy belongs in the conversation.

FSA staff consistently say the strongest sign-up meetings happen early in the window, when producers arrive with their questions already answered. It’s the last-week crunch—when everyone’s buried and just trying to avoid missing the deadline—that leads to “just do what we did last year” decisions, even when the farm’s financial picture has shifted significantly.

What If You Cut Tier 2 and 2026 Turns Ugly?

This is the question that sits in the back of everyone’s mind. And honestly, it should.

If you look at your 2025 results, decide you’re strong enough to drop or scale back Tier 2, and then 2026 turns into another rough year, will there be mornings when you wish those Tier 2 checks were coming?

Of course. That’s the nature of insurance. Regret always shows up loudest after the fact.

So instead of asking whether you’ll regret it if the worst happens—because that answer is almost always yes—it’s more useful to ask:

  • Given our current runway, debt service coverage, leverage, and break-even, could we realistically survive another difficult margin year using Tier 1 DMC, our cash reserves, and existing credit without Tier 2?
  • How much margin risk are we truly comfortable carrying ourselves now, compared to what we could carry going into 2023?

For some farms, after putting the real numbers on the table with their lender, the answer is still: “We’re not quite there yet. Tier 2 is survival coverage for us.”

For others—especially those sitting on more than six months of runway and strong debt service coverage—the answer moves closer to: “We can shoulder more of this ourselves now, and those Tier 2 dollars might work harder somewhere else.”

A test-year approach for stronger herds

What’s emerging in some extension workshops is a “test-year” strategy. It goes like this:

  • Max out the expanded Tier 1: 6 million pounds at $9.50.
  • Skip Tier 2 for one coverage year.
  • Move the money you would have spent on Tier 2 premiums—around $20,000 in the 300-cow example—into a dedicated reserve account earmarked for margin shocks.

If 2026 turns rough, that reserve plus Tier 1 payments gives you a self-funded cushion. If 2026 is decent, you’ve effectively paid that premium to yourself and strengthened your working capital.

It won’t fit everyone, and it absolutely should be run past your lender first. But it shows how stronger balance sheets and a more generous Tier 1 structure are giving some farms more options, not fewer.

Your Action Plan Between Now and February 26

Let me bring this back to the kitchen table.

Tonight or this week:

  • Run your runway test. Grab your bank and loan statements and figure out how many months of fixed costs your current cash covers.
  • Pull your key ratios. Look at where your debt service coverage, leverage, and break-even landed for 2025.
  • Run scenarios with USDA’s DMC Decision Tool. It’s available on FSA’s website and was developed with UW-Madison specifically to help producers compare coverage options using their own production history.

Over the next week or two:

  • Decide what job Tier 2 is doing. Is it still survival coverage for your operation, or has it shifted into peace-of-mind territory you might resize?
  • Talk with your lender. Bring your runway number and ratios. Ask whether your current position can support self-insuring some risk.
  • Ask about multi-year enrollment at FSA. Get clear on what a six-year commitment would mean for your situation.

Before February 26:

  • Choose your 2026 structure intentionally. Decide your Tier 1 and Tier 2 levels, whether you’re going year-by-year or locking in for six years, and how that fits with any DRP strategy.
  • Walk into FSA with a plan. Use your appointment to execute a decision you’ve already made, based on good information.

The Bottom Line

DMC remains one of the most cost-effective safety nets under the U.S. milk check. But the opportunity in 2026 isn’t just to get enrolled.

It’s to enroll like the farm you’ve become—not the farm you were before 2023—and to line up your coverage with the cows you’re milking, the numbers on your books, and the level of risk you can genuinely live with now.

The 2026 DMC deadline is February 26. If you don’t run this math before then, the odds are high you’ll either overpay for coverage you don’t need, or underinsure a risk your balance sheet still can’t carry.

Neither is where any of us want to be. 

Key Takeaways:

  • $15,800 is hiding in your 2026 DMC renewal. The Tier 1 cap jumped from 5 million to 6 million pounds—shifting a million pounds from $1.81/cwt premiums down to $0.15 for 300-cow dairies.
  • Most producers will miss it. They’ll renew on autopilot without realizing the program changed. Don’t be most.
  • Tier 2 runs $70/cow. Is that survival coverage—or an expensive habit? If your balance sheet is stronger than it was in 2023, the answer has likely changed.
  • Run the runway test. Cash on hand ÷ monthly fixed costs. Under 3 months = Tier 2 is still essential. Over 6 months = you have real options.
  • February 26 deadline. The $15,800 is there. Claim it—or leave it on the table.

Complete references and supporting documentation are available upon request by contacting the editorial team at editor@thebullvine.com.

Learn More

The Sunday Read Dairy Professionals Don’t Skip.

Every week, thousands of producers, breeders, and industry insiders open Bullvine Weekly for genetics insights, market shifts, and profit strategies they won’t find anywhere else. One email. Five minutes. Smarter decisions all week.
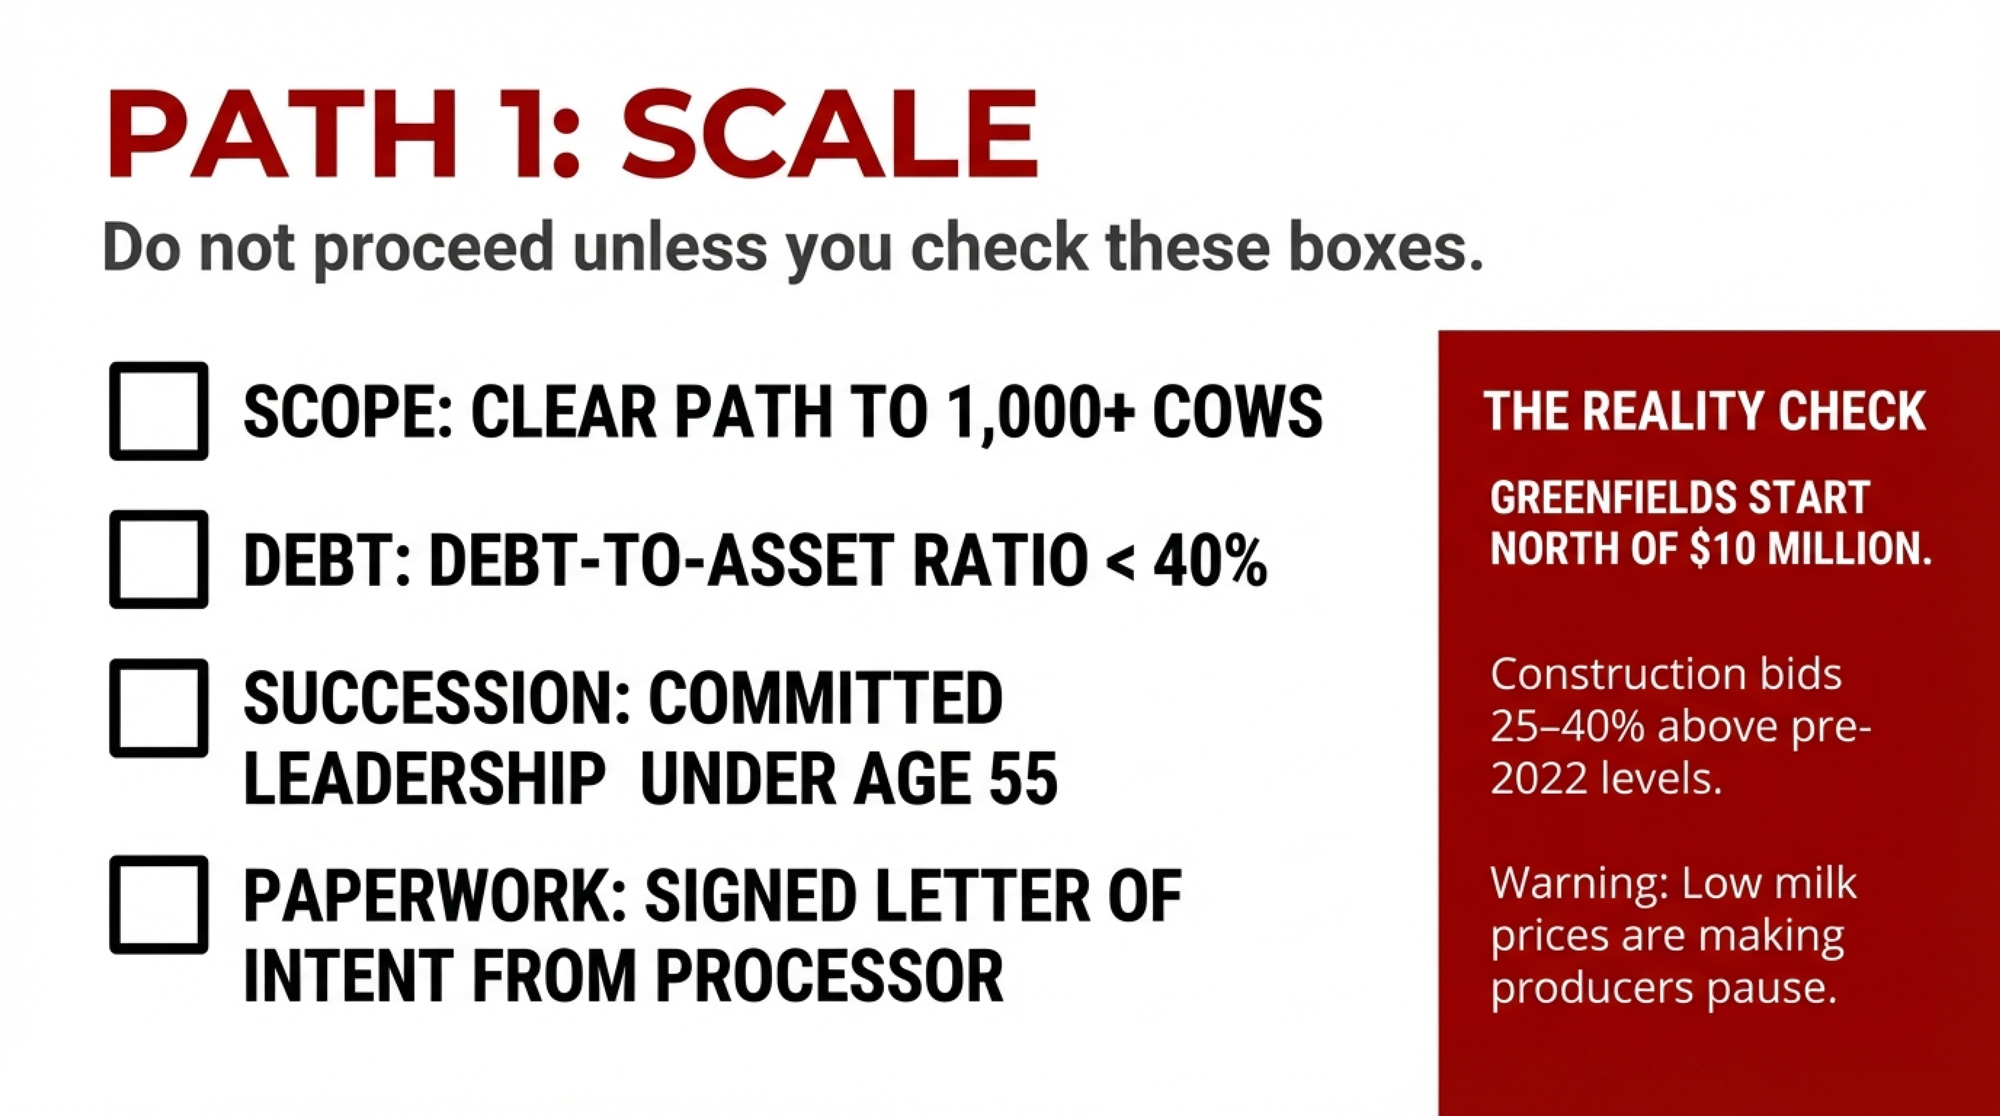
NewsSubscribe
First
Last
Consent

Same Milk, Different Payday: How Your Processor’s Product Mix Shapes Your Future

Two good herds. Same calving nights. Same butterfat goals. Five years later, one family had $400K more equity. The gap wasn’t created in the barn—their processor’s product mix created it.

Executive Summary: U.S. cheese and butter consumption hit all-time highs in 2023, and total dairy demand reached levels not seen since 1959—a real tailwind for the industry. But USDA projects more milk coming through 2026 with all-milk prices in the low-$20s: solid for some herds, uncomfortably close to breakeven for others. What’s increasingly separating those outcomes isn’t just fresh cow management or component focus; it’s where milk actually lands after it leaves the lane—pizza cheese and specialty yogurt versus commodity powder and private-label fluid. For a 400-cow herd, a steady $1/cwt pay-price difference adds up to roughly $400,000 in equity over four years. Inside, you’ll find six questions to ask your processor, three conversations to prioritize this year, and a framework for matching your channel position with your true cost of production. In this market, knowing where your milk goes may matter as much as anything happening inside your barn.

Let me start with a scene you probably know all too well.

Two 400-cow herds. Both kinds of barns are the kinds most of us would call “good.” Cows right around that 80-pound mark. Butterfat levels the field rep is happy with. Fresh cow management through the transition period is under control. No major train wrecks in the dry cow pen. Parlors are humming along well enough that nobody’s cursing the schedule over coffee.

Fast-forward four or five years. One of those farms has quietly added $300,000 to $400,000 in equity. The other is wondering why, after all the nights in the maternity pen and all the feed tweaks, the balance sheet isn’t where they hoped it’d be.

The difference often isn’t robots versus parlors, or sand versus mattresses, or who’s running what ration software. What I keep seeing, in conversations with producers and in the numbers themselves, is that it comes down to a question we didn’t really ask much fifteen years ago:

Where does your milk actually go when it leaves the lane—and what is that processor doing with it?

Looking at the latest data and at where processors are spending their capital, that “where” might matter just as much as anything you’re doing inside your fences.

Strong Demand, Tight Prices: The Current Picture

Let’s start with demand, because honestly, that part of the story is more encouraging than you’d think, listening to some outside commentators.

USDA’s Economic Research Service tracks how much dairy Americans eat each year on a milk-equivalent, milkfat basis. For 2023, they put per-capita dairy consumption at 661 pounds—7 pounds higher than 2022. Analysis of that dataset noted that 661 pounds ties the highest mark in the modern series and is the best level since 1959, when Americans consumed about 672 pounds on the same milkfat basis. The International Dairy Foods Association picked up on that too, using it to remind people that total U.S. dairy demand is anything but dead.

You know all the talk about cheese? The data backs it up. Using those same ERS tables, analysis shows 2023 per-capita cheese consumption at about 40.2 pounds, up from 39.9 pounds the year before and a new record. Grouping some cheeses more broadly, lands around 42.3 pounds per person. The precise number depends on how you slice the categories, but the trend line doesn’t change: Americans have never eaten more cheese than they do right now.

Butter’s right there with it. ERS data summarized by IDFA shows per-capita butter consumption at 6.5 pounds in 2023, the highest since the mid-1960s. Given where butter sat in the low-fat decades, that’s a meaningful swing back in our direction.

And if you zoom in further, some “old-made-new” products really jump out. Working off Circana retail data for the 52 weeks ending December 1, 2024, notes that paneer sales were up roughly a third, burrata climbed just over 30 percent, and queso quesadilla gained more than 20 percent. On top of that, ERS numbers show cottage cheese climbing from 1.9 to 2.1 pounds per person in 2023—an 11-plus percent increase. If you’ve walked a grocery dairy aisle recently, you’ve probably seen the explosion in cottage cheese brands, flavors, and single-serve packs yourself.

Fluid milk is the outlier. ERS figures show fluid milk consumption dropping to about 128 pounds per person in 2023, down from 130 the year before and well below the mid-1970s peak of around 247 pounds per person. Many Midwest and Northeast producers don’t need a chart to see that decline; they’ve watched the fluid case shrink for decades.

So, stepping back, the demand picture looks like this:

  • Overall dairy consumption is at or near record levels.
  • Cheese and butter are at all-time highs.
  • High-protein products like cottage cheese are clearly gaining ground.
  • Fluid beverage milk continues a very long, slow slide.

Now, if that were the whole story, we’d all be breathing easier. But you know it’s not.

USDA’s Livestock, Dairy, and Poultry outlooks for 2025 and 2026, summarized by Brownfield and Farm Progress, have had a consistent theme: more cows and more milk per cow. In mid-2025, Brownfield reported that USDA had bumped its 2026 milk production forecast up to about 231.3 billion pounds, nearly a billion pounds higher than the previous month’s estimate, based on herd expansion and productivity.

On price, USDA’s all-milk projections have shifted around as those production and demand expectations change. One widely cited outlook cut the 2026 all-milk price projection down to about $20.40 per hundredweight, roughly $1.50 lower than the prior version. Later in 2025, Brownfield covered another update where USDA raised that same 2026 all-milk projection to around $21.65 on improved demand assumptions. When you line up those various WASDE and LDP reports, you get a 2026 range that generally sits in the high teens to low twenties per hundredweight.

Putting it together:

  • Demand is strong, especially for cheese, butter, and some high-protein products.
  • USDA expects more milk on the market in 2025 and 2026.
  • Price projections are workable for some herds but will feel uncomfortably tight for others, especially after debt service and family living.

That combination is exactly why it’s worth asking not just “How well are we farming?” but “Where does our milk actually land in the chain?”

Same Pound, Different Payback

You know this in your gut already: not every pound pays the same.

Let’s walk through two different paths for a pound of cheese.

In the first path, your milk goes into mozzarella and blends for pizza chains and other foodservice accounts. The flow looks something like this: milk leaves your bulk tank and heads to the cheese plant, the plant turns it into blocks or shreds that move to a foodservice distributor or straight into a chain’s distribution network, and those shreds end up on pizzas where “extra cheese” is part of the selling point. Margins still get taken along the way, but the chain is relatively short, and the cheese is directly tied to perceived menu value.

In the second path, that same pound of cheese ends up as a private-label shredded bag or as part of a budget frozen entrée. Milk goes to the processor, cheese is shipped to another facility that turns it into frozen meals or snack items, and those products move through a retailer’s warehouse network and onto the shelf as house brands or value-tier items. More hands in the pot. More processing steps. More packaging. More trucks and cold storage.

Industry discussions in Dairy Global and processor profiles in Dairy Foods make a few things pretty clear:

  • When people cook at home, they generally don’t use as much cheese per serving as restaurants do. A pizza chain wants the cheese to be obvious in every bite; a family looking at a $6 bag of shredded cheese is often trying to make it stretch across several meals.
  • Every extra step after cheese leaves the vat—shredding, blending, bagging, freezing, plus added warehousing and retailer handling—adds cost. Those costs eat into the share of the final dollar that can flow back toward the raw milk.
  • Private-label fluid, commodity cheese, and butter have grown their share in many retail categories. Large retailers use their bargaining power to hold prices down, squeezing processor margins and limiting how much they can raise prices to farms without hurting themselves.

So that “pound of cheese” in USDA’s per-capita numbers might be part of a high-value pizza program, a premium specialty cheese, or a low-priced frozen meal. The consumption statistic looks the same. The payback back to your lane doesn’t.

When you put some numbers on it, the scale of that difference is hard to ignore. Take a 400-cow Holstein herd averaging around 80 pounds. That’s roughly 32,000 pounds a day—about 320 hundredweight. Over a year, you’re in the ballpark of 110,000 to 120,000 hundredweight. Data suggest that’s a realistic production level for many herds of that size. If your farm is shipping that much over four years, a consistent $1-per-hundredweight difference in pay price adds up to around $400,000 to $480,000 in gross milk revenue.

That’s the sort of gap that doesn’t just make the milk check look nicer—it shows up plain as day when you sit down with your banker and look at your equity.

MetricPizza Cheese & Specialty (Growth Channel)Powder & Commodity (Flat/Decline Channel)
Typical Product FocusMozzarella, specialty cheese, pizza chains, yogurt, high-protein beveragesSkim milk powder, bulk butter, private-label fluid, commodity cheddar
Annual Milk Volume (400-cow herd)~120,000 cwt~120,000 cwt
Base All-Milk Price (2026 USDA proj.)$21.50/cwt$20.50/cwt
Average Pay Price Premium+$1.00/cwt–$0 (baseline)
Annual Revenue Difference per Farm+$120,000
Processor Capital Investments (5-yr outlook)Adding vats, new packaging lines, export infrastructureMaintenance mode, modest efficiency upgrades
Product Demand Trend↑ Growing (cheese +record, yogurt +specialty)↓ Declining (powder commodity-driven, fluid secular decline)
Component Reward (Butterfat/Protein)Strong premium for high solidsMinimal differentiation on components
Margin for Production ErrorModerate to comfortableThin to uncomfortable
4-Year Cumulative Equity Impact+$520,000+$415,000

Why Processors Want “Predictable” Milk

Now, let’s do something we don’t always like doing and think like a plant manager for a minute.

Retailers and restaurant chains have spent years sharpening their forecasting. There’s a lot of software and analytics behind using multi-year sales history, seasons, promotions, and so on to predict how much they’ll sell each week. That “no surprises” mindset is pretty standard now.

In conversations with co-op folks and plant managers, and in reading between the lines in trade interviews, that thinking has crept upstream into how processors view farms.

Nobody at USDA hands them a template that says, “score your suppliers like this.” But if you listen to supply-chain managers quoted in places like Dairy Foods and Feedstuffs, you hear similar patterns:

  • They look at several years of volume history for each farm, not just last month’s ticket.
  • They watch butterfat and protein trends across seasons, so they know who’s steady and who’s up-and-down.
  • They track somatic cell and bacteria counts over time, looking at how often and how badly they spike.
  • They pay attention to how wildly loads swing when the weather is ugly or when feed quality changes.

In Wisconsin operations, in New York and Ontario freestalls, and out in California and Idaho dry lot systems tied into big plants, managers will quietly say they’d rather rely heavily on a smaller group of steady suppliers than juggle a large pool that’s always throwing them surprises.

From your side of the lane, that quietly raises the value of a few things:

  • Somatic cell counts that live in a narrow, low band instead of bouncing around.
  • Butterfat and protein that hold reasonably steady across seasons thanks to balanced rations and good fresh cow management.
  • Shipments that don’t yo-yo week to week, even when heat, mud, cold, or smoke are testing your team.

In component-based pay systems—which cover most of the U.S. and Canada—those traits can be worth even more. Plants making cheese and butter are fundamentally buying butterfat and protein. Those component pounds are exactly what generate premiums when markets are strong. Strong butterfat performance and solid protein don’t just help your check; they matter even more when your milk is going into cheese and butter plants that can turn those solids into high-value products, as opposed to fluid or powder plants where there’s less reward for components.

If you’re already strong on quality, components, and steady volume, that’s encouraging. You look like the kind of supplier plants are trying to keep and grow with.

Health Trends and High-Protein Dairy

Now let’s step briefly into something that sounds more like a doctor’s office than a dairy meeting, but it’s already shaping the dairy case: health trends, weight-loss medications, and “better-for-you” products.

There’s been a lot of buzz about GLP-1 drugs and weight management. Most of the detailed projections of how many people will use them come from medical journals and financial analysts, not from dairy economists. But there’s a clear theme in the nutrition advice around them: people taking these meds often eat fewer calories overall, and dietitians encourage them to keep their protein intake up and focus more on nutrient-dense foods.

You know where that points are.

Industry sources have noted that high-protein dairy is one of the hottest growth areas: Greek and skyr-style yogurts, high-protein spoonable and drinkable yogurts, performance-oriented dairy beverages, cottage cheese, and protein-enriched milks. When they look at scanner data, those products generally show stronger growth than a lot of traditional low-protein dairy desserts.

Cottage cheese is the poster child right now. ERS data show per-capita cottage cheese rising from 1.9 to 2.1 pounds in 2023, and analysis calls out cottage as one of the fastest-growing segments. The nutrition messaging and the dairy case are actually pulling in the same direction for once.

So nobody can honestly say, “GLP-1 will add exactly X pounds of extra dairy demand.” But the broader trend—less empty calories, more protein—is pulling in the same direction as high-protein dairy. If your milk is going into plants that specialize in those kinds of products, you’re plugged into one of the segments where nutrition advice and consumer behavior are aligning with what dairy offers.

What Farmers Are Finding Out

Most producers can rattle off their rolling herd average, butterfat levels, pregnancy rate, and cull percentage without even thinking. But if you ask, “What portion of your milk ends up as pizza cheese, specialty cheese, butter, powder, or fluid gallons?”, the answers often get a lot less precise.

In eastern Wisconsin, for example, a producer shared at a meeting that he’d long assumed most of his milk went into mozzarella and cheddar for foodservice. That was the story in his head. When he sat down with his co-op field rep and walked through their actual product and channel mix, he realized a bigger share than he’d thought was showing up as private-label fluid and commodity butter. His cows hadn’t changed. His ration hadn’t changed. But his understanding of where his milk really sat in the value chain changed overnight.

In the Northeast, a New York producer told a story almost the opposite of that. He moved from a co-op that leaned heavily on fluid and commodity American-style cheese into a plant specializing in mozzarella and Hispanic cheeses with strong export ties. Over several years, as that plant added cheese capacity and grew export business—and as he pushed harder on components and quality—he saw his average pay price improve in a meaningful way. That’s consistent with data showing Mexico alone buying roughly 392 million pounds of U.S. cheese in a recent year, accounting for about 38 percent of total U.S. cheese exports, with other Latin American and some Asian markets also growing. When your plant is tied to that kind of demand, the conversation changes.

Out West, many dry lot systems in California and Idaho, shipping primarily to powder plants, tell a different story. Their processors are heavily tied to skim milk powder and bulk butter. USDA outlooks and export analyses keep reminding us that these are critical products but are heavily commodity-driven and more volatile, with generally thinner margins than many cheese and value-added categories. For those herds, the biggest constraint often isn’t how well they manage the transition period or reproduction—it’s that their milk is structurally tied to products whose prices are set on a very competitive global market.

In Canada, supply management and quota changes alter some dynamics, but the channel question still bites. If your milk is locked into a processor focused on fluid or basic butter, and your hauling radius or quota setup limits your ability to move, your channel options can be even narrower than what some U.S. neighbors face.

Six Questions That Make the Picture Clearer

The nice thing is, you don’t need a consultant’s binder to start. A notebook and a bit of courage to ask direct questions go a long way.

Here are six questions that, in many cases, have really shifted how producers see their situation:

  1. “Broadly speaking, where does our milk go by channel?” Ask for rough percentages. How much of their total volume goes into foodservice, how much into retail, how much into ingredient sales, and how much into export? They already track this when they talk to the USDA and big customers. You’re just asking them to translate it into farmer terms.
  2. “What are the main products our milk becomes?” Try to get past “cheese and butter.” Is your milk mainly feeding fluid gallons, private-label cheddar and slices, process cheese, butter and powder, pizza cheese, yogurt, specialty cheeses? Your processor knows which buckets your milk is filling.
  3. “Over the last three to five years, have those product lines grown, stayed flat, or shrunk for you?” You’re listening for things like: “We’ve added vats for pizza cheese,” “specialty cheese and yogurt are where our growth is,” or “our branded fluid has been under real pressure.” That tells you whether your milk is riding an up-escalator, standing on level ground, or being pulled down.
  4. “Where are you investing for the next five to ten years?” The trade press has covered billions of dollars in investments in new cheese plants, dryers for higher-end powders, yogurt lines, and export packaging. Ask where your buyer is putting its own capital. Are they adding vats, building new lines, upgrading for exports, or mostly just patching roofs?
  5. “How is your customer base changing?” Are they picking up quick-service restaurant accounts, export cheese contracts, and health-focused retail customers—segments industry analysts call growth areas—or are they mostly trying to hold onto private-label fluid and butter slots in the face of aggressive pricing?
  6. “Based on quality and consistency, where would you place our farm in your supplier group?” Are you in their top third, the middle of the pack, or on the bottom rung? Many co-ops and plants maintain internal rankings based on multi-year quality, component, and volume data, even if they don’t share them with you. It’s nearly impossible to improve your position if you don’t know where you’re starting from.

What to Bring to Those Meetings

Before you sit down with your processor, your accountant, or your lender, it helps to have your own homework done. A few things to pull together:

  • Last 3 years of monthly pay prices and component tests. This shows your trends and lets you compare against co-op or regional averages.
  • Last 12 months of SCC and quality records. Plants are looking at your consistency, not just your best month.
  • A simple cost-of-production summary with your breakeven per cwt. If you don’t know this number, your accountant or extension office can help you get there.
  • Any recent processor or co-op letters outlining product/market changes. These often signal where they’re headed before they announce it publicly.

Having this in hand turns a vague conversation into a focused one.

Matching the Map With Your Own Numbers

Most dairy business consultants and land-grant economists will tell you that you really should know, at a minimum:

  • Your operating margin per hundredweight—milk income minus cash operating costs, divided by hundredweight shipped.
  • Your debt-to-asset ratio—total liabilities compared to the fair-market value of your assets.
  • Your interest coverage—operating margin divided by annual interest expense.
  • Your breakeven milk price, including family living—total costs (feed, labor, repairs, interest, depreciation) plus a realistic family draw, divided by hundredweight.

Recent dairy budgets and case-farm studies from universities like Wisconsin, Penn State, and Michigan State often show full-cost breakevens for 300- to 800-cow herds in the upper teens to low $20s per hundredweight under 2023–2025 feed, labor, and interest conditions. National statistics put many real herds in that same neighborhood once family living gets factored in.

On the revenue side, USDA’s 2025 and 2026 all-milk forecasts, as summarized LDP reports, suggest national all-milk prices in the low-$20s in 2025 and somewhere in the high-teens to low-$20s in 2026, depending on how production, exports, and domestic use unfold.

So here’s a practical rule of thumb a lot of advisors use—not as gospel, but as a conversation starter:

  • If your true breakeven, including family living, is at least about $2 per hundredweight below where USDA expects all-milk prices to land, and your processor is tying your milk into growing, value-added channels like cheese, butter, yogurt, and high-protein products, then you’ve got room to talk about modest expansion or targeted upgrades.
  • If your breakeven is within roughly $1 per hundredweight of those projected prices, and a big chunk of your milk is tied to low-margin, commodity-driven channels like powder and basic fluid, then your margin for error is thin, and your structural risk is high.

To put some flesh on that: a herd with a full-cost breakeven of $18/cwt, shipping into a plant that’s investing in mozzarella vats and pizza cheese programs and operating in a $21 all-milk environment, has cushion and options. A herd with a $20/cwt breakeven in a region where most of its milk goes to a powder plant and the all-milk price is expected to hover around $21, with global skim and butter driving things, is in a very different spot.

For herds in that second situation, tools like Dairy Revenue Protection or simple forward contracts can help keep that cushion intact—something worth discussing with your risk management advisor alongside your channel strategy.

Different Farms, Different Realities

One thing that comes through pretty clearly, both in the numbers and in conversations at the diner, is that not every dairy has the same realistic menu of options.

Farms Already Hooked to Growth Channels

Some of you are in a structurally favorable position.

In Wisconsin operations and across parts of the Upper Midwest, that often means shipping to a plant where the core business is mozzarella and other cheeses for domestic chains and export markets. Industry data shows that Mexico alone often buys close to 40 percent of U.S. cheese exports in a given year, with other Latin American and some Asian markets also growing. That kind of cheese demand helps underwrite those plants’ investments and their appetite for milk.

In the Northeast, it might be a specialty cheese plant or a yogurt plant with strong branded products and foodservice clients. On the West Coast, maybe it’s a facility focused on high-protein dairy beverages or value-added performance nutrition powders.

If your processor is talking about adding vats, installing new lines for drinkable yogurt, signing export cheese contracts, or launching functional dairy products—and they’re telling you they want more of your milk—that’s a good sign you’re tied to channels with built-in growth.

For farms in this situation, the questions usually sound like: How do we make sure we stay in their “must-keep” supplier group by being rock-solid on quality, components, and volume? Given our breakeven and USDA’s price outlook, does a careful move from 400 to 550 cows actually improve our resilience, or does it just stretch our labor and capital too thin? Are there specific investments—cooling, feed storage, data systems—that would make our milk more valuable to this particular plant?

Farms in the Middle

Then there’s a big group of herds—across the Northeast, Michigan, and many central U.S. regions—where the answer is more like, “It depends.”

They might ship mainly to a co-op that leans hard on private-label fluid and commodity butter, have a second potential buyer that focuses on cheddar and whey for domestic retail and ingredient markets, or sit within hauling distance of a specialty cheese, organic, or yogurt plant that’s open to new suppliers under certain conditions.

For these farms, you tend to see a mix of strategies. Some do change processors when the math and channel mix make sense—hauling costs, contract terms, and the new plant’s focus all have to stack up. Others seriously consider organic, grass-fed, or other identity-preserved paths, but only where there’s a credible buyer and where the land base and finances can support the costs and risks those systems bring. Quite a few stick with their main co-op but work hard to climb into the top tier of their quality and component grids and tap into any higher-value pools or programs they can.

There isn’t a one-size-fits-all answer here. The right move depends heavily on where you are, what your numbers look like, and what your family wants the operation to be ten years from now.

Farms That Are Structurally Boxed In

And then there are herds—often in more remote High Plains areas, some western dry lot regions, or parts of Canada where quota and hauling really limit options—where the structure of the local processing base makes the decision tree much narrower.

That usually looks like one realistic plant within economical hauling distance, focused on commodities like powder, bulk butter, or low-margin fluid, with no serious plans for new dairy processing capacity in the area.

Even very well-run herds can find their futures heavily constrained by the economics of that one plant. USDA outlooks and export analysis don’t mince words: skim milk powder and bulk butter are crucial to balancing the market, but global commodity prices heavily influence them and tend to be more volatile and lower-margin than many cheeses and value-added channels.

Families in those spots end up asking some hard questions: Do we spend the next several years focusing on harvesting as much income as we can, paying down debt, and maintaining our facilities, rather than betting big on expansion? Is it time to start talking seriously about succession, sale, leasing, or other exit options while we still have enough equity and time to choose our path? Would relocating to a stronger dairy region or diversifying into other enterprises make more sense than relying solely on a constrained local dairy market?

They’re not easy conversations, but they’re a lot easier while the farm is still in a strong enough position to make choices rather than having choices made for it.

Three Conversations Worth Having This Year

So if we boil it all down to “What do we do with this?”, there are three conversations worth putting on the calendar.

A Real Sit-Down With Your Processor or Co-op

Take those six questions and ask for some uninterrupted time. You’re trying to understand where your milk actually fits in their product and channel mix, and whether they see your farm as part of their long-term growth story or as volume they can dial up or down.

If they can’t—or won’t—give you a rough breakdown of where your milk goes and what it becomes, that alone tells you something about the relationship.

A Numbers-Focused Session With Your Accountant or Business Advisor

Ask them to help you put your true breakeven milk price, including family living, down in black and white. Look at how your equity has moved over the last three to five years. Line your numbers up next to the USDA’s price forecasts and regional cost-of-production benchmarks.

Most advisors and lenders have experience with the major land-grant tools and statistics and can translate them into what they mean for your particular herd, debt load, and capital plan. If you don’t know your breakeven, this is the year to fix that.

A Candid Conversation With Your Lender

Whether that’s Farm Credit, a regional ag bank, or your local lender, they see patterns across lots of dairies and processors. It’s worth asking how they view your processor’s financial strength and long-term outlook, what they’d need to see from you—on cash flow, equity, and channel position—to be comfortable supporting a modest expansion or a significant capital project, and what a planned, orderly scale-down or exit might look like for your operation if that ever seems like the right path.

Doing nothing is a decision too. The risk is leaving it so long that the market, the plant, or the bank ends up making the decision for you.

The Bottom Line

The data tells us Americans are eating more dairy than they have in decades—especially cheese and butter—and that high-protein products like Greek yogurt and cottage cheese are gaining real traction. USDA is signaling more milk in 2025 and 2026, and all-milk prices in a range where some operations will be comfortable, while others will be uncomfortably close to breakeven.

Where your milk goes really does matter. A pound going into pizza cheese, specialty cheese, or high-protein yogurt in a growing plant is not the same as a pound going into low-margin fluid or powder in a plant that’s heavily exposed to commodity swings.

Consistency is getting more valuable. As plants lean on data and forecasting, they favor farms that deliver steady milk quality, components, and volume. Strong butterfat and protein have much more earning power in cheese and butter plants than they do when your milk ends up in products that don’t reward solids as much.

Different farms need different strategies. The best move for a 600-cow freestall twenty minutes from a mozzarella plant in Wisconsin isn’t going to be the best move for a 600-cow dry lot tied to a powder plant in a remote region.

You still control what happens inside your fences: cow comfort, fresh cow care, feed efficiency, repro, and people. That’s the foundation.

What this moment adds is one more layer we can’t afford to ignore: Do you really know where your milk goes, whether those channels are growing or shrinking, and whether you’re tied to the right processor for the next decade?

If you know your channels and you know your breakeven, you’re in a much better spot to choose your path—expansion, steady state, pivot, or exit—before the market chooses it for you.

Key Takeaways:

  • Cheese and butter demand hit record highs in 2023, but USDA projects more milk through 2026 with all-milk prices in the low-$20s—the margin for error is shrinking
  • What your processor does with your milk—pizza cheese or powder, specialty yogurt or private-label fluid—shapes your pay price as much as your butterfat or SCC
  • A steady $1/cwt pay-price difference adds up to roughly $400,000 in equity over four years for a 400-cow herd—real money captured or left on the table
  • Ask your processor directly: What products does my milk become? Are those channels growing or shrinking? Where does my farm rank among your suppliers?
  • Know your breakeven, understand your channel exposure, and have candid conversations with your co-op, advisor, and lender—before the market makes decisions for you 

Learn More

Record Corn Won’t Save You: The $100K Margin Hit Coming for Mid-Size Dairies in 2026

Cheap feed won’t save you. At $19 milk, a 300-cow dairy loses $100K in 2026—even with record corn.

Executive Summary: Cheap feed won’t save you in 2026—and the math proves it. USDA’s January reports confirmed record corn production at 17.021 billion bushels, dropping DMC feed costs to $9–$10/cwt, the lowest since October 2020. But here’s the problem: all-milk prices are forecast to fall from $21.05 to $19.25/cwt, a decline that outpaces feed savings by more than a dollar per hundredweight. For a typical 300-cow dairy, that translates to roughly $90,000–$100,000 less operating margin in 2026 than in 2025. ERS cost data shows the squeeze hits hardest in the middle—herds under 50 cows face $42.70/cwt in total costs, while 2,000+ cow operations run $16–$19/cwt, leaving mid-size dairies caught in between. This is a sorting year: invest in proven efficiency improvements, adjust your business model, or plan an exit while cows and equity are still in good shape.

2026 dairy profit margins

You’ve probably heard the good news by now: corn is cheap, soybeans are plentiful, and your feed bill should finally give you some breathing room in 2026. And honestly? That part’s true.

But here’s what’s been nagging at me—and what I think deserves a real kitchen-table conversation. When you actually run the numbers, cheaper feed doesn’t automatically mean a better year. For a lot of herds, 2026 could mean tighter margins than 2025, not wider ones. The math surprised me when I first worked through it, and I think it’s worth walking through together.

Let me show you what I mean.

The January Numbers That Changed the Conversation

USDA’s January 2026 reports confirmed what the trade had been whispering about: 2025 U.S. corn production hit a record 17.021 billion bushels on a national yield of 186.5 bushels per acre. Brownfield Ag News and Farm Progress both noted these figures came in above nearly all pre-report estimates, which explains why March corn futures dropped more than 20 cents on release day, sliding into the low $4.20s.

Ending stocks jumped to 2.227 billion bushels, up from 2.029 billion just a month earlier. That’s the most comfortable corn supply we’ve had in years. Soybeans tell a similar story: 4.262 billion bushels at a record 53 bushels per acre, with ending stocks around 350 million bushels.

What this means for your feed bunk is straightforward. Dairy Herd reported that DMC feed costs dropped to $9.38 per hundredweight in August 2025—the lowest since October 2020—and DairyReporter’s November analysis showed feed costs expected to stay in that 9–10 dollar band into 2026.

So yes, the feed side genuinely is better. If you’re in a grain-deficit region, this is a different world than the $5-plus corn of recent years.

But here’s where it gets complicated.

The Milk Price Reality

USDA’s current outlook, as reported by DairyReporter and confirmed by Southeast Ag Net, has the U.S. all-milk price averaging about $21.05 per hundredweight in 2025—then dropping to around $19.25 in 2026.

That’s roughly a $1.80 decline in your milk check. And when feed costs only drop by maybe 35–50 cents per hundredweight, the math doesn’t work in your favor.

Analysis published in October 2025 put it bluntly: “Milk Margins Likely to Fall Along with Feed Prices.” CoBank’s dairy analysts commented in early January that dairy markets turned downward in late 2025, and the Class IV futures don’t look encouraging. DairyReporter drew on CoBank’s outlook to note that profit margins for U.S. dairy farmers are expected to tighten in 2026 as rising milk production continues to pressure prices.

This is where herd size and cost structure really start to matter.

The Cost Curve You Need to See

Here’s where the conversation gets real. USDA’s Economic Research Service has been tracking production costs by herd size, and the pattern is stark. Let me lay it out in a way that makes the 2026 implications clear:

Herd SizeTotal Economic Cost ($/cwt)2026 Margin at $19.25 MilkRisk Level
<50 cows$42.70–$23.45 (severe deficit)🔴 Critical
50–99 cows$33.54–$14.29 (large deficit)🔴 Critical
100–499 cows$19–$21$0 to –$1.75 (breakeven/tight)🔴 High
500–999 cows$17–$19$0.25–$2.25 (slim)🟡 Moderate
2,000+ cows$16–$19$0.25–$3.25 (variable)🟡 Moderate

Sources: ERS 2021 ARMS data; ERS 2016 “Consolidation in U.S. Dairy Farming”; Dairy Global February 2025. Note: Costs vary significantly by management quality within each size class—Hoard’s Dairyman has documented low-cost producers in smaller categories matching high-cost producers in larger categories.

The numbers are sobering. ERS economist Jeffrey Gillespie reported that in 2021, the average total production cost was $42.70 per hundredweight for herds with fewer than 50 cows, versus $19.14 for herds with 2,000 or more. Dairy Herd’s summary of ERS consolidation data showed herds under 50 cows at $33.54 per hundredweight compared to $17.54 for 2,500-cow operations in 2016. Dairy Global’s February 2025 feature showed operating costs of $18.44 for small herds compared to $16.16 for the largest operations.

What’s worth noting here is that there’s huge variation within each size class. Low-cost producers running 100–199 cow herds can have total production costs around $19.76 per hundredweight, which puts them right alongside high-cost producers running 2,000-plus cows at $19.63. Management matters as much as scale.

But that table tells you something important: at $19.25 all-milk, a lot of herds in that 100–499 cow range are looking at breakeven or worse, even with cheap feed. And smaller herds? The math is brutal unless you’re among the best managers in your size class.

A 300-Cow Reality Check

Let’s make this concrete with a scenario that probably feels familiar.

Picture a 300-cow Holstein dairy in Wisconsin, Michigan, or Pennsylvania. Freestall housing, parlor milking, solid fresh cow management, respectable butterfat levels. Annual production around 23,000 pounds per cow—that’s 6.9 million pounds of milk per year, or 69,000 hundredweights.

Based on ERS benchmarks and university cost-of-production data, a well-managed herd in this size range typically runs total economic costs in the upper teens to low twenties per hundredweight—call it $19 to $21 when you include all labor, capital, and overhead.

Now do the math:

  • 2025: At $21.05 all-milk, that’s roughly $1–$2/cwt operating margin for well-managed herds
  • 2026: At $19.25 all-milk with maybe 40 cents in feed savings, you’re looking at about $1.30–$1.50/cwt lessmargin than 2025

On 69,000 hundredweights, that translates to $90,000 to $100,000 less operating margin in 2026 than in 2025—even with cheaper feed.

You might still be in the black. But you’re definitely a lot closer to the line.

Why USDA’s Big Corn Number Felt Off on the Ground

It’s worth noting that this record corn number felt like a gut punch to many people actually raising the crop.

Interviews with farmers right after the January WASDE. North-central Kansas producer Shale Porter described the report as “kind of a gut punch,” saying the larger-than-expected production and increased ending stocks created a fresh blow to an already fragile marketing environment.

What I’ve noticed over the years is that this disconnect often traces back to structure and technology. The largest crop farms are much more likely to use GPS guidance, yield monitors, and variable-rate fertilization. When USDA aggregates data to calculate a national average yield, that average gets pulled up by highly managed, highly instrumented acres—even in years when smaller or less-equipped farms are just “average” or worse.

On the dairy side, you see a similar pattern in production costs. The national averages don’t always reflect what’s happening on your specific operation.

Regional Realities: Same Numbers, Different Stories

The same USDA and ERS numbers play out very differently depending on where your milk truck pulls in. Here’s the quick read on each region:

Upper Midwest (Wisconsin, Michigan, Minnesota)

  • Sweet spot: 200–400 cow herds with strong forage programs
  • The X-factor: Home-grown forage quality can make or break competitiveness
  • Many operations blend grazing with TMR for cost control without sacrificing precision
  • University of Wisconsin data shows well-managed mid-size herds can compete with larger neighbors on cost

Northeast (Pennsylvania, New York, New England)

  • Higher land costs and labor, but proximity to dense consumer markets
  • Growing success with direct-to-consumer: farmstead cheese, on-farm bottling, farm stores
  • Class III/IV prices matter less when retail margins drive revenue
  • Penn State and Cornell have documented resilient small/mid-size models

West and Southwest (California, Idaho, Texas, New Mexico)

  • Dominated by 1,000–5,000 cow dry lot and large freestall operations
  • Lowest per-unit costs, highest milk per cow
  • Key vulnerability: Heavy exposure to export markets and Class IV volatility
  • Water and environmental scrutiny are intensifying
  • CoBank noted butterfat oversupply hitting some processors hard

Southeast

  • Heat and humidity are the defining challenge
  • Cow cooling isn’t optional—it’s survival infrastructure
  • Extension research consistently shows robust cooling improves intake, production, reproduction, and butterfat
  • Herds without adequate fans, soakers, and shade see summer production crash
  • Heat stress losses can quickly eat up lower feed costs

Canada

  • Quota changes pricing structure, but not cost fundamentals
  • Larger freestall dairies with automation have lower unit costs than smaller tie-stall herds
  • Canadian Cattlemen coverage shows technology adoption driving cost differences similar to U.S. patterns

The takeaway: national averages set the stage, but your 2026 story depends on your region, your barn, your debt, and your marketing options.

Where Farms Are Actually Moving the Needle

Looking at this trend, farmers are gravitating toward four broad response paths—often combining a couple of them.

1. Tightening the Fundamentals That Still Pay Back Fast

A lot of herds are going back to basics: Where’s the relatively easy money still on the table?

  • Feed efficiency: Extension nutritionists discuss feed efficiency benchmarks that vary by lactation stage and measurement method, with top-performing herds consistently outperforming average operations. At 9–10 dollars per feed cost, even modest improvements can be worth meaningful dollars per cow annually. The tools are management, not marble: consistent TMR mixing, solid feed-push habits, minimizing sort.
  • Reproduction and transition: University economic modeling regularly puts a significant per-cow annual value on better pregnancy rates and fewer transition disorders—once you count extra milk, fewer days open, fewer culls, and lower treatment costs. Getting days open into the 120s instead of the 150s shows up quickly in milk shipped per stall.
  • Mastitis economics: Research consistently shows significant avoidable cost. A 2024 Wageningen University study put typical clinical mastitis costs at $224–$275 per case, while Michigan State work by Dr. Pam Ruegg found costs ranging from about $120 to $330 per cow per case, depending on severity and farm. Hoard’s Dairyman reported similar findings, noting costs of $120 to $350, with an average of around $192. Dropping SCC into the 150–200,000 range protects premiums and usually correlates with steadier production and better butterfat.

What I’ve noticed: lower grain prices give you breathing room to work on these fundamentals without panicking about every extra half-pound of dry matter.

2. Picking a Different Lane: Grazing, Organic, and Specialty

Another group—especially 60–250 cow herds—is asking whether they really want to keep running a pure commodity race.

  • Intensive rotational grazing: Cost-of-production work on grass-based dairies shows that well-managed systems can cut total cost per hundredweight by several dollars compared with comparable confinement herds. Milk per cow runs lower (18,000–22,000 pounds), but when debt is manageable and the grain bill is small, net returns can stack up well.
  • Organic and premium programs: ERS research shows organic operations have substantially higher production costs—sometimes 50 percent more—but receive much higher farm-gate prices when markets are balanced. Some farms layer on grass-fed, A2A2, or animal-welfare certifications for specific branded programs.
  • On-farm processing: University case studies document how small- and mid-size dairies are building resilient businesses on retail margins and consumer loyalty rather than Federal Order checks.

These paths trade commodity risk for marketing and logistics challenges. But for some families, they’re more realistic than trying to quadruple herd size.

3. Teaming Up Instead of Going It Alone

In areas with clusters of mid-size dairies, there’s more serious talk about partnerships.

Dairy Herd’s coverage has highlighted examples of two or three neighboring families forming joint ventures, combining herds, and investing together in more efficient facilities. Think: two 250-cow herds consolidating into one 500-cow freestall with a modern parlor and specialized labor roles.

Common benefits lenders and advisers see:

  • Lower labor hours per cow through specialization
  • Better delivered feed costs buying in semi loads
  • Lower fixed costs per hundredweight across shared infrastructure

Partnerships require trust and clear agreements, but for the “too big to be small, too small to be big” crowd, they’re worth considering.

Response StrategyBest ForKey Actions2026 Margin OutlookRisk
INVESTWell-capitalized, solid-footed herds in viable size range (150–500 cows)Fresh cow facilities, cooling, precision feed systems, robotic parlor prepMargin improves 2027+ as efficiency gains compound; 2026 tight but survivableDebt service if markets weaken further
ADJUSTHerds with land, family labor, and willingness to change model (80–250 cows)Shift to grazing, organic, direct-to-consumer, on-farm processing, dairy partnershipsHigher per-cwt return on lower volume; less commodity-market exposureMarketing complexity; buyer education required
EXITProducers within 5–10 years of retirement; tired operators; no clear successionPlan dispersal while cows/equipment in good condition; family succession or sale-to-neighbor negotiationPreserve equity; exit on your terms while margins still existEmotional; requires discipline not to wait for “better year”

4. Treating 2026 as a Planning Year

For producers within five to ten years of retirement without a clear successor, this discussion hits differently.

Reports suggest many dairy exits in the next decade will be driven by cost position, age, and family goals more than any single bad year. Advisers stress that planned transitions—family succession, sale to a neighbor, well-timed dispersals—preserve more equity than waiting until tough years force rushed decisions.

Auction data indicate that well-organized dispersal sales, held while cows are in good condition and equipment is maintained, regularly outperform “end-of-the-rope” liquidations.

2026 might be the right year to ask blunt questions: What does cash flow look like at $19 milk and $10 feed for another full cycle? And if you’d rather be out in two to five years, what does exiting on your terms look like while you still have margin?

Don’t Lose Sight of Components

With all the feed talk, it’s easy to forget that butterfat and protein still drive a big chunk of your milk check.

Component pricing work shows that butterfat increases can add meaningful revenue—often comparable to or greater than what you’d gain from modest corn price movements on the same volume of milk.

Here’s what’s interesting, though. CoBank’s 2026 outlook noted that butterfat has actually moved to an oversupply situation. Their Knowledge Exchange report from December put it plainly: dairy processors are awash with butterfat, and some have even capped butterfat payment levels on farmgate milk in response. In October, Corey Geiger with CoBank said spot butter markets had dropped almost seventy cents since August 1st due to excess supply.

That underscores why protein may be where the action shifts—and why watching your components still matters even as the market dynamics change.

Fresh cow management sits at the center of component performance. Extension materials consistently show that smooth transitions lead to higher peaks, fewer health problems, better fertility, and stronger components.

The question worth asking: Is there a change in fresh cow management, cow comfort, or milking routine that will pay more in milk and components than you’d ever save squeezing a few more cents from corn?

For a lot of herds, that’s where the biggest upside is hiding.

Your 2026 Checklist

1. Run a realistic 2026 budget.
Use $19.25 all-milk and 9–10 dollar feed costs. Know your actual cost per hundredweight with full labor and overhead. If you’re well north of the upper teens, something has to change.

2. Benchmark where you really stand.
Compare your cost, feed efficiency, reproduction, mastitis rates, and butterfat against ERS benchmarks and regional top-quartile data. Remember what Hoard’s documented: low-cost producers in smaller herds can match the costs of high-cost, large operations. Identify the two or three levers that would move your margin most.

3. Decide: Invest, Adjust, or Exit.

  • Invest in proven improvements—fresh cow facilities, cooling, feed systems
  • Adjust your model—grazing, organic, processing, partnership
  • Plan an exit that protects equity while cows and equipment are still solid

The Bottom Line

2026 doesn’t look like a disaster year, and it doesn’t look like a home-run year. It looks like a sorting year—where clarity and decisions matter most.

Feed is finally in your favor. But milk prices are expected to be below 2025 levels, and most serious margin analyses suggest spreads will tighten for many herds.

The herds that make it through stretches like this aren’t always the biggest. They’re the ones who know their numbers, think beyond the next milk check, and make intentional choices before the market does.

The math this year is universal. What you decide to do with it is personal—written at your own kitchen table, with your own records, and the people you trust sitting there with you.

Key Takeaways

  • Cheap feed won’t save you: Record corn pushed DMC feed costs to $9–$10/cwt, but milk prices are dropping faster—net margin tightens, not loosens
  • $100K on the line: A typical 300-cow dairy loses roughly $90,000–$100,000 in operating margin in 2026 compared to 2025
  • The scale gap is brutal: Small herds face $42.70/cwt total costs vs. $16–$19/cwt for large operations—mid-size dairies are caught in between
  • This is a sorting year: Invest in efficiency, adjust your model, or plan your exit—there’s no standing still in 2026

Complete references and supporting documentation are available upon request by contacting the editorial team at editor@thebullvine.com.

Learn More

The Sunday Read Dairy Professionals Don’t Skip.

Every week, thousands of producers, breeders, and industry insiders open Bullvine Weekly for genetics insights, market shifts, and profit strategies they won’t find anywhere else. One email. Five minutes. Smarter decisions all week.
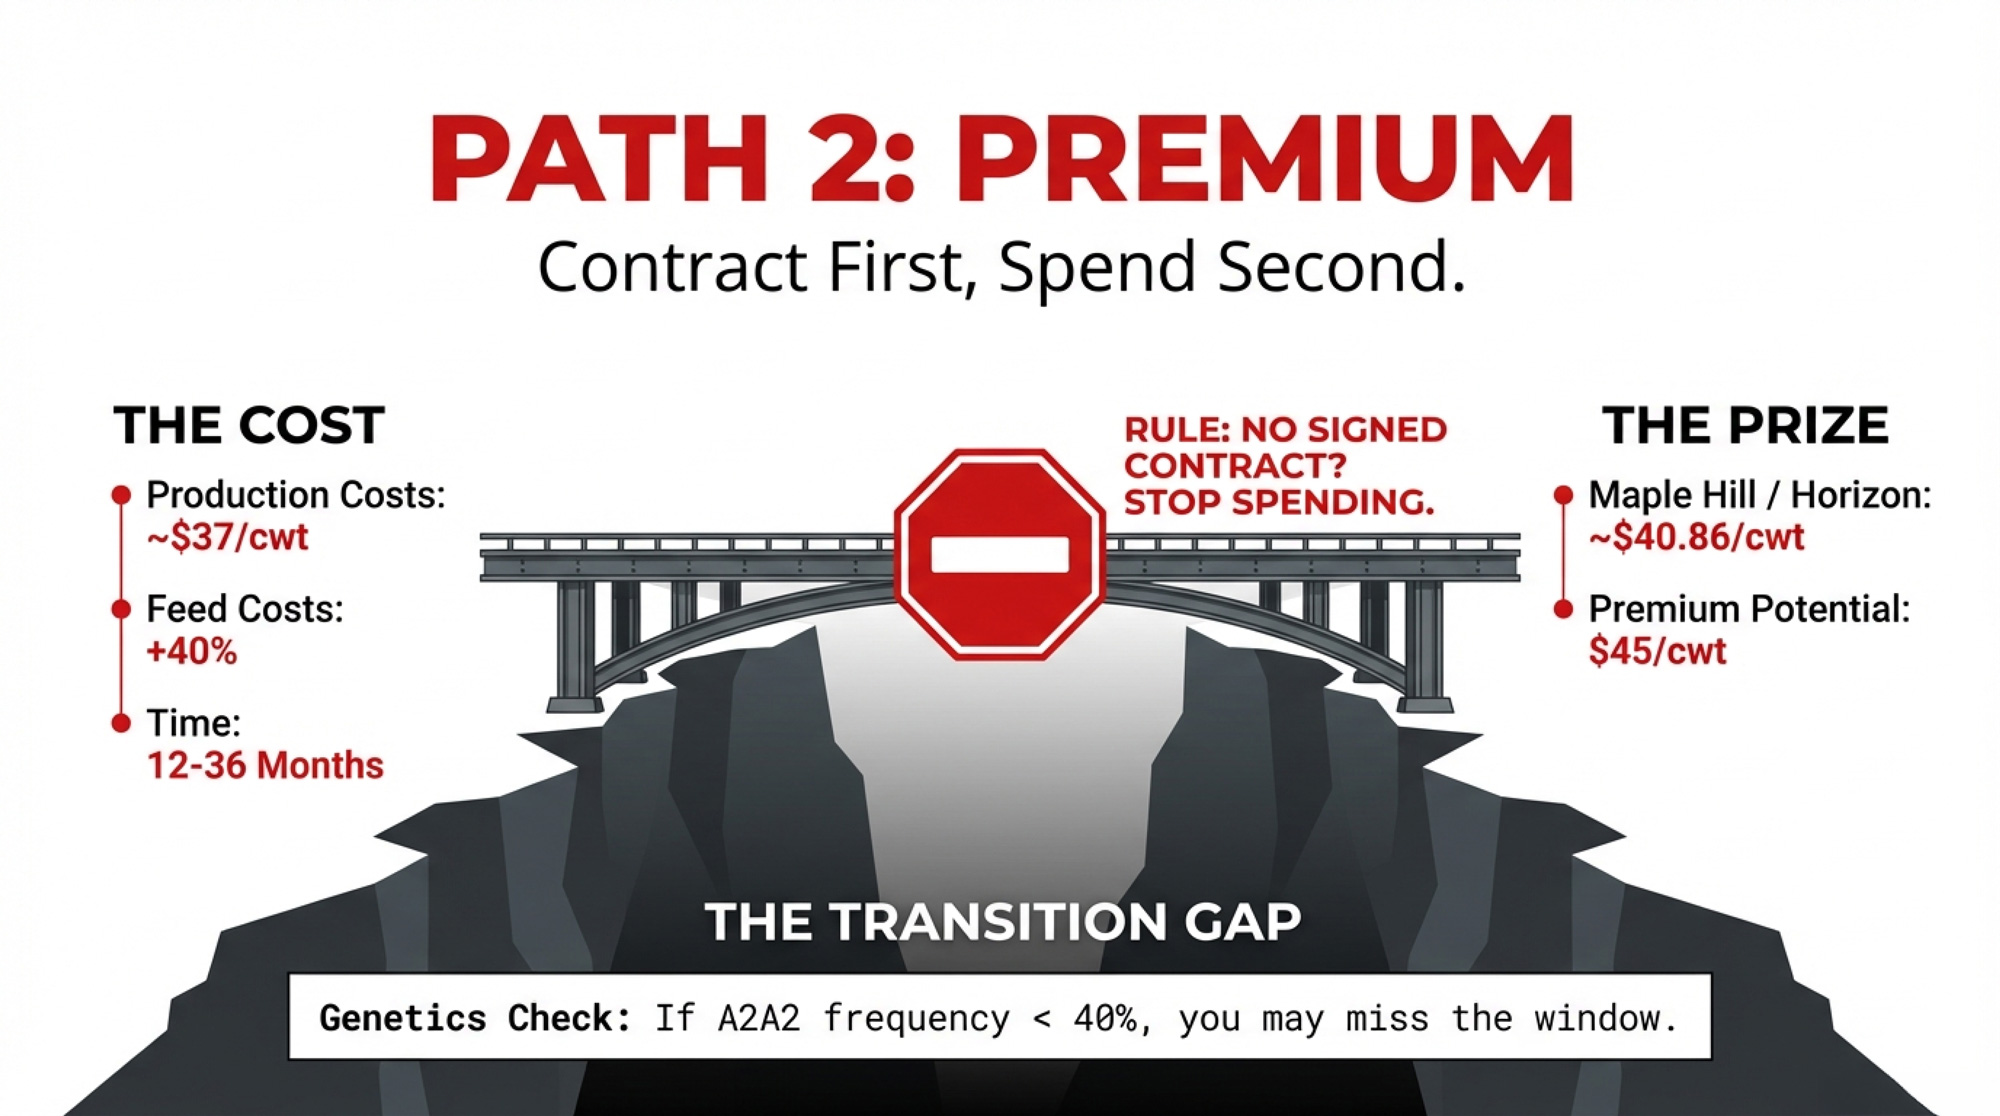
NewsSubscribe
First
Last
Consent

The $900/Cow Hit You Can’t Outbreed by April: Western Canada’s 70/25/5 Reckoning

You can’t outbreed 70/25/5 by April. The only question is whether you fix your ration and cash flow before it costs $900/cow.

EXECUTIVE SUMMARY: Western Canada’s April 1, 2026, shift to a 70/25/5 payment ratio is the clearest signal yet that protein and solids‑non‑fat now drive far more of your milk cheque than they used to. Retail and utilization data show yogurt and cheese still growing, butter stocks at five‑year highs, and CDC Class 3(d) and 4(a) prices that put real money on protein, not just butterfat. For high‑fat, lower‑protein herds—think 4.5–4.7% butterfat and 3.0–3.1% protein—modeled scenarios with 2025 prices point to a possible $80,000–$100,000 annual hit on a 100‑cow herd under the new ratio, or roughly $900 per cow and 8.5–9.0 cents per litre. The problem is you can’t breed your way out of that by April, because even with genomics, shifting herd‑level components usually takes four to six years of consistent sire selection and culling. So the real play over the next 12–24 months is tightening up nutrition to add 0.10–0.20 points of protein, re‑aiming sire choices and genomic sorting toward balanced fat and protein kilos, and reworking cash‑flow with your lender before the lower cheques arrive. The article also walks straight into the succession conversation, since a 15‑point change in component weighting—and talk of more to come in 2027—forces families to rethink risk, investment, and what it really means to pass a quota‑based dairy to the next generation. And when you zoom out to U.S. Federal Order reforms, and EU forecasts that favour cheese over butter and powders, it’s clear this isn’t a one‑off Western policy quirk but part of a global shift toward paying harder for solids and yield.

70/25/5 payment ratio

If you sit down at a winter producer meeting in Western Canada right now, you don’t get too far into the coffee before the same topic comes up: that new component ratio change landing on April 1, 2026.

You probably know the basics already. The Western Milk Pool boards—BC Milk, Alberta Milk, SaskMilk, and Dairy Farmers of Manitoba—are moving from the long‑standing 85% butterfat / 10% protein / 5% other solids weighting to a new structure of 70% butterfat, 25% protein, and 5% other solids for allocating pool dollars to producers. That’s laid out clearly in BC Milk’s October 9, 2025, Notice to Producers, so it’s not rumour; it’s policy.

ComponentOld Ratio (Until March 31, 2026)New Ratio (From April 1, 2026)Change
Butterfat85%70%-15 points
Protein10%25%+15 points
Other Solids5%5%No change

What’s interesting here—and what I’ve noticed is really bothering people—is the timing. For years, most Western herds have been bred and fed for strong butterfat performance because that’s what the cheque rewarded. Now the rules shift with only a few months’ lead time, while herd genetics need several years to change direction.

So you’ve got policy moving on a six‑month clock and cows moving on a four‑to‑six‑year clock. That gap is where the uneasiness lives.

Looking at this trend, the aim here is pretty simple: make sense of why the ratio changed, what the data suggests about markets and pricing, and what practical levers you still have—nutrition, genetics, and finances—during this transition period.

Why the Ratio Changed: Following the Value Chain

If you read BC Milk’s explanation, they’re quite clear about the intent. The new 70/25/5 ratio is being introduced to support increased milk volume in the Western Milk Pool to meet industrial processing commitments—whole milk powder and other manufacturing uses—and to encourage butterfat tests to stabilize rather than keep climbing.

And when you look at the numbers across Canada, that story holds up.

In its September 2025 Markets Report, Dairy Farmers of Ontario summarized national retail sales for the 52 weeks ending August 2, 2025. Yogurt was the standout, up 6.5 percent year‑over‑year; butter was up 4.9 percent, cheese 3.1 percent, ice cream 4.0 percent, cream 1.2 percent, and fluid milk barely budged at 0.2 percent.

Product CategoryYoY Growth (%)
Yogurt+6.5%
Butter+4.9%
Ice Cream+4.0%
Cheese+3.1%
Cream+1.2%
Fluid Milk+0.2%

The data suggests demand is still solid, but the real growth is coming from products that lean heavily on protein—like yogurt and many cheese types—rather than from plain fluid milk.

At the same time, stock levels tell another part of the story. That same DFO report showed butter stocks at 41,063 tonnes in July 2025—the highest level in five years—and cheese stocks at 108,038 tonnes, also historically high for that month.

Farmtario’s November 2025 analysis added that butterfat‑equivalent production in September 2025 was up 4.48 percent compared to a year earlier, while butterfat imports over the prior 12 months were up 10.18 percent. Put simply, the system isn’t short of fat.

Now layer in component pricing. The Canadian Dairy Commission’s 2025–26 component schedules show that in Class 3(d)—cheese and related products—butterfat is priced at $11.3565 per kilogram, protein at $9.7035, and other solids at $0.8921.

ComponentCDC Class 3(d) Price ($/kg)CDC Class 4(a) SNF Price ($/kg)Payment Weighting (Old vs New)
Butterfat$11.36N/A (Class 4a is SNF)85% → 70%
Protein$9.70~$2.82 (protein + OS)10% → 25%
Other Solids$0.89Included in $2.82 SNF5% → 5%

In Class 4(a) solids‑non‑fat, the protein and other solids price for fall 2025 sits around $2.82 per kilogram. And in the special Class 5 ingredient/export categories, both protein and butterfat carry strong values, enabling processors to compete internationally with powders and other products.

If we glance south, the pattern lines up. As part of Federal Milk Marketing Order modernization, USDA has been working with updated standard composition factors—roughly 3.3 percent true protein, 6.0 percent other solids, and 9.3 percent nonfat solids—to better match actual milk composition.

Recent USDA class and component price bulletins, summarized in outlets like Cowsmo and Hoard’s Dairyman, have shown months when Class III protein has been close to $3 per pound while butterfat has sat noticeably lower, often in the mid‑one‑dollar range per pound. Values move month to month, but the relationship has frequently favoured protein in cheese milk.

So this development suggests that the boards are trying to align the producer pay structure with where value is truly being created in the chain. Butterfat still matters—no one’s taking that off the table—but under 85/10/5, protein’s contribution was under‑recognized relative to what markets were paying for it.

It’s worth noting one more line in the BC Milk notice. They mention that, if required, a further change may be applied in 2027 to decrease component “densities” to accommodate growth in volume. That tells you this is not viewed as a one‑time tweak, but part of a longer journey in how milk is valued in the Western Milk Pool.

How 70/25/5 Shows Up on Your Milk Cheque

You know as well as anyone that ratios don’t feel real until you run them through a herd. So let’s walk through a simple, realistic example. This is a modeled scenario using typical Western Canadian component levels and current CDC values—not someone’s actual settlement, but it shows the direction.

Herd A: High Butterfat, Lower Protein

  • 100 cows
  • About 10,500 litres per cow per year (10,500 hL shipped)
  • Components: 4.6% butterfat, 3.1% protein, ~5.8% other solids

Herd B: Balanced Components, Slightly Higher Volume

  • 100 cows
  • About 11,000 litres per cow per year (11,000 hL shipped)
  • Components: 4.1% butterfat, 3.5% protein, ~6.0% other solids

Under 85/10/5, Herd A has been the star. As many of us have seen in Western DHI summaries, herds with butterfat levels of 4.5–4.7% have consistently ranked near the top of payout lists for years.

Under 70/25/5, when you apply those weights with current Class 3(d) values, Herd A still benefits from strong butterfat performance, but Herd B’s extra protein and slightly higher volume dramatically close the gap. In quite a few realistic price combinations, a balanced herd like B can edge ahead on net dollars per cow.

To put some rough numbers on it, advisors modeling real farms with similar profiles using recent CDC prices have seen cases where a high‑fat, lower‑protein 100‑cow herd’s annual milk revenue under the new ratio pencils out $80,000–$100,000 lower than under 85/10/5, while a more balanced herd might see only minor changes.

Herd ProfileUnder 85/10/5 (Baseline)Under 70/25/5Revenue Change
Herd A (High fat: 4.6% BF / 3.1% Protein, 10,500 L/cow)$0 (baseline)-$90,000-$90,000
Herd B (Balanced: 4.1% BF / 3.5% Protein, 11,000 L/cow)$0 (baseline)-$5,000-$5,000

If you spread a $90,000 hit over 100 cows, that’s about $900 per cow per year. On a per‑hectolitre basis for Herd A (10,500 hL), that’s roughly 8.5–9.0 cents per litre in modeled scenarios. Your exact numbers will differ, but the direction is clear: the further out on the “fat‑heavy/protein‑light” end your herd sits, the more exposed your cheque is.

What’s interesting here is that many of the herds most at risk are also some of the best‑run operations on butterfat. They did exactly what the previous payment structure encouraged. That’s the sting.

The Real Tension: Policy Moves in Months, Genetics in Years

Here’s where the frustration really surfaces when you talk with producers and geneticists.

Genomic selection has absolutely changed the game. Industry reports and peer‑reviewed work show that AI programs have shortened sire generation intervals from roughly 5–7 years to around 2–3 years, enabling much faster genetic gain in traits like fat and protein. Hoard’s Dairyman, for instance, has highlighted how these “unprecedented genetic gains” are driving record component levels even in periods when total milk volume flattens.

But on a commercial dairy, you live with herd structure and replacement rates. In practical terms, it looks more like this:

  • You breed a heifer to a more protein‑balanced bull this year.
  • She calves in roughly two years.
  • She reaches peak performance in the second lactation, another year out.
  • Her daughters start meaningfully influencing the bulk tank a couple of years after that.

University extension specialists and genetic advisors generally agree that it takes around four to six years of consistent sire selection and culling for a new breeding emphasis to show up clearly in bulk tank butterfat and protein levels. That lines up with what producers in Western Canada, the Upper Midwest, and the Northeast have seen when they’ve tried to shift components on their own herds.

Now set that against the policy timeline:

  • October 9, 2025: BC Milk and the other Western boards issue the notice announcing the shift to 70/25/5.
  • April 1, 2026: the new ratio takes effect.

So policy moved on a roughly six‑month timeline, while biology—through genetics—needs four to six years to respond fully. That’s the core tension farmers are feeling.

Timeline TypeStartEndDuration
Policy Change (85/10/5 to 70/25/5)October 2025April 20266 months
Herd Genetic Shift (meaningful bulk tank change)Breeding decision todayBulk tank impact48–72 months (4–6 years)

What farmers are finding is that the herds that look “fortunate” right now are often the ones that started nudging toward higher protein and more balanced components around 2021–2023. Some were watching Ontario’s solids‑non‑fat and SNF:BF policy adjustments in the P5 pool and realizing excessive butterfat relative to SNF could be penalized.

Others were paying attention to how often U.S. Class III prices were placing a premium on protein in cheese milk compared to butterfat. Their early decisions are walking into the parlour now, while many other herds are just beginning that pivot.

So the question becomes: if genetics is a four‑to‑six‑year lever, where can you still move the needle in the next 12–24 months?

Where You Still Have Levers to Pull in 2026

The good news is that genetics aren’t the only lever you have. Producers across Western Canada—and, honestly, across regions like Wisconsin and New York as well—are leaning hard on three major fronts: nutrition, breeding strategy, and financial planning.

Looking at Nutrition: Adding Protein Without Losing Butterfat or Fresh Cows

On the nutrition side, the question that keeps coming up is, “Can we pick up some protein without hurting butterfat performance or making fresh cow management riskier?”

Recent peer‑reviewed milk quality and nutrition reviews, along with university feeding trials, show that balancing key amino acids—especially methionine and lysine—can lift milk protein yield and often nudge protein percentage up by about 0.10–0.20 points when the base ration (forage quality, effective fibre, starch) is solid. That effect is strongest in early and mid‑lactation cows when energy balance is good.

In many Western rations this season, that’s translating into:

  • Adding rumen‑protected methionine and lysine and aiming for a metabolizable protein profile with a lysine: methionine ratio around 2.8–3.0:1, which is consistent with extension recommendations and controlled studies.
  • Budgeting typical costs in the range of 15–25 cents per cow per day for these protected amino acid products, which pencils out to roughly $5,500–9,000 per year for a 100‑cow herd based on common product pricing in North American ration budgets.
  • Seeing protein percentage gains in the 0.10–0.15 point range in many well‑managed herds, with some trials and field reports showing improvements up toward 0.20 points when all other ration basics are well aligned.

On top of that, nutritionists are re‑examining the balance between energy and fibre in high‑fat herds.

Where cows are sorting TMR or where there are signs of subacute rumen acidosis, it’s common to see underperformance in milk protein and, sometimes, unstable butterfat. Adjustments like moderating starch levels, improving forage chop consistency, and increasing the share of high‑quality legume or grass‑legume forage can improve rumen function and help cows convert dietary protein into milk protein more efficiently.

Western diets have long relied on canola meal as a rumen-degradable protein source, and research from Canadian and U.S. universities supports its positive effect on milk protein yield when used correctly in TMRs. Some producers are now fine‑tuning canola or expeller soybean meal levels in high‑producing groups to shore up protein without driving starch or unsaturated fat too high.

What’s encouraging is that none of these changes require blowing up the ration. The goal isn’t to tank fat just to chase protein. It’s to:

  • Keep butterfat performance stable and respectable.
  • Protect cow health and fresh cow management through this transition period.
  • Capture that 0.10–0.20% protein improvement that’s now worth more under 70/25/5.

To make it even more concrete: if a 100‑cow herd can sustainably move protein from 3.1% to 3.25% without sacrificing butterfat or health, that extra protein can easily be worth several thousand dollars a year under the new weighting, depending on exact prices and volumes. It’s not a silver bullet, but it’s real money.

InterventionCost per Cow per DayRealistic Protein Gain (percentage points)Annual Cost (100-Cow Herd)Est. Annual Revenue Gain Under 70/25/5 (100-Cow Herd)
Rumen-Protected Methionine & Lysine$0.15–$0.25+0.10 to +0.20$5,500–$9,000$8,000–$15,000
Improved Forage Quality & TMR BalanceVariable (forage cost)+0.05 to +0.10Varies by operation$3,000–$8,000
Canola/Soy Meal Optimization$0.05–$0.10+0.05 to +0.10$1,800–$3,600$3,000–$8,000
Combined Nutrition Strategy$0.20–$0.35+0.15 to +0.30$7,300–$12,800$12,000–$25,000

Looking at Genetics: Re‑aiming Without Erasing Past Gains

On the genetics side, most producers are rightly treating this as a course correction, not a full reset.

What farmers are finding is that a few clear rules of thumb help re‑aim the program:

  • Put more emphasis on protein kilos alongside fat kilos. Many Western and Upper Midwest herds are now setting minimums of +35–40 kg protein and +35–45 kg fat for bulls, then checking that daughters are projected to land around 3.4–3.5% protein and 4.0–4.2% butterfat at realistic production levels—profiles that align with both Canadian and U.S. component pricing trends.
  • Use indexes that reflect your market. In Canada, that often means putting more weight on LPI or custom indexes that emphasize protein and functional traits, rather than relying solely on Net Merit, which is calibrated to U.S. conditions. In Wisconsin and the Northeast, similar shifts toward protein‑friendly indexes have been observed as processors reward higher protein.
  • Use genomic testing as a sorting tool, not a luxury. At roughly $30–40 per head, genomic tests give a much clearer picture of which heifers and young cows carry the best combination of components, fertility, and health traits. Field data from AI organizations and extension programs show that herds using genomics this way can accelerate progress by:
    • Breeding the top 20–30 percent to sexed dairy semen to build the next generation.
    • Using conventional dairy or beef‑on‑dairy in the middle tier according to replacement needs.
    • Using beef semen on the lowest tier and planning to cull those lines more quickly.

I recently sat down with a producer in central Alberta—190 Holsteins, a mix of free‑stall and dry lot systems, managing about 2.3 kg of quota per day—who’s been working through this with his herd advisor, a licensed independent genetics and nutrition consultant.

He said, “We didn’t do anything wrong, breeding for fat when that’s what was being paid for. Now we just need to pivot, and we know that’s going to take a few years. The goal for us is not to panic, but to make sure every heifer we keep from here on out is pointed in the right direction.”

That mindset mirrors what geneticists with major AI organizations and extension specialists have been urging in recent conferences and webinars.

What’s interesting here is that similar thinking is already well established in high‑protein U.S. cheese regions. In Wisconsin operations, for example, herds supplying specialty cheese plants have deliberately moved toward sires with stronger protein and balanced fat, and those choices now show up in their bulk tank tests and pay statements. Western Canada is essentially being nudged toward that same “balanced components” zone by the 70/25/5 shift.

Looking at Finances: Turning a Shock into a Managed Transition

The third major lever—and it’s easy to overlook when we’re focused on cows—is how you manage the money through this transition period.

What lenders and farm financial advisors are recommending, in both Canadian and U.S. dairy regions, is remarkably consistent:

  • Build a realistic 12–24 month cash‑flow projection that reflects your current components under the new ratio. That means taking your actual DHI butterfat and protein tests, applying the 70/25/5 allocation, and using realistic price assumptions based on CDC component tables and board guidance to sketch how your milk cheque might look from April onward.
  • Sit down with your lender before the first reduced cheque shows up. Past experience with policy and price shocks—including recent farm‑gate price adjustments in Canada and supply‑driven squeezes in the U.S.—shows that producers who come in early, with numbers and a plan, have more options: interest‑only periods on term loans, temporary increases to operating lines, or adjusted covenant targets.
  • Be selective with big capital projects. In many operations, this may not be the year to stretch for a new loader or major barn expansion unless the balance sheet is very strong. At the same time, investments that clearly support cow performance—improved ventilation, transition cow facilities, repro tools—can still make sense if you can quantify the payback in milk and components, as multiple cost‑of‑production studies have shown.
  • Protect the investments that actually drive revenue. Economic work on dairy cost structures consistently shows that cutting corners on nutrition consulting, hoof care, repro programs, or fresh cow management often costs more in lost production and health problems than it saves in fees.

If you put some numbers to it, that modeled $80,000–$100,000 revenue impact on a 100‑cow high‑fat herd is roughly $6,500–$8,500 per month. Knowing that ahead of time lets you and your lender decide whether to make ration changes, temporary credit adjustments, capital deferrals, or some combination of all three to cover that gap.

In Ontario, Midwest, and Northeast operations, we’ve seen this pattern over and over: farms that do the cash‑flow homework and engage their lenders early tend to navigate policy and price changes with less long‑term damage. Western herds can draw on that same playbook here.

The Succession Question That’s Hard to Ignore

There’s another layer to this story that doesn’t appear in any price table: how the change intersects with succession.

In recent years, many Western farms had fairly clear succession timelines. A son or daughter was coming back from an ag diploma program, or a long‑time employee was gradually buying in. The underlying assumption was that while class prices might swing, the basic structure of producer payments wouldn’t change dramatically over a six‑month period.

Now, after a 15‑point swing in component weighting announced in October 2025 and effective in April 2026—and with the possibility of further adjustments mentioned for 2027—some families are re‑examining what they’re asking the next generation to commit to.

Farm transition specialists and lender‑side advisors have been increasingly explicit that policy risk needs to sit alongside debt and asset values in these conversations.

What farmers are finding in succession meetings this winter is that the most constructive approach is full transparency:

  • Share projected revenue scenarios under 70/25/5 using real component data and realistic price bands.
  • Explain the steps being taken in nutrition, genetics, and finance to adapt.
  • Be clear about debt levels, risk tolerance, and time horizon for the current generation.

Then let the next generation respond. Some will say, “I see the challenge, but I still want in.” Others may decide to build their careers in allied sectors—such as nutrition companies, genetics firms, lenders, or equipment dealers—while maintaining a more gradual or partial involvement in the farm.

Similar patterns have been observed in California (around water and environmental regulation) and in Wisconsin (during periods of extreme Class III price volatility), where policy and market risks shaped when and how the next generation entered ownership.

What’s encouraging, based on both research and experience, is that families who have these discussions early and honestly tend to land on more durable long‑term arrangements, whether that means full succession, shared ownership, or a different path altogether.

How This Fits Into the Bigger Dairy Picture

If you zoom out beyond Western Canada, the 15‑point shift is part of a broader pattern in how milk is being valued.

In the U.S., modernization of Federal Orders and ongoing debates over pricing formulas are aimed at aligning producer pay more closely with what plants actually make and what customers buy—cheese, powders, butter, and fluid products.

Recent analyses in Hoard’s Dairyman and Dairy Herd Management have highlighted that even when national milk volume softens, component levels—especially butterfat and protein—have continued to climb thanks to genetics and focused nutrition.

Globally, market reports from sources such as Dairy Global and DairyReporter show strong, steady demand for whole milk powder, skim milk powder, whey products, and cheese, with butter prices moving alongside a broader, solids‑driven landscape. The longer‑term trend has favoured higher solids and more flexible ingredient production, and Canada’s special class pricing is structured to help processors compete in that environment.

Here at home, the Western boards’ move to 70/25/5 is one regional expression of this bigger shift. It’s an effort to ensure that the signals producers see in their milk cheques are more closely aligned with retail demand, processing economics, and international market conditions.

Pulling It Together: What Producers Can Do Next

If we were standing in a barn alley or catching up at a conference, and you asked, “So what do I actually do with all of this?” here’s how it boils down:

  • The 70/25/5 shift is anchored in real market signals. Retail data points to strong growth in protein‑dense products like yogurt, stock levels show no shortage of fat, and component prices—both here and in the U.S.—have been rewarding protein in several key classes.
  • Breeding for butterfat under 85/10/5 wasn’t a mistake. Western herds that pushed butterfat performance were responding exactly to what the pay structure incentivized. The issue isn’t what those herds did; it’s that policy has now moved faster than herd genetics can keep up.
  • Genetics are a slower but powerful lever. Even with genomics, you’re looking at roughly 4 to 6 years of consistent sire selection and culling to shift herd‑level butterfat and protein levels materially. The bull decisions you make over the next couple of years are really about where you want your components to be around 2030.
  • Nutrition can help in the near term. Thoughtful use of rumen‑protected amino acids, good forages, balanced starch and fibre, and solid fresh cow management can often add 0.10–0.20 percentage points of protein in many herds. Under 70/25/5, that’s worth more than it used to be.
  • Balanced cows are your safest long‑term bet. Herds targeting both solid butterfat and solid protein, rather than extremes on either side, tend to be the most resilient when pricing formulas or markets change.
  • Financial planning matters as much as ration planning. Honest cash‑flow projections, early lender conversations, and disciplined choices about where to invest (and where to wait) can turn a sudden policy shock into a managed transition rather than a crisis.
  • Succession plans deserve a fresh, honest look. This isn’t about pushing the next generation away from dairy. It’s about making sure they understand both the opportunities and this newer layer of policy risk, where pricing structures can change faster than biology.

Your 90‑Day Playbook

If you’re wondering what to do between now and April, here’s a simple action list:

  1. Pull your last 12 months of DHI component records and model your milk cheque under 70/25/5 using current prices.
  2. Sit down with your nutritionist to set a realistic protein target and a stepwise plan to get there without hurting butterfat or fresh cows.
  3. Re‑screen your sire list and adjust your selection criteria to favour balanced fat and protein kilos, plus health traits.
  4. Book a meeting with your lender to walk through your modeled cash‑flow and discuss options for the transition period.

The Bottom Line

What’s encouraging, after looking at the data and talking with producers, advisors, and researchers, is that the tools needed to navigate this change are the same ones that have always mattered: good cows, good forages, thoughtful fresh cow management, disciplined breeding, realistic numbers, and open conversations at home and with your advisory team.

As many of us have seen—whether on Western Canadian freestall herds, Wisconsin tie‑stall dairies, or Northeast dry lot systems—dairy farmers are remarkably good at adapting when they understand the rules of the game.

This component shift is a big adjustment, no doubt. But with clear information, measured changes in how you feed and breed, and proactive financial planning, there’s every reason to believe Western herds can come through this transition and still be milking strongly when the next generation is the one hosting the coffee in the kitchen. 

KEY TAKEAWAYS:

  • Protein just got 2.5× louder on your cheque: Western Canada’s 70/25/5 ratio takes effect April 1, 2026—what you ship in protein now matters almost as much as butterfat. ​
  • Top butterfat herds face the biggest hit: Modeled scenarios show a 100-cow herd at 4.6% fat / 3.1% protein could lose $80,000–$100,000/year under the new ratio—roughly $900/cow. ​
  • You can’t outbreed this by April: Genetics need 4–6 years to shift bulk-tank components materially; policy gave you six months. ​
  • Three levers to pull now: Dial in amino-acid nutrition for 0.10–0.20 pt protein gain, re-screen sires for balanced fat + protein kilos, and sit down with your lender before the smaller cheques arrive. ​
  • Succession plans need a policy-risk conversation: A 15-point swing—with 2027 changes floated—means the next generation deserves full transparency on what they’re really buying into. ​

Complete references and supporting documentation are available upon request by contacting the editorial team at editor@thebullvine.com.

Learn More

The Sunday Read Dairy Professionals Don’t Skip.

Every week, thousands of producers, breeders, and industry insiders open Bullvine Weekly for genetics insights, market shifts, and profit strategies they won’t find anywhere else. One email. Five minutes. Smarter decisions all week.
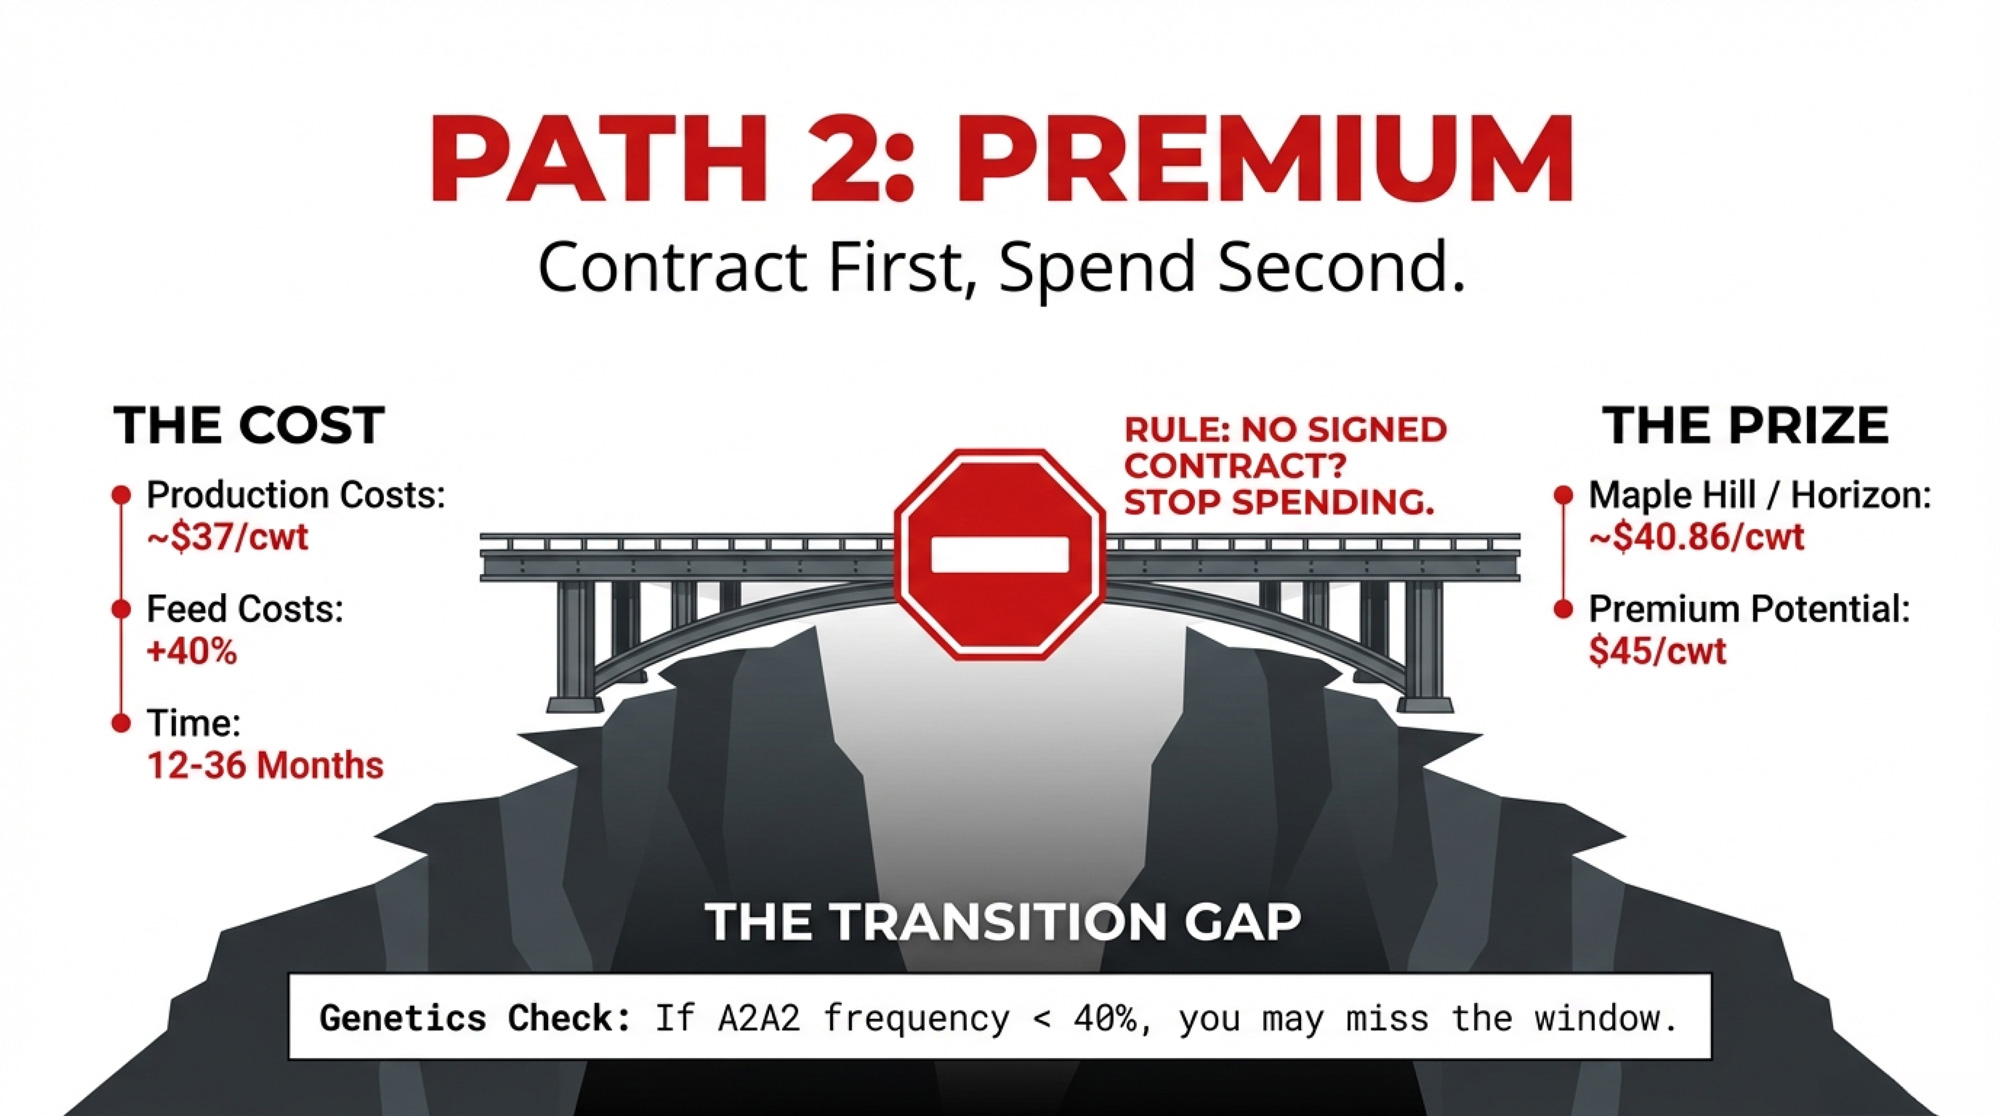
NewsSubscribe
First
Last
Consent
Send this to a friend