Archive for Dairy Markets – Page 3

The Bullvine Dairy Curve: 15,000 U.S. Farms by 2035 and Under 10,000 by 2050 – Who’s Still Milking?

15,000 dairies by 2035. Under 10,000 by 2050. The Bullvine Dairy Curve shows exactly who survives that curve—and who gets priced out.

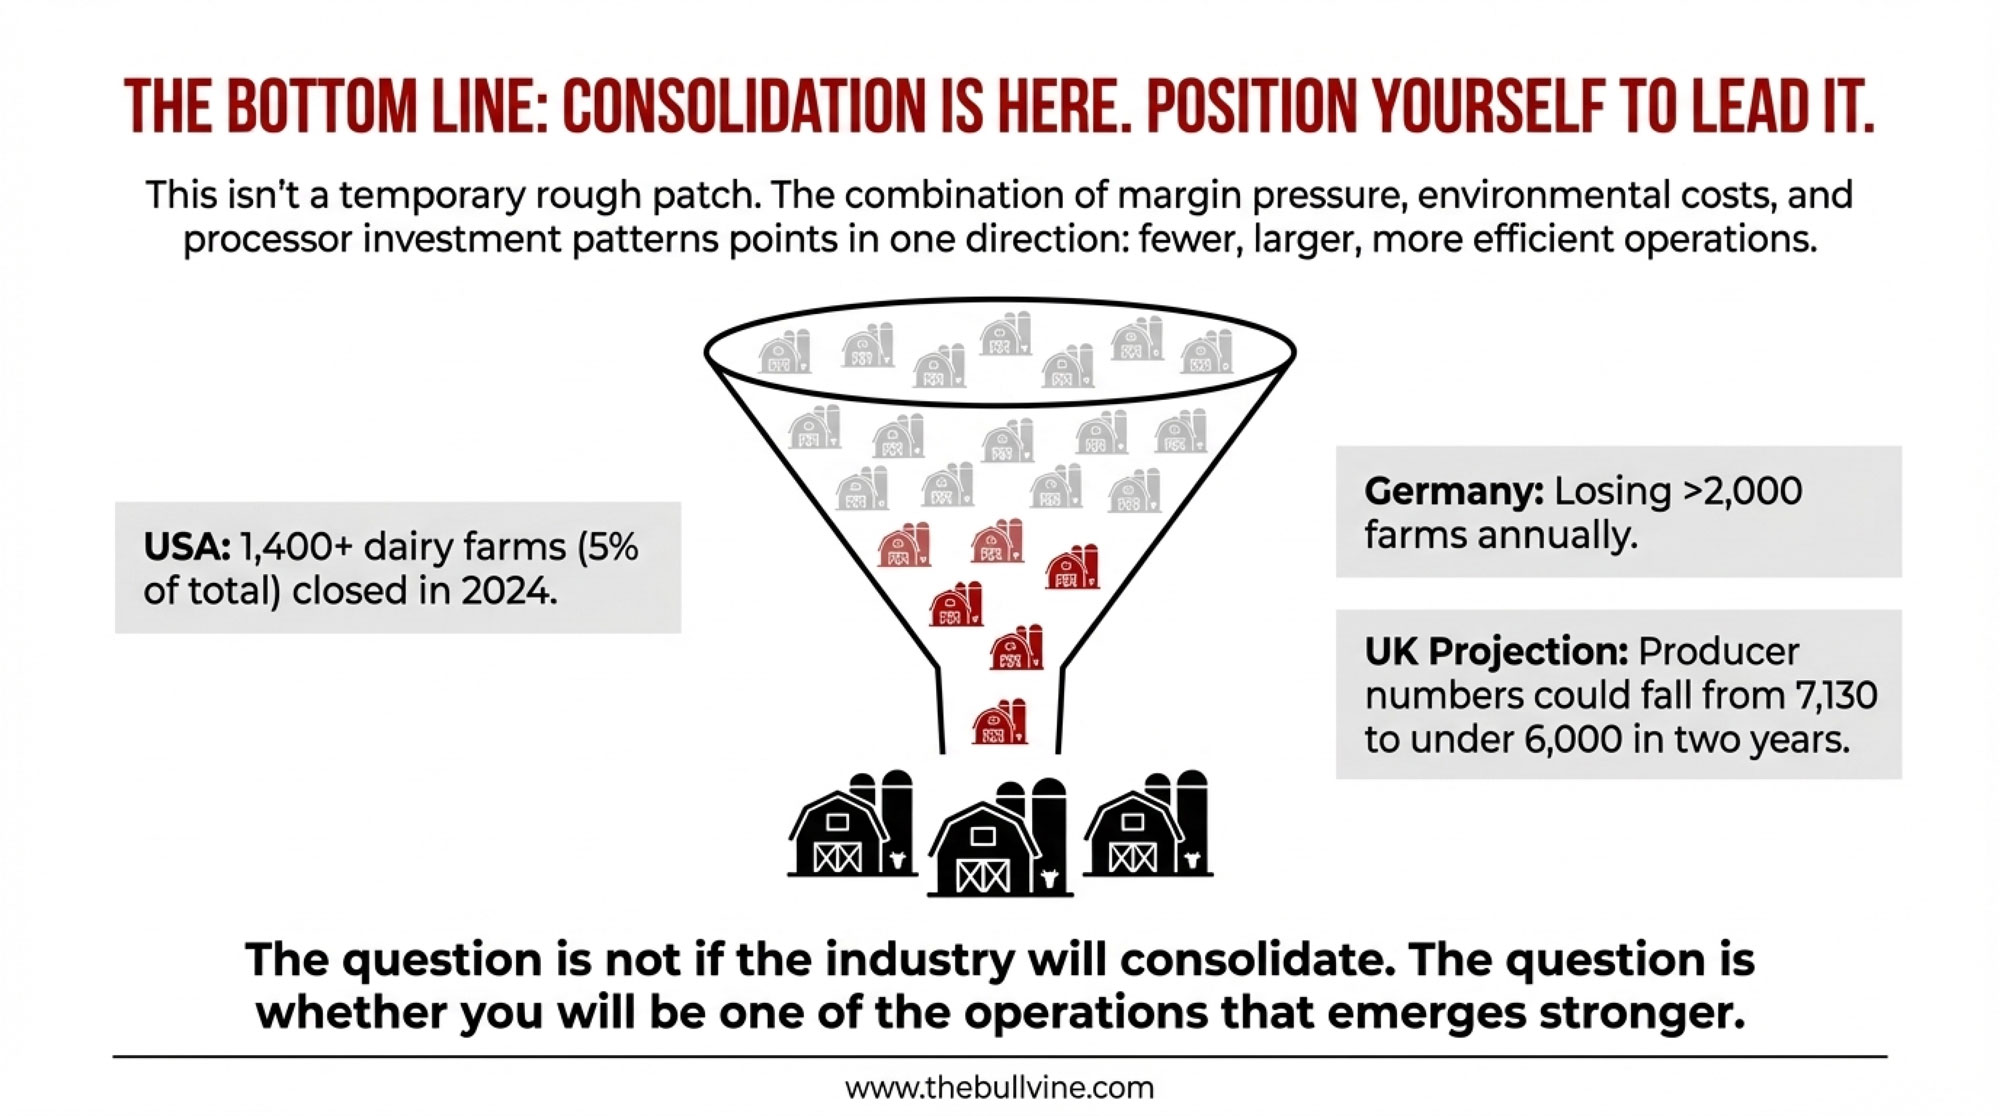
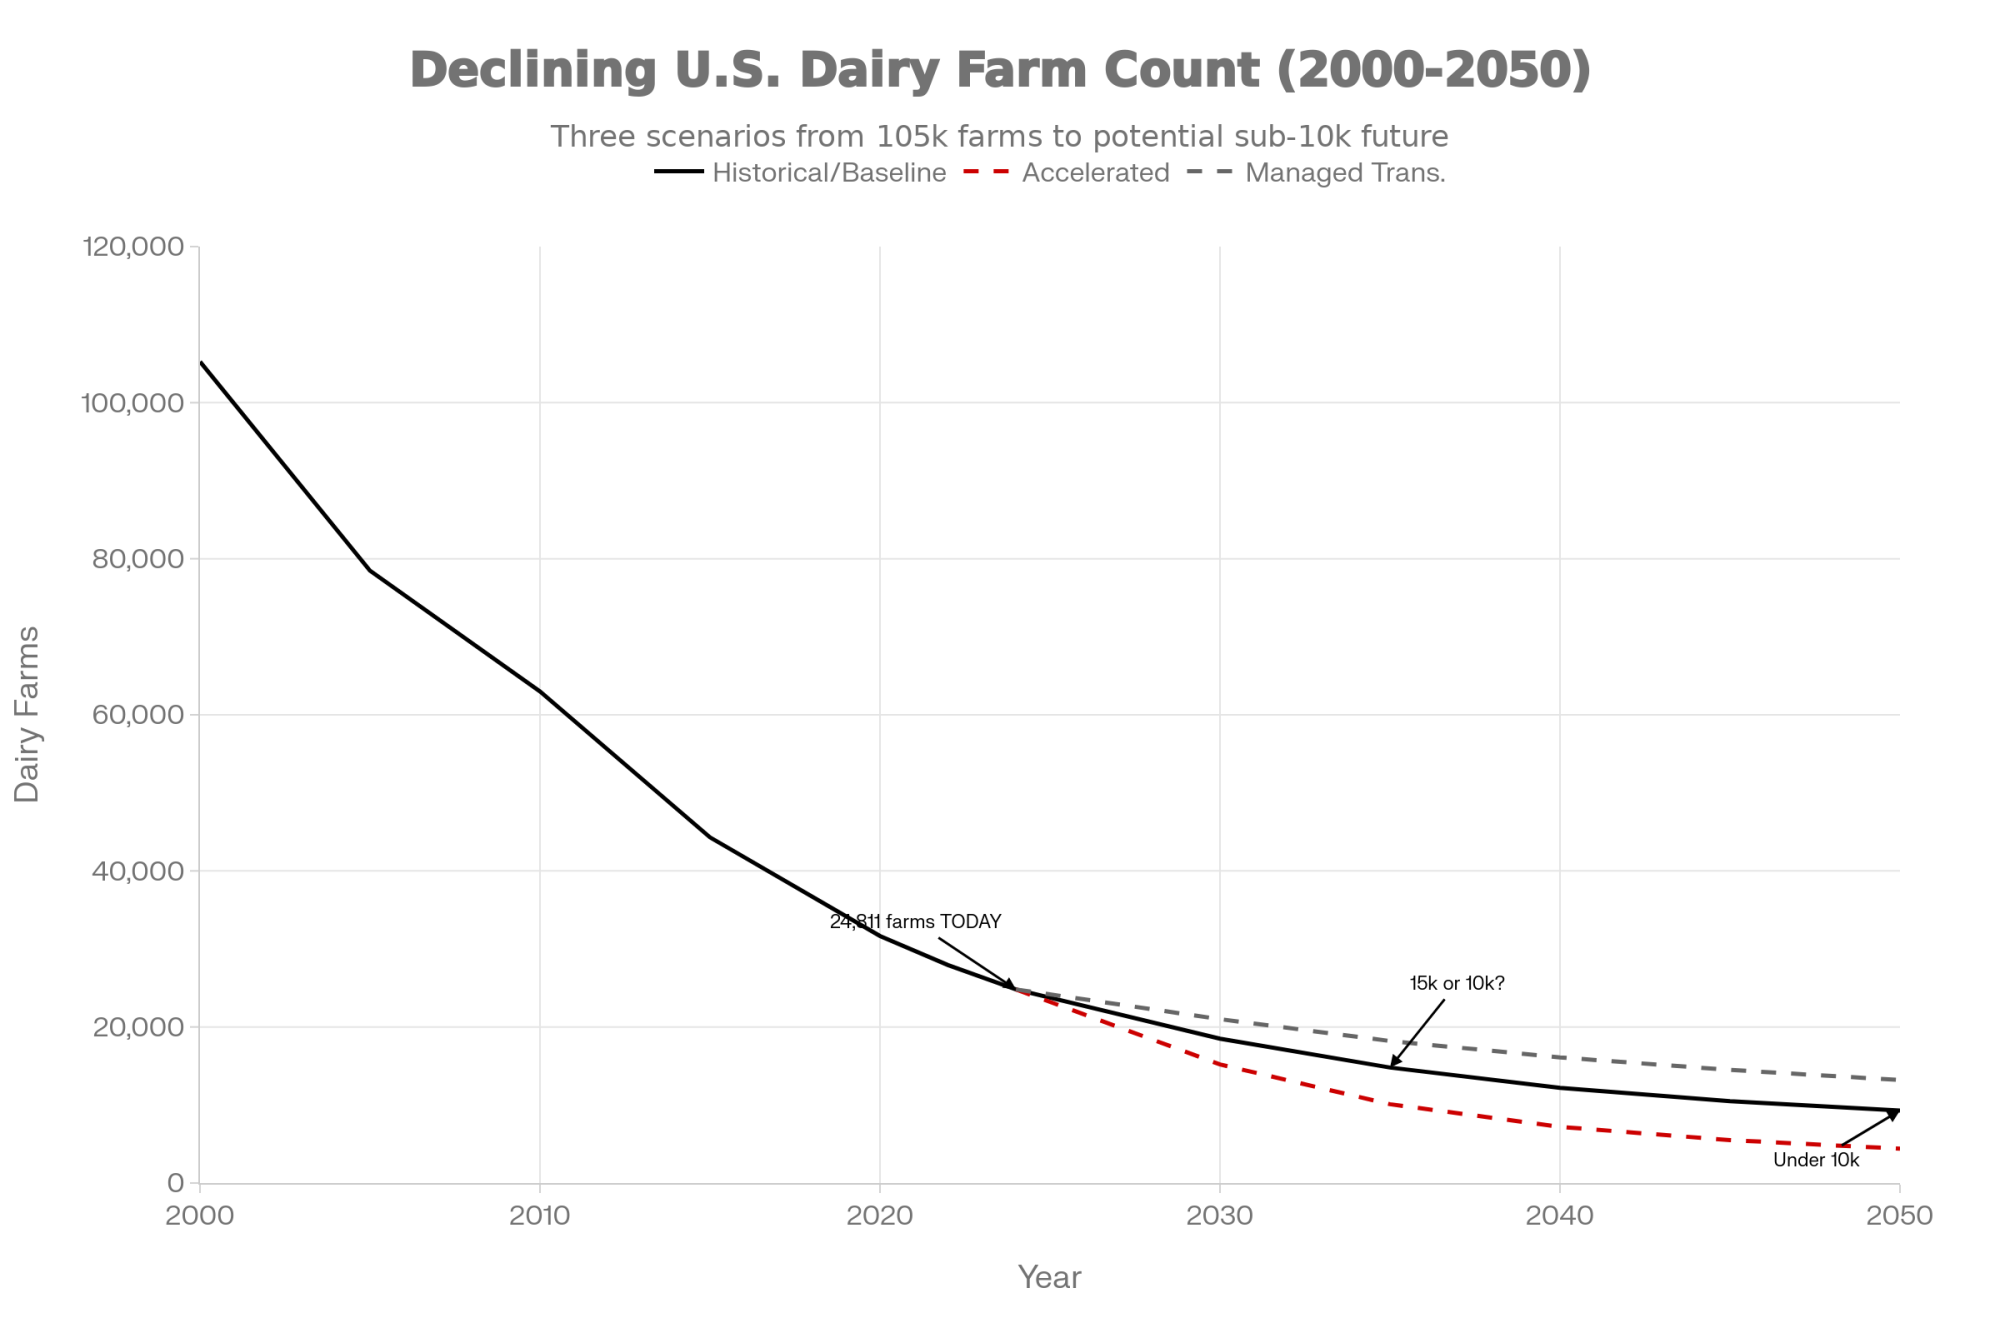
By 2035, roughly 15,000–16,000 U.S. dairies will be doing the work that nearly 30,000 did a generation ago—and the line between 5,000 and 15,000 herds by 2050 is being drawn right now in cost structure, technology, and succession decisions. What’s interesting is that you don’t have to buy into worst‑case doom to see it; you just have to follow the numbers we already have.

Almost 40% of U.S. dairies disappeared between the 2017 and 2022 Census of Agriculture, even as total milk output increased, and Canadian Agriculture and Agri‑Food Canada (AAFC) data show a similar “fewer farms, more milk” trend under supply management. Using those official data as the foundation, the Bullvine Dairy Curve points to three structural paths:

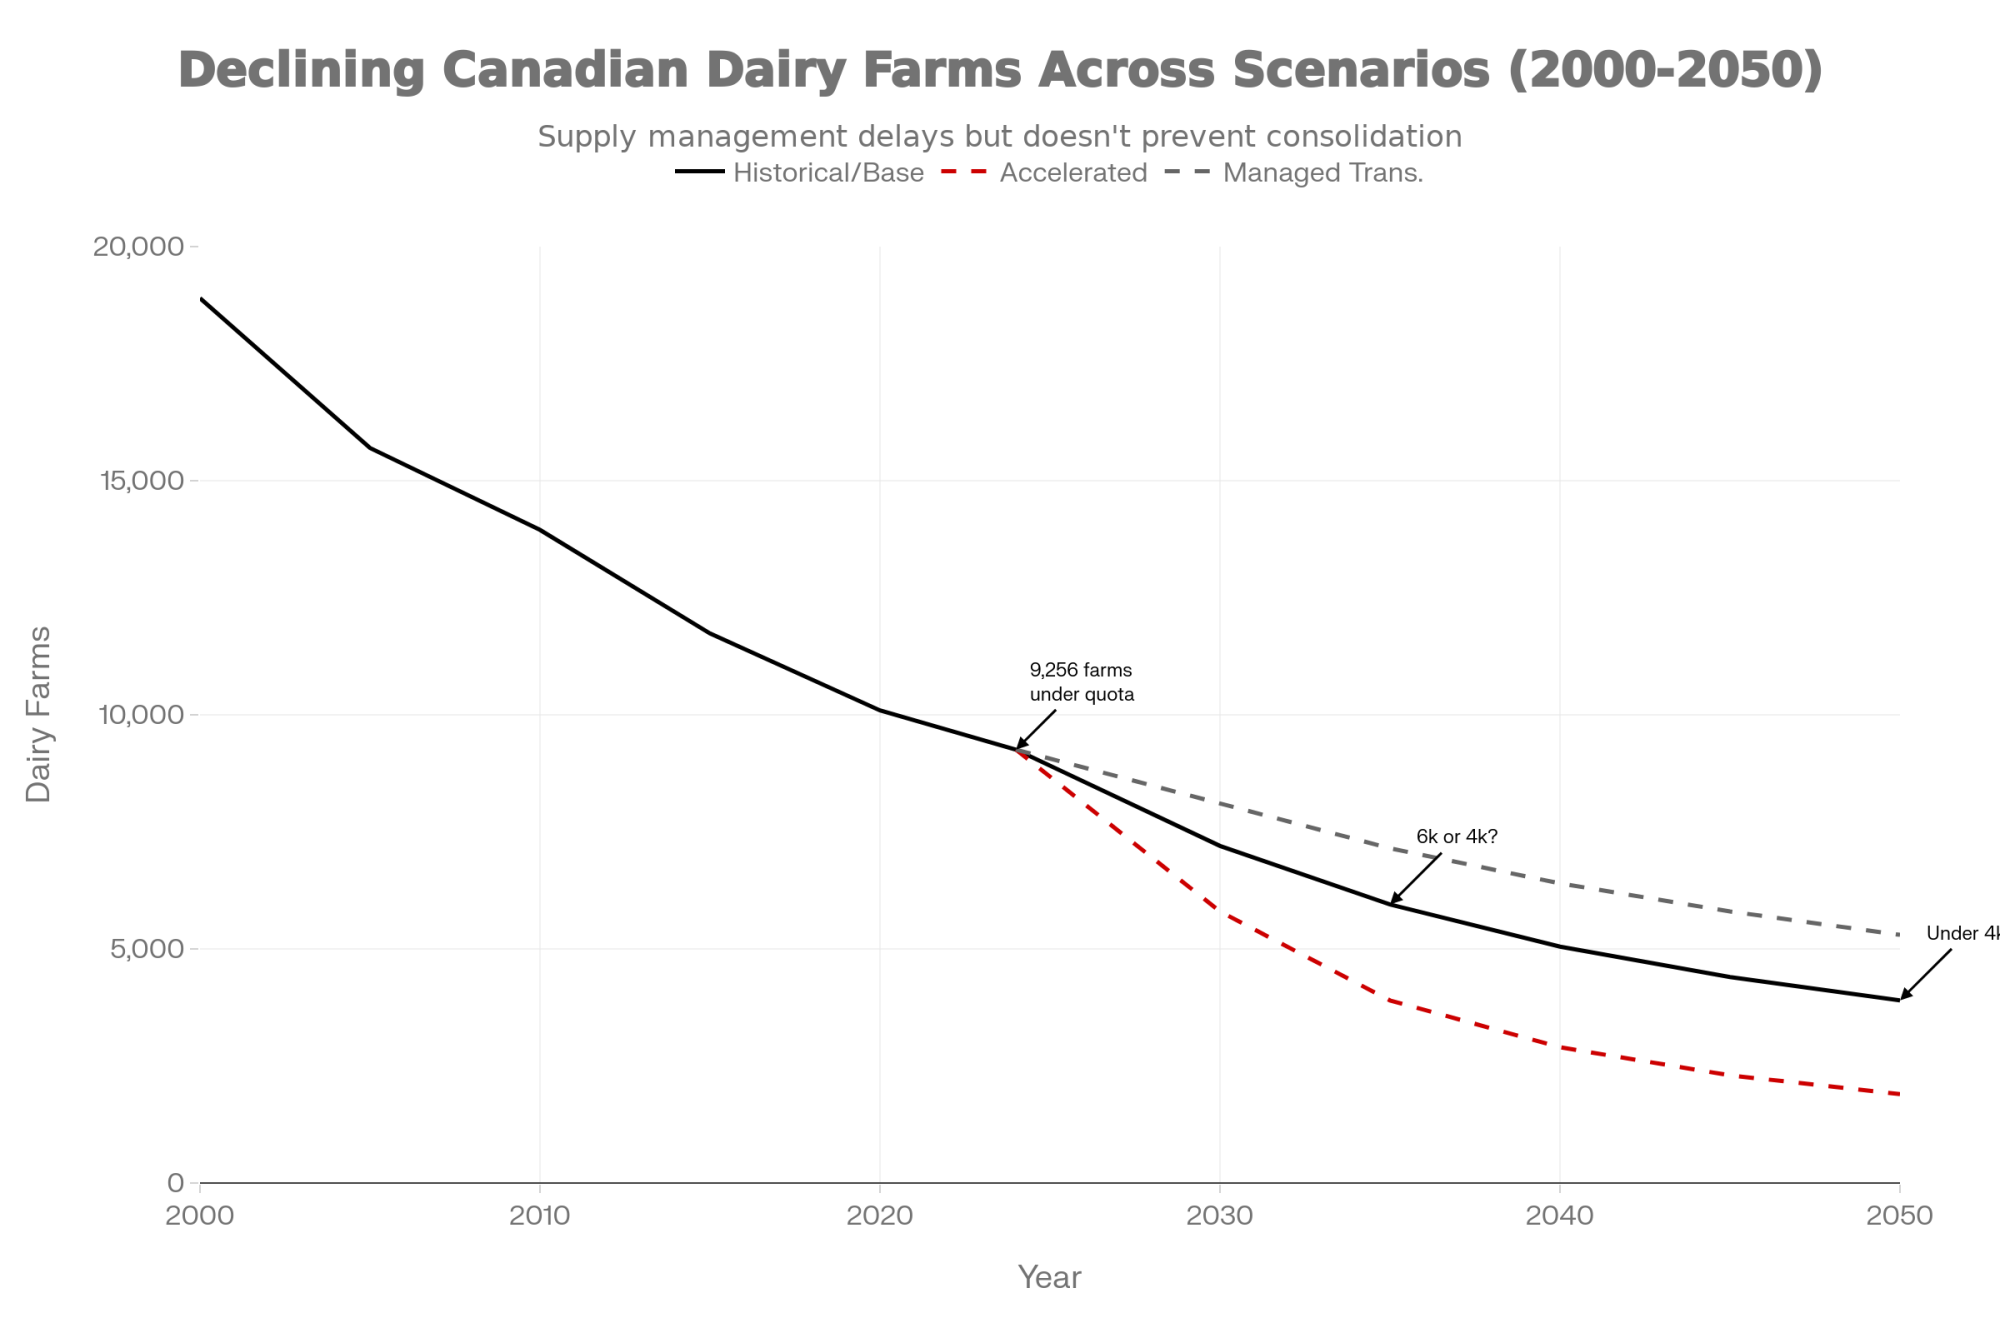
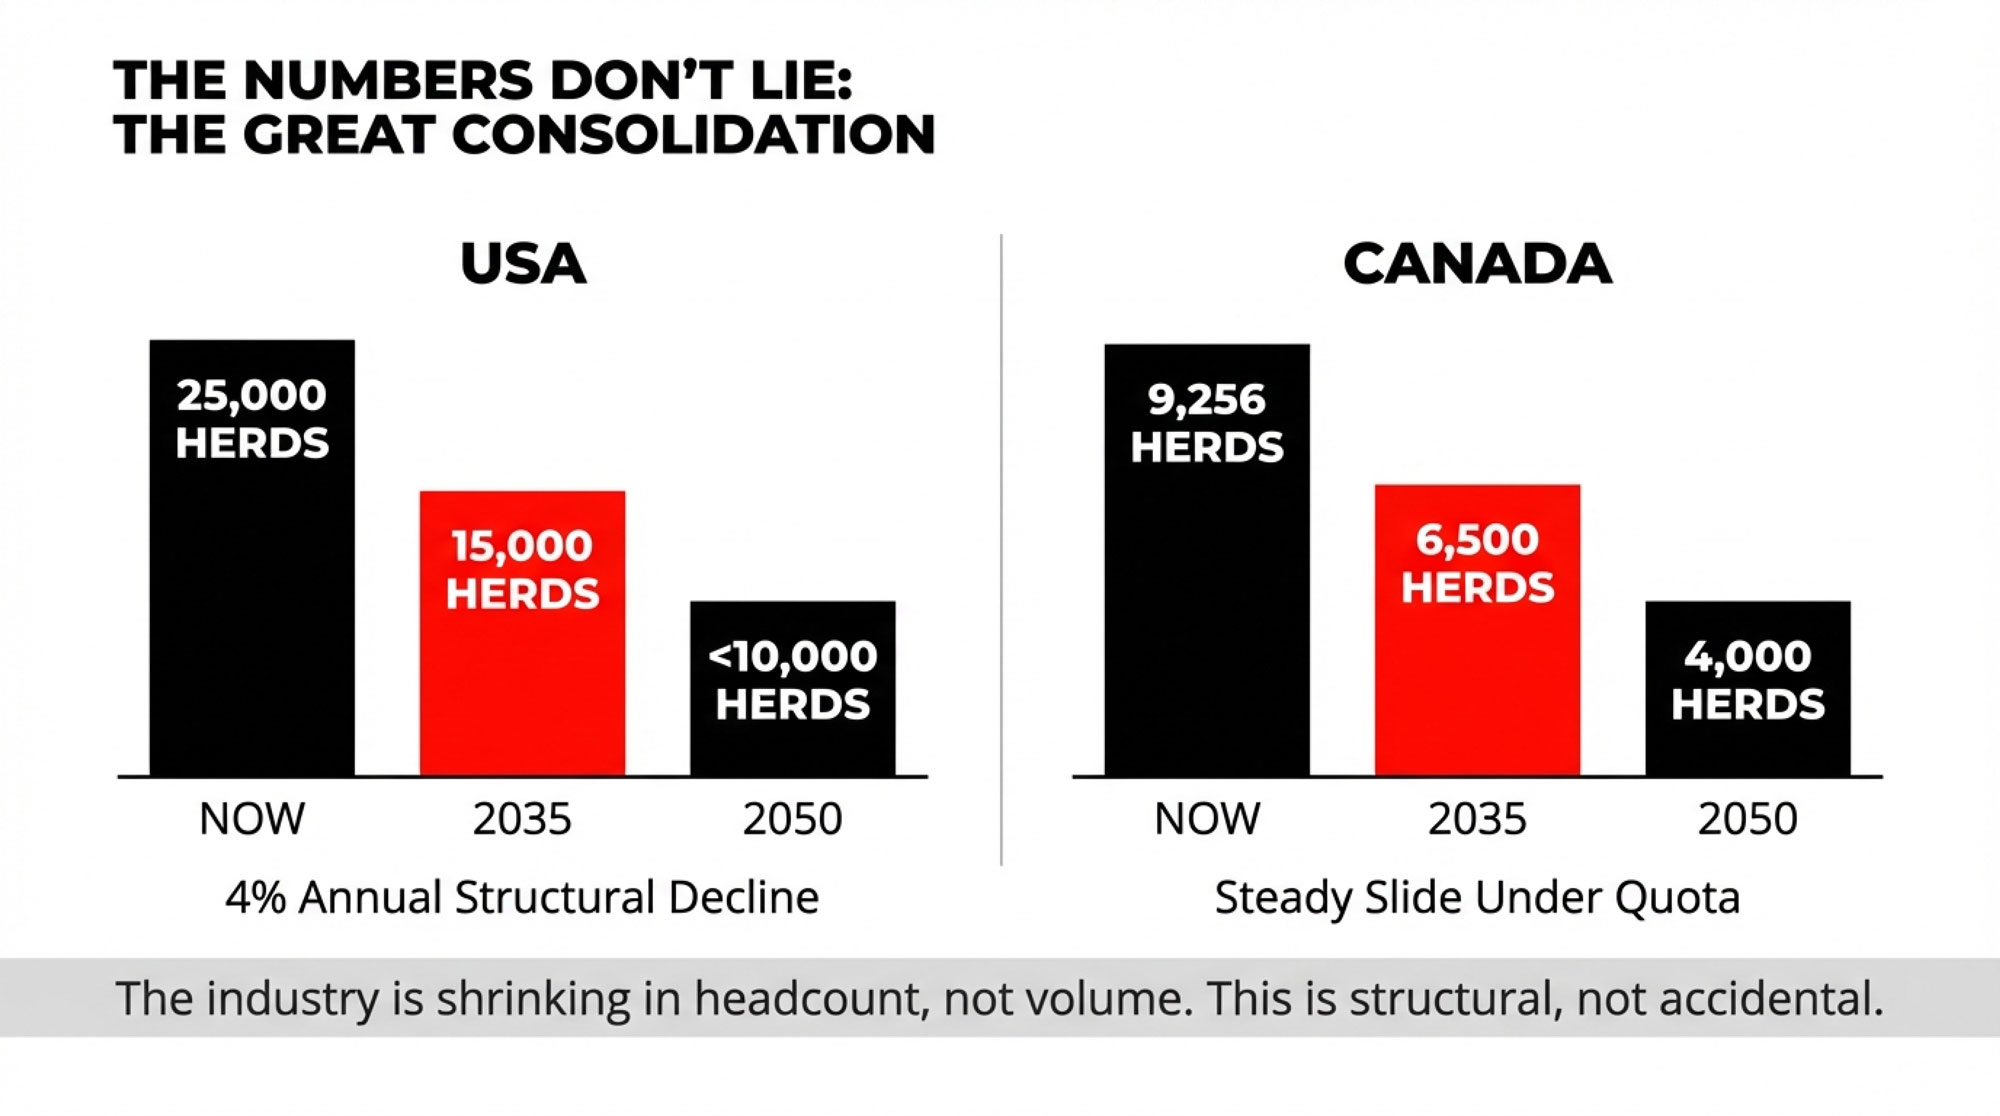
  • business‑as‑usual path where U.S. herd numbers decline around 4% per year and land in the 15,000–16,000 range by 2035 and well under 10,000—typically 8,000–9,000—by 2050; Canada tracks toward 6,500–7,000 by 2035 and 4,000–5,000 by 2050 under quota.
  • faster consolidation path where tighter labour, higher compliance costs, and alternative products push U.S. farms closer to 5,000 herds and Canadian herds into the 3,500–4,000 range by 2050.
  • managed transition path where better use of margin tools, disciplined capital decisions, and deliberate succession planning slow effective exit rates, keeping the U.S. closer to 15,000 herds and Canada around 6,500 by mid‑century.
PathU.S. Herds 2035U.S. Herds 2050Canada Herds 2035Canada Herds 2050Key Drivers
Business-as-usual15,000–16,0008,000–9,0006,500–7,0004,000–5,000~4% U.S. decline, 2–3% Canada under quota
Faster consolidation~12,000~5,000~5,5003,500–4,000Labour, compliance, alt products, weak margins
Managed transition~15,000~15,000~6,500~6,500Margin tools, disciplined capex, succession

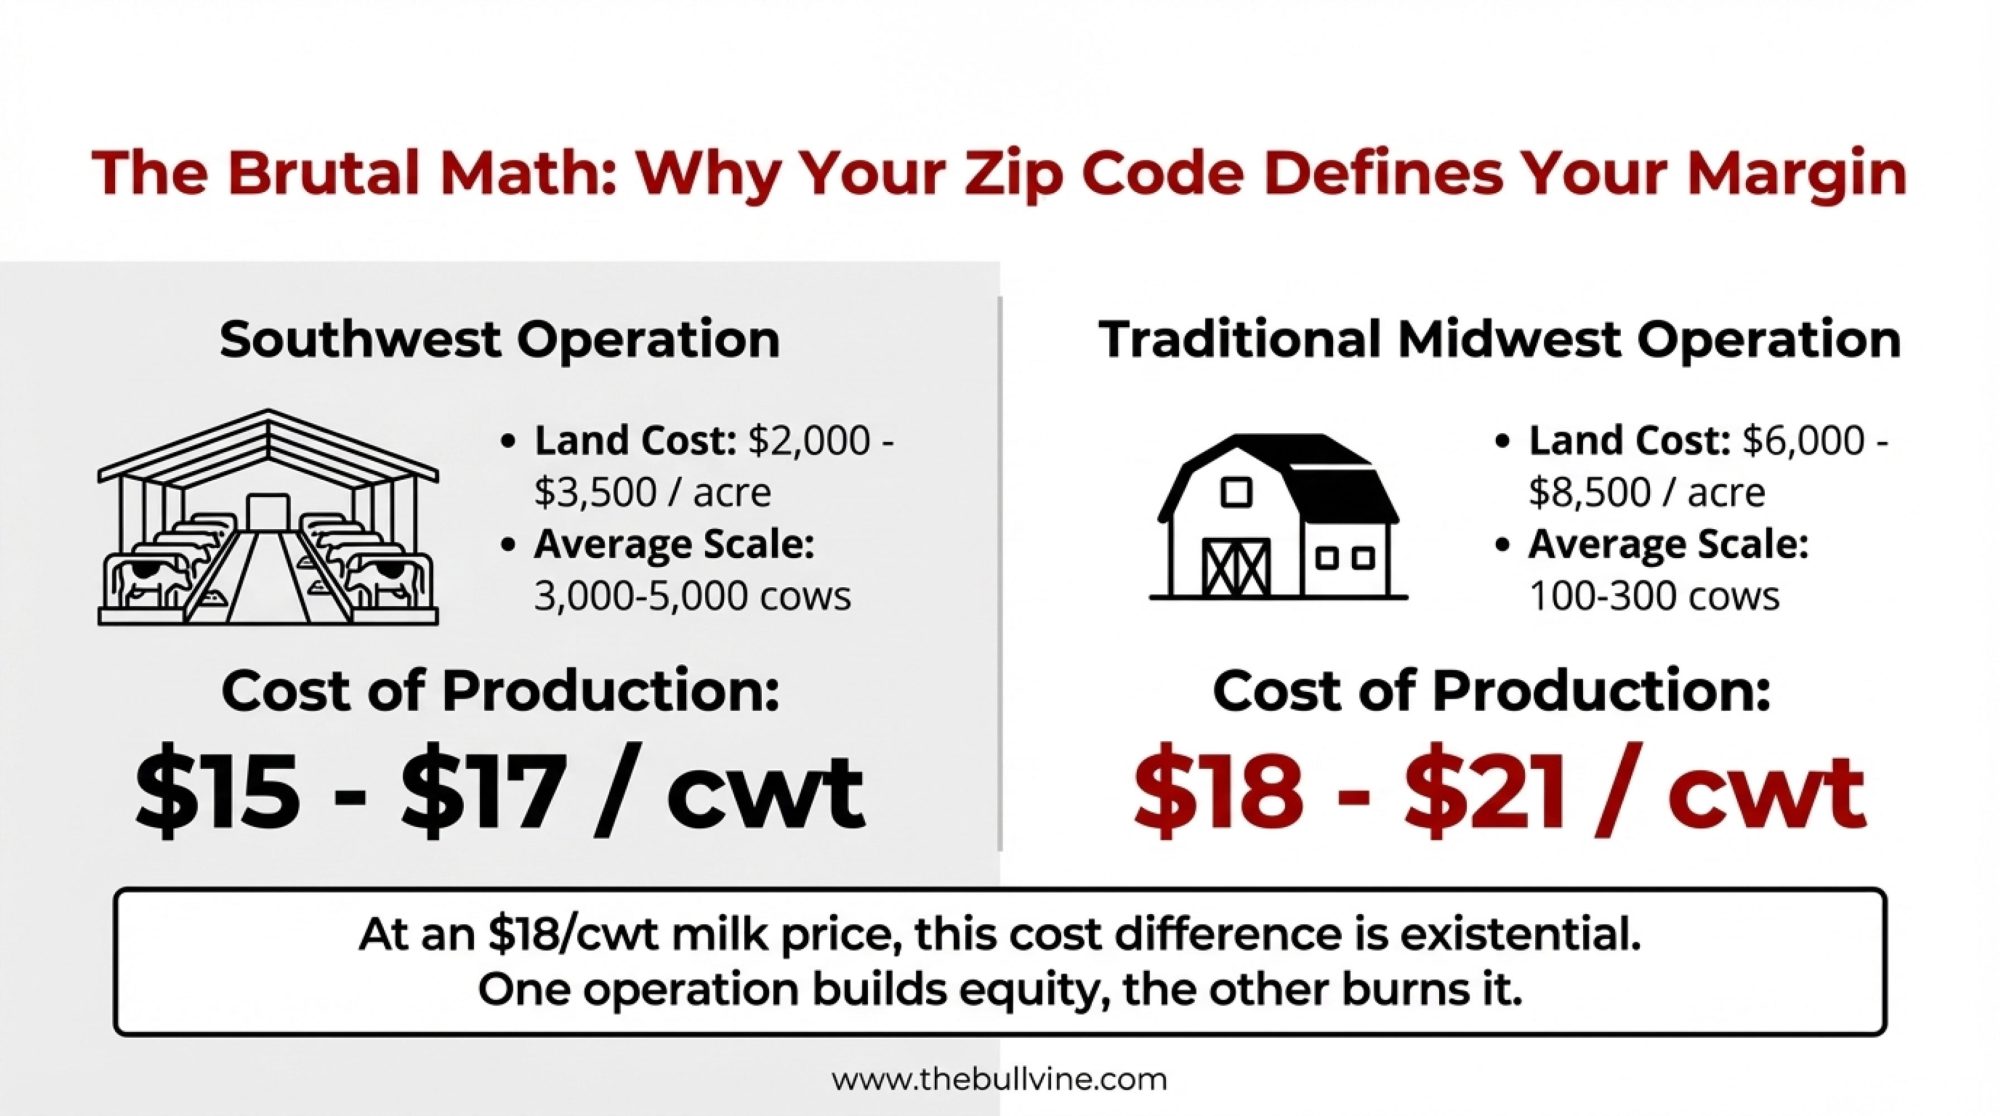
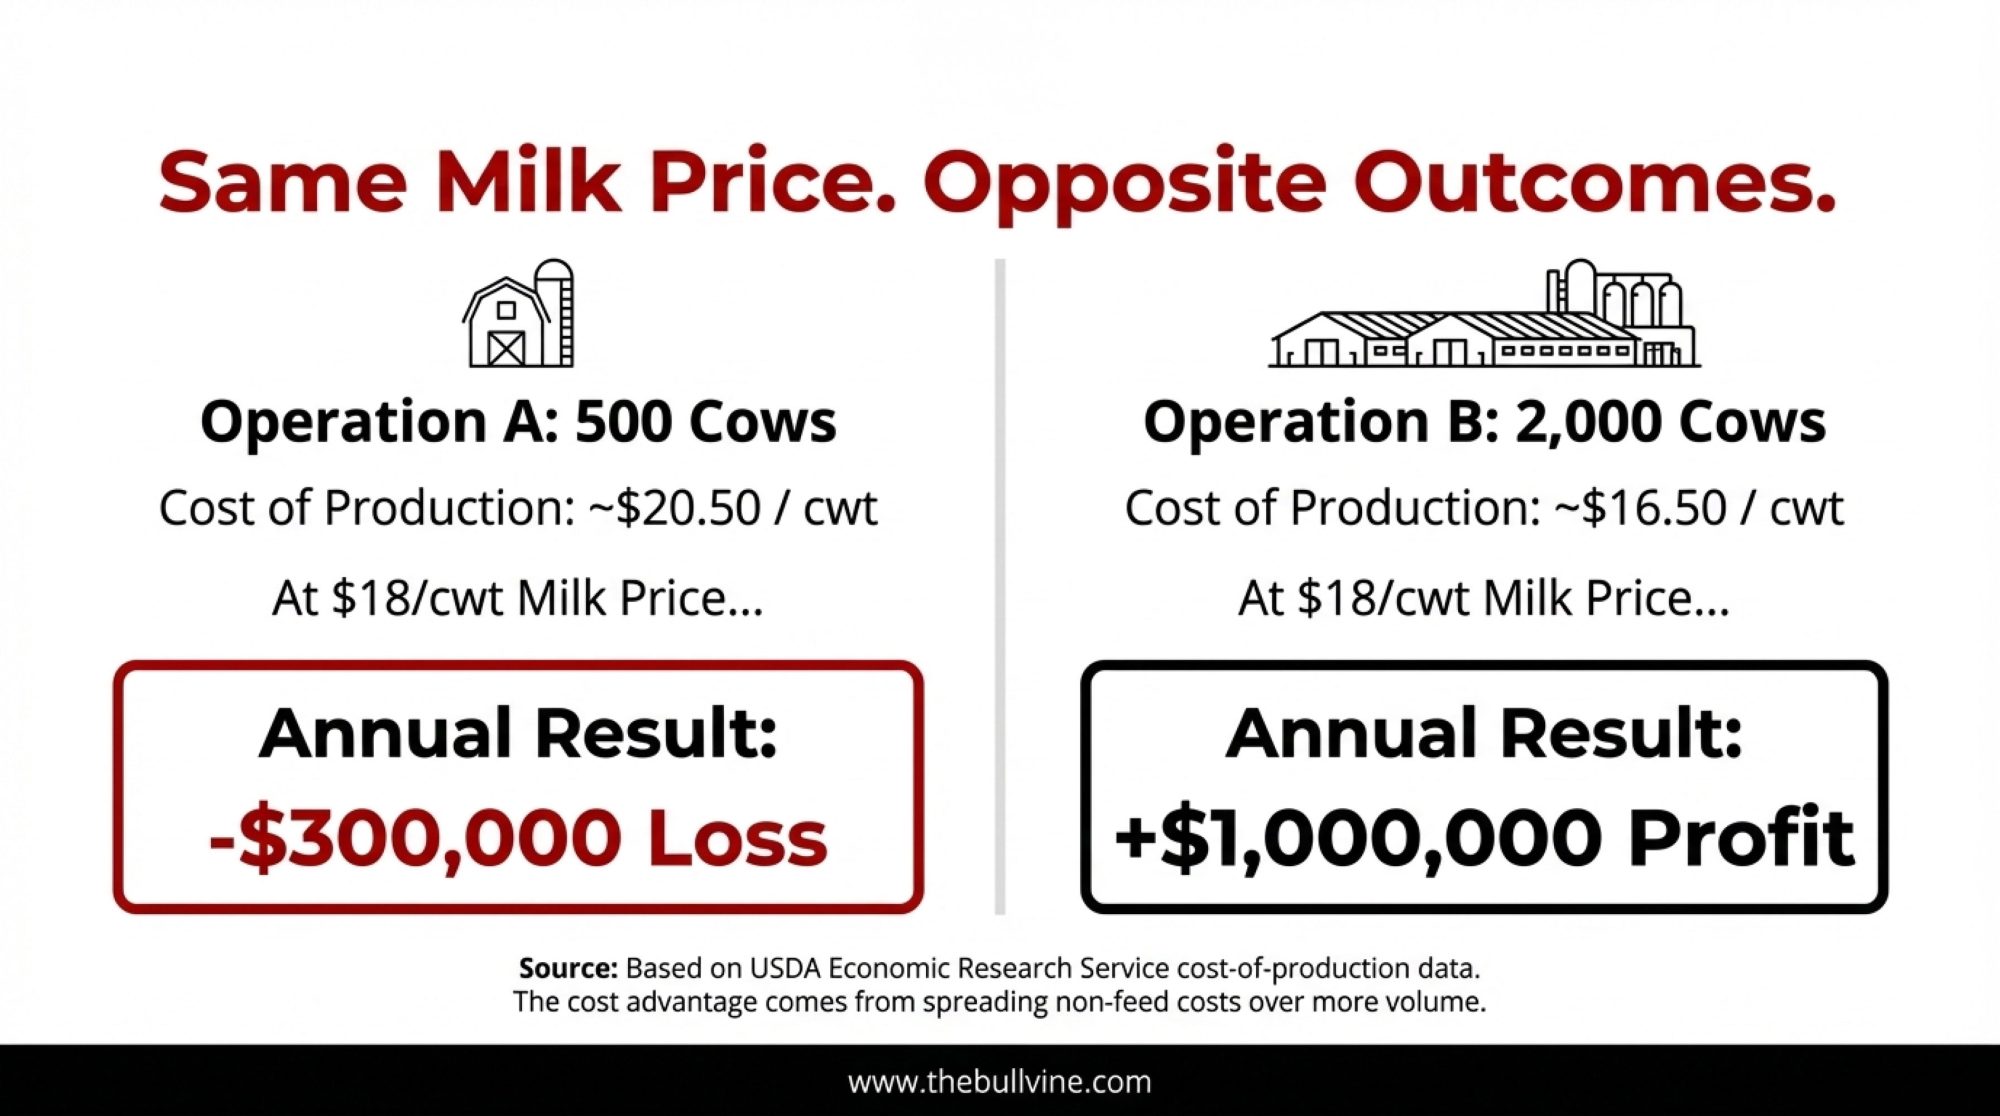
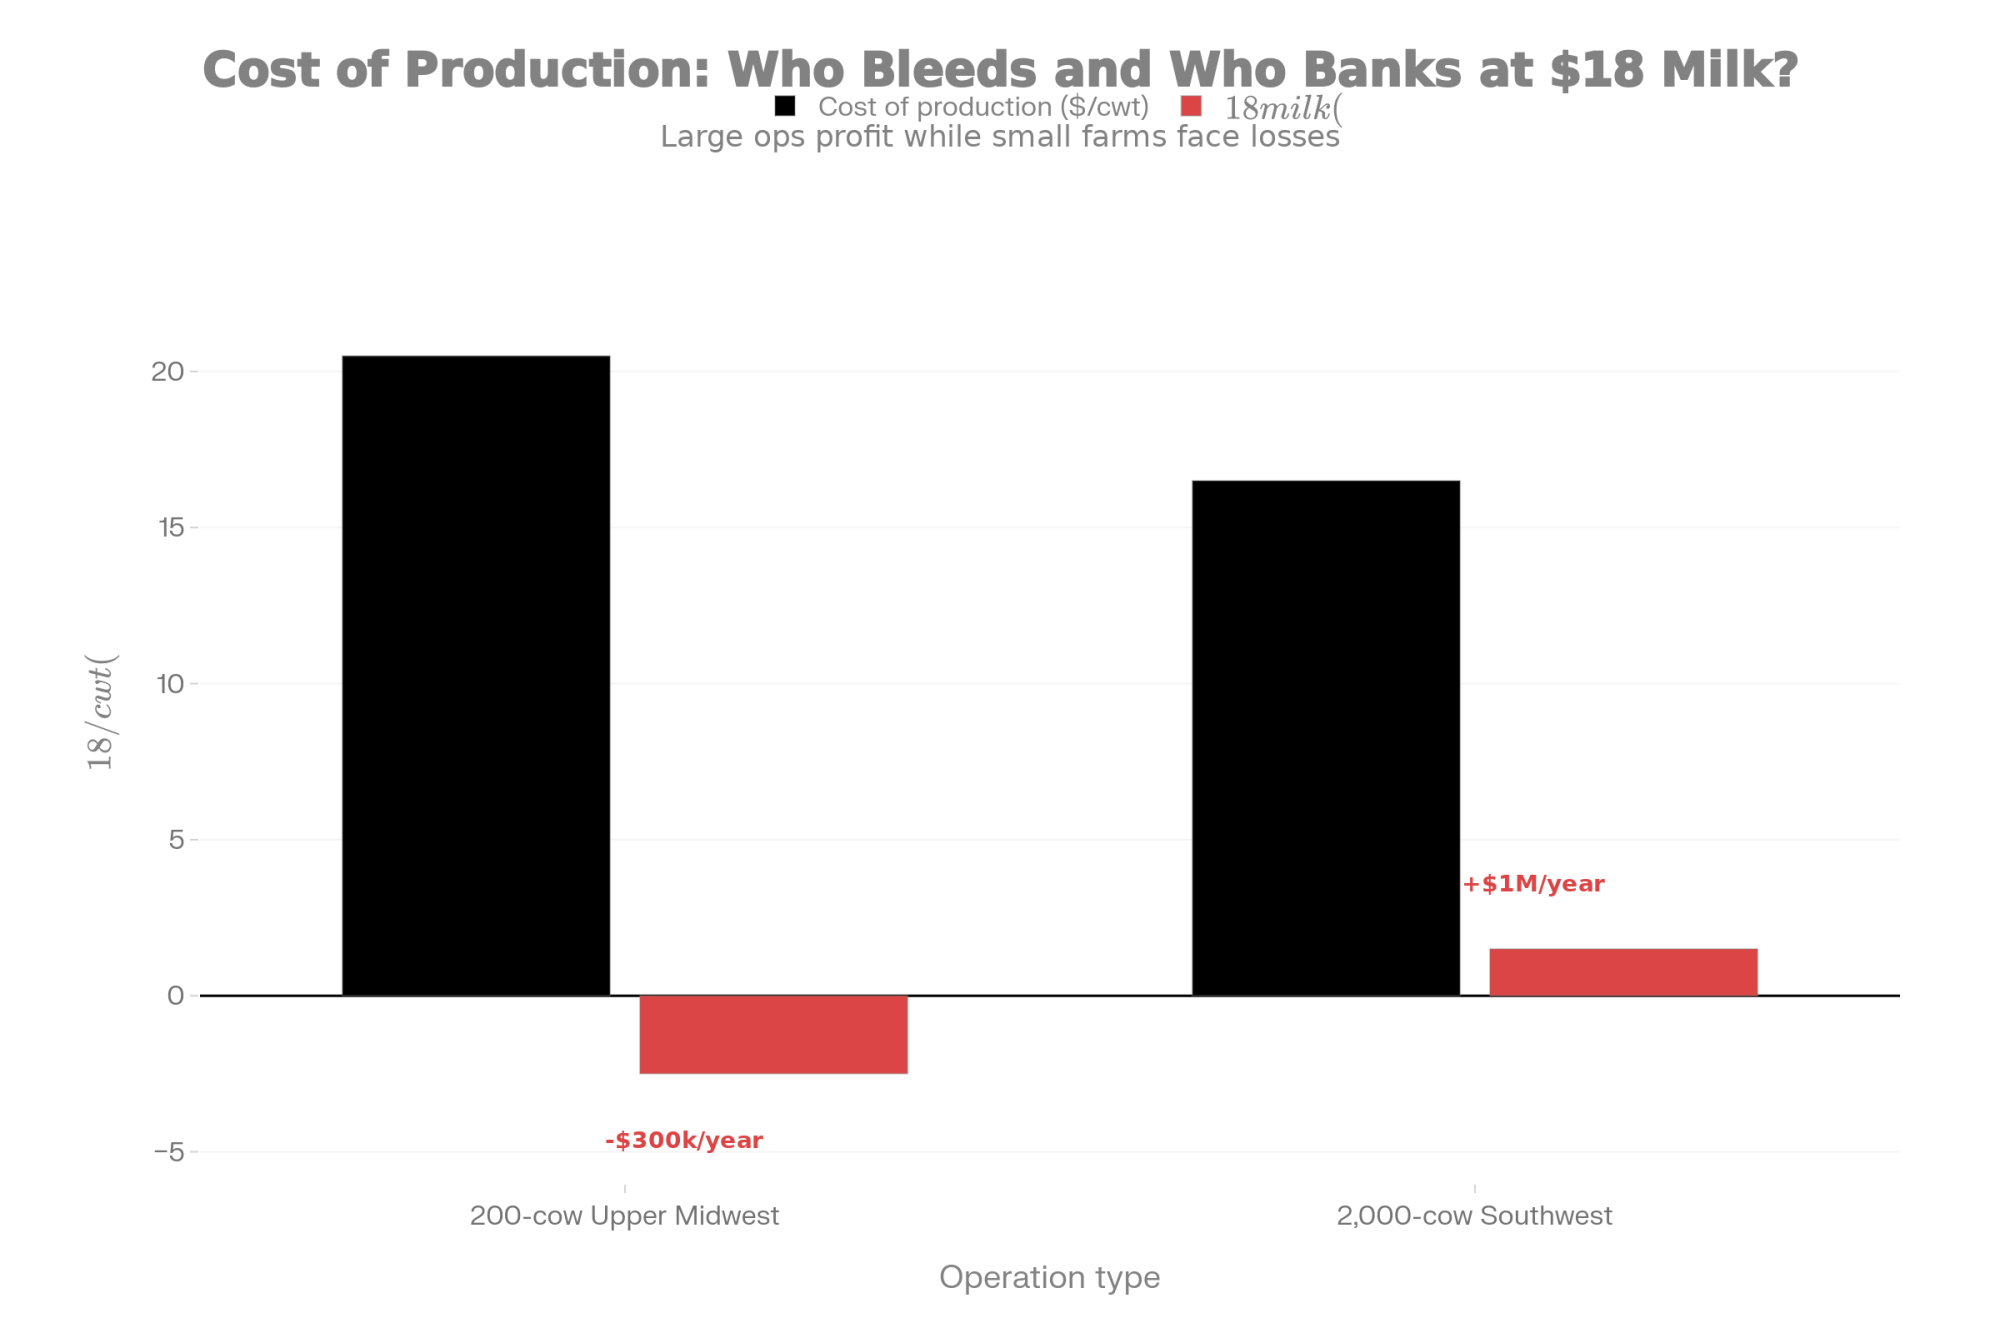
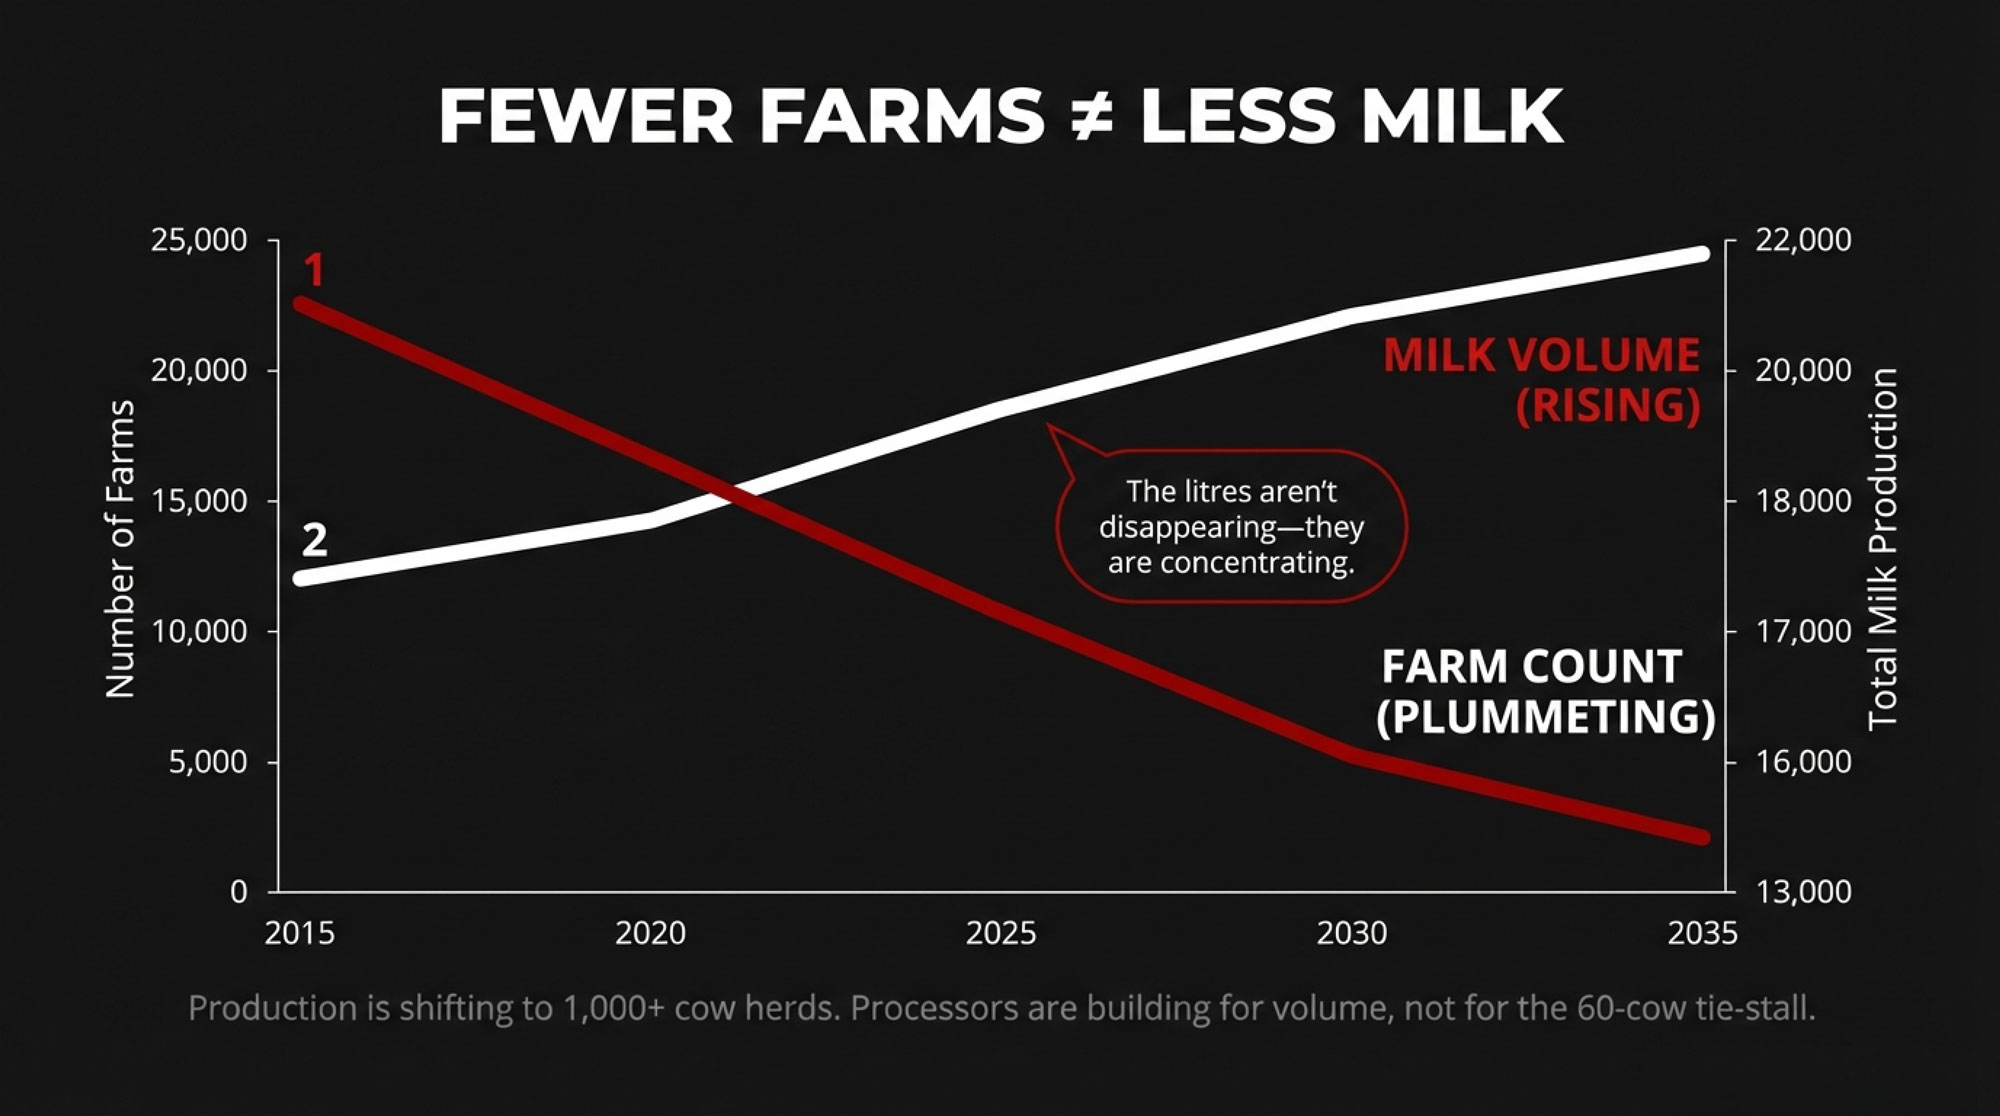
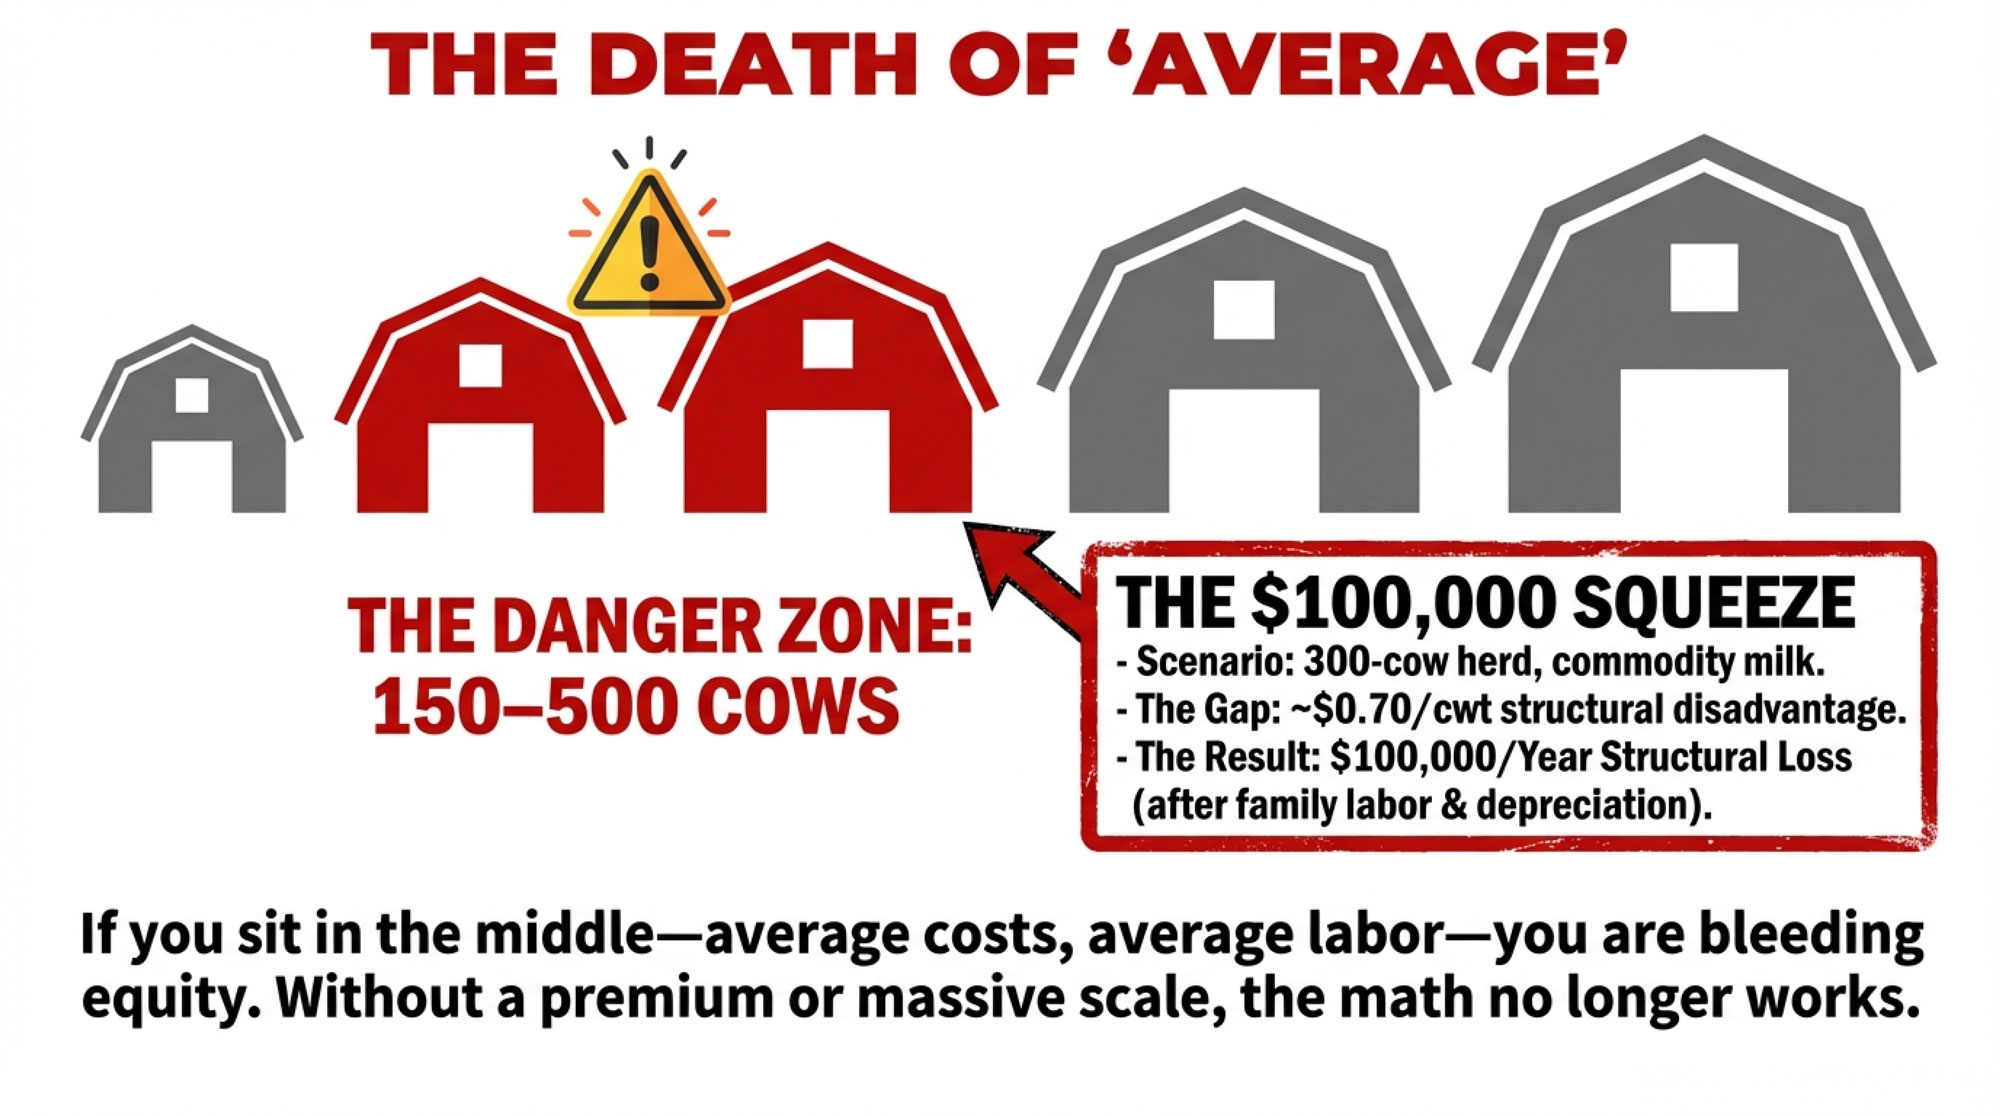
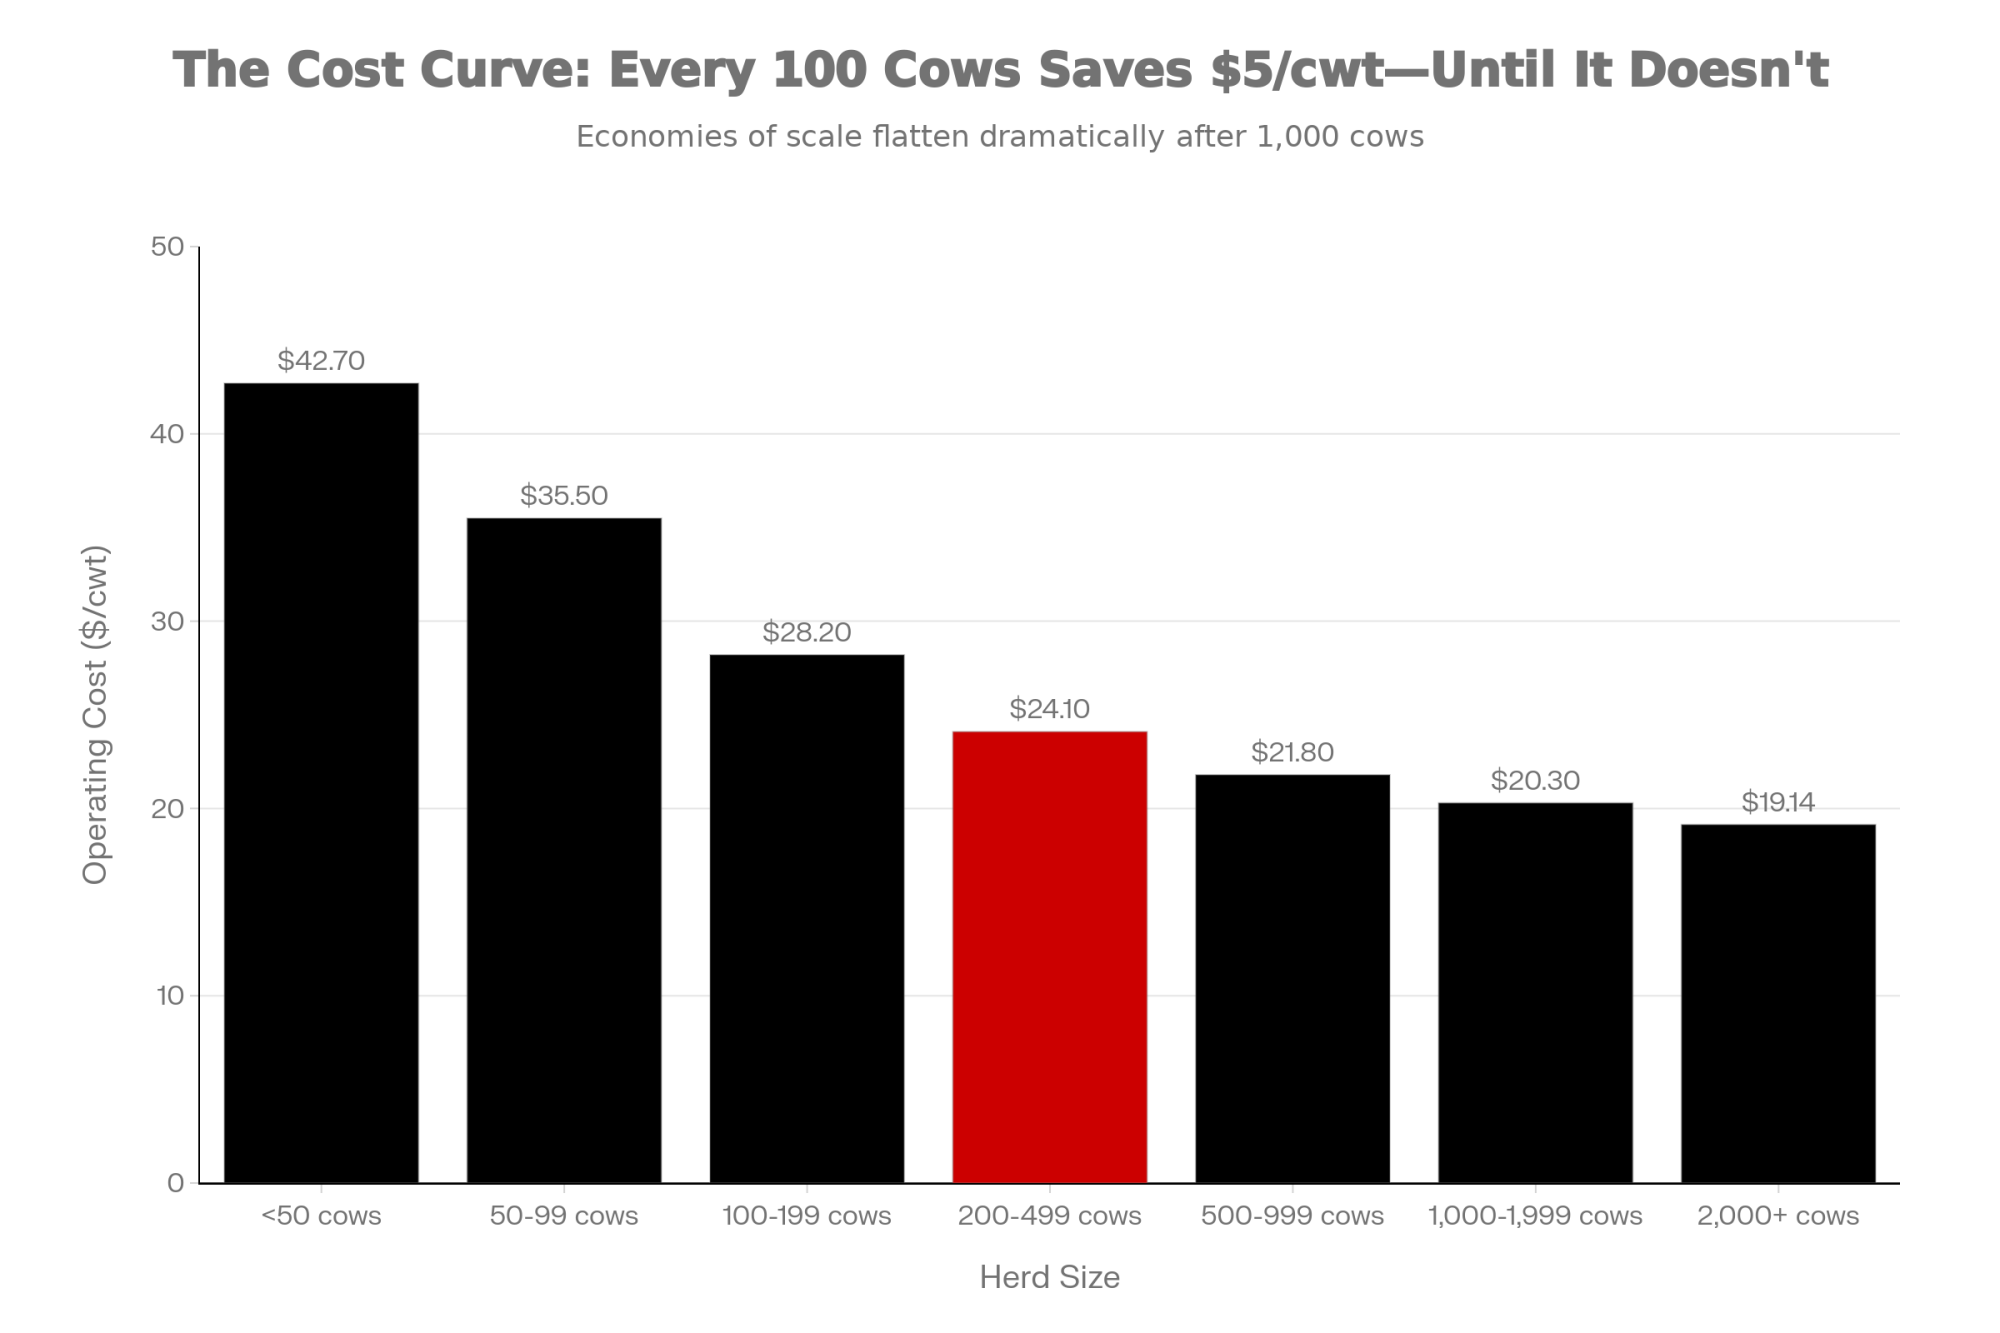
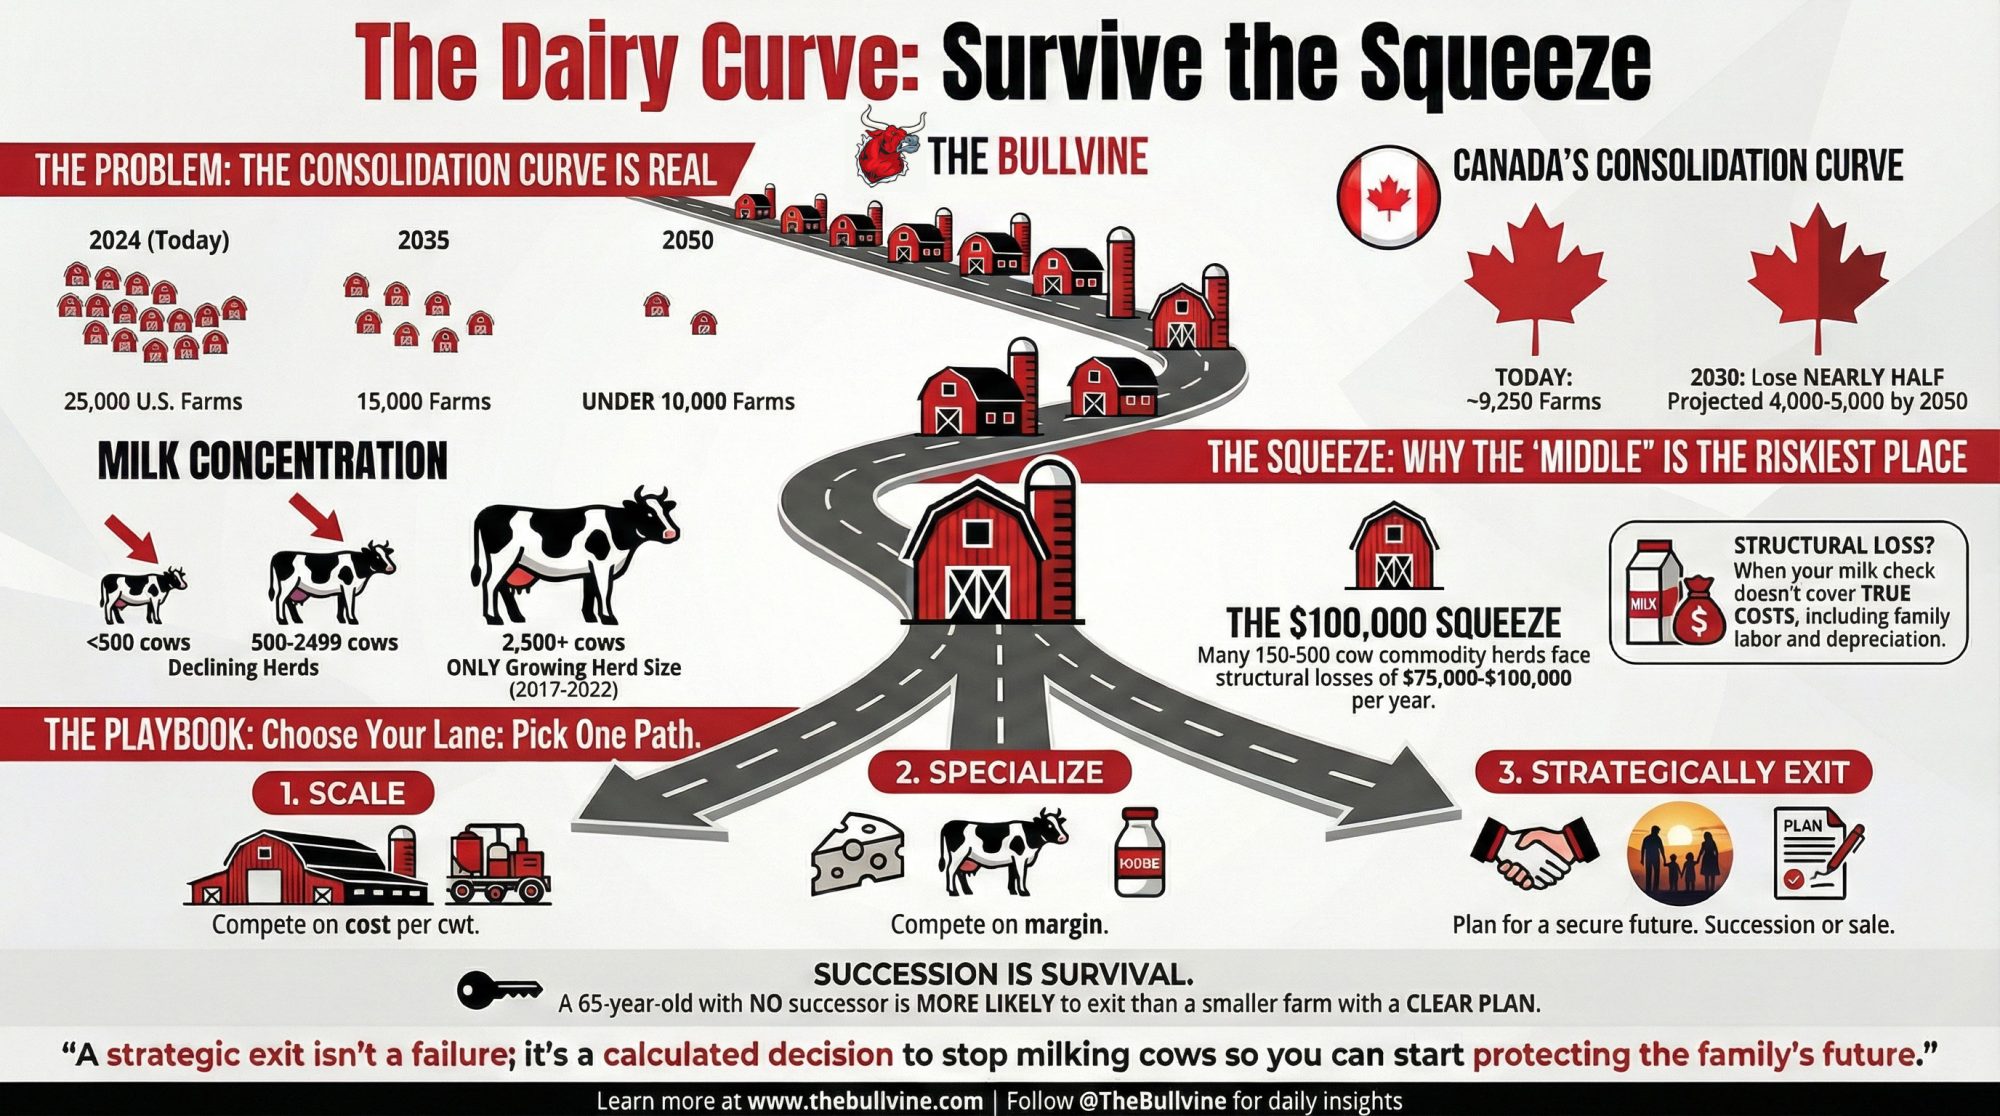
In all three paths, the litres don’t disappear—they concentrate. The largest freestall and dry‑lot systems steadily capture a larger share of the milk pool as economies of scale and processor preferences reward low‑cost, high‑volume suppliers. In that world, 150–500 cow herds that sit “average” on cost and are fully exposed to commodity pricing are often bleeding $75,000–$100,000 per year in structural losses once full labour and capital costs are factored in. That forces a three‑way choice: scale toward 1,000+ cows, pivot into premium/value‑add markets, or cash out while equity is still intact.

The rest of this article lays out the Bullvine Curve in plain language: what the official numbers say, how Bullvine’s forecasts connect the dots out to 2035 and 2050, and a barn‑level playbook to decide whether your operation is building to survive that structure—or quietly betting against it.

Where we’re actually standing today

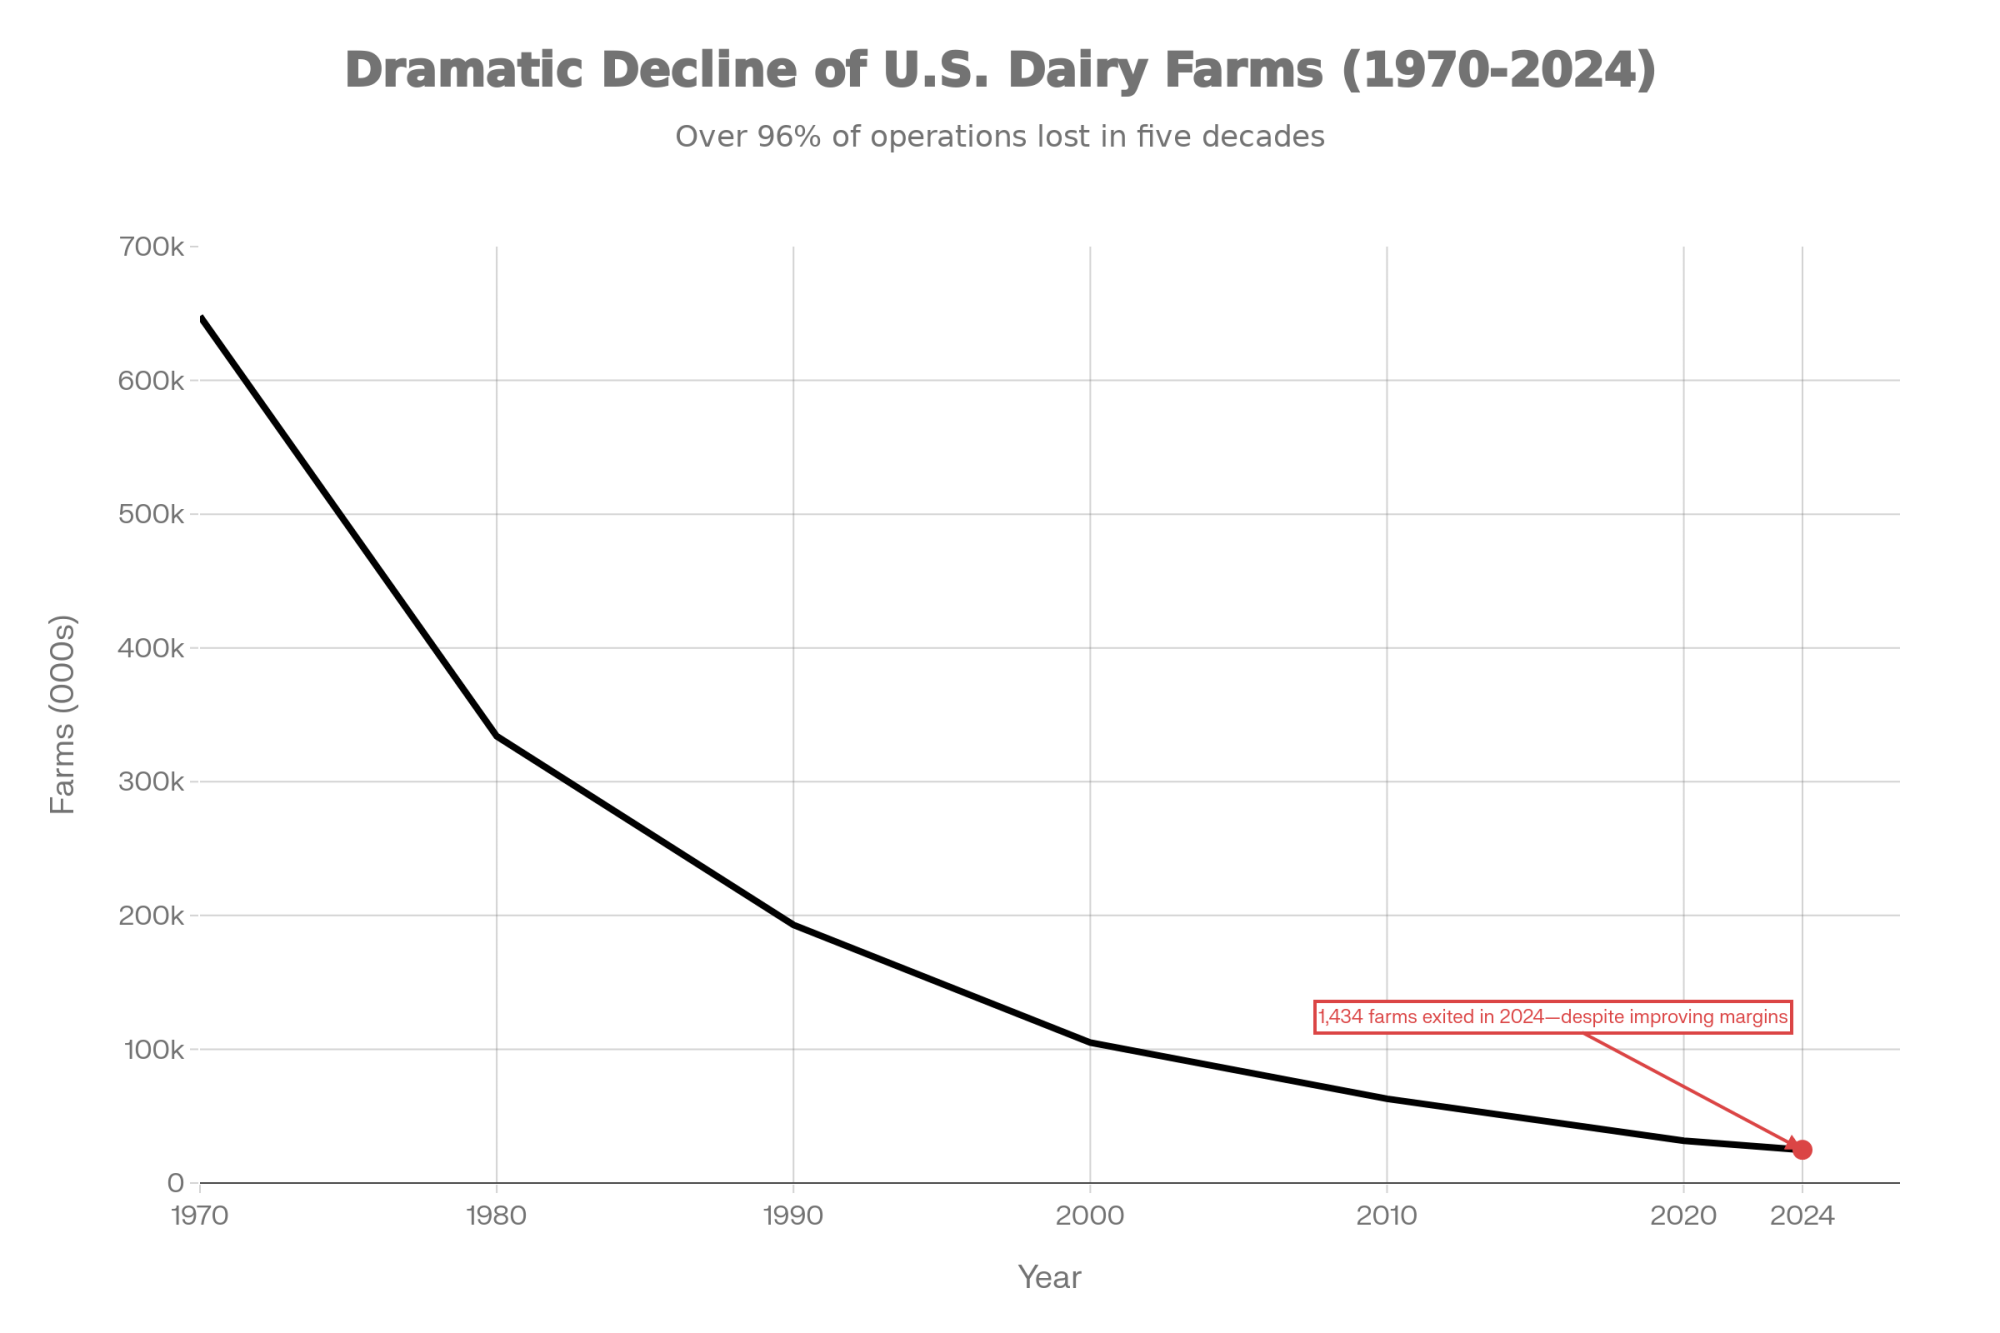
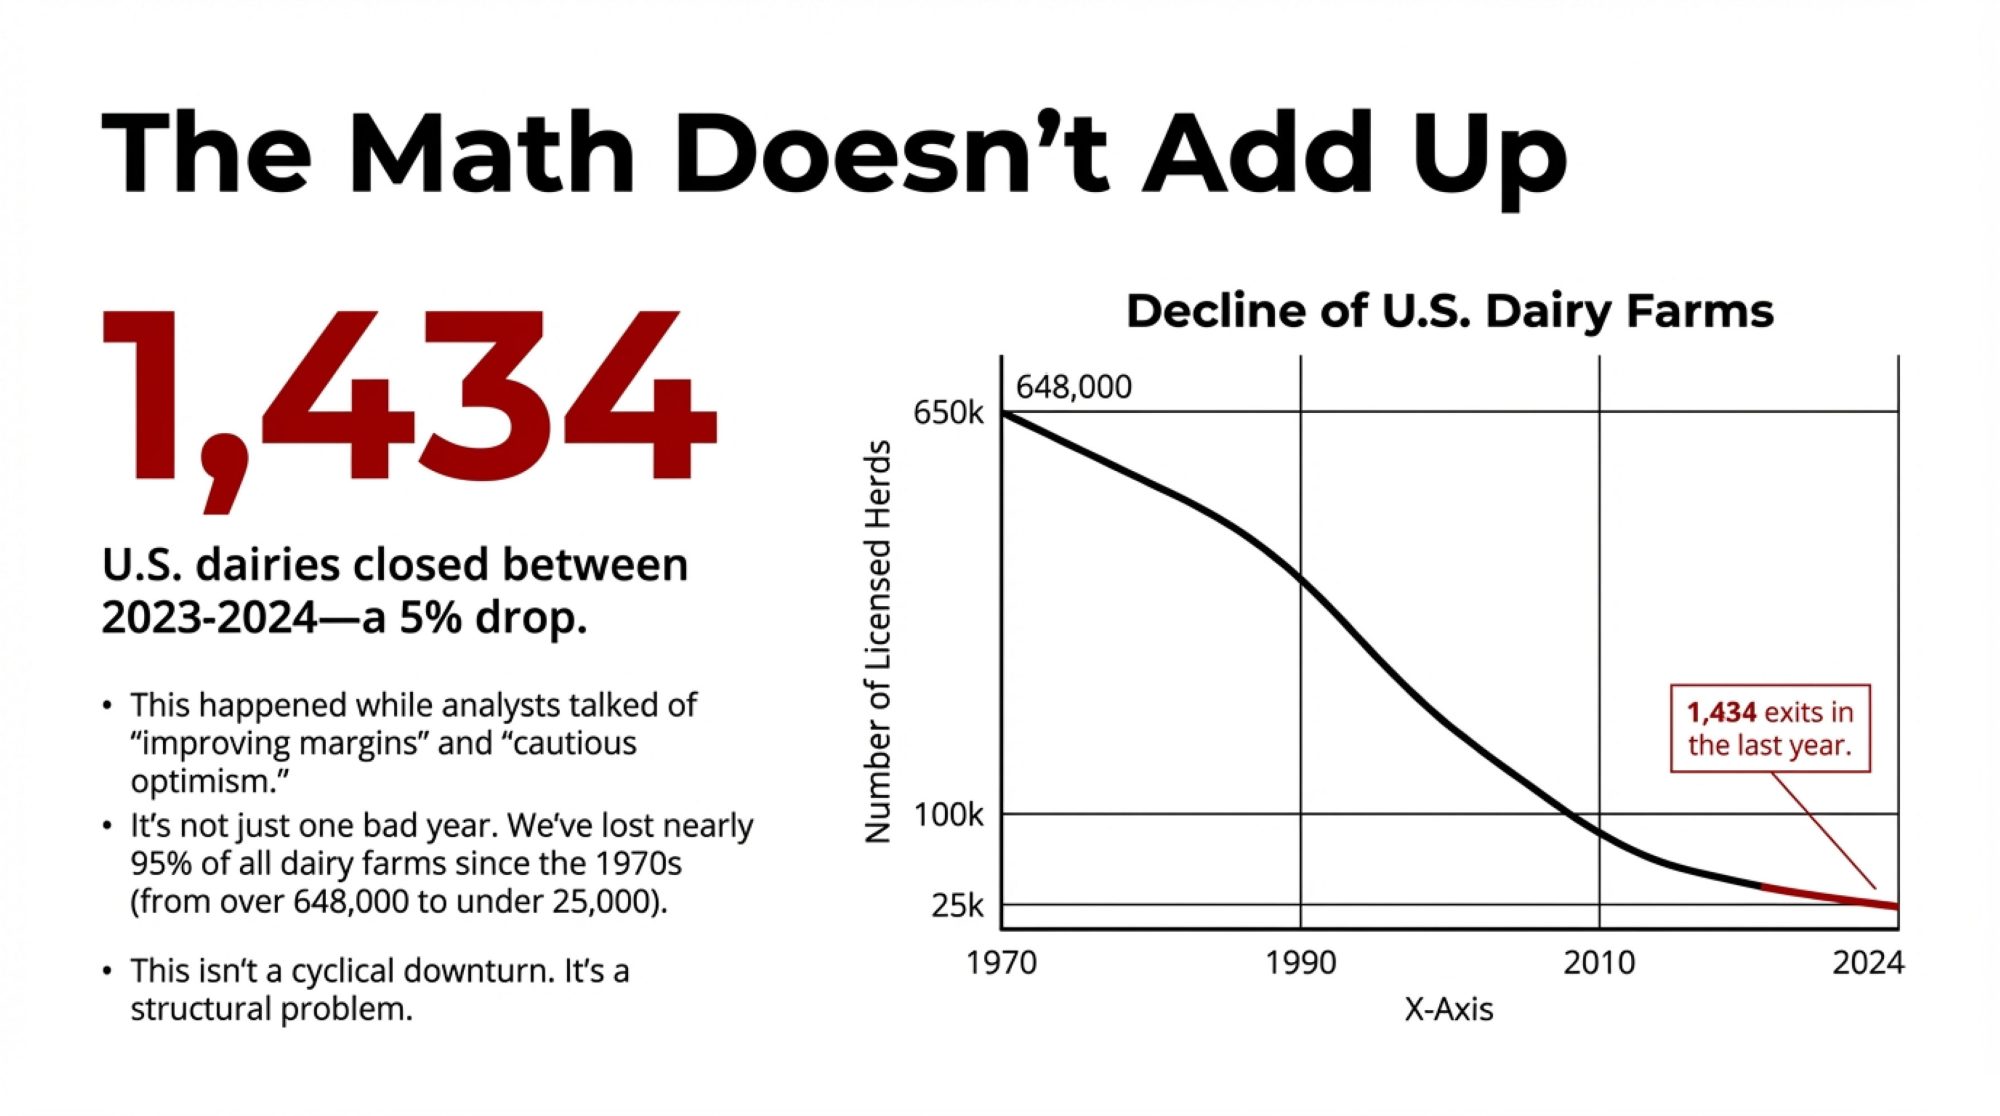
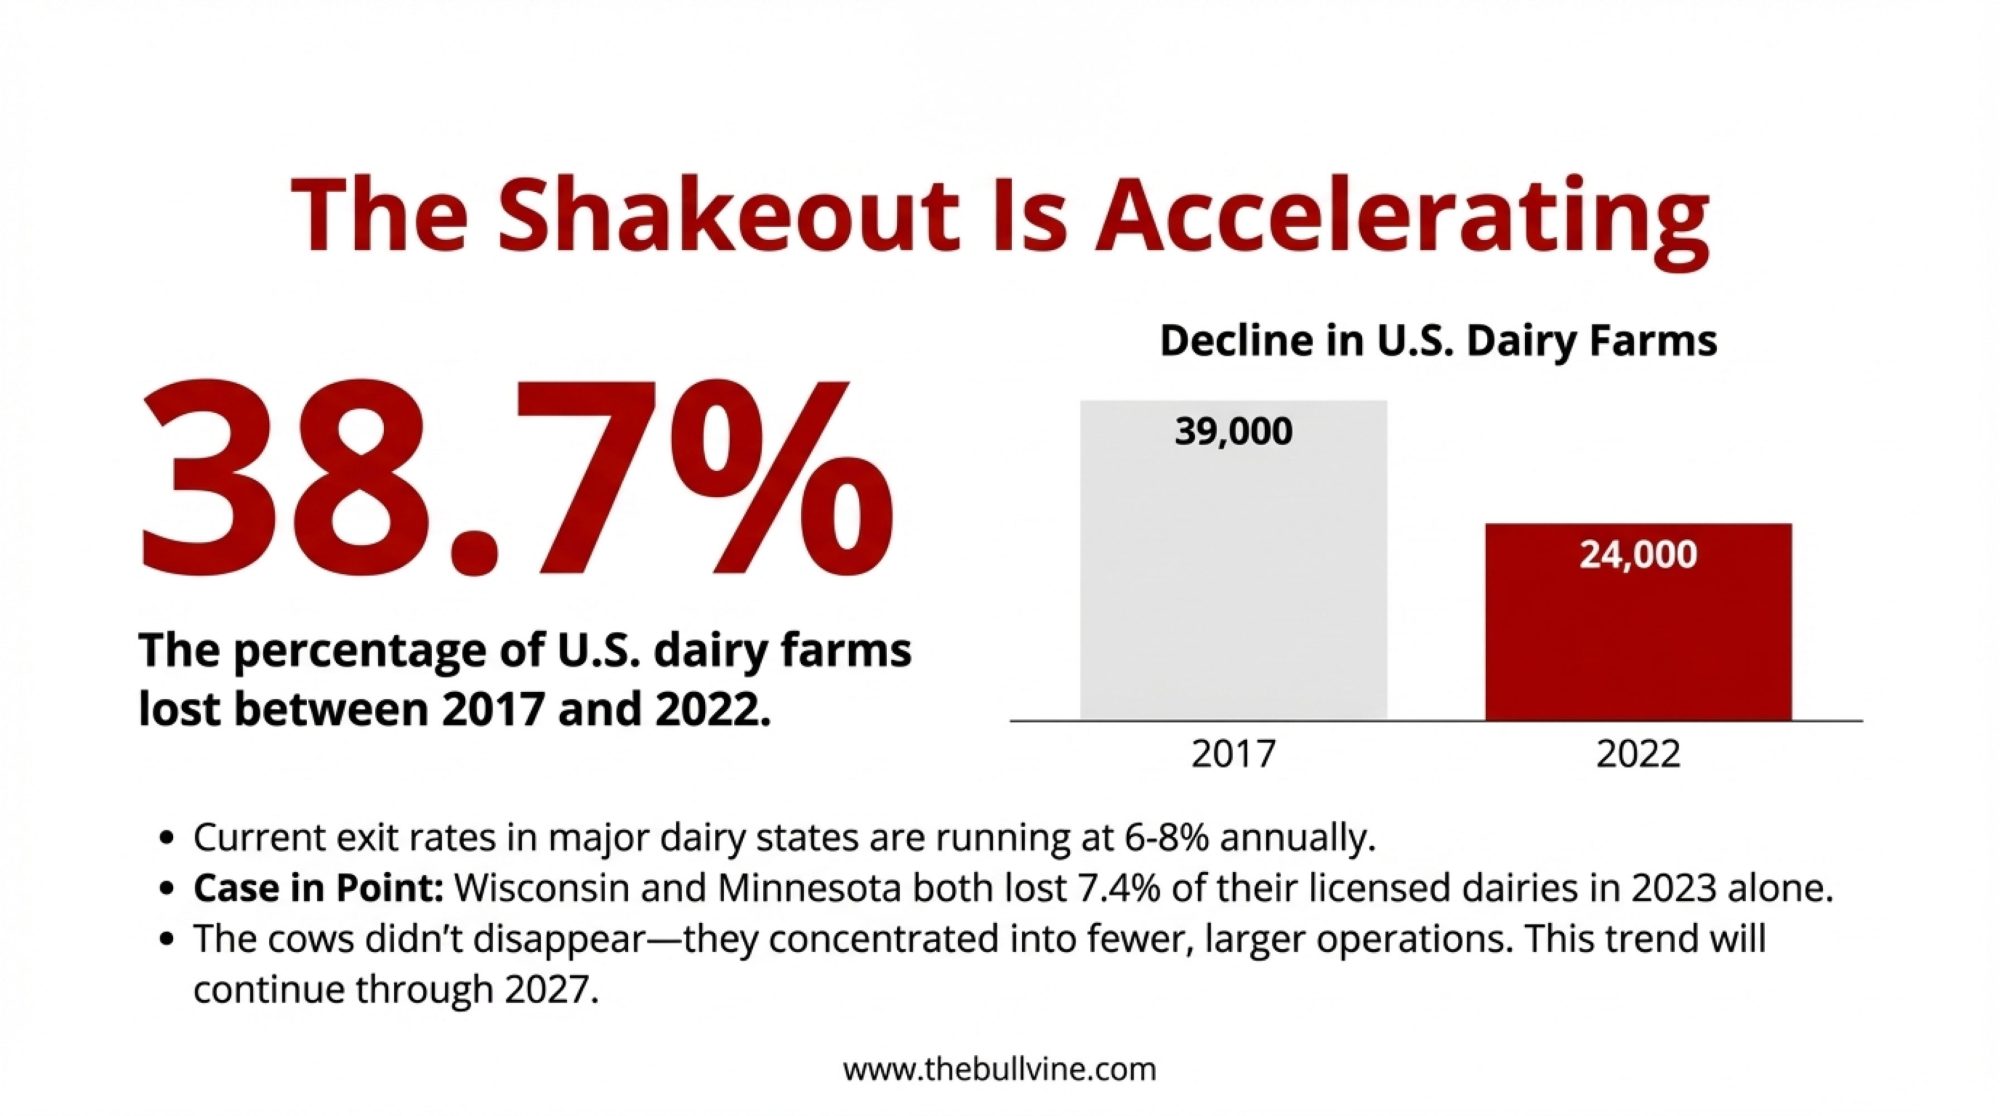
You don’t need a chart to know things have changed; you see it in auction bills and quiet parlours. The 2017 Census of Agriculture recorded 39,303 U.S. farms that sold milk from cows; by 2022, that number had dropped to 24,094, a decline of almost 40% in just five years, even as total U.S. milk production nudged about 5% higher on roughly the same total number of cows. USDA’s Economic Research Service found the longer‑run trend is the same: between 2002 and 2019, licensed U.S. dairy herds fell by more than half while national output increased, with the rate of decline accelerating in 2018–2019 and production shifting toward larger herds with higher yields per cow.

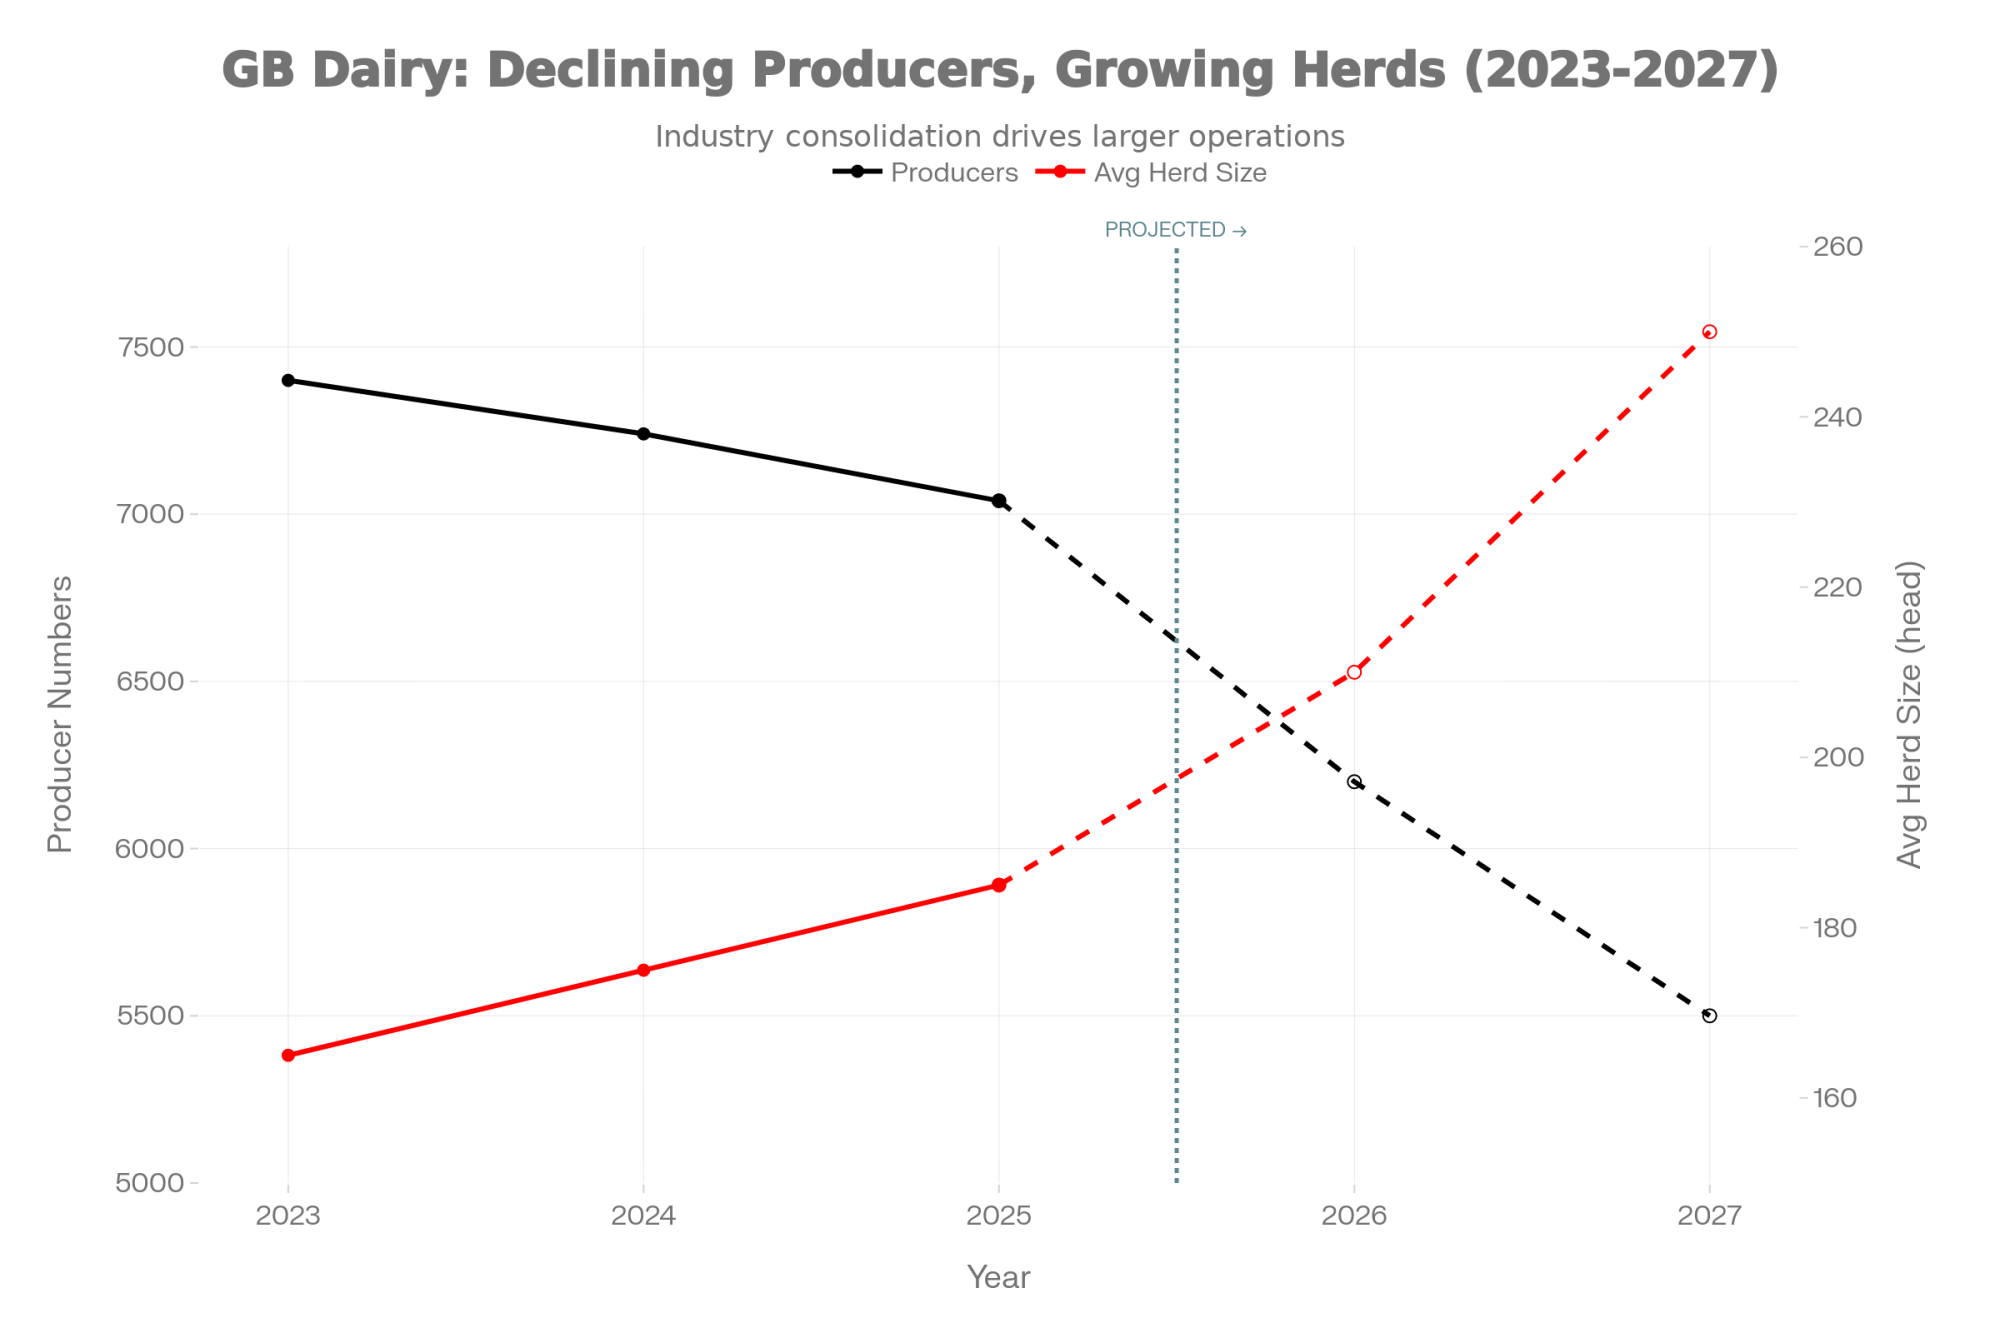
In Canada, AAFC’s Dairy Sector Profile shows farm numbers falling from 12,007 in 2014 to 9,256 in 2024—an average decline of about 2.6% per year—while milk production rose from roughly 78.3 to 96.6 million hectolitresand average farm milk prices increased from just over $82 per hectolitre to more than $97. So on both sides of the border, the story is the same: fewer herds, more milk, with the U.S. consolidating faster and Canada sliding more slowly under quota.

That’s the data the Bullvine Dairy Curve starts from: official census and ERS/AAFC work, but extended into structural scenarios that ask a more practical question—which herds are still milking in 2035 and 2050, and what do they look like?
The Bullvine Dairy Curve: 15,000 by 2035, <10,000 by 2050

ERS’s Consolidation in U.S. Dairy Farming gives the cleanest long‑term U.S. baseline: herd numbers down about 55% from 2002–2019, roughly a 4% annual decline, while national production increased and midpoint herd size kept rising. When you extend that 4% curve from today’s roughly 25,000 U.S. herds and overlay it with the 2017–2022 cliff—where the only U.S. size class that actually grew was herds with 2,500+ cows—you land in the same band Bullvine’s early consolidation work described.

  • U.S. baseline band: about 15,000–16,000 licensed herds by 2035, with 8,000–9,000 by 2050 if that structural rate holds.
  • Canadian baseline band: a slower but steady slide toward 6,500–7,000 farms by 2035 and 4,000–5,000 by 2050, consistent with 2–3% annual attrition under supply management.

Since those first Bullvine forecasts, the signals have only sharpened. Follow‑up Bullvine work has documented that U.S. closures have effectively been running closer to 4–8 farms per day, and that about half of U.S. farms vanished between 2013 and 2025, with another 50% reduction projected by 2035 if current pressures persist—implying the industry could land in the lower half of that 15,000–16,000 band. In Canada, commentary that the country is “on track to lose nearly half of its remaining dairy farms by 2030,” with production concentrating in Quebec and Ontario, aligns with the 6,500/4,000–5,000 Bullvine bands.

PathU.S. Herds 2035U.S. Herds 2050Canada Herds 2035Canada Herds 2050Key Drivers
Business-as-usual15,000-16,0008,000-9,0006,500-7,0004,000-5,000~4% U.S. decline, 2-3% Canada under quota
Accelerated consolidation~12,000~5,000~5,5003,500-4,000Labor, compliance, alt products, weak margins
Managed transition~15,000~15,000~6,500~6,500Margin tools, disciplined capex, succession

The exact number isn’t the point. The curve is. The Bullvine Dairy Curve says: plan for an industry with far fewer farms, more concentrated milk, and a structure where being “average” in the middle is the riskiest place to stand.
How the curve hits different herd sizes and regions

Under ~150 cows: small, but only if it’s specialized

Cost‑of‑production work and intensification studies consistently show that small conventional herds carry higher costs per cwt unless they combine very low debt, strong home‑grown forage, and heavy reliance on family labour. The small herds that are thriving as the curve plays out almost all made a deliberate move away from being “average” commodity suppliers—into organic, grass‑based, A2, on‑farm processing, or other premium systems where margin comes from price, not just volume.

This development suggests that “staying small” only works when you’re deliberately un‑average—either in cost or in the milk cheque you’re targeting. A 60‑cow tie‑stall under quota with direct‑marketed fluid milk or value‑added cheese lives on a different part of the curve than a 60‑cow conventional herd shipping into a generic pool.
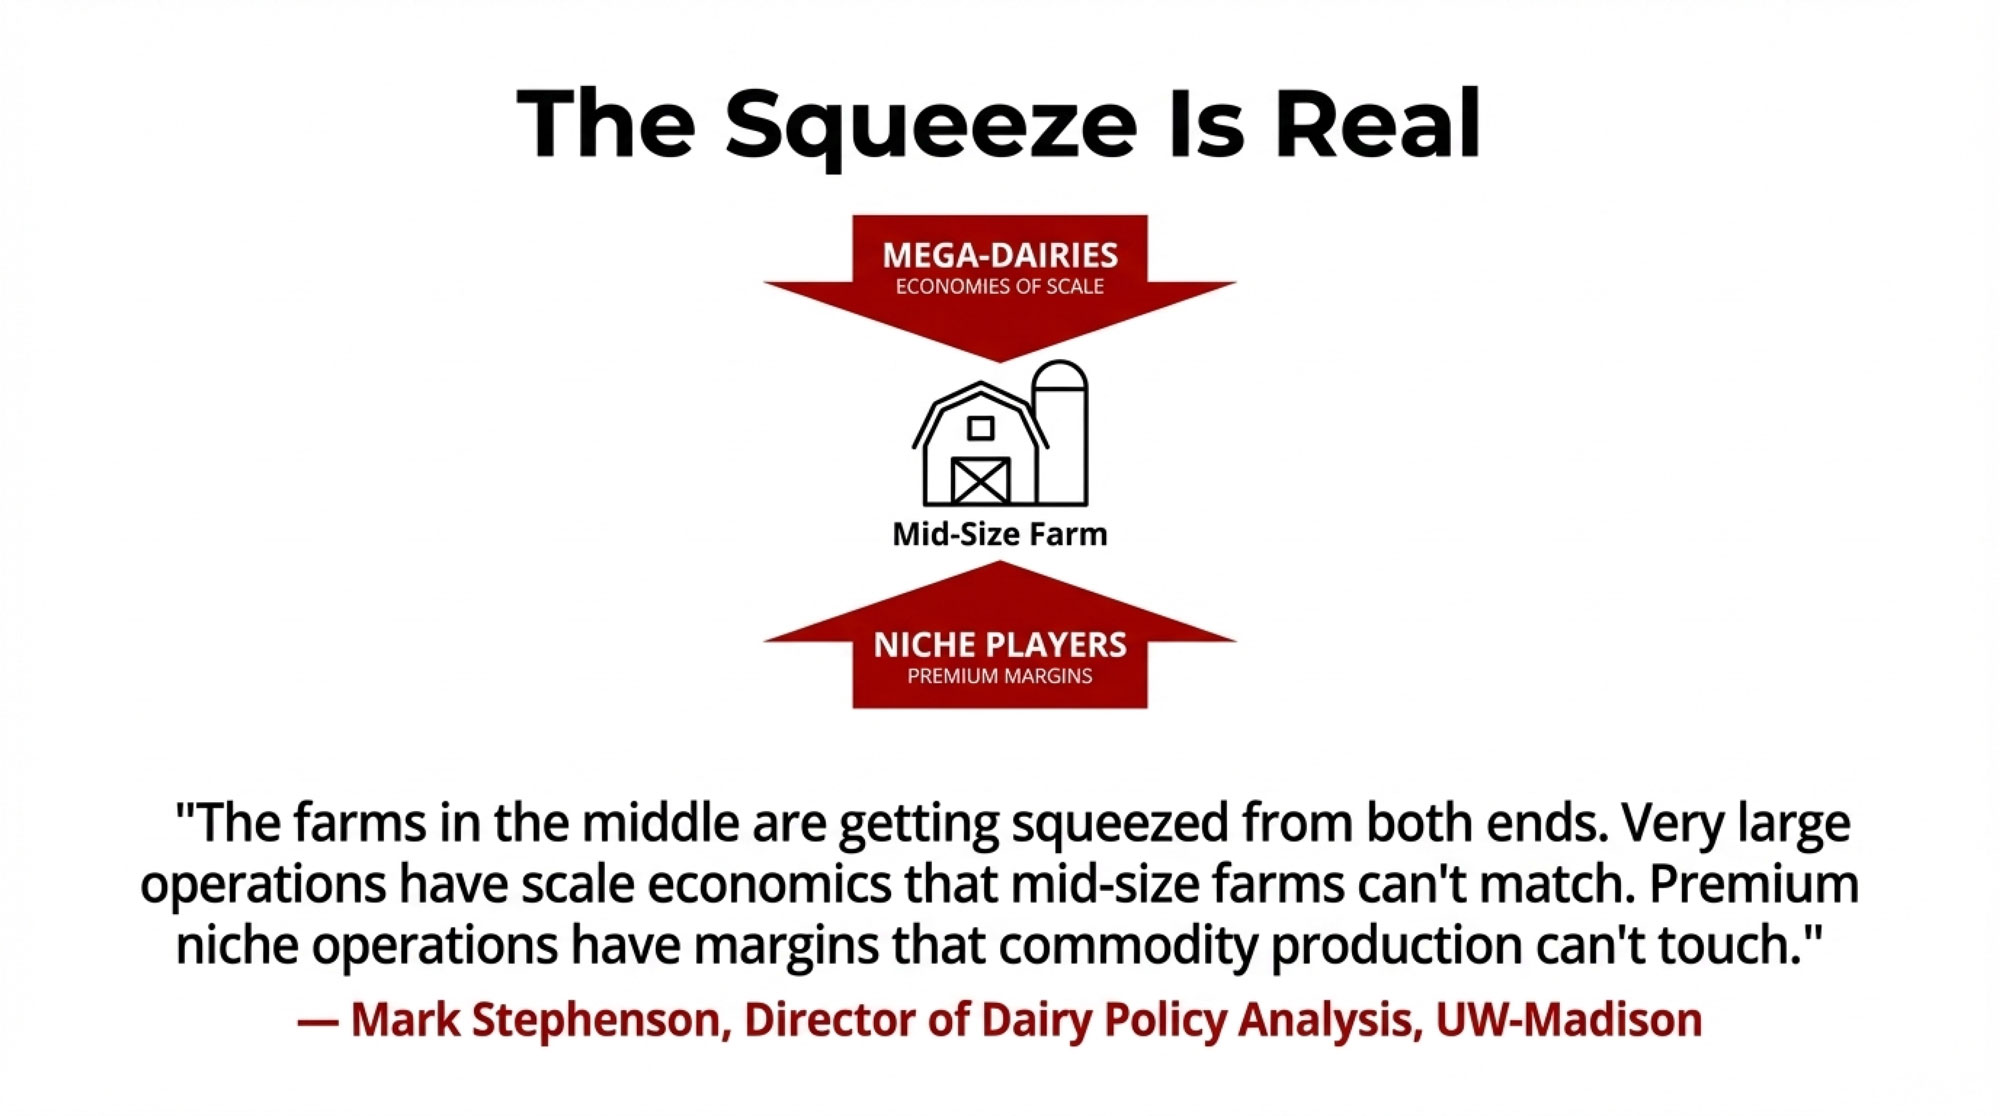
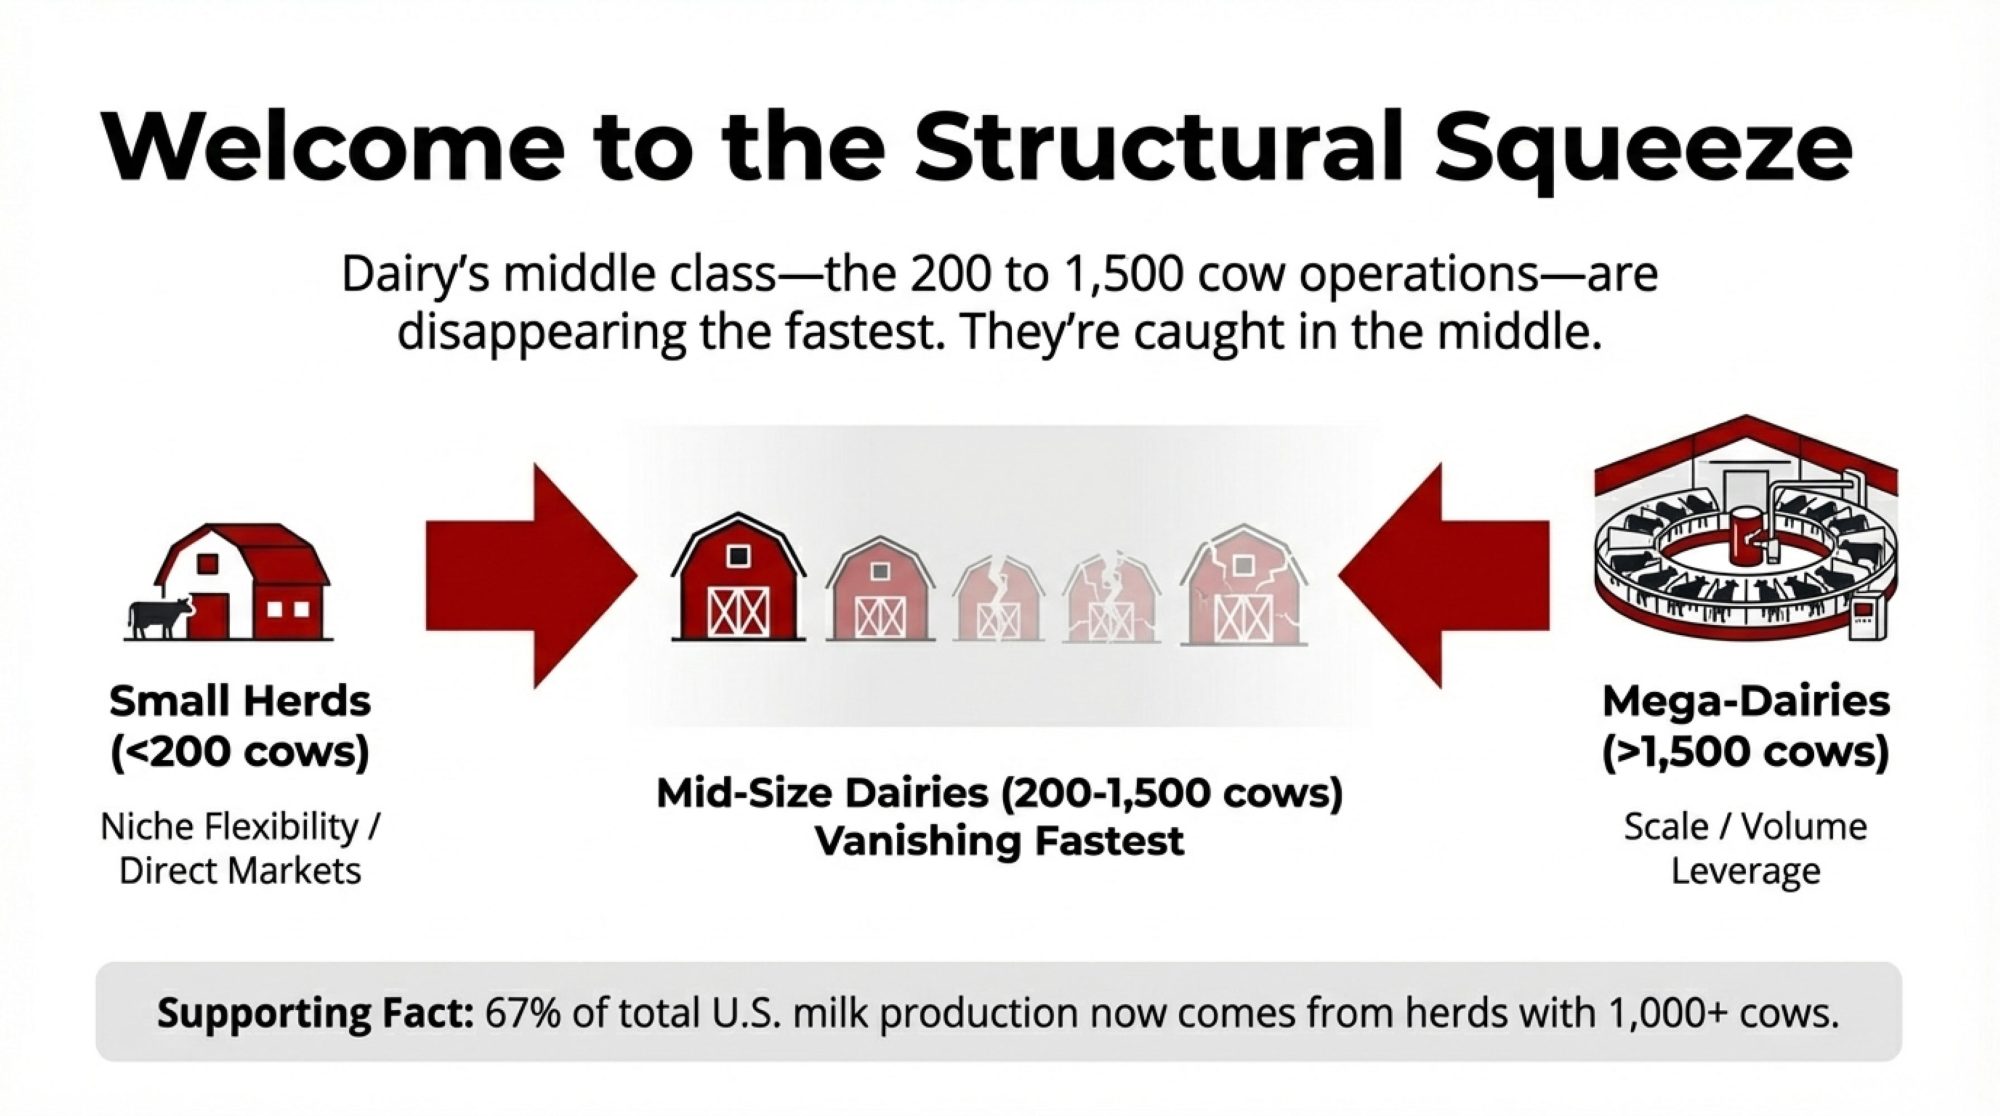
150–500 cows: the middle that the math squeezes first

Bullvine’s early projections already highlighted structural pressure on 250–400 cow freestalls: too big to be niche without a clear premium plan, too small to spread fixed costs like a 1,500‑cow system. Updated census and case work show that:

  • Over 15,200 U.S. dairy farms vanished between 2017 and 2022, with a big share in the 100–499 and 500–999brackets.
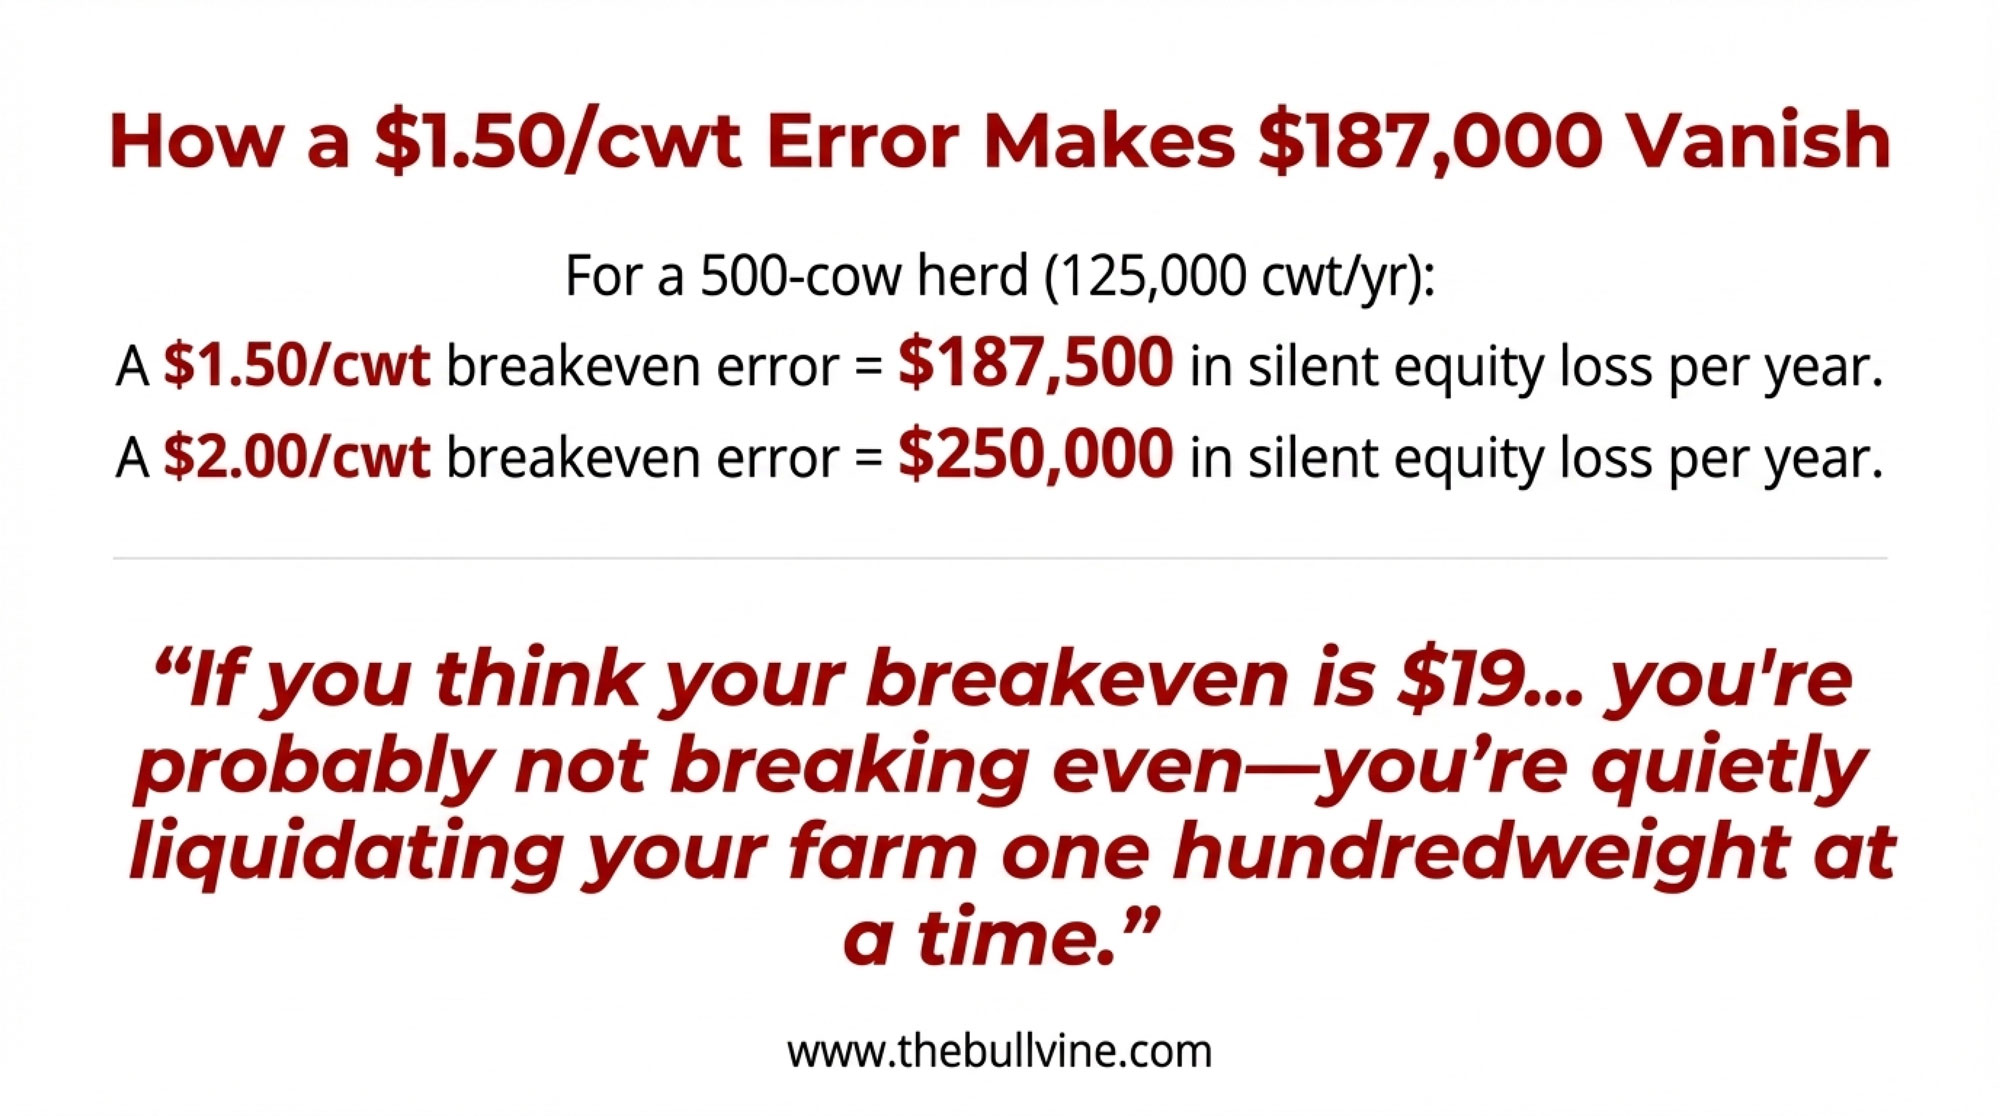
  • Many 250–400 cow herds running “average” cost structures and fully exposed to commodity pricing are carrying $75,000–$100,000 in structural losses per year once full labour and capital costs are accounted for.
Herd SizeCowsAnnual Milk (cwt)Structural Gap ($/cwt)Annual Loss (approx.)
Small mid20096,000$0.80$76,800
Core mid300144,000$0.70$100,800
Large mid400192,000$0.60$115,200

One Upper Midwest producer told us their 320-cow herd looked profitable on their milk cheque—until they ran a full-cost analysis with realistic family labour and depreciation. The gap? About $0.72 per cwt, which worked out to roughly $95,000 a year, they’d been quietly losing without realizing it. That’s not a bad year; that’s structure.

That’s why the Bullvine Curve is so blunt about this band: in a 15,000‑farm, <10,000‑farm future, the conventional middle either deliberately scales, specializes, or exits; drifting is the expensive option.

Honestly, what jumps out is how many 300‑cow herds are still trying to play yesterday’s game—commodity milk, average cost, no clearly defined premium hook—in a structure that’s already priced that strategy out for a lot of regions.

1,000+ cows: where the early assumptions became reality

From the beginning, the structural projections assumed economies of scale and lower total cost per cwt would keep pulling volume into larger herds, with a significant share of U.S. milk concentrated in herds of 2,000–2,500 cows by 2050. ERS follow‑up work and Bullvine’s Great Consolidation analysis confirm that:

  • Net returns for 1,000+ cow herds have outpaced smaller herds in most years studied.
  • Only the 2,500+ cow herd class actually grew in number between 2017 and 2022, and those herds now account for a very large share of U.S. milk sold.
Farm SizeAnnual Exit Rate10-Year SurvivalRisk Level
10-49 cows12%28%CRITICAL
50-99 cows8%43%HIGH
100-199 cows7%48%HIGH
200-499 cows5%60%MODERATE
500-999 cows3%74%LOW
1,000+ cows2%82%STABLE

In Canada, the curve is flatter, but the logic is similar: fewer farms, more quota concentrated in larger herds, and a national structure where roughly 90% of farms are now clustered in a few provinces, especially Quebec and Ontario.

What’s interesting here is that the “big herds win on cost” assumption from 10–15 years ago has largely become a day‑to‑day reality—but with it comes a different risk profile tied to environmental regulation, export dependence, water, and labour, especially in dry‑lot systems.
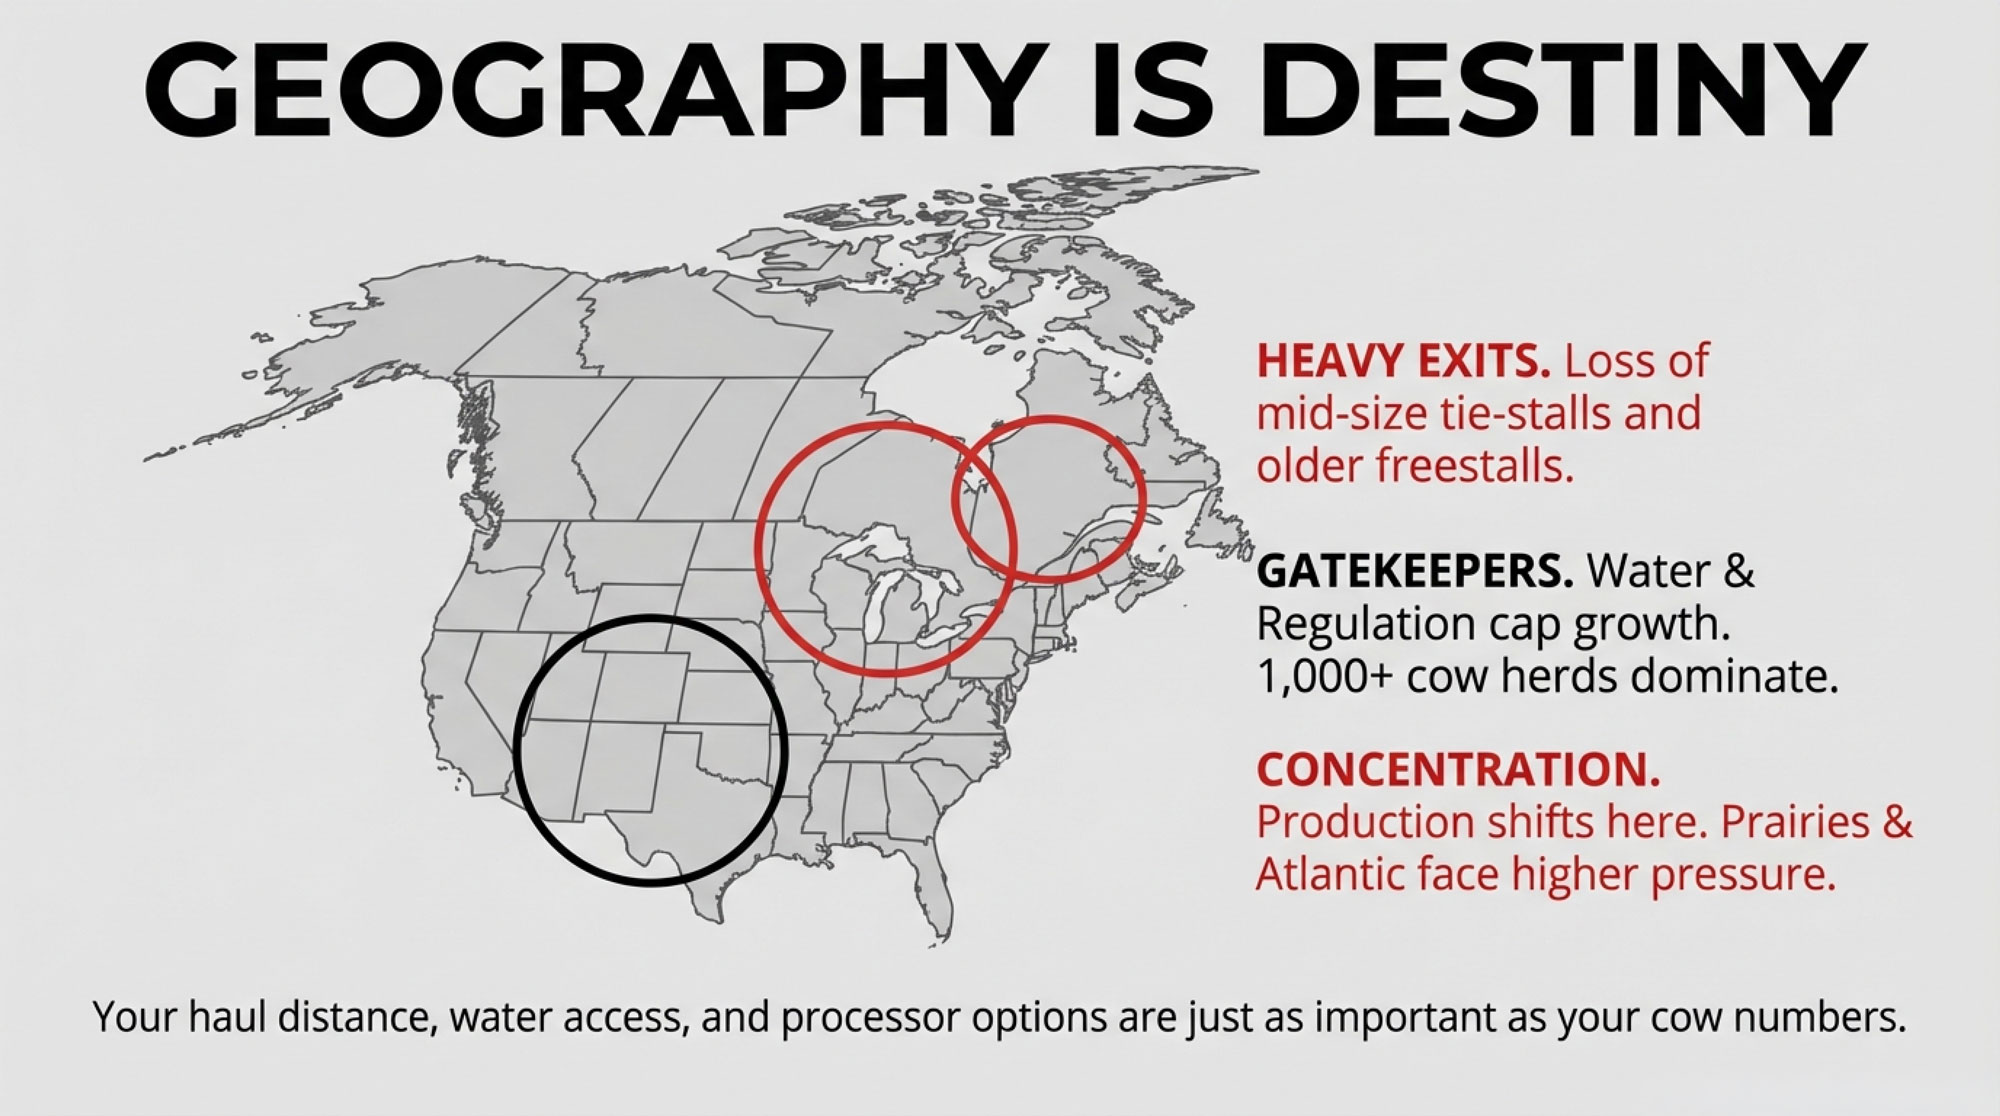
Regional reality: the curve isn’t smooth everywhere

The Bullvine Curve was never “every region looks the same.” The shape is similar; the slopes and pain points aren’t.

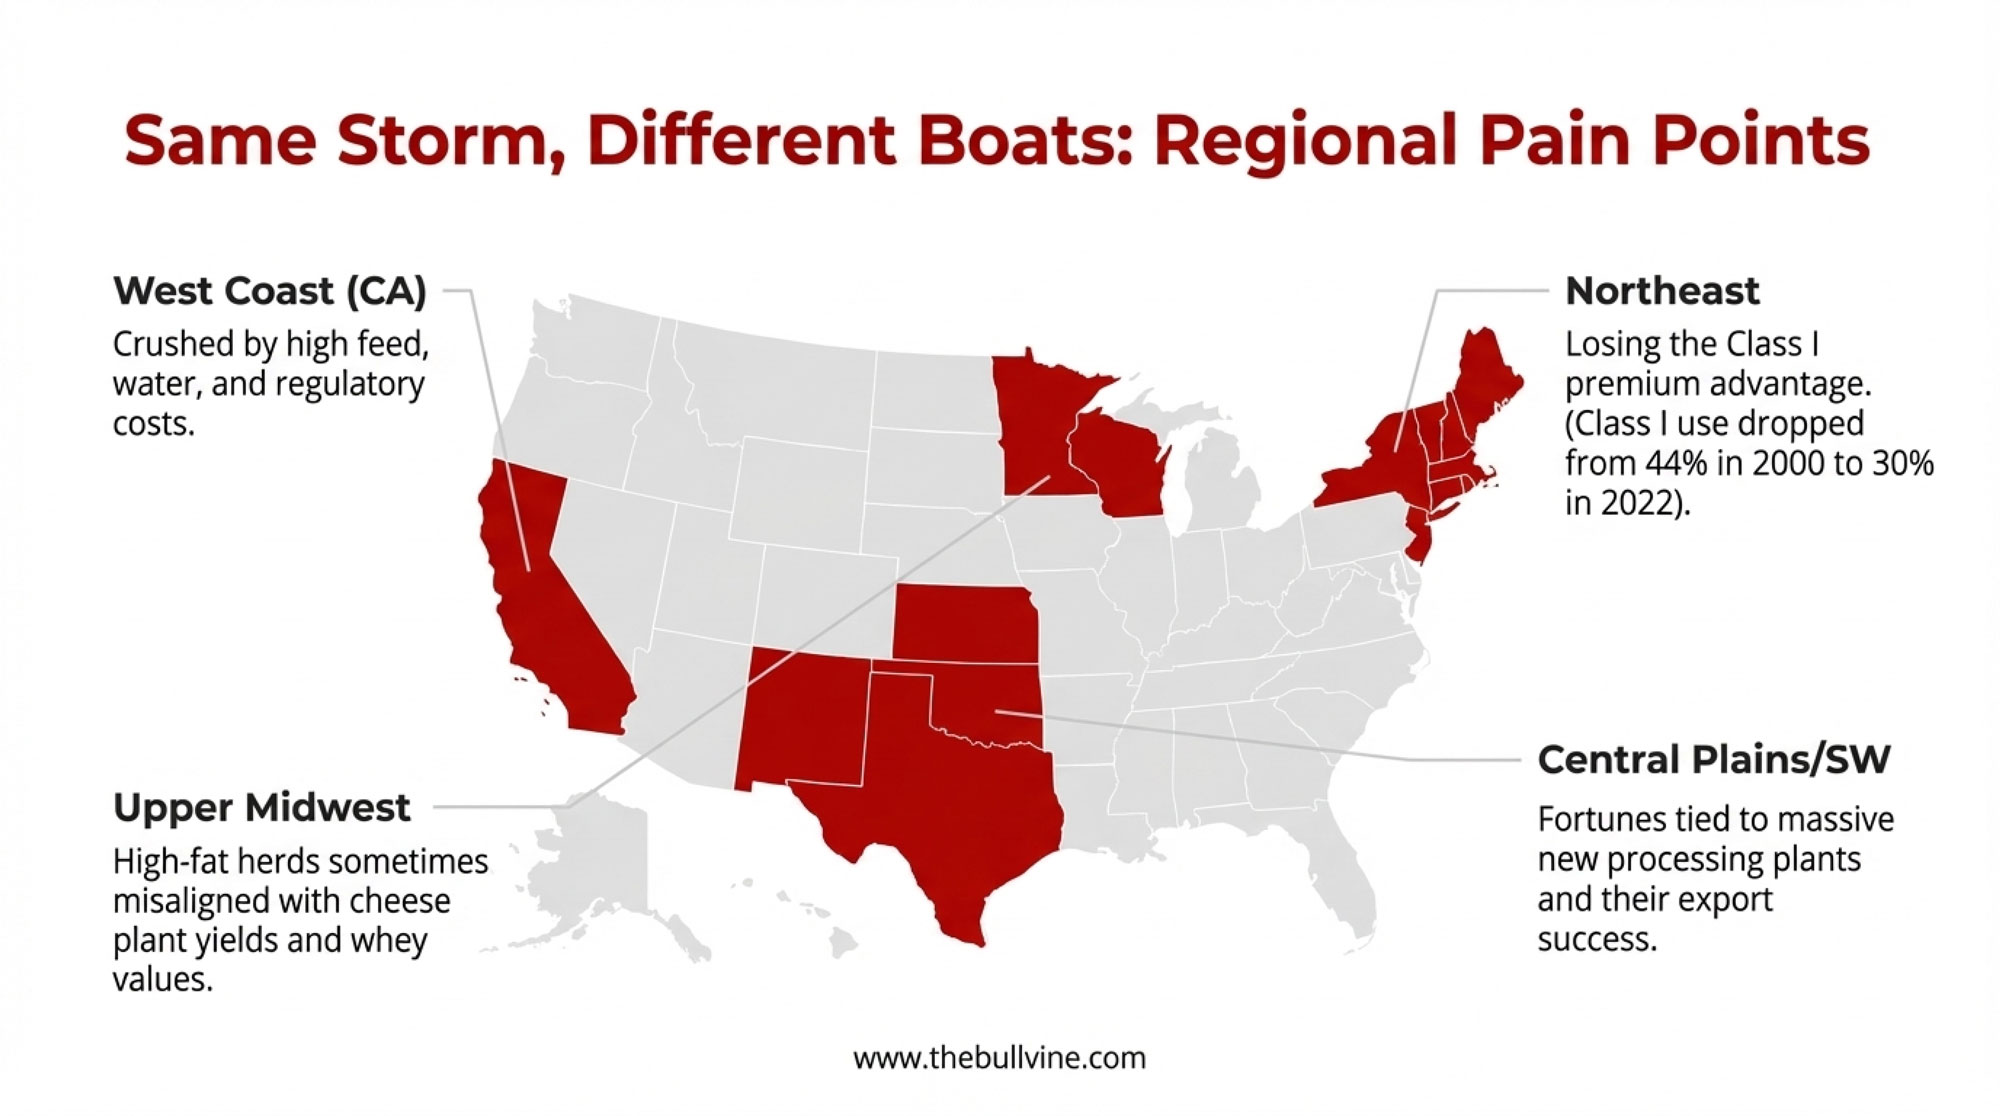
  • In the Upper Midwest and Northeast, exits are concentrated among smaller and mid‑size tie‑stalls and older freestalls, with modest growth in 1,000–2,000 cow herds and strong but concentrated production in states like Wisconsin and New York.
  • In the Southwest and High Plains, a relatively small number of very large freestall and dry‑lot systems supply big cheese and powder plants, with water, heat, and environmental rules acting as both risk and gatekeeper.
  • In Canada, AAFC data and quota policy mean the curve is slower and more managed, but the direction is the same: fewer farms, more litres per herd, and more of that production anchored in Quebec and Ontario, with smaller operations in the Atlantic and Prairies under more pressure.

I’ve noticed that when producers really “get” the curve, it’s often after they plot themselves against regional realities: haul distance, processor options, land prices, and labour pool, not just cow numbers.

From forecast to milk‑house: the Bullvine playbook

Forecasts only matter if they change decisions. The Bullvine Dairy Curve is built to drive a handful of blunt, barn‑level questions rather than just scare charts.

1. Which lane are you actually in?

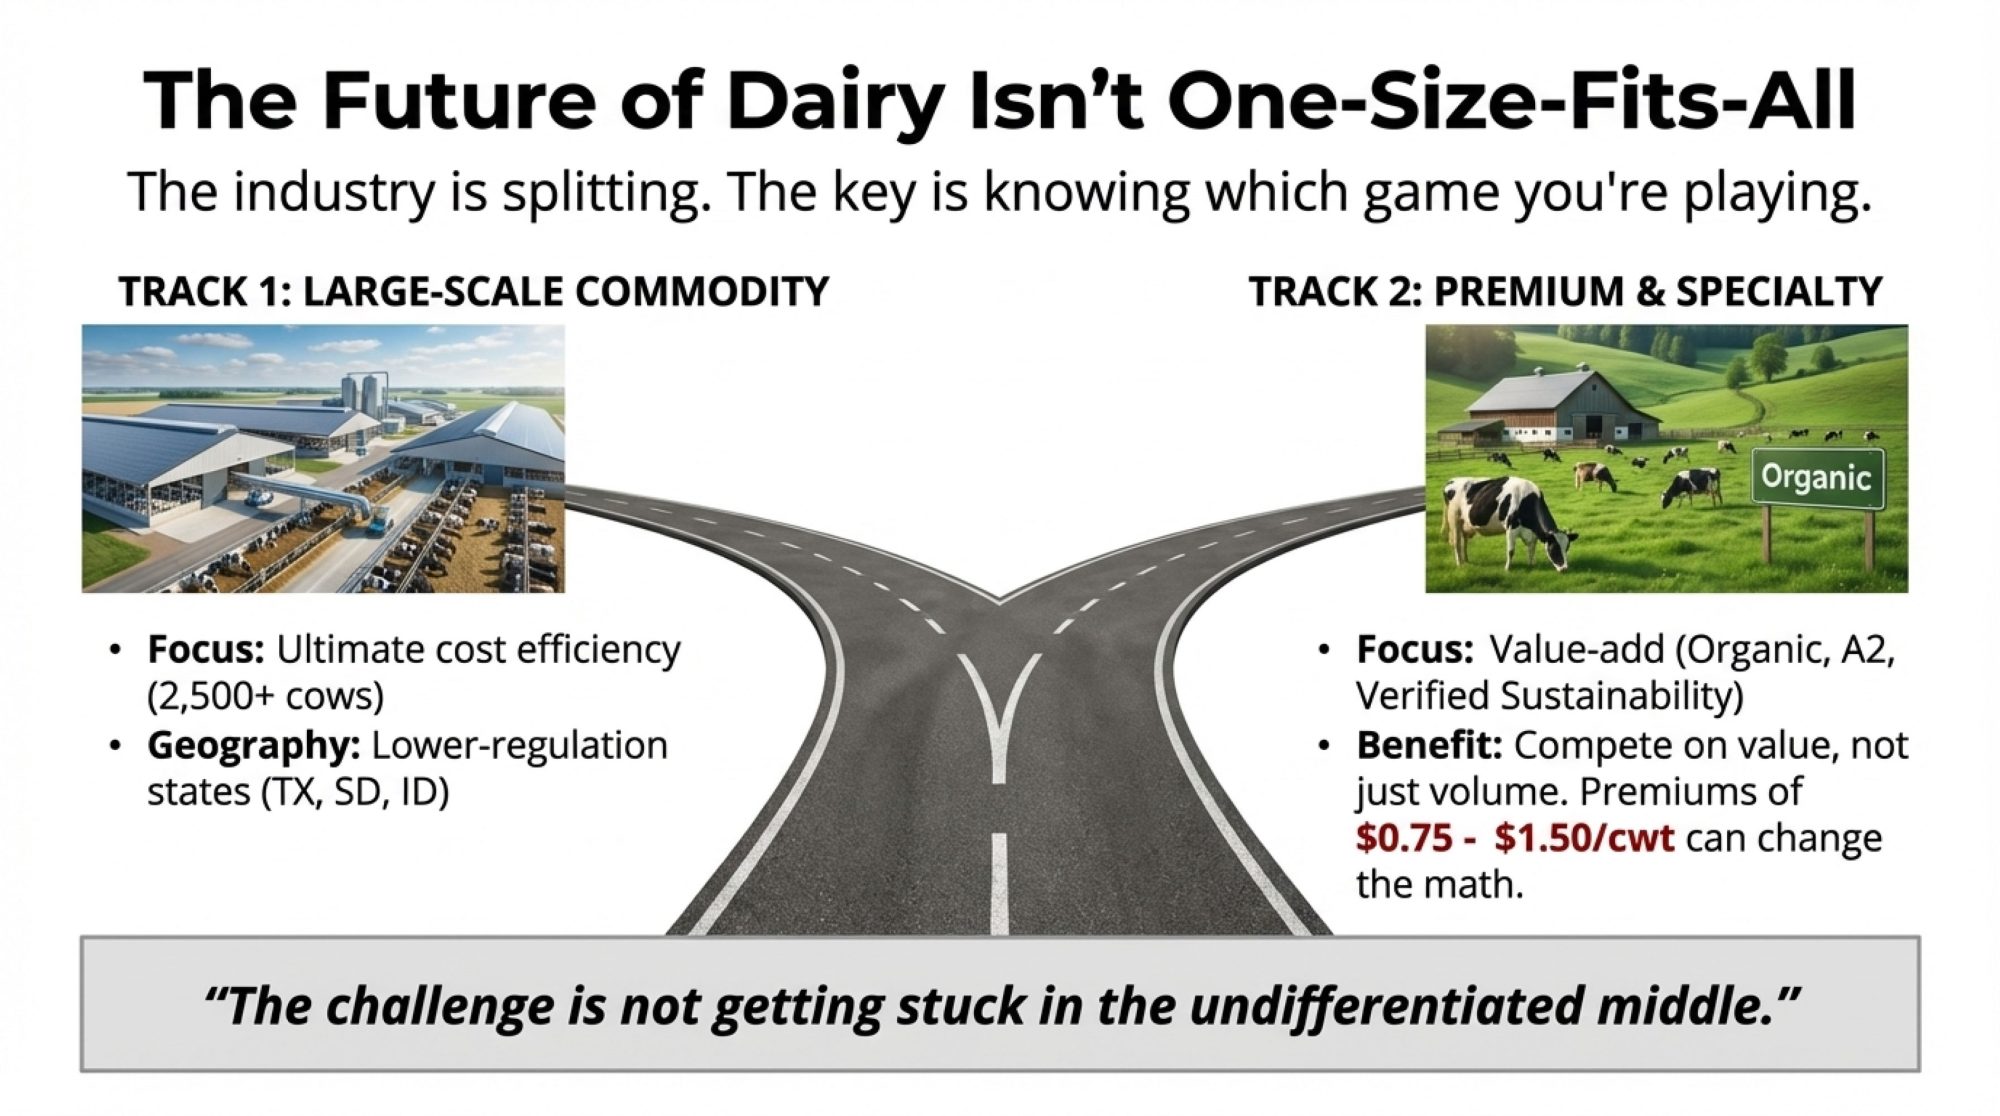
In a 15,000‑farm, <10,000‑farm world, most herds that stay in the game long‑term are choosing one of three lanes:

  • Scale: Build toward 1,000+ cows with a cost structure that genuinely competes per cwt, understanding the capital, labour, and concentration risk.
  • Specialize: Stay smaller or mid‑size but sell into markets that pay on margin—organic, grass‑based, A2, on‑farm processing, or tightly integrated supply contracts.
  • Strategic exit: Use the forecast window to sell or transition on your terms while equity is intact, especially where succession isn’t clear.

Not choosing is still a choice; it just lets the curve choose for you. What farmers are finding is that being vague—“we’ll see how it goes”—is often the costliest option.

2. What is your true cost per cwt and “danger zone”?

ERS cost‑of‑production data and extension tools show that, on average, larger herds have lower total economic costs per hundredweight, but there’s a wide spread inside every size class. The farms that navigate the curve best usually:

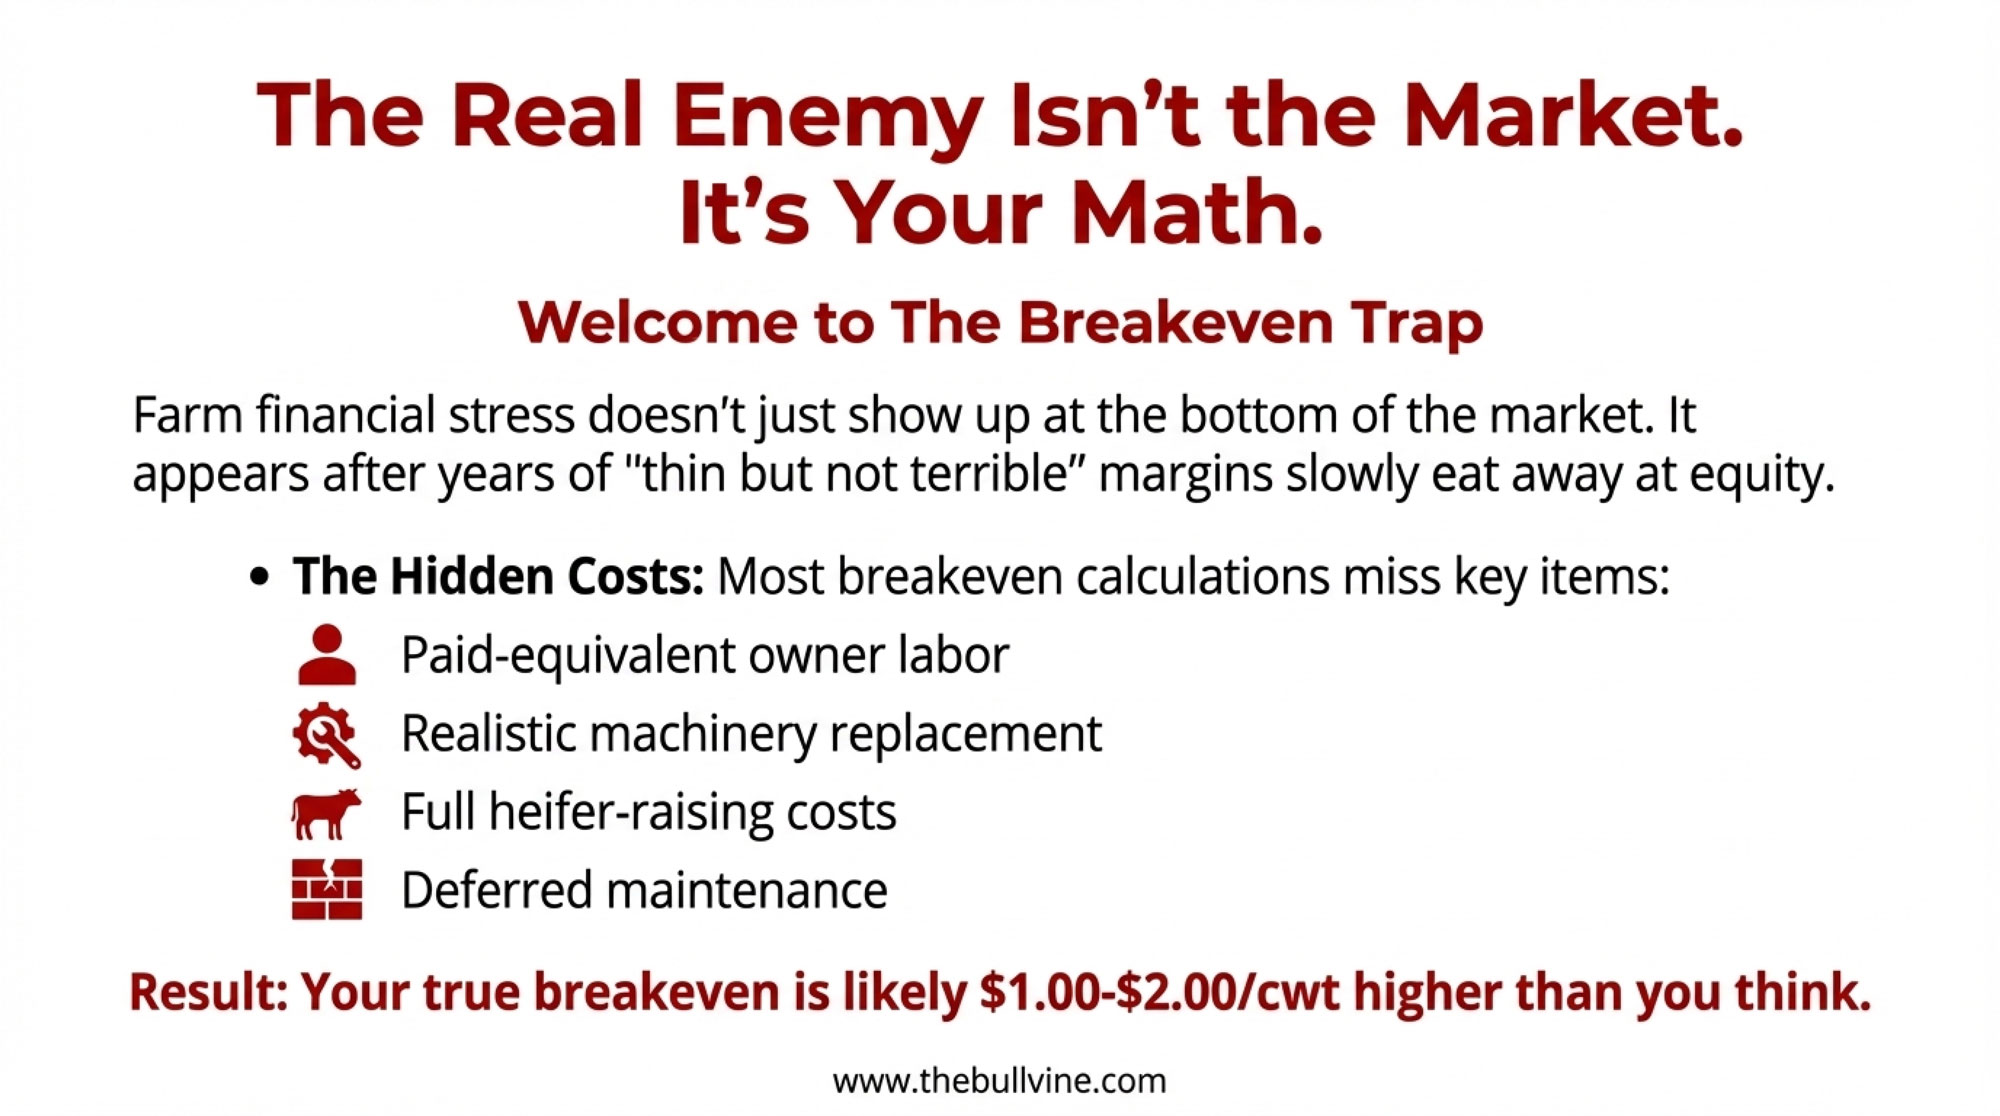
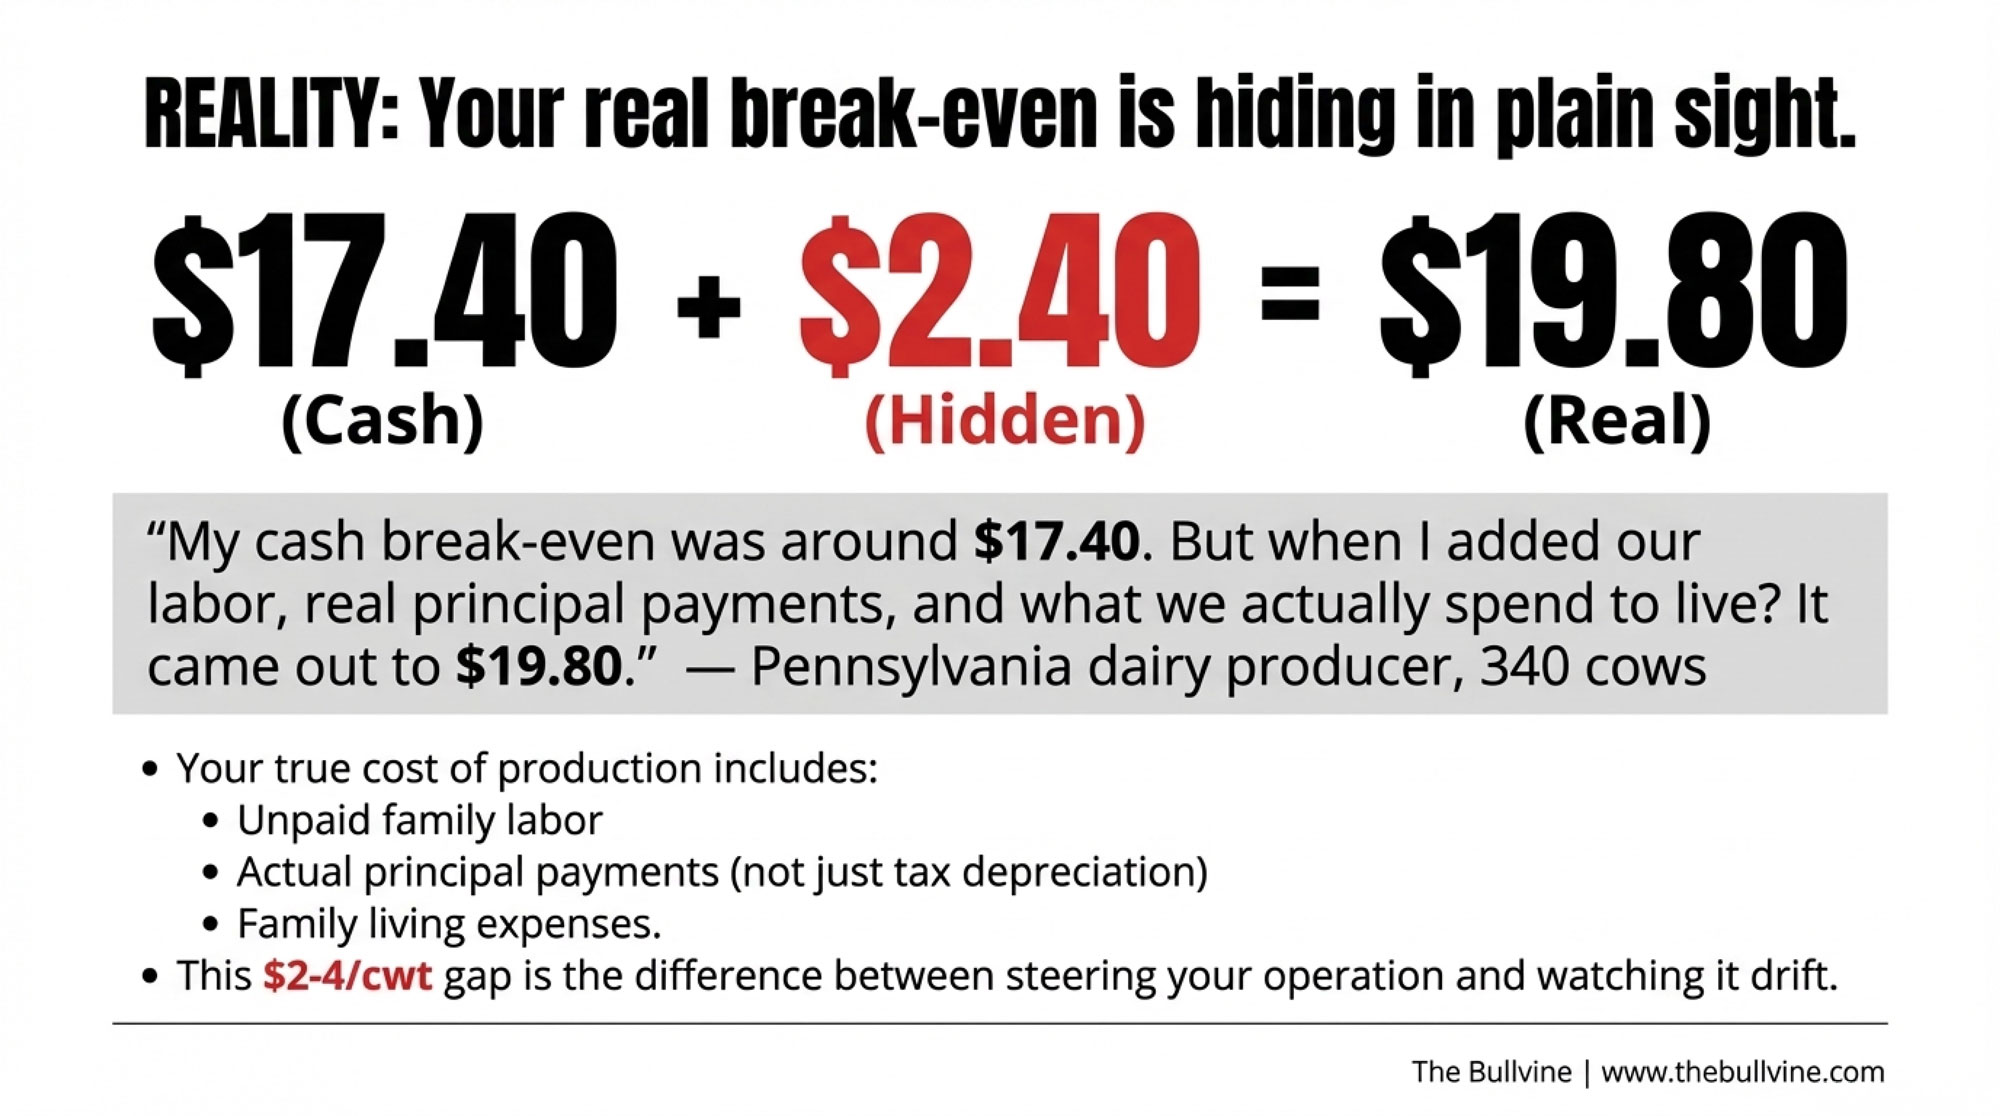
  • Know their full cost per cwt with realistic values for family labour and capital.
  • Have a clear milk‑feed ratio “danger zone” where they tighten capital, sharpen feed, and check in with lenders more often.

In a 200‑cow herd shipping 8,000 cwt a month, a 50‑cent swing in margin is roughly $4,000 a month or $48,000 a year—almost exactly the gap between treading water and investing in the next needed project. That’s the kind of math that quietly decides whether you can upgrade a parlour or add stalls to lift butterfat performance and fresh cow comfort.

3. Is your next dollar going into scale, comfort, or robots—and why?
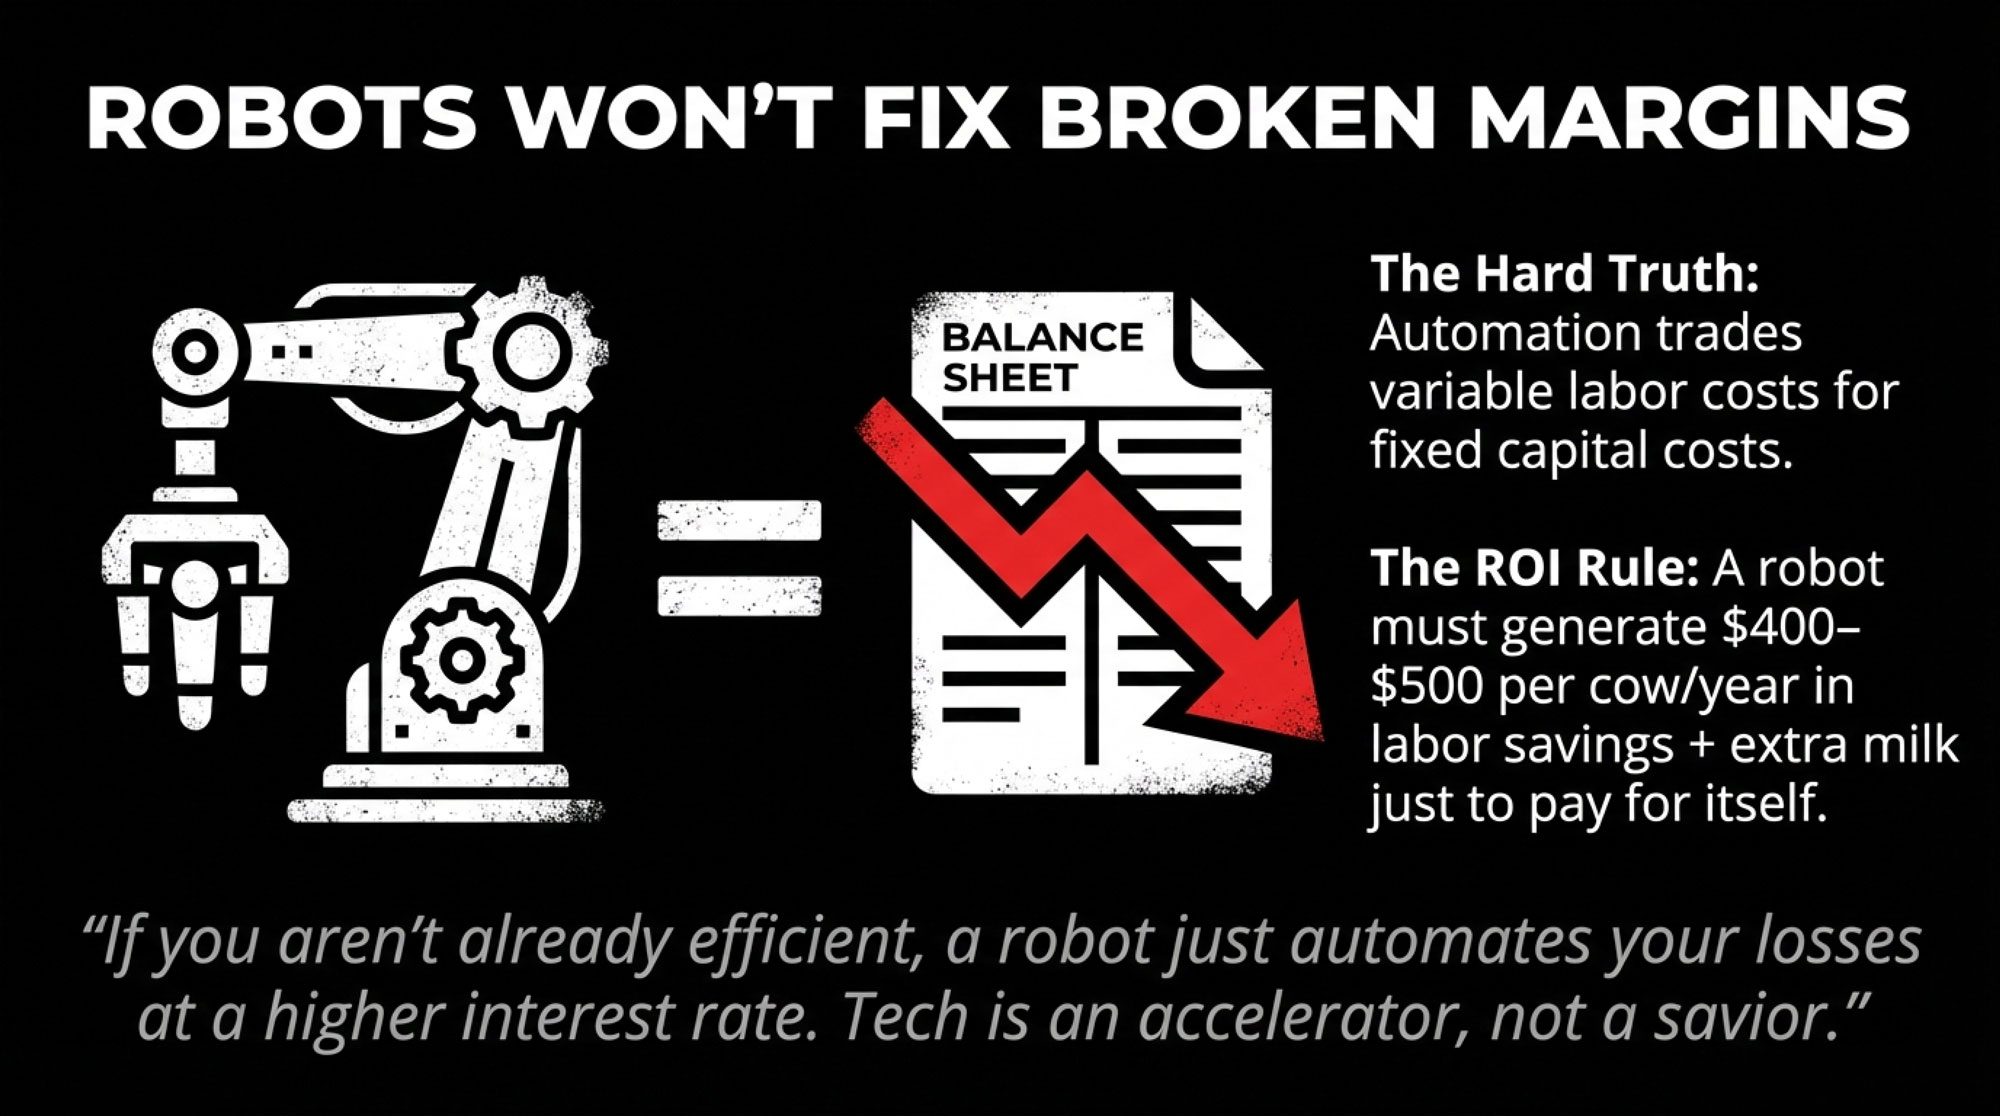
The curve doesn’t say “robots good, parlours bad,” it says “robots amplify whatever is already in your numbers.” While Automated Milking Systems (AMS) solve the immediate headache of labor availability, they fundamentally shift your balance sheet. You are trading variable labor costs for high fixed capital costs. In a “commodity milk” lane, this move pushes you further into the “efficiency required” lane: because your fixed costs per hundredweight are now higher, your margin for error on milk production and components disappears.

  • On smaller herds under ~100–120 cows, AMS often struggles to pencil out unless there’s a premium market, off‑farm income, or a clear growth plan.
  • In the 150–250 cow band, robots can work where labour is genuinely tight, and management is strong, but they typically need $400–500 per cow per year in a mix of labour savings and extra milk to carry their weight over a typical financing term.
  • Larger freestall/dry‑lot systems treat robots, high‑throughput parlours, sort gates, and sensors as part of broader cow‑flow and labour strategy, not silver bullets.

The Robot Reality Check: If your herd isn’t already hitting top-tier production and health metrics, a robot won’t fix the margin—it will just automate the loss at a higher interest rate.

The Bullvine playbook is simple: if you can’t show on paper where the extra dollars per cow per year come from, ask whether stalls, feed storage, or transition pens would move your position on the curve more. In other words, don’t let fatigue drive a million‑dollar robot decision if fresh cow management and housing are still your biggest bottlenecks.

4. Who actually wants to be milking here in 2035?

Succession is the quiet driver you don’t see on the milk cheque, but it shows up in the forecast. National surveys by lenders and advisory firms consistently find that only a minority of producers have formal written succession plans, even when an adult child is active. Research on exits also shows that age and the presence of an identified successor are strong predictors of whether a farm continues to operate 10–15 years later, even after controlling for herd size and profitability.

In practice, that means a financially solid 65‑year‑old with no successor is more likely to be on the “exiting half” of the Bullvine Curve than a somewhat smaller or slightly less efficient herd where a 35‑year‑old is already leading breeding, facilities, and lender meetings. Putting a basic timeline and ownership plan on paper is one of the simplest ways to move your operation onto the “still milking by choice” side of the 2035/2050 lines.

I’ve seen more than one herd where the real turning point wasn’t a bad milk price year—it was the moment the family admitted no one under 40 actually wanted night checks and bank meetings for the next 20 years.

The “Strategic Exit”: Harvesting Equity, Not Admitting Defeat 

One of the hardest parts of the Bullvine Dairy Curve is the “Exit” conversation. We need to change the vocabulary around leaving the industry. In every other sector of the global economy, “exiting” at the top of a market or when equity is strongest is called a successful business cycle.

If the curve shows that your regional processor access is shrinking or your cost structure is hitting a structural ceiling, executing a Strategic Exit is an act of leadership. It allows you to:

  • Protect Generational Wealth: Cash out while land and quota values are high, rather than “burning the house for warmth” by eroding equity during years of structural losses.
  • Define Your Legacy: Transitioning the land to its next best use—whether that’s cash crops, beef, or development—on your timeline, not the bank’s.

A strategic exit isn’t a failure; it’s a calculated decision to stop milking cows so you can start protecting the family’s future.

5. Does your regional strategy match the curve you’re actually in?

Processor access, hauling distance, water rules, land markets, and labour conditions shape how the curve feels locally. A 200‑cow freestall near several plants in southern Ontario lives in a different structural world than a 200‑cow herd in northern Vermont or a 3,000‑cow dry lot in west Texas.

The Bullvine Curve is a map, not a script; the job is to locate your farm on that map honestly—by size, cost, region, and succession—and then build a plan that fits the structure you’re heading into, not the one you remember.

The Bullvine Bottom Line: forecasts as a tool, not a headline

The consolidation trend itself isn’t up for debate anymore; the 2022 Census of Agriculture, USDA ERS work, and AAFC’s Dairy Sector Profile all tell the same story of fewer herds, more milk, and more of that milk coming from larger operations. What the Bullvine Dairy Curve adds is a clear, named set of paths—15,000–16,000 vs <10,000 U.S. herds, 6,500–7,000 vs 4,000–5,000 Canadian herds—and a practical way to turn those numbers into decisions about cost structure, technology, and succession while there’s still time to move.

The data strongly suggest there will be fewer dairy farms in 2050 than there are today; they do not say which farms those will be. That part is still being written—day by day, barn by barn—and the whole point of the Bullvine forecast is to help you write your own line on the curve instead of letting the averages write it for you.

KEY TAKEAWAYS 

  • 15,000 U.S. farms by 2035. Under 10,000 by 2050. Where do you land? The Bullvine Dairy Curve extends the 4% annual decline documented by the USDA from 2002 to 2019. Canada tracks toward 6,500–7,000 farms by 2035 and 4,000–5,000 by 2050. These aren’t worst-case guesses—they’re the middle of the road.
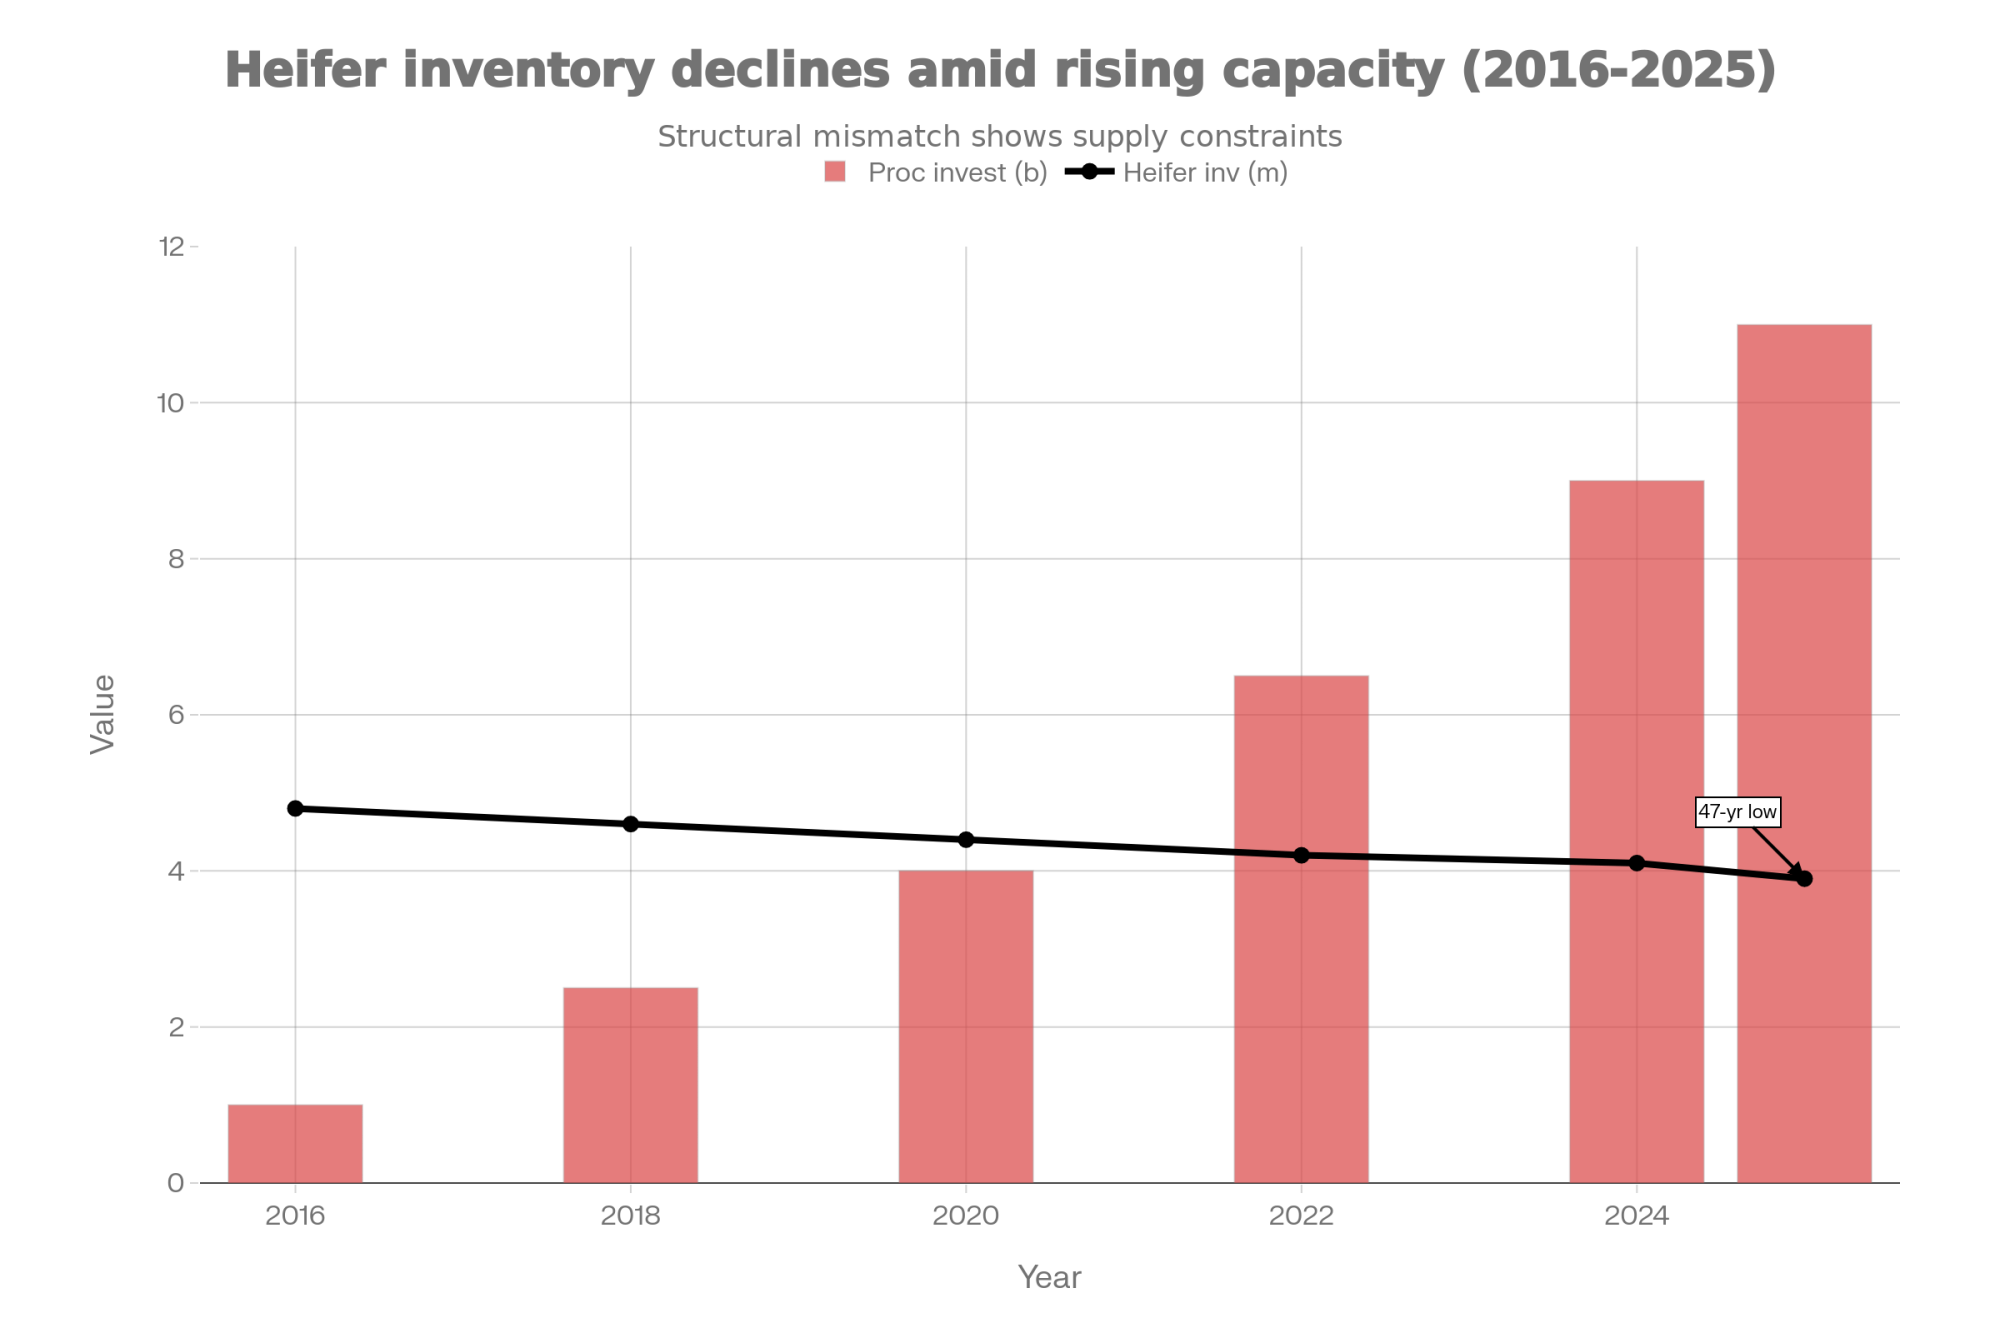
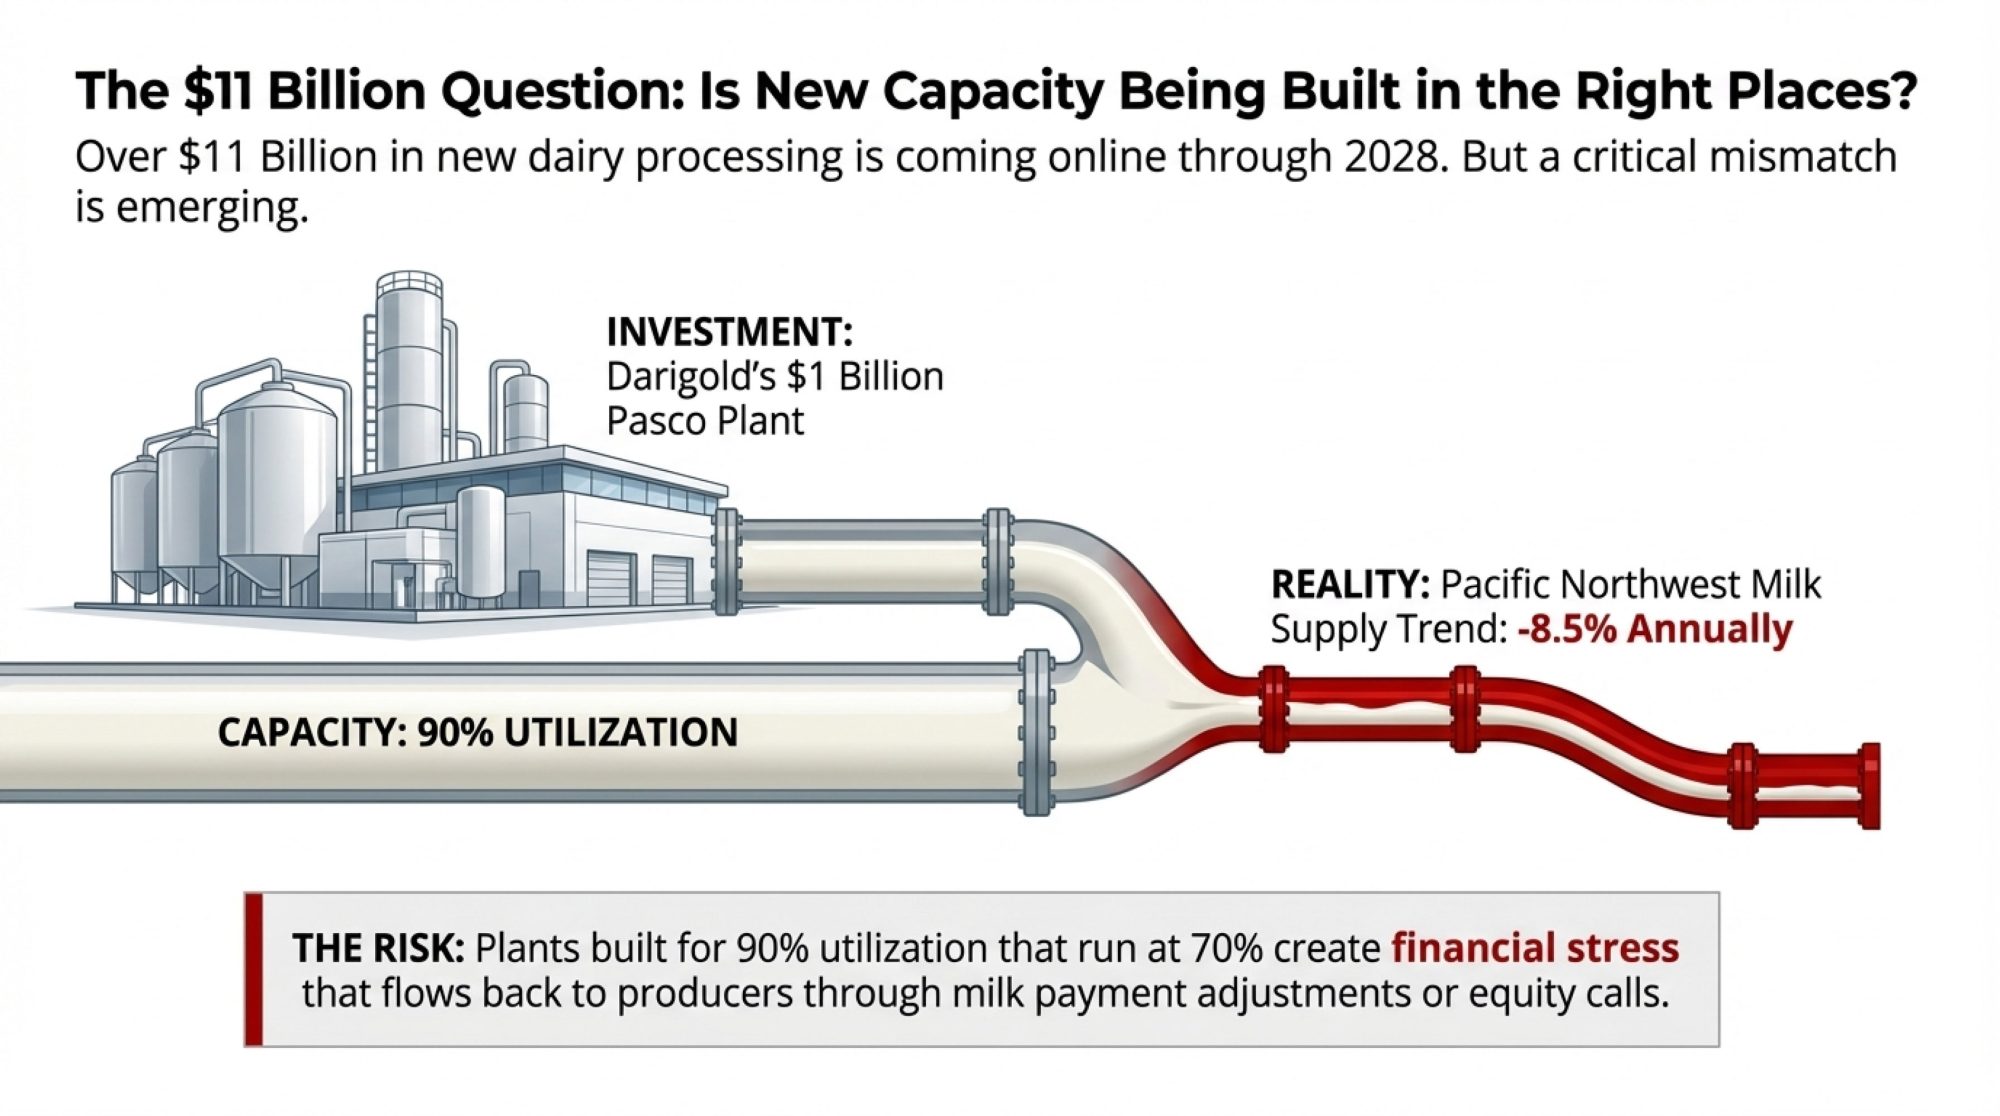
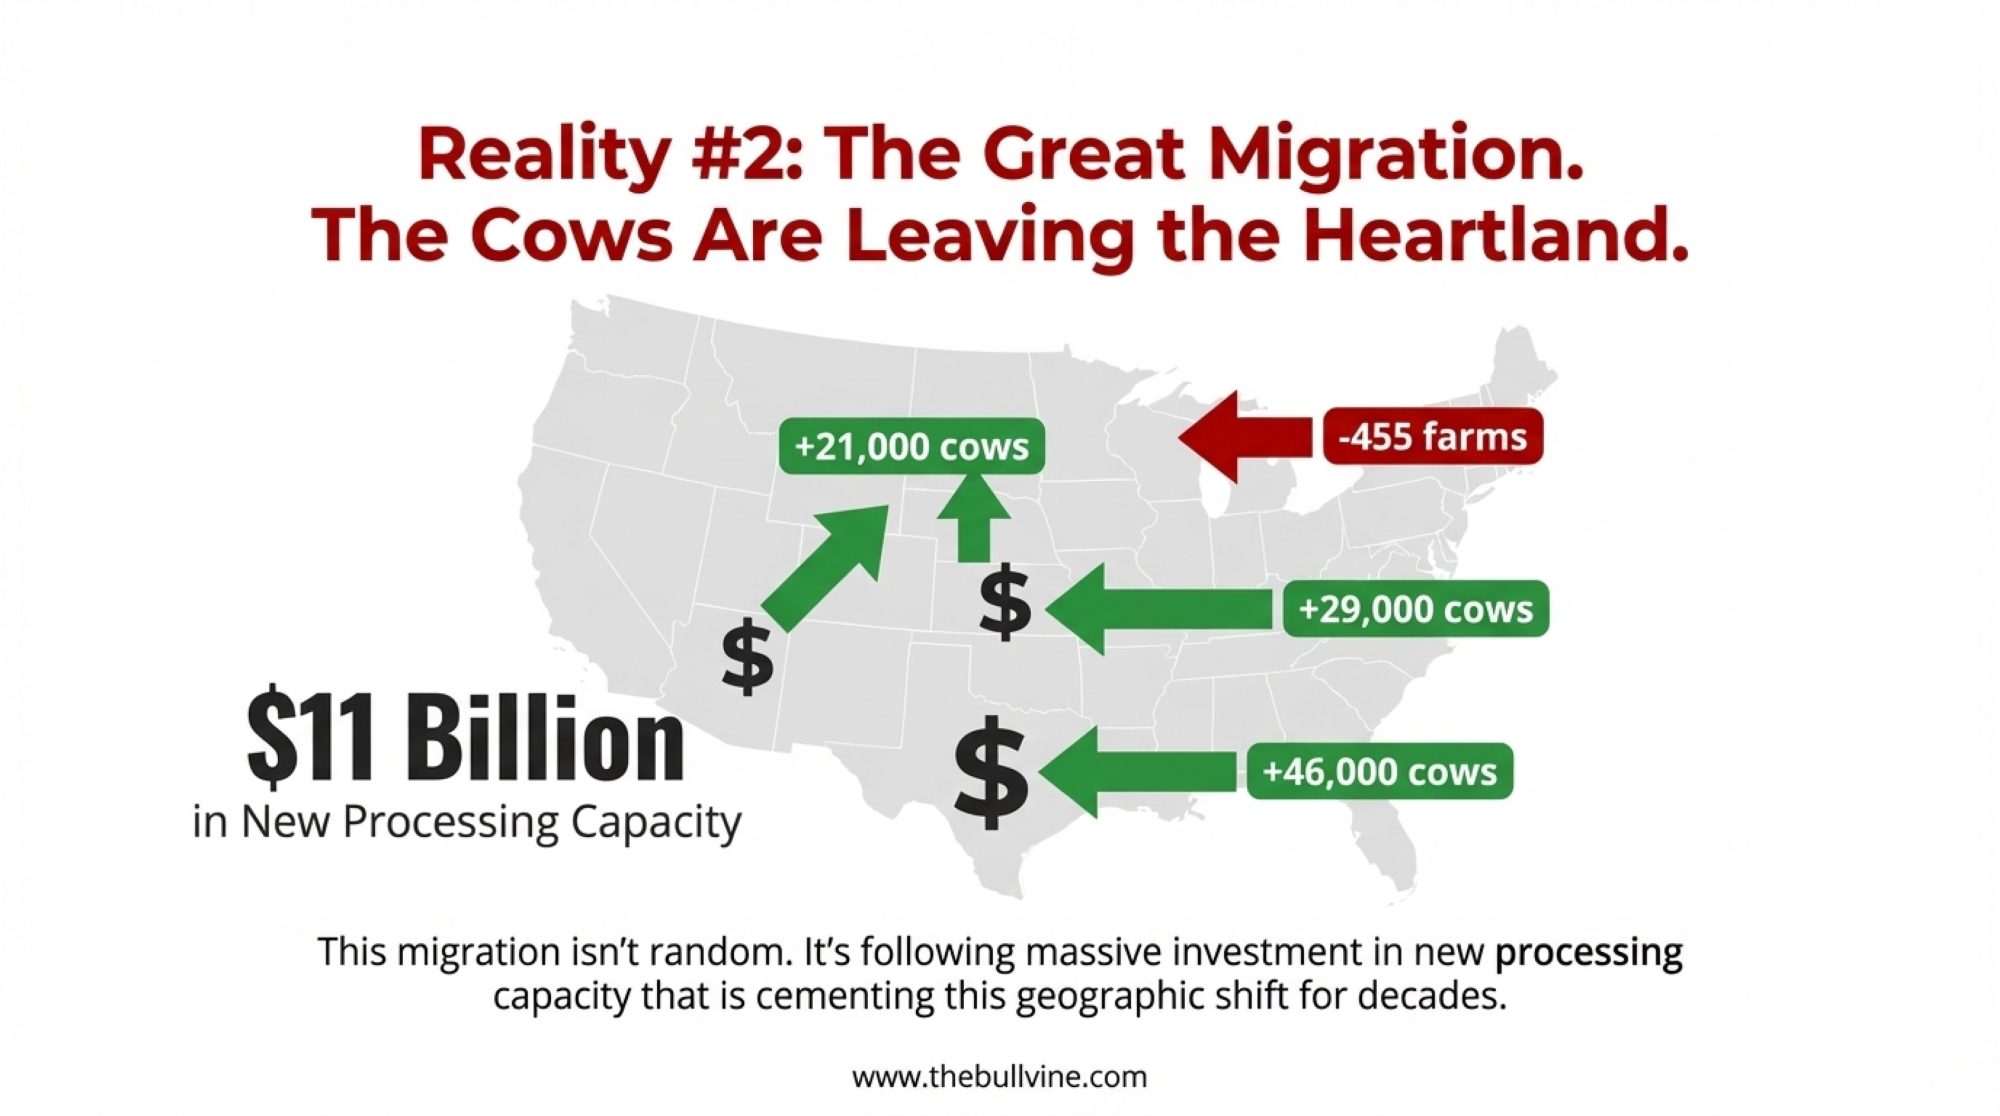
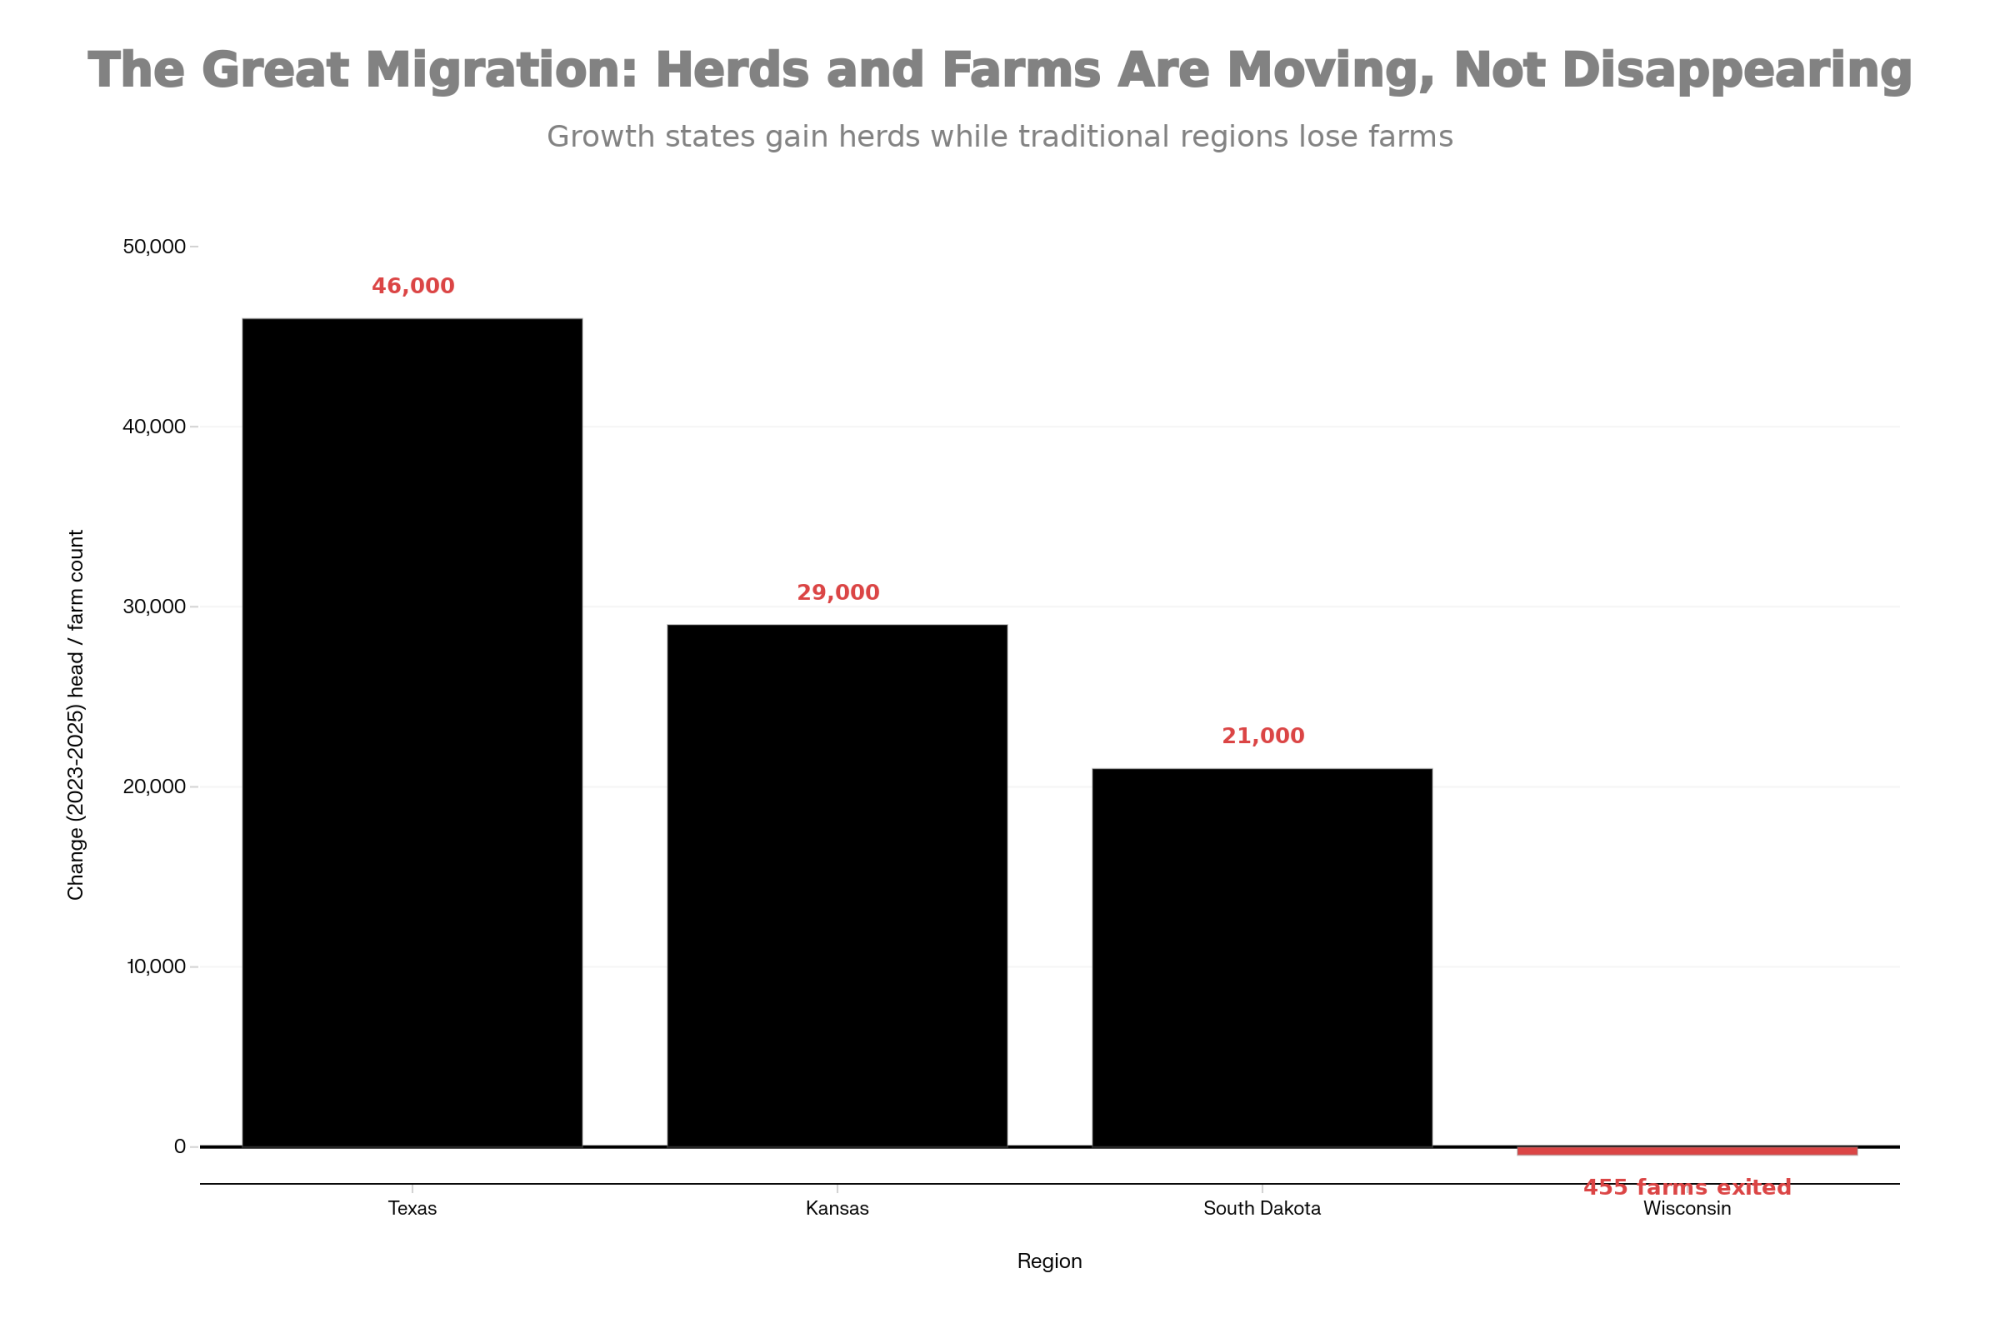
  • Milk isn’t disappearing—it’s moving into bigger barns. The 2,500+ cow herd class is the only one that grew between 2017 and 2022. Processors are building $11B in new capacity around these mega-suppliers, not 300-cow herds.
  • The $100k squeeze hits mid-size hardest. Many 150–500 cow commodity herds running “average” costs incur $75,000–$100,000 in structural losses per year. Stay average, and you’re betting against the curve.
  • Three paths remain—pick one. Scale toward 1,000+ cows with genuinely competitive cost per cwt, specialize into premium markets that pay on margin, or execute a strategic exit while equity is intact. Not choosing lets the curve choose for you.
  • Succession decides who’s still milking in 2035. A 65-year-old with no successor is more likely to exit than a smaller herd where a 35-year-old already leads. Put the timeline on paper now—”someday” isn’t a plan.
Executive Summary: 

By 2035, the Bullvine Dairy Curve has U.S. dairy farms shrinking from roughly 25,000 herds today to 15,000–16,000, and to well under 10,000 by 2050. That’s what happens if the long‑run 4% annual decline identified by USDA’s Economic Research Service continues. In Canada, AAFC’s Dairy Sector Profile and Bullvine’s modelling show a slower but similar slide from 12,007 farms in 2014 to 9,256 in 2024, heading toward roughly 6,500–7,000 farms by 2035 and 4,000–5,000 by 2050—even as national milk output climbed about 23%, from 78.3 to 96.6 million hectolitres. Across all three paths—business‑as‑usual, a faster shakeout, or a more managed transition—the litres don’t disappear; they concentrate into larger freestall and dry‑lot systems as processors, and lenders channel more volume to 1,000‑plus‑cow herds with lower cost per cwt. That structural shift leaves many 150–500 cow commodity herds that sit “average” on cost and fully exposed to commodity pricing, facing $75,000–$100,000 a year in structural losses, unless they either scale, specialize into premium/value‑add markets, or plan a strategic exit while equity is still strong. This article turns the Bullvine Dairy Curve into a five‑question barn‑level playbook—covering lane choice, true cost per cwt, tech and barn investments, succession, and regional realities—so you can decide whether your operation will be one of the 15,000 still milking by choice in 2035 and beyond, or one of the herds the curve quietly averages out.

About the Bullvine Dairy Curve Model

The Bullvine Dairy Curve is an analytical framework—not an official government forecast—built by extending documented historical trends into scenario-based projections. The U.S. baseline draws on USDA’s 2017 and 2022 Census of Agriculture (39,303 farms → 24,094 farms) and USDA Economic Research Service report ERR-274, Consolidation in U.S. Dairy Farming, which documented a roughly 4% annual decline in licensed herds from 2002–2019 alongside rising national production and increasing concentration in larger operations. The Canadian baseline uses Agriculture and Agri-Food Canada’s Dairy Sector Profile, which tracks farm numbers from 12,007 in 2014 to 9,256 in 2024 (approximately 2.6% annual decline) under supply management. Rather than a single-point prediction, the Bullvine Dairy Curve presents three scenario paths: a business-as-usual path that extends historical decline rates, a faster consolidation path that accounts for accelerating pressures (labor constraints, compliance costs, alternative proteins, and margin compression), and a managed transition path where disciplined use of margin tools, capital decisions, and succession planning slow effective exit rates. All projections assume continued structural concentration—consistent with Census data showing the 2,500+ cow herd class as the only size category that grew between 2017 and 2022—and are intended as planning tools for producers, lenders, and advisors rather than definitive forecasts.

Complete references and supporting documentation are available upon request by contacting the editorial team at editor@thebullvine.com.

Learn More

The Sunday Read Dairy Professionals Don’t Skip.

Every week, thousands of producers, breeders, and industry insiders open Bullvine Weekly for genetics insights, market shifts, and profit strategies they won’t find anywhere else. One email. Five minutes. Smarter decisions all week.
NewsSubscribe
First
Last
Consent

Global Dairy Markets Kick Off 2026 With A Surprise Rally – But Don’t Get Too Comfortable Yet

The first 2026 GDT rally is real—but the farms that win from it will be the ones already managing margin, not chasing price.

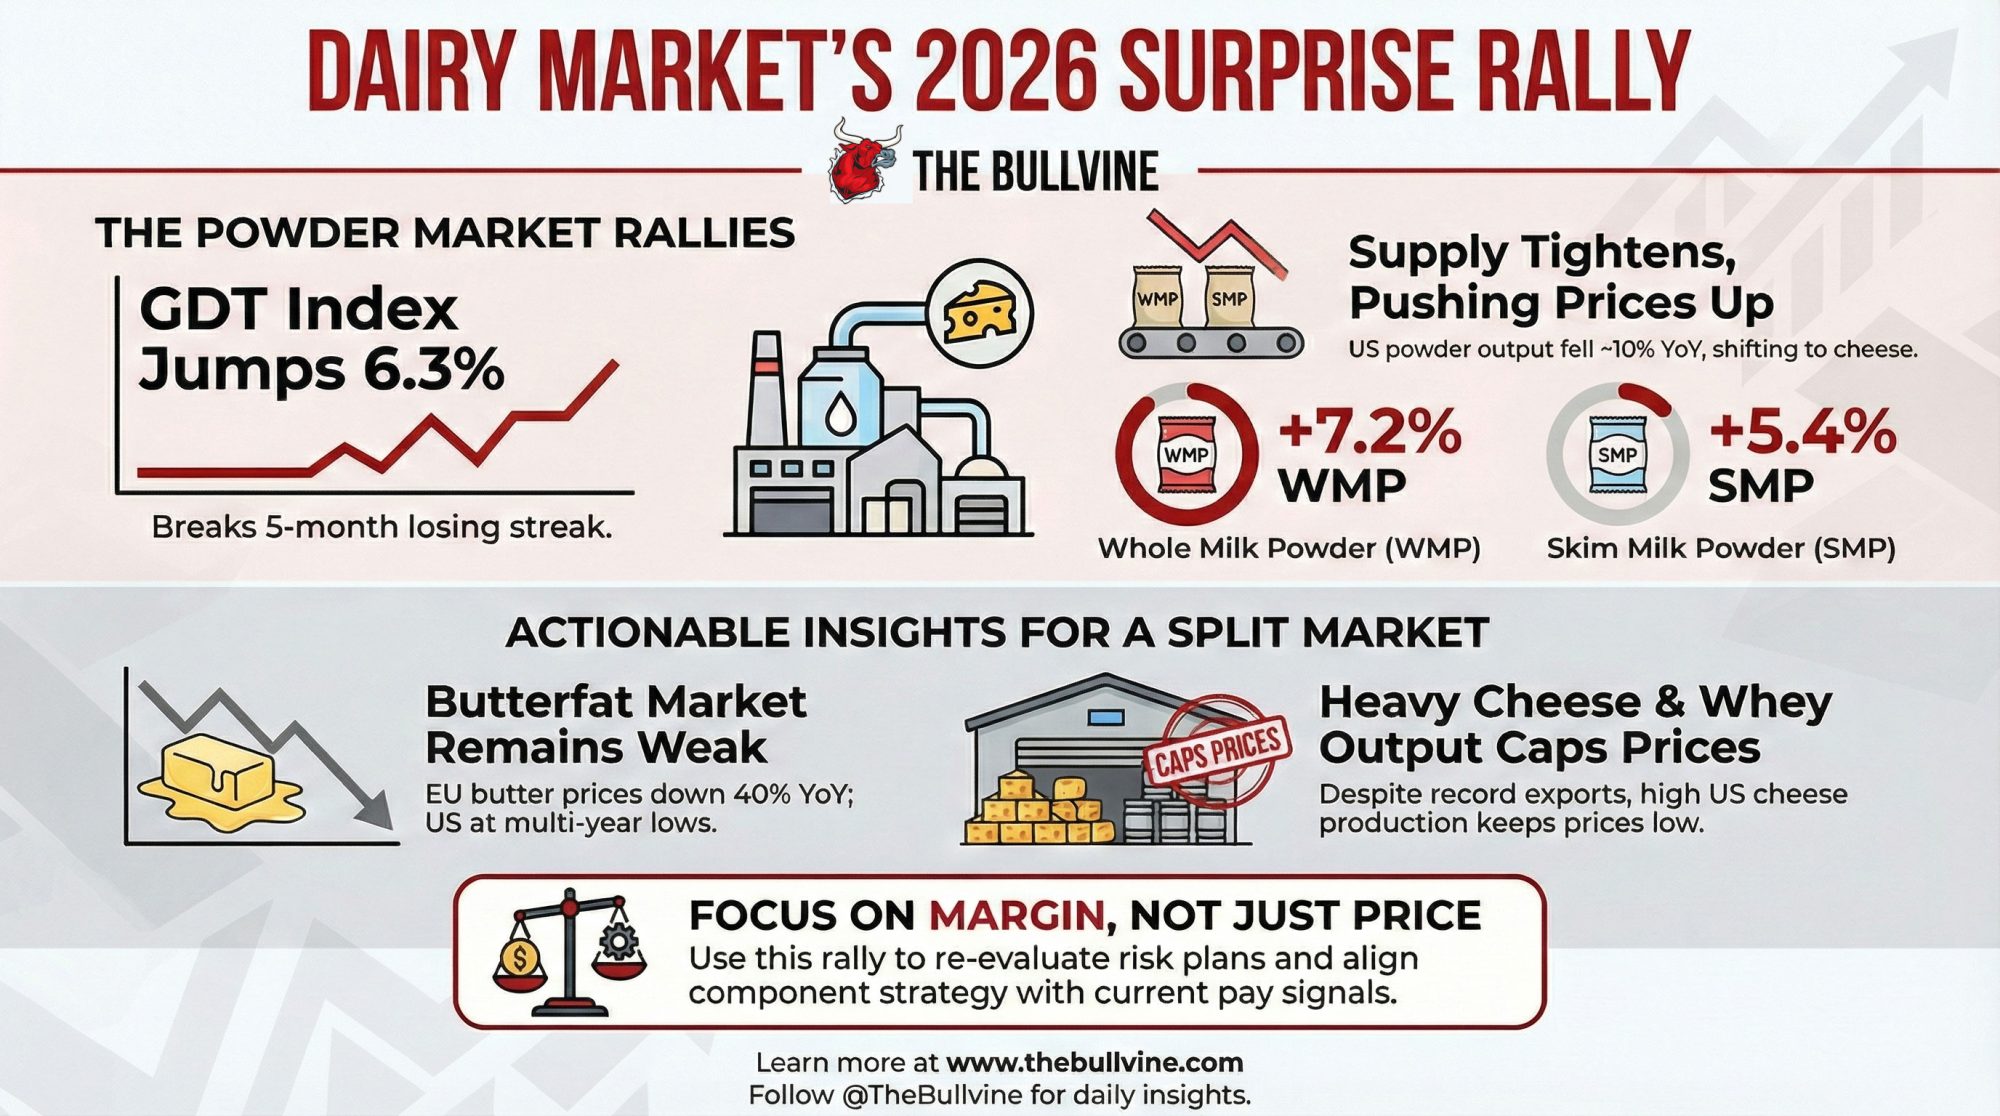
Executive Summary: Global dairy got a welcome jolt to start 2026 when the first GDT auction pushed the index up 6.3%, led by stronger whole and skim milk powder prices, after a long stretch of weaker events. Behind that headline, the shift is being driven less by a demand boom and more by tighter powder supply: New Zealand offered less product, and US plants have cut powder output by roughly 10% year‑on‑year as milk moves into cheese and high‑protein ingredients instead. At the same time, EU butter prices around €4,400 per tonne, sizeable EU butter stocks, US butter stuck in the mid‑$1.30s, and heavy cheese and whey production all remind us that the world is still working through a “wall of milk,” even if it looks different in Europe, North America, Oceania, and China. Futures markets in Europe and Singapore are quietly confirming this firmer tone, but most official outlooks still point to only modest milk price gains against relatively high input and finance costs. For farmers, this combination means the rally is useful but not a rescue: the biggest wins will come from tightening margin‑management plans, rechecking butterfat versus protein strategy against current pay programs, and using tools like dairy‑beef where local buyers can genuinely support it. In short, this is a moment to use better prices to strengthen your position, not a signal that the hard part of this cycle is behind us.

Global Dairy Market Trends

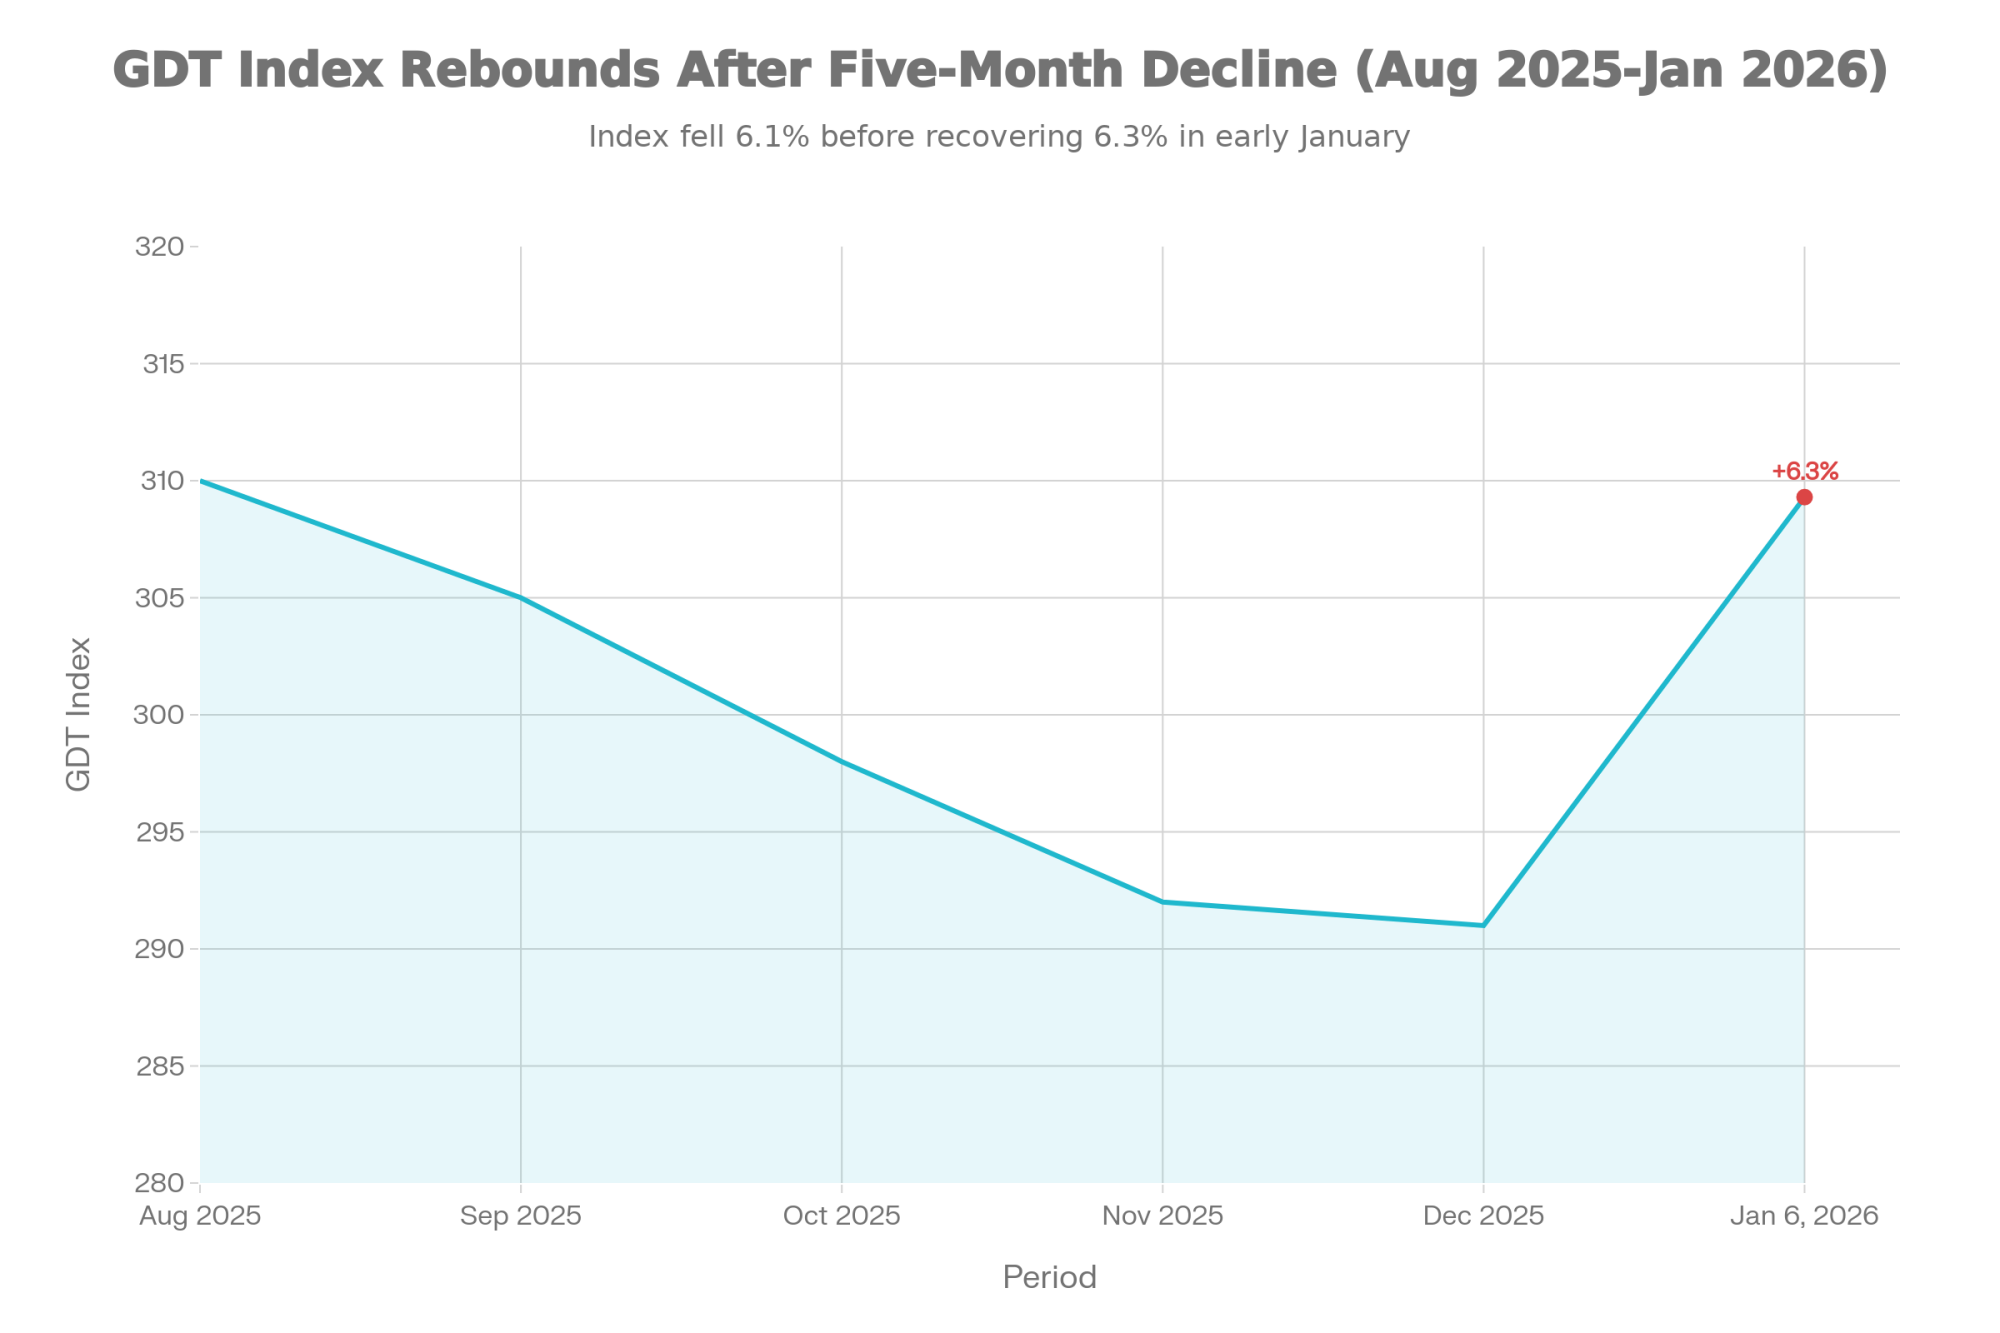
You know those weeks when the market finally gives you something other than bad news? The first Global Dairy Trade auction of 2026 was one of those weeks. The January 6 event pushed the GDT Index up 6.3 percent, according to official GDT results and confirmed by NZX Dairy Insights. That broke a five-month slide that had been wearing on everyone’s nerves.

GDT Index Snaps Five-Month Slide—But Don’t Mistake a Rally for a Recovery 

Before we dig into what’s driving all this, here are the numbers that matter most right now:

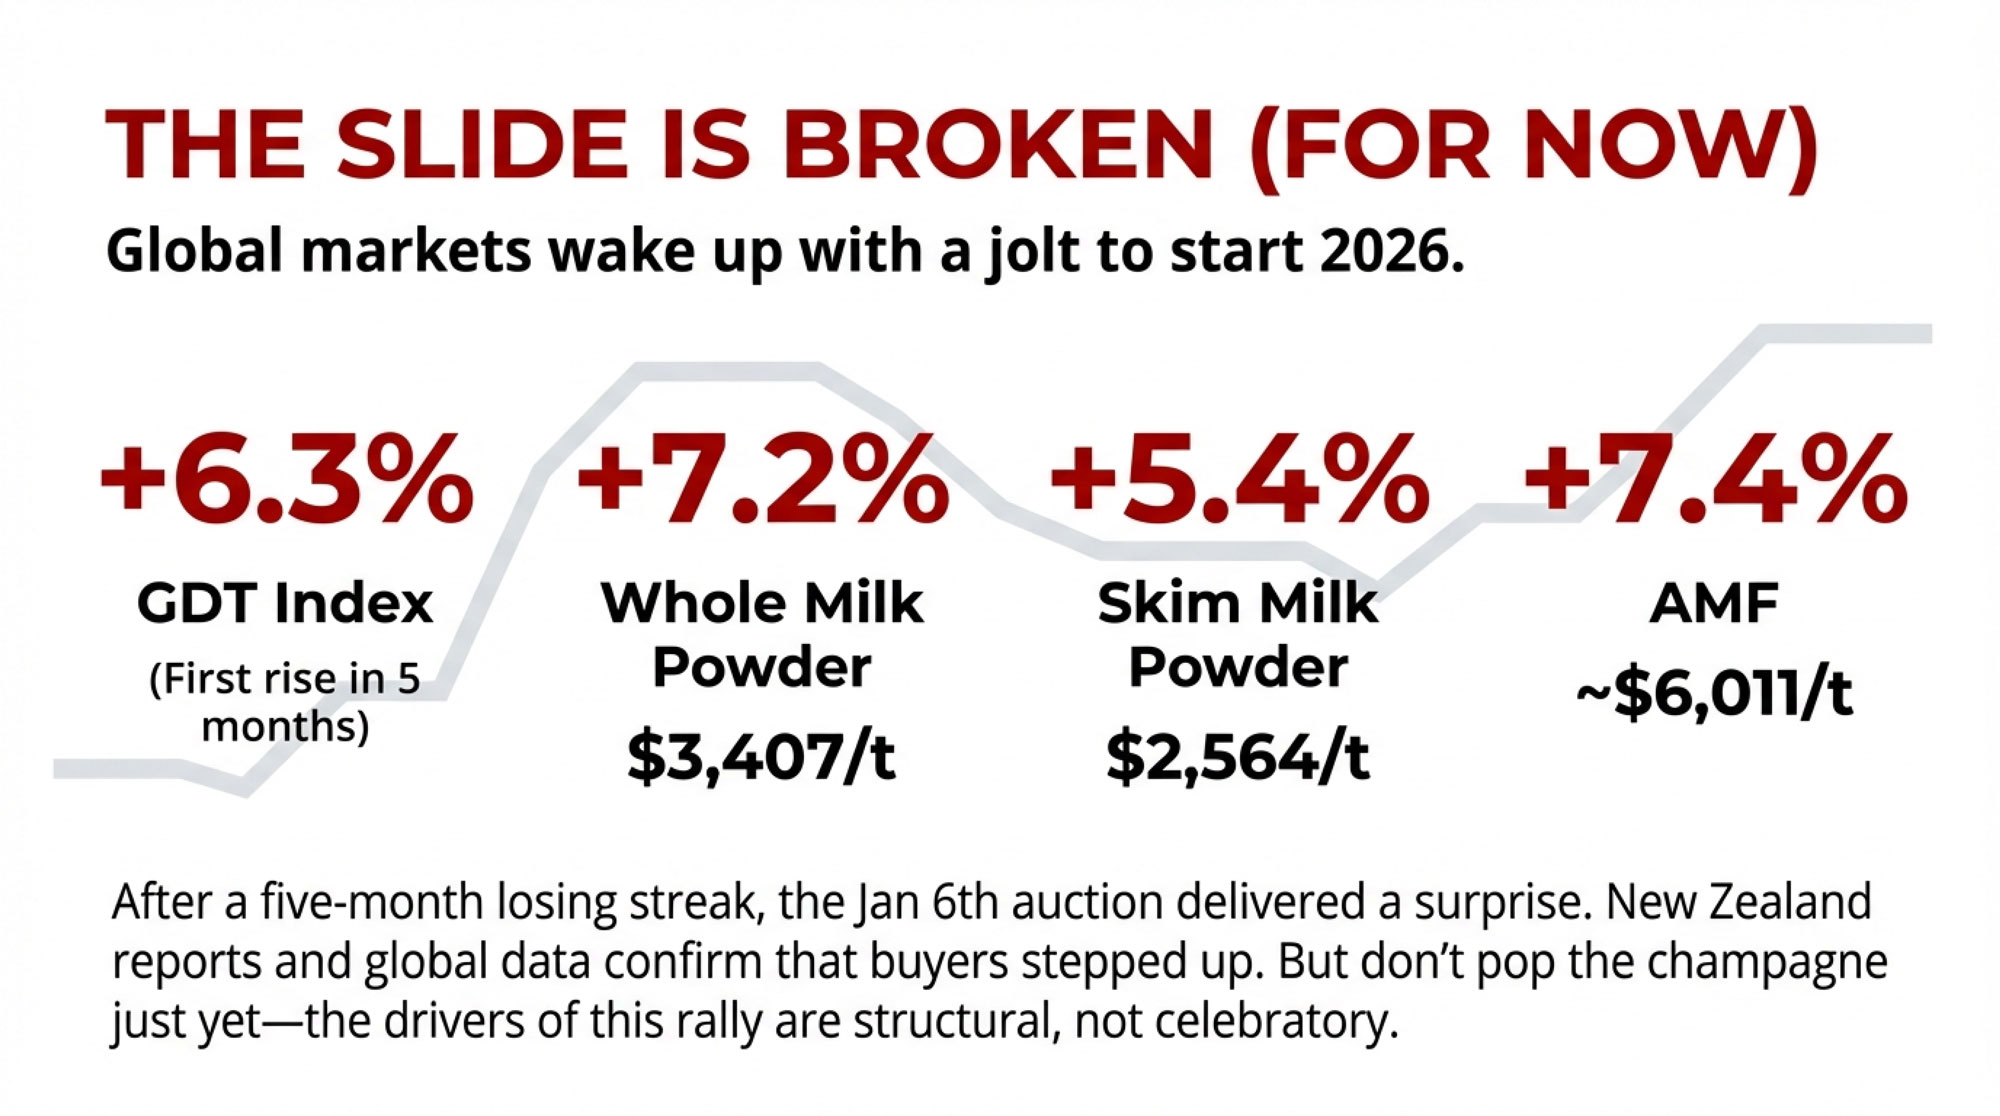
  • GDT Price Index: Up 6.3% at Event 395, the first increase since August 2025
  • Whole Milk Powder: Up 7.2% to roughly $3,407 per tonne
  • Skim Milk Powder: Up 5.4% to about $2,564 per tonne
  • Anhydrous Milkfat: Up 7.4% to around $6,011 per tonne
  • US Spot NDM: Reached $1.265 per pound for the week ending January 9
  • EU Butter Reference: Around €4,408 per tonne, down roughly 40% year-on-year
  • CME Spot Butter: Trading in the mid-$1.30s per pound, near multi-year lows
  • CME Dry Whey: Slipped into the low-70-cent range per pound

New Zealand and global dairy reports told the same story: less product on offer from Oceania and stronger demand from Asia and the Middle East combined to move the needle. Average winning prices at GDT moved into the mid-$3,500-per-tonne range, which was a welcome change from the drift we’d been seeing.

What’s encouraging is that this is the first time in a while we’ve seen both fat and powder move up together in a meaningful way. It doesn’t mean the year is saved. But it does tell us the market still responds when supply tightens, and buyers step forward.

Powder’s Quiet Turn: Less Balancing, More Bite

Looking at the powder side of this rally, you start to see some interesting structural changes at work. In early January, US spot nonfat dry milk climbed into the mid-$1.20s per pound. The T.C. Jacoby Weekly Market Report, which draws heavily on CME and USDA data, pegged the weekly average at $1.265 per pound for the week ending January 9. That’s a real improvement from where we sat late last year.

At the same time, USDA’s Livestock, Dairy, and Poultry Outlook still points to modest US milk growth for 2026. The October projections have national production rising from around 231 billion pounds in 2025 to 234 billion pounds in 2026, driven by a slightly larger herd averaging just under 9.5 million cows and higher yield per cow. On the surface, you’d expect “more milk” to mean softer powder prices, not firmer.

So what changed? On the production side, you see, we’re simply not making as much powder as we used to. That same Jacoby report highlighted October US nonfat/skim production at just under 150 million pounds, about 10 percent below the same month a year earlier. The analysts described it as one of the lighter October figures they’ve seen in recent years based on USDA’s monthly time series.

MetricOctober 2025October 2024ChangeYoY %
Total US Milk Production19.25B lbs18.98B lbs+270M+1.4%
Nonfat Dry Milk (NDM) Output148.5M lbs165.0M lbs-16.5M-10.0%
US Cheese Production286M lbs271M lbs+15M+5.5%
Whey Protein Streams42M lbs38M lbs+4M+10.5%

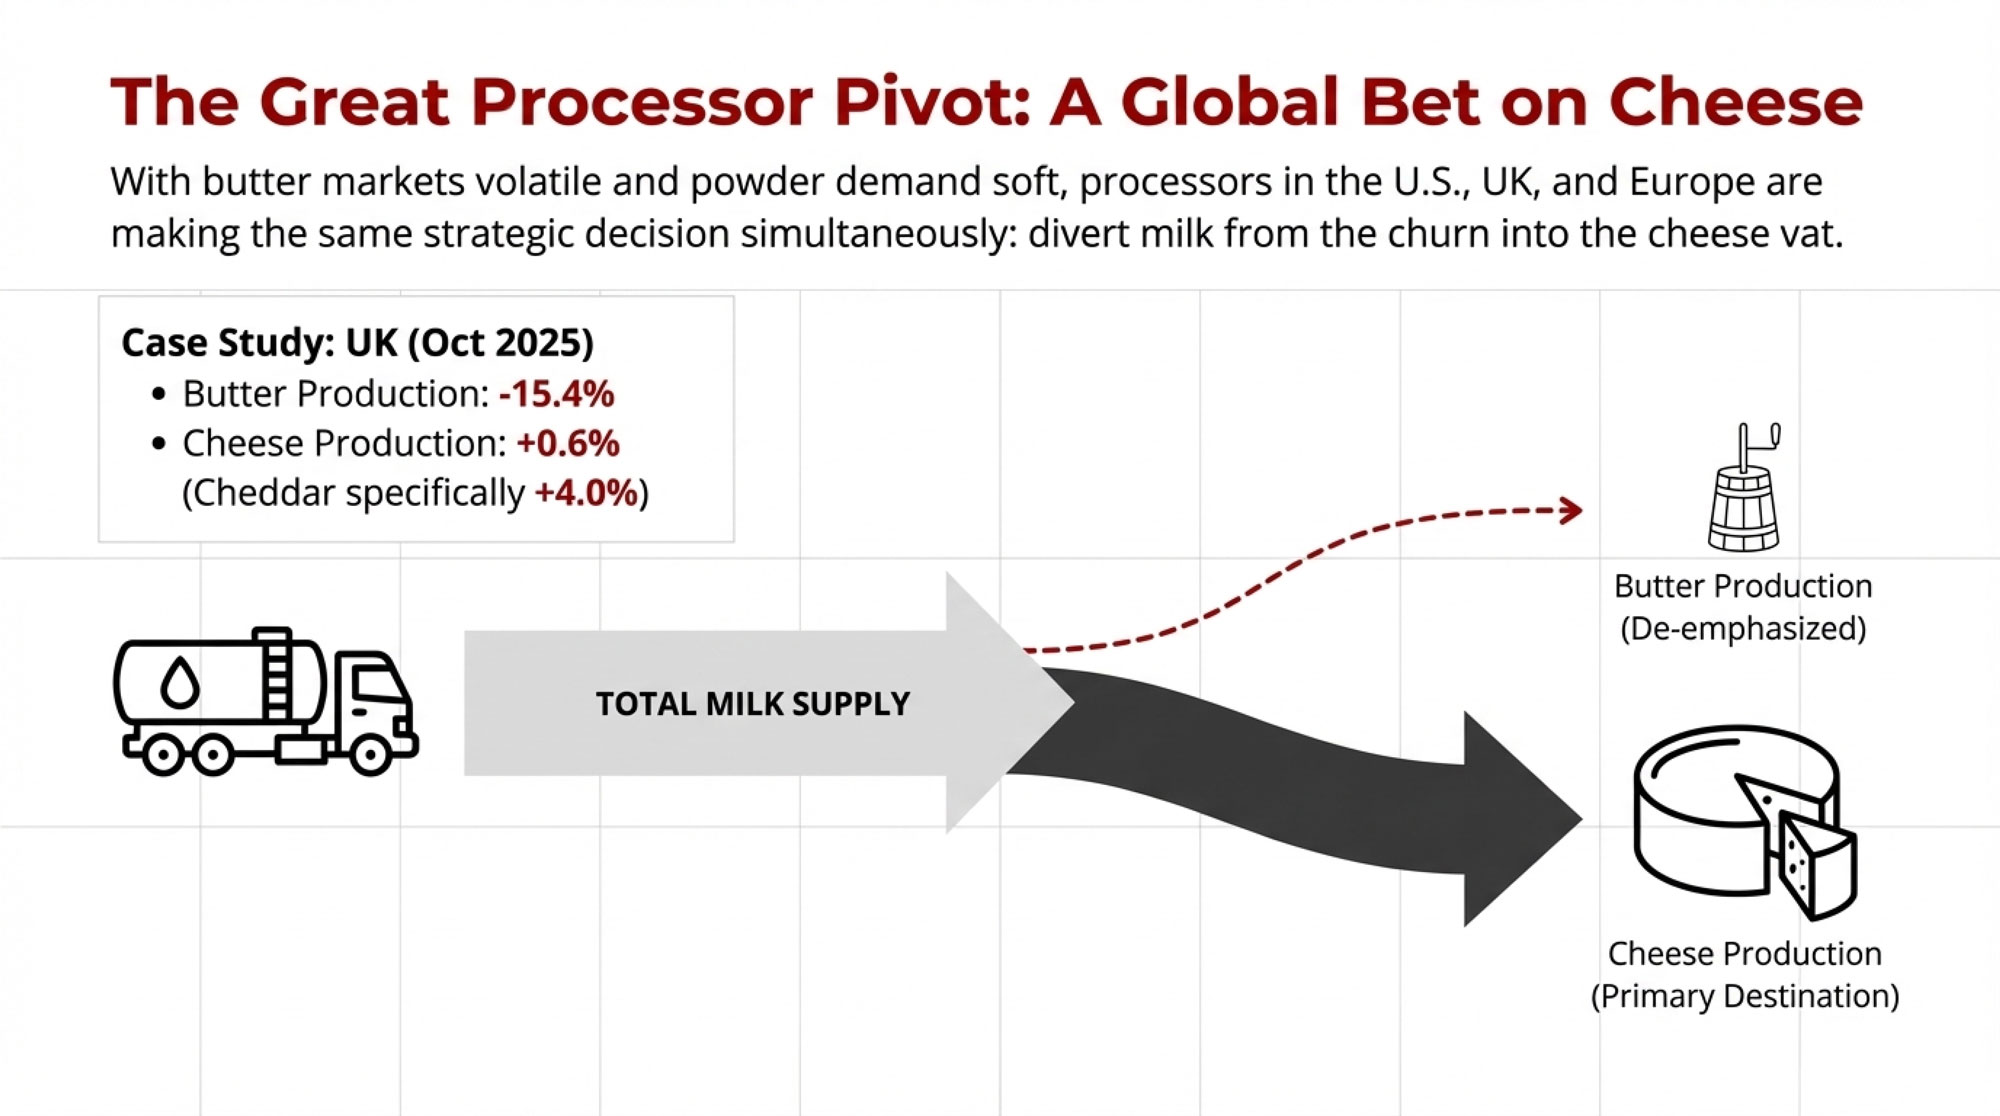
On the ground, plants are using their dryers less as a balancing tool. With all the new cheese vats and high-protein lines that have come online across the Midwest and West over the past few years, extra milk that would have gone to powder a decade ago is now more often going into cheese or specialty proteins. A plant manager in the Central Plains told me recently, “If I can put a load into cheese or a protein stream, I’ll do it before I even think about the dryer.” That attitude is becoming pretty common.

Now put that together with the GDT story. Ahead of the first 2026 auction, New Zealand sellers cut back their offered volumes of whole and skim milk powder compared with earlier events, according to NZX Dairy Insights. Milk collections there aren’t running away, and co-ops are managing volume more tightly. Buyers still came to the table, and between that and tighter US production, the whole powder market suddenly looked a lot less heavy than it did in the fall.

So the data suggests this powder rally isn’t just a random bounce. It’s built on less supply meeting stable-to-better demand. The open question is how long that balance holds.

What The Futures Are Whispering

If you sit down with anyone who lives in the risk-management world, they’ll tell you the futures curves matter. And right now, they’re quietly backing up what we’re seeing in spot markets.

On the European Energy Exchange, skim milk powder futures for the early-to-mid-2026 months moved into the low € 2,200-per-tonne range right after the GDT lift. That’s a few percent higher than where they sat in late December. Whey futures edged higher, too, though not by as much.

Over in Singapore, which has become a key hub for hedging Oceania-linked product, whole milk powder futures for the January–August window climbed into the upper-$3,300s per tonne, with skim in the high-$2,600s to low-$2,700s. Anhydrous milkfat and butter futures there saw even stronger percentage gains after the auction.

Why does any of this matter at the farm level? Because these are the curves your co-op or processor looks at when they’re deciding whether to lock in export deals. On Wisconsin farms that ship into export-focused co-ops, and in California plants that rely heavily on overseas powder sales, marketers are much more willing to write business when EEX and SGX curves are firm and active. Those deals, in turn, show up in premiums, base prices, and risk-sharing programs.

You might never place a futures order yourself, but it’s worth knowing that the people pricing your milk are watching those screens every day.

Butterfat: Valuable In Theory, Awkward In Practice

Now, let’s talk butterfat, because this is where many of us feel a disconnect between the “fat is back” headlines and the actual pay stub.

In Europe, the composite butter price, based on Dutch, German, and French quotations, has been around €4,408 per tonne in early January. That’s a bit better than December, but still about 40 percent below where it was a year ago. Vesper’s late-2025 analysis estimated EU butter surpluses at roughly 93,700 tonnes across the first three quarters of 2025, with production up more than 86,000 tonnes year-on-year. That’s a lot of butter to work through, and Vesper expects prices to slip below €4,000 per tonne in the first quarter of 2026.

Product / RegionPrice (Current)Price (Year Ago)YoY ChangeStatus
EU Butter Composite€4,408/tonne€7,347/tonne-€2,939⚠️ -40.0%
US Spot Butter (CME)$1.37/lb$2.15/lb-$0.78⚠️ -36.3%
US Class III (Cheese)~$18.50/cwt~$17.80/cwt+$0.70↑ +3.9%
NYS Protein Milk Price~$19.25/cwt~$18.10/cwt+$1.15↑ +6.4%

In the US, it’s a different flavour of the same challenge. Spot butter at the Chicago Mercantile Exchange has started 2026 in the mid-$1.30s per pound. Butter at $1.3750 on January 1, and Ever.Ag’s early-January “Margin Matters” commentary described it as testing multi-year lows. USDA data show butter production in late 2025 still running ahead of year-ago levels, even after accounting for strong cream usage elsewhere in the system.

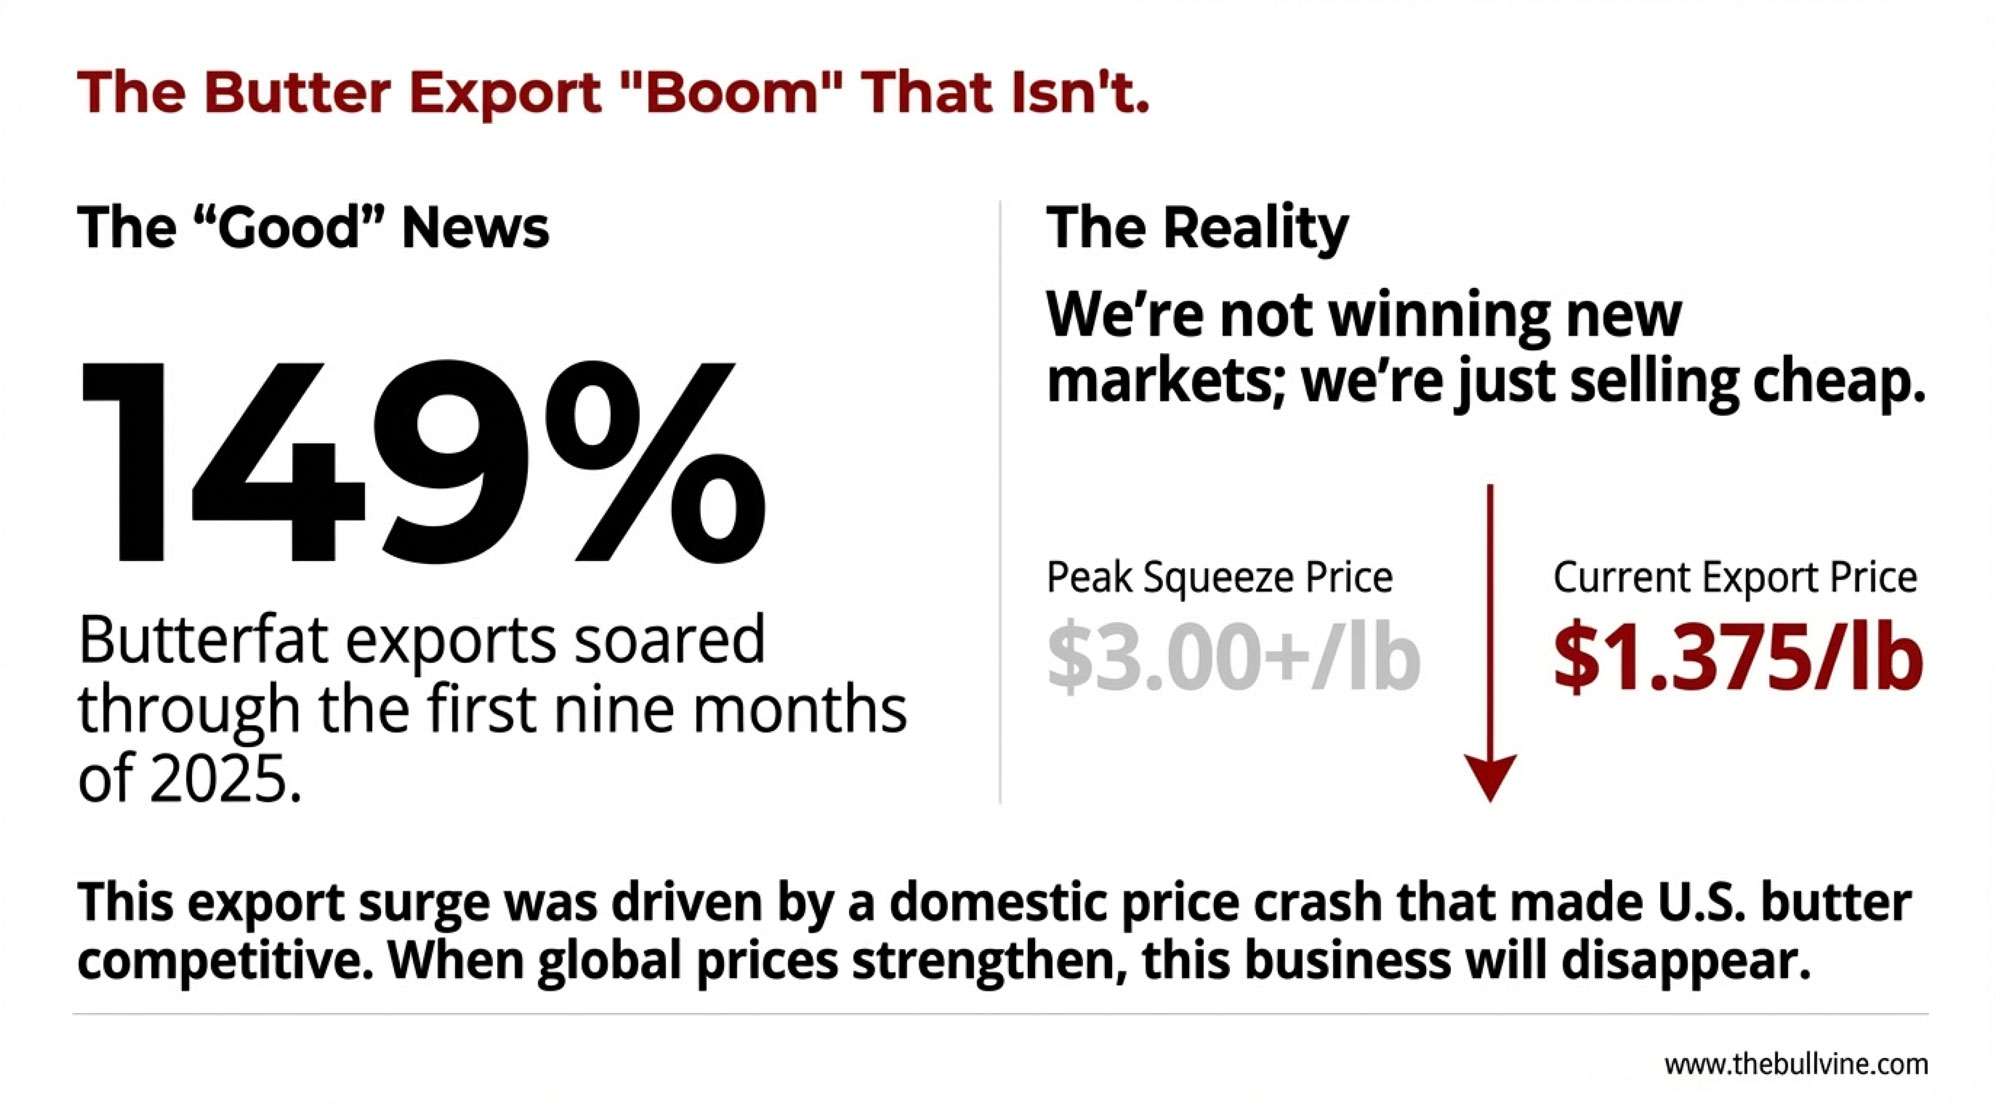
Exports, interestingly, have improved. Late-2025 export summaries from USDA and dairy trade coverage show US butter shipments several times larger than the year before and strong growth in anhydrous milkfat exports as well. International buyers are clearly taking advantage of the discount on US fat relative to European and New Zealand product.

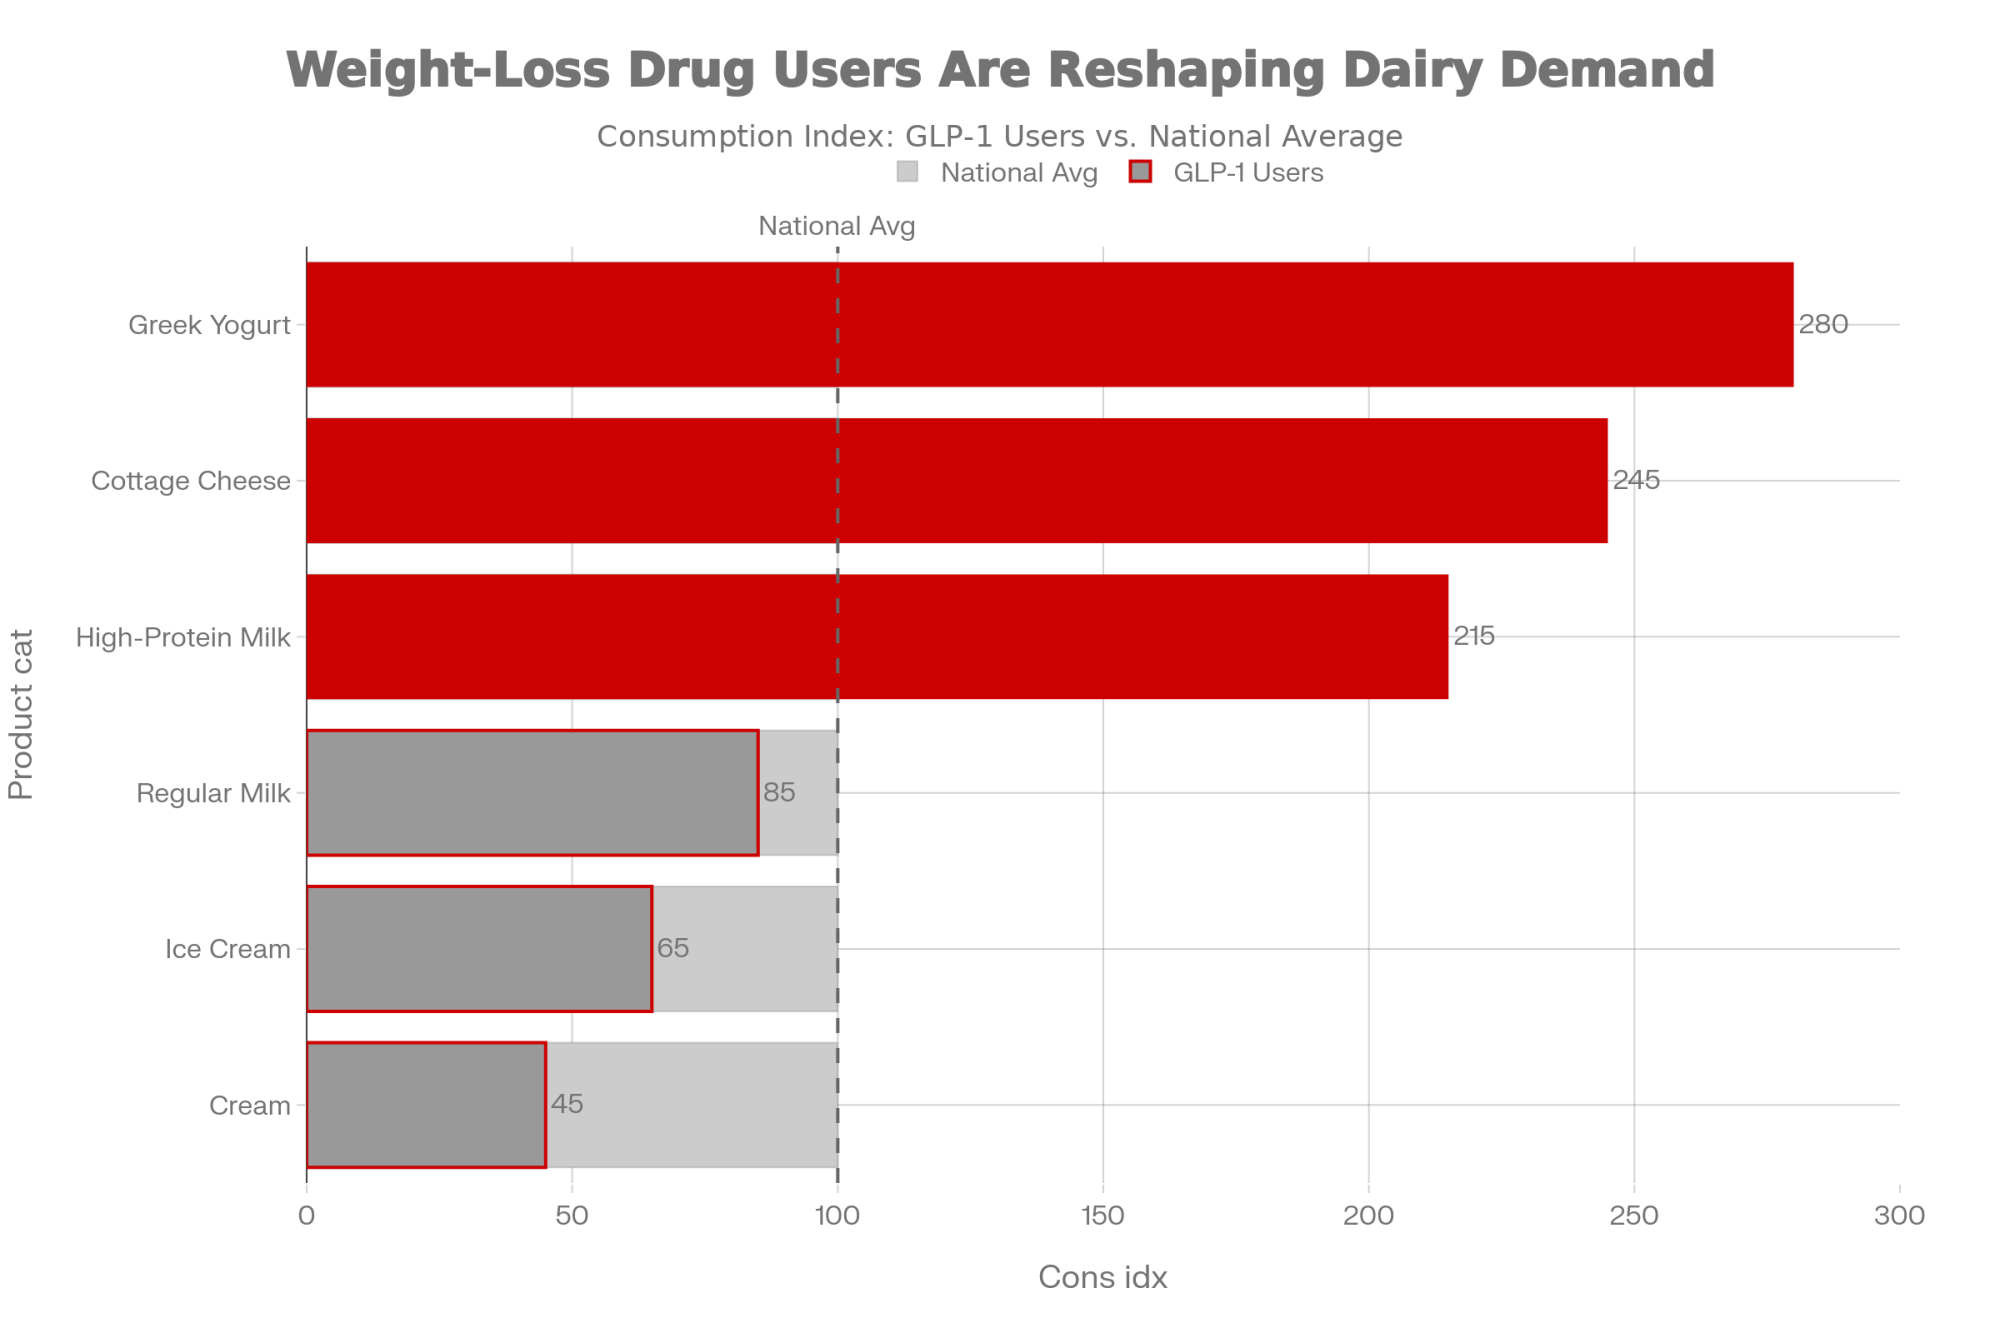
Domestically, the picture is nuanced. Consumers haven’t gone back to low-fat diets. USDA production reports show yogurt and cottage cheese output growing in recent years, while ice cream and sour cream have been flat to slightly down. So people are still comfortable with fat, but they seem to prefer it when it’s paired with protein or cultures.

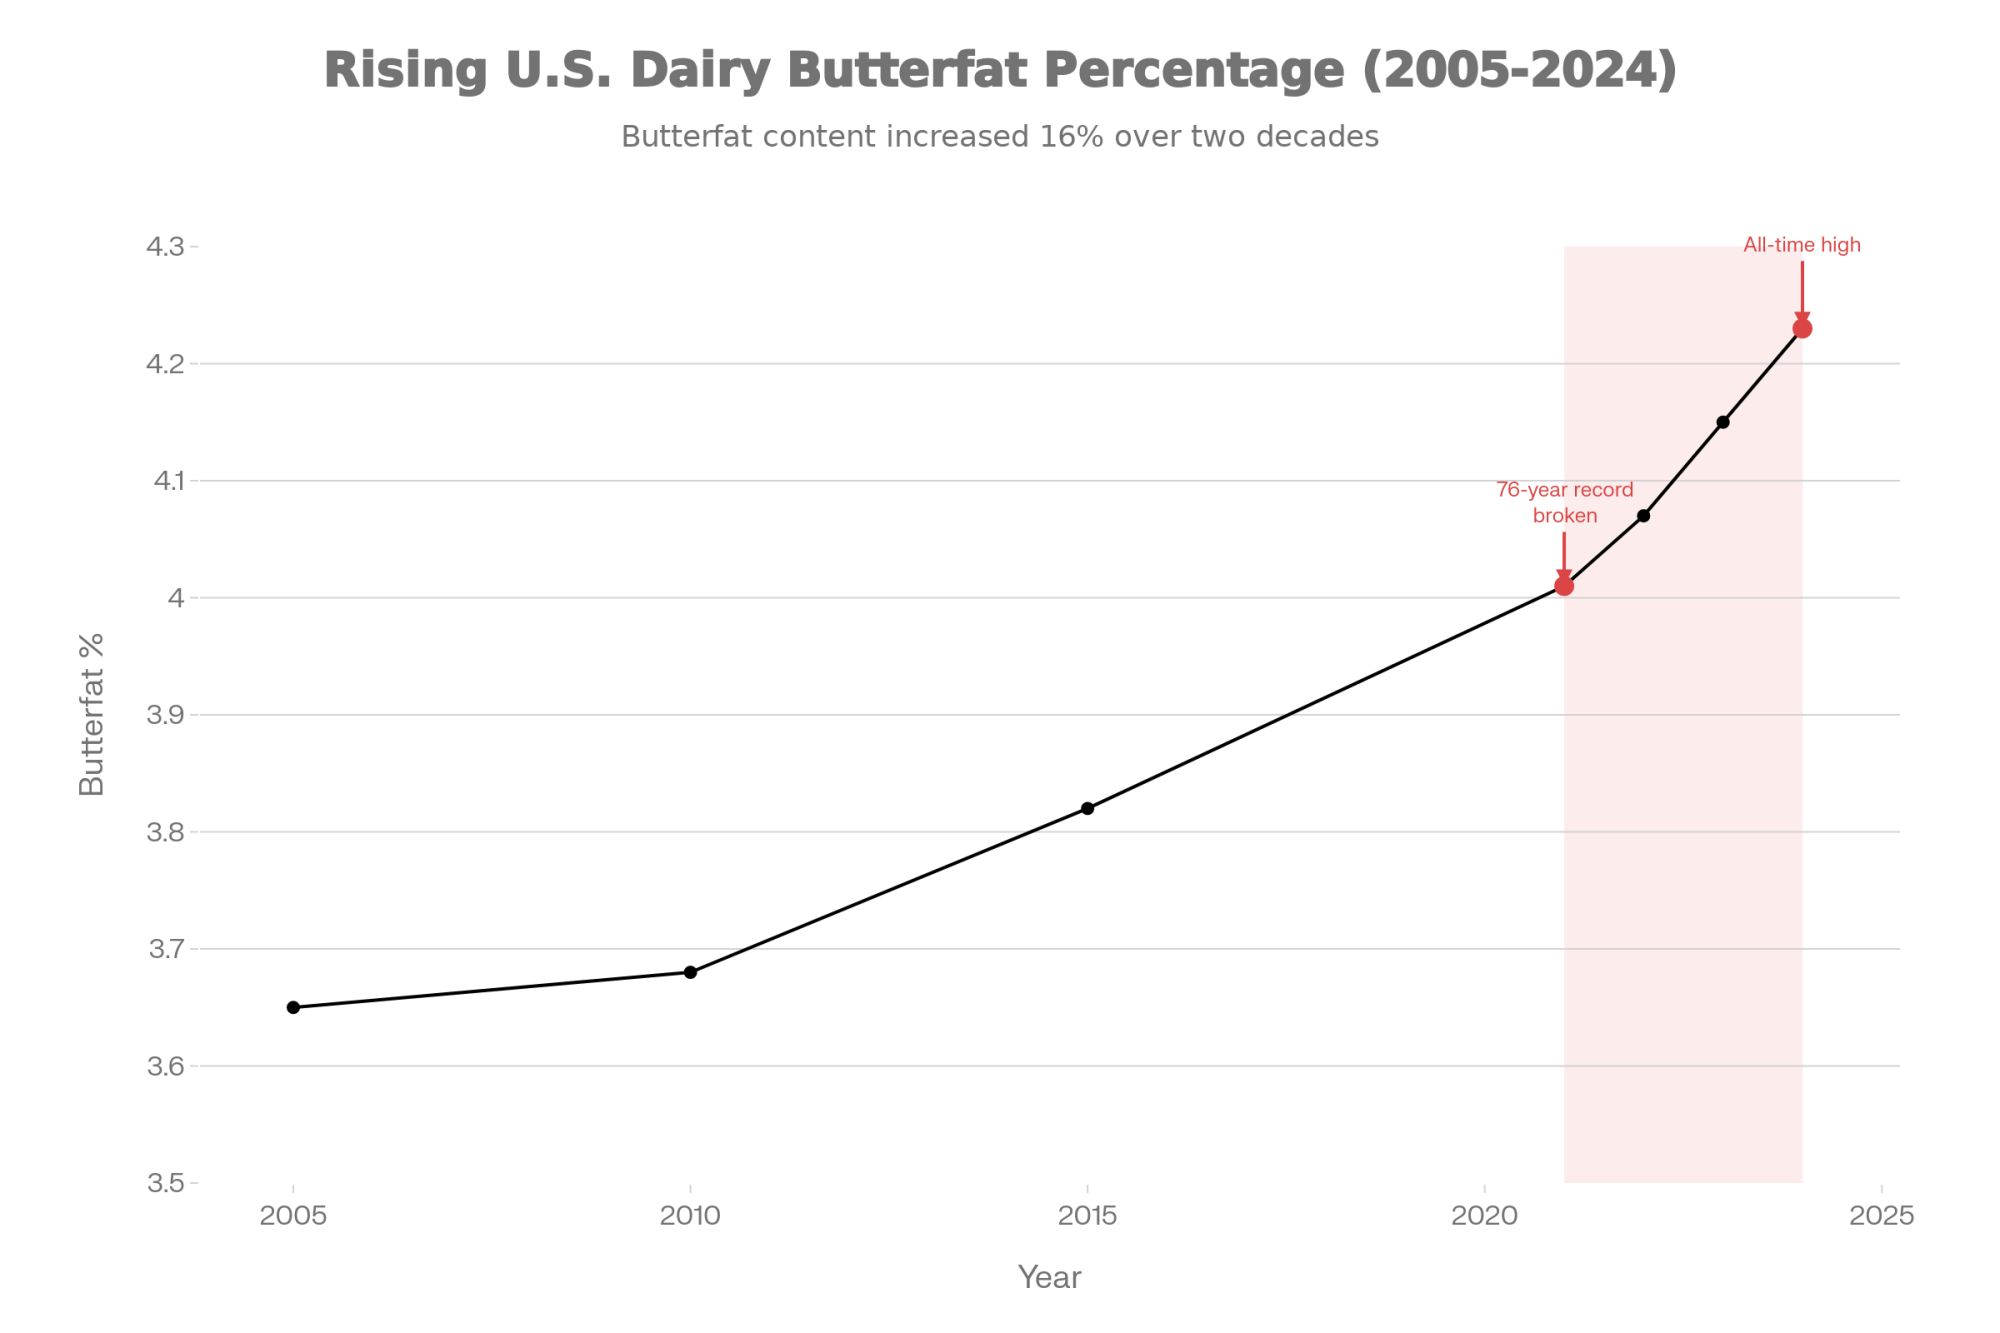
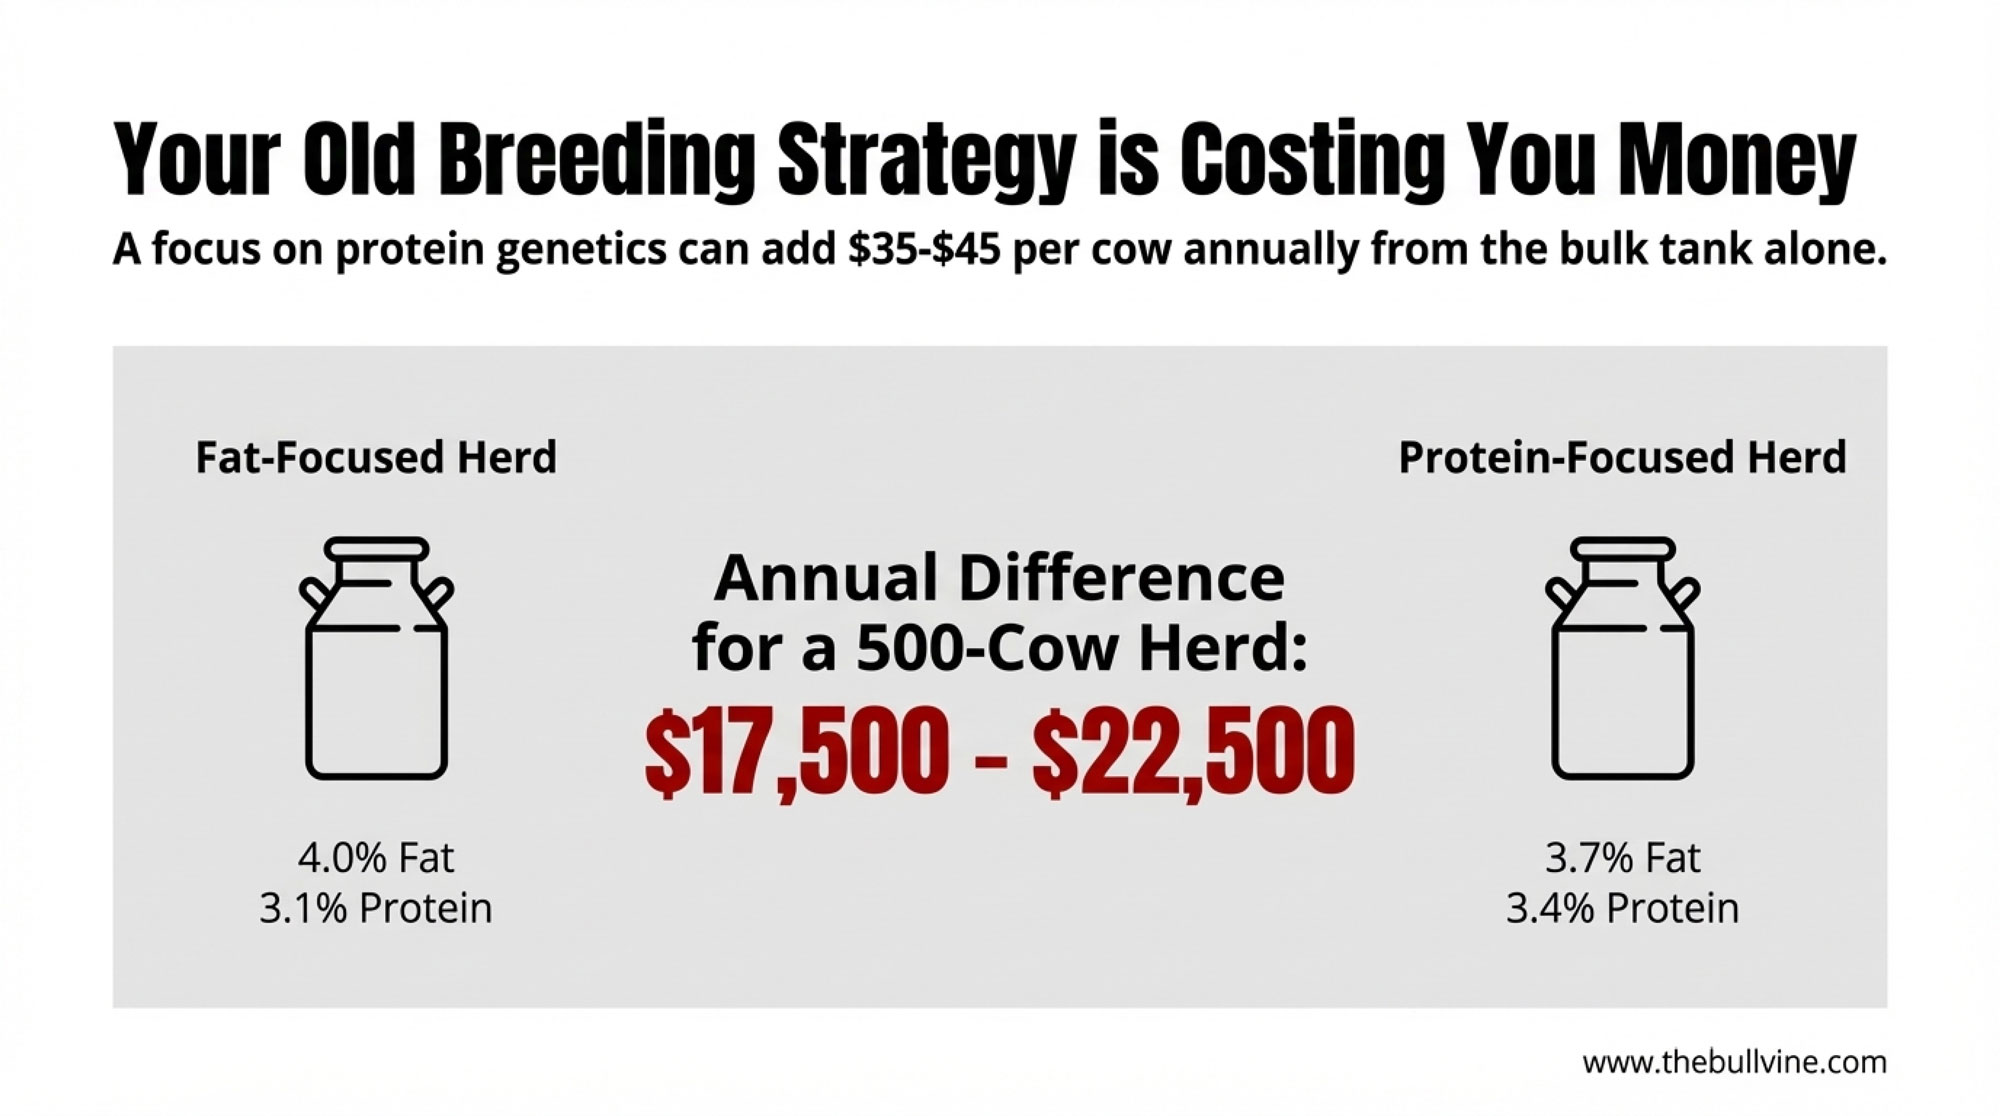
What does that mean for butterfat levels on your farm? Over the last decade, many herds have pushed fat up through better fresh cow management, strong transition programs, and careful ration work. On Northeast and Upper Midwest farms, it’s not unusual now to see rolling herd averages north of 4.0 percent fat. But with butter this cheap, the extra dollars you spend chasing an extra few points of fat may not pay back like they did when butter was at $2.50 or more.

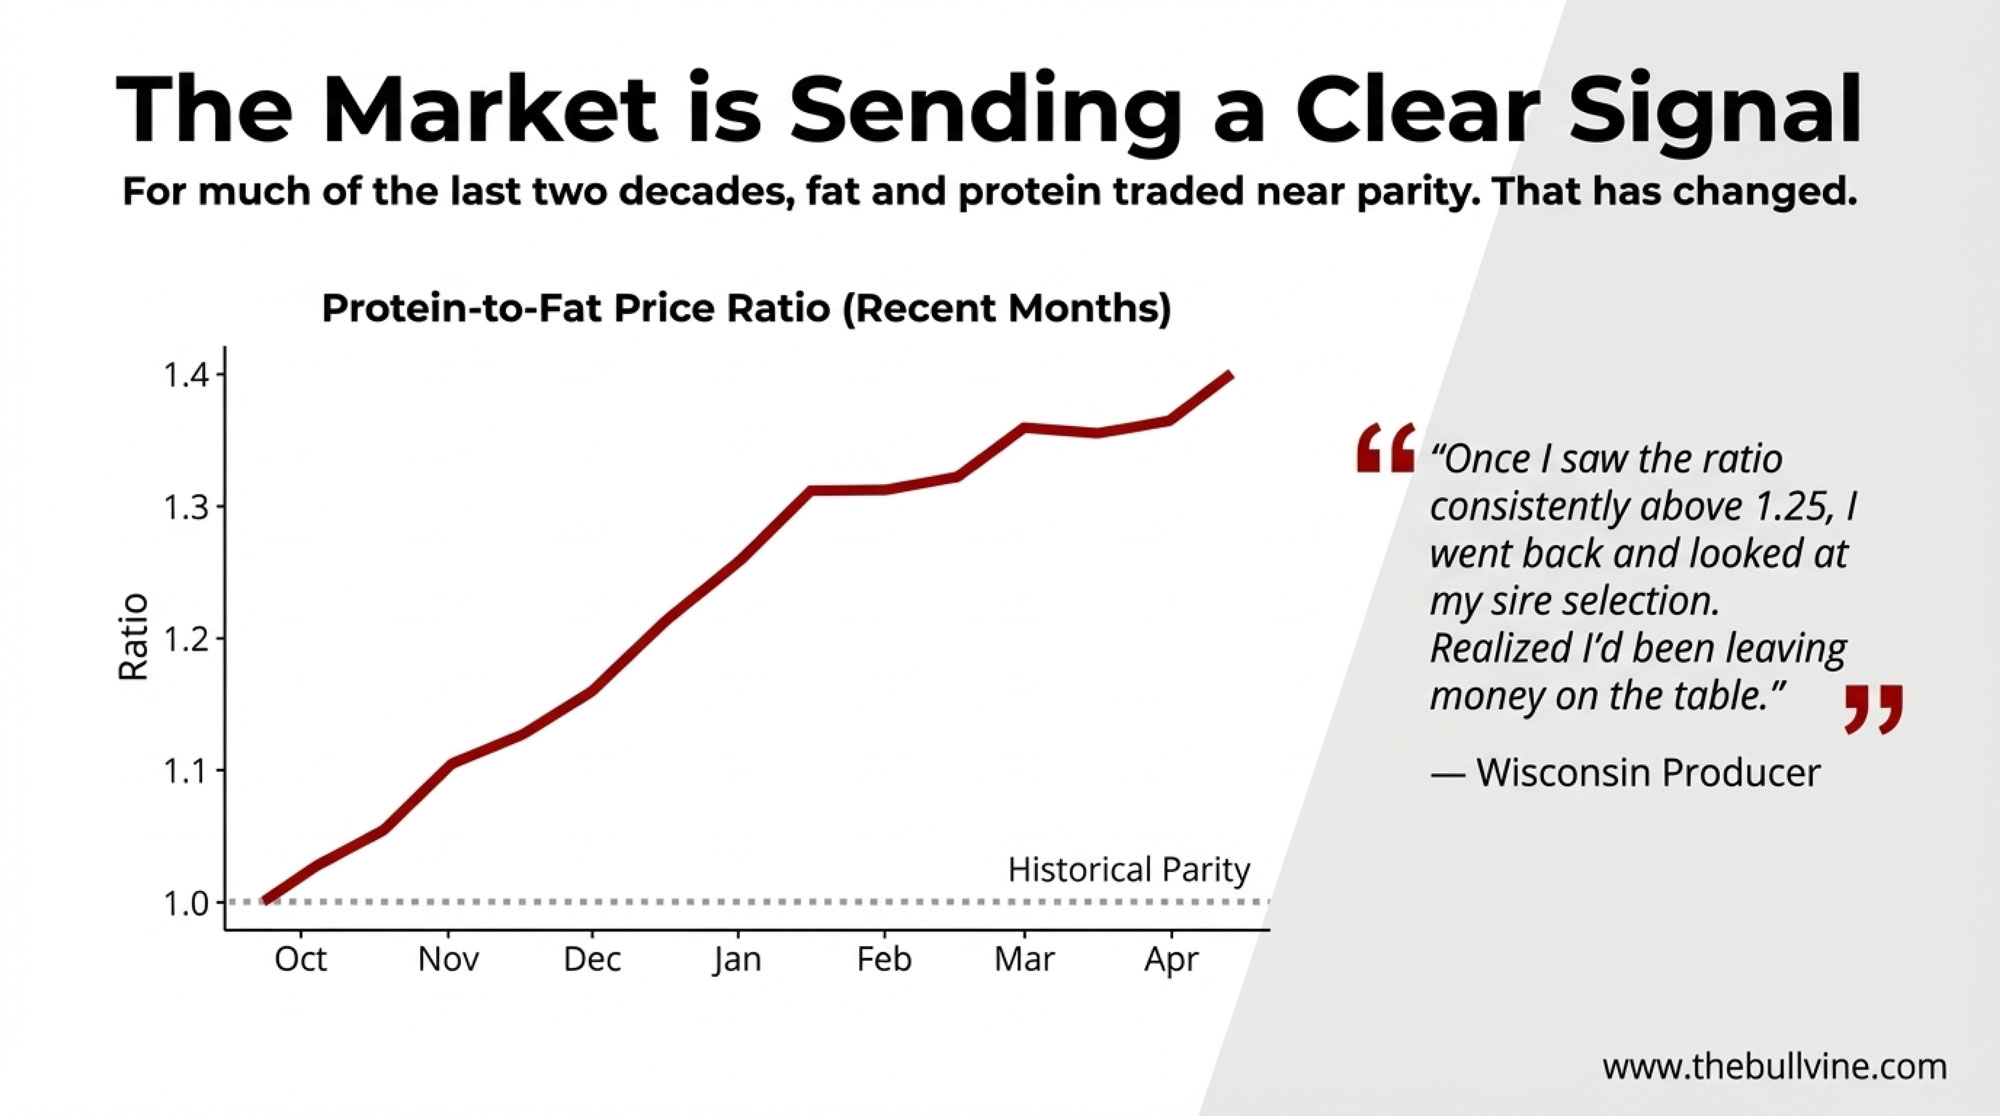
That doesn’t mean you stop caring about fat. It does mean it’s worth sitting down with your nutritionist and milk statement to see whether your current component strategy still lines up with how your buyer is paying today. On some Ontario and New York farms, for instance, processors are quietly putting more emphasis on protein because of where their products – yogurt, cheese, high-protein drinks – are headed. That shifts the economics.

Cheese And Whey: Strong Demand, Full Vats

Cheese has been the main growth engine for the US dairy industry in recent years, as many of us have seen. USDA’s 2025 production data shows total cheese output running several percentage points ahead of the previous year, with some months close to 6% growth. New plants in places like Michigan, Texas, and Idaho are very visible examples of that expansion.

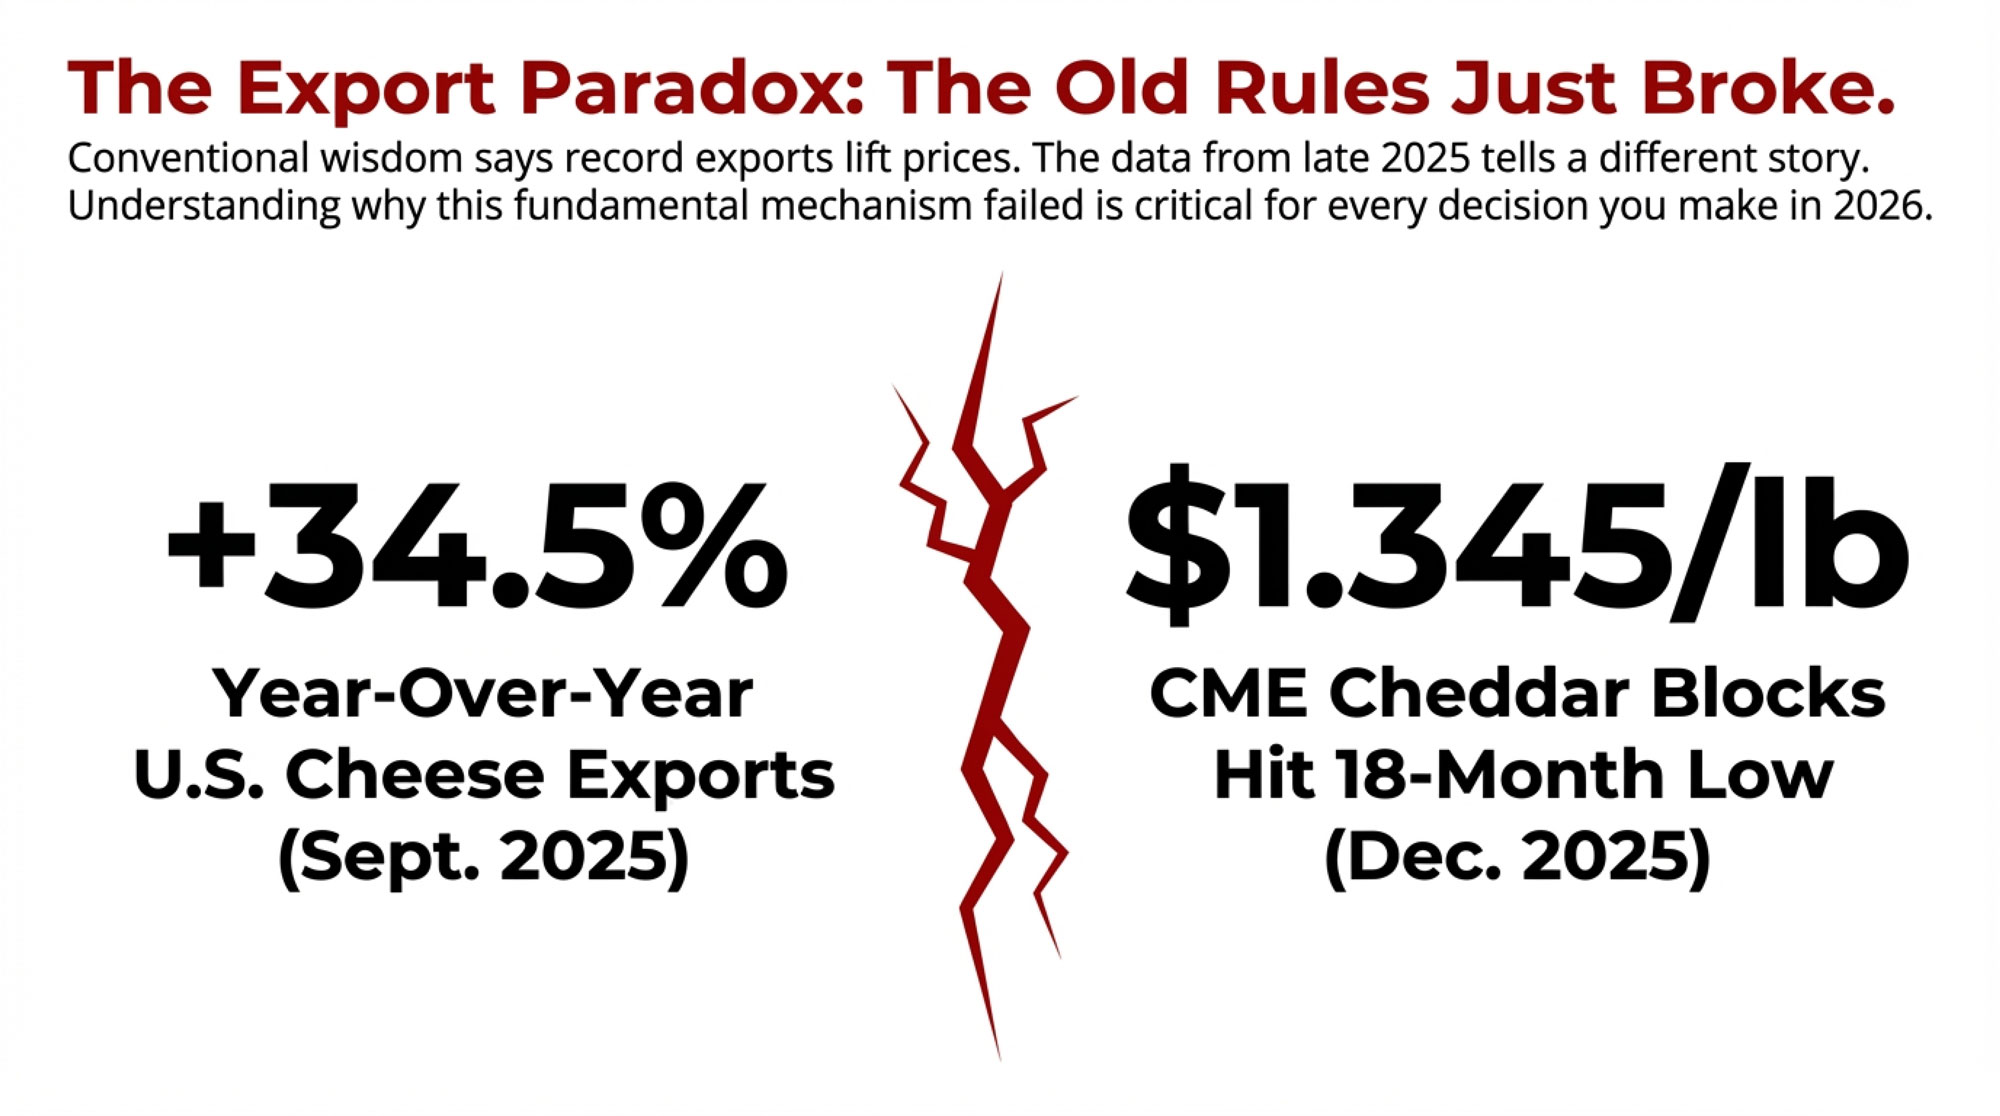
On the price side, CME block Cheddar has been trading in the low-$1.30s per pound to start 2026, down from the $1.60–$1.80 range that held for much of last spring and summer. During that higher-price period, US cheese exports set record or near-record volumes in several months, especially into Mexico and parts of Asia, according to USDA export statistics.

MetricCurrent StatusYear AgoChangeImplication
US Total Cheese Production+6.0% YoYBaselineHigher volumeSupply exceeds domestic + export growth
US Cheese ExportsRecord+ to Mexico & AsiaYear-ago baselineRecord volumesDemand is real, but can’t absorb all new production
Domestic Cheese ConsumptionRelatively flatFlatNo growthMore product chasing same home market
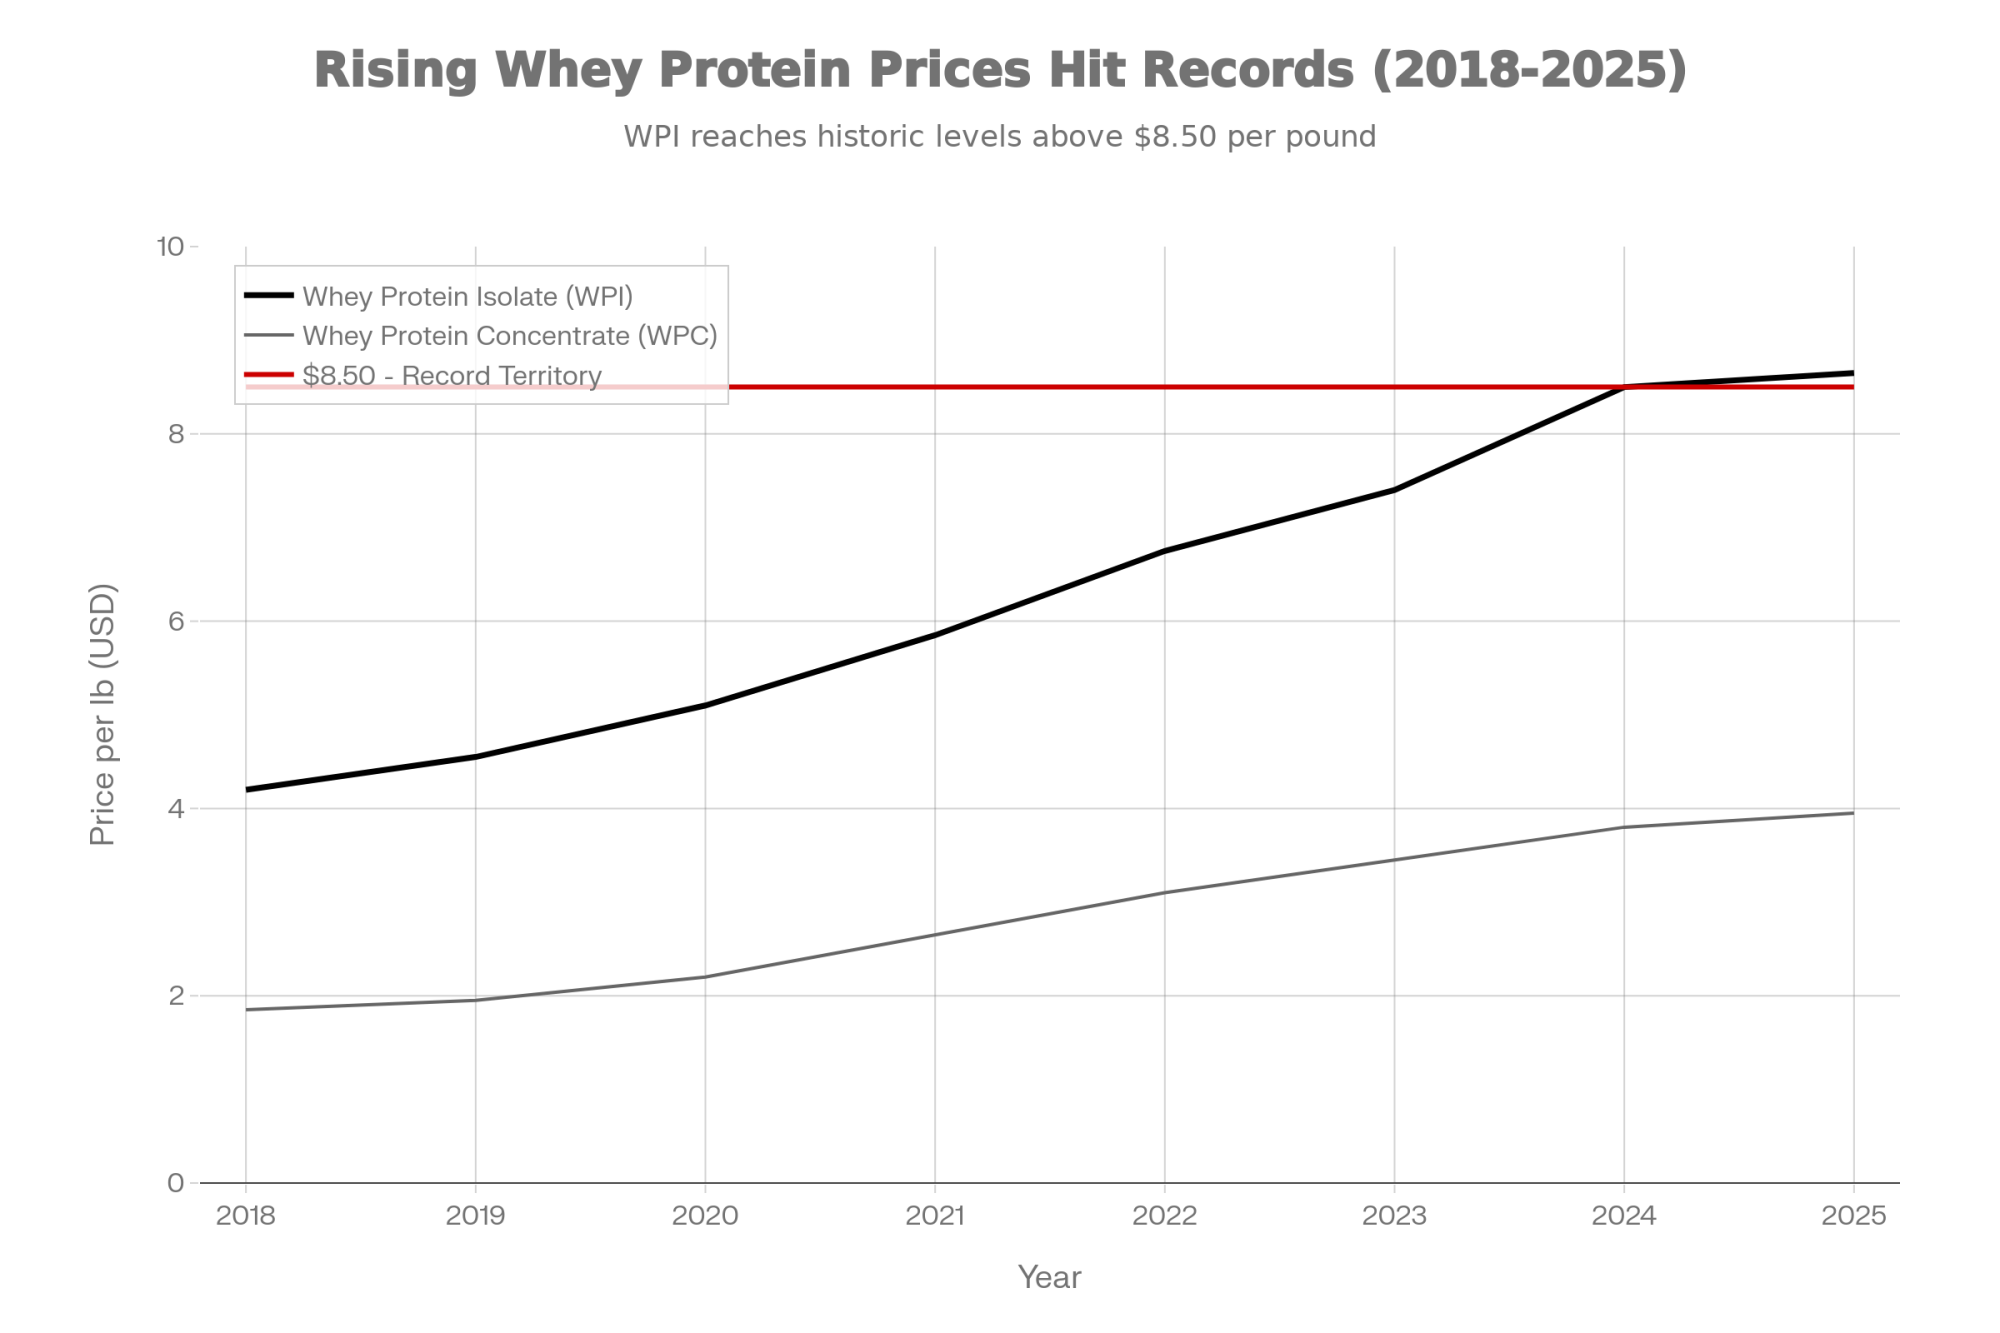
Dry Whey (CME Spot)$0.70–$0.73/lb$0.88–$0.92/lb-20% to -22%Substantial pressure; excess supply; downside drag
Whey Protein Concentrates (WPC)Firm (specialty)StrongStable to slightly higherValue-added fractions holding; commodity pressure below

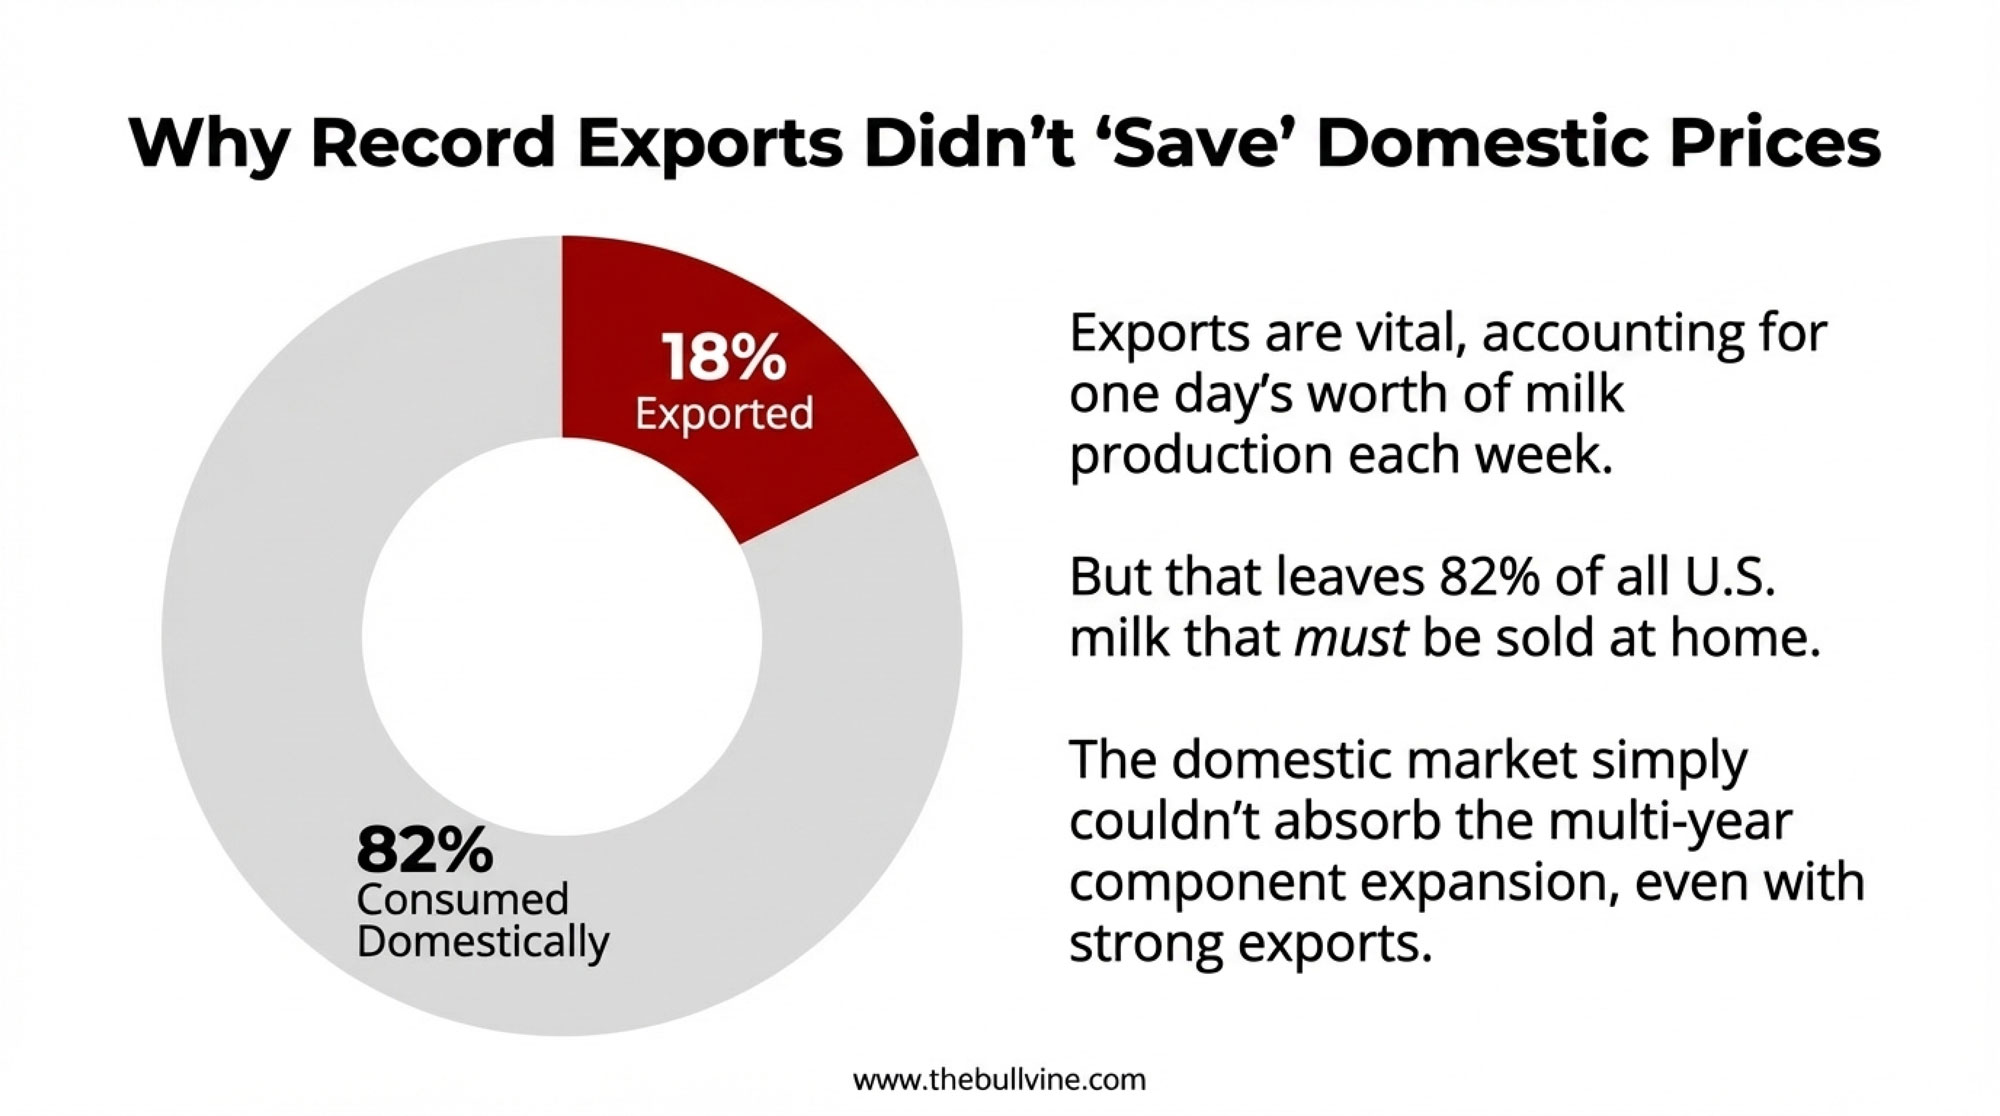
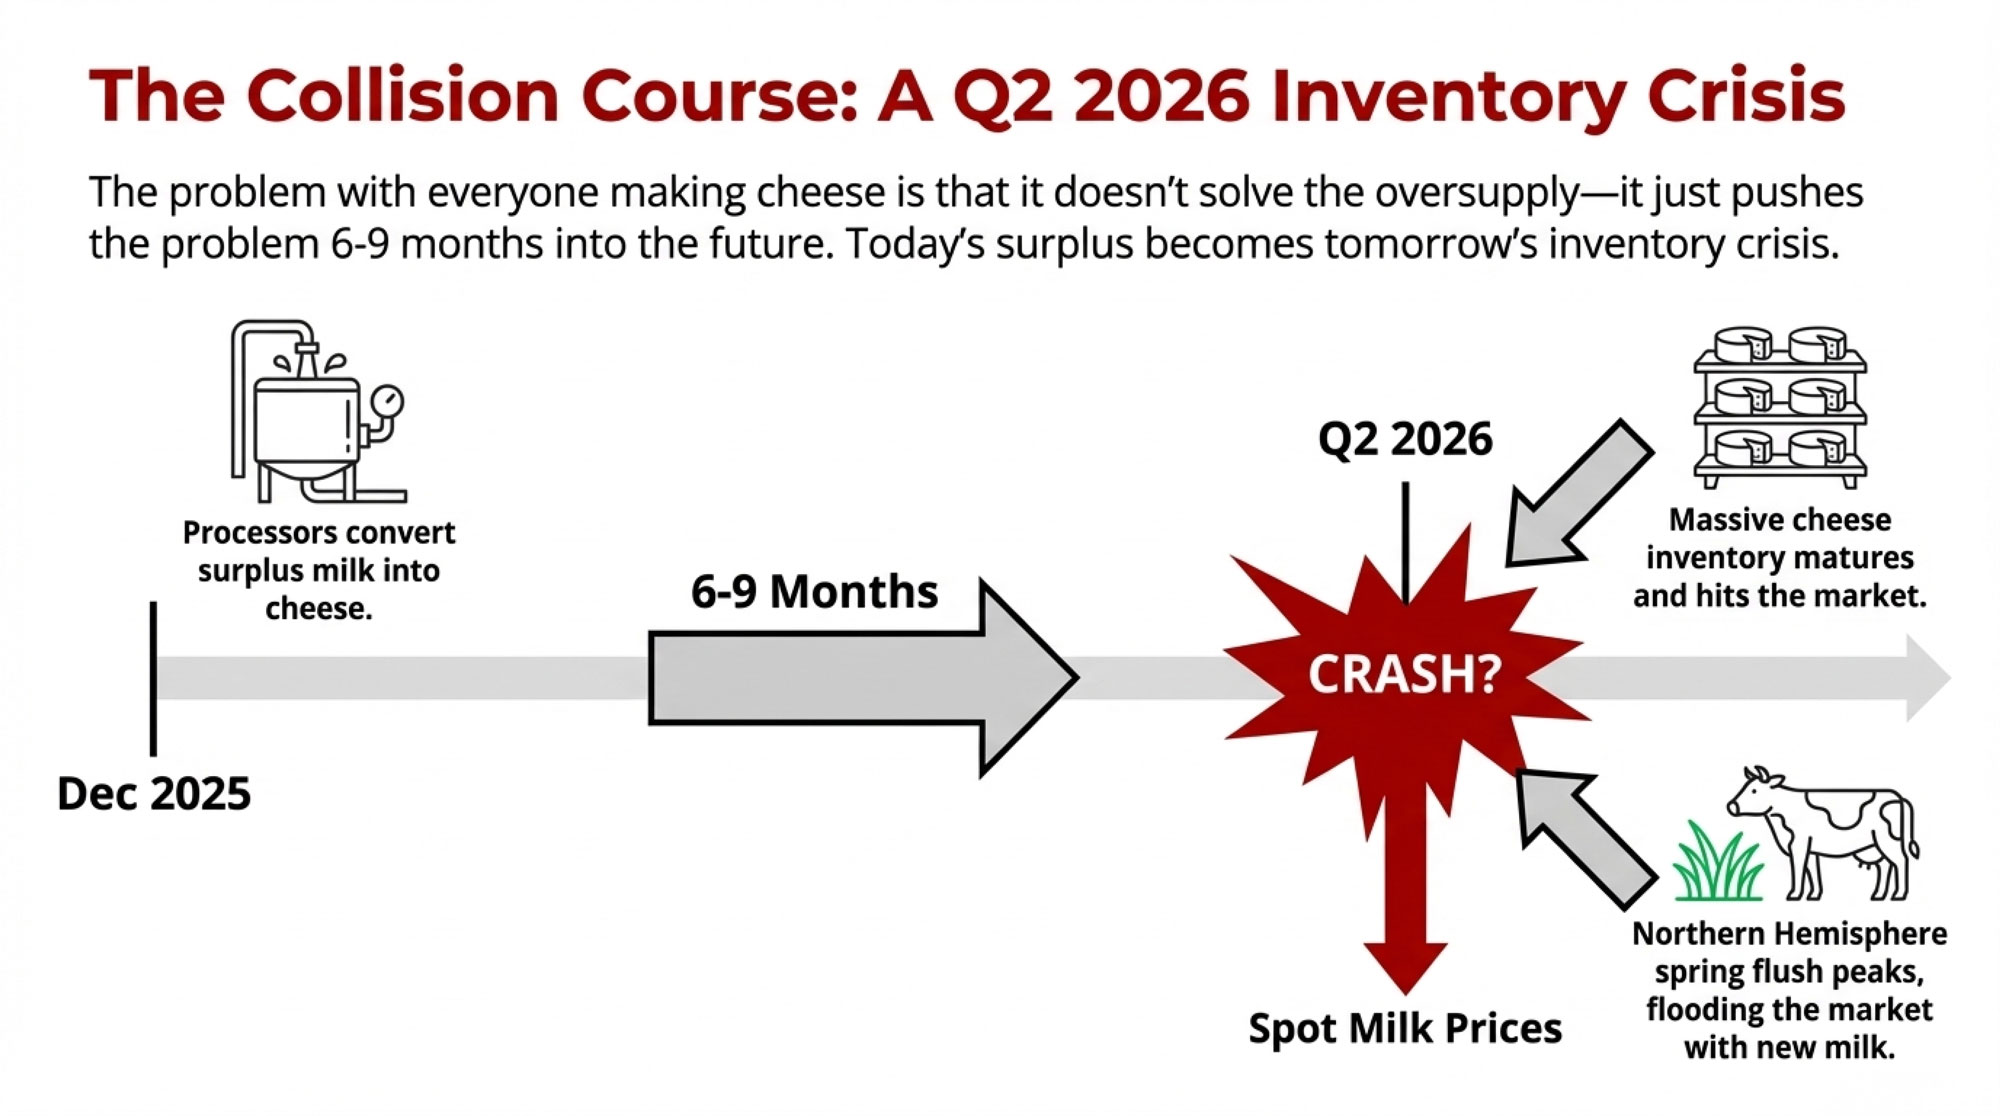
So why are prices back down? It comes back to volume. Even when exports are “record,” they still only take a slice of total output. The rest has to be eaten domestically or stored. When production grows faster than both domestic use and exports, prices simply don’t have much room to move higher.

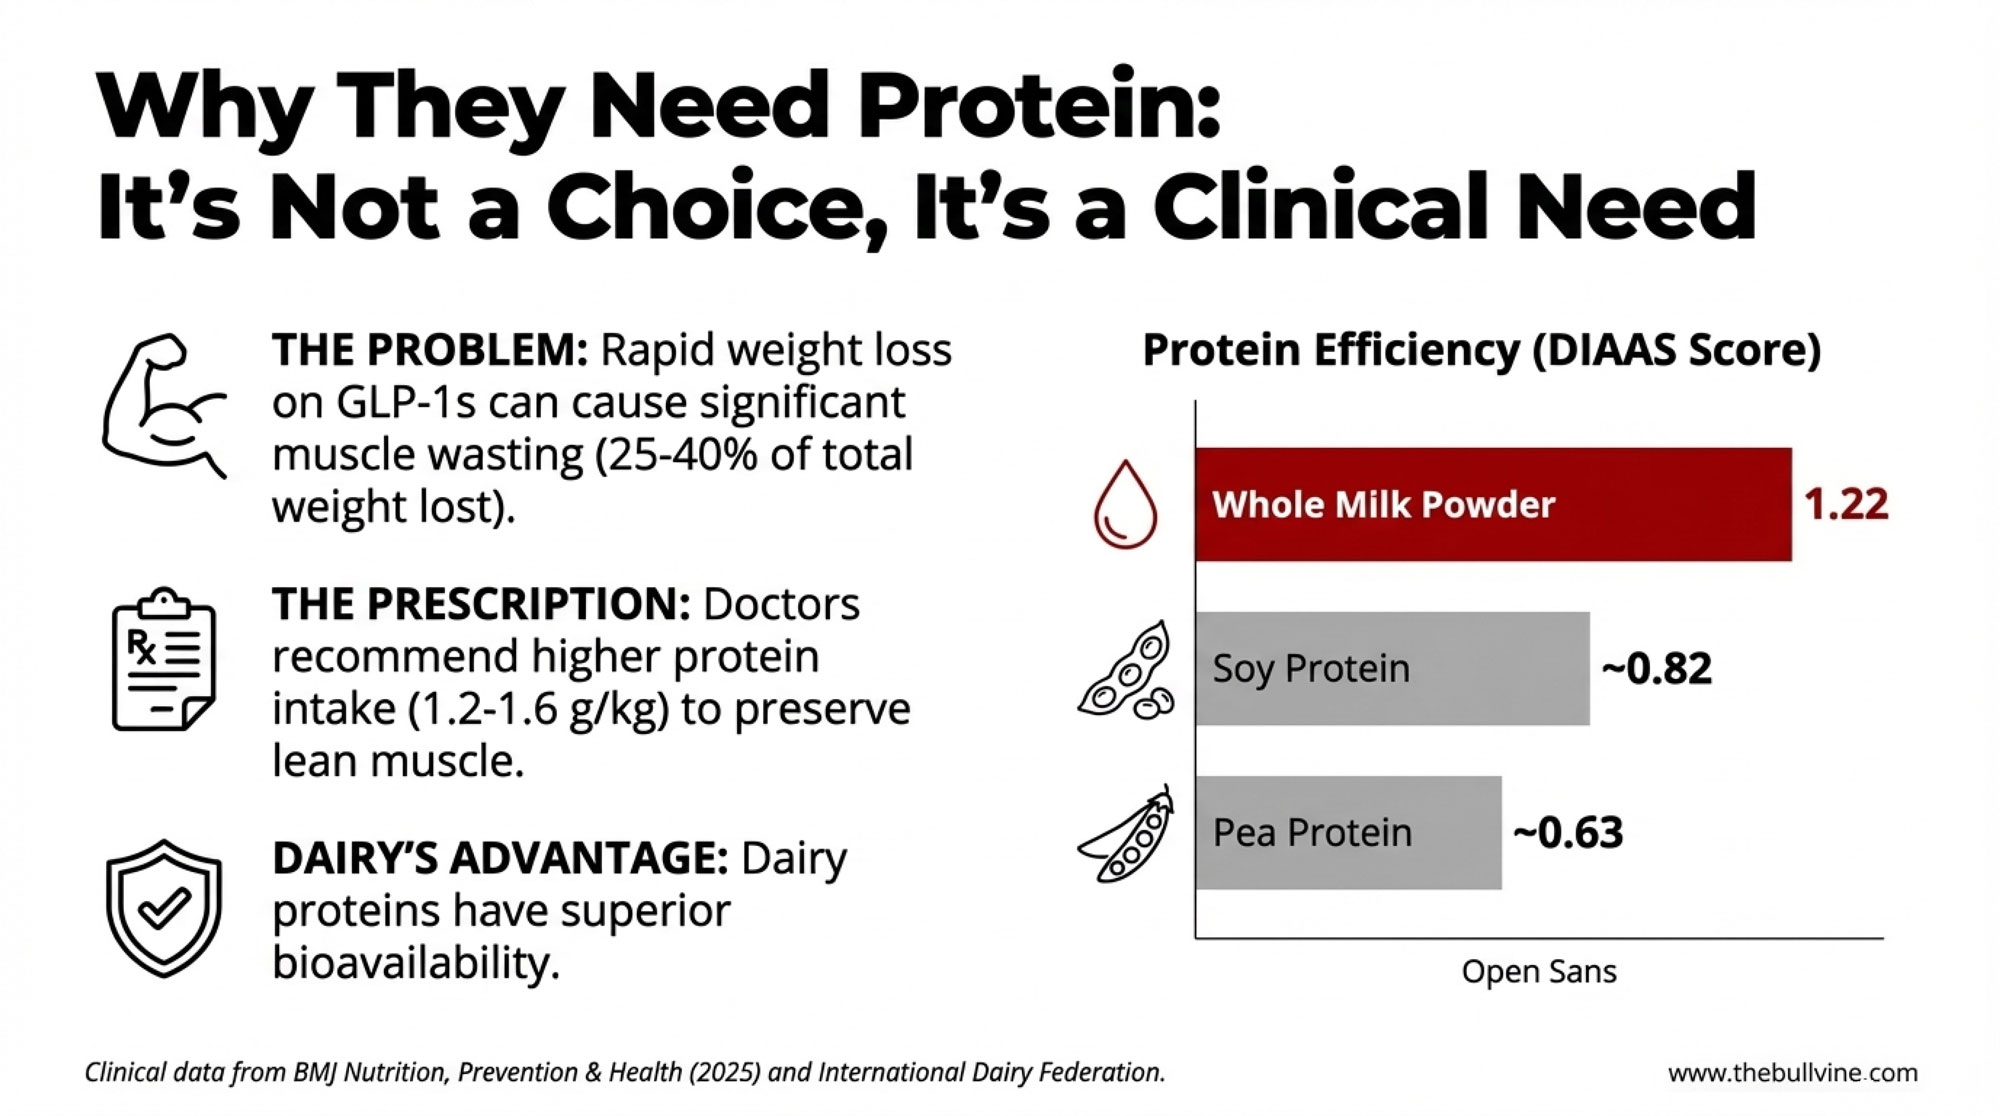
Whey is part of this story. Protein demand hasn’t gone away. In fact, consumer research and nutrition studies from the last few years show continued growth in demand for high-protein foods and supplements. Dairy proteins remain a central ingredient in many sports and wellness products.

But every pound of cheese brings whey with it. Processors tend to strip out the higher-value fractions – whey protein concentrates, and isolates – and those markets remain fairly tight. The commodity dry whey that’s left, though, has been under pressure. To start 2026, CME dry whey has slipped into the low-70-cent range per pound, lower than it was in early autumn. Industry analyses point to several months where dry whey output has run ahead of the previous year, adding to stocks.

So, as with butterfat, the headline (“protein is hot”) doesn’t always tell you what’s happening at the commodity end. The details of how your milk is used – commodity cheese, specialty cheese, high-value protein ingredients – matter a lot when it comes back to your mailbox.

The Wall Of Milk: It Doesn’t Look The Same Everywhere

RegionNov Collection (Local Unit)YoY % ChangeYTD TrendKey Driver
Germany+5.0%Slightly behind 2024 YTDHigher milksolids (4.1% fat, 3.5% protein)
Italy+3.5%Positive YTDSolid seasonal strength
Spain-2.0%Positive YTDLower volume, but higher solids
Ireland-2.1%Strong YTD leadSpring flush strength carrying year
Australia-2.2%Behind 2024 YTDBeef prices, weather, cow numbers under pressure
New Zealand~FlatN/A (seasonal producers)Tight GDT offerings, managed supply
China+3.2%Above 2024 (cautious)Farmgate prices linked to global powder; selective demand

We all hear about the “wall of milk,” but when you look region by region, it doesn’t look uniform at all. Here’s what the latest data show:

  • Germany: November milk collections came in close to 5 percent higher than a year earlier, with milksolids up even more, thanks to butterfat around 4.1 percent and protein near 3.5 percent. But year-to-date, Germany is still slightly behind 2024 because the early months were weaker.
  • Italy: November collections were roughly 3.5 percent higher year-on-year, with milksolids up about 4 percent.
  • Spain: November volumes were down a couple of percent, yet cumulative milk solids ticked higher as fat and protein percentages improved.
  • Ireland: November milk was down just over 2 percent while still holding a solid lead in year-to-date milk and solids thanks to a strong spring flush.
  • Australia: November production was around 875,000 tonnes, more than 2 percent lower than a year earlier, and season-to-date volumes are also behind. Dairy Australia and analysts like Bendigo Bank have been open about the drivers: strong beef prices, weather challenges, and structural issues are all making it harder to rebuild cow numbers.
  • New Zealand: Ahead of the January auction, local analysts talked about lower milk collection forecasts and reduced whole and skim milk powder offerings compared with previous events, per NZX Dairy Insights. When those smaller catalogs arrived at GDT, and buyers still wanted volume, prices responded quickly.
  • China: Official data put December farmgate milk prices in major producing provinces around 3.03 Yuan per kilogram, slightly higher than in November and a few percent above the year before. Academic studies have shown that Chinese raw milk prices have become more tightly linked to international powder prices as imports have grown. When global powder is weak, Chinese farmers feel it quickly; when international prices firm, Chinese buyers become more active, but step by step.

So the global “wall of milk” is really a patchwork. Some bricks are growing, some are shrinking, some are fairly static.

A Practical Playbook For The Year Ahead

Let’s bring this back to the farm office and the kitchen table. What do we do with all this?

1. Use The Powder And Fat Lift To Recheck Your Risk Plan

With powder and fat both stronger than they were in the fall, this is a reasonable time to revisit your risk-management approach. You don’t need to swing for the fences.

You might:

  • Talk with your co-op or buyer about locking in a portion of your spring or early-summer milk if Class IV or powder-linked prices offer margins that work for your cost structure.
  • In the US, review Dairy Revenue Protection and Dairy Margin Coverage again. University of Wisconsin dairy economists have repeatedly noted that these tools can provide a useful safety net when both milk and feed are volatile.

Mark Stephenson, director of dairy policy analysis at the University of Wisconsin, has been emphasizing for years that producers shouldn’t wait for the “perfect” price. “If you can lock in a margin that covers your costs and leaves something reasonable, that’s worth serious consideration,” he’s noted in recent extension presentations. That kind of thinking – focusing on acceptable margins instead of a perfect price – often serves farms better over the whole cycle.

2. Make Sure Components Match Today’s Pay Signals

Over the past decade, a lot of energy has gone into improving butterfat levels through fresh cow management, solid transition programs, and refined rations. Many herds have made impressive gains. But with butter pricing where it is right now, it’s worth asking whether every extra pound of butterfat is paying back the way it did a few years ago.

Take a recent milk cheque and ask yourself:

  • How is each unit of butterfat valued compared to protein?
  • Has your processor or co-op changed those relative values in light of current market conditions?

On some Wisconsin and Northeast farms, nutritionists are still prioritizing high-fat content but also placing greater emphasis on protein yield and overall cow health, especially as processors lean into higher-protein products like yogurt, cottage cheese, and protein-enriched milks. The point isn’t to back off on fat, but to ensure your component strategy aligns with today’s economics, not yesterday’s.

3. Lean Into Dairy-Beef Only Where The Market Can Absorb It

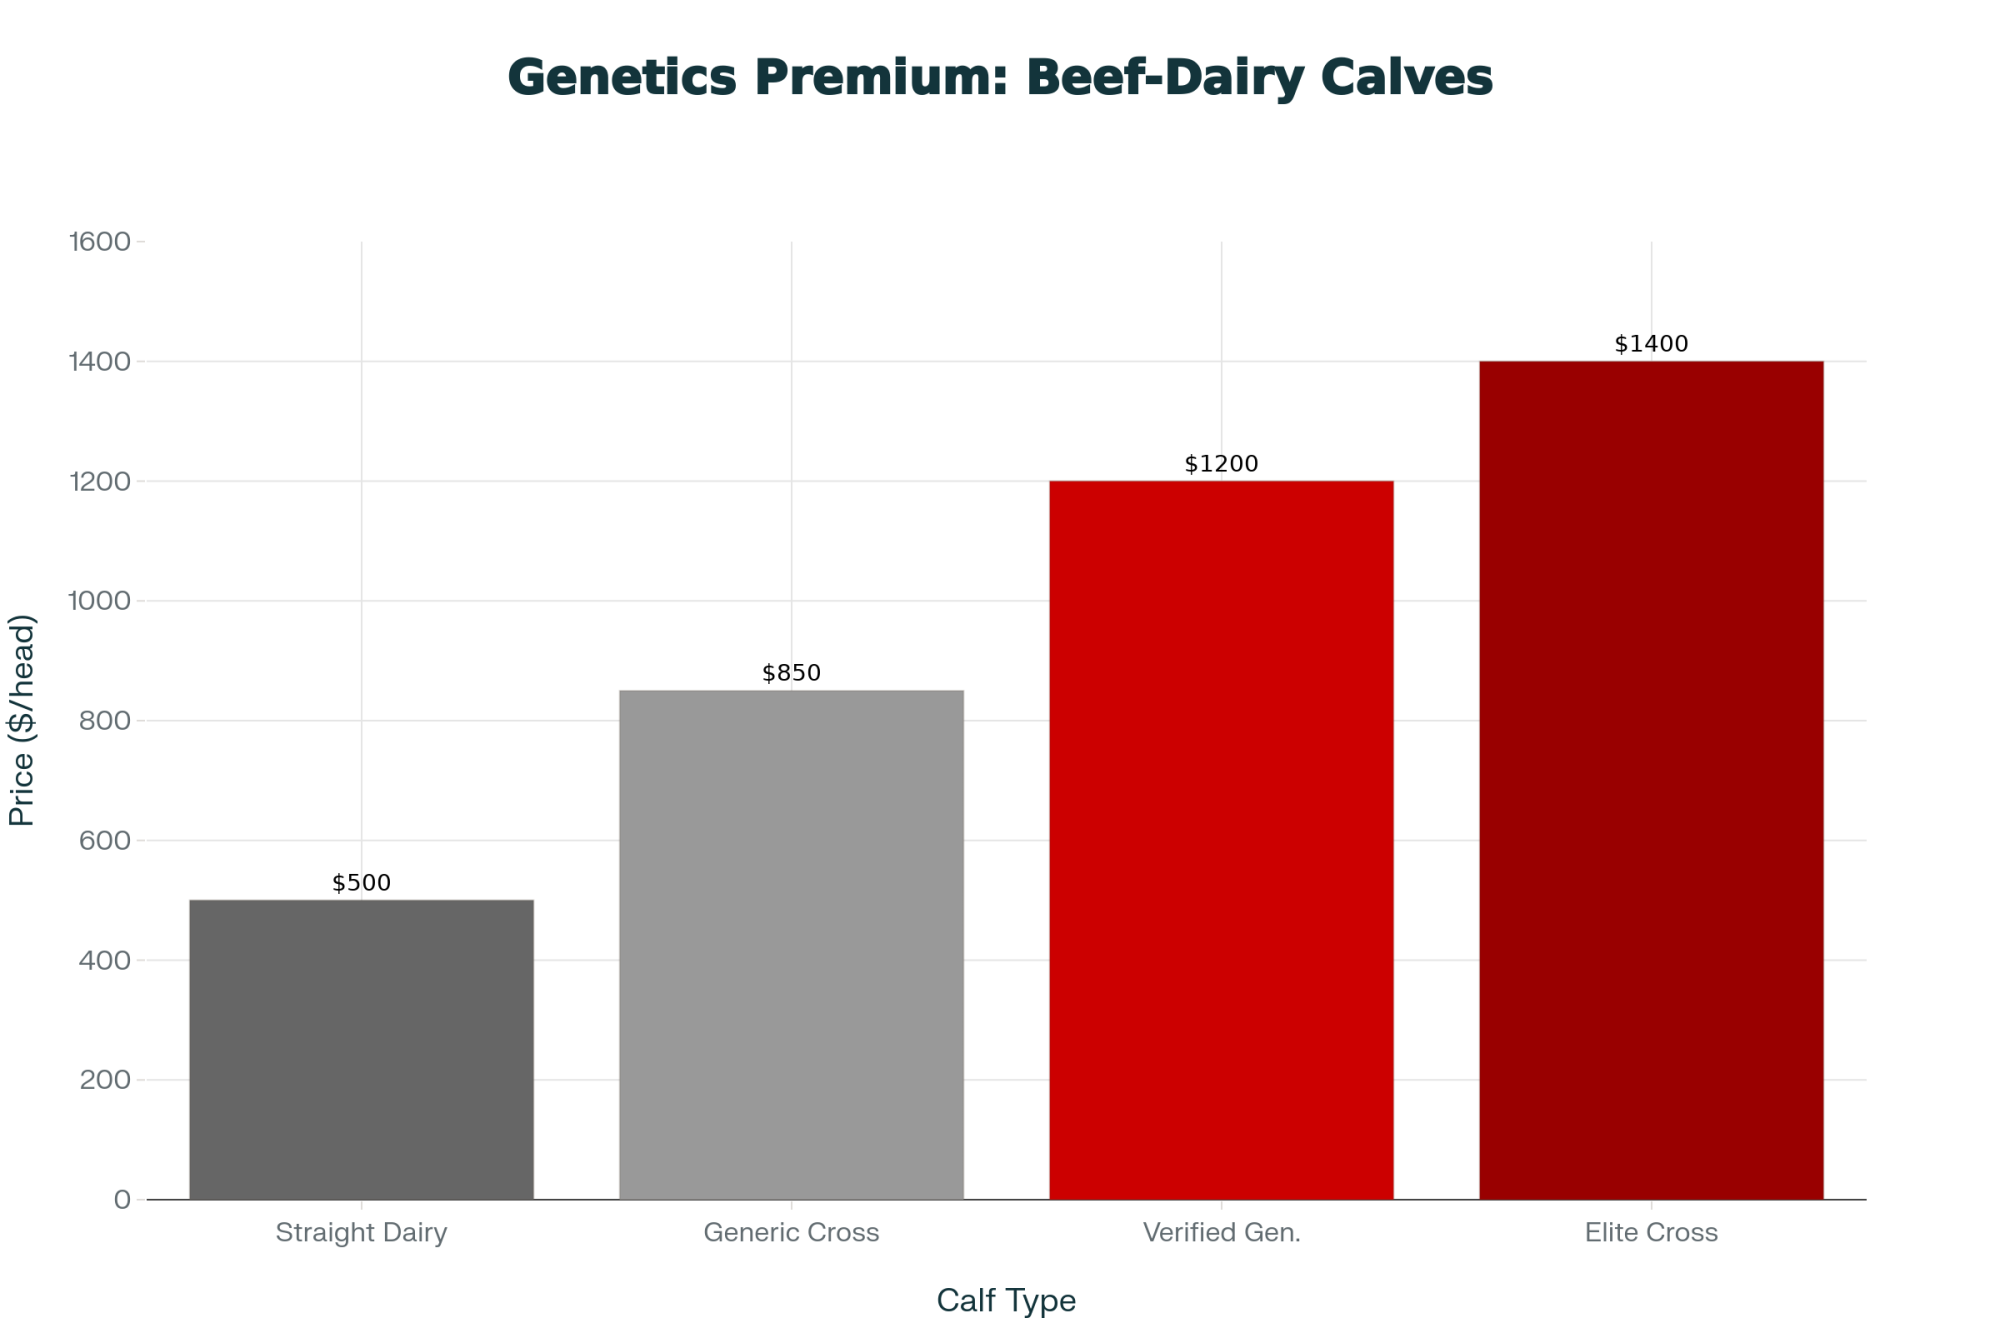
Beef-on-dairy has grown very quickly. Farm Bureau Market Intel analyses and USDA data show that many herds are using beef semen strategically on lower-genetic dairy cows. That’s generating a lot more crossbred calves than we had ten years ago.

When everything is lined up – sire choice, health programs, and marketing channels – those calves often bring a clear premium over straight Holstein bull calves. Feedlot operators in the US and Canada have said publicly that well-bred dairy-beef crosses can perform better on growth and carcass traits than traditional Holstein steers. University research from institutions like Penn State and Kansas State supports that.

But not every region is set up the same way. On parts of the Northeast and some more remote Western areas, producers still report challenges finding reliable buyers willing to pay a premium for crosses. So it’s important to match your breeding strategies to your local marketing reality.

Before expanding beef-on-dairy, it’s worth a very practical conversation with your calf buyer or local feedlot:

  • What specific genetics are they looking for?
  • What health standards and documentation do they require?
  • What kind of premium can they realistically sustain over time?

Those answers will tell you whether dairy-beef is a valuable outlet or a potential headache in your area.

4. Think In Margins, Not Just In Class Prices

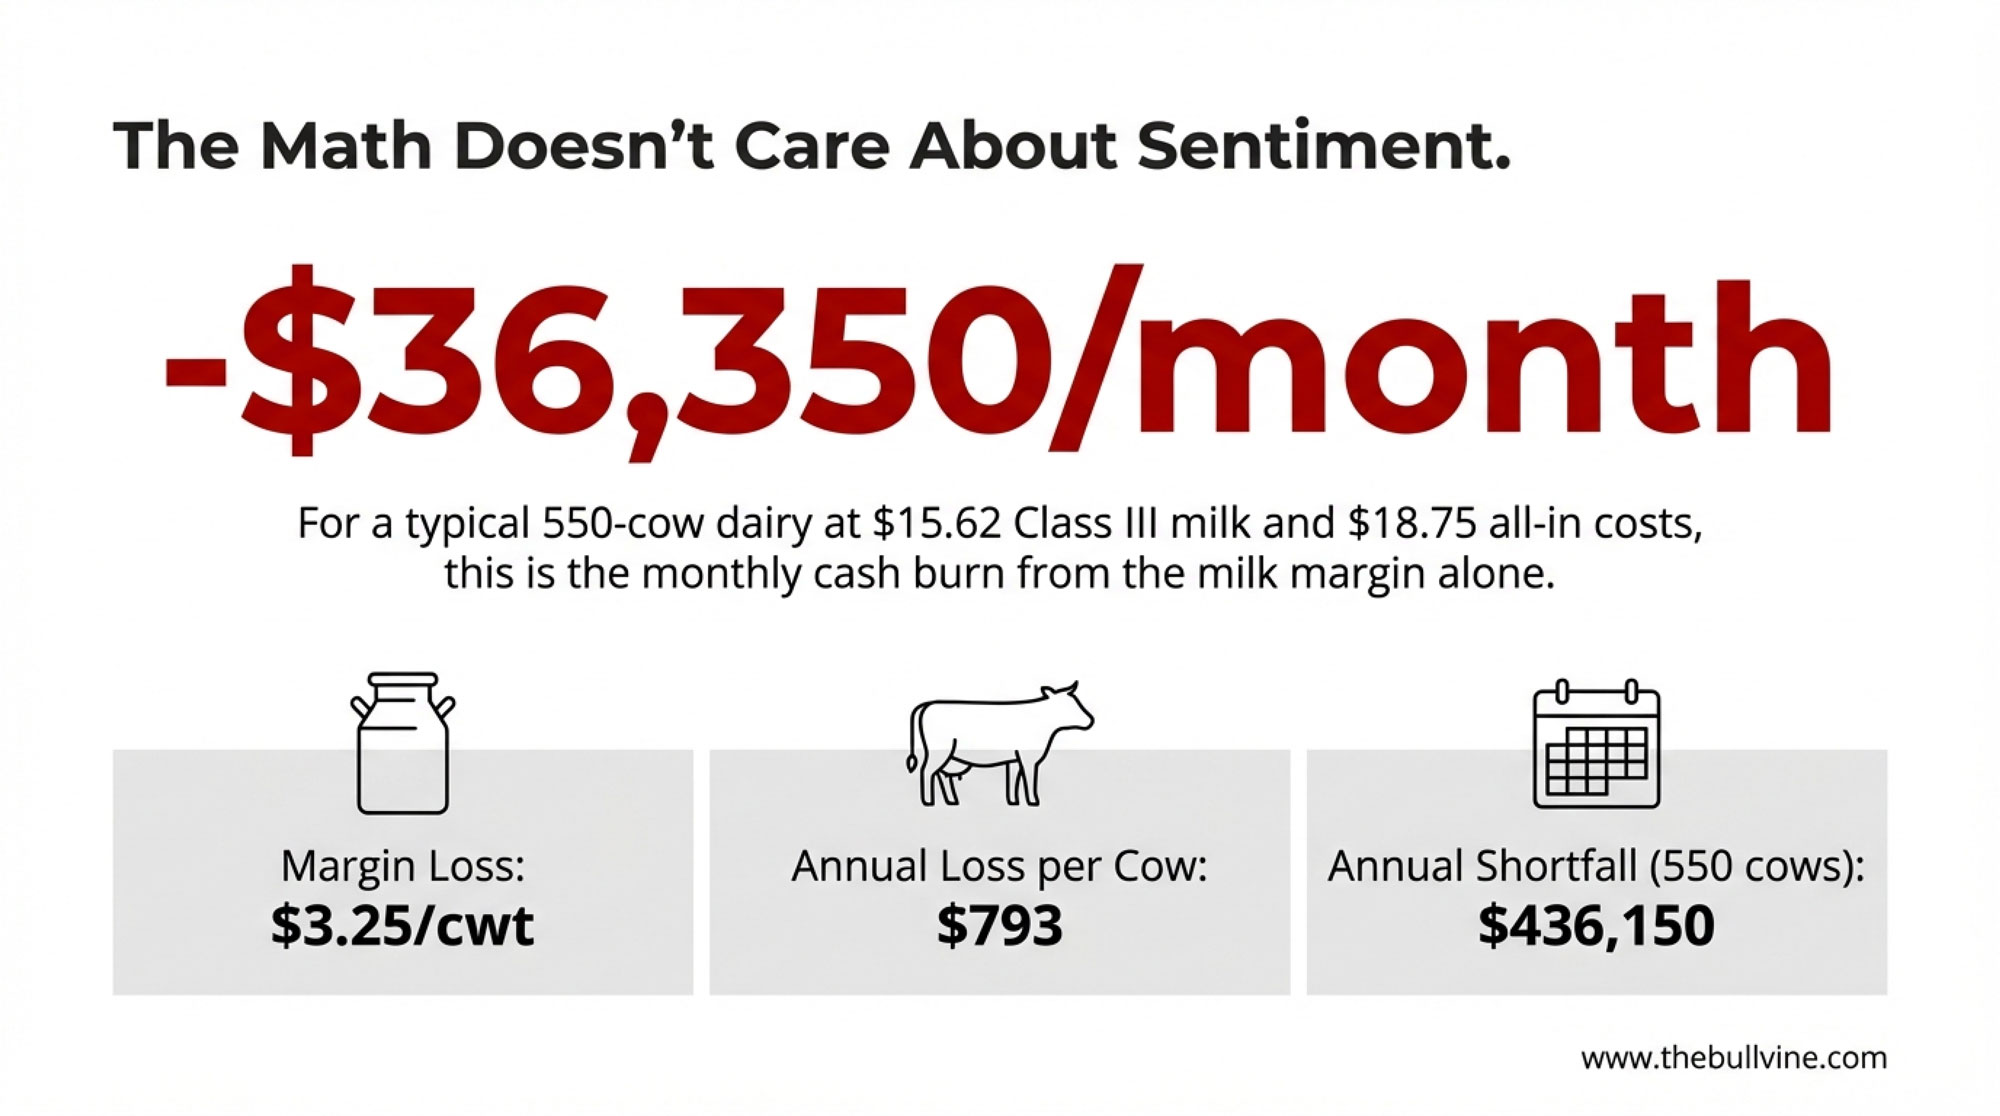
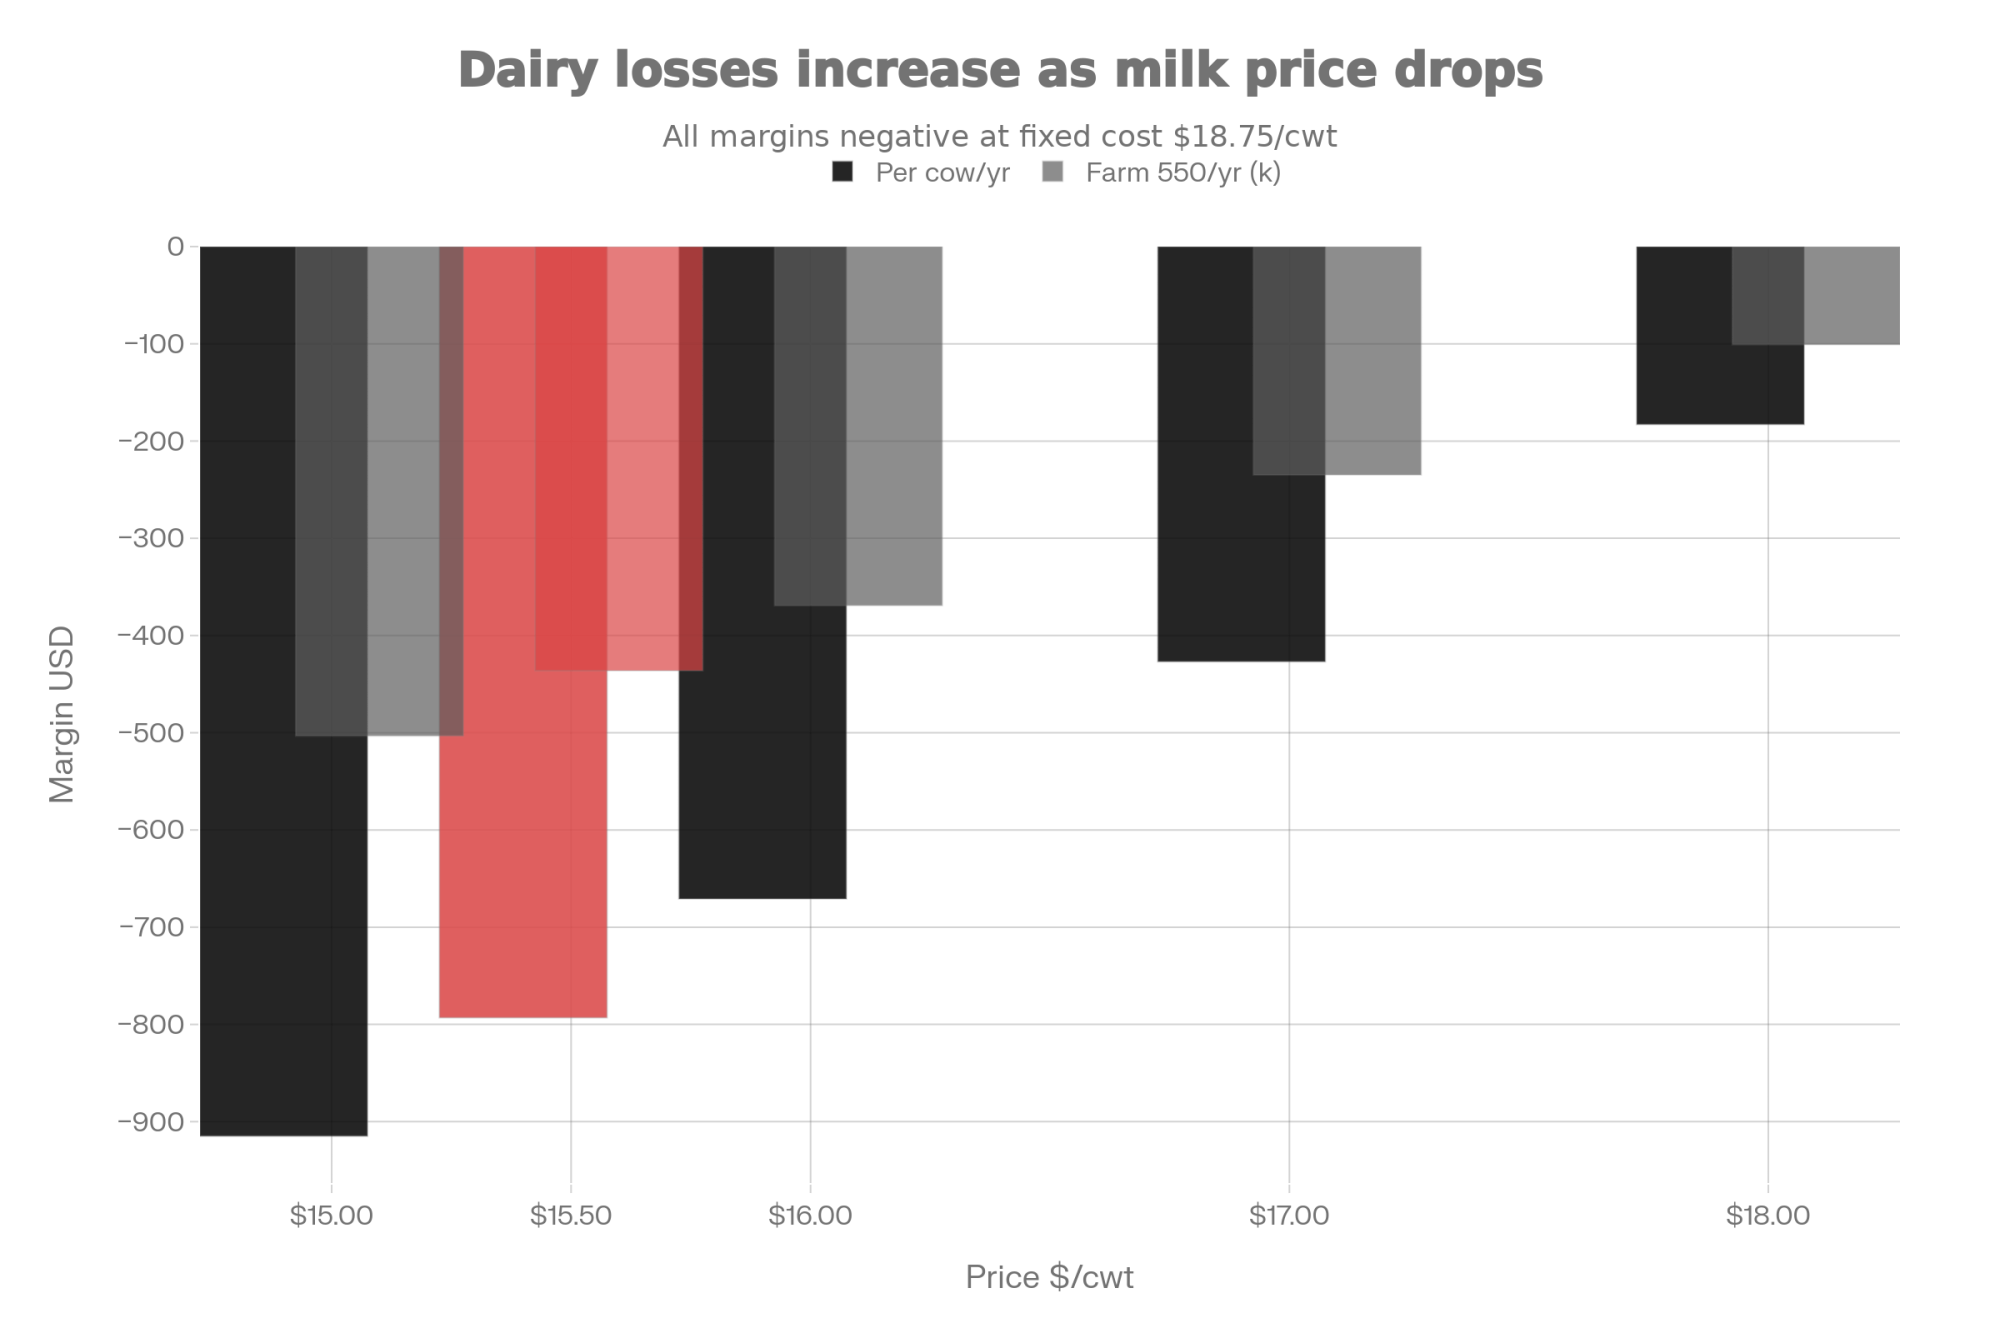
We all look at the headline Class III and IV prices. They’re a quick barometer. But as recent years have reminded us, margin per hundredweight is what keeps the lights on.

Recent USDA projections suggest that while milk prices may stay under pressure, feed costs are off the extreme highs we saw not long ago. Corn and soybean meal are still volatile, but not at the peaks that squeezed margins so brutally in 2022. That changes the math.

PeriodClass III Milk Price ($/cwt)Corn Price ($/bu)SBM Price ($/ton)Estimated Margin ($/cwt)
Q3 2024$17.50$3.45$315+$2.10
Q4 2024$17.20$3.65$325+$1.85
Jan 2026 (Est. post-GDT)$18.25$3.55$318+$2.45
2-Year Historical Average$18.80$3.20$290+$3.10
Peak (2022)$23.50$6.85$480-$0.50

This season, it’s useful to:

  • Update your cost of production with your adviser, including interest, labor, and repairs.
  • Talk with your lender about how much downside you can realistically handle before major changes would be needed.
  • Decide ahead of time what actions you’ll take if milk or feed prices cross certain thresholds, rather than waiting until stress is high.

Farms that understand their true margin – not just the milk price – tend to make steadier decisions when things get choppy.

5. Keep An Eye On Global Signals, Without Letting Them Drive Every Move

Global benchmarks like GDT, EU wholesale prices, and futures on EEX and SGX have become regular reference points for processors. That doesn’t mean you need to live in the data, but it does help to have a basic feel for where those numbers are.

A practical approach might be:

  • Glancing at a simple GDT summary after each event to see if WMP, SMP, butter, and AMF are rising or falling.
  • Following one or two reliable sources for EU butter and SMP price trends.
  • Asking your co-op rep once or twice a year how closely your local prices track these global indicators.

That way, when you hear “GDT was up six percent this week,” you already have some sense of what that might mean for export-linked values and, eventually, for your own milk cheque.

The Bottom Line

Stepping back, this early-January rally has given the industry something it’s been lacking: a little bit of positive momentum. Powder and fat have come off their lows. Futures markets in Europe and Asia have acknowledged that shift. And we’ve seen that when supply tightens, and buyers stay active, prices can still move.

At the same time, we’re not out of the woods. Milk production across key exporting regions is still ample. Cheese and whey output remains heavy. Butter stocks in Europe are comfortable. Chinese demand looks better than it did, but it’s still cautious rather than aggressive. And on many farms – from smaller family dairies in the Northeast to large dry lot systems in the Southwest – the milk cheque still feels tight for the amount of capital and effort involved.

While the rest of 2026 is far from written, early indications suggest this may be a year where small, smart moves matter: a slightly better hedge, a ration that protects components without overspending, a breeding plan that matches local markets, a stronger relationship with your buyer. None of these alone will transform a balance sheet, but together they can make a meaningful difference.

What’s particularly noteworthy is that we’re starting this year from a place of pressure, but not panic. The supply side will adjust over time. Some regions will scale back faster than others. As that plays out, the operations that keep a clear eye on margins, stay flexible, and base decisions on solid information will be the ones best positioned to benefit when the market finally swings more decisively back in favour of producers.

And that’s why conversations like this – whether at the kitchen table, in the barn office, or over coffee at a conference – still matter. We’re all trying to read the same signals and make the best decisions we can for our herds, our families, and our businesses in a very interconnected dairy world.

Key Takeaways :

  • The slide is broken—for now. GDT kicked off 2026 with a 6.3% rally, whole milk powder up 7.2%, skim up 5.4%. First increase in five months.
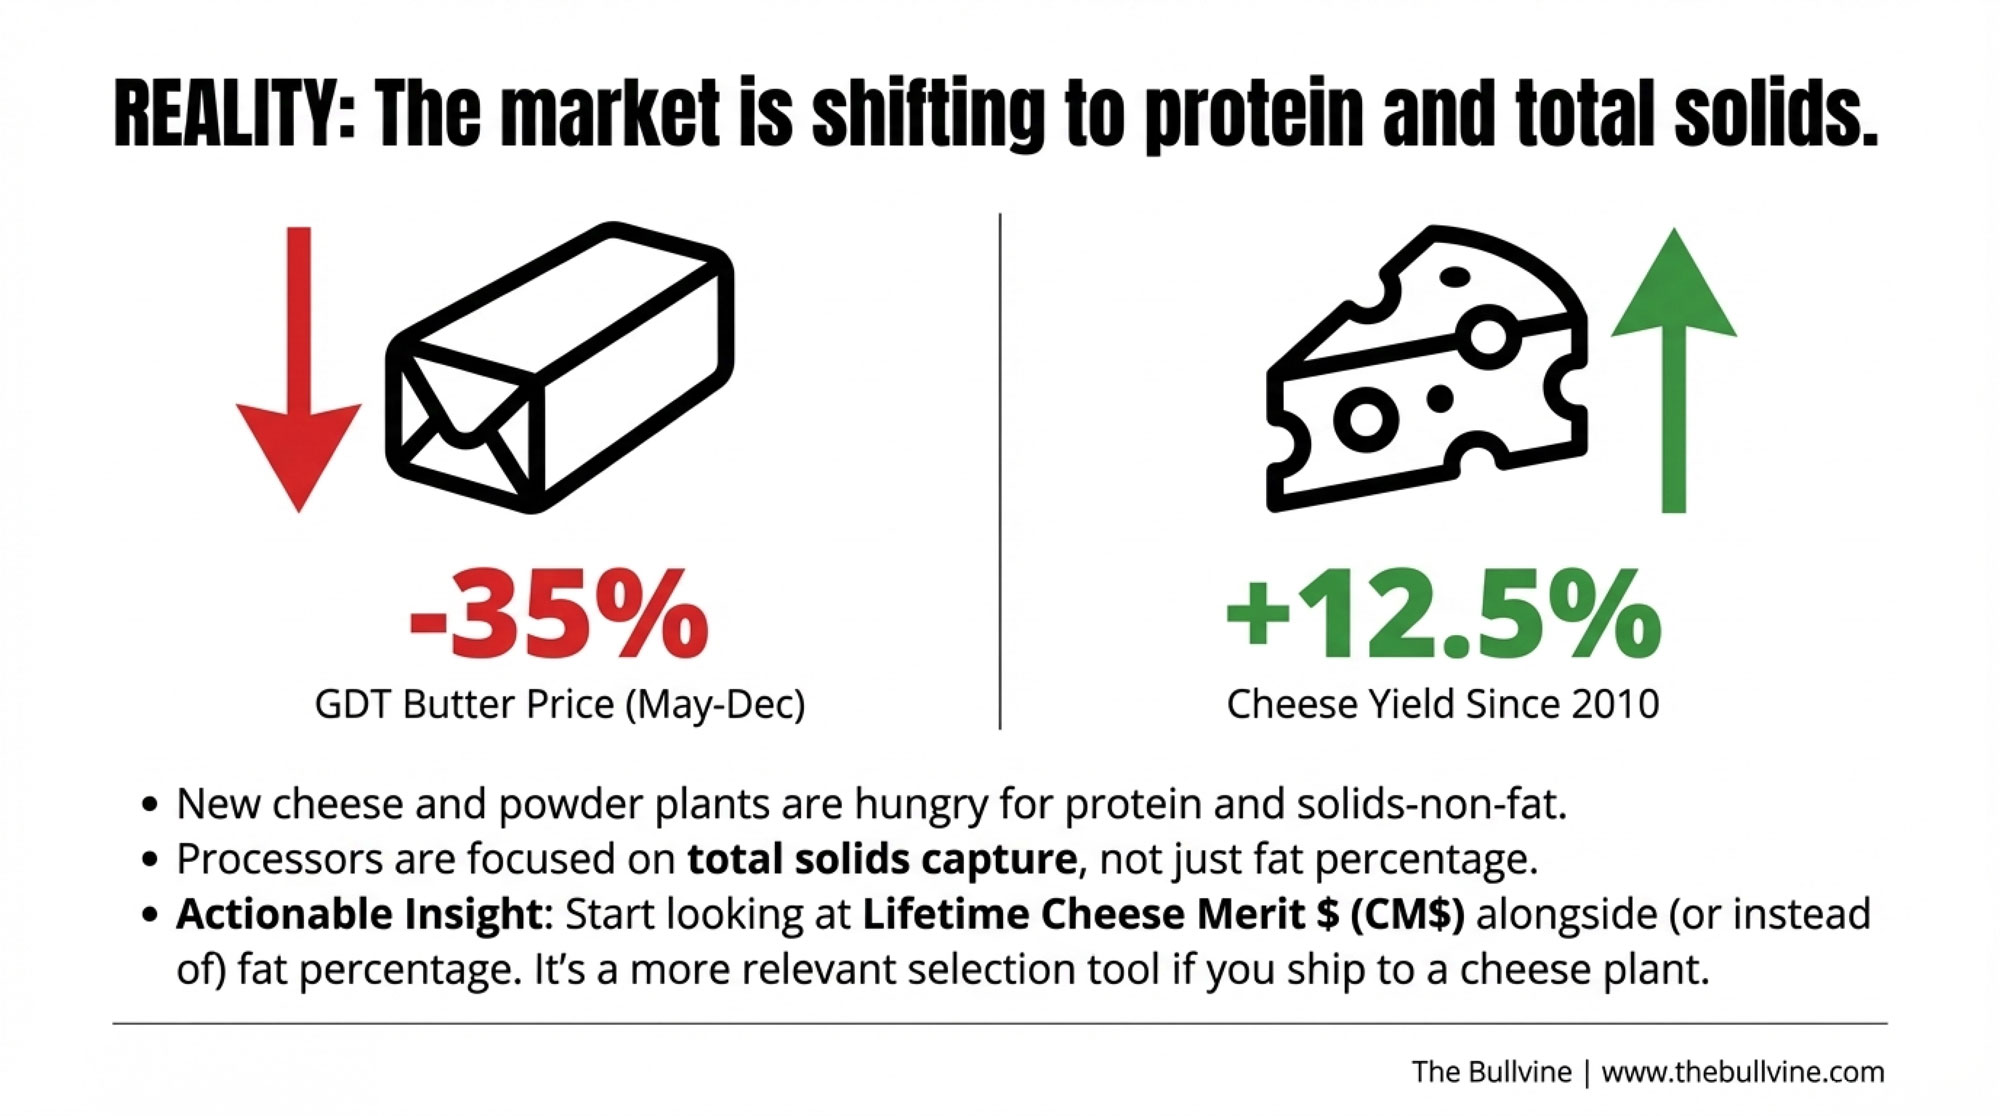
  • Supply, not demand, is driving it. US powder output fell ~10% year-over-year in October as milk shifts to cheese and protein streams. New Zealand also trimmed GDT offerings.
  • Fat markets aren’t following. EU butter stocks near 94,000 tonnes, US butter in the mid-$1.30s—don’t expect butterfat to carry your cheque like it did in 2022.
  • Futures confirm the turn. EEX and SGX dairy curves have firmed, giving processors more confidence to lock in export deals that eventually flow back to farm prices.
  • Act now, not later. Use this window to tighten margin plans, recheck your component strategy against current pay signals, and push dairy-beef only where local buyers genuinely support it.

Complete references and supporting documentation are available upon request by contacting the editorial team at editor@thebullvine.com.

Learn More

The Sunday Read Dairy Professionals Don’t Skip.

Every week, thousands of producers, breeders, and industry insiders open Bullvine Weekly for genetics insights, market shifts, and profit strategies they won’t find anywhere else. One email. Five minutes. Smarter decisions all week.
NewsSubscribe
First
Last
Consent

18 Months to Fix Your Dairy Math: Culls, Heifers and Processor Power in the New Dairy Reality

39% fewer farms. Record milk. If your strategy is ‘wait for the next good cycle,’ this article is your reality check.

Executive Summary: Dairy isn’t just in a rough patch—it’s in a structural reset where exits don’t automatically tighten supply anymore. USDA’s 2022 Census shows a 39% drop in farms selling milk between 2017 and 2022, yet total production still climbed to about 226 billion pounds from roughly 9.4 million cows, backing Rabobank’s finding that nearly 70% of U.S. milk now comes from herds with 1,000+ cows. At the same time, CoBank reports that replacement heifer inventories are at a 20‑year low and could shrink by another 800,000 head even as processors pour about $10 billion into new plants that will need more reliable, high‑volume milk supplies. High cull values, record heifer prices, and strong beef‑on‑dairy calf markets are reshaping net replacement costs and culling strategy, while regional realities—from Darigold’s $4/cwt Pasco deduction in the Pacific Northwest to stronger Class I returns in the Southeast and thin‑margin “deadly middle” herds in the Upper Midwest—are making geography as important as genetics. This feature gives producers an 18‑month playbook: clean out chronic problem cows while beef is still strong, treat a 0.1 gain in feed efficiency as a $35–55/cow/year opportunity, and sit down with processors and lenders before they end up making the big decisions for the farm. The aim isn’t to preach a single “right” model, but to put the math, regional context, and survival questions on the table so every herd—from 200‑cow grazing outfits to 4,000‑cow dry‑lot systems—can decide whether to grow, pivot, or exit on its own terms.

Most of us have ridden out more than one down cycle. You know the pattern: prices drop, some herds sell out, milk supply tightens, and eventually things come back around.

Back in the 2000s, Cooperatives Working Together (CWT) ran 10 herd retirement rounds between 2003 and 2010 that removed 506,921 cows and an estimated 9.672 billion pounds of milk, according to CWT program reports and University of Missouri economic analysis cited in both Progressive Dairy coverage and academic case studies on U.S. dairy market power.  Those removals were designed to pull milk off the market and did help support farmer milk prices during the 2009 crash, based on those evaluations.  The playbook then was pretty straightforward: enough cows and herds left the industry, and the market eventually corrected.

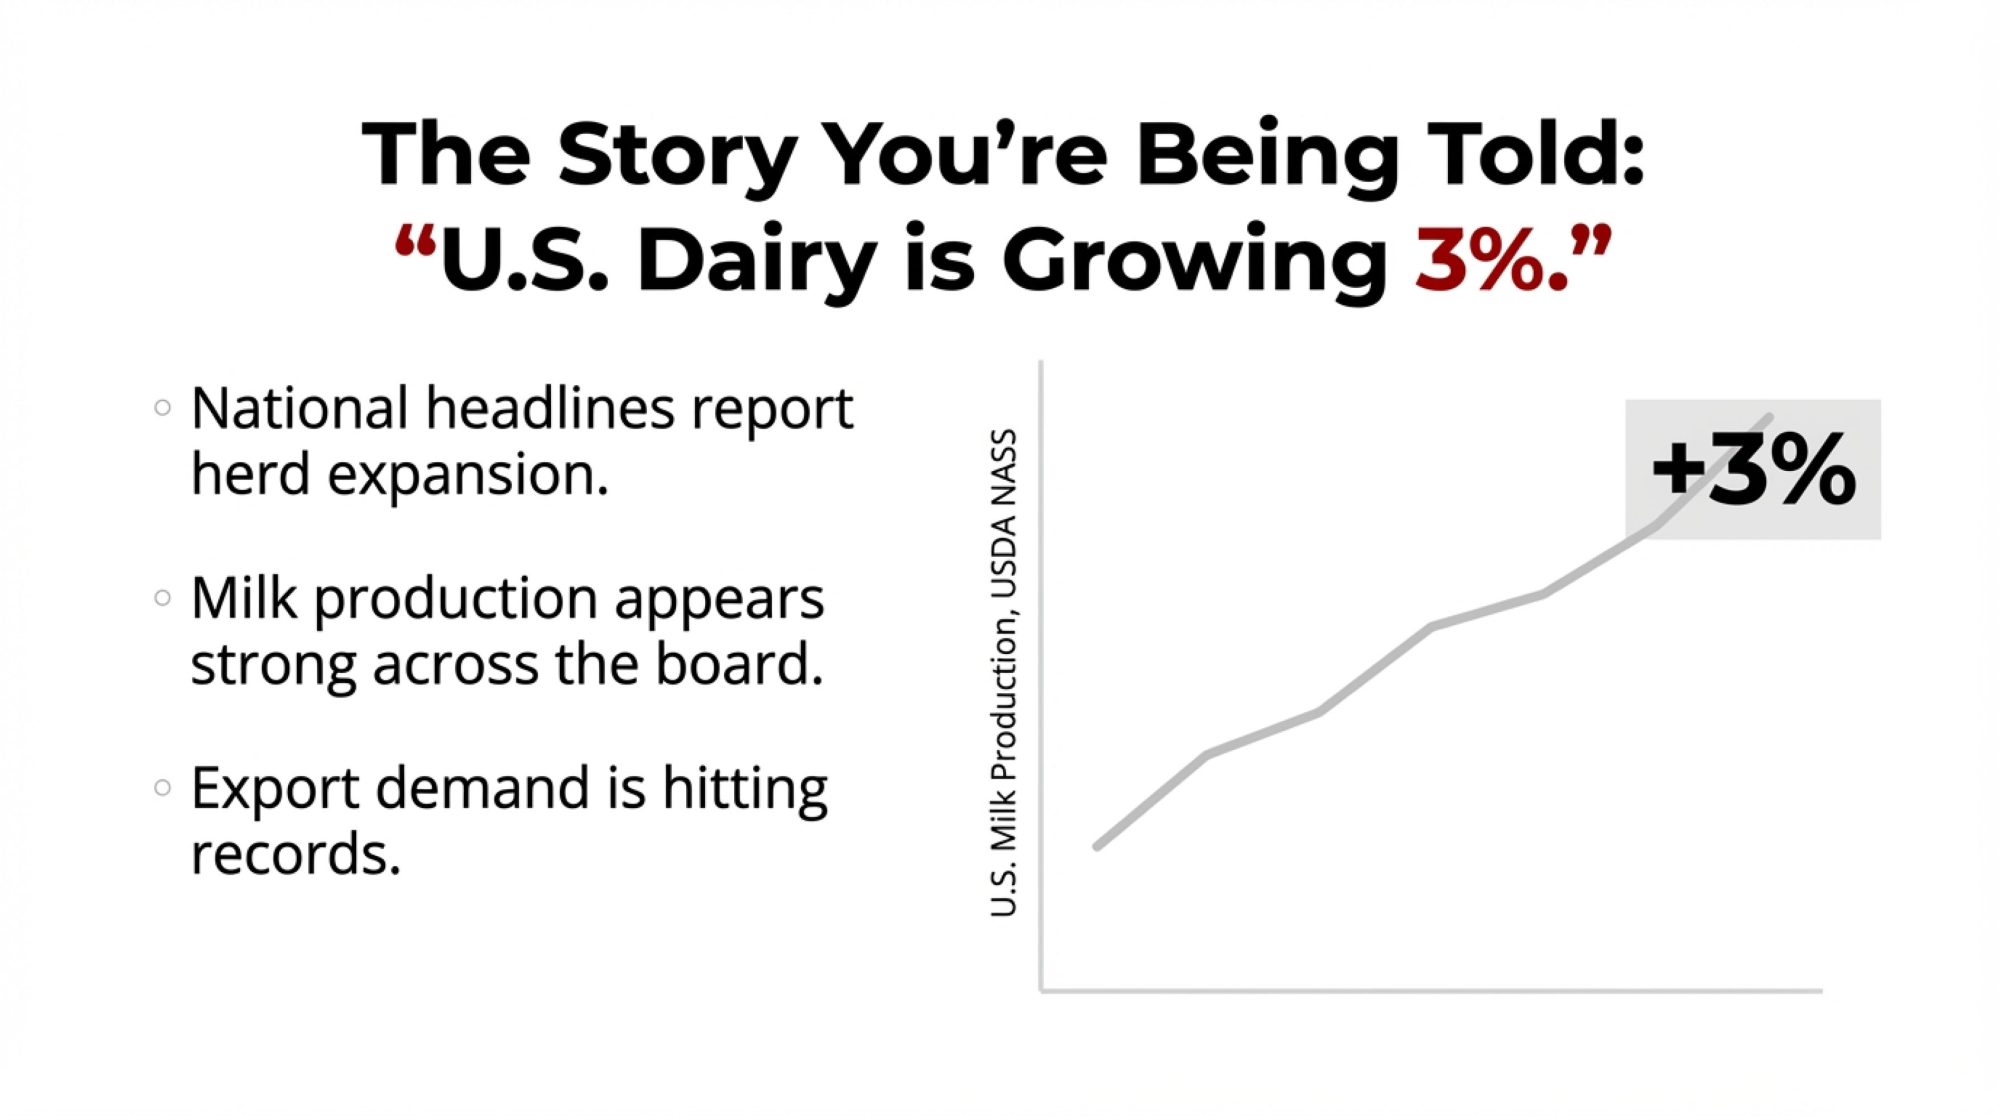
What’s interesting now is that we’re seeing plenty of exits again—but the milk isn’t disappearing the way it used to. USDA’s 2022 Census of Agriculture and milk-production summaries show that while farms with sales of milk from cows dropped from 40,336 in 2017 to 24,470 in 2022—a decline of about 39%—national milk output still climbed to around 226 billion pounds in 2022 with about 9.4 million milk cows, essentially steady cow numbers compared to prior years.  Industry outlets covering the same census data have underscored that almost 4 in 10 dairy farms disappeared over those 5 years, yet total U.S. milk sales rose about 5%.

The Great Dairy Paradox: Between 2017 and 2022, U.S. dairy farms dropped 39% while national milk production increased 5% – proving the old “herd retirement tightens supply” playbook is broken

So the quiet question a lot of folks are asking—over coffee at winter meetings or in the parlor office—is: if this isn’t just another cycle, what exactly are we dealing with?

And honestly, if you’re still betting the next round of sellouts will rescue your milk price, you’re betting against the numbers.

Let’s walk through what the data says, how it’s playing out in different regions, and the kinds of decisions that seem to matter most over the next 18 months.

Looking at This Trend: Old Playbook vs. New Reality

Looking at this trend over time, it’s pretty clear that the industry’s default settings have changed. The tools that worked from roughly 2000 through the mid‑2010s just don’t behave the same way anymore.

The Structural Reset

MetricOld Playbook (2000–2015)New Playbook (2026+)
Supply controlHerd retirements and voluntary supply cuts through programs like CWTOn-farm culling targeted at performance, health, and butterfat; exits absorbed by larger herds
Growth strategyAdding more stalls and more cowsMaximizing energy-corrected milk per cow and per pound of dry matter; feed efficiency as the primary lever
Primary incomeAlmost entirely from the milk checkMilk check plus stronger beef value from beef-on-dairy calves and high cull prices; some herds adding niche or premium markets
Heifer strategyRaising nearly every dairy heifer born into the herdSexed dairy semen on top cows, beef semen on lower-end cows; raising or buying fewer, higher-value replacements
Risk exposureCyclical price swings; debt servicingCo-op capital risk, processor consolidation, regional policy divergence, replacement heifer shortages

The old mindset assumed that enough CWT rounds or herd sales would tighten supply and lift prices. The data suggest something different: larger herds with lower costs per hundredweight are ready to step in when neighbors exit, blunting the supply‑tightening effect of those departures. University of Illinois economists looking at the 2022 Census noted that herds with 2,500 cows or more actually increased their share of the national milk supply even as total farm numbers dropped, confirming what many of us have seen anecdotally.

That’s a big shift in how risk and opportunity line up.

What the Census Is Really Telling You

The 2022 snapshot gets pretty eye‑opening when you dig into it. USDA’s dairy census highlights show that farms with sales of milk from cows fell from 40,336 in 2017 to 24,470 in 2022, a 39% drop in just five years.  Over that same period, NASS milk‑production data show total U.S. milk production at roughly 226 billion pounds in 2022, with an average of 9.4 million cows—almost the same number of cows producing more milk.

Rabobank’s consolidation analysis provides more detail. Senior dairy analyst Lucas Fuess points out that about 67–68% of U.S. milk is now produced on farms with 1,000 or more cows, even though those herds account for only a small single‑digit share of total operations.  Summary of the same work notes that farms with more than 1,000 head produced 67% of U.S. milk in 2022, up from 60% in 2017.

So what many of us have seen on the ground—the milk concentrating on fewer, larger farms—is exactly what the national numbers are telling us.

You probably know this pattern already if you’ve watched what happens when a neighbor exits. Many larger operations in Wisconsin, the West, and the Plains report absorbing cows from exiting neighbors—keeping the best animals, tightening up their fresh cow management and transition period, and culling more sharply for poor butterfat performance, health, and reproduction. The net result is that the milk doesn’t really leave the system. As one producer put it at a recent regional meeting, when a herd sells out, “the milk just changes addresses.”

That’s why one of the old assumptions—“enough farms sell out, and prices will snap back”—just isn’t as reliable as it used to be. The supply side has become much more resistant to exits because large herds, often with strong genetics and efficient systems, are ready and able to absorb the volume.

Regional Darwinism: Why Geography Is Now Destiny

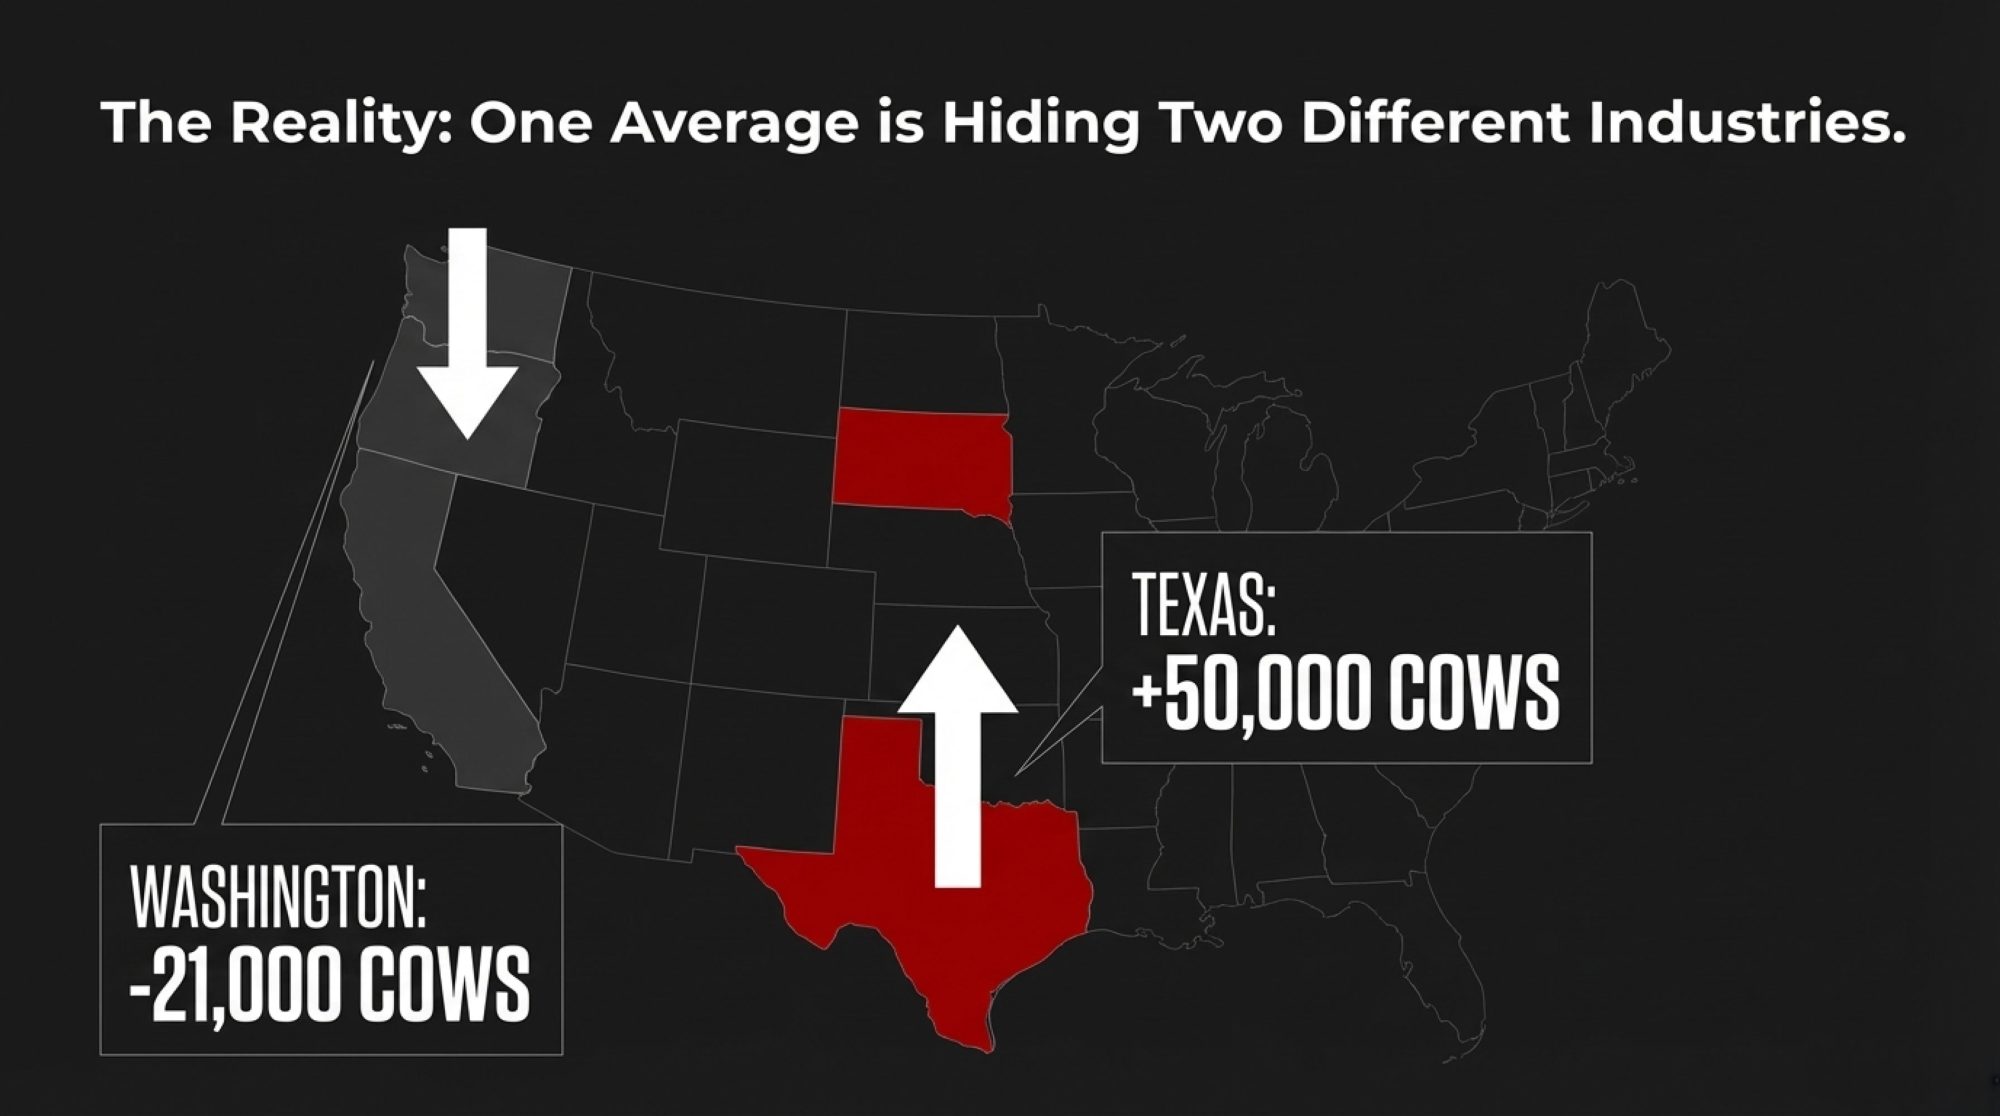
What farmers are finding is that national averages hide a lot. Your region—and quite often your processor mix—now matters almost as much as your butterfat and protein levels when it comes to long‑term viability.

RegionStructural TailwindsStructural HeadwindsClass I Utilization2025 Outlook
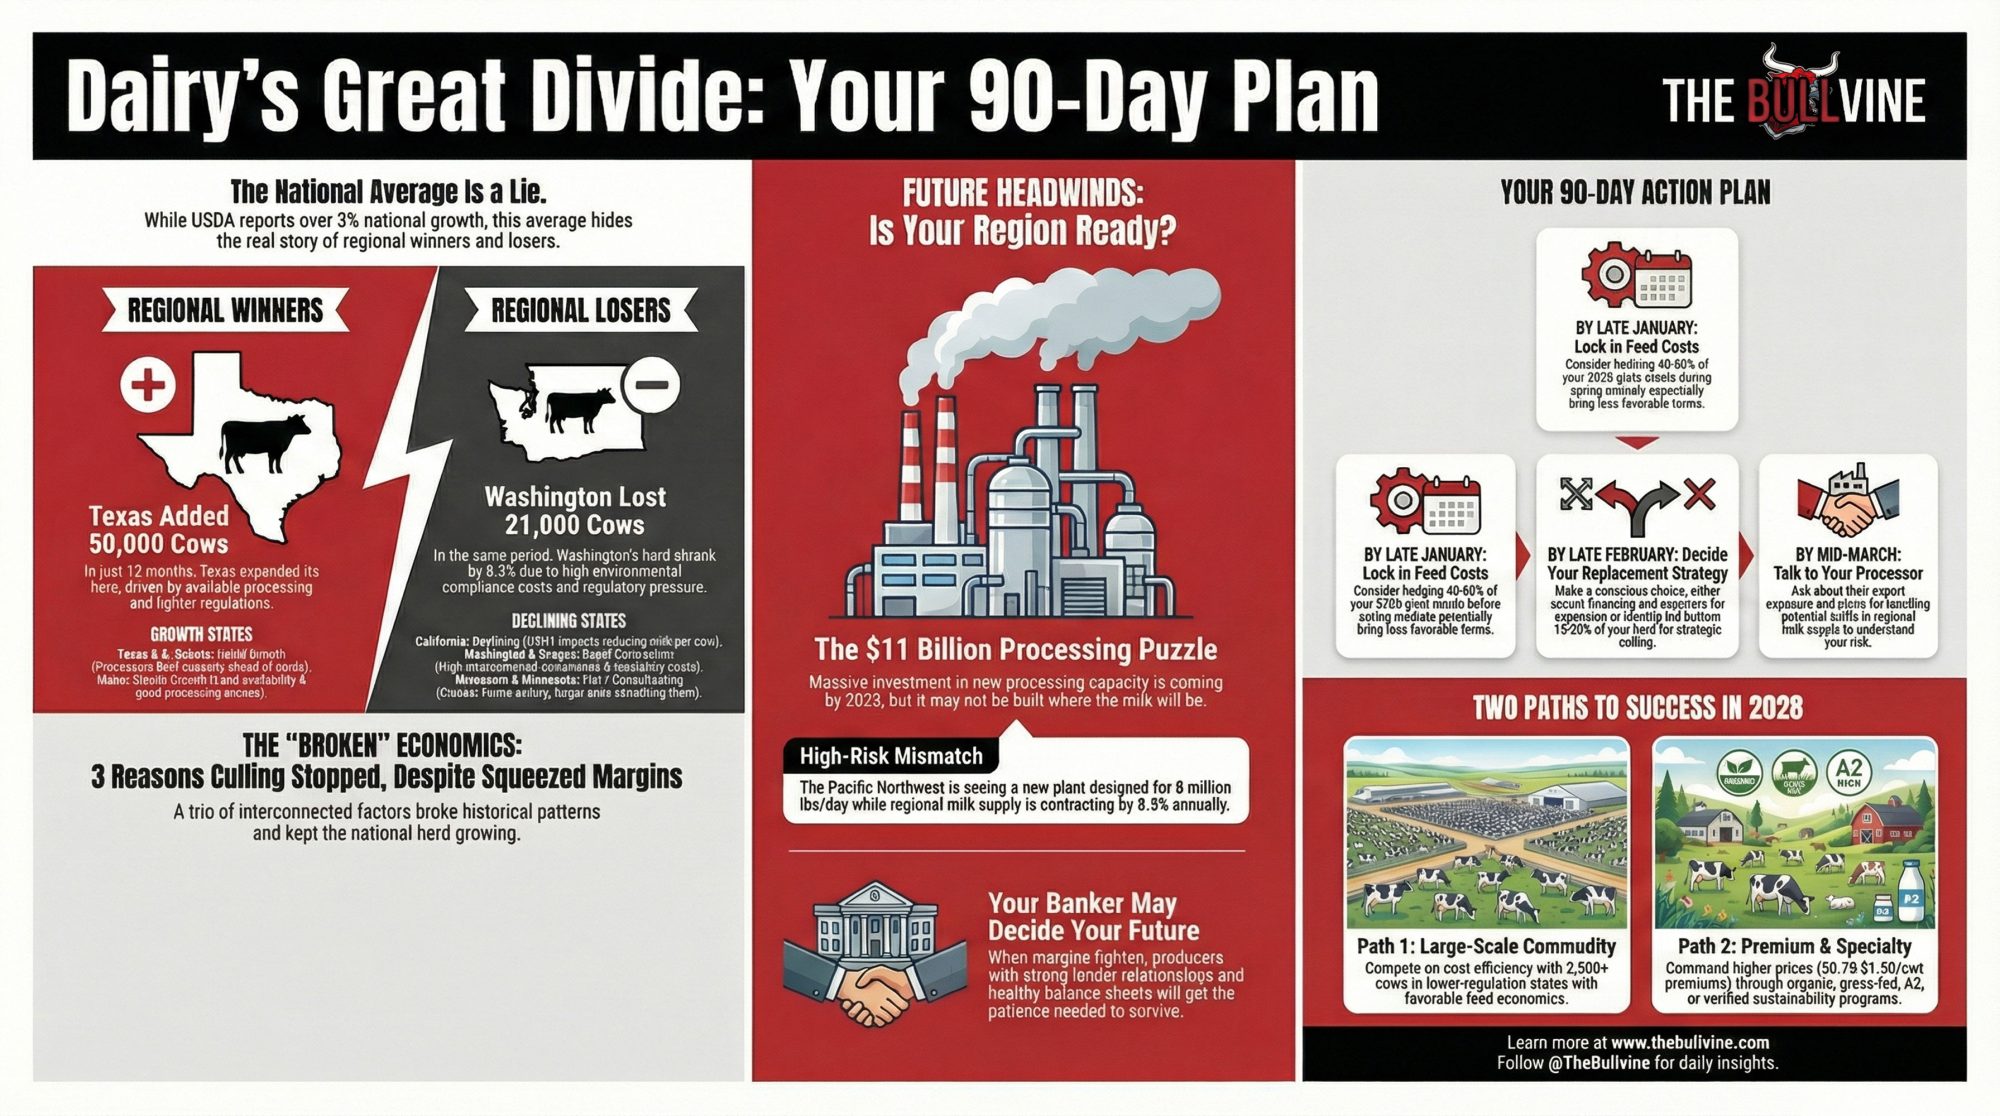
Pacific NorthwestExport-oriented processing capacity (Pasco plant)$4/cwt co-op deduction, low Class I (~20%), environmental scrutiny~20–22%High risk: Co-op capital costs hitting checks directly
SoutheastHigh Class I demand, restored “higher-of” pricing, dense populationLimited land for expansion, summer heat stress~28–32%Favorable: Policy and demographics working together
Upper MidwestStrong processing base, established supply chains, agronomic fit“Deadly middle” herd size squeeze, thin margins, weather volatility~23–26%Mixed: Efficiency separates winners from exits
CaliforniaMassive scale, sophisticated genetics, year-round productionHigh land/labor costs, strict environmental regs, water constraints~21–24%Stable consolidation: Fewer, larger, more efficient herds

Pacific Northwest: When Headwinds Stack Up

In the Pacific Northwest, especially Washington and Oregon, producers are facing several headwinds at once.

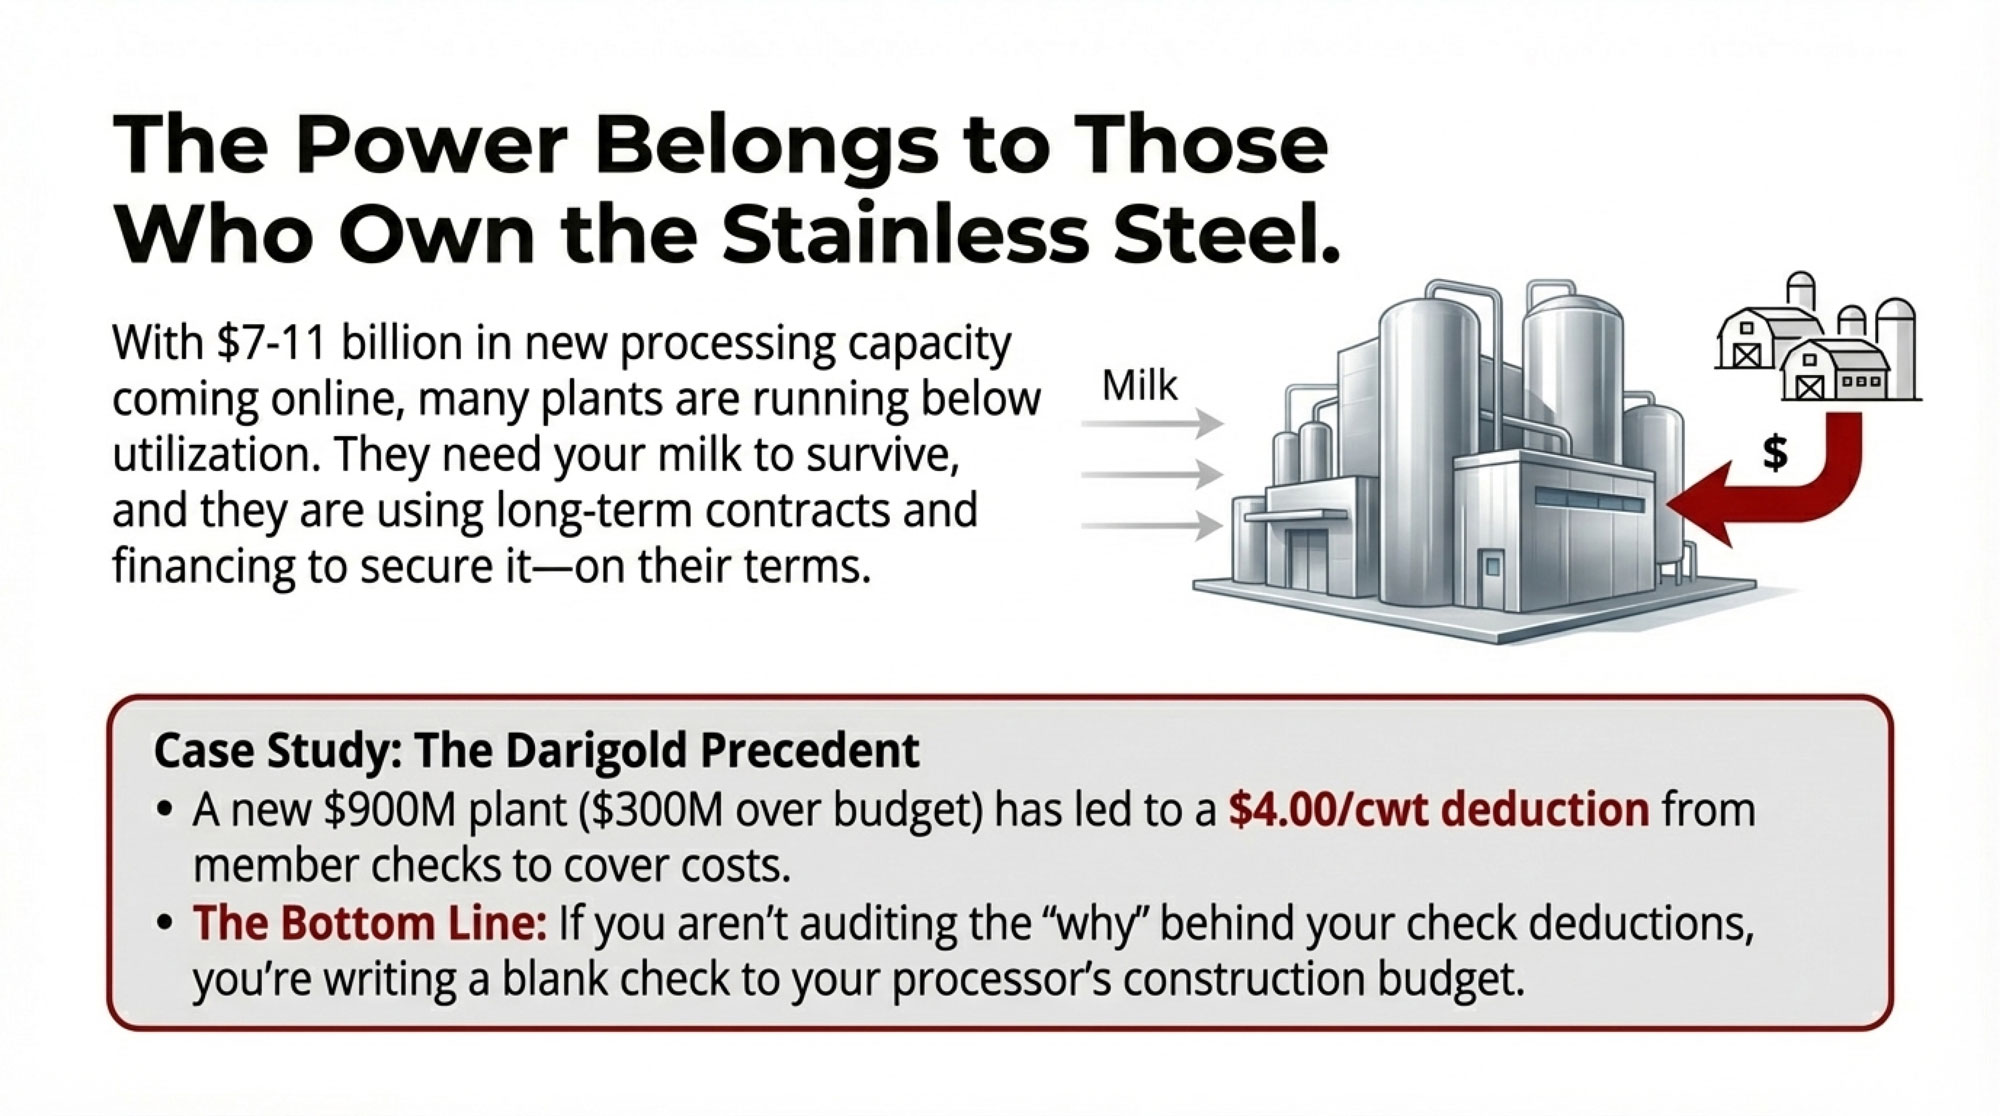
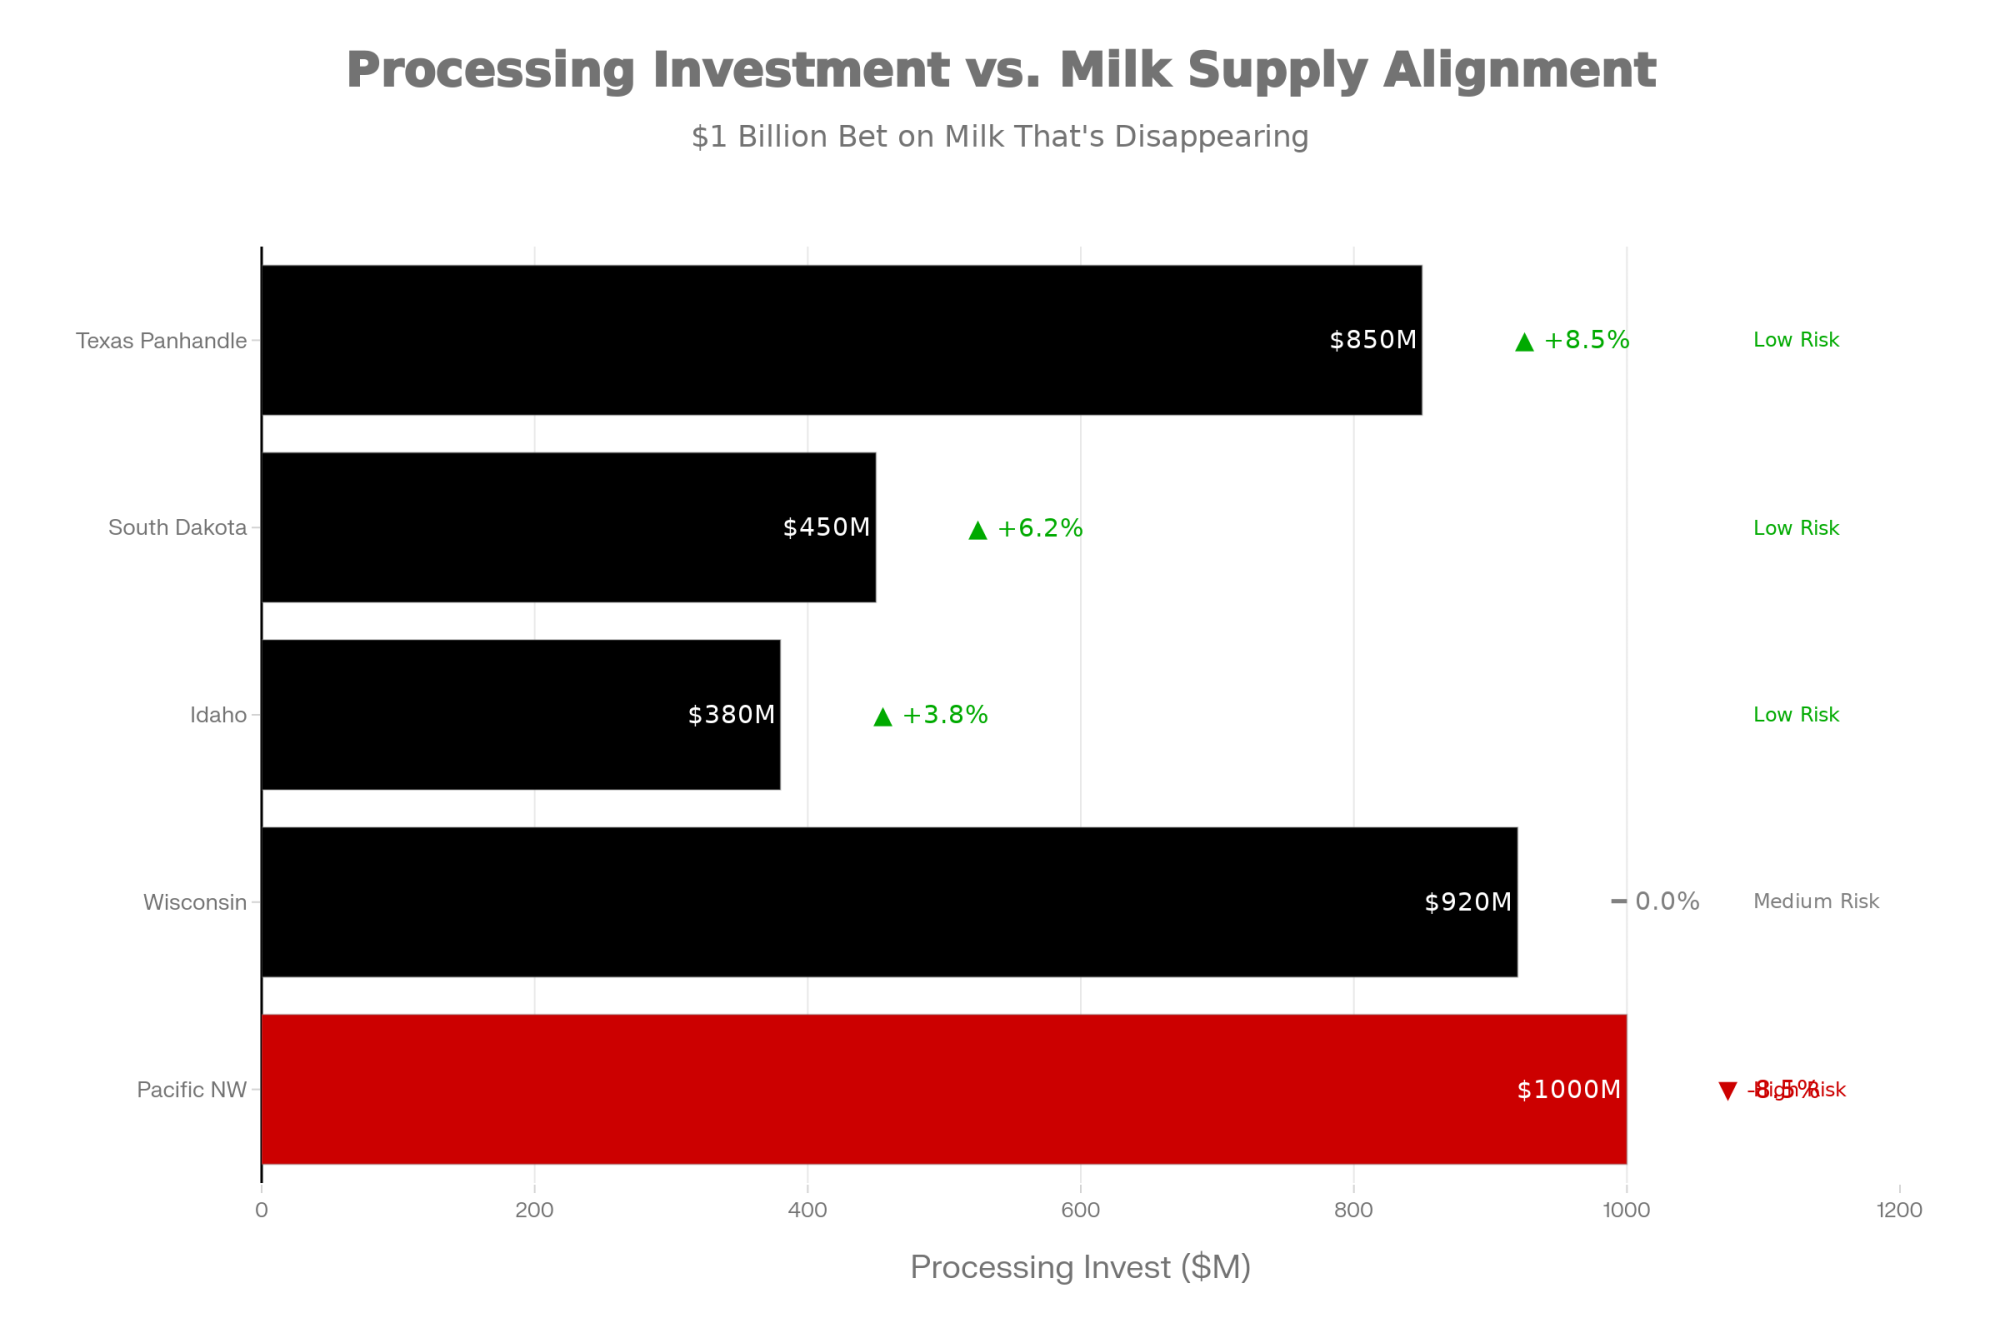
The one everyone’s talking about is Darigold’s new plant at Pasco, Washington. Darigold announced and broke ground on a $600‑million production facility at the Port of Pasco in 2022, designed to handle milk for butter and powder and serve export markets, according to cooperative announcements and Bullvine coverage.  By May 2025, Capital Press was reporting that the plant was about $300 million over budget, based on people familiar with the project, pushing total costs toward $900 million.  Follow‑up coverage has described the Pasco facility as the largest dairy plant in the Northwest, coming online at a much higher price tag than originally forecast.

To help cover those overruns and broader financial strain, Darigold’s board approved a $4‑per‑hundredweight deduction on member milk checks for at least several months, with $2.50 of that earmarked explicitly for Pasco construction costs, according to a mid‑April member letter.  The $4/cwt reduction hit member pay prices in mid‑2025.  For a 500‑cow herd shipping 125,000 cwt a year, that’s roughly $500,000 less milk income across 12 months—before you even talk about feed, labor, or interest.

Darigold’s Pasco plant ballooned from $600M to $900M, triggering a $4/cwt member deduction that costs a typical 500-cow operation roughly $500,000 annually

Several Washington producers shipping to Darigold have told reporters at Dairy Herd Management and local papers that the $4/cwt reduction, stacked on top of regular cooperative deductions, made it very hard to cash flow their operations.  Those are the kinds of numbers that separate “tight” from “unworkable.”

Then there’s the federal order piece. USDA federal order data shows Class I (fluid) utilization in the Pacific Northwest order hovering around 20–22% in recent years, while “All Markets Combined” Class I utilization nationally is typically in the mid‑ to upper‑20% range.  That gap matters because it means more milk in that region gets priced into lower‑valued Class III and IV pools rather than the Class I fluid market.

Regulation adds another layer. In Washington’s Yakima Valley, nitrate contamination concerns have led to consent decrees and added oversight of several large dairies, with some operations closing or restructuring under pressure from regulators and environmental groups, as described by Capital Press and Washington State Dairy Federation representatives.  So producers there are trying to operate under below‑average Class I utilization, substantial environmental scrutiny, and a major co‑op project that’s gone significantly over budget.

The Pasco Lesson: When Co‑op Projects Become Producer Risk

The Darigold Pasco story has become a cautionary lesson about how cooperative‑led capital projects can shift risk back onto member farms.

  • Initial plan: A $600‑million, world‑class plant to process up to 8 million pounds of milk per day and export butter and powder to more than 30 countries.
  • Updated reality: Cost overruns pushing total investment toward $900 million, plus a $4/cwt deduction on member milk checks, with $2.50 directly tied to the plant and the remainder covering other financial shortfalls.

What this development suggests isn’t that co‑ops shouldn’t invest. It’s that:

  • The scale and risk of major projects need to be clearly communicated to members at the farm level.
  • There should be a realistic plan for what happens if budgets slip or markets change.
  • Producers need to know how much of their milk check might be diverted to debt service if things don’t go according to plan.

In plain terms, Pasco is a reminder of what co‑op membership really means: you’re not just selling milk—you’re partnering in capital decisions. That kind of surprise bill would hurt any operation, no matter how well run.

Southeast: Structural Tailwinds and Careful Optimism

Now slide across the map to the Southeast—Florida, Georgia, the Carolinas, parts of the lower Appalachians—and the structural picture looks very different.

USDA federal order summaries consistently show higher Class I utilization in Southeast‑oriented orders because of dense population and strong fluid‑milk demand.  That built‑in demand has always mattered, but recent policy changes have made it even more important.

USDA’s federal order modernization decision restored the “higher‑of” Class I skim pricing formula and updated Class I differentials. Analysis found that these changes tend to increase Class I values more in fluid‑deficit markets in the East and Southeast than in regions dominated by manufacturing.  Progressive Dairy and Dairy Herd coverage of the 2024–2025 seasons described many Southeastern producers as having one of their better financial years in a while, with improved Class I pricing, decent overall milk prices, and somewhat softer feed costs lining up in their favor.

So if you take two 500‑cow herds—similar genetics, comparable butterfat performance, similar feed efficiency—and put one in a strong Southeast Class I market and the other in a Western market with lower Class I utilization, it’s common for the Southeast herd to see significantly higher gross revenue at the same production level. That’s geography and policy working together, not just management.

Upper Midwest: The “Deadly Middle” in America’s Dairy Heartland

In Wisconsin and Minnesota, the story is familiar but still evolving. This region still feels like the heart of U.S. dairying, but a certain band of herds is under real structural pressure.

USDA and state data show licensed dairy herds in Wisconsin falling from more than 10,000 in the early 2010s to under 7,000 by 2022, even as total state milk production stays near or at record highs.  Farmdoc’s national work highlights the same pattern: sharp drops in herd numbers, modest changes in total cow numbers, and higher milk production overall.

Zisk Analytics’ profitability maps, featured regularly in Dairy Herd and other farm media, often show the Southeast and parts of the Southwest near the top for projected profit per cow, with many Upper Midwest herds—especially smaller and mid‑size ones—clustered in thinner‑margin categories.  Plenty of Midwest producers say they’re still “making it work,” but they also admit there isn’t much cushion left if something goes sideways.

The 400–600 Cow Squeeze: Dairy’s “Deadly Middle”

This is the segment that’s really stuck in the middle.

Typical profile of the 400–600 cow “no‑man’s land” herd:

  • 400–600 Holsteins, often in 20‑ to 30‑year‑old parlors or older freestalls
  • Solid, but not elite, feed efficiency and components
  • Bulk milk is sold into commodity pools, with limited premiums
  • Mix of family and hired labor, with real payroll costs
  • Some debt, but not extreme

Too big to run purely on family labor. Too small to fully capture the per‑cow cost advantages that 1,500‑ or 3,000‑cow herds can achieve. Not differentiated enough to earn strong value‑added premiums consistently. That picture lines up with Rabobank’s census‑based finding that farms with 100–499 cows have lost share of U.S. milk output while 1,000‑plus cow units gained share.

In many Wisconsin operations and across the Upper Midwest, what I’ve noticed is that these herds often feel boxed in. They can’t easily cut costs without hurting cow comfort or fresh cow management. They can’t easily scale without major capital. And they’re not always well‑positioned for organic, grass‑based, or on‑farm processing.

If you’re in that 400–600 cow band, the uncomfortable reality is that staying “average” has become a very risky strategy. Hoping your way out of structural math isn’t a plan—it’s a gamble. That doesn’t mean you’re out of options. It does mean this group needs especially clear decisions: whether to pursue scale, chase premiums, partner with neighbors, or plan a well‑timed transition. Just waiting for the next “good cycle” is a much bigger bet than it used to be.

California: Big, Efficient, and Still Under Pressure

We can’t talk about U.S. dairy without mentioning California. The state still has more dairy cows than any other and remains a powerhouse for cheese, butter, and milk powder.

Reports from the California Department of Food and Agriculture and USDA’s milk production summaries show that California’s dairy cow numbers have leveled off or edged down slightly in recent years, while per‑cow production remains among the highest in the country.  Many of those cows are in large freestall and drylot systems with strong genetics, sophisticated feeding programs, and very deliberate fresh-cow management.

At the same time, California herds are navigating:

  • Groundwater and surface‑water regulations that shape where and how dairies can operate
  • Air quality and manure‑management rules that add cost and complexity
  • High land and labor costs relative to many other regions
  • A competitive but sometimes volatile processing environment

Analysts generally expect California to remain a major milk state, but to continue consolidating toward fewer, larger herds—similar to broader trends in the West.  Some operations will double down on scale and efficiency, while others are leaning into value‑added products or multi‑state footprints to spread risk.

What Farmers Are Finding About Feed Efficiency

What farmers are finding, as they dig into their numbers with nutritionists and Extension, is that feed efficiency may be one of the most powerful levers they still fully control.

A national dairy Extension article on feed efficiency describes energy‑corrected milk per pound of dry matter as one of the strongest and most overlooked tools on many dairies. As a guideline, that article notes that for each improvement of 0.1 unit in feed efficiency—say, from 1.4 to 1.5—the increase in income can range from 15 to 22 cents per cow per day, assuming typical milk and feed prices.  University economists and consultants have shown similar numbers, with Mike Hutjens demonstrating that feed efficiency improvements can quickly add tens of cents per cow per day to margins when feed costs are 15 cents per pound of dry matter.

To stay conservative, many advisors suggest budgeting 10–15 cents per cow per day for a 0.1 improvement. Over a full year, that’s about $35–55 per cow. On a 500‑cow herd, that’s roughly $18,000–27,500 a year from one modest bump in efficiency.

Feed efficiency improvements offer $35-55 per cow annually with no capital investment – on a 600-cow herd, that’s up to $33,000 from better forage allocation and transition management
Herd SizeLow Estimate ($35/cow)High Estimate ($55/cow)Total Range
200 cows$7,000$11,000$7K–$11K
400 cows$14,000$22,000$14K–$22K
600 cows$21,000$33,000$21K–$33K
800 cows$28,000$44,000$28K–$44K
1,000 cows$35,000$55,000$35K–$55K

Peer‑reviewed work and Extension surveys on transition health and disease keep reinforcing that connection. A 2021 study of dairy herds in the journal Pathogens and subsequent reviews in Animals and other journals documented that mastitis and other health events increase treatment costs, reduce milk yield, and increase culling risk.  Reviews of cow longevity and economic performance show that herds with fewer transition‑period problems and better reproductive performance can improve both animal welfare and profitability by extending productive lifespans.

On real farms, the herds that are squeezing more milk out of each pound of dry matter tend to share a few habits:

  • Forage testing and smart allocation. Forage analyses—NDF digestibility, starch, protein—are actually used, not just filed. The highest‑quality forages go to fresh and high‑producing cows, with lower‑quality lots assigned to late‑lactation cows and heifers. Extension specialists and industry nutritionists consistently show how differences in forage quality drive both butterfat performance and overall feed efficiency.
  • Transition period as a non‑negotiable. Comfortable close‑up and fresh pens, consistent DCAD and energy strategies, and careful monitoring of fresh cow intakes and health are built into daily routines. Field work and research keep showing that fewer fresh‑cow disorders mean higher peaks, better reproduction, and more efficient use of feed over a cow’s life.
  • Bunk management discipline. Feeding times are consistent, loading errors are minimized, refusals are checked, and feed is pushed up often enough that cows can access it throughout the day. Economists and nutritionists have pointed out how inconsistency—especially in timing and mix accuracy—can quietly erode both feed efficiency and component yields.

What’s encouraging is that most of these improvements don’t require new concrete. They require better measurement, clear targets, and consistent habits. In a year where margins are tight and interest isn’t cheap, that’s where a lot of the hidden money is.

Replacement Heifers, Beef‑on‑Dairy, and the New Culling Math

CategoryTypical 2025 Range (USD)Annual Impact (500-cow herd, 35% cull rate)
Replacement heifer (national avg)$2,400 – $2,900+$420,000 – $507,500 (175 replacements)
Western springer (top end)$3,500 – $4,000+$612,500 – $700,000 (if sourcing West)
Beef-on-dairy calf(weaned/feeder)$1,000 – $1,400+$50,000 – $70,000 (50 calves)
Day-old beef-cross calf$600 – $750+$30,000 – $37,500 (50 calves)
Cull cow (sound, 1,400 lb)$1,700 – $1,800+$297,500 – $315,000 (175 culls)
Net replacement cost (heifer – cull)$800 – $1,300 per head+$140,000 – $227,500 annual
Cost per CWT across tank$0.50 – $0.75/cwtSpread across 125,000 cwt shipped
Cull price risk (20% decline)–$340 – $360 per cull–$59,500 – $63,000 if you wait

To understand why culling decisions feel so different now, you’ve got to look at heifers and calves.

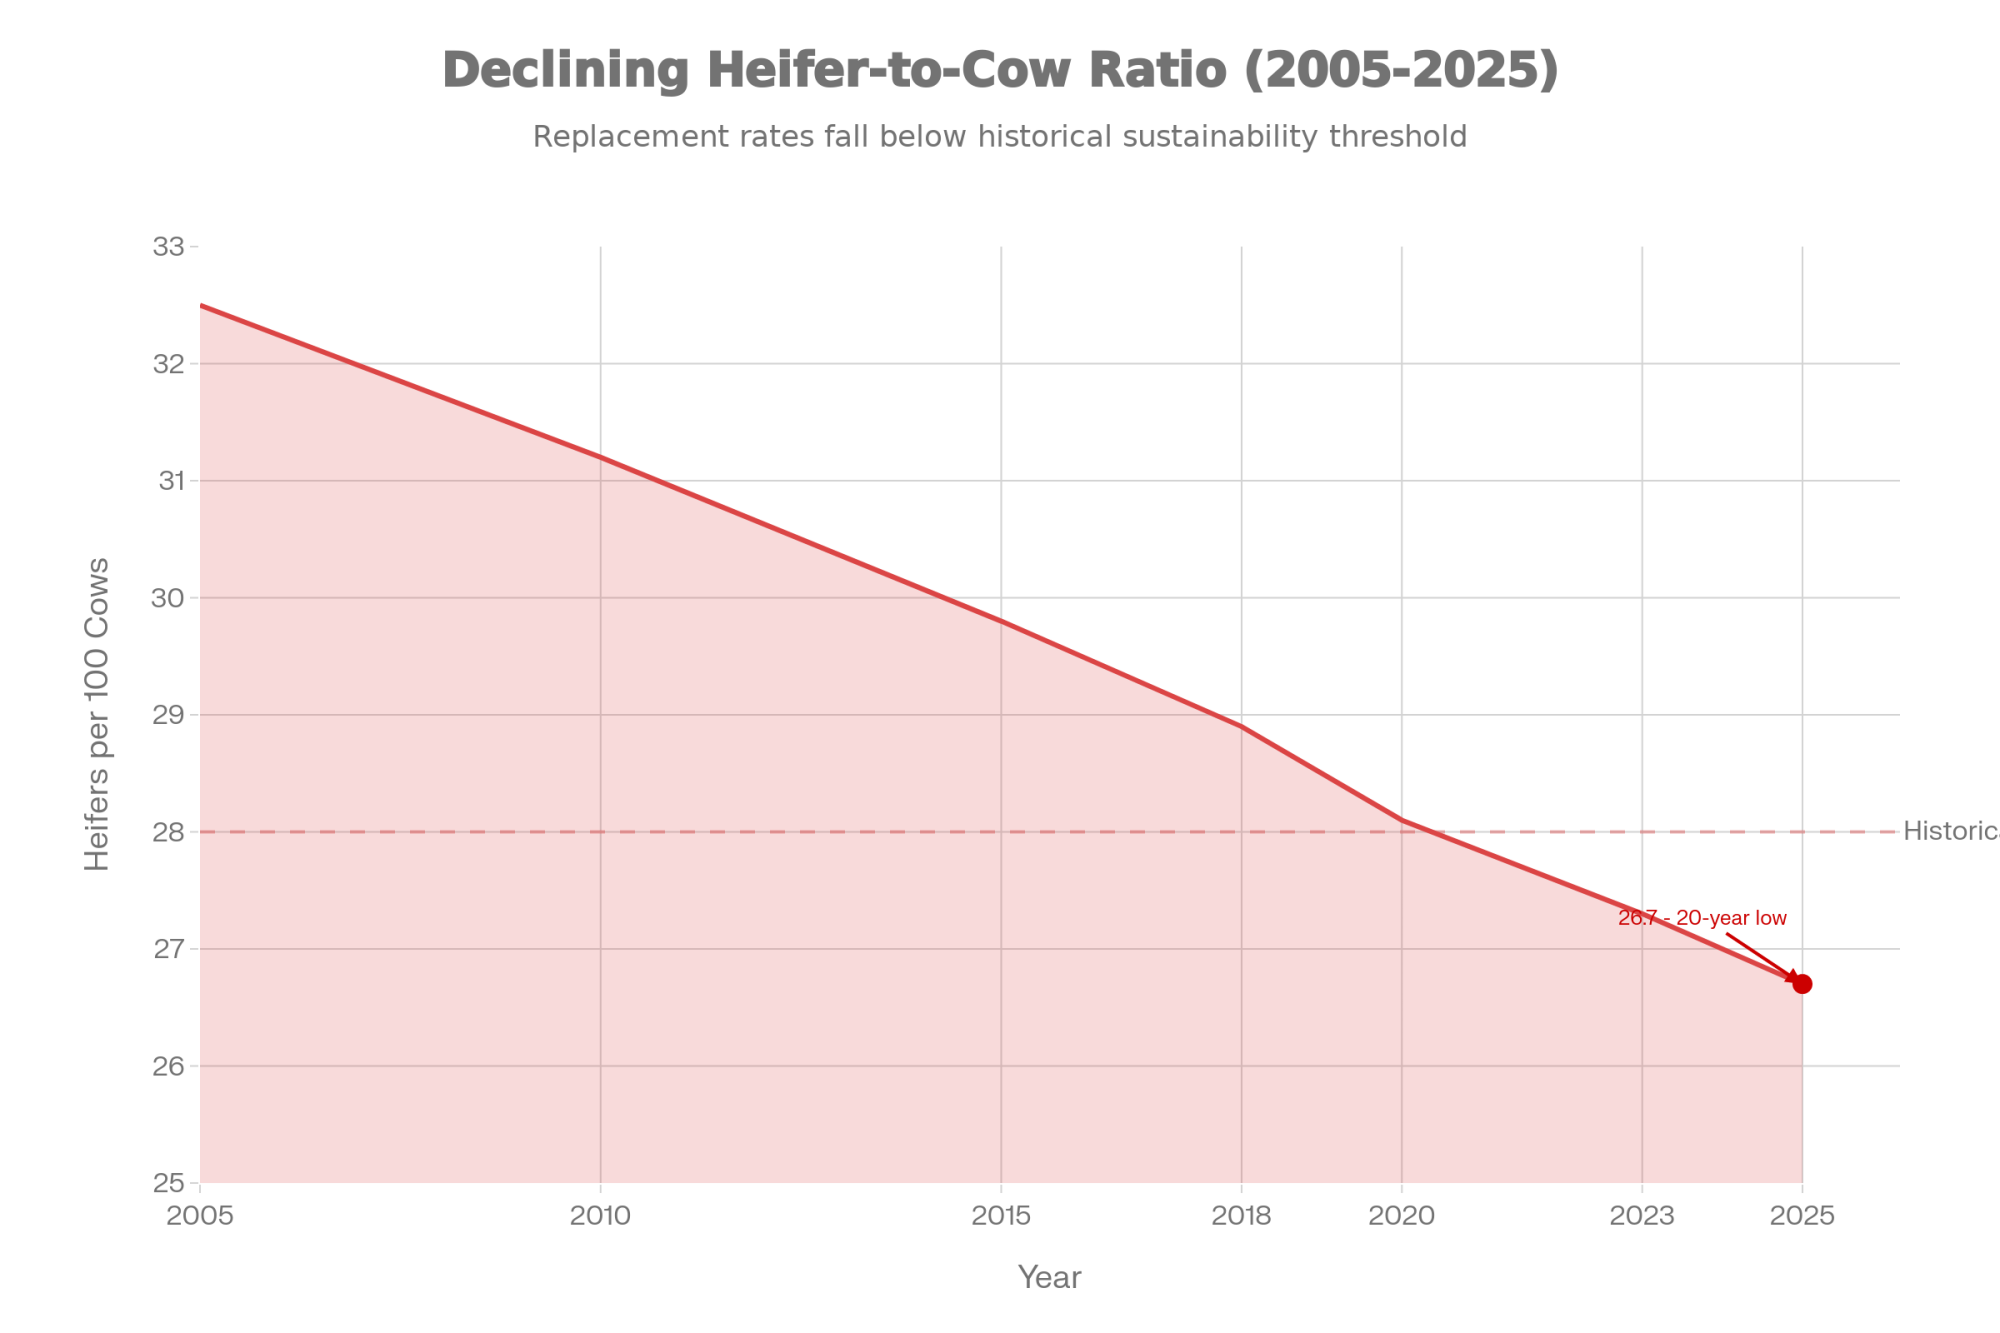
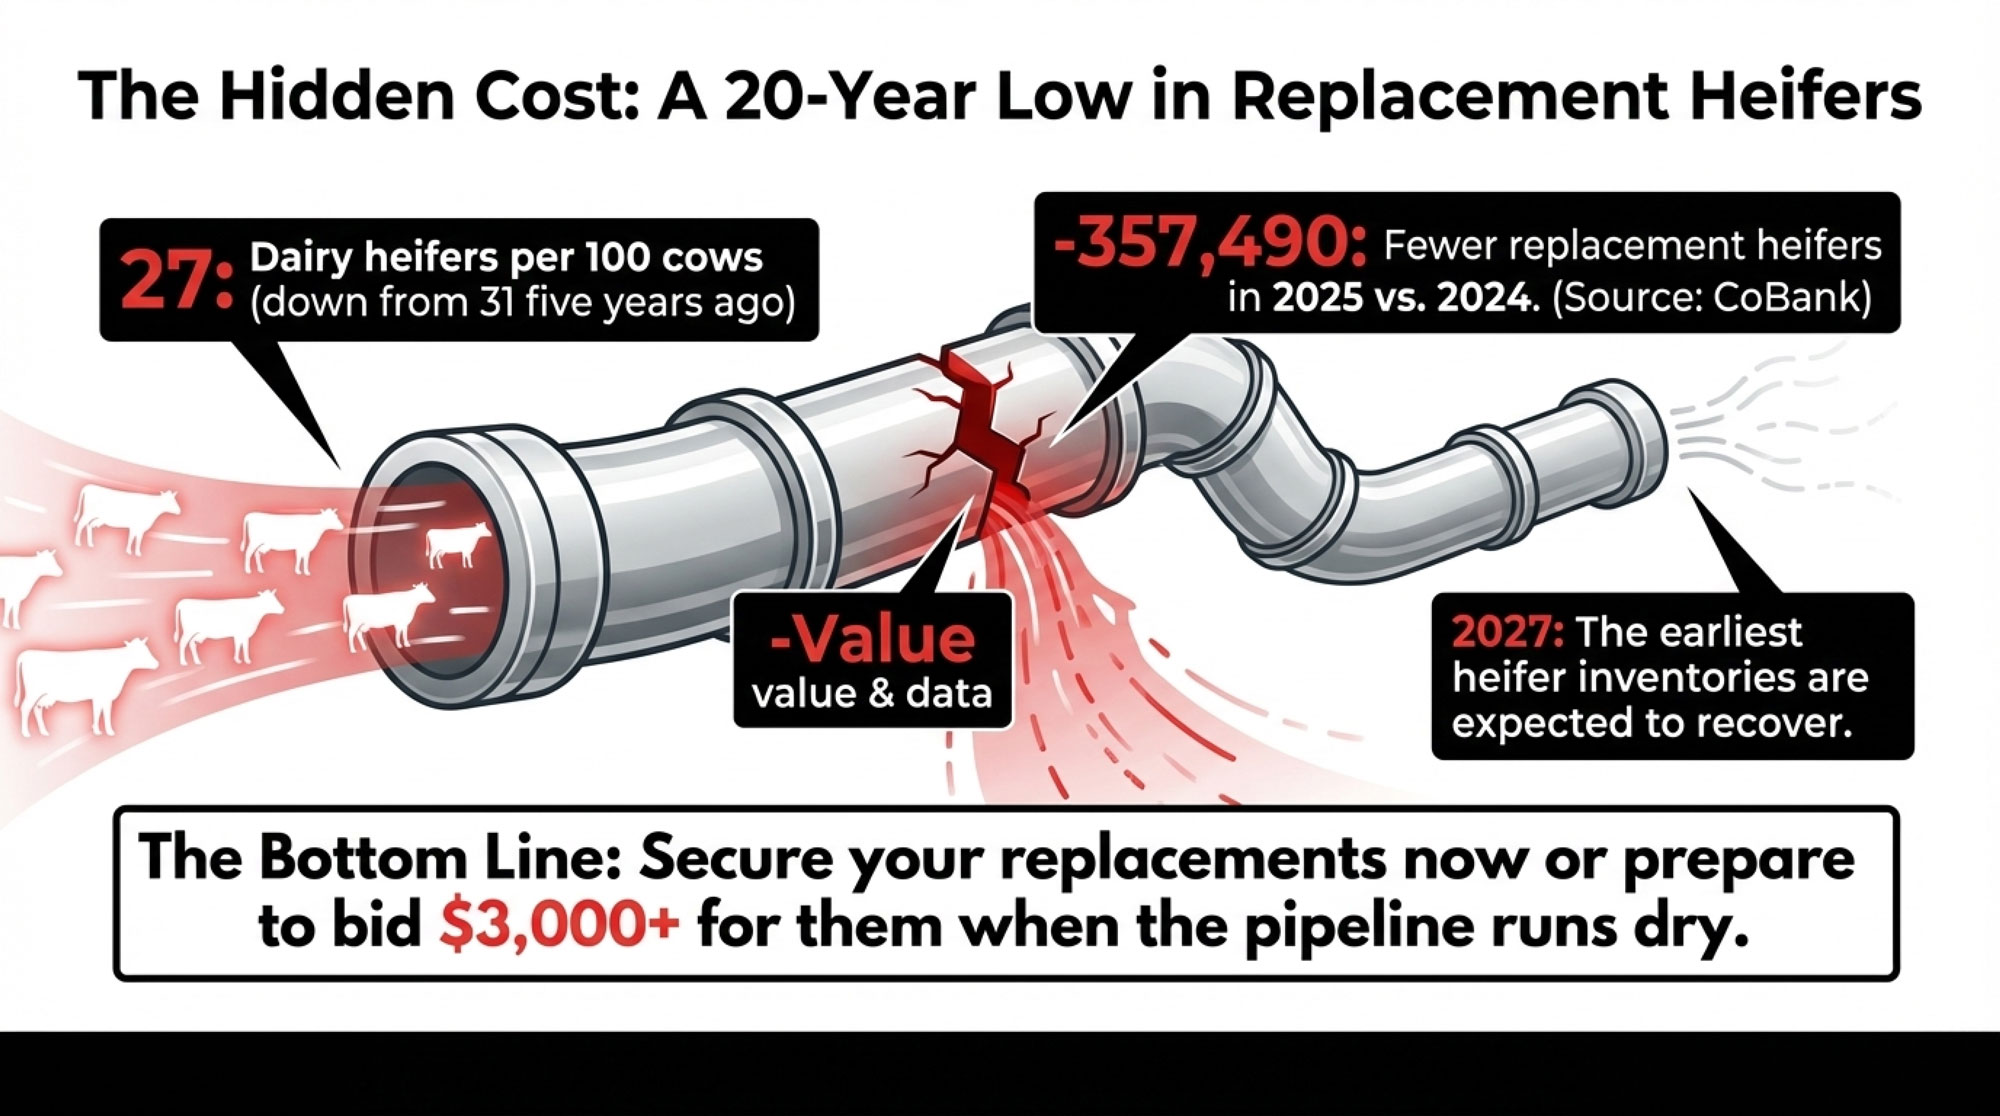
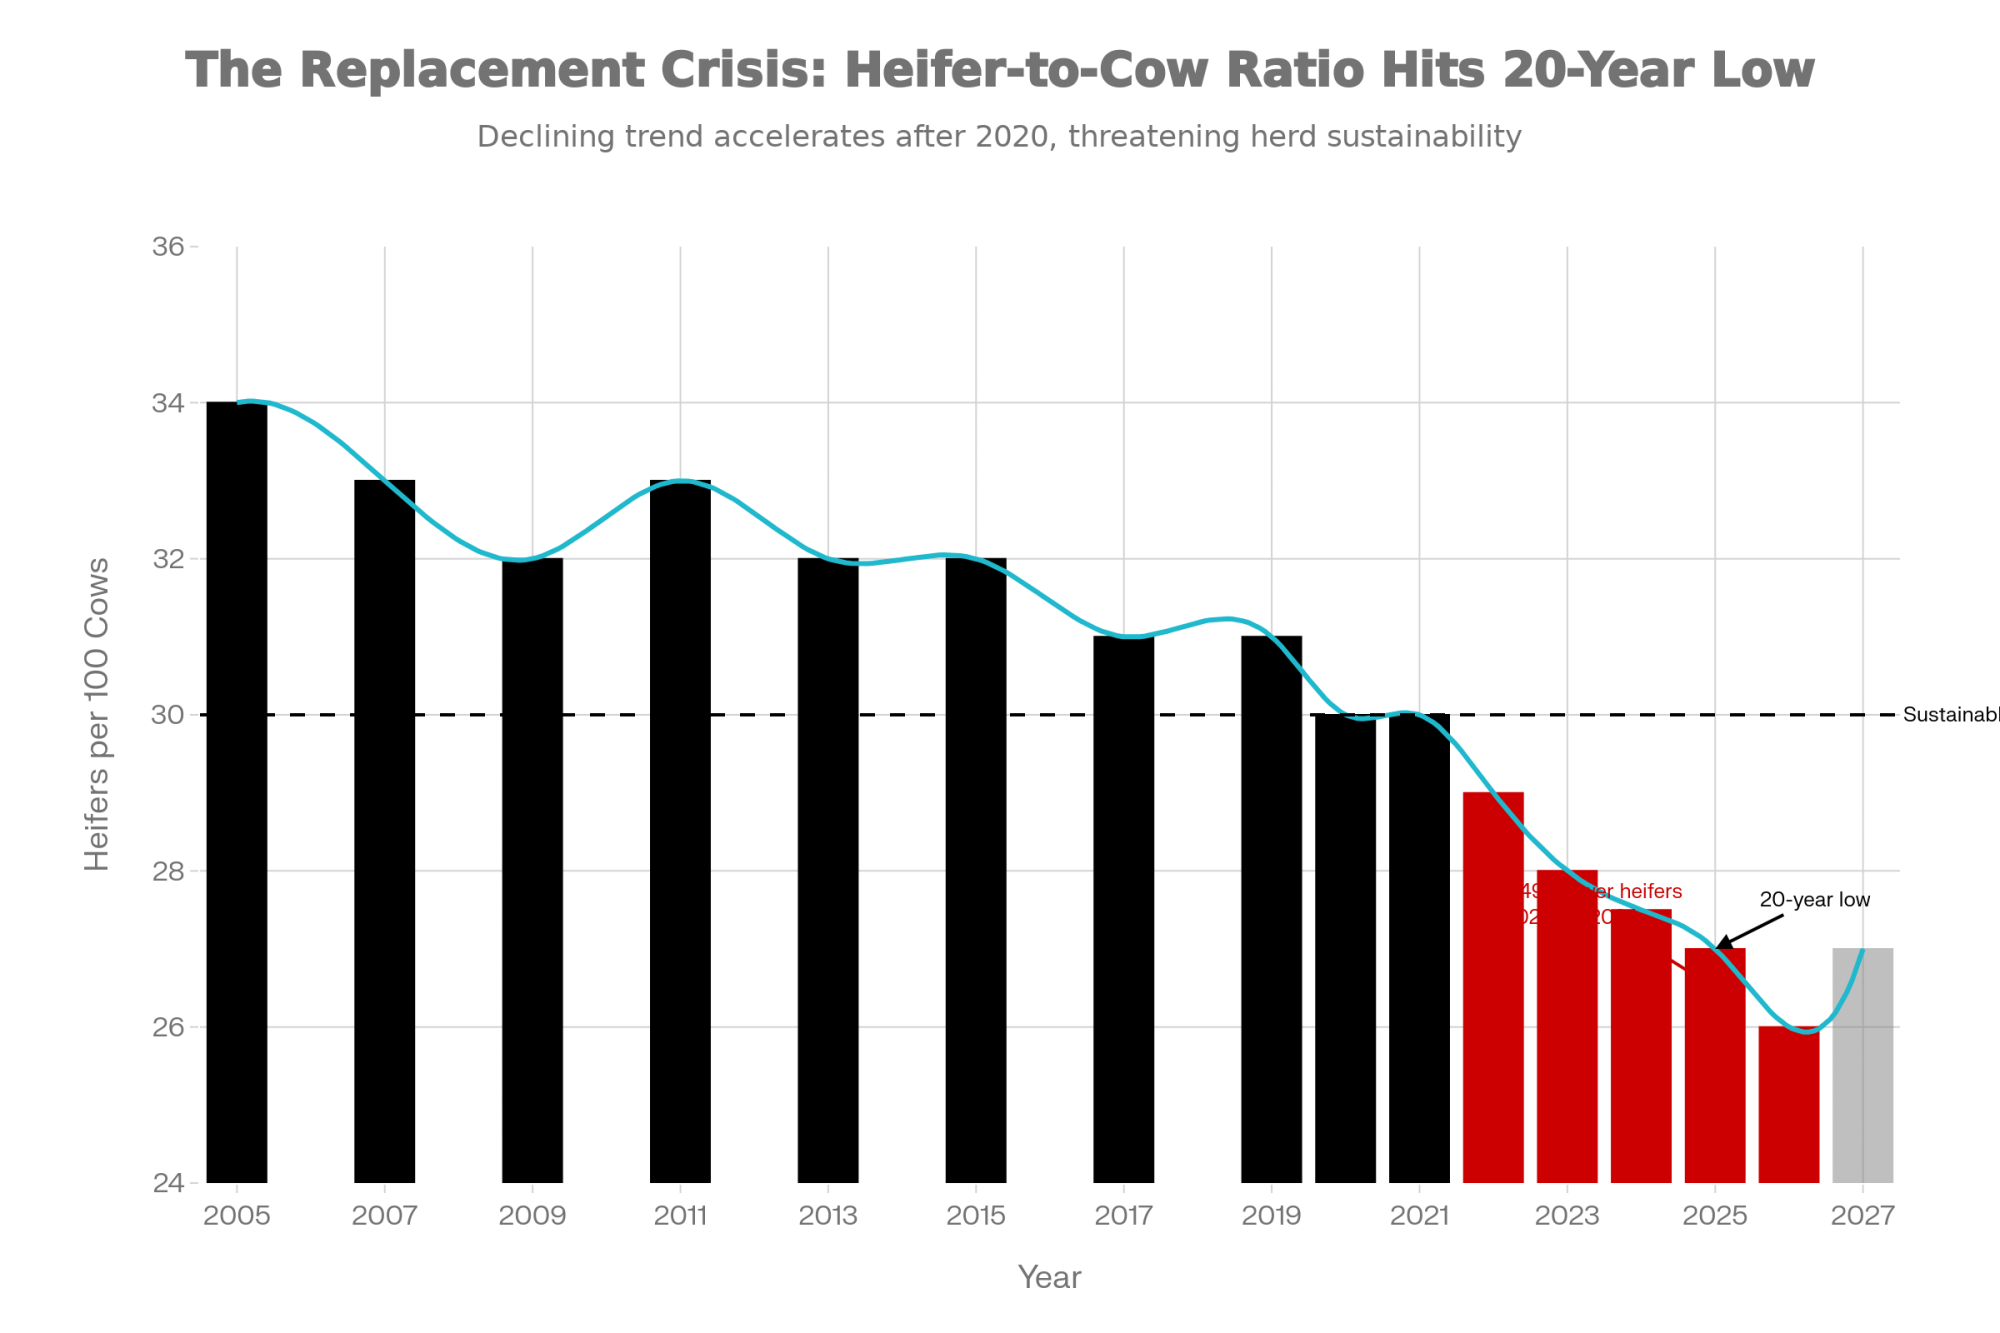
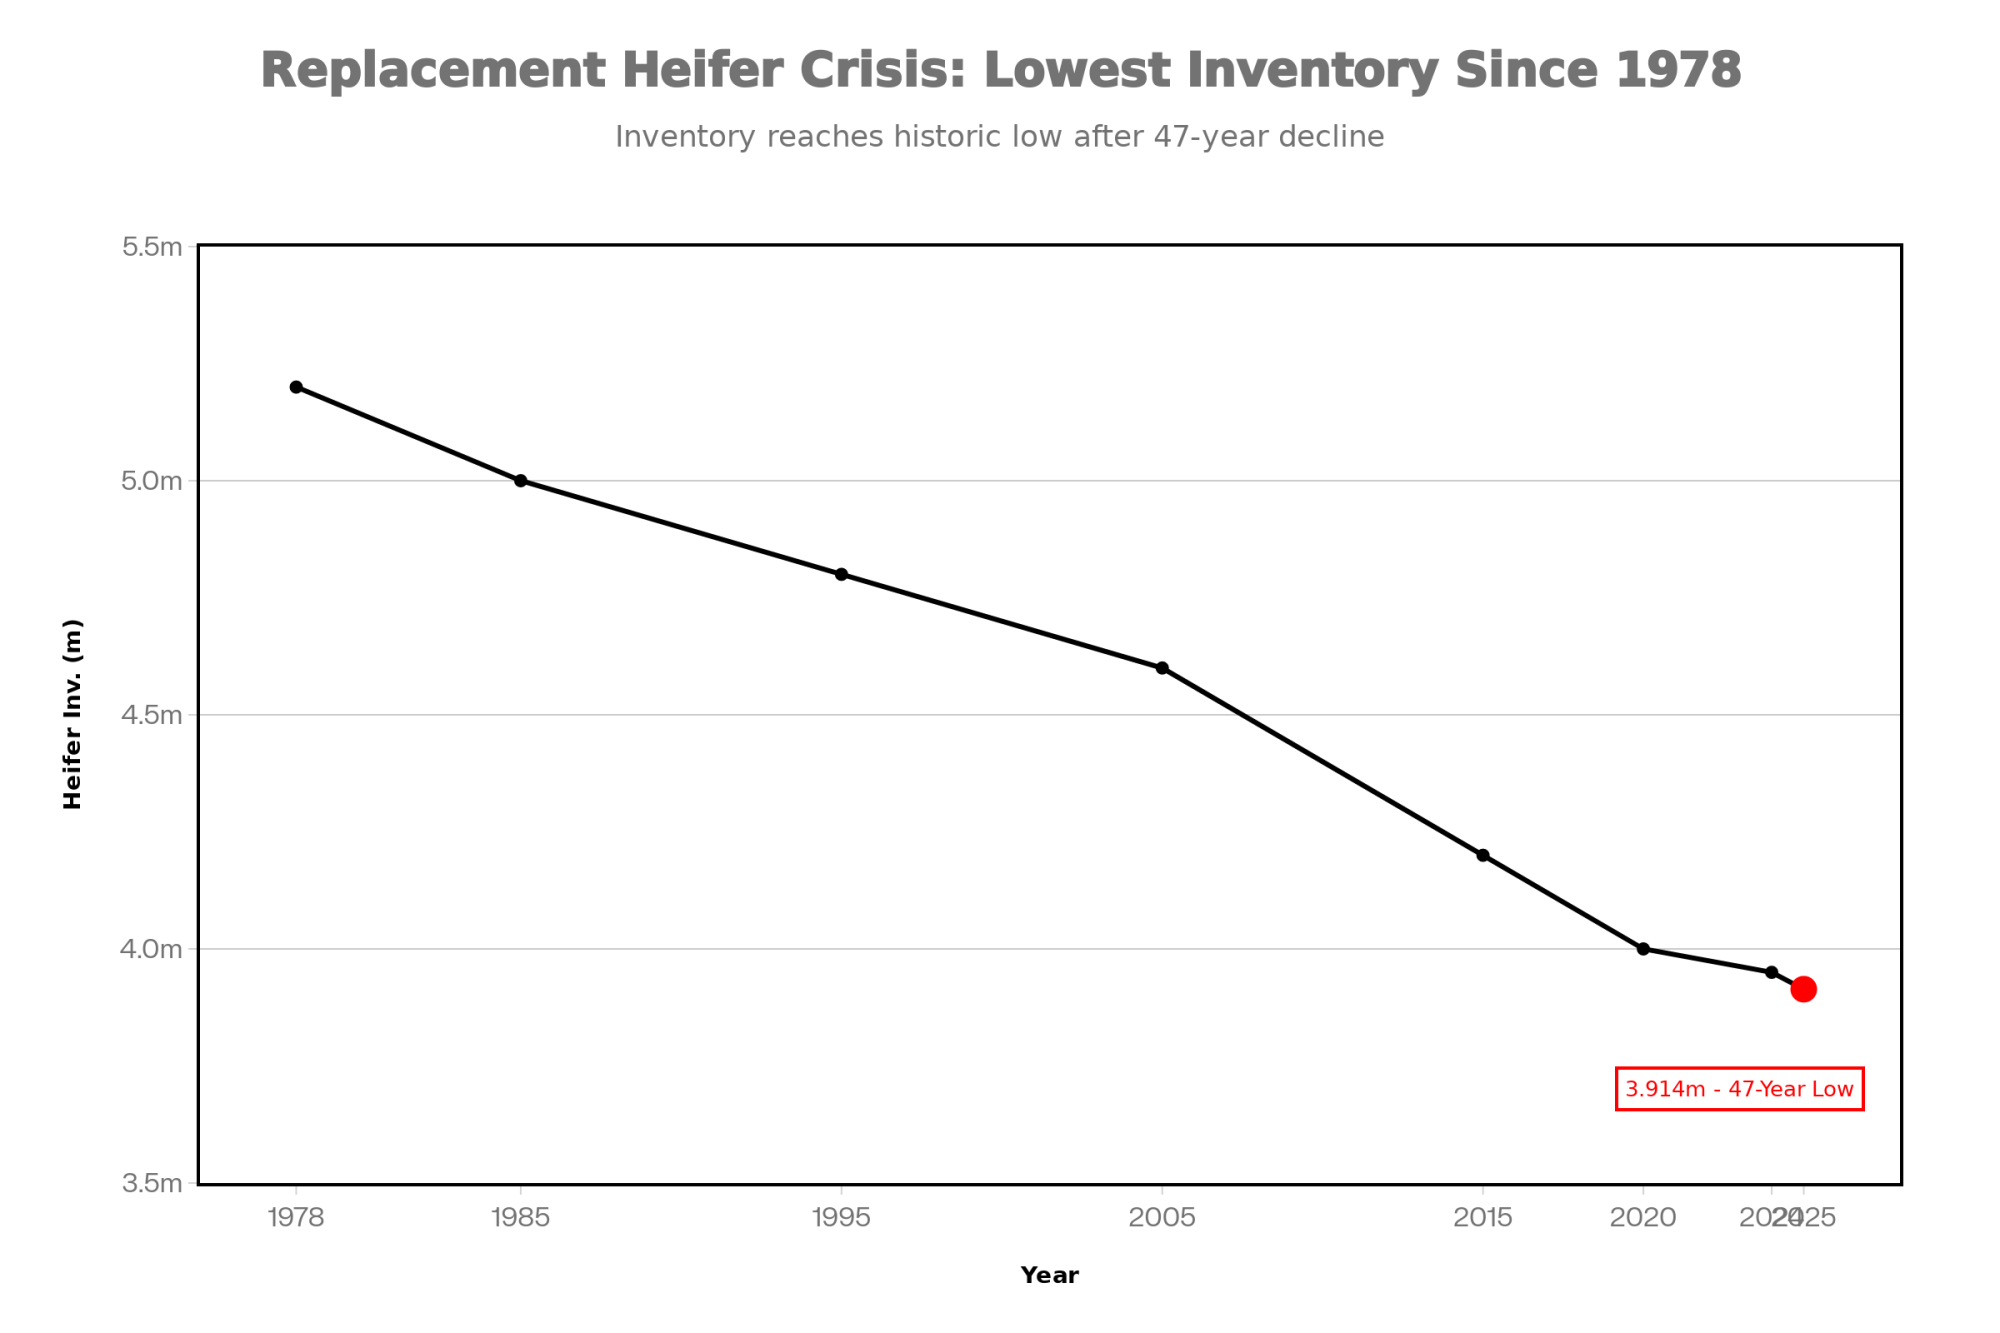
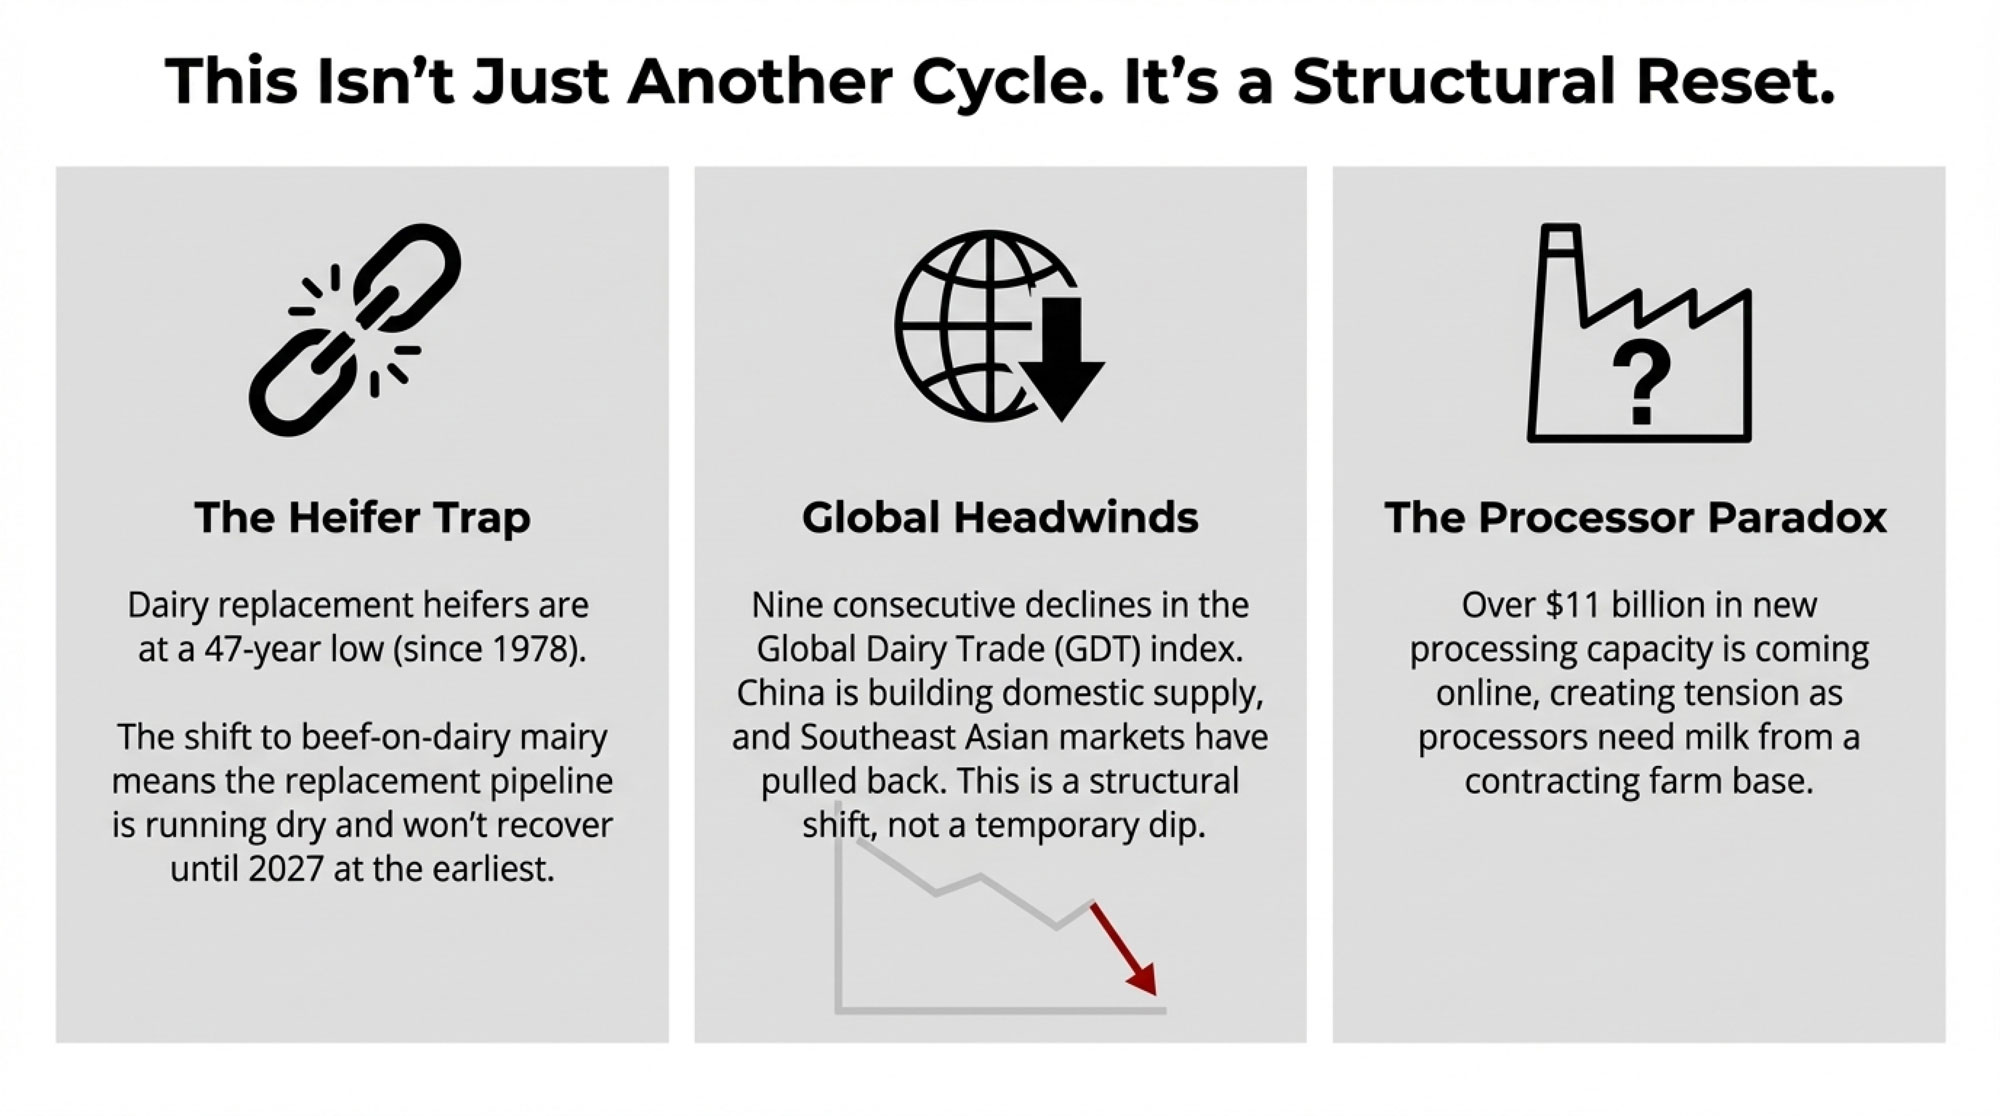
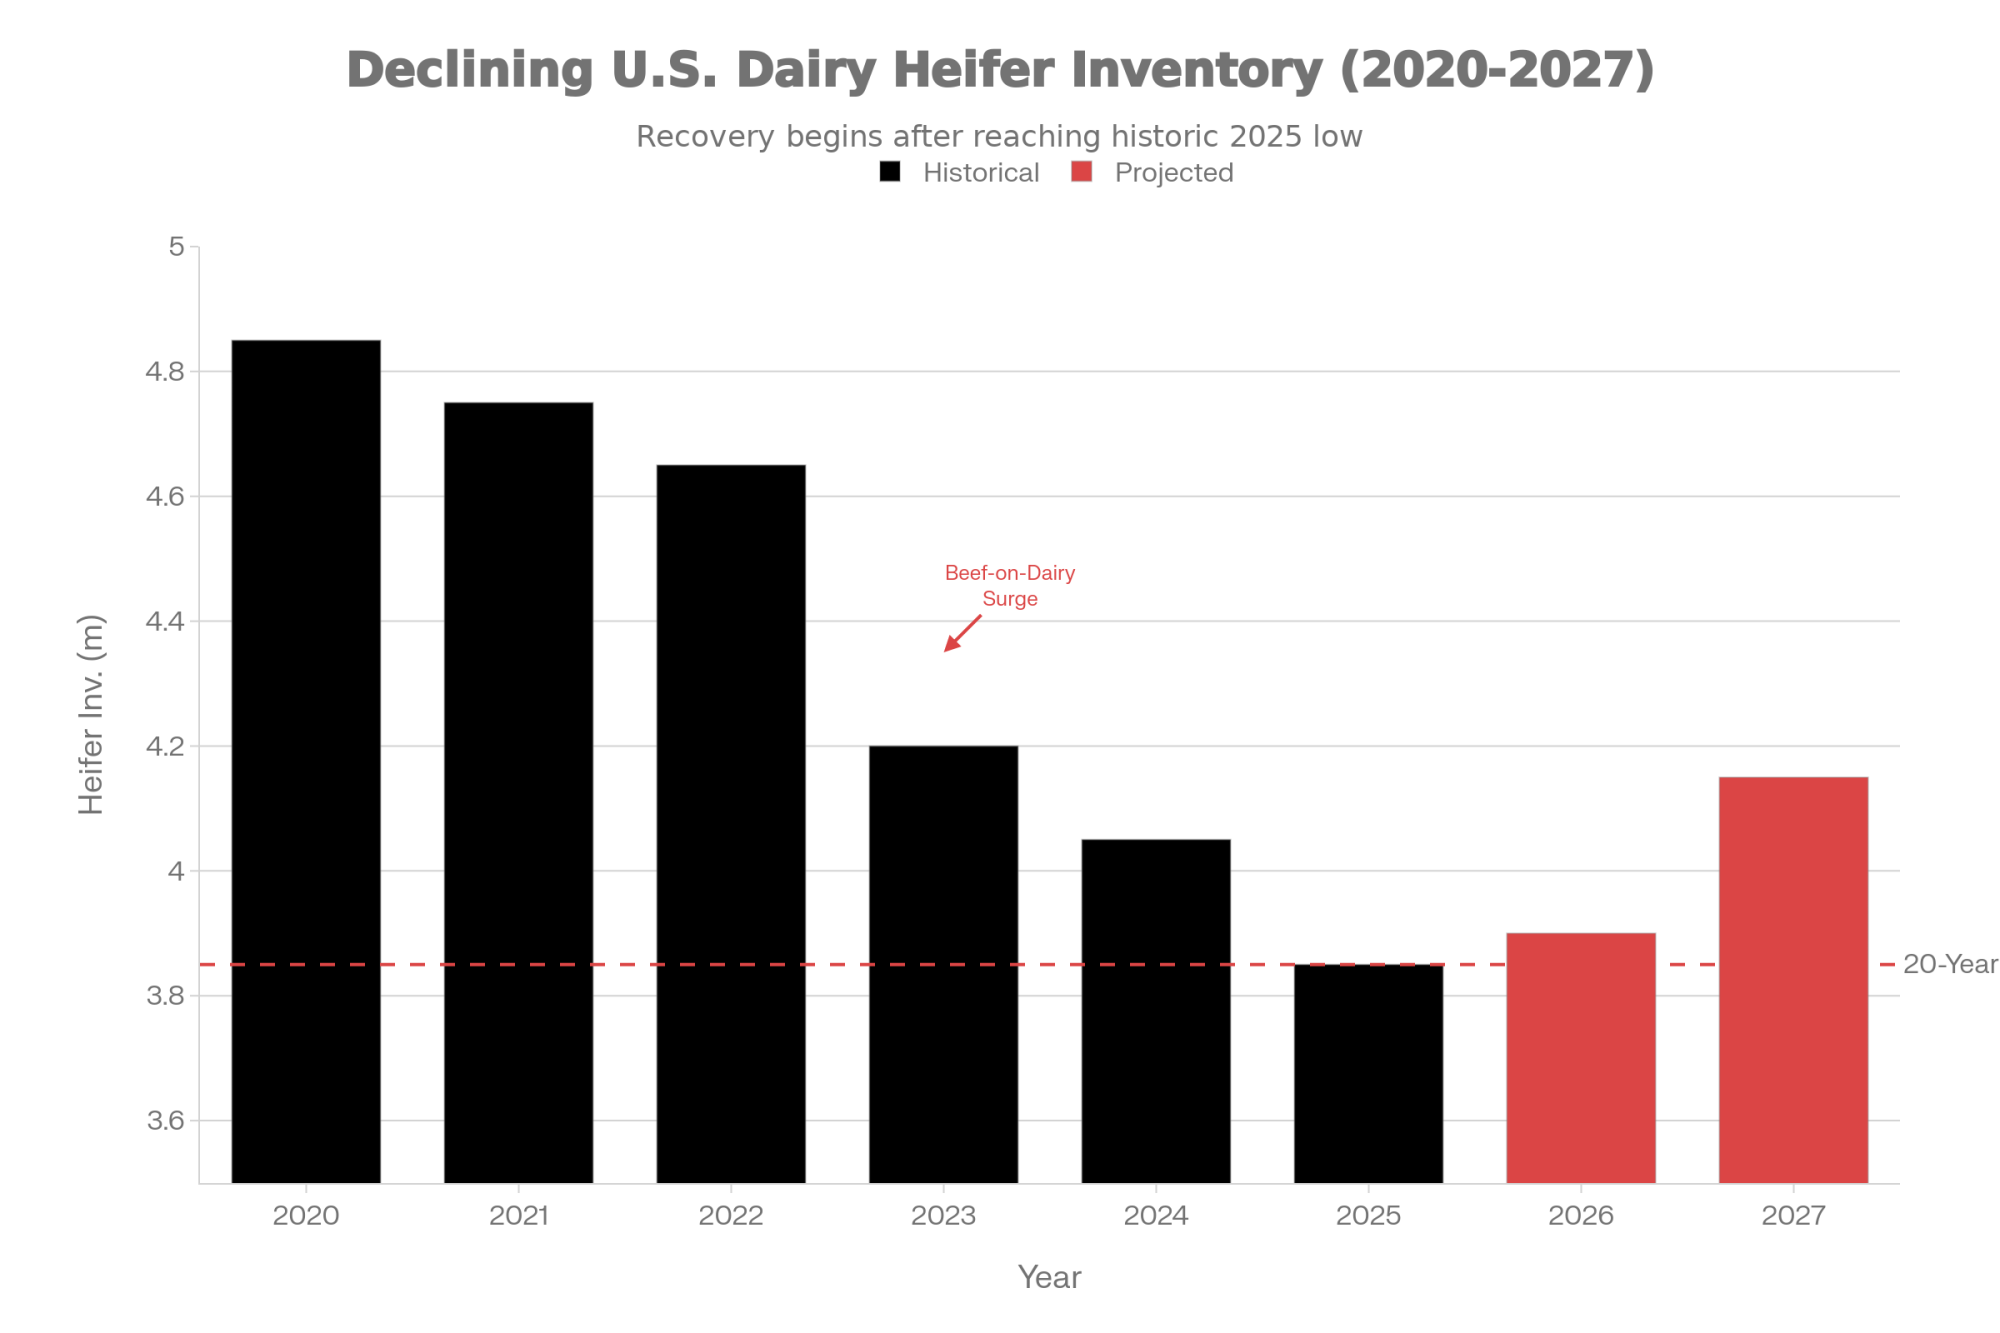
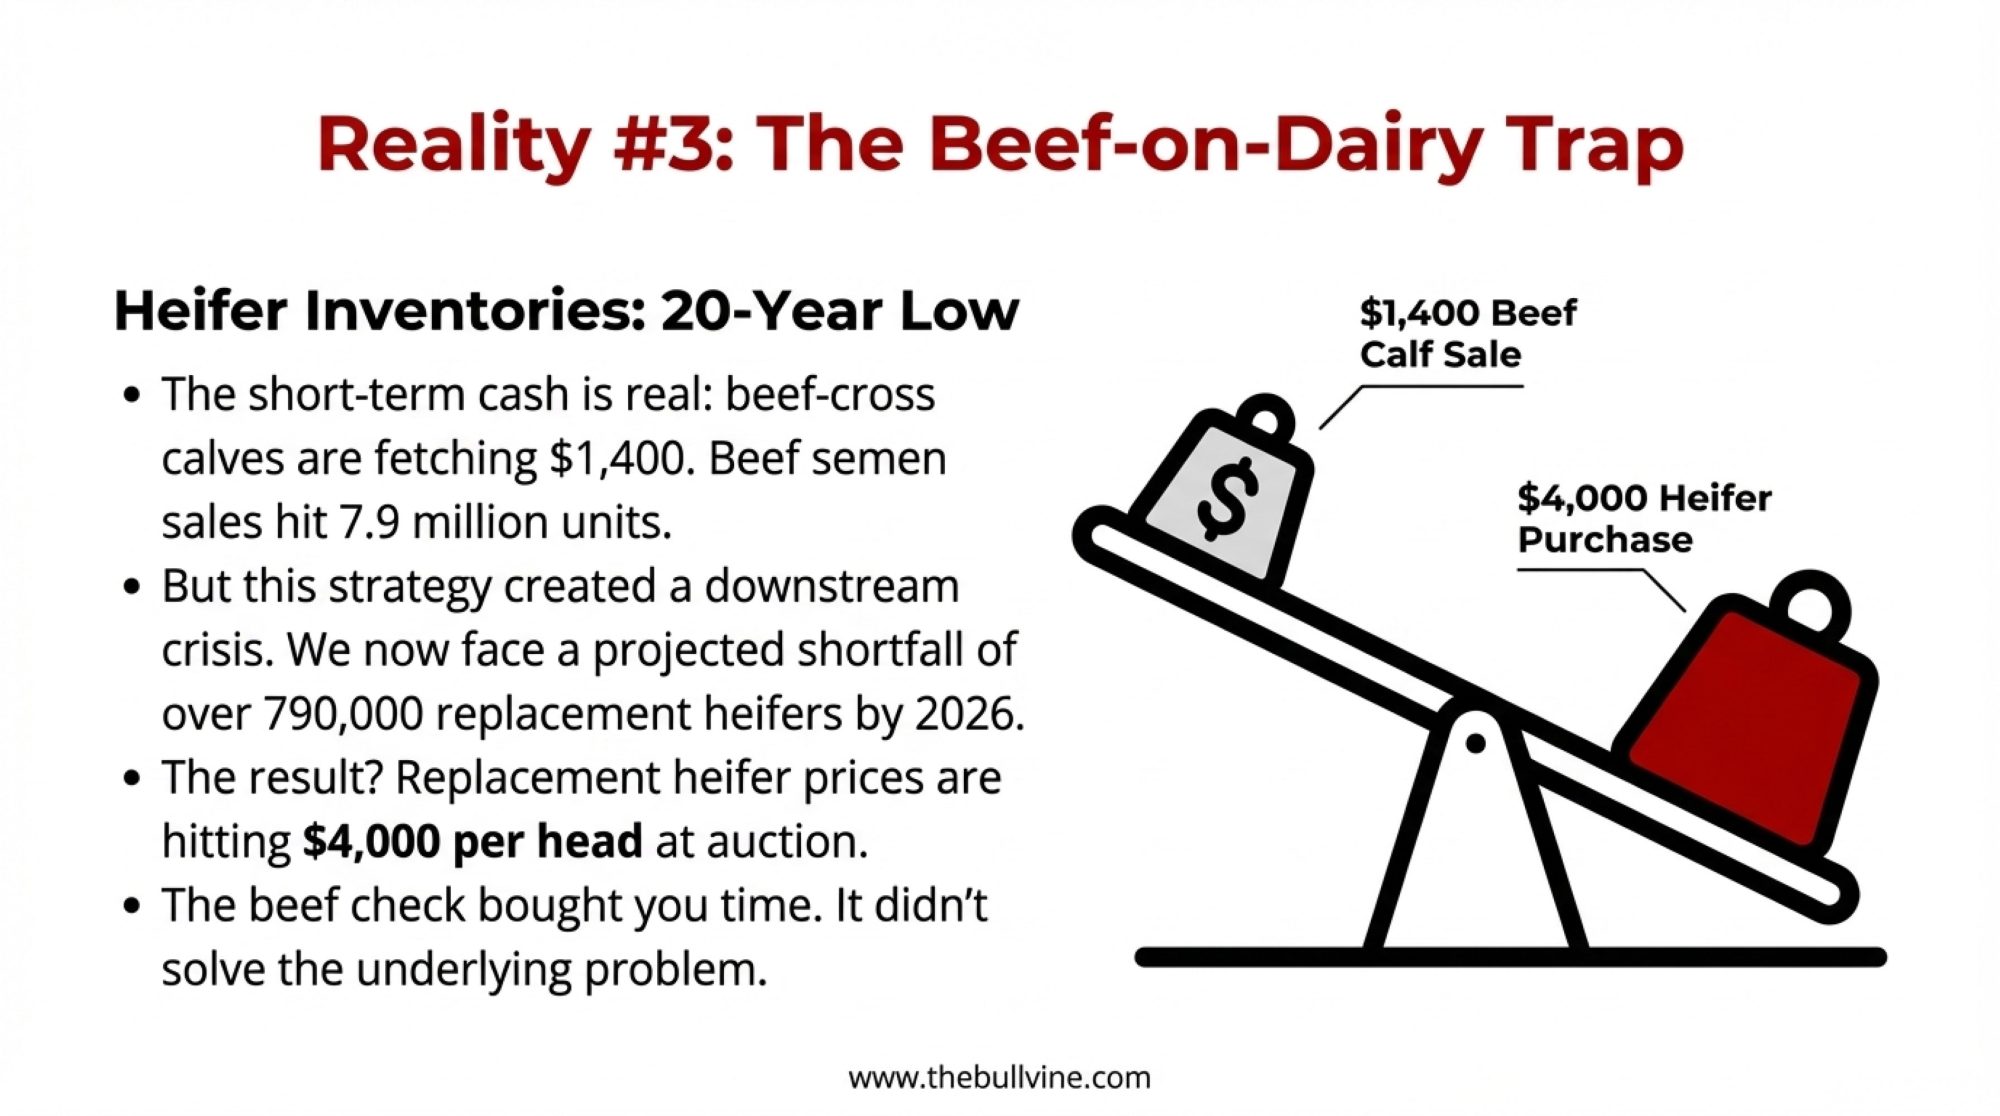
A 2025 report from CoBank’s Knowledge Exchange, highlighted that U.S. dairy replacement heifer inventories have fallen to a roughly 20‑year low.  CoBank’s modeling suggests heifer inventories could shrink by another 800,000 headover the next two years before beginning to rebound around 2027, based on predictions of breeding practice changes and herd demographics.  That’s coming from sexed dairy semen being used more strategically on the top end of the herd, beef semen on the rest, and more disciplined replacement strategies.

USDA’s Agricultural Prices reports show average replacement dairy heifer values moving into the mid‑$2,000s nationally, with some states seeing averages in the high‑$2,000s.  In Wisconsin, the average replacement heifer prices jumped from about $1,990 to roughly $2,850 year over year—about a 69% increase—as the beef‑on‑dairy trend curtailed dairy heifer supply.  Reports also show Western Holstein springers bringing $4,000 or more at the top end.

On the beef side, allied beef‑on‑dairy programs have documented how crossbred calves that might have brought $600–700 a few years ago are now often selling for $1,000–1,400 in many markets, depending on weight and timing, and how reports of day‑old beef‑cross calves at $600–750 in some Midwest and Plains auctions have become more common.  Straight Holstein bull calves, as most of you unfortunately know from the checks, still trade at much lower levels.

In CoBank’s 2025 outlook, Corey Geiger, lead dairy economist at CoBank, emphasized that beef is contributing a larger share of total dairy revenue every year and that beef‑on‑dairy breeding has moved a significant portion of calves out of replacement pipelines and into beef streams.

Heifer & Beef‑on‑Dairy Economics at a Glance

CategoryTypical 2025 Range
Replacement heifer (national avg)$2,400–$2,900+
Western springer (top end)$3,500–$4,000+
Beef‑on‑dairy calf (weaned/feeder)$1,000–$1,400
Day‑old beef‑cross calf$600–$750
Cull cow (sound, 1,400 lb)$1,700–$1,800
Net replacement cost$800–$1,300/head

Spread across the tank, that net replacement cost can quickly add 50–75 cents per cwt to your true cost of production, depending on cull rate and herd size. When you add in the fact that the transition period is still the highest‑risk phase of a cow’s life for disease, culling, and reproductive failure—something documented repeatedly in herd‑health research and field data—you can see why many herds are taking a closer look at which cows they ship and which they keep.

What I’ve noticed, talking with producers from the Upper Midwest to California’s Central Valley, is that many herds are shifting in three ways:

  • Using culling to clean up truly chronic problems first: repeated mastitis or high SCC, cows that don’t breed back after multiple services, recurring lameness, and persistently low fat‑protein corrected milk.
  • Being more thoughtful about longevity: hanging on to efficient, healthy fourth‑ or fifth‑lactation cows if they’re still producing well and breeding back, instead of automatically moving them just because of age. Recent work on cow longevity and economic performance from European and North American studies supports the idea that well‑managed, longer‑lived cows can improve both welfare and profit.
  • Raising or buying fewer replacement heifers overall, but putting more emphasis on genetics, calf and heifer management, and a smooth transition into the milking herd for those they do keep.

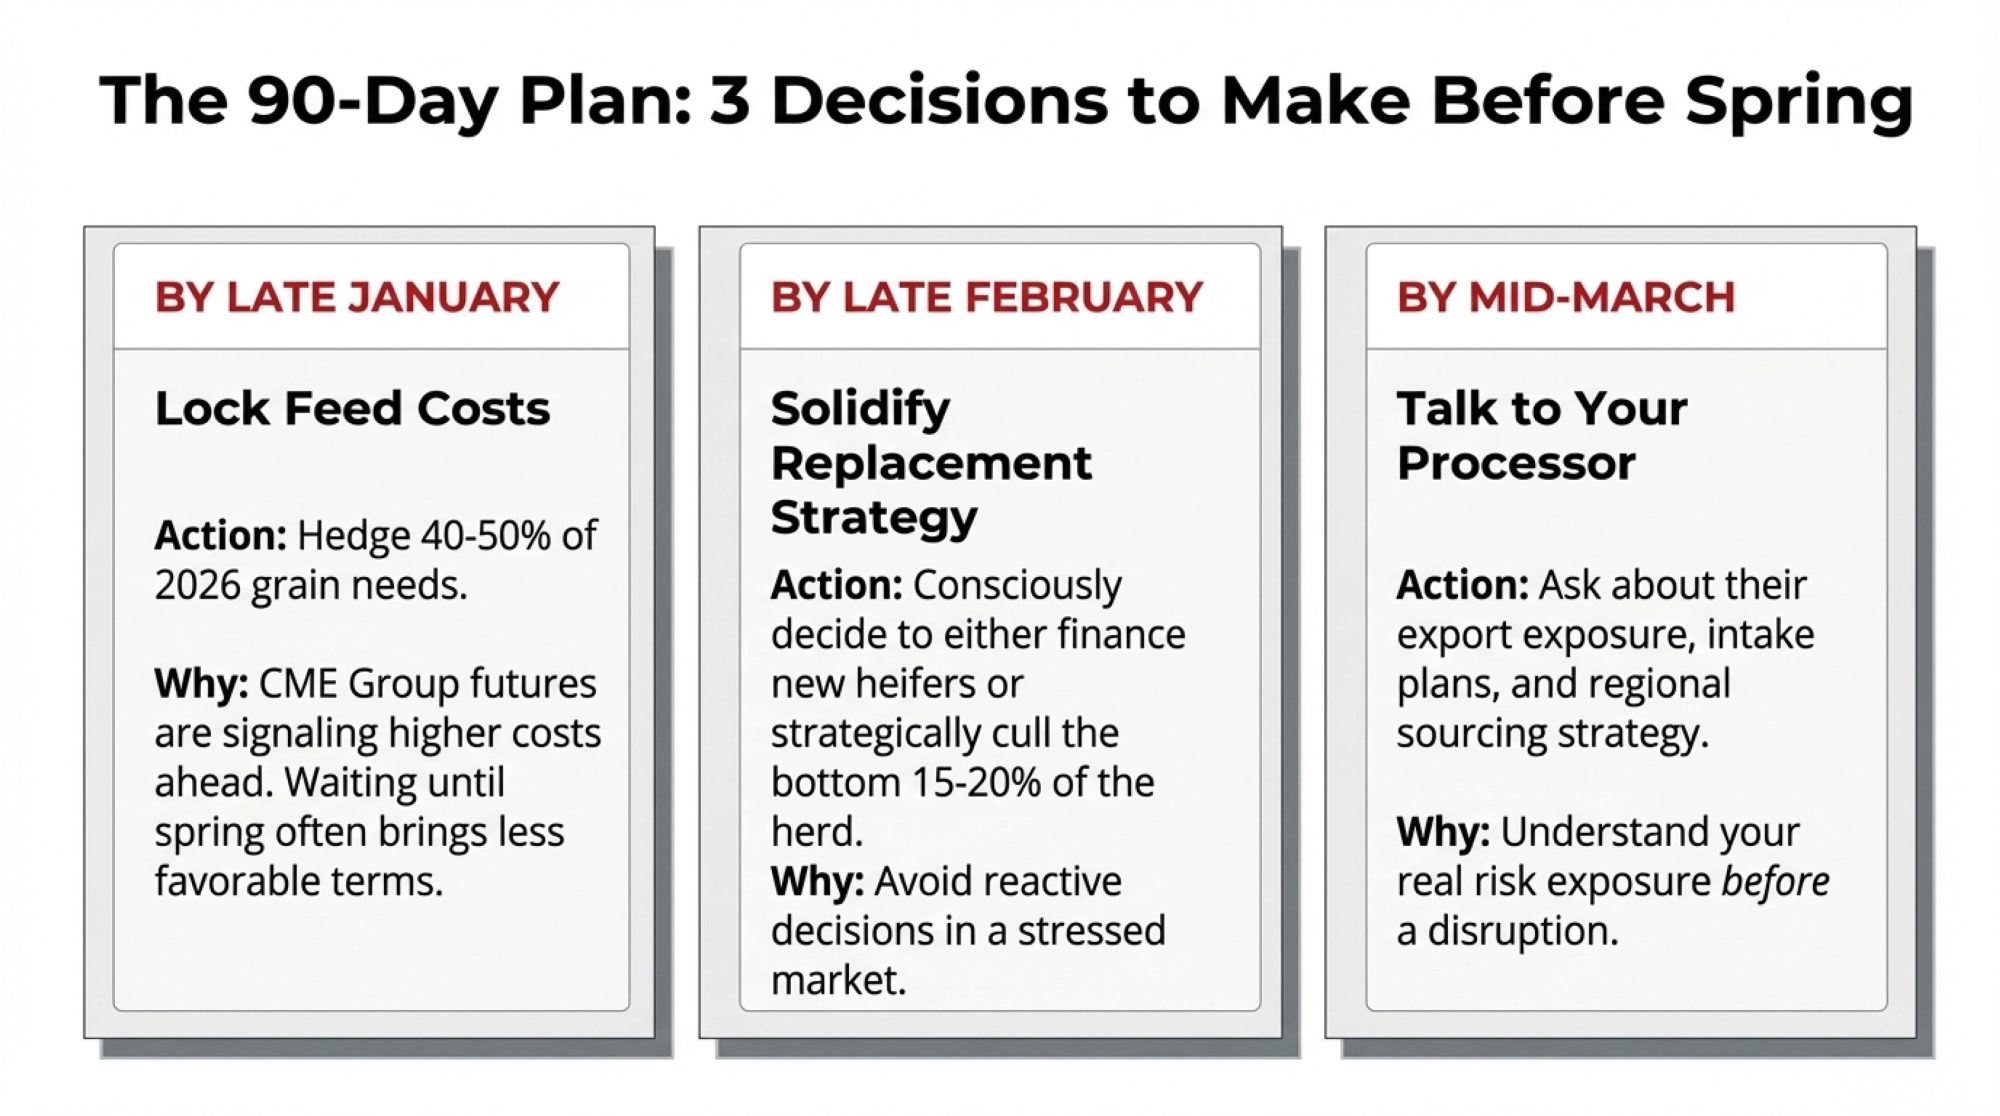
Three Decisions That Matter in the Next 90 Days

Given all this—consolidation, regional differences, heifer inventories, processor investment—three near‑term decision areas keep coming up in conversations with producers, nutritionists, and lenders.

1. Culling While Beef Prices Are Still Favorable

Right now, cull cow values are historically strong in many regions. USDA market reports and industry summaries show sound cull cows bringing high prices relative to long‑term averages, supported by a tight national beef supply after heavy beef‑cow liquidation.  Beef‑market outlooks in USDA’s Livestock, Dairy, and Poultry Outlook and land‑grant analyses note that as the U.S. beef cow herd slowly rebuilds from very low levels, cull prices could soften over the next couple of years, especially if slaughter numbers ease.

For a 1,400‑pound cow, that’s easily a $250–300 swing per head between today’s strong prices and a softer market. For a 500‑cow herd with a 35% cull rate, that’s $40,000–50,000 across the year. So if you’ve got cows that are clearly on your “watch list”—chronic mastitis, repeated reproductive failures, recurring lameness that never fully resolves, consistently poor butterfat performance—the timing matters.

A simple cull checklist that many herds are using with their vets and consultants looks like this:

  • Chronic mastitis or consistently high SCC despite treatment
  • More than two or three unsuccessful breedings this lactation
  • Recurring hoof problems affecting production or mobility
  • Persistently low fat‑protein corrected milk compared with pen mates

At a recent Extension meeting in the Upper Midwest, a herd manager described sitting down with their vet and nutritionist, flagging about 60 cows that met those criteria, and prioritizing shipping them over several weeks while beef prices stayed strong. The cull income went straight to reducing their operating line and funding upgrades in their fresh‑cow area. Examples like that are showing up more often in Extension case studies and farm financial workshops.

If cull prices are 20% lower next year, are there cows you’ll wish you’d moved sooner? That’s the kind of question this window forces you to ask.

2. Treating Feed Efficiency as a Standing Agenda Item

We’ve already walked through the economics: a 0.1 bump in feed efficiency can reasonably be worth $35–55 per cow per year, or $18,000–27,500 on a 500‑cow herd, using conservative values drawn from Extension and economic analysis.

What farmers are finding is that the herds capturing that value aren’t necessarily spending more—they’re just managing more intentionally. A practical way to bake feed efficiency into your routine is to treat it as a standing agenda item at your regular herd meetings.

Here’s a simple framework to work from:

  • This month: forage and ration review
    • Are all current forages tested for NDF digestibility, starch, and protein?
    • Are the highest‑quality forages being targeted to fresh and high‑producing groups?
    • Are ration changes reflected in updated dry‑matter intake targets for each group?
  • This quarter: transition and fresh cow focus
    • Are close‑up and fresh pens overcrowded or short on bunk space?
    • Are fresh cows being checked daily for intakes, temperature, and behavior during the first 10–14 days in milk?
    • Are DA, ketosis, metritis, and early culling rates tracked and reviewed with your vet and nutritionist?
  • Every week: bunk management habits
    • Are feeding times consistent from day to day?
    • Are refusals checked and recorded, not just guessed at?
    • Are feed push‑ups happening often enough to keep feed in reach between feedings?

From Wisconsin freestalls to Texas dry lot systems to Northeastern tie‑stalls, I’ve noticed the same pattern: the herds that treat feed efficiency as a core KPI—not just a once‑a‑year number—tend to be the ones that stay more resilient when margins tighten.

3. Getting Ahead of Liquidity and Risk Management

Class III futures and industry outlooks remain volatile for 2026, with projections shifting as feed costs, export demand, and herd size estimates change. USDA’s 2025 dairy outlooks highlight a wide range of possible milk‑price outcomes depending on those factors, rather than a single clear price path.  For herds with low cost of production and strong efficiency, most reasonable price scenarios can still work. For those needing $18–19 just to break even—including full debt service and family living—it’s worth paying very close attention.

Farm financial advisors—from land‑grant universities to private consultants—keep coming back to a few core moves:

  • Use today’s strong beef and calf checks to build working capital. Paying down the operating line or building cash reserves when beef and beef‑cross calf prices are high gives you more room to maneuver if milk prices under‑perform. With interest costs where they are, every dollar you take off your line is worth more than it used to be.
  • Sit down with your lender early, not late. Bringing updated cost‑of‑production numbers, your culling and heifer plan, and your feed‑efficiency priorities to the table changes the tone: you’re managing risk, not just reacting to it. University Extension finance specialists make the same point in their 2024–2025 dairy profitability guides.
  • Match your risk tools to your comfort level. That might mean Dairy Margin Coverage for smaller herds, Dairy Revenue Protection or LGM for others, and selective use of forward contracting on milk or feed. The goal isn’t to hit the top of the market every time; it’s to keep the worst‑case scenarios off the table.

As one Wisconsin‑based advisor told a group at a recent meeting, you don’t want your first serious talk with the bank to be when you’re already in trouble. You want it to be when you still have options.

Why Processors Are Still Building While Farms Are Closing

A question that comes up a lot right now is: if producers are under this much pressure, why are processors pouring billions into new plants?

CoBank’s Knowledge Exchange team tackled that in a 2025 report. They estimate that the U.S. is undergoing a historic $10‑billion investment in new dairy‑processing capacity, expected to come online through 2027, much of it in large cheese, powder, and extended‑shelf‑life beverage plants in Texas, the Southwest, the Midwest, and the Northeast.  Darigold’s Pasco facility is one example of these large investments in the Northwest.

Rabobank’s consolidation reports reinforce the big picture: processors see long‑term domestic and export demand for dairy proteins and fats, but expect that demand to be met by fewer, larger, more efficient herds with lower per‑unit costs.  Modern plants designed to process 5–8 million pounds of milk per day require high utilization and a consistent supply to remain profitable.

Those plants aren’t being built for a world with more small herds. They’re being built assuming fewer, bigger suppliers who can hit volume and quality specs every day.

When you talk with processor representatives at meetings and plant tours, what often comes through is that they’re laser‑focused on reliability. They want suppliers who can hit volume, component, and food‑safety targets day in and day out. It’s simply easier to do that with a smaller group of large herds than with hundreds of small ones.

That doesn’t mean smaller and mid‑size farms are written out of the story. But it does mean they’re more likely to thrive if:

  • They’re among the most efficient herds in their region.
  • They supply processors that value specific quality traits—such as components, traceability, animal care, or local branding.
  • They focus on premium or niche markets where volume isn’t the only metric that matters.

So Where Does This Go—and What Can You Do?

USDA’s long‑term baseline projections, combined with outlooks from CoBank and Rabobank, point in a broadly similar direction:

  • Fewer dairy farms overall, but national cow numbers are hovering around 9–9.5 million in the medium term.
  • A growing share of milk is coming from herds with 1,000 or more cows, continuing the trend already highlighted by the 2022 Census and consolidation analyses.
  • Continued growth in regions like Texas, New Mexico, Idaho, South Dakota, and parts of the Southeast, with slower growth or contraction in higher‑cost or heavily regulated areas such as parts of the PNW and California.
  • Ongoing processor consolidation and large‑scale plant investments, including dry lot and freestall‑based supply clusters in the Plains and Southwest.

Nobody can promise exactly what the five‑year average milk price will be. But the structural forces—consolidation, plant expansion, heifer shortages, beef‑on‑dairy, Class I reform—are not hypothetical. They’re visible in USDA data, industry reports, and the checks you’re cashing.

Different operations will respond differently. A 4,000‑cow dry lot in west Texas, a 1,600‑cow freestall in California’s Central Valley, a 600‑cow parlor dairy in Wisconsin, and a 200‑cow grazing herd in Vermont all have different strengths, constraints, and family goals.

What’s encouraging is that some of the most important questions are the same for all of them:

  • Where’s our real edge—cost of production, components, quality, location, niche market, or some combination?
  • Are we measuring feed efficiency, fresh cow performance, and butterfat and protein yields clearly enough to guide decisions?
  • Does our region and processor mix support the kind of operation we want to be five to ten years from now?
  • If not, what realistic paths do we have—scaling up, shifting markets, partnering with neighbors, or planning a dignified exit or transition?

The Bottom Line: Three Moves for the Next 18 Months

If you boil this down, here’s the hard truth: hoping the next “good cycle” will fix structural math is a much riskier bet than it used to be. In the next 18 months, most herds will be better off if they:

  • Ship chronic problem cows while beef is still strong and replacement math still pencils, rather than waiting for cull prices to soften.
  • Put a real dollar figure on a 0.1 feed‑efficiency gain for their own herd and pick one or two habits to move that number, using Extension benchmarks and their own records.
  • Look their processor and region in the eye—on paper—and decide whether they’re doubling down, diversifying, or slowly pivoting, given the $10‑billion processing build‑out and the consolidation patterns already underway.

The “18‑month window” isn’t a countdown clock to disaster. It’s a realistic horizon in which most herds still have meaningful choices—about culling, feed efficiency, liquidity, and long‑term direction. Those choices are a lot easier to make while you still have room to maneuver than when your bank, your cooperative, or your cash flow is making them for you.

What I’ve noticed, talking with producers from British Columbia to Florida and from California to New York, is that the farms that come through tough stretches in good shape usually aren’t the ones with the fanciest barns. They’re the ones that combine solid cow sense with uncomfortable honesty about their numbers, their region, and their options—and then act before circumstances force their hand.

There’s still time to be one of those herds. The real opportunity in this next 18‑month stretch is to quietly, deliberately tilt the odds in your favor for whatever dairy looks like in 2030 and beyond. 

Key Takeaways

  • Farm exits no longer fix milk prices. USDA’s 2022 Census shows 39% fewer dairy farms since 2017, yet total U.S. milk still climbed to 226 billion pounds—large herds absorb the volume, and the old “sellouts tighten supply” assumption no longer holds.
  • Heifer inventories are at a 20-year low—and still falling. CoBank projects another 800,000-head decline before a 2027 rebound, pushing replacements into the mid-$2,000s nationally and past $4,000 for top Western springers.
  • Geography now rivals genetics for survival. Darigold’s $4/cwt Pasco deduction, below-average Class I utilization in Western orders, and stronger fluid returns in the Southeast are making your region and processor mix as important as your herd’s butterfat.
  • Feed efficiency is hidden cash you already control. A 0.1 improvement can add $35–55 per cow per year—up to $27,500 on a 500-cow herd—without new buildings or equipment.
  • The next 18 months are a decision window, not a waiting room. Cull chronic cows while beef checks are strong, put a real dollar target on efficiency gains, and sit down with your lender while you still have options—not after your cash flow decides for you.

Complete references and supporting documentation are available upon request by contacting the editorial team at editor@thebullvine.com.

Learn More

The Sunday Read Dairy Professionals Don’t Skip.

Every week, thousands of producers, breeders, and industry insiders open Bullvine Weekly for genetics insights, market shifts, and profit strategies they won’t find anywhere else. One email. Five minutes. Smarter decisions all week.

NewsSubscribe
First
Last
Consent

$8.2B Exports, $2,500 Heifers: Why Your Milk Check Is Stuck – and the Beef‑on‑Dairy and Genetics Decisions You Can’t Duck in 2026

$600 beef calf or $2,500 heifer? The farms still standing in 2026 didn’t trade their future for today’s calf check.

Executive Summary: U.S. dairy exports hit $8.2 billion in 2024, yet milk checks stayed stubbornly flat—and understanding why matters for your next move. The gap comes down to three forces: processing overcapacity that needs export markets to clear marginal pounds, a component shift in which cheese plants now reward protein over extreme butterfat, and a heifer shortage, many herds created by chasing $600 beef calf checks instead of protecting replacements. Today, quality heifers command $2,500–$3,000+, and the math has flipped. Consolidation has reshaped the landscape, too—15,000 dairies exited between 2017 and 2022, with 1,000+ cow herds now producing two-thirds of U.S. milk and demanding “invisible” cows that stay off the treatment list. The operations thriving in this environment share a playbook: components tuned to their plant’s grid, genomics and beef-on-dairy strategies that secure the replacement pipeline, and risk management treated as routine—not a crisis response. The next 12–24 months will separate the farms that planned from the farms that hoped.

You’ve probably lived this. You sit through a winter meeting where someone from the co‑op says, “Exports are strong, global demand looks good, U.S. dairy is well‑positioned.” The slides are full of big numbers. Then you get home, sit down at the kitchen table, open your milk check… and it feels like you’re farming in a different industry than the one they just described.

What’s interesting here is that those export numbers really are big. USDA’s Foreign Agricultural Service, in numbers summarized by IDFA, Dairy Processing, Dairy Foods, and Progressive Dairy, put 2024 U.S. dairy exports at about 8.2 billion dollars, the second‑highest export value on record after the 9.5‑billion‑dollar peak in 2022. Mexico took roughly 2.47 billion dollars of that total, and Canada about 1.14 billion, so together those two neighbors account for just over 40 percent of everything the U.S. ships overseas by value. Export coverage from USDEC highlights that Mexico is consistently the top buyer of U.S. cheese and skim milk powder.

Early 2025 commentary from market analysts suggests exports have generally held up reasonably well compared to 2024, with cheese shipments in particular staying firm in several key months. So that “exports are strong” line on the slides isn’t spin.

The question you and a lot of producers are asking is simple: if exports look that good, why doesn’t the milk check feel the same? To get at that, let’s walk through what’s happening at the plant, what’s changed with butterfat performance and protein, why geography still matters, what’s going on in Mexico—and then bring it right back to genetics, beef‑on‑dairy, fresh cow management, and risk decisions on your own farm.

Looking at This Trend from the Plant Side

Looking at this trend from the processor’s side is where the fog starts to clear a bit.

Over the last several years, processors have poured serious money into stainless steel. IDFA and industry analysts have talked about “historic levels” of processing investment, and Hoard’s Dairyman reported that roughly 8 billion dollarsworth of dairy processing projects—new cheese plants, powder facilities, and ingredient expansions—are in the works across the Upper Midwest, Plains, and Southwest. Brownfield Ag News and Dairy Herd have described “widespread growth underway,” citing new or expanded plants in South Dakota, Kansas, Texas, Idaho, and New York.

You see it most clearly along the I‑29 corridor. South Dakota has become one of the fastest‑growing dairy regions in the U.S., as new cheese capacity along I‑29 pulled in cows and capital. Kansas appears in USDA Milk Production reports and Progressive Dairy summaries as another state with steady multi‑year growth, driven by large freestall herds and added processing capacity. In New York, big yogurt and cheese plants—including Chobani’s facility at New Berlin—are regularly flagged in state and federal reports as major buyers anchoring regional milk sheds.

Here’s where the math gets real. Large cheese and powder plants are incredibly capital‑intensive. Dairy economists and plant managers consistently note that these facilities are built to run at high utilization—typically targeting 80 percent or higher—to spread fixed costs over as many cwt as possible. If you build a plant to handle 7 million pounds of milk a day and it only runs at 4 million, your cost per cwt jumps because the debt, labor, utilities, and maintenance don’t shrink just because the milk flow does.

So if the domestic market can only comfortably absorb, say, two‑thirds of what this whole system could produce at profitable prices, the rest has to move somewhere. That “somewhere” is export markets. USDEC summaries show that in 2024, the U.S. shipped record or near‑record volumes of cheese to destinations such as Mexico, South Korea, and Central America, and moved significant quantities of skim milk powder and whey to Asia and Latin America.

From the plant’s point of view, moving that extra product overseas at thin margins is often better than leaving vats idle. From your side of the milk check, those marginal export pounds don’t always create enough added value per cwt—after you factor in global competition, freight, and currency—to show up as a big jump. The plant can spread its fixed costs over a larger volume. You might see a bit better basis at times, but not the windfall “8.2 billion dollars” sounds like on a slide.

That’s the first piece of the export paradox: big export dollars and stubborn milk checks can absolutely coexist.

What Farmers Are Finding About Components

Now let’s bring this back into the parlor, because butterfat levels and protein are doing more of the talking on your milk check than many of us expected a few years ago.

For much of the last decade, butterfat looked like the star. USDA and CME data show U.S. butter prices and per‑capita butter consumption rising, and for many years, Class III and IV values put butterfat at a clear premium over protein on a solids basis. So a lot of us leaned into butterfat—through breeding, rations, and fresh cow management—to capture those butterfat premiums.

As more milk has flowed into cheese vats, though, the balance has shifted. Cheesemakers live on protein. That’s what builds curd. The Federal Milk Marketing Order Class III formulas use cheese, whey, and butter prices to calculate fat and protein values using specific yield factors. The way those formulas are structured creates a kind of see‑saw: when butterfat prices move sharply higher, the implied value of protein tends to get pulled down, and when butterfat softens, protein can carry more of the pay pool.

If you look at USDA component price reports across 2024, butterfat values often ran in the 3.00 to 3.50 dollars per pound range, while Class III protein values showed significant volatility—bouncing from around 1.10 to over 2.50 dollars per pound depending on the month. Dairy market updates from MCT Dairies and federal order bulletins highlighted several months where fat was historically strong while protein sagged, reflecting that cheese‑heavy product mix. Analysts like Sarina Sharp with the Daily Dairy Report have talked about co‑ops finding themselves “long on cream” at times, which makes it hard to fully reward sky‑high butterfat tests when protein and cheese demand are really driving the bus.

What farmers are finding—and what a lot of field nutritionists and independent advisers will tell you—is that balancedmilk tends to pay better than extreme milk in this environment. Herds averaging around 3.5–3.8 percent protein and 3.8–4.1 percent butterfat, with solid fresh cow management and a smooth transition period, often see more stable component checks than herds that push butterfat into the mid‑4s while letting protein linger around 3.0–3.1 percent. That profile matches what many cheese plants say they want: strong pounds of solids, but in a ratio that actually fits their vats.

MonthButterfat ($/lb)Protein ($/lb)
Jan3.151.85
Mar3.351.45
May3.102.20
Jul3.451.30
Sep3.252.05
Nov3.052.45

If you haven’t done it recently, it’s worth a quick kitchen‑table exercise:

  • Take a month’s milk statement and write down the total pounds of fat shipped and total pounds of protein shipped.
  • Divide each by the total pounds of milk shipped to confirm your average butterfat and protein tests.
  • Then look up that month’s USDA or co‑op Class III/IV component values and see how many dollars per cwt those pounds are really generating.

A recent review on milk quality and economic sustainability points out that herds with better component performance and milk quality tend to show stronger economic sustainability—so long as they aren’t trading away health and fertility to get there. And Mike Hutjens, Professor Emeritus and extension dairy specialist at the University of Illinois, has hammered the same point for years: it’s pounds of fat and protein shipped per cow and per cwt that drive income, not just pretty percentages on the DHI sheet.

This development suggests something important: chasing maximum butterfat at the expense of protein and cow health doesn’t pay the way it once might have. The money today is in a balanced component profile, backed by good transition‑period management and consistent TMRs.

Why Your ZIP Code Still Matters More Than You’d Like

Looking at this trend across regions, it’s hard to ignore how much your postal code still shapes your milk check.

USDA Milk Production reports make it pretty clear that cows and milk have been shifting into certain regions, especially the interior. South Dakota is one of the clearest examples. The state has become a major growth engine as the I‑29 corridor cheese plants and expansions pulled in herds and investment. Kansas appears in USDA and Progressive Dairy statistics as another state with consistent year‑over‑year growth, driven by large freestall operations and added plant capacity. At the same time, USDA/NASS and state reports often rank Michigan near the top for milk per cow, thanks to strong forage programs, cow comfort, and efficient parlors.

What I’ve noticed, looking at those numbers and listening to producers, is that geography flows directly into basis and hauling. A 1,500‑cow freestall in eastern South Dakota, 20 or 30 miles from a modern cheese plant, is playing a different game than a 200‑cow tie‑stall in a New England valley where there’s limited processing and plants are already full. The close‑in herd may save 30–50 cents per cwt on hauling and pick up stronger over‑order premiums and quality incentives because the plant really needs their milk. The more remote herd often pays more just to get milk to town and has fewer realistic buyers if contracts change.

To put some rough numbers on it, imagine a herd shipping 20,000 cwt per month. If better basis and lower hauling together net 0.75 dollars per cwt more than a herd in a less favored location, that’s 15,000 dollars per month, or roughly 180,000 dollars per year. That’s just an example based on USDA and regional data; every farm will have its own version of that spread. But it shows why two herds can read the same export headlines and feel completely different realities when the milk checks arrive.

FactorHerd A: Close to Growing Plant (SD, KS, TX)Herd B: Remote or Declining Region (VT, Upstate NY, Rural West)
Distance to Plant20–30 miles80–150+ miles
Hauling Cost$0.25–$0.40/cwt$0.60–$1.00/cwt
Over-Order Premium/Basis$0.50–$1.25/cwt$0.00–$0.50/cwt
Quality/Volume IncentivesStrong (plant needs milk)Weak (plant at capacity or shrinking)
Monthly Advantage (20,000 cwt)Baseline−$15,000
Annual ImpactBaseline−$180,000

It’s not about “good” or “bad” states. It’s about plant geography, infrastructure, and policy. Many producers in the Midwest and Plains will tell you their biggest advantage right now is simply being inside the pull radius of expanding cheese plants. Producers in some Northeast or Mountain West pockets, or even parts of Canada, may have very competitive herds but face higher freight and less processor competition, even while exports are booming.

Mexico: Our Best Customer—and a Big Exposure

Now let’s talk about where a lot of those extra cheese and powder pounds actually end up: Mexico.

USDA FAS, IDFA, USDEC, and trade outlets like Dairy Processing are all on the same page here: Mexico is the single largest foreign market for U.S. dairy by value. In 2024, the U.S. shipped roughly $2.47 billion in dairy products to Mexico and about $1.14 billion to Canada. Together, Mexico and Canada account for more than 40 percent of U.S. dairy export value, with Mexico consistently the top buyer for U.S. cheese and skim milk powder.

What’s encouraging in the near term is that Mexico is structurally short on milk. CoBank’s export analysis and USDA FAS reports describe a situation where Mexican dairy demand has outpaced domestic production, leaving a persistent gap that imports—mostly from the U.S.—fill. Per‑capita dairy consumption in Mexico is still lower than in the U.S., which gives some headroom for growth as incomes rise. That combination—structural deficit plus room for per‑capita growth—is a big part of why analysts see Mexico as critical to U.S. dairy’s near‑term export outlook.

But there’s another side that matters for your risk. FAS and industry coverage point out that Mexico is investing in its dairy sector, particularly in northern states, where newer farms are increasingly resembling large freestall and dry-lot systems in the U.S. Southwest, with upgraded genetics, improved feed efficiency, and better milk-handling infrastructure. The goal is to trim back some of that import dependence over time.

So what farmers are finding is that Mexico is both a tremendous asset and a concentration point. Over the next one to three years, it’s hard to imagine a strong U.S. export story that doesn’t lean heavily on Mexico. Over a three‑to‑ten‑year window, if Mexico succeeds in significantly boosting its own production, the growth rate of U.S. exports there could slow, or the mix of products could shift—even if the trading relationship remains strong.

For Canadian readers in Ontario and Quebec, supply management and quota systems buffer your farm‑gate price from a lot of these swings, as multiple analyses of the 2022 Census and Canadian policy have noted. But U.S. export performance and Mexico’s appetite still shape the broader North American environment you’re operating in—especially for processors, trade negotiations, and on‑going USMCA disputes.

One Herd That Fits Today’s Market

Sometimes these big forces are easier to digest when you see how they play out in a real barn.

Top‑Deck Holsteins, a roughly 700‑cow Holstein herd in Iowa, is one of those examples. A recent profile describes Top‑Deck as a freestall operation shipping milk with a rolling herd average around 33,500 pounds per cow per year, built on intentional management and breeding decisions. The exact numbers can move with feed and weather, but the pattern is what matters.

On the cow side, that profile explains that Top‑Deck:

  • Pushes forage quality and ration balance hard to drive dry matter intake and feed efficiency.
  • Treats cow comfort as a core investment—stall design, bedding, ventilation, and milking routines are all tuned for long lying times and low stress.
  • Watches fresh cow management and the transition period closely, with protocols aimed at catching issues early and supporting strong peaks without burning cows out at 30–60 days in milk.

Genetically, Top‑Deck uses genomic testing to rank heifers and cow families, then:

  • Uses sexed Holstein semen on top‑merit animals to generate replacements with strong production, components, fertility, and health traits.
  • Uses beef semen—often Angus—on lower‑merit animals to produce calves that bring better beef value than traditional Holstein bull calves.

Recent genomic and evaluation‑system reviews in the Journal of Dairy Science and related outlets note that millions of dairy animals worldwide have been genotyped, and that using genomic evaluations with economic indexes has significantly improved progress in production, fertility, and health compared with relying on parent averages. Work from the University of Guelph’s “beef on dairy” research program—funded through the Ontario Agri‑Food Innovation Alliance and national beef research groups—shows that beef‑sired dairy calves, when managed and marketed correctly, can deliver clearly higher prices than straight Holstein bull calves, and that optimizing their early‑life management is key to maximizing value.

What’s interesting here is that Top‑Deck’s approach isn’t about chasing one extreme number. It’s about building cows that quietly ship a lot of pounds of fat and protein, stay healthy and fertile, and leave behind replacements that can do the same—while using beef‑on‑dairy to lift calf revenue. That’s exactly the kind of herd that fits a cheese‑heavy, component‑sensitive, export‑connected world.

The Consolidation Reality—and What It Means for Genetics

Now let’s punch in the consolidation piece, because this really matters for breeders and for anyone thinking about where their herd fits.

The 2022 Census of Agriculture shows U.S. dairy farm numbers dropping from 39,303 in 2017 to 24,082 in 2022. That’s roughly a 39 percent decline—about 15,000 dairies gone in five years—even as total U.S. milk production climbed roughly 5 percent, on about 9.4 million milk cows. Rabobank analysis cited in those same reports estimates that herds with more than 1,000 cows now produce around two‑thirds of U.S. milk by value, up from around 60 percent in 2017.

On top of elemental market forces, environmental and labor policies are nudging in the same direction. California, Washington, and other states have tightened manure, water, and methane rules, pushing dairies toward digesters, lagoon covers, and more sophisticated nutrient management systems—investments that are easier to justify on a 2,000‑cow dairy than on an 80‑cow tie‑stall. Labor and immigration constraints also tend to hit smaller farms harder, while larger operations often have more tools to recruit, pay, and house workers.

So the center of gravity has shifted. The buyers of genetics and semen are increasingly large freestall and dry-lot herds milking 1,000, 3,000, or 10,000 cows, not just smaller family herds picking bulls at a local sale. And those large herds are demanding a specific type of cow.

European and Scandinavian research has started using the phrase “invisible cows” to describe the ideal animal in large, modern dairy systems: basically trouble‑free, almost boring cows that don’t show up on the treatment list, have few metabolic or hoof problems, calve easily, breed back reliably, and quietly ship components that fit the plant’s grid. U.S. management and genetics advisers are framing similar ideas—focusing on cows that minimize disruptions in high‑throughput, labor‑tight environments.

What I’ve noticed, talking with large‑herd managers and AI folks, is that this is changing the genetic marketplace. Big herds don’t want “project cows” that constantly need special attention. They want cows that are almost invisible day‑to‑day:

  • Strong on productive life and livability.
  • Good mastitis resistance and udder health.
  • Sound feet and legs that keep them moving to the bunk and parlor.
  • Fertility and calving traits that keep fresh cow problems to a minimum.
  • Moderate size with solid feed efficiency.
Trait CategoryOld Priority (Show Ring / Single Trait)2025 Large-Herd Priority (“Invisible Cow”)
ProductionMax milk volume or max butterfat %Balanced pounds of fat + protein shipped per cow/year
HealthTreat problems as they comeMastitis resistance, low SCC, minimal treatments
FertilitySecondary concernStrong heat detection, conception rate, calving interval
CalvingSome assistance acceptableCalving ease (sire & maternal), low stillbirths
LongevityCull and replace as neededProductive life, low cull rate, multiple lactations
StructureExtreme dairy form, show-ring styleSound feet/legs, good locomotion, moderate frame
TemperamentNot formally selectedCalm, easy to handle in high-throughput parlors
Feed EfficiencyRarely consideredModerate intake, strong component output per lb DMI

For breeders, that has two big implications. First, there’s an opportunity for those who can breed and market families that consistently deliver these trouble‑free, “invisible” cows and back it up with real herd performance. Second, there’s risk if a herd or breeding program stays focused only on show‑ring traits or single‑trait extremes without a clear economic story tied to big‑herd, high‑throughput systems.

As herds get larger, the market is slowly but surely rewarding genetics that reduce problems rather than create them.

Beef‑on‑Dairy: Cash Cow or Heifer Trap?

Now let’s lean into beef‑on‑dairy and replacements, because this is where a lot of operations are feeling both opportunity and pain.

Over the last several years, beef semen sales into dairy herds have surged. CoBank analysts and semen company data indicate that beef semen units going into dairy cows have roughly tripled compared to the late 2010s, with estimates that 7–8 million beef units were sold into U.S. dairies in 2024 alone. The attraction is obvious: in many markets, newborn beef‑on‑dairy calves can bring 600 to 900 dollars per head in the first week, while Holstein bull calves often lag well behind that.

At the same time, USDA’s annual Cattle reports and independent analyses have been ringing the bell on dairy replacement inventories. A 2024 Farmdoc Daily review noted that just 2.59 million dairy heifers were expected to calve and enter the herd that year—the lowest since USDA began tracking that series in 2001. More recent updates and CoBank commentary suggest replacement inventories have been revised downward multiple times and remain historically tight.

On the price side, USDA’s Agricultural Prices reports show average dairy replacement heifer values moving into the 2,200 to 2,700 dollar range in many regions over 2023–2024, with springing heifers at auctions commonly bringing 2,500 to 3,000 dollars, and top lots in some Midwest and Western states touching 3,600 to 4,000 dollars. Several economic studies and extension bulletins peg the cost of raising a replacement heifer from birth to calving around 1,700 to 2,400 dollars, depending on the system—confinement, dry lot, or pasture.

So here’s the hard truth many of us are dealing with: a lot of farms leaned into beef‑on‑dairy so aggressively—because that 600–900 dollar beef calf check looked awfully good—that they’re now staring at 2,500‑plus replacement heifer prices when they want to expand or even just maintain herd size. Analysts in Dairy Herd have gone so far as to say that America’s heifer shortage is actively limiting expansion and that the “big money in beef‑on‑dairy” is one of the key drivers.

For a Bullvine reader, the warning needs to be crystal clear:

Don’t sell your future for a 300‑dollar calf check today.

Decision PointToday’s CashCost to RaiseMarket PriceReal Economics
Beef-on-Dairy Calf$600–$900$0 (buyer’s problem)N/AImmediate income, no future cow
Holstein Bull Calf$150–$250$0 (buyer’s problem)N/AMinimal income, no future cow
Keep & Raise Heifer$0 today$1,700–$2,400$2,500–$3,60024-month investment, future production
Annual Impact (100 beef calves)+$60,000–$90,000Clear−$250,000–$360,000 in replacement costsNet position depends on replacement needs

In some markets, the calf check is 600 or 800 dollars, not 300, but the principle is the same. Beef‑on‑dairy is a powerful tool when it’s aimed at the bottom of the herd with a clear replacement plan. Used without a plan, it can hollow out your future cow herd and leave you paying top-of-the-market prices to fill stalls.

The sweet spot, based on both research and what well‑run farms are doing, looks something like this:

  • Top 30–40 percent of females: Genomic‑tested and top‑merit cows and heifers get sexed dairy semen to generate replacements.
  • Middle group: Conventional dairy semen, adjusted up or down depending on your replacement needs.
  • Bottom end: Clearly identified low‑merit cows and heifers get beef‑on‑dairy semen to turn them into higher‑value calves.

And that plan isn’t static. It gets revisited each year as calf, beef, and replacement markets change. But the order of operations doesn’t change: protect your future herd first; chase beef calf checks second.

What Farmers Are Finding Works Right Now

Talking with producers from Wisconsin to South Dakota, from Idaho to Ontario, three themes keep showing up on farms that seem to be navigating all this better than most.

Breeding for Profit and “Invisible” Cows

Looking at this trend in breeding decisions, the herds that look most resilient aren’t chasing a single extreme trait. They’re using tools like genomic selection, economic indexes, and on‑farm records to build cows that are profitable and low‑drama.

Peer‑reviewed work on dairy genetics and national evaluation systems, summarized by the Council on Dairy Cattle Breeding and others, shows that genomic selection combined with economic indexes like Net Merit (U.S.) and Pro$ or LPI (Canada) can significantly improve progress in production, fertility, and health traits compared to traditional selection. That’s the backbone of how most major AI studs and progressive herds are making mating decisions today.

On the farms I’ve seen, a practical genetics plan often looks like this:

  • Use a profit index (Net Merit, Pro$, LPI) as the main filter rather than picking bulls off a single trait like butterfat or total milk.
  • Inside that pool, favor bulls that nudge both fat and protein percentages modestly upward while maintaining or improving fertility, udder health, and productive life.
  • Put real weight on traits that keep cows in the herd: mastitis resistance, hoof health and locomotion, calving ease, and overall robustness.

In that context, many commodity‑oriented herds are targeting cows with butterfat around 3.8–4.0 percent, protein in the mid‑3s, and reproduction performance that aligns with their culling and replacement plans. That doesn’t win you banners at a show, but it tends to win you more predictable component checks, fewer headaches, and a cow that’s “invisible” in the best way—just quietly doing her job.

Turning Genomics and Beef‑on‑Dairy into Everyday Tools

Genomics and beef‑on‑dairy aren’t fringe ideas anymore—they’re everyday tools for a growing number of herds.

Recent genomic reviews indicate that genomic evaluations can roughly double the accuracy of selecting young animals compared to using parent averages alone, especially for complex traits such as fertility and health. Breeding programs that use sexed semen on the top tier of females and beef semen on the bottom tier to accelerate dairy genetic gain while also lifting calf value.

On many commercial farms, that has turned into a straightforward three‑tier system like the one above. The key shift on farms that are doing it well is that they’ve stopped guessing:

  • They genomic‑test at least a subset of heifers to identify which families deserve replacements.
  • They run replacement‑need projections based on real cull rates, expansion plans, and age at first calving.
  • They adjust the proportion of sexed, conventional, and beef semen to hit those replacement targets rather than just chasing what the calf market looks like this month.

University of Guelph research and beef‑on‑dairy extension materials emphasize that dairy‑beef cross calves can command solid premiums over straight Holstein bull calves when marketed correctly, but they also warn that early‑life management and health are critical to capturing that value. The farms that treat beef‑on‑dairy as a strategic tool—not just a quick cash grab—are the ones turning it into a durable advantage.

Making Risk Management Routine Instead of a Panic Button

The third big shift isn’t genetic or nutritional—it’s in how farms treat price risk.

Extension economists and dairy market advisers have been pushing for years now that tools like Dairy Margin Coverage and Dairy Revenue Protection should be part of a routine risk plan, not just something you sign up for when prices crash.  Herds that quietly use DRP or basic options strategies year after year to put a floor under part of their milk price while leaving some upside open.

What many advisers suggest, as a starting point, is that producers consider protecting something like 30–50 percent of their expected milk production with DRP, options, or fixed‑price contracts when forward prices cover their cost of production and debt needs. It’s not a rule; it’s a range that seems to work for a lot of operations. Some herds are comfortable covering more, while others are less comfortable, depending on their balance sheets and risk tolerance.

A simple example might look like this:

  • A 900‑cow herd in Wisconsin, selling mainly into Class III, uses DRP to set a revenue floor under part of its projected spring and summer milk based on its typical butterfat and protein tests and the markets it ships into.
  • At the same time, the herd forward‑contracts a portion of its corn and soybean meal when futures plus local basis give them a feed cost that supports a margin they can live with.

The rest of the milk and feed stays unhedged, leaving room to benefit if markets move higher. The point isn’t that 900 cows in Wisconsin need this exact plan. The point is that treating risk tools as normal business practice—as much a part of the job as booking soybean meal—can turn wild swings into manageable bumps.

From conversations with producers who’ve made that shift, the hardest step usually wasn’t understanding the math. It was deciding to stop waiting for the next crisis to start learning.

Different Starting Points, Different Options

Given all this, the logical question is: “So what does this mean for my farm?” The honest answer depends on your size, your location, and your timeline. But some patterns show up pretty consistently.

Larger Herds Close to Growing Plants

If you’re milking 800–3,000 cows in eastern South Dakota, western Kansas, the Texas Panhandle, southern Idaho, or near growing plants in Wisconsin or New York, you’re in a spot where processors need your milk. That doesn’t solve everything, but it’s a real advantage.

On farms like yours that seem to be in decent shape, you usually see:

  • Sharp focus on components and cow flow. Butterfat and protein targets are tuned to what nearby cheese and ingredient plants actually pay for, and fresh cow management during the transition period is geared to support strong peaks without wrecking cows.
  • Structured breeding and replacement plans. Genomics and sexed semen build replacements from the top of the herd; beef‑on‑dairy is used thoughtfully on the bottom end to boost calf revenue without starving replacements.
  • Habitual risk management. DRP, DMC, options, and feed contracts are used when the math works, not just when the market is already in free fall.
  • Cautious growth decisions. Expansion plans are stress‑tested against lower milk prices and higher costs, often with lender and adviser input, not just modeled on today’s strong basis.

Mid‑Size Herds in Stable Regions

If you’re running 400–800 cows in places like Wisconsin, Michigan, Pennsylvania, Vermont, or Southern Ontario, you’re big enough to feel serious capital pressure but not always big enough to be your plant’s top priority.

Mid‑size herds that look resilient tend to:

  • Drive the cost of production hard. They lean into cow comfort, parlor throughput, and ration consistency to get into the top third of their region’s cost curve, using benchmarks from lenders, extension, and trade media.
  • Make themselves “must‑keep” suppliers. Plants know they can count on them for consistent volume, strong quality, and components that fit the product mix.
  • Explore niches where they truly fit. Some find success with organic, grass‑fed, A2A2, on‑farm processing, or regional branding—especially in the Northeast and Upper Midwest—but only when local demand and the family’s temperament for marketing line up.
  • Treat succession and timing as strategic variables. Major upgrades or expansions are tied to clear family plans for who wants to be there in 5–10 years, not just to what the bank will finance.

Smaller or More Isolated Herds

If you’re milking 50–200 cows in a rural pocket far from growing plants, or in a region losing processing, the export‑driven, capacity‑heavy system frankly isn’t built with you in mind.

Smaller herds in that position that manage to stay in the driver’s seat often:

  • Get brutally honest about cost and equity trends. They know, in numbers, whether they’re gaining ground, treading water, or slowly slipping.
  • Decide what role the dairy plays. For some, the dairy is still the primary economic engine. For others, it’s part of a mix with off‑farm jobs, cash crops, custom work, or direct‑marketing businesses. That choice shapes everything else.
  • Explore niches carefully, not desperately. On‑farm processing, direct‑to‑consumer sales, or agritourism can work—especially near population centers—but only when location, market, and family skills align. They’re not automatic lifelines.
  • Plan early for transitions. The most successful exits or step‑downs start with early, candid conversations with family, lenders, and advisers—before external forces make the decision for them.

A Few Practical First Steps

If you’re looking at your own numbers and wondering where to start, here are a few simple, concrete steps that many producers have found useful:

  • Pull a year’s worth of milk checks and component reports.
    Work out your true average butterfat and protein tests, and—more importantly—your pounds of fat and protein shipped per cow and per cwt. Then talk with your field rep or plant contact about how that profile lines up with what your leading buyer wants and pays best for.
  • Map your replacement needs before you map beef‑on‑dairy.
    Sit down with your records and figure out your real replacement rate and any expansion plans. Estimate how many quality dairy heifers you’ll need calving in over the next two to three years. Use that number to double-check how much beef‑on‑dairy your breeding program can truly support without putting you in the heifer penalty box.
  • Pilot genomic testing on a subset of heifers.
    Work with your AI rep or herd vet to test a group, rank them, and use that ranking to decide who gets sexed dairy semen and who gets beef. Treat this as a learning process, not a one‑off experiment.
  • Schedule an hour with a risk adviser.
    Sit down with someone from your co‑op, a dairy‑focused broker, or an extension economist and ask them to walk you through what it would look like to protect roughly 30–50 percent of your expected milk and some of your feed at prices that cover your costs and debt needs. Then adjust that percentage based on your own risk tolerance and lender expectations.
  • Run a stress‑test budget.
    Put together a simple cash‑flow scenario at a lower milk price—say 13–14 dollars Class III—and slightly higher feed costs. See where the pinch points are. Use that information to decide whether your next move should be to tighten costs, adjust debt, lock in some margins, pursue measured growth, or plan a gradual pivot.

Three Questions Worth Asking Yourself

As you work through all that, three blunt questions keep coming up in good kitchen‑table conversations:

  • Do my components actually fit my buyer’s product mix and pricing grid—or am I leaving money on the table chasing the wrong butterfat/protein profile?
  • Am I using genomic tools and beef‑on‑dairy with a clear replacement strategy—or am I selling my future herd for today’s calf checks?
  • Do I have even a basic risk plan for the next 12–24 months, or am I still gambling that spot markets will treat me kindly?

The Bottom Line

At the end of the day, the export headlines and your milk check are telling different parts of the same story. The export dollars keep plants running and markets open. The milk check reflects how that big system—stainless steel, global competition, butterfat and protein pricing, consolidation, geography, heifer supply, and policy—lines up with your cows, your barn, and your ZIP code.

What I’ve noticed, sitting at a lot of kitchen tables and in a lot of barn offices, is that once you really understand those connections, the whole situation feels a little less random. You won’t control the world price of cheese. But you can control how your herd is bred, how your fresh cows come through the transition period, what your cost of production looks like, and whether you use the genetics, beef‑on‑dairy, and risk tools that are already on the table.

There isn’t one right answer. For some operations, the smart play will be to lean in and grow with the local plant. For others, it’ll be carving out a well‑defined niche that truly fits their region and family. And for some, the bravest and best decision will be planning a thoughtful transition that protects family, equity, and sanity. The key is making that call with clear eyes, honest numbers, and a solid grasp of the forces that are shaping all of us—whether we like them or not.

Key Takeaways 

  • $8.2B exports, stubborn checks: Record dairy shipments didn’t lift every milk check because expanded plant capacity needs export markets to clear marginal pounds—at margins that rarely flow back to producers.
  • Protein now drives the pay grid: Cheese plants reward curd yield, not extreme butterfat. Herds balancing 3.5–3.8% protein with 3.8–4.1% fat are capturing more consistent component premiums than single-trait chasers.
  • Beef-on-dairy created a heifer crisis: Replacement inventories fell to their lowest since 2001. Farms that grabbed $600 beef calf checks now face $2,500–$3,000+ heifer bills—proof that short-term cash can cost long-term cows.
  • Big herds are buying “invisible” cows: 15,000 dairies exited in five years; 1,000+ cow operations now ship two-thirds of U.S. milk. They’re paying for genetics that deliver fertility, health, and components—not project cows that hit the treatment list.
  • Three moves that separate planners from hopers: Tune your component profile to your plant’s grid, use genomics and beef-on-dairy with a locked-in replacement plan, and treat DRP and feed hedges as standard practice—not emergency measures.

Complete references and supporting documentation are available upon request by contacting the editorial team at editor@thebullvine.com.

Learn More

The Sunday Read Dairy Professionals Don’t Skip.

Every week, thousands of producers, breeders, and industry insiders open Bullvine Weekly for genetics insights, market shifts, and profit strategies they won’t find anywhere else. One email. Five minutes. Smarter decisions all week.
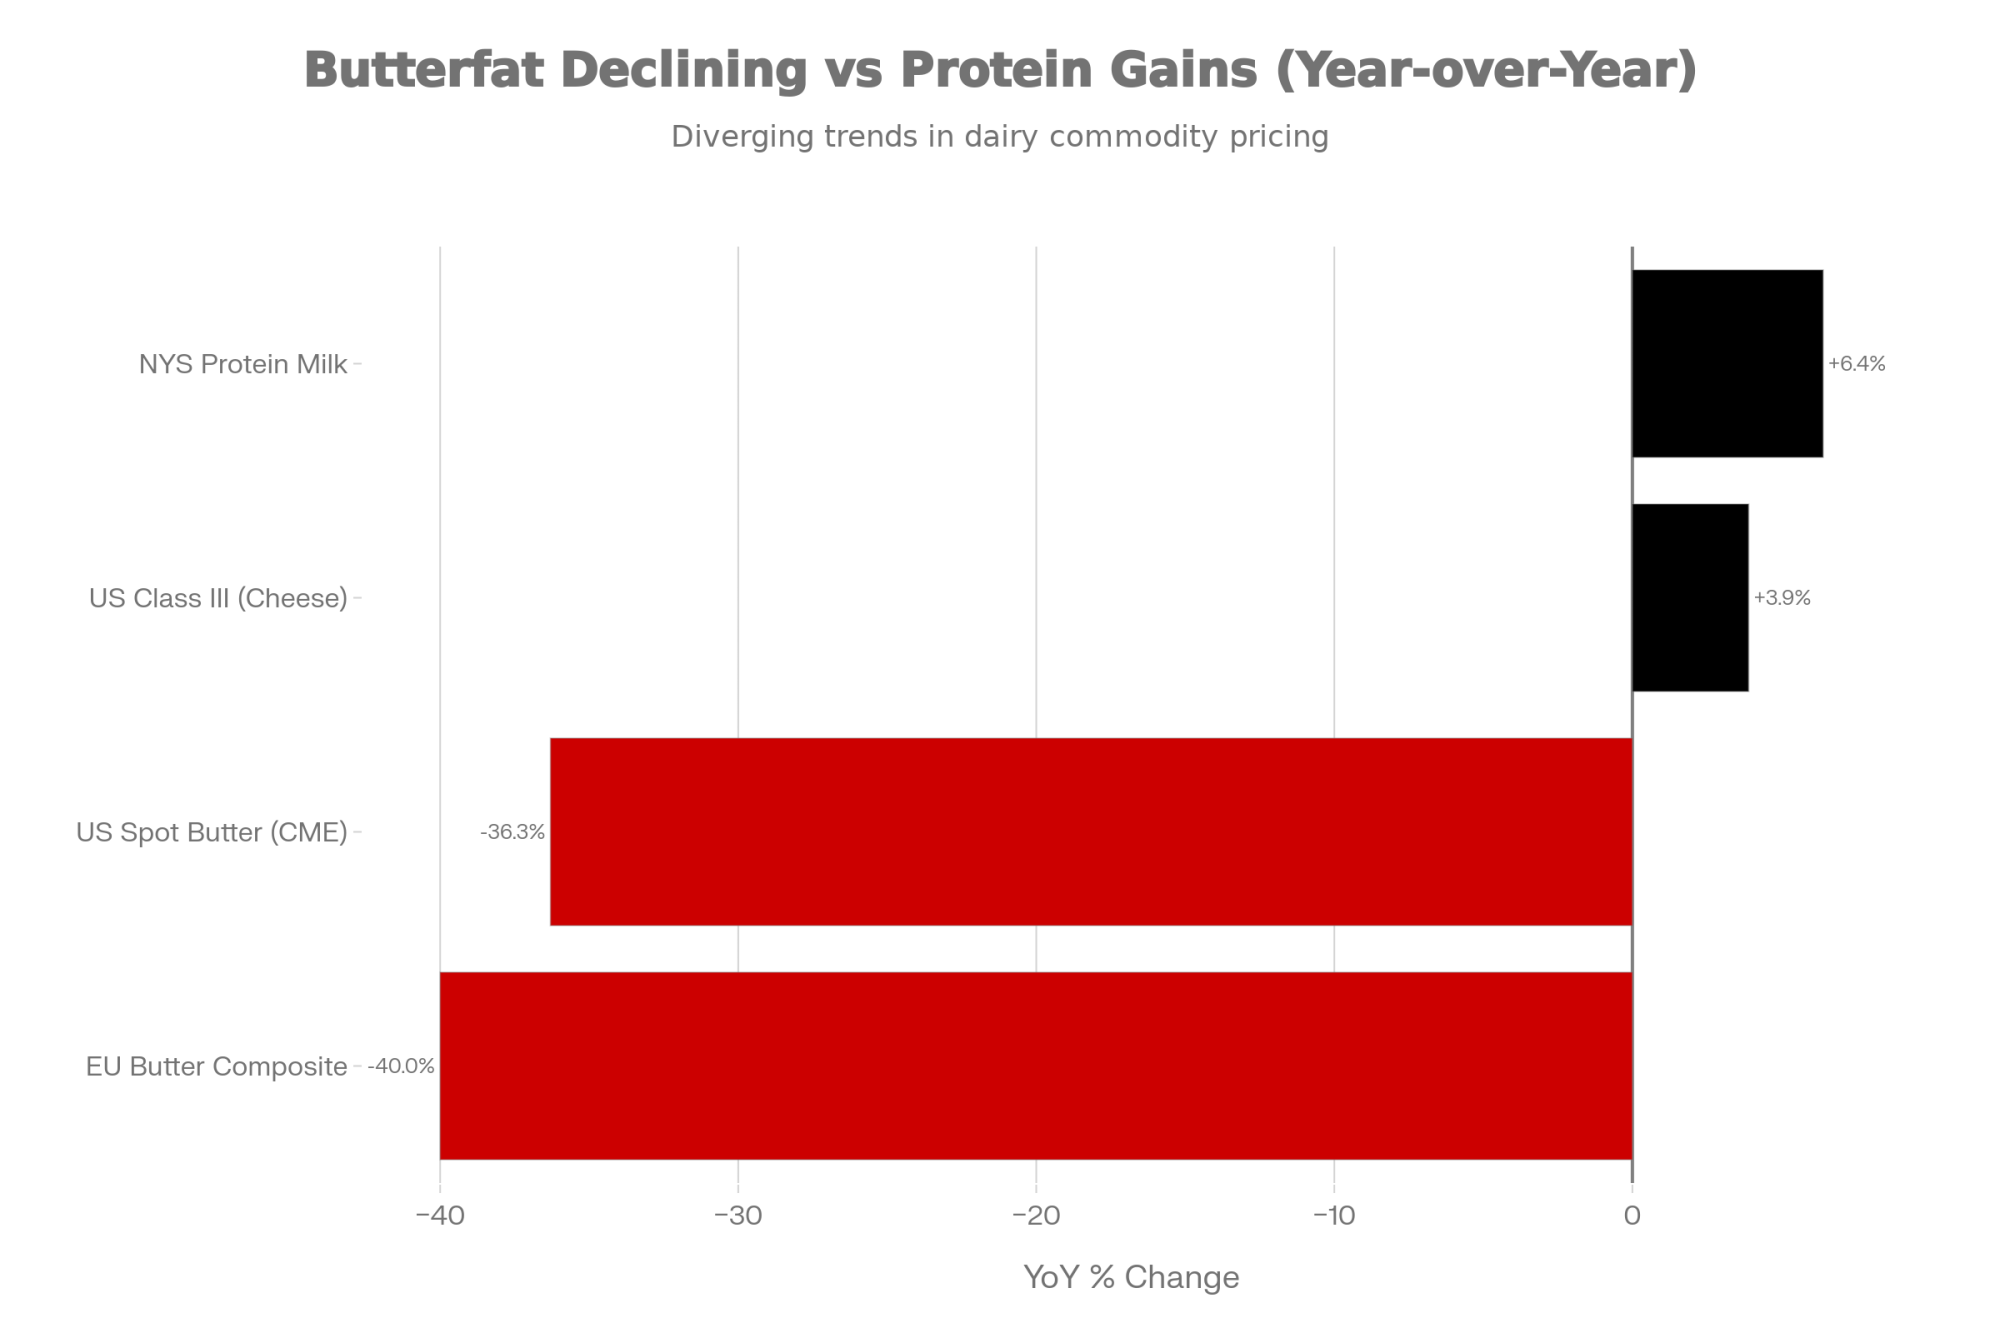
NewsSubscribe
First
Last
Consent

You Won the Whole Milk Fight. Here’s Why Your Milk Check Didn’t Move.

Whole milk finally won. Your check didn’t move. The $140/cow answer is in your protein-to-fat ratio.

Executive Summary: This feature digs into why, even after full‑fat dairy won big in the 2025–2030 Dietary Guidelines and whole milk returned to U.S. schools, many producers aren’t seeing bigger milk checks. It shows how years of chasing butterfat performance left U.S. herds slightly out of step with cheese and whey plants that now pay more attention to protein and protein‑to‑fat ratio than to record fat tests. Using current data from CoBank, Federal Orders, and major plant investments, the article walks through real numbers—including a two‑herd example with a $70,000‑per‑year difference in component revenue—to prove how protein is quietly becoming the main driver of milk value in cheese‑heavy markets. Regional sections help producers in the Upper Midwest, California, the Northeast, and Canada see how these shifts look under their own pricing and quota systems. The core takeaway is simple: if you want to stay ahead, you need to manage for protein at least as actively as you manage for butterfat. A three‑stage playbook then outlines what to do next—short‑term component audits and ration tweaks, one‑year genetics and genomics choices, and three‑year positioning around new cheese, whey, and sustainability‑linked programs—delivered in a practical, farmer‑to‑farmer tone that respects both the win for whole milk and the new math on the milk check.

milk protein-to-fat ratio

If you just skimmed the headlines this year, you’d swear dairy finally got everything it’s been asking for.

In early January, the U.S. Department of Agriculture and the Department of Health and Human Services rolled out the new 2025–2030 Dietary Guidelines for Americans under the “Eat Real Food” banner at realfood.gov, and dairy is right in the middle of that plate. The guidelines lay out a 2,000‑calorie pattern that includes three daily servings of dairy and spell out that when people consume dairy, they can choose full‑fat dairy with no added sugars as part of a healthy eating pattern, describing dairy as an excellent source of protein, healthy fats, vitamins, and minerals. USDA and HHS press materials even call this a historic reset of nutrition policy that puts real, minimally processed foods—meat, eggs, full‑fat milk, fruits, vegetables—front and center while urging people to prioritize protein and cut back on added sugars and highly processed foods.

On the industry side, the International Dairy Foods Association jumped in with both boots. In a January 6, 2026 statement, Michael Dykes, D.V.M., president and CEO of IDFA, said these guidelines “send a clear and powerful message to Americans: dairy foods belong at the center of a healthy diet,” and he highlighted that the document recommends dairy products “at all fat levels,” including whole and full‑fat milk, yogurt, and cheese. That’s a long way from the older “choose low‑fat or fat‑free dairy most often” messaging many of you have been pushing back against for years.

At the same time, Congress finally moved on to something dairy has chased for more than a decade: getting whole milk back into schools. The Whole Milk for Healthy Kids Act of 2025—H.R. 649—updates National School Lunch and School Breakfast rules so schools can serve whole, 2%, 1%, and fat‑free milk, flavored and unflavored, and it excludes milk’s saturated fat from the weekly saturated‑fat limits used to score school menus. Coverage from Dairy Reporter and farm policy outlets notes that the law also tightens rules for what counts as a nutritionally equivalent non‑dairy beverage, and both dairy and plant‑based groups weighed in heavily as the bill advanced. USJersey organizations formally backed the legislation, arguing that it restores whole- and reduced‑fat milk options in cafeterias and better reflects what families actually drink at home.

On paper, that’s full vindication for how a lot of you have been feeding your own kids for decades.

Then the milk check lands on the table… and the numbers don’t exactly say, “You’re finally getting paid for this,” do they?

So let’s walk through why that is, and what it really means for your butterfat performance, your protein, and your next moves.

Looking at This Trend: What Really Changed in the Guidelines

Looking at this trend, here’s what’s interesting: it’s not just that dairy survived another guideline cycle. It’s that full‑fat dairy stepped out of the penalty box.

The new guidelines on realfood.gov lay out a 2,000‑calorie pattern with three servings of dairy and clearly state that when people consume dairy, they can choose full‑fat dairy with no added sugars as part of a healthy eating pattern. The text calls dairy an excellent source of protein, healthy fats, vitamins, and minerals, and it emphasizes that Americans should prioritize protein-rich foods at every meal, including dairy. USDA and HHS fact sheets describe the package as ending the “war on healthy fats,” encouraging more dairy and other whole‑food fat sources, while still stating that saturated fat should remain below 10% of total calories.

Harvard’s T.H. Chan School of Public Health weighed in with a JAMA Viewpoint in January 2025 that’s worth noting. The authors point out that the numeric saturated‑fat cap stayed at 10% of calories, but the visuals and examples in the new guidelines now prominently feature steak, butter, and full‑fat milk, which could easily make people think the cap has quietly loosened. They argue that the “eat real food” emphasis reflects justified worry about ultra‑processed diets, yet also raises fair questions about whether the 10% cap will be applied consistently in practice.

On the research side, more nutrition scientists have been questioning the old blanket advice always to pick low‑fat dairy. A 2021 review in Nutrients concluded that the evidence supporting a strict saturated‑fat cap is more nuanced than many past guidelines suggested and that saturated fat in whole foods such as full‑fat dairy may not carry the same risk profile as saturated fat in ultra‑processed snacks. A 2024 analysis of U.S. diets found that a large share of saturated fat and added sugar comes from processed meats, desserts, and snack foods, rather than just milk and cheese, which supports a more targeted approach to “bad actors” in the diet.

Now fold in the Whole Milk for Healthy Kids Act. The Congress.gov summary of H.R. 649 spells out that schools in the National School Lunch and School Breakfast Programs can once again offer whole and reduced‑fat milks, both flavored and unflavored, and that fluid milk’s saturated fat is excluded from the weekly saturated‑fat calculation used to judge school menus. Dairy Reporter’s coverage shows dairy groups praising the bill for restoring taste and choice, while public‑health advocates worry it could raise saturated‑fat intake among kids who already overshoot recommended levels.

So nutritionally and politically, the wind is finally at dairy’s back. Full‑fat milk, cheese, and yogurt are back in government advice and school cafeterias.

But as many of you have already noticed, that doesn’t automatically change what your processor pays the most for in each hundredweight of milk.

What Farmers Are Seeing: Butterfat Performance and the Protein Gap

What I’ve seen, looking at the data and listening to producers, is that U.S. herds have done an outstanding job at one thing: butterfat.

University of Minnesota’s Isaac Salfer, assistant professor of dairy nutrition, has tracked bulk tank fat tests in the Upper Midwest in work shared through Dairy Herd Management and extension channels. He showed that from roughly 2000 through 2012, average bulk tank butterfat in that region floated around 3.7 to 3.8 percent. By 2021, the regional average climbed above 4.0 percent, and in January 2022, the average fat test for Upper Midwest herds came in around 4.25 percent. Salfer has even commented that a 3.75% fat test—once considered high for Holsteins—now looks more like the low end of what he expects from well‑managed herds with modern genetics and feeding.

From “pretty good” to “best in the neighborhood” in 25 years: Upper Midwest herds pushed butterfat from 3.7% to 4.33%—hitting that target right when mozzarella plants decided they didn’t need any more cream

National numbers line up with that story. The average U.S. butterfat climbed from about 3.8% in 2015 to 3.94% in 2020, then 4.01% in 2021, and hit 4.33% by March 2025, based on Federal Milk Marketing Order data. CoBank’s 2025 analysis on components goes a step further and notes that butterfat percentage in U.S. milk has risen about 13% over the last decade, compared to only 2–3% growth in places like the European Union and New Zealand.

The gap tells the story: U.S. dairy pushed butterfat 13% higher in a decade while protein crawled ahead just 6%—leaving many herds fat-rich and protein-poor exactly when cheese plants started begging for the opposite

Protein has been moving too, but not nearly as fast. That same CoBank work points out that the average true protein in U.S. milk has increased roughly 6% over the decade, from about 3.1% to around 3.3%. Solid progress, but the gap between fat gains and protein gains is exactly where the trouble starts for processors.

None of this happened by accident. A lot of you have deliberately pushed butterfat performance:

  • Picking sires with strong butterfat PTAs, including some Jersey influence in Holstein herds to boost fat and total component yields, as reflected in both CoBank’s commentary.
  • Improving forage quality—more digestible fiber, better harvest timing—and ration balance so cows can produce more milk fat without getting knocked off balance energy‑wise.
  • Tightening up fresh cow management through the transition period—watching negative energy balance, ketosis risk, rumen function—so higher butterfat doesn’t come with more displaced abomasums or down cows.

For several years, that was exactly what the market seemed to want. CoBank notes that butterfat pay prices led protein in eight of the ten years heading into the mid‑2020s, fueling what its analysts call a butterfat boom. Butter prices ran strong, cream multiples were attractive, and churns running hard while cream supplies periodically looked for a home.

The hitch is that protein hasn’t kept up, and processors—especially the cheese and whey plants—are showing more and more concern about that imbalance.

CoBank’s component work shows that from 2000 to 2014, protein prices exceeded butterfat every year, which encouraged a pretty balanced growth in both components and kept the national protein‑to‑fat ratio in the 0.82–0.84 range. As butterfat advanced in both genetics and pricing, the ratio slipped to roughly 0.77. For plants that need a tight balance of casein and fat to fill cheese vats and whey dryers efficiently, that shift matters a lot.

The number your co-op watches closer than you do: the U.S. protein-to-fat ratio slid from 0.84 to 0.77 over 25 years—meaning more cream to manage, less protein for cheese, and higher costs. Cheese plants want you back above 0.80

Why Processors Care So Much About the Protein‑to‑Fat Ratio

Looking at this trend from the plant’s side of the road, you start to see why they keep talking about protein‑to‑fat ratios instead of just “more components is better.”

Cheese makers design their yields around a specific relationship between casein and fat. Many plants like their incoming milk somewhere around 3.2% protein and 4.0% fat, giving a protein‑to‑fat ratio near 0.80—not because they’re fussy, but because that ratio makes their cheese vats and whey systems run efficiently. When milk rolls in at, say, 4.2% fat and 3.1% protein, a few things happen:

  • There’s more cream than they can easily use in the products they’re making today.
  • There are fewer pounds of protein per hundredweight to turn into cheese and high‑value whey proteins.
  • They have to spend extra time and money standardizing milk just to hit the specs their equipment and contracts are built around.

CoBank lays that trajectory out clearly. For years, fat and protein grew in step, and protein generally sat ahead of butterfat on the price sheet, so plants got a nicely balanced stream of components. Then, as butterfat stayed “the money maker” in many markets, genetics and feeding strategies pushed fat faster than protein, leaving cheese‑oriented plants awash in cream but relatively short on protein.

At the same time, USDA Class and component price announcements show that butterfat and protein often trade closer together than many folks expect. For example, March 2025 Federal Order component prices reported butterfat near the mid‑$2.60s per pound and protein in the mid‑$2.40s, with month‑to‑month swings moving those numbers back and forth. In some 2025 months and orders, protein has led fat; in others, fat has led protein. Either way, the gap isn’t always as wide as “butterfat always wins” would suggest.

Corey Geiger, CoBank’s lead dairy economist, has been pretty frank about it. In an October 2025 interview, he pointed out that U.S. butterfat percent is up about 13% over the past decade, while New Zealand and the EU sit closer to 2%, and that U.S. true protein is up around 6%. His takeaway was that U.S. producers in many markets should start shifting some focus from butterfat toward producing more protein, especially as cheese and whey plants expand and protein “takes over the pole position on milk checks” in those regions.

So if it feels like you spent ten years building the butterfat levels the market seemed to want, just in time for the same market to start telling you it’s short on protein, you’re not imagining it.

What Producers See in Their Checks: A Simple Milk Check Example

You know how sometimes the only way to really feel a change is to run the math on two herds that look a lot like what you see in your area? Let’s do that.

Picture two 500‑cow herds shipping to the same cheese‑and‑whey plant in a Midwestern Federal Order:

  • Herd A (Holstein‑Jersey cross): 75 lb of milk per cow per day, 4.2% butterfat, 3.1% protein.
  • Herd B (Holstein): 78 lb of milk per cow per day, 3.8% butterfat, 3.35% protein.

Now layer on representative 2025 component values from Federal Order announcements where both butterfat and protein are in play—think butterfat somewhere in the mid‑$2.60s per pound and protein in the mid‑$2.40s to low‑$2.50s, depending on the month. In some recent orders, protein has nudged above fat; in others, fat has had the edge. But they’re in roughly the same ballpark.

Under those kinds of prices:

  • Herd A clearly “wins” on butterfat performance and ships more pounds of fat per cow.
  • Herd B gives up some fat, but pushes more protein pounds and a bit more milk.

When you crank those numbers through an actual component pay sheet—with each herd’s fat and protein production multiplied by their respective prices, plus a bit of milk yield difference—it’s easy to reach a scenario where Herd B’s milk brings in tens of thousands of dollars more per year in component revenue than Herd A, despite Herd A’s better fat test. CoBank’s modeling and case examples bear this out in a variety of cheese‑heavy markets: modestly lower fat with noticeably higher protein and milk volume often wins the total component dollar race when protein prices are competitive.

MetricHerd A (Fat Focus)Herd B (Protein Balance)DifferenceWinner
Herd Size500 cows500 cows
Milk Yield (lb/cow/day)7578+3 lbHerd B
Butterfat %4.20%3.80%-0.40%Herd A
Protein %3.10%3.35%+0.25%Herd B
Protein:Fat Ratio0.740.88+0.14Herd B
Total Daily Milk (lb)37,50039,000+1,500 lbHerd B
Est. Annual Revenue AdvantageBaseline+$72,400+$144/cow/yearHerd B

Your exact math will depend on your local component values, premiums, solids‑non‑fat rules, quality bonuses, and hauling costs. But that basic story—that very high butterfat can be outgunned financially by strong protein plus solid fat in a cheese‑oriented market—is showing up again and again when producers, nutritionists, and farm business advisors sit down and run 6–12 months of milk checks through real pay grids.

Regional Reality Check: It Doesn’t Look the Same Everywhere

It’s worth saying out loud here that the “right” butterfat‑to‑protein balance isn’t identical in every region or every plant.

In Wisconsin and the broader Upper Midwest, Federal Order 30 and neighboring areas send a large share of milk into cheddar, mozzarella, and other cheeses, with modern whey protein recovery. CoBank has noted that these plants tend to be especially sensitive to the protein-to-fat ratio and overall component balance because both cheese and whey yields depend heavily on those ratios. It’s not unusual to hear co‑op reps there say they’re comfortable around 4.0% fat, but they get more excited when they see protein closer to 3.3–3.4%.

In California, the picture is more mixed. Since joining the Federal Order system in late 2018, California milk has flowed into a blend of Class I fluid products, Class III cheese, and Class IV butter and powder. State and federal data make clear that nonfat dry milk and skim powder still matter a lot for that market, which means solids‑non‑fat, class utilization, and balancing costs share the stage with component pricing. A large dry lot herd near Tulare shipping to a plant making both cheddar and powder is playing a slightly different game than a freestall herd in central Wisconsin shipping primarily to a mozzarella‑plus‑whey facility.

In the Northeast, Orders 1 and 33 still lean more heavily on Class I fluid, with strong branded players in whole milk, flavored milk, and ice cream. Those brands often pay healthy butterfat premiums because they’re selling the “cream line” and indulgence story, even while yogurt, cheese, and ultra‑filtered milk plants in the region are watching protein very closely. That’s why you’ll see some Northeast‑targeted analysis—including Bullvine pieces—warning that a 3.15% protein test doesn’t cut it anymore if you want to land in the top tier of certain processor grids.

Then there’s Canada, where the entire structure is different. Under supply management and the Canadian Dairy Commission’s component pricing, producers are paid based on a national grid that’s designed to match butterfat and solids‑non‑fat production with domestic demand for different milk classes. A Holstein herd in Quebec or Ontario that pushes fat too high relative to SNF can quickly bump into quota over‑production penalties or create an SNF surplus, even if the component test looks impressive on paper. That’s a very different optimization problem than a U.S. herd chasing Federal Order component prices and cheese‑plant premiums.

So while the national numbers say butterfat is up double digits, and protein is up single digits, your local reality might be:

  • “Our mozzarella plant really wants more protein and doesn’t pay much once we’re above 4.0% fat.”
  • Or, “Our regional fluid brand still rewards butterfat heavily because most of our milk ends up in bottles and ice cream.”
  • Or, “Our quota system is about staying in tight butterfat and SNF bands, not maxing out a single component.”

In that context, one of the most useful questions you can ask your buyer is very simple: “For the products you’re actually making, what does ideal milk look like for you over the next five years?” It sounds basic, but many of us don’t ask it directly enough.

Region / MarketPrimary ProductsPreferred Butterfat %Preferred Protein %Target RatioKey Notes
Upper Midwest (WI, MN)Cheddar, mozzarella, whey3.9–4.1%3.3–3.4%0.80–0.85Cheese-focused; protein drives value; above 4.2% fat adds cost
CaliforniaCheese, powder, fluid mix3.8–4.0%3.2–3.3%0.80–0.83SNF matters for powder; Class IV still significant; balancing act
Northeast (NY, PA, VT)Fluid milk, yogurt, ice cream4.0–4.3%3.2–3.4%0.75–0.85Fluid brands reward fat; UF/Greek yogurt wants protein; mixed signals
Canada (Supply Mgmt.)Quota-based mix3.9–4.1%3.3–3.4%0.80–0.85Exceeding quota in any component triggers penalties; balance is mandatory

Where School Milk Fits: Stabilizer, Not Silver Bullet

Looking at this trend, you know, it’s tempting to think, “Great—whole milk is back in schools, so butterfat is king again, and we’re saved.”

From a nutrition and category‑health standpoint, the Whole Milk for Healthy Kids Act really is a big win for dairy. The law lets cafeterias put whole and reduced‑fat milk back on the line by exempting milk’s saturated‑fat content from the weekly limit used in menu scoring, and it clarifies what counts as a nutritionally equivalent non‑dairy alternative. Dairy groups have highlighted better taste, greater acceptance, and improved nutrition for kids, while public‑health advocates worry this adds saturated fat back into diets that already exceed recommended levels.

From a volume and pricing standpoint, though, the impact is more modest. Federal Order utilization data and CoBank’s broader market analysis both show that beverage milk is now a minority of total U.S. milk disappearance, and school milk is just one piece of that Class I segment. CoBank economists describe school milk policy changes as important stabilizers: they support butterfat demand, likely raise the floor under fat pricing a bit, and help defend dairy’s relevance with younger consumers. But they’re not big enough to re‑balance a national milk supply that’s become very efficient at producing cream in a system where new stainless steel is increasingly pointed at protein.

So yes, whole milk in schools is a long‑overdue positive. It’s just not a magic lever that can rescue butterfat pricing in markets where everything else is screaming for more protein.

What Producers Are Learning: Reading the Signals That Matter

What I’ve noticed, listening to producers from larger freestall setups in Wisconsin to big dry lot systems in Idaho to smaller tie‑stall herds in the Northeast, is that the folks who seem a little calmer right now aren’t necessarily the ones who guessed every move right. They’re the ones who have been quietly watching a few key signals and adjusting as they go.

First, they’ve watched where the stainless steel is going. CoBank’s late‑2025 work on “Protein will drive milk checks for the foreseeable future” highlights roughly $11 billion in new and expanded dairy plant investments across the U.S., with cheese projects leading the way at about $3.2 billion and significant additional investment in high‑protein fluid and yogurt/cultured dairies. That’s a huge bet on turning milk into cheese, whey, protein‑forward beverages, and cultured products—categories where protein drives a lot of the value.

Hilmar Cheese’s Dodge City, Kansas, facility is a good real‑world example. Company announcements and state economic‑development releases describe an investment north of $600 million, roughly 250 new jobs, and a new cheese and whey production plant designed to handle a substantial stream of milk in southwest Kansas. The message around that project is all about cheese and whey—no one is building a plant like that just to chase cream.

On the cultured side, expansions at places like Chobani’s Twin Falls, Idaho complex have turned it into one of the world’s largest yogurt operations, with multiple rounds of investment in Greek‑style yogurt and other high‑protein cultured products. Those lines rely heavily on ultrafiltration and protein concentration. Butterfat still matters for flavor and mouthfeel, but protein is very much in the lead role in the business model.

Second, some herds have quietly fine‑tuned how they look at genetics. Land‑grant extension specialists and geneticists have been pointing out that composite indexes like Net Merit are built around assumptions about component prices and milk usage that get updated in stages. When butterfat enjoyed a long run of leading the milk check, those indexes reflected that. As protein becomes more valuable in cheese‑heavy markets, there can be a lag before the standard indexes fully adjust. That’s why you see some progressive herds—especially larger ones with more replacements and genomic budgets—using custom indexes that put extra weight on protein PTA, total pounds of fat plus protein, and cheese‑specific traits alongside fertility, health, and feed efficiency.

Third, these operations talk with their processors in pretty practical terms. In some cheese‑heavy areas, field reps have told producers, “We’re fine around 4.0% fat, but what we really want is 3.3–3.4% protein.” That kind of specific feedback has a way of influencing ration design, bull selection, and even which cows get sexed semen versus beef semen when replacement numbers aren’t the bottleneck.

None of this guarantees big margins. But it does show how paying attention to where plants are investing, where component prices actually sit on your milk check, and what your buyer says they need can help you tune your herd toward where the market is going, not just where it’s been.

So What Can You Do? A Time‑Framed, Practical Look

So, given all that, the real question is: given your herd, your market, and your resources, what can you realistically do from here?

I’ve found it helps to think in three timeframes: the next few months, the next year, and the next three years.

In the Next Few Months: Low‑Cost Levers and Better Information

In the short term, you’re not going to rewrite your genetics. But you can sharpen your picture of where the money’s really coming from and see if your ration is leaving easy protein dollars on the table.

A good first step is a simple component value audit. Sit down with your nutritionist, accountant, or farm business advisor and pull out the last 6–12 months of milk checks. Using the USDA’s component price announcements alongside your plant’s pay sheet, calculate what you effectively received per pound of butterfat and per pound of protein once you factor in quality bonuses, premiums, and any penalties. In conversations with extension folks from Minnesota, Wisconsin, and New York, many producers say that once they see those numbers in black and white, they’re surprised at how much work protein is doing in their own pricing grid.

Once you know your real numbers, ask your nutritionist whether small ration changes could nudge protein up while keeping butterfat performance and cow health solid. That might mean:

  • Fine‑tuning amino acid balance—through rumen‑protected methionine and lysine, for example—so the cows have what they need to add 0.10–0.15 point of protein and potentially a bit more milk, which recent nutrition research suggests is feasible when correctly balanced.
  • Re‑evaluating bypass fat or specialty fat products to make sure you’re truly getting paid enough for those extra butterfat pounds to justify the cost and any impact on intakes or rumen function.
  • Double‑checking fiber digestibility and effective fiber so any push toward higher protein doesn’t trigger butterfat drops or more fresh cow problems during the transition period.

These tweaks might add a few cents per cow per day to your feed cost, depending on products and inclusion rates. Before you spend the money, it’s worth running the full cost‑benefit: if you add X cents per cow per day in amino acid products and get Y more pounds of protein and milk, how does that compare to your actual protein prices and margins?

To keep things manageable, there are three numbers worth tracking closely this month:

  • Your average butterfat percent.
  • Your average protein percent.
  • Your herd’s protein‑to‑fat ratio.

Those three alone will tell you if you’re in the ballpark for your market or if you’ve drifted into very high‑fat, modest‑protein territory that might not fit where your milk is going.

Over the Next Year: Genetics and Relationships

Over the next year, the biggest levers you’ll pull are about genetics and relationships.

On the genetics side, it’s a good time to ask whether your bull selection has leaned too hard toward fat at the expense of protein. CoBank’s work on protein‑driven milk checks, combined with the component gains we’re already seeing, suggests that in many cheese‑oriented markets, protein is poised to do more of the heavy lifting in the milk check, even as butterfat stays important. That doesn’t mean abandoning butterfat—it means looking for bulls that deliver strong combined fat and protein, with a bit more emphasis on protein PTA and total component pounds than you might have used five or ten years ago, especially if your milk is headed primarily into cheese and whey plants.

Many studs now offer custom or cheese‑oriented indexes, and university geneticists and extension specialists have shown how to build your own in‑house index that weights fat, protein, fertility, health traits, and feed efficiency according to your actual pay program and costs. For large freestall or dry‑lot herds shipping primarily into cheese and whey plants, those tools can make a noticeable difference in total component yield and income over a few calf crops.

Genomics fits into this picture differently depending on herd size and replacement pressure. For a 2,000‑cow herd, targeted genomic testing can help identify families that reliably deliver higher components and feed efficiency, and that information can shape both culling and mating plans; extension work in states like Wisconsin and California suggests that this kind of targeted approach tends to pencil out better than testing every heifer. For a 120‑cow tie‑stall herd, it often makes more sense to limit genomics to a handful of top heifers each year, lean on proven sires with strong component proofs, and focus more attention on fresh cow management, forage quality, and reproduction.

On the relationship side, this is a very good year to have a plain‑language component conversation with your co‑op or plant. Some questions worth asking directly:

  • “Given what you’re making now, what butterfat and protein levels would you most like to see from us?”
  • “Are there specific protein thresholds where you start paying more, or fat levels where it doesn’t really pay for us to push higher?”
  • “As new plants or product lines come online, do you expect your component pricing or premiums to shift in the next few years?”

You won’t get a perfect forecast, but even a rough answer can tell you whether chasing another 0.05 point of butterfat is really the smartest use of your dollars, or whether leaning into protein, overall component balance, or even sustainability metrics might be a better focus for your market.

Over the Next Three Years: Positioning Around Protein and New Trends

Once you stretch the horizon out to three years, you’re really deciding what sort of milk you want to produce and where you want it to end up.

On the traditional processing side, CoBank’s December 2025 analysis and related industry reporting highlight that processors have made about an $11 billion bet on protein‑oriented capacity—cheese and whey plants at the front, followed by high‑protein fluid and yogurt/cultured investments. Cheese projects alone account for roughly $3.2 billion of that investment, with the rest spread across fluid and cultured plants that are often geared toward ultra‑filtered and high‑protein products. The message for many U.S. regions is pretty clear: protein is becoming the main driver of value at the plant level, even as butterfat remains vital.

On the emerging technology side, precision‑fermented dairy proteins have moved from PowerPoints into actual steel tanks. Perfect Day’s acquisition of Sterling Biotech in India and the build‑out of a whey‑protein facility in Gujarat—with commercial production targeted for 2026 and scale‑up into 2027—is one example of how non‑farm protein production is stepping into markets like sports nutrition powders, ready‑to‑drink protein beverages, and specialized foods. At the same time, companies like Bel Group are working on precision‑fermented casein and on turning acid whey from cheese and yogurt plants into higher‑value ingredients instead of a disposal headache.

What’s encouraging, even if it’s complicated, is that analysts are still divided on how big a bite precision‑fermented proteins will take out of traditional dairy. Some see them as a growing but niche ingredient stream; others think they’ll capture a meaningful share of specific protein ingredient markets over the next decade. Either way, they’re unlikely to replace the bulk of conventional cheese and milk anytime soon, but they will complicate pricing and positioning for certain whey and casein markets.

Layered on top of that, global buyers like Nestlé and Arla are steadily tightening their climate and sustainability expectations. Nestlé has piloted net‑zero and low‑carbon dairy farms, including projects highlighted in Dairy Global, and Arla’s Climate Check program has been paying its farmers a sustainability incentive tied to farm‑level climate performance while building a massive dataset on emissions per kilo of milk. Those programs aren’t identical to U.S. efforts, but they give a good sense of where large buyers and brands are aiming.

For small and mid‑sized farms in regions like the Northeast, Upper Midwest, and certain Western milksheds, that means the long‑term strategy conversation now includes questions like:

  • “Do we want to position ourselves for a low‑carbon or regenerative milk program if our buyer offers one?”
  • “Are there animal‑welfare or environmental certifications that could stack on top of our component premiums?”
  • “Does it make more sense for us to stay a pure commodity shipper, or to direct a portion of our milk into a program that pays for attributes beyond components?”

Those are big questions, and they won’t have the same answers in every region. But they’re increasingly part of the same conversation as butterfat, protein, and where your milk actually ends up.

The Part We Don’t Put in Charts: Being “Right” at the Wrong Time

There’s one more piece here that doesn’t show up in the spreadsheets, and that’s how this all feels.

A lot of farm families have spent decades defending whole milk—at school board meetings, in conversations with dietitians, even in the grocery aisle—while official advice kept pushing low‑fat and fat‑free dairy. Over those same years, many of you re‑tooled your herds and feeding programs to take butterfat performance from “good enough” to “best in the neighborhood,” while steadily improving forage quality, TMR consistency, and transition‑cow programs so those high components didn’t wreck your fresh pens.

Now the federal government finally turns around and says, “Full‑fat dairy belongs in a healthy diet, and we’re putting whole milk back in schools,” at almost the exact moment your processor is telling you, “We really need more protein in your tank.”

I’ve heard more than one producer say some version of, “My dad argued for whole milk in schools his whole life. He’d love to see this—but it’s crazy it took this long, and it’s not what’s moving our check now.” That kind of bittersweet feeling is real. It deserves to sit right alongside any butterfat or protein chart in this discussion.

What’s interesting is that the farms that tend to ride these swings better over time usually aren’t the ones that predicted every move. They’re the ones that treat each new policy change, plant announcement, and component price sheet as more information—not as a verdict on past decisions. They ask, “Given what we know now, what’s the next smart adjustment for our herd, our market, and our family?” and they keep doing that year after year.

That doesn’t make the frustration go away—especially when you feel like you were “right” about whole milk nutritionally for decades and still aren’t getting rewarded the way you’d hoped. But it does give you a way to respond with intention instead of just reacting.

The Bottom Line

So, you’re sitting at the kitchen table with your milk checks, ration sheets, and breeding list. Where does all this leave you?

A few things feel pretty solid:

  • The new Dietary Guidelines and the Whole Milk for Healthy Kids Act are real wins for dairy’s image and full‑fat milk’s place in U.S. nutrition policy. They reflect updated nutrition science and finally line up a bit better with what many of us have believed and practiced on our own farms since the early 2010s.
  • At the same time, CoBank’s component work, USDA price announcements, and billions of dollars in cheese, whey, and high‑protein dairy plant investments all point to protein being a major driver of milk value in many U.S. markets over the next several years, especially where most of the milk ends up in manufactured products.
  • U.S. herds have done an exceptional job with butterfat performance. The next big opportunity is to balance that fat with stronger protein so your component profile lines up with what your plant can actually use and pay for most profitably—not just with what a genetic index favored during the butterfat boom years.
  • You still have practical levers: short‑term ration tweaks that respect cow health and the transition period, medium‑term breeding and genomic choices that nudge your herd toward better component balance, and longer‑term positioning around where your milk goes—cheese, fluid, powders, or value‑added and sustainability‑linked programs.

You don’t have to fix everything this season. You don’t have to stop being proud of the butterfat performance you’ve built. But given where the money and the stainless steel are moving—from Washington’s “Eat Real Food” rollout to Hilmar’s cheese and whey lines in Kansas, from high‑protein yogurt lines in Idaho to new whey‑protein tanks in Gujarat—it’s worth asking yourself a simple question:

What’s one step I can take this season, and one step over the next year, that nudges our herd a little closer to where our milk, our component pricing, and our margins are actually headed?

Because the rules around components and milk pricing have changed before, and they’ll change again. The farms that tend to stay in the game are the ones that keep reading the signals, keep asking good questions, and keep making those small, smart adjustments—without losing who they are in the process. 

Key Takeaways

  • Policy wins ≠ bigger milk checks. Full-fat dairy in the Dietary Guidelines and whole milk back in schools are image wins—but your processor still pays on components, not nutrition headlines.
  • Butterfat boomed; protein lagged. U.S. butterfat jumped ~13% over the past decade while protein rose only ~6%, pushing the national protein-to-fat ratio to 0.77—below the ~0.80 cheese plants need.
  • Protein now drives the check in cheese markets. A 500-cow herd shipping 3.35% protein and 3.8% fat can out-earn a 4.2% fat, 3.1% protein herd by $70,000+ per year at the same plant.
  • Know your three numbers. Track butterfat %, protein %, and protein-to-fat ratio monthly. These reveal whether your component profile matches what your market actually rewards.
  • Act across three timeframes. Now: audit components and adjust rations. This year: shift genetics toward balanced fat + protein. Next three years: align your herd with new cheese, whey, and high-protein plant investments.

Complete references and supporting documentation are available upon request by contacting the editorial team at editor@thebullvine.com.

Learn More

The Sunday Read Dairy Professionals Don’t Skip.

Every week, thousands of producers, breeders, and industry insiders open Bullvine Weekly for genetics insights, market shifts, and profit strategies they won’t find anywhere else. One email. Five minutes. Smarter decisions all week.
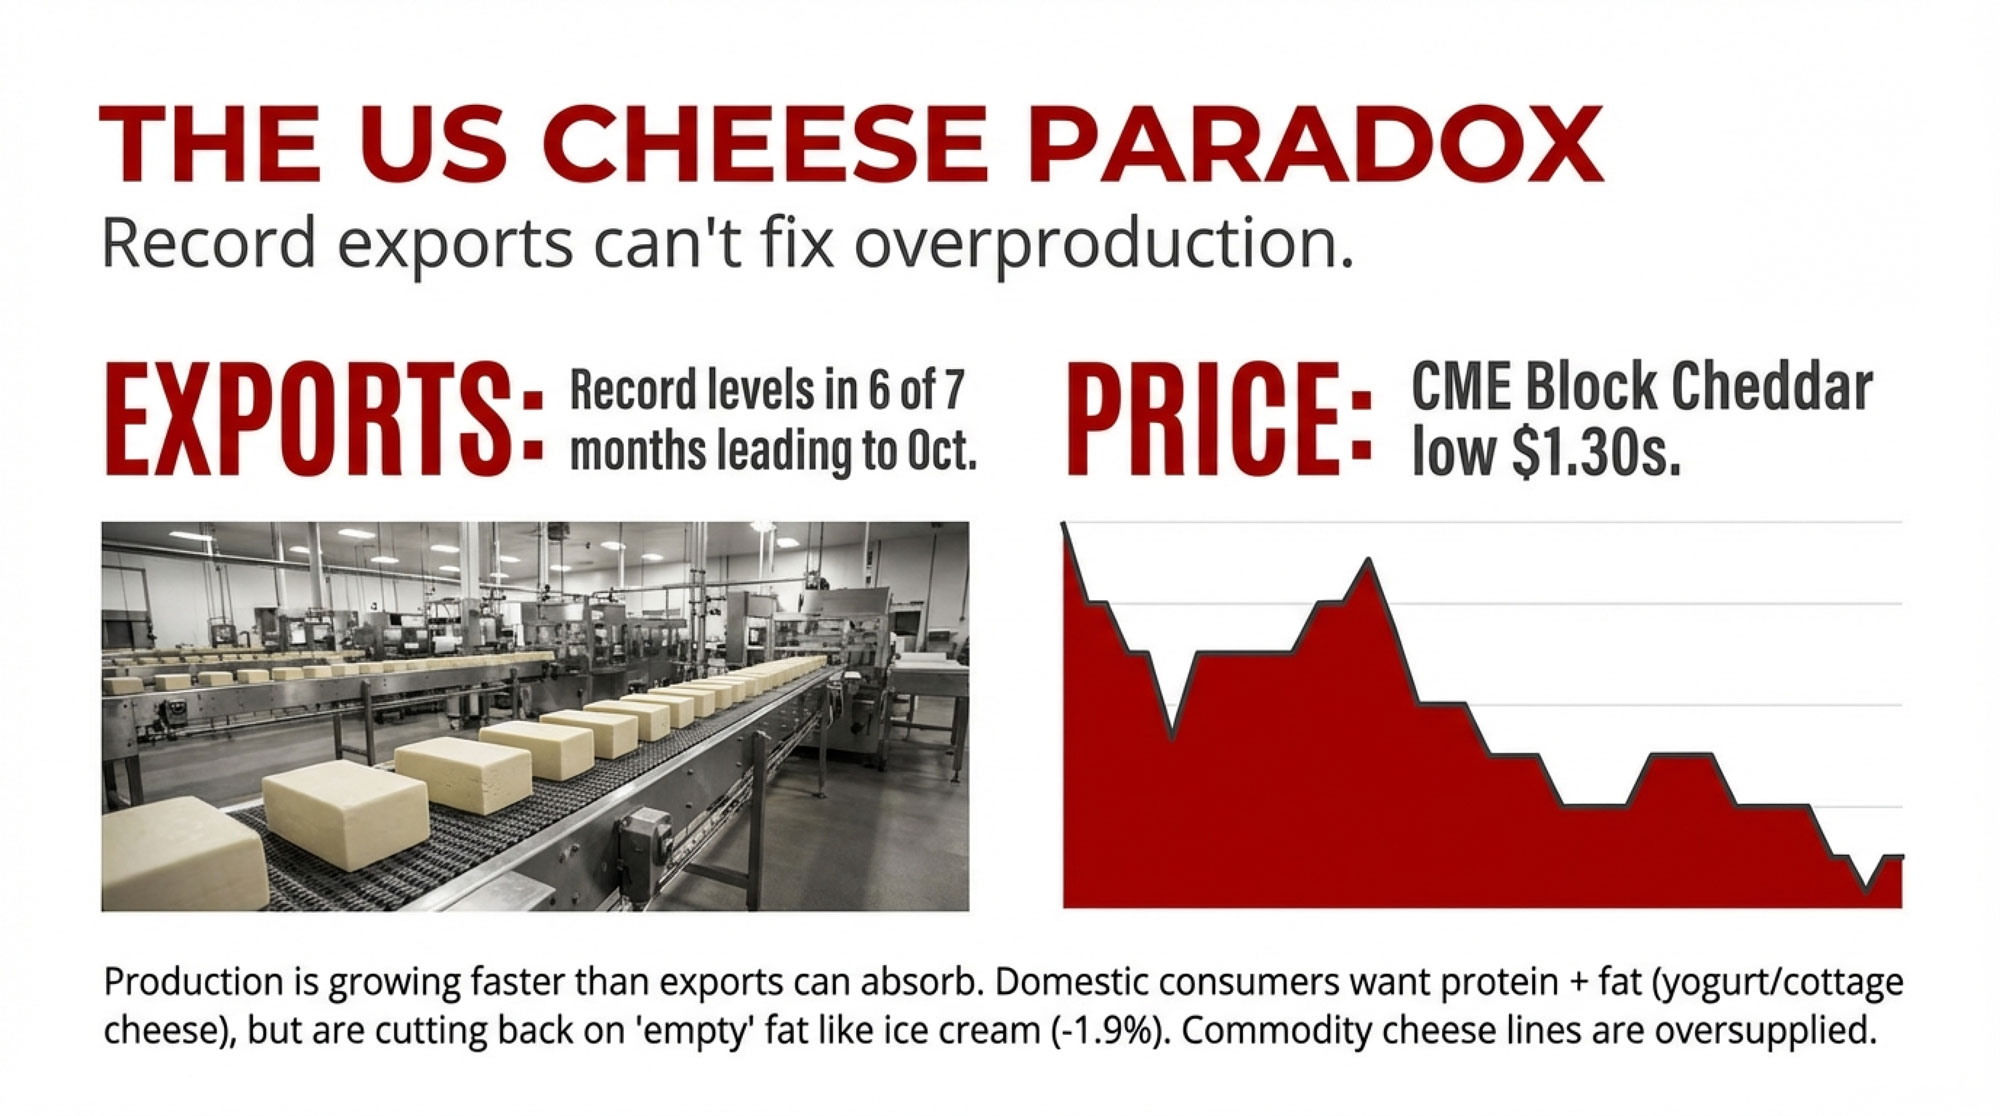
NewsSubscribe
First
Last
Consent

Mercosur Math: Why 30,000 Tonnes of Cheese is Actually 550 Displaced Herds

Mercosur was sold as “modest.” The math says 550 EU family herds’ milk and a headwind that can shave cents off every litre you ship. Ready to see where you stand?

Executive Summary: EU dairy farmers are walking into the Mercosur era with costs already running hot, milk output basically flat at about 149.4 million tonnes, and some of the toughest environmental and welfare rules anywhere. The “modest” EU–Mercosur deal quietly opens the door to 30,000 tonnes of cheese, 10,000 tonnes of milk powder, and 5,000 tonnes of infant formula on zero‑tariff quotas once it’s fully phased in—roughly 345,000 tonnes of milk when you convert it back to tanker‑loads. That’s the annual production of more than 500 average EU family herds trying to find a home in a market where cow numbers and drinking‑milk use are already slipping. This article walks through that “Mercosur math,” shows what those quota volumes could mean for your milk cheque over a season, and lays out the practical questions every EU dairy should be asking about compliance costs, product mix, and risk‑sharing with processors.

You know that feeling. The milk cheque shows up, it’s lighter than you hoped, the co‑op newsletter says it’s been “a solid year,” and then the radio starts talking about Brussels pushing the EU–Mercosur trade deal across the finish line.

That’s usually when the questions you’ve been parking for months finally bubble up: “So what does this actually mean for my milk price? For our cows? For whether this place is still viable ten years from now?” Those are fair questions. And they deserve more than slogans, whether they’re coming from farm groups or politicians.

So let’s walk through this together. We’ll start with the cost pressure you’re already feeling, then dig into what’s really in the Mercosur dairy package, translate it into tanker loads and euros, and finish with some practical things you can do at the kitchen table over the next 90 days.

Looking at the Cost Gap We’re Up Against

Looking at this trend over the last five years, here’s what’s interesting: every major dairy region has seen costs go up, but not at the same speed or from the same starting point.

AHDB in the UK pulled together a clear summary of Rabobank’s latest global milk production cost work early in 2025. They looked at eight big exporting regions—Argentina, Australia, China, Ireland, New Zealand, the Netherlands, California, and the US Upper Midwest—from 2019 through 2024. Across that group, average total production costs rose about 14%, which works out to roughly 6 US cents more per litre over that period, and more than 70% of that increase occurred between 2021 and 2024, as feed, energy, and labour spiked. Rabobank’s team also highlighted that feed expenses were the main culprit, with average feed bills across those regions up around 19% since 2019.

The same work shows Oceania at the sharp end of low‑cost production. New Zealand and Australia have been neck‑and‑neck for the lowest cost among the eight regions, with a five‑year average total cost of about US$0.37 per litre versus roughly US$0.48 for the others. That’s roughly a 17% advantage for Oceania once you standardise for milk composition and express everything in US dollars. By contrast, production costs in local currencies in the US, the Netherlands, and China rose about 10–20% over that period, around 25% in Australia and New Zealand, and roughly 30–40% in Ireland and Argentina.

What I’ve found, looking across north‑west Europe, is that this lines up pretty well with what many of you are seeing in your own books. Once you add feed, labour, power, interest, and then the cost of complying with environmental and animal‑welfare rules, you’re often looking at a cost base that’s several euros per 100 kg higher than a low‑cost pasture system in New Zealand or some of the better Mercosur herds. Rabobank’s comparisons suggest that on a typical European cost level, that 17% gap can easily translate into a few euros per 100 kg of milk once everything is counted in.

And it’s not that EU cows are managed badly. In most freestall herds in France, Germany, the Netherlands, or Ireland, butterfat performance, fresh cow management during the transition period, and general cow comfort would look very familiar to good herds in Wisconsin or Ontario. What really racks up the bill is what sits around the cows rather than the cows themselves.

So where do those extra euros actually hide:

  • Animal‑welfare and environmental rules that govern cubicle dimensions, stocking densities, bedding, sometimes minimum days on pasture, and increasingly strict slurry and housing rules tied to EU nitrates and climate policy
  • Traceability and food‑safety systems that mean more tagging, sampling, milk recording, and third‑party audits than you’d see in many lower‑regulation exporting regions
  • Labour laws and social charges that make every hired hour more expensive than in much of South America or Oceania

What’s interesting is that when families actually sit down with their accountant and a highlighter, and pull out projects and costs that exist mainly because of regulation—extra lagoon capacity, environmental testing, certification and audit fees, software for traceability systems—it’s common to end up with a compliance bill in the low single‑digits of euro cents per kilo of milk. A recent systematic review of milk quality and economic indicators in dairy farming backs up the idea that quality schemes and regulatory measures are significant cost drivers, even if the exact cents‑per‑litre number varies from farm to farm. It’s not some official EU‑wide metric, but it’s big enough to matter, especially when global prices turn down.

That’s the cost base Mercosur milk and cheese is going to be bumping into.

What’s Actually in the Mercosur Dairy Package?

So, what’s actually in this deal? Because you’ve probably heard everything from “it’s a minor opening” to “it’ll wipe out EU dairy.”

EU trade documents on the EU–Mercosur association agreement, along with analysis from AHDB, all draw a very similar picture. On the dairy side, the agreement adds new duty‑free tariff‑rate quotas (TRQs) for three main products:

  • Up to 30,000 tonnes of cheese per year, where current most‑favoured‑nation tariffs sit around 28%
  • Up to 10,000 tonnes of milk powder per year, also dropping from roughly 28% to zero in‑quota
  • Up to 5,000 tonnes of infant formula per year, down from about 18% duty to zero on those quota volumes

These aren’t switched on at full volume on day one. European Dairy Association commentary notes that cheese quotas are expected to start around 3,000 tonnes in the first year and then step up to 30,000 tonnes by year ten, while milk powder TRQs move from 1,000 to 10,000 tonnes over the same period. Infant formula quotas are phased in to a final volume of 5,000 tonnes.

On the flip side, EU processors gain better access to Mercosur markets—especially Brazil—for European cheeses, powders, and infant nutrition products, plus stronger protection for EU geographical indications, such as key cheese names. That’s why you see support from groups like the European Dairy Association; they’re looking at supermarket shelves in São Paulo as much as at your yard in Brittany.

But if you’re milking cows in Bavaria or western France, the key question isn’t “is this good for EU industrial exports overall?” It’s “what do those tonnes actually mean on the milk side and on my milk cheque?”

Turning Policy Tonnes Into Tanker Loads

This is where the math gets real.

On paper, 30,000 tonnes of cheese doesn’t sound like much when the EU produces close to 150 million tonnes of milk. To get a feel for it, you have to convert that cheese and powder back into the milk that made it.

Cheese makers often use a rule of thumb of roughly 8.5 kg of whole milk to produce 1 kg of semi‑hard cheese, depending on fat and protein levels. For milk powder, typical technical references put whole milk powder at around 7.8 kg of milk per kg of powder and skim milk powder at just over 10 kg; using 9 as a blended average for a basket of powders is a fair shorthand.

If we run those numbers:

  • Cheese: 30,000 tonnes × 8.5 kg milk/kg cheese ≈ 255,000 tonnes of milk equivalent
  • Powder: 10,000 tonnes × 9 kg milk/kg powder ≈ 90,000 tonnes of milk equivalent

Together, that’s roughly 345,000 tonnes of milk equivalent per year, once those quotas are fully ramped up.

Now let’s lay that alongside EU milk production.

A USDA GAIN report on the EU, summarised by Dairy Global, forecasts total EU milk deliveries at about 149.4 million tonnes in 2025, roughly 0.2% below a revised estimate for 2024. That same analysis expects domestic consumption of fluid milk to keep easing and notes that cheese production is likely to edge higher, with more milk being channelled to cheese and powders.

So, into a basically flat pool of around 149–150 million tonnes, you add the equivalent of 345,000 tonnes of milk.

To make that concrete, German data from BZL show that by the end of 2023, Germany had 50,581 dairy cattle holdings—about 2,400 fewer than in 2022—and a national herd of roughly 3.7 million cows, down 2.5% in a year. Average yield was around 8,780 kg per cow, up from 8,504 kg in 2022. On those numbers, a 75‑cow family herd ships roughly 658,500 kg—call it 650 tonnes—of milk per year.

Divide 345,000 tonnes of milk equivalent by 650 tonnes per 75‑cow herd, and you’re looking at the annual output of about 530–550 herds of that size.

No, that doesn’t mean 550 farms will shut their doors the day this deal kicks in. Markets don’t work in straight lines. But you can see why something labelled as a “modest” quota package starts to feel a lot less modest when you translate it into tanker loads and real farms.

And if you turn that into price pressure, here’s a handy way to think about it. Say that extra competition from Mercosur trims the milk price by an average of 1–2 cents per litre over a cycle. On 650,000 litres of milk, that’s €6,500–€13,000 a year. On 2 million litres, you’re talking €20,000–€40,000. It’s not a forecast; it’s just basic arithmetic. But it puts a number on what “a bit more headwind” could mean in everyday cash‑flow terms.

Annual Milk VolumeImpact at 1 cent/LImpact at 2 cents/L
500,000 L€5,000€10,000
650,000 L€6,500€13,000
1,000,000 L€10,000€20,000
2,000,000 L€20,000€40,000

Where the EU Dairy Sector Is Starting From

Before we hang everything on Mercosur, it’s worth being honest about where EU dairy already stands.

The same three threads keep showing up in USDA GAIN summaries, forecast, and national statistics.

First, milk production is flat to slightly down. For 2025, EU milk deliveries are forecast at about 149.4 million tonnes, 0.2% below 2024, as tight margins, environmental restrictions, and disease pressures push some smaller farmers out and cow numbers keep easing.

YearEU Milk Production (M tonnes)German Dairy Farms (thousands)
2019151.264.5
2020150.862.5
2021150.560.4
2022150.153.0
2023149.650.6
2024149.6 (est.)
2025149.4 (forecast)

Second, cow numbers and farm numbers are steadily shrinking. We already talked about Germany losing about 2,400 dairy farmers in 2023, with cow numbers slipping to 3.7 million and average yields rising to 8,780 kg. Similar structural change is underway in France and the Netherlands, even if the exact figures differ.

Third, the product mix is shifting. The same GAIN‑based forecast expects domestic fluid‑milk consumption to continue declining, down by about 0.3% in 2025, while cheese production holds or grows slightly, and more milk heads into cheese and powders.

If you glance across the Atlantic, you see a related pattern. Hoard’s Dairyman recently highlighted that average US butterfat in the national bulk tank has climbed steadily, with annual averages moving from roughly 4.01% in 2021 to about 4.15% in 2023, and monthly data in 2024 showing every month at or above 4.0% fat. That mirrors what many of you are seeing on your own test sheets: cows that used to sit at 3.6–3.7% butterfat now comfortably over 4.0. In the Upper Midwest, for example, butterfat in the federal order serving Wisconsin averaged over 4% for the first time in 2021, driven by the cheese focus in that region.

So the EU isn’t unique. High‑standard dairy regions worldwide are trying to get more value out of every litre—more fat, more protein, more cheese yield—without relying on endless volume growth. The twist is that EU farms are doing it under some of the strictest welfare and environmental rules anywhere, which means their cost of production is higher before they even start.

And if you’re reading this in Wisconsin, Ontario, or Canterbury, you’ll recognise some of these pressures: higher input costs, tighter environmental expectations, more scrutiny from buyers, and a slow drift away from fluid milk into cheese and ingredients. The details differ, but the direction of travel feels familiar.

So What Does This Do to Price?

This is the question everyone wants answered in one number: “How much does Mercosur take off my litre?”

Here’s the honest take: nobody reputable is putting a clean, Mercosur‑only discount into a forecast yet. But there are enough signals to sketch the shape of the impact.

Rabobank’s work on structural costs makes a straightforward point: regions like north‑west Europe, with higher labour, land, and regulatory costs, will face ongoing margin pressure if they’re playing in global commodity markets. The path forward, in their view, is more scale, more differentiation, or both.

Analysis of Rabobank’s 2024 outlook for EU farmers notes that margins are expected to improve compared to the worst of 2022, with an average base price in the high 40s €/100 kg, but it also warns that costs remain elevated and that weaker Chinese demand and low output in Argentina are key uncertainties. AHDB’s own work on 2024–2025 costs underlines that while fertiliser and some purchased feeds have come off their peaks, total production expenses are still well above 2019 levels.

Then you drop Mercosur into that picture. You’ve got a mature, high‑cost market, where milk volume is flattening, and you add a stream of lower‑cost cheese and powder competing at the commodity end. Over time, that acts like a headwind on prices—peaks don’t climb quite as high, and recoveries after a downturn can be slower and shallower.

Farm organisations have been very clear on this. Groups like the European Milk Board and Copa‑Cogeca argue that EU farmers are being asked to meet some of the strictest environmental and animal‑welfare standards in the world while competing against imports that don’t face those same on‑farm obligations. They see the risk that, unless the value chain pays properly for higher standards, more low‑cost imports will tighten already narrow margins and accelerate structural change.

On the other side, the European Dairy Association and export‑oriented processors see opportunities. They’ve publicly welcomed progress on the EU–Mercosur deal, pointing to better access for EU cheeses and ingredients, and stronger protection for European cheese names, as ways to grow value in Mercosur markets. From their perspective, this is about getting more branded EU product onto high‑value shelves abroad.

The short version? For a commodity‑leaning family farm, Mercosur is another weight on a scale that was already tipping toward tighter margins. For a processor with good brands and strong GI‑protected products, it’s a mix of added risk at home and new opportunity abroad. And for the co‑ops and private buyers in the middle, it raises the stakes on how they share risk and reward with suppliers.

In some regions, you’re starting to see buyers offer longer‑term cost‑plus or fixed‑margin contracts on a slice of milk—tying pay‑out more closely to real costs for part of your volume—which is one way to spread the risk between farm and plant. It’s still early days for those models, though. Most of you are still living off the commodity roller coaster.

Mirror Clauses: Why “Same Standards for Imports” Is Harder Than It Sounds

When farmers hear all this, it’s totally understandable that the first instinct is: “Fine—if they want to ship dairy here, make them meet our standards.”

On principle, it feels fair. You’ve invested in better housing, in slurry storage that actually holds enough for the whole winter, in emissions and nutrient management plans, in full traceability. Why should you compete with milk that hasn’t carried the same load?

The catch is that most of what drives your cost is about how things are done, not the physical product you test at the dairy plant. That’s where life gets tricky for mirror‑clause ideas.

You can lab‑test cheese and milk powder for residues, pathogens, and composition. You can’t test a block of cheese for stall dimensions, resting time, or whether the cows had 120 grazing days that year. Those are process standards. They’re invisible at the border.

We’ve already seen how tough that gets with the EU’s deforestation regulation. When Brussels moved to regulate imports linked to illegal deforestation, there was a lot of optimism that satellite imagery and digital tools would make things straightforward. In practice, enforcement has run into mismatches between forest maps and national land registries, patchy local records in exporting regions, and the sheer volume of supply chains that have to be traced. Dairy would have similar traceability headaches, just without the helpful “forest/no forest” satellite contrast.

Trade lawyers also point out that under WTO rules, it’s generally easier to defend restrictions based on what a product is—its composition, safety, or residues—than on production methods that don’t change the product itself. Push too far on telling exporting countries they have to run their barns and manure systems just like Europe does, and you risk a trade dispute that’s hard to win.

There’s also a simple economic angle. If Mercosur exporters really had to meet fully equivalent EU‑level requirements for housing, slurry storage, and emissions—and if those rules were enforced correctly—their cost advantage would shrink. At that point, their appetite for pushing big volumes into an already competitive EU dairy market might cool.

So mirror clauses are likely to make inroads on some clear things—keeping banned substances out of the food chain, tightening traceability on deforestation-linked feed—but they’re not a magic wand for equalising on‑farm standards and costs in the near term.

What’s Going On in Mercosur Dairy?

To keep this fair, we shouldn’t pretend Mercosur is static either.

Brazil and Argentina are the main dairy players in that bloc. Global trade reports and USDA’s “Dairy: World Markets and Trade” show that over the last decade, both countries have increased dairy exports, particularly in whole‑milk powder, cheese, and UHT milk, into neighbouring Latin American markets, North Africa, and parts of the Middle East. Brazil, in particular, has swung between being a net importer and a net exporter depending on domestic demand, currency, and policy.

If you look at typical export‑oriented herds in those regions, you see a lot more pasture and semi‑intensive systems than full concrete‑and‑steel freestalls. Housing tends to be lighter, with cows spending more time on grass and less in enclosed barns. Land and labour costs, in local terms, are generally lower than in north‑west Europe, even allowing for inflation and volatility. Environmental and animal‑welfare rules exist and are evolving, but they don’t yet put the same pressure on stocking rates, slurry storage, or greenhouse gas accounting that EU farmers are now dealing with.

Rabobank’s cost analysis notes that while production costs in Argentina and Ireland have jumped 30–40% in local currency since 2019, farms in low‑cost pasture systems still tend to sit below EU per‑litre costs because they started from a lower base and have fewer regulatory-driven capital investments to service.

From a Mercosur perspective, the EU deal is about locking in stable, rules‑based access to a high‑value market. From Brussels’ perspective, dairy is one moving part in a larger trade‑off that also covers sectors like cars and machinery, where the political stakes are high.

And from your parlour? It’s another external force you can’t control but have to respond to, just like feed markets or weather.

How Some Farms Are Adjusting Their Playbook

So let’s bring this back to the farm gate. Given higher structural costs, flat or slowly easing milk volumes, and this new trade headwind, what can a dairy actually do?

What I’ve noticed, visiting herds and talking with producers in Germany, the Netherlands, France, and Ireland—and comparing notes with folks in Wisconsin or Ontario facing their own pressures—is that farms which seem to be staying a step ahead have a few habits in common.

1. Treating Compliance as a Real Cost, Not Just a Headache

A lot of us complain about regulation, but relatively few actually put a number on it. On the herds that do, the conversation changes fast.

Here’s what that looks like in practice:

  • They list capital projects where regulations were the main driver—extra slurry storage to meet new rules, lagoon covers for emissions, manure separators, stall renovations for welfare standards, upgraded ventilation that goes beyond pure production needs
  • They pull out ongoing expenses that are mostly about compliance—environmental sampling, emissions monitoring, nutrient‑management plans, audit and certification fees, software licences for traceability and quality programmes
  • They estimate the labour hours that go into paperwork and inspections that simply wouldn’t exist in a lower‑regulation environment

When you add those up and divide by litres delivered, you don’t get a perfect number. But you do get a rough compliance cost per 100 kg. On some farms, that works out to just above one cent per kilo; on others, especially right after big environmental investments, it creeps closer to two or three. A 2024 systematic review on milk quality and economic sustainability makes the same point: regulatory and quality‑scheme demands are a real component of total cost, and they vary widely by system and region.

A simple way to start is this: print last year’s accounts, grab a highlighter, and mark anything that’s there primarily because of regulations or certification schemes. On one European case example, that list looked like roughly €12,000 for extra slurry storage, €3,000 for environmental testing and nutrient planning, and €1,500 in audit and certification fees—about €16,500 spread over roughly 800,000 litres. That’s the kind of breakdown that turns “regulation is expensive” into something you can actually talk through with your bank, your advisor, and your buyer.

Compliance Cost ComponentTypical Annual Cost (EUR)Cost Type
Extra slurry storage (beyond production need)€2,000Amortized
Environmental testing & nutrient plans€3,000Recurring
Audit & certification fees€1,500Recurring
Emissions monitoring equipment€1,200Amortized
Traceability software & milk recording€800Recurring
Welfare-driven barn upgrades€3,500Amortized
TOTAL (Annual Equivalent)€12,000Mixed

Once you’ve got your own ballpark compliance cost written down, a few deeper questions come almost automatically:

  • Are we carrying too much fixed compliance infrastructure for the litres we’re producing?
  • Does our current herd size spread those fixed costs sensibly?
  • Are we picking up any premium for the standards we’re already meeting, or are we just ticking boxes?

You don’t have to like the answers. But you can’t manage what you won’t measure.

2. Moving a Slice of Milk Out of the Commodity Stream

The second pattern you see, especially near towns and cities, is farms that accept they can’t compete on cost for every litre, so they move a slice of their milk into a different game.

We’re not talking massive on‑farm bottling plants. A typical success story looks more like this:

  • An 80–120‑cow freestall or loose‑housing herd on the edge of a Dutch town, a German city, or a French provincial centre
  • Modest capital spend—a small pasteuriser, one or two simple cheese vats, decent refrigeration, and either a tidy farm shop or a regular place at local markets
  • A family member who doesn’t mind dealing with customers and local social media

Case studies out of regions like Minas Gerais in Brazil and various European direct‑sale operations show that when everything is set up sensibly, the milk that goes through that direct channel can net 20–40% more per litre than the base co‑op price, after you’ve covered packaging, extra labour, and energy. The majority of milk still goes on the truck. But that 20–40% slice can be the difference between a red year and a black one.

Of course, that’s the best‑case scenario. You probably know someone whose on‑farm processing turned into an expensive, exhausting second job. The key conditions that keep coming up, both in the research and in real herd stories, are:

  • You’re within a reasonable distance of enough customers who value local dairy
  • You keep the product range focused and manageable
  • You run the numbers hard, including your own time and the extra compliance burden

So before you rush out to buy a pasteuriser, it’s worth asking:

  • Are we close enough to a town or city with people who’ll pay more for local milk and cheese?
  • Do we have someone in the family who genuinely likes selling and storytelling, not just milking and scraping?
  • What existing platforms—farmers’ markets, local food shops, online “farm‑to‑door” schemes—could we plug into first, before we build everything ourselves?

If you can line up “yes” answers for those, then looking at a small, seasonal product line—like ice cream or fresh cheese—might be a sensible toe‑in‑the‑water move.

3. Turning Constraints Into a Product Story

In mountain and hill regions, the options look different again. You’re dealing with slopes, short growing seasons, and fragmented fields. Big dry lot systems or 700‑cow freestalls just aren’t realistic on that ground.

What’s encouraging is that some of these farms are still hanging in—and some are thriving—because their milk is tied into PDO or GI cheeses and dairy products with strong regional identities. Studies of mountain dairy systems in the Alps and other upland regions show that farms linked into well‑managed GI value chains often receive higher average prices per kilo of solids than standard commodity milk, though they also face higher production costs and depend more on environmental payments.

In other words, they’ve turned what might look like “inefficiencies”—steep land, traditional breeds, strict building rules—into part of the brand and value story.

If you’re already in one of those regions, or your co‑op is talking about building a new origin or welfare scheme, you might want to ask three blunt questions:

  • What’s the average farm‑gate price difference compared with standard milk for farms actually in the scheme?
  • How many local farms have successfully transitioned into it, and what did they have to change in terms of housing, feeding, or certification?
  • How steady has that premium been through the last couple of price cycles?

Research and farm‑level evidence suggest that in some regions the premium holds up well; in others, it narrows during low‑price periods. Knowing which kind of region you’re in matters before you commit to major changes.

Five Questions for a Winter Night at the Kitchen Table

By this point, it’s easy to feel like the world is throwing too many variables at you at once: global costs, trade deals, standards, climate, and consumer shifts. You can’t fix any of those alone.

What you can do is see your own situation clearly and make a few deliberate moves.

Here are five questions worth scribbling down and working through with whoever shares in the decisions on your farm.

1. What’s our best estimate of compliance cost per 100 kilos?
Grab last year’s accounts and a highlighter. Mark the items that wouldn’t be there—or would be much smaller—if you didn’t have to meet today’s environmental, welfare, and traceability rules: slurry and storage projects, environmental testing, nutrient plans, emissions monitoring, audit fees, and software for quality schemes. Add them up and divide by your litres. It won’t be perfect, but it will turn “regulation is expensive” into a number you can bring to your bank, your advisor, and your processor.

2. Does our current scale fit our region and our system?
Very small herds sometimes survive with low debt and off‑farm income. Very large units spread fixed costs—buildings, slurry, compliance, labour—over a lot of litres. The 60–200‑cow, fully regulated freestall herd is often caught hardest—too big to be a hobby, too small to spread heavy fixed overhead comfortably. Given your land base, labour, building layout, and local rules, are you trying to carry more cows than you can handle efficiently, or is your physical and regulatory infrastructure too big for your current litres?

3. Where does each litre of our milk actually go—and under what contract terms?
Map it out. How much milk goes into pure commodity cheese and powder pools? How much, if any, goes into premium streams—pasture‑based, non‑GMO, organic, higher‑welfare, local‑origin? A good question for your buyer is: “What premium programmes—pasture‑based, non‑GMO feed, higher‑welfare, local—do you offer today, and what would it take for us to qualify?” In some northern EU regions, pasture milk contracts pay an extra one or two cents per litre in exchange for documented grazing days and limits on concentrates, while GMO‑free feed contracts can offer similar premiums if you can show full feed traceability. Not every farm can make those programmes work—but you don’t know until you ask.

4. How much are we relying on emergency support to balance our risk?
The last few years—Covid disruptions, energy price spikes—have shown that EU and national support schemes do appear when things get rough, but they can also be slow and administratively heavy. It’s sensible to argue for better policy. It’s risky to build your whole business plan on the hope that the next crisis cheque will land when you need it. So ask: “If prices were poor for the next two years and no new support arrived, what would we actually do—cut costs, change system, adjust scale, or something else?”

5. Who are we comparing ourselves with, and who can we be honest with?
Benchmarking and business clubs aren’t just a British thing. Chambers of agriculture, levy bodies like AHDB, and private consultants run groups where people share real numbers, not just coffee‑shop talk. In Wisconsin and Ontario, similar business‑focused producer groups have helped farms identify which changes actually move the needle in their systems. If you’re not part of any peer group like that, one practical 90‑day goal after reading this could be: find or form a small circle where you can put actual figures on the table and talk openly about strategy.

If you want a simple starting point for the next three months, it might look like this:

  • Estimate your own compliance cost per 100 kilos.
  • Have a direct conversation with your buyer about premium contract options and what it would take to join one.
  • Commit to at least one meeting—formal or informal—where you compare real numbers with peers instead of just stories.

None of that changes Mercosur. But it does change how exposed—or how prepared—you are for the headwinds it adds to a game that was already getting tougher.

The Bottom Line

The EU–Mercosur deal isn’t going to change what your cows need tomorrow morning. Fresh cows still need careful handling through the transition period, calves still need feeding, and loans still need paying. What it does change is the wind you’re sailing in: a bit more pressure from low‑cost imports in a market where your costs are already high, and your support systems aren’t always fast or generous.

You can’t stop that wind. What you can do is understand it—and then decide what kind of boat you’re in, how you’re trimming your sails, and who you’re rowing with. In a world where none of us can afford to just drift, that’s where your real leverage lies. 

Key Takeaways:

  • “Modest” adds up fast: The Mercosur deal’s 30,000 tonnes of cheese and 10,000 tonnes of powder convert to about 345,000 tonnes of milk, like dropping the annual output of 550 EU family herds into an already flat market.
  • The cost gap is real and structural: Rabobank shows New Zealand and Australia holding a roughly five‑cent‑per‑litre edge, while EU herds carry extra euros in slurry, emissions, welfare, and traceability costs that low‑cost competitors simply don’t pay.
  • Mirror clauses sound fair, but won’t fix it: You can lab‑test cheese for residues—you can’t test it for stall dimensions or grazing days. Process standards are nearly impossible to enforce at the border.
  • Mercosur lands where EU milk is already headed: With EU production flat at 149.4 million tonnes and more milk flowing into cheese and powders as fluid demand fades, the quota volumes compete exactly where margins are thinnest.
  • Your best lever is knowing your own numbers: Farms that can pin down their compliance cost per 100 kg, push buyers on premium contracts, and benchmark honestly with peers will ride this headwind better than those waiting on Brussels to fix it.

Complete references and supporting documentation are available upon request by contacting the editorial team at editor@thebullvine.com.

Learn More

The Sunday Read Dairy Professionals Don’t Skip.

Every week, thousands of producers, breeders, and industry insiders open Bullvine Weekly for genetics insights, market shifts, and profit strategies they won’t find anywhere else. One email. Five minutes. Smarter decisions all week.
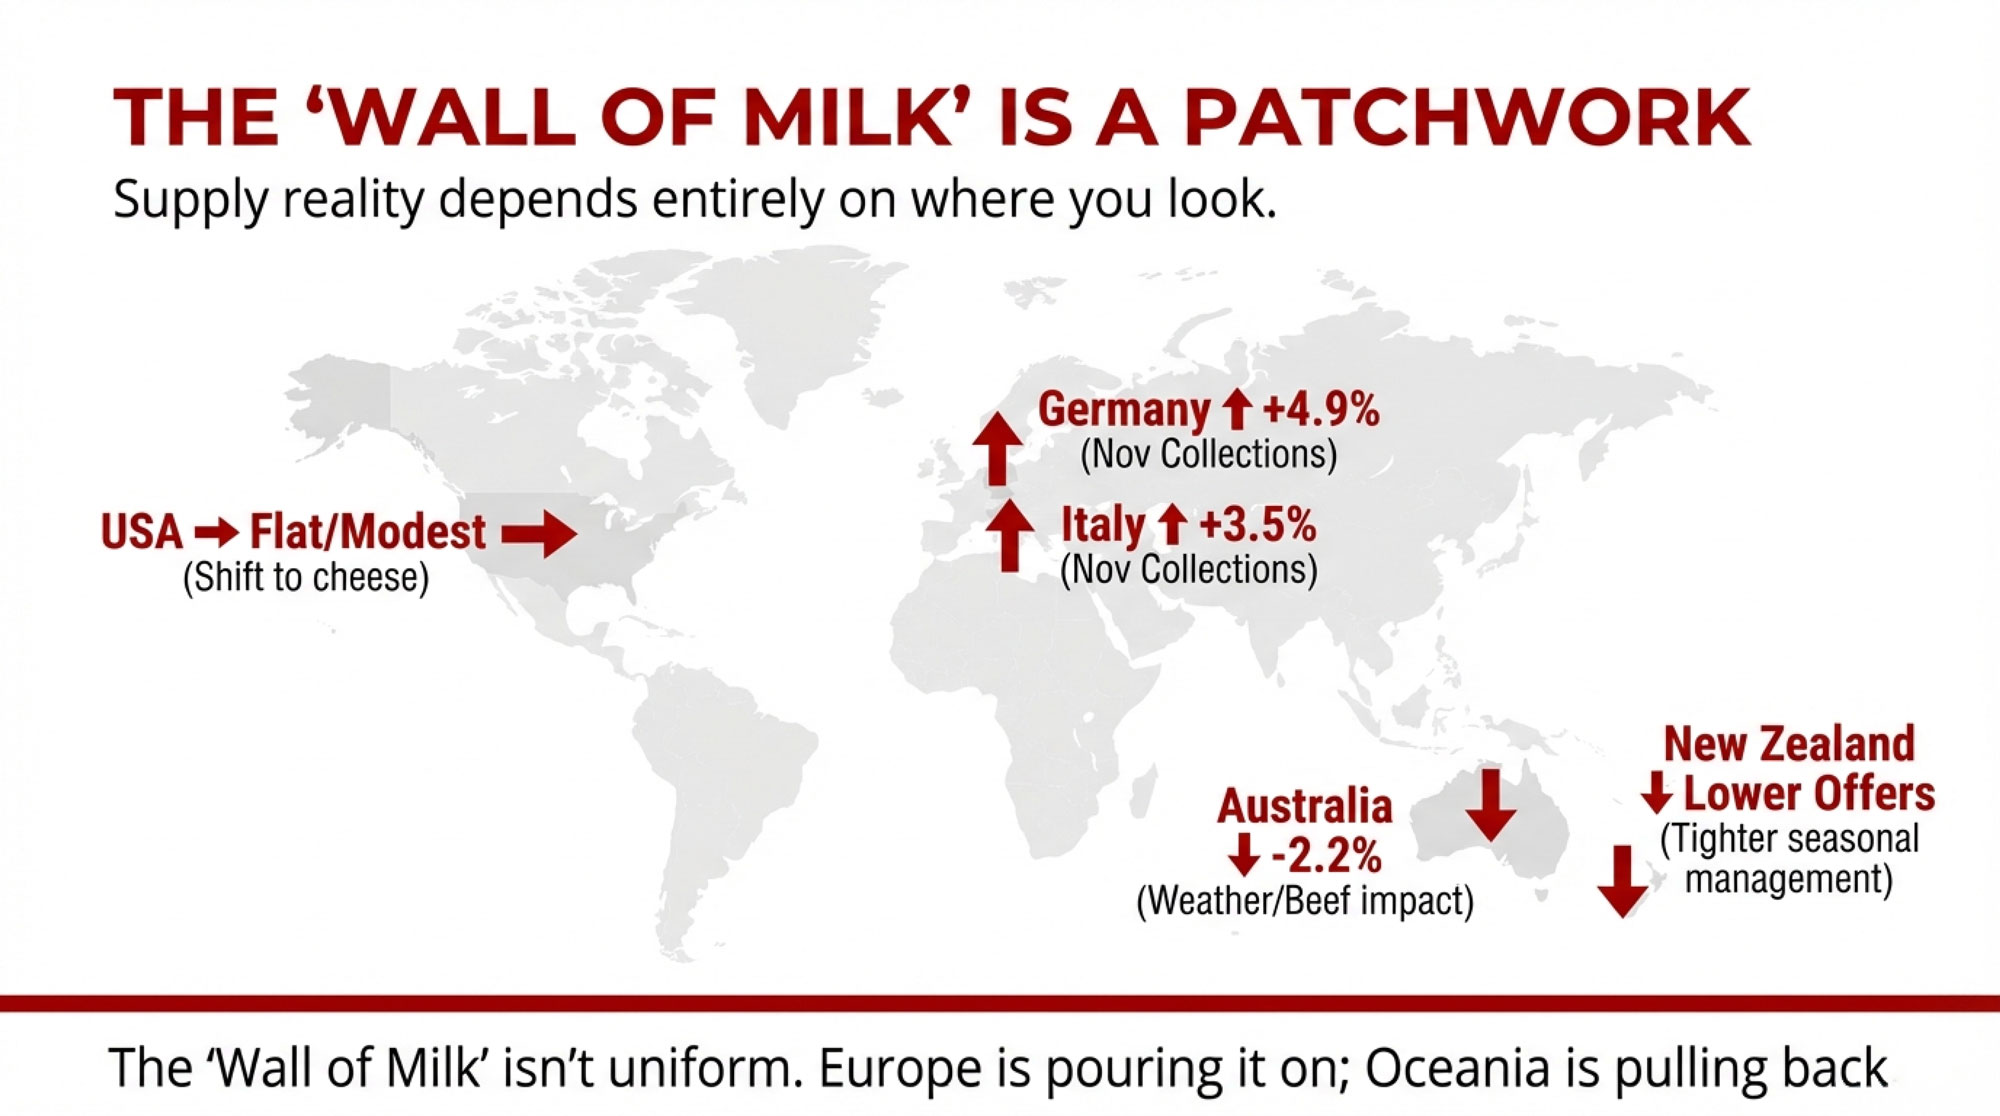
NewsSubscribe
First
Last
Consent

European Butter Down 35%: The 90-Day Playbook That’s Helping Dairy Farmers Protect $150,000+

European butter crashed 35%. History shows your milk check is due in 90 days. The farmers protecting six figures right now aren’t smarter. They’re just 90 days earlier.

Executive Summary: European butter crashed 35%—your milk check follows in 60-90 days. With Class III at $17-18/cwt, production growth running three times normal pace, and spring flush weeks away, the proactive window is narrowing. The wealth gap between acting at 1.3 DSCR versus waiting until 1.0 typically exceeds $150,000—not because one group is smarter, but because they moved earlier. This framework covers the metric your lender is watching, component strategies adding $800-1,200/month, and beef-on-dairy premiums hitting $350-700/head. The playbook mirrors 2015-16: three conversations before pressure hits—accountant, nutritionist, lender.

You know, German retail butter dropped to €0.77 per pack in late December 2025. That’s down from nearly €2.00 just a few months earlier—a correction that barely registered in most North American dairy publications. But here’s what caught my attention: for farmers who’ve learned to read global dairy signals, that price move wasn’t just European grocery news. It might be a 60-90 day advance signal for what’s heading toward our milk checks.

I spoke with a Wisconsin producer running about 280 cows near Fond du Lac recently. He put it simply: “I started watching European butter after 2015. That year taught me that what happens in Germany doesn’t stay in Germany. By the time it shows up in your mailbox, you’re already behind.”

The 60-90 Day Warning System: When European butter dropped 35% from €7,200 to €4,400 between early 2024 and late 2025, it preceded U.S. Class III pressure by roughly 75 days. The Wisconsin producer who learned this pattern in 2015 gained a $150,000+ advantage over his neighbor who ignored these global signals 

And he’s not wrong. Understanding these global connections—and knowing when they might warrant action—is becoming increasingly valuable for dairy operations navigating interconnected markets. So let me walk you through what farmers across North America are learning about price signals, financial positioning, and the strategic decisions that can make the difference between weathering market pressure and getting caught flat-footed.

AT A GLANCE: Key Insights

  • The Signal: European wholesale butter down ~35% year-over-year; historically correlates to North American price pressure within 60-90 days
  • The Metric That Matters: Know your Debt Service Coverage Ratio—acting at 1.3x versus waiting until 1.0x can mean a six-figure difference in preserved wealth
  • Near-Term Strategies: Feed-based butterfat improvements can add $800-1,200/month within 60-90 days; beef-on-dairy premiums running $350-700/head
  • The Framework: Proactive positioning beats reactive response—farmers who move early consistently outperform those who wait
  • The Bottom Line: Markets may surprise either direction, but stress-testing your operation at $15-16/cwt scenarios is sound management

How European Butter Prices Connect to Your Milk Check

The relationship between European dairy commodities and North American milk prices follows a transmission path that agricultural economists have tracked for over a decade now. It typically unfolds across 60-90 days, which—when the signals are reliable—gives observant farmers a meaningful window to prepare.

Dr. Mark Stephenson, who served as Director of Dairy Policy Analysis at the University of Wisconsin-Madison before his recent retirement, studied this lag extensively throughout his career. His research shows that when European wholesale butter drops significantly, the effects tend to ripple through Global Dairy Trade auctions in New Zealand within 2-3 auction cycles, then influence contract negotiations across Oceania before reaching North American processor discussions.

What’s happening right now appears to fit that pattern. European wholesale butter fell from over €7,200 per tonne in early 2024 to the €4,000-5,000 range by late 2025, according to AHDB’s EU wholesale tracking—that’s roughly a 35% year-over-year decline. Class III futures for Q1-Q2 2026 are currently trading in the $17.00-18.00/cwt range on CME, which is actually better than some analysts projected a few months back, but still tight for operations with higher cost structures.

Industry estimates suggest that breakeven for mid-size Wisconsin dairies typically runs $18-19/cwt when all costs, including family living and debt service, are accounted for. Operations in California’s Central Valley often see higher numbers due to feed costs and regulatory compliance, while Northeast operations face their own regional dynamics. Western operations dealing with water constraints and Southeast dairies facing heat stress economics have their own cost pressures layered on top. Canadian producers navigate a different reality entirely—quota values and supply management provide price stability but bring their own capital and cash flow considerations. The specific math varies by region and management, but the directional pressure applies when Class III hovers near or below regional breakevens.

RegionTypical All-In Breakeven ($/cwt)Primary Cost DriversCurrent Margin @ $17.50 Class IIIProjected Margin @ $15.50 ScenarioRisk Level Q2 2026
Wisconsin$18.00 – $19.00Feed, labor, debt service-$0.50 to -$1.50-$2.50 to -$3.50Moderate-High
California Central Valley$20.00 – $22.00Feed costs, water, regulatory compliance-$2.50 to -$4.50-$4.50 to -$6.50High
Northeast (NY, PA, VT)$19.00 – $21.00Labor, fuel, regional feed premiums-$1.50 to -$3.50-$3.50 to -$5.50Moderate-High
Texas/New Mexico$17.50 – $19.50Water constraints, heat stress mitigation, feed$0.00 to -$2.00-$2.00 to -$4.00Moderate
Southeast (GA, FL)$19.50 – $21.50Heat stress, humidity management, feed transport-$2.00 to -$4.00-$4.00 to -$6.00High
Canada (Quota Systems)Quota value amortized variesQuota costs, supply management compliancePrice stability via quota systemPrice stability via quota systemLow (different market structure)

Now, I want to be clear about something. Markets can and do surprise us. Futures have been wrong before—2022 comes to mind, when projections sat around $18, and actual prices hit $23 on unexpectedly strong export demand. Some analysts I’ve spoken with remain cautiously optimistic that domestic demand strength could offset some of the pressure we’re discussing. But what’s different about the current setup is the structural inventory situation, which has its own timeline regardless of demand fluctuations.

The Financial Metric Your Lender Is Already Watching

If there’s one number that shapes the conversation you’ll have with your bank—whether it’s a proactive discussion or a reactive one—it’s your Debt Service Coverage Ratio. DSCR tells you whether your operation generates enough cash to cover debt obligations with breathing room… or whether you’re running closer to the edge than you might realize.

Farm Credit Canada’s educational materials lay out the basics pretty clearly. A DSCR of 1.5 is generally considered healthy—it means you’ve got 1.5 times more cash available than your debt obligations require. Drop below 1.0, and you’re looking at difficulty servicing debt without off-farm income or other support. Most agricultural lenders use similar thresholds, though the specific trigger points for increased monitoring or restructuring conversations vary by institution.

DSCR RatioFinancial PositionWho Controls the ConversationRestructuring Options AvailableTypical Cost of Restructuring
1.5x or higherHealthy, strong cushionYou lead; bank followsFull menu: extend terms, consolidate, refinance at competitive ratesStandard processing fees (~$500-1,500)
1.25x – 1.49xAdequate but tighteningPartnership discussionMost options available; minor rate premiums possibleStandard to slight premium (~$1,000-3,000)
1.0x – 1.24xOperating in yellow zoneShared control; bank monitoring increasesLimited options; rate premiums likelyModerate premium (~$3,000-8,000 + 50-100 bps higher interest)
0.85x – 0.99xDistressed territoryBank controls termsRestricted; workout scenarios$8,000-15,000 + 100-150 bps higher interest
Below 0.85xCrisis modeBank workout team drivesForced asset sales likely$15,000+ legal/processing + distressed sale losses

Here’s what farmers are discovering—sometimes later than they’d prefer—the difference between acting at 1.3x DSCR and waiting until you hit 1.0x isn’t just about the numbers themselves. It’s about who’s leading the conversation and who’s following.

I spoke with a senior agricultural lender at a Midwest Farm Credit association who asked to remain anonymous but offered this perspective: “When a producer comes to us at 1.3 with a plan, we’re partners working on optimization. When they come at 0.95 because their operating line is maxed, we’re in workout mode. Same bank, same farmer, completely different dynamic.”

Why does this matter so much? Industry data on distressed agricultural loans shows some significant cost differences. Farms entering workout typically pay 100-150 basis points higher on restructured debt and face substantially higher legal and processing fees. Proactive restructuring—the kind you initiate while your ratios still look reasonable—generally costs a fraction of what a reactive workout costs. And perhaps more importantly, you’re often selling assets into stable markets rather than whatever conditions happen to exist when you’re forced to act.

Agricultural lenders like AgAmerica have documented case studies showing the financial benefits of proactive restructuring. In their published examples, operations that restructured early reported significant annual savings through debt consolidation and strategic use of bridge financing during capital-intensive phases. These options existed because producers initiated conversations while their ratios still demonstrated operational viability.

Here’s a calculation worth doing this week:

Pull your most recent income statement and loan documents. You need three numbers:

  1. Net cash income (gross revenue minus operating expenses—but don’t subtract interest, depreciation, or principal payments)
  2. Annual debt service (all monthly loan payments × 12)
  3. Divide the first by the second

Pro-tip: Remember that while your tax preparer uses depreciation to lower your tax bill, your lender “adds it back” to your net income to determine your actual cash flow capacity. Don’t let a “paper loss” scare you away from a proactive lender meeting. That $80,000 depreciation expense on your Schedule F doesn’t mean you’re $80,000 poorer in cash—it’s an accounting entry, not money leaving your checking account. Lenders understand this, and you should too when evaluating your real financial position.

If you’re above 1.3, you likely have options and time to be strategic. Between 1.0 and 1.25, the window for proactive decisions may be narrowing. Below 1.0, that conversation with your lender probably needs to happen soon—and having a professional guide you in is worth considering.

RED FLAGS: Signs You May Already Be Past Proactive Positioning

  • Operating line balance is climbing more than $5,000/month for three consecutive months
  • Deferred maintenance backlog growing—you’re skipping repairs you’d normally make
  • Breeding decisions driven by cash flow rather than genetic strategy
  • Accounts payable stretching beyond normal terms with key suppliers
  • Finding yourself calculating “which bills can wait” rather than “which investments make sense.”

If three or more of these apply, the proactive window may be closing. That doesn’t mean it’s too late—but it does mean the conversation with your lender needs to happen this month, not next quarter.

What’s Building Toward Q2 2026

Several market forces appear to be converging, potentially creating price pressure this spring. I want to be thoughtful here—market projections are exactly that, projections—but the structural setup is worth understanding so you can make your own assessment.

The cheese inventory factor: When butter prices declined through late 2025, processors across the U.S., UK, and EU made a logical shift. Butter had compressed margins and ongoing storage costs. Cheese—particularly aged cheddar—can sit in inventory for months as it matures, serving as a financial buffer during uncertain times.

You probably already know the aging timelines: mild cheddar reaches market readiness in 2-3 months, medium in 4-9 months, and sharp in 9-12 months. The cheese made in December 2025 and January 2026 will mature and need to be moved to market starting around April-May 2026. That’s not speculation about demand—that’s just aging biology meeting calendar math.

The spring flush timing: Every dairy farmer knows spring flush, but the research on its consistency is worth noting. Studies published in the Journal of Dairy Science on annual rhythms in U.S. dairy cattle show that the spring production peak is remarkably consistent across regions, parities, and management systems—driven more by photoperiod and reproductive biology than management decisions.

USDA’s December 2025 forecast projects U.S. milk production for 2026 at 106.2 million metric tons, up 1.2% from 2025. StoneX Director of Dairy Market Insight Nate Donnay noted in late December that milk production growth was running at an estimated 5.5% pace in September and October—about three times the normal rate. That’s notable context heading into the new year.

The export question: Here’s what’s been encouraging—September 2025 U.S. cheese exports hit 116.5 million pounds, up about 35% year-over-year, according to USDA Foreign Agricultural Service data. That was a remarkable achievement for the industry. The question some analysts are asking is whether markets that absorbed those record volumes will have the same appetite just as domestic production peaks.

None of this means $13 milk is coming. Markets find equilibriums, demand can surprise to the upside, and spring flush intensity varies year to year. But farmers projecting cash flow for Q2 2026 might consider running scenarios at $15.00-16.00/cwt alongside their base case assumptions. That’s not pessimism—it’s the kind of stress-testing that helps operations stay resilient when surprises happen.

Why Component Performance Is Becoming a Competitive Advantage

One of the most significant structural shifts in U.S. dairy over the past decade has been the steady improvement in milk components. And the numbers here are pretty remarkable. CoBank’s Knowledge Exchange published an analysis in September 2025 showing that U.S. butterfat levels increased approximately 13% over the past decade—from about 3.75% in 2015 to 4.24% by 2024. That’s roughly six times the improvement rate seen in the EU and New Zealand.

What’s particularly noteworthy is how this shifts farm-level economics during price compression. Class III and Class IV pricing formulas reward butterfat and protein by the pound rather than by volume. When base prices compress, the premium for higher components becomes proportionally more valuable as a share of the milk check.

Let me walk through some rough math on two cows producing identical volume but different components:

Cow A at 3.7% butterfat: 75 lbs/day = 2.78 lbs butterfat daily
Cow B at 4.4% butterfat: 75 lbs/day = 3.30 lbs butterfat daily

At current butterfat component pricing—which has been running in the $1.55-1.75/lb range in recent months according to USDA announcements—that 0.52-pound daily difference represents roughly $0.80-0.90 per cow per day. Scale that across a 200-cow herd over a year, and we’re talking meaningful revenue differences.

Now, genetic improvement takes 2-3 years to show up meaningfully in the bulk tank. But feed ration adjustments can produce measurable butterfat improvements within 60-90 days—which matters for operations looking at near-term margin pressure.

A Penn State study published in the Journal of Dairy Science in June 2024 found that replacing about 5% of ration dry matter with whole high-oleic soybeans improved income over feed cost by approximately $0.27/cow/day—roughly $99/cow annually. The research synthesized results from multiple feeding trials, so the findings are pretty robust.

Dairy nutritionists generally recommend adding 2-5% molasses to TMR to stimulate fiber-digesting bacteria and boost acetate production, which supports butterfat synthesis. Many farms report butterfat increases of 0.10-0.15 percentage points from this relatively simple adjustment. Protected fat supplementation—combinations of palmitic and oleic acids—can increase milk fat yields within 30-45 days of implementation.

For farms facing compressed margins, even a 0.15-0.2% butterfat improvement translates to meaningful revenue—potentially $800-1,200 monthly for a 200-cow operation at current component pricing. It’s not a complete solution to price pressure, but it’s real money that shows up in the tank relatively quickly.

The ration adjustment that pays for itself in monthly milk checks: Feed-based butterfat improvements show up in the tank within 60-90 days—potentially adding $800-1,200 monthly for a 200-cow operation. Penn State research found protected fat and molasses additions can boost butterfat 0.10-0.15 percentage points within 30-45 days

The Beef-on-Dairy Opportunity

One revenue diversification strategy that’s gained remarkable traction is beef-on-dairy crossbreeding. Industry surveys, including data from the American Farm Bureau Federation, based on Purina’s 2024 producer research, indicate that roughly seven in ten dairy operations are now actively implementing crossbreeding programs. That’s a significant shift from even five years ago.

The economics are fairly straightforward. Industry analysis shows that the majority of dairy farmers participating in these programs receive meaningful premiums for beef-on-dairy calves, with reports of additional revenues ranging from $350 to $700 per head compared to straight dairy bull calves. For an operation producing 70 male calves annually, switching half to beef crosses could generate $18,000-$20,000 in additional annual revenue.

What stands out to me about this trend is the timeline. Beef-on-dairy calves sell at 6-9 months, meaning breeding decisions made in Q1 2026 generate cash in Q4 2026. That’s a faster payoff than almost any other diversification strategy available to dairy producers—which matters when you’re managing through uncertain price periods.

Penn State Extension research on beef×Holstein crosses shows these animals have greater potential to put on muscle than purebred Holstein steers and generally show improved feedlot performance. The carcass quality has proven competitive, and the market infrastructure has developed rapidly to accommodate increased supply. One California producer I spoke with mentioned that his local auction now has specific beef-on-dairy sales days—something that would have seemed unlikely five years ago.

A Texas Panhandle operation I connected with recently shared a different angle on this. They’ve been running beef-on-dairy for three years now and emphasized that buyer relationships matter as much as genetics. “We spent six months building connections with regional feedlots before we started,” the manager told me. “Knowing where those calves are going—and what those buyers want—shaped our sire selection from day one.”

Implementation is fairly straightforward for most operations: genomic testing identifies which cows should continue breeding to elite dairy genetics (typically top 50% by genomic merit) versus which shift to beef sires—Angus, Simmental, or Charolais being common choices depending on regional buyer preferences.

WHAT ONE PRODUCER LEARNED FROM 2015

A 320-cow operation in Dodge County, Wisconsin, offers a useful case study. The producer—who asked that I not use his real name but was willing to share his experience—was running at about 1.28 DSCR in October 2015 when he started noticing warning signs.

“My accountant said I was fine. My neighbor said I was overreacting. But I’d been watching powder prices in Europe drop for months, and I had a feeling about what was coming.”

He restructured his equipment notes that November, extending terms and reducing his monthly obligation by $2,800. He culled 40 head—his bottom performers on both production and components—before spring 2016.

“When milk hit $13 that summer, I was tight but managing. My neighbor, who waited until April to act? He was in a workout by July. Similar starting points, different decisions, very different outcomes.”

His estimate of the wealth difference: around $150,000-$180,000 preserved by moving about six months earlier. Not from being smarter, he emphasized—just from reading the signals and acting before he had to.

What Peer Accountability Groups Are Teaching Farmers

There’s growing evidence suggesting that farms participating in structured peer groups make major financial decisions 6-12 months earlier than farms relying solely on individual analysis. And the mechanisms behind this are fascinating—rooted in behavioral economics as much as farm management principles.

Research on structured farm management groups has consistently shown meaningful financial advantages for participants. Studies tracking farms in peer advisory programs have found notable improvements in operating profit and return on assets compared to non-participants—though the specific magnitude varies by region, group structure, and management intensity.

The Ohio State University Extension put together a helpful fact sheet on peer group value that explains part of the mechanism. As they describe it, “With trusting relationships, members can share their farm’s production data such as yield, inputs, labor, and equipment, along with core financial ratios. Peers then act as an informal board of directors by identifying the strengths and areas for improvement.”

Here’s something I’ve noticed over the years: most dairy farmers don’t actually know their neighbor’s DSCR. They might know what kind of tractor he bought or roughly what he’s feeding, but the real financial picture? That stays behind closed doors. And that isolation can be expensive.

Having sat in on several of these groups over the years, I’ve observed something important about what actually happens in those rooms. The groups seem to override the cognitive biases that can cause all of us—not just farmers—to delay difficult decisions. Loss aversion makes culling cows feel worse than the abstract benefit of “preserving financial flexibility.” Status quo bias creates comfort with continuing current practices even when data suggests change might be warranted. Optimism bias whispers, “we’ve always made it through before.”

The farmers losing the most money right now aren’t necessarily the ones with the worst operations. They’re often the ones who calculated correctly but couldn’t pull the trigger—who knew what they should do but found reasons to wait another month, another quarter, another year.

Peer groups interrupt these patterns through straightforward mechanics: quarterly meetings with financial transparency, benchmarking against similar operations, and accountability for stated commitments. When you tell five other farmers in January that you’re going to restructure your equipment debt and cull your bottom 15%—and they’re going to ask you about it in April—it changes the calculus.

Kim Gerencser, a Saskatchewan-based farm business and management consultant who has been facilitating peer groups for well over a decade, has written and spoken extensively about the value of accountability structures. In interviews with Country Guide, he’s emphasized that the groups that sustain themselves over many years do so because participants find genuine value in the structure. The accountability piece, he’s noted, is what really matters.

For farmers who haven’t participated in this kind of group, options include Cornell’s Dairy Profit Discussion Groups, various state extension programs, cooperative-facilitated groups, and private consultant-led formations. The common elements that seem to make groups effective: quarterly meetings, financial transparency among members, neutral facilitation, and strong confidentiality agreements.

A Practical Six-Month Framework

For farmers who’ve assessed their position and decided proactive action makes sense, here’s what a practical timeline might look like. I want to emphasize that this isn’t the only approach, and every operation’s circumstances differ. A 500-cow California dairy faces different cost structures and cooperative relationships than a 150-cow Vermont operation or a 2,000-cow Texas facility.

But the underlying framework—financial clarity first, then cost structure adjustment, then ongoing accountability—seems to apply broadly based on what I’ve seen work across different regions and operation sizes.

Month 1 (January): Financial Clarity

The starting point is knowing exactly where you stand. Complete the DSCR calculation using both historical and projected prices. Pull your operating line balance trend over the past six months—if it’s been climbing $3,000-8,000 monthly, you may already be running negative cash flow, regardless of what last year’s financial statement showed.

Review your DHIA reports to identify the bottom 15-20% of your herd by combined production and components. These become your first-look candidates if cash flow requires culling decisions.

And if you’re considering a lender conversation, schedule it now while you’re initiating from a position of relative strength. The framing matters. Something like: “I’ve run forward projections based on current futures. I’d like to discuss options while we’re still well above your monitoring threshold” positions you as a proactive manager rather than a distressed borrower.

Month 2 (February): Cost Structure Adjustment

If culling decisions make sense for your operation, executing them while cattle prices remain stable preserves value. Current market prices for cull cows typically range from $1,200-1,800/head, depending on region and market conditions; distressed selling in a soft spring market could mean $800-1,100. That difference across 35 cows adds up quickly—real money for most operations.

Implement any feed ration adjustments to improve butterfat. The 60-90 day timeline for feed-based component gains means February changes can show up in April milk checks.

If beef-on-dairy makes sense for your operation, begin that breeding protocol on lower genomic performers. Revenue arrives in Q4 2026.

Month 3 (March): Risk Management and Accountability

Evaluate hedging options based on your operation’s risk tolerance and expertise. Dairy Revenue Protection and Class III options are available for farms that want price-floor protection, though they come with costs and basis risk that warrant careful evaluation—ideally with someone who understands these tools well.

Consider joining or establishing a peer accountability group. The first meeting should present your current position and action plan. Having external accountability through the spring flush period can be valuable.

Months 4-5 (April-May): Monitor and Maintain Discipline

Track actual versus projected cash flow weekly. This is where discipline matters—there can be temptation to reverse culling decisions or restructuring if short-term prices tick up.

If you’re in a peer group, the meeting during this period provides external validation. Present your January baseline, your April position, and your variance analysis. Let the group help you assess whether you’re on track.

Month 6 (June): Assessment and Forward Planning

Compare actual DSCR to January projections. Evaluate what worked, what didn’t, and what you’ve learned. Develop your Q3-Q4 plan incorporating any beef-on-dairy calf revenue and continued component focus.

What success might look like: A farm that entered January at 1.3x DSCR with $18.50/cwt breakeven, facing uncertain milk prices, emerges in June at 1.15-1.18x DSCR with $16.80/cwt breakeven—having maintained position above the critical 1.0x threshold even through potential price pressure. That’s not a dramatic turnaround story. It’s just solid management under challenging conditions.

The Conversation That Matters Most

Perhaps the hardest part of proactive financial management isn’t the calculations or even the lender meetings. It’s the kitchen table conversation about making significant changes before a crisis becomes undeniable.

What farmers who act early seem to be deciding is whether the discomfort of acknowledging vulnerability now is worth the financial protection it might provide later. And honestly, that’s not an easy trade-off. Culling cows you’ve raised can feel like a retreat. Calling your lender proactively can feel like admitting weakness. Joining a peer group and sharing your financials can feel uncomfortable.

But the alternative—waiting until circumstances force the same decisions from a weaker position—tends to cost real money, according to the research and case studies I’ve reviewed. The wealth difference between proactive and reactive positioning can range from $150,000 to $300,000 or more over a 2-3-year market cycle, depending on the operation’s size and the severity of the downturn.

That’s what tends to happen when operations restructure at penalty rates rather than market rates, sell cattle into distressed markets rather than stable ones, pay workout fees rather than standard processing fees, and navigate restricted credit access for years rather than maintaining banking relationships.

Key Takeaways

On global market signals:

  • European butter prices and Global Dairy Trade auction results can provide 60-90 days of advance indication for U.S. milk price direction
  • Current signals suggest potential price pressure in Q2 2026, though markets can surprise, and projections always carry uncertainty
  • Worth monitoring: GDT auction results at globaldairytrade.info, AHDB EU wholesale prices, and CLAL’s international databases

On financial positioning:

  • DSCR is the metric lenders watch most closely—knowing yours and projecting it forward matters
  • The wealth difference between acting proactively versus reactively can be substantial over a market cycle
  • Proactive restructuring conversations tend to yield significantly better terms than reactive conversations during distress

On operational strategies:

  • Component improvement through feed rations can generate meaningful monthly revenue within 60-90 days
  • Beef-on-dairy crossbreeding offers $18,000-$20,000 potential annual revenue diversification with a  6-9 month payoff timeline
  • Culling decisions reduce cost structure but require careful analysis of volume versus efficiency trade-offs specific to each operation

On decision-making:

  • Peer accountability groups appear to help farmers make structural decisions earlier than solo analysis
  • The psychological barriers to early action—loss aversion, status quo bias, optimism bias—are normal human tendencies
  • The farms that navigate market pressure most successfully seem to share a common trait: they made uncomfortable decisions while they still had meaningful control over terms and timing

The Bottom Line

The European butter correction of 2024-2025 wasn’t just a European story. It appears to be an early chapter in a global market adjustment that’s still developing. For dairy farmers willing to monitor these signals, clearly understand their financial position, and make proactive decisions, it may also represent an opportunity to strengthen operations before market pressures fully test them.

The question isn’t whether to prepare—smart operators are always preparing. The question is whether you’ll do it on your terms or the bank’s.

For producers reading this in January 2026, that means three conversations in the next 30 days: one with your accountant to calculate your current DSCR, one with your nutritionist about component-focused ration adjustments, and—if your number is below 1.25—one with your lender before spring flush hits. The farmers who preserved six figures in 2015-2016 didn’t have better operations. They had better timing.

For dairy producers seeking resources: University extension dairy programs in most states offer farm financial analysis services. The Center for Dairy Profitability at UW-Madison publishes annual benchmarking data. Regional cooperatives increasingly offer member financial planning support. Farm Credit institutions provide forward-looking cash flow analysis. The key is engaging these resources while your financial position still allows flexibility to act thoughtfully on what you learn.

Note: Market projections are inherently uncertain. This article provides educational framework, not financial advice. Consult qualified professionals for operation-specific decisions.

Complete references and supporting documentation are available upon request by contacting the editorial team at editor@thebullvine.com.

Learn More

The Sunday Read Dairy Professionals Don’t Skip.

Every week, thousands of producers, breeders, and industry insiders open Bullvine Weekly for genetics insights, market shifts, and profit strategies they won’t find anywhere else. One email. Five minutes. Smarter decisions all week.

NewsSubscribe
First
Last
Consent

4.23% Butterfat, $187,000 Gone: The Margin Math That Broke 2025 – And Shapes Your 2028

4.23% butterfat—an all-time record. $187,000 gone from a 500-cow herd—silently. That’s not bad luck. It’s the margin math that broke 2025 and shapes who wins by 2028.

Executive Summary: U.S. butterfat hit 4.23% in 2024—an all-time record. Exports topped $8.2 billion. Margins still collapsed. For a 500-cow herd underestimating true breakeven by just $1.50/cwt, that translates to roughly $187,000 in equity vanishing annually—often invisibly, until the lender starts asking hard questions. This isn’t cyclical bad luck; genomic selection has locked the national herd into high-component production through at least 2028, while 82% of U.S. milk still clears domestically, no matter how strong exports run. Regional pain points vary sharply: eroding Class I premiums in the Northeast, punishing cost structures in California, and processor-dependent fortunes across the Southwest. What follows is the margin math that explains 2025’s wreckage—and a 2026-2028 checkpoint framework for aligning genetics, breakeven reality, and processor fit before options narrow further.

Dairy Margin Math

You know that feeling when you look at the milk check and think, “This isn’t what the markets promised me a year ago”? A lot of dairy folks were right there in 2025.

What I’ve found, digging through the numbers and talking with economists, lenders, and producers across the country, is that 2025 wasn’t just “one bad year.” It was the point where years of genetic progress in butterfat performance, record-high component tests, and massive processing investments finally collided with the hard limits of demand and pricing. And that’s the math we need to walk through together.

The 2025 Reality: Less About Volume, More About Butterfat

Looking at this trend, one of the first surprises is that the U.S. didn’t suddenly drown in extra milk. Industry analysis based on 2024 and 2025 statistics indicates that total U.S. milk production has been relatively flat compared with earlier decades of growth. So the story isn’t just “too many cows.”

What really changed was what was in the tank.

Here’s what’s interesting. Industry reports traced national milkfat trends going back decades, and for a long stretch—from the mid-1960s up to about 2010—average U.S. butterfat hovered in a remarkably tight band, around 3.65–3.69 percent. Then things started to climb. By 2021, we hit a national average of about 4.01 percent milkfat for the first time in recorded history—breaking a record that had stood since 1944 and 1945.

That moved to roughly 4.06–4.08 percent in 2022 and 4.14–4.15 percent in 2023, depending on the calculation method, with each year setting a new record. By 2024, calculated national averages around 4.23 percent butterfat and 3.29 percent protein using monthly USDA National Agricultural Statistics Service data. That lines up with what many of you are probably seeing on DHI sheets—cows that were once 3.6–3.7 percent now sitting comfortably over 4.0.

It’s worth noting that because total milk volume hasn’t grown nearly as fast as butterfat tests, the total pounds of milkfat have jumped faster than the pounds of milk. From 2022 to 2023 alone, U.S. milkfat production increased by about 136.2 million pounds—a 1.5 percent gain—despite modest growth in total milk.

At the same time, price reports and commentary from CME, USDA, and the Farm Bureau, along with our own analysis here at The Bullvine, showed butter and cheese markets under pressure in 2024 and 2025 as stocks built and global competition intensified. So the 2025 reality wasn’t just “more milk.” It was a lot more fat in roughly the same milk pool, with fewer places to sell that fat at the premiums we’d gotten used to.

The Long Component Shift, in One Glance

To put the component story in perspective, here’s a simple snapshot using ranges and figures drawn from USDA statistics and industry analysis.

Table 1. The Component Shift (National Picture)

YearApprox. Avg. Milkfat %Primary Market FocusPhase
2005mid-3.6% rangeFluid milk / volumeOld baseline
20214.01%Fat premiums are gaining tractionThe “pivot”
20234.14–4.15%Fat clearly leading the checkThe “boom”
2024~4.23% (estimated)High-component “new normal.”The “overload”

Industry reports confirm that milkfat set a new annual record four years in a row, leading into 2024. And when you combine that with industry genetics coverage and what we’ve been tracking here, the component gains have been fueled by coordinated genetic selection, nutrition programs, and management improvements. Put together, the message is clear: we’re not drifting back to 3.6–3.7 percent as a national norm anytime soon.

Why Exports Didn’t “Save” 2025

What farmers are finding—and you probably know this already if you’ve been watching the trade reports—is that the export story is a bit of a double-edged sword.

USDA’s Foreign Agricultural Service and industry groups like USDEC and IDFA have all highlighted that U.S. dairy exports hit record or near-record levels in recent years. Dairy Foods reported that U.S. dairy exports topped $8.2 billion in 2024—the second-highest total export value ever—with strong cheese and powder shipments to key buyers such as Mexico and Southeast Asia. And here’s the figure that really matters: according to IDFA, roughly 18 percent of U.S. milk production, on a solids basis, is now exported. That’s about one day’s worth of milk produced on America’s dairy farms each week going overseas. A huge change from 20 years ago.

So it’s fair to ask: if exports were that strong, why did domestic prices still slump?

The scale math is pretty unforgiving. If about 18 percent of U.S. milk production goes out as exports, that still leaves roughly 82 percent that has to be consumed domestically. At the same time, the national butterfat average went from roughly 4.01 to 4.08 to 4.15 to over 4.2 percent in just a few years. So even if total milk volume is nearly flat, the pounds of fat looking for a home are not.

Market Destination% of U.S. Milk (Solids Basis)Key Vulnerability2024–2025 Reality
Domestic consumption82%Hard ceiling on fat absorptionButter stocks built despite record components; Class I utilization down to 30% in Northeast
Export markets18%Price competition with EU/Oceania$8.2B record exports in 2024, but often at discounted prices to move volume
Processing capacity100%Processor product mix locked in$11B in new plant investments (2025), but most designed for specific component profiles

On top of that, USDEC and Farm Bureau’s dairy trade analysis have emphasized that keeping those export channels open often means being competitive on price. In multiple periods, U.S. butter and skim milk powder have had to trade at a discount to European and Oceania products to move volume.

Industry reports have described that dynamic as a mix of record exports and tight margins, as a defining feature of the last couple of years. We covered the implications of this in our piece on 2025’s dairy dilemma.

What’s encouraging is that in some regions, especially in the West and Southwest, export-oriented plants have been a lifeline. Industry coverage of new powder and cheese facilities in Texas, New Mexico, and Kansas shows how those plants have created strong localized demand and a better basis for dairies in those draw areas, many of them large freestall or dry lot systems. In those cases, exports aren’t an abstraction; they’re the reason the local processor can keep taking milk.

But zooming out, the data from USDEC, IDFA, Farm Bureau, and industry analysts suggests exports did about as much as they reasonably could—and still couldn’t completely mop up the extra butterfat coming out of U.S. herds. When 80-plus percent of your product still has to clear domestically, multi-year component expansion will eventually show up in the price.

Genetic Momentum: The Part You Can’t Undo Next Breeding Season

Here’s where the genetics piece comes in, and it’s one of the most important parts of this whole story.

Coverage has spelled out how dairy cattle in the U.S. have essentially entered a “high-component era” thanks to genomics and selection for fat and protein. Genomic selection, shorter generation intervals, and focused breeding goals have stacked more fat and protein into the national herd over the last decade.

And the research backs this up. Peer-reviewed genetics papers published in journals such as Genetics, Selection Evolution, and PNAS have documented that genomic selection has increased genetic gain rates for production and component traits by 50% or more compared with traditional progeny-testing systems. Some studies show even larger gains—the Frontiers in Genetics review on U.S. dairy cattle genomic selection noted that the program has essentially doubled the rate of genetic gain.

The April 2025 Holstein base change really drove this home. According to documentation from NAAB and Select Sires, this was one of the largest base changes in history—resetting values to 2020-born cows with PTAs for fat dropping by about 44-45 pounds in the adjustment. That tells you just how much the genetic level has climbed. We covered the implications in our April 2025 US Holstein Evaluations analysis.

Here’s what that means in the parlor. A heifer you bred in 2021 or 2022 to a high-component genomic bull freshened in 2023 or 2024. Her daughters—already on the grow—will be milking through 2028–2030. So while you can start adjusting your sire lineup today—maybe shifting a bit more emphasis toward protein, feed efficiency, and health—you can’t un-breed the decisions from five years ago.

Land-grant university extension programs have been pretty clear in their 2024–2025 outlook discussions: the industry is genetically “pre-loaded” for high butterfat and strong solids for at least the next several years. The cows in the pipeline and the base-change data both point in that direction.

If current component and utilization trends continue, it’s hard to see a world in the late-2020s where butterfat returns to scarcity. Much more likely is a reality where high butterfat is the baseline, and the true differentiators are metabolic efficiency, health, and how closely your herd’s profile matches your plant’s needs.

Regional Pain Points: Same Storm, Different Boats

What farmers are finding is that the same national trends play out very differently depending on where you are and who you ship to.

Table 2. Regional Pain Points (2025–2026 Snapshot)

RegionPrimary Market StructureBiggest Margin Killer (2025)Est. Breakeven Range ($/cwt)Strategic Position
Northeast (FMMO 1)Fluid-to-manufacturing shiftLoss of Class I premiums (44% → 30% utilization)$21–$24High-cost structure meets manufacturing pricing; margin squeeze acute
California & West CoastMixed fluid/manufacturing/exportFeed + regulatory costs + co-op loss pass-throughs$20–$23Punishing input costs; basis often below U.S. average
Upper Midwest (WI/MI)Cheese-focused, high componentsComponent mismatch with some plants; 4.2%+ fat not always rewarded$17–$20Strong processing diversity, but not all plants optimize ultra-high butterfat
Central Plains / Southwest (TX/NM/KS)New cheese & ingredient plants, export-linkedProcessor-dependent; need consistent volume to justify $11B buildout$16–$19Best positioned if tied to new plants; vulnerable if outside draw areas

In the Northeast, FMMO 1 data and Cornell/Penn State extension work indicate that Class I (fluid) utilization has declined significantly. Analysis has documented that in the Northeast, Class I milk utilization fell from 44 percent in 2000 to 30 percent by 2022. That’s a dramatic shift, and it means more milk is being priced in manufacturing classes. Coverage of FMMO reform and Order 1 discussions has highlighted how that erodes the fluid premium that used to support many smaller and mid-size herds. Producers there are now being judged much more directly on components and the all-in cost structure.

In California and other Western states, the cost picture is especially tight. Feed, water, and regulatory burdens are already higher than in many other regions.

On top of that, reports have documented co-ops passing losses through to members during tough stretches, leaving some producers with net milk prices materially below the national all-milk price. Stack those together, and you have a very narrow margin for error.

In the Central Plains and Southwest, there’s been massive investment in new processing capacity. IDFA reported in October 2025 that more than $11 billion is flowing into 53 new or expanded dairy manufacturing facilities across 19 states, with Texas alone receiving about $1.5 billion. We examined these dynamics in our piece on the $11 billion wave of processor investments. Industry coverage has documented specific projects including Cacique Foods in Amarillo, Great Lakes Cheese in Abilene, H-E-B in San Antonio, and Leprino Foods in Lubbock. Many of those plants are designed around large freestall and drylot systems that supply consistent volume. Producers in those regions often report strong local demand and aggressive base allocations, even in weaker price windows, but they’re also tied tightly to the success of those new plants and their export programs.

In Wisconsin and other Upper Midwest states, statistics and extension data show a mix of strong production, high butterfat, and diversified processing: cheese, butter, whey, specialty products. But even there, when state and national butterfat levels pushed firmly into the 4.0+ range, not every product mix could reward unlimited fat—especially plants focused heavily on cheese yield and whey solids.

A Note for Canadian Producers: The specifics differ north of the border—quota systems buffer volume swings and provide different price dynamics. But the underlying component and cost pressures are real in Canada too, and conversations about efficiency, genetics, and processor fit are just as relevant. The genetic momentum we’re describing is continental, not just American, and many of the strategic questions around breeding emphasis and cost structure apply regardless of which side of the border you’re milking on.

So while the national numbers are the same for everyone, the pain points—and the opportunities—vary a lot by region and processor.

The Breakeven Trap: Where “Almost Okay” Eats Equity

Here’s the part that’s easy to overlook when you’re just trying to get through another month: the breakeven math.

Farm financial analysts, including those at American Farm Bureau and in land-grant university farm management programs, have flagged a significant uptick in Chapter 12 bankruptcies. Chapter 12 filings were up 56 percent in June 2025 compared to the prior year. Farm Policy News documented that family farm bankruptcies increased 55 percent in 2024 compared to 2023. And University of Arkansas Extension noted that Q1 2025 saw 88 Chapter 12 filings compared to just 45 in Q1 2024.

What’s striking is that these filings often don’t coincide with the absolute lowest milk prices we’ve ever seen—they show up after a few years of “thin but not terrible” margins. We explored this pattern in depth in our analysis of the 55% surge in strategic bankruptcies.

Our own “$200K Dairy Margin Trap” analysis here at The Bullvine walked through an example of how a relatively modest $1.25–$1.75/cwt squeeze between expected and actual margins can quietly drain $150,000–$200,000 a year out of a 500-cow operation. You don’t always feel that in any one month, but the balance sheet sure feels it in three to five years.

Extension bulletins from universities like Wisconsin and Penn State have stressed that many farms underestimate their true cost of production by omitting paid-equivalent owner labor, reasonable machinery replacement, heifer-raising costs, and deferred maintenance. When those are fully accounted for, breakeven often ends up $1–$2 per hundredweight higher than the “mental” number many producers are using.

To put some real numbers on it: a 500-cow herd averaging about 25,000 pounds per cow per year ships roughly 12.5 million pounds—125,000 hundredweight. If your real breakeven is $1.50/cwt higher than you think, that’s around $187,500 a year in unrecognized loss. At $2.00/cwt, it’s roughly $250,000. On a 150-cow herd producing around 37,500 hundredweight, the same $1.50–$2.00 error still adds up to roughly $56,000–$75,000 per year—enough to decide whether you can replace a tractor or re-roof a barn.

“If you think your breakeven is $19 but you haven’t fully counted owner labor, capital replacement, heifer costs, and deferred maintenance, you’re probably not breaking even—you’re quietly liquidating your farm one hundredweight at a time.”

Across three lean years, that’s hundreds of thousands of dollars of equity quietly eroded. It’s no wonder some producers feel blindsided when the bank suddenly looks nervous; the erosion happened slowly, while everyone hoped “next year” would fix it.

That’s why you’re seeing more talk from lenders and extension teams about detailed cost tracking, FINBIN-style benchmarking, and honest breakeven exercises. The goal isn’t to beat anyone up; it’s to make sure the math behind the milk check is as clear as the test sheet for butterfat.

Rethinking “Winning” in a High-Component Era

So, what farmers are finding is that the definition of “winning” has shifted.

Most serious market outlooks—including USDA’s Livestock, Dairy, and Poultry Outlook, CoBank’s Knowledge Exchange dairy briefs, Farm Bureau’s dairy market overviews, and multiple land-grant university outlook meetings—converge on a similar picture: a high-component milk supply, robust processing capacity, strong but not unlimited export growth, and ongoing Class I decline. They don’t pretend to know the exact Class III price in 2027, but they do suggest the structural pressures we’re seeing now aren’t going away.

Against that backdrop, three themes keep emerging in industry coverage and in our analysis here at The Bullvine.

1. Genetics: From “More Fat” to “Smart Fat.”

Industry analysts have shown we can absolutely keep breaking component records with the tools we have. The question isn’t “Can we add more fat?” anymore; it’s “Is more fat the best use of the next unit of genetic progress on this farm, with this processor?”

Reviews on milk quality and economic sustainability in journals such as Animals, and systematic reviews on performance indicators, point to a growing emphasis on metrics such as feed efficiency, health, and fertility. These align with what extension geneticists say: we now have the genomic tools to select for cows that convert feed into milk solids more efficiently, stay healthier through the transition period, and last longer in the herd.

For herds shipping mainly to cheese plants with strong whey and lactose streams, it can make sense to lean a little harder into protein, casein, and efficiency traits, while maintaining solid butterfat performance. For plants more dependent on butter and cream, maintaining high butterfat is still logical—but even there, balancing it with health and feed efficiency can keep production sustainable.

2. Efficiency and Health: Durable Competitive Edge

Our margin analysis and university farm business summaries both highlight that in tight times, the herds that stay profitable are the ones that consistently produce higher income over feed cost per stall, not just more pounds per cow. We explored the feed cost dynamics in our recent piece on why smart dairies are spending more on feed.

Research on seasonal milk composition, transition cow health, and fresh cow management shows that better control of the transition period—reducing displaced abomasum, ketosis, retained placenta, and metritis—pays off in both milk components and lower vet bills. The National Mastitis Council’s “Best of the Best” roundtable and industry coverage of quality award winners show that herds with strong udder health and milking routines capture more premiums and generally have more stable production.

In practical terms, as many of us have seen and extension case studies generally support, herds that clean up transition management and tighten ration consistency often see substantial improvements in income over feed cost—sometimes more than a dollar per cow per day—without adding new technology. That’s the kind of advantage that holds up whether butter is $1.80 or $3.00.

3. Market Alignment: Matching Cows to Plants

Industry coverage and our market pieces here keeps coming back to one simple idea: the same hundredweight of milk can be worth very different amounts, depending on what your plant does with it.

Cheese plants with advanced whey and ingredient streams can usually capture more value from both protein and fat than butter-powder plants with no side-streams. Plants that sell a lot of branded consumer products may be less exposed to global commodity swings than plants that sell mostly unbranded bulk product. Co-ops that spent heavily on certain commodity investments have more riding on specific market segments.

In Wisconsin operations, for example, producers shipping to specialty cheese plants with strong whey programs often report different checks than neighbors shipping to a more traditional commodity mix, even with similar butterfat performance and protein levels. In Texas and Kansas, dairies tied to new cheese/ingredient plants have reported strong demand and competitive pricing, while those just outside certain draw areas don’t see the same benefits.

The farms that seem to be navigating this best aren’t always the biggest, but they usually have a clear grasp of three things:

  • How their buyer makes money
  • How their butterfat and protein profile fits that product mix
  • How their cost of production stacks up against the risk profile of that market

2026–2028: Checkpoints Instead of Crystal Balls

So, where does that leave you when you sit down with your family, your lender, or your advisory team?

Nobody can tell you exactly where prices will be in June 2027. But the combination of USDA data, component trends, USDEC/IDFA trade reports, CoBank outlook briefs, and farm financial analysis provides enough structure to use checkpoints rather than crystal balls.

2026: Get Honest and Get Oriented

  • Lock in a real breakeven. Work with a farm business specialist or your lender to build a fully loaded cost of production that includes owner labor, realistic machinery replacement, heifer raising, and deferred maintenance.
  • Map your buyer. Identify your processor’s main products—cheese, powder, butter, fluid, ingredients, branded retail—and how they price butterfat and protein. Ask them directly how your component profile helps or hurts their system.
  • Audit your herd plan. With your genetic advisor, review whether your current sire choices and culling strategy still make sense for where you expect your milk to go in 2029–2031, not just where it went in 2022.

2027: Test Your Plan Against Reality

  • Compare plan vs. actual. Take your 2026 plan and match it against your actual margins, cull rates, heifer inventory, and debt service. Did the quiet equity erosion show up despite your adjustments?
  • Reassess market fit. If your plant is clearly long on cream and struggling with butter, but you’re chasing ever-higher butterfat performance, it might be time to rebalance breeding goals and rations slightly toward protein, efficiency, and health.
  • Decide whether to fix or pivot. If you’re still below true breakeven after making reasonable operational changes, 2027 is the year to have honest conversations about restructuring, resizing, or exploring different income strategies before equity erosion gets out of hand.

2028: Choose Your Long-Term Role

If current genetic and utilization trends continue, by 2028, we’re likely still in a world of high component prices, strong processing capacity, and export markets that are vital but not omnipotent. At that point, it’s less about hoping for a return to “normal” and more about choosing who you want to be in this system.

  • Are you positioned as a lean, efficient, component-savvy herd aligned with a processor that can pay for what you produce?
  • Is your breeding program clearly set up for metabolic efficiency, health, and the component balance your market values, not the one it valued five years ago?
  • Does your balance sheet give you room to keep investing in fresh cow management, transition cow care, and facilities that support cow comfort, instead of just plugging leaks?

Those aren’t easy questions, but the sooner they’re asked, the more options you tend to have.

Editor’s Note on Data and Methods

The numbers in this article come primarily from USDA National Agricultural Statistics Service milk production and composition data; U.S. dairy statistics; USDEC/IDFA and Dairy Foods export summaries; Farm Bureau, Farm Policy News, and University of Arkansas Extension analysis of dairy financial stress and bankruptcy trends; CoBank Knowledge Exchange dairy briefs; IDFA manufacturing investment data; and The Bullvine’s own breakeven and margin modeling. Genetic trends and efficiency themes reflect published reviews on milk composition and economic sustainability in peer-reviewed journals, including Genetics, Selection, Evolution, PNAS, and Frontiers in Genetics, as well as NAAB/Select Sires base change documentation. These are national or regional averages and may not mirror your exact situation; that’s why we encourage you to run your own numbers and share your experience.

The Bottom Line

What’s interesting is how consistently the data and the on-farm stories line up when you step back. USDA analysis shows a steady march to higher butterfat; industry genetics coverage shows record components driven by genomics; USDEC, IDFA, and Farm Bureau show exports doing well but still capped around that 18-percent share; and farm financial analysis points to slow, quiet equity erosion when breakeven is misjudged.

What’s encouraging is that producers have more tools than ever—genomic testing, better transition period nutrition research, fresh cow management protocols, quality benchmarking, and robust financial tools—to respond thoughtfully rather than just react.

If current trends continue, the late-2020s likely won’t be about “getting back” to some old version of the milk check. They’re going to be about thriving in a world where high butterfat is common, where efficiency and health are as valuable as raw output, and where being matched to the right plant matters more than ever.

The 2025 downturn wasn’t a random fluke; it was a feature of a system that finally caught up to its own success in components and capacity. The big question going forward isn’t when the market will fix itself. It’s whether our cows, our costs, and our contracts are lined up with the market we actually have.

So let me leave you with the same question I’ve been asking in winter meetings:

Are you still breeding and budgeting for the 2022 milk check—or are you starting to design your herd and your business for the 2028 reality the data keeps pointing toward?

KEY TAKEAWAYS:

  • Record butterfat broke the margin math: 4.23% components and $8.2 billion in exports still left producers struggling—82% of milk clears domestically, and American fat demand has hard limits
  • $187,000 vanishes without warning: A 500-cow herd underestimating true breakeven by just $1.50/cwt bleeds that much equity every year—often invisibly, until the lender starts asking hard questions
  • Genetics locked this in through 2028: Genomic selection doubled the rate of component gain; the high-fat cows freshening now were bred years ago, and their replacements are already growing out
  • Same storm, very different boats: Northeast herds face eroding Class I premiums, California operations fight punishing cost structures, and Southwest dairies have bet heavily on new processing capacity
  • Decide by 2027 or drift into trouble: Lock in your real breakeven, understand what your processor actually pays for, and audit your breeding direction—the window for strategic repositioning shrinks every season

Complete references and supporting documentation are available upon request by contacting the editorial team at editor@thebullvine.com.

Learn More

The Sunday Read Dairy Professionals Don’t Skip.

Every week, thousands of producers, breeders, and industry insiders open Bullvine Weekly for genetics insights, market shifts, and profit strategies they won’t find anywhere else. One email. Five minutes. Smarter decisions all week.
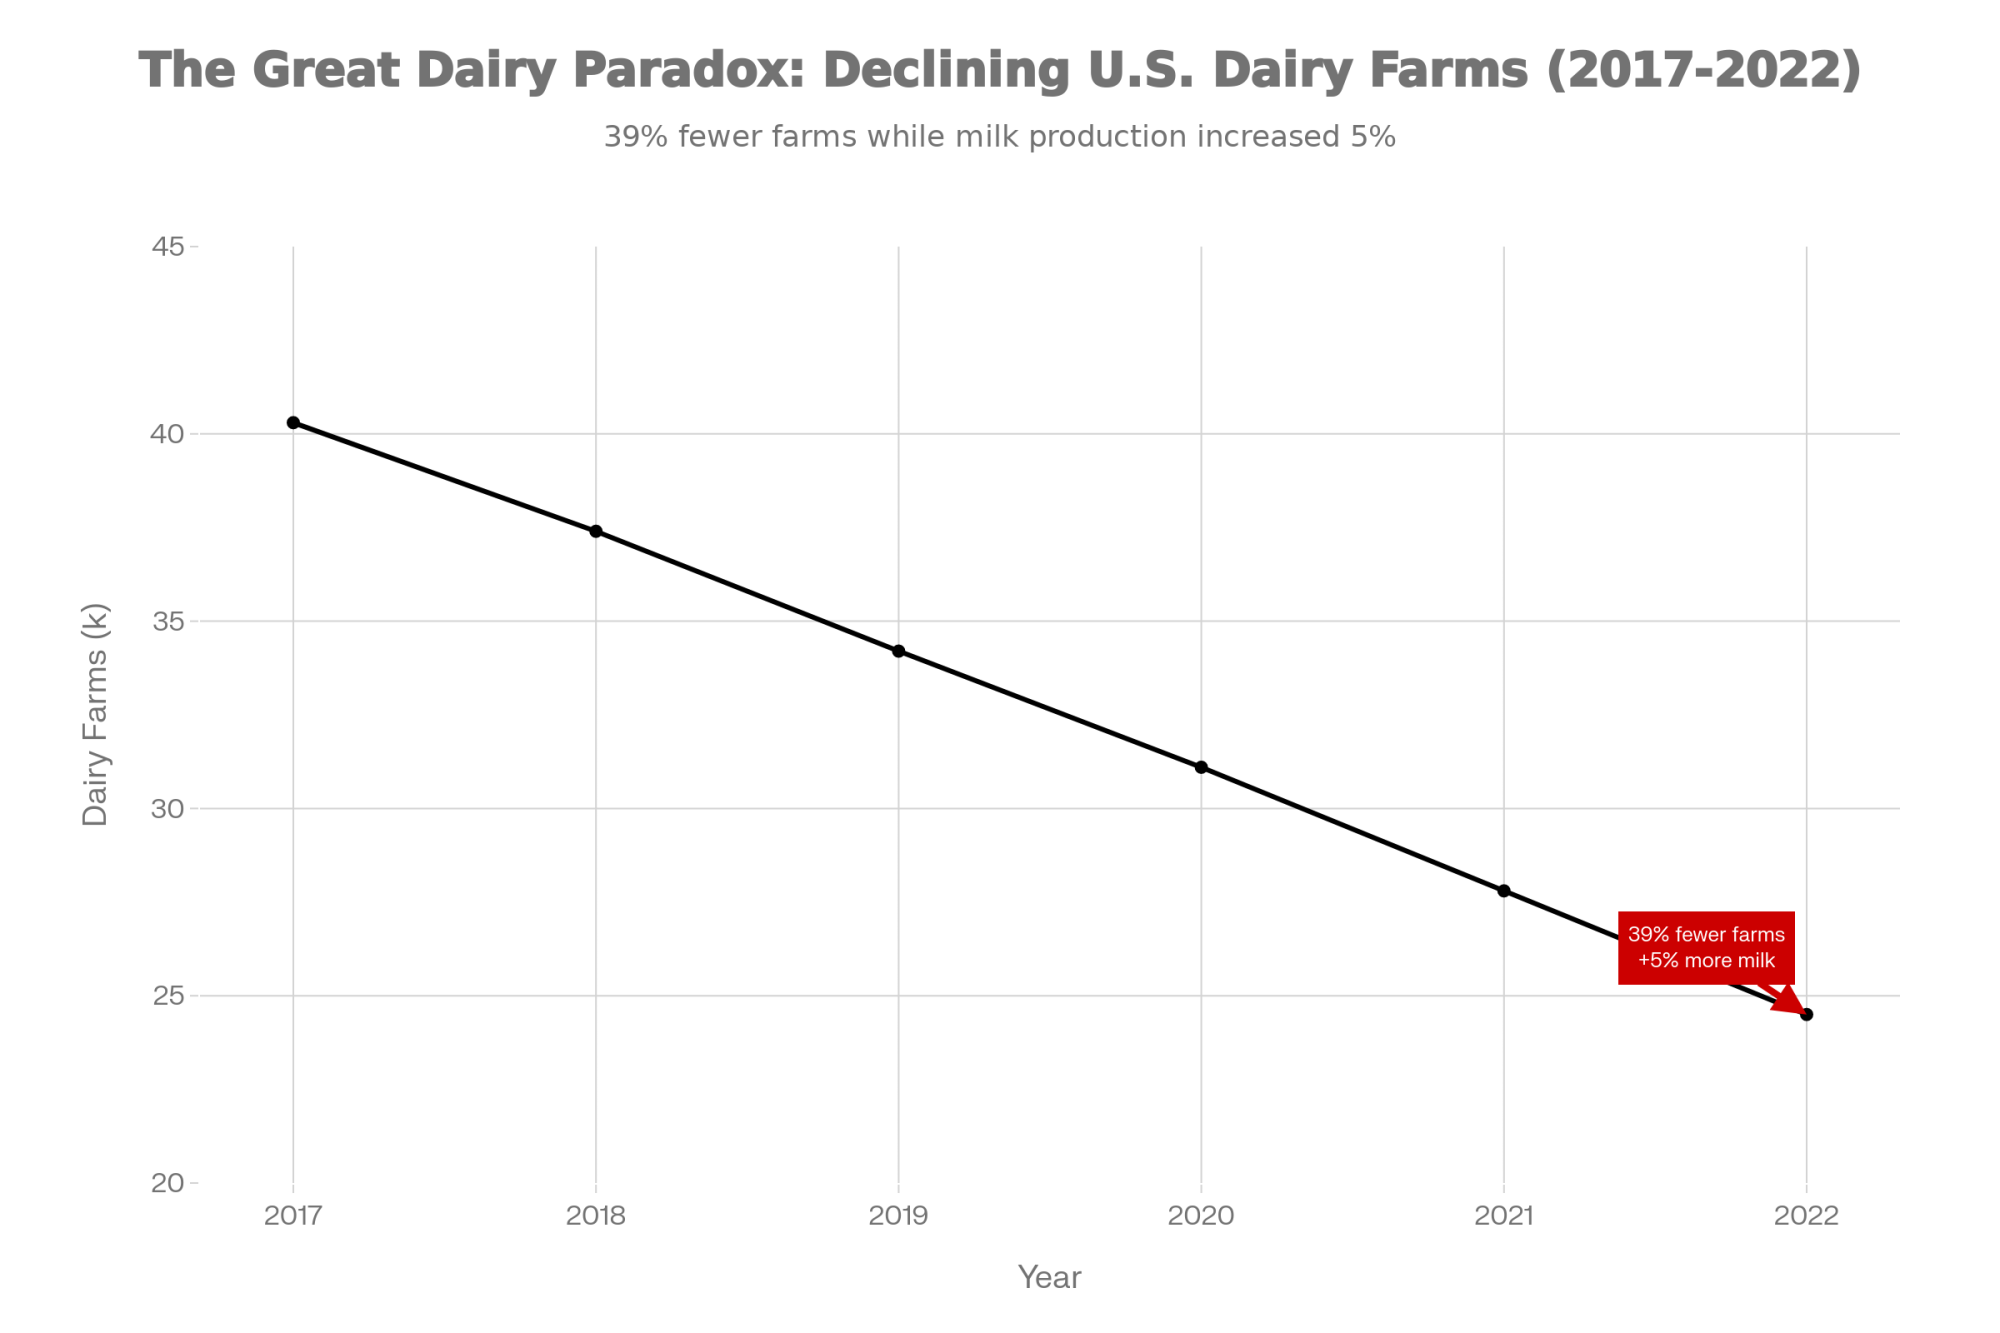
NewsSubscribe
First
Last
Consent

The 18-Month Protein Window: $11 Billion in New Plants Signals It’s Time to Rethink Your Sire Lineup

$11 billion in new processing capacity. A protein-hungry consumer base. And an 18-month breeding window that will shape your milk check through 2030.

Executive Summary: The protein line on your milk check is about to matter more—and your next 18 months of breeding decisions will determine whether your herd is positioned to benefit. GLP-1 weight-loss medications now reach 15.5 million Americans, with clinical guidance steering patients toward protein-dense dairy like Greek yogurt and cottage cheese. Processors have responded by locking in $11 billion in new cheese and cultured capacity across 19 states, scheduled to come online by 2028. University of Minnesota research shows many Holstein herds already carry significant A2 and favorable kappa-casein genetics without active selection, and genomic testing at $30-50 per head makes it practical to know where you stand. The timeline is clear: calves from 2026 matings will hit peak production just as this new capacity reaches full stride. Whether you’re scaling for growth, navigating mid-career capital decisions, or planning a clean exit, the protein opportunity is real, and the window to position for it is now.

Healthcare analysts tracking GLP-1 medications like Ozempic, Wegovy, and Mounjaro are projecting that this class of drugs could grow from about 64.42 billion dollars in annual sales in 2025 to roughly 170.75 billion by 2033—around 13 percent growth per year, according to MarketsandMarkets’ latest global forecast. And that number may have more to say about your protein line than any milk market report you’ve read this year.

Here’s what’s interesting: analysts have been telling food and agriculture reporters that a market that big doesn’t just change what’s in the pharmacy aisle. It spills over into what people put in their carts and on their plates, because these drugs influence appetite, satiety, and what doctors and dietitians tell patients to look for in the grocery store.

And that’s where our dairy conversation really starts to get interesting over coffee.

Why Protein Seems to Be Doing More of the Work

Not long ago, I was at a winter meeting in Wisconsin and a producer leaned over between sessions and said, “You know, I’m starting to see protein doing more of the heavy lifting on my milk check than it used to. It’s not huge yet, but it’s moving.” In a lot of Midwest herds, when folks actually line up a few years of milk cheques, they see the same thing—the protein line quietly pulling a bit more weight relative to butterfat performance than it used to.

If you look north of the border, the Canadian Dairy Commission has adjusted support prices and farm-gate returns to reflect rising feed and operating costs, and those decisions feed into the detailed component-based payment formulas that provincial boards publish. When you study those formulas in Ontario or across Western Canada, you can see that protein and other non-fat solids account for a substantial share of the value, especially in classes tied to cheese and yogurt.

On the U.S. side, federal order component pricing and plant pay schedules in cheese-oriented markets show the same general pattern: butterfat still matters a lot, but protein has become more important as plants capture value from cheese, powders, and high-protein ingredients.

The thing that jumps out to me is that this shift at the pay-stub level isn’t happening in isolation. If you step back and connect a few dots—the GLP-1 story, a growing stack of gut-health research around yogurt and fermented dairy, and more than 11 billion dollars in new processing investments that IDFA says are already locked in—you start to see a pretty coherent picture pointing toward solids, and especially protein.

That’s why I keep coming back to this simple idea: the bulls you pick over the next 18 months are a direct bet on what your milk check looks like in 2029.

GLP-1: The Drug Class Turning Up the Volume on Protein

Looking at this trend, we’ve got to spend a little time on GLP-1 drugs, even though they can feel a long way from the parlor.

Peer-reviewed clinical reviews published in PubMed-indexed journals describe how these medications mimic incretin hormones and work on several fronts: they reduce appetite, slow gastric emptying, improve insulin secretion, and lead to substantial weight loss in people with type 2 diabetes and obesity when used as prescribed.

What the clinical literature also shows—and this is where it becomes relevant for us—is that rapid weight loss can involve loss of lean mass if patients don’t maintain adequate protein intake and engage in some resistance activity. That’s why many clinicians now emphasize maintaining a solid protein intake, or even increasing it, when patients start GLP-1 therapies.

Dairy-focused outlets have begun connecting that clinical guidance to what’s happening in the dairy case. Analysis that combined polling and retail data showed that around 15.5 million U.S. adults were using GLP-1 injectables as of 2023, with adoption expected to reach roughly 9% of the adult population by 2030. Those users reported cutting daily calories by about 20 percent—roughly 800 kilocalories—while shifting away from high-sugar products toward lean proteins.

Registered dietitians explained that they often recommend Greek yogurt, dairy-based protein drinks, and cottage cheese to patients on GLP-1s because these foods deliver convenient, high-quality protein and align with satiety- and gut-friendly patterns supported by the clinical literature.

Now, it’s worth saying out loud that not every GLP-1 user suddenly becomes a model high-protein eater. Real-world adherence, side effects, out-of-pocket costs, and insurance coverage limits all affect how many people stay on these medications and how they actually use them.

But when you put tens of billions of dollars in current GLP-1 sales together with a well-publicized forecast that the market could more than double, and you pair that with a consistent medical message—”eat less overall, but don’t short yourself on protein”—it’s not surprising that food companies and retailers are re-examining their high-protein offerings.

If your cows are producing the milk that ends up in those products, that’s a signal worth keeping in mind the next time you’re standing in front of the semen tank.

Gut Health, Fermented Dairy, and the Slow Burn That’s Paying Off

At the same time, yogurt and fermented dairy have been building their own steady momentum, well before GLP-1 became a household word.

Large prospective nutrition cohorts, such as the Nurses’ Health Study and the Health Professionals Follow-up Study, have tracked people’s diets and health outcomes for decades. Analyses of those cohorts published in journals like the American Journal of Clinical Nutrition have repeatedly found that higher yogurt consumption is associated with a lower risk of type 2 diabetes, even after adjusting for body mass index, smoking, and physical activity.

Umbrella reviews that pool data from multiple observational studies have reached similar conclusions, reporting that yogurt intake tends to align with modestly lower diabetes risk and somewhat better cardiometabolic profiles overall.

On the intervention side, randomized controlled trials have tested yogurt enriched with prebiotic fibers, such as inulin and konjac glucomannan, in adults with type 2 diabetes. Over a few weeks to months, those enriched yogurts improved insulin sensitivity, fasting glucose levels, lipid profiles, and, sometimes, inflammatory markers compared with control products.

Reviews of fermented dairy and the gut microbiome describe how specific cultures and fermentation processes can shift gut bacteria toward profiles that appear beneficial for metabolic and digestive health.

So what do shoppers do with all that? Market research shows that consumers consistently rank yogurt, kefir, and other cultured dairy products among the foods they see as “good for their gut,” and sales data indicate these categories have grown into multi-billion-dollar markets with high single-digit or better growth in many recent years.

Put that together with the GLP-1 protein push, and you can see why there’s so much interest in milk that shows up with consistent protein and butterfat performance, not just volume.

What Jumps Out: The 11-Billion-Dollar Vote for Components

One of the clearest signals in all of this isn’t in survey data at all; it’s in concrete and stainless.

In October 2025, IDFA kicked off Manufacturing Month by highlighting that U.S. dairy processors are investing more than 11 billion dollars in new and expanded processing capacity across 19 states, spread across more than 50 individual building projects scheduled between 2025 and early 2028.

IDFA president and CEO Michael Dykes, D.V.M., has said this reflects a “growth mindset” among processors who expect U.S. milk production to rise by about 15 billion pounds by the end of the decade and want to be ready to turn that milk into higher-value products rather than dumping it into lower-value uses.

When you look at the breakdown, cheese facilities are attracting about $ 3.2 billion. Milk and cream operations account for nearly 3 billion, while yogurt and cultured products draw another 2.8 billion.

By state, New York is slated to receive about 2.8 billion in projects, Texas roughly 1.5 billion, Wisconsin around 1.1 billion, and Idaho and Iowa about 720 million each, making those states some of the biggest beneficiaries of this capex wave.

In New York, those projects layer onto a milk shed already producing roughly 16 billion pounds of milk per year, according to USDA NASS data. Texas has climbed into the top three milk-producing states, anchored by large dry lot systems in the Panhandle and High Plains. Wisconsin continues to deepen its role as a cheese and whey hub, while Idaho and Iowa are adding cheese and powder capacity that fits their existing dairy and feed bases.

You can see where this is going: when processors put that kind of money into cheese vats, separators, and dryers, they’re voting for solids. You don’t design a modern cheese plant or whey protein line around thin, low-component milk. You design it around protein and fat. That doesn’t mean volume suddenly doesn’t matter—but it does change what kind of volume they value most.

The Genetics: You Might Be Closer Than You Think

Now, at this point, somebody usually asks, “Okay, but how far behind am I really?”

Here’s where the data is a bit more encouraging than a lot of folks expect.

When the University of Minnesota genotyped its entire research herd in 2019, more than 50 percent of the Holstein cows turned out to be A2A2 for beta-casein, even though the herd hadn’t been selected for that trait. A separate 1964 Holstein genetic line in the same project had only 26 percent A2A2, showing how selection can shift things over time, and their crossbred cows and heifers ranged from 36 to 50 percent A2A2.

Herd Type / PopulationSelection Pressure for A2?A2A2 Frequency (%)Key Insight
UMN Holstein Research Herd (2019)None50%Half the herd was A2A2 without trying
UMN 1964 Genetic LineNone (frozen 1964 genetics)26%Shows effect of modern selection drift
General Holstein Population (est.)Minimal to moderate~33%Roughly 1 in 3 Holsteins could be A2A2
Jersey / Guernsey / Brown SwissLow to moderate70%+Heritage breeds carry higher baseline
UMN Holstein-Jersey CrossesNone (F1 crosses)36-50%Crossbreeding can accelerate A2 shift

Broader genetic research published in peer-reviewed animal science journals suggests the A2 allele frequency in Holsteins runs somewhere in the 50 to 60 percent range, which mathematically implies that roughly a third of Holsteins in general might be A2A2, with the rest mostly A1/A2.

Jersey, Guernsey, Normande, and Brown Swiss populations tend to carry higher A2 frequencies—often 70 percent or more in Swiss breeds and even higher in some heritage populations.

Now, that doesn’t mean every commercial Holstein herd is sitting at UMN-level A2A2 percentages. Actual numbers vary with sire usage and the age of sire lines. But the university data and industry allele estimates suggest that many herds probably have more A2 genetics—and more favorable kappa-casein genotypes—walking around than you’d guess just by looking at cows in the freestalls.

Over the past 10 to 15 years, genomic testing has really changed how we can use that information. Modern genomic panels routinely report beta-casein type, kappa-casein genotype, predicted transmitting abilities for fat and protein yield and percentages, and indices for health, fertility, and even feed efficiency.

In practical terms, most commercial genomic panels used on heifers and cows today cost between $ 30 and $ 50 per head, depending on the panel and the volume of samples. Holstein Canada’s 2024 fee schedule shows base animal testing at $ 33, which aligns with what extension budgets and on-farm case studies report.

AI catalogs from major studs show that A2A2, high-component, favorable kappa-casein bulls often carry a small price premium over more “average” Holstein sires, but still sit within what most breeding programs can handle.

This suggests that for many herds, this isn’t a “start from scratch” situation. It’s more a case of figuring out what you already have and then nudging your breeding decisions in a direction that lines up with where the plants and the people seem to be going.

A Wisconsin Coffee Shop Scenario

Let’s ground this with a scenario that’ll feel familiar to a lot of Midwest producers.

Say you’re running 450 Holstein cows in south-central Wisconsin. You’re milking in a double-12. You’ve got sand-bedded freestalls, respectable butterfat performance, and good enough fresh-cow management in the transition period that you don’t dread opening the DHI packet. At the same time, your stall bases and manure system are over 20 years old, and every January you catch yourself wondering which piece of steel or concrete is going to cause trouble this year.

If you look at UW-Extension summaries and USDA cost-of-production data for similar-sized freestall herds in Wisconsin, total economic breakevens often fall in the mid- to high-teens per hundredweight, once you account for hired labor and realistic debt service. Let’s say your true breakeven is around 17 dollars. A lot of Wisconsin operations would recognize that as a believable number when they work through their own books.

You’re 48. Your daughter is finishing a dairy science degree and wants to come back, but she wants to see a path that looks like building a business for the next 15 to 20 years, not just hanging onto tired infrastructure.

In that position, here’s the kind of path I’ve seen work in real herds:

  • You decide to test all milking cows and heifers genomically. At roughly 40 dollars a head and 600 head total, that’s about 24,000 dollars—a noticeable check to write, but still a fraction of any major building project.
  • The results come back and, like UMN, you discover a decent chunk of your Holsteins are A2A2 and that a meaningful fraction carry kappa-casein genotypes that cheese makers like.
  • You sit down with your genetics advisor and draw up a simple plan: the top tier of heifers and cows on components and health get bred to A2A2, high-protein, favorable kappa-casein bulls; the bottom tier gets beef semen. Your overall semen bill goes up a bit—maybe a thousand or two a year—but you stop multiplying the genetics that hold back components and cow health.
Investment ItemCost / ValueTimelineNotes
Genomic Testing (600 head)$24,000One-time upfrontTests all cows + heifers; identifies A2, kappa-casein, component PTAs
Premium A2/High-Component Semen+$1,500-$2,000/yearOngoingSmall incremental cost vs. standard Holstein semen
Total First-Year Investment~$26,000Year 1One-time test + first year of premium semen
Milk Production (450-cow herd)20-22 million lbs/yearBaselineTypical for well-managed Midwest freestall herd
Component Value Improvement (conservative scenario)+$0.15-$0.25 per cwtYears 3-5+Even modest protein % gains + favorable casein = higher pay
Annual Return (conservative)$15,000-$30,000+/yearOngoing after calves freshenBased on 20M lbs at $0.15-0.25/cwt improvement
Simple Payback Period<2 years$26K investment / $15-30K annual return
10-Year Net Benefit (conservative)$120,000-$270,000Years 1-10Assumes modest component gains hold across herd lifecycle

On the calendar, calves from those matings in 2026 are born through early 2027. Those heifers freshen in your parlor in 2028. By 2029-2030, a big slice of your herd is in second lactation with more consistent protein percentages and solid butterfat performance, as long as your nutrition and cow comfort keep pace.

A 450-cow herd milking well could easily be shipping on the order of 20 to 22 million pounds of milk a year. In some component pay systems used by cheese-oriented plants, even a small improvement in how protein is valued—a couple of cents per pound of protein, depending on the exact formula—can turn into tens of thousands of dollars a year for a herd that size when you run real solids and volume numbers through actual federal order and plant pay schedules.

Nobody can guarantee exactly what your protein line will look like in 2030. Pay formulas and markets change. But when the cost side of the strategy is a one-time genomic investment and a modest ongoing semen premium, and the upside sits in that “tens of thousands per year” range in a world that’s clearly leaning into protein-dense dairy, you can see why more producers are at least sharpening their pencils.

Western Dry Lot Systems: When Components Become “Exported Water”

Now, slide that coffee mug over to a friend running 3,000 cows in a dry lot system in the Texas Panhandle or eastern New Mexico, and the conversation sounds a little different. The underlying theme is the same, though.

In those systems, water and purchased feed are usually the top two headaches.

U.S. Geological Survey data on the Ogallala Aquifer shows that in heavily irrigated parts of western Kansas and the Texas High Plains, groundwater levels have dropped significantly over the past several decades—in some areas, declines of 50 to 70 feet or more in the most heavily pumped townships. USDA Climate Hubs data shows similar patterns in Texas and Oklahoma. That’s a long-term structural issue, not just a “bad year.”

Climate and hydrology work on the Colorado River basin tells a similar story. Multiple research studies and federal data confirm that since about 2000, average river flows have been roughly 20 percent below the 20th-century average. The Nature Conservancy, Colorado State University researchers, and coverage in High Country News all point to reduced snowpack and higher temperatures—a “hot drought” pattern that’s likely to persist under current climate projections.

At the same time, USDA hay market reports and Western extension bulletins regularly show Supreme and Premium alfalfa in states like California, Arizona, Idaho, and New Mexico, bringing noticeably higher prices per ton than comparable hay in Wisconsin or Minnesota, reflecting irrigation costs and freight.

Delivered costs for corn and other concentrates are also higher when you’re far from the Corn Belt, something our previous coverage has been highlighting in its pieces on regional profitability and the “processing gap” between where milk is produced and where it’s processed.

So in that context, when Western producers talk about components, they’re often thinking less about a formal protein premium line on the cheque and more in terms of “How many pounds of fat and protein can I ship for each unit of water I’m legally and affordably pumping and each ton of feed I’m buying?”

That’s what people really mean when they talk about components as a way of “exporting water.” You’re not literally putting your irrigation water in the tanker, but the more solids you produce per acre-inch of water and per ton of dry matter, the more value you’re effectively moving off the farm with each load of milk.

In practical terms, that’s where genomic selection for traits like protein percentage, feed efficiency, and health, paired with sharp ration work and solid fresh cow management during the transition period, becomes a survival tool rather than just a nice genetics project.

Why the Next 18 Months Matter More Than They Seem

If you lay all this out on a simple timeline, you can see why a lot of conversations keep circling around an “18-month window.”

From breeding to first calving is about nine months of gestation. Then you’ve got a couple of months for the heifer to get through the transition period and settle in, and at least one full lactation before you really know who she is in terms of components, health, and fertility. Realistically, it takes several years of consistently breeding in a chosen direction before that genetic shift really shows up in the bulk tank.

On the processing side, most of the projects in that 11-billion-dollar wave are slated to start up between now and the end of the decade. If they stay roughly on schedule, the new cheese, yogurt, and ingredient plants will be running full out right when the calves you breed in the next 18 months are in their first and second lactations.

GLP-1 use and gut health awareness aren’t expected to disappear over that same period, either, based on current clinical and market outlooks.

So, whether you think about it this way or not, every sire selection you make today is a kind of futures contract on your 2029 milk check. You’re deciding how much of your herd, three to five years from now, will be built mainly for volume, and how much will be built for components that match the products and markets your milk will flow into.

Talking With Your Processor: Three Questions Worth Asking

I’ve noticed that the farms that navigate this best aren’t just tweaking genetics in a vacuum; they’re also having better conversations with the folks who cut the checks.

If you pick up the phone or catch your field rep in the yard, three simple questions can open up a lot:

  • First: “Looking at the new plants we’re building into, how do you expect protein and butterfat to be valued over the next five to ten years compared to today?”
  • Second: “Are there specific quality or composition targets—like protein percentage, A2 status, or other specs—that you expect to reward more as these projects come online?”
  • Third: “Based on your data, where does my herd stand today on components and quality relative to your overall supplier base?”

Processors and co-ops often have more visibility into future product mix than we do from the farm side. Asking these questions doesn’t mean you’ll get a perfect forecast—nobody has that—but it can help you decide how aggressively to steer your genetics, nutrition, and fresh cow management toward components.

And honestly, that’s the kind of conversation that separates the farms steering the bus from the ones just along for the ride.

Different Farms, Different Plays—And That’s Okay

As many of us have seen over the years, there’s never just one “right” answer that fits every farm.

If you’re a younger operator—say under 45—with a competitive cost of production and a realistic plan to be milking for another 15 to 20 years, this protein-heavy future probably looks more like an opportunity than a threat. Genomic testing a meaningful share of your herd, tightening sire selection around protein, butterfat, and casein while still protecting fertility and cow health, and working with your nutritionist to support solids as well as volume, are all moves that research and extension work suggest can pay back over a longer time horizon.

If you’re in that mid-career zone—mid-40s to mid-50s—and staring at a parlor, freestalls, or manure setup that’s near the end of its useful life, your decisions get more complicated. Industry data shows robotic milking units typically ranging from 150,000 to 230,000 dollars per unit, and full conversions for 400- to 600-cow herds can easily clear a million dollars once buildings and support systems are included. Payback estimates often fall in the seven- to ten-year range, depending on actual labor savings, component shifts, and day-to-day management.

In that situation, what a lot of mid-career producers are doing is leaning first on lower-capital levers: improving genetics for components and health, tightening fresh cow management in the transition period, putting serious effort into forage quality and consistency, and, where appropriate, using tools like Dairy Margin Coverage or private revenue protection to soften some of the income swings while they make those improvements.

If you’re closer to retirement and there’s no clear successor ready to step in, the smartest move may be different again. USDA and land-grant land value reports show that farm real estate in good dairy regions—especially around the Great Lakes—has held value well and, in many cases, has increased substantially over the past 15 years. In some strong dairy counties, values have doubled or more.

In that context, it often makes sense for someone in their late 50s or 60s to focus on maintaining cow health and respectable components, avoid taking on major new debts that won’t realistically be paid off during their working years, and keep the place clean and marketable so they can sell or rent out on their own terms when the time feels right.

None of these paths is “better” in every situation. They’re just different ways of responding to the same set of signals, depending on where you and your family are in your own story.

A Note for Canadian Producers

For those of you milking under quota north of the border, the component picture plays out a little differently—but the underlying direction is similar.

Canadian Dairy Commission support prices and provincial board formulas have always valued butterfat heavily, and that hasn’t changed. But the rising importance of protein in cheese yields and in high-protein consumer products is shaping how milk classes are structured and valued.

If you’re considering A2 or kappa-casein genetics, the economics work a bit differently under quota than under U.S. federal orders, but the potential for premium marketing channels—particularly for fluid A2 milk and specialty cheese—is growing in Canada too.

Reports show that in early 2025 that Minnesota dairy farmers are increasingly interested in A2 milk, and that interest is mirrored across the border as Canadian processors explore differentiated product lines.

The strategic question is similar: know your herd’s genetic profile, understand where your processor is headed, and make breeding decisions that line up with both.

The Long Game: Water, Land, and Where Dairy Stands

Before we drain the coffee pot, it’s worth zooming out one last time and thinking about the long game.

Those water trends I mentioned earlier—the Ogallala declines, the Colorado “hot drought”—are already forcing Western agriculture, including dairies, to adjust cropping patterns, scale back irrigated acres, and in some cases rethink long-term viability.

RegionPrimary Water SourceStatus / TrendLong-Term OutlookStrategic Implication
Texas / Kansas / Oklahoma High PlainsOgallala Aquifer-50 to -70 feet in heavily pumped areas since 2000Continued decline; fossil waterRisk: Rising costs, limited expansion, potential exit
Southwest / Colorado River BasinColorado River-20% avg. flow since 2000; persistent “hot drought”Likely permanent reduction per climate modelsRisk: Competing demands, regulatory limits on ag water
Great Lakes Region (WI, MI, NY, PA, OH)Great Lakes + groundwaterStable; 20% of global fresh surface water; renewableSecure; regulated but abundantOpportunity: Water-secure base for high-component dairy
Northeast / Upper Midwest (MN, IA)Surface + renewable groundwaterGenerally stable; localized stress in some areasSecure to moderately secureOpportunity: Can support expansion near processing hubs
Idaho / Pacific NorthwestSnake River, Columbia BasinModerate stress; dependent on snowpack trendsVariable; snowpack declines a concernMixed: Secure short-term; watch long-term snowpack

Meanwhile, regions around the Great Lakes and much of the Northeast, while facing their own regulatory and environmental pressures, sit over comparatively robust and renewable water supplies.

In outlook meetings and trade coverage, economists from places like UW-Madison and the Food and Agricultural Policy Research Institute have pointed out that, over the long term, water-secure regions in the mid-section and upper Midwest are likely to remain very competitive bases for high-value, component-dense dairy production, especially as water limits and climate volatility tighten elsewhere.

So when you put all of this together—GLP-1 nudging people toward higher-protein diets, gut-health research backing fermented dairy, processors pouring billions into cheese and cultured capacity, herd genetics already carrying more A2 and kappa-casein variation than many of us realized, and export demand for high-protein powders and cheeses continuing to grow in markets like Asia and the Middle East—it’s not surprising that so many barn-office and meeting-hall conversations keep circling back to components.

Key Takeaways for Your Farm

If you like things boiled down, here are a few questions and actions worth mulling over in the next 18 months:

  • Know your genetics: Do you actually know your herd’s A2, kappa-casein, and component profile, or are you guessing? A targeted genomic test can answer that.
  • Align sires with where plants are going: Are you picking bulls that match the protein-heavy, cheese-and-cultured future your local plants are investing in?
  • Talk to your buyer: Have you asked your processor how they expect to value protein and fat over the next five to ten years, and how your herd stacks up today?
  • Match strategy to stage: Given your age, equity, and family plans, are you better off leaning into growth, tightening the current system, or focusing on a clean exit with strong land value?

The Bottom Line

If we were actually sitting at your kitchen table, I wouldn’t pretend there’s an easy, one-size-fits-all answer.

What I’ve seen, watching a lot of different farms, is that the ones that come through big shifts like this in the best shape aren’t always the biggest or the fanciest. They’re the ones that stay curious, pay attention to where the science and the money are pointing, and then make a handful of well-timed, thoughtful decisions instead of either doing nothing or trying to change everything at once.

When you lay the GLP-1 billions, the 11-billion-processor bet, and your own protein line side by side, it’s hard to argue that this is just another passing fad. The genetics are already in your pens, at least to some degree. The concrete is being poured at the plants. The health trends aren’t evaporating next week.

The real question is how you want to position your herd—and your milk check—for the chapter that’s already starting to unfold.

Complete references and supporting documentation are available upon request by contacting the editorial team at editor@thebullvine.com.

Learn More

The Sunday Read Dairy Professionals Don’t Skip.

Every week, thousands of producers, breeders, and industry insiders open Bullvine Weekly for genetics insights, market shifts, and profit strategies they won’t find anywhere else. One email. Five minutes. Smarter decisions all week.
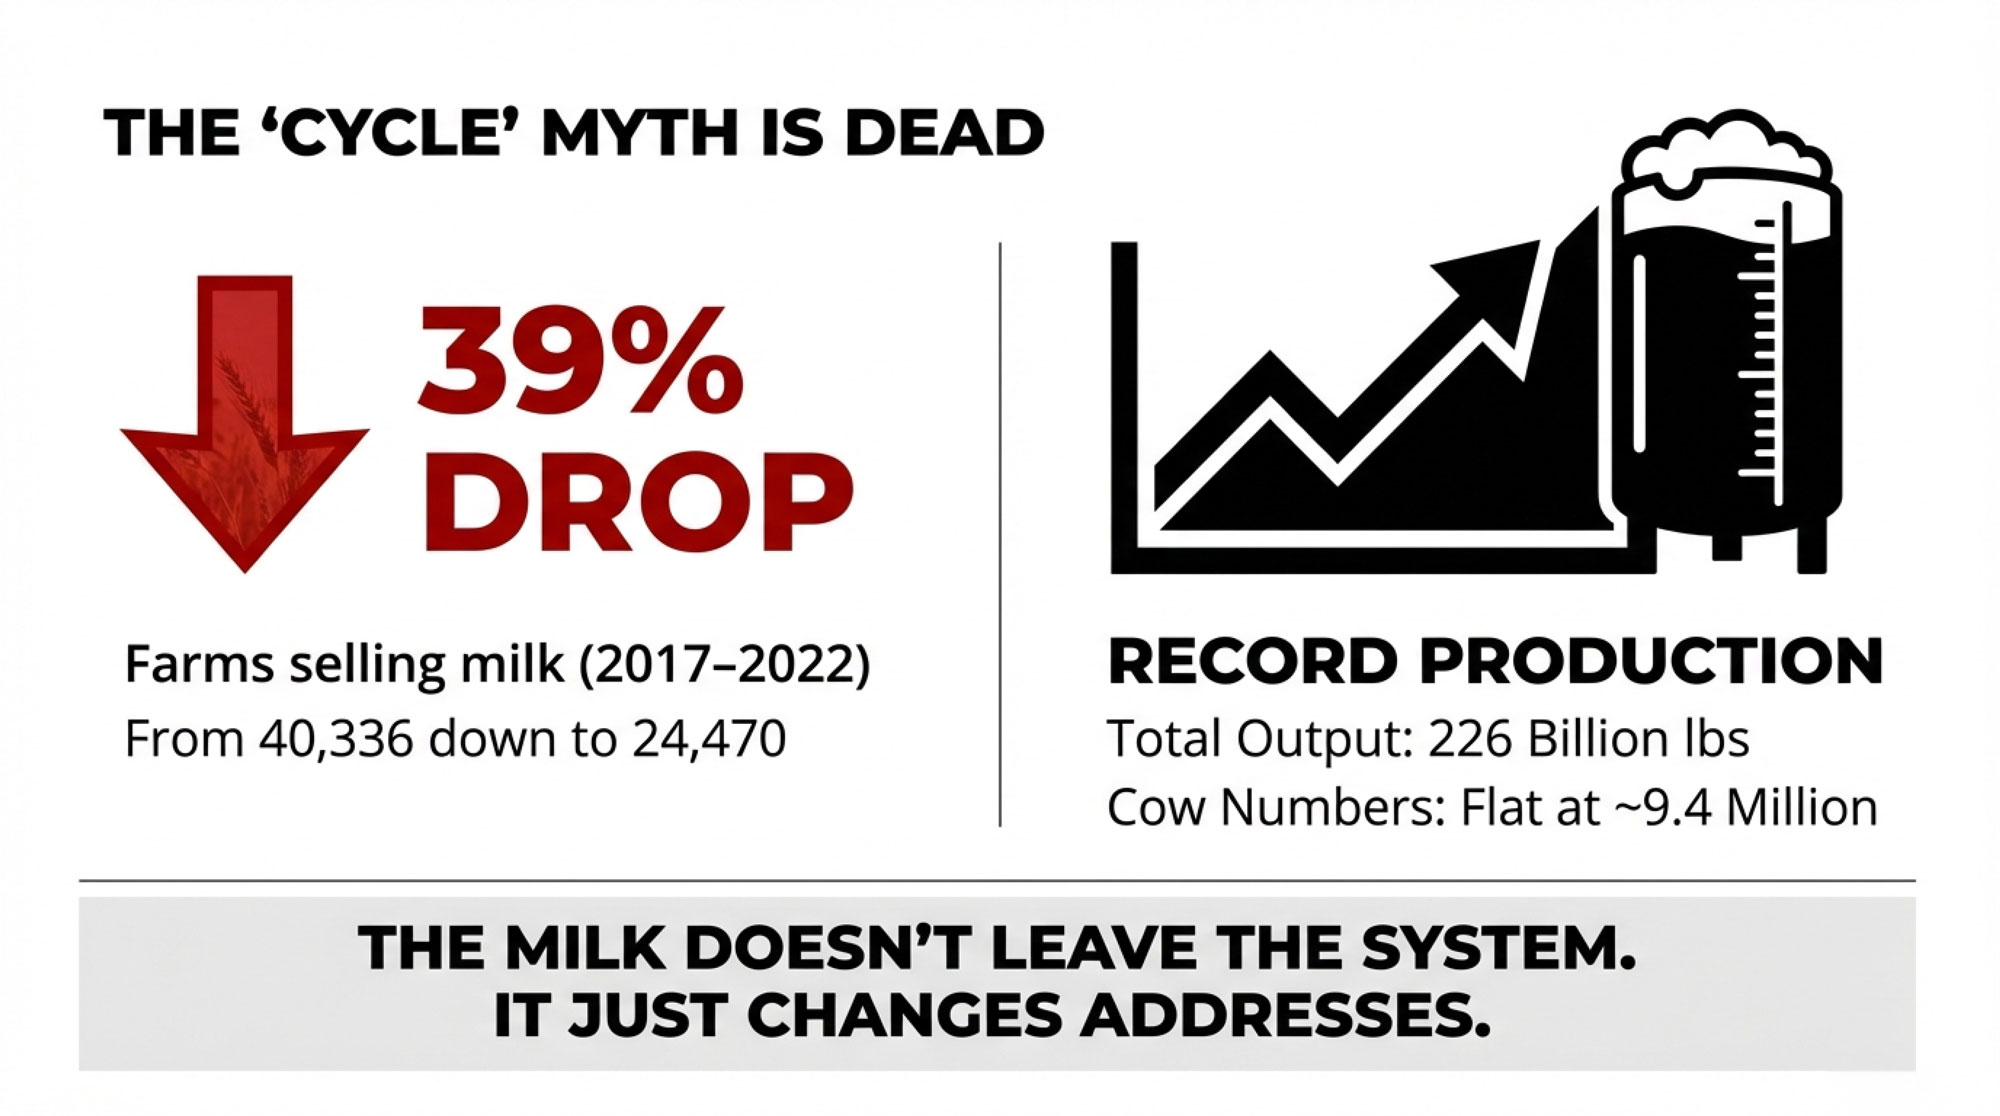
NewsSubscribe
First
Last
Consent

Where Did All That Cheese Go? What the USDA’s November Dairy Product Production Report Really Means for Your Milk Check

More cheese, no price crash: did 44 million pounds of U.S. cheese really ‘disappear’ in November—and what does that do to your milk check?

Executive Summary: U.S. cheese production jumped 5.9% to 1.22 billion pounds in November 2025, and milk output rose 4.7%—yet Cold Storage stocks didn’t hit new records, and Class III held firmer than the old “more cheese = lower prices” rule would predict. The reason is structural: roughly 40 to 50 million pounds of cheese flowed through channels that bypass traditional inventory tracking—contract mozzarella for food service, record exports exceeding 1 billion pounds in 2024 (led by Mexico at 38% of volume), and fast-turn value-added products. CME cheddar and Class III now reflect a shrinking share of total U.S. cheese, which means producers relying on those signals alone are flying partially blind. Midwest cheddar-heavy farms still need Cold Storage and CME, but Western and export-linked operations should track USDEC export data and global demand just as closely. The playbook: diversify your indicators, hedge 30–50% of your milk when prices fit your cost structure, ask your buyer how much of their output is cheddar vs. mozzarella vs. exports, and invest in components and transition-cow management—the variables you actually control. The cheese didn’t vanish; the market just evolved faster than many mental models could keep up.

Forty‑four million pounds. That’s not a rounding error; that’s a pretty good sign that the way U.S. dairy moves is changing on us, and you can feel it in your milk check long before you sit down with the latest USDA report.

Looking at the hard numbers first keeps everyone honest. In its Dairy Products report released January 6, 2026, USDA’s National Agricultural Statistics Service says total natural cheese production, excluding cottage cheese, was 1.22 billion pounds in November 2025, 5.9% higher than in November 2024. At the same time, USDA Cold Storage data describe cheese inventories as substantial but still below the “record cheese in cold storage” mark set back in October 2023, when stocks hit about 1.46 billion pounds and made headlines as an all‑time high.

So the data suggests production moved up sharply, but stocks didn’t jump to fresh record levels alongside it. When you put that 5.9% year‑over‑year increase on a 1.22‑billion‑pound base next to “high but not record” storage language, you end up with a rough, implied gap on the order of tens of millions of pounds—somewhere in that 40‑ to 50‑million‑pound neighborhood of cheese that got made in November but didn’t show up as a big extra bulge in the Cold Storage number most of us still watch.

Production climbed 6% year-over-year while Cold Storage stayed below 2023 records—the 40-to-50-million-pound monthly gap is real, and it’s structural

And you know, this isn’t happening in a year when milk is just muddling along. USDA’s Milk Production report released December 22, 2025, puts November output in the 24 major dairy states at 18.1 billion pounds, up 4.7% from November 2024, with total U.S. production at 18.8 billion pounds, up 4.5% on the year. Recent media reports have all noted how quickly both cow numbers and production per cow rose in 2025 compared with 2023–24. On top of that, work on milk composition and efficiency, along with extension discussions from programs like Wisconsin, Cornell, and Penn State, continues to show gradual gains in butterfat performance and protein levels, tied to better fresh-cow management, tighter transition‑period protocols, and greater focus on cow comfort and ration design.

So the milk is there, and the components are there. But the old, simple pattern—more milk, more cheese, more cheese piling up in storage—just doesn’t jump out of the latest reports the way it used to, and that’s where the story really starts to matter for your milk check.

Looking at This Trend Without the Noise

What farmers are finding, when they actually sit down with a coffee and walk through the USDA reports, is that the November numbers make a lot more sense once you separate “how much we made” from “where it went.”

On the production side, the story is pretty straightforward. USDA’s November 2025 Dairy Products summary lays it out plainly: total cheese output (excluding cottage cheese) was 1.22 billion pounds, 5.9% above November 2024 and 3.4% below October 2025. Earlier Dairy Products releases in 2025, and coverage in Brownfield and Cheese Market News describe “more cheese and butter, less whey and powder” and solid year‑over‑year growth across much of the cheese complex, which lines up with what a lot of you have seen in plant‑level reports. Reports has also noted that as butterfat and protein levels in the milk pool have trended higher, more cheese can be produced from every 100 pounds of milk.

On the inventory side, USDA Cold Storage reports and late‑2023 commentary from Brownfield make it clear that October 2023 remains the record high for cheese in storage, at around 1.46 billion pounds. Later updates through 2024 and into 2025 talk about “heavy” or “ample” stocks but don’t flag new records, which fits with what we see in the market: plenty of cheese around, but not a repeat of that 2023 peak.

When you put those two pieces together, the math keeps pointing in the same direction. Production is up sharply. Inventories aren’t pushing into new record territory. The difference—again, roughly that 40‑ to 50‑million‑pound range in a month like November, when you ballpark it—is being absorbed somewhere other than long‑term storage. The real question is where it’s going, and that’s where things start to get interesting.

ChannelEstimated Monthly Volume (Million lbs)% of GapWhy It Bypasses Cold Storage
Export Programs15–2035–40%Moves plant → port consolidator → container; not surveyed in NASS commercial stocks
Contract Mozzarella (Food Service)12–1825–35%Tight delivery schedules for pizza chains; lean inventories, frequent shipments
Fast-Turn Value-Added Products5–810–15%Shredded blends, cheese ingredients, protein-fortified products sold B2B with short lead times
Direct Retail & Private Label3–56–10%Moves quickly through retailer DCs; minimal time in commercial cold storage
Other & Timing Differences2–44–8%Reporting lags, in-transit inventory, non-surveyed smaller warehouses
TOTAL GAP40–50100%

What’s Interesting About Mozzarella Right Now

Looking at this trend, what’s interesting is that the cheese telling the story isn’t cheddar; it’s mozzarella.

USDA’s breakdowns for Italian‑type and American‑type cheeses in the Dairy Products reports show multiple recent months when Italian‑type cheese—including mozzarella—grew faster than total cheese, while American‑type cheese, including cheddar, lagged behind or even slipped below year‑ago levels. September 2024 total cheese production was about 1.16 billion pounds, up slightly from 2023, with Italian‑type cheese up 1.5% year‑over‑year at 487 million pounds and American‑type cheese down 3.7% from a year earlier. That same USDA snapshot showed butter production at 159 million pounds, up 11.3% on the year; nonfat dry milk production up 14.3%; and skim milk powder down 21.4%, which suggests plants are actively shifting cream and skim between product streams as markets move.

From a technical angle, researchers at places like the University of Wisconsin’s Center for Dairy Research and other dairy science groups have explained that low‑moisture mozzarella for pizza is designed for fast movement rather than long aging. The functional shelf life and performance window for pizza mozz are shorter than those for many cheddar styles, and large food‑service buyers—national pizza chains, regional restaurant distributors—try to run lean inventories with regular, frequent deliveries rather than big piles of cheese sitting in a freezer somewhere.

MonthItalian-Type CheeseAmerican-Type Cheese
Sep 2024+1.5%-3.7%
Oct 2024+3.2%-1.2%
Nov 2024+2.8%+0.5%
Sep 2025+4.1%+1.0%
Oct 2025+5.3%+2.1%
Nov 2025+6.2%+3.4%

On the ground, what I’ve noticed—and it lines up with what you hear in risk‑management workshops and plant visits—is that mozzarella lines are often heavily tied to contracts. Plants usually have a pretty tight handle on what their core accounts need week to week and month to month, whether that’s a national chain program, a regional distributor, or a long‑term export deal, and they run those vats accordingly. They’re not churning out mozzarella “on spec” the way some cheddar used to move; they’re filling orders that are already on the books.

Cheddar’s role is shifting at the same time. USDA data shows American‑type cheese growing more slowly than “all cheese” in several months, and in some cases running below year‑earlier levels while Italian‑type keeps climbing. Analysis of cheese markets and export opportunities has also highlighted about $ 4 billion in new cheese plants slated to come online through 2027, with new facilities already taking milk in Kansas and Texas and more expansions underway in the Upper Midwest, along the East Coast, and in the West. Company announcements and industry reporting emphasize mozzarella, Hispanic cheeses, and other value‑added styles as key outputs from many of these investments, often alongside powders and concentrated fat and protein ingredients.

This development suggests a structural disconnect that a lot of you are feeling in your milk checks. The CME spot market and the Class III milk price formula still lean heavily on cheddar blocks and barrels plus dry whey, as research on U.S. dairy futures, price transmission, and market integration has documented. When a growing share of U.S. cheese production is mozzarella and other styles that are locked into contracts or export channels, and a smaller share is “loose” cheddar available to show up in CME trading and Cold Storage, total cheese production and CME‑visible cheddar supply just aren’t tied together like they used to be.

To put some numbers behind that feeling, think about a farm shipping around 80,000 pounds of milk in a month. Each one‑dollar move in Class III is roughly 800 dollars up or down in gross revenue for that month, because 80,000 pounds is 800 hundredweights. On a 500‑cow freestall in the Midwest, that’s a noticeable swing. On a 3,000‑cow dry lot system in the Southwest, you multiply that impact several times over. So the way cheese moves—cheddar versus mozzarella, domestic versus export—flows straight back to your bottom line.

Herd Size / TypeMonthly Milk Volume (lbs)Impact of $1.00 Class III Move (Monthly)Impact of $1.50 Range Over 12 Months (Annual)% of Typical Net Margin
80-cow grazing (Northeast)80,000$800$14,400~12–15%
500-cow freestall (Midwest)500,000$5,000$90,000~10–13%
1,200-cow (Western/Midwest)1,200,000$12,000$216,000~9–12%
3,000-cow dry lot (West)3,000,000$30,000$540,000~8–11%

And if you zoom out a bit, a $1.50 per hundredweight range over a year on those same 80,000 pounds a month adds up to about $14,400 of gross revenue, swinging one way or the other. That’s real money when you start lining it up against feed bills, interest payments, or the cost of upgrading fresh cow facilities.

Exports: The Other Big Piece of the Puzzle

What farmers are finding, when they look beyond domestic reports, is that exports are quietly soaking up a lot of that “extra” cheese.

Media reports in early 2025 that U.S. cheese exports through November 2024 reached 1.028 billion pounds, the first time they’d crossed the billion‑pound mark. Mexico alone accounted for 392 million pounds of that total, roughly 38% of all U.S. cheese exports, and increased its cheese imports from the U.S. by 32% compared with the same period in 2023. The Bullvine’s own coverage of that milestone drew on USDEC and USDA Foreign Agricultural Service data and noted that South Korea, Japan, Central America, and several Middle Eastern buyers also increased their cheese purchases from the U.S., helping push exports over that threshold.

YearMexico All Other Destinations Total
2022280 million lbs420 million lbs700 million lbs
2023298 million lbs482 million lbs780 million lbs
2024392 million lbs636 million lbs1,028 million lbs

A 2024 export review in Progressive Dairy and Dairy Processing reported that total U.S. dairy export value reached about 8.2 billion dollars in 2024, with cheese exports totaling roughly 508,808 metric tons—about 1.12 billion pounds—an improvement of around 17% over 2023. That same coverage highlighted Mexico and Canada together taking more than 40% of U.S. dairy export value, with Mexico importing about 2.47 billion dollars’ worth of U.S. dairy products and Canada around 1.14 billion. USDEC’s own summaries reinforce that cheese has become a leading export item by volume and value for the U.S. in recent years, especially into North American and Asian markets.

In plain language, those buyers are acting like a second home market for U.S. cheese. That’s the kind of demand that can absorb a lot of “extra” product before it ever shows up as a big stock build in Cold Storage.

So if you step back from the individual line items, it’s pretty clear where a big chunk of that “missing” 40‑ to 50‑million‑pound gap in a month like November can go. It doesn’t stick around in domestic Cold Storage because much of it simply leaves the country through export channels.

Physically, export cheese tends to follow a different path than domestic retail cheese. It often moves from the plant to a specialized consolidator or a warehouse near a port, then into refrigerated containers bound for overseas destinations, spending relatively little time in the broad commercial cold‑storage facilities that NASS surveys for its stock reports. The same pattern holds for concentrated butterfat products—anhydrous milk fat and high‑fat blends—produced for export or industrial customers, which are usually sold under contract and don’t always show up neatly in the familiar “butter in cold storage” figures.

Fast‑Moving Channels and Value‑Added Products

What’s interesting here is that exports aren’t the only thing changing how cheese and components move. Domestic distribution has been evolving right alongside the global story.

Industry reporting has highlighted the growing share of cheese and dairy ingredients moving through food‑service and business‑to‑business channels, supported by regular, frequent shipments and lean inventory strategies. Major restaurant chains and broadline distributors often prefer multiple smaller deliveries rather than big, infrequent loads, especially when they’re dealing with shredded mozzarella, custom blends, or ingredient cheeses tailored to specific food manufacturers.

At the same time, research reviews and applied nutrition work are documenting steady growth in value‑added fluid and high‑protein dairy products—filtered milks, protein‑fortified beverages, and specialty dairy drinks—that build on higher butterfat and protein levels in the milk supply. Several recent and planned processing projects in states like Kansas and Texas, highlighted by regional agribusiness outlets, are designed to produce both cheese and higher‑value components, capturing more value from butterfat and protein rather than simply pushing volume into commodity powder and bulk butter.

All of this lines up with what many of us have seen on the ground over the last decade: that old “production minus stocks” rule of thumb used to capture a big chunk of what was happening in the market. Today, it describes a smaller slice. The milk still gets turned into product, and the product still gets sold, but more of it is moving through channels—export programs, contract‑driven mozzarella lines, food‑service and ingredient streams, and value‑added beverages—that don’t create large, slow‑moving inventories in the specific warehouses USDA tracks as “cheese in cold storage.”

How This Feels in Different Milksheds

The national data might be the same on paper, but it sure doesn’t feel that way on every farm. Regional context matters a lot, and it’s worth talking about that openly.

In Wisconsin operations and across much of the Upper Midwest, a large share of milk still goes into plants with substantial American‑type cheese capacity, even though many of those plants have added Italian‑type and specialty cheese lines in recent years. Many Midwest producers will tell you they still watch Cold Storage reports and CME cheddar prices almost like a weather forecast, because historically those numbers have been tightly linked to local basis and premiums—a relationship regional market updates and extension economists in that area often highlight. As more capacity in the Midwest shifts toward mozzarella and specialty cheeses, though, that one‑to‑one connection gets noisier. The indicators still matter; they just don’t explain everything the way they used to.

In California and the broader West, a lot of major plants built or expanded over the last decade were designed from day one with exports and value‑added production in mind. These facilities commonly produce mozzarella, Hispanic cheeses, milk powders, and concentrated fat and protein ingredients for both domestic and international customers, a pattern that shows up repeatedly in Western market updates and company announcements. Western producers shipping to those plants are often just as focused on export program health, port congestion, and global demand as they are on Cold Storage or the latest Dairy Products report, because their milk checks are heavily influenced by what’s happening outside U.S. borders.

In the Northeast, quite a few smaller and grazing‑based family farms still ship to fluid bottlers, regional brands, or specialty cheesemakers. Their daily reality revolves around local retail demand, co‑op policies, and regional brand strength, which is a story you see in provincial and state‑level dairy board and market reports. Even so, their blend prices and over‑order premiums still flow out of a federal order system tied back to national Class I, III, and IV values, which respond to the same production, inventory, and export trends we’ve been walking through.

For Canadian readers operating under supply management, it’s worth noting that while quota systems and Canadian Dairy Commission programs do buffer day‑to‑day volatility at the farm gate, the same global trends in cheese exports, product mix, and component emphasis still influence processor investment decisions and trade pressures that show up in national board discussions and long‑term policy debates.

So, as many of us have seen, one size doesn’t fit all. The November numbers are the same across the country—and, in many ways, across the border too—but the way they land in your mailbox depends heavily on who’s buying your milk, what they’re making with it, and how much of their business leans on cheddar, mozzarella, Class III versus Class IV, exports, or value‑added products.

Region / MilkshedDominant Cheese TypesPrimary Price Signals to WatchExport ExposureHedging PriorityWhat Keeps You Up at Night
Midwest (WI, MN, IA)Cheddar, some mozzarellaCME blocks/barrels, Cold Storage, Class III futuresModerate (15–25% of volume)CME Class III options, DRPCold Storage builds, cheddar oversupply
West (CA, ID, NM, TX)Mozzarella, Hispanic cheeses, powdersUSDEC exports, global powder prices, Class III & IVHigh (30–45% of volume)Class III/IV combo, export contract hedgesMexico demand swings, port delays, trade disputes
Northeast (PA, NY, VT)Regional brands, specialty, fluidClass I differentials, regional blend price, over-order premiumsLow (5–15% of volume)Basis contracts, limited futuresFluid demand decline, retail brand strength, local co-op health

What Farmers Are Finding Helps in This Environment

So, sitting here over coffee, the real question is: what do you actually do with all this?

One thing I’ve noticed, and it matches what land‑grant risk‑management programs are teaching, is that relying on a single gauge doesn’t work very well anymore. Watching only cheese production, or only Cold Storage, or only the Class III board is a good way to be surprised. The producers who seem most comfortable navigating this changing landscape tend to watch a mix of signals—USDA Milk Production and Dairy Products reports, Cold Storage updates, USDEC and USDA export statistics, plus the information they get from their buyers and co‑ops.

That’s why much of the extension work focuses on partial hedging strategies rather than “all in” or “all out” approaches. The idea isn’t to guess the exact top or bottom; it’s to lock in a portion of your milk—often something in that 30% to 50% range—for a few months ahead when futures or Dairy Revenue Protection coverage levels line up with your cost structure, and leave the rest open to the market. That way, a nasty price surprise doesn’t hit 100% of your volume, but you’re not completely locked into a price that might look too low if markets rally later. For a 500‑cow herd shipping around 80,000 pounds a month, covering even a third of that volume means several hundred hundredweights are insulated if Class III falls apart for a few weeks, which can be the difference between a bad month and a really rough one.

Of course, none of those tools are free. Hedging carries costs and margin requirements, and stepping up your risk‑management program means investing more time in tracking markets and working with advisors. Improving fresh cow management and the transition period requires investing time, training, and often capital in facilities, rations, or monitoring, as on-farm case studies and extension bulletins regularly point out. But when you line those costs up next to the revenue swings that come with a volatile Class III and the kind of structural shifts we’re seeing in cheese markets, a lot of farms are deciding it’s worth putting at least some of those tools to work.

On top of price tools, butterfat performance and protein yield are still right at the center of most advisory conversations, and for good reason. Research and on‑farm work from programs such as Penn State, Cornell, and Wisconsin consistently show that better transition‑period management, less stress on fresh cows, and careful ration balancing are among the most reliable levers you’ve got for improving components and overall milk value. You can’t control where CME cheddar settles next week. You absolutely can influence how your cows come through calving, what their transition period looks like, and how efficiently they convert feed into fat and protein.

It’s also worth talking directly with your buyer or co‑op. Producers who ask questions such as, “Roughly what share of your cheese output is cheddar versus mozzarella or other styles?” and “How much of your volume is tied to export programs or food‑service contracts?” usually walk away with a much clearer picture of what drives their basis and premiums. You’re not asking them to hand over their business plan; you’re trying to understand whether your milk check is more exposed to CME cheddar swings, changing export demand, or shifts in domestic retail and food‑service patterns.

If you want to get even more practical, here are a few simple starting points producers are using:

  • If you’re a Midwest farm heavily tied to cheddar:
    Keep a close eye on CME block and barrel prices, USDA Cold Storage cheese stocks, and Class III futures, and ask your co‑op how much of their output is still commodity cheddar versus mozzarella or specialty styles. That helps you judge how quickly a cheddar price break could hit your basis compared with a neighbor shipping to a plant with a more mixed product portfolio.
  • If you’re shipping to a Western plant focused on mozzarella and exports:
    Add USDEC export summaries, global cheese price comparisons, and port or logistics updates to your watch list, and ask how much of your milk ends up in export programs under long‑term contracts. That gives you a better handle on how trade disputes, freight issues, or foreign demand swings might show up in your mailbox, even when domestic stocks look comfortable.
  • If you’re a smaller Northeast or grazing‑based operation:
    Track Class I, III, and IV prices plus regional blend prices, and talk with your buyer or co‑op about how their product mix—fluid, regional brands, or specialty cheese—feeds back into your over‑order premiums. That helps you see whether your check is more sensitive to local fluid demand or to the same cheese and export forces driving the national conversation.

For co‑ops and processors, the same November data push in a similar direction. Channel mix is now a strategic decision, not just an operational detail. Knowing how much of your product mix goes into retail grocery, food‑service, industrial ingredients, and export programs helps you decide which data streams you absolutely need on your dashboard—Cold Storage, Dairy Market News, Global Dairy Trade auctions, USDEC export statistics, scanner data for retail cheese and butter, and even global futures where appropriate. It’s why more co‑ops and plants are building simple internal dashboards that put USDA production and inventory reports next to export volumes and global price indices, something extension economists and industry consultants have been encouraging in board‑room and planning sessions.

The Bottom Line

What’s encouraging in all this is that the system isn’t broken; it’s evolving.

We’ve got more milk and more cheese than we did a year ago, according to the USDA’s Milk Production and Dairy Products reports for November 2025. Butterfat performance and protein levels have improved on many farms after years of work on genetics, fresh-cow management, and the transition period, a trend reflected in both research and industry commentary. U.S. cheese exports have pushed past the billion‑pound mark for the first time, with Mexico and a growing list of other countries playing major roles, as documented by USDEC‑linked trade summaries. New plants worth billions of dollars are coming online, many of them designed to make mozzarella and other value‑added cheeses along with powders and concentrated components for both domestic and global markets.

So when someone says, “Forty‑four million pounds of cheese disappeared in November,” you know the cheese didn’t vanish. It moved through channels that our old mental shortcuts don’t always capture very well—contract‑driven mozzarella destined for pizza ovens, record‑level export programs, fast‑turn food‑service and ingredient sales, and value‑added dairy products that don’t pile up in the Cold Storage bins we all grew up watching.

If you keep that bigger picture in mind while you’re checking USDA reports, talking with your buyer, and planning your own risk and herd management, you’ll be in a better spot to decide what to lock in, what to leave open, and where to invest your time and dollars—whether that’s tightening transition‑cow protocols, tweaking rations to support stronger butterfat performance, or asking a few more pointed questions at your next co‑op meeting about where your milk really goes once it leaves the yard. 

Key Takeaways:

  • Production up, stocks flat: November 2025 cheese hit 1.22 billion pounds (+5.9% YoY), yet Cold Storage didn’t set new records—roughly 40-50 million pounds moved through exports, contract mozzarella, and fast-turn channels that bypass traditional tracking.
  • Exports are a second-home market: U.S. cheese exports topped 1 billion pounds in 2024 for the first time; Mexico took 38% of the volume, absorbing supply before it piles up in storage.
  • CME cheddar no longer tells the whole story: Class III reflects a shrinking slice of total U.S. cheese—if Cold Storage and block prices are your only signals, you’re flying partially blind.
  • Regional exposure varies: Midwest cheddar-heavy farms still need CME and Cold Storage; Western and export-linked operations should weight USDEC data and global demand equally.
  • Control what you can: butterfat performance, transition-cow protocols, partial hedging (30-50%), and knowing where your milk actually goes matter more than guessing where cheddar will settle next week.

Learn More

Complete references and supporting documentation are available upon request by contacting the editorial team at editor@thebullvine.com.

Learn More

The Sunday Read Dairy Professionals Don’t Skip.

Every week, thousands of producers, breeders, and industry insiders open Bullvine Weekly for genetics insights, market shifts, and profit strategies they won’t find anywhere else. One email. Five minutes. Smarter decisions all week.

NewsSubscribe
First
Last
Consent

$80 Per Cow Vanishing Monthly: 5 Moves Dairy Producers Must Make Before Spring

You’re bleeding $80/cow every month, and the industry just added 211,000 more cows to make it worse. 5 moves to make before spring.

Executive Summary: Every month you wait, you’re losing $80 per cow. Class III has crashed from $20 to $15.86 since spring—and the industry just added 211,000 cows to make sure it stays there. California’s rapid H5N1 recovery, surging EU production, and strong New Zealand output have created a global oversupply that isn’t easing anytime soon. Need replacements? Quality springers now cost $4,000-plus amid the tightest heifer pipeline in 20 years. Add $4.40 corn to the equation, and margins are getting crushed from every angle. Here’s what’s actually driving the squeeze—and five specific moves to protect your operation before spring.

Dairy Market Squeeze

The U.S. dairy industry just added 211,000 cows in 12 months—the largest herd since 1993, according to USDA NASS—at the exact moment Class III prices dropped from $20 to $15.86 per hundredweight. Meanwhile, anyone trying to expand is staring at $4,000 springers and the tightest heifer supply in two decades. That collision of forces is going to define 2026 economics for operations of every size, whether you’re milking 80 cows in Vermont or 8,000 in the Central Valley.

Let me walk through what the numbers actually show and what the producers who are navigating this successfully are doing differently.

The Production Surge Nobody Can Ignore

USDA NASS confirmed that November 2025 milk production in the 24 major states hit 18.1 billion pounds—a 4.7% jump from the prior year. Nationwide, we’re looking at 18.8 billion pounds, up 4.5% year-over-year. For context, that’s the kind of production growth that typically takes two to three years to accumulate. We got it in twelve months.

And California’s recovery has accelerated the math. After H5N1 hammered the state through late 2024 and into 2025—federal livestock program records indicate roughly 75% of commercial herds experienced infections at some point—production is now running more than 10% above year-ago levels. November 2024 represented a 20-year production low for California. The turnaround has happened faster than most analysts expected, and all that milk is flowing back into national markets.

Class III milk prices have collapsed from $20.50 to $15.30 per hundredweight in just 12 months—a 25% decline that’s costing dairy producers $80-90 per cow monthly across all operation sizes 

Here’s what this means for your check: at $15.86 Class III versus $18.50 three months ago, that’s roughly $80-90 per cow per month in lost revenue for a typical Holstein operation. On a 200-cow herd, you’re looking at $16,000-18,000 less coming in between now and spring—assuming prices don’t drop further.

Herd SizeMonthly Loss ($80/cow)Spring Loss (3 months)Annual Impact
50 cows$4,000$12,000$48,000
100 cows$8,000$24,000$96,000
200 cows$16,000$48,000$192,000
500 cows$40,000$120,000$480,000
1,000 cows$80,000$240,000$960,000
2,500 cows$200,000$600,000$2,400,000

The Heifer Bottleneck Is Real

This is the constraint that will shape expansion decisions over the next three years, so let’s dig into it.

USDA data shows approximately 26.7 heifers expected to calve per 100 milk cows—the lowest ratio in at least two decades. Total dairy heifers expected to calve in 2025? Just under 2.5 million head, the lowest since USDA began tracking this metric.

The heifer-to-cow ratio has declined to a 20-year low of 26.7 per 100 cows, creating a replacement crisis that explains why quality springers now cost $4,000+ and why expansion-minded producers need to source animals immediately

The economics driving this aren’t mysterious. Ag Proud market reports show beef-cross calves bringing $1,100-1,400 at many auctions, sometimes higher for well-bred Angus or Limousin crosses. Straight dairy heifers? Often $300-500 unless they come from high-genomic programs with strong marketing. When beef-on-dairy creates that much value differential, producers make rational decisions about their breeding programs.

I was talking with a Wisconsin producer last month who’s running about 70% beef semen across his herd. His logic is straightforward: the premium on those crossbred calves more than offsets the cost of purchasing replacements when he needs them. For his operation and cash flow, that math works.

MetricBeef-Cross CalfRaise Own Dairy HeiferBuy Springer
Calf Sale Value$1,250$400N/A
Heifer Raising Cost (to calving)$0 (sold)$2,200$0
Purchase Price (springer)N/AN/A$4,000
Net Economics per Head+$1,250-$1,800-$4,000
Value DifferentialBaseline-$3,050 vs beef-$5,250 vs beef

A Northeast producer I know takes the opposite approach—she’s kept her replacement program intact because she doesn’t want to be buying springers at $4,000 when she needs them. Her calculation: the heifer she raises for $2,200 all-in is worth $1,800 more than the one she’d have to buy.

Both strategies can pencil out. The question is which matches your operation’s cash flow, facilities, and expansion timeline.

The practical implication: quality springer replacements now command $3,500-4,000 or more in many markets. If you’re planning any expansion over the next 18-24 months, heifer sourcing needs to be part of your planning conversation this month. The animals aren’t available in the numbers we’ve historically seen.

Global Oversupply Compounds the Problem

Four major dairy-producing regions are simultaneously flooding global markets with increased production—California up 10%, EU up 6%, U.S. overall up 4.7%, and New Zealand up 2.9%—creating synchronized oversupply that’s crushing milk prices worldwide

It’s not just U.S. production running hot. The latest AHDB market review shows EU milk deliveries jumped around 6% in September after the bloc worked through its bluetongue challenges. DairyNZ and LIC statistics show that New Zealand’s 2024/25 season finished with total milk solids production up 2.9% to 1.94 billion kilograms.

The Global Dairy Trade auctions have posted nine consecutive declines now, reflecting strong global supply meeting softer demand from key importing regions. If you’re shipping to a plant with export exposure—and that includes many operations in Wisconsin, Idaho, and the Southwest—those GDT results eventually flow back into your mailbox price.

For Canadian producers watching from across the border, the U.S. production surge creates its own dynamics. American oversupply tends to intensify pressure on USMCA access negotiations and affects cross-border pricing signals, even within the quota system.

California’s role amplifies these dynamics domestically. The state produces roughly 18% of U.S. milk, but here’s what really matters for price discovery: California Dairies Inc. alone churns over 480 million pounds of butter annually (about 23% of U.S. production), and the state manufactures the largest share of nonfat dry milk powder in the country. When California production swings, commodity pricing moves for everyone.

The Butter Paradox

Here’s something that looks like good news until you understand what’s actually happening.

USDEC data shows butter exports surged in 2025. January alone was up 41% year-over-year, and through the first nine months, total butterfat exports soared 149%.

Sounds great, right? Here’s the catch: U.S. prices had dropped enough to compete in markets we typically can’t reach. Brownfield Ag News reports CME spot butter trading around $1.375 to $1.40 per pound as we moved into January—a long way from the $3.00-plus prices we saw during the supply squeeze.

We were essentially selling butter globally because domestic prices made us competitive, not because we’d developed new market access. That’s fundamentally different from export growth driven by structural demand improvement. When global prices strengthen, that business disappears.

Cheese Exports: The Genuine Bright Spot

If you’re looking for actual strength in the dairy complex, cheese exports tell a legitimately positive story.

USDEC confirmed that August 2025 reached 54,110 metric tons—the highest monthly volume in the history of U.S. cheese exports. That’s 28% above year-ago levels, and the growth has come from multiple markets rather than depending on any single buyer.

Mexico remains our foundation, accounting for roughly a third of total U.S. cheese exports, according to USDEC trade data. But South Korea, Japan, and Australia all posted strong growth in the first half of 2025. The fundamentals here—growing global demand, improved U.S. product quality, established market relationships—look durable.

One constraint worth watching: USTR data shows USMCA quota utilization is still around 42%, suggesting meaningful upside if Canadian market access improves. That’s a trade policy question beyond any individual producer’s control, but it represents real unrealized potential.

The GLP-1 Demand Question

GLP-1 drugs have some dairy economists predicting significant demand shifts. The actual data tells a more nuanced story, concerning in specific categories but not the catastrophe some suggest.

Kaiser Family Foundation polling indicates about 12% of American adults have used a GLP-1 medication at some point, with roughly 6% currently taking one. That’s real market penetration.

Cornell University and Numerator recently published detailed grocery purchasing data on this population. Households with GLP-1 users reduced cheese purchases by 7.2% and butter by 5.8%. They cut sweet bakery items and cookies by 6-11% across categories.

Here’s how I’d frame this practically: it matters, but it’s not an existential threat—yet. The protein density of dairy actually positions products like Greek yogurt and cottage cheese favorably for consumers who are eating less but prioritizing nutrient-dense foods.

Where I’d watch more carefully is high-fat categories. If GLP-1 adoption reaches the 15-24% levels Morgan Stanley projects for the early 2030s, premium ice cream and butter-heavy applications could face meaningful headwinds. Worth factoring into long-term product mix thinking, but not a reason to panic about 2026.

Current Price Reality

Let’s be direct about where we are.

According to USDA’s official Class and Component Price announcements, December Class III came in at $15.86/cwt—January futures point to the low-to-mid $15 range. That’s the math when production expands as quickly as it has.

The Class III to Class IV spread has been particularly notable. December showed Class III at $15.86 versus Class IV at $13.64—a $2.22 gap favoring cheese markets over butter and powder. If you’re a Class IV shipper, you’ve felt that spread directly in your check. Geography and market assignment matter more than usual right now.

On the feed side, corn has been trading around $4.40 per bushel according to Trading Economics futures data. USDA projects an average farm price around $4.00 for the 2025/26 marketing year, which would provide some relief—but that’s not guaranteed.

What to Do Before Q2

Based on the data and the producer conversations I’ve been having, here are five moves worth considering before spring:

  • Run your break-even calculation this week. Know exactly what Class III price puts you underwater. If you haven’t updated this math since prices were $20, you’re operating blind. Have contingency triggers ready—what do you cut first at $15? At $14?
  • Audit your heifer pipeline now. Calculate your replacement availability for the 2027-2028 calving. If you’re below 28 heifers per 100 cows, start sourcing conversations immediately. Set a price ceiling before you need animals urgently—desperation buying at $4,500 in twelve months is a lot more expensive than planned purchasing at $3,800 today.
  • Evaluate your beef-on-dairy math quarterly. The premium calculation shifts with calf prices and heifer availability. A 70% beef semen strategy that worked at $1,400 crossbred calves might need adjustment if those prices soften. Don’t set-and-forget your breeding program.
  • Review feed cost protection. With corn at $4.40 and possible relief toward $4.00, evaluate whether forward contracts make sense for Q1-Q2 before spring planting volatility. Locking in $4.25 corn looks smart if prices spike; it looks expensive if they fall to $3.80. Know your risk tolerance.
  • Examine your processor relationship. If you’re Class IV-dependent and watching checks come in $2.20 below Class III equivalents, it’s worth exploring whether component shipping options or processor alternatives exist in your region. Not every operation has flexibility here, but some do and aren’t using it.

The Bottom Line

The operations that navigate the next 12-18 months successfully won’t be the ones waiting for prices to recover on their own. They’ll be the ones who used this window to lock in replacement animals before the shortage intensifies, controlled feed costs where possible, and knew their break-even to the penny.

Dairy has always been cyclical. Strong production, recovering global supply, and moderating prices—we’ve been through this pattern before. What’s different this time is the heifer constraint underneath it all. The industry can’t simply expand out of tight margins when replacement animals don’t exist.

That constraint will eventually support prices. But “eventually” might be 2027 or 2028. The question is whether your operation’s financial position lets you wait that long—and whether you’re taking the steps now that position you to expand when the cycle turns.

The fundamentals of dairy demand remain constructive. Protein consumption is growing. Convenience continues driving category growth. Despite years of plant-based competition, real dairy holds its market share.

Those realities matter. But so does the math of $15.86 Class III with $4.40 corn and $4,000 springers. The producers who acknowledge both—the long-term demand strength and the short-term margin pressure—are the ones making decisions right now that they won’t regret in 2027. 

Key Takeaways 

  • You’re bleeding $80/cow monthly — Class III crashed to $15.86; that’s $16,000 vanishing from a 200-cow herd before spring
  • 211,000 cows added in 12 months — Largest U.S. herd since 1993; prices won’t recover until supply corrects
  • Springers hit $4,000+ — Tightest heifer pipeline in 20 years; replacement economics have flipped
  • Global milk keeps flooding in — California +10%, EU +6%, New Zealand +3%; no relief coming in 2026
  • 5 moves to make now — Know your break-even, source heifers before desperation, reassess beef-on-dairy, lock feed, review your processor

Complete references and supporting documentation are available upon request by contacting the editorial team at editor@thebullvine.com.

Learn More

The Sunday Read Dairy Professionals Don’t Skip.

Every week, thousands of producers, breeders, and industry insiders open Bullvine Weekly for genetics insights, market shifts, and profit strategies they won’t find anywhere else. One email. Five minutes. Smarter decisions all week.
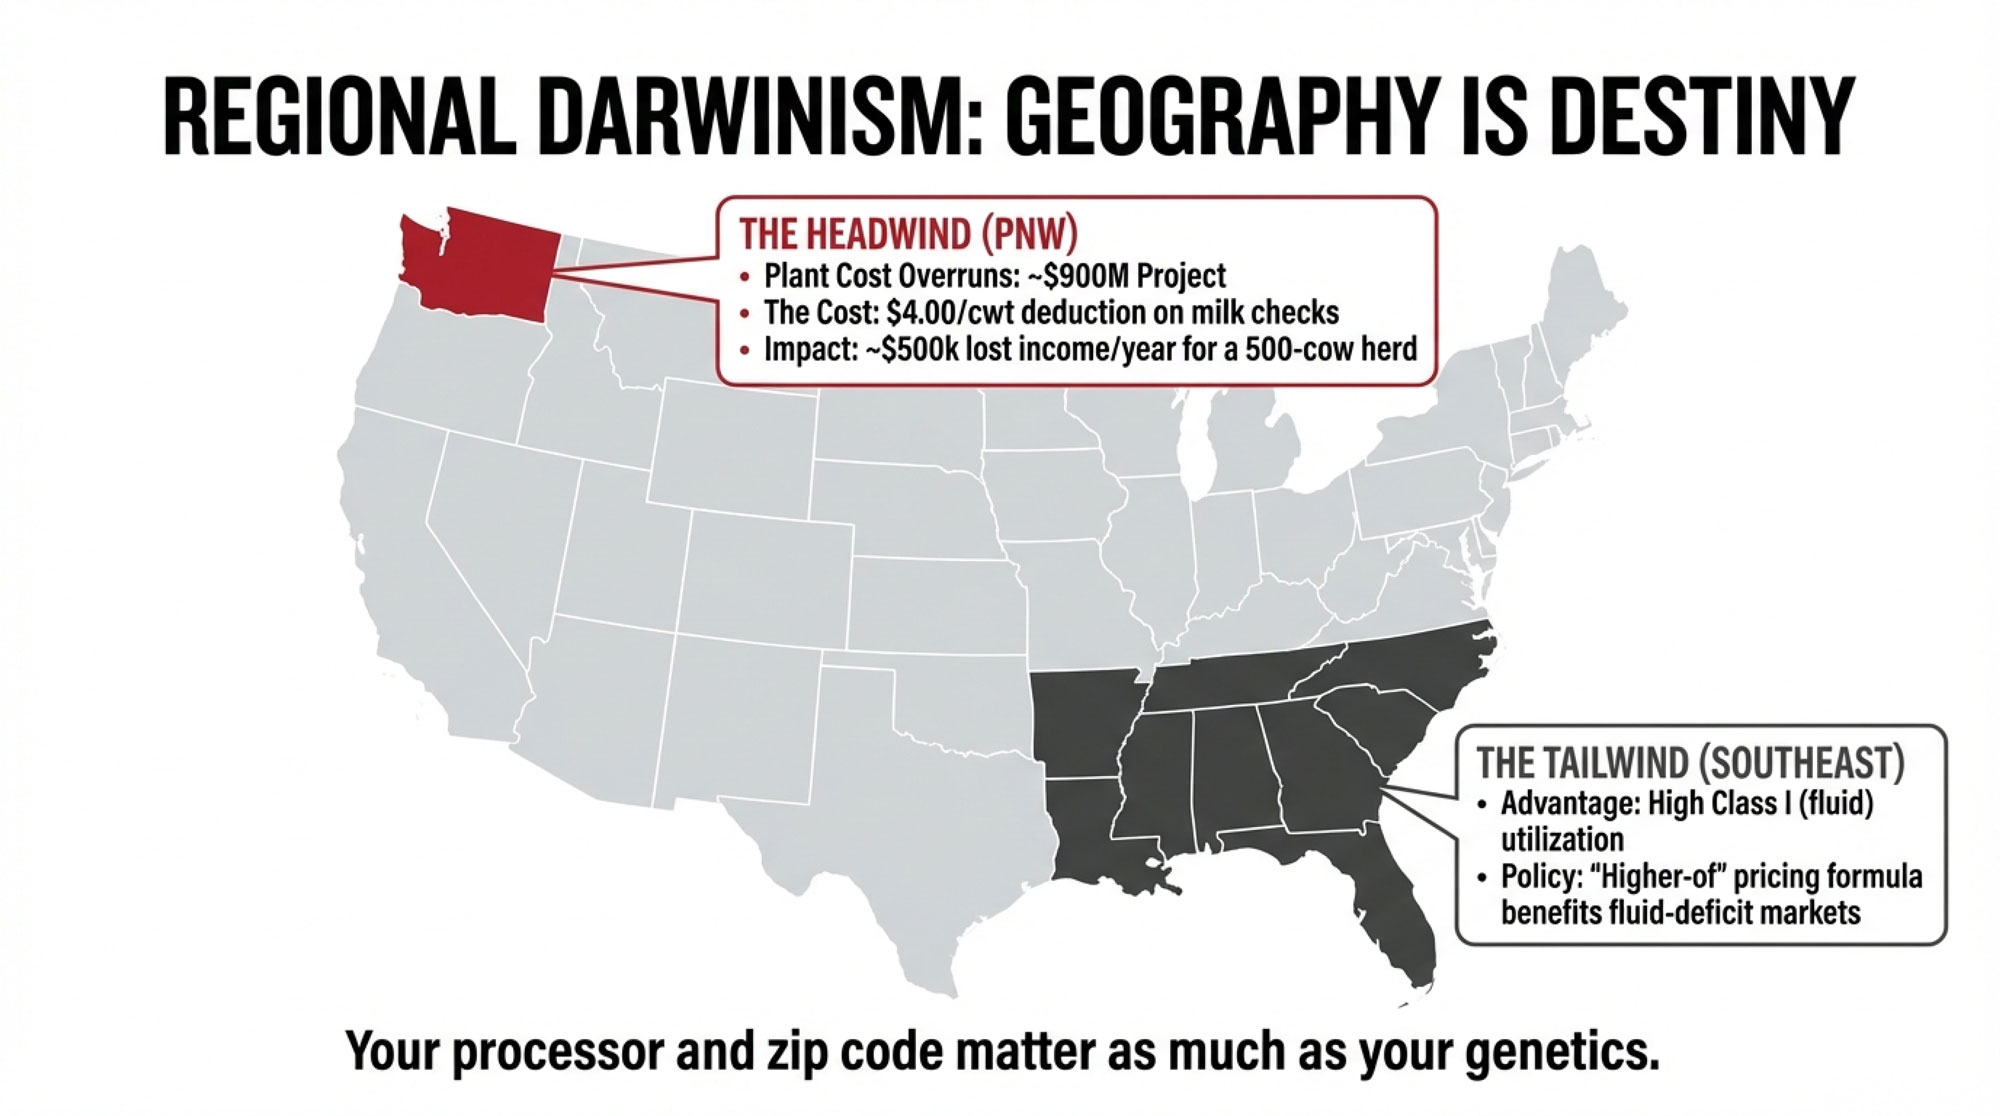
NewsSubscribe
First
Last
Consent

211,000 More Dairy Cows. Bleeding Margins. The 2026 Math That Won’t Wait.

$17.40 cash break-even. $19.80 real break-even. That $2.40/cwt you’re ignoring? It’s the whole ballgame in 2026.

EXECUTIVE SUMMARY: Something’s broken in dairy economics. The U.S. herd grew by 211,000 cows in 2025—while margins collapsed. The culprit: beef-on-dairy premiums ($900-$1,400/calf) are keeping genetically weaker cows in barns that should be empty, starving the replacement pipeline to a 20-year low of just 27 heifers per 100 cows. Add $11 billion in new processing capacity hungry for volume, a component shift from fat toward protein, and producers underestimating their true break-even by $2-4/cwt—and this stops looking like a cycle. It’s a structural reset. With $17-18 milk projected through 2026 and heifer supplies not recovering until 2027, the next six months are a decision window, not a waiting period. The playbook: know your real costs, deploy beef-on-dairy only on your bottom 20-30% of genetics, and lock risk coverage before spring. Producers who act on this will shape their future. The rest will have it shaped for them.

Think about what that means for a moment. Milk prices are sliding. Margins compressing. Every traditional economic signal is screaming that producers should be culling hard and contracting supply. That’s what happened in 2015. That’s what happened in 2018. It’s what the textbooks say should happen when prices drop.

Instead, the national herd keeps expanding.

USDA’s November milk production report confirmed what many of us already sensed: production in the 24 major dairy states is running 4.7 percent above year-ago levels, with total U.S. milk up about 4.5 percent.

I’ve been watching dairy markets for over a decade now, and what’s unfolding feels meaningfully different from the cyclical downturns we’ve navigated before. The mechanisms that usually bring supply and demand back into balance… they’re just not functioning the way they used to, understanding why that’s happening matters to anyone trying to figure out their path forward.

The Numbers That Matter

Before diving deeper, here’s the data that should frame every strategic conversation you’re having right now:

MetricFigureSource
Dairy cow increase (YoY)+211,000 headUSDA November 2025
Fewer replacement heifers (2025 vs 2024)-357,490 headCoBank modeling
Replacement ratio27 heifers per 100 cowsUSDA January 2025 Cattle Inventory
Cash break-even vs. true break-even gap$2.00–$4.00/cwtCornell DFBS analysis
Butter price decline (May–December)~35%Global Dairy Trade
Heifer inventory recovery expected2027 at the earliestCoBank forecast

The Beef-on-Dairy Equation Changed the Calculus

Let’s start with what’s driving that herd expansion, because it explains a lot about the current situation—and raises some serious questions about where we’re headed genetically.

Beef-cross calves are commanding strong premiums right now. Reports from Purina, and various auction summaries show day-old beef-on-dairy calves commonly bringing $900 to $1,400, depending on genetics and region. Laurence Williams, over at Purina’s dairy-beef cross program, has been tracking averages right around $1,400 for quality calves.

Compare that to straight Holstein bull calves, which in many sale barns are still bringing only a few hundred dollars—often in the $200 to $400 range. The math is just too compelling to ignore.

Industry breeding data and semen sales trends show that beef-on-dairy has gone from a niche to the mainstream. Many herds are now using beef semen on a sizable share of lower-index cows. A 500-cow operation breeding a quarter of its herd to beef generates somewhere around $150,000 to $175,000 in additional annual revenue from calf sales alone.

But here’s what’s keeping me up at night: we’re creating a crisis of replacement heifers.

CoBank’s analysis is sobering. Their model predicted 357,490 fewer dairy heifers for 2025 compared to the prior year—driven by more beef-on-dairy calves, fewer conventional dairy semen sales, and only modest gains from sexed semen. Replacement heifer inventories are at a 20-year low and aren’t expected to rebound until 2027 at the earliest.

According to analysis of USDA’s January 2025 Cattle Inventory Report, the dairy herd’s replacement ratio has dropped to just 27 dairy heifers expected to calve for every 100 cows—down from 31 heifers per 100 cows just five years ago. That’s a dangerously thin pipeline.

And there’s a genetic dimension here that doesn’t get enough attention. When we keep older, less efficient cows in the herd because they’re carrying a valuable beef calf, we’re slowing genetic progress for milk production. Every lactation we add to a genetically inferior cow is a lactation we’re not getting from her higher-merit replacement. Research published in the Journal of Dairy Science has documented that herds with high availability of potential replacement heifers have substantially better longevity management options—and faster genetic turnover.

Industry geneticists estimate that every year of delayed genetic turnover costs dairy operations approximately $50 to $75 per cow, due to foregone production improvements, health trait gains, and feed efficiency advances. That’s not nothing—especially compounded across a herd over multiple years.

One Wisconsin producer I spoke with recently—running about 280 cows in the central part of the state—put the dilemma this way:

“I’ve got cows that aren’t really paying their way on milk. Maybe they’re giving me 55 pounds a day, but the components are just okay. Three years ago, she’s on the truck without question. But now she’s carrying a beef calf worth $1,300. How do I justify selling her?”

— Central Wisconsin dairy producer, 280 cows

He’s asking a reasonable question. But multiply that decision across thousands of operations, and you get a national herd that keeps growing even when milk economics alone would suggest contraction—while simultaneously starving the replacement pipeline and slowing genetic progress.

Traditional culling response to low milk prices has been significantly muted. Beef-on-dairy revenue is keeping cows in the herd that would otherwise have been on the truck months ago.

The strategic takeaway: Use beef-on-dairy on your verified bottom 20-30 percent of genetic performers—not random animals, and definitely not your genetic core. Genomic testing matters more than ever when you’re making these decisions.

A Global Situation Worth Understanding

What makes the current environment particularly complex is that this isn’t just a U.S. story.

USDA and international analysts expect global milk production to edge higher in 2025, led by strong U.S. growth and recovering production in Oceania, even as EU output slips slightly. The European Union is actually forecasting a small decline due to environmental and cost pressures, but that’s being more than offset by what’s happening elsewhere.

Normally, when one region overproduces, somewhere else contracts. That’s been the pattern for decades. Research published in the Journal of Dairy Science has documented these offsetting regional cycles going back years—they’ve been a defining feature of how global dairy trade finds equilibrium.

This season looks different.

The Global Dairy Trade auction platform—where about $3 billion worth of dairy products trade annually—has seen prices decline for nine consecutive sessions as of mid-December. That 4.4 percent drop in the most recent auction marked the ninth straight decline in the index. Whole milk powder, butter, cheese… all softening as supply growth outpaces demand.

What this suggests for U.S. producers is that we may not be able to count on export markets to absorb domestic oversupply the way they have in past cycles. International buyers have more options now. Multiple suppliers competing for their business means everyone’s offering competitive prices.

For Canadian producers operating under supply management, the dynamics play out differently—but they’re not immune. P5 quota holders watching U.S. oversupply should recognize that cross-border price pressure affects ingredient markets, and the component value shifts happening south of the border tend to ripple through eventually. The fundamentals around protein versus fat valuation are worth watching regardless of which side of the border you’re milking on.

That said—and I want to be fair here—trade dynamics can shift quickly. Strong demand from Southeast Asia or supply disruptions elsewhere could change the picture. But for planning purposes, it’s worth understanding the current global context.

The Processing Paradox

Here’s something that seems counterintuitive at first but makes more sense once you understand the underlying economics: all the new processing capacity coming online might actually be contributing to the challenge rather than solving it.

The International Dairy Foods Association released some eye-opening numbers back in October. Between 2025 and early 2028, more than $11 billion is being invested in over 50 new or expanded dairy processing facilities across 19 states. We’re talking major expansions by companies like Leprino Foods in Texas, Valley Queen in South Dakota, and Darigold out in Washington—substantial capacity additions for cheese, butter, and powder.

On the surface, more processing capacity should help absorb milk supply and support prices. In practice, it’s a bit more complicated than that.

These plants were planned and financed three to five years ago, when milk was running $20 to $24 per hundredweight, and the outlook was considerably more optimistic. The facilities incur substantial fixed costs—debt service, equipment depreciation, utilities, staffing—that don’t change much whether they’re operating at 50 percent capacity or at full utilization.

To cover those fixed costs, the plants need to operate at 70 to 80 percent utilization or better. That means they need milk. Consistently. Regardless of what’s happening in end markets.

Here’s the uncomfortable truth: volume is the processor’s friend, but it’s the producer’s enemy.

When processors compete for milk to fill their vats, it’s helpful to nearby producers. But all that processing creates output—cheese, butter, powder—that still needs buyers. So while a Wisconsin producer might see premiums from regional processor competition, they’re also seeing more cheese hitting markets that were already well-supplied. USDA Economic Research Service data shows domestic cheese consumption growing by maybe 1 to 2 percent annually. New capacity is adding somewhat more to production. Without proportional growth in exports or domestic demand, inventories build, and prices stay under pressure.

Mike North, who leads dairy market intelligence at Ever.ag, addressed this at the 2025 Dairy Strong Conference in Madison. What he said kind of surprised me: “We don’t have enough animals to make all the milk to supply all the plants in the U.S.”

That sounds puzzling, given everything about herd expansion, right?

The explanation lies in geography. The new capacity isn’t always located where the milk is. So you get regional competition for supply, with processors paying premiums to secure the milk they need to run efficiently.

“With all of this cheese potentially coming online, we have a real need for exports,” North noted. “Because we are going to be creating a lot of additional products.”

What’s Happening With Component Values

For nearly a decade, the consistent message to producers was straightforward: push butterfat. And you know what? Producers delivered impressively.

CoBank’s analysis shows U.S. butterfat levels grew from the mid-3.7s in 2015 to just above 4.2 percent by 2024, with some months hitting 4.26 percent according to University of Wisconsin Extension data. That’s remarkable progress driven by Jersey crossbreeding, thoughtful genetic selection, and nutrition programs. Processors rewarded high-component milk with meaningful premiums.

That dynamic appears to be shifting.

USDA Cold Storage data shows butter inventories running above prior-year levels for much of 2025. And spot butter values have trended lower from earlier highs—GDT butter prices dropped from about $3.59 per pound back in May down to roughly $2.31 at December auctions. That’s around a 35 percent decline.

Here’s what I think is really driving the shift: while fat was the “golden child” of the 2010s, these new processing plants—mostly cheese and powder-focused—are hungry for protein and solids-non-fat.

Analysis from earlier this year really drove this home. Cheese yields have climbed to historic highs—100 pounds of milk now yields 11.41 pounds of cheese, up a whopping 12.5 percent from 2010, when yields sat at 10.14 pounds. And what’s driving that improvement? Butterfat and protein together. The processors I’ve talked with are increasingly focused on total solids capture, not just fat percentage.

The Federal Milk Marketing Order pricing adjustments taking effect are affecting how component values translate into producer checks, and the effects are still sorting themselves out.

Practical suggestion: If you’re not already looking at your Lifetime Cheese Merit $ (CM$)—published by the Council on Dairy Cattle Breeding—alongside or even instead of straight fat percentage, now’s the time to start. CM$ places more weight on traits valued in herds selling milk into cheese markets, including greater emphasis on protein. For operations shipping to cheese plants, it may be a more relevant selection tool than traditional indexes.

This really comes back to the breeding decisions you’re making right now. Operations that built genetic programs around butterfat maximization may want to evaluate whether some shift toward protein emphasis makes sense for their situation. That kind of genetic transition, as you probably know, takes three to five years to implement fully.

Of course, component values will keep fluctuating, and every operation’s situation is different. The point isn’t that fat is suddenly worthless—it’s that the economics have become more nuanced than the simple “more fat equals more money” equation that held for most of the past decade.

The Cost Calculation That Deserves Your Attention

This might be the most practically important topic to address, because it directly affects how you evaluate your situation and think through strategic decisions.

Most operations track what I’d call “cash costs”—feed, hired labor, vet bills, utilities, supplies. When producers mention their break-even point, they’re usually referencing this number.

But cash costs don’t capture the complete picture. Not by a long shot.

When you add in unpaid family labor—and Cornell’s Dairy Farm Business Summary work values this at meaningful dollar amounts per full-time equivalent—the numbers shift noticeably. A farm with the operator and spouse both working full-time represents substantial labor value that may not appear in your break-even calculation.

Then there’s the gap between tax depreciation and actual principal payments on debt. Your tax return might show $75,000 in depreciation on facilities. But if you’re actually paying $180,000 in principal annually on those loans, your real cost is quite different. Cornell’s DFBS work shows that when you factor in actual principal payments instead of just tax depreciation, total cost can easily rise by $1 to $2 per hundredweight compared to cash-cost estimates.

Add family living expenses that come from farm income but don’t show up on Schedule F. Add what economists call the opportunity cost of having capital tied up in the dairy rather than invested elsewhere.

Recent Cornell Dairy Farm Business Summary reports show operating costs for many New York farms in the high teens per hundredweight, with total economic costs—including unpaid labor, capital costs, and family living—often running into the low twenties.

“I ran the numbers three times because I couldn’t believe them. My cash break-even was around $17.40. But when I added our labor, real principal payments, and what we actually spend to live? It came out to $19.80. That was a hard conversation to have with my wife.”

— Pennsylvania dairy producer, 340 cows

Cost CategoryCash Break-Even ($/cwt)Real Break-Even ($/cwt)
Feed & Purchased Inputs$8.50$8.50
Hired Labor$2.80$2.80
Veterinary & Breeding$1.20$1.20
Utilities & Fuel$1.10$1.10
Supplies & Maintenance$1.50$1.50
Interest Paid$1.20$1.20
Tax Depreciation$1.10
Unpaid Family Labor$1.85
Actual Principal Payments$2.40
Family Living Expenses$1.05
Opportunity Cost of Capital$0.20
TOTAL BREAK-EVEN$17.40$19.80
Hidden Cost You’re Ignoring+$2.40/cwt

That gap matters when you’re looking at USDA projections suggesting extended periods of $17 to $18 milk in 2026. Operations that believe they’re “close to break-even” based on cash costs may actually be losing $2 to $4 per hundredweight when everything is honestly accounted for.

This isn’t meant to be discouraging—it’s meant to help you see clearly. You can’t make good strategic decisions without understanding your real numbers.

Risk Management Tools Worth Your Consideration

For producers who’ve worked through their cost calculation and recognize potential exposure, several risk management tools deserve a closer look. Each has strengths and limitations worth understanding.

  • Dairy Margin Coverage enrollment typically runs from late winter to early spring—check with your local FSA office for exact dates, as they can vary year to year. Historically, the top coverage level has come with a relatively low per-hundredweight premium after federal subsidy, making it inexpensive catastrophic protection for the first 5 million pounds. Here’s a consideration worth noting: with feed costs currently moderate—corn projected in the $ 4 range—DMC margins may stay above trigger levels even with softer milk prices. Generally speaking, corn would need to push above $5.50 before DMC payments become likely under current milk price projections. It’s probably not wise to count on meaningful payments, but the coverage is cheap enough that enrollment makes sense for most operations.
  • Dairy Revenue Protection offers quarterly revenue coverage with federally subsidized premiums. One detail that catches some producers off guard: coverage typically starts about 5 percent below current market prices. On $17 milk, that means your floor is around $16.15 before protection kicks in. Robin Schmahl has noted this limitation in his market commentary—put options may offer better protection for producers whose break-evens sit meaningfully above projected prices.
  • Put options through the CME require a higher upfront premium but allow you to select strike prices based on your actual situation rather than accepting a built-in discount. For operations facing real exposure, the math sometimes favors options despite the higher initial cost.
  • Feed forward contracts represent an opportunity worth evaluating this season. Many risk-management advisers suggest locking in a portion—often 40 to 60 percent—of projected feed needs when forward prices look favorable, while leaving some flexibility to take advantage of future dips.

Key Risk Management Considerations for 2026

ToolCoverage Level / StrikePremium CostBest ForKey Limitation2026 Action Timing
Dairy Margin Coverage (DMC)Top tier: Margin above feed costLow(~$0.15/cwt after subsidy for 5M lbs)Catastrophic protection; tight-margin operationsUnlikely to trigger unless corn >$5.50 with $17 milk; covers margin, not priceEnroll late Feb-early Mar (check local FSA)
Dairy Revenue Protection (DRP)~5% below current marketModerate(federally subsidized)Operations within 10-15% of break-evenCoverage starts 5% below market—$17 milk = $16.15 floorEarly Feb for Q2 (Apr-Jun coverage)
CME Put OptionsCustom strike at/above break-evenHigher (full premium, not subsidized)Operations with break-even >$19; need specific floorUpfront cost; requires market knowledgeQ1 2026before volatility increases
Feed Forward ContractsLock corn/soybean pricesVaries by basis, timingSecuring input costs when forwards favorableLose flexibility if cash market drops; typically lock 40-60%Q1 2026 for growing season
LGM-DairyGross margin protectionModerate-High (some subsidy)Comprehensive margin coverageComplex; 27-hour weekly enrollment windowsWeekly Fri-Sat windows

The timing element matters here. Options and insurance products tend to become more expensive as market volatility increases. Producers who secure protection earlier—before first-quarter results confirm or deny margin pressure—typically access better pricing than those who wait until the situation becomes clearer.

Strategic Considerations for Different Operations

The segment facing perhaps the most complex decisions right now is the 200- to 400-cow operation. Large enough to have meaningful capital at risk. But potentially facing questions about whether the scale economics work if milk settles into the $19 to $20 range that many analysts suggest as a reasonable baseline.

Looking at the options realistically, there are three general paths producers are considering:

  • Scaling up to 700 to 1,000-plus cows can achieve cost structures that work better at projected price levels. The requirements are substantial, though—$3 to $5 million for facilities, equipment, and livestock based on current costs. And then there’s labor. Finding and retaining quality employees has become increasingly challenging across dairy regions, and larger operations require more sophisticated workforce management. This path tends to make sense for operations with strong balance sheets, favorable regional positioning, clear next-generation commitment, and confidence in building a reliable team.
  • Optimizing at the current size while managing costs aggressively remains viable for operations that can get their numbers to work. University of Wisconsin Extension analysis suggests realistic reductions of $0.75 to $1.20 per hundredweight are achievable through improved feed efficiency, labor optimization, and purchasing improvements. Whether that’s sufficient depends entirely on where your true break-even point sits relative to projected prices—and on your broader goals for the operation.
  • Strategic transition while equity remains strong represents a financially rational consideration for some, particularly producers approaching retirement age without clear succession or those in regions where cost structures have become especially challenging. The reality—uncomfortable as it may be to discuss—is that producers who make this decision while they’re choosing rather than being forced generally achieve better outcomes than those who wait.

Now, I want to be fair here. There’s a different perspective worth acknowledging. Not everyone sees the outlook the same way. Some analysts point to potential supply response as beef-on-dairy calf values moderate, or unexpected demand growth from food service channels. Keith Woodford, an agricultural economist who’s studied dairy markets extensively, has cautioned against assuming current trends continue in a straight line. Markets have surprised observers before, and they’ll do it again.

Even the more optimistic scenarios, though, tend to suggest $19 to $20 milk as a reasonable baseline—not the $22 to $24 levels of 2022. The question isn’t really whether an adjustment is happening; it’s how significant and how prolonged it is.

Regional Factors That Shape Your Decision

Geography matters considerably in how these dynamics play out for individual operations.

In Wisconsin, Michigan, Idaho, South Dakota, and parts of Texas, producers often benefit from proximity to new processing capacity, relatively moderate cost structures, and continued infrastructure investment. Expansion strategies tend to pencil out more favorably in these regions, and break-evens generally run lower due to feed costs and regulatory environments.

The Northeast faces different arithmetic. Higher land costs, higher labor costs, and limited expansion opportunities make large-scale operations harder to justify economically. Many of the successful operations I’ve encountered in New York, Pennsylvania, and Vermont have differentiated themselves through organic certification, grass-fed programs, or direct-to-consumer relationships rather than competing primarily on volume.

California still leads the nation in total milk production, but its share of U.S. output has slipped as growth has shifted inland to states like Texas, Idaho, South Dakota, and Kansas. Higher labor and compliance costs, along with water constraints, are part of that story—and the trend seems likely to continue, though California will certainly remain a major dairy state.

Practical Considerations for the Year Ahead

After working through all of this, what actually matters for producers making decisions right now?

  • Understanding your real numbers. The true cost of production—including unpaid labor, actual principal payments, family living, and capital costs—often runs several dollars per hundredweight above cash costs alone. Strategic decisions work better when they’re based on complete information.
  • Recognizing this environment may be different. The mechanisms that normally bring markets back into balance—culling in response to low prices, regional production adjustments, export market absorption—don’t appear to be functioning quite the way they have historically. Planning for eventual recovery to $22-$24 milk may be optimistic.
  • Using beef-on-dairy strategically, not reflexively. Genomically test everything. Target your verified bottom 20-30 percent of genetic performers for beef crosses—not random animals, and definitely not your genetic core. The calf premium matters, but having quality replacements available in 2027-2028 matters more.
  • Rethinking component selection. Look at the Lifetime Cheese Merit $ (CM$) if you’re shipping to cheese markets. Protein is gaining importance relative to fat as new cheese capacity comes online.
  • Considering risk management earlier rather than later. Check with your local FSA office about the timing of DMC enrollment. Feed contracts secured in the first quarter protect against potential price increases. Protection tools are generally most cost-effective before volatility increases.
  • Making decisions proactively. The first half of 2026 is a window during which most producers still have options. Waiting to see how things develop sometimes means accepting whatever options remain.

The Bottom Line

Over the next few years, the U.S. dairy industry will likely produce roughly the same total milk volume—but with fewer operations, greater geographic concentration in lower-cost regions, and generally larger scale.

The adjustment period won’t be comfortable for everyone. But it also creates opportunity for those who recognize what’s happening and position accordingly—whether that means building an operation optimized for current market realities, or thoughtfully transitioning capital and energy elsewhere.

The producers who navigate this period successfully won’t necessarily be those who love dairy the most—though that passion certainly helps sustain the effort through difficult stretches. They’ll tend to be the ones who understood their numbers, made decisions based on realistic assumptions, and built for the emerging market rather than the one that existed five years ago.

I don’t pretend to know exactly how the next few years will unfold. Markets have surprised me before, and they’ll do it again. But the patterns in the data—herd expansion despite margin pressure, a replacement heifer crisis building in the background, global supply dynamics, processing capacity hungry for volume, component value shifts—suggest this is a period that rewards clear thinking and early action rather than hopeful waiting.

Based on CoBank’s modeling, we likely won’t see heifer inventories stabilize until 2027 at the earliest—which means the decisions you make in the next six months will determine your position when that inflection point arrives.

For those of you reading this, the first part of 2026 offers a window for decisions that will shape outcomes for years to come. They’re not easy decisions. They’re not comfortable. But they’re worth making deliberately rather than letting circumstances make them for you.

KEY TAKEAWAYS 

  • 211,000 more cows while margins collapse — Beef-on-dairy premiums ($900-$1,400/calf) are keeping genetically weaker cows in herds, breaking the culling math that normally corrects oversupply
  • 27 heifers per 100 cows — Down from 31 five years ago. A 20-year low that won’t recover until 2027. Secure your replacements now or bid $3,000+ for them later
  • $17.40 cash break-even vs. $19.80 real — That $2-4/cwt gap you’re ignoring? It’s the difference between steering your operation and watching it drift
  • $11B in new plants need your milk — Processors cover fixed costs with volume. Your oversupply is their leverage. They’re not losing sleep over your margins
  • The 2026 playbook — Beef-on-dairy on the bottom 20-30% of genetics only. Breed for protein (CM$), not just fat. Lock risk coverage before spring. Decide now or react later

Complete references and supporting documentation are available upon request by contacting the editorial team at editor@thebullvine.com.

Learn More

The Sunday Read Dairy Professionals Don’t Skip.

Every week, thousands of producers, breeders, and industry insiders open Bullvine Weekly for genetics insights, market shifts, and profit strategies they won’t find anywhere else. One email. Five minutes. Smarter decisions all week.

NewsSubscribe
First
Last
Consent

From 52¢ to 25¢: Where Your Milk Dollar Goes Now – And 3 Ways to Reclaim Your Share

1980: Farmers got 52¢ of every dairy dollar. 2024: Just 25¢. Farm prices dropped 11% last year. Retail prices? Barely moved.

EXECUTIVE SUMMARY:  A Wisconsin farmer did the math: he gets $1.07 for the milk in a gallon, selling for $4.89. That $3.82 gap isn’t new—but it’s widening. Farm share of the retail dairy dollar has dropped from 52 cents in 1980 to just 25 cents today, and when farm prices fell 11% last year, retail prices barely moved. So where does the money actually go? European research offers a surprising answer: farmer organization may matter more than processor consolidation. German farmers, working through strong cooperative structures, capture 80-85% of price transmission; French farmers negotiating individually capture just 23%. For mid-size U.S. operations, three strategic paths emerge—efficiency optimization (where top performers capture $350,000-$550,000 more annually than average), strategic scaling or collaboration, and premium market positioning. With $11 billion in new processing investment flowing toward facilities that favor large-scale supply, the time to choose your path is now.

I spoke with Mark recently, a dairy farmer who has been milking cows in central Wisconsin for 31 years. Last Tuesday, he stopped at the Kwik Trip in Marshfield after dropping a load at the cooperative and watched a young mother put a gallon of whole milk in her cart. The price tag read $4.89.

His milk check that morning showed $20.90 per hundredweight—down from $23.60 just twelve months earlier. USDA’s National Agricultural Statistics Service released those August 2025 numbers in September, and you know how it is… standing in that convenience store aisle, Mark did what every dairy farmer eventually does: the math.

“I’m getting roughly a dollar-seven for the milk in that gallon,” he told me over coffee later that week. “She’s paying four-eighty-nine. Where’s the other three-eighty-two going?”

It’s a fair question. And thanks to some useful academic research coming out of Canada and Europe, we’re getting clearer answers—ones that have honestly changed how I think about dairy market dynamics.

The Dairy Dollar Has Shifted Over Time

Here’s what the historical data shows. And it’s worth understanding these numbers in context, because they tell us something important about structural changes in our industry.

Farm share of the retail dairy dollar has plummeted from 52 cents in 1980 to just 25 cents today—a 52% decline that reflects fundamental structural shifts in dairy market power, not temporary cycles

 THE DAIRY DOLLAR: WHAT WE KNOW

For every $1.00 consumers spend on dairy products today:

Segment2024 ShareChange Since 1980
Farm$0.25↓ from $0.52
Marketing & Distribution$0.75

The marketing share includes processing, retail margins, transportation, and packaging. USDA ERS tracks farm share but doesn’t publish detailed breakdowns of marketing components—which is itself part of the transparency challenge we’ll get to later.

Source: USDA Economic Research Service, Price Spreads from Farm to Consumer, 2024

Back in 1980, dairy farmers captured approximately 52 cents of every retail dollar spent on milk. By 1999, that share had dropped to 32 cents. USDA’s Economic Research Service has tracked this through its Food Dollar Series for decades, and the most recent numbers from its 2024 Price Spreads data put the farm share of the retail dairy product basket at roughly 25 cents on the dollar.

Now, some of that shift reflects legitimate changes in the supply chain—more sophisticated processing, extended cold chains, greater product diversity, and increased food safety requirements. These things cost money, and that cost shows up somewhere.

But here’s what caught my attention: when farm prices dropped 11.4% between August 2024 and August 2025, retail prices barely moved. Bureau of Labor Statistics data shows that the average gallon of conventional whole milk ranged from $3.99 to $4.32 during that period.

The margin had to go somewhere. Understanding where—and why—matters for how we think about pricing dynamics going forward.

What Academic Research Reveals About Price Transmission

This brings us to some research that deserves more attention in our industry. It’s the kind of work that helps explain howprice changes actually move through the supply chain—or don’t.

A study published in the Journal of Food Research by economists at the University of Guelph examined price transmission through Canadian agricultural supply chains. They compared supply-managed commodities like dairy with market-driven commodities like pork, and their findings raise some interesting questions for us.

What the Guelph researchers found:

  • In supply-managed dairy systems, price changes were transmitted relatively symmetrically—when farm prices rose, retail prices followed at roughly the same rate as when farm prices fell
  • In competitive pork markets, the pattern looked different: retail prices responded quickly when farm prices increased, but declined much more slowly when farm prices dropped
  • The researchers attributed this asymmetry directly to processor and retailer concentration

As they put it: “Because of processor and retailer concentration, consumer prices respond more quickly to upward than downward movements of farm prices.”

Why does this matter for U.S. dairy? Because our system shares some characteristics with that competitive model they studied. When input costs rise, those increases tend to move through the chain relatively quickly. When costs fall… well, the benefits don’t always flow back to producers at the same pace. Many of us have seen this play out firsthand.

The European Evidence

European research adds another dimension that I found genuinely surprising. A 2020 study from the EU’s VALUMICS project examined dairy value chains across Germany, France, and the United Kingdom, and what they found challenges some conventional thinking.

The key findings:

  • Germany and the UK showed 80-85% price transmission—meaning most price changes at the farm level eventually reached retail
  • France showed only 23% transmission—most farm-level price changes got absorbed somewhere in the middle of the chain
  • Here’s what’s interesting: the difference wasn’t primarily about processor consolidation
  • The key variable was the farmer organization—how collectively producers could negotiate

So Germany has relatively fragmented processing—many mid-sized processors and cooperatives competing for milk. France has more consolidated processing, with Lactalis and Sodiaal controlling over 20% of the national milk collection.

CountryPrice Transmission %Farmer OrganizationProcessor Structure
Germany80-85%Strong cooperative structures with collective negotiating leverageFragmented: many mid-sized processors competing
United Kingdom80-85%Strong cooperative frameworks backed by legal structuresMixed competitive environment
France23%Individual farmer negotiation with limited collective leverageConsolidated: Lactalis & Sodiaal control 20%+ of national milk

Conventional thinking might suggest German farmers would face more pressure in that competitive processor environment. But the data showed the opposite. Germany achieved 80-85% symmetric price transmission. France achieved 23%.

The researchers pointed to the farmer organization as the critical variable. Germany’s cooperative structure provides producers with collective negotiating leverage backed by legal frameworks. French farmers negotiate more individually with those consolidated processors.

I want to be careful not to overstate this—European dairy markets differ from ours in important ways, and correlation doesn’t establish causation. But the findings suggest that how farmers organize may matter as much as how processors consolidate. That’s worth thinking about.

Dr. Andrew Novakovic, who has studied dairy markets at Cornell University for decades, has made similar observations about collective bargaining mechanisms. Information alone doesn’t necessarily translate into better prices—farmers need ways to act on that information collectively.

What might that look like practically? Active participation in cooperative governance, engagement with FMMO hearing processes, and support for producer organizations that advocate on pricing issues. None of these offer quick fixes, but they represent the mechanisms through which farmers can influence market outcomes beyond their individual operations.

Regional Pricing Variation

One aspect of U.S. dairy pricing that merits discussion—and you probably already know this if you’ve ever compared notes with producers in other regions—is the variation in what farmers actually receive.

USDA Agricultural Marketing Service mailbox price data shows meaningful spreads between regions. The 2024 annual averages had Southeast states around $24.58 per hundredweight, while New Mexico averaged $19.96. That’s nearly a five-dollar difference for essentially the same product.

I recently spoke with a producer in California’s Central Valley who noted similar frustrations. “We’re watching cheese exports hit record levels,” she told me, “and our mailbox price doesn’t seem to reflect that demand.” It’s a sentiment I’ve heard echoed from Vermont to Idaho—the sense that global market strength isn’t translating into farm-level returns as producers expect.

Some of this reflects legitimate factors: Federal Milk Marketing Order formulas, transportation costs, local supply-demand balance, and plant proximity. The FMMO system was designed to ensure orderly marketing and prevent predatory practices when milk couldn’t travel far.

But the magnitude of regional differences raises questions worth exploring. I spoke with Dr. Mark Stephenson, recently retired director of dairy policy analysis at the University of Wisconsin-Madison, about this dynamic.

“The regional pricing system reflects historical infrastructure and political compromises as much as current economic realities,” he observed. “Whether it still serves farmers optimally is a legitimate question.”

For individual operations, the practical takeaway is straightforward: understand the dynamics of your specific FMMO region. USDA publishes monthly mailbox prices by state—tracking where you stand relative to other regions can inform marketing decisions.

Processing Sector Changes

Any discussion of dairy pricing should include what’s happening on the processing side. And the numbers tell a story of significant consolidation over the past several decades.

USDA Rural Development cooperative statistics show U.S. dairy cooperatives declined from 1,244 in 1964 to 118 by 2017. Today, the four largest dairy cooperatives market approximately 41% of all U.S. milk. The 2020 acquisition of 44 Dean Foods facilities by Dairy Farmers of America for $425 million represented a significant moment in this trend.

It’s worth noting that cooperatives themselves vary considerably in structure and function. Some focus primarily on bargaining and milk marketing—negotiating prices and finding homes for member milk without owning processing assets. Others operate significant cheese plants, bottling facilities, or ingredient manufacturing. Regional cooperatives often serve different functions than national organizations, and a producer’s relationship with a bargaining-only cooperative differs meaningfully from membership in a cooperative that processes your milk directly.

Understanding what your cooperative actually does, and how its structure affects your returns, matters more than ever in this environment.

Now, I think it’s important to understand the processor’s perspective here too. These are businesses operating in challenging conditions—thin margins, intense retail pressure, significant capital requirements, and increasing regulatory complexity around food safety and environmental compliance.

Mike Brown, senior vice president of economics at the International Dairy Foods Association, has explained the rationale pretty clearly: “Processing is a low-margin business. The investments we’re making in new capacity require a reliable, consistent supply to achieve the economies of scale that make modern processing viable.”

A cheese plant processing 4-5 million pounds of milk daily needs supply certainty. That’s a legitimate operational requirement. The question isn’t whether processors are making rational business decisions—clearly they are. The question is how the overall market structure affects outcomes across the dairy sector.

New Processing Investment and Export Growth

What’s encouraging is the investment flowing into the industry right now. The International Dairy Foods Association reports approximately $11 billion in new dairy processing investment across more than 50 facilities in 19 states. NMPF president and CEO Gregg Doud has called it unprecedented in American agricultural history.

Much of this investment is oriented toward export markets—cheese, butter, and milk powder destined for growing demand in Asia and other regions. U.S. dairy exports have grown substantially over the past decade, and this processing capacity positions the industry to capture more international market share.

That’s genuinely positive for the industry’s future. Expanded processing capacity creates new market opportunities for milk, and export growth provides demand beyond what domestic consumption alone can support.

The nuance worth noting: much of this new capacity appears oriented toward long-term supply agreements with larger operations—dairies that can provide consistent, high-volume supply year-round. For a 400-cow dairy in Michigan or a 600-cow operation in Pennsylvania, this raises practical questions about market access as the processing landscape evolves.

This isn’t cause for alarm, but it is cause for planning. Understanding where processing investment is flowing—and what supply characteristics those facilities seek—can inform strategic decisions.

Policy Developments

On the policy front, Senators Kirsten Gillibrand of New York and Susan Collins of Maine have introduced the Fair Milk Pricing for Farmers Act, that’s H.R. 295 in the House and S. 581 in the Senate. The bill would require processors to report production costs and product yields to the USDA every two years.

Senator Gillibrand framed the rationale in her February 2025 announcement: “Requiring manufacturers to report dairy processing costs on a biennial basis will give dairy producers, processors, and cooperatives the data they need to ensure that their prices accurately reflect the costs of production.”

This seems like a reasonable transparency measure, and it’s attracted bipartisan support from both producer and processor organizations.

That said, it’s worth understanding what the legislation does and doesn’t do. It creates baseline transparency—useful for FMMO hearing processes when make allowances and pricing formulas are adjusted. It doesn’t set minimum prices, mandate formula changes, or establish collective bargaining frameworks.

As the European research suggests, transparency is valuable but may not be sufficient on its own. It’s one piece of a larger puzzle.

Strategic Options for Mid-Size Operations

Given these market dynamics, what can mid-size operations actually do? After conversations with farm management specialists, agricultural economists, and producers across several regions, three strategic directions keep emerging.

StrategyCapital RequiredTime to ROIPotential Annual Gain (500-600 cow herd)Risk Level
Efficiency Optimization$50K-250K (monitoring systems, feed tech, genetics)7-12 months$350K-550K annually (gap between average and top-quartile execution)Low-Medium
Scale Expansion$8M-12M per 1,000 cows (40% equity required: $3.2M-4.8M)5-7 yearsScale-dependent; driven by per-cow efficiency at 2,000+ headHigh (labor, capital, market access)
Premium Positioning (Organic/Farmstead)$50K-150K + 36-month transition without premium income3-5 years$100K-300K annually (based on $20-30/cwt premium capture)Medium-High (market, transition, certification)

Which path makes sense depends partly on where you are in the business cycle—and honestly, on generational considerations. An operation with a clear succession plan and incoming family labor faces different calculations than one where the next generation has moved on. The strategic choices you make today will shape what kind of operation exists in ten or fifteen years, whether that’s for family members to continue or for an eventual transition. That reality should inform which path you pursue.

Here’s what the numbers suggest: on a well-managed 500-cow dairy, the gap between average and top-quartile execution across efficiency measures could mean $350,000-550,000 annually. That’s the difference between surviving commodity cycles and building genuine equity. The three paths below represent different ways to capture that value.

Path One: Efficiency Optimization

For many operations, the most practical path is executing the fundamentals exceptionally well. And the performance gap between average and top-performing herds of similar size can be more meaningful than you might expect—Penn State Extension dairy specialists have documented income-over-feed-cost differences of $2.00-3.00 per cow per day between operations with similar herd sizes.

On a 600-cow dairy, that daily difference compounds to something significant over a year.

Where does that improvement come from? A few areas consistently matter:

Feed management remains the largest controllable cost. Most operations run TMR consistency at 4-8% variation; top performers achieve 2% or less. Testing every cutting—rather than assuming values carry over—adjusting rations weekly based on actual components, and managing bunk dynamics… these practices can reduce feed costs by $0.30-0.50 per hundredweight according to University of Wisconsin research.

Health monitoring has advanced considerably. Rumination and activity monitoring can identify mastitis and lameness 2-3 days before visual symptoms appear. Systems from SCR, Afimilk, Lely, and others typically run $50-100 per cow for basic monitoring, with more comprehensive systems at $150-250 per cow. The payback comes through earlier intervention, reduced treatment costs, and avoided production losses—particularly during the transition period when fresh cow problems tend to cascade.

Component optimization rewards attention to genetics and nutrition. Operations targeting butterfat levels of 4.0%+ can capture meaningful premiums. Montbéliarde crosses and select Holstein families have shown strong component performance, though results vary by management system and feeding program.

Beef-on-dairy programs have created new revenue streams that many of us didn’t have five years ago. Breeding 20-30% of the herd to beef bulls—Angus, Charolais, or Limousin, depending on your market—produces crossbred calves selling at $350-400 versus $80-100 for dairy bull calves. That’s meaningful additional revenue for operations with solid reproductive management.

This path suits operations with manageable debt, adequate working capital, and a genuine interest in data-driven management.

💡 BULLVINE INSIDER TIP: Efficiency Optimization

Based on what producers are actually seeing in 2025, here’s where the fastest returns are coming from:

What’s working right now:

  • AI-powered ration optimization software — Early adopters are reporting 5-10% feed cost reduction with ROI within 7-8 months, according to Lactanet’s herd analytics data. On a 500-cow dairy, that’s $50,000-100,000 annually to your bottom line.
  • Integrated health monitoring (not standalone sensors) — Systems that combine rumination, activity, and temperature data outperform single-metric monitors. Look for platforms that integrate with your existing herd management software rather than creating another data silo.
  • Smart calf monitoring — Operations using automated calf health systems are seeing significant reductions in mortality. One Dutch dairy documented a 19% improvement in calf survival within a single lactation cycle, with wearable sensors detecting illness 12+ hours before visual symptoms appeared. Payback typically runs under 12 months.

What to skip for now: Standalone activity monitors without integration capability. False-positive rates often create more work than they’re worth.

Path Two: Scale Expansion

Some operations have the capital position and management depth to expand to the scales preferred by new processing facilities. And I want to be honest about what this actually requires.

The economics are demanding. Expansion from 600 to 2,000+ cows typically requires $8,000-12,000 per cow in capital investment. For a 1,400-cow expansion, that’s $11-17 million. Most lenders currently require around 40% equity for dairy expansion—meaning $4.5-6.8 million just to reach the financing table.

When the numbers work, larger operations do show profitability advantages. University of Minnesota FINBIN data consistently shows per-cow returns increase with scale, all else equal.

But all else is rarely equal. Labor presents a genuine challenge—a 2,000-cow operation requires different workforce management than a family operation, and finding reliable dairy labor has become difficult in many regions. Geographic factors matter too: Idaho and parts of the Southwest still see active development, while the Upper Midwest and Northeast face higher land costs and tighter environmental constraints.

Here’s something worth considering, though: Collaborative scaling offers some of the benefits of scale without the full capital burden. Machinery-sharing cooperatives—common in Europe through what’s called the CUMA model—are now emerging in Ireland and parts of North America.

Actually, Ireland’s first farm machinery sharing cooperative was formed by members of the Kilnamartyra dairy discussion group in West Cork, according to Teagasc (Ireland’s agricultural authority). Their first joint purchase was a low-emissions slurry tanker—equipment that would’ve been uneconomical for individual operations but made sense when shared across several farms.

The CUMA model is widely used in France, where up to 50% of farmers are members of some type of machinery cooperative. Beyond equipment, some operations here are exploring multi-family partnerships or formal alliances for input purchasing, young stock raising, or even shared labor pools. Wisconsin’s dairy discussion groups and organizations, such as the Dairy Business Association, have facilitated some of these arrangements.

It’s not a full-scale expansion, but it captures some economies without the $11-17 million capital requirement. Worth exploring if you’re in that middle ground.

💡 BULLVINE INSIDER TIP: Scale Expansion

If you’re seriously exploring expansion or collaboration:

Before committing capital:

  • Map your processor relationships first — Talk directly with your co-op or processor about their 5-year capacity plans. Some are actively seeking mid-size suppliers; others are locked into large-operation contracts. Know before you build.
  • Explore collaborative structures — Contact your state’s dairy business association about machinery-sharing cooperatives or multi-family partnership models. The SARE (Sustainable Agriculture Research & Education) program has published practical guides on legal structures for equipment sharing that can help you avoid common pitfalls.
  • Run the labor math honestly — a 2,000-cow operation needs 8-12 full-time employees with skill sets different from family labor. If you can’t staff it reliably, the expansion economics fall apart regardless of milk price.

Geographic reality check: Expansion feasibility varies dramatically by region. Idaho, the Texas panhandle, and parts of Kansas still have processor demand for a new large-scale supply. Upper Midwest and Northeast markets are largely committed—expansion there often requires displacing existing supply relationships, which is a different game entirely.

Path Three: Premium Market Positioning

The third direction involves capturing more retail value through differentiation—such as organic certification, farmstead processing, or direct-to-consumer sales.

The economics genuinely shift here. Commodity milk at $20-22 per hundredweight captures about 25-49% of retail value, depending on the product—USDA data shows fluid milk’s farm share runs higher than cheese or butter. Farmstead cheese operations can realize $40-60 per hundredweight equivalent, capturing 60-70% of retail value, according to case studies from Penn State Extension and the Vermont Agency of Agriculture.

Market PositionPrice ($/cwt equivalent)Farm Share of Retail %Market Access Reality
Commodity Milk$20-2225%Immediate; established processor relationships
Organic Certified$40-46 (varies by buyer; grass-fed premiums $36-52)50-60%36-month transition without organic premiums; buyer commitment required first
Farmstead Cheese/Processing$50-6560-70%3-5 year market development; requires proximity to metro areas 100 miles or less

For organic specifically, the transition requires careful planning. USDA organic certification requires three years of chemical-free land management before milk can be sold as organic—and during that transition period, you’re bearing organic production costs without organic premiums. Capital requirements typically run $50,000-150,000, depending on your starting point.

What I’m hearing from certifiers and industry groups is that certification costs have risen notably for 2025—the new Strengthening Organic Enforcement rule has created additional paperwork requirements, and several certifiers have raised prices in response. Factor that into your projections.

Some operations have navigated the transition successfully by phasing it across their land base, but it requires 18-24 months of cash flow management without premium returns. Go in with your eyes open.

For farmstead processing, the requirements are significant. Penn State Extension notes that total costs for setting up a cheese enterprise “can easily total over $100,000” depending on scale and regulatory requirements. Vermont case studies show a wider range—$15,000- $40,000 for small-scale farmer-built facilities processing limited volumes, up to $150,000- $ 500,000 for commercial, licensed operations with turnkey equipment.

You generally need proximity to markets—within 100 miles of metro areas with appropriate demographics—and patience. Plan on 3-5 years before profitability.

Northeast operations have shown particular success with this model, given the region’s population density and consumers’ willingness to pay premiums for local products. But I’ve also seen successful farmstead operations in unexpected locations—sometimes it’s about finding the right niche rather than the perfect geography.

This path suits operations near population centers with a genuine interest in marketing and brand-building. It’s not for everyone, but it’s created viable businesses for producers with the right circumstances and inclinations.

💡 BULLVINE INSIDER TIP: Premium Market Positioning

Before committing to organic transition or farmstead processing:

Organic pathway:

  • Secure a buyer commitment first — Contact organic processors (Organic Valley, Maple Hill, regional buyers) about supply needs before starting the transition. Some regions are oversupplied; others are actively recruiting. NODPA’s September 2025 pay price survey shows grass-fed organic premiums ranging from $36/cwt to $52/cwt, depending on the buyer and certification level.
  • Budget for the paperwork — Certification costs are up for 2025 due to the Strengthening Organic Enforcement rule implementation, and record-keeping requirements have increased substantially. Factor in 4-6 hours weekly for compliance documentation.
  • Model the transition cash flow — You’ll carry organic production costs for 36 months before organic premiums kick in. Most successful transitions maintain conventional income on part of the operation during this period.

Farmstead processing pathway:

  • Start with farmers markets — Test your product and build a customer base before investing in full retail infrastructure. Many successful farmstead operations started selling 50-100 pounds of cheese weekly at local markets.
  • Connect with your state extension — Penn State, Vermont, and Wisconsin all offer farmstead dairy programs with technical assistance and business planning resources that can help you avoid costly mistakes.
  • Visit operating farmstead dairies — Nothing replaces seeing the daily reality of retail cheese production. Most farmstead operators are generous with their time for serious prospective producers.

The Bottom Line

Looking at these dynamics—the structural shifts, the research findings, the strategic options—what should producers do?

I don’t think there’s one right answer. Different operations face different circumstances, and what works for a 2,000-cow Idaho dairy won’t necessarily fit a 400-cow Wisconsin operation or a 200-cow Vermont farmstead. You know your situation better than any analyst does.

But I do think waiting for commodity markets to resolve these questions isn’t a strategy. Processing investments are being made now. Supply relationships are being established now. Operations are positioning for the next decade; decisions are being made now.

If you take three things from this analysis, make them these:

First, pull your operation’s income-over-feed-cost trend and compare it against Penn State Extension benchmarks for your herd size. Know where you stand before choosing a path. The gap between average and top-quartile performance is where hundreds of thousands of dollars hide on mid-size operations.

Second, have a direct conversation with your cooperative or processor about their capacity plans for the next five years. Are they seeking supply? Locked into large-operation contracts? Planning new facilities? This isn’t information that comes to you automatically—you have to ask for it.

Third, understand where processing investment is flowing in your region and what supply characteristics those facilities are seeking. IDFA tracks the $11 billion investment wave; your state dairy association can often tell you what’s happening locally.

These aren’t the strategic decisions themselves—they’re the foundation for making those decisions clearly.

The collective questions the research raises—cooperative governance, policy engagement, industry organization—matter too, though they operate on longer timeframes and require collective action. Showing up at cooperative meetings, engaging with your board, participating in industry organizations… these things feel distant from daily farm management, but they’re how farmers influence the structures that shape their prices.

The farms that will be thriving in 2035 won’t be the ones that waited for conditions to improve. They’ll be the ones that understood conditions clearly and positioned themselves accordingly.

Resources for Further Information:

Key Takeaways:

  • Farm share of the retail dairy dollar has declined from 52% in 1980 to approximately 25% today, reflecting both legitimate supply chain costs and structural market dynamics
  • European research suggests that farmer organization and collective bargaining mechanisms may influence price transmission as much as processor market structure
  • $11 billion in new processing investment is reshaping the industry, with much of the capacity oriented toward export markets and large-scale supply relationships
  • On a well-managed 500-cow dairy, the gap between average and top-quartile execution could mean $350,000-550,000 annually—that’s the real opportunity in efficiency optimization
  • Mid-size operations face three viable strategic paths: efficiency optimization, collaborative or individual scale expansion, or premium market positioning
  • Strategic clarity and committed execution will distinguish operations that thrive through the next decade

Complete references and supporting documentation are available upon request by contacting the editorial team at editor@thebullvine.com.

Learn More

The Sunday Read Dairy Professionals Don’t Skip.

Every week, thousands of producers, breeders, and industry insiders open Bullvine Weekly for genetics insights, market shifts, and profit strategies they won’t find anywhere else. One email. Five minutes. Smarter decisions all week.
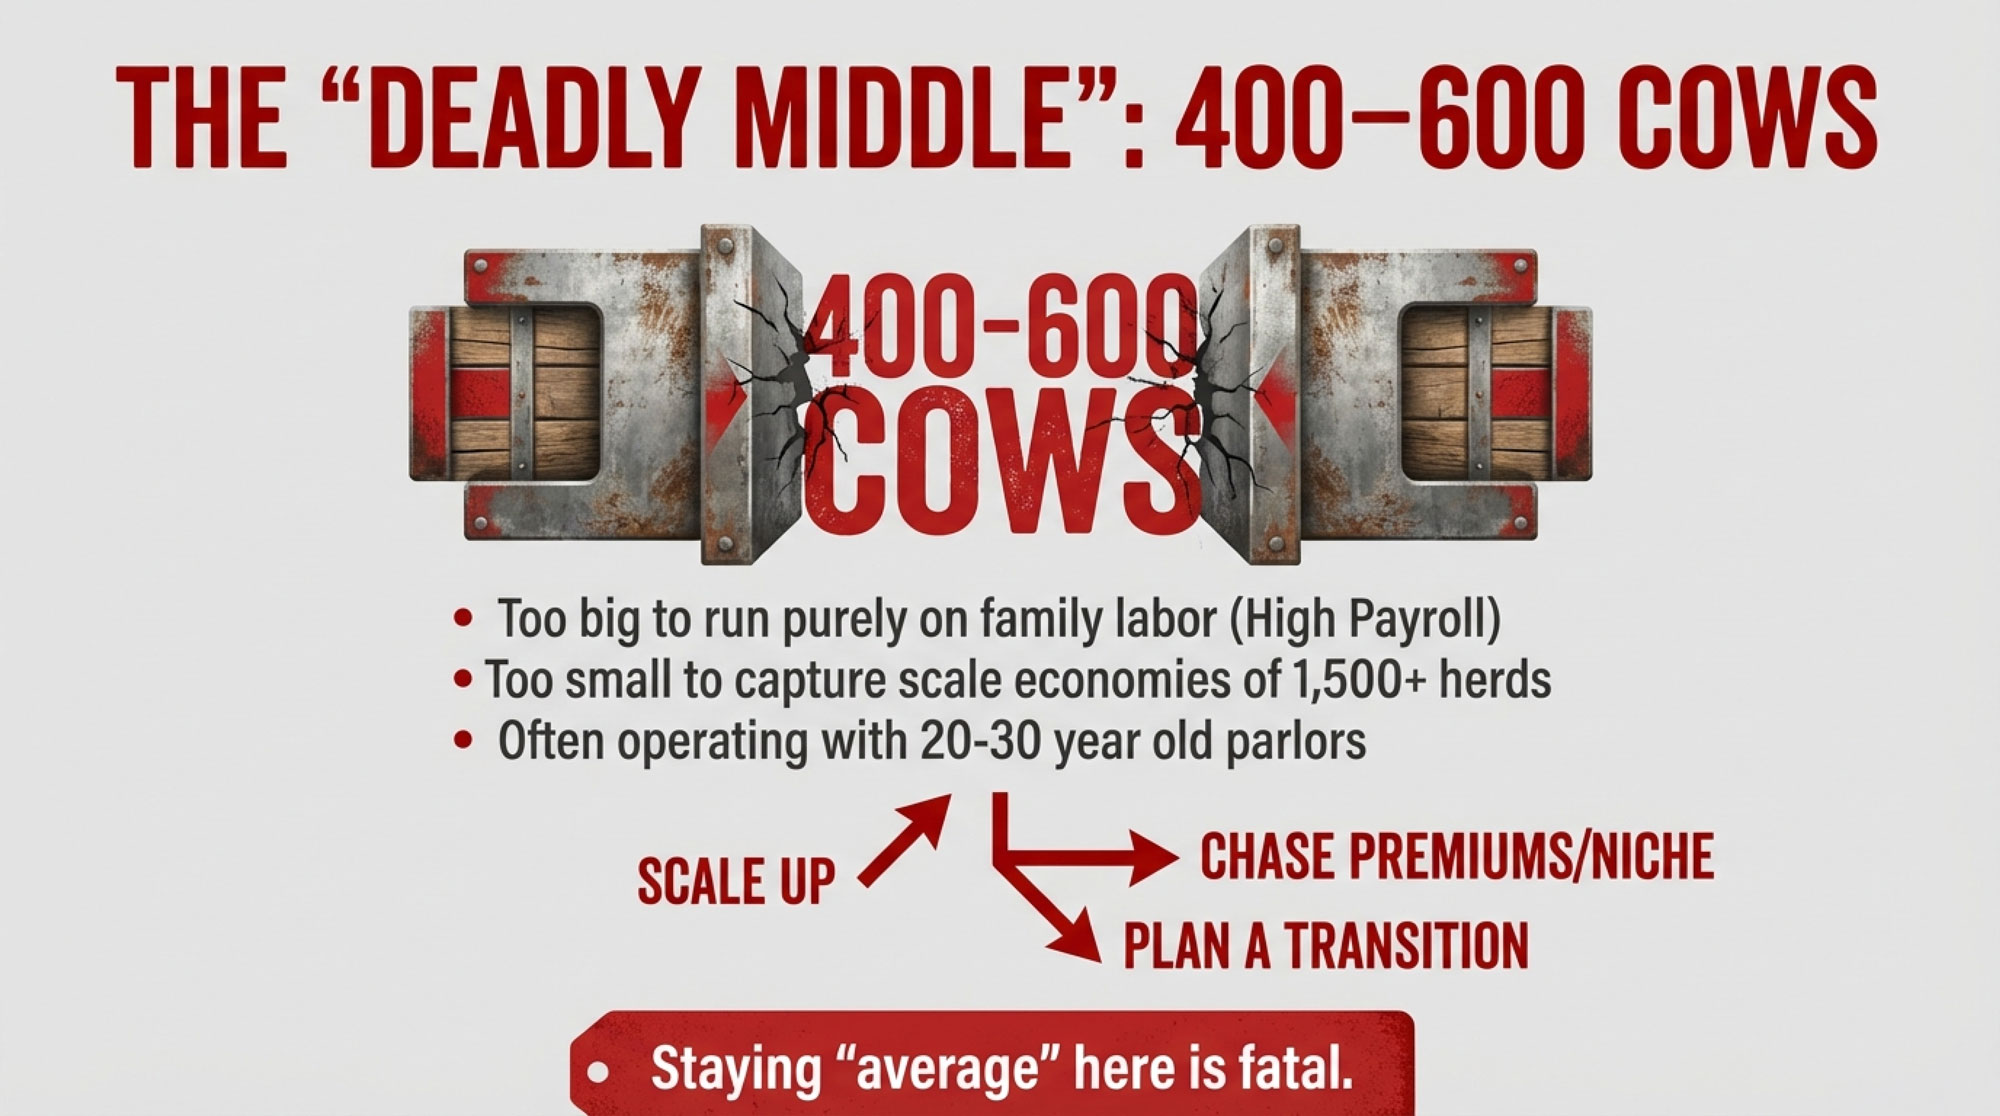
NewsSubscribe
First
Last
Consent

Whole Milk Won – $4.3 Billion Too Late. Your Playbook for the Next 90 Days (And the Next Policy Fight)

Congress just reversed the whole milk ban—$4.3 billion and 13 years after dairy farmers first called it out. But here’s the uncomfortable truth: the farms best positioned to profit aren’t the ones that fought for it. Your 90-day playbook to change that.

Executive Summary: Whole milk won—13 years and $4.3 billion too late. Congress reversed school milk restrictions in December 2025, finally acknowledging what a 28-study meta-analysis proved in 2020: children who drink whole milk have a 40% lower risk of obesity than those who drink skim. The catch for most producers: school contracts require 500+ gallons daily, effectively locking out two-thirds of U.S. dairy farms. But the opportunity is real if you know where to look—mid-sized operations should be pushing cooperatives toward whole milk school packaging lines, smaller farms can tap a $2.15 billion premium market where marketing fat as a feature beats hiding it, and component-focused genetics now align with both institutional and consumer demand signals. This playbook segments 90-day action steps by herd size because the market opportunity from this shift is unevenly distributed. The lesson that outlasts whole milk: surviving in dairy means building operations resilient enough to weather the years between when science proves you right and when policy finally catches up.

Whole Milk Policy Strategy

Thirteen years of watching kids push away skim milk cartons. $4.3 billion in estimated industry losses. Roughly one-third of U.S. dairy farms are gone.

And now, finally, whole milk is coming back to schools.

The U.S. Senate passed the Whole Milk for Healthy Kids Act by unanimous consent on November 20, 2025. The House followed on December 15. But before you celebrate, here’s the uncomfortable truth: the farms best positioned to capture this win aren’t necessarily yours—unless you’re running several thousand cows or you’ve already built direct consumer relationships.

So what can the rest of us actually do with this?

The Policy Shift at a Glance

 2012 Restrictions2025 Reversal
Flavored milkFat-free onlyWhole and 2% permitted
Unflavored milkFat-free or 1% onlyAll fat levels permitted
Saturated fat rulesMilk counted toward weekly limitsMilk exempted from sat-fat caps
Scientific basis1980s-era low-fat consensusA 2020 meta-analysis showing 40% lower obesity risk with whole milk
Market accessFavors large processorsStill favors large processors

The Component Math: Why This Actually Matters to Your Milk Check

Let’s talk numbers—because this is where the policy shift translates into real economics.

Whole milk contains 3.25% butterfat. Skim milk? Essentially zero. That’s a 3.25-pound butterfat difference per hundredweight.

According to the USDA’s November 2025 component price announcement, butterfat is currently priced at $1.71 per pound. That means whole milk in school channels carries approximately $5.56 per cwt additional butterfat valuecompared to skim.

Milk TypeButterfat %Nov 2025 Value/cwtJan 2025 Peak Value/cwt
Skim milk0.0%Baseline ($0)Baseline ($0)
1% milk1.0%+$1.71+$2.95
2% milk2.0%+$3.42+$5.90
Whole milk3.25%+$5.56+$9.59

Here’s where it gets interesting: butterfat prices have been volatile this year. Earlier in 2025, butterfat ran as high as $2.95 per pound back in January, which would put that same differential at roughly $9.59 per cwt. Even at today’s lower prices, the component value difference is meaningful.

Quick ROI comparison—Premium Channel Economics:

ChannelPrice per cwtAnnual Revenue (100 cows, 23,000 lbs/cow)
Commodity (Class III, Nov 2025)~$17.18~$395,140
Premium direct/organic (based on Intel Market Research organic grass-fed pricing, typically 2-3× conventional)~$40-50~$920,000-$1,150,000
Difference $525,000-$755,000

The math explains why producers willing to build direct relationships are capturing fundamentally different economics—even if the transition requires significant upfront investment.

The Genetics Connection: Breeding for a Whole Milk Future

Here’s something worth considering for those of you making breeding decisions right now: the whole milk policy shift adds another data point to an already strong case for component selection.

According to CDCB, the April 2025 genetic base evaluation showed unprecedented gains—Holsteins improved by 45 pounds for butterfat and 30 pounds for protein. The butterfat number’s almost double any number that’s taken place in the past.

The drivers are clear: genomic testing has improved selection accuracy, and multiple-component pricing allocates the majority of milk check value to butterfat and protein—the two components that drive your check under current FMMO formulas. With 61% of all dairy semen sold in the U.S. now coming from sexed categories, producers can accelerate genetic progress by creating heifer calves from top-component females while using beef semen on the rest.

Industry analysts projects that genetic selection could push average butterfat content above 5% within the next decade if herd nutrition can keep pace with genetics.

The practical takeaway for breeding programs: The whole milk policy shift reinforces demand signals that already favor component-focused genetics. If you’re not already emphasizing butterfat and protein in your sire selection, the economics increasingly favor that direction. Top Holsteins are now adding 45 lbs butterfat per genetic base reset—that’s real money showing up in component checks.

How We Got Here

The original policy wasn’t arbitrary. When the Healthy, Hunger-Free Kids Act passed in 2010, policymakers were responding to real concerns—childhood obesity had tripled since the early 1970s, climbing from around 5% to 15% by 2000, according to CDC data.

And you know what? The people who designed these policies weren’t acting in bad faith. They were working within the scientific framework available at the time. The problem? That framework had blind spots that dairy farmers spotted immediately.

Kids stopped drinking the milk. Schools added sugar to improve palatability. The anticipated health benefits never materialized.

When we chatted with a producer who runs a 650-cow operation near Fond du Lac, Wisconsin—who is a third generation on his family’s farm—he put it to me pretty directly: “We knew something was off within the first year. You’d watch the trash cans fill up with barely-touched cartons. The nutritionists were telling us fat was the problem, but we could see with our own eyes that kids just wouldn’t drink the stuff. My dad used to say the same thing about the low-fat push in the ’80s—consumers know what tastes right.”

It’s a sentiment I’ve heard echoed across dairy country, from Vermont to California.

What the Research Actually Found

The turning point came in February 2020. Dr. Jonathon Maguire, a pediatrician at the University of Toronto’s St. Michael’s Hospital, led a meta-analysis published in the American Journal of Clinical Nutrition that encompassed 28 studies across seven countries.

The findings were striking:

  • Children drinking whole milk had 40% lower odds of being overweight or obese
  • Not a single study showed that reduced-fat milk is associated with a lower obesity risk
  • The biological mechanism makes intuitive sense: dietary fats support satiety; remove them, and kids end up consuming more calories elsewhere

What I found particularly frustrating in this research was the timing. A 2013 University of Virginia study had already pointed in this direction—preschoolers who drank 1% or skim milk had higher odds of being overweight than peers who drank whole milk.

That study came out just one year after the restrictions took effect. It took seven more years for the Toronto meta-analysis and five more for the policy reversal.

Which raises an uncomfortable question many of us have asked ourselves: how many farms might still be operating if the policy had responded to evidence more quickly?

The Economic Damage

The American Farm Bureau’s analysis documents the consumption collapse pretty clearly:

  • School milk use fell from 4.03 cartons per student per week (2008) to 3.39 (2018)—a 15% drop
  • Rate of decline accelerated 77% after the 2012 rule change compared to the years before
  • An industry analysis by The Bullvine estimated a total economic impact of around $4.3 billion (though, like any economic model, that involves assumptions about multiplier effects and competitive dynamics)

“A policy that takes 13 years to correct can put an operation out of business long before the evidence wins out.”

The farm-level damage has been severe. USDA analyses show licensed U.S. dairy farms have fallen by roughly one-third over the past decade. You probably know some of those families personally.

Regional breakdown tells its own story:

State/Region2012 Licensed Farms2025 Licensed FarmsChange (Farms)% Decline
Vermont973439-534-49%
Wisconsin~11,800~6,800~-5,000~-42%
California~1,600~1,150~-450~-28%
Pennsylvania~6,800~4,900~-1,900~-28%
National (U.S.)~58,000~35,000~-23,000-40%
  • Vermont: 973 farms (2012) → 439 farms (March 2025 UVM Dairy Update)—a 49% decline
  • Wisconsin: Steady reduction throughout the decade, particularly among smaller herds
  • California: Fewer but larger operations capturing an increasing production share

Canadian producers operate under different economic conditions—quota systems insulate them from some commodity volatility but create constraints on fluid milk innovation. The whole milk policy shift is a U.S.-specific development, but Canadian producers watching cross-border trends should note the demand signals. If American consumers are increasingly seeking full-fat dairy products, that sentiment doesn’t stop at the border. Some Ontario and Quebec processors are already watching U.S. premium channel growth with interest, and there may be lessons here for Canadian direct-market producers positioning their own operations.

A third-generation Vermont producer who transitioned to organic during this period described the frustration I’ve heard from many in the region: the school milk situation was just one piece of the economic pressure, but it was the piece that felt most frustrating because producers could see with their own eyes it wasn’t working.

What the Reversal Actually Means for Markets

Here’s where we need to be realistic with each other.

The Farm Bureau projects whole milk could shift 2-3% of U.S. butter production into higher-value bottled milk channels. That’s meaningful volume—but it’s not transformational on its own.

The adoption timeline is going to stretch out:

  • Early 2026: Districts start releasing procurement RFPs
  • Spring 2026: Contract bids due
  • July 1, 2026: First-wave contracts begin
  • Year 1: Maybe 40-50% district adoption, realistically
  • Year 3: Perhaps 50-60% adoption

School milk procurement requires a minimum of 500 gallons per day and favors operations that can consistently meet volume and delivery demands. For herds under 300 cows—roughly two-thirds of remaining U.S. dairy farms—direct school contracts just aren’t realistic. The logistics don’t pencil out.

The “Missing Middle” Problem—And What to Do About It

If you’re running 300 to 1,000 cows, you’re in a tough spot. Too small for institutional school contracts. Too large (and too busy) for a farmers’ market stand on Saturday mornings.

But you’re not without options. And frankly, your cooperative’s board probably isn’t thinking about this as hard as you are. That’s your job to push them.

Pressure your cooperative to innovate. Farmers own their co-ops—you can sit on the board, attend meetings, and push for change. Major cooperatives, including DFA, Land O’Lakes, and California Dairies, all offer forward contracting and risk management programs for members. Land O’Lakes launched its Dairy 2025 Commitment, a sustainability and processing innovation initiative. Some specific asks worth raising at your next member meeting:

  • School-specific packaging lines for whole milk that your co-op can bid on district contracts
  • Higher-fat fluid product development—the demand signal from this policy shift is clear
  • Regional processing partnerships that keep more value closer to member farms

Consider cooperative processing arrangements. One Minnesota cooperative involving four farms with a combined 1,800 cows reports routing 25% of collective production through a small processing facility they financed together, according to a recent Bullvine analysis of mid-sized farm strategies. That portion generates roughly twice the commodity price. The remaining 75% continues through traditional channels, so they’re not betting the whole operation on one approach.

“We didn’t have the scale individually to make processing investment work,” one participating farmer explained. “Together we did.”

This isn’t quick or easy—figure 24-36 months for facility build-out and $200,000-$500,000 in shared investment. But for operations with geographic proximity and complementary goals, it’s worth having a feasibility conversation over coffee with neighboring farms.

What if you do nothing? Let’s run those numbers honestly. If you’re in the 300-1,000 cow range, shipping commodity milk at ~$17/cwt while premium channels deliver $35-50/cwt, every year of inaction leaves roughly $200,000-$400,000 on the table (depending on herd size and component production). Over a five-year window, that’s potentially $1-2 million in foregone revenue—capital that could have funded the very infrastructure needed to access premium markets. The cost of waiting isn’t zero, even if it feels safer in the short term.

Advocate for policy that helps mid-sized operations. The school milk win came from organized industry pressure sustained over the years. The same approach applies to FMMO reform, processing infrastructure grants, and cooperative development programs. Individual voices get lost; collective voices get heard.

Your 90-Day Action Checklist

For operations under 300 cows (direct-to-consumer potential):

  • [ ] Contact your state dairy promotion board about marketing support programs—Midwest DairyAmerican Dairy Association NortheastSoutheast Dairy Association, and regional councils often have resources specifically for small-scale direct marketing
  • [ ] Research farmers’ market requirements and seasonal milk subscription models in your region
  • [ ] Calculate your break-even point for premium channel investment (licensing, packaging, refrigeration)
  • [ ] Identify 2-3 neighboring farms for potential cooperative marketing conversations
  • [ ] Develop your “whole milk story” messaging for consumer-facing channels

For operations 300-1,000 cows (cooperative innovation focus):

  • [ ] Request your cooperative’s current school milk bid status and whole milk product plans
  • [ ] Attend your next cooperative member meeting with specific asks (school packaging lines, higher-fat fluid products)
  • [ ] Explore regional processing partnership feasibility with 2-3 neighboring farms
  • [ ] Review your forward contracting options through DFA, Land O’Lakes, or your current cooperative
  • [ ] Assess your genetics program’s component emphasis and adjust sire selection if needed

For operations 1,000+ cows (institutional positioning):

  • [ ] Contact your cooperative about direct school district procurement opportunities
  • [ ] Request information on your cooperative’s 2026 school milk RFP timeline and bid process
  • [ ] Evaluate your component production against school milk volume requirements
  • [ ] Explore branded whole milk partnership opportunities with regional processors
  • [ ] Consider school district direct outreach in your geographic area
Herd SizePrimary Opportunity90-Day Priority ActionInvestment/Timeline
<300 cowsPremium direct-to-consumer channelsContact state dairy promotion board; research farmers’ market + subscription models$15K-$50K (licensing, packaging, refrigeration); 6-12 months to first sales
300-1,000 cowsCooperative innovation + shared processingAttend co-op member meeting with specific asks (school packaging lines, higher-fat fluid products); explore regional processing partnerships$200K-$500K shared investment; 24-36 months facility build-out
1,000+ cowsDirect school district contracts + institutional positioningContact cooperative about 2026 school RFPs; request school milk bid timeline; explore branded whole milk partnershipsImmediate (contracts start July 1, 2026); leverage existing volume

The Premium Opportunity: Marketing the Fat

Here’s where smaller operations have a genuine advantage—if they understand what’s actually working out there.

Market research from Intel Market Research estimates the U.S. organic grass-fed milk market at $2.15 billion in 2025, projected to reach $3.28 billion by 2032 at roughly 7.3% annual growth. Subscription-based delivery models grew 92% over the past year alone.

But here’s what I’ve noticed watching the producers winning in this space: they’re not just producing premium milk. They’re marketing the fat. That’s a meaningful distinction.

Take Painterland Sisters, a fourth-generation Pennsylvania organic dairy. According to a recent Forbes profile, co-founder Stephanie Painter puts it directly: “We aimed to change the narrative surrounding milk fat.”

Their skyr yogurt contains 6% milkfat—double cream. According to Dairy Processing, each 5.3oz container holds the equivalent of four cups of milk. The sisters have emphasized that those healthy fats are central to their product’s nutritional profile—it’s a feature, not something to minimize or apologize for.

The result? Over 6,000 stores in all 50 states, including Whole Foods, Sprouts, and Publix. Forbes’ “30 Under 30” list. The fastest-growing yogurt brand in the natural foods space.

Their insight is instructive: the whole milk vindication isn’t just about returning to what was—it’s about actively marketing fat as a feature.

“Our story is what sets us apart on the shelves,” they told in a recent interview. “Every detail on the cup is designed to tell a story, bridging the gap between the farm and the fridge.”

For farms considering this pathway: launching farmers’ market sales, subscription programs, or an on-farm store requires real investment in licensing, packaging, and refrigeration. Your state dairy promotion board or cooperative extension office can connect you with producers who’ve made similar transitions in your region.

The honest question to ask yourself: Do you have the temperament for direct customer relationships, the capital for infrastructure, and the patience to build a brand? It’s not for everyone—and that’s okay. But for farms that fit the profile, the whole milk story provides a ready-made narrative that consumers genuinely want to hear right now.

Why Policy Correction Takes So Long

Understanding this dynamic helps prepare for whatever comes next—methane regulation, climate requirements, antibiotic restrictions. There’s always something on the horizon.

Research published in 2022 in the journal Public Health Nutrition examined the Dietary Guidelines Advisory Committee. The finding: 19 of 20 members (95%) had at least one documented financial or professional relationship with actors in the food or pharmaceutical industries.

Now, this doesn’t mean committees are corrupt or that members are consciously biased. What it illustrates is something more structural: these committees naturally draw from pools of credentialed experts who’ve built careers within existing consensus frameworks. Challenging established positions carries professional risk. Confirming them is safer. The incentive structure doesn’t reward rapid revision, even when new evidence accumulates.

The result? A system that changes slowly, regardless of how compelling the contradicting evidence becomes.

For producers, the takeaway isn’t that experts can’t be trusted. It’s that policy timelines operate on a different clock than farm economics. Plan accordingly.

Practical Lessons for What Comes Next

Build flexibility into your revenue structure. The farms that survived the last 13 years weren’t entirely dependent on a single market channel. Diversification provides a cushion when policy shifts unexpectedly against you.

One California producer I spoke with recently—running about 2,200 cows in the Central Valley—described it as “not putting all your milk in one tank.” He’s got relationships with three different buyers, plus a small direct-sales operation his daughter runs. When one channel gets disrupted, the others absorb the shift. It’s not complicated, but it requires intentionality.

Consider your story as an asset. If you’ve been farming through these years, you have credibility with consumers who’ve grown skeptical of institutional guidance. A farm that can authentically say “we knew whole milk was nutritious when experts said otherwise” has differentiation that larger operations simply can’t replicate.

Engage policy discussions before consensus hardens. The dairy industry’s organized response to school milk restrictions gained real momentum only after substantial damage had already accumulated. For emerging issues—such as methane regulation and climate requirements—earlier engagement yields better outcomes.

Plan for policy timelines, not evidence timelines. You might be right about the science for years before policy catches up. Your operation needs to survive that gap. That means capital reserves, operational flexibility, and revenue diversification that doesn’t depend on regulatory environments being rational.

The Bottom Line

The immediate market impact from whole milk’s return will be modest—a few percentage points of butterfat utilization, phased in over several years as districts convert.

But the broader lessons apply to whatever comes next:

  • Policy corrections take longer than farm economics can absorb. Build flexibility to survive the gaps.
  • Being right doesn’t automatically translate to market benefit. Thousands of farms closed while dairy farmers were correct about whole milk.
  • Market opportunity distributes unevenly. Large operations win on institutional contracts; small operations can win on premium positioning; mid-sized farms need cooperative innovation or collective processing strategies.
  • Direct consumer relationships provide policy insulation. And marketing the fat—not just producing it—is what’s actually working in premium channels.
  • Genetics reinforce the direction. Component-focused sire selection aligns with both premium market demand and institutional whole milk needs—top Holsteins are now adding 45 lbs butterfat per genetic base reset, and that’s real money showing up in component checks.

And honestly, that’s what this whole 13-year story comes down to. The farms that thrive going forward will likely be those that learned from this experience: not just that whole milk was right, but that surviving in this industry requires building operations resilient enough to weather the gaps between when evidence emerges and when policy finally responds.

That’s the real lesson here. Not just vindication—preparation.

We’ll be tracking school district adoption rates and Class I utilization by FMMO region throughout 2026—watch for quarterly updates on how whole milk demand is actually showing up in producer checks. 

KEY TAKEAWAYS

  • $4.3 billion too late: Whole milk won in December 2025—but one-third of U.S. dairy farms closed during the 13 years policy ignored the science that proved them right
  • School milk isn’t your opportunity (yet): Contracts require 500+ gallons daily, locking out two-thirds of farms. Push your cooperative to bid on school packaging—that’s how mid-sized herds access this market
  • Your 90-day move by herd size: Under 300 cows → premium direct channels (organic grass-fed is $2.15B, growing 7.3%). 300-1,000 cows → cooperative pressure + shared processing ($200K-$500K). 1,000+ cows → 2026 school RFPs start soon
  • Butterfat math favors whole milk: At $1.71/lb, whole milk carries $5.56/cwt more value than skim. Top Holsteins now add 45 lbs butterfat per genetic base reset—component breeding pays regardless of channel
  • Build resilience before the next policy fight: Thirteen years between science and policy correction is normal, not unusual. Methane rules, climate mandates, antibiotic restrictions—your operation needs to survive the next gap, not just celebrate this win

Complete references and supporting documentation are available upon request by contacting the editorial team at editor@thebullvine.com.

Learn More

The Sunday Read Dairy Professionals Don’t Skip.

Every week, thousands of producers, breeders, and industry insiders open Bullvine Weekly for genetics insights, market shifts, and profit strategies they won’t find anywhere else. One email. Five minutes. Smarter decisions all week.
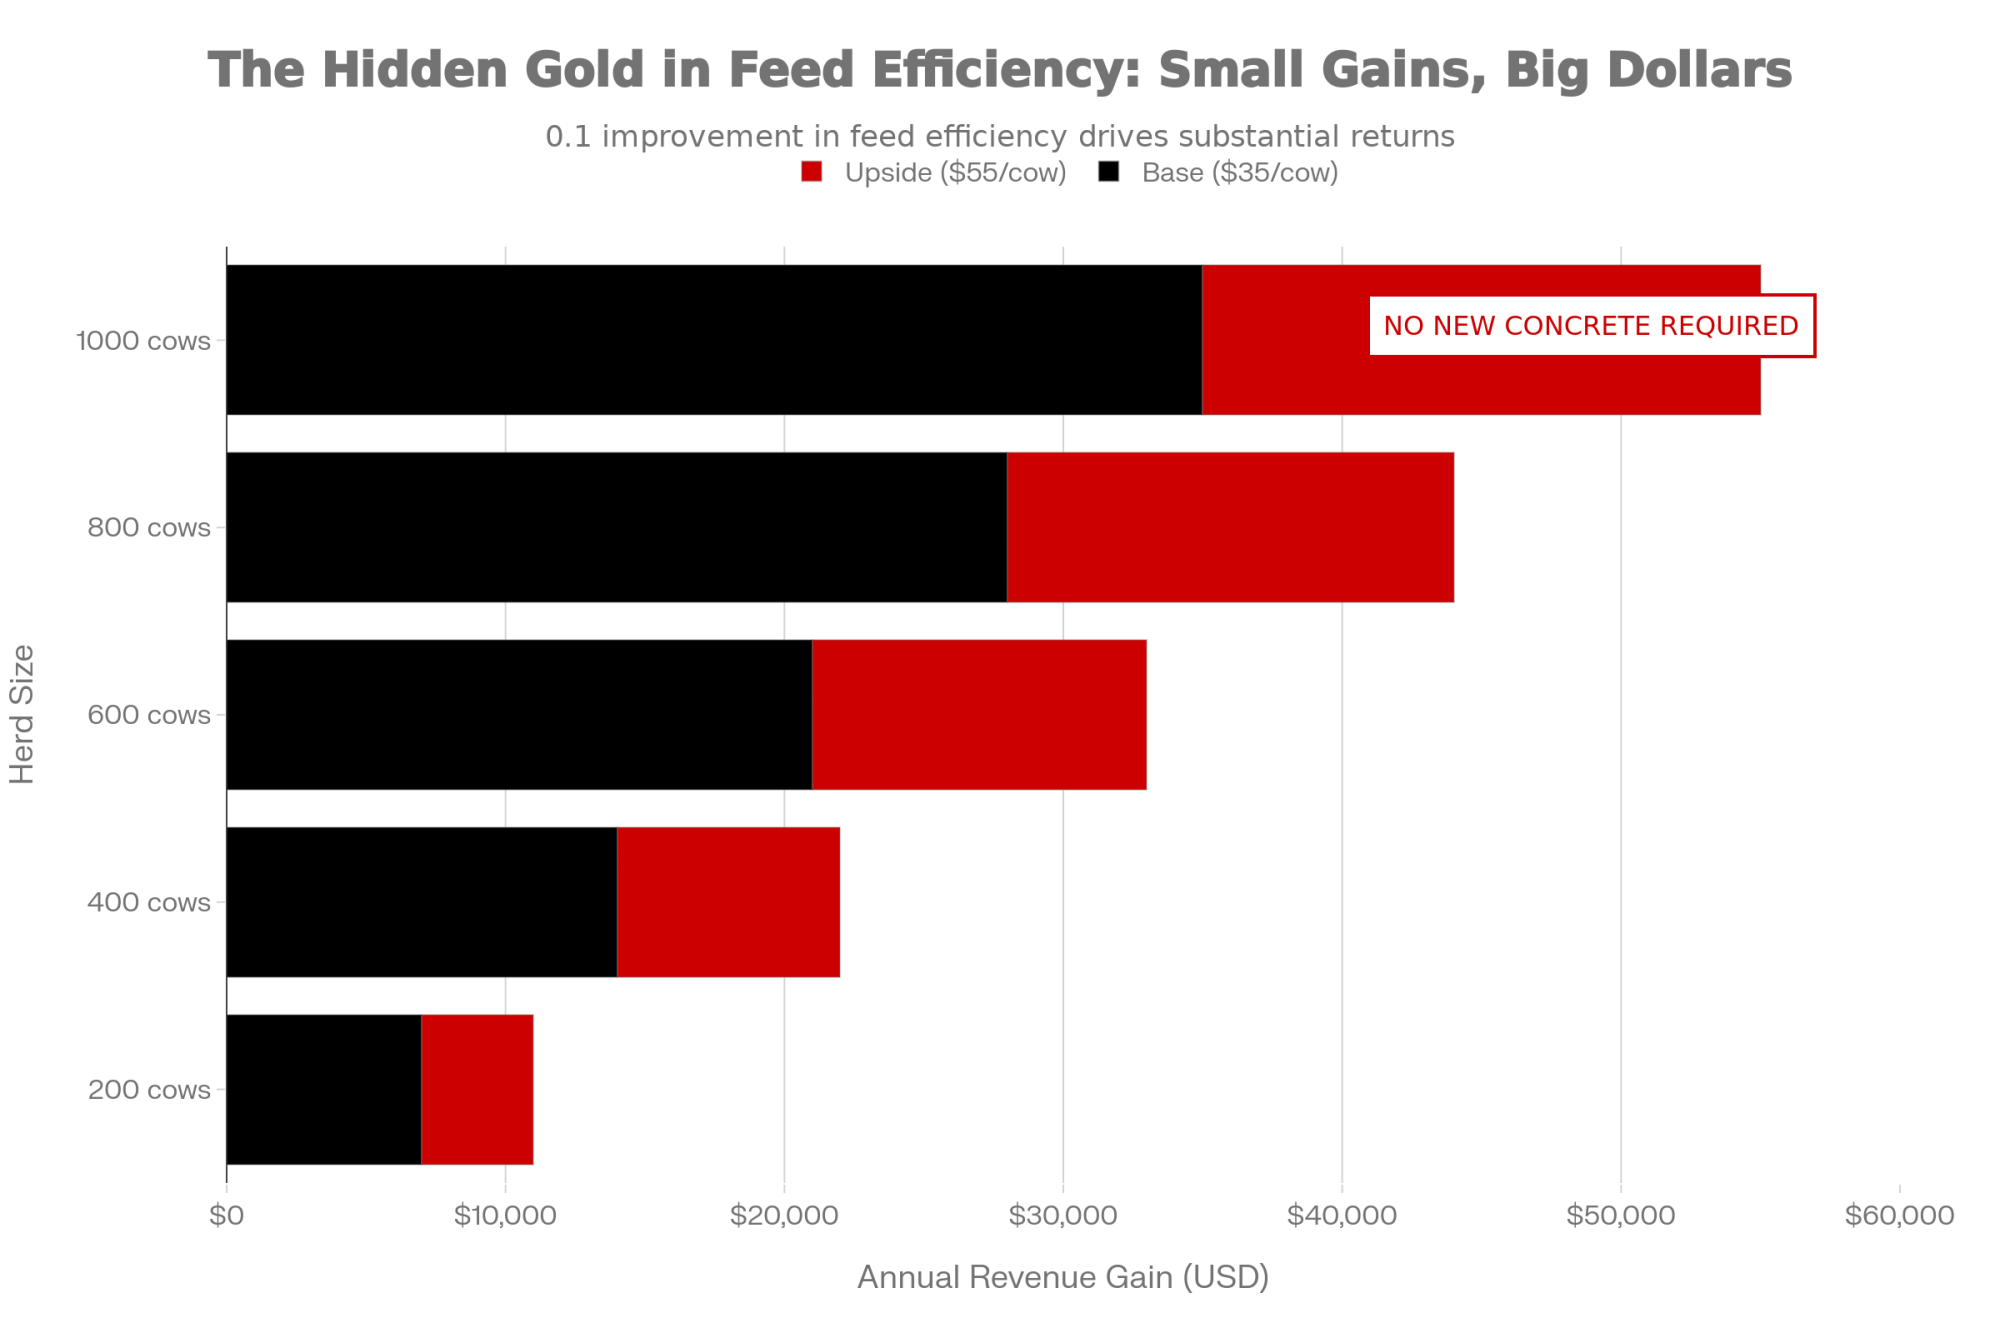
NewsSubscribe
First
Last
Consent

The Butterfat Reckoning: $337 Million Lost in 90 Days – And Your Herd’s Best Trait May Be Next

You bred for butterfat. You won. Now $337M is gone in 90 days—and processors want less of what made your herd profitable. The math changed. Did anyone tell you?

EXECUTIVE SUMMARY: U.S. dairy farmers lost $337 million in 90 days under new FMMO rules—and the genetics they spent a decade perfecting are now working against them. Butterfat climbed 13% since 2015, but protein didn’t keep pace: the average protein-to-fat ratio is 0.77, well below the 0.85-0.90 range processors need for efficient cheesemaking. Some plants have restructured contracts, paying reduced premiums for butterfat above threshold levels, while AFBF analysis shows Class price cuts of 85-93 cents per hundredweight. Canadian producers face parallel pressure—Western provinces shift from 85% butterfat pricing to 70% in April 2026. The playbook for 2026: get your contract terms in writing this week, calculate your herd’s ratio today, and select genetics for component balance rather than butterfat alone. The producers navigating this best understood their contracts before the rules changed.

When a 550-cow operator in east-central Wisconsin reviews his numbers these days, the economics look different than they did a few years back. His herd tests 4.58% butterfat—a genetic achievement that would have earned solid premium dollars not long ago. Today, his processor’s payment structure means production above a certain threshold earns reduced premiums.

“We did exactly what we were told to do for years,” he explained in a conversation for this article, asking that his name be withheld due to ongoing contract negotiations. “Now I’ve got daughters in the milking string from bulls I selected back in 2019, and I can’t change that overnight.”

He isn’t alone in this. Not by a long shot. For the past decade, U.S. dairy farmers responded to clear market signals. They bred for butterfat. They optimized rations for components. They invested in genetics that pushed Holstein herds from 3.75% butterfat in 2015 to 4.24% by 2024—a 13% increase in just ten years, according to USDA milk production data and Council on Dairy Cattle Breeding records. The CoBank Knowledge Exchange reported in September 2025 that this growth rate is roughly six times faster than that of the European Union or New Zealand over the same period.

Now, producers across the country are navigating a market where some of those premium structures are changing. Certain processors have adjusted how they value components above certain thresholds. Export markets that absorbed excess butterfat face trade policy questions. The situation keeps evolving, and thoughtful producers are adapting their strategies accordingly.

This isn’t a story about mistakes—farmers or otherwise. It’s a story about how pricing signals, genetic acceleration, and processor economics can create dynamics that shift over time. Understanding these forces helps us make better decisions going forward.

The Logic Behind Butterfat Focus

To understand the current landscape, it helps to revisit the reasoning that drove butterfat optimization. And honestly? The logic was sound based on the information and incentives available at the time.

Back in 2013, butterfat accounted for about 32% of the Class III milk price, according to Federal Milk Marketing Order data. By 2015, that figure had climbed above 50%. Then by July 2017—and those of you watching milk checks closely will remember this—butterfat was trading at $2.95 per pound while protein sat at $1.22. Nearly a 2.4:1 premium for fat over protein. Progressive Dairy documented this shift extensively, and it naturally influenced breeding priorities across the industry.

The genetic selection tools aligned with these market signals. Leadership at the Council on Dairy Cattle Breeding has explained that Net Merit$ weightings reflect what the market signals to producers—in this case, more fat and more components. The pricing system was essentially communicating: we value more butterfat.

The farm-level economics were compelling. According to analysis from June 2025, producing one pound of strategic butterfat over the past decade generated an average of $2.54 in gross income while requiring only about 52 cents in nutrient costs—a marginal net return of roughly $2.02 per pound. With numbers like that, breeding for fat made clear economic sense.

Key factors driving butterfat selection from 2014 to 2020:

  • Federal Milk Marketing Order pricing that rewarded components
  • Consumer demand is shifting toward butter, whole milk, and premium cheese
  • Genomic testing (available since 2009) enabling rapid genetic acceleration
  • Net Merit$ index weighting butterfat at historic highs
  • COVID-era quota systems that encouraged component density over volume

Genomic testing particularly accelerated the pace of change. Before 2009, genetic progress moved more gradually—farmers waited years for bull daughters to prove a sire’s value. After genomic testing became available, breeders could predict about 70% of a young bull’s genetic potential immediately, deploying high-butterfat genetics across the national herd within a few breeding cycles.

The April 2025 genetic base change illustrates this progress pretty clearly. Butterfat shifted by 45 pounds for Holsteins—an 87.5% larger adjustment than the 24-pound change in 2020, according to CDCB. That represents the fastest butterfat genetic gain in Holstein breed history.

Kevin Jorgensen, senior Holstein sire analyst at Select Sires, noted the continuing trajectory in January 2025: “Absolutely, we’re going to see additional gains. The emphasis placed upon this is not waning.”

So the genetics kept pushing forward even as some market dynamics began shifting underneath.

Understanding the Processor Side

This is where things get technical, but stick with me—it’s worth understanding because it explains what’s driving some of these contract changes.

Cheesemakers generally achieve better efficiency with milk at a protein-to-fat ratio roughly in the mid-0.80s to 0.90 range, though this varies somewhat by cheese type. At ratios in that range, fat and protein transfer into the cheese curd efficiently, waste is minimized, and yields are optimized. The American Dairy Products Institute has emphasized that standardizing the fat-to-protein ratio is one of the most important factors in ensuring optimal cheese quality and quantity.

Here’s the challenge. Current U.S. milk averages a ratio of about 0.77—down from the 0.82-0.84 range that held fairly steady from 2000 to 2017. The CoBank Knowledge Exchange reported in September 2025 that butterfat has been growing at roughly twice the pace of protein, which has driven the decline in that ratio. Both Feedstuffs and Hoard’s Dairyman covered this imbalance in their fall 2025 coverage.

MetricProtein-to-Fat Ratio
Current U.S. Average0.77
Processor Optimal Range (Low)0.85
Processor Optimal Range (High)0.90
Gap from Optimal-0.08 to -0.13

Research published in Frontiers in Veterinary Science has demonstrated that milk composition significantly affects cheese-making efficiency, with the protein-to-fat ratio playing a central role in determining both fresh and ripened cheese yields. When milk composition deviates from optimal ranges, processors can experience reductions in cheese output and higher nutrient losses in the whey stream.

Why does this matter to farmers? Because processors have costs they need to manage, and those costs ultimately affect what they can pay for milk.

Common processor approaches to managing composition:

  • Cream removal: Separating excess butterfat before cheesemaking, then selling that cream separately—sometimes at different margins than cheese
  • Protein fortification: Adding nonfat dry milk, condensed skim, or ultrafiltered milk to rebalance the ratio before processing
  • Ultrafiltration investment: Installing membrane technology to concentrate proteins and adjust composition

Each approach involves expense. From the processor’s perspective, they’re managing milk composition to optimize their operations. Understanding this helps explain why some contract structures are evolving.

What Farmers Are Experiencing

The picture became clearer for many producers in late 2025 when component premiums stopped scaling as they had previously. Reports from multiple regions indicate that some processors have introduced payment structures where the incremental value of butterfat above certain thresholds is reduced. While individual levels vary by contract, producers in several areas report that additional butterfat above their processor’s preferred range no longer receives full premiums.

In October 2025, cheese processors reported milk is too high in fat relative to milk protein. Some cheese plants were essentially saying, “Don’t send me more butterfat.” By December, industry analysis indicated that premiums for higher butterfat had diminished for production above certain thresholds. What we saw is, the milk check, it got way too heavy in components.

To illustrate how this might affect an operation:

For a 600-cow herd shipping about 13.8 million pounds of milk annually at 4.6% fat, if the payment structure recognized full premiums only up to a certain point—say around 4.5%—the 0.1-point difference would represent roughly 13,800 pounds of butterfat that might earn a reduced premium. At even $0.50 per pound reduction in premium value, that’s approximately $6,900 in foregone annual income—or roughly $11.50 per cow per year left on the table. The actual impact varies considerably by contract, but the math helps illustrate why this matters.

One aspect that keeps coming up in conversations is that these details weren’t always clearly communicated upfront. A central Wisconsin producer described his experience: “I had to sit down with three months of milk checks and back-calculate before I understood what was happening. Nobody had really walked me through how the payment structure worked at higher test levels.”

I heard something similar from a California producer in the San Joaquin Valley who’s been running the same analysis. “We’re at 4.4% fat and thought we were in good shape,” he shared. “Then I realized our processor changed how they calculate premiums above 4.2%. Different market out here, but same basic dynamic.”

This points to an opportunity—and one of the most practical recommendations we can make: understanding your specific contract terms in detail.

How Other Regions Approached Component Growth

An interesting comparison emerges when we look at how other major dairy regions experienced this same period. Why did European and New Zealand farmers see different outcomes?

The differences trace back to structural factors rather than farmer decision-making.

Breed composition plays a significant role. The U.S. dairy herd is predominantly Holstein—a single breed that responded uniformly to genomic selection pressure. When U.S. farmers bred for butterfat, the national herd moved in that direction together. New Zealand’s herd is about 60% Holstein-Friesian/Jersey crossbreeds—the “KiwiCross”—with the remainder split among various breeds. The EU has significant breed diversity across countries. Different breed mixes respond differently to selection pressure.

Jersey crosses naturally produce higher protein-to-fat ratios. When New Zealand farmers selected for components, they achieved more balanced improvements in both fat and protein.

Pricing structures created different incentives. U.S. Federal Milk Marketing Orders explicitly reward individual components—which is why U.S. farmers responded so directly to component signals. EU milk pricing is largely based on intervention prices for butter and skim milk powder rather than on component premiums paid directly to farmers, according to the European Commission DG AGRI Dashboard. Different incentive structures led to different breeding emphases.

Here’s how the numbers compare:

RegionButterfat 2015Butterfat 202410-Year Change
U.S.3.75%4.24%+13.0%
EU4.03%4.13%+2.5%
New Zealand5.02%5.14%+2.4%

Source: CoBank Knowledge Exchange analysis (September 2025) reporting actual 2024 calendar year data; CLAL international dairy statistics

New Zealand already had higher butterfat than the U.S. Their breeding programs emphasized maintaining ratio balance while improving overall efficiency. Neither approach is inherently superior—they reflect different market structures and breeding objectives. But understanding these differences helps contextualize the U.S. experience.

But the international comparison isn’t just academic—because those other regions are also our customers.

The Export Market Factor

During early to mid-2025, U.S. butterfat exports frequently ran more than 140% above year-earlier levels, with some months nearly tripling prior-year volumes, according to USDA Foreign Agricultural Service data. Brownfield Ag News reported in November 2025 that butterfat exports to Canada alone were up 73%, with butter exports climbing 190%.

That export growth absorbed domestic production and supported prices. But it also created dependencies worth monitoring.

Current export market concentration:

  • Mexico: More than 25% of all U.S. dairy exports—our largest and most consistent customer. CoBank’s December 2024 analysis noted that Mexico’s share of U.S. dairy product exports had grown to about 29% by late 2024.
  • Canada: Second-largest market by value at $1.14 billion in 2024
  • China: A key market for whey and specialty products, though exports have declined since 2022
Export MarketShare of U.S. Dairy Exports2026 Trade Risk
Mexico~29%USMCA renegotiation
Canada~18%Supply management tensions
China~12%Trade policy uncertainty
Other Markets~41%Mixed/regional

These three markets account for a substantial share of U.S. dairy export volume. All three face some degree of trade policy uncertainty heading into 2026, with USMCA renegotiation on the calendar and China trade dynamics continuing to evolve.

The American Farm Bureau Federation has described the U.S. dairy’s trade outlook as requiring careful navigation. CoBank’s lead dairy economist, Corey Geiger, has emphasized in multiple analyses that trade relationships—particularly with Mexico—are increasingly important to domestic market stability and that disruptions could pose significant challenges.

For producers focused primarily on their milk checks, trade policy can seem distant. But export market access affects domestic supply-demand balances, which ultimately influences what processors can pay.

What Canadian Producers Should Know

For our Canadian readers, the dynamics play out differently under supply management—but the underlying tension between fat and protein is creating similar conversations north of the border.

Canada’s Western Milk Pool is making a significant shift. The BC Milk Marketing Board announced in October 2025 that, effective April 1, 2026, Western Canadian provinces (British Columbia, Alberta, Saskatchewan, and Manitoba) will change their component pricing allocation from 85% butterfat / 10% protein / 5% other solids to 70% butterfat / 25% protein / 5% other solids. That’s a major rebalancing—protein’s share of producer payments will more than double.

ComponentCurrent (Pre-April 2026)New (April 1, 2026)Change
Butterfat85%70%-15 pts
Protein10%25%+15 pts
Other Solids5%5%

The signal is clear: even in a quota system that’s historically emphasized butterfat, there’s growing recognition that protein deserves more weight in producer payments. Canadian producers selecting genetics today should factor this shift into their breeding decisions. The April 2025 Canadian genetic evaluations highlighted sires like FRAHOLME VEC TRITON-PP, ranking 30th on GLPI with +940 kg Milk, +105 kg Fat, and +63 kg Protein—the kind of balanced production profile that may become increasingly valuable under the new payment structure.

Practical Approaches Farmers Are Taking

Producers who recognized these dynamics early have been adapting their strategies. Their approaches offer useful frameworks to consider—whether you’re running a 200-cow family operation in Vermont, a 2,000-cow dairy in the Central Valley, or something in between. Specific processor options and contract structures vary by location, but the underlying principles apply broadly.

Contract clarity has become a priority. The question on a lot of minds right now: “At what point does my component premium structure change, and how?” Getting this in writing enables informed decision-making about ration and genetic investments.

An eastern Wisconsin producer described his experience after getting clearer on his contract terms in fall 2025: “Once I understood exactly how the payment structure worked at different test levels, I could actually plan around it. Before that, I was working with incomplete information.”

Ration adjustments are becoming more common. Nutritionists report increased interest in shifting from maximum-butterfat rations toward balanced-component approaches. Typical adjustments include:

  • Reducing rumen-protected fat supplementation from 1.5% to 0.5% of dry matter
  • Increasing alfalfa hay/haylage proportion for protein support
  • Adding rumen-protected amino acids (lysine, methionine) to maintain protein while moderating fat

University of Minnesota dairy nutrition work led by Isaac Salfer, assistant professor of dairy nutrition, suggests that in many herds, component changes begin to show within roughly 4-6 weeks of a ration adjustment, with new steady-state levels often reached by 8-12 weeks—though actual timelines can vary by herd and ration specifics. These aren’t overnight changes, but they’re not multi-year horizons either.

  • Exploring processor options makes sense. Farmers with competitive alternatives are obtaining quotes from multiple processors before contract renewals. Even without switching, documented alternatives provide useful context for conversations with current partners.
  • Revenue diversification continues expanding. The beef-on-dairy approach has gained significant traction, with Holstein/Angus and Jersey/Angus cross calves commanding premium prices at weaning, according to recent USDA livestock market reports. Breeding a portion of the herd to beef genetics generates meaningful calf revenue—diversification that reduces dependence on any single revenue stream. Several producers I’ve spoken with describe this as one of their more impactful recent decisions.
  • Genetic planning is evolving. While existing genetics represent previous decisions—those daughters are already producing—future breeding choices can emphasize a balance between protein and fat alongside other traits. Sire catalogs still feature many high-butterfat genetics. Dairy Global reported in January 2025 that among the top 100 Holstein sires, only six were negative for the fat test. But balanced-ratio options exist. The April 2025 evaluations identified sires showing strong component balance—bulls transmitting positive deviations for both fat percentage and protein percentage, rather than fat alone. When reviewing sire summaries, look beyond total pounds to the percentage deviations and the fat-to-protein relationship in the proof.

What’s Likely to Change

Now, I know federal order math isn’t anyone’s favorite topic, but the numbers here matter because they’re already hitting milk checks.

The 2025 FMMO reform isn’t just a policy update—it’s a fundamental reset of the American milk check. After a record 49-day national hearing that concluded in January 2024, USDA released its final decision on November 12, 2024. Producers in all 11 federal orders voted to approve the changes, and the new pricing formulas took effect June 1, 2025, according to USDA’s Agricultural Marketing Service.

Product CategoryMake Allowance Increase (¢/lb)
Cheese5.0
Butter5.4
Nonfat Dry Milk5.9
Dry Whey6.6

The changes are substantial. Make allowances increased by 5 to 7 cents per pound across cheese, butter, nonfat dry milk, and dry whey—representing a larger share of wholesale value going to processors. Farm Credit East documented the specific increases: cheese up 5 cents, butter up 5.4 cents, nonfat dry milk up 5.9 cents, and dry whey up 6.6 cents per pound.

The financial impact has been significant. Danny Munch, economist with the American Farm Bureau Federation, told Brownfield Ag News in June 2025 that once you net the negative make allowances against the benefits from updated Class I differentials and the return to the “higher of” Class I mover, dairy farmers still face meaningful losses. By September 2025, AFBF’s detailed analysis showed farmers had lost more than $337 million in combined pool value in just the first three months under the new rules, with Class price reductions ranging from 85 to 93 cents per hundredweight depending on the order.

The composition factor changes—updating baseline assumptions to 3.3% protein, 6% other solids, and 9.3% nonfat solids—took effect December 1, 2025, according to USDA’s final rule. These updated factors finally acknowledge what’s actually in today’s milk rather than formulas designed when milk tested around 3.5-3.6% fat and 3.1% protein.

Between processor payment restructuring and FMMO reform impacts, high-butterfat herds face a potential double squeeze heading into 2026. The producers navigating this best are those who understood their contracts before the rules changed—and who are now positioning their herds for what processors actually need, not what the old incentives rewarded.

Processor consolidation continues. The Arla Foods/DMK Group merger, expected to complete in 2026, will create a cooperative of more than 12,000 member farms processing approximately 19 billion kilograms of milk annually—the largest dairy company in Europe, according to Dairy Reporter’s April 2025 coverage. Similar consolidation dynamics exist in other regions. Larger processors typically have greater standardization capacity and different economics for managing milk composition.

Component evaluation discussions are evolving. CoBank economists suggested in their September 2025 analysis that protein may increasingly drive breeding decisions as market conditions evolve. Industry discussions increasingly focus on developing selection tools that emphasize component ratio balance rather than maximizing individual components—a recognition that what processors need and what the genetic indexes have been rewarding may not always align perfectly.

Industry leaders continue pushing for mandatory processor cost surveys to inform future make allowance discussions. NMPF CEO Jim Mulhern emphasized in October 2025 comments to Brownfield Ag News that ongoing reform is necessary for the federal order system to remain effective. The conversations are happening at every level, from cooperative boardrooms to Capitol Hill.

Your Monday Morning Checklist

  1. Get your contract in writing—this week. Call your processor or co-op field rep and request complete written documentation of how component payments work at different test levels. Don’t accept verbal explanations. You need the actual payment schedule showing where premiums flatten or decline.
  2. Calculate your herd’s protein-to-fat ratio today. Pull your last DHI test or bulk tank analysis. Divide protein percentage by fat percentage. If you’re below 0.80, you’re producing milk that costs your processor money to rebalance. That matters for your next contract conversation.
  3. Review one month of ration costs against component returns. Sit down with your nutritionist this month and calculate the actual ROI on your rumen-protected fat supplementation. At current component values, is that investment still paying?
  4. Get a competitive quote before your next contract renewal. Even if you have no intention of switching processors, having documented alternatives strengthens your position. Make three calls.
  5. Flag three sires in your tank for ratio review. Look at your current AI lineup. For each sire, check whether the fat percentage deviation significantly exceeds the protein percentage deviation. Consider whether that balance still serves your operation’s future.
  6. Set a calendar reminder for trade and policy news. Block 15 minutes monthly to scan USDA export reports and FMMO announcements. What happens in Washington and at the border affects your milk check more than most producers realize.

The Bottom Line

The butterfat gains achieved between 2015 and 2024 represent remarkable genetic progress. U.S. farmers responded effectively to market signals and improved their components, while their global counterparts didn’t. The current situation isn’t about those decisions being wrong—it’s about market conditions evolving and creating opportunities for strategic adjustment.

What producers across the Midwest and beyond are experiencing is a transition period. The signals were real, the decisions were rational, and the current landscape calls for thoughtful adaptation. The opportunity now lies in applying the same analytical approach that drove butterfat gains toward more balanced outcomes: genetics aligned with processor requirements, contracts with clear terms, and diversified revenue that provides flexibility.

The question every producer should be asking their co-op board right now: When did you know component pricing was shifting, and why didn’t you tell us?

“I’m not upset about it,” the east-central Wisconsin producer reflected. “I’m just adjusting. That’s what we do. But I wish somebody had laid out the whole picture five years ago instead of just highlighting the premium check.”

Farmers who recognized these dynamics and began adapting in 2025 will likely view this period as a recalibration rather than a setback. The question for every operation is whether current decisions account for where markets are heading—not just where they’ve been.

Additional Resources

For those interested in exploring these topics further:

  • Council on Dairy Cattle Breeding (CDCB): Genetic evaluation tools and Net Merit$ component weightings at uscdcb.com
  • University of Minnesota Extension Dairy: Research on component management through nutrition at extension.umn.edu/dairy
  • CoBank Knowledge Exchange: Quarterly dairy economic analyses, including component and trade reports at cobank.com
  • USDA Agricultural Marketing Service: Federal Order pricing data and component values at ams.usda.gov/market-news/dairy

In upcoming coverage, The Bullvine will examine specific breeding strategies for optimizing the protein-to-fat ratio over a five-year genetic plan—including which sire lines are showing promising balance characteristics for evolving market conditions.

KEY TAKEAWAYS 

  • $337 million gone in 90 days — FMMO reforms cut Class prices 85-93¢/cwt. This isn’t projection—it’s already hitting milk checks.
  • The ratio gap is driving it — U.S. milk averages 0.77 protein-to-fat. Processors need 0.85-0.90. That mismatch explains why contracts are changing.
  • Premium structures are shifting — Some plants now cap full butterfat premiums at threshold levels. Most producers haven’t seen their actual payment schedule. Have you?
  • Canada confirms the trend — Western provinces shift from 85% butterfat pricing to 70% in April 2026. Protein’s value is rising on both sides of the border.
  • Three moves to make this week: (1) Get your contract payment terms in writing. (2) Calculate your herd’s protein-to-fat ratio. (3) Review your sire lineup for component balance.

Complete references and supporting documentation are available upon request by contacting the editorial team at editor@thebullvine.com.

Learn More

The Sunday Read Dairy Professionals Don’t Skip.

Every week, thousands of producers, breeders, and industry insiders open Bullvine Weekly for genetics insights, market shifts, and profit strategies they won’t find anywhere else. One email. Five minutes. Smarter decisions all week.
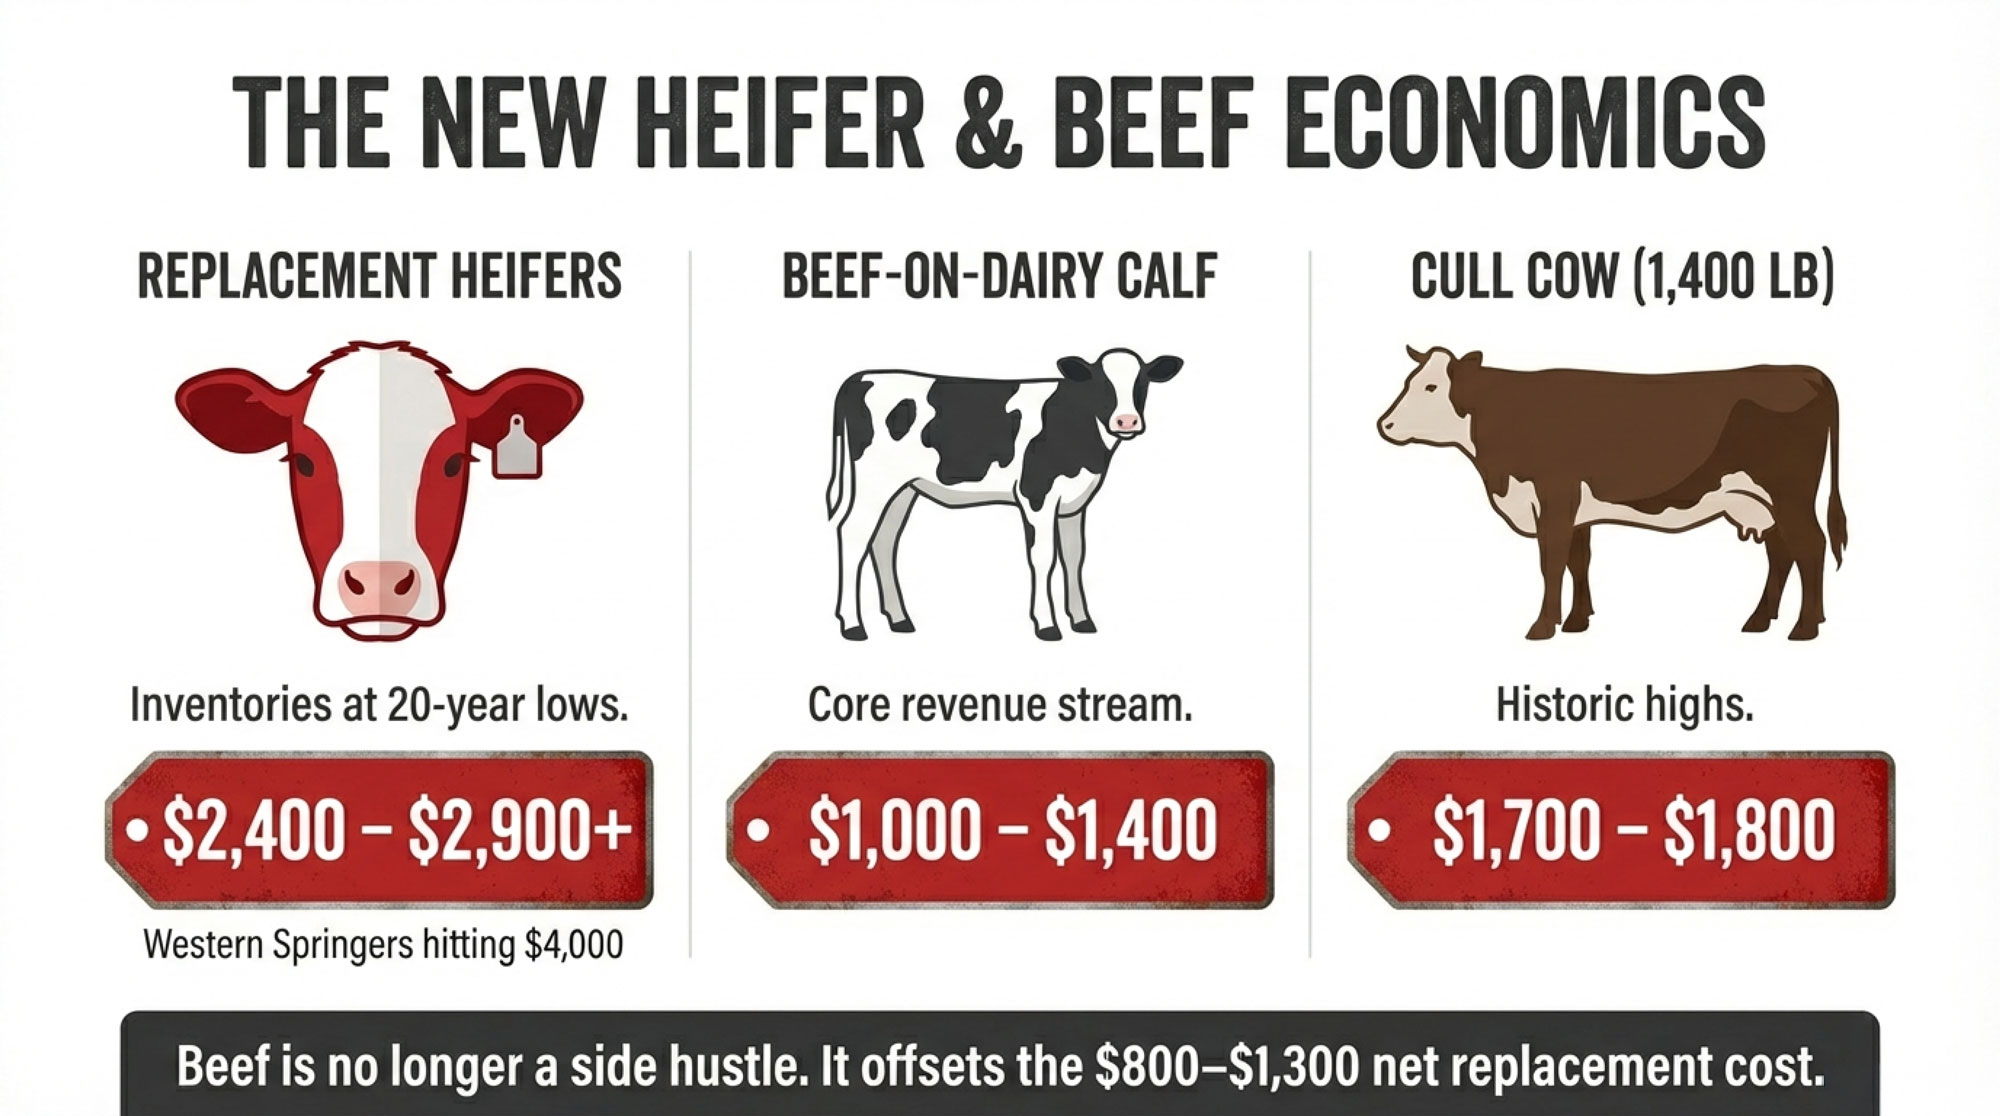
NewsSubscribe
First
Last
Consent

Stop Tightening Your Belt: Dairy’s $6.35/cwt Gap and Your 90-Day Window to Close It

90 days to reposition before 2026 hits. The top 25% of dairy operations already moved. This is the playbook they’re using.

EXECUTIVE SUMMARY: Tightening your belt won’t save you this time. The shifts hitting dairy in 2025-2026—production running 4.7% above year-ago levels, replacement heifers at a 47-year low, butterfat collapsed from $3.00 to $1.40/lb, processors leveraging billions in new capacity—aren’t cyclical headwinds that reverse when prices recover. They’re structural changes to how this industry operates. Cornell Pro-Dairy data makes the stakes clear: a $6.35/cwt efficiency gap separates top-quartile from bottom-quartile farms, a difference exceeding $100,000 annually between similar-sized operations. The producers repositioning now—locking in feed costs, enrolling in risk management before January deadlines, recalibrating breeding programs for the beef-on-dairy era—will be the ones thriving in 2028. You have a 90-day window. This is the playbook.

Dairy Market Shift 2026

You’ve probably seen the headlines by now. U.S. milk production has been running hot—really hot—through the back half of 2025. We’re talking 3.7 to 4.2 percent above year-ago levels in September and October, and then November came in at 4.7 percent higher than the same month in 2024, according to USDA’s latest milk production reports and Cheese Reporter’s analysis of the data. That’s the kind of year-over-year growth we haven’t seen since the COVID recovery period.

And the industry is still figuring out where all that extra milk should go.

USDA’s November estimates show the national dairy herd has grown to approximately 9.57 million head—up 211,000 cows from a year ago. Per-cow productivity keeps climbing, too. USDA data shows milk per cow running 20 to 40 pounds higher per month than a year earlier across the major dairy states.

When you multiply those gains across millions of cows, you end up with substantial incremental production that needs to find a home.

I’ve been tracking dairy markets for a long time, and this moment feels genuinely different. Not catastrophically so—dairy will remain viable, and there are real opportunities for well-positioned operations—but different enough that the playbook from 2016 or 2020 may need some adjustment in 2026.

Let me walk through what’s actually happening and what it might mean for your operation.

The Production Picture That’s Emerging

The supply situation requires some unpacking because it’s not just about one factor. It’s several forces converging at once.

Herd numbers have expanded meaningfully after years of modest growth, and productivity gains keep compounding. Modern genetics and management practices—better transition cow protocols, improved fresh cow management, tighter reproduction programs—keep pushing output higher. That additional 20-40 pounds per cow per month doesn’t sound dramatic until you’re looking at the national numbers.

The regional story has gotten interesting, too. Some areas hit by HPAI and weather challenges in 2024 saw temporary production setbacks, but by late 2025, USDA data show California’s milk output actually rising sharply—up about 6.9 percent year-over-year in October—as both cow numbers and per-cow production recovered.

Meanwhile, expansion in Texas, parts of the Upper Midwest, and states like South Dakota continues to reshape the geography of the U.S. milk supply.

I recently spoke with a producer in the Texas Panhandle who has been farming for 30 years. He noted that five years ago, he could count the large dairies in his county on one hand. Now there are several major operations within a reasonable drive, all competing for the same labor pool and feed resources. That kind of regional shift creates both opportunities and new competitive pressures.

What economists like Dr. Marin Bozic at the University of Minnesota have been tracking is a fundamental geographic redistribution of U.S. milk production. The industry is less concentrated in traditional dairy regions, which has real implications for processor logistics and regional pricing.

For our Canadian readers, the contrast is striking—while U.S. producers navigate oversupply pressure, Canada’s supply management system, with quota prices ranging from CAD $24,000 to over $56,000 per kilogram of butterfat per day, depending on province (according to Agriculture Canada’s 2025 data) and tariffs of 200-300% on imports creates an entirely different market reality. That protection comes with its own trade-offs, but it insulates Canadian producers from the volatility American farmers are facing.

So what does this mean practically? USDA forecasts indicate domestic production will likely continue exceeding consumption growth through at least mid-2027. That suggests continued pressure on milk prices—though as always, unexpected developments could change the trajectory.

What’s Actually Happening to Component Premiums

For a lot of operations, component pricing—particularly butterfat premiums—has been a crucial margin driver over the past several years. That dynamic is shifting in ways worth understanding.

Butterfat values have come down significantly from their recent peaks. CME spot butter prices, which topped $3.00 per pound at various points in 2023-2024, have declined through 2025. By August, prices had dropped to around $2.18 per pound according to market tracking. September brought a new year-to-date low of around $2.01.

And by October, butter had fallen to $1.60 per pound. As of late December, we’re looking at butter trading in the $1.40 range—a meaningful change in butterfat economics that affects the math for many feeding strategies.

What’s driving this? A combination of factors. Farmers responded to high premiums by selecting for higher-fat genetics and adjusting rations—exactly what economic incentives encourage. At the same time, retail demand for butter and full-fat products has moderated somewhat. Supply caught up with demand, and premiums softened accordingly.

As Dr. Mike Hutjens, Professor Emeritus of Animal Sciences at the University of Illinois, has emphasized in his extension work over the years, chasing very high butterfat often raises feed costs faster than it raises milk checks. Many herds find better margins around moderate butterfat—say, 3.8 to 4.0 percent—with solid protein performance, rather than pushing fat above 4.2 percent and paying for the extra inputs.

That guidance feels particularly relevant given where butter is now.

Of course, every operation is different. Farms with cost-effective access to high-fat supplements may still find the economics work. The key is running the numbers for your specific situation rather than assuming what worked in 2023 still pencils out today.

It’s also worth noting that Federal Milk Marketing Order modernization proposals released by USDA in late 2024 are expected to adjust how components are valued over time. How butterfat and protein strategies pay going forward may look quite different than what we’ve seen in the past few years.

The Genetic Revolution That’s Rewriting Replacement Math

Let’s be direct about something: What’s happening with replacement heifers isn’t just a market trend or a temporary shortage. It’s a genetic revolution that has fundamentally altered how dairy farmers must think about herd replacement—and most operations haven’t yet fully grasped the implications.

USDA’s January 1, 2025, Cattle Inventory report shows 3.914 million dairy heifers 500 pounds and over. That’s the smallest number since 1978, as Dairy Reporter and multiple other outlets have noted. We’re at a 47-year low for replacement inventory.

The data from USDA and HighGround Dairy shows just 2.5 million dairy heifers expected to calve in 2025—the lowest level since that dataset began in 2001. That’s a drop of 0.4 percent compared to 2024, and industry analysts suggest tight replacement numbers will keep heifer availability constrained for several years.

Here’s what makes this different from previous heifer shortages: this one was deliberately created through breeding decisions.

The beef-on-dairy movement isn’t some accident of market forces—it represents a fundamental shift in how progressive dairy operations view their genetic programs. Every breeding decision is now a strategic choice about whether you’re in the business of making milk, making beef, or both.

The old mental model—breed everything dairy, cull what doesn’t work—is obsolete. The new reality requires treating your replacement pipeline as a distinct enterprise with its own P&L, not an afterthought of your breeding program.

The economic forces driving this shift were compelling. When beef calves were bringing $750 more than they had been two years prior, concentrating dairy genetics on your best animals while capturing beef premiums on the rest made perfect sense. USDA and industry commentary explicitly connect lower replacement inventories to increased use of beef semen on dairy cows.

But here’s what the numbers don’t always show: The farms that executed this strategy well didn’t just chase beef premiums—they simultaneously intensified their genetic selection on the dairy side. They used genomic testing to identify the top 30-40% of females, bred them aggressively with sexed dairy semen, and captured beef value on the rest.

The April 2025 CDCB genetic base change—moving the reference population from cows born in 2015 to cows born in 2020, with updated Net Merit formula weights—gives producers better tools for these decisions. The December 2025 evaluation updates added further refinements to health and type trait data, according to CDCB. Farms making breeding decisions without current genomic information are essentially flying blind in this new environment.

The farms that got caught were the ones who saw beef-on-dairy as a revenue grab rather than a genetic strategy. They reduced dairy breedings without upgrading the genetic intensity of the ones they kept.

Consider a scenario many Midwest operations have navigated: A 600-cow Wisconsin dairy that shifted from 70 percent gender-sorted dairy semen to 40 percent in 2024 might have captured an additional $300,000 in beef calf revenue that year. But that same operation now faces needing 75-100 more replacement heifers than their breeding program will produce—a gap that requires careful planning to address at current prices.

The gain was immediate and visible. The cost is delayed and often larger.

“We got caught up in the beef premium along with everyone else,” one 700-cow operator in central Wisconsin told me. He asked to stay anonymous, which is understandable. “The checks were great in 2024. Now I’m looking at replacement costs that eat into those gains significantly. Looking back, I might have maintained a higher percentage of dairy breedings. But the economics at the time pointed toward beef.”

Recent reports show that U.S. replacement dairy cow prices are reaching record highs in late 2025, with many quality cows and bred heifers trading well above earlier levels of $2,000-$2,200. At those prices, buying your way out of a heifer deficit isn’t just expensive—it may not be possible at scale.

The strategic question every operation needs to answer: What percentage of your herd represents your genetic future, and are you breeding them accordingly?

The good news is that farmers are recalibrating. The National Association of Animal Breeders reports gender-sorted dairy semen sales grew by 1.5 million units in 2024—a 17.9 percent growth rate in just one year—as producers adjust their programs.

The farms that will thrive in this new environment aren’t abandoning beef-on-dairy—they’re getting smarter about it. They’re using genomics to make precise decisions about which animals deserve dairy genetics and which should produce beef calves. They’re treating replacement inventory as a strategic asset, not a byproduct.

This is the genetic revolution in action. The question is whether you’re driving it or being driven by it.

The Power Shift to Those Who Own the Stainless Steel

Let’s talk plainly about something the industry doesn’t always acknowledge directly: The power dynamic between dairy farmers and processors has fundamentally shifted. The leverage now belongs to those who own the stainless steel.

Significant processing capacity has come online over the past several years. Industry reports from Cheese Reporter, CoBank, and others tally multi-billion-dollar investments in new cheese, butter, and specialty dairy plants in the U.S.—with estimates ranging from $7 billion to $11 billion in committed or recent capacity additions, depending on the source and timeframe.

Major projects from Hilmar, Bel Brands, Leprino, and others were predicated on expectations of continued milk supply growth and strong export demand. These processors made massive bets on dairy’s future—and now they need milk to justify those investments.

Here’s where it gets uncomfortable: Analysts and trade publications report that several recently commissioned cheese and powder plants are running below their designed capacity.

That creates enormous pressure for processors carrying major capital investments. And that pressure flows directly to farmers in the form of supply commitments, pricing structures, and partnership terms that increasingly favor the processor’s position.

Run the numbers from their side. A $500 million cheese plant sitting at 70 percent utilization is bleeding money. The incentive to lock up milk supply through multi-year agreements, financing arrangements, and expansion partnerships isn’t altruism—it’s survival.

The Darigold situation in the Pacific Northwest illustrates this dynamic clearly. Local reports indicate their new Pasco, Washington plant has seen its price tag rise from initial estimates of $600 million to over $900 million—approximately $300 million over budget. As a result, the cooperative has implemented a $4 deduction per hundredweight from member milk checks, with $2.50 allocated explicitly to construction costs.

Even in a cooperative structure—where farmers theoretically own the processing—the capital requirements of modern dairy manufacturing mean producers are effectively captive to infrastructure decisions made on their behalf. For a farm shipping 5 million pounds monthly, that $4 deduction represents $200,000 annually coming out of your check. Whether you are in a co-op or independent, if you aren’t auditing the ‘why’ behind your check deductions in 2026, you’re essentially writing a blank check to your processor’s construction budget.

When processors offer financing for heifer purchases, equipment upgrades, or expansion projects in exchange for multi-year milk supply commitments, understand what’s really happening: They’re converting your flexibility into their supply security. That’s not necessarily bad—capital access and price stability have genuine value—but you need to recognize the trade.

Economists like Mark Stephenson, Director of Dairy Policy Analysis at the University of Wisconsin-Madison, have observed that processors who invested billions in new capacity now face utilization challenges.

When evaluating these arrangements, consider them with clear eyes:

  • Who benefits more from the locked-in supply? In a rising market, fixed pricing hurts you. In a falling market, it helps. But the processor gets supply certainty regardless.
  • What are the exit provisions? If your situation changes, what does it cost to get out?
  • Are you financing their utilization problem? Expansion commitments that serve processor capacity needs may or may not align with your operation’s optimal scale.
  • What’s the opportunity cost of reduced flexibility? Five-year agreements made in 2025 lock you into a world that might look very different by 2028.

None of this means you shouldn’t engage with processors or consider partnership structures. It means you should engage as a businessperson who understands that the party with the capital makes the rules. Get independent financial advice. Model the downside scenarios. Understand what you’re giving up, not just what you’re getting.

The Export Picture: Opportunity and Uncertainty

Exports have absorbed substantial U.S. dairy production in recent years, with 2024 reaching $8.2 billion—the second-highest export value ever, according to USDEC and IDFA reporting. Understanding the current export environment helps put domestic market dynamics in context.

Mexico remains the dominant destination—and deserves close attention. USDA Foreign Agricultural Service data and USDEC reporting show Mexico accounts for more than a third of all U.S. cheese export volume—by far the largest single destination. Mexico purchased 37 percent of all U.S. cheese sold to international customers through September 2024, and Cheese Reporter confirms 424 million pounds of cheese were exported to Mexico in 2024.

This concentration creates both opportunity and exposure. Mexican economic conditions—including inflation pressures and remittance flows—directly influence demand. The relationship has been remarkably durable, but it’s worth monitoring.

The China situation represents a more structural shift. USDA and Rabobank analysis show Chinese dairy imports dropping from a peak of nearly 845,000 metric tons in 2021 to about 430,000 metric tons in 2023—a decline of nearly 50 percent in just two years, as Dairy Reporter and Capital Press have documented.

USDA GAIN reports and Rabobank describe China’s strategy to boost domestic raw milk production and reduce import dependence. Chinese dairy imports were down roughly 10-14 percent in early 2024, with forecasts suggesting continued pressure.

The consensus among economists studying global dairy trade is that China deliberately increased self-sufficiency. That suggests planning for Chinese demand to return to 2021 levels may not be realistic—though trade relationships can shift in unexpected ways.

On a more positive note, other markets continue developing. Southeast Asia, the Middle East, and parts of Latin America offer growth potential. And USDEC confirms U.S. dairy export volume was up 1.7 percent through the first three quarters of 2025, indicating continued demand despite the China headwinds.

Global competition remains a factor. EU milk production is forecast to decline modestly in 2025, according to European Commission data—about 0.2 percent—as environmental regulations and cost pressures affect European producers. New Zealand, Australia, and South American producers continue competing in key markets.

Building business plans that work at realistic domestic price levels, while remaining positioned to benefit from export opportunities, seems like a prudent approach.

What Could Change This Outlook

Markets regularly surprise us, and it’s worth considering scenarios where conditions might improve faster than current projections suggest.

Weather or disease events could tighten global supply. A significant drought in New Zealand or production challenges in European herds would reduce global competition. U.S. dairy would benefit from being a reliable supplier in that environment.

China’s approach could evolve. Economic pressures, food security priorities, or trade negotiations could reopen Chinese import demand. It’s not the base case, but it’s possible.

Domestic demand could strengthen. Cheese consumption has grown modestly but consistently. A shift in consumer preferences or successful product innovation could accelerate demand. The foodservice recovery post-COVID continues developing.

Trade policy could create openings. New trade agreements or the resolution of existing disputes could improve access to markets that are currently restricted.

I wouldn’t build a business plan assuming these developments, but they’re worth monitoring. They’re also reasons for measured optimism rather than pessimism about dairy’s long-term prospects.

Practical Steps for the Months Ahead

For dairy operators assessing their position, several action areas warrant attention in the near term. These aren’t theoretical—they’re decisions with specific windows. And while the priorities may vary based on your operation’s size and situation, the core principles apply broadly.

Feed Cost Management

With corn prices running around $4.00-4.05 per bushel in late December—down from $4.20-plus earlier in the fall and well below the $5-plus levels of 2023—this represents a genuine opportunity, according to USDA and CME data.

Forward contracting 50-70 percent of the anticipated 2026 grain requirements provides cost certainty regardless of how commodity markets move. For a 600-cow operation, that’s roughly 1,200-1,800 tons of corn equivalent. If prices move higher by spring, you’ve protected yourself.

Smaller operations—say, 100-200 cows—might target the lower end of that range to preserve cash flexibility, while larger commercial dairies with dedicated nutritionists and storage capacity might push toward 70 percent or higher.

I spoke with a nutritionist in the Northeast who mentioned that several of her clients locked in corn in October and are already seeing the benefit as prices have firmed. “It’s not about timing the absolute bottom,” she noted. “It’s about knowing your costs and removing uncertainty.”

The window for favorable pricing exists now, though markets can always move in either direction.

Risk Management Tools

Both the Dairy Revenue Protection and Dairy Margin Coverage programs offer downside protection worth evaluating. Each works differently:

DRP protects revenue and allows customizable coverage levels. Recent quotes in the Upper Midwest have shown producers can often secure Class III price floors in the high-$17 to low-$19 range, with premiums typically running a few dozen cents per hundredweight, depending on coverage level and quarter. These numbers move with the market, so working with your agent on current pricing makes sense.

DMC protects margins—milk price minus feed costs—and offers subsidized rates for smaller operations. As Wisconsin Extension and Ohio State confirm, Tier 1 coverage at $9.50 margin costs just $0.15 per hundredweight for qualifying operations—genuinely affordable protection for smaller producers.

Dr. John Newton, Vice President of Public Policy and Economic Analysis at the American Farm Bureau Federation, has noted that more sophisticated operators are layering both programs. DMC provides base margin protection; DRP covers revenue risk on top of that. The combination requires some investment, but it’s comprehensive.

A note on operation size: DMC’s Tier 1 subsidized rates make it particularly attractive for smaller operations with a production history of under 5 million pounds production history. Larger operations may find DRP more cost-effective on a per-hundredweight basis.

Insurance enrollment deadlines typically fall in mid-to-late January. This is an immediate decision point worth prioritizing.

ProgramWhat It ProtectsCoverage Cost ($/cwt)Best ForEnrollment Deadline
Dairy Revenue Protection (DRP)Milk revenue (price × volume)$0.30 – $0.70 (varies)Larger operations, revenue focusMid-January (quarterly)
Dairy Margin Coverage (DMC) Tier 1Margin (milk price – feed costs)$0.15 (subsidized)Small farms (<5M lbs history)Mid-January (annual)
DMC Tier 2Margin (milk price – feed costs)$1.11 – $1.53Mid-size operationsMid-January (annual)
No Coverage (Exposed)Nothing$0High-risk strategyN/A

Balance Sheet Assessment

Operations carrying significant debt—particularly debt originated at lower interest rates that’s now repricing—benefit from proactive lender conversations.

The math matters. A $4.5 million debt portfolio repricing from 3.5 to 7.5 percent adds roughly $180,000 in annual interest expense. On a typical-size operation, that extra interest alone can add $1.00-1.50 per hundredweight to your cost of production—money that comes straight off your margin.

Options worth discussing with your lender:

  • Amortization extensions that reduce annual payments by stretching repayment
  • Refinancing into FSA programs—USDA’s December 2025 announcement confirms current rates at 4.625 percent for direct farm operating loans and 5.75 percent for farm ownership loans
  • Covenant modifications that provide flexibility during market transitions

A lender I know in the Upper Midwest told me that producers who come in early with clear projections and a realistic plan typically achieve the best outcomes. “It’s the ones who wait until they’re already stressed who have fewer options,” he observed.

Initiating these conversations proactively, with clear financial projections showing you understand market conditions, typically produces better results than waiting.

Herd Composition Review

Evaluating whether lower-producing animals justify their feed and labor costs becomes more important as margins compress.

The efficiency gap between top and bottom performers in most herds is larger than many farmers realize. Cornell Pro-Dairy data shows the lowest quartile of farms averaging operating costs of $22.32 per hundredweight, while the highest quartile averages just $15.79—a difference of $6.35 per hundredweight that translates to performance gaps exceeding $100,000 between similarly-sized operations.

The math often favors addressing the bottom 10 percent of producers rather than carrying them through a soft market. For a 600-cow herd, that’s 60 animals consuming feed, requiring labor, and potentially affecting rolling herd average.

This doesn’t necessarily mean culling aggressively—it might mean more intensive management of problem cows, faster culling decisions on chronic cases, or adjusting breeding priorities. The right approach depends on your specific situation.

Regional Considerations

These strategies apply broadly, but regional variations matter.

Operations in Texas and the expanding Southwest face different labor markets and heat stress considerations than Wisconsin or Michigan dairies. California operations navigating recovery from recent challenges have unique constraints. Farms in traditional dairy regions may have more processor options and competitive milk pricing than those in emerging areas.

Working with your local extension specialists and financial advisors to calibrate these recommendations to your specific situation makes sense. Generic advice only goes so far.

The Efficiency Conversation—What It Actually Means

“Get more efficient” has become standard advice. But what does meaningful efficiency improvement actually involve at a practical level?

Milk quality management delivers measurable returns. Operations maintaining somatic cell counts below 200,000 capture quality premiums while avoiding the production losses, treatment costs, and discarded milk associated with elevated SCC.

Extension economists at Cornell, Penn State, and elsewhere estimate that reducing bulk tank SCC from the 400,000 range to under 200,000 can improve returns by several hundred dollars per cow per year, including quality premiums, reduced discarded milk, and lower treatment costs.

I visited a 400-cow operation in Pennsylvania last spring that had invested significantly in parlor upgrades and milking protocols. Their SCC dropped from 280,000 to 140,000 over eighteen months. The owner estimated the combination of premium capture and reduced mastitis treatment was worth about $350 per cow annually. “It wasn’t cheap to get there,” he acknowledged, “but the payback has been solid.”

For operations considering larger capital investments, robotic milking systems are showing compelling economics for the right situations—studies cited by Progressive Dairy and industry analysts show payback periods of 5-7 years when labor savings, production increases, and improved herd health detection are factored together, though ROI varies significantly based on herd size, labor costs, and management intensity.

Feed efficiency metrics matter more than ever. Tracking pounds of milk produced per pound of dry matter intake reveals opportunities many operations overlook.

Research documented in the Journal of Dairy Science and confirmed by Michigan State’s extension work shows each 1 percent improvement in forage NDF digestibility translates to approximately 0.55 pounds additional milk per cow per day and about 0.38 pounds more dry matter intake, according to a summary of the research.

On a 600-cow herd, that 0.55 pounds daily adds up to 330 pounds across the herd, or roughly 120,000 pounds annually. At $16 milk, you’re looking at around $19,000 in additional revenue from a single percentage point improvement in forage quality. That’s why forage testing and harvest timing decisions carry such significant economic weight.

Labor productivity varies widely across operations, too. Farms running 120-140 cows per full-time equivalent generally outperform those at 80-100 cows per FTE on a cost-per-hundredweight basis. This doesn’t mean minimizing staff—it means ensuring labor investments produce proportional output through good systems, appropriate automation, and reduced turnover.

The farms navigating current conditions most successfully tend to excel across multiple efficiency dimensions simultaneously rather than focusing narrowly on any single metric. It’s the combination that creates a durable competitive advantage.

Why ‘Tightening Your Belt’ Won’t Save You This Time

Here’s what I keep coming back to when I look at all of this: The biggest risk for dairy farmers right now isn’t any single market factor. It’s the assumption that this is just another cycle that will correct itself if you tighten your belt and wait it out.

Dairy farmers are extraordinarily resilient. You’ve navigated 2008-2009, 2015-2016, 2020, and everything in between. Every time you cut costs, got more efficient, and made it through to better prices.

That resilience has been your greatest asset. But in this environment, the traditional playbook has limits.

The structural changes we’re seeing—the genetic revolution reshaping replacement dynamics, the power shift toward processors, the permanent loss of Chinese import demand, the capital intensity that favors scale—these aren’t cyclical headwinds that will reverse when milk prices recover. They’re fundamental changes in how the industry operates.

Tightening your belt works when you’re waiting out a temporary downturn. It doesn’t work when the game itself has changed.

The farms that will emerge strongest from 2026-2028 aren’t necessarily the biggest. They’re the ones that recognized early that some operating conditions have shifted permanently and adjusted their approaches accordingly.

That means:

  • Building cost structures that work at $16-18 milk, while remaining positioned to benefit if prices improve
  • Managing debt proactively rather than assuming refinancing will always be available on favorable terms
  • Making breeding decisions that balance near-term revenue with longer-term replacement needs—and treating your genetic program as a strategic asset
  • Evaluating processor partnerships with clear eyes about who holds the leverage
  • Focusing on profitability at the current size rather than assuming growth solves margin challenges

The Bottom Line

The dairy industry has weathered difficult periods before, and it will navigate this one as well. Domestic and global demand for quality dairy products remains substantial. Well-managed operations will continue finding paths to profitability.

The question is which operations will position themselves to thrive in the industry’s next chapter. And that positioning is happening now, in the decisions being made over the next 90 days.

The farmers who approach this moment with clear-eyed realism—neither panic nor complacency—and take deliberate action to strengthen their operations will look back in 2028 with satisfaction at the choices they made.

That outcome is available to you. That window closes faster than you think.

Key Takeaways

The market reality:

  • U.S. milk production running 3.7-4.7 percent above year-ago levels through fall 2025—the strongest growth since the COVID recovery
  • National herd at 9.57 million head, up 211,000 from a year ago
  • Domestic supply projected to exceed demand growth through at least mid-2027
  • China’s import decline—from 845,000 to 430,000 metric tons—represents a structural policy shift
  • Mexico accounts for more than a third of U.S. cheese exports

The structural shifts:

  • Beef-on-dairy isn’t a trend—it’s a genetic revolution requiring new replacement math
  • Power has shifted to processors who control the stainless steel and need milk to justify their investments
  • Butterfat premiums have collapsed—butter from over $3.00/lb to around $1.40/lb
  • Replacement heifer inventory at 47-year lows (3.914 million head); record prices

Action items for the next 90 days:

  • Evaluate forward contracting 50-70 percent of the 2026 feed needs
  • Review DRP and DMC options before January enrollment deadlines
  • Initiate lender conversations—FSA operating loans at 4.625%
  • Reassess breeding strategy: What percentage of your herd represents your genetic future?
  • Model breakeven at $16-18 milk and identify improvement areas

The mindset shift:

  • “Tightening your belt” is a failing strategy when the game has changed
  • Resilience means proactive adaptation, not passive endurance
  • Q1 2026 decisions will significantly influence outcomes through 2028

Complete references and supporting documentation are available upon request by contacting the editorial team at editor@thebullvine.com.

Learn More

The Sunday Read Dairy Professionals Don’t Skip.

Every week, thousands of producers, breeders, and industry insiders open Bullvine Weekly for genetics insights, market shifts, and profit strategies they won’t find anywhere else. One email. Five minutes. Smarter decisions all week.
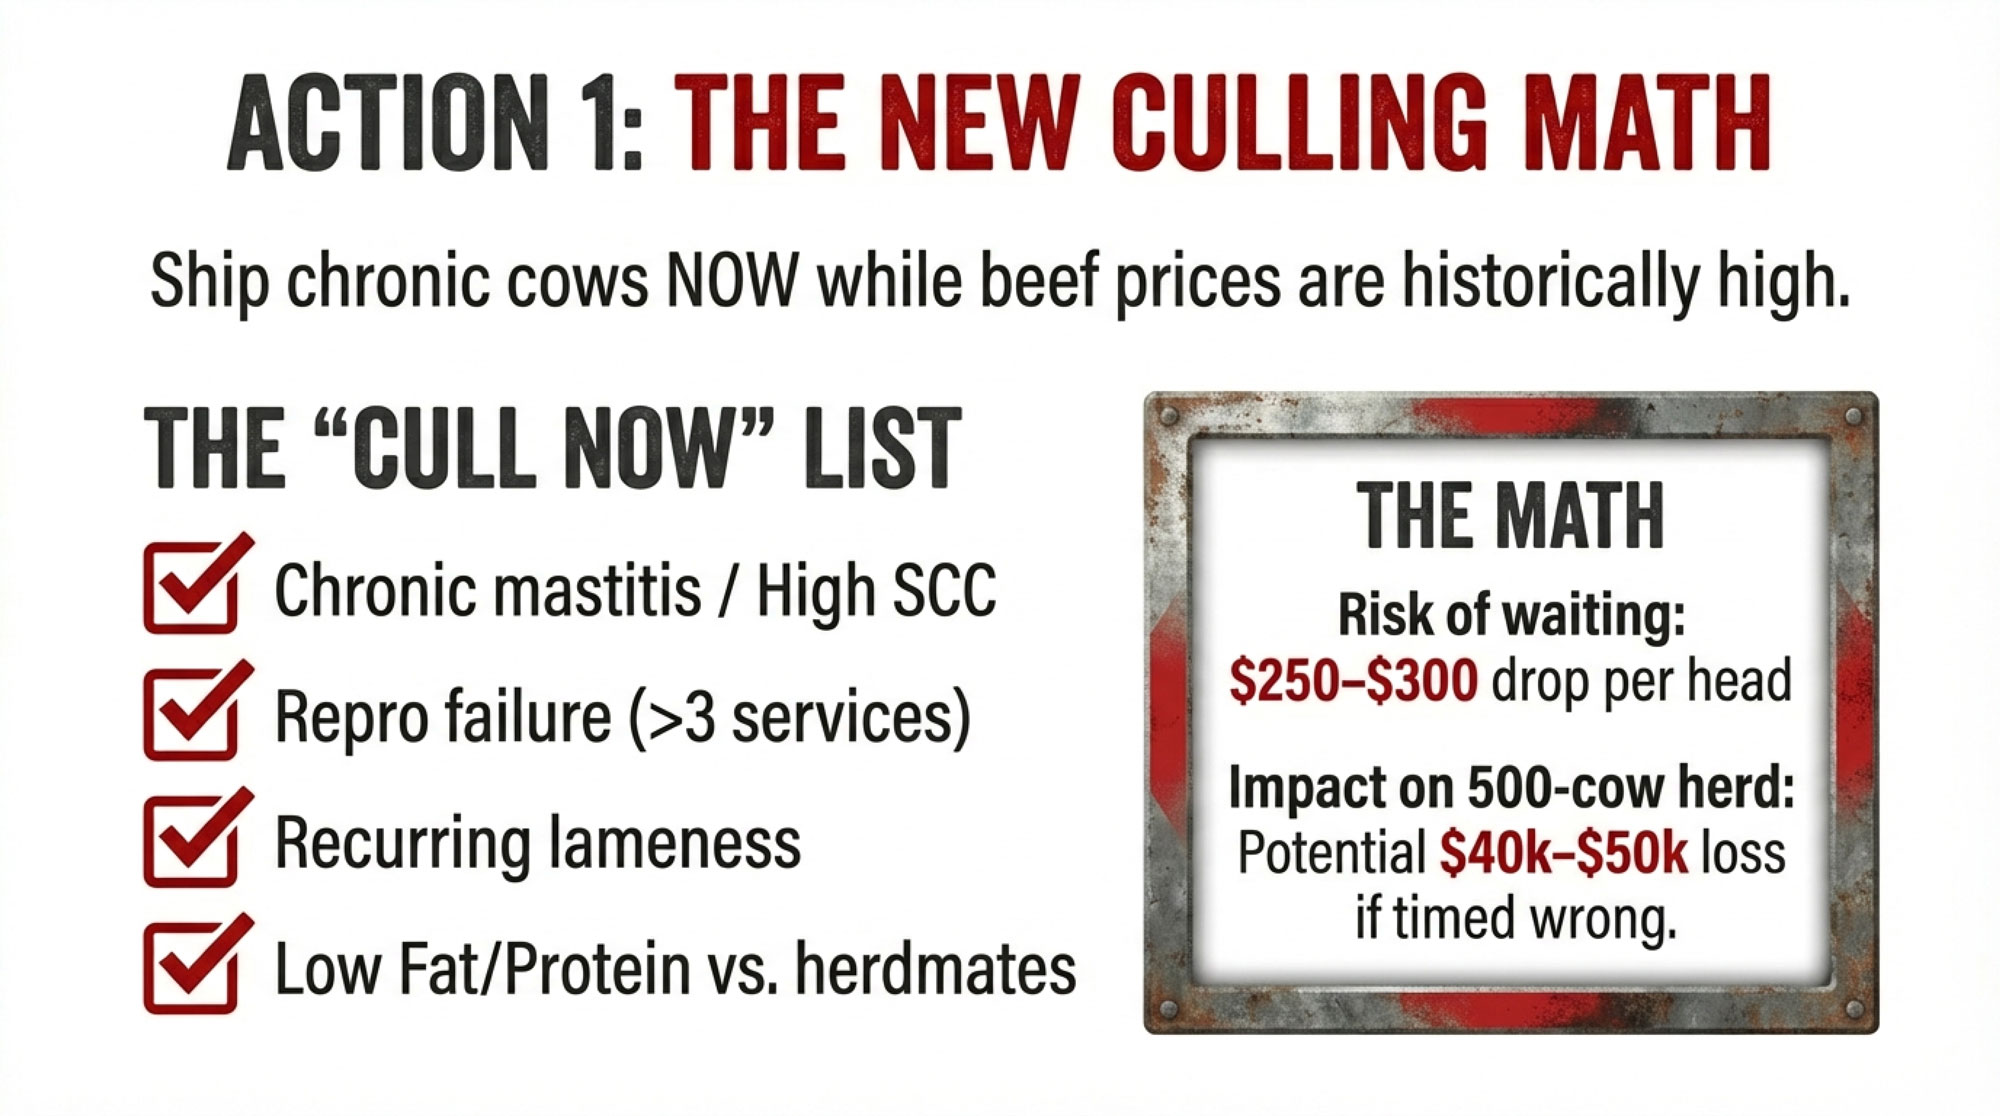
NewsSubscribe
First
Last
Consent

China’s 42.7% Dairy Tariff Hits the EU – Why Your Milk Check Won’t See the Boost You’re Expecting

China’s 42.7% EU dairy tariff? Don’t celebrate yet. NZ ships duty-free with 51% market share—and China built their herd with genetics we sold them.

Executive Summary: China’s 21.9%–42.7% tariffs on EU dairy, announced December 22, 2025, are being called an opportunity for American exporters—but the market math doesn’t add up. New Zealand ships to China duty-free and holds 51% of the import market share. The U.S. exports primarily whey (95%), not the specialty cheeses being tariffed, limiting substitution potential. Most significant: China expanded domestic production to 43 million tonnes using genetics purchased from Western suppliers, including the U.S. For producers, this isn’t a moment to expect export rallies—it’s a signal to assess your processor’s export exposure, stress-test finances assuming flat Class III prices, and focus on what you control: components, efficiency, and diversification strategies like beef-on-dairy.

You know, I’ve been watching trade disputes affect dairy farmers for two decades now, and what happened today feels different. When China announced provisional tariffs of up to 42.7% on European Union dairy imports—a decision Reuters confirmed this morning—the industry press releases started flying within hours. “Opportunity for U.S. producers.” “Market share available.” “Ready to step into the gap.”

Those statements reflect genuine optimism. But there’s more context here that deserves attention. Context that can help you make better decisions about your operation, regardless of how this dispute plays out.

Grab a coffee—this one’s got some layers to it.

How Electric Vehicles Became a Dairy Problem

Back in August 2024—August 21st specifically, according to China’s Ministry of Commerce—Beijing announced it would investigate European dairy imports for alleged subsidies. The timing wasn’t coincidental. When the EU finalized tariffs of up to 45.3% on Chinese EVs that October, China had already begun its response.

Rather than targeting European cars directly, Beijing identified politically sensitive export categories: brandy, pork, and dairy. Smart strategy, honestly.

“It is highly frustrating that again, dairy seems to be used as a political pawn in a wider trade dispute between the EU and China regarding electric vehicles,” Conor Mulvihill, director of Dairy Industry Ireland, told reporters. Irish dairy exports to China topped €385 million in 2024, according to Bord Bia figures, and that revenue is now at risk.

The tariff structure ranges from 21.9% for cooperative companies up to the full 42.7% for non-cooperative ones, according to China’s Ministry of Commerce.

Assessing the Opportunity—Multiple Perspectives

Here’s where we need to think carefully. A Midwest processor I spoke with last week was measured:

“There might be some incremental business here, but anyone expecting a flood of new orders is probably going to be disappointed.” — Midwest dairy processor

The International Dairy Foods Association has offered a more optimistic view, noting U.S. exporters are ready to step into opportunities created by trade actions affecting competitors.

But here’s what many producers don’t appreciate: the U.S. and EU don’t sell the same products to China.

According to the UK’s Agriculture and Horticulture Development Board, around 95% of U.S. dairy exports to China consist of whey and whey products—commodity ingredients for food processing and animal feed. The EU sends specialty cheeses, infant formula base, and UHT milk. Premium consumer products.

So when a Chinese buyer stops purchasing French Brie because of a 42% tariff, they’re not necessarily in the market for American permeate. Different products, different purposes.

The New Zealand Factor

The AHDB reported that New Zealand controlled approximately 51% of China’s dairy import market in H1 2024—up from 42% in 2023. And thanks to their Free Trade Agreement, Kiwi dairy now enters China completely duty-free as of January 2024.

New Zealand’s Trade Minister Todd McClay confirmed it directly: all safeguard duties on milk powder have been eliminated.

China Market Access at a Glance

ExporterTariff Status (Dec. 2025)Market PositionKey Products
European Union21.9%–42.7% provisional dutiesGermany 7%, France 4% of importsSpecialty cheese, infant formula
United StatesExisting MFN + retaliatory tariffs~13% share; second-largest supplierWhey (95%), lactose, commodities
New Zealand0% (duty-free)~51% share; largest supplierWhole milk powder, butter, cheese

Sources: China Ministry of Commerce; AHDB (H1 2024); Dairy Global

When European cheese gets more expensive, who captures that demand? New Zealand—and they’ve been working this market for decades.

Understanding China’s Domestic Situation

China’s tariffs serve multiple purposes. Yes, retaliation. But also breathing room for a domestic industry facing challenges.

According to the USDA’s November 2024 report, Chinese raw milk production reached approximately 41-42 million tonnes. Rabobank forecasts 43.3 million tonnes for 2024. China has essentially added a New Zealand’s worth of production inside their own borders over five years.

Meanwhile, demand has slowed. China’s birth rate dropped to a record low of 6.39 per 1,000 in 2023, continuing a multi-decade decline. Fewer babies means less infant formula demand—one of the highest-value import categories.

Chinese processors are converting fresh milk to powder for storage. If you’ve been in dairy long enough, you recognize that as a classic oversupply signal.

The Genetic Paradox: Did We Export Our Own Market?

For Bullvine readers who understand breeding, this is worth sitting with.

Where did China get the cows for this expansion? From us.

According to the NAAB 2024 Semen Sales Report, the U.S. exported 30.8 million units of dairy semen globally—up 1.6 million from 2023. China has historically been a top destination. Sexed semen technology accelerated the process considerably, allowing Chinese operations to rapidly multiply their female inventory using genetics that took Western breeders generations to develop.

This was normal commercial activity—nobody did anything wrong. But the dynamic is worth recognizing. The better our genetics got, the faster we enabled competitors to catch up.

The Southeast Asia Pivot

With China’s import appetite moderating, U.S. trade organizations are developing alternative markets. IDFA’s Michael Dykes notes these efforts promise improved access in growing Southeast Asian markets.

Current trade values show the scale challenge: Malaysia ~$118 million, Vietnam ~$127 million, Thailand ~$87 million in U.S. dairy sales according to USDA data. Growing markets, but building presence takes years.

“We’re excited about Southeast Asia, but we’re also realistic. Each country has different food safety standards, different labeling requirements. This isn’t switching customers—it’s building relationships from scratch.” — Wisconsin cheese exporter

New Zealand has been working these markets for decades with established relationships and geographic proximity. The Southeast Asia pivot is a real strategy—it’s also a multi-year project.

Processing Capacity: The Math That Hits Your Milk Check

Here’s where this gets personal for producers, even those who never think about exports.

According to IDFA’s October 2025 report, U.S. processors are investing more than $11 billion in new capacity across 19 states, with projects coming online between 2025 and early 2028. This investment assumed continued production growth and export demand.

Modern cheese plants generally need 85-95% utilization to hit economic targets. When volume drops, fixed costs per pound climb fast.

Let’s run some numbers. For a 500-cow dairy averaging 75 lbs/cow/day, you’re shipping roughly 13.7 million pounds annually. Now, not all of that is equally exposed to export market volatility—it depends on your plant’s product mix. But if 10-15% of your production value ties to export-sensitive products like whey going to China, a $1.50/cwt effective price decline on your total check translates to roughly $20,000-30,000 in annual revenue impact. For operations more heavily exposed, multiply accordingly.

Herd SizeAnnual Production (cwt)Revenue Loss @ $1.50/cwtRevenue Loss @ $2.50/cwt
250 cows68,438$102,657$171,095
500 cows136,875$205,313$342,188
750 cows205,313$307,969$513,282
1,000 cows273,750$410,625$684,375

Here’s a specific scenario: If you’re an Upper Midwest producer shipping to a plant that sends 40% of its whey to China, and Chinese buyers shift to duty-free New Zealand sources, your plant’s utilization could drop. Even if your milk still gets processed, reduced efficiency often shows up in basis adjustments, component premiums, or year-end patronage dividends.

For producers in Class III-heavy federal order regions—such as Wisconsin, Minnesota, and the Upper Midwest—these dynamics matter more. When export-oriented cheese plants face utilization challenges, it pressures Class III specifically.

5 Signs Your Co-op May Be Too Export-Dependent

  1. More than 30% of plant output goes to export markets (especially single-country concentration)
  2. Whey or lactose represents a significant revenue stream with heavy China exposure
  3. No active diversification into Southeast Asian or Mexican markets is underway
  4. Recent capital investments were justified primarily by “growing Asian demand.”
  5. Member communications emphasize export opportunities without discussing contingencies

If three or more apply, it’s time to ask harder questions at your next member meeting.

Warning SignRisk ThresholdQuestion to Ask Your Co-op
Export concentration>30% of output to export markets“What percentage of our plant’s production goes to export, and to which countries specifically?”
China-specific exposure>20% of whey/lactose revenue from China“How much of our whey revenue depends on Chinese buyers, and what’s our backup plan?”
Market diversification<3 active export regions“Are we building relationships in Southeast Asia and Mexico, or concentrated in East Asia?”
Capital investment rationale“Asian growth” as primary justification“Were recent expansions underwritten by export growth assumptions? What if those don’t materialize?”
Communication transparencyExport opportunities mentioned without contingencies“What’s our plan if China’s self-sufficiency push continues reducing import demand over the next 3-5 years?”

Practical Considerations for Your Operation

3 Questions to Ask Your Co-op Today

  1. Exposure: “What percentage of our plant’s output is tied to Chinese markets or other export-dependent products?”
  2. Diversification: “Do we have active sales relationships in Malaysia, Vietnam, or Mexico—or are we concentrated in East Asia?”
  3. Contingency: “What’s our plan if China’s self-sufficiency push continues reducing import demand?”

The breakeven question: At what export exposure does this tariff situation materially affect your milk check? Based on typical plant economics, producers shipping to facilities with export concentrations of 25-30% or more—particularly to China—face meaningful price risk if trade dynamics shift.

Component focus: Markets increasingly reward milk components over fluid volume. Breeding and feeding strategies that emphasize component density—managing your TMR for butterfat performance, making genetic selections that improve protein yields—can improve returns even when prices are flat.

Diversification strategies: The beef-on-dairy trend represents a rational response to moderating replacement heifer needs and provides revenue diversification independent of dairy market conditions.

Financial positioning: Planning for flat-to-modest milk prices provides a more stable foundation than relying on export-driven rallies. Programs like Dairy Revenue Protection exist precisely for this uncertainty.

The Labeling Dimension

China is establishing cheese naming standards, potentially aligning with European Geographical Indication protections. The EU is pursuing similar provisions throughout Southeast Asia.

The implication: American cheeses using names like Parmesan or Feta could face market access challenges regardless of tariffs. The long-term response involves building identity around distinctly American varieties—Wisconsin Original, California Dry Jack, and Vermont Creamery styles.

Your Next Moves

Final determinations are expected by February 2026. CNBC noted Beijing significantly reduced preliminary pork tariffs in final rulings, so flexibility remains possible. But regardless of how this dispute resolves, the underlying dynamics aren’t changing.

Here’s what to do now:

  1. Assess your exposure. Ask your co-op directly what percentage of plant output goes to export markets—especially China. If it’s above 25-30%, you have meaningful trade risk.
  2. Run your own numbers. Calculate what a $1.50-2.50/cwt Class III decline would mean for your operation annually. Know your vulnerability before it materializes.
  3. Evaluate your processor’s diversification. Are they actively building relationships in Southeast Asia and Mexico, or are they concentrated in markets facing structural headwinds?
  4. Double down on components. Regardless of trade outcomes, butterfat and protein premiums reward operational excellence. That’s within your control.
  5. Stress-test your finances. Model flat prices for 18-24 months. If that scenario creates problems, address leverage and cash reserves now while milk checks are decent.

The producers I see positioning themselves well are treating export markets as valuable but variable—additional revenue opportunity rather than baseline assumptions. They’re asking good questions and planning for multiple scenarios.

That’s the kind of thinking that builds durable farm businesses.

Key Takeaways:

  • New Zealand wins this one: Duty-free access plus 51% market share means Kiwi dairy—not American—captures displaced EU demand
  • Product mismatch limits upside: We export whey to China (95% of shipments); they’re tariffing specialty cheeses we don’t sell
  • The genetics paradox: China reached 43M tonnes domestic production using genetics we sold them—we enabled our own competition
  • Know your exposure number: If your co-op sends 25%+ of output to export markets, trade volatility hits your milk check directly
  • Control beats hope: Component premiums, operational efficiency, and beef-on-dairy diversification outperform waiting for export rallies

Complete references and supporting documentation are available upon request by contacting the editorial team at editor@thebullvine.com.

Learn More

The Sunday Read Dairy Professionals Don’t Skip.

Every week, thousands of producers, breeders, and industry insiders open Bullvine Weekly for genetics insights, market shifts, and profit strategies they won’t find anywhere else. One email. Five minutes. Smarter decisions all week.

NewsSubscribe
First
Last
Consent

The $97,500 Protein Shift: How Weight-Loss Drug Users Are Rewriting Your Breeding Strategy

$97,500. That’s what weight-loss drugs are worth to a 500-cow dairy. Here’s how to capture it.

milk protein premiums

Executive Summary: $97,500 annually. That’s what a 500-cow dairy can capture by responding to the protein shift—a market realignment most producers haven’t traced to its source. GLP-1 weight-loss drugs have reached 41 million Americans who now consume high-protein dairy at triple the normal rate, reshaping what your milk is worth. Protein premiums have hit $5/cwt at cheese facilities, and December’s Federal Order update raised baseline protein to 3.3%—meaning below-average herds now subsidize neighbors who ship higher components. The opportunity stacks three ways: nutrition optimization ($8,750-$15,000), protein-focused genetics ($17,500-$22,500), and processor premiums ($24,000-$60,000). The catch: breeding decisions this spring won’t reach your bulk tank until 2029, rewarding producers who move early. The math is clear, the window is open, and this analysis shows exactly how to capture it.

A number worth sitting with: households taking GLP-1 weight-loss medications are consuming yogurt at nearly three times the national average. Not 20% more. Not double. Three times.

That data point comes from Mintel’s 2025 consumer tracking. It tells you something important about where dairy demand is heading—and raises questions worth considering if your breeding program has been focused primarily on butterfat.

Something meaningful is shifting in how the market values what comes out of your bulk tank. This isn’t a temporary blip or a pricing anomaly. What we’re seeing appears to be a structural change driven by forces that weren’t on most of our radars even five years ago—pharmaceutical trends, aging demographics, and global nutrition demands all converging at once.

This creates opportunities for producers positioned to respond. It also creates challenges for those caught off guard. The difference often comes down to understanding what’s actually driving these changes.

THE QUICK MATH: What’s This Worth?

For a 500-cow herd positioned to capture the protein shift:

OpportunityAnnual Value
Nutrition optimization (amino acid balancing)$8,750 – $15,000
Genetic improvement (protein-focused selection)$17,500 – $22,500
Processor premiums (above-baseline protein)$24,000 – $60,000
Combined Annual Opportunity$50,000 – $97,500

These figures assume: 500 cows, 24,000 lbs/cow annually, current component price relationships, and access to a processor paying protein premiums. Individual results vary based on current herd genetics, ration, and market access.

The Pharmaceutical Connection

When GLP-1 drugs first hit the market, I didn’t give much thought to dairy implications. Weight-loss medications seemed pretty far removed from breeding decisions and component pricing.

That thinking needed updating.

As of late 2025, roughly 12% of Americans—about 41 million people—have used GLP-1 medications like Ozempic, Wegovy, or Mounjaro. That figure comes from a KFF poll reported in JAMA in mid-2024, with subsequent tracking by RAND and others confirming the trend has held. Market projections for these drugs range from $157 billion to $324 billion by 2035, depending on which analyst you ask. This isn’t a niche trend anymore. It’s a mainstream pharmaceutical category reshaping eating behavior at a population level.

What makes this relevant to your operation is how these medications change consumption patterns. GLP-1 drugs work by slowing gastric emptying—patients feel full faster and eat much less. But their protein requirements don’t drop. If anything, clinical guidance suggests they increase.

Obesity medicine specialists now recommend GLP-1 users consume 1.2 to 1.6 grams of protein per kilogram of body weight daily—backed by research in the Journal of the International Society of Sports Nutrition and clinical practice guidelines from multiple medical organizations. That’s substantially higher than typical recommendations. The reasoning? Rapid weight loss without adequate protein intake leads to significant muscle wasting.

And this is where it gets clinically important: studies published in peer-reviewed journals indicate that between 25% and 40% of weight lost on these medications can come from lean body mass rather than fat. A 2025 analysis in BMJ Nutrition, Prevention & Health quantified this at “about 25%–40%” as a proportion of total weight loss. That’s a real concern for patients and their physicians—and it’s driving specific dietary recommendations.

So you have millions of people who can only eat small portions but genuinely need concentrated protein sources. What foods fit that profile?

High-protein dairy fits it remarkably well.

The consumption data supports this. According to Mintel’s tracking, Greek yogurt and cottage cheese consumption has increased significantly among GLP-1 users, while higher-fat dairy categories have moved in the opposite direction. Reports in June 2025 showed that “plain dairy and protein powders hold steady” while “processed goods are taking the biggest hit.” The exact percentages vary by study, but the directional trend is consistent.

There’s also a bioavailability dimension worth understanding. The DIAAS score—Digestible Indispensable Amino Acid Score, the FAO-recommended measurement method—indicates how efficiently the body uses different protein sources. According to research by the International Dairy Federation and the Global Dairy Platform, whole milk powder scores around 1.22 on DIAAS, while other dairy proteins consistently score 1.0 or higher. Compare that to soy at roughly 0.75-0.90, depending on processing, and pea protein at 0.62-0.64. For someone eating limited quantities, that efficiency difference matters considerably.

What does this means practically? This isn’t just a preference shift—there’s a physiological basis driving these patients toward nutrient-dense protein sources. Dairy happens to fit that need particularly well.

Reading Your Milk Check Differently

So consumer preferences are shifting. What does that actually mean for component pricing?

The answer depends partly on your market, but broad trends are worth understanding.

Looking at USDA component price announcements over recent months, protein has traded at a meaningful premium over butterfat. Through late 2025, the protein-to-fat price ratio has been running in the range of 1.3 to 1.4—a notable departure from historical norms. For much of the past two decades, these components traded closer to parity, with fat often commanding a slight premium.

I recently spoke with a Wisconsin producer who’d been closely tracking this shift. “I started paying attention about two years ago,” he told me. “Once I saw the ratio consistently above 1.25, I went back and looked at my sire selection. Realized I’d been leaving money on the table.”

That experience isn’t unusual. Many producers look at their check, review the component breakdowns, and maybe note whether fat or protein prices have changed from last month. But they’re not calculating what the spread actually means for breeding strategy over time.

Let me put some illustrative numbers on it, using late 2025 component price relationships as a guide.

Consider a 500-cow operation producing 24,000 pounds per cow annually. If you compare a fat-focused breeding approach averaging 4.0% fat and 3.1% protein against a protein-focused approach averaging 3.7% fat and 3.4% protein, the difference in total component value can run $35 to $45 per cow annually from the bulk tank alone (these figures shift as component prices move, but the general principle holds when protein maintains its current premium over fat). For that 500-cow herd, you’re looking at roughly $17,500 to $22,500 in annual difference from genetics alone.

That’s before considering processor premiums that cheese and ingredient plants often pay for high-protein milk. Factor those in, and the opportunity can be larger still.

I want to be measured here. I’m not suggesting everyone immediately overhaul their breeding strategy. What I am suggesting is that this ratio deserves more attention than most producers have been giving it.

The Federal Order Update

Another dimension affects how money flows through the pricing system.

The June 2025 updates to Federal Milk Marketing Order formulas—finalized by USDA in January 2025 after the producer referendum—adjusted baseline composition factors to reflect current herd averages. According to the USDA Agricultural Marketing Service final rule, protein moved from 3.1% to 3.3%, other solids from 5.9% to 6.0%, and nonfat solids from 9.0% to 9.3%. The composition factor updates became effective December 1, 2025.

Why does this matter practically? Processors now assume your milk contains 3.3% protein as the baseline. If you’re consistently shipping 3.0% or 3.1%, you’re not just missing premiums—you may be contributing to the pool that pays premiums to higher-component herds.

I’ve spoken with producers who didn’t fully grasp this dynamic at first. They knew their components were “a little below average” but figured it wasn’t significant. When we worked through their position relative to the pool, they were surprised to see how much value was being transferred out of their operation each month.

The system isn’t unfair—it’s designed to reward quality. But you need to understand where you stand within it.

Genetic Strategies Worth Considering

For operations looking to improve protein production, genetic selection offers the most durable path forward. The challenge, as we all know, is that results take time to show up in the bulk tank.

The timeline reality looks something like this:

From Breeding Decision to Bulk Tank Impact

  • Select high-protein sires (January 2026) → Semen in tank
  • Breed cows (Spring 2026) → Conception
  • Gestation (Spring 2026 – Winter 2027) → Calf born
  • Heifer development (2027 – 2028) → Growing replacement
  • First calving (Late 2028) → Enters milking string
  • First full lactation data (2029) → Bulk tank impact measurable
PhaseTimingMonths from Decision
Sire SelectionJanuary 20260
Breeding/ConceptionSpring 20263–6
GestationSpring 2026 – Winter 202712–15
Heifer Development2027 – 202824–30
First CalvingLate 202833–36
Measurable Bulk Tank Impact202936–48

If you breed a cow this spring, her daughter won’t enter the milking string until late 2028 at the earliest. That’s just the biology. So breeding decisions you make in the next few months will shape your herd’s component profile three to five years from now.

MetricFat-Focused StrategyProtein-Focused Strategy
Avg Fat %4.0%3.7%
Avg Protein %3.1%3.4%
Component Value/Cow/Year$1,245$1,290
Processor Premium/Cow/Year$0$120
Total Annual Herd Revenue (500 cows)$622,500$705,000
Revenue Advantage+$82,500

This is why genetics is a long game—but it’s also the only permanent solution. Nutrition can help capture more of your genetic potential today, but it can’t exceed what the genetics allow.

One development that’s accelerating this timeline for some operations: genomic testing. If you’re testing heifers at a few months of age, you can identify your high-protein genetics earlier and make culling decisions before investing in two years of development costs. It doesn’t change the biological timeline, but it does let you be more selective about which animals you’re developing in the first place.

Selection Index Considerations

Most producers default to Total Performance Index (TPI) when evaluating Holstein sires, and it remains useful for balanced selection. But if protein improvement is a specific priority, Cheese Merit (CM$) rankings warrant closer scrutiny.

Trait CategoryMinimum ThresholdProtein-Focused TargetWhy It Matters
PTA Protein %+0.03%+0.04% to +0.06%Improves concentration—the key to premiums
PTA Protein Pounds+40 lbs+50 lbs or higherEnsures volume doesn’t drop as % increases
PTA Fat %No minimum+0.01% to +0.03%Hedges against protein premium narrowing
Productive Life (PL)+2.0+3.0 or higherCows must last long enough to justify investment
Daughter Pregnancy Rate (DPR)+0.5+1.0 or higherPoor fertility destroys genetic progress
Somatic Cell Score (SCS)2.90 or lower2.85 or lowerHigh SCC kills premiums faster than low protein
Inbreeding CoefficientMonitor: keep below 6.25%Aggressive protein selection can concentrate genes
Selection IndexUse CM$ or updated NM$Better protein weighting than traditional TPI

CM$ places greater emphasis on protein per pound and protein percentage than TPI does. It was designed for operations shipping to cheese plants, where protein drives vat yield. The updated Net Merit (NM$) formula has also adjusted component weightings in recent years to reflect market realities.

General Thresholds to Consider

When evaluating individual sires for protein improvement, what many nutritionists and AI representatives suggest—keeping in mind these are general guidelines, not hard rules:

  • PTA Protein %: Bulls at +0.04% or higher are generally considered strong for protein concentration. Bulls above +0.06% are moving the needle meaningfully.
  • PTA Protein Pounds: Targeting +50 lbs or higher helps maintain total protein production while improving percentage.
  • Combined approach: The ideal sires show positive values in both categories. Bulls that improve percentage by diluting volume aren’t actually helping you.

One important caution: don’t chase protein so aggressively that you sacrifice health and fertility traits. A cow that burns out after 1.8 lactations isn’t profitable regardless of her component profile. Setting minimum thresholds for Productive Life and Daughter Pregnancy Rate before optimizing for components makes sense. Talk with your AI rep about what fits your specific situation.

Intervention StrategyLow EstimateHigh EstimateTimeline to Impact
Nutrition Optimization (amino acid balancing)$8,750$15,0002–4 weeks
Genetic Improvement (protein-focused sires)$17,500$22,5003–5 years
Processor Premiums (high-protein milk)$24,000$60,000Immediate (if available)
TOTAL ANNUAL OPPORTUNITY$50,250$97,500Varies by strategy

A Note on Inbreeding

Another consideration doesn’t get discussed enough: selecting heavily for narrow trait clusters can accelerate inbreeding. Pennsylvania State University’s Dr. Chad Dechow, who has extensively studied genetic diversity in Holsteins, notes that intense selection for specific traits can accelerate genetic concentration faster than many producers realize—as he’s put it, “if it works, it’s line breeding; if it doesn’t, it’s inbreeding.” Research published in Frontiers in Animal Science found that selection for homozygosity at specific loci (like A2 protein) significantly increased inbreeding both across the genome and regionally. The takeaway: if you’re selecting aggressively for protein traits, monitor inbreeding coefficients and work with your genetic advisor to maintain adequate diversity in your sire lineup.

The Beef-on-Dairy Angle

There’s strategic flexibility that comes with the current beef market. Beef-on-dairy calves have been commanding strong prices—industry reports from late 2025 show day-old beef-cross calves going for $750 to over $1,000 in many markets, with well-bred calves sometimes topping $1,600 depending on genetics and condition. Dairy Herd Management reported in August 2025 that Jersey beef-on-dairy calves were fetching $750 to $900 at day of birth, with the market remaining robust through the fall.

Some producers are using this strategically: breed your top 40-50% of the herd to high-protein dairy sires for replacements, and use beef semen on the bottom half. You capture immediate cash flow from beef calves while concentrating genetic improvement on animals that will actually move the herd forward.

A California producer I spoke with recently has been doing exactly this for three years. “It changed my whole approach to replacement decisions,” she said. “I’m more selective about which genetics I’m actually keeping in the herd, and the beef calves are paying their own way.”

It’s not the right approach for every operation, but it’s worth thinking through.

The Nutrition Bridge

Genetics determine the ceiling for what your cows can produce. Nutrition determines how close you get to that ceiling. And unlike genetics, nutrition interventions can show results within weeks.

The most targeted intervention for protein production involves amino acid supplementation—specifically rumen-protected methionine.

The background: in typical U.S. dairy diets built around corn silage and soybean meal, methionine often becomes the limiting amino acid for milk protein synthesis. You can feed all the crude protein you want, but if the cow runs short on methionine, she can’t efficiently convert it to milk protein. The excess nitrogen gets excreted.

Rumen-protected forms of methionine—coated to survive rumen degradation—allow the amino acid to reach the small intestine, where absorption actually happens.

What the Research Shows

University trials—including work from Cornell, Penn State, and Wisconsin dairy extension programs—have demonstrated that rumen-protected methionine can boost milk protein percentage, often by 0.08% to 0.15% within 2 to 3 weeks of implementation. Results vary by herd and baseline diet, so verifying response on your own operation before committing fully makes sense.

Run a trial with one pen of mid-lactation cows for 21-30 days. Compare their component tests to a control group or their own pre-trial baseline. Work with your nutritionist on the economics—supplement costs, expected response, and whether it pencils at current protein prices. If you’re seeing the expected response, roll it out more broadly. If not, you haven’t invested much to find out.

One thing I’ve noticed, talking with nutritionists across the Midwest and Northeast, is that the response tends to be most consistent in herds that haven’t previously optimized their amino acid balance. If you’ve already been balancing for methionine and lysine, the incremental gain may be smaller. Fresh cows and early-lactation groups often show the most dramatic response, since that’s when protein synthesis is competing most with other metabolic demands during the critical transition period.

For a 500-cow herd seeing a 0.10-0.12% protein increase, that can translate to $8,750 to $15,000 annually in additional component value at current prices—often exceeding the supplement cost by a meaningful margin.

An additional benefit: because you’ve addressed the limiting amino acid, you may be able to reduce total ration crude protein slightly without sacrificing production. That can offset some or all of the supplement cost.

Processor Relationships

This dimension deserves more attention than it typically gets.

Not all processing facilities are equally equipped to capture the value of high-protein milk. Before making significant changes to your breeding program, it’s essential to understand what your buyer can actually afford.

Cheese plants—particularly the large cooperative facilities across Wisconsin’s cheese belt and specialty operations in California’s Central Valley—are generally the most straightforward. Higher protein concentration means more cheese per gallon processed. A plant can increase output without expanding capacity simply by sourcing higher-protein milk. Clear economic incentive exists to pay for it.

Processor TypeProtein ThresholdPremium per CWTAnnual Value (500 cows)
Commodity Powder PlantNo premium$0.00$0
Regional Cheese Co-op3.3%$0.50–$0.75$60,000–$90,000
Large Cheese Facility (WI)3.3%$1.00–$1.50$120,000–$180,000
Specialty Protein Plant3.35%$2.00–$3.00$240,000–$360,000
Direct Contract (High-volume)3.4%$3.00–$5.00$360,000–$600,000

Cheese plant managers I’ve spoken with confirm they’re actively seeking higher-protein milk supplies. One plant manager in central Wisconsin told me their facility has increased protein premiums twice in the past eighteen months, specifically to attract higher-component milk. “We’re competing for that milk now,” he said. “Five years ago, we weren’t having that conversation.”

What Premiums Actually Look Like

Processor premiums vary considerably by region and facility, but here’s what the market data shows: USDA Dairy Market News reports the average protein premium is around $1.25 per hundredweight above baseline. Some producers shipping to cheese-focused cooperatives report premiums in the $0.50 to $0.75/cwt range for modest improvements, while direct contracts with protein-hungry facilities can reach $3.00 to $5.00/cwt for milk consistently testing above 3.35% protein—though these premium contracts typically require volume commitments and consistent quality.

For a 500-cow herd producing 120,000 cwt annually, even a $0.50/cwt premium adds $60,000 to the annual milk check. At $1.00/cwt, that’s $120,000. The math quickly draws producers’ attention.

Ingredient and filtration plants making whey protein concentrates, milk protein isolates, and similar products also value protein highly. Operations in Idaho and across the West are specifically tooled to extract and monetize protein fractions. These facilities serve the growing functional nutrition market, including products for GLP-1 users.

Fluid milk bottlers and commodity powder dryers may have less ability to monetize elevated protein. If a bottler standardizing for the Southeast fluid market is already adjusting milk to regulatory specifications, excess protein beyond those specs doesn’t necessarily yield premium returns.

PROCESSOR CONVERSATION CHECKLIST

Download and bring to your next meeting with your milk buyer:

☐ Premium Structure

  • “What protein threshold triggers premium payments?”
  • “Is there a cap on protein premiums, or do they scale continuously?”
  • “How is the premium calculated—per point above threshold, or tiered brackets?”

☐ Testing & Verification

  • “How frequently is my milk tested for components?”
  • “Can I access my component test history for the past 12 months?”

☐ Plant Capabilities

  • “Does your plant have protein standardization capability?”
  • “What’s your target protein level for incoming milk?”

☐ Market Trends

  • “Are you seeing increased demand for high-protein products from your customers?”
  • “Do you anticipate changes to your premium structure in the next 12-24 months?”

☐ Contract Options

  • “Are direct premium contracts available for consistent high-protein suppliers?”
  • “What volume and consistency requirements would apply?”

Keep notes from this conversation—the answers should inform your breeding and nutrition decisions.

The answers might influence how aggressively you pursue protein genetics. If your buyer caps premiums at 3.3%, there is less incentive to push for 3.5%. If they’re paying meaningful premiums with no cap because they’re expanding ingredient production, that’s entirely different information.

A Decision Framework

Given this complexity, a framework for thinking through whether an aggressive protein pivot makes sense:

Consider aggressive protein focus if:

  • You ship to a cheese plant or ingredient facility
  • Your current herd averages below 3.25% protein
  • Your buyer explicitly pays protein premiums without caps
  • You have flexibility in your replacement strategy
  • Your herd health metrics are already solid

Consider a balanced approach if:

  • You ship to a fluid bottler or a diversified cooperative
  • Your herd already averages 3.3%+ protein
  • Your buyer caps protein premiums at a specific threshold
  • You’re still working on fertility or longevity genetics
  • You operate in a region with limited processor options

Consider maintaining the current strategy if:

  • Your processor has no protein premium structure
  • Switching buyers isn’t practical for your location
  • Your herd has significant health or fertility challenges to address first
  • You’re already at or above pool averages for both components

There’s no single right answer here. The key is matching your genetic strategy to your actual market circumstances.

Your Current SituationAggressive Protein FocusBalanced ApproachMaintain Current Strategy
Processor pays protein premiums?Yes, uncapped or high capYes, but capped at 3.3–3.4%No premium structure
Current herd protein averageBelow 3.25%3.25–3.35%Above 3.35%
Milk buyer typeCheese/protein plantDiversified co-opFluid bottler/powder plant
Herd health & fertility statusAlready solid (DPR >20%)Some challengesSignificant problems to fix first
Ability to switch processorsYes, within 50 milesLimited optionsLocked into current contract
Replacement strategy flexibilityCan use beef-on-dairyRaising most replacementsMust raise 100% replacements
Risk toleranceWilling to commit 3+ yearsModerateConservative
RECOMMENDATIONGo aggressive: aim for 3.4–3.5% proteinIncremental improvement: target 3.3–3.4%Focus on other profit drivers first

Regional Considerations

This analysis doesn’t apply uniformly across all operations and regions—something worth acknowledging.

Upper Midwest herds shipping to Wisconsin cheese plants are positioned differently than Southeast operations serving fluid markets. A 3,000-cow operation in the San Joaquin Valley faces different economics than a 100-cow farm in Vermont or a grazing dairy in Missouri.

Those shipping to cheese-focused cooperatives in Wisconsin and Minnesota have generally been tracking protein-to-fat ratios more closely—some for several years—and have adjusted breeding programs accordingly. In conversations with producers in these areas, I’ve repeatedly heard that neighbors who were initially skeptical are now asking about sire selections.

But producers in fluid-heavy markets often take a more measured approach. If your buyer can’t pay for high protein, breeding for a premium you can’t capture doesn’t make economic sense. Watching trends while maintaining flexibility is entirely reasonable.

Both perspectives make sense given their circumstances.

The fundamental trends—GLP-1 adoption, component pricing shifts, global protein demand—are real regardless of location. But how you respond depends on your specific situation: current herd genetics, processor relationship, cash flow position, and risk tolerance.

The Global Context: America’s Protein Export Opportunity

What’s happening domestically aligns with broader international patterns—and positions the U.S. dairy industry for a significant strategic shift.

New Zealand’s dairy industry—historically the world’s dominant dairy exporter—has hit production constraints. Environmental regulations capping nitrogen runoff have effectively frozen their national herd. Rather than competing for market share in commodity whole milk powder, they’ve pivoted toward high-value protein products.

According to a 2023 report from DCANZ and Sense Partners, protein products rose from 8.6% to 13.2% of New Zealand’s export mix between 2019 and 2023. DairyNZ reported that protein product exports increased 120% over that period, reaching $3.4 billion. That’s a deliberate strategic shift, not an accident.

Here’s what’s interesting for U.S. producers: we’re no longer just a dairy exporter—we’re increasingly becoming a protein exporter. According to the International Dairy Foods Association, U.S. dairy exports reached $8.2 billion in 2024, the second-highest level ever recorded. That’s a remarkable transformation. As IDFA noted in their February 2025 analysis, “After being a net importer of dairy products a decade ago, the United States now exports $8 billion worth of dairy products to 145 countries.”

The composition of those exports is shifting in telling ways. Brownfield Ag News reported in November 2025 that high-protein whey exports rose nine percent, led by sales to Japan. Farm Progress confirmed in July 2025 that “high-end whey exports continue to grow both in volume and value,” specifically noting that whey protein concentrates and isolates with 80% or more protein are driving the growth. According to the U.S. Dairy Export Council’s reference materials, the United States is now the largest single-country producer and exporter of whey ingredients in the world, with total whey exports reaching 564,000 metric tons in 2023—up 14% from 2019.

The industry is investing, and strong growth prospects have led to $8 billion in new processing plant investments set to increase production over the next two years. By mid-2025, nearly 20 million additional pounds of milk were flowing through new facilities, with much of that capacity focused on cheese—and the whey protein streams that come with it.

This matters for producers because U.S. dairy protein must increasingly meet global specifications. The U.S. Dairy Export Council has been working with the American Dairy Products Institute to develop industry standards for U.S. products and with the International Dairy Federation to develop worldwide technical standards. The National Milk Producers Federation prompted an investigation in 2025—through the U.S. International Trade Commission—into global competitiveness for nonfat milk solids, including milk protein concentrates and isolates.

Why does this matter at the farm level? Asian markets have evolved. China’s domestic milk production has grown, reducing the need for basic powder imports. What they’re purchasing now are specialized high-protein ingredients: lactoferrin for infant formula, protein isolates for clinical nutrition, functional ingredients for the growing urban fitness market.

With New Zealand capacity-constrained and the U.S. investing heavily in protein-processing infrastructure, there’s a genuine opportunity—but only if we’re producing what global buyers want. They’re not paying premium freight costs to import commodity milk. They want protein density that meets international quality standards. The farms supplying that milk are part of an increasingly export-oriented value chain, whether they realize it or not.

Balancing Opportunity and Risk

Any time someone presents a market opportunity, you should ask: “What if the assumptions don’t hold?”

Fair question.

What if the protein premium narrows?

It could happen. Processor capacity might expand. Consumer trends might shift. The protein-to-fat ratio could drift toward historical norms.

My thinking: even if protein premiums moderate, protein is unlikely to become less valuable than fat on a sustained basis. The fundamentals—bioavailability advantages, consumer demand for functional nutrition, processing economics—support continued protein value.

More importantly, breeding for combined solids rather than protein alone provides insurance. Bulls that improve both fat and protein percentages protect against shifts in the ratio. The market has never penalized producers for shipping high total solids. The risk is in low-component production, not in being wrong about which component the market favors most.

What if GLP-1 adoption plateaus?

Possible, but current trajectory suggests otherwise. These medications are being prescribed not just for weight loss but for diabetes management and cardiovascular protection. Insurance coverage is expanding. Pill formulations are entering the market. The user base appears to be institutionalizing rather than peaking.

But even setting GLP-1 aside, other demand drivers—aging populations seeking muscle preservation, fitness culture emphasizing protein intake, Asian markets wanting protein imports—remain intact.

Practical risk management approaches:

  • Use Net Merit (NM$) rather than extreme protein indexes for a balanced hedge
  • Maintain health and longevity trait minimums regardless of component goals
  • Keep some flexibility through beef-on-dairy rather than raising 100% of replacement heifers
  • Consider nutrition interventions (reversible) before genetic changes (permanent)
  • Monitor inbreeding coefficients when selecting heavily for protein traits

Practical Takeaways

Bringing this together into actionable items:

Understanding Where You Stand

  • Calculate the protein-to-fat price ratio from your last few milk checks
  • Compare your herd’s protein percentage to the Federal Order pool average (now 3.3%)
  • Have an explicit conversation with your milk buyer about protein premiums and thresholds

Evaluating Genetic Options

  • Review your current sire lineup for protein trait emphasis
  • Consider CM$ or updated NM$ rankings alongside traditional TPI
  • Set minimum thresholds for health and fertility traits before optimizing for components
  • Look for bulls positive in both protein percentage and protein pounds
  • Work with your AI rep on what makes sense for your herd
  • If you’re genomic testing heifers, use protein traits in your retention decisions
  • Monitor inbreeding levels when concentrating selection on protein traits

Near-Term Nutrition Interventions

  • Discuss rumen-protected methionine with your nutritionist
  • Consider a 21-30 day pen trial before full implementation
  • Track component response carefully to verify ROI on your operation
  • Pay particular attention to fresh cow and early lactation response

Timeline Expectations

  • Nutrition changes: visible results in 2-4 weeks
  • Genetic changes: first daughters milking in 3+ years
  • Spring 2026 breeding decisions will shape your 2029 bulk tank

Questions to Keep Asking

  • Does my processor have the infrastructure to pay for high-protein milk?
  • Am I positioned above or below the pool average for components?
  • What’s my risk tolerance for genetic strategy changes?
  • Am I tracking the protein-to-fat ratio, or just looking at absolute prices?

The Bottom Line

The dairy industry has navigated plenty of transitions over the decades. What makes this moment noteworthy is the convergence of forces—pharmaceutical, demographic, and economic—pointing in a consistent direction.

I’m not predicting that butterfat will become worthless or that every operation needs to overhaul its breeding program immediately. What I am suggesting is that assumptions many of us have operated under for the past decade deserve fresh examination.

The market is sending signals. Processors are paying premiums for protein that would have seemed unusual five years ago. Consumer demand is shifting in ways that favor nutrient density over volume. Global buyers are seeking protein ingredients, not commodity powder. And American dairy is increasingly positioned as a global protein exporter, not just a domestic commodity producer.

The combined opportunity is real. For a 500-cow herd that optimizes nutrition, adjusts genetic selection, and captures processor premiums—we’re talking $50,000 to $97,500 annually in additional value. That’s not theoretical. It’s math based on current market conditions and achievable improvements.

Producers who take time to understand these dynamics—and thoughtfully evaluate what they mean for their specific operations—are well positioned. Those who assume the old rules still apply may find themselves wondering why neighbors’ milk checks look different.

This isn’t about chasing trends. It’s about recognizing when fundamental market structures are shifting and responding accordingly. For some operations, that response might be modest adjustments. For others, more significant changes might make sense. Either way, understanding what’s actually happening is the essential first step.

That protein-to-fat ratio on your milk check? It’s telling you something. 

Complete references and supporting documentation are available upon request by contacting the editorial team at editor@thebullvine.com.

Learn More

The Sunday Read Dairy Professionals Don’t Skip.

Every week, thousands of producers, breeders, and industry insiders open Bullvine Weekly for genetics insights, market shifts, and profit strategies they won’t find anywhere else. One email. Five minutes. Smarter decisions all week.

NewsSubscribe
First
Last
Consent

28p vs. £300 Million: The 2025 Milk Price Gap Nobody’s Explaining

Asked Arla and Müller how £300M in expansions aligns with 28p milk. No response. Their annual reports answered anyway: €401M profit, margins tripled.

EXECUTIVE SUMMARY: Lakeland’s November 2025 price of 28.8p per litre—the first below 30p in over a year—means the average farm loses 15p on every litre produced. Processor economics tell a different story: Arla netted €401 million profit, Müller tripled operating margins to £39.6 million, and the sector poured £300 million into new capacity. This pattern extends globally. US lenders expect only half of dairy borrowers to profit this year; Germany loses 6 farms a day; Darigold members describe $4/cwt deductions making cash flow “impossible.” Factor in 2-3p/L in looming environmental compliance costs, and margins compress further still. Farms positioned to navigate this share clearly have the following characteristics: debt below 50% of assets, production costs under 38p, and component or contract strategies that capture value beyond the base price. The global dairy industry is consolidating faster than at any point since 2015. What you decide in the next 90 days shapes whether your operation leads that consolidation or gets swept up in it.

Milk Price Gap

The text came through just after 6 AM on a wet December morning in County Fermanagh. Lakeland Dairies had announced November’s price: 28.8 pence per litre. The Irish Farmers Journal confirmed it was the first time we’d seen prices dip below 30p since November 2023.

For the farmer who shared it with me—180 cows, third-generation operation, silage already put up for winter—the math took about thirty seconds. At 28.8p against his actual production cost of roughly 44p, he’s losing just over 15p on every litre his cows produce. That works out to around £2,500 a month in the red, assuming nothing else goes sideways between now and spring.

“Dairy farming is not sustainable for families at the minute,” is how he put it when we spoke later that week. “They talk about it coming back at the second half of next year—the second half of next year could be December.”

You know what struck me about that conversation? It wasn’t the frustration. Every dairy farmer I’ve talked to lately has plenty of that. It was the clarity. He’d already run his numbers. He knew exactly how many months of working capital he had left, what land he could move if it came to that, and at what price point he’d need to start having some hard conversations about the herd’s future.

That kind of clear-eyed planning is becoming more common across dairy operations worldwide right now. And given where things stand, that’s probably smart.

The 70p Gap: Where Your Milk Money Actually Goes

So let’s dig into what we actually know about where the money flows in late 2024.

The headline numbers tell a pretty stark story. Lakeland’s 28.8p base price for Northern Ireland suppliers is the first time we’ve breached that 30p floor in over a year. Meanwhile, you walk into any Tesco Express or Sainsbury’s Local, and you’re looking at somewhere between £1.00 and £1.50 for a litre of milk.

That’s a gap of 70p to 120p per litre between what we’re getting at the farm gate and what consumers pay at checkout.

Now here’s the thing—and you probably know this already—a good chunk of that gap is completely legitimate. Processing costs real money. So does transport, packaging, refrigeration, retail labour, and the considerable energy costs of keeping those dairy cases cold around the clock. A reasonable industry estimate for post-farm costs is 25-35p, depending on the product and supply chain.

But even accounting for all those real costs, there’s still a meaningful portion—perhaps 40p or more—being captured at various points along the supply chain between the bulk tank and the checkout. Understanding where that value ends up, and why, helps when you’re trying to make sense of your own situation.

SegmentTypical revenue per litre (p/L)Approximate cost per litre (p/L)Approximate margin per litre (p/L)
Dairy farm28.844.0-15.2
Processor45.035.010.0
Retailer110.070.040.0
Whole chain110.0149.0*

Here’s what gets interesting when you look at the regional breakdown. According to AHDB data from October 2025, the UK average farmgate price is 46.56p per litre, with Great Britain at 47.99p. Northern Ireland? Just 39.09p—and remember, that’s the average, which includes farms on better contracts. The 28.8p base price we’re talking about sits well below even that regional figure.

I was chatting with a Devon producer last month who put it pretty plainly:

“We’re getting 38p on a standard liquid contract, which isn’t great, but it’s survivable if you’re careful. When I hear what lads in Fermanagh are getting, I honestly wonder how they’re managing it.”

So why such a big difference across regions? Some structural factors help explain it.

The Export Trap: Why Northern Ireland is the Canary in the Coal Mine

Here’s the key thing about Northern Ireland that shapes everything else: roughly 80% of NI milk production—that’s from AHDB’s latest figures—heads straight for export markets. Cheese, butter, powder destined for Europe, Africa, and beyond. That’s a fundamentally different setup from Great Britain, where more milk stays domestic and flows through liquid contracts with the major retailers.

What that export focus means—and this is really the central point—is that pricing works on completely different terms. When you’re selling mozzarella into European food service or milk powder into global commodity markets, you’re competing against New Zealand, Ireland, and every other major exporter out there. Your price gets driven by the Global Dairy Trade index, not by whether Tesco needs to keep shelves stocked.

And there’s a geographic reality that also constrains options. You can’t economically truck raw milk across the Irish Sea to chase a buyer in Liverpool. The collection infrastructure, the processing capacity, the contractual relationships—they’re all concentrated within Northern Ireland. That creates a different competitive environment than what a Cheshire farmer might have with potentially more buyers nearby.

Why does this matter for producers elsewhere? Because what’s happening in Northern Ireland is a preview of what export-dependent regions face globally when commodity markets soften. The same dynamics are playing out in New Zealand right now, where Fonterra is facing pressure on its farmgate milk price forecast amid supply outpacing global demand. Australia’s southern export regions have seen similar pressure on milk prices compared to last season, according to recent Rabobank analysis.

Cyril Orr, the Ulster Farmers’ Union Dairy Chairman, has been pushing hard on the transparency issue through all of this. “As dairy farmers, we are entering a challenging period marked by significant market uncertainty and pressure on farm gate prices,” he said in a December statement. “It is more vital than ever that farmers can place trust in their processors. We need to see greater openness, transparency, and genuine collaboration within milk pools.”

That call for transparency reflects something I’ve heard from producers across the UK, Ireland, and frankly, the US too: there’s a real desire for clearer information about how product values actually translate into what shows up on our milk checks.

The £300 Million Question: What Processor Investments Really Tell Us

Here’s where things get more nuanced—and it’s worth thinking through carefully.

If the dairy sector were struggling across the board, you’d typically expect processors to pull back on capital spending, maybe close some facilities, and issue profit warnings. That’s what we saw during the 2015-2016 downturn, as many of us remember.

But that’s not what’s happening now.

Over the past 18 months, UK and Ireland-based processors have committed nearly £300 million to capacity expansion:

  • Arla Foods: £179 million for Taw Valley mozzarella capacity, announced July 2024
  • Müller: £45 million at Skelmersdale for powder and ingredients
  • Dale Farm: £70 million for the Dunmanbridge cheddar facility in Northern Ireland, plus a major long-term supply deal with Lidl covering 8,000 stores across 22 countries

You don’t commit nearly £300 million to capacity expansion unless you’re confident about future milk availability and market demand. That’s just business sense.

It’s worth looking at the processor financials, too. Arla Foods group-wide posted €401 million in net profit for 2024—up from €380 million the year before—on revenues of €13.8 billion, according to their February annual report. Müller UK, according to The Grocer’s September coverage, nearly tripled its operating profit to £39.6 million after turning a profit again.

What does all this suggest? Well, one way to read it is that while farm-level economics are under real pressure, other parts of the supply chain have found ways to maintain or even improve their positions. Whether that’s a temporary rebalancing or something more structural… honestly, reasonable people can look at these numbers differently. The situation is complex.

I reached out to both Arla and Müller for comment on how their investment plans align with current farmgate pricing. Neither responded. And you know, that silence tells you something too.

A Global Squeeze: This Isn’t Just a UK Problem

Before we go further, it’s worth zooming out—because this margin pressure isn’t unique to the UK. Not by a long shot.

In the US, agricultural lenders now expect only about half of farm borrowers to turn a profit this year. That’s a marked decline from previous expectations. Out in the Pacific Northwest, Darigold—a cooperative serving around 250 member farms across Washington, Oregon, Idaho, and Montana—announced a $ 4-per-hundredweight deduction earlier this year to cover construction cost overruns at its new Pasco facility. As Capital Press reported in May, one farmer bluntly described the situation: “The $4.00 deduct, combined with all the other standard deductions, has made it impossible for us to cash flow.”

The EU picture isn’t any rosier. A December 2024 USDA GAIN report forecast that EU milk production would decline in 2025 due to declining cow numbers, tight dairy farmer margins, and environmental regulations. Germany has been losing over 2,000 dairy farms annually—that’s roughly six operations closing every single day, according to analysis of federal statistics. Poland’s dairy industry profitability is “teetering on the edge,” per a recent Wielkopolska Chamber of Agriculture report. And across Eastern Europe, thousands of farms have exited in recent years amid what industry leaders describe as significant crisis conditions.

The pattern is unmistakable: processors investing, producers struggling, margins getting captured somewhere in between.

What’s interesting is how different regions are responding. And one of the more instructive comparisons—with lessons worth considering—is how Irish farmers handled similar pressure.

When Farmers Fought Back: The Irish Playbook

When Irish processors announced cuts in late 2024, the response was notably coordinated. Over 200 farmers gathered outside Dairygold’s headquarters in Mitchelstown on September 19th—Agriland covered it extensively—and many of them brought printed copies of their milk statements. A broader group eventually mobilised roughly 600 suppliers to raise specific questions about pricing formulas and the calculation of value-added returns.

What made this different was the specificity of it. Rather than general complaints about “unfair prices,” farmers showed up with documented questions: How does the Ornua PPI relate to what’s actually showing up in our milk checks? How are value-added premiums being allocated? What are the real margins on different product categories?

Pat McCormack, the ICMSA President, was pretty direct in his assessment—he suggested processors were using milk prices to absorb volatility that might otherwise hit other parts of the chain. The IFA raised concerns about what continued cuts might mean for production levels.

Within a few weeks, several cooperatives did adjust their pricing. The movement wasn’t dramatic, but it showed that organised, data-driven engagement could influence outcomes.

Here in the UK, the farming unions—NFU, NFU Scotland, NFU Cymru, and UFU—took a different approach, issuing a joint letter calling for “responsible conduct” across the supply chain. Professional and measured.

I’m not saying one approach is inherently better than another—different markets and structures call for different strategies. But the contrast raises some interesting questions about which kinds of engagement actually move the needle. Something to think about.

The Environmental Wildcard: Already on Your Balance Sheet

Here’s a factor that’s reshaping farm economics right now—not someday, but today: environmental regulation. And honestly, it probably deserves more attention than most of us are giving it.

What happened in the Netherlands—where nitrogen limits led to mandatory herd reductions—shows how fast the regulatory picture can shift. Irish farmers have already felt it from nitrate derogation adjustments. Ireland’s water quality issues prompted the EU to reduce the limit to 220kg/ha in some areas starting January 2024, forcing affected farmers to cut stock or find more land.

For UK producers, several things are worth watching:

  • Water quality pressure: Defra’s getting pushed to address agricultural contributions to river catchment issues. Dairy-heavy areas in the South West and North West could face new requirements as review cycles progress.
  • Ammonia targets: The Clean Air Strategy includes a UK commitment to cut ammonia emissions by 16% by 2030 compared to 2005—that’s according to official government reporting. Housing and slurry management are big focus areas.
  • ELMS implications: How dairy operations fit into the Environmental Land Management scheme’s eligibility—and whether future support involves stocking density requirements—are still evolving questions with real implications.

Why does this matter for your cost of production calculation? Because compliance investments aren’t optional anymore—they’re line items. If you’re running your numbers at 44p and not factoring in upcoming environmental requirements, you might be underestimating your true breakeven by 2-3p per litre. That’s the difference between surviving and not in a sub-30p market.

If UK policy moves toward firmer livestock limits, the ripple effects would run right through the supply chain. Processing infrastructure designed for current volumes faces different economics if milk availability shifts through regulation rather than markets.

The Numbers That Actually Matter for Your Operation

If you’re milking cows right now and trying to figure out where you stand, all this industry analysis provides useful context. But your specific numbers are what really matter. Here’s a framework several farm business consultants have been using—not hard rules, but useful reference points:

What to TrackGenerally ComfortableWorth Watching⚠️ Needs Attention
Debt-to-Asset RatioBelow 50%50-60%Above 60%
Working Capital Runway12+ months6-12 monthsUnder 6 months
True Cost of ProductionUnder 38p/L38-42p/LAbove 42p/L
Annual Volume2M+ litres1.5-2M litresUnder 1.5M litres

The debt-to-asset calculation you probably know—total liabilities divided by total asset value. What matters about that 60% threshold is that above it, your ability to absorb an extended low-price period gets pretty limited. You might find yourself servicing debt out of equity rather than cash flow, and any softening in land or livestock values creates additional pressure you don’t need.

Working capital runway—current assets minus current liabilities, divided by your monthly cash burn—tells you how long you can keep going if nothing changes. Dairy pricing cycles generally take 6-18 months to shift meaningfully, so shorter runways don’t leave much room to wait things out.

And the cost of production number? That’s where honest self-assessment really matters. Include everything: variable inputs, fixed overhead, family labour at what you’d actually have to pay someone else, full finance charges—and now, factor in those environmental compliance costs we just discussed. If that figure’s above 42p and there’s no clear path to getting it under 38p in the next 90 days… that’s a structural challenge that better markets alone probably won’t fix.

Three Questions Worth Asking Your Processor This Week

  1. What’s the current Ornua PPI or equivalent product return index, and how does my price track against it?
  2. What market factors might support a price adjustment in Q1 2025?
  3. Are there aligned contract opportunities available, and what would I need to qualify?

You might not get detailed answers. But asking demonstrates you’re engaged, and it creates a record of the conversation.

What’s Working for Producers Who’ve Been Here Before

In conversations with farmers who’ve navigated previous cycles, several themes consistently emerge. Here’s what seems to be helping.

On feed costs: “Lock what you can while grain markets are favourable” was something I heard over and over. Feed generally runs over 40% of variable costs for most of us, so it’s one of the bigger levers you can actually pull. Forward contracting through Q2 2025 won’t entirely offset a 15p/litre shortfall, but it removes one variable from the equation. Several farmers mentioned negotiating extended payment terms—60-90 days—in exchange for volume commitments. Worth exploring.

On component strategy: Here’s something that doesn’t get enough attention in these pricing discussions: butterfat and protein premiums can meaningfully offset base price pressure for operations set up to capture them. UK butterfat levels averaged 4.44% in October 2025 according to Defra statistics—but there’s wide variation between herds. First Milk’s Mike Smith noted in their June 2025 announcement that component payments directly affect their manufacturing litre price, with the standard calculated at 4.2% butterfat and 3.4% protein. Farms consistently running above those benchmarks are realizing additional value that doesn’t show in base-price comparisons. If your herd genetics and nutrition programme support higher components, that’s real money—potentially 1-2p/L or more depending on your processor’s payment structure.

On culling decisions: With beef prices relatively strong right now, the math on marginal cows looks different than it might in other years. The general guidance is to look hard at your bottom 15% by productivity—but timing matters too. Cull values tend to be better now than they might be if spring brings a wave of dispersal sales from farms exiting. One Cumbrian producer told me he’d moved 20 cows in November specifically because he expected prices to soften by February. Smart thinking.

On contracts: Farmers with competitive cost structures and solid compliance credentials may benefit from exploring retailer-aligned pools. The premium over standard contracts—typically 2-5p per litre—can add up to £35,000-£90,000 annually on a million-litre operation. Application windows for Q1 usually run in autumn, so timing for 2025 might be tight, but it’s worth a conversation.

And here’s something that doesn’t get talked about enough: farmers on well-structured, aligned contracts often say it’s the stability, not just the premium, that makes the real difference during volatile times. Knowing your price three months out changes how you plan, how you manage cash flow, and, honestly, how those conversations with your bank manager go.

On sharing information: Producer Organisations provide a framework for collective engagement that individual suppliers just don’t have. The Fair Dealing regulations have given these structures more teeth. Several farmers mentioned that even informal setups—WhatsApp groups where neighbours compare milk checks and input costs—have been really valuable for understanding whether their situation reflects broader patterns or something specific. Shared information helps everyone.

Breeding Decisions in a Survival Economy

Here’s something worth thinking through carefully if you’re making genetic decisions right now: the beef-on-dairy question has gotten a lot more complicated.

The numbers tell part of the story. According to AHDB’s December 2025 analysis, dairy beef now makes up 37% of GB prime cattle supply—up from 28% in 2019. Dairy-beef calf registrations increased another 6% in the first half of 2025 compared to the same period in 2024. That’s a significant shift in how our industry contributes to the broader meat supply.

What’s driven it? Pretty straightforward economics, really. When beef-cross calves were bringing strong premiums and replacement heifer values had collapsed to around £1,200 back in 2019, the maths pushed many operations toward more beef semen at the bottom end of the herd. Made perfect sense at the time.

But here’s what’s changed: replacement heifer economics have flipped dramatically. In the US, USDA data shows replacement dairy heifer prices jumped 69% year-over-year in Wisconsin—from $1,990 to $2,850 by October 2024. CoBank’s August 2025 analysis reported prices reaching $3,010 per head nationally, with top heifers in California and Minnesota auctions fetching over $4,000. That’s a 164% increase from the 2019 lows.

The UK hasn’t seen quite the same spike, but the trend is similar: quality replacement heifers are getting harder to source and more expensive when you find them.

So what does this mean for breeding decisions right now? A few things worth considering:

  • Genomic testing economics have shifted. When heifers were cheap, testing your youngstock and culling aggressively on genomics felt like a luxury. Now, with replacement costs significantly higher, knowing which animals are worth developing and which should go to beef makes real financial sense.
  • The fertility-longevity trade-off matters more. Every open cow or early cull represents a replacement purchase in a tight heifer market. Genetic selection for fertility and productive life has direct cash flow implications that weren’t as acute three years ago.
  • Component genetics intersect with pricing strategy. If your processor pays meaningful butterfat and protein premiums, breeding decisions that move those numbers aren’t just about future herd composition—they’re about capturing more value from the milk you’re already producing.

I’m not suggesting everyone should immediately pivot away from beef-on-dairy—the calf values are still there, and for many operations the economics still work. But the calculation has changed enough that it’s worth running the numbers fresh rather than assuming what worked in 2021 still makes sense in 2025.

The Bottom Line: Consolidation is Coming—Position Yourself Now

Let me be direct about what I see happening.

The UK dairy industry isn’t just going through a temporary rough patch. It’s consolidating. The combination of margin pressure, environmental compliance costs, and processor investment patterns all point in the same direction: fewer, larger operations capturing a greater share of production. USDA data shows more than 1,400 US dairy farms closed in 2024—that’s 5% of all operations in a single year. Germany is losing over 2,000 dairy farms annually. The Andersons Outlook report projects GB dairy producers could fall to between 5,000 and 6,000 within the next two years, down from 7,130 in April 2024. The pattern is global, and it’s accelerating.

That’s neither good nor bad—it’s just reality. The question is whether you’re positioned to be one of the operations that emerges stronger, or whether the current squeeze catches you unprepared.

The farms that will thrive through this cycle share some common characteristics: debt loads below 50%, production costs under 38p, component levels capturing premium payments, breeding programmes balancing replacement needs against beef income, and the willingness to explore non-traditional arrangements—whether that’s aligned contracts, on-farm processing, or strategic partnerships.

The current environment is genuinely challenging, but it’s not the same for everyone. Some farms will work through this and find opportunities on the other side. Others face situations where operational improvements alone may not be enough.

Figuring out which category your operation falls into is the essential first step. Run your numbers honestly. Have proactive conversations with your lender—before they’re calling you. Think through the full range of options, including the possibility of stepping away with equity intact rather than waiting until choices narrow.

If it’s been more than a couple of months since you’ve really dug into your financial position, this might be a good week for that work. The decisions made now—with complete information and realistic expectations—are usually the ones that still look sound eighteen months down the road, whatever direction ends up making sense for your situation.

The processors are betting on continued milk availability. The question is: at what price, and from whom?

KEY TAKEAWAYS

  • You’re Losing 15p on Every Litre: 28.8p farmgate vs. 44p production cost = £2,500/month loss for average herds. First sub-30p price in over a year.
  • Processors Are Expanding While Farms Contract: €401M Arla profit. Müller margins tripled to £39.6M. £300M in new capacity committed. The pain isn’t distributed equally.
  • This Is Global Restructuring, Not a Local Dip: Half of US dairy borrowers expected to be unprofitable in 2025. Germany loses six farms daily. Same pattern, different currencies.
  • Your True Breakeven Is 2-3p/L Higher: Environmental compliance—ammonia targets, water-quality regs—is now a line item. Update your numbers before your lender does.
  • The 90-Day Survival Test: Debt below 50%? Costs under 38p/L? Strategy capturing value beyond base price? Farms passing all three will shape the consolidation. The rest will be shaped by it.

Complete references and supporting documentation are available upon request by contacting the editorial team at editor@thebullvine.com.

Learn More

The Sunday Read Dairy Professionals Don’t Skip.

Every week, thousands of producers, breeders, and industry insiders open Bullvine Weekly for genetics insights, market shifts, and profit strategies they won’t find anywhere else. One email. Five minutes. Smarter decisions all week.

NewsSubscribe
First
Last
Consent

The 90-Day Reckoning: What Your Milk Check Is Really Saying About 2026

The math doesn’t care about sentiment. At $15.62 milk and $18.75 costs, a 550-cow dairy burns $36,350/month. What’s your number?

EXECUTIVE SUMMARY: At $15.62 Class III milk and $18.75 all-in costs, a 550-cow dairy burns $36,350 every month—and the math doesn’t care about sentiment. Heifer inventories have hit a 47-year low. Nine consecutive GDT auctions have declined. Over $11 billion in new processing capacity is coming online while farms contract. This isn’t a cycle; it’s a structural reset. For producers with costs in the $17-19 range and limited liquidity, the window to preserve family equity through a controlled transition is roughly 90 days. The frameworks are here—true cost of production, liquidity runway, decision pathways—because knowing your real numbers is the difference between making decisions and having them made for you.

You know how it goes this time of year. You’re wrapping up evening chores, maybe checking futures on your phone while the parlor finishes up, and the numbers just don’t add up the way you need them to.

Class III contracts for early 2026 have been trading in the mid-teens on the CME—January 2026 recently settled around $15.62—and for a lot of operations, that’s a couple of dollars or more below what’s needed to cover everything. Not just feed and labor. Everything. The mortgage, the equipment note, and family living expenses.

Here’s what makes this moment unusual, though. Feed costs have actually come down. Corn’s running around $4.40-4.45 a bushel on the Chicago Board of Trade as of mid-December. Soybean meal’s around $300-320 a ton—well below where it was a couple of years back. Butter inventories look manageable. Domestic cheese demand is holding steady.

So why does the math still feel so difficult?

After spending the past few weeks going through the data—conversations with economists, reports from CoBank and the extension services, watching the Global Dairy Trade auctions—I’ve come to believe that what we’re looking at in early 2026 isn’t just another down cycle. Global supply growth, shifting export dynamics, and significant new processing capacity all arriving at once… these conditions seem likely to reshape dairy’s structure over the next several years.

This isn’t about waiting for prices to recover. It’s about understanding where your operation actually stands—and thinking through your options while they’re still open.

The Numbers Nobody Wants to See

The Global Dairy Trade auctions have been tough to watch lately. The December 16th event marked the ninth consecutive decline, with the index dropping 4.4% according to GDT Event 394 results. The auction before that fell 4.3%. Whole milk powder values have softened enough to create real headwinds for exporters trying to move product internationally.

On the domestic side, butter’s been trading in the mid-$2 range per pound, down from earlier this fall. Block cheese has settled into the mid-$1.60s after pushing toward $1.90 in October, based on CME spot market data. Not terrible, but not where most of us need it to be either.

What’s worth noting—and this is something that’s frustrated a lot of folks—is what’s happening with Dairy Margin Coverage. The program triggered a solid payment in January 2024 when margins dipped below $9.50, according to USDA Farm Service Agency records. Since then? With feed costs lower than they were, the formula shows margins that look healthy on paper, even when your cash flow is telling a very different story.

Danny Munch, an economist at the American Farm Bureau Federation, has spoken to this dynamic. When corn and soybean meal prices drop, the DMC calculation can paint a rosier picture than what many farms are actually experiencing. The safety net’s still there, but the way the formula works means it doesn’t always deploy when you’d expect it to.

💰 THE MATH THAT MATTERS

What margin pressure actually looks like per cow:

At $18.75 all-in cost and $15.50 Class III milk:

  • $3.25/cwt margin loss
  • Average U.S. cow produces ~24,375 lbs/year (that’s from USDA’s December 2025 Economic Research Service forecast)
  • That works out to 244 cwt × $3.25 = $793/cow/year loss

For a 550-cow dairy:

  • $436,150 annual margin shortfall
  • $36,350/month cash burn from milk margin alone

And that’s before you add debt service, family living, and depreciation. You can see why liquidity evaporates faster than most folks expect.

The Heifer Trap

Those of us who’ve been through 2009, 2015-16, and 2018 know what price cycles look like. We’ve navigated them before. But a few things are converging now that really do set this period apart.

The replacement pipeline is running dry. USDA’s cattle inventory data from January 2025 showed dairy replacement heifers over 500 pounds at around 3.9 million head—the lowest since 1978, according to the National Agricultural Statistics Service. That’s a 47-year low. Let that sink in for a moment.

How did we get here? Well, you probably know, because you may have made some of the same decisions I’ve seen across the industry. When beef-on-dairy started penciling out so well, a lot of operations shifted their breeding programs. NAAB data shows beef semen use on dairy operations climbed substantially over the past decade. It made economic sense at the time—those crossbred calves brought good money, and they still do. But it means fewer heifers in the replacement pipeline, and that’s not something that corrects quickly.

CoBank’s August 2025 Knowledge Exchange report projected that heifer inventories will likely tighten further before any meaningful recovery, probably not until 2027 at the earliest. Biology takes time. You can’t speed up gestation.

Export markets have shifted underneath us. China has been building domestic production capacity for years now. USDA Foreign Agricultural Service and OECD-FAO analyses show they’re meeting most of their dairy needs internally these days internally, with imports focused more on specific ingredients than on bulk commodities. That’s a structural change, not a temporary dip.

Several Southeast Asian markets—Indonesia, Vietnam, the Philippines—have also pulled back from where they were a few years ago, according to USDA’s Dairy: World Markets and Trade reports. There’s still an opportunity there, but competition has intensified considerably.

Processing is expanding while farms contract. According to IDFA data released in October 2025, more than $11 billion in new and expanded dairy processing projects are underway across 19 states, with over 50 facilities scheduled to come online between 2025 and early 2028. That represents significant demand for raw milk—but also creates some interesting pressure on the supply side.

This creates a tension that’s worth watching closely. Processors built capacity expecting continued production growth. The heifer shortage complicates that considerably. And margin pressure is affecting decisions across the board. Everyone in the supply chain is working through the same challenges simultaneously.

Editor’s note: We’re working on a follow-up piece—”What Your Milk Buyer Wants You to Know About 2026″—examining how processors are managing supplier relationships during this consolidation period. If you’re a processor willing to share perspective, reach out to us at info@thebullvine.com.

Know Your Real Numbers

I’ve been talking with financial consultants and extension specialists about what metrics matter most right now. Every operation is different—different debt structures, different facilities, different family circumstances—but a few numbers keep coming up in those conversations.

Your Actual Cost of Production

This is probably the most important number you can know. It’s also the one most commonly underestimated.

A farm financial analyst who works with Midwest dairies shared something that stuck with me: most producers he sits down with think they know their cost of production, but once they work through everything carefully, they often find they’re $1.50 to $3.00 higher than they thought. That’s a significant gap when margins are already tight.

A complete picture typically includes:

  • Cash operating costs—feed, fuel, labor, utilities, supplies. For most operations, that’s somewhere in the $10.50-12.50 per hundredweight range, according to Penn State Extension dairy breakeven analyses.
  • Debt service—equipment payments, real estate, operating lines. That can add another $3-5 per hundredweight depending on your situation.
  • Family living—what you actually draw, not what you budgeted. Another $1.50-2.50. And be honest here.
  • Depreciation—what it really costs to maintain and replace equipment and facilities over time. Perhaps $1-2 more.

When you add everything up, many mid-sized operations are running $17.50 to $21.50 per hundredweight all-in. The Penn State Extension dairy breakeven tools, the Wisconsin Center for Dairy Profitability benchmarking data (which compares over 500 farms annually), and the University of Minnesota extension work all show similar ranges.

Regional pricing differences matter here, too. Your mailbox price depends heavily on where you’re located and your Federal Order. California’s quota system creates dynamics different from those in FMMO regions. Upper Midwest producers in Order 30 generally benefit from proximity to processing—Wisconsin’s weighted average hauling charge runs around 47 cents per hundredweight, according to Federal Order 30 market administrator data from May 2025.

Cost Scenario (all‑in)Margin per cwt (USD)Margin per cow per year (USD)550‑cow farm margin per year (USD)Monthly cash flow (USD)
$17.00/cwt-1.00-244-134,200-11,183
$18.50/cwt-2.50-610-335,500-27,958
$20.00/cwt-4.00-976-536,800-44,733

But if you’re in the Northeast under Order 1 or the Southeast under Order 7, you’re facing different math entirely. The June 2025 FMMO reforms increased Class I differentials specifically to reflect the higher cost of servicing fluid markets in those regions—the Southeast saw the largest increase nationally at $1.74 per hundredweight on average, according to USDA analysis. Recently passed intraorder transportation credits are helping offset some of those long-haul costs for Southeast producers, according to Progressive Dairy’s 2025 State of Dairy report. Still, when you’re calculating your margins, make sure you’re using your actual milk check, not a national average.

If your true cost is north of $18 and milk’s in the mid-teens, the gap becomes challenging to manage for very long. You know this already. The question is what to do about it.

The Runway Calculation

This next calculation can be uncomfortable, but it’s genuinely important.

📊 YOUR LIQUIDITY RUNWAY

The Formula: (Available Cash + Remaining Operating Credit) ÷ Monthly Loss at Current Prices = Months of Runway

What It Means:

  • 6+ months: Time to evaluate options strategically
  • 3-6 months: Decisions needed in next 30-60 days
  • Under 3 months: Urgent situation requiring immediate action

Example: $87,000 cash + $140,000 credit line = $227,000 total liquidity At $21,000 monthly loss = 10.8 weeks of runway

Farm finance advisors tell me that many mid-sized operations—the ones in that $18-19 breakeven range—have roughly 3-4 months of liquidity right now. Factor in what’s already been drawn during Q4, and some folks are looking at eight to twelve weeks before things get genuinely difficult.

Can Growth Change the Equation?

Some producers are thinking: if I could get bigger, spread fixed costs over more milk, maybe I could bring my per-hundredweight costs down enough to make this work.

Sometimes that does pencil out. Often it doesn’t.

Here’s one way to think about it: take the investment required—new parlor, additional cows, facility improvements—and divide it by the capital you can realistically access. If that ratio gets much above 2.0, the new debt service often consumes the efficiency gains. I’ve seen operations attempt to grow their way out of margin pressure and find themselves worse off because interest payments exceeded the cost savings they achieved.

What About Premium Markets?

Organic, grass-based, A2—there are genuine opportunities in specialty markets. Premiums in the $22-28 range exist for the right product in the right market.

But transitions require time and capital. Organic certification is a three-year process under the USDA National Organic Program rules. That’s three years of meeting the requirements without receiving the premium. If your liquidity runway is 12 months, that timeline just doesn’t work, regardless of the long-term potential.

One Family’s Experience

Let me share what this analysis looks like in practice. I spoke with a 550-cow dairy in east-central Wisconsin a few weeks ago. The family asked me not to use their names, but they were willing to walk through their numbers openly.

When they sat down in early December to really nail down their cost of production, they initially thought they were at about $17.25. That’s the figure they’d been carrying in their heads. But once they included the equipment loan from their 2021 parlor renovation, actual family health insurance costs, and what they’d really been drawing for living expenses—not the budget, but actual spending—they landed at $18.75.

Their available cash was $87,000. Operating line had about $140,000 remaining. Total liquidity: $227,000.

At current milk prices, their monthly cash burn worked out to roughly $21,000. That gave them about 11 weeks.

“Eleven weeks sounds like almost three months until you realize one of those months is already half gone. We thought we had until spring to figure this out. Turns out we had until mid-February.”

— Wisconsin dairy producer, 550 cows

They’re now working with their lender on an orderly timeline. Not the outcome anyone hoped for. But better to understand the situation in December than to discover it in April when options have narrowed considerably.

Three Paths Forward

Based on where your numbers fall, you’re likely looking at one of three general situations. And I want to be clear about something—these aren’t judgments about management ability. Cost structures reflect decisions made over decades, regional differences, facility age, land costs, and interest rates at the time of financing. This is simply about matching current circumstances to realistic options.

📅 CALENDAR OF NO RETURN: Key Decision Windows

If you’re considering a controlled transition, timing affects value significantly:

DateDecision PointWhy It Matters
Jan 15, 2026Final date to list heifer calves for late-winter salesHeifer calf values typically are strongest before the spring flush; Dairy Herd Management reported Holstein springers hitting $3,500-$4,550 and beef-cross calves commanding $1,200-$1,650 at fall 2025 auctions
Feb 1, 2026Lender conversation deadline for Q1 actionBanks close Q1 books in March; flexibility drops significantly after February conversations
Feb 15, 2026Last reasonable date for Q1 controlled exit planningAllows 6-8 weeks for orderly herd dispersal before the spring flush depresses values
March 15, 2026Point of no return for spring timingAfter this date, you’re competing with spring flush volumes; asset values typically soften as supply increases

These windows assume a controlled transition. Crisis liquidations follow different, more compressed timelines.

SituationKey IndicatorsPrimary Focus
Well-PositionedCosts under $17/cwt, 6+ months liquidity, solid debt coverageStrategic positioning for the consolidation period
Middle GroundCosts $17-19/cwt, 3-6 months liquidity, tight but manageable debtEvaluate controlled transition within 90 days
Immediate PressureCosts above $19/cwt, under 3 months liquidity, debt coverage below 1.0Proactive restructuring or professional consultation

The Strong Position Play

All-in costs under $17, 6+ months of liquidity, solid debt coverage, and a good lender relationship.

This describes a minority of operations currently—more common among larger Western dairies with scale efficiencies and some newer Midwest facilities with recent upgrades. If this is your situation, you have the runway to work through the consolidation period ahead.

What tends to make sense here: lock in feed costs while they’re favorable. Ensure your Dairy Revenue Protection coverage is in place for 2026. Have substantive conversations with your milk buyer about 2026-27 arrangements. If heifer availability improves through processor partnerships—and CoBank reports some buyers are offering co-financing to maintain key supplier relationships—you may be positioned to grow at reasonable terms.

The key discipline is avoiding overextension. The operations that emerged strongest from 2015-16 were often those that stayed conservative even when they had the capacity to expand. There’s wisdom in that.

The 90-Day Window

Costs in that $17-19 range, three to six months of liquidity, and debt coverage that’s manageable but tight.

Many farms fall into this category—probably the largest group, honestly. For this group, the window for a controlled transition that preserves meaningful equity is roughly 90 days.

Financial advisors who work with dairy operations consistently report that farms executing planned transitions early in a downturn preserve significantly more equity than those who wait until circumstances force their hand. The Wisconsin Center for Dairy Profitability has tracked these patterns through multiple price cycles.

Timing matters because asset values—particularly herd values—typically soften when many farms are selling simultaneously. Operations moving in March or April will likely realize stronger prices than those waiting until May or June if exit activity accelerates as some expect. Dairy Herd Management’s fall 2025 auction reports showed Holstein springers commanding $3,500-$4,550 per head and beef-cross calves bringing $1,200-$1,650—but these premiums depend on moving before the market gets crowded.

What does a controlled transition look like? Liquidate heifer calves first while prices remain firm. Market cull cows and productive animals over six to eight weeks rather than all at once. Apply proceeds strategically to debt, prioritizing real estate obligations. Communicate openly with your lender throughout.

I spoke with a regional agricultural lending officer in the Upper Midwest who’s worked with dairy borrowers for over 20 years. His perspective: “We’d much rather work with a producer on an orderly plan than deal with a surprise. When someone comes to us early and says, ‘Here’s what I’m seeing in my numbers, here’s what I’m thinking,’ we can usually find more flexibility than if they wait until they’ve missed payments and we’re both in a corner.”

An operation with $6 million in assets and $4.5 million in debt can potentially preserve $1 million or more in family equity through well-timed management. That’s meaningful capital for whatever comes next—whether that’s a different agricultural venture, off-farm investment, or retirement.

When Restructuring Is the Reality

Costs above $19, less than three months of liquidity, and debt coverage below 1.0.

A growing number of farms find themselves here. For this group, the question isn’t whether restructuring happens—it’s whether you’re making the call or someone else is.

Chapter 12 bankruptcy was designed specifically for family farm operations under the Bankruptcy Abuse Prevention and Consumer Protection Act. It provides court protection for three to five years. Lenders can’t foreclose during that period, and debt typically gets reduced by 30-50%.

An agricultural bankruptcy attorney in Iowa who handles dairy cases offered this perspective: file proactively rather than waiting for your lender to accelerate the note. Farmers who seek advice before they’re in full crisis tend to have better outcomes than those who wait until foreclosure is imminent.

The honest reality with Chapter 12: it works when restructured debt levels actually allow the operation to generate positive cash flow going forward. For situations where even halving the debt wouldn’t create sustainable margins at current milk prices, restructuring may delay the outcome rather than change it. That’s a hard truth, but it’s worth considering carefully.

Hard-Won Wisdom

I reached out to several producers who navigated the 2015-16 downturn to ask what they learned from it. Their perspectives are worth hearing.

A 400-cow producer in upstate New York—he asked to remain anonymous—emphasized the lender relationship: “Your banker isn’t working against you. They don’t want to foreclose—that’s a loss for them too. But they need to know what’s happening. The worst thing you can do is go quiet and let them be surprised.”

A manager at a 2,200-cow operation in California’s San Joaquin Valley offered additional perspective. Scale doesn’t eliminate these challenges, he noted—it changes the arithmetic. “We have more runway because of volume, but we also have more at stake. The weight of these decisions feels the same.”

Several people I spoke with mentioned the difficulty of separating emotional attachment from financial analysis. These are multi-generational operations. Family history, land that’s been worked for decades, identity tied to being a dairy farmer—that’s all profoundly real. But financial calculations don’t account for sentiment. And the operations that survive to transition to the next generation potentially require decisions grounded in numbers.

Where to Find Help

If you’re working through these calculations and want assistance, the land-grant universities offer genuinely valuable tools:

Penn State Extension provides a dairy breakeven cost worksheet that walks through the analysis in detail, available at extension.psu.edu.

The Wisconsin Center for Dairy Profitability has benchmarking tools that compare your numbers against more than 500 farms, accessible through the UW-Madison Division of Extension.

University of Minnesota Extension offers financial planning worksheets through their farm management program.

Your local extension dairy specialist can often sit down with you and work through the numbers—that’s exactly what they’re there to help with. Don’t hesitate to reach out.

For DMC specifically, the USDA Farm Service Agency maintains a decision tool on their website at fsa.usda.gov.

Five Questions to Answer This Week

If you take nothing else from this piece, sit down sometime in the next few days and work through these:

  1. What’s your true all-in cost of production? Not the number you’ve been carrying in your head. The real figure, including debt service, family living, and depreciation.
  2. What’s your actual liquidity runway at current prices? Cash on hand plus remaining credit, divided by monthly losses. Be honest about what you find.
  3. What would need to change for your operation to cash flow at $16 milk? Is that achievable, or would it require changes that aren’t realistic?
  4. When did you last have a substantive conversation with your lender about your financial position? If it’s been more than 90 days, that conversation is overdue.
  5. What does your best realistic outcome look like two years from now? Not the hopeful scenario—the one you’d actually bet money on.

The Road Ahead

If your position is strong, use this time wisely—secure favorable feed costs, strengthen processor relationships, and maintain discipline on growth decisions.

If you’re in that middle ground, recognize that the window for preserving equity through a managed transition is perhaps 90 days. Earlier timing—March or April—will likely yield better outcomes than waiting until mid-summer.

If you’re facing immediate pressure, consult with professionals now, before you’re in crisis. Outcomes improve significantly when decisions are proactive rather than reactive.

The Bottom Line

The dairy industry that emerges from 2026-27 will look different from what we see today. More consolidated. Different economics of scale. That’s a difficult reality to acknowledge—these are real families, real communities, real legacies at stake.

But the market data is clear. The frameworks for decision-making are available. What remains is the hard part: making choices based on numbers rather than hope, and making them while options remain.

The producers I’ve come to respect most aren’t those who never faced difficult decisions. They’re the ones who faced them honestly, made the best choice available with the information they had, and found a way forward.

Whatever path makes sense for your operation, the most challenging choice may be making no choice at all.

KEY TAKEAWAYS 

  • Run your numbers this week: At $15.62 Class III and $18.75 all-in costs, a 550-cow dairy loses $793/cow/year—that’s $36,350 in monthly cash burn.
  • Recognize this for what it is: Heifer inventories at a 47-year low, nine consecutive GDT declines, $11B in new processing capacity arriving. This isn’t a down cycle. It’s a structural reset.
  • Calculate your true cost of production: Include debt service, actual family draw, and depreciation. Most producers discover they’re $1.50-$3.00/cwt higher than the number they’ve been carrying.
  • Know your liquidity runway: (Cash + remaining credit) ÷ monthly loss at current prices = months until decisions get made for you.
  • Act while options remain: For operations in the $17-19 cost range with limited liquidity, the window to preserve family equity through a controlled transition is roughly 90 days. March moves beat June moves.

Complete references and supporting documentation are available upon request by contacting the editorial team at editor@thebullvine.com.

Learn More

The Sunday Read Dairy Professionals Don’t Skip.

Every week, thousands of producers, breeders, and industry insiders open Bullvine Weekly for genetics insights, market shifts, and profit strategies they won’t find anywhere else. One email. Five minutes. Smarter decisions all week.
NewsSubscribe
First
Last
Consent

Why Camel Dairy Gets $35/Liter, and You’re Stuck at Blend Price

His camels make 6 liters/day at $35 each. Your Holsteins make 50 liters/day at blend price. You’re outproducing him 8-to-1. He’s out-earning you. Why?

Executive Summary: You outproduce camel dairies 8-to-1. They out-earn you. That’s not genetics—it’s market structure. Three walls lock conventional dairy into commodity pricing: FMMO pooling eliminates farm-level quality premiums, processor contracts surrender your pricing power, and debt loads punish transition attempts. But walls can be climbed. UW-Madison, Iowa State, and Virginia Tech research reveals specific paths: validate customers before capital investment, test demand through co-packing, and choose positioning that competitors can’t easily copy. What follows covers the economics, the barriers, and the practical playbook—plus one question mid-size operations can’t ignore. Can you survive on efficiency gains alone when mega-dairies have scale and niche players have margins you’ll never touch?

When Sam Hostetler got a phone call from a doctor asking if he could supply camel milk for patients with digestive issues, he didn’t see dollar signs. He saw a problem he could solve.

Hostetler had spent four decades working with exotic animals at his operation in Miller, Missouri. Camels weren’t new to him. But milking them commercially? Different story.

“Twelve years ago, I was contacted by a doctor to see if I would consider milking camels,” Hostetler shared in a recent interview. “I said, ‘Milking a camel? I didn’t know they milked camels in this country.’ Then she said, ‘They don’t, but I need milk for a patient.’ To which I replied, ‘Well, I’ve been known to do some crazy things. One more won’t hurt me.'”

That conversation launched Humpback Dairy—now home to about 200 camels, including roughly 100 breeding-age females.

Camel dairies generate roughly ten times more daily revenue per animal than Holstein herds despite producing a tiny fraction of the milk. This visual makes it painfully clear that genetics and feed efficiency aren’t the problem—pricing power and market structure are. For family‑scale dairies, it reframes strategy away from “more liters” toward “better positioned liters” that actually move the milk check.

Here’s the number that should get your attention: Hostetler sells milk at around $26 per liter. Meanwhile, conventional dairy farmers—managing far more animals with far more infrastructure—fight for margins at $19-21 per hundredweight.

THE BOTTOM LINE: The U.S. camel dairy market hit $1.37 billion in 2024 and is projected to reach $3.16 billion by 2034, according to Research and Markets. But this isn’t about competition. It’s about understanding where premium value goes—and why you can’t access it.

Let’s Talk Scale First

Camel dairy is tiny. We’re talking 3,000-5,000 camels across the entire country. According to CBS4, Camelot Camel Dairy in Wray, Colorado, is one of only two fully licensed camel dairies in the United States.

Compare that to 9.35 million dairy cows tracked by USDA NASS for 2024.

Production per animal? Not even close. Camels produce 1-6 liters daily according to FAO research. Your Holsteins? 30-40 liters daily for typical operations, with top herds pushing 50+ liters in well-managed TMR systems.

So why does this matter?

The Price Gap Is Staggering

  • Camel milk: $25-35 per liter retail. Desert Farms charges $35 per liter, according to SkyQuest market research.
  • Your milk: $4.39 per gallon average in 2024, per USDA AMS data. That’s regional variation from $3.29 in Louisville to $5.92 in Kansas City.
  • The margin story: Camel operators report 40-60% gross margins. Conventional dairy? 15-25% based on USDA ERS cost-of-production tracking.

A Wisconsin producer told me last month: “It’s not that I want to milk camels. But when I see someone getting $35 a liter, and I’m getting paid commodity price for milk that took three generations of genetic work to produce… you start asking questions.”

He’s asking the right questions.

ModelMilk price received (USD/cwt)Net margin per cwt (USD)Net margin per cow per year (USD)
Commodity Holstein herd20.03.0900
Premium-positioned Holstein26.07.02,100
Difference (premium – comm.)6.04.01,200
% Advantage of premium herd+30%+133%+133%

KEY INSIGHT: The gap isn’t about production. Holstein genetics have never been better. The gap is about market positioning and who captures the margin between your farm gate and the consumer’s refrigerator.

ProductFarm value (USD)Processing/packaging (USD)Marketing/DTC operations (USD)Distribution/retail profit (USD)Total retail price (USD)
Holstein milk – 1 gallon1.001.1002.304.40
Camel milk – 1 liter14.007.006.008.0035.00

This Isn’t Disruption. It’s Segmentation.

When investors see camel dairy’s growth, they think tech-style disruption. New thing kills old thing.

That’s not what’s happening here.

Mark Stephenson, Director of Dairy Policy Analysis at the University of Wisconsin-Madison, has studied dairy markets for over two decades. The distinction he draws matters: disruption makes the old model obsolete. Segmentation splits the market into different value tiers.

Camel dairy isn’t replacing anything. Even at $3.16 billion by 2034, it’s a rounding error on total dairy volume.

What it IS doing: capturing margin-rich slices of the market that conventional dairy structurally abandoned.

Premium Segments Punch Above Their Weight

Look at how premium dairy has evolved:

  • Organic: ~7% of fluid milk volume (RaboResearch), commanding 25-30% premiums
  • A2 genetics: 2-3% of volume, 50-100% premiums (a2 Milk Company data)
  • Grass-fed: 1-2% of volume, premiums often exceeding 100% (American Grassfed Association)
  • Specialty products: Under 1% of volume, 300-1000%+ premiums

Conventional dairy controls most of the volume but captures a shrinking share of total market value.

That gap? It’s billions in premium revenue that most of us can’t touch.

Why You Can’t Access Those Premiums

Here’s where it gets uncomfortable.

What actually stops a well-managed operation with excellent genetics and superior milk quality from capturing premium prices?

I’ve talked to producers who tried. I’ve reviewed extension research on premium transitions. The barriers aren’t operational. They’re structural.

Structural barrierPremium blocked (USD/cwt)
FMMO pooling2.0
Exclusive processor contracts2.0
High leverage/debt load1.5

A California producer put it bluntly: “My SCC runs under 80,000, my butterfat is consistently above 4.2%, and my protein is top-tier for the region. But I get paid the same blend price as everyone else in the pool.”

Let’s break down the three walls standing between you and premium margins.

Wall #1: The Pooling System

Under the Federal Milk Marketing Order system, your milk is pooled with other milk in regional pools. Prices get set by commodity markets—cheese, butter, and powder trading on the CME.

Everyone in the pool gets essentially the same blend price. Your superior milk—better components, cleaner production, stronger genetics—earns the same per hundredweight as lower-quality milk.

The system was designed to stabilize prices. It’s done that. But the tradeoff? It eliminates individual quality premiums at the farm level.

Yes, component premiums exist for butterfat and protein. Upper Midwest operations have benefited. But there’s no mechanism to capture extra value for A2/A2 genetics, exceptional SCC, or other differentiators.

The processor captures brand premium. You get blend price.

REALITY CHECK: The FMMO system isn’t broken—it’s working exactly as designed. The question is whether that design serves your operation’s future.

Wall #2: Contract Lock-In

Over 90% of conventional operations work under exclusive supply contracts with processors. These provide real benefits: guaranteed market access, predictable pickups, and reduced marketing burden.

Tom Kriegl, who spent years as a farm financial analyst at the University of Wisconsin Extension’s Center for Dairy Profitability, has written extensively about these economics. The tradeoff is clear: you gain stability but surrender pricing flexibility.

Processors aren’t villains here—they face their own margin pressure from retailers and foodservice. But the structure concentrates pricing power away from farms.

Wall #3: Your Debt Load

This is the one nobody talks about enough.

A typical 500-cow dairy carries $3-4 million in debt, based on USDA ERS data. That debt is collateralized against assets and depends on consistent cash flow from commodity milk sales.

Want to transition to premium positioning? You’ll need capital for processing, branding, and marketing infrastructure. You’ll face production disruptions. Revenue won’t stabilize for 12-24 months.

David Kohl, Professor Emeritus of Agricultural Finance at Virginia Tech, has studied this for decades. The dynamic he describes: lenders want stable, predictable revenue. Transition uncertainty makes them nervous.

A Northeast producer told me about approaching his lender: “They said they’d need 18 months of premium sales revenue before restructuring our terms. But I couldn’t build that history without capital to get started.”

Classic chicken-and-egg. And it keeps a lot of good farmers locked into commodity production.

“The farms in the middle are getting squeezed from both ends. Very large operations have scale economics that mid-size farms can’t match. Premium niche operations have margins that commodity production can’t touch.”

— Mark Stephenson, UW-Madison

What Actually Works for Premium Positioning

Not everyone should chase premium markets. But if you’re considering it, here’s what the research shows about operations that succeed.

Get This Backwards, and You’ll Fail

Most farms considering premium positioning do it this way:

  1. Decide to transition
  2. Invest in infrastructure
  3. Convert production
  4. Search for buyers

That’s backwards.

Larry Tranel, dairy field specialist at Iowa State University Extension, has watched this play out with dozens of farms. The operations that succeed flip the sequence:

  1. Identify customers
  2. Validate willingness to pay
  3. Secure commitments
  4. THEN invest in production changes

Research in the Journal of Dairy Science found the same pattern. Farms with existing customer relationships experienced minimal disruption during organic conversion. Farms that converted first and sought markets later? Profitability problems that lasted years.

THE RULE: If you can’t get 30-50 people to put down deposits before you spend anything on infrastructure, you don’t have a market. Better to learn that early.

Why Camel Dairy Has Natural Protection

When someone pays $35/liter for camel milk, they’re not comparing it to your milk price. They’re asking if this specific product meets their specific needs.

The scarcity of camels—13-month gestation periods, two-year calving intervals, limited U.S. population, only a handful of licensed dairies—creates natural barriers to competition.

Compare that to A2 positioning. Any farm can test genetics and claim A2 certification. As more enter, premiums compress.

Durable premiums combine:

  • Verifiable attributes
  • Relationship-based customer loyalty
  • Some barrier to easy replication

Pure attribute claims (“my milk is A2” or “my cows are grass-fed”) get competed away faster than relationship positioning, where customers connect with YOUR specific operation.

The Customer Service Reality Nobody Mentions

Premium operations accept that customer relationship management IS the product. Not overhead. Not a distraction. The actual product.

Direct-to-consumer dairy means substantial time on order management, delivery logistics, emails, complaints, and retention.

Tranel sees this all the time: producers try direct sales for 6 months and quit. Not because the economics don’t work. Because they’re spending 15 hours a week on customer service instead of their animals.

That’s not failure. That’s recognizing that premium positioning requires different skills than production excellence. Both paths are legitimate. They’re just different paths.

Lower-Risk Ways to Test Premium Markets

If you want to explore premium positioning without betting the farm, here are approaches extension specialists recommend.

The Co-Packing Model

Skip the $30,000-50,000+ for on-farm pasteurization. Many states let you produce Grade A raw milk and contract with a licensed processor for pasteurization and bottling under YOUR brand.

ModelStartup capital required (USD)Additional net income per year (USD)Estimated payback period (years)Extra weekly marketing time (hours)
Status quo commodity-only000
On-farm processing/brand build-out40,00060,0000.720
Co-packed, branded fluid milk pilot12,00035,0000.315
Co-packed + subscription delivery tier15,00050,0000.318

Startup cost: $6,500-15,000 for branding, packaging, cold storage, and delivery setup (extension estimates)

Timeline: 8-10 weeks to first sales in states with straightforward pathways

Find a processor willing to do small runs—usually smaller regional plants with excess capacity. State dairy associations can point you in the right direction.

This lets you test demand before committing major capital.

The Validation Sequence

Months 1-2: Research customer segments. Test messaging at farmers markets, social media, and community groups. Collect contacts. Don’t sell yet—gauge interest.

Month 3: Survey interested people. What volumes? What prices? What delivery preferences? Separate real purchase intent from casual curiosity.

Months 4-5: Request deposits. A $50 commitment separates talkers from buyers.

Months 6+: With 30-50 committed customers, consider minimal infrastructure investment.

Positioning Options Compared

PositioningPremiumProtectionTimeline
Organic25-30%Medium5-7 years to saturation
A2 genetics30-50%Low2-3 years
Grass-fed50-100%Medium3-5 years
Regenerative30-50%Medium-High5-10 years
Hyper-local branded40-80%HighOngoing investment

The pattern: Premiums last longer when you combine verifiable attributes with relationships and real barriers to replication.

Regulations: Check Before You Build

State rules on on-farm processing and direct sales vary wildly. This trips up a lot of producers.

Raw milk examples:

  • Wisconsin: Prohibits retail sales; gray areas around farm-gate transfers
  • Vermont: Permits sales with minimal licensing
  • California: Requires extensive testing and licensing
  • Pennsylvania: Allows sales with appropriate permits

On-farm pasteurization pathways exist in some states (New York and California have processes) but not in others. Co-packing rules depend on location and whether products cross state lines.

Before spending anything: Contact your state Department of Agriculture’s dairy division. Ask specifically about raw milk regulations, on-farm processing licenses, and co-packing arrangements. Get it in writing.

State inspectors are more helpful when you ask before building than after.

While we’ve highlighted US examples, the trend of margin-capture vs. commodity-volume is playing out across Canada, the UK, and Australia in similar ways.

Honest Questions Before You Decide

Does customer interaction energize or drain you? Premium positioning means hours of emails, delivery coordination, and complaint handling. If that sounds exhausting, this isn’t your path.

Can you handle 12-24 months of uncertainty? Premium revenue takes time. Do you have reserves or off-farm income to bridge gaps?

Is your positioning defensible? What makes your story compelling AND hard to copy?

Is your family aligned? This changes daily work patterns. Everyone affected needs to understand and support it.

If these questions raise concerns, that’s not failure. That’s valuable information for better decisions.

The Bigger Picture

Camel dairy’s success reflects something larger: dairy markets are stratifying into distinct value tiers where margins concentrate among operations that control their positioning, customer relationships, and narrative.

The Trends Reinforcing This

Vertical integration: Fairlife (Coca-Cola-owned), a2 Milk Company, major organic cooperatives—they capture production AND brand premiums by controlling the whole chain.

Consumer willingness to pay: IFIC Foundation research consistently shows that substantial segments are willing to pay premiums for health, environmental, or local-sourcing stories. This preference has stayed stable for years.

Technology lowering barriers: Online ordering, subscription management, delivery logistics—tools that once required custom development now cost $50/month.

THE STRATEGIC QUESTION: Is efficiency-focused commodity production, competing against ever-larger operations with superior scale economics, a viable long-term path for family-scale farms?

Key Takeaways

Premium markets are real. They capture disproportionate revenue despite modest volume.

Barriers exist, but aren’t absolute. Co-packing, graduated transitions, and customer-first approaches can manage risk.

Sequencing is everything. Build a customer base before investing capital.

Customer work is core. If you hate it, premium positioning isn’t for you.

Defensibility determines durability. Attributes get copied. Relationships and complexity hold value.

Question your assumptions. “Better genetics + lower costs = eventual reward” faces structural headwinds. Operations capturing premium value succeed through positioning, not just production.

The Bottom Line

Camel dairy at $35/liter isn’t a threat. It’s a signal.

Dairy markets have stratified. Commodity production remains essential—it serves the majority of consumption. The infrastructure, genetics, and management expertise we’ve developed over generations matter.

But the assumption that production excellence alone generates adequate returns—especially for mid-size operations squeezed between large-scale efficiency and premium margins—deserves hard examination.

The question isn’t whether to milk camels. It’s whether some version of premium positioning might complement commodity production as markets continue to evolve.

The operations best positioned over the next decade will figure out how to produce excellent milk AND capture value that currently flows elsewhere.

That’s what camel dairy’s unlikely success actually demonstrates. The animal matters far less than the market structure lessons embedded in those $35-per-liter prices.

Whether the industry is ready to learn those lessons… that’s the open question.

Complete references and supporting documentation are available upon request by contacting the editorial team at editor@thebullvine.com.

Learn More

  • Dairy Farm Profitability: It’s Not Just About More Milk – Stop chasing pounds and start chasing profit with this operational overhaul. It delivers the specific cost-analysis tools you need to identify hidden leaks in your system, ensuring every management decision on Monday morning directly improves your bottom line.
  • The Future of the Family Farm: Strategy Over Scale – Position your operation for the next decade by understanding the inevitable stratification of the global milk supply. This strategic guide exposes why the “get big or get out” mantra is failing and reveals how mid-size farms can reclaim their competitive advantage.
  • A2 Milk and Beyond: The Real ROI of Niche Markets – Evaluate the genuine ROI of emerging premium tiers before you commit your herd’s genetics. This analysis strips away the marketing hype around niche attributes, delivering the data-backed reality of which certifications actually hold their value against future market saturation.

The Sunday Read Dairy Professionals Don’t Skip.

Every week, thousands of producers, breeders, and industry insiders open Bullvine Weekly for genetics insights, market shifts, and profit strategies they won’t find anywhere else. One email. Five minutes. Smarter decisions all week.

NewsSubscribe
First
Last
Consent

The $4/cwt Your Milk Check Is Missing – And What’s Actually Working to Get It Back

You know that moment—scrolling to the bottom of your milk statement, already doing the math in your head? Mike Boesch’s DMC said $12.29. His deposit said $8.

Executive Summary: Dairy producers everywhere are doing the math twice lately—and they’re not wrong. There’s a $4/cwt gap between what DMC margins show on paper and what’s actually hitting farm accounts. The causes stack up fast: make allowance increases that cost farmers $337 million in just three months, regional price spreads running nearly $7/cwt, and component formula changes that blindsided many operations. Milk keeps flowing despite the pressure—expansion debt doesn’t pause for soft markets, and the lowest heifer inventory since 1978 makes strategic culling nearly impossible. With USDA projecting $18.75/cwt All-Milk prices for 2026, margin relief likely won’t arrive until late 2027. The producers gaining ground are focusing on what they can control: component-focused genetics, beef-on-dairy programs built on smart sire selection, and risk management tools that most operations still aren’t using.

Dairy profitability strategies

You know that feeling when the numbers on paper don’t quite match what’s hitting your bank account? Mike Boesch, who runs a 280-cow operation outside Green Bay, Wisconsin, put it well when we talked last month. He pulled up his December milk statement, scrolled straight to the bottom—like we all do—and there it was. His Dairy Margin Coverage paperwork showed a comfortable $12.29/cwt margin. His actual deposit? After cooperative deductions, component adjustments, and those make allowance changes that kicked in last June, he was looking at something closer to $8/cwt.

“I keep two sets of numbers in my head now. The one the government says I’m making, and the one my checkbook says I’m making. They’re not the same number.” — Mike Boesch, Green Bay, Wisconsin (280 cows)

He’s far from alone in this experience. I’ve been talking with producers from California’s Central Valley to Vermont’s Northeast Kingdom over the past few months, and I keep hearing variations of the same observation. There’s a growing disconnect between what the formulas say margins should be and what’s actually landing in farm accounts. Understanding why that gap exists—and what you can do about it—has become one of the more pressing questions heading into 2026.

The Math That Isn’t Adding Up

YearCorn ($/bu)Soymeal ($/ton)All‑Milk ($/cwt)
20236.5443022.50
20245.1038021.80
20254.0030021.35

Here’s what makes this situation so frustrating for many of us. Feed costs dropped meaningfully through 2025. Corn’s been trading in the low $4s per bushel—USDA’s November World Agricultural Supply and Demand Estimates report projected $4.00 for 2025-26—down considerably from that $6.54 peak we saw in 2023. Soybean meal’s been running in the high $200s to low $300s per ton through fall. For most operations, that translates to real savings on the feed side.

But milk revenue softened faster. USDA National Agricultural Statistics Service data shows September’s All-Milk price came in at $21.35/cwt, with Class III at $18.20. That’s below what many of us were hoping for at this point in the year.

What I’ve found talking to producers and running through numbers with nutritionists and farm business consultants: even with clearly lower feed costs, the decline in milk revenue has offset—and in many cases more than offset—those feed savings. The specifics vary by operation. Your ration, your components, and your cooperative’s pricing structure all matter. But the pattern holds across a lot of different farm types.

Mike’s take stuck with me: “I saved money on feed. But I lost more on milk. The feed savings felt like winning a $20 scratch ticket after your truck got totaled.”

Where Your Money Is Actually Going

So what’s creating that $4/cwt gap between calculated margins and received margins? It comes down to several deductions that the DMC formula doesn’t capture.

The Make Allowance Shift

When the Federal Milk Marketing Order updates took effect on June 1, processors received larger deductions for manufacturing costs. American Farm Bureau Federation economist Danny Munch analyzed the impact, and his findings show the higher make allowances reduced farmer checks by roughly $0.85-0.93/cwt across the four main milk classes.

Key Finding: $337 Million Impact

Farm Bureau’s Market Intel analysis found that farmers saw more than $337 million less in combined pool value during the first three months under the new rules—that’s June through August alone.

ScenarioPool Value ($ billions)
Without new make allowance6.00
With new make allowance5.66

Source: American Farm Bureau Federation, September 2025

I talked with a Midwest cooperative field rep who asked to stay anonymous, given how sensitive pricing discussions can be. His perspective added some nuance worth considering: “Nobody wanted to make allowances to go up. But processing costs genuinely increased—energy, labor, transportation. The alternative was plant closures, and that would have helped nobody. It’s a situation where producers and processors both feel squeezed.”

He raises a fair point. The processing sector faced real cost pressures, and there’s a legitimate argument that updated make allowances were overdue. That said, the timing has been difficult for producers already navigating softer milk prices.

What’s worth understanding here is that the DMC formula uses pre-deduction prices. So your calculated margin looks healthy, while your actual check reflects those higher processor allowances.

Regional Pricing Reality

DMC uses national average milk prices, but anyone who’s compared notes with producers in other states knows the spread can be significant.

The Regional Price Gap: Same Month, Different Reality

RegionApproximate Mailbox PriceVariance
Southeast (Georgia)~$26.00/cwt+$4.65
Northeast (Vermont)~$22.80/cwt+$1.45
Upper Midwest (Wisconsin)~$21.50/cwt+$0.15
Pacific (California)~$20.40/cwt-$0.95
Southwest (New Mexico)~$19.20/cwt-$2.15

Source: USDA Agricultural Marketing Service Federal Order mailbox prices, Fall 2025

The regional story plays out differently depending on where you’re milking cows. Upper Midwest producers deal with cooperative basis adjustments and seasonal hauling challenges. California’s Central Valley operations face water costs that have fundamentally changed their cost structure—some producers there tell me water now rivals feed as their biggest variable expense. Southwest operations running large dry-lot systems have entirely different economics.

The Component Pricing Shuffle

Here’s one that caught a lot of producers off guard: the June 2025 FMMO changes removed 500-pound barrel cheddar from Class III pricing calculations. Now, only 40-pound block cheddar prices determine protein valuations—the USDA Agricultural Marketing Service confirmed this in their final rule.

Sounds technical, I know. But when barrels were trading higher than blocks—which they were in early summer—that switch affected producer checks. The rationale was to reduce price volatility and better reflect actual cheese market conditions, though the timing meant lower payments for many during that transition period.

Stack all of these together, and you get that $4-5/cwt gap between what DMC says you’re earning and what you’re actually receiving.

The Production Paradox

One thing that keeps coming up in conversations: if margins are this tight, why does milk keep flowing?

USDA NASS data shows national production running 1-4% above year-earlier levels in many recent months. July 2025 came in 3.4% higher than July 2024, totaling 19.6 billion pounds nationally.

At the same time, we’re watching a steady structural decline in dairy farm numbers. USDA has documented this trend for years—thousands of farms exiting nationally over the past decade, with several hundred closing each year just in heavily dairy states like Wisconsin.

Expert Insight: Leonard Polzin, Ph.D. Dairy Economist, University of Wisconsin-Madison Extension

“What we’re seeing is expansion commitments made in 2022-2023 when margins looked completely different. That debt doesn’t care about today’s milk prices. Producers have to keep milking to service those loans.”

There’s also the heifer situation. Replacement heifer inventory has dropped to 3.914 million head—the lowest level since 1978, according to USDA cattle inventory reports and confirmed by Dairy Herd Management coverage. Producers who might otherwise strategically cull their way to a smaller herd can’t easily replace the animals they’d be selling.

And then there’s processing. Since 2023, substantial new cheese processing capacity has come online—much of it financed through long-term USDA Rural Development loans requiring consistent milk intake. Those plants need milk regardless of farmgate prices.

For your operation: the supply response to low prices is likely to be slower than historical patterns suggest. If you’re planning around industry-wide production cuts that are expected to boost prices by late 2026, a longer timeline may be more realistic.

Why the Export Safety Valve Is Stuck

I’ve had producers ask when China might start buying again. Honestly? That valve is essentially closed for the foreseeable future.

Between 2018 and 2023, China added roughly 10-11 million metric tons of domestic milk production—equivalent to around 24-25 billion pounds. Rabobank senior dairy analyst Mary Ledman noted that’s almost like adding another Wisconsin to their domestic supply. The result? Self-sufficiency jumped from about 70% to 85% during this period.

China’s Dairy Transformation: The Numbers

MetricBefore (2018)After (2023)Change
Self-sufficiency~70%~85%+15 pts
WMP imports670,000 MT/yr avg430,000 MT-36%
Impact on competitors7% of NZ production was displaced

Sources: Rabobank/Brownfield Ag News

This wasn’t market fluctuation—it was deliberate government policy. And they’re not walking it back. In July 2025, China’s Dairy Association announced plans to maintain at least 70% self-sufficiency through 2030.

For U.S. producers, this represents a structural shift. Other markets—Southeast Asia, Mexico, and parts of the Middle East—continue to show growth potential. But that traditional “surplus absorption” mechanism that China provided? It’s significantly smaller than it used to be.

What’s Actually Working: Four Strategies From the Field

Enough about challenges. Let’s talk about what’s actually moving the needle on margins.

Getting Paid for Components

Sarah Kasper runs a 340-cow operation in central Minnesota that she transitioned to component-focused management three years ago. Her approach: genomic testing on every replacement heifer, sire selection emphasizing butterfat and protein over milk volume, and ration adjustments optimizing for component production rather than peak pounds.

“We dropped about 1,200 pounds of production per cow. But our component premiums more than made up for it. We’re getting paid for what processors actually want.” — Sarah Kasper, Central Minnesota (340 cows)

University of Minnesota Extension dairy economic analyses document component premiums ranging from $120 to $ 180 per cow annually for operations achieving above-average butterfat and protein levels. With genomic testing running $30-50 per animal, the return on investment can be meaningful—especially compounded over multiple generations.

What processors increasingly want is component value, not volume. April 2025 USDA data showed cheese production up 0.9% year-over-year while butter production fell 1.8%—processors are routing high-component milk toward their highest-margin products.

The Beef-on-Dairy Opportunity

This strategy has seen remarkable adoption. CattleFax data reported by Hoard’s Dairyman shows there were about 2.6 million beef-on-dairy calves born in 2022, up from just 410,000 in 2018. CattleFax projects that it could grow to 4-5 million head by 2026.

The economics are fairly straightforward. Use sexed dairy semen on your top-performing cows to secure replacements, then breed the remaining 60-70% of your herd to beef genetics. A dairy bull calf might bring $200-400. A well-managed beef cross with the right genetics and colostrum management can fetch $900-1,250 through direct feedlot relationships, according to Iowa State University Extension beef-dairy market reports.

Beef-on-Dairy Economics: Per-Calf Comparison

ScenarioCalf ValueSemen CostNet Advantage
Dairy bull calf$250$8-15Baseline
Beef cross (average genetics)$700$15-25+$435
Beef cross (premium genetics + direct marketing)$1,100$20-35+$830

Note: Values vary significantly by region, genetics quality, and buyer relationships Sources: Iowa State Extension; Hoard’s Dairyman market reports

But here’s where genetics selection really matters—and where I see a lot of operations leaving money on the table.

Research published in the Journal of Dairy Science in 2025 found the average incidence of difficult calving in beef-on-dairy crosses runs around 15%. But breed selection makes a significant difference: data from the Journal of Breeding and Genetics shows Angus-sired calves had only 7% calving difficulty compared to 13% for Limousin when looking at male calves.

Beef Sire Selection: The Calving Ease vs. Carcass Quality Tradeoff

Here’s the tension every producer needs to understand: beef sires selected for ease of calving and short gestation are often antagonistically correlated with carcass weight and conformation, according to research in Translational Animal Science.

Priority 1 — Protect the Cow:

  • Calving Ease Direct (CED): Select from the top 25% of beef sires
  • Birth Weight EPD: Lower is generally safer for dairy dams
  • Gestation Length: Angus adds ~1 day vs. Holstein; Limousin adds 5 days; Wagyu adds 8 days

Priority 2 — Optimize Calf Value:

  • Frame Size: Moderate-framed bulls generally produce more feed-efficient animals
  • Ribeye Area (REA) EPD: Higher values improve carcass muscling
  • Marbling EPD: Targets quality grade premiums
  • Yearling Weight EPD: Predicts growth performance

Sources: Journal of Dairy Science (2025); Penn State Extension; Michigan State Extension; Translational Animal Science

A Hoard’s Dairyman survey found that most dairies currently prioritize conception rate, calving ease, and cost when selecting beef sires—but feedlot and carcass performance traits aren’t priorities for most farms yet. Michigan State Extension notes this is a missed opportunity: selecting for terminal traits that improve growth rate and increase muscling should be a priority.

The bottom line from peer-reviewed research: sire selection for beef-on-dairy should firstly emphasize acceptable fertility and birthweight because of their influence on cow performance at the dairy; secondarily, carcass merit for both muscularity and marbling should receive consideration.

Tom and Linda Verschoor, who run 1,200 cows near Sioux Center, Iowa, started their beef-on-dairy program in 2022 with this balanced approach. “We figured out we only need about 35% of our herd for replacements,” Tom explained.

They report that in 2024, they generated roughly $185,000 more revenue from beef-cross calves than they would have from traditional dairy bull calves. Results will vary depending on genetics quality, calf care, and buyer relationships. But the opportunity is real for operations set up to capture it.

Actually Using the Risk Management Tools

This is where I see one of the biggest gaps between what’s available and what producers actually use.

DMC Tier 1 coverage costs $0.15/cwt, with a $9.50/cwt margin protection on the first 5 million pounds. University of Wisconsin-Extension analysis shows that from 2018-2024, DMC triggered payments in 48 of 72 months—about two-thirds of the time. Average net indemnity ran $1.35/cwt during payment months. It’s essentially catastrophic margin insurance at minimal cost.

ScenarioCovered Milk (million lbs/year)Net Avg Indemnity ($/cwt in pay months)Approx. Extra Margin per Year ($)
No DMC enrollment00.000
DMC Tier 1 at $9.50 margin51.3545,000

Beyond DMC, Class III futures and options let you establish price floors. If your break-even is $16/cwt and you can lock $17/cwt through futures, you’ve reduced margin uncertainty—even if it means giving up potential upside.

Expert Insight: Marin Bozic, Ph.D. Dairy Economist, University of Minnesota

Bozic often reminds producers at risk-management meetings that relying on prices to improve on their own simply isn’t really a strategy. Most producers are still hoping prices improve rather than locking in prices that work. That’s understandable. But hope alone doesn’t protect margins.

Finding Premium Channels

The spread between commodity milk and premium markets continues widening:

  • Organic certified: $33-50/cwt depending on region and buyer (USDA National Organic Dairy Report)
  • Grass-fed certified: $36-50/cwt with current supply shortages (Northeast Organic Dairy Producers Alliance)
  • Value-added processing: On-farm yogurt or cheese production can generate meaningful additional margin, though capital requirements are real

I’m hearing from processors that organic supply is currently short in the Northeast and Upper Midwest—there’s genuine demand if you can make the transition work.

Premium Channel Pathways: What’s Actually Involved

ChannelTransition TimelineKey RequirementsRegional Considerations
Organic36 monthsUSDA NOP certification; organic feed sourcing; no prohibited substancesStrong processor demand in the Northeast, Upper Midwest; fewer options in the Southwest
Grass-fed12-18 monthsThird-party certification (AWA, PCO, or equivalent); pasture infrastructureWorks best with existing grazing infrastructure; limited in western dry lot operations
On-farm processing12-24 monthsState licensing; food safety compliance; marketing/distribution capabilityStrong local food demand helps; it requires entrepreneurial capacity beyond milk production

Sources: USDA Agricultural Marketing Service; Northeast Organic Dairy Producers Alliance; Penn State Extension

The transition timeline matters. Organic requires three years of certified organic land management before you can sell organic milk—and you’ll need reliable organic feed sourcing, which can be challenging and expensive depending on your region. Grass-fed certification moves faster but requires pasture infrastructure that not every operation has. On-farm processing offers the highest margin potential but demands skills well beyond dairy farming.

Whether these channels make sense depends on your land base, labor situation, existing infrastructure, and appetite for marketing complexity. They’re not right for every operation, but for those with the right setup, the premium differential is substantial.

What the Analysts Are Actually Saying About 2026

Let me share what the forecasts show, because realistic timeline expectations matter.

Producer conversations often reference recovery by “late 2026.” The analyst forecasts suggest a more gradual path.

2026 Price Outlook: Key Forecasts

Source2026 All-Milk ForecastAssessment
USDA December WASDE$18.75/cwtDown from $20.40 (Nov)
2025 Actual$21.35/cwtBaseline comparison
Rabobank“Prolonged soft pricing through mid-to-late 2026” 
StoneXProduction slowdown not until Q2-Q3 2026 

Here’s the key difference: analysts are describing prices “bottoming out” in early to mid-2026. That means the decline stabilizes—not that prices bounce back to 2024 levels. Most forecasts suggest meaningful margin recovery is more likely a late-2027 development.

This isn’t cause for panic. Markets are cyclical, and conditions will eventually improve. But it does suggest planning for an extended timeline.

The Conversation Worth Having

For producers with potential successors, this margin environment brings important conversations into focus. University of Illinois Extension notes that less than one in five farm owners has an estate plan in place. The Canadian Bar Association found 88% of farm families lack written succession plans.

Expert Insight: David Kohl, Ph.D. Professor Emeritus, Virginia Tech

Kohl emphasizes that families starting succession talks early navigate transitions more smoothly than those who wait until circumstances force the conversation.

His framework:

  1. Know your actual numbers — true break-even, debt maturity, realistic equity position
  2. Find out what your kids actually want — not what you assume
  3. Lay out options honestly — status quo, restructuring, strategic exit, or succession

You’re not solving everything in one meeting. You’re getting information on the table.

The Bottom Line

“I’m not pretending the math is good right now. But I’ve stopped waiting for someone else to fix it. We enrolled in DMC at the $9.50 level, we’re breeding 60% of our herd to Angus, and we had that kitchen table conversation with our son over Thanksgiving. First real talk about whether he wants this place.”

He paused. “I’d rather know where we stand than keep guessing. At least now we’re making decisions instead of just hoping.” — Mike Boesch

That’s really the choice in front of all of us right now. The margin environment is challenging—that’s just the reality for the foreseeable future. But producers who understand the dynamics, assess their positions honestly, and implement available strategies aren’t just getting through this period; they’re succeeding. Some are building advantages that will serve them well when conditions improve.

The math is difficult. It’s not impossible. The difference comes down to whether you’re making decisions based on information or just waiting to see what happens.

Key Takeaways

  • The $4/cwt gap is real—and it’s not your math. Make allowances, regional spreads, and formula changes explain why your milk check doesn’t match your margins.
  • $337 million left producer pockets in 90 days. June’s make allowance increases pulled that from the pool values before summer ended.
  • Plan for a long haul. USDA projects $18.75/cwt for 2026—a meaningful margin recovery likely won’t show up until late 2027.
  • Don’t count on production cuts to save prices. Expansion debt keeps cows milking, and the lowest heifer inventory since 1978 limits strategic culling.
  • The wins are in the details. Component premiums, smart beef sire selection, and actually enrolling in DMC at $9.50—that’s where producers are finding margin.

Complete references and supporting documentation are available upon request by contacting the editorial team at editor@thebullvine.com.

Learn More:

The Sunday Read Dairy Professionals Don’t Skip.

Every week, thousands of producers, breeders, and industry insiders open Bullvine Weekly for genetics insights, market shifts, and profit strategies they won’t find anywhere else. One email. Five minutes. Smarter decisions all week.
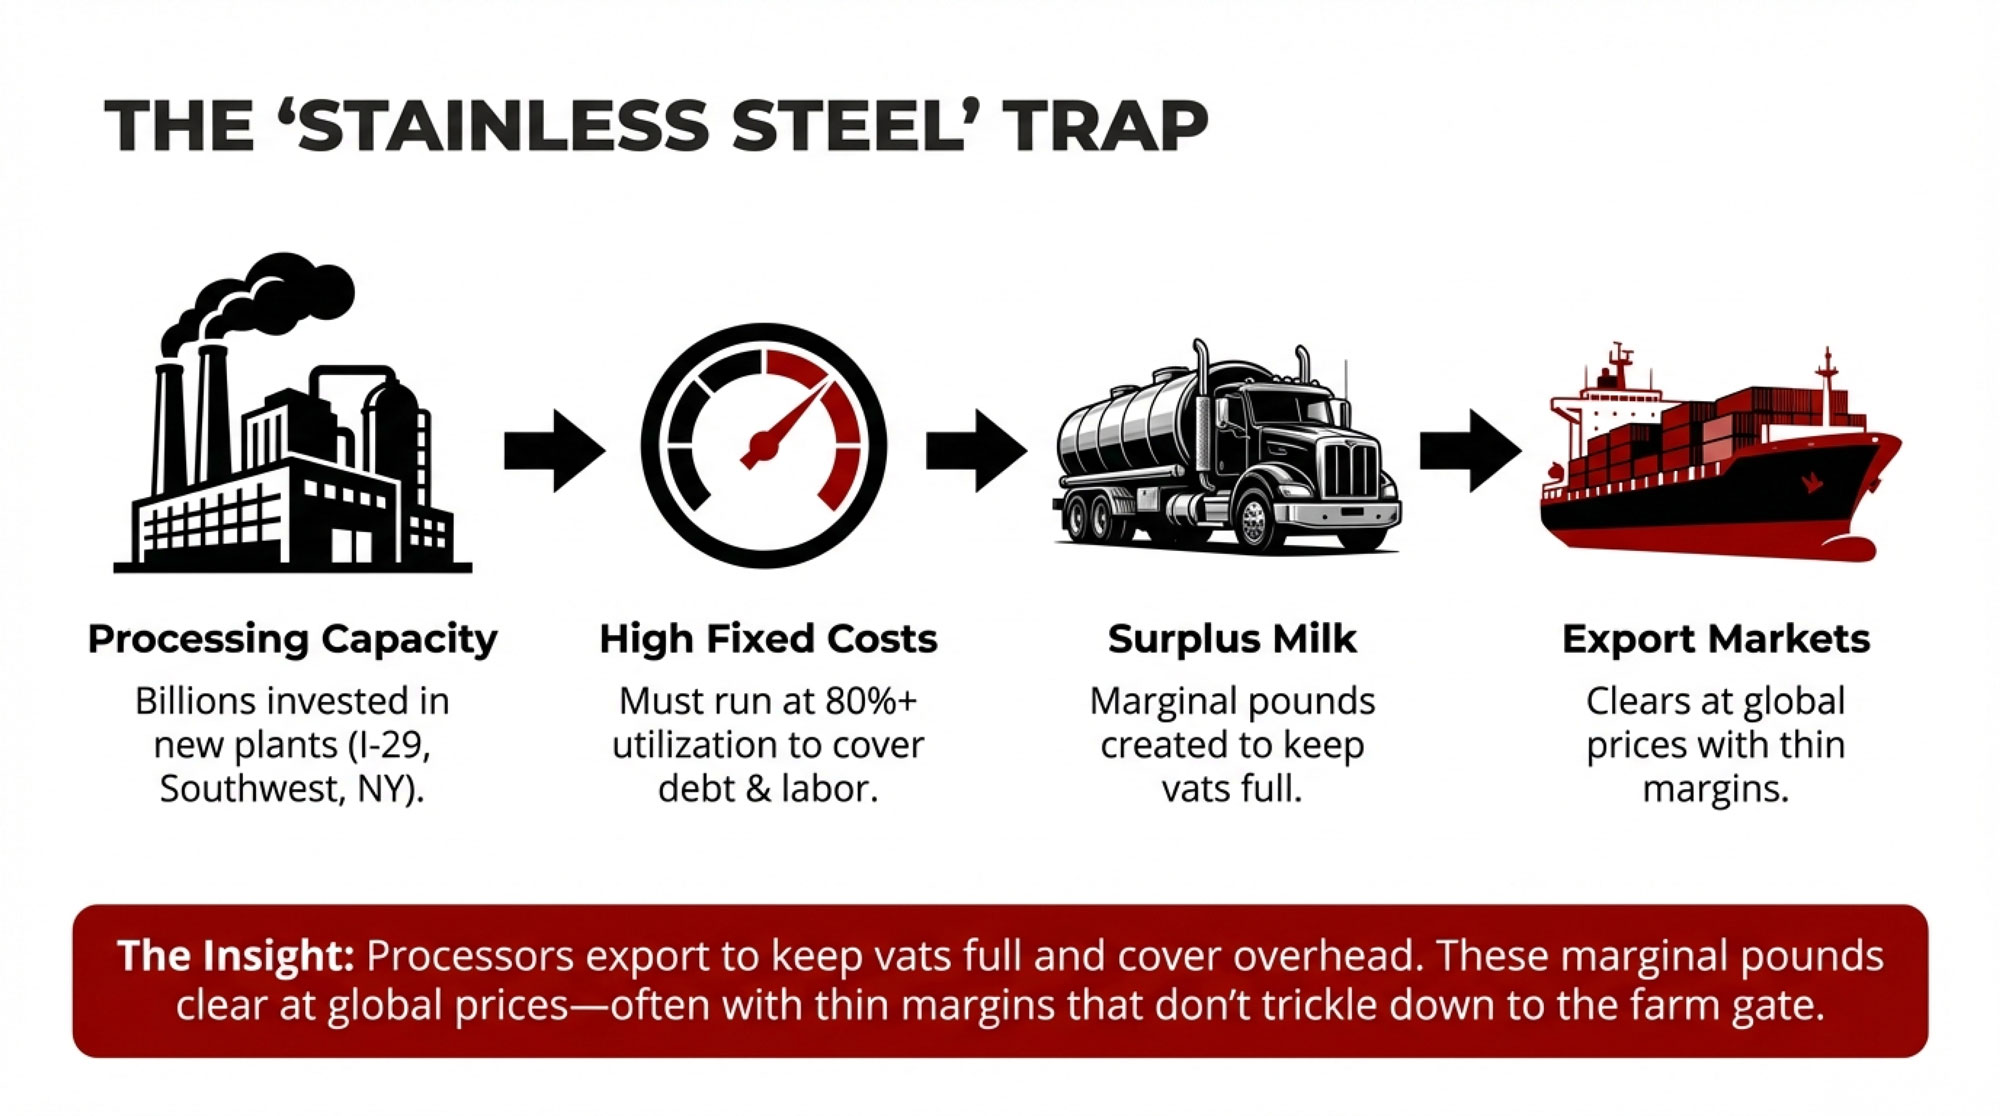
NewsSubscribe
First
Last
Consent

The Week Every Dairy Market Crashed Together- and Why Record Exports Couldn’t Stop It

Dec 15: Germany’s butter -9.3%. Chicago cheese at 18-month low. NZ powder is falling. Every dairy market crashed the same week—despite record exports. What broke, and what’s next for your operation

Executive Summary: Record dairy exports should lift prices—instead, every global market crashed simultaneously the week ending December 15, 2025, revealing that fundamental pricing mechanisms have broken. U.S. cheese shipments hit all-time highs while CME prices fell to 18-month lows; European butter dropped 5.8%; powder weakened globally. The paradox persists because cheap feed costs ($4.40 corn) enable production growth despite distressed milk prices—the normal supply response isn’t working. Worse, processors worldwide are simultaneously shifting from butter into cheese, creating concentrated inventory that will mature in Q2 2026 precisely when the spring flush arrives—a collision that could severely pressure spot milk prices. This signals a structural reset, not a cyclical downturn: operations must rebuild for sustained viability at $15-16 milk through cost efficiency, component optimization, balance sheet strength, and strategic feed hedging. The industry emerging from this transition will operate under fundamentally different economics than those of the past decade.

You probably felt it in your milk check before you saw it in the data. But here’s what actually happened the week ending December 15, 2025: butter futures crashed 3.6% in Leipzig to €4,314. EU physical butter dropped 5.8% to €4,313. Whole Milk Powder on the Global Dairy Trade fell to $3,230 per metric tonne. And CME Cheddar blocks hit $1.345 per pound—the lowest since July 2023. When every major commodity tanks simultaneously across every major exchange, we’re not looking at another rough patch. We’re watching the global dairy industry reset itself in real time.

Market/ProductPrice (Week of Dec 15)Weekly ChangeSignificance
German Butter€4,150/tonne-€425 (-9.3%)Steepest weekly crash
EU Physical Butter (avg)€4,313/tonne-€251 (-5.8%)18-month low
CME Cheddar Blocks$1.345/lb-4.1%Lowest since July 2023
Global Dairy Trade WMP$3,230/tonne-3.8%Sustained weakness
Dutch Butter€4,070/tonne-€250 (-5.8%)Export benchmark falls
EEX Butter Futures (Leipzig)€4,314/tonne-3.6%Futures signal no recovery
EU Young Gouda€2,961/tonne-34.3% YoYNear five-year lows
EU Mild Cheddar€3,248/tonneJust €4 above 5-yr lowTesting historical floor

Here’s the part that should really get your attention: U.S. cheese exports hit 116.5 million pounds in September—up 34.5% from the previous year and representing the highest daily average on record, according to the U.S. Dairy Export Council. Record exports should be lifting prices, not coinciding with an 18-month low. That mechanism just broke, and understanding why matters for every decision you’re making about 2026.

MonthU.S. Cheese Exports (Million lbs) – Left AxisCME Cheddar Blocks ($/lb) – Right Axis
Mar 202595.2$1.62
Apr 202598.7$1.58
May 2025102.3$1.54
Jun 2025107.8$1.49
Jul 2025110.5$1.46
Aug 2025113.2$1.41
Sep 2025116.5$1.38
Dec 2025118.8 (est)$1.345

A Brief Look Back: Context for What We’re Seeing

Before diving into current dynamics, it’s worth understanding that synchronized global dairy price collapses of this magnitude are relatively rare. The last time we saw coordinated weakness across multiple regions and products simultaneously was during the 2014-2016 period, when a combination of Russian import bans, a slowdown in Chinese demand, and the removal of European quotas created a global surplus that took nearly two years to work through. That episode saw U.S. Class III milk drop from over $24/cwt in 2014 to under $14 in 2016.

What eventually resolved that situation was a combination of weather-driven production disruptions (the 2016 New Zealand drought), gradual demand recovery in Asia, and ultimately, many smaller farms exiting the industry entirely. The recovery wasn’t quick, and the industry that emerged on the other side looked structurally different—more consolidated, more efficient, and arguably more vulnerable to the kind of dynamics we’re seeing today.

When the Safety Valves Stop Working

For as long as most of us have been in this industry, global dairy markets have operated with a kind of built-in equilibrium. When prices drop in one region, traders buy there and sell elsewhere, which lifts the cheap market and cools the expensive one. If a U.S. product is discounted, exports surge until domestic prices align with international benchmarks. It’s the arbitrage mechanism that keeps regional markets from getting too far out of whack.

What’s striking about mid-December is how that mechanism appears to have stopped functioning.

Looking at the data from European exchanges, German physical butter crashed by €425 in a single week—that’s a 9.3% drop—settling at €4,150. The weekly EU dairy quotations showed Dutch butter at €4,070, down €250. Yet French butter actually firmed €200 to €4,720. So you’ve got a €650 per tonne spread between French and Dutch butter, which shouldn’t persist in an integrated market.

At the same time, the Singapore Exchange was seeing pressure across its dairy complex despite solid trading volumes of 18,915 tonnes for the week. And back in the States, CME Cheddar blocks are sitting at $1.345 per pound—the lowest we’ve seen since summer 2023.

When these markets all move down together like this, it tells you the buyers are either already full or they’re waiting for even lower prices. That’s a fundamentally different dynamic than we’re used to seeing. What we’re watching is the global dairy complex running out of capacity to absorb current production levels at anything close to recent historical prices.

Why Production Keeps Growing Despite Terrible Prices

In a typical cycle, you’d expect falling prices to trigger pretty predictable responses. Farmers cull marginal cows, dial back feed inputs where it makes sense, and overall production gradually contracts. That supply reduction creates scarcity, and prices eventually recover. It’s the classic pattern the industry has relied on for generations.

That’s not what’s happening, and here’s why it matters.

The USDA’s December World Agricultural Supply and Demand Estimates held 2025 U.S. milk production steady at 115.70 million tonnes—still up 2.4% from 2024. They lowered the 2026 projection slightly, from 117.15 to 117.05 million tonnes, citing reduced dairy cow inventory offsetting per-cow production gains. But even with that downward revision, we’re still looking at 1.2% growth in 2026.

Think about that for a minute. Even with prices at distressed levels across multiple product categories, American milk production is forecast to keep expanding.

And if you want to understand why, take a look at what’s happening in feed markets. The December USDA grain outlook shows March 2026 corn futures trading around $4.405 per bushel, with projected ending stocks of 2.03 billion bushels. That’s the highest level in seven years and 32% greater than last season. The agency actually raised its corn export forecast to 3.2 billion bushels—that’s up 12% from last year’s record—yet domestic supplies remain massive. Soybean meal closed the week at $302 per ton, down $5.40.

What this creates is production that stays high because historically cheap feed costs insulate producers from the full pain of low milk checks. When you run the income-over-feed-cost calculations—and I know most of you do this weekly if not daily—many operations can still pencil out positive margins even with Class III in the mid-$15s. That math keeps marginal cows in the herd even when finished product prices are screaming oversupply.

I was looking at numbers from a 500-cow Wisconsin operation recently that illustrates this perfectly. With corn at $4.40, their feed costs are down 18% from last year. That keeps their IOFC positive at $16.50 milk, even though that’s $3 below what they budgeted for 2025. So the economic signal telling them to cut back gets overwhelmed by the reality that they’re still cash-flow positive on a monthly basis.

PeriodFeed CostOther CostsMilk PriceIOFC Margin
Q4 2023$10.20$7.50$19.80$9.60
Q1 2024$9.80$7.60$18.50$8.70
Q2 2024$9.20$7.70$17.90$8.70
Q3 2024$8.90$7.80$17.20$8.30
Q4 2024$8.40$7.90$16.80$8.40
Q1 2025$7.80$8.00$16.20$8.40
Q4 2025$7.20$8.10$15.90$8.70

Here’s something else worth noting: the USDA report mentions explicitly that winter weather isn’t the constraint it used to be, particularly in the Midwest. Modern housing systems mean operations in Wisconsin, Michigan, and Minnesota can maintain high production levels regardless of what’s happening outside. Better ventilation, more sophisticated environmental controls—which is great for consistency and animal welfare, but it also makes production less responsive to price signals.

The Export Picture Gets Complicated

Here’s where things get really interesting, and why the volume numbers deserve a closer look.

September numbers from the U.S. Dairy Export Council showed cheese exports up 34.5% year-over-year to 116.5 million pounds—the highest daily average shipments on record. Butter exports were 2.7 times larger than the previous year. Whey powder exports hit their highest level since March 2023, up 8.3%.

You’d think those export numbers would support domestic prices. When foreign buyers aggressively purchase U.S. products, that should create competition for available inventory. But that’s not what we’re seeing. Strong export volumes are coinciding with some of the weakest domestic prices in years.

What this tells you is that the industry is exporting what it has to produce to keep processing plants running at capacity. These modern cheese plants have massive fixed costs and debt service obligations. You can’t afford to run at 70% capacity—your cost per unit skyrockets. So you run full-throttle and discount product to move volume into export channels.

And here’s where the story gets more nuanced. While cheese exports are at record levels, nonfat dry milk exports collapsed 18.5% year over year in September, hitting an eight-month low. Even sales to Mexico—and Mexico has been one of our most reliable powder markets—dropped 17.3%. When you can’t move powder to Mexico, that tells you demand is genuinely soft across categories.

The cheese export story breaks down in interesting ways by region. Mexico remains the dominant market, which makes sense given proximity and trade relationships. But what’s notable is that Australia has become the third-largest destination for U.S. cheese. USDEC data shows Australia has already imported more U.S. cheese in 2025 than in any previous year on record, and we’ve still got three months of shipments to count.

This matters because it represents a shift in the Australian dairy sector. Chronic drought conditions and herd contraction have pushed Australia from being a dairy-surplus nation to one that’s increasingly dependent on imports. U.S. cheese is essentially backfilling the gap left by shrinking Australian milk production.

The challenge with this dynamic is sustainability. Mexico is buying finished U.S. cheese because, at current prices, it’s cheaper than importing powder and manufacturing cheese themselves. Australia is buying because they don’t have enough domestic milk. Neither situation represents organic demand growth driven by expanding consumption—they’re opportunistic purchases driven by price dislocations and supply shortfalls elsewhere.

When those conditions change—and at some point they will—it raises legitimate questions about where all that U.S. cheese production capacity is directed.

Europe’s Markets Fragment Under Pressure

The European physical spot markets during the week of December 10 showed how extreme stress can break down normally efficient trading systems, and it’s worth understanding these dynamics because they affect global price relationships.

The weekly EU dairy quotations showed the aggregate butter index down 5.8% to €4,313. But that overall number hides some significant regional variations. German butter crashed €425 per tonne in a single week—that 9.3% decline—settling at €4,150. Dutch butter, which tends to serve as a key pricing benchmark for export markets, fell €250 to €4,070. Yet French butter actually firmed €200 to €4,720.

So you’ve got a €650 per tonne spread between French and Dutch butter. That’s roughly a 16% price difference for essentially the same commodity in neighboring countries with no trade barriers. Under normal circumstances, traders would move product to capture that arbitrage opportunity, and the spread would compress.

The persistence of this spread likely reflects panic selling in the German and Dutch markets—processors liquidating inventory to generate cash flow—while France’s unique regulatory structure (particularly the Loi EGalim laws that protect farmer margins) and strong domestic preference for high-quality branded butter with protected designations create price support that can’t be easily arbitraged away.

Meanwhile, the European cheese complex is testing historical support levels. The EEX European Weekly Cheese Index shows Mild Cheddar trading at €3,248—just €4 above its five-year low. Cheddar Curd sits at €3,221, €27 above its five-year floor. Young Gouda has fallen to €2,961, down 34.3% year-over-year.

When you’ve got multiple cheese varieties simultaneously trading within pennies of multi-year lows during what should be a seasonally firm period—pre-holiday demand, typically lower winter milk production—it signals fundamental oversupply rather than temporary weakness. The market is grinding against production costs, and may already be below them for higher-cost operators.

The Strategic Pivot Creating Future Pressure

One pattern emerging from the data that has real implications for 2026 is a simultaneous shift by processors across multiple countries away from butter production and toward cheese.

UK production statistics from DEFRA for October 2025 tell the story: butter production down 15.4% year-over-year while cheese production increased 0.6%, with Cheddar specifically up 4.0%. You’re seeing similar dynamics in U.S. processing facilities—milk diverted from volatile butter markets into cheese vats.

The logic makes sense on paper. Butter is highly price-sensitive and difficult to store long-term without incurring significant cold-storage costs. Cheese, particularly aged varieties like Cheddar, can sit in inventory for 6 to 12 months as it matures. From a processor’s perspective, cheese acts as a kind of financial buffer—you can convert today’s surplus milk into a solid commodity and hope that by the time it’s ready for market, prices will have improved.

The complication is that when processors in the U.S., UK, and EU all make the same decision simultaneously, they shift oversupply in time and concentrate it into a single product category.

All that cheese being produced right now in December 2025 will mature and need to move to market in mid-2026—right around the time the Northern Hemisphere spring flush begins, bringing another seasonal surge in milk production. If export warehouses in key markets like Mexico and Australia are already well-stocked from late 2025’s record shipments, buyer demand could slow just as supply peaks.

MonthU.S. Cheese ProductionEU Cheese ProductionUK Cheese ProductionTotal Industry Production
Oct 202552038045945
Nov 202554039547982
Dec 2025565410521,027
Jan 2026580415531,048
Feb 2026590420541,064
Mar 2026605435481,088
Apr 2026630455501,135
May 2026655475521,182
Jun 2026670485531,208

This creates what you might call borrowed demand—the cheese you’re making today to avoid the butter price collapse will need to clear the market in six months. If prices haven’t recovered by then, given the volume being produced across multiple regions, you’ve delayed the problem and possibly intensified it by concentrating everyone’s surplus into the same product at the same maturity window.

What Futures Markets Are Signaling

Despite the physical market’s weakness, there’s a notable divergence in how futures markets are pricing the outlook for different milk classes, and it’s worth understanding what that spread reveals about traders’ expectations.

CME Class III futures for December 2025 fell 12 cents during the week to settle at $15.90 per hundredweight. But deferred 2026 contracts showed some resilience. The market seems to be betting that somewhere around the $15.50-16.00 range represents something close to a floor—that at these levels, demand will kick in enough and production will slow enough to stabilize things.

Class IV futures—driven by butter and nonfat dry milk prices—remain stuck in the mid-$13s through early 2026. The futures curve doesn’t show Class IV climbing above $14 until March at the earliest.

This spread reveals how traders are thinking about clearing mechanisms for different product categories. They’re betting that cheese can be cleared through aggressive export pricing, despite concerns about inventory. The record U.S. shipment volumes support that view. But they see no similar clearing mechanism for butter and powder, where domestic consumption is relatively fixed, and export competition from New Zealand and Europe remains intense.

MonthClass III FuturesClass IV Futures
Dec 2025$15.90$13.45
Jan 2026$15.75$13.50
Feb 2026$15.65$13.60
Mar 2026$15.80$14.05
Apr 2026$16.10$14.20
May 2026$16.35$14.40
Jun 2026$16.55$14.65
Jul 2026$16.75$14.85

Another factor supporting Class III that is often overlooked is the relative strength in the dry whey market. While butter and cheese prices are under serious pressure, whey is showing some resilience. The EU weekly quotation showed whey firming €15 to €989 per tonne, now up 12.6% year-over-year—making it the only major dairy commodity showing positive year-over-year performance in European markets. U.S. whey powder exports jumped 8.3% in September, with strong sales to China and Vietnam.

Because the Class III formula includes both cheese and whey components—specifically cheese price times 9.6 plus whey price times 5.9—the strength in whey provides a mathematical floor that Class IV doesn’t have. Even if cheese prices stay depressed, firm whey values help support the overall Class III calculation.

The question is whether futures traders are correctly assessing the inventory risk. If those strong cheese export numbers reflect stockpiling by buyers taking advantage of low prices rather than genuine ongoing consumption demand, then the apparent clearing mechanism could weaken in Q2 2026, just when the spring flush and all that aged cheese hit the market simultaneously.

The Feed Cost Variable Worth Watching

While most market signals point toward continued pressure through early 2026, there’s one variable that could shift the equation, and it’s worth keeping on your radar: what happens in grain markets.

The current dairy situation is enabled by historically low corn and soybean meal prices. As long as those input costs stay depressed, the income-over-feed-cost margins for many operations remain positive enough to justify maintaining production even with low milk prices.

But grain markets can turn quickly. The USDA is forecasting massive corn ending stocks, but those projections assume reasonably normal weather conditions. If drought develops in Brazil or Argentina during their growing season—December through March—grain prices could spike. The soybean complex, in particular, is trading with skepticism about Chinese demand. U.S. commitments to export soybeans through early November were running 40% lower than the prior year.

If China steps back into the market aggressively, or if South American weather turns problematic, soybean meal could rally from current levels near $300 per ton to $350 or higher fairly quickly. That kind of move would change the feed cost equation that’s currently supporting milk production despite low prices.

A grain rally might trigger a supply response driven by economics rather than operational necessity. If feed costs spike while milk prices stay low, you’d see the cull rate accelerate. That would tighten milk supplies before the spring flush, which might prevent some of the more challenging scenarios being discussed for Q2.

The complication, of course, is that this kind of adjustment through higher input costs isn’t exactly a rescue—it would address the oversupply by further pressuring margins. But it might be one of the few mechanisms left that can trigger a meaningful supply response.

Looking Ahead to Spring 2026

As we look toward the next few months, there are several scenarios worth considering, and I think it’s important to think through both the optimistic case and the more challenging possibilities.

The optimistic case would be that export demand continues absorbing U.S. cheese at roughly current volumes, European production contracts modestly as various forecasts suggest, New Zealand’s season ends normally, and the market finds a new equilibrium at these lower price levels without major disruption. Farmers who can operate profitably at Class III in the $15-16 range continue; those who can’t gradually exit through normal business cycles. It’s a slow grind, but it avoids a crisis.

The challenge with that scenario is that it assumes multiple things align favorably simultaneously, and it doesn’t fully account for the inventory dynamics building in the cheese complex.

A more complete assessment acknowledges that we’re heading into Q2 2026 with several risk factors converging. The spring flush will bring seasonal increases in production—that’s biology; you can’t avoid it. Cheese produced in late 2025 and early 2026 will be maturing and needing to move to market. And if export warehouses in key markets are already well-stocked from late 2025’s record shipments, buyer demand could slow as supply peaks.

In that scenario, cold storage space becomes a limiting factor. Processors would face pressure to either move product into lower-value channels—such as converting aged cheese into processed cheese ingredients—or implement supply management measures. Spot milk prices could come under significant pressure in some regions.

Whether these dynamics develop into a more serious situation depends on variables we can’t yet fully predict—export demand patterns, weather affecting production, and policy responses. But the risk is substantial enough that operations should plan for various scenarios rather than assume conditions will improve on their own.

What This Means for Your Operation

So, where does all this leave us? I think there are some practical considerations worth thinking through, and they vary depending on your role in the industry.

For Producers:

The evidence suggests we’ve moved beyond a typical cyclical downturn. Relying on historical price recovery patterns to guide current decision-making carries real risk.

The most important focus right now is cost structure. In a market where establishing a lower baseline price, efficiency matters more than production volume. A realistic assessment of your operation’s true breakeven point is critical. If your business model requires $18-19 milk to be profitable, fundamental changes may be necessary because the market is signaling that $15-16 could be the range for extended periods.

Component quality is becoming increasingly important in compressed markets. When commodity prices are under pressure, the premiums for high-protein, high-fat milk become proportionally more valuable. Fresh cow management, ration formulation, and genetic selection decisions that maximize components—all of this can add meaningful value when the base price is low. I’ve seen operations in the Upper Midwest boost their component checks by 80 cents to a dollar per hundredweight through focused attention to butterfat and protein levels, and that differential matters more than ever in this environment.

StrategySpecific ActionPotential ImpactPriority Status
Cost Structure OptimizationConduct fresh breakeven analysis; identify and eliminate non-essential costs; renegotiate vendor contractsLower breakeven $1.50-2.00/cwtCritical Action
Component Premium MaximizationFocus fresh cow management; optimize rations for fat/protein; select genetics for componentsAdd $0.80-1.20/cwt to milk checkHigh Priority
Balance Sheet ResilienceBuild working capital reserves; defer non-critical capital projects; restructure high-interest debtSurvive 6-12 months low pricesCritical Action
Feed Cost ManagementForward contract 50-60% of corn/soy needs through summer 2026 at current lows ($4.40 corn)Lock controllable cost advantageHigh Priority
Risk Management ToolsImplement Dairy Revenue Protection or LGM; set minimum price floors for Q2-Q3 2026Protect against worse-case scenariosRecommended

Balance sheet resilience will be critical heading into 2026. Operations with stronger working capital and lower debt service obligations will be better positioned to navigate extended low prices. This may not be the optimal time for major expansion projects or capital spending that increases fixed costs. I know that’s difficult advice when you’ve got planned improvements or a son or daughter wanting to come back to the farm, but timing matters.

Feed cost management deserves attention. With corn and soybean meal at multi-year lows, locking in favorable input costs for at least a portion of needs provides one of the few controllable variables in the current environment. Even partial coverage—50-60% of expected needs—can provide meaningful protection if grain markets rally. Some Northeast operations I’m familiar with are forward contracting corn through summer 2026 to remove at least that uncertainty from their planning.

For Processors:

Inventory management has moved from routine practice to strategic necessity. The industry-wide shift toward cheese production requires realistic planning for when and where that inventory will clear. Frank conversations with customers about forward commitments and careful evaluation of speculative inventory positions are warranted, given uncertainty about the timing of price recovery.

Export channel diversification matters more in volatile markets. Heavy reliance on one or two markets—particularly those that may be engaging in stockpiling rather than steady consumption—creates vulnerability if buying patterns shift.

Processing flexibility offers strategic advantages. Assets that can shift between products as market conditions change provide more options than single-purpose facilities in volatile environments. I recognize that’s easier said than done when you’ve got specialized equipment and a trained workforce, but it’s worth considering in future capital planning.

For the Broader Industry:

The synchronized weakness across global markets raises questions about coordination and supply discipline. Without mechanisms to better align supply with realistic demand expectations, these boom-bust cycles may become more frequent and severe. This doesn’t necessarily mean government intervention, but it might involve processors implementing more structured base-excess programs or cooperatives taking stronger action to manage supply.

Export infrastructure and market development will become increasingly critical if the U.S. continues to position itself as a large-scale global supplier. This means sustained investment in logistics, market access, technical assistance to importing countries, and trade relationships that can reliably absorb substantial volumes.

Better market intelligence and information sharing could help prevent simultaneous strategic pivots that amplify imbalances. If processors in different regions had better visibility into global production decisions, they might make different product-mix choices. Industry associations and market data services have a role in providing that transparency.

The Bottom Line

The week of December 15, 2025, may mark a transition point—when global dairy markets shifted from familiar cyclical volatility into something more structural and challenging to navigate.

The traditional mechanisms that historically dampened these cycles are evolving. Smaller farms that used to exit during downturns and help tighten supply represent a declining share of production. Regional markets that operated somewhat independently are increasingly interconnected and moving together. Feed costs, which tend to move inversely with milk prices and provide a natural hedge, are currently low, removing that counterbalance.

What’s emerging is a more consolidated, more efficient production system that responds to price signals differently than in previous decades. Large operations with modern facilities and low per-unit costs can remain profitable at price levels that would have historically triggered widespread exits. That’s economically efficient in many ways, but it also means markets may need to fall further and stay low longer to trigger the supply response needed to rebalance.

For all of us navigating this transition, the fundamental challenge is to build operations and business models that remain viable at these new baseline prices rather than relying on assumptions of a return to historical averages. The traditional wisdom that low prices eventually cure low prices still holds. The cure is working—you can see it in the data. But the adjustment period may be longer than in previous cycles required.

These are sending clear signals about the current supply-demand balance. The question facing every operation is how to adapt business strategies and risk management approaches to this evolving reality while maintaining the flexibility to capitalize on opportunities as they develop.

Market data referenced in this analysis comes from the European Energy Exchange (EEX), Singapore Exchange (SGX), Global Dairy Trade platform, CME Group, USDA World Agricultural Supply and Demand Estimates (WASDE), U.S. Dairy Export Council (USDEC), UK Department for Environment, Food & Rural Affairs (DEFRA), and European Commission weekly dairy quotations for the period ending December 15, 2025.

Key Takeaways:

  • The Export Paradox: Record U.S. cheese exports (+34.5%) met 18-month price lows as every global dairy market crashed simultaneously the week of December 15—revealing fundamental pricing mechanisms have broken.
  • Why Supply Won’t Self-Correct: Cheap feed ($4.40 corn, $302 soy meal) keeps income-over-feed-cost positive at $15-16 milk, preventing the production cuts that normally cure oversupply.
  • Q2 2026 Inventory Collision: Processors globally are shifting from butter to cheese simultaneously. This inventory matures in spring 2026, precisely when the flush hits—creating a potential crisis for spot milk prices.
  • This Is a Reset, Not a Cycle: Class III holding near $16 while Class IV languishes in mid-$13s signals new baseline economics. Operations must be built for sustained viability at these levels, not temporary survival.
  • Immediate Producer Priorities: (1) Cost structure over production volume, (2) Maximize component premiums—they matter most in compressed markets, (3) Strengthen balance sheets before spring, (4) Lock feed costs now via forward contracting.

Complete references and supporting documentation are available upon request by contacting the editorial team at editor@thebullvine.com.

Learn More:

The Sunday Read Dairy Professionals Don’t Skip.

Every week, thousands of producers, breeders, and industry insiders open Bullvine Weekly for genetics insights, market shifts, and profit strategies they won’t find anywhere else. One email. Five minutes. Smarter decisions all week.

NewsSubscribe
First
Last
Consent

Weekly Global Dairy Market Recap Dec 15th, 2025: The “Wall of Milk” vs. The Heifer Shortage (Why 2025 is Different)

Every major dairy region is producing more milk—at the exact same time. That almost never happens. And prices are showing it.

Executive Summary: The world is awash in milk. The U.S., Europe, New Zealand, and South America are all growing production simultaneously—a rare alignment that almost never occurs and has crushed the Global Dairy Trade index by 4.3%, with butter plunging 12.4% in a single auction. U.S. cheese exports are setting records, yet spot cheddar sits at just $1.35/lb; America has become the world’s bargain supplier. RaboResearch analysts don’t see meaningful price recovery through 2026, given relentless production growth. But here’s the structural twist worth watching: CoBank reports dairy heifer inventories at 20-year lows, with an 800,000-head deficit baked into the system from beef-on-dairy breeding decisions made in 2022-2023. Biology may ultimately accomplish what price signals haven’t. For farmers navigating this extended trough, the priorities are clear: cost control, component premiums, and cash reserves.

2025 Dairy Market Outlook

Something unusual is happening across the global dairy landscape right now—every major milk-producing region on earth is growing production at the same time. That almost never happens. And it’s reshaping price expectations heading into 2026.

Typically, when American parlors are running full, New Zealand deals with drought. When Europe expands, South American margins collapse. But as we close out 2025, that natural counterbalancing act has broken down entirely—and the market is feeling it.

“Milk output is growing in all key exporting regions, which is not common,” explained Lucas Fuess, senior dairy analyst at RaboResearch, in a December 2025 analysis. “Typically, at least one part of the world is dealing with a limiting factor that is reducing milk growth—either weather, disease, margins, or something else. Now, the U.S., EU, New Zealand, and South America are all seeing growth—simultaneously.” 

What this means practically is that the usual relief valves aren’t working. When everyone’s producing, someone has to buy—and right now, demand simply isn’t keeping pace.

For the first time since 2018, all four major exporting regions are growing production simultaneously. Historically, drought in New Zealand or margin collapse in South America provided natural relief valves. Not this time. South America’s relentless 3.2% growth (red line) combined with New Zealand’s seasonal surge is flooding global markets—and that’s before we factor in the U.S. becoming the world’s discount cheese supplier. 

Global Dairy Trade: What the December Numbers Show

The Global Dairy Trade price index fell 4.3% at the most recent auction, with most product categories posting declines. Butter took the hardest hit—down 12.4% in a single event. Only cheddar (+7.2%), lactose (+4.2%), and buttermilk powder (+1.8%) managed gains. 

While the headline GDT index dropped 4.3%, the December auction revealed massive divergence: butter collapsed 12.4% in a single event, extending a five-month slide from May highs, while cheddar actually firmed +7.2%. This matters because it signals where global buyers see value—and where they don’t.

What strikes me about these numbers is the divergence between commodities. Butter has been sliding since May, when it reached five-year highs. Meanwhile, cheddar actually firmed at the latest auction. That kind of split tells you something important about how global buyers are thinking—they’re not avoiding dairy, they’re just getting selective about where they source it and what they’re buying.

Why U.S. Butter Became the World’s Bargain in 2025

Here’s something that deserves more attention: U.S. butter prices have sat well below European and New Zealand prices throughout all of 2025. That gap created an opportunity that global buyers noticed—and acted on.

“The US butter price has been well below the EU and NZ price throughout all of 2025,” Fuess noted. “This has driven global buyers to procure product from the US instead of other regions to recognize the value in US product.” 

John Hallo, procurement business partner at Maxum Foods, offered additional context on the New Zealand correction: “New Zealand pricing had been running at a premium from the USA/EU for four months, so I could argue their price was overinflated. Along with peak season supply of NZ fat, we have inevitably seen the correction.” 

The practical implication? That American price advantage is narrowing as global prices converge downward. Farmers who’ve been benefiting indirectly from strong export demand should watch these spreads closely heading into 2026.

U.S. Dairy Exports 2025: Record Cheese Volumes Meet Softening Spot Prices

The American export picture presents an interesting paradox. CME spot cheddar blocks closed the week of December 8-12 at $1.35 per pound, with butter averaging $1.4785/lb. Class III futures for December settled around $15.88/cwt, with Class IV hovering in the mid-$13s—hardly inspiring numbers for the milk check. (Daily Dairy Report, December 12, 2025)

And yet, U.S. cheese exports are having a record year. September shipments jumped 35% year-over-year, putting year-to-date volume at 453,076 metric tonnes. That’s already more cheese shipped abroad in nine months than in any full calendar year except 2024. The U.S. Dairy Export Council projects we’ll likely top 600,000 MT for the full year. (USDEC, December 11, 2025)

What I find telling is that we’re moving record cheese volumes at the exact moment spot prices are hitting 18-month lows. That disconnect reveals how global buyers think—they’re responding to relative value, not absolute price levels. When an American product is cheap compared to alternatives, they buy American. Simple as that.

U.S. cheese exports are on track to exceed 600,000 MT in 2025—a record—while spot cheddar sits at $1.35/lb, down nearly 30% from mid-2024 peaks. This isn’t competitive excellence; it’s competitive desperation. Global buyers are choosing American cheese because we’re cheap, not because we’re better. 

Katie Burgess, dairy market advising director with Ever.Ag raised an important concern at the Oregon Dairy Farmers Convention earlier this year: “If we can’t get the cheese exported, and we’re making a lot of it, it means we’re going to need to eat a lot more cheese.” 

What University Research Is Showing About Milk Solids

Leonard Polzin, dairy markets and policy outreach specialist at the University of Wisconsin-Madison, has been tracking something important: production efficiency gains are outpacing headline milk volume. Despite modest total production growth, calculated milk solids production has increased more substantially because butterfat and protein tests keep climbing. (UW Extension Farms, 2025 Dairy Situation and Outlook)

For context, back in 2020, the average butterfat test was 3.95% and the protein test was 3.181%. Today’s tests are running notably higher than usual. This matters because it means the industry can meet demand for milk solids more quickly than raw production numbers suggest—processors get more usable product per hundredweight than they did five years ago. 

Additionally, UW-Madison research highlights that Federal Milk Marketing Order reforms taking effect are expected to decrease the All Milk Price by approximately $0.30/cwt, with a more pronounced impact on Class III prices. (UW Extension Farms, February 2025) That’s not a dramatic hit, but it’s another headwind for margins already under pressure.

The Heifer Constraint Nobody’s Talking About Enough

Here’s what makes the current situation genuinely unusual: despite soft milk prices, there’s a structural ceiling on how fast production can actually grow. Talk to producers across the Upper Midwest, and you hear the same story—replacement heifers are scarce and expensive.

According to CoBank’s August 2025 sector analysis, U.S. dairy replacement heifer supplies have fallen to their lowest levels in twenty years. The research projects heifer inventories will shrink by approximately 800,000 head over the next two years before beginning to recover in 2027. (CoBank/Wisconsin Ag Connection, August 2025)

CoBank’s research reveals an 800,000-head deficit already baked into the system—the direct result of beef-on-dairy breeding decisions made during 2022-2023’s high beef prices. Here’s what makes this genuinely different: even if milk prices doubled tomorrow, you can’t breed your way out of a heifer shortage when the calves weren’t born three years ago. 

That 800,000-head deficit is already baked into the system based on breeding decisions made during 2022 and 2023 when beef-on-dairy crossbreeding surged. Biology dictates timing here—you can’t simply buy your way out of a heifer shortage when the calves weren’t born.

What this means practically: even if milk prices rose tomorrow and every producer wanted to expand, the replacement animals aren’t there to support rapid growth. It’s one reason why the supply response to current low prices may be slower than historical patterns would suggest—and why some analysts see eventual price support emerging from the supply side rather than demand.

The Bullvine Breeder’s Takeaway

The 800,000-head heifer deficit changes the math on your genetic inventory. Here’s what that means for breeding decisions:

  • Your heifer pen is now a gold mine. Verified high-genomic females will likely command premium prices through 2026 as processors compete for milk to fill new capacity.
  • Stop culling lightly. With replacements at 20-year lows, that “marginal” cow might be worth keeping for one more lactation.
  • Inventory as asset class. Heifers are no longer just a cost center—they’re increasingly liquid assets in a supply-constrained market.
  • Rethink beef-on-dairy. If you swung 70%+ to beef semen in 2023, review your genetic strategy immediately. The market is signaling a need for replacement purity, and premiums for verified dairy replacements are likely within 12 months.

European Dairy 2025: Less Milk, More Cheese

The EU situation offers its own set of complexities. USDA GAIN reports forecast milk deliveries at 149.4 million metric tonnes in 2025—down 0.2% from 2024. Low farmer margins, environmental regulations, and disease outbreaks continue pushing smaller producers out. 

But here’s the nuance that matters: European processors are deliberately prioritizing cheese over butter and powder. EU cheese production is forecast to rise 0.6% to 10.8 million metric tonnes, even with less total milk available. They’re making a strategic choice about where to allocate their milk supply—and cheese is winning. 

For American producers competing in export markets, this means European cheese will remain a competitive threat even as their overall milk production contracts.

New Zealand and Fonterra: Strong Collections, Cautious Outlook

New Zealand’s dairy sector continues performing well, though Fonterra’s latest forecast signals caution about where prices are heading. The cooperative narrowed its 2025/26 farmgate milk price range from NZ$9.00-$11.00 per kgMS down to NZ$9.00-$10.00 per kgMS in late November, with the midpoint dropping from NZ$10.00 to NZ$9.50. (Fonterra, November 25, 2025)

At the same time, Fonterra increased its milk collection forecast for the 2025/26 season from 1,525 million kgMS to 1,545 million kgMS—reflecting strong on-farm production conditions. Season-to-date collections through October were running 3.8% above last season. (Fonterra Global Dairy Update, November 2025)

CEO Miles Hurrell noted the cooperative has seen strong milk flows this season, “both in New Zealand and other milk-producing nations,” resulting in seven consecutive price drops at recent Global Dairy Trade events. Fonterra’s cooperative structure provides some insulation from spot-market volatility that investor-owned processors don’t enjoy, but its price guidance suggests it’s not expecting quick relief from current conditions.

China: Modest Import Recovery on the Horizon

After a brutal 17% decline in dairy imports through the first eight months of 2024, Rabobank forecasts Chinese dairy imports will improve by 2% year-on-year in 2025. Chinese farmgate milk prices have fallen to near 10-year lows, forcing herd reductions and farm exits that are constraining domestic supply. (Tridge/Rabobank, November 2024)

That said, a 2% increase helps at the margins but won’t fully absorb the global surplus on its own. The AHDB notes that most import growth is expected in the latter half of 2025 as domestic stocks weaken. (AHDB, February 2025) It’s a positive signal, not a rescue.

Feed Costs 2025: The One Clear Bright Spot

There’s genuinely good news on the cost side. March corn futures settled around $4.405/bu in mid-December, while January soybean meal closed near $302/ton. These represent meaningful relief for ration costs heading into 2026.

The catch—and there’s always a catch—is that feed savings don’t help if milk revenue falls faster. Margins are being compressed from the revenue side right now, not the cost side. Strong feed conversion efficiency and component production matter more than ever when the milk check is lean.

Cost/Revenue ComponentMid-2024 AverageDec 2025 AverageChange per Cow/Year
Corn ($/bu)$4.85$4.41-$96 (savings)
Soybean Meal ($/ton)$365$302-$142 (savings)
Total Feed Cost per Cow/Year$3,420$3,182-$238 (savings)
Milk Price per Cwt (Class III avg)$18.20$15.88-$522 (loss)
Annual Milk Revenue per Cow$4,368$3,811-$557 (loss)
Net Margin Impact (Revenue – Feed)-$319 per cow

The Price Signal That Hasn’t Triggered Supply Response

What farmers are finding, according to Fuess, is that milk prices simply haven’t dropped far enough to trigger the supply response markets typically need.

“Milk prices have declined in the US, but total dairy farmer income likely remains higher than the cost of production for most farmers, meaning there has not yet been a strong enough price signal to tell farmers to cull cows or cut production.” 

This creates a frustrating dynamic. Prices are low enough to hurt, but not low enough to force the contraction that would eventually support recovery. We may be stuck in this uncomfortable middle ground for a while—though the heifer shortage could ultimately do what price signals haven’t.

2026 Dairy Price Outlook: What Analysts Are Watching

Both Rabobank and Maxum Foods expect Europe to slip into a meaningful contraction next year, which should help ease the current oversupply.

“For the EU, there is a lag in falling farmgate price and reduction in milk production,” Hallo explained. “Coming off the back of good market conditions for farmers, the farms still produce good quantities despite falling commodity prices. This may look to correct itself mid-2026.” 

For U.S. producers, Fuess offered a more sobering assessment: “While volatility is never gone from the market, it is unlikely that US milk prices will see significant growth in 2026 due to the continually growing production.” 

Practical Considerations for Your Operation

Every farm faces different circumstances, but several themes emerge from the current market environment:

  • Cost management becomes your primary lever. With corn affordable and milk prices soft, feed efficiency and labor productivity matter enormously. Every dollar saved drops directly to the bottom line. This isn’t the time for sloppy ration management or deferred maintenance.
  • Component premiums over raw volume. High-protein, high-butterfat milk commands better prices at most plants. The Pennsylvania Dairy Producer Survey found that “increasing milk components” ranked among the highest-rated priorities across the state’s dairies in 2025. (Center for Dairy Excellence/Penn State Extension, 2025 Survey Results)Chasing volume into a surplus market amplifies the problem for everyone.
  • Beef-on-dairy revenue remains strong. With beef prices at historic highs, strategic terminal breeding can supplement dairy income while managing replacement inventory. The sustained strength in beef has made this supplementary income stream increasingly important to overall farm profitability—though it’s worth remembering that heavy beef breeding during 2022-2023 contributed to the heifer shortage now constraining expansion. 
  • Build cash reserves for an extended trough. Futures markets suggest sub-$16 Class III and sub-$14 Class IV through early 2026. That’s not a dip—that’s a prolonged soft period. Make sure your balance sheet can absorb six more months of tight margins, because the market isn’t signaling quick relief.

One important caveat: margin pressures vary significantly by region and operation size. Upper Midwest operations face different feed cost structures than Western dry-lot dairies, and component premiums differ by processor. What works for a 150-cow grazing operation in Vermont won’t necessarily apply to a 3,000-cow confinement dairy in Texas. Consult your nutritionist, your lender, and your local extension economist about your specific situation.

The Bottom Line

The global dairy market is sending a clear message: there’s more milk than buyers need right now, and sustained low prices will likely be required to rebalance supply and demand. Some analysts believe we’re approaching a floor. History suggests inflection points are notoriously difficult to call.

What’s interesting is that biology may ultimately accomplish what price signals haven’t—the 800,000-head heifer deficit documented by CoBank creates a hard ceiling on expansion that capital alone can’t override. By 2027, when $10 billion in new processing capacity needs filling, the cows to supply it may simply not exist.

Operations focused on efficiency, component quality, and cost discipline will be best positioned to weather this period—and to capitalize when conditions eventually turn.

Margin StrategyEstimated Impact per Cow/YearImplementation DifficultyWorks Best ForWhat this means
Component premium focus+$180-$320MediumAll herd sizes“Non-negotiable. Volume into a surplus is suicide.”
Feed efficiency optimization+$140-$220Low-MediumHerds >100 cows“Low-hanging fruit. Audit your ration immediately.”
Strategic beef-on-dairy+$250-$400LowHerds with replacement flexibility“Beef prices won’t save you, but they’ll soften the blow.”
Heifer inventory as asset+$150-$500HighHerds with genomic programs“Your heifer pen is now a gold mine. Stop culling verified genetics.”
Cash reserve buildingN/A (protects survival)MediumAll farms“Six months operating capital. Non-negotiable for 2026.”
Cull rate discipline+$80-$180LowHerds facing heifer shortage“That ‘marginal’ cow is worth one more lactation.”

Editor’s Note: Market data in this analysis comes from CME Group, Global Dairy Trade platform, USDA FAS reports, University of Wisconsin-Madison Extension, Penn State Extension, CoBank sector research, and industry analyst commentary from RaboResearch, Maxum Foods, and Ever.Ag (December 2025). National and regional averages may not reflect your specific operation’s circumstances. Feed and milk prices vary significantly by region, management practices, and market access.

Key Takeaways

  • Rare synchronized surplus: U.S., Europe, New Zealand, and South America are all growing milk production simultaneously—a phenomenon that almost never occurs and is crushing prices globally
  • December market snapshot: GDT index down 4.3%, butter plunged 12.4% in one auction, spot cheddar at $1.35/lb, Class III futures hovering near $15.88/cwt
  • America’s export paradox: U.S. cheese exports are setting records precisely because we’ve become the world’s cheapest supplier—though that advantage narrows as global prices converge
  • The 800,000-head constraint: Dairy heifer inventories have hit 20-year lows; this structural deficit from beef-on-dairy breeding may eventually limit supply when price signals alone haven’t
  • 2026 outlook and action items: RaboResearch sees no meaningful recovery until European contraction mid-year; prioritize cost control, component premiums, and cash reserves to weather an extended trough

Complete references and supporting documentation are available upon request by contacting the editorial team at editor@thebullvine.com.

Learn More:

The Sunday Read Dairy Professionals Don’t Skip.

Every week, thousands of producers, breeders, and industry insiders open Bullvine Weekly for genetics insights, market shifts, and profit strategies they won’t find anywhere else. One email. Five minutes. Smarter decisions all week.
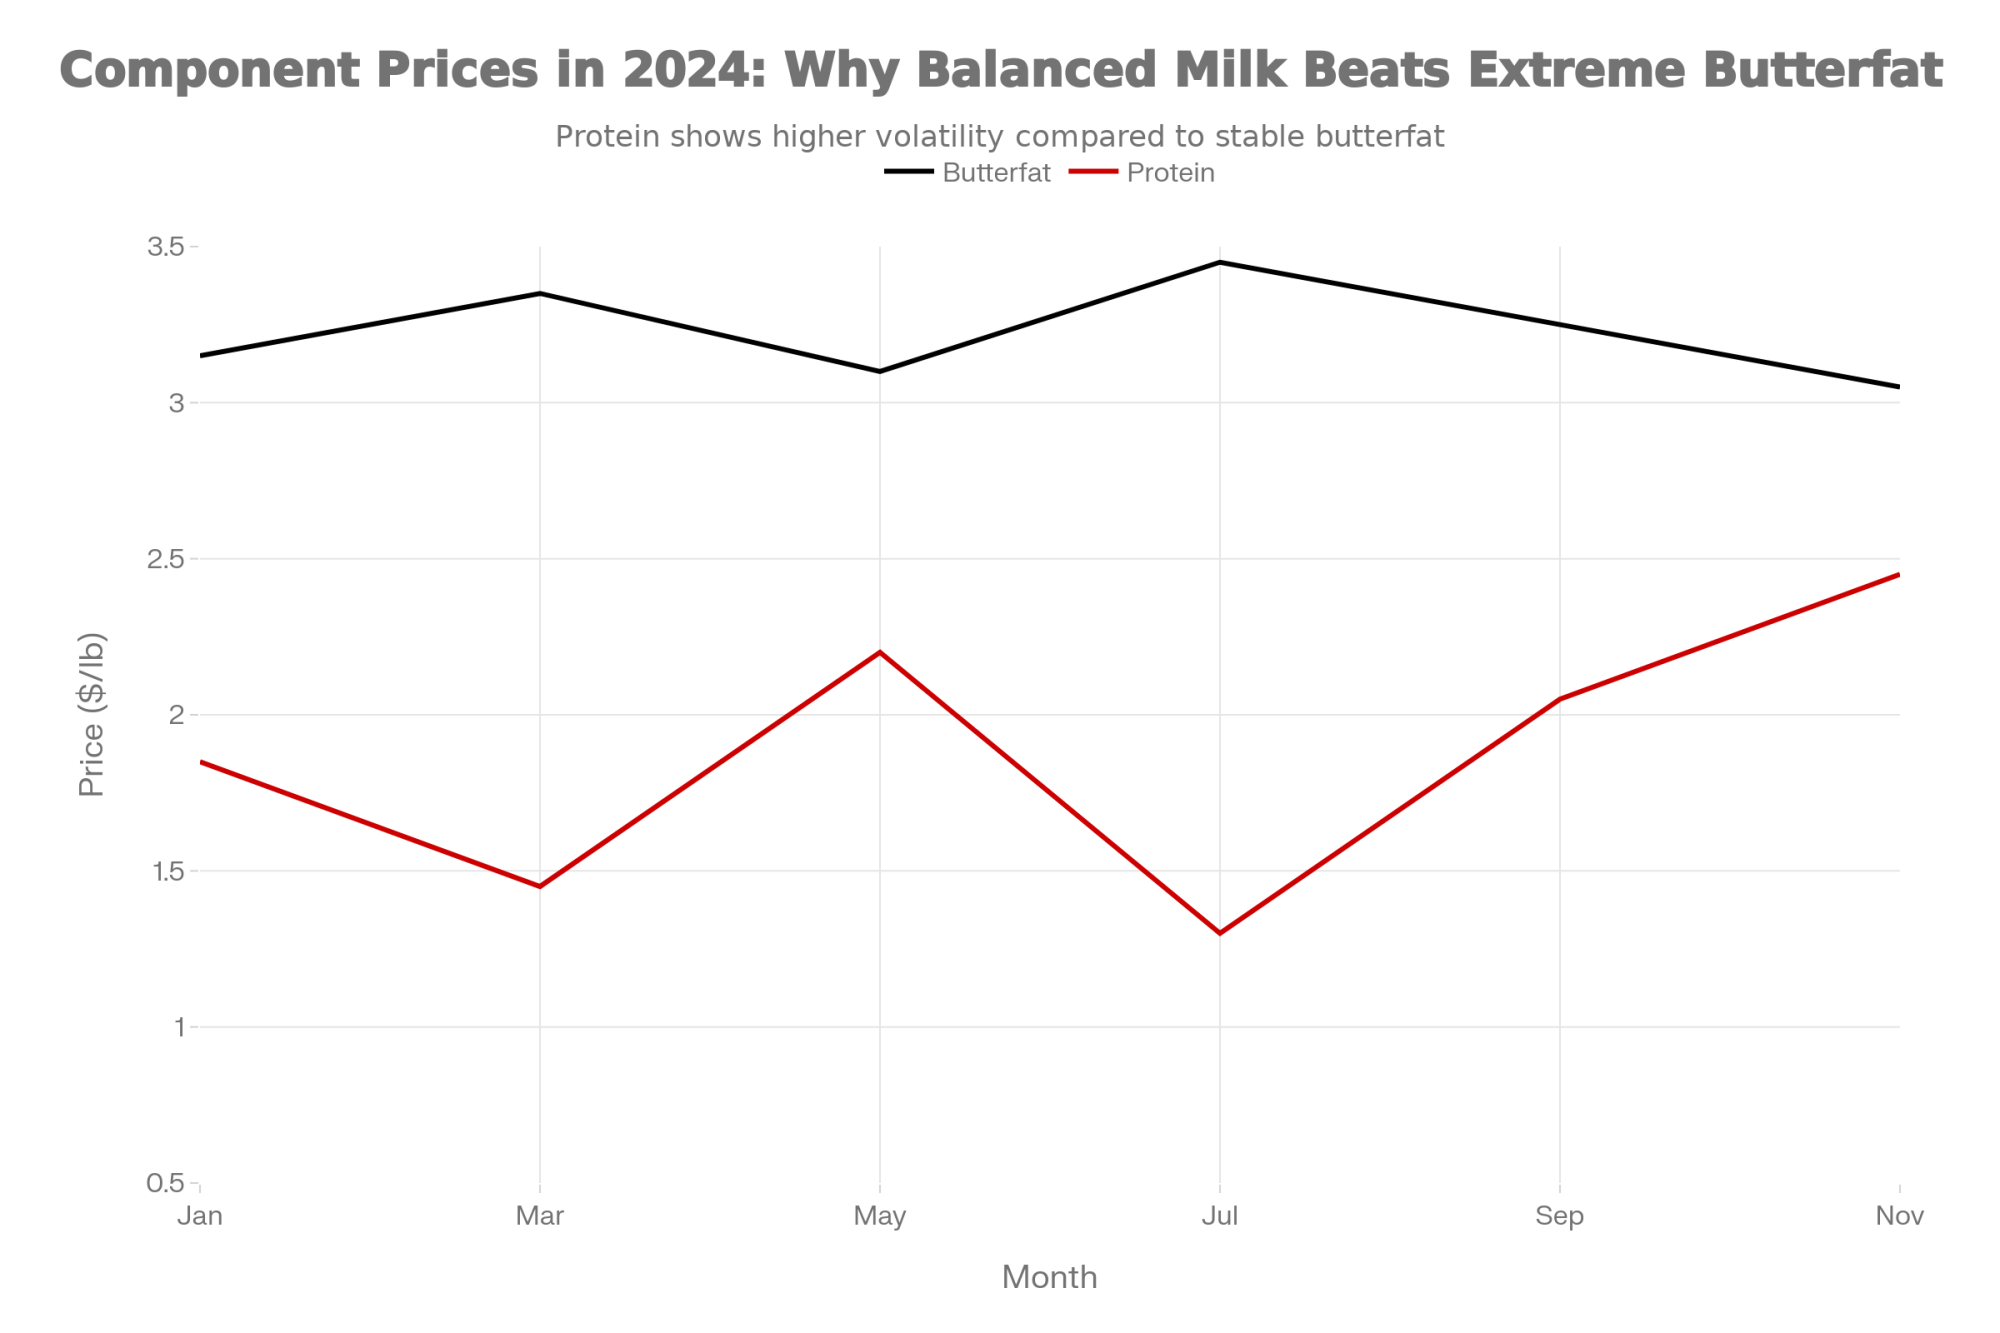
NewsSubscribe
First
Last
Consent

£10,000 a Month in the Red: Why UK Dairy Margins Collapsed – And What’s Actually Working

When processor profits climb while your milk check drops, it’s not a coincidence. It’s a message. And once you understand what that message is telling you about how the modern dairy supply chain works, you can stop second-guessing yourself and start making strategic decisions.

Executive Summary: A 200-cow UK dairy loses roughly £10,000 every month when milk price sits 8-10ppl below cost of production. Right now, that describes most operations. AHDB’s April 2025 data shows just 7,040 producers remaining in Great Britain—down 2.6% in a single year—while First Milk’s operating profit climbed 22% to £20.5 million. Retail discounters now command nearly 20% of UK grocery spend, and post-Brexit policy lacks the milk-specific safety nets that cushioned the 2015-2016 crisis. This isn’t farm failure. It’s market structure. Three approaches are delivering real results for producers fighting to stay viable: strategic culling of the bottom 15% of the herd, precision feed management with qualified nutritionist support, and capturing beef-cross calf premiums through targeted breeding. Combined, these strategies can reduce monthly losses by £7,000-8,000—buying time to explore processor alternatives and the collective engagement approaches already producing results in Ireland.

UK dairy margin pressure

I’ve been talking with UK dairy farmers a lot lately, and you know what keeps coming up? This quiet worry that maybe they’re just not good enough at this anymore. That somehow the losses they’re seeing reflect something they’re doing wrong.

Here’s what I want to say to that: if you’re running a technically sound operation—decent yields, reasonable cell counts, professional management—and you’re still hemorrhaging money, that’s not farm failure. That’s market structure. And there’s a real difference between those two things.

Let me walk you through what I’m seeing.

The Numbers Behind the Frustration

So let’s start with the processor side, because that’s where this story begins.

First Milk’s Annual Financial and Impact Report for the year ending March 2025 shows turnover of roughly £570 million and operating profit around £20.5 million—up from £16.8 million the previous year. That works out to an operating margin just over 3.5%. The cooperative points to higher product volumes and the full integration of BV Dairy as key drivers.


Metric
2023/242024/25Change
First Milk Operating Profit£16.8 million£20.5 million+22% ↑
First Milk Operating Margin~3.2%~3.6%+0.4pp ↑
GB Dairy Producers~7,2407,040-2.6% ↓
Farms Exitedn/a~200-200 farms ↓

Meanwhile, AHDB’s producer numbers survey from April 2025 shows we’re down to about 7,040 dairy producers in Great Britain. That’s around 160 fewer than the previous survey in October, and nearly 200 fewer than a year ago—a 2.6% annual decline. The exits tend to cluster ahead of winter housing, which makes sense when you think about the capital and workload involved in bringing cows inside.

Here’s what’s interesting, though. Even as farm numbers drop, total milk production keeps climbing. AHDB data shows the GB milking herd continuing its gradual decline, but litres per farm keep rising. Fewer farms, bigger herds, more milk per unit. That pattern’s been consistent for decades now.

And the cost picture? The Dairy Group’s September 2024 newsletter pegs the UK cost of production for 2023/24 at around 45 ppl, with their forecast for 2024/25 at approximately 44.2 ppl. Their analysis suggests it’s “extremely unlikely” we’ll see costs drop back below 40 ppl anytime soon.

So when farmgate prices sit in the mid-30s and the cost of production hovers in the mid-40s, you’ve got a gap of roughly 8-10 ppl. For a 200-cow herd producing about 1.5 million litres annually, that works out to something like £120,000 a year—close to £10,000 a month just to stand still.

The £10,000 gap that’s killing UK dairy farms isn’t about bad management—it’s about market structure.

Now, every farm pencils out differently. But consultants I’ve spoken with say these kinds of numbers line up pretty closely with what they’re seeing in real accounts.

Why This Cycle Feels Different

If you’ve been farming through previous downturns, you’re probably thinking about 2015-2016 right now. Similar oversupply pressures, similar price corrections. But something feels different this time, and I think that instinct is worth exploring.

During the 2015-2016 crisis, Brussels stepped in with a €150 million EU-wide scheme—created through Delegated Regulation 2016/1612—that paid farmers voluntarily to reduce milk deliveries for a few months. According to the European Court of Auditors’ special report on the EU’s response to the milk market disturbances, aid was set at €14 per 100 kg of milk to reduce deliveries by around 1.1 million tonnes. It wasn’t a perfect solution, but it was something.

Since leaving the EU, the UK hasn’t had a like-for-like replacement for that specific tool. Support has tended to come through broader environmental schemes and general farm payments rather than milk-specific production incentives. When processors announce cuts today, there’s less cushion. And it’s worth noting that devolved agricultural policies mean Scottish and Welsh producers face different support landscapes than those in England—something that adds another layer of complexity when comparing notes with neighbours across borders.

The retail landscape has shifted, too. Kantar’s December 2025 grocery data shows Aldi holding about 10.5% of the UK market and Lidl at 8.1%. Together, discounters now account for close to a fifth of all grocery sales—up from around 13.6% just five years ago. That buying power inevitably influences how hard they push wholesale prices, including dairy prices. It’s not that traditional supermarkets don’t care about farmgate sustainability—many genuinely do—but it’s harder to hold that line when your competitors are focused purely on cost.

And then there’s the processor balance sheet question. First Milk and others have taken on debt for capacity investments and acquisitions. When leverage ratios are around 3x and debt service coverage needs to be protected, there’s real pressure to maintain margins. I don’t think farmers should dismiss these constraints as excuses—they’re genuine business realities that boards have to navigate.

What producers are discovering is that the support architecture from the last major crisis has changed. Understanding that helps you think more clearly about your options.

Three Approaches That Are Actually Working

Understanding the market is useful, but you need actionable steps. I’ve been tracking what’s delivering results for farms navigating this environment, and three approaches keep coming up in the operations that are extending their runway.

Taking a Hard Look at the Herd

Here’s something that sounds counterintuitive but makes good financial sense: thoughtful culling can improve your monthly position even while reducing production.

You probably know this already, but the bottom 15% of most herds—cows with persistent cell counts above 400,000, yields consistently below 20 litres daily, or chronic fertility challenges—consume similar feed, labour, and veterinary resources as top performers while generating less revenue meaningfully. We’ve understood this principle for years, but current market conditions make acting on it more urgent.

I recently spoke with a consultant who walked through the numbers with a 200-cow client in northern England. They identified about 30 chronically under-performing cows—high cell counts, repeated fertility issues, cows that had been given plenty of chances—and sold them into a solid cull market at roughly £650 a head. That brought in close to £20,000 in cash.

Financial ComponentCalculation (200-cow herd)Impact
Bottom 15% Identified30 chronically under-performing cowsHigh SCC, low yield, poor fertility
Immediate Cull Revenue30 cows × £650/head£19,500 cash
Monthly Feed SavingsReduced ration costs + supplements£2,000-3,000/month
Annual Feed Savings£2,500/month × 12 months£24,000-36,000/year
Total Year 1 Financial ImpactCash + savings£43,500-55,500

Source: Consultant case study, northern England; cull market pricing autumn 2025

More importantly, the farm cut its monthly feed bill by several thousand pounds and saw modest savings in vet and labour costs. The net effect moved them from a deeply negative monthly position to a more manageable one.

While every herd pencils out differently depending on your system, your cull market, and your costs, these are the kinds of numbers many accountants are now working through with clients. The key is being honest about which animals are genuinely contributing and which are just consuming resources. Work with your vet to ensure culling decisions account for your calving pattern and transition cow management—you don’t want to create gaps in your fresh cow pipeline that cause problems six months down the road.

With December and January typically being strong months for cull cow demand—processors need to fill orders before spring, and the beef trade tends to hold up well through winter—the timing for these decisions is actually reasonable right now.

Getting Smarter on Feed

Feed typically represents 40-60% of production costs, so even modest improvements here compound meaningfully. Two levers deserve attention, and they work well together.

The first involves precision nutrition. Advisers from groups like The Dairy Group and Kingshay regularly highlight the gap between typical and efficient operations on concentrate use—sometimes 0.50 kg per litre versus 0.41 kg per litre. That gap represents real money over the course of a lactation.

But here’s the thing—and I can’t stress this enough—closing that gap requires proper involvement from a nutritionist. Cut too aggressively without professional guidance, and you risk losing more in butterfat and protein performance than you save on inputs. I’ve seen farms try to do this on their own and end up worse off because yields or components drop. Get someone qualified involved before you change rations.

The second lever is collective purchasing. Advisers from Kingshay and The Dairy Group report that members of their buying groups can often secure noticeably better prices on straights and blends than lone buyers—sometimes shaving several pounds per tonne off the ticket price. The exact savings vary by region and by what you’re buying, but across a winter, those differences add up.

What’s encouraging is that I’m hearing about more farms in the Southwest and Midlands joining these groups this autumn. The administrative overhead is minimal, and the buying power is real.

Finding Revenue on the Margins

This is where farms can add income without major capital requirements.

In current UK auctions, it’s not unusual to see well-bred beef-cross dairy calves selling for several times the value of plain dairy bull calves. One recent market report from the South of England showed continental-cross calves comfortably into the low hundreds of pounds, while plain dairy bulls lingered at much lower values. Using sexed beef semen on cows not needed for herd replacement is a straightforward way to capture some of that premium.

Calf TypeTypical Market ValueAnnual Calves (200-cow herd)Annual RevenuePremium vs Dairy Bull
Plain Dairy Bull£20-4050£1,000-2,000Baseline
Beef-Cross (Continental)£100-15050£5,000-7,500+£4,000-5,500
Your OpportunitySwitch 40-50 calves40-50+£3,200-6,000£80-120 per calf

For a 200-cow operation with flexibility on breeding decisions for 100-plus females, targeting 40-50 beef crosses annually can add meaningful revenue without changing much else about your system.

The contracting opportunity also deserves a look. The NAAC Contracting Prices Survey for 2024-25 puts typical charges for slurry spreading with a tanker and trailing shoe at around £75 per hour, with forage harvesting operations ranging from £83 to over £200 per acre depending on the service level. For a farm with decent machinery and some spare labour capacity, doing a modest amount of contract work for neighbours can turn idle time into a few hundred pounds a month during peak seasons.

Neither of these is transformative on its own. But combined with the herd and feed work, they add up to something that can make the difference between a sustainable position and a forced exit.

44-45 ppl
Your real cost of production
According to The Dairy Group's September 2024 analysis, this is where UK operations sit today. If your milk check is in the mid-30s, you're underwater before you start.
7,040
Dairy producers remaining in Great Britain
AHDB's April 2025 survey count. That's 2.6% fewer than a year ago. The exits are accelerating, and they're concentrated in winter—right now.
£10,000/month
What a 200-cow herd loses when prices sit 8-10 ppl below cost
That's £120,000 a year just to stand still. This is the gap farms are trying to close with the strategies in this article.

The Combined Picture

When I model all three approaches together—strategic culling, feed optimisation, and revenue diversification—the financial shift becomes meaningful.

For a 200-cow operation starting at roughly £10,000 monthly losses, you might get that down to £2,000-3,000 monthly through these changes, plus a one-time cash injection from the cull animals. For larger 500-cow operations, the numbers scale accordingly.

From crisis to breathing room in three strategic moves. This waterfall chart shows the actual financial trajectory when UK dairy farms implement

That’s not a permanent solution—farmgate prices are still below the full cost of production. But it creates time. Time to explore processor alternatives if better prices are available elsewhere. Time to think about collective approaches. Time to restructure financing if needed. Time to plan transitions thoughtfully rather than under immediate pressure.

And that time matters more than people often realise.

What the Irish Experience Suggests

I’ve been following developments at Dairygold in Ireland because they offer an interesting case study in producer coordination.

When Dairygold announced pricing adjustments this autumn, Irish farming media reported that several hundred farmers quickly organised around concerns about pricing and attended regional meetings with detailed written questions. While the exact figures vary depending on who you talk to, producers on the ground say this collective approach helped prompt partial improvements in the farmgate price rather than further cuts.

Their approach was notably constructive—no protests or supply withholding, just organised attendance at meetings with specific questions about pricing formulas, operational costs, and capital allocation. When a meaningful share of your supplier base shows up with identical written questions, it changes the tone of the conversation.

What’s worth noting is that UK farmers actually have stronger legal frameworks available to them. Recent Defra regulations mandate pricing transparency and good-faith engagement in dairy contracts, and producer organisation structures enable collective dialogue without competition law concerns.

The barrier isn’t legal authority—it’s coordination. And the Irish experience suggests coordination doesn’t require formal structures or membership dues. It requires communication channels, commitment mechanisms, and producers willing to engage constructively with specific questions.

Looking Ahead: What the Projections Suggest

If current pricing dynamics persist, what trajectory should producers anticipate?

Based on AHDB data and Andersons’ outlook analysis, the consolidation pattern we’ve seen for decades looks set to continue—possibly accelerate. According to the Andersons Outlook report covered by Dairy Global, authors Mike Houghton, Oliver Hall, and Tom Cratchley project that GB dairy producers could fall to between 5,000 and 6,000within the next two years. Average herd size would continue climbing, possibly toward 250 head or beyond. Total production would likely remain stable as surviving farms expand.

In 24 months, UK dairy could lose another 1,500 farms—and average herd size will climb past 250 head. 

Exit rates will probably vary significantly by scale and region. Smaller operations—those under 100-150 cows—generally face steeper challenges because their cost structures tend to run higher. Larger operations often achieve better economies of scale on fixed costs. That’s not a judgment about who’s a better farmer; it’s just the economics of spreading overhead across more litres.

Understanding this trajectory helps you make informed decisions about your own operation and timeline.

A Word on Cooperatives

Under UK cooperative law, boards are expected to act in the long-term interests of the society and its members, which often means paying close attention to balance-sheet strength, covenants, and investment needs alongside the current milk price. In practice, management decisions sometimes lean toward protecting the co-op’s viability, even when members face short-term income pressure.

I want to be fair here—boards aren’t being malicious when they make difficult pricing decisions. They’re navigating genuine constraints and competing obligations. But fairness has limits.

Loyalty is a two-way street. If the governance structure consistently prioritizes the institution over the member’s survival, the member has to ask a hard question: Am I actually an owner here, or am I just a supplier with a liability attached?

Because there’s a difference between a cooperative that asks members to share sacrifice during difficult periods and one that protects its margins while members bleed equity. The first is partnership. The second is something else entirely.

Different cooperative models do exist internationally. Some Canadian and European structures have achieved farmgate prices meaningfully above UK equivalents through different charter provisions and member engagement approaches. Whether UK cooperatives could evolve similarly is an open question—but it won’t happen without sustained producer engagement in governance processes. Boards respond to pressure. If members don’t apply it, nothing changes.

The Bottom Line

If you’ve read this far, you’re probably thinking about what all this means for your own situation. Let me offer a few thoughts.

First, understand where your losses are actually coming from. If you’re losing money but your operational metrics—yield, cell count, fertility, labour efficiency—compare reasonably well to industry benchmarks, your challenge is primarily market structure rather than farm management. That distinction matters for how you respond.

Second, don’t wait to act on the things within your control. The herd optimisation, feed work, and revenue diversification I described aren’t heroic measures—they’re sound management practices worth pursuing regardless of market conditions. Many farms should already have been doing this work. Current conditions just make it more urgent.

Third, explore your options on processor relationships. If there are meaningful price differences between your current buyer and alternatives, those differences add up fast. A few pence per litre on a million-plus litres is real money. Understand your contract terms, your notice requirements, and what’s actually available in your area.

Fourth, consider whether collective engagement makes sense for you. The Irish example shows that coordinated, fact-based dialogue can influence how processors make decisions. You don’t need to start a movement—even talking with neighbours about what you’re seeing in your milk cheques and what questions you’d want answered can be valuable.

And finally—and this one matters—make your decisions from clear analysis rather than frustration or self-doubt. If your operation is technically sound and you’re still losing money, that’s important context. It means the problem isn’t fundamentally about you. It means there are structural market factors at work. And understanding that changes how you evaluate your options.

These are difficult times in the UK dairy industry. But difficult times also clarify what matters and what actions are worth taking. The farms that navigate this well won’t be the ones who hoped for markets to improve. They’ll be the ones who understood their situation clearly, acted on what they could control, and made thoughtful decisions about their future.

That’s within everyone’s reach.

Practical Resources

  • AHDB Dairy: Benchmarking tools, market data, and cost of production analysis at ahdb.org.uk/dairy
  • Kingshay: Dairy costings service and buying group information at kingshay.com
  • The Dairy Group: Technical consultancy and feed analysis at thedairygroup.co.uk
  • NAAC Contractor Rates: Current pricing guides at naac.co.uk

Key Takeaways 

  • The gap is £10,000/month. That’s what a 200-cow herd loses when milk sits 8-10ppl below cost. Most UK dairies are there now.
  • It’s not your farming. Processor profits up 22%. Producer numbers down 2.6%. This is market structure—not management failure.
  • Three moves that work. Cull the bottom 15%. Tighten feed with a nutritionist. Capture beef-cross premiums. Combined savings: £7,000-8,000/month.
  • You’re buying time, not salvation. These strategies create breathing room—to switch processors, explore collective action, or plan transitions on your terms.
  • Coordination changes everything. Irish producers shifted pricing through organised, fact-based engagement. UK farmers have stronger legal tools. They just need each other.

Complete references and supporting documentation are available upon request by contacting the editorial team at editor@thebullvine.com.

Learn More:

The Sunday Read Dairy Professionals Don’t Skip.

Every week, thousands of producers, breeders, and industry insiders open Bullvine Weekly for genetics insights, market shifts, and profit strategies they won’t find anywhere else. One email. Five minutes. Smarter decisions all week.

NewsSubscribe
First
Last
Consent

Cheap Milk Is Breaking the Farm: What’s Really Hollowing Out Dairy’s Middle Class

Too big for local markets. Too small for volume deals. The 200-1,500 cow dairies—dairy’s middle class—are disappearing fastest. Here’s why.

EXECUTIVE SUMMARY: Something doesn’t add up. Last year, 1,434 U.S. dairies exited—a 5% drop—even while margins were supposedly improving. That’s not a rough patch; it’s a structural squeeze. Mid-size family operations (200-1,500 cows) are disappearing fastest, caught between the flexibility of small herds and the leverage of mega-dairies. Ownership is aging—22% of producers are now 65 or older—while more than half of on-farm labor comes from immigrant workers, quietly reshaping the traditional family farm model. The economics keep tightening too: farmers capture just 25 cents of every retail dairy dollar on average, yet absorb rising input and compliance costs that never show up in the milk check. With Chapter 12 bankruptcies in 2025 already exceeding last year’s full total, the warning signs are impossible to ignore. This analysis breaks down what’s really driving these exits—pricing structures, policy gaps, regulatory burdens, succession cliffs—and provides concrete early-warning indicators and financial benchmarks to help you evaluate what comes next.

Here’s a number that should give every dairy producer pause. The United States now has roughly 24,800 licensed dairy herds, down about 5% from just a year ago—that’s according to Progressive Dairy’s 2024 statistics and confirmed by USDA’s milk production reports. And if you zoom out further, we’ve lost close to 95% of our dairy farms since the early 1970s. Back then, over 648,000 operations were milking cattle. Today? Fewer than 25,000.

And yet—here’s what’s puzzling—national outlooks for 2024 and into 2025 have talked about “improving” margins. Feed costs came down a bit. Wholesale prices firmed up. Analysts started using phrases like “cautious optimism.” So why did roughly 1,400 more dairies still exit last year? Why are so many families I talk with saying they’re drawing down equity just to keep the lights on?

I’ve had versions of this conversation with producers from small tie-stalls in Vermont to large dry lot operations out West and mid-size freestalls across Wisconsin. And what’s becoming clear is that we’re not just dealing with another bad price year in one region. We’re looking at something more structural: the collision of 365-day biology, equipment, and regulatory realities, cheap-food expectations, reactive subsidy programs, and a market structure that has steadily shifted bargaining power away from the farm gate.

The goal here is to unpack those pieces and pull them together into something practical—warning signs to watch, questions to ask, and options to consider, whatever your herd size or region.

Where We Really Stand: Fewer Farms, More Milk, and Thinner Buffers

Let’s start with the big picture, because it sets the stage for everything else.

USDA economists have been documenting this shift for three decades now. According to their consolidation research, about 65% of the nation’s dairy herd now lives on operations with 1,000 cows or more—Rabobank’s analysis puts it even higher, around 67% of total U.S. milk production. Average herd size keeps climbing in almost every region, while total farm numbers decline between censuses.

Analysis of the 2022 Ag Census showed the same pattern in sharper detail: fewer dairy farms, higher total output, and production increasingly concentrated in states that favor large confinement or dry lot systems—California, Idaho, Texas, and parts of the High Plains.

Recent 2024 statistics added some granularity: about 1,434 dairies closed between 2023 and 2024, a reduction of roughly 5%, even though total U.S. milk production ticked up thanks to gains in per-cow output. Those gains are coming from exactly the things many of you have invested in—better forage quality, more consistent fresh cow management, tighter reproduction programs, and genetics that support higher butterfat performance.

Who’s Actually Leaving—and Who’s Staying

There’s a demographic story underneath these numbers that’s worth understanding. According to the USDA’s 2022 Census of Agriculture dairy highlights, 99% of dairy farm producers are white, and while dairy producers skew younger than farmers overall—averaging 51.4 years compared to 58.1 for all U.S. producers—22% are already 65 or older. That’s a significant portion of the industry approaching retirement age.

Here’s what makes this particularly challenging: the exits are heavily concentrated among older operators who lack identified successors. When you combine aging ownership with the capital intensity of modern dairy, you get a widening gap between who holds the farm titles and who actually does the daily work.

The 2024 Farmworker Justice report and National Milk Producers Federation research—going back to their 2014 labor survey and confirmed by more recent industry estimates—tell the other half of this story: more than half of all dairy labor is now performed by immigrant workers, predominantly Hispanic and Latino. Cornell University’s Richard Stup, who studies dairy labor extensively, puts the figure at 50-60% in the Northeast and Midwest, and closer to 80% in the Southwest and Western states. On large operations, especially, the workforce keeping those herds milked, fed, and managed looks very different from the families whose names are on the deeds.

These dynamics play out differently depending on the operation type as well. Large confinement dairies and dry lot systems in the West tend to have higher reliance on hired immigrant labor, while smaller grazing-based operations in the Northeast and Upper Midwest often still depend more heavily on family labor—though even many of those have shifted toward hired help for milking and feeding as family members pursue off-farm careers.

This isn’t a criticism—it’s a structural reality. What we used to call “the family farm” is increasingly becoming a “family-owned, diverse-labor-managed” operation. And that shift has real implications for how we think about equity, succession, and the long-term sustainability of dairy communities.

The Consolidation Math

From a national efficiency standpoint, these structural shifts have lowered average costs per hundredweight by spreading fixed investments—parlors, manure systems, feed centers—over more cows. From a family-business standpoint, the picture looks different. Mid-size operations in the 200 to 1,500-cow range have been exiting at significantly higher rates than very small lifestyle herds or the very largest facilities.

AttributeSmall Operations (<200 cows)Mid-Size Operations (200-1,500 cows)Large Operations (1,000+ cows)
Herd Size50-200 milking cows200-1,500 milking cows1,000-10,000+ milking cows
Labor ModelPrimarily family labor; occasional part-time helpMixed family + hired labor—high wage pressure, management complexityFully professionalized hired workforce; structured HR systems
Capital IntensityLower fixed costs; older facilities often fully depreciatedHigh fixed costs with inadequate scale to spread them; deferred cap-ex commonVery high fixed costs, but spread over large volumes; access to institutional capital
Milk Marketing LeverageCan pivot to direct sales, on-farm processing, local co-opsToo large for niche markets; too small for volume premiums or bargaining powerStrong negotiating position; dedicated hauling; premium access
Revenue DiversificationAgritourism, farmstead cheese, direct retail, CSA models viableLimited flexibility—committed to commodity production without scale advantagesVertical integration opportunities; partnerships with major processors
Fixed Cost per CWT$9-12/cwt (higher per-unit, but lower total exposure)$11-15/cwt—worst of both worlds: high per-unit costs + large total debt load$8-10/cwt (economies of scale in feed, facilities, management)
Primary VulnerabilitySuccession risk; aging infrastructure; isolation from supply chainCaught in structural vise: can’t pivot like small farms, can’t compete on cost like large farmsRegulatory exposure; environmental permits; commodity price swings
Exit Rate TrendStable or slowly declining (lifestyle/legacy farms)Exiting fastest—5-7% annual decline in many regionsGrowing slowly; acquiring exiting mid-size operations

In the Upper Midwest, where processing infrastructure has consolidated significantly over the past decade, this dynamic plays out in real time. When a regional cheese plant closes, or a co-op consolidates routes, the ripple effects hit mid-size operations hardest—they’re too big to pivot to direct marketing easily, but not big enough to justify dedicated hauling arrangements or negotiate volume-based premiums.

You know, I was talking with a group of extension economists recently, and one of them put it pretty well: from a national efficiency standpoint, consolidation looks neat and tidy on paper. From a family business standpoint, it often looks like the ladder is missing a few crucial rungs in the middle.

That’s worth sitting with for a moment.

Dairy’s 365-Day Biology: Why Downtime Hurts More Than It Looks on Paper

When we start talking about regulations, equipment costs, or subsidy programs, the conversation can drift into abstractions pretty quickly. Let’s bring it back to the cows for a minute, because that’s where the rubber meets the road.

Row-crop producers manage a biological asset that, once harvested, becomes inventory. Corn can sit in a bin for months without changing its metabolic state. Dairy is fundamentally different. A high-producing Holstein or Jersey in early lactation is closer to a marathon runner than a pallet of grain—her rumen pH, energy balance, and immune function can swing quickly if feed timing or quality shifts even modestly.

The research on transition periods and feeding behavior is pretty consistent on this. Even moderate disruptions in feeding time or abrupt ration changes can reduce dry matter intake, bump up subacute ruminal acidosis risk, and depress milk yields for days, particularly in fresh cow groups. Poorly timed or executed silage harvest—chopped too wet or too dry, packed insufficiently—reduces fiber digestibility and energy density. That can cost you one to several pounds of milk per cow per day for as long as you’re feeding that forage.

And inadequate manure scraping or holding capacity? That leads to longer standing times in wet alleys or stalls, which correlates with higher lameness, digital dermatitis, and elevated somatic cell counts.

Here’s what I’ve noticed in talking with producers across different regions: any disruption that delays feeding, degrades forage quality, or compromises cow comfort quickly becomes more than today’s problem. It affects the entire lactation curve and, through reproduction, the next generation of calves.

That’s as true on a 120-cow freestall in upstate New York as it is on a 3,000-cow dry lot in west Texas.

So when your feed mixer won’t start before the morning milking, it doesn’t just shuffle your chore schedule. It upsets the biology of every cow in that pen. When a chopper breakdown pushes corn silage harvest half a week later than planned, the economic cost isn’t just the repair bill—it’s tied directly to metabolism for the next twelve months.

DEF Systems: When Compliance Technology Meets the Feed Alley

This brings us to diesel exhaust fluid, or DEF. If you’ve spent any time around dairy operations or rural trucking in the last few years, you’ve probably heard the stories: tractors, TMR mixers, or milk trucks derating or shutting down because of DEF-related faults, even when the engine itself was mechanically sound.

These problems typically involve sensors, heaters, or software in the DEF system triggering power reductions or full shutdowns meant to enforce emissions compliance—but doing so at exactly the wrong moments.

In August 2025, the EPA responded to these sustained concerns. According to the agency’s official announcement, confirmed by DieselNet’s technical coverage, EPA Administrator Lee Zeldin—speaking at the Iowa State Fair—announced revised guidance requiring engine and vehicle manufacturers to update software and control strategies. The goal was to prevent many DEF failures from causing sudden power loss or stalls, especially in conditions critical to agriculture and freight.

The EPA’s own documentation acknowledges what many of us have experienced firsthand: “widespread concerns from farmers, truckers, and other diesel vehicle operators about a loss of speed and power, or engine derates.”

Looking at this development, a couple of things stand out.

The original implementation of DEF shutdown logic didn’t fully account for the continuous, time-sensitive nature of dairy operations—particularly around feeding and harvest logistics. The economic burden of those design choices has been borne primarily by producers and rural businesses, not by those who designed the regulatory framework or the equipment.

From an environmental perspective, the general scientific consensus is that tailpipe emissions from individual farm machines constitute a relatively small portion of dairy’s total greenhouse gas footprint, compared with enteric methane, manure storage, and feed production. That doesn’t mean emissions controls don’t matter. But it does suggest the highest climate return per dollar for dairy likely comes from investments in manure management—lagoon covers, digesters—along with improved feed efficiency and methane-reducing feed additives, rather than from single-point exhaust controls alone.

What’s encouraging is that some of the most forward-thinking farms are pushing on both fronts now. They’re advocating for uptime-aware emissions policy and equipment accountability, while simultaneously exploring digesters, improved covers, and ration strategies that can generate new income streams where the economics pencil out. It’s still early days for many of these technologies, but the direction is promising.

The Hidden Cost of “Cheap” Milk

Let’s talk about what happens between your bulk tank and the supermarket shelf, because this is where much of the producer frustration comes from—and it’s worth understanding the dynamics clearly.

USDA’s Economic Research Service tracks price spreads from farm to consumer, and the numbers are revealing. According to their 2024 data, the share of the retail dollar that actually reaches the farm varies dramatically by product. What jumps out from this data is the extent of variation across products. Butter returns the most to producers at 57 cents on the dollar—partly because it’s less processed and has fewer intermediary steps. Whole milk comes in around 49 cents. But once you get into cheese (32 cents) and the overall dairy basket average (just 25 cents), you’re looking at a system where three-quarters of what consumers pay goes to processing, packaging, transportation, wholesale and retail margins, and marketing.

So when you hear figures about farmers getting “30 cents on the dollar,” the reality depends a lot on what’s being measured. For fluid milk, it’s closer to half. For the processed products that dominate grocery dairy cases, it’s considerably less.

Meanwhile, consumer research tells an interesting story. A 2024 PwC Voice of the Consumer survey—and this has been widely reported—found that respondents were willing to pay about 9.7% more for products they considered genuinely sustainable, even amid inflationary pressures. Studies on dairy specifically suggest that animal welfare and local sourcing claims can raise stated willingness to pay in survey environments.

Here’s the disconnect, though. When input and compliance costs rise—energy, labor, animal care programs like the National Dairy FARM Program, new traceability requirements—processors and retailers can often pass some of those higher costs into the shelf price. Farm-gate prices, though, remain heavily anchored to commodity values for cheese, powder, and butter that respond to global supply and demand, not necessarily to local regulatory costs.

The net result? A lot of the cost of “better” milk—documented welfare practices, carbon tracking, rigorous food safety systems—gets absorbed as thinner producer margins and greater income volatility, rather than being fully and transparently reflected in retail pricing.

I was talking with a producer group in the Northeast recently, and one of them made a point that stuck with me: consumers think paying 50 cents more for a gallon is lining the farmer’s pockets. In reality, we’re often the last ones to see that extra dime.

For many family dairies, that’s exactly where the feeling comes from that they’re subsidizing cheap milk with their own balance sheets.

Subsidies, Bridge Payments, and Why the Math Still Feels Tight

When farm incomes come under pressure, federal policy typically reaches for supplemental payments. Over the past several years, we’ve seen quite a few.

The Market Facilitation Program responded to trade tensions in 2018 and 2019. Coronavirus Food Assistance Program rounds during the pandemic provided significant support to dairy producers. Dairy Margin Coverage kicks in when national milk-over-feed margins fall below elected trigger levels, and Dairy Revenue Protection offers another insurance layer.

Here’s the thing about government payments, though—and this is where context matters. According to the USDA’s Economic Research Service, direct government payments are forecast at about $40.5 billion for 2025. But that’s an exceptional year with significant emergency support programs. In 2024, government payments across all of agriculture were considerably lower—in the range of $9 to $11 billion, according to USAFacts analysis of federal farm subsidy data.

During pandemic years like 2020, payments were dramatically higher, and yes, at those peak moments, government support did represent an unusually large share of net farm income. But those were crisis-response situations, not the normal baseline.

The pattern most producers experience is that these tools are reactive and temporary by design. They kick in when margins drop below certain levels or when specific events—such as tariffs, pandemics, or droughts—trigger relief. They don’t kick in when long-term cost structures gradually drift out of alignment with average prices.

Once prices recover above a DMC trigger or an aid window closes, payments stop—even if interest, wages, insurance, and environmental compliance costs remain elevated.

Policy researchers have noted that while such subsidies can stabilize incomes in the short run, they don’t rewrite the underlying pricing rules. They can even encourage more leverage and land-cost inflation if they’re treated as permanent rather than emergency measures.

That’s part of why many mid-size dairies feel like they’re always one interest-rate move or one equipment breakdown away from serious trouble. The safety net might catch a fall, but it doesn’t rebuild the ladder’s rungs.

The Structural Squeeze: Consolidation Isn’t an Accident

Here’s an important point that sometimes gets lost: today’s dairy structure isn’t random drift. It’s the outcome of long-running economic forces that have shaped investment patterns, technology adoption, and market relationships for decades.

Larger herds tend to have lower fixed costs per hundredweight for parlors, manure systems, feed centers, and management overhead—at least up to a point. New technologies like automated milking and feeding systems, fresh cow monitoring tools, and advanced reproductive programs often deliver their best returns when spread over more cows.

As a result, the “median” efficient herd size in cost-of-production data has marched steadily upward, and many risk-management tools, co-op contracts, and lender products have been quietly built around that larger baseline. A recent Dairy Global overview noted that access to technology and capital intensity now create a sharper divide between operations able to keep reinvesting and those that struggle to maintain core infrastructure.

It’s worth stressing that large doesn’t automatically mean “bad,” and small doesn’t automatically mean “good.” I’ve visited well-run 5,000-cow dry lot operations out West that manage cow comfort, reproduction, and butterfat performance exceptionally well, with sophisticated fresh cow protocols and strong employee training programs. I’ve also seen 80-cow tie-stall herds in the Northeast that are profitable and deeply connected to local markets—and others struggling in outdated facilities with no clear successor.

The challenge many 200 to 1,200-cow family operations face is that they sit in the middle of this spectrum. They’re large enough to need hired labor, structured management protocols, and regular capital replacements. But they may not yet have the scale or bargaining leverage of the very largest units.

That’s where questions about whether the current system still works for their model become most pointed.

Early Warning Signs: Is This a Tough Patch or a Structural Problem?

This is one of the most important questions producers can ask themselves, and there’s no single metric that definitively answers it. But there are some early-warning signs worth watching—patterns that show up consistently in both the data and in conversations with lenders and advisers.

Local Exit Velocity

If your county or region is seeing dairy farm numbers fall 4 to 6 percent per year for several years running—similar to or worse than the national rate—that signals potential infrastructure risk. When too many mid-size herds disappear, processors may consolidate plants, haulers reduce routes, and local service providers struggle to justify coverage. That can increase costs and vulnerabilities for those who remain.

Bankruptcies Ticking Up Again

This one’s getting attention. According to American Farm Bureau Federation data, farm bankruptcies declined after 2019, and 2020—2023 was actually the lowest since 2008. But they’ve started climbing again. Nationwide, 216 farmsfiled Chapter 12 bankruptcy in 2024, up 55% from the previous year, according to industry coverage of the court data.

And here’s what’s concerning: the Farm Trader reported in July 2025 that 361 Chapter 12 cases were filed in just the first half of this year—already exceeding the entire 2024 total. When legal filings increase while analysts are talking about “decent” average margins, it often suggests that structural factors such as debt levels, interest costs, and local market concentration are pushing some operations into distress.

Chronic Cap-Ex Deferral

If you and neighboring farms have delayed major barn repairs, parlor upgrades, manure storage expansions, or equipment replacements for multiple years—not because the investments aren’t needed, but because cash flow simply won’t stretch—that’s a warning sign. Extension economists describe “feeding dead-weight debt” when working capital is used to service old loans rather than maintaining productive capacity. That pattern often precedes forced restructuring.

Milk Check Lagging the Headline Number

If the announced All-Milk price suggests healthy margins, but your blended check—after basis, hauling, quality adjustments, and pooling—runs consistently $1.50 to $3.00 per hundredweight lower, it’s worth asking why. Sometimes the answer involves legitimate differences in product mix or quality. Other times, it may reflect processing concentration, contract structures, or transportation arrangements worth revisiting through your co-op or buyer relationships.

Debt and Stress Moving Together

This one’s harder to quantify but may be the most important. Studies on rural mental health consistently link financial stress, high debt burdens, and a sense of powerlessness to increased depression and suicide risk among farmers. When rising debt-to-asset ratios, tight interest coverage, and burnout all show up simultaneously, that’s more than a rough patch. That’s usually when it pays to bring in a broader advisory team—lender, accountant, extension specialist, sometimes a counselor—to help clarify options.

Looking Over the Fence: What Other Systems Are Teaching Us

Producers often look north to Canada because it offers a fundamentally different model operating in real time.

Canada’s dairy sector operates under a supply-management system that combines production quotas with administered farm-gate prices based on cost-of-production formulas. The Canadian Dairy Commission regularly reviews cost data from representative farms—feed, labor, energy, capital—and recommends support prices implemented through provincial marketing boards.

According to Agriculture and Agri-Food Canada’s official dairy sector profile, there are about 9,256 dairy farms in Canada as of 2024. Dairy Farmers of Canada puts the average at roughly 105 milking cows per farm—considerably smaller than the U.S. average, but operating with much lower year-to-year price volatility at the farm level. The sector remains dominated by family operations with relatively stable debt levels and a higher rate of successful intergenerational transfers.

Canadian economists and policy analysts are also clear about the trade-offs. Consumers pay somewhat higher prices on certain products. Trade commitments constrain export opportunities. And significant capital is tied up in quotas, which new entrants must finance—creating barriers to entry that the U.S. system doesn’t.

In Europe, the 2014 to 2016 milk market crisis prompted the EU to deploy crisis reserve funds and voluntary supply-reduction schemes within the Common Agricultural Policy. Evaluations suggest these tools helped reduce some volatility but also highlighted challenges with targeting and timeliness.

None of these models can simply be transplanted into the U.S. context. But here’s what they do demonstrate: policy design—how prices are set, how supply is managed, how bargaining power is structured—has real impact on how risk and reward are shared across the chain.

That’s a useful lens to keep in mind whenever we hear that current outcomes are purely the inevitable result of “the market.”

There are signs of experimentation closer to home, too. Some U.S. cooperatives are pushing for more flexible, transparent federal milk pricing and stronger collective bargaining tools. Others are investing in value-added channels and direct-to-retail partnerships to capture a larger share of the consumer dollar for producers. Early days, but these efforts hint at ways the rules might evolve.

Succession, Identity, and the Hardest Questions on the Table

Behind all the economics and policy discussions are families deciding what comes next. This is where the numbers meet real life.

Surveys from Progressive Dairy and land-grant extension programs suggest that a majority of producers hope to pass their farms to the next generation. Yet only a minority have written, formal succession plans. Broader research on family enterprises finds that only about one in six survives as a healthy business into the third generation—and farms aren’t immune to that pattern.

The demographic data makes this more urgent. With 22% of dairy producers already 65 or older according to the 2022 Census, and with exits concentrated among operators without identified successors, the next decade will see a significant wave of transitions—planned or otherwise.

Meanwhile, cooperatives like Agri-Mark have felt compelled to include suicide hotline and counseling information on milk checks, responding to real mental-health concerns in their membership. Policy briefs and studies link financial strain, long working hours, and social isolation to elevated mental-health risks in agricultural communities.

Given that backdrop, some of the most constructive conversations families are having right now revolve around three questions:

If this operation were a startup your son or daughter was considering buying—same balance sheet, same cash flow—what would you tell them?

If you could exit or significantly scale down in the next 18 to 24 months and preserve substantially more equity than waiting until a lender forces the issue, would that change how you view your options?

What does “success” really mean for your family at this stage—owning a certain number of cows, maintaining a particular way of life, or building flexible wealth and health for the next generation?

For some families, the answers lead toward doubling down: investing in scale or specialization, engaging more actively in co-op governance and policy debates, positioning the dairy to compete under whatever rules emerge. For others, a strategic sale, a shift into specialized niches like on-farm processing or direct marketing, or even a full pivot out of milking may make more sense.

What’s encouraging is that more advisers, lenders, and producer groups are normalizing these discussions. They’re emphasizing that choosing a planned exit or transition can be a strategic business decision—not a personal failure. That shift in attitude makes it easier for families to talk openly about options before they’re forced into them.

Three Numbers to Review With Your Lender This Winter

As a practical takeaway, here are three metrics worth putting on paper before your next advisory meeting:

Debt-to-asset ratio: Where are you today, and how has that moved over the last five years? Many extension resources flag ratios above 60 percent as elevated risk territory for dairy operations.

Interest coverage: How many dollars of operating income are available to service each dollar of interest expense? Rising rates over the past couple of years have tightened this metric for many otherwise solid operations.

Cap-ex backlog: What major replacements or upgrades have you deferred—parlor, manure storage, feed center, housing—and what’s the realistic cost to bring those systems up to standard over the next five to ten years?

These numbers don’t decide your future. But they make it much easier to have honest, fact-based conversations about whether to expand, hold, restructure, or plan a managed exit.

The Bottom Line

Looking across all of this, a few grounded lessons stand out.

Dairy isn’t struggling because the biology stopped working. The cows, land, and genetics on many U.S. operations are performing at remarkably high levels. The strain comes from how pricing, policy, and bargaining power are configured around that biology.

Uptime and reliability are strategic concerns now, not just repair headaches. Tracking DEF-related and other critical downtime—including downstream effects on forage quality and fresh cow performance—gives you leverage in equipment decisions and conversations about policy reform.

Knowing your true cost of production is non-negotiable. Full-cost budgets that include family labor and realistic depreciation let you evaluate milk prices, insurance tools, and investment opportunities against your actual situation—not the “average.”

Early-warning signs are already visible in many regions. Rising bankruptcies, steady annual farm losses, chronic cap-ex deferral, and milk checks that lag headline prices all point toward structural pressure, not just bad luck.

Alternative policy designs show that different outcomes are possible. Canadian supply management, EU crisis tools, and emerging U.S. discussions around federal order reform and co-op bargaining all demonstrate that rules shape results.

And succession decisions are about people as much as they are about numbers. Honest conversations about equity, risk, mental health, and family goals matter just as much as any spreadsheet when deciding whether to grow, hold, or exit.

The goal here isn’t to say there’s one correct path for every dairy. It’s to put as much of the big picture on the table as possible—so that when you sit down with your family or your team, you’re making decisions with clear eyes and solid information.

The system around dairy will evolve. It always does. The more producers understand how it works today, the more influence they can have on what it becomes tomorrow.

For tools and resources mentioned in this article, check with your state’s land-grant university extension service. Wisconsin’s Center for Dairy Profitability offers FINPACK-based financial analysis, Penn State Extension provides dairy cost-of-production worksheets, and Cornell’s PRO-DAIRY program has succession planning guides—all available at low or no cost and adaptable to your specific operation.

KEY TAKEAWAYS

  • Exits are accelerating despite “better” margins. One thousand four hundred thirty-four dairies closed in 2024—a 5% drop—while analysts talked of improvement. That’s not a bad year; it’s structural pressure.
  • Dairy’s middle class is vanishing fastest. Operations running 200-1,500 cows are caught in the squeeze—too large for niche flexibility, too small for volume leverage.
  • You’re keeping less than you think. Farmers capture just 25 cents of every retail dairy dollar on average, yet absorb rising costs that never reach the milk price formula.
  • A demographic cliff is coming. 22% of producers are 65+, few have written succession plans, and more than half of daily labor now comes from immigrant workers, reshaping what “family farm” means.
  • The warning signs are flashing now. Chapter 12 bankruptcies in 2025 have already exceeded last year’s total. Three numbers to review with your lender: debt-to-asset ratio, interest coverage, and deferred cap-ex.

Complete references and supporting documentation are available upon request by contacting the editorial team at editor@thebullvine.com.

Learn More:

The Sunday Read Dairy Professionals Don’t Skip.

Every week, thousands of producers, breeders, and industry insiders open Bullvine Weekly for genetics insights, market shifts, and profit strategies they won’t find anywhere else. One email. Five minutes. Smarter decisions all week.
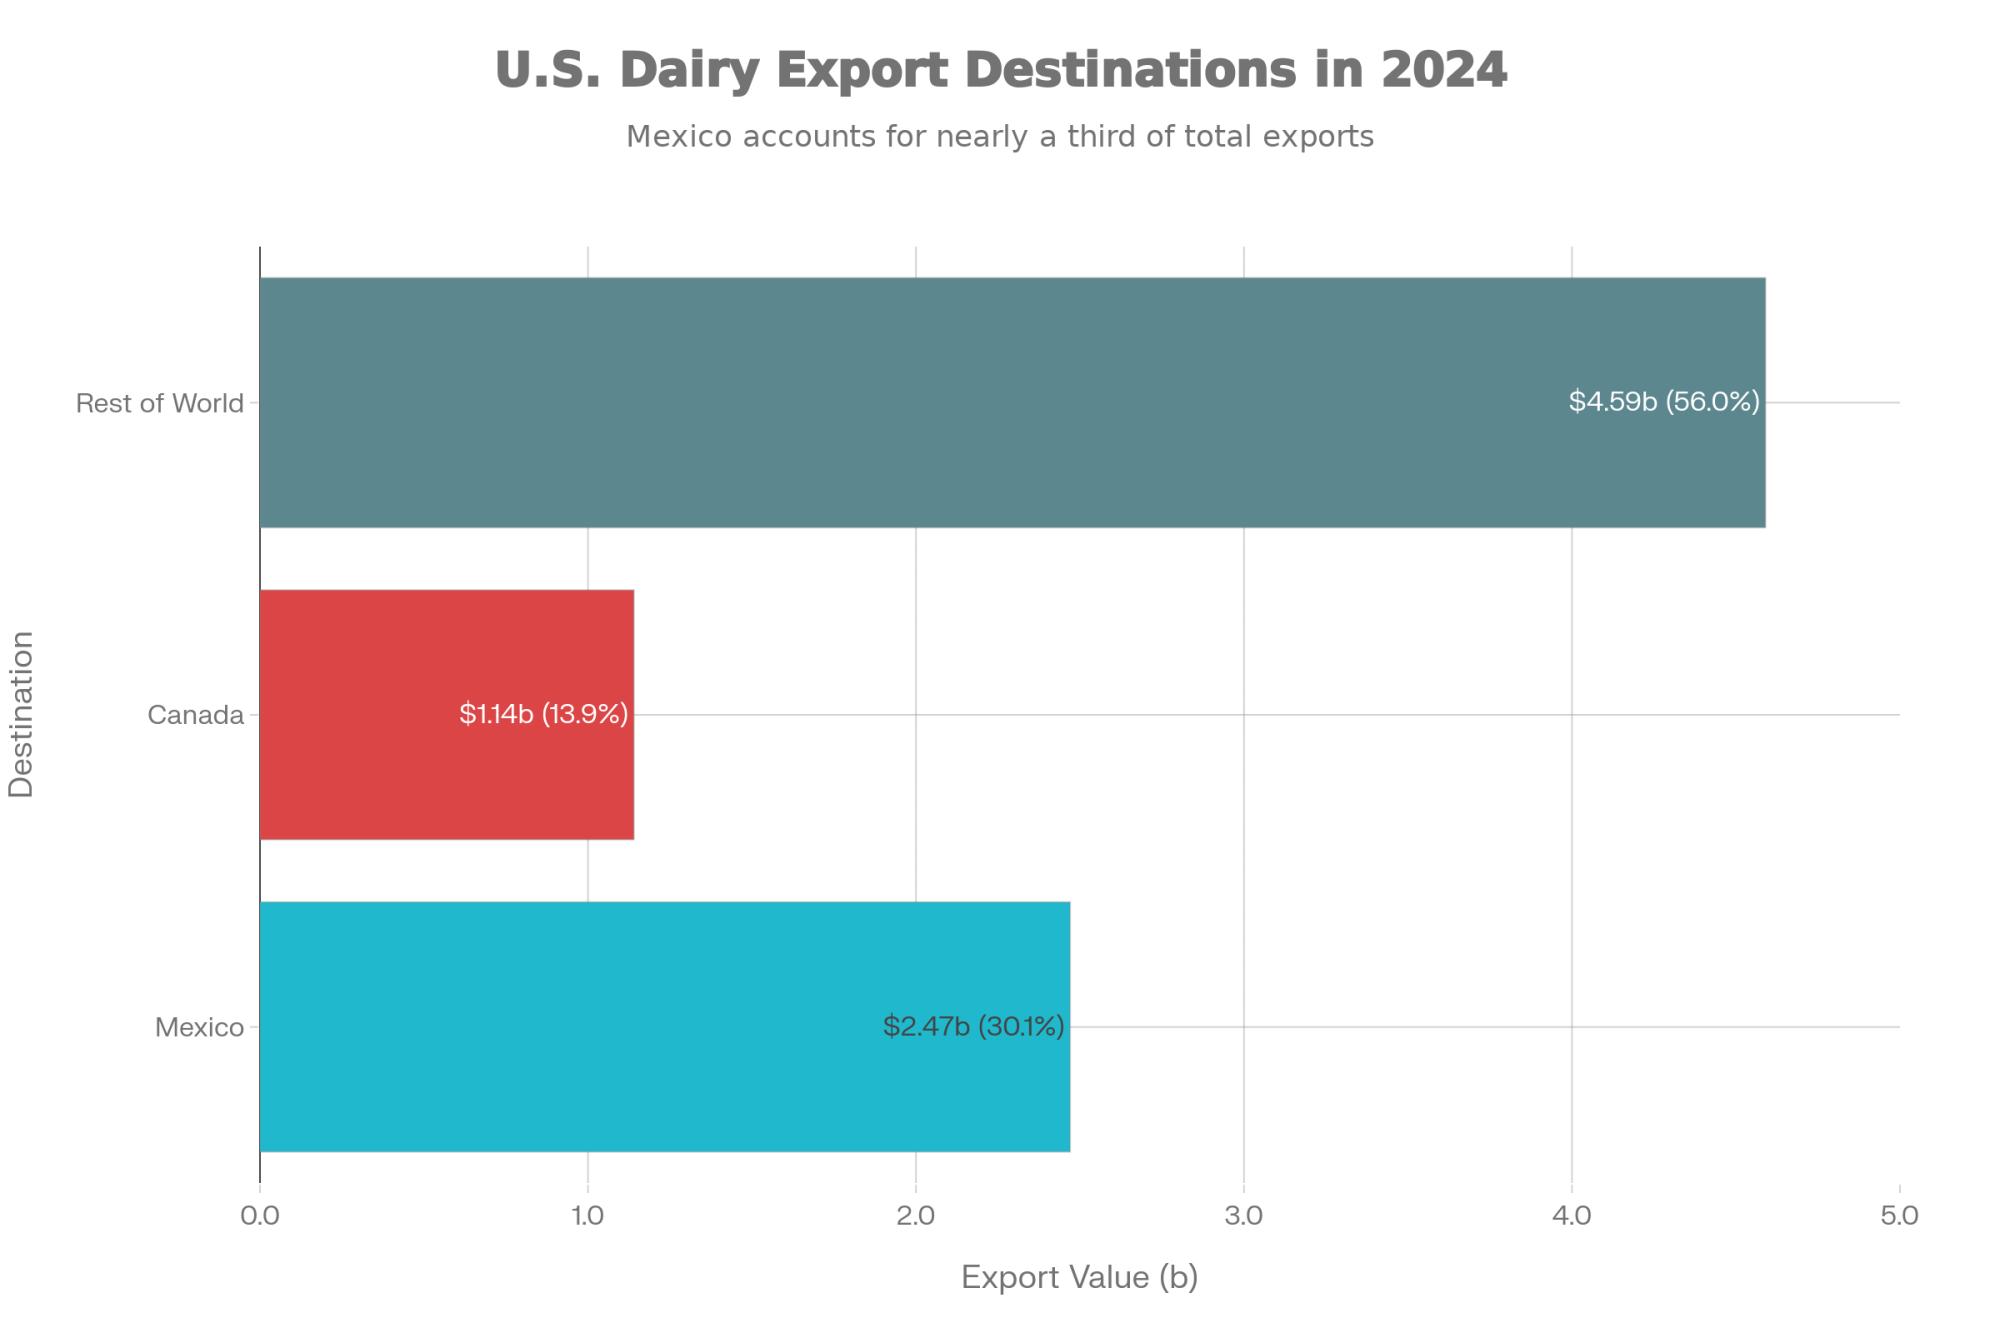
NewsSubscribe
First
Last
Consent

$11 Billion Bet on Protein: Is Your Milk Check Positioned to Win?

A structural shift in dairy economics is creating new opportunities for farms producing protein-rich milk—and understanding these dynamics can help inform decisions in the months ahead.

Executive Summary: Dairy processors just made an $11 billion bet on protein—and that changes the equation for every milk check in America. With whey protein isolate trading above $8.50 per pound and the April 2025 Net Merit revision boosting Feed Saved from 12% to nearly 18%, the industry is signaling where value is heading for the next decade. Producers combining targeted genetics with amino acid nutrition are seeing protein improvements worth $60,000-70,000 annually on 500-cow operations. The catch? Your pricing structure determines whether you actually capture that value. Farms in large pooled cooperatives often keep only a fraction of their component gains, while those on direct Class III pricing retain most of what they produce. Before investing in protein optimization, one comparison matters most: what you received per pound of protein versus the Class III protein price over your last three months. That gap reveals whether this opportunity is real for your operation—or whether you’d simply be subsidizing someone else’s premium.

You know, if you’ve been watching your milk checks closely over the past year or so, you’ve probably noticed something shifting. Back in May 2024, USDA Cold Storage data showed butter inventories climbing to nearly 380 million pounds—the highest we’d seen since 2020. That’s a lot of butter sitting in warehouses.

Metric20202024Change
Butter Cold Storage (million lbs)282380+35%
Whey Protein Isolate Price ($/lb)$5.10$8.50+67%
New Protein Facility Investment$2.1B$11.0B+424%

And here’s what got my attention: around the same time, cheese processors across the Upper Midwest started signaling they were receiving more cream than they needed for optimal cheese production. For those of us who remember when butterfat premiums seemed like they’d climb forever, it was a notable moment.

What’s happening isn’t that butterfat suddenly lost value—it hasn’t. It’s that processors have committed serious capital to cheese and whey protein facilities, and that’s changing what they need from the milk supply. The International Dairy Foods Association announced in October 2025 that America’s dairy processors have invested more than $11 billion in new and expanded manufacturing capacity across 19 states—with over 50 projects coming online between now and 2028.

That’s not a small bet. And it tells you something about where the industry sees value heading over the next decade.

Following the Investment Money

When I’m trying to understand where dairy markets are heading, I’ve always found it useful to watch where processors actually put their capital. Talk is cheap, but $870 million facilities tell you something.

That’s what Leprino Foods committed to their Lubbock, Texas plant—a decision the Texas Governor’s office and Texas Tech Research Park both documented back in April 2022. We’re talking about an 850,000-square-foot facility designed from the ground up for integrated mozzarella and whey protein production. When you build that kind of infrastructure, you’re making a decade-long bet on where value will come from.

And Leprino isn’t alone in this. Hilmar cut the ribbon on a $600 million facility in Dodge City, Kansas, back in March 2025—Dairy Processing magazine covered the opening extensively. Fonterra invested $240 million in New Zealand mozzarella capacity a few years back. Across Wisconsin and Minnesota, regional processors have been adding whey protein recovery equipment alongside cheese expansion projects.

What’s interesting is that this isn’t just a U.S. phenomenon. You’re seeing similar capital flowing toward protein and whey infrastructure in the EU and Oceania—which suggests this shift reflects global demand patterns rather than a temporary domestic trend. When processors on three continents are making the same bet, it’s worth paying attention.

What’s different about these investments compared to previous buildouts? The explicit focus on capturing whey value. I remember hearing Dr. Mark Stephenson—who recently retired as Director of Dairy Policy Analysis at UW-Madison—make this point at an industry meeting. Modern cheese plant economics increasingly depend on monetizing both the cheese and whey streams. Processors who can efficiently convert whey into high-value protein products have developed a meaningful competitive advantage.

The pricing reflects this shift. USDA data from late 2024 showed whey protein isolate climbing above $8.50 per pound—record territory—and prices have continued strengthening into 2025. If you look at USDA Dairy Market News reports, whey protein concentrate has more than doubled in many markets from where it sat back in 2018.

Why such sustained strength? Several factors have converged globally, which is part of what makes this feel structural rather than cyclical. China remains one of the world’s largest importers of dairy ingredients, with significant demand for infant formula components. Sports nutrition markets in Asia and Europe continue expanding. Meanwhile—and this one caught most of us off guard—the rapid adoption of GLP-1 weight-loss medications has created substantial new protein demand. Industry analysts have noted that patients on drugs like Ozempic are advised to maintain high protein intake, and that’s flowing through to whey consumption in ways nobody predicted five years ago.

When processors can generate meaningful revenue from whey alone, their willingness to pay for protein-rich milk makes straightforward economic sense.

What the Net Merit Changes Tell Us

The April 2025 revision to Net Merit offers another window into where the industry sees value heading. If you haven’t looked at the updated trait weights from the Council on Dairy Cattle Breeding, they’re worth examining.

Here’s how the emphasis shifted:

TraitPrevious Weight (2021)New Weight (2025)Change
Feed Saved12.0%17.8%+5.8%
Butterfat28.6%31.8%+3.2%
Protein19.6%13.0%-6.6%
Productive Life11.0%8.0%-3.0%
Cow Livability7.0%8.0%+1.0%
Heifer Livability1.3%2.0%+0.7%

That decrease in protein weight catches people off guard at first—it seems to contradict everything we’ve been discussing about protein demand. But dig into the methodology, and it makes more sense. Protein value is now being captured through multiple pathways in the formula—feed efficiency, component relationships, and longevity factors. A bull producing efficient daughters with strong components and a good productive life captures protein value across several trait categories rather than just one line item.

What does this means practically? Bulls that looked middling under older indexes—solid on efficiency and percentages but perhaps not flashy on production—are ranking considerably higher now. I’ve talked with several producers who’ve gone back through old sire catalogs and found bulls they’d passed over now sitting in the top tier.

One Wisconsin dairyman put it well: “Same genetics, completely different economic picture. The index finally caught up with what processors want to buy.”

The Nutrition Piece

Farms seeing the strongest protein gains are generally combining genetic direction with targeted nutrition work. The approach that’s gotten the most traction centers on rumen-protected amino acid supplementation—specifically methionine and lysine.

The science here is fairly well established at this point. Research published in the Journal of Dairy Science and extension work from programs like Penn State has documented that methionine and lysine are frequently the first-limiting amino acids for protein synthesis in typical corn silage-based Midwest rations. When you can get adequate methionine past the rumen and into the small intestine, cows can convert more of their dietary protein into milk protein.

What does implementation actually look like? Based on extension recommendations from Wisconsin, Minnesota, and Cornell, most successful protocols run around 15 grams of rumen-protected methionine per cow daily, balanced with lysine at roughly a 3:1 ratio. But the amino acids aren’t magic—they work best when the underlying ration is already well-balanced.

And here’s something I’ve noticed: farms often see protein responses from improving the basics before they even add supplements. Better feeding frequency, improved bunk management, attention to fresh cow nutrition during those critical first 60 days… sometimes the fundamentals matter most.

The transition period deserves particular attention. Research from land-grant universities has shown that close-up dry cow nutrition influences early lactation performance in meaningful ways. Getting that pre-fresh nutrition right sets the table for everything that follows.

When farms execute this well, they’re typically seeing protein improvements of 0.15 to 0.25 percentage points within a month or two—though results vary depending on the baseline diet and management. Run that math on a 500-cow herd, and you’re looking at meaningful dollars—potentially $60,000-70,000 annually at current component premiums.

Of course, there’s investment required on the front end. Amino acid programs run $25,000-35,000 per year for a herd that size, plus genetic program costs. Most farms doing this well are seeing positive returns within about a year.

But—and this is important—that math depends heavily on how your milk is actually priced.

The Pricing Question That Matters Most

Here’s where individual circumstances become crucial, and where I’ve seen producers make costly assumptions.

Not all milk payment systems reward improvements to components equally. Depending on your situation, the same investment might generate very different returns.

If you’re on component-indexed pricing—straight Class III or IV federal order payments—protein improvements generally flow through to your check within a few weeks. These operations typically capture a significant portion of the commodity value from their component gains.

Pooled cooperative pricing is more complicated. When your milk blends with dozens or hundreds of other farms before payment calculations happen, individual component improvements get diluted across the pool. I spoke with a producer in central Wisconsin who learned this the hard way—invested significantly in nutrition and genetics, moved his tank from 3.05% to 3.28% protein, but his cooperative pools 94 farms, and the pool average barely budged. He got paid on the pool number, not his individual achievement.

Fixed contracts present another scenario. Multi-year arrangements may not reflect component changes until renegotiation, regardless of what’s happening in commodity markets.

⚠️ A Word of Caution for Large-Pool Operations

If you’re shipping to a cooperative that pools 100+ farms, it’s worth getting written confirmation of how your individual component improvements will be valued before ramping up amino acid spending. Ask specifically: “Will my protein be paid out above the pool average, or blended into the pool before my check is calculated?”

I’ve seen situations where producers invested $30,000+ annually but captured only a fraction of the value their cows actually produced—in some cases, by my rough math, maybe 20-30% of what they’d have received under direct component pricing. Your numbers will be different, so pull your last few settlement sheets, compare your protein line item to the Class III protein price during those months, and see what the gap actually looks like for your operation.

Get the details in writing before you write that first feed additive check.

Pricing StructureComponent CapturePayment LagAnnual Impact (500-cow)Risk
Direct Class III90-98%2-3 weeks+$68,000Low
Small Pool Co-op (20)70-85%4-8 weeks+$52,000Moderate
Large Pool Co-op (100+)25-35%8-12 weeks+$22,000High
Fixed Multi-Year0% until renewal12-36 months$0-$15,000High

Before committing resources to protein optimization, have a direct conversation with your cooperative or processor. Some questions worth asking:

Questions for Your Processor

  • How exactly is protein valued in my payment?
  • What premium applies per point above baseline?
  • Is my pricing tied to commodity markets or fixed?
  • How does my individual production factor into payment versus pool averages?
  • Are changes to component pricing under consideration in the next few years?

Getting clear answers—ideally in writing—helps ensure your investments match your actual payment reality.

Thinking About Timing

Farms that started this work back in late 2024 have developed certain advantages—genetic progress, processor relationships, and, in some cases, contract terms that reflected the recruitment phase of new facility buildouts.

Looking at how things are unfolding: 2024-2025 represented the buildout phase, with new capacity coming online and processors actively seeking milk to fill facilities. Premium arrangements were more available during that window.

Through 2026-2027, we’ll likely see that capacity reaching target utilization. Processor relationships are solidifying, and the terms available to new suppliers may differ from what early movers secured.

By 2028-2029, assuming demand projections hold, markets should approach something like equilibrium. Premiums probably moderate from current peaks—not disappear, but normalize.

For operations starting now, this means entering somewhat behind early movers. Genetics compound over time, so there’s a gap that doesn’t fully close. But farms that begin today can still achieve meaningful improvement compared to operations that make no changes. The opportunity looks different from than it did in 2024, but it’s certainly not gone.

A Few Things Worth Thinking Through

Every strategic direction involves tradeoffs, and the protein focus is no exception. Here are a few considerations that deserve honest attention.

Component ratio balance matters for cheese manufacturing. Research from the American Dairy Products Institute indicates that most cheese production works best with protein-to-butterfat ratios in the 0.80-0.90 range. CoBank economist Corey Geiger has noted that cheesemakers strive for ratios near 0.80—anything significantly lower can affect cheese quality. Farms that substantially increase protein while butterfat falls may find their milk components less desirable for certain applications.

Input cost variability has surprised some operations. Rumen-protected amino acid prices spiked significantly back in 2021-2022 when supply disruptions hit. Building some flexibility into nutrition programs helps manage that exposure.

Genetic diversity deserves ongoing attention, too. With genomic selection concentrating breeding on popular sire families, inbreeding levels have climbed substantially over the past couple of decades—recent CDCB data shows levels exceeding 15% in some young Holstein bull populations. The costs show up in fertility and health over time, though they’re easy to overlook in the short term. Maintaining reasonable sire diversity isn’t just academic—it’s practical risk management.

Regional market variation matters quite a bit as well. Upper Midwest farms near major cheese processors are well-positioned for this approach. Operations in fluid milk markets or regions where butter production dominates may see more limited benefit regardless of their component achievements. Knowing your market matters before optimizing for it.

The Sustainability Angle

When sustainability premiums first entered industry conversations, I’ll admit to some skepticism about whether they’d actually show up at the farm level. That picture seems to be evolving.

With the EU’s Carbon Border Adjustment Mechanism set to take full effect next month, in January 2026, processors exporting cheese to Europe will face new carbon-intensity-based costs. This creates real incentive to source lower-emission milk. Paying farmers for documented carbon reductions becomes economically rational when it saves on export compliance costs.

Here’s what connects this to protein work: farms improving feed efficiency while maintaining strong milk components inherently reduce emissions per unit of output. Research from universities including Penn State and UC Davis suggests that improved efficiency translates to lower carbon intensity per pound of milk solids produced.

Done thoughtfully, component optimization and emissions reduction can complement each other rather than compete.

Several European cooperatives have already implemented farmer incentive programs along these lines. U.S. processors are developing pilot programs. This probably isn’t the primary reason to pursue protein optimization today, but it’s an increasingly relevant factor that may strengthen the case over time.

Getting Started Thoughtfully

For operations considering this direction, the first 90 days often matter more than elaborate long-term plans. Based on conversations with producers who’ve navigated this successfully, here’s a reasonable framework:

The first month should focus on understanding your actual situation. Document current milk composition—protein, butterfat, and their ratio. Have honest conversations with your processor about how components are valued in your payment. Look at your current genetics through the updated Net Merit lens.

The second month is for testing at conservative levels. Maybe start amino acid supplementation around 10-12 grams rather than full protocols. Focus on feeding fundamentals and bunk management. Track composition weekly rather than waiting for monthly tests.

By month three, you should have enough information to determine whether this fits your operation. If the response looks positive, genomic testing can identify your strongest replacement genetics. Continue building processor relationships with real data. Evaluate whether deeper investment makes sense given what you’ve learned.

This approach generates actual information before requiring major commitments.

The Bottom Line

The dairy industry is working through its most significant component value evolution in quite some time. How individual farms respond will depend substantially on their specific circumstances—pricing structure, regional market, capital situation, and risk tolerance.

A few things seem reasonably clear from the data and from conversations with producers navigating these decisions:

The underlying shift appears structural. Processor investments of $11 billion don’t respond to temporary signals. The infrastructure going in will influence economics for years.

Individual circumstances determine actual returns. Understanding precisely how your milk is priced matters enormously before committing resources.

Nutrition typically shows results faster than genetics. Amino acid work can demonstrate effects within weeks; genetic progress compounds over years. Using nutrition gains to fund genetic investment creates sustainable momentum.

Thoughtful risk management enhances outcomes. Maintaining component balance, reasonable fertility standards in genetic selection, sire diversity, and program flexibility all contribute to durable success.

Some farms will determine, after careful analysis, that their situation makes this direction less attractive. That’s genuinely useful information.

For others, there’s still an opportunity to develop a thoughtful approach aligned with where the industry appears headed. The terms differ from early mover advantages, but the fundamental economics remain sound for many operations.

Here’s your challenge: Pull your milk checks from the last 3 months this week. Calculate exactly what you received per pound of protein versus what the Class III protein price was during those months. If the gap is more than 15%, you’re losing money to your payment structure—and no amount of genetic progress or nutrition investment will close that gap until you address the pricing problem first.

The processors have placed their bets. The question is whether your operation is positioned to benefit—or whether you’re subsidizing someone else’s protein premium.

Key Takeaways 

  • $11 billion in new facilities signals processors are betting long-term on protein—this is structural, not cyclical
  • Net Merit 2025 reshuffled genetics—Feed Saved jumped from 12% to 18%; some bulls you overlooked now rank at the top
  • Nutrition delivers faster than genetics: 15g daily methionine + 3:1 lysine ratio can boost protein 0.15-0.25 points within 60 days
  • Your pricing structure is everything—farms in large pooled co-ops may capture only 20-30% of component improvements
  • Do the math before you invest: Compare 3 months of protein payments to Class III prices—a gap over 15% means fix pricing first

Complete references and supporting documentation are available upon request by contacting the editorial team at editor@thebullvine.com.

Learn More:

The Sunday Read Dairy Professionals Don’t Skip.

Every week, thousands of producers, breeders, and industry insiders open Bullvine Weekly for genetics insights, market shifts, and profit strategies they won’t find anywhere else. One email. Five minutes. Smarter decisions all week.
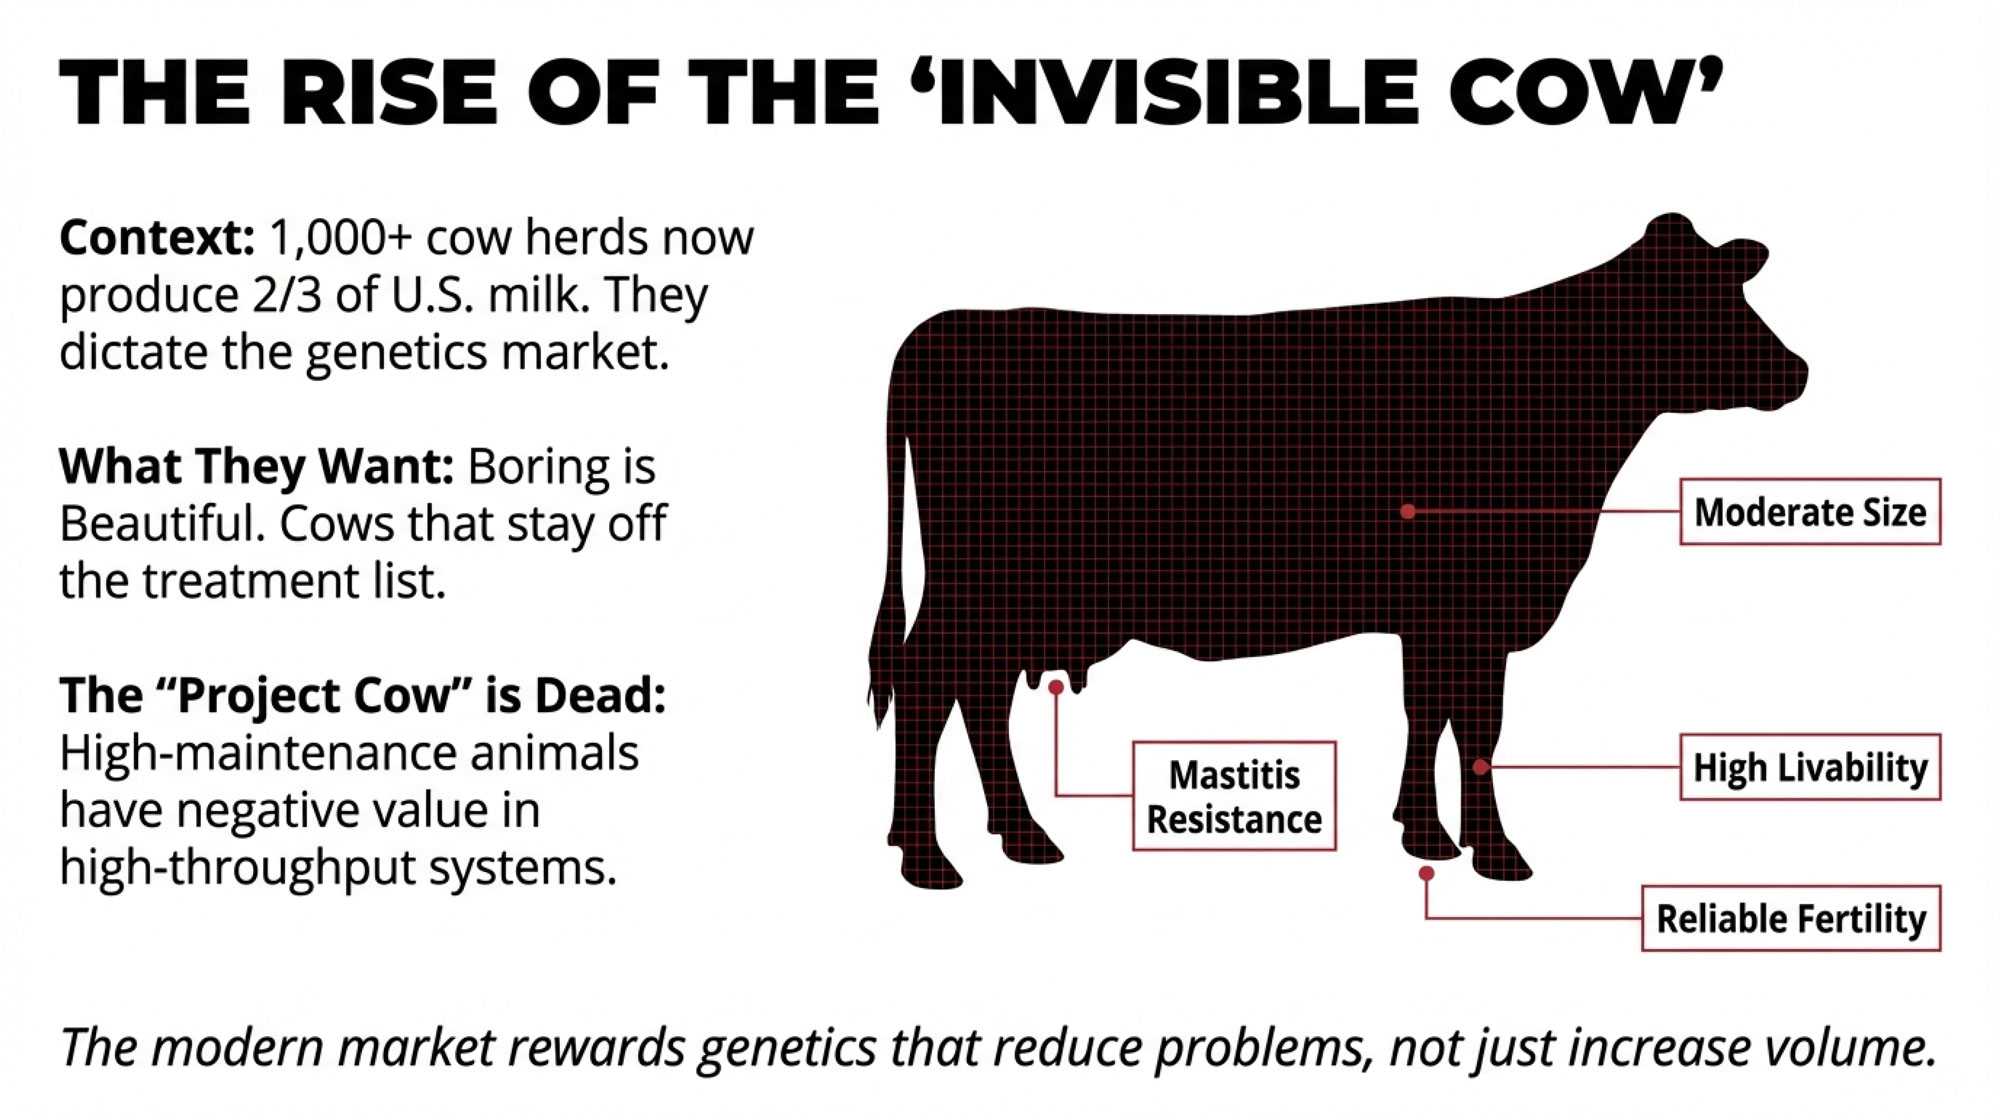
NewsSubscribe
First
Last
Consent

Dairy’s National Average Is a Lie: Texas +50,000 Cows, Washington -21,000 – Your 90-Day Plan

Here’s the thing about national averages—they can hide more than they reveal. While USDA reports 3%+ growth, one state added 50,000 cows and another lost 21,000. Let me walk you through what’s really happening and the decisions that matter most before spring.

Executive Summary: Here’s what the national dairy numbers aren’t telling you: Texas added 50,000 cows last year while Washington lost 21,000—and both get averaged into that 3% growth everyone’s celebrating. Three self-reinforcing factors explain why herds haven’t contracted despite margin pressure: heifer prices above $3,400, making culling uneconomical; beef-on-dairy breeding consuming 25% of the herd’s replacement capacity; and feed costs near multi-year lows. Add $11 billion in new processing capacity coming online through 2028—much of it potentially misaligned with where milk will actually be produced—and you’ve got an industry approaching a meaningful reset. Smart producers have a 90-day window to hedge feed costs, lock in replacement strategies, and have honest conversations with their processors and bankers. The operations that come out ahead won’t just be the best operators—they’ll be the ones who understood their regional trajectory and kept enough flexibility to move when the time came.

2026 Dairy Industry Outlook

You’ve seen the headlines by now. Milk production up. Herd expanding. Cheese exports are hitting records.

Now here’s what those numbers don’t tell you.

There isn’t one U.S. dairy industry anymore. There are at least two, maybe three—and they’re operating under completely different conditions, facing completely different futures. A producer in the Texas Panhandle and a producer in Washington’s Yakima Valley might see similar milk prices on any given month. But you know what? They’re playing entirely different games right now.

I should mention upfront: not everyone sees it this way. I was talking with a consultant last month who made a pretty compelling case that strong export demand signals continued growth across the board. And honestly, the optimists might be right. But the regional divergence I’ve been tracking suggests the headline numbers are masking something we all need to understand.

So let me show you what I mean.

The Great Divide: Where Dairy Is Growing vs. Where It’s Shrinking

That national milk production number everyone’s quoting—up more than 3% in August according to USDA NASS—is really just the average of dramatically different regional stories.

Here’s how it actually breaks down:

RegionWhat’s HappeningThe NumbersWhat’s Driving It
TexasRapid expansion+50,000 cows in 12 monthsProcessing built ahead of herds; lighter regulations
South DakotaStrong growthValley Queen is adding capacity for 25,000 cowsProcessor investment is pulling producers in
IdahoSteady growthContinued herd expansionLand availability; good processing access
WisconsinFlat, consolidatingProduction is barely above flat in 2025Smaller farms exiting; larger ones absorbing neighbors
MinnesotaConsolidatingSteady structural changeSimilar pattern to Wisconsin
CaliforniaDecliningProduction down despite stable herdH5N1 impacts; milk per cow dropping
WashingtonRapid contraction-21,000 cows year-over-year; -8.5% outputEnvironmental compliance costs; EPA involvement
OregonSteady declineContinued farm attritionAir quality regulations; rising costs

Data from USDA NASS September 2025, Dairy Herd Management, Farmers Advance, and IDFA analysis

You see what’s happening here? Texas added enough cows to fill a major cooperative. Washington lost enough to empty one. And we’re calling that a “national trend.”

What’s Fueling the Growth States

I had a chance to tour a newer Texas Panhandle operation last spring, and a few things really stood out to me.

First—and this is important—the processing came before the cows. Cheese plants in Dumas, Amarillo, and Lubbock were already running when producers started expanding. That sequencing matters more than people sometimes realize. You don’t have to wonder where your milk’s going when there’s a plant down the road hungry for supply.

The feed economics work differently out there, too. Land costs and crop prices create structural advantages that are hard to replicate in traditional dairy regions. And while Texas certainly has regulations, the overall compliance burden is measurably lighter than that faced by coastal operations.

South Dakota’s telling a similar story. Dairy Herd Management reports that Valley Queen’s expansion could accommodate roughly 25,000 additional cows over 2025-2026. The processor built the capacity first. The cows are following.

What’s Driving the Contraction

Now, Washington’s situation… that’s tougher to watch.

A producer I know in the Yakima Valley—third-generation, solid operator—told me he’s spending more time with regulators than with his cows some weeks. That’s an exaggeration, but it captures something real about what’s happening out there.

The challenges are stacking up: groundwater nitrate issues have brought EPA involvement to some operations. The Washington State Department of Ecology is proposing regulations that would substantially increase costs. Labor costs run higher than competing regions. And the result, according to Dairy Herd Management, is 21,000 fewer cows in October compared to the prior year.

California’s dealing with its own complexity—H5N1 outbreaks have hit productivity in numerous Central Valley herds, contributing to declining milk per cow even while the overall herd held relatively steady. It’s a different challenge, but the direction is similar.

Producers Who’ve Made the Move

Not everyone’s standing still, though. I’ve talked with a few producers who saw the writing on the wall and made strategic relocations. One Wisconsin family I know sold their 800-cow operation two years ago and partnered with an established South Dakota dairy. They’re now managing a larger string with better margins and—here’s what surprised them—less overall stress despite the bigger numbers. “The regulatory load alone,” the son told me, “freed up 15 hours a week we used to spend on paperwork.”

That’s not the right move for everyone. Plenty of operations have deep roots, family land, and established processor relationships that make staying put the smarter play. But it’s worth noting that some producers actively choose their region rather than just accept the one they inherited.

The Math Is Broken: Why High Costs Didn’t Shrink the Herd

Here’s something that’s been puzzling economists for months now: margins got squeezed, but culling rates stayed low. The national herd actually grew when every historical pattern said it should contract.

What’s going on? Three factors, and they’re all connected.


Metric
202220242025
Replacement Heifer Price ($/head)$2,400$2,900$3,400
Beef-on-Dairy Breeding Rate (%)18%22%25%
Feed Cost ($/cwt)$11.20$10.10$9.38
Cull Rate (%)38%34%31%
Heifer Shortage SeverityModerateElevatedCritical

Replacement Heifers Got Really Expensive

You probably know this already if you’ve been to an auction lately. Current prices from USDA Agricultural Marketing Service reports:

  • Upper Midwest: $3,200-$3,500 per head for quality replacements
  • Premium springers: $4,000+ at some California and Wisconsin auction barns

Mark Stephenson—he’s the director of dairy policy analysis at the University of Wisconsin-Madison—has pointed out that at these prices, payback periods on marginal replacements stretch to nearly 15 years.

I was talking with a 400-cow producer in central Wisconsin who put it pretty simply: “At $3,400 a head, I’m not culling anything that can still put milk in the tank.” And that sentiment seems widespread.

Beef-on-Dairy Changed Everything

This is the part that doesn’t get enough attention, in my view. Council on Dairy Cattle Breeding data shows roughly 25% of the dairy herd is now bred to beef genetics. Those crosses are generating $400-$600 premiums—sometimes more—for quality blacks with good conformation.

But here’s the catch, and it’s a big one: every beef-cross calf is a dairy heifer that doesn’t exist.

The heifer shortage isn’t temporary. It’s structural. And it’s self-reinforcing.

Feed Costs Hit Multi-Year Lows

The USDA Dairy Margin Coverage program calculated feed costs at $9.38 per cwt for August 2025. The Center for Dairy Excellence confirmed that figure—down nearly 50 cents from July. That’s among the lowest readings we’ve seen in years.

When feed is cheap, even that older cow in the back pen—the one you’d normally have shipped by now—can still contribute to cash flow. The economic pressure to cull just isn’t there.

And here’s the trap: These factors reinforce each other. Expensive heifers mean you keep old cows. Keeping old cows means you don’t need expensive heifers. Beef-on-dairy means fewer heifers get born anyway. And cheap feed makes all of it pencil out.

For now, anyway.

Feed Cost Outlook: Why Many Advisors Are Saying Hedge Now

Here’s what’s interesting about the forward markets. CME Group data shows that December 2026 corn futures are trading above current spot prices. The market’s signaling higher costs ahead.

TimeframeWhat Corn’s Telling UsWhat It Means for Feed Costs
Right nowFavorable pricing$9.38/cwt (August DMC calculation)
Dec 2026 futuresHigher than spotCould push toward $11.00+/cwt
Normal price swing+$0.50-$0.75/bushelAdds $1.50-$2.00/cwt to your feed line

Now, futures markets have been wrong before—I want to be honest about that. But the signal’s worth noting.

The window to lock in favorable feed pricing may be closing. I’ll get into specific timing in the action steps below.

PeriodFeed Cost ($/cwt)Futures Signal
Aug 2025$9.38Spot (Favorable)
Nov 2025$9.50Favorable
Mar 2026$10.20Rising
Jun 2026$10.80Elevated
Sep 2026$11.20High
Dec 2026$11.40High

The Processing Puzzle: $11 Billion in New Capacity—But Is It in the Right Places?

IDFA confirmed during Manufacturing Month that more than $11 billion in new dairy processing capacity is coming online through 2028 across 19 states. That’s cheese plants, butter facilities, powder operations, and fluid processing. It’s a massive investment that reflects real confidence in American dairy’s future.

But here’s the question worth asking: Is it being built where the milk will be?

The Mismatch Worth Watching:

RegionProcessing InvestmentMilk Supply TrendWhat to Watch
WisconsinMajor expansions underwayEssentially flat productionWhere does the milk come from?
Pacific NorthwestDarigold’s $1 billion Pasco plant (8M lbs/day)Contracting 8.5% annuallyReal supply/capacity tension
Texas/South DakotaMatched to growthExpanding steadilyBetter alignment

I don’t have a definitive answer on how Darigold plans to fill a billion-dollar facility when regional supply is declining nearly 9% annually. Their leadership clearly sees a path forward that I may not fully appreciate—and they know their market far better than I do.

But facilities built expecting 90%+ utilization that end up running at 70-75%… that financial stress eventually flows somewhere. Often, back to producers through milk payment adjustments or cooperative equity calls. It’s something to be aware of.

The Silent Partner: Why Your Banker Decides Who Survives 2026

Here’s something that rarely makes industry headlines but may matter as much as milk price or feed cost.

When margins compress—and they will at some point; they always do—the question isn’t just “Can my farm cash flow at $14 milk?” It’s “Will my lender give me time to get back to $17?”

That’s not purely an economic question. That’s a relationship question. And it might quietly decide who’s still farming in 2028.

Two producers with nearly identical cost structures can face completely different outcomes:

Producer AProducer B
Modest leverageAggressive expansion of debt from low-interest years
Six months of working capitalThin operating lines
Lender who’s been through dairy cyclesLender with stressed ag portfolio
Gets patience when neededGets pressure instead

A farm financial consultant I was talking with in Minnesota made this point effectively: the best-positioned producers right now aren’t just focused on cost per cwt. They’re using this window—while milk checks are decent and lines aren’t maxed—to:

  • Clean up any covenant issues
  • Term out short-term debt into longer amortizations
  • Build transparent, data-driven relationships with their lenders

The operations that emerge as consolidators on the other side of any transition won’t necessarily be the best operators. They’ll often be the ones whose banks stayed in the game.

The Biosecurity Wildcard: H5N1

I’d be remiss not to mention what’s been on everyone’s mind this year.

USDA APHIS has confirmed Highly Pathogenic Avian Influenza outbreaks in dairy cattle across multiple states, including Kansas, Idaho, Texas, Iowa, and others. The virus can move between herds, particularly through cattle movements and the use of shared equipment.

The current picture: Economic damage has been contained and localized so far. Some affected dairies experience temporary production drops during transition periods and during the fresh-cow phase. Export partners are watching but haven’t acted dramatically.

The risk: If regulators move from “monitor and manage” to “contain and control,” the orderly consolidation we’ve been discussing could become something more disruptive.

What to do now: The basics matter more than ever. Review boot and clothing protocols. Tighten visitor policies. Isolate new animals before introducing them to the string. Be thoughtful about shared equipment between operations.

None of this is new advice for anyone who’s been around dairy cattle. But the stakes for following it have increased.

The Sustainability Angle: $0.75-$1.50/cwt in Potential Premiums

Let’s skip the greenwashing debate and talk about what actually matters here: money.

Global food companies—Nestlé, Danone, and PepsiCo—have legally binding 2030 emission targets they must meet. Multiple pilot programs are already paying producers premiums for:

  • Verified methane reductions
  • Documented feed efficiency improvements
  • Low-carbon-intensity milk tagged to specific supply chains

The math that actually matters:

A “preferred” supplier with documented feed conversion efficiency, verified practices, and tight nutrient management could capture $0.75-$1.50/cwt in stacked value—base premiums, carbon credits, sustainability bonuses, and preferential contract access.

What’s encouraging is that a well-managed 1,500-cow Wisconsin or New York operation with strong sustainability credentials could compete with a 3,000-cow commodity operation. The premium contracts change the math.

Scale isn’t the only path forward. For producers looking for differentiation that doesn’t require doubling herd size, this is worth exploring.

The 90-Day Plan: What to Do Before Spring

Given everything we’ve walked through, what should you actually be doing between now and late March? Let me get specific.

By Late January: Consider Locking Feed Costs

  • Target: Hedge around 40-50% of your projected 2026 grain needs
  • Why now: December 2026 corn futures are already pricing above spot; winter weather and planting signals will move markets further
  • Risk of waiting: March and April often bring less favorable terms

Worth talking through with your nutritionist and financial advisor.

By Late February: Make Your Replacement Decision

If you’ve got capital flexibility:

  • Establish financing now
  • Identify heifer suppliers
  • Be positioned to move fast if prices soften mid-2026

If you’re focused on efficiency:

  • Identify the bottom 15-20% of your string
  • Target chronic health cases and poor reproduction performers
  • Consider strategic culling Q1-Q2 while beef prices remain favorable

The key: Make a conscious choice. Operations that drift into mid-2026 without a strategy end up reacting rather than acting. And reactive decisions during stressed markets rarely work out as well.

By Mid-March: Have the Processor Conversation

Four Questions Worth Asking:

  1. What percentage of our facility’s intake goes to export markets? Which destinations?
  2. What’s our Mexico concentration—and how might USMCA review affect intake decisions?
  3. If you needed to reduce intake by 15-20%, what would the notification timeline be?
  4. If regional supply keeps changing, how does that affect sourcing and our cost structure?

These conversations are easier to have now than during a disruption. The answers tell you a lot about your actual risk exposure.


Deadline
Critical ActionWhy NowRisk of Delay
Late JanuaryHedge 40-50% of 2026 grain needsDec 2026 futures above spotHigher feed costs locked in
Late FebruaryLock replacement strategy (buy or cull)Heifer prices still elevatedForced culling decisions
Mid-MarchProcessor/banker conversationsBuild relationships pre-crisisReactive instead of proactive
April (Post-Action)Monitor and adjustFlexibility to pivotLost opportunities

What 2028-2029 Might Look Like

If current trends hold—and that’s always a meaningful “if”—here’s what seems to be taking shape:

Fewer, larger operations. U.S. dairy farms dropped from over 40,000 to under 25,000 over the past couple of decades. Generational transitions without clear successors continue to accelerate this. It’s not inherently good or bad—it’s just the reality we’re working with.

Geographic shifts. Texas, South Dakota, and Idaho are capturing share. The Pacific Northwest faces headwinds. California likely remains the largest state, but its market share is declining.

Two distinct tracks are emerging. This is the part I find most interesting. The industry’s splitting into large-scale commodity operations—think 2,500+ cows competing primarily on cost efficiency, often in lower-regulation states with favorable feed economics—and premium/specialty production commanding meaningful price premiums through organic certification, grass-fed programs, A2/A2 genetics, or verified sustainability credentials.


Production Model
Typical Herd SizeMilk Price Range ($/cwt)Primary StrategyRisk Level
Large Commodity2,500+$16-18Cost efficiencyCommodity exposed
Mid-Size Conventional800-1,500$17-19Scale up or exitHigh vulnerability
Organic Certified400-900$26-28Premium captureProtected
Grass-Fed/Verified300-800$23-26Direct relationshipsModerate
A2/Specialty200-600$22-25Niche differentiationModerate

I know a 900-cow organic operation in Vermont that’s pulling $26-28/cwt consistently while their conventional neighbors struggle at $18. Different game entirely. And a grass-fed producer in Missouri who’s built direct relationships with regional grocery chains that insulate him almost completely from commodity price swings.

Both tracks can work. The challenge is being clear about which game you’re playing—and not getting stuck in the undifferentiated middle where you’re too small for cost leadership but not specialized enough for premium markets.

This isn’t a story of decline. Dairy demand remains solid. Exports keep expanding. Well-run operations build real wealth.

But it is a story of restructuring. And the producers who navigate it successfully will be those who understand the forces at play, make deliberate choices, and maintain enough flexibility to adapt.

Resources Worth Bookmarking

If you want to track the indicators we’ve discussed, a few sources are worth checking monthly—it takes maybe 20 minutes:

  • USDA NASS Milk Production Reports — released around the 20th
  • CME Group Dairy Futures — corn, soybean meal, Class III/IV signals
  • CoBank Quarterly Rural Economy Reports — solid dairy analysis, heifer market outlook
  • USDA APHIS H5N1 Updates — current outbreak status

The planning window’s open. What you do with it is up to you.

We’ll be watching these developments and keeping you informed as things unfold.

KEY TAKEAWAYS

  • The national average is hiding two industries: Texas +50,000 cows, Washington -21,000—both called “3% growth”
  • Three factors broke the old economics: $3,400+ heifers, beef-on-dairy taking 25% of replacements, and feed costs at multi-year lows
  • $11B in new processing capacity may be misaligned: Plants expanding where milk supply is flat or declining
  • Your 90-day action window: Hedge 40-50% of feed (January) → Lock replacement strategy (February) → Processor/banker conversations (March)
  • Your lender decides who survives: The winners won’t just be the best operators—they’ll be the ones whose banks stayed in the game

Complete references and supporting documentation are available upon request by contacting the editorial team at editor@thebullvine.com.

Learn More:

  • Feed Smart: Cutting Costs Without Compromising Cows in 2025 – Provides a tactical playbook for the “feed cost hedging” strategy mentioned in your 90-day plan. Learn specific methods for forward contracting corn below $4.60 and optimizing forage digestibility to protect margins against the potential spring rally.
  • The Wall of Milk: Making Sense of 2025’s Global Dairy Crunch – Expands on the “24-month trap” and global supply factors currently capping milk prices. This strategic analysis explains why the U.S., EU, and New Zealand expanding simultaneously creates the specific market ceiling your banker is watching closely.
  • Generate $15,000+ Annual Carbon Revenue: The Dairy Producer’s Guide – Delivers the implementation roadmap for the “sustainability premiums” opportunity. Discover how to stack Section 45Z tax credits with feed additives and carbon markets to generate new revenue streams without increasing herd size.

The Sunday Read Dairy Professionals Don’t Skip.

Every week, thousands of producers, breeders, and industry insiders open Bullvine Weekly for genetics insights, market shifts, and profit strategies they won’t find anywhere else. One email. Five minutes. Smarter decisions all week.
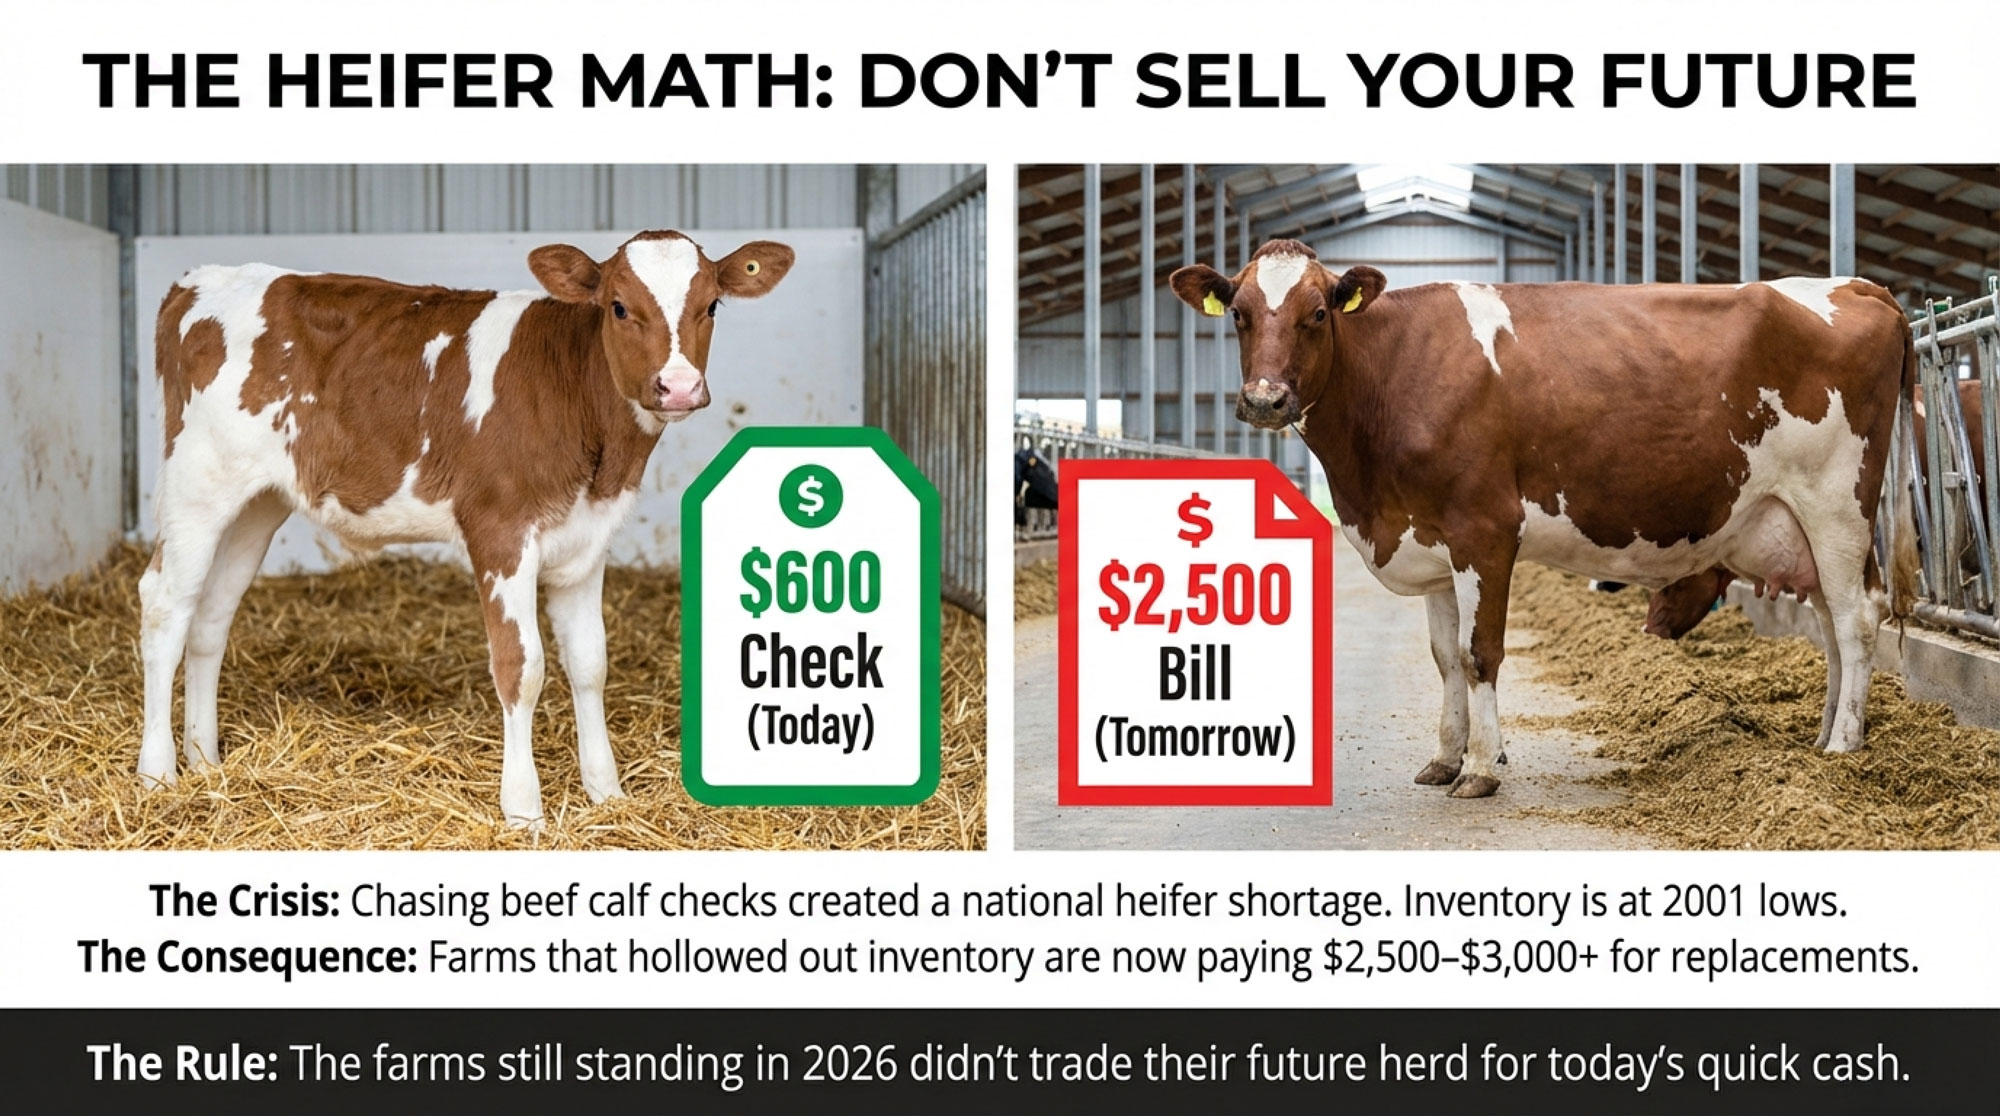
NewsSubscribe
First
Last
Consent

The One-Dollar Margin: A Global Wake-Up Call from New Zealand’s Dairy Squeeze

A $9.50 milk price sounds great—until you see the $8.50 break-even. NZ’s one-dollar margin is a wake-up call for dairy farmers everywhere.

Executive Summary: When the world’s lowest-cost milk producers are farming on a dollar of margin, that’s a wake-up call for dairy everywhere. New Zealand’s December 2025 numbers: $9.50/kgMS milk price, $8.50 break-even, one dollar left for debt, drawings, and reinvestment. They’re not alone. Teagasc projects Irish dairy incomes dropping 42% in 2026. UK farmgate prices have fallen below production costs. Rabobank calls global output growth ‘stunning’—the very oversupply compressing margins worldwide. And China’s shift from aggressive importer to tactical buyer has removed the demand safety valve the industry once counted on. The old formula—high prices equal comfortable margins—no longer holds. The farms that make it through will be those building resilience now: feed efficiency, component focus, diversified revenue, right-sized debt. Not growth for growth’s sake. Strategic survival.

When the world’s lowest-cost milk producers are working on about one dollar of operating margin per kilogram of milk solids, that’s worth every dairy farmer’s attention.

That’s exactly where New Zealand finds itself heading into 2026.

Here’s what makes this relevant beyond the Pacific: it’s essentially a real-time stress-test of the global dairy model. From Wisconsin freestalls to Irish grass paddocks to Canterbury’s irrigated pastures, the underlying question is the same.

If New Zealand’s efficient pasture systems can’t maintain comfortable margins at these milk prices, what does that mean for the rest of us?

The narrative has shifted. It’s less about waiting for the next price spike and more about adapting to a new reality—one defined by persistent cost pressure, cautious global buyers, and markets that recover more slowly than they used to.

Understanding the One-Dollar Margin

DairyNZ’s December 2025 Economic Update paints a clear picture.

Farm working expenses have climbed 16 cents to $5.83 per kgMS. Meanwhile, Fonterra revised its 2025-26 farmgate milk price forecast down to a midpoint of $9.50 per kgMS—a notable drop from the earlier $10.00 projection.

DairyNZ puts the break-even milk price for an average reference farm at around $8.50 per kgMS.

That leaves roughly a dollar per kgMS as operating surplus. And that’s before capital repayments, family drawings, or any reinvestment.

Metric2024-25 Season2025-26 SeasonChange
Milk Price ($/kgMS)$10.00$9.50-$0.50
Break-even Cost ($/kgMS)$8.34$8.50+$0.16
Operating Margin ($/kgMS)$1.66$1.00-$0.66
Farm Working Expenses ($/kgMS)$5.67$5.83+$0.16
Interest Costs ($/kgMS)$1.46$1.11-$0.35

Tracy Brown, DairyNZ’s chair and herself a Waikato dairy farmer, offered some measured perspective in their December update: “Profit is still on the table, but the margin gap has clearly tightened, and that means every spending decision on farm needs a harder look.”

That’s a statement worth sitting with.

What This Looks Like on a Real Farm

Think about a fairly typical New Zealand herd—400 cows producing 400 kgMS each. That gives you 160,000 kgMS for the season.

At $9.50 per kgMS, gross milk revenue comes to about $1.52 million NZD. With a break-even point of around $8.50, core operating costs consume roughly $1.36 million.

That leaves approximately $160,000 NZD of operating surplus.

On paper, that’s profit. But reality includes broken gates, aging tractors, and family obligations. The buffer is much thinner than the headline suggests.

I recently spoke with a consultant who works across both New Zealand and Australian operations. His observation: for a 200-cow farm, that surplus might only be $80,000 NZD before tax and drawings. For a 2,000-cow operation, you’re looking at roughly $800,000—but spread across substantially higher fixed costs and larger teams.

Farm SizeProduction (kgMS)Gross RevenueOperating CostsOperating SurplusMargin Per Cow
200 cows80,000$760,000$680,000$80,000$400
400 cows160,000$1,520,000$1,360,000$160,000$400
2,000 cows800,000$7,600,000$6,800,000$800,000$400

The ratio matters more than the headline number. Whether you’re milking 200 or 2,000, everyone’s working with a narrower buffer.

The Takeaway: A $9.50 milk price sounds strong. But with $8.50 break-evens, you’re farming on a dollar of margin—and that dollar has to cover everything else.

Tracing the Cost Increases

Where exactly did those 16 cents go? Understanding the drivers makes them easier to address.

DairyNZ’s Econ Tracker identifies three primary contributors.

Cost CategoryIncrease (¢/kgMS)400-Cow Farm ImpactControllability
Feed Costs+7¢+$11,200Medium – Nutrition strategy
Fertiliser+4¢+$6,400Low – Global commodity
Electricity/Irrigation+2¢+$3,200Low – Fixed infrastructure
Wages+2¢+$3,200Low – Labour market
Repairs/Maintenance+1¢+$1,600Medium – Defer vs invest
Compliance+1¢+$1,600None – Regulatory
Other Operating-1¢-$1,600Variable
TOTAL+16¢+$25,600

Feed costs have risen meaningfully year-on-year across most categories. Palm kernel has been somewhat more stable, but grain and purchased roughage have risen noticeably.

Fertiliser continues to pressure budgets. Phosphate and urea prices remain elevated, driven by energy market dynamics and export restrictions from major suppliers. Teagasc’s Outlook 2026 suggests costs will climb further as the EU Carbon Border Adjustment Mechanism takes effect.

Other operating costs—repairs, freight, wages, fuel, compliance—have all experienced inflation.

The encouraging news? DairyNZ reports that interest costs are easing. Payments are forecast to drop about 35 cents to $1.11 per kgMS for 2025-26.

The catch? Those interest savings are largely offset by increases elsewhere. The budget might show relief on one line, but feed, fertiliser, and operating costs are absorbing it.

For a 200-cow farm, this might mean choosing between replacing an ageing parlour component or making do with repairs. On a 2,000-cow dry-lot operation, it could be the difference between upgrading a feed mixer or deferring that decision another year.

The Takeaway: Feed and fertiliser are eating your interest rate savings before you ever see them.

The Production Paradox

This is where the situation becomes counterintuitive.

New Zealand is currently in its spring flush. DairyNZ reports national milk collections running about 3.4% ahead of last season, with August and October 2025 volumes among the highest on record.

South Island production in October was up 5.7% year-on-year. Customs data shows palm kernel imports are up significantly—a clear indicator that farmers leaned into purchased feed to boost production.

Why does this matter? Because the same pattern is playing out across multiple dairy regions simultaneously.

I’ve been following similar trends in US and European coverage. Where corn or by-products are relatively affordable, there’s considerable temptation to push cows harder to maintain cashflow. Especially when fixed obligations don’t adjust downward just because your milk price does.

At the individual farm level, this appears entirely rational. If you’ve already invested in the parlour, the effluent system, and the bank financing, pushing a few more kilograms through spreads those fixed costs.

But collectively? When New Zealand, the US, Ireland, and parts of Europe all make that same calculation simultaneously, you end up with what Rabobank’s December 2025 commentary described as “stunning” global output growth.

Region2026 Growth ForecastImpact on Global Supply
Argentina+4.0%Aggressive expansion continues
United States+1.3%Steady growth despite tight margins
New Zealand+1.0%Spring flush pushing volumes
European Union0.0%Only major exporter hitting brakes

That additional milk is precisely why price forecasts have moderated.

A Midwest producer I spoke with recently put it simply: “We’re not trying to grow anymore—we’re trying to survive long enough to see the other side.”

The Takeaway: What makes sense on your farm might be making things worse for everyone—including you.

Regional Perspectives

New Zealand’s experience offers the clearest current signal. But similar pressures are emerging across other major dairy regions.

RegionCurrent Margin (2025)2026 ForecastKey Pressure PointCompetitiveness
New Zealand+$1.00/kgMSTight ($0.80-1.00)Feed & fert eating savingsHigh — Pasture based
Ireland€0.115/LSevere (-45%)Butter price collapseMedium — Scale challenges
United KingdomBelow cost (38.5p/L)Further pressureCommodity liquid pricingLow — High costs
United States (DMC)Above $9.50/cwtStable (low feed)Production growthVariable — Regional
European UnionSqueezed — variedContraction likelyChina probe uncertaintyMedium — Policy support

Ireland: Preparing for a Correction

Teagasc’s Outlook 2026 projects that average Irish dairy farm incomes could decline by approximately 42% in 2026. That would take the average income from an estimated €137,000 this year to around €80,000.

Their baseline anticipates milk prices moderating from the high-40s cent per litre range back toward approximately 42 cents.

At 11.5 cents per litre, the average dairy net margin in 2026 is forecast to be down 45% from 2025 levels.

For a 70-hectare, 100-cow family farm, cash surplus after drawings and loan repayments could drop from around €80,000 to closer to €45,000.

That’s manageable if the debt is moderate. For operations that expanded aggressively, the adjustment will be sharper.

The UK: Below-Cost Production

Recent market data shows that farmgate milk prices have fallen below full production costs for many operations.

As of late 2025, Arla’s conventional price sits around 39.21 pence per litre. Müller’s Advantage price drops to 38.5ppl from January 2026.

Industry estimates place all-in production costs closer to the 40-45ppl range.

The picture varies by contract type. Producers on cheese or retailer-aligned arrangements often fare better. But in the commodity liquid segment, some operations are producing milk at a level below full economic cost.

Processors have responded by shifting toward component-based and fixed-volume contracts. Retailers continue to prioritise competitive shelf prices, putting pressure on producers’ margins.

The US: Regional Variations

The American experience differs due to policy structure—and substantial regional variation.

The Dairy Margin Coverage programme has provided meaningful support. The University of Wisconsin Extension reports that through the first ten months of 2023, DMC distributed over $1.27 billion in indemnity payments. That averaged approximately $74,453 per enrolled operation, with around 17,059 dairy operations participating.

But the experience varies dramatically by region.

In California, water costs and environmental compliance add layers of expense that Midwest operations don’t face. Wisconsin operations are navigating processor consolidation and volatility in the cheese market. Northeast producers face declining fluid milk demand and processing capacity constraints.

Larger US herds—1,000 cows and above—are increasingly relying on scale economies and diversified revenue streams. Beef-on-dairy programmes, heifer development, and energy projects are becoming standard.

The Takeaway: The squeeze is global, but every region has its own version. Know your local dynamics.

The China Factor

For two decades, much of dairy’s long-term optimism rested on a straightforward assumption: China would continue buying more.

That assumption deserves recalibration.

New Zealand Treasury’s 2024 dairy exports analysis, Rabobank’s global outlooks, and trade reports identify three meaningful shifts.

Product Category2021 Imports (MT)2024 Imports (MT)ChangeTrend
Whole Milk Powder1,680,000740,000-56%Domestic production surge
Milk Powder (Total)2,580,0001,360,000-47%Structural decline
Skim Milk Powder900,000620,000-31%Domestic substitution
Whey480,000380,000-21%US tariff impact
Cheese140,000170,000+21%Foodservice growth
Butter110,000135,000+23%Bakery sector expansion

Domestic production has expanded substantially. China has invested heavily in large-scale dairy operations. This is structural import substitution, not a temporary measure.

Per-capita consumption growth has moderated. Dairy consumption continues trending upward, but at slower rates than during the expansion years. The steepest part of the adoption curve appears behind us.

Purchasing behaviour has become tactical. Chinese buyers now step back when prices strengthen and increase purchases when value emerges—rather than consistently supporting auctions.

China remains a vital market. But it’s no longer the automatic release valve that absorbs surplus production.

The Takeaway: Don’t count on China to bail out oversupply anymore. That era is over.

What Farmers Are Actually Doing

When margin discussions move from conferences to kitchen tables, what are producers actually changing?

Managing Through Feed

In New Zealand, palm kernel imports are up significantly. Many farmers chose to push production while payout expectations remained near $10/kg MS.

Similar decisions are playing out in US operations where corn and by-products remain relatively affordable.

The logic is straightforward: when principal payments and family expenses don’t flex with milk price, spreading fixed costs across more production can appear to be the only short-term lever.

Strengthening Balance Sheets

New Zealand’s Ministry for Primary Industries notes that some farmers used the strong 2021-2023 payouts to reduce debt rather than adding infrastructure.

That decision is looking increasingly prudent.

On a 200-cow farm, this might translate to directing an extra $20,000 annually toward debt reduction rather than equipment upgrades. On a 2,000-cow operation, it could mean restructuring short-term facilities into longer-term arrangements.

Diversifying Revenue

Beef-on-dairy has become mainstream. Industry analyses suggest crossbred calves can add $100-200 per cow annually, depending on local markets.

Sustainability-linked premiums are emerging as processors develop payment structures tied to documented environmental outcomes.

Even modest additional revenue streams—$50,000-$100,000 annually on a mid-sized operation—can make a meaningful difference when the milk cheque alone isn’t covering the spread.

The Takeaway: Smart operators aren’t just cutting costs. They’re restructuring debt and finding new revenue.

StrategyShort-Term CashflowMargin ImpactRisk LevelBest For
Push Production (Palm Kernel)Improved$0.85/kgMSHigh — Adds to oversupplyHigh debt, large scale
Cut Costs AggressivelyPreserved$1.15/kgMSMedium — Quality risksMedium farms, low debt
Maintain Status QuoSqueezed$1.00/kgMSHigh — Thin bufferNo flexibility
Reduce Debt FirstReduced$1.00/kgMSLow — Future flexibilityStrong balance sheet

Strategic Levers by Scale

Even in challenging margin environments, individual operations retain meaningful levers. They won’t shift global prices, but they determine which side of the margin line you occupy.

Feed Efficiency and IOFC

Research consistently documents substantial variation in feed efficiency—both between herds and within individual herds.

Progress typically comes from:

  • Forage quality management—harvest timing, processing, storage, feedout
  • Fresh cow protocols that establish strong intake patterns during those critical first 30-60 days
  • Active use of income over feed cost metrics as management tools, not retrospective reports

Getting started: On smaller operations, work with a nutritionist to develop simple IOFC reporting by production group. On larger TMR operations, establish monthly review rhythms to identify underperforming groups.

Component Value Capture

As payment systems emphasise solids over volume, butterfat and protein percentages deserve strategic attention.

The value ranges from 75 cents to $1.25 per hundredweight in many component-based systems, even at equivalent volume.

Getting started: Talk with your AI representative about reorienting sire selection toward fat and protein kilograms. Pair that with a nutritionist input on optimising rumen health, not just energy delivery.

Beef-on-Dairy Integration

This has evolved from a niche strategy to standard practice.

Getting started: Begin with market research. Talk with calf buyers about which terminal breeds and calving ease profiles actually command premiums in your area.

Financial Structure

What research keeps showing—across EU and Latin American farms alike—is that how you structure debt often matters as much as how efficiently you produce.

Getting started: Have proactive lender conversations before cash flow challenges emerge. Walk through three-year projections under multiple price scenarios.

The Takeaway: You can’t control global milk prices. But you can control feed efficiency, component focus, revenue diversity, and debt structure.

StrategyImmediate Impact1-Year Margin GainResilienceCapital Required
Feed Efficiency FocusModerate — Slow gains+$0.10-0.20/kgMSHigh — PermanentLow — Nutrition/management
Component OptimizationModerate — Genetic lag+$0.15-0.25/kgMSHigh — PermanentLow — Semen/consulting
Beef-on-Dairy IntegrationHigh — Instant revenue+$0.08-0.15/kgMSMedium — Market dependentLow — Contract only
Aggressive Debt ReductionLow — Reduces cashflow$0/kgMSVery High — Future flexibilityHigh — Requires surplus
Volume Push (Status Quo)High — Spreads fixed costs-$0.05 to +$0.05/kgMSLow — Worsens oversupplyModerate — Feed purchases

What Could Actually Change Things?

If current margin pressure is structural, what developments might shift the trajectory?

Genuine supply contraction would require sustained exits that actually reduce production capacity. We’re seeing accelerating consolidation in parts of Europe, the UK, and Australia. It’s unclear whether the pace is sufficient.

Emerging market demand growth offers longer-term potential in Southeast Asia, Africa, and Latin America. But developing those markets takes time.

Policy and structural changes—such as transition support, improved risk-sharing between processors and producers, and trade agreements—could shift the environment. But political processes move slowly.

None of these are quick fixes. But understanding the possibilities helps inform longer-term positioning decisions.

Key Takeaways

Price levels don’t ensure margin. A $9.50 per kgMS payout with $8.50 break-evens means strong prices can coexist with tight margins.

Volume gains require margin verification. More production can support cashflow while contributing to oversupply. Check IOFC, not just output.

Input decisions carry strategic weight. Feed and fertiliser now warrant careful analysis, not routine repetition.

Revenue diversification has moved mainstream. Beef-on-dairy and sustainability premiums are standard elements, not experiments.

Financial structure shapes survival. Operations that reduced debt during good years enter this period with more flexibility.

Opportunity persists, but looks different. More competition, more selective buying, more scrutiny. Adapt or get squeezed.

The Bottom Line

No individual farm can resolve global oversupply. No policy will quickly restore previous comfort levels.

But careful attention to what New Zealand’s numbers reveal—and thoughtful application regardless of region or scale—can improve the odds of staying on the right side of that one-dollar margin line.

The farms that thrive in 2030 are making decisions right now. Not necessarily to get bigger. But to get more resilient, more diversified, more intentional about where margin actually comes from.

Complete references and supporting documentation are available upon request by contacting the editorial team at editor@thebullvine.com.

Learn More:

The Sunday Read Dairy Professionals Don’t Skip.

Every week, thousands of producers, breeders, and industry insiders open Bullvine Weekly for genetics insights, market shifts, and profit strategies they won’t find anywhere else. One email. Five minutes. Smarter decisions all week.
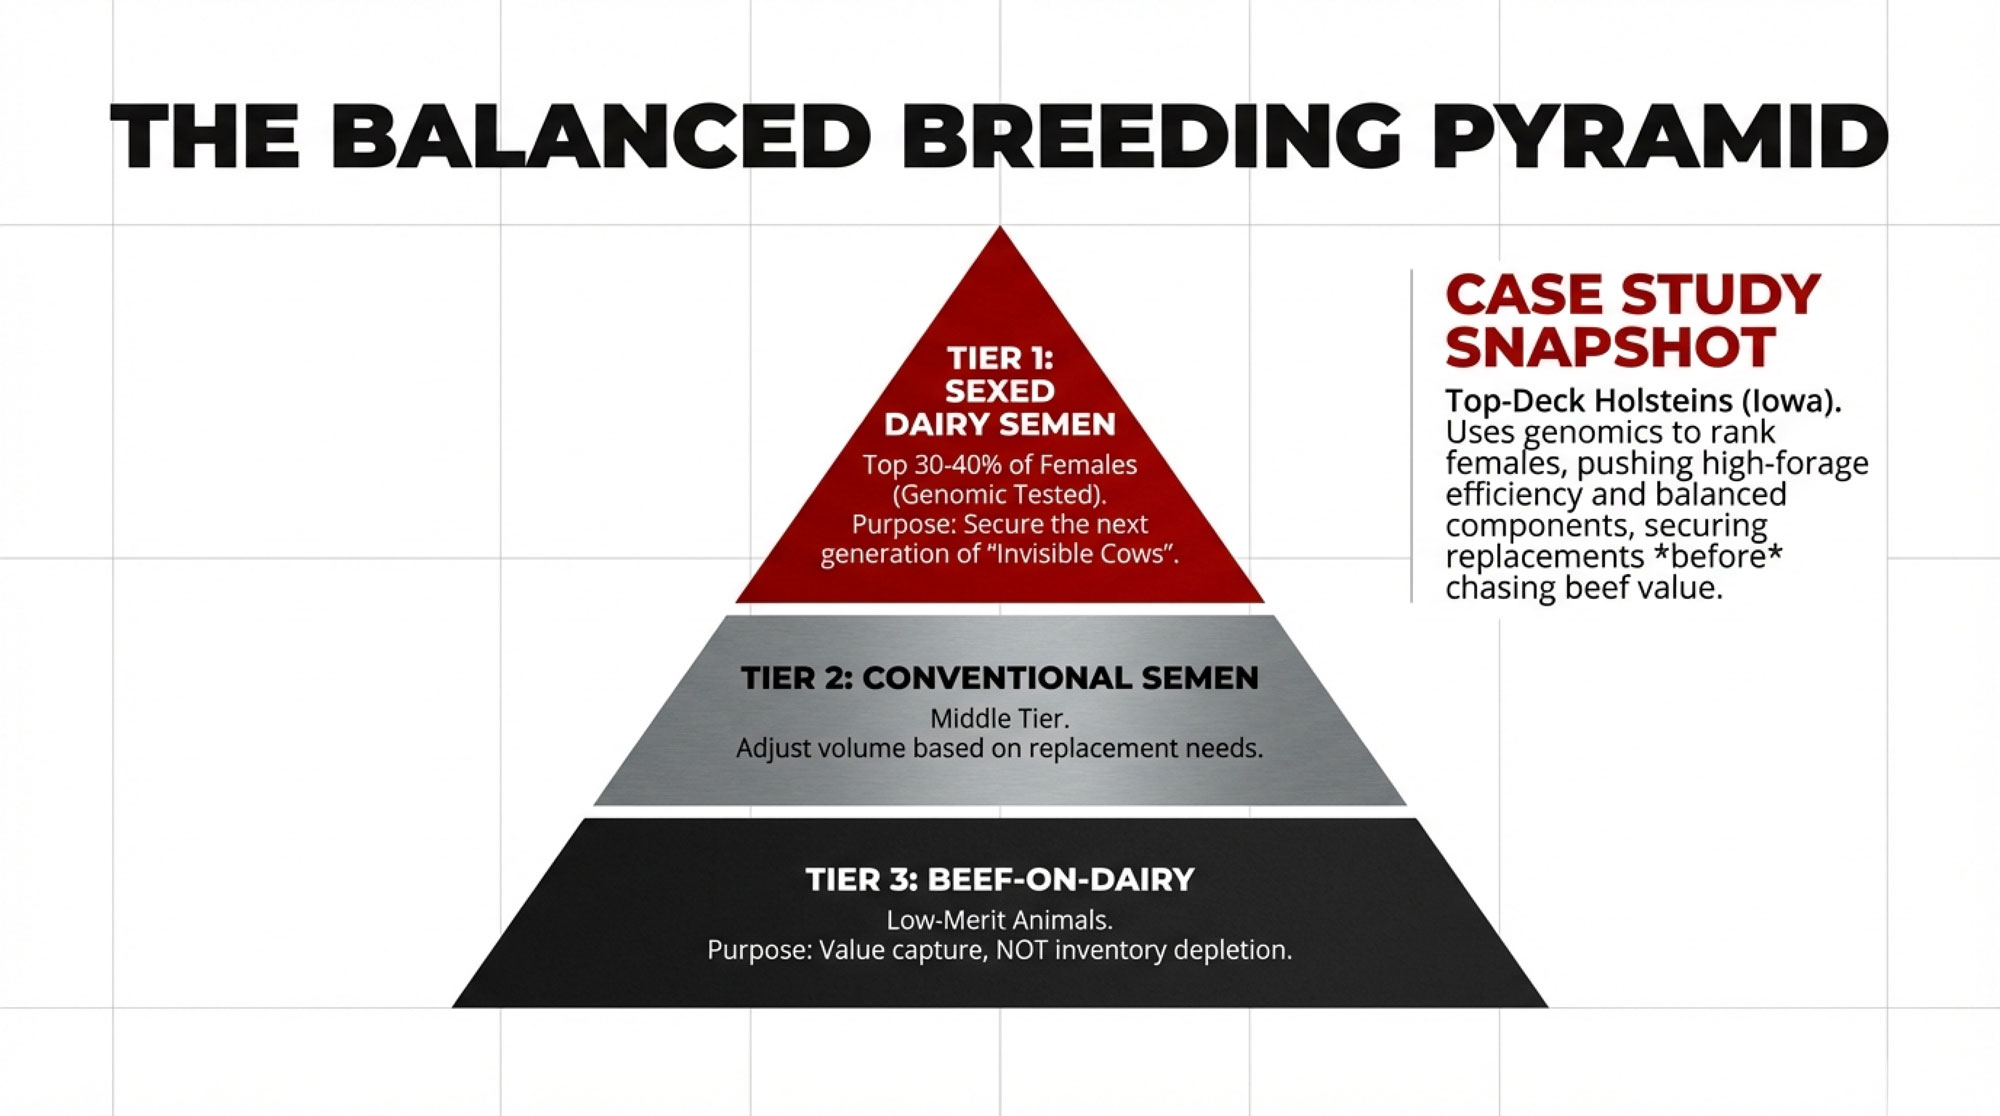
NewsSubscribe
First
Last
Consent

The Cycle Isn’t Coming Back: A Structural Shakeout Is Picking Dairy’s Winners Now

Why this downturn is different—and the brutal math deciding which operations survive

EXECUTIVE SUMMARY: The dairy cycle you’re waiting for isn’t coming back. China added 22 billion pounds of domestic production since 2018, permanently closing a market that absorbed half of global import growth. Meanwhile, American dairying is migrating: Texas gained 46,000 cows last year while Wisconsin lost 455 farms, and $11 billion in new Southwest processing capacity is cementing this shift for the foreseeable future. The economics have turned existential. Operations above $20 per hundredweight are hemorrhaging cash, while larger dairies at $16-17 are building war chests for acquisition. Beef-on-dairy bought time, but created a replacement crisis—heifer inventories at 20-year lows, prices hitting $4,000. This structural shakeout accelerates through 2027. The market doesn’t care about your heritage. It cares about your production costs. Do the math now, or the bank will do it for you.

Stop waiting for the cycle to turn.

Economists tracking dairy markets are increasingly using a word we don’t often hear: structural. This isn’t 2009 or 2018. The game board has changed.

The FAO’s November numbers tell the story: the Dairy Price Index recorded its fifth consecutive monthly decline, dropping to 137.5 points—the lowest since September 2024. Global food prices have fallen for three straight months. But what’s making veteran producers uneasy isn’t just the price decline. It’s what’s driving it.

The forces reshaping this market aren’t cyclical headwinds that will reverse when prices fall far enough. They’re structural shifts that have permanently altered the demand equation. Understanding that distinction changes everything about how we should approach the next few years.

The China Syndrome: Why the Export Dragon Stopped Roaring

If there’s one development that separates this market environment from previous downturns, it’s China’s move toward dairy self-sufficiency. We’ve heard “China is changing everything” before, and sometimes those predictions haven’t aged well. But this time? The numbers don’t lie.

Between 2018 and 2023, China increased domestic milk production by 10 million metric tonnes. Let that sink in for a moment—that’s roughly 22 billion pounds of new milk supply that used to come from exporters like us. According to the USDA Foreign Agricultural Service, they reached the 40.5 million tonne target ahead of schedule. This wasn’t gradual market evolution. It was deliberate policy execution backed by massive state investment.

The Rabobank analysts tracking this have documented the shift in brutal detail. China’s dairy self-sufficiency climbed from roughly 70% in 2018 to approximately 85% by 2023. Their whole milk powder imports got cut in half in a single year—dropping from 845,000 metric tonnes in 2022 to just 430,000 in 2023.

And the domestic farms driving this aren’t small operations. Chinese dairy farms with more than 1,000 head grew from 24% of the national herd in 2015 to 44% by 2020, with government targets pushing toward 56% by 2025. These are modern, efficient mega-dairies designed to eliminate import dependency.

Why does this matter for a dairy farmer in Minnesota or Idaho, or Vermont? Because China was absorbing roughly half of global dairy import demand growth during the 2010-2020 period. That demand engine hasn’t just stalled—it’s running in reverse.

In five years, China added over 10 million tonnes of domestic milk and pushed self‑sufficiency toward 85%. That milk used to be your outlet. Betting on a Chinese demand rebound today is like betting that a brand‑new barn will sit empty.

Industry economists point out that even optimistic forecasts project only about 2% growth in Chinese imports for 2025. That’s nowhere near sufficient to absorb the additional production coming from major exporting regions.

Could Chinese demand recover faster than expected? A severe domestic disease outbreak or major policy shift could alter the trajectory. But those mega-dairy operations represent 20-30 year infrastructure investments. They’re not going away. Building your business plan around hoping they will is a recipe for disappointment.

The Great Migration: Why the Cows Are Leaving the Heartland

While global demand dynamics shift, something equally dramatic is happening right here at home. The geographic center of American dairying is moving—and moving fast.

The USDA’s production reports tell the story. Texas added about 46,000 dairy cows between late 2023 and early 2025, increasing from about 635,000 to roughly 690,000. Texas accounted for about 56% of all U.S. herd growth during that period. Production in the state increased by more than 10% year over year. Kansas added another 29,000 head. South Dakota grew by 21,000.

What’s driving it? Processing capacity. New cheese plants are pulling production to the region like gravity.

Texas A&M AgriLife Extension has been tracking the build-out: Cacique Foods opened their cheese plant in Amarillo in May 2024. Great Lakes Cheese completed their Abilene facility late last year. H-E-B’s processing operation in San Antonio opens this summer. And Leprino Foods’ Lubbock facility reaches Phase 1 completion in early 2026.

Meanwhile, traditional dairy states are hemorrhaging farms. Data from the Wisconsin Department of Agriculture shows the state lost 455 licensed dairy farms in 2023, with monthly exits running at 87-94 operations through late 2024—94 dairies exited in October, 94 in November, and 87 in December.

Here’s the twist: total herd size stayed relatively flat at around 1.27 million cows, and production actually ticked up slightly. The remaining farms are becoming remarkably more efficient—Wisconsin producers achieved 10-pound-per-cow yield gains last year, double the national average.

California faces its own pressures—water constraints and regulatory costs have contributed to herd reductions in recent years, though the state remains the nation’s top milk producer. In the Northeast, many operations have found viability through fluid milk premiums and direct market relationships that provide some insulation from commodity swings.

The cows aren’t leaving these states entirely. They’re concentrating into fewer, larger operations. That’s consolidation, not collapse—though the distinction offers cold comfort to the families exiting the business.

Texas, Kansas, and South Dakota are quietly adding tens of thousands of cows, while Wisconsin loses hundreds of licenses. This isn’t a slow fade; it’s a rerouting of national milk supply toward steel, stainless, and dryer capacity in the Southwest.

The Brutal Math: Why Location Determines Survival

Let’s cut through the sentiment.

When you build a new dairy operation in Texas or the Southwest, you’re typically building at a 3,000-5,000 cow scale with modern facilities optimized from the ground up. Land costs range from $2,000 to $ 3,500 per acre. Feed availability is strong—corn belt proximity, regional sorghum production, steady distillers grain supplies. University extension budgets from the region suggest efficient large operations can often achieve costs of production in the $15-17 per hundredweight range.

Wisconsin operations face different math. Land costs run $6,000-8,500 per acre—two to three times Texas levels. Existing farms often average 100-300 cows. Extension analysis from the region puts the average dairy’s cost of production in the $18-21 per hundredweight range.

At current milk prices of $17-19, that cost differential isn’t just significant; it’s substantial. It’s existential.

A Texas 4,000-cow dairy optimized from scratch can show positive margins at these prices. A 200-cow dairy in the Upper Midwest at the same prices is bleeding cash every single month.

Heritage and sentiment don’t pay the bills. If you’re milking 200 cows in Wisconsin without a niche market or paid-off land, the math is working against you every single month. That’s not pessimism—it’s arithmetic.

This doesn’t mean Upper Midwest dairy is dead. Wisconsin has real advantages: exceptional forage quality, deep industry infrastructure, generations of expertise, and world-class cheese-making facilities. But the farms that thrive there will look different than the traditional model. Larger. More efficient. More specialized. The producers who recognize this and adapt will survive. The ones waiting for the old economics to return will not.

Following the Cheese: Where the Processing Money Is Going

Dairy processors are making strategic allocation decisions that favor cheese production over commodity powders. These decisions have direct implications for which farms command premium pricing.

The investment numbers are staggering. According to the International Dairy Foods Association’s October announcement, U.S. dairy processors are putting approximately $11 billion into more than 50 new or expanded facilities across 19 states, with projects coming online between 2025 and early 2028. Industry publications are calling it the largest investment wave in U.S. agricultural processing history.

The market signal is clear: cheese demand remains genuinely strong. Global cheese market projections show growth of 4-5% annually through 2035. U.S. cheese exports surged significantly in 2025. Domestic consumption continues climbing.

Powder markets tell a different story. The FAO noted that weak import demand for powders—particularly from Asia—contributed to recent price declines, with heavy butter and skim milk powder inventories in the EU adding pressure.

This creates a pricing divergence showing up directly in milk checks. Industry reports from October showed the spread between Class III and Class IV prices reaching around $2.47 per hundredweight—historically wide. For a 500-cow farm, that’s a meaningful income difference depending on how your milk gets allocated.

The guidance from dairy economists is straightforward: think carefully about component profiles and processor relationships. Farms optimizing production for cheese components—typically balanced butterfat-to-protein ratios in the 1.15-1.20 range—are positioning themselves for the products processors actually need.

The Beef-on-Dairy Trap: When Short-Term Cash Creates Long-Term Problems

Beef-on-dairy helps cash flow. No question about it. According to NAAB data, beef semen sales to dairy farms reached 7.9 million units in 2023, with 2024 showing continued growth. Farms producing 300 beef-cross calves annually at current market prices of around $1,400 per head are generating substantial supplemental income.

But beef-on-dairy creates downstream consequences that are about to bite.

CoBank’s dairy analysis team has documented what’s coming: they project roughly 357,000 fewer dairy replacement heifers available in 2025, with an additional 439,000 fewer in 2026. These shortfalls reflect breeding decisions made in 2022-2023 that can’t be reversed. It takes more than two years for a heifer calf born today to enter the milking string.

Here’s where the math gets ugly. CoBank’s analysis shows heifer inventories have fallen to a 20-year low, with prices at some auctions reaching $4,000 per head. Think about that for a moment. If you’re selling beef-cross calves for $1,400 and you need to buy replacement heifers at $3,500-$4,000, the economics of that trade look very different from than they did two years ago.

New processing capacity coming online in 2025-2026 needs milk supply now. But the heifer rebound won’t materially impact milk supply until 2027-2028 at the earliest.

“The beef check helps. But it buys time rather than solving the underlying milk price problem. What producers do with that time is the real question.”

The Scale Advantage: Why Size Matters More Than Ever

USDA’s Economic Research Service publishes cost-of-production data that shows why scale has become the critical survival factor.

For a 500-cow operation at current prices around $18 per hundredweight, total production costs often run in the $20-21 per hundredweight range. Run those numbers across annual production, and you’re looking at losses approaching $300,000 or more per year. That’s roughly $600 per cow in the red.

A 2,000-cow operation at the same milk price sees different economics. Total production costs can run closer to $16-17 per hundredweight when you spread overhead across more volume. That translates to potential profit approaching $1 million annually—$450-500 per cow in the black.

Same milk price. Opposite outcomes.

A 200‑cow Upper Midwest dairy can lose roughly $300,000 a year at $18 milk while a 2,000‑cow Southwest unit clears close to $1 million. Same mailbox price, completely different story. If you don’t know which cost bar represents your farm, you’re flying blind into this shakeout.

The cost advantage comes primarily from non-feed costs: overhead, labor, equipment, and management spread across more production. Agricultural economists note that the cost curve has gotten steeper over the past decade. The spread between high- and low-cost producers has widened, meaning price downturns hit the bottom quartile much harder than in previous cycles.

Operations losing $300,000 annually are burning through reserves. With typical liquid reserves of $50,000-150,000, these farms face 6-18 months before financial stress forces difficult conversations with lenders. The larger operation strengthens its balance sheet—positioning to weather extended weakness or acquire neighboring operations.

The Consolidation Trajectory: Where We’re Headed

According to USDA Census data, the U.S. had about 24,000 dairy farms as of 2022, down from over 39,000 in 2017. That’s a 38.7% decline in five years. During this period, total milk production grew, and the national herd stayed near 9.4 million cows. The cows didn’t disappear—they concentrated into fewer, larger operations.

Current exit rates in major dairy states are running 6-8% annually. Wisconsin and Minnesota both saw 7.4% declines in 2023 alone.

Based on current cost structures and price forecasts, industry analysts project continued consolidation through 2026-2027, with exit rates potentially moderating toward 2028-2030 as the bottom of the cost curve exits and remaining operations stabilize.

These projections could shift based on several variables, including policy changes to the Dairy Margin Coverage program, unexpected demand recovery, disease events, or significant movements in feed costs. But they represent the trajectory suggested by current economics.

What’s Working: Patterns from Farms That Are Thriving

Certain patterns emerge among operations that are well positioned for this environment. None of this is magic—it’s execution.

Component optimization. Forward-thinking operations are shifting focus from pounds of milk to butterfat and protein pounds. Producers selecting for component production and feed efficiency rather than just milk yield are seeing butterfat gains of 0.2-0.3 points and protein improvements of 0.1-0.15 points. At current component prices, that’s often worth more than chasing another 1,000 pounds of milk per cow.

Balance sheet strength. Farms that will weather extended price weakness are preserving every dollar of margin for cash reserves or debt reduction. Agricultural lenders consistently advise producers to manage as if prices were $2 lower than they actually are. The farms that build 12-plus months of operating reserves will have options. The ones operating margin-to-margin won’t.

Feed cost management. With corn prices relatively favorable—USDA projects season-average prices around $3.90 per bushel for 2025—strategic operations are securing pricing on multi-month contracts. The operation with 60% of corn needs forward-priced knows its costs precisely. That certainty creates planning ability when milk prices are volatile.

Proactive lender relationships. Farms approaching lenders early—before struggling—are presenting scenarios showing performance at $18, $17, and $16 per hundredweight. Lenders who understand an operation’s position in advance tend to be more flexible than those who discovering stress after the fact.

The Questions That Matter

As you evaluate your operation, here are the questions that will determine your future:

On your cost position: What’s your true cost of production? Not the industry average—your number. How many months can you sustain current conditions with the reserves you actually have?

On your market position: Is your milk optimized for what processors need? Do you know whether your processor has growing, stable, or declining capacity needs?

On your regional position: Is new processing capacity coming to your area? What’s happening with your neighbors—expanding, maintaining, or showing signs of exiting?

On your timeline: If you’re contemplating an exit, does acting sooner preserve more equity than waiting? If you’re committed to continuing, what specific improvements can you implement in the next 90 days?

The Bottom Line

The dairy industry that emerges from this period will feature fewer, larger, more efficient operations concentrated in regions with processing capacity and favorable cost structures. That’s the direction the data points, consistent with trends underway for decades—just compressed and accelerated.

Some farms will use this period to strengthen their position and emerge as regional leaders. Others will make the difficult but wise choice to exit while equity remains intact.

The market doesn’t care about your family history. It cares about your production costs. Do the math, or the bank will do it for you.

KEY TAKEAWAYS:

  • This isn’t cyclical—it’s structural. China added 22 billion pounds of domestic milk production since 2018, permanently closing a market that absorbed half of global import growth.
  • The cows are moving Southwest. Texas gained 46,000 head last year; Wisconsin lost 455 farms. $11 billion in new processing capacity is cementing this shift for decades to come.
  • Scale now determines survival. Operations above $20/cwt are hemorrhaging cash at current prices. Larger dairies at $16-17/cwt are building war chests for acquisition.
  • Beef-on-dairy bought time—at a price. Heifer inventories hit 20-year lows. Replacements are reaching $4,000 per head.
  • Act while options exist. This shakeout accelerates through 2027. Know your true cost of production—before the bank calculates it for you.

Complete references and supporting documentation are available upon request by contacting the editorial team at editor@thebullvine.com.

Learn More:

The Sunday Read Dairy Professionals Don’t Skip.

Every week, thousands of producers, breeders, and industry insiders open Bullvine Weekly for genetics insights, market shifts, and profit strategies they won’t find anywhere else. One email. Five minutes. Smarter decisions all week.
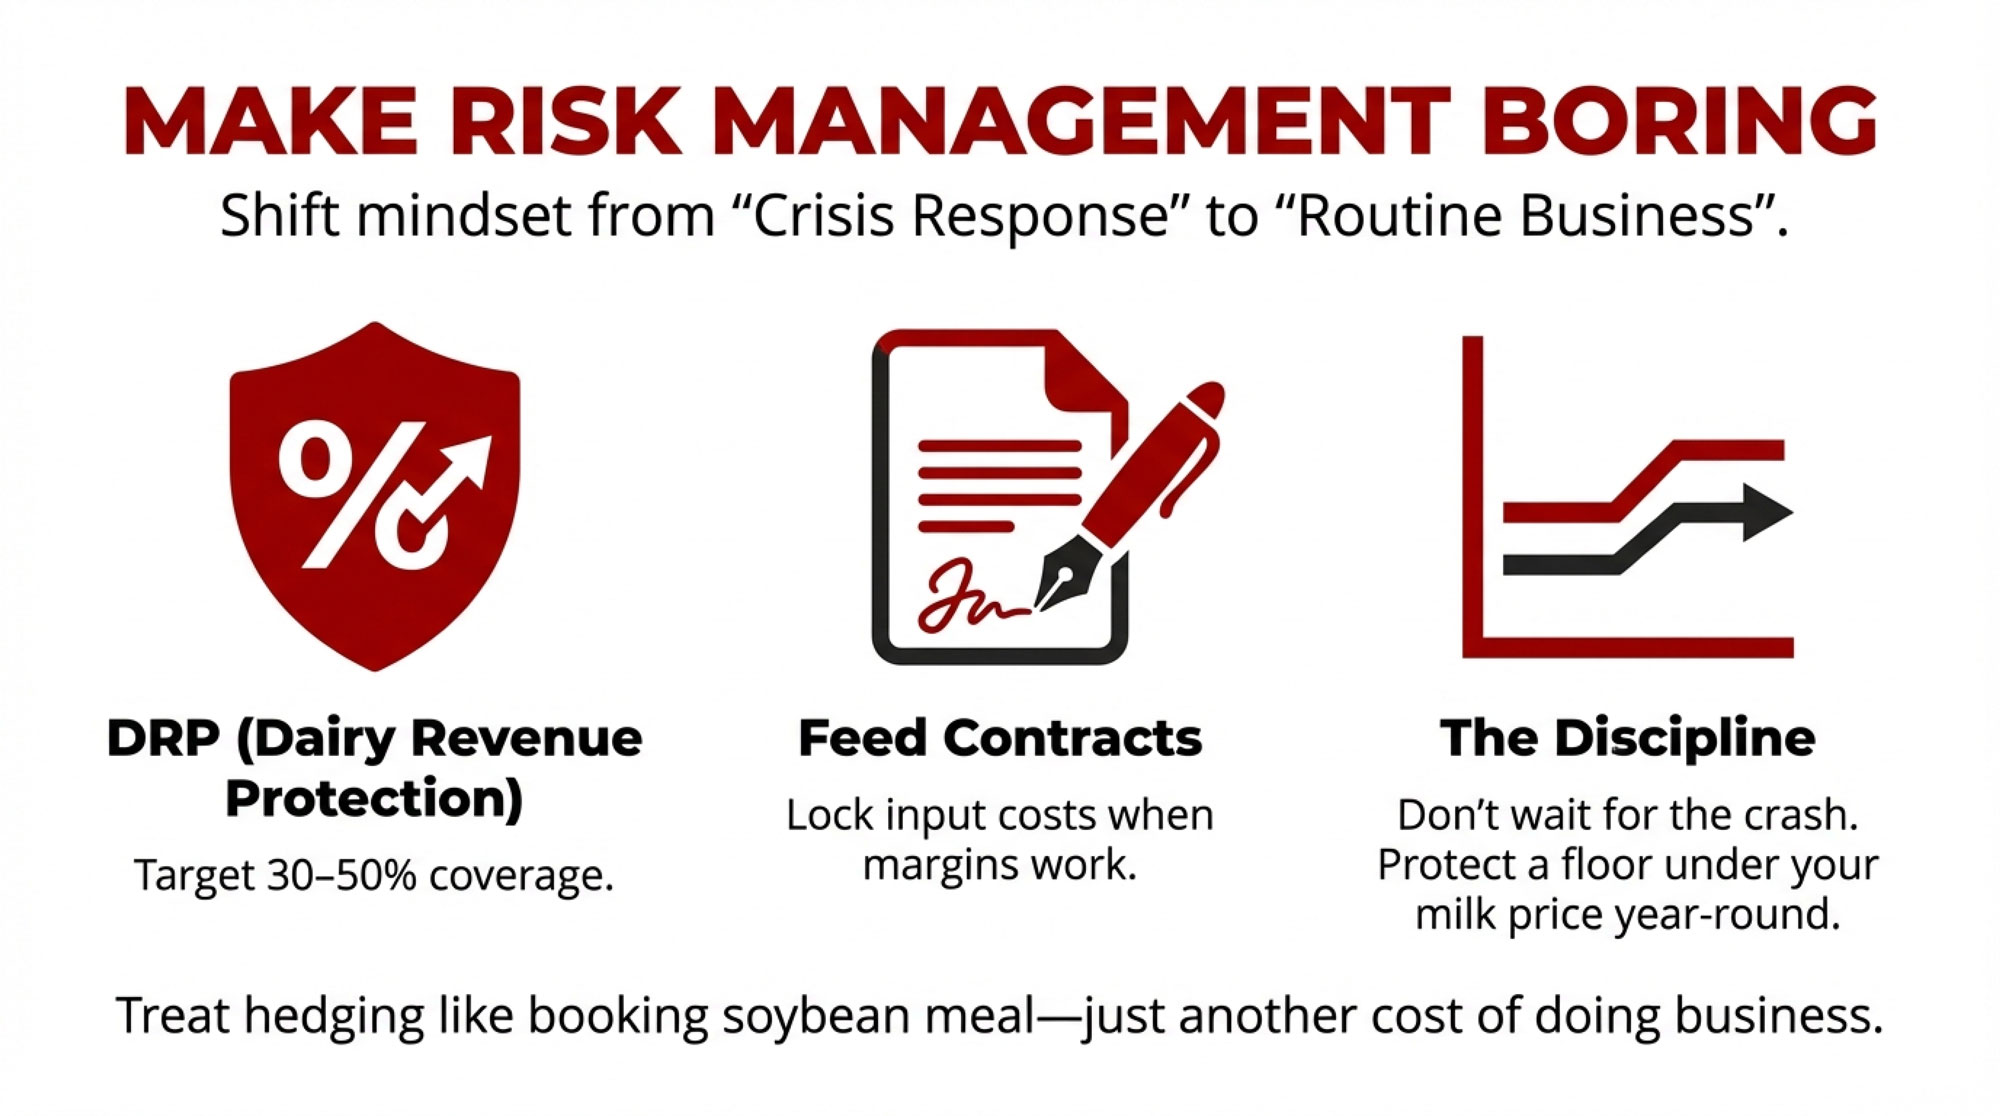
NewsSubscribe
First
Last
Consent

USMCA 2026: The $200M Question – Why Only 42% of U.S. Dairy Access to Canada Gets Used

USMCA gave us access to dairy markets in Canada. We’re using 42% of it. New Zealand just showed it can be fixed. The 2026 review is our window.

EXECUTIVE SUMMARY: USMCA promised U.S. dairy approximately $200 million in new annual access to Canada’s market. We’re using less than half. TRQ fill rates averaged just 42% in 2022/23, with Canada’s allocation system still favoring domestic processors—despite two dispute panels that exposed loopholes in the agreement’s original language. There’s reason for cautious optimism, though: New Zealand just pushed Canada past cosmetic adjustments through CPTPP, securing $157 million in annual export value. The 2026 USMCA review, combined with the ITC’s nonfat solids report due March 2026, gives U.S. dairy its clearest window to turn paper access into real orders. With consolidation accelerating—Wisconsin and Minnesota each lost 7.4% of their dairy farms in 2023—what happens in this review will ripple from trade policy down to your milk check. Here’s what happened, what’s possible, and what producers should watch as 2026 approaches.

You know how it goes. You’re out in the barn at 4 a.m., making sure the fresh cows are settling in, keeping an eye on that heifer that’s been off her feed. And somewhere in the back of your mind, you’re wondering what decisions being made in Ottawa or Washington might mean for next month’s milk check.

Trade deals get signed, politicians shake hands, there’s talk about “wins”—and then we wait to see if any of it actually turns into orders that need our milk.

Here’s what’s interesting about USMCA when you dig into the numbers. The University of Wisconsin Extension put out a detailed review earlier this year that adds up all the dairy tariff-rate quotas. They conclude that once everything’s fully phased in, U.S. exporters can ship up to about 3.6% of Canada’s annual dairy consumption into that market tariff-free. We’re talking milk, cream, cheese, butter, yogurt, powders—the works. Canadian trade law firms looking at the same schedules land on essentially that same number.

Now, Canada’s domestic dairy market runs around $17 billion, according to Dairy Reporter’s coverage earlier this year. So that 3.6% works out to roughly $200 million in potential new annual access for American dairy, based on Wisconsin Extension’s analysis.

And here’s the thing—total U.S. dairy exports to Canada have already climbed to an estimated $877 million in 2024, up from around $525 million back in 2021. That’s 67% growth in three years, which isn’t nothing.

But—and this is important—there’s a real difference between access on paper and orders that actually show up at the plant. That gap is where this whole story gets complicated, and honestly, where it starts to matter most for your operation.

USMCA Dairy at a Glance

  • Market access: 3.6% of Canada’s dairy market (~$200M in new annual access)
  • Total U.S. exports to Canada (2024): $877 million (up 67% since 2021)
  • TRQ fill rate (2022/23): Just 42% average; 9 of 14 quotas below 50%
  • Key date: ITC nonfat solids report due March 23, 2026
  • U.S. farm losses: 15,000+ dairies gone since 2017

The Spring That Changed Everything

You probably remember hearing about this, or maybe you lived through it yourself. Spring of 2017, when Canada’s policy changes stopped being something you heard about at meetings and started showing up in mailboxes.

Grassland Dairy sent letters to dozens of producers in Wisconsin and neighboring states saying their milk wouldn’t be picked up after May 1. Wisconsin Public Radio reported at the time that Grassland officially ended contracts with around 58 Wisconsin farms after giving them about a month’s notice. The Wisconsin Department of Agriculture, Trade, and Consumer Protection confirmed those numbers.

Grassland’s leadership told reporters the trigger was Canada’s new Class 7 pricing for ultra-filtered milk, which suddenly made Canadian-sourced protein ingredients cheaper and essentially squeezed out U.S. exports overnight.

What happened next showed something about our industry, though. State officials and dairy groups moved fast to line up alternatives. Dairy Farmers of America signed contracts with a significant number of the affected farms, and the Dairy Business Milk Marketing Cooperative helped coordinate other placements. By late spring, all but two of those Wisconsin herds had found new buyers—though many landed on shorter-term or trial contracts, which isn’t exactly the same as having that steady relationship you’d built over years.

I’ve spoken with producers who lived through that period, and many still describe it as a turning point. The frustration runs deep. You can do everything right in the barn—strong butterfat levels, solid fresh cow management, healthy transition periods—and then a milk pricing class in another country decides whether the truck shows up.

Stories like that are a big part of why dairy ended up so prominent in the USMCA negotiations.

What USMCA Actually Put on the Table

So what did the agreement really change?

First, Canada agreed to eliminate its Class 7 milk category—and, in some provinces, the related Class 6—and fold those volumes back into the existing pricing system. Analysis points out that this was specifically designed to prevent another situation like the ultra-filtered milk mess that had undercut U.S. exports.

Second, USMCA created new dairy tariff-rate quotas specifically for American products. Wisconsin Extension’s 2025 analysis goes line by line through the agreement and concludes that when all those TRQs are phased in over roughly six years, they add up to about 3.5–3.6% of Canada’s dairy market reserved for U.S. exporters. That covers milk, cream, cheese, butter, skim milk powder, yogurt, whey, and other products.

Now, most of us aren’t sitting around with calculators figuring out percentages of another country’s market. But here’s how I think about it: if Canada’s dairy sector runs around $17 billion domestically, and the agreement carved out roughly 3.6% for U.S. access, we’re talking about approximately $200 million a year in potential new trade value if it’s actually used. That’s real money for the processors and co-ops that handle our milk.

Canadian farmers noticed too. Dairy Farmers of Canada president Pierre Lampron called the signing of USMCA “a dark day in the history of dairy farming in Canada.” DFC’s statement said that, taken together, CETA, CPTPP, and USMCA had opened approximately 18% of Canada’s domestic dairy market to foreign competition, which they argued would destabilize supply management.

So from the U.S. side, USMCA’s dairy chapter looked like a major opportunity. From the Canadian side, it felt like one more cut into a carefully managed system. Both reactions are rooted in the same numbers—just different perspectives on what those numbers mean.

The Quota Puzzle: Access vs. Gatekeeping

Here’s where things get frustrating, and honestly, where the agreement shows its limitations.

On paper, USMCA’s dairy TRQs are pretty clear—they spell out how many tonnes of each product category can come into Canada each year at low or zero tariffs, and how those volumes grow over time. In practice, what matters just as much is who gets those quotas inside Canada.

Canada has the right to design its own TRQ allocation system, provided it complies with the agreement’s general rules. In its first go-round, Global Affairs Canada set up allocation rules that reserved a significant share of many dairy quotas for Canadian processors and “further processors.”

You can probably see where this is going. U.S. negotiators and dairy groups argued that this effectively put much of the access in the hands of companies that already had every reason to run Canadian milk through their plants, leaving less opportunity for importers, retailers, or food-service companies that actually wanted to bring in American product.

The United States requested a USMCA dispute panel. In early 2022, that panel released a report agreeing with the U.S. and Canada’s practice of reserving quota pools exclusively for processors, which conflicted with Article 3.A.2.11(b), which says countries shouldn’t limit access to allocations to processors. Hoard’s Dairyman described that panel result as an important step toward making the dairy quotas actually usable.

Canada rewrote its allocation policies. They removed the explicit processor-only set-asides and introduced “neutral” eligibility criteria based on market share and dairy trade activity. On paper, that was a shift.

In reality—and this is the part that still bothers many people—since large processors already dominate the market, they continued to receive most of the quota anyway.

The U.S. wasn’t satisfied and requested another panel in late 2022. This time, the second panel concluded that Canada’s usage of market-share calculations, while still favoring processors, didn’t technically violate the specific text of USMCA. It exposed a loophole in the original drafting of the agreement.

USTR Katherine Tai said she was “very disappointed by the findings,” and U.S. dairy organizations called the ruling a dangerous precedent.

So you end up with this real gap between a legal win and a commercial win. The first panel forced Canada to drop explicit processor-only pools, which mattered. The second panel showed that even with those pools gone, Canada can design rules that keep most of the quota in processor hands—and unless the agreement’s language is tightened, there’s not much the dispute system can do about it.

What’s the practical result? The International Dairy Foods Association reported that the average tariff fill rate was only 42% across all 2022/23 quotas, with 9 of the 14 TRQs falling below half the negotiated value. That’s a lot of access sitting unused.

The Protein Side: Export Caps and What’s Coming

Alongside TRQs into Canada, USMCA also tried to address something many of us worry about—the impact of surplus skim solids and proteins flooding world markets.

Under the agreement, Canada accepted limits on exports of skim milk powder and certain milk protein products. Reports breakdown notes that Canada agreed to cap combined exports of skim milk powder and milk protein concentrates at 55,000 tonnes in the first year and 35,000 tonnes in the second, with exports above those thresholds facing hefty charges.

For infant formula, the limits start at 13,333 tonnes in year one and rise to 40,000 tonnes in later years. The idea is to keep a supply-managed system from dumping excess solids into global markets at prices that drag down everyone’s Class IV.

In the early years after USMCA took effect, Canadian export volumes stayed under those caps—at least on paper. But Wisconsin Extension’s 2025 review points out that some processed food and blend categories containing milk solids have grown. U.S. analysts have raised questions about whether some of those flows are consistent with the spirit of USMCA’s export rules, even if they technically fit within defined product categories.

Why the ITC Report Matters

To move beyond questions and into actual evidence, USTR asked the U.S. International Trade Commission to conduct a deep dive. In May 2025, the ITC announced a new investigation into competitive conditions for nonfat milk solids covering 2020–2024. The report is due to USTR by March 23, 2026.

This is worth paying attention to. In July 2025, senior staff from the U.S. Dairy Export Council and the National Milk Producers Federation testified before the ITC, outlining how they believe foreign export policies—including Canada’s—shape global nonfat solids markets.

By the time USMCA’s formal review gets going, negotiators won’t just be leaning on anecdotes. They’ll have a thorough, independent dataset on how nonfat solids have actually moved under current rules.

What New Zealand Just Demonstrated

Sometimes, to see what’s actually possible, it helps to watch how another dairy-heavy country handled the same trading partner.

New Zealand brought a dispute under CPTPP over Canada’s dairy TRQ administration. They argued Canada’s allocation system was so restrictive that it effectively blocked much of the access promised on paper. A CPTPP panel sided with New Zealand, finding that several elements of Canada’s system breached its obligations.

At first, Canada made minimal adjustments. New Zealand officials—including Trade and Investment Minister Todd McClay—publicly said those changes didn’t go far enough and signaled they were prepared to keep pressing, including toward potential retaliatory steps.

That persistence paid off.

In July 2025, New Zealand announced it had reached a settlement with Canada. The Ministry of Foreign Affairs and Trade said Canada is committed to modify how it manages dairy TRQs, including how quota is allocated and reallocated when it goes unused. McClay stated that the agreement would deliver “up to $157 million per year in export value” for New Zealand’s dairy industry.

Cheese Reporter covered the announcement, noting that Canadian officials described the changes as “technical policy changes” that maintain the core of supply management. The modifications to Canada’s TRQ process will be published on October 1, 2025, for implementation with the 2026 calendar year quotas.

What jumps out to me in that story is the combination: clear panel rulings, solid data, and a government willing to push hard enough to get beyond cosmetic tweaks. It shows Canada can and will move further on quota administration when a trading partner builds a strong case and sticks with it.

For U.S. dairy, that’s an encouraging precedent heading into the 2026 review.

Why 2026 Is the Inflection Point

USMCA includes a formal six-year joint review. The three countries agreed to return to the table to assess how the agreement is working, where it’s falling short, and what needs updating.

That review isn’t limited to dairy—it’ll likely touch autos, labor provisions, dispute mechanisms, and supply-chain concerns tied to China.

On dairy specifically, U.S. groups have already sketched out their priorities. Looking at policy statements from the National Milk Producers Federation, U.S. Dairy Export Council, and regional organizations, a few themes keep coming up:

  • TRQ allocation rules that don’t effectively ring-fence most access for Canadian processors
  • Stronger “use-it-or-lose-it” provisions so unused quota gets reallocated in time, actually to be used
  • Clearer language on export disciplines so products that act like skim milk powder can’t bypass caps by shifting tariff codes
  • More responsive tools for resolving dairy disputes before they drag on for years

At the same time, dairy has to compete with other sectors for attention. Trade specialists note that autos and labor enforcement could dominate parts of the review.

That’s where the ITC report and farm-state congressional engagement become critical. Brownfield has reported that dairy-state lawmakers are asking for clear resolutions to cross-border disputes and signaling that they want USMCA’s renewal tied to stronger enforcement.

The Consolidation Reality Behind All This

While policy discussions play out in hearing rooms, the structure of our own industry keeps changing in ways you can see when driving from one township to the next.

USDA’s 2022 Census of Agriculture shows that U.S. farms with milk sales fell from 39,303 in 2017 to 24,082 in 2022—a loss of over 15,000 dairies in five years. Dairy Reporter’s analysis of that data, drawing on Rabobank research, notes that “almost 12,000” of those losses came from smaller operations.

Over that same period, total milk output grew, and the milking herd held near 9.4 million cows. The cows moved; they didn’t vanish.

Rabobank estimates that farms with more than 1,000 cows now produce about 67–68% of U.S. milk, up from around 60% in 2017. Reports essentially the same number. Cheese Reporter’s summary of the Rabobank work notes that the very largest operations—those with more than 2,500 cows—are a small slice of all dairies but produce close to half the milk.

In Wisconsin, the story is obvious. DATCP data shows the state lost 455 dairy farms in 2023, a 7.4% drop in licensed herds, while cow numbers and total production stayed roughly steady. That left Wisconsin with 5,895 dairies at the start of 2024.

Minnesota lost 146 dairies in the same period—also about 7.4% of its dairy farm base. Many of those exits were smaller family herds under 200 cows.

USDA’s Economic Research Service has tracked this “fewer but bigger” trend for years. Their research shows that economies of scale in feed handling, housing, and labor help explain why larger operations often have lower costs per hundredweight. Rabobank’s analysis reaches a similar conclusion and notes that newer technologies—from milking systems to data-driven management—tend to favor bigger herds that can spread the costs.

In many Midwest and Northeast communities, you can see it in the farm auction ads and the empty milk houses. In Western states, you see it in new freestall and dry-lot systems being built near export-oriented plants.

Trade policy isn’t the only driver—not by a long shot—but it’s part of the environment we’re all trying to navigate.

How It Looks from the Canadian Side

From our side of the border, Canadian supply management can look like a wall. From their side, the story has more layers.

Under supply management, Canada uses national and provincial quotas to align production with domestic demand, sets target prices through cost-of-production formulas, and relies on high over-quota tariffs—up to 300% —to limit imports, according to Dairy Reporter.

Dairy Global’s discussion of the system notes that it has historically provided more stable milk cheques than U.S. producers typically see, and it’s often credited with helping keep dairy herds across multiple provinces rather than allowing rapid regional hollowing out.

But Canadian economists have been pointing to serious weaknesses within that system.

Sylvain Charlebois, professor and director of the Agri-Food Analytics Lab at Dalhousie University, has written that Quebec now produces close to 40% of Canada’s milk even though its share of the population is just over 20%. Roughly 90% of the country’s dairy farms are concentrated in a small number of provinces.

In a column earlier this year, he warned that if current trends continue, Canada could lose nearly half of its remaining dairy farms by 2030—even with supply management—because high quota costs and structural pressures make it harder for smaller and younger producers to enter or stay in.

On the other side, Dairy Farmers of Canada and provincial organizations stress that supply management has shielded their farmers from the worst price collapses. It’s also allowed the federal government to design compensation programs tied directly to trade concessions.

Government of Canada announcements confirm that total compensation measures to dairy farmers for market access granted under CETA, CPTPP, and USMCA amount to $3.2 billion CAD—roughly $330,000 per dairy farm, according to USDA Foreign Agricultural Service analysis. DFC has argued these payments, combined with controlled borders, are essential to preserving viable dairy farms in rural communities.

As Canada heads into the 2026 review, its negotiators are trying to protect a system many producers view as vital, while also facing internal voices calling for modernization. That context matters when we think about how far they can realistically move on TRQs and export rules.

What This Means on Your Farm

From a practical standpoint, here are three things worth keeping in mind:

  • USMCA created real, measurable access—about 3.6% of Canada’s dairy market, worth approximately $200 million annually in new opportunities—but TRQ design has limited how fully that access gets used. Fill rates averaged just 42% in 2022/23.
  • U.S. dairy is consolidating fast—over 15,000 farms gone since 2017, with large herds now producing most of the milk.
  • Wisconsin and Minnesota’s 7.4% herd losses in 2023 show how intense the pressure remains on small and mid-size dairies, even when total production holds steady.

Smaller Herds (Under ~200 Cows)

In many Midwest and Northeast operations of this size, the daily focus is on keeping feed costs in line, managing labor, and getting fresh cows through the transition period without problems. You’re working on butterfat performance, trying to keep cows out of the hospital pen, because every health issue shows up on the milk check.

For herds this size, trade policy usually shows up as background volatility in the pay price rather than something you feel directly every week. A better-functioning USMCA can’t fix tight local basis or labor headaches, but it can help support more stable demand for cheese, powders, and butterfat—which, over time, makes planning a little easier.

It’s often helpful for operations this size to ask your buyer or co-op how much of their volume ends up in export channels, including Canada. And risk-management tools that fit your scale—such as Dairy Margin Coverage and simple forward contracts through your co-op—can help cushion the impact when global markets shift.

Mid-Size Herds (Roughly 200–800 Cows)

In Wisconsin or New York, a 400-cow freestall herd might ship somewhere around 9 million pounds of milk per year. A $0.50 per hundredweight swing in average price adds or subtracts roughly $45,000 annually; a $1.00 swing is about $90,000.

That’s the kind of money that can decide whether you move ahead with a parlor upgrade, improve transition-cow facilities, or keep nursing along older infrastructure.

Conversations I’ve had with mid-size producers across the Northeast and Upper Midwest often come back to a similar theme—they’re not big enough to ride out a bad year on volume alone, and not small enough to just tighten the belt and wait it out. A $0.75 swing per hundredweight can mean the difference between reinvesting and treading water.

For these farms, the way USMCA performs becomes a meaningful piece of the margin puzzle. Worth considering: sitting down with your lender or financial adviser and running a couple of “what if” scenarios for pay price over the next five years, especially around the 2026 review window.

And talking with your processor or co-op about how they’re currently using USMCA access and where they see Canada fitting into long-term plans.

Large Herds (800+ Cows)

In Idaho, California, the Texas Panhandle, and eastern New Mexico—large freestall and dry lot systems often ship to plants that rely heavily on exports. USDEC data and industry coverage indicate that these plants depend on markets such as Mexico, Canada, and various Asian and Middle Eastern countries to balance their solids.

Operations at this scale already treat trade policy as a central piece of their risk map, alongside water, labor, and environmental regulations.

The sentiment I hear from managers running these larger operations is that they watch USMCA the way they watch their water supply. It’s not the only thing that matters, but when it moves, it affects everything downstream.

For large herds, a stronger USMCA dairy chapter can reduce uncertainty about where incremental solids can go, encourage processors to invest in new dryers and cheese capacity that need dependable outlets, and lower the risk that policy shocks derail expansion plans.

It won’t change the need for good cow comfort or people management, but it does affect how risky that next big capital project feels.

What to Watch as 2026 Approaches

With everything else on your plate, here are three signals worth tracking—plus a few questions you can take straight to your next co-op or lender meeting.

The ITC’s Nonfat Solids Report

When the ITC releases its report, look at whether it clearly documents how foreign support and export practices—including Canada’s—are influencing nonfat solids markets.

Does it identify specific product categories that appear to be carrying milk solids in ways that don’t match USMCA’s intent? Does it quantify competitive effects on U.S. Class IV and powder markets?

The more concrete and specific it is, the more leverage U.S. negotiators will have.

Dairy-State Lawmakers’ Engagement

Brownfield and other outlets are already reporting that dairy-state legislators are asking for stronger enforcement on Canadian TRQs and export caps.

Watch for formal hearings or bipartisan letters tying USMCA’s long-term renewal to measurable improvements in dairy access.

When elected officials start using the same numbers you see in farm papers—like the 7.4% herd losses in Wisconsin and Minnesota—that’s a sign dairy is on their radar.

How Canadian Officials Frame the Review

Canadian ministers and Dairy Farmers of Canada have typically described past trade-driven dairy changes as “technical” or “administrative” adjustments while insisting supply management’s core remains untouched.

It’ll be telling to see whether they talk about the 2026 review purely as housekeeping, or whether you start hearing language about making quotas “function commercially” for trading partners—similar to the framing that emerged after the New Zealand settlement.

Questions to Ask Your Processor

To bring this closer to where your own milk truck turns in, here are three questions worth asking your plant or co-op:

  1. How important is Canada in your current and planned export mix compared to Mexico and Asia?
  2. Are you using USMCA dairy quotas now? If not, what would need to change—on TRQ rules or export caps—to make them worth pursuing?
  3. If USMCA’s dairy chapter gets stronger or weaker in 2026, how would that change your investment plans over the next five to ten years?

Their answers will tell you a lot about what the review might mean for your milk check.

The Bottom Line

When you step back from all the numbers and panel rulings, the picture is reasonably clear.

USMCA did open a real, quantified slice of Canada’s dairy market—around 3.6%, worth approximately $200 million in new annual access—to U.S. exporters and forced the elimination of Class 7. Total U.S. dairy exports to Canada have grown to an estimated $877 million in 2024, up 67% from 2021. That’s genuine progress.

The first USMCA panel showed that Canada’s original processor-heavy allocation wasn’t acceptable under the agreement. The second panel showed the limits of what legal text alone can achieve when the specific wording leaves loopholes.

New Zealand’s CPTPP experience demonstrated that a combination of solid evidence, favorable rulings, and persistent follow-through can push Canada into changes with real commercial value—not just cosmetic adjustments.

At the same time, consolidation on both sides of the border is a reality, not a forecast. U.S. data show over 15,000 dairies gone since 2017, with most milk now coming from herds over 1,000 cows. Wisconsin and Minnesota’s 7.4% herd losses in 2023 are just one sharp snapshot.

In Canada, economists like Sylvain Charlebois are warning they could lose nearly half their remaining dairy farms by 2030 if nothing changes—even under supply management.

The honest takeaway is this: USMCA isn’t going to decide, all by itself, whether you milk cows next year. That still comes down to your forage program, butterfat performance, fresh cow management, your debt load, your labor situation, and the people around your kitchen table.

What this agreement can do—especially if the 2026 review delivers targeted improvements—is narrow the range of bad surprises. It can make it less likely you wake up to another shock like those Grassland letters, or find that the access that looked good in a press release never made it past the quota gatekeepers.

In a business where we’re already juggling weather, feed, labor, and regulations, having one more piece of the puzzle behave a bit more predictably is worth paying attention to.

And as many of us have seen over the years, when producers speak up—to co-ops, to farm organizations, to lawmakers—it does shape how these agreements evolve. As 2026 gets closer, it’s not a bad time to think about what you’d like this deal to do for the people who actually care for the cows, and to make sure those voices are heard.

KEY TAKEAWAYS 

  • The Access Gap: USMCA promised U.S. dairy $200 million in new annual access to Canada. Fill rates average just 42%—more than half goes unused because of how Canada allocates quota to domestic processors
  • The Enforcement Limit: The first dispute panel ruled in our favor. The second exposed a loophole: Canada can design allocation rules that favor processors without technically violating USMCA’s language
  • New Zealand’s Playbook: Their CPTPP settlement forced Canada past cosmetic fixes, securing $157 million in annual export value. Persistent, evidence-backed pressure works
  • The 2026 Window: The formal USMCA review and the ITC’s nonfat solids report (due March 2026) give U.S. dairy its clearest shot at turning paper access into real orders
  • Your Move: Ask your processor about their Canada strategy. Run price scenarios with your lender around the 2026 timeline. Make sure dairy-state lawmakers hear from producers—not just lobbyists

Complete references and supporting documentation are available upon request by contacting the editorial team at editor@thebullvine.com.

Learn More:

The Sunday Read Dairy Professionals Don’t Skip.

Every week, thousands of producers, breeders, and industry insiders open Bullvine Weekly for genetics insights, market shifts, and profit strategies they won’t find anywhere else. One email. Five minutes. Smarter decisions all week.
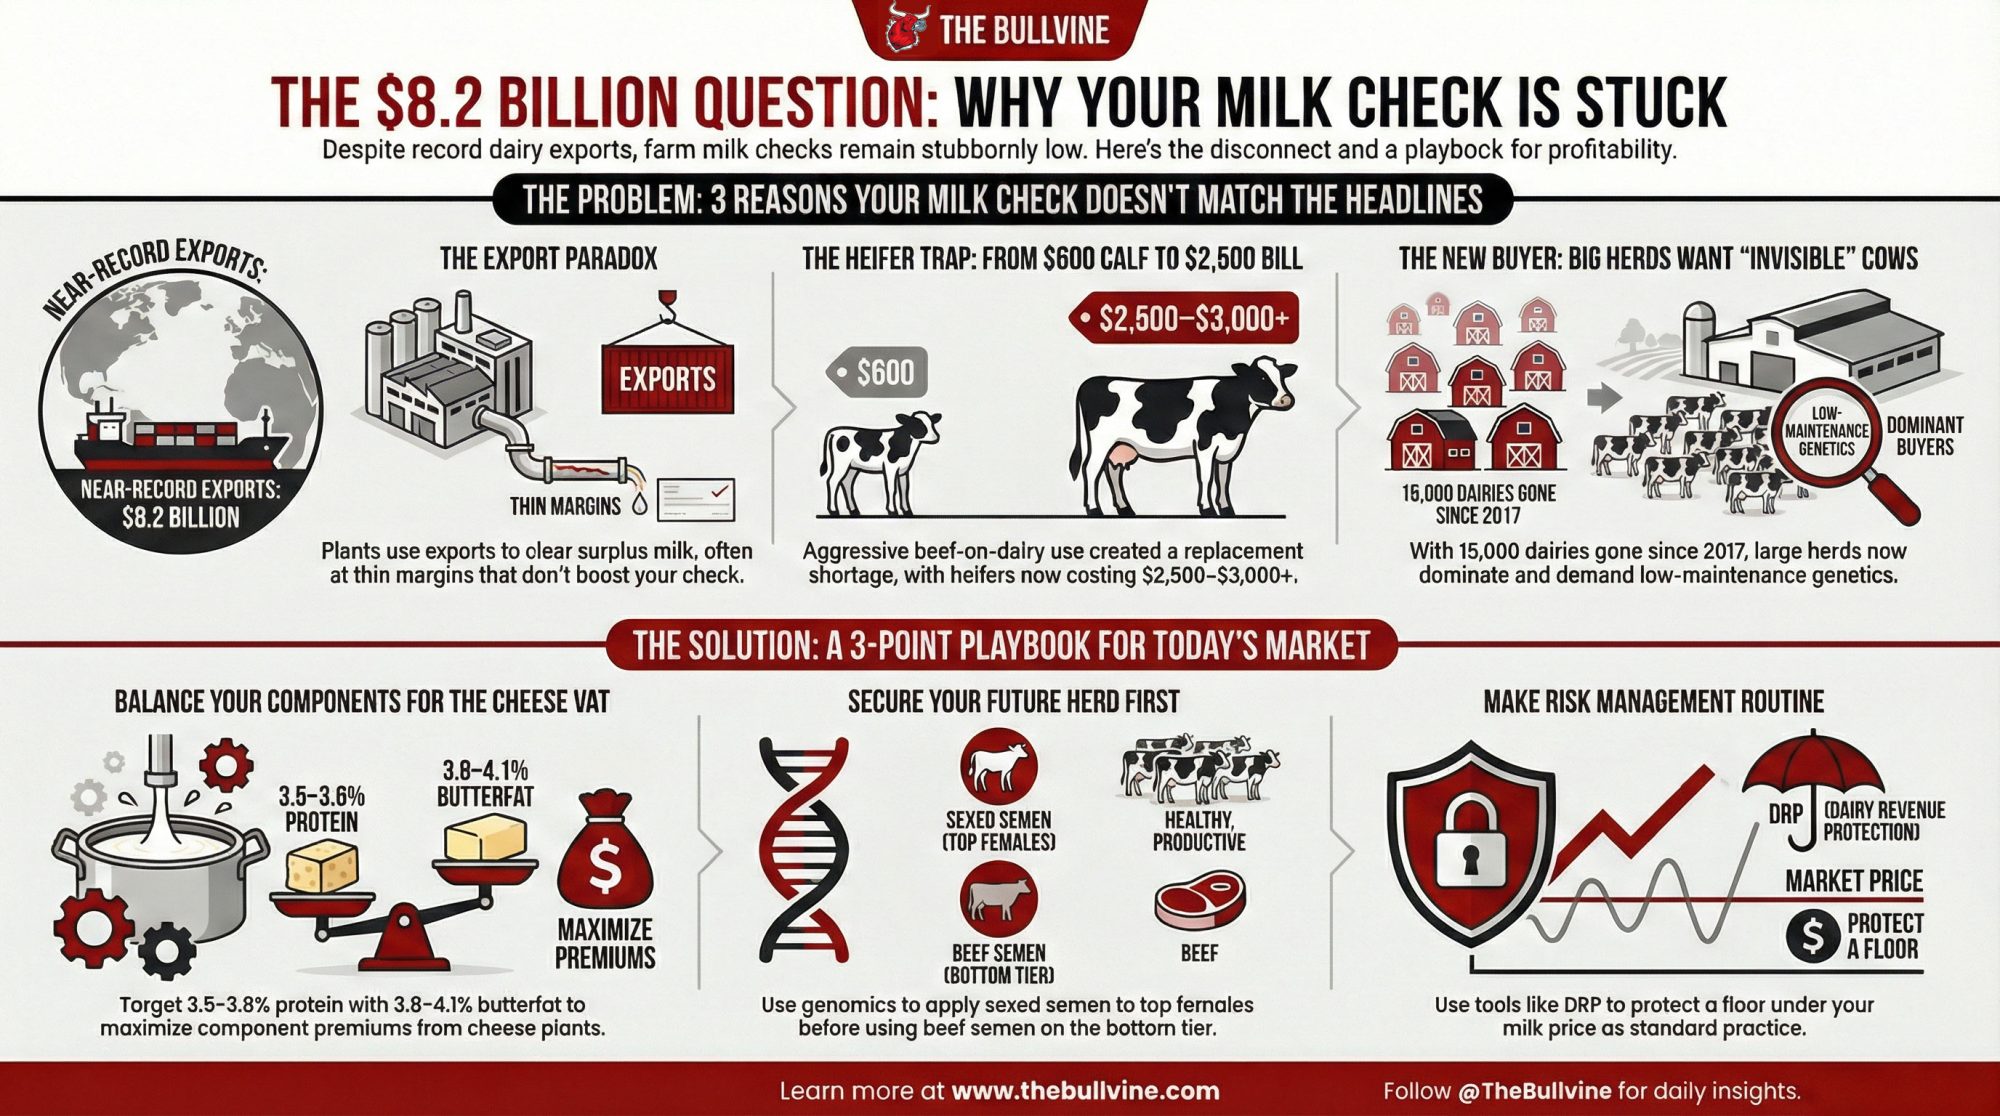
NewsSubscribe
First
Last
Consent

Bailouts, Beef, and Butterfat: When $15K Won’t Fix a $370K Hole

$15,000 from Washington. $370,000 in the red. The bailout’s a band-aid on a bullet wound—here’s what producers who’ll survive 2026 are doing right now.

EXECUTIVE SUMMARY: The $12 billion bailout sounds big—until you run the numbers. Dairy competes for scraps from a $1 billion ‘other commodities’ pool. A 500-cow operation might see $15,000. That covers 4% of projected annual losses exceeding $368,000. The June FMMO reforms made it worse: producers lost $337 million in pool revenue in just 90 days, according to AFBF analysis. But the dairies positioned to survive aren’t waiting on Washington. Beef-on-dairy crossbreeding is generating $90,000-$135,000 in new annual revenue. Component optimization is adding $50,000-$90,000 through butterfat gains. The bailout’s a band-aid—these moves are what separate survivors from casualties heading into 2026.

When the bailout announcement hit Monday morning, Jeff Voelker did what he’s done every month for the past year—he pulled up his spreadsheet and reran the numbers.

Voelker milks 480 cows outside of Marshfield in central Wisconsin. Good herd. Solid genetics. Third-generation operation. The kind of dairy that should be thriving. Instead, he’s been watching his working capital erode month after month, wondering how long the runway really is.

“I appreciate any help Washington sends our way,” Voelker told me when we spoke Tuesday. “But I’m not making business decisions based on that check. I’m making them based on what my cows and my land can actually do.”

That sentiment—grateful but exhausted—captures where a lot of mid-size producers find themselves this December. Because let’s be honest: after years of margin compression, trade wars, pandemic disruptions, and now FMMO reforms that took another bite out of the milk check, there’s a weariness setting in. Another bailout announcement. Another round of wondering if Washington actually understands what’s happening on the ground.

The Trump administration’s $12 billion agricultural aid package brings welcome relief. But for most dairy operations, it’s a band-aid on a bullet wound. Understanding what it actually covers—and more importantly, what it doesn’t—requires looking past the headline figures and getting realistic about what comes next.

Where Dairy Fits in This Package

Let’s be brutally honest: if you’re banking on this $12 billion to fix a structural deficit in your operation, you’re already in trouble. The check will clear, the lights will stay on for another month, but the fundamental math of 2026 hasn’t changed.

Here’s what the check actually looks like.

The bulk of the package—roughly $11 billion according to USDA program details and confirmed by the Washington Times and Forbes—flows through the new Farmer Bridge Assistance program targeting row crop producers affected by trade disruptions. Soybeans, corn, wheat. The commodities that dominate political conversations in farm states.

Dairy’s allocation comes from the remaining $1 billion designated for “other commodities”—a pool we’re sharing with specialty crops and other livestock sectors. USDA officials noted at Monday’s briefing that specific payment rates are “still being finalized.” If you’ve been around long enough, you recognize that language.

What we can do is look at precedent. During the 2018-2019 Market Facilitation Program, dairy received commodity-specific payments of $0.20 per hundredweight according to USDA Farm Service Agency program records. If something similar applies here—and that remains genuinely uncertain—we can start modeling what individual farms might expect.

Estimated payment ranges by operation size:

Herd SizeAnnual ProductionLikely Payment Range
100 cows~23,500 cwt$3,000 – $5,000
500 cows~117,500 cwt$12,000 – $20,000
1,000 cows~235,000 cwt$20,000 – $35,000
2,000+ cows~470,000+ cwt$35,000 – $50,000*

*The MFP had a $250,000 per person cap, with a total household cap of $500,000, which limited larger operations

These estimates assume dairy captures roughly half of that $1 billion “other commodities” allocation. That might prove optimistic depending on how specialty crop interests advocate for their share. We’ll have better clarity when USDA publishes the final rule, likely sometime in January.

The Margin Picture Heading Into 2026

To put these payments in proper context, it helps to understand where dairy margins actually stand right now. And the picture isn’t pretty.

USDA Economic Research Service projects an all-milk price around $19.25-$19.50 per cwt for 2026, which aligns with what dairy economists have been tracking. Mark Stephenson, who spent years as director of dairy policy analysis at the University of Wisconsin-Madison before his recent retirement, has been following these projections closely, and the outlook has remained stubbornly consistent.

Meanwhile, production costs for mid-size operations—those 300 to 700 cow dairies that form the backbone of states like Wisconsin, Minnesota, and Michigan—are running $21.50 to $23.00 per cwt according to University of Illinois FarmDoc analysis and USDA cost of production data. The exact number depends on your region, feed situation, and labor management.

Based on those projections, here’s what the math looks like for a representative 500-cow dairy:

📊 THE 500-COW REALITY CHECK

CategoryAnnual Figure
Milk Production117,500 cwt
Gross Revenue (at $19.50/cwt)$2,291,250
Operating Costs (at $22.64/cwt)$2,660,200
Net Position-$368,950
Bailout Payment~$15,000
Bailout as % of Loss4.1%

That potential $15,000 bailout payment represents about 0.6% of annual operating costs. It covers roughly two weeks of feed. Maybe a month of debt service. It’s meaningful as supplemental support—nobody should dismiss it. But it’s not moving the needle on a $370,000 annual loss.

What’s been consistent in conversations with producers over recent weeks is this recognition. They’re grateful for assistance, but they’ve learned not to build business plans around government payments that may arrive on uncertain timelines and in uncertain amounts. The operations weathering this period best are focused on what they can actually control.

Understanding the June FMMO Changes

This brings us to something that is still causing real frustration across the industry: the Federal Milk Marketing Order reforms that took effect on June 1, 2025.

I’ve talked with several producers who know their milk checks have changed but aren’t entirely sure why. So let me walk through this carefully.

The reforms included several adjustments, but the one generating the most anger is the increase in “make allowances.” These are the manufacturing cost credits that processors deduct from raw milk prices before pool distribution—essentially, what processors retain to cover their costs of turning your milk into cheese, butter, or powder.

Under the new rules, these allowances increased from approximately 5 cents to 7 cents per pound across cheese, butter, and powder classes according to the USDA Agricultural Marketing Service final rule. That adjustment comes directly out of producer prices before you ever see it.

Processors and cooperative leaders will tell you these updates were necessary corrections to the 2008 economics. And sure, inflation is real for everyone—manufacturing costs for labor, energy, and equipment have increased substantially over the past seventeen years. There’s some validity to that argument.

But for the producer on the receiving end of a 7-cent deduction, it feels less like an “update” and more like a wealth transfer from the milking parlor to the processing plant. It’s a bitter pill to swallow watching your milk check shrink to subsidize the processing sector, especially while some of those same processors post record earnings and cooperative patronage dividends remain flat.

The numbers tell the story. The American Farm Bureau Federation analyzed the first three months following implementation. AFBF economist Danny Munch reported in September 2025 that dairy producers collectively received approximately $337 million less in pool revenues than they would have under the previous formula. That’s $337 million out of producer pockets in just 90 days.

For individual farms, the impact varies by region and milk utilization. Operations in cheese-producing regions—Wisconsin, Idaho, parts of California’s Central Valley—appear most affected, with some producers reporting effective price reductions of $0.75 to $0.87 per cwt compared to pre-reform levels.

What this means practically: A 500-cow dairy that might have expected $2.39 million in milk revenue under the old formula could now be looking at $2.29 million—a $100,000 annual difference that makes any bailout payment look like pocket change.

The reform also returned the Class I pricing formula to a “higher-of” structure intended to benefit fluid milk producers and updated composition factors for protein and other solids. For operations in fluid-heavy markets, those changes may partially offset the make allowance impact. But for cheese-market producers—which describes most of the Upper Midwest—the make allowance adjustment dominates everything else.

The Global Context

One factor that often gets overlooked in domestic policy discussions: we’re operating in an interconnected global market, and right now, milk is flowing everywhere.

Rabobank’s quarterly Global Dairy reports show milk supply growth of around 2% across major exporting regions for the second half of 2025. New Zealand posted solid production gains despite earlier concerns about drought. The EU has been running above year-ago levels through much of the year.

This matters because global supply dynamics put a ceiling on how high U.S. prices can realistically climb. That same Rabobank analysis projects supply growth moderating to under half a percent by 2026, but continued pressure on world dairy commodity prices appears likely through at least mid-year.

The takeaway isn’t pessimism—it’s realism. Even if domestic conditions improve, global supply patterns suggest we shouldn’t expect dramatic price recovery to solve margin challenges. Which brings us to what actually might.

How Forward-Thinking Producers Are Responding

Here’s where the conversation becomes more encouraging—and more actionable.

Across the industry, I’m seeing producers treat this moment as an opportunity to accelerate changes they’d been considering. The operations that seem most confident heading into 2026 aren’t waiting for market recovery or larger government programs. They’re focused on revenue diversification and operational refinement—variables within their direct control.

Three approaches keep emerging in conversations.

Building Revenue Through Beef-on-Dairy

This might be the most significant shift in dairy economics over recent years, and if you haven’t run the numbers for your operation, you’re probably leaving serious money on the table.

With beef markets strong, verified crossbred calf values are running $350-$500 per head compared to $25-$75 for traditional Holstein bull calves. According to an American Farm Bureau Federation analysis, dairy-origin cattle account for roughly 20-28% of the annual U.S. calf crop, with beef-on-dairy crossbreds now representing an estimated 12-15% of fed cattle slaughter—and growing rapidly. A 2024 Purina survey found that 80% of dairy farmers and 58% of calf raisers now receive a premium for beef-on-dairy calves.

📊 THE BEEF-ON-DAIRY MATH (500-cow herd, 60% bred to beef)

Revenue SourceHolstein BullsBeef-Cross Calves
Calves sold annually~300~300
Value per head$25-$75$350-$500
Annual calf revenue~$15,000$105,000-$150,000
Net gain from the switch+$90,000 to +$135,000

That’s not a typo. We’re talking about a potential six-figure revenue swing from a breeding decision you can make this week.

I recently spoke with Mark Hendricks, who milks 520 cows near Charlotte, Michigan. He made the transition in 2023. “It’s not complicated,” he explained. “I identified my bottom 60% on genomics, stopped using dairy semen on them, and contracted with a beef aggregator. My calf revenue went from around $15,000 to over $100,000 in one year.”

But here’s what really excites the breeder in me about this strategy: it’s not just about the calf check. When you commit to breeding beef on your bottom 60%, you’re forcing yourself only to generate replacements from your absolute best females. Every heifer that enters your milking string comes from a top-40% dam. You’re accelerating genetic progress while getting paid to do it.

Think about that for a moment. Instead of keeping mediocre replacements because you need the numbers, you’re culling harder, breeding smarter, and generating a six-figure revenue stream in the process. The economics align with the genetics in a way that rarely happens in this industry.

Key considerations if you’re exploring this approach:

  • Forward contracts with beef finishers typically offer $100-$200 per head premium over spot market sales
  • Sire selection matters significantly—calving ease scores and carcass merit both influence value
  • Some cooperatives now offer specific programs for verified crossbred calves
  • Plan breeding strategy around your herd’s actual genetic ranking, not arbitrary percentages
  • Work with your genetics advisor to identify the true cutoff line for dairy replacements

What’s particularly noteworthy is how quickly this has shifted from experimental to standard practice among progressive herds. Five years ago, breeding dairy cows to beef was something you did with your problem animals. Now it’s a deliberate profit center and genetic accelerator.

Optimizing for Components

The FMMO reforms reinforced something that’s been building for years: the market rewards components over fluid volume. If you’re still managing primarily for pounds of milk, you’re chasing the wrong number.

Looking at Council on Dairy Cattle Breeding data and current component pricing, each 0.1% increase in butterfat is worth approximately $0.25 per cwt. That accumulates quickly.

For a 500-cow dairy, moving from 3.8% to 4.1% butterfat—a 0.3-point improvement achievable through genetics and nutrition over 18-24 months—translates to roughly $88,000 in additional annual revenue.

Maria Gonzalez runs a 650-cow operation with her husband near Hanford in California’s Central Valley. “We stopped chasing pounds five years ago,” she told me. “Our rolling herd average dropped about 2,000 pounds, but our milk check went up $40,000. Components changed everything for us.”

What this looks like practically:

  • Shifting genetic selection toward Net Merit (NM$ or CM$) indexes that weight components more heavily
  • Working with your nutritionist on rations supporting de novo fatty acid synthesis
  • Making reproduction decisions based on component performance, not just production volume
  • Tracking Combined Fat + Protein in pounds per cow per day

Producers who do this well tend to set Combined F+P above 7 lbs/cow/day as their benchmark. That seems to be where the economics really accelerate under current pricing structures.

Evaluating Scale and Structure

This is genuinely the most difficult topic, and there’s no universal answer.

Industry economists have noted that operations with 300 to 700 cows often face particular challenges—too large to operate primarily with family labor, but not large enough to capture the fixed-cost efficiencies available to larger operations fully.

USDA Economic Research Service cost of production estimates from 2023-2024 illustrate the scale dynamics:

  • Under 200 cows: $24-$28/cwt
  • 200-500 cows: $21-$25/cwt
  • 500-1,000 cows: $19-$22/cwt
  • Over 2,000 cows: $17-$20/cwt

That $2-$4 per cwt cost advantage at larger scale isn’t primarily about management quality—many smaller dairies are exceptionally well-managed. It’s largely about spreading fixed costs across more production units.

This doesn’t mean mid-size dairies can’t succeed. Many do, consistently. But success at that scale typically requires exceptional operational efficiency, premium market positioning, diversified revenue, or creative approaches to capturing scale benefits.

Options worth considering:

Collaborative arrangements with neighboring operations—sharing equipment, labor, or specialized services without full merger. Several partnerships I’m aware of in Wisconsin and Minnesota involve family operations sharing nutritionists, coordinating heifer programs, or jointly owning harvest equipment. These capture meaningful efficiencies while preserving independent ownership.

Strategic expansion for operations with strong balance sheets and available resources. The numbers suggest reaching 800-1,200 cows meaningfully improves cost structure—if the transition can be managed well.

Thoughtful transition planning for producers approaching retirement without identified successors. Recognizing that exiting while asset values remain relatively strong may better serve family interests than extended losses followed by a distressed sale. That’s not failure—it’s sound business judgment.

The Cooperative Conversation

One topic that emerged repeatedly in my reporting: how cooperatives participated in the FMMO reform process.

The January 2025 referendum approving the FMMO changes passed in ten of the eleven Federal marketing orders. The voting structure itself raised questions for some producers.

Under regulations established in the Agricultural Marketing Agreement Act, cooperatives can exercise “bloc voting”—casting ballots on behalf of member producers rather than requiring individual votes. This means many producers didn’t receive personal ballots; their cooperative boards voted based on their assessment of member interests.

Reasonable perspectives exist on both sides of this structure. Cooperative leaders note that bloc voting enables efficient administration of complex decisions and that elected boards are specifically chosen to make these judgments. That’s a legitimate point, and cooperative governance has deep roots in American agriculture.

Some producer advocates, including the American Farm Bureau Federation, have proposed “modified bloc voting,” allowing individual producers to request separate ballots when they disagree with their cooperative’s position. AFBF’s October 2025 policy brief outlined several such reforms.

USDA hasn’t adopted changes, though discussions continue.

What I’d encourage: understand how your cooperative makes policy decisions and engage actively. Most cooperatives solicit member input before major votes. Participating in those forums—attending meetings, asking questions, communicating with board representatives—is the most direct way to influence decisions affecting your operation.

Succession Considerations

One aspect deserving more attention: what current conditions mean for generational transfer.

When support programs maintain elevated land and asset values despite operating losses, the mathematics for incoming generations become brutal. Young farmers looking to purchase or assume 500-cow operations face asset valuations often based on historical performance or land appreciation, but an operating reality that includes current losses requiring significant working capital.

Farm Credit Canada’s November 2025 succession report found that capital requirements now constitute the primary barrier to next-generation entry, ahead of land availability, family dynamics, or technical knowledge. That finding likely applies similarly in the U.S.

“The worst outcome is transferring an operation to the next generation based on optimistic projections that don’t materialize,” observes Jennifer Horton, a farm succession specialist with University of Minnesota Extension who works extensively with dairy families throughout the Upper Midwest. “Honest conversations about margin expectations, capital needs, and risk tolerance need to happen before transfer. The families that navigate this successfully are those willing to examine real numbers together.”

If you’re considering succession—whether within the family or through an outside sale—this period offers an opportunity for realistic planning while asset values remain relatively strong.

The Bottom Line

Where does this leave the typical mid-size producer?

The bailout represents real assistance. For 500-cow operations, payments in the $12,000-$20,000 range provide meaningful cash flow support—perhaps a month of debt service or a quarter’s veterinary and breeding costs. That matters. But it’s not a strategy.

Here’s what actually moves the needle:

On revenue diversification: If you haven’t evaluated beef-on-dairy seriously, the $90,000-$120,000 annual revenue potential warrants attention this winter. Talk to your genetics advisor and explore forward contracting options.

On components: The $50,000-$90,000 annual impact from butterfat and protein optimization is achievable for most operations. Review genetic direction and nutritional programs through a component lens.

On positioning: Be honest about your cost structure relative to the market. Whether the answer involves collaboration, expansion, efficiency, or a thoughtful transition, making clear-eyed decisions now preserves more options than waiting.

On cooperative engagement: Understand how your cooperative makes policy decisions. Your voice carries more weight than you might assume—but only if you use it.

The dairy industry has navigated challenging periods before and emerged stronger. The operations that thrive through this one will be those that make proactive adjustments based on solid information—not those that wait for Washington to write a check that fixes everything.

That’s not pessimism. It’s practical wisdom.

KEY TAKEAWAYS:

  • The bailout covers 4% of your loss: ~$15,000 for a 500-cow dairy against $368,000+ in annual red ink
  • FMMO reforms already cost producers $337 million: Cheese-region operations are down $0.75-$0.87/cwt on every check
  • Beef-on-dairy is a six-figure decision: Breed your bottom 60% to beef for $90,000-$135,000 in new annual revenue—and faster genetic progress
  • Chase butterfat, not bulk tank pounds: A 0.3% fat improvement = $88,000/year. Target: 7+ lbs Combined F+P daily.
  • The check won’t save you. These moves might. Lock beef contracts and revisit genetics before spring breeding.

Complete references and supporting documentation are available upon request by contacting the editorial team at editor@thebullvine.com.

Learn More:

The Sunday Read Dairy Professionals Don’t Skip.

Every week, thousands of producers, breeders, and industry insiders open Bullvine Weekly for genetics insights, market shifts, and profit strategies they won’t find anywhere else. One email. Five minutes. Smarter decisions all week.
NewsSubscribe
First
Last
Consent

4.3% Butterfat and a Shrinking Check: The 90-Day Window to Reposition Your Operation

Record butterfat. Shrinking checks. The industry’s 25-year breeding strategy just ate itself.

Dairy Farm Profitability 2026

Executive Summary: Here’s the paradox: U.S. dairy herds are testing 4.23% butterfat—an all-time record—yet milk checks are running $3-5/cwt below last year. The genetic industry’s 25-year push for components worked perfectly, and now everyone’s drowning in the success. Butter stocks are up 14%, Class IV prices hit $13.89/cwt in November (lowest since 2020), and the traditional cull-and-restock response is off the table with springers at $3,000+ and heifer inventory at a 47-year low. For operations in the 500-1,500 cow range carrying moderate debt, the next 90 days are decisive—DMC enrollment closes in February, DRP in March, and the choices made before spring will separate farms that reposition from those that get squeezed. Three viable paths exist: optimize for efficiency, transition to premium markets, or exit strategically while equity remains. Standing still isn’t on the list.

I’ve been talking with farmers across the Midwest and Northeast over the past few weeks, and there’s a common thread running through those conversations. A producer will mention their herd’s butterfat at 4.3%—exactly what they spent a decade breeding for—and then pause. Because that same milk is now flowing into a market where the cream premiums just don’t look like they used to.

It’s a strange place to be. You made sound breeding decisions. The genetics are performing. The components are there. And yet the check doesn’t quite reflect it.

So what’s actually going on here? And more importantly, what can we realistically do about it in the next 90 days?

[Image: Side-by-side comparison of a milk check from 2023 vs. 2025 showing component premiums shrinking despite higher butterfat test]

After reviewing the latest market data and speaking with lender advisors, farm management consultants, and producers who’ve been through similar cycles, a clearer picture emerges. This isn’t simply a temporary dip that’ll correct by spring flush. It’s a structural shift that’s been building for years—and the farms that come through it successfully will be those that understand both what’s driving it and which decisions actually move the needle.

The Component Trap: How 25 Years of Smart Breeding Created Today’s Problem

Here’s something that needs to be said plainly, even if it’s uncomfortable: the genetic industry—breeders, AI companies, genomic providers—collectively steered the entire U.S. dairy herd in one direction, and now we’re all standing here wondering what comes next.

That’s not an accusation. Everyone was following the economic signals. But the result is undeniable.

You probably know the broad outlines already, but it’s worth walking through the numbers because they’re pretty striking when you see them together. None of this happened by accident. It’s the result of pricing signals that consistently rewarded butterfat production across two and a half decades.

Consider the trajectory. The average Holstein was testing around 3.7-3.8% butterfat back in 2000, according to Council on Dairy Cattle Breeding historical data. By 2024, that figure had climbed to a record 4.23%—a substantial jump in component concentration. CoBank’s lead dairy economist, Corey Geiger, noted in his analysis last year that milkfat, on both a percentage and per-pound basis, reached an all-time high. In high-genetics herds, 4.3-4.5% is now pretty common.

U.S. Holstein herds have steadily climbed from roughly 3.7% to over 4.2% butterfat in just two and a half decades

This wasn’t a failure of individual breeding decisions. It was a success—of everyone doing the exact same thing at the exact same time.

[Image: Line graph showing U.S. average butterfat percentage climbing from 3.7% in 2000 to 4.23% in 2024]

Federal Milk Marketing Order formulas rewarded butterfat with premium pricing, and the industry responded accordingly. Then, genomic selection tools, which really gained traction around 2009, accelerated genetic progress dramatically. What once took 15-20 years of conventional breeding can now be achieved in roughly half that time. The April 2025 CDCB genetic base reset tells the story—it rolled back butterfat by 45 pounds for Holsteins, nearly double any previous adjustment. That’s how much progress has accumulated in the genetic pipeline.

The economics seemed compelling at the time. A farm producing 4.2% butterfat milk versus 3.8% butterfat earned roughly $0.80-1.20/cwt more on the same volume, based on component pricing formulas. For a 1,000-cow herd producing 25,000 lbs/cow annually, that translated to $200,000-300,000 in additional annual revenue. The incentives pointed clearly in one direction.

And here’s where it gets tricky.

When an entire industry simultaneously optimizes for the same trait, supply eventually outpaces demand. U.S. butter production has grown substantially over the past decade, according to USDA Agricultural Marketing Service data. Cold storage butter inventories showed elevated stocks throughout late 2024, with USDA Cold Storage data reporting September levels at approximately 303 million pounds—up about 14% from year-earlier figures.

Class IV milk futures, which price butter and powder, have reflected this pressure. USDA announced the November 2025 Class IV price at $13.89/cwt—levels we haven’t seen since 2020.

The question nobody in the genetic industry is asking publicly: Should we have seen this coming? And what does it mean for how we select sires going forward?

The Heifer Crisis: Why Your Normal Playbook Won’t Work This Time

What makes this particular cycle tricky is that some of the standard farm-level responses to low prices just aren’t available anymore. I’ve watched this play out in conversations with producers who are working through every option—and finding that familiar levers don’t pull the way they expect.

[Image: Infographic showing dairy heifer inventory decline from 4.5 million in 2018 to 3.914 million in 2025]

The Numbers That Should Keep You Up at Night

The logical response to component oversupply would be culling toward different genetics and restocking. But there’s a significant constraint worth understanding.

Replacement heifers simply aren’t available in the numbers many operations need—and the available ones have gotten expensive. The widespread adoption of beef-on-dairy breeding, which made excellent economic sense when beef prices surged, has reduced dairy heifer inventories to approximately 3.914 million head according to the January 2025 USDA cattle inventory report. That’s the lowest level since 1978.

Replacement heifer numbers have dropped by roughly 600,000 head since 2018, driving springer prices above $3,000

Here’s where the math gets painful. CoBank reported these figures in their August 2025 analysis:

  • National average springer price (July 2025): $3,010 per head
  • Wisconsin average: $3,290 per head
  • California/Minnesota top auction prices: $4,000+ per head
  • April 2019 low point: $1,140 per head
  • Price increase since then: 164%

Let that sink in. If you want to cull your bottom 50 cows and replace them, you’re looking at $150,000-$225,000 just in replacement costs—before you account for the production lag while those heifers freshen and ramp up.

This creates real tension. Operations that would like to cull more aggressively face either limited availability or elevated replacement costs. It’s a completely different calculation than we’ve seen in past downturns.

There’s also a timing consideration that’s easy to overlook. The replacement heifers entering milking strings in 2025-2026 were born and selected 2-3 years ago, when butterfat premiums were still paying handsomely. That genetic pipeline takes time to shift—meaningful changes in herd composition typically require 5-7 years, even with aggressive selection, according to dairy geneticists at the University of Wisconsin-Madison Extension.

The practical takeaway: Even if you start selecting differently today, you won’t see the results in your tank until 2030.

The Ration Workaround That Doesn’t Actually Work

Some producers have explored nutritional adjustments to modify butterfat percentage. I’ve heard this come up in several conversations, and it’s worth addressing directly.

Here’s the challenge—the rumen chemistry driving fat synthesis is interconnected with overall milk production in ways that make targeted adjustments difficult. Dairy nutritionists at Penn State and other land-grant universities have studied this extensively: adjustments that reduce butterfat typically also reduce total milk yield by 3-8%. The feed cost savings, maybe $0.30-0.50/cow/day depending on your ration costs, are often outweighed by lost milk revenue of $1.00-2.00/cow/day at current prices.

In most scenarios, ration manipulation doesn’t improve the overall financial picture. Counterintuitive, but the numbers generally bear it out.

The China Factor: The Export Valve That Closed

One element that’s amplified the current situation—and this deserves more attention in domestic discussions—is the shift in Chinese dairy import patterns.

[Image: Bar chart comparing China whole milk powder imports: approximately 800,000-850,000 MT peak around 2021 vs. approximately 430,000 MT in 2024]

For roughly two decades, China served as a significant outlet for global dairy surplus. When exporting regions overproduced, Chinese buyers absorbed much of the excess. That dynamic has evolved considerably.

China’s domestic milk production has grown substantially over the past several years, reaching over 41 million tonnesaccording to USDA Foreign Agricultural Service data. Self-sufficiency has risen from roughly 70% to around 85%, thereby reducing import demand.

The import trends tell the story clearly. Whole milk powder imports peaked at approximately 800,000-850,000 metric tonnes around 2021, according to Chinese customs data compiled by Rabobank. By 2024, that figure had declined to around 430,000 metric tonnes—a reduction of roughly 50%.

China’s demand for imported whole milk powder has fallen by roughly 50% since its 2021 peak, closing a major export outlet

Here’s what that means at the farm level: when 400,000 metric tonnes of powder that used to go to Shanghai starts competing for space in domestic and alternative export markets, that’s pressure that eventually shows up in your component check. Global dairy markets are interconnected in ways that weren’t true 20 years ago.

Rabobank senior dairy analyst Michael Harvey noted in their Q4 2024 Global Dairy Quarterly that Chinese imports could surprise to the upside if domestic production disappoints and consumer confidence improves. That’s a reasonable alternative scenario to consider.

Honestly? Nobody knows exactly where China goes from here. But planning as if that export outlet will suddenly reopen at 2021 levels seems optimistic at this point.

The Consolidation Accelerator

Dairy farming has been consolidating for decades—that’s well understood by anyone who’s watched their neighbor’s barn go quiet. What’s different about this period is the potential for that trend to accelerate under sustained margin pressure.

According to U.S. Courts data reported by Farm Policy News, 361 Chapter 12 farm bankruptcy filings occurred in the first half of 2025—a 13% increase over the same period last year.

Here’s an important nuance, though: milk production isn’t expected to decline in proportion to the number of farms. The operations most likely to exit tend to be smaller ones that represent a modest share of total volume. USDA projects national milk output at 231.3 billion pounds in 2026—essentially flat—even as the number of operations continues to decrease.

What this means for price recovery: Supply adjustments through consolidation happen more gradually than we might hope.

Three Directions for the Coming Months

For farmers operating in that 500-1,500 cow range—moderate scale, moderate debt, positioned to continue but facing real pressure—the next 90 days present some important decisions.

What’s been striking in conversations with experienced advisors is how consistently they point to the same priorities. The focus isn’t on finding some novel solution. It’s about executing fundamentals with careful attention during a demanding period.

[Image: Calendar graphic highlighting key deadlines: February 2026 (DMC), March 15 (DRP), March 31 (SARE grants)]

Key Dates Worth Tracking

  • December 31, 2025: Target for completing financial position analysis
  • February 2026: DMC enrollment deadline (confirm with your FSA office)
  • March 15, 2026: DRP enrollment deadline for Q2 coverage
  • March 31, 2026: SARE grant application deadline for organic transition support
  • Q2 2026: Period when margin pressure may be most pronounced

Priority 1: Knowing Exactly Where You Stand (Weeks 1-2)

Here’s what farm management consultants consistently emphasize: many operations lack precise clarity about their actual cost of production by component. They know their budgeted figures, but actual costs in the current environment often run $2-4/cwt higher than estimates suggest.

Consider a professional cost analysis through your lender or an independent agricultural accountant. Costs typically run $1,500-3,000, depending on scope and region—but the analysis frequently reveals $50,000-100,000 in costs that weren’t clearly showing up in standard bookkeeping. Your actual investment depends on your operation’s complexity.

Model three price scenarios for 2026:

ScenarioClass IIIClass IV
Base Case$17/cwt$14/cwt
Stressed$15/cwt$12/cwt
Severe$13/cwt

The key benchmark: if your debt service coverage ratio falls below 1.25x in the base case, you’re facing primarily a financing challenge rather than a production management challenge. That distinction shapes everything that follows.

Priority 2: Securing Protection Before Deadlines (Weeks 2-3)

DMC triggered payouts in August-September 2025 when milk margins compressed below coverage thresholds, according to USDA Farm Service Agency payment data. For operations that had enrolled, those payments provided meaningful cash flow support. For those that hadn’t… well, that opportunity has passed.

For a 700-cow operation, margin protection typically costs $35,000-40,000 in premiums based on standard coverage levels—though actual costs vary by operation size and coverage choices. What matters is the asymmetric protection: coverage that could preserve $200,000-300,000 in margin under severe scenarios.

[Related: Understanding DMC Enrollment for 2026 — A step-by-step walkthrough of coverage options and deadlines]

Priority 3: Choosing a Direction (Weeks 3-4)

 Efficiency FocusPremium MarketsStrategic Transition
Best suited forSub-$15/cwt cost structure, solid cash positionWithin 50 miles of metro market, $300K+ reserveAge 55+, elevated debt, uncertain direction
90-day focusIOFC-based culling, Feed Saved geneticsFile organic transition, apply for SARE grantsProfessional appraisal, explore sale/lease
Timeline12-18 months36-48 months6-12 months
Capital requiredLow to moderate$200K-400KLow (advisory fees)

[Image: Decision tree flowchart helping farmers identify which of the three paths fits their situation]

Path A: Efficiency Focus

The core approach remains culling the bottom 15-20% of cows ranked by income-over-feed-cost, not by volume alone. Your 50 lowest-margin cows likely cost $300-400/month more than your top 50 to produce milk. Addressing that can improve annual cash flow by $180,000-240,000.

What I keep hearing from producers who went through aggressive IOFC-based culling during 2015-2016 is pretty consistent: it felt counterintuitive at first. Some of those cows were producing 90 pounds a day. But when they ran the actual economics, those high-volume cows were undermining their cost structure. Taking them out changed everything. Many came out of that period in better shape than they went in.

Producers running large dry lot operations in the West report similar experiences. The temptation is always to keep milking cows. But when you run the numbers, the bottom 10-15% of the herd is often break-even in a good month and loses money in a bad one. Letting them go without immediately restocking—just accepting a smaller herd—can actually improve your average component check per cow. Sometimes, smaller really is more profitable.

On the genetics side, it’s worth looking at “Feed Saved” as a selection trait. CDCB introduced this in December 2020, specifically to identify animals that are more efficient at converting feed to milk. The trait’s weight in Net Merit increased to 17.8% in the 2025 update, which tells you how seriously the industry is taking feed efficiency now. The potential savings vary by herd, but for operations where feed accounts for 50-60% of costs, even modest efficiency gains can translate into meaningful dollars. Talk to your AI rep about what realistic expectations might look like for your specific situation.

Path B: Premium Market Transition

For operations within a reasonable distance of major metro markets and with capital reserves to absorb transition costs, organic conversion or specialty milk contracts offer an alternative direction.

This path involves more complexity than it might initially appear. Organic transition typically means 3-year yield reductions of 10-15% according to data from the Organic Dairy Research Institute, followed by meaningful price premiums once certified. The economics can work—eventually—but the transition period requires substantial financial runway.

What I hear consistently from producers who’ve made this transition: the middle years are harder than expected. You’re essentially getting conventional prices while operating organically. But once you reach certification, the price difference is real. NODPA and USDA Organic Dairy Market News report certified operations receiving farmgate prices ranging from the mid-$20s to $30s per cwt for conventional organic, with grass-fed premiums often running significantly higher—sometimes into the $40s or above depending on your processor and region.

If this direction fits your situation, the 90-day priorities include:

Connect with certified organic dairies in your region through your state organic association—NOFA chapters in the Northeast, MOSA in the Upper Midwest, or similar organizations in your area. Request 2-3 farm visits to understand actual transition costs and challenges. The real-world experience matters more than marketing materials.

Explore SARE grants before the March 31, 2026, deadline. These grants may provide significant cost-sharing support for organic transition—contact your regional SARE coordinator for current funding levels and application requirements, since program specifics change annually.

If you’re committed, file your transition plan with your certifier by March 1, 2026, to start the 3-year clock. Earlier starts mean earlier access to premium pricing.

[Related: Organic Transition Economics: What the Numbers Actually Look Like — Real producer case studies and financial breakdowns]

Important consideration: This path makes most sense if you have substantial equity reserves and you’re genuinely within reach of organic market demand. Not every region has processors paying meaningful organic premiums. Market research should come before commitment—talk to Organic Valley, HP Hood, or whoever handles organic milk in your region about their current intake and premium structure.

Path C: Strategic Transition

This is the path that’s hardest to discuss, but for operators over 55, carrying elevated debt, or genuinely uncertain about long-term direction, a strategic exit while equity remains may represent sound financial planning.

Here’s what farm transition specialists consistently emphasize: a farm with a 45% debt-to-asset ratio that transitions strategically today typically retains significantly more family wealth than the same farm forced to exit in 2027-2028 after extended margin erosion. The difference can easily be $300,000-500,000, depending on circumstances.

That’s not failure. That’s recognizing circumstances and making a thoughtful decision.

University of Wisconsin Extension farm transition advisors make this point regularly in producer workshops: the families who come through in the best financial shape are almost always the ones who made the call themselves, not the ones who waited until circumstances forced their hand. There’s real value in choosing your path.

The 90-day approach for this path:

Obtain a professional appraisal ($2,500-4,000 depending on operation complexity) covering real estate, equipment, herd genetics, and any production contracts.

Explore multiple options—they’re not mutually exclusive:

  • Direct sale to a larger operation (typically a 12-18 month process)
  • Lease arrangement retaining land equity
  • Solar lease opportunities—rates vary significantly by region, but can provide meaningful annual income on 20-30+ acres depending on your location and utility contracts
  • Custom heifer rearing using your existing facilities—particularly relevant given the shortage we discussed earlier

Consult with a farm transition tax advisor. How you structure an exit matters enormously for what you ultimately retain—installment sales versus lump sum, 1031 exchanges, charitable remainder trusts, and other tools can make six-figure differences in after-tax proceeds.

Regional Realities: One Market, Many Situations

One pattern that emerges from these conversations is how differently the same market dynamics play out depending on where you’re farming. The fundamentals we’ve discussed apply broadly, but the specific numbers vary considerably by region.

In Idaho and the Southwest, large-scale operations with export-oriented processing face one set of calculations. These are often dry lot systems with 3,000+ cows, lower land costs, and direct relationships with major cheese manufacturers. When Glanbia or Leprino adjusts their intake, the regional implications differ from what you’d see in Wisconsin. The scale efficiencies are real, but so is the commodity price exposure. Producers in the Magic Valley are watching Class III futures more closely than component premiums—their economics are tied to cheese demand in ways that Upper Midwest producers selling to smaller plants simply aren’t.

In Wisconsin and the Upper Midwest, you’re more likely to encounter diversified operations—500-1,200 cows, often family-owned across generations, with a mix of cheese plant contracts and cooperative relationships. The smaller average herd size means fixed costs per hundredweight run higher, but there’s also more flexibility to adapt. I’ve talked with Wisconsin producers seriously exploring farmstead cheese or agritourism as margin supplements—approaches that wouldn’t make sense at 5,000 cows but can work at 400.

In the Northeast, higher land costs and proximity to population centers create yet another calculation. Fluid milk markets still matter more here than in most regions, even as fluid consumption continues its long decline. The premium path—organic, grass-fed, local branding—tends to be more viable in Vermont or upstate New York than in the Texas Panhandle simply because the customer base is closer and the logistics work better.

Here’s the bottom line on regional differences: Conversations with farmers and advisors who know your specific market really matter. Your cooperative field staff, extension dairy specialist, or lender can help translate these broader trends into your local context. The three-path framework applies everywhere, but the details of execution—which processors are actively buying, what premiums are realistically available, how constrained the local heifer market is—vary enough to influence decisions.

The Bottom Line

The farms that navigate this period most successfully won’t be those that discovered some novel solution—there isn’t one waiting to be found. They’ll be operations that understood the dynamics early, made honest assessments of their own position, and moved decisively while flexibility remained.

The window for making these decisions is now.

For additional resources on margin protection enrollment and strategic planning, contact your local FSA office, cooperative field representative, agricultural lender, or university extension dairy specialist.

Editor’s Note: Production cost data comes from the USDA Economic Research Service 2024 reports. Heifer pricing reflects USDA NASS data through July 2025. Bankruptcy statistics are from U.S. Courts data reported by Farm Policy News. Genetic progress figures reference the CDCB April 2025 genetic base reset. Cold storage and production data are from the USDA Agricultural Marketing Service. International trade figures come from the USDA Foreign Agricultural Service and Rabobank Global Dairy Quarterly. National and regional averages may not reflect your specific operation, market access, or management system. We welcome producer feedback for future reporting.

Key Takeaways:

  • Record butterfat, weaker checks: U.S. herds are averaging 4.23% butterfat, but Class IV has slipped to $13.89/cwt, and butter stocks are up 14%, so the component bonuses many bred for are no longer rescuing the milk check.
  • Heifer math has flipped: Dairy heifer inventory is at a 47-year low (3.914 million head), and quality springers are $3,000+ per head, which means the traditional “cull hard and restock” playbook often destroys equity instead of saving it.
  • This is a structural shift, not a blip: Twenty-five years of selecting for butterfat, China’s reduced powder imports, and slow-moving U.S. consolidation are combining into a multi-year margin squeeze, not just another bad winter of prices.
  • Your next 90 days are critical: Before DMC and DRP deadlines hit in February and March, farms in the 500–1,500 cow range need a clear cost-of-production picture, stress-tested cash-flow scenarios, and margin protection in place.
  • You have three realistic paths: Use this window to either tighten efficiency and genetics around IOFC and Feed Saved, transition into premium/organic markets where they truly exist, or plan a strategic exit while there’s still equity to protect—doing nothing is the highest‑risk option.

Complete references and supporting documentation are available upon request by contacting the editorial team at editor@thebullvine.com.

Learn More:

  • Is Beef-on-Dairy Causing America’s Heifer Shortage? – Reveals the structural mechanics behind today’s replacement crisis, detailing how the aggressive industry-wide shift to beef genetics created the specific inventory gap that is now driving heifer prices to record highs.
  • Cracking the Code: Behavioral Traits and Feed Efficiency – Provides the tactical “how-to” for the Efficiency Focus path, explaining how wearable sensors and behavioral data (rumination/lying time) can identify the most feed-efficient cows to retain when you can’t afford to restock.
  • How Rising Interest Rates Are Shaking Up Dairy Farm Finances – Delivers critical financial context for the Strategic Transition path, analyzing how the increased cost of capital is compressing margins and why debt servicing capacity—not just milk price—must drive your 2026 decision-making.

The Sunday Read Dairy Professionals Don’t Skip.

Every week, thousands of producers, breeders, and industry insiders open Bullvine Weekly for genetics insights, market shifts, and profit strategies they won’t find anywhere else. One email. Five minutes. Smarter decisions all week.

NewsSubscribe
First
Last
Consent

China Promised 100%. Delivered 2.7%. Here’s Your 48-Hour Defense Plan.

They announced 12 million tons of soybeans. Shipped 332,000. That’s 2.7%—and the gap between those numbers is where farms go broke.

Back in October, the headlines announced that China had committed to purchasing 12 million tons of U.S. soybeans. By mid-November, USDA export data told a different story: just 332,000 tons had actually been shipped. For operations making real financial commitments based on trade optimism, that gap is everything.

It’s the elephant in the room at every co-op meeting, yet nobody wants to say it out loud: the headlines are lying to us. Not maliciously, maybe. But consistently.

This isn’t a one-off. When the Phase One trade agreement was signed back in January 2020, China committed to purchasing $80.1 billion in U.S. agricultural goods over two years. The Peterson Institute for International Economics tracked what actually happened: $61.4 billion in purchases. That’s about 77% of the agricultural target and just 58% overall.

Whether that’s a freestall expansion in Wisconsin or new milking equipment out in the Central Valley—these numbers matter enormously when you’re penciling out that loan.

The Promise-Delivery Gap: 2.7% to 77%. That’s the range of what trade has actually delivered in recent years. It’s a wide spread—and it’s the reality farm financial planning needs to account for.

The 2.7% Reality: China’s trade commitments consistently fall short, with the 2025 soybean deal delivering a catastrophic 2.7% while Phase One averaged 77%—a pattern that should change every dairy farmer’s expansion calculus.
Risk FactorPhase One (2020-2021)China Soybean (2025)What Farmers Assumed
Historical Delivery Rate64-87% delivery2.7% delivery100% delivery
Market DependencyMedium – diversified buyersHigh – China-specificLow – “”guaranteed deal””
Price Impact per Deal$0.15-0.25/cwt estimated$0.35/cwt confirmedPrice increases expected
Timeline to Farm Impact90-180 days30-90 daysImmediate benefit
Cooperative ProtectionAbsorbed losses initially€149M losses, mergersCo-op will handle it
Individual Farm DefenseLimited – most expandedDMC available if enrolledNo action needed

The Pattern Nobody Talks About

Trade announcements follow a consistent pattern. Farmers who’ve watched a few cycles are starting to read them differently than the headlines suggest.

The Phase One trajectory:

  • 2020: Deal signed with $200 billion in purchase commitments over two years
  • 2021-2022: China’s agricultural imports from all sources surged to record levels; U.S. exports to China hit approximately $41 billion
  • 2023-2024: Import volumes declined as Phase One commitments expired and China diversified its suppliers
  • 2025: New tariff escalations with announced deals delivering at single-digit percentages

Here’s what makes this tricky: those 2021-2022 numbers were real. China genuinely did purchase record agricultural volumes. Processors genuinely did see elevated component prices. You probably saw the improvement in your own milk check.

The data supporting expansion decisions wasn’t fabricated—it was completely accurate for that specific window.

The question most operations didn’t ask was whether those volumes represented a sustainable baseline or a cyclical peak. That’s a hard question to ask when the current numbers look great, and your lender’s nodding along with the business plan.

Why 2022 Was a Peak, Not a Floor

The gap between black promises and red reality: Phase One targets soared to $43.6B while actual imports peaked at $41B in 2022, then collapsed—proving strong recent years were cyclical highs, not sustainable baselines for your 20-year expansion loan.

Several indicators were available in real-time. Here’s what the data was showing:

African Swine Fever recovery was completing. China’s hog population lost roughly 40% of its sow inventory in 2018-2019, according to OECD analysis. The rebuilding phase drove massive feed imports through 2021. By early 2022, Iowa State University’s Ag Policy Review documented that herd recovery was largely complete. That import surge had an endpoint built in.

Phase One commitments expired December 31, 2021. The agreement was a two-year commitment with a hard stop date. After expiration, continued purchases became voluntary.

China’s dairy self-sufficiency targets were public. The Chinese government explicitly targeted 70% dairy self-sufficiency. By 2022, according to Hoogwegt analysis, they’d reached 66% and climbing. When you’re managing your fresh cow nutrition and component production here, remember—they’re building their own capacity over there.

Economic growth projections were declining. The Asian Development Bank projected that China’s GDP growth would slow from around 8% in 2021 to 5% by 2024-2025.

These indicators were available to anyone looking. The challenge is that recent strong performance tends to overwhelm forward-looking warning signals. That’s an understandable response to good data, not poor decision-making.

How This Hits Your Milk Check

Trade policy disruptions create cascading effects that move from Washington to your milk check faster than most realize.

The 2025 tariff escalation:

When retaliatory tariffs on U.S. dairy into China escalated from 10% to 125% between February and April, the impacts were immediate:

Whey markets contracted sharply. China had been taking about 42% of U.S. whey exports according to USDEC data. When that market closed, domestic supply backed up and prices compressed. If you’ve been watching whey premiums in your component pricing, you’ve felt this.

Lactose faced similar pressure. With China holding roughly 72% of the U.S. lactose export market share, the tariff wall forced processor restructuring.

USDA revised price forecasts downward. Class III projections dropped by about $0.35 per hundredweight.

In practical terms: For a typical 1,000-cow operation producing around 26,000 pounds per cow annually, that $0.35 reduction works out to roughly $91,000 in annual revenue. That affects replacement heifer decisions, equipment upgrades, everything.

University of Wisconsin-Madison dairy economists project that net farm income across the U.S. dairy industry could decline by $1.6 to $7.3 billion over the next four years due to tariff disruptions, with individual farms facing potential income reductions of 25% or more.

Real example: Half Full Dairy in upstate New York—a 3,600-cow operation run by AJ Wormuth—got hit from both sides. Steel and aluminum tariffs added $21,000 to a barn renovation order while milk revenues fell. As Wormuth told reporters in April, they’re facing “a double challenge” in which they can’t raise prices while expenses keep rising.

Whether you’re running a 200-cow grazing operation in Vermont or a 5,000-cow dry lot in New Mexico, that squeeze feels familiar.

What’s Really Happening with Cooperatives

Common assumption: cooperative membership provides meaningful insulation from trade volatility.

Reality: cooperatives face the same structural pressures as individual farms, just with less flexibility to respond.

Case study: FrieslandCampina-Milcobel merger

FrieslandCampina reported a €149 million loss in 2023. Milcobel posted an €11.6 million loss. These weren’t management failures—they reflected a structural challenge.

The cooperative bind: They must accept all member milk regardless of market conditions. That’s the deal. But when processing capacity gets built for peak-year volumes and deliveries decline, cooperatives face rising per-unit costs with limited ability to adjust.

Unlike private processors who can exit markets quickly, cooperatives are bound by charter obligations. The result: they absorb losses to maintain member pricing, eroding equity over time. When losses become unsustainable, mergers or sales become the path forward.

We saw this with Fonterra’s 88% member vote to sell consumer operations to Lactalis this past October.

Rabobank dairy analyst Emma Higgins put it directly: “For dairy cooperatives, the challenges are even more complex, as lower milk intake generally coincides with members withdrawing capital.”

The counterpoint: Some cooperatives have navigated better. Agropur achieved a significant turnaround by aggressively restructuring its debt and refocusing on high-margin segments such as cheese and specialty ingredients. The model isn’t doomed—but it requires proactive management.

Your cooperative’s financial health directly affects your returns. Ask questions at the next annual meeting.

What Smart Operations Are Doing

Several practical approaches keep coming up:

Applying historical execution rates. Rather than planning for 100% delivery, they’re discounting based on historical performance. If Phase One delivered 77%, that becomes the planning assumption.

Stress-testing against zero deal impact. Before expansion decisions, they’re modeling, assuming the deal contributes nothing. If viability depends entirely on the deal working, that’s a different conversation with your lender and family.

Maximizing DMC enrollment. Dairy Margin Coverage provides protection when margins compress—and it doesn’t depend on trade promises. It depends on actual market prices.

Maintaining working capital flexibility. Operations that kept debt-to-asset ratios conservative have more options when markets shift. It’s not pessimism—it’s room to maneuver.

Exploring market diversification. Direct sales, specialty products like organic or A2, and regional processor relationships. Not for everyone, but it’s optionality that didn’t exist a decade ago.

Your 48-Hour Playbook for Trade Announcements

When the next deal gets announced, work through these steps:

Step 1: Check the History (30 minutes)

The Peterson Institute maintains a tracker showing the promised versus actual purchases under Phase One. Before reacting to any announcement, look at historical delivery rates.

The calculation: New promise × historical execution rate = realistic delivery estimate.

Phase One ran at 58-77%. The 2025 China soybean promise delivered 2.7%. That range gives you boundaries for scenario planning.

Step 2: Model for Zero (1-2 hours)

Have your accountant run a 12-month cash flow assuming no additional revenue from the announced deal.

Questions to answer:

  • What’s my debt-service-coverage ratio? (Target: 1.25+ per Farm Credit guidelines)
  • Can I cover debt service if export demand doesn’t materialize?
  • How many months can working capital sustain at reduced prices?

Document what you find. This strengthens lender conversations later.

Step 3: Verify DMC Status (45 minutes)

Contact your local FSA office and confirm Dairy Margin Coverage enrollment. If open and you’re not enrolled, evaluate immediately.

The timing trap: Trade announcements create optimism. Farmers skip enrollment. Then deals underperform, prices fall, and the window is closed. The 2025 enrollment closed on March 31.

The protection is most valuable when purchased before you think you need it.

Principles That Hold Up

Announcements are risk factors, not guarantees. The gap between announcement and execution is where farm financial planning actually lives.

Peaks aren’t baselines. Strong recent performance may represent cyclical highs, not sustainable floors. Expansion decisions financed over 10-20 years should be stress-tested across multiple scenarios.

Understand your cooperative’s position. Their balance sheet health affects your returns. Request financial information.

Maintain optionality over optimization. Operations preserving flexibility have more choices when conditions shift. There’s value in leaving room, even if it means not maximizing every metric.

Document your process. Whether you expand or hold back, a record of analysis strengthens lender conversations and demonstrates sound management.

The Bottom Line

Trade promises that deliver between 2.7% and 77% of announced targets raise legitimate questions about how agricultural trade policy functions. Whether the gap reflects deliberate choices or institutional limitations is hard to say.

What’s clear: farmers absorb the consequences while having limited ability to influence outcomes.

This doesn’t mean trade agreements lack value. U.S. dairy exports remain significant—Mexico, Canada, and other markets provide important revenue. The question is how to make sound decisions when the market outlook depends on commitments with highly variable execution.

Until the product ships and checks clear, a trade announcement is a press release, not a market.

The framework we covered—checking history, stress-testing for zero, securing DMC—provides concrete steps within 48 hours of any announcement. None guarantees good outcomes, but it positions you for realistic scenarios rather than headline optimism.

The fact that dairy farmers need a defensive playbook for government trade promises tells us something about the system. Whether by design or neglect, the pattern is clear: promises at 100%, delivery between 2.7% and 77%, farmers navigating the gap.

Until that changes, treat every announcement as a risk to manage—not an opportunity to bet the farm on.

That may sound conservative. Given the track record, it’s the smart play.

Key Takeaways:

  • The promise-delivery gap: 2.7% to 77%. Never 100%. Budget accordingly.
  • The cost: $0.35/cwt price drop = $91,000 annual loss on a 1,000-cow dairy.
  • Cooperatives won’t save you: FrieslandCampina lost €149M. Fonterra members voted 88% to sell.
  • Your 48-hour playbook: Check historical rates. Model for zero revenue. Verify DMC enrollment.
  • The bottom line: Until product ships and checks clear, a trade deal is a press release—not a market.

Executive Summary: 

China promised 12 million tons of soybeans. They shipped 332,000. That’s 2.7%—and your lender doesn’t care about the other 97%. Phase One delivered just 58-77% of agricultural targets, and dairy farmers absorbed the gap: $91,000 in annual losses for a typical 1,000-cow operation when Class III dropped $0.35/cwt. Even cooperatives can’t escape—FrieslandCampina lost €149 million; Fonterra’s members voted 88% to sell to Lactalis. The pattern is consistent: promises at 100%, delivery between 2.7% and 77%, farmers managing the difference. Here’s your 48-hour defense plan for the next trade announcement.

Complete references and supporting documentation are available upon request by contacting the editorial team at editor@thebullvine.com.

Learn More:

The Sunday Read Dairy Professionals Don’t Skip.

Every week, thousands of producers, breeders, and industry insiders open Bullvine Weekly for genetics insights, market shifts, and profit strategies they won’t find anywhere else. One email. Five minutes. Smarter decisions all week.
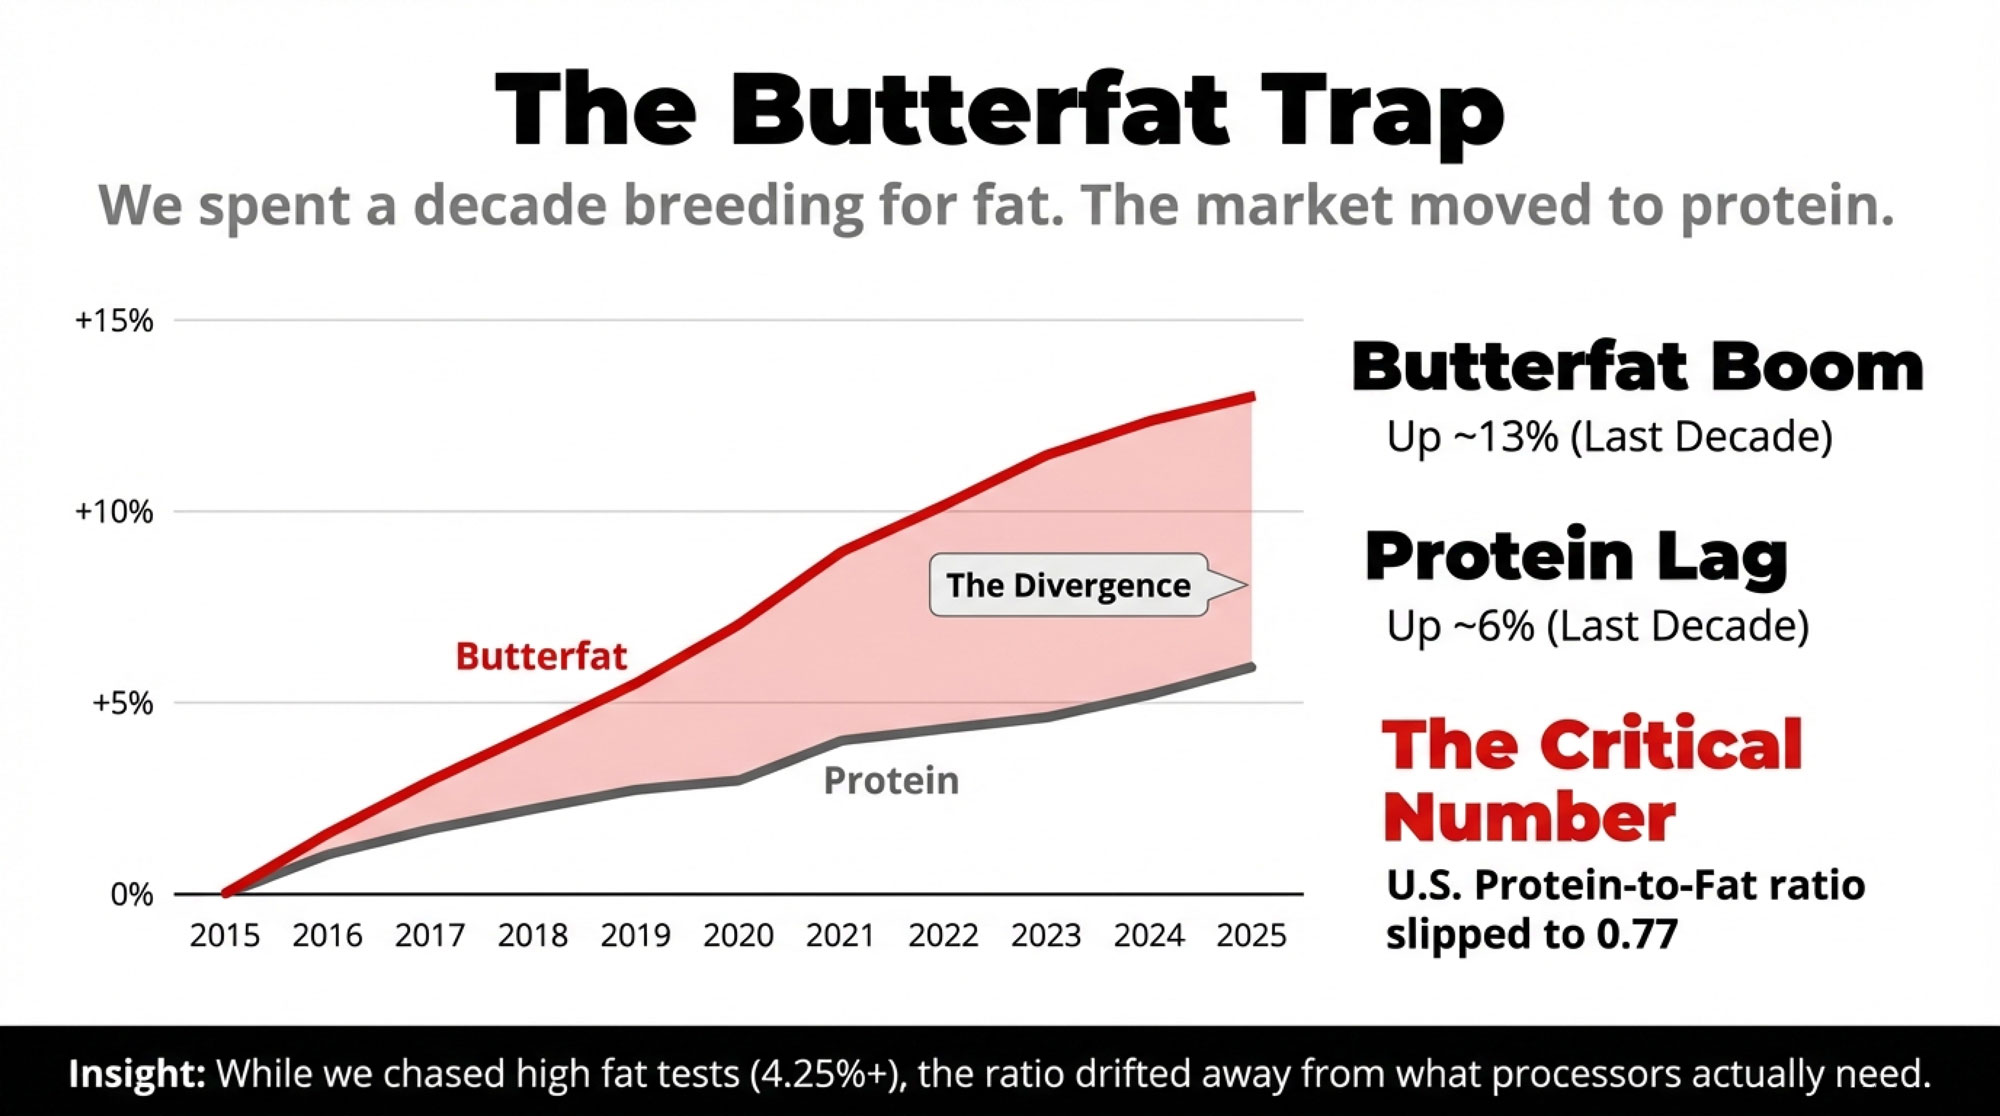
NewsSubscribe
First
Last
Consent

Your Milk Check Is at the Mercy of a Cheese Shredder: What the Great Lakes Recall Reveals About Dairy’s Broken Supply Chain

Perfect SCC. Elite components. Tight ship. Then a shredder in Ohio failed—and none of it saved your milk check.

EXECUTIVE SUMMARY: Great Lakes Cheese sneezed in Ohio—and dairy farms across 31 states caught pneumonia. The October 2025 recall of 250,000 cases revealed a brutal truth: in a converter supply chain, when middlemen fail, farms absorb the pain through 5-15% intake cuts regardless of milk quality or management excellence. Your perfect SCC won’t save you from quality failures at companies you’ve never heard of. The strategic response isn’t panic—it’s diversification. Beef-on-dairy with verified genetics now commands $1,000-$1,400 per calf, organic premiums reach $33-$45/cwt in undersupplied markets, and cooperative infrastructure can slash traceability costs by 60-75%. With FSMA 204 extended to July 2028, producers have a runway to reposition—and the farms that thrive will be the ones who stopped waiting for a broken system to protect them.

When a metal fragment in a cheese shredder in Ohio can hit a milk check in Wisconsin, we have a problem. The Great Lakes Cheese recall isn’t just a food safety blip—it’s a warning shot about the fragility of the modern “converter” supply chain. And your farm is the one exposed.

I’ve been having conversations with producers across the Upper Midwest lately, and a pattern keeps emerging. Farmers who had no direct relationship with Great Lakes Cheese are feeling ripple effects. Milk intake adjustments here. Some price volatility there. That unsettling realization that something happening several steps down the supply chain can show up on your bottom line.

Let’s walk through what’s actually going on.

Understanding What Happened

Great Lakes Cheese, headquartered in Hiram, Ohio, ranks among North America’s largest cheese companies. They supply roughly a quarter of all packaged cheese in U.S. retail—brands like Walmart’s Great Value, Target’s Good & Gather, Aldi’s Happy Farms. The company has been expanding steadily, including a major facility in Franklinville, New York, that Governor Hochul announced at $500 million back in 2022. Due to inflation and supply chain challenges, that project ended up costing over $700 million by the time it came online in late 2024, according to reporting from the Olean Star.

The recall itself occurred in early October 2025—the FDA publicly classified it in December—and affected over 250,000 cases of shredded and sliced cheese across 31 states. The issue was traced to metal fragments in the supplier’s raw materials.

Here’s what you need to understand about how they operate. Great Lakes functions primarily as what the industry calls a “converter.” They’re not manufacturing cheese from milk in most facilities. Instead, they purchase 40-pound commodity cheese blocks from various suppliers, then shred, slice, and package those blocks for retail.

Put bluntly: Great Lakes is essentially a middleman with a massive retail footprint. And when a middleman of that scale has a problem, they don’t absorb the pain—they pass it upstream immediately. Their suppliers get hit. Their suppliers’ suppliers get hit. And eventually, that pressure falls on the farms that produce milk.

Mark Stephenson—Director of Dairy Policy Analysis at the University of Wisconsin-Madison—notes that the converter model allows processors to source globally, optimize costs, and concentrate capital on packaging and retail relationships. From a business perspective, it makes sense. But from a risk perspective? When the Great Lakes sneezes, they don’t catch a cold. Their suppliers catch pneumonia.

When a cheese shredder fails in Ohio, your milk check drops 15%—even if you’re running a spotless operation 500 miles away. This is what “converter supply chain risk” actually looks like when it hits your bank account

How Disruptions Travel Upstream

Three weeks. That’s how long it took for a metal fragment problem in Ohio to wipe out 12% of revenue for farms that never shipped a drop of milk to Great Lakes. Notice the recovery is twice as slow as the crash—welcome to commodity dairy’s asymmetric risk model

This is where things get practical for those of us producing milk. Understanding these mechanics matters because they reveal how interconnected—and sometimes how exposed—farm-level economics really are.

When Great Lakes pulled those 250,000-plus cases from shelves, their immediate demand for incoming cheese blocks dropped. That reduced demand traveled to their commodity cheese suppliers. Those suppliers adjusted milk intake from processing facilities. And those facilities modified contracts with cooperatives and farms.

USDA Agricultural Marketing Service data shows Class III prices at $19.95 per hundredweight for November 2024—historically a decent number. But regional volatility increased in the weeks following the recall announcement, with cooperatives in affected areas reporting intake adjustments ranging from 5% to 15%, depending on their processor relationships.

What does that mean for a working operation? Consider an 1,800-cow dairy producing around 41 million pounds annually. A 12% intake reduction sustained over several months—reports I’m hearing fall in that range—represents roughly $430,000 in displaced revenue at that Class III price.

I recently spoke with a Wisconsin producer navigating exactly this situation. What struck me was his observation that excellent milk quality scores didn’t provide.

“We run a tight ship. But in a commodity system, my SCC numbers don’t protect me from problems three levels down the chain.”

That’s the reality of the converter supply chain. Your operational excellence doesn’t matter when someone else’s quality control failure determines your fate.

The Broader Context: Industry Trends Worth Watching

I’ve been following dairy consolidation for about two decades now, and the current moment feels distinct. Food safety concerns are accelerating trends already underway—traceability requirements, processor consolidation, and shifting leverage in supply relationships.

The FDA’s Food Traceability Final Rule (FSMA 204) was originally scheduled for January 2026. FDA has since extended the compliance deadline by 30 months to July 20, 2028—that extension was confirmed earlier this year. Still, processors are already adjusting supplier expectations in anticipation.

What the rule requires, regardless of final timing, is detailed record-keeping at each “Critical Tracking Event” that enables regulators to obtain data within 24 hours. For certain cheeses on the Food Traceability List, this creates real implications for supplier selection.

The consumer dimension reinforces these trends. Label Insight research from 2016 found that 73% of consumers are willing to pay more for products that offer complete transparency in sourcing and ingredients. Subsequent industry tracking has consistently confirmed that demand—if anything, it’s grown stronger, particularly among younger consumers.

What this means practically: processors and retailers are beginning to differentiate suppliers based on traceability capability. Some are offering premiums. Others are simply making it a qualification requirement. Either way, the capital needed to meet these expectations isn’t trivial.

What Traceability Systems Actually Cost

One question I kept encountering was straightforward: what does this actually cost a working dairy? I spent time examining land-grant university extension analyses and talking with operations that have made these investments.

According to the University of Minnesota Extension’s 2024 dairy technology investment analysis—with similar findings from Wisconsin and Cornell dairy programs—the picture breaks down into roughly three tiers:

Traceability Investment by Scale

This is the chart that keeps 800-cow dairy owners awake at night. Too big to ignore traceability requirements, too small to spread fixed costs efficiently. The 500-2000 cow range is where cooperative infrastructure starts making financial sense—or you’re paying $120+ per cow for systems the mega-dairies get at $85
Investment LevelCapital CostWhat It IncludesPremium PotentialScale Threshold
Basic Compliance$20,000–$35,000Tank sensors, basic IoT monitoring, cloud record-keepingMeets minimums; limited premiumAny size
Advanced Traceability$350,000–$500,000Individual animal sensors, RFID, blockchain integration, and real-time monitoringPreferred supplier status; $0.50–$0.75/cwt potential3,500+ cows
Comprehensive Digital$1,000,000+AI health monitoring, automated feeding, full supply chain integrationMaximum differentiation; $1.00+/cwt potential5,000+ cows

Financing makes these numbers more challenging. Agricultural lending rates have been running 7.5-8.5% according to late 2024 Federal Reserve surveys—multi-decade highs. A $500,000 loan at those rates requires annual debt service of $65,000 to $75,000 over 10 years. For a 2,000-cow dairy with typical margins, that’s substantial.

Now, it’s worth noting that some operations view this investment differently—not just as a compliance cost but as an operational improvement that generates returns through better fresh cow management, reduced health costs, and improved efficiency across the transition period and beyond. The calculation isn’t purely about premium capture.

Strategies That Are Working

Here’s where I want to shift from analysis to practical observation, because producers are navigating these pressures in genuinely creative ways. Not every approach fits every operation, but these patterns keep emerging in conversations.

Beef-on-Dairy: Quality Genetics or Don’t Bother

The most accessible opportunity—requiring minimal capital—involves strategic use of beef genetics on dairy herds. This trend has been building for years, but current economics make it particularly compelling.

USDA data from January 2024 shows U.S. beef cow inventory at approximately 28.2 million head—the lowest since 1961. Texas A&M AgriLife has confirmed this represents historically tight supplies, and CoBank analysis suggests meaningful herd rebuilding won’t happen until 2027 at the earliest.

But here’s what I need to emphasize, and it’s something The Bullvine has been beating the drum on for years: random beef bulls don’t cut it. The premium prices everyone talks about? They’re not available to just anyone throwing beef semen at their bottom-tier cows.

Every dairy farmer hears about beef-on-dairy premiums, but most are leaving $700 per head on the table. The difference between “some random beef semen” and verified genetics with documented EPDs is the gap between a side hustle and a profit center

Straight dairy bull calves now bring $400-$600 per head at many auctions—a dramatic improvement from the $100-$150 common just a few years back. Beef-cross calves from verified, high-quality genetics (proven Angus, Simmental, or Charolais sires with documented carcass data on Holstein dams) command $1,000-$1,400 at auction today—up from $650 averages just three years ago, according to Laurence Williams, dairy-beef cross development lead at Purina. Premium calves from elite sires can reach $1,500 or more at well-managed sales.

The key word there is verified. Feedlots and calf buyers have gotten sophisticated. They know the difference between a calf sired by a proven Angus bull with marbling EPDs in the top 10% versus some random beef semen picked up cheap. The price gap between generic beef-cross calves and those from verified genetics programs can exceed several hundred dollars per head—a difference driven almost entirely by genetic documentation and buyer confidence.

National Association of Animal Breeders data shows beef semen sales to dairy operations stabilized at record levels—approximately 7.9 million units in both 2023 and 2024—following rapid growth between 2017 and 2022. This isn’t temporary. It’s become structural.

I spoke recently with a California producer who’s breeding 45% of his herd to beef genetics—but he’s meticulous about which sires he uses. His observation: “We tried the bargain-bin approach the first year. Got bargain-bin prices. Now we use verified high-accuracy sires with actual carcass data, and the difference in our calf checks is substantial. The genetics investment pays for itself multiple times over.”

Beyond genetics, calf management determines whether you capture premium prices. Operations achieving top dollar have excellent colostrum protocols (within that critical four-hour window), careful processing procedures, and established feedlot relationships. Quality genetics combined with quality management is the formula. One without the other leaves money on the table.

Organic Markets: A Regional Calculation

For operations in certain regions—particularly the Northeast—organic and grass-fed markets remain undersupplied. The Northeast Organic Dairy Producers Alliance continues tracking demand that outpaces regional supply.

Organic cooperative contracts typically pay $33-$45 per hundredweight, according to NODPA’s 2025 reporting, compared to $18-$22 for conventional contracts. The premium is substantial, though it varies considerably by region, volume, and contract terms.

The challenge, of course, is transition. USDA organic certification requires 36 months of organic management before milk qualifies for premium pricing. That’s three years of elevated costs—organic feed runs 40-60% above conventional—without premium capture.

A Vermont producer I spoke with made the transition between 2019 and 2022. Her assessment was candid: “Those middle months were hard. You’re paying organic costs, selling at conventional prices, and hoping the math works on the other side.” It did work for her operation—she’s now receiving over $40/cwt through her cooperative contract. But she emphasized that financial staying power was essential.

Geography matters enormously here. Northeast markets remain undersupplied for organic milk. Midwest and Western markets show more saturation. If you’re considering this path, regional supply-demand dynamics should drive the decision as much as on-farm capabilities.

Other Diversification Pathways

Beyond beef-on-dairy and organic, I’m seeing producers explore several other approaches worth mentioning.

A2 milk programs are gaining traction in some regions, with processors offering premiums typically ranging from $0.50 to $1.50/cwt for herds genetically tested for the A2 beta-casein variant. The investment is primarily in genetic testing ($25-$40 per animal) and, potentially, in culling or breeding decisions over time. It’s not a dramatic premium, but for operations already making genetics decisions, it’s relatively low-friction additional income.

Direct-to-consumer operations—farmstead cheese, on-farm stores, local delivery—offer meaningful margin opportunities for operations within roughly 50 miles of population centers with populations exceeding 100,000. The catch is bandwidth: you’re adding retail management, food safety compliance, and customer relationships to an already demanding operation. Producers who succeed here generally have family members or partners explicitly dedicated to the retail side.

Agritourism components can leverage dairy heritage for smaller operations near tourist corridors or suburban areas. Farm tours, educational programs, and seasonal events won’t replace milk revenue, but they can provide supplemental income while building community connections that support other direct-sales efforts.

None of these represents a universal solution, but they illustrate the range of options available beyond commodity milk production.

Cooperative Infrastructure: An Emerging Model

One development I find encouraging—though it’s still early—is the rise of cooperative approaches to infrastructure investment. The logic is straightforward: if individual 2,000-cow farms can’t justify $500,000 in traceability technology, can ten farms sharing that investment make it viable?

Several farmer groups in Wisconsin and Minnesota are exploring this model. Typical structures involve 8-12 farms forming an LLC or cooperative, pooling capital to fund shared traceability platforms, and, in some cases, shared processing capacity for value-added products.

Early indications suggest per-farm costs can decrease substantially—potentially 60-75%—while still meeting processor requirements. The trade-off is governance complexity. These arrangements require genuine trust, aligned incentives, and careful legal structuring.

A Minnesota producer involved in exploratory discussions put it this way: “You’re giving up some independence. That’s real. But competing individually against 10,000-cow operations for processor contracts has its own costs.”

It’s worth watching how these structures develop. They may represent an important pathway for mid-size operations facing scale disadvantages in technology investment.

on-dairy with verified genetics sits in the sweet spot—minimal capital, 9-month payback, $320/cow annual return. The bottom-right corner (Direct-to-Consumer) looks tempting until you realize you’re now running two businesses

Maintaining Perspective

I want to be thoughtful about framing here. This isn’t a crisis moment requiring panic. Dairy has always been cyclical. Consolidation has proceeded for decades. Many mid-size operations have successfully navigated previous transitions and will do so again.

What does seem genuinely different about the current environment is the convergence of several trends: regulatory requirements for traceability (even with the FSMA extension to mid-2028), consumer expectations for transparency, the capital intensity of compliance, and processor consolidation, which is affecting market leverage.

Dr. Marin Bozic, the dairy economist at the University of Minnesota who advises Edge Dairy Farmer Cooperative and has testified before Congress on milk pricing, captures this well: “The farms that will thrive over the next decade are those making strategic decisions now—not reactive decisions later. That doesn’t mean panic. It means thoughtful positioning.”

The Great Lakes Cheese recall didn’t create these dynamics. But it made them visible in ways worth understanding. When a quality control issue at a supplier you’ve never heard of can affect your milk revenue, it reveals something meaningful about the supply chain’s structure and risk distribution.

Thinking Through Your Situation

Rather than prescribe universal solutions—every operation differs—here’s how these considerations tend to vary by scale:

Smaller operations (under 500 cows): Comprehensive traceability systems rarely pencil out at this scale. Specialty markets—organic, grass-fed, A2, direct-to-consumer—offer more realistic pathways to premium capture. Beef-on-dairy genetics (verified genetics, not bargain semen) can supplement income meaningfully regardless of herd size. The question becomes: where can you differentiate?

Mid-size operations (500-2,000 cows): This is arguably the most challenging position currently. Large enough that specialty market pivots are difficult, but lacking scale for major technology investments to generate positive returns individually. Cooperative approaches to shared infrastructure, combined with beef-on-dairy diversification using verified genetics, represent viable near-term strategies. The extended FSMA timeline—mid-2028—provides runway to explore options.

Larger operations (2,000+ cows): Comprehensive traceability investments become more justifiable as fixed costs spread across greater production. The strategic question shifts: invest in positioning as a preferred supplier to consolidated processors, diversify revenue streams to reduce channel dependence, or both? Many larger operations are pursuing parallel strategies.

Questions Worth Considering

Before committing to any particular direction, some honest self-assessment helps clarify options:

What’s your realistic timeline? Beef-on-dairy generates returns within months. Organic transition requires years. Which matches your financial position and planning horizon?

What’s your regional market reality? Is organic milk undersupplied or saturated in your area? Are established beef-cross calf buyers accessible? What specialty processors operate within a reasonable hauling distance?

Do you have neighbors who are suitable for a cooperative investment? Shared infrastructure approaches require aligned values and compatible operations. Not every neighboring farm makes a good partner.

What does your succession plan suggest? If the next generation isn’t committed to dairy, heavy investment in long-term technology infrastructure deserves careful evaluation.

Where are your operational strengths? Some farms excel at cow comfort and health management—organic or A2 programs might leverage that. Others have strong calf-raising infrastructure that positions them well for beef-on-dairy premiums.

There aren’t universal answers. But asking these questions honestly tends to clarify which paths make sense for specific situations.

The Bottom Line

What I’ve tried to do here is present what I’m observing as clearly as possible—drawing on USDA and FDA data, land-grant university extension analysis, conversations with credentialed economists, and reports from producers navigating these conditions directly.

The Great Lakes Cheese recall was, in one sense, routine—a food safety incident identified and addressed through established procedures. The system functioned as designed.

But the recall also exposed the ugly truth about converter supply chains: the risk flows upstream while the profits flow down. Your milk quality doesn’t protect you. Your operational efficiency doesn’t protect you. Your SCC scores don’t protect you. In a commodity system feeding into consolidated converters, you’re exposed to failures you can’t see coming and can’t prevent.

The encouraging news: farmers have options. Beef-on-dairy genetics—verified, quality genetics—offer immediate revenue diversification with minimal capital requirements. Specialty markets reward quality and management in ways commodity channels don’t. Cooperative structures can distribute infrastructure costs across multiple operations.

None represent a complete solutions. All require evaluation against individual circumstances, regional markets, and operational capabilities. But they represent genuine pathways—ways to build some insulation against a system that otherwise treats your operation as a disposable input.

That positioning—concentrating on factors within your control while clearly understanding those that aren’t—strikes me as exactly the right approach. The producers I talk with who seem most confident about the future share that orientation. They’re not ignoring industry headwinds. They’re just not waiting for those winds to determine their direction.

Key Takeaways:

  • When Great Lakes pulled 250K cases, farms 31 states away lost 5-15% income—even though they never sold to Great Lakes. Your SCC won’t protect you from converter failures.
  • Beef-on-dairy with verified genetics: $1,000-$1,400/calf. Straight dairy: $400-$600. The genetics gap is worth hundreds per head.
  • FSMA 204 extends to July 2028, but processors are moving now. Alternative revenue streams aren’t optional—they’re insurance.

Complete references and supporting documentation are available upon request by contacting the editorial team at editor@thebullvine.com.

Learn More:

The Sunday Read Dairy Professionals Don’t Skip.

Every week, thousands of producers, breeders, and industry insiders open Bullvine Weekly for genetics insights, market shifts, and profit strategies they won’t find anywhere else. One email. Five minutes. Smarter decisions all week.
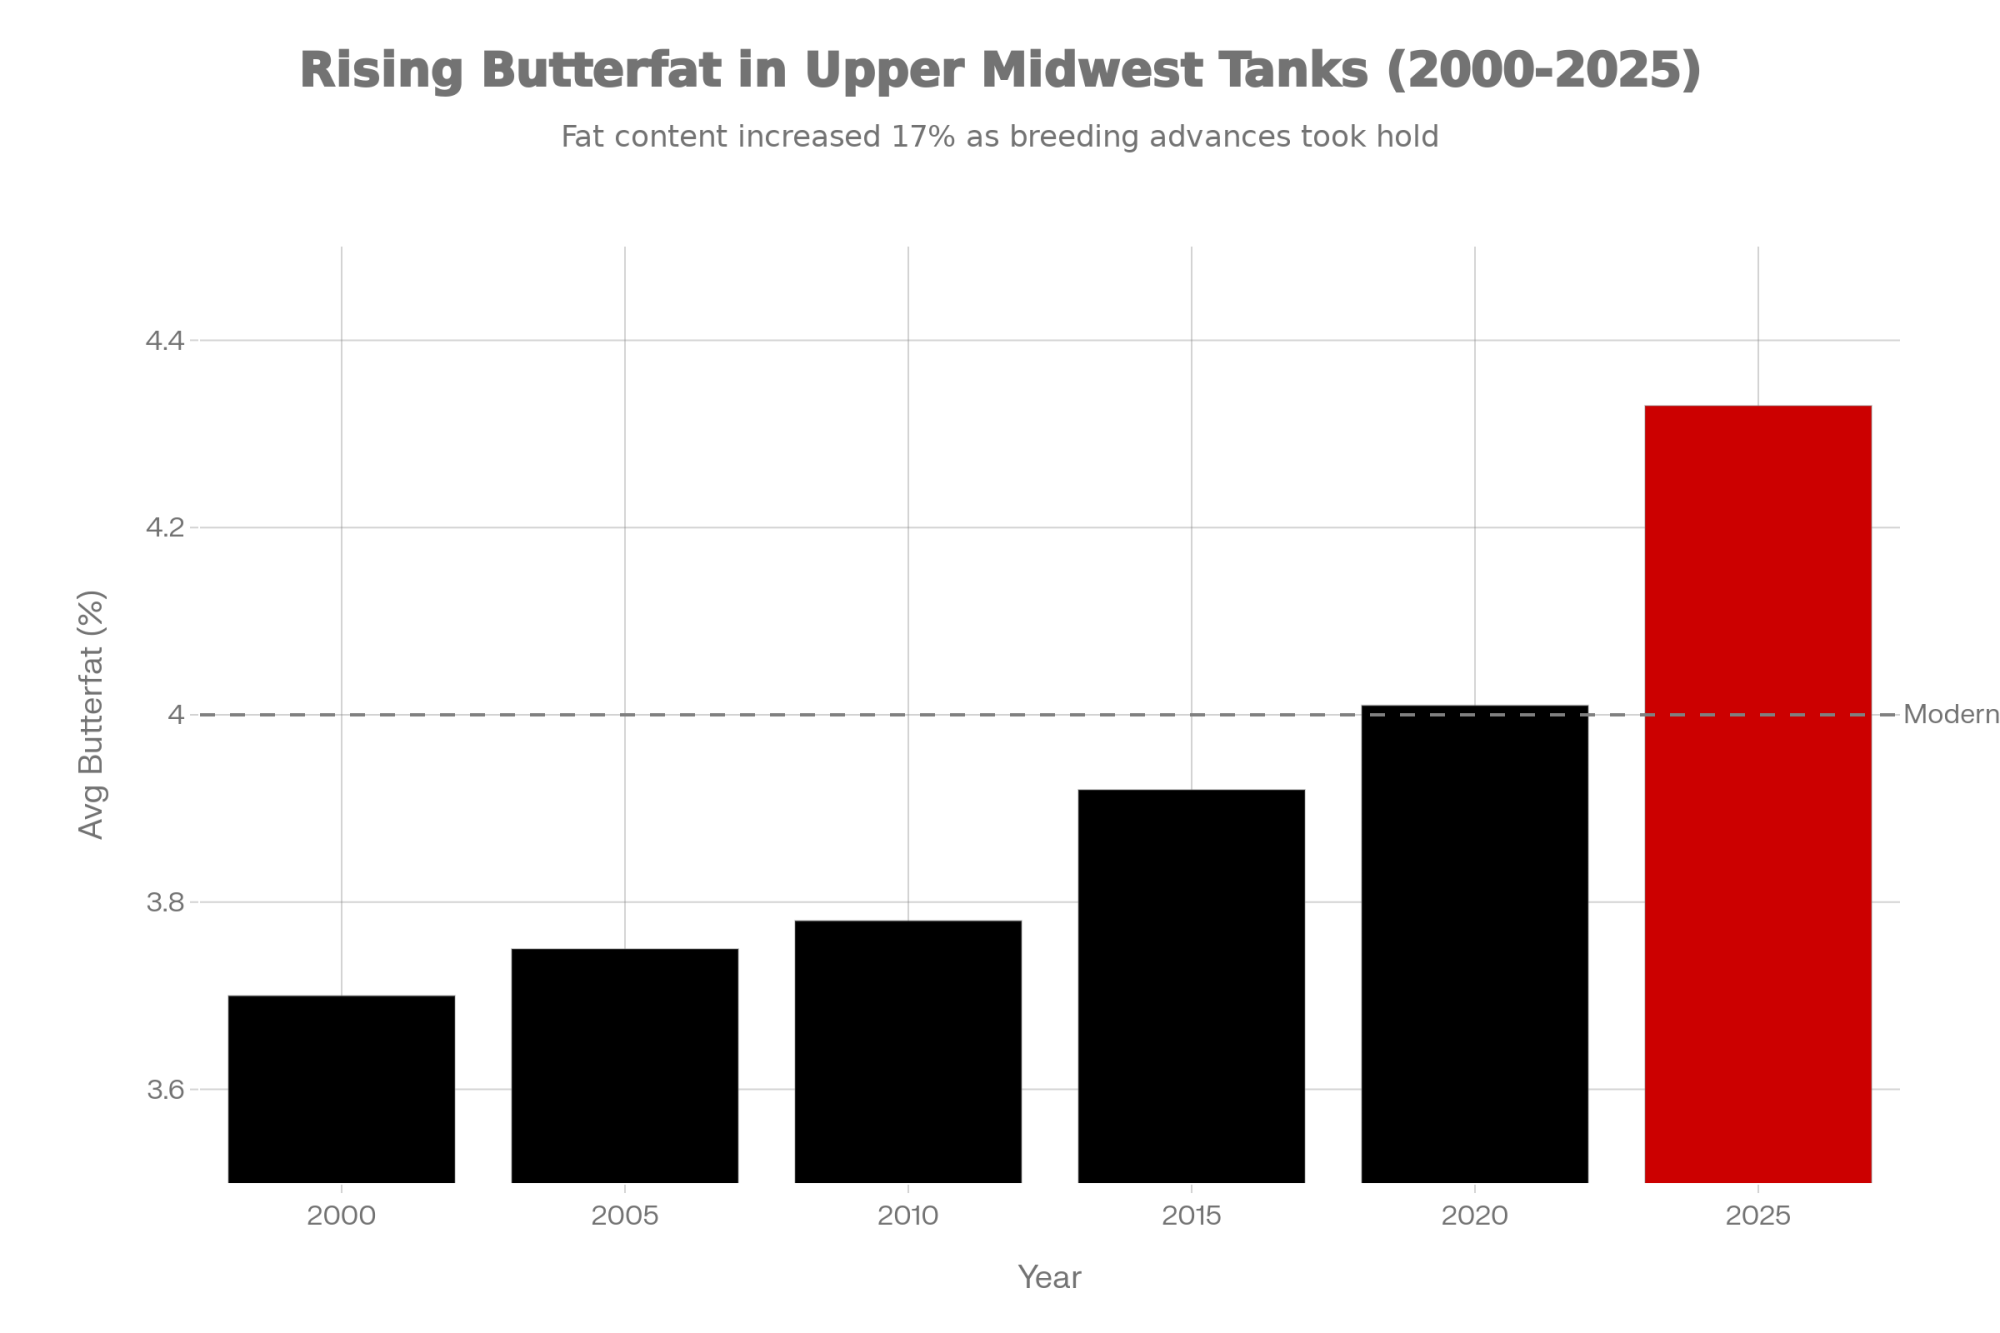
NewsSubscribe
First
Last
Consent

The €185,000 Trade: What Dairy Farmers Gain – and Give Up – in the FrieslandCampina-Milcobel Merger

That’s real money. But my plant is on the closure list.’ The €185,000 decision 16,000 dairy farmers face on December 16.

EXECUTIVE SUMMARY: On December 16, roughly 16,000 dairy farming families face a vote they can’t take back: merge Milcobel into FrieslandCampina and collect €185,000+ in loyalty bonuses—or walk away and keep the flexibility to leave. For some farmers, the merger offers genuine upside: scale, technical resources, and substantial payments for operations near retained facilities with sustainability practices already in place. For others, plant closures could add thousands in annual hauling costs, and Foqus planet compliance ranges from minor documentation to six-figure capital investments. History provides both warnings and encouragement—DFA’s consolidation brought in $290 million in antitrust settlements, while Irish co-op mergers helped farmers reach export markets they couldn’t access on their own. Geography and current infrastructure determine which outcome you’re likely to see. This analysis provides the framework to run your own numbers, because the right answer depends on your specific situation—and once you vote yes, you can’t vote no later.

Dairy cooperative merger

For one Milcobel member near Antwerp, the December 16 vote isn’t about spreadsheets. It’s about whether her family’s 80-year-old dairy operation will still make sense five years from now.

She milks 95 cows on a farm her grandfather started in 1946. Been a Milcobel member for eighteen years. And like thousands of other Belgian and Dutch dairy farmers, she’s got just over a week to decide whether to merge her cooperative into FrieslandCampina—creating what Dairy Reporter is calling a “€14 billion co-op” that would rank among Europe’s largest.

“They’re offering us €8 per hundred kilos to stay three years,” she told me last week, asking that her name not be used because she’s concerned about pushback from cooperative leadership. “That’s real money. But my nearest plant is on the closure list. So what am I actually voting for?”

Financial reality check: The same merger creates four different outcomes. Geography and infrastructure determine whether €185,000 in loyalty bonuses becomes genuine profit or disappears into hauling costs and compliance investments

You know, it’s the kind of question that doesn’t have an easy answer. What’s unfolding in Belgium and the Netherlands isn’t just one cooperative merger—it’s part of a broader consolidation wave reshaping how milk moves from farm to consumer. And the dynamics here offer a useful perspective for dairy producers everywhere, whether you’re milking cows in Flanders, Wisconsin, or New Zealand.

What’s Actually on the Table

Let me walk you through what FrieslandCampina and Milcobel are proposing, because there’s quite a bit of information floating around, and some of it gets confusing.

The merger would combine both cooperatives’ member farms into one organization. According to FrieslandCampina’s official announcement from December 2024, we’re talking about approximately 16,000 member dairy farmers processing around 10 billion kilograms of member milk annually. That’s across facilities in the Netherlands, Belgium, Germany, and northern France.

The headline incentive—and this is what most farmers are focused on—is an €8 loyalty bonus per 100 kilograms for farmers who commit to the merged cooperative for three years. Dairy Reporter confirmed these terms in their December 2025 coverage.

But here’s where it gets more complicated. The merger also involves what the proposal calls “network optimization”—consolidating processing facilities to improve efficiency. Several plants have been identified for potential closure or transition, according to reporting from Dairy Reporter and the Dutch publication Veeteelt. And that changes the math considerably depending on where you’re located.

EXAMPLE FARM SCENARIO: Mid-Sized Belgian Operation

FactorWhat It Looks Like
Annual production760,000 liters
Three-year loyalty bonus€186,000 total (about €62,000/year)
If the nearest plant closes (+47km hauling)Significant additional transport costs
Potential basis compressionHard to predict, but historical patterns suggest concern
Net positionDepends heavily on your specific situation

The outcome ultimately comes down to plant-closure decisions and post-merger pricing dynamics.

How Geography Shapes the Math

If your current receiving facility remains operational, the merger economics work in your favor. If your nearest plant is closing, you’re looking at a different calculation entirely. And right now, there’s still uncertainty about which facilities fall into which category.

Here’s what we know from previous consolidations—and as many of us have seen, there’s substantial experience with this from the United States and Oceania. Plant closures create real costs for affected farmers. The exact numbers vary quite a bit by region and contract structure, but the pattern is consistent: more distance means more money out of your pocket.

Dr. Marin Bozic, an assistant professor in dairy foods marketing and economics at the University of Minnesota, has extensively studied cooperative pricing dynamics. His work suggests that when farmers have multiple processors competing for their milk, basis stays tight. When options narrow, processors face less price-based competitive pressure. In regions where significant processing capacity has closed, the research indicates the basis can widen over time—sometimes meaningfully.

A farmer from West Flanders, whose nearest plant is on the consolidation list, walked me through his numbers: “The next closest facility is 47 kilometers further. That’s going to add real money to my hauling costs every year. Add potential basis compression, and I’m not sure the bonus covers it.”

Geography is destiny: The Antwerp farmer facing a 47km haul to the next plant? She’ll lose 25% of her loyalty bonus just to transport milk. At 100km, 58% vanishes – turning €185,000 into pocket change

It’s the kind of calculation that keeps you up at night.

Understanding Sustainability Compliance Costs

The merger brings Milcobel farmers into FrieslandCampina’s Foqus planet sustainability program. And you know, this is worth understanding because similar programs are becoming increasingly common across European cooperatives—and many U.S. processors are moving in this direction too.

Here’s what’s encouraging. According to FrieslandCampina’s reporting—and FoodBev covered this in June 2024—member farms received over €245 million in sustainability premiums in 2023. That’s real money flowing to farmers who meet the criteria.

The program offers up to €3.50 per 100kg for full compliance, with a €0.60 per 100kg cooperative deduction regardless of achievement level. Those numbers come directly from FrieslandCampina’s milk price documentation.

What does compliance actually cost? Here’s where things get variable, and I think this deserves more attention than it typically gets in these discussions. Industry estimates and contractor quotes from the Benelux region suggest these rough ranges:

SUSTAINABILITY COMPLIANCE: What Farmers Are Seeing

RequirementEstimated RangeContext
Methane-reducing feed additives€10,000-€15,000/yearFor a 100-cow herd; pricing is still evolving
Grassland biodiversity programs€5,000-€15,000Establishment plus ongoing management
Monitoring & documentation€2,000-€8,000May overlap with existing herd management software
Anaerobic digestion (if required)€500,000-€700,000+Capital cost; not required for all farms

These are general industry estimates. Your actual costs will depend on your current infrastructure and practices.

Two Farmers, Two Very Different Situations

A 130-cow operator from the Netherlands told me he’s feeling optimistic: “I’ve already got most of the grassland practices in place, and my vet has us on a solid animal health monitoring program. We track everything from fresh cow management through the transition period. Hitting the premium tiers is realistic for me.”

His neighbor faces a completely different situation—needs a new slurry system just to get started. “We’re looking at the same merger,” the first farmer said, “but the economics couldn’t be more different.”

And that’s really the story of this whole thing, isn’t it? Same vote, vastly different implications depending on where you stand.

The sustainability trap: Maximum Foqus Planet compliance pays €3.50/100kg – but requires €60,000 annual investment. For medium-sized farms, the math doesn’t work. You’re paid to be green, but you can’t afford to get there

What Global Patterns Tell Us

One thing I’ve noticed covering dairy consolidation over the years: the patterns tend to repeat across regions. Understanding what’s happened elsewhere offers useful context—though not necessarily predictions—for farmers weighing this decision.

Dairy Farmers of America grew substantially in 2020 when they acquired 44 processing plants from bankrupt Dean Foods for $433 million, as Dairy Herd reported at the time. They now handle roughly 30% of U.S. milk production.

History’s harsh lesson: DFA has paid $290 million in antitrust settlements since 2013. The pattern reveals what can happen when cooperative consolidation eliminates competitive pressure – farmers end up suing their own co-op for suppressing milk prices

The legal record is worth knowing about. DFA has paid approximately $290 million in antitrust settlements since 2013:

SettlementAmountWhat Happened
Southeast (2013)$158.6 millionFarm and Dairy and Hoard’s Dairyman covered the court approval
Northeast (2014)$50 millionConfirmed by Dairy Reporter and the National Agricultural Law Center
CME price manipulation (2013)$46 millionDairy Reporter reported on this one
Southwest (2025)$34.4 millionReceived preliminary court approval in August—DFA contributing $24.5 million, Select Milk Producers paying $9.9 million

DFA settled each case without admitting wrongdoing—that’s standard legal practice. But the payments themselves tell you that regulators and courts found the concerns substantial enough to warrant significant compensation.

Fonterra in New Zealand offers another data point. Their farmgate payments dropped from a record NZ$8.40 in the 2013-14 season to NZ$3.90 by 2015-16—a 54% decline in just two years. CowSmo and the New Zealand Commerce Commission both documented this painful period.

And just this October, 88% of Fonterra farmers voted to sell the cooperative’s consumer brands to Lactalis for NZ$4.22 billion. Dairy Reporter covered that vote extensively. The decision reflected, at least in part, the need for capital relief after years of volatile returns.

Now, let me be direct here: I’m not suggesting FrieslandCampina will follow these exact patterns. European dairy operates in a different policy environment—the legacy of milk quotas, CAP support structures, and generally more regional processor competition than you see in parts of the U.S. or New Zealand’s highly concentrated market. But the structural dynamics—processor consolidation, farmer lock-in periods, margin pressure during downturns—are similar enough that the history is worth considering.

Consolidation begets consolidation: FrieslandCampina-Milcobel’s €14 billion merger looked massive in December 2024. Four months later, Arla-DMK announced an even bigger combination. The industry is racing toward fewer, larger players – and farmers are becoming smaller voices in bigger rooms

When Consolidation Has Actually Worked

It’s equally important to acknowledge that not every consolidation story involves the challenges I’ve described. Some have delivered genuine benefits, and that perspective deserves fair representation.

In Ireland, consolidation into entities like Glanbia and Kerry Group helped farmers access export markets and technology that would’ve been impossible at smaller scale. Farmgate prices have generally remained competitive within Europe.

A Dutch producer who went through the original FrieslandCampina formation back in 2008—when Friesland Foods and Campina merged, as Dairy Reporter covered at the time—shared his experience: “The first few years were uncertain. But over time, the scale gave us market access we wouldn’t have had otherwise. My milk price has been competitive.” His operation has grown from 85 to 140 cows since then, and he credits cooperative technical support for improving his herd’s butterfat performance and component quality.

What seems to distinguish successful consolidations? Market structure appears to be key. When the merged entity still faces meaningful competition—either from other processors or export alternatives—farmers tend to fare better. In parts of Belgium and the Netherlands, Arla, Lactalis, and smaller regional processors still compete for milk. That’s a meaningful difference from some U.S. regions where DFA dominates.

Governance at 16,000 Members

Here’s something that doesn’t get discussed enough: what “member control” actually means when cooperative membership reaches the thousands.

With 16,000+ members, each farmer’s direct influence is naturally spread thin. You’re one voice among hundreds in your district, electing representatives who are one voice among many. Some of those representatives become farmer voices on a board that also includes professional directors and relies on executive management for operational decisions.

Farmer advocacy organizations across Europe have raised questions about this dynamic. FrieslandCampina representatives counter that their district structure provides a meaningful local voice, and point to farmer-directors who actively shape major strategic decisions.

Both perspectives have merit. The question for individual farmers: what kind of influence matters most to you, and how does that factor into your decision?

Why This Is Happening Now

Understanding the timing helps contextualize what’s being proposed.

U.S. milk production surged 4.2% year-on-year in September 2025, according to the USDA NASS report—that’s 18.3 billion pounds in the 24 major dairy states. But globally, the picture is more varied. Chinese dairy imports remain well below their 2021-2022 peaks. Processors face margin pressure from multiple directions.

This merger is being proposed because market conditions are difficult and consolidation offers a path to cost reduction—not because times are good and there’s bounty to share.

That’s not necessarily bad for farmers. Cost reduction can translate to competitive milk pricing over time. But it’s worth understanding the motivation clearly.

When the Merger Might Work Well

This merger will likely work well for some farmers:

  • Large operations near retained facilities: The €8 bonus is largely an additive income
  • Farmers already meeting sustainability targets: Compliance means documentation changes, not capital investment
  • Operations planning to expand: Larger cooperatives often offer better access to credit and technical support
  • Succession situations: Three years of predictable bonus payments during transition has real value

Five Questions Worth Asking Yourself

QuestionWhat to Think About
What’s my actual baseline?Real farmgate price after all deductions—not the announced price
What’s my plant closure risk?Distance to the next facility if yours closes
What will sustainability cost me?Investment needed vs. the premium I can realistically achieve
What’s my net position?Bonus minus added costs
What’s flexibility worth?Once you’re locked in, your options narrow

The Part That Doesn’t Fit in Spreadsheets

The Antwerp farmer I spoke with shared something that’s stayed with me: “My grandfather started this farm because he wanted to be his own boss. My father kept it going because he believed in the cooperative model—farmers working together as equals. Now I’m being asked to vote for something so large that my individual voice becomes very small.”

That feeling deserves respect. It doesn’t override economics. But it’s not irrational either.

What It Comes Down To

  • Run your own numbers. Generic promises don’t translate uniformly across all operations.
  • Know your geography. Plant closure risk matters more than almost anything else.
  • Be realistic about sustainability costs. Premium programs create genuine opportunities—but so do the investments required to qualify.
  • Learn from history, but don’t assume it repeats. Every situation has unique elements, and European dairy markets differ meaningfully from U.S. and New Zealand structures.
  • Understand the trade. You’re exchanging flexibility for scale benefits and transition payments.

The Antwerp farmer will cast her vote on December 16. She’s still undecided—running numbers, talking with neighbors, trying to separate what matters from background noise.

“Once I vote yes, I can’t vote no later,” she said. “That’s worth sitting with.”

She’s right. The financial analysis matters. But so does understanding clearly what you’re being asked to exchange—and whether what you’re getting back genuinely works for your operation and your family.

Have you experience with cooperative mergers? We’d like to hear from you. Contact our editorial team at www.thebullvine.com—farmer perspectives help the entire industry better understand these decisions.

KEY TAKEAWAYS:

  • €185,000+ in real money: Loyalty bonuses for farmers committing three years to the merged cooperative—enough to ease debt loads, fund equipment, or smooth a succession transition
  • A lock-in you can’t escape: Three years committed with no exit clause, even if your plant closes, hauling costs spike, or circumstances change dramatically
  • Geography determines your math: Farmers near retained facilities see the bonus as additive income; those facing plant closures may watch it disappear into hauling costs and basis compression
  • History offers both warnings and models: DFA’s $290 million in antitrust settlements shows consolidation risk; Irish co-op mergers demonstrate that scale can genuinely benefit farmers when competition remains
  • Run your numbers before December 16: Plant closure risk, Foqus planet compliance costs, and current infrastructure determine your actual outcome—and once you vote yes, you can’t vote no later

Learn More:

The Sunday Read Dairy Professionals Don’t Skip.

Every week, thousands of producers, breeders, and industry insiders open Bullvine Weekly for genetics insights, market shifts, and profit strategies they won’t find anywhere else. One email. Five minutes. Smarter decisions all week.
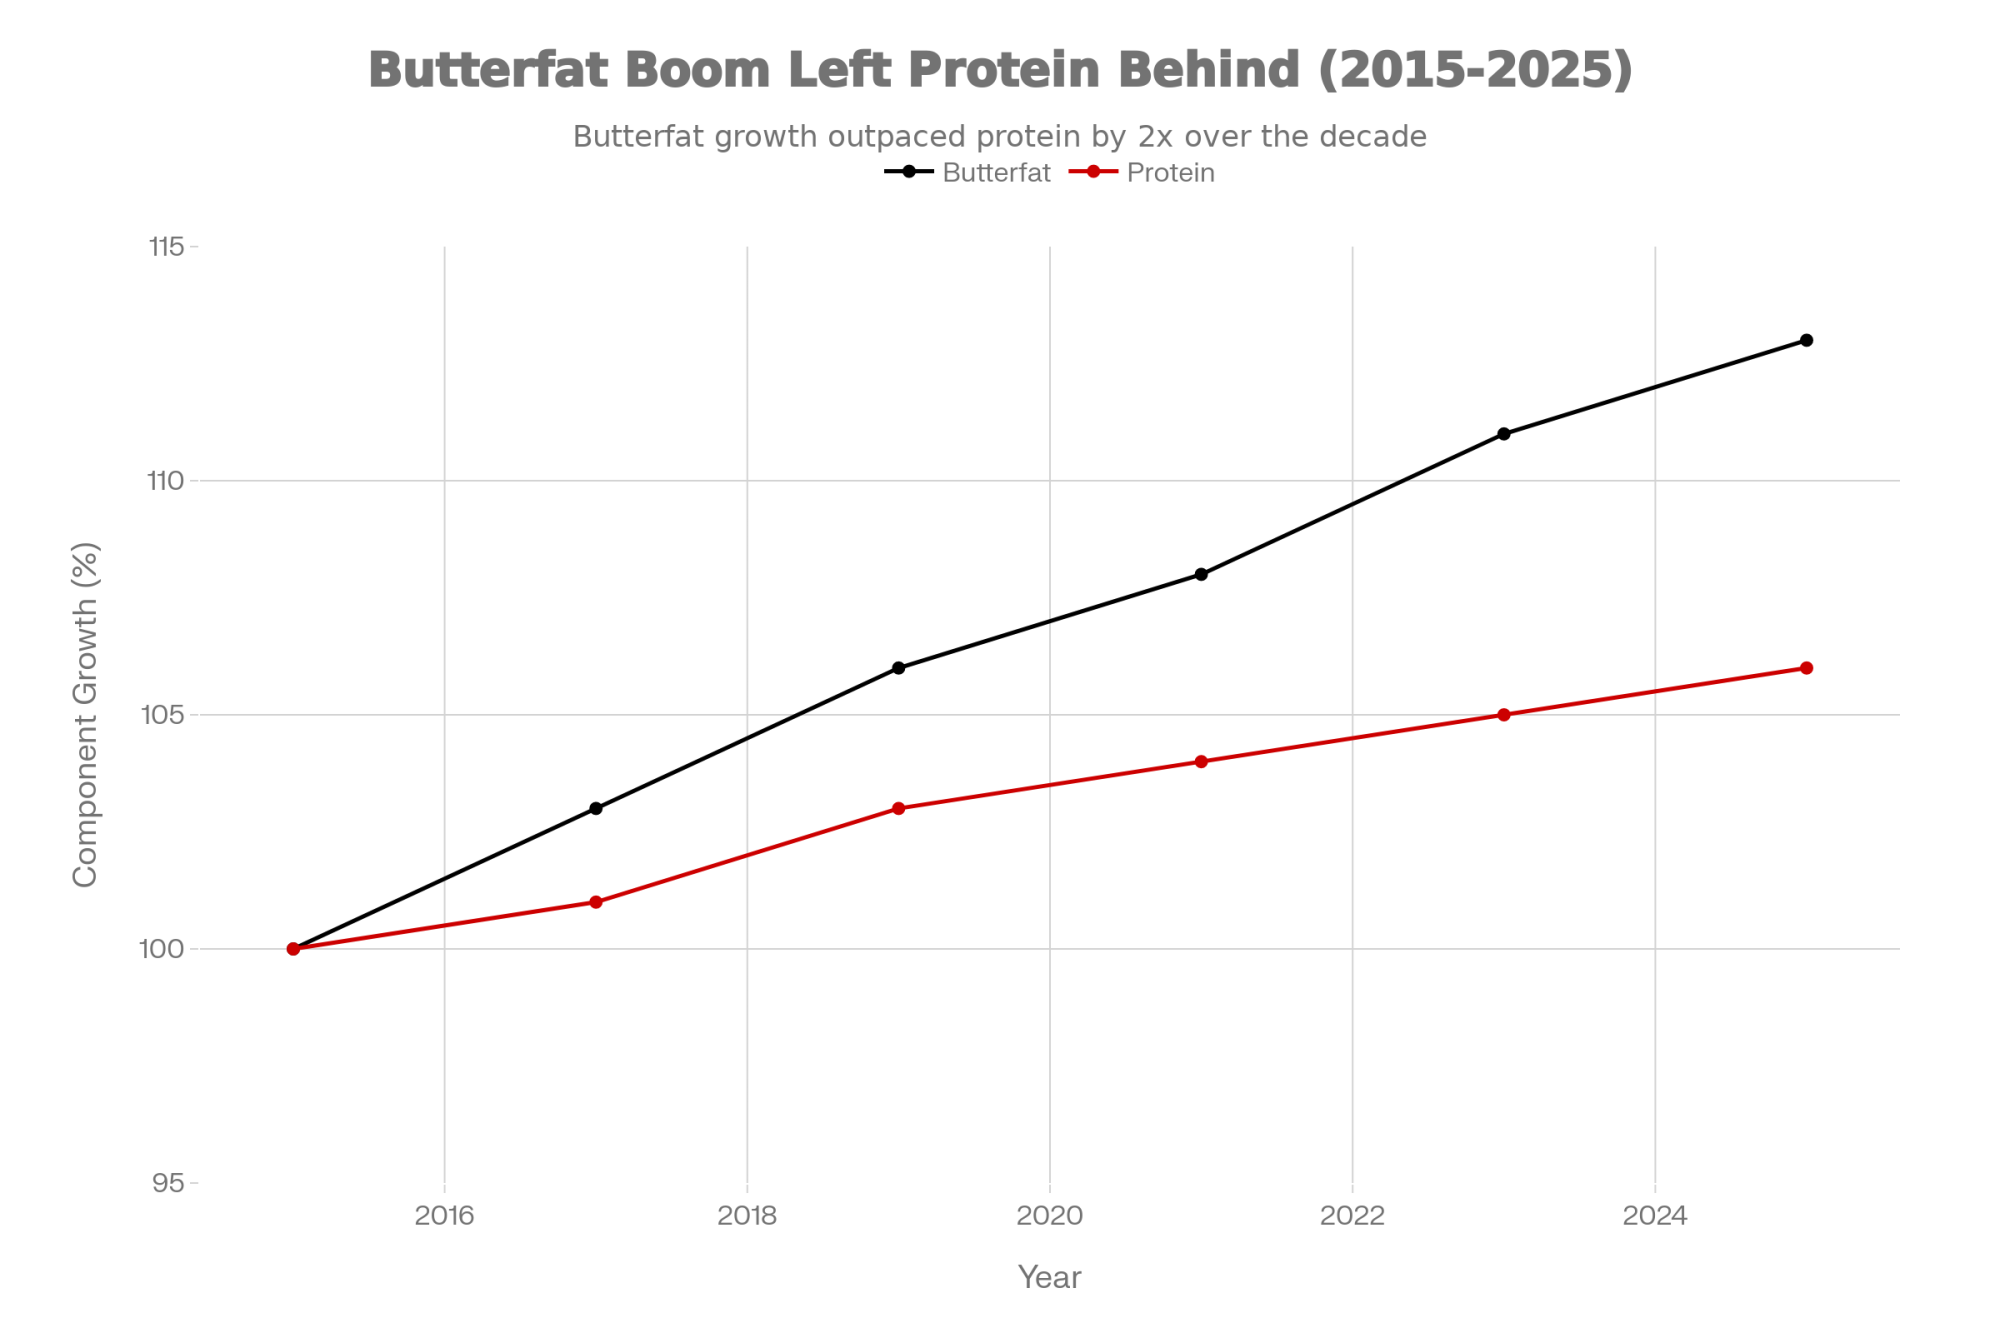
NewsSubscribe
First
Last
Consent

The Cheap Feed Trap: Why the Wall of Milk Won’t Break and How to Protect Your Margins

Your cows cover their feed. Your banker’s calm. So why are the sharpest producers culling now? Because they see what’s coming.

EXECUTIVE SUMMARY: Dairy farmers worldwide are caught in a trap: record milk production, collapsing wholesale prices, yet on-farm economics that make every cow look like she’s paying her way. AHDB’s December 2025 forecast puts UK output at “uncharted levels”—13.05 billion litres, up 4.9%—while USDA projects US production hitting 229.1 billion pounds in 2026. Three factors are blocking the market’s usual self-correction: milk-to-feed ratios near 20-year highs, strong cull values that encourage waiting, and contract structures that delay price pain for weeks. The 2015-16 EU crisis offers a hard lesson—farms that survived prioritized margin over volume, kept fixed costs lean, and acted early. Those that waited often lost their operations. This feature delivers a three-step culling framework, worked financial examples, and the critical questions to ask your banker and nutritionist before the exit window closes.

Looking at global dairy markets right now, the most striking thing isn’t just that milk is plentiful—it’s how long production is holding up despite softer prices.

Great Britain’s latest milk forecast tells the story pretty clearly. AHDB’s December update has 2025/26 output reaching a record 13.05 billion litres, up about 4.9% on the previous milk year, with April–November deliveries already running 5.5% ahead of last season. Those are significant numbers for a mature market.

At the same time, AHDB’s November wholesale data paint a sobering picture: UK butter averaging £4,290 per tonne—down nearly £1,870 since June. Bulk cream is now worth almost half what it was in September 2024. And mild Cheddar has broken below £3,000 per tonne for the first time since July 2021.

What farmers are finding—in Britain, across the EU, in the US and down in Oceania—is that this doesn’t feel like a short, sharp price dip that will quietly self-correct. The usual brakes we’re used to seeing (high feed costs, weak cull prices, big government buying programmes) aren’t in the same place they were ten years ago.

Now, weather swings, animal disease, or policy shifts could certainly change the picture faster than any forecast suggests. But the smart bet right now is to plan as if this is a phase, not a quick bounce.

This feature takes a farmer-first look at the data, the history, and the on-farm decisions that matter most over the next 12–18 months.

Global Milk Production: Multiple Exporters Expanding at Once

Here’s what makes this particular cycle different: several major exporters are expanding at once, rather than one region growing while another pulls back.

In Great Britain, AHDB’s December forecast describes the situation as “uncharted levels”—their words, not mine. Strong grass growth and better yields per cow are driving those record volumes. Meanwhile, US data mirrors this saturation: USDA’s July WASDE report raised the 2025 forecast to 228.3 billion pounds and the 2026 forecast to 229.1 billion pounds—that’s 900 million pounds higher than they projected just a month earlier. Modest herd growth and continued gains in milk per cow are doing the work on both sides of the Atlantic.

Record UK and US milk volumes underscore why the ‘wall of milk’ is so slow to crack

Producers across the UK report experiences similar to those of their American counterparts—favorable conditions pushing rolling averages up significantly, with milk flowing whether the market wants it or not.

Across the wider EU, the picture is a bit more nuanced. While overall production for 2025 was initially forecast marginally below 2024 levels according to the USDA’s December 2024 outlook, conditions in the second half of the year have supported stronger-than-expected output in several key exporting regions. AHDB’s October review noted European milk production “roaring back to life in Germany and France,” helped by milder weather and those lower feed costs we’re all noticing.

Down in Oceania, New Zealand’s pasture-based sector has recovered from recent weather challenges. USDA and CLAL data show that from January to June 2025, New Zealand milk yields totaled 8.71 million tonnes—a 1.4% increase compared to 2024 —and June’s figures exceeded previous records thanks to favorable weather and early calving.

And then there’s the demand side—this is where it gets particularly interesting. China, which for years acted as the pressure valve for global skim and whole milk powder, is in a very different phase. Domestic raw milk output has increased while per-capita dairy consumption growth has slowed. Multiple industry analyses indicate that China’s stronger domestic production is constraining import demand for Oceania powders compared with earlier years.

Why does this matter? Because we don’t have the classic offset we’ve seen in other cycles. There isn’t a major drought knocking one exporter back, or a sudden demand boom somewhere else to soak up the surplus. From a farm-gate perspective, that’s worth careful consideration.

Three Reasons the Market Isn’t Self-Correcting

In the old pattern many of us remember—and I’ve watched a few of these cycles now—milk prices slid, feed stayed expensive, margins got squeezed, and the response was fairly quick: more culling, fewer fresh heifers, supply eased, prices stabilised in 9–12 months.

This time, three features are slowing that self-correction.

The Three Reasons at a Glance:

  1. Cheap feed is softening the blow—milk-to-feed ratios near 20-year highs
  2. Strong cull values create a false sense of “I can always sell later.”
  3. Contract structures delay price signals by weeks or months

Cheap feed is softening the blow

First up is feed. In many regions, it’s simply cheaper than milk has been for some time.

AHDB market commentary and UK advisory notes for 2025 show the milk-to-feed price ratio near multi-year highs. As AHDB analyst Susie Stannard noted in a June Dairy Reporter piece, feed costs are reasonable enough that the milk-to-feed ratio is at an almost 20-year high. AHDB’s Q2 review confirmed that although the ratio has declined very slightly, it remains near that 20-year peak.

In the US, the Dairy Margin Coverage programme’s income-over-feed margin has often sat just above the main payout triggers—not because milk prices have been spectacular, but because corn, alfalfa, and soybean meal backed off their 2022 peaks. Wisconsin and California producers report the same thing: feed’s cheap, so the cow still pencils out on paper.

Here’s the thing, though. Extension economists at Wisconsin and other land-grant universities have pointed out something worth considering: this can make individual cows look better on paper than the whole business feels. A fresh cow might more than cover her ration and transition costs, but the farm still has to pay labour, power, interest, and machinery from a tighter cheque.

This is the paradox driving today’s oversupply: ration economics scream “keep milking,” while cull cheques whisper “you could exit anytime.” That’s fine in a short dip; it’s lethal in a long, flat market.

On many spreadsheets, the conclusion becomes, “The cow is paying her way, so we’ll keep her.” The risk? That spreadsheet is looking at feed, not the full cost of keeping that stall filled.

Strong cull prices create a false sense of security

The second feature is cull value—and this one cuts both ways.

UK beef and cull reports for 2025 show deadweight cow prices averaging around 420–450p/kg for much of the year. That’s well above long-term norms. North American reports tell a similar story: tight beef supplies and solid cattle prices have supported cull values through 2024 and into 2025.

Penn State Extension educator Michael Lunak made an interesting observation in a Dairy Herd article last autumn: the more a dairy can shift its culling from involuntary (injury, disease, breakdowns) to voluntary (strategic removal of low producers or problem cows), the more likely it is to be successful. As he put it, “Culling cows from the bottom of the herd makes room for more profitable cows.” He noted that typical overall cull rates around 35–37% aren’t inherently bad if more of those are strategic choices rather than forced exits.

From one angle, this environment makes culling a valuable financial tool. Every “passenger” cow you move today can generate more cash for feed bills, repairs, or debt reduction than she would have three or four years ago.

But there’s another side to consider: strong cull values can quietly encourage a mindset of, “If things really get bad, I can always sell a bunch of cows later.” If many producers end up thinking the same thing and time that “later” together, the exit door can get crowded quickly—and cull values can soften faster than anyone expects.

Contract structures delay price signals

The third factor lives in the milk contract—and this is something that’s evolved significantly over the past decade.

We’ve seen more UK and EU buyers move to deals that blend retail-aligned or cost-of-production-style pricing for a base volume, with A/B or similar structures for extra litres (where A is paid at the headline price and B is tied more closely to commodity returns).

Defra’s fair dealing rules and AHDB explainers go into how these contracts are meant to balance risk between buyer and producer while giving processors tools to manage surplus. In principle, that’s reasonable. In practice, it creates some timing challenges.

When markets are tight, B-litres can be a useful outlet. When butter, cream, and powder are under pressure, they can drop well below the cost of production. Farmers in GB and Ireland have reported that, in late 2025, B-milk, particularly powder, has at times been priced far below their overall costings—even while their A-price looked stable on paper.

The twist is timing. You make feeding, breeding, and fresh cow stocking decisions today; the milk cheque that fully reveals the effect of low-priced B-milk arrives weeks later.

A 2023 study on UK dairy price transmission, published in the journal Commodities, found that shocks at the farm level don’t always pass cleanly downstream, and that movements in one part of the chain often lag those in another. This builds on what researchers have observed for years: dairy supply is genuinely difficult to stabilise because of all these small delays and signals that don’t line up neatly.

Putting this all together, cheap feed, strong culls, and delayed contract signals go a long way toward explaining why barns are still full, even as global price indicators are flashing amber.

Lessons from the 2015–16 Dairy Crisis

To get a better handle on what might come next, it helps to look back at the 2015–16 EU milk crisis, when the end of quotas, steady supply growth, and weaker demand combined into a tough 18-month stretch for European producers.

Several independent studies and farm-business reviews have since examined which operations were more likely to come through that period intact. The patterns are fairly consistent—and they offer some useful guidance for today.

More milk from forage, less from the feed wagon

Research in agricultural economics journals found that European herds that got a larger share of their production from home-grown grass and silage tended to have lower and more resilient production costs.

Those farms could trim concentrate levels or push grazing and forage utilisation harder when prices dropped, without their output collapsing. By contrast, high-yield units where an extra 3,000–4,000 litres per cow were driven primarily by bought-in concentrates were more exposed. When milk prices dipped below the marginal value of that extra feed, the economics quickly stopped working.

Here’s what’s encouraging, though—this is something farmers can actually work on. Teagasc’s National Dairy Conference messaging in December 2025 reinforced that the strongest relationship with profitability in Irish grass-based systems isn’t milk per cow. It’s the grass utilised per hectare. About 40% of the variability in margin is explained by how much grass the farm grows and uses well.

That’s a powerful finding, and it applies beyond Ireland. Whether you’re running a grazing operation in the Southwest of England or managing a TMR system in the Midwest, the principle holds: the more of your milk that comes from home-grown feed, the more flexibility you have when prices tighten.

Lower fixed cash commitments

A second pattern was around capital structure—and this one deserves careful thought.

EU and national analysis showed that many farms which struggled the most had loaded up on new parlours, machinery, and buildings during the good years, and went into the downturn with high monthly finance payments. Those payments didn’t shrink when milk did.

Farms running older but paid-off kit (maybe with more workshop time and fewer shiny tractors) often had greater ability to cut back on non-essential spends without breaching covenants temporarily. Advisors who went through that period still talk about “machinery per litre” and “barn cost per stall” as critical resilience metrics.

I’m not suggesting anyone should avoid investment—modern facilities and equipment matter for efficiency and quality of life. But the timing and financing of those investments make a real difference when cycles turn.

Liquidity, timing, and fresh cow management

The third difference was liquidity and timing. Farms that entered the 2015–16 period with some cash on hand (or at least undrawn credit) and acted early tended to have more options.

Many of them did a “strategic shrink” in the first six months: they culled the bottom 10–15% of the herd while cull prices were still decent, used the cash to shore up their balance sheet, and ran the remaining cows harder and smarter.

Those who tried to “wait it out” with a full herd and no buffer were more likely to be forced to sell cows or land later, often at lower prices.

Producers who came through 2015–16 in good shape often note the same pattern: the cows they kept were the ones that freshened well and bred back. That wasn’t a coincidence—it was a strategy. Strong fresh cow management made every remaining stall more valuable, especially when the decision had been made to run fewer cows.

It’s worth saying: quotas and policy tools are different today, and climate rules add another layer. But the core operational lessons—milk from forage, sensible fixed costs, sound transition management, some liquidity, and willingness to adjust sooner rather than later—still apply.

Supply Chain Dynamics: Where Processors and Retailers Fit In

What farmers also notice, quite understandably, is that pain isn’t always evenly distributed along the chain.

Work on UK milk price transmission found that retail prices can be sticky on the way down. Wholesale and farm-gate prices may react more quickly to global markets than the price of a block of cheese or a pint of milk in the supermarket chiller. Similar studies on EU dairy supply chains have flagged that processor and retailer margins may widen for a time when farm-gate prices fall, until contracts and competition pull them back towards normal levels.

That can feel frustrating—and it’s a fair observation.

From a farm-level planning view, though, the practical takeaway is this: the fastest and most controllable levers are on your own side of the bulk tank.

Processors, retailers, and traders will make their adjustments, and there are legitimate pressures on them too (energy costs, labour, and environmental compliance). But those changes take time to filter back into milk prices. That’s why the rest of this piece focuses on what’s inside your control.

Strategic Herd Reduction: A Three-Step Framework

Farmers who came through previous downturns in reasonably good shape rarely talk about “chasing litres at all costs.” More often, they talk about tightening up the margin per cow and protecting cash.

In practice, that often started with a structured look at which cows were genuinely contributing and which were simply filling stalls.

The Three-Step Framework at a Glance:

  1. Pull the right data: DIM, pregnancy status, SCC trends, component yields, contract structure, feed costs
  2. Flag the passengers: Open/late cows, chronic SCC problems, repeatedly lame or problem animals
  3. Rank by value, not volume: Sort by fat+protein kilos, stress-test bottom 10–15% at B-milk prices

Here’s how to work through each step using your own recording data and a bit of quiet time at the kitchen table.

Step 1: Pull the right herd data

From your herd management software and milk recording, pull days in milk and pregnancy status for each cow, recent somatic cell count trends (at least the last three tests), and milk, fat, and protein kilos per cow over a consistent recent period—say the last 30 or 60 days. Also note your current contract structure, including any A/B litres and how B-milk is priced.

From your costings (AHDB’s Promar Milkminder in GB, Teagasc reports in Ireland, or university benchmarks in North America), have your latest feed cost per cow per day and an up-to-date estimate of the total cost of production.

This sounds basic, but you’d be surprised how many operations don’t have all of this in one place.

Step 2: Flag the obvious “passengers”

Next, make a first pass with clear rules that don’t require a calculator.

Look for cows that are open and late—any cow open beyond an agreed DIM threshold (say, greater than 150–200 days) with no clear breeding plan, particularly if she’s in her third or later lactation. Flag chronic SCC or mastitis cases—cows that have repeatedly tested over your bonus threshold and regularly drag the bulk tank toward penalty territory. Losing a quality bonus can be the difference between black and red ink. And note problem cows: repeatedly lame animals, three-quartered cows, dangerous or extremely slow milkers that add stress to every milking.

This ties back to Lunak’s point from Penn State: the more you can shift culling from involuntary to voluntary—strategic removal of low producers or problem cows—the more likely you are to improve herd profitability over time.

Mark these as “review candidates.” Once you see them all on one page, there are usually more than you expect.

Step 3: Rank by milk value, not just milk volume

This is where the conversation gets interesting. Instead of just looking at litres, shift to milk solids.

Many buyers in Europe, Oceania, and North America increasingly pay on fat and protein, and even where volume is still primary, higher-solids milk often has more value once it’s into cheese, butter, or powder.

Sort the remaining cows by fat plus protein kilos per day, not just litres. Identify the bottom 10–15% on that solids basis. Often, these are cows that look “good” because of fluid yield, but when you factor in components and feed, they’re not pulling their weight.

Now ask a simple “what if?” question for that bottom slice: if this milk were effectively priced at a lower B-price or spot value, would this cow still cover her feed and variable costs?

To stress-test, some advisers suggest modelling those cows at a conservative milk price consistent with recent B-milk or spot values (especially where powder and cream have come under pressure) and subtracting your current feed cost per cow. If the margin is tiny or negative, that animal is essentially being subsidised by her herdmates.

Industry commentary in Dairy Herd Management and Hoard’s has echoed this approach, noting that when herds go through their books honestly, a bottom 10–15% group almost always emerges that can be culled with surprisingly little impact on total milk revenue—and a meaningful impact on cash and labour load.

Worked Example: What a 10% Cull Actually Looks Like

Let’s put some rough numbers around this, because the concept is easier to grasp with specifics.

Take a 200-cow, year-round calving herd in GB or the northern US. Average yield: 32 litres per cow per day, 4.0% fat, 3.3% protein. Latest costings show feed cost at about £4.00 (or roughly $5.00) per cow per day, with total cost of production around 35–36p/litre or $18–19/cwt.

Suppose that, using the framework above, the farm identifies 20 cows that are late-open, chronically high in SCC, and at the bottom of the solids ranking. If those animals average 300 kg deadweight at around 430p/kg (consistent with recent UK cull averages from AHDB cattle data), the cull cheque comes to roughly £26,000 before costs.

Daily feed costs drop by about £80, or around £2,400 per month, plus a bit of saved parlour time, bedding, and transition management overhead.

Milk sold might fall by 500–600 litres per day, but if those were mainly low-solids, higher-risk litres that were pushing the farm into B-milk, the hit to revenue can be smaller than expected. In some A/B setups, that reduction in total volume can actually improve the average milk price by keeping more litres in the better-valued A-band.

Obviously, every farm is different. Some will decide to cull more, some less, and some not at all. The point isn’t the exact number. It’s that a small, strategic shrink can unlock both immediate cash and lower monthly outgoings without undermining the core of the herd.

Conversations with Your Banker and Nutritionist

What farmers are finding is that conversations with lenders, nutritionists, and accountants go better when they’re started early and anchored in numbers rather than gut feel.

A few questions that have come up again and again in advisory meetings this season:

“If milk averaged X pence per litre (or $Y/cwt) for the next 12 months, what would that do to our cash-flow and overdraft?”

“How many months of operating costs do we currently have in working capital or undrawn credit?”

“What happens to our covenants if we reduce cow numbers by 10–15% but improve margin per cow?”

“Are there any high-cost debts we can refinance to ease monthly pressure if prices stay only average through 2026?”

These aren’t comfortable conversations. But they’re far better to have now, when you have options, than later when you don’t.

On the nutrition side, advisers are encouraging herds to look at whether they’re still feeding “for the cheque they had last year” or for the one they have now.

That might mean trimming some additives, shifting emphasis slightly from maximum litres to steadier components, or matching rations more tightly to groups (fresh cows versus late-lactation) to squeeze a bit more efficiency out of each tonne of silage and concentrate.

Strong fresh cow management—keeping transition problems, culls, and early deaths down—also shows up in the research as a major driver of both animal welfare and long-run profitability. Healthy, well-transitioned cows are far more likely to make it into that top tier of solids producers that you really want in the barn.

In Canada, supply management and quota systems buffer much of the day-to-day price volatility, but even there, Dairy Farmers of Canada and Farm Credit Canada have noted that tighter returns and changing product mixes are placing greater emphasis on cost control, milk quality, and component yield per kilogram of quota. The efficiency conversation is happening everywhere, even where prices are more stable.

Risk Management: Insurance, Not Speculation

Risk-management tools—such as fixed-price contracts, futures, and options—often spark mixed reactions. Some producers have used them for years; others have had experiences that make them cautious.

Recent guidance from university and industry economists is fairly consistent: treat these tools as insurance against very bad prices, not a way to outguess the market.

In practice, that might look like locking in or insuring a portion of expected milk at a level that, when combined with your costings, at least covers feed, routine bills, and a realistic debt payment. It means accepting that you won’t hit the exact top—the win is not being forced to sell all your milk at the bottom. And it means matching hedge volumes to your realistic production after any planned culling or stocking changes, so you aren’t over-hedged and tied to volumes you might not ship.

In Europe, some processors now offer fixed-price pools or index-linked contracts that can serve a similar purpose for farmers who are uncomfortable with direct futures trading. In New Zealand, Fonterra and others have rolled out fixed milk price schemes and options that are increasingly used as planning tools rather than speculation.

The common thread is using these tools deliberately, as part of a broader risk plan, not on a hunch.

What’s interesting is that when you talk with operations that have come through choppy periods in decent shape, they rarely say “hedging saved us.” They more often say “hedging helped us sleep at night while we did the real work on costs, cows, and grass.”

Wildcards: Weather, Disease, and Policy

It’s also fair to say that models and forecasts only get us so far. Weather, animal disease, and policy can all quickly tilt the board.

Recent years have reminded us how regional droughts, wet harvests, or mild winters can turn forage plans upside down and push more or less milk into the system than expected. Animal health issues—from mastitis pressure in wet housing to broader concerns like avian influenza affecting dairy operations in some regions—can affect both productivity and trade flows. Policy changes related to climate, trade, or support programmes can also alter incentives. The EU’s ongoing environmental targets are one example; Canadian quota policy and US farm bill debates are another.

All of that is a long way of saying: your plan for 2026 doesn’t need to be set in stone. It does, though, help to have a plan—and to revisit it a couple of times a year as new information comes in.

The Bottom Line

Pulling this together, a few practical lessons seem to be emerging from both the current data and the 2015–16 experience.

We’re probably in a longer phase, not a quick dip. Multiple exporters are growing at once while major buyers like China are more cautious, and outlooks from AHDB, USDA, Teagasc, and others still point to comfortable supplies into 2026. Building plans that assume a full, rapid rebound may be optimistic.

Cheap feed and good cull values are helpful but can mask underlying stress. They make it possible to carry marginal cows longer and delay decisive action—which works out fine if prices turn up quickly, but creates risk if they don’t.

Margin per cow is a better guide than litres per cow. Whether you’re on pasture-based grass systems or TMR in a freestall or dry lot, the herds that consistently earn room to reinvest tend to know their milk-from-forage numbers, watch solids, manage fresh cows carefully, and think in terms of margin rather than volume.

Liquidity and flexibility buy options. Cash in the bank, undrawn credit, and manageable fixed payments give breathing space when prices wobble or fresh cow problems crop up. It’s often the lack of liquidity—not a single bad month—that forces hard decisions.

There’s no single “right” answer. For some, the best move is to tighten the belt, trim the bottom of the herd, and ride this out. For others—especially where succession is unclear, or debt is heavy—an orderly, thought-through exit while cow and land values are still decent might be the wiser route. Either way, it’s better to make that choice on your own terms than have it made for you.

What this oversupply episode is really doing is pushing every dairy business—big or small, housed or grazing-based—to ask a simple but important question:

What do we actually want this farm to look like in five years, and what steps today move us towards that rather than away from it?

There’s no template, and there’s no shame in different answers. The common thread is taking a hard, honest look at numbers, cows, and goals—and then making changes while you still have room to manoeuvre.

KEY TAKEAWAYS 

  • The cheap feed trap is real: Milk-to-feed ratios near 20-year highs make every cow look profitable—masking a global oversupply that won’t self-correct
  • Margin per cow beats litres per cow. Every time. Farms that survived 2015-16 knew this and acted early, before options disappeared
  • Find your passengers: Late-open cows, chronic SCC cases, and low-component producers are quietly being subsidized by your best animals
  • Have the hard conversations now: Model cash flow at lower prices. Stress-test your covenants. Your banker would rather hear your plan than your panic
  • The exit window is open—but not for long: Today’s strong cull prices are an opportunity to act, not a reason to wait. If everyone sells later, that door closes fast

Complete references and supporting documentation are available upon request by contacting the editorial team at editor@thebullvine.com.

Learn More:

  • The True Cost of Raising Heifers: Are You Raising Too Many? – Breaks down the hidden impact of heifer inventory on farm liquidity and demonstrates how reducing heifer numbers can free up working capital without sacrificing future production potential—a key tactic for the “Strategic Shrink.”
  • Beef on Dairy: The Golden Ticket? – Provides a strategic analysis of the beef-on-dairy market, offering producers methods to maximize the value of their lower-ranking animals and leverage the “strong cull values” mentioned in the main article to create a second, reliable revenue stream.
  • Why Genomics is the Best Investment You Can Make – Delivers the technical “how-to” for the article’s Step 3: Rank by Value, showing how to use genomic data to accurately identify the bottom 15% of the herd that drains profit, ensuring you are culling the right cows for the right reasons.

The Sunday Read Dairy Professionals Don’t Skip.

Every week, thousands of producers, breeders, and industry insiders open Bullvine Weekly for genetics insights, market shifts, and profit strategies they won’t find anywhere else. One email. Five minutes. Smarter decisions all week.
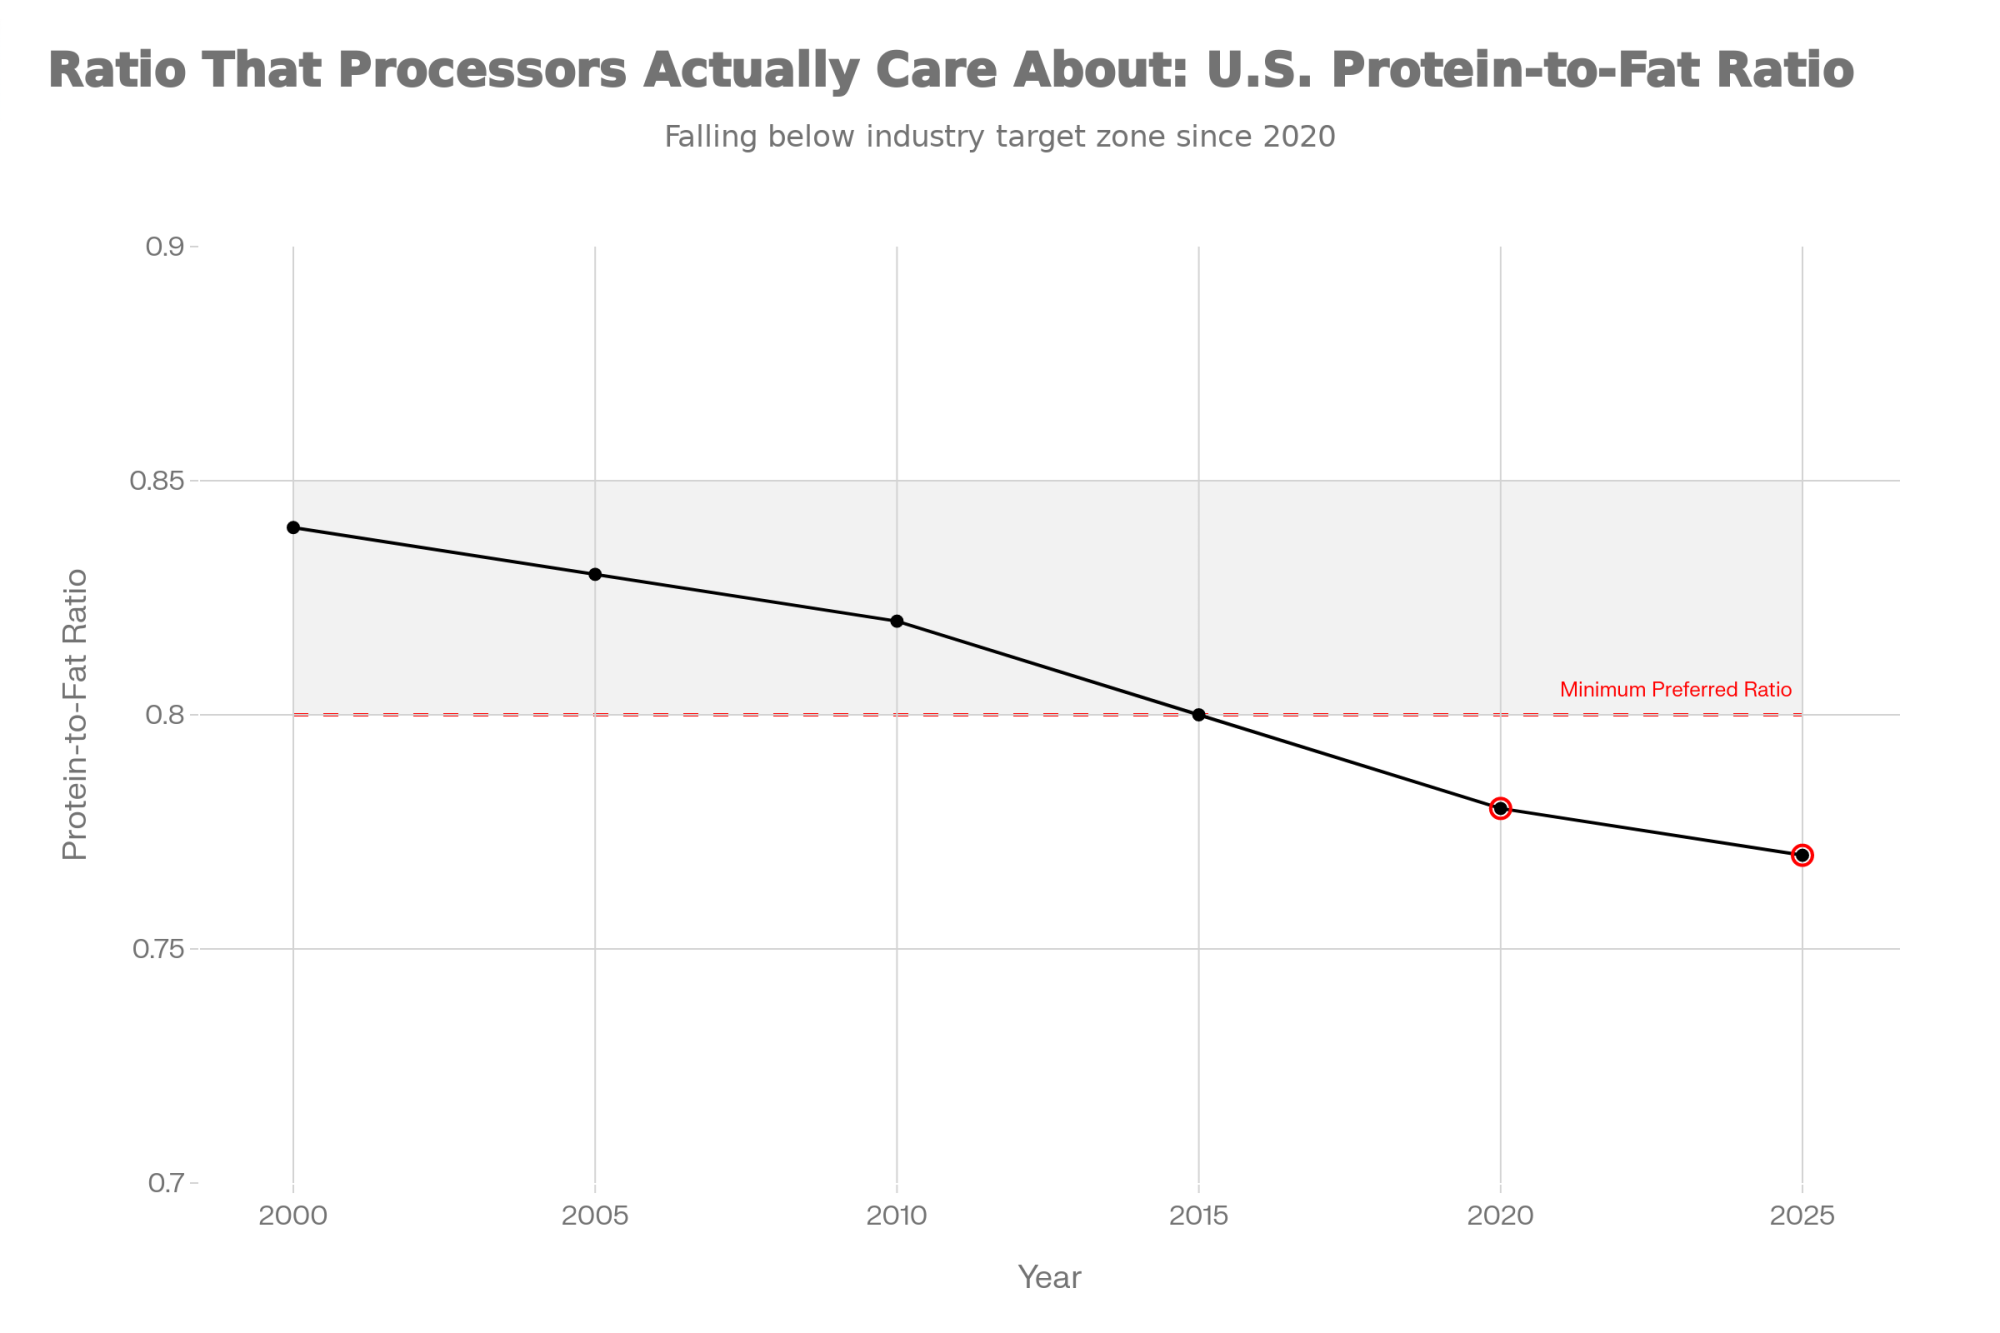
NewsSubscribe
First
Last
Consent

The $200K Dairy Margin Trap: What Cheap Feed Won’t Tell You About 2026

Feed dropped 75¢. Milk dropped $2. That’s not savings—that’s a $200K trap.

EXECUTIVE SUMMARY: Everyone’s celebrating cheap corn—but the math tells a different story. USDA projects 2026 milk at $19.25/cwt while feed costs have dropped only modestly, creating net margin compression of $1.25-1.75/cwt—that’s $156,000 to $218,000 in lost cash flow for a 500-cow dairy. New Zealand’s lowest-cost producers see what’s coming: they paid down $1.7 billion in debt this year rather than expand. Top U.S. operators are responding with feed efficiency gains, component optimization, IOFC-based culling, and beef-on-dairy programs that can protect $1.50+ per cow daily. With Chapter 12 bankruptcies up 55% and ag lenders reporting eight straight quarters of declining repayment rates, the window for strategic positioning is narrowing. The question isn’t whether margins compress in 2026—it’s whether you’ll position your operation before they do.

You know that feeling when everything looks fine on paper, but something in your gut says otherwise?

It’s the kind of conversation happening at kitchen tables across dairy country right now. The milk check looks okay—maybe even decent by recent standards. Feed costs have come down. The cows are milking well.

And yet something feels off.

That instinct isn’t wrong.

The FAO has been tracking global food prices for decades, and its November numbers tell an interesting story. The overall Food Price Index has dropped for three consecutive months, and the dairy sub-index has declined for five straight months.

New Zealand just posted a 17.8% production surge in their early season, according to their Dairy Companies Association data. U.S. milk output keeps climbing, too.

What’s worth understanding—and this is something many of us tend to underestimate—is the timeline between when these global signals show up and when they hit our milk checks.

Generally speaking, we’re looking at about six to eight months.

So the softening that started this fall? It’s likely showing up in Q2 and Q3 2026 checks.

Mark Stephenson, who spent years as Director of Dairy Policy Analysis at the University of Wisconsin-Madison before his recent retirement, studied these price transmission patterns extensively throughout his career. His research documented this lag across multiple market cycles.

The movement in international powder and butter prices isn’t really a question of whether it affects domestic markets—it’s more about when and how much.

USDA’s November World Agricultural Supply and Demand Estimates projects the all-milk price at $19.25 per hundredweight for 2026. That’s a meaningful change from the $22-24 range that many operations built their budgets around during stronger periods.

So what are the producers who’ve navigated these cycles before actually doing about it?

The Feed Cost Conversation That’s Missing Something

Walk into any farm supply store or dairy meeting right now, and you’ll hear some version of the same reassurance: “At least feed costs are down.”

And that’s true.

Corn is trading around $4.37 per bushel on the Chicago Board of Trade as of early December. Soybean meal is running around $310-$315 per ton. The DMC feed cost calculation is in a favorable territory compared to recent years—no question about that.

But here’s what that conversation often leaves out.

When milk prices were $22.75, and feed costs were about $11.00 per hundredweight, producers captured roughly $11.75 in income over feed costs.

Run the same math with 2026 projections—$19.25 milk and lower feed costs—and that margin still compresses to around $9.00.

Feed improved by maybe seventy-five cents. Milk dropped by more than two dollars.

The net effect is still a $1.25 to $1.75 per hundredweight margin compression for most operations.

On a 500-cow dairy producing 125,000 hundredweight annually, that’s $156,000 to $218,000 in reduced cash flow. Real money that has to come from somewhere—whether that’s reduced family living, deferred maintenance, or tighter input decisions.

Michael Dykes, who leads the International Dairy Foods Association as their President and CEO, put it well in a recent industry briefing. Lower feed costs are helpful, no question, but they’re best understood as breathing room to make strategic moves—not as a solution to margin pressure.

I recently spoke with an Upper Midwest nutritionist who put it more directly:

“I’ve got producers telling me they’re holding off on decisions because corn is cheap. That’s exactly backwards. Cheap corn is the opportunity to lock in favorable feed contracts and build some cushion—not permission to wait and see what happens.”

The timing matters here.

Producers who lock in Q1 and Q2 2026 feed contracts now, while basis levels remain favorable, capture that advantage regardless of what happens to spot markets later. Those who wait may find the window has closed.

It’s worth running the numbers with your feed supplier at a minimum.

What’s Actually Happening in Export Markets

The China situation deserves more attention than it typically gets in domestic dairy discussions, even for producers who don’t think of themselves as export-dependent.

Why does this matter to all of us? The economics tell the story.

The current reality is pretty stark.

U.S. dairy products face total tariffs of 84 to 125 percent in China following the trade escalation that peaked in April 2025—China’s Ministry of Finance and Reuters covered this extensively at the time.

New Zealand, by contrast, completed their Free Trade Agreement phase-in on January 1, 2024, and now ships dairy to China at zero percent tariff.

The market share shift has been significant.

While exact percentages shift quarter to quarter, the direction is clear: New Zealand has captured the lion’s share of China’s powder imports while U.S. product faces what amounts to a prohibitive tariff wall.

That displaced volume didn’t disappear—it backed up into domestic markets.

Even producers selling exclusively to domestic processors feel this effect, as Mary Ledman at Rabobank has pointed out in her global dairy market analysis. She’s been tracking these patterns as their Global Dairy Strategist for years now.

When export channels close, that milk has to go somewhere. It adds supply pressure that affects everyone, even if indirectly.

The regional effects aren’t uniform, though.

California and Idaho operations—traditionally more export-oriented through Pacific Rim trade—feel this more acutely than Upper Midwest producers whose milk flows primarily into domestic cheese markets.

I spoke with a Wisconsin cheesemaker recently who said his plant’s order book looks fine through mid-2026, but he’s watching West Coast capacity closely because displaced milk eventually tends to find its way east.

What’s particularly noteworthy is how New Zealand producers are responding to their advantageous position.

Despite favorable prices and strong production conditions, Kiwi farmers repaid NZ$1.7 billion in debt in the six months through March 2025 rather than expanding. ANZ Bank and New Zealand’s rural news outlets have been tracking this closely.

When the world’s lowest-cost producers choose balance sheet repair over growth during historically good times… well, it suggests they’re preparing for extended market softness.

That’s a signal worth paying attention to.

Reading the Financial Signals

Several data points help distinguish what’s happening now from typical cyclical patterns.

Chapter 12 farm bankruptcy filings—the specialized bankruptcy provision for family farmers—hit 216 cases in 2024, up 55 percent from the prior year. The American Farm Bureau Federation has been tracking federal court records on this, and the first half of 2025 saw additional filings running well ahead of 2024’s pace.

Context matters here. Bankruptcy filings alone don’t tell the whole story—they can reflect access to legal resources, regional legal practices, and individual circumstances as much as broad economic conditions.

But the trend is notable.

Geographic patterns show particular stress in California, Iowa, Michigan, Kansas, and Wisconsin—a mix of traditional dairy regions and areas affected by specific challenges, such as avian influenza and water constraints.

Debt service coverage ratios tell a related story.

Farm Progress recently reported on data from the Minnesota FINBIN farm financial database showing that the average producer had a concerning coverage ratio of around 85 percent in 2024—meaning operations were generating only 85 cents for every dollar of debt service obligation.

The remaining gap has to come from equity drawdown, off-farm income, or loan restructuring.

What concerns many lenders is the compounding effect.

Interest costs have roughly doubled over the past three years as rates have reset. An operation that was comfortable at 3.5 percent interest faces a completely different equation at 7.5 percent—as many of us have experienced firsthand.

The Federal Reserve Bank of Chicago’s Q3 2025 agricultural credit survey found 38 percent of banks reporting lower repayment rates—the eighth consecutive quarter of deterioration. More than two-thirds of lenders expect farmland values to flatten or decline in 2026.

None of this predicts any individual operation’s future—every farm has its own circumstances, strengths, and challenges.

But it does suggest the industry overall is experiencing stress levels that reward careful financial planning over optimistic assumptions.

The Expansion Paradox

One of the more counterintuitive aspects of current markets—and something I find genuinely interesting to think through—is why production keeps growing despite weakening price signals.

The biological reality is that dairy expansion decisions made two to three years ago are just now showing up in production numbers.

Heifers conceived in early 2023 are entering milking strings in late 2025. Facilities that broke ground during strong margins in 2023 and 2024 are now completing and being populated.

Once those commitments are made—once the cows are bred, raised, and the facilities built—the production is essentially locked in.

Debt service creates similar momentum.

Operations carrying expansion loans need to maintain production to meet their obligations. Reducing herd size often costs more than continuing to milk at marginal profitability, especially when the alternative is triggering loan covenant violations.

Christopher Wolf, the E.V. Baker Professor of Agricultural Economics at Cornell, has written thoughtfully about this dynamic. The economics of stopping are often worse than the economics of continuing.

That’s not irrational behavior—it’s responding logically to the debt structure and fixed-cost reality that exist in most operations.

Processing capacity investment adds another layer.

More than $11 billion in new U.S. dairy processing capacity is under construction or recently completed—IDFA released a detailed report in October covering 50-plus projects across 19 states.

That processing investment creates a regional demand pull that can support local expansion even when broader markets are oversupplied. A producer within hauling distance of a new plant in Dodge City or along the I-29 corridor faces different economics than one in a region without recent processing investment.

I’ve been hearing about this regional divide increasingly this season.

In Texas and New Mexico, where several major cheese and powder facilities have opened or expanded, local producers report being actively recruited with multi-year contracts.

Meanwhile, some Northeast producers describe tighter relationships with their cooperatives—fewer premium opportunities and more pressure on base pricing.

Same industry, very different regional realities.

What Successful Producers Are Doing Differently

Conversations with producers navigating current conditions successfully reveal consistent patterns. These aren’t revolutionary changes requiring massive capital—they’re an intensified focus on fundamentals.

1. Feed Efficiency Optimization

Top-performing herds are achieving feed efficiency ratios of 1.5 to 1.8 pounds of milk per pound of dry matter intake. The industry average sits around 1.4.

The Impact: Each tenth of a point improvement translates to roughly $0.20 to $0.30 per cow/day in margin enhancement.

The Tactic: Weekly NIR analysis on forages (~$15/sample) allows for immediate ration adjustments, rather than guessing between monthly tests.

I recently spoke with a Wisconsin producer who started as a custom heifer raiser before transitioning to his own milking herd. He described implementing weekly NIR testing on every forage load.

“The payback is maybe ten to one in ration accuracy,” he said. “We were basically guessing before.”

Most producers I’ve talked with see measurable results within 45 to 60 days—though individual results vary based on starting point and forage variability.

2. Component Value Capture

Producers focusing on butterfat performance and protein levels report capturing an additional $0.75 to $1.25 per hundredweight compared to volume-focused approaches.

The Tactic: Using rumen-protected choline during transition periods and summer heat stress (~$0.08/cow/day) to prevent butterfat depression.

The genetic piece is a longer-term play—daughters of high-component sires won’t hit the milking string for two-plus years—but the nutritional interventions can show results within a milk test cycle or two.

Worth having a conversation with your nutritionist about current ration fatty acid profiles and where component optimization opportunities might exist for your herd.

3. Strategic Culling Based on IOFC

Rather than culling primarily based on age, reproduction metrics, or production levels, progressive operations calculate income over feed cost for each cow and move out animals that are consistently below $1.50 per cow daily.

The Shift: “A seven-year-old cow giving 60 pounds might look fine on paper,” one herd manager at a 1,200-cow Minnesota dairy told me. “But when you run her actual IOFC with her feed intake and health costs, she’s sometimes underwater. We’re making decisions on math now, not sentiment.”

For operations without individual cow feed intake data (which is most of us), pen-level IOFC calculations still identify which groups are carrying the herd versus dragging it down.

Most herd management software can generate these reports with minimal setup.

4. Beef-on-Dairy Integration

Producers systematically breeding bottom-tier genetics to beef sires report equivalent revenue of $2.50+ per hundredweight from crossbred calf sales.

The Math: A straight Holstein bull calf might bring $150. A beef-cross brings $1,000 or more based on current USDA feeder cattle reports.

The Genetics Play: Use genomic testing or breeding values to identify the bottom 20-30% of your herd’s genetic merit. Breed those animals to proven beef sires with good calving ease scores, and establish buyer relationships before calves hit the ground.

This is where your genomic data becomes a direct revenue driver—not just a breeding tool.

Operations that treat beef-on-dairy as an afterthought leave money on the table compared to those who plan the program strategically.

The Emerging Structure: Two Viable Paths

Looking at where the industry appears headed over the next three to five years, a structural pattern is emerging that’s worth understanding—even if it raises uncomfortable questions.

The data increasingly suggests two economically viable models:

Large-scale efficiency operations—generally 1,500 cows and above—achieving production costs in the $14 to $17 per hundredweight range through scale economics, technology adoption, and processing relationships.

USDA’s Economic Research Service cost-of-production data confirms that this scale advantage has widened over the past decade. Many of these operations use dry-lot systems or hybrid facilities to maximize throughput efficiency.

Premium-differentiated operations—typically 50 to 500 cows—capturing $4 to $8 per hundredweight premiums through organic certification, grass-fed positioning, or direct-to-consumer channels.

These require proximity to metro markets and significant transition investment, but create a margin cushion independent of commodity prices.

Operations in the middle face the most challenging economics under the current market structure.

This isn’t a judgment about the value of family-scale dairy farming or the communities these farms anchor. It’s an observation about where the current market structure creates clearer paths forward.

Regional variation matters significantly.

A 300-cow dairy in Vermont with Boston market access faces different options than a similar-sized operation in central Wisconsin without nearby premium channels.

A Framework for Evaluation

For producers working through these questions—and most of us are—several considerations help clarify the path forward.

For operations considering expansion:

  • Is there processing capacity within 200-300 miles actively seeking suppliers?
  • Is replacement heifer availability realistic? National inventory sits at roughly 3.9 million dairy replacement heifers 500 pounds and over—the lowest absolute level since 1978, according to USDA’s January 2025 Cattle report. The heifer-to-cow ratio of 41.9% is the lowest since 1991.
  • Can production costs realistically reach sub-$17 per hundredweight at expanded scale?
  • What do debt service requirements look like at current interest rates, not 2021 rates?

For operations considering premium positioning:

  • Is there a metro market within a reasonable distance with demonstrated premium demand?
  • What’s the realistic timeline? Organic certification alone typically takes three years under USDA National Organic Program rules.
  • Does the land base and climate support pasture-based systems?
  • Is there family interest in direct marketing relationships?

For operations evaluating the current position:

  • What’s the actual debt service coverage ratio at projected 2026 milk prices?
  • When do loans mature, and at what interest rate reset?
  • Has the processor offered multi-year supply contracts?
  • What’s the true breakeven with full cost accounting—including family labor and reasonable return on equity?

These aren’t comfortable questions.

But they’re better asked now than answered by circumstances later.

The Timing Reality

One thread runs through conversations with producers, lenders, and analysts who’ve navigated previous downturns: timing matters more than most people acknowledge.

Producers who assess their position and make strategic decisions during 2025 and early 2026—while milk prices are still serviceable, while cull cow prices remain historically strong—retain meaningfully more options than those who wait.

December through February: Run your real numbers. Calculate the actual DSCR at $19.25 milk. Have the honest conversation with your lender—most good lenders appreciate proactive communication.

This is also the window for DMC enrollment decisions. If you haven’t reviewed your coverage levels against projected margins, now’s the time. LGM-Dairy is worth a conversation with your insurance agent, too, especially for operations wanting more flexible coverage options.

February through April: Make feed decisions. Lock contracts if the math works. Implement efficiency improvements that deliver results by summer.

Spring 2026: Evaluate first-quarter performance against projections. Adjust culling strategy based on actual margins. Make the bigger strategic calls with real data rather than hope.

The Bottom Line

The dairy industry has navigated challenging transitions before, and it will again.

The producers who came through previous cycles strongest were generally those who saw conditions clearly, made decisions based on their specific circumstances, and acted while they still had choices.

That window is open now.

The question is what each of us does with it.

The Bullvine provides market analysis and industry perspective for dairy producers worldwide. This article reflects conditions and data available as of early December 2025. Individuals should consult their own financial advisors, lenders, and Extension specialists when making significant business decisions. Every farm’s situation is unique, and the right path forward depends on factors only you and your advisors can fully evaluate.

KEY TAKEAWAYS

  • The Trap: Feed dropped 75¢. Milk dropped $2. That’s not savings—that’s $200K in vanishing cash flow for a 500-cow dairy.
  • The Global Signal: NZ farmers paid down $1.7 billion in debt instead of expanding. The world’s lowest-cost producers expect extended softness.
  • The Warning Signs: Chapter 12 bankruptcies up 55%. Ag loan repayments have been declining for 8 quarters straight. Financial stress is accelerating.
  • What Top Producers Are Doing: Capturing $1.50+/cow/day through feed efficiency, component optimization, IOFC-based culling, and beef-on-dairy integration.
  • The Window Is Now: Cull values are strong. Milk checks are still serviceable. Lenders are still flexible. Make strategic decisions while you still have options.

Complete references and supporting documentation are available upon request by contacting the editorial team at editor@thebullvine.com.

Learn More:

  • The $700 Truth: Your Best Milkers Are Your Worst Investment – Reveals why high-volume cows often lose $3/day in actual margin and demonstrates how to use Residual Feed Intake (RFI) data to identify the true profit-drivers in your herd.
  • The $228,000 Exit Strategy Reshaping Dairy – Uncovers the “Section 1232” tax provision behind the recent surge in Chapter 12 filings, explaining how strategic bankruptcy is helping retiring producers preserve equity rather than losing it in traditional sales.
  • Robot Revolution: Why Smart Dairy Farmers Are Winning – Analyzes the 2025 ROI of automated milking systems beyond simple labor savings, providing a blueprint for the “efficiency-at-scale” model that allows family operations to compete with larger consolidators.

The Sunday Read Dairy Professionals Don’t Skip.

Every week, thousands of producers, breeders, and industry insiders open Bullvine Weekly for genetics insights, market shifts, and profit strategies they won’t find anywhere else. One email. Five minutes. Smarter decisions all week.
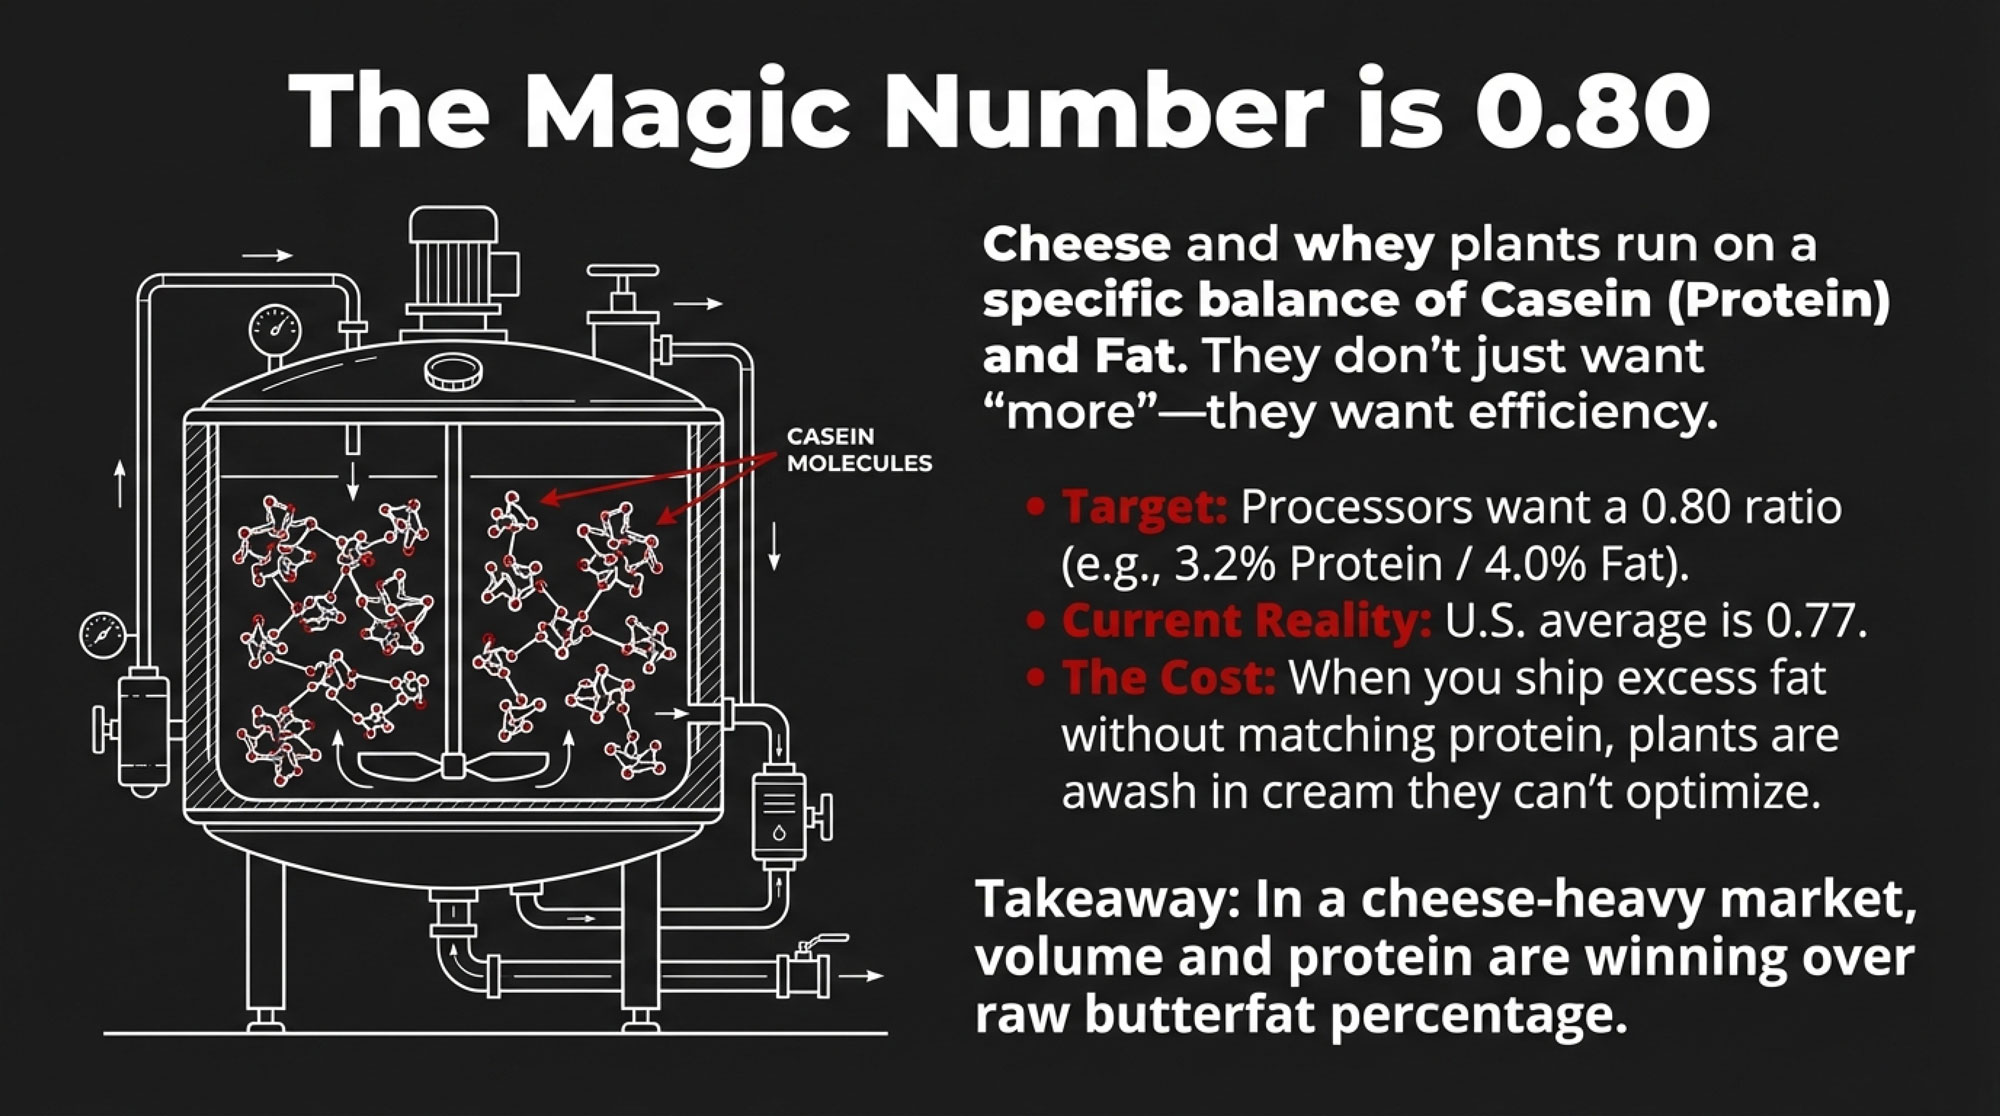
NewsSubscribe
First
Last
Consent

The Cooperative Trap: UK’s 32p Milk Crash Proves Your Co-op Won’t Save You

When a Welsh dairy farmer sat in that boardroom and voted to slash his own income by £78,000 a year, he wasn’t being foolish. He was being a fiduciary. And that distinction matters for every cooperative member reading this.

Executive Summary: Mike Smith milks 450 cows in Wales and serves as vice chairman of First Milk. This month, he voted to cut his own milk price to 32.25p—a decision that costs his operation approximately £6,500 every month. He wasn’t being foolish. He was fulfilling his legal duty: UK company law requires cooperative directors to protect the enterprise first, even when farmgate prices fall below the 43-47p most producers need to break even. That tension between member interests and cooperative survival explains why UK dairy has consolidated from 35,000 farms in 1995 to roughly 7,000 today—and why analysts project just 4,000-5,000 by 2030. Cooperatives deliver real value: market access, collective bargaining, shared risk. But insulation from global oversupply? That’s not part of the deal. North American producers shipping through DFA, Agropur, or provincial marketing boards face the same structural dynamics—and understanding them now, while you still have options, is the point.

Dairy Farm Profitability Strategies

Mike Smith runs a 450-cow dairy in Pembrokeshire, Wales. He’s also vice chairman of First Milk, one of the UK’s largest British-headquartered farmer-owned cooperatives. This month, he sat in a boardroom and voted to cut his own milk price—a decision that will cost his operation roughly £6,500 every single month.

That image stuck with me as I worked through what’s happening across UK dairy right now. A farmer-owner, voting against his own short-term interest, because the alternative was watching the cooperative face serious financial difficulty. It tells you something important about how cooperative economics actually work when markets turn challenging—and it’s something Wisconsin, Ontario, and every other cooperative-heavy dairy region should understand.

This chart shows how UK dairy farms collapsed from roughly 35,000 to 7,000 in a single generation, with another third likely gone by 2030. Cooperatives kept processing capacity afloat, but the price mechanism quietly selected who stayed and who exited. The system is working exactly as designed—and that should scare any producer betting their future on membership alone.

The Numbers Behind the Decision

First Milk announced its January 2026 price at 32.25 pence per litre, down a staggering 3.6ppl from the prior month. That’s no small adjustment. According to Mike Smith in First Milk’s official announcement: “This change reflects the continuing challenges in the market. UK and global milk production remain at record levels, and there is still no sign of improvement in the supply/demand imbalance.”

Production costs vary significantly across UK dairy operations. What’s interesting here is that grazing systems generally run lower than housed herds, and regional differences in feed and labor costs create quite a range. Industry benchmarking from AHDB and farm business consultancies like Kite Consulting consistently shows that fully-housed systems average somewhere in the mid-to-upper 40s pence per litre when all costs, including unpaid family labor, are accounted for. According to Promar International’s UK Dairy Producer Cost Analysis 2025, leading producers sustain production costs of 41-43 pence per litre.

Let’s run some realistic numbers on a 150-cow herd shipping about 103,000 litres monthly. If we assume production costs around 43ppl—reasonable for a well-managed system:

  • Monthly revenue at 32.25ppl: £33,217
  • Monthly production cost at 43ppl: £44,290
  • Monthly shortfall: Around £11,073

That’s burning through £133,000 or more each year before the family draws any income for living expenses. The 3.6ppl cut alone strips roughly £3,700 monthly from an already tight position.

Here’s what’s worth noting, though. First Milk has maintained a strong corporate performance—the BV Dairy acquisition significantly expanded its processing capacity. But those processor-level numbers don’t change the reality that farmgate prices have to track global commodity markets, regardless of how well the creameries perform. The processing business can be healthy while the farm business struggles. That disconnect frustrates producers, understandably so.

This comparison shows the brutal reality of December 2025 pricing: all conventional UK processors are paying members less than even the best‑in‑class 43ppl breakeven cost. Only organic producers clear the breakeven wall. When co‑op boards talk about ‘alignment with market conditions,’ this is what they mean.

Understanding Why Cooperative Boards Make Difficult Choices

I’ve followed cooperatives across three continents over the years, and the pattern at First Milk is one I’ve seen before. Understanding these mechanics matters because they apply across all cooperatives that handle commodity dairy.

First, let’s acknowledge what cooperatives genuinely provide—and these benefits are real and significant. Collective bargaining power. Guaranteed market access even when spot buyers disappear. Shared infrastructure investment that individual farms couldn’t finance alone. There’s a good reason the cooperative model has endured for over a century in dairy.

But when global supply substantially exceeds demand—as it does currently—those benefits don’t override fundamental market dynamics.

First Milk’s board includes farmer directors like Mike Smith, who manage substantial operations themselves. These aren’t distant executives making decisions about someone else’s livelihood. They’re producers facing the same pressures as every other member.

Why did they vote for reductions? Three factors typically converge in these situations.

There’s a fiduciary duty. UK company law—specifically Section 172 of the Companies Act 2006—requires directors to act in the best interest of the enterprise as a going concern. When the cooperative faces potential covenant pressure on significant debt, preserving the business takes legal precedence over maximizing short-term member returns.

Then there’s the volume obligation built into the cooperative structure. Unlike corporate processors who can decline volume, cooperatives generally must accept what members ship. When global supply surges, that milk needs processing—even when margins suffer. Müller’s agriculture director Richard Collins acknowledged this pressure directly in their November announcement: “We’re seeing market price reductions, and daily collection volumes are still significantly higher than they were last year.”

And competitive positioning matters more than many producers realize. Arla UK set December prices at 39.21ppl (down 3.50ppl). Müller moved to 38.5 ppl (down 1.5 ppl). Freshways went to 30.4ppl. If First Milk holds significantly above market while competitors price lower, retailers shift contracts. Volume drops. Fixed processing costs are spread across fewer litres. The trajectory from there becomes concerning.

How One Welsh Family Is Working Through the Numbers

What follows is a composite based on industry figures and conversations with UK dairy advisors—not a specific identifiable operation, but representative of decisions many families are working through right now.

The Morgans milk 165 cows on 200 acres outside Carmarthen. Third generation on the land. Two children—one considering returning to farm after agricultural college, one leaning toward other opportunities.

Their numbers heading into 2026:

  • Monthly production: 114,000 litres
  • First Milk price (January): 32.25ppl = £36,765 revenue
  • All-in production cost: 44ppl = £50,160
  • Monthly gap: Around £13,395

They’re carrying about £340,000 in debt—equipment loans, a 2019 cubicle shed, and an operating line. Their debt-to-asset ratio sits around 45%. DEFRA’s Balance Sheet Analysis suggests that’s actually in reasonable shape compared to many UK dairy operations.

The family has been running scenarios this autumn:

Scale up option: Adding 80-100 cows would require roughly £400,000 in new investment—buildings, livestock, and slurry capacity. At current prices, that creates a larger shortfall with more debt service. They’d need milk to recover to 38-40ppl within three years for expansion to work financially. That’s possible, but far from certain.

Exit option: Cull cow prices are historically strong right now. AHDB’s weekly livestock reports from late 2025 showed deadweight cows averaging well above the five-year average. Land in their area has traded around £8,500/acre recently, according to Farmers Weekly market reports. They could likely clear debt and retain meaningful equity. But three generations of work and the children’s potential inheritance make this more than a financial calculation.

Reduce and reassess: They’re seriously considering culling 25-30 head this winter, generating £40,000-50,000 in cull revenue while beef prices hold. That cuts feed costs immediately and gives 18 months to see how markets develop. It’s not a permanent solution—more of a managed pause that preserves options.

Herd SizeMonthly LitresRevenue @ 32.25pCost @ 43pMonthly LossAnnual Bleed
100 cows68,000£21,930£29,240-£7,310-£87,720
150 cows103,000£33,218£44,290-£11,072-£132,864
200 cows137,000£44,183£58,910-£14,727-£176,724
300 cows205,000£66,113£88,150-£22,037-£264,444
450 cows (Mike Smith)308,000£99,330£132,440-£33,110-£397,320

The son, home for Christmas, asked his father what he thought would happen to UK dairy over the next decade. The response was sobering: “A lot of the farms that are here now won’t be in ten years. The question is whether we’re among those who continue or those who don’t.”

The Global Supply Dynamics Driving These Pressures

This situation feels different from previous dairy downturns—and that distinction matters for how farmers might respond.

The 2015-16 downturn was largely demand-driven. Russia embargoed EU dairy. Chinese buying slowed significantly. When those external factors resolved, prices recovered. This time, pressure is coming from the supply side. That’s more challenging because there’s no single external event to wait out.

Irish milk production increased substantially through 2025. AHDB’s tracking shows January-May 2025 Irish output running 7.6% above the same period in 2024—with March up 8%, April up 13%, and May up 7%. That’s farmers pushing volume ahead of tightening nitrate regulations—an understandable response to policy changes, but one that’s flooding markets with additional supply.

Meanwhile, European production dynamics are complex. USDA’s Foreign Agricultural Service EU Dairy Forecast from February 2025 showed EU milk deliveries forecast to decline marginally by 0.2% in 2025, with low farmer margins and environmental restrictions pushing some smaller producers out. But GB production tells a different story entirely—AHDB’s December 2025 forecast update projects UK milk production for 2025/26 at a record-breaking 13.05 billion litres, up 4.9% from the previous milk year.

The Global Dairy Trade auction results reflect these dynamics. The December 2025 auction saw the index decline 4.3%—the eighth consecutive decline—with butter crashing 12.4% to US$5,169 per tonne. AHDB noted that “increasing global dairy milk supplies and product stocks are weighing heavily on prices currently.”

Global dairy prices have fallen at every single GDT auction since spring, with the steepest hit in November and butter down 12.4% in December. That’s not a storm you ‘ride out’ with a bit of overdraft. It’s a structural oversupply that forces co‑ops to use your milk cheque as the shock absorber.

Independent dairy analyst Chris Walkland offered a stark assessment in late November: some producers could face milk payments between 30 and 35 pence per litre for eight to nine months.

The Brexit Trade Dimension

Everything described so far applies to dairy producers globally. But UK farmers are navigating the same supply environment while operating outside the EU’s single market. That creates additional complexity.

Trade data analyzed by Logistics UK shows UK dairy and egg exports to the EU declined approximately 6% since Brexit. The documentation requirements have proven substantial.

The mechanics are straightforward but add costs. Every dairy shipment to the EU requires export health certificates, veterinary sign-off, and potential border inspections under the sanitary and phytosanitary (SPS) control framework introduced in 2024. An analysis by Stone X noted that “the UK and EU now treat each other as ‘third countries,’ meaning any dairy products moving across the Channel are subject to rigorous SPS checks.”

John Lancaster, head of EMEA and Food Consultancy at Stone X, observed: “Volatility is nothing new for the dairy sector, but the nature of that volatility is evolving. The UK, traditionally a net importer of dairy, has seen strong milk collections in recent months, likely leading to reduced imports in 2025. This elevated supply, combined with administrative barriers to export, has meant that local spot prices can swing more sharply.”

UK dairy exports to the EU have slipped around 6% since Brexit—not because Europe banned our products, but because red tape throttles every truckload. While Irish and Dutch milk moves freely inside the single market, British producers fight the same oversupply with added paperwork drag.

Ireland and the Netherlands face similar global supply pressures. But they operate within the single market—frictionless trade, shared regulations, and access to EU support mechanisms. UK producers are competing with additional administrative and cost burdens that other major producing regions don’t face.

What Successful Adaptation Looks Like

Alongside these challenges, some operations are finding paths forward. The strategies vary but share a common element: reducing pure commodity exposure.

Millbrook Dairy in the West Midlands has developed direct export relationships, particularly targeting Middle Eastern markets where UK cheese commands a premium positioning. According to Dairy Reporter’s coverage from May 2025, the company has faced Brexit, COVID-19, the Red Sea crisis, and US tariffs—but rising global demand for premium cheese and butter has created opportunities for those willing to navigate the complexity.

Several Welsh operations have moved toward organic certification and secured premium contracts. While conventional prices have crashed below 35ppl for some, organic producers continue receiving prices in the upper 50s ppl—First Milk’s organic price remains at 57.95ppl, unchanged from the conventional cuts.

We’re actually seeing similar patterns in North America. Some Upper Midwest producers have moved into farmstead cheese or on-farm processing to capture more margin. A few Ontario operations have built agritourism components that complement their dairy income. These aren’t easy pivots—they require capital, skills, and market access—but they show the “expand or exit” framework isn’t the only path available.

None of these approaches fit every situation. They require specific circumstances and opportunities that vary significantly by region and operation. But they illustrate that other paths exist for those positioned to pursue them.

Questions Worth Asking Your Cooperative

For North American farmers watching the UK situation, there’s practical value in understanding what to monitor closer to home. DFA handles a substantial share of the US milk supply through cooperative structures. Canadian cooperatives like Agropur and provincial marketing boards face similar dynamics when global markets shift.

Having specific questions ready when cooperative leadership presents forecasts or pricing updates can be valuable:

On volume management:

  • Is the cooperative implementing or considering base-excess programs or volume adjustments?
  • What percentage of members are shipping above base allocation?
  • How does the cooperative plan to balance supply if market conditions weaken?

On financial position:

  • What are the cooperative’s current debt covenants, and how much flexibility exists?
  • What milk price level would create covenant concerns?
  • How much of the operating profit comes from processing versus member milk margin?

On forward planning:

  • What price scenarios is management modeling for the next 12-24 months?
  • At what price level would capacity rationalization become necessary?
  • How are competing processors positioned, and what’s the risk of contract shifts?

These aren’t confrontational questions—they’re the kind of information that business owners should reasonably have about enterprises they collectively own.

Indicators Worth Watching

The UK situation offers a framework for what to monitor. Several metrics are worth tracking.

Supply growth provides early signals. USDA’s monthly Milk Production report is the primary source. If year-over-year growth exceeds 3% for six consecutive months, supply is outpacing demand. That pressure eventually reaches farmgate pricing. Wisconsin producers might watch regional production trends particularly closely, given the concentration of cooperative membership in the Upper Midwest.

Futures markets offer forward visibility. CME Class III cheese futures below $17/cwt for extended periods suggest markets are pricing in oversupply conditions. Monthly checks of forward curves provide useful context for planning.

Cooperative communications often signal direction if you listen carefully. When leadership emphasizes “supply balance,” “market alignment,” or “production discipline,” they may be preparing ground for pricing adjustments. Richard Collins at Müller noted they’re “keeping a close eye on supply and demand”—that language often precedes action by 60-90 days.

Cull market conditions indicate exit dynamics. Strong cull prices create exit incentive—but also suggest culling hasn’t reached levels that would meaningfully reduce supply.

When multiple indicators converge, the UK pattern becomes more relevant to local planning.

The Broader Industry Pattern

After three decades in this industry—starting with a Master Breeder operation and later founding The Bullvine—I keep returning to a pattern that deserves direct discussion.

Cooperative commodity dairy, by its structural design, tends to address supply-demand imbalances partly through changes in membership. That’s not necessarily a failing of the model—it’s inherent to how cooperatives function in commodity markets. When global supply exceeds demand, and prices fall below production costs, cooperatives adjust farmgate pricing to maintain processing viability. Those price adjustments create pressure on higher-cost operations. Some exit. Supply eventually contracts. Prices stabilize for continuing producers.

The cooperative continues. Membership consolidates. The cycle continues.

AHDB’s latest survey of milk buyers revealed an estimated 7,040 dairy producers in GB as of April 2025—a loss of 190 producers (2.6%) since the previous year. Against a backdrop of rising volumes, this suggests a continued shift toward fewer, larger farms. Industry exits typically occur during the winter months, before housing and other input requirements rise seasonally.

This isn’t an argument against cooperatives. Their benefits remain genuine—market access, collective bargaining strength, shared risk, and infrastructure investment beyond individual farm capacity. But it does argue for a realistic understanding of what cooperative membership provides. Insulation from global market forces isn’t among those benefits.

Practical Considerations by Situation

For operations with strong balance sheets—debt-to-asset below 40%: This environment may present opportunities. Industry transitions often create acquisition possibilities. Operations that can achieve competitive production costs at scale, with family commitment to a long-term horizon, may be well-positioned for the consolidation ahead.

For operations with moderate leverage—40-60% debt-to-asset: Focus on cash preservation and maintaining flexibility. Cull strategically to generate near-term cash while beef prices remain favorable. Explore loan restructuring while lenders remain accommodating. Develop realistic exit valuations to understand your position. The objective is to navigate 24 months without eroding equity, then reassess.

For operations with higher leverage—above 60% debt-to-asset —the situation requires an honest assessment. At current UK price levels, highly leveraged operations face compounding challenges that can steadily erode equity. Voluntary, well-planned transition while cull and land markets remain favorable often preserves more family wealth than delayed, pressured decisions. That’s a difficult conversation, but an important one.

For all operations: Know your actual cost of production—including properly valued family labor. Understand your cooperative’s financial position and be prepared to ask informed questions. Watch the indicators that might signal your region following similar patterns. And recognize that choosing your timing generally produces better outcomes than having timing determined by circumstances.

Editor’s Note: All pricing data cited in this article comes from official processor announcements and AHDB reports from November-December 2025. Production cost figures reference AHDB, Promar International, and Kite Consulting industry benchmarks. National and regional averages may not reflect your specific operation’s circumstances. We welcome producer feedback and regional case studies for future reporting. Contact: andrew@thebullvine.com

Resources for Ongoing Monitoring:

Key Takeaways

  • 32p milk, 43p costs. First Milk’s January 2026 price leaves most UK producers hemorrhaging cash—£11,000+ monthly on a mid-size herd. The gap isn’t a glitch. It’s global oversupply working exactly as markets do.
  • A farmer voted to cut his own pay. Vice Chairman Mike Smith slashed his milk price by £6,500/month because UK law requires cooperative directors to protect the enterprise first. Fiduciary duty trumps member income when the cooperative’s survival is at stake.
  • Cooperatives manage consolidation—they don’t prevent it. UK dairy shrank from 35,000 farms to 7,000 over thirty years. Cooperative membership provided orderly exits and market access for survivors, not insulation from structural economics.
  • The supply glut is structural, not seasonal. Irish milk up 7.6% through May. GB production at record highs. Eight straight declines in the Global Dairy Trade auction. There’s no external shock to wait out—this is the new baseline until supply contracts.
  • Your turn is coming. DFA, Agropur, and provincial marketing boards face identical cooperative economics. The producers who understand these dynamics now—and position accordingly—will have options when pricing pressure arrives. The rest will have the options the market gives them.

Complete references and supporting documentation are available upon request by contacting the editorial team at editor@thebullvine.com.

Learn More:

  • Decide or Decline: 2025 and the Future of Mid-Size Dairies – This strategic guide targets the “squeezed middle” (700-1,200 cows), outlining three specific survival paths: intended expansion, rigorous optimization, or strategic exit. Essential reading for producers needing to calculate if their debt-to-asset ratio supports the scale required to survive current consolidation trends.
  • Global Dairy Market Dynamics: Navigating Volatility and Strategic Opportunities in 2025 – Expand your understanding of the supply-side pressures mentioned above with this deep dive into 2025 Global Dairy Trade (GDT) indices and regional production forecasts. It provides the broader economic context needed to anticipate price floor movements before they hit your milk check.
  • Digital Dairy: The Tech Stack That’s Actually Worth Your Investment in 2025 – Move beyond buzzwords with this ROI-focused analysis of farm automation and data integration. It demonstrates how integrating specific technologies—like AI-driven feed management—can slash costs by 5-10%, offering a tangible way to protect margins when milk prices fall below production costs.

The Sunday Read Dairy Professionals Don’t Skip.

Every week, thousands of producers, breeders, and industry insiders open Bullvine Weekly for genetics insights, market shifts, and profit strategies they won’t find anywhere else. One email. Five minutes. Smarter decisions all week.
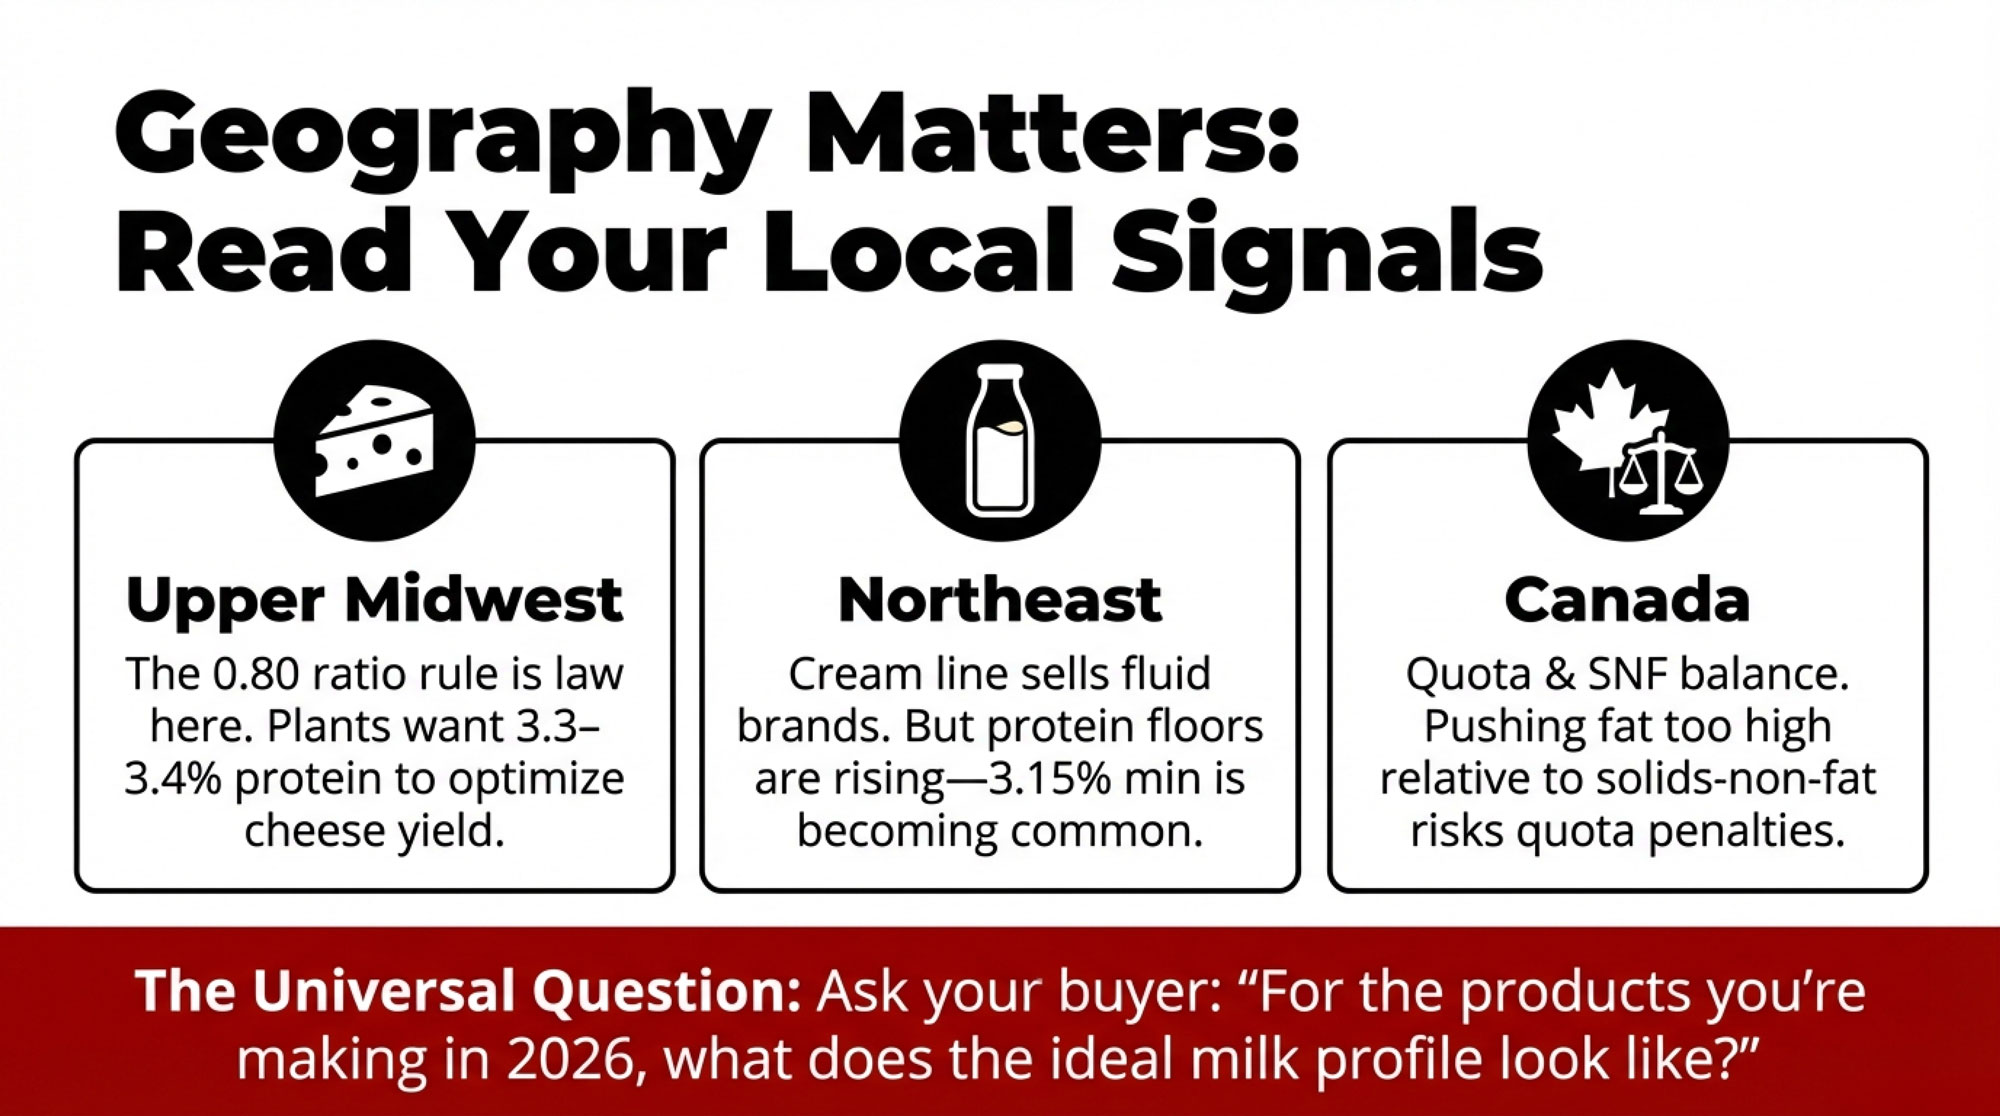
NewsSubscribe
First
Last
Consent

8 Straight GDT Declines. The Genetic Culling and Cash Strategies That Separate 2026 Survivors.

Raising mediocre genetics into an $18 market is a $3,000 mistake walking on four legs. 8 GDT declines say it’s time to cull harder.

EXECUTIVE SUMMARY: Eight straight GDT declines—the worst streak since 2015—isn’t a cycle. It’s a structural reset. China’s self-sufficiency jumped from 70% to 85%, erasing 200,000+ metric tons of annual demand that isn’t returning. Production keeps accelerating everywhere: the US up 3.3%, the EU up 6%, Argentina up 10.9%. For operations still budgeting $21 milk, the math turns brutal fast—at $18/cwt, working capital burns in months, not years. The response demands ruthless clarity: cull the bottom 20% of your genetics, sell $1,000-1,400 beef-on-dairy calves instead of raising $3,000 replacement heifers, lock in price protection, and call your lender before covenants force the conversation. The dairies thriving in 2027 won’t be those that waited for recovery—they’ll be those that used 2026 to make the hard calls their competitors avoided.

Something shifted in global dairy markets this fall. Those of us watching the twice-monthly Global Dairy Trade auctions could sense it building, but the numbers from Event 393 on December 2nd brought it into sharp focus.

The damage in one auction:

  • GDT Price Index: Down 4.3%
  • Butter: Down 12.4% (the hardest hit)
  • Whole Milk Powder: Down 2.4%
  • Average price: US$3,507/MT (lowest in nearly two years)
  • Streak: Eight consecutive declines—worst since 2015
Butter prices collapsed 12.4% at Event 393. Anhydrous milk fat fell 9.8%. These aren’t modest corrections—they’re demand destruction in fat products. Meanwhile cheddar climbed 7.2% and lactose 4.2%. Message: high-fat commodity products are vulnerable in this market. Component strategy must shift toward cheese and protein, away from butter margin dependency.

For producers mapping out Q1 and Q2 of 2026—whether you’re managing a 200-cow operation in Vermont, running 3,000 head in the Central Valley, or navigating the unique economics of Southeast pasture-based systems—these results raise questions that deserve careful thought.

Is this a cyclical correction that resolves in a few months? Or does it reflect something more structural?

Here’s my read: eight consecutive declines with this breadth across product categories suggests supply-demand fundamentals that may take longer to rebalance than we’d like. That’s not cause for panic, but it is a reason for strategic action. The operations that navigate the next 12-18 months successfully will be those that understand what’s driving this weakness—and position accordingly.

The Supply Picture: Everyone’s Running Hot

The basic dynamic is pretty clear once you lay it out. Global milk production across major exporting regions is growing faster than demand can absorb. USDA Foreign Agricultural Service data and Rabobank’s quarterly analysis both point to this imbalance persisting through at least mid-2026.

Everyone’s running hot. Argentina’s milk production surged 10.9% in Q1 2025. The EU is up 6%. The US 3.3%. The problem? Demand isn’t returning. When all suppliers produce simultaneously into shrinking demand, there’s only one outcome: prices collapse.

What makes this period particularly concerning is the breadth. It’s not one region running hot while others moderate. Everyone’s pushing milk at the same time:

RegionGrowth RateSource
New ZealandSeason-to-date up 3.0%Fonterra November Update
United StatesAugust production up 3.3% (24 major states)USDA Milk Production Report
European UnionSeptember deliveries up 6.0%AHDB Market Analysis
ArgentinaQ1 2025 up 10.9%USDA Attaché Reports

Fonterra has already raised their collection forecast from 1,525 million kgMS to 1,545 million kgMS. The US herd continues expanding even as futures soften. You know how it goes—once you’ve invested in facilities, genetics, and labor, the economic pull favors keeping stalls occupied.

“This cycle, we’re seeing production accelerate into declining prices. That pattern—when it persists—typically indicates a longer adjustment period ahead.”

The China Shift: This Isn’t Cyclical

No factor shapes the global dairy trade outlook quite like China’s changing import patterns. For nearly a decade, China served as the primary growth engine for dairy exports worldwide. What’s shifted there helps explain everything we’re seeing at GDT.

China’s government-backed self-sufficiency push worked. From 70% to 85% domestic production in five years. Translation: 200,000+ metric tons of annual demand that exported countries will never see again. This isn’t a market cycle. It’s geopolitics as food security policy.

The key numbers:

  • Self-sufficiency: Climbed from ~70% (2020-2021) to ~85% (2025) per USDA and Rabobank estimates
  • WMP imports: Dropped from 845,000 MT at peak to ~430,000 MT by 2023
  • Missing demand: 200,000-240,000 MT annually that isn’t coming back soon

Rabobank’s Mary Ledman, its global dairy strategist, framed it clearly: China moved from about 70% self-sufficiency to roughly 85%, and that shift cascades through global trade flows. When China’s import demand contracts, it affects pricing for exporters worldwide.

What this means: Business planning built around a rapid return to peak Chinese imports probably warrants reconsideration. Beijing invested heavily in domestic processing capacity as a food security priority. Some analysts believe import demand could stabilize if domestic production growth slows—but for planning purposes, assuming reduced Chinese appetite persists seems prudent.

Where’s the Milk Going?

With China absorbing less, displaced volume is finding alternative homes—but at a cost:

Secondary markets are absorbing volume. The Middle East, Southeast Asia, and parts of Latin America have increased purchases at competitive pricing. But these markets are smaller and more price-sensitive. They take the milk—just at prices that drag everything down.

Product mix is shifting. EU processors are directing more milk toward cheese and whey rather than powder. This doesn’t eliminate surplus; it redistributes pressure across product streams.

Inventories are building. US nonfat dry milk stocks have grown through 2025, according to USDA Dairy Products data. The milk is moving, but it’s backing up. That overhang suppresses spot prices until stocks normalize.

Farm-Level Math: Where It Gets Real

For individual operations—particularly those carrying debt from recent expansions—extended margin compression creates genuine planning challenges.

Fonterra’s adjustment illustrates how GDT weakness hits farmgate: They narrowed their 2025/26 price range from NZ$9.00–$11.00/kgMS to NZ$9.00–$10.00/kgMS. For a farmer supplying 200,000 kgMS, that 50-cent midpoint reduction means roughly NZ$100,000 less this season.

US operations face a similar arithmetic:

  • 500-cow dairy producing 25,000 lbs/cow annually
  • Each $1/cwt change = approximately $125,000 in gross revenue impact

I recently spoke with a producer running about 450 cows in east-central Wisconsin—debt-to-asset ratio around 47%, which isn’t unusual for operations that expanded during 2021-2022. At $22/cwt, modest positive cash flow. At $18-19/cwt, he’s projecting monthly shortfalls of $35,000-45,000. Working capital covers roughly three months at that burn rate.

His approach? Running all projections at $18 now, not $21.

“I’d rather be surprised by better prices than caught short by worse ones.”

The timeline pressure: Working capital reserves on many operations cover 2-4 months of shortfalls. When those deplete, operating lines of credit come at higher rates—what was 6-7% might now cost 10-11%, further pressuring cash flow.

Practical Responses That Are Working

Across regions, proactive producers are responding with concrete adjustments. The specifics vary—feed costs differ between California and Wisconsin, Southeast operations face different heat-stress economics, and Northeast producers navigate distinct cooperative structures—but certain approaches work broadly.

Get Brutally Honest on Cash Flow

Run projections at $18.00/cwt, not $21-22. Answer these questions candidly:

  • What’s the monthly cash flow at current prices through Q2 2026?
  • How many months can you sustain negative cash flow before exhausting working capital?
  • At what price does the operation return to breakeven?

Operations projecting shortfalls above $30,000-50,000/month should initiate lender conversations now—before covenant pressures force them.

Lock In Some Protection

Forward contracting and hedging deserve fresh attention:

  • Forward contract 30-50% of near-term production through co-ops or direct processor contracts
  • Put options on Class III or Class IV milk for downside floors with upside participation
  • Dairy Margin Coverage enrollment at coverage levels matching your debt structure

Options protection typically costs $0.20-0.40/cwt. That’s insurance math—worth evaluating against your exposure.

Strategic Cost Management

Ration optimization remains the biggest lever. Maximize the number of components per pound of dry matter intake. With butterfat and protein premiums available through many marketing arrangements, component-focused feeding can partially offset lower base prices. Transition cow nutrition and fresh cow management remain areas where investment pays returns—you probably know this, but it bears repeating during tight margins.

Forward purchase feed ingredients at current favorable levels for 6-12 months.

Capital discipline—defer projects that don’t show clear payback within 12 months at $18/cwt.

Ruthless Heifer Inventory Calibration

This is where genetics strategy meets financial survival.

Stop raising the bottom 20% of your genetics. Move from 110% of replacement needs to strictly 100%. Use beef-on-dairy crosses on everything that isn’t top-tier. In a market like this, raising a mediocre heifer is a luxury you cannot afford.

Downturns are the time to concentrate genetic investment. Focus sexed semen only on your elite animals. Let beef sires cover the rest. The operations that emerge strongest from price cycles are typically those that used the pressure to accelerate genetic progress—not those that kept feeding average genetics because “we’ve always raised our own replacements.”

Here’s what’s interesting about the economics right now. Dairy beef has become a meaningful revenue stream—according to Hoard’s Dairyman, dairy-beef crosses now represent 15-20% of national beef production. That $1,000-1,400 dairy-beef calf you’re selling at a few days old is worth far more than a replacement heifer you’ll spend $2,500-3,000 raising only to freshen into an $18 milk market. The math has completely flipped from where it was just a few years ago, when those calves were bringing $350-400.

Early Lender Engagement

For operations where projections suggest restructuring may be needed, earlier conversations produce better outcomes. Options farmers are exploring:

  • Extending term debt amortization (10 → 15 years) to reduce annual payments
  • Converting operating lines to term debt for covenant breathing room
  • Adjusting payment timing to align with milk check cycles
  • Providing additional collateral for better terms

Lenders prefer restructuring to foreclosure. But that preference is strongest when borrowers approach proactively—not when they’re already in technical default.

The Coordination Reality

Could coordinated production cuts accelerate rebalancing? Probably not.

US antitrust law restricts coordination on production or pricing. Cooperative structures require accepting all member milk. And even if one region cut output, others would expand to capture the opportunity—Argentina’s 10.9% Q1 surgeshows how fast capacity elsewhere fills gaps.

Historical precedent: During 2014-2016, US milk production actually grew despite severely compressed margins. Recovery came when demand improved—not from coordinated supply reduction. The survivors managed through individually: maintaining reserves, restructuring early, achieving efficiencies their neighbors didn’t.

Market rebalancing will occur through aggregated individual responses to economic pressure. That places the burden on each operation to assess its own position and act accordingly.

How the Next 18 Months Might Unfold

Here’s one informed perspective—not prediction:

Through Q1 2026: Current dynamics persist. Production growth continues despite weak prices, China maintains a reduced import posture, and inventories stay elevated. GDT likely stays below $3,500/MT, potentially testing $3,200-3,300.

By mid-2026: Margin compression forces more decisive responses. Some operations exit through individual financial pressure. Others restructure and emerge leaner. Consolidation accelerates.

Late 2026 into 2027: If sufficient capacity adjusts, supply comes into better balance. Prices recover—though likely to equilibrium levels reflecting China’s structurally lower imports and more consolidated global production.

The operations positioned well for 2027 won’t necessarily be the largest. They’ll be those that assessed their situations honestly now, made difficult decisions while options remained, and configured for a market that differs from 2021-2022.

The Bottom Line

This market weakness is structural, not cyclical. Eight consecutive GDT declines, plus China’s sustained import reduction, create headwinds that won’t resolve quickly.

Run your numbers at $18/cwt. Operations showing significant monthly negative cash flow face decisions within 6-12 months.

Talk to lenders before you have to. Proactive conversations yield better outcomes than forced ones.

Concentrate your genetic investment. Stop subsidizing mediocre genetics with expensive heifer development. Use beef-on-dairy aggressively—at $1,000+ per calf, the economics have never been better.

Protect some downside. Evaluate forward contracting and options based on your specific debt exposure.

Early action preserves options. Delayed response narrows them.

These are genuine challenges—and ones the industry has navigated before. The operations thriving when conditions improve will be those making informed decisions now: understanding what market signals indicate, assessing their position realistically, and acting while choices remain.

Your local extension dairy specialists and farm business management educators can provide perspective tailored to your specific circumstances. Run your numbers, have the conversations, and position your operation for whatever comes next.

We’ll continue tracking these developments. In the meantime—sharpen your pencil, sharpen your genetics, and sharpen your strategy.

Key Takeaways 

  • Stop waiting for recovery. China’s at 85% self-sufficient. That 200,000+ MT of vanished demand isn’t returning. This is the market now.
  • Budget at $18. Today. At $21, you’re planning for a market that no longer exists. Run your numbers at $18 and see if your runway is months—or weeks.
  • Cull the bottom 20%. Ruthlessly. A $1,400 beef calf at 3 days old beats a $3,000 heifer raised to freshen into $18 milk. That math has permanently flipped.
  • Call your lender this week. Proactive conversations get restructuring options. Forced conversations get whatever terms are left.
  • The 2027 winners are being decided now. They won’t be the biggest operations—they’ll be the ones that culled harder, budgeted tighter, and moved while competitors waited.

Complete references and supporting documentation are available upon request by contacting the editorial team at editor@thebullvine.com.

Learn More:

The Sunday Read Dairy Professionals Don’t Skip.

Every week, thousands of producers, breeders, and industry insiders open Bullvine Weekly for genetics insights, market shifts, and profit strategies they won’t find anywhere else. One email. Five minutes. Smarter decisions all week.
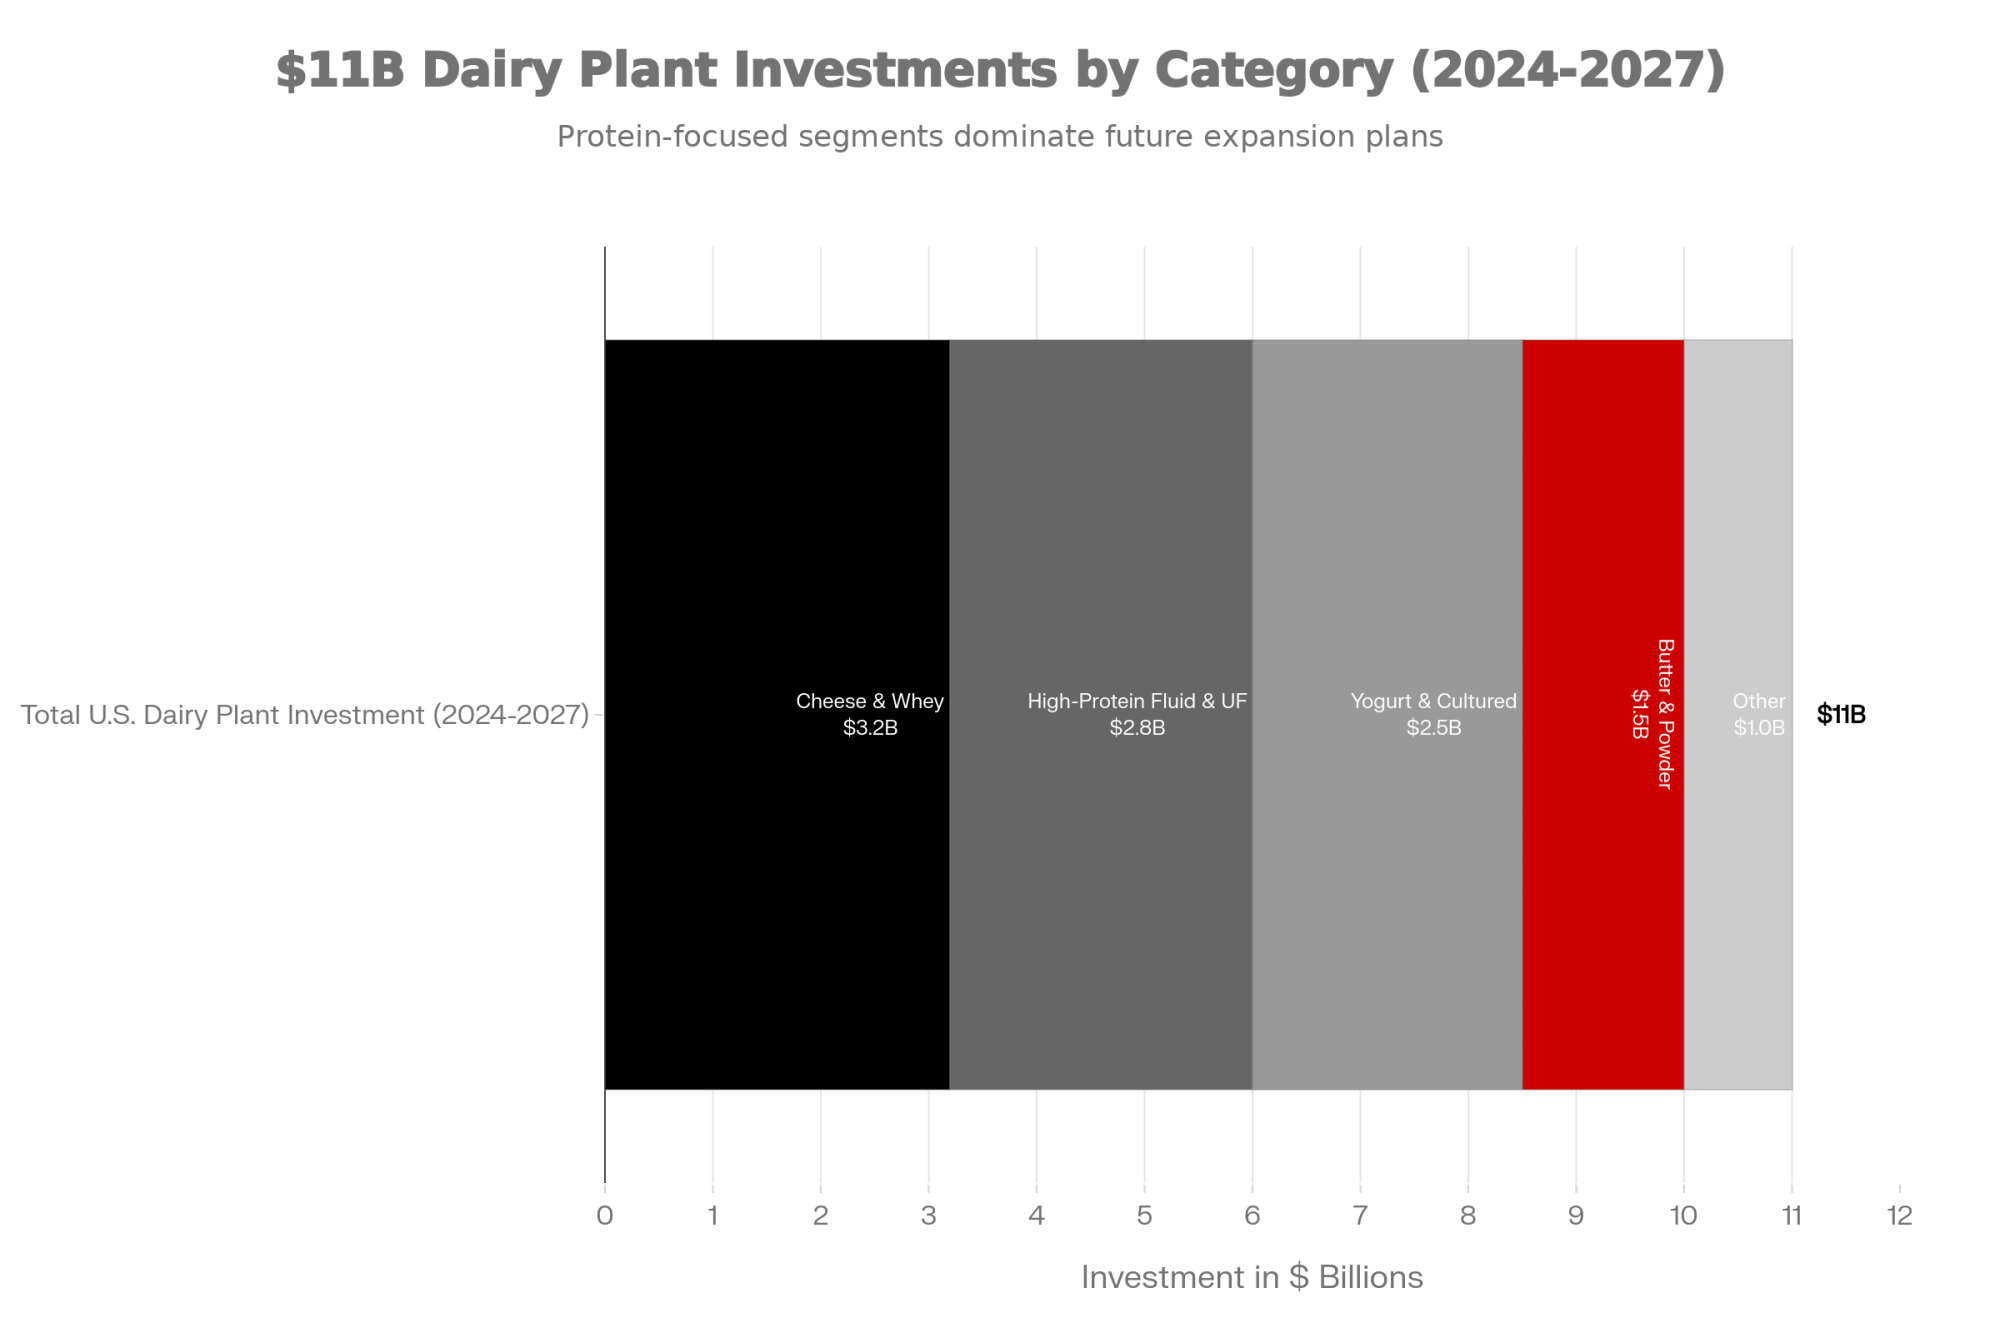
NewsSubscribe
First
Last
Consent
Send this to a friend