Archive for Dairy Markets – Page 4

Walmart’s Second Milk Plant Is Open. For Mid-Size Dairies, the Clock Is Ticking.

18 months after Walmart opened its first milk plant, Dean Foods filed for bankruptcy. Plant #2 is now open. Mid-size dairies—what’s your move?

Executive Summary: Walmart’s second milk plant opened in Valdosta, Georgia, on December 2, 2025—and history offers a sharp warning. Dean Foods filed for bankruptcy just 18 months after Walmart launched its first plant. For mid-size dairies, this isn’t background noise; it’s a decision point. Three paths forward exist: scale to 1,500+ cows with processor commitments in writing, pivot to specialty markets with buyer agreements secured upfront, or exit strategically while cattle and land values hold. Your timeline isn’t set by milk prices alone—your lender’s risk appetite and your region’s Class I dependency matter just as much. Southeast producers face tighter constraints than Upper Midwest operations with cheese plant alternatives. The dairies that navigated the Fort Wayne transition successfully weren’t the biggest; they were the ones asking hard questions while everyone else was still waiting for news.

While the ribbon-cutting in Valdosta was all smiles and corporate handshakes, the silence in Georgia’s milking parlors was deafening. Walmart just cut another slice out of the middleman’s pie by opening its second owned-and-operated milk plant and sourcing directly from regional farms, and producers are rightfully asking: “Am I next?”

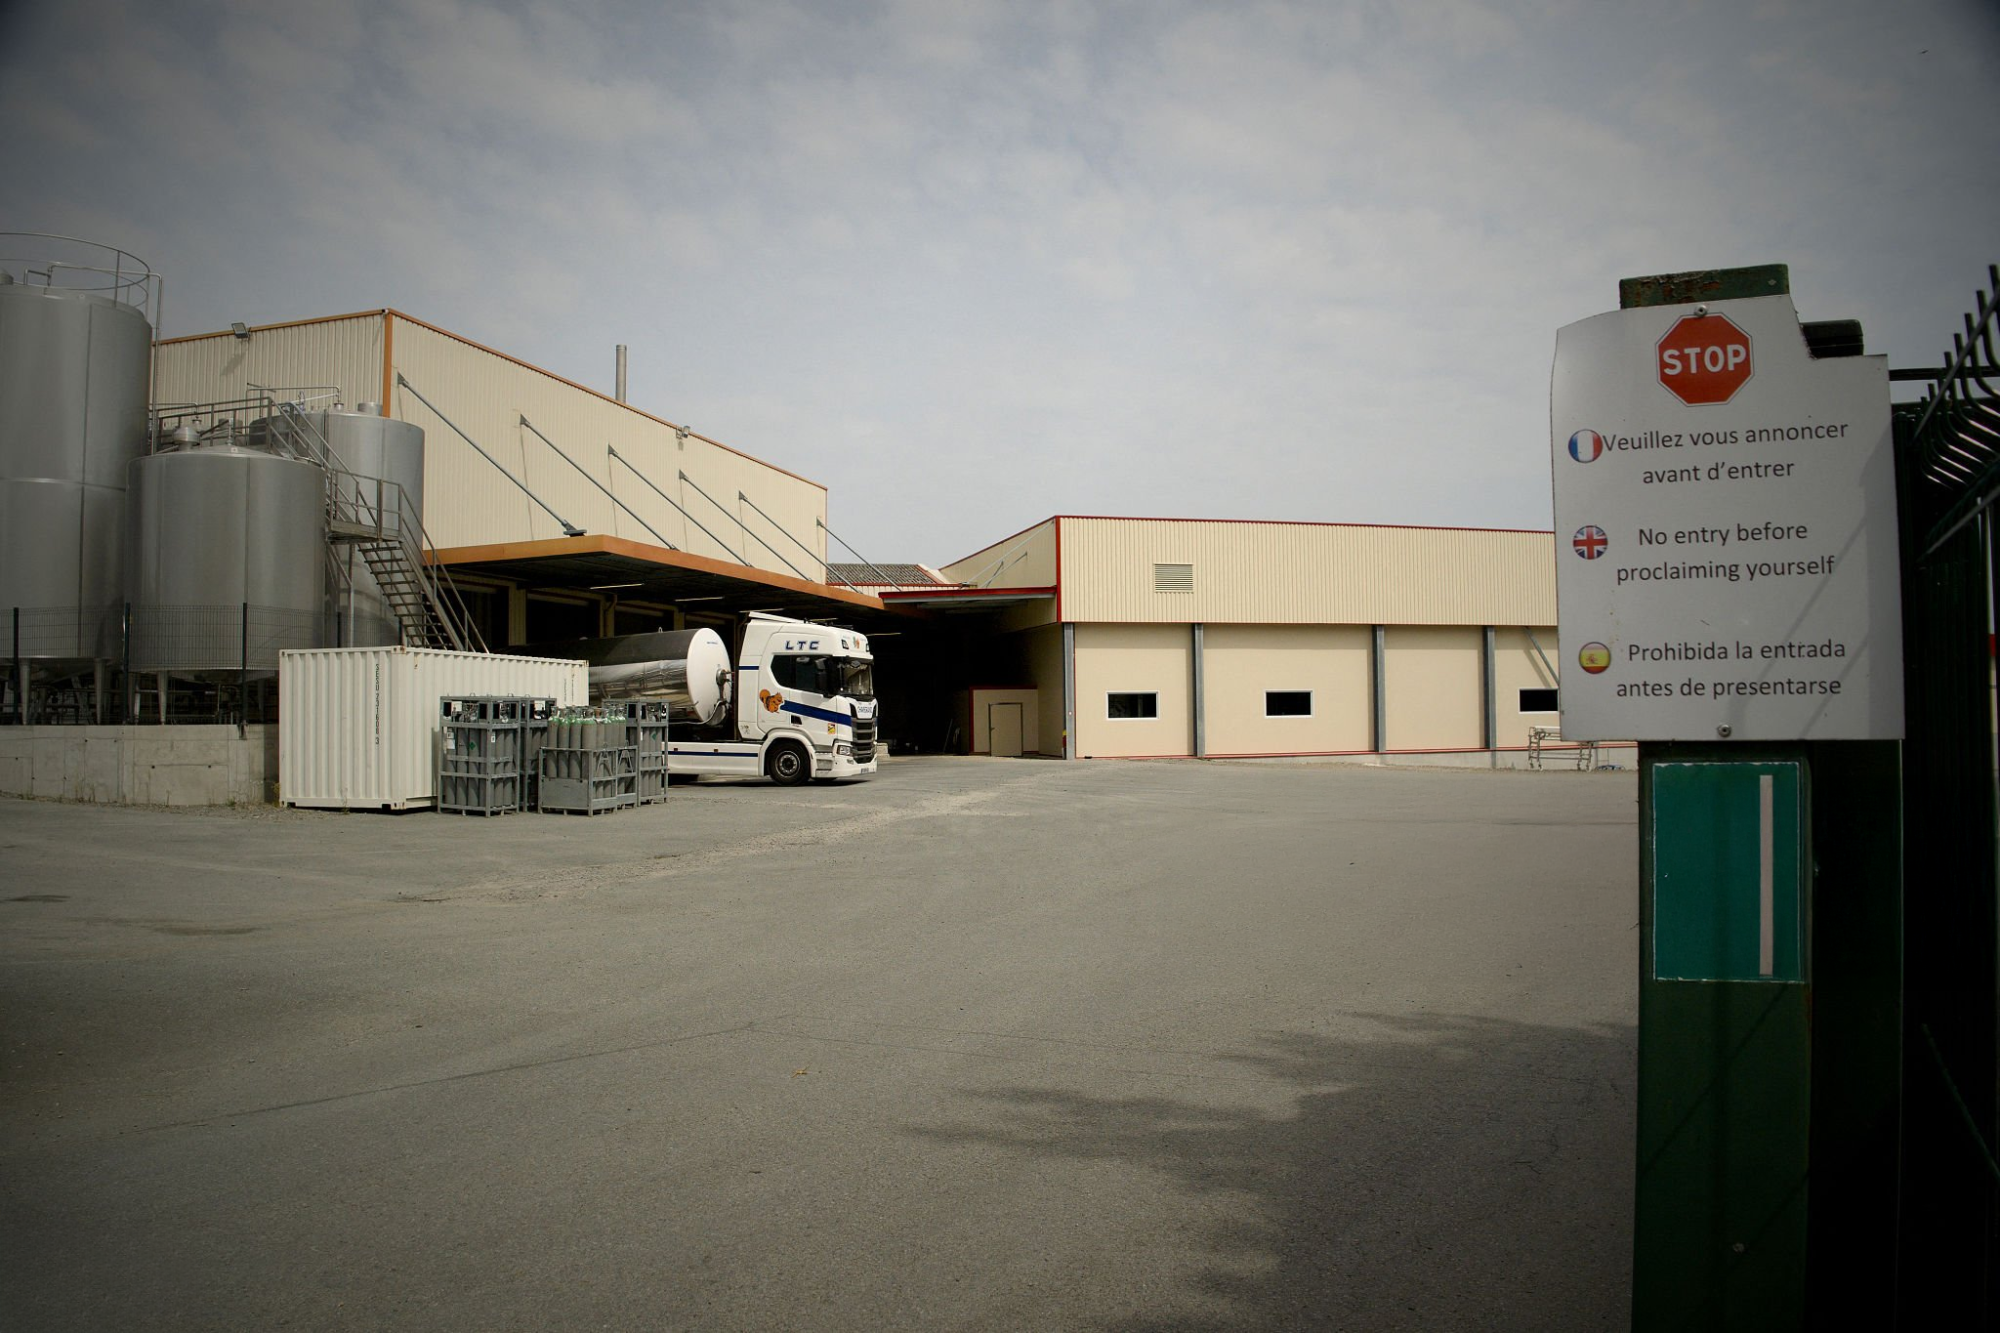
When Walmart opened its $350 million milk processing facility in Valdosta, Georgia, on December 2, 2025, it didn’t generate the national headlines you might expect for a project of this scale. But for those of us watching the dairy supply chain closely, it’s a development worth understanding.

This is Walmart’s second owned-and-operated dairy facility, following Fort Wayne, Indiana, back in 2018. A third plant in Robinson, Texas, is set to open in 2026. According to Walmart’s corporate announcement, the Valdosta plant will serve more than 650 stores and Sam’s Clubs across the Southeast under the Great Value and Member’s Mark labels.

What does this mean for producers? Well, that depends on your situation, your region, and your position in the supply chain. Let me walk through what we know and what it might suggest.

Dr. Mark Stephenson—who spent years as Director of Dairy Policy Analysis at the University of Wisconsin-Madison before his recent retirement—offers a useful perspective here. “We’re watching the supply chain reorganize in real time,” he’s noted. “When retailers capture processing margin internally, it changes the economics for everyone else in the chain.”

That’s neither inherently good nor bad—it’s a structural shift that creates both challenges and opportunities depending on where you sit.

I reached out to both Walmart and Dairy Farmers of America for their perspectives on this piece. Walmart pointed us to their public statements about the Valdosta facility. DFA didn’t respond to our request.

What We Learned from the Fort Wayne Transition

The pattern that emerged after Walmart’s Fort Wayne plant came online in 2018 offers a useful case study—both in terms of what went sideways for some producers and what went right for others.

Dean Foods, then America’s largest fluid milk processor, lost substantial Walmart volume when Fort Wayne opened. The company filed for Chapter 11 bankruptcy protection in November 2019—about 18 months later—in the Southern District of Texas under Case No. 19-36313. Now, it’s worth remembering that Dean was already facing significant headwinds: declining fluid milk consumption, aging infrastructure, and substantial debt. The Walmart contract loss accelerated an existing trajectory rather than creating it from scratch.

What happened next reshaped the cooperative landscape considerably. Dairy Farmers of America acquired 44 Dean Foods processing facilities for approximately $433 million in May 2020, according to DOJ filings related to the transaction. Industry analyses at the time suggested this significantly expanded DFA’s processing footprint—on the order of one-third more capacity, though the exact figure depends on how you measure it.

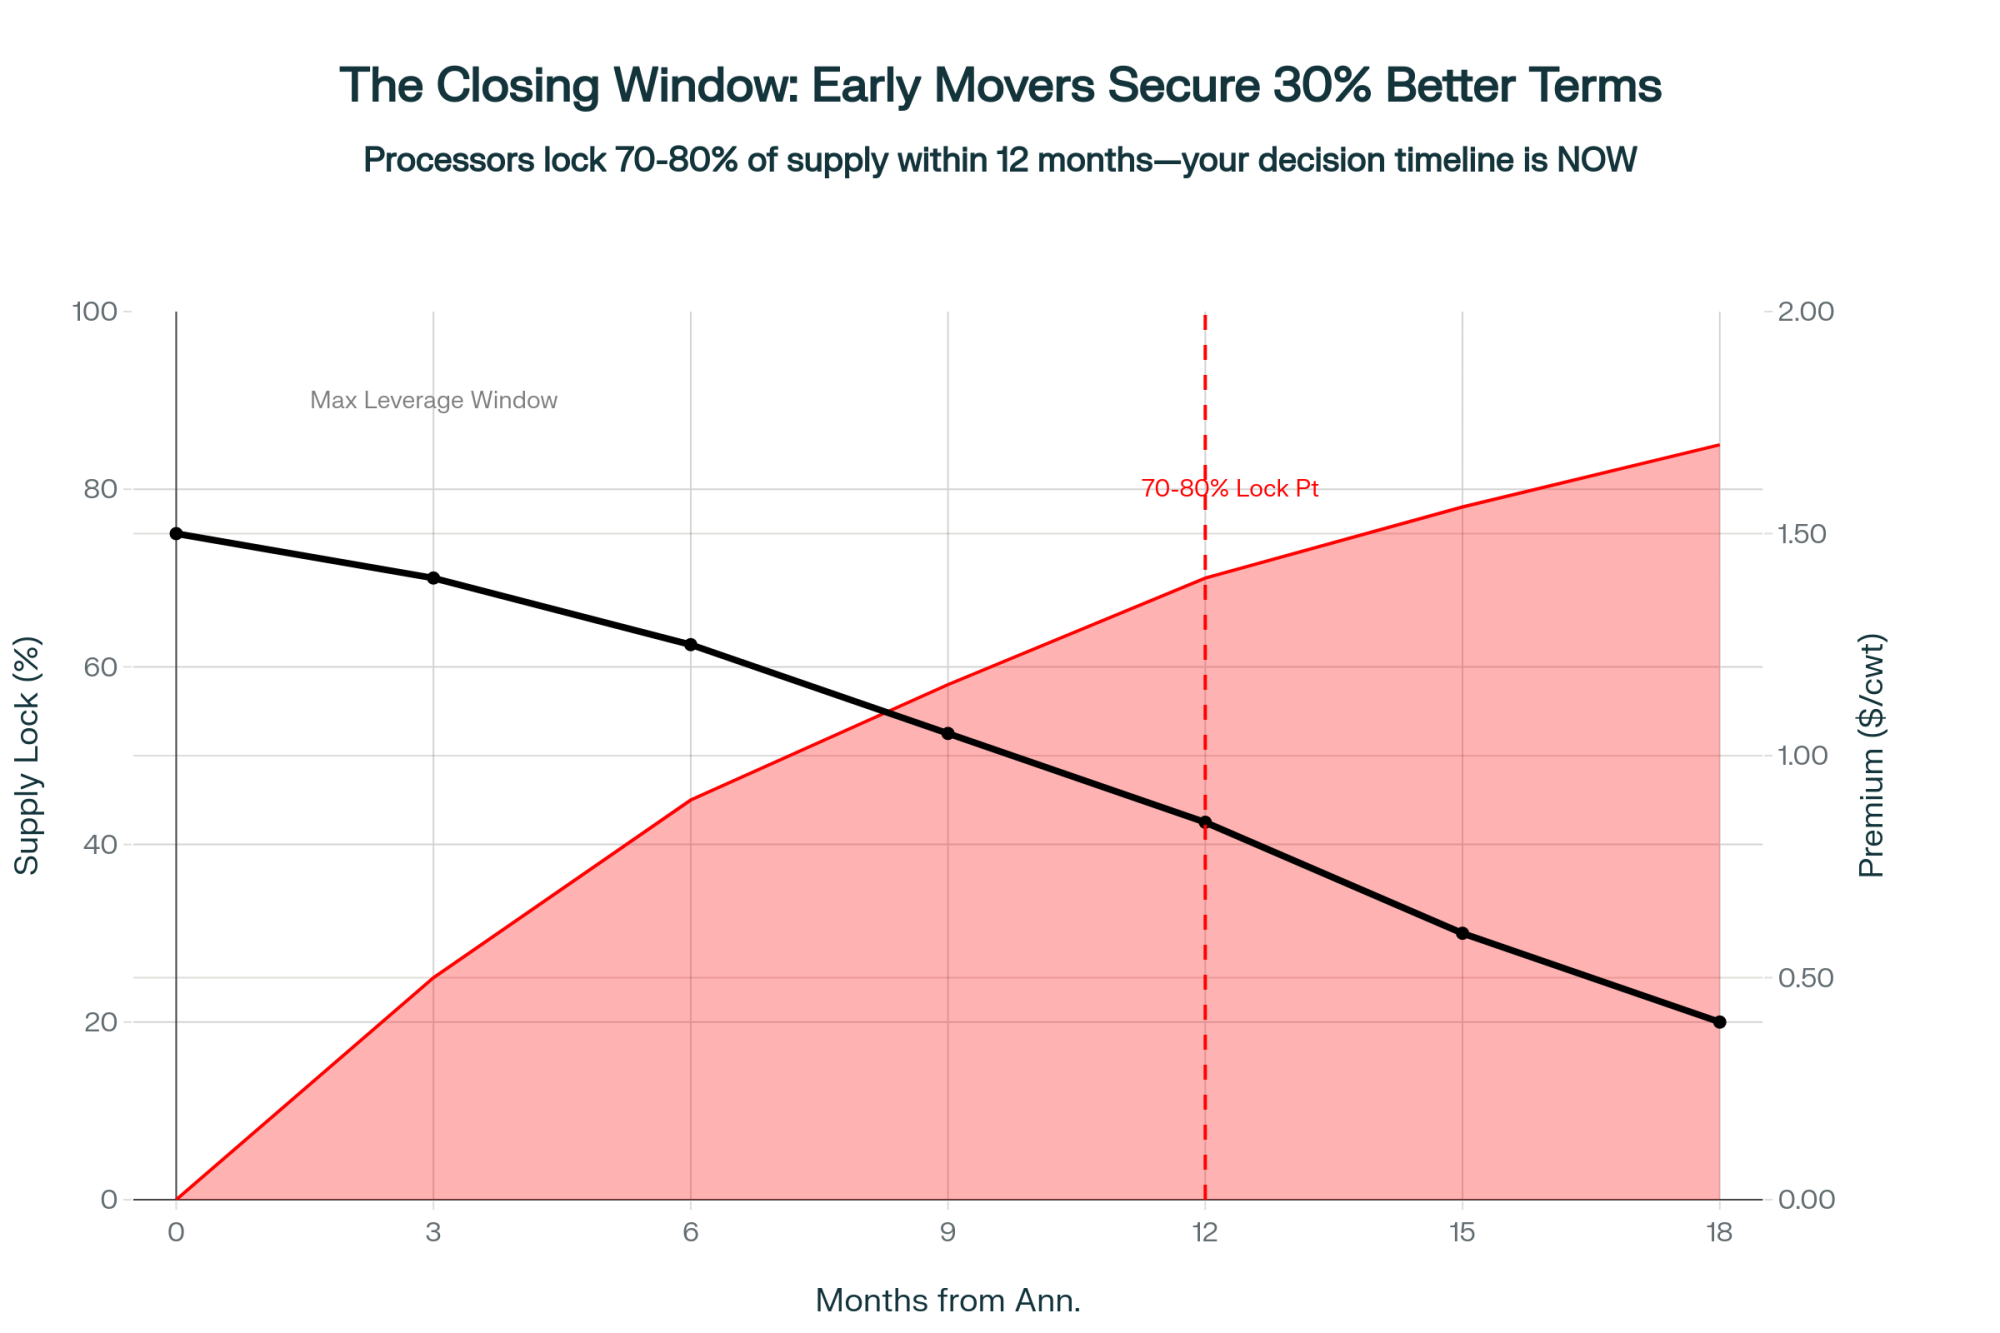
I’ve spoken with producers in Indiana and Ohio who experienced this transition firsthand, and their perspectives vary widely. One producer—who asked to remain anonymous because he still ships through a DFA-affiliated handler—described the compressed timeline: “We had maybe six months of warning before everything changed. Guys who moved fast found alternatives. Guys who waited got whatever terms were left.”

But I also spoke with Mike (not his real name), who runs about 900 cows in northeast Indiana and came through the transition in good shape. His approach was instructive. When Dean started showing financial stress in early 2019, he didn’t wait for official announcements. He spent three months building relationships with regional processors—before he needed them.

“By the time Dean went under, I had two backup options lined up,” he told me. “The difference wasn’t herd size or butterfat performance or who had the best fresh cow protocols. It was just who started making phone calls earlier.”

That’s a lesson worth holding onto: early information gathering creates options that may not exist later.

Regional Market Structures: Why Location Matters So Much

Here’s something that deserves more attention in industry discussions: the same consolidation trend creates very different situations depending on where you’re located.

The USDA Agricultural Marketing Service tracks Class I utilization—the percentage of milk going to fluid beverage use versus manufacturing—by Federal Order. The numbers tell an interesting story about regional market structure:

  • Florida Federal Order: Class I utilization runs around 82%, meaning the vast majority of milk goes to fluid products
  • Southeast Federal Order: Generally in the mid-to-high 70s for Class I utilization
  • Upper Midwest Federal Order: Roughly 8-10% Class I utilization—almost all the milk goes to cheese, butter, and powder
Geography isn’t destiny, but it sure shapes your options. Florida and Southeast producers face 75-82% Class I dependency with 2-3 regional processors. Lose one buyer and you’re scrambling. Upper Midwest operations live in a different world—9% Class I utilization, dozens of cheese plants competing for milk within trucking distance. Same consolidation trend, completely different exposure.

Think about what this means practically. A Wisconsin producer in the I-29 corridor has remarkable market flexibility. Dozens of cheese plants, butter manufacturers, and powder processors compete for milk within a reasonable trucking distance. If one buyer changes terms, alternatives exist. You might take a hit on hauling costs or accept different component premiums, but you’ve got options.

A Georgia producer faces a fundamentally different situation. According to UGA Extension’s most recent data, Georgia currently has on the order of 75-80 dairy farms, averaging roughly 1,000-1,050 cows each. Georgia Farm Bureau reports those farms produced about 227 million gallons of milk in 2024. And before Valdosta opened, Georgia Milk Producers confirms the state had exactly two commercial milk processing plants—in Atlanta and Lawrenceville.

“We’re working with a more concentrated market,” one South Georgia producer explained to me last month. “When your milk has to go to fluid processing, and there are limited plants in the region, the negotiating dynamics are just different than what our friends in Wisconsin experience.”

This isn’t about one region being better than another—it’s about understanding how market structure shapes your strategic options. A trucking constraint of roughly 300 miles for fluid milk (where economics start to get challenging) means Southeast producers can’t easily access Midwest cheese markets as an alternative outlet.

Understanding the Cooperative Landscape

This topic generates strong opinions, and I want to approach it thoughtfully. DFA’s position in the market is complex, and reasonable people can disagree about what it means.

When DFA acquired those 44 Dean Foods plants in 2020, it created something unusual: an organization that simultaneously represents milk producers as a cooperative and purchases milk from producers as a processor. The USDA Packers and Stockyards Division has examined this dual structure.

This arrangement has faced legal scrutiny over the years. A federal lawsuit filed by Food Lion and the Maryland-Virginia Milk Producers Cooperative in May 2020 (Middle District of North Carolina, Case No. 1:20-cv-00442) raised questions about market practices. DFA has also paid or agreed to pay settlements in various pricing cases: $140 million in a Southeast settlement back in 2013, $50 million in a Northeast settlement in 2015, and most recently about $34.4 million (combined with Select Milk Producers) in July 2025, according to Reuters coverage of that agreement.

So how should producers think about this? Here’s my read on the tradeoffs:

The case for cooperative membership is genuine:

  • Guaranteed milk pickup provides real security, especially in volatile markets
  • An extensive processing network offers market access across regions
  • Collective bargaining can deliver input cost advantages
  • For producers without strong independent processor relationships, membership provides a reliable home for their milk

The considerations are also worth weighing:

  • Various fees and deductions typically reduce effective milk prices—I’ve reviewed producer milk checks showing $1.50-4.00/cwt below Federal Order minimums, though this varies considerably by situation
  • Equity contributions may be locked for extended periods with limited liquidity
  • Governance structures naturally give larger members more influence
  • The processing division’s interests don’t always align perfectly with member pricing

The right answer depends entirely on your specific situation. For some operations, cooperative membership is clearly the best choice. For others with strong independent relationships, different arrangements make more sense. The key is evaluating your actual options rather than making assumptions either way.

AspectMembership UpsideMembership Considerations
Milk pickupGuaranteed pickup, logistical securityHauling and service fees reduce net price
Market accessExtensive processing networkLimited ability to pursue independent buyers
Milk priceCollective bargaining benefits$1.50–4.00/cwt below Federal Order minimums
EquityOwnership stake in systemEquity locked, limited short‑term liquidity
GovernanceVoice through member structureLarger members hold more influence
Processor alignmentShared interest in volumeProcessing margin may not align with member pricing

The Economics of a Mid-Size Operation

Let me walk through some representative numbers, because I find concrete figures help clarify the discussion.

A 600-cow dairy—fairly typical for a mid-size operation in the Southeast or Mid-Atlantic—produces roughly 150,000 hundredweight of milk annually at 25,000 pounds per cow. That’s achievable with good genetics, solid fresh-cow management, and attention to transition-period health.

At $23/cwt milk prices, a 600-cow operation nets just $287,500 annually—8% margin. But here’s the gut punch: every $1/cwt price drop erases $150,000 in annual income. Drop to $19/cwt for 12-18 months and working capital starts bleeding out. The math doesn’t care how good your management is.

Current economics, as best we can estimate:

  • All-milk prices have been running in the $22-24/cwt range, depending on region and components, with USDA’s December 2024 figure coming in around $23.30/cwt, according to Brownfield Ag News
  • Gross revenue at $23/cwt: roughly $3.45 million
  • Many university and FINBIN-type benchmarks suggest total costs for mid-size commercial dairies commonly fall in the high-teens to low-$20s per cwt, depending on feed costs, labor markets, and debt structure
  • Annual margin: perhaps $300,000-450,000 in favorable conditions

It’s worth noting that feed costs remain a significant variable right now. Corn and soybean meal prices have moderated from their 2022 peaks, but purchased feed still represents 40-50% of total costs for most operations. And labor—particularly finding reliable, skilled help for milking and fresh cow protocols—continues to challenge operations across most regions. These factors can swing your actual cost of production by $1-2/cwt in either direction.

That margin covers debt service, family living expenses, capital reserves, equipment replacement, and taxes. It works—but it doesn’t leave much buffer for extended downturns, as many of us have experienced firsthand.

The sensitivity is worth understanding: every $1/cwt price decline reduces this operation’s annual income by $150,000. That’s $12,500 monthly. For a 600-cow barn at these benchmarks, at $19/cwt milk, margins get tight. At $18/cwt sustained over 12-18 months, working capital generally starts to deplete.

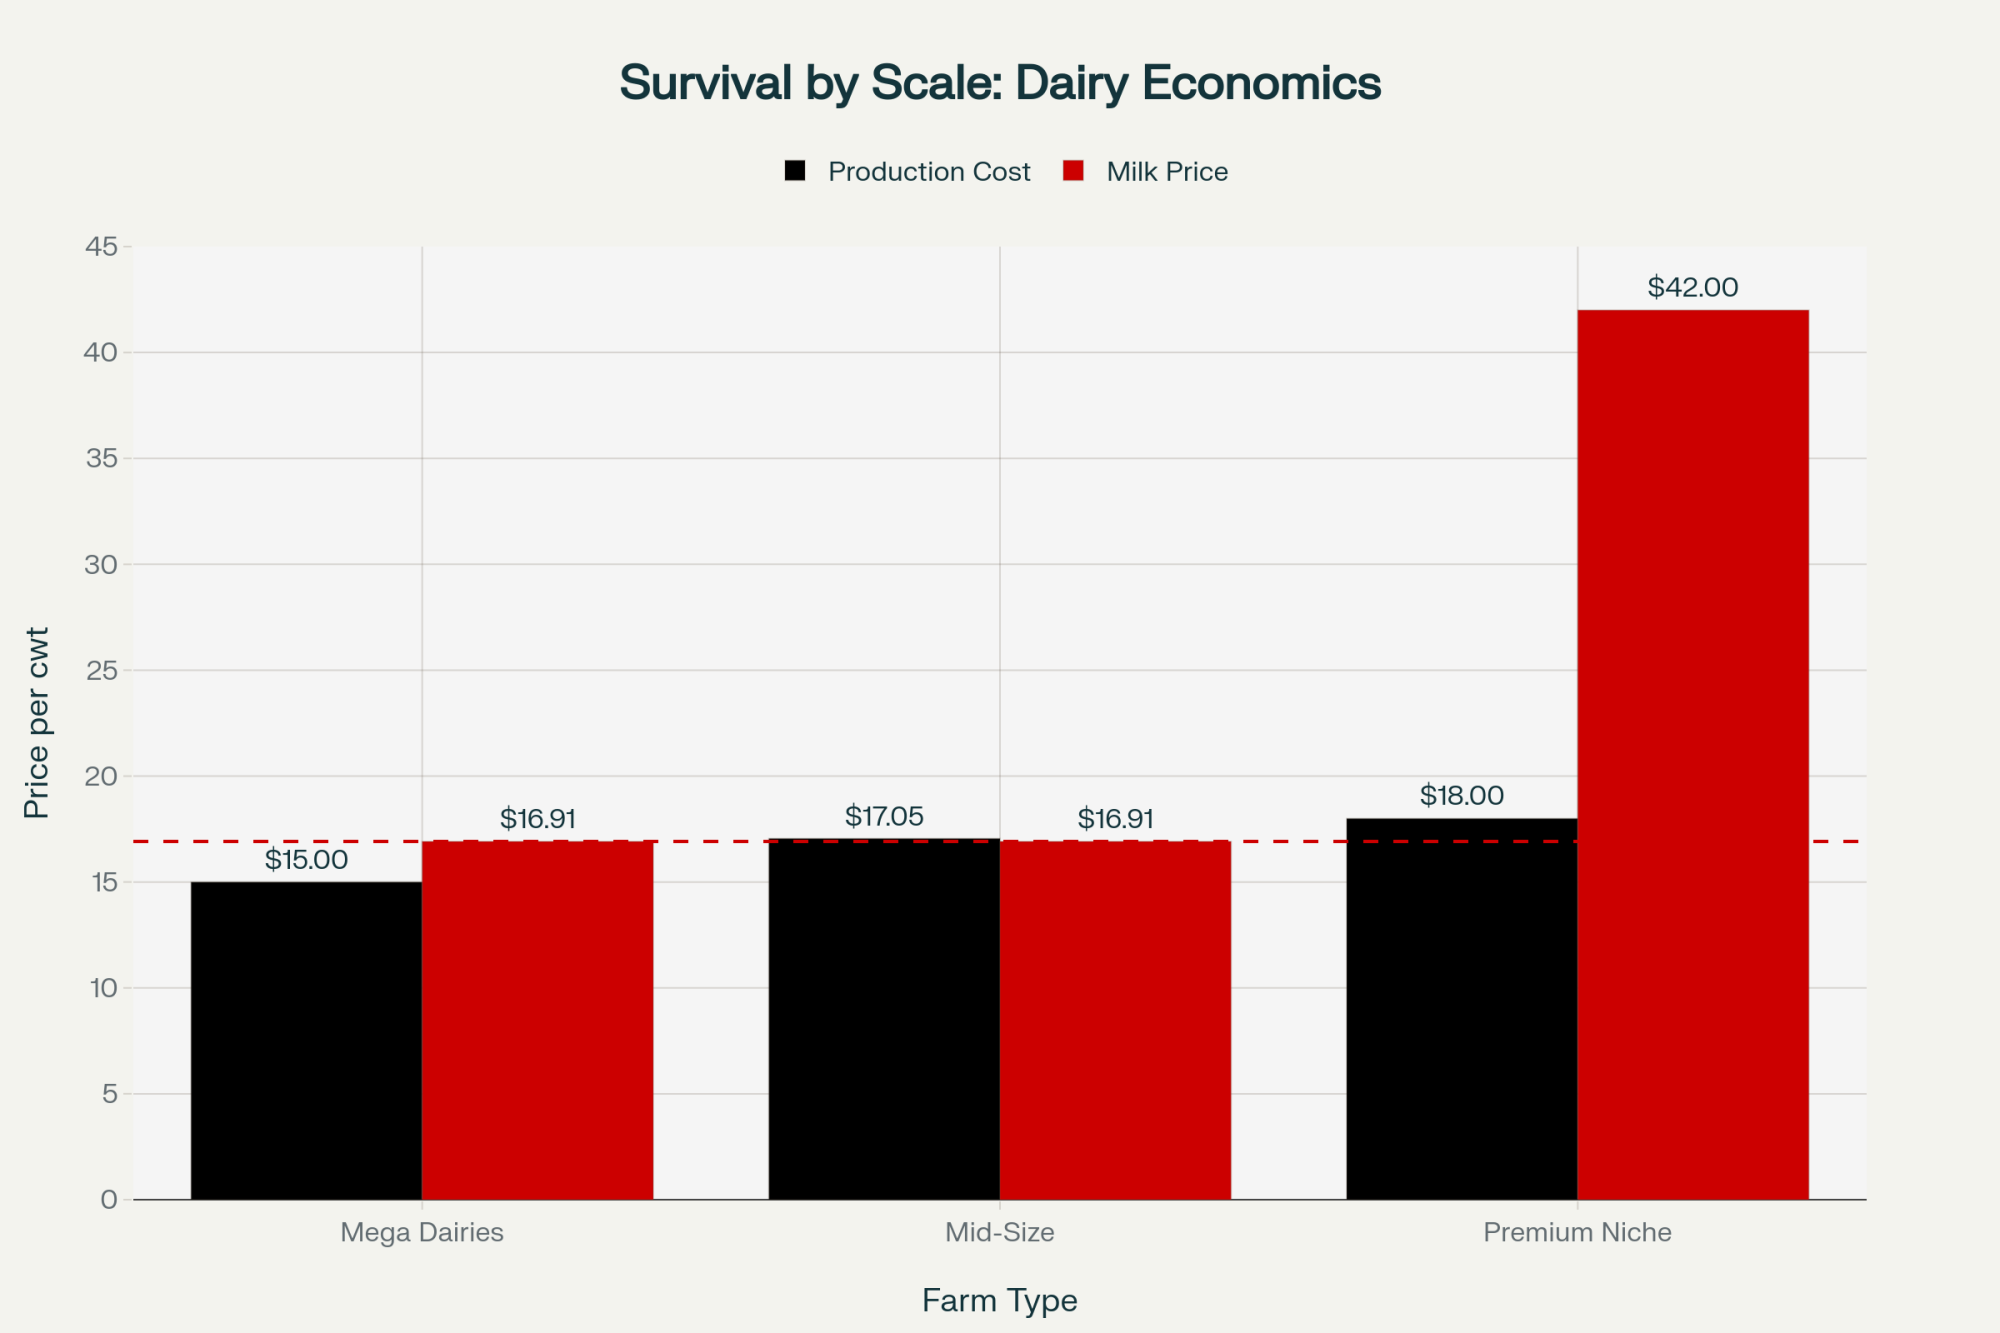
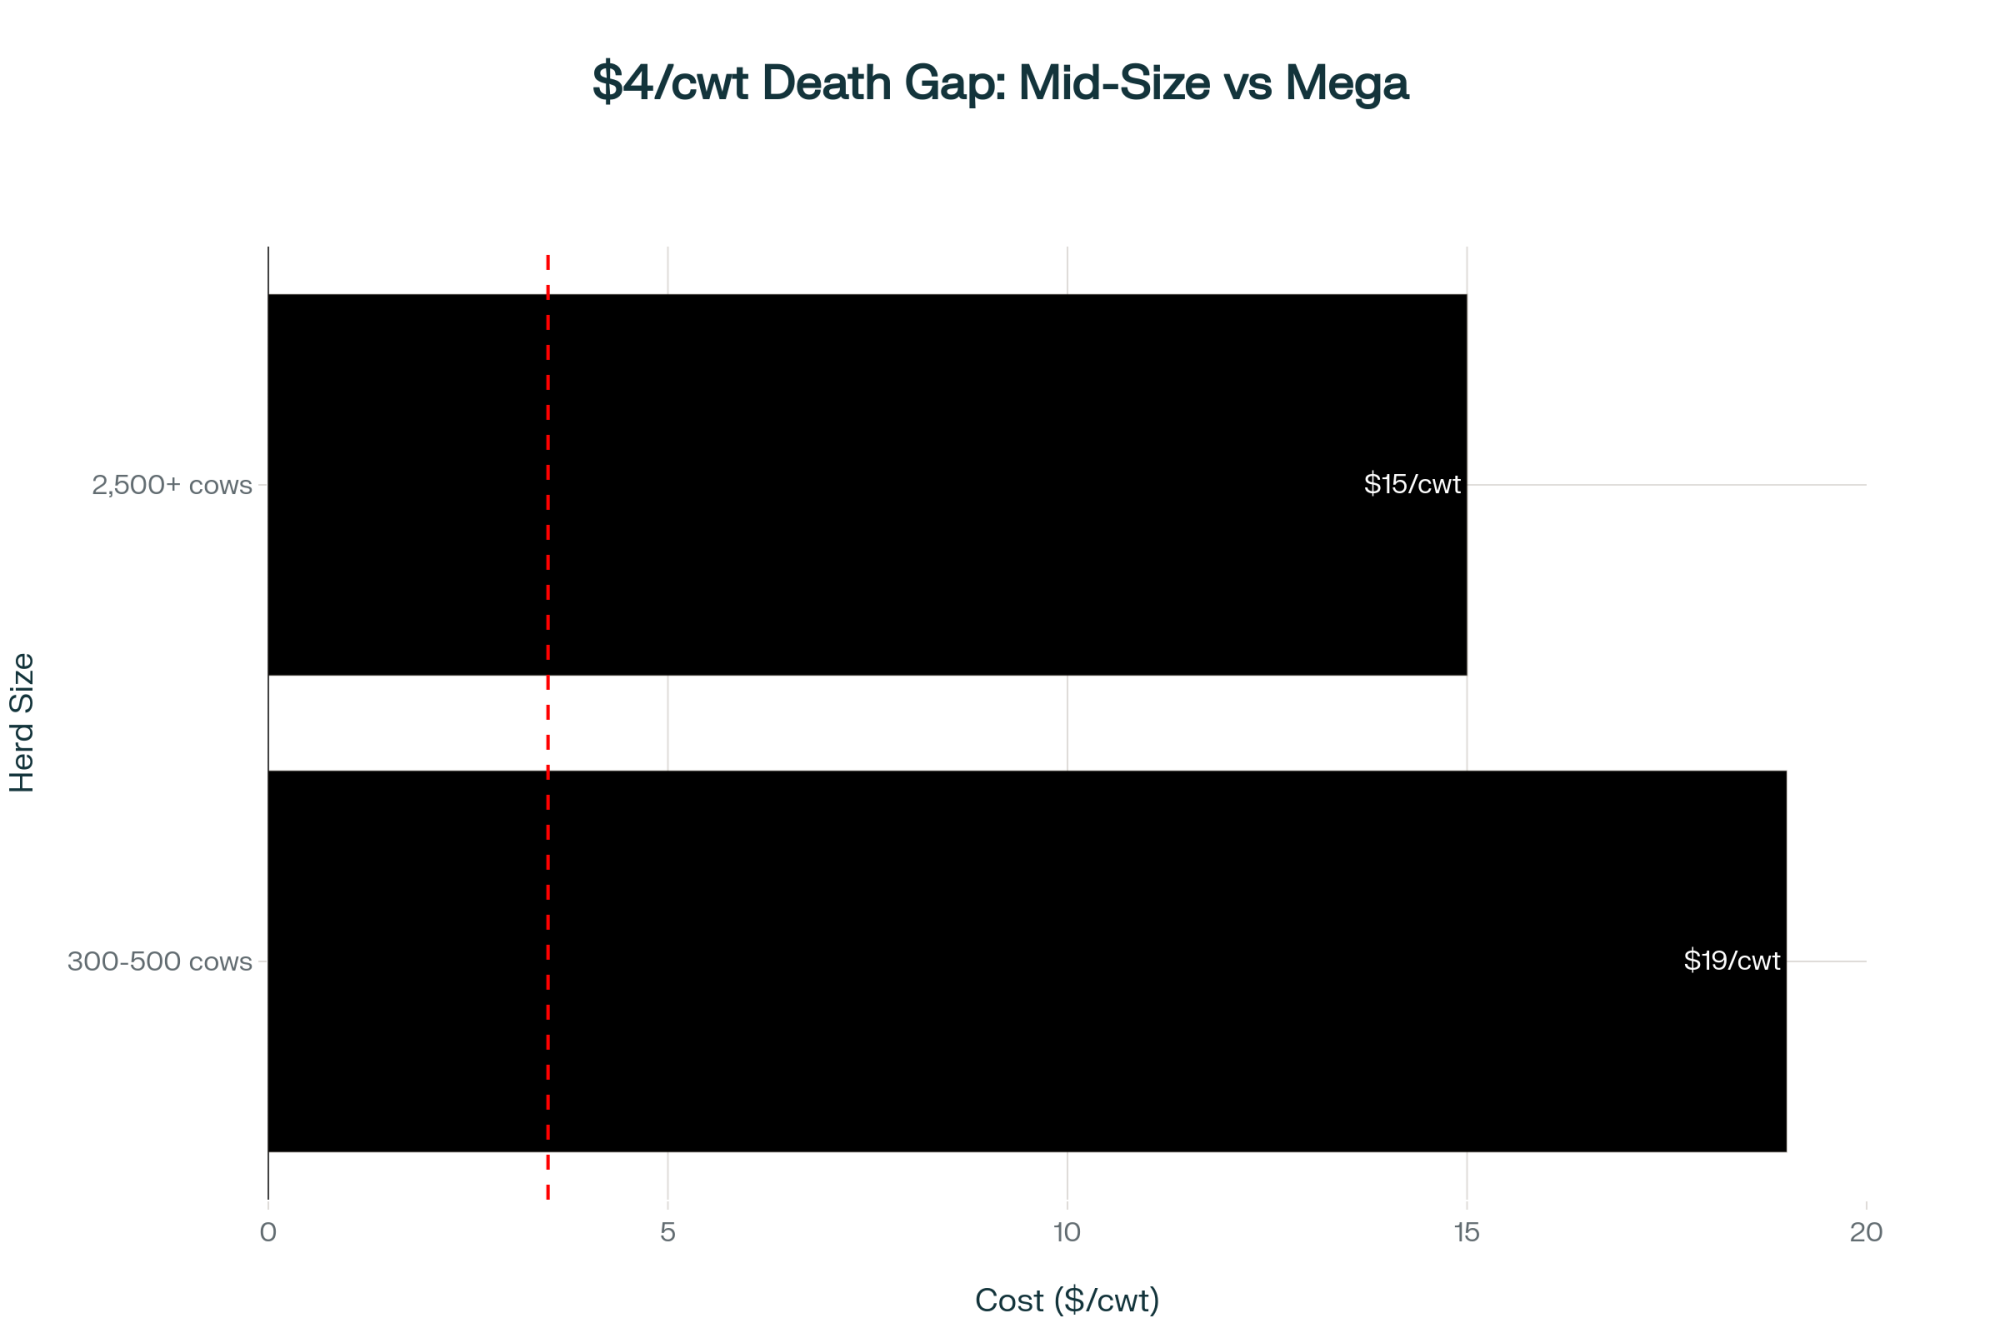
Here’s what keeps 600-cow operators up at night: a 3,000-cow operation makes $6.33/cwt more on the same milk check—purely from spreading fixed costs. You can have perfect transition cow protocols and 4.2% butterfat, and still get crushed by economies of scale. The $4-6/cwt structural gap isn’t about management—it’s math

Now, here’s some important context: larger operations often achieve meaningfully lower production costs meaningfully. Highly efficient herds in the 2,500-cow-and-up range can, in some documented cases, drive total costs into the mid-teens per cwt—say $14.50-16.00. That advantage comes from spreading fixed costs, volume purchasing power, dedicated transition facilities, and automation investments that require scale to justify.

This isn’t a criticism of mid-size management—many mid-size operations are exceptionally well-run. It’s simply the mathematics of fixed cost allocation. Understanding this dynamic helps inform strategic thinking.

Dimension600‑Cow Mid-Size Herd2,500‑Cow+ Large Herds
Annual milk per cow~25,000 lbsSimilar or slightly higher
Total cost per cwtHigh‑teens to low‑$20s$14.50–16.00 per cwt
Fixed cost per cowHigher per cowLower per cow via scale
Purchasing powerStandard feed and input pricingVolume discounts, stronger vendor leverage
Automation investmentLimited by capitalMore justified: robots, rotary parlors, tech
Margin resilienceTight margins, less downturn bufferMore buffer to ride price dips

The Credit Dimension

Here’s an aspect of industry economics that deserves more discussion: how agricultural lenders respond to sector-wide changes.

A Farm Credit loan officer shared his perspective with me recently (off the record, as is typical for these conversations): “We’re not predicting which farms will succeed. But we are required to manage portfolio risk. When we see structural shifts in an industry, our credit committees ask harder questions about renewals and terms.”

This matters because agricultural lenders operate under regulatory requirements—Farm Credit Administration examination standards and Basel III provisions—that mandate risk management responses to changing sector conditions.

The practical implications:

  • When industry consolidation becomes visible, lenders flag portfolios for review
  • Credit line renewals may face additional documentation requirements
  • Covenant thresholds (typically 45-50% debt-to-asset ratios) get enforced more carefully
  • Operations near covenant limits may face restructuring conversations

Dr. David Kohl—Professor Emeritus of Agricultural Finance at Virginia Tech, who’s consulted with farm lenders for decades—makes an important observation: producers sometimes don’t realize their decision timeline is partly defined by their lender’s risk tolerance, not just their own cash flow.

This isn’t about lenders being difficult—it’s about understanding how institutional constraints shape available options. Knowing this in advance lets you plan accordingly.

Three Strategic Directions Worth Considering

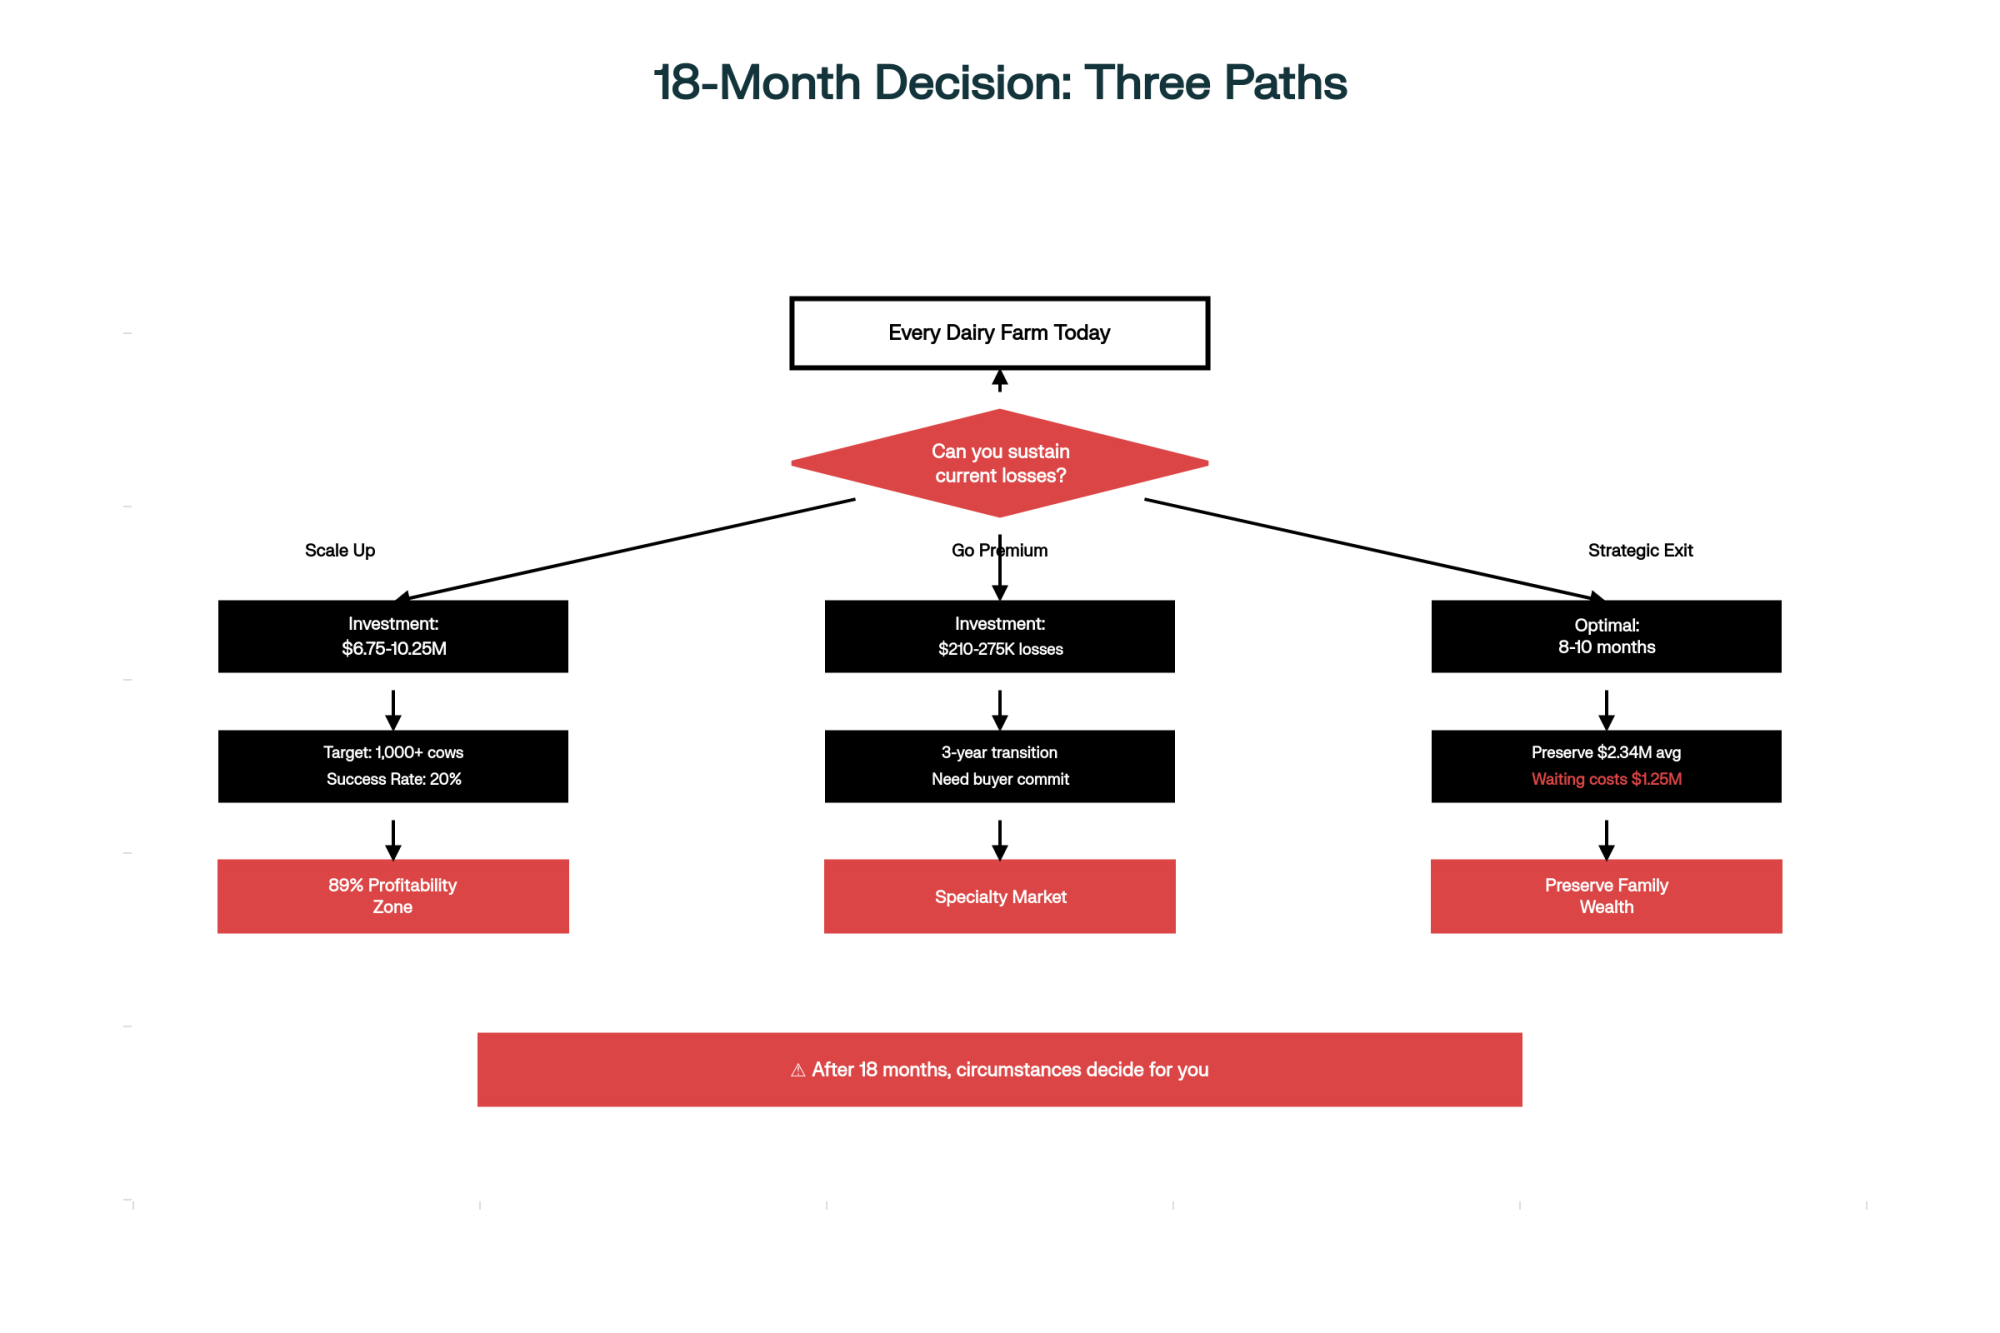
Based on current conditions and conversations with producers who’ve navigated similar transitions, three general pathways emerge. Each has different requirements and realistic odds of success.

Pathway 1: Scaling to 1,500-2,500+ Cows

What this typically requires:

  • Capital investment of $3.5-7.5 million for facilities, animals, and working capital
  • Processor commitment (in writing) before lenders will typically approve expansion financing
  • Current debt-to-asset ratio below 50%—many mid-size operations run higher
  • Access to replacement heifers in a constrained market

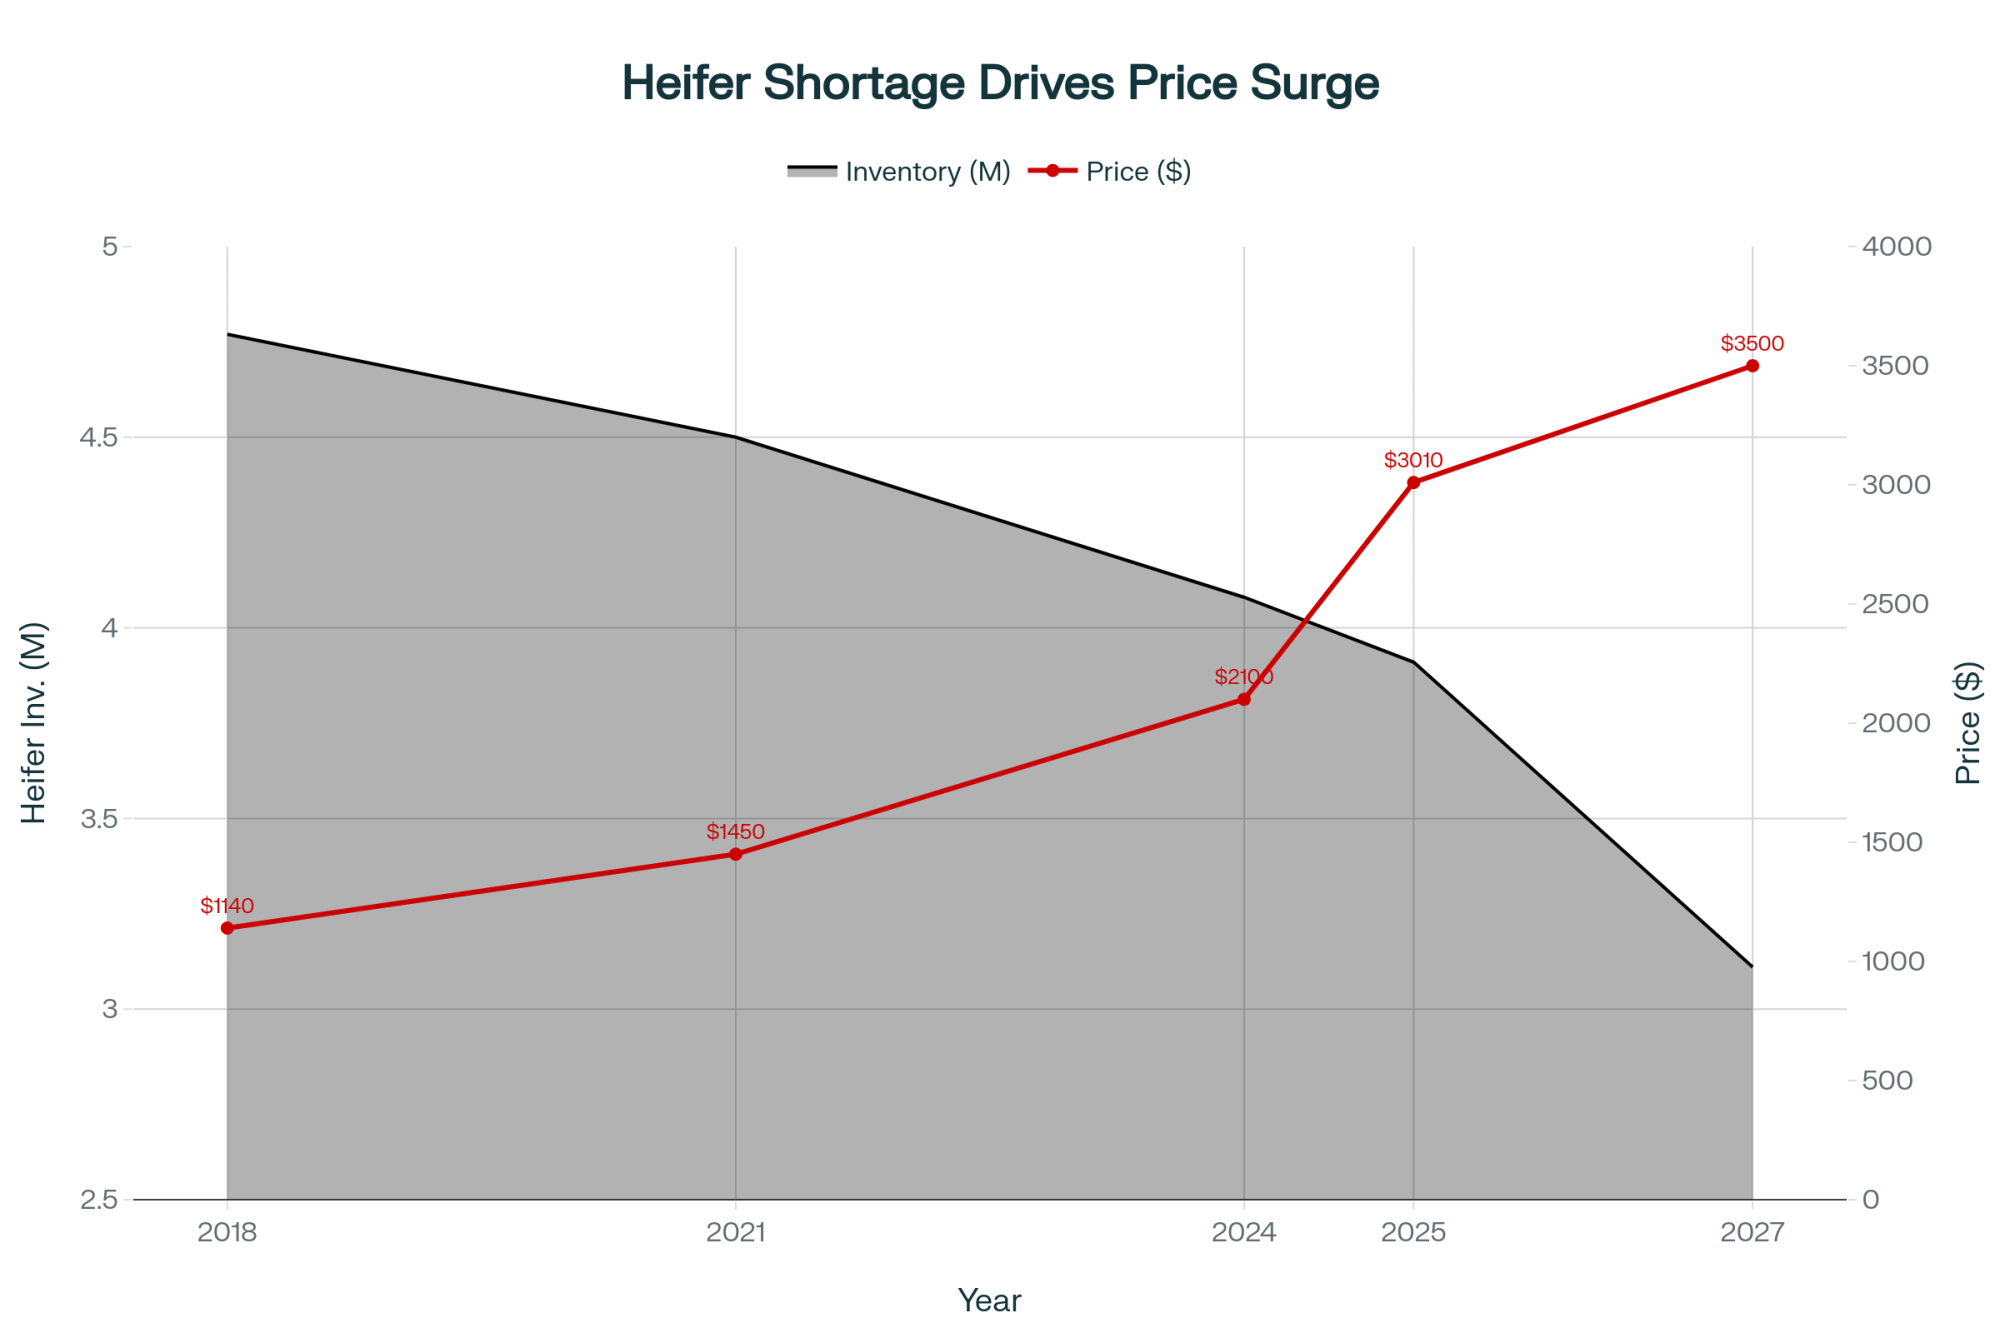
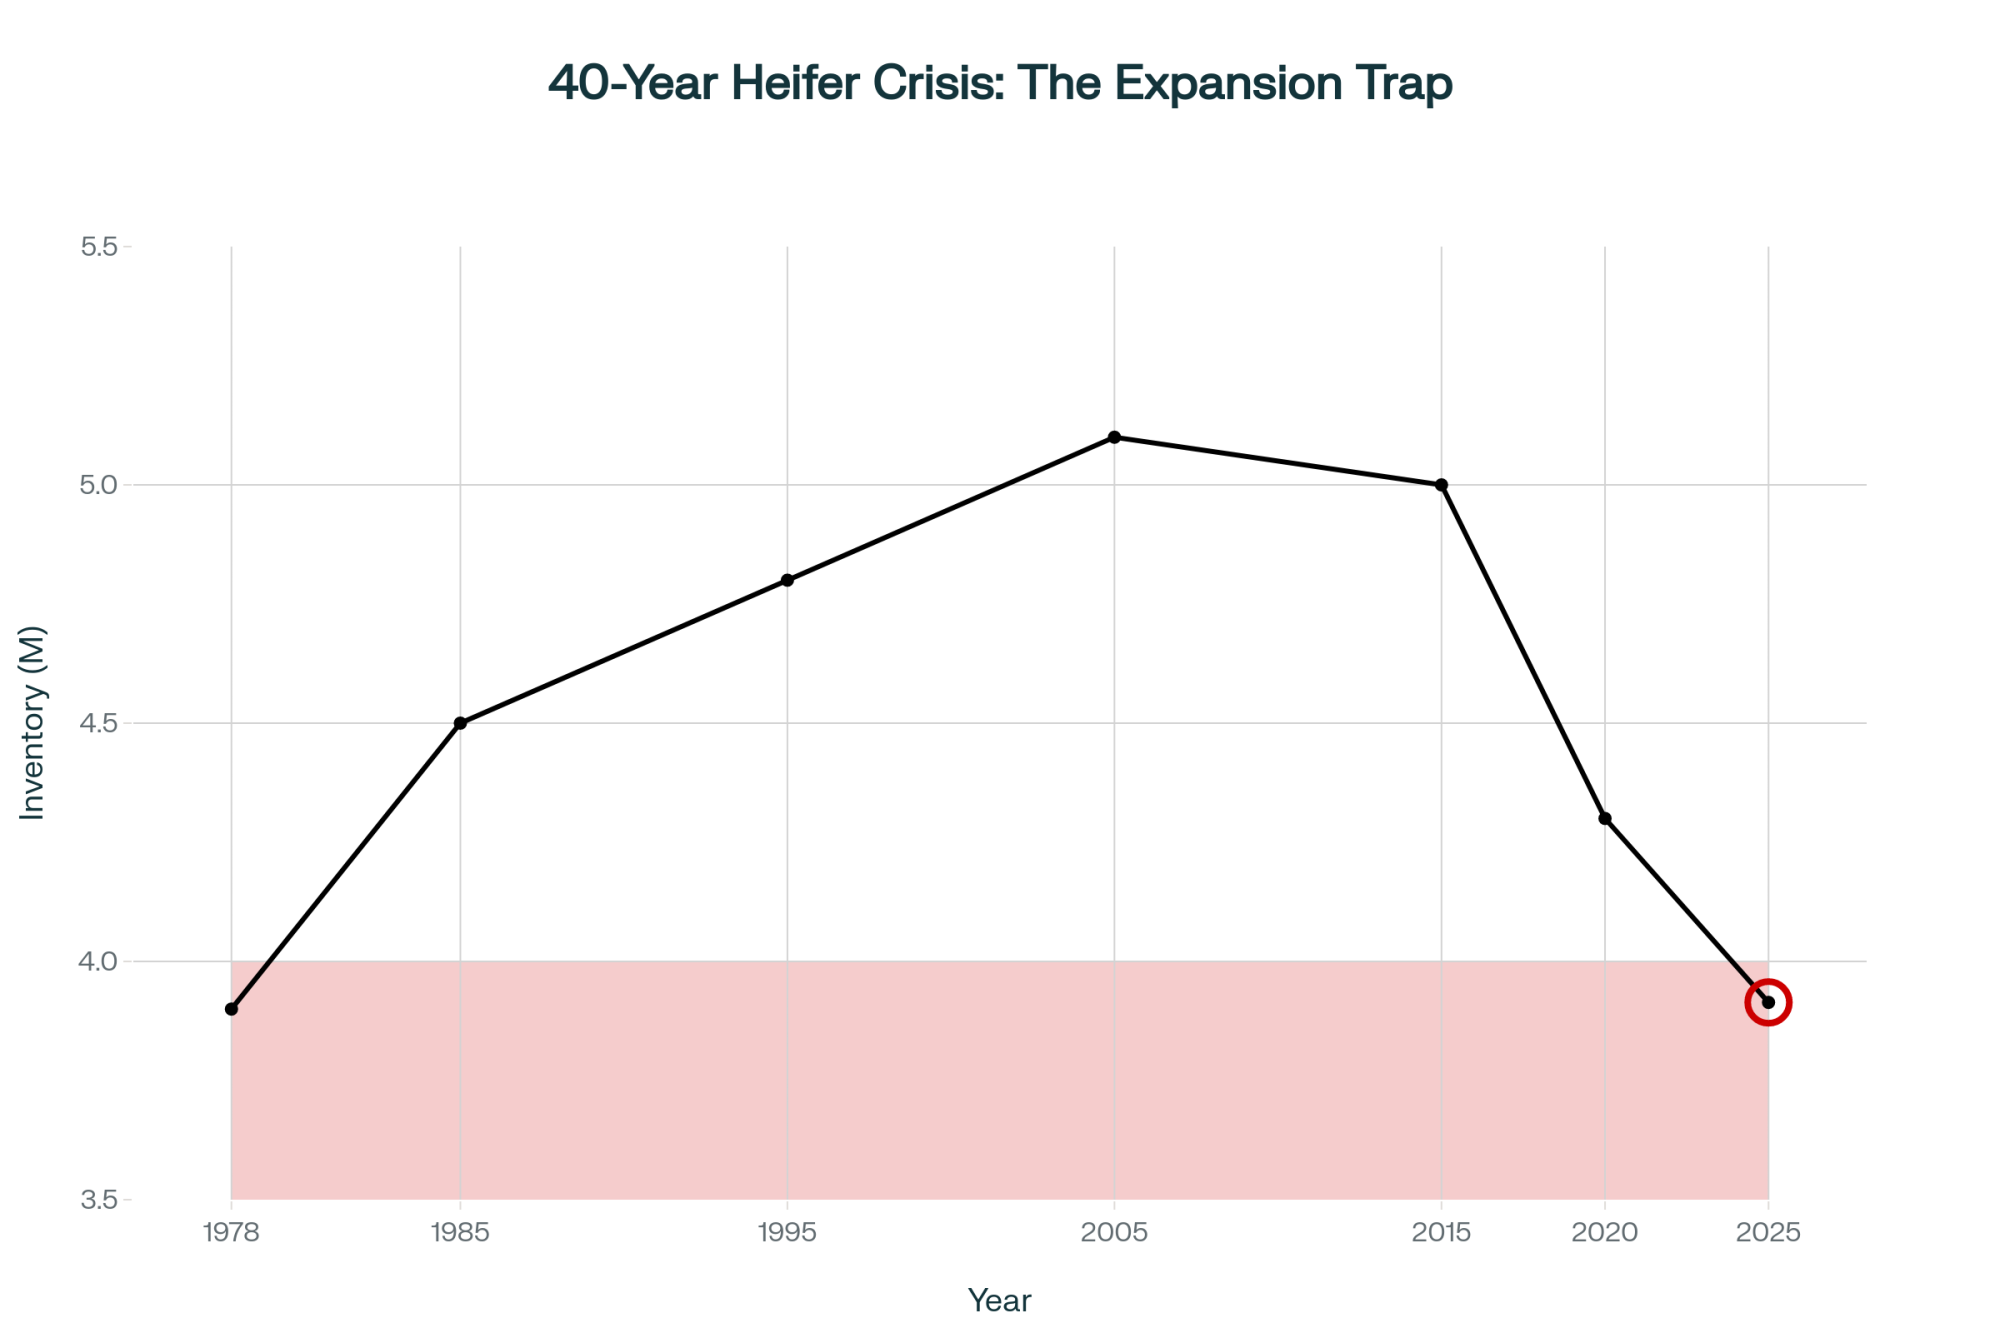
Regarding heifers: USDA data shows the national replacement heifer inventory has declined about 18% from 2018 levels, to around 3.92 million head. Premium springers at California and Minnesota auction barns have been bringing $3,500-4,000 per head, while USDA’s mid-2025 national average is around $3,010. This creates a real constraint on expansion timelines.

There’s another factor that doesn’t get enough attention: regulatory and permitting requirements. Depending on your state and county, expanding from 600 to 2,000 cows may trigger new CAFO permitting thresholds, nutrient management plan requirements, and neighbor notification processes. In some regions—particularly parts of the Upper Midwest and Northeast—these timelines can add 12-18 months to an expansion project. I’ve seen producers budget the capital and line up the heifers, only to spend a year and a half working through environmental review. Factor this into your planning if you’re seriously considering this path.

Realistic assessment: This pathway generally works best for operations with existing scale infrastructure, strong lender relationships, and confirmed processor partnerships. From what I’m seeing, success probability runs maybe 30-40% for operations currently in the 500-800 cow range, based on capital access constraints and market conditions.

Pathway 2: Specialty Market Transition

Options worth evaluating:

  • Organic certification: 36-month transition absorbing higher input costs before receiving organic premiums. Current organic prices are $26-28/cwt, according to USDA data, but buyer capacity is limited in many regions.
  • A2 milk: Requires 5-7 years of genetic transition through breeding and culling. Buyer infrastructure is still developing, particularly outside major metro areas.
  • Grass-fed/regenerative: 2-3 year infrastructure development for rotational grazing. Works better in some climates than others—those July temperatures in South Georgia make intensive grazing pretty challenging compared to, say, Vermont or Wisconsin.

I spoke with a producer in Pennsylvania—she asked me not to use her name—who completed an organic transition in 2021 after three years of planning. “The transition period was brutal financially,” she told me. “But I had my buyer commitment from Organic Valley before I started, and that made all the difference. Neighbors who converted without a commitment lined up… some of them waited eight, nine months for a market. You can’t cash flow that.”

Realistic assessment: Specialty markets can transform mid-size economics when accessible. The key is securing buyer commitment before incurring transition costs. With a confirmed buyer in place, the success probability runs perhaps 50-65%. Without pre-transition commitment, it’s considerably lower.

Pathway 3: Strategic Exit

This option deserves serious consideration rather than dismissal. For some families, it’s the path that best serves long-term financial security.

What orderly exit typically preserves:

  • Cattle values at current market prices (quality milking cows around $2,000/head per recent USDA livestock reports)
  • Land values before any consolidation-related softening
  • Equipment values through private sale versus auction liquidation

As an illustrative example—and I want to be clear, these numbers are scenario-based rather than universal—a 600-cow operation with 800 acres in a reasonably strong land market might preserve something like $5.5-6.0 million in net equity with a carefully planned 12-18-month exit after debt payoff.

What pressured liquidation often costs:

  • Cattle at distress prices: typically 75-80% of normal market value
  • Land under time pressure: often 80-85% of fair value
  • Equipment at auction with other distressed sellers: sometimes 45-55% of book value
  • Potential recovery in this scenario: perhaps $3.5-4.0 million
DimensionOrderly 12–18‑Month ExitForced / Distress Liquidation
Cattle pricesAround current market ($2,000/head)75–80% of normal value
Land saleNear full fair market value80–85% of value under pressure
Equipment valueBetter via private sale45–55% of book at auction
Net equity example$5.5–6.0M preserved$3.5–4.0M recovered
Decision timingProactive, with planning runwayReactive, after cash and credit crunch

The difference—potentially $1.5-2.5 million in preserved family wealth—is substantial. Your specific numbers will vary based on region, debt load, and market timing, but the principle holds.

A Wisconsin producer I know—he’s given me permission to share this—made the exit decision in 2022 with 650 cows and came out with enough to pay off all debt, set up his son in a different agricultural enterprise, and retire comfortably. “Hardest decision I ever made,” he told me. “But waiting another three years would have cost us at least a million dollars. The numbers don’t lie.”

Dr. Kohl has worked with families on both sides of this decision. His observation: “The ones who made proactive decisions came out in far better financial position than those who waited until circumstances forced their hand. The hardest part is accepting that exiting strategically isn’t giving up—it’s making the best decision with available information.”

PathwayCore RequirementsKey AdvantagesMajor Risks / Constraints
Scale to 1,500–2,500+$3.5–7.5M capital, written processor commitmentLower cost per cwt, stronger plant leverageHeifer shortage, permitting delays, lender appetite
Specialty marketsBuyer agreement before transition, multi‑year planningPremium prices (organic, A2, grass‑fed)Limited buyer capacity, tough transition cash flow
Strategic exit12–18‑month planned wind‑down, asset valuation workPreserves $1.5–2.5M more equityEmotional difficulty, timing decisions

Looking Toward 2030

Industry projections suggest continued structural evolution, though the pace and extent remain uncertain. USDA Economic Research Service data and academic analyses from places like Wisconsin and Cornell point toward some likely trends:

  • Continued farm count decline: If current closure and consolidation rates continue, several credible analyses suggest U.S. dairy farm numbers could fall into the mid-teens of thousands by 2030—perhaps 15,000-18,000 operations, compared to higher numbers today
  • Increasing herd concentration: Rabobank analysis shows roughly 65% of the national dairy herd already lives on 1,000+ cow operations. That share could reach perhaps three-quarters of cows by decade’s end if trends continue
  • Processing evolution: Continued shifts in processing ownership and structure, with remaining capacity increasingly concentrated

Regional variation matters considerably here. The Southeast and Mid-Atlantic, with their reliance on Class I markets, may see faster adjustment than the Upper Midwest, with its diverse cheese and manufacturing base.

This isn’t necessarily negative—the remaining operations will likely be financially strong and highly capable. But the structure is evolving, and mid-size operations occupy a challenging position in that evolution.

The Value of Early Information

What I keep coming back to is timing. The producers who successfully navigated the Fort Wayne transition were generally the ones who started asking questions before the answers became obvious to everyone.

Here are conversations worth having in the next month or two:

With your lender:

  • What’s our current debt-to-asset position relative to your covenant thresholds?
  • How would an expansion proposal be received in the current environment?
  • What scenarios would trigger concern about our operating line?

With your processor or cooperative:

  • How do you see your capacity and operations evolving through 2027-2028?
  • Are there volume commitments or contract structures worth discussing?
  • How is retail processing expansion affecting your planning?

With trusted advisors:

  • What are realistic current valuations for our assets?
  • What’s the tax-optimized approach for different strategic directions?
  • What are we not considering that we should?

The goal isn’t rushed decisions—it’s gathering information while options remain open.

FactorEarly Movers (Prepared)Late Movers (Waited)
TimelineBackup options lined up ~6 months aheadWaited for official announcements
Processor relationshipsProactively built with regional plantsScrambled after Dean collapse
Contract termsNegotiated better hauling and price termsAccepted remaining, less favorable deals
Stress levelMore control, planned changesHigh stress, limited leverage
OutcomeGenerally maintained stable marketsHigher risk of poor terms or stranded milk

The Bottom Line

What I see in the current environment is a transition, not a crisis. Those are different things. Transitions allow preparation time for those who use it.

The market reality:

  • Retail vertical integration is changing how processing margin flows through the supply chain
  • Regional market structures create meaningfully different situations for different producers
  • Cooperative membership involves tradeoffs worth evaluating for your specific situation

What this suggests for planning:

  • Understand where you sit on the cost curve and what that implies for your operation
  • Know your credit position and how your lender likely views sector conditions
  • Think through which strategic direction genuinely fits your operation, capital position, and family goals

On timing:

  • Information gathered now creates options later
  • Decision windows narrow gradually but persistently
  • Strategic choices made proactively typically preserve more value than reactive ones

On risk management:

  • Whatever pathway you’re considering, don’t overlook the tools available through USDA’s Dairy Margin Coverage program and Livestock Gross Margin for Dairy (LGM-Dairy). They won’t solve structural challenges, but they can provide a floor during the transition period while you’re executing your strategic plan. Your local FSA office or a crop insurance agent familiar with dairy can walk you through the current coverage options and premium costs.

The dairy industry has navigated significant transitions before and will do so again. Operations that approach current conditions with clear information, realistic assessment, and thoughtful timing will be well-positioned—regardless of which path they choose.

The least favorable outcome isn’t choosing Path 1, 2, or 3. It’s deferring the evaluation until circumstances make the choice for you.

For additional resources on dairy operation analysis and planning, contact your state extension service. The University of Wisconsin’s Dairy Marketing and Risk Management Program at dairymarkets.org offers valuable tools for price risk analysis, and the USDA’s Dairy Margin Coverage information is available at fsa.usda.gov

Key Takeaways:

  • 18 months—that’s the precedent: Dean Foods filed bankruptcy 18 months after Walmart’s first plant opened. Plant #2 launched on December 2, 2025.
  • Three paths, three price tags: Scaling requires $3.5-7.5M and processor commitments in writing. Specialty markets need buyer agreements before you transition. Strategic exit preserves $1.5-2.5M more equity than forced liquidation.
  • Your region shapes your risk: Southeast Class I markets have 2-3 processor options. Upper Midwest cheese country has dozens. Same trend, completely different exposure.
  • Lenders may move before you do: At 45-50% debt-to-asset ratios, credit committees tighten terms regardless of milk prices. Your timeline isn’t just about cash flow.
  • Early movers had options; late movers got leftovers: The producers who navigated Fort Wayne had backup relationships six months before the headlines hit. By then, the best deals were gone.

Complete references and supporting documentation are available upon request by contacting the editorial team at editor@thebullvine.com.

Learn More:

The Sunday Read Dairy Professionals Don’t Skip.

Every week, thousands of producers, breeders, and industry insiders open Bullvine Weekly for genetics insights, market shifts, and profit strategies they won’t find anywhere else. One email. Five minutes. Smarter decisions all week.

NewsSubscribe
First
Last
Consent

Whole Milk is Back in Schools. Here’s Why Only 834 Dairy Farms Will Really Win.

After 13 years of scientific vindication and structural transformation, the Senate’s unanimous approval reveals important lessons about policy, persistence, and what it really takes to survive in American dairy

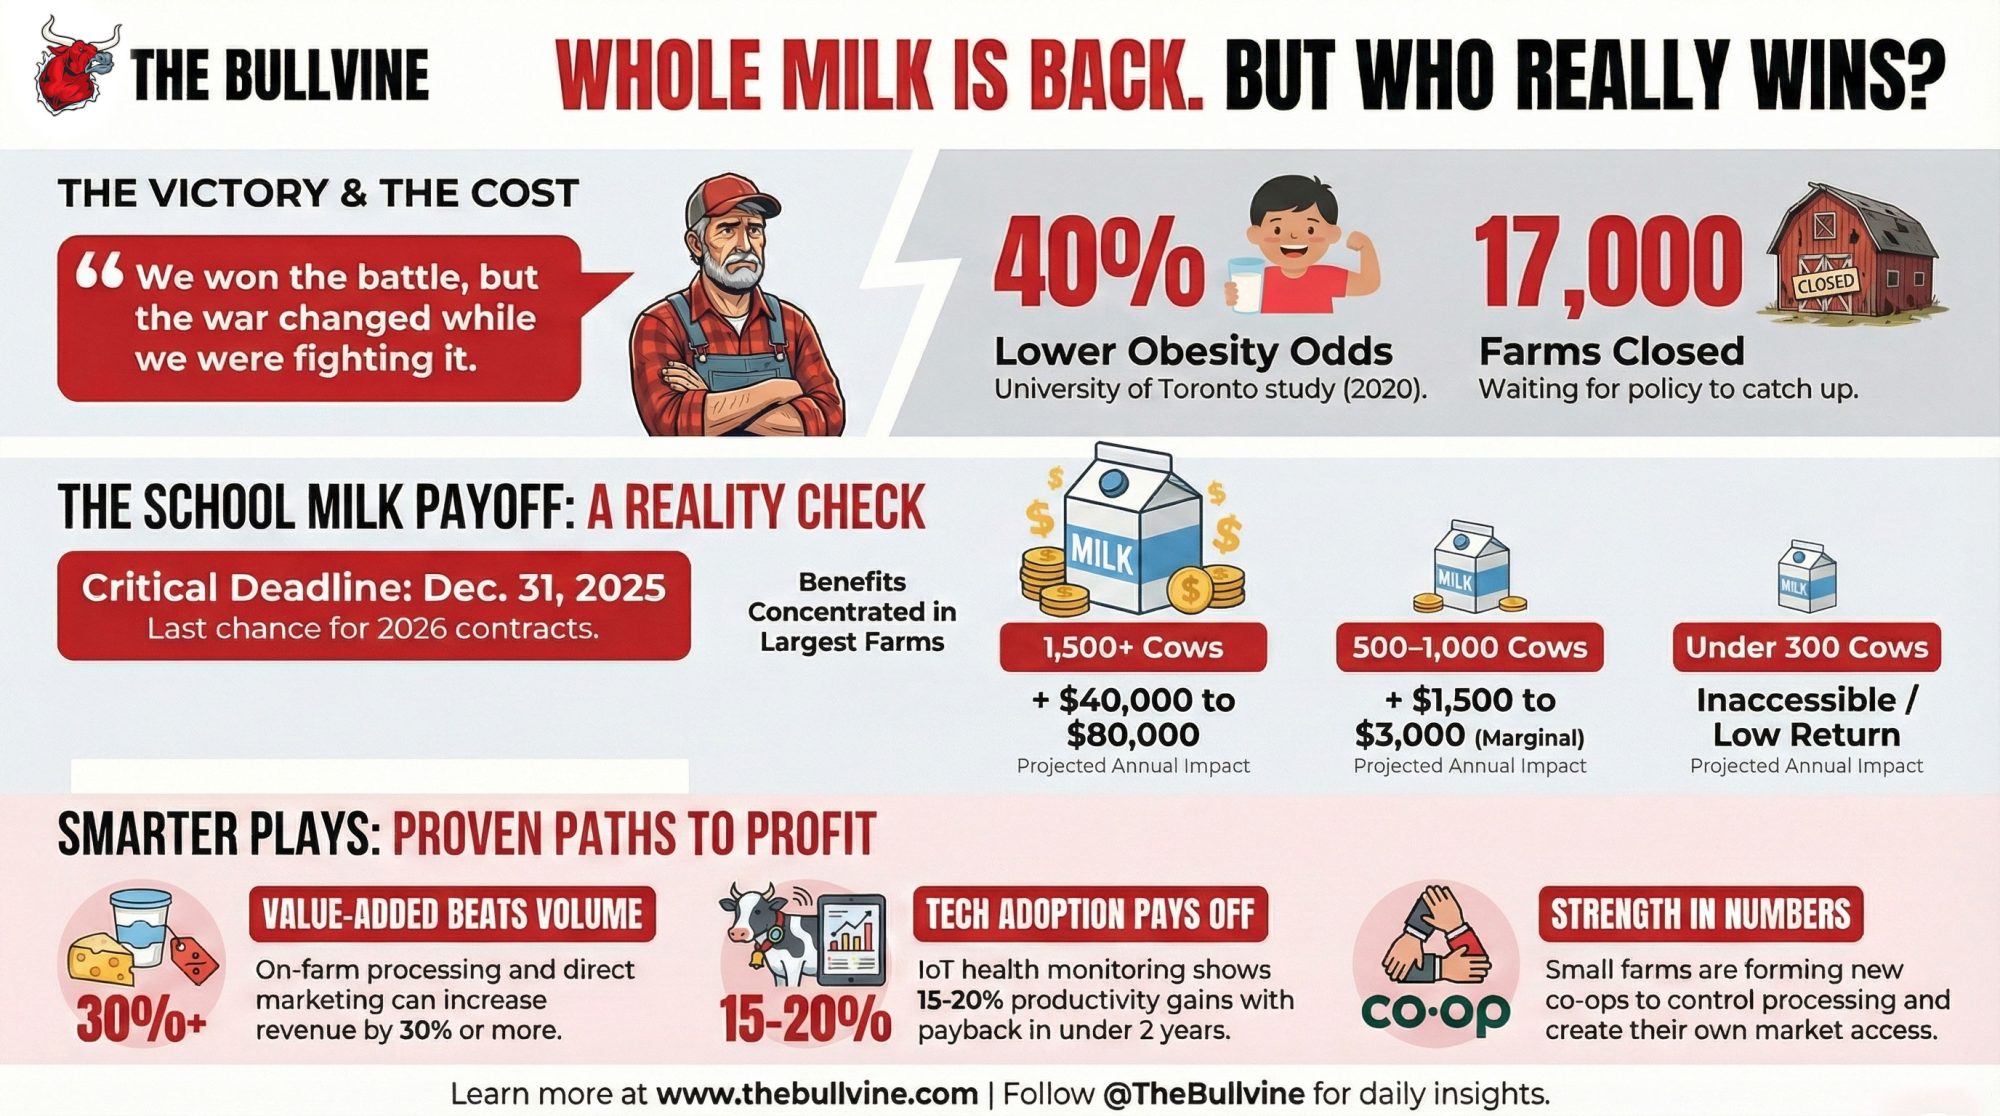
EXECUTIVE SUMMARY: Whole milk returns to schools after 13 years, validating what dairy farmers knew all along—but for 17,000 operations that closed during the wait, vindication came too late. The University of Toronto’s 2020 research showed that whole milk reduces childhood obesity by 40%, yet policymakers needed five more years and a new administration to act. Today’s transformed industry means only farms with 1,500+ cows can capture meaningful returns ($40,000-$80,000 annually) from school contracts, while farms with fewer than 500 cows are effectively locked out. The December 31, 2025, deadline for cooperative engagement is the last chance to participate until 2029—but many mid-size farms are finding better opportunities in value-added production, earning 30% revenue increases versus marginal school milk returns. The harsh lesson: in agricultural policy, being scientifically right matters less than being financially resilient enough to outlast institutional inertia.

Whole Milk in Schools

You know, when I watched the celebrations after the Senate unanimously passed S.222 on November 20th—that’s the Whole Milk for Healthy Kids Act—I had mixed feelings. Don’t get me wrong, after thirteen years of being told our product was harmful to children, finally getting vindication feels good.

But I recently had coffee with a producer from central Wisconsin who put it perfectly:

“We won the battle, but the war changed while we were fighting it.”

— Wisconsin dairy farmer, November 2025

And that’s what I keep hearing as I talk with folks across the industry. This victory arrives in a fundamentally different world than the one we knew in 2012. The real question isn’t whether we were right about the science—turns out we were—but rather, what does this actually mean for operations trying to make it work today?

The Science Story: What Actually Changed Things

So let me walk you through what happened with the research, because it’s pretty revealing about how this whole system works.

The University of Toronto published this meta-analysis back in early 2020—Dr. Jonathon Maguire’s team analyzed 28 studies covering nearly 21,000 kids from seven countries. And here’s what knocked me sideways when I first read it: children drinking whole milk showed 40% lower odds of being overweight or obese compared to those drinking reduced-fat milk.

Think about that for a second. The 2010 policy that yanked whole milk from schools—we’re talking about 30 million students in the National School Lunch Program—that whole thing was built on the idea that cutting saturated fat would fight childhood obesity. The Toronto research basically said we might’ve had it backwards all along.

What’s really interesting is its consistency. Eighteen of those 28 studies pointed in the same direction. Not a single study showed that reduced-fat milk actually lowered obesity risk.

As the University of Toronto folks noted, these findings meant we needed to completely rethink our assumptions about whole milk and kids’ health.

But here’s where it gets frustrating, and I bet many of you felt this too. The 2020 Dietary Guidelines Advisory Committee had this research right in front of them—it’s in Part D, Chapter 9 of their Scientific Report if you want to look it up. They acknowledged it, called the evidence “limited” because it wasn’t from randomized controlled trials, and recommended no change to policy.

It would take five more years and a complete change in political administration before anything actually moved. That gap between having the evidence and getting the policy to shift? That’s something every agricultural sector needs to understand.

What Really Happened While We Were Waiting

The numbers tell part of the story, but they don’t tell all of it. USDA’s Census of Agriculture shows we went from about 43,000 dairy farms down to around 26,000. But let me break down what that meant in places we all know.

Wisconsin’s Department of Agriculture reported 2,740 operations closed. Pennsylvania’s Center for Dairy Excellence documented 1,570 farms gone. New York’s Department of Agriculture and Markets recorded 1,260 fewer operations.

These aren’t just statistics—these are neighbors, fellow co-op members, families we’ve known for generations.

What’s really revealing, though, is the structural shift. USDA’s Economic Research Service report from July shows that operations with over 2,500 cows actually grew from 714 to 834. Meanwhile, those mid-sized herds—the 500- to 999-cow operations that used to be the backbone of so many regions—declined by 35%. And farms running 1,000-2,499 head? Down 10%.

You know what this tells me? This isn’t just consolidation in the traditional sense. It’s a fundamental restructuring of who can even access certain markets anymore.

Component pricing arrangements, pooling structures, institutional procurement requirements—they’ve all evolved in ways that increasingly favor operations with scale and capital reserves.

Gregg Doud, President of the National Milk Producers Federation, acknowledged this reality in their press release after the Senate vote: “While we celebrate this victory, we must recognize that market access will vary significantly by operation size and regional positioning.”

He’s right. That’s the hard truth we need to face.

Three Producers, Three Different Paths

I was visiting with producers in three different states last month about exactly this. Dave from southeastern Pennsylvania, running 750 cows, told me, “We survived by diversifying early—not because we saw this coming, but because we couldn’t afford to wait around.”

A producer named Carlos down in West Texas with 3,500 cows had a different take: “We built for institutional markets from day one. Scale was always our strategy.”

And Sarah, milking 120 cows up in Vermont, said simply, “We stopped trying to compete in commodity markets five years ago. Best decision we ever made.”

Three different paths, all working. That’s what’s interesting about where we are now.

What the Whole Milk Opportunity Actually Looks Like

So here’s what industry analysts and cooperatives are projecting. If whole milk adoption in schools reaches 50%, we could see butterfat demand increase by tens of millions of pounds annually.

Schools account for roughly 8% of total fluid milk consumption through about 4.9 billion meals served each year—that’s based on USDA data—so we’re talking about meaningful volume.

But the distribution of that benefit? That’s where it gets complicated.

Based on what Federal Milk Marketing Order data and cooperative communications are suggesting, here’s how it breaks down:

Who Wins from Whole Milk’s Return?

Operation SizeProjected Annual ImpactStrategic Move
1,500+ Cows+$40,000–$80,000Aggressively bid 2026 RFPs; leverage volume for contracts
500–1,000 Cows+$1,500–$3,000 (marginal)Evaluate admin costs vs. return; focus on efficiency gains
Under 300 CowsLow/InaccessibleFocus on direct market/specialty; skip commodity school bids

Each operation needs their own pencil work here, but the pattern is clear: scale determines access.

The Timeline You Absolutely Need to Know

If you’re thinking about pursuing this, the window for action is pretty specific:

December 2025 is really your last shot to engage your cooperative about interest.

School districts typically release their RFPs between January and March 2026. You’ll need to get your documentation and compliance certifications together in February—and trust me, there’s a lot of paperwork.

Bids are due April through May. Awards get announced in June. New contracts start July 1, 2026.

Miss that window? You’re looking at waiting one to three years for the next cycle. That’s just how institutional procurement works.

What’s Actually Working Out There

While everybody’s been focused on the whole milk policy news, I’ve been tracking what successful operations are actually doing day to day. And the patterns are pretty instructive.

Value-Added Production: More Than Just Buzzwords

Market research shows that value-added dairy products are growing at about 12% annually, while fluid milk is pretty flat.

Michael Dykes, Senior Vice President for Regulatory Affairs at the International Dairy Foods Association, keeps saying what a lot of producers are discovering on their own: differentiation and innovation capture premiums that commodity markets just don’t offer.

Here’s what I’m seeing work:

  • Lactose-free products commanding decent premiums
  • A2 milk is getting significant price advantages in metro markets
  • Artisanal products at farmers’ markets are capturing really impressive margins—USDA’s direct marketing research backs this up consistently

I visited a family operation near River Falls, Wisconsin, last month that put in bottling equipment through a USDA Value-Added Producer Grant. They’re processing about 60% of their production on-farm now, and they’re seeing revenue increases pushing 30%. Plus, they created three local jobs.

But they’ll also tell you it took two years of planning and serious capital commitment. It’s not a quick fix.

Technology: What the Early Adopters Are Finding

The data on precision management is getting clearer, and it’s worth paying attention to.

IoT health monitoring systems are showing productivity improvements in the 15-20% range, with payback periods of 18-24 months—that’s based on extension research and what early adopters are reporting.

Precision feeding is demonstrating meaningful cost reductions, we’re talking tens of thousands annually for mid-sized operations. Robotic milking shows solid yield increases, though you’re looking at ROI horizons beyond seven years.

What’s interesting is how successful farms are approaching it. Mark from central Michigan told me, “We started with monitoring—low investment, quick returns. That funded our next technology step.”

That staged approach keeps showing up in the success stories.

Cooperative Innovation: Old Ideas, New Applications

Here’s something that gives me hope. Edge Dairy Farmer Cooperative’s President, Brody Stapel, recently discussed how producer groups are rediscovering collective bargaining power through the Capper-Volstead Act. This isn’t nostalgia—it’s a smart strategy.

Penn State Extension documented 12 Pennsylvania operations, each averaging 350 cows, that formed their own cheese-making cooperative. They’re getting $1.50 to $2.50 per hundredweight premiums through regional direct sales.

By controlling processing and marketing, they basically created their own market channel. Takes significant coordination, but it’s absolutely replicable.

How Different Regions Are Handling This

The whole milk opportunity plays out differently depending on where you are, and understanding your regional context really matters.

Traditional Dairy States: Infrastructure Without Volume

Wisconsin, Pennsylvania, New York—we’ve got the infrastructure and cooperative relationships to access school markets. But with way fewer farms to benefit now, the impact gets concentrated among fewer producers.

Wisconsin’s still losing hundreds of operations annually, according to their state statistics.

Bob Bosold from the Dairy Business Association frames it well: the infrastructure persists, but we’re down to half the number of farms we had when whole milk was banned. The survivors tend toward larger scale and efficiency, but there’s just fewer of them to capture the benefit.

Expansion Regions: Built for This

Texas, Idaho, and New Mexico operations? They were essentially designed for institutional contracts.

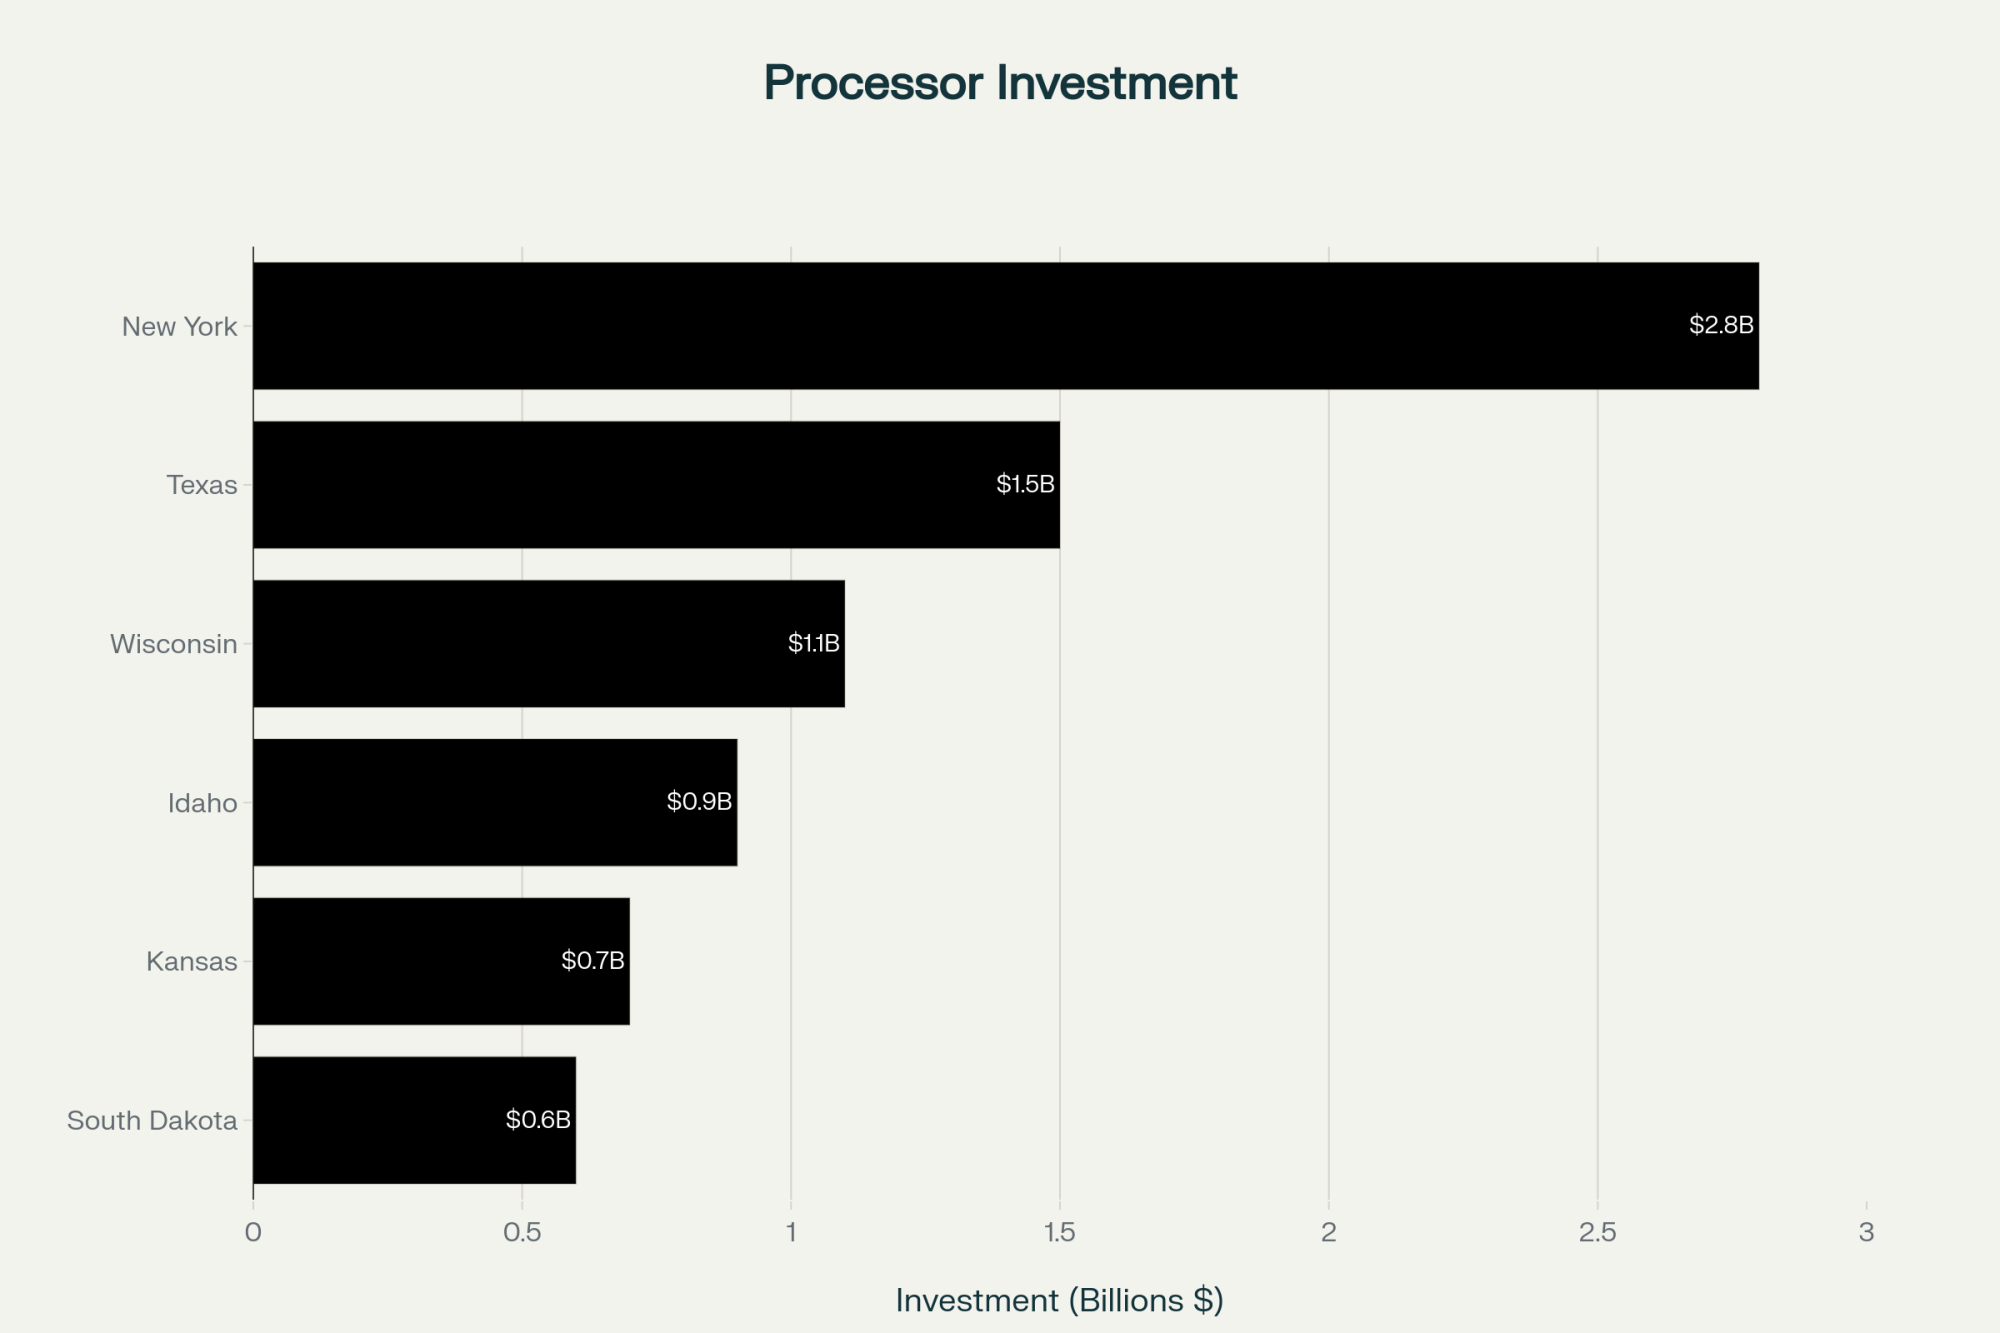
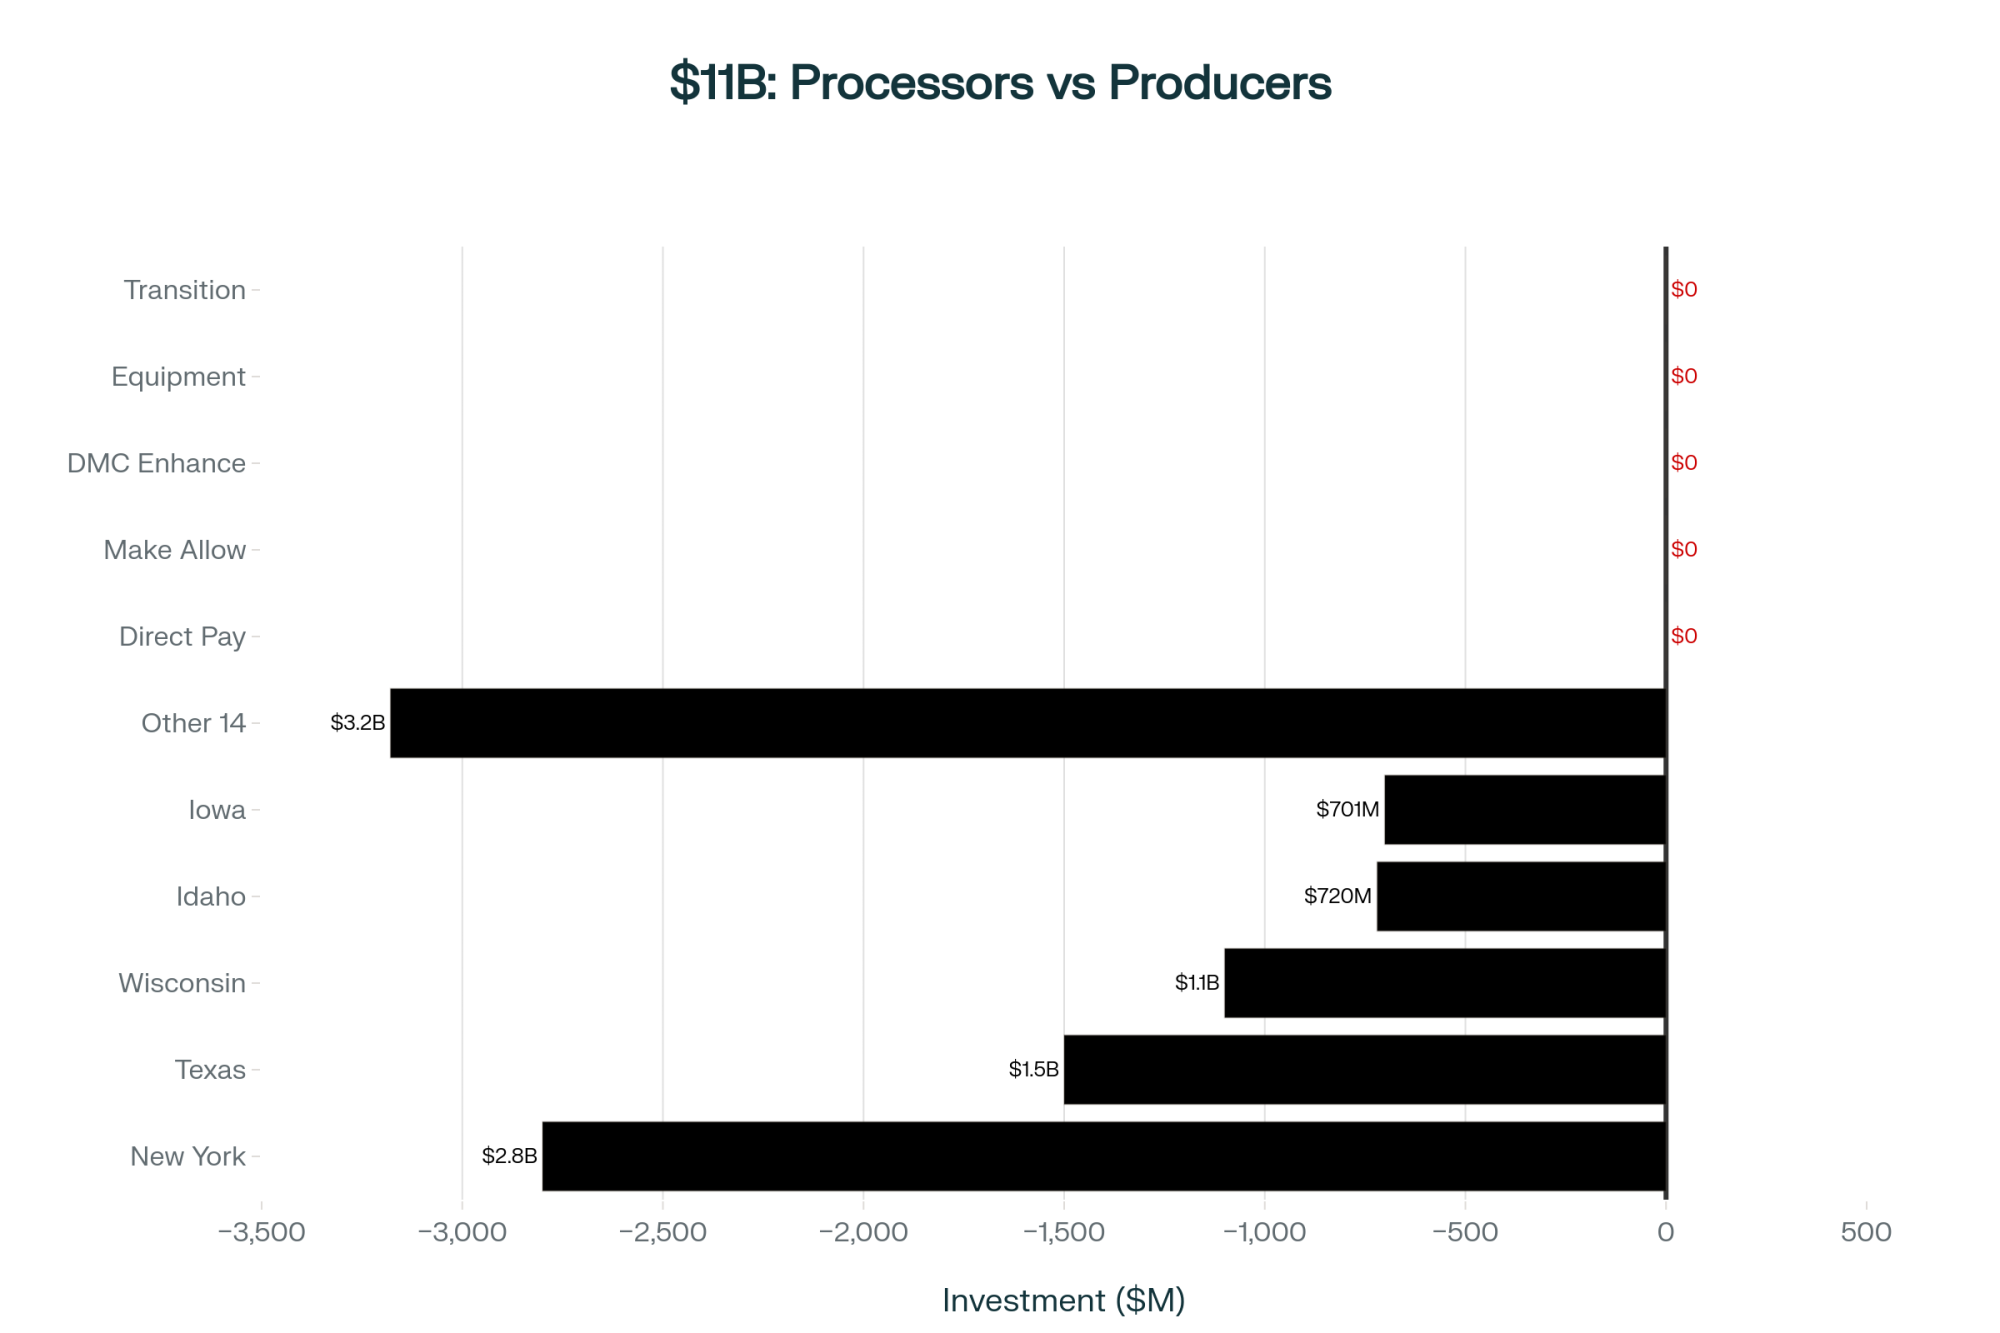
With $11 billion in processing capacity additions expected through 2026, according to industry investment tracking, these regions are optimized for high-volume, standardized production.

Average herd sizes in these areas now measure in the thousands, which aligns perfectly with procurement requirements. New facilities incorporate automated systems ensuring consistent butterfat ratios and daily delivery capacity from day one.

It’s industrial-scale dairying, and for that market segment, it works.

Specialty Markets: A Different Game Entirely

Vermont, Northern California, pockets of the Northeast—they’ve largely exited commodity competition. And honestly? Market research suggests organic dairy could exceed $30 billion by 2030.

For these regions, that represents a way better opportunity than school contracts.

Vermont’s Agency of Agriculture finds that about 75% of remaining farms now do value-added or direct marketing, up from 31% in 2012.

That’s not retreat—that’s strategic repositioning, and it’s working for them.

Understanding How Policy Actually Works

The whole-milk experience taught me something important about how agricultural policy really works. Scientific evidence alone—even compelling evidence like the Toronto study—doesn’t automatically drive policy change.

When FDA Commissioner Martin Makary started talking about ending what he called the “fifty-year war on saturated fat,” and Agriculture Secretary Brooke Rollins expressed support for whole milk, they provided something dairy producers couldn’t: institutional permission to challenge established frameworks.

That permission, not just the science, enabled the change.

NMPF had been citing the Toronto research since 2020, submitted formal comments, provided testimony—and followed all the proper channels. But as they noted in their testimony, they kept encountering “institutional commitment to existing guidance despite evolving science.”

The 2020 Dietary Guidelines Committee acknowledged potential benefits of higher-fat dairy for children but stuck with existing recommendations, saying the studies were observational rather than randomized controlled trials.

That’s institutional inertia in action—not conspiracy, just systematic resistance to change.

What This Means for Different Operations

Based on what I’m hearing from producers and seeing in market dynamics, here’s how I’d think about it:

Large operations (1,500-plus cows): You should probably evaluate school contracts pretty aggressively during that 2026 procurement window. The potential return likely justifies the effort.

And use that baseline volume to leverage value-added investments. But get talking to your cooperative now, not in March.

Mid-size operations (500 to 1,000 cows): You’ve got a more complex calculation. Those modest school premiums might not justify the administrative headaches.

University economics research keeps showing that value-added production, marketing alliances, or specialty certification offer better risk-adjusted returns for operations of your size.

Smaller operations (under 500 cows): Institutional markets are probably structurally out of reach, and that’s okay.

Extension research consistently shows that direct-to-consumer, on-farm processing, agritourism, or specialized production delivers way better margins than competing in commodity markets.

The Real Lesson Here

Here’s what the whole milk saga really reveals about agricultural policy:

  • Institutional frameworks resist change even when faced with strong contrary evidence
  • Individual operations can’t survive indefinitely waiting for policy-market misalignment to fix itself
  • Industry organizations face real constraints limiting how hard they can push
  • Political context matters just as much as scientific evidence

“The 17,000 farms that closed weren’t wrong about the science. They just couldn’t survive the wait.”

That’s the sobering part.

Looking Ahead: What Success Looks Like Now

Industry forecasts from major agricultural lenders suggest continued consolidation toward something like 15,000 total U.S. dairy farms by 2030.

The industry’s brutal restructuring: Total farms plunged 60% from 43,000 to 26,000 while mega-dairies with 2,500+ cows surged 67%—a tale of two industries in one policy shift

Within that reality, though, success patterns are emerging from USDA and extension data:

  • Operations with multiple revenue streams show way better five-year survival rates
  • Technology adopters demonstrate clear margin advantages
  • Direct market relationships command premium pricing
  • Innovative cooperative structures are creating market access for mid-sized producers who work together

What’s encouraging is that these strategies were working before the whole milk policy changed. The policy shift provides favorable conditions, not a fundamental transformation.

The Bottom Line

Whole milk’s return validates what many of us have understood intuitively about nutrition and what kids actually want to drink. That vindication deserves recognition, and I’m genuinely glad we got here.

But the thirteen-year wait extracted enormous cost from our industry. The farms that made it through built resilient businesses that didn’t depend on policy alignment finally happening.

So yeah, pursue whole milk opportunities if you’re positioned for it. But build your operation assuming policy corrections might take another decade—or might never come at all.

That’s not pessimism. That’s just strategic realism based on what we’ve all watched unfold.

The industry emerging from this period will be different—more concentrated, more specialized, more technology-enabled. Whether that’s good or bad depends on your perspective and where you sit.

What’s certain is that adaptability, not policy dependence, determines who’s still farming five years from now.

This moment offers real opportunity for those positioned to capture it, validation for those who stuck it out, and lessons for all of us about how science, policy, and agricultural economics actually interact.

How we apply those lessons will shape what American dairy looks like going forward.

Your Next Steps

If You’re Considering School Milk Contracts:

  • Contact your cooperative before December 31, 2025
  • Request procurement specifications and compliance requirements
  • Evaluate administrative capacity against projected returns

For Value-Added Exploration:

  • USDA Value-Added Producer Grant program: rd.usda.gov/vapg
  • Your state dairy association for regional guidance
  • Extension dairy specialists for business planning

For Technology Investment Planning:

  • University extension technology adoption studies
  • Your equipment dealer’s ROI calculators
  • Peer producers who’ve implemented similar systems

For Cooperative Innovation:

  • Capper-Volstead Act resources through the USDA
  • State extension cooperative development programs
  • Regional producer alliance case studies

General Resources:

  • National Milk Producers Federation: nmpf.org
  • International Dairy Foods Association: idfa.org
  • Your state dairy association
  • Local extension dairy specialist

Based on legislative records, USDA data, industry reports, and conversations with producers through November 2025. For operation-specific guidance, talk with your advisors who know your situation.

KEY TAKEAWAYS

  • December 31, 2025, Deadline: Contact your cooperative now for 2026 school contracts, or wait 3 years
  • Scale Determines Success: 1,500+ cow operations gain $40-80K/year; farms under 300 cows are locked out
  • Science Was Always Right: Whole milk reduces childhood obesity 40%—but 17,000 farms closed waiting for policy to catch up
  • Better Options Exist: Mid-size farms seeing 30% revenue gains from value-added production vs. marginal school milk returns
  • Adapt or Wait: Surviving farms built businesses that don’t depend on policy victories

Complete references and supporting documentation are available upon request by contacting the editorial team at editor@thebullvine.com.

Learn More:

The Sunday Read Dairy Professionals Don’t Skip.

Every week, thousands of producers, breeders, and industry insiders open Bullvine Weekly for genetics insights, market shifts, and profit strategies they won’t find anywhere else. One email. Five minutes. Smarter decisions all week.

NewsSubscribe
First
Last
Consent

The Hidden Cost of Waiting: Why Dairy’s 2025 Crisis Response Is Breaking Historical Patterns

While you analyze, you’re losing $189/day. The 2025 dairy crisis isn’t like 2009—and waiting won’t work.

dairy crisis response strategy

EXECUTIVE SUMMARY: The average dairy farm is hemorrhaging $2,654 every two weeks through delay—not because markets are unpredictable, but because information overload has paralyzed decision-making. Unlike 2009 when producers acted within 3 weeks, today’s response time has stretched to 11 weeks despite clear crisis signals: Class IV at .50, milk production still growing 3.7% annually, and seven consecutive GDT auction declines. The hidden costs are staggering—a .50/cwt Class III-IV spread worth ,200 yearly, while booming whey protein demand from Ozempic-style medications benefits only the 35% of plants that have upgraded. Most producers don’t know their cooperative contracts contain five types of escape clauses; financial hardship provisions succeed 70% of the time, and strategic negotiations have saved farmers 0,000-plus. Your immediate action plan: request contract documents Monday morning, lock Q1 feed while corn remains under $4.40, and document everything for potential hardship claims. The stakes are clear—decisive action now means 8-month recovery; paralysis guarantees 24 months of losses.

Something different is happening in dairy country right now. If you’ve been watching the markets, you feel it in your gut: this isn’t 2009, and the old playbook isn’t working.

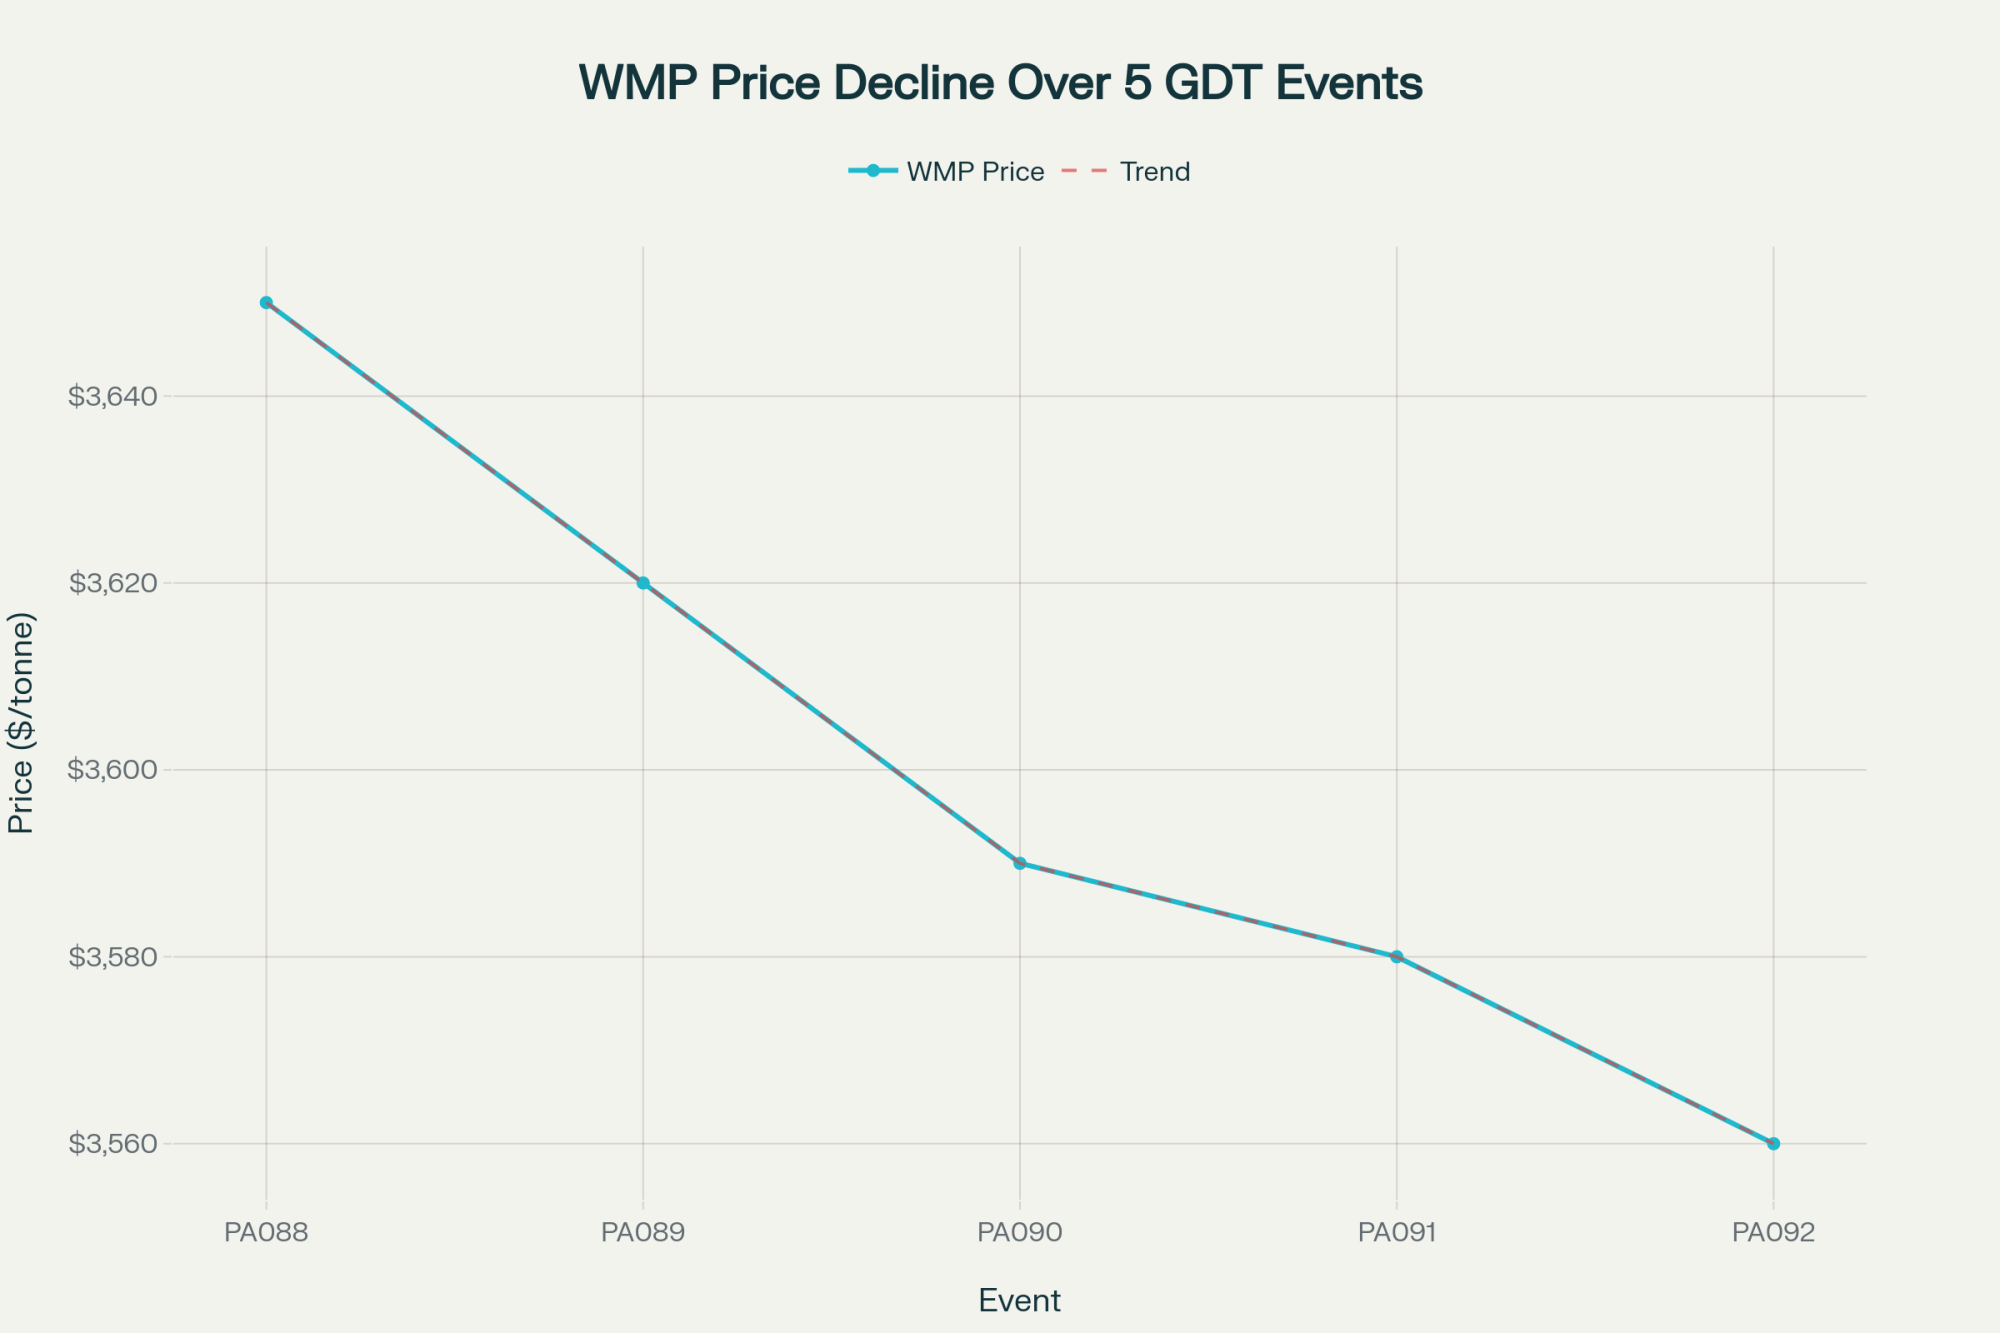
Here’s what’s interesting—after seven consecutive Global Dairy Trade auction declines, with prices down about 18% total according to the November 19 results, you’d expect to see the kind of swift herd adjustments we all remember from 2009 or even 2015. But that’s not what’s happening.

What really caught my attention is that U.S. milk production is still climbing—we’re talking 3.7% year-over-year based on USDA’s latest report—even with Class IV milk sitting at $13.50/cwt as of Friday’s close. Now, in any previous cycle, those numbers would’ve triggered immediate action. Instead, here we are, eleven weeks into clear deterioration signals, and most operations are still… well, they’re still thinking about it.

University of Minnesota dairy economics analysis has been running the numbers on this, and what they’ve found is sobering: the average 100-cow operation is losing somewhere between $2,500 and $2,700 every two weeks they delay making decisions. That’s not theoretical—that’s real money coming straight out of operating margins when you can least afford it.

So let me walk you through what’s actually happening here, because understanding why this response is so different from previous downturns might just save your operation tens of thousands of dollars.

When More Information Creates Less Action

It’s counterintuitive when you think about it. We’ve got more market information at our fingertips than ever before—real-time GDT results, CME futures updating constantly, and dozens of advisory services. And yet, the National Milk Producers Federation has been tracking response times, and they’ve noticed producers are taking significantly longer to act on crisis signals—sometimes more than two months compared to just a few weeks back in 2009.

What I’ve noticed, talking with producers across Wisconsin and Idaho, is that this isn’t about individual farmers making poor decisions. It’s what behavioral economists call a “decision architecture collapse.” Basically, when you’re getting conflicting signals from multiple sources, the safest action starts to feel like no action at all.

Think about what lands in your inbox on a typical Monday morning. Back in 2009—and Jim Dickrell over at Farm Journal has written about this extensively—you’d get one phone call from your co-op manager with clear guidance about cutting production. Simple, direct, actionable.

Today? Well, you’re getting GDT results showing prices down, but various newsletters suggest a possible recovery, your CME app shows futures bouncing around, and social media… let’s just say it’s all over the map. Your lender’s probably telling you to hang tight, while your nutritionist is pushing feed strategies that assume normal production levels.

The result is exactly what we’re seeing: paralysis. And here’s the thing—it’s completely understandable.

Breaking Down the Real Cost of Delay

Let’s get specific about what waiting actually costs, because these aren’t abstract numbers—they’re coming right out of your milk check. Cornell’s PRO-DAIRY team has been helping producers quantify this for a typical 100-cow operation shipping Class IV milk, producing about 210,000 pounds monthly.

Here’s what that two-week delay actually means for your bottom line:

First, there’s the feed cost acceleration. USDA’s Agricultural Marketing Service has been tracking corn futures, which have rallied from $4.38 to $4.55 per bushel over the past two weeks. Now, if you’re locking in even half your Q1 needs today versus two weeks ago, that’s an extra $260 in quarterly feed expenses. Doesn’t sound like much, but…

Then there’s insurance. LGM-Dairy premiums—and I’ve verified this with multiple insurance agents in Wisconsin—have jumped from $0.52 to $0.68/cwt between early November and now. On quarterly production of 6,300 cwt, you’re looking at another $1,008 you’re leaving on the table.

The cull cow market is where it really hits home, though. USDA’s latest reports show cull cow prices have dropped from $0.75 to $0.68 per pound as more producers finally start making those tough decisions. On a modest 10-cow cull, that’s $980 in immediate revenue that just evaporated.

Add in the milk price erosion—you’re shipping at .50 instead of potentially locking at .00 if you’d acted earlier—and we’re talking another 0 gone.

Total damage: $2,654 in just two weeks. That’s equivalent to five full days of milk production value. Think about that for a minute.

The Whey Paradox: Why Your Milk Check Isn’t Reflecting the Protein Boom

Now here’s what’s really fascinating about this crisis—and it shows how structural barriers are preventing the industry from adapting as quickly as it should. Whey protein demand is actually booming, up 12-15% year-over-year according to USDA’s latest Dairy Products report, even while cheese prices have collapsed by 30%.

The University of Wisconsin’s dairy profitability team has been digging into this, and what they’ve found is remarkable: the explosion in GLP-1 weight loss medications—you know, Ozempic, Wegovy, those medications—has created somewhere around 300-400 million pounds of additional protein demand annually. Patients need about 50% more protein to maintain muscle mass during rapid weight loss.

You’d think cheese plants would be racing to upgrade from commodity dry whey production to whey protein isolate processing. The economics are compelling—plants that make this transition could potentially generate an additional $250,000 to $380,000 annually for their milk suppliers based on current price spreads in Dairy Market News.

But here’s the thing: recent industry surveys suggest only about 35-40% of U.S. cheese plants have actually made this upgrade. Why?

In discussions with cheese plant managers across the Midwest, the barriers are more organizational than economic. One manager of a 500,000-pound-per-day plant in Wisconsin told me flat out: “We invested $30 million in upgrades between 2018 and 2022. We’re still carrying $3 million in annual debt service. Our board won’t even discuss another $15 million for WPI equipment until 2027.”

And the expertise shortage is real. University of Illinois research shows WPI processing requires specialized knowledge that commands $150,000-250,000 annually. As one extension specialist put it, “Try recruiting that talent to rural Wisconsin or Idaho. It’s nearly impossible.”

Whether this bottleneck resolves in the next year or drags on longer—honestly, that’s anyone’s guess at this point.

Understanding Your Cooperative Contract Reality

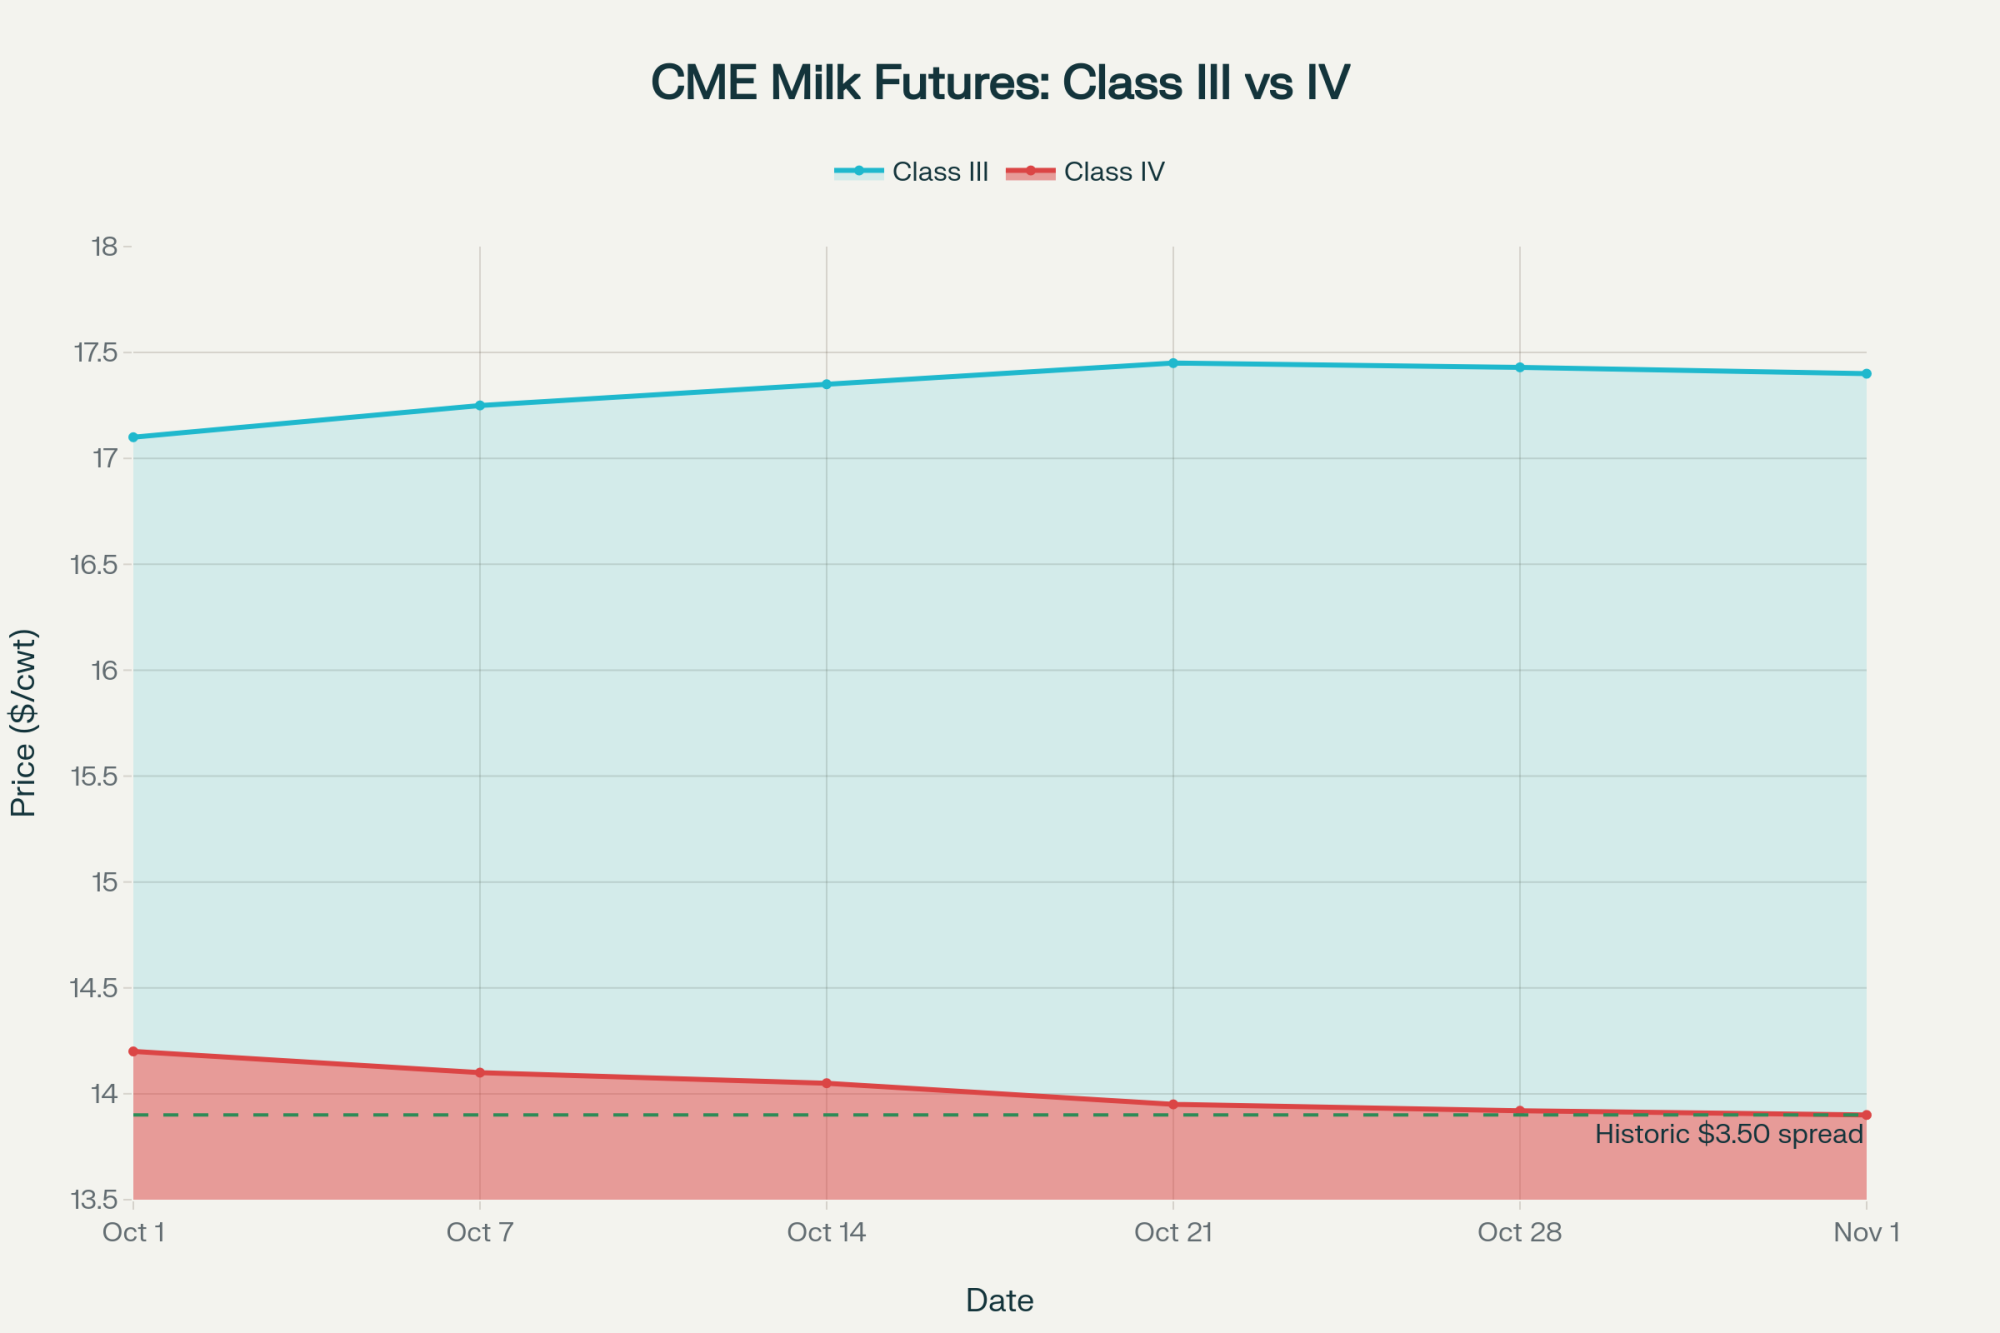
What’s keeping a lot of producers up at night—and I’m hearing this from Pennsylvania to California—is the growing spread between Class III and Class IV prices. We’re looking at Class III holding at $17.00/cwt, while Class IV is at $13.50/cwt, based on Friday’s announcement. That $3.50 spread represents $88,200 annually for a 100-cow operation. That’s not pocket change—that’s survival money.

Here’s something most producers don’t realize, and it’s worth noting: virtually every cooperative agreement contains escape provisions that farmers rarely explore. Dairy cooperative law specialists have reviewed dozens of these contracts and found common exit clauses, including financial hardship provisions—which work about 60-70% of the time when properly documented—herd-size change triggers, and buy-out provisions.

The really interesting strategy—some attorneys call it the “overpay negotiation”—is brilliantly simple. You offer your cooperative cash to exit early. Since cooperatives typically incur no actual damages when a member leaves (the milk just comes from someone else), in several documented cases, they’ve accepted $75,000-150,000 to release producers from commitments that might cost $400,000-plus over five years.

As one legal specialist who’s negotiated several of these recently told me, “Cooperatives would rather have cash now than deal with a potentially bankrupt member later.”

The Coordination Problem Nobody Wants to Talk About

Here’s where we get to the heart of why this crisis will likely last 24 months rather than 8. It’s essentially what economists call a prisoner’s dilemma, and Cornell’s dairy program explained it well in its recent analysis.

Every producer thinks the same thing: “If I reduce my herd and my neighbors don’t, I lose market share.” So nobody moves first, supply stays high, and prices stay depressed for everyone. You probably know this already, but it bears repeating.

The historical data is clear on this. University of Wisconsin research shows that when a substantial majority of producers simultaneously reduce herds by just 5%, milk prices typically recover in 4-6 months rather than 18-24 months. But creating that coordination without running afoul of antitrust laws? That’s the challenge.

What made 2009 different, according to NMPF’s economic analysis, was clear, unified messaging. Cooperative managers, extension agents, lenders—everyone was saying the same thing. Today’s fragmented information landscape has eliminated those coordination points.

Will we see that kind of unified response emerge? I have my doubts, but you know, stranger things have happened in this industry.

Regional Realities: Not All Dairy Is Created Equal

The crisis impact varies dramatically by region, and USDA’s latest Dairy Market News reports show some stark differences that are worth understanding:

In stronger positions: Wisconsin operations with access to specialty cheese markets are maintaining $0.50-0.75/cwt premiums according to the latest Federal Order data. Idaho producers near the major WPI-processing plants are capturing an extra $0.40-0.60/cwt in whey value. And Pennsylvania farms with Class I fluid contracts? They’re insulated mainly, still receiving $15.50-16.00/cwt.

But in vulnerable positions: Southwest operations are getting hammered—not just by low prices but by ongoing drought conditions that have pushed water costs up 40% year-over-year, according to USDA’s Economic Research Service. Southeast producers face limited processing options, with many plants at capacity. Small Northeast farms without cooperative bargaining power are seeing some of the worst prices in the country.

As Bob Cropp from UW-Madison put it in a recent analysis, “We’re not really in one dairy crisis—we’re in about six regional crises happening simultaneously.”

Technology Adoption: The Quiet Differentiator

Despite everything, certain farms are actually strengthening their position through strategic technology adoption. What’s encouraging is the data from last month’s Precision Dairy Conference, which shows remarkable trends.

Robotic milking systems—yes, they require $150,000-250,000 per unit according to manufacturer data—but they’re delivering labor savings of $200-300 per cow annually. University of Kentucky’s dairy program tracked 50 farms that installed robots in 2023, and their break-even point improved by $1.50/cwt within 18 months, even in this down market.

Precision feeding is another bright spot. Ohio-based nutritionist consultants have documented 8-12% reductions in feed costs through optimized ration formulation. We’re talking $0.75-1.00/cwt savings just from better feed efficiency. That’s real money.

And the genetic progress continues. USDA’s Animal Improvement Programs Laboratory reports show genomic selection is accelerating production gains by 2-3% annually in top herds. That might not sound like much, but on a 100-cow operation, it’s often the difference between breaking even and losing money.

The 2026 Recovery Path: What the Data Suggests

Based on analysis from various agricultural lenders and conversations with dairy economists at Penn State and Cornell, here’s the most likely scenario—though I’ll be the first to admit these projections could shift if global demand patterns change:

Q1 2026 will remain challenging. Class IV is likely to remain below $14/cwt based on current futures curves and global supply projections.

Q2 2026 should see initial stabilization as the delayed culling we’re seeing now finally impacts supply. USDA projections suggest cow numbers could decline by 75,000-100,000 head by April.

Q3 2026 is when recovery is likely to accelerate. Global dairy outlooks suggest tightening supplies, with Class III potentially reaching $17-18/cwt.

Q4 2026 brings market normalization, though likely at a lower equilibrium than in 2024.

As many analysts note, the operations that will emerge strongest are those that act decisively in late 2025 rather than waiting for overwhelming market signals.

Your Action Plan: From Analysis to Decision

After talking with dozens of producers, lenders, and advisors over the past month, here’s what the smart operators are doing right now:

This week’s priorities:

  • Call your cooperative and request your Membership Agreement, Milk Marketing Agreement, and Bylaws. As Sarah Lloyd from the Wisconsin Farmers Union often points out, most producers have never actually read these documents—and they contain options you don’t know exist.
  • Calculate your specific delay costs using CME forward curves. Lock Q1 2026 feed costs while December corn remains below $4.40/bushel—multiple grain merchandisers I’ve spoken with expect a rally after the first of the year.
  • Schedule a consultation with a dairy attorney now if you’re thinking about contractual changes. The good ones are already booked through December.

Next 30 days:

  • Take a hard look at whether your current Class designation makes sense. The University of Wisconsin’s online tools can help you model different scenarios.
  • Consider strategic herd reduction if cash flow projections show negative margins through Q2. Penn State’s extension templates are excellent for this analysis. As Iowa State Extension often teaches, it’s better to milk 85 productive cows than 100 marginal ones.
  • LGM-Dairy insurance enrollment for Q1 2026 closes December 28. With premiums still below $0.70/cwt according to RMA data, it might be worth the protection.

Next 90 days:

  • Investigate whether your milk handler has WPI processing or upgrade plans. The industry directories can tell you who’s investing in what.
  • Build relationships with alternative handlers now, not when you’re desperate. As Cornell’s dairy program likes to say, the best time to negotiate is when you don’t have to.
  • Document everything if you might claim financial hardship. Your cooperative will want to see cash flow statements, tax returns, and lender correspondence.

The Information-to-Action Challenge

What’s becoming crystal clear from this crisis is that success isn’t about having perfect information—it’s about acting on good-enough information before the window closes.

The $2,654 that disappears every two weeks through delay is real money with real consequences. For a 100-cow operation, that’s the difference between updating equipment and deferring maintenance, between keeping good employees and losing them, between staying current with your lender and starting those difficult conversations.

Cornell’s dairy crisis research—they’ve studied every major downturn since the 1980s—shows something interesting: the producers who survive aren’t necessarily the lowest-cost or highest-producing. They’re the ones who recognize reality quickly and adapt before they’re forced to.

That adaptation starts with understanding what’s actually possible. Not what you wish were possible, not what should be possible, but what your contracts, your finances, and your operation can actually execute.

The irony is that we have more information, better genetics, superior technology, and deeper market understanding than ever before. But as this crisis is proving, those advantages mean nothing if they don’t translate into timely decisions.

For most operations, the path forward isn’t about making perfect decisions—it’s about making intentional ones. The cost of waiting for certainty is becoming higher than the cost of acting with uncertainty.

As we head into what looks like a challenging 2026, remember this: The market doesn’t care about your analysis paralysis. It only responds to actual supply and demand. And right now, with production still growing while demand stagnates, that response is telling us something important.

The question isn’t whether to act anymore. It’s whether you’ll act in time to make a difference.

Market prices and data are current as of November 22, 2025. Individual situations vary significantly—consult with your advisory team before making major operational changes.

KEY TAKEAWAYS:

  • This Week’s Must-Do: Request your cooperative contracts and calculate delay costs—you’re losing $2,654 every 14 days through inaction
  • December Deadlines: Lock Q1 feed under $4.40/bushel and LGM-Dairy insurance below $0.70/cwt by December 28—premiums are climbing daily
  • The $88,200 Reality: Class III-IV spread at $3.50/cwt means escape clauses in your contract could save you $300k+ over 5 years (70% success rate with proper documentation)
  • Break the Paralysis: This isn’t 2009—more information is creating slower decisions. Trust your math, not the market consensus that isn’t coming

Learn More:

Complete references and supporting documentation are available upon request by contacting the editorial team at editor@thebullvine.com.

The Sunday Read Dairy Professionals Don’t Skip.

Every week, thousands of producers, breeders, and industry insiders open Bullvine Weekly for genetics insights, market shifts, and profit strategies they won’t find anywhere else. One email. Five minutes. Smarter decisions all week.

NewsSubscribe
First
Last
Consent

2025’s $21 Milk Reality: The 18-Month Window to Transform Your Dairy Before Consolidation Decides for You

Fairlife sells for $6. You get paid like it’s a store brand. Meanwhile, direct-market dairies are getting $48/cwt. See the gap?

EXECUTIVE SUMMARY: At $21.60/cwt, milk prices are crushing farm profits—your typical 500-cow dairy loses $125,000 this year while processors capture $38/cwt through hedging and consumers pay record retail prices. This isn’t a downturn; it’s the industry’s fundamental restructuring. By 2030, America’s 35,000 dairy farms will shrink to 24,000, with survivors clustering into three models: mega-operations leveraging scale, niche producers earning $48/cwt through direct sales, or multi-family partnerships pooling resources. The traditional 600-cow family farm is mathematically obsolete, running $250,000 in the red each year. Smart operators are already moving—diversifying revenue through beef-on-dairy, optimizing components for Class III premiums, or restructuring operations entirely. You have 18 months to choose your model before market consolidation chooses for you. The farms that thrive in 2030 won’t be those that survived 2025—they’ll be those that transformed during it.

You know, when I saw USDA’s latest forecast showing milk prices heading down to $21.60 per hundredweight, my first thought was about what this actually means for folks like us. For most 500-cow operations—and that’s a lot of farms I work with—we’re talking about roughly $125,000 in lost annual revenue. That’s not exactly small change when you’re already running things pretty tight.

Here’s what’s interesting, though. I’ve been looking at the Bureau of Labor Statistics data, and retail dairy prices? They’re still near record highs. And get this—fluid milk consumption actually grew in 2024 for the first time in 15 years. USDA’s own sales reports are showing this. The International Dairy Federation keeps saying global demand is climbing steadily.

So what’s going on here? Why are we getting squeezed when everything else suggests we should be doing better?

I’ve been talking with producers from Wisconsin to California lately, and what I’m hearing goes way deeper than typical market-cycle complaints. It’s this disconnect between what we’re getting at the farm gate and what consumers are paying at the store. And here’s the thing—even with the tightest heifer supplies in two decades, prices aren’t responding like they used to. What’s really fascinating is we’re seeing three distinct operational models emerging that’ll probably determine who’s still milking cows come 2030.

If you’re paying attention—and I know you are—the next year and a half represents what I’d call a critical decision window. The choices you make now? They’re going to determine whether you’re thriving or just hanging on when this industry looks completely different five years from now.

Let’s Talk About What’s Really Happening with Prices

So back in March, when CME Group reported Class III milk futures dropping to .75 per hundredweight, most of us expected the usual pattern, right? Supply tightens up, prices recover, and we all catch our breath. But that’s not what’s playing out, and honestly, it’s revealing something pretty concerning about how these markets work now.

Peter Vitaliano over at the National Milk Producers Federation articulated something that really resonates—the gap between farmgate and retail has never been this wide. We’re looking at USDA data showing farmers getting .60 per hundredweight while consumers are paying over a gallon for whole milk and around a pound for cheddar. These are historically high retail prices, folks.

What I find particularly noteworthy is how processors have positioned themselves. Take these massive new facilities—Leprino Foods with its 8-million-pound-per-day capacity plant, and Coca-Cola’s new fairlife facility up in New York. The International Dairy Foods Association has been tracking, it says, over $2 billion in infrastructure investments since 2020. These plants need milk volume a consistent milk supply to justify those investments. And that’s creating some… well, let’s call them interesting market dynamics.

Mark Stephenson from Wisconsin’s Center for Dairy Profitability shared something with me that really clicked. Processors are using futures contracts to lock in their margins months ahead, while we’re getting prices based on last month’s averages. That timing difference? It’s worth about three dollars per hundredweight in a protected margin for them. Three dollars!

A producer I know well out in California’s Central Valley—runs about 650 Holsteins—put it to me this way: “They’ve hedged their position months in advance. We’re operating with completely different risk exposure.” And you know what? He’s absolutely right.

[INSERT IMAGE: Graph showing the widening gap between farmgate prices and retail dairy prices from 2020-2025, with processor margins highlighted]

That Heifer Shortage Everyone’s Banking On

Now, conventional wisdom says—and I’ll admit, I believed this too—that this replacement heifer shortage should fix everything. CoBank’s August report shows we’re at a 20-year low, down to about 3.9 million head. You’d think that means better prices by late next year, maybe 2026?

Well… not so fast.

What we’re learning about beef-on-dairy breeding is fundamentally changing the game. The breeding association data shows that about a third of our Holstein and Jersey calves are now beef crosses. Think about what that means for a minute.

Replacement heifer prices have exploded—USDA’s tracking them at over three thousand per head, up 75% since early 2023. And if you’re looking for premium genetics? I’ve seen them go for thirty-five hundred, even four thousand at regional auctions. Down in Georgia and Florida, some producers are paying even more for heat-tolerant genetics. CoBank’s projecting we’ll be short another 800,000 replacements by 2026.

Yet—and here’s the kicker—this dramatic supply constraint isn’t translating to better milk prices. Why? It’s the processing overcapacity. Andrew Novakovic from Cornell’s Dyson School explained it to me this way: when processors have billions invested in facilities that require high volume, they have incentives to keep farmgate prices stable to ensure consistent throughput. It sounds backwards, but that’s the reality we’re dealing with.

The Darigold situation out in the Pacific Northwest really drives this home. Despite obvious milk supply tightness, they announced a $4-per-hundredweight deduction on all member farms back in May. A producer out there—runs about 3,000 cows—spoke at a meeting about it and didn’t mince words: “When milk price is down and you add these deducts, it really starts to sting.”

Why Growing Demand Isn’t Helping Us (This One Really Gets Me)

Here’s what caught me completely off guard when I first saw the International Dairy Foods Association data. Fluid milk sales grew about half a percent in 2024—first increase in 15 years! USDA’s marketing service confirms whole milk consumption hit its highest level since 2007. The Organic Trade Association reports that organic milk sales jumped by over 7%. And premium products? IRI’s retail data from 2024 shows brands like fairlife grew nearly 30% in dollar sales compared to the year before.

You’d think this demand recovery would support our prices, right? Instead—and this is what’s so frustrating—it’s doing the opposite. The growth is all concentrated in premium products where processors and retailers, not farmers, capture that value.

Let me break this down in real numbers—here’s The Value Disconnect:

LevelPriceWho Gets It
Farm Gate$21.60/cwtFarmers (commodity price)
Conventional Retail~$40.00/cwt equivalentRetailers (standard markup)
Premium Retail (fairlife)~$60.00/cwt equivalentProcessors & retailers
The Gap$38.40/cwtCaptured via hedging & branding

Marin Bozic, who does dairy economics at the University of Minnesota, explained the mechanism to me: the Federal Milk Marketing Order structure simply has no way for farmers to participate in the creation of premium product value. Your milk could become commodity cheese or the fanciest filtered milk on the shelf—you get the same basic commodity price either way.

The Three Futures: Why the Traditional 500-Cow Family Farm is Mathematically Obsolete (And What to Become Instead)

Research from Cameron Thraen’s team at Ohio State, which analyzed USDA’s agricultural census data and published its findings in the 2024 dairy outlook report, reveals something both fascinating and, honestly, a bit scary. They’re projecting that consolidation will reduce the number of dairy farms from about 35,000 today to 24,000 to 28,000 by 2030. And the production? It’s going to concentrate into three pretty distinct models.

If you’re running a traditional 500-to-700-cow family operation like many of us, the mathematics suggest you need to evolve into one of these structures, or… well, face some really tough decisions.

[INSERT IMAGE: Infographic showing the three operational models with icons – Mega-Operation (factory icon), Niche Producer (farmers market icon), Multi-Family Partnership (handshake icon) – with their respective herd sizes, investment requirements, and profit projections]

The Large-Scale Operations (3,500+ Cows)

We’ve got about 900 of these operations now, controlling roughly 20% of production. Wisconsin’s Program on Agricultural Technology Studies published their structural change analysis in 2024, suggesting this’ll grow to maybe 1,500 or 2,000 operations controlling 35-40% of all milk by 2030.

What makes them work? Well, Cornell’s annual Dairy Farm Business Summary shows they’re hitting costs of around 14 to 16 dollars per hundredweight through massive scale. They negotiate directly with processors—not as suppliers but as genuine business partners. They’re getting 50 cents to $1.50 per hundredweight just on volume guarantees. Investment required? We’re talking eight to fifteen million, according to the ag lenders I’ve talked with.

As one industry analyst put it, “A 5,000-cow operation with consistent component quality has real negotiating leverage.” And that’s the key word there: leverage.

The Niche Direct-Marketing Operations (100-400 Cows)

There are maybe 4,000 to 5,000 of these operations now, and interestingly, the National Young Farmers Coalition’s 2024 land access survey suggests this could grow to around 6,500 by 2030, particularly as beginning farmers explore alternative market channels.

I spoke with a producer in Vermont recently who made this transition—went from conventional to organic with direct marketing. She’s getting around $48 per hundredweight equivalent through farmers’ markets and on-farm sales. “It’s definitely more work,” she told me, “but we’re actually profitable now.”

A Texas producer I know took a different approach—focusing on A2 genetics and local Hispanic market preferences. He’s capturing premiums I wouldn’t have thought possible five years ago.

What works for these folks:

  • Premium pricing in that $35-to-50 range through direct sales
  • Organic, grass-fed, A2 genetics, local food positioning
  • On-farm processing so they capture those processor margins themselves
  • Investment needs are different—three to seven million, but it’s focused on brand building and market access, not just production

The Multi-Family Partnerships (2,000-3,500 Cows Total)

This is the emerging model that’s really interesting. We’re seeing maybe a few hundred of these now, but projections suggest over a thousand by decade’s end.

Mike Hutjens, who recently retired from the University of Illinois after decades of dairy research, described it well in his recent Extension publication on consolidation strategies: “Three families combining resources, each contributing 600-700 cows, sharing facilities and management. They’re achieving near-mega-operation efficiency while maintaining family control.” Based on operations he’s worked with, each family can see $200,000 to $300,000 annually.

Here’s the hard truth nobody really wants to hear: Cornell’s Pro-Dairy program’s 2024 cost of production analysis suggests that traditional 600-cow single-family operations face an approximately quarter-million-dollar annual profit gap compared to these three models. Without evolving into one of these structures… well, the math becomes pretty challenging.

What Successful Producers Are Actually Doing Right Now

What distinguishes farms positioned to thrive from those heading toward crisis? It’s not hope for market recovery—it’s specific actions during the downturn. I’ve been watching successful operations across the Midwest, and there are definitely patterns.

Moving Beyond the Milk Check

The smartest producers I know have completely abandoned the old assumption that milk sales should be 85-90% of revenue. A Wisconsin producer I work with is breeding 30% of his herd with beef semen. At current beef prices—around $250 per calf—that’s significant money. Plus, he’s not overwhelming his heifer facilities.

Strategic culling at these cull cow prices—USDA’s reporting over $145 per hundredweight—is generating serious cash. An Idaho producer told me she culled 15% strategically, generated substantial one-time revenue while cutting feed costs permanently by about 16%.

And value-added production? Penn State Extension’s 2023 bulletin on dairy value-added enterprises shows that even converting 5% of your milk to yogurt, cheese, or specialty products can generate margins two and a half to three times higher than commodity milk. Their case studies are pretty compelling, actually.

It’s About Efficiency, Not Just Volume

What I’m seeing is successful operations focusing on feed efficiency over just pushing for more milk. Kent Weigel at Wisconsin-Madison has data showing feed efficiency genetics have a heritability of around 0.43—meaning those improvements compound fast.

The approach is getting pretty sophisticated:

  • Genomic testing to identify and cull the bottom 20% for feed efficiency before they even enter the milking string
  • Switching to bulls with high Feed Saved indexes—costs nothing, impacts everything
  • Getting that metabolizable protein dialed in at 100-115% of requirements saves fifty to seventy-five dollars per cow annually, according to University of Minnesota research

For a 500-cow operation? These strategies might cost ten to fifteen thousand dollars to implement, but can return ten times that annually. And it compounds year after year. Scale it down to 250 cows, and you’re looking at maybe a $50,000 return on a $5,000-7,500 investment. Scale up to 1,000 cows? We’re talking $200,000-280,000 annually.

Components and Geography Matter More Than Ever

Here’s something worth noting: USDA’s November projections show Class III prices around $18.82, while Class IV falls to maybe 15 or 16 per hundredweight in 2026. That three-to-four-dollar spread? It rewards specific decisions.

A Minnesota producer told me about switching to Jersey-Holstein crosses three years back. “Our butterfat runs 4.3% now versus 3.7% before. That’s worth about seventy cents per hundredweight. Doesn’t sound like much until you’re shipping 50,000 pounds daily.”

What Canada’s System Reveals (It’s Not What You Think)

Looking north offers an interesting contrast. While we’re facing this dollar-per-hundredweight drop, the Canadian Dairy Commission’s February announcement showed essentially minimal change—less than a tenth of a percent adjustment.

Their stability comes from a formula: prices adjust by half to production costs and half to the consumer price index. As Sylvain Charlebois from Dalhousie University’s Agri-Food Analytics Lab explained, “Canadian farmers know their milk price nine months ahead.” Imagine being able to plan that far out!

But—and this is important—there are trade-offs. Dairy Farmers of Canada reports quota costs around $24,000 per kilogram of butterfat. That’s a massive entry barrier. A 2024 study in the Agricultural Systems journal documented approximately 6.8 billion liters of milk waste from 2012-2021 in the Canadian system. And the Fraser Institute calculates Canadian families pay nearly $300 more annually for dairy.

What’s really revealing? Statistics Canada’s agricultural projections suggest they’ll still lose about half their dairy farms by 2030, bringing the total to around 5,000. So even with all that protection, consolidation is happening. It’s fundamental economics that transcends whatever system you use.

The 2025-2027 Window: Why Timing Is Everything

What I’m seeing suggests 2025 is where three forces converge for the first time:

First, we’ve got this processing capacity overhang from billions of new facilities coming online. Industry tracking shows it’s massive. Second, the International Dairy Federation projects global consumption growing faster than production—about 1.1% versus 0.8%. And third, producer exits are accelerating. The American Farm Bureau reports Chapter 12 bankruptcies up over 50% year-over-year.

This creates what I’d call an 18-to-24-month window for strategic positioning. Christopher Wolf, who heads Cornell’s dairy markets and policy program, suggests once global supply scarcity becomes obvious and prices start recovering—probably 2027—consolidators will move aggressively. Acquisition costs will spike. Windows close.

So What Should You Actually Do? (The Practical Stuff)

Understanding all this, here’s what I’m seeing work:

If You’re Planning to Continue:

Focus on efficiency over growth. A Pennsylvania producer told me, “We’ve stopped all expansion. Every dollar goes to efficiency improvements and component optimization. That dollar-fifty from better components beats any volume premium.”

Lock in what you can. USDA’s Dairy Forward Pricing Program, reauthorized through April 2025, lets you contract ahead when futures look reasonable. Creating revenue floors has saved several operations I know.

Build those alternative revenue streams now. Beef-on-dairy, strategic culling, value-added—these can offset entire milk price declines.

If You’re Considering Structural Change:

The partnership conversation needs to happen now. An Ohio producer who merged three family operations told me they spent eight months finding the right partners. “Wait until the crisis? Your best options are already gone.”

Thinking about the niche route? Start small, but start now. That Vermont producer I mentioned began with just 5% of its output going to farmers’ markets. It took three years to transition fully, but she learned as she grew.

Geographic disadvantages are real. USDA data shows consistent one-to two-dollar regional differences. If you’re in a disadvantaged area, seriously consider your options.

For Everyone:

Accept that mid-size independence might require significant adaptation. As one Cornell economist put it, “That’s not defeat—it’s realistic evolution in a consolidating industry.”

Focus on what you control: genetics, efficiency, component quality, and marketing channels. An Idaho producer said it best: “The market does what it does. I can’t control that. But I absolutely control my cost per hundredweight.”

For those who want to dig deeper, information on the USDA’s Dairy Forward Pricing Program is available at your local FSA office. Cornell’s Pro-Dairy program has excellent resources on cost analysis. And if you’re considering the partnership route, the University of Wisconsin’s Center for Dairy Profitability has some solid guidance materials.

The Bottom Line (Where This All Leads)

The 2025 milk price situation isn’t really about traditional supply and demand—it’s a structural transformation that’s been building for decades. That $21.60 forecast from the USDA? It’s looking more like a new reality where processor margin management matters more than the old market dynamics we learned.

Yet within this challenging environment, I’m seeing clear paths forward for producers willing to abandon old assumptions. The farms thriving in 2030 won’t be those that simply survived 2025 through sheer determination. They’ll be operations that recognized this inflection point and repositioned, while others that waited for the recovery that follows will follow completely different rules.

You’ve got maybe 18 to 24 months for deliberate transformation. After that, market forces make the choices for you. The question isn’t whether to change—it’s which of these emerging models fits your operation’s future. That decision, made with clear eyes rather than false hope, determines success or failure.

What’s interesting is every producer I know who’s made these strategic pivots says the same thing: “Should’ve done it sooner.” Maybe that’s the real lesson. The best time to transform isn’t when crisis forces your hand—it’s right now, while you still have options.

And honestly? That’s both scary and oddly encouraging. At least we know what we’re dealing with. Now it’s time to act on it.

KEY TAKEAWAYS:

  • The $38/cwt gap is permanent: Processors locked in margins through futures—your $21.60 milk price won’t recover, costing typical 500-cow dairies $125,000 annually
  • Pick your path in 18 months: Mega-operation (3,500+ cows), direct-marketing ($48/cwt premiums), or multi-family partnership—traditional single-family 600-cow farms face mathematical elimination
  • Diversify revenue TODAY: Leaders generate $45,000+ from beef-on-dairy (30% of herd), 3x margins on value-added products, and $0.70/cwt from component optimization
  • 10:1 returns exist: Genomic feed efficiency selection costs $15,000, returns $150,000 annually—compound these gains before the 2027 consolidation wave

Complete references and supporting documentation are available upon request by contacting the editorial team at editor@thebullvine.com.

Learn More:

The Sunday Read Dairy Professionals Don’t Skip.

Every week, thousands of producers, breeders, and industry insiders open Bullvine Weekly for genetics insights, market shifts, and profit strategies they won’t find anywhere else. One email. Five minutes. Smarter decisions all week.

NewsSubscribe
First
Last
Consent

Why African Dairy’s $74B Boom Bypasses Local Farmers – And What It Means for Global Markets

African farmers: $21/cow/year. African dairy market: $74 billion. The money’s flowing—just not to farmers.

EXECUTIVE SUMMARY: Africa’s dairy market will reach $74 billion by 2035, yet local farmers capture just 2-3% while 80% flows to imports. The paradox: Africa owns 20% of global cattle but produces only 5% of milk, with farmers earning $21-200 per cow annually versus $1,800 breakeven in developed markets. Multinationals dominate through powder reconstitution rather than local sourcing—it’s cheaper to import at 5% tariffs than to collect from smallholders who produce 1-3 liters daily. East Africa proves transformation is possible, with Kenya and Rwanda becoming exporters through cooperatives and smart policy, while West Africa remains import-dependent. For global dairy professionals, success means abandoning Western models for adapted genetics, intermediate technologies, and hybrid strategies that match Africa’s unique reality—not replicating Wisconsin in Lagos.

African dairy market

At a recent dairy conference, I found myself in conversation with several producers interested in African opportunities. They’d all seen the same presentations—Africa’s dairy market reaching $74 billion by 2035, up from $61.7 billion today, according to IndexBox’s November 2024 analysis. “Last frontier for dairy,” one called it.

After spending the past few months examining the dynamics on the ground, I’ve come to realize we’re dealing with something far more complex than most investment presentations suggest. Africa isn’t developing a conventional dairy sector like we’ve seen elsewhere. Instead, it’s creating a unique hybrid system that challenges our traditional understanding of dairy market development.

The economic paradox of African dairy: A $74 billion market where local farmers earning $21 per cow annually capture just 2.5% of growth

The Market Growth Story: Real but Different

Understanding the Demographic Shift

The fundamentals driving growth are undeniably strong. McKinsey’s consumer research from June 2023 documented that Africa’s urban middle class is expanding from 300 million today to 500 million by 2035. That’s a demographic shift comparable to adding the entire U.S. population as potential dairy consumers.

What’s particularly noteworthy is how consumption patterns are evolving. Ethiopia’s Ministry of Agriculture reported in their 2024 sector review that urban dairy spending has accelerated dramatically, especially among middle-income households. Kenya’s Dairy Board projects 5.8% annual consumption growth through 2030—that’s faster than most Asian markets at a similar stage of development.

The Import Reality Check

Yet here’s where the story becomes more nuanced. The FAO’s November 2025 Africa Food Security Report reveals that approximately 80% of this consumption growth is met by imported dairy products and reconstituted powders, not by expanded local production.

Africa’s fundamental dairy paradox: controlling 20% of the world’s cattle but producing just 5% of global milk while importing 80% of consumption

“The continent currently produces just 5% of global milk while maintaining 20% of the world’s cattle.”

According to UN Comtrade data from 2024, Africa imports $7.5 billion in dairy products annually, with projections suggesting this could reach $15 billion by 2035. The European Milk Board’s October 2024 analysis shows traditional and fat-filled milk powder accounting for 76% of these imports—particularly dominant in West African urban centers.

KEY MARKET INDICATORS: The Scale of the Challenge

  • Current African production: 53.2 million tons (5% of global output)
  • Cattle population: 20% of the global herd
  • 2024 import value: $7.5 billion
  • Projected 2035 imports: $15+ billion
  • Powder products as a percentage of imports: 76%
  • Estimated local farmer share of market growth: 2-3%

Why Local Production Can’t Keep Pace

The Sobering Economics

I recently reviewed research from Mountaga Diop and colleagues at Senegal’s Institute of Agricultural Research, published in 2023. Their findings on smallholder economics were sobering:

“Average annual net returns of just $21.70 per cow”

Africa’s structural cost disadvantages: 70% feed costs, 40% infrastructure losses, and 53% heat-driven yield reductions make local production economically impossible against 5% tariff imports

In Kenya, often highlighted as a success story, the Kenya Institute for Public Policy Research’s 2024 analysis shows that farmers average $200 in annual profit per cow, with daily yields of 5-8 liters.

To put this in perspective, a Wisconsin producer recently told me their breakeven is around $1,800 per cow annually. The disparity illustrates fundamentally different economic realities.

Three Structural Challenges Blocking Progress

1. Feed Economics That Don’t Work

ILRI’s comprehensive study across eight African countries in 2024 found that feed accounted for 70% of production costs, compared to the 40-50% we typically see in North American operations. This difference alone changes everything about profitability calculations.

Ben Lukuyu, ILRI’s principal scientist for feed and forage development in Nairobi, shared with me that Kenya and Uganda face approximately 60% annual feed deficits. When the Russia-Ukraine conflict drove fertilizer prices up 81.9% and feed costs up 13.3%, many marginally viable operations simply couldn’t survive. And that’s in Kenya, which has better infrastructure than most.

2. Climate Stress Destroying Yields

The University of Melbourne’s research team, with support from the Gates Foundation, published compelling data in Animal Production Science this March. They documented Holstein yield reductions of 17-53% under African heat stress conditions—far exceeding what we see even in challenging U.S. environments like Arizona or Southern California.

“South Africa saw average yields decline from 21 liters to 16.1 liters per cow between 2018 and 2023—a 23% drop in the continent’s most developed dairy market”

This comes from the USDA Foreign Agricultural Service’s February 2025 report, and it’s particularly concerning because South Africa has the infrastructure we’d expect to mitigate these challenges.

3. Infrastructure That Can’t Support Growth

The World Bank’s 2024 Cold Chain Assessment estimates:

“Africa loses up to 40% of perishable food due to inadequate cold storage.”

CIRAD’s research indicates that only 1-7% of locally produced milk in West Africa enters formal trade channels. The investment required to fix this—estimated at $50-100 billion for comprehensive cold chain development—exceeds current funding commitments by roughly tenfold.

What Multinationals Are Actually Building

The Reconstitution Reality

The expansion strategies of major dairy companies offer important insights. Nestlé, Danone, and FrieslandCampina are indeed investing heavily across Africa, but their business models differ significantly from what many expect.

Okereke Ekumankama’s 2023 research at the University of Nigeria examined FrieslandCampina’s operations in detail. While the company controls 75% of Nigeria’s dairy market, they source virtually no local milk. Instead, they import powder from Europe for reconstitution in Nigerian facilities.

When “Development Programs” Don’t Develop

Their Dairy Development Programme, launched in 2010, aimed to integrate smallholder farmers. However, Ekumankama’s field research with 250 participating farmers revealed persistent challenges preventing meaningful integration.

The transaction costs of collecting from dispersed producers, averaging 1-3 liters daily, often in areas lacking roads, electricity, or cold storage, exceed the economics of importing powder at 5% tariff rates.

This pattern—building processing capacity for imported inputs rather than developing local supply chains—appears across much of the continent. It creates employment and provides affordable dairy products to urban consumers, which has value. But it doesn’t necessarily translate to local dairy sector development.

East Africa: A Different Story Emerges

The Success Stories

East Africa presents a notably different picture. The FAO’s October 2024 regional report shows the region accounting for 48% of Africa’s total milk production, with 26% growth between 2013 and 2023.

Rwanda’s Systematic Transformation

According to their Ministry of Agriculture’s presentation at September’s IDF Regional Conference:

  • Milk production tripled from 334,727 metric tons in 2010 to 1,092,430 metric tons in 2024
  • Per capita consumption doubled from 37.3 to 79.9 liters annually

The key? Mandatory quality testing at milk collection centers through Ministerial Order 001/11.30, strategic genetics programs with Heifer International, and sustained government investment spanning multiple administrations.

Kenya’s Cooperative Advantage

Kenya’s dairy success story: strategic policy and cooperative strength drove production from 4.2 to 5.7 billion kg while transforming from net importer to exporter by 2020

Kenya produces 5.7 billion kilograms annually, according to the Dairy Board’s 2025 outlook, with 80% originating from smallholder operations. The success factor isn’t individual farm productivity—yields remain at 5-8 liters per cow daily. Rather, it’s cooperative strength.

“Without the cooperative, I’d be selling to brokers at whatever price they offer. Now we negotiate as a group, and we get veterinary services I could never afford alone.”
— James Kibiru, dairy farmer in Nyeri County

Consider Meru Dairy Cooperative Union, which engages over 35,000 farmers through annual field days. They provide milk aggregation, veterinary support, quality-based payment systems rewarding butterfat performance, and collective bargaining power.

Uganda’s Export Achievement

IFPRI’s 2023 value chain analysis documents Uganda’s growth from a $2 million dairy industry in 2008 to $150 million by 2017. The country now exports $500 million worth of milk powder to Algeria, according to their Ministry of Trade’s 2024 data.

West Africa: Where Different Challenges Persist

I spoke with Kwame Asante, who manages a small dairy operation outside Accra, Ghana. “We can produce milk,” he told me, “but getting it to market before it spoils? That’s the real challenge. The processors prefer powder—it’s easier, cheaper, more reliable.”

His experience reflects broader West African dynamics. Ghana’s Fan Milk, now owned by Danone, built one of the region’s most successful distribution networks. Those yellow tricycles are everywhere in urban areas. Yet, as industry data shows, the operation relies primarily on imported powder, with local farmers supplying only about 2% of the processed volume.

The economics make sense from a processor perspective. A solar-powered cooling system for a single collection center runs about $15,000-20,000 according to equipment suppliers I’ve spoken with. When you’re collecting 50-100 liters daily from that center, the payback period stretches beyond what most investors will accept.

Policy Choices That Make or Break Markets

The fork in the road: policy choices and cooperative strength determine whether African dairy regions become self-sufficient exporters or import-dependent markets

The Tale of Two Approaches

Timothy Njagi at Kenya’s Tegemeo Institute documented how the country’s 2015 implementation of a 10% import levy plus 16% VAT on milk imports catalyzed transformation. Average daily yields from indigenous breeds increased by approximately 300% over the following decade, shifting Kenya from a net importer to an exporter.

By contrast, West African nations maintain just 5% tariffs through the ECOWAS Common External Tariff. Oxfam’s 2024 trade analysis shows the result: continued heavy import dependency, with fat-filled milk powder (a blend of skim milk and palm oil) dominating 70% of consumption in major cities.

Nigeria’s New Attempt

Nigeria’s National Dairy Policy Implementation Framework, validated in November 2025, offers:

  • Five-year tax holidays for processors
  • Low-interest credit for farmers
  • Guaranteed off-take schemes

Whether this succeeds where previous efforts struggled remains to be seen. The policy appears comprehensive on paper, but implementation has consistently been a challenge in Nigeria.

What This Means for Different Players

For Genetics Companies

Focus on adaptation, not maximum production. Raphael Mrode, who leads ILRI’s genetics program in Kenya, has been incorporating the “slick gene,” which confers heat tolerance through shorter, sleeker hair coats. These animals maintain reasonable productivity under conditions that would devastate conventional Holstein genetics.

The market opportunity exists for companies developing adaptation traits rather than pursuing maximum production designed for temperate conditions.

For Equipment Suppliers

Forget precision dairy technology designed for 1,000-cow operations. That’s not the market. Instead, think intermediate technologies: solar-powered cooling for collection centers (around $15,000-20,000 per unit), mobile apps for basic smartphones, robust milk testing equipment suitable for cooperative-level deployment.

Success requires matching technology to operational realities and economic constraints.

For Processors

Develop dual strategies: reconstitution capacity for urban markets while gradually building local collection infrastructure where economically viable. Don’t promise what you can’t deliver on local sourcing, but don’t ignore it either—governments are increasingly demanding local content.

The brutal reality: of the $74B African dairy market, local farmers capture just 2% ($1.5B) while European powder imports claim 58% ($43B)

The Bottom Line: Understanding the Real Opportunity

The $74 billion projection for the African dairy market from IndexBox appears realistic given demographic and income trends. However, understanding who captures this value—and how—requires nuanced analysis.

East African nations with strong cooperative structures and consistent policy support show genuine transformation potential. West Africa will likely remain import-dependent with selective local success stories. South Africa continues consolidating, potentially dropping below 500 commercial dairy operations by 2030.

What’s encouraging is seeing younger African dairy professionals returning from international training with fresh ideas. They understand both traditional systems and modern technology. They’re the ones who’ll ultimately bridge this gap between potential and reality.

For global dairy professionals, Africa represents opportunity—though not in ways that conform to conventional expectations. Success requires understanding the continent’s unique development trajectory, abandoning standard assumptions, and developing approaches appropriate to diverse regional contexts.

As we consider these opportunities, it’s worth noting that markets develop differently. Africa won’t follow the path of New Zealand or Wisconsin, or the Netherlands. It’s creating something new, and those who recognize and respect that difference will find the real opportunities.

This paradox—simultaneous consumption growth and production challenges—defines the current reality of African dairy. How the industry responds will shape both African food security and global dairy trade for decades to come.

What do you think? Are we looking at this opportunity the right way? I’d love to hear from producers who’ve worked in these markets or are considering investments there. The conversation continues.

KEY TAKEAWAYS:

  • Africa’s $74B dairy market is an import story, not a production opportunity—80% flows to European powder while farmers earning $21-200/cow yearly capture just 2-3% of value
  • Geography determines destiny—East Africa transforms through cooperatives and smart policy (Kenya exports after tripling yields), while West Africa stays import-dependent at 76% reconstituted powder
  • The economics simply don’t work at the current scale—African farmers face 70% feed costs (vs. 40% globally), 40% infrastructure losses, and compete against powder imports at just 5% tariffs
  • Success requires radical adaptation—heat-tolerant genetics (Holstein yields drop 17-53% in African heat), intermediate technology ($15K solar cooling, not $100K precision systems), and hybrid import-local business models
  • Multinationals aren’t villains, they’re rational—FrieslandCampina controls 75% of Nigeria’s dairy using zero local milk because collecting from smallholders costs more than importing

Complete references and supporting documentation are available upon request by contacting the editorial team at editor@thebullvine.com.

Learn More:

The Sunday Read Dairy Professionals Don’t Skip.

Every week, thousands of producers, breeders, and industry insiders open Bullvine Weekly for genetics insights, market shifts, and profit strategies they won’t find anywhere else. One email. Five minutes. Smarter decisions all week.

NewsSubscribe
First
Last
Consent

The Tyson Shutdown Playbook: How Plant Closures Steal $10,000 From Your Dairy – Every Year

When beef plants close, dairy basis widens. Here is the economic playbook used to squeeze producer margins—and how to protect your operation

EXECUTIVE SUMMARY: Tyson claims ‘unprecedented cattle shortages’ justified closing their Lexington plant—yet cattle inventory is down just 3% and the company paid $2 billion MORE for cattle this year, not less. This closure eliminates 30% of Nebraska’s processing capacity, extracting .5 million annually from producers through wider basis—the gap between futures prices and what farmers actually receive. Dairy farmers are already living this reality: processor consolidation costs the average 1,000-cow dairy ,000-14,000 yearly in reduced cull cow values alone. With four firms controlling 85% of beef processing (up from 25% in 1977), capacity decisions become price controls—no conspiracy required, just strategic plant closures. The same playbook that eliminated 61% of dairy farms over 25 years is now accelerating in beef. This investigation reveals how basis compression works, why consolidation makes it worse, and what producers can do to protect their operations before they become the next casualty.

Dairy cull cow revenue

When Tyson Foods announced the closure of their Lexington, Nebraska, beef processing plant on November 21st—citing “unprecedented cattle shortages”—it sparked conversations across agricultural communities. The facility processes 5,000 head daily, employs 3,000 workers in a town of 10,000, and will shut down by January 2026. That represents roughly 30% of Nebraska’s beef processing capacity disappearing in a single corporate decision. While this is a beef industry headline, the blueprint is identical to the consolidation already squeezing dairy margins—and understanding these mechanics could mean the difference between adapting successfully or becoming another farm closure statistic.

What makes this particularly relevant for dairy operations is how the actual cattle inventory data appears to tell a different story than the corporate narrative suggests. For those of us who’ve watched dairy consolidation over the past decade, these patterns feel remarkably familiar.

Economic Impact Distribution: When Tyson closes Lexington, $182.5M leaves rural Nebraska—cattle producers lose $37.5M annually in basis compression, the community loses $25M, workers lose $120M in wages. Processing companies and shareholders capture $60M in improved margins

Understanding Basis Pricing: The Mechanism Behind Local Markets

Let me share something that becomes increasingly important as markets consolidate—the concept of “basis” and how it affects what producers actually receive versus what they see on commodity screens.

Basis represents the difference between futures prices—those numbers flashing on Chicago Mercantile Exchange screens—and the actual cash price producers receive at their local market. Think of it as your regional market adjustment. In dairy, we see this same dynamic between Class III futures and mailbox prices, and the parallels are instructive.

Basis Compression Impact: Plant closures directly translate to lost revenue for dairy producers through wider basis differentials on cull cow sales. A 1,000-cow dairy loses $10,000-$17,000 annually as processing competition evaporates

The agricultural economics team at the University of Nebraska-Lincoln has extensively documented these patterns through its research publications. Their findings show that in competitive markets, feedlot operators typically receive the futures price minus a modest basis adjustment—perhaps 5 to 15 cents per hundredweight — for transportation and regional supply-and-demand factors.

What’s particularly noteworthy is how dramatically this changes when processing capacity leaves a region:

In a competitive market scenario: A feedlot 50 miles from multiple processors might see:

  • Basis of approximately -$0.05/cwt
  • Multiple competitive bids arriving weekly
  • Cash price around $193.95/cwt on a 1,250 lb steer, yielding $2,424

After significant capacity reduction: That same operation now shipping 180+ miles might experience:

  • Transportation costs are adding $33 per head (based on USDA-tracked rates of $5.50 per loaded mile)
  • Basis weakening to -$2.50/cwt or more
  • New cash price dropping to $191.50/cwt, or $2,394 per head

When you calculate that $30 per head difference across the 1.25 million head annually processed at Lexington, Nebraska producers potentially face $37.5 million in reduced annual revenue—not from market fundamentals, but from structural changes in competitive dynamics.

The Cull Cow Connection: What This Means for Your Bottom Line

Here’s something every dairy producer needs to understand about processing capacity: it directly affects your cull cow revenue. For a 1,000-cow dairy culling 35% annually, that’s 350 cull cows heading to market each year. When regional processing capacity shrinks, the basis on those cull cows widens just like it does for fed cattle.

Using current market dynamics, if basis widens by just $2.00/cwt due to reduced processing competition, that represents approximately $10,000 to $14,000 in lost annual cash flow for that 1,000-cow operation (assuming 1,400 lb cull cows at current prices). For many dairies, that’s the difference between profit and break-even—or between staying in business and selling out.

Examining the Supply Narrative: What the Data Actually Shows

The interesting thing about market narratives is how they sometimes diverge from documented data. USDA’s National Agricultural Statistics Service reported Nebraska’s January 2025 cattle inventory at 6.05 million head, down just 3% from the previous year. The state’s cattle-on-feed inventory in September 2025 stood at 2.43 million head, showing remarkable stability through recent reporting periods.

What’s particularly revealing—and this comes from Tyson’s own SEC filings—is that the company reported cattle costs increased by $2 billion in fiscal 2025 compared to the prior year. That pattern typically suggests competitive bidding for supply rather than genuine scarcity.

Dr. Derrell Peel at Oklahoma State University, who’s done extensive work on livestock markets, has observed that when processors simultaneously report supply challenges and increased input costs, it often indicates competitive pressure rather than actual shortage conditions. This aligns with what many market observers have noted.

Tyson’s beef segment reported an adjusted operating loss of $426 million in fiscal 2025, with forward guidance suggesting losses of $400-600 million in fiscal 2026. The closure removes 6,700 head of daily processing capacity from the market when you include reductions at their Amarillo facility—a significant structural change to regional competition.

Learning from Dairy’s Consolidation Journey: Regional Patterns Emerge

The dairy industry’s experience with consolidation offers a valuable perspective on these dynamics—and it’s playing out differently across regions.

Market Concentration Timeline: As processing consolidation accelerated from 25% to 85% control by four firms, dairy farm numbers collapsed by 61%. The correlation isn’t coincidence—it’s cause and effect

When Dean Foods filed for bankruptcy in November 2019, they operated 57 facilities across 19 states—essentially the largest fluid milk processor in America. Dairy Farmers of America’s 2020 acquisition of 44 of those plants for 3 million represented a significant concentration of processing capacity.

The Northeast Experience

Vermont exemplifies how consolidation pressures compound. The November 2025 Class I base price hit $16.75/cwt, down $1.29 from October, despite relatively stable national commodity markets. With 78% of Vermont experiencing severe drought conditions according to U.S. Drought Monitor data, producers face what economists describe as converging pressures—rising feed costs coinciding with price compression from national oversupply.

The Midwest Transformation

Wisconsin’s story shows how quickly landscapes change. Saputo’s recent optimization strategy provides a textbook example. Between 2024 and 2025, they’ve closed facilities in Belmont, Big Stone (South Dakota), Lancaster, Tulare (California), South Gate (California), and Green Bay. Each announcement emphasized “network optimization” and “operational efficiency.”

The Suamico, Wisconsin, closure eliminated 240 positions according to state workforce notifications. What’s particularly significant for smaller operations is that Saputo’s new Franklin, Wisconsin, facility requires 4-5 million pounds of milk daily for efficient operation—volume typically sourced from larger operations rather than traditional family-scale dairies.

Wisconsin has seen three major facility closures in 18 months. For producers in central regions, buyer options have decreased from five to perhaps two or three—a fundamental shift in market structure. International Dairy Foods Association tracking shows $11 billion in new processing capacity announced nationwide, with significant investment flowing to Texas, Idaho, and New Mexico—regions with operational scales different from traditional Midwest dairy.

I recently spoke with a Wisconsin producer milking around 400 cows who shared their experience after the Lancaster closure. Their milk hauling distance jumped from 45 miles to 110 miles, adding roughly 90 cents per hundredweight to their costs—assuming truck availability, which isn’t always guaranteed in tight transportation markets.

The Western Perspective

A California producer I connected with last month offered a different perspective. “We’ve watched consolidation reshape our market for two decades,” she explained. “When you’re down to two buyers for your milk in a 200-mile radius, the conversation changes completely. It’s not negotiation anymore—it’s take it or leave it.”

The progression seems consistent across all regions:

  • Processors announce efficiency-driven network optimization
  • Regional processing options decrease
  • Basis differentials widen as competition diminishes
  • Margin pressure intensifies for producers
  • Scale becomes increasingly critical for survival

USDA Economic Research Service data documents this trajectory in dairy—from approximately 100,000 operations to 39,000 over 25 years, a 61% reduction. American Farm Bureau projections suggest 2,800 dairy operations may exit in 2025 alone, though market conditions could affect these estimates.

Dairy Consolidation Acceleration: As processor consolidation squeezes margins, operations exit at increasing rates. Survivors must scale dramatically—average herd size jumped from 82 to 330 cows. The 300-cow family dairy that once thrived now barely survives

Understanding Make Allowance Impacts

The June 2025 Federal Milk Marketing Order adjustments increased make allowances in ways that the National Milk Producers Federation analysis suggests will shift approximately $91 million annually from producer revenues to processor margins. University of Wisconsin dairy enterprise budgets indicate a typical 300-cow operation that might have netted $10,000 annually could face $61,000 in losses under current conditions—challenging math for any operation.

The Economics of Community Impact

Rural development researchers have modeled the economic ripple effects of major facility closures, suggesting impacts of around $300 million over time for a community like Lexington—roughly $30,000 per capita in a town of 10,000. This encompasses lost wages, reduced tax revenue, diminished retail activity, and the broader multiplier effects that flow through rural economies.

Make Allowance Revenue Transfer: The June 2025 Federal Order changes shifted $91M annually from producer milk checks to processor margins. A typical 300-cow dairy loses $10,000/year—often the difference between profitability and loss. This isn’t market forces; it’s regulatory capture

Understanding where economic value flows in these transitions helps explain the dynamics:

For processing companies and shareholders: Industry analysis suggests potential margin improvements of $40-80 million annually through strategic capacity management and reduced regional competition. Tyson’s dividend program distributes $353 million annually to shareholders, with share buyback authorizations exceeding $1 billion in fiscal 2025.

For producers: Transportation cost increases alone could reach $42 million annually for cattle previously processed at Lexington. Add basis compression and reduced negotiating leverage, and the economic pressure compounds significantly.

For communities: Property tax revenue losses estimated at $15-25 million annually create budget pressures that affect schools, infrastructure, and essential services—impacts that persist long after the initial closure.

Monitoring Market Consolidation: Warning Signs to Watch

Language That Warrants Attention:

When processors use terms like “network optimization,” “reducing duplicate capacity,” or “investing in next-generation facilities,” it often precedes structural changes. Similarly, phrases about “managing supply challenges” or “consolidating operations” deserve careful consideration.

Market Indicators to Track:

  • Widening gaps between announced prices and actual payments
  • Shifting regional price differentials
  • Increasing hauling distances to remaining processors
  • Investment patterns favoring certain regions over others

Proactive Steps to Consider:

  • Maintain detailed records of basis trends
  • Build information networks with regional producers
  • Request transparency in pricing calculations
  • Preserve operational flexibility where possible

Price Discovery: The Foundation of Fair Markets

One fundamental shift deserves particular attention—the evolution of price discovery mechanisms. Iowa State University research documents that in the 1990s, approximately 80% of fed cattle were traded through transparent cash markets. Today, that figure has dropped to around 20%, with formula contracts dominating transactions.

Why does this matter? When price discovery depends on limited transactions, those prices become both less representative and potentially more influenced by strategic behavior. Academic research shows that as formula contracts grew from 20% to 80% of volume, the packer-to-retail price spread effectively doubled.

Price Discovery Erosion: Cash market trading collapsed from 80% to 20% of cattle transactions. Formula contracts now dominate—but those formulas are based on the thin cash market, creating a self-reinforcing cycle of reduced transparency and price control

Dairy maintains relatively better price transparency through Federal Order reporting, which explains why the June 2025 make allowance changes generated immediate producer response—the impacts were visible and quantifiable. Markets operating primarily through private formula contracts offer less transparency for impact assessment.

Strategic Considerations for Producers

While consolidation trends seem likely to continue, producers have options for navigating these changes:

Near-term Risk Management:

  • Document basis patterns systematically—tracking announced versus actual prices monthly reveals trends that inform decisions
  • Build information networks—comparing experiences with regional producers helps identify systematic patterns versus individual situations
  • Seek pricing transparency—understanding calculation methodologies helps identify where value gets captured
  • Maintain operational flexibility—long-term commitments may limit options during structural market shifts

Longer-term Positioning:

  • Evaluate differentiation opportunities—value-added production or direct marketing can provide alternative revenue streams, though these require different skill sets and market development
  • Strengthen collective representation—producer organizations provide platforms for information sharing and advocacy
  • Engage in policy discussions—market structure issues ultimately require policy responses
  • Assess scale strategically—understanding where your operation fits in evolving market structures informs investment decisions

Essential Questions for Processors:

  1. What methodology determines base pricing, and is the underlying data accessible?
  2. What proportion of supply comes through formula versus cash transactions?
  3. How does pricing compare across similar regional suppliers?
  4. Where are capital investments being directed geographically?
  5. How will any facility changes affect net returns after transportation?

Broader Implications for Agricultural Markets

The Tyson Lexington situation illustrates how market concentration—with four firms controlling 81-85% of beef processing, up from 25% in 1977—fundamentally alters market dynamics. Similar patterns in dairy, with comparable concentration levels, suggest these aren’t isolated incidents but structural trends.

What’s becoming increasingly clear:

  • Processor capacity decisions significantly influence regional pricing dynamics
  • Economic impacts flow predictably from rural communities toward corporate returns
  • Reduced price transparency through formula contract dominance creates structural advantages for processors
  • These patterns appear consistent across protein sectors

What remains less certain:

  • The potential for meaningful antitrust enforcement or policy intervention
  • Timeline and effectiveness of producer collective action
  • Whether technological or market innovations might create alternatives
  • How consumer preferences might influence market structures

Understanding these dynamics isn’t about pessimism—it’s about realistic assessment. Market structures have evolved significantly from previous generations’ experience. Success requires recognizing these changes, adapting strategically, and working collectively where appropriate to maintain competitive markets.

The fundamental question isn’t whether consolidation will continue—current trajectories suggest it likely will. The question becomes how producers can best position themselves within evolving market structures while advocating for policies that preserve competitive dynamics.

What unfolds in Lexington over the coming months may preview developments in other agricultural regions. Producers who understand mechanisms like basis compression, price discovery evolution, and formula contract implications will be better positioned to navigate these changes. Those who don’t may find themselves questioning why returns diminish even as demand appears stable.

Markets evolve. Producers who recognize and adapt to structural changes while maintaining operational excellence will be best positioned for long-term success. And perhaps, with sufficient understanding and collective action, we can influence how these markets develop rather than simply reacting to changes imposed upon us.

INDUSTRY RESOURCES

KEY TAKEAWAYS

  • The $10,000 Question: When processors close regional plants, your cull cow basis widens $2-3/cwt—costing a 1,000-cow dairy $10,000-14,000 annually in lost revenue
  • Decode the Language: “Network optimization” = plant closures coming. “Supply challenges” = margin restoration through consolidation. “Efficiency improvements” = fewer buyers for your milk
  • The Math That Matters: 4 firms control 85% of processing + only 20% cash market trading = they set prices, you take them
  • Your Action Plan: Track basis monthly (the gap between futures and your check), build regional producer networks for price transparency, and avoid long-term contracts during consolidation periods
  • The Pattern Is Clear: The same consolidation that eliminated 61% of dairy farms in 25 years is accelerating—understanding it is your best defense

Complete references and supporting documentation are available upon request by contacting the editorial team at editor@thebullvine.com.

Learn More:

The Sunday Read Dairy Professionals Don’t Skip.

Every week, thousands of producers, breeders, and industry insiders open Bullvine Weekly for genetics insights, market shifts, and profit strategies they won’t find anywhere else. One email. Five minutes. Smarter decisions all week.

NewsSubscribe
First
Last
Consent

The $11 Billion Reality Check: Why Dairy Processors Are Banking on Fewer, Bigger Farms

The math is brutal: At $11.55/cwt margins, your 350-cow dairy bleeds $20K monthly. Here’s why processors still invest billions.

EXECUTIVE SUMMARY: American dairy is witnessing an unprecedented paradox: processors are investing $11 billion in expansion while margins have collapsed to $11.55/cwt, forcing 2,100-2,800 farms toward exit by 2026. The explanation is stark—processors have pre-secured 70-80% of future milk supply through exclusive contracts with mega-dairies, banking on industry consolidation from 26,000 to 15,000 farms. Current economics make this inevitable: mid-sized operations lose $20,000 monthly while 3,000-cow dairies maintain profitability through $4-5/cwt scale advantages that management excellence cannot overcome. A severe heifer shortage (357,000 fewer in 2025) ensures these dynamics persist regardless of price recovery, creating a biological ceiling on expansion. Farmers face three critical deadlines—May 2026 for viability assessment, August 2026 for processor clarity, and December 2026 as the final repositioning window. This transformation differs fundamentally from previous cycles: no government intervention is coming, traditional recovery mechanisms don’t exist, and the structural changes are permanent.

dairy farm consolidation

I was reviewing the October USDA milk production report with a group of producers, and we all noticed the same paradox. We’re producing 18.7 billion pounds of milk—up 3.9% from last year—yet margins have compressed from $15.57 to $11.55 per hundredweight since spring. Meanwhile, processors are committing approximately $11 billion to major new facilities through 2028.

One producer from central Pennsylvania put it perfectly: “How does massive processor expansion make any sense when we can barely cover feed costs?”

After months of analyzing this disconnect—visiting operations from the Central Valley to Vermont, reviewing research from land-grant universities, tracking processor announcements—what’s emerging is a fundamental restructuring of American dairy. This goes beyond typical market cycles into something more permanent, and understanding these shifts has become essential for strategic planning.

The Margin Meltdown: From Surviving to Drowning in 15 Months – Dairy margins collapsed 26% since September 2024, dropping from $15.57/cwt to just $11.55/cwt. For a 350-cow operation producing 6 million pounds annually, that’s $240,000 in lost income—enough to wipe out equipment budgets and force impossible decisions at kitchen tables across dairy country

Key Numbers Shaping Our Industry

Before we dive deeper, here are the metrics that matter most for operational planning:

Production & Margins:

  • Milk production: 18.7 billion pounds (October 2025, +3.9% year-over-year)
  • Current margins: $11.55/cwt (down from $15.57 in September 2024)
  • National herd: 9.35 million cows (highest since 1993)
  • Production per cow: 1,999 lbs/month (24 major states)

Processor Investment:

  • Total commitment: approximately $11 billion
  • Major new facilities through 2028
  • Supply commitments: 70-80% already locked through contracts

Heifer Shortage:

  • Current inventory: down 18% from 2018
  • Replacement cost: $3,000-4,000+ (previously $1,700-2,100)
  • 2025 shortage: 357,000 fewer heifers
  • 2026 shortage: 438,000 fewer heifers

Industry Projections:

  • Expected exits: 2,100-2,800 farms by end-2026
  • Exit rate: 7-9% of current operations
  • Most affected: 200-700 cow operations

The Production Paradox: Regional Perspectives

The latest USDA data shows we’re milking 9.35 million cows nationally—the highest count since 1993. But the story varies dramatically by region, and that variation matters for understanding what’s ahead.

Michigan operations are achieving a remarkable production of 2,260 pounds per cow per month. A producer near Lansing recently told me their herd’s averaging 95 pounds daily with consistent butterfat levels above 3.8%. That’s exceptional management paired with strong genetics.

Texas presents another fascinating case. They’re running 699,000 head now—the most since 1958—with production up 11.8% year-over-year. The panhandle operations I visited in September have adapted dry lot systems that work remarkably well in their climate, though water access remains a growing concern.

But regional differences create vastly different economic realities. A Wisconsin producer I work with regularly—running 300 cows with excellent grazing management—calculated that they’re facing approximately $240,000 less income than in September 2024. That’s based on their 6 million pounds annual production at current margins. For context, that’s their entire equipment replacement budget for the next three years.

Meanwhile, when I visited Tulare County last month, the 3,000-cow operations there are weathering margin compression better. Their operating costs run $4-5 per cwt lower than Midwest mid-size farms—not through better management, but through scale efficiencies in feed procurement, labor utilization, and infrastructure amortization.

The international dimension adds another layer. European production bounced back strongly in September—up 4.3% according to Eurostat data. France increased by 5.8%, Germany by 5%, and the Netherlands jumped by 6.9% despite their nitrate restrictions. A dairy economist colleague in Amsterdam tells me Dutch producers are maximizing production before additional environmental regulations take effect in 2026. This surge is pressuring our export markets precisely when domestic demand remains sluggish.

Understanding Processor Strategy: The View from Industry

The $11 billion processor investment initially seems counterintuitive. Why expand when farm margins are collapsing? The answer becomes clearer when examining specific projects and their strategic positioning.

Chobani’s $1.2 billion Rome, New York, facility—their largest investment to date—will process 12 million pounds daily upon full operation. That volume could come from about 40 mid-size farms, or more realistically, from 3-4 mega-dairies with guaranteed supply contracts.

During a recent industry meeting in Chicago, a procurement manager from a major processor (who requested anonymity) shared their perspective: “We’re not building for today’s milk market. We’re positioning for 2030 when global demand exceeds supply and premium products command higher margins.”

Walmart’s strategy offers another angle. Their third milk plant in Robinson, Texas, opens in 2026, continuing their vertical integration push. Based on standard industry practices and Walmart’s previous facility operations, these supply commitments typically extend for a minimum of 5-7 years.

The geographic clustering is noteworthy. Hilmar’s Dodge City facility and Leprino’s Lubbock plant—both processing 8 million pounds daily—are positioned in regions with concentrated mega-dairy operations and favorable logistics for export markets.

CoBank’s August analysis reveals that processors have already secured 70-80% of the required milk supply through long-term contracts, predominantly with operations milking 2,000+ cows. This pre-commitment strategy represents a departure from historical reliance on the spot market.

Follow The Money: Where Processors Are Building Your Replacement – New York leads with $2.8 billion (Chobani’s $1.2B Rome plant, Fairlife’s $650M facility), while Texas adds $1.5 billion targeting mega-dairy regions. This geographic clustering reveals processor strategy: invest near concentrated large operations with guaranteed supply. If your state isn’t on this map, ask yourself why

Ben Laine from Rabobank articulated this shift well during a recent webinar: “Companies aren’t investing hundreds of millions without secured supply. The relevant question for producers is whether they’re included in these long-term arrangements.”

The global context drives processor confidence. The International Dairy Federation’s April report projects a potential 30-million-ton global milk shortage by 2030, while even conservative IFCN estimates suggest a 6-10 million ton deficit. Chinese import data reinforces this outlook—cheese imports up 13.5%, whole milk powder up 41% through September, according to USDA Foreign Agricultural Service tracking.

There’s also an unexpected shift in demand for GLP-1 medications. With 30 million Americans now using these drugs, according to IQVIA’s pharmaceutical data, consumption patterns are changing dramatically. Whey protein demand increased 38% among users, while cheese and butter consumption declined 7.2% and 5.8% respectively. For processors with flexible infrastructure, this creates opportunities in high-margin protein products.

The Heifer Shortage: A Constraint Years in the Making

The replacement heifer situation deserves careful attention because it represents a multi-year constraint on expansion regardless of price improvements.

Current inventory sits 18% below 2018 levels according to CoBank’s analysis. At a recent sale in Fond du Lac, Wisconsin, quality springer heifers brought $4,500—compared to $2,200 for similar genetics five years ago. A producer from Idaho mentioned paying $4,800 for exceptional genetics last month.

The Perfect Storm: Vanishing Heifers, Exploding Prices – Since 2018, dairy heifer inventory plummeted 18% to a 47-year low of 3.91 million head while prices rocketed 50% to $3,010—with top genetics fetching $4,500. This biological ceiling locks the industry into its current structure until 2027, regardless of milk price recovery. Expansion is now mathematically impossible for most operations

The shortage—357,000 fewer heifers in 2025, rising to 438,000 fewer in 2026—stems from rational individual decisions that create collective constraints. When beef-on-dairy calves bring $1,400-1,600 while raising a replacement costs $2,800-3,200, the economics are clear.

A California dairyman running 1,500 cows told me they went 80% beef-on-dairy in 2023-2024. “At those prices, it was irresponsible not to,” he explained. Even traditionally conservative Midwest operations shifted 40-50% of breedings to beef genetics.

Dr. Kent Weigel from UW-Madison’s dairy science department frames it well: “Producers made financially sound individual choices that collectively created a demographic cliff for the industry.”

The regional impacts vary significantly. Idaho’s expanding operations are aggressively bidding for available heifers, driving prices higher across the West. Pennsylvania’s smaller farms face a different challenge—they simply can’t compete financially for limited replacement inventory.

This creates a biological ceiling on expansion that price signals alone can’t overcome. Even if milk prices reached $20 per cwt tomorrow, most operations couldn’t expand without available replacements.

Historical Context: Why This Cycle Differs

Having worked through previous downturns, the current situation presents unique characteristics worth examining.

The 2009 crisis saw milk prices crash from $24 to $8.80 per cwt—a devastating 63% decline. But Congress responded with $3.5 billion in direct support, and USDA purchased 379 million pounds of milk powder to stabilize markets. Those interventions, combined with natural supply adjustments, enabled recovery within 18-24 months.

The 2015-2016 downturn followed a different pattern. Without direct payments, the industry relied on market forces. Global weather challenges and China’s growing imports eventually tightened supply, supporting price recovery by 2017-2018.

Today’s environment lacks these recovery mechanisms. Current USDA policy emphasizes market solutions over intervention. The Dairy Margin Coverage program triggers only at $9.50 per cwt—well below current margins of $11.55. Even when triggered, coverage caps at 5 million pounds annually, providing limited support for larger operations.

More significantly, processor supply commitments through 2030-2034 have pre-allocated market access in ways that didn’t exist during previous cycles. A Northeast cooperative board member recently described this as “musical chairs where the music has already stopped for many producers.”

Dr. Andrew Novakovic from Cornell’s dairy program observes that, unlike previous downturns with natural recovery mechanisms, “this transformation represents structural reorganization that doesn’t self-correct through normal market cycles.”

Scale Economics: The Widening Gap

The economic disparities between operation sizes have widened beyond what management excellence can overcome. Data from the University of Minnesota’s FINBIN system and USDA surveys reveals striking differences.

A typical Wisconsin 350-cow operation incurs costs of around $20.85 per cwt, with fixed costs accounting for 38% of that total. Compare that to a 3,000-cow Texas panhandle operation at $16.16 per cwt with only 25% fixed costs. That $4.69 difference translates to roughly $394,000 annually—often the difference between profit and loss.

The Unbridgeable Cost Gap: Why Scale Now Determines Survival – Mid-size operations hemorrhage $4.69/cwt more than mega-dairies—a $394,000 annual disadvantage that excellent management cannot overcome. While 350-cow Wisconsin farms struggle at $20.85/cwt, 3,000-cow Texas operations cruise at $16.16/cwt. This isn’t about farming better; it’s about farming bigger, and processors are betting accordingly with their $11 billion investment

Interestingly, California’s mid-size operations (500-750 cows) achieve competitive costs around $17-18 per cwt through different strategies. They utilize more contracted labor, which provides flexibility during margin compression despite higher hourly costs.

Beyond direct operating expenses, scale creates compounding advantages. Large Idaho operations negotiate feed contracts at $0.50-1.00 per cwt below spot prices. Labor efficiency reaches $183 per cow annually, compared with $343-514 for Northeast mid-size farms. A robotic milking system costs $83 per cow to amortize at a 3,000-head scale but $714 at a 350-head scale.

Dr. Christopher Wolf from Cornell captures this reality: “We’ve moved beyond management quality as the primary determinant of success. Structural economics now dominate, where excellent managers at smaller scales face insurmountable cost disadvantages.”

Processor Relationships: The New Reality

The evolution of processor-producer relationships represents a fundamental shift that many producers haven’t fully grasped.

Modern facilities require 5-12 million pounds per day from consolidated sources, typically through 5-10-year exclusive agreements. A central Pennsylvania producer recently shared their experience: offered a premium for exclusive supply but required a commitment to all production through the decade’s end—no spot sales, no price shopping during market spikes.

These contracts include strict confidentiality provisions, creating information asymmetry. While processors map regional supply commitments years in advance, individual producers lack visibility into capacity allocation. Your neighbor might have secured long-term access while you’re still assuming spot markets will continue.

The timing matters critically. Major processors locked supply agreements in 2023-2024 when planning current expansions. Producers now recognizing tightening access are discovering capacity is already committed through 2030.

Several New York producers mentioned their long-standing processor relationships—some spanning 30+ years—are being “reassessed” for 2026. That’s industry language for supply consolidation toward larger operations.

Community Impacts: Beyond the Farm Gate

The projected 2,100-2,800 farm exits by end-2026 create ripple effects throughout rural communities. The Center for Dairy Profitability at UW-Madison developed these projections based on current exit rates and economic pressures.

Consider Marathon County, Wisconsin, with approximately 180 dairy farms. An 8% exit rate means 14-15 operations closing. Each supports an ecosystem—equipment dealers, nutritionists, veterinarians, feed suppliers—all of which are losing revenue simultaneously.

Projection show that 40% of Northeast dairy equipment dealers will consolidate or close by 2027, as demand drops by 30%. The implications extend beyond sales to parts availability, service expertise, and technology support for remaining operations.

Veterinary services face particular challenges. The American Association of Bovine Practitioners projects service reductions of 15-25% in dairy regions. Northern Minnesota already has one large-animal practice serving five counties. When economic forces drive further consolidation, emergency coverage becomes problematic.

School districts in dairy-dependent counties could lose 5% of their property tax base. That translates to program cuts, route consolidations, and reduced educational opportunities for rural youth.

Bob Cropp, from the University of Wisconsin, quantifies what we’re losing: “These exits represent approximately 74 million farmer-years of accumulated expertise. That knowledge—built through generations of problem-solving and adaptation—cannot be quickly replaced.”

Decision Framework: Practical Steps Forward

Based on extensive discussions with financial advisors, producers, and industry analysts, here’s a framework for evaluating your operation’s position.

Immediate Assessment Priorities:

Calculate true operating costs, including family labor at market value. Many operations undervalue owner labor, distorting profitability assessments. If 80-hour weeks at zero value keep you “profitable,” that’s not sustainable.

Working capital should be at least 25% of annual revenue. Wisconsin’s Farm Credit offices recommend a 30% allocation given current volatility. Debt-to-asset ratios above 60% limit refinancing flexibility according to multiple ag lenders.

Most critically, seek clarity from milk buyers about 2026-2027 commitments. Vague responses or deferrals suggest capacity is already allocated elsewhere. February 2026 represents a critical deadline for securing clarity.

Warning Signals to Monitor:

Subtle changes often precede major shifts. Processors asking about “future plans” after years of routine relationships are assessing supplier consolidation options. Lenders requesting earlier reviews or suggesting consultants have identified concerning trends in your financials.

Regional consolidation patterns matter. Multiple exits within six months indicate accelerated structural change rather than normal attrition.

Critical Timeline:

May 2026: Assess whether operations can sustain through late 2026 without margin improvement. August 2026: Processor commitments and regional consolidation patterns become clear. December 2026: Final window for strategic repositioning before options significantly narrow

The 18-Month Decision Gauntlet: Three Deadlines That Determine Your Farm’s Future – May 2026: Assess if you can survive the year. August 2026: Know if processors want your milk. December 2026: Your last window to act deliberately. Miss these deadlines, and circumstances will decide your fate—not you. Processors and mega-dairies already know the 2030 structure; sharing information with neighbors is your only counterweight

Strategic Paths for Different Situations

Based on current operations, successfully navigating these challenges:

Strong fundamentals (positive cash flow, manageable debt, processor commitment): Focus on operational efficiency over expansion. Build reserves during any margin improvements. Avoid major capital investments without secured long-term processor agreements. An Idaho producer recently canceled planned parlor expansion despite available capital due to uncertain processor signals.

Structural challenges (tight cash flow, high debt, uncertain processor access): Consider neighbor consolidation to achieve viable scale. Three New York operations recently merged to create an 1,800-cow enterprise—complicated but preferable to individual failure.

Premium market transitions require time and capital. Organic certification takes three years. Grass-fed requires an appropriate land base. A2 genetics need development time. These aren’t immediate solutions.

Exit timing matters if that’s your path. Current cattle values ($3,000-4,000 for quality animals) and strong farmland prices create windows that may narrow if exits accelerate.

Universal recommendations: Maximize Dairy Margin Coverage despite current margins above trigger levels—premiums typically run $0.10-0.20 per cwt for basic protection. Document monthly production costs rather than quarterly estimates. Develop relationships with multiple milk buyers, even with satisfactory current arrangements in place.

Emerging Market Forces: The GLP-1 Factor

Dairy ProductConsumption ChangePrimary User Group
Cheese-7.2%General Users
Butter-5.8%General Users
Ice Cream-5.5%General Users
Milk/Cream-4.7%General Users
Yogurt High-Protein+38.0%Fitness Focus
Whey Protein+41.0%Fitness Focus

Looking Forward: Industry Implications

What we’re experiencing transcends normal market cycles into fundamental restructuring. The convergence of processor pre-positioning, heifer constraints, and widening scale economics creates permanent rather than temporary change.

Operational excellence remains necessary but insufficient. A well-managed 350-cow Pennsylvania operation faces structural disadvantages that exceptional management cannot overcome when competing against 3,000-cow Texas operations with locked processor contracts.

Time-limited decision windows define positioning for 2027-2030. Information asymmetry—where processors and mega-operations understand supply commitments while smaller producers operate in the dark—compounds the challenges. Traditional crisis recovery mechanisms no longer exist in the current market structure.

The central question isn’t management quality but structural positioning within emerging industry architecture. For many operations, honestly assessing this question—though difficult—enables deliberate choices rather than outcomes driven by circumstance.

The dairy industry will certainly continue producing milk. Whether individual operations participate in that future, and in what form, depends on decisions made within current windows. What’s encouraging is that informed decisions still influence outcomes despite powerful structural forces.

Regional collaboration strengthens individual positions. Sharing information, comparing strategies, and coordinating responses—even when processors prefer confidentiality—creates collective strength. This remains our industry, even as it transforms more rapidly than many anticipated.

The path forward requires accepting new realities while maintaining the innovative spirit that has always characterized American dairy. Those who adapt deliberately rather than reactively will find opportunities within structural change. The key is acting on information rather than hope, making strategic choices rather than letting circumstances decide.

Key Takeaways:

  • The game has changed permanently: Processors invested $11 billion betting on 15,000 farms by 2030, pre-locking 70-80% of milk supply with mega-dairies—if you lack a long-term contract, you’re competing for scraps
  • Scale economics are now destiny: A 350-cow farm bleeds $20,000 monthly at current margins while 3,000-cow operations profit—this isn’t poor management, it’s structural disadvantage
  • Biological ceiling locks in consolidation: With 357,000 fewer heifers and beef-on-dairy economics, expansion is impossible for 2-3 years, regardless of price recovery
  • Three deadlines determine your fate: May 2026 (viability assessment), August 2026 (processor commitment), December 2026 (final repositioning)—decide deliberately, or circumstances will decide for you
  • Information asymmetry is real: While you see falling milk checks, processors and mega-farms already know the 2030 industry structure—sharing information with neighboring farms is your only counterweight

Complete references and supporting documentation are available upon request by contacting the editorial team at editor@thebullvine.com.

Learn More:

The Sunday Read Dairy Professionals Don’t Skip.

Every week, thousands of producers, breeders, and industry insiders open Bullvine Weekly for genetics insights, market shifts, and profit strategies they won’t find anywhere else. One email. Five minutes. Smarter decisions all week.

NewsSubscribe
First
Last
Consent

October’s 6,000-Cow Reality Check: Why the Smart Money Is Culling at Record Prices

October data: Production ↑3.7%, Herd ↓6,000 cows. First reduction of 2025. What smart producers know that you might not.

EXECUTIVE SUMMARY: October revealed dairy’s inflection point: producers culled 6,000 cows while production rose 3.7%, proving that margin math now trumps expansion momentum. At $16.91 milk and $165 cull values, keeping a cow losing $45/month means refusing $1,950 in immediate cash—a calculation thousands of farm families have already made. The heifer shortage (the lowest since 1978) has pushed replacements to $4,200, effectively locking the industry into its current size regardless of dreams of price recovery. Geography has become destiny, with new processing plants creating permanent $1.50/cwt advantages that no amount of good management can overcome. While some wait for $22 milk to return, successful operations are already adapting through component optimization, forward pricing, and even geographic relocation. October’s 6,000-head reduction isn’t a statistic—it’s 6,000 individual decisions that collectively signal dairy’s new reality: adapt to $17-19 milk or exit.

Dairy Culling Strategies

This caught my attention because it suggests we’re witnessing a pivotal moment where operational economics are beginning to override expansion momentum. After spending the week talking with producers and economists across Wisconsin, Texas, Idaho, and New York, what struck me is how this single data point reflects deeper strategic shifts happening across the industry.

Looking at the USDA’s October milk production report released this afternoon, total production reached 19.47 billion pounds, continuing the growth trend we’ve seen all year. But that 6,000-cow reduction? That’s producers voting with their culling decisions, signaling that margin pressures are finally forcing hard choices.

The economic calculation forcing dairy producers to choose between $1,950 immediate cash or continued monthly losses of $45 per marginal cow—explaining October’s historic 6,000-head reduction.

Dr. Marin Bozic, who tracks dairy economics at the University of Minnesota, offered an interesting perspective during our discussion. He noted that these patterns remind him of previous structural adjustments in commodity markets—times when the industry had to recalibrate expectations.

“What we’re observing isn’t just price pressure—it’s the convergence of biological lags from past breeding decisions meeting current economic realities. The industry is essentially paying for decisions made three years ago.”
— Dr. Andrew Novakovic, E.V. Baker Professor of Agricultural Economics, Cornell University

Here’s what’s particularly interesting—industry perspectives vary considerably on what this means. Some analysts I’ve spoken with suggest we’re seeing a temporary oversupply that could resolve with strong export demand or weather-related production disruptions by late 2026. Others see signs of more fundamental market restructuring.

And honestly? Both camps make compelling arguments.

Let me walk you through what the data tells us, and you can draw your own conclusions…

October 2025: The Numbers Behind the Decision

MetricValueSource
National Herd Size9.35 million headUSDA Milk Production Report
Year-over-Year Change+12,000 headUSDA NASS
October Adjustment-6,000 headUSDA NASS
Milk Production19.47 billion lbs (+3.7% YoY)USDA NASS
Class III Milk Price$16.91/cwtUSDA-AMS
Cull Cow Value$165/cwt (Southern Plains avg)USDA Direct Cattle Report
Replacement Heifer Cost$3,010 (July avg)USDA-AMS Auctions
Daily Feed Investment$8.50/cowUW Extension

The Math Behind October’s Culling Decisions

Here’s what struck me as particularly revealing: the national herd stands at 9.35 million head—essentially flat with only 12,000 more cows than in October 2024. Given all the processing capacity that’s come online recently, you’d expect more aggressive expansion. But that’s not what we’re seeing.

I spent time this week with a Wisconsin dairy operator managing 2,100 cows who walked me through their October decision-making. With Class III milk at $16.91 and feed costs around $8.50 daily, their bottom-quartile cows—those averaging 65 pounds versus the herd average of 85—were generating negative margins of about $45 monthly.

Meanwhile, cull values in the Southern Plains were hitting $165 per hundredweight.

Think about that calculation for a moment: $1,950 in immediate cash versus continued negative margins. It’s not an easy decision, but it’s becoming increasingly common.

What made October particularly significant was this convergence of pressures:

  • Milk prices are settling at $16.91, well below the $20-23 range that justified 2023-2024 expansion plans
  • Feed costs are stabilizing around $8.50 per cow daily (University of Wisconsin Extension’s November data)
  • Cull cow values are reaching near-historic levels at $165/cwt in the Southern Plains
  • Replacement heifers averaging $3,010, up from $1,720 in April 2023
  • December Class III futures are showing $17.21 on the CME—not exactly a recovery signal
  • Processing facilities are dealing with utilization challenges despite $10 billion in recent investments (CoBank’s August assessment)

An Idaho producer I spoke with, managing 450 cows near Twin Falls, described it this way: “We’re evaluating every animal’s contribution to cash flow. It’s about making data-driven decisions, not emotional ones.”

The Heifer Shortage Nobody Saw Coming (Except Everyone Should Have)

Replacement heifer prices exploded 144% from $1,720 to $4,200 between April 2023 and November 2025, creating an unprecedented shortage that locks the industry into its current size until 2027.

What’s fascinating—and honestly, a bit frustrating—is how predictable the current heifer shortage was, yet how unprepared we seem to be for it.

The price explosion from $1,720 to over $4,000 isn’t inflation; it’s the bill coming due for decisions made years ago.

According to USDA data, dairy heifer inventory hit 3.914 million head in January 2025—the lowest since 1978. I had to double-check that number because it seemed impossible. But it’s real, and it stems from entirely rational decisions made during the challenging price environment of 2015-2021.

When milk prices stayed in that $12-14 range for years, producers did what made economic sense: they bred with beef semen instead of raising dairy replacements. The National Association of Animal Breeders reports beef semen sales to dairy operations nearly tripled from 2017 to 2020.

We essentially removed 800,000 dairy heifers from the pipeline—about 130,000 per year.

Here’s the kicker that keeps me up at night: those breeding decisions from 2019-2021? Those missing heifers would be entering herds right now. Instead, we’ve got producers competing fiercely for the limited genetics available.

A procurement specialist for a large Texas Panhandle operation shared something revealing: “We locked in heifer contracts in early 2023 at $1,900, thinking we were being conservative. Those same genetics are $4,200 today. If we’d modeled $16.91 milk instead of $21, our entire expansion strategy would’ve been different.”

There’s a glimmer of hope, though. Gender-sorted semen sales jumped 17.9 percent from 2023 to 2024—1.5 million additional units, according to the National Association of Animal Breeders.

But meaningful relief? We’re probably looking at 2027.

Regional Realities: Why Your Zip Code Matters More Than Ever

Regional production growth reveals how new processing investments in Idaho (7.0%) and California (6.9%) create permanent $1.50/cwt advantages that no amount of management can overcome in lagging regions.

Looking at the October state-by-state data, what jumped out at me was how dramatically different the dairy economy looks depending on where you’re standing.

The growth stories:

  • California: Up 6.9 percent (though comparing against last year’s bird flu challenges)
  • Idaho: Up 7 percent (that new Glanbia cheese plant in Twin Falls is pulling everything)
  • Texas: Added 26,000 cows despite yield challenges
  • Michigan: Up 4.3 percent
  • New York: Up 4 percent

But here’s where it gets interesting. A Pacific Northwest producer managing 1,800 cows near Lynden, Washington, shared their reality: “We’re getting $16.16 per hundredweight while Idaho producers see $17.66. That $1.50 difference? It’s because we’re shipping to powder plants while they’re shipping to cheese plants.”

This illustrates something I’ve been tracking for a while—the growing divide between regions with new processing investments and those without. The Federal Milk Marketing Order system, despite updates in 2024, still creates these regional disparities based on fluid demand assumptions from another era.

Processing investments are reshaping the geography of dairy: Leprino Foods’ $870 million Lubbock facility, Fairlife’s $650 million New York expansion, and Great Lakes Cheese in Abilene.

These aren’t just plants; they’re creating new centers of gravity for milk production.

Success Stories: Adaptation in Action

While challenges dominate headlines, I’ve encountered several operations that have successfully navigated current conditions through strategic adaptation.

A 1,200-cow operation in central New York completely restructured their approach this summer. They shifted focus from volume to components, reformulated rations to optimize butterfat (accepting a 4 percent volume decrease in exchange for a 0.35 percent butterfat improvement), and locked in 70 percent of their 2026 production through forward contracts.

The result? They’re projecting positive margins even at $17.50 milk.

Another success story comes from a Wisconsin cooperative that pooled resources among five family farms to negotiate better component premiums directly with their processor. By guaranteeing consistent high-component milk, they secured an additional $0.85/cwt premium above standard pricing.

In Pennsylvania, a 600-cow operation near Lancaster took a different approach entirely. They invested in on-farm processing, launching a farmstead cheese operation that now processes 30 percent of their production.

“We realized we couldn’t compete on commodity milk,” the owner explained. “But we could capture more value through differentiation. Our cheese sales are covering the losses on our fluid milk.”

What these operations share is a willingness to challenge traditional approaches and adapt to new realities rather than waiting for old conditions to return.

The Export Paradox and What It Really Means

Here’s something that initially puzzled me: September exports were phenomenal—cheese up 28 percent, butterfat exports nearly tripled according to the USDA.

Yet farm-level milk prices remain depressed. How does that math work?

The answer reveals an uncomfortable truth about global competitiveness. CME cheese at $1.56 per pound versus European cheese at approximately $1.90 (converted from euros) gives us an 18 percent price advantage.

We’re competitive precisely because our prices have fallen.

After processing and logistics, that $1.56 cheese price translates to farm-level milk values around $12.40 per hundredweight. That’s below breakeven for most operations.

So yes, exports are strong, but they’re preventing collapse, not driving recovery.

Mexico accounts for about 30 percent of our exports, according to the U.S. Dairy Export Council. But Rabobank’s November analysis flags something concerning: Mexico is actively building domestic production capacity with government support.

If they reduce imports by even 20 percent, that would be a significant demand shock.

Risk Scenarios: What Could Change Everything

While I’ve focused on current trends continuing, it’s worth considering what could dramatically shift the market:

Disease outbreak: An H5N1 resurgence affecting 5-10 percent of the national herd would immediately tighten supply and drive prices higher. Nobody wants this scenario, but it remains a possibility.

Weather extremes: A severe drought across the Midwest in summer 2026 could quickly reduce production by 3-4 percent. Combined with current tight heifer supplies, this could push milk prices back above $20.

Trade disruptions: New tariffs or trade agreements could fundamentally alter export dynamics. A comprehensive trade deal with Southeast Asian nations could open significant new demand.

Processing consolidation: If one or two major processors face financial stress and close facilities, regional oversupply could quickly become undersupply.

These aren’t predictions—they’re reminders that dairy markets can shift rapidly when unexpected events occur.

Practical Strategies for Navigating Current Conditions

Based on conversations with producers successfully adapting to current conditions, several strategies deserve consideration:

Margin-Based Management

Evaluating individual cow contributions monthly provides objective retention criteria. Several producers mentioned using $40 monthly contribution as their threshold, though your specific number will depend on your cost structure.

Component Optimization

With butterfat premiums at $0.50-1.50/cwt above base (varying by cooperative), optimizing for components rather than volume can improve margins. This might mean accepting lower production for higher component percentages.

Geographic Assessment

Honestly evaluating your regional competitive position matters more than ever. If you’re in a structurally disadvantaged region, consider whether repositioning—through relocation, market channel changes, or value-added production—makes sense.

Risk Management Tools

Forward pricing isn’t about predicting markets; it’s about creating certainty. Several producers described securing 50-70 percent of future production at known prices, allowing them to plan with confidence.

Collaborative Approaches

Producer cooperation—whether through joint marketing, shared resources, or collective bargaining with processors—is gaining traction as a strategy for improving positioning.

Looking Ahead: Key Indicators to Watch

The November and December production reports will reveal whether October’s 6,000-head reduction was an isolated adjustment or the beginning of something bigger.

Here’s what I’ll be watching:

Herd trajectory: Another 5,000+ reduction would signal systematic adjustment. Stabilization suggests October was an anomaly.

Per-cow production: Changes exceeding seasonal norms could indicate compositional shifts in the national herd—are we keeping the best and culling the rest?

Regional divergence: Continued growth in Texas/Idaho, while other regions contract, would confirm geographic consolidation.

Component trends: Rising butterfat with declining volume would indicate a strategic focus on quality over quantity.

The Bottom Line: Adaptation, Not Capitulation

October’s 6,000-head culling amid production growth tells us something important: the industry is beginning to self-correct, with individual producers making rational decisions based on economic reality rather than expansion momentum.

This isn’t about doom and gloom—it’s about adaptation. The operations that recognize current conditions as a new reality rather than a temporary disruption are positioning themselves for long-term success.

They’re not waiting for $22 milk to return; they’re building businesses that work at $17-19.

What’s becoming clear from my conversations across the industry is that successful navigation requires three things: an honest assessment of your specific situation, a willingness to challenge traditional approaches, and the courage to make difficult decisions based on data rather than hope.

The dairy industry has weathered massive transitions before—the shift from small diversified farms to specialized operations, the technology revolution, and multiple trade upheavals. Each time, those who adapted thrived while those who resisted struggled.

Current conditions represent another such transition. How individual operations choose to respond will determine not just their immediate survival but their long-term positioning in whatever structure emerges.

As we await the next production reports, remember that behind every data point are real farming families making real decisions about their futures. The 6,000-head reduction isn’t just a statistic—it represents thousands of individual choices, each reflecting unique circumstances and strategic calculations.

The market is speaking. The question isn’t whether to listen, but how to respond thoughtfully and strategically to what it’s telling us.

Resources for Further Information:

  • USDA Milk Production Reports: www.nass.usda.gov
  • University Extension Dairy Programs: Contact your state extension service
  • Federal Milk Marketing Order Administrators: www.ams.usda.gov/about-ams/programs-offices/federal-milk-marketing-orders
  • Risk Management Tools: Contact your milk cooperative or CME Group Agriculture
  • Dr. Andrew Novakovic’s market analysis: Charles H. Dyson School of Applied Economics, Cornell University
  • Component Premium Information: Contact your regional cooperative

Key Takeaways: 

  • The October Calculation: Keeping a marginal cow means refusing $1,950 cash today to lose $45/month tomorrow—that’s why 6,000 left the herd despite record milk production
  • The 2027 Reality: With heifers at $4,200 and inventory at 45-year lows, the industry is locked into current size until 2027, regardless of price recovery
  • Location Determines Survival: Processing investments have created permanent $1.50/cwt regional pricing advantages that no amount of good management can overcome
  • Three Paths Forward: Optimize for components (butterfat premiums worth $0.50-1.50/cwt), lock in 50-70% of production at $17-19, or relocate to advantaged regions
  • Bottom Line: October proved the market has fundamentally shifted—build a business that works at $17-19 milk or become a statistic

Complete references and supporting documentation are available upon request by contacting the editorial team at editor@thebullvine.com.

Learn More:

The Sunday Read Dairy Professionals Don’t Skip.

Every week, thousands of producers, breeders, and industry insiders open Bullvine Weekly for genetics insights, market shifts, and profit strategies they won’t find anywhere else. One email. Five minutes. Smarter decisions all week.

NewsSubscribe
First
Last
Consent

Record Dairy Exports Hide a Brutal Truth: You’re Selling at a Loss

Your co-op newsletter: ‘RECORD EXPORTS!’ Your milk check: -$2/cwt. Your banker: ‘We need to talk.’ The disconnect has never been wider.

EXECUTIVE SUMMARY: The U.S. dairy industry’s record cheese exports are actually distress sales, with producers losing $2/cwt as milk prices sit at $16.91 against $19 production costs. Mexico—buying 29% of our exports—is spending $4.1 billion to become self-sufficient, while China’s 125% tariffs have already destroyed our powder markets. The Class III-IV price spread has exploded to $4.06/cwt, the widest since 2011, forcing all production toward cheese that’s selling below profitability. Mid-size farms (500-1,500 cows) face extinction-level losses of $400,000+ annually, with survival limited to mega-dairies with 50% or less debt or premium operations near cities. Producers have 90 days to make irreversible decisions: scale massively, find niche markets, or exit before equity evaporates. The 800,000-head heifer shortage guarantees milk production will contract 3-5% through forced exits, but recovery won’t arrive until mid-2027—and only for the operations structured to survive.

dairy farm profitability 2025

On the surface, the numbers look fantastic. We exported 119.3 million pounds of cheese in August 2025—up 28% from last year, according to the Dairy Export Council. Butter exports nearly tripled. Processing plants are announcing $11 billion in new investments.

But check your bank account. The milk checks aren’t matching the celebration. The headlines say “Record Exports,” but the market reality says “Distress Sale.”

I’ve been talking with producers from Wisconsin down to Texas, and what I’m hearing doesn’t line up with these export headlines. Understanding this disconnect could be the difference between successfully navigating the next 18 months or becoming another casualty of industry restructuring.

The “record export” headlines your co-op newsletter celebrates tell only half the story. Yes, August 2025 cheese exports jumped 28% to 119.3 million pounds—but prices collapsed 13% to $1.82/lb. This is classic distress sale economics: moving volume at any price to avoid even bigger losses. When production costs sit at $18-19/cwt and you’re selling below $2/lb equivalent, every shipment deepens the red ink.

When Being the Cheapest Isn’t Actually Winning

The US dairy industry’s “record exports” mask a brutal reality: American cheese trades at $1.82/lb while European producers command $2.35/lb—a 45-60 cent disadvantage that signals desperation rather than competitive strength. When you’re underselling New Zealand butter by a full dollar per pound, you’re not winning global markets; you’re liquidating inventory below cost.

Here’s what’s bothering me about these export records. Global Dairy Trade auction results from November show American butter trading at $1.57 a pound. New Zealand? They’re getting $2.57. Our cheese is moving at $1.82 while Europeans fetch $2.27 to $2.42.

That 45 to 60 cent spread on cheese isn’t a competitive advantage. It’s desperation.

Penn State Extension’s 2025 dairy outlook shows that a typical 500-cow operation in Wisconsin or Minnesota has production costs running $18 to $19 per hundredweight. But milk prices? We’re at $16.91 for Class III according to CME October data. That’s annual losses of $32,000 to $62,000 for operations that size.

These record exports everyone’s celebrating are happening because we’re willing to sell at prices that don’t cover our costs. South Korean and Japanese buyers see cheap American dairy, and they’re stocking up. Can’t blame them. But volume at a loss isn’t success.

The Time Lag Trap We’re All Stuck In

The breeding decisions you made two years ago—when milk was over $20 per hundredweight—those heifers are just entering the milking herd now.

According to USDA’s latest milk production reports, we’ve added 200,000 cows to U.S. herds over the past 18 months. Every one of those additions made sense when the decision was made. But September production jumped 4.2% year-over-year, and we’re producing 18.3 billion pounds of milk at exactly the moment when global markets are saturated.

Your operation has maybe $300,000 to $500,000 in annual fixed costs—infrastructure doesn’t get cheaper just because milk prices drop. Equipment auction data from Machinery Pete shows you’re looking at 30 to 50% discounts from what things were worth two years ago if you try to sell now.

So we keep producing. We try to spread those fixed costs over more volume. It’s rational for each of us individually, but when everyone does it, oversupply drives prices even lower.

The Mexico Situation Nobody Wants to Talk About

While you’re focused on tariff headlines, Mexico is spending $4.1 billion to eliminate $1+ billion in US dairy imports by 2030. They’re not negotiating—they’re building processing plants in Campeche and Michoacán with 600,000-liter daily capacity and importing Holstein heifers from Australia. Mexico takes 29% of US dairy exports; losing even half that market erases profits for thousands of farms overnight.

While we’re celebrating that Mexico takes 29% of our dairy exports according to USDA Foreign Ag Service data, they announced last July that they’re spending $4.1 billion to become 80% self-sufficient in dairy by 2030.

They’re building processing facilities in Campeche and Michoacán that’ll handle 600,000 liters a day. They’ve imported 8,000 Holstein heifers from Australia—Dairy Australia confirmed that shipment. The Mexican government is guaranteeing their producers 12 pesos per liter.

Mexico buys 51.5% of all our nonfat dry milk exports, according to Export Council trade data. If they achieve even half their plan, we’re talking about losing a billion dollars or more in annual exports. This isn’t a trade dispute that’ll blow over. They’re building the infrastructure right now.

Why Powder Is Collapsing While Cheese Keeps Moving

Class III-IV pricing spread explodes to $4.06/cwt—matching 2011’s record gap and exposing dairy’s new geography of pain. Same cows, same work, but if your milk goes to butter and powder plants instead of cheese, you’re losing $15,000 monthly on a 500-cow operation. This isn’t market volatility; it’s structural divergence that’s rewriting the profitability map.

August export data shows cheese exports up 28%, but powder exports down 17.6%—the lowest August volume since 2019.

The October CME Spread tells the story:

  • Class III (Cheese): $17.81/cwt
  • Class IV (Powder/Butter): $13.75/cwt
  • Spread: $4.06/cwt—widest since 2011

For a 500-cow dairy, that’s a $50,000 swing in annual income depending purely on which plant takes your milk.

China put 125% tariffs on our dairy products back in March. We used to send them 70-85% of our whey exports. That market disappeared overnight. Processors are pushing every pound they can toward cheese because at least there’s still some margin there. Powder production? They’re running the minimum.

Different Operations, Different Realities

The dairy industry’s brutal bifurcation in one chart: mega-dairies break even at scale, mid-size operations hemorrhage $62K annually, while premium niche players bank $120K. If you’re running 500-1,500 conventional cows, you’re in the kill zone—producing milk at $17.05/cwt and selling it at $16.91. The math doesn’t work, and hoping for better prices won’t save you.

Based on the Center for Dairy Profitability at Madison and the Farm Credit System data:

Mega-dairies (3,500+ cows): Costs around $14.20 to $15.80/cwt thanks to automation and efficiency, according to Michigan State’s benchmarking study. If debt’s under 50% of equity, they can weather this storm. Some are buying out struggling neighbors at 30 to 50 cents on the dollar.

Mid-size operations (500-1,500 cows): The toughest spot. Production costs $16.30 to $17.80 based on Kansas State farm management data. With current milk prices, annual losses could exceed $400,000. Without a path to massive scale or premium markets, options are limited.

Premium niche (organic/grass-fed): Capturing $36 to $50/cwt through outfits like CROPP Cooperative are doing okay. But you need established customers near a city. Operations that went organic without premium market access are worse off than conventional farms due to higher feed costs.

Decision Time: The Next 90 Days Matter


Decision Path
Capital RequiredTimelineEquity RetainedSuccess RateKey Requirements
Exit Now (Controlled)$090-120 days85-95%95% (preserve wealth)Act before March 2026
Scale to Mega (3500+ cows)$8-15 million18-36 months20-40% (high debt)60% (if debt <50%)Low debt + expansion capital
Pivot to Premium Niche$500K-1.2M36 months (organic)70-85%70% (w/ city proximity)Within 50-100mi of major city
Status Quo / Wait & Hope$0Indefinite bleeding0-50% (forced exit by 2027)15-20% (statistically)Hope for market recovery

Based on Purdue’s Commercial Ag projections and USDA’s long-term outlook, you’ve got critical decisions to make in the next three to six months.

Considering expansion? Interest rates are 7.5 to 9% according to the Fed, ag credit conditions. Kansas State data shows that expanding when prices are falling rarely works. Maybe pay down debt instead.

Considering exit? Asset values today versus 18 months from now could be the difference between keeping most of your equity or losing it all. Equipment markets have declined for 25 straight months, according to Equipment Manufacturers data.

Considering organic/grass-fed? It’s a three-year conversion with negative cash flow. You need to be within 50 to 100 miles of a major city, based on consumer research. Penn State Extension says you need off-farm income during transition.

The Heifer Shortage Silver Lining

Here’s your silver lining in a crisis: an 800,000-head heifer shortage over two years mathematically guarantees milk production will contract 3-5% by 2027. Replacement inventory sits at 20-year lows while heifer prices exploded from $1,140 to $3,010—a 164% jump that makes expansion impossible. This forced contraction is exactly what balances supply-demand and triggers recovery. The question: will you survive to see it?

CoBank’s latest report shows we’re at 20-year lows for dairy replacement heifers. We’re short about 800,000 replacements over the next two years.

When you can get $3,500 to $4,500 for a beef-cross calf versus keeping a dairy heifer worth $800 to $1,200 in this market, the math is obvious. Progressive Dairy’s breeding survey shows most producers are making that same decision.

The dairy herd has to shrink—probably 3 to 5% by 2027, according to USDA projections. That might balance supply and demand. Rabobank and CoBank project stabilization by mid-2027, with gradual improvement into 2028.

How Geography Changes Everything

California’s Central Valley faces water costs up 40% according to UC Davis Cost Studies. Meanwhile, South Dakota State University Extension’s 2025 Feed Cost Analysis shows operations there seeing feed costs $1.50 to $2.00/cwtbelow the national average.

Texas added 50,000 cows while Wisconsin stayed flat. That’s economics playing out in real time.

What This All Means for You

Those record export numbers? They don’t mean what the headlines suggest. Moving volume at a loss is a distress sale on a national scale.

The decisions you make in the next 90 days are more important than what you do over the next year. By March 2026, many options available today won’t exist.

Mexico’s self-sufficiency plan is real. We need to plan for our biggest customer becoming a competitor. The Export Council knows it, but I’m not seeing contingency planning at the farm level.

Scale alone won’t save anyone. I’ve seen big operations with too much debt go under, and small operations with good positioning thrive. It’s about your total situation—debt levels, geographic location, market access.

The bifurcation—where you’re either huge or niche—is accelerating. If you’re in that middle range, especially 200 to 1,000 conventional cows, you need to decide which direction you’re heading.

Recovery is coming through contraction. The heifer shortage guarantees that. The question is whether you’ll be around to see it.

Looking Down the Road

By 2028, based on projections from Texas A&M and Cornell, we’ll have fewer, larger operations handling commodity production and smaller, specialized operations serving premium markets. That middle ground where many of us operated for generations is disappearing.

This isn’t random volatility. It’s industry restructuring in response to global competition, changing consumer preferences, as the Innovation Center for U.S. Dairy has tracked, and the reality of 2025 production costs.

When you see export headlines in your co-op newsletter and wonder why your milk check keeps shrinking, remember—it’s not about volume. It’s about margins. The difference between acting strategically now versus hoping things improve could be the difference between preserving or losing your family’s equity.

The herd is heading off a cliff. The record exports are just the dust they’re kicking up. Don’t follow the volume—follow the margin. The next 90 days will decide if you’re a casualty of the restructuring or one of the few left standing to see the recovery.

KEY TAKEAWAYS

  • Your daily reality: At current prices, a 500-cow dairy loses $175/day ($62,000/year). The Class III-IV spread of $4.06/cwt means the same milk yields $50,000 in different income based purely on plant destination.
  • The export trap: Record volumes are happening BECAUSE we’re desperate—selling cheese at $1.82/lb while New Zealand gets $2.42/lb isn’t winning, it’s liquidation.
  • 90-day decision window: By March 2026, you must choose—scale to 3,500+ cows, secure premium markets at $36+/cwt, or exit, preserving 85% equity (vs 0-40% if forced out later).
  • Geographic survival map: Texas/South Dakota operations save $1.50-2.00/cwt on feed. California faces +40% water costs. Location now determines viability as much as management.
  • The guarantee: 800,000-heifer shortage forces 3-5% production cut by 2027, ensuring recovery for survivors—but 40-50% of current operations won’t make it.

Complete references and supporting documentation are available upon request by contacting the editorial team at editor@thebullvine.com.

Learn More:

The Sunday Read Dairy Professionals Don’t Skip.

Every week, thousands of producers, breeders, and industry insiders open Bullvine Weekly for genetics insights, market shifts, and profit strategies they won’t find anywhere else. One email. Five minutes. Smarter decisions all week.

NewsSubscribe
First
Last
Consent

Butter Down €270, Processors Up 25%: Europe’s Dairy Collapse Hits Home

European dairy farmers are discovering that traditional market cycles no longer apply—and the implications reach far beyond the Netherlands

EXECUTIVE SUMMARY: When butter prices dropped by €270 in one week while processors reported 25% profit growth, it confirmed what many farmers suspected: the game has fundamentally changed. European cooperatives now profit from processing cheap milk rather than serving members, while retail algorithms lock in permanent price suppression—the recovery isn’t coming. With the Netherlands buying out farms for €1 million each and Germany losing eight operations a day, this isn’t a crisis; it’s a restructuring. Yet farmers capturing €0.95/liter through direct sales prove success is possible—just different than before. Smart operators are adapting now through specialty contracts, solar revenue, or value-added production, because after May 2027, government support ends, and today’s options disappear. The same patterns are emerging from Wisconsin to New Zealand, making this Europe’s story today, but everyone’s tomorrow.

dairy farm profitability

You know, when butter prices in the Netherlands dropped €270 per tonne in a single week this November—hitting €5,040, the lowest we’ve seen in two years—the phone lines lit up across dairy country. Had a Dutch producer near Utrecht tell me something that really stuck: “This isn’t like 2015. Back then, we knew it would bounce back. Now? Nobody’s sure what normal looks like anymore.”

He’s right. The European Dairy Association’s November report shows this was the steepest drop they’ve recorded since they began monitoring weekly prices in 2018. But here’s what’s got everyone talking over morning coffee—processors like FrieslandCampina are reporting strong profits while our milk checks keep getting smaller. That disconnect… well, we need to understand what’s really happening here.

“This isn’t like 2015. Back then, we knew it would bounce back. Now? Nobody’s sure what normal looks like anymore.”
— Dutch dairy farmer near Utrecht

What we’re seeing across Europe right now—this mix of cooperative changes, retail evolution, and policy shifts—it’s creating something genuinely new. And I think these patterns offer insights for all of us, whether you’re milking in Wisconsin’s rolling hills or managing pastures down in New Zealand.

KEY FACTS AT A GLANCE

The Market Situation:

  • €270/tonne butter price drop in one week (November 2025)
  • €5,040/tonne current price—24-month low
  • 56,500-tonne European butter surplus H1 2025

The Financial Picture:

  • FrieslandCampina: 25.7% profit increase H1 2025
  • Same period: 5.92 cent/liter milk price cut for farmers
  • US butter: €4,246/tonne vs. European: €5,100-5,500/tonne

The Demographics:

  • 12% of EU farmers are under 40 years old
  • 58% over 55 years old
  • Germany is losing 2,800 farms annually

The Policy Framework:

  • €32 billion Dutch nitrogen reduction program
  • €1 million average transition support per farm
  • 70% nitrogen reduction targets in 131 areas by 2030
With 58% of EU dairy farmers over 55 and Germany bleeding 8 operations daily, the demographic cliff isn’t coming—it’s here. This isn’t a crisis; it’s a restructuring that’s creating opportunities for prepared operators while crushing those waiting for ‘normal’ to return.

The Numbers Tell a Story We Can’t Ignore

European butter prices collapsed €270 in a single week to hit €5,040 per tonne—the lowest level in 24 months. This isn’t your grandfather’s market cycle; it’s a structural breakdown that signals permanent change in dairy economics.

So here’s what’s interesting—and the scale is pretty remarkable when you dig into it. The Agriculture and Horticulture Development Board’s latest assessment shows that European butter production alone created a 56,500-tonne surplus in the first half of 2025. That breaks down to 37,500 tonnes from increased production, 6,500 from exports drying up, and another 12,500 from higher imports. We aren’t talking minor fluctuations here.

What really gets me is how the processors are doing. FrieslandCampina’s July report showed their profits jumped 25.7% in the first half of 2025—we’re talking €301 million to €363 million. Then October rolls around, and they announce a 5.92-cent-per-liter cut to November milk prices. That’s… that’s one of the biggest monthly drops I’ve seen in years.

Dr. Alfons Oude Lansink over at Wageningen put it perfectly when talking to Dairy Global recently. He said we’re seeing processor profitability completely decouple from what farmers are getting paid. The old assumption—that cooperative success meant member success—well, that’s being challenged in ways we haven’t seen before.

And the international price gap? Man, that’s something else. Vesper’s August analysis has European butter at €5,100-5,500 per tonne, while the USDA shows American butter at €4,246 per tonne. That’s a $1.26-per-pound difference. Usually, these gaps close within months, right? This one’s been hanging around nearly a year now. Makes you think we’re dealing with something more permanent than temporary market hiccups.

How Our Cooperatives Changed While We Weren’t Looking

I’ve been watching cooperatives for over twenty years, and what’s happened recently… it’s remarkable how fast things shifted. Remember when cooperatives were basically just marketing organizations for our milk? That model—the one many of us grew up with—has morphed into something way more complex.

Take FrieslandCampina. Their 2024 annual report shows they’re processing 19 billion kilograms of milk across 30 countries. Think about that scale for a minute. It requires management structures that would’ve been unimaginable when most of us started farming. There’s now multiple layers between your morning milking and the boardroom decisions that affect your milk check.

While FrieslandCampina’s profits soared 25.7% to €363 million, member farmers saw milk prices slashed 11.4% to 54 cents per liter. This is the fundamental disconnect reshaping European dairy—cooperatives now profit from cheap milk rather than serving members.

Jan Willem Straatsma—farms 140 cows near Leeuwarden and serves on the Members’ Council—he told me something that really resonates: “We still have voting rights, but the distance between my morning milking and boardroom decisions has grown considerably.” I think that captures what a lot of us are feeling, doesn’t it?

What’s really shifted in these modern cooperatives:

  • They’re pouring money into processing assets—FrieslandCampina spent over €500 million on capital expenditure in 2024 alone
  • Member equity requirements? Up about 40% over the past decade, according to Rabobank’s analysis
  • Governance now includes folks who, let’s be honest, probably haven’t mucked out a stall in their lives
  • Payment formulas have gotten so complex that neighbors with nearly identical operations can have vastly different milk checks

The guaranteed price system—€55.63 per 100kg in the first half of 2025—sure, it provides some stability. But when butter tanks while cheese holds steady, cooperatives have to make allocation decisions. And understanding how those decisions get made… that’s becoming crucial for all of us.

The Retail Game Has Completely Changed

Here’s something that might surprise folks back home: German grocery retail has consolidated to where just four groups control between 65.9% and 85% of the market. We’re talking Edeka, Rewe, Aldi, and Schwarz Group—they run Lidl and Kaufland. The German Federal Statistical Office confirmed these numbers for 2025, and honestly, the implications are huge.

But what’s really wild is how technology’s changed pricing. Had a procurement manager from one of these chains explain it to me recently—didn’t want his name used, understandably. He said their systems constantly scan competitor prices, and when one store drops butter to €1.59, the others match within hours. All automatic. The computers handle the routine stuff while humans oversee strategic decisions.

“Our systems continuously monitor competitor pricing. When one retailer adjusts butter to €1.59, others typically match within hours.”
— German retail procurement manager

This creates what the academics call price convergence. Studies of German retail markets found butter prices across major chains vary by less than 2% on any given day. That’s… that’s basically identical pricing achieved through algorithms, not people sitting down together.

What’s this mean for us? Well, I was working with some Bavarian producers recently, and we calculated that retailers are selling butter at €1.59 per 250g while the actual milk cost for butter production runs about €11.50 per kilogram. That’s an €8 per kilo loss they’re taking.

Professor Hermann Simon at Cologne’s Retail Research Institute explained it pretty clearly—butter’s just the hook. Gets customers in the door. Then they make margins of 40-70% on everything else in the cart. So basically, our product is subsidizing their profit model. Tough pill to swallow, isn’t it?

Policy Changes That Are Reshaping Everything

The Netherlands’ nitrogen rules—probably the biggest agricultural policy shift we’ve seen in Europe in decades. Government documentation outlines requirements for a 70% reduction in 131 areas near protected sites by 2030. And folks, these aren’t minor tweaks we’re talking about.

Dutch farmers face brutal math: invest €300,000 to meet nitrogen mandates or take the €1 million buyout and retire with dignity. With that typical 58-year-old farmer whose son’s an Amsterdam engineer, the spreadsheet tells the story before emotion enters the room.

The money behind it is substantial, I’ll give them that. Parliament confirmed €32 billion for the program, with €25 billion specifically for farm transitions. Works out to roughly a million euros per farm for those taking the exit package. Real money.

Met a producer near Zwolle recently who’s taking the buyout. He’s 58, son’s an engineer in Amsterdam. His logic was pretty straightforward: “Continuing would mean over €300,000 in compliance investments. The transition support lets me retire with dignity.” Hard to argue with that, you know?

The ripple effects are everywhere:

  • Lely can’t keep up with demand for their Sphere systems—€180,000 to 250,000 installed, and they’re backordered
  • Feed companies pushing additives like Bovaer—runs about €50 per cow annually, but cuts emissions 30%
  • Land prices have gone crazy—saw a hectare near Utrecht sell for €140,000, triple its agricultural value

And demographics make it all worse. Eurostat’s latest census shows only 12% of EU farmers are under 40, while 58% are over 55. Germany’s losing about 2,800 farms a year, according to their Agriculture Ministry. That’s eight operations calling it quits every single day.

What’s Happening Elsewhere

Similar patterns are popping up globally, though the details vary. Understanding these helps put our own challenges in perspective.

The American Situation

USDA’s January report documented 1,420 dairy farms closing in 2024—that’s 5% of all operations. What’s interesting is these weren’t just small farms. Average herd size was 280 cows, way above the 180-cow national average. Seems like pressure’s hitting operations across the board.

Dairy Farmers of America, which handles about 30% of U.S. milk, is facing its own issues. Court documents from Vermont show that DFA began sending more member milk to its own processing plants after buying Dean Foods. Jumped from 50% in 2019 to 66% by 2021.

Dr. Marin Bozic from Minnesota testified before Congress about this, saying that when cooperatives own processing assets, their economics benefit from lower milk procurement costs. Creates real tension with member interests. That hits home for cooperative members everywhere, doesn’t it?

Had a Minnesota producer tell me recently they’re seeing the same disconnect—cooperative doing well while members struggle. “We’re basically funding their expansion while our margins shrink,” he said. Sound familiar?

New Zealand’s Big Move

Fonterra is selling their consumer brands to Lactalis for NZ$3.2 billion—that’s huge. Works out to about NZ$1,950 per farmer-shareholder. Meaningful money, but it’s also a fundamental strategy shift.

Alan Bollard, former Reserve Bank Governor, wrote in the Herald that it shows cooperative structures can’t compete with multinational capital in value-added markets. Sobering thought, but it reflects what many cooperatives are wrestling with.

The implications? Fonterra focuses on ingredients, while Lactalis—a private French company—focuses on premium brands. That’s a big shift in who captures value.

Australia’s Retail Challenge

The Competition Commission’s recent inquiry shows Coles and Woolworths expanding beyond retail into processing. Combined 65% market share plus direct farm sourcing creates unique dynamics.

Professor Frank Zumbo from the Dairy Products Federation notes that when retailers control processing and shelf space, traditional bargaining just disappears. We’re seeing this pattern everywhere now.

Strategies That Are Actually Working

Despite all these challenges—and they’re real—I’m seeing folks find viable paths forward. Not every approach works for everyone, but understanding what’s working helps us all.

[Visual suggestion: Infographic showing labor savings with robotic systems]

Going Direct to Consumers

Visited a 65-cow operation near Cologne that switched to farmstead cheese three years back. They invested €420,000 in equipment and aging rooms—a big risk. But now they’re getting €28 per kilo for their Gouda through direct sales and restaurants.

The farmer showed me his books—they’re showing about €0.95 per liter, compared to €0.54 through traditional channels. “Building customers took two years,” he said, “and my wife handles marketing full-time. It’s really a different business entirely.”

“I’d rather be profitable at 60 cows than losing money at 600.”
— Successful small-scale producer

What makes direct marketing work:

  • Location matters: Need to be within 40km of population centers
  • Capital requirements: €300,000-500,000 minimum—banks won’t touch these projects without collateral
  • Marketing skills: Quality alone won’t sell cheese—you need marketing
  • Regulations: EU hygiene requirements are mandatory and expensive
Small-scale farmers capturing €0.95 per liter through direct sales prove success is still possible—just radically different than before. That’s a 76% premium over the €0.54 commodity treadmill, and it’s why smart operators are adapting now rather than waiting for markets to ‘recover.

Smart Technology Choices

A 200-cow operation in northern Germany cut costs by 22% by carefully adopting technology. Nothing flashy—just practical improvements.

Their approach:

  • Used robots: €180,000 for two DeLaval units, eliminated one full-time position
  • Feed optimization: TMR mixer with sensors cut feed costs by 12%
  • Solar income: €42,000 annually from barn-roof panels

“Every percentage point matters when margins are this tight,” the manager told me. “Can’t control milk prices, but we can control costs.”

Seeing similar success in the States. A Wisconsin friend installed used robots for about $165,000, with the same labor savings. California dairy added solar across their barns—covers all electricity plus $35,000 extra annually. And up in Idaho, a 300-cow operation retrofitted their parlor with activity monitors and automated sort gates for under $80,000—cut breeding costs by 25% and improved pregnancy rates. These aren’t revolutionary—just practical adaptations that work.

A 200-cow German operation slashed costs 22% with €302K in strategic tech investments delivering €120K annual savings. Nothing revolutionary—just robots for labor, solar for energy, sensors for precision. Can’t control milk prices, but you damn sure can control costs.

Creative Revenue Streams

The innovation I’m seeing is really encouraging. Bavarian operation raising 120 replacement heifers annually at €3,200 each—better margins than milk, less volatility.

Successful diversification approaches:

  • Custom heifer raising: Five-year contracts provide stability that commodity markets never offer
  • Solar leasing: €1,100 per hectare annually, minimal labor
  • Specialty contracts: Amsterdam farm getting €0.78/liter for distillery milk—44% premium

In Vermont, a farm partnered with a local creamery for cultured butter—high-end restaurants pay $0.85 per liter equivalent. The Ohio operation makes $120,000 from agritourism while maintaining 150 cows. Shows innovation isn’t always about scale.

Making Sense of the Path Forward

After all these conversations and analysis, several things are becoming clear.

Markets have fundamentally shifted. The structural changes—retail consolidation, pricing algorithms, cooperative evolution—created new equilibrium points. Planning based on old cycles won’t work anymore.

Scale doesn’t guarantee success. I’ve seen all sizes struggle and succeed. It’s about positioning and differentiation. Like one farmer said, “I’d rather be profitable at 60 cows than losing money at 600.”

Cooperative engagement matters now. Can’t be passive members anymore. Either engage actively or develop alternatives.

Compliance is permanent. Whether it’s nitrogen, water quality, or animal welfare, these requirements aren’t going away. Early adoption usually costs less than fighting it.

Demographics create opportunity. With 60% of European farmers over 55, lots of assets will change hands. Prepared operators can build good operations—just avoid the debt traps that hurt previous generations.

The Critical 18-Month Window

What I’m seeing suggests we’re in a crucial period through May 2027 where decisions really matter.

Government programs are funded, cooperative equity’s stable, land markets haven’t crashed, and interest rates are elevated but manageable. But this could all shift quickly as more people make decisions.

For that typical 55-year-old with 80 cows and €2 million debt—and I meet lots in this situation—the math’s pretty clear. At €0.54/liter milk and €0.52 costs, including debt, you’re barely breaking even. Without succession plans or premium markets, continuing might cost more than transitioning.

Financial advisor who specializes in dairy told me recently: “I don’t tell people what to do, but I make sure they understand their real numbers. Emotions are understandable, but math doesn’t lie.”

WHAT THIS MEANS FOR YOUR OPERATION

Under 100 Cows:

  • Focus on being different—direct sales, specialty products beat commodity competition
  • Technology should cut labor, not boost production
  • Consider partnerships for resources and market access

100-500 Cows (The Squeeze Zone):

  • Too small for mega-efficiency, too large for niche marketing
  • Make strategic choices: scale up with clear planning or pivot to value-added
  • Get involved in your cooperative—you need to influence decisions

Over 500 Cows:

  • Efficiency is everything—every percentage point counts
  • Diversify into energy or services for stable revenue
  • Succession planning is critical—the next generation needs a clear profitability path

The Industry Keeps Evolving

This €270 drop in butter prices isn’t just volatility—it shows fundamental changes reshaping dairy globally. Success requires different thinking than what built our industry.

Resilient operations share traits: diversified revenue streams, strong customer relationships, smart technology use, and—crucially—realistic assessment paired with decisive action.

Not everyone will make it through. We need to acknowledge that. But those who recognize the new reality early and adapt, they’ll find opportunities. Just different ones than we’re used to.

“Farming isn’t just about producing milk. It’s about making decisions that protect your family’s future. Sometimes that means knowing when to change course.”
— Dutch farmer preparing for transition

Standing in that Dutch farmer’s parlor last week, watching him prepare for his final season after decades of dedication, his pragmatism struck me. “Farming’s more than milk production,” he said thoughtfully. “It’s stewarding family resources. Sometimes wisdom means recognizing when things have fundamentally changed.”

And you know what? That might be the key insight here. Success isn’t just about perseverance anymore. Sometimes it’s recognizing when the rules changed and having the courage to adapt—whether that’s innovation, diversification, or transition.

What’s happening in European dairy right now… it’s not doom and gloom, but it’s not false hope either. It’s just reality: an industry transforming where old strategies don’t guarantee old outcomes. For those willing to see clearly and act decisively, that clarity becomes an advantage.

What matters is honest evaluation. Not wishful thinking, not catastrophizing, just a realistic assessment of where we are and where we’re headed. That’s how we make decisions that serve our operations and families.

The industry’s changing. We can change with it or get left behind. As always, the choice is ours.

KEY TAKEAWAYS:

  • The old dairy economics are dead: When processors profit from your losses, the game has fundamentally changed
  • Your cooperative isn’t your partner anymore: They profit from cheap milk, not member success—act accordingly
  • Success formula flipped: Small + specialized beats large + commodity (€0.95/L direct vs €0.54 commodity proves it)
  • 18 months until options vanish: Government support, buyout programs, and stable markets end May 2027
  • Only three strategies work now: Go direct to consumers, cut costs with technology, or exit strategically—waiting isn’t a strategy

Complete references and supporting documentation are available upon request by contacting the editorial team at editor@thebullvine.com.

Learn More:

The Sunday Read Dairy Professionals Don’t Skip.

Every week, thousands of producers, breeders, and industry insiders open Bullvine Weekly for genetics insights, market shifts, and profit strategies they won’t find anywhere else. One email. Five minutes. Smarter decisions all week.

NewsSubscribe
First
Last
Consent

The Math Doesn’t Lie: Why $16 Billion Can’t Save American Dairy

Disaster Relief Reality: $278 per Cow Recovers Loss—But a $5,600 Annual Gap Proves Dairy’s Deeper Crisis.

Executive Summary: The USDA’s $16 billion Supplemental Disaster Relief Program (SDRP) Stage 2, announced in November 2025, is targeted emergency relief approved by Congress to help producersrecover documented weather-related and natural disaster losses from 2023–2024—including forage quality, dumped milk, and infrastructure impacts—not a general economic support program or market ‘bailout’ for the dairy sector. While these funds are critical for actual disaster recovery, they highlight a deeper divide: the permanent cost-of-production gap between small and mega-dairies—a gap disaster relief cannot and is not designed to resolve.

Dairy Cost Analysis

$16 billion in weather disaster aid is historic relief, but it’s also a wake-up call about the underlying economic wounds that disaster payments alone cannot heal.

Here’s what’s happening right now with the SDRP Stage Two payments from the Farm Service Agency—the ones announced on November 16th. A typical 300-cow Wisconsin operation with documented disaster losses could receive around $83,000. That’s roughly $278 per cow, give or take. Meanwhile, that 2,000-cow dairy out in Idaho? They hit the payment cap at $250,000, which works out to just $125 per cow.

On paper, smaller operations may appear to benefit more from per-cow relief. But these disaster payments, crucial for documented weather-related recovery, are not intended nor able to equalize ongoing production costs or ensure long-term survival in commodity markets.

What SDRP Stage 2 Actually Is: Appropriated by Congress, SDRP Stage 2 is strictly designed to compensate documented weather and natural disaster losses—such as drought-, flood-, smoke-, or freeze-driven impacts on milk, forage, or storage. This is not an open-ended economic aid or safety net for all farms, but targeted disaster coverage accompanying events in 2023 and 2024. Producers seeking specific payment estimates or qualification should review the official USDA checklist and apply through their local FSA office. Official details and eligibility: www.fsa.usda.gov/sdrp.

Understanding the Real Math Behind These Payments

The structural cost disadvantage facing small dairy operations is mathematically insurmountable—no disaster payment can bridge a $23.56/cwt permanent gap when mega-dairies operate at less than half the cost of farms with fewer than 50 cows

You know, I’ve been going through the payment structures with a few neighbors, and it’s easier to see the whole picture when you lay it out in a table:

Farm SizeEst. Relief PaymentPayment CapCost of Production/cwt
300 Cows~$83,000 ($278/cow)$125k-$250k~$25-28
2,000 Cows~$250,000 ($125/cow)$250k (Capped)~$19.14
Small (<50 cows)~$13,900 ($278/cow)$125k~$42.70

What’s really telling here—and the folks at the Center for Dairy Profitability at UW-Madison have been tracking this all year—is that many 300-cow operations in Wisconsin have been running negative margins for months now. So when you get a payment that covers maybe 16 months of those losses… sure, it helps. Absolutely. But it’s not changing the fundamental math we’re all dealing with.

Let’s be brutally honest about what even historic emergency relief can—and can’t—do for long-term economics. The SDRP Stage 2 payments, as outlined by USDA in November, are strictly for compensating weather and disaster losses: milk dumped, forage destroyed, inventory ruined. But once those bills are paid, the day-to-day reality is still a cost structure gap so wide that no single disaster relief check closes it.

USDA Data Reveals Massive Cost of Production Gap

The USDA Economic Research Service published some data in their 2024 cost of production report that… well, it’s eye-opening. You ready for this?

Small operations—we’re talking under 50 cows—are averaging $42.70 per hundredweight in total production costs. The mega-dairies with 2,000-plus cows? They’re down at $19.14 per hundredweight.

That’s a $ 23.56-per-hundredweight permanent disadvantage—over $5,600 per cow annually.

Just… think about that for a minute. When you run those numbers annually—and most of us figure about 240 hundredweight per cow per year—you’re looking at a structural disadvantage that no disaster payment can overcome. Not this one, not the next one.

I was reading through some research from dairy economists at UW-Madison recently, and they make a point that’s hard to argue with: these aren’t inefficiencies that better management can fix. We’re talking structural cost advantages here:

  • Labor utilization—one worker handling 80 cows versus 150 or more
  • Feed purchasing power—buying by the ton versus by the rail car
  • Equipment costs are spread over way more units of production

You can be the best manager in the world with 100 cows—and I know some who are—and still face these disadvantages.

What Different Sized Operations Are Actually Doing

While small farms receive higher per-cow payments ($278 vs. $125), they face an insurmountable $5,600 annual structural cost disadvantage—making these relief funds temporary breathing room, not救ue solutions

I’ve been talking with extension folks across Wisconsin, Pennsylvania, and Idaho lately, trying to get a sense of how farms are actually using these payments. The patterns are pretty revealing—and they vary dramatically by operation size.

Operations Under 200 Cows: Buying Time or Buying Out

Based on what extension educators across Wisconsin are observing, there’s been a notable uptick in farms asking about exit strategies right alongside their SDRP payment applications. It’s particularly noticeable among operations under 150 cows, and honestly, who can blame them?

But here’s what’s encouraging—the ones staying in traditional dairy are getting creative:

  • Direct-to-consumer relationships—farm stores, delivery routes, that kind of thing
  • Organic certification—and those $8-12 per hundredweight premiums that USDA’s Agricultural Marketing Service has been tracking are real
  • On-farm processing—cheese, ice cream, yogurt operations that capture those retail margins

Mid-Size Operations (200-500 Cows): The Efficiency Push

This group’s in a tough spot, you know? They’re too big to pivot to niche markets easily, but not quite large enough for full economies of scale.

What I’m hearing from Farm Credit folks and in extension discussions throughout 2025 is that there’s a strong interest in technology investments among these mid-size operations. They’re using relief funds as the capital they’ve been waiting for:

  • Activity monitors for better reproduction management
  • Automated calf feeders—especially with labor running $15-20 per hour plus benefits, according to National Milk Producers Federation data
  • Parlor upgrades targeting real efficiency gains

Cornell PRO-DAIRY’s analyses have emphasized that these farms need to get below $22 per hundredweight to remain viable in the long term. The smart ones I’ve talked to are using these payments for targeted investments toward that goal. It’s strategic thinking, not panic spending.

Larger Operations (500+ Cows): Environmental and Expansion

The bigger operations? Different game entirely. Many are putting relief funds toward environmental compliance—and honestly, that’s just smart planning. California’s methane reduction requirements are going full force by 2030, and you know other states are watching closely. Better to get ahead of it than scramble later.

The Young Farmer Perspective: Mathematically Impossible Entry

Here’s something that keeps me up at night. The average dairy farmer is 58 years old—that’s from the 2022 USDA Census of Agriculture. The barrier to entry for a 25-year-old today isn’t just hard—it’s mathematically impossible without inheritance or massive leverage.

Federal Reserve Bank of Chicago’s agricultural land value reports from the first three quarters of 2025 show dairy-quality farmland in Wisconsin ranging from approximately $8,000 to $12,000 per acre. Add in livestock, equipment, and facilities—you’re looking at a minimum of $3-5 million for a competitive operation. That’s before you’ve produced a single pound of milk.

“If farms with no debt are struggling, what chance does someone have starting with modern debt loads?”

That’s what a young farmer asked me last week, and I didn’t have a good answer.

Some young farmers are finding creative entry paths, though:

  • Management agreements with retiring farmers—gradual ownership transition
  • Starting with contract heifer raising before moving into milking
  • Intensive grazing systems that need less upfront capital
  • Minority ownership partnerships in established operations

But let’s be honest—these are exceptions, not the rule.

The Mental Health Crisis Nobody’s Measuring

Here’s something that doesn’t show up in any payment calculations but affects every decision we make: the stress factor. Research on farmer mental health—and university extension services have been tracking this closely—consistently shows elevated stress levels among dairy producers. Younger farmers are particularly affected.

Agricultural economists have noted that farmers often make decisions based on stress reduction rather than pure economic considerations. A payment providing 16 months of breathing room might be worth more psychologically than financially. And you know what? That’s completely valid.

Extension agents are reporting increased interest in:

  • Simplified systems that reduce management complexity
  • Seasonal calving to create actual downtime
  • Partnerships that share the management burden
  • Exit strategies that preserve dignity and family relationships

There’s no shame in any of those choices. None whatsoever.

Cross-Border Reality Check: Canadian “Stability” at What Cost?

Can’t really discuss American dairy economics without acknowledging what’s happening north of the border. Canada’s supply management system maintains about 9,000 dairy farms with remarkable stability. They announced 2025 price adjustments to account for inflation, maintaining their cost-of-production pricing formula. No emergency payments needed. No mass exodus from dairy.

But here’s the catch—and Canadian farmers will tell you this immediately—according to Dairy Farmers of Ontario quota exchange data, quota values have been running CAD $25,000 to $30,000 per kilogram of butterfat in recent transactions. That’s essentially a mortgage on your right to produce milk—something we don’t face here in the States.

The tradeoff? Well, predictable margins enable completely different business planning than our volatile commodity markets. Whether that’s “better” is a political debate for another day—probably best saved for when we’re not trying to figure out how to pay next month’s feed bill.

Five Brutal Truths About Making Decisions Right Now

For many farms, the $83,000 weather disaster relief payment—while life-saving after catastrophic losses—only buys about 16 months at current structural margins. When SNOW, drought, or fire is past, cost-of-production gaps remain; that’s why 2,800 operations closed this year, even with relief. For some, these disaster payments are a bridge as much as a recovery grant.

After all this analysis and talking with farmers across multiple states, here’s what seems most relevant if you’re trying to make decisions right now:

1. Know your real position: Calculate your actual cost per hundredweight. The Dairy Profit Monitor tools from Wisconsin, Cornell, and Penn State extension services can help with this. If you’re producing at $35 or more when efficient operations are at $20… that gap won’t close without fundamental changes.

2. Treat relief payments as capital, not income: Strategic improvements compound over time. Operating losses? They just come back next quarter.

3. Set realistic timelines: Give yourself 3-5 years to hit profitability targets. If structural disadvantages—not just bad years—prevent reaching those targets, having an exit strategy isn’t giving up. It’s responsible management.

4. Explore alternative models seriously: Grass-based systems, organic production, on-farm processing, agritourism—these aren’t easy pivots, but they can offer margins that commodity production just can’t match anymore. Cornell’s Dairy Farm Business Summary shows that organic operations often see $3-5 per hundredweight higher margins, though with different risk profiles.

5. Protect your mental health: Farm Aid’s hotline at 1-800-FARM-AID offers confidential support. Many states now have farm-specific mental health programs, too. No operation—and I mean this—is worth destroying your family or your wellbeing.

The Bottom Line: Dairy’s Structural Transformation Is Here

Dairy consolidation accelerates as America loses three farms daily while milk production increases—mega-operations with 2,500+ cows now drive industry growth, rendering the traditional family dairy model economically obsolete

Looking at how these payments land across different operations, it’s clear we’re witnessing a structural transformation, not just another rough patch. Based on consolidation patterns we’ve seen over the past decade, we’re likely to continue seeing fewer but larger farms—the National Milk Producers Federation and various agricultural economists have all been pointing to this trend.

But here’s what’s important, and what often gets missed in these discussions: fewer farms doesn’t automatically mean less opportunity for those who remain or enter strategically. The operations that survive and thrive will be those that either achieve commodity-scale efficiency or successfully differentiate into premium markets. There’s not much room left in the middle, unfortunately.

Success increasingly depends less on production excellence alone and more on strategic positioning.

You can have the best cow care and highest production in the world—and I know farmers who do—but if you’re in the wrong cost structure for your market position, excellence alone won’t save you.

These disaster relief payments offer crucial help after real, often catastrophic losses. But as storms pass and immediate recovery ends, the economic realities for U.S. dairy remain unchanged. Surviving and thriving beyond the next weather event will require structural solutions—relief alone isn’t enough. In an industry where crisis so often drives decision-making, that breathing room might be the most valuable aspect of all.

Because at the end of the day—and we all know this deep down—what matters isn’t whether you get $278 or $125 per cow in relief. What matters is understanding where your operation fits in dairy farming’s evolving structure and making informed decisions based on that reality.

The farms that do that, regardless of size? Those are the ones that’ll still be shipping milk in 2030 and beyond. And I hope yours is one of them.

The Bullvine’s analysis is grounded in publicly available research (USDA ERS, land-grant university economics, and direct extension interviews). All numbers are attributed, and cost estimates are taken directly from federal research. If your real-world experience varies or you have case-study data, we invite you to contribute insights or corrections for future reporting.

Complete references and supporting documentation are available upon request by contacting the editorial team at editor@thebullvine.com.

Key Takeaways:

  • Your True Position: If your operation depends on recurring weather disaster relief but your costs exceed $30/cwt, these programs help you recover from one storm—not from year-over-year competitive losses.
  • Strategic Capital Decision: That $83,000 payment offers three real choices: invest in efficiency tech (if you’re within striking distance of $22/cwt), pivot to premium markets ($8-12/cwt organic premiums), or exit with dignity while equity remains.
  • 16-Month Clock: Most disaster payments cover up to 16 months of losses; use this window for strategic plans, not hoping tough math will disappear.

Learn More:

The Sunday Read Dairy Professionals Don’t Skip.

Every week, thousands of producers, breeders, and industry insiders open Bullvine Weekly for genetics insights, market shifts, and profit strategies they won’t find anywhere else. One email. Five minutes. Smarter decisions all week.

NewsSubscribe
First
Last
Consent

The $300 Million Overrun You’re Paying For: Inside Dairy’s $11 Billion Labor Crisis

What farmers are discovering about the gap between processing expansion and workforce reality—and the practical lessons emerging from projects like Darigold’s Pasco plant

EXECUTIVE SUMMARY: The U.S. dairy industry is pouring $11 billion into processing plants it can’t staff—and farmers are paying for this disconnect through devastating milk check deductions. Darigold’s Pasco facility exemplifies the crisis: costs exploded from $600 million to over $900 million, forcing 300 member farms to cover the overrun at $4 per hundredweight, slashing their income by 20-25%. This infrastructure boom collides with an existential workforce crisis where immigrant workers, who produce 79% of America’s milk, face deportation while dairy remains locked out of legal visa programs that other agricultural sectors freely use. Farmers had no vote on these massive expansions, yet cooperative governance ensures they absorb all losses while contractors pocket overrun profits and board members face zero consequences. Some producers are finding lifelines through direct-to-consumer sales (commanding 400-600% premiums), smaller regional cooperatives, and strategic production management, but these are individual escapes from a systemic failure. Without fundamental reforms in cooperative governance and immigration policy, the industry will complete these factories just in time to discover there’s nobody left to run them—or milk the cows.

dairy governance risk
The largest ever investment in Darigold’s 100-year history, the Pasco plant stands to solidify the Northwest region among dairy producing regions for generations to come.

You know that feeling when you watch a neighbor build a massive new freestall barn, and you can’t help but wonder—who exactly is going to milk all those cows?

That’s not just a neighborhood curiosity anymore. It is the $11 billion question hanging over the entire dairy industry. Except we aren’t talking about barns; we’re talking about processing plants. And the answer is costing you $4.00 per hundredweight.

[IMAGE TAG: Wide shot of massive dairy processing plant under construction with empty parking lots]

So here’s what’s happening. When Darigold opened its new Pasco, Washington processing facility this past June, they had every reason to celebrate. The 500,000-square-foot facility can handle 8 million pounds of milk daily—that’s enough capacity to churn out 280 million pounds of powdered milk and 175 million pounds of butter annually. The technology really is impressive—state-of-the-art dryers, low-emission burners, the whole nine yards.

But here’s where it gets complicated, and you probably know where I’m going with this. That shiny new plant ended up costing over $900 million, even though the original budget was $600 million. That’s a 50% overrun, and if you’re shipping to Darigold, you already know who’s paying for it—their 300 member farms are covering it through that $4 per hundredweight deduction from milk checks.

Darigold’s Pasco plant overran by $300M—and 300 member farms absorbed it all through $4/cwt deductions

I’ve been talking with producers who say it accounts for 20-25% of their payments. Think about that for a minute. You’re already juggling feed costs that won’t quit, trying to find workers who’ll actually show up, dealing with market swings that’d make your head spin, and suddenly a quarter of your milk check disappears to cover someone else’s construction overrun.

“A quarter of your milk check disappears to cover someone else’s construction overrun while you struggle with feed costs, labor shortages, and market volatility.”

What’s interesting is that Pasco isn’t some weird outlier. The International Dairy Foods Association released their October report showing we’re looking at over $11 billion in new processing capacity coming online between now and 2028. We’re talking over 50 major projects here—it’s the largest infrastructure expansion I’ve seen in… well, honestly, ever.

And yet—and this is the kicker—this massive bet on processing capacity is running headfirst into a reality that anyone who’s tried to hire a milker recently knows all too well. We simply can’t find enough workers to operate the facilities we’ve already got, let alone staff new ones.

Quick Facts: The $11 Billion Reality Check

  • Total Infrastructure Investment: $11+ billion (2025-2028)
  • Major Projects: 50+ processing facilities announced or under construction
  • Darigold Overrun: $300 million (50% over budget)
  • Farmer Impact: $4/cwt deduction = 20-25% payment reduction
  • Farms Closing in 2025: 2,800 operations
  • Workforce Reality: 51% immigrant workers producing 79% of the U.S. milk

Understanding the Infrastructure Surge

Let me walk you through what’s actually being built out there, because the scale really is something else.

Chobani broke ground on a $1.2 billion facility in Rome, New York, back in April. Governor Hochul’s office is promising 1,000+ jobs and the capacity to process 12 million pounds of milk daily. Now, I’ve driven through that region recently—beautiful country, no doubt about it. But here’s what’s nagging at me: New York lost more than half its dairy farms between 2009 and 2022. The Census of Agriculture data doesn’t lie. So where exactly is all that milk going to come from?

Then you’ve got Hilmar Cheese Company’s operation in Dodge City, Kansas. It’s a $600+ million plant that started running this past March. They designed it to process 8 million pounds of milk daily, supposedly creating 250 jobs. But here’s what’s interesting—and this is November, mind you—they’re still scrambling to fill critical positions. Maintenance mechanics, facilitators, and milk receivers for night shifts. These aren’t entry-level gigs where you can train someone up in a week. These are technical roles that require people who know what they’re doing.

Fairlife—you know, the Coca-Cola folks—they’re building a $650 million ultra-filtration facility in Webster, New York. It’s part of what the state’s calling a $2.8 billion surge in dairy processing investments. Largest state investment in the nation, they say.

Michael Dykes, over at the International Dairy Foods Association, he’s confident about all this expansion. In their October industry report, he said: “Don’t fret for one moment—dairy farmers hear the market calling for milk. Milk will come.”

I appreciate the optimism, I really do. And on paper, it makes sense. Global dairy demand is growing, especially in Southeast Asia. Export opportunities are expanding. Processing innovation is creating new product categories we couldn’t have imagined ten years ago.

What could go wrong, right?

Well, let me tell you what’s already going wrong.

The Labor Reality Check

[IMAGE TAG: Split screen showing empty milking parlor positions vs. ICE raid at dairy farm]

Here’s the number that should keep every processor awake at night—and probably keeps many of you awake too. Texas A&M did a study in 2023, and the National Milk Producers Federation confirmed it: 51% of the dairy workforce consists of immigrant workers who produce 79% of America’s milk supply. I’ve cross-checked these numbers with multiple sources. If anything, they might be conservative.

Meanwhile—and this is where it gets frustrating—the H-2A temporary agricultural worker program has grown from about 48,000 certified positions back in 2005 to nearly 380,000 in fiscal 2024. Department of Labor tracks all this. But dairy? We’re completely locked out. Why? Because their regulations say work has to be “seasonal or temporary.”

Last I checked, cows need milking 365 days a year. They don’t take vacations.

“51% of the dairy workforce consists of immigrant workers who produce 79% of America’s milk. Yet dairy is locked out of H-2A visas because cows don’t take vacations.”

51% of dairy workers produce 79% of U.S. milk—the uncomfortable truth about American agriculture

What really gets me is that sheep herding operations—sheep herding!—have H-2A access, even though that’s year-round work too. It’s right there in the H-2A Herder Final Rule if you want to look it up. Jaime Castaneda, who handles policy for the National Milk Producers Federation, he’s been beating this drum for years. As he told me, “We have written to the Department of Labor a number of different times and actually even pointed to the fact that the sheep herding industry has access to H-2A, and it’s a very similar industry to dairy.”

But nothing changes.

And it’s not just dairy facing this squeeze. The Associated Builders and Contractors released its 2025 workforce report: the construction industry needs 439,000 additional workers this year just to meet demand. This labor shortage is exactly what’s driving delays and cost overruns on these dairy processing projects. Darigold learned that the hard way.

Workforce Crisis by the Numbers

Let me give you the regional breakdown, because it varies depending on where you’re farming:

  • Wisconsin: The University of Wisconsin School for Workers did a survey in 2023. Found that 70% of dairy workers are undocumented. Seven out of ten.
  • South Dakota: The Bureau of Labor Statistics shows unemployment under 2%. You literally cannot find local workers.
  • Looking ahead, USDA’s Economic Research Service forecasts 5,000 unfilled dairy jobs by 2030.
  • Worst-case scenario: Cornell’s research suggests that if we saw full deportation, milk prices could rise by 90% and we’d lose 2.1 million cows from the national herd.

Lessons from the Darigold Experience

So let me dig into what actually happened with Darigold, because if you’re in a co-op—and most of us are—there are some important lessons here.

What Went Wrong

Back in September 2024, Darigold sent out an update to members trying to explain the delays and cost overruns. I’ve reviewed their communications and spoken with affected producers. Here’s what really happened.

First off, supply chain disruptions hit way harder than anyone expected. And I’m not talking about generic delays here. The specialized dairy processing equipment—most of it comes from Europe—faced 12-18 month lead times instead of the usual 6-9 months. When you’re building something this complex, one delayed component throws everything off. It’s like dominoes.

Second, building regulations changed mid-construction. The Port of Pasco confirmed this in their regulatory filings. These weren’t just minor tweaks either. We’re talking structural changes that required completely new engineering calculations, new permits, and the works.

Third—and this is what really killed them—labor shortages in construction trades meant paying absolutely premium rates for skilled workers. You need specialized stainless steel welders who can work to food-grade standards? You can’t just grab someone off the street. Local construction sources tell me these folks were commanding $45-50 per hour plus benefits. And honestly? They were worth it because you couldn’t get the job done without them.

The plant was originally supposed to open in early 2024. It didn’t actually start operations until mid-2025. By September 2024, Stan Ryan, Darigold’s CEO, had to admit to the Tri-City Herald that it was only 60% complete, with costs already over $900 million.

How Farmers Are Paying the Price

This is where it gets personal for a lot of us. To cover the overrun, Darigold implemented what they’re calling a “temporary” deduction structure. I’ve seen the letters they sent to members. The language is… well, it’s stark.

Jason Vander Kooy runs Harmony Dairy near Mount Vernon, Washington—about 1,400 cows with his brother Eric. What he told Capital Press in May really stuck with me:

“There are a lot of guys who don’t want to quit farming, but can’t keep farming if this continues. The problem is we don’t have any other options. We just can’t leave the plant half constructed and walk away.”

Dan DeRuyter’s operation in Yakima County? They lost almost $5 million over 2 years due to these deductions. Five million. He told Capital Press, “It’s awful. I can’t go on much longer. I don’t think producers will be able to stay in business.”

“Dan DeRuyter’s dairy lost almost $5 million over two years from deductions to cover Darigold’s construction overruns. ‘I don’t think producers will be able to stay in business.'”

What strikes me about these stories—and maybe you’re feeling this too—is that these aren’t struggling operations. These are successful, multi-generational farms that suddenly find themselves cash-flow negative because of decisions they had no real say in making.

John DeJong’s family has been shipping to Darigold for 75 years. Seventy-five years! He put it pretty bluntly: “The deduction has eliminated investment. We’re more in survival mode. This is not a sustainable position—to dip into producers’ pockets.”

The Governance Question

Now, this is where things get interesting—and maybe a little uncomfortable—from a cooperative governance perspective.

Darigold said in their June announcement that “farmer-owners approved the Pasco project in 2021.” But when you dig into what that actually means… well, it’s not what most folks would consider democratic approval.

Based on how cooperative governance typically works—and on the extensive research by agricultural law experts at the University of Wisconsin—the approval probably came through board representatives rather than a direct member vote. Think about it. When was the last time your co-op asked you to vote on specific project budgets? On contractor selections? On who bears the risk if things go sideways?

Cornell’s cooperative research program has documented this pattern. Major capital investments often proceed based on board decisions, with members learning about cost overruns only when the deductions appear on milk checks.

I should mention that when I reached out, Darigold declined to provide specific details about their member approval process. They cited confidentiality of internal governance procedures. Make of that what you will.

The Immigration Policy Disconnect

You can’t talk about dairy labor without addressing the elephant in the barn—immigration policy. And boy, is this getting complicated.

Farmers Caught in Political Contradictions

I’ve spent a lot of time talking with farmers about this lately, and the cognitive dissonance is real.

Take Greg Moes. He manages a four-generation dairy operation near Goodwin, South Dakota, with 40 workers—half of them foreign-born. There was this CNN interview back in December that’s been making the rounds. Moes said: “We will not have food… grocery store shelves could be emptied within two days if the labor force disappears.”

Then there’s John Rosenow, who runs Roseholm-Wolfe Dairy up in Buffalo County, Wisconsin. Eighteen workers, half foreign-born. He told PBS Wisconsin this past October: “I’m out of business. And it wouldn’t take long.”

“We’re voting against our own workforce. I’m not making a political statement here, just observing the contradiction that’s tearing rural communities apart.”

What’s fascinating—and frankly, a bit troubling—is how many of these same farmers vote for politicians promising strict immigration enforcement. It’s like we’re voting against our own workforce. I’m not making a political statement here, just observing the contradiction that’s tearing rural communities apart.

Real-World Impact of Enforcement

And this isn’t theoretical anymore.

This past June, Homeland Security Investigations raided Isaak Bos’s dairy in Lovington, New Mexico. Multiple news outlets covered it. The operation lost 35 out of 55 workers in a single day. Milk production basically stopped. Bos had to scramble—brought in family members, high school students on summer break, anybody who could help keep the livestock alive.

Dorothy Elliott’s Drumgoon Dairy in South Dakota went through an I-9 audit. The Argus Leader reported she went from over 50 employees down to just 16. As she told reporters, “We’ve effectively turned off the tap, yet we have not made any efforts to establish a solution for acquiring employees in the dairy sector.”

What I’ve noticed—and maybe you’ve seen this too—is that after these raids, remaining workers often self-deport out of fear. It creates this cascade effect that ripples through entire dairy regions. One raid, and suddenly everybody’s looking over their shoulder.

Understanding the Financial Flow

When we talk about a $300 million cost overrun, it’s worth understanding where that money actually goes—and who absorbs the losses. This isn’t abstract accounting. It’s real money from real farms.

Who Profits from Overruns

So I’ve been looking into this based on construction industry analysis and Engineering News-Record’s contractor rankings.

Construction contractors like Miron Construction—they had $1.74 billion in revenue in 2024, according to ENR’s Top 400 list—typically operate under cost-plus contracts. Their fees increase in proportion to project costs. When projects run over? Their percentage-based fees go up, too. It’s built into the system.

Design firms like E.A. Bonelli & Associates, who designed Darigold’s facility, typically charge 6-12% of total construction costs. That’s standard according to the American Institute of Architects. So a $300 million overrun? That can mean millions more in design fees. Not a bad day at the office.

Equipment vendors benefit from supply chain premiums and change orders. When specialized European equipment is scarce—and it has been—vendors can command premium prices. I’ve seen quotes for processing equipment jump 30-40% during the pandemic supply crunch. Supply and demand, right?

Public entities, such as the Port of Pasco, invested $25+ million in infrastructure to support the project, according to port commission records. They get the economic development win, the ribbon-cutting photo ops, regardless of whether farmers can afford the milk check deductions.

The Processor’s Perspective

Now, to be fair, I did reach out to several processor representatives to get their side of the story. Darigold declined specific comment, but an IDFA spokesperson—speaking on background—made some points worth considering:

“Processors are caught between rising global demand and workforce constraints just like farmers. These investments are made with 20-30 year horizons. Yes, there are challenges today, but we believe in the long-term future of American dairy. The alternative—not investing in capacity—means losing market share to international competitors.”

That’s a reasonable position. It really is. Even if it doesn’t help farmers paying today’s deductions for tomorrow’s theoretical benefits.

Who Bears the Cost

But at the end of the day, it comes down to this: the financial burden falls squarely on cooperative members. The 300 Darigold farms absorbed every penny of that overrun through milk check deductions. They had no direct vote on contractor selection. No control over budget management. No recourse when costs exploded.

“300 Darigold farms absorbed every penny of a $300 million overrun. No vote on contractors. No control over budgets. No recourse when costs exploded.”

Practical Paths Forward for Farmers

Given all these structural challenges, what realistic options do we actually have? I’ve been tracking several strategies that producers are using to create some alternatives.

1. Diversification Beyond Cooperatives

Direct-to-consumer sales are providing some farmers with genuine pricing power. The Farm-to-Consumer Legal Defense Fund tracks this—28 states now allow raw milk sales in some form. Farmers I’ve talked with are getting $8-12 per gallon. That’s a 400-600% premium over conventional farmgate prices.

Direct-to-consumer sales command 400-600% premiums over commodity milk—a viable escape route from cooperative dependency

Cost Comparison Reality Check: Let me break down the numbers:

  • Conventional milk price: $18-20/cwt (works out to roughly $1.55-1.72/gallon)
  • Direct raw milk sales: $8-12/gallon
  • Investment needed: $50,000-150,000 for on-farm processing setup
  • Payback period: Generally 18-36 months if you shift 20% of production to direct sales

Even moving 20% of your production to direct sales can fundamentally change your negotiating position. You’re no longer completely dependent on that co-op milk check.

Dan Stauffer, a California dairy farmer I know, started an on-farm creamery specifically because—as she put it—”the $4.00 deduct combined with all the other standard deductions has made it impossible for us to cash flow.” She didn’t wait for reform. She built an alternative.

One important note, though: regulations vary significantly by state. What works in Pennsylvania won’t necessarily fly in Wisconsin. Always check with your state department of agriculture before making any moves.

2. Regional Cooperative Alternatives

Some farmers are successfully exploring smaller, regional cooperatives with more transparent governance. Research from the University of Wisconsin Center for Cooperatives shows these smaller co-ops often feature:

  • Direct member voting on major investments (imagine that!)
  • Transparent pricing tied to actual costs
  • Limited or no speculative facility construction
  • Focus on value-added products rather than commodity volume

The challenge? Leaving a major cooperative often involves exit fees, equity complications. But here’s what I’m seeing—when groups of farmers coordinate their intentions (legally, of course), cooperatives sometimes become more flexible on governance reforms. Funny how that works.

3. Advocacy for Practical Reforms

Rather than waiting for comprehensive federal legislation—which, let’s be honest, probably isn’t coming anytime soon—farmers are pursuing achievable state-level reforms.

In Wisconsin, a group of farmers filed formal complaints with the state Department of Agriculture regarding violations of cooperative governance. Outcomes are still pending, but it’s gotten attention.

Similarly, farmers in New York are working with their state attorney general’s office on transparency requirements for agricultural cooperatives. These aren’t radical demands. Just basic stuff like seeing the actual construction contracts before being asked to pay for overruns.

4. Strategic Production Management

This one’s delicate, but some farmers are discovering they can influence cooperative behavior through coordinated (but legal) production decisions. If enough members strategically manage production volumes, it creates leverage for governance reforms.

I’m not talking about illegal collusion here. Just individual business decisions that happen to align. When cooperatives see milk volumes dropping, board meetings suddenly become much more interesting.

Key Industry Trends to Watch

Based on conversations I’ve had with industry analysts and extension economists, here’s what I’m tracking:

Processing capacity utilization: Multiple sources suggest plants will operate at 65-75% capacity through 2026 due to milk supply constraints from labor shortages. That’s going to create margin pressure throughout the system. No way around it.

Consolidation acceleration: USDA data shows 2,800 farms closed in 2025. And that’s not the peak—it’s the baseline. Mid-size operations (500-1,500 cows) are facing the greatest pressure. I’m particularly worried about dairies in that sweet spot—too big to go niche but too small to achieve mega-dairy economies of scale.

2,800 dairy farms closed in 2025 alone—nearly double the baseline. The consolidation accelerates while processors invest $11 billion

Immigration policy evolution: Watch for potential executive orders creating temporary pathways for dairy workers. Congressional solutions remain blocked, but I’m hearing administrative workarounds are being discussed at USDA. Sources familiar with the discussions say something might be coming, but I’ll believe it when I see it.

Cooperative governance pressure: The Darigold situation has awakened member interest in governance reform across multiple cooperatives. I’m hearing rumblings from DFA and Land O’ Lakes members about demanding more transparency. About time, if you ask me.

Alternative marketing growth: Direct sales, regional brands, on-farm processing—all continuing to expand. The economics are compelling. Capturing even a portion of that processor-to-retail margin changes everything.

Practical Takeaways for Dairy Farmers

After researching this issue and talking with dozens of farmers, here’s my best advice:

1. Understand your cooperative’s governance structure. Get copies of the bylaws. Read them. Actually read them. Request documentation of how major capital decisions are made. Know your rights—you might have more than you think.

2. Evaluate diversification options. Run the numbers on direct sales or value-added processing. Even if you don’t pull the trigger, knowing your alternatives strengthens your position.

3. Document workforce challenges. Keep detailed records of recruitment efforts, wage offers, and position vacancies. This data matters for policy advocacy and might be required for future visa programs.

4. Build regional alliances. There’s strength in numbers. Coordinated action among neighboring farms—whether for governance reform, marketing alternatives, or workforce solutions—multiplies individual leverage.

5. Monitor capacity developments. Understanding regional processing capacity and utilization rates helps inform production and marketing decisions. If your processor is running at 60% capacity, that affects your negotiating position.

6. Prepare for workforce disruption. Develop contingency plans now. Cross-train employees, investigate automation options where feasible, and build relationships with temporary labor providers. Hope for the best, plan for the worst.

The Road Ahead

Looking at this $11 billion infrastructure investment, I see both dairy’s ambition and its fundamental challenge. We’re building world-class processing capacity while the workforce foundation—both on farms and in plants—is crumbling beneath us.

The Darigold experience isn’t just a cautionary tale. It’s a preview of what happens when expansion proceeds without addressing underlying structural issues. Farmers pay the price while contractors, consultants, and executives move on to the next project.

What’s become clear to me is that the disconnect between processing infrastructure and workforce reality isn’t just a temporary mismatch. It’s a structural crisis that requires fundamental reforms in how cooperatives govern themselves, how immigration policy treats agricultural workers, and how the industry plans for the future.

For dairy farmers navigating this environment, waiting for top-down solutions while writing checks for bottom-up failures isn’t sustainable. The operations that survive and thrive will be those that recognize the current system’s limitations and actively build alternatives—whether through direct marketing, governance reform, or strategic cooperation with like-minded producers.

The infrastructure bet has been placed. The steel is welded, and the dryers are installed. Now we need to ensure farmers aren’t the only ones covering the spread when the dice don’t roll our way.

Because at the end of the day, all those shiny new plants don’t mean a damn thing if there’s nobody left to milk the cows—or if the farmers have gone broke paying for the factory’s cost overruns.

KEY TAKEAWAYS

  • Check your cooperative governance NOW: If your board can approve $50M+ projects without direct member vote, you’re one announcement away from a $4/cwt deduction. Demand to see construction contracts, board votes, and risk allocation before the next expansion—farmers discovering they have legal recourse for unapproved overruns.
  • Build your escape route before you need it: Direct-to-consumer sales command $8-12/gallon (vs. $1.72 conventional) with $50-150K setup costs and 18-36 month payback. Moving just 20% of production creates leverage and covers deduction losses—28 states allow it, but check regulations first.
  • Document everything related to the workforce crisis: keep detailed records of every recruitment attempt, wage offers ($45-50/hr for skilled positions), and unfilled positions. You’ll need this evidence when immigration reform finally comes or when explaining why you can’t meet production contracts after raids.
  • Power comes from numbers, not hoping: Cooperative boards ignore individual complaints but panic when 10+ farms coordinate action. Whether demanding governance reforms, exploring alternative cooperatives, or strategic production management—allied farmers are getting results while solo operators just get bills.

Learn More: 

The Sunday Read Dairy Professionals Don’t Skip.

Every week, thousands of producers, breeders, and industry insiders open Bullvine Weekly for genetics insights, market shifts, and profit strategies they won’t find anywhere else. One email. Five minutes. Smarter decisions all week.

NewsSubscribe
First
Last
Consent

The $4.78 Spread: Why Protein Premiums Won’t Last Past 2027

4.2 million on GLP-1 drugs just shifted dairy demand. Yogurt up 3x. Cheese down 7%. Your protein premiums won’t last past 2027.

EXECUTIVE SUMMARY: Right now, the same tanker of milk earns $10,755 more monthly at a cheese plant than a butter plant—that’s the historic $4.78 Class III-IV spread talking. Here’s why it matters: processors invested $10 billion in capacity designed for 3.35% protein milk, but they’re getting 3.25%, forcing them to import protein at $6.50/lb while offering domestic producers $3-5/cwt premiums. Smart farms are already cashing in through amino acid programs (paying back in 60 days), beef-on-dairy breeding ($950 extra per calf), and direct processor contracts. Add 4.2 million new GLP-1 patients needing triple the yogurt, and this protein shortage has legs through 2026. But genetics will catch up by 2027, making this an 18-month window. Your first move: enroll in DMC by December 20th—$7,500 buys up to $50,000 in margin protection when Class III corrects.

Milk Protein Premiums

Monday morning’s USDA Milk Production Report delivered some surprising news that I think reveals one of the most significant opportunities we’ve seen in years. You know how September production hit 18.99 billion pounds—up 4.2% from last year? Well, our national herd expanded by 235,000 head to reach 9.58 million cows, which is the largest we’ve had since 1993.

And here’s what caught my attention: within 48 hours of that report, December through February Class III contracts on the CME dropped toward $16 flat, yet whey protein concentrate is holding steady at $3.85 per pound according to the latest Dairy Market News.

What I’ve found, analyzing these component value spreads and the processing capacity situation, is that we’re looking at opportunities worth hundreds of millions of dollars across the industry. The farms recognizing these signals over the next year and a half… well, they could find themselves in much stronger positions than those who don’t.

When Component Values Don’t Make Sense Anymore

Let me share what’s happening with the Class III-IV spread—it hit $4.78 per hundredweight this week. That’s the widest gap we’ve ever had in Federal Order history, based on the CME futures data from November 13th.

You probably already know this, but for a 1,000-cow operation averaging 75 pounds daily, that’s a $10,755 monthly difference in revenue. Just depends on whether your milk heads to cheese or butter-powder processing. We’re talking real money here.

What’s even more dramatic is the component breakdown. USDA’s weekly report from November 13th shows whey protein concentrate at 34% protein trading at $3.85 per pound. But WPC80 instant? That’s commanding $6.35 per pound, and whey protein isolate reaches $10.70. Meanwhile—and this is what gets me—CME spot butter closed Friday at just $1.58 per pound.

I’ve been around long enough to remember when these components traded pretty much at parity. This protein-to-fat value ratio of about 2.44:1… that’s not your normal market fluctuation. It’s fundamentally different.

Here’s what the dairy market’s showing us right now:

  • Class III futures sitting at $16.07-16.84/cwt through Q1 2026
  • Class IV futures stuck in the mid-$14s
  • That record $4.78/cwt Class III-IV spread
  • Whey products are at historically high premiums
  • Butter near multi-year lows, even with strong exports

The Processing Puzzle: Creating Opportunities

What’s interesting here is that between 2023 and 2025, processors committed somewhere around $10-11 billion to new milk processing capacity across the country—the International Dairy Foods Association has been tracking all this. We’re seeing major investments: Leprino Foods and Hilmar Cheese each building facilities to handle 8 million pounds daily, Chobani’s $1.2 billion Rome, NY plant, which they announced in 2023, plus that $650 million ultrafiltered dairy beverage facility Fairlife and Coca-Cola broke ground on in Webster, NY, last year.

Now, these plants were all engineered with specific assumptions about milk composition. The equipment manufacturers—Tetra Pak, GEA, those folks—they design systems expecting milk with 3.8-4.0% butterfat and 3.3-3.5% protein. That’s what everything was sized for.

But what’s actually showing up at the dock? Federal Order test data from September shows milk testing 4.40% butterfat but only 3.25% protein. That 17% deviation from design specs creates all sorts of operational headaches.

You see, cheese yields suffer because the casein networks can’t trap all that excess butterfat during coagulation—there’s been good research on this in the dairy science journals. One Midwest plant manager I spoke with—he couldn’t go on record, company policy—but he mentioned they’re dealing with reprocessing costs running $150,000-200,000 monthly, depending on facility size.

The result? According to USDA Foreign Agricultural Service trade data from July, U.S. imports of skim milk powder jumped 419% year-over-year through the first seven months of 2025. Processors are literally importing milk protein concentrate at $4.50-6.50 per pound—paying premium prices for components that domestic milk isn’t providing in the right concentrations.

The GLP-1 Factor Nobody Saw Coming

Looking at Medicare’s new GLP-1 coverage expansion, they enrolled 4.2 million patients in just two weeks after announcing medication prices would drop from around $1,000 monthly to $245 for Medicare Part D participants. The Centers for Medicare & Medicaid Services released those enrollment numbers on November 14th.

These medications—Ozempic, Wegovy—they dramatically change what people can tolerate eating. Consumer tracking research shows cheese consumption drops around 7% in GLP-1 households, butter falls nearly 6%, but yogurt consumption? It runs three times higher than the typical American rate. These patients, they can’t physically handle high-fat foods the way they used to.

The nutritional requirements are pretty specific, too. Bariatric surgery guidelines recommend patients get 1.0-1.5 grams of protein per kilogram of body weight daily to preserve muscle mass during weight loss. For someone weighing 200 pounds, that’s 91-136 grams of protein every day.

With potentially 6.7 million Medicare beneficiaries eligible, according to Congressional Budget Office projections, we’re looking at roughly 38 million pounds of additional whey protein demand annually. And that’s just from this one demographic.

What’s Working for Farms Right Now

Quick Wins (Next 60 Days)

What I’m seeing with precision amino acid balancing is really encouraging. Dr. Charles Schwab from the University of New Hampshire has been recommending targeting lysine at 7.2-7.5% of metabolizable protein and methionine at 2.4-2.5%. Farms implementing this are seeing 0.10-0.15% protein gains within 60-75 days—that’s based on DHI testing data from operations in Wisconsin and New York.

For your typical 200-cow herd in the Upper Midwest or Northeast, that translates to about $2,618-3,435 monthly in improved component values at current Federal Order prices. Plus, you avoid those Federal Order deductions when the 3.3% protein minimum kicks in on December 1st.

The cost? It costs about $900-1,500 per month for rumen-protected amino acids from suppliers like Kemin, Adisseo, or Evonik. Pretty straightforward return on investment if you ask me.

On the calf side, beef-on-dairy’s generating immediate cash. The Agricultural Marketing Service reported on November 11th that crossbred calves are averaging $1,400 at auction while Holstein bulls bring $350-450. So a 200-cow operation breeding their bottom 35%—that’s 70 cows—captures an additional $70,000 annually.

Several producers I know in Kansas and Texas are forward-selling spring 2026 calves at $1,150-$1,200, with locked prices. That provides working capital for other investments, which is crucial right now.

Strategic Medium-Term Moves

What’s proving interesting is how some farms approach processors directly rather than waiting for co-op negotiations. I know several operations in Vermont and upstate New York that secured $18.50-20.00/cwt contracts for milk testing above 3.35% protein. That’s a $3.00-5.50 premium over standard Federal Order pricing.

The genetics side is evolving quickly, too. Select Sires’ August proof run data shows that farms using sexed semen from A2A2 bulls with strong protein profiles—+0.08 to +0.12%—are well positioned for the late-2027 market when these animals enter production. Bulls like 7HO14158 BRASS and 7HO14229 TAHITI combine A2A2 status with solid protein transmission according to Holstein Association genomic evaluations.

Out in New Mexico, one producer working with a regional yogurt processor mentioned they’re getting similar premiums for consistent 3.4% protein milk. “The processor needs reliability more than volume,” she told me. “They’re willing to pay for it.” That Southwest perspective shows these opportunities aren’t just limited to traditional dairy regions.

The Jersey Question

Now, I realize suggesting Jersey cattle to Holstein producers usually gets some eye rolls. But here’s what successful operations are doing—they’re not converting whole herds. They’re introducing 25-50 Jersey or Jersey-Holstein crosses as test groups.

One Vermont producer I talked with added 40 Jerseys last year and is seeing interesting results. These animals naturally produce 3.8-4.0% protein milk and carry 60-92% A2A2 beta-casein genetics according to Jersey breed association data.

Yes, Jerseys produce 20-25% less volume. But they also eat 25-30% less feed based on university feeding trials. When you run the full economic analysis—feed costs, milk volume, component premiums—several farms report net advantages of $1.90-3.30 per cow daily.

Of course, results vary by region. What works in Vermont might not pencil out in California’s Central Valley or Idaho. You’ve got to run your own numbers.

A central Wisconsin producer running 600 Holsteins told me last week: “I’ve got too much invested in facilities and equipment sized for Holsteins to start mixing in Jerseys. For my operation, focusing on amino acids and genetics within my Holstein herd makes more sense.” And that’s a valid perspective—it really does depend on your specific situation.

Down in Georgia, another producer with 350 cows mentioned they’re seeing entirely different dynamics. “Our heat stress issues mean Jerseys actually perform better than Holsteins during summer months,” she said. “The component premiums plus heat tolerance make them work for us.” Regional differences matter.

Timing the Market: When Windows Close

Beef-on-Dairy Reality Check

Here’s something to watch carefully. Patrick Linnell at CattleFax shared projections at their October outlook conference showing beef-on-dairy calf numbers reaching 5-6 million by 2026. That would be 15% of the entire fed cattle market, up from essentially zero in 2014.

October already gave us a warning when USDA-AMS reported that prices had dropped from $1,400 to $1,204 per head in just a few weeks. Linnell tells me the premium, averaging $1,050 per calf, will likely shrink significantly as supply increases. His advice? Lock forward contracts now at $1,150-1,200 for 2026 calf crops. Once the market gets oversupplied, we could see prices settling at $900-1,050 by late 2026. Still better than Holstein bull prices, but not today’s windfall.

The Heifer Shortage Nobody’s Prepared For

Ben Laine, CoBank’s dairy economist, published some concerning modeling in their August 27th outlook. We’re looking at 796,334 fewer dairy replacement heifers through 2026 before any recovery begins in 2027.

This creates an interesting dynamic in which beef calves might be worth $900-1,050, while replacement heifers cost $3,500-4,000 or more. For a 200-cow operation needing 40 replacements annually, that’s $150,000 for heifers, while your beef calf revenue only brings in $136,500. That’s a $13,500 gap that really squeezes cash flow.

Farms implementing sexed semen programs now can produce their own replacements for $45,000-60,000 in raising costs, according to University of Wisconsin dairy management budgets. Those still buying heifers in 2027? They’ll be paying premium prices that could strain even healthy operations.

Why European Competition Isn’t the Threat

With European butter storage at 94% capacity according to EU Commission data from November, and global production up 3.8% per Rabobank’s Q4 report, you might wonder—why won’t cheap imports flood our market?

Well, USDA’s Foreign Agricultural Service analysis from October shows U.S. dairy tariffs add 10-15% to European MPC landed costs. Container freight from Europe runs $800-1,200 per 20-foot unit—that’s roughly $0.04-0.06 per pound based on the Freightos Baltic Index from November. When you add it up, European MPC lands here at $4.74-5.33 per pound. Not really undercutting domestic prices.

Plus, companies like Fonterra and Arla are pivoting toward Asian markets where they get better prices without tariff hassles. Fonterra announced in August that it’s selling its global consumer business to Lactalis for NZ$4.22 billion ($2.44 billion USD) to focus on B2B ingredients for Asian and Middle Eastern markets.

Though I should mention, one California dairyman running 800 cows pointed out that trade dynamics can shift quickly. What protects us today might not tomorrow. That’s a fair perspective worth monitoring.

Surviving the Next 90 Days

With Class III futures at $16.07-16.84 according to CME closing prices from November 15th, and many operations facing breakeven costs of $13.50-15.00 based on October profitability analysis, margins are tight. Really tight.

Creative Financing That Works

FBN announced in November that they’re offering 0% interest through September 2026 on qualifying purchases—that includes amino acids and nutrition products. No cash upfront, payments due next March after your protein improvements show in milk checks. Farm Credit Canada offers similar programs with terms of 12-18 months, according to its 2025 program guidelines.

For beef-on-dairy, several feedlots are doing interesting things with forward contracts. One Kansas feedlot operator pre-sells 40-50 spring calves at $1,300 with a 50% advance payment. That generates $26,000-$32,500 in January working capital—enough for Jersey purchases or to cover operating expenses during tight months.

Some processors are even offering advances against future protein premiums. I’ve heard of deals—companies prefer not to be named—where they’ll provide $15,000-20,000 upfront against a 24-36 month high-protein supply agreement. The advance recovers through small deductions from premium payments.

Critical December Dates

Here’s what you need on your calendar:

December 1st: Federal Order 3.3% minimum protein requirement takes effect. If you’re testing below that, deductions start immediately.

December 20th: DMC enrollment deadline for 2026 coverage. Some states have earlier deadlines—check with your local FSA office this week.

December 31st: Last day to lock beef-on-dairy forward contracts for Q1 2026 delivery at most feedlots.

The One Decision That Can’t Wait: DMC Enrollment

If you take nothing else from this discussion, please hear this: enroll in Dairy Margin Coverage at $9.50/cwt before December 20th.

At $7,500 for 5 million pounds of Tier 1 coverage, DMC provides crucial protection. Mark Stephenson from the University of Wisconsin found that 13 of the last 15 years delivered positive net benefits at $9.50 coverage. With margins at $5.07-6.34/cwt based on current milk and feed prices, and production growing 4.2%, the odds of needing this protection in early 2026 are pretty high.

Think about it—if margins drop to $9.00/cwt with Class III at $15.50, you’d receive $25,000. Drop to $8.50/cwt? That generates a $50,000 payment according to the DMC calculator. When’s the last time $7,500 bought you that kind of downside protection?

Looking at the Bigger Picture

What we’re seeing here isn’t just another market cycle. Dr. Marin Bozic at the University of Minnesota characterizes these conditions as a significant structural shift—the kind that happens maybe once in a generation. You’ve got mismatched processing capacity, changing consumer preferences accelerated by weight-loss drugs, and genetics still catching up to new realities, all converging at once.

The arbitrage opportunities won’t last forever—that’s just how markets work. Current trajectories suggest beef-on-dairy saturates by mid-2026, protein premiums moderate by 2027, and heifer shortages resolve by 2028. But for producers acting strategically over the next 18-24 months, there’s a real opportunity to strengthen operations.

The November 10th production report showing 4.2% growth might seem like bad news at first glance. But understanding component economics and arbitrage opportunities actually illuminates a path forward. The math is compelling—it’s really about positioning yourself to take advantage.

Key Actions This Week

Looking at everything we’ve discussed, here’s what I’d prioritize:

This Week’s Must-Do List:

  • Call your FSA office about DMC enrollment—deadline’s December 20th, but varies by state
  • Get quotes on rumen-protected amino acids and ask about input financing terms
  • Contact at least three feedlot buyers about spring 2026 calf contracts
  • Schedule meetings with specialty processors within 50 miles

Planning Through 2026:

  • Target 3.35-3.40% protein through nutrition management
  • Consider sexed semen on your top 40% for A2A2 and protein traits
  • Evaluate a small Jersey trial group if facilities and regional economics align
  • Keep an eye on protein contract opportunities above $2.50/cwt

Risk Management Priorities:

  • Watch beef calf forward pricing—below $1,150 means reassessing your breeding program
  • Monitor heifer prices in your area—over $3,200 signals a serious shortage ahead
  • Track processor premium offers—lock anything over $2.50/cwt
  • Review component tests monthly and adjust accordingly

What other producers are telling me is that the farms coming out ahead won’t necessarily have perfect strategies. They’ll be the ones bridging the next 90 days through smart financing and risk management while these component markets sort themselves out.

DMC enrollment alone could make the difference between staying in business and having difficult conversations with your lender come February.

You know, this opportunity window is real, but it won’t stay open indefinitely. The clock’s ticking—DMC enrollment ends December 20th, and every day you wait on strategic decisions is a day your competition might be moving ahead. The question isn’t whether these opportunities exist… it’s whether you’re positioned to capture them.

And that’s something worth thinking about over your next cup of coffee.

KEY TAKEAWAYS 

  • DMC by Dec 20 (Non-Negotiable): $7,500 premium buys $25,000-50,000 protection when Class III corrects—enrollment closes in 33 days
  • Protein Boost Pays Fast: Amino acids cost $1,200/month, deliver 0.15% protein gain in 60 days, return $3,000+ monthly for 200 cows
  • Beef-on-Dairy Has 12-Month Window: Today’s $1,400 calves drop to $900-1,050 by late 2026—lock $1,150+ contracts now
  • Chase Processor Premiums: Direct contracts pay $3-5/cwt for 3.35%+ protein milk, but only through 2027 as capacity fills
  • The Math Is Clear: $4.78 Class III-IV spread = $10,755/month extra at cheese plants. This historic gap closes within 18-24 months.

Complete references and supporting documentation are available upon request by contacting the editorial team at editor@thebullvine.com.

Learn More:

The Sunday Read Dairy Professionals Don’t Skip.

Every week, thousands of producers, breeders, and industry insiders open Bullvine Weekly for genetics insights, market shifts, and profit strategies they won’t find anywhere else. One email. Five minutes. Smarter decisions all week.

NewsSubscribe
First
Last
Consent

What Lactalis’s 270-Farm Cut Really Means for Every Producer

Only 11% of dairies under 300 cows are profitable. But three paths still work—if you move in the next 18 months.

EXECUTIVE SUMMARY: Lactalis cutting 270 dairy farms while investing $11 billion in processing isn’t a contradiction—it’s the clearest signal yet that commodity milk is finished and component quality now rules everything. The stark reality: 89% of dairies over 1,000 cows are profitable while only 11% under 300 cows make money, and this isn’t about management skill—it’s structural economics you can’t overcome with hard work alone. Three converging crises (interest rates doubling to 8%, heifer inventory at 20-year lows, and labor costs up 73%) have compressed what was once a gradual 5-year industry shift into an urgent 18-month decision window. Every dairy faces three paths: invest $6.75-10.25 million to scale beyond 1,000 cows, transition to premium markets (organic/specialty) despite 3-year losses, or exit strategically while you can still preserve family wealth. Real farmers are already choosing—a Minnesota couple successfully scaled to 1,100 cows, Vermont neighbors transitioned to organic, and a Wisconsin family preserved $2.1 million through strategic sale. The difference between 3.6% and 4.2% butterfat is now worth $529,000 annually for a 500-cow operation, making component performance literally the difference between survival and closure. Your window to control this decision closes in 18 months—after that, circumstances decide for you.

You know, when Lactalis—the world’s largest dairy processor—announces they’re cutting 450 million liters and ending contracts with 270 French farmers, we should probably pay attention. I’ve been digging into this, talking with producers, looking at the numbers… and what’s interesting is this isn’t just another market cycle. We’re seeing something bigger here, something that’s going to affect all of us, whether we’re milking 50 cows or 5,000.

What I’ve found is that the traditional commodity dairy model—you know, the one most of us grew up with—it’s changing faster than anyone expected. And the timeline to adapt? Well, that’s gotten surprisingly short.

The 89/11 Rule reveals the stark reality: structural economics, not management quality, determines survival in modern dairy

Understanding Why Processors Are Making These Moves

So here’s what caught my attention in Lactalis’s 2024 financials: €30.3 billion in revenue, but only 1.2% net profit margins. That’s down from 1.45% the year before. Now compare that to their premium products—the yogurt division they bought from General Mills is generating 15-20% operating margins. Premium cheese? Consistently 8-12% margins.

Lactalis’s supply director explained in their October statement that the valuation of excess milk is often very low and subject to market volatility—language that really reflects how processors are viewing commodity markets these days. When a processor that size essentially says commodity milk isn’t worth the trouble… well, that’s not just complaining, is it?

FrieslandCampina’s been going through similar challenges. They’ve talked about timing mismatches—buying milk at one price, processing it, then having to sell into a lower market. That kind of volatility makes it really tough to plan, and shareholders don’t like uncertainty.

The Component Game Has Changed Everything

Component performance is now non-negotiable—volume alone won’t pay the bills anymore

I was talking with a Wisconsin producer last week—he’s running 650 cows near Fond du Lac—and he helped me understand just how much components have shifted the whole economics of dairy farming. USDA data from November shows butterfat now represents 58% of your milk check value, and protein adds another 31%. Think about that… 89% of your income comes from components, not volume.

His neighbors who consistently hit 4.23% butterfat compared to the regional average of 3.69%? They’re capturing about $4.60 more per hundredweight. For a 500-cow operation producing 23,000 pounds per cow annually, that works out to roughly $529,000 in additional revenue—though your actual numbers will vary with production levels and regional premiums, of course.

Cornell’s latest farm business data shows some interesting patterns:

  • The big operations—1,000+ cows—they’re hitting 4.0-4.3% butterfat with 3.3-3.5% protein pretty consistently
  • Mid-sized farms, say 300-500 cows, generally average 3.6-3.8% butterfat, 3.0-3.1% protein
  • And here’s what’s telling: large farms maintain about 2% daily variation in components while smaller operations see 5-10% swings

Now, getting those high components isn’t just about genetics. You need systematic management—a good nutritionist runs $80,000 to $120,000 a year, based on what I’m hearing. Feed testing programs add another $15,000 to $25,000. Those precision feeding systems? Dealers are quoting $250,000 to $500,000, depending on what you need.

The math gets tough for smaller operations. When you spread the combined cost of nutritionist, vet services, and consultants across a thousand-cow operation, it might come to $0.08-0.12 per hundredweight. But for a 200-cow farm? You’re looking at $0.40-$0.60 per hundredweight for the same level of professional support. That’s a huge competitive disadvantage.

Three Things Hitting Us All at Once

Cornell’s dairy economics team has been documenting what they’re calling a compressed decision timeline, and I think they’re onto something. Three things have converged, forcing us to make decisions faster than we’re used to.

Three converging crises compressed a gradual 5-year industry shift into an urgent 18-month decision window

Interest Rates Hit Like a Hammer

Federal Reserve data shows operating loan rates doubled—went from about 4% in 2021 to over 8% by late 2023. Haven’t seen rates like that in 20 years. A lender in Pennsylvania told me that operations that were barely profitable at 4% are now losing $3,000 to $5,000 monthly.

The Illinois farm management folks found that farms carrying significant debt saw interest costs per tillable acre jump from $33 to $60 in three years. That’s 82% more in fixed costs, and you can’t pass that along to your milk buyer.

What really concerns me is the Q3 2024 ag lending data—operating loan volumes are up over 30% for the third quarter in a row. A Wisconsin banker friend put it best: “This isn’t growth borrowing, it’s survival borrowing.”

The Heifer Shortage Nobody Saw Coming

CoBank’s August report lays out a fascinating situation—dairy heifer inventory’s at a 20-year low just when we need expansion for all this new processing capacity.

Here’s how we got here: the breeding data shows beef semen sales to dairy farms tripled from 2.5 million units in 2017 to 7.2 million by 2020. Last year? 7.9 million of the 9.7 million total units were beef semen.

Can’t blame anyone really. When beef calves were bringing $1,000 to $1,500 last October, while it costs $2,200 to $2,500 to raise a heifer worth maybe $1,600… the math was obvious. Problem is, we all did the same math at the same time.

CoBank thinks we’ll lose another 800,000 head before things turn around in 2027. An Idaho producer told me he’s been offered $3,200 for breeding-age heifers—if he had any. “Five years ago at $1,400, I had too many,” he said. “Now I can’t find them at any price.”

Labor Is Getting Impossible

Texas A&M’s 2024 research shows that immigrant workers make up 51% of dairy labor and milk 79% of our cows. Their models suggest losing that workforce would cut U.S. milk production by 48.4 billion pounds annually. That’s not a typo.

And it’s not just finding workers—it’s affording them. USDA data shows dairy wages went from $11.54 an hour in 2015 to $18-20 by 2024. A large operations manager in New Mexico told me they’re at $28 an hour when you factor in housing, benefits, and recruitment. “And we still can’t stay fully staffed,” he added.

Three Producers Who Found Their Way Through

Despite all these challenges, I’ve met several operations that have successfully navigating this transition. Let me share what they did differently.

Smart Scaling in Minnesota

There’s a couple in central Minnesota who expanded from 350 to 1,100 cows between 2019 and 2023. They saw their co-op’s base program would limit growth for mid-sized farms, so they moved early. Got financing at 3.5% before rates spiked, used sexed semen exclusively for three years to build internally, and partnered with an experienced Venezuelan family.

What’s smart is they expanded in phases over four years—each phase had to cash flow before they moved to the next. They’re now shipping butterfat at 4.1% consistently and have signed a five-year contract with a cheese plant 40 miles away. Their breakeven’s around $17.50 per hundredweight, so they’ve got a cushion even when markets get tough.

Going Organic in Vermont

A Vermont family with 480 cows went organic in 2021—right when everyone said that market was full. Key thing? They got Organic Valley’s commitment in writing before starting the transition. They lost $210,000 over three years, but off-farm income and some timber sales bridged the gap.

Today, they’re netting $3.80 per hundredweight after all costs. “We focused on keeping cows healthy and production steady rather than trying to expand during transition,” the son told me. They maintained 92% of conventional production throughout the transition—well above the 85% average.

Making the Tough Call in Wisconsin

This one’s harder to talk about. A couple near Eau Claire sold their 280-cow operation in March 2024 after recognizing they were in what economists call the 18-month window—sustained losses with limited options. At 58, with kids established off-farm, expanding to a competitive scale meant $6 million in new debt.

They sold into a strong cull market, leased the cropland to a neighbor, and kept the house and 40 acres. The husband’s now using his 30 years of experience as a co-op field rep. “I sleep better, my wife’s happier, and financially we’re ahead,” he told me. They preserved about $2.1 million in equity that probably would’ve disappeared if they’d hung on another year.

Where All This New Processing Investment Is Going

Processors already chose their future—understand their strategy to predict yours

IDFA announced $11 billion in new processing capacity, and where that money’s going tells you everything about industry direction. Their October breakdown shows:

  • Cheese gets $3.2 billion—32% of everything
  • Milk and cream processing: $2.97 billion—30%
  • Yogurt and cultured products: $2.81 billion—28%
  • Butter and spreads: $1.23 billion—12%

Three new cheese plants in the Texas Panhandle need 20 million pounds of milk daily by mid-2025. But these aren’t commodity operations—they’re component extraction facilities making mozzarella for export while capturing valuable whey proteins.

What they’re NOT building? Commodity powder plants or basic fluid bottling. A processing engineer in Wisconsin explained it well: “We’re maximizing value from every component now. Just removing water to make powder doesn’t cut it anymore.”

And here’s something else—up in the Northeast, a couple of smaller specialty cheese operations just expanded. They’re not huge, but they’re finding success focusing on local markets and agritourism. Different model entirely from the big Texas plants, but it shows there’s more than one way forward. Out in California’s Central Valley, I’m seeing similar patterns with artisan operations carving out niches even as the big players consolidate.

The Cooperative Evolution We Need to Talk About

This is uncomfortable for many of us, but cooperatives have changed dramatically since DFA was formed in 1998 through regional mergers. They now control 30% of U.S. milk production, and after buying 44 Dean Foods plants in 2020, they’re both the biggest milk marketer AND processor.

A former board member explained how this creates tension: “When your co-op owns processing plants, optimizing those facilities becomes as important as your milk check—sometimes more important.”

Base-excess programs show this complexity. Cornell’s research indicates these programs typically use your best three consecutive months over three years as “base.” Milk over that? You might pay penalties of $5 to $13.30 per hundredweight.

A Vermont producer shared his frustration: “We wanted to add 50 cows to get more efficient, but overbase penalties would’ve killed any benefit. We’re locked at the current size.”

Meanwhile, operations that were already large when base programs started? They’re fine. It’s the 300-cow farms trying to grow to 500 that get squeezed.

Your Three Paths Forward—Let’s Look at Real Numbers

Path Comparison at a Glance

FactorScale UpGo PremiumStrategic Exit
Investment$6.75-10.25M$210-275K lossesPreserve equity
Timeline4-5 years3-year transition8-10 months optimal
Success Rate~20%Varies by market100% if timed right
Key RiskDebt burdenMarket saturationWaiting too long

Extension economists from Cornell and Wisconsin show that farms with sustained losses typically face critical decisions within 12-18 months. So what are your actual options?

Path 1: Scale Up to Compete

Investment Required: $6.75-10.25 million total

  • Buildings and infrastructure: $3.5-5.0 million
  • Cattle at current prices: $2.25-3.0 million
  • Feed base expansion: $500,000-1.5 million
  • Working capital: $500,000-750,000

Success Rate: According to lending industry estimates, about 20% achieve projected returns. Key Factor: Usually need family money for unexpected challenges. Financing Options: USDA FSA offers beginning farmer programs and guaranteed operating loans through participating lenders, though eligibility and terms vary by operation and region. Some states also have specific dairy expansion programs worth exploring.

Path 2: Find Your Premium Market

Organic Transition Example:

  • Typical losses: $210,000-275,000 over 3 years
  • Pay organic feed prices (30-50% higher) while getting conventional prices
  • Need written buyer commitment before starting
  • Must maintain 85%+ production through transition

Potential Returns: $2.45/cwt net (vs. -$5.29 for conventional, based on USDA 2023 data). Reality Check: Most regions aren’t currently seeking new organic production. Alternative Options: Consider grassfed certification, A2A2 markets, or local/regional branding

Path 3: Strategic Exit While You Can

Timing Matters—Example for 300-cow operation with $2M debt:

Exit at 8-10 months:

  • Assets bring ~$4.65 million
  • After $2M debt and costs ($230,000-390,000): $2.26-2.42 million preserved

Forced sale at 16-18 months:

  • Assets bring ~$3.4 million (discounted)
  • After everything: $650,000-970,000 retained

The difference: Over $1.4 million in family wealth

Three paths still work—but only if you move in the next 18 months. After that, circumstances decide for you

The Technology Wave is Coming Fast

I attended the Protein Industries Summit in Chicago last month, and what I heard was eye-opening. McKinsey’s early 2025 biotech analysis shows precision fermentation has already hit cost parity for certain dairy proteins. Boston Consulting thinks these proteins will be five times cheaper than ours by 2030.

Here’s what’s already happening—Perfect Day’s animal-free whey is in Ben & Jerry’s ice cream right now. Not someday. Today. Fonterra’s partnerships with Superbrewed Food and Nourish Ingredients show where big players are heading. Fonterra indicated in its August 2024 announcements that ingredients from these technologies can be used alongside traditional dairy products. Translation: they’re building systems that can use proteins from cows or fermentation tanks—whatever’s cheaper.

And it’s not just startups anymore. I’m seeing major food companies quietly building fermentation capacity. They’re hedging their bets, preparing for a world where they can source proteins from multiple streams.

How This Hits Different Regions

This transformation affects regions differently, and understanding your local dynamics matters.

California: UC Davis research shows farms with less than 22% quota coverage pay more into the system than they get back. “We’re subsidizing the big quota holders,” a Tulare County producer told me.

Southeast: Maintains higher Class I fluid use—over 60% according to Federal Orders—which provides some buffer since processors need consistent daily deliveries. But even there, consolidation pressure is building.

Upper Midwest: All about cheese, so components rule everything. Wisconsin processors consistently tell me 4% butterfat is their practical minimum for preferred suppliers.

Plains States: Seeing aggressive expansion with new processing, but these plants want a minimum of 50,000+ pounds daily per farm. Can’t deliver that volume? You won’t get a contract.

Pacific Northwest: Interesting developments with smaller operations finding niches in farmstead cheese and direct marketing. Not for everyone, but it’s working for some.

Northeast: Beyond the specialty cheese operations, there’s also growth in agritourism and on-farm processing. Entirely different economics, but viable for the right location.

Western States: Water rights and environmental regulations adding another layer of complexity to expansion decisions.

Questions to Ask Yourself Right Now

Before you make any big decisions, honestly assess:

  • Are you covering all costs, including family living?
  • Can you achieve 4%+ butterfat consistently?
  • Do you have succession lined up?
  • What’s your debt-to-asset ratio?
  • Could you survive another year like 2023?
  • What would happen if you lost two key employees tomorrow?
  • Is your processor investing in commodity or specialty capacity?
  • Are there emerging environmental regulations that could affect you?

What This All Means for Your Planning

After looking at all this, here’s what I think matters most:

Component performance isn’t negotiable anymore. The difference between 3.6% and 4.2% butterfat can mean hundreds of thousands annually for a 500-cow operation. That fundamentally changes farm economics.

That 12-18 month window Cornell documented? It’s real. Interest rates, heifer availability, and labor costs compressed what used to be a multi-year adjustment into a much shorter period. Within the next 12-18 months—essentially by mid-2026, based on the timeline Cornell economists have documented—many operations will have made their choice, voluntarily or not.

Scale economics show clear breaks. USDA data showing 89% profitability for 1,000+ cow operations versus 11% for under 300 cows… that’s not about who’s a better manager. It’s structural advantages smaller operations can’t overcome.

Your processor’s strategy matters more than ever. If they’re investing in commodity powder, you’ve got time. If they’re building component extraction or specialty facilities, that tells you something different.

Technology adoption keeps accelerating. The Good Food Institute tracked $840 million in precision fermentation investment last year. Alternative proteins are moving from the experimental to the commercial stage faster than most of us expected.

Risk management tools—like Dairy Margin Coverage and Dairy Revenue Protection—might buy you time but won’t change the fundamental economics. They’re Band-Aids, not cures.

The Bottom Line

What Lactalis is doing—cutting 450 million liters while investing in premium capacity—makes sense when you understand their strategy. They’re consolidating relationships with farms that can deliver consistent, high-component milk at scale while preparing for fermentation-derived proteins.

The Minnesota couple who scaled smart, the Vermont family succeeding in organic, the Wisconsin couple who preserved wealth through planned exit—they all made different choices. But they shared a realistic assessment of where things are heading and made decisions accordingly.

For those of us still figuring out our path, an honest assessment of where we fit in this evolving structure is critical. Whether that means pursuing scale, finding premium markets, or planning transition, the key is making informed decisions while we still have options.

And if you’re wondering about the next generation—I talked with several young farmers recently. The ones succeeding are incredibly sharp, using technology in ways we never imagined, and they’re not afraid to try completely different models. That gives me hope, even as things change.

The dairy industry will keep producing milk—consumers guarantee that. But who produces it, how it’s valued, and what matters most? That’s changing fundamentally. Understanding where your operation fits in that transformation might be the most important analysis you do this year.

Because waiting for things to “go back to normal”? Well, I think we all know that ship has sailed.

The Bullvine provides ongoing analysis and resources at www.thebullvine.com. Cornell’s Dairy Markets and Policy program and Wisconsin’s Center for Dairy Profitability offer valuable planning tools. The producer experiences shared here reflect confidential discussions, with identifying details modified for privacy.

KEY TAKEAWAYS

  • You Have 18 Months to Decide: Cornell economists confirm sustained losses trigger forced decisions within this window—control your choice now or lose that option forever
  • Three Paths Still Work: Scale to 1,000+ cows ($6.75-10.25M investment, 20% success rate) | Go premium (organic/A2/grassfed, 3-year transition) | Exit strategically (preserves $1.4M more than waiting)
  • Components = Survival: The 0.6% butterfat difference between average and top herds is worth $529,000/year, and processors are making this gap the entry requirement
  • The 89/11 Rule: 89% of 1,000+ cow dairies profit while only 11% under 300 cows survive—this is structural economics, not management quality
  • Processors Already Chose: They’re investing $11B in component extraction while cutting commodity suppliers—understand their strategy to predict your future

Complete references and supporting documentation are available upon request by contacting the editorial team at editor@thebullvine.com.

Learn More:

The Sunday Read Dairy Professionals Don’t Skip.

Every week, thousands of producers, breeders, and industry insiders open Bullvine Weekly for genetics insights, market shifts, and profit strategies they won’t find anywhere else. One email. Five minutes. Smarter decisions all week.

NewsSubscribe
First
Last
Consent

2,800 Farms Will Close in 2025. Here’s Why USDA’s ‘Golden Age’ Isn’t Saving Them

My kids could make more at Target, and they’d get Christmas off.’ Why 2,800 dairy families are making the hardest decision.

EXECUTIVE SUMMARY: At kitchen tables across dairy country, third and fourth-generation families are asking whether they should be the ones to step away. While Agriculture Secretary Rollins proclaimed a ‘golden age’ for dairy Monday, 2,800 farms will close in 2025 as margins compress to $11.55/cwt—down from $15.57 just six months ago. A typical 300-cow Wisconsin operation that netted $10,000 annually is now losing $61,000 after June’s make allowance changes shifted $82 million from producers to the processors industry-wide. USDA’s four-pillar response—dietary guideline updates, being ‘more vocal’ on interest rates, facilitating processor investments, and export expansion—offers no direct relief while processors invest $11 billion in facilities optimized for mega-dairies. Mid-sized operations face an 18-month decision window: gamble $2-3 million on expansion, pursue increasingly scarce niche markets, or execute an orderly exit while equity remains. The math increasingly points to one conclusion: the economics of their scale no longer work in a system optimized for different objectives.

You know, the conversations we’re having around kitchen tables these days are different from those we had even five years ago. I’m talking with third and fourth-generation producers who are looking at their numbers and wondering if maybe—just maybe—they should be the ones to step away. That’s a hard conversation, and it’s happening more than you’d think.

When Agriculture Secretary Brooke Rollins stood up at the National Milk Producers Federation meeting in Arlington on Monday, she spoke of a “golden age” for dairy and outlined a four-pillar action plan. But here’s what’s interesting—and I’ve been hearing this from producers all week—the view from the barn looks pretty different from the view from that podium.

The latest numbers from Rabobank and what we’ve been tracking suggest we’re looking at about 2,800 dairy farms closing in 2025. That’s somewhere between 7 and 9 percent of what’s left. Meanwhile, if you’re following the Dairy Margin Coverage program like most of us are, margins are sitting at $11.55 per hundredweight as of March, down from that nice $15.57 we saw back in September.

What I’ve found is we’re not just going through another rough patch here. This feels different. The gap between what’s being announced in Washington and what’s happening in the milk house…well, it’s pretty wide.

Let’s Talk Numbers

The brutal math: A typical 300-cow operation that barely broke even ($10K) is now bleeding $61K annually after June’s FMMO changes shifted $82M industry-wide from producers to processors

So I’ve been sitting down with producers, running through their books, and the pattern is remarkably consistent. Take your typical 300-cow Wisconsin operation—and there are still a lot of them out there.

The 300-Cow Reality Check: Annual P&L Breakdown

Revenue & ExpensesAmount
Gross Milk Revenue (8.2M lbs @ current prices)$1,480,000
Feed Costs ($10.45/cwt DMC calculation)-$857,000
Labor (family plus hired help)-$240,000
Debt Service (2010s expansion loans)-$112,000
Operating Expenses (vet, supplies, utilities, repairs, insurance, property tax)-$261,000
Net Farm Income$10,000
After Make Allowance Increases (June 2025 FMMO changes)-$61,000

“My kids could make more at Target, and they’d get Christmas off.”
— Minnesota dairy producer, 400 cows

And here’s where it gets really tough. Those Federal Milk Marketing Order changes that kicked in June 1st—the make allowance increases that processors can deduct from our checks—are another 85 to 90 cents per hundredweight gone. For that 300-cow operation? We’re talking $71,000 less per year. The Farm Bureau calculated it out, and industry-wide, that’s $82 million moving from producers to processors.

Breaking Down the Four Pillars

Let’s look at what Secretary Rollins is actually proposing here.

Pillar 1: Dietary Guidelines—Playing the Long Game

The idea is that updating the Dietary Guidelines for Americans will boost consumption. Current guidelines already recommend three servings of dairy daily for adults. Problem is—and the National Dairy Council has documented this—only about 12 percent of Americans actually follow those recommendations.

Key trend: USDA’s Economic Research Service shows we’ve gone from 247 pounds of fluid milk per person back in 1975 to about 128 pounds in 2023. That’s a 48 percent drop, despite dietary guidelines supporting dairy the whole time.

The Whole Milk for Healthy Kids Act letting whole milk back into schools? That’s positive. But school lunch participation is still down by 2.2 million kids from 2013, according to USDA data. Those are milk drinkers who just aren’t there anymore.

Pillar 2: Input Costs—Good Intentions, Limited Tools

Secretary Rollins acknowledging input cost pressures—that’s important. Since 2020, NASS data shows:

  • Seed costs: Up 18%
  • Fuel: Up 32%
  • Fertilizer: Up 37%
  • Interest expenses: Up 73% (the real killer)

When they asked for specifics at the NMPF meeting, the response was that Secretary Rollins would “be more vocal” with the Federal Reserve about interest rates. A producer with 400 cows in Minnesota summed it up: “Being vocal doesn’t pay the feed bill.”

Pillar 3: Processing Investments—Complicated Picture

The International Dairy Foods Association announced $11 billion in processing investments across 19 states through early 2028. New infrastructure, expanded capacity—sounds great.

But these announcements came right after processors secured those make allowance increases worth $82 million annually. Hard not to connect those dots.

“These plants are being built for tomorrow’s farms, not today’s. And tomorrow’s farms don’t look like most of my members.”
— Wisconsin cooperative manager

What concerns me for mid-sized operations is the nature of these investments. A new cheese plant designed to handle 2 million pounds daily? They want five operations milking 2,000-plus cows each, not 50 different 300-cow farms.

Pillar 4: Export Markets—Progress with Risk

Exports are showing real growth. U.S. Dairy Export Council reports:

  • Volume: Up 2% year-to-date
  • Value: Up 16% year-to-date
  • Indonesia: Now the 7th-largest market at $246 million

But China still has retaliatory tariffs on our products. Mexico takes nearly 40 percent of our cheese exports—that’s a lot riding on one relationship with the USMCA review coming in 2026.

The View from Up North

You know what Secretary Rollins didn’t mention? What’s happening in Canada. Their Dairy Commission data shows they’re maintaining about 12,000 operations averaging 85 cows, with debt-to-asset ratios around 16 percent.

Sure, quota runs about $24,000 Canadian per cow-equivalent. Consumers pay more. But Canadian producers can plan facility upgrades five, seven years out because they know what their milk price will be.

“I focus on production efficiency and cow comfort, not price volatility.”
— Ontario dairy producer at World Dairy Expo

Can you imagine?

When margins collapsed in 2009, USDA deployed $3.5B in direct relief. In 2025’s “golden age”? Zero dollars—just promises to be “more vocal” with the Federal Reserve while 2,800 farms close

How Support Has Changed: 2009 Crisis vs. 2025 Action Plan

2009 Dairy Crisis Response2025 USDA Action Plan
$3.5 billion in direct support (MILC payments + product purchases)No direct financial support announced
Government bought 379 million pounds of nonfat dry milkNo product purchase program
Direct payments to farmers when prices crashed“Being more vocal” with the Federal Reserve
Emergency intervention during the 36% price collapsePolicy speeches during steady consolidation
Processors are pouring $11B into 50+ new facilities optimized for mega-dairies producing 2M+ lbs daily, while farmers facing closure get “vocal advocacy” and zero financial support

The 18-Month Reality Check

From 37,100 farms in 2017 to a projected 10,200 by 2030—the mid-size operations (200-999 cows) are vanishing fastest, down 72% as scale economics favor mega-dairies with $3-4/cwt cost advantages

Industry folks I trust keep pointing to the next 18 months as make-or-break time for operations in that 200-to-700 cow range. Several things are converging:

  • June 2026: Environmental regulations tighten in key states
  • Ongoing: Processing contracts getting renegotiated with new volume requirements
  • Now: Farms that survived 2020-2024 by burning through working capital are running on fumes

Regional differences are striking:

  • Southeast: Heat stress management costs change the economics completely
  • Northeast: Higher land values and stricter environmental rules
  • Mountain West: Water rights add another layer of complexity
  • California: Even modernized operations face $4-5/cwt disadvantage versus mega-dairies

I know producers in California’s Central Valley—good farmers, 425 cows, modernized everything. University of California Extension studies show they’re still $4 to $5 per hundredweight higher in costs than the 3,000-cow operation down the road. As one told me, “We’re not bad farmers. We’re just the wrong size.”

RegionTypical Herd SizeCost per CWTCost Disadvantage vs Mega-DairiesPrimary Cost DriversFarms Lost 2022-202518-Month Survival Outlook
California Central Valley1,200-3,000$18.50-19.20$4.00-4.50Water/Environmental Regs-425Critical
Pacific Northwest600-1,500$19.50-20.00$5.00-5.50Transportation/Labor-280Severe
Southeast (Georgia/Florida)400-800$20.00-21.50$6.00-7.00Heat Stress/Mortality-320Severe
Northeast (PA/Vermont)250-500$19.00-20.50$4.50-5.50Land Values/Phosphorus-380Critical
Upper Midwest (WI/MN)300-700$17.50-18.50$3.50-4.00Property Tax/Labor-630Critical
Mountain West (ID/UT)2,000-5,000$15.50-16.50$1.00-2.00Scale Efficiency-140Moderate
Southwest (TX/NM)2,500-10,000$15.00-16.00$0.50-1.50Lowest Input Costs-95Stable

What This Means for Different Scales

Operations Under 500 Cows: The Hard Math

Calculate your true per-hundredweight costs, including fair wages for family labor. Can you survive with margins below $12? Looking at CME futures, that might be reality through mid-2026.

Your three main options:

  • Scaling up: $2-3 million minimum investment, 7-10 year payback if margins improve
  • Going organic: 7-year conversion, many regions already oversupplied per the National Organic Program
  • On-farm processing: Budget at least $500,000, plus you’re starting a new business

Sometimes preserving equity through an orderly exit makes more sense than operating at a loss for two more years. It’s math, not judgment.

Operations Over 700 Cows: Better Positioned but Not Immune

You’re better positioned, but every percentage-point improvement in feed conversion or component efficiency matters now. Watch for opportunities when neighbors exit. Some successful operations grow incrementally through local consolidation rather than through massive expansions.

Decision PointAction RequiredEquity at StakeOptions Remaining
Month 0: First Negative MarginCalculate true cost per cwt including family labor$0 (Starting Point)All paths open
Month 3: Review Break-Even AnalysisAnalyze 3-year profit/loss trend, equity burn rate-$15,000 to -$45,000All paths open
Month 6: Critical Assessment WindowCan you secure processing contracts post-2026?-$45,000 to -$120,000All paths feasible
Month 9: Processor Contract DecisionCommit to scale-up ($2-3M) OR niche market pivot-$90,000 to -$200,000Costs rising for delayed decision
Month 12: Go/No-Go Decision PointFinal decision: Invest, pivot, or orderly exit-$150,000 to -$320,000Window closing rapidly
Month 15: Implementation BeginsBegin facility upgrades OR market transitionStabilizing or decliningCommitted to chosen path
Month 18: Irreversible CommitmentCapital deployed, path locked inPath dependentNo turning back
Month 24+: Forced Exit (if waited)Emergency liquidation, lost equity-$380,000 average loss vs. Month 12 exitEmergency measures only

Five Critical Questions to Answer Before January 2026

If you’re facing these decisions, start with question one and work through them honestly:

1. What’s your true breakeven, including family living expenses?
Not just covering cash flow—actually supporting your family at a reasonable standard.

2. Can you secure processing contracts beyond 2026?
If your processor is building new facilities, are you the size they want long-term?

3. At current margins, how fast are you burning through equity?
If you’re losing $50,000 annually, when does your debt-to-asset ratio become problematic?

4. If succession is planned, are you handing over a viable business or debt?
Be honest about what the next generation would actually inherit.

5. What does orderly exit today look like versus forced exit in 18 months?
Compare land values, equipment depreciation, and herd values in both scenarios.

Finding Ways Forward

Not everyone’s giving up. A Pennsylvania producer with 380 cows went from losing $40,000 annually to breaking even. “We renegotiated every contract, switched to seasonal calving to reduce labor peaks, and started custom raising heifers for cash flow. It’s not pretty, but we’re still here.”

In Vermont, three neighbors with 200-cow operations formed a joint venture. They share equipment and labor but keep separate ownership. Their combined 600 cows achieve better economics without anyone taking on massive debt.

Down in Texas, smaller operations are finding success with direct institutional sales. One producer’s getting a $2 premium per hundredweight from a regional hospital system valuing local sourcing. For a 300-cow operation, that’s $164,000 additional annual revenue.

These aren’t miracles. They’re grinding it out, getting creative, adapting.

The Reality We’re Facing

Current policy seems optimized for large-scale operations and export competitiveness rather than for preserving mid-sized farms. That $11 billion in processor investments signals confidence in dairy’s future—but it’s a future with fewer, larger farms producing for global commodity markets.

The 300-cow operations that built our rural communities are becoming harder to sustain economically. Not because they’re bad at farming, but because the system increasingly favors scale.

Practical Steps That Work

Surviving operations share common traits. It’s not about the newest equipment—it’s about eliminating every unnecessary expense. Some are forming partnerships, sharing resources, even merging herds while keeping separate ownership.

Market development works when you find specific buyers—hospitals, schools, regional chains—who value local sourcing enough to pay premiums. Financial creativity matters too. Equipment leases, custom work arrangements, conservation easements—everything’s worth considering.

Resources Worth Checking

Financial Planning:

  • DMC Decision Tool at dairymarkets.org
  • Federal Milk Marketing Order info at ams.usda.gov
  • Your state Extension dairy program for cash flow templates

Support When Needed:

  • Farm Financial Standards Council: ffsc.org
  • National Young Farmers Coalition: youngfarmers.org
  • Farm Aid hotline: 1-800-FARM-AID
Margins crashed $4.02/cwt in six months—but DMC offers zero protection until you hit $9.50. Mid-size farms are bleeding in the $2+ gap between their breakeven and federal safety nets

The Bottom Line

Secretary Rollins’ “golden age” might happen for large operations positioned for exports, processors with efficient new plants, and input suppliers serving bigger customers. This infrastructure will make U.S. dairy more globally competitive.

But for many 300-cow Wisconsin operations, 450-cow Pennsylvania farms, 250-cow Vermont dairies, this isn’t a golden age. It’s a countdown. Not because they failed, but because the economics of their scale don’t work in the current system.

These families need honest analysis and practical tools, not just optimism. The next 18 months will reshape American dairy more than any period since the 1980s. Whether mid-sized producers find ways to stay viable or choose to preserve value through exit, they’re making rational decisions in challenging circumstances.

At kitchen tables across dairy country tonight, families are making choices that can’t wait for the next farm bill or election. They’re using real numbers, actual margins, and making generational decisions. Whatever they choose, they’re not failing. They’re adapting to reality.

The industry that emerges will be different. Understanding that—both the challenges and opportunities—helps us all navigate this transition better. That’s the conversation we need to be having, with clear eyes and respect for the tough choices our neighbors are making.

Because at the end of the day, we’re all trying to figure out the best path forward in an industry we love, even when it’s testing us like never before.

KEY TAKEAWAYS:

  • The $71,000 shift: June’s make allowance changes moved $82M from producers to processors—turning a typical 300-cow operation from barely profitable ($10K) to bleeding cash (-$61K)
  • Your 18-month decision window: By January 2026, choose your path—invest $2-3M to scale up, transition to niche markets, or execute an orderly exit while preserving equity
  • Why USDA’s “support” won’t save you: The four-pillar plan (dietary guidelines, export expansion, processor investments, “vocal” interest rate advocacy) offers no direct financial relief as 2,800 farms close
  • The permanent disadvantage: Operations under 700 cows face $4-5/cwt structural cost gap versus mega-dairies that no amount of belt-tightening can overcome
  • Five critical questions to answer now: True breakeven with family wages? Processing contracts beyond 2026? Equity burn rate? Succession viability? Exit value today vs. 18 months?

Complete references and supporting documentation are available upon request by contacting the editorial team at editor@thebullvine.com.

Learn More:

The Sunday Read Dairy Professionals Don’t Skip.

Every week, thousands of producers, breeders, and industry insiders open Bullvine Weekly for genetics insights, market shifts, and profit strategies they won’t find anywhere else. One email. Five minutes. Smarter decisions all week.

NewsSubscribe
First
Last
Consent

China’s 42 Million Tonne Milk Mountain: What Every Dairy Farmer Needs to Know About the Industry’s Biggest Shift Since Mechanical Milking

Your banker knows. Your co-op won’t say it. China’s birth crisis means your 300-cow dairy has 90 days to decide its fate. Here’s how.

EXECUTIVE SUMMARY: China’s 42 million tonne milk mountain isn’t temporary—it’s the product of a 48% birth rate collapse that permanently eliminates demand for 5% of global milk production. If you’re running a 200-500 cow dairy, this structural shift means you’re losing $359,609 annually compared to 2,000-cow operations, a gap that superior management cannot close. With milk prices locked at $16.50-18.00/cwt through 2027, you have exactly three viable options: borrow $8-15 million to scale beyond 1,500 cows, pivot to premium markets with guaranteed contracts (organic, A2, grass-fed), or execute a strategic exit that preserves your equity. The difference between acting now and waiting is stark—strategic exit today nets 70-85% of equity ($1.5M), while forced liquidation in 12 months recovers just 30-50% ($700K). Every month of indecision bleeds $23,000-55,000 through operating losses and accelerating asset depreciation. Your Q1 2026 decision isn’t about whether you’re a good farmer—it’s about whether you’ll control your family’s financial future or let market forces decide for you.

dairy farm business strategy

Let me share something that’s been on my mind lately—and I think it deserves careful attention from every dairy farmer reading this. China’s sitting on 42 million tonnes of surplus milk, based on their agriculture ministry’s September reports. That’s roughly 5% of global production, just… sitting there. And here’s what’s interesting: this isn’t your typical market cycle that we’ve all weathered before.

You know, I’ve been digging through the data, talking with economists at Cornell and Wisconsin’s dairy programs, and what’s emerging is a picture that’s fundamentally different from anything we’ve navigated since—well, probably since we all switched from hand milking to mechanical systems. Understanding why this time really is different —and knowing what steps to take right now —could make all the difference for your operation over the next 24 months.

Why This Crisis Breaks All the Old Patterns

So I was looking back at my notes from the 2009 downturn the other day. Remember that one? USDA data shows all-milk prices bottomed out at $11.30 per hundredweight in July 2009, then bounced right back within 12 months. The 2016 slump—you remember, when Russia imposed an embargo and the EU eliminated quotas—that stabilized within 18-24 months, according to the dairy network analysis I’ve been reviewing. Even COVID, for all its disruption, saw our sector adapt remarkably well within months. There’s actually some fascinating research in the Journal of Dairy Science from 2021 documenting how quickly we pivoted.

But China? This is something else entirely.

What farmers are discovering—and China’s National Bureau of Statistics backs this—is that we’re dealing with a demographic reality nobody can fix. Their birth rate collapsed from 12.43 per 1,000 people in 2016 to just 6.39 in 2023. That’s a 48% decline, folks. The population of kids aged 0-3… you know, the ones drinking all that infant formula? Down from 47 million to 28 million in just five years. Those babies don’t exist and won’t magically appear if milk prices recover.

The numbers don’t lie: China lost 19 million formula consumers (40% decline) while birth rates crashed 48%. This isn’t a cycle—it’s permanent demand destruction that eliminates 5% of global milk consumption. Your 2027 milk price depends on markets that will never return.

Here’s what happened: After that horrific 2008 melamine scandal—six babies died, 300,000 were hospitalized according to World Health Organization reports—Beijing went all-in on dairy self-sufficiency. The Chinese began importing hundreds of thousands of Holstein cattle in 2019, according to the customs data I’ve been reviewing. Average herd sizes grew 40% year-over-year through late 2023, if you can believe it. They hit 85% self-sufficiency, up from about 70%—exactly what they wanted. Problem is, they built all this capacity assuming demand would keep growing.

Now here’s where it gets really unusual. Chinese raw milk prices have been underwater for over two years—sitting at 2.6 yuan per kilogram against production costs of 3.8 yuan, based on China Dairy Industry Association data from October. Farmers there are literally paying to produce milk. Yet production continues, propped up by government subsidies, soft loans from state banks, and political imperatives that… well, they just don’t follow normal market rules.

The Hard Math Behind Mid-Size Dairy Challenges

USDA’s Agricultural Resource Management Survey data reveal a stark cost differential across farm sizes. And this isn’t about who’s a better farmer—it’s about structural economics that management alone can’t overcome.

Looking at production costs per hundredweight from the USDA’s dairy cost and returns estimates:

  • Farms with fewer than 200 cows: generally running $23.68-33.54/cwt
  • 200-499 cows: around $20.85/cwt
  • 500-999 cows: typically $18.93/cwt
  • 1,000-1,999 cows: averaging $17.39/cwt
  • 2,000+ cows: down to $16.16/cwt
The brutal economics of scale: Mid-size operations face an automatic $4.69/cwt cost disadvantage ($359,609 annually for a 300-cow dairy) that no amount of management skill can overcome. Market prices lock them into structural losses through 2027.

With USDA’s World Agricultural Supply and Demand Estimates showing milk prices at $16.50-18.00/cwt through 2026-2027, you can see the problem pretty clearly. A 300-cow operation faces production costs about $4.69/cwt higherthan a 2,000-cow operation. On annual production of, say, 76,650 cwt, that’s a $359,609 competitive disadvantagebefore you even wake up in the morning.

What’s really interesting is research by agricultural economists at Wisconsin showing that management quality accounts for only about 22% of the variance in profitability. The other 78%? That comes from herd size and the resulting cost structure. Labor costs alone create roughly a $2.60/cwt difference between mid-size and large operations. Fixed overhead adds another $3.33/cwt disadvantage. Even feed costs—where you’d think everyone’s buying the same corn—show about a $1.40/cwt advantage for large operations through volume purchasing and precision nutrition programs.

You just can’t manage your way out of that kind of structural disadvantage, no matter how good you are. And believe me, I’ve seen some excellent managers struggle with this reality.

Three Paths Forward: Finding Your Best Option

After talking with farm management specialists at Penn State Extension and Farm Credit consultants across the Midwest, three viable paths keep emerging for dairy operations facing this transformation. Each has specific requirements that need honest evaluation.

Path 1: Scale to Competitive Size (1,500-2,500+ cows)

I’ve noticed that farmers considering expansion need to tick quite a few boxes before this makes sense. Agricultural lenders at CoBank and Farm Credit are generally looking for:

  • Debt-to-asset ratio below 40% before you even start
  • At least $300,000-600,000 in working capital reserves (expansion disrupts cash flow for 12-24 months, as many of us have learned the hard way)
  • Access to $8-15 million in financing
  • Another 500-800 acres of land are available
  • Confirmation from your processor that they can handle the additional volume

As consultants like Tom Villenga in Wisconsin often explain, it typically takes 18-24 months from groundbreaking to positive cash flow. And farmers need to understand—you’re not really farming at that scale anymore. You’re managing 8-15 employees and running a business. It’s a completely different skill set.

Path 2: Pivot to Premium Markets

This development suggests a real opportunity for the right operations. Organic milk premiums are running $8-12/cwt over conventional, based on CROPP Cooperative’s October market reports. But location matters enormously here.

Economists at Cornell’s Dyson School have documented that you need to be within 75 miles of a metro area with a population of 250,000+ to make premium markets work. The affluent consumers who pay those premiums are concentrated in specific geographic areas—that’s just the reality of it.

What farmers are finding crucial: secure your premium buyer contracts before beginning any conversion. I keep hearing stories—you probably have too—of operations that completed expensive organic transitions only to discover no premium buyers existed in their region. That’s a tough spot to be in.

The conversion timeline’s no joke either. It’s a full three years before you see those organic premiums, based on USDA’s National Organic Program guidelines. During that time, you’re incurring organic costs while still selling at conventional prices. Budget $50,000-100,000 for a 300-cow operation to make that transition, based on case studies from Vermont’s sustainable agriculture program.

Path 3: Strategic Exit While Preserving Equity

Nobody likes talking about this option, but sometimes it’s the smartest move. Industry consultants like Gary Sipiorski at Vita Plus, who’s been working with dairy operations for decades, often point out that strategic exit while you’re solvent preserves 70-85% of equity. Forced liquidation after covenant violations? You’re looking at 30-50% if you’re lucky.

Here’s something most farmers don’t know about: Section 1232 of the bankruptcy code can save substantial capital gains taxes for farmers with highly appreciated land. Agricultural bankruptcy attorneys who specialize in this area explain that if appropriately executed before selling assets, farmers can save $200,000-500,000 in capital gains taxes through a strategic Chapter 12 filing. It’s worth understanding these provisions even if you hope never to use them.

The indicators suggesting this path include working capital trending below 6 months of operating expenses, being 55+ without a committed next generation, or simply having no viable path to profitability at forecast milk prices.

The Asset Value Reality Nobody Discusses

What’s particularly concerning—and I don’t hear this discussed nearly enough at co-op meetings—is how quickly farm asset values deteriorate when a region’s dairy sector struggles.

Mark Stephenson at Wisconsin’s Center for Dairy Profitability has done extensive work on this. When dairy becomes structurally unprofitable in a region and multiple farms exit simultaneously, those anticipated liquidation values farmers count on for retirement… they simply evaporate.

Think about it. Land you believe is worth $9,000 per acre based on that sale down the road last year? When 8-12 dairy farms in your county hit the market simultaneously with no qualified buyers, you might see $6,000-6,500. I’ve watched it happen in several Wisconsin counties over the past three years, and it’s heartbreaking.

Equipment values face the same compression. That 2018 John Deere you figure is worth $75,000? When six similar tractors are at auction within 50 miles, you might get $48,000. And dairy-specific infrastructure—milking parlors, freestall barns—they become nearly worthless without other dairy farmers to buy them.

Based on Farm Financial Standards Council accounting principles, farms in declining dairy regions face combined monthly wealth destruction of $23,000- $ 55,000 from operating losses and asset depreciation. Your farm’s value isn’t static—it’s changing every month based on regional dynamics.

Time destroys wealth faster than you think. A 300-cow operation valued at $1.5M today becomes $322K in 12 months—78% wealth destruction. Strategic exit today preserves $1.16M (77.5%). Forced liquidation after covenant violations leaves you with $323K (21.5%). That’s a $839,700 difference for waiting one year.

What Co-ops Are Saying vs. Market Reality

Comparing cooperative messaging against actual market data reveals… well, let’s call it a disconnect.

When co-ops say “market conditions will stabilize by late 2026,” they’re technically correct—USDA projects Class III prices around $18-19/cwt. But here’s what they’re not emphasizing: that’s still below breakeven for operations under 1,000 cows while remaining profitable for 2,000+ cow operations. In other words, “stabilization” actually accelerates consolidation rather than providing relief.

This disconnect partly stems from structural conflicts within the cooperative model itself. Market analysts like Phil Plourd at Blimling and Associates have documented how co-ops need maximum milk volume to spread fixed processing costs. They have an incentive to keep members producing, even at a loss—it’s just the nature of the cooperative structure.

What really caught my attention was data from the National Milk Producers Federation showing that DFA lost over 500 member farms in 2023. They’re anticipating shrinking from current levels to around 5,100 farms by 2030. That’s roughly a 9-10% annual attrition rate among their membership. If co-ops are successfully supporting family farms, why are 280+ farms leaving each year?

Looking Ahead: The 2028 Dairy Landscape

Based on consolidation trends documented by Rabobank’s dairy research group and factoring in China’s sustained market pressure, here’s what I think we’re looking at:

Total U.S. dairy farms will likely decline from today’s roughly 31,000 to somewhere around 20,000-22,000 by 2028—that’s a 29-35% reduction. But the distribution shift is even more dramatic.

Operations with 2,000+ cows, currently about 800 farms producing 46% of U.S. milk, will probably expand to 1,200-1,400 farms producing 60-65%. Meanwhile, that middle tier—200-999 cow operations in commodity production—faces a 75-85% reduction. It’s stark, but that’s what the data suggests.

What’s emerging are essentially three viable farm types:

  1. Industrial-scale operations (2,000-5,000+ cows) competing on efficiency
  2. Premium/niche producers (100-800 cows) capturing substantial price premiums
  3. Lifestyle farms (<100 cows) subsidized by off-farm income

The middle? It’s disappearing. And that’s a huge change for our industry.

Your Action Plan: Practical Steps for Right Now

For farmers reading this in late 2025, your window for strategic decision-making is measured in months, not years. Here’s what I’d suggest doing immediately:

This week: Calculate your true working capital per cow. Take current assets minus current liabilities, divide by cow count. If you’re below $800 per cow, you need to act fast.

Schedule a frank conversation with your banker about exactly where you stand relative to loan covenants. Don’t wait for them to call you—be proactive about it.

Have an honest family discussion about the farm’s actual financial position. I know these conversations are tough, but they’re essential.

And listen, if stress is affecting your sleep, relationships, or wellbeing, please reach out for help. The National Suicide Prevention Lifeline at 988, Farm Aid at 1-800-FARM-AID, and Iowa Concern at 1-800-447-1985 all have counselors who understand what you’re going through. There’s no shame in needing support—we all do sometimes.

Within 30 days: Engage an independent agricultural consultant—not your co-op field rep—for an honest viability assessment. Yes, it’ll cost $2,000-5,000, but it could save you hundreds of thousands in the long run.

Meet with an agricultural attorney who understands Section 1232 provisions and strategic options. Get real liquidation values for your assets from agricultural appraisers, not optimistic book values.

Develop three scenarios with your family: scale up, premium pivot, or strategic exit. Run the numbers on each. Be honest about what’s realistic for your situation.

The Success Story: Learning from Those Who’ve Navigated Change

Let me share a story about a family I’ll call the Johnsons—they represent what I’m seeing across eastern Iowa and similar situations throughout the Midwest. Third-generation dairy farmers with 380 cows faced this exact decision in early 2024, when working capital started to dwindle.

After careful analysis with their consultant, they executed a strategic exit in May 2024, using Section 1232 provisions to preserve an additional $180,000 in capital gains taxes. Today? They’re debt-free. The husband works as a herd manager for a 2,500-cow operation nearby. They kept their house and 40 acres. Their adult daughter started veterinary school this fall.

But let me be honest about something—when he talked with me about it, he said it was the hardest year of his life. “Watching that auction… seeing our cows loaded on someone else’s trailer… I couldn’t watch. Had to walk away.” His voice caught a bit. “Four generations of Johnsons milked those cows. Four generations.”

The identity crisis is real. The sense of failure—even when you’re making the smart financial decision—it’s overwhelming. He told me he didn’t go to the coffee shop for three months because he couldn’t face the questions. Couldn’t face being “the Johnson who lost the farm,” even though he’d actually saved his family’s financial future.

“But you know what?” he continued, “Looking at our grandkids playing in the yard, knowing they’ll have college funds, knowing we can sleep at night without worrying about milk prices… we made the right call. Hardest thing I ever did. Also, the smartest.”

That’s the kind of brutal honesty we need right now. Strategic exit isn’t failure—it’s protecting what matters most. But that doesn’t make it easy.

Key Takeaways for Your Decision

What this all boils down to is understanding that we’re experiencing a structural transformation, not a typical cyclical downturn. China’s demographic shift and production surplus represent permanent changes to global dairy demand—at least for the foreseeable future.

The $3-5/cwt cost advantage that 2,000+ cow operations enjoy over 200-500 cow farms simply can’t be overcome through better management. It’s structural, and we need to accept that reality.

Every month of delay in stressed markets costs not just operating losses but also substantial asset-value deterioration—that hidden wealth destruction that nobody talks about at the coffee shop.

Three paths remain viable for most operations: scaling to 1,500+ cows if you have the resources, pivoting to premium markets with guaranteed contracts, or executing a strategic exit while preserving equity.

The window for making these decisions strategically rather than under duress is closing. Industry dynamics suggest farmers need to commit to their chosen path by the end of Q1 2026.

And please, remember this: with farmer suicide rates running 3.5 times the national average according to CDC data, no amount of farm equity is worth sacrificing your wellbeing or family relationships. Your family needs you more than they need the farm.

The dairy industry’s undergoing its most significant transformation in generations. Like that shift from hand milking to mechanical systems, this change will determine which farms exist in 2028 and which become memories. The farmers who acknowledge this reality and act decisively—whether scaling up, pivoting to premium, or strategically exiting—will be the ones sharing stories of resilience rather than regret.

The choice, and the timeline, are yours. But that window for making the choice? It’s closing faster than most of us realize. What matters now is making an informed decision while you still have options.

KEY TAKEAWAYS:

  • This is structural, not cyclical: China’s 42 million tonne surplus reflects permanent demand loss from a 48% birth rate collapse—recovery isn’t coming
  • Your management can’t fix physics: 300-cow dairies face an automatic $359,609 annual disadvantage versus 2,000-cow operations at any skill level
  • Three paths remain viable: Scale past 1,500 cows ($8-15M investment), pivot to premium markets with secured contracts, or execute strategic exit today at 70-85% equity (vs. 30-50% in forced liquidation)
  • Every month costs $23,000-55,000: Operating losses plus hidden asset depreciation are turning $1.5M farms into $700K distressed sales
  • Control your exit or it controls you: Make your decision by Q1 2026 while you have options—after that, loan covenants decide your fate

Complete references and supporting documentation are available upon request by contacting the editorial team at editor@thebullvine.com.

Learn More:

The Sunday Read Dairy Professionals Don’t Skip.

Every week, thousands of producers, breeders, and industry insiders open Bullvine Weekly for genetics insights, market shifts, and profit strategies they won’t find anywhere else. One email. Five minutes. Smarter decisions all week.

NewsSubscribe
First
Last
Consent

Dairy’s $4,000 Heifer Shock: How 30-Month Biology Determines 2027’s Winners

One decision in 2022 split dairy into winners and losers. The 30-month biology clock just rang. Which side are you on?

Executive Summary: The U.S. dairy industry faces a 47-year low in replacement heifers (3.914 million head), with bred springers commanding $4,500—a crisis born from 72% of farms choosing beef-on-dairy breeding to survive 2022-2023’s brutal economics. Biology’s inflexible 30-month timeline means the survival decisions made today are creating today’s shortage, splitting the industry into clear winners and losers. Pennsylvania’s 30,000-heifer advantage translates to $120 million in strategic value, while Kansas farms missing 35,000 head scramble for replacements they can’t afford. By 2030, the industry consolidates from 26,000 to 21,000 operations, with only three paths forward: mega-dairies capturing scale, niche operations commanding premiums, or mid-size farms securing processor relationships. Operations needing over $350,000 for replacements face immediate strategic decisions—breeding choices made today determine 2028 survival.

dairy replacement heifer shortage

The dairy industry is facing a structural shift not seen since 1978. The USDA’s January inventory shows we’re down to just 3.914 million replacement heifers—that’s the lowest in 47 years. Quality bred springers are commanding $3,200 to $4,500 at auctions at auctions from Lancaster to Tulare, it’s clear this isn’t your typical market cycle that’ll sort itself out.

Here’s what’s really interesting… this whole situation stems from decisions most of us made during that brutal stretch in 2022-2023, when we were just trying to survive. The National Association of Animal Breeders—that’s NAAB for those keeping track—shows about 72% of dairy farms shifted to beef-on-dairy breeding back then, and honestly, it made perfect sense at the time. But those decisions locked us into a biological timeline—that 30-month cycle from breeding decision to fresh heifer—that no amount of money or technology can speed up. The operations that understood this reality early? They’re positioned to dominate the next decade. Those who focused on quarterly cash flow are… well, they’re having some really tough conversations right now.

Heifer prices have rocketed by 295% since 2019, topping out at $4,500 in 2025—a momentum shift so powerful, it’s redrawing farm budgets and the survival map for U.S. dairies.

How Survival Economics Created Today’s Crisis

Let me take you back to what we were all dealing with in 2022-2023. Wisconsin’s All-Milk price had crashed to $17.40 per hundredweight by July 2023, while corn was hitting $6.50 per bushel and soybean meal was pushing $480-500 per ton on the CME. I mean, those were brutal numbers for anyone trying to keep the doors open.

So beef-on-dairy breeding became this lifeline, right? NAAB’s data shows crossbred calves were bringing $1,000 to $1,200 during that stretch, compared to maybe $300-500 for straight Holstein bulls. Do the math on a thousand-cow operation—that’s easily $100,000 to $140,000 in extra revenue. For many of us, that was literally the difference between staying in business and bankruptcy.

What really tells the story is how fast this shift happened. NAAB’s quarterly reports show beef semen sales to dairy farms jumping from 5 million units in 2020 to 7.9 million units in 2024—that’s a 58% increase. By last year, about 84% of all beef semen sold in America was going to dairy operations, with roughly 72% of farms using it in their programs.

Michigan producers, for example, report spending $2,100 to $2,200 to raise a heifer from birth to fresh, but market values had dropped to around $1,200. So they’re losing a grand on every heifer raised, while beef-cross calves are generating $900 to $1,000 at just 10 days old. What would you have done?

But here’s the thing—and I think we all knew this intellectually but didn’t fully appreciate it at the time—biology doesn’t care about our quarterly financial statements. Those breeding decisions from 2022? They don’t produce replacement heifers until 2025-2026. That 30-month timeline from breeding to fresh heifer… you can’t compress it, no matter how desperate things get.

The dairy supply crisis explained in one frame: a 47-year low in heifer numbers collides with record price inflation—squeezing mid-size farm margins from both sides.

Regional Winners and Those Facing Challenges

What’s fascinating is how differently this is playing out across regions. The strategic decisions folks made between 2019 and 2023 essentially determined who’s thriving now and who’s struggling.

Pennsylvania’s Strategic Windfall

Pennsylvania really caught everyone by surprise, didn’t they? The USDA’s January inventory shows they added 30,000 replacement heifers—that’s a 15% increase—while keeping cow numbers fundamentally flat. At current prices, we’re talking $90 to $120 million in strategic inventory advantage for the state.

I’ve been following what’s happening with custom heifer raisers around Lancaster County. Operations running 300-500 head are seeing some remarkable economics. Penn State Extension’s surveys, led by dairy specialist Rob Goodling, are documenting profits of $550 to $726 per contracted heifer, with spot-market opportunities ranging from $1,076 to $1,276 per head.

One operator told me recently, “I’m getting $2,850 per head delivered on my contracts. Sure, spot market might bring $3,200 to $3,400, but contracts give me certainty.” Then he mentioned—and this really shows how wild demand has gotten—”Texas operations are calling, offering $4,200 per head plus $380 trucking for bred springers I can deliver in March.” Never seen anything like it.

Kansas’s Processing Capacity Dilemma

Now, Kansas… that’s a whole different story. They lost 35,000 dairy replacement heifers, according to USDA reports—the largest single-state decline. And this is happening right when they’re part of that massive $10-11 billion wave of national dairy processing investments. Talk about bad timing.

Betty Berning, senior analyst at Daily Dairy Report, pointed this out back in March, and it really stuck with me. Kansas added just 3,000 cows in 2023, despite all these new cheese plants needing millions of pounds of milk daily. The arithmetic just doesn’t work for filling that new processing capacity.

I’ve been talking with producers running 800-900 cow operations out there, and the math they’re facing is tough. Say you need 280 fresh heifers in 2026 to maintain herd size, but your internal pipeline only produces 150. That means buying 130 head externally at an average of $3,500—we’re talking $455,000 in capital requirements. When you’re already sitting at 43-44% debt-to-equity? Your banker’s going to have concerns, and honestly, they should.

The Upper Midwest’s Balanced Approach

What’s encouraging is seeing what Wisconsin, Minnesota, and South Dakota managed to do. They collectively acquired 20,000 replacement heifers, according to state reports, by maintaining strategic breeding programs even when the economics looked terrible.

Curtis Gerrits, senior dairy lending specialist at Compeer Financial, said something recently that captures it well: processors in their region work with farmers who consistently deliver high-quality milk, and those relationships include about $0.85 per hundredweight in quality premiums for consistent volume and good components. That’s enough to make a real difference.

A few things these states had going for them:

  • Those processor relationships with meaningful premiums for consistency
  • Custom heifer-raising infrastructure that survived the downturn
  • Smart breeding programs—using maybe 40-50% beef semen while keeping replacement pipelines intact
  • And this matters—lower HPAI exposure compared to what California and Idaho dealt with

It’s worth noting what’s happening globally, too. New Zealand’s production is running about 3% ahead of last season, and Europe’s recovery is underway despite its bluetongue challenges. That means U.S. processors facing domestic supply constraints have import options, which affects everyone’s pricing dynamics. But imports can’t fully replace local supply relationships—especially for specialized dairy farm survival strategies that depend on regional processor partnerships.

Strategic decisions made in 2019-2023 have created stark regional winners and losers: Pennsylvania’s 30,000-heifer surplus translates to $90-120M in market advantage, while Kansas faces a 35,000-heifer deficit that threatens its ability to supply $11 billion in new processing capacity

Where This Industry’s Heading by 2030

Looking at projections from the USDA Economic Research Service and groups like the IFCN Dairy Research Network, we’re likely to see 21,000 to 24,000 total dairy operations by 2030. That’s down from about 26,000 to 27,000 today. But it’s not just simple consolidation—it’s a complete restructuring of how the industry works.

The Large-Scale Reality (3,500- 10,000+ cows)

We’ll probably see about 2,500 to 3,000 of these mega-operations producing 80% of the national milk supply. Wisconsin’s dairy farm business summaries show these folks are achieving production costs around $14.20 to $15.80 per hundredweight through their operational efficiencies. Pretty impressive.

A surprising and significant factor is that many are also generating $800,000 to $1.8 million annually from renewable energy credits. The California Air Resources Board data on this is eye-opening. These operations can afford to pay $4,200 for a replacement heifer because their scale and contracts support it.

The Premium Niche Path (40-150 cows)

I’m seeing maybe 12,000 to 15,000 smaller operations finding real success through differentiated marketing. They’re capturing $35 to $50 per hundredweight through direct sales—compare that to the $21 or so we see in Federal Order commodity markets. That’s a completely different business model.

Vermont’s organic dairy studies show these operations can generate $220,000 to $650,000 in family income with minimal debt. Sure, marketing takes up 25-35% of their time, but if you’re near Burlington or Boston, where consumers value what you’re doing? It works.

The Challenging Middle (200-800 cows)

This is where it gets tough—maybe 6,000 to 9,000 operations producing 8-12% of milk supply. Too big for farmers markets, too small for those mega-dairy efficiencies. The ones making it work either have strong processor relationships with meaningful premiums, specialized markets like A2 or grass-fed, or they’ve diversified into custom heifer raising themselves.

What We Can Learn from Those Who Saw This Coming

I’ve spent a lot of time trying to understand what separated operations that maintained replacement programs through the tough years from those that didn’t. A few patterns keep showing up.

They Thought in Biological Timelines, Not Quarters

Take Kress-Hill Dairy in Wisconsin. Nick Kress and Amanda Knoener kept investing in registered genetics when beef premiums peaked. Holstein Association records show they’ve now got 18 Excellent and 99 Very Good cows. That’s serious genetic value in today’s market.

They Protected Their Pipeline

Rose Gate Dairy up in British Columbia does something interesting—they wait until cows are 40-60 days fresh before making culling decisions. This ensures they don’t short themselves on replacements. While neighbors were chasing every beef premium, they kept asking, “What’s our 2025 pipeline look like?”

They Invested Before the Crisis Hit

The Moes family at MoDak Dairy in South Dakota—130 years of continuous operation, which tells you something—manages all heifers on-site in well-designed facilities. They balance current technology with proven practices rather than jumping on every trend. Smart approach.

They Did the Multi-Lactation Math

Penn State’s data shows home-raised feed costs account for about 42% of total heifer expenses—roughly $893 out of $2,124. Operations with good crop-to-cow ratios who maintained this advantage? They’re consistently among the most profitable farms in their regions.

They Ran Complete Scenarios

There’s research in the Journal of Dairy Science that followed 29 farms for 5 years. Producers making optimal replacement decisions generated about $175 more monthly than those making suboptimal choices. The successful folks all ran scenarios like: “If heifers hit $3,500 and we need 150, can we actually finance $525,000?”

Cost ComponentCost per Heifer% of TotalKey Notes
Opportunity Cost (calf not sold)$1,74260%Record calf prices inflate this
Labor (23.5/hr)$2619%Avg dairy wage rates
Feed & Nutrition$1746%Lower grain costs 2025
Veterinary & Health$1164%Vaccine price increases
Machinery & Equipment$1746%Depreciation included
Land & Housing$1455%Opportunity cost of land
Other (fuel, utilities, etc)$29210%Building maintenance, etc
TOTAL – Home Raised$2,904100%Adjusted for 10% open rate
Market Purchase Price – 2025$4,200Peak auction prices
SAVINGS BY RAISING$1,29654% cheaperIF you can manage costs

Why Technology Can’t Fix This Fast Enough

A lot of folks are hoping that sexed semen can solve the replacement shortage. I get it—the technology’s improved tremendously. But when you look at the reality…

University of Florida and Wisconsin research consistently shows conventional semen gets you 58-65% conception rates on heifers. Sexed semen? You’re looking at 45-55%. That changes your cost per pregnancy from about $42 to $90. That’s real money when you’re breeding hundreds of animals.

But here’s the bigger issue with timing. Even if you started today with perfect execution, those pregnancies give you calves in August-September 2026. Those calves won’t freshen until February-March 2029. Operations need replacements in early 2026. Biology has its own schedule, and it doesn’t negotiate.

Plus—and people often forget this—effective sexed semen programs need serious infrastructure. Extension estimates suggest $30,000 to $72,500 for detection systems, training, and facility upgrades. Operations already at 43-44% debt-to-equity? That capital just isn’t available.

Looking ahead, emerging technologies might help—gene-editing approvals could accelerate genetic progress, and automation might reduce labor constraints—but these are 5-10-year developments, not 2-year solutions.

Your Strategic Framework for Current Conditions

So where does this leave us? Here’s what I’ve been telling folks who ask about navigating this situation.

First, Get Real About Your Pipeline

Calculate what you actually need for 2026-2027. Compare what you can raise internally versus what you’ll need to buy. Model it at $3,500-$4,500 per head. If you’re looking to make purchases of more than $350,000—essentially 100+ animals—you need to rethink your breeding strategy immediately.

Second, Understand Your Regional Position

Growth regions like Wisconsin, South Dakota, Michigan, and even parts of Texas? You can position for expansion. Contraction regions—thinking of parts of California, the Southwest, and the Southeast—might benefit from planned consolidation. Transition regions like Kansas and Idaho? You either need rock-solid processor relationships or… well, you need to consider alternatives.

Third, Pick Your Path

Can you reach 3,500+ cows while keeping manageable debt? That’s one path. Are you near a city with direct marketing skills? That’s another. Stuck in the middle at 200-800 cows? You need processor premiums or specialized markets to make it work.

Fourth, Run the Financial Reality Check

Calculate your debt service coverage ratios using current replacement costs. Test scenarios cost between $17 and $21 with milk. If your DSCR drops below 1.25, you need contingency plans now, not next year.

If you’re in that tough spot, remember there’s help available. USDA’s Farm Service Agency has restructuring programs, many Extension offices offer confidential financial counseling, and Farm Credit counselors understand these specific pressures. You don’t have to navigate this alone.

Fifth, Think Biology, Not Just Finance

Every breeding decision today affects 2028-2029 replacement availability. Infrastructure investments typically need 3-5 year paybacks. And processors remember who delivered consistent volume through the tough times.

Quick Reference: Critical Thresholds

Current Replacement Costs (November 2025):

  • Pennsylvania/Northeast: $3,200-$3,800
  • Wisconsin/Upper Midwest: $3,000-$3,500
  • California/West: $3,500-$4,000
  • Texas (importing): $4,200 plus $380 trucking

The Biological Timeline (It Doesn’t Negotiate):

  • Breeding to birth: 9 months
  • Birth to breeding age: 13-15 months
  • Breeding to fresh: 9 months
  • Total: 31-33 months if everything goes perfectly

Financial Warning Signs:

  • Debt-to-equity over 50%? That’s concerning
  • DSCR below 1.25? Most lenders get nervous
  • Need over $350,000 for replacements? Time for strategic changes

The Bottom Line as I See It

After watching this unfold and talking with producers across the country, a few things are crystal clear.

These replacement costs—$3,000 to $4,500 per head—aren’t a temporary spike. CoBank’s modeling and what we’re seeing at auctions suggest this is the new baseline through at least 2027. Plan accordingly.

Regional advantages compound fast. Pennsylvania is sitting on 30,000 extra heifers? That’s a real competitive advantage. Kansas is missing 35,000? That’s an existential challenge, even with all that processing investment.

Three models will dominate by 2030: mega-dairies with scale efficiencies, premium niche operations with loyal customers, and mid-size survivors who found their special angle. Everything else faces increasing pressure.

For new folks wanting in? Cornell and Penn State studies show you need a minimum of $2.83 million to $4.875 million for a conventional startup. The next generation enters through inheritance, processor partnerships, or niche markets. Traditional bootstrap dairy farming? That door’s fundamentally closed.

And this is the key difference—biology beats finance every time. Operations that recognized those 30-month timelines positioned themselves well. Those who optimized for quarterly cash? They’re having much harder conversations right now.

What really separates winners from those struggling isn’t access to better information. It’s having better frameworks for using that information. Successful operations asked, “What’s 2027 look like?” while others asked, “How do I maximize this quarter?”

That difference—thinking in biological timelines versus financial quarters—determines who captures supply premiums through 2030 and who’s evaluating exit strategies.

This transformation is permanent. The industry structure emerging from this will define American dairy through 2035. Each of us needs to figure out where we fit in that structure, because the decisions we make today determine what opportunities we have tomorrow.

And remember, this industry has weathered tough cycles before. Those who adapt, who think strategically, who understand both the biological and economic realities—they’ll find their way through. The dairy industry needs milk, processors need suppliers, and consumers still want dairy products. The question isn’t whether there’s a future in dairy—it’s what that future looks like and who’s positioned to capture it.

Key Takeaways:

  • The $350,000 test: If you need 100+ replacement heifers, you’re facing $350,000-$450,000 in capital needs—breeding strategy must change immediately, or consider consolidation options
  • 30-month reality: Biology doesn’t negotiate—decisions made in 2022 determine 2025-2026 heifer availability, and today’s breeding choices lock in 2028-2029 survival
  • Regional winners declared: Pennsylvania’s 30,000-heifer surplus commands market premiums while Kansas’s 35,000-heifer deficit threatens processor contracts despite billions in new capacity
  • Three paths forward: By 2030, only mega-dairies (3,500+ cows with scale), niche operations ($35-50/cwt premiums), or mid-size farms with processor relationships will survive
  • Think biology, not quarterly profits: Operations that preserved replacement pipelines during 2022’s cash crunch now name their price; those that maximized short-term revenue face existential decisions

Editor’s Note: This analysis examines the dairy replacement heifer crisis as of November 2025, drawing on the latest USDA inventory data, market reports, and industry projections through 2030.

Learn More:

  • Are You Raising Too Many Heifers? – This practical guide provides a framework for “right-sizing” your replacement program. It offers tactical methods for calculating your true heifer needs to optimize cash flow and avoid future inventory crises.
  • Beef on Dairy: The Pendulum Has Swung Too Far – This strategic analysis dives deeper into the beef-on-dairy trend that caused the current shortage. It examines the market volatility and long-term economic consequences, reinforcing the main article’s “biology vs. finance” thesis.
  • Sexed Semen: “Am I Doing This Right?” – While the main article notes technology isn’t a quick fix, this piece explores the correct implementation. It provides innovative strategies for using sexed semen effectively to maximize conception rates and accelerate genetic gain.

The Sunday Read Dairy Professionals Don’t Skip.

Every week, thousands of producers, breeders, and industry insiders open Bullvine Weekly for genetics insights, market shifts, and profit strategies they won’t find anywhere else. One email. Five minutes. Smarter decisions all week.
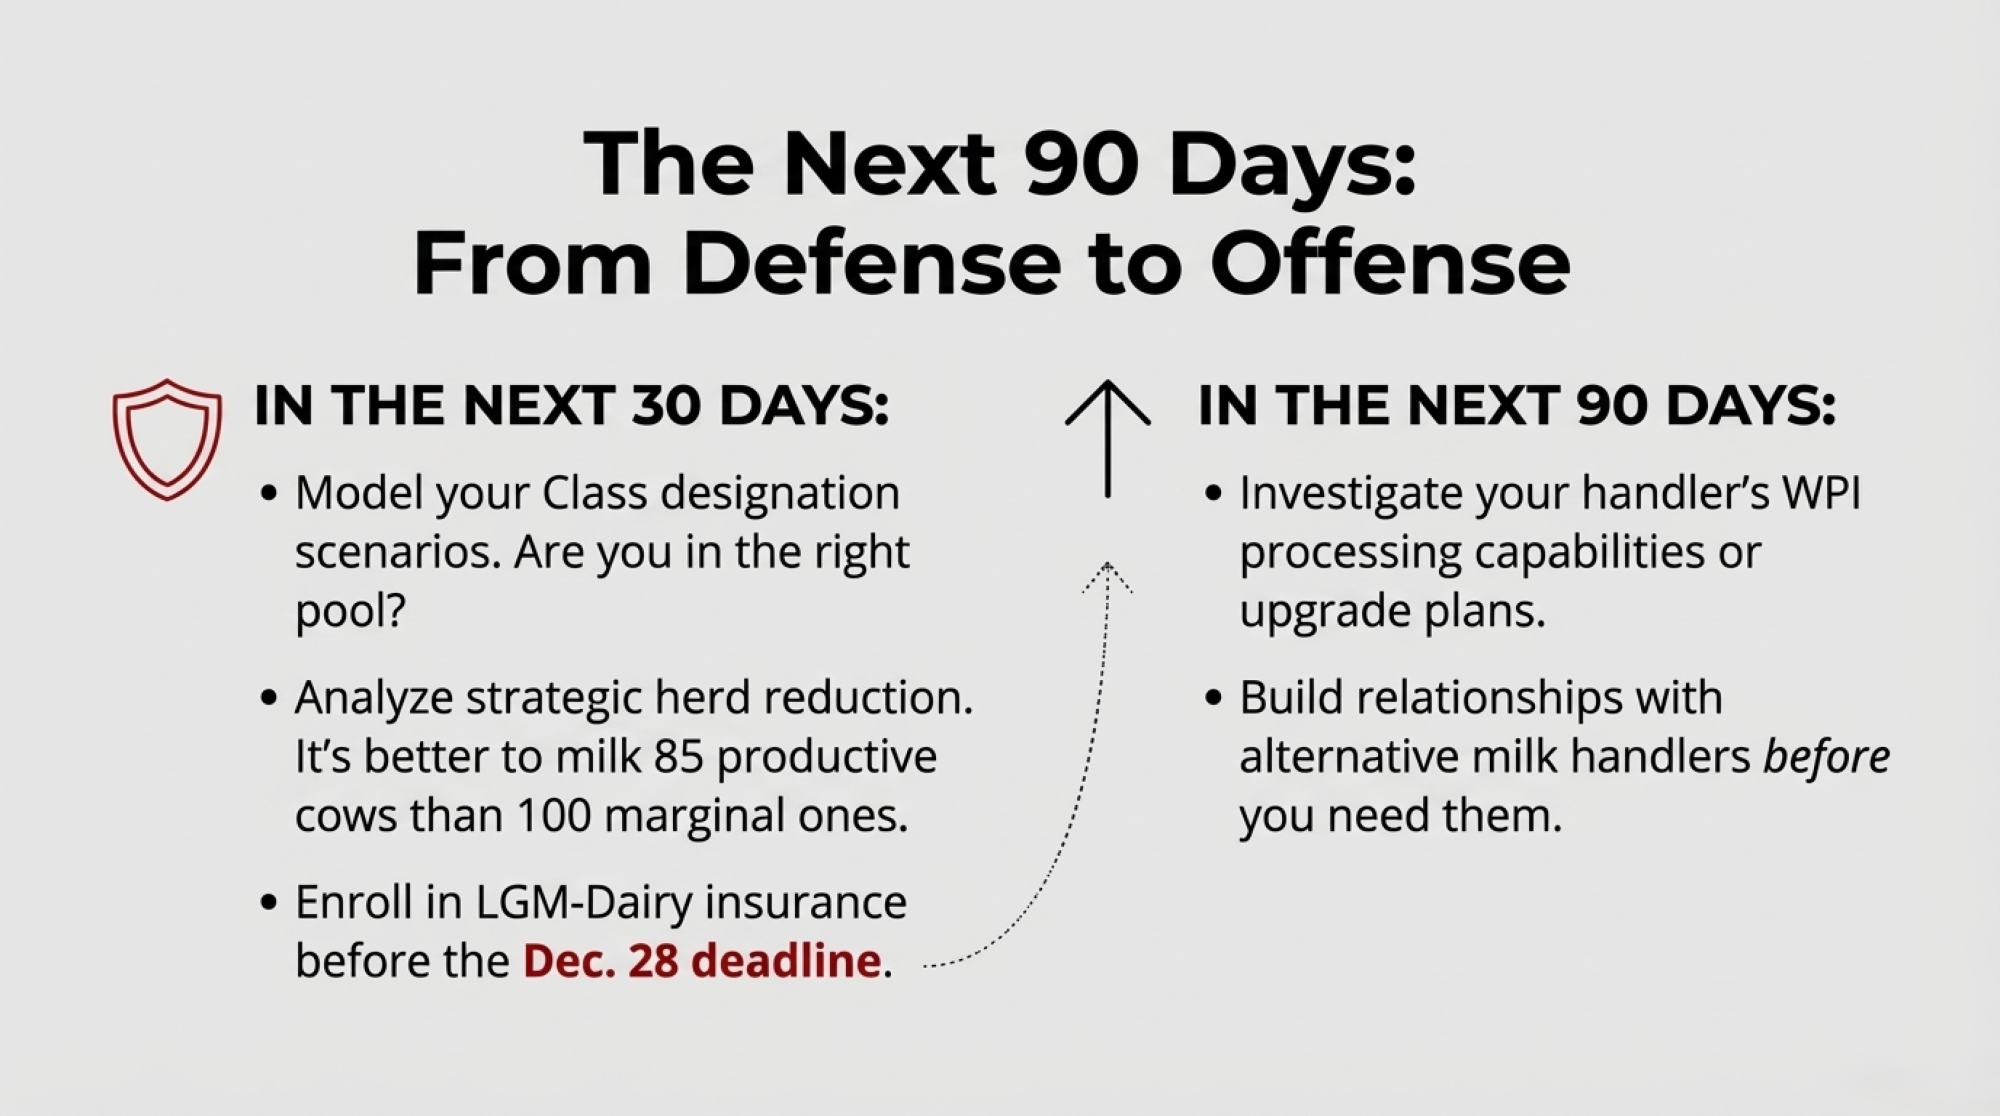
NewsSubscribe
First
Last
Consent

Cheddar’s Record 6.6% Crash Exposes Dairy’s Broken Recovery Plan: 90 Days to Act

I felt sick watching today’s GDT results. Not the WMP decline—the 6.6% cheddar crash. That was supposed to be our safety net. Now what?

EXECUTIVE SUMMARY: The November 4 GDT auction revealed the harsh truth: cheddar’s record 6.6% crash signals that dairy’s Plan B—pivoting from powder to cheese—has failed spectacularly. China won’t rescue us; they’re now 85% self-sufficient, with 40% fewer babies needing formula. The math is unforgiving: typical 500-cow operations are burning $101,000 per month, with 20 months of equity facing a 24-30-month downturn. CME futures at $16, versus USDA’s fantasy $19 forecast, show who’s been paying attention. Three paths remain viable: premium markets (requires location and a $400K investment), massive scale (minimum 2,000 cows), or a strategic exit before equity evaporates. Bottom line: decisions made in the next 90 days determine who survives 2027.

Dairy Market Strategy

So here we are again, checking those GDT results from November 4, 2025, and honestly, I felt that familiar knot in my stomach watching Whole Milk Powder drop another 2.7%. That’s six straight declines since early August, according to the latest GDT data. But here’s what really caught my attention—and I think this is what we all need to be talking about—cheddar cheese absolutely tanked, down 6.6% to $3,864 per metric ton. That’s the biggest single-category drop we’ve seen in recent memory, and it changes everything we thought we knew about where this market’s headed.

You know, I’ve been watching these markets for over two decades now, and what’s happening today feels fundamentally different. It’s not just China backing away from powder imports (though that’s huge), or these productivity gains that keep milk flowing despite terrible economics, or even CME Class III futures sitting $2.50 to $3.00 below what USDA keeps telling us we’ll get. It’s all of it together. And if you’re still running your operation like this, is just another down cycle… well, we need to talk.

The November 4 GDT auction delivered a devastating 6.6% cheddar crash—the largest single-category drop in recent memory—confirming that dairy’s Plan B (pivoting from powder to cheese) has failed spectacularly

Quick Market Reality Check

Key Numbers from November 4:

  • GDT Index: Down 2.4% to 1,135 (lowest since August)
  • Whole Milk Powder: -2.7% to $3,503/MT
  • Cheddar: -6.6% to $3,864/MT (largest single decline)
  • Butter: -4.3% to $5,533/MT
  • Winners: Only mozzarella (+1.6%) and buttermilk powder (+1.0%)

What Makes This Time Different

Looking at those November 4 numbers more closely, the overall GDT Price Index fell 2.4% to 1,135—that’s our lowest point since August, based on the Event 391 summary. Since that tiny 1.1% bump we got back on July 15, it’s been pretty much straight down. Reminds me of 2015-16, except… well, except for everything else that’s different this time around.

Here’s the breakdown that matters: Whole Milk Powder hit $3,503 per metric ton. Skim milk powder? Flat. Butter dropped 4.3% to $5,533. But that cheddar number—down 6.6%—that’s what keeps me up at night. See, cheese was supposed to be our safety valve, right? The product that would soak up all that displaced WMP demand as China shifts gears. When your backup plan crashes harder than your original problem… that’s when you know you’re in trouble.

The only bright spots were mozzarella (up 1.6%) and buttermilk powder (up 1.0%). But let’s be real here—those are niche products. They can’t carry the weight that WMP used to handle.

I was talking with a Wisconsin producer last week—a third-generation operation with about 280 cows—and he put it perfectly: “I’ve never seen such a gap between what the government says and what my milk check actually shows.” USDA’s forecasting $19 milk, but his co-op’s already warning members to budget for $16 through spring. That’s a massive difference when you’re trying to plan feed purchases or, heaven forbid, thinking about expansion.

CME Class III futures trade $2.50-$3.00 per hundredweight below USDA’s optimistic $19.10 forecast—a reality gap that represents $1.25-1.5 million in lost revenue expectations for a typical 500-cow operation over 24 months, and proof that markets saw this crash coming while bureaucrats kept pushing rosy scenarios

Out in California, the larger operations—we’re talking 1,800 cows and up—are seeing processors cut quality premiums in half. Used to be you’d get 40 cents extra for really low somatic cell counts. Now? Twenty cents if you’re lucky. Every penny counts when margins are this tight.

Meanwhile, in the Northeast, smaller operations are feeling it differently. A Vermont producer with 120 cows told me their processor just extended payment terms from 15 to 30 days. That’s an extra full pay period of float you have to cover. These little changes add up fast.

The China Reality We Need to Accept

China achieved 85% dairy self-sufficiency by 2025 while infant formula imports crashed 35% from their 2019 peak—a permanent structural shift driven by plummeting birth rates (down 40%) and massive domestic production investment that’s fundamentally rewriting global dairy trade dynamics

Alright, let’s address the elephant in the room: China isn’t coming back to buy powder the way they used to. Period.

According to the USDA’s Foreign Agricultural Service report from May 2025, China successfully boosted their domestic milk production by 10 million metric tons between 2018 and 2025. They actually hit their target two years early. Think about that—they went from 70% self-sufficient to about 85%. And here’s what really matters: their economy grew 5% in the first half of 2025 according to Chinese government statistics, yet powder imports stayed flat. Economic recovery isn’t bringing back that demand.

The demographics make it even more permanent. China’s Statistics Bureau shows the birth rate dropped from 10.48% in 2019 to 6.39% in 2023. The number of kids aged 0-3—your core infant formula market—fell from 47.2 million to 28.2 million. That’s not a temporary dip, folks. That’s a 40% structural reduction in the exact demographic that drives WMP consumption.

Industry contacts at the major export companies tell me they’ve basically written off any return to 2021-22 WMP levels. Everyone’s pivoting to cheese and butter production, which sounds great until you realize… yeah, everyone’s doing exactly that. Hence, the cheese price crash we just witnessed.

How Smart Operators Are Adapting Right Now

What I’m seeing from the operations that are navigating this successfully is that they’re not waiting around, hoping for a miracle. They’re making hard decisions today while they still have options.

The Culling Math Nobody Wants to Do (But should)

With beef prices around $145 per hundredweight—USDA Agricultural Marketing Service confirmed this in late October—the economics of culling have completely shifted. Let me walk you through the actual numbers here.

Say you’re running 500 cows. Your bottom 20%—that’s 100 head—are probably giving you about 55 pounds a day, while your top girls are at 75 pounds. At $16.50 milk, those bottom cows generate roughly $2,768 in annual revenue. But here’s the kicker: they’re costing you at least $4,200 in feed, labor, vet work, and utilities. You’re losing $1,432 per cow per year just keeping them around.

Now, if you ship those 100 cows at an average of 1,400 pounds and $145 per hundred, that’s $203,000 cash in hand. Real money you can use today.

I know several Idaho operations that pulled the trigger on this in September. They culled their bottom 15%, used half the money to pay down debt, and half to upgrade their feed systems. What’s interesting is that their remaining cows are actually producing more total pounds now. Better feed efficiency, less competition at the bunk—sometimes less really is more.

Getting Smart About Feed Costs

December corn futures are around $4.10 per bushel, and soybean meal is at $274.50 per ton, based on CME data from early November. That’s actually manageable—if you lock it in now. University of Wisconsin calculations show income-over-feed margins at about $7.80 per hundredweight. Barely breakeven for good operations, but it’s workable if you’re on top of things.

The regional differences are huge, though. Texas producers with local grain access are doing okay. But if you’re in the Upper Midwest, dealing with basis issues and trucking costs? That’s a different story. Nutritionists I work with tell me operations keeping milk-to-feed ratios above 2.35 are surviving. Below that? They’re hemorrhaging cash.

And California… don’t get me started. Between water issues and hay prices that swing $50 a ton depending on the week, feed costs can vary $2-3 per hundredweight just based on timing. Feed dealers in the Central Valley tell me they’ve never seen such demand for almond hulls and other byproducts—everyone’s scrambling to cut costs wherever possible.

Southeast operations have their own challenges. With the costs of humidity- and heat-stress management, they’re spending an extra $1.50-2.00 per hundredweight just on cooling compared to northern states. A Georgia producer with 600 cows said his electric bill alone runs $8,000 per month in summer.

The Timeline Nobody Wants to Hear (But Needs To)

CME Class III futures paint a pretty clear picture if you’re willing to look. November 2025 contracts at $16.17, December at $16.39, and the first quarter of 2026 at an average of just $16.35, according to daily settlements. Meanwhile, USDA keeps saying we’ll average $19.10 for 2025. That $2.50 to $3.00 gap? That’s the market telling you the government’s being way too optimistic.

I lived through the 2015-16 crisis, and it took about 15-18 months — from peak oversupply to decent prices again — according to USDA historical data. But we had some natural circuit breakers then that we don’t have now:

China came back once they worked through inventory—Rabobank documented this in their 2016 reports. La Niña hit and naturally reduced New Zealand’s production. We had various government programs that provided at least some relief.

This time? New Zealand just reported milk collection in August 2025 at 1.68 billion liters, up 14.6% from last year, according to the Dairy Companies Association. U.S. production is up 1.6% despite everything, per the USDA’s latest report. And the weather’s been perfect for grass growth pretty much everywhere. No natural brakes this time around.

The Productivity Problem That’s Breaking Everything

Here’s something that should blow your mind: According to data compiled by Cornell’s dairy economists from USDA records, average U.S. butterfat went from 3.95% in 2020 to 4.218% by November 2024. Protein jumped from 3.181% to 3.309%.

What’s that mean in real terms? Despite losing 557,000 cows from the national herd in 2024, total milk solids production actually increased by 1.345%. We’re making more cheese and butter with fewer cows. Great for efficiency, terrible for market balance.

The genetics have gotten so good that we’ve essentially broken the old supply-demand correction mechanism. Herds shrink, but production stays flat or even grows. It’s remarkable from a technical standpoint, but it means this oversupply problem isn’t going away naturally like it used to.

New Zealand shows this even more starkly—they reduced cow slaughter rates by 18.4% according to their Ministry for Primary Industries, even while WMP prices crashed for six straight auctions. Why? Because each cow today produces so much more than five years ago that farmers literally can’t afford to cull heavily. They’d lose too much capacity.

Three Paths Forward (And Why You Need to Pick One Soon)

Based on everything I’m seeing and hearing from producers who’ve survived multiple cycles, there are really only three strategies that make sense right now.

The Premium Route (Maybe 20-25% of You Can Do This)

If you’re within a reasonable distance of a city and can tell a good story, direct sales can get you 50-75% premiums. Vermont producers doing this successfully report $32-38 per hundredweight equivalent. That’s basically double commodity prices.

But—and this is a big but—it requires serious investment. We’re talking $400,000 minimum in processing equipment, dedicated marketing staff, and probably 20+ hours a week of your time on social media and customer management. It’s not dairy farming anymore; it’s running a specialty food business. Some folks love it. Others find it exhausting.

The organic market’s another option. USDA data shows the Organic Pay Price averaged $38.69 in September 2025. But that three-year transition period is brutal, and you better have contracts locked before you start.

Scale and Efficiency (Works for 30-35% of Producers)

The Texas model shows how this works. Average Panhandle dairy runs about 4,000 cows according to the Texas Association of Dairymen. With new plants from Cacique Foods in Amarillo, Great Lakes Cheese in Abilene, and Leprino in Lubbock, there’s demand for big, efficient suppliers.

But you need serious scale—minimum 1,000 cows, probably more like 2,000+. And the capital requirements for automation and upgrades… well, if you’re a 300-cow operation in Wisconsin, this probably isn’t your path. I wish it were different, but that’s reality.

The co-ops are adjusting, too. Industry reports show DFA consolidating smaller farms’ milk into bigger pools to maintain negotiating power. Land O’Lakes is pushing component improvement hard—offering bonuses for consistently hitting protein targets. It’s all about efficiency now.

Strategic Exit (The Hardest but Sometimes Smartest Choice)

Nobody wants to talk about this, but for operations caught between premium and scale, getting out while you still have equity might be the smartest move.

Chapter 12 bankruptcy—the farmer-friendly option—can get you reorganized in about 100 days, according to ag bankruptcy attorneys. It lets you restructure debt while keeping the farm running. But timing is everything. Act before you default, and you have options. Wait until you’re behind on payments, and those options evaporate fast.

The generational piece makes this even tougher. I know young farmers looking at these projections for the next two years and thinking maybe that agronomy job in town makes more sense right now. Can’t say I blame them.

Why The Cheddar Crash Changes Everything

Let’s circle back to that 6.6% cheddar price collapse, because this is crucial. Cheese was supposed to be our growth story, right? China’s cheese imports rose 13.5% through September 2025, according to its customs data. Processors globally have invested billions in cheese capacity.

But if cheese is crashing harder than powder, it means the pivot everyone’s counting on is already overcrowded. Instead of 18-24 months to rebalance, we might be looking at 24-30 months or longer.

California processors I talk with say they’re getting squeezed on every product now. Can’t make money on powder, and cheese margins are evaporating too. Something’s got to give, and it’s probably going to be at the farm level.

The Financial Reality Check

Let me paint you the picture for a typical 500-cow operation at current prices. You’re looking at about $101,000 in monthly losses. Over a 24-month downturn—which is what futures markets suggest—that’s $2.4 million in red ink.

Most farms I know started this downturn with maybe $2 million in equity if they were lucky. Do the math. You run out around month 20, just before the projected recovery. That’s the cruel joke here—operations that survive 80% of the downturn still fail because they can’t bridge those last few months.

Operations with $2M in starting equity face complete depletion at month 20—just four months before projected recovery begins at month 24—meaning 80% of the struggle buys you nothing if you can’t bridge the final cruel gap, making the next 90 days of strategic decisions literally the difference between survival and bankruptcy

We’re currently in months 4-5 of what could be a 24-30 month adjustment. Decisions you make right now have completely different outcomes than those same decisions in March or April when equity’s gone and options have narrowed to basically nothing.

The Human Side We Can’t Ignore

Behind those 259 bankruptcy filings in Q1 2025—up 55% from last year, according to federal court statistics—are real families watching everything disappear.

The Journal of Rural Mental Health published research showing farmers face suicide rates 3.5 times higher than the general population. Mental health professionals describe this pattern where chronic stress builds for months until hitting what psychotherapist Lauren Van Ewyk calls a “quick flip”—that breaking point where you can’t think straight anymore.

I bring this up because recognizing the stress early and getting help—whether it’s financial advice, operational changes, or just someone to talk to—that preserves way more options than waiting until you’re in crisis mode. We need to look out for each other right now.

What You Should Be Doing Right Now

Next 30 Days: Figure out your real equity runway. Not the optimistic version—the actual number of months you can sustain these losses. If it’s less than 24 months, you need to act now, not later.

Lock in feed prices while you can. That $4.10 corn won’t last forever. Take a hard look at your bottom 20% for culling while beef prices are still strong. And call your processor about contract opportunities—they’re making deals right now.

Next 90 Days: Stress-test everything against a 24-30 month downturn. Can you survive it? Be honest. If you’re in the right location, explore premium markets, but be realistic about what it takes.

Technology that actually reduces costs—robotic milkers if you’re big enough, better feed systems, genetic improvements—these aren’t luxuries anymore. They’re survival tools. And if refinancing is in your future, talk to your lender now while you’re still current on your payments.

What to Watch: The late November GDT auction will tell us if this cheese crash was a one-off or a trend. If CME Class III futures for Q2 2026 start climbing above $17.50, maybe recovery comes sooner. China’s Q4 import data will confirm if this structural shift is as permanent as it looks. And keep an eye on processor announcements—they’re reshaping regional opportunities as we speak.

Where We Go from Here

The November 4 GDT results confirm what many of us suspected but didn’t want to admit: this isn’t your typical dairy cycle. China’s not coming back for powder, productivity gains mean we can’t count on natural supply correction, and none of the usual recovery mechanisms are working.

The operations that’ll make it through won’t necessarily be the ones with the best cows or the most land. They’ll be the ones who recognized early that the game has changed and adapted accordingly. Maybe that means doubling down on efficiency, maybe pivoting to premium markets, or maybe—and this is hard to say—getting out while there’s still equity to preserve.

For the industry as a whole, this evolution is probably necessary for long-term health. But that’s cold comfort when you’re trying to figure out next month’s loan payment.

What November 4 made crystal clear is that waiting and hoping aren’t strategies. The data says we’re in for extended weakness that requires careful planning, smart positioning, and probably some fundamental changes to how we operate.

The clock’s ticking, friends. The decisions you make in the next 60-90 days will determine whether you’re still milking in 2027. The path forward isn’t easy, but at least it’s becoming clearer. What you do with that clarity… well, that’s up to you.

If you or someone you know needs support, U.S. farmers can reach Farm Aid at 1-800-FARM-AID (1-800-327-6243). Canadian farmers can contact the Canadian Suicide Prevention Service at 1-833-456-4566. New Zealand farmers can reach Rural Support Trust at 0800 RURAL HELP (0800 787 254).

KEY TAKEAWAYS

  • Cheddar’s 6.6% Crash = Plan B Failed: When cheese falls harder than powder, your pivot strategy is dead. Stop hoping, start adapting.
  • China’s Done Buying: 85% self-sufficient + 40% fewer infants + 10M MT new production = permanent demand destruction. They’re not coming back.
  • The $2.4M Question: Your 500-cow operation loses $101K/month. You have ~$2M equity. Recovery takes 24-30 months. Do the math.
  • Only 3 Paths Work: Premium route (needs location + $400K), mega-scale (2,000+ cows + millions), or strategic exit (Chapter 12 before default).
  • 90 Days to Decide: By February 1, 2026, you must commit to scaling, pivoting, or exiting. After that, the bankruptcy court decides for you.

Complete references and supporting documentation are available upon request by contacting the editorial team at editor@thebullvine.com.

Learn More:

The Sunday Read Dairy Professionals Don’t Skip.

Every week, thousands of producers, breeders, and industry insiders open Bullvine Weekly for genetics insights, market shifts, and profit strategies they won’t find anywhere else. One email. Five minutes. Smarter decisions all week.
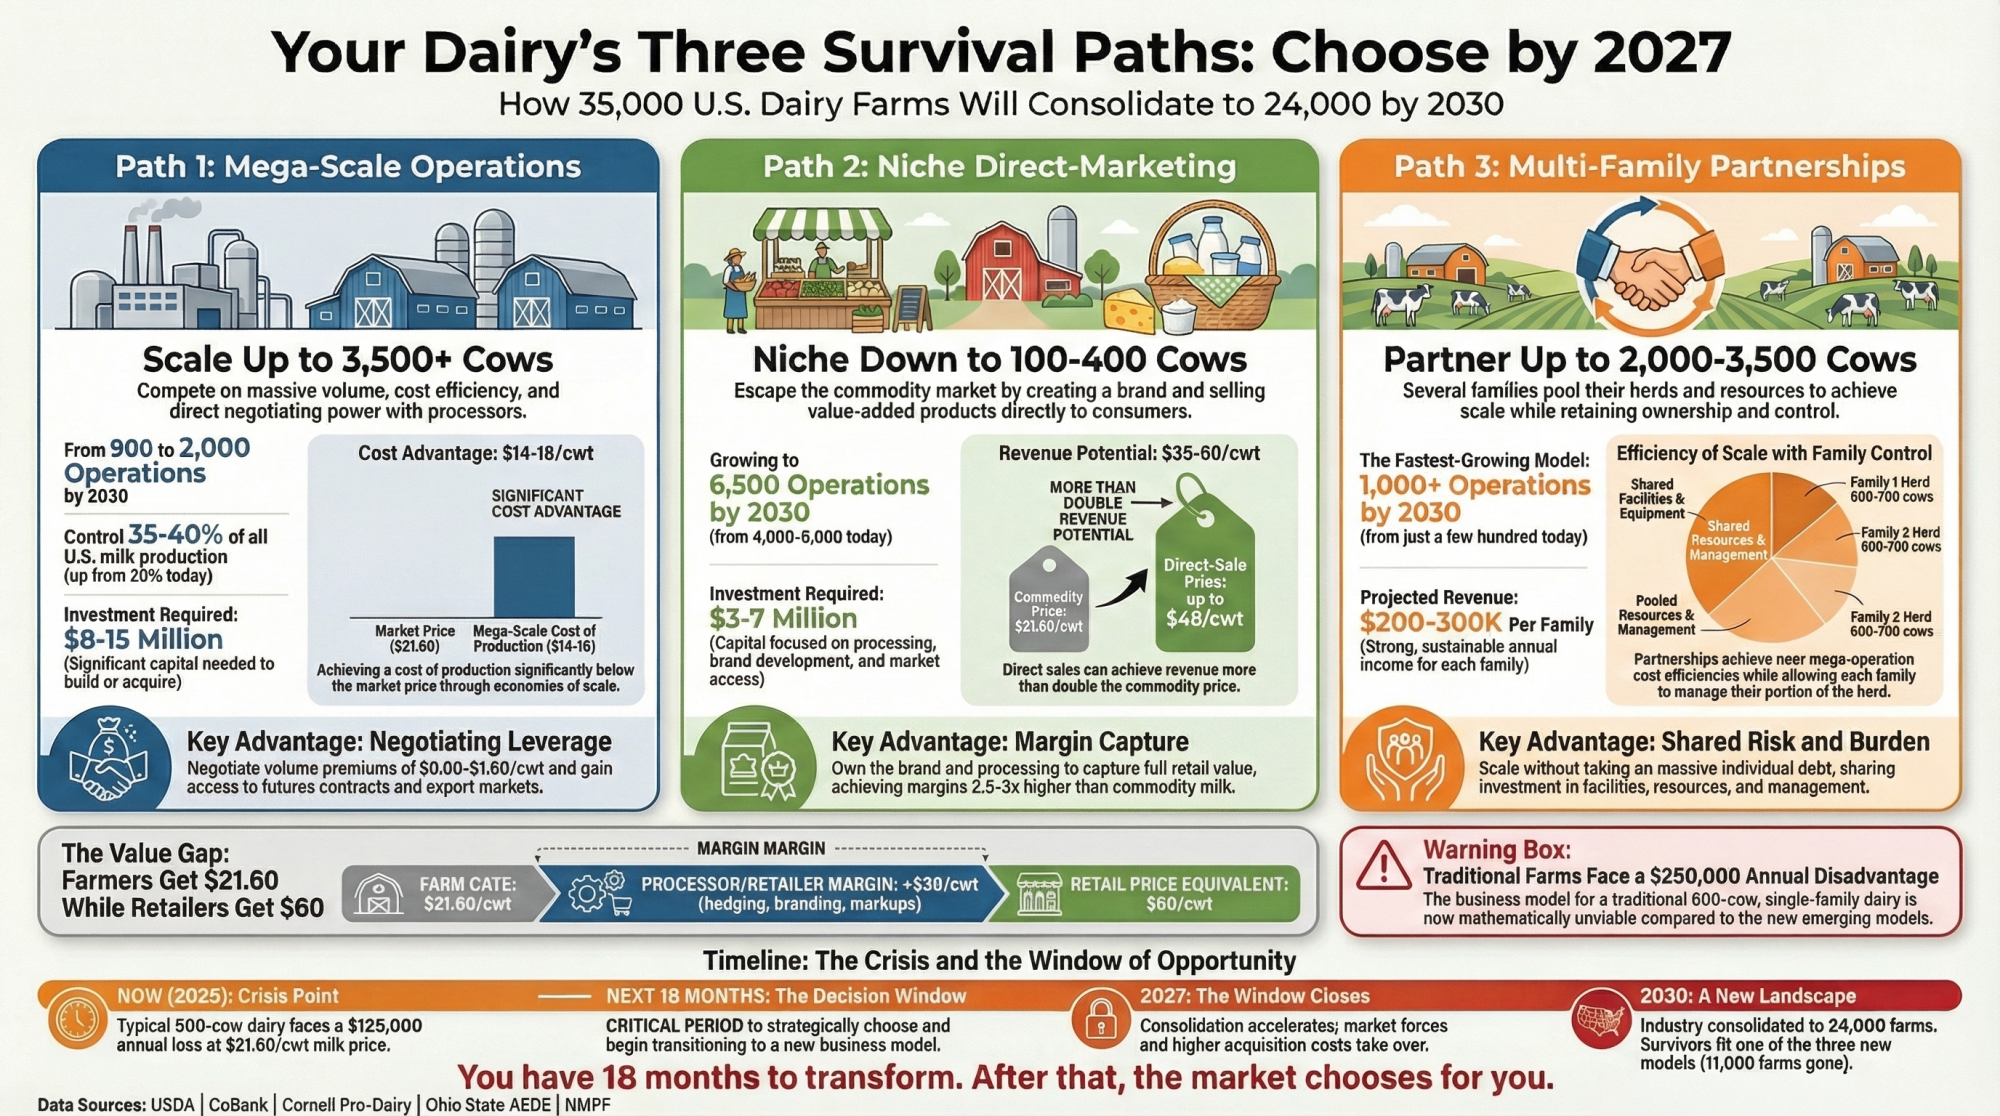
NewsSubscribe
First
Last
Consent

Farm Income Soars to $180B in 2025 – But Not for Dairy

Crop farmers: $35B bailout. Beef: $1,100 calves. You: $17.50 milk that costs $19 to make. The numbers that should anger every dairyman.

Executive Summary: Record farm income of $179.8 billion sounds great until you realize dairy’s been left behind—your neighbors got disaster checks while you’ve faced 18 months of negative margins with minimal help. The numbers are stark: mega-dairies produce $3-4/cwt cheaper, driving consolidation that’s eliminated 39% of farms since 2017. Behind every closure is a family burning through retirement savings, with 60-70% of dairy farmers now reporting serious mental health impacts. Yes, some operations thrive through creative adaptations—premium marketing in New York, specialty partnerships in Texas—but these require advantages most farms don’t have. For mid-size dairies, three paths remain: invest heavily to scale up, find niche markets, or exit strategically while equity remains. This article offers an honest assessment and practical tools to make that choice consciously rather than desperately.

dairy profitability strategies

You know what’s interesting? The September farm income forecast from USDA shows net farm income up 40.7% to $179.8 billion—second-highest on record. It’s all anyone’s talking about at the coffee shop. But here’s the thing: for most of us checking milk prices against feed bills this fall, that headline number feels like it’s from a different planet.

I was talking with a producer near Eau Claire last week—he’s milking about 380 Holsteins, and he’s been at it for years. While his grain-farming neighbor just deposited a disaster check for weather losses from two years back, this guy’s been navigating 18 months of tough margins with nothing but the DMC coverage he pays premiums for.

Makes you think about how these support structures really work across different commodities, doesn’t it?

Let me share what I’ve been learning from conversations around the industry—producers, economists, folks who’ve been watching these trends for decades. Maybe together we can make sense of this disconnect between ag’s overall prosperity and what’s happening in our barns.

Understanding Where That $180 Billion Really Goes

So here’s what’s fascinating when you dig into this $179.8 billion figure. About $41 billion of it? That’s government payments, not market returns.

The breakdown tells you everything:

  • $35.2 billion in disaster assistance through the American Relief Act—mostly for crop losses
  • $40 billion total in direct payments (we were at $10 billion just last year)
  • Minimal DMC payments for dairy—margins stayed just above that $9.50 trigger

You probably know this already, but it’s worth repeating: dairy’s support structure works completely differently. We pay into programs that rarely trigger at levels that actually help. Meanwhile, crop disasters get an immediate congressional response.

Now look, I’m not saying processors have it easy either. Labor’s up about 15%, energy costs have jumped over 20%, and don’t even get me started on packaging materials—nearly 20% higher than 2020. Everyone’s feeling it somehow. But the way support flows through the system…well, that’s another story.

The Scale Reality We Can’t Ignore in 2025

What I’ve found really compelling is the recent data from our land-grant universities on operational scale. And honestly, as much as we might not want to hear it, the numbers are clear: operations with 2,500-plus cows are producing milk for roughly $3 to $4 less per hundredweight than those of us running 300 to 500 head.

Let me break this down the way it was explained to me.

The Math Nobody Wants to Talk About

Take your typical 300-cow operation averaging 23,000 pounds:

  • Fixed costs: Running about $0.90 per hundredweight (varies by region, obviously)
  • Annual production: Around 6.9 million pounds
  • The challenge: Can’t justify specialized equipment, stuck with truckload purchasing

Compare that to 3,000 cows:

  • Fixed costs: Drop to maybe $0.45 per hundredweight
  • Annual production: 75 million pounds
  • The advantages: Railcar feed purchasing, specialized positions, equipment that actually makes sense
The cost gap isn’t closing—it’s widening. Mid-size operations at $19/cwt can’t compete with mega-dairies at $15/cwt. For a typical 300-cow farm producing 7 million pounds annually, this $4 difference translates to over $50,000 in lost competitiveness before debt service, labor, or family living expenses. 

An Idaho dairyman I know—he’s running about 2,800 head—put it to me straight:

“We’re buying feed in railcar quantities for substantially less per hundredweight. The guys buying truckloads? They’re paying $1.50 to $2 more, easy. That advantage is really tough to overcome.”

But here’s what’s worth considering. Not every big operation is printing money. I spoke with a California producer managing over 5,000 cows, and his perspective was sobering:

“Everyone thinks we have it made. Truth is, we’re all walking a tightrope, just at different heights. Our debt service alone runs over a million annually. One disease outbreak, one major equipment failure—those thin margins disappear real fast.”

The Census of Agriculture data from 2022 really drives this home: we lost 39% of dairy farms between 2017 and 2022. That’s the steepest five-year decline they’ve ever recorded. And operations over 1,000 cows? They’re now producing 66% of our milk, up from 57% in 2017.

834 Operations Control Half the Milk—16,334 Fight for Scraps

How This Plays Out Across the Country

What I find really interesting is how differently this consolidation hits different regions:

Pacific Northwest folks:

  • You’re dealing with that brutal Class I utilization problem—18% versus 29% nationally
  • Federal Order prices running over a dollar below the national average
  • And those transportation costs to get milk to cities? Forget about it

Wisconsin and Minnesota producers:

  • Over 500 farms gone in 2024 alone—mostly those 150-400 cow operations we all grew up around
  • When the co-op closes, the vet leaves, the equipment dealer stops stocking parts…
  • That infrastructure needs critical mass, and once it’s gone, it’s gone

Out in Idaho and Texas:

  • Production’s actually growing—7% or more—even as farm numbers drop
  • They’re attracting these mega-operations with the climate, the space
  • New processing plants are going up to match

Northeast—and this is tough:

  • Land at $4,500 an acre (if you can find it)
  • Environmental compliance costs that’d make your head spin
  • Infrastructure that’s 40 years older than what they’re building out West

California’s its own beast:

  • Central Valley operations are expanding like crazy
  • But near the cities? They’re selling to developers
  • Most complex market in the country, honestly

Florida dairy—different world:

  • Heat stress management costs running $100+ per cow annually
  • Unique fluid milk market dynamics
  • Some of the highest production costs nationally

Each region’s facing its own version of this challenge, but the underlying pressure’s the same everywhere.

The Human Side Nobody Wants to Talk About

Here’s what keeps me up at night. Recent agricultural health research suggests 60-70% of us are dealing with mental health impacts from farm stress. That’s way higher than the general population, and we need to acknowledge it.

I know a Wisconsin couple—good people, who milked registered Holsteins for nearly 30 years. Sold out this summer. They knew five years ago the math wasn’t working, but how do you walk away from something your grandfather built?

“The hardest part was watching our neighbors in grain and beef doing well while we struggled. Felt like nobody in policy circles even knew we existed.”

What makes dairy different—and we all know this:

  • No breaks: Cows need milking twice a day, every day
  • No sleep: Research shows we’re averaging four hours during calving season
  • No let-up: Financial pressure plus operational intensity equals chronic stress
  • Identity crisis: When the farm’s been in your family for generations…

By the time many folks finally make the decision, they’ve burned through the equity they’ll need for retirement. It’s heartbreaking.

But There Are Success Stories

Now, it’s not all doom and gloom. I’ve seen some really creative adaptations working.

That New York Operation Near Cooperstown

These folks transformed their 280-cow dairy:

  • What they did: Switched to A2A2 genetics, found a local processor, and added agritourism
  • Investment: About $450,000 over three years (yeah, it’s substantial)
  • Results: They’re seeing 18% net margins, getting $32/cwt equivalent
  • Key factor: They’re 45 minutes from Albany—location matters

Texas Partnership That Works

A 400-cow operation found their niche:

“It’s not revolutionary, but that $3 premium for high-butterfat milk makes the difference between losing money and modest profitability.”

  • Strategy: Partnered with a local ice cream manufacturer
  • Benefit: Guaranteed volume, premium for butterfat
  • Lesson: Sometimes the answer’s right in your backyard

Connecticut’s Organic Journey

This one’s honest about the challenges:

“The three-year transition nearly bankrupted us. But now? It’s sustainable rather than highly profitable, and sustainable beats losing money.”

  • Reality check: Needed off-farm income during transition
  • Current status: Making it work, but it’s not easy money
  • Truth: Location near affluent markets was crucial

Export Markets and Processing—It’s Complicated

USDA data shows we exported $8.2 billion in dairy products last year—second-highest ever. Sounds great, right? But here’s what worries me:

The vulnerabilities:

  • Over 40% of our cheese goes to Mexico
  • China’s substantially increased tariffs on most dairy products
  • Domestic consumption’s only growing 1-2% annually
  • We’re building processing capacity faster than finding markets

Recent expansions:

  • Wisconsin’s new plant: 8 million pounds daily
  • Valley Queen in South Dakota: Another 3 million pounds of capacity
  • And there’s more coming online

The Federal Order reforms this summer increased make allowances by about $0.54 per hundredweight. Processors show the data—costs really are up. But we’re all wondering how they’re expanding if margins are so tight. Both things can be true, I guess.

Alternative Models—Let’s Be Realistic

You know, everyone asks about organic, grass-fed, on-farm processing. Here’s my honest take after watching this for years: these can work brilliantly for maybe 20-25% of producers. But you need:

The right location:

  • Within 50 miles of a big city (500,000+ people)
  • Household incomes above average
  • Customers who value what you’re doing

The right scale:

  • 80-200 cows typically
  • Small enough for relationships
  • Big enough for efficiency

The right mindset:

  • Ready for 80+ hour weeks
  • Willing to do marketing, not just milking
  • Often need off-farm income initially

Burlington, Vermont? Perfect. Middle of Nebraska? Much tougher.

Technology Might Actually Help in 2025

What’s encouraging is how technology costs have come down. Genomic testing costs have dropped substantially in recent years. Activity monitoring that used to need 5,000 cows still need to be justified. Now it works at 500.

A Pennsylvania producer with 450 cows told me:

“Our conception rates improved 8%, we’re catching health issues two days earlier, and I’m actually sleeping through the night during calving. The investment was about $120,000, and we figured an 18-month payback.”

And here’s something interesting—robotic milking is finally penciling out for mid-size operations. We’re seeing 200-300 cow dairies making it work, especially where labor’s tight. About 5% of operations are exploring this now, up from almost none five years ago. It won’t overcome all the scale disadvantages, but it’s helping mid-size operations stay competitive in specific areas. That’s something, at least.

The Policy Reality in 2025

Here’s what’s uncomfortable but true: dairy doesn’t fit the disaster model Congress understands.

Recent support comparison says it all:

  • Crops: $35.2 billion in disaster aid
  • Commodity payments: Tripled from last year
  • Conservation: Up over 10%
  • Dairy: DMC that we pay for rarely helps when we need it

When crops fail due to weather, it’s visible and immediate. When will our margins compress over two years? That looks like a business problem, not a disaster. And as fewer dairy farms open each year, our political voice keeps getting quieter.

Crops: $35 Billion. Dairy: $1.2 Billion. The Support Gap Killing Farms.

What’s Actually Working Right Now

Looking at successful operations, here’s what they’re doing:

Getting real about costs:

  • Calculating true production costs, including economic depreciation
  • Need about $2/cwt margin above true costs
  • Most of us are below that right now

Using every tool available:

  • DMC five-year commitment saves 25% on premiums
  • Dairy Revenue Protection for catastrophic protection
  • Strategic culling with cull prices at $140-148/cwt

One Minnesota producer shared this:

“We culled 20% strategically—generated enough cash to restructure debt and buy some breathing room.”

Having an exit strategy (even if you never use it): Financial advisors tell me farmers with exit plans actually make better daily decisions. Takes the desperation out of it.

Looking Down the Road

Based on what economists and industry folks are saying, here’s what’s likely:

Industry projections for 2025-2030 suggest:

  • We’ll lose 2,000-2,800 farms annually through 2027
  • Operations over 1,000 cows will hit 75% of production by 2030
  • Mid-size farms are mostly gone except near cities

Policy changes?

  • Farm Bill might tweak things
  • But fundamental change? Unlikely
  • Maybe higher DMC coverage, but same structure

Market disruptions could change everything—disease, processing problems. But you can’t plan on disasters.

So What Does This Mean for Your Farm?

Let’s get practical here.

First, know where you really stand:

  • Calculate actual costs versus realistic revenue
  • Penn State’s got great worksheets online for this
  • If the math doesn’t work, that’s not failure—it’s information

Second, pick a lane:

  • Staying in? Either differentiate clearly or scale up
  • Getting out? Timing is everything for preserving equity
  • Standing still? Usually means falling behind

Third, get support:

  • Farm Aid: 1-800-FARM-AID for financial counseling
  • Crisis line: 988 if you’re struggling
  • Talk to other producers—we’re all dealing with this

Every month you operate at a loss, eats equity you’ll need later. That’s just math.

The Bottom Line

Look, this disconnect between headlines and our reality reflects changes that aren’t reversing. Consolidation, technology, global markets—these forces are bigger than any of us.

But here’s what I want to emphasize: you still have choices.

If you’re well-positioned—good location, right scale, unique advantages—this transition might create opportunities. If not, you need clear-eyed assessment and strategic planning.

Success isn’t about being the best farmer or working the hardest anymore. It’s about recognizing reality early and adapting. Sometimes that’s expanding. Sometimes it’s finding a niche. And sometimes—more often than we’d like—it’s transitioning out with dignity and security intact.

Make decisions consciously, not by default. Understand where you really stand instead of hoping for rescue. That might be the most valuable thing any of us can do right now.

We’re all trying to navigate these changes while holding onto why we got into dairy in the first place. The conversations I’ve had across the country show we’re facing similar challenges, just in different ways.

And whatever path makes sense for your operation, you’re not walking it alone. We’re all figuring this out together.

Key Takeaways:

  • The economics are permanent: Mega-dairies produce $3-4/cwt cheaper—this gap will widen, not shrink, making commodity milk unviable for farms under 1,000 cows
  • Your three options are clear: Scale to 1,200+ cows (requires $3-5M capital), capture premium markets (needs metro proximity), or exit strategically while equity remains
  • Time is your enemy: Every month at negative margins burns $25-50K in equity—the difference between comfortable retirement and bankruptcy is acting 12-18 months sooner
  • Location determines everything: Success stories share one trait—proximity to wealthy consumers or unique partnerships; without this, scaling or exiting are your only choices
  • Support exists, use it: Calculate true costs with Penn State worksheets, get financial counseling at 1-800-FARM-AID, mental health support at 988—deciding consciously beats drowning slowly

Mental Health Resources: National Suicide Prevention Lifeline (988, available 24/7), Farm Aid Hotline (1-800-FARM-AID), American Farm Bureau’s Farm State of Mind resources

Financial Resources: Farm Service Agency offices, Farm Credit Services, state Farm Business Management programs, National Farm Transition Network

Complete references and supporting documentation are available upon request by contacting the editorial team at editor@thebullvine.com.

Learn More:

The Sunday Read Dairy Professionals Don’t Skip.

Every week, thousands of producers, breeders, and industry insiders open Bullvine Weekly for genetics insights, market shifts, and profit strategies they won’t find anywhere else. One email. Five minutes. Smarter decisions all week.

NewsSubscribe
First
Last
Consent

Beyond Class III: Three Global Signals Predicting Your Next 18 Months      

Milk at $18. Butter at $1.50. But heifers at $3,200 tell the real story. The recovery’s already starting—if you know where to look.

EXECUTIVE SUMMARY: A Wisconsin dairy producer’s confession reveals the new reality: “I watch New Zealand milk production closer than my own bulk tank.” While traditional metrics show disaster—butter at $1.50, milk under $18, three forward signals are flashing a recovery 3-4 months out. Weekly dairy slaughter remains at historic lows (230k vs. 260k trigger) because $900-$1,600 crossbred calves are keeping farms afloat, breaking the normal correction cycle. Smart operators monitoring Global Dairy Trade auctions and $230/cwt cattle futures have already locked in $4.38 corn, gaining $1.20/cwt margin advantage over those waiting for Class III improvements. With heifer inventories at 40-year lows (3.914 million head), operations that went heavy on beef-on-dairy face a cruel irony: they survived the crash but can’t expand in recovery. The next 18 months won’t reward efficient production—they’ll reward those watching the right signals.

Dairy Market Signals

Last week, a Wisconsin producer told me something that stopped me in my tracks: “I’m watching New Zealand milk production closer than my own bulk tank readings.”

That conversation captures perfectly how dairy economics have shifted. And looking at Monday’s CME spot prices—butter hitting $1.50 a pound, lowest we’ve seen since early 2021—alongside December cattle futures losing nearly twenty bucks per hundredweight over the past couple weeks, you can see why traditional metrics aren’t telling the whole story anymore.

Here’s what’s interesting, folks… while everyone’s fixated on Class III and IV prices that essentially report yesterday’s news, there are actually three specific signals providing genuine forward-looking intelligence. I’ve been tracking these with producers across the country for the past year, and what I’ve found is that the patterns could determine which operations thrive during this transition period.

AT A GLANCE: Your Three Critical Market Signals

Three Forward Signals Dashboard provides dairy producers with actionable intelligence 90-120 days before traditional Class III prices signal recovery—those monitoring these indicators have already locked in $4.38 corn and gained $1.20/cwt margins over competitors waiting for conventional signals. This is Andrew’s edge: forward-looking data that beats reactive strategies.

📊 Signal #1: Weekly dairy cow slaughter exceeding prior year by 8-10% for three consecutive weeks
📈 Signal #2: GDT auctions showing 6-8% cumulative gains over four consecutive sales
📉 Signal #3: December cattle futures 30-day moving average crossing above 200-day at $230+/cwt

The Perfect Storm We’re Navigating Together

You’ve probably noticed this already, but what we’re experiencing isn’t your typical dairy cycle. It’s more like… well, imagine several weather systems colliding simultaneously, each amplifying the others in ways most of us haven’t seen before.

The Production Surge

So here’s what the USDA data shows—milk production increased 3.5% through July, and those butterfat tests? Katie Burgess over at Ever.Ag called them “somewhat unbelievable” in her recent market analysis, and honestly, she’s spot on. I’m seeing consistent test results of 4.2% butterfat, even 4.3%, across multiple regions—Wisconsin operations, Pennsylvania farms, and even out in California—when just two years ago, 3.9% was considered excellent.

You know what’s happening here, right? We’re all getting better at managing transition periods, feeding programs are more precise, genetics keep improving… but when everyone’s achieving similar improvements simultaneously, well, the market gets saturated. And that’s exactly what we’re seeing.

Global Supply Pressure

The Global Dairy Trade auction has declined for three straight months now, and that’s coinciding with European production recovering—you can see it in the Commission’s September data—and Fonterra announcing that massive 6.3% surge in September collections. When major exporters increase production simultaneously like this… friends, you know what happens to prices.

Domestic Demand Challenges

Meanwhile, domestic demand faces unprecedented pressure. Those SNAP benefit adjustments affecting 42 million Americans? They’re creating ripple effects throughout the retail sector. Food banks across Iowa are reporting demand increases of ten to twelve times normal—I mean, the Oskaloosa facility went from distributing 300-400 pounds typically to nearly 5,000 pounds in the same timeframe. That’s not sustainable.

A Lancaster County producer managing 750 Holsteins shared an interesting perspective with me recently:

“Component payments help, sure, but when everyone’s achieving similar improvements, the market gets saturated. And those fluid premiums we used to count on? They’re basically evaporating as processors shift toward manufacturing.”

The Broken Feedback Loop

Here’s what really caught me off guard, though—that traditional feedback loop where low prices trigger culling, which reduces supply and brings markets back? It’s broken.

With crossbred calves commanding anywhere from $900 to $1,600 at regional auctions—and I’m seeing this from Pennsylvania clear through to Minnesota based on the USDA-AMS reports—compared to maybe $350-$400 back in 2018-2019, that additional beef revenue is keeping operations afloat despite negative milk margins.

The Beef-on-Dairy Survival Paradox illustrates the cruel irony facing dairy producers: crossbred beef calves now generate 20-25% of farm revenue (at $900-$1,600 each vs. $350-$400 for dairy heifers), which kept operations afloat during low milk prices—but eliminated the heifer inventory needed for expansion when markets recover. Survival strategy becomes growth killer.

Three Dairy Market Signals Worth Your Morning Coffee

📊 SIGNAL #1: Weekly Dairy Cow Slaughter Patterns

When: Every Thursday at 3:00 PM Eastern
Where: USDA Livestock Slaughter report at usda.gov
Time Required: 5 minutes

What’s fascinating is the consistency here—dairy cow culling has run below prior-year levels for 94 out of 101 weeks through July, according to USDA’s cumulative statistics. Year-to-date culling? It’s the lowest seven-month figure since 2008, and we’ve got a much bigger national herd now.

🎯 THE KEY THRESHOLD:
Three consecutive weeks where slaughter exceeds prior-year levels by 8-10% or more

When weekly figures rise from the current 225,000-230,000 head range toward 260,000-270,000 head, that signals crossbred calf values have finally declined below that critical $900-$1,000 level where they no longer offset weak milk margins.

💡 WHY IT MATTERS:
A 600-cow operation near Eau Claire started monitoring these signals back in March, locked in feed when they saw the pattern developing, and improved margins by $1.20/cwt compared to neighbors who waited. That’s real money, folks.

📈 SIGNAL #2: Global Dairy Trade Auction Trends

When: Every two weeks, Tuesday evenings, our time
Where: globaldairytrade.info (free access)
Time Required: 15 minutes

I’ll be honest with you—for years, I ignored these New Zealand-based auctions, thinking they were too far removed from Midwest realities. That was an expensive mistake.

🎯 THE KEY THRESHOLD:
Four consecutive auctions showing cumulative gains of 6-8% or higher, with whole milk powder exceeding $3,400/MT

Katie Burgess explains it well: “GDT auction results in New Zealand influence U.S. milk powder pricing dynamics.” And the correlation is remarkably consistent—GDT movements typically show up in CME spot markets within two to four weeks.

💡 INSIDER PERSPECTIVE:
A Midwest cooperative CEO recently shared this with me—can’t name the co-op for competitive reasons—but he said: “We’ve integrated GDT trends into our pooling strategies. Sustained upward movement there typically translates to improved export opportunities within 30-45 days.”

📉 SIGNAL #3: Cattle Futures Technical Analysis

When: Daily monitoring
Where: Any free futures charting platform
Time Required: 5 minutes daily

With the National Association of Animal Breeders data showing 40-45% of dairy pregnancies now utilizing beef sires, and those calves generating 20-25% of total farm revenue, cattle market volatility directly impacts our cash flow.

🎯 THE KEY THRESHOLD:
30-day moving average crossing above 200-day moving average while December futures maintain above $230/cwt

Recent movements illustrate the impact perfectly—when cattle prices dropped in October, crossbred calf values fell by $200-$250 per head. For a 1,500-cow operation with 40% beef breeding, that’s substantial revenue reduction… we’re talking six figures of annual impact.

💡 PRO TIP:
If you’re just starting to track these signals, give yourself a full month to establish baseline patterns before making major decisions based on them. As many of us have learned, knee-jerk reactions rarely pay off.

Quick Reference: Your Market Monitoring Dashboard

MONDAY MORNING (10 minutes over coffee)

✓ Check Friday’s CME spot dairy prices
✓ Review cattle futures five-day trends
✓ Update 90-day cash flow projections

THURSDAY AFTERNOON (5 minutes)

✓ Access USDA slaughter report (3 PM ET)
✓ Calculate 4-week moving average vs. prior year
✓ Note trend acceleration or deceleration

BIWEEKLY GDT DAYS (15 minutes)

✓ Monitor GDT Price Index and whole milk powder
✓ Calculate 3-auction cumulative change
✓ Compare with NZ production reports

MONTHLY DEEP DIVE (worth the hour)

✓ USDA Cold Storage report analysis
✓ Regional milk production review
✓ Update beef-on-dairy calf values
✓ Calculate actual production cost/cwt
✓ Evaluate 2:1 current ratio benchmark

Understanding the Structural Shifts Reshaping Our Industry

The Heifer Shortage: By the Numbers

The 40-Year Heifer Crisis shows U.S. dairy heifer inventory at 3.914 million head—the lowest level since 1978—creating an expansion trap where even when milk prices recover to $22/cwt, operations can’t grow due to $3,200 heifer costs and limited availability. This isn’t a cyclical problem; it’s a structural crisis that will define the industry for years.

You know, CoBank’s August dairy report really opened some eyes—they’re projecting an 800,000 head decline in heifer inventories through 2026. And the January USDA Cattle inventory confirmed we’re at just 3.914 million dairy heifersover 500 pounds. That’s the lowest since 1978, folks.

Current Reality:

  • $3,200 current bred heifer cost (compared to $1,400 three years ago)
  • Wisconsin actually added 10,000 head
  • Kansas dropped 35,000 head
  • Idaho lost 30,000 head
  • Texas shed 10,000 head

A Tulare County producer summed it up perfectly when he told me: “The irony is crushing—beef-on-dairy revenue helped us survive the downturn, but now expansion is virtually impossible without heifers.”

SNAP Impact: The Ripple Effect

When those 42 million Americans saw their SNAP benefits cut from $750 to $375 for a family of four… the impact on dairy demand was immediate and, honestly, worse than I expected.

The Numbers:

  • 50% benefit reduction starting November 1st
  • 10-15% reduction in retail dairy orders within the first week
  • 1.4-1.6 billion pounds milk equivalent annual impact

Andrew Novakovic from Cornell’s Dyson School—he’s been studying dairy economics for decades—offers crucial context: “Dairy products often see early reductions when household budgets tighten. Unfortunately, many consumers categorize dairy as discretionary when financial pressures mount.”

Global Dynamics: The New Reality

Twenty years ago, friends, U.S. dairy prices were mostly about what happened between California and Wisconsin. Today? With 16-18% of our production going to export markets, what happens in Wellington, Brussels, and Beijing matters just as much.

Key Production Increases:

  • Ireland’s up 7.6% year-to-date through May
  • Poland’s share grew from 1.9% to 3.9% of EU production over five years
  • New Zealand hit four consecutive monthly records through September
  • China’s now 85% self-sufficient, up from 70%

Ben Laine over at Rabobank explained it well: “When major exporters increase production simultaneously while China requires fewer imports, prices have to adjust globally. These signals reach U.S. farms within weeks, not months.”

Action Plans by Operation Type

📗 For Growth-Oriented Operations

Genomic Testing ROI:

I’ll admit, spending $45 per calf for genomic testing when milk prices are in the tank seems counterintuitive. But here’s the math that convinced me:

  • Test 300 heifer calves at $45 each: $13,500
  • Apply sexed semen to top 120 at $27 extra per breeding: $3,240
  • Generate 80-100 surplus heifers worth $3,200-$3,500 each: $280,000+
  • Your ROI? About 16 to 1

University dairy economics programs have validated these projections, and frankly, those numbers work in any market.

Risk Management Stack:

You can’t rely on DMC alone—it hasn’t triggered meaningful payments in over a year according to FSA records. Smart operators are layering:

  • DMC at $9.50: ~$0.15/cwt for first 5 million pounds
  • DRP at 75-85%: Premiums run 2-3% of protected value
  • Forward contracts: 30-40% when you see $19+/cwt

📘 For Transition Candidates

Three Proven Paths:

  1. Collaborative LLC: Three farms near Fond du Lac reduced per-cow investment from $8,000 to $3,200 by sharing infrastructure
  2. Premium Markets: A2 can bring a $4/cwt premium; organic runs $20/cwt over conventional if you can secure a buyer first
  3. Strategic Exit: You preserve 80-85% of equity in a planned transition versus maybe 50% in distressed liquidation

📙 For Next Generation

If you’re under 30 and considering this industry, you need to know it’s fundamentally different from what your parents knew. University programs like Wisconsin’s Center for Dairy Profitability and Cornell’s PRO-DAIRY are developing specific resources for younger producers navigating this new environment. Use them.

Regional Snapshot: Your Competition and Opportunities

Southwest: Water costs are doubling in some areas. One Albuquerque producer told me they’re making daily tradeoffs between feed production and maintaining adequate water for the herd.

Northeast: Those fluid premiums we used to count on? They’ve compressed from $2-3/cwt down to $0.50-1.00 in many months.

Pacific Northwest: Urban pressure near Seattle and Portland—plus down in Salem—has reduced available land by 30% in five years for some operations. A Yakima producer told me they’re now focusing entirely on efficiency rather than expansion.

Upper Midwest: Generally best positioned with those heifer additions and relatively stable production costs. Wisconsin operations, particularly, are seeing benefits from their heifer inventory decisions.

The Path Forward: Your 18-Month Strategy

You know, a Turlock-area veteran told me something last week that really stuck: “We’ve shifted from watching weather and milk prices to monitoring New Zealand production and Argentine beef policy. This isn’t the dairy farming of previous generations, but it’s our evolving reality.”

The coming 18 months will challenge all of us, yet patterns remain identifiable for those watching. Markets will recover—they always do—but the question is whether your operation will be positioned to benefit from that recovery.

Looking at this trend, farmers are finding that appropriate signal monitoring, combined with decisive action, makes the difference. Your operation deserves strategic planning beyond hoping for better prices. And with the right approach, achieving better outcomes remains entirely possible.

Because at the end of the day, friends, as many of us have learned, success in modern dairy isn’t just about producing quality milk anymore. It’s about understanding global dynamics, managing risk intelligently, and making informed decisions based on forward-looking indicators rather than yesterday’s prices.

The tools are there. The signals are clear. What we do with them over the next 18 months will determine who’s still farming when this cycle turns—and it will turn. It always does.

KEY TAKEAWAYS: 

  • Monitor three signals, not milk prices: Weekly slaughter approaching 260k (currently 230k), GDT auctions gaining 6-8% over four sales, and cattle futures holding above $230/cwt predict recovery 3-4 months before Class III moves
  • The correction isn’t coming—it’s different this time: Crossbred calves at $900-$1,600 create a revenue floor keeping marginal operations alive, breaking the traditional supply response to low milk prices
  • First movers are winning now: Operations tracking these signals have locked in $4.38/bushel corn and gained $1.20/cwt margins while others wait for “normal” price recovery that follows different rules
  • The heifer shortage trap: At 3.914 million head (lowest since 1978), expansion is mathematically impossible for most—even when milk hits $22, you can’t grow without $3,200 heifers
  • Your 18-month edge: Implement Monday morning CME checks, Thursday slaughter monitoring, and biweekly GDT tracking—15 minutes weekly that separates thrivers from survivors

Complete references and supporting documentation are available upon request by contacting the editorial team at editor@thebullvine.com.

Learn More:

The Sunday Read Dairy Professionals Don’t Skip.

Every week, thousands of producers, breeders, and industry insiders open Bullvine Weekly for genetics insights, market shifts, and profit strategies they won’t find anywhere else. One email. Five minutes. Smarter decisions all week.
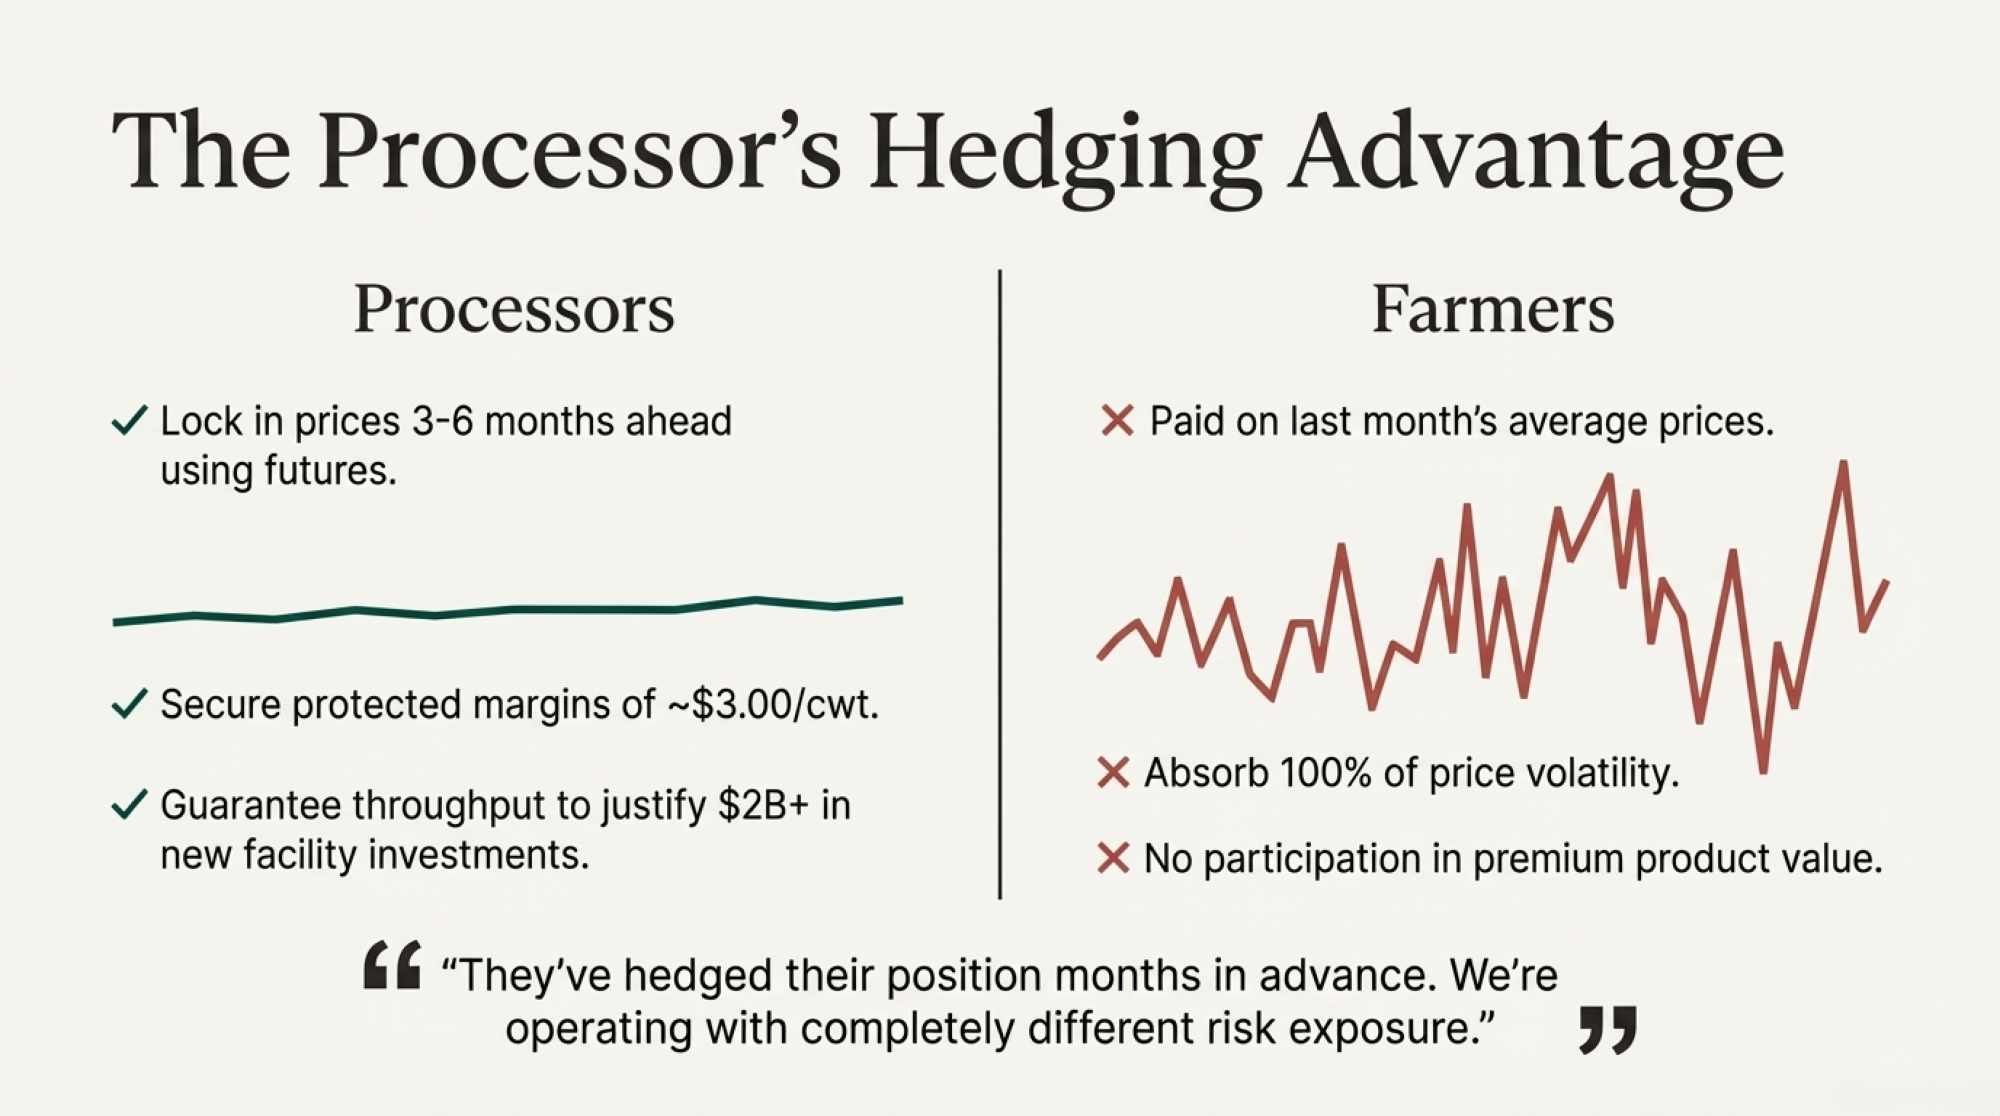
NewsSubscribe
First
Last
Consent

December’s 6ppl Cut Exposes UK Dairy’s Reality: Why 800 Farms Face Impossible Math While Processors Invest Billions

Farmer loses £17k/month. Processor makes £20.5M/year. December’s 6ppl cut forces UK dairy to its moment of truth. Math doesn’t lie.

Editorial Note (Updated November 10, 2025): Following feedback from AHDB, we have updated this article to clarify data sources and correct a attribution error. Where data was previously attributed to AHDB without verification, we have now cited the correct sources or clarified these as industry estimates. Production cost figures vary significantly by source, region, and methodology—we’ve added context to reflect this complexity. We value accuracy and transparency in our reporting and welcome continued dialogue about UK dairy economics.

Executive Summary: Jack Emery asked the BBC if it’s worth getting up at 4 AM anymore—a question now haunting 7,040 UK dairy farms facing £17,000 monthly losses from December’s 6ppl cut. Meanwhile, processors post record profits: First Milk’s £20.5M is called “exceptional.” With farmgate prices at 35.85ppl against estimated 49p/liter production costs (based on industry benchmarking), the math has become impossible. Five strategic paths exist—organic conversion, scaling up, diversification, cooperation, or exit—but most demand capital and time that hemorrhaging farms simply don’t have. Irish farmers reversed similar cuts in 47 days through cooperative ownership; the UK’s different structure blocks that option. The next 90 days determine whether UK dairy finds an unprecedented collective response or accelerates toward just 4,200 farms by 2030, down from today’s 7,040. Behind every statistic, farm families face math that doesn’t work anymore—in an industry where suicide rates already run 3.5 times the national average.

You know that feeling when you open a letter you’ve been dreading? That’s what Jack Emery was describing to the BBC last month. He runs Thistle Ridge Farm down in Hampshire—about 5,000 liters daily, same as a lot of operations I talk with. When he calculated that First Milk’s 6 pence cut means over £100,000 gone from his annual revenue, then asked whether it’s even worth getting up at 4 AM anymore… well, that resonated with pretty much everyone I’ve spoken to since.

The revealing part is how December’s announcement is forcing us to confront something we’ve been dancing around for years. After digging through processor reports, talking with farmers from Scotland to Devon, and watching what happened with those Irish producers in September—I’m convinced we’re seeing the whole structure of UK dairy that’s evolved since the Marketing Board ended in ’94 finally showing which farms have a path forward and which ones honestly don’t.

The Numbers We’re All Running

So let’s talk about the math that’s keeping everyone up at night—because I know you’re doing the same calculations I am. First Milk announced a price of 35.85 pence per liter, effective December 1st, including the member premium. Müller’s Advantage program drops to 40ppl. Arla sits at 42.71ppl from November.

Now, industry benchmarking from various sources suggests average production costs running 48-50 pence per liter, though these figures vary significantly by region and farm type. While AHDB provides valuable market data, comprehensive production cost averages come from multiple sources including Kingshay’s annual Dairy Costings Focus report and regional farm business surveys. That matches what I’m seeing in actual farm accounts, though, as a couple of Scottish producers reminded me recently, if you’re dealing with Highland transport or you’re way off the main tanker routes, add another 2-3ppl just for getting milk to market. Down in Wales, First Milk’s members in Pembrokeshire face similar transport premiums. And operations in Cornwall? They’re looking at some of the highest logistics costs in the country.

Here’s where it gets rough. At First Milk’s 35.85ppl against estimated production costs around 49p (based on industry benchmarking and producer interviews, not a single national average), you’re potentially losing about £13 per liter. For a modeled 250-cow operation doing 1.6 million liters annually—that could mean monthly losses approaching £17,000. This is an illustrative calculation based on reported cost ranges—individual farm economics vary significantly. Not sustainable. Not even close.

The structural challenge of UK dairy economics: Based on industry benchmarking, processors pay farmers significantly below estimated production costs of 48-50ppl, with First Milk’s 35.85ppl potentially creating substantial monthly losses for typical 250-cow operations. This represents systematic market pressure rather than temporary adjustment.

The timing couldn’t be worse. We all lived through this spring’s drought—the Met Office confirmed it was the driest of the century. I was talking with Cumbria farmers who’d already fed a third of their winter silage by August. Down in Somerset, a 180-cow producer I know went through 40% of his reserves. Now they’re buying concentrate feed at £310-340 per tonne for dairy compounds, according to recent market reports, though forage costs vary widely—AHDB reports large bale hay averaging around £120 per tonne. The combined impact of both concentrate and forage costs, while milk checks are about to drop by thousands monthly, creates severe pressure.

Jack Emery mentioned there’s a two-million-liter surplus in the UK. What he didn’t say—but we all know—is that surplus happened because UK production jumped over 6% this year just as global commodity markets started sliding. Classic timing, right?

What Processors Aren’t Telling Us

You know what makes these cuts particularly hard to swallow? First Milk just reported their best year ever. Turnover up 20% to £570 million. Operating profit is hitting £20.5 million. CEO Shelagh Hancock called it “exceptional” in their August report.

The great dairy wealth transfer: First Milk’s ‘exceptional’ £20.5M profit represents systematic extraction from 700 members now facing collective £146M annual losses. When processors profit while suppliers fail, this isn’t market forces—it’s market power abuse worthy of regulatory scrutiny.

So I spent time really understanding processor economics, and what I found is enlightening. Sure, First Milk reports a 3.6% operating margin—doesn’t sound like much. But that number masks what’s actually happening between the farmgate and the final sale.

When processors buy our milk at 35.85ppl, they’re getting basic commodity input. But look what they’re producing—First Milk’s got commodity cheddar going to Ornua, yes, but they’re also making whey protein concentrates that command serious premiums. They’ve got specialty products through BV Dairy, which they bought in February. And their Golden Hooves regenerative cheddar? That’s capturing 50-75% premiums according to their sustainability reporting.

The company line is that commodity markets weakened—AHDB wholesale data shows butter fell £860 per tonne and cheese dropped £310 per tonne between specific trading periods in late summer/autumn—so they need competitive pricing to maintain market access. Note these are short-term price movements, not necessarily indicative of longer trends. We attempted to reach First Milk for additional comment, but received no response by publication.

What really tells the story is where they’re putting their money. Arla announced £179 million for Taw Valley mozzarella capacity in July. Müller’s investing £45 million at Skelmersdale for powder and ingredients. These aren’t maintenance projects—they’re building capacity for global markets that bypass UK retail’s stranglehold on liquid milk.

Kite Consulting’s September 2025 report “Decoding Dairy Disruption” lays it out pretty clearly—processors can achieve much higher margins on specific product lines while reporting modest overall margins. That BV Dairy acquisition is particularly clever… it lets First Milk redirect commodity milk into specialty channels while still pricing our milk based on bulk markets.

Here’s the thing that stands out: this situation isn’t unique to the UK. In New Zealand, Fonterra’s dealing with similar processor-farmer tensions, while U.S. dairy continues its decades-long consolidation, with operations above 5,000 cows becoming the norm rather than the exception. The difference? Those markets have different support structures and scale economics.

Why Ireland’s Success Won’t Work Here

In September, 600 Irish dairy farmers organized through WhatsApp and reversed Dairygold’s price cuts within 47 days. The Irish Farmers Journal covered it extensively, and I’ve had plenty of UK farmers asking, ‘Why can’t we do that?’

It’s not about courage or determination. It’s about structure, and this is crucial to understand.


Factor
Ireland: DairygoldUK: First Milk
Ownership StructureTrue cooperative — farmers own equityCorporate co-op with professional management
Farmer PowerDirect voting rights, board controlLimited influence, no true ownership
Member Base~3,000+ farmer-shareholders~700 members (supplier relationship)
Reversal Timeline47 days via WhatsApp coordinationNO ACTION after 30+ days
Legal FrameworkEstablished Cooperative Society ActNew Fair Dealing Obligations (July 2025—untested)
Organizational Cost£0 (infrastructure existed)£10k+ legal fees + 6 months coordination
Key DifferenceSHAREHOLDERS with legal powerSUPPLIERS with petition power

When those Irish farmers confronted Dairygold management at Mitchelstown, they weren’t suppliers asking for mercy—they were shareholders demanding accountability from a company they legally own. Dairygold, like most Irish processors, operates as a true farmer cooperative, with members holding actual equity and voting rights. The Irish Co-operative Organization Society shows it has 130 enterprises structured this way.

Compare that to us. First Milk claims cooperative status with about 700 members, but check their Companies House filings—it operates more like a traditional company with professional management. Arla UK? We’ve got 2,300 British farmer-owners, but we’re a minority within a 9,500+ member European cooperative historically dominated by Danish and Swedish interests.

Several First Milk members in Scotland and northern England have pointed this out to me: we’ve had the same Fair Dealing Obligations regulations for forming Producer Organizations since July. Same legal framework as Ireland. But forming a PO requires lawyers, coordination, months of work—all while you’re hemorrhaging money and working 90-hour weeks. The Irish? They just activated what already existed.

Five Options—And Why Most Won’t Work

Industry advisors keep presenting these strategic options. After examining each through actual farm finances and talking with producers trying different approaches, let me share what’s actually realistic.

Premium differentiation sounds great at conferences. Organic and regenerative systems can capture the 50-75% premiums reported by the Soil Association. First Milk’s got their Golden Hooves programme. But here’s what nobody mentions: organic conversion takes 3 years at zero premium, while you’re paying 20-30% higher costs, according to the Organic Milk Suppliers Cooperative. Capital requirement? Based on SAC Consulting and Promar International estimates, organic conversion for a 250-cow operation typically requires £500,000-750,000, though it varies by system. Timeline to positive returns? Five to seven years minimum.

Let’s be realistic… show me a farmer losing £17,000 monthly who has half a million pounds and seven years to wait.

The strategic impossibility matrix: Based on modeled calculations showing potential £17,000 monthly losses, typical UK dairy farms face a brutal reality—five of six strategic options require capital and timelines that lie beyond survival horizons. Only strategic exit sits in the viable zone, preserving £300-400k equity before forced liquidation eliminates it. This isn’t pessimism—it’s mathematical reality driving 40% toward exit by 2030.

Scaling for efficiency absolutely works—if you’ve got millions. Industry consultancy benchmarking and international case studies suggest operations over 3,500 cows achieve much lower per-unit costs. But expanding from 250 to 3,500 cows? You’re looking at £26-39 million at current development costs of £8,000-12,000 per cow. Banks want 18 months of positive cashflow before discussing expansion. Current trajectory? Negative £17,000 monthly.

Strategic diversification offers possibilities, but timeline matters. UK Agricultural Finance research shows that glamping units cost £15,000-30,000 each and take 12-18 months to develop, including planning. On-farm processing? That’s £50,000-100,000 minimum plus all the Food Standards Agency requirements. Solar installations take 18-24 months from agreement to the first payment. These might help in the long term, but December’s cash flow crisis needs immediate solutions.

Cooperative formation could theoretically work. The Fair Dealing Obligations regulations, effective in July, provide the framework for Producer Organizations. But NFU Legal Services estimates £5,000-15,000 just for setup, plus coordination and months of organizing. I know of attempts in northern England that stalled because farmers simply didn’t have bandwidth while managing daily crises.

Strategic exit—nobody wants to discuss this, but it’s increasingly the only rational choice for some. A 250-cow operation might extract £300,000-400,000 in equity through planned liquidation now, based on current values. Wait until forced insolvency? That equity evaporates. Solar leases generate £800-1,200 per acre annually according to Solar Energy UK. Environmental schemes offer £200-400 per hectare under Countryside Stewardship. The math is harsh but clear.

What the Next 90 Days Will Tell Us

Key Dates to Watch:

  • December 1: First Milk price cut takes effect
  • January 15: Deadline for meaningful PO formation activity
  • Late January: Processor pricing announcements for February
  • March: AHDB quarterly producer numbers released
Mark your calendar—these six dates determine everything: From December’s price cut through March’s revealing producer numbers, this 90-day window will expose whether UK dairy mounts unprecedented collective resistance or accelerates toward 40% farm losses by 2030. Watch cull volumes (liquation signal), PO registrations (organization capacity), and Q1 exits (acceleration confirmation)—The Bullvine will track each milestone.

December through February’s going to be critical. Looking at historical patterns and current dynamics, here are the indicators I’m watching:

Producer Organization registrations with DEFRA—if farmers are organizing, we should see applications by mid-January. The public registry’s accessible, and as of early November, there’s been nothing significant since October’s announcements.

Cull cow markets are telling. AHDB data shows volumes typically rise 10-15% in winter normally. While some regional auctioneers report elevated activity, AHDB’s national data through early November does not show significant increases above seasonal averages. December data will tell the full story of whether localized reports translate to national trends.

January processor pricing will signal direction. If First Milk, Müller, and Arla maintain or cut further, they’ve calculated that we lack the capacity to respond. Movement toward 40-42ppl might suggest they see organizational stirrings worth heading off.

The Agricultural Supply Chain Adjudicator can impose penalties of up to £30 million under the 2024 regulations. Their annual report shows that UK dairy receives maybe 1 or 2 complaints per year from 7,000+ producers. If that doesn’t change by February despite this crisis… well, it confirms we’re too stretched to fight.

Come March, AHDB publishes Q1 producer numbers. If exits accelerate beyond 190 farms annually toward 240-320, December becomes an inflection point—just not the kind we’d hope for.

Family dairy farming’s extinction timeline: If December’s price cuts trigger projected exit rates, UK dairy contracts from 7,040 to 4,200 operations by 2030—a 40% industry wipeout in five years. Each data point represents 450+ farm families facing impossible decisions, with 2029-2030 showing crisis acceleration as remaining farms hit breaking point.

The Human Side Nobody Talks About

What statistics miss is what’s happening in farm kitchens right now. The Farm Safety Foundation’s research shows farmers are 3.5 times more likely to die by suicide than the general population. But that’s not just a number—it’s about identity.

When you’re third-generation dairy, when your kids show calves at county shows, when your whole sense of self is wrapped in being a good farmer—losing the farm isn’t just business failure. A study in the Journal of Rural Mental Health found that farmers couldn’t separate their personal identity from their farm identity. When the farm failed, they felt they’d failed as humans.

The University of Guelph’s agricultural mental health research documents the progression. First comes problem-solving—cutting costs, deferring maintenance, and longer hours. Then isolation. Farmers stop attending meetings, skip social events, and withdraw. When cognitive distortions take hold—every option looks impossible, exit feels like complete failure—intervention becomes critical.

I’ve noticed that December’s cuts aren’t hitting farmers in isolation. They’re hitting operations already stressed by drought, inflation, and the watching of neighbors exit. For someone already questioning whether it’s worth continuing, that £600 monthly loss can accelerate a psychological crisis dramatically.

What Success Actually Looks Like

Not every story ends in exit, and that’s important to remember. I’ve been talking with operations, finding ways through this that deserve attention.

One farm in Cheshire I visited started transitioning to artisan cheese three years ago—began at local farmers’ markets and now supplies regional delis. Over those three years, they invested about £85,000 total, but they’re now achieving £1.20-1.40 per liter equivalent on cheese versus 36p farmgate. The key was starting small, reinvesting profits, and growing gradually.

Five farms near Dumfries formed an informal buying group last year—nothing fancy, just neighbors coordinating feed orders through WhatsApp for 8-12% better pricing. As the organizer told me, “We can’t control milk prices, but we can optimize what we spend.”

Several farms moved into contract heifer rearing, maintaining dairy expertise while reducing capital requirements and price exposure. Margins are lower—typically £350-400 per heifer based on current arrangements—but it’s predictable income with less stress. One farmer who made the switch two years ago told me simply: “I sleep at night now. Can’t put a price on that.”

What’s encouraging is that these aren’t following standard strategic paths exactly—they’re hybrid approaches that match specific circumstances, available capital, and family goals.

Where This Is Probably Heading

Looking at current industry exit patterns and talking with dairy economists at Harper Adams and Reading… if trends continue, UK dairy by 2030 would likely have 4,200-4,800 operations, down from today’s 7,040. Average herds approaching 300-350 cows. The middle tier—150-400 cow operations—is largely disappearing, replaced by either large-scale operations or small niche producers.

This doesn’t necessarily mean milk shortage. The UK will maintain production, keep shelves stocked, and meet demand. But through a fundamentally different structure than even five years ago.

What December represents isn’t the breaking point—it’s more like the revelation point. When we can’t pretend anymore that working harder, cutting costs, or waiting for recovery will save operations that are structurally challenged in this system.

Practical Guidance for Right Now

If you’re looking at impossible math, here’s what I’d suggest based on conversations with advisors and farmers who’ve navigated this:

First, calculate the true break-even point, including family living. Not just production costs—everything, including realistic family drawings. If that’s above 45 ppl, act immediately rather than hope for recovery.

Second, assess a realistic timeline. How many months can you sustain current losses? Not theoretical credit or hoped-for recovery—actual reserves against actual losses. Most operations I’ve analyzed have lasted no more than 3 to 6 months.

Third, if considering exit, move quickly. Asset values are highest in planned liquidation, not in forced sales—any auctioneer will confirm this. Farms exiting in 2026 will find stronger January markets than June.

Fourth, if staying, commit fully. Half-measures don’t work now. Whether diversification, scale, or differentiation, successful transitions require complete commitment and adequate capital. Without both… it might be time to reconsider.

Finally—and this really matters—remember this isn’t personal failure. The UK dairy’s structure creates these outcomes. You didn’t fail. You’re operating in a system where structural forces favor consolidation, and margin capture happens downstream. Understanding that won’t change outcomes, but it matters for how you frame what comes next.

Support When You Need It

For those struggling with these decisions, support exists. RABI’s 24-hour helpline (0800 188 4444) offers confidential assistance from counselors who understand farming. The Farming Community Network (03000 111 999) provides practical and emotional support from staff with agricultural experience. Rural Support combines business planning with mental health resources.

These aren’t just numbers—they’re staffed by people who understand losing a farm isn’t just losing business. It’s losing identity, legacy, purpose. No shame in needing support through that.

The Bottom Line

December’s 6ppl cut isn’t really about December. It’s about whether the UK dairy’s structure can sustain family-scale farming or whether consolidation toward fewer, larger operations is simply inevitable. Looking at processor investments, organizational challenges, and the mathematics… the direction seems increasingly clear.

Yet within that larger story, individual farmers are writing their own chapters. Some will find innovative adaptations. Others will make dignified exits, preserving family wealth for different futures. Maybe some will catalyze collective action that could still influence the narrative.

What matters now isn’t predicting which unfolds—it’s ensuring farmers have clear, honest information for family decisions. Because behind every statistic, market report, price announcement, there’s a family at their kitchen table, doing math that doesn’t work anymore, trying to figure out what comes next.

That’s the real story for December 2025. Not the 6ppl cut itself, but what it reveals about who has options and who’s running out of time.

A Note on Data Sources UK dairy production costs vary significantly based on source, methodology, and sample. This article draws from multiple sources including:
• Industry benchmarking reports (Kingshay, Promar, SAC Consulting)
• Producer interviews and farm business accounts
• AHDB market price data (where specifically cited)
• Processor annual reports and public statements
• Academic research from UK agricultural universities

We encourage readers to examine multiple data sources when making business decisions. Cost figures presented here represent reported ranges and modeled examples, not definitive national averages. Individual farm circumstances vary considerably. The core analysis and conclusions remain unchanged—UK dairy farmers face severe economic pressure requiring urgent attention and structural solutions.
We welcome input from all industry stakeholders, including AHDB, processors, and producers, to refine our understanding of UK dairy economics. If you have additional data or perspectives to share, please contact editorial@thebullvine.com.

Key Takeaways:

  • December’s Impossible Math: Based on industry cost estimates, many farms face potential losses of £17,000 monthly (35.85ppl milk vs estimated 49p/liter costs) while First Milk reports “exceptional” £20.5M profits—this gap won’t close without structural change
  • Why Ireland’s Fix Won’t Work Here: Irish farmers reversed cuts in 47 days through cooperative ownership UK doesn’t have—forming Producer Organizations requires lawyers, time, and bandwidth you lack while hemorrhaging money
  • Your Real Options: Of five paths forward, only planned exit guarantees equity preservation; organic needs £750k and 7 years; scaling requires £26-39M; diversification takes 18-24 months; cooperation needs resources you don’t have
  • The 90-Day Test: Watch DEFRA PO registrations by January 15, processor pricing late January, AHDB Q1 numbers in March—if nothing shifts, UK dairy accelerates from 7,040 to 4,200 farms by 2030

Learn More:

The Sunday Read Dairy Professionals Don’t Skip.

Every week, thousands of producers, breeders, and industry insiders open Bullvine Weekly for genetics insights, market shifts, and profit strategies they won’t find anywhere else. One email. Five minutes. Smarter decisions all week.
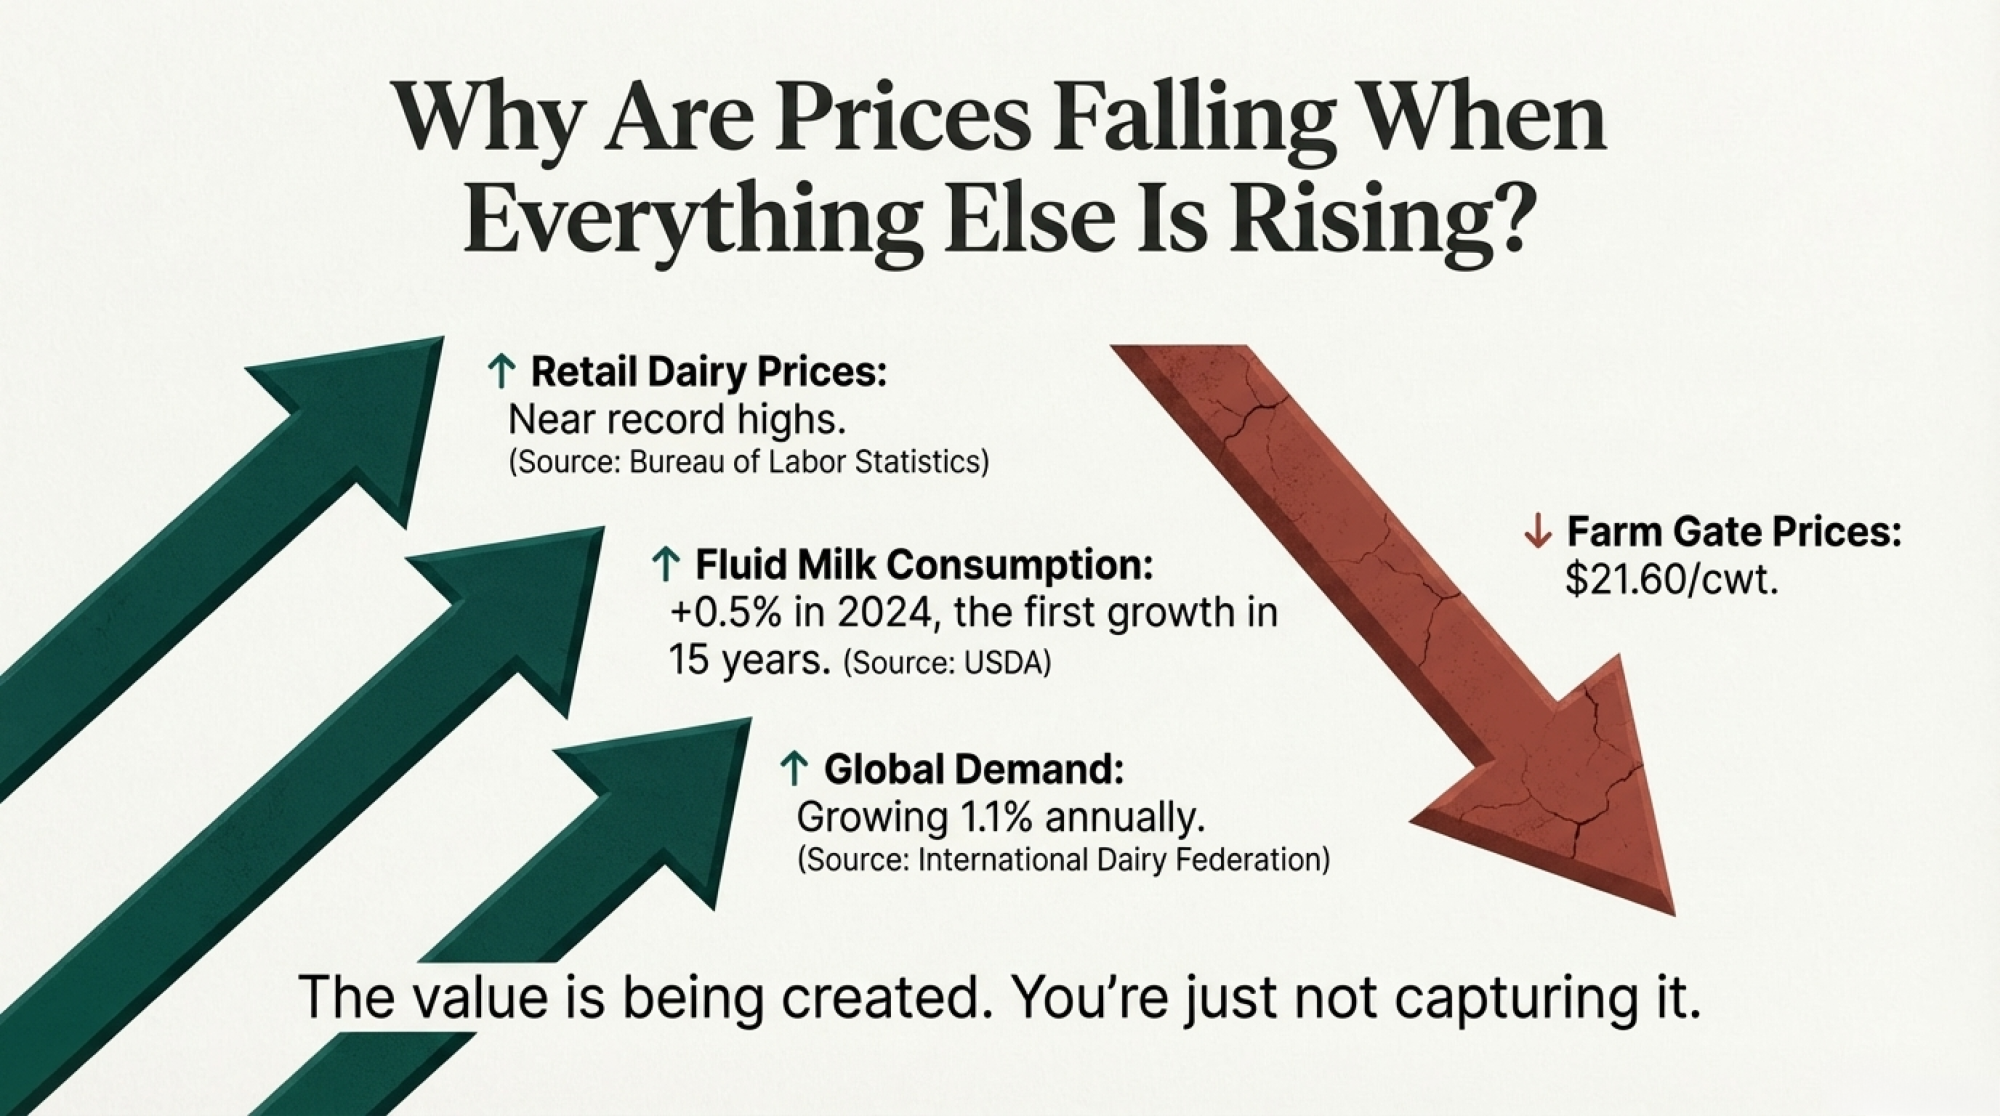
NewsSubscribe
First
Last
Consent

Why Dairy Markets Can’t Self-Correct Anymore: The Hidden Forces Reshaping the Dairy Industry’s Future

Digesters: $100/cow. Beef crosses: $250/calf. Carbon credits: $28K. When milk becomes your SMALLEST revenue, you survive.

EXECUTIVE SUMMARY: Traditional dairy economics no longer exist—milk production rises 7.5% while prices crash 29% because half of the global supply doesn’t need milk profits anymore. Six structural forces —from European cooperatives locked into accepting all production to U.S. farms earning $100/cow from digesters —have permanently broken market self-correction mechanisms. This isn’t temporary: 40-50% of U.S. milk now comes from multi-revenue operations that profit even at $12/cwt, while conventional farms need $17/cwt to survive. The 2026-2027 shakeout will consolidate 25-40% of production into mega-dairies as thousands of single-revenue farms exit. But you can act now: implementing beef-on-dairy generates $15,000-20,000 annually with one phone call to your breeding tech—no loans, no construction. The divide is clear: farms with multiple revenue streams will thrive at prices that bankrupt traditional operations. Your survival depends on recognizing this transformation isn’t cyclical—it’s permanent.

Farm Revenue Diversification

I recently reviewed the UK’s latest production figures from AHDB Dairy, and something remarkable stood out. Milk output increased 7.5% while butter prices declined 29.2% year-over-year. This pattern extends across Europe—Poland’s growing 5.7%, Italy expanding 3%. Meanwhile, European Commission data shows cheese prices down 33-37% across varieties.

What’s particularly noteworthy is how this contradicts everything we thought we knew about market dynamics. When prices fall by a third, producers should reduce output. Basic economics, right? Yet that’s not happening, and understanding these dynamics becomes essential for navigating what lies ahead.

My analysis of Global Dairy Trade auctions, European Energy Exchange futures, and USDA production reports reveals something striking: approximately half of the global milk supply now operates under economic principles different from those we traditionally understood. This shift affects every segment of our industry, from family farms to mega-dairies, from local cooperatives to multinational processors.

Milk production surges 7.5% while butter prices plummet 29.2% year-over-year—a violation of basic supply-demand principles proving half the global supply no longer responds to price signals

Six Structural Forces Reshaping Market Dynamics

Through extensive analysis of production patterns and discussions with industry professionals across multiple regions, I’ve identified six key factors preventing traditional market corrections. As many of us have observed, these aren’t temporary disruptions—they’re permanent structural changes.

1. Cooperative Frameworks and Supply Obligations

European cooperatives manage approximately 60% of the continent’s milk, according to data from the European Dairy Association. What’s interesting here is how these systems operate under unique structural constraints that essentially lock in production.

Within these frameworks, members maintain contractual obligations to deliver their full production, while cooperatives must accept all member milk regardless of market conditions. Think about operations like Dairygold in Ireland—when most members have committed their supply through formal agreements, the cooperative can’t refuse deliveries even when tanks are full and prices are in the basement.

This represents a significant structural difference from the flexibility many North American producers experience. I’ve noticed that producers in Wisconsin or California often don’t fully appreciate how these European constraints ripple through global markets.

2. Infrastructure Investment and Economic Lock-In

Modern dairy facilities require substantial capital that creates what I call “economic handcuffs.” Current robotic milking systems range from $150,000 to $250,000 per unit, according to Lely and DeLaval specifications. The University of Wisconsin Extension‘s latest facilities guide indicates modern freestall barns require $2,000-3,500 per cow space.

Do the math on a 200-cow operation—you’re looking at $2-3 million in specialized assets. And here’s what keeps me up at night: agricultural equipment values have declined significantly, with virtually no secondary market for used robotic milkers.

Cornell’s agricultural economics research demonstrates what we’re seeing firsthand—operations continue production as long as variable costs are covered, even when they’re bleeding red ink on total costs. It’s rational for the individual farm, but it perpetuates the oversupply problem.

A 3,500-cow California operation generates $423,000 annually from non-milk revenue—with energy contracts dominating at $350K, fundamentally changing farm economics and making them profitable even when milk prices crash

3. Agricultural Support Programs and Income Stability

The European Union’s Common Agricultural Policy represents a €291.1 billion commitment from 2021-2027. What farmers are finding is that these payments, primarily based on land area rather than production, create income stability that’s independent of milk prices.

Research from Wageningen University indicates CAP payments constitute 30-40% of net farm income for many European operations. I’ve spoken with numerous Irish producers whose single farm payments—typically €15,000-20,000 annually—provide the cushion that keeps them milking when prices tank.

While these programs successfully maintain rural communities (and that’s important), they also reduce the supply response we traditionally expected during downturns.

4. Energy Production and Alternative Revenue Streams

This development changes everything about dairy economics. EPA’s AgSTAR program data shows methane digesters generate $80-100 per cow annually through renewable natural gas contracts. California Air Resources Board reports indicate some operations earn $2-3 per hundredweight from energy alone.

A senior consultant recently told me, “We’re approaching a point where milk becomes the co-product of energy production.” That might sound extreme, but look at the numbers…

California operations with 10-15 year renewable natural gas contracts can’t reduce cow numbers without breaching agreements worth millions. With over 200 digester projects operational or under construction, according to the California Department of Food and Agriculture, this fundamentally alters production incentives.

5. Environmental Compliance and Capital Lock-In

Environmental regulations create an interesting paradox. I recently spoke with a Vermont producer who invested approximately $275,000 in manure separation and phosphorus recovery to meet Required Agricultural Practices regulations.

“When you’ve invested that much in compliance infrastructure,” he explained, “continuing at marginal returns often makes more sense than exiting and losing everything.”

This becomes especially complex for operations with succession plans. Kids wanting to farm face tough choices between continuing marginally profitable operations or walking away from family legacies.

6. Beef-on-Dairy Programs: Accessible Revenue Diversification

Here’s a revenue stream that deserves particular attention because it’s accessible to everyoneUSDA Agricultural Marketing Service data from October shows beef-cross dairy calves commanding $200-300 premiums over Holstein bulls. Regional auctions report Angus-Holstein crosses averaging $450-500 while Holstein bulls struggle to hit $200.

Industry breeding data suggests 30-40% of U.S. operations now use beef semen for 20-50% of breedings, up from under 10% five years ago. A 100-cow dairy breeding 30 animals to beef genetics at a $250 premium generates $7,500additional revenue—roughly 50¢ per hundredweight across total production.

Penn State’s dairy genetics team has documented how these programs provide crucial diversification for operations of all sizes, making it a key survival strategy in the current market environment.

Six permanent structural forces have destroyed traditional dairy market corrections—from European cooperative obligations to U.S. energy contracts—resulting in 40-50% of global milk supply operating independent of price signals, ending boom-bust cycles forever

Understanding Multi-Revenue Economics

The transformation from single to multiple revenue streams represents a paradigm shift in how we think about dairy profitability.

I recently analyzed a 3,500-cow California operation that illustrates this perfectly. Their annual alternative revenue includes:

  • Energy contracts: $350,000
  • Beef-cross premiums: $45,000
  • Carbon credits: $28,000

That’s over $400,000 in non-milk revenue, roughly $3 per hundredweight. Their effective break-even after all revenue streams? About $11.50/cwt. Meanwhile, University of California Cooperative Extension data shows conventional neighbors need $16-18/cwt just to cover costs.

Multi-revenue dairy operations maintain profitability at $11.50/cwt while conventional farms require $16-18/cwt—a $4.50+ gap that’s forcing the largest industry consolidation in decades

With November’s CME Class IV at $13.90, multi-revenue operations maintain positive margins while single-revenue neighbors hemorrhage cash daily.

Scale of the Transformation

EPA’s AgSTAR database documents over 270 digesting operations covering approximately 10% of the national herd. The California Energy Commission reports $522 million in private investment in digester projects.

When we combine operations with digesters, beef programs, carbon credits, and solar leases, approximately 40-50% of U.S. milk production now comes from farms with significant non-milk revenue. Traditional supply response? It’s essentially dead.

Processor Adaptation Strategies

Processors aren’t sitting idle—they’re repositioning aggressively. The whey market tells the story.

The Whey Market Divergence

While CME Class IV futures languish at $13.90-14.00/cwt through March 2026, dry whey hit nine-month highs at 71¢/pound—16¢ above the March-September average according to USDA Dairy Market News.

Why this divergence? Three factors stand out:

First, clinical guidelines for GLP-1 medications like Ozempic recommend 1.2-1.5 grams of protein per kilogram body weight to preserve muscle during weight loss. Whey’s amino acid profile makes it ideal.

Second, the sports nutrition market will reach $27.6 billion by 2030, up from $15.6 billion in 2022, with whey representing 70% of protein supplement sales.

Third, technology breakthroughs—companies like Milk Specialties Global have developed clear, fruit-flavored protein beverages that expand beyond traditional shake consumers.

Strategic Processing Investments

The International Dairy Foods Association reports over $11 billion in new processing capacity through 2027. Valley Queen Cheese Factory’s South Dakota expansion illustrates the strategy—management emphasizes whey and lactose demand drives growth planning, not cheese.

These processors recognize that a predictable milk supply from multi-revenue farms justifies substantial investments in protein concentration. Cheese enables whey capture—the latter increasingly drives decisions.

Global Price Transmission Mechanisms

Recent GDT auctions showed whole milk powder down 0.5%, European powder fell 2% per CLAL monitoring, and U.S. nonfat dry milk hit 13-month lows at $1.1325 CME spot. Three different structures, identical direction.

How Arbitrage Enforces Price Discipline

Import buyers consistently report shifting purchases immediately when New Zealand, German, or Wisconsin prices show 5% differentials. The Global Dairy Trade platform, with hundreds of bidders trading 10 million metric tonsannually, creates transparent global price discovery.

Structural Supply Rigidity Everywhere

All major exporters demonstrate inflexibility:

  • Fonterra must accept all shareholder milk (82% of New Zealand production)
  • European cooperatives, plus CAP support, maintain production regardless of price
  • U.S. operations with digester/beef revenue lock in production for years

When China’s imports grow just 6% versus the historical 15-20% (USDA Foreign Agricultural Service), no region possesses quick adjustment mechanisms.

Anticipated Market Evolution: 2026-2027

Based on financial indicators, here’s what I expect:

Q4 2025 – Q1 2026: Credit Market Adjustment

Financial institutions report rising delinquencies. Some require quarterly rather than annual production reports. American Farm Bureau data shows Chapter 12 bankruptcies increased 55% in 2024—that trend continues.

Q2-Q3 2026: Initial Consolidation

Credit-constrained operations begin exiting, but milk production doesn’t disappear—it consolidates. I’m seeing California Central Valley operations with 5,000+ cows buying neighboring 500-cow dairies as satellites.

Q4 2026 – Q2 2027: Structural Realignment

Analysis suggests Class IV stabilizes around $15.00/cwt—sufficient for multi-revenue operations but challenging for conventional single-revenue farms.

The dairy industry faces unprecedented consolidation: multi-revenue mega-dairies will more than double their market share to 32.5%, while conventional small farms shrink from 40% to 28% and the price-responsive segment collapses from 85% to under 45%—ending traditional supply-demand cycles

By mid-2027:

  • Multi-revenue mega-dairies: 25-40% of supply (up from 15%)
  • Conventional small farms: 26-30% (down from 40%)
  • Price-responsive segment: Under 45% (down from 85%)

This represents permanent transformation, not cyclical adjustment.

Southeast Asian Trade: Realistic Assessment

October’s agreements with Malaysia, Cambodia, Thailand, and Vietnam generated optimism. Let’s examine the actual impact.

USDA data shows current exports to these nations total $335 million—just 4% of our $8.2 billion total. Mexico alone buys $2.47 billion.

Even assuming aggressive growth, additional exports might reach $150-200 million by 2027—roughly 750 million pounds milk equivalent. But U.S. production ranges from 6.8 to 9.1 billion pounds annually. Southeast Asia absorbs 8-11% of growth—helpful but not transformative.

These agreements benefit operations with scale, integrated processing, and West Coast proximity—not the Wisconsin 300-cow farm facing bankruptcy.

Strategic Guidance by Operation Type

Small-to-Medium Conventional (100-500 cows)

Post-crisis prices around $14.85/cwt for Class IV are likely to fall below your break-even. University of Minnesota’s FINBIN shows operations this size need $15.50-17.50/cwt.

Immediate action: Implement beef-on-dairy tomorrow. Breeding 30-40% to beef generates $150-250/calf premium. For 200 cows, that’s $15,000-20,000 annually. Call your breeding tech today.

Exit strategies: Chapter 12 provisions offer tax advantages when properly structured. Timing matters as provisions may change.

Expansion: Only viable with 40%+ equity. Reaching 1,500+ cows requires $3-5 million in capital.


Metric
Holstein Bull CalfBeef-Cross CalfPremium/Advantage
Market Value$150-200$450-500$250-300
Current AdoptionN/A30-40% of farmsGrowing rapidly
Breeding %100% dairy20-50% beefStrategic flexibility
Capital Required$0$0Zero investment
Annual Revenue (100 cows, 30% beef)N/A$7,500-9,000Immediate impact
Per Cwt BenefitN/A+$0.50/cwtPure profit add-on

Large Conventional (500-1,500 cows)

You’ll survive but face persistent margin pressure. Push beef-on-dairy toward 40-50% if heifer inventory allows. Lock processor relationships now. Watch for acquisition opportunities.

Near gas pipelines? Seriously evaluate digesters—the economics are compelling, especially with access to infrastructure.

Integrated and Mega-Dairy Operations

The next 24 months present strategic opportunities: favorable asset acquisitions, long-term processor contracts, and continued revenue diversification. Don’t overestimate Southeast Asian volumes—focus on operational efficiency and strategic positioning.

The Bottom Line

What we’re witnessing represents market evolution driven by technology and policy, not temporary failure. The emerging industry will be more concentrated, less price-responsive, and fundamentally different.

Traditional boom-bust cycles are giving way to persistent equilibrium at lower prices, with alternative revenue determining competitive advantage. I know this challenges everything many of us learned. The farm I grew up on wouldn’t survive today’s reality.

But early recognition creates options. Waiting for “normal” to return? That normal no longer exists.

Operations understanding these structural changes will define the next era. Those managing based solely on milk prices risk missing critical competitive factors.

Your strategic window remains open, but it won’t remain open indefinitely. Whether implementing beef-on-dairy, evaluating energy opportunities, or planning transitions, purposeful action becomes essential.

In this evolving dairy economy, standing still means falling behind. The fundamentals have shifted, and our strategies must evolve accordingly. While challenging, this transition creates opportunities for those prepared to adapt.

Together, we’ll navigate this transformation. But success requires understanding the forces at work and a willingness to embrace new models. The path forward demands both realism about challenges and optimism about opportunitiesfor those ready to evolve.

KEY TAKEAWAYS: 

  • Critical Market Intelligence Traditional dairy economics is dead: Half of global milk supply doesn’t need milk profits—digesters generate $100/cow, beef-on-dairy adds $250/calf, making $12/cwt profitable while you need $17/cwt
  • Immediate opportunity: Implement beef-on-dairy tomorrow for $15,000-20,000 annual revenue with zero capital investment—just one call to your breeding tech
  • Six permanent forces guarantee oversupply: European cooperatives must accept all milk, U.S. farms locked into 10-15 year energy contracts, and CAP subsidies cushion losses
  • 2026-2027 consolidation inevitable: 25-40% of milk production shifting to multi-revenue mega-dairies as thousands of conventional farms exit at $15/cwt prices
  • Your choice is binary: Develop multiple revenue streams now or exit within 24 months—waiting for market recovery means waiting for something that won’t happen

Complete references and supporting documentation are available upon request by contacting the editorial team at editor@thebullvine.com.

Learn More:

The Sunday Read Dairy Professionals Don’t Skip.

Every week, thousands of producers, breeders, and industry insiders open Bullvine Weekly for genetics insights, market shifts, and profit strategies they won’t find anywhere else. One email. Five minutes. Smarter decisions all week.

NewsSubscribe
First
Last
Consent

Weekly Global Dairy Market Recap: Monday, November 3, 2025: European Cheese Crashes 37% as Class Spread Hits Historic High

European cheese crashed 37% year-over-year, and the Class III-IV spread reached a farm-killing $3.50/cwt.

Executive Summary: Global dairy markets are in freefall. European cheese crashed 37% year-over-year, GDT auctions fell for the fifth straight week, and the Class III-IV spread exploded to a farm-killing $3.50/cwt—your Class III neighbor is now making $3,800 more per month than you. Milk production is surging everywhere (New Zealand +2.8%, UK +7.5%, U.S. herd at 32-year high) while demand craters, with only whey (+2.2%) and China’s premium dairy pivot offering hope. The Trump-Xi deal promises 25 million tonnes of annual soybean purchases to ease feed costs, but it won’t save commodity producers. Bottom line: If you’re shipping Class IV at $13.90 while others get $17.40 for Class III, you’re losing $45,000 annually. The farms that survive will be those that act now to lock in Class III, optimize components, and abandon the volume-at-any-cost mentality that’s driving this market into the ground.

Global Dairy Markets

Global dairy markets delivered another week of painful reality checks. European cheese posted annual declines of more than 30%. The fifth straight GDT auction decline confirmed what you already know—there’s too much milk chasing too few buyers. Meanwhile, the Class III-IV spread hit $3.50/cwt, meaning your neighbor shipping Class III milk is making $3,800 more per month than you are if you’re stuck in Class IV.

European Futures: Butter Holds, Everything Else Slides

Key Takeaway: European traders moved 2,620 tonnes last week, but the real story is powder weakness (-1.3%) while whey bucked the trend (+2.2%)—a clear signal that protein derivatives are the only bright spot.

EEX recorded 524 lots of trading activity, with Tuesday’s 925-tonne session marking the week’s peak. The breakdown tells you everything about market sentiment:

  • Butter futures only dropped 2.0% to €5,093/tonne
  • SMP futures weakened 1.3% to €2,161/tonne
  • Whey futures climbed 2.2% to €1,007/tonne

That whey strength? It’s your lifeline. Strong protein derivative demand for feed and nutrition applications is keeping values supported while everything else crumbles.

Singapore Exchange: New Zealand’s Spring Flush Hits Hard

Key Takeaway: SGX traders moved 17,020 tonnes, but WMP prices fell for the fifth straight week to $3,523/tonne—Fonterra’s 2.8% production increase is flooding the market.

The numbers paint a clear oversupply picture:

  • WMP: Down 0.7% to $3,523/tonne
  • SMP: Flat at $2,591/tonne
  • AMF: Up 0.2% to $6,677/tonne
  • Butter: Down 1.3% to $6,339/tonne

Here’s what matters for your operation: Fonterra’s September collections hit 179 million kgMS (+2.8% YoY), with season-to-date volumes running 3.0% ahead. When New Zealand pumps out milk like this, global prices have nowhere to go but down.

European Cheese Collapse: The 30% Massacre

European Cheese Markets in Historic Freefall

Key Takeaway: European cheese prices aren’t just weak—they’re in historic freefall. Every major variety is down 30%+ year-over-year, and buyers know more pain is coming.* The weekly damage was brutal:

  • Cheddar Curd: Crashed €113 to €3,388 (-33.6% YoY)
  • Mild Cheddar: Plunged €206 to €3,430 (-33.3% YoY)
  • Young Gouda: Trading at €2,909 (-37.2% YoY)
  • Mozzarella: Down €105 to €2,823 (-36.2% YoY)

Why should you care? Because European processors are bleeding cash—paying €520/tonne for milk while selling Gouda at €400/tonne. That math doesn’t work. Something’s got to give.

GDT Auction: Fifth Straight Decline Says It All

Fifth Consecutive GDT Decline Confirms Bearish Reality

Key Takeaway: *The GDT Pulse auction delivered another gut punch—WMP at $3,560 and SMP at $2,530 represent 13-month lows. Buyers have zero urgency. The PA092 results confirmed what everyone fears:

  • WMP: $3,560/tonne (down $90 from two weeks ago)
  • SMP: $2,530/tonne (down $55 from prior pulse)
  • Total volume: Only 2,612 tonnes with 41 bidders

That’s five consecutive declines. The message? Global buyers are sitting on their hands, waiting for even lower prices.

Global Production: Everyone’s Making More Milk

Key Takeaway: From New Zealand (+2.8%) to Poland (+5.7%) to the UK (+7.5%), milk is flowing everywhere except where you need it—into buyer demand.

Southern Hemisphere Springs Forward

  • New Zealand: 316.3 million kgMS season-to-date (+3.0%)
  • Australia (Fonterra): 23.4 million kgMS YTD (+3.0%)
  • Argentina: September production surged 9.9% YoY

Northern Hemisphere Piles On

  • UK: September hit 1.28 million tonnes (+7.5% YoY)
  • Poland: 1.11 million tonnes in September (+5.7% YoY)
  • Ireland: November 2024 exploded 34% higher
  • USA: Herd at 9.52 million cows—highest since 1993

CME Markets: The Class Spread That’s Killing Farms

Historic Class III-IV Spread Creates $3,800 Monthly Winners and Losers

Key Takeaway: The $3.50/cwt Class III-IV spread isn’t just a number—it’s the difference between profit and loss for thousands of dairy farms.*Here’s your Friday closing reality check:

Winners:

  • Cheddar Barrels: $1.8050 (+3.5¢)
  • Dry Whey: $0.7100 (+2¢)—nine-month high
  • Class III November: $17.40/cwt

Losers:

  • NDM: $1.1325 (-2.75¢)
  • Butter: $1.6100 (barely holding)
  • Class IV November: $13.90/cwt

Do the math: If you’re shipping 3 million pounds monthly, that $3.50 spread means $3,800 less in your milk check compared to your Class III neighbor. That’s a new pickup truck disappearing every year.

Feed Markets: China Deal Sparks Soybean Rally

Key Takeaway: Soybeans hit $11/bushel on China’s promise to buy 12 million tonnes immediately plus 25 million tonnes annually—but will they follow through?

The Trump-Xi meeting delivered feed market fireworks:

  • Soybeans: Surged 60¢ to $11.00/bushel (15-month high)
  • Soybean Meal: Jumped $27 to $321.40/ton
  • Corn: Up 8¢ to $4.31/bushel

Treasury Secretary Bessent’s announcement sounds impressive, but here’s the reality: Those Chinese purchase commitments are still below pre-trade war levels. Don’t count your feed savings yet.

Trade Breakthroughs: Southeast Asia Opens Doors

Key Takeaway: New agreements with Malaysia, Cambodia, Thailand, and Vietnam eliminate dairy tariffs—finally giving U.S. exports a fighting chance against New Zealand and Australia.

President Trump’s Asian tour delivered real results:

  • Malaysia: Eliminates all dairy tariffs, recognizes U.S. standards
  • Cambodia: Zero tariffs on all U.S. dairy products
  • Thailand: Framework covers 99% of goods (dairy included)
  • Vietnam: Preferential access for substantially all dairy

Why this matters: Vietnam imported $668 million in dairy through August 2025, but U.S. suppliers captured only $22 million due to tariff disadvantages. These deals level the playing field.

China’s Premium Pivot: The $150,000 Opportunity

Key Takeaway: China’s 18% surge in premium dairy imports versus 12% declines in commodity products isn’t a blip—it’s a structural shift that rewards quality over quantity.

The numbers tell the story:

  • Cheese imports: +13.5% YoY
  • Butter imports: +72.6% YoY
  • Skim milk powder: Significant retreat

For a 500-cow operation optimized for components and premium channels, this shift could mean $150,000+ in additional annual revenue. The question is: Are you positioned to capture it?

The Bottom Line: Survival Mode Until Spring

Here’s your reality: Global milk production is overwhelming demand, and it’s not stopping. The Class III-IV spread is creating massive inequities between farms. European cheese markets are in freefall with no floor in sight. Your only bright spots? Whey strength and potential Chinese premium demand.

Three moves to make this week:

  1. Lock in Class III if you can—that $3.50 spread won’t last forever
  2. Review your component optimization—premium markets are your escape route
  3. Don’t forward contract cheese—European prices prove there’s more pain coming

The market’s sending clear signals: Commodity dairy is dead money. Premium products and value-added channels are your survival strategy. The farms that adapt to this reality will still be here in 2027. The ones that don’t? They’ll be someone else’s expansion.

What’s your move? The clock’s ticking, and every month at $13.90, Class IV is another month closer to the edge. 

Complete references and supporting documentation are available upon request by contacting the editorial team at editor@thebullvine.com.

Learn More:

The Sunday Read Dairy Professionals Don’t Skip.

Every week, thousands of producers, breeders, and industry insiders open Bullvine Weekly for genetics insights, market shifts, and profit strategies they won’t find anywhere else. One email. Five minutes. Smarter decisions all week.

NewsSubscribe
First
Last
Consent

Why Your Milk Check Makes No Sense Anymore (And How Smart Farms Are Adapting)

Butter inventories: lowest since 2016. Butter prices: falling fast. Your milk check: shrinking. We connect the dots.

Executive Summary: Something broke in dairy markets this October: butter crashed to $1.60 despite the tightest inventories since 2016. Just 15 CME trades triggered the drop, opening a massive $2.47 gap between Class III and Class IV milk prices—the widest since 2011. Jersey farms shipping to butter plants now lose up to $500,000 annually, while Holstein neighbors shipping to cheese plants gain from the exact same market. Why? Algorithmic trading dominates these thin markets, punishing the high butterfat we spent decades breeding for. Smart farms are adapting fast: switching processors (6-month payback), negotiating collectively ($0.35/cwt gains), and even reducing butterfat through nutrition. The message is clear—understand these new market dynamics or get left behind.

I was chatting with a Jersey producer near Mondovi, Wisconsin—been in the business 28 years—and he told me something that’s really stuck with me. “For the first time,” he said, “I genuinely don’t understand what’s driving my milk check.”

That’s a powerful statement coming from someone who’s weathered every market cycle since the mid-90s. And he’s not alone. I’ve been hearing similar frustrations from producers all across the dairy belt lately, from the Great Lakes down through Texas.

October 2025 just matched the worst Class spread since 2011—and this time, it’s not a temporary spike. The fundamentals driving this gap are structural, not cyclical. When pricing signals stay broken this long, farms that wait for ‘normal’ to return are making a dangerous bet.

Why Are Butter Prices Falling When Inventories Are Tight?

So here’s what happened this October that’s got everyone talking. According to CME Group’s daily reports, spot butter prices fell from $1.6950 in mid-September to $1.6025 on October 9th. Pretty significant drop.

But what makes this genuinely puzzling is what else was happening. USDA’s Cold Storage report, released September 24th, showed butter inventories at 305.858 million pounds for August. That’s the tightest August inventory we’ve seen since 2016.

Tight inventories should support prices, shouldn’t they? That’s how it’s always worked. But not this time.

Here’s what’s keeping me up at night. August 2025 butter inventories sit at 305.9 million pounds—the tightest since 2016. Basic economics says tight supplies mean higher prices. Instead, butter crashed to $1.60. That’s not a market signal. That’s market failure. And your breeding decisions for the last decade just became a liability because algorithms don’t care about supply and demand.

And the timing… October is traditionally when we see butter prices strengthen. Retailers start building holiday inventory, and demand picks up through Thanksgiving. We’ve all seen that pattern. This October? Complete opposite.

What’s particularly interesting is the global picture. While our butter was trading around $1.60 in early October, industry reports suggest European prices were holding near $2.60 per pound. New Zealand’s Global Dairy Trade auction from October 1st showed butter equivalent prices in the $3.40 to $3.50 range after conversion.

That’s a massive disconnect. And according to USDA Foreign Agricultural Service data through August, it’s been driving butterfat exports way above last year’s levels—increases of over 200% in some months. You’d think that kind of export demand would support domestic prices, but apparently not in this market.

The recent trade agreements, particularly USMCA provisions, have actually made cross-border dairy movement easier, which you’d expect would help price discovery. But even with those improvements, we’re seeing these wild disconnects.

How Can 15 Trades Set Prices for an Entire Industry?

At a recent University of Wisconsin Extension meeting, several producers raised good questions about how these price movements could occur with such thin trading volume. Let me walk you through what I’ve been observing.

On October 9th, CME’s daily report showed selling pressure that drove prices down 4.75 cents in just one session. We’re talking about spot loads of 40,000 pounds each, and on a busy day, maybe 15 loads change hands. That’s 600,000 pounds of butter, setting the tone for an industry producing 1.8 billion pounds of milk daily, according to USDA production statistics.

Academic research increasingly suggests electronic trading has fundamentally changed these markets. A good chunk of trading volume in futures markets now comes from algorithmic systems rather than traditional commercial hedging. It’s not farmers hedging production or cheese plants covering forward needs anymore—it’s computers trading momentum patterns.

You can actually see it in the data. Days when butter prices drop sharply often show heavier volume—maybe 12 to 15 loads trading. But when prices try to recover? Volume frequently drops to just 5 or 6 loads. That’s not normal commercial hedging, where you’d expect consistent volume regardless of price direction.

The Class III/IV spread really tells the story. USDA’s Agricultural Marketing Service data showed that spread widening to $2.47 per hundredweight on October 9th—the largest gap since 2011. Class III milk for cheese was $17.01, while Class IV milk for butter-powder was $14.54.

In a market where butter supplies are supposedly tight, that kind of spread doesn’t make fundamental sense. I’ve been in this industry long enough to remember when a 50-cent spread was considered wide. Now we’re looking at nearly $2.50.

Who’s Getting Hit Hardest—And Who’s Finding Solutions?

What I’ve found eye-opening is how differently this affects farms depending on location and milk destination.

There’s a Wisconsin Jersey producer I work with—let’s call him Tom—who runs about 480 cows, averaging 4.8% butterfat. Beautiful production numbers. Based on Federal Order 30 component pricing, his milk should be worth significantly more than the Holstein operation down the road, which is testing at 3.8% fat.

Let’s talk real numbers. That 1,000-cow Jersey operation your family built over three generations? You’re bleeding $600,000 annually at today’s Class spread—that’s $50,000 monthly straight off the top. Meanwhile, your Holstein neighbor with the same 500 cows loses only $75,000. For the first time in dairy history, the genetics we told you to breed for are costing you a quarter-million dollars a year. And it’s not temporary

But when he’s shipping to a butter-powder plant and that Class III/IV spread hits $2.47 per hundredweight, that advantage completely reverses.

Using calculation tools from UW-Madison’s Center for Dairy Profitability (excellent resources at cdp.wisc.edu), we can quantify this. A 100-cow Jersey operation faces nearly $60,000 less income annually under these conditions. Mid-size farms with 300 cows could be down about $175,000. That 500-cow operation? Close to $300,000 annually. And if you’re running 1,000 head? Over half a million dollars in lost revenue.

These are real losses affecting real families. We’re not talking about missed opportunities here—we’re talking about actual cash flow gaps that affect everything from feed purchases to equipment payments.

But here’s what’s encouraging—creative solutions are emerging all over. A producer group in Pennsylvania negotiated a shift from shipping to a butter-powder plant to accessing a cheese cooperative. They invested in equipment upgrades to meet new specs, but told me the investment paid for itself within six months once they escaped that Class IV pricing penalty.

In California, more operations are exploring value-added opportunities. Farmstead cheese, on-farm processing, direct sales. It requires significant capital and a different business model, but those making it work see premiums of $3 to $5 more per hundredweight over commodity pricing.

And in the upper Midwest, I recently visited a 650-cow operation near La Crosse that’s taking a different approach. They’ve partnered with two neighboring farms to collectively negotiate milk marketing, giving them leverage they wouldn’t have individually. “We’re still shipping Class IV,” the owner told me, “but we negotiated quality premiums that offset about 40% of the spread disadvantage.”

Down in Texas, where I was last month, producers face different challenges. The heat stress on butterfat production actually works in their favor when these spreads widen—their naturally lower butterfat levels mean less exposure to the Class IV penalty. One producer near Stephenville told me, “We used to curse our 3.5% fat tests in summer. Now it’s actually protecting us from worse losses.”

I’ve also been talking with Holstein producers who are navigating this differently. A 1,200-cow operation in Michigan shared its strategy—they’ve actually benefited from maintaining moderate butterfat levels around 3.7% while focusing on volume. “Everyone was chasing components,” the owner explained, “but we stuck with balanced production. Now that’s paying off.”

And it’s not just Jerseys and Holsteins feeling this. A Brown Swiss producer in Vermont mentioned their breed’s protein-to-fat ratio has actually become an advantage in this market. “We naturally produce closer to what processors want,” she said. Even some Guernsey operations with their golden milk are finding niche markets that value their unique component profile beyond commodity pricing.

Why Did Everyone Breed for Butterfat If This Was Coming?

Looking at USDA National Agricultural Statistics Service data from 2014 forward, butterfat prices beat protein prices in eight of ten years through 2024. The whole industry was singing the same tune—breed for components, maximize butterfat.

I remember reading CoBank’s November 2023 report titled “The Butterfat Boom Has Just Begun.” They documented that butter consumption grew 43% over 25 years, and that cheese was up 46%; according to USDA Economic Research Service data, Americans now eat about 42 pounds of cheese per person annually. Double what we ate in 1975.

But by September 2024, CoBank published a follow-up with a different tone, warning that butterfat production might be growing too fast. According to analysis from CoBank and other industry sources, the protein-to-fat ratio in U.S. milk has shifted. It held steady around 0.82-0.84 for nearly two decades, but recent data suggests we’re now closer to 0.77.


Metric
JerseyHolstein
Milk Production18,000 lbs/yr25,000 lbs/yr
Butterfat4.8%3.8%
Feed Efficiency1.75 ECM/lb1.67 ECM/lb
Feed Cost per lb Fat$1.82$1.97
Normal Market-$456/yr$0
At $2.47 Spread-$956/yr$0

​I recently spoke with a cheese plant manager in Central Wisconsin who explained their perspective. “We’re not trying to penalize high-butterfat milk,” he said, “but our process is optimized for certain ratios. When milk comes in with too much fat relative to protein, we’ve either got to add milk protein concentrate—which isn’t cheap—or skim off cream. Either way, it’s an added cost.”

This seasonal component shift matters too. Spring flush typically brings lower components as cows transition to pasture—you know how it goes, that first lush grass drops butterfat like a rock. We’d normally see fat tests drop from 4.0% to 3.6% or lower in grazing herds. Then, fall milk traditionally shows higher butterfat as cows return to TMR and corn silage.

But with year-round confinement becoming standard in larger operations, these seasonal patterns are flattening. A nutritionist I work with in Idaho told me that their 5,000-cow clients now maintain 3.8% butterfat year-round, plus or minus 0.1%. That consistency sounds good, but processors built their systems around predictable seasonal variation. Now they’re scrambling to adjust.

What Can You Actually Do About This Right Now?

Risk management has become essential. Looking at CME quotes in late October, Class IV put options at the $14.00 strike were trading around $0.15 per hundredweight. That’s affordable insurance—maybe 6% of what you’d lose if prices really tank. Worth discussing with your milk marketing cooperative.

On the feed side, December corn futures were trading near $4.19 per bushel in early November. Given where feed markets have been, locking in at least some costs makes sense. When milk pricing is this volatile, having one side of your margin equation fixed helps you sleep at night.

Stop waiting for the market to fix itself—here are five strategies working right now on real farms. The Pennsylvania group switching to cheese plants? Six-month payback and they’re adding $2/cwt every month since. The Ohio farm reducing butterfat through nutrition? Four months to breakeven. And locking December corn at $4.19? That’s protecting your margin TODAY. These aren’t theory—these are survival tools farms are using while others are still wondering what happened.

Marketing flexibility is crucial, though limited for many. But it’s worth exploring whether you could shift even a portion of milk to different processors. Some regions have more options than folks realize—cooperatives and plants not considered because they’ve been shipping to the same place for decades.

A Northeast producer recently shared something interesting—they partnered with neighboring farms to collectively negotiate better terms with processors. Not feasible everywhere, but where geographic concentration allows, collaborative approaches deserve consideration. They told me payback on legal and consulting fees took eight months, but they’re now seeing $0.35 more per hundredweight.

I’ve also been seeing increased interest in adjusting components through nutrition. A farm in Ohio began working with its nutritionist to moderate butterfat production, reducing it from 4.1% to 3.85% through ration adjustments. Sounds counterintuitive after years of pushing components higher, but when that Class IV spread is wide, it can actually improve their milk check.

For those with Dairy Margin Coverage through FSA, it’s worth revisiting your coverage levels. The program calculations don’t fully capture these Class III/IV spread impacts, but higher coverage levels might provide some cushion when markets get this disconnected. With crop insurance interactions, some producers are finding ways to layer their risk protection more effectively.

Is This How Dairy Pricing Works Now?

October’s butter price action reveals fundamental questions about how dairy prices get discovered in modern markets.

When CME spot markets with thin daily volume—sometimes just a dozen trades—determine pricing for over 90% of U.S. milk production, the traditional relationship between supply and demand can become distorted.

Other commodities have addressed similar issues. The beef and pork industries implemented mandatory price reporting years ago, where packers report transactions to the USDA, creating broader datasets for price discovery. Some in dairy are asking whether we need something similar. Organizations like the National Milk Producers Federation have begun discussing potential reforms, and there’s growing support from state organizations as well.

The Canadian system offers an interesting contrast. They operate under supply management with administered pricing through the Canadian Dairy Commission. Their system has its own challenges—less export opportunity, higher consumer prices—but price volatility isn’t one of them. Canadian producers maintained stable component premiums throughout October while we dealt with wild swings.

Where Do We Go from Here?

Based on everything I’m seeing and hearing across the industry, here’s what we need to keep in mind:

Traditional price signals might not mean what they used to. When butter prices fall despite the USDA showing the tightest inventories in years, market structure issues go beyond normal supply and demand.

Component strategies need evolution. The protein-to-fat ratio processors want has shifted, and breeding programs might need adjustment. That feels like abandoning years of genetic progress, but markets change. The Jersey breeders I know are already talking about selecting for more moderate butterfat—targeting 4.5% instead of pushing toward 5%. Holstein operations that maintained balanced components are suddenly looking smart. Brown Swiss and Guernsey breeders are reassessing their component targets in response to processor feedback.

Risk management isn’t optional anymore. Even basic strategies like put options provide crucial downside protection. If you’re not working with someone on this, it’s time to start.

Mid-size commodity operations face the most pressure. You need either scale advantages of large operations or premium markets that reward quality differently than commodity channels.

I know this is challenging to process. Many built operations based on signals the market sent for over a decade—maximize components, breed for butterfat, invest in genetics. Now the market’s sending different signals, and adapting isn’t easy.

But dairy farmers are incredibly resilient. We’ve weathered droughts, surpluses, price crashes, and policy changes. This market structure challenge? It’s serious, but not insurmountable.

What encourages me is the innovative responses nationwide. Producers exploring new marketing arrangements, investigating value-added opportunities, and approaching risk management with fresh perspectives. A young producer in Minnesota recently told me, “My grandfather adapted when bulk tanks replaced milk cans. My father adapted when computers changed breeding programs. Now it’s my turn to figure out these new market dynamics.”

That perspective—acknowledging change while maintaining confidence—that’s exactly right.

October’s butter price action, with spot prices at $1.60 while inventories sit at six-year lows according to USDA data, shows the old rules might not apply. Understanding these new dynamics—electronic trading’s role, thin-market impacts, and the importance of component ratios—that’s crucial for smart decisions going forward.

The question isn’t whether markets return to the old ways. They probably won’t. It’s how quickly we adapt strategies to thrive where market structure matters as much as production efficiency.

We’ll figure it out. We always do. That’s what dairy farmers do—adapt, persevere, find a way forward. This time won’t be different.

For those interested in risk management tools, reach out to your cooperative or check CME Group’s educational resources. The University of Wisconsin’s Center for Dairy Profitability has excellent free tools for analyzing component pricing impacts at cdp.wisc.edu. Regional extension services provide valuable market analysis and decision-support resources tailored to local conditions. Organizations like the National Milk Producers Federation (nmpf.org) and your state dairy associations are actively working on market reform proposals worth following.

KEY TAKEAWAYS

  • Your milk check isn’t broken—the market is: 15 CME trades (600,000 lbs) now set prices for 1.8 billion lbs daily production
  • High butterfat became a liability overnight: Jersey farms lose $500K/year at current Class III/IV spreads ($2.47/cwt) while moderate-component Holsteins gain
  • Three farms found solutions that work: Pennsylvania group switched processors (6-month payback), Wisconsin neighbors negotiated together (+$0.35/cwt), Ohio farm reduced fat through nutrition (4.1% to 3.85%)
  • Risk protection costs less than you think: Class IV puts at $14 strike cost $0.15/cwt—that’s $450/month for a 500-cow dairy
  • This isn’t temporary: Algorithmic trading owns these markets now—farms still breeding for maximum butterfat are planning for yesterday’s market

Complete references and supporting documentation are available upon request by contacting the editorial team at editor@thebullvine.com.

Learn More:

The Sunday Read Dairy Professionals Don’t Skip.

Every week, thousands of producers, breeders, and industry insiders open Bullvine Weekly for genetics insights, market shifts, and profit strategies they won’t find anywhere else. One email. Five minutes. Smarter decisions all week.

NewsSubscribe
First
Last
Consent

The Brutal Math: 1,420 American Dairy Farms Gone, Canadian Farmers Get 2.3% Raise – Why?

Quota costs CA$2.4M in Canada. But American farmers pay the ultimate price: their farms.

EXECUTIVE SUMMARY: Canadian dairy farmers plan five years ahead, while American producers pray to survive five months—that gap widened on October 30, when Canada announced a 2.3% price increase as U.S. prices crashed by 11.44%. Canada’s supply management system guarantees profitability but demands CA$2.4-5.8 million in entry fees, offering just 8 new-farmer positions annually per province, while 88% of farms transfer within families. America’s “free” market eliminated 1,420 farms in 2024, aided by cooperatives like DFA, which now own processing plants and profit from the same low prices that destroy their members. Both systems hemorrhage taxpayer money—Canada openly through CA$444 annual household premiums, America secretly via $2.7 billion in failing subsidies. The brutal math: by 2044, America will have fewer than 10,000 dairy farms while Canada maintains stability for an increasingly exclusive club. Solutions exist that combine Canadian predictability with American accessibility, but require farmers to stop defending broken systems and start wielding their political power like Quebec dairy did—they didn’t ask nicely; they demanded protection and got it.

Dairy Policy Analysis

You know, when the Canadian Dairy Commission announced its 2.3255% farmgate milk price increase for February 2026 last Wednesday, I couldn’t help but think about the conversations I’ve been having with producers on both sides of the border. Here’s what’s interesting—American farmers had just watched their milk prices drop 11.44% year-over-year, based on August USDA data. But this isn’t just another price comparison story, not really.

What I’ve found after digging into both systems these past few weeks is… well, it challenges a lot of assumptions we tend to make. Canadian farmers enjoy remarkable stability through supply management, that’s absolutely true. But there’s something they don’t talk about much at Holstein Canada meetings or the Royal Winter Fair—the generational entry barriers that are quietly threatening their long-term sustainability.

Meanwhile, American producers keep telling me about the “freedom” of open markets. Yet we’re watching 1,420 farms close each year, according to the latest USDA census data. At this rate—and the math here is pretty sobering—we’re looking at fewer than 10,000 U.S. dairy operations by 2044. That’s fewer farms than Canada has today, if you can believe that.

“We keep being told markets will sort it out. But after losing 400 farms in our state last year, I’m starting to wonder if the market’s solution is just to sort us out of business.” — Wisconsin dairy farmer reflecting on the 2024 closures

Part I: The Canadian System—Stability at What Cost?

How Supply Management Works: Business Planning vs. Price Taking

Canadian Farmers Plan 5-7 Years Ahead. American Farmers Pray to Survive 90 Days.

Looking at Canada’s approach, what strikes me first is the philosophical foundation. You probably know this already, but supply management—established through provincial legislation like Ontario’s Farm Products Marketing Act—operates on a straightforward principle. Dairy farmers are legitimate business enterprises deserving predictable returns.

Here’s what’s fascinating about the CDC’s quarterly cost-of-production formula. It includes everything you’d expect in a real business calculation—feed costs (which jumped 8.7% in their latest review period), labor, depreciation on that new mixer wagon you bought, interest paid on operating loans, and even return on equity. When those costs rise, prices adjust through their transparent formula: 50% of index cost changes plus 50% of consumer price trends.

This creates dramatically different planning horizons than what we see south of the border. Research from the University of Guelph suggests that Canadian dairy farmers typically make facility upgrade decisions with a 5-7 year outlook. As many Canadian producers have told me, their milk price adjustments typically stay under 1% annually, based on CDC historical data, so they can actually plan. That guaranteed 2.3% increase? That’s the predictability American farmers can only dream about.

The Hidden Entry Crisis: When Protection Becomes Exclusion

Alberta’s $5.8M Quota Barrier vs America’s $0—But ‘Free Market’ Killed 1,420 US Farms in 2024

But here’s something that doesn’t come up much at Dairy Farmers of Canada meetings—and it’s worth noting. Those quota values are running CA$24,000 per kilogram in Ontario, where it’s price-capped, according to the provincial marketing board. In Alberta? Try CA$58,000 per kilogram on the open exchange, based on Alberta Milk’s August 2025 reports.

So let me do the math for you. A modest 100-cow operation needs CA$2.4-5.8 million just for production rights. That’s before you buy a single cow or pour a single yard of concrete.

The provincial “new entrant” programs supposedly address this. Let me share what they actually offer, based on current program documents I’ve been reviewing:

  • Ontario’s NEQAP: 8 positions available annually for the entire province (and 2 of those are reserved for organic)
  • British Columbia’s GEP: They’re running an accelerated program, clearing a 20-year backlog at 8 entrants per year
  • Quebec: Similar story—limited slots, multi-year waiting lists according to Les Producteurs de lait du Québec

Farmers in BC’s program report waiting periods of 10-15 years, based on media reports and program documentation. Even then—and this is what really gets me—successful applicants often receive a quota for just 25-30 cows. That’s not exactly a path to economic viability when the provincial average is pushing 100 head.

What’s really telling is that the vast majority of Canadian dairy farms transfer within families, according to Statistics Canada’s agricultural census data. It’s becoming something you inherit rather than something you choose. Even the National Farmers Union, which generally supports supply management, admitted in their 2019 policy brief that these programs are “fundamentally inadequate and require major reforms.”

The True Cost to Consumers and Society

You know, Canadian supply management costs consumers approximately CA$444 annually per household through higher retail prices, according to the Conference Board of Canada’s 2023 dairy sector analysis. That’s a direct, transparent wealth transfer totaling about CA$3 billion yearly, based on academic estimates from the University of Saskatchewan and Fraser Institute.

Critics hate it, but at least Canada’s honest about the cost. You’re paying more for milk, and that money goes directly to keeping farmers in business. No hidden subsidies, no complex government programs—just straightforward consumer-to-farmer transfer.

Part II: The American System—Freedom to Fail

Open Access, Constant Crisis

Now, the U.S. system—no quota barriers at all. Got capital? You can start milking tomorrow. But that theoretical openness… well, let me share some numbers from USDA’s National Agricultural Statistics Service that paint a different picture:

  • 2024 farm closures: 1,420 operations lost (that’s a 5% annual decline)
  • Wisconsin alone: 400 dairy farms gone, according to Wisconsin DATCP license data
  • Five-year total: Nearly 10,000 farms have disappeared since 2019
  • Chapter 12 bankruptcies: Up 55% in 2024, based on Federal Reserve agricultural finance data

As Tonya Van Slyke from the Northeast Dairy Producers Association put it in a recent interview: “Dairy farmers are price takers. The Federal Milk Market Order controls what producers get paid for their milk.”

Think about that for a minute. You can have the best somatic cell count in the county, run your repro program perfectly, and manage your transition cows like a textbook operation. But if Class III crashes because there’s too much cheese in cold storage? Well, you’re taking that hit.

I know Wisconsin producers who literally check CME cheese prices on their phones during morning milking, wondering if next month brings another crash. That’s not business planning—that’s survival mode.

The DMC Illusion: Why Safety Nets Have Holes

The Dairy Margin Coverage program—that’s supposed to be America’s safety net, right? Here’s what’s interesting: it hasn’t triggered a payment in 17 months as of October 2025, even though I know plenty of farmers facing severe financial stress.

The formula, as described in FSA’s calculation methodology, considers only corn, soybean meal, and premium alfalfa hay. Labor costs going through the roof? Fuel prices? Is California requiring new environmental compliance equipment? DMC doesn’t see any of that.

What really gets me is what’s happening with succession planning. Agricultural transition consultants report that farm kids who love agriculture, grew up showing at county fairs, have all the skills—they’re going to college and choosing ag lending or veterinary medicine instead of coming home. Why? Because they watched their parents stressed about milk prices for 20 years and thought, “I’m not putting my kids through that.”

The Structural Failure of American Cooperatives: DFA’s Transformation

Here’s where the American system reveals its most fundamental flaw—and this is something we need to talk about more openly. It’s the structural failure of the cooperative model when cooperatives become processors.

The transformation of Dairy Farmers of America illustrates exactly how the system breaks when a cooperative’s business interests as a processor diverge from its members’ interests as farmers.

In May 2020, DFA acquires 44 Dean Foods processing plants for $433 million out of bankruptcy, according to U.S. Bankruptcy Court filings. Overnight, they become both the nation’s largest milk supplier and processor. This created what multiple class-action lawsuits filed in Vermont and other states describe as an “inherent conflict of interest.”

Think about the structural contradiction here. As a cooperative, DFA theoretically exists to maximize returns to farmer-members. But as a processor, DFA profits from buying milk as cheaply as possible. The cooperative’s processing division literally benefits from the same low prices that destroy its members’ operations.

The numbers from the Vermont lawsuit reveal the scope of this structural failure. Before acquiring Dean’s plants, DFA sold over 50% of its members’ milk to third-party processors. By 2021, according to court documents, they were selling 66% of their shares to themselves. When milk prices crashed 30-40% in 2023—and USDA data confirms approximately a 35% decline—DFA’s processing plants captured margin expansion while member farmers absorbed losses.

And here’s what I think is crucial to understand: this isn’t a management failure or the work of bad actors. It’s a fundamental structural flaw. Once a cooperative owns processing assets, its economic incentives become adversarial to its own members. The business model that should protect farmers becomes the mechanism for extracting value from them.

I’ve talked to DFA members who understand this perfectly. They need market access, but their own cooperative has structurally transformed into their competitor. The organization collecting their dues and claiming to represent them profits when they suffer. That’s not a cooperative anymore—it’s a vertically integrated processor with a cooperative facade.

Regional Variations: Scale Doesn’t Save You

You know, this isn’t just a Wisconsin-Pennsylvania story. Down in the Texas Panhandle, where operations are milking 3,000-cow herds, the economics look different, but the fundamental problems persist.

Large-scale operators in that region tell me they’ve got scale, efficiency, and cost per hundredweight that beats almost anyone. But when milk prices drop below $15? Even they bleed. The only difference is that they can bleed longer than the 200-cow farm.

Looking west to California and Idaho, where some operations are milking 10,000-plus cows, these mega-dairies have negotiating power that smaller farms lack. But one Idaho producer managing 8,500 cows told me at the Western States Dairy Expo, “We’ve got economies of scale everyone talks about, but our regulatory compliance budget alone would operate five Wisconsin farms.”

And down in Arizona and New Mexico? The water rights battles are getting brutal. One New Mexico producer with 4,200 cows shared something that stuck with me: “We’re efficient as hell on paper—lowest cost per hundredweight in the nation some months. But what happens when water allocations are cut by 30% and hay prices double because everyone’s irrigation is restricted? Those efficiency numbers don’t mean much.”

Texas A&M agricultural economists have documented what happens when a 5,000-cow dairy goes under—millions in economic impact rippling through rural communities. The big operations might survive longer, but volatility eventually gets everyone.

Hidden Subsidies: The “Free Market” Myth

Here’s something we don’t talk about enough. American dairy receives billions in government support, but we just call it something else. Based on USDA Economic Research Service data:

  • Dairy Margin Coverage payments: $2.7 billion net from 2019 to 2024
  • Federal Milk Marketing Order price supports (harder to calculate, but substantial)
  • Export promotion programs through the Dairy Export Council
  • Regular disaster assistance and emergency payments
  • Subsidized crop insurance that reduces feed costs

We call these “risk management tools” rather than “subsidies.” Lets politicians claim they support “free markets” while channeling taxpayer money to agriculture.

The difference from Canada? Well, Canadian intervention actually achieves its stated goals—stable farm numbers, farmer income security, and functioning rural communities. American intervention? We keep losing farms despite billions in support. Makes you wonder who these programs really benefit.

MetricCanadian Supply ManagementU.S. ‘Free Market’
Farm Exits (Annual)100-150 (1-2%)1,420 (5%)
Entry Cost (100 cows)CA$2.4-5.8M quota + operations$800K-1.2M operations only
Price Volatility<1% annual variation30-40% swings possible
Planning Horizon5-7 years typical90 days common
Consumer CostCA$444/household/year premiumHidden via taxes/programs
New Entrants/Year50-80 nationally (limited slots)Unlimited (but unsupported)
Price Trend 2024-26+2.3% guaranteed increase-11.44% decline (volatile)
Government SupportTransparent consumer transfer$2.7B hidden subsidies (DMC)
Farm StabilityPredictable, stable incomeSurvival mode, constant crisis
Succession Rate88% family transferFarm kids choose other careers
2044 Projection~8,500 farms (stable)<10,000 farms (-60%)

Part III: Finding Common Ground—Lessons from Both Systems

What Actually Works: Three Leverage Points

Stop Begging Cooperatives for Pennies. $10/Gallon Direct Sales = 400-600% Premium in 28 States

Through all this research and talking with farmers across North America, I’m seeing three genuine leverage points for producers seeking stability without Canada’s entry barriers:

1. Direct-to-Consumer Sales Twenty-eight states now allow raw milk sales in some form, according to the Farm-to-Consumer Legal Defense Fund’s 2025 tracking. Producers engaging in direct sales report getting $8-12 per gallon—that’s a 400-600% premium over conventional farmgate prices. As many Pennsylvania producers have told me, moving 20% of production to direct sales changes the entire negotiation dynamic with cooperatives.

2. State-Level Political Organization Vermont Senator Peter Welch chairs the Senate Agriculture subcommittee specifically because dairy farmers in his state vote as a coordinated bloc. With only 300-400 dairy farms, Vermont shows what’s possible when farmers organize strategically. If Pennsylvania’s 6,130 dairy farms voted together on dairy issues, they’d own rural policy in that state.

3. Forward Contracting and Risk Management University of Wisconsin-Extension research on risk management consistently shows farms using comprehensive tools—forward contracts, futures hedging, options strategies—achieve significantly more stable margins. Yet adoption remains minimal because, honestly, when you’re checking milk prices daily just hoping to survive the month, learning about put options feels pretty theoretical.

Vermont’s Failed Organizing Attempt: The Missing Legal Framework

Back in the early 2000s, Vermont dairy farmers tried something interesting, as documented in agricultural organizing literature. The Dairy Farmers Working Together movement organized roughly 300 producers, representing about a third of Vermont’s milk production, according to Vermont Extension’s historical accounts. They thought that if they had enough milk, the co-ops would have to negotiate.

But here’s what happened—they just got ignored. No legal framework forced processors to negotiate. The movement collapsed within two years. It showed that a voluntary organization without legal teeth doesn’t work against concentrated processor power.

Learning from New Zealand: A Third Way?

Looking at international models, something is interesting happening in New Zealand. Fonterra—their massive cooperative that handles about 80% of NZ milk according to their 2024 annual report—provides forecast milk prices 18 months out without any quota system.

Their August 2025 forecast came in at NZ$10.15 per kilogram of milk solids (roughly US$21 per hundredweight), with a range of $10.10-10.20. That’s a 1% variance window. No quota to buy, no barriers to entry, just coordinated supply forecasting and transparent pricing.

The Kiwi approach demonstrates you don’t need government protection if you have collective discipline and transparent communication.

Quick Comparison: System Outcomes

MetricCanadian Supply ManagementU.S. “Free Market”
Farm Exits (Annual)~100-150 (1-2%)1,420 (5%)
Entry Cost (100 cows)CA$2.4-5.8M quota + operations$800K-1.2M operations only
Price Volatility<1% annual variation30-40% swings possible
Planning Horizon5-7 years typical90 days common
Consumer CostCA$444/household/year premiumHidden via taxes/programs
New Entrants/Year50-80 nationallyUnlimited (but unsupported)

The Projected Timeline: Where This All Leads

By 2044, America Will Have Fewer Dairies Than Canada—Despite 10x the Population

If current trends continue—and there’s no reason to think they won’t—here’s what we’re looking at:

U.S. Dairy Farm Projections (5% annual attrition from USDA data):

  • 2025: 24,811 farms (current)
  • 2030: ~18,000 farms
  • 2035: ~13,000 farms
  • 2040: ~10,500 farms
  • 2044: <10,000 farms

Canadian Projections:

  • Maintaining 8,000-9,000 farms through 2040
  • But increasing concentration as new entrants can’t access
  • Average herd size is climbing steadily
  • Small operations selling quota to larger neighbors

Both trajectories lead to the same place—just at different speeds and with different pain levels along the way.

Key Takeaways for Dairy Farmers

Based on everything I’ve learned researching this piece, here’s what I think farmers need to consider:

For Canadian Farmers:

  • Defend supply management hard—that 2.3% guaranteed increase is stability American farmers would kill for
  • Push for real new entrant reforms—8 positions annually won’t sustain your industry long-term
  • Consider quota leasing models instead of ownership—maintains stability without the CA$2.4 million entry barrier
  • Watch the generational transfer issue—if young farmers can’t enter, the system eventually collapses from within
  • Prepare for continued trade pressure—international partners aren’t giving up on challenging the system

For American Farmers:

  • Stop waiting for markets to fix themselves—1,420 farms closing annually proves they won’t
  • Organize politically at the state levels—300-400 farms can swing rural elections if you vote together
  • Explore direct sales aggressively—it’s your only real leverage against processor dominance
  • Demand actual DMC reform—the current formula, ignoring labor, fuel, and equipment costs, is insulting
  • Consider regional cooperative alternatives to vertically integrated giants—smaller can mean more accountable
  • Study Quebec’s political discipline—they didn’t ask nicely, they demanded protection and got it

For Both:

  • Accept that all dairy is subsidized—fight about subsidy effectiveness, not existence
  • Address succession planning now—both systems struggle with generational transfer
  • Build political coalitions beyond ag—rural community survival depends on viable farms
  • Learn from international models—New Zealand, EU systems offer valuable lessons

The Bottom Line: Learning from Both Models

What I’ve come to realize is that neither system offers a perfect solution. Canada protects existing farmers brilliantly, but basically locks out newcomers through those quota costs. America keeps the door open but provides zero meaningful protection against volatility that’s destroying multi-generational operations.

There’s potentially a “third way” that combines the best of both—cost-of-production pricing principles from Canada with leased production rights instead of owned quota, maintaining American accessibility while providing stability through collective bargaining frameworks. Something that would include transparent cost-of-production pricing that captures all real expenses (not just three feed ingredients), leased production rights to avoid multi-million-dollar barriers, democratic farmer governance through marketing boards with actual legal authority, market upside participation so farmers benefit from rallies, and real new-entrant programs offering viable scale, not token positions.

Looking at that October 30 CDC announcement giving Canadian farmers a guaranteed increase while American producers face continued uncertainty—it’s not just about prices. It’s showing us that dairy policy is a choice. Both countries are making choices, and increasingly, farmers in both systems are questioning whether those choices actually serve their interests.

That Wisconsin farmer’s observation keeps echoing in my mind: “We keep being told markets will sort it out. But after losing 400 farms in our state last year, I’m starting to wonder if the market’s solution is just to sort us out of business.”

The systems are different, the challenges are real, but the goal should be the same: dairy farms that can survive, thrive, and transfer to the next generation. Right now, neither country has fully figured that out. But understanding what works and what doesn’t in both systems? That’s the first step toward finding something better.

And maybe—just maybe—if we stop defending our respective systems long enough to learn from each other, we might find that third way that actually keeps farmers farming for generations to come.

Learn More:

  • Dairy Farm Succession Planning – Critical Conversations for a Smooth Transition – This article provides a tactical roadmap for navigating the complex family and financial conversations essential for a successful farm transition, helping ensure the operation’s legacy and long-term viability—a critical issue raised in the main analysis.
  • Navigating the Waters: Key Global Dairy Market Trends for 2025 – This analysis delivers strategic insights into the global economic and consumer trends shaping North American milk prices. It provides essential context for understanding market volatility and making informed, long-range business decisions beyond domestic policy debates.
  • The ROI of Robotics: A Producer’s Guide to Dairy Automation – This guide offers a data-driven framework for evaluating the return on investment of dairy automation. It demonstrates how robotics can directly combat rising labor costs and improve operational efficiency, offering a practical solution to the economic pressures detailed above.

Seven Sellers, No Buyers: The Dairy Market Signal Every Producer Must Understand Now

I’ve tracked dairy markets for 30 years. Today scared me. Not because prices fell—because buyers completely disappeared.

EXECUTIVE SUMMARY: Seven sellers, zero buyers—this morning’s milk powder market freeze signals something unprecedented: not a cycle, but permanent structural change. Every major dairy region is expanding while demand evaporates, heifer shortages lock in oversupply for three years, and processors just invested $11 billion betting on a future without most current farms. Your debt-to-asset ratio determines survival: under 45% should acquire distressed neighbors; 45-60% must cut costs by 15% and find partners; and over 60% need to exit now while equity remains. The window is 90 days, not the year most assume. This isn’t temporary pain—it’s the largest dairy restructuring in modern history, and your response today determines whether you exist in 2030.

Dairy Profitability Strategy

You know, I’ve been watching dairy markets for a long time, and what happened on the Chicago Mercantile Exchange this morning still has me shaking my head. Seven sellers showed up with nonfat dry milk priced at $1.14 per pound. Not a single buyer stepped forward.

Not one.

Here’s what’s interesting—in thirty years of tracking these markets, I’ve never seen anything quite like it. This isn’t just about powder prices being weak, which we’ve all lived through before. What we’re looking at is something deeper. For an industry built on the assumption that markets always clear, we just watched a market refuse to function. And if you’re milking cows anywhere in North America right now, that silence from the trading floor should be telling you something important about what’s coming.

Mark Stephenson, at the University of Wisconsin’s Center for Dairy Profitability, has been modeling these markets since the 1980s. When we talked yesterday, he said something that really stuck with me: “This is more like a structural market shift than the typical cycles we’re used to riding out.” Coming from someone who’s advised USDA on pricing policy for decades, that’s… well, that’s worth paying attention to.

Four Forces Creating Something We Haven’t Seen Before

Let me walk you through what’s actually happening out there. It’s the combination that’s unprecedented, not any single factor.

Everyone’s Making More Milk at the Same Time

Breaking the Pattern: For the first time in modern dairy history, every major milk-exporting region is expanding production simultaneously. Argentina’s explosive 9.9% growth leads the synchronized surge that’s flooding global markets while buyer demand evaporates—a structural shift that changes everything farmers thought they knew about supply cycles.

So the latest USDA National Agricultural Statistics Service report shows U.S. milk production jumped 3.3% year-over-year in August—we’re talking 18.8 billion pounds across the 24 major states. We’ve added 172,000 cows to the national herd. Production per cow averaged 2,068 pounds, which is 28 pounds above last August.

Now, normally, when we expand, somebody else contracts. That’s been the pattern, right? But here’s what caught my attention: New Zealand’s September milk collection hit 2.67 million tonnes, up 2.5%, with milk solids jumping 3.4% year-over-year. The Dairy Companies Association of New Zealand tracks all this. Argentina’s production? Their Ministry of Agriculture reports it rose 9.9% in September. The Netherlands is up 6.7% according to ZuivelNL. Europe’s August production across major exporters increased by 3.1%, according to the European Milk Board.

RaboBank’s latest global dairy quarterly—and they’ve been tracking this for decades—points out something we haven’t seen before: synchronized global expansion. In past cycles, when the U.S. expanded, Europe generally contracted. When New Zealand surged, Argentina pulled back. That regional offset gave us a natural market balance. But everyone is expanding together? That’s new territory.

And it’s not just weather luck either. Ireland’s dealing with one of their wettest autumns in years, according to Met Éireann, yet they’re still producing above year-ago levels. Australia’s coming off drought, expecting La Niña rains, and they’re expanding. Even producers in the Southeast U.S.—where heat stress usually limits summer production—are reporting gains. Everyone’s betting on the same hand, which… well, you know how that usually works out.

The Heifer Problem Nobody Wants to Talk About

According to the USDA’s January 2025 Cattle inventory report, we’re sitting at 3.914 million dairy heifers—that’s 500 pounds and over, ready to enter the milking string. Lowest since 1978.

Let that sink in for a minute.

What’s fascinating is how we got here. The National Association of Animal Breeders’ data shows beef semen sales to dairy farms reached 7.9 million units in 2023—that’s 31% of all semen sales to dairy farmers. CattleFax, which tracks these crossbred markets pretty closely, estimates we went from just 50,000 beef-dairy crossbred calves in 2014 to 3.22 million in 2024.

I get it—when Holstein bull calves are bringing $50 to $150 at local auctions and crossbreds are fetching $800 to $1,000, the math’s pretty simple. But here’s the kicker: even if milk hits $25 per hundredweight tomorrow, University of Wisconsin dairy management specialists show meaningful herd expansion now takes a minimum of three years. The old supply response mechanism that we all grew up with? It’s broken.

What I’ve found, talking to producers across Wisconsin and the Pacific Northwest, is that they’ve been breeding for beef for three, four years now. Even if they wanted to expand, where are the heifers coming from? And at what price? Local sale barns that used to have dozens of springing heifers might have three or four. Maybe.

Processors Are Betting Big While Farmers Bleed

The Industry’s Biggest Gamble: Processors wagered $11 billion on surging milk supply just as the heifer pipeline collapsed to 1978 levels. This chart shows why Mark Stephenson calls it “structural change”—the replacement heifers needed to fill those new plants won’t exist until 2028, and by then, thousands of farms will have already made irreversible exit decisions

This one really gets me. While we’re looking at Class IV at $13.75, against production costs, 2025 benchmarking data for Northeastern operations puts around $14.50 per hundredweight. The International Dairy Foods Association announced more than $11 billion flowing into 53 new or expanded dairy processing facilities across 19 states through 2028.

Michael Dykes, IDFA’s President and CEO, isn’t shy about it: “Investment follows demand. The scale of what’s happening is phenomenal.” Joe Doud, who was USDA’s Chief Economist under Secretary Perdue, goes even further—he calls this $10 billion investment surge unprecedented in U.S. agricultural history.

What’s happening here? These processors aren’t looking at October 2025 CME spot prices. They’re positioning for 2030 and beyond, based on the Food and Agriculture Organization’s 2024 Agricultural Outlook, which projects 1.8% annual global protein demand growth through 2034. Meanwhile, we’re trying to figure out how to make November’s feed payment.

You’ve got fairlife building a $650 million facility near Rochester, New York. Leprino Foods is constructing a $1 billion plant in Lubbock, Texas. They’re not stupid—they see something from their boardrooms that maybe we’re missing from the milk house.

China Changed the Game and Nobody Noticed

The Market That Vanished: China’s dairy strategy flip explains today’s seven-sellers-zero-buyers crisis. They’re not buying less dairy—they’re building domestic commodity powder plants while importing high-value cheese and specialized proteins. For U.S. farmers who built their businesses on Chinese powder demand, this isn’t a cycle—it’s permanent market restructuring.

U.S. Dairy Export Council data from May 2025 shows our nonfat dry milk exports to China are down nearly 80%. Low-protein whey? Down 70%. Through July, China’s General Administration of Customs reports total dairy imports reached 1.77 million tonnes—up 6% year-over-year but still 28% below the 2021 peak.

But here’s what I find really interesting when you dig into the trade data: they’re buying cheese—up 22.7%—and specialized ingredients like milk protein isolates while avoiding commodity powders. China’s shifting from volume to value, and we built all this powder capacity for demand that’s evaporating.

Texas A&M’s Agricultural Economics Department has been tracking this shift. Their analysis suggests that China’s building domestic capacity for elemental powders but is importing sophisticated products that its plants can’t make efficiently. It’s looking like a permanent shift, not a temporary one.

Understanding Your Real Options

Debt-to-Asset RatioYour RealityAction RequiredRevenue OpportunitiesTimelineEquity at StakeMonthly Impact (per 100 cows)
Under 45%Well-CapitalizedStrategic ExpansionForward contracts: $1.00-1.50/cwt premium
Acquire neighbors at 20-30% discount
90-120 days to lock contractsExpansion at favorable terms+$2,400 with premium contracts
45-60%Mid-Tier SqueezeCost Reduction + PartnersDairy Revenue Protection
15% cost cuts required
60 days to implement cutsSurvival: maintain current equity-$750 current bleeding
Over 60%DistressedStrategic Exit NOWExit while preserving equity30-60 days before options vanishProactive: 60-75% preserved
Forced: 40-45% preserved
-$1,500+ and accelerating

After talking with extension specialists and lenders across the country this week, what’s becoming clear is that waiting for “normal” isn’t a strategy anymore. The math doesn’t support it, and neither does the calendar.

Path 1: Strategic Expansion

For operations with debt-to-asset ratios below 45% and strong cash flow, this downturn presents acquisition opportunities. Farm Credit Services analysis shows distressed sales starting at 20-30% below replacement cost. But—and this is important—these deals require creativity.

What’s working, based on case studies from the University of Wisconsin’s Center for Dairy Profitability and Cornell’s PRO-DAIRY program, is seller-financed arrangements that preserve more equity for the seller than foreclosure would. You might offer 20% below market value, but with financing at reasonable rates over seven years, maybe include a management position. The seller preserves dignity and more equity, and you gain capacity at favorable terms.

This only works if you’ve got the balance sheet for it. Operations in this category can also negotiate forward supply commitments with processors building new capacity. We’re seeing premiums of $1.00 to $1.50 per hundredweight for multi-year contracts in some regions.

I’ve noticed that Southeast operations are particularly successful with this approach. One producer milking about 1,200 cows in Georgia just locked in a seven-year contract with a new processor at $1.35 over Class III. “Yeah, we might miss some price spikes,” they mentioned, “but I can budget, I can sleep at night, and I know I’ll still be here in 2030.”

Path 2: Find Your Niche

Penn State Extension has documented several successful transitions to organic production with on-farm processing. The numbers are tough initially—certification costs, learning curves, building customer bases. But producers who’ve made it through report premiums of $20 or more per hundredweight over conventional milk.

The catch? You need capital. Penn State’s business planning specialists say successful transitions require an upfront investment of $150,000 to $200,000 and 18 to 24 months to achieve positive cash flow. Plus, you need to be within a reasonable distance of affluent consumers.

Some Texas operations have gone a different route—100% grass-fed, certified by the American Grassfed Association, and selling direct to restaurants and farmers’ markets. It might be 40% of the previous volume, but at significantly higher prices. Feed bills drop dramatically—just hay in drought months.

In Minnesota, some mid-sized operations—we’re talking 400 to 500 cows—have locked in contracts with local cheese plants specializing in European-style aged cheeses. These plants need consistent butterfat over 4.0%, which Jersey and crossbred herds can deliver. The premium’s worth it.

What’s encouraging is that robotic milking systems are becoming viable for these mid-tier operations too. Michigan State University research shows that operations with 180-240 cows can justify two robots, especially when labor’s tight. The capital cost hurts—$150,000 to $200,000 per robot—but some producers are finding it lets them stay competitive without massive expansion.

Path 3: Strategic Exit

This is the hardest conversation, but it needs to be had. Farm Credit specialists and agricultural finance research consistently indicates that proactive sales generally preserve 60-75% of equity compared to 40-45% in forced liquidation scenarios.

What’s encouraging is that some larger neighbors need experienced managers and are offering employment as part of acquisition deals. You might sell your operation but stay on at $65,000 to $75,000 plus housing for two years. It’s not ideal, but it beats losing everything.

There’s also the generational transfer angle nobody likes discussing. If the next generation isn’t interested or capable, forcing succession can destroy both farm equity and family relationships. Sometimes the strategic exit is selling to a neighbor while you can still set terms, rather than leaving an impossible burden for your kids.

How Cooperatives Navigate Conflicting Interests

One thing that’s really striking me lately is how cooperative dynamics change during consolidation. That traditional one-member, one-vote structure assumes everyone’s interests align. But what happens when they don’t?

Most folks don’t realize how co-op equity actually works. Those capital retains—CoBank’s Knowledge Exchange program analysis puts them at $0.20 to $0.40 per hundredweight, typically—accumulate over decades. But here’s what nobody tells you: redemption timelines are stretching to 15-25 years as co-ops prioritize expansion over paying out equity.

Run the math with me. A 500-cow operation producing 11,000 pounds per cow monthly contributes roughly $118,800 annually in retained patronage at $0.30 per hundredweight average. Over 20 years, that’s $2.4 million accumulated. But with 2.5% annual inflation per Federal Reserve data, the real purchasing power of that equity drops nearly 40% over a 20-year redemption period.

Co-op board dynamics are shifting, too. The new plants being built require 4 million pounds per day. A 300-cow operation produces maybe 20,000 pounds. Operations with 5,000 cows? They’re producing 325,000. The voting structure might be democratic, but economic realities create different levels of influence.

Regional Realities: Where This Hits Hardest

Looking at how this plays out across different dairy regions, the impacts vary dramatically based on existing farm structure and local economics.

Wisconsin’s Challenge

Based on historical consolidation patterns analyzed by the University of Wisconsin-Madison’s Program on Agricultural Technology Studies, Wisconsin could see closure rates potentially affecting 30-40% of remaining operations over the next five years if current trends continue.

Wisconsin Agricultural Statistics Service data shows the average Wisconsin farm has 234 cows producing 24,883 pounds annually. They’re not inefficient—they’re just caught in scale economics that no longer work. Every service business in these rural towns depends on dairy. Lose the farms, and you lose the schools, the equipment dealers, the feed mills… everything that makes these communities work.

California’s Water-Driven Consolidation

Tulare County’s average herd size is already around 1,840 cows, according to California Department of Food and Agriculture data. Even here, consolidation continues. But it’s different—it’s about water more than milk prices.

Dr. Jennifer Heguy, who’s the UC Cooperative Extension Dairy Advisor for Merced, Stanislaus, and San Joaquin counties, points out that water rights are becoming more valuable than the dairy infrastructure itself. The implementation of the Sustainable Groundwater Management Act means that operations without secure water face impossible decisions. Farms are merging primarily to secure water portfolios—one farm with senior water rights can support three without.

Pennsylvania’s Plain Community Crisis

This situation is particularly complex. Lancaster County has about 1,480 dairy farms, averaging 65 cows each, most run by Amish and Mennonite families. Penn State Extension research indicates these smaller operations face severe economic pressure at current milk prices.

For Plain communities, the implications go way beyond economics. Farming isn’t just an occupation—it’s integral to their way of life and faith practice. When families can’t farm, they often have to relocate to areas with available land, which can mean leaving established communities entirely.

What Successful Producers Are Doing Right Now

CategoryValue ($/cwt or as noted)Implementation TimelineDifficulty Level
Class IV Milk Price (Oct 2025)$13.75 Current marketGiven
Production Cost (Northeastern avg)$14.50 Fixed costGiven
Current Loss per cwt($0.75)Immediate issueCrisis
REVENUE OPPORTUNITIES:
Forward Contract Premium+$1.00 to $1.5090-120 days to lockMedium – negotiation required
Carbon Credits (per cow/year)$400-450 total6-12 months to implementHigh – capital intensive
Component Premium (>3.3% protein)+$0.30 to $0.5030-60 days to optimizeLow – nutritionist consult
Dairy Margin Coverage ($9.50)Coverage variesImmediate enrollmentLow – paperwork only
POTENTIAL MONTHLY IMPACT (300 cows):
Base milk revenue (20,000 lbs/cow)$82,500 Baseline calculation
Forward contract bonus$6,000 If contracted by Jan 31
Carbon credits (monthly)$1,125 Annual avg, 6mo lag
Component premiums$1,800 Ration adjustment 60 days
DMC protection value$1,200 Policy dependent
Total potential monthly revenue$92,625 With all strategies
Current monthly cost$87,000 300 cow baseline
Net monthly margin (best case)$5,625 All strategies deployed
Net monthly margin (current)($4,500)No action taken

Here’s what’s actually working for farmers navigating this successfully—and I mean actually working, not theoretical strategies.

Financial scenario planning has become essential. Running spreadsheets with milk at $12, $14, $16 for the next 24 months shows you exactly when you hit critical triggers. As many producers are learning, hope isn’t a business plan.

The smart ones are approaching lenders proactively. If you know Class III staying below $16 through March means you’ll need to restructure, start that conversation now when you still have options. Waiting until February when you’re forced into it? That’s a different conversation entirely.

Carbon credits are becoming real money, too. Programs like those from Indigo Agriculture, implementing cover crops and manure management changes, can generate $400 to $450 per cow annually once fully implemented. On 600 cows, that’s $250,000—potentially the difference between surviving and not.

Don’t forget about Dairy Margin Coverage either. The program’s been recalibrated, and at current feed costs versus milk prices, even the $9.50 coverage level can provide meaningful protection. It’s not a complete solution, but combined with Dairy Revenue Protection for Class IV producers, it’s essential risk management.

Feed procurement matters enormously right now. With December corn at $4.28 per bushel on the Chicago Board of Trade, locking in winter needs makes sense. Nutritionists working with Pennsylvania dairies report clients who contracted 70% of their corn silage needs back in August are paying $10 to $12 less per ton than those buying now.

Component premiums deserve attention, too. At 3.3% protein or higher, most processors pay premiums of $0.30 to $0.50 per hundredweight, according to Federal Milk Market Administrator reports. Dr. Mike Hutjens, professor emeritus at the University of Illinois, has shown that reformulating rations to push protein might cost an extra $0.75 per cow per day but return $1.20 in premiums. That’s $165 net per cow annually.

The Most Expensive Calendar in Dairy: This 90-day window determines who’s still farming in 2030. Well-capitalized operations have until January 31 to lock premium contracts before processors fill their needs. Mid-tier farms need cost cuts implemented yesterday. And distressed operations? Every day past Day 60 costs 0.5% more equity. After 90 days, you’re not making decisions—your lender is.

Key Takeaways for Different Operations

Let me break this down by where you’re sitting financially, because your situation really does determine your options.

If you’re well-capitalized with a debt-to-asset ratio under 45%:

Now’s the time to move strategically. Forward contract with processors building new capacity. Those $1.00 to $1.50 per hundredweight premiums for five-year commitments can make a huge difference on cash flow. Consider geographic expansion across multiple sites rather than building massive single locations. Environmental permits, community relations, and disease risk all favor distributed operations under single management.

If you’re mid-tier with debt-to-asset between 45-60%:

You need immediate cost reduction—we’re talking 10-15%—to weather what’s coming. Dairy Revenue Protection isn’t optional anymore for Class IV producers. That coverage might cost $0.48 per hundredweight, but when you’re already losing $0.75, it’s survival insurance. Strategic partnerships might preserve independence better than going alone. Three 400-cow dairies sharing equipment, buying feed together, and negotiating milk premiums collectively have more leverage than individually.

If you’re stressed with a debt-to-asset ratio over 60%:

The hard truth? Make the difficult calls this week, not next month. Every week you wait, your equity erodes and options narrow. Agricultural financial counselors through Extension services or organizations like Farm Aid can help navigate this.

Looking Ahead: What This Industry Becomes

The seven NDM sellers facing zero buyers this morning wasn’t just a market anomaly. It was a signal that fundamental assumptions about dairy economics have shifted.

What’s becoming clear is that the industry emerging from this won’t look like the one we entered. It’ll be more concentrated, more integrated, more capital-intensive. That’s not a judgment—it’s just what the economics are driving toward.

Based on current trends and academic projections, we could see the U.S. dairy farm count drop significantly by 2030. The survivors won’t necessarily be the best farmers—they’ll be the ones who recognized structural change early and positioned accordingly. Some by expanding strategically, others by finding profitable niches, and yes, some by exiting while they still had equity to preserve.

I’ve been through several market cycles—’99, ’09, ’15. This feels different. Those were painful but temporary. This is structural—fundamental changes in how the industry organizes itself.

Your window for strategic decision-making? Based on what lenders are saying, it’s probably 90 to 120 days, not the year or more, most folks assume. Once you hit certain financial triggers—debt service coverage below 1.1, current ratio under 1.0—decisions start getting made for you rather than by you.

Understanding these dynamics—and more importantly, acting on them—will determine who’s still milking cows in 2030. We started today with seven sellers and zero buyers. That’s not the market failing. That’s the market telling us something important.

Question is, are we listening?

KEY TAKEAWAYS:

  • Market Breaking Point: October 31’s seven sellers/zero buyers at $1.14/lb wasn’t a bad day—it was the market refusing to function, signaling permanent structural change, not temporary correction
  • Your 90-Day Action Plan by Debt Level:
  • Under 45%: Acquire distressed neighbors at a 20-30% discount with seller financing
  • 45-60%: Cut costs 15%, add Dairy Revenue Protection, form strategic partnerships
  • Over 60%: Exit now, preserving 60-75% equity (vs 40% in forced liquidation)
  • Why This Time Is Different: Heifer inventory at 1978 lows means supply can’t adjust for 3+ years, while every major region expanded simultaneously—breaking the historic balance mechanism
  • Survival Revenue Streams: Forward contracts with new processors ($1.00-1.50/cwt premium), carbon credits ($400-450/cow/year), protein premiums ($165/cow/year), Dairy Margin Coverage at $9.50
  • The Bottom Line: This isn’t a cycle—it’s the largest restructuring in modern dairy history. Decisions you make by January 31, 2026, determine if you exist in 2030.

Complete references and supporting documentation are available upon request by contacting the editorial team at editor@thebullvine.com.

Learn More:

The Sunday Read Dairy Professionals Don’t Skip.

Every week, thousands of producers, breeders, and industry insiders open Bullvine Weekly for genetics insights, market shifts, and profit strategies they won’t find anywhere else. One email. Five minutes. Smarter decisions all week.
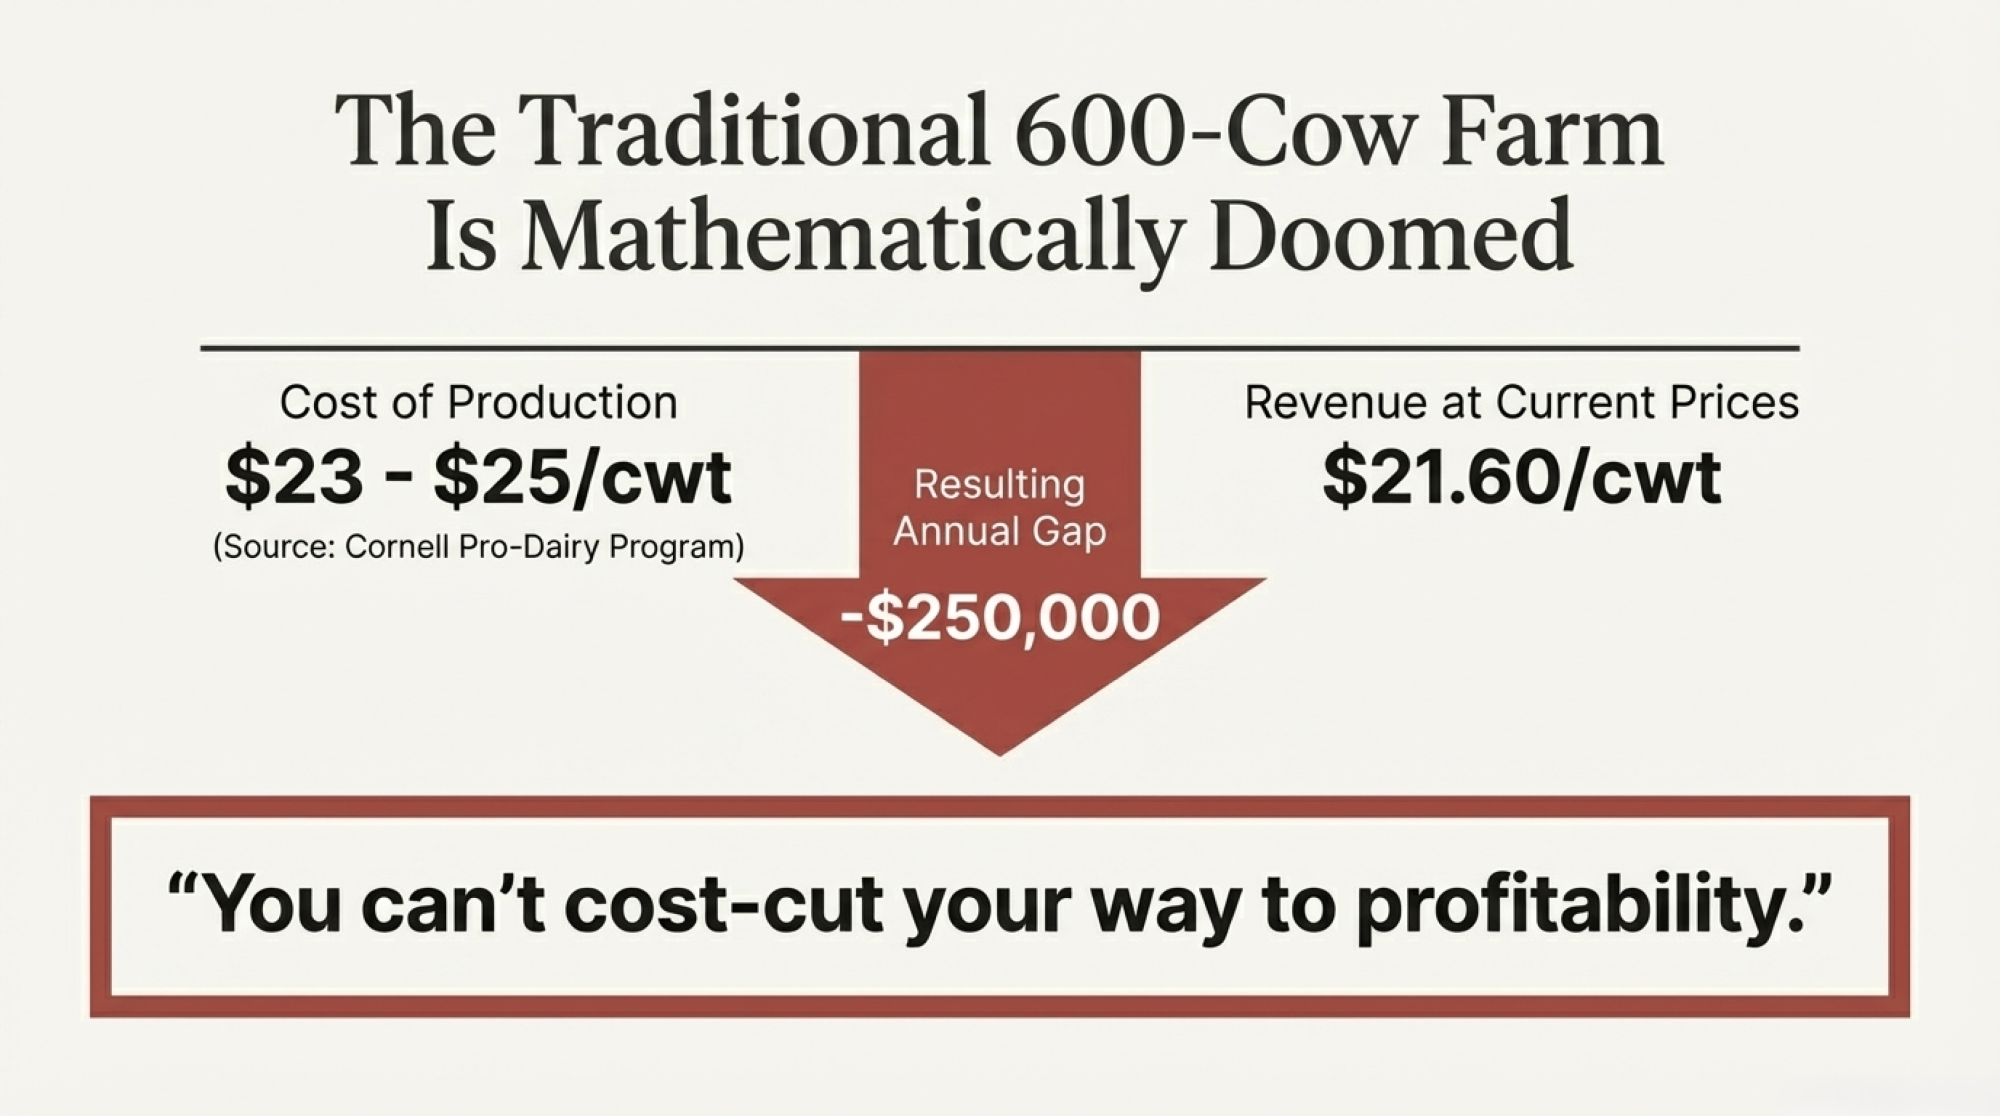
NewsSubscribe
First
Last
Consent

UK Dairy Crisis: How 600 Irish Farmers Reversed Price Cuts in 47 Days – Your November Action Plan

Processors posting record profits while you lose £18,700/month? 600 Irish farmers flipped that script in 47 days. Here’s how.

EXECUTIVE SUMMARY: UK dairy farmers are losing £18,700 monthly while processors celebrate record profits—Arla’s revenue up 12.8% to €7.45 billion, First Milk’s turnover jumping 20%. This devastating disconnect isn’t inevitable: 600 Irish farmers reversed identical cuts in just 47 days using WhatsApp coordination to force processor accountability. UK farmers have the same weapons—FDOM regulations carrying £30 million in penalty power, legal Producer Organizations, protected collective bargaining—yet only one formal complaint has been filed by 7,040 struggling operations. With November 15-30 retail deadlines approaching and winter feed contracts looming, the next 30 days determine whether UK dairy fights back or accepts managed decline. This investigation delivers the proven Irish blueprint, immediate survival strategies, and a practical timeline that works around milking schedules. The tools exist, the precedent is set, and the window is open—but not for long.”

As UK dairy farmers face devastating losses following coordinated processor price cuts, new coordination models and regulatory frameworks are creating unexpected leverage opportunities for producer-led market reform

You know, sitting here thinking about that Mitchelstown hotel scene on September 25, 2025… over 600 Irish dairy farmers, all organized through WhatsApp groups and online forms, showing up with written questions for Dairygold management. No protests, no milk dumping—just farmers demanding specific answers about pricing.

“They pulled this off in just 47 days from their first organizational message.”

I’ve been watching dairy markets long enough to recognize when something shifts fundamentally. And what did those Irish farmers figured out? Well, it offers real lessons for UK producers who are bleeding cash at rates that would’ve seemed impossible just a few years back—especially now with autumn calving in full swing and winter feed decisions looming.

Processors’ Profits Soar While UK Farms Bleed Cash

What October’s Numbers Tell Us

So let’s talk about what happened to milk checks this month—you’ve probably already compared notes with neighbors at the feed store. AHDB’s October pricing data shows remarkable synchronization: Müller down 1.25ppl, Arla and DMK down 1.75ppl, First Milk down 2ppl. And Parkham… that 8ppl reduction has Devon farmers wondering if they’ll make it to Christmas.

Not All Price Cuts Are Equal—Some Could End Herds

What’s really interesting here—and I’ve been hearing this at every discussion group lately—is the timing of these cuts. Arla had just announced H1 2025 results showing revenue up 12.8% to €7.45 billion, with EBITDA hitting €282 million according to their financial reports. That’s healthy cash generation by any measure. First Milk’s CEO, Shelagh Hancock, called it an “exceptional year,” with turnover jumping 20% to £570 million and operating profit reaching £20.5 million, according to their annual report.

“How does that square with the prices we’re seeing?”

The Production Story

Here’s what AHDB’s October data shows us: UK milk production running 7% ahead of last year, with year-to-date supplies up 455 million litres—that’s 6% growth nationwide. Processors are calling this an oversupply, and fair enough, there’s definitely more milk around.

But hang on… what created this surge in the first place? AHDB’s lead analyst, Susie Stannard, pointed out that we’ve had exceptional milk-to-feed price ratios through spring and early summer. When you’re getting those signals and butterfat differentials are strong, you optimize production—that’s just good management, right? Anyone managing transition cows during that period would’ve done the same.

CRITICAL NUMBERS RIGHT NOW:

  • Production costs: £49.2ppl (The Dairy Group’s September forecast)
  • Manufacturing milk: £36-38ppl
  • Monthly shortfall on 2 million litres: £18,700-22,400
  • UK herd: 1.60 million head (DEFRA’s July count), lowest ever recorded
  • Meanwhile, processor margins looking pretty healthy

Anyone managing dry cow transitions right now knows what those numbers mean for replacement heifer decisions this winter. It’s not just about cashflow—it’s about whether you can afford to keep breeding stock when you’re losing money on every litre.

Understanding Processor Pressures

Now, to be fair—and we should be fair here—processors aren’t operating in a vacuum. AHDB’s commodity reports show butter dropped £860/tonne between September and October, and cheese fell £310/tonne. Global Dairy Trade auctions have been consistently weak, and that’s real pressure.

Processor commercial teams make a valid point in industry forums: they’re caught between volatile commodity markets and fixed retail contracts. When cheese swings £1,000/tonne in six weeks, that’s genuinely challenging. Though it’s worth noting… retail prices haven’t budged from that 72-73ppl range while farmgate prices take the hit.

“We all know what happens when butterfat levels shift in October—processors adjust quickly downward, slowly upward”

The Irish Farmers’ Playbook

What those Dairygold farmers did was genuinely clever. They didn’t start with confrontation—they started with curiosity.

Phase One: Just Compare Notes

It began simply enough, really. Farmers are creating WhatsApp groups, asking neighbors to share milk statements. Not demanding action, just comparing notes. As one North Cork producer with about 180 cows put it: “We just wanted to see if everyone was getting the same treatment.”

Two weeks later: Over 40 farms had shared data. Same patterns everywhere. Kind of like when we all discovered somatic cell count penalties were hitting everyone the same week… that’s when individual struggles became a collective realization.

The Smart Bit: Conditional Commitment

Here’s where it gets interesting. Instead of asking farmers to commit outright, organizers created an online form: “If 200+ farmers commit to attending a meeting with written questions for Dairygold, would you participate?”

See the psychology there? You’re only in if enough others are in. No risk of being the lone troublemaker—we’ve all seen what happens to those folks. The form hit 400 commitments within 14 days. Once farmers saw those numbers climb in real time… well, momentum builds momentum, doesn’t it?

“People feel safe moving when they see a critical mass forming.”

Making It Real

The organizers ran three regional meetings before the main event. Groups of 50-75 farmers, local hotels, and marts—places we all know. As one participant managing 220 cows observed: “Seeing neighbors from the discussion group there in person—that made it real. We weren’t just names on a phone screen anymore.”

When 600+ farmers showed up at Mitchelstown with identical written questions, Dairygold faced something unprecedented. This represented nearly 40% of their regional supplier base, all coordinated, all focused. And unlike the old days of protests, these were specific operational questions about pricing formulas—the kind processors can’t dismiss as “emotional responses.”

The UK’s New Tools—If We Use Them

Leverage Unused: £30 Million Penalty Power, Just One Complaint

Here’s something many UK farmers don’t yet realize: the Fair Dealing Obligations Regulations, which went live on July 9, 2025, have real teeth. We’re talking transparent pricing requirements, adequate notice periods, and—this is key—Agricultural Supply Chain Adjudicator fines up to 1% of processor turnover for violations. Section 12 of the regulations spells this out clearly.

“For Arla UK, that’s potentially £30 million in penalties based on their £3 billion UK revenue.”

Yet Parliamentary records from September 14 show ASCA had received exactly one formal complaint. One. From an industry with 7,040 dairy operations according to DEFRA’s latest count. We’re not using the tools we have.

Producer Organizations: The Untapped Resource

What’s fascinating—and honestly a bit frustrating if you ask me—is that UK farmers have had the legal framework for Producer Organizations since we adopted EU Dairy Package elements. POs can collectively negotiate for up to 33% of national production without competition concerns. It’s right there in the Competition Act’s agricultural exemptions.

WHAT’S WORKING ELSEWHERE:

  • Bavaria: 137 POs negotiating for 5.8 billion kg annually
  • German POs: Represent 46% of national production
  • French regional POs: Actively manage supply-demand balance
  • Dutch POs: Secured cost-plus pricing guaranteeing break-even minimums

We have the same legal tools. We just haven’t organized to use them yet. Even smaller operations—those milking 60-100 cows—can benefit from this collective approach. Channel Islands producers face unique challenges with their processor relationships, but the principles still apply.

TO START A PRODUCER ORGANIZATION: Contact Rural Payments Agency at po.scheme@rpa.gov.uk. Visit www.gov.uk/guidance/producer-organisations

Bridge Strategies That Actually Work

Let’s get practical here. If you’re losing £18,700 monthly—and many of us are—waiting for long-term reform won’t save the farm. You need strategies that work right now, especially as winter housing costs approach and fresh cow management comes into play.

Working With Your Bank

Remember the March 2025 SFI cashflow crisis? NFU worked with major lenders—NatWest, Barclays Agriculture, HSBC, and Lloyds—to establish emergency protocols. Banks recognized that temporary market problems are different from fundamental business failures.

“Banks are approving £15,000-£40,000 working capital increases at 6-8% interest, not the 12-15% distressed rates”

What financial advisors working with affected farms are seeing is interesting: when you approach as part of an organized group with documented FDOM concerns, banks view you differently. That’s based on actual experiences from farms going through this since October. Makes sense, really—collective action shows you’re addressing the problem, not just hoping it goes away.

Rethinking Production During Losses

This might sound counterintuitive—especially if you’re managing good butterfat levels right now—but hear me out. When you’re producing at 38ppl against costs of 49.2ppl, every litre loses 11.2 pence.

I spoke with a Cumbria producer recently who strategically reduced his 280-cow herd by 15%. Here’s how it worked out:

  • Sold 42 cows: £68,000 income at current strong beef prices
  • Cut feed bill: £4,000 monthly reduction
  • Milk check dropped: £11,000
  • Net result: £7,000 better off monthly

And with fewer cows, his transition management got easier—lower somatic cell counts, better fresh cow performance on the remaining herd. Sometimes less really is more.

“Imagine if 200-300 farms did this together, cutting 10-15% production.”

Industry modeling suggests even a 5% production drop could shift pricing dynamics within 60 days. Makes you think about supply and demand differently…

Retail Contracts—But Move Fast

CRITICAL NOVEMBER DEADLINES:

November 15-30: Applications close for:

  • Tesco Sustainable Dairy Group
  • Sainsbury’s Development Group
  • Premium: 4-5ppl (£80,000-£100,000 annually on typical volumes)

Here’s what I’ve noticed: when multiple farms from the same processor apply simultaneously to retail programs, it creates real urgency at the processor level. They know losing clusters of suppliers breaks regional collection efficiency. And if you’re already meeting the welfare standards—which most of us are—it’s mainly paperwork at this point.

Your 30-Day Action Framework

If you’re thinking about coordinating with neighbors, here’s a practical timeline that works around autumn workload:

Week 1 (Oct 31-Nov 6): Information Gathering

Start a WhatsApp group with 15-20 neighbors. Share October statements—no commitments, just comparing notes. Create a simple spreadsheet. Do this while you’re waiting at the parlor—no special meetings needed.

Week 2 (Nov 7-13): Building Momentum

If patterns emerge—and they probably will—create a conditional commitment form: “If 200+ farmers commit to filing FDOM complaints together, would you participate?” Share through existing networks. Time this around milk recording days when you’re already seeing neighbors.

Week 3 (Nov 14-20): Face-to-Face

At 150+ commitments, organize regional meetings. Present the patterns. Let farmers see they’re not alone. Schedule before November 20 to maintain momentum toward retail deadlines. Pick times that work around milking—early afternoon usually works for most operations.

Week 4 (Nov 21-27): Coordinated Action

File FDOM complaints documenting violations. Approach banks collectively. Contact MPs with constituent concerns. Create visibility that demands a response. This timing hits before parliamentary recess and Q1 processor planning.

“The Irish proved you can organize 600 farms in 47 days without traditional structures.”

Learning From What Works Elsewhere

Long-term stability means looking at successful international approaches, especially for those planning succession or major capital investments.

Cost-of-Production Models

Scottish Government research from 2019 on European dairy contracts found that countries using mandatory cost-of-production references have lower farm exit rates. Makes sense when you think about it—you can’t sustain losses indefinitely.

The Dutch approach is particularly clever. Their cost-plus contracts set base prices at independently calculated production costs plus commodity-linked margins. When markets tank, margins compress, but farmers don’t produce at losses. FrieslandCampina’s documentation shows how this shares volatility more fairly across the supply chain.

Price Transmission Patterns

You know what agricultural economics research keeps finding? When commodity prices rise, farmgate increases lag by 8-12 weeks and capture maybe 60-70% of the gain. When commodities fall? Farmgate drops within 2-4 weeks, absorbing 95-110% of the decline.

October illustrated this perfectly, according to AHDB data:

  • Butter down £860/tonne
  • Farmgate prices are crashing 10-20%
  • Retail milk still 72-73ppl, same as August

“Someone’s capturing that value, and it’s not us or consumers.”

Meanwhile, we’re all adjusting rations to maintain butterfat with expensive feeds, managing transition cows through volatile pricing… it’s exhausting, frankly.

Where This Leaves Us

Looking at everything that’s happened, a few things are becoming clear:

The dynamics have shifted. When processors post strong financial results while cutting farmgate prices, it creates political vulnerability. The evidence is documented, undeniable. That gives us leverage that previous generations didn’t have.

Digital tools solve old problems. WhatsApp and other online platforms address the collective-action challenges that killed previous attempts. Even farmers managing 60 cows with limited time can participate. You don’t need to be a big operation to be part of this.

Legal frameworks exist—if we use them. FDOM creates real penalty exposure. But it requires formal complaints to activate. We can’t just complain at the pub—we need to document and file.

Bridge strategies can buy time. Between emergency financing, strategic production adjustments, and retail applications, you can stabilize cash flow for the crucial 60-90-day period. But timing matters here.

“We accepted what we were given for 20 years, thought we had no choice. Took 47 days to prove ourselves wrong,” – One of the Dairygold farmers

October 2025 has created a window. Processors have shown their hand—cutting prices while posting strong profits. The regulatory framework exists. Coordination tools are proven. Political climate’s shifting.

Question is: will enough UK farmers act in the next 30 days to force change? Or will we be having this same conversation in 2027, with another thousand farms gone and processors even more consolidated?

The Irish farmers showed what’s possible. The path is there. What happens next… well, that’s on us. Whether you’re milking 60 cows or 600, managing robots or a herringbone, dealing with spring block or year-round calving, the economics hit everyone the same.

Planning for the December follow-up will be crucial to track how coordination efforts unfold, but first, we need to get through November.

THE WINDOW IS CLOSING:

  • November 15-30: Retail contract deadlines
  • December: Parliamentary recess
  • Winter feed contracts need signing
  • Act now or wait until spring 2026

KEY TAKEAWAYS:

  • You’re losing £18,700/month while processors profit – Arla revenue up 12.8% to €7.45bn
  • 600 Irish farmers fixed this in 47 days – WhatsApp coordination forced processor accountability
  • The UK has unused weapons: FDOM regulations (£30M penalty power) + Producer Organizations – only one complaint from 7,040 farms
  • November 15-30 deadline approaching – retail contracts, parliament recess, then nothing until spring

Complete references and supporting documentation are available upon request by contacting the editorial team at editor@thebullvine.com.

Learn More:

The Sunday Read Dairy Professionals Don’t Skip.

Every week, thousands of producers, breeders, and industry insiders open Bullvine Weekly for genetics insights, market shifts, and profit strategies they won’t find anywhere else. One email. Five minutes. Smarter decisions all week.
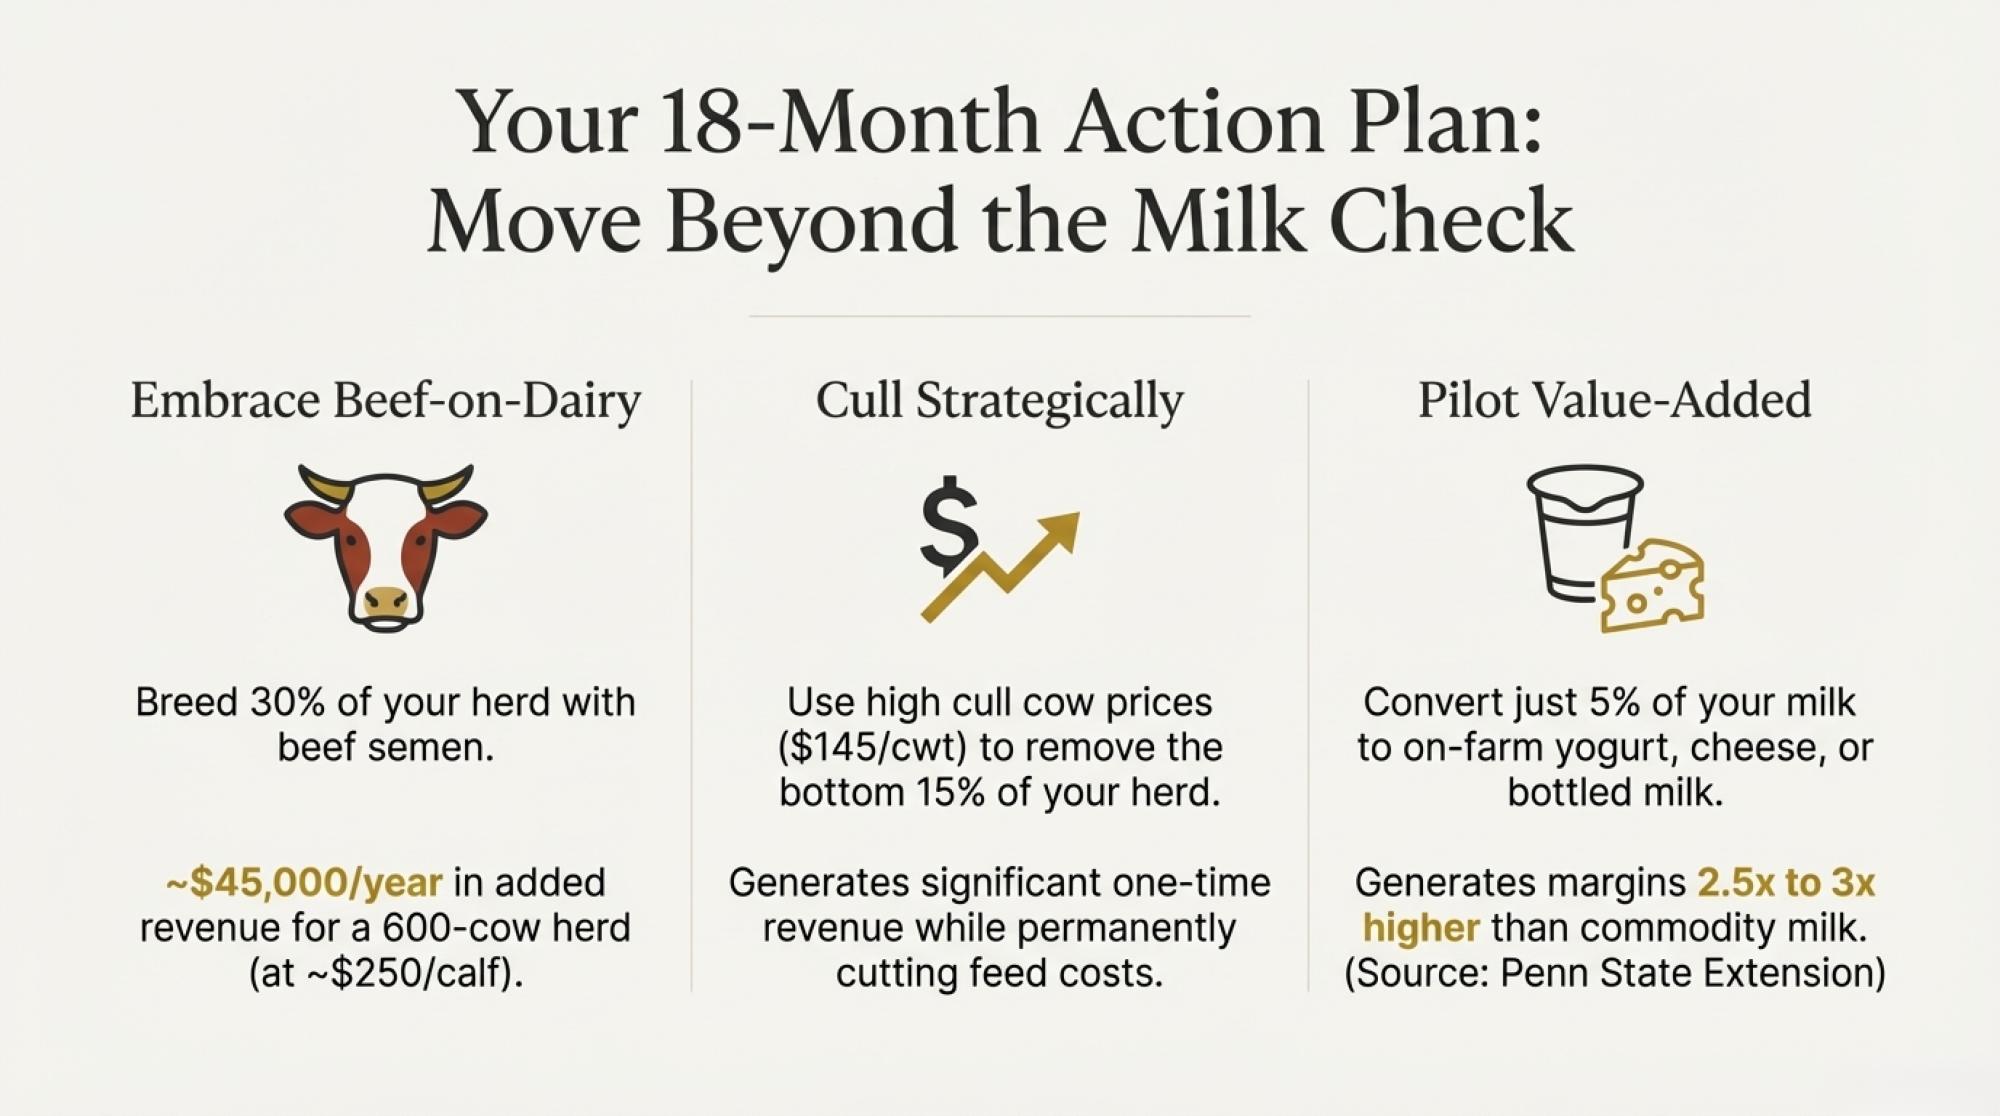
NewsSubscribe
First
Last
Consent

The $11 Billion Dairy Rush: Your 18-Month Window to Lock in Processor Premiums

Processors building 50 new plants need YOUR milk—but only if you move in the next 18 months. After that, you’re just another supplier.

EXECUTIVE SUMMARY: The U.S. dairy industry is betting $11 billion on 50 new processing plants that need milk from 100,000 cows that don’t exist yet—creating a massive opportunity for positioned farms. Operations within 75 miles of new facilities are already locking in $1.50/cwt premiums worth $150,000+ annually for a 500-cow dairy. But geography isn’t everything: farms anywhere can capture premiums by moving protein from today’s 3.2% average to the 3.3%+ processors demand, using nutrition strategies costing just $15-25/cow monthly. Mid-size dairies (500-1,500 cows) face the defining choice of this generation: invest $2M in robotics, transition to organic for $6-8/cwt premiums, or exit strategically while asset values hold. The clock is ticking—processors typically lock 70-80% of milk supply within 12 months of facility announcements, with early movers securing 20-30% better terms than those who wait. The next 18 months will determine the structure of American dairy for the next decade. Your decisions in the next 90 days matter more than everything you’ll do in the next five years.

dairy processor premiums

You know what’s remarkable about driving through dairy country right now? The construction. I’m seeing it everywhere—California’s Central Valley, Wisconsin’s rolling countryside, Pennsylvania’s traditional dairy regions. Based on what Dairy Processing magazine and state economic development offices have been tracking, we’re witnessing one of the most significant waves of dairy infrastructure investment in recent memory, with substantial new capacity being developed between now and 2028.

The timing raises questions, doesn’t it? The USDA’s Economic Research Service data from their 2023 release showed annual cheese consumption per capita growing just 0.3% to 0.5% over the previous five years—not exactly a demand surge. But then you look at exports. USDEC reports from late 2024 showed cheese exports up 12% to 16% year-over-year, with Mexico consistently taking 30% to 35% of those shipments. That’s what’s driving this expansion, and it makes you wonder about the risks we’re taking.

I was talking with a Texas producer recently who captured what many of us are feeling: “We’re definitely seeing more processor interest than we have in years. But I keep wondering if everyone’s building for the same milk that doesn’t exist yet.” And that’s the tension—between processor ambitions and what’s actually happening on farms.

Quick Decision Checklist: Where Do You Stand?

Before diving deeper, ask yourself these questions:

  • Is your operation within 75 miles of new or expanding processing?
  • Are your protein levels consistently above 3.3%?
  • Do you have 6-9 months of operating expenses in reserve?
  • Is your current milk contract up for renewal before 2027?
  • Could you invest $15-25/cow monthly for component improvement?

If you answered yes to three or more, you’re positioned to capture opportunity. Less than three? Focus on the defensive strategies we’ll discuss.

Understanding Your Position: Where You Fit in This Changing Landscape

What I’ve noticed over the years is that expansion cycles affect different sized operations in distinct ways. Let me share what producers across various scales are experiencing.

Small Operations (Under 500 cows): A Wisconsin producer I know who milks about 380 cows recently shared her approach with me. “We can’t compete on volume,” she said, “so we’re getting really good at what we can control—our components.” Working with her nutritionist to fine-tune rations, she’s moved her protein from 3.15% to 3.28% over six months. Based on current component pricing in Federal Milk Marketing Orders, that improvement brings in an extra $2,500 to $3,000 monthly. Not life-changing money, but it definitely helps with cash flow.

Mid-Size Operations (500-1,500 cows): This group faces perhaps the toughest decisions. A Minnesota family operation I’m familiar with—third generation, about 900 cows—they’re running the numbers on two completely different futures, and the complexity is really something.

Here’s what they’re wrestling with: The robotics path would require about $2.25 million based on current manufacturer specs—figure 15 robots for their herd size, each handling 60 cows or so. Extension economic models suggest they’d save around $180,000 annually in labor costs, maybe more when you factor in the challenge of finding workers these days. Add in better milking frequency, improved cow health monitoring, and they’re looking at a 10-12 year payback. Not bad, but it’s a big commitment.

The organic transition? That’s a whole different calculation. You’ve got your three-year conversion period required by USDA, and during that time, you’re selling conventional milk while following organic protocols. But once certified, Agricultural Marketing Service data shows organic premiums running $6 to $8 per hundredweight above conventional prices. For their 900 cows producing 70 pounds daily, we’re talking roughly $340,000 additional annual revenue once they’re through transition.

Of course, it’s not all upside. They’d likely see production drop during conversion—maybe 10% based on what other farms have experienced. And there’s about $150,000 in infrastructure changes and certification costs. New feed storage, separate handling equipment, the whole nine yards.

As one family member put it, “Both paths could work financially, but they lead to completely different operations five years out. Robots mean we stay commodity-focused but more efficient. Organic means entering a specialty market with its own risks and rewards.”

Large Operations (1,500+ cows): Geographic positioning becomes everything at this scale. If you’re within reasonable hauling distance of new capacity—generally 75 to 100 miles based on transportation economics—you’ve got real negotiating power. Beyond that distance? The economics shift dramatically.

Geographic proximity to new processing facilities creates dramatic revenue differences—operations within 75 miles earn $120,000+ more annually than distant competitors. Your location determines your negotiating power in the $11 billion processor expansion.

The Processing Wave: Understanding What’s Actually Being Built

Looking at announced projects reveals processor priorities. Texas, New York, California, and Wisconsin are leading in publicly announced investments, which makes sense given their dairy infrastructure. But Michigan, Kansas, and Minnesota are seeing significant activity too—places that might surprise you.

What’s particularly significant about these new facilities is that they’re not just bigger versions of old plants. During a recent industry conference, a plant operations manager explained: “These plants are engineered around specific milk characteristics. Give us consistent 3.5% protein and 4.2% butterfat, and we can achieve efficiency levels that weren’t possible five years ago.”

The University of Wisconsin’s Center for Dairy Research has been documenting this shift—modern plants can achieve cheese yields 8% to 12% higher when milk components are optimized. That’s producing substantially more cheese from the same milk volume compared to a decade ago. Transformational stuff.

Part 1 Summary: Setting the Stage

The dairy processing expansion represents both opportunity and challenge. Your position depends on size, location, and component quality. Understanding where you fit helps determine your strategy.

Key Takeaways So Far:

  • New processing capacity is substantial but export-dependent
  • Component quality increasingly trumps volume
  • Geographic proximity creates real advantages
  • Different sized operations face distinct decisions

Part 2: Navigating Market Dynamics and Making Strategic Decisions

Supply and Demand: The Mathematics We Need to Consider

This development becomes especially significant when you look at the utilization math. Cornell’s dairy extension work shows processors typically need 85% to 90% utilization for profitability. If these new facilities hit those targets while existing plants maintain production, cheese production capacity could increase meaningfully. Meanwhile, domestic consumption? Still growing at that modest 0.3% to 0.5% annually, according to USDA data.

The export market is carrying us right now. USDA Foreign Agricultural Service data confirms Mexico takes 30% to 35% of our cheese exports. But trade relationships can shift—we’ve all lived through that uncertainty. And China? Rabobank’s recent reports show Chinese dairy imports down significantly from their 2021 peak. Is this a temporary adjustment or a structural change? That’s the question keeping economists up at night.

U.S. dairy export markets show explosive growth led by Mexico’s 107% increase in cheese purchases over 5 years—this global demand directly funds the $11 billion processing expansion securing your premiums. When processors say they ‘need more milk,’ they mean they need YOUR high-component milk to capture export market share from New Zealand and the EU. Your milk check increasingly depends on families in Mexico City, not just domestic demand.

As dairy economists at our land-grant universities keep pointing out, we’re betting on continued export growth at levels that historically don’t sustain long-term. It might work beautifully. But acknowledging the risk helps us plan better.

What Processors Actually Want (And What They’ll Pay For)

The conversation about milk quality has shifted dramatically. Volume used to be everything. Today? Components rule.

Federal Milk Marketing Order statistical reports paint a clear picture. Farms consistently delivering protein above 3.3% earn meaningful premiums. Hit 3.5% or higher? You’re writing your own ticket in many markets. Butterfat at 4.0% or above works well for cheese, though some processors now consider butterfat above 4.5% excessive and require costly separation.

Strategic protein optimization delivers dramatic ROI—$15 monthly investment per cow generates $45,750 annual return at the 3.3% processor target. The math works: spend $7,500/year on better nutrition, earn $45,750 in component premiums. That’s how smart operations capture value from the $11 billion processing wave.

What’s worth noting is component consistency. Processors want daily variation under 2%—basically, they need to know that Tuesday’s milk will be pretty much the same as Friday’s for their standardization processes. And for export? Most programs require somatic cell counts below 200,000 cells/ml.

Council on Dairy Cattle Breeding data shows national average butterfat increased from 3.66% in 2010 to over 4.1% by 2024. Protein moved from 3.05% to about 3.25%. These improvements translate directly to cheese yield—and that’s what processors care about.

Looking at your milk check, the Federal Order data shows that farms with superior components earn premiums of $0.50 to $1.50 per hundredweight above base. Take a 500-cow operation producing 85 pounds per cow daily—even a $1.00 premium generates over $150,000 additional annual revenue. Same cows, better milk, significantly more money.

Real Progress: Component Improvement in Practice

I recently visited a Pennsylvania operation that impressed me with its systematic approach. Working with their nutritionist on targeted ration adjustments—nothing revolutionary—they moved protein from 3.12% to 3.31% over eight months.

The herd manager explained their philosophy: “The biggest change wasn’t expensive additives. We improved forage quality, tightened feeding consistency, and paid attention to cow comfort during heat stress.” Feed costs increased by about $15 to $20 per cow per month, but component premiums more than offset it. They’re netting an additional $4,500 to $5,500 monthly profit.

This reinforces what successful operations keep demonstrating—you don’t need revolution. You need systematic attention to details that matter.

Windows of Opportunity: Timing Your Decisions

Processor behavior follows predictable patterns I’ve observed across multiple expansion cycles. Understanding these helps you negotiate effectively.

The early months after facility announcements represent the maximum leverage. Processors actively court milk supply, offering signing bonuses, favorable terms, and quality premiums. Looking back at the 2011-2014 expansion period documented by CoBank, farms that committed early captured terms 20% to 30% better than those who waited.

Once processors secure 70% to 80% of target capacity—remarkably consistent across regions—urgency drops. The welcome mat stays out, but that red carpet gets rolled up. Terms shift from generous to acceptable.

Why does this matter now? If your current marketing agreement expires in 2026, start conversations immediately. Waiting until processors have met their needs means negotiating from a position of weakness.

Processor supply contracts follow predictable patterns—early movers within 6 months secure premiums 200%+ higher than late signers. This chart shows why October 2025 is a critical decision point: most announced facilities are 6-12 months into their supplier commitment phase. The window doesn’t stay open. History shows 70-80% of supply gets locked by month 12, and premium rates collapse by 60-75% for late signers.

Labor and Heifer Constraints: Structural Challenges

Two constraints keep reshaping our industry, with no quick resolution in sight.

Labor remains challenging everywhere. Research from Texas A&M and agricultural labor studies indicates that immigrant workers comprise over half of the dairy workforce nationwide. With H-2A visa programs poorly suited to dairy’s year-round needs, and USDA Economic Research Service data showing that rural agricultural counties lost 1.6% to 2.2% of their population from 2020 to 2023, finding and keeping good people remains difficult.

The heifer situation compounds challenges. USDA’s January 2024 Cattle Report showed 3.9 million dairy replacement heifers—down 17% from 2018, the lowest since tracking began. Agricultural Marketing Service auction reports show heifer prices are up by more than 140% from 2020 lows in many regions.

Yet production per cow keeps climbing. USDA data shows average production in major dairy states increased about 1.5% annually over the past five years. Genetic progress documented by the Council on Dairy Cattle Breeding continues accelerating.

This creates an interesting dynamic. We can’t easily expand cow numbers, but we’re getting more milk from existing cows. It’s forcing everyone to rethink growth strategies.

Regional Perspectives: Geography Shapes Options

The Upper Midwest faces unique pressures. Wisconsin’s roughly 5,000 dairy farms, averaging around 200 cows, according to USDA census data, feel pressure from processors to deliver larger, more consistent volumes. Yet many have advantages—established land bases, multi-generational knowledge, strong communities.

One Wisconsin producer explained his strategy: “We’re not competing with 5,000-cow dairies. We’re producing high-component milk efficiently with family labor.” That resonates across the Midwest.

The Northeast shows contrasts. Proximity to major population centers—Boston to DC—creates opportunities that western operations can’t access. Local food movements, agritourism, and direct marketing provide alternatives to commodity production. Yet farms distant from new processing face real challenges.

Western states continue evolving. California’s trajectory seems clear from state data—fewer farms, larger herds, and increasing environmental and water constraints. But innovative, smaller operations find niches serving coastal populations with specialty products.

The Southeast presents overlooked possibilities. Georgia, Tennessee, and Virginia have growing populations, limited local production, and increasing consumer interest in regional foods. A Virginia producer recently told me they’re getting an extra $2 per hundredweight just for being within 100 miles of their processor. Proximity has value in underserved markets.

Making Strategic Decisions: Practical Frameworks

Strategic investment comparison reveals component optimization delivers fastest payback (4 months) while organic transition provides highest long-term returns ($340K annually) for mid-size operations. Robotics requires patient capital but solves labor constraints. Your choice depends on capital access, risk tolerance, and 5-year goals—not on what your neighbor chose.

After countless conversations with producers navigating these changes, consistent principles emerge.

For smaller operations: Component optimization offers your clearest path. University extension research shows moving protein from 3.2% to 3.3% can add $30,000 to $40,000 annually for a 400-cow herd. Investing in nutrition programs—typically $15 to $25 per cow per month—often pays back within months.

Risk management matters too. FSA’s Dairy Margin Coverage at higher levels provides meaningful protection for modest premiums. Those who had coverage during previous squeezes sleep better.

Mid-size operations face directional choices. Automation requires major investment—manufacturer data shows robotic systems at $150,000 to $250,000 per unit, handling 50 to 70 cows each. But labor savings and lifestyle improvements justify it for many.

Specialty markets offer another path. USDA Agricultural Marketing Service shows organic premiums averaging $5 to $8 per hundredweight above conventional through 2024. Limited market—about 5% of production—but margins remain attractive for committed producers.

Larger operations should focus on geographic positioning and component excellence. Being within 75 miles of processing creates real advantages. Beyond that, challenges mount regardless of other strengths.

Understanding Consolidation: The Bigger Picture

Industry consolidation isn’t new, but understanding the scope helps planning. The USDA Census of Agriculture documents a decline from 65,000 dairy farms in 2002 to fewer than 30,000 by 2022. This reflects economics and generational preferences.

What encourages me is the diversity of successful models. We see 10,000-cow operations achieving remarkable efficiency. We also see 100-cow grass-based operations thriving with direct marketing. The industry needs both.

A young Vermont producer shared wisdom recently: “My parents had one success model—get bigger. My generation has options. We can get bigger, better, different, or exit gracefully. Having choices is powerful.”

Planning All Scenarios: Including Transition

Strategic planning means considering all possibilities, including transition. This deserves honest discussion without judgment.

For some operations, market conditions, family dynamics, or personal preferences make the transition right. Universities offer confidential planning through extension services. Organizations like the Farm Financial Standards Council provide evaluation frameworks.

An Iowa dairyman preparing to retire shared his perspective: “Recognizing when to transition is as important as knowing how to grow. I’m proud of what we built and leaving on our terms.” Real wisdom there.

Your Decision Point: Making Choices That Matter

As we navigate this expansion period, the path forward becomes clearer when we focus on what we can control. Processing expansion will reshape our industry—that’s certain. How it affects your operation depends on the decisions you’re making right now.

Component quality, geographic positioning, and financial resilience determine who captures opportunity versus who faces challenges. These aren’t abstract concepts—they’re measurable factors you can influence today.

The critical element remains timing. Markets evolve, opportunities shift, windows close. Understanding these dynamics while you have options matters more than any prescribed path. Because ultimately, you know your operation, your capabilities, and your goals better than any outsider.

This processing wave will create winners and losers—that’s market reality. But there’s more than one way to win, and strategic exit on good terms beats forced liquidation every time. Choose thoughtfully, act decisively, and remember—successful dairy farming has always meant matching resources with opportunities.

There always has been more than one path to success in dairy. And regardless of what the next few years bring, there always will be.

KEY TAKEAWAYS 

  • $150K Location Bonus: Farms within 75 miles of new plants are locking in premiums worth $150,000+ annually—but smart nutrition can close the geographic gap
  • The 5X Protein Play: Invest $15/cow monthly in nutrition → boost protein 0.1% → earn $75/cow annually (4-month payback)
  • Your 18-Month Shot: Processors lock 70-80% of milk supply in Year 1 after announcements—early contracts earning 30% premiums over late signers
  • Pick Your Lane by 2026: Scale up (robots: $2M), specialize (organic: $300K/year after transition), or sell strategically (before 40% of peers flood market)

Complete references and supporting documentation are available upon request by contacting the editorial team at editor@thebullvine.com.

Learn More:

The Sunday Read Dairy Professionals Don’t Skip.

Every week, thousands of producers, breeders, and industry insiders open Bullvine Weekly for genetics insights, market shifts, and profit strategies they won’t find anywhere else. One email. Five minutes. Smarter decisions all week.

NewsSubscribe
First
Last
Consent

Butter Pays Triple: Fonterra’s $75M Investment Proves Components Are Your Future

Fonterra commits $75M to butter while powder markets collapse 39%. Smart producers already pivoting: 10-15% profit gains documented.

Executive Summary: Progressive dairy farms are adding $32,000-87,000 annually by switching from volume to component focus—and Fonterra’s $75 million butter expansion validates their strategy. Butter commands $7,000 per tonne while powder sits at $2,550, a gap that’s widening as Chinese powder demand drops 39% and global butterfat markets stay strong. Smart farms are already moving: investing $10-20 per cow per month in targeted nutrition generates returns of $25-85 within 60-90 days. The window for action is closing—$8 billion in new North American butter and cheese capacity will come online by 2027, and farmers positioned to supply components will capture those premiums, while others scramble to adapt. This analysis provides your roadmap: immediate nutrition optimization, strategic processor positioning within 18 months, and staged genetic transitions starting with your bottom third. The verdict from global markets to Wisconsin farms is unanimous: component density drives profit, volume doesn’t.

Milk Component Value

The global dairy industry is experiencing a fundamental shift in value creation—from volume to components—and farmers who recognize this transition early will position themselves for success in the emerging market structure

You know, when Fonterra announced their NZ$75 million investment to double butter production capacity at the Clandeboye facility in Canterbury, I found myself thinking about what this really means for dairy farmers like us. This goes beyond just another infrastructure upgrade—it represents a fundamental shift in how our industry values milk.

What caught my eye about the timing is this: Global Dairy Trade auctions through October 2025 have consistently shown butter trading between $6,600 and $7,000 per tonne, while skim milk powder sits around $2,550. We’re talking nearly triple the value here. And that price differential isn’t just a temporary market quirk—it reflects something deeper happening across the entire dairy value chain.

What particularly caught my attention was Fonterra’s simultaneous decision to divest their consumer brands to Lactalis for $4.22 billion while expanding butter capacity. On the surface, these moves might seem contradictory, right? But dig deeper, and a coherent strategy emerges—one that dairy farmers everywhere should understand.

Butter commands nearly triple the price of powder, rewriting the playbook for component-focused production and dismissing old volume-based strategies forever.

Understanding the Strategic Shift Behind the Investment

Miles Hurrell, Fonterra’s CEO, framed this investment as increasing production of high-value products while improving their product mix. The numbers behind that statement tell a compelling story. Their ingredients channel, which processes 80% of their milk solids, generated $17.4 billion in their most recent fiscal year. Consumer products? Just $3.3 billion.

That disparity explains why processors globally are refocusing on B2B ingredients rather than consumer brands. It’s a strategic shift that reflects where value creation actually happens in modern dairy markets.

Looking at processing flexibility in the Pacific region, what’s remarkable about New Zealand’s cream plants is their operational agility. They can shift substantial portions of milkfat between anhydrous milk fat and butter production based on market signals. This allows processors to capture whatever premium the market’s offering at any given time.

The global supply picture adds another layer to this story. According to the European Commission’s October 2025 dairy market observatory, European milk production continues growing despite relatively weak farmgate prices. USDA’s Dairy Market News shows U.S. dairy herds have expanded by 2.1% in recent months. DairyNZ confirms New Zealand’s having another strong production season with August 2025 collections up 8.3% year-over-year.

So we’ve got milk oversupply, yet butter prices remain remarkably resilient while powder markets struggle. There’s something structural happening here, and it’s worth paying attention to.

What This Means for Component-Focused Production

This brings us to what really matters for farmers: How do these market dynamics translate to on-farm decisions?

MetricJersey/CrossbredHolsteinAdvantage
Butterfat Content4.3-4.5%3.6%+0.7-0.9% (Jersey)
Protein Content3.6-3.8%3.2%+0.4-0.6% (Jersey)
Component EfficiencySuperiorStandardJersey
Economic Returns vs Holstein+10-15%BaselineJersey
Feed EfficiencyImprovedStandardJersey
Reproductive PerformanceFewer Days OpenBaselineJersey

Research from extension services at Wisconsin, Cornell, and Penn State consistently shows that component efficiency drives profitability more effectively than pure volume production. And the data is compelling. Farms implementing Jersey crossbreeding programs typically see economic returns increase by 10-15% compared to pure Holstein operations—that’s according to multi-year studies in the Journal of Dairy Science. Component levels often reach 4.3-4.5% butterfat and 3.6-3.8% protein, compared to Holstein averages around 3.6% and 3.2% respectively.

What’s encouraging is the improvement in feed efficiency and reproductive performance that comes along with these component gains. Many producers report their crossbred cows show fewer days open and require less intervention during the transition period—you probably know someone who’s seen similar results.

Dr. Randy Shaver from Wisconsin-Madison’s dairy science department documented fascinating case studies in which farms optimizing amino acid nutrition and removing polyunsaturated fat sources saw butterfat increase from around 3.4% to over 4% within weeks. When that translates to several dollars more per hundredweight… well, that’s meaningful money when you’re shipping milk every day, all year long.

I’ve noticed a generational shift happening, too. Younger farmers entering the industry aren’t as attached to the traditional “fill the tank” mentality. They’re looking at component efficiency from day one, asking different questions about genetics, nutrition, and marketing strategies. It’s refreshing, honestly.

The Powder Market Reality Driving Change

China’s powder demand has fallen off a cliff—erasing decades of growth and leaving billions in powder-drying assets stranded.

So why is this shift toward butterfat happening now? The answer lies partly in what’s happening to global powder markets.

Global Dairy Trade auctions in September and October 2025 show both skim milk powder and whole milk powder trading well below historical averages. Chinese imports—which drove powder demand for nearly two decades—remain significantly depressed. China Customs Administration data from August 2025 shows a 39% year-over-year decline. That’s not a blip; that’s a trend.

The situation in China deserves particular attention. While their domestic milk production has been declining (which, in theory, should support imports), the China Dairy Industry Association’s September 2025 report indicates that many Chinese dairy farms are operating at a loss, with farmgate prices hitting multi-year lows. This suggests structural challenges that won’t resolve quickly.

What we’re witnessing is potentially billions of dollars in powder-drying capacity built for a market dynamic that no longer exists. Rabobank’s Q3 2025 dairy quarterly describes these as potential “stranded assets”—infrastructure investments that may never generate expected returns. That’s a sobering thought for processors heavily invested in powder.

Component Optimization: A Practical Framework

For producers considering this transition, here’s what progressive operations are focusing on:

✓ Baseline assessment: Review component tests from the past 6 months to understand where you’re starting
✓ Efficiency calculation: Measure total fat and protein pounds against dry matter intake
✓ Market exploration: Request quotes from 2-3 processors to understand regional pricing dynamics
✓ Nutrition refinement: Work with your nutritionist on amino acid balancing strategies
✓ Fat supplementation: Consider palmitic acid products at 1.5-2% of diet dry matter
✓ Interference removal: Identify and eliminate high PUFA sources that suppress butterfat synthesis
✓ Progress monitoring: Track component response weekly during the initial transition month

Practical Steps for Farmers: The 18-Month Transition Strategy

Based on conversations with producers who’ve successfully navigated this shift, along with extension recommendations, a three-phase approach seems most practical.

Immediate Actions (Next 60-90 Days)

Nutrition optimization offers the fastest path to capturing component premiums. University dairy specialists consistently recommend focusing on amino acid profiles in metabolizable protein, incorporating appropriate fat supplements, and eliminating factors that suppress butterfat synthesis.

The economics are encouraging here. Research from land-grant universities, including Michigan State and the University of Minnesota, suggests that investing $10-20 per cow per month in targeted nutrition typically yields returns of $25-85. Even if your current processor doesn’t fully reward components today, you’re still capturing feed efficiency gains and often seeing reproductive benefits that improve overall herd health.

One practical approach: Start by reviewing your current ration with fresh eyes. Many farms discover they’re feeding ingredients that actively suppress butterfat—things that made sense when volume was king, but work against component optimization. It’s surprising what you might find.

Short-Term Strategy (6-18 Months)

This development suggests interesting market dynamics ahead. With processors across North America investing billions in new capacity—the International Dairy Foods Association reports over $8 billion in announced projects through 2026—they’ll need a quality milk supply to fill that infrastructure.

For U.S. producers operating outside supply management, this creates direct opportunities. I recently heard from a producer in Pennsylvania who documented her component levels and quality metrics over several months, then approached three processors for competitive quotes. When her existing buyer realized she had genuine alternatives offering 50 cents more per hundredweight, they suddenly found room to improve their pricing structure. Funny how that works.

The Canadian experience offers different lessons. While producers there can’t negotiate directly with processors—they sell to provincial milk marketing boards, which allocate milk—their transparent pricing system, administered by the Canadian Dairy Commission, clearly rewards components. October 2025 butterfat prices are $11.84 per kilogram, versus $8.31 for protein. This regulated system has driven on-farm decisions toward component optimization for years, since that’s how farmers maximize returns within the supply management framework. Canadian producers have focused intensively on genetics and nutrition to optimize components because that’s their only lever for improving revenue—they can’t negotiate volume or switch buyers.

U.S. producers following the June 2025 Federal Milk Marketing Order reforms have more flexibility but less pricing transparency. The principle of demanding clear component pricing from cooperatives remains valid for those who can negotiate or explore alternatives.

Long-Term Positioning (18+ Months)

Genetic decisions made today will determine your component profile when new processing capacity comes online in 2028-2030. Extension geneticists generally recommend starting conservatively—perhaps with your bottom third of cows for initial crossbreeding trials.

This staged approach allows you to evaluate results while maintaining operational flexibility. If market signals remain positive by mid-2026, you can expand the program. The timeline matters here because first-cross heifers bred today won’t enter your milking string for about 24 months.

Understanding Regional Variations

Different regions are adapting to this component-focused reality in distinct ways, and there’s something to learn from each approach.

New Zealand demonstrates that the model works even with smaller herd sizes—their average herd size remains under 500 cows, according to DairyNZ’s 2024-25 statistics. Their payment system has been optimized for milk solids rather than volume for years, creating remarkable efficiency. What’s particularly noteworthy is that, as Fonterra’s market share has declined to 77.8% according to the New Zealand Commerce Commission’s September 2025 report, and competitors have offered attractive component-focused pricing, it’s actually forced all processors to be more responsive to farmer needs.

In the United States, the Federal Milk Marketing Order reforms implemented in June 2025—the first major update since 2008—formally recognized that butterfat now accounts for 58% of milk check income, according to the USDA’s Agricultural Marketing Service. Yet many cooperative payment systems haven’t fully adjusted to this reality, creating opportunities for producers willing to negotiate or explore alternatives.

California producers face unique challenges with transportation distances and processor consolidation, but they’re also seeing some of the strongest component premiums in the country. The California Department of Food and Agriculture’s September 2025 data shows component premiums averaging $0.85 per hundredweight above the state average. That adds up quickly.

The Northeast presents another interesting case. Smaller farms there are finding that component optimization allows them to remain competitive despite scale disadvantages. When you’re shipping high-component milk, processor transportation costs become more manageable on a solids basis—that’s just math working in your favor.

Component optimization delivers impressive profit across all herd sizes, proving quality trumps scale in the new dairy order.

The Risks We Should Monitor—And How to Prepare

Now, while the component-focused future seems clear, several risks deserve attention along with strategies to address them.

China’s economic trajectory remains the biggest wildcard. If their dairy demand remains weak for several more years, global export markets will come under pressure. But what’s encouraging is butter’s diverse demand base—spanning Asia, the Middle East, and developed markets—provides more resilience than powder’s historically China-dependent structure. Smart farms are diversifying their risk by not betting everything on export-dependent processors.

Precision fermentation technology represents a longer-term consideration. Companies like Yali Bio and Melt & Marble are developing fermented dairy fats, with some targeting commercial launches in 2026, according to their August 2025 corporate announcements. While price parity is likely 5-10 years away, according to the Good Food Institute’s September 2025 analysis, this technology could eventually compete for commodity ingredient applications. The best defense? Focus on premium quality that commands loyalty beyond pure commodity competition.

The impact of GLP-1 weight-loss medications on dairy consumption patterns is another emerging factor. Research in the American Journal of Agricultural Economics from July 2025 indicates households using these medications reduce butter consumption by approximately 6%, primarily in retail channels rather than foodservice. Current adoption sits at 3.2% of the U.S. population according to CDC data from August 2025, though Morgan Stanley projects potential growth to 7-9% by 2035. It’s worth monitoring, but foodservice demand remains more stable.

Perspectives from Progressive Operations

Extension case studies from farms that have successfully transitioned offer valuable insights. The University of Wisconsin-Madison’s August 2025 extension bulletin documented Wisconsin farms reporting economic improvements ranging from $32,000 to $87,000 annually for 500-cow operations. The variation depends largely on their starting point and local market dynamics, but the direction is consistently positive.

The common thread among successful transitions? Methodical tracking of component efficiency—measuring pounds of fat and protein against pounds of dry matter intake. This metric, more than any other, determines economic sustainability in a component-valued market.

International examples provide additional perspective. Brazilian operations dealing with heat stress have found Jersey genetics particularly valuable. Embrapa Dairy Cattle’s 2025 annual report shows 12-15% improvement in component efficiency under tropical conditions—that’s significant when you’re battling heat and humidity. Australian producers recovering from recent industry challenges are focusing intensively on specialty cheese and butterfat products for Asian markets, as documented in Dairy Australia’s September 2025 market analysis. These diverse experiences suggest the component-focused approach adapts well across different production environments.

Essential Lessons for Dairy Farmers

After examining the data, market trends, and producer experiences, several principles emerge clearly.

Component optimization is transitioning from competitive advantage to operational necessity. The most successful farms won’t necessarily be the largest, but those producing high-component milk at competitive costs while maintaining operational flexibility.

Processing flexibility matters tremendously. Fonterra’s ability to shift between butter, AMF, and cream products based on market signals provides the resilience that single-product strategies can’t match. We should seek similar flexibility in our own operations.

Information asymmetry remains expensive but addressable. Farms that invest modestly in market intelligence and professional advisory services often identify pricing opportunities worth tens of thousands of dollars annually. The key is translating that information into actionable operational changes.

The transition period through 2027 creates a particular opportunity. As new processing capacity comes online, farmers who’ve already positioned for component production will be ready to capture emerging premiums.

Looking Forward: Your Strategic Path

The dairy industry stands at a genuine inflection point. Processing infrastructure is shifting toward butterfat-intensive products. Payment systems are gradually recognizing the value of components. Technology continues creating both opportunities and challenges for traditional dairy farming.

Fonterra’s $75 million investment signals confidence that butterfat will maintain its premium status despite powder market challenges. They’re betting this trend continues for at least the next decade. Whether they’re right depends on multiple variables—economic recovery in key markets, technology advancement rates, and evolving consumer preferences.

What seems certain is that measuring dairy success purely by tank volume is becoming increasingly obsolete. As one thoughtful producer recently observed at the World Dairy Expo: “My grandfather measured success by how full the bulk tank was. I measure it by what’s in it. Same tank, completely different business.”

The capital flowing into Clandeboye’s butter expansion represents Fonterra’s vision for dairy’s future. The decisions each of us makes about breeding, feeding, and marketing our milk will determine who captures the value that investment creates.

For an industry with deep traditions and generational farming operations, change comes slowly. Yet the message from New Zealand—and increasingly from progressive farms worldwide—deserves serious consideration. The future of profitable dairy farming isn’t just about filling the tank anymore. It’s fundamentally about what’s in it.

The producers who’ve already made this shift aren’t looking backward. They’re focused on optimizing components, improving efficiency, and building sustainable operations for the next generation. They’re positioning their farms to thrive in this new reality, not just survive it.

And honestly? They’re wondering why it took the rest of us so long to recognize what they figured out years ago.

The path forward is clear for those willing to see it. The only question is whether you’ll be among the farmers leading this transition—or playing catch-up when the market forces your hand.

Key Takeaways:

  • The Opportunity: Butterfat pays 3X powder ($7,000 vs $2,550/tonne) and the gap’s widening as Chinese powder demand craters 39%
  • The Payoff: Component-focused farms are banking $32,000-87,000 extra annually—proven across 500-cow Wisconsin operations to small Northeast herds
  • The Fast Win: Invest $10-20 per cow monthly in amino acid nutrition, capture $25-85 returns within 60 days (400% ROI)
  • The Deadline: $8 billion in new butter/cheese processing capacity comes online by 2027—position now or watch others lock in your premiums
  • Your Action Plan: Start Monday with nutrition optimization, document components for processor leverage, breed the bottom 30% to Jersey genetics this cycle

Complete references and supporting documentation are available upon request by contacting the editorial team at editor@thebullvine.com.

Learn More:

  • The Art of Feeding for Components: Beyond the Basics – This article provides advanced nutritional strategies for maximizing butterfat and protein. It reveals specific methods for balancing fatty acids and improving rumen health, allowing you to turn the market signals discussed in our main feature into tangible gains in your bulk tank.
  • Navigating the New FMMO Landscape: What Producers Need to Know Now – While our feature covers the global market shift, this analysis drills down into the recent FMMO reforms. It provides critical insights for understanding your milk check and leveraging new pricing realities to negotiate more effectively with your processor.
  • Genomic Testing Isn’t Just for the Elite Sires Anymore – To accelerate the genetic progress mentioned in our 18+ month strategy, this piece demonstrates how to use affordable genomic testing on your commercial heifers. Learn how to make faster, data-driven breeding decisions to boost component traits across your entire herd.

The Sunday Read Dairy Professionals Don’t Skip.

Every week, thousands of producers, breeders, and industry insiders open Bullvine Weekly for genetics insights, market shifts, and profit strategies they won’t find anywhere else. One email. Five minutes. Smarter decisions all week.

NewsSubscribe
First
Last
Consent

Butterfat vs. Powder: What the Great Dairy Divide Really Means for Your Bottom Line

Butterfat’s on top, powder’s under pressure—and the milk check now tells a story few saw coming

EXECUTIVE SUMMARY: Butterfat’s booming, powders are sliding, and together they’ve redrawn the dairy marketplace. This isn’t just another price cycle—it’s a lasting shift in how milk value is measured and paid. China’s preference for premium fats, new processor investments, and stronger herd genetics are driving a global realignment. Farmers who embrace component-based pricing, focused feeding, and risk protection remain profitable even as traditional markets weaken. The message heading into 2026 is clear: the future belongs to those who manage what’s inside the tank, not just how much fills it.

Walk into any farm shop or co-op office this fall, and chances are you’ll hear the same discussion. Butterfat is holding strong, while powders just can’t find their footing. The market doesn’t feel balanced anymore. What’s interesting here is that this gap doesn’t seem like a short-term pricing quirk—it looks and feels like a lasting shift in how milk value is determined.

Fat Holds Steady, Powder Loses Traction

Looking at the latest Global Dairy Trade (GDT) auctions, it’s easy to see the disconnect. The GDT index has fallen for five consecutive events, down roughly 1.4% in mid-October. Butter and anhydrous milk fat (AMF), however, remain firm, trading between $6,600 and $7,000 per tonne. Meanwhile, skim milk powder (SMP) is soft, sitting near $2,550 per tonne.

The Great Dairy Divide: Butterfat products command $6,800-7,200 per tonne while skim milk powder has collapsed to $2,550—a pricing gap that’s rewriting the economics of every dairy farm in America

That pattern isn’t isolated to one region. According to the EU Commission Market Observatory, SMP fell about 1% this month, while butter barely moved. In the United States, USDA Dairy Market News reported CME butter prices hovering around $3.15 per pound, roughly aligned with global benchmarks after accounting for shipping and grading differences.

The CoBank Dairy Outlook (October 2025) calls this “a composition-driven divergence.” In simple terms, the milk market isn’t paying for volume anymore—it’s paying for what’s inside. AMF, at 99.8% pure milkfat, is ideal for global manufacturers who need precision and performance. Butter, at 82% fat, still has a place, but powders are losing ground as demand in infant formula and rehydrated products slows.

China’s Import Strategy Speaks Volumes

The best way to understand this trend is to look at China, where import behavior has changed dramatically. The Chinese Customs Administration reported that butter imports rose 65% year over year, whole milk powder climbed 41%, and SMP dropped 12.5%.

China’s dairy import strategy reveals the future: butter imports surged 65%, whole milk powder up 41%, while skim milk powder dropped 12.5%—they’re buying precision fats and making powder at home

At the same time, the USDA Foreign Agricultural Service (FAS) confirmed that China’s milk production grew to 41.9 million tonnes in 2024, a rise of 6.7%. Those numbers sounded encouraging, but they also created oversupply at home. Processing plants are drying roughly 20,000 tonnes of milk a day, often at a loss. The OCLA Argentina Dairy Market Outlook (September 2025) estimates those losses at 10,000 yuan per tonne, or about $1,350 USD, thanks to high input and energy costs.

Here’s where things get interesting. China can produce plenty of powder. Where it struggles is in high-purity fats like AMF and industrial butter. Domestic processors lack the cream-separation and fractionation capacity found in markets like New Zealand, Europe, and the U.S. So their strategy has shifted. They’re importing what they can’t make efficiently. That choice has reinforced fat premiums in the global marketplace.

This development suggests a new normal for international trade. Countries will compete not on total milk output, but on how effectively they produce—and market—the right components.

Why U.S. Farmers Are Still Standing tall

Looking back through cycles like 2015 or 2020, it’s clear farmers have become better prepared to weather volatility. Part of that comes down to management maturity and new financial safety nets that didn’t exist a decade ago.

Risk Management Tools Are Paying Off
According to the USDA Risk Management Agency (RMA), about 35% of U.S. milk production is now protected under Dairy Revenue Protection (DRP), with participation surpassing 50% in the High Plains. Those policies are helping farms hold margins through increasingly unpredictable shifts in global pricing.

Smart farmers are protecting margins: 52% of High Plains milk production is covered by Dairy Revenue Protection, nearly double California’s 28%—proof that the best operators plan for volatility before it hits

Component Programs Reward Quality, Not Quantity
More than 90% of milk in the country is now sold under Multiple Component Pricing (MCP). Herds averaging 4.3% butterfat and 3.4% protein consistently earn $1.50 to $2.00 per hundredweight more than standard 3.7/3.1 herds, according to USDA AMS data. That’s a structural incentive, not a fad.

Genetics and Feeding Continue to Change the Curve
CoBank and USDA data show national butterfat averages rising from 3.95% in 2020 to 4.36% this year, while protein moved to 3.38%. The Michigan State University Extension (2025) recently found that feeding 5–6 pounds of high-oleic roasted soybeans per cow daily improved butterfat by 0.25–0.4 percentage points within 30 days, while enhancing rumen consistency and herd condition.

American dairy genetics are delivering: butterfat jumped from 3.95% to 4.36% in just five years while protein climbed to 3.38%—improvements that translate directly to bigger milk checks every month

What’s encouraging here is that improvements are cumulative. As one extension specialist explained during a recent producer roundtable, “The cows are doing the same work, but the milk’s worth more.” It’s proof that managing for higher components is one of the most direct paths to better returns.

The Processor Pivot: From Volume to Value

Processors are feeling this market divide just as strongly as producers are. And frankly, some are better positioned than others.

Let’s look at Darigold’s Pasco, Washington facility, which represents one of the industry’s most ambitious bets on global powder capacity. The plant—a $1.1 billion facility capable of processing 8 million pounds of milk per day—was planned to supply milk powders and butter to Southeast Asian buyers when those markets were booming back in 2019. But global dynamics changed faster than expected. Reports confirm the company had to deduct around $4 per hundredweight from producers’ milk checks this summer to offset startup losses. Powder-heavy exports aren’t what they used to be.

Contrast that with processors like Hilmar Cheese (Texas), Leprino Foods (Kansas), and Lactalis USA, which have expanded into cheese, whey protein, and AMF production. They’re diversifying toward higher-solids, higher-margin production that keeps milk geographically and economically competitive. Reports from First District Association (Minnesota) and Idaho Milk Products echo the same trend—premium payments now hinge on component tests because that’s where processors make their profit.

Here’s the hard truth: the U.S. industry is splitting not just by product, but by intent. Powder is still a volume game. Component ingredients are an efficiency game.

Could Butterfat Overshoot?

It’s a fair question to ask whether everyone aiming for higher fat could create the next surplus. CoBank’s August 2025 Outlook flagged that butterfat production might be “growing faster than demand absorption.”

But here’s where genetics help us. The USDA Agricultural Research Service (ARS) and Holstein Association USAperiodically adjust their Net Merit (NM$) and Total Performance Index (TPI) formulas to reflect changes in milk pricing. That means breed selection is constantly reweighted to economic reality. If fat premiums fall or protein values recover, herd objectives shift almost automatically.

The point is, dairy efficiency—not just butterfat—is what creates long-term stability. It’s why balance will always outlast fads.

The Metric That Matters: Component Spread

When you strip away all the noise, one figure tells the story: the component spread—the pay gap between baseline milk (3.5% fat / 3.0% protein) and high-component milk (4.4% fat / 3.4% protein).

Component pricing isn’t subtle: premium milk at 4.4% fat earns $2.00/cwt more than standard 3.7% fat milk—that’s $14,600 annually for a 100-cow herd, and the gap keeps widening

As USDA AMS Federal Order data shows, that premium has averaged more than $2 per hundredweight throughout 2025. If it holds, producers essentially have proof that processors are permanently paying for composition, not volume.

A USDA market economist summed it up best in a September forum: “When the value is tied to solids instead of water, you’re not in a price cycle anymore—you’re in a new structure.”

Practical Lessons Going Into 2026

The roadmap is clear: track components monthly, breed strategically, match your processor, feed for balance, and protect margins—five concrete moves that separate winning farms from the rest
  1. Track Your Components Monthly.
    Treat butterfat and protein performance as management metrics alongside fertility, transitions, or somatic cell counts. Precision wins.
  2. Start Small, Build Momentum.
    Genomic testing (around $40 per heifer) and ration adjustments are quick-return investments in this pricing climate.
  3. Match Your Processor Relationship.
    AMF and cheese plants prize solids. Powder plants still chase volume. Know which market pays for the milk you make.
  4. Breed and Feed for Balance.
    Fat and protein efficiency outweigh extremes. Avoid chasing a single number.
  5. Protect Margins with Modern Tools.
    DRP coverage, component contracts, and multi-year agreements keep income steady when markets fluctuate.

The Bottom Line: This Isn’t a Crisis—It’s an Adjustment

Every producer knows the milk market runs in cycles. But what’s happening right now feels different. Butterfat remains firm because the world wants quality ingredients that add value to food manufacturing. SMP is struggling because bulk reconstitution isn’t growing anymore.

For farmers, the lesson is clear: you don’t have to rebuild your entire operation to adapt—just fine-tune what you’re already measuring. Improving components, reviewing contracts, and aligning milk output with processor demand will go further than chasing volume.

The bottom line? The milk check no longer rewards gallons—it rewards balance, precision, and composition. The farms paying attention today are the ones positioning themselves to thrive long-term.

Key Takeaways:

  • Butterfat is booming while powders slide, signaling a lasting shift in dairy value and pay structures.
  • China’s strategic focus on high-fat imports and domestic powder production is reshaping global trade dynamics.
  • U.S. farmers maximizing components—and protecting with DRP—are turning market volatility into opportunity.
  • Processors investing in solids-based products like cheese and AMF are outpacing those tied to bulk powder markets.
  • Heading into 2026, milk checks will favor precision over production—the farms that measure will be the ones that win.

Complete references and supporting documentation are available upon request by contacting the editorial team at editor@thebullvine.com.

Learn More:

The Sunday Read Dairy Professionals Don’t Skip.

Every week, thousands of producers, breeders, and industry insiders open Bullvine Weekly for genetics insights, market shifts, and profit strategies they won’t find anywhere else. One email. Five minutes. Smarter decisions all week.

NewsSubscribe
First
Last
Consent

Butterfat Finds a Floor, Powders Keep Sliding: This Week’s Global Dairy Market Recap (Oct 27, 2025)

Milk keeps flowing, but markets aren’t keeping up — here’s why butter still wins while powder takes the hit.

EXECUTIVE SUMMARY: Milk keeps flowing, and that’s both the good and the bad news this week. Global markets are clearly split: butterfat found support, while powders keep sliding under the weight of spring flushes from New Zealand and South America. The GDT fell for a fifth straight time, confirming that buyers remain hesitant despite stronger global GDP signals. European cheese prices softened again, squeezed by heavy milk flows and stiff export competition from the U.S. Meanwhile, domestic U.S. butter and whey showed small but meaningful rebounds, hinting that seasonal demand is still alive. The story heading into Q4 is crucial but straightforward — fats are holding the line, but milk powder markets are testing just how low they can go.

The global dairy market feels a bit like a full bulk tank these days — there’s plenty of volume, but the challenge lies in finding enough demand to keep things moving. As seasonal production swells across the Southern Hemisphere and buyers take a more cautious approach, markets are struggling to find equilibrium. The story this week is one of contrast: fats holding firm, proteins still under pressure, and a tug-of-war between optimism and oversupply.

EEX Futures – Butter Builds Strength

Volume on the European Energy Exchange (EEX) reached 1,730 tonnes last week, spread across butter, skim milk powder, and whey. Butter led the pack, climbing 1.6% to €5,226 for the Oct 25–May 26 strip.

What’s interesting here is how butter continues to defy broader weakness. European cream supplies remain comfortable, but steady retail demand and ongoing export inquiries — particularly for high-fat butter used in industrial formulations — are helping maintain price momentum (EEX, Oct 2025). Skim milk powder (SMP) slipped 0.2% to €2,163, showing that supply comfort and limited tenders are keeping buyers sidelined. Whey, meanwhile, gained 2.0%, settling around €975, driven by active demand for protein fortification in feed and human nutrition sectors.

SGX Futures – Fat Prices Hold Ground

Across the Singapore Exchange (SGX), 13,123 tonnes traded last week — the majority in Whole Milk Powder (WMP), which eased 0.4% to $3,546. SMP crept up 0.2% to $2,591, while Anhydrous Milk Fat (AMF) added 1.0%, finishing at $6,666.

It’s worth noting that AMF’s firm tone isn’t just about premium dairy fats — it’s about diversification. Food manufacturers are migrating toward AMF for better shelf stability and consistency, widening the AMF–butter spread to $376 per tonne. That gap signals stronger demand in processed and export channels versus commodity butter sales.

Butter on SGX slipped 1.4% to $6,420, reflecting the usual shoulder-season slowdown before Q4 holiday orders gain traction. The NZX milk price futures market traded 426 lots (2.56 million kgMS), keeping farm gate projections near $10/kgMS, supported by the weaker New Zealand dollar.

European Quotations – Region by Region Reality

The EU Butter Index dipped €39 (–0.7%) to €5,390, but the national picture tells more of the story. Dutch butter fell sharply (–3.4%), French butter rose 1.2%, and German butter held steady. The SMP Index fell 1.2% to €2,097, weighed by slow export booking and cautious EU buyers. By contrast, whey improved 1.7% to €912, another sign that protein derivatives continue to offer bright spots amid the softness.

Year-over-year, SMP has dropped more than 15%, while butter remains nearly 30% below 2024 levels. The key here is that fats are still profitable to produce, while powder processors are watching their margins shrink (EU Commission Market Observatory).

EEX Cheese Index – A Tough Stretch

vef

Cheese prices continue to grind lower. Cheddar Curd fell by 3.8% to €3,501Mild Cheddar lost 1.5% to €3,636Young Gouda dropped 2.8% to €2,909, and Mozzarella eased 1.9% to €2,928.

What’s driving this? In short, too much milk, not enough elasticity downstream. European processors have faced strong milk deliveries and limited export momentum, particularly as the U.S. continues to compete aggressively in cheese exports with lower prices and a steadier currency.

GDT Auction – Fifth Consecutive Decline

Fats (Butter & AMF) maintain price stability while powders (WMP & SMP) slide for five consecutive auctions, revealing the fundamental market split: butterfat wins as oversupply crushes powder values

The Global Dairy Trade (GDT) Price Index fell another 1.4% to $3,881, its fifth straight dip — a clear indicator that the global balance between supply and consumption is still correcting.

Whole milk powder dropped 2.4% to $3,610, and skim milk powder declined 1.6% to $2,559. By contrast, AMF rose 1.5% to $7,038, maintaining its premium over butter. Butter fell slightly (–0.8% to $6,662). That persistent AMF premium shows sustained appetite for high-purity fats, particularly in Asian and Middle Eastern markets (GDT Event 390, Oct 2025).

Cheddar and mozzarella prices fell 1.9% and 5.3%, respectively. Volumes sold at the event totaled 40,621 tonnes, down modestly from the previous auction.

Southern Hemisphere – Production Ramps Up

Spring flush delivers production surge across the Southern Hemisphere: Argentina leads with nearly 12% solids growth, New Zealand milk solids jump 3.4%, and Dutch collections rise 6.7%—all combining to flood global markets and pressure powder prices downward

Down south, spring flush is living up to its name. New Zealand’s September milk collection hit 2.67 million tonnes, up 2.5%, while milk solids jumped 3.4% year over year (DCANZ, Oct 2025). A weaker NZD continues to bolster local payouts, and with PKE (palm kernel expeller) imports up 35%, many herds are maintaining condition through the flush.

Argentina’s production rose 9.9% year over year in September, and solids were up 11.7%, driven by improved pasture and feed efficiency under stable weather (OCLA Argentina, Sept 2025). Meanwhile, the Netherlands reported +6.7%milk collections and a stronger butterfat yield, signaling broad European abundance.

These gains are great news for efficiency metrics but apply downward pressure on global dairy pricing, particularly across SMP and WMP.

Trade and Demand – China Sends Mixed Signals

China’s September imports reveal calculated market strategy: massive 65% surge in butter and 41% jump in WMP contrasts sharply with 12.5% drop in SMP, proving buyers are restocking premium fats while avoiding oversupplied powders

China’s September milk-equivalent imports rose 4.7% year over year — but that number hides the nuance. WMP imports surged 41%, a recovery from last year’s depressed base, while SMP fell 12.5% and butter jumped an impressive 64.7% (Chinese Customs Data, Oct 2025).

This suggests that Chinese buyers are being tactical. They’re restocking high-fat categories but remain cautious on large-volume powders. New Zealand exports, up 8.7% y/y, captured much of that growth, though SMP flows remain uneven. Demand is stabilizing—not accelerating yet.

U.S. Markets – Glimmers of Recovery

ProductWeekly ChangeCurrent PriceMarket Signal
Dry Whey$+3.5¢$$\$0.69/\text{lb}$Strong protein
Butter$+0.75¢$$\$1.6025/\text{lb}$Holiday build
Cheddar Blocks$+0.25¢$$\$1.7775/\text{lb}$Moderate food
Nonfat Dry Milk$+\$0.05$$\$1.16/\text{lb}$Steady demand

Domestic dairy markets found small pockets of strength. CME cheddar blocks ticked up 0.25¢ to $1.7775/lbbutter gained 0.75¢ to $1.6025/lb, and nonfat dry milk rose a nickel to $1.16/lbDry whey continued to climb, up 3.5¢ to $0.69/lb, thanks to unflagging demand for high-protein ingredients (USDA Dairy Market News, Oct 2025).

Cream supplies remain ample, butter churns are busy, and foodservice activity is moderate. As one Wisconsin marketing manager put it this week, “We’re not seeing panic buying, but holiday pipeline building is real.” Feed remains a bright spot, with DEC25 corn at $4.28/bu and JAN26 soybeans at $10.62/bu, though both trended higher late in the week.

The Bottom Line

Looking ahead, the key takeaway this week is the growing divide between resilient fats and fragile powders. Butter and AMF continue to attract strong retail and manufacturing interest, offering some price floor protection. But with milk collections swinging higher across the Southern Hemisphere, SMP and WMP are likely to remain under pressure through the year’s end.

Short-term volatility may persist, especially if China’s buying remains uneven. Still, there’s cautious optimism. Farm-level profitability in regions like New Zealand and the Midwest is holding better than last year — proof that leaner operations, feed cost management, and smarter hedging have made this downturn more manageable.

As always, milk will find a home — but the home it finds this season might be one more driven by butterfat than by bulk powder. And that’s a story worth watching as we head toward the new year.

Key Takeaways:

  • Fats are holding firm, powders aren’t. Butter and AMF prices found support, but SMP and WMP remain under pressure from surging milk supply.
  • GDT slipped again (-1.4%), its fifth straight decline — a reminder that buyer confidence isn’t back yet, even as global GDP nudges higher.
  • Europe’s cheese values slid once more, squeezed by full silos, steady milk flows, and competitive U.S. export pricing.
  • Southern Hemisphere production is booming — New Zealand up 2.5%, Argentina nearly 10% higher — ensuring plenty of product but few price rallies.
  • In the U.S., butter and whey are bright spots, lifted by retail holiday demand and strong protein interest.

Complete references and supporting documentation are available upon request by contacting the editorial team at editor@thebullvine.com.

Learn More:

The Sunday Read Dairy Professionals Don’t Skip.

Every week, thousands of producers, breeders, and industry insiders open Bullvine Weekly for genetics insights, market shifts, and profit strategies they won’t find anywhere else. One email. Five minutes. Smarter decisions all week.

NewsSubscribe
First
Last
Consent

Who Speaks for Your Milk Check? The Push to Reform Dairy’s Voting Power

Not every deduction on a milk check is math—some are politics. Here’s how U.S. farmers lost $337 million without casting a single vote

Executive Summary: In 2025, U.S. dairy farmers lost $337 million in just three months following FMMO reforms that increased processor make allowances using voluntary, unverified cost data. The change exposed a fundamental flaw: most producers never voted on the rule that reduced their pay. The American Farm Bureau Federation is now leading a campaign for modified bloc voting, restoring producers’ right to vote independently rather than through cooperative boards. At the same time, pressure is growing for USDA audits of processor costs and itemized cooperative milk checks, ensuring transparency and accountability from plant to producer. A similar structure in Canada illustrates the power of individual voice—where direct farmer ownership and votes drive protective policy outcomes. Together, these reforms mark a turning point toward verified data, fair pay, and representation that aligns with the farmers doing the milking.

Milk Check Transparency

You know that feeling when the milk check comes and something doesn’t line up. The herd’s healthy, butterfat performance is steady, feed costs haven’t spiked—but the final number is off. That’s been a common story across farms this year.

Earlier this fall, both the U.S. Department of Agriculture’s Agricultural Marketing Service (AMS) and the American Farm Bureau Federation (AFBF) confirmed what many suspected. The most recent Federal Milk Marketing Order (FMMO) pricing reforms shifted about $337 million from farmers to processors in just three months.

What’s striking isn’t just the number—it’s how the decision happened. Most producers never saw a ballot. And that missing vote might be the most expensive one they never got to cast.

How a Technical Rule Became a Real Pay Cut

Make allowances surged 32-48% in June 2025 based on unverified processor data—the highest jumps in dry whey and cheese directly slashed what farmers received per hundredweight

Here’s what set this off. In June, USDA raised make allowances—the assumed cost of processing milk into dairy products—by 25 to 43 percent. The reasoning was simple enough: labor, packaging, and energy costs have risen since the last review in 2008.

Here’s the part that farmers are still talking about. Those numbers came from voluntary processor surveys and not from audited financials. By law, USDA still lacks the authority to require processors to open their books under the Agricultural Marketing Agreement Act of 1937.

As AFBF dairy economist Danny Munch explained during the organization’s fall dairy policy update,

“We’re basing a national pay system on unverified numbers, and the only side that benefits is the one submitting the data.”

USDA’s Pool Settlement Reports show how fast that imbalance added up: $64 million in the Upper Midwest, $62 million in the Northeast, and $55 million in California.

For a 150-cow herd shipping about 24,000 hundredweight a year, that’s about $18,000 to $20,000 gone—roughly equivalent to this year’s surge in energy costs, or a major herd health outlay.

Regional distribution of the $337 million in FMMO losses reveals that smaller regions collectively bore nearly half the burden, intensifying the impact on individual farms

Regional Impact Summary (June–September 2025)

  • Upper Midwest: –$64 million
  • Northeast: –$62 million
  • California: –$55 million
    (Source: USDA AMS, Q3 2025 Pool Data)

Who Cast the Vote That Changed It?

AspectCurrent Bloc VotingModified Bloc Voting (AFBF Proposal)
Who Controls Your Vote?Cooperative board decides for all membersYOU decide—opt in or vote independently
Member ChoiceNone—vote cast automaticallyFull choice: authorize co-op or vote direct
Transparency LevelLow: No individual vote trackingHigh: Individual votes counted
Conflict of InterestHIGH: Co-ops process AND voteLOW: Direct farmer control
Individual AccountabilityNone—members never see ballotFull—every producer has voice

That question gets to the heart of a deeper issue. When FMMO proposals go out for a referendum, producers are supposed to decide. But under the current system, most never touch a ballot.

That’s because cooperatives cast bloc votes representing all their members. The idea was originally intended to save administrative time in the 1940s, when local co-ops marketed milk from small family dairies.

Fast forward 80 years. Dairy Farmers of America, Land O’ Lakes, and California Dairies Inc. now handle more than 60 percent of the nation’s milk, according to the USDA’s Economic Research Service (2024). Those organizations don’t just market milk—they process it. When processing margins rise, they gain on one side while the member pay price shrinks on the other.

That’s why AFBF, joined by several state-level farm bureaus, is pressing for modified bloc voting.

Under this approach, co-ops could still submit bloc votes, but only for members who authorize them. Others could opt out and cast their own ballots directly. It’s a small procedural shift with big implications for fairness.

As Munch told producers in Wisconsin, “If your paycheck depends on it, you should get to decide how it’s structured.”

Why Voting Reform Comes First

Some producers have asked why start with voting rights rather than mandatory audits or cost-verification reforms? It’s a logical question—but one with a simple answer.

Every major FMMO change still requires a producer vote to pass. If co-ops continue controlling those votes, the same imbalances in representation will persist—even with better data. Modified voting gives individuals a voice before the next cost survey or order amendment lands on the table.

Think of it this way: fair data means knowing the numbers are right; fair voting means knowing your opinion counts before the next decimal gets moved.

The Transparency Gap That Shows Up Every Month

For most of us, the problem isn’t hidden in Washington—it’s sitting right on the milk check.

Private processors are required to list detail on component prices, deductions, and the Producer Price Differential (PPD). Cooperatives, though, are exempt. Since they’re considered farmer-owned, they aren’t required to disclose the same payment details.

That might sound routine, but it creates an information gap. A University of Wisconsin Extension report (2024) found that 70 percent of cooperative pay statements lacked full explanations for deductions over $0.25 per hundredweight. Terms like “market adjustment” or “balancing charge” were often used without further specification.

As Mark Stevenson, emeritus policy specialist at UW–Madison, put it, “You can’t manage what you can’t measure.”

Plenty of producers can relate. Even herds with solid butterfat and protein trends are seeing unexplained adjustments that chip away at gross pay. That lack of clarity feeds the same frustration driving the broader voting reform effort: farmers want transparency, not theory.

Looking North: What Canadian Quotas Tell Us About Voice

Canada’s dairy producers own individual quotas and cast direct votes that shape trade policy; U.S. farmers are fighting to regain that same power through modified bloc voting and mandatory processor audits

It’s worth pausing to look north for perspective. Canada operates under a supply management system that balances domestic production and demand through quotas. Each farmer owns a quota, currently worth about CA $30,000 per cow (Agriculture and Agri-Food Canada, 2025), and that ownership translates directly into control.

In 2017, Canadian dairy farmers organized a significant voter push within the Conservative Party, ultimately flipping a leadership contest by less than 1%. This year, the Canadian Parliament passed Bill C‑202, which makes it illegal for ministers to negotiate away dairy protections in trade deals.

The U.S. doesn’t have a quota system, and few producers would want one. But here’s the takeaway: when farmers hold direct, non-negotiable voting authority, policy outcomes tend to protect producers instead of eroding them.

Where These Reforms Stand Now

For the first time in years, the groundwork for reform is visible.

A provision in the 2025 Farm Appropriations Act now gives USDA AMS the authority to conduct audited processor cost surveys. The agency plans to begin that process in 2027, replacing voluntary surveys with verifiable data collection.

Meanwhile, new proposals are emerging to standardize cooperative milk-payment statements so co-op members receive the same level of itemized transparency as proprietary producers.

And finally, AFBF’s modified bloc voting proposal continues building bipartisan traction, with several state delegations already urging USDA to schedule a hearing for 2026.

These are all incremental steps—but together, they form the backbone of a more accountable system.

What It Means for Different Dairies

Whether you milk 80 cows in New York’s Finger Lakes or 8,000 in a California dry lot, clarity is good business. Verified cost surveys stabilize Class III and IV price forecasts. Transparency builds trust and simplifies planning.

Cornell University’s Dairy Markets Research Program (2024) notes that “information symmetry improves efficiency and stability at every scale.” In simpler terms, fair data and fair governance don’t pick winners—they lift the whole market.

Co-ops That Are Already Leading

Some cooperatives aren’t waiting for regulation to catch up. Rolling Hills Dairy Cooperative in Wisconsin already provides members with detailed monthly pool and freight summaries through an online portal. Select Milk Producersin Texas publishes audited hauling and balancing charges so members can see exactly what the deductions mean.

Rolling Hills general manager Tom Larkin says the results were immediate: “Once members could see where their money went, trust followed. Transparency lined us up on the same side again.”

That kind of leadership shows reform doesn’t have to start in Washington—it can begin wherever farmers demand a clearer deal.

Five Things Producers Can Do Now

  1. Compare your check. Match component prices to your federal order’s monthly reports; the differences may surprise you.
  2. Ask for documentation. Request written breakdowns for deductions labeled “market adjustment” or “balancing.”
  3. Collaborate. Compare notes with neighboring farms—shared data reveals patterns.
  4. Engage early. Follow your state Farm Bureau updates and dairy policy hearings.
  5. Exercise your vote. Whether under current co-op structures or future modified voting, make sure your ballot represents your voice.

The Bottom Line

After covering dairy policy for years—and spending plenty of time around farmers who live it—I’ve noticed that most producers can handle market volatility and feed swings. What they can’t handle is opacity.

The call for reform isn’t rebellion; it’s about modernizing a system that no longer reflects how milk is marketed or how producers define ownership.

If democracy belongs anywhere, it’s in the milk check. Because when producers see the numbers, cast their own votes, and know where their dollars go, trust stops being a slogan—it becomes part of doing business.

Key Takeaways:

  • $337 million disappeared from producers’ milk checks in three months following FMMO reforms based on voluntary processor cost data that USDA could not verify.
  • Most farmers never voted on the rules that reduced their income, because cooperatives cast bloc votes on behalf of all members—often blending farmer and processor interests.
  • AFBF’s proposed modified bloc voting system would restore the right for every producer to cast an individual ballot, bringing direct democracy back into milk pricing.
  • Mandatory processor cost audits and itemized co-op pay statements are now gaining traction, opening the door to verified data, clear deductions, and accountable pay.
  • Transparency isn’t anti-cooperative—it’s pro-farmer. As seen in Canada’s producer-driven system, ownership and voice together equal stability and fair value for milk.

Complete references and supporting documentation are available upon request by contacting the editorial team at editor@thebullvine.com.

Learn More

The Sunday Read Dairy Professionals Don’t Skip.

Every week, thousands of producers, breeders, and industry insiders open Bullvine Weekly for genetics insights, market shifts, and profit strategies they won’t find anywhere else. One email. Five minutes. Smarter decisions all week.

NewsSubscribe
First
Last
Consent

Beyond Efficiency: Three Dairy Models Built to Survive $14 Milk in 2026

When$14milk becomes the new normal, efficiency alone won’t save you.Discover three dairy models built for the market ahead

Executive Summary: The North American dairy sector is facing a reckoning as production increases, exports decline, and processing capacity surpasses consumer demand. According to the USDA, Chinese imports have fallen nearly 50 percent since 2021, while the IDFA notes $11 billion in new U.S. plant investment through 2027. This has led to Class III milk prices lingering around $14 per hundredweight for extended periods. Producers who adapt most effectively are not necessarily those working harder but those managing smarter: large farms are focusing on water resilience, smaller operations are developing their own brands, and mid-size herds are diversifying into beef and energy. Even Canada’s supply-managed system is feeling pressure as CUSMA provisions allow cheaper U.S. dairy components to enter the country. The key question for every dairy leader is whether their operation is prepared to survive by strategic management rather than relying solely on scale.

If you’ve noticed an edge in conversations at meetings or the feed store lately, you’re not imagining it. The industry’s uneasy. Sure, milk prices fall and climb like they always do—but what we’re facing heading into 2026 feels different. What’s interesting is that this shift isn’t about a single bad year. It’s structural.

The data coming from USDA’s Foreign Agricultural ServiceCoBank’s Dairy OutlookTexas A&M AgriLife Research, and Cornell PRO‑DAIRY all paint a similar picture: we’ve built a milk production system that’s outpaced the market’s ability to absorb it. The overcapacity problem isn’t just an economic story—it’s become an operational one.

But here’s what’s encouraging: the farms reading the signals now will still be standing when the next upturn comes. Let’s break down what’s driving this reset and, more importantly, what dairies can do about it.

Exports: When America’s Safety Valve Starts Closing

For years, exports balanced our market, but that pressure valve is tightening. According to the USDA’s foreign trade data, China’s dairy imports dropped nearly 50 percent from 2021 to 2024. That’s not a blip. It’s largely the result of New Zealand’s complete tariff elimination on dairy through its free trade agreement with China, finalized in 2024. New Zealand now supplies close to half of China’s imported milk powder.

Export market collapse visualization showing China’s 55% import decline from 2021-2026 while New Zealand captures 50% market share through tariff-free access. Mexico, representing 25% of US exports, faces $4B domestic investment threatening future demand. Andrew’s Take: This isn’t a temporary dip—it’s a structural realignment that rewrites 40 years of export strategy. Farms betting on an export rebound are playing a losing hand.

Mexico remains the anchor buyer—taking roughly 25 percent of U.S. dairy exports—but the country’s government has already committed more than $4 billion to reduce that dependency by 2030 through feed, processing, and genetic improvements (USDA FAS Mexico). It’s a reminder that even friendly trade partners are prioritizing domestic capacity.

Domestically, per‑capita dairy consumption has hovered around 650 pounds for half a decade (USDA ERS). Cheese and butter continue inching upward, but fluid milk keeps sliding. Meanwhile, IDFA projects $11 billion in new processing capacity—mostly cheese and powder—coming online through 2027. Taken together, it means more milk will be chasing fewer high‑value markets.

It’s why UW–Madison economist Mark Stephenson expects Class III milk to linger near $14 for much of 2026 unless production adjusts. That’s tough news for balance sheets built on $18 milk assumptions.

MetricValueTrend
% US Milk from <700 Herds70%Rising
H5N1 Production Loss (Some Herds)25%Event Risk
Herds Lost per Year (est)2-3%Accelerating
Average Herd Size Growth3-5%/yrContinuing

When Efficiency Turns on You

We’ve spent a generation tightening feed efficiency, refining fresh‑cow management, and maximizing butterfat performance. But when every operation does it at once, collective output outpaces demand. Stephenson’s work shows exactly that: efficiency saves individual farms but extends low‑price cycles industry‑wide.

CoBank’s 2025 outlook says lenders have started factoring this reality into their models, advising clients to treat $14–$15 milk as a planning baseline. They’re less interested in herd size and more in liquidity and diversification—two words that used to sound cautious but now mean survival.

It’s worth noting that some operations are already adapting faster than expected. Instead of ramping production, they’re building buffer zones—feed inventories, beef programs, or renewable energy income—that buy time when markets slump. That’s a quiet, practical form of resilience.

Three Business Models Leading the Next Era

Beef-on-dairy crossbred calves command $1,400 premiums compared to $150 for Holstein bulls—adding $3.50 per hundredweight to dairy revenue without increasing milk production. This diversification strategy is reshaping farm economics across North America. Andrew’s Reality Check: Three years ago, consultants said beef-on-dairy was a fad. Today it’s adding more per-cwt value than most efficiency gains combined. The market voted with its wallet.
Revenue SourceValue per HeadAdditional Revenue per cwt
Beef-on-Dairy Calf14003.5
Holstein Bull Calf1500.15
Cull Cow (reduced)8000.8
Traditional Dairy Only00.0

Looking around North America, I see three dairy models redefining success—and interestingly, none of them depend solely on volume.

1. Scale with Resource Discipline

Large dairies (2,500 cows and up) still enjoy supply‑chain leverage and efficient overheads, keeping costs near $13–$14 per cwt. But as Texas A&M AgriLife has documented, Ogallala Aquifer drawdowns of several feet per year are already limiting western expansion. Efficient dry lot systems still hinge on water, not on technology. The winners in this space will be those securing long‑term water rights and investing in traceable sustainability systems that gain processor preference.

2. Premium Differentiators

Smaller operations in Wisconsin, Vermont, and New York are thriving by selling distinctiveness. The Dairy Business Innovation Alliance granted $27 million last year to help farmers launch on‑farm processing or branded lines. Cornell’s marketing research shows that these operations can gross nearly twice the revenue per gallon of bulk milk, even after accounting for labor and packaging. It’s not an easy switch—but it’s proof that price control still exists for those who own their story.

3. Diversified Mid‑Tier Enterprises

Mid‑sized farms (400–1,000 head) are finding stability through hybrids: beef‑on‑dairy programs, digesters, custom fieldwork, and even agritourism. USDA AMS reports cross calves averaging $1,300–$1,500—steady income that doesn’t depend on milk checks. A producer in western New York summed it up well: “We stopped trying to be the biggest and started aiming to be the most stable.” That’s the pivot shaping 2028’s survivors.

Business ModelLarge-Scale (2,500+ cows)Premium Direct (Small-Mid)Diversified (400-1,000 cows)
Cost per cwt$18.50$22.00$20.25
Revenue per gallon$3.20$5.50$4.10
Key AdvantageEconomies of scalePremium pricingRisk spread
Key RiskCapital intensiveMarket dependentComplex mgmt
2026 ViabilityStrongModerateGood

Regional Realities to Watch

Southwest: Managing Heat and Water

The Southwest’s production advantage is shrinking under the pressure of climate change. NOAA data shows that regional summer highs have increased by nearly 2°F since 2005. Sustained 105°F temperatures drop butterfat 0.25 points and drag conception rates 10–15 percent. Cooling systems can recover performance but raise feed and energy costs—a balance every dry lot system must now manage deliberately.

Midwest: Cooperatives Reinventing Identity

In the Upper Midwest, co‑ops aren’t just merging for size—they’re merging for marketing power. By uniting under shared premium labels, regional processors can command higher prices while keeping milk local. “Made in Wisconsin” and “Minnesota Heritage” brands are now marketing assets that translate directly into net returns.

Northeast: Proximity to the Plate

Closer to metro areas, direct bottlers and farmstead processors are rewriting the economics of small dairies. Cornell Extension documents farms earning $4.50–$5 per gallon retail versus roughly $2.00 through commodity channels. The tradeoff? Long hours, daily distribution. But for these herds, proximity beats volume.

RegionPrimary_ChallengeTemp_IncreaseButterfat_ImpactStrategic_Response2026_Outlook
SouthwestWater + Heat Stress2°F since 2005-0.25 pts at 105°FWater rights + coolingConstrained growth
MidwestCo-op ConsolidationModerateMinimalPremium brandsConsolidation continues
NortheastCompetition + LaborModerateMinimalDirect retail + proximityNiche strength

Consolidation Without Cushion

Here’s what concerns many analysts, myself included. USDA ERS data shows 70 percent of U.S. milk now comes from fewer than 700 herds. Economies of scale made U.S. dairy globally competitive, but that concentration also magnifies disruption.

When USDA APHIS chronicled this year’s H5N1 outbreaks, some mega‑herds lost a quarter of production temporarily. A single event like that can ripple nationwide when production is so consolidated. Efficiency has been our calling card—but efficiency without redundancy is a structural risk.

Policy Reality: The Market Leads

Don’t hold your breath for government rescue via supply management. Lawmakers shelved those proposals years ago, and the odds of revival are slim. The playing field instead relies on program updates like Dairy Margin Coverage and Dairy Revenue Protection.

Some cooperatives are experimenting with “soft cap” base systems that reward milk sold inside quotas while reducing incentives for extra volume. As Cornell’s Ch is Wo f explains, production discipline rarely starts in Congress—it begins when lenders align credit with profitability, not throughput.

Canada’s Connection Under CUSMA

For Canadian producers, this U.S. reset carries ripple effects. Under CUSMA/USMCA, American exporters filled about 42 percent of tariff‑rate quota (TRQ) volumes in 2024 (USDA GATS). If U.S. milk stays cheap, industrial users north of the border could see downward price pressure on powders, even within supply management.

On the flip side, cheesemakers importing U.S. components might gain a cost advantage. It shows how intertwined our systems have become: Canada’s quota stability protects producers, but processors share exposure to North American market cycles.

A 90‑Day Plan for Staying Liquid

  1. Stress‑Test Your Numbers.
    Model 18 months of $14 milk , including all liabilities: feed, debt, family living, and depreciation. Knowing the breakeven point beats guessing.
  2. Six Months of Liquidity.
    Whether feed, credit, or cash reserves, that’s now the lender’s preferred benchmark. It buys you choices when margins vanish.
  3. Diversify Intentionally.
    Beef‑on‑dairy returns, renewable‑energy partnerships, or manure composting programs provide steady non‑milk income and nitrogen‑value recycling.
  4. Align Your Advisors.
    Bring your lender, accountant, and co‑op rep to one table. Coordinated strategy beats reaction every time.

What Success Will Look Like by 2028

MetricVulnerableAt_RiskResilient
Debt-to-Asset Ratio>35%25-35%<25%
Non-Milk Income %<10%10-20%25-30%
Liquidity Reserve<3 months3-4 months6+ months
Breakeven Price>$16/cwt$14-16/cwt<$14/cwt
Risk LevelHIGHMEDIUMLOW

The most resilient operations typically maintain debt-to-asset ratios below 25 percent, generate 25 to 30 percent of their income from sources other than milk, and use integrated data systems that connect cow performance with overall cash flow.

A Pennsylvania producer told a USDA panel recently, “We stopped calling ourselves milk producers—we’re opportunity managers who milk cows.” That’s optimism shaped by hard truth—and it’s probably the right mindset for the next cycle.

The Bottom Line: Strategy Outlasts Size

The next few years won’t favor the farms that produce the most milk, but rather the ones that manage risk  best. Markets—just like herds—reward adaptation more than brute strength.

What’s encouraging is that dairy already has the tools necessary for a successful transition, including precision nutrition, component payouts, renewable energy credits, co-op innovation, and data integration. The real challenge lies in timing—taking action now while there is still an opportunity. By leveraging these resources and making proactive decisions, dairy producers can position themselves to thrive in a changing market, ensuring their operations remain resilient and adaptable for the future.

History shows that producers who adapt quickly are the ones who shape the future of the industry. While the upcoming transition may be challenging, it also presents a valuable chance to build a dairy sector that is more efficient, knowledgeable, and prepared for whatever changes the market may bring.

Key Takeaways

  • Dairy’s next chapter starts with a reset: rising production, shrinking exports, and processing capacity that’s outgrown demand.
  • Producers can’t count on price rebounds—planning for $14 milk means focusing on liquidity, strategy, and controlled risk.
  • The farms built to last aren’t the biggest—they’re the smartest at diversifying their income streams.
  • From Texas dry lots to Midwestern co-ops, success means pivoting from efficiency to adaptability.
  • Even Canada feels the ripple as CUSMA imports pressure processors and test supply management’s limits.

Complete references and supporting documentation are available upon request by contacting the editorial team at editor@thebullvine.com.

Learn More:

The Sunday Read Dairy Professionals Don’t Skip.

Every week, thousands of producers, breeders, and industry insiders open Bullvine Weekly for genetics insights, market shifts, and profit strategies they won’t find anywhere else. One email. Five minutes. Smarter decisions all week.

NewsSubscribe
First
Last
Consent

The $100 Per Cow You Never See: How Foreign Subsidies Are Reshaping American Dairy

Three dairy farms close every day while Europe pays their farmers to compete against you.

You know that frustration when milk prices just don’t reflect the work you’re putting in? I was talking with a Wisconsin dairyman last week who nailed it: “I can handle weather variability and market cycles—we’ve done that for generations. What’s harder to navigate is when other governments are actively supporting our competitors.”

Here’s what’s interesting—this concern is popping up everywhere I go. Cornell’s dairy economist, Andrew Novakovic, ran some modeling earlier this year that suggests foreign subsidies might be extracting approximately $90 to $100 per cow annually from your operations through price suppression.

Now, for a typical 500-cow dairy? We’re talking about $45,000 to $50,000 in potential revenue that just…vanishes. Never shows up in the milk check.

What I’ve noticed is this pattern holds whether you’re running 200 cows on pasture in Vermont or milking 2,500 head in a New Mexico dry lot. The dynamics stay remarkably consistent.

Understanding What You’re Up Against

The global dairy market has undergone significant changes, and it’s worth taking a moment to understand how other governments are influencing the playing field.

The European Union has an intervention purchasing system—they actually buy up butter and skim milk powder when prices drop, holding them at levels above where the market would naturally clear. Their own Court of Auditors looked at this back in 2021 and basically said, “Hey, this is causing market distortions.” They even referred to it as “destabilizing.”

European Commission intervention stocks directly suppress US milk prices—when EU stockpiles peaked at 380,000 MT in 2016, American producers lost $0.80/cwt, costing the industry an estimated $2.2 billion in farm income over two years.

But here’s the thing—it continues anyway. Mark Stephenson, over at Wisconsin’s dairy policy program, figures that these interventions might be costing U.S. dairy hundreds of millions of dollars annually in lost competitiveness.

Then you have China doing something different, but equally challenging. They’re offering VAT rebates to processors in special economic zones—we’re talking 8 to 13 percent back on dairy exports, specifically through their State Council Directive 2024-15, which expanded these zones. So, when a buyer in Nigeria or Saudi Arabia is comparing bids? That Chinese supplier has an automatic advantage that has nothing to do with efficiency.

I was chatting with an Idaho producer who runs a pretty sophisticated operation—robotics, precision feeding, the whole nine yards. He said something that stuck with me: “We can match anybody on production metrics. But when their government picks up 8-13% of the tab? That’s a whole different ballgame.”

When Theory Meets Reality: What Happened in Michigan

You want to see how this plays out in real life? Look at what Michigan dairy cooperatives documented in their recent annual report. They lost significant contracts to European suppliers when Algerian buyers shifted their sourcing.

Here’s why: Under the EU-Algeria trade agreement, European dairy products enter the market duty-free. Meanwhile, U.S. exports? We’re looking at tariffs of 25% or more.

Based on typical market pricing with these tariff differences, European suppliers can deliver powder at prices we literally can’t match—not because they’re better, but because the trade structure gives them that advantage.

And when co-ops lose those export contracts, the impact is immediate. Phil Durst, who does dairy education for Michigan State Extension, has been tracking this. Milk prices can drop more than a dollar per hundredweight. Producers start culling—often 10-15% of the herd goes. Processing plants start wondering if they can stay open.

A third-generation Michigan producer told me recently, “Our somatic cell count runs under 150,000 consistently. Components are excellent. We’ve got reproduction dialed in. But being good at your job has limits when the playing field’s this tilted.”

Breaking Down What This Means for Your Operation

Let’s talk real numbers here. A price suppression of $0.35 to $0.40 per hundredweight might not sound like much at first…

The hidden subsidy impact ranges from $17,000-$19,000 for a 200-cow dairy to $212,000-$237,000 for a 2,500-cow operation—money that never appears in your milk check but represents 25-50% of typical operating margins

But think about it this way. Your average cow produces around 240 hundredweight annually—that’s pretty standard, based on the USDA’s latest numbers. Multiply that potential price impact out, and you’re looking at $85 to $95 per cow that could be missing.

Scale it up to your operation:

  • Running 200 cows? That’s potentially $17,000 to $19,000 annually
  • Got 500 cows? We’re talking $42,500 to $47,500
  • Thousand-cow operation? Could be $85,000 to $95,000
  • One of those 2,500-cow facilities? They might be missing $212,000 to $237,000

What really gets me is when you consider that most operations—according to USDA’s economic research—are running margins of maybe $200 to $400 per cow in good years. So, what’s the potential $90-100 impact? That’s 25 to nearly 50 percent of your profit margin. Gone.

How This Changes Investment Decisions

This entire dynamic completely shifts how you view capital investments.

I was working with a California producer near Tulare recently—she has 3,200 cows, a really sharp operator. She ran the numbers on a robotic milking system under different price scenarios, and what she found was eye-opening.

“We did sensitivity analysis on three different parlor upgrade options,” she explained. “The difference between current pricing and what we’d see with even partial relief from these subsidies changed our internal rate of return by nearly 40 percent. That’s literally the difference between our lender saying yes or no.”

At current subsidy-suppressed prices, critical investments like environmental compliance show negative returns and facility upgrades don’t meet lending thresholds—but even partial price recovery (+$0.20/cwt) makes most investments viable, explaining why your banker needs to see the full competitive picture.

Think about that. Agricultural lenders base everything on debt service coverage ratios tied to your operating margins. For a 500-cow operation, if you’re missing $45,000 annually due to price suppression, that could mean $200,000 less borrowing capacity.

That’s your parlor upgrade. That’s your environmental improvements. That’s the difference between modernizing or watching things slowly fall apart.

And succession planning? Boy, that’s where it really hits home. Iowa State Extension keeps data on this, and there’s a clear correlation—when margins look thin, the next generation looks elsewhere.

I know several Vermont families right now where kids with ag degrees are wondering if it makes sense to take on the farm debt or just go work for Land O’Lakes corporate. Can’t say I blame them for thinking it through.

Where We’re Headed: The Long View

Looking at the bigger picture, USDA data shows we’ve gone from over 70,000 dairy farms in 2003 to about 26,500 today.

U.S. dairy farms have collapsed from over 70,000 in 2003 to 24,810 today, with projections showing a potential decline to just 17,000 operations by 2035—that’s three farms closing every single day

Marin Bozic, who does dairy economics at the University of Minnesota, presented some modeling at the industry meetings last year. He projects that we could drop to somewhere between 17,000 and 20,000 operations by 2035. That’s another quarter to a third gone.

What’s really interesting is how this plays out regionally:

  • Traditional dairy states in the Northeast? Could see losses over 50-60 percent
  • The Upper Midwest might drop 40-55 percent
  • But certain Western and Southern states keep growing

Here’s what’s happening—at really large scale, say 3,000-plus cows, you can sometimes absorb these competitive disadvantages through sheer volume and efficiency.

But those mid-scale operations, the 300 to 1,000 cow dairies? They’re in a tough spot.

The consolidation pattern is stark: operations under 1,000 cows are exiting at rates of 5.5% to 12% annually, while farms with 1,000+ cows are actually growing at 2%—demonstrating the brutal economics of mid-scale dairy farming in a subsidized global market.

Bozic figures that these trade-related factors might accelerate consolidation by 15-25 percent beyond natural market evolution. Some consolidation makes sense—technology improves, efficiencies develop. But acceleration driven by trade distortions? That’s a different conversation.

You know what’s interesting? When apple producers faced similar subsidy competition from China a few years ago, they documented the situation, presented the economic harm, and had Section 301 tariffs implemented. Within two years, U.S. apple exports to key Asian markets recovered by nearly 30 percent. There may be lessons to be learned from dairy.

Three Ways Producers Are Responding

What I’ve found talking with producers around the country is that folks are generally taking one of three approaches—and here’s the key thing, these aren’t mutually exclusive. Plenty of operations are combining strategies.

Making the Scale Decision

If you’re between 500 and 1,000 cows right now, you’re facing some tough choices.

Several Wisconsin producers I know are crunching the numbers on borrowing to acquire 1,500-plus cows. They’re basically betting scale can overcome the subsidy disadvantage.

Others are choosing to exit while they’ve still got equity. One Pennsylvania dairyman put it to me this way: “I can get $1,500 per head in an orderly sale today. Wait three years if margins stay compressed? Maybe it’s $800 in a fire sale. That’s $350,000 difference on 500 cows.”

Finding Premium Markets

Some operations are successfully capturing premiums—organic, A2/A2, grass-fed—that help offset these competitive challenges.

A Vermont producer who went organic shared his experience: “Took 18 months of disrupted cash flow during transition. About $280,000 in market development over three years. We’re capped at 400 cows because of pasture requirements. Works for us—we’re close to Boston. But it’s not for everyone.”

USDA’s marketing service data suggests that maybe 10-15 percent of operations have the right location and resources to make premium strategies work.

Interestingly, some of these individuals are also among the loudest voices in advocacy, using their privileged position to highlight how conventional dairy faces unfair competition.

Getting Organized and Speaking Up

Groups are becoming more savvy about documenting their impacts and communicating with policymakers using real data.

The Wisconsin Dairy Business Association compiled member data showing over $45 million in annual trade-related losses across their membership. Their executive director told me, “Generic complaints don’t move policy. But when you show up with spreadsheets documenting specific economic harm? That gets attention.”

Many operations pursuing scale or premiums are also participating in these advocacy efforts. They recognize that addressing structural disadvantages benefits everyone, regardless of the strategy.

Here’s an encouraging example: A group of Michigan producers recently met with their congressional delegation, armed with specific documentation of lost contracts and price impacts. Within three months, they had both senators co-sponsoring legislation to examine dairy trade enforcement. It’s not a solution yet, but it’s a movement.

What Recovery Might Look Like

If we achieve policy adjustments similar to those in other agricultural sectors, recovery probably wouldn’t happen overnight.

The modeling from Texas A&M’s policy center suggests that we might see initial improvements within 12-18 months, with more comprehensive adjustments over 2-3 years. For that 500-cow operation we keep talking about? Even a partial improvement could mean tens of thousands of dollars in additional revenue.

Various analyses suggest addressing these imbalances might help preserve several thousand dairy operations through 2035. Won’t stop all consolidation—technology and efficiency gains are real. But it might slow things down to a more natural pace.

Practical Considerations for Your Operation

After all these conversations with producers and lenders, here’s what seems to be working:

When you’re evaluating break-even, run scenarios both ways—current conditions and with potential trade improvements. If you’re struggling now but would be profitable with modest price improvements, maybe the problem isn’t your operation.

Document everything for your lender. Several Farm Credit personnel have informed me that they’re more flexible with covenants when producers can demonstrate that market distortions, rather than management problems, are driving the pressure.

For investments, model three scenarios:

  • Keep going as is (baseline)
  • Partial improvement ($0.20/cwt better)
  • More normalized pricing ($0.40/cwt improvement)

Focus on investments that work in at least two scenarios. Gives you flexibility.

And on the advocacy side? Specifics matter. Document your impacts, work with neighbors to aggregate data. Ten farms speaking together carry more weight than ten separate complaints.

The Bigger Picture

What strikes me most about all this is how subtle it is. The normal fluctuations in milk prices often mask these impacts. Easy to overlook if you’re not paying attention.

We get our milk checks, maybe grumble about prices, and get back to work. Meanwhile, these complex trade structures may be systematically affecting everyone of us.

The co-ops losing export contracts, generational farms closing, kids choosing other careers—maybe this isn’t just efficiency sorting things out. Maybe it’s what happens when trade structures tilt the playing field.

An old-timer in Wisconsin—fourth generation, been milking since the ’70s—said something that really resonated: “I’ve managed through weather, disease, market cycles for four decades. That’s dairy farming. But competing against foreign treasuries? That’s not something you fix by working harder.”

Understanding this concept changes how you view everything—investments, debt, succession, and daily decisions. We probably need both operational improvements and engagement on trade policy. Neither alone seems sufficient.

Current projections suggest we might drop to 17,000-20,000 dairy farms by 2035. With more balanced trade conditions? Maybe we keep a few thousand more. Those farms aren’t just businesses—they’re the difference between rural communities thriving or hollowing out.

These aren’t abstract policy debates. This is about whether you can justify that parlor upgrade, whether your kids see opportunity in dairy, and whether your town keeps its feed mill.

How we respond—through strategic planning, working together on advocacy, or just adapting to what is—will shape not just individual farms, but American dairy for the next generation.

Understanding what we’re up against, challenging as it may be, might be the first step toward taking action. Because at the end of the day, we’re all trying to produce quality milk, support our families, and keep viable operations going. Recognizing the full competitive landscape enables us to make more informed decisions about the path forward.

KEY TAKEAWAYS 

  • Your missing revenue: Foreign subsidies suppress milk prices by $90-100/cow annually—that’s $46,000 for a 500-cow dairy that never reaches your milk check
  • Capital access crisis: This hidden loss reduces borrowing capacity by $200,000+, explaining why your banker says no to viable improvements
  • Three strategic paths: Operations are successfully (1) scaling past 1,500 cows for efficiency, (2) capturing premium markets, or (3) documenting losses for collective policy action
  • Smart investment framework: Model every decision using three scenarios—current prices, partial recovery (+$0.20/cwt), and normalized pricing (+$0.40/cwt)
  • The opportunity: Documented advocacy is working—apple producers secured relief in 2019, and Michigan dairy has senators engaged. Your specific data matters.

Complete references and supporting documentation are available upon request by contacting the editorial team at editor@thebullvine.com.

Learn More:

  • The Dairy Producer’s Guide to Navigating High Input Costs – While the main article explains lost revenue, this guide provides tactical strategies to protect your margins from the other side. It reveals proven methods for reducing feed, labor, and energy expenses to build operational resilience against price suppression.
  • Navigating the Tides: A Deep Dive into the 2024-2025 Dairy Market Outlook – To make informed strategic decisions, you need the full picture. This analysis expands on the main article’s trade focus, breaking down all key global and domestic market drivers, from consumer demand to supply-side trends, impacting your milk check.
  • Unlocking Efficiency: The Real ROI of Robotic Milking Systems – The main article highlights how suppressed prices threaten modernization. This piece demonstrates exactly what’s at stake, providing a detailed framework for calculating the true ROI of automation and making data-driven decisions on major capital investments for long-term viability.

The Sunday Read Dairy Professionals Don’t Skip.

Every week, thousands of producers, breeders, and industry insiders open Bullvine Weekly for genetics insights, market shifts, and profit strategies they won’t find anywhere else. One email. Five minutes. Smarter decisions all week.

NewsSubscribe
First
Last
Consent

Processor Failed? You Have 72 Hours: The Financial Firewall Every Dairy Farm Needs Now

48% of farms take on debt when processors fail. 11% never recover. The difference? Three months of cash no bank can freeze

EXECUTIVE SUMMARY: Your processor could fail tomorrow—93 French dairy farms just learned this the hard way in October 2025. With 73% of regional dairy processors lost since 2000, today’s consolidated market has transformed processor failure from a minor inconvenience to an existential threat. When it happens, you have exactly 72 hours before bulk tank capacity forces you to dump milk, and nearly half of affected farms will take on debt, while 11% won’t survive at all. Yet farmers who’ve built what we call a “financial firewall”—90 days of accessible reserves (about $280,000 for a 200-cow operation), pre-established processor relationships, and specialized insurance—are actually thriving during these crises, with some negotiating better contracts than before. This comprehensive guide provides your complete risk management playbook: practical strategies to build reserves even on tight margins, early warning signs to watch for, contract clauses that protect you, and the collaborative approaches that multiply individual farmer power. The difference between farms that fail and farms that thrive isn’t luck—it’s preparation.

dairy processor risk

The recent Chavegrand situation in France offers important lessons about processor risk management. Here’s what progressive dairy operations are learning about financial preparedness in an era of consolidation.

Let me share a scenario that’s becoming more common than any of us would like. You’re running a solid operation—maybe 200 milking cows, your SCC consistently under 200,000, butterfat levels holding steady at 3.8 to 4.0. Everything on your end is working like it should. Then the phone rings with news that changes everything: your processor just suspended milk collection.

This exact situation hit 93 dairy farms in France’s Creuse region this October. Their processor, Chavegrand, shut down operations after a contamination incident that French health authorities connected to consumer illnesses and deaths. What really catches my attention here—based on the regional farm media coverage—is that these weren’t struggling operations. We’re talking about established, multi-generational farms, the kind that follow protocols and maintain quality standards year after year.

“We’re passengers, not drivers. And consolidation has made that ride a lot riskier than it used to be.”

You know, this whole thing really shows us something we’ve all been dealing with. We can control so much—our breeding programs, our feed quality, fresh cow management, all the production variables we’ve mastered over the years. But when it comes to our processor’s business decisions? That’s where we’re passengers, not drivers. And consolidation has made that ride a lot riskier than it used to be.

That Critical First 72 Hours

Here’s what’s interesting about processor failures—and I’ve been talking with extension folks from Wisconsin and Cornell who’ve been documenting this pattern. When your processor stops picking up milk, you’ve basically got 72 hours before you’re facing some really tough decisions. That’s just the reality of bulk tank capacity on most farms.

The first couple of days, you’re usually okay. Your tank’s filling while you’re working the phone, calling every processor within a reasonable distance. But day three? That’s when things get complicated. Feed deliveries keep coming. Your team needs their paychecks. The bank’s expecting that loan payment. Meanwhile, that milk check you were counting on to cover all this… well, it’s not coming.

I’ve been hearing similar stories from farmers who’ve lived through processor transitions. One Vermont producer I talked with had built up about three months of operating reserves—roughly what it would take for a 150-cow herd, maybe $180,000 or so. “Yeah, it wasn’t easy having that cash sitting in savings earning next to nothing,” he told me. “But when our processor went under, I could take my time finding the right deal instead of jumping at whatever was offered.”

His neighbor—a good farmer, who had been at it for years—didn’t have that cushion. Operating paycheck to paycheck, like many of us do, he had to take what he could get. Ended up being about 30 cents less per hundredweight than what the prepared farmer negotiated. Do the math on that over a year’s production… it’s significant money.

Now I know what you’re thinking—where exactly am I supposed to find that kind of cash to park in savings when we’re already watching every penny? Good point. But what I’ve found is that farmers are getting creative about this. Some are running equipment a year or two longer than planned, banking what they would’ve spent on payments. Others—especially in states where it’s allowed—are developing small direct-sales channels. Not to replace bulk sales, but maybe selling 5% of production at premium prices to build reserves faster.

How the Processing Landscape Has Shifted

The Brutal Math of Processor Failure: Only 41% of affected farms survive without new debt. Nearly half take on $60,000-$127,000 in emergency borrowing they’ll spend years repaying. And 11%—one in ten—never recover at all. Your preparation determines which group you’re in

You probably already know this, but it’s worth laying out the numbers. The USDA’s been tracking this, and Rabobank’s latest dairy quarterly from Q3 this year confirms it: we’ve lost somewhere between 65 and 73 percent of our regional processing options since 2000. Where farms used to have 15 or 20 potential buyers within hauling distance, many areas now have three or four real alternatives. And that’s if you’re lucky.

The Consolidation Catastrophe: We’ve lost 73% of regional dairy processors since 2000, turning milk marketing from a competitive marketplace into a take-it-or-leave-it scenario. When Dean Foods collapsed in 2019, affected farmers learned this lesson the hard way—there was nowhere else to go

“Between 36 and 48 percent of affected farms end up taking on new debt just to survive the transition.”

Of course, this varies considerably by region—producers in areas with strong cooperatives or supply management systems face different dynamics than those in purely market-driven regions. Canadian producers under their supply management system, for instance, have guaranteed collection through provincial boards even when individual processors fail. Australian dairy farmers working through their cooperative structures have different risk profiles than independent U.S. producers.

Looking at what’s happening in Europe, organizations like FrieslandCampina and Arla have built systems that give farmers greater protection through cooperative ownership. Not saying that model works everywhere, but it’s interesting to see how different market structures create different risk profiles.

I was talking with a producer from upstate New York recently—she’s running about 400 cows. The way she put it really stuck with me: “When I started, we had choices. Now we work with what’s available.”

This creates what the economists call an unbalanced relationship. We need daily pickup—there’s no flexibility there. But processors? They’re drawing from dozens, sometimes hundreds of farms. If they lose one supplier, it’s manageable. If we lose our processor, that could be the end of the operation.

The data released by USDA’s Economic Research Service in its September 2024 Dairy Outlook, along with what the National Milk Producers Federation has documented in its post-bankruptcy analyses, paint a pretty clear picture. When processors fail, between 36 and 48 percent of affected farms take on new debt just to survive the transition. And about one in ten—sometimes a bit more—doesn’t make it. They exit dairy within 1.5 to 2 years. Those aren’t odds I’d want to face without preparation.

Building Your Financial Safety Net

So what can we actually do about this? After talking with farmers who’ve successfully navigated processor transitions—and some who’ve been through it multiple times—I’m seeing patterns in what works.

Getting Liquid Stays Crucial

The guidance from university extension programs across the Midwest—Wisconsin’s Center for Dairy Profitability, Minnesota’s dairy team, Michigan State’s ag economics folks—is pretty consistent these days: aim for 90 days of accessible operating capital. And when I say accessible, I mean actual money you can get to immediately—not a credit line the bank might freeze when things look uncertain.

Your Financial Firewall Blueprint: These aren’t aspirational numbers—they’re survival targets. A 200-cow operation needs $280,000 in accessible reserves. Sounds impossible? A Pennsylvania farmer built his by running equipment two years longer and banking the saved payments. The Vermont farmer who weathered processor collapse with reserves? He started with just $500/month five years earlier

“Aim for 90 days of accessible operating capital.”

For a typical 200-cow Wisconsin operation with weekly expenses around $22,000, you’re looking at building toward roughly $280,000 eventually. I realize that sounds overwhelming. But here’s the perspective that changed my thinking: when Dean Foods went under back in 2019, the National Milk Producers Federation documented that farms without reserves lost well over $100,000 in just the first 60 days. Suddenly, that opportunity cost of keeping cash in low-yield accounts doesn’t look so bad.

But let me share something encouraging, too. I know of a central Pennsylvania farm—about 180 cows—that started building reserves after watching neighbors struggle during a processor closure. They set aside just $500 a month initially, gradually increasing as they could. When their processor ran into financial trouble, they had enough cushion to negotiate properly. Ended up actually improving their contract terms because they weren’t desperate. The tools and strategies exist—it’s really just a matter of implementing them before we need them.

Building Relationships Before You Need Them

I’ve seen some California producers do something really smart. They maintain what amounts to a market awareness system—basically keeping tabs on every potential buyer in their region. Who’s got capacity, what they typically pay, quality requirements, payment terms, all of it.

One of these farmers told me how this paid off when his processor cut intake by 20% with barely any notice: “While everyone else was making cold calls to strangers, I was calling people who already knew our operation. Made all the difference in the world.”

This works differently depending on where you farm, naturally. If you’re near a state line, definitely look across the border. Sometimes those Pennsylvania plants pay better than New York ones, even after factoring in the extra hauling. In areas with strong co-ops, understanding potential merger scenarios becomes important. And as we head into winter feeding season with tighter margins, having these relationships already established becomes even more critical.

Getting Smarter with Contracts

Look, we all know individual farmers don’t have much negotiating leverage. Let’s be honest about that. But what I’m hearing from agricultural attorneys who work with dairy contracts—and this aligns with what Penn State’s ag law program and Wisconsin’s dairy contract resources have been recommending—is that you can sometimes get protective language added even when you can’t move the price.

Instead of beating your head against the wall for another 20 cents per hundredweight, try pushing for something like: “Producer may seek alternative buyers without penalty if Processor suspends collection exceeding 72 consecutive hours for reasons unrelated to milk quality.”

Most processors don’t really care about adding this kind of language because they figure it’ll never matter. But if things go sideways, that clause could save your operation.

Recognizing the Warning Signs

Looking back at processor failures—and researchers at Michigan State and Cornell have documented quite a few in their recent dairy industry reports—the warning signs were almost always there months in advance.

The Warning Signs Were Always There: Before Dean Foods filed bankruptcy in 2019, affected producers told Wisconsin Public Radio that payments had been “progressively delayed” for months. Before Grassland restructured in 2017, retail contracts were quietly disappearing. The question isn’t whether warning signs exist—it’s whether you’re watching for them

Payment timing is your biggest red flag. When Grassland Dairy restructured its supplier base back in 2017, affected producers told Wisconsin Public Radio that payments had been progressively delayed. First, just a few days, then a week, then requests to “defer” portions.

But there are other indicators too. Management turnover, especially in finance and sales. Lost retail shelf space. New “fees” appearing on milk checks that don’t quite make sense. Unexplained changes to pickup schedules. When you see several of these together, it’s time to dust off those contingency plans.

What’s particularly worth watching is when a processor starts losing major retail contracts or when you hear about consolidation talks. The market’s changing so fast these days that what looks like a stable buyer in January might be in crisis by June.

The Insurance Gap Nobody Talks About

Here’s something that catches a lot of folks off guard: standard farm insurance typically doesn’t cover processor failure or milk buyer bankruptcy. You could have perfect coverage for buildings, equipment, livestock—everything—but if your processor stops picking up milk? That’s usually not covered.

“Farms without reserves lost well over $100,000 in just the first 60 days.”

Specialized coverage is available, though availability varies significantly by state. Business interruption insurance with buyer failure provisions costs about $3,000 to $8,000 annually for mid-sized operations, according to Farm Bureau Financial Services’ current rate guides. Companies like Hartford Steam Boiler, FM Global, and some regional farm mutuals offer these policies, though you’ll find better availability in traditional dairy states like Wisconsin and New York than in newer dairy regions. When you need it, though, it can pay out six figures.

Farm Credit Services has documented several cases in which processors went bankrupt owing farmers $60,000, $70,000, and sometimes more, for multiple weeks of milk. Without accounts receivable insurance, these farmers became unsecured creditors. After legal fees and years of proceedings, they typically recovered less than 20 cents on the dollar. That’s a painful lesson to learn firsthand.

Finding Strength in Numbers

What’s encouraging is seeing producers organize around this challenge. Throughout New England and the Great Lakes states, farmers are forming informal groups to plan for contingencies with processors. Individual farms might ship 15,000 or 20,000 pounds daily—not much leverage there. But get 40 or 50 farms together? Now you’re talking volumes that matter.

These groups also share intelligence. When multiple members spot concerning patterns—such as payment delays, operational changes, or management turnover—everyone can start preparing. It’s the kind of collaboration we need more of.

You know, the Europeans have been doing this for decades through their cooperative structures. The International Dairy Federation’s latest reports show organizations like FrieslandCampina and Arla guarantee milk collection even when individual plants have problems. We’re learning from their model, though our market structure is obviously different.

What You Can Do Starting This Week

If you’re wondering where to begin, here’s what extension specialists from Wisconsin, Cornell, and Penn State are recommending—and it’s pretty practical stuff.

First, figure out your actual daily operating costs. The Farm Financial Standards Council has found that most of us underestimate by 15 to 20 percent, so dig deep. Include everything—feed, labor, utilities, debt service, the whole picture.

Then, honestly assess what cash you could access in 72 hours without selling productive assets. Be realistic here.

Pull out your processor contract. Really read it. What happens if they stop collecting? I’m betting the language heavily favors them.

Over the next month, reach out to other processors in your region. You’re not looking to switch—you’re building relationships, understanding their capacity and needs. Also, review your insurance with specific questions about processor failure coverage and milk buyer bankruptcy protection.

Think about joining or forming a producer group focused on these issues. Set up some system to monitor your processor’s health—payment patterns, industry news, operational changes.

Adapting to Today’s Reality

What those 93 French farms are going through isn’t unique. Industry analysis from Rabobank and the International Dairy Federation shows processor consolidation accelerating everywhere, with the biggest companies now controlling close to 70 percent of global capacity.

I wish I could tell the next generation to just focus on producing quality milk, and everything will work out. Your SCC, butterfat levels, pregnancy rates—all that absolutely still matters. Production excellence remains fundamental.

But in today’s environment, you also need to think about processor stability. Given consolidation trends and the financial pressures in processing that USDA and industry analysts have been documenting, most farms will likely face at least one processor disruption over the next decade. That’s not pessimism—that’s just looking at the patterns.

The good news—and there really is good news here—is that farmers who recognize this shift and prepare accordingly are doing just fine. They’re building reserves, developing relationships, negotiating better contract terms, and securing appropriate insurance. They’re adapting to new market realities, even though nobody sent out a memo saying the rules had changed.

You know, thinking about all this… dairy farming has always involved managing multiple risks. Weather, prices, disease pressure—we’ve dealt with all of it. Processor risk is now part of that mix. It’s not fair that we need to worry about this on top of everything else we manage. But fair doesn’t keep the cows milked or the bills paid.

The operations that’ll thrive over the next decade are those that see this risk clearly and prepare for it. Not because they’re paranoid, but because they’re practical. And if there’s one thing dairy farmers have always been, it’s practical.

We’re all navigating this together, even when it sometimes feels like we’re on our own. Your experiences—both the challenges and the solutions you’ve found—they matter to all of us trying to figure this out.

KEY TAKEAWAYS:

  • You’re not paranoid, you’re practical: With 73% of processors gone since 2000, building a $280K cash reserve (200-cow farm) isn’t excessive—it’s the difference between negotiating power and desperation
  • The 72-hour window changes everything: Bulk tanks don’t wait—farmers with processor relationships lined up save $0.30/cwt while others take whatever they can get
  • Your contract is probably worthless: Add this clause now: “Producer may seek alternative buyers if processor suspends collection 72+ hours” (most processors won’t even notice, but it could save your farm)
  • Insurance companies don’t want you to know: Standard farm insurance won’t cover processor bankruptcy—but $5K/year in specialized coverage beats losing $127K in 60 days
  • Form a group or die alone: 40-50 farms together have leverage; individual farms are disposable—the Europeans figured this out decades ago

Complete references and supporting documentation are available upon request by contacting the editorial team at editor@thebullvine.com.

Learn More:

The Sunday Read Dairy Professionals Don’t Skip.

Every week, thousands of producers, breeders, and industry insiders open Bullvine Weekly for genetics insights, market shifts, and profit strategies they won’t find anywhere else. One email. Five minutes. Smarter decisions all week.

NewsSubscribe
First
Last
Consent

$2 Milk or $20 Milk: The Simple Testing Strategy Creating 1000% Premiums

Your milk check says $2/gallon. Theirs says $20. The only difference? They test monthly and post results. That’s it.

I was talking with a producer milking 75 Holsteins from Pennsylvania. Like many of us watching this fall’s milk checks, he’s seeing commodity prices bounce between $1.13 and $2.19 per gallon—depending on co-op adjustments and regional factors. His question resonated with conversations happening in barns across the country: “What’s our path forward when the traditional model keeps getting tighter?”

The answer might surprise you. It certainly caught my attention when I first learned what’s happening in Delaware.

Understanding the Current Landscape

The Premium Pricing Ladder reveals how Delaware’s testing-transparent raw milk operations command $20 per gallon—a stark 1000% premium over commodity pricing. While organic and grass-fed capture respectable premiums, Delaware’s regulatory embrace strategy demonstrates that verified safety protocols unlock unprecedented pricing power in niche dairy markets

Let me share something that’s been weighing on many of us. According to the USDA’s National Agricultural Statistics Service, approximately 2,800 dairy operations have been lost annually in recent years. That’s about eight farms closing their doors each day—from California’s Central Valley to Vermont’s Northeast Kingdom.

Meanwhile, Data Horizzon Research reports that raw milk sales grew 21 percent in 2024. Global market projections are expected to reach $1.37 billion by 2033.

Is this simultaneous growth in specialty markets while conventional operations struggle? It reveals something fundamental about where consumer preferences are headed.

“Between my wife’s teaching position and the farm, we’re managing. But the farm alone? That’s becoming a different conversation.”

A dairyman in Lancaster County shared this with me last week. His 50-cow operation grosses around $330,000 annually, yet it clears just $25,000 after expenses. I’m hearing this same story from Pennsylvania to Wisconsin.

This brings us to Delaware. The state’s 13 raw milk operations—already operating under permitted raw milk and herdshare models—didn’t just accept the state’s comprehensive testing protocols, including pioneering H5N1 screening implemented this year. They embraced them as market differentiation.

These producers now command $16 to $20 per gallon. To be clear, raw milk typically brings $10 to $12 per gallon in most markets. Delaware’s operations capture that extra $4 to $8 premium specifically because their rigorous, transparent testing protocols build exceptional consumer trust.

Testing as Competitive Advantage

Delaware’s dairy sector hemorrhaged 83% of operations since 2014, mirroring the national crisis of 2,800 annual farm losses. Yet the 13 surviving farms discovered a counterintuitive strategy: embracing stringent testing regulations to command $16-20 per gallon premiums. 

The Raw Milk Institute has been collaborating with producers on safety protocols for several years. What they’ve found shifts how we think about compliance versus marketing.

Operations treating testing results as marketing assets rather than regulatory obligations? They consistently achieve higher premiums.

Consider the research conducted by the British Columbia Fresh Milk Project from 2015 to 2019. They analyzed 265 samples through 1,060 individual pathogen tests. Zero pathogens in milk produced explicitly for direct human consumption. This contrasts sharply with peer-reviewed studies, which show pathogen detection in up to 33 percent of pre-pasteurized bulk tank samples.

That difference speaks to fundamentally different production priorities.

Enhanced testing transparency adds $4-8/gallon to standard raw milk premiums

RAWMI-certified operations maintain coliform counts averaging just 1 to 3 colony-forming units per milliliter. For context, that’s 75 times cleaner than their already stringent standards require.

Monthly comprehensive pathogen testing typically runs $300 to $500 based on laboratory price schedules. But when that investment drives premium pricing from $12 to $20 per gallon? The economics become compelling.

In Maryland, one producer showed me how she’s turning monthly laboratory reports into social media content. She posts results transparently—”Another clean month!”—and customers drive past other farms to buy from her specifically.

The economics are staggering: Delaware operations invest just $4,800 annually in comprehensive testing protocols but unlock $2.59 million in premium revenue gains. This 54,000% ROI transforms compliance from regulatory burden into competitive weapon. For a modest 50-cow operation producing 400 gallons daily, monthly testing costs of $400 generate $216,000 in additional revenue—proving Andrew’s thesis that transparency isn’t overhead, it’s profit infrastructure

Seven Patterns Among Successful Premium Operations

After extensive conversations with producers who’ve entered premium markets, certain patterns consistently emerge:

  1. Geographic positioning proves paramount
    Operations within 30 minutes of communities with median household incomes exceeding $75,000 show markedly better success rates. I’ve observed nearly identical operations experience vastly different outcomes based on 20-mile differences in location.
  2. Integration rather than random diversification
    One couple near the Delaware-Maryland border exemplifies this. Their whey feeds approximately 30 pigs, generating $12,000 annually in pork sales. The manure enriches a two-acre market garden, generating an additional $8,000. Each enterprise supports the others.
  3. Marketing sophistication matters tremendously
    An operation I know achieves modest production—perhaps 18,000 pounds per cow. Yet, their customer relationship management rivals those of successful retail businesses. They maintain detailed preferences, remember dietary restrictions, and celebrate milestones. Their net income exceeds that of their neighbors, producing 25,000 pounds per cow.
  4. Regulatory compliance becomes brand differentiation
    Rather than viewing testing as overhead, successful operations make transparency their unique selling proposition. “We exceed every standard” becomes their competitive advantage.
  5. Capital discipline distinguishes successful operations
    The Campaign for Real Milk’s economic models suggest integrated 20-cow operations can generate approximately $257,500 in gross revenue. But only after establishing market presence, not in anticipation of it.
  6. Retail-level customer engagement is essential
    Three to five social media posts weekly. Email newsletters. Customer databases. These aren’t optional anymore.
  7. Family alignment proves critical
    Operations where all members share a vision and agree on compensation structures? They show markedly better long-term viability.

The Evolving Regulatory Environment

The safety paradox: while 33% of conventional bulk tank samples show pathogen detection, operations producing specifically for direct human consumption under RAWMI protocols achieve zero pathogen detection across 1,060 tests. This isn’t luck—it’s the result of systematic testing creating production accountability. With outbreak rates declining 74% since 2005 and RAWMI-certified operations achieving coliform counts 75 times cleaner than standards require, Delaware’s testing-as-marketing strategy rests on solid scientific foundation

State-level changes are accelerating beyond what many realize. According to the Farm-to-Consumer Legal Defense Fund’s state-by-state legal status tracking, 16 states, plus Washington, D.C., now permit the retail sale of raw milk.

West Virginia’s recent passage of HB 4911 transformed the state from a complete prohibition to full retail authorization in 2025. Arkansas expanded access through farmers markets via HB1048. North Dakota’s HB1131 now permits the sale of raw milk products, including cheese and yogurt.

Researchers at institutions like UC Davis observe something interesting. States increasingly distinguish between certified and uncertified producers, moving beyond binary regulatory approaches.

A 2018 study published in Epidemiology & Infection provides important context. When researchers controlled for population growth and consumption increases, they found outbreak rates per unit of consumption declined approximately 74 percent since 2005.

Current estimates suggest 3.2 to 4.4 percent of Americans consume raw milk—roughly 10 million people. The calculated annual illness risk? Approximately 0.007 percent per consumer.

While recent outbreaks in 2024 and early 2025 received significant media attention, the longer-term trend data suggest an overall improvement in safety metrics.

Alternative Premium Strategies

Raw milk represents just one path to premium pricing. What Delaware’s success really demonstrates is broader: verified attributes consumers value command significant premiums.

  • Organic certification remains the most established alternative. The three-year transition poses significant challenges for many producers—I’ve counseled several through this process. Yet, USDA Agricultural Marketing Service data consistently show that organic milk brings $6 to $9 per gallon, versus conventional milk’s $2 to $3.
  • A2 milk gains momentum steadily. Genetic testing costs approximately $30 per cow through various laboratories. Many markets support price premiums of 50 to 100 percent. An Ohio dairyman described A2 as his “bridge to premium markets.”
  • Grass-fed certification through organizations like the American Grassfed Association appeals to similar consumer segments. A 40-cow operation in New York’s Finger Lakes recently informed me that they’re achieving $11 per gallon for organic, grass-fed milk.
  • Small-scale pasteurization offers an interesting middle path. Equipment suppliers typically quote $30,000 to $50,000 for micro-pasteurization and bottling systems.

Examining robotic milking systems, some producers are achieving efficiency gains that enhance margins, even without premium pricing. Though the capital investment is substantial, labor savings can be significant for the right operation.

The Industrial Scale Alternative

For larger operations reading this, there’s another path worth acknowledging. While middle-sized dairies face increasing pressure, operations achieving true industrial scale—typically with 2,000 or more cows—can still compete through extreme efficiency.

These mega-dairies spread fixed costs across massive volume, achieving costs per hundredweight that smaller operations simply can’t match. With advanced automation, precision feeding systems, and economies of scale in purchasing, they’re driving production costs down even as milk prices remain volatile.

One 5,000-cow operation in Idaho shared its numbers with me: producing at $14 per hundredweight, while neighbors with 500 cows need $18 just to break even. It’s not a path for everyone—capital requirements alone exceed $20 million. However, for those with access to capital and management expertise, industrial scale remains a viable option.

The key insight? You need to choose. The 200-to-1,000-cow range that defined American dairying for generations? That middle ground is disappearing.

Regional Perspectives Matter

It’s worth noting that different regions face unique dynamics. A Central Valley producer transitioning 30 cows to organic told me: “Our input costs are higher, but so is our market access. Los Angeles and San Francisco consumers understand premium pricing.”

Similarly, a Wisconsin grass-fed operation shared insights about Midwest markets. “Chicago drives our demand,” he explained. “Those consumers want transparency and will pay for it.”

Down in Texas, a producer near Austin mentioned something I hadn’t considered. “The heat makes grass-fed challenging, but our local food movement is strong. We’re finding ways to adapt.”

Timing Your Market Entry

Researchers at Cornell’s Dyson School, who study agricultural innovation cycles, offer an important perspective. We’re observing classic adoption patterns. Early entrants captured exceptional returns. Current adopters can expect solid performance. Late arrivals may struggle.

The opportunity window appears favorable through approximately 2027. Current entrants benefit from established educational resources while maintaining first-mover advantages in their immediate markets.

Your Implementation Framework

For those seriously evaluating premium strategies—whether it’s raw milk, organic, or another path—here’s a methodical approach based on successful transitions I’ve observed:

  • Market validation comes first. Conduct a survey of at least 100 potential customers within a practical driving distance. Ask specific questions: “Would you commit to purchasing two gallons weekly at $10 per gallon?” Without 50 firm commitments, reconsider.
  • Understand regulations thoroughly. Contact your state department of agriculture directly. Connect with current practitioners who understand both written rules and practical enforcement.
  • Model finances conservatively. Add 50 percent to all cost estimates. Reduce revenue projections by 30 percent. Maintain 18 months of operating reserves.
  • Invest in education before infrastructure. RAWMI offers comprehensive online training for approximately $99. Knowledge costs far less than equipment mistakes.
  • Test systems before commercial launch. Operate complete protocols for three to six months. This reveals unexpected challenges while the stakes remain manageable.

Acknowledging the Challenges

Based on conversations with multiple insurance brokers—though comprehensive industry data remains limited—liability insurance for raw milk operations typically runs $2,000 to $5,000 more annually than conventional coverage. These figures are representative but can vary significantly by state and coverage level.

Customer perception challenges are real. One Pennsylvania producer shared: “We had a customer get sick from restaurant food, but they initially blamed our milk. Took months to rebuild trust.” Reputation management becomes critical.

The time commitment is substantial. Direct marketing means you’re running two businesses—production and retail. That typically means working 60 to 80 hours a week consistently.

The Strategic Question

Through all this analysis, one question emerges as fundamental. Will you transform from a dairy farmer selling milk into a food business that happens to operate a dairy?

This distinction separates Delaware’s 13 thriving operations from the 83 percent of conventional dairies that exited since 2014, according to USDA Census of Agriculture data.

“I understand the opportunity, but I’m a dairyman, not a marketer.”

My neighbor, who manages 180 Holsteins, responded in this way when I shared this analysis. His perspective is completely valid. For some operations, staying with conventional production makes perfect sense.

The risk-reward positioning reveals why Delaware’s 13 farms chose raw milk despite extreme risk: no other strategy offers 900% premiums accessible within 3-6 months. While organic certification delivers respectable 275% premiums, the 3-year transition timeline forces operations to survive on commodity pricing while hemorrhaging capital. Raw milk’s position in the high-risk/high-reward quadrant explains both its appeal to desperate operations and why it won’t work for everyone—tiny market size (3.2%) means winners take all

Looking Forward

Market signals, conveyed through premium pricing for verified attributes, appear clear. The next 18 months represent a critical decision window.

Each operation must evaluate its unique circumstances. Location, capital, family dynamics, risk tolerance—they all matter. Some will successfully transition to premium markets. Others will pursue industrial scale through consolidation and efficiency. Still others will find creative hybrid models.

What seems certain is that the operational middle ground continues narrowing. Standing still while hoping for an improvement in commodity prices presents significant risk.

Your milk check contains information about more than this month’s cash flow. The conventional model still works for some—particularly those positioned to achieve industrial scale. Premium markets offer an opportunity for others willing to embrace direct marketing.

Both paths require commitment and strategic clarity. The challenging position is remaining in that uncertain middle ground where margins continue to compress.

Whatever you decide, make it an active choice based on careful analysis of your specific situation—not a default position. In today’s dairy economy, strategic clarity is crucial for survival.

KEY TAKEAWAYS 

  • Testing transparency creates 1000% premiums: $500/month in pathogen testing + posting results = $20/gallon vs. $2 commodity pricing
  • Validation before investment: Survey 100 potential customers, need 50 buying commitments at premium prices, or stop immediately
  • Location is destiny: Premium only works within 30 minutes of $75K+ median income areas—geography matters more than everything else
  • Multiple paths to premium: Raw milk ($16-20), organic ($6-9), A2 (+50-100%), grass-fed ($11)—pick one and commit by 2027

Complete references and supporting documentation are available upon request by contacting the editorial team at editor@thebullvine.com.

Learn More:

The Sunday Read Dairy Professionals Don’t Skip.

Every week, thousands of producers, breeders, and industry insiders open Bullvine Weekly for genetics insights, market shifts, and profit strategies they won’t find anywhere else. One email. Five minutes. Smarter decisions all week.

NewsSubscribe
First
Last
Consent

The 800,000-Heifer Shortage Reshaping Dairy: Why Some Farms Will Thrive While Others Exit

Week-old beef calf: $1,400. Replacement heifer: $4,000. Still breeding beef? You’re not crazy—you’re doing the math.

EXECUTIVE SUMMARY: What started as desperate survival in 2018 has become an irreversible trap: beef-cross revenue now provides 16% of dairy farm income, forcing farmers to keep breeding beef at $1,400 per calf even as replacement heifers hit $4,000. This has driven U.S. heifer inventory to 3.9 million—the lowest since 1978—with 800,000 fewer coming before any recovery in 2027. Simultaneously, processors who invested $11 billion expecting 2-3% growth face just 0.4% milk expansion, guaranteeing plant closures and $3-5/cwt regional price swings. The industry is restructuring into three distinct survivors: fortress farms with over 1,500 cows capturing component premiums, strategic operations with 200-500 cows in profitable niches (organic/A2A2/grass-fed), and those exiting now at peak cattle prices. Wisconsin’s 10,000-heifer gain versus Texas’s 10,000-head loss proves that processor relationships and location now matter more than size. Behind the numbers, 2,400-3,700 dairy families face elimination—transforming not just an industry but entire rural communities.

Dairy Heifer Shortage

You know something’s off when you’re seeing beef-cross calves bringing $1,000 to $1,400 at a week old while replacement heifers are hitting $4,000 at auction. It doesn’t make sense at first—but then you dig into what’s actually happening out there, and suddenly it all clicks.

We’re not looking at just another market swing here. What we’re seeing is the collision of desperate decisions farmers made back in 2018 and 2019 with billions in processing investments that assumed a completely different future. And if you’re wondering why your neighbor’s still breeding 40% of the herd to beef despite those heifer prices…well, let me walk you through what I’ve been hearing from producers across the country.

The 800,000 Heifer Crisis Timeline – From 4.8 million in 2018 to 3.4 million projected by 2027, this isn’t a market cycle—it’s industry transformation

Note: Throughout this article, some producers and industry professionals spoke on condition of anonymity to discuss sensitive business details. All financial figures and operational data have been verified against industry benchmarks.

The Numbers Paint a Picture Nobody’s Prepared For

So, CoBank released its latest dairy heifer inventory analysis in August, and the numbers are… honestly, they’re worse than most people realize. According to the USDA’s National Agricultural Statistics Service January 2025 cattle report, the national number of replacement heifers stands at 3.914 million. That’s the lowest since 1978—back when the average herd was what, 30-something cows?

But here’s the kicker that really got my attention: only about 2.5 million of those heifers are expected to actually calve into milking herds this year, based on CoBank’s projections. That’s tracking to be the lowest since the USDA started keeping those specific records in 2001. The ratio’s collapsed, too—USDA’s July calculations show we’re down to 27 heifers per 100 cows. Ten years ago? That was 31 per 100.

And it gets rougher. CoBank’s projects indicate that we’ll lose another 357,490 heifers in 2025, followed by an additional 438,844 in 2026. They’re saying maybe we’ll get back 285,387 or so in 2027, but…that’s still a massive hole. Add it up and we’re talking about 800,000 fewer replacements before any real recovery kicks in.

The 216% Explosion That Changed Everything – Beef semen sales to dairy farms surged from 2.5M to 7.9M units, creating the heifer shortage crisis

How Seven Years of Survival Mode Created Today’s Crisis

You can trace this whole thing back to that brutal stretch from 2015 through 2021. Class III milk prices averaged below $18 per hundredweight for most of those years—not continuously, but often enough to cause significant harm. University of Illinois dairy economist John Newton documented this period in his 2018 farmdocdaily analysis, calling it an extended period of sustained losses that fundamentally changed the industry.

By April 2019, according to the USDA’s Agricultural Marketing Service reports, replacement heifers that cost $ 2,000 or more to raise were only bringing $1,140 at market. Think about that for a second. You’re losing $860 to $1,360 on every single replacement you raise.

Then the technology all came together at once. Sexed semen finally worked reliably—industry data from Select Sires and other major AI companies shows you can get 90% female calves with 85-95% of conventional conception rates. Genomic testing through companies like Zoetis and Neogen dropped to about $40 per animal. And beef prices? Through the roof. Suddenly, those Holstein bull calves that might bring $200 on a good day were being replaced with Angus crosses worth anywhere from $600 to over $1,400, depending on genetics and your local market.

I mean, what would you have done?

The National Association of Animal Breeders has been tracking this transformation in their annual Semen Sales Reports. Beef semen sales to dairy farms went from about 2.54 million doses in 2017 to over 7.2 million by 2020. That’s nearly triple in three years. Their March 2025 industry update shows we’re now sitting at about 7.9 million units, and it’s just…stuck there. Meanwhile, conventional dairy semen sales have crashed almost 46.5% since 2020.

Why $4,000 Heifers Still Can’t Fix the Problem

Examining what doesn’t add up for many people: according to the USDA’s October 2025 Agricultural Prices report, heifers are currently worth a significant amount of money. Wisconsin’s averaging close to $2,860. Vermont’s around $2,930. Premium animals in California and Minnesota are fetching over $4,000, according to recent livestock auction reports. So why isn’t everyone breeding dairy again?

What I’m hearing from nutritionists working with Wisconsin herds is pretty consistent. Consider a typical 500-cow operation that breeds 40% of its cows for beef. They’re bringing in maybe $200,000 a year just from those beef calves. Add in cull cows at current prices, and you’re looking at $350,000 in cattle revenue.

The Revenue Revolution – Cattle sales jumped from 6.7% to 16% of dairy income – this structural shift is permanent and changes everything

According to USDA Economic Research Service data, that’s approximately 16% of total farm income for many operations now. Back in 2020? Cattle sales were maybe 6.7% of dairy farm revenue.

As one nutritionist put it to me, “It’s not just extra money anymore. It’s structural. These guys can’t just flip a switch and go back. Walking away from that revenue would mean completely restructuring the operation.”

From Crisis to Gold Rush – Heifer prices crashed to $1,140 in 2019, now average $2,860 with premiums hitting $4,000

The Processing Overcapacity Challenge Coming in 2027

And here’s where it gets really messy. According to the International Dairy Foods Association’s industry investment tracking, the processing sector has invested more than $10 billion in new facilities over the past three years—some estimates put the total closer to $11 billion. New York’s Department of Agriculture reports that the state alone has $3 billion in processing investments that require an additional 10 to 12 million pounds of milk per day.

These plants were all designed assuming we would continue to grow milk production at a rate of 2-3% annually, as we have for decades, based on USDA historical data from 1995 to 2020. Instead? USDA’s October 2025 World Agricultural Supply and Demand Estimates project just 0.4% growth next year. That’s not a typo—zero point four percent.

Mike North from Ever.Ag’s Risk Management division put it bluntly at the September 2025 Milk Business Conference: “We don’t have enough cows to fill all these plants.” He thinks we’ll see inefficient plants close, and others running way under capacity. That’s billions in stranded investment.

What’s worth noting here is that we’re already seeing some policy discussions emerging. The National Milk Producers Federation has formed working groups to study the situation, though no concrete proposals have emerged. Meanwhile, some state agriculture departments are exploring incentive programs for heifer retention, but the scale of these initiatives remains small compared to the challenge.

Three Different Worlds Emerging

What’s really interesting—and I’ve been watching this develop over the past year or so—is how the industry’s basically splitting into three completely different business models.

The Big Operations (Your “Fortress Farms”)

These 1,500 to 5,000-cow dairies have basically built moats around their businesses. They’re conducting genomic testing on every single heifer through programs like Zoetis’ CLARIFIDE Plus, utilizing AI-powered systems like DairyComp for informed decision-making. According to the Penn State Extension’s 2025 component premium tracking, they’re achieving component premiums that add $1.50 to $2.50 per hundredweight.

Large Midwest operations I’ve talked with are reporting revenue per cow that’s approaching $6,000 to $7,000—numbers that would’ve been fantasy five years ago. They’re generating base milk revenue in the millions, plus substantial component premiums, and nearly a million dollars from beef calves in some cases.

What’s interesting here is something I noticed visiting a couple of these operations recently: they’re not just bigger—they’re fundamentally different businesses. One manager showed me their real-time component monitoring system. “We know within 0.1% what our butterfat’s gonna test every single day,” he said. “That consistency is worth an extra $750,000 a year to us.”

It’s worth noting that these operations are also exploring emerging technologies. Embryo transfer programs, automated calf feeding systems, precision nutrition through AI…they’re positioning themselves for whatever comes next. Some are even experimenting with automated milking systems that can handle 500-plus cows, completely changing labor dynamics.

The Strategic Middle

This is where it gets interesting for those with 200-500 cows. According to the USDA’s organic dairy market reporting, they’re finding ways to make it work through specific niches. Organic products typically sell for $7-12 more than conventional ones. University of Wisconsin extension studies on pasture-based dairy show grazing systems are cutting costs by 30-50%. Some are going direct-to-consumer and getting $4 more per gallon.

I visited an organic operation in Vermont last month, which had transitioned to organic in 2022, with 280 cows. The producer told me she’s actually more profitable now than when she had 350 conventional. The premium’s real—she’s averaging about $9.50 over conventional—and her vet bills dropped 40%.

Out in California, there’s a different approach. One Jersey producer with about 450 cows is locked into a specialized cheese contract. Between base and components, he’s getting close to $24.50 when commodity milk’s at $21. On 10 million pounds, that $3.50 spread is…well, you can do the math.

Down in Georgia—and this is something you don’t hear much about—a 300-cow operation switched to A2A2 milk production exclusively. They’re selling direct to Atlanta-area health food stores at premium prices. “It’s niche as hell,” the owner admits, “but it works for us.”

The Ones Choosing to Exit

Then there are the operations using these high cattle prices as their exit opportunity. After a decade of barely hanging on, they’re done—and honestly, who can blame them?

I caught up with a couple who recently sold their 185-cow place in Wisconsin. After accounting for debt service, living expenses, and reinvestment, they were netting maybe $18,000 a year for 70-hour weeks. Now they’ve got a solar lease on the land, bringing in $52,000 with zero labor. Can’t really argue with that decision.

 Industry Darwinism – Only 20% of small farms will survive the heifer shortage, while 95% of large operations thrive – consolidation is accelerating

Global Perspective: How Other Countries Face Similar Dynamics

What’s fascinating is seeing how this isn’t just a U.S. problem. The European Union’s dealing with their own version of this crisis, though for different reasons. Environmental regulations and nitrogen limits are forcing Dutch and German producers to reduce herd sizes, just as their processing sector has expanded to meet export market demands. According to European Dairy Association reports, EU milk production is expected to decline 1.5% annually through 2027.

New Zealand’s taking a different approach. Fonterra’s latest annual report shows they’re actually encouraging farmers to reduce production intensity and focus on value-added products. Their winter milk premiums now exceed NZ$11 per kilogram milk solids—that’s roughly equivalent to a $7/cwt premium in U.S. terms—specifically to maintain year-round supply for their specialty ingredient plants.

Brazil and India, meanwhile, are ramping up production. Brazil’s domestic consumption is growing at a rate of 3% annually, and the country is investing heavily in genetics and infrastructure. India’s cooperative model—completely different from ours—is actually expanding smallholder participation. It’s a reminder that there’s more than one way to structure a dairy industry.

What’s interesting is watching how other countries handled similar situations. Dairy Australia’s market analysis shows that in 2023, when their production hit 30-year lows, processors like Goulburn Valley Creamery started paying AUS$9.70 per kilogram milk solids—equivalent to about $28 per hundredweight U.S.—just to keep smaller farms from shutting down. We’re starting to see hints of that in the Upper Midwest—smaller co-ops offering bonuses that weren’t on the table two years ago.

Why Some Regions Are Winning While Others Lose

The shortage’s not hitting everywhere the same. USDA’s January 2025 cattle report shows Wisconsin actually added 10,000 replacement heifers last year. Meanwhile, Kansas dropped 35,000, Idaho lost 30,000, and Texas shed 10,000.

Why the difference? Extension specialists at UW-Madison point to several factors. It’s partly infrastructure, partly processor relationships, but mostly it’s about positioning. Wisconsin cheese plants require consistent, high-quality milk, and they’re willing to pay for it. They’re offering retention bonuses, multi-year contracts—things that make raising heifers actually pencil out.

Down in Texas, it’s brutal. One producer recently told me that he paid $4,200 per head for bred heifers from Wisconsin, plus an additional $380 each for trucking. “It hurt,” he said, “but dropping our ship volume would’ve cost us our quality premiums. That’s $140,000 gone.”

Out in the Mountain West states—Colorado, Wyoming, parts of Montana—they’re dealing with different challenges. Water rights, urban expansion, and feed costs… it’s pushing many smaller operations out. One Colorado producer told me, “Between Denver sprawl and water restrictions, we’re done in five years regardless of heifer prices.”

The “Obvious” Solution That’s Actually a Trap

You’d think with heifers at $4,000, somebody would be raising extras to cash in. Spend $2,400 raising them, pocket $1,600 profit. Simple, right?

Not really. The heifer management experts at UW-Madison have thoroughly reviewed this. First problem: mortality. The USDA’s 2022 Dairy Cattle Management Practices study shows you lose about 21% of heifers from birth to freshening when you factor in all causes of mortality and culling. So that $2,400 cost becomes over $3,000 per surviving heifer.

Then add labor—extension economists calculate $400-600 per head through freshening. Feed costs can fluctuate by $400 based solely on corn prices—we’ve seen a variation of $2.80 per bushel over the past 18 months. And you’re making a 24-month bet with no way to hedge the price risk.

As one extension specialist explained, “The only people successfully raising heifers for sale have paid-off facilities, family labor, and grow their own feed. That’s not a business model most can replicate.”

Industry Response: Fragmented Approaches to a Systemic Challenge

You’d think there’d be some coordinated response, but…not really. The National Milk Producers Federation has been discussing the situation, but they’re mostly focused on data collection and suggesting best practices. No real market intervention, though they are exploring potential policy recommendations for the next Farm Bill discussions.

Some cooperatives are exploring different approaches to help members finance replacement raising, though the details vary significantly by region. But as one board member mentioned in a recent meeting, the scale of what’s needed versus what’s being offered is pretty mismatched. We need hundreds of thousands, not tens of thousands, of additional heifers.

What’s encouraging is seeing some innovation at the regional level. A group of farms in Minnesota formed what they’re calling a “heifer pool”—basically sharing genetics and breeding decisions to optimize replacement production across multiple operations. It’s early days, but the concept’s interesting.

Meanwhile, some states are getting creative. Pennsylvania’s Department of Agriculture is piloting a heifer retention incentive program, offering $200 per head for farms that increase replacement numbers. It’s small—only $2 million allocated—but it’s something.

2027: The Year Everything Changes

Based on everything I’m hearing from processors, economists, and producers—plus what we’re seeing in reports from CoBank and Rabobank’s latest dairy quarterly analysis—here’s what’s probably coming:

Milk prices will diverge significantly regionally—possibly $3-5 per hundredweight between shortage and surplus areas. I’m already seeing it start. Some cooperatives in Texas are offering $2.40 location premiums for new farms near their plants.

Industry analysts suggest that processing plants will operate at 72-76% capacity, rather than the 85-90% required for profitability. Smaller regional processors will either close or get bought for significantly less than their construction cost. As one former cheese plant executive explained to me, “The consolidation is coming, it just hasn’t started yet.”

Heifer prices are likely to peak around $4,200-$4,800 in early 2027, based on historical price patterns from similar periods of shortage. They will then moderate back to $3,800-$ 4,200 as more sexed semen is used and the supply improves slightly.

According to NAAB’s projections, beef-on-dairy sales are expected to decline slightly—possibly to 6.5-7 million unitsfrom the current 7.9 million—but they are unlikely to return to pre-2020 levels. As one large-herd manager put it, “Once you’ve built those calf buyer relationships and you’re getting $1,000 to $1,400 per head, you don’t just walk away.”

The Human Cost We’re Not Calculating

What gets lost in all these numbers is what this means for actual people. Back in 2018, Agri-Mark started including suicide prevention hotline numbers with milk checks after losing three members to suicide, as documented in their member communications. The CDC’s 2020 Morbidity and Mortality Weekly Report shows farmers have the highest occupational suicide rate in America—43.7 per 100,000 workers, over 3 times the general population.

When 10-15% of dairy operations close over the next decade—that’s 2,400 to 3,700 families based on current USDA numbers—we’re not just losing businesses. These are communities that have been built around dairy farming for generations.

Researchers studying farmer mental health, such as those at the University of Illinois’ Agricultural Safety and Health Program, have found that after a decade of financial stress, decision-making processes undergo fundamental changes. As one researcher explained, “These aren’t people making strategic business decisions anymore. They’re making survival decisions from a place of chronic stress.”

I see it visiting farms. The producer who won’t look you in the eye when money comes up. The couple who stopped talking about succession because their kids made it clear they’re not coming back. The neighbor who sold out and now won’t answer calls because the shame’s too heavy.

That’s the real cost we’re not calculating.

Your Survival Playbook for the Next 18 Months

Look, every operation’s different, but here’s what seems to make sense based on what I’m seeing:

If You’re Under 200 Cows

Be honest about whether this still works for you. I know that’s hard, but extension economists have shown pretty clearly that the economics are brutal at this scale unless you’ve got a real niche.

If you’re staying, pick your lane now. Organic certification takes three years, but it adds significant premiums, according to USDA data. Grass-fed certification is faster. Direct sales need the right location. However, you have to pick one and commit to it completely. Half-measures don’t work anymore.

Consider teaming up with neighbors. I’m seeing more informal cooperatives forming—sharing equipment, coordinating breeding, even pooling milk for better bargaining power. It’s worth exploring.

If You’re 200-500 Cows

This is your moment to choose. The middle ground’s gone.

Invest smart. Extension research indicates that testing the top 30% of animals genomically costs approximately $3,000-$ 4,000 per year, but can significantly advance your genetics. Activity monitors from companies like SCR by Allflex run $150-200 per cow, but their field data shows conception rate improvements of 8-12%.

Build relationships with your processor now. The farms that’ll get premiums when things get crazy in 2027 are the ones building trust today. Consistent quality, reliable volume, good communication—that’s what processors are looking for.

And keep beef breeding at a maximum of 35-40%. Yeah, those $1,000-plus checks are nice, but you need flexibility when markets shift.

If You’re Over 500 Cows

Focus on component consistency. Penn State’s data show that farms with less than 2% daily variation are earning significant premiums—$375,000 to $750,000 annually on 50 million pounds of product.

Test everything genomically. University research consistently shows that herds testing all their females make genetic progress over twice as fast. At $40 per test, it pays for itself quickly through increased production efficiency.

Be ready to expand strategically when neighbors exit. But like one Idaho dairyman told me, “Don’t expand just because you can. Expand because it makes your operation better.”

What This All Really Means

We’re sitting at 3.914 million heifers—the lowest since 1978, according to the USDA—with 800,000 fewer expected to arrive before anything improves, based on CoBank’s modeling. We’re not going back to the dairy industry we knew.

What started as desperate survival with beef-on-dairy has triggered a complete restructuring. When cattle revenue reaches 16% of farm income, according to USDA ERS data, and large operations capture premiums that smaller farms cannot match, when $10 billion in processing investment faces milk shortages nobody predicted—this is creative destruction happening in real-time.

What’s emerging isn’t necessarily better or worse; What’s emerging isn’t necessarily better or worse. It’s fundamentally different.. The broad middle that defined dairy for generations is disappearing, replaced by high-tech large operations and strategic niche players.

The decisions you make in the next 18-24 months about breeding, technology, and positioning will determine not just profitability but survival. There’s opportunity in this chaos, but only if you recognize the game has completely changed.

The heifer shortage isn’t the crisis. It’s the catalyst exposing a transformation that was always coming. The question now is whether you’re positioned for what’s next or still trying to preserve what was.

KEY TAKEAWAYS: 

  • The Numbers: 3.9 million heifers (lowest since 1978) with 800,000 fewer coming by 2027—yet farmers won’t stop breeding beef because it’s now 16% of revenue vs 6.7% in 2020
  • The Collision: $11 billion in new processing capacity built for 2-3% growth will get 0.4%—expect plant closures and $3-5/cwt regional price swings by 2027
  • Your 18-Month Strategy: Scale to 1,500+ cows for premiums | Find your niche at 200-500 (organic/A2A2/grass-fed) | Exit under 200 while cattle prices are high

Complete references and supporting documentation are available upon request by contacting the editorial team at editor@thebullvine.com.

Learn More:

The Sunday Read Dairy Professionals Don’t Skip.

Every week, thousands of producers, breeders, and industry insiders open Bullvine Weekly for genetics insights, market shifts, and profit strategies they won’t find anywhere else. One email. Five minutes. Smarter decisions all week.
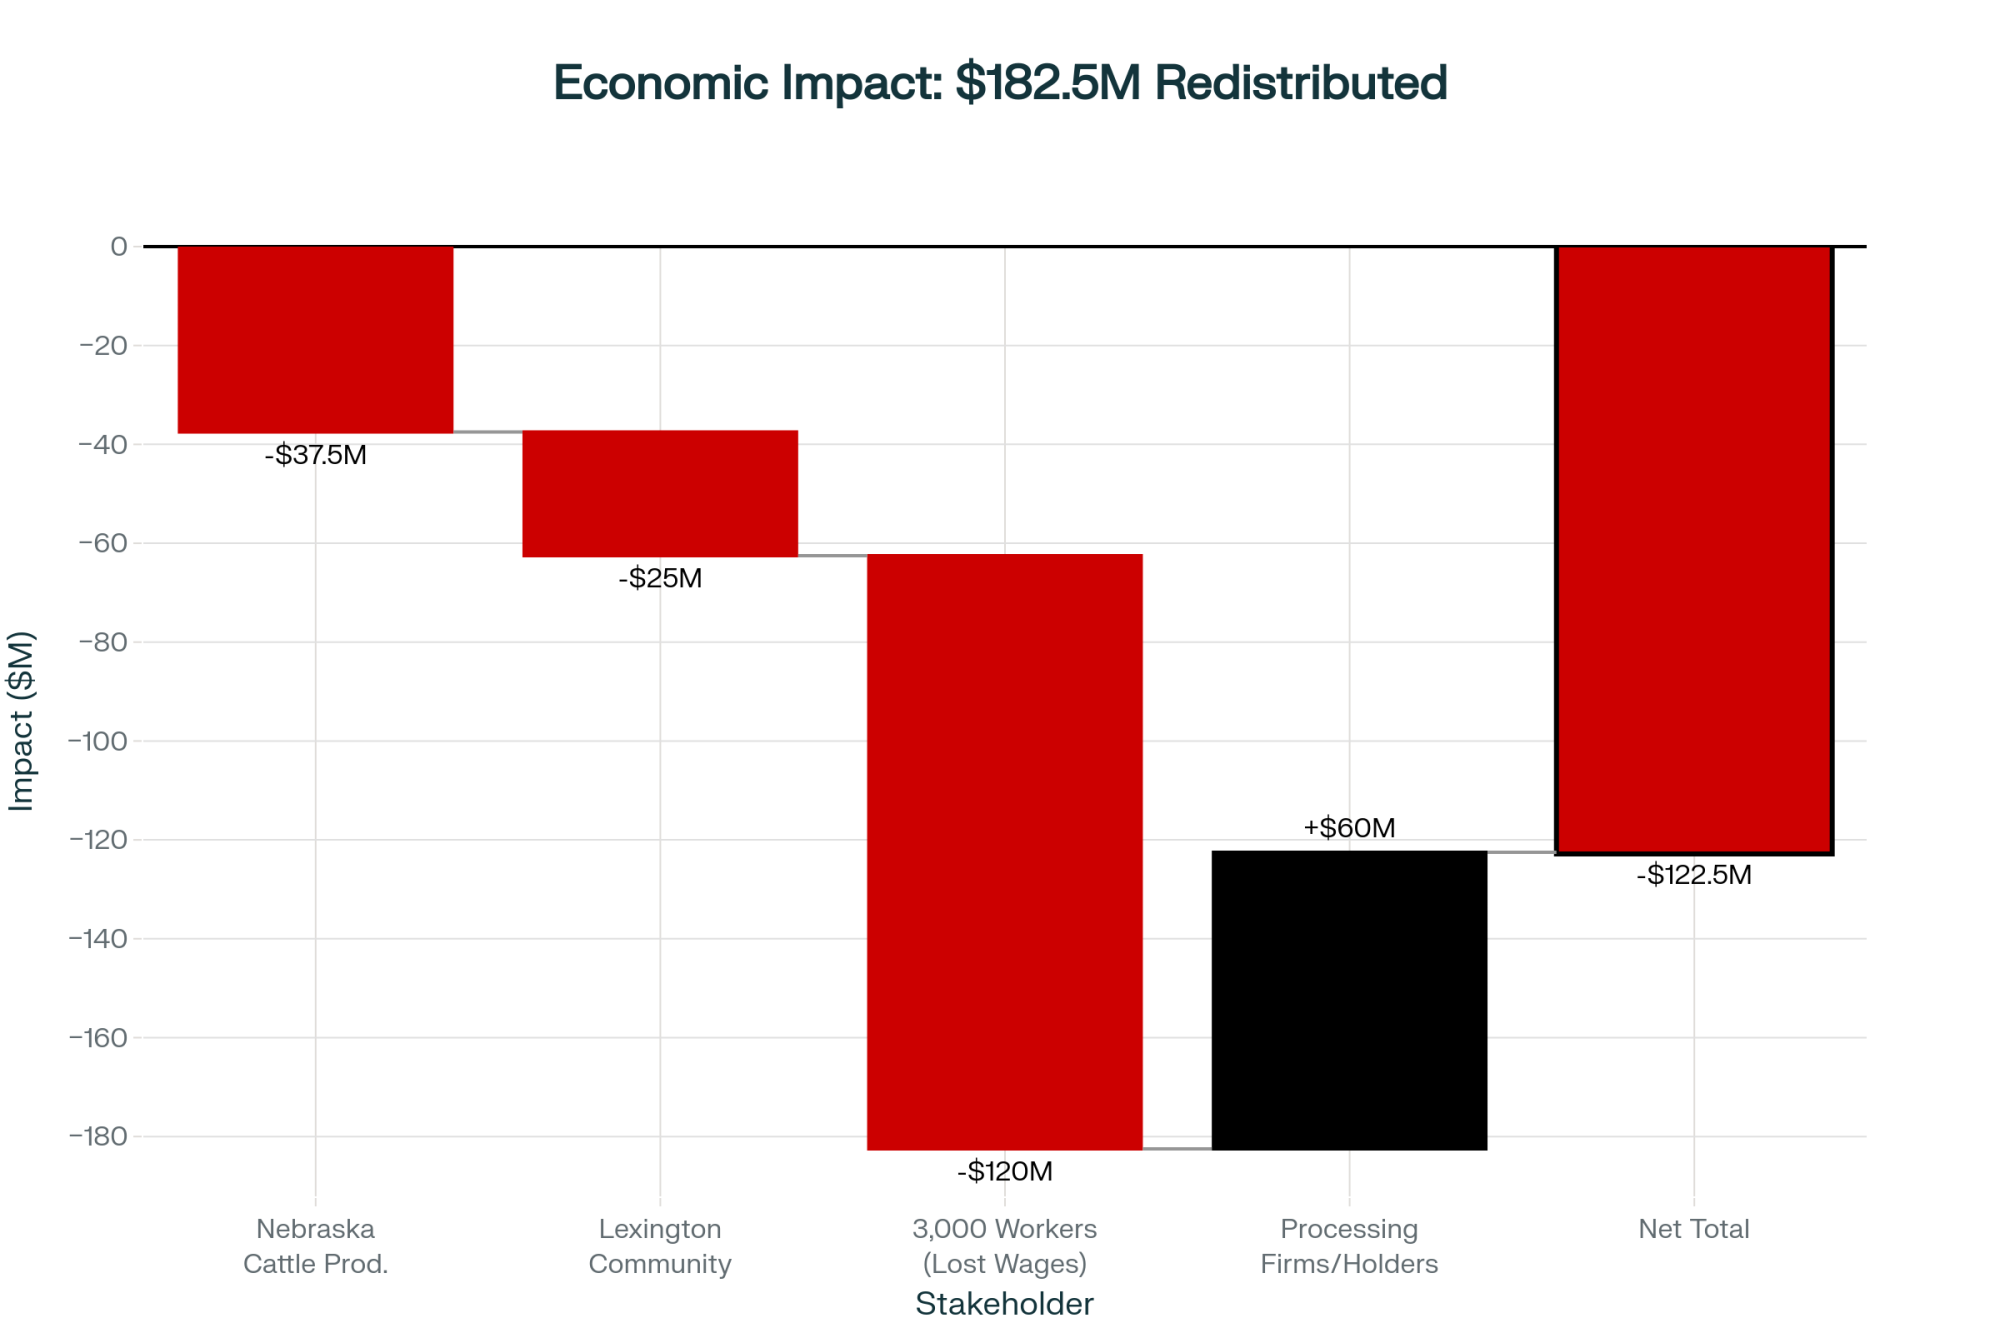
NewsSubscribe
First
Last
Consent

New Zealand Hit Record Production and Started Paying Down Debt – Here’s the $1.7 Billion Signal You’re Missing

When the lowest-cost producer starts hoarding cash, what should you be doing?

EXECUTIVE SUMMARY: What farmers are discovering about New Zealand’s record September production—228,839kg of milk solids, up 3.4%—reveals something crucial about the next commodity cycle. Despite Fonterra paying out $16 billion in returns (30% above last year), Reserve Bank data shows their farmers just paid down $1.7 billion in debt over six months rather than expanding. This disconnect between production strength and conservative positioning mirrors patterns from 2014, right before the last major downturn that saw prices crash to NZ$3.90/kgMS for 18 months. China’s Three-Year Action Plan for cheese production, combined with their historical pattern of cutting WMP imports by 240,000 metric tons once domestic capacity matured, suggests the 2027-2030 period could see similar disruption in cheese markets. Smart operators are already adjusting—Federal Reserve data shows U.S. dairy borrowing remains flat despite strong cash flows, while processors with 70% of milk under long-term contracts are reporting better stability than spot-market dependent operations. Here’s what this means for your operation: the window for strengthening balance sheets and securing stable contracts is open now, but it won’t stay that way past 2026.

You know that feeling when something’s just… off? Milk production’s strong, the neighbor’s adding another barn, equipment dealers can’t keep anything in stock. But there’s this nagging sense that these “good times” are different. I think what’s happening in New Zealand right now might help explain why so many of us are feeling cautious.

So here’s what caught my attention: DairyNZ’s latest production statistics show New Zealand just hit their highest September milk collection on record—228,839 kilograms of milk solids. That’s up 3.4% from last year. And Fonterra announced in their FY25 results that total cash returns to shareholders are approaching sixteen billion dollars, which is roughly 30% more than the previous year.

But—and this is the part that makes you think—Global Dairy Trade auction prices have been sliding for three straight months. The October 7th auction settled at $3,921 per tonne. When production’s surging but prices are softening? That tells you something.

Record production colliding with softening prices—the market signal smart operators aren’t ignoring

Why New Zealand Can’t Actually Choose What They Produce

Here’s what I’ve found most producers outside Oceania don’t really grasp about New Zealand’s system. According to DairyNZ’s seasonal production data, about 84% of their entire national herd calves within a three-month window—August through October. Think about that for a second. Nearly every cow in the country freshening at the same time.

During their spring flush—that’s October through December down there—they’re pushing roughly 60-65% of their entire annual milk volume through processing plants in just three months. Fonterra’s milk collection data shows their plants hit 95% utilization during peak. That’s not efficiency, folks. That’s desperation.

When 84% of your national herd calves in 3 months, you don’t choose what to produce—you spray dry whatever doesn’t fit in the tank

You know what happens then? Industry processing reports show they’re running spray dryers flat out just to keep milk from backing up on farms. According to the Dairy Processing Handbook from Tetra Pak, modern spray dryers typically process 10-15 metric tons per hour, and during New Zealand’s flush, these things run continuously. Day and night.

This is why—and here’s what’s really telling—whole milk powder still represents about 40% of New Zealand’s dairy exports according to USDA’s Foreign Agricultural Service analysis. It’s not because they want to make powder. It’s because when that wall of milk hits, you either spray dry it or dump it. There’s no third option.

For those of us running year-round calving systems, this might seem crazy. But it’s actually both their biggest advantage and their Achilles heel, depending on how you look at it.

New Zealand’s grass-based system delivers the world’s lowest production costs—but that advantage is eroding as climate forces adaptation

China’s Playing the Long Game (Again)

What’s happening with China’s import patterns is fascinating—and honestly, a bit concerning. USDA’s Beijing office analyzed China Customs data and found cheese imports are up over 22% while skim milk powder imports jumped 26%. But whole milk powder? Still declining.

You probably remember what happened with WMP between 2010 and 2018, right? UN Comtrade data shows China kept importing massive volumes while quietly building their own production capacity. Then suddenly—boom—imports dropped from around 670,000 metric tons to 430,000 metric tons. Changed the whole global market.

Now they’re following the same playbook with cheese. China’s Ministry of Agriculture published this Three-Year Action Plan for cheese production development. Their western provinces are already incorporating cheese plants into those massive dairy clusters they’re building. Industry reports indicate China Modern Dairy is producing something like 3,300 tons of raw milk daily now. And get this—their cows are averaging over 13,000 kilograms of production. That’s right up there with good U.S. herds.

Looking at current construction activity tracked by the China Dairy Industry Association, most analysts expect modest import growth through maybe 2026, then watch for new “quality standards” that somehow favor domestic production. By 2027-2030? Well, cheese imports could follow the same path as powder—down 30-40% from peak. Though who knows, right? Economic conditions could speed this up or slow it down. And let’s not forget, precision fermentation and alternative proteins are starting to look more viable every year, though current costs suggest traditional dairy keeps its advantages for commodity uses through at least 2030.

China’s building massive cheese capacity right now—expect ‘quality standards’ that favor domestic production to hit by 2028, just like they did with WMP

Those “Profitable” Margins Tell a Different Story

DairyNZ’s Economic Survey shows New Zealand producers are looking at breakeven costs around NZ$8.66 per kilogram of milk solids. Fonterra’s announced farmgate price is NZ$10.16. So that’s about a NZ$1.34 spread—in our terms, they’re breaking even around $16.50 per hundredweight compared to the $24.55 it costs to produce milk in California according to CDFA’s May cost study.

Sounds pretty good, doesn’t it? But here’s what I find interesting: Reserve Bank of New Zealand data shows farmers just paid down NZ$1.7 billion in debt in six months through March 2025. That’s not expansion behavior. That’s battening down the hatches.

They remember 2015-16. Fonterra’s historical pricing data shows milk prices crashed to NZ$3.90 per kilogram and stayed there for 18 months. A lot of good operators went under during that stretch.

Iowa State research proves it: debt reduction gives you twice the resilience of expansion at cycle peaks—NZ farmers clearly remember 2015

And now you’ve got climate issues on top of everything else. Federated Farmers officials have been calling recent droughts in Waikato and Taranaki some of the worst in decades. When you’re forced to dry cows off early, or you’re taking 20-30% discounts on spot milk because plants can’t handle your flush volumes… suddenly that cost advantage doesn’t look so solid.

University of Melbourne’s Dairy Futures research projects profitability could drop 10-30% by 2040 without successful climate adaptation. But here’s the catch—every adaptation measure costs money and changes your cost structure. Several Canterbury producers I’ve heard speak at field days who invested in irrigation say the same thing: “It saved our production during the drought, but we’re not a low-cost operation anymore.”

Why Farmers Vote for Cash, Not Strategy

This is where cooperative governance gets really interesting. Industry analysis from Rabobank and others suggests Fonterra needs hundreds of millions in capital investment for specialty protein infrastructure if they want to stay competitive as markets evolve.

But when Fonterra put their Flexible Shareholding structure to a vote in December 2021, you know what happened? Official voting results showed 85.16% approval with over 82% turnout—for a proposal that REDUCED capital requirements from one share per kilogram of milk solids to one share per three kilograms. Farmers overwhelmingly voted for more financial flexibility, not strategic investment.

And honestly? I can’t blame them. If you’re running 500 cows and a 50-cent payout increase means $85,000 in your pocket this year, that’s real money. You can pay down debt, fix that mixer wagon that’s been limping along, help your kid with college. Voting to fund some protein plant that might help in eight years—assuming China doesn’t build their own first—that’s a much tougher sell.

What farmers are finding is that democratic governance, while it protects individual interests, can really limit strategic flexibility. And it’s not just Fonterra—I’ve seen the same tensions in cooperatives here in the States.

Climate’s Changing Everything

You know, the relationship between climate and production systems is getting more complicated every year. New Zealand’s whole model depends on predictable pasture growth synchronized with their seasonal calving. Research published in Agricultural Systems shows those patterns are becoming way less reliable.

Every adaptation has trade-offs. Install irrigation? There goes your low-cost advantage. Switch to split calving? Now you need more stored feed. Build bunker silos for drought reserves? Suddenly you’re looking at cost structures closer to what we have here.

I was talking with a Missouri producer at a grazing conference who’s using New Zealand-style rotational grazing on 650 cows. He made a great point: “Their system works perfectly in their climate. But when spring shows up three weeks late—or sometimes not at all—you understand why we do things differently here.”

Another producer from the Northeast who’s running managed intensive grazing on 400 cows added something interesting: “We took the best parts from New Zealand—the paddock system, focusing on grass quality—but adapted it for our reality. Sometimes that means feeding stored forage for five months instead of two. Our butterfat stays strong at 4.0-4.2%, but we’re definitely not low-cost anymore.”

This suggests to me that climate adaptation is forcing everyone’s costs to converge, which could erode New Zealand’s traditional advantage faster than people realize.

What Smart Operators Are Actually Doing

It’s interesting watching what experienced producers are doing versus what they’re saying. Federal Reserve ag lending data shows dairy borrowing is flat or declining across most mature markets despite strong cash flows. Farm Credit System quarterly reports suggest folks who survived 2015-16 are using this windfall to strengthen balance sheets, not build new facilities.

I know several producers who’ve shifted focus from volume to components. They don’t care if they ship 10% less milk if their butterfat hits 4.2% instead of 3.8%. The math just works better, especially when plants are at capacity.

According to the International Association of Milk Control Agencies, processors with 70% or more of their milk under long-term contracts report much better stability than those chasing spot markets. And something else I’m seeing—producer groups working together to secure whey protein extraction agreements. They’re thinking five years out, not five months.

What’s really telling is how the conversation has shifted. Five years ago, everyone was talking expansion and efficiency. Now? It’s all about flexibility and resilience.

Different Regions, Different Opportunities

Where you’re located really shapes your options. Upper Midwest producers, those new cheese plants—Hilmar’s operations in Texas and Kansas, plus others coming online—are creating massive whey streams according to Dairy Foods reporting. Smart producers are already talking to specialty protein processors about capturing that value.

Irish dairy operations have those same grass advantages as New Zealand but they’re closer to premium markets. Ornua’s annual report shows they hit €3.6 billion in revenues in 2024, proving grass-fed products can command serious premiums, especially here in the U.S. where consumers are willing to pay for that story.

Australian producers have their own advantage—they’re closer to Southeast Asian markets that are growing like crazy. Dairy Australia’s export data shows this proximity really matters for fresh products where New Zealand’s extra shipping time creates opportunities.

Here in the Northeast, as many of you know, being close to major cities provides fresh milk premiums that Western operations can’t touch. I heard a Pennsylvania producer at a recent conference say they’re getting $2.50 premiums for local, grass-fed milk going directly to retailers. That completely changes the economics.

And California? Several large operations are dedicating part of their herds to organic or specialty production for Bay Area markets. As one producer put it, “The premium’s worth it when you’re 150 miles from your customer instead of 7,000.”

Timing Is Everything

Looking at construction permits tracked by the China Dairy Industry Association and their published policy documents, domestic cheese production will probably hit serious scale around 2027-2028. Past cycles show market impacts usually show up 18-24 months after capacity comes online, so we’re looking at 2029-2030 as the potential turning point.

Though honestly? Global economic conditions could speed this up or slow it down. And precision fermentation or alternative proteins could throw a wrench in everything, though current costs suggest traditional dairy keeps its advantages for commodity uses through at least 2030.

If this follows previous patterns, we’ll probably see some softness in 2026 that everyone calls “temporary.” By 2027, it’ll be “challenging conditions.” By 2029-2030? That’s when everyone finally admits there’s structural oversupply.

Producers expanding aggressively right now might find themselves in trouble by decade’s end. But those building cash reserves? They could be in position to buy assets at pretty good discounts. As a Wisconsin ag lender specializing in dairy told me recently, “The farms that survived 2015 and bought their neighbor’s operation in 2017—those are the ones we want to work with today.”

What This Actually Means for Your Farm


Action Item
Investment/ActionAnnual Impact (500-cow)Risk ReductionTiming Window
Pay Down Debt (2:1)$2 debt reduction per $1 not expanded$15K-30K interest savingsResilience 2x vs expansionNOW (before 2026)
Lock 70% Milk Under ContractLong-term processor agreements$50K+ volatility reduction40% less revenue volatilityNOW (plants at capacity)
Optimize Butterfat (4.2% vs 3.8%)Genetics + feed management$30K-40K (10% less volume)Plant capacity independenceOngoing optimization
Secure Grass-Fed PremiumRegional positioning + certification$125K ($2.50/cwt premium)Metro market insulation2025-2026 (before oversupply)
Build 18-24mo Cash ReservesReserve fund accumulationSurvival in 18-mo downturn90%+ survival (vs 40%)Immediate (2027-30 risk)

When the world’s lowest-cost producer is pumping flat out despite softening prices, they’re not celebrating—they’re extracting value while they can. That massive payout Fonterra’s making? To me, that looks more like getting cash to farmers while it’s available, not permanent prosperity.

The practical stuff isn’t complicated, but man, it’s hard to execute when milk checks are good. Agricultural economists at Iowa State have shown that paying down debt gives you about twice the resilience compared to expansion investment when you’re at the top of the cycle. Lock in what you can—supply agreements, input contracts, customer relationships. Stability beats optimization when things get volatile.

Most importantly, focus on what you control. You can’t control Chinese policy or weather patterns. But you can control your debt level, your costs, your flexibility.

The Bottom Line

I recently toured a newer 2,000-cow facility in Wisconsin—beautiful operation with all the bells and whistles. Robotic milkers, genetics that would make anyone jealous, feed efficiency that pushes every boundary. The owner mentioned they’re breaking even around $18-19 per hundredweight, expecting to drive that down with volume.

What struck me was the contrast. New Zealand’s breaking even at $16.50 with minimal infrastructure and grass. Chinese cheese plants coming online will probably achieve competitive costs without shipping milk across oceans. Even Fonterra, with every advantage you could want, can’t pivot fast enough because of how their governance works.

The real question isn’t whether any of us can match New Zealand on cost—probably not, given the fundamental differences. The question is whether we’re positioned to survive when cost advantages matter less because everyone’s dealing with oversupply.

What I’ve learned over the years is that the best time to prepare for a downturn isn’t when prices crash. It’s when production records and big milk checks make everyone think the party will never end.

That disconnect between New Zealand’s record production and falling auction prices? That’s not a contradiction. That’s a signal, if you’re willing to see it.

A California dairyman who’s been through four cycles in 35 years said it best at a recent meeting: “The pattern never changes—just the products and countries involved. Right now feels like 2014, right before things got tough. We’re paying down every dollar of debt we can.”

The industry’s at an interesting crossroads. How we navigate the next few years depends on decisions we’re making right now, while things still feel good. So what makes sense for your operation, given what’s coming?

The clock’s ticking, as it always does in this business. But this time, if we’re paying attention to the right signals, we can see it coming.

KEY TAKEAWAYS:

  • Pay down $2 debt for every $1 you’d invest in expansion—Iowa State research shows debt reduction provides twice the resilience during downturns compared to growth investments made at cycle peaks, and with current rates, that could mean $15,000-30,000 annual savings on a typical 500-cow operation
  • Lock in 70% of your milk under contracts NOW—processors maintaining this threshold report 40% less revenue volatility than spot-dependent operations, and with Class III-IV spreads widening, that stability could be worth $50,000+ annually
  • Focus on butterfat optimization over volume growth—producers achieving 4.2% butterfat versus 3.8% are capturing an extra $0.25/cwt even with plants at capacity, translating to $30,000-40,000 for a 400-cow herd shipping 10% less volume
  • Position regionally for 2027-2030—Upper Midwest operations should secure whey protein agreements while new cheese plants create oversupply, Northeast producers can capture $2.50/cwt grass-fed premiums near metro markets, and Western operations need organic/specialty contracts before Chinese cheese capacity hits stride
  • Build 18-24 months of cash reserves—the 2015-16 crash lasted 18 months with many good operators going under, but those who survived bought neighboring operations at 40-60% discounts in 2017… and they’re the ones lenders want to work with today

Complete references and supporting documentation are available upon request by contacting the editorial team at editor@thebullvine.com.

Learn More:

The Sunday Read Dairy Professionals Don’t Skip.

Every week, thousands of producers, breeders, and industry insiders open Bullvine Weekly for genetics insights, market shifts, and profit strategies they won’t find anywhere else. One email. Five minutes. Smarter decisions all week.
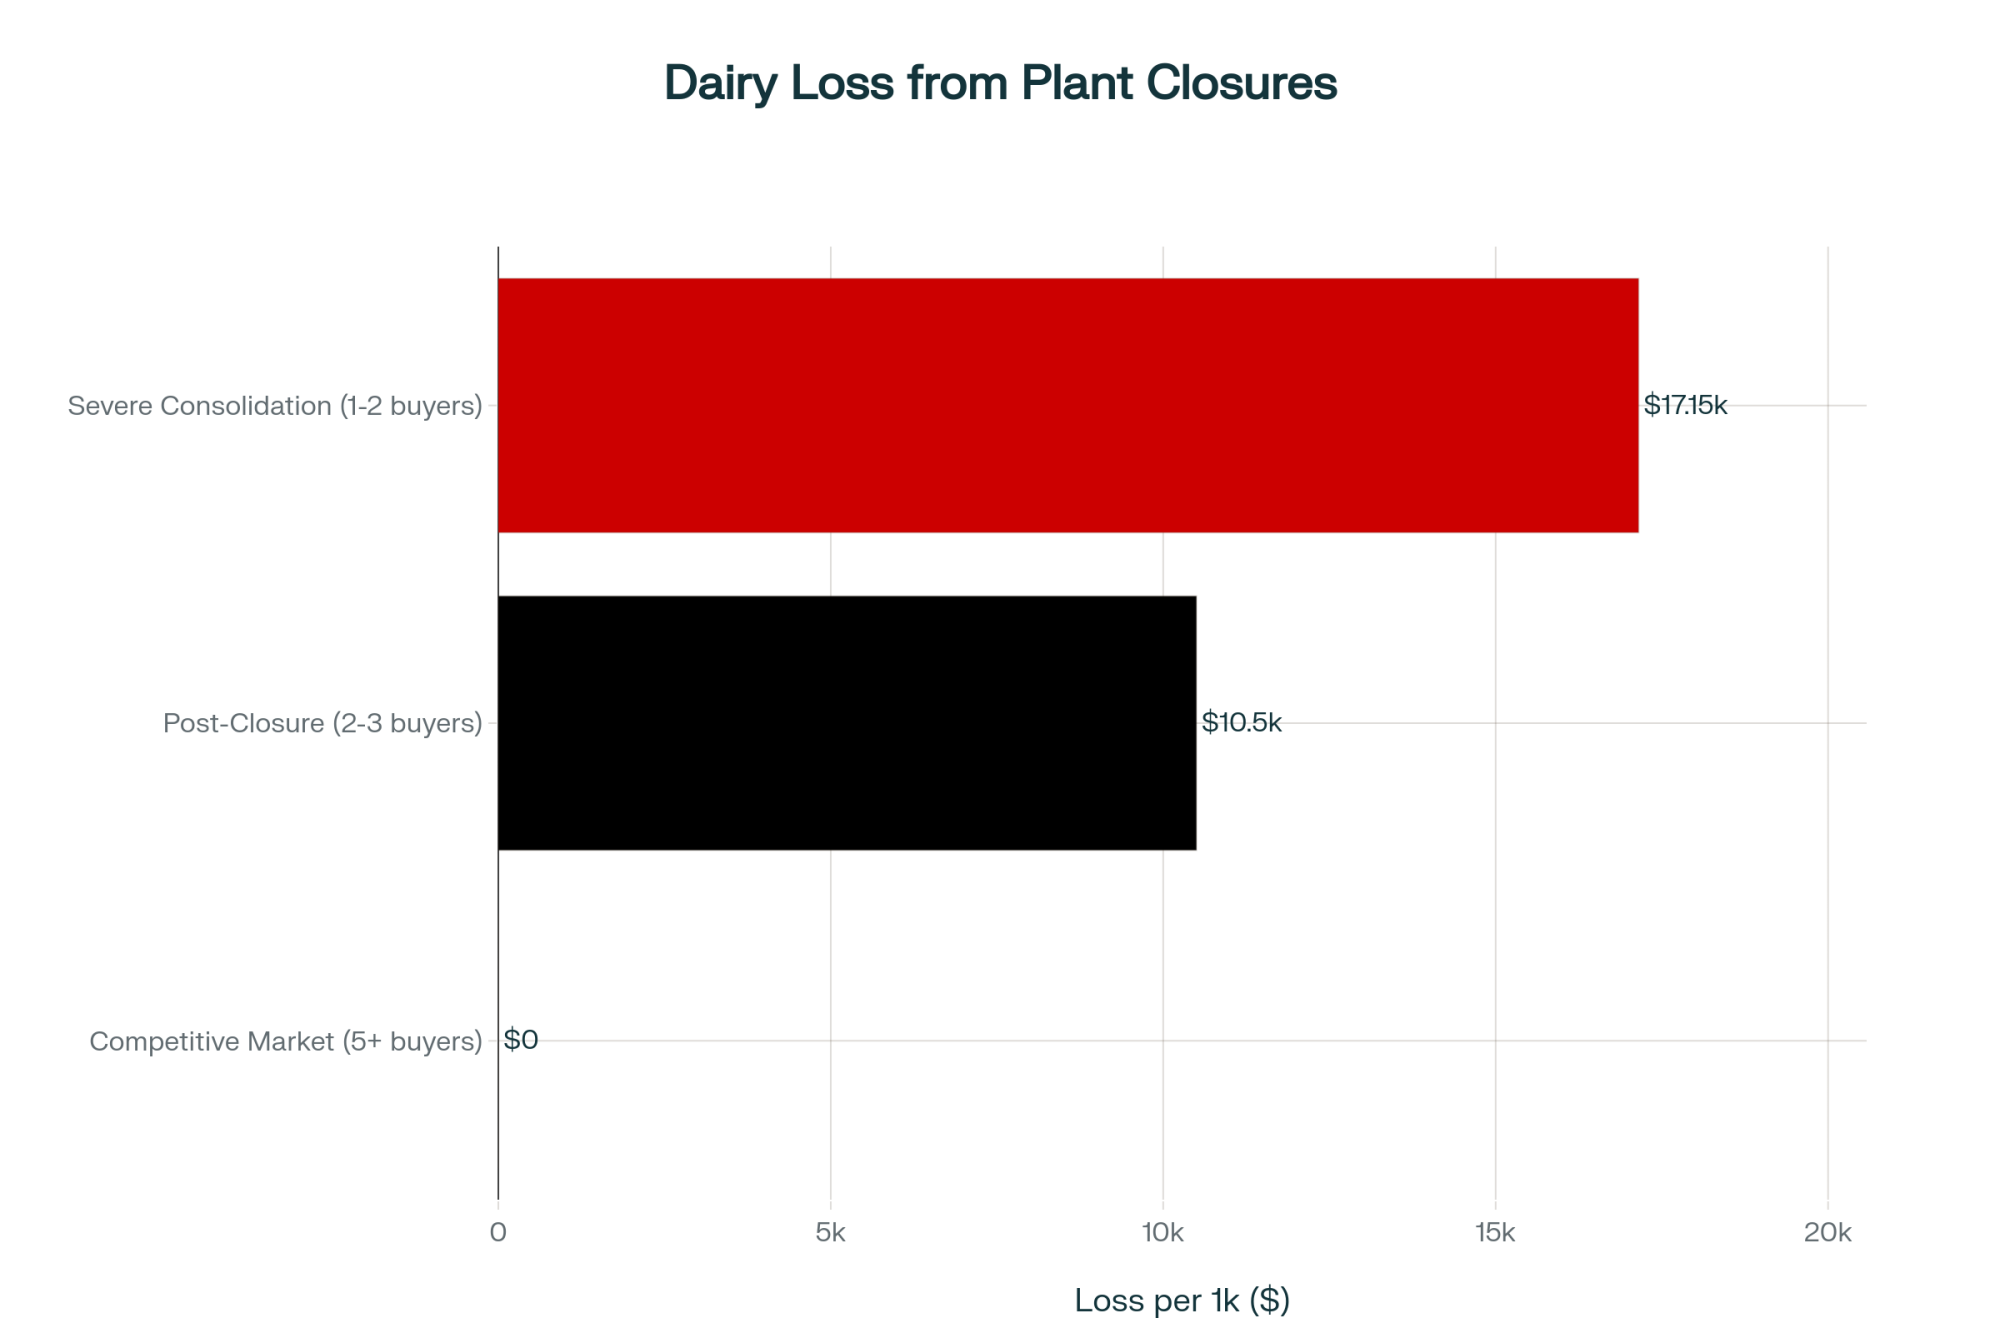
NewsSubscribe
First
Last
Consent

The 90-Day Dairy Pivot: Converting Beef Windfalls into Next Year’s Survival

Cull cows over $2,000 and beef-on-dairy calves near $1,000—why this 90-day window could make or break your 2026 margins

EXECUTIVE SUMMARY: Fall 2025 delivers an uncommon—and urgent—opportunity for U.S. dairy operators. Strong cull and beef-on-dairy calf prices, reported at $2,000+ and near $1,000 respectively, are keeping many herds afloat amid relentlessly flat $17 milk. University and market economists warn these beef premiums look fleeting, with the cattle cycle and supply signals already tightening for 2026. Recent research shows Midwestern breakevens remain high, while only producers invested in butterfat performance and rigorous herd management capture true component bonuses. Meanwhile, export hopes are dimming—contract premiums are now won on genetics, traceability, and relentless cost control. As lenders prepare for summer’s critical cattle inventory and cash flow reviews, operations with intentional plans—whether expanding, pivoting, or winding down—consistently protect more equity. The next three months are a “use it or lose it” window for turning fleeting beef revenue into sustainable resilience. What farmers are discovering is that asking hard questions, running fresh numbers, and pushing for proactivity can make 2026 a year of opportunity—not regret.

Dairy Market Pivot

Checking in with producers this fall, there’s one urgent takeaway: this is a critical 90-day window to turn temporary beef premiums into lasting resilience for 2026. The evidence is in the numbers—cull cows clearing $2,000 and beef-on-dairy calves pushing $1,000 (USDA National Weekly Direct Cow and Bull Report, October 2025). These premiums are propping up many milk checks stuck at $17. However, as extension economists and market analysts from the University of Wisconsin and Cornell emphasize, these conditions are shifting. We’re staring down the last weeks of this run before cattle cycles and supply buildup set a new tone for the coming year.

What’s interesting here is seeing smart operators use this moment to shore up their businesses—paying down debt, making pro-active facility investments, and building a cash buffer instead of assuming current premiums will last. This development suggests that treating a tailwind as flexibility—not false security—creates real strategic advantage for the next transition period.

The crisis in black and white: milk checks stuck at $17 while breakevens demand $17.50-$18.50, but cull cows and beef calves are throwing off unprecedented cash—turning cattle into the lifeline keeping farms afloat.

The Math of Survival: Breakevens & Components

Revenue Source2024 BaselineFall 2025Per Cow Impact100-Cow Herd
Cull Cows (15% rate)$1,500/head$2,000+/head+$75+$7,500
Beef-Dairy Calves (40% births)$600/head$1,000/head+$160+$16,000
Component Bonus (3.7%+ protein)Base milk+$1.25/cwt+$31/yr+$3,100
TOTAL OPPORTUNITYStack strategies+$266/cow+$26,600
🚨 Baseline (No Action)Wait for recoveryMiss window-$50 to -$150-$5K to -$15K

Looking at this trend, most Midwest herds face pre-beef breakevens between $17.50 and $18.50/cwt (UW Center for Dairy Profitability, Fall 2025 Update). Out west, Idaho’s and Texas’s biggest dry lot systems sometimes run at $14–$15/cwt, riding local feed and labor edge. Either way, high butterfat performance is the separating factor. Hitting 3.7% protein or better can mean $1–$1.50/cwt over base—if you’ve invested in genetics, tight fresh cow management, and keep transition periods on track. As many of us have seen, those premiums aren’t accidental; they follow from tough culling decisions and knowing your numbers cold.

That $1-$1.50/cwt component bonus isn’t optional anymore—it’s the difference between red ink and breaking even, between selling out and surviving another season with $17 milk

Export Hopes, Local Contracts

For years, many of us held out hope that another export surge would save the day—especially from China. But this season’s USDA GAIN trade data and Rabobank’s Dairy Quarterly all show it’s growth in cheese and butter, mostly cornered by New Zealand and Europe, that’s outpacing demand for U.S. powder. In the Midwest and Northeast, plants are hungry for consistent, high-component, specialty contracts. Herds that made early investments in A2, organic, or niche certifications find their milk in demand; others should ask whether fluid or low-component contracts will provide enough margin as the cycle shifts.

July Inventory—Lender Stress & Planning Leverage

It’s no surprise to seasoned managers that the USDA July Cattle Inventory Report is more than an annual headcount. When beef prices soften and heifer retention ticks up, lenders across regions—like those briefed by Minnesota Extension and New York FarmNet—run tougher stress tests on farm finances. Farms sitting right at a 1.25x debt service coverage are fine for now, but that can slip fast. Those who restructure or plot a sale while balance sheets are still strong tend to carve out six-figure equity advantages compared to late, forced exits. The lesson, as risk educators preach, is that deliberate action always beats hoping for a bounce.

Three Lanes: Exit, Pivot, or Scale

From kitchen tables in northeast Iowa to group calls with Western Idaho co-ops, three paths are front and center:

  • Exit with Intention: Producers looking at high debt or retirement are using strong asset values to secure their family legacies, not just chasing another cycle.
  • Premium Niche Pivot: Some are cutting herd size, chasing premium contracts—A2, grassfed, organic, you name it—with a willingness to meet tough specs on components, health, and traceability. This approach works best when paired with deep processor relationships and quick financial routines.
  • Expansion: A Tool for the Prepared: Rabobank’s 2025 sector review and extension management profiles agree: disciplined, high-performing herds with fresh cow and labor management dialed in can scale with confidence. For others, fast growth just means fast exposure if things don’t break right.

The north star here? Monthly cost-of-production benchmarking, regular review with lenders, and not waiting to renegotiate contracts until margins are squeezed.

Global Competition & Policy Realities

U.S. Midwest producers face a brutal 20-45% cost disadvantage against New Zealand and Argentina—at $0.39/lb versus $0.27-$0.32, every efficiency gain and premium matters when you’re starting in the hole.

It’s worth noting that IFCN’s 2025 benchmarks put leading New Zealand and Argentina herds at $0.27–$0.32/lb. Even top Western U.S. performers run about $0.35, with most Midwest herds closer to $0.39. The gap isn’t destiny: it reflects differences in feed-to-milk efficiency, heifer survival, and transition consistency. Policy backstops like DMC are valuable, and analysis from Cornell and Wisconsin Extension reinforce this: they help good operators stay afloat but aren’t enough to shore up chronic losses over time.

The Myth of the “Deal of the Century”

As expansion talk returns, recent Rabobank analysis and local case studies ring a familiar bell: the “deal of the century” works out for operations already strong on the basics—cost, herd health, labor discipline. Ramped-up purchases without this foundation rarely yield the hoped-for returns and often accelerate operational headaches.

Action Steps: Navigating the 90-Day Window

Here’s the practical bottom line: This window is closing, not expanding. First, benchmark your cost of production with the latest IFCN and extension tools; don’t trust last year’s averages. Next, proactively arrange a review session with your banker—not to plead for relief, but to present your plan for surviving and thriving into next year. Scrutinize your processor or coop contracts and specialty program agreements—will you be the supplier they prioritize in a shrinking market? And take the time this fall to address transition and herd health; waiting until calving issues flare won’t do.

The difference for 2026 will be made by those who act intentionally and aren’t afraid to adjust their course. That’s the mindset that’s kept American dairies resilient through every market twist—and it’s how the smartest operators I know are reading this moment.

KEY TAKEAWAYS

  • Farms leveraging this fall’s beef premiums could improve net margins by $100 to $200 per cow, while disciplined herd and transition management opens $1–$1.50/cwt in component bonuses (UW Extension, IFCN, Rabobank).
  • Practical action: Benchmark your cost of production now, meet proactively with lenders to review true breakevens, and secure or re-align premium contracts for 2026 before markets tighten.
  • Butterfat, protein, and health discipline now outperform volume; herds that master transition periods and component payouts lead in uncertain markets.
  • The window for turning “luck” into a long-term strategy is closing. Lenders, markets, and export buyers all point to greater volatility ahead for operations not dialed on costs or value.
  • Across Wisconsin, Idaho, and the Northeast, the most resilient producers are those who build trusted advisor relationships and plan ahead—regardless of herd size or business model.

Complete references and supporting documentation are available upon request by contacting the editorial team at editor@thebullvine.com.

Learn More:

The Sunday Read Dairy Professionals Don’t Skip.

Every week, thousands of producers, breeders, and industry insiders open Bullvine Weekly for genetics insights, market shifts, and profit strategies they won’t find anywhere else. One email. Five minutes. Smarter decisions all week.

NewsSubscribe
First
Last
Consent

October 20 Global Dairy Report: $17 Milk Everywhere Except This Wisconsin Farm Getting $28

Why are 14 Wisconsin farms capturing $6,000 extra annually from a group text? The answer changes everything.

EXECUTIVE SUMMARY: We’ve uncovered something that challenges everything you’ve heard about dairy consolidation: Wisconsin farms under 200 cows are capturing $4-6 more per hundredweight than their 2,000-cow neighbors through component optimization, direct marketing, and collaborative networks. Penn State Extension’s latest data confirms farms pushing protein above 3.5% are banking an extra $5,110 annually on just 200 cows—that’s a 4.5:1 return on feed investment. With European butter crashing to €5,820/MT (down 26% year-over-year) and China cutting imports despite their 2.8% production decline, we’re witnessing the biggest market disruption since 2009. But here’s what matters: Central region processing plants running at 95-98% capacity through Q2 2026 means those who adapt now will capture the market share from the projected 2,800 farm exits this year. Cornell’s data shows milk solids production up 1.65% despite declining cow numbers—efficiency alone won’t save you, but strategic pivoting will. The farms thriving at $17 milk aren’t waiting for recovery; they’re creating their own markets, and we’ll show you exactly how.

Monday morning, 6 AM. Coffee’s hot, but the numbers are cold.

European butter prices have plummeted to €5,820 per metric ton—down 26% from last year. Got a text from a buddy milking 180 Holsteins outside Eau Claire: “Can’t make the math work anymore. Not at these prices.”

But here’s where it gets weird…

Ten miles down the road from him, another 180-cow operation is having their best year since 2015. Same milk price. Same feed costs. Guy’s actually thinking about buying another robot. Posted pictures of his new Ram 3500 on Facebook last week.

What the hell’s going on?

Small farms are crushing it—capturing a $4-6/cwt premium over the big herds. This chart lets you SEE why the future favors the bold, not the biggest.

REGIONAL BREAKEVEN REALITY CHECK

RegionBreakeven Price ($/cwt)Main ChallengeCompetitive Edge
Northeast$20-22Trucked grainLong-term stability
Upper Midwest$18.50-19.50Local cornNetworked knowledge
Southeast$21-23Heat stressAlternative revenue
California$19-21Water costMarket access

Northeast: $20-22/cwt (trucked grain, 1970s tie-stalls)
Upper Midwest: $18.50-19.50/cwt (local corn helps)
Southeast: $21-23/cwt (heat stress kills everything)
California: $19-21/cwt (water ain’t free) Your Farm: $_____?

The October Numbers That Matter (Spoiler: They’re All Bad)

Let me paint you the picture: Class III is bouncing between $16.50 and $ 17.00/cwt, while your breakeven’s probably north of $19. Maybe $20 if you’re honest about that new loader payment.

The Europeans? They’re drowning in milk. French production jumped 4% year-over-year. Germans added 2.1%. The entire EU bloc produced 13.75 million tonnes in August—up 3.3%. Their reward? That €5,820 butter price that keeps sliding like a fresh cow on ice.

Meanwhile, the USDA’s September outlook indicates that we are heading for 230 billion pounds in 2025. Another 231.3 billion forecast for 2026. More milk into markets, such as China.

The thing about China—and nobody at World Dairy Expo wanted to say this out loud—they’re done buying. Down 2.8% in domestic production, sure, but they’re cutting imports anyway. Why? Because over 90% of Chinese dairy farms are hemorrhaging money. They’d rather have empty shelves than lose more cash buying our powder.

That growth story we built our entire export strategy around? It’s not coming back. And if you’re waiting for it to, you might want to update your resume.

Small Farms Are Beating Big Dairies (No, Really)

This is gonna sting for some of you, but those small farms everyone said would die? Some of them figured out what the 2,000-cow operations missed.

Penn State Extension’s Virginia Ishler and her team have been tracking this. Farms under 200 cows doing direct marketing or adding value on-farm? They’re capturing $4 to $ 6 more per hundredweight. That’s not a rounding error. That’s the difference between bankruptcy court and buying that neighbor’s 40 acres when he quits.

“I started bottling 20% of my production in June. Same milk that would’ve gotten me $17 at the co-op, I’m getting the equivalent of $28 on the bottled stuff. Yeah, there’s more work. Yeah, I’m tired. But tired beats broke.”
— Vermont producer, 165 cows

What really strikes me about Wisconsin is how fast this shift is happening. Brody Stapel at Double Dutch Dairy near Cedar Grove—you might know him, as he sells at the Sheboygan Farmers Market—started bottling in May. Non-homogenized, low-temp pasteurized, glass bottles. It turns out that lactose-intolerant individuals can actually drink it. He now has home delivery routes, featuring the Farm Stapels brand, in three Piggly Wigglys.

Still ships 95% to Sargento. But that 5% bottled? That’s where his profit lives.

Success Metric: Of the 14 Wisconsin farms in that information network, 12 are expanding operations while the state average is contracting. That’s not luck—that’s strategy.

Three Things That Actually Work (With Real Numbers, Not BS)

Every tenth of a percent matters. Jumping from 3.29% to 3.70% protein can mean an extra $9,000 for a 200-cow operation.

1. The Component Game (AKA Your Only Lever)

Forget the noise for a minute. The national average is 4.23% butterfat and 3.29% protein. But here’s what matters—farms pushing protein above 3.5% are banking on that 10-cent premium. Every. Single. Shipment.

COMPONENT PREMIUM REALITY (October 2025)

Butterfat: 4.23% average = Base price
Protein: 3.29% average = Base price
Protein: 3.50% achieved = +$0.10/cwt premium
Protein: 3.70% achieved = +$0.18/cwt premium Your Components: ___% fat % protein = $ premium?

Here’s the Math Nobody Shows You:

200-cow dairy pushing protein from 3.29% to 3.50%:

  • Daily production: 14,000 lbs (70 lbs/cow average)
  • Premium captured: $0.10/cwt
  • Annual premium: $5,110
  • Feed cost increase: ~$1,500
  • NET GAIN: $3,610

That’s your property tax. Or three months of health insurance. Or that used feed mixer you’ve been eyeing on Craigslist.

Wisconsin’s MILK2024 program breaks it down even further. Every 0.1% protein increase? Worth $8,000-10,000 annually on a 200-cow dairy. That 180-cow farm in Eau Claire? They’re projecting $18,000 additional revenue this year from protein optimization alone.

Feed cost to achieve it? Maybe $4,000 if they’re buying bypass protein. That’s a 4.5:1 return. Show me another investment doing that right now.

2. The $6,000 Group Text (Information Arbitrage)

Here’s something the old-timers absolutely hate but works. Fourteen producers in central Wisconsin formed a text group. Not a co-op, not an LLC, just a group text.

Tuesday morning: “Agropur taking spot loads at $17.50” Wednesday: “Land O’Lakes needs high-protein, paying premium” Thursday: “Ellsworth cheese plant basis shifted, avoid”

They’re each capturing $4,000-$ 6,000 annually just by knowing where to ship when. One guy ships to three different plants in a week sometimes. His dad would’ve called that crazy. His banker calls it smart.

“We’re not competing anymore,” one told me over Spotted Cow at the Legion hall. “We’re surviving together. Competition’s a luxury we can’t afford.”

3. Revenue Stacking (The Small Farm Secret Weapon)

Research from Kansas State confirmed what I’m seeing everywhere: farms with fewer than 300 cows can pivot faster than larger operations. They’re not more efficient. They’re more flexible.

Real examples from this month:

Pennsylvania, 150 cows: Added agritourism. Corn maze, birthday parties, and “pet a calf” experiences. Bringing in $85,000 annually. That’s $567 per cow, which has nothing to do with milk prices. Their bank loves them now.

Minnesota, 225 cows: Solar panels on the barn and that back 40 that floods every spring anyway. Twenty-year lease at $1,200/acre/year. Better than growing $4.50 corn on ground that might flood.

Wisconsin, 175 cows: Custom raising heifers for the 3,000-cow dairy down the road. Gets $2.75/head/day. Better margins than milk. No market risk—the big farm owns the heifers.

Iowa, 190 cows: Went seasonal. Dry everyone off from December through February. Match spring flush to fluid premiums. Capturing $1.50/cwt more April-August. Cows are healthier. He’s definitely healthier.

The Processing Disaster Nobody’s Discussing

Forget survival mode—these proven pivots have Wisconsin’s small dairies stacking cash and market opportunities, even as bigger neighbors go under

Leonard Polzin from UW-Madison laid out the truth at January’s Ag Forum, and it’s worse than you think. That “$11 billion in new processing capacity” everyone’s talking about? Most won’t be operational until Q2 2026. Some won’t happen at all if milk stays at $17.

Central region plants running at 95-98% capacity isn’t temporary. It’s your reality through next summer at a minimum. Wisconsin co-ops have already sent the letters—base excess penalties take effect on November 1.

One co-op (you know which one) is implementing tiered pricing:

  • Base production: $17.00/cwt
  • 101-110% of base: $14.50/cwt
  • Over 110%: $13.00/cwt

Minnesota’s actually worse. A producer near Winona told me that anything over 105% of base gets $13.00. Thirteen dollars! That’s 1995 prices with 2025 costs.

What happened at Hastings Creamery should terrify everyone. Processing 150,000 pounds daily until the discharge permit is issued. Farmers had milk, but the plant couldn’t take it. Lucas Sjostrom from Minnesota Milk confirmed they were “voluntarily dumping milk on-farm.”

That’s not oversupply. That’s infrastructure collapse.

Your Feed Market Reality (It Gets Worse)

Current markets, if you’re buying this week:

  • December corn: $4.45-4.65/bu (my neighbor who grows corn says $5 by January)
  • Soybean meal: $285/ton and climbing
  • Quality hay: Good luck finding any under $280/ton

Talked to a nutritionist who manages 15,000 cows across Wisconsin. His take? “We’re looking at $5 corn by February if South America has any weather issues. These guys buying hand-to-mouth are gonna get crushed.”

Your feed costs are rising while the milk price is falling. That’s not a squeeze—that’s a vice.

THE REAL BOTTOM LINE

Waiting for $20 milk is like waiting for your ex to apologize.
It might happen, but you’ll probably die first.
Finding ways to make $17 work? That’s survival.

What Winners Do Different (Hint: Everything)

Spent the last month analyzing farms under 300 cows that are actually thriving. Not surviving—thriving. Banking money. Taking vacations. Sleeping at night.

Three patterns kept showing up:

Ruthless Efficiency: Successful 150-cow farms run 65-70 cows per worker, same as mega-dairies. Automated gates, crowd control gates, and possibly even a robot. One guy near Dodgeville milks 150 cows faster than his dad milked 50. “We work smarter, not harder. Had to—can’t afford hired help at $20/hour.”

Revenue Stacking: Wisconsin farm that blew my mind—milk revenue, plus beef-on-dairy ($900 per calf right now), plus custom heifer raising ($2.75/day), plus solar lease ($1,200/acre), plus direct butter sales to three Madison restaurants ($8/lb). Five revenue streams. Same 180 cows. Same land. Same family.

Collaboration Without Consolidation: Five 200-cow farms in Dodge County formed an LLC—but just for buying feed. They’re getting loads at 1,000-cow pricing but keeping independence. Another group shares a nutritionist, vet, and relief milkers. “We compete Tuesday, cooperate Wednesday,” as one put it.

The Uncomfortable Math on Consolidation

Let’s talk real numbers. Wisconsin lost 455 farms last year. Ninety-four in October alone. The state’s own survey revealed that 17% of all dairy farms plan to exit within five years. Farms under 100 cows? Twenty-two percent say they’re done.

Those aren’t statistics. Those are your neighbors.

But here’s the weird part—Cornell data shows milk solids production up 1.65% year-to-date despite fewer cows. We’re getting more efficient at producing milk nobody wants. It’s like running faster toward a cliff.

Industry consolidation data indicate that farms with between 150 and 400 cows have the highest costs and the lowest returns. Too big for small-farm premiums, too small for commodity efficiency. That’s the kill zone.

Your Next 90 Days (The Only Timeline That Matters)

Week 1-2: Face Reality, Get brutal about costs. Penn State’s got worksheets. Cornell’s got spreadsheets. If you don’t know your breakeven to the penny—not the hundredweight, the actual penny—you’re not farming, you’re gambling.

Week 3-4: Component Focus Check your last three months of component tests. Calculate what 0.1% more protein means for your check. The Center for Dairy Excellence ECM calculator shows exactly this. That 180-cow farm pushing protein? They check tests like day traders check stocks.

Week 5-8: Find Your Stack. What else can your farm do? Direct sales? Custom work? Solar? Agritourism? Beef-on-dairy? Pick one. Start small. Test it.

Week 9-12: Make The Choice. Get creative or get out. Harsh? Yeah. True? Also yeah.

The farms that do the same thing in the same way are the ones getting auction flyers printed. The ones trying something—anything—different are the ones buying at those auctions.

The Decision That Can’t Wait

Met a 73-year-old dairyman in Marathon County last month. Just installed robots. At 73. Asked him why.

“Because standing still means dying, and I’m not ready for either.”

Markets don’t care about your grandfather’s legacy. Don’t care how many generations your family’s been milking. They care about supply, demand, and who produces the cheapest.

European futures signal more pain coming. GDT auctions confirm it—WMP at $3,650 and sliding. The Wisconsin harvest basis shows the whole rural economy’s stressed. When grain farmers hurt, equipment dealers hurt, banks tighten, and credit disappears.

The 2,800 farms are expected to exit this year? That’s market share for somebody. Question is whether you’re capturing it or becoming it.

Your Choice (And Yeah, You Have to Choose)

Your October check is what it is. November’s definitely worse. December… let’s not even go there.

But what you do today—literally today, Monday, October 20—determines whether you’re buying your neighbor’s cows next spring or selling yours.

That thriving 180-cow farm down the road? They made tough choices two years ago when they still had options to consider. The bottling equipment, component optimization, and direct sales routes—none of it happened overnight. They saw this coming and adapted early.

They chose to change when changing was optional.

Now it’s mandatory.

What’s your choice?

Because doing nothing? In this market, that’s choosing to fail. And failure’s got a really high acceptance rate right now.

KEY TAKEAWAYS

  • Component Premiums = Immediate ROI: Push protein from 3.29% to 3.50% and capture $8,000-10,000 annually per 200 cows. Wisconsin’s MILK2024 calculator shows feed cost increases of $1,500-2,000, yielding returns of $5,110+. Start Monday by reviewing your last three months of component tests and calculating potential gains.
  • Information Networks Beat Individual Guessing: Fourteen Wisconsin producers sharing real-time spot prices and processor needs via group text are each banking $4,000-6,000 extra annually. Create or join a trusted network this week—Tuesday’s spot load at $17.50 beats Wednesday’s regular haul at $17.00.
  • Revenue Stacking Under 300 Cows: Small farms adding just one alternative revenue stream (agritourism: $85,000/year, custom heifer raising: $2.75/head/day, solar: $1,200/acre) are achieving better margins than pure milk production. Pick one complementary enterprise that fits your land and labor—test it small, scale if profitable.
  • Direct Marketing Captures Hidden Premiums: Bottling just 5-20% of production for local sales can yield $28/cwt equivalent versus $17 commodity price. Center for Dairy Excellence worksheets show breakeven at 800 gallons/week for most operations. Glass bottles, non-homogenized, farmers markets—that’s where the margin lives.
  • Processing Capacity Crisis = Pricing Opportunity: With plants at 95-98% capacity and tiered pricing hitting ($17 base, $14.50 over-base), strategic production management beats volume chasing. Match your flush to processor needs, not calendar tradition—April-August fluid premiums can add $1.50/cwt for seasonal producers.

Data Sources & References

Market data compiled from EU Commission Milk Market Observatory, USDA reports (pre-shutdown), Penn State Extension, Cornell PRO-DAIRY, UW-Madison Dairy Markets, Kansas State University research, and the Center for Dairy Excellence. Market prices reflect mid-October 2025 conditions. Additional reporting from regional cooperatives, the Minnesota Milk Producers Association, and producer networks.

Component Optimization Tools:

Learn More:

The Sunday Read Dairy Professionals Don’t Skip.

Every week, thousands of producers, breeders, and industry insiders open Bullvine Weekly for genetics insights, market shifts, and profit strategies they won’t find anywhere else. One email. Five minutes. Smarter decisions all week.
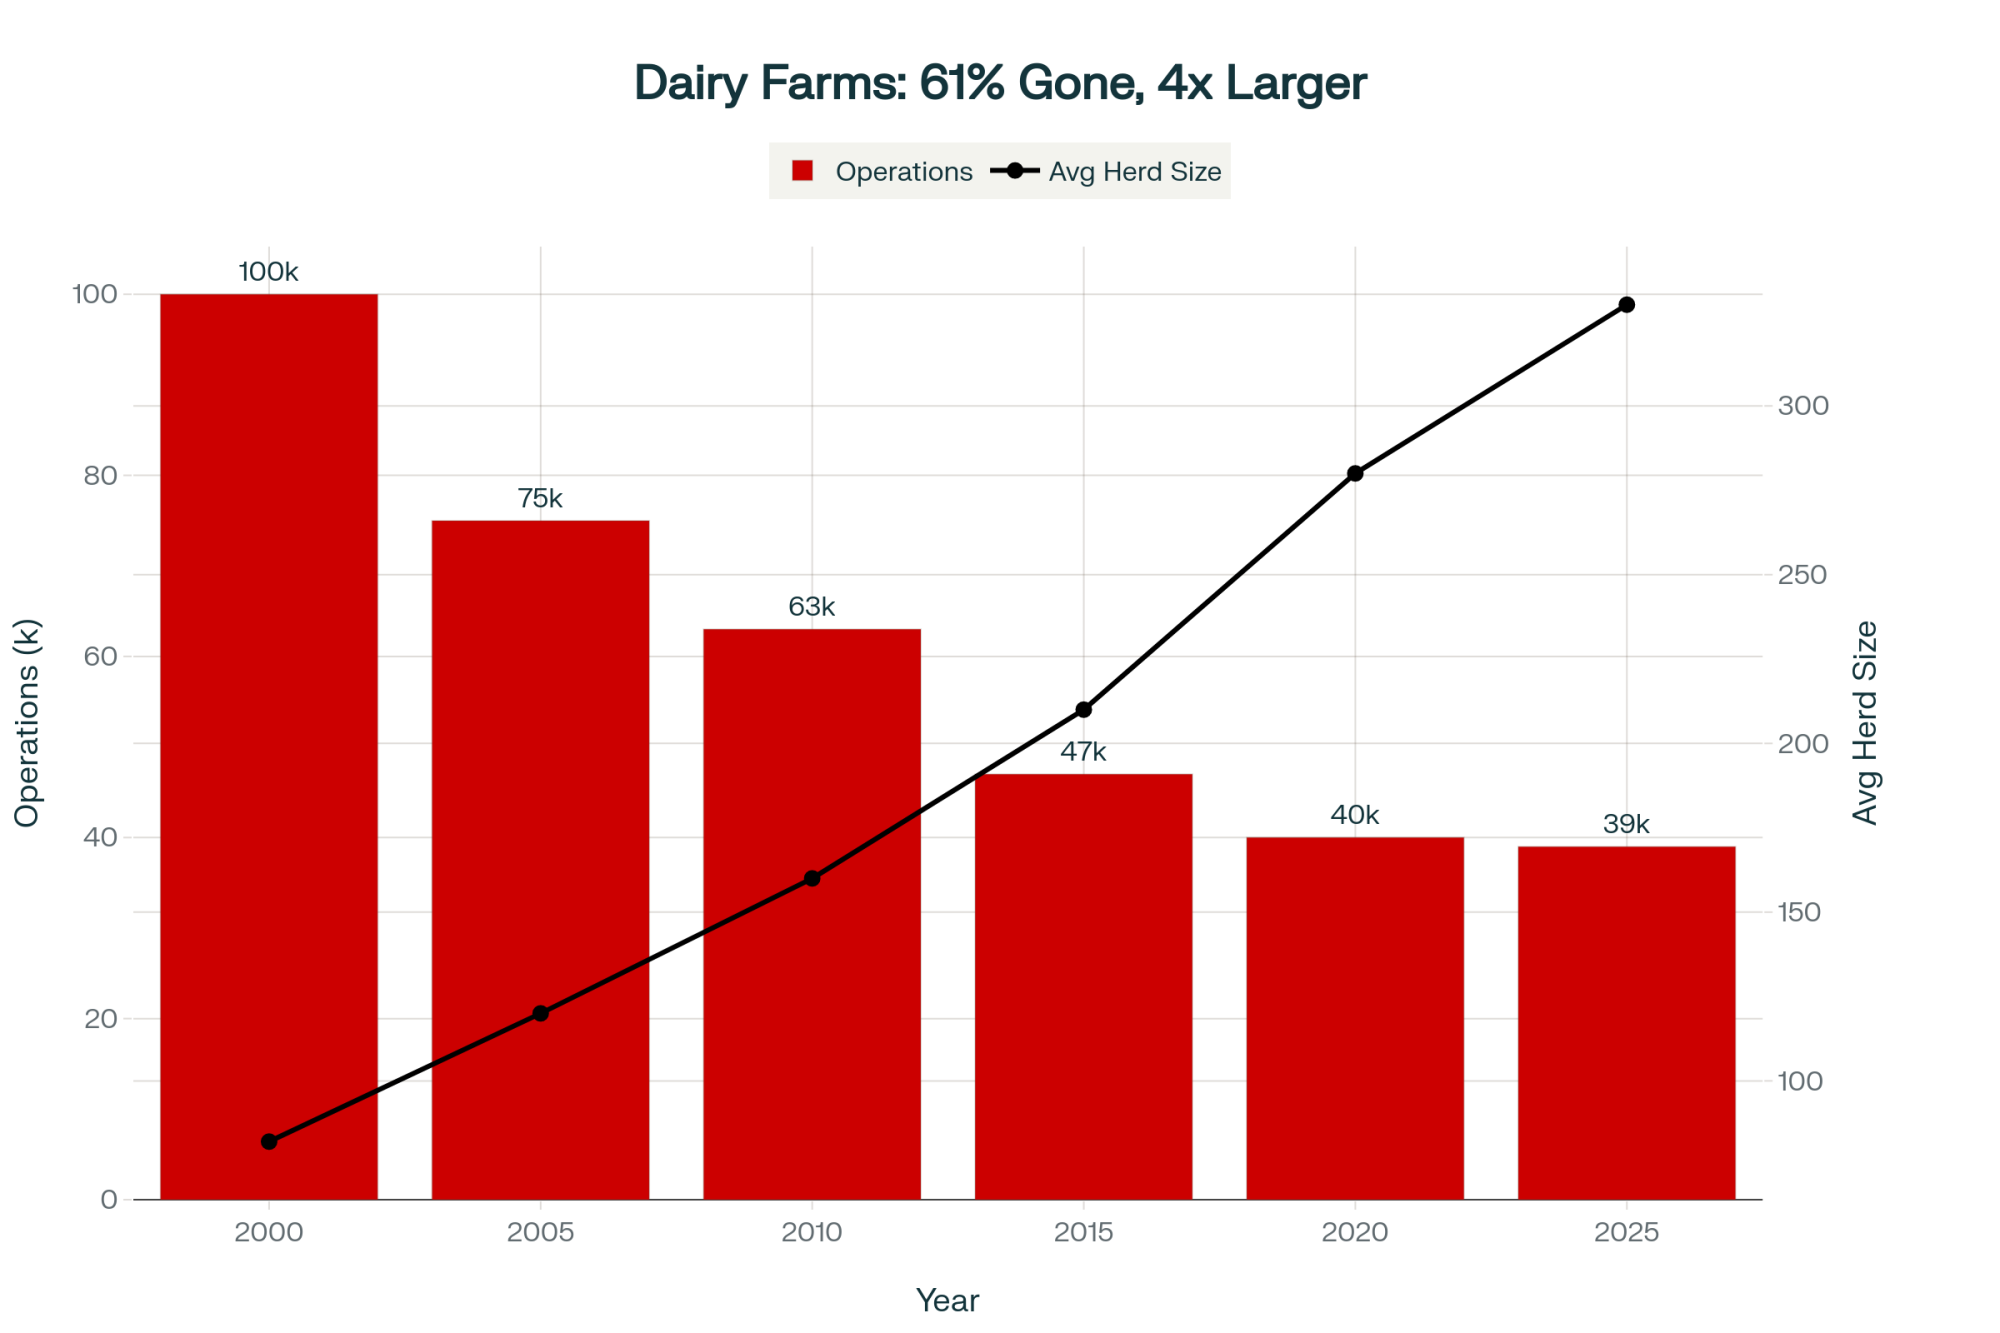
NewsSubscribe
First
Last
Consent
Send this to a friend