Archive for Dairy Markets – Page 5

The $8.2 Billion Export Paradox: Your 3-Path Playbook for $16 Milk

Why does record demand mean less money? The answer changes everything about your operation.

EXECUTIVE SUMMARY: What farmers are discovering right now is that record dairy exports—$8.2 billion in 2024 according to USDA—aren’t translating to profitable milk checks, with Class III futures stuck between $16-17 per hundredweight. The University of Wisconsin’s analysis shows the June 2025 Federal Order changes shifted about 52 cents per hundredweight from farmers to processors through increased make allowances, costing a typical 750-cow operation $75,000-$80,000 annually. Meanwhile, Cornell Pro-Dairy research reveals that operations finding success are those capturing $2-4 premiums through quality differentiation or investing in value-added processing that returns $40-60 per hundredweight. With 67% of dairy farms meeting financial stress criteria according to Farm Credit’s Q3 report, and FSA forbearance ending December 31st, the window for strategic repositioning is narrowing. Yet regional opportunities remain strong—from Wisconsin’s specialty cheese premiums to sustainability payments of $8-12 per hundredweight from major food companies. The path forward isn’t about waiting for markets to recover… it’s about choosing your lane now: scale efficiency, premium capture, or value-added processing.

dairy farm profitability

You know that disconnect we’re all feeling at co-op meetings? Export announcements sound fantastic—USDA’s Foreign Agricultural Service reported $8.25 billion in dairy exports for 2024, second-highest on record. Mexico alone bought $2.47 billion worth of our products.

And yet… here we sit with Class III futures trading between $16 and $17 per hundredweight for November delivery on the CME.

Something’s not adding up, right? Looking at this data might change how you think about your operation’s future.

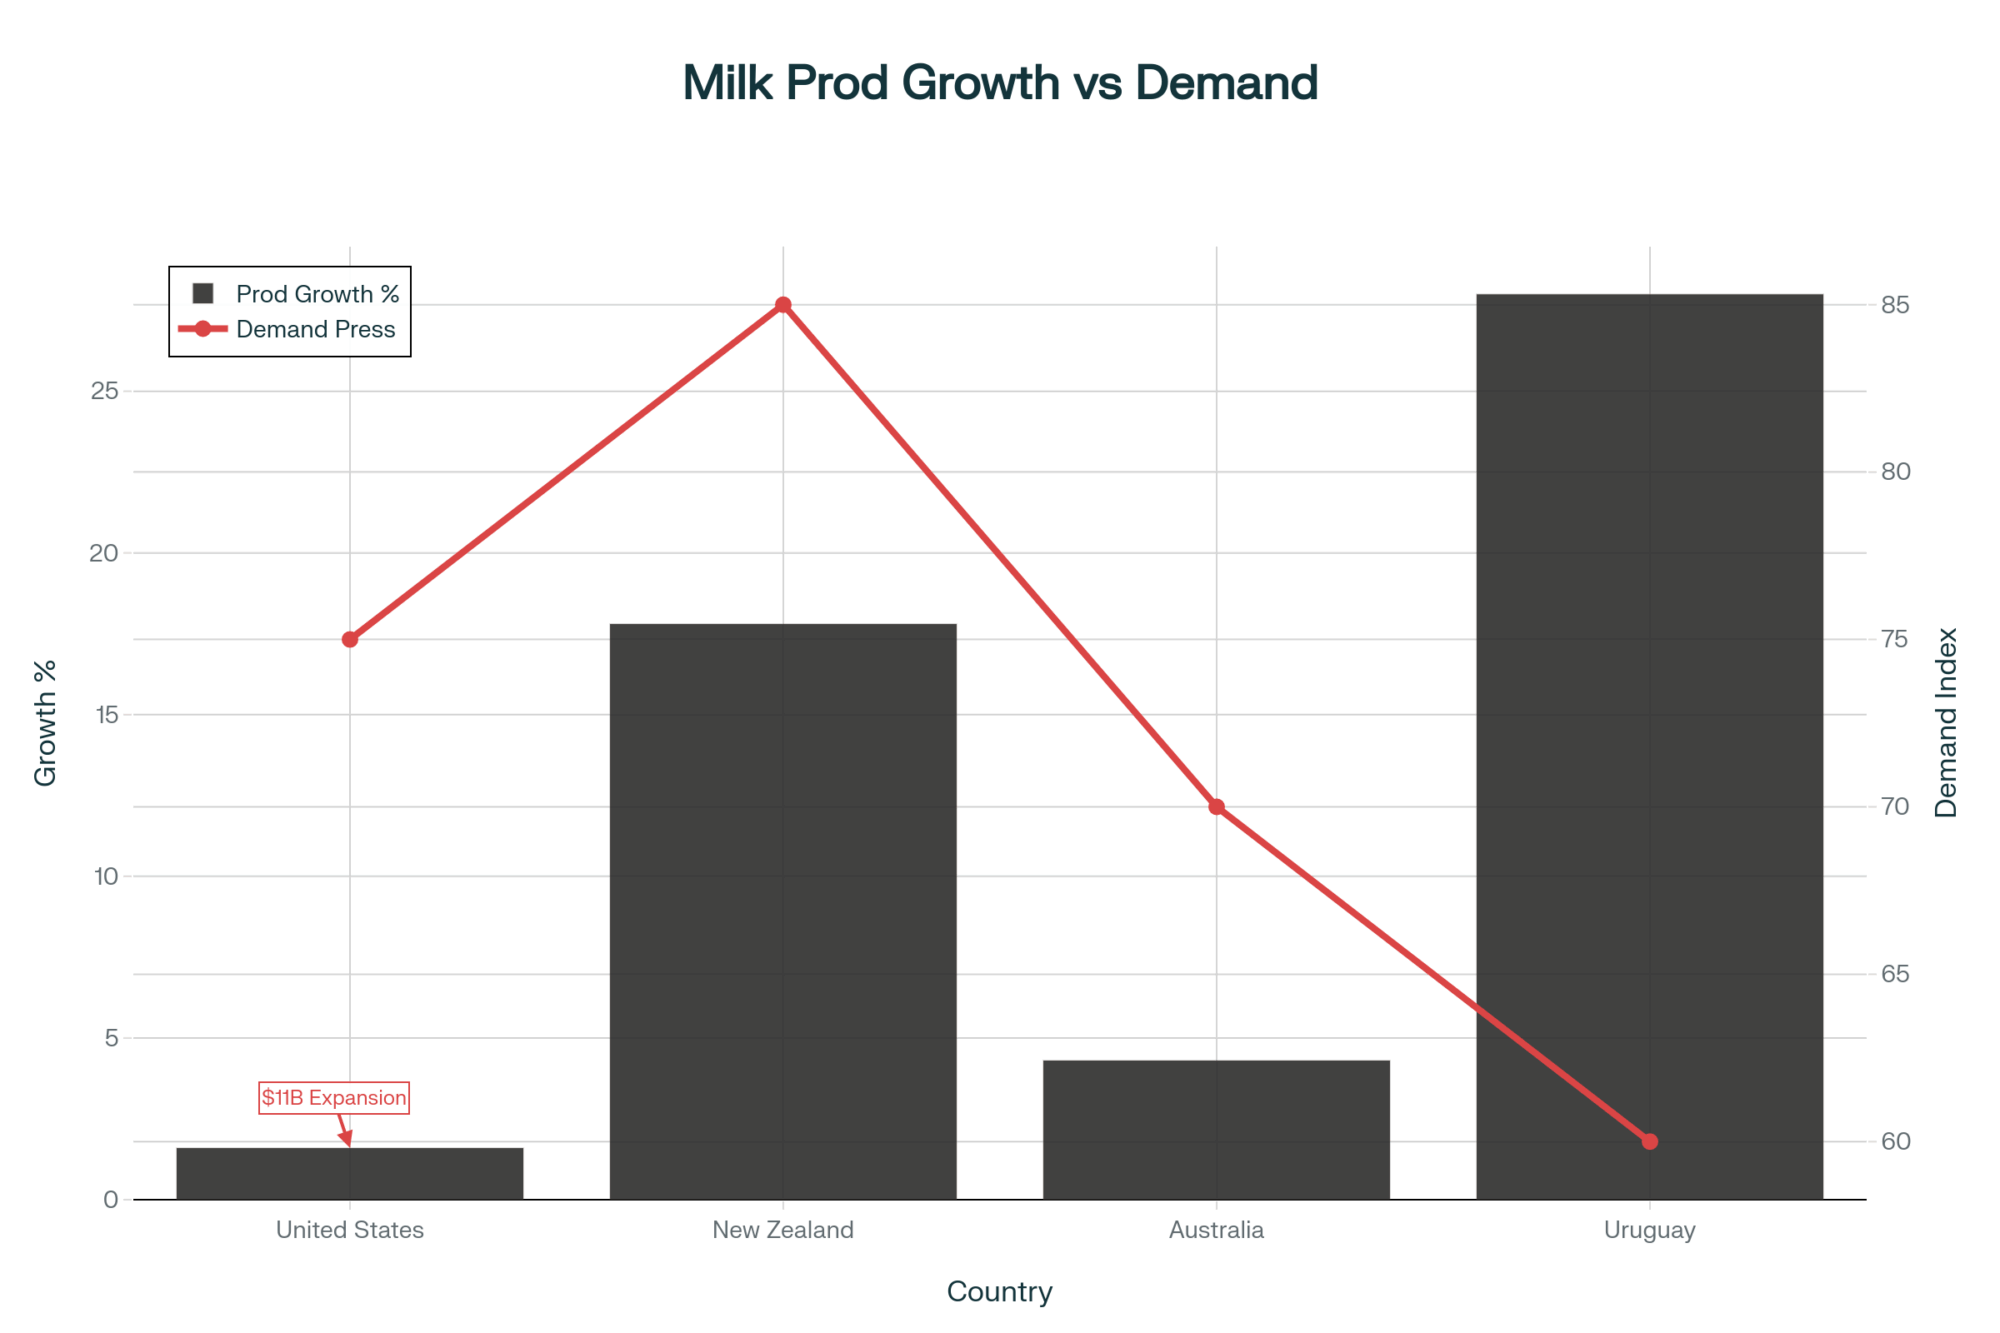
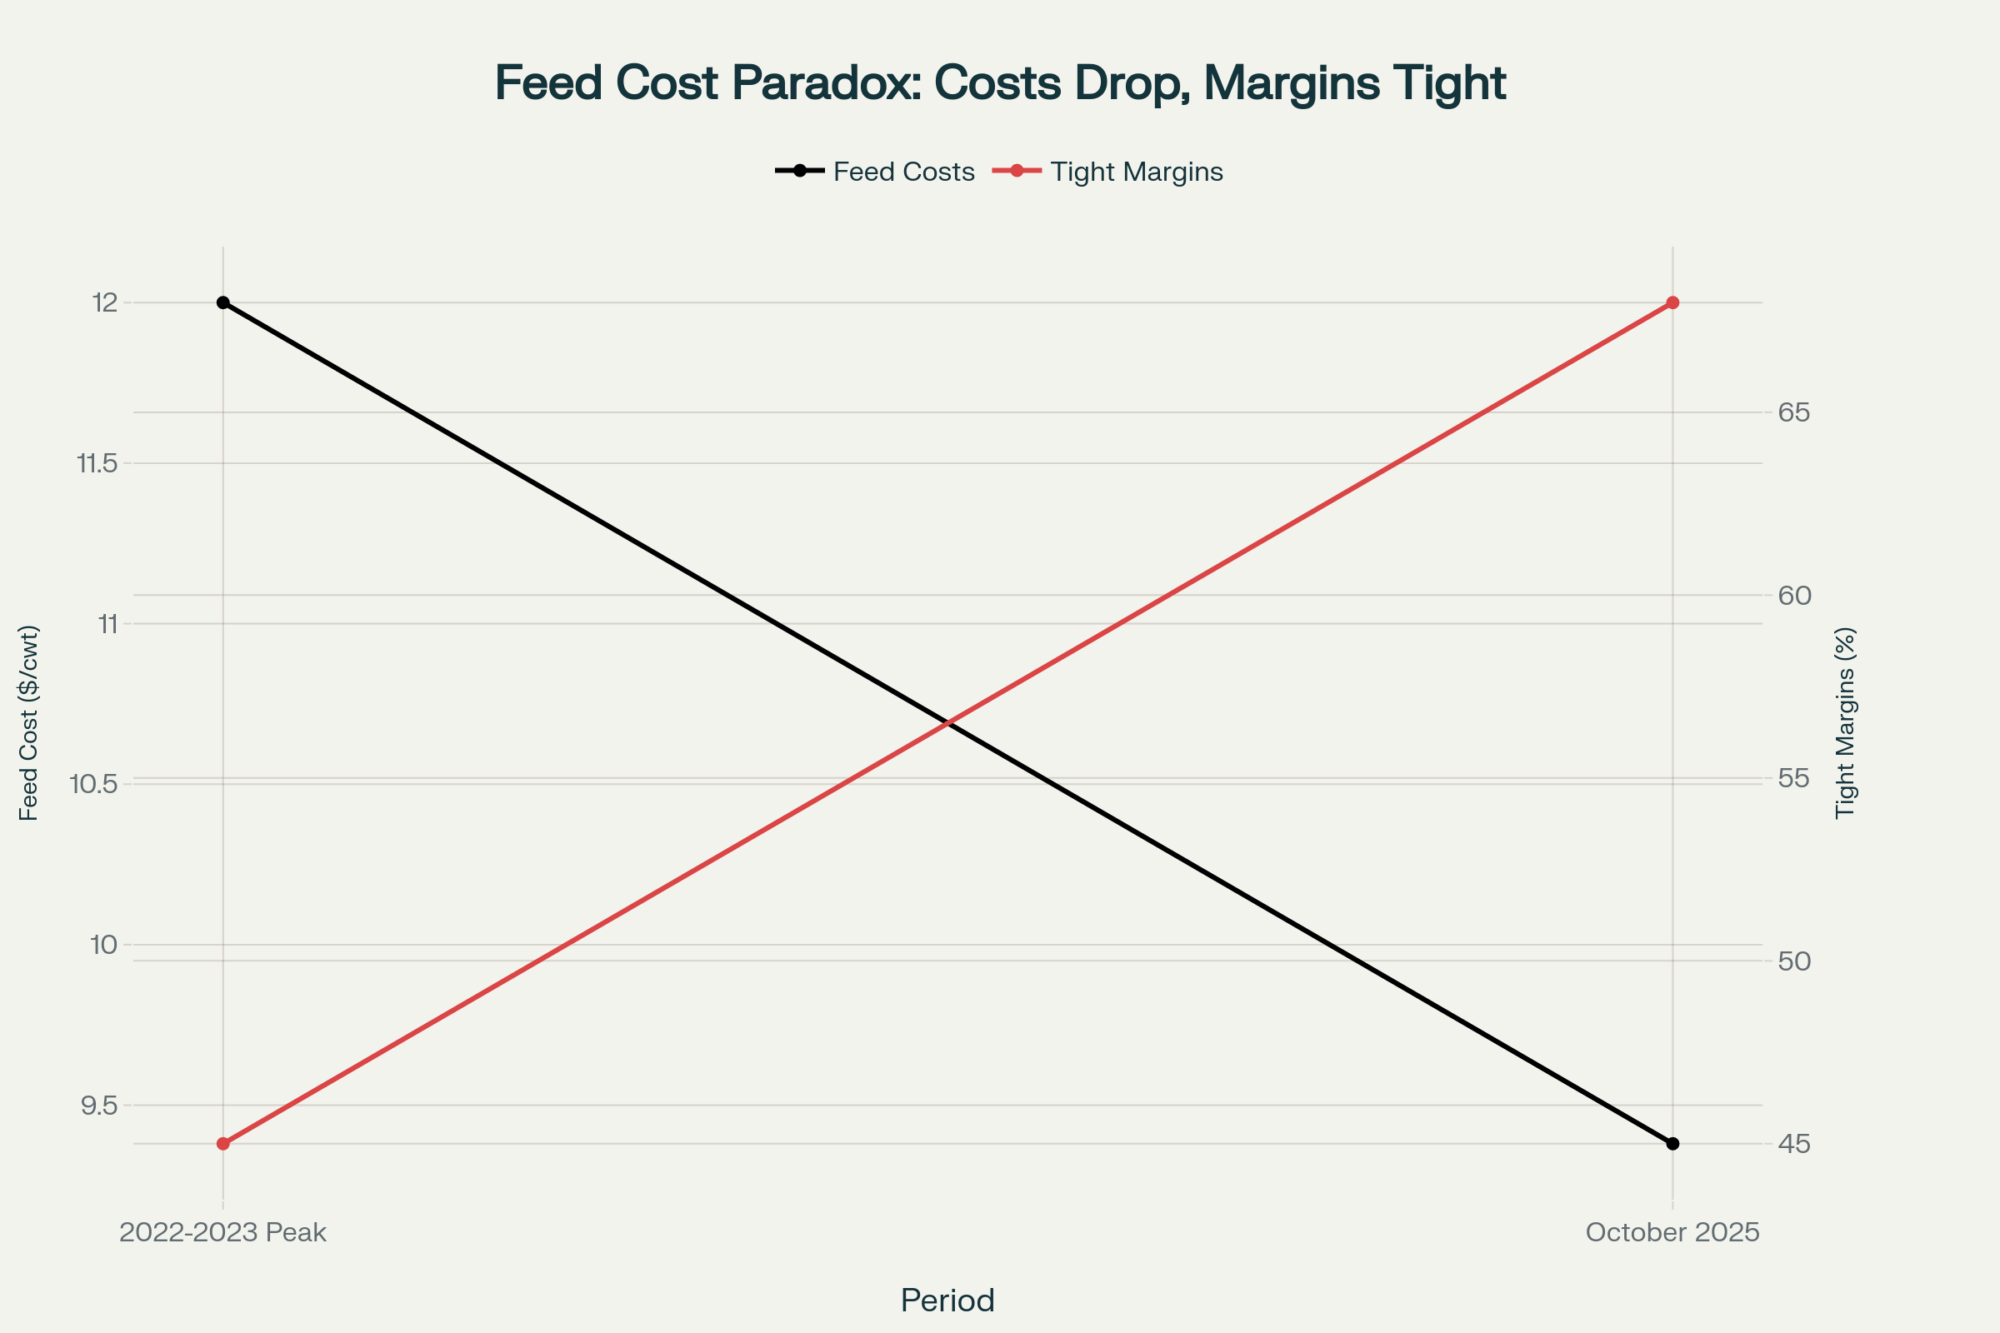
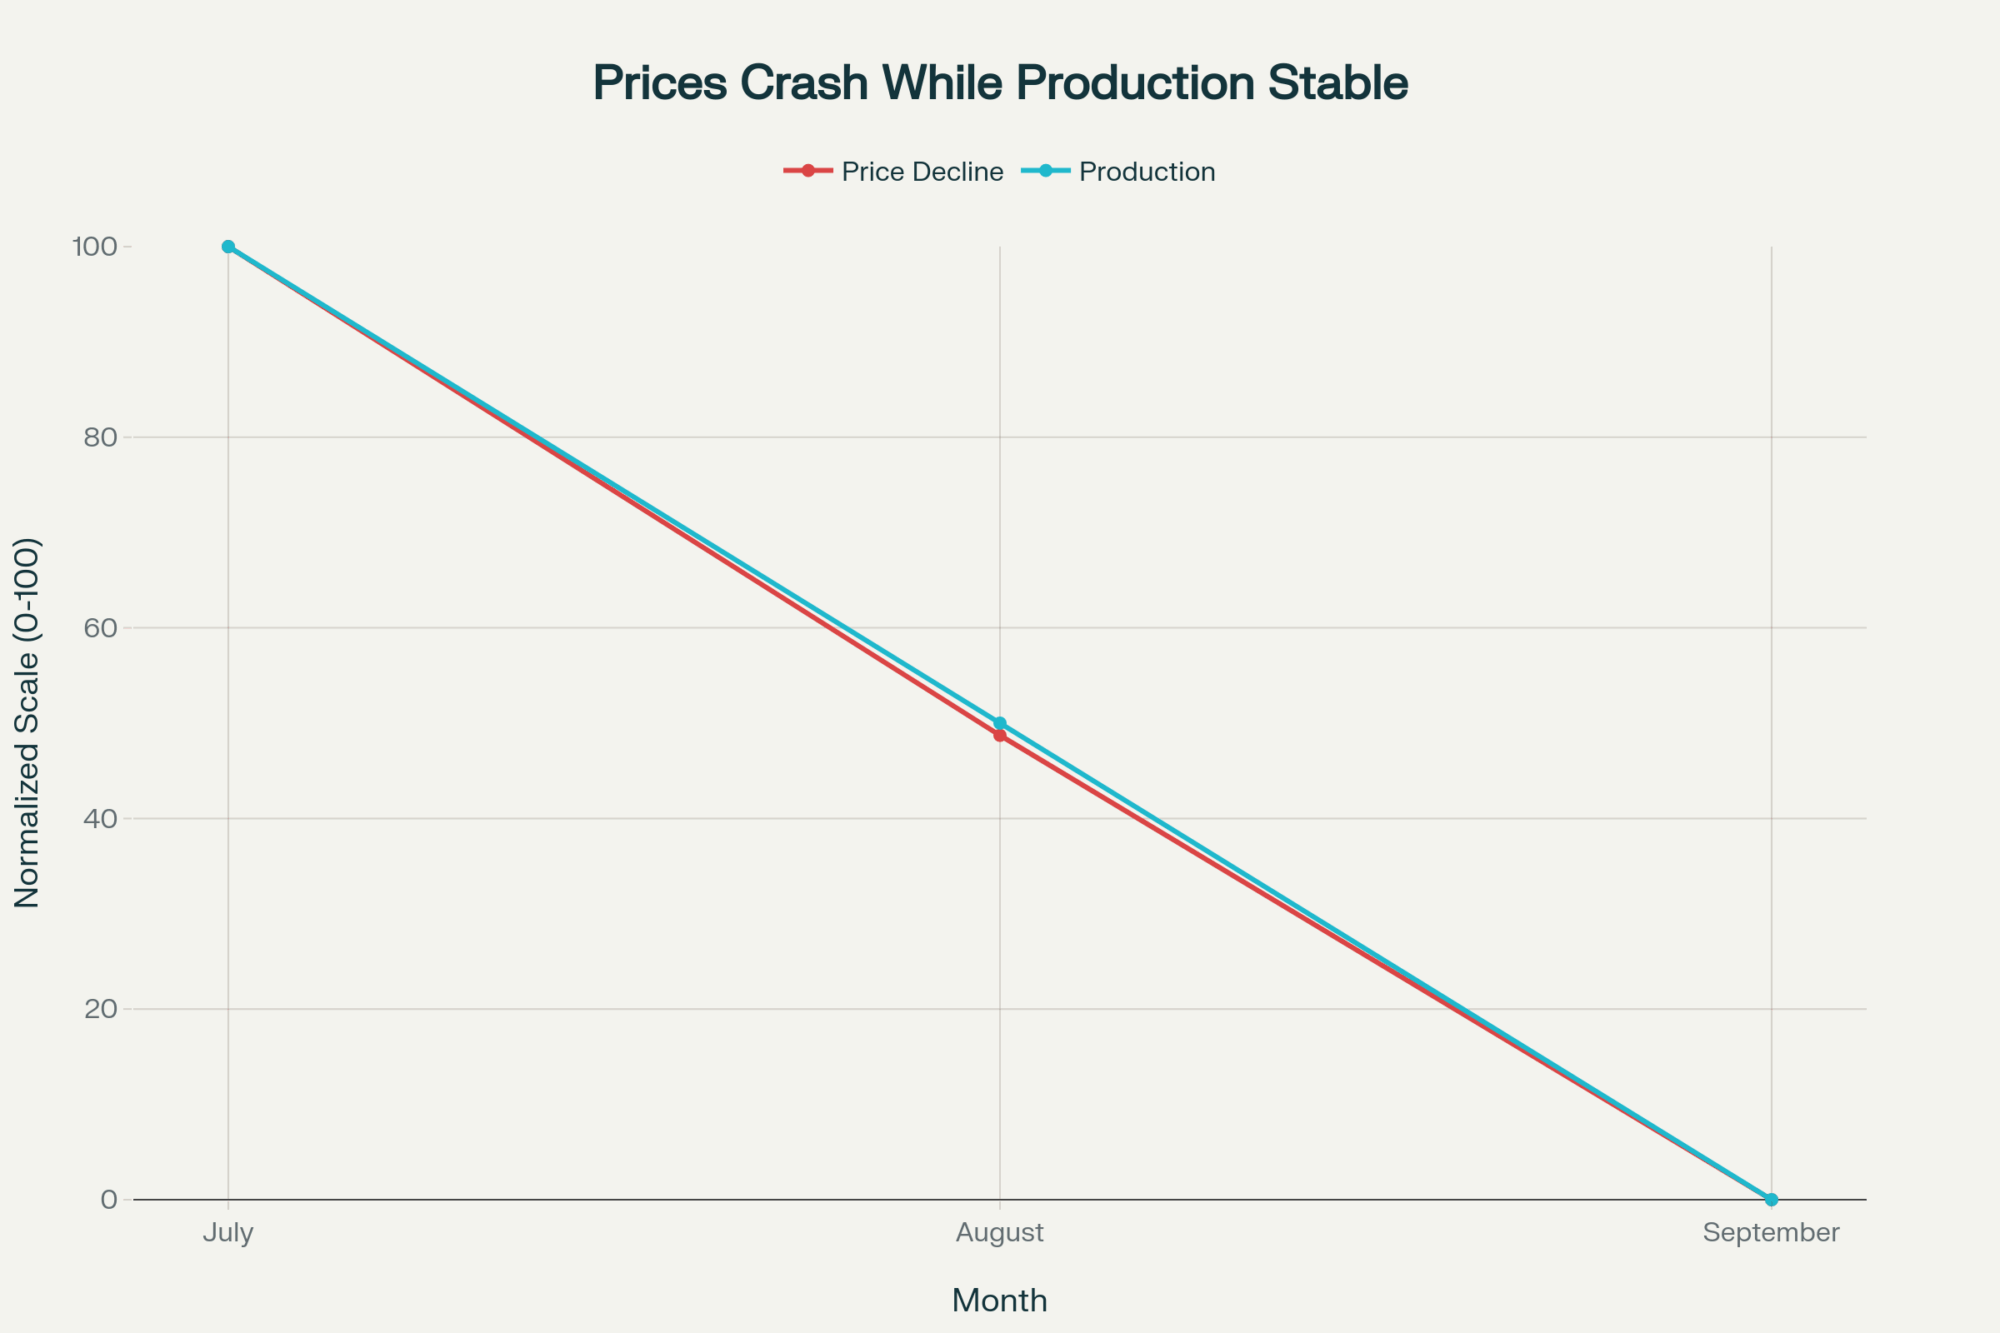
U.S. dairy exports remain strong at $8.2-8.4 billion, yet Class III futures languish between $16-17/cwt—a disconnect that reveals how record demand doesn’t automatically translate to profitable milk checks. The 2022 peak of $9.5B in exports coincided with $21.63/cwt pricing, but that relationship has broken down

Why Processing Margins Tell the Real Story

DateEventImpactUrgencyMonths Until
June 1, 2025New FMMO Rules EffectiveMake allowances increased 85-92¢/cwtActive-4.0
Current (Oct 2025)67% Farms in Financial StressFarm Credit Q3 2025 report thresholdCurrent State0.0
Dec 31, 2025FSA Forbearance ExpiresPayment deadlines hit stressed operationsCritical2.5
Jan 1, 2026New USMCA ProvisionsBorder trade rules shiftHigh3.0
Q1 2026Debt Restructuring Wave$146.3B ag debt needs restructuringCritical3.0

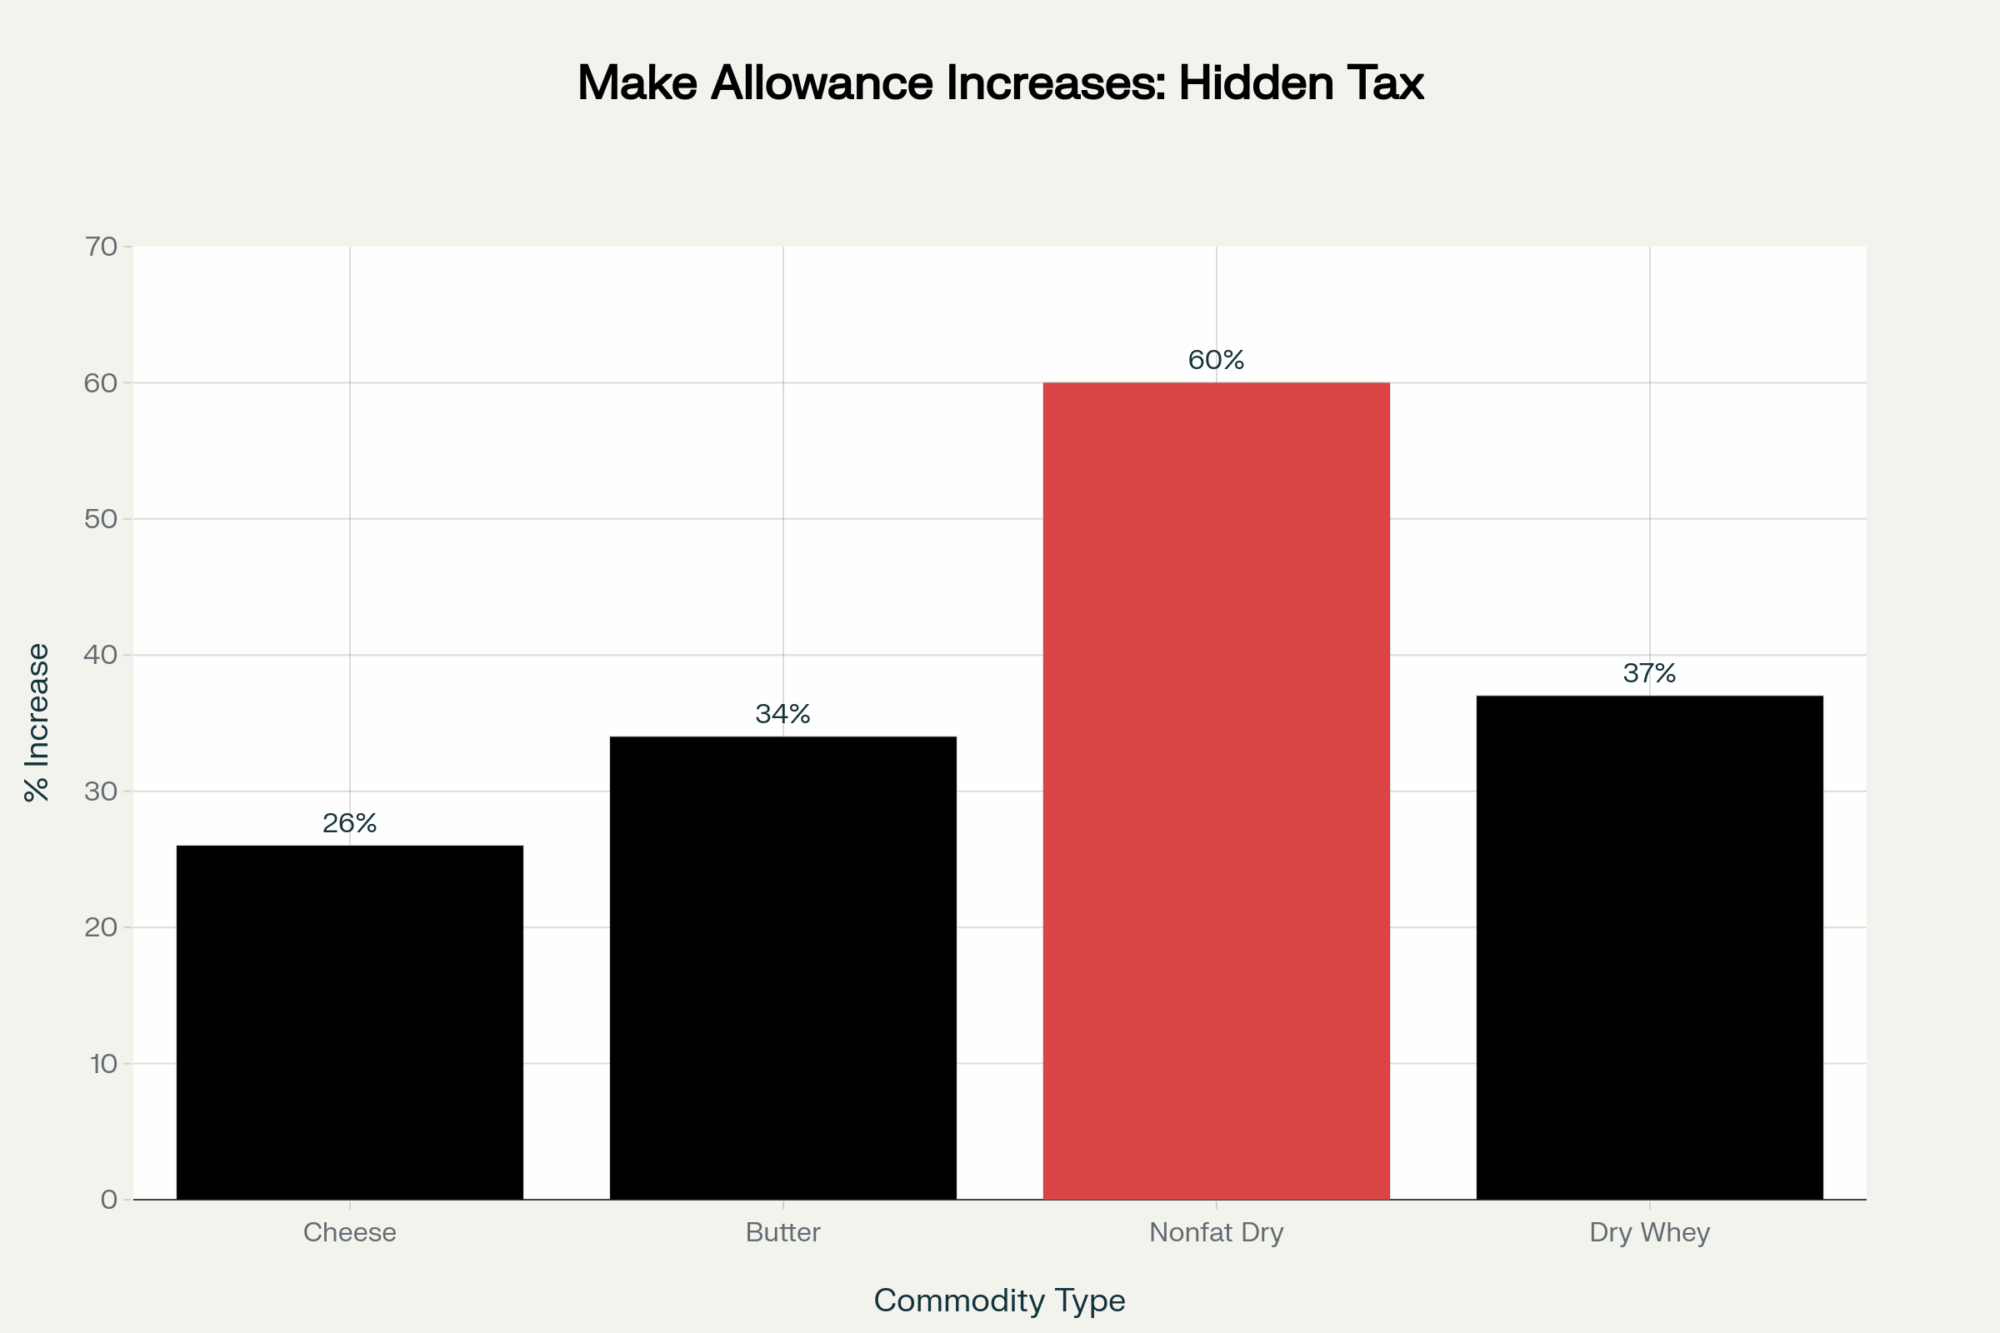
So here’s what’s interesting about the June 2025 Federal Milk Marketing Order adjustments. When the Federal Register published the AMS final rule this past June, they bumped up make allowances—$0.2519 per pound for cheese, $0.2272 for butter, and $0.2393 for nonfat dry milk.

The University of Wisconsin’s Center for Dairy Profitability calculated that works out to about 52 cents less per hundredweight in our pockets. Here’s how: Higher make allowances mean lower component prices in the FMMO formulas. When processors are credited with higher manufacturing costs, the regulated minimum price paid to farmers drops proportionally. For a 750-cow operation? That’s $75,000 to $80,000 less annually.

Processing plants operate 30-40% below USDA-assumed costs, capturing millions while farmer milk checks shrink by $75,000-$80,000 annually for a typical 750-cow operation. The June 2025 Federal Order changes made this gap even wider

What farmers are finding is that modern cheese plants—especially those running three shifts—operate way below those make allowances. We’re talking 30 to 40 percent below what USDA assumes they need.

Think about it. Processors buy milk at June’s $18 Class III price, turn it into 10 pounds of cheese plus whey. CME cheese at $1.80 per pound plus dry whey at 50 cents (according to Dairy Market News) brings in about $18.50 gross. The margin between actual costs and make allowances? Well, you can see where that goes.

How China’s Trade Shift Changed Everything

Market Access FactorUnited StatesNew Zealand
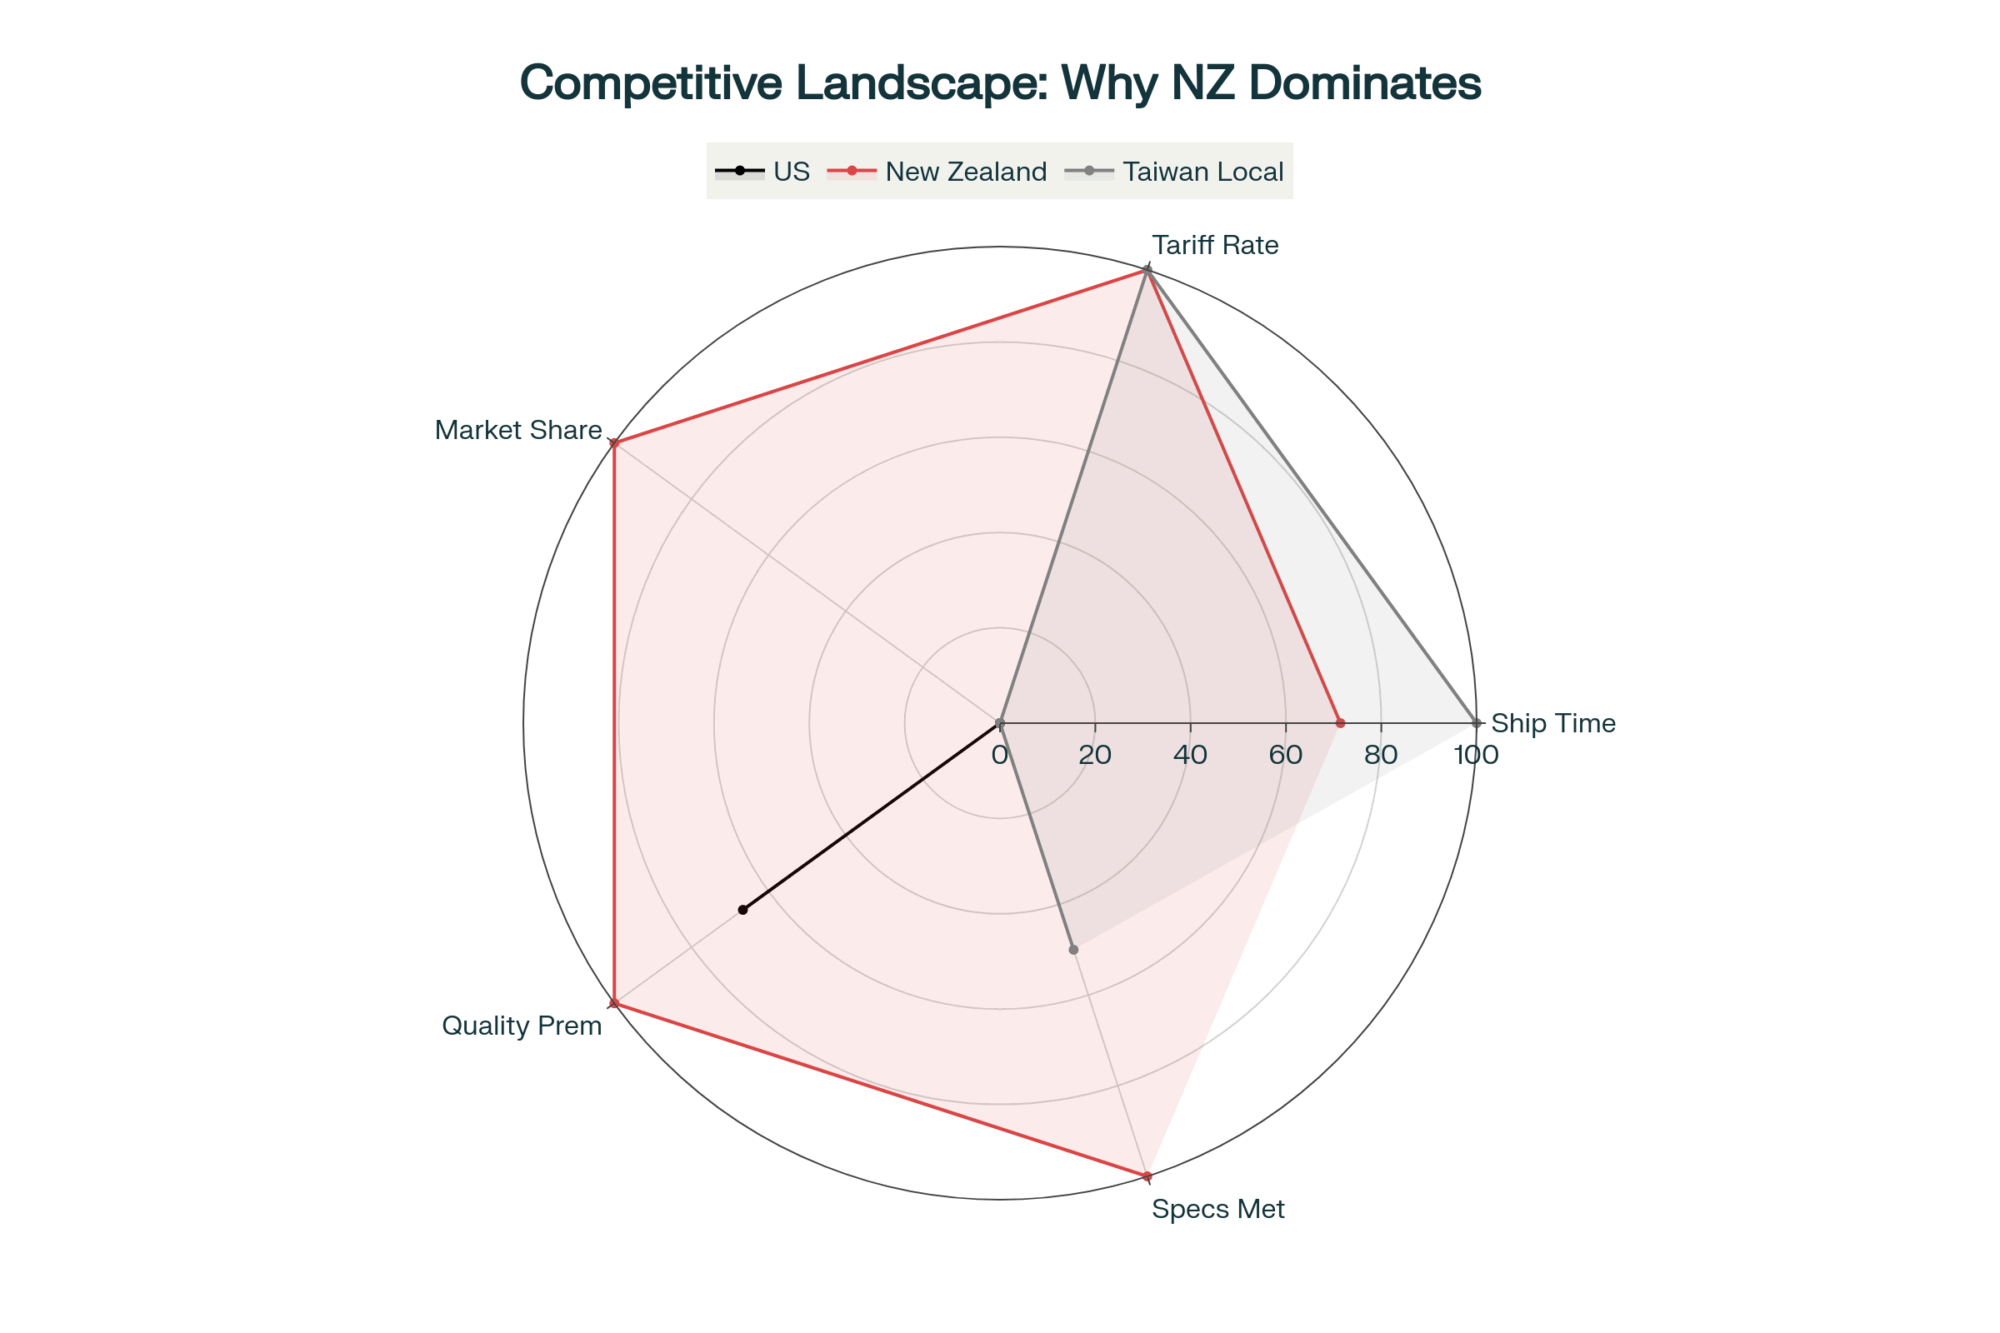
Tariff Rate to China10% base (125% peak tariff)0% (duty-free since Jan 2024)
Dairy Export Value 2024$584M (down from $2.47B total exports)Dominates 46% China imports
China Market ShareDeclining rapidly46% and growing
Trade Agreement StatusNone with ChinaFTA since 2008, upgraded 2024
Government Subsidy EdgeLimitedHeavy support
Cost Advantage per TonBaseline+$350M advantage

Looking back at July 2018, China slapped those 125% retaliatory tariffs on our dairy—documented in the U.S. Trade Representative’s Section 301 schedules. NASS data shows farmgate prices dropped $4 per hundredweight within months.

But China didn’t stop buying dairy. They just stopped buying ours.

New Zealand’s Ministry for Primary Industries now reports supplying 46% of China’s dairy imports, duty-free since January 2024. Rabobank calculates that’s about $350 million in advantages their farmers get that we don’t.

During 2018-2020, while farms bled red ink, SEC filings show the processing sector announced $8 billion in expansions. DFA alone opened an $85 million Nevada facility and bought 44 Dean Foods plants for $433 million when Dean went bankrupt. Interesting timing.

Technology ROI: Why Your Scale Matters More Than Ever

What I’ve noticed, talking with producers, is how technology hits different scales differently. Robotic milking runs $150,000 to $200,000 per stall according to manufacturer pricing. A 120-cow robot barn? That’s $1.5 to $2 million.

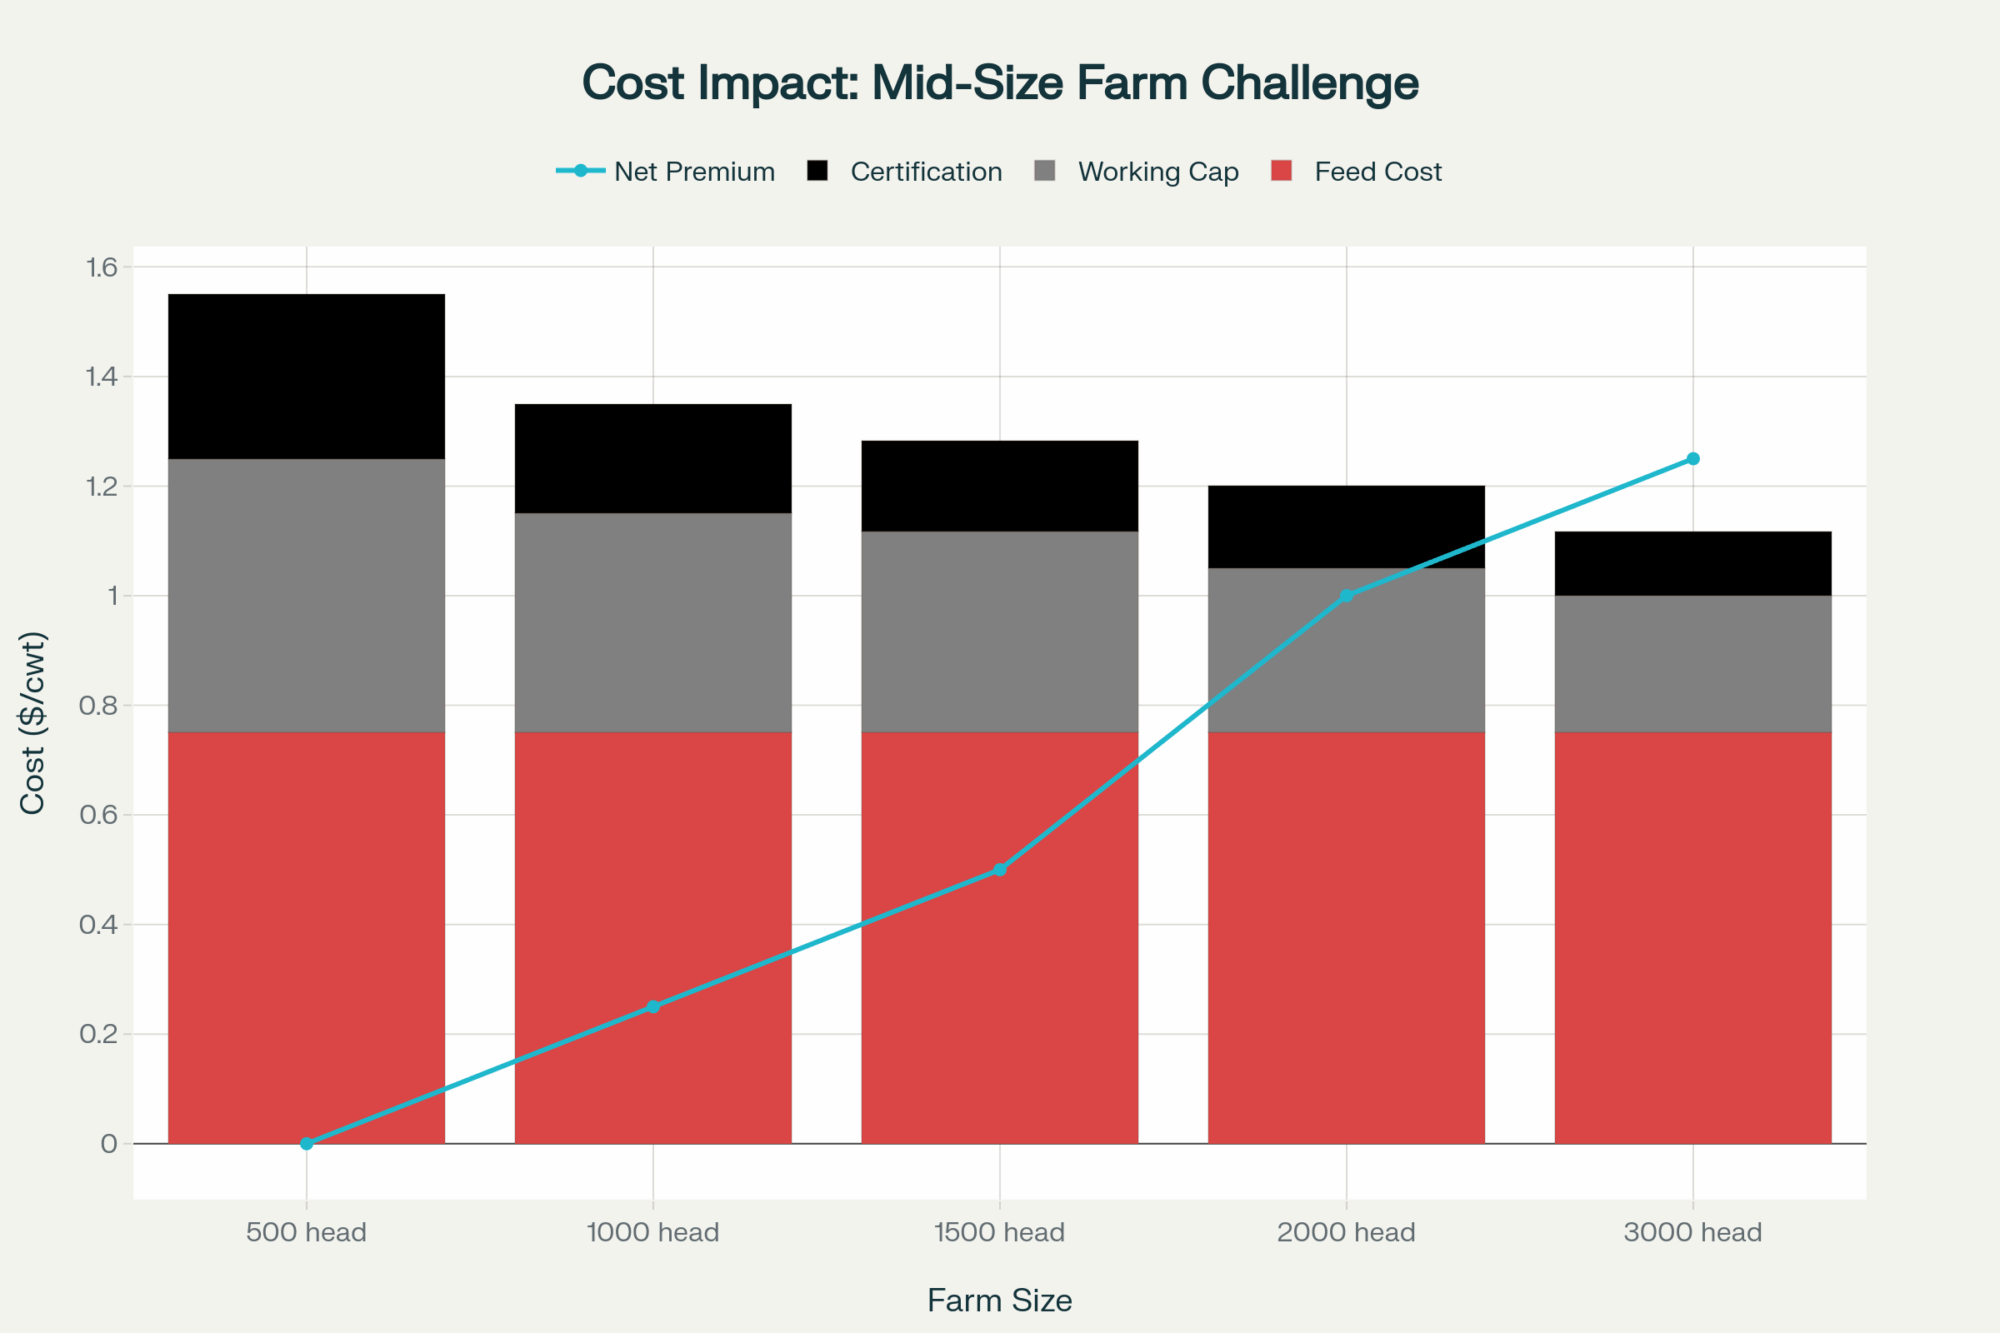
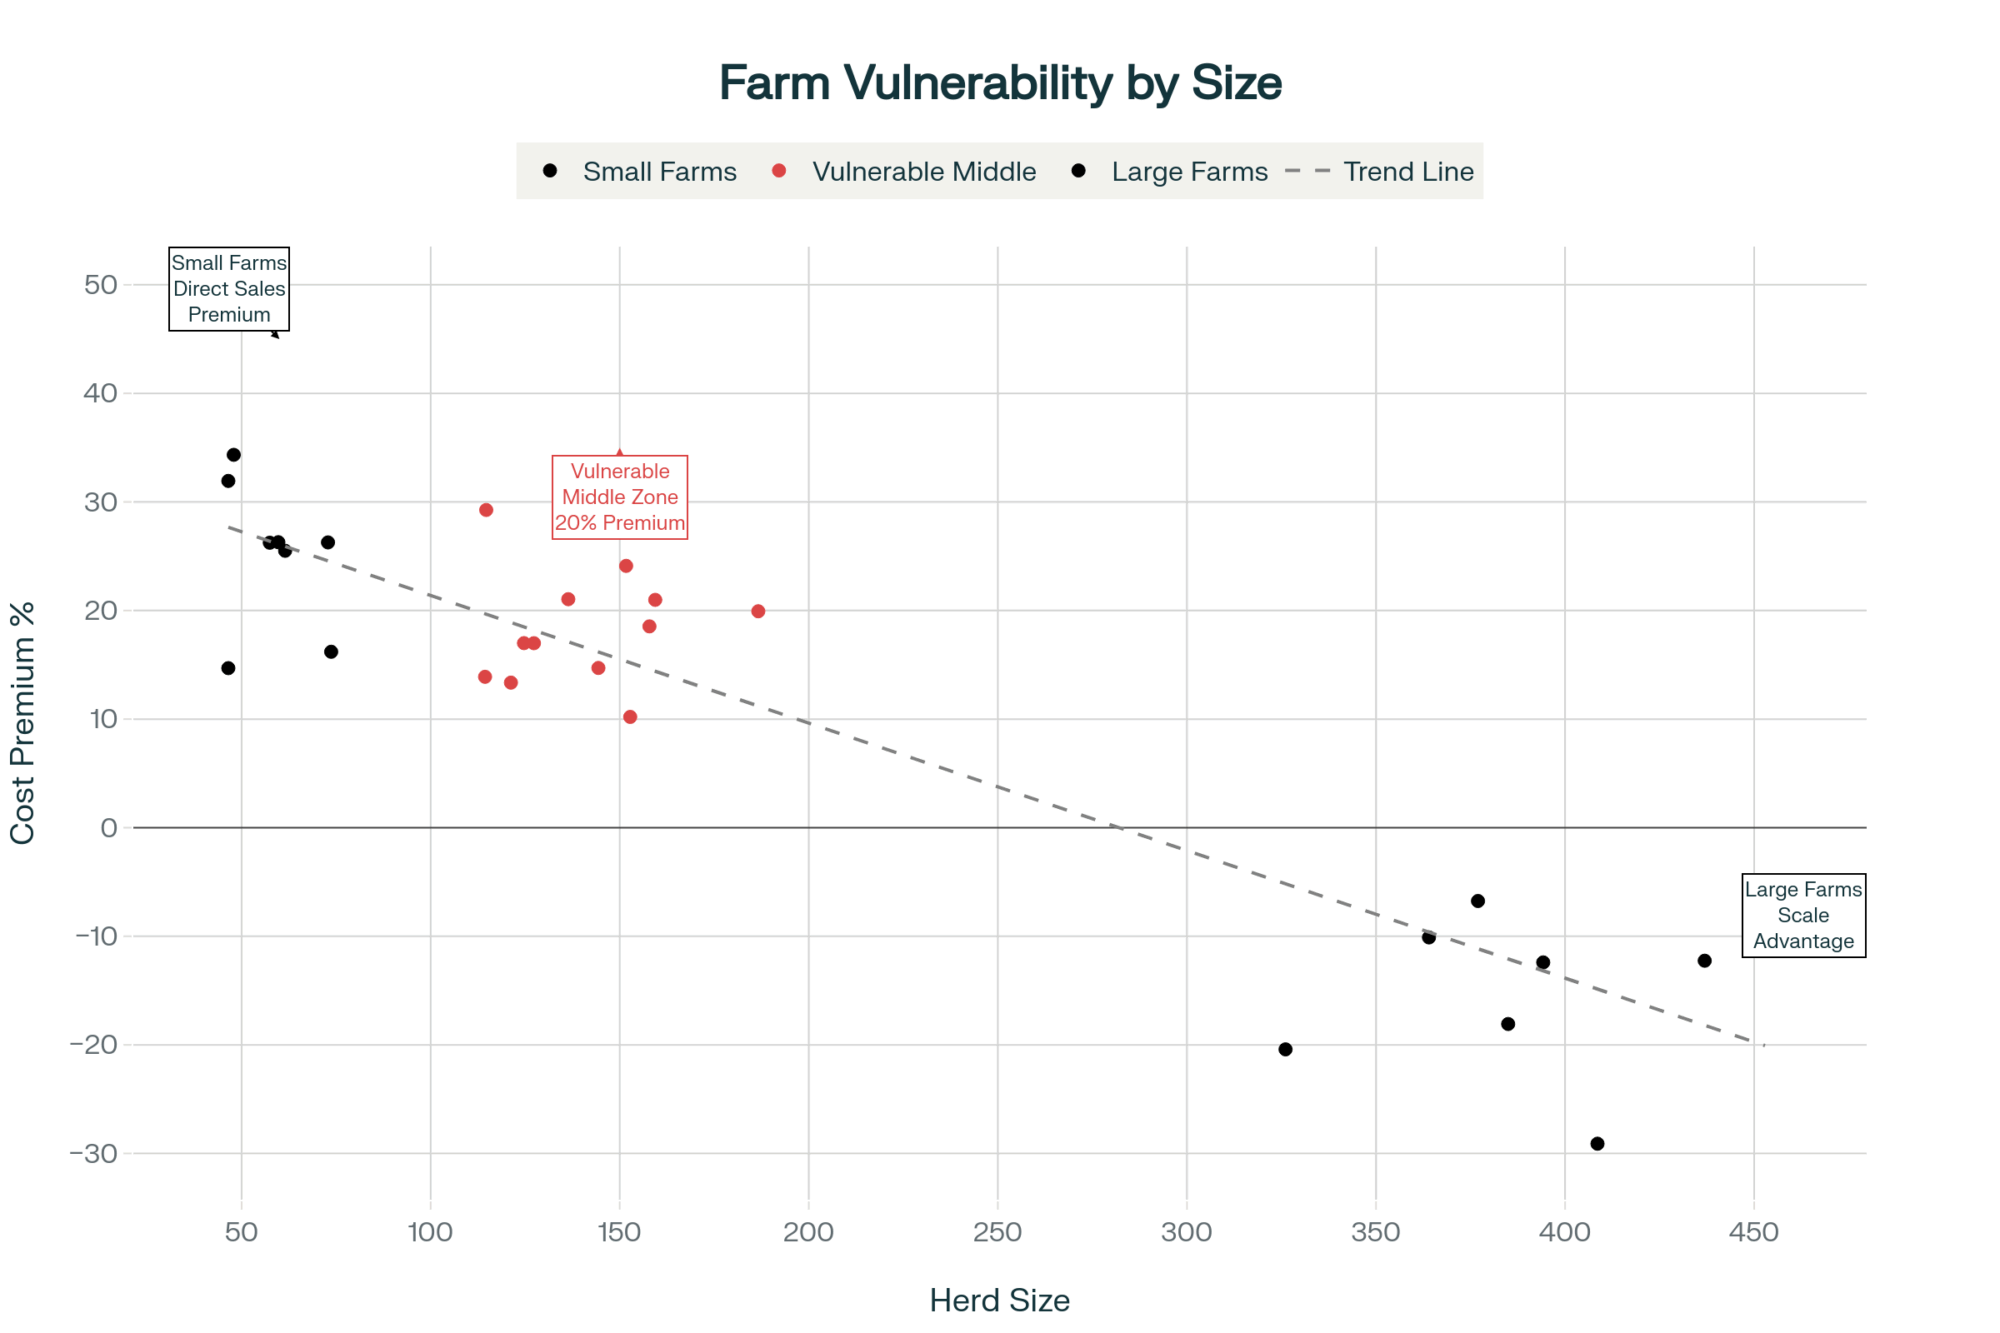
Large operations spread those costs. Small farms might save enough on labor to justify it. But that 500 to 1,500 cow middle? Too big for family labor, too small for real economies of scale.

Cornell’s Pro-Dairy documented precision feeding systems saving 50 cents to a dollar per hundredweight. On 15 million pounds, that’s $75,000 to $150,000 saved. But implementation costs $50,000 to $100,000. Again, scale determines everything.

Premium Milk Markets: What’s Actually Working

Despite challenges, Wisconsin’s Milk Marketing Board documents mid-size operations—500 to 1,000 cows—capturing real premiums through quality and components.

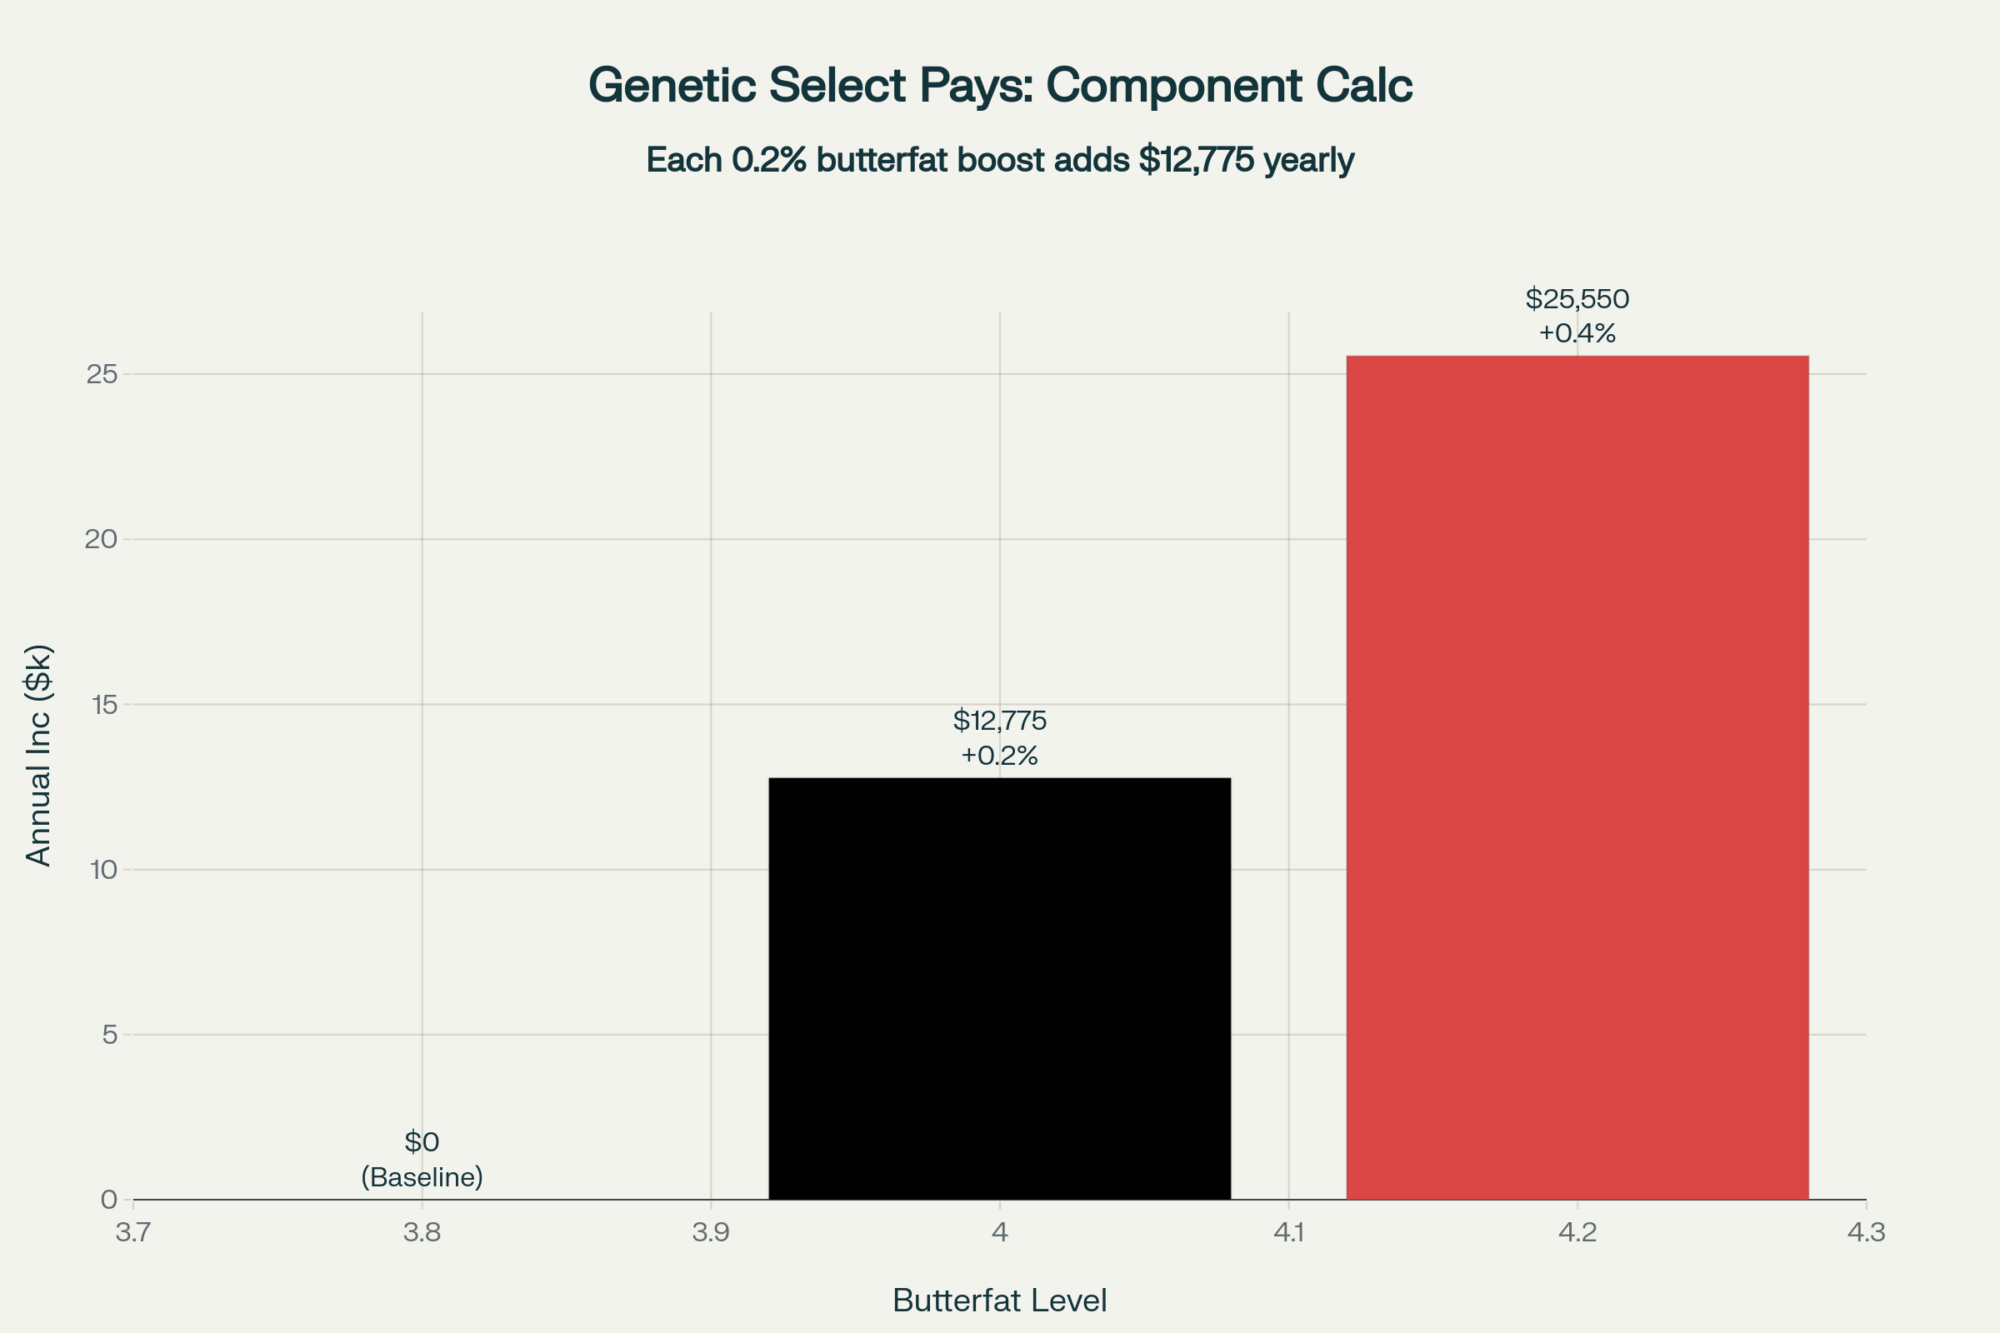
What works? Focus. Some hit somatic cell counts consistently below 100,000. Others boost protein by 0.15 to 0.20 percentage points. Extension case studies show investments of $50,000 to $150,000 in cooling or feed management can generate $150,000 to $300,000 annual returns for positioned operations.

Regional specialty cheese makers often pay $2 to $4 premiums for milk meeting exact specifications. It’s not a radical transformation—it’s targeted improvements aligned with specific opportunities.

While some U.S. farms find success carving out these niche markets, it’s worth examining how our neighbors to the north approach dairy economics entirely differently.

Canada’s System: A Different World

Statistics Canada’s 2024 Farm Financial Survey shows Canadian dairy farmers averaging $246,264 in net income. Bankruptcies? So rare that they don’t track them separately.

Their supply management matches production to demand and sets prices based on Canadian Dairy Commission cost calculations. Yeah, farmers pay $30,000 per cow in quota. Nielsen Canada shows consumers pay 15-20% more for dairy. Trade-offs.

But Farm Credit Canada lends 70-80% against quota value because cash flow’s predictable. That’s different from U.S. dairy, where every loan feels like venture capital.

Whether we’d want their system is debatable, but understanding different approaches helps us evaluate our own opportunities—including those critical dates fast approaching.

Critical 2026 Dates You Need to Know

Financial pressure on dairy farms has returned to crisis levels, with 67% meeting stress indicators in Q3 2025—matching the worst periods since 2019. The brief recovery of 2021-2022 proved temporary, and with FSA forbearance ending December 31st, many operations face critical decisions in the next 60 days

With Fed rates at 4.25-4.50% (per the July FOMC minutes) and the Kansas City Fed showing ag loans over 7.25%, expansion math changed completely. A $3 million project costs an extra $112,500 annually versus 2021 rates.

Farm Credit’s Q3 2025 report shows 67% of dairy operations meeting financial stress indicators. Many rely on FSA forbearance expiring December 31st.

Mark these dates:

  • December 31, 2025: FSA forbearance expires
  • January 1, 2026: New USMCA dairy provisions affect border operations
  • Q1 2026: Congressional Research Service projects $146.3 billion ag debt needs restructuring

Beyond managing immediate financial pressures, forward-thinking operations are exploring new revenue streams through sustainability and value-added production.

Sustainability Premiums and Value-Added Options

StrategyFarm Size (Cows)Investment RequiredAdditional Revenue per CowAnnual Payback (750-cow equivalent)Risk LevelTimeline to Profitability
Small Farm Value-Added<200$400K-$600K+$40-60/cwt$300K-$450KHigh18-24 months
Mid-Size Premium Quality500-1,000$50K-$150K+$2-4/cwt premium$150K-$300KMedium6-12 months
Large-Scale Efficiency2,000+$2M+Sub-$14/cwt cost$750K+ savingsMedium-High3-5 years

General Mills’ 2025 sustainability report details $8-12 premiums for regenerative practices. NRCS estimates managed grazing costs $20,000-$40,000 in fencing and water. Cover crops run $50-$150 per acre.

USDA’s Value-Added Producer Grant database shows cheese operations needing $400,000-$600,000 in equipment. Takes 18-24 months to profitability, but returns often hit $40-60 per hundredweight, double to triple commodity prices.

The Organic Trade Association reports organic premiums at $8-10. Even without certification, documenting sustainable practices opens doors with major food companies.

Global Trade: Why We’re Losing Ground

The European Commission’s September 2025 report shows EU exports to Southeast Asia up 34%. U.S. exports there dropped 12% (USDA FAS). Why? EU-Vietnam eliminated dairy tariffs. We still pay 10-20%.

Australia captured 18% of Japan’s cheese imports (up from 11%) despite drought, according to Japanese customs data. Their trade agreement provides access we lack.

Plant-based competition? The Plant Based Foods Association reports $2.6 billion in 2024 U.S. retail sales. That’s our former market share.

These global dynamics play out differently across U.S. regions, each facing unique challenges and opportunities.

Regional Realities Shape Your Options

RegionFluid Milk Premium ($/cwt)Cheese Plant DensityWater Cost ChallengeHeat Stress ImpactKey Opportunity
Northeast3.5MediumLowLowFluid premiums
Southeast4.0LowLowHigh ($150-200/cow)Population growth
Upper Midwest0.5Very High (600+)LowLowCheese premiums
California1.0HighHigh ($400/acre-ft)MediumYear-round production
Southwest2.0MediumMediumHighExpanding fluid market

California gets year-round production but faces $400 per acre-foot water costs (California Department of Water Resources). Northeast captures $2-5 fluid premiums (Federal Order data) but manages 30% seasonal swings.

Wisconsin’s 600-plus cheese plants (per the Wisconsin Cheese Makers Association) mean opportunity and competition. Southwest sees expansion with volatile feed costs. Southeast? University of Georgia shows heat stress costs $150-200 per cow, but growing populations drive fluid premiums up. And Florida’s unique challenges—humidity, hurricanes, and limited local feed—create both obstacles and opportunities for those who adapt.

What works in Idaho won’t work in Vermont. Know your context.

Next Generation’s Challenge

USDA’s Beginning Farmer program shows new dairy farmers need $2-3 million in capital. At current rates, that’s $175,000-$260,000 debt service before operating.

Creative solutions emerge. Share-milking lets young farmers manage facilities for milk check percentage—entry without massive capital. The National Young Farmers Coalition documents successful transitions through these models, including beef-on-dairy programs requiring less capital.

Making Your Numbers Work

Calculate true costs, including family labor. Cornell’s Dairy Farm Business Summary has free worksheets. FSA’s Dairy Margin Coverage shows a national average at $21.67 per hundredweight. Below that? You’re converting equity to cash.

Look beyond traditional buyers. Federal Order data shows premium spreads exceeding $3 per hundredweight between buyers. On 5 million pounds, $2 difference equals $100,000.

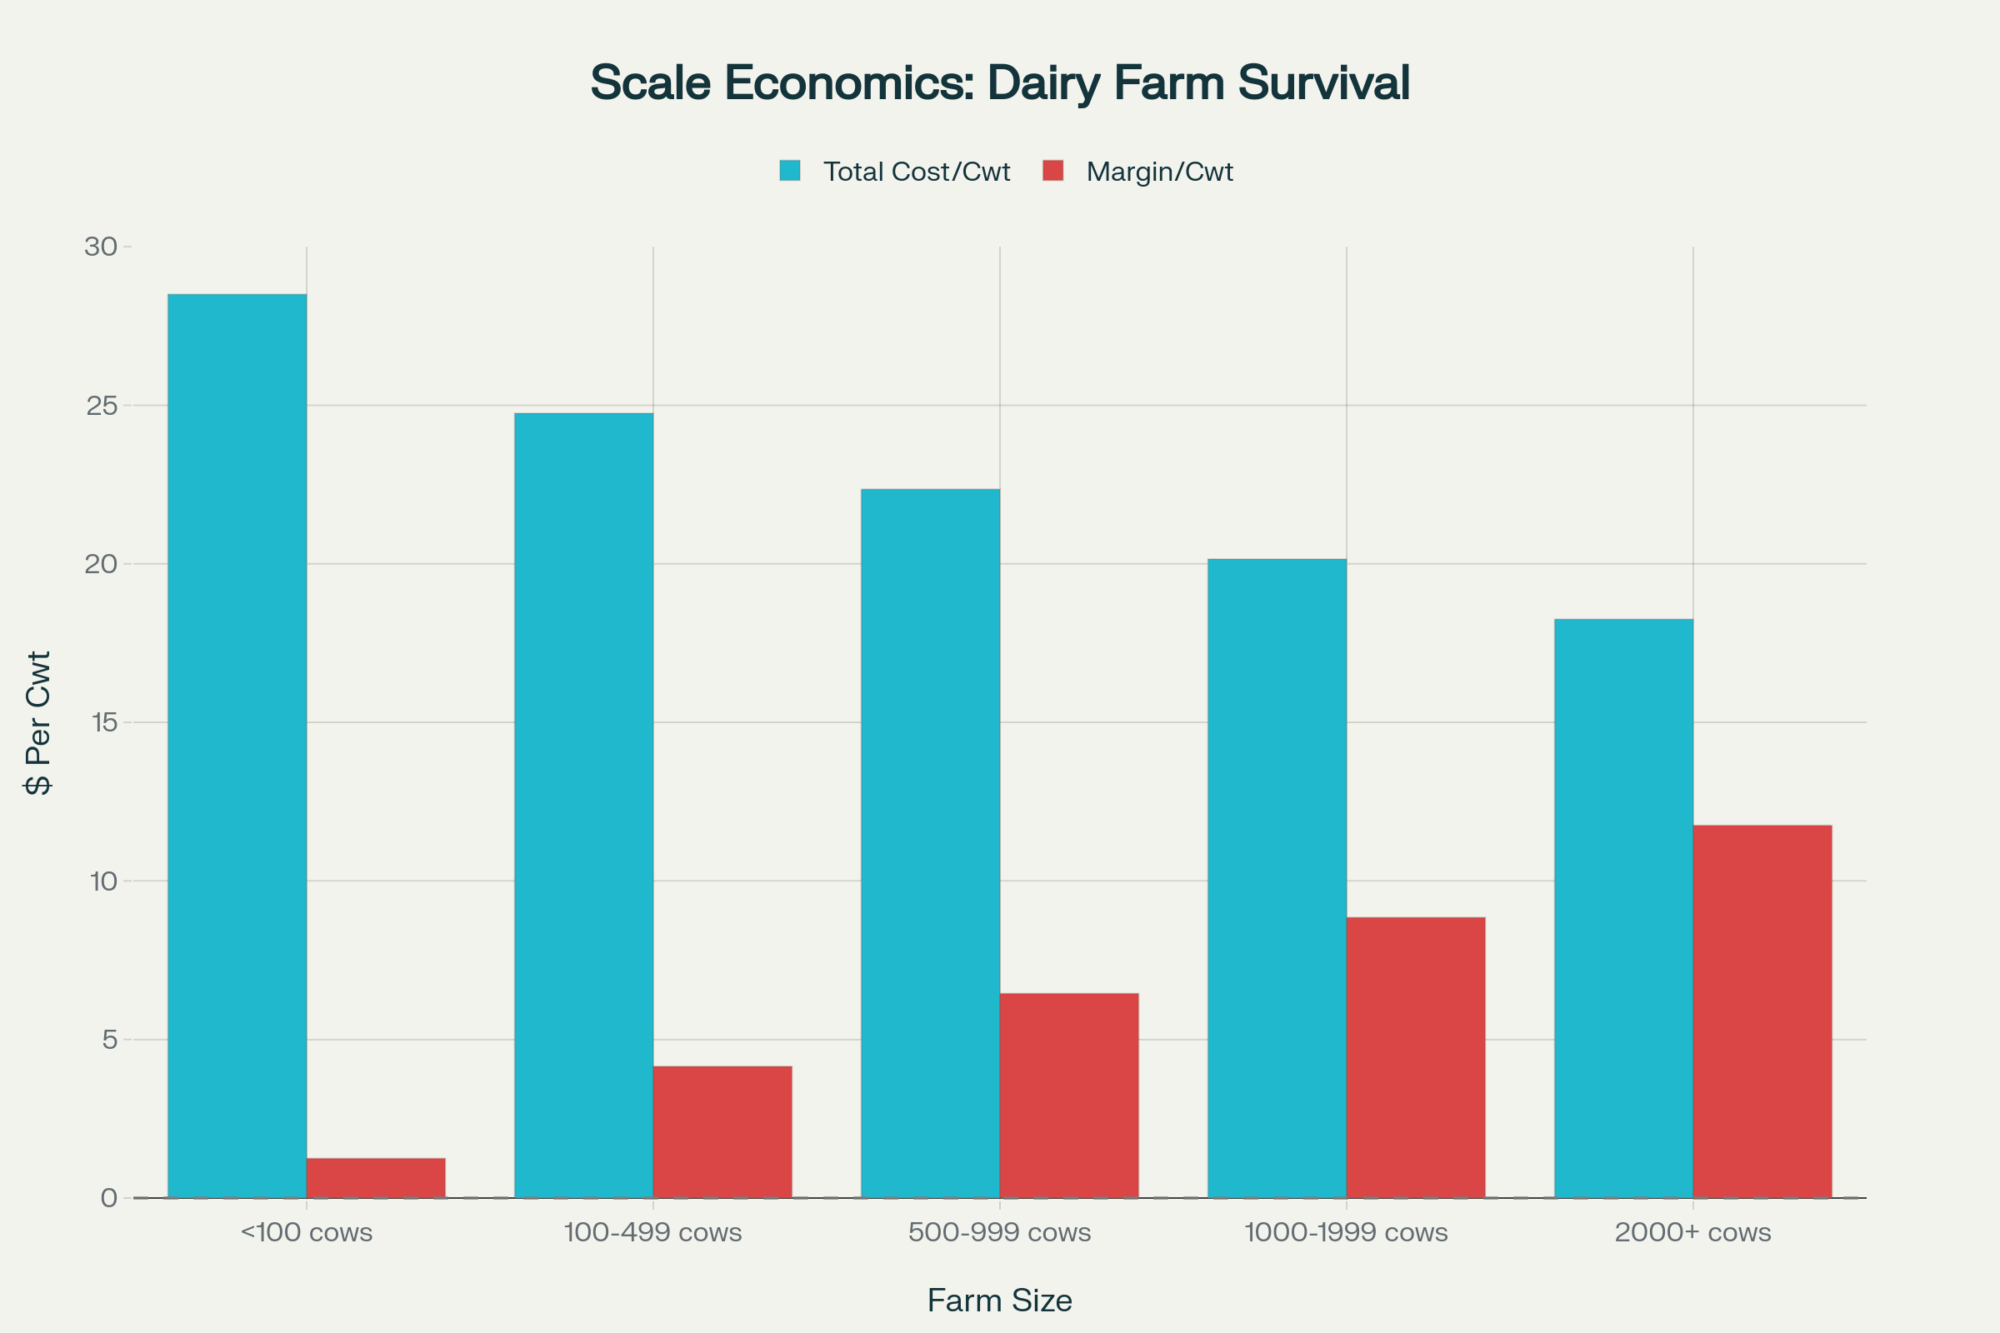
Land Grant research consistently shows two models working: small with value-added ($800+ additional per cow) or large, achieving sub-$14 production costs. That 500-1,500 cow middle needs strategic positioning—quality premiums, components, or niche markets.

The Farm Financial Standards Council shows operations with 15-20% revenue in working capital survive downturns better. Liquidity might matter more than efficiency right now.

The Path Forward: Three Critical Questions

The disconnect between record exports and struggling farms reflects structural market evolution. This isn’t a cycle that patience fixes.

After digesting all this, here are the three strategic questions every operation should be asking:

1. What’s your true breakeven? Not what you hope it is, but what it actually is, including family labor, management time, and equity cost. If you don’t know this number precisely, that’s job one.

2. Where can you capture premium value? Whether through quality, components, sustainability, processing, or scale—identify your most realistic path to differentiation. Generic commodity milk at minimum prices isn’t sustainable for most operations.

3. How much runway do you have? With FSA forbearance ending and refinancing getting tougher, know exactly how many months you can operate at current margins. This determines whether you have time for gradual adjustment or need dramatic change.

Operations across all scales are finding profitable paths. Small farms through processing. Mid-size through quality differentiation. Large through efficiency we couldn’t imagine before.

The dairy industry always rewarded adaptation. Today, it demands it more than ever. But genuine opportunities exist for those positioned right. Whether through technology, premiums, scale, or value-added—the paths are there.

Choose the path fitting your operation, family, and future. This industry will keep evolving. Our job is evolving with it—thoughtfully, strategically, profitably. And remember, we’ve weathered tough times before. We’ll weather these too, just differently than we expected.

KEY TAKEAWAYS

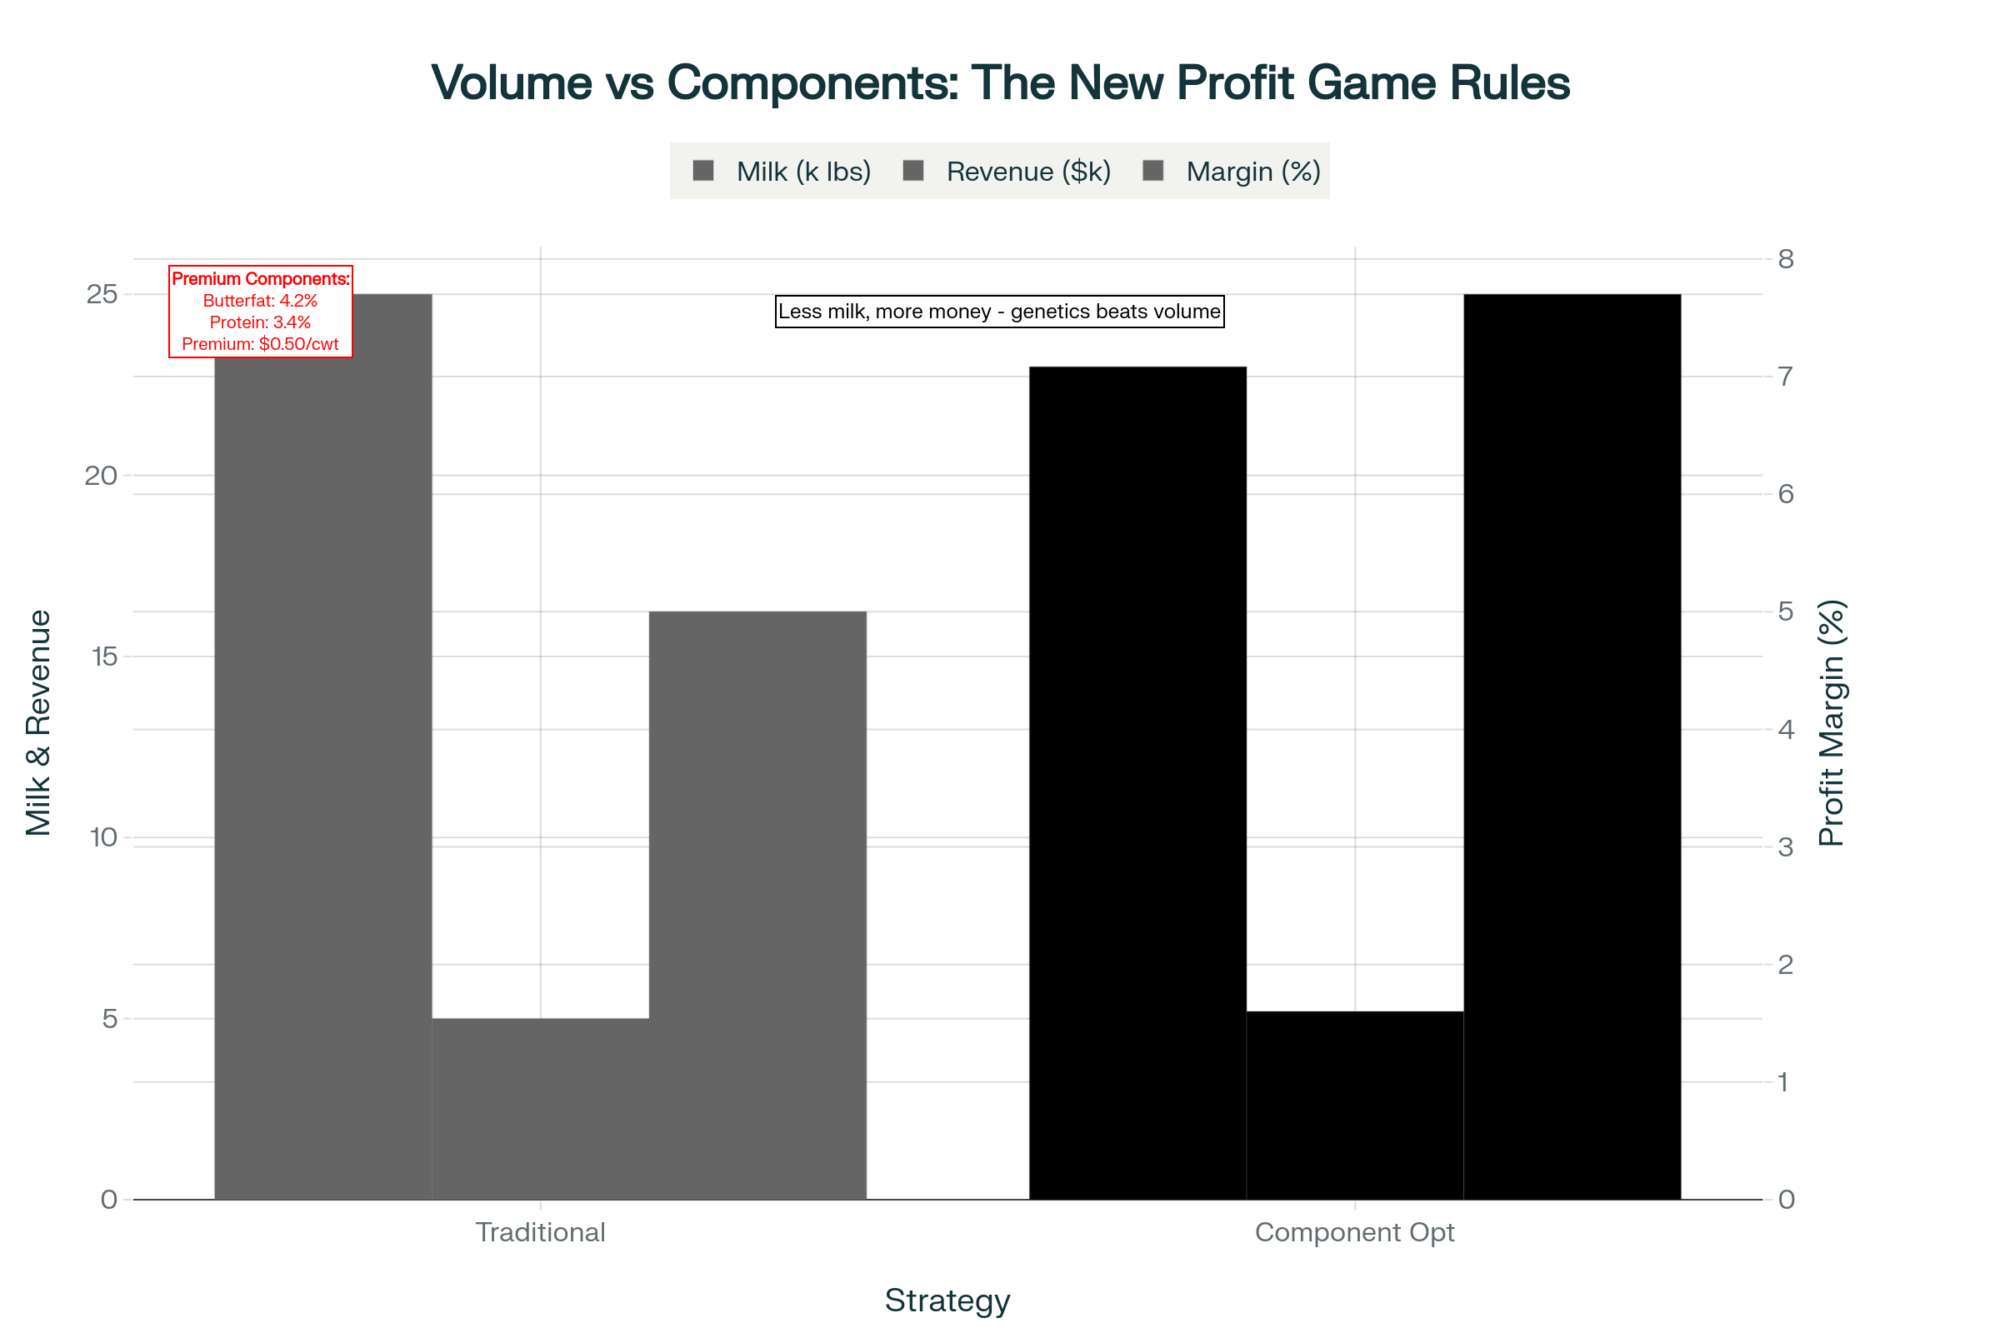
  • Premium markets deliver real returns: Operations achieving sub-100,000 somatic cell counts or boosting protein 0.15-0.20 percentage points capture $2-4/cwt premiums—that’s $150,000-$300,000 annually on 7.5 million pounds, with investments typically running $50,000-$150,000
  • Technology ROI depends entirely on your scale: Robotic milking ($150,000-$200,000 per stall) works for large operations spreading costs or small farms saving labor, but that 500-1,500 cow middle range struggles to justify the math
  • Three proven paths exist for different scales: Small operations with value-added processing generate $800+ additional per cow, large dairies over 2,000 cows achieve sub-$14/cwt production costs, while mid-size farms succeed through strategic quality premiums and component optimization
  • Critical dates demand immediate planning: FSA forbearance expires December 31, 2025, new USMCA provisions kick in January 1, 2026, and Congressional Research Service projects $146.3 billion in ag debt needs restructuring Q1 2026—know your runway now
  • Regional advantages matter more than ever: California faces $400/acre-foot water costs but enjoys year-round production, the Northeast captures $2-5 fluid premiums despite 30% seasonal swings, Wisconsin’s 600 cheese plants create both opportunity and competition—match your strategy to your geography

Complete references and supporting documentation are available upon request by contacting the editorial team at editor@thebullvine.com.

Learn More:

The Sunday Read Dairy Professionals Don’t Skip.

Every week, thousands of producers, breeders, and industry insiders open Bullvine Weekly for genetics insights, market shifts, and profit strategies they won’t find anywhere else. One email. Five minutes. Smarter decisions all week.

NewsSubscribe
First
Last
Consent

Mexico’s Gone, Cheese Hit $1.67, DMC’s Broken – Here’s Your Playbook

When your best customer starts making their own milk, it’s time to rethink everything about your business model

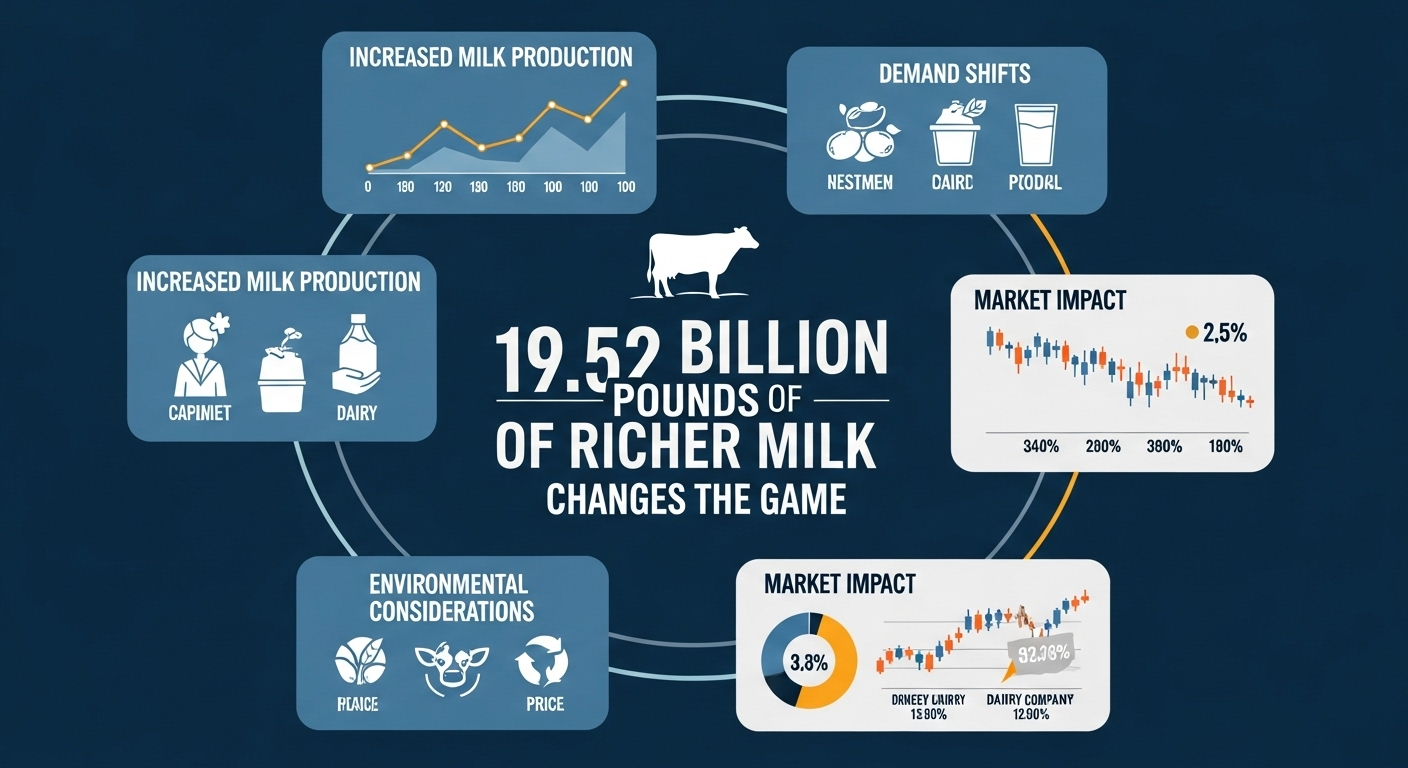
EXECUTIVE SUMMARY: What farmers are discovering right now is that October 2025’s cheese price drop to $1.67 isn’t just another market dip—it’s the canary in the coal mine for structural changes reshaping dairy economics. Mexico’s commitment of 83.76 billion pesos toward dairy self-sufficiency through 2030 effectively removes our largest export customer, who bought $2.47 billion worth of U.S. dairy products last year and absorbed over half our nonfat dry milk exports. Meanwhile, the disconnect between DMC’s calculated $11.66/cwt margin and actual farm economics—where labor costs alone have increased by 30% since 2021, while machinery expenses have risen by 32%—reveals a safety net that no longer accurately reflects operational reality. Recent FMMO data shows protein climbing to 3.38% while butterfat hits 4.36%, creating component pricing opportunities for farms that can quickly adjust rations to capture premiums before the December 1st formula changes. With our national herd at 9.52 million head (the highest in 30 years), producing into weakening demand, and processing plants built on export assumptions that won’t materialize, the next 18 months will determine which operations successfully pivot toward margin management over volume growth. The good news? Producers layering risk management tools, optimizing beef-on-dairy programs, and adding $0.50-0.75/cwt are already demonstrating that adaptation—while challenging—remains entirely achievable, targeting protein-to-fat ratios of 0.80+ and beyond.

Dairy Profitability Strategy

You know that feeling when you check the CME spot market and something just feels… off? That’s what hit most of us Monday when block cheese broke through $1.70 to trade at $1.67 on October 13, 2025. After tracking these markets for years, I’ve learned that when those established price floors start giving way, there’s usually something bigger happening beneath the surface.

Here’s the Bottom Line this week:

  • Mexico’s push toward dairy self-sufficiency is reshaping export dynamics
  • DMC margins no longer reflect true on-farm costs, especially labor and machinery [USDA Farm Labor Survey; U of I]
  • Component pricing has flipped: protein premiums are now outpacing butterfat [FMMO data]

Mexico’s Strategic Shift: What It Really Means for U.S. Producers

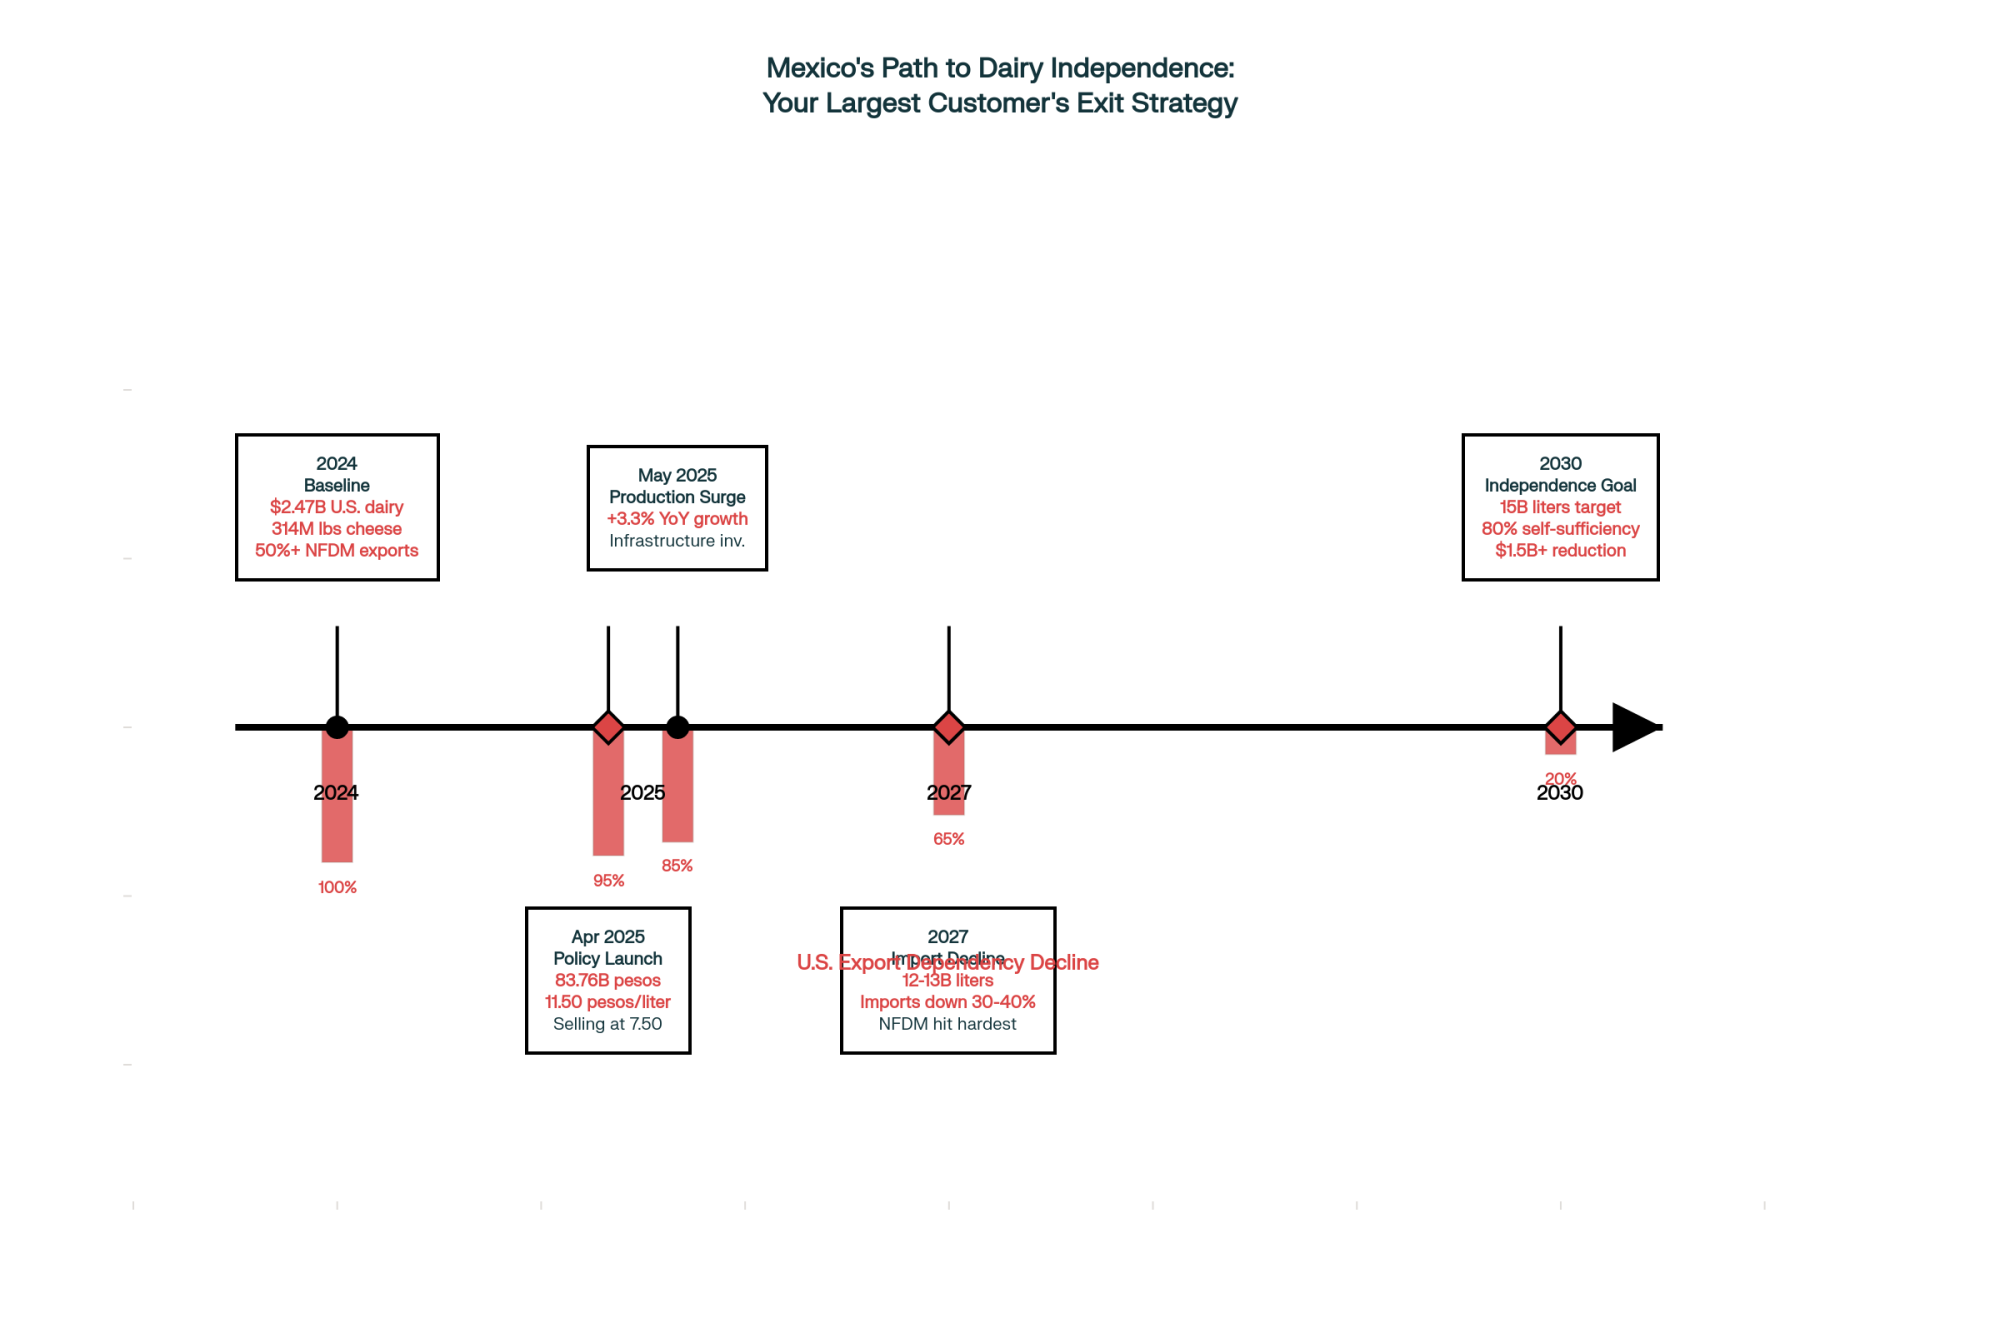
Looking at this trend, Mexico bought $2.47 billion of U.S. dairy in 2024—more than Canada and China combined. They’ve taken over half our nonfat dry milk exports and imported 314 million pounds of cheese through September 2025.

In April, President Sheinbaum announced the “Milk Self-Sufficiency Plan,” committing 83.76 billion pesos (~$4.1 billion USD) through 2030 to boost production to 15 billion liters annually and reach 80% self-sufficiency by 2030. They guarantee producers 11.50 pesos per liter while selling at 7.50 pesos—absorb­ing that 4-peso difference, roughly $0.22 USD per liter. What farmers are finding is that policy talk is turning into infrastructure: production ran 3.3% ahead of last year through May 2025.

Mexico’s 83.76 billion peso commitment through 2030 isn’t just policy talk—production already runs 3.3% ahead, and your $2.47 billion customer is building capacity to replace U.S. imports within five years

The DMC Disconnect: When the Safety Net Doesn’t Match Reality

I recently had coffee with a 600-cow producer in central Wisconsin who said, “DMC shows an $11.66 margin, but I’m burning through equity just keeping the lights on”. This disconnect deserves a closer look.

The DMC Disconnect reveals a $9.75/cwt gap between calculated margins and on-farm reality—labor and machinery costs that jumped 30%+ since 2021 don’t factor into the safety net formula

The DMC formula originated when feed costs represented half of all expenses. University budget analyses now show feed often runs only 35–45% of costs—not because feed got cheaper, but because labor and machinery soared. USDA’s Farm Labor Survey documents a 30% increase in wages since 2021. A 500-cow operation can spend $300,000–400,000 annually on labor alone—about $1.50–2.00 per cwt that DMC ignores [USDA Farm Labor Survey].

Equipment costs tell a similar story. University of Illinois data shows machinery expenses jumped 32% from 2021 to 2023 and have continued upward through 2025. A 310-HP tractor at $189.20/hour in 2021 now runs $255.80/hour—financing at 7–8% adds another $0.80–1.00 per cwt [U of I].

“The DMC formula often shows acceptable margins while extension economists note significant divergence from on-farm cash flow when non-feed costs rise.”
—Dr. Mark Stephenson, Director of Dairy Policy Analysis, UW-Madison, Distinguished Service to Wisconsin Agriculture Award [UW News]

Component Pricing: Why Protein’s Suddenly the Star

ScenarioProtein %Butterfat %Protein-to-Fat RatioPremium Before Dec 1Premium After Dec 1Monthly Gain (500 cows)
Current Average U.S.3.384.360.77BaselineBaseline$0
Target Optimized3.454.300.80+$0.25/cwt+$0.38/cwt$1,900
Wisconsin Case Study3.38 (from 3.12)4.280.79+$0.42/cwt+$0.58/cwt$2,900

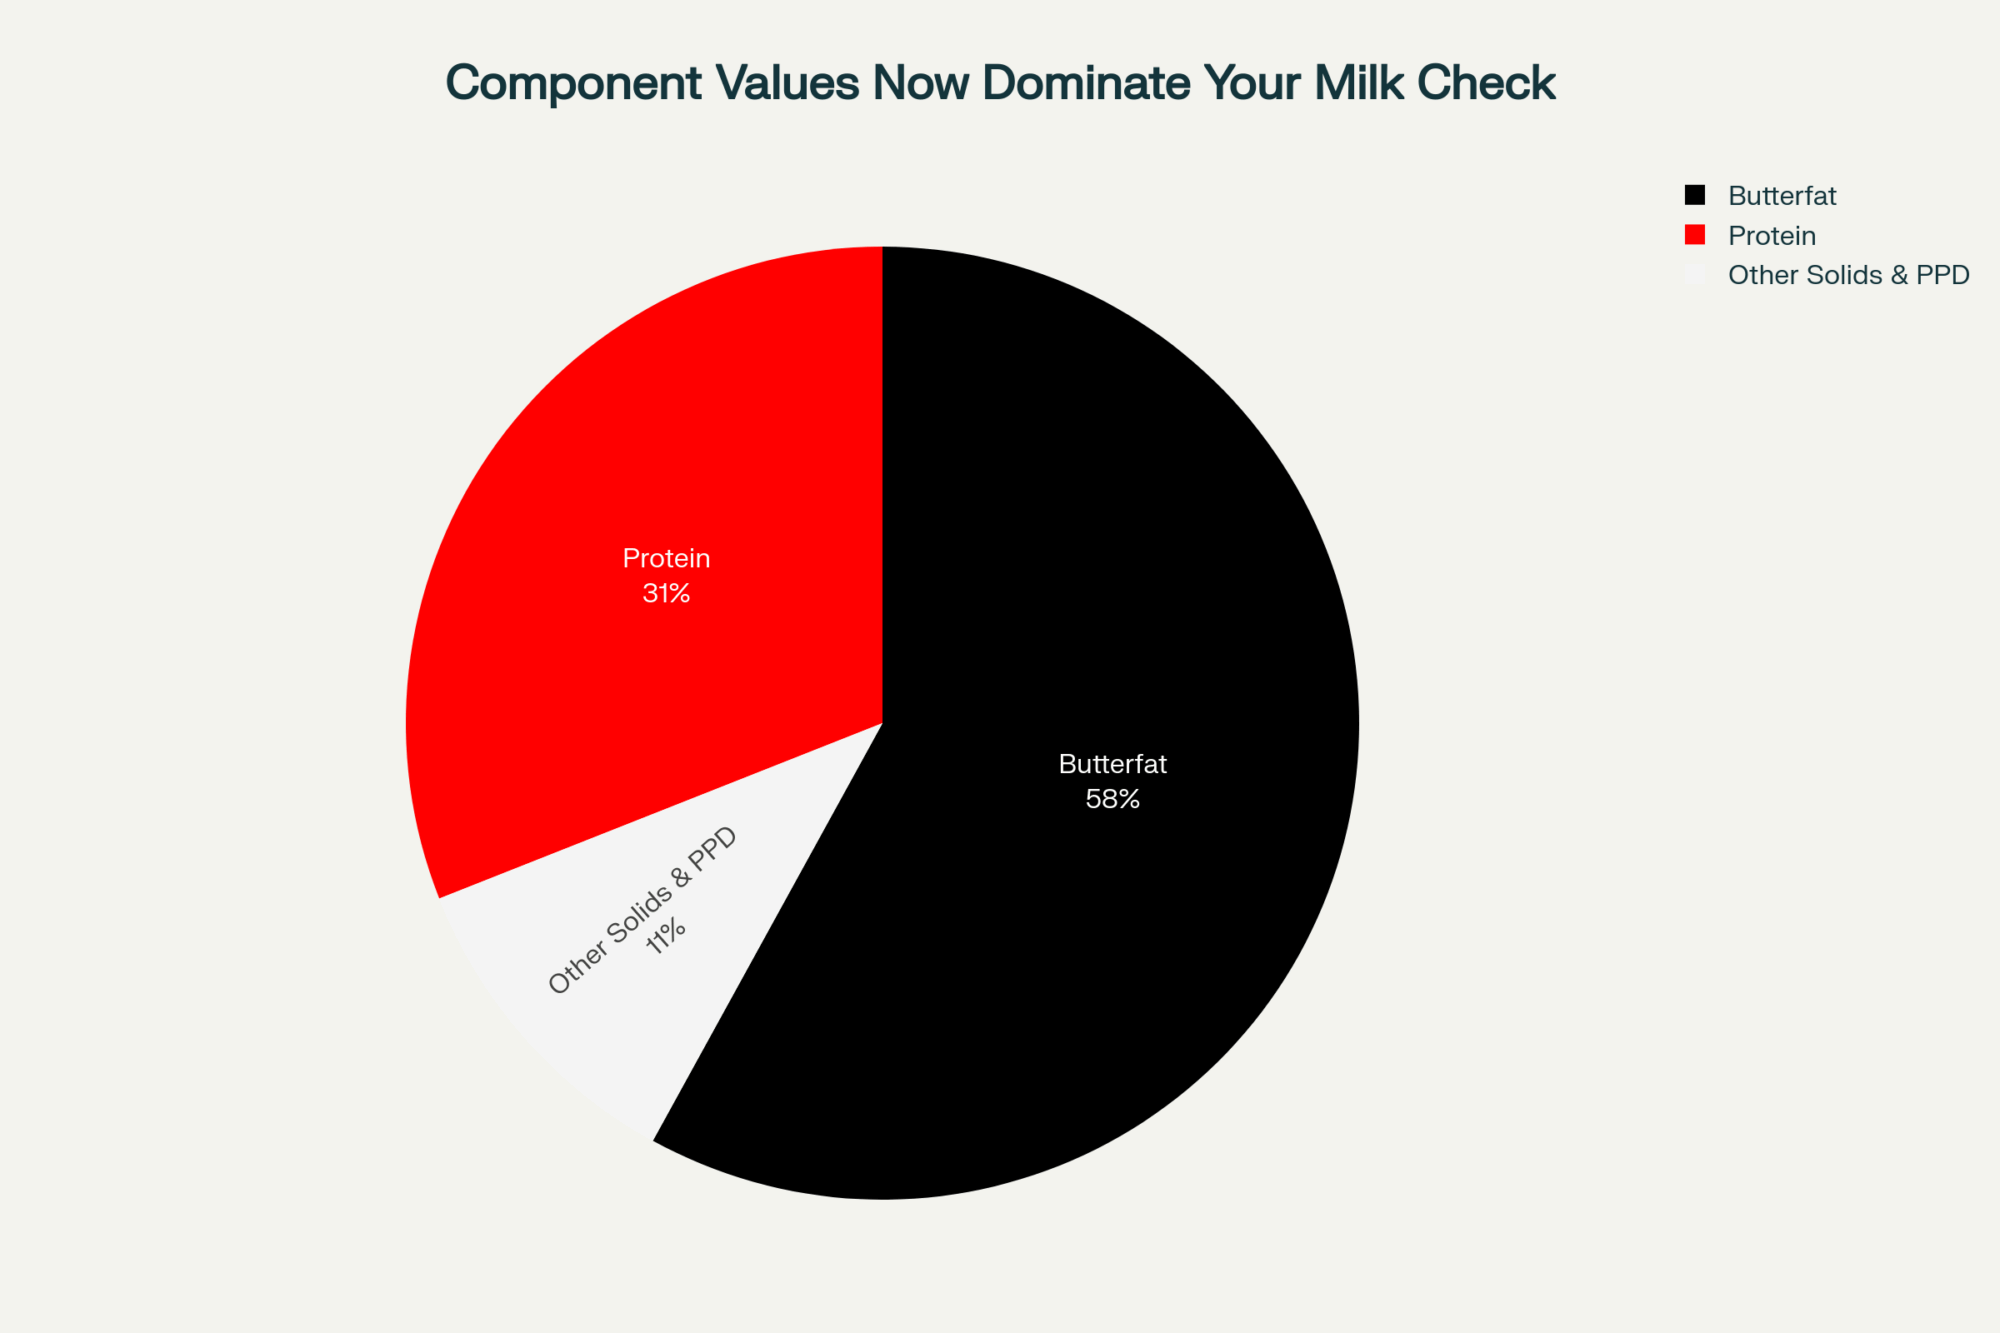
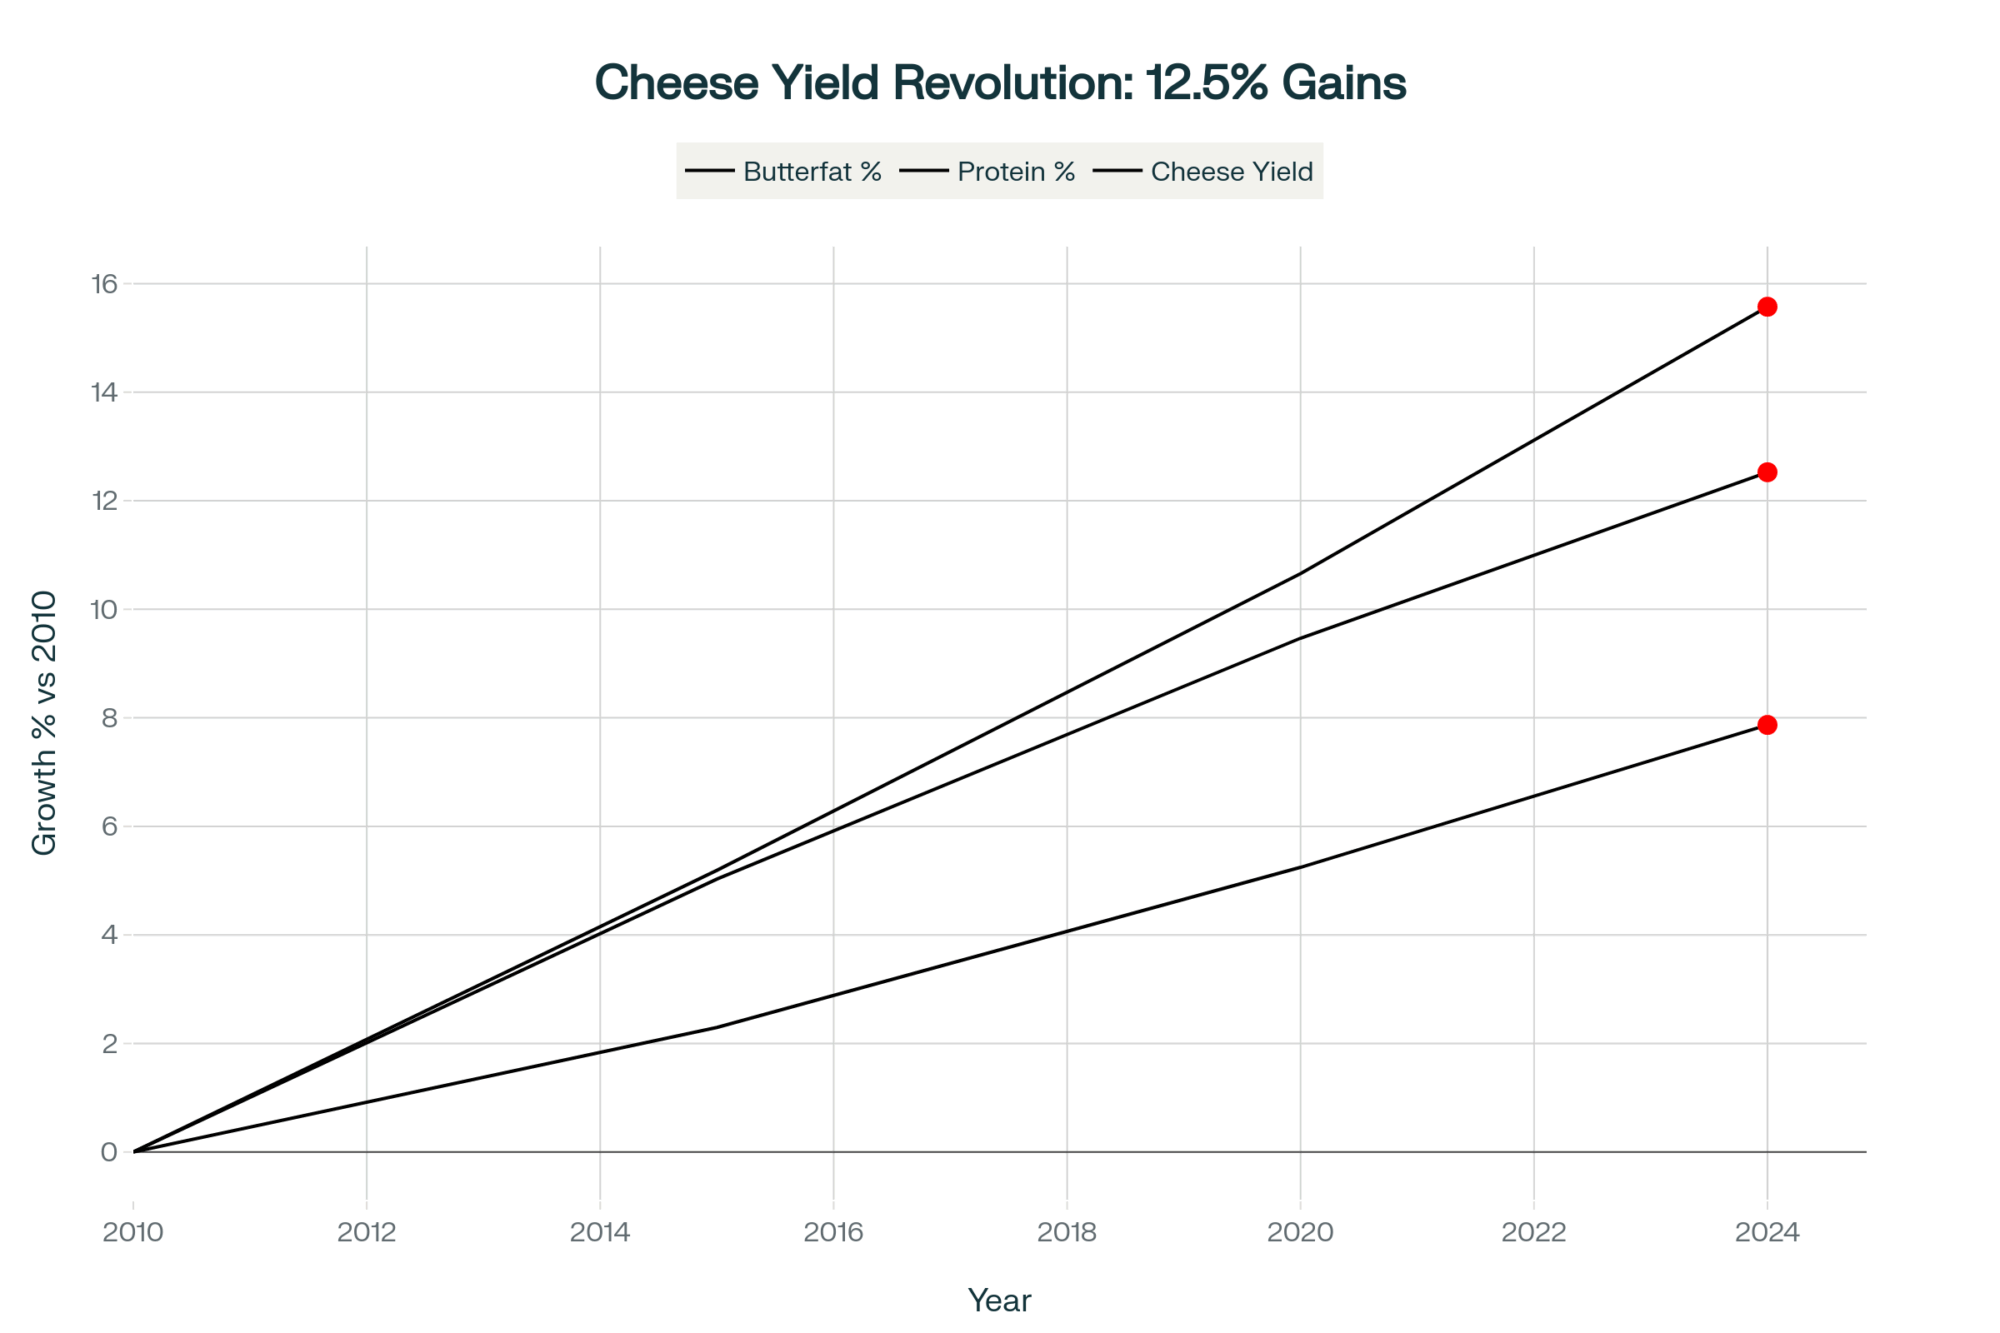
What’s interesting here is that component pricing has flipped. Butterfat averaged 4.36% through September, up from 3.95% five years ago [FMMO data]. Protein climbed from 3.181% to 3.38% but still lags butterfat gains. Cheesemakers generally target a 0.80 protein-to-fat ratio; U.S. milk sits around 0.77, forcing processors to add nonfat dry milk powder [FMMO data].

The FMMO changes effective December 1—boosting protein factors to 3.3 lbs and other solids to 6.0 lbs per cwt—will amplify premiums for higher-protein milk [USDA AMS]. A Sheboygan herd I spoke with pushed protein from 3.12% to 3.38% in eight weeks through amino acid balancing and bypass protein, adding $0.42 per cwt, roughly $3,200 per month on 450 cows.

Herd Dynamics: When Culling Economics Don’t Make Sense

The August USDA report shows 9.52 million head—the highest in 30 years. Why keep expanding herds when margins are tight? Auction data puts replacement heifers at $3,500–4,000, and CDCB research shows cows average 2.8 lactations before exit. When cows leave before paying back replacements, the usual 35% turnover target collapses [CDCB data].

Despite record $157/cwt cull cow prices in July 2025 [USDA AMS], many producers hold onto older cows because replacing them costs more. Beef-on-dairy adds complexity: cross-bred calves fetch $1,370–1,400 at auction, so breeding for beef income often outweighs dairy replacement logic [Auction reports].

Key Takeaways for Action This Week

  1. Review risk coverage
    – Enroll DMC at $9.50 coverage ($0.15/cwt for first 5 M lbs)
    – Layer in Dairy Revenue Protection at 60–70% quarterly coverage
  2. Optimize components
    – If protein-to-fat <0.77, schedule a nutrition consult
    – December 1 FMMO changes make ratios more lucrative
  3. Assess finances
    – Maintain debt service coverage >1.25
    – Keep working capital >15% of gross revenue
  4. Consider beef-on-dairy
    – At $0.50–0.75/cwt extra revenue, review breeding strategy
  5. Lean on the community
    – Share experiences at coffee shops and meetings

Regional Adaptation: Different Strategies for Different Situations

RegionCurrent ChallengeWinning StrategyPremium OpportunityRisk LevelTimeline
WisconsinMid-size squeeze (500-1,500 cows)Scale to 2,500+ OR pivot to specialty (300-400)Specialty: $8-10/cwtHIGH – Middle vanishingDecide by Q2 2026
Texas/New MexicoScale competition intensifyingMega-scale expansion (10,000+ cows, +20% growth)Efficiency: $0.30-0.50/cwtMEDIUM – Capital intensiveExpand through 2027
SoutheastFluid premiums fadingGrass-fed organic + agritourism pivotOrganic: $12-15/cwtMEDIUM – Market transitionTransition 2025-2026
CaliforniaTwo-tier system emergingCentral Valley scale OR North Coast farmstead cheeseFarmstead: $15-20/cwtHIGH – Two extremesOngoing divergence
Pacific NorthwestCapacity limits + basis discountsRegional cooperative consolidationLimited due to isolationVERY HIGH – Exit risk 2026Some exits planned 2026
NortheastHigh costs vs legacy marketsLocal glass-bottle programs + direct salesDirect sales: $10-12/cwtMEDIUM – Niche viableBuilding programs now

Wisconsin’s mid-size producers face tough choices: scale up to 2,500+ cows for efficiency or shrink to 300–400 and chase specialty markets. That middle ground is disappearing.

Down in Texas and New Mexico, mega-dairies double down on scale. A 10,000-cow manager plans 20% expansion by 2027, betting automation offsets price pressures. “Every penny of efficiency multiplies,” he said.

The Southeast leans on fluid milk premiums, though processors warn they’ll fade. Several Georgia farms are shifting to grass-fed organic, accepting lower volumes for higher margins.

California’s dairy scene splits into two worlds: Central Valley mega-dairies expanding, North Coast farmstead cheesemakers thriving on agritourism and direct sales.

The Pacific Northwest battles capacity limits and isolation. Basis discounts bite, and some producers plan 2026 exits if conditions don’t improve.

The Northeast juggles legacy fluid markets with new ventures like local glass-bottle programs to offset high costs.

Global Competition: Learning from Other Exporters

The EU’s production is essentially flat (+0.15% in 2025), despite a 1% decline in herd size, with raw milk at EUR 53.3/100 kg (28% above the five-year average) [EU Commission]. They’re pivoting to value-added and sustainability premiums.

New Zealand’s Fonterra posted 103% profit growth in Q3 2025 but is divesting consumer brands to focus on B2B ingredients. Their NZ$10.00/kgMS forecast suggests confidence in fundamentals but a shift away from commodity volume.

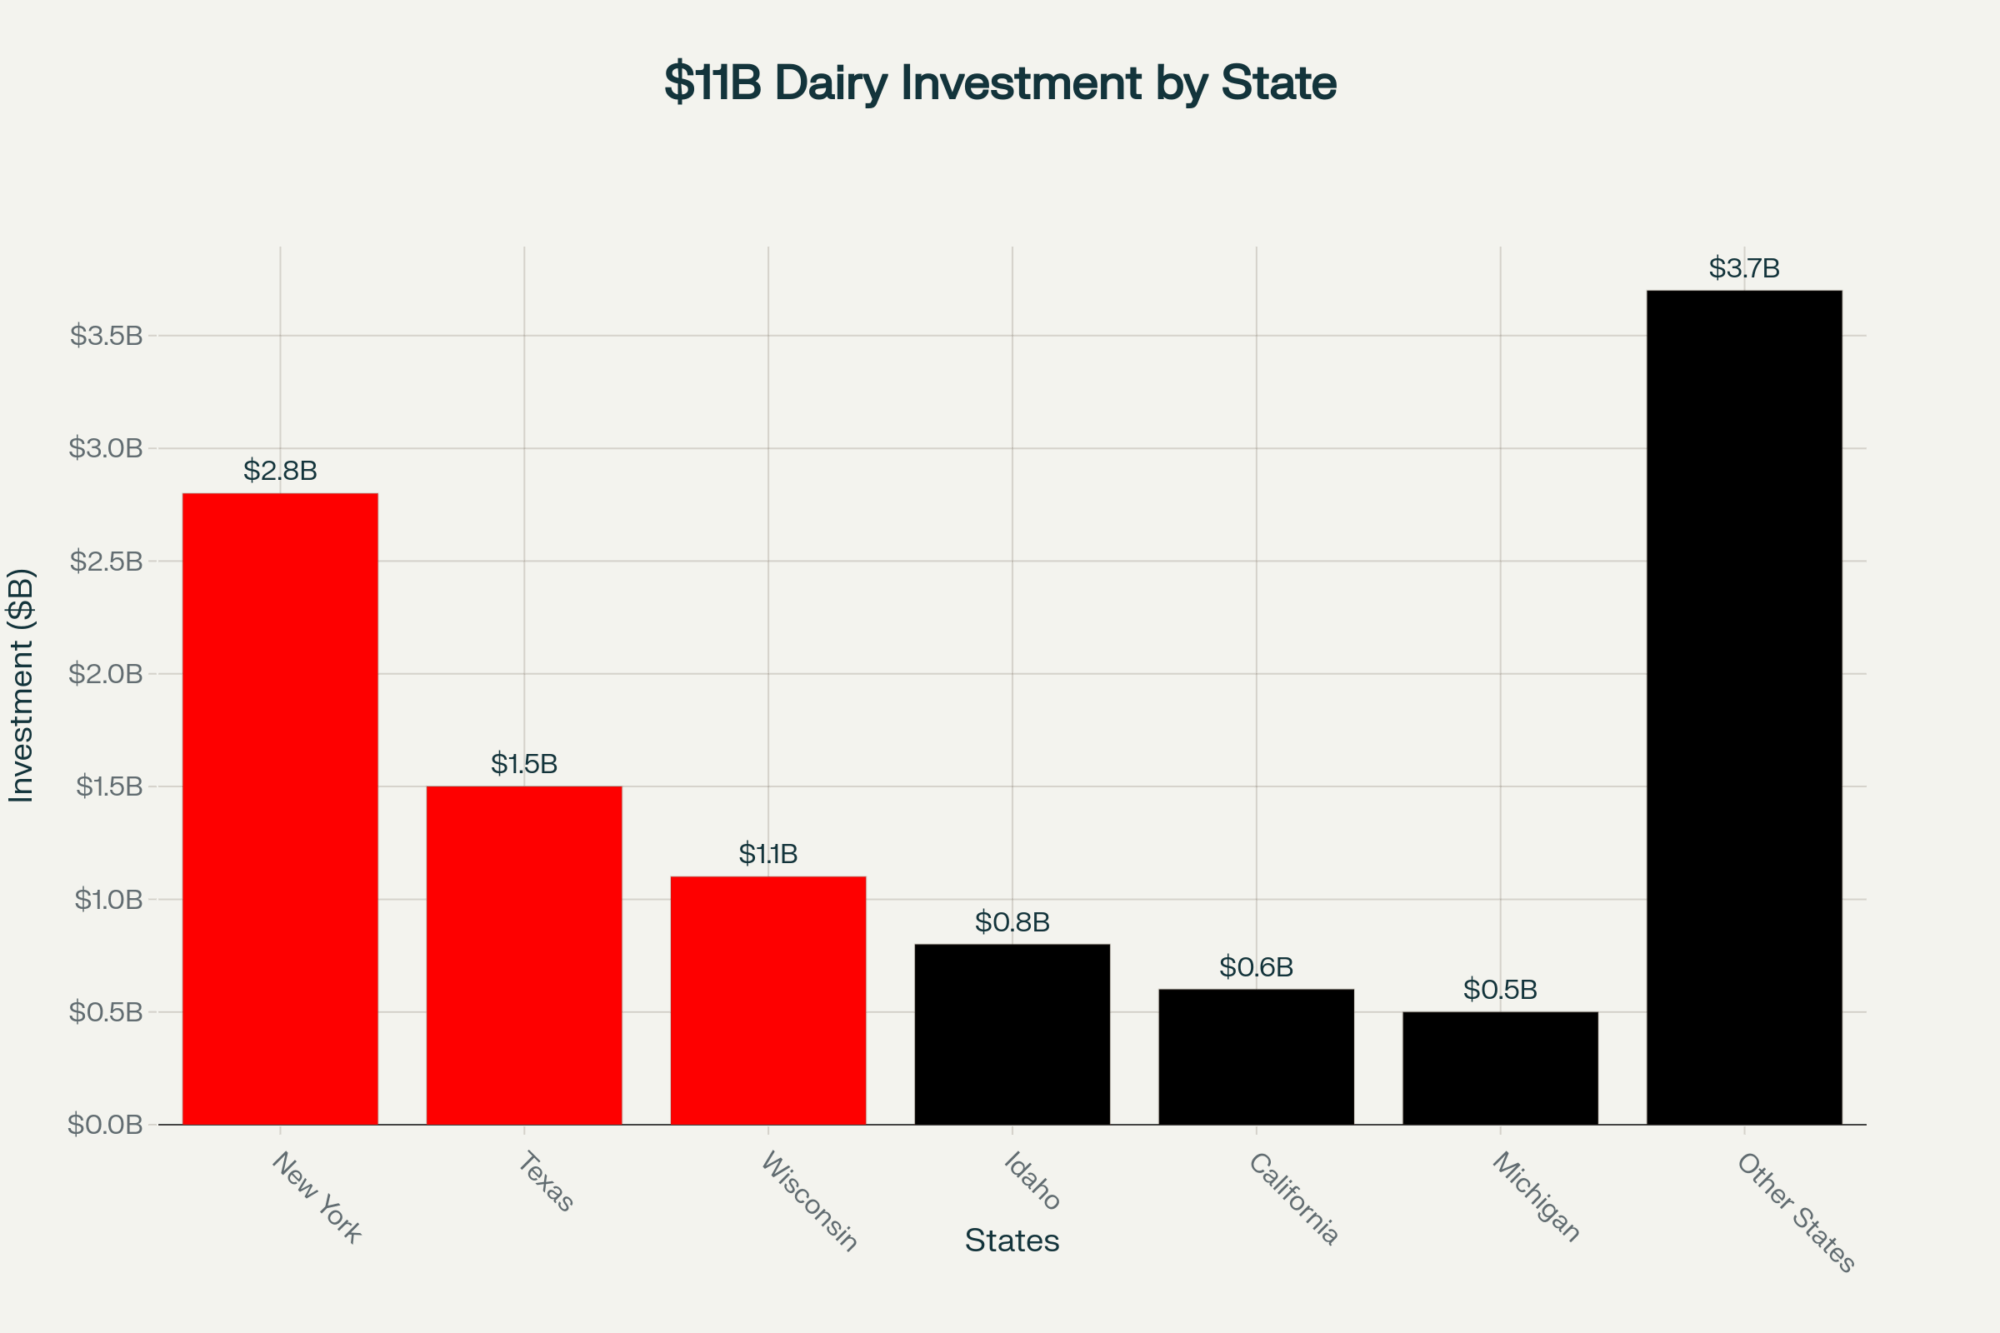
The U.S. stands out for its $11+ billion capacity build-out on export assumptions now under pressure [IDFA]. Few competitors committed similar investment levels.

Risk Indicators: Recognizing Warning Signs Early

Financial MetricHealthy RangeWarning ZoneCritical RiskWhy It Matters
Debt Service Coverage≥1.251.10-1.24<1.10Cash flow to cover debt payments + cushion
Working Capital≥15% of revenue10-14% of revenue<10% of revenueOperating funds to handle market swings
Variable Rate Debt≤50% of total51-60% of total>60% of totalExposure to rate increases (7-8% currently)
Culling Rate≥30%25-29%<25%Herd turnover and productivity indicator
Somatic Cell Count≤250,000250,000-300,000>300,000Milk quality affects premiums/penalties
Feed Efficiency≥1.4 lbs milk/lb DMI1.3-1.39 lbs/lb<1.3 lbs/lbFeed cost management and profitability

Extension economists highlight key stress markers:

Financial

  • Debt service coverage <1.25
  • Working capital <15% of revenue
  • Variable rate debt >50%

Operational

  • Culling <30%
  • Somatic cell count >250,000
  • Feed efficiency <1.4 lbs milk/lb DMI

Behavioral

  • Withdrawing from the community
  • Deferred maintenance
  • Increased accidents
  • Family health issues

Spotting these early lets you adjust course before crises develop.

Strategic Positioning: What’s Working for Successful Operations

Conversations with top-performers reveal common themes:

  • Layered risk management: DMC + DRP for comprehensive coverage
  • Feed cost hedging: Options on corn/soymeal 6–12 months out protect margins
  • Component focus: Hitting 0.80–0.85 protein-to-fat captures premiums
  • Beef-on-dairy: Crossbred calves add $0.50–0.75/cwt; LRP support starts 2026

Looking Ahead: Probable Scenarios Through 2028

The next 18 months separate survivors from exits—Class III tests mid-$14s through 2027 as the herd contracts by 600,000+ head, then stabilizes at $16-17 once supply finally matches reduced export demand

Based on talks with lenders, processors, and economists:

  • Mid-2026: Zombie phase persists. Credit tightens; bankruptcies climb 55% in some regions [USDA, AFBF, UArk].
  • Late 2026: More plant closures follow Saputo and Upstate Niagara moves, stranding some producers.
  • 2027: Mexico’s self-sufficiency hits export volumes; global production pressures domestic prices; Class III may test mid-$14.
  • 2028: Herd contracts by several hundred thousand head; Class III stabilizes around $16–17; significant exits reshape the industry.

The Human Element: Supporting Each Other

These challenges take a human toll. Farmer suicide rates run 3.5× higher than the general population, and rural rates climbed 46% between 2000 and 2020 [CDC; NRHA]. These aren’t just numbers—they’re neighbors and friends under immense pressure.

Research from land-grant universities identifies several early warning signs, including routine changes, declining animal care, family health issues, and farmstead neglect. Recognizing these patterns lets communities step in before crises deepen. For those struggling, the National Suicide Prevention Lifeline (988) and National Farmer Crisis Line (1 866 327 6701) offer confidential support from counselors who understand farm life.

The Bottom Line

Even now, opportunities exist. Producers pivoting to specialty markets report net incomes rising despite lower volumes. Beef-on-dairy revenue can offset labor cost hikes. Component optimization often pays for its cost within weeks when executed well.

The next 24–36 months will test us like never before, but this is a structural change, not a cyclical downturn. Government programs can’t restore lost export markets or close idle capacity built for vanished demand. Success will go to those who recognize new fundamentals early and adapt strategically: focus on margins over prices, relationships over volume, and long-term sustainability over endless growth.

Coffee-shop conversations may feel quieter these days, but they matter more than ever. Sharing success stories and stumbling blocks—our collective resilience and adaptability—will guide us through to a sustainable, though different, future. 

KEY TAKEAWAYS:

  • Capture immediate protein premiums worth $0.42/cwt by adjusting rations to hit 0.80-0.85 protein-to-fat ratios before December 1st FMMO changes—Wisconsin herds report $3,200 monthly gains on 450 cows through amino acid balancing and bypass protein strategies
  • Layer risk protection starting at $0.15/cwt with DMC at $9.50 coverage for your first 5 million pounds, then add Dairy Revenue Protection at 60-70% quarterly coverage to protect margins as Mexico’s production ramps up and displaces exports
  • Maximize beef-on-dairy revenue, adding $0.50-0.75/cwt to current milk checks—with crossbred calves fetching $1,370-1,400 at auction and Livestock Risk Protection coverage starting in 2026, this strategy offsets rising labor costs that DMC ignores
  • Monitor three critical financial ratios weekly: debt service coverage above 1.25, working capital exceeding 15% of gross revenue, and variable rate debt below 50% of total borrowing—extension economists identify these as early warning indicators before operational stress becomes a crisis
  • Choose your strategic path by Q2 2026: Wisconsin’s mid-size operations show the middle ground between 500-1,500 cows is vanishing—either scale toward 2,500+ head for efficiency, pivot to specialty markets (grass-fed, organic, local) capturing $8-10/cwt premiums, or plan an orderly exit while equity remains

Complete references and supporting documentation are available upon request by contacting the editorial team at editor@thebullvine.com.

Learn More:

The Sunday Read Dairy Professionals Don’t Skip.

Every week, thousands of producers, breeders, and industry insiders open Bullvine Weekly for genetics insights, market shifts, and profit strategies they won’t find anywhere else. One email. Five minutes. Smarter decisions all week.

NewsSubscribe
First
Last
Consent

2025’s Dairy Dilemma: Record Exports, Falling Checks, and What Every Producer Must Decide Next

July 2025 exports soared 53% year-over-year—yet most U.S. dairy farms saw shrinking profit margins, not bigger milk checks.

Executive Summary: Dairy exports shattered records in 2025, with the U.S. shipping 1.6 billion pounds of product abroad in July alone—a staggering 53% surge compared to the prior year. But beneath those headlines, American producers are battling tight margins as block cheese dipped to $1.67/lb and Class III futures slumped below $16/cwt, despite robust global demand. Recent research and USDA data highlight that this disconnect is driven by low export pricing, aggressive global competition, and a shrinking pipeline of replacement heifers—a result of widespread beef-on-dairy breeding. While mega-operations leverage scale and small niche dairies build premium brands, mid-sized farms face contraction at a rate of 7-8%. Practical insights from universities and leading advisors reveal that strategic culling, honest financial assessment, and proactive reinvestment now will best position operations for the volatile months ahead. Looking forward, success in 2026 depends not on riding out the “old normal,” but on embracing new models—whether that means cost control, vertical integration, or value-added marketing. The choices you make today could shape your farm’s resilience for years to come.

dairy margin solutions

You can’t sit around the farm kitchen table or check your milk check without someone bringing up the gap between those record-smashing export headlines and what we’re actually seeing on the farm. This year’s export stats (2025, per USDEC, USDA, and CME data) are wild—so let’s walk through the fine print, and offer a clear, honest look at what the numbers do (and don’t) mean for your bottom line.

Looking Past the Headlines: Big Numbers, Real Questions

July 2025 delivered a headline: U.S. dairy exports hit 1.6 billion pounds milk-fat equivalent—a staggering 53% higher than last year, with cheese breaking records for 13 months straight and butter exports more than doubling (USDEC, August 2025). Mexico, Southeast Asia, and the Middle East are fueling those gains. (Editorial suggestion: Here’s where a quick online chart comparing U.S. and EU butter prices, or a timeline of shrinking mid-size herds, could really drive it home.)

The brutal irony driving 2025’s dairy crisis: exports hit all-time highs while farm gate prices plummet. This inverse relationship reveals how discount export pricing—driven by aggressive global competition—is bleeding value from domestic producers. When you’re the world’s cheapest cheese supplier, volume growth becomes a liability, not an asset.

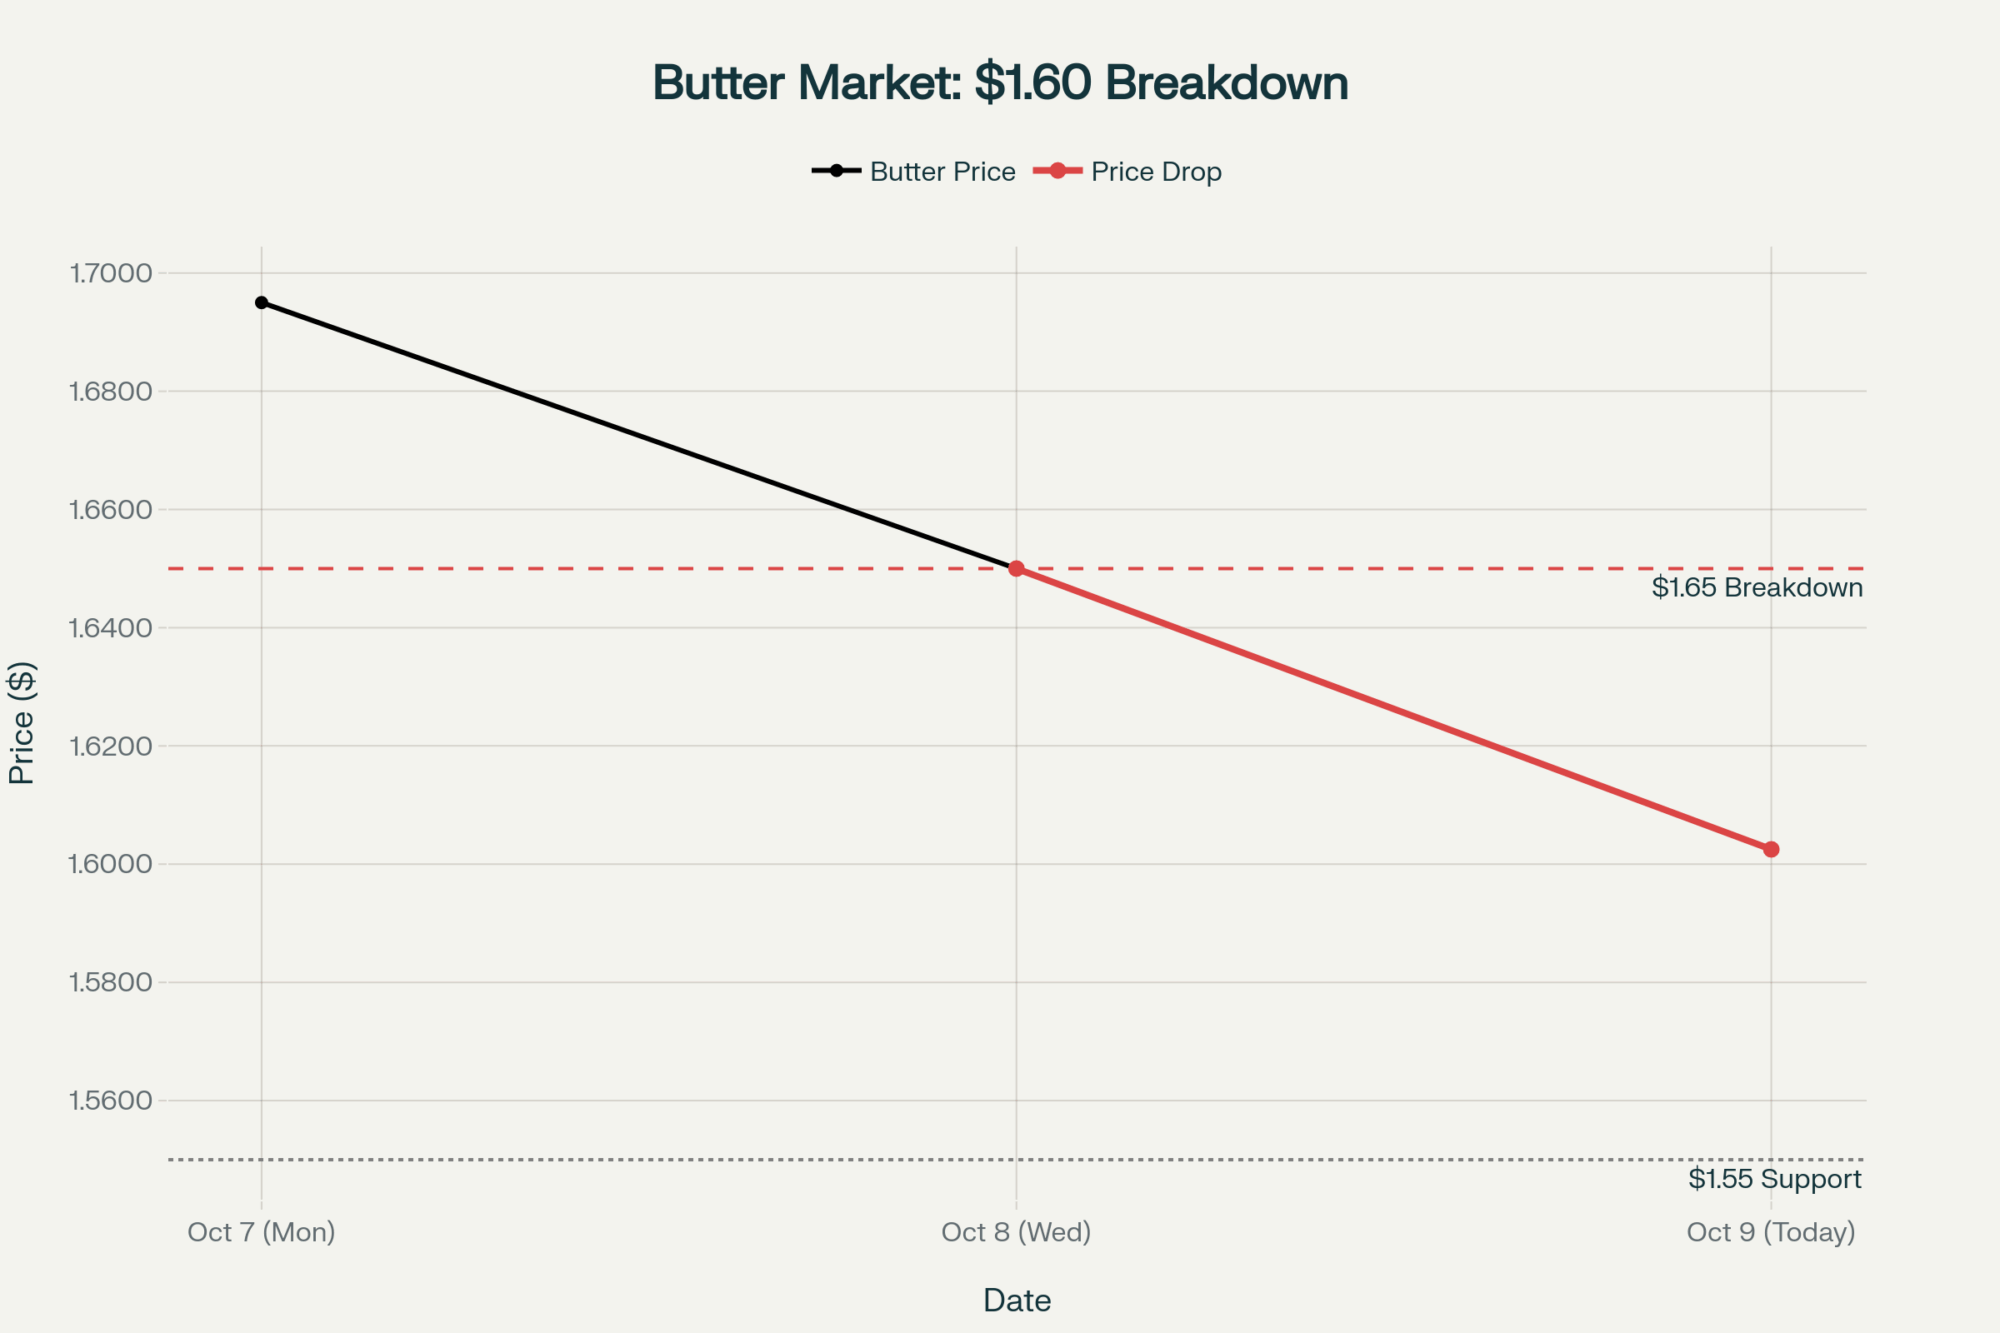
But talking with neighbors from Wisconsin to California, a different reality surfaces. Class III milk futures for November struggled below $16/cwt in October (CME Oct 2025), block cheese found a floor at $1.67/lb, and butter—the one bright spot early—crashed from $2.48/lb in August down to $1.65. Feed, fuel, and labor bills just keep nipping at margins. As Dr. Mark Stephenson at UW-Madison says, “There’s a world of difference between what’s happening on the docks and what’s happening in the mailbox.”

Why Export Growth Isn’t Filling Milk Checks

Take a closer look, and you’ll see what’s really moving: American products is cheap. U.S. butter traded at $1.65/lb in October, while EU butter held firm at $2.80/lb (EU Commission). The world always chases a bargain—and lately, we’re it.

Mexico now accounts for nearly a third of U.S. dairy exports—including over half of the nonfat dry milk produced in American plants (USDEC/USDA FAS, July 2025). However, the Mexican government’s 2025 policy papers and NMPF trade summits clearly indicate that they’re backing local dairy expansion and processing, preparing to buy less from us as soon as possible.

Think about Southeast Asia: U.S. powder lands in Vietnam or Indonesia precisely because it’s cost-effective for local processors to build finished value at home. Rabobank’s summer 2025 reports refer to it as “the Asian processing pivot.” It isn’t about U.S. branding; it’s pure economics.

CME Spot Cheese: Small Trades, Big Impact

It always comes up at local co-op meetings—how is the price for millions of pounds of milk set by just a few trades, a couple of times a week? Less than 1% of U.S. cheese goes through the CME spot market (Wisconsin JDS industry surveys, 2024), but that market sets the base for half the nation’s milk. Since the move to all-electronic trading in 2017, those price swings are sometimes driven by a single processor’s urgency, rather than real supply/demand.

Plenty of us wonder: can a handful of loads really justify moving cheese price brackets for thousands of family farms? Truth is, the market says yes—for now.

Processing Expansion: Efficiency and Exposure

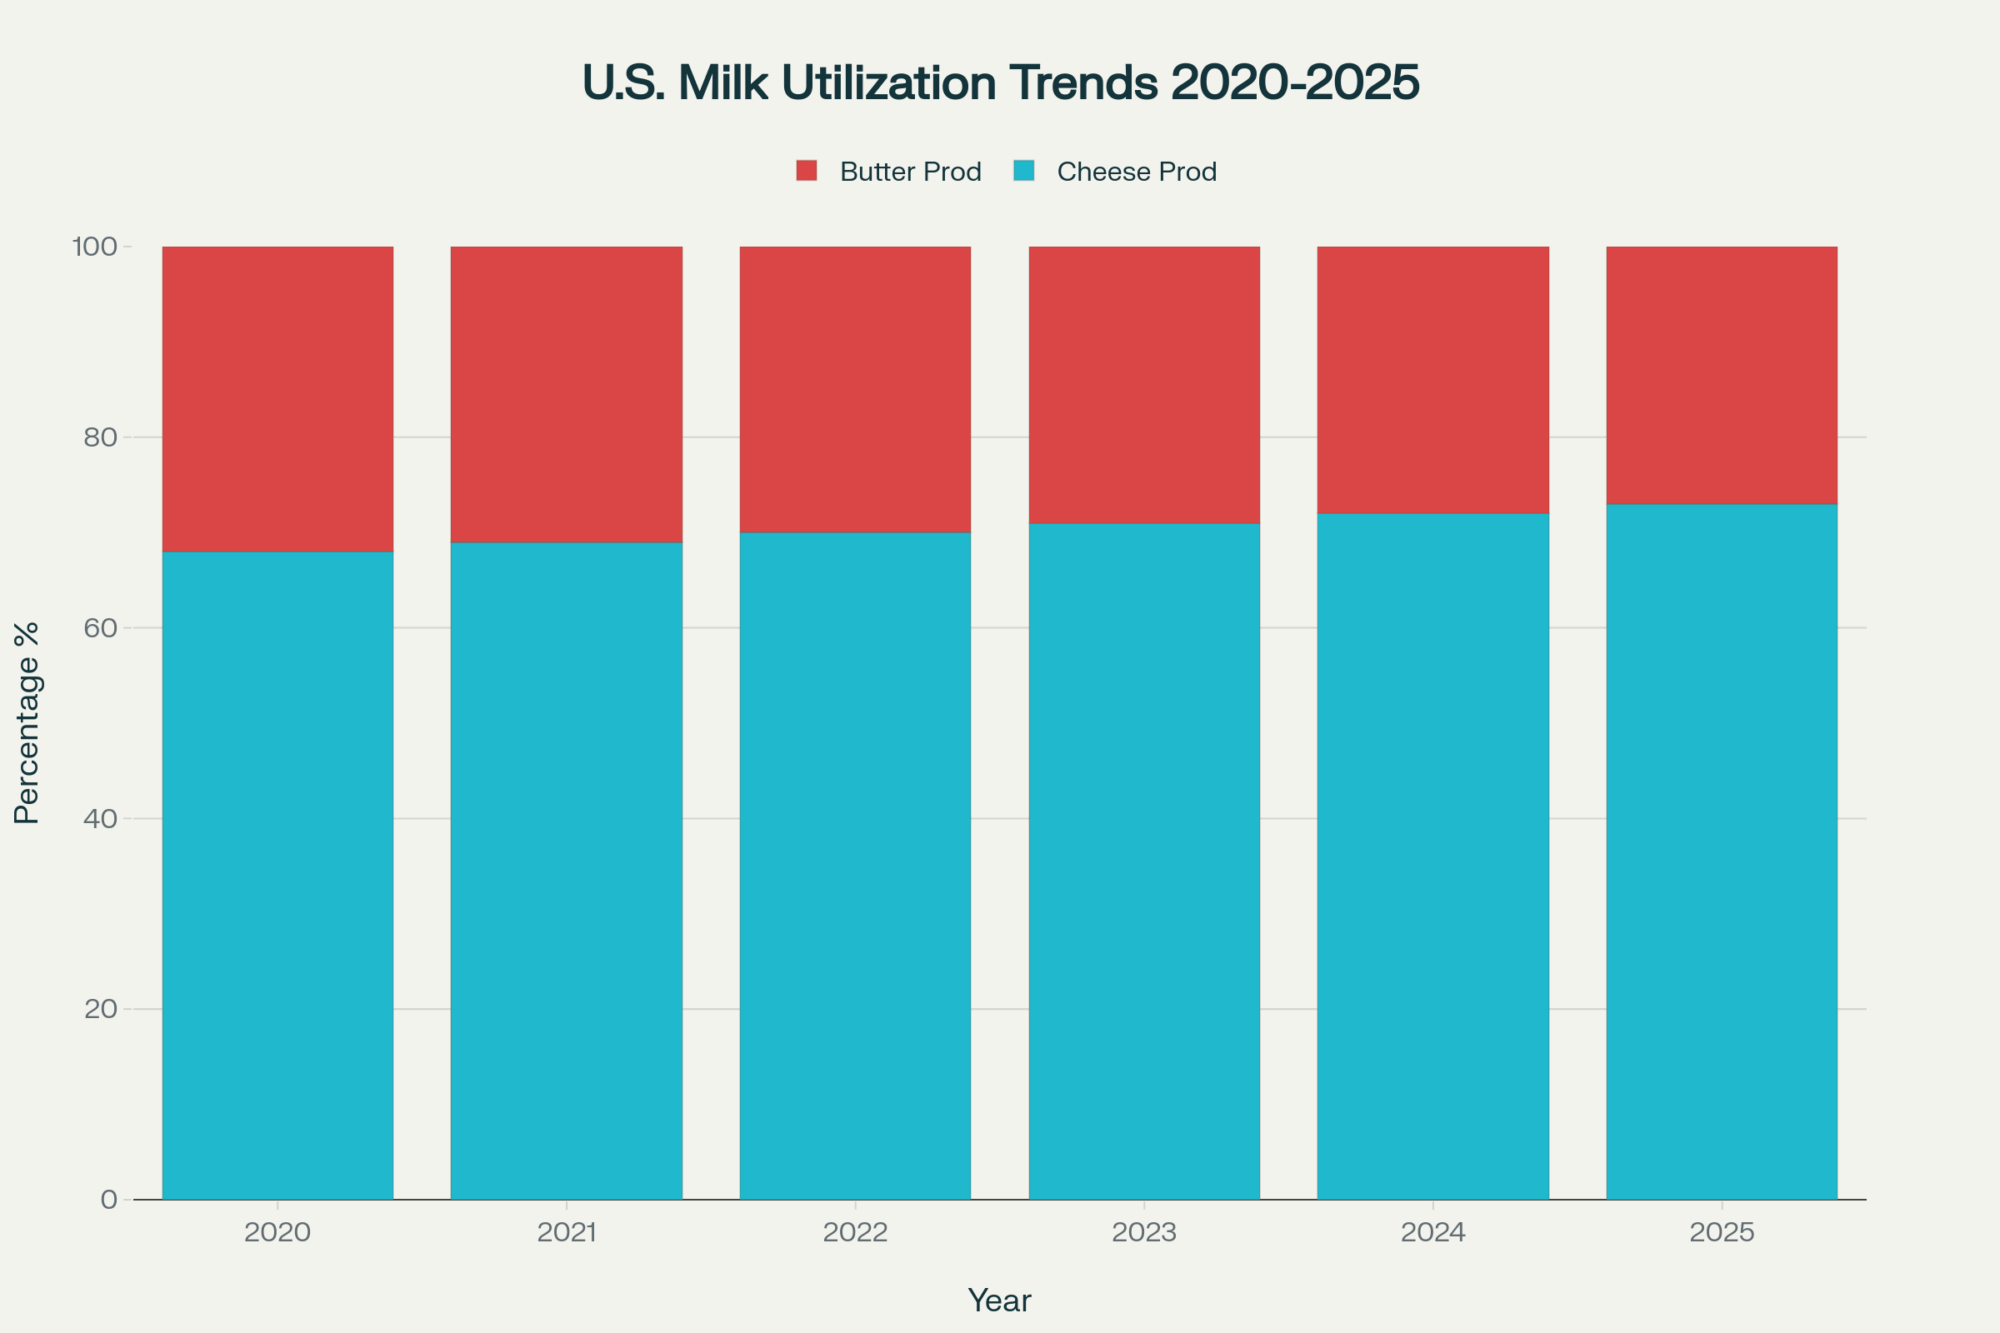
You’ve likely heard the figures: since 2023, about $10 billion’s been sunk into new plants (Rabobank, Dairy Quarterly Q3 2025; Cheese Reporter, Jan. 2025). Many are capable of running over 20 million pounds daily—an incredible show of confidence in the future.

But here’s the rub: those plants need full pipelines to pay off. If exports soften or domestic demand plateaus, processors continue to churn out product, often selling it abroad at marginal prices. All too often, this reality is felt not at headquarters, but on the farm, reflected in base price pressure and pooling deductions.

Beef-on-Dairy: Quick Cash, Long-Term Crunch

Every $1,000 beef-cross calf sold today is gutting tomorrow’s milk supply. Heifer inventories have plummeted 10% in three years while prices rocketed 192%—creating a replacement crisis that will constrain expansion through 2027. The math is brutal: today’s survival strategy becomes tomorrow’s bottleneck

Talk to any extension officer or herd consultant this year, and beef-on-dairy is front and center. Those beef-cross calves fetching $800 to $1,200 (USDA AMS, 2025) are saving some farm budgets, especially when pure Holstein bulls bring half that—at best.

But the development suggests a tightening squeeze just over the horizon. USDA’s July 2025 inventory shows replacement dairy heifers over 500 lbs are at their lowest since the 1970s (just under 3.9 million head). Extension consensus (CoBank, UW, MSU) expects that, unless beef-on-dairy trends change, bred springer prices will start a strong upward climb by 2026–27, right as herds may want to rebuild. The risk is real: today’s survival could complicate tomorrow’s comeback.

The Industry Barbell: Big, Niche—Middle at Risk

UC Davis, USDA, and regional co-ops are all reporting similar realities: large, vertically integrated herds with dry lot systems and their own processing arrangements continue to gain market share—especially in the Southwest and California. Scale gives them leverage most can’t touch.

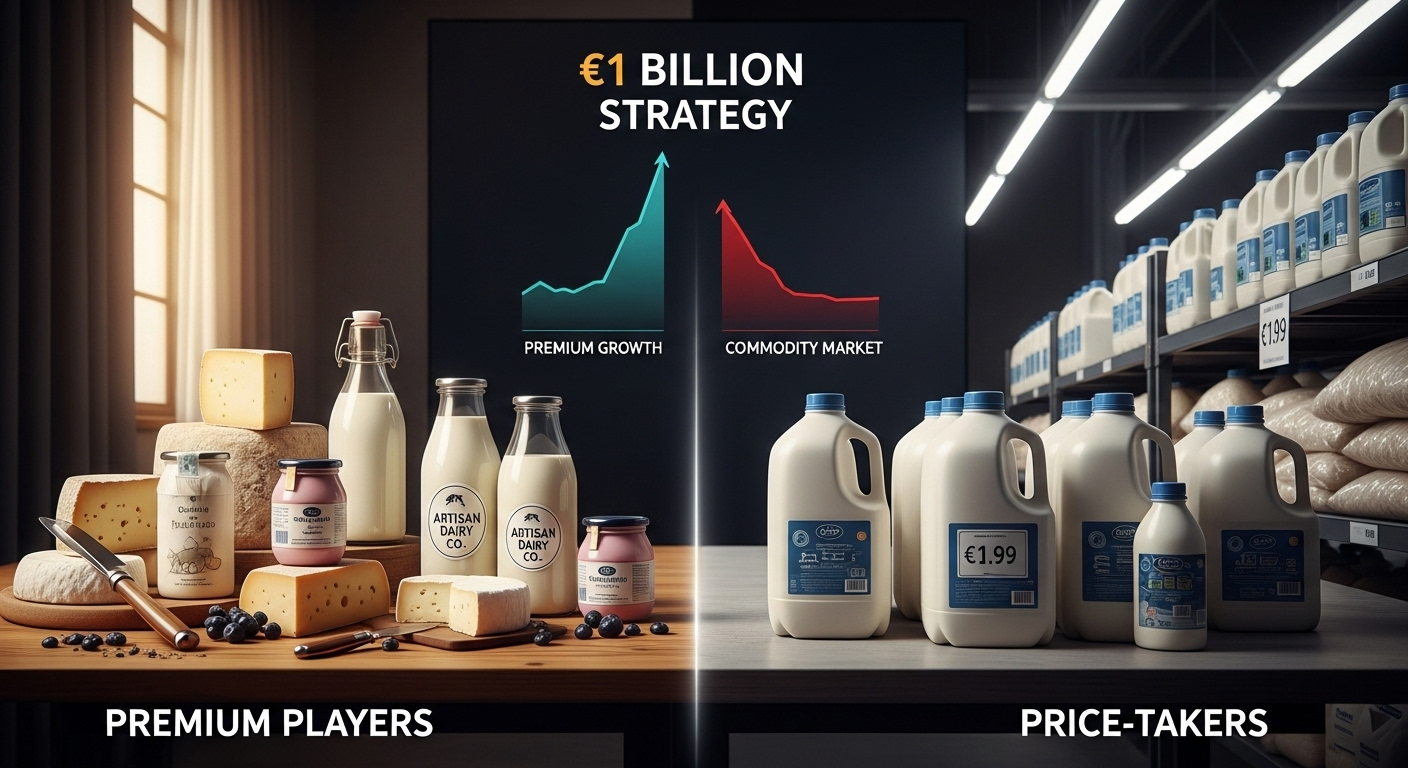
Smaller, direct-sale focused herds—think Vermont or Pennsylvania bottlers, specialty cheese producers—are thriving by telling their story, emphasizing butterfat, freshness, and a personal connection. They can get $30–$50/cwt retail. It’s not easy, but the premium is real.

Yet the traditional family operation—the 200 to 1,500 cow “community dairy”—faces the tightest squeeze. Recent USDA structure reports show these farms contracted by 7–8% in 2025. Once those barns go quiet, the loss is felt far and wide.

The middle is collapsing. Operations with 200-1,500 cows—the backbone of rural communities—are contracting at 7-8% while mega-dairies and specialty producers expand. This isn’t market evolution; it’s forced consolidation driven by scale economics that mid-sized farms simply can’t match at current milk prices.

Exit Trends: More Quiet Closures Than Court Losses

Higher-profile bankruptcies get headlines (361 Chapter 12 filings as of August 2025, US Courts), but five times that many farms have transitioned out over the year without court involvement—through voluntary sale, lender wind-down, or generational transition. Extension and local lenders across Wisconsin and Iowa confirm this broader landscape. Every exit isn’t just less milk; it’s a ripple to schools, dealerships, feed outfits, and beyond.

Here’s the dirty secret: DMC margins staying above $9.50 doesn’t mean you’re making money—it means the government won’t bail you out. Mid-sized operations need $15.50/cwt to actually survive, creating a $2.70-$5.20 monthly shortfall that’s draining equity faster than most producers realize. The ‘safety net’ catches you after you’ve already fallen.

Surviving and Thriving: Pragmatic Action Beats Waiting

It’s not always what you want to hear, but this fall, the best extension and ag lender advice is simple: Cull sooner, cull harder. With cull cow prices at $145–$157/cwt (USDA AMS), and the forecast for 2026 pointing to lower levels, producers who right-size now are shoring up working capital, easing transition period stress, and improving herds’ butterfat performance.

Groups like FarmFirst Dairy and others have even started pooling supply power, making the Capper-Volstead Act mean something again in regional price discussions. Meanwhile, value-added co-ops, marketing alliances, and on-farm processing efforts (boosted by local and USDA Rural Development grants) are offering mid-size and small producers a path to retain more margin.

Three Questions Every Farm Should Ask

Set these out before winter business meetings:

  1. Can you weather another 12–18 months at $16–$17/cwt milk without burning through savings or risking your land?
  2. Is $18/cwt all-in cost a realistic or reasonable goal based on your geography, size, and current practices? What benchmarks or systems will close the gap?
  3. Is everyone on board with your next phase—expanding, holding, or planning an exit? The answers shape what you do before the next market cycle.

Regional Realities: No One-Size Solution

The playing field is uneven. West Coast and Northwest dairies incur $1.50-$2/cwt higher base costs than their Midwest peers (OSU/WSU Extension, 2025), primarily due to transportation and regulatory overhead. California herds are finding their margins in digesters, water rights, and environmental mitigation. In the Midwest and Northeast, adaptive grazers are focusing on low-input strategies, diversified crop rotations, and shifting genetic emphasis to achieve whole-herd resilience.

The Real Bottom Line: Adaptation and Community

If there’s one message carrying through from every conference and farm walk this year, it’s that success hinges on honesty—with yourself, your partners, and your books. Peer benchmarking, ongoing dialogue with advisors and neighbors, and clear, sometimes tough, family talks are what keep businesses and communities weatherproof.

What farmers are finding is that adaptation—sometimes fast, sometimes gradual—isn’t a choice anymore; it’s a business necessity. We’ve steered the dairy industry through harder times before, and every forward step now is a brick in the path to the next, better cycle.

So, keep asking, keep sharing, and let’s keep steering together. Our best solutions always start in these conversations. 

Key Takeaways

  • Despite a 53% increase in exports, most U.S. milk checks fell in 2025 as global buyers capitalized on discount pricing.
  • Strategic culling now—while cull prices are high—can safeguard cash flow, boost butterfat performance, and reduce transition headaches.
  • Use regional benchmarking and trusted university data to determine if your operation can realistically hit sub-$18/cwt all-in costs.
  • Don’t wait: initiate open succession talks, review lender relationships, and explore value-added/cooperative marketing to hedge future risk.
  • Adaptation—whether through efficiency, product innovation, or strategic exit—is essential for all farm sizes as the middle ground shrinks and 2026 market volatility looms.

Complete references and supporting documentation are available upon request by contacting the editorial team at editor@thebullvine.com.

Learn More:

The Sunday Read Dairy Professionals Don’t Skip.

Every week, thousands of producers, breeders, and industry insiders open Bullvine Weekly for genetics insights, market shifts, and profit strategies they won’t find anywhere else. One email. Five minutes. Smarter decisions all week.

NewsSubscribe
First
Last
Consent

2,800 Dairy Farms Will Close This Year—Here’s the 3-Path Survival Guide for the Rest

Mid-size dairies are discovering they have 18 months to pick: premium, scale, or strategic exit 

EXECUTIVE SUMMARY: Rabobank’s projection that 7-9% of U.S. dairy operations will disappear annually through 2027 isn’t just another statistic—it represents roughly 2,800 farms making their final milkings each year, with mid-size operations bearing the brunt of this consolidation. What farmers are discovering through hard experience is that traditional 150-400 cow dairies face an impossible equation: spending $35,000-$55,000 annually on calf management labor while those calves generate just $15,000-$30,000 in net returns. Research from Cornell and Wisconsin’s dairy programs confirms that the industry is bifurcating into two distinct models—premium differentiation, which captures 50-75% price premiums for the 20-25% of producers near metropolitan markets, and efficiency-focused operations that achieve costs $3-4 per hundredweight below average through scale and technology. The next 18 months represent a critical decision window, as environmental regulations tighten, the Farm Bill implementation begins, and processor consolidation accelerates the pressure on uncommitted operations. Here’s what’s encouraging: producers who recognize this shift and commit fully to one path—whether premium, efficiency, or strategic transition—are finding renewed profitability and purpose. The conversation isn’t about whether change is coming; it’s about choosing your direction while you still have options to shape your farm’s future on your terms.

According to Rabobank’s latest North American dairy outlook, we’re losing 7-9% of U.S. dairy operations annually through 2027—that’s potentially 2,800 farms disappearing each year. Walking through a 500-cow operation in County Roscommon last week, where Irish media reports indicate that Department of Agriculture inspections uncovered systematic management failures that had developed over several years, I saw firsthand what happens when mid-sized operations get caught between two increasingly divergent business models.

Here’s why the next 18 months matter: Environmental regulations are expected to tighten in key regions by 2026. The next USDA Farm Bill cycle begins implementation. And consolidation accelerates at a pace that makes waiting increasingly costly. The window for proactive choices is narrowing fast.

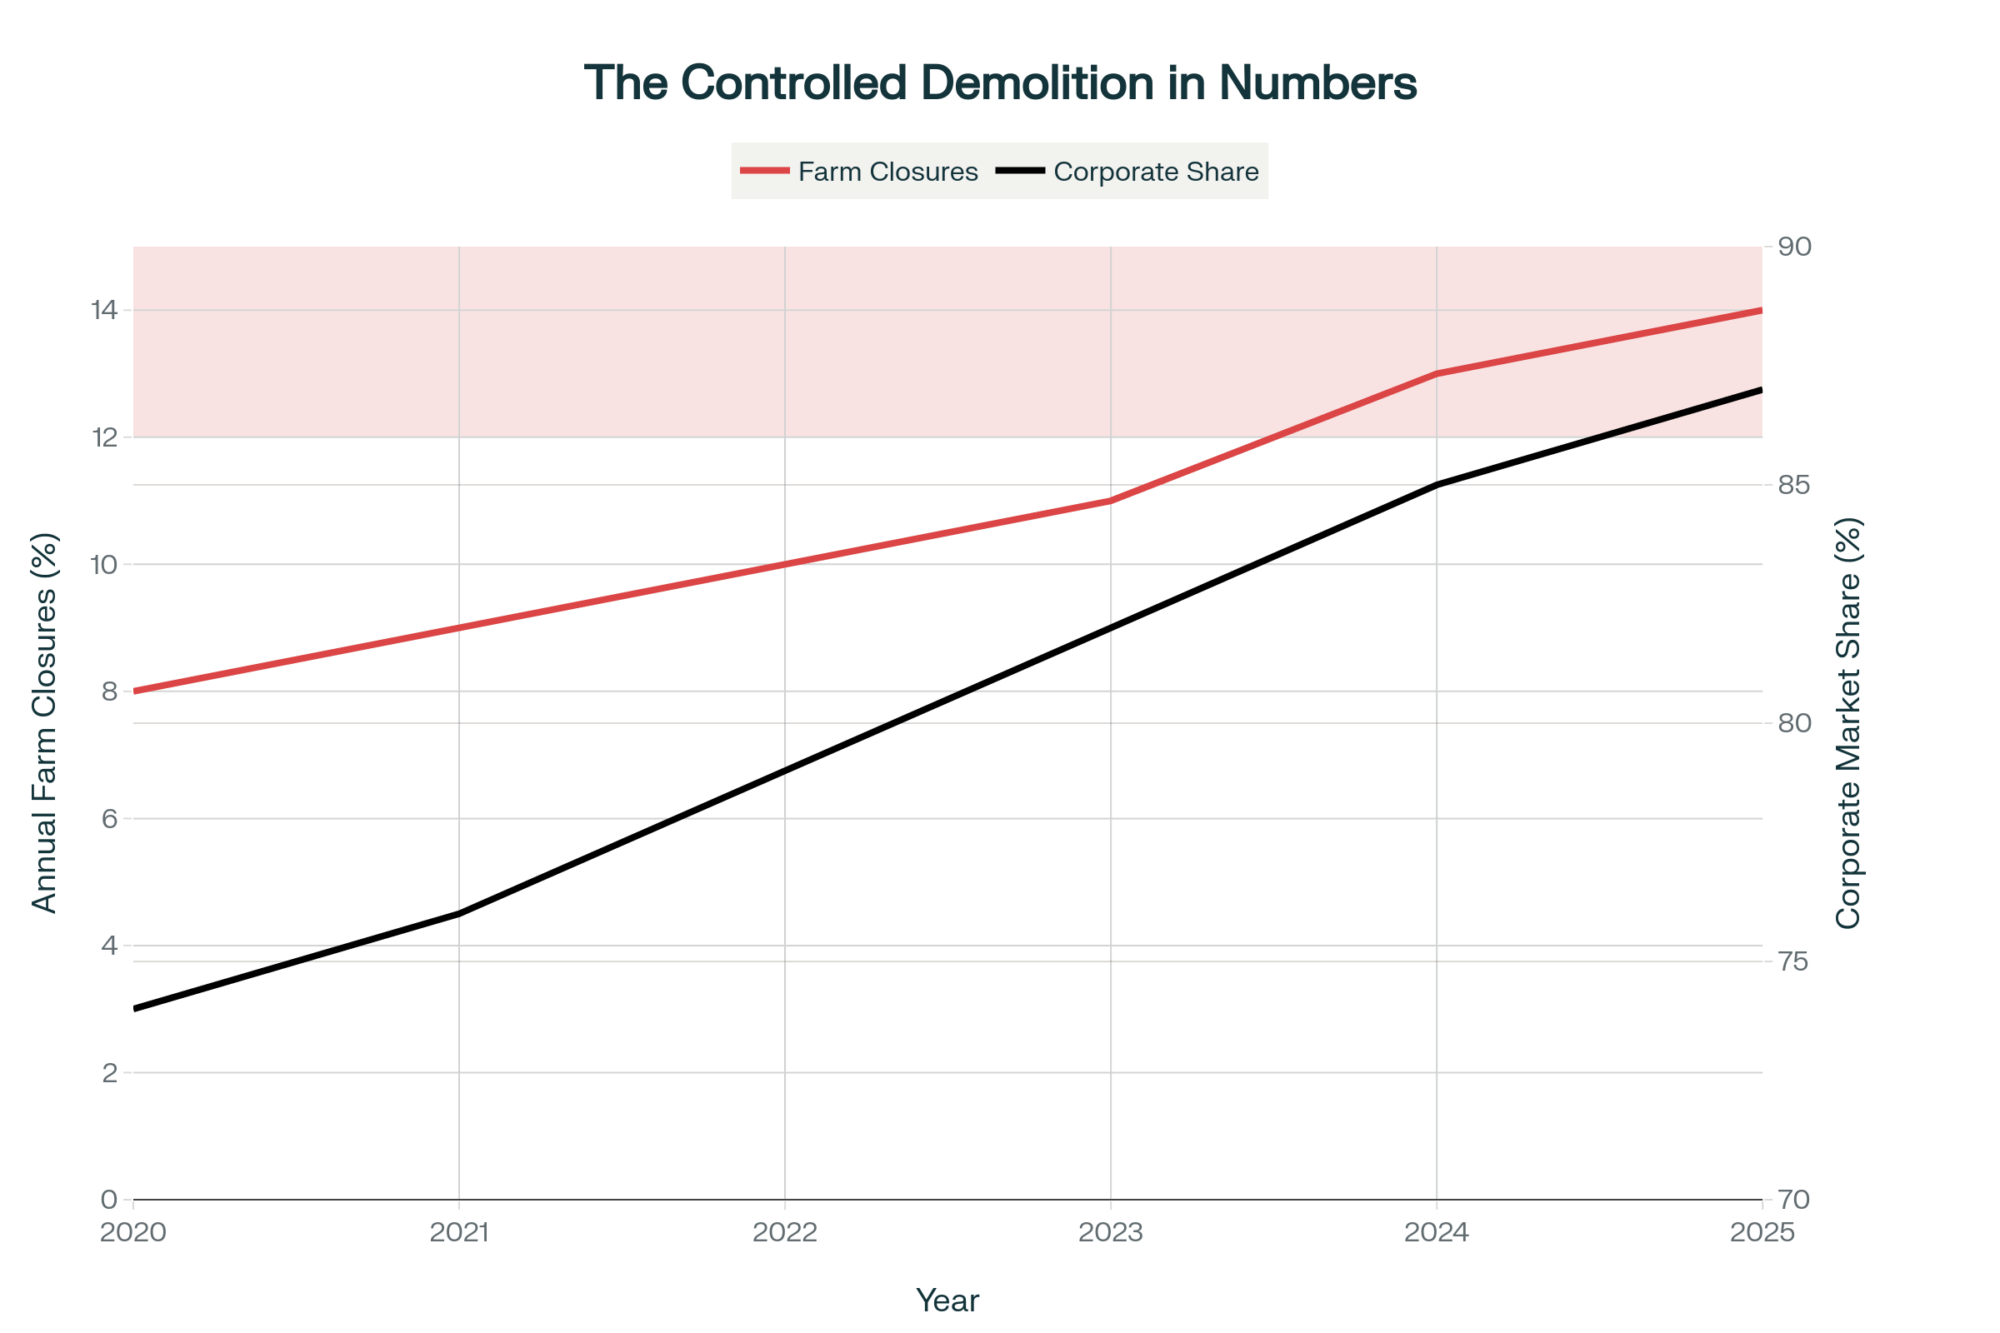
Rabobank’s projection isn’t just a statistic—it represents the death spiral of mid-size operations caught between impossible economics and regulatory pressure

Understanding the New Economics of Dairy Farm Profitability

Let me share some numbers that a Wisconsin producer showed me last month, as they reveal the impossible math that breaks traditional dairy models.

The shocking math behind dairy’s consolidation crisis: Mid-size operations spend double on labor what their entire calf enterprise generates

Consider a 500-cow operation—substantial by most regional standards, right? With normal breeding patterns, you’re managing approximately 250 bull calves annually. In current markets, based on what I’m seeing in USDA market reports, those dairy bull calves typically bring $50 to $200, depending on breed and season. Even with beef-cross breeding programs—which data from Cornell shows about two-thirds of Northeast dairies have now adopted—prices generally range from $150 to $400 in stronger markets.

The best-case scenario generates approximately $30,000 to $50,000 in gross revenue from the entire calf enterprise. After accounting for transportation, health management, and the typical 8-12% mortality rate that even well-managed operations experience, net returns often fall to $15,000 to $30,000.

Now, here’s where it gets uncomfortable: hiring dedicated calf management costs $35,000 to $55,000 annually, based on current agricultural wage data, excluding benefits and overhead.

You’re spending double on labor what the entire calf enterprise generates.

As one producer in central Wisconsin put it: “That math doesn’t work.” And you know what? It’s not just a Wisconsin problem. Down in the Southeast, where heat stress adds another layer, a Georgia dairyman running 600 cows told me at a recent conference: “Between June and September, my calf mortality jumps to 15%. The cost of climate-controlled housing would bankrupt us, but the losses are killing us slowly anyway.”

What’s happening in Florida is even tougher. A producer near Okeechobee shared that their summer calf mortality can hit 20% without intensive management. “We’re basically choosing between two ways to lose money,” she said.

Learning from Different Models Around the World

What’s particularly revealing is how various countries have addressed these structural challenges. Each approach tells us something about potential pathways forward.

Canada’s Quota System: When Compliance Becomes Valuable

Canadian dairy producers operate within a unique framework. According to recent data from the Canadian Dairy Commission, production quotas in provinces like Ontario currently trade at significant values—tens of thousands of dollars per kilogram of butterfat. A typical 70-cow operation might hold a quota worth well over a million dollars. Their proAction program, mandatory since 2017, ties welfare compliance directly to market access.

“The validation costs us about CAD$400 every two years,” a producer near Guelph told me during a recent Ontario farm tour. “But if we lose compliance, we can’t ship milk. That quota value? Gone. It completely changes how you think about management decisions.”

What I’ve noticed is that Canadian producers rarely discuss cutting corners on animal care. When your compliance is tied to an asset worth more than most people’s retirement funds, you find ways to make it work.

The Netherlands: Environmental Limits as Management Boundaries

The Dutch discovered something fascinating, almost by accident. After EU milk quotas ended in 2015, they implemented phosphate rights to manage environmental concerns. Research from Wageningen shows that this system effectively caps expansion—farmers must either acquire additional phosphate quotas or invest in manure processing, which typically costs between €10 and €25 per ton, sometimes more.

A researcher at Wageningen explained it well during a recent webinar: “We didn’t intend to prevent management overreach. But when expansion requires such significant capital investment, farmers naturally stay within their management capacity.”

Denmark: Market Premiums for Higher Standards

Denmark represents yet another model. Based on industry data from their agricultural council, they’ve implemented enhanced welfare standards beyond EU requirements. More importantly, cooperatives like Arla support these through sustainability incentive programs—real money per kilogram that can add up to thousands of euros annually for an average farm.

Robotic Systems in the Mountain West: A Different Path

What I’ve been watching with interest is how Mountain West producers are approaching this differently. I visited a 240-cow operation near Twin Falls, Idaho, that installed robotic milking units a few years back. “We went from three full-time employees to one,” the owner explained. “The robots cost us several hundred thousand, but we’re saving over $100,000 annually in labor. More importantly, our cows are healthier—somatic cell count dropped significantly.”

That’s not a path for everyone—you need reliable power, technical support within driving distance, and cows that adapt to the system. However, it demonstrates how technology can bridge some gaps for mid-sized operations.

The Emerging Bifurcation: Dairy Consolidation Trends Accelerate

Through conversations with agricultural economists at various land-grant universities, as well as lenders from Farm Credit and other institutions, a clear pattern emerges. As one Cornell economist recently put it: “We’re watching the industry split into two distinct business models, with the traditional middle ground becoming economically unsustainable.”

The Premium Path: Quality and Differentiation

The brutal math of dairy economics: Small operations lose money, mega-dairies print it, and the middle ground has vanished forever

Research from the USDA and analyses from agricultural lenders suggest 20-25% of production is moving toward differentiated markets. These operations capture real premiums—but success requires specific conditions.

Organic Valley’s latest member report shows that their farmers are receiving significantly higher prices—sometimes 50-75% premiums over conventional prices. But achieving this requires patient capital and proximity to premium markets.

A Vermont organic producer who successfully transitioned shared a valuable perspective at a recent conference: “Year one through three, we lost money. Years four through six, we broke even. Since year seven, we’ve been profitable. But that seven-year journey? Not everyone can make it.”

Here’s what consumer research consistently shows: only about a quarter of consumers regularly pay meaningful premiums for differentiated dairy products—and they’re concentrated in metropolitan areas with higher household incomes.

Beyond organic, there’s a young farmer in Texas who’s found success with A2 milk production. “We’re getting a 30% premium selling directly to Houston markets,” she told me. “But it took two years to build the customer base, and we had to change our breeding program completely.”

The Efficiency Model: Scale and Optimization

The majority of production—roughly 75%—continues moving toward efficiency-focused operations. USDA Census data shows the average U.S. dairy herd has grown significantly over recent years, with the largest operations now producing well over a third of the nation’s milk.

Mike, who manages 850 cows near Eau Claire through a combination of owned and leased facilities, shared his approach: “Every decision focuses on efficiency. We utilize precision feeding systems that significantly reduce feed costs. Automated health monitoring catches issues days earlier. Our per-hundredweight production cost runs well below the state average. In volatile markets, that’s survival.”

When milk prices experience significant volatility—as we have seen in recent years—large, efficient operations tend to survive, while smaller farms often struggle to cover their operating costs.

A California producer running 3,000 cows in the Central Valley puts it differently: “We’re not farming anymore, we’re manufacturing. Every process is standardized, measured, and optimized for efficiency. It’s not romantic, but it keeps us in business.”

The Challenge for Mid-Size Operations

Here’s where it gets difficult for operations between 150 and 400 cows—what USDA classifies as mid-size commercial dairies. They’re too small for significant economies of scale but too large for niche marketing approaches.

Research from dairy profitability programs consistently shows farms in this range have the highest per-hundredweight production costs and lowest return on assets. They incur compliance costs similar to those of larger operations but can’t spread them across a sufficient production volume.

A third-generation producer near Viroqua who recently sold his 185-cow operation explained: “We calculated everything honestly. After debt service, family living, and reinvestment needs, we were left with a net annual income of $18,000 for 70-hour weeks. The solar lease on our land now generates $52,000 annually with zero labor.”

This isn’t failure—it’s recognition of changed economics. And you know what? More folks are coming to similar conclusions.

Young Farmers Face Unique Pressures

What worries me most is what I’m hearing from young producers. At a recent young farmer conference in Madison, the mood was notably different than even two years ago.

“My parents want me to take over our 220-cow operation,” a 26-year-old from Minnesota told me. “But the numbers don’t work. I’d need to double the herd size to make it viable, which would mean incurring $2 million in debt. Or transition to organic, which means seven years of uncertainty. Either way, I’m betting my entire future on factors I can’t control.”

The next generation crisis: Access to capital and equipment costs create insurmountable barriers for young farmers, explaining dairy’s aging demographic

But there are success stories too. I met a 28-year-old in Pennsylvania who took over her family’s 180-cow operation and immediately began bottling milk on the farm. “We’re capturing $4 more per gallon than commodity pricing,” she said. “It was scary taking on the debt for processing equipment, but we’re actually profitable now.”

Data from beginning farmer programs shows dairy has the lowest rate of young farmer entry among agricultural sectors—just 6% of dairy farmers are under 35, compared to 8% across all agriculture. That should concern all of us.

Technology’s Role and Limitations

Examining precision dairy technologies reveals genuine benefits. Recent research in dairy science journals indicates that automated health monitoring can significantly reduce treatment costs and improve conception rates. Several Wisconsin producers report real improvements from adoption.

Yet technology alone won’t resolve structural challenges. Studies consistently find that most commercially available precision dairy systems haven’t been independently validated for all their claims.

As one precision dairy specialist noted at World Dairy Expo: “Technology amplifies good management. It doesn’t replace it or change basic economic realities.”

The technology truth: Health monitoring and precision feeding deliver fastest ROI, while robotic milking requires patient capital and skilled management

Carbon Credits and Environmental Opportunities

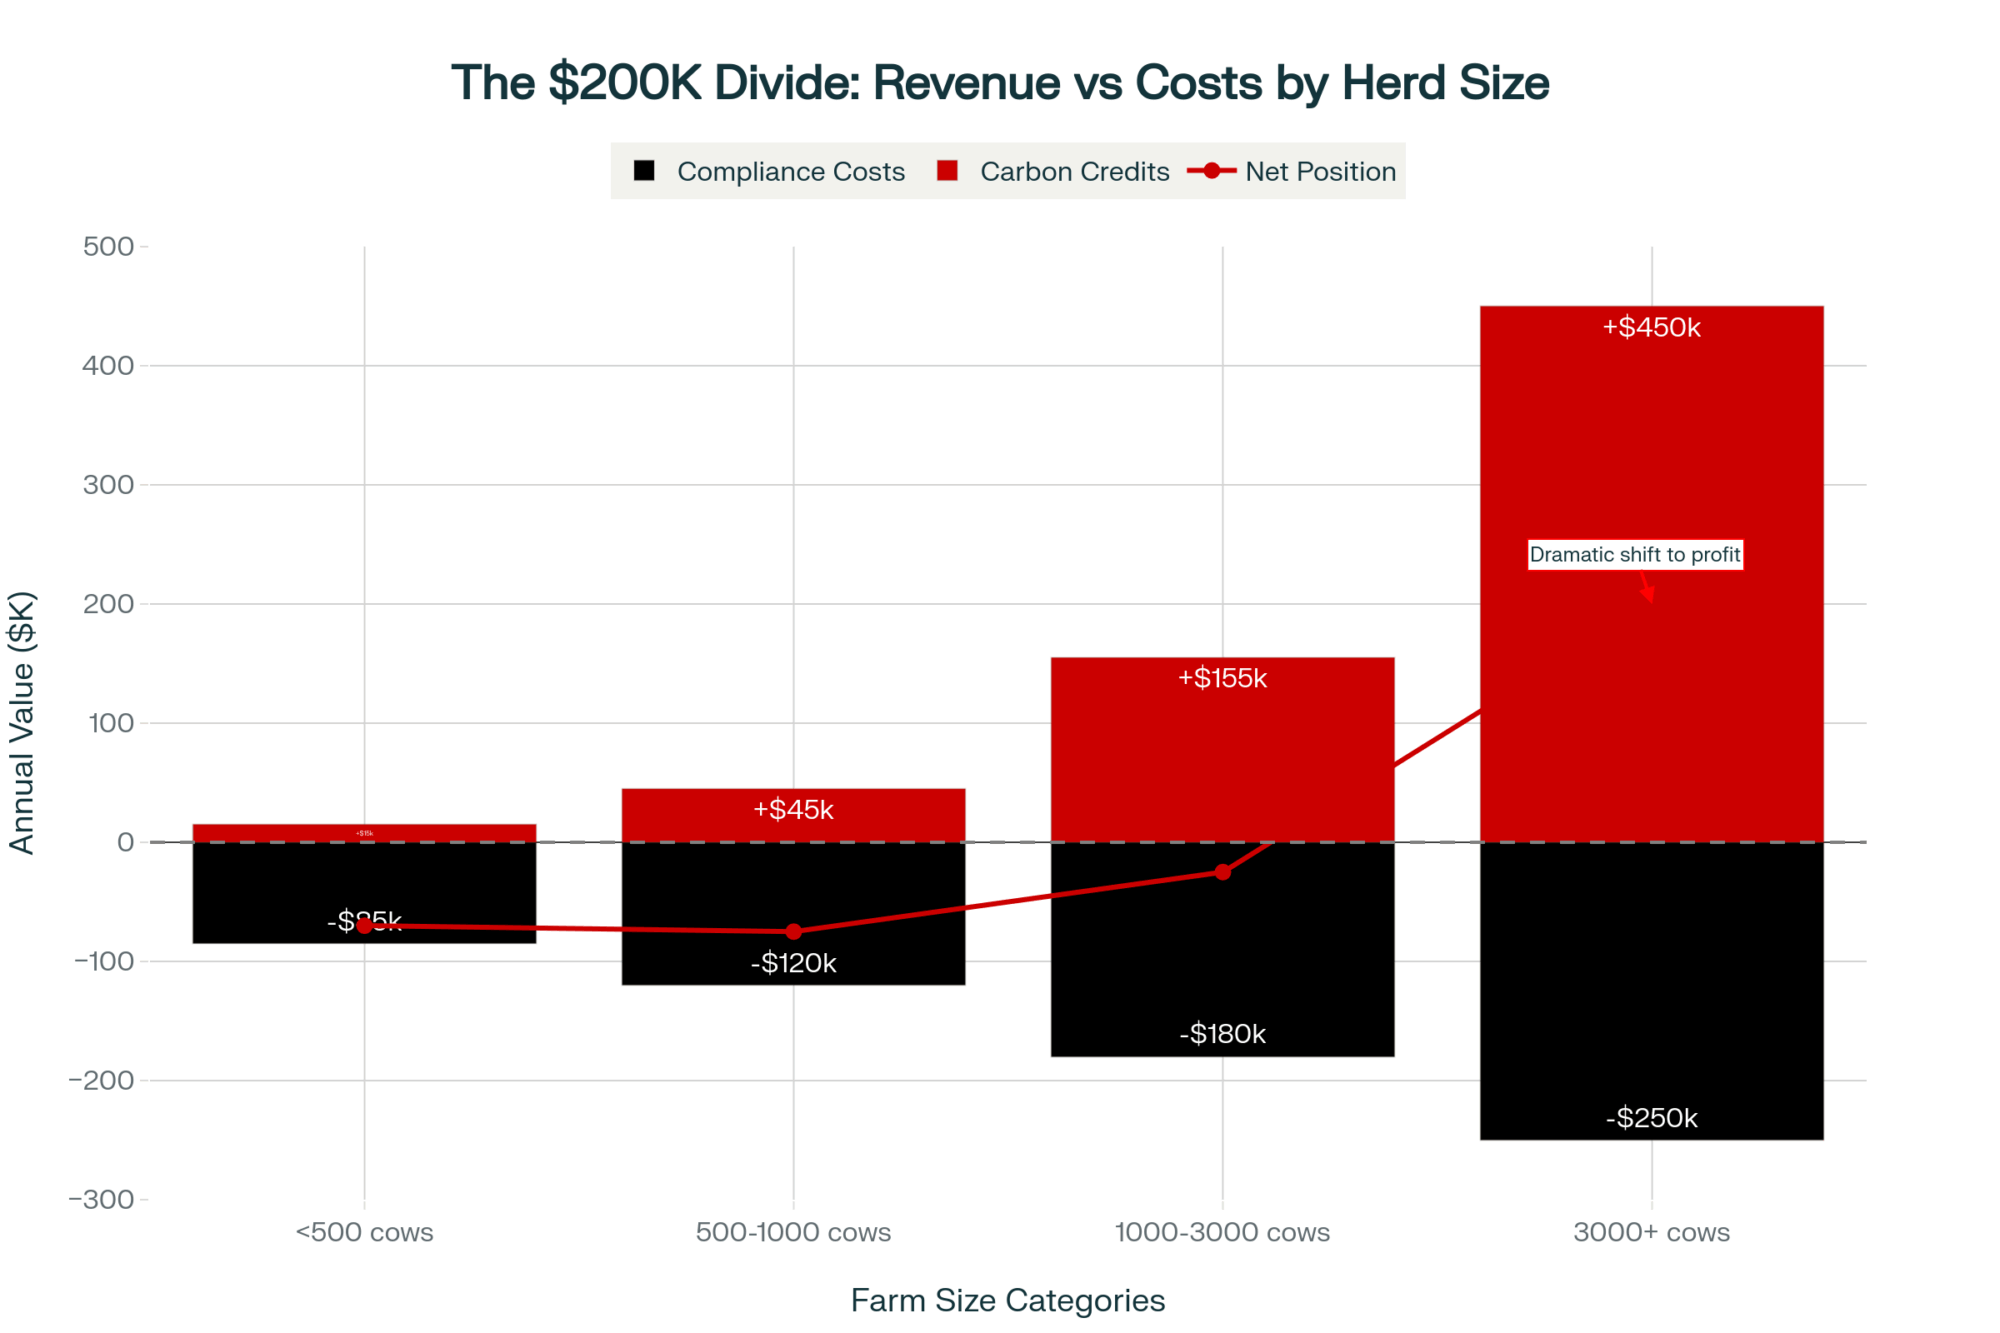
One emerging opportunity that’s still developing: carbon markets. California’s Air Resources Board offset program now includes dairy digesters, paying substantial amounts per metric ton of CO2 equivalent reduced. A large operation with a digester can generate $150,000 to $200,000 annually in carbon credits.

But here’s the catch—digester installation costs run into the millions, and you need consistent manure management to make it work. Plus, these programs favor larger operations that can afford consultants to navigate the complexity.

“It’s another way the big get bigger,” a medium-sized producer in California told me, shaking his head. “We looked at it, but the upfront costs and ongoing management requirements put it out of reach.”

What The Next 18 Months Will Bring

Based on regulatory filings, market projections, and discussions with industry analysts, several trends are accelerating toward critical decision points:

Environmental Regulations (By June 2026):

  • California’s methane reduction requirements are getting real teeth
  • The Netherlands is continuing with a significant reduction in dairy cow numbers through buyout programs
  • Wisconsin is implementing new phosphorus limits affecting hundreds of farms in sensitive watersheds

Market Consolidation (Accelerating Now):

  • That 7-9% annual reduction in farm numbers continues through 2027
  • Processor consolidation is creating fewer, larger milk buyers with stricter requirements
  • Premium market growth is slowing from the previous rapid expansion

Economic Pressures (Building Through 2026):

  • Federal Reserve keeping interest rates elevated through at least mid-2026
  • Input costs are stabilizing but remaining well above pre-2020 levels
  • Labor availability is declining, with visa costs increasing significantly

What farmers are finding is that these pressures compound each other. It’s not just one challenge—it’s all of them hitting simultaneously.

Making Strategic Decisions: Your Three Paths Forward

After analyzing hundreds of operations across different models, three viable strategies emerge. And honestly? There’s honor in all three choices.

Path 1: Commit to Premium Differentiation

Requirements:

  • Location within a reasonable distance of metropolitan markets with substantial populations
  • Capital for a multi-year transition period (typically several hundred thousand for a 200-cow operation)
  • Willingness to develop direct marketing relationships or join an established cooperative

First Three Steps:

  1. Contact established premium cooperatives for transition planning—they offer mentorship programs
  2. Engage the USDA Natural Resources Conservation Service for transition funding opportunities
  3. Develop realistic cash flow projections with significant revenue discounts during transition

Success Example: A Vermont farm transitioned its 220-cow herd to organic production over a six-year period. They’re now grossing significantly more per hundredweight than regional conventional averages. “The transition nearly broke us,” the owner admits, “but we’re now set for the next generation.”

Path 2: Scale for Efficiency

Requirements:

  • Access to capital for expansion (typically thousands per cow for facilities and equipment)
  • Management systems for larger operations
  • Ability to weather significant price volatility

First Three Steps:

  1. Develop an expansion feasibility study with an agricultural lender—many offer specialized dairy expansion analysis
  2. Investigate management partnerships or qualified labor sources
  3. Implement precision management technologies, starting with feed management, for the fastest return

Success Example: Three neighbors in Idaho formed an LLC, consolidating their operations into a single, larger facility. Shared labor, bulk purchasing, and professional management significantly reduce costs. “Individually, we were struggling. Together we’re competitive.”

Path 3: Strategic Transition

Requirements:

  • Honest assessment of long-term viability
  • Understanding of asset values and alternative uses
  • Willingness to preserve equity while options exist

First Three Steps:

  1. Obtain a professional business valuation, including all assets
  2. Investigate alternative land uses (solar leases can generate substantial annual income in suitable locations)
  3. Consult a tax advisor regarding timing and structure

Success Example: A family converted their dairy to custom heifer raising and leased cropland, maintaining expertise while eliminating unprofitable segments. “We kept what we’re good at, eliminated what wasn’t working, and actually improved our quality of life.”

The Fourth Option: Cooperative Formation

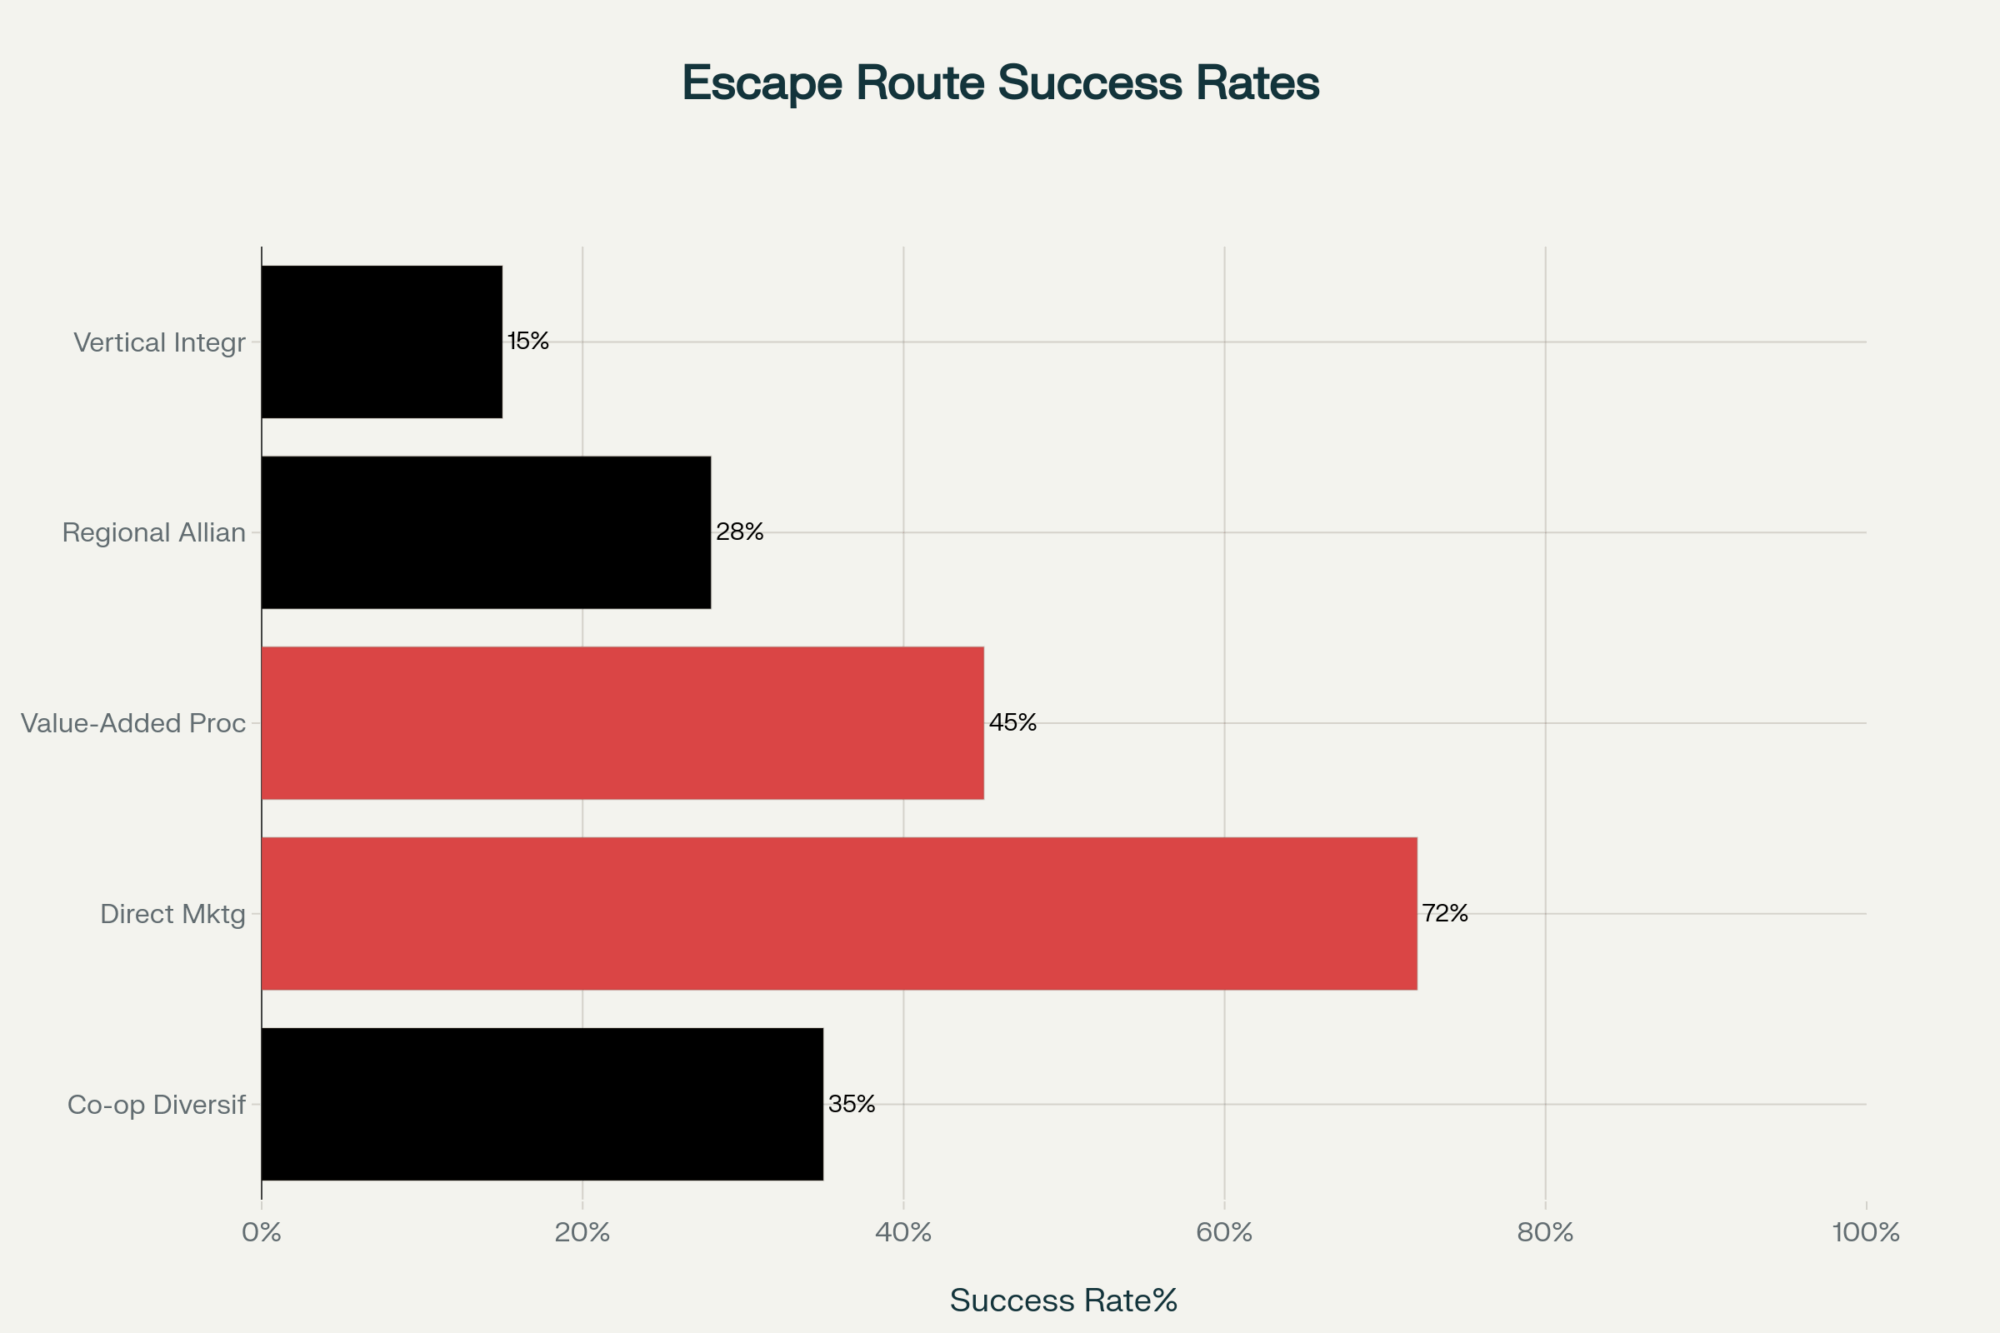
What’s interesting is there’s potentially a fourth path emerging—small groups of producers forming new cooperatives. I’m watching a group of five 200-cow operations in Ohio that are exploring joint processing and marketing. “Individually we’re too small for premium markets, too big for farmers markets,” one explained. “Together we might have something.”

FactorPremium PathEfficiency PathStrategic Exit
Initial InvestmentHigh ($500K)Very High ($2M+)Minimal
Time to Profitability5-7 years3-5 yearsImmediate
Market AccessLimited/RegionalGlobal/CommodityN/A
Labor RequirementsHigh SkilledAutomated/TechN/A
Regulatory ComplianceComplexStandardMinimal
Milk Price Premium50-75%0%0%
Risk LevelMediumHighLow
Success Rate (%)256090

Looking Ahead: The Industry We’re Building

The dairy industry continues evolving toward this bifurcated structure. This isn’t a temporary disruption—it’s structural realignment driven by global economic forces.

What encourages me is seeing producers who’ve found their path and committed fully. Whether it’s the organic producer in Vermont finally turning profits, the Wisconsin operation that merged with neighbors to achieve scale, or the family that transitioned to custom heifer raising—success comes from clear decisions and full commitment.

The industry needs both models. Premium producers cater to consumers who are willing to pay for specific attributes. Efficient operations meet global demand for affordable nutrition. What it can’t sustain is the uncertain middle ground where costs exceed commodity returns but premiums remain out of reach.

For those committed to the future of dairy, multiple viable paths exist. The key is choosing one that aligns with your resources—financial, geographic, and personal—and executing fully. Half-measures don’t work in this environment. They never really have, but now it’s obvious.

As spring flush approaches in a few months, Holstein operations may have different considerations than Jersey farms when it comes to component pricing and efficiency models. But regardless of breed, the fundamental choice remains the same.

The conversation we need isn’t about whether this transformation is happening—it’s about how individual producers will navigate it successfully. That decision window remains open, but based on every indicator I’m tracking, it won’t stay open past 2026.

Choose your path. Commit fully. Execute well. The future belongs to those who do.

KEY TAKEAWAYS

  • The calf enterprise math reveals the deeper crisis: Mid-size dairies are spending $35,000-$55,000 on labor to manage calves worth $15,000-$30,000 net—and that’s just one symptom of why farms with 150-400 cows show the highest production costs and lowest returns according to Wisconsin’s Center for Dairy Profitability
  • Three proven paths forward, each with specific requirements: Premium differentiation needs proximity to metro markets and 5-7 year transition capital; efficiency scaling requires $8,000-$12,000 per cow expansion investment; strategic transition preserves equity through alternatives like solar leases generating $800-$1,200 per acre annually
  • Regional solutions vary, but the timeline doesn’t: Whether you’re dealing with Southeast heat stress pushing calf mortality to 20%, California’s methane regulations, or Wisconsin’s phosphorus limits affecting 580 farms—the 18-month window before 2026 regulatory changes remains constant
  • Technology amplifies but doesn’t replace fundamentals: Automated health monitoring reduces treatment costs by 18% and robotic systems save $100,000+ annually in labor, but as precision dairy specialists confirm, these tools work only within economically viable business models
  • Young farmers face unique pressures requiring creative solutions: With only 6% of dairy farmers under 35 (versus 8% across agriculture), successful transitions involve innovations like on-farm bottling, capturing $4 more per gallon, or forming new cooperatives where five 200-cow operations achieve together what they couldn’t alone

Complete references and supporting documentation are available upon request by contacting the editorial team at editor@thebullvine.com.

Learn More:

The Sunday Read Dairy Professionals Don’t Skip.

Every week, thousands of producers, breeders, and industry insiders open Bullvine Weekly for genetics insights, market shifts, and profit strategies they won’t find anywhere else. One email. Five minutes. Smarter decisions all week.

NewsSubscribe
First
Last
Consent

Why UK Farmers Are Expanding Into £0.35 Milk – And the 90-Day Plan to Survive It

UK dairy: 5% production surge meets £0.35/L crash while 17% of farms face 60%+ debt ratios

EXECUTIVE SUMMARY: UK dairy farmers find themselves caught in an unprecedented paradox—production’s up 5% while farmgate prices plummet toward £0.35 per liter, creating what could be the industry’s most challenging period since Brexit. AHDB’s October data reveals the cruel mathematics at work: that 1.78 milk-to-feed ratio historically signals expansion, yet farmers following this indicator are walking into a structural crisis, not a cyclical downturn. With 17% of UK dairy operations already carrying debt-to-asset ratios above 60% according to DEFRA’s July survey, and working capital averaging just £800-1,200 per cow versus the £1,500 recommended minimum, the next three months will determine who survives this consolidation. What’s different this time is the convergence of permanent factors: Brexit has eliminated our EU export safety valve (down 21% since 2018), processing capacity’s shrinking as plants close, and global oversupply’s hitting simultaneously, with the US up 4.2% and Argentina up 7.7%. The farms that will survive will be those that take action now: locking in feed costs at current levels before winter volatility, applying for retail contracts offering 4-5p premiums over manufacturing milk, and having honest conversations with lenders before January reviews. This isn’t about weathering another cycle—it’s about recognizing a fundamental market restructuring that’ll likely see UK dairy consolidate from 8,500 to around 5,500 farms by 2030, with survivors emerging stronger but the middle ground disappearing entirely.

Dairy crisis action plan

So here’s what caught my attention this week. I’m reading through AHDB’s October quarterly review, and UK milk production increased by 5% last quarter, while farmgate prices dropped by nearly 10% to £0.38 per liter. Northern Ireland’s pushing production up 8.1%, England’s at 6.2%… and yet we’re all watching prices slide toward what could be £0.35 by February.

You know what’s really interesting, though? This actually makes sense when you look at that milk-to-feed ratio AHDB calculates every month. At 1.78, it’s telling producers to expand—that’s what the numbers say. Feed’s relatively cheap compared to milk, historically speaking. But I’ve been doing this long enough to know that sometimes the numbers don’t tell the whole story.

Why Good Farmers Are Making Tough Calls

I was talking with a Shropshire producer last week—let’s call him Tom—who runs about 280 cows near Market Drayton, and he summed up what a lot of you are probably feeling. “Look,” he said, “I’ve already put £150,000 into expanding the parlor. Started construction in March when things looked different. The heifers are bred, the concrete’s poured. What do you want me to do, just walk away?”

And honestly? He’s got a point. Most expansion decisions were made back in the spring when the outlook was completely different.

Here’s something interesting from the Journal of Dairy Science that came out in March—they found that farmers feel losses about twice as strongly as gains. Makes sense, right? When you’ve already invested that much, stopping feels worse than pushing through, even when the numbers get tight.

The math producers are doing… I get it. Your barn mortgage is £8,000 a month, whether you milk 200 cows or 250. The mixer wagon, the parlor equipment—those costs don’t change. So you think, well, if I can spread those fixed costs over more milk…

The thing is, when everyone thinks that way, we create our own problems.

What Brexit Really Changed (And Nobody Wants to Talk About)

You know what’s different this time around? We can no longer simply ship excess milk to Europe. Government trade stats from September show our dairy exports to the EU are down 21% since 2018. Meanwhile—and this is what really gets me—HMRC data shows New Zealand imports to the UK jumped 81% just in the first half of this year.

Remember 2015-2016? When prices tanked, we could at least move milk to Irish processors or French cheese makers. Not a great amount of money, but it kept things moving. That safety valve? It’s gone.

I’ve been reading through the House of Commons trade committee report from last year, and the reality is stark. Between sanitary certificates, health requirements, and three-day border delays, fresh dairy exports just don’t pencil out anymore. The Trade Policy Observatory figures these non-tariff barriers add 5-10% to costs. That’s not something that fixes itself when prices recover—it’s the new normal.

The Numbers That Keep Me Up at Night

The dangerous 17% – farms with debt ratios above 60% face six months to financial reckoning when milk hits £0.35/L

I’ve been reviewing the Farm Business Survey data—DEFRA has published their July numbers—and there are some clear warning signs. Approximately 17% of dairy farms already have debt-to-asset ratios exceeding 60%. That’s… that’s concerning.

Here’s how I think about it:

  • Below 40% debt-to-asset: You can probably ride this out for 12-18 months
  • 40-60% debt-to-asset: Vulnerable but manageable with strategic adjustments
  • Above 60% debt-to-asset: At £0.35 milk, you’ve got maybe six months before the bank starts asking hard questions

Working capital’s the other piece that worries me. The Farm Finance Institute’s been saying for years you need about £1,500 per cow as a buffer. But Kite Consulting’s recent surveys? Most UK farms are running at a cost of £800 to £1,200 per cow. And if you drop below £500 per cow… well, one major breakdown, one disease outbreak, and you can’t make payroll.

Working capital crunch exposed – farms averaging £1,000 per cow are £500 short of recommended levels and dangerously close to survival threshold. Every cow counts.

Michael Thompson over at Promar—he’s worked with over 200 dairy clients through the years—he put it to me straight: “Banks don’t care about your profit projections. They care about whether you can make next month’s payment.”

Why I Think £0.35 Is Coming by February

Now, I’m not one to make predictions, but the math here is fairly straightforward. AHDB has been tracking this for 15 years, and their Milk Market Value model indicates a three-month lag between commodity prices and what we receive at the farm gate. Typically accounts for about half of the commodity price movement.

Look at where commodities are right now. The EU Milk Market Observatory’s October data has butter at €605 per 100kg—that’s down 22% from last year. Skim milk powder’s off 12%. And those Global Dairy Trade auctions? Down nearly 6% across September and October.

When that works through our processing contracts… According to Dr. Robert Chen from AHDB’s market intelligence team on Tuesday, and he estimates the probability of reaching £0.35-0.36 by February at approximately 85%. The only thing that changes this is if we experience a major supply shock or China suddenly starts buying again. Neither looks likely right now.

What Different Regions Are Teaching Us

What’s fascinating is watching how different parts of the UK are handling this. Scotland’s production is only growing production by 1.2% according to Dairy UK’s latest numbers. Why the restraint?

Regional milk production growth reveals the paradox – Northern Ireland leads at 8.1% while Scotland shows restraint at 1.2% after processor closures. Geography drives survival strategy in this crisis.

Well, they learned the hard way. When Müller closed those plants in East Kilbride and Aberdeen back in 2018, 43 farms in northeast Scotland suddenly had nowhere to send their milk. They ended up paying 1.75p per liter just to truck milk to Bellshill—that’s over 100 miles. When you’re getting £0.35 at the gate and paying nearly 2p for transport… you’re basically paying to produce milk.

Northern Ireland? Totally different story. They’re expanding by 8.1%, but here’s the context: Dale Farm invested £70 million in its Dunmanbridge facility last June. They’ve secured an £8 billion deal to supply Lidl stores across 22 countries. When your processor’s investing that kind of money and has those contracts locked in, expansion makes more sense.

I was just in Devon last month, and producers there are taking a completely different approach. A small operation I visited—about 85 cows—they’ve gone fully grass-based, selling directly to local shops at £0.65 per liter. Different game entirely.

Your Next 90 Days: The Decisions That Matter

1. Lock Your Feed Costs (This Week, Seriously)

The Chicago Board of Trade had corn at $4.20 a bushel and beans at $10.17 as of October 15th. That’s not terrible, historically. But you know how fast that can change. Progressive Dairy’s data shows January-February usually brings volatility when South American weather becomes a factor.

Emma Davies at ForFarmers—she handles purchasing for over 150 dairy clients—she made a great point to me last week: “Forward contracting through March doesn’t cost anything upfront if your credit’s good. Why wouldn’t you lock that in?”

Think about it. If corn jumps to $6—which happened in the 2012 drought—you’re looking at an extra £0.04 per liter in feed costs. For a 200-cow farm, that’s £64,000 a year. That’s not margin optimization anymore, that’s survival money.

2. Those Retail Contracts (Application Windows Are Now)

Retail contracts offer 4.5p per liter premium – worth £72,000 annually for average farm, but application windows close in November. Miss this, wait another year.

Here’s what really struck me in the October price announcements. Arla and First Milk cut manufacturing contracts by 1.00 to 1.66p per liter. But the retail-aligned contracts? The Tesco Sustainable Dairy Group and Sainsbury’s groups actually increased by 0.88 to 2.85p.

We’re talking about a 4-5p per liter gap opening up. On 1.6 million liters a year, that’s a £64,000 to £80,000 difference. That’s transformative for cash flow.

However, and this is crucial, these applications typically run from October through November for Q1 contracts. Miss this window? You’re waiting another whole year. And next year, everyone will be trying to get in.

3. Hard Choices About Herd Size

If your working capital’s dropping toward £500 per cow, or you’re burning through more than £15,000 a month in cash… strategic culling might be necessary. I know how that sounds when you’ve been building the herd, but sometimes taking a step back is the smart move.

AHDB’s latest deadweight prices show culls at £3.20 to £3.80 per kg—so £800 to £1,000 per head depending on condition. However, history tells us from 2016 that when everybody starts selling, prices can drop by 30-40%. You could be looking at £550-650 by February if panic sets in.

Three Things That Could Make Everything Worse

  • The Heifer Shortage Nobody’s Watching

British Cattle Movement Service data shows UK cow numbers actually dropped 0.6% year-over-year. However, what concerns me is that the replacement pipeline’s drying up.

AHDB Breeding+ stats show beef-on-dairy programs are up 40% this year. Makes sense for cash flow, right? But Genus ABS tells me sexed semen’s now 60-70% of all breedings. Add in farms selling pregnant heifers for quick cash, and we’re setting up a replacement shortage for the 2027-2028 period.

Current market reports have bred heifers at £1,400-1,600. Based on what happened after 2016, when will the shortage hit? Those could easily reach £2,200-£ 2,800. Farmers selling heifers now won’t be able to buy them back when things recover.

  • Banks Are Quietly Changing the Rules

I can’t name names, but I’ve talked to lending officers at three major UK banks, and they’re all tightening up. Operating lines that used to get annual reviews? Now it’s quarterly. Farms with weakening ratios are seeing credit limits cut 10-20%. They’re asking for more collateral across the board.

The killer is the timing. Banks do their big reviews in January-February—exactly when milk prices will be at their worst, and your numbers look terrible. A farm expecting to roll over £200,000 in operating credit might get offered £140,000 at higher rates. That £60,000 difference in working capital, right when you need it most? That could be the ballgame.

  • Processing Capacity Keeps Shrinking

Kite Consulting’s September analysis is sobering. We have too much processing capacity for a market where liquid consumption’s dropping by about 1.5% annually, according to Dairy UK. When processors can’t make money at £0.35 per liter of milk, plants close.

Remember what happened to those Scottish farms after Müller’s closures. And that Skelmersdale plant breakdown last April that caused 12 days of dumping? Word is that they’re “evaluating the facility’s future”—that’s code for “might close.”

If you don’t have a backup plan for what happens to your milk if your processor shuts down or cuts contracts, you need one. Now.

Looking Past the Crisis: UK Dairy in 2030

Industry consolidation accelerates – 35% of UK dairy farms expected to exit by 2030, leaving survivors stronger but middle ground eliminated. The great reshaping begins now.

We will get through this—we always do—but UK dairy will look different on the other side. Based on historical consolidation patterns and current trends, I anticipate that we will have approximately 5,500 farms by 2030, down from around 8,500 today. Three main types of operations will likely dominate:

The big effort from efficient farms—350 to 600 cows—with retail contracts and costs below £0.35 per individual —folks entered this crisis with a strong balance sheet, likely to acquire assets from distressed neighbors. You’ll see them clustered near the big processing hubs in the Midlands, and Yorkshire, and Northern Ireland.

The premium producers—smaller operations, typically with 60 to 120 cows—sell organic, grass-fed, or direct-to-consumer products at £0.50 to £0.70 per liter. They’re avoiding the commodity game entirely. Scotland and Wales tourism areas will probably have clusters of these.

The diversified operations—200 to 350 cows—mixing milk production with beef-on-dairy, maybe some renewable energy, and custom heifer raising. Multiple income streams mean that when one market tanks, you’re not sunk.

What probably won’t make it? A traditional 150- to 250-cow farm operating on commodity contracts with debt exceeding 50%. That middle ground… it’s just tough to see how it works anymore.

The Conversation We Need to Have

Look, I know this is heavy. For most of us, this isn’t just business—it’s family, it’s identity, it’s everything we’ve worked for. The stress is real. It affects everything from how you sleep to how you make decisions.

Dr. Lisa Roberts at Edinburgh has done great work on farm mental health, and she’s right—reaching out for help, whether that’s financial advisors, family, or counseling, is not a sign of weakness. That’s being smart. The best farmers I know are those who recognize when they need an outside perspective.

And for some operations… this is hard to say, but if the numbers truly don’t work, exiting on your terms now might be better than bleeding equity for 18 months, hoping for a miracle. That’s not failure. That’s protecting what you’ve built.

Why This Time Really Is Different

I’ve been through 2009, 2015-2016, COVID, and a bunch of smaller crashes. This one feels different because it IS different.

Brexit changed our export markets permanently—that 21% drop isn’t coming back. Processors are consolidating, not expanding. And the whole world’s producing more—USDA data shows the US up 4.2%, Argentina up 7.7%—while China’s barely importing based on their customs data.

This isn’t just a cycle that’ll fix itself. It’s a structural shift. The ones that make it will be more profitable, but there’ll be fewer of them.

The Clock’s Ticking

Every crisis creates winners and losers. The difference usually isn’t resources—it’s timing. The decisions you make in the next 90 days matter more than what you hope happens in the next 90 weeks.

Lock in feed costs. Apply for retail contracts if you can. Have honest conversations with your bank now, not in February. Look at your working capital realistically. And if the numbers say you need to make changes, make them while you still have options.

That 1.78 milk-to-feed ratio everyone’s watching? It’s yesterday’s indicator for tomorrow’s market. The game’s changed. Question is whether you change with it.

Make the calls. Have the conversations. Run the real numbers, not the hopeful ones.

February’s coming whether we’re ready or not. What you do between now and then… that’s what determines whether you’re still milking in 2027.

KEY TAKEAWAYS

  • Lock feed costs this week to save £64,000 annually—with Chicago Board corn at $4.20/bushel (October 15), forward contracting through March protects against potential jumps to $6 that would add £0.04/liter to costs on a typical 200-cow operation
  • Retail contract applications close in November for Q1 2026—the 4-5p/liter premium between manufacturing and liquid contracts (Tesco Sustainable Dairy Group, Sainsbury’s programs) represents £64,000-80,000 annual difference on 1.6 million liters, but miss this window and you’re waiting another full year
  • Strategic culling becomes necessary below £500/cow working capital—with AHDB showing cull prices at £800-1,000/head currently, versus likely £550-650 by February, when panic selling starts, farms burning over £15,000 monthly need to act while values hold
  • Regional strategies vary based on processor infrastructure—Northern Ireland’s 8.1% expansion makes sense with Dale Farm’s £70 million investment and Lidl contracts, while Scotland’s 1.2% restraint reflects lessons from Müller closures that left farmers paying 1.75p/liter transport
  • Bank credit reviews in January-February will catch unprepared farms—lending officers at major UK banks confirm they’re cutting operating lines 10-20% for weakening operations, meaning that a £200,000 credit renewal might only get £140,000 right when milk prices hit their floor

Complete references and supporting documentation are available upon request by contacting the editorial team at editor@thebullvine.com.

Learn More:

  • UK Dairy’s Lupin Bet: Are the Profits Real in 2025? – This tactical guide reveals how to achieve immediate, quantifiable cost savings by replacing 50% of soya protein with lupin. Learn the key milling and contract strategies to save over £750 monthly on a 250-cow herd, directly boosting your working capital during the price crash.
  • The Real Reason 190 UK Dairy Farms Disappeared – And What They’re Not Telling You – Gain critical strategic insight into the structural forces driving farm exits. This analysis uncovers the harsh reality of processor redlining, geographic transport penalties, and market power dynamics, providing a vital risk assessment tool for your long-term survival strategy.
  • The Great UK Dairy Cull: What’s Really Driving the Farm Exodus – Learn how scale and technology are now essential survival metrics. This article details the automation reckoning, providing crucial ROI metrics for robotic milking and achieving feed conversion ratios below 0.9 kg/litre to survive the coming industry consolidation.

The Sunday Read Dairy Professionals Don’t Skip.

Every week, thousands of producers, breeders, and industry insiders open Bullvine Weekly for genetics insights, market shifts, and profit strategies they won’t find anywhere else. One email. Five minutes. Smarter decisions all week.

NewsSubscribe
First
Last
Consent

$1.67 Cheese, 3.9 Million Heifers, $10 Billion in Steel: The Math That’s Rewriting Dairy’s Future

When plants need 8M lbs daily but heifers hit 47-year lows, something fundamental shifts

EXECUTIVE SUMMARY: What farmers are discovering across the dairy belt is that we’re not facing another typical downturn—we’re watching structural forces reshape the entire industry landscape. With block cheese at $1.67 per pound and heifer inventories at their lowest since 1978 (just 3.914 million head according to USDA’s January report), the traditional 18-24 month recovery cycle appears fundamentally broken. Over $10 billion in new processing capacity needs to be fed, regardless of demand, while consumer confidence sits at 55 points—its lowest level since 2020—and restaurant traffic has declined for seven consecutive months. University of Wisconsin research shows that even at $25 milk, meaningful herd expansion would take a minimum of three years, eliminating the supply response that has balanced our markets for generations. For operations facing this reality, the next 30 days represent a critical decision window: implement aggressive risk management (locking in 60-70% at current levels), optimize component revenues (potentially adding $33,000 annually for a 100-cow operation), or consider strategic transition while equity remains intact.

dairy structural shift

When block cheese crashes to $1.67 while new plants demand 8 million pounds of milk daily, something fundamental has shifted in dairy economics.

You know the rhythm. Milk prices crash, you cut costs, cull some cows, and wait 18-24 months for recovery. It’s worked since your grandfather’s time.

Yet conversations with producers across the dairy belt lately keep returning to the same concern—the playbook we’ve relied on for decades might not work this time. And honestly? They might be onto something.

Reading the Room: What Consumer Behavior Really Tells Us

The University of Michigan’s Consumer Sentiment Index reached 55 points in October, marking its third consecutive month of decline. Now, we’ve weathered confidence dips before, but here’s what caught my attention in the underlying data.

Less than half of Americans expect income growth next year, according to the Conference Board’s October release. That’s down from nearly 60% back in April. Almost half think unemployment’s heading higher. Historical patterns of the Federal Reserve suggest that when pessimism reaches these levels, actual job losses typically follow within six months.

OCTOBER 2025 MARKET SNAPSHOT

Consumer Indicators:

  • Consumer confidence: 55 points (lowest since 2020)
  • Restaurant traffic: Down seven consecutive months
  • Private label dairy: Dominates 11 of 14 categories

Supply Constraints:

  • Heifer inventory: 3.914 million (47-year low)
  • Beef-cross calves: $800-1,000 vs Holstein bulls $50-150

Industry Investment:

  • New processing capacity: $10+ billion coming online
  • Fixed costs requiring: 95%+ utilization regardless of demand

What farmers are finding—and I’m hearing this from Wisconsin to California—is that weak consumer sentiment hits dairy demand in unexpected ways. The NPD Group’s latest data show that restaurant traffic has been down for seven consecutive months through August. But here’s the kicker… Black Box Intelligence reports that fine dining experienced a 13% decline, while quick-service restaurants dropped by 3.4%.

Why should you care? Well, the International Dairy Deli Bakery Association documented that full-service restaurants use about 2-3 times more cheese per customer than QSR joints. So when Applebee’s loses traffic but McDonald’s holds steady with $5 meal deals, we’re actually losing way more cheese volume than the headlines suggest.

And get this—Technomic’s September analysis shows that even with aggressive discounting, traffic continues to decline. That’s not folks being cheap. That’s behavioral change.

The Store Brand Revolution Hiding in Plain Sight

IRI’s FreshLook data from February revealed something I don’t think we’ve fully grasped yet. Private label dairy experienced a 3.9% increase in dollar sales last year, while national brands grew by just 1%.

The Private Label Manufacturers Association now reports store brands outsell national brands in 11 of 14 dairy categories. Eleven out of fourteen!

According to the Food Marketing Institute’s September survey, 63% of consumers believe that store brands match or exceed the quality of national brands. They’re not “making do” with cheaper options anymore—they’re choosing them.

I spoke with a procurement manager from a major Midwest chain last month (I won’t name them, but you’d likely recognize the logo). Once their customers try store brand dairy at 20-30% savings, he said, maybe one in ten switches back. Maybe.

For farms shipping to processors heavily weighted toward national brands, this trend… well, let’s just say it deserves more attention than it’s getting.

That $10 Billion Processing Bet Nobody’s Talking About

CoBank documented over $10 billion in new processing capacity between 2021 and 2025. Hilmar announced their $1.1 billion Dodge City facility in May 2021. Leprino unveiled plans for their $870 million Lubbock plant that October. Valley Queen’s expanding in South Dakota.

When these decisions were made—mostly 2021 through early 2023—everything looked bulletproof. USDA’s Foreign Agricultural Service was showing 7% annual export growth. Nielsen panels indicated Americans couldn’t get enough protein. Kansas and Texas dairies were expanding at a rate of 3-4% yearly, according to NASS.

The International Dairy Foods Association told their March 2024 conference that farmers would respond to market signals. More heifers, better genetics, increased production. Made sense at the time.

Then the USDA’s January 2025 Cattle Report landed like a brick. Heifer inventories at 3.914 million head—lowest since 1978. University of Minnesota’s applied economics team ran the numbers… even with aggressive retention starting today, we’re looking at 2028 before meaningful expansion is possible.

Think about what this means. Leprino’s Lubbock plant requires approximately 3.65 billion pounds of milk annually, based on its 8-million-pound daily capacity. Standard financing on $870 million translates to approximately $60 million in annual interest. Before making a pound of cheese.

These plants can’t not run. They must operate near capacity, regardless of market conditions.

A Texas producer told me plants were competing hard six months ago—50-cent premiums weren’t unusual. Now? Those premiums are evaporating as plants lock in supply. Classic pattern, but the scale this time is unprecedented.

Why 2009’s Recovery Script Won’t Work

Looking back at 2009 helps explain why this time feels different.

Traditional 18-24 month recovery cycles are dead—2025’s flat trajectory means waiting for recovery guarantees bankruptcy

CME data shows Class III hit $8.40 in January 2009, then recovered to $16.50 by December. The FAO Dairy Price Index jumped 82% from its February bottom. Quick, painful, but quick.

What drove that recovery? The USDA’s Economic Research Service documented aggressive culling—reducing 150,000 head in six months. The government purchased 200 million pounds of powder through the Dairy Product Price Support Program. China’s imports surged 94% year-over-year, according to their customs data.

Now look at today. With heifers at 3.914 million head (according to the USDA’s January report), we can’t expand when prices recover. Beef-on-dairy economics make it worse—Agricultural Marketing Service reports from October show crossbred calves bringing $800-1,000 while Holstein bulls fetch $50-150.

University of Kentucky’s animal science department figures that’s worth $3-4/cwt if you’re breeding 30% of your herd to beef. Good money today, but it locks in lower milk production tomorrow.

Wisconsin-Madison’s dairy economics team presented data last month showing that even at a $25 milk price, a meaningful expansion takes a minimum of three years. The supply response mechanism that’s balanced our markets for half a century? It’s broken.

Government intervention? Not happening at scale. WTO rules are tighter. There is no political appetite for large dairy purchases. And China? Their Q3 2025 imports hit 15-year lows according to customs data. No cavalry coming from that direction.

Structural Shift or Normal Cycle? Here’s How to Tell

Ohio State’s ag economics team published some useful indicators in August. You’re looking at structural change when:

Feed drops, but margins don’t improve. USDA’s October Agricultural Prices report shows feed at $9.38/cwt, down from over $12. Yet, Progressive Dairy’s September cost survey found that 68% of farms reported tighter margins than ever.

Why? The Bureau of Labor Statistics reports that dairy labor has increased by 20% since 2020. Equipment costs rose 23%, according to the Association of Equipment Manufacturers. Cooperative deductions range from $2 to $3/cwt, based on the financial statements I’ve reviewed. Hidden costs are eating every penny saved on feed.

Recoveries get progressively weaker. CME historical data show that the period from 2007 to 2009 achieved a 175% price recovery. Recent cycles? Maybe 20-30% bounces. Each rebound becomes shallower because oversupply cannot be cleared with traditional mechanisms in place.

Your neighbors accelerate exits. Census of Agriculture typically shows 3-4% annual attrition. When you see multiple farms in your area close within months? That’s systemic pressure, not individual failure.

Three Paths Forward (Pick One Soon)

StrategyImplementationAnnual Impact (500-cow)TimelineSuccess Rate
Risk ManagementLock 60-70% production at $17-18/cwtSave $200,000 (limit losses to $3/cwt vs $5/cwt)Immediate (30 days)85% survive 24+ months
Component OptimizationGenomic testing + 30% beef cross + butterfat focusAdd $165,000 ($100K beef + $65K components)60-90 days full implementation70% achieve targets
Strategic TransitionExit with equity intact while values remainPreserve $2-3M equity vs 18-month bleed90-120 days for optimal exit95% preserve 60%+ equity

What’s encouraging is seeing how different operations are adapting successfully. They’re not necessarily the biggest or most efficient—they’re the ones who recognized this isn’t a normal cycle.

Risk Management That Actually Works

Traditional wisdom says hedge 40-60% to preserve upside. However, CME futures curves as of October 16 suggest that we’re facing a high probability of extended sub-$15 milk, with limited rally potential.

StoneX and other commodity advisors increasingly recommend 60-70% coverage at $17-18 through DRP or LGM-Dairy. Sounds conservative until you run the math.

For a 500-cow dairy, the difference between $5/cwt losses fully exposed versus $3/cwt with protection? That’s roughly $200,000 annually. One scenario means tough decisions. The other means bankruptcy.

Component and Diversification Strategies

Smart money controls what it can control. Genomic testing through Zoetis or similar identifies your best component producers. Breed the bottom 30% to beef. Optimize rations for butterfat and protein.

Based on current markets, a 100-cow operation might see:

  • Beef-cross premiums: $20,000 annually (October auction reports)
  • 0.2% butterfat improvement: $13,000 annually (USDA component pricing)
  • Combined: $33,000 additional revenue

That’s the difference between meeting payroll comfortably or scrambling every month.

Marketing Flexibility (Your Insurance Policy)

Remember Grassland Dairy’s April 2018 termination of 75 Wisconsin farms? Thirty days’ notice, done. That pattern accelerates during structural shifts.

Having documented alternatives—even if you never switch—changes everything. Several producers I know negotiated recent “temporary assessments” down significantly just by having options.

The 2028 Landscape

Wisconsin’s Center for Dairy Profitability projects that farm numbers will drop to 17,000-19,000 from today’s 25,000. The top 5% producing over half of the total milk supply. Median herd size is expected to reach 800-1,000 cows, compared to the current 250.

Yet total production stays flat or grows slightly. Survivors expand through acquisition—Farm Credit Services data suggests that discounts of 30-50% to replacement cost are common in many deals.

Cornell’s Dairy Farm Business Summary, combined with premium market data, identifies four survivor categories:

  • Large operations with 18% scale advantages
  • Premium producers capturing 30-60% price premiums
  • Component optimizers generating $3-5/cwt advantages
  • Strong balance sheets weathering losses through equity

California and Idaho show the preview. Wisconsin specialty cheese producers might find niches. Mid-size commodity operations in traditional dairy states? That’s the tough spot.

Your 30-Day Decision Framework

Financial advisors from Vita Plus and similar firms emphasize the importance of immediate assessment. Calculate your true breakeven—the price that, sustained 18 months, forces exit. For most, it’s $13-15/cwt.

Then, honestly assess the probability of extended pricing below that threshold. With consumer confidence at 55 points, restaurant traffic down seven months, $10 billion in new capacity, and China imports at 15-year lows… I’d say 50-60% probability. Maybe higher.

If your survival timeline looks shorter than the probable downturn duration, you’ve got three choices:

Managed adaptation: Lock in risk management, optimize components, and develop alternatives. Buys 18-24 months based on what I’m seeing.

Strategic transition: Exit with equity intact rather than bleeding out slowly. Several producers near retirement have chosen this path after running the numbers.

Expansion commitment: Well-capitalized operations near efficient scale might find acquisition opportunities. Some Wisconsin groups are already positioning for 2026 distressed sales.

The Hard Truth Nobody Wants to Say

The dairy industry will emerge stronger and more efficient, with fewer but larger operations producing the same amount of milk. That’s economic reality.

But that macro view doesn’t help individual farms facing immediate decisions. As one producer put it recently: “Three generations built this, but forcing a fourth generation into an unsustainable structure? That’s not preserving a legacy—it’s prolonging an inevitable outcome.”

A veteran dairyman shared something that stuck with me: “Being right about eventual recovery means nothing if you don’t survive to see it.”

Tomorrow’s milking happens regardless. Whether it’s part of strategic progress or gradual decline depends on the decisions made now, while options are still available.

What strikes me most is how fast things can change. Processors announce consolidations overnight. Equity built over decades evaporates in 18 months of $14 milk. Today’s heifer decisions affect 2028’s production capacity.

This isn’t pessimism—it’s pattern recognition. The forces reshaping dairy won’t adjust to individual situations. Consumer behavior, as documented by Michigan and the Conference Board, processing overcapacity confirmed by CoBank, and biological constraints verified by the USDA… these aren’t going away.

However, these same forces also create opportunities for those who anticipate them. Farms bought during the 2015 downturn at 40% discounts now generate returns that were previously impossible.

Whether your opportunity involves adaptation, consolidation, or transition depends on honest assessment and timely action. The traditional playbook won’t work here. But understanding why—and adjusting accordingly—that’s the difference between thriving through transformation and becoming another statistic.

Make your choice with eyes wide open. Whatever you decide, make it with an understanding of the forces at play and the time you have left to act.

KEY TAKEAWAYS:

  • Risk management math has changed: Locking in 60-70% of production at $17-18/cwt isn’t conservative—it’s survival insurance. For a 500-cow dairy, the difference between $5/cwt losses fully exposed versus $3/cwt protected equals roughly $200,000 annually, often determining whether you meet obligations or face insolvency.
  • Component optimization delivers immediate returns: Genomic testing to identify top performers, breeding bottom 30% to beef, and optimizing rations can generate $33,000 additional revenue for a 100-cow operation—that’s $20,000 from beef-cross premiums plus $13,000 from 0.2% butterfat improvement based on October auction reports and current component pricing.
  • Your true breakeven determines everything: Calculate the milk price that, sustained for 18 months, forces exit (typically $13-15/cwt for most operations). With current indicators suggesting a 50-60% probability of extended pricing below that threshold, survival timelines shorter than probable downturn duration require immediate strategic action.
  • Four survivor profiles are expected to emerge by 2028: large operations with 18% scale advantages, premium producers capturing 30-60% price premiums, component optimizers generating $3-5/cwt advantages, and strong balance sheet operations weathering losses through equity. Mid—size commodity producers without differentiation face the toughest transition.
  • Processing overcapacity creates permanent pressure: With facilities like Leprino’s Lubbock plant facing $60 million annual interest on $870 million investment, these operations must run at 95%+ capacity regardless of market conditions, fundamentally altering traditional supply-demand dynamics through 2027 and beyond.

Complete references and supporting documentation are available upon request by contacting the editorial team at editor@thebullvine.com.

Learn More:

The Sunday Read Dairy Professionals Don’t Skip.

Every week, thousands of producers, breeders, and industry insiders open Bullvine Weekly for genetics insights, market shifts, and profit strategies they won’t find anywhere else. One email. Five minutes. Smarter decisions all week.
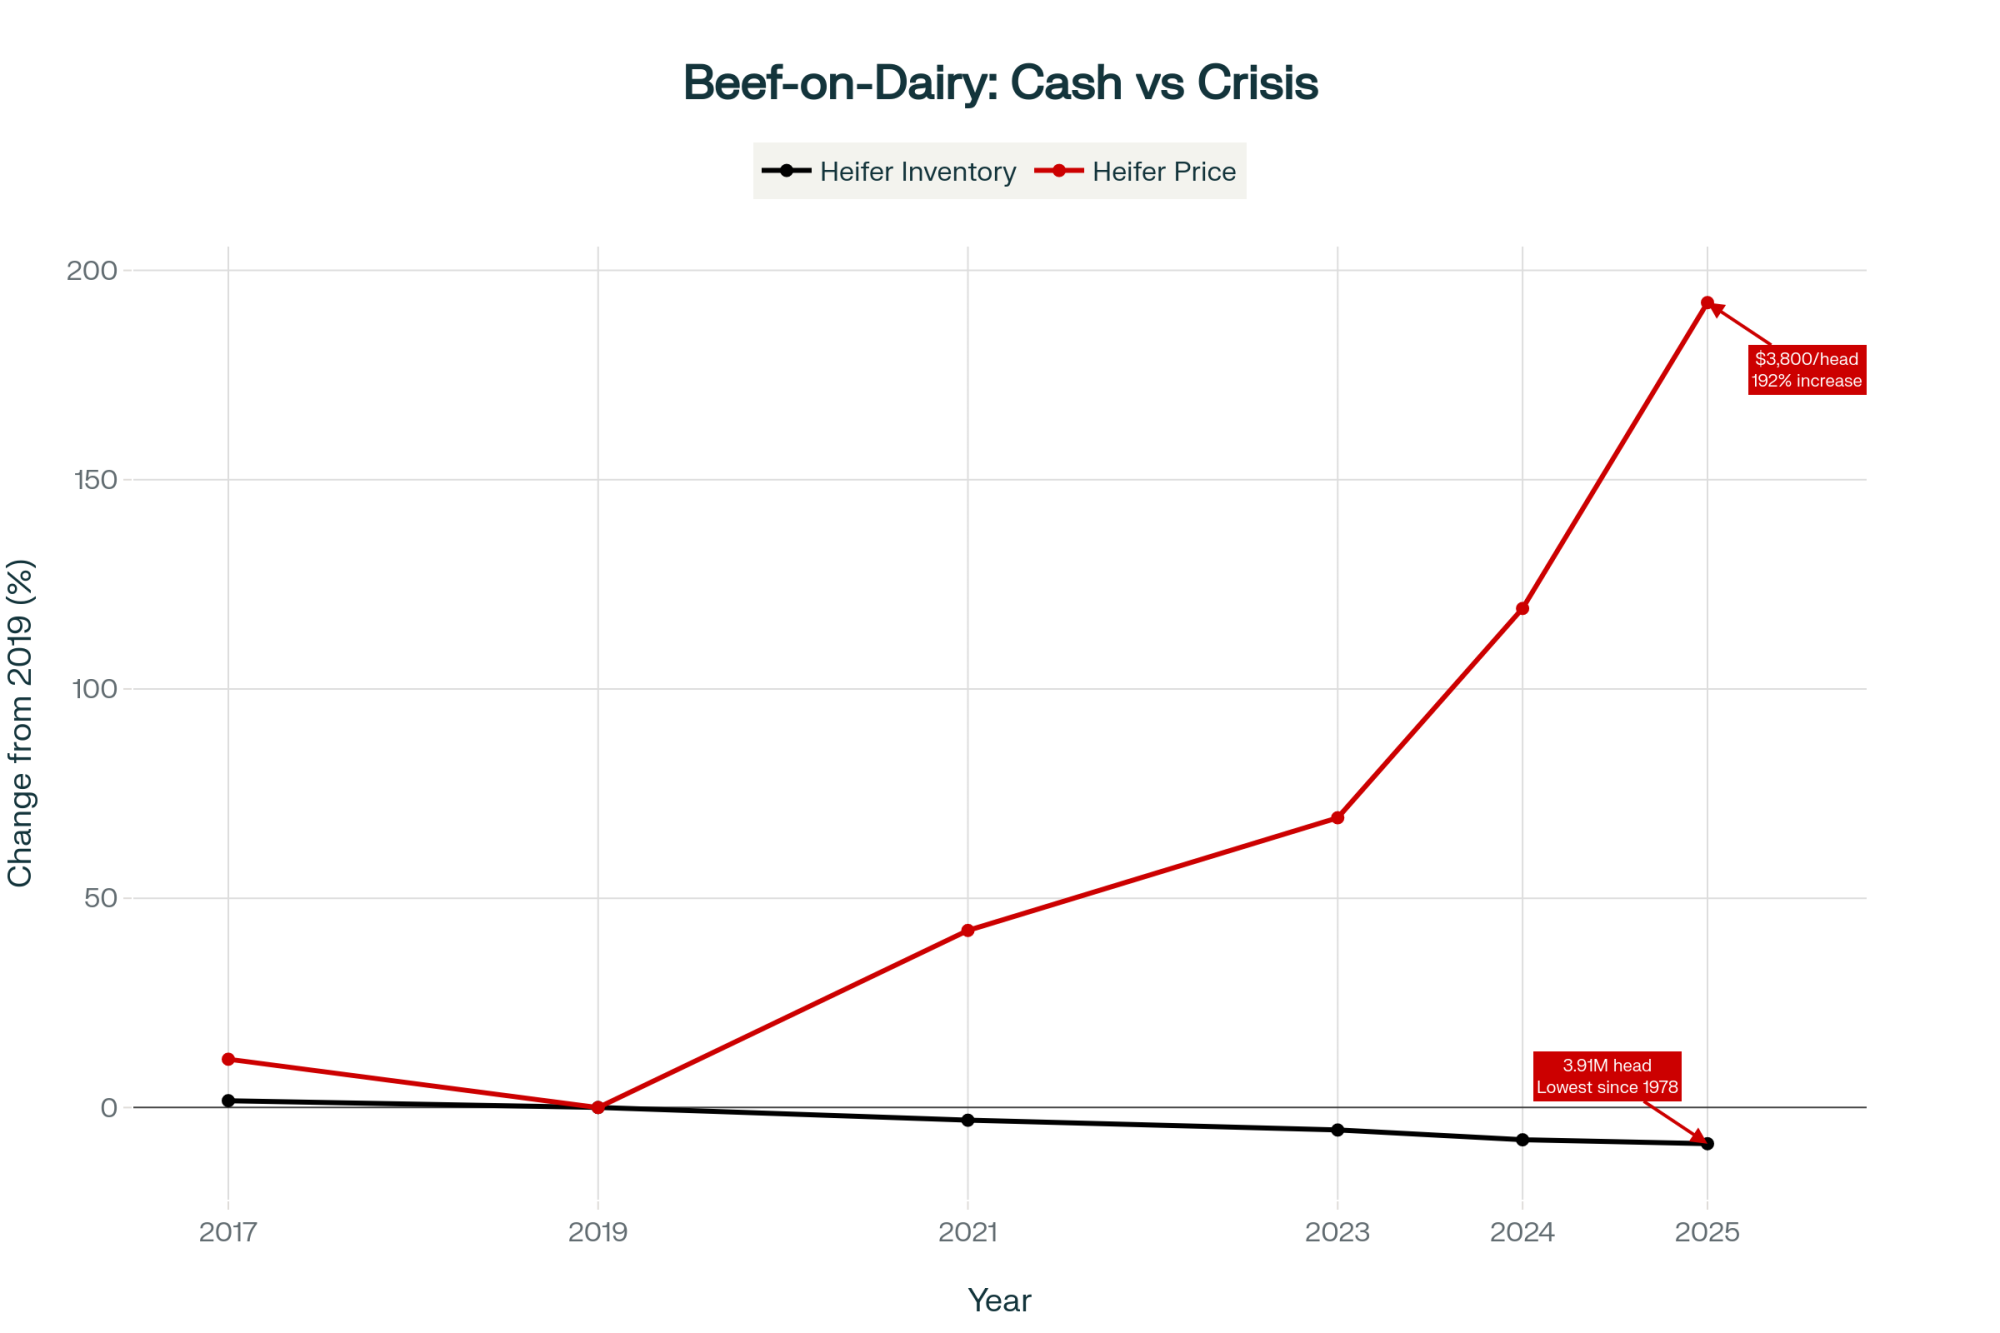
NewsSubscribe
First
Last
Consent

Same Cows, $15,000 Monthly Gap: Your Class III-IV Decision Window Closes Spring 2026

Your genetics are perfect for 2015’s market—but it’s 2025, and processors want different components

EXECUTIVE SUMMARY: What farmers are discovering across the country is that today’s unprecedented $2.47 per hundredweight spread between Class III and Class IV milk prices isn’t just another market cycle—it’s a structural shift that demands strategic action before spring 2026. The numbers tell a sobering story: a typical 500-cow dairy locked into Class IV pricing faces a $15,000 monthly disadvantage compared to neighbors shipping to cheese plants, according to October’s USDA pricing data and analysis from the University of Wisconsin’s dairy markets program. This spread, the widest we’ve sustained since 2011, stems from three converging factors that aren’t going away: our herds now average mid-four percent butterfat when processors desperately need protein, China’s dairy imports have declined significantly as they’ve built domestic capacity equivalent to Wisconsin’s entire annual production, and billions invested in cheese plants can’t process the butterfat surplus we’re creating. Research from Cornell’s dairy program and the Center for Farm Financial Management shows operations successfully navigating this transition fall into three clear paths—strategic expansion for those near cheese plants with strong succession plans, smart adaptation through component management and risk tools for those with moderate leverage, or planned exits that preserve 85-95% of asset value versus the 50-65% retained in forced sales. The window for action is narrowing, with historical consolidation patterns suggesting the best opportunities for expansion and the most favorable exit terms will close by spring 2026. Here’s what’s encouraging: producers who honestly assess their situation using clear decision frameworks and act decisively—regardless of which path they choose—consistently achieve better outcomes than those waiting for conditions to improve.

What farmers are discovering about today’s unprecedented Class III-IV differential—and how the smartest operations are turning crisis into opportunity while others prepare strategic exits

Tim Anderson was checking tank weights at 4:45 a.m. in his South Dakota parlor when the October milk statement arrived on his phone. The Federal Order changes that took effect in June had dropped his mailbox price again—another reminder that the reforms we’d hoped would help actually made things more challenging for many of us, particularly those shipping Class IV milk.

What struck me about Tim’s situation was this: while he was preparing to expand by acquiring a neighbor’s operation, a California producer I’d met at the Holstein convention was making equally prudent plans to exit the industry entirely. Same market conditions. Same unprecedented pricing spread between Class III and Class IV milk. Yet both were making the right decision for their particular circumstances.

TL;DR – THE 30-SECOND VERSION

  • The Crisis: $2.47/cwt Class III-IV spread—widest since 2011
  • The Impact: $15,000 monthly loss for 500-cow Class IV operations
  • The Choice: Expand, adapt, or exit by spring 2026

BY THE NUMBERS: KEY FACTS AT A GLANCE

  • $2.47/cwt – Current Class III-IV spread (October 2025)
  • 32,000 → 23,000 – Projected U.S. dairy farms by 2027
  • $15,000/month – Income gap for 500-cow Class IV operations
  • 85-95% – Asset value retained in planned exits vs. 50-65% in forced sales
  • 14 months – Average technology payback period for smart investments

QUICK ACTION GUIDE: YOUR 90-DAY ROADMAP

Your SituationYour PathFirst Step This Week
✅ Under 45, near cheese plants, succession securedEXPANDCall the banker for acquisition credit
⚖️ Moderate debt, some flexibility, 5-10 year horizonADAPTSchedule a component optimization consult
🔄 No succession, burning equity, geographic disadvantagesTRANSITIONGet a professional valuation

Resources to get started:

  • LGM-Dairy information: Your local FSA office or check the RMA website
  • Component optimization: Talk to your nutritionist or extension dairy specialist
  • Market analysis: University of Wisconsin’s Understanding Dairy Markets program
  • Exit planning: The Center for Farm Financial Management has excellent resources

Understanding Today’s Market—It’s Different This Time

So you’ve probably noticed your milk check acting strange lately. If you’re fortunate enough to ship Class III milk for cheese production, October’s USDA pricing announcement puts you around seventeen dollars per hundredweight. But what about milk that goes to butter and powder production? You’re looking at about $14.50.

The unprecedented Class III-IV milk price spread hit $2.47/cwt in October 2025—the widest sustained gap since 2011, costing Class IV operations $15,000 monthly versus cheese plants. 

Now, here’s what’s interesting—this differential of roughly two dollars and forty-seven cents is something we haven’t seen sustained at this level since 2011. The folks at the University of Wisconsin’s dairy markets program have been tracking this, and historically, we’ve seen spreads average well below a dollar per hundredweight. When it gets this wide, it fundamentally changes the economics of dairy farming depending on what your milk is used for.

Why This Spread Hits Different

You know, I was reviewing the numbers last week, and for a typical 500-cow dairy, being locked into Class IV pricing versus Class III means you’re looking at roughly $15,000 less income every month. That’s real money—the difference between breaking even and burning equity.

Mark Stephenson, who runs UW-Madison’s dairy policy analysis program, made a point recently that really resonated with me. He’s saying this looks more like a structural market shift than the typical cycles we’re used to riding out. And I think he’s right.

What’s also worth noting is the international perspective here. A New Zealand producer I connected with online mentioned they’re dealing with similar component imbalances, though their cooperative structure handles it differently. Sometimes, examining how other countries address these challenges provides us with fresh insights.

The Component Balance Nobody Planned For

The dairy industry has made significant progress in genetic advancements over the past twenty years. Council on Dairy Cattle Breeding data shows most herds now average in the mid-four percent range for butterfat, while protein levels sit in the low threes. That’s remarkable progress, really.

But here’s the thing—I was at a Wisconsin Center for Dairy Research meeting last month, and John Lucey made this observation that stuck with me. He said we essentially optimized our genetics for a market that existed when China was buying everything we could produce. Those breeding decisions made sense at the time, but now…

A Wisconsin producer told me last week, “My DHI reports look fantastic—4.4% butterfat, 3.2% protein. Ten years ago, I’d be thrilled. Now my processor is penalizing me for excess butterfat.” And that’s the reality many of us are dealing with. Even if we completely changed our breeding strategy today—focused entirely on protein—we’re looking at five to seven years before those genetics fully express themselves in the milking herd.

The Export Picture Has Changed

What’s happened with exports is particularly sobering. USDA’s Foreign Agricultural Service has been tracking China’s dairy imports, and they’ve declined significantly from where they were just a few years back. The Chinese have made massive investments in domestic production—it’s a food security thing for them, and honestly, you can understand why.

I was speaking with a dairy economist from Cornell last month, who shared something that really puts this into perspective: China added more milk production capacity between 2020 and 2024 than Wisconsin produces in an entire year. That’s not a temporary blip—that’s a fundamental change in global dairy markets.

And Mexico—our biggest export market, taking about 30% of what we send overseas—they’re implementing their own expansion plans. The U.S. Dairy Export Council has been monitoring this closely, and it appears that our exports to this market could decline significantly over the next few years.

Down in the Southeast, producers are feeling this too. A Georgia dairyman I know said, “We used to count on steady growth in powder exports through Savannah. Now we’re planning for flat to declining volumes.”

Peter Vitaliano at National Milk made a point that I think deserves serious consideration. These aren’t the kind of temporary trade disputes that get resolved when administrations change. These are countries making long-term strategic decisions about food security.

Processing Capacity in the Wrong Places

Since 2020, the dairy industry has invested billions in new processing capacity—CoBank’s been documenting this, and it’s impressive. The problem is that we have a mismatch. Most of the investment went into cheese plants, but we’re producing more butterfat than those plants know what to do with.

A processing engineer explained it to me this way: “Converting a cheese plant to butter production would be like trying to turn a Toyota factory into a bakery. Everything about the process is different—the equipment, the workflows, everything.”

Making Sense of Your Options: A Framework

Through conversations with producers across the Midwest and lenders from various institutions, I’ve noticed successful operations tend to evaluate these factors honestly:

Eight Questions That Matter

What to ConsiderGood PositionChallenging Position
Cash FlowBreaking even or betterBurning over $40K monthly
SuccessionKids are committedNo clear plan
Your EnergyReady for big changesExhausted thinking about it
LocationNear cheese plantsStuck with Class IV
Debt LevelUnder 45% debt-to-assetOver 60% debt-to-asset
Your AgeUnder 45Over 58
Other OptionsDairy’s your best betBetter opportunities exist
Staying PowerCan handle 24 monthsLess than 12 months of runway

You know, if you’re scoring well on six or more of these, you might want to think about expansion or really pushing adaptation. If you’re only hitting a couple? Well, that’s a different conversation entirely.

There’s another factor worth considering—cooperative strategies. I’ve been hearing about groups of smaller producers pooling resources for shared technology investments or negotiating power. It’s not for everyone, but it’s an option some are exploring.

The Opportunities Hidden in This Market

Cornell’s dairy program has documented how consolidations like this historically create opportunities for those positioned to capture them. And we’re seeing that play out right now.

What’s Available If You’re Looking

The auction tracking services—Machinery Pete, Ritchie Brothers—they’re reporting some interesting numbers:

  • Complete dairy operations going for $1,200-1,500 per cow (replacement cost is easily double that)
  • Used equipment at 40-60% of new prices
  • Dairy-suitable land down 20-30% from recent peaks

I talked with a South Dakota producer last week who just acquired a 400-cow operation for $1,350 per cow. “Five years ago,” he said, “this would’ve cost me three grand per cow minimum. The math is completely different at these prices.”

However, and this is crucial, you must plan the integration carefully. Another producer I know rushed an acquisition and told me, “I got a great price on the cows, but I totally underestimated integration costs. It took 18 months before we saw positive cash flow from that expansion.”

How Processor Relationships Are Changing

As neighbors exit and milk supplies tighten in certain regions, the producers who remain are finding themselves in a different negotiating position. I’ve been hearing about some interesting deals in Wisconsin and Minnesota:

  • Protein premiums running $0.35-0.40/cwt
  • Volume commitment bonuses of $0.25-0.30/cwt
  • Quality bonuses for low somatic cells hitting $0.20-0.25/cwt

Add it all up, and some operations are getting close to a dollar per hundredweight above base prices. That’s significant money.

A procurement manager explained the processor’s perspective to me: “We’d rather pay premiums to secure a reliable supply than risk running our plant at 70% capacity. Empty vats don’t pay bills.”

The Economics of Exit—Let’s Be Honest About This

How You ExitWhat You KeepTimeline500-Cow Example
🟢 Planned Exit85-95% of valueYou control it$5.5M → $4.7-5.2M
🔴 Forced Sale50-65% of valueBank controls it$5.5M → $2.8-3.6M
🟡 Alternative UseSometimes, more than dairy value18-24 monthsVaries widely

These numbers come from the Center for Farm Financial Management’s analysis of recent dairy exits

When Getting Out Makes Sense

This is a difficult topic to discuss, but for some operations, planning an orderly exit can be the smartest business decision. I recently worked with a Pennsylvania producer who put it this way: “It wasn’t about giving up. It was recognizing I could preserve $3 million in equity by exiting now versus maybe $1 million if I waited until the bank forced it.”

Different Regions, Different Opportunities

In California’s Central Valley, water costs have reached $400-500 per acre-foot, according to the state’s water resources data. Combined with being locked into Class IV pricing, the math becomes challenging. Several producers I know are finding better returns with solar leases at $1,200-$ 1,500 per acre annually, or converting to almond production.

One California producer told me straight up: “Between water costs, regulations, and Class IV pricing, I’m basically paying for the privilege of milking cows. That’s not a business—that’s an expensive hobby.”

In the Northeast—specifically, Vermont, New York, and Pennsylvania—fluid premiums that used to be $0.35 are now under a dollar, according to Federal Order One data. But here’s the thing: development pressure means land values remain strong. A Vermont producer recently sold 200 acres for development at $18,000 per acre. “The irony,” he said, “is that the same development pressure that makes farming difficult also creates our exit opportunity.”

The Upper Midwest generally has more flexibility, though distance from cheese plants matters more than ever. Every ten miles from processing adds about ten cents per hundredweight in hauling costs. Beyond fifty miles? That becomes a real structural disadvantage.

Down South, the situation varies widely. A Tennessee producer shared, “We’re seeing opportunities in agritourism and direct sales that didn’t exist five years ago. Some of my neighbors are making more from farm tours than milk sales.”

There is a growing trend in North Carolina and Virginia, where producers are converting to grass-fed operations for premium markets. It’s not easy, but for some, it’s working.

Adaptation Strategies That Are Actually Working

For most of us—those neither expanding nor exiting—we need to make some significant adjustments. Here’s what I’m seeing work:

Getting Components Right

Mike Hutjens, the Illinois nutritionist many of you are likely familiar with, has been working with farms on this. In recent trials he supervised, producers saw:

  • Protein boost of about 0.18% at twenty cents per cow daily
  • Some fat reduction that actually saved money
  • Net improvement of thirty to forty-five cents per hundredweight

“We’re not trying to eliminate butterfat,” Mike explains. “The genetics won’t let us. We’re optimizing the ratio to match what processors want.”

Risk Management That Makes Sense

I talked with a Wisconsin producer running 500 cows who shared his approach: “I cover 60% with LGM-Dairy—costs about forty cents per hundredweight after subsidies. Another 25% with Class III puts. Leave 15% open for upside. Total cost? About five grand monthly. But it guarantees I can pay bills regardless of what the market does.”

What’s changed is how lenders view this. “It used to be seen as speculation,” a Minnesota producer told me. “Now my banker basically requires it.”

Technology Investments That Pay

Not every technology makes sense, but some really do. A Minnesota dairy with 600 cows shared their results with activity monitors:

  • Spent $38,000 on the system
  • Pregnancy rate went from 18% to 24%
  • Health treatment costs dropped $18 per cow annually
  • Saved an hour and a half daily on heat detection
  • Paid back in 14 months

“The key,” the owner said, “is choosing technology that solves a specific problem, not just buying the latest gadget.”

I’ve also seen good returns from robotic milking in certain situations. An Ohio producer with 180 cows installed robots last year: “It’s not just labor savings—our components improved, SCC dropped, and my knees don’t hurt anymore.”

However, there’s another aspect to consider—data management systems. A Michigan producer running 800 cows told me their investment in comprehensive herd management software paid back in eight months through better breeding decisions and health interventions alone.

How Federal Order Reform Actually Played Out

So the changes that took effect June 1st… they didn’t go quite as we’d hoped. USDA’s November announcement increased make allowances—what processors deduct for manufacturing costs—pretty substantially:

ProductOld RateNew RateImpact on Your Milk Check
Cheese$0.20/lb$0.25/lbDown about $0.52/cwt
Butter$0.17/lb$0.23/lbDown about $0.56/cwt
Powder$0.17/lb$0.24/lbDown about $0.72/cwt

The net effect? Most of us are down eighty-six to ninety-one cents per hundredweight through November. Component improvements are scheduled for December 1st, which should help—USDA estimates about fifty cents—but we’re still in the hole.

As Marin Bozic at the University of Minnesota put it, “Federal Order reform addressed how we calculate prices, but it can’t fix the fundamental supply-demand imbalance. We’re producing components the market doesn’t want at current levels.”

Looking Ahead—What This Industry Becomes

Based on what we’re seeing now and historical patterns from USDA’s Economic Research Service, if current trends continue—and that’s a big if—by 2027, we might see:

  • Total operations dropping to maybe 23,000-24,000 from today’s 32,000
  • Average herd size passing 500 cows nationally
  • The biggest 2,000 operations controlling half of all production
  • Smaller operations under 200 cows are becoming increasingly specialized or exiting

The growth appears to be occurring in areas such as South Dakota (three new cheese plants), Idaho (water and infrastructure), and the Texas Panhandle (feed availability and new processing facilities). Meanwhile, California, the Northeast, and remote areas of the Midwest are experiencing contraction.

What’s particularly interesting is how quickly certain things are becoming standard. A processor quality manager told me: “Five years ago, maybe 20% of our producers actively managed components. Now it’s 75% and growing. If you’re not adapting, you’re at a serious disadvantage.”

Looking internationally, the EU is facing similar consolidation pressures, although its subsidy structure creates different dynamics. Sometimes I think we focus so much on our own challenges that we miss that this is a global phenomenon.

Your Three Paths Forward

After looking at how different operations are navigating this, three strategies keep emerging:

Path 1: Strategic Expansion

If you’re under 45, near cheese plants, with succession secured

Your next 90 days:

  1. Weeks 1-2: Set up that acquisition credit line
  2. Weeks 3-4: Identify who might sell
  3. Month 2: Approach them privately
  4. Month 3: Do your homework thoroughly

A South Dakota producer who just expanded told me, “The cheap part was buying the cows. The expensive part was integrating them properly. Budget twice the time and money you think you’ll need.”

Path 2: Smart Adaptation

If you’ve got moderate debt, some flexibility, and 5-10 years left

Focus on these priorities:

  • Get your nutritionist working on components immediately
  • Set up LGM-Dairy coverage (seriously, do this)
  • Talk to your processor about premium programs
  • Only buy technology with a clear payback under 18 months

“The mistake I see,” a Wisconsin banker told me, “is producers trying to change everything at once. Pick two or three high-impact changes and execute them well.”

Path 3: Strategic Exit

If there’s no succession, you’re burning equity, or better opportunities exist

Protect what you’ve built:

  • Get a professional valuation now
  • Talk to your accountant about tax optimization
  • Explore all options—whole farm, parcels, alternative uses
  • Most importantly: control your timeline

A Pennsylvania dairyman who recently retired reflected: “I spent 40 years building this operation. Taking 18 months to exit properly preserved 40% more value than if I’d waited until the bank forced it.”

The Window Is Closing

Considering market dynamics and historical patterns, the window for capturing opportunities or avoiding worse outcomes likely extends through spring 2026. After that, options start getting limited.

What I’ve noticed is that producers who honestly assess their situation and act decisively—regardless of which path they choose—consistently outperform those who wait for conditions to improve.

As I finish writing this, I’m thinking about Tim Anderson in South Dakota, probably heading out for evening milking. And that California producer, maybe reviewing exit strategies with his accountant. Both are facing this with eyes wide open. Both are making the right call for their situation.

The dairy industry will get through this transition—it always does. The question is whether your operation will be part of what comes next, and if so, in what form.

Take the Next Step

The conversations I’ve had while researching this article convinced me of one thing: having a clear framework for decision-making is essential right now. That’s why we’ve been working on resources to help producers evaluate their situations objectively.

Here’s what can help:

  • Connect with other producers facing similar decisions through The Bullvine’s online forums
  • Access our collection of planning worksheets and calculators
  • Read detailed regional market analyses updated weekly
  • Join our monthly video discussions with industry experts

Have specific questions about your operation? Send them to us—we’re featuring reader questions in upcoming articles, and your situation might help others facing similar decisions.

Because in today’s dairy industry, none of us should have to figure this out alone.

KEY TAKEAWAYS

  • The $180,000 annual impact is real and measurable: Operations shipping Class IV milk to butter/powder plants face a $2.47/cwt disadvantage that translates to $15,000 monthly losses for a 500-cow dairy—money that determines whether you’re building equity or burning through it while neighbors with identical herds but different processors thrive.
  • Three proven paths emerged from producer experiences: Expand strategically if you’re under 45 with cheese plant access and can acquire operations at current valuations of $1,200-1,500 per cow (half of replacement cost), adapt through component optimization that delivers $0.30-0.45/cwt improvements and LGM-Dairy coverage costing $0.40/cwt after subsidies, or exit strategically while controlling timing to preserve 85-95% of asset value.
  • Component management pays immediate dividends: Wisconsin and Minnesota producers working with nutritionists report achieving 0.18% protein increases at $0.20/cow daily cost while reducing expensive butterfat supplements, netting $0.30-0.45/cwt improvements—that’s $36-54 more per cow monthly without genetic changes that take five to seven years.
  • Geography increasingly determines destiny: Every 10 miles from cheese processing adds $0.10/cwt in hauling costs, California’s Central Valley producers face $400-500/acre-foot water costs plus Class IV lock-in, while Northeast operations see fluid premiums drop from $3.50 to under $1.00/cwt—but development opportunities offer $15,000-25,000/acre exits.
  • Technology investments with 14-18 month paybacks make sense now: Activity monitoring systems ($38,000 for 600 cows) boost pregnancy rates from 18% to 24% while cutting health costs $18/cow annually, and smart producers focus on solving specific problems—heat detection, health intervention, component optimization—not buying the latest gadgets.

Complete references and supporting documentation are available upon request by contacting the editorial team at editor@thebullvine.com.

Learn More:

The Sunday Read Dairy Professionals Don’t Skip.

Every week, thousands of producers, breeders, and industry insiders open Bullvine Weekly for genetics insights, market shifts, and profit strategies they won’t find anywhere else. One email. Five minutes. Smarter decisions all week.

NewsSubscribe
First
Last
Consent

Why This $0.01 Ingredient Costs You $2.00: The Midland Farms Wake-Up Call

Half-cent DHA costs processors $0.01, but you pay $2 extra. Midland Farms just proved why that math no longer works.

EXECUTIVE SUMMARY: What farmers are discovering through the Midland Farms case is that functional milk pricing has been more about market positioning than production necessity. This 23-year-old family processor in upstate New York has just proven that they can deliver Cornell award-winning omega-3 fortified milk at conventional prices while maintaining profitability—something that challenges everything we’ve assumed about dairy economics. Recent Bureau of Labor Statistics data and industry cost analyses reveal that paid-off facilities enjoy advantages of 40 to 80 cents per hundredweight over newer operations, which explains how processors like Midland can fortify milk for half a penny per half-gallon, while others charge consumers premiums of $1.50 to $2.00. Extension specialists across Wisconsin, California, and other major dairy-producing states report that processors are quietly evaluating similar accessible-pricing strategies, with regional pilots likely to emerge by spring 2026. Here’s what this means for your operation: the 18- to 24-month window before major retailers launch functional private label at conventional prices represents both opportunity and urgency—opportunity if you’re positioned with the right processor relationships, and urgency if you’re still relying on premium pricing for basic fortification. The trajectory seems clear, but farmers who recognize these dynamics early and adapt their strategies—whether through volume optimization, true differentiation, or cooperative models—will maintain options while others scramble to adjust.

dairy profit margins

A family-owned processor in upstate New York just proved that omega-3 fortified milk can win quality awards AND sell at conventional prices—what this means for operations like yours

You know how sometimes a single piece of news makes you rethink everything you thought you understood about your market? That’s what happened to me when I heard about Midland Farms taking home Silver at this year’s New York State Dairy Products Contest.

I’ve been tracking dairy economics for over two decades, observing how processors price functional products and how these decisions impact farm-level decisions. But this Midland story? It challenges assumptions I’ve held for years about the relationship between product innovation and pricing.

Here’s what’s got everyone talking: Their Thr5ve milk—fortified with marine-sourced DHA omega-3s, enhanced vitamins A and D, plus improved mouthfeel from skim powder—is selling at the exact same price as regular milk. Not a penny more. On the same shelf, with the same price tag, but offering all those functional benefits, we’ve been told to command premium pricing.

Hugo Andrade, who runs operations at Midland, credits their “excellent milk supply, great farmers and co-ops” for making this work. And you know, that relationship between processor and producer definitely matters. However, what I’ve been learning from extension specialists and economists across the country suggests that there’s something bigger happening here—something about how the economics of processing might be shifting beneath our feet.

The Processing Side of the Story

So here’s what’s interesting about processor economics—and I know this isn’t the usual coffee shop conversation, but bear with me because it affects all of us. Midland’s been running that facility since 2002. Twenty-three years. Their equipment’s paid for, they’re not servicing massive debt, and they don’t have investors demanding quarterly growth.

Compare that to what we’re seeing with the mega-facilities going up. Hundreds of millions in investment. All that capital has to get paid back somehow, right? And we all know who ultimately ends up covering those costs.

The Cost Structure Reality

Facility Depreciation Impact on Processing Costs:

Facility AgeDepreciation as % of Total CostsCost per Hundredweight
New Facility (0-5 years)15-25%$2.40-$4.00
Mid-Age Facility (10-15 years)8-12%$1.28-$1.92
Paid-Off Facility (20+ years)3-5%$0.48-$0.80

Based on industry cost analyses and extension program data

That difference—we’re talking 40 to 80 cents per hundredweight—that’s real money when you’re competing on price.

Labor’s another piece of this puzzle. Bureau of Labor Statistics data from May 2024 show that food manufacturing workers in the Albany-Schenectady-Troy metropolitan area earn median wages of around $19 to $21 per hour. Now, if you’re running a facility near a bigger city, or you’ve got union contracts, those numbers jump considerably. Could be another 30 to 80 cents per hundredweight difference right there.

But here’s the part that really made me think…

The Real Cost of DHA Fortification

Breaking down the premium myth:

  • Actual DHA cost per half-gallon: $0.005 – $0.015
  • Typical retail premium charged: $1.50 – $2.00
  • Markup: 100-400x the ingredient cost

Based on standard fortification levels—those 32 to 50 milligrams of DHA per serving—and wholesale ingredient pricing when buying in bulk, the actual cost to fortify comes out to roughly half a penny to maybe a penny and a half per half-gallon.

Half a penny to a penny and a half. Yet walk into any store and that omega-3 milk costs an extra buck-fifty, sometimes two bucks more. Makes you wonder, doesn’t it?

Why That Cornell Award Matters

What’s particularly noteworthy about Midland winning that Silver is how Cornell runs these competitions. The judges don’t know if they’re tasting a premium brand or a store label. It’s all blind evaluation—they’re running polymerase chain reaction tests for bacterial counts, using trained sensory panels, measuring shelf stability with accelerated aging protocols.

They’re examining the butterfat consistency to the hundredth of a percentage point, evaluating mouthfeel, and testing for off-flavors. Real science, not marketing.

“Quality is quality. The testing doesn’t care about your marketing budget or price point. It measures what’s actually in the bottle.”
— Dairy science professor involved in Cornell competitions

So when a family processor makes private-label brands—Midland does Derle Farms, Cherry Valley, Farm Fresh, several others—when they prove their fortified milk matches or beats products charging twice the price… well, that tells you quality isn’t necessarily tied to price point the way we’ve been led to believe.

The Ingredient Supply Question

Now, you might be thinking what I initially thought—sure, one processor can do this, but if everyone starts fortifying with DHA, won’t the ingredient market go crazy?

Here’s what’s interesting about that. Current estimates put global algal DHA production capacity somewhere between 25,000 and 35,000 metric tons annually. That’s based on the disclosed capacities from major producers—DSM has its Veramaris operation, which it established in collaboration with Evonik in 2019, as well as Lonza, Cellana, and others.

DHA Supply vs. Dairy Demand

The scale perspective:

  • Global DHA production capacity: 25,000-35,000 metric tons/year
  • U.S. fluid milk DHA requirement (if all fortified): 1.5-2.0 metric tons/year
  • Percentage of global capacity needed: <0.01%

For context: Infant formula accounts for approximately half of global algal DHA production

Let me put this in perspective. If we fortified all the fluid milk sold through major U.S. retail channels—using those standard fortification levels—we’d need approximately 1.5 to 2.0 metric tons of pure DHA annually. That’s less than 0.01 percent of global capacity.

And pricing varies significantly with volume. Small purchasers pay substantially more per kilogram than industrial buyers who negotiate annual contracts. We’re talking prices that can drop by half or more when you move from small-batch to industrial-scale purchasing. Additionally, the fermentation technology continues to improve, driving down production costs year over year.

What Other States Are Doing

The extension folks I talk with in Wisconsin and California are watching this Midland situation pretty closely. Wisconsin has increased funding for its Dairy Processor Grant Program. Since 2014, they’ve funded 135 projects, and the Center for Dairy Research at Madison reports that they’re receiving more questions about functional milk formulation than they’ve seen in years.

Out in California, it’s a slightly different angle. Some Central Valley operations I’ve visited recently are exploring what they call “climate-smart nutrition”—tying functional benefits to sustainability messaging. Between the technical support from UC Davis and modernization grants through the Cal State system, they’ve got the infrastructure to experiment.

Of course, this plays differently in the Southeast, where co-op structures vary, or in Mountain states where processor density is lower, but the fundamental dynamics remain pretty consistent. Even in Texas, where rapid growth in dairy has created different relationships between processors and producers, the same questions are being asked. In Florida, where heat stress challenges are unique, processors are exploring functional products as a means to differentiate themselves in a competitive market.

What strikes me is how many processors are quietly running the numbers right now. Not all of them will move forward—some lack operational flexibility, while others are constrained by capital—but the conversations are happening. And that’s new.

What This Means for Your Operation

Let’s get practical here, because that’s what matters. Whether you’re milking 50 cows or 500, this shift is going to affect your milk marketing decisions.

If you’re currently shipping to a processor making premium functional products, it might be time for some frank conversations. The economics we’re seeing—based on what Clayton Christensen documented in his research on disruption—suggest that if processors can deliver quality, functional milk at conventional prices while maintaining margins, then perhaps those claims about needing premium milk but not being able to pay premium prices deserve another look.

Extension specialists report that component premiums in major dairy states commonly range from 40 to 85 cents per hundredweight—varying with butterfat levels, protein content, and somatic cell counts. These aren’t charity payments. They’re processors recognizing they need exceptional raw materials to compete.

Recent analyses from agricultural lenders, as documented in their quarterly reports, consistently show that success concentrates at either end—either cost-efficient commodity production or genuinely differentiated, premium products. The middle ground, where you’re sort of premium at sort of premium prices, is getting squeezed out.

Key Questions to Ask Your Processor

  • What’s the age of your processing facility and debt structure?
  • Are you planning any functional product launches in the next 18 months?
  • How do you calculate component premiums, and will those change?
  • What’s your strategy if major retailers launch a functional private label?

You have a strategic decision coming up. Either optimize for volume—maximizing components, keeping those somatic cell counts low, delivering consistent quality day in and day out—or pursue genuine differentiation through organic, grass-fed, regenerative practices that command real premiums.

The Timeline We’re Looking At

Based on how disruption typically plays out in food categories—Clayton Christensen’s work extensively documented this pattern, and we saw it with Greek yogurt capturing over one-third of the yogurt category within five years—here’s what I think we might see.

The Disruption Timeline

Phase 1 (Now – Spring 2026): Regional pilots in Wisconsin, California

  • Consumer testing of accessible-price functional milk
  • Industry dismisses as “regional quirk”

Phase 2 (Summer-Fall 2026): Regional retailer adoption

  • Wegmans, Meijer, and H-E-B evaluate category opportunity
  • Sales data shows 3-5x velocity vs. premium brands

Phase 3 (Late 2026 – Early 2027): National rollout discussions

  • Major chains commit to functional private label
  • Category of economics shift fundamentally

Historical precedent: Greek yogurt captured over one-third of the yogurt category within five years of mainstream adoption

By late 2026 or early 2027, when a major chain commits to a functional private label at conventional pricing, based on historical patterns, that tends to reshape the entire category pretty quickly.

How Premium Evolves, Not Disappears

What’s encouraging is that premium dairy won’t just vanish—it’ll evolve into something that actually makes sense.

Regenerative production with legitimate third-party certification—programs like Regenerative Organic Certified or Land to Market—creates real constraints that justify premiums. These require fundamental changes to how you farm, taking years to implement. We’re talking verified soil carbon sequestration, biodiversity improvements, the whole nine yards.

What I’m hearing from producers across different regions is that recent transitions to regenerative practices typically involve three-year conversion periods, significant upfront investment, and result in premiums ranging from $1.00 to $1.50 per hundredweight through contractual guarantees. The economics work when you have the right land base and a commitment to see it through.

Ultra-local transparency is another path. Single-farm or micro-regional milk with complete traceability. Some operations are already using blockchain so consumers can see exactly which cows contributed to their milk, when it was processed, and the works. That doesn’t scale to national distribution, which is exactly what protects its value.

Technical innovation continues, too. Ultrafiltration, A2 genetics, and precision fermentation, which require years of careful development and precision fermentation to create novel compounds, necessitate significant capital or proprietary knowledge, creating real barriers.

What probably won’t survive as a premium? Basic fortification. Adding DHA, protein, vitamins—that’s becoming baseline. Like homogenization or pasteurization. Nobody thinks of those as premium features anymore.

Research from Cornell’s Dyson School shows that willingness to pay premiums for basic fortification drops significantly when identical nutrition is available at conventional prices. Maintaining quality consistency across a distributed network won’t be simple, but the economics suggest it’s worth tackling those challenges.

Real Considerations for Real Farms

StrategyInvestment RequiredTime to ROIPremium PotentialRisk LevelKey Advantages
Volume OptimizationLow ($5K-$15K)6-12 months$0.40-$0.85/cwtLowQuick returns, proven model
True DifferentiationHigh ($30K-$250K)3+ years$1.00-$1.50/cwtHighDefensible margins, brand control
Cooperative RenaissanceMedium ($50K-$150K)18-36 months$0.60-$1.20/cwtMediumShared risk, processor margins

I’ve been talking with producers across different regions about how they’re thinking through this shift. What’s emerging are a few distinct strategies that seem to make sense depending on your situation.

Three Strategic Paths Forward

1. Volume Optimization

  • Focus on maximizing components (butterfat 4.0%+, protein 3.3%+)
  • Keep somatic cell counts consistently under 150,000
  • Build relationships with multiple regional processors
  • Target efficiency and consistency over differentiation

2. True Differentiation

  • Invest in regenerative certification (3-year transition, $30-50K investment)
  • Develop on-farm processing capabilities ($150-250K for small-scale)
  • Pursue ultra-local/blockchain transparency models
  • Accept lower volume for guaranteed premiums

3. Cooperative Renaissance

  • Join or form producer-owned processing ventures
  • Capture functional dairy margins at the processor level
  • Share capital requirements and risk across members
  • Maintain control over pricing and market positioning

Some folks are focusing on strengthening relationships with regional processors who are pursuing volume strategies. These processors need a reliable, high-quality supply and often pay meaningful premiums for exceptional components and low somatic cell counts. The math works when you’re optimized for efficiency and consistency.

Others are investing in differentiation that can’t be easily replicated. What I’m hearing from these producers is that they see it as a long-term investment in market position. Yes, it requires time and capital—we’re talking about significant investments in small-scale processing equipment—but it creates lasting value.

There’s also renewed interest in cooperative models. When producers see the margins available in functional dairy, naturally, they start asking why processors should capture all that value. The cooperative tradition runs deep in dairy—maybe this is what brings it back.

Where We Go from Here

What Midland’s shown with their Cornell Silver award isn’t just about one processor’s pricing strategy. They’ve demonstrated that the premium pricing structure for basic nutritional enhancement might be more about market positioning than production necessity.

That’s not meant as criticism—it’s recognition that things are changing. Processors with the right cost structure can profitably deliver enhanced nutrition at accessible prices. Those with different structures need to adapt or find new ways to create value. Both paths can work with the right approach.

For dairy farmers, this creates both opportunity and urgency. Opportunity because processors competing on volume and quality need exceptional milk supplies. Urgency because your current processor relationships might shift significantly as markets evolve.

Building relationships with multiple potential outlets makes sense. Understanding their strategies, cost structures, and market approaches—these conversations matter more than ever. Inquire about facility investments, debt levels, and the company’s strategic direction. This isn’t being nosy; it’s being smart about your business.

The trajectory seems fairly clear: accessible nutrition is on its way to dairy. When major retailers launch functional milk at conventional prices—likely within 18 to 24 months based on historical patterns—the category economics shift fundamentally. The question isn’t whether this happens, but how your operation is positioned for it.

Processors who understand these dynamics are already planning. Farmers who recognize them early maintain options. Those who wait… well, they get what’s left.

What are you seeing in your area? Are processors discussing functional products differently? How are you thinking about positioning as things evolve? I’m genuinely curious about what you’re observing, because these conversations help all of us navigate what’s coming.

While we’re focused on U.S. markets here, it’s worth noting that similar dynamics are emerging in European and Oceanic dairy markets too. Dutch processors are experimenting with accessible-price functional dairy, while New Zealand cooperatives are reevaluating their premium positioning strategies. This isn’t just a regional shift—it’s a global phenomenon.

KEY TAKEAWAYS:

  • Your milk check could increase 40-85¢/cwt by targeting processors pursuing volume strategies who need exceptional components (4.0%+ butterfat, 3.3%+ protein) and consistently low somatic cell counts—these processors recognize that quality raw materials matter more than ever as competition shifts from brand positioning to actual product quality
  • The real DHA fortification cost is $0.005-$0.015 per half-gallon, not the $1.50-$2.00 premium you see at retail—with global algal DHA production at 25,000-35,000 metric tons annually and U.S. dairy needing just 1.5-2.0 tons if fully fortified, ingredient scarcity isn’t the issue processors claim it is
  • Three strategic paths make sense for different operations: Volume optimization for efficiency-focused farms, regenerative certification ($30-50K investment, 3-year transition) for those seeking defensible premiums of $1.00-$1.50/cwt, or cooperative processing ventures ($150-250K small-scale) to capture margins currently going to processors
  • Timeline matters—you’ve got 18-24 months before major retailers likely launch functional private label at conventional prices, based on historical disruption patterns like Greek yogurt’s capture of one-third market share in five years
  • Ask your processor four critical questions now: What’s their facility age and debt structure? Are they planning functional launches? How will component premiums change? What’s their strategy when Walmart launches accessible-price omega-3 milk?

Complete references and supporting documentation are available upon request by contacting the editorial team at editor@thebullvine.com.

Learn More:

The Sunday Read Dairy Professionals Don’t Skip.

Every week, thousands of producers, breeders, and industry insiders open Bullvine Weekly for genetics insights, market shifts, and profit strategies they won’t find anywhere else. One email. Five minutes. Smarter decisions all week.

NewsSubscribe
First
Last
Consent

$320,000 Now or Dairy Legacy Forever? The October 30 Vote Splitting New Zealand’s Farmers

Why sell brands posting 103% profit growth? 10,700 farmers decide Oct 30 if $320k now beats legacy forever.

EXECUTIVE SUMMARY: Fonterra’s proposed $3.8 billion sale of its consumer brands to Lactalis presents 10,700 farmer shareholders with one of the cooperative dairy’s most consequential decisions—vote by October 30 on whether to cash out brands that have shown a remarkable turnaround. The consumer division’s operating profit surged from NZ$146 million to NZ$319 million year-over-year (103% growth), driven by expanding sales of South Asian packaged milk powders and the UHT market in Greater China, according to Fonterra’s Q3 financials. This valuation—between 10 to 15 times earnings with a 15-25% premium over typical dairy transactions—suggests that Lactalis sees long-term value in New Zealand’s grass-fed reputation, which took generations to build. With Fonterra carrying NZ$5.45 billion in debt at 39.4% gearing, the board views this sale as a means to balance sheet strengthening, although farmers must weigh the immediate capital needs against surrendering their connection to consumer markets. What farmers are discovering through discussions from Taranaki to Canterbury is that this vote transcends individual operations—it could reshape global cooperative strategies, as the boards of DFA, Arla, and FrieslandCampina watch closely. The decision ultimately asks whether farmer cooperatives can compete in consumer markets or should retreat to ingredients and processing. Each shareholder must evaluate their operation’s specific needs, succession plans, and vision for dairy’s future before casting a vote that, once done, can’t be undone.

You know that feeling when you’re doing evening chores and something on the news makes you stop and really think? That’s been happening a lot lately with this Fonterra situation. Back in August, they announced they’re selling their consumer brands to Lactalis—the French dairy giant—for NZ$3.845 billion, according to their official announcements. Could increase to $4.22 billion, including the Australian licenses.

And here’s what has got me, and many other farmers, talking… With 10,700 farmer shareholders voting on October 30, we’re looking at something that could change how we all think about cooperative dairy.

The Numbers We’re All Trying to Figure Out

So here’s what’s interesting about the financial performance, and I’ve been digging through Fonterra’s Q3 reports to get this straight. The consumer division—encompassing Mainland cheese, Anchor butter, and Kapiti specialty products—saw its operating profit increase from NZ$248 million to NZ$319 million in Q3, representing approximately a 29% rise, according to their FY25 financial presentations.

Now, where that 103% figure comes from gets a bit specific—it’s actually the quarter-on-quarter comparison. When comparing Q3 this year to Q3 last year, the consumer division’s operating profit surged 103%, increasing from approximately NZ$146 million to NZ$319 million. That’s impressive growth, anyway you slice it, driven largely by higher sales volumes of packaged milk powders in South Asia and UHT milk in Greater China, according to their quarterly updates.

I’m not sure about you, but that timing leaves me scratching my head a bit. After years—and I mean years—of hearing “just wait, the turnaround is coming,” it finally arrives. And now we’re selling?

What I’ve found interesting in the latest annual reports is the valuation itself. When you adjust for standalone costs, Lactalis is paying somewhere between 10 and 15 times earnings, with a premium of about 15 to 25 percent over what these deals typically cost. That’s… substantial. They’re clearly seeing something valuable here. And it makes you wonder—could this affect Fonterra’s position as one of the world’s largest dairy exporters? That’s something worth thinking about.

Key Facts at a Glance:

  • Sale price: NZ$3.845 billion (potentially $4.22 billion)
  • Voting date: October 30, 2025
  • Farmer shareholders: 10,700
  • Consumer operating profit: NZ$319 million in Q3 FY25 (up from NZ$248 million)
  • Quarter-on-quarter growth: 103% (Q3 FY25 vs Q3 FY24)
  • Current debt: NZ$5.45 billion
  • Gearing ratio: 39.4%

Different Farms, Different Calculations

Here’s the thing about this vote—and this is what makes it so complicated—it means something different for every operation and every region.

Take farmers supplying milk to Te Rapa, one of Fonterra’s largest manufacturing sites, down in Waikato. The plant produces over 300,000 tonnes of milk powder and cream products annually, according to Fonterra’s operational data. If you’re one of those suppliers, you’re probably thinking more about the ingredients side of the business since that’s where your milk’s likely going anyway.

However, if you’re in a region that supplies plants producing consumer products—such as some of the operations near cheese plants or butter facilities—this sale hits differently. You’ve been directly involved in building those brands.

If you’re running a smaller herd, maybe 400 to 600 cows, like a lot of farms in Taranaki or up in Northland, that potential payout could be a game-changer. We’re talking real money that could help with debt from that new rotary you put in, or finally let you upgrade that aging effluent system. With feed costs where they are and milk prices doing their usual dance, breathing room matters. Though it’s worth noting—depending on how the payout’s structured, there might be tax implications to consider. That’s something to discuss with your accountant before counting chickens.

But then… and this is where I keep getting stuck… these brands weren’t built overnight. Your milk, your parents’ milk, probably your grandparents’ milk, went into building that New Zealand dairy reputation. What’s that worth over the next 20 years? Hard to put a number on it, really.

Now, if you’re running 2,000-plus cows—like some of those bigger operations down in Canterbury or Southland—you might be looking at this differently. Many of those farms are already pretty commodity-focused anyway. For them, maybe the immediate capital for expansion or debt reduction makes more sense than holding onto consumer brands they feel disconnected from.

And then there’s everyone in between. I was speaking with a farmer near Rotorua last week who runs approximately 850 cows. She’s torn. “The money would help,” she said, “but I keep thinking about what we’re giving up. My daughter’s interested in taking over someday—what kind of industry am I leaving her?”

Farmers in regions more dependent on the consumer business—those near plants that have historically focused on value-added products—may feel this more acutely than those in regions with heavy milk powder production. It’s not just about the money; it’s about what part of the value chain your community has been connected to.

Consider the rural communities as well. When farm families have more capital, it flows through the local economy—equipment dealers, feed suppliers, the café in town. But long-term? If we lose that connection to consumer markets, what happens to the value of what we produce? And what about future cooperative dividends, considering that those higher-margin consumer products will not contribute to them?

Why Lactalis Wants In

The French aren’t throwing this kind of money around without good reason, that’s for sure. According to industry analysis, several factors are converging simultaneously.

First, there’s the Asian market access. But honestly, I think it’s more than that. It’s that grass-fed story we’ve built over decades—you know what I mean? That image of cows on green pastures, the clean environment, the careful breeding programs we’ve all invested in. Lactalis knows they can’t just create that from scratch.

And think about it—how many years of getting up at 4 AM, dealing with wet springs and dry summers, constantly working on pasture management and milk quality… all of that goes into that premium reputation. You can’t just buy that off the shelf.

What’s also interesting is how this compares to what’s happening in other markets. In the States, cooperatives like DFA have been under similar pressure. Europe’s seeing the same thing with Arla and FrieslandCampina facing questions about their consumer strategies. Down in Australia, Murray Goulburn farmers went through a similar experience with Saputo a few years ago; it might be worth asking them how that worked out.

I haven’t heard any major farming organizations take official positions on this yet, but you can bet they’re watching closely. The implications go beyond just Fonterra.

The Financial Reality Check

Now, we can’t pretend Fonterra hasn’t had some rough patches. Is that a Beingmate investment in China? Lost NZ$439 million according to their financial reports from a few years back. Other ventures also didn’t pan out.

According to their latest interim reports, they’re carrying NZ$5.45 billion in net debt, with a gearing ratio of 39.4%. That’s… well, that’s a fair bit of debt. So you can understand why the board might see this sale as a way to clean things up.

But here’s my question—and maybe you’re thinking the same thing—are we selling the profitable parts to fix past mistakes? Because that’s kind of what it feels like.

There’s also the environmental regulation side of things to consider. With nutrient management rules becoming increasingly stringent every year, some farmers are wondering if having more capital now might help them meet these requirements. It’s another factor in an already complicated decision.

And let’s not forget about currency. The NZ dollar’s been all over the place lately. Receiving a lump sum payment now versus relying on favorable exchange rates for future dividends… that’s something else to consider.

What This Means Beyond the Farm Gate

Here’s something to chew on—what happens in New Zealand doesn’t stay in New Zealand anymore. Not in today’s global dairy market.

I was speaking with a fellow who ships to a cooperative in Wisconsin last month, and he mentioned that their board is already receiving questions about their consumer brands. “If Fonterra’s doing it, why aren’t we?” That kind of thing. And you know how these conversations go—once one big cooperative makes a move, others start wondering if they should follow.

We’ve all seen what happens when cooperatives become just milk suppliers to companies that own the brands. The whole bargaining dynamic changes. Ask any of those farmers who used to supply Dean Foods in the States how that worked out. Once you’re just a supplier, not a brand owner… well, it’s a different game entirely.

There’s also something to be said about cooperative governance here. This entire situation may serve as a wake-up call about who we elect to boards and what questions we ask them. Perhaps we should be more involved in these strategic decisions before they reach the voting stage.

Questions That Keep Coming Up

Winston Peters made some good points in Parliament about this whole thing—and regardless of what you think of politicians, the questions were valid. What exactly are the terms of these supply agreements with Lactalis? I mean, if New Zealand milk becomes relatively expensive compared to, say, European or South American sources, what happens then?

These aren’t just theoretical worries. They’re the kind of practical concerns that could affect milk checks for years to come. And honestly? Farmers deserve clear answers before voting on something this big.

If you want to dig deeper into the details, Fonterra’s shareholder portal has the full transaction documents. Your local discussion group is likely covering this topic as well—it might be worth attending the next meeting to hear what your neighbors are thinking. And for those wondering about the voting process itself, it can be conducted in person at designated locations, by proxy if you are unable to attend, or through postal voting—details should be included in your shareholder materials that were distributed last month.

Regarding the timeline, if farmers vote ‘yes’ on October 30, the deal is likely to close in early 2026, pending receipt of regulatory approvals. That’s when you’d see the money, but also when the brands would officially change hands.

Thinking It Through

So, where’s all this leave us with October 30 coming up? Well, like most things in farming, it depends on your situation.

If your operation needs capital right now—and I know many that do, given current margins—this payout could be exactly what keeps you going. There’s absolutely no shame in prioritizing your farm’s survival. We all do what we need to do.

However, if you’re thinking longer term, especially if you have kids showing interest in taking over someday, you have to wonder what you’re giving up. These brands represent decades of dedication and hard work by New Zealand farmers. All those early mornings, all that attention to quality… once those brands are gone, they’re gone.

Two Different Roads

If this sale goes through, Fonterra will essentially become an ingredients and processing company. That’s a pretty fundamental shift from what the cooperative has been. We’d be supplying milk primarily for ingredients markets, with Lactalis controlling the consumer-facing side of things.

If farmers vote no? Well, that’s a statement too, isn’t it? We still believe that farmer cooperatives can compete in consumer markets. This might even encourage other cooperatives around the world to continue building their brands rather than selling them off.

The Bottom Line

You know what really strikes me about all this? Sure, the money’s important—nobody’s saying it isn’t. However, it’s really about what we think dairy farming should be in the future.

Those brands—Mainland, Anchor, Kapiti—they mean something. They’re the result of generations of farmers getting up before dawn, dealing with whatever the weather throws at us, and constantly working to improve. That connection to consumers, that ability to capture value beyond the farm gate… once you hand that over, you don’t get it back.

The vote’s coming whether we’re ready or not. Whatever you decide, make sure it’s something you can live with—not just when that check clears, but years down the road when you’re looking at what the industry’s become.

Because here’s the truth: once this is done, there’s no undoing it. Dairy farmers everywhere will be watching closely to see what New Zealand decides. And whatever way it goes, it will influence how cooperatives think about their future for years to come.

Take your time with this one. Discuss it with your family, and chat with your neighbors at the next discussion group meeting. Get all the information you can from Fonterra’s shareholder resources and those quarterly reports they’ve been putting out. Consider discussing the tax implications with your accountant as well. This is one of those decisions that really does shape the industry for the next generation.

Make it count.

KEY TAKEAWAYS:

  • Immediate financial impact varies by operation size: Smaller 400-600 cow farms could see debt relief equivalent to 18 months operating costs, while 2,000+ cow operations might fund expansion—but all sacrifice future dividend streams from consumer products showing 103% profit growth.
  • Regional implications differ based on plant specialization: Farmers supplying Te Rapa’s 300,000 tonnes of milk powder production think differently than those near cheese and butter facilities who’ve directly built these consumer brands over generations.
  • Tax and timing considerations require planning: If approved on October 30, the deal is expected to close early in 2026, pending regulatory approval. Farmers should consult with accountants about the potential tax implications of lump-sum payouts versus future dividend streams.
  • Global cooperative precedent at stake: This vote influences whether farmer-owned brands remain viable worldwide, as U.S. and European cooperatives face similar pressures—Murray Goulburn’s experience with Saputo offers cautionary lessons about becoming just suppliers.
  • Three ways to vote before deadline: Shareholders can participate in person at designated locations, submit proxy votes if unable to attend, or use postal voting with materials distributed last month—full transaction documents available through Fonterra’s shareholder portal.

Complete references and supporting documentation are available upon request by contacting the editorial team at editor@thebullvine.com.

Learn More:

The Sunday Read Dairy Professionals Don’t Skip.

Every week, thousands of producers, breeders, and industry insiders open Bullvine Weekly for genetics insights, market shifts, and profit strategies they won’t find anywhere else. One email. Five minutes. Smarter decisions all week.

NewsSubscribe
First
Last
Consent

Pick Your Lane or Perish: The 18-Month Ultimatum Facing 800-1,500 Cow Dairies

October’s $2.47 Class spread proved it: mid-size dairies must choose between commodity and premium now. The middle is gone.

Executive Summary: October 2025’s market data delivered a death sentence to fence-sitters: mid-size dairies (800-1,500 cows) must choose between commodity and premium pricing within 18 months, or risk ceasing to exist. The Class III-IV spread now penalizes operations that haven’t optimized for either protein or butterfat, while global markets are permanently split between simple ingredients (winning) and value-added products (losing). Small farms with fewer than 500 cows survive through premium specialization, while operations with more than 3,000 cows thrive on commodity efficiency. But the middle ground—profitable for three generations—is gone forever. Irish farmers are betting their futures on 2027’s regulatory consolidation. Chinese buyers are only interested in specialty proteins, and industrial customers will pay premiums for consistency over brand. You have 18-24 months to pick your lane: scale up, specialize, or sell out.

Dairy Strategic Planning

Here’s the thing that’s been keeping me up at night—and probably you, too, if you’re running 800 to 1,500 cows. The dairy market’s doing something we haven’t seen before. There’s this growing gap between New Zealand and European dairy prices that should close through normal trading, but it just… won’t. The October GDT auctions show Western European whole milk powder trading at significant premiums compared to New Zealand product for near-term contracts. This structural gap, seen across multiple products, confirms that the market bifurcation is deepening.

But you know what’s really caught my attention?

The gap isn’t just global anymore—it’s right here in our milk checks. October CME data shows a widening spread between Class III and Class IV futures that’s crushing operations heavy on butterfat. With butter prices facing significant pressure while cheese prices hold relatively steady, the Class IV value is reaching levels we haven’t seen in years. This component value crisis is the clearest signal yet that the old rules are broken.

The $2.47 Spread That’s Killing the Middle: October’s Class III/IV gap represents the widest since 2011, costing Jersey operations $180K annually

What farmers are finding is that the comfortable middle ground—where most of us have operated successfully for decades—is vanishing faster than morning fog in July. And if you’re still making decisions based on what worked even two years ago, well, we need to talk.

The Value Paradox Nobody Saw Coming

Operation TypeButterfat %Protein %Class PrefRevenue Impact ($/cwt)Annual Impact (1000 cows)
BF-Focused (Jersey-Heavy)4.8%3.6%Class IV−$2.47−$180k
Protein-Focused (Holstein)3.6%3.2%Class III$0.00$0
Balanced Components (Holstein)4.1%3.4%Mixed−$1.20−$87k

Looking at September 2025 market reports from the EU Milk Market Observatory, something curious jumps out. European butter—you know, the premium stuff that’s supposed to command top dollar—has been taking a beating. Meanwhile, AMF (anhydrous milk fat), which is essentially melted and clarified butter, appears to be holding up better. Recent Global Dairy Trade data suggests AMF is actually outperforming butter in percentage terms. The simple, non-branded ingredient is holding value better than its consumer-facing counterpart. This is the Value Paradox playing out in real-time, right down to the component level.

Now, why would the simple product outperform the sophisticated one?

I was talking with a Wisconsin dairy producer last week who runs a larger operation in the central part of the state. He’d invested heavily in specialty cheese equipment a few years back, thinking he’d capture those artisan premiums. “Know what’s paying the bills now?” he asked me. “Straight cream to the bakery suppliers. No fancy packaging, no marketing story, just consistent butterfat at 40% minimum.”

Here’s the surprising part—whey powder, the stuff we literally paid to get rid of twenty years ago, now commands respectable prices in the protein market. Yet those beautiful aged cheddars that take skill, time, and capital to produce? They’re facing intense price pressure from all sides.

What’s encouraging, though, is that this shift creates opportunities for those who recognize it early. It’s making me rethink everything we thought we knew about value creation in the dairy industry.

Why Irish Farmers Are Expanding into a Glut

The production numbers coming out of Ireland lately seem counterintuitive. Recent data from their Central Statistics Office shows milk output climbing steadily through the summer months. Belgium’s showing similar patterns according to their agricultural statistics. All this while European butter inventories are already substantial. Industry reports from late summer suggest oversupply conditions in the European market, with stockpiles building to levels not seen since the intervention buying days.

You’d think these folks have lost their minds. But there’s a method to this apparent madness.

Ireland’s nitrate derogation—the rule that allows them to run higher stocking rates than standard EU regulations permit—expires at the end of this year. When that happens, industry observers from Teagasc estimate that significant production capacity could disappear. Some projections suggest up to 20% of current output might be affected. Belgium faces similar pressures from the EU’s Farm to Fork strategy, though their timeline stretches out a bit further.

So these farmers are expanding now? They’re not playing for today’s prices. They’re positioning for 2027 and beyond, when half their neighbors might be out of business.

A dairy farmer I met at a conference last spring—runs a mid-size operation in County Cork—put it this way: “We’re not thinking about next year’s milk check. We’re thinking about who’s still standing in five years and what market share they’ll control.”

It’s a high-stakes bet on regulatory-driven consolidation. Risky? Absolutely. But, when you understand the regulatory chess game being played, it starts to make strategic sense.

The Chinese Market That Defies Logic

This is where things get genuinely puzzling, especially if you’re used to thinking about dairy as a straightforward commodity.

Recent reports from China’s agricultural authorities indicate that domestic farmgate prices remain under pressure, generally declining year over year, depending on the province. They have adequate production capacity, according to their own data. Traditional economics suggests that imports should be declining.

Instead? Recent customs data suggests import volumes are holding steady or even growing for certain categories. The unexpected piece is the shift in what they’re buying. While whole milk powder imports have moderated, specialty ingredients, such as whey products, appear to be growing. This shift from buying bulk commodities to high-value protein ingredients reinforces the idea that their purchasing is becoming highly selective, focused on functional and premium status, not basic commodity volume.

What’s happening here—and this pattern is also showing up in India, Vietnam, and Indonesia, according to recent observations from the USDA Foreign Agricultural Service—is that consumers in these markets don’t view domestic and imported dairy as the same thing. It’s no longer about measurable quality differences. We’re talking about perception, trust, and increasingly, social status.

An industry contact who works with Asian markets explained it to me this way: “Customers there aren’t comparing prices between domestic and imported milk. To them, it’s like comparing a Corolla to a Lexus. Both get you where you’re going, but they serve completely different needs.”

We’re starting to see this same split here in mature markets. Look at what organic commands—often substantial premiums according to USDA Agricultural Marketing Service data, despite conventional milk meeting all the same safety and nutritional standards. Or A2 milk, grass-fed brands, local farm labels. The bifurcation’s happening everywhere.

Industrial Buyers Play a Different Game

What catches my attention in all this market analysis is how differently industrial buyers behave compared to grocery chains.

When Kroger or Walmart needs butter, they typically put it out to bid quarterly and accept the lowest price that meets the specifications. Simple transaction, price drives everything.

But when a commercial bakery needs AMF for their croissant line? Completely different conversation. Their ovens are calibrated for specific melt points. Their recipes assume consistent moisture content—we’re talking plus or minus half a percent. Switching suppliers means reformulation, line testing, and potential product recalls if something’s off.

Industry procurement specialists I’ve talked with say they’ll routinely pay meaningful premiums just for supply security. One mentioned that every supplier switch costs them tens of thousands of dollars in testing and adjustments, sometimes more if the equipment needs recalibration. So yeah, they’ll pay extra for consistency.

This creates real opportunities for producers who can reliably meet industrial specifications. It’s not glamorous work—nobody’s writing magazine articles about your commodity ingredient sales. But, these contracts often offer better margins and more stability than chasing consumer trends.

Hard Lessons from the Big Cooperatives

Want to understand why those regional price advantages everyone talks about aren’t as permanent as they seem? Take a look at what has been happening with major cooperatives over the past eighteen months.

Even the big players—organizations with decades of export experience, established supply chains, unified farmer bases—have been announcing restructuring plans. Cost cutting initiatives. Plant consolidations. Some are even outsourcing core functions they’ve handled internally for generations.

What happened? Simple—they built cost structures around market conditions they assumed were permanent. Those nice premiums they were capturing a couple of years ago? Turned out to be temporary benefits resulting from supply chain disruptions and unusual demand patterns. When global shipping rates normalized and consumption patterns shifted back, the premiums vanished almost overnight.

A board member from a regional cooperative shared this perspective with me recently: “We all got a little too comfortable with those margins. Built our strategic plans around them. What we’re learning—again—is that very few advantages in commodity markets last more than a cycle or two.”

The Reality Check for Different Size Operations

Let me share what recent economic analyses from various land grant universities are telling us about profitability by herd size. The patterns are striking and, frankly, a bit concerning for those of us in the middle.

Smaller operations—let’s say under 500 cows—often achieve higher mailbox prices than the big guys. We’re talking sometimes a dollar fifty to two dollars more per hundredweight through direct marketing, on-farm processing, specialty programs. Sounds great, right?

But here’s the catch—their cost of production typically runs several dollars higher per hundredweight, too, according to extension studies. So that premium price? It’s often not enough to offset the higher costs. Many of these smaller operations are working incredibly hard just to break even.

On the flip side, operations over 3,000 cows generally receive lower prices—maybe fifty cents to a dollar below the smaller farms. But their cost structure? They’re often producing for significantly less per hundredweight than mid-size operations. Volume multiplied by even small margins adds up.

The really tough spot? That 800 to 1,500 cow range. Not big enough to capture serious economies of scale. Not small enough to be nimble with specialty markets. These operations are either expanding aggressively right now or transitioning to some form of differentiated production. Standing still is no longer viable.

The Death Zone Exposed: Mid-size dairies trapped between specialty premiums and commodity efficiency are bleeding money at -2.1% margins

Here’s what I’ve noticed about how different regions are handling this—and it’s telling. In California’s Central Valley, where water rights and environmental regulations create unique pressures, several mid-size operations have formed marketing cooperatives to achieve scale without individual expansion. Northeast producers, located near major population centers, are exploring the benefits of shared processing facilities and distribution networks. Down in Texas and New Mexico, where expansion’s still possible, they’re going big—really big—with new facilities starting at a minimum of 5,000 head. And in the Southeast? They’re dealing with heat stress and hurricane risks that add another layer to these strategic decisions. Each region’s finding its own path through this transition.

Choosing Your Lane (Because You Have To)

After watching hundreds of operations navigate these changes, it’s becoming increasingly clear: you must pick a strategy and commit to it fully. The days of hedging your bets, of being pretty good at everything? Those days are over.

If you’re going the commodity route, several factors become absolutely critical. First, you need scale—probably a minimum of 2,000 cows in the Midwest, based on recent farm management analyses, and more like 3,500 in the West, where you’re competing with those massive operations. Second, you need industrial customers who value consistency over brand. Third, you must accept that you’re selling ingredients, not food, and optimize your approach accordingly.

If you’re choosing the differentiated path, different rules apply. You need a story that resonates—organic certification, grass-fed verification, local processing, something authentic that consumers will pay for. You need direct relationships or processors who value what makes you different. You have to accept higher costs, likely several dollars more per hundredweight, based on various enterprise budgets, in exchange for capturing those premiums.

Are the operations struggling the most? Those trying to do both. I am aware of a Pennsylvania dairy that has installed robots to reduce labor costs, yet it still sells commodity milk. Their debt service alone is crushing them. Another farm in Vermont has built a beautiful processing facility, but cannot achieve enough consistent volume to run it efficiently.

And here’s something worth considering—how does your chosen path affect succession planning? If you’re hoping the next generation takes over, which strategy gives them the best shot at success? The commodity route requires constant reinvestment and scale. The premium path needs marketing savvy and customer relationships. Neither’s wrong, but they require different skills and interests from whoever’s taking the reins.

Practical Decisions for Today’s Reality

So what does this mean for your operation over the next few years?

For smaller dairies with fewer than 500 cows, specialization appears to be the key. Pick something you can be genuinely excellent at. Perhaps it’s organic production, perhaps it’s A2 genetics, or perhaps it’s on-farm bottling with local distribution. But competing head-to-head with large commodity operations? The math rarely works.

For larger operations over 2,000 cows, it’s about operational excellence and simplification. Strip out complexity, focus on one or two products at most, and secure those industrial contracts. The 3,000-cow dairy selling everything to a single cheese plant at predetermined prices might not be exciting, but they’re sleeping well at night.

And if you’re in that challenging middle zone—800 to 1,500 cows? You’re facing the toughest decisions. Based on what extension economists are seeing, you’ve probably got 18-24 months to make a strategic choice. Scale up significantly, find a genuine differentiation strategy, or… well, we all know what the third option looks like.

Here’s what’s worth tracking closely in your own operation:

  • What’s your actual premium above base price? Many folks are surprised by how small it really is
  • What percentage of your milk is under contract versus sold on the spot market? Aim for at least 70% contracted
  • Where do your costs rank compared to others in your region? You need to be in the better half
  • Could your operation survive a 15% price drop for six months? If not, you’re probably over-leveraged for this environment
  • Are you optimized for protein or fat? Recent market shifts show component strategy is no longer optional—it’s essential for survival

Examining government programs reveals some resources worth exploring. USDA’s Value-Added Producer Grants can help with the transition to specialty markets. Environmental Quality Incentives Program funding may offset some of the costs of organic transition. State-level programs vary widely—Minnesota, Wisconsin, and Vermont all offer different types of support for dairy operations making strategic transitions.

The Transition Nobody Talks About

What often gets overlooked in these strategic discussions is the cost and complexity of transitioning from one model to another.

Going organic? That’s a three-year transition period during which you’re paying organic feed prices but receiving conventional milk prices. Extension studies suggest that transition costs can run into the hundreds of dollars per cow, plus you need secured market access before you start.

Scaling up to commodity efficiency? We’re talking millions in capital investment for meaningful expansion based on recent construction trends, and that’s if you can find the labor. Speaking of labor—good luck finding qualified people right now. Everyone’s struggling with that.

Even switching to industrial supply contracts requires investment. Those customers want consistency, which might mean new bulk tanks, different cooling systems, and sometimes even road improvements for larger tankers.

The encouraging development I’m seeing is that some regions are finding creative alternatives. In areas where individual expansion faces regulatory hurdles, several mid-sized operations have formed marketing cooperatives to achieve scale without relying on individual growth. Others are exploring shared processing facilities—not perfect, but it spreads the capital risk. Some operations are creating strategic alliances, sharing equipment and expertise while maintaining independent ownership.

Looking Forward

Those pricing gaps we’re seeing between regions and products? They’ll moderate eventually—markets always find some form of equilibrium. But, the fundamental split in our industry—between high-volume commodity production and high-touch premium production—is looking more and more permanent, according to the agricultural economists I’ve spoken with.

Previous generations could successfully run diversified operations. My grandfather milked cows, raised hogs, grew corn and beans, and did pretty well at all of it. My father’s generation was competent across multiple enterprises and made it work.

Today? Today, rewards focus and excellence in a chosen strategy. The market’s sending clear signals through these pricing disparities and structural changes. We can either listen and adapt or ignore them at our peril.

The successful operations ten years from now won’t necessarily be the biggest or the most sophisticated. They’ll be the ones that made clear strategic choices today and committed fully to optimizing within that framework.

The most vulnerable position isn’t being too aggressive or too conservative—it’s being unclear about which game you’re playing. Pick your lane, optimize everything for that choice, and don’t look back.

Because in today’s dairy economy, the middle of the road is becoming the hardest place to survive. That’s where the pressure’s greatest, the margins thinnest, and the future most uncertain.

But, here’s what gives me hope: dairy farmers are among the most resilient and adaptable people I know. We’ve weathered worse storms than this. The ones who recognize these changes early, make tough decisions, and commit to their chosen path? They’ll not just survive—they’ll thrive.

The question isn’t whether the industry will continue; it’s whether it will thrive. It’s whether your operation will be part of its future. And that decision? That’s entirely in your hands.

Key Takeaways:

  • Pick Your Lane in 18 Months or Perish: Operations with 800-1,500 cows must commit fully—scale to 2,000+ for commodity efficiency, specialize for premium capture, or exit. Half-measures guarantee failure.
  • Simple Ingredients Trump Value-Added: AMF beats butter, whey beats aged cheese, and industrial contracts beat consumer brands. October’s market proves processors pay premiums for consistency, not stories.
  • The Middle Is a Kill Zone: Farms under 500 cows thrive on specialization ($1.50-2.00/cwt premiums), operations over 3,000 profit on scale. But 800-1,500? Neither advantage = both disadvantages.
  • Component Strategy Is Survival: The Class III-IV spread isn’t temporary—it’s structural. Optimize for protein OR fat, not both. Your bulk tank average means nothing if components are wrong.

Complete references and supporting documentation are available upon request by contacting the editorial team at editor@thebullvine.com.

Learn More:

The Sunday Read Dairy Professionals Don’t Skip.

Every week, thousands of producers, breeders, and industry insiders open Bullvine Weekly for genetics insights, market shifts, and profit strategies they won’t find anywhere else. One email. Five minutes. Smarter decisions all week.
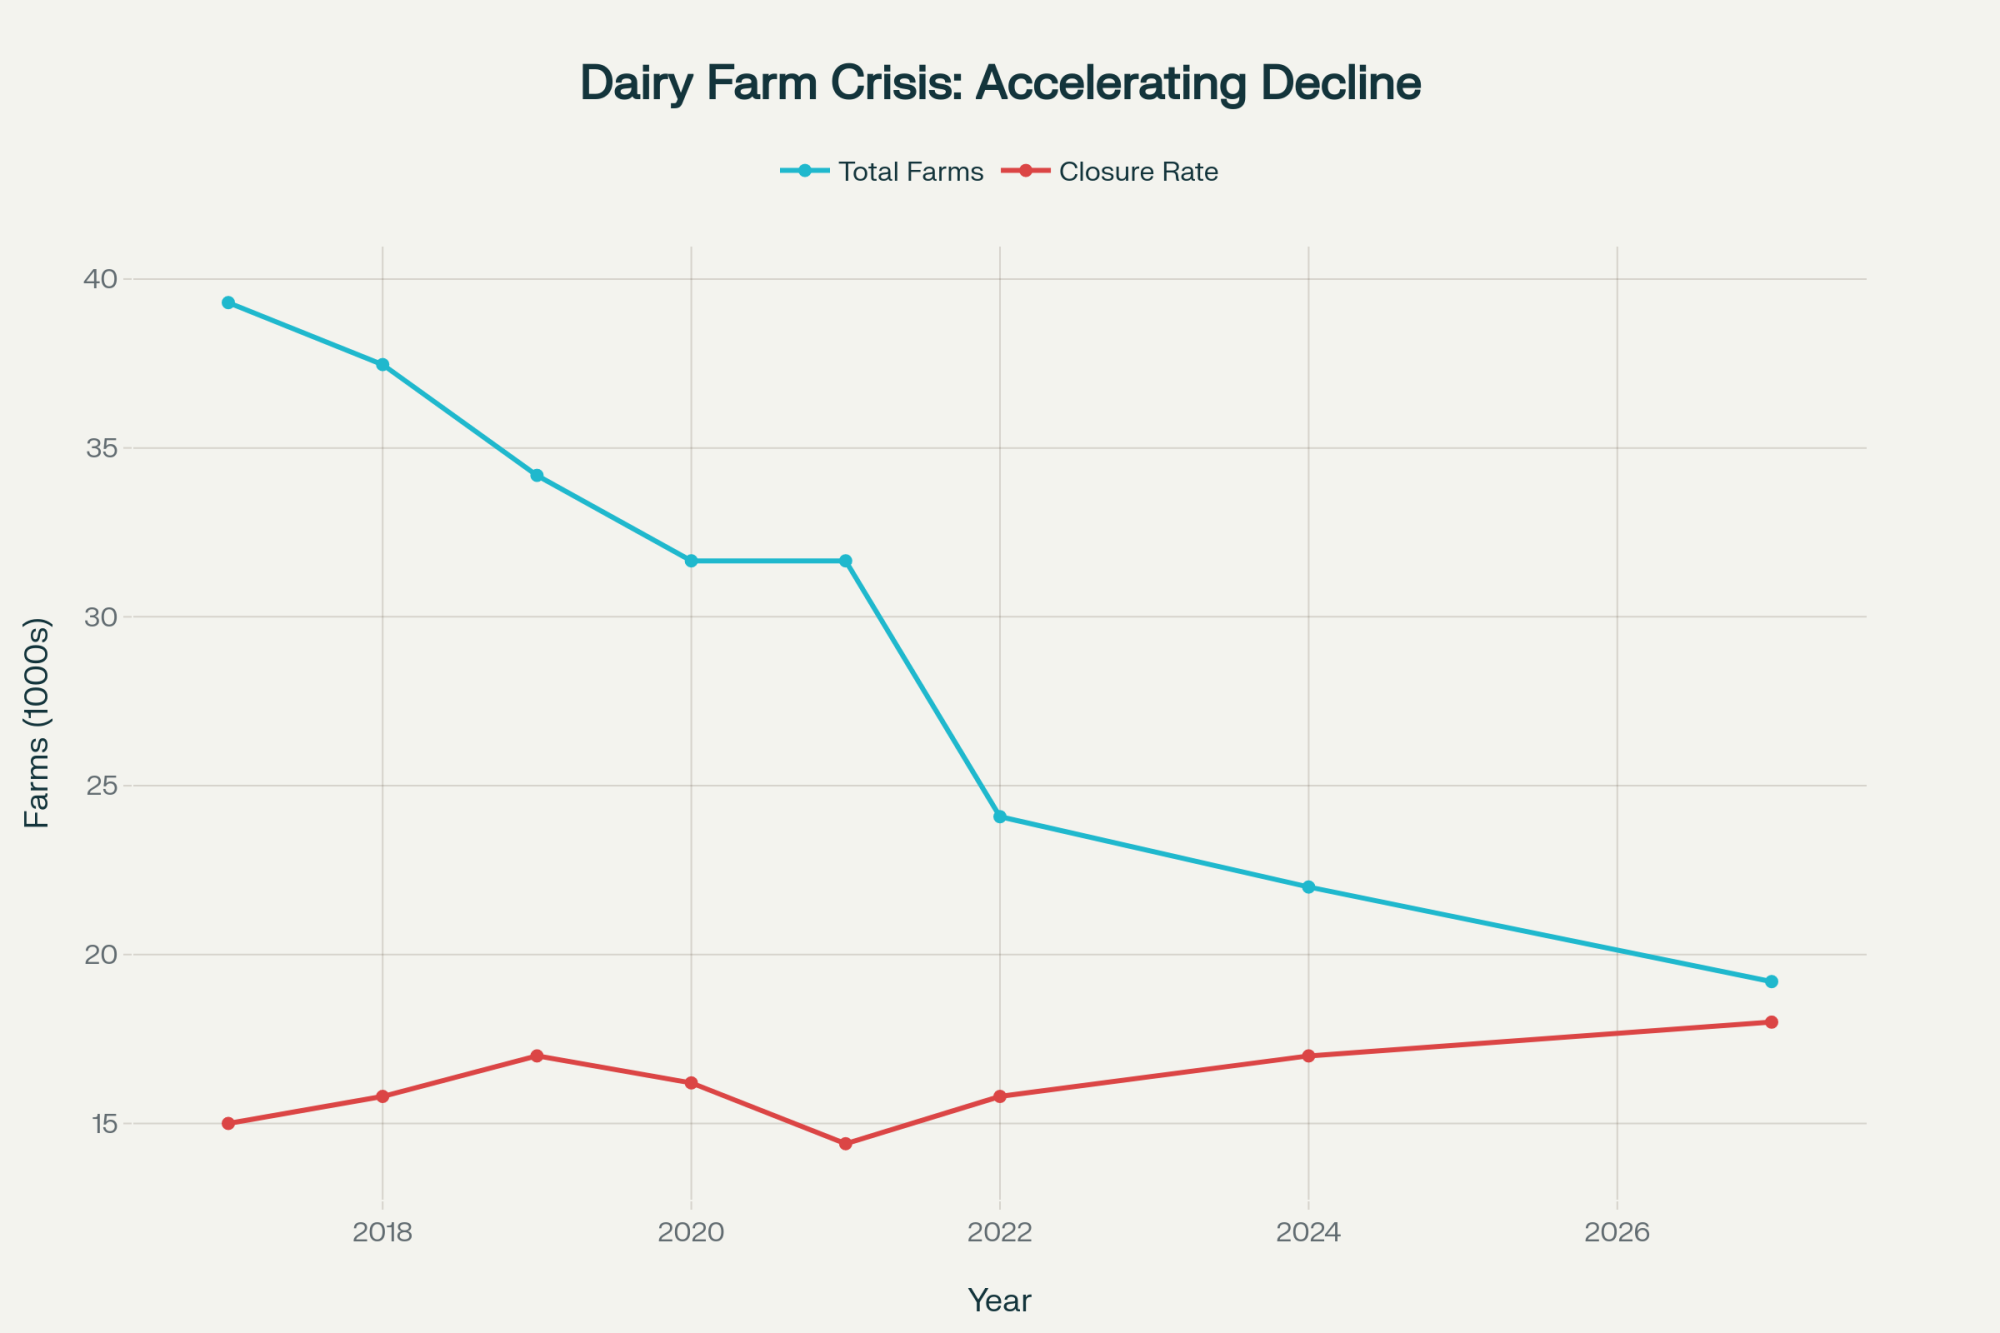
NewsSubscribe
First
Last
Consent

When Butter Sinks Below Cheese: The Market That Refused to Trade

Butter just crashed below cheese, CME froze up, and the global dairy market is rewriting every play farmers thought they knew. Is your operation ready for the new normal?

Executive Summary: Butter just sank below cheese, CME trades froze, and global dairy pricing rules are being rewritten in real time. What’s fascinating is how quickly protein has stolen butterfat’s thunder—today’s mailbox check is won or lost on what your cows put in the vat, not just how many pounds fill the tank. The flood of new U.S. processing plants won’t rescue margins if exports stall, especially with Europe and New Zealand cranking out more milk to chase slow demand. Input costs might be finally easing, but so are milk prices—so efficiency, not expansion, is the edge that matters most right now. It’s a moment that rewards the bold: managing risk, tweaking diets, and staying lean on labor can make all the difference. Everyone’s watching and waiting, but real leaders will act before they’re forced. The bottom line? In the 2025 milk market, the fastest to adapt will stand to gain, while those standing still will already be behind.

Dairy profitability, component feeding, Class III hedging, dairy market volatility, farm efficiency, protein premium, North American dairy

Let’s be honest: what happened last week on the CME was unlike anything we’ve seen since the pandemic. On October 8, not a single contract changed hands—no spot cheese, no butter, no nonfat dry milk, nothing at all. That’s more than a rare occurrence; it’s a signal that uncertainty and risk are now running the show in dairy’s major pricing arena.

What’s interesting here is that when the market goes silent, it’s usually not confidence—it’s confusion. Butter actually dipped to $1.65/lb, while cheese held at $1.7375/lb. When’s the last time butter traded below cheese? You’d have to dig back to 2021 or early 2022 to find that particular inversion, and the implications for milk pricing—especially for anyone playing the class and component game—are immediate and sweeping.

The Great Inversion: For the first time since 2021, butter has crashed below cheese prices—a seismic shift that’s rewriting every dairy farmer’s component strategy overnight

The GDT Auction: Reading the Global Thermometer

Looking at the numbers from Global Dairy Trade’s TE389 auction (October 7), you get a sense of just how widespread the turbulence is. Here’s a breakdown, with direct source attribution to the GDT/USDA for verification:

ProductPrice Change (%)Winning Price (US$/tonne)
Whole Milk Powder (WMP)-2.3%$3,696
Skim Milk Powder (SMP)-0.5%$2,599
Anhydrous Milk Fat (AMF)+1.2%$6,916
Butter-3.0%$6,712
Cheddar+0.8%$4,858
Mozzarella-11.8%$3,393
Buttermilk Powder (BMP)-2.3%$2,768

The standout? Mozzarella got hammered, losing 11.8%, while AMF eked out a rare gain. What’s worth pausing on here is that Fonterra’s SMP maintains a premium of $105/tonne over the top European competitors—a spread that’s both unusual and unsustainable long-term. Buyers and sellers alike are weighing whether New Zealand is overpriced or if Europe’s downward spiral is a bigger issue.

Europe in the Red: Pressure on Every Front

European Dairy Collapse: The devastating numbers reveal an industry in crisis, with Young Gouda down 36% year-over-year and butter hemorrhaging nearly 30%

European dairy prices have been bleeding for months, but the latest quotes make that trend painfully clear. Citing data verified via the EEX and the EU’s weekly surveys:

CommodityWeekly Change (%)Current Spot (€ per tonne)Year-over-Year (%)
Butter-1.5%€5,533-29.6%
SMP-0.5%€2,159-14.9%
WMP-1.8%€3,740-13.8%
Whey+0.6%€890+0.6%
Young Gouda-2.4%€3,115-36.1%

What I’ve noticed over the years is that when European butter prices move this sharply, they tend to drag global fat values along with them. The decrease of €2,329 per tonne on butter this year is severe even for volatile markets, and SMP’s year-on-year losses are hardly better. For producers exporting into—or competing with—the EU, these are tough numbers.

The U.S. Spotlight: Processing Boom Meets Margin Squeeze

You want to talk about structural shifts? U.S. dairy is investing $11 billion in processing expansion across 50 new and expanded plants in 19 states through 2028, as verified by IDFA and federal development filings. This is happening due to two factors: persistent bottlenecks in cheese and powder production, and a rush to capture more global value as domestic consumption levels off.

But here’s the catch: bigger processing doesn’t necessarily mean bigger margins. As hundreds of millions of new pounds of milk are processed through cheesemakers in states like Texas, South Dakota, and New York, pricing pressure grows—not just due to feed, labor, or weather, but also from global market fluctuations and export volatility. I’ve had processors tell me flat out: “Volume can cannibalize value unless exports hold up.” They’re not wrong.

Component Pricing Clarity: Where’s the Money Now?

Here’s where the new component math really bites. With butter spot at $1.65 and cheese at $1.7375, current theoretical values work out as follows using the USDA Federal Milk Marketing Order Class III and Class IV formula calculations for the week ending October 10, 2025:

  • Butterfat: Approx. $2.19/lb
  • Protein: Approx. $2.71/lb

For years, protein was the underdog, and butterfat was king. Now? We’re in a market where protein drives the milk check and butterfat takes a back seat. What’s remarkable is how quickly this change came about—a swing like this would have looked improbable just last fall.

What does this mean practically? If you’re near the break-even point, even a small shift in herd average protein—from, say, 3.05% up to 3.12%—could change your bank balance more than anything you do on butterfat. That’s especially true with Class III at $17.19/cwt and Class IV at $14.60/cwt; protein premiums are back in charge, at least for now.

Feed Costs, Herds and Margins: The Reality on the Ground

Now, feed costs are down this fall—corn’s at about $4.13 and soy meal around $275. However, here’s the paradox: margins didn’t exactly return to their original levels. I’ve spoken to several producers who saw input costs ease by 10-15%, but lost even more due to falling milk prices. In this kind of margin environment, efficiency beats expansion. Producers rocking 15–25% better feed efficiency—usually those leveraging precision diets and sharp dry lot management—are far outperforming neighbors still running by last year’s playbook.

It’s also worth noting that with replacement heifer numbers at a multi-decade low, aggressive culling isn’t just a cost control—it’s a competitive advantage. Keep your best cows fresh, don’t hang on to underperformers, and watch the butterfat-protein balance in your breeding goals.

Global Forces: More Milk, More Competition

Global Production Surge Meets Demand Reality: While milk output explodes worldwide, processing capacity can’t save margins when export markets stall.

Let’s talk about the milk waves. The U.S. added another 114,000 cows year-over-year, now at 9.45 million, and lifted production 1.6% in May. Irish and Belgian farmers both reported strong late-summer surges, with Ireland’s August total increasing by 6.8% and Belgium’s by 3.6%.

But what’s striking is the pressure coming from Oceania. New Zealand kicked off its new season with a 17.8% production bump, and Australia pumped up August exports by 4.3% despite back-to-back years of drought. All this is happening while China’s local output and cow numbers are stabilizing or even declining slightly, which complicates demand-side optimism.

Even in South America, Uruguay’s dairy exports are capturing new market share, increasing by 28% in September alone. The takeaway? The competition for export slots—especially for cheese and powders—is intensifying by the month. The world doesn’t need surplus milk from every region at once, especially when consumer demand in places like China remains tepid.

If You’re Milking Cows, Three Moves You Should Consider

Looking at these numbers, what stands out is that there’s no single “right” answer for every farm. But the directional signals are clear:

  1. Actively Manage Risk: If you can lock in Class III or IV futures at a profit, don’t wait. The market could tighten, but it’s far more likely we stay volatile, and margin squeezes hurt more than missing a few cents.
  2. Feed for Components, Not Just Volume: It’s a fresh-cow-to-dry-cow world now. Precision feeding, component-oriented breeding, and tighter culling have real paybacks.
  3. Watch the Processing and Export Play: Growth in U.S. processing capacity is a double-edged sword—great for local demand, tough for global price stability. Farms able to pivot into value-added or more reliable regional supply chains (think specialty cheeses, A2 products, grass-fed claims) may find less risk, more reward.

So, Where Are We Headed?

This past week’s trading freeze isn’t just a blip. It’s a signal that nobody at the big end of the market is sure what’s next. Butter’s below cheese. Protein is paying. The U.S. is betting big on processing, but the world’s awash in milk, and margins are one bad export report from falling through the floor.

However, here’s my perspective, after decades in this space: challenge breeds innovation. The producers who stay nimble, watch the fundamentals, and act decisively on both feed and marketing will come out ahead. It’s not about surviving the tidal wave, it’s about learning how to surf it.

Suppose you’re looking for further reading and validation. In that case, I encourage you to dig into the latest weekly USDA Dairy Market News, spot market details at the CME, EEX, and GDT auction reports, IDFA and federal investment data, and regional herd and feed guidance from your local extension or university resource.

After decades in dairy, I’ve learned: hope can’t milk cows or balance the books. The market’s rewrite is a chance to step up. Those who adapt—fast—will turn volatility into advantage. Those who wait will watch margins vanish.

Key Takeaways:

  • Butter dropped below cheese—for the first time in years. Big warning for milk pricing ahead.​
  • Not a single dairy futures trade at CME; uncertainty just went off the charts.​
  • Protein now rules the milk check—if you haven’t shifted your herd’s diet, you’re losing dollars.​
  • U.S. plants are expanding, but global competition and weak demand are causing margins to shrink rapidly.​
  • Feed your best cows smarter; efficiency now beats herd size every time when profits are tight.​

Complete references and supporting documentation are available upon request by contacting the editorial team at editor@thebullvine.com.

Learn More:

  • Spring Pasture Powerplay: Balancing Grazing Efficiency with Milk Component Goals – This tactical guide reveals immediate, on-farm methods like using Rumen-Protected Amino Acids (RPAAs) and strategic buffer feeding to optimize milk protein and butterfat. It provides actionable component feeding adjustments and rotational grazing strategies to capture efficiency gains and stabilize rumen health, ensuring your herd can meet the new protein demand.
  • Global Dairy Market Dynamics: Navigating Volatility and Strategic Opportunities in 2025 – Extend your strategic understanding beyond the CME freeze with a deep dive into global market drivers. This analysis identifies major trends—from European oversupply and shifting policy to logistics normalization—and emphasizes the data-driven KPIs (like Feed Conversion Ratio) producers must track to maintain competitiveness amid sustained international volatility.
  • Your Feed Room’s Hidden $58400 Leak – And How Smart Dairy Farms Are Plugging It – To directly achieve the 15-25% efficiency gains discussed in the main article, this report quantifies the financial risk of feed shrink. It demonstrates how precision feeding technology and real-time tracking can plug losses worth up to $58,400 annually for a 100-cow dairy, turning input cost control into a major profit center.

The Sunday Read Dairy Professionals Don’t Skip.

Every week, thousands of producers, breeders, and industry insiders open Bullvine Weekly for genetics insights, market shifts, and profit strategies they won’t find anywhere else. One email. Five minutes. Smarter decisions all week.

NewsSubscribe
First
Last
Consent

Ireland’s 54,000 Missing Calves Signal the Regulatory Storm Heading Your Way

When Ireland’s grass-fed advantage meets Brussels’ nitrogen limits, everyone’s milk check changes

EXECUTIVE SUMMARY: Ireland’s registration of 54,396 fewer calves this year signals a fundamental shift that’s already reshaping global dairy markets. With the nitrates derogation expiring December 31st, Irish farms face potential nitrogen limits dropping from 250kg to 170kg per hectare — a 32% reduction that could force meaningful herd culls despite EPA data showing river nitrogen at eight-year lows. This matters beyond Europe because Ireland, while producing just 1.5% of global milk, controls approximately €1 billion in annual infant formula exports serving Asia’s booming premium segment, which grew from a 32.8% to a 37% market share this past year. What farmers are discovering through Vermont’s success with GPS-guided manure application — an 18-month payback through reduced fertilizer costs — suggests that technology adoption might be the bridge between environmental compliance and profitable production. December’s Brussels decision will ripple through milk prices globally, but smart producers are already diversifying markets, documenting their environmental performance, and learning from Ireland’s experience that scale doesn’t guarantee survival when regulations shift. The conversation we’re having today about Ireland becomes tomorrow’s reality for dairy regions worldwide, making this the moment to build operational flexibility before regulatory pressure arrives at your farm gate.

 Dairy regulatory compliance

I was reviewing the latest ICBF data last week when something really caught my attention. Ireland registered 54,396 fewer calves so far this year — both the Farmers Journal and Agriland confirmed these numbers recently. And you know what? This isn’t your typical seasonal variation. This is something worth understanding.

Here’s what’s interesting: from boardrooms to barn meetings, everyone’s trying to figure out what this means. Industry experts are warning that significant herd reductions could occur in the coming years if the derogation situation doesn’t work out. The scale… well, that’ll depend on what Brussels decides in December. Having watched similar transitions play out in other regions, I think we’re seeing early signs of change that’ll affect all of us, regardless of where we’re milking cows.

Ireland’s dramatic calf registration decline signals fundamental shifts in global dairy markets as regulatory pressure intensifies. 

Understanding Ireland’s Journey

Let’s discuss how Ireland arrived at this point, as it’s quite a story. When EU milk quotas ended in 2015 — you remember that whole situation — Irish farmers really went for it. The national dairy herd has grown from approximately 950,000 cows to nearly 1.6 million today. Teagasc’s National Farm Survey confirms we’re looking at almost 70% growth in less than a decade.

But it wasn’t just about adding cows. The average herd size increased from around 80 head to 131, based on Teagasc’s People in Dairy Project from May of this year. About 82% of these operations utilize spring-calving systems, which makes perfect sense given Ireland’s grass-growing conditions. It’s a model that works beautifully… if you’ve got their climate.

What’s particularly noteworthy is the efficiency they maintained during this expansion. Frank O’Mara’s research team at Teagasc has documented a carbon footprint of just 0.88 kg CO2e per kilogram of fat- and protein-corrected milk. The global average? That’s running around 2.5 kg. So you can see why people pay attention to what happens over there.

 Ireland’s sustainability and market advantages in grass-fed dairy face elimination under potential nitrogen restrictions.

The investment required was substantial. The Irish Farmers Association documented about €2.2 billion in farmer investment during the post-quota expansion period, with processors adding another €1.3 billion in capacity. That’s real money, borrowed against real assets.

December’s Decision Point

Now here’s where things get really interesting. December 31st is when Ireland’s nitrates derogation expires. For those unfamiliar with European regulations, the derogation permits qualifying farms to apply up to 250kg of nitrogen per hectare annually — significantly exceeding the standard 170kg limit. Most Irish farms have already reduced their stocking rates to 220kg as of January 2024, and maintaining that level is uncertain.

What I find encouraging is that the Netherlands submitted their derogation extension request back in July, according to Agriland’s reporting. So Ireland won’t be negotiating alone, which might influence how things play out in Brussels.

I’ve been talking with several Irish producers about this, and their frustration is understandable. The EPA monitoring shows nitrogen in Irish rivers hit an eight-year low in 2024 — that’s real environmental progress, which RTÉ covered back in March. Yet Brussels added these new requirements under the Habitats Directive, demanding individual assessments for 46 different catchments. I mean, can you imagine managing that paperwork while you’re trying to keep fresh cows healthy during transition?

“Good data is becoming as important as good genetics” — Wisconsin dairy producer on technology adoption

Denis Drennan from ICMSA has been pretty clear that milk prices need to stay strong in 2025 just to cover the increasing regulatory burden. And with co-ops reporting notable year-over-year reductions in deliveries during parts of this year — the magnitude varies by region and month — those newly expanded processing plants are facing some real challenges.

Why This Matters Globally

This is where Ireland’s situation becomes everyone’s business. Despite producing only about 1.5% of global milk, Teagasc research from June indicates that Ireland generates approximately €1 billion in annual infant formula exports, with six major manufacturers operating there. That concentration of expertise… it’s not something you can quickly replicate elsewhere.

The Asian market dynamics are particularly relevant here. Analysis from July shows China’s premium infant formula segment grew from about 32.8% to 37% market share over the past year. These consumers specifically want products with verified grass-fed credentials—and they’re willing to pay for them.

You know, the nutritional advantages from grass-based systems — higher CLA levels, better omega-3 profiles — that’s not just marketing. Those are measurable differences that processors can document. However, here’s the thing: these advantages stem from specific climate conditions, decades of infrastructure development, and genetics selected for grass-based production… you can’t just flip a switch and replicate that.

Similar challenges are playing out in California, where water restrictions shape production decisions, or in the Northeast, where land costs drive different operational choices. Each region has its unique pressures. In Canada, supply management adds another layer of complexity, while Australian producers navigate drought cycles that make Ireland’s consistent rainfall look like a paradise.

How Processors Are Adapting

The processing sector they’re really scrambling right now. Companies like Danone, Glanbia, and Kerry Group invested hundreds of millions based on growth projections that seemed reasonable at the time. Now they’re looking at potential supply drops while those fixed costs aren’t going anywhere.

What I’m hearing is that processors are stress-testing all kinds of options. Some are exploring powder reconstitution for specific applications, others are recalibrating their product mix, and many are focusing on supply diversification. But when your competitive advantage is rapid conversion from farm to finished product — that speed-to-value that’s so critical in infant nutrition — workarounds have limitations.

According to industry contacts, processors aren’t waiting for December. They’re actively reviewing supply chain contingencies, adjusting portfolios, and working through various scenarios. Many are now seeking long-term supply diversification contracts in other low-cost regions. It’s pragmatic planning in uncertain times.

Technology’s Growing Role

Technology TypeInvestment CostPayback PeriodAnnual SavingsRegional Example
GPS-guided manure application$45,00018 months$30,000Vermont (fertilizer reduction)
Robotic milking systems$175,00048 months$43,000Wisconsin (labor + efficiency)
Precision feed management$25,00024 months$15,000Ireland (compliance ready)
Heat detection collars$15,00012 months$16,000Netherlands (conception rates)
Environmental monitoring$8,00015 months$6,500California (water compliance)

Something that really caught my attention was ICBF’s September update to their Economic Breeding Index. The Farmers Journal reported that average EBI values dropped about €83 per animal — not because genetics suddenly went bad, but because they shifted the base cow from 2005-born to 2015-born animals. That’s the industry recalibrating for new realities.

The technology adoption gap is becoming really apparent. Farms with advanced parlor management systems, comprehensive data collection… they’re navigating these challenges differently. When you have automated heat detection improving conception rates, robotics helping with consistency — and we’re talking $150,000 to $200,000 for quality robotic systems — these are no longer luxuries. They’re becoming necessities.

A producer I know in Wisconsin put it well: “The difference between operations that invested in precision technology five years ago and those that didn’t is becoming a chasm. This includes everything from advanced feed efficiency sensors and GPS-enabled manure application systems that maximize nutrient use, to automated health monitoring collars. Good data is becoming as important as good genetics.”

And here’s the ROI that’s catching attention: one operation in Vermont saw their investment in GPS-guided manure application pay back in 18 months through reduced fertilizer purchases and improved compliance documentation. That’s the kind of return that makes technology adoption a no-brainer, especially when regulatory pressure continues to build.

Regional Variations Matter

Not every part of Ireland faces the same challenges, which is worth thinking about. The southeast, with its free-draining soils and longer growing seasons, operates under different conditions than those in the northwest, which deal with heavier ground. Spring-calving herds — that’s about 82% of Irish operations, according to Teagasc — they’ve got all their nutrient management concentrated into tight windows.

These variations… they really make you wonder about one-size-fits-all regulations. You’ve got farms achieving excellent bulk tank counts, managing transition periods effectively, keeping their herd health metrics strong — but they’re facing challenges based on nitrogen calculations that might not fully account for grass-based efficiency.

Looking at Three Possible Scenarios

ScenarioTimelineKey Outcomes
Managed AdjustmentQ1-Q2 2026Derogation renewed with tighter restrictions. Modest production adjustments, premium markets tighten, and some global price movement. Processors adapt toward higher-value products.
Political CompromiseQ2 2026Farmer advocacy leads to compromise. Technology investments enable progress in maintaining production. Politicians declare victory, farming continues.
Sharp ContractionMid-2026 onwardsMinimal derogation renewal. Significant production drops within 18 months. Premium market disruption, price volatility, supply gaps.

What This Means for Your Operation

So what should we take away from all this?

First, regulatory dynamics are accelerating everywhere. What starts in Brussels has a way of showing up in other jurisdictions. Environmental regulations are increasingly shaping how we farm, whether we’re in California dealing with methane rules, Wisconsin managing nutrient plans, or anywhere else.

Second, if you have genuine production advantages — whether that’s organic certification, grass-fed systems, local market access, or any other unique aspect of your operation — now’s the time to document and protect those advantages. Ireland’s grass-fed position took generations to build. Once it’s gone, it’s gone.

Third, market relationships need diversification. When supply gets tight, operations with multiple outlets generally fare better. That’s not pessimism — it’s risk management. And beyond just infant formula, Irish dairy also supplies significant volumes to specialty cheese makers and premium butter operations across Europe. Those alternative channels become crucial when primary markets shift.

Fourth, technology adoption is shifting from optional to essential. Being able to document your environmental performance, optimize inputs, and adapt quickly —that’s increasingly what separates operations that thrive from those that just survive.

And here’s something interesting — scale no longer guarantees success. Some of Ireland’s most efficient large operations face real challenges because they’re over nitrogen thresholds, while smaller operations with direct market access and flexibility sometimes prove more adaptable.

The Human Side

Behind every statistic are real families making tough decisions. UCD’s School of Psychology published research in August showing nearly all Irish farm families report work-family conflict, with younger, debt-leveraged farms particularly affected.

These aren’t abstract business decisions. When families have mortgaged generational land to build facilities, they might not be able to fully use… that pressure extends way beyond finances. I’ve witnessed similar situations unfold in various dairy regions, and the stress on rural communities is indeed a real concern.

For those needing support, organizations such as Farm Aid in the US (1-800-FARM-AID), the Farm Community Network in the UK, and the Irish Farmers Association’s member support services offer resources for farmers facing transition pressures. There’s also the International Association of Agricultural Producers, which offers global support networks. Please don’t hesitate to reach out if you need assistance.

Where We Go from Here

Ireland’s 1.5% of global production creates amplified disruption effects across premium markets and regulatory frameworks worldwide. 

What’s happening in Ireland represents more than just regional adjustment. We’re watching environmental objectives, food security needs, and agricultural economics intersect in real time. This dynamic between production efficiency and regulatory requirements… it’s not unique to Ireland. It’s emerging globally.

Those 54,396 fewer calves aren’t just numbers. They’re the leading edge of changes that’ll influence global dairy markets over the next several years. How this affects your operation depends largely on the decisions you’re making right now.

December’s derogation decision will have far-reaching consequences that extend well beyond Ireland. Smart producers are already considering various scenarios and building operational flexibility to adapt to changing market conditions. Most importantly, they’re learning from Ireland’s experience to prepare for similar challenges that might emerge closer to home.

Because if there’s one thing that’s becoming clear, it’s this: success in modern dairying requires understanding both market fundamentals and regulatory dynamics. Political and policy factors are increasingly influencing decisions that were once purely economic in nature. Recognizing and adapting to this reality may well determine which operations thrive in tomorrow’s dairy industry.

The conversation continues, and we’re all part of it. How we respond collectively to these challenges will shape dairy farming for the next generation. What strategies are you implementing to prepare for these changes? Share your thoughts and experiences — because learning from each other is how we’ll navigate this transition successfully.

KEY TAKEAWAYS

  • Technology ROI beats regulatory burden: Vermont operations seeing 18-month payback on $150,000-200,000 precision systems through 20-30% fertilizer savings and streamlined compliance documentation — making tech adoption essential, not optional
  • Market diversification matters more than size: Irish farms over nitrogen thresholds face elimination despite peak efficiency, while smaller operations with direct sales to specialty cheese and premium butter markets show better resilience — suggesting 3-5 market outlets minimum for risk management
  • Environmental progress isn’t protecting producers: Ireland achieved EPA-verified eight-year low nitrogen levels while maintaining 0.88 kg CO2e per kg milk (vs. 2.5 kg global average), yet still faces production cuts — document your sustainability metrics now before regulators set the narrative
  • Premium markets concentrate risk: China’s grass-fed infant formula segment commands 50% price premiums, but Ireland’s potential 15-25% production drop threatens €1 billion in exports — operations dependent on single premium channels need contingency plans by Q1 2026
  • Regional advantages require active protection: Ireland’s grass-fed position took generations to build through climate, genetics, and infrastructure, but December’s decision could eliminate it overnight — whether you’re organic, pasture-based, or locally focused, start building your verification systems today

Complete references and supporting documentation are available upon request by contacting the editorial team at editor@thebullvine.com.

Learn More:

The Sunday Read Dairy Professionals Don’t Skip.

Every week, thousands of producers, breeders, and industry insiders open Bullvine Weekly for genetics insights, market shifts, and profit strategies they won’t find anywhere else. One email. Five minutes. Smarter decisions all week.

NewsSubscribe
First
Last
Consent

Weathering Europe’s Dairy Waves: Real-World Strategies for Your Milk Check

Europe’s milk moves could flood your mailbox. Is your dairy ready for the next wave?

EXECUTIVE SUMMARY: European milk production swings are making an outsized impact on North American dairy margins this season. As the EU, U.S., and New Zealand jostle for global export leadership, every volume shift and new regulation from Brussels lands directly on U.S. farm income and risk. From compliance costs to feed volatility, today’s market noise looks more like a set of fast-moving waves than the predictable old cycles. That’s why top producers are leaning into real-time break-even tracking, component-driven strategies, and flexible risk coverage. This article gets practical—highlighting lessons from the 2015 quota flood, the importance of managing debt and working capital, and exactly which steps farmers are taking to lock in resilience. If staying afloat—and ahead—in this new dairy world is your goal, the toolbox outlined here belongs in every barn.

You know, sometimes it feels like the global milk market is just one noisy, unpredictable stock tank. I’ve had a dozen conversations this harvest about how a seemingly small regulatory change in Brussels or a surge in Irish production leaves folks scratching their heads when the mailbox check or feed bill shows up in Wisconsin or Idaho. So let’s break down what’s actually factual, what matters for North America right now, and the smart steps farms are taking to stay steady in choppy global waters.

Europe’s Ripple Effect—Bigger Than Ever

Looking at data from the FAO and European Commission this season, Europe’s share of global dairy exports is as high as any region in the world—routinely neck-and-neck with New Zealand and the U.S. USDA FAS trade briefs and figures from the International Dairy Federation confirm that EU policy, volume, and even local weather matter for price benchmarks in every major importing region, from China to Algeria and Saudi Arabia [FAO Dairy Market Review 2024; European Commission Milk Market Observatory 2025; USDA Dairy: World Markets and Trade 2025].

After the big quota-lift in 2015, history proved these ripple effects: Europe’s open floodgates sent milk downstream to world markets, dropping global prices and shrinking margins back home. This dynamic (and similar cycles since) is widely documented by USDA’s Economic Research Service and industry analyses [USDA ERS 2016 Dairy Outlook]. These aren’t hypothetical models—they’re what producers are still living through, every time a big EU volume shift combines with U.S. or Oceania constraints or demand spasms in China.

Market Moves: When Data and Intuition Don’t Always Match

What’s interesting right now, reading updates from USDA Dairy Market News and IDF, is how export punches keep rolling—U.S. butter and nonfat dry milk exports are at multi-year highs as of August and September. Yet the same sources, and public updates from major global processors, flag that key importers (especially in Asia) are warming only slowly after a soft patch. Price is now set at the intersection of commodities, shipping, trade policy (yes, tariffs still sting), and shifts in government intervention or environmental regulation.

And here’s the farmer’s perspective: global milk prices don’t just bounce up and down like a ball. With international markets more closely linked than ever, a wave in Europe or Oceania can hit North American producers’ returns like the surge on a big tidal pond: unpredictable and fast.

Debt, Leverage, and Reluctance to Slow Down

I’ve noticed most extension meetings address debt and capital structure more than ever, thanks to USDA and Farm Credit reporting higher average borrowing in new builds—and Wageningen and Thünen Institutes in Europe showing similar trends in Dutch and German herds [USDA ERS 2025; Wageningen University 2024 Dairy Finance; Thünen Institute German Survey 2024]. The same stubborn reality: high fixed payments don’t let a producer ramp down milk flow very quickly, even if the next three months look ugly on paper. Most of us end up chasing volume, not conservation, because loan payments wait for nobody.

Feed: The Margin Maker (or Breaker)

The data from Penn State, UW-Madison, and Cornell extension budgets for 2024 are crystal clear: feed claims 50–60% of the average conventional herd’s cost structure—a number that climbs higher if you’re buying more feed than you grow [PSU Dairy Budgets 2024; UW Center for Dairy Profitability 2025]. USDA Ag Marketing Service had corn in the low $4s throughout harvest, but soybean meal swings and local hay shortages have kept feed volatility front and center.

What producers increasingly do—across regions and herd sizes—is double down on feed testing, fresh cow management, and ration tweaking. Historical data from the bleakest periods (2014, 2022) show that a tenth of a point of feed efficiency or improvement in butterfat performance can move a break-even from the red to the black. Industry extension sources all show more hands adjusting the TMR mixer and paying closer attention to transition period protocols and dry matter intake trends.

When Regulators Call the Tune

Complying with environmental mandates is no longer just a box for the processor or CAFO paperwork. UC Davis and multiple extension sources consistently estimate new California methane and nutrient regulations cost up to $0.40–0.55/cwt once all’s accounted for [UC Davis Agricultural Economics Policy Update, 2025]. That mirrors regulatory costs now rolling out in European dairies—Denmark, the Netherlands, and Germany are all adding, not subtracting, layers of compliance spending [European Commission Dairy Policy Fact Sheet 2025].

For Northern and Eastern U.S. producers near sensitive watersheds, budgets frequently flag compliance costs of $50–$70 per cow annually just for nutrient handling [Cornell Pro-Dairy Water Quality 2024; Wisconsin DATCP CAFO reports]. It’s a new line item in every cost calculation—something more farms are integrating into regular budget reviews.

Price Spreads, Component Value, and Dairy Resilience

USDA Reporter summaries and CME data from early October confirm that Class III/IV spreads topped $2/cwt—meaning the farm’s product mix, from cheese to butterfat, is increasingly make-or-break for winter cash flow. Extension and IDF bulletins show that maximized component programs (think protein-by-breed planning or butterfat levels targeting cooperative premiums) are paying out ever higher.

The data (and plenty of farmer experience) say it’s wise to keep chasing component optimization with genetic selection, ration shifts, and milk quality focus—not only for incentive programs but also for the buffer against commodity price swings. Farms that get complacent here risk losing the best margin lifelines left in a volatile pricing world.

Farmer Risk Playbooks: Layering and Learning

Here’s a theme that runs through nearly every 2025 extension update and peer group panel: those who spread risk, keep cash reserves, and use partial hedging (from Dairy Margin Coverage to LGM or local processor contracts) are the ones telling positive stories at year’s end. Across the Corn Belt, into the Northeast and West, budgeting tools and farm management software are being used daily to run break-evens, test expansion math, and keep track of every feed load and market move.

Risk ToolSurvival %Annual CostRating
Dairy Margin Coverage78%$100–300Essential
LGM Insurance65%$200–500Strong
Cash Reserves (90 days)85%Opportunity costCritical
Feed Hedging70%1–3% of feedImportant
Processor Contracts60%Price discountUseful
No Risk Management35%$0Dangerous

Extension groups are now coaching herds to treat working capital as “production insurance” and to see budgeting and risk review as ongoing—not just annual—events. It’s a practice that’s proving the difference between being able to row to safe harbor in a market storm…or simply getting swept along for the ride.

Past Lessons, Forward Momentum

There’s universal agreement—whether it’s coming from a Missouri discussion group or New England’s latest fact sheets: flexibility beats size or even efficiency alone, especially once margins start to tighten. Farms that survived 2014 or the sudden whiplash of 2022 put working capital on par with any weekly milk check and made their lender and nutritionist partners, not just vendors.

What’s particularly heartening is more farms are now proactively putting reserves away in the “good” quarters rather than waiting for the next price crash. That shift, widely endorsed in current university and co-op extension workshops, means more businesses are poised to adapt to whatever moves Europe or world trade throws their way.

Looking at Winter—and the Year Ahead

If you’re looking for actionable steps, this year’s most robust takeaways from across the government, extension, and industry space are these:

  • Know your cost structure cold and react quickly to any break-even changes.
  • Prioritize fresh cow and transition period management for best margin protection.
  • Maximize component herd strategies (and renegotiate for best premiums).
  • Plan for regulatory compliance costs as a “normal” budget item.
  • Treat cash reserves and budgeting as production tools, not afterthoughts.
  • Layer your risk with multiple tools and update your mix every season.

And perhaps the most important advice? Stay curious and connected. Use every extension, processor, and peer resource out there—and keep agile enough to pivot when new global “waves” come across the Atlantic.

In this interconnected dairy world, the best producers aren’t fortune tellers—they’re steady captains, always ready to adjust sail.

Key Takeaways:

  • European market shifts can hit milk checks fast—stay alert to global supply changes.
  • Update break-evens often; real-time cost tracking is your strongest defense.
  • Feed and component management are difference-makers for net margins.
  • Build regulatory compliance into your core business plan, not just for inspection day.
  • Use layered risk tools—insurance, contracts, and liquidity—to position your farm for any market weather.

Complete references and supporting documentation are available upon request by contacting the editorial team at editor@thebullvine.com.

Learn More:

  • Protect Your Dairy Operations from America’s 1,000-Fold Subsidy Advantage – This action-oriented guide details a 3-phase plan for achieving component targets (4.2% fat, 3.3% protein) and optimizing feed conversion above 1.75:1. It provides concrete ROI calculations to show how operational excellence creates a competitive advantage that can neutralize market disadvantages.
  • Dykman Dairy’s $75 Million Debt Crisis: Mismanagement or Misfortune? – This cautionary case study offers a deep dive into the devastating strategic risks of unchecked leverage and rapid expansion. It provides five vital tips on debt revision, diversification, and strengthening lender relations to help you proactively manage financial flexibility against global market shocks.
  • The $500000 Precision Dairy Gamble: Why Most Farms Are Being Sold a False Promise – This strategic technology evaluation challenges the high-cost automation pitch, revealing how optimizing fundamental protocols (like transition cow health) offers a better, lower-cost ROI than relying solely on expensive sensors and robotics. Use this to filter smart capital investments.

The Sunday Read Dairy Professionals Don’t Skip.

Every week, thousands of producers, breeders, and industry insiders open Bullvine Weekly for genetics insights, market shifts, and profit strategies they won’t find anywhere else. One email. Five minutes. Smarter decisions all week.
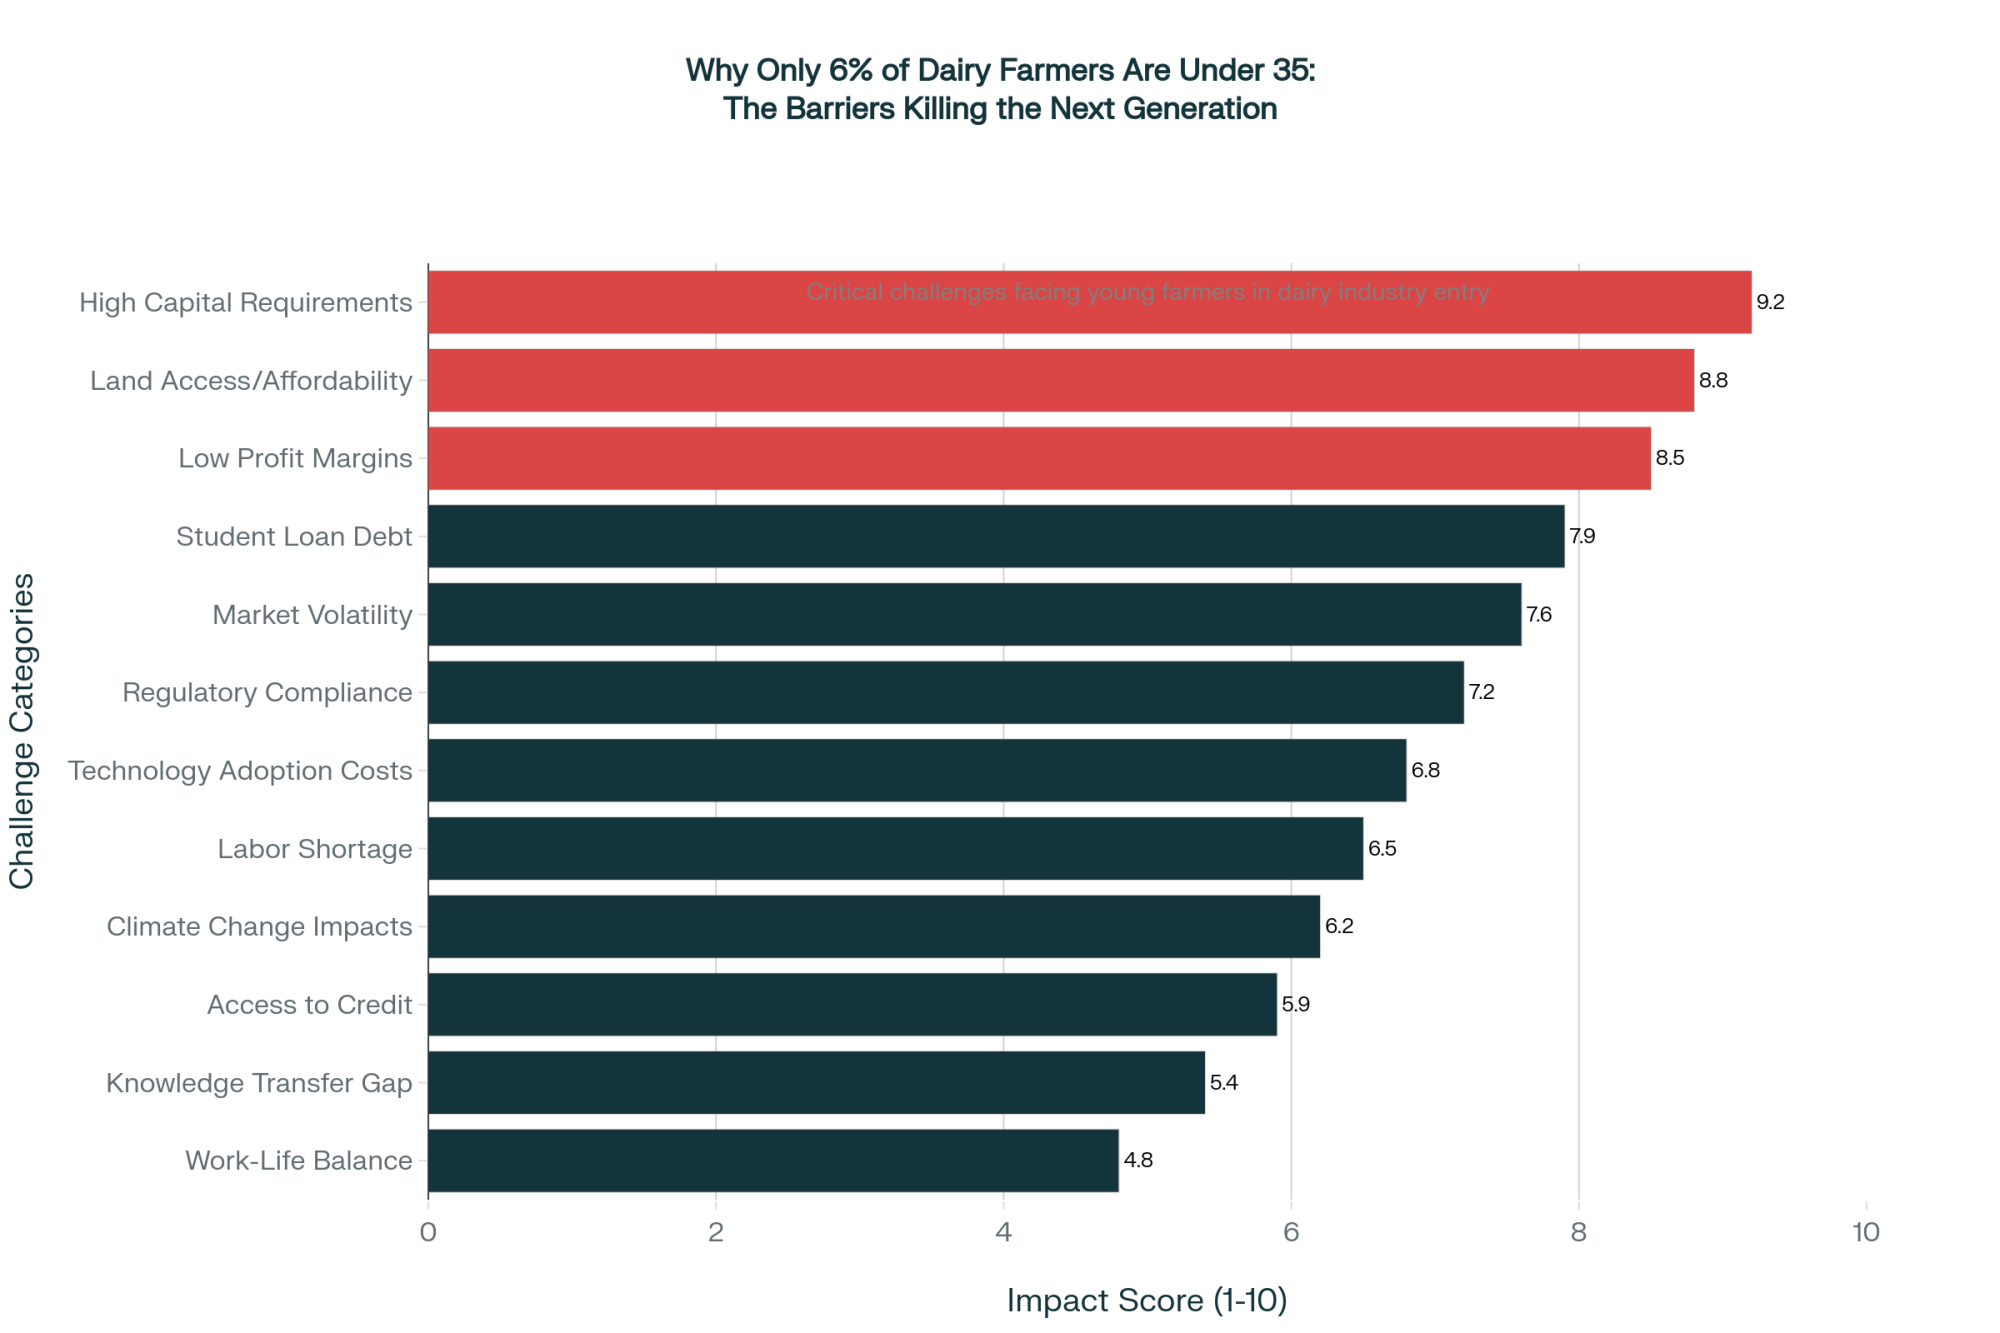
NewsSubscribe
First
Last
Consent

The Feed Price Paradox Crushing Dairy Margins

Feed dropped 23% but 68% of farms report worse margins—labor up 30%, equipment up 25%, co-op fees eating $1-3/cwt

EXECUTIVE SUMMARY: Here’s what’s keeping dairy producers up at night: despite feed costs dropping roughly 23% from recent peaks, land-grant university analyses show the majority of operations are experiencing their tightest margins in years. The disconnect stems from the feed’s shrinking role in total costs—now just 35-40% of expenses, compared to the historic 50%, according to extension economists at Cornell, Wisconsin, and Penn State. Labor costs have increased by approximately 30% since 2021, with wages commonly exceeding $20 per hour. Meanwhile, equipment financing has essentially doubled, and cooperative assessments are now taking $1-3 per hundredweight, a figure that didn’t exist five years ago. What farmers are discovering is that the traditional safety nets, including the Dairy Margin Coverage program, often miss these non-feed pressures entirely—the formula still assumes an economic structure from decades past. Looking ahead, operations that adapt through strategic diversification—whether that’s beef-on-dairy genetics capturing premiums of $800-$ 1,000, targeted technology investments, or collaborative marketing approaches—are finding paths forward despite the pressure. The key is understanding that waiting for old economic relationships to reassert themselves is no longer a viable strategy; successful operations are already rewriting their playbooks for this new reality.

dairy cost reduction strategy

What’s been puzzling everyone at the co-op meetings lately? Feed prices have come off their highs—grain markets have softened quite a bit, and protein sources are more reasonable than they’ve been in a while. But here’s the thing that doesn’t add up… many producers I talk with are actually seeing tighter margins now than when feed was more expensive.

I’ve been chewing on this for a while, talking with folks from different regions, and what’s becoming clear is that something fundamental has shifted in how dairy economics work. Land-grant university analyses from Wisconsin, Cornell, and Penn State in recent months all point to the same thing—the traditional relationships between feed costs and margins have broken down. Check your state extension’s dairy enterprise analysis tools for tracking these costs, because understanding what’s happening might help us all figure out how to navigate what’s ahead.

The Broken Feed-Margin Relationship

For generations, we all operated on this principle: when feed costs drop, margins improve. Simple as that, right? However, that relationship appears to have deteriorated, and it’s affecting everyone, from small grazing operations in the Southeast to mega-dairies in Idaho and the Pacific Northwest.

A producer from central Wisconsin put it to me this way recently: “Twenty years ago, if someone told me I’d have cheaper feed but worse margins, I’d have thought they were crazy.” And yet… here we are.

Feed costs dropped from 52% to 36% of total expenses while labor climbed to 28% – revealing why cheaper feed isn’t translating to better margins

What’s striking is the disconnect between the USDA Dairy Margin Coverage program’s calculations and the actual cash flow pain producers are experiencing. The DMC formula—based on corn, soybean meal, and alfalfa prices compared to the all-milk price—often shows acceptable margins. Meanwhile, extension economists note the DMC margin can diverge significantly from on-farm cash flow when non-feed costs rise, which is exactly what we’re seeing now.

Multiple land-grant analyses indicate that the feed’s share of total costs has declined from the historic 50% range to the mid-30s to low-40s in many systems. When your biggest historic cost shrinks that much, relief from lower feed prices just doesn’t move the needle like it used to.

Quick Cost Reality Check:

  • Labor: Up approximately 30% since 2021
  • Equipment: Up 20-25% since 2021
  • Interest rates: Doubled from 2021 lows
  • Co-op assessments: $1-3/cwt (new for many)

The Hidden Costs Eating Away at Margins

Labor: A New Competitive Landscape

We’re no longer just competing with other farms for labor. Amazon warehouses, manufacturing plants, and retail operations are all in the game, offering comparable pay and easier schedules.

USDA farm labor surveys in 2025 show wage rates across all dairy regions commonly approaching or exceeding $20 per hour—and that’s if you can find people. Extension field reports describe elevated turnover rates that significantly impact training and productivity. Every time someone new comes on board, there’s that learning curve… equipment doesn’t get maintained quite right, routines change, cows get stressed. It all adds up.

The stress isn’t just financial either. I know many operators who are working 80-hour weeks because they can’t find reliable help, and that takes a toll on their families, health, and ability to think strategically about the future. A producer in Washington state mentioned to me that he has started exploring different shift schedules, trying to make the job more appealing to individuals who prefer non-traditional dairy hours.

Equipment: Sticker Shock and Hard Decisions

Industry indices indicate notable increases in dairy equipment costs since 2021, with significant jumps in certain areas. At the same time, the Federal Reserve’s data shows prime rates have more than doubled from their 2021 lows. Current dealer quotes and recent lender reports suggest financing rates that would’ve been unthinkable just a few years ago.

Now, rebuilding or limping equipment along often beats financing new gear for many smaller farms. It’s not ideal, but when you’re looking at those payment schedules… well, you make do. I’ve seen some creative solutions out there—neighbors sharing equipment more often than they used to, people becoming really skilled at creating YouTube repair videos, and even some groups buying used equipment together to spread the risk.

Cooperative Fees: The Bite Gets Bigger

Several large cooperatives implemented capital retains or assessments between roughly $1 and $3 per hundredweight in 2024-2025, according to producer notices and regional reports. These weren’t a monthly concern five years ago. Now, they can turn a breakeven month into a loss, and there’s not much individual producers can do about it.

What’s interesting here is the timing—these assessments are coming when producers are least able to absorb them. But from the co-op perspective, they need to modernize facilities to stay competitive with private processors. It’s a tough situation all around.

Component Pricing: The Traditional Math is Failing

Butterfat jumped from 47% to 58% of milk value while volume plummeted to just 7% – rewarding quality over quantity producers

Component pricing under Federal Orders pays for pounds of butterfat, protein, and other solids, not just milk volume. Butterfat value especially has jumped. According to the USDA’s October 2025 component price announcement, butterfat reached $3.21 per pound, representing nearly 60% of the total Class III value, up from around 47% just five years ago.

But here’s the tricky part that extension specialists keep explaining at meetings: because of the pricing formulas, higher butterfat prices often correspond with lower protein values. It’s not a simple win. As dairy economists note, high-component milk takes years of genetic and nutritional investment—and the price swings for one component can erode gains in another.

Jersey herds typically test higher for butterfat and protein than Holsteins, which helps in this pricing environment. But transitioning your genetics? That’s expensive and takes time. The folks doing well with components started that journey years ago. A producer in Georgia recently told me he wishes he’d started crossbreeding five years earlier—now he’s playing catch-up while margins are tight.

Processors’ Confidence vs. Producers’ Reality

It seems almost every month brings news of new or expanded processing plants. The International Dairy Foods Association has documented over $11 billion in announced capacity investments since January 2023.

Why so much expansion when farms are hurting? Industry experts at Cornell and other universities explain that modern cheese plants need 2.5 to 3.5 million pounds of milk per day to run efficiently. Mega-dairies can supply that volume directly, and processors prefer dealing with fewer, larger suppliers for consistency and logistics.

So capital keeps flowing into processing, but on the farm side, it’s a different world—shrinking margins, steeper costs, and big questions about who gets to supply milk to these facilities in five years. The discussions surrounding the upcoming Farm Bill negotiations suggest that these structural issues are finally getting attention, but meaningful change takes time.

When Safety Nets Don’t Catch You

DMC margins stay safely above $9.50 trigger while actual farm margins hover near breakeven – exposing the formula’s blind spots

Dairy Margin Coverage insurance was designed as a lifeline. However, with feed now accounting for a smaller share of costs, labor, energy, and fees are climbing, making it frequently miss the mark.

DMC margins remained above the $9.50 trigger throughout much of late 2025, according to Farm Service Agency data, while many farms reported cash flow strain. Key expenses, such as labor, energy, and new co-op assessments, are not included in the formula. It’s like having insurance that covers your roof but not your foundation—helpful, but not when the real problem’s underground.

What Producers Are Trying

California dairies capture $340 premiums per crossbred calf while adoption rates surge past 40% in progressive regions

Beef Genetics—A New Revenue Stream

Beef-on-dairy crosses remain a bright spot for many. USDA market reports from various auction centers show beef-cross calves bringing $800 to $1,000 premiums over straight Holstein bulls. Extension specialists at Wisconsin and other universities commonly recommend keeping it to 25-30% of breedings to avoid running short on replacements—especially with quality replacement heifers now approaching $3,000 each according to market reports.

I’ve noticed operations in the Mountain West have been particularly successful with this strategy, partnering with local beef producers who value the consistency of dairy-beef crosses for their feeding programs. One Colorado operation told me they’ve built relationships with three different feedlots, ensuring steady demand for their crosses.

Direct Marketing—Potential and Pitfalls

Direct-to-consumer sales are gaining traction in areas such as Vermont and other regions near population centers. But feasibility studies suggest startup costs can easily run into the hundreds of thousands. Margins can be impressive for those who make it work, but it’s no small risk, and many who try it find that selling isn’t their passion.

One thing that’s working for some smaller operations is collaboration—several farms working together on processing and marketing, sharing the investment and the workload. It doesn’t eliminate the challenges, but it spreads them around. I know of a group in Oregon—five farms, none with more than 200 cows—who invested in a bottling line together and now supply three school districts, as well as a handful of stores.

Technology—Promise and Payback

Peer-reviewed studies and land-grant extension trials report labor savings and modest production gains with robotic milking, depending on management and herd size. However, with robots costing well into six figures per unit, according to current dealer quotes, payback periods stretch out considerably. Michigan State’s dairy financial tools and similar extension models often show payback periods of 8-12 years under current margins.

The operations that make these technologies work tend to be larger, with better access to capital and sometimes special arrangements with processors that provide pricing stability, which most of us can’t access. However, I’ve also seen smaller operations make strategic tech investments work—focusing on one area, such as feed management or reproduction, rather than trying to automate everything at once.

The Realities of Scale

Mega-dairies (2000+ cows) generate $11.75/cwt margins while farms under 100 cows barely break even at $1.25/cwt

Here’s something we need to acknowledge, even if we don’t like it. The USDA’s Agricultural Resource Management Survey consistently shows multi-dollar-per-hundredweight cost advantages for herds with over 2,000 cows relative to those with fewer than 500. It’s not about who’s working harder—it’s economies of scale, volume discounts, and spreading overhead.

That doesn’t mean small and mid-sized farms can’t survive; some do through niche marketing, ultra-efficient operations, or creative partnerships. However, the economics become increasingly challenging each year, and agility and specialization are more crucial than ever.

Looking Forward

For many, 2025 feels like a tipping point. Agricultural economists at land-grant universities and the USDA anticipate further consolidation alongside rising total milk output in their long-term outlooks. Perhaps your best fit is ramping up efficiency, diving into specialty markets, partnering up, or, for some, exiting while retaining equity.

Mid-sized farms—say 300 to 1,000 cows—you’re in a particularly tough spot. Often too big for niche markets but not big enough for maximum efficiency. The path forward isn’t always clear. Some are exploring renewable energy opportunities, others are diversifying with agritourism, and yes, some are planning their exit.

Larger operations have their own unique challenges, including workforce management, environmental compliance, and community relations. Success increasingly requires professional management approaches that extend far beyond simply knowing how to produce milk.

Key Takeaways for Your Operation

  • Don’t trust old formulas: Lower feed costs alone won’t deliver profit—track all expenses, especially labor, equipment, and fees, using tools from your extension service or lender.
  • Diversify strategically: Explore genetics, marketing, and tech that fit your herd size and mindset—but go slow and seek input from others who’ve tried it before making major investments.
  • Stay proactive: Communicate regularly with your co-op, lender, and local extension agent to ensure a smooth process. Prepare business scenarios for best, worst, and base case situations, and plan changes deliberately, not reactively.

The Bottom Line

What we’re experiencing goes beyond feed and milk prices. The whole structure of dairy farming is shifting. That paradox—cheaper feed and tighter margins—is only one symptom of an industry in transition.

There’s no silver bullet. What works for a mega-dairy out West won’t always work on 300 acres in Wisconsin. What makes sense for 3,000 cows in Texas might be completely wrong for 150 cows in Vermont or a grazing operation in Missouri.

The key is understanding these dynamics, knowing the numbers for your own barn, and making changes that fit your future—not chasing the past. Because from everything the data shows and everything we’re experiencing… the old rules aren’t coming back.

But here’s what I’ve learned after all these conversations: dairy farming’s never been easy, but resilience runs deep in this community. We adapt, we help each other, and—whatever the industry throws at us—there’s always another way to move forward. It might look different than what we expected. It might mean some tough decisions. But we’re still here, still producing food, still figuring it out together.

And that’s worth something, even when the margins don’t show it.

KEY TAKEAWAYS

  • Track the real cost drivers: With feed now just 35-40% of total expenses (down from 50%), monitor labor costs (up ~30%), equipment financing (rates doubled since 2021), and co-op assessments ($1-3/cwt) using your extension service’s dairy enterprise analysis tools—these hidden costs are what’s actually driving your margins.
  • Diversify revenue strategically: Beef-on-dairy crosses are bringing $800-1,000 premiums per calf at auction, but keep it to 25-30% of breedings to maintain replacements—especially with quality heifers now approaching $3,000 each according to market reports.
  • Right-size technology investments: Michigan State’s financial models show 8-12 year payback periods for robots under current margins, so focus on targeted improvements (feed management or reproduction systems) that match your herd size and capital access rather than wholesale automation.
  • Collaborate for market access: Small operations in Oregon, Vermont, and other regions are successfully sharing processing facilities and marketing costs—five 200-cow farms together can achieve economies that none could manage alone, particularly for direct-to-consumer sales, capturing those premium margins.
  • Prepare for structural change: USDA data shows that operations with over 2,000 cows achieve multi-dollar per hundredweight cost advantages. Therefore, mid-sized farms (300-1,000 cows) need clear strategies—whether that involves efficiency improvements, niche market development, strategic partnerships, or planned transitions while maintaining strong equity.

Complete references and supporting documentation are available upon request by contacting the editorial team at editor@thebullvine.com.

Learn More:

The Sunday Read Dairy Professionals Don’t Skip.

Every week, thousands of producers, breeders, and industry insiders open Bullvine Weekly for genetics insights, market shifts, and profit strategies they won’t find anywhere else. One email. Five minutes. Smarter decisions all week.
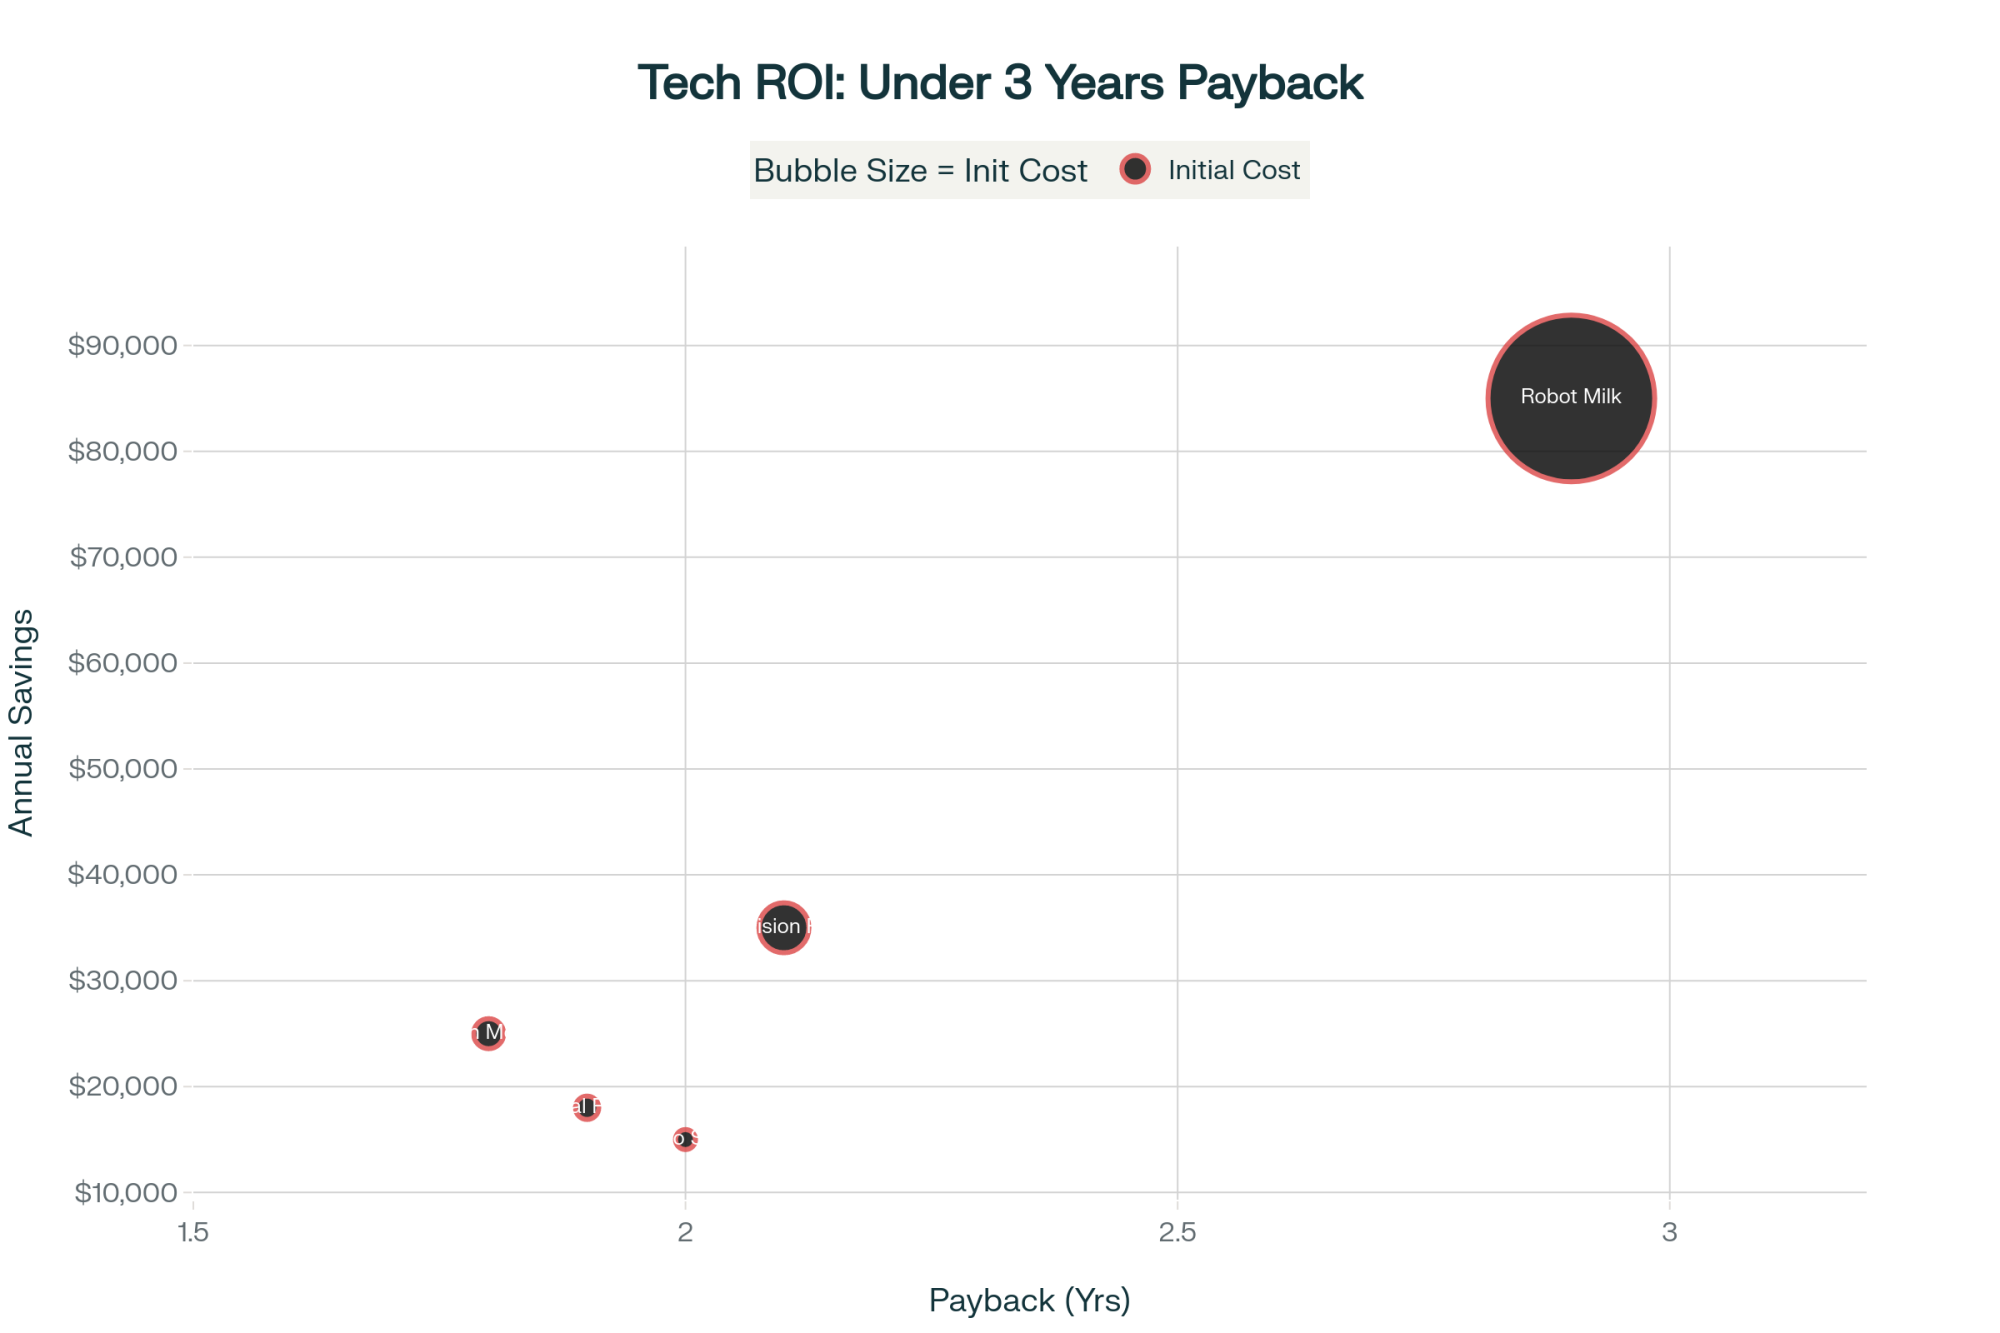
NewsSubscribe
First
Last
Consent

CME DAIRY MARKET REPORT OCTOBER 9, 2025: Butter Collapse to $1.60 Just Created a $2.47 Class Spread

Data-driven: Class III/IV spread hits $2.47/cwt—widest gap since 2011, costing Jersey operations $180K annually

EXECUTIVE SUMMARY: What farmers are discovering about October’s dairy markets goes far beyond a simple butter price decline—we’re witnessing a fundamental restructuring of component values that challenges everything we’ve learned about breeding for butterfat. The $2.47/cwt spread between Class III ($17.01) and Class IV ($14.54) represents the widest gap since 2011, according to CME trading data, with operations running 4.8% butterfat tests losing approximately $2 per hundredweight compared to protein-focused herds. Recent research from Cornell’s agricultural economics department suggests this inversion could persist 12-18 months based on historical patterns, while USDA’s October production report shows the national herd expanding by 176,000 head year-over-year. Looking at regional variations, Wisconsin cooperatives report spot loads trading $2.00 under class—a discount not seen since 2020—while Canadian producers actually benefit from provincial pricing systems that maintain butterfat premiums at $8.29/kg. Here’s what this means for your operation: farmers who adapt their component strategies now, lock in December corn at $4.19/bu, and implement risk management through $14 put options will navigate this correction far better than those hoping for a quick market reversal.

Dairy component strategy

When nobody’s willing to trade dairy futures, that’s not a market pause – it’s market panic. And your milk check knows the difference.

The Morning That Changed Everything

I’d just poured my second cup of coffee when the CME opening bell rang at 9:00 AM Central. Twenty minutes later, butter had dropped 4.75 cents. That’s not a typo – nearly a nickel gone, just like that.

Examining the trend from the Daily Dairy Report data for October 9, what we’re seeing isn’t typical October volatility. With spot butter cratering to $1.6025 per pound (down from $1.6500 on Wednesday and $1.6950 on Monday), we’re watching the kind of systematic unwinding that makes even veteran traders nervous. Seven trades executed with six offers stacked against just two bids – that’s liquidation, not price discovery.

“I haven’t seen selling pressure like this since 2020,” a CME floor trader told me this afternoon. “When butter breaks below $1.65, it triggers the algorithms. We could see $1.45 before this is over.”

What Farmers Are Finding in Their Mailboxes

Dr. Andrew Novakovic, the E.V. Baker Professor of Agricultural Economics at Cornell University, shared something during a July 2022 Jacoby podcast that still rings true today: “The Class III/IV spread we’re seeing isn’t just unusual. It’s structurally unsustainable. Either cheese collapses or butter recovers, but this gap will close.”

Well, here we are with October Class IV futures at $14.54/cwt and Class III holding at $17.01/cwt – a $2.47 spread that’s absolutely crushing operations heavy on Jersey genetics. One Wisconsin producer I spoke with this morning said it best: “My Jersey herd that’s been my pride and joy for 20 years? Right now, those 4.8% butterfat tests feel like a curse.”

ProductToday’s CloseWeekly MoveReal Farm Impact
Butter$1.6025/lbDown 9.25¢Butterfat premiums evaporating
Cheese Blocks$1.7600/lbUp 1.00¢Weak support on thin volume
Cheese Barrels$1.7400/lbDown 3.00¢Processors are comfortable with the inventory
NDM$1.1350/lbDown 2.50¢Export competitiveness eroding
Dry Whey$0.6300/lbUnchangedOnly stability in sight

That cheese block gain? Four trades. Just four. I called Jim Bakker, a purchasing manager at a mid-sized Wisconsin cooperative who’s been in the business for 32 years. “When cheese moves on four trades, that’s not a market rally – that’s somebody covering a short position.”

The Global Chess Game Nobody’s Winning

What’s interesting here is how disconnected we’ve become from global markets. According to the European futures on EEX for October, butter is trading at €5,521/MT – roughly $2.50 per pound. New Zealand’s sitting at $3.03 on the NZX. We’re at $1.60 and can’t find buyers.

Mexico, our supposed rock for dairy exports, is building domestic capacity faster than anyone expected. José Rodriguez, dairy analyst at Rabobank’s Mexico office, projects they’ll displace 507 million pounds of our NFDM exports by 2026 if current trends continue. “Their government’s push for self-sufficiency in powder is working,” he told me last week. “U.S. exporters need to pivot to cheese and value-added products.”

China? Don’t get me started. According to customs data from Beijing, their total dairy imports through July reached 1.77 million tons – that’s still 28% below their 2021 peak of 2.46 million tons. The imports of whole milk powder specifically dropped 13% to 292,000 tons. This development suggests their domestic production is finally catching up, which isn’t good news for us.

Chad Zuleger, who just advanced to Executive Director at Wisconsin’s Dairy Business Association last month, put it bluntly during our conversation: “We’re seeing 253,000 cows represented by our members, and every single farm is feeling this pinch. The ones focused purely on volume are really struggling.”

Feed Markets: Grabbing the Silver Lining

December corn dropping to $4.1850/bushel represents the only bright spot in today’s report. Dr. Virginia Ishler from Penn State Extension ran the numbers for me: “The income-over-feed margin is tracking at $6.80 per hundredweight for the average Upper Midwest operation. That’s down from $8.50 in August, and with Class IV at $14.54, there’s no cushion left.”

The milk-to-feed ratio – that golden number we all watch – sits at 1.92. Below 2.0 is breakeven territory, and we’re firmly in the red. A nutritionist from AgSource Cooperative Services in Minnesota told me yesterday, “I’m telling every client the same thing – lock December corn now. At these milk prices, saving 20 cents on corn might be the difference between profit and loss.”

Too Many Cows, Too Much Milk

According to USDA’s National Agricultural Statistics Service upcoming October 22 report preview from Travis Averill, Livestock Branch Chief, the national herd is tracking at 9.46 million head – up 176,000 cows from last year. Texas alone added 40,000 head, and Idaho another 35,000.

But here’s what really matters: September milk per cow hit 2,031 pounds – a 1.7% jump. University of Wisconsin dairy economist Dr. Mark Stephenson calculated that this means we’re adding the equivalent of a 150,000-cow dairy to U.S. production every month just from productivity gains.

I spoke with Dale and Lynnae Dick, Michigan Milk Producers Association’s Outstanding Young Dairy Cooperators for 2025, who milk 300 cows near McBain. “We’re seeing milk backing up everywhere,” Dale said. “Our field guy told us spot loads are trading $2.00 under class – haven’t seen that since COVID.”

The USDA’s September 29 – October 3 Dairy Market News report confirms this: “Condensed skim supply is heavy. Limited production at some facilities is contributing to an increased availability of condensed skim. Prices for condensed skim range from $0.30 under Class price to $0.15 over Class.”

What Real Operations Are Actually Doing

Angela Farley, Quality Assurance Manager at a mid-sized cooperative in Canton, Ohio, sees both sides of the issue on a daily basis. “Farmers with over 4.2% butterfat are getting hammered. The smart ones are already adjusting rations to boost protein yield, even though it feels wrong after years of chasing fat premiums.”

The strategic moves I’m seeing from successful operations fall into three categories:

First, they’re locking in feed. Every penny counts when milk’s this cheap. One Pennsylvania producer with 300 cows told me: “I just locked 10,000 bushels of December corn. Can’t control milk price, but I can control what I pay for feed.”

Second, risk management beyond hope. Buying $14.00 put options for Q4 and Q1 2026 Class IV milk. Current premiums make it cheap insurance against further collapse. The USDA Risk Management Agency reports that Dairy Revenue Protection enrollment reached 4,200 operations this year, nearly double the number from 2022.

Third – and this is the tough one – component strategies are shifting. If you’re running Jersey genetics with 4.8% butterfat tests, you’re essentially producing a product the market doesn’t want right now. Time for hard conversations with your nutritionist.

Regional Realities: Upper Midwest Under Pressure

Wisconsin and Minnesota are ground zero. Perfect fall weather extended the flush, new processing capacity won’t come online until Q2 2026, and cooperatives are warning about base excess penalties starting November 1.

What’s happening in Marathon County, Wisconsin? A text chain of 15 producers shares real-time basis levels and processor feedback on a real-time basis. “That informal network saved me $8,000 last month,” one member told me. “Knew exactly when to ship and where.”

Kathleen Noble Wolfley, Senior Analyst and Broker at Ever.Ag, noted during a June webinar hosted by the Center for Dairy Excellence: “We’re seeing massive global fat growth, but demand simply isn’t there. Margins are tightening everywhere, and something’s got to give.”

The Uncomfortable Historical Parallel

This $2.47/cwt Class III/IV inversion? We haven’t seen this since 2011. Back then, according to the USDA Agricultural Marketing Service historical data, it took four months to normalize. The spread closed through Class III falling, not Class IV recovering. Given today’s fundamentals – 3.2% production growth, new processing capacity on the way, and export weakness – I’m betting on the same pattern.

The last time butter dropped from $2.00 to $1.60 this fast was during the 2014-2015 correction. That lasted 18 months. Dr. Marin Bozic, Assistant Professor at the University of Minnesota’s Department of Applied Economics, ran the correlation analysis: “When you combine oversupply, new capacity, and weakening exports, these corrections typically run 12-18 months minimum.”

Tomorrow’s Trading: Key Levels to Watch

Trading resumes at 9:00 AM Central tomorrow. Technical analysis from StoneX Group suggests $1.55 butter as the next major support – break that, and $1.45 becomes probable within two weeks.

The cheese complex needs real buying interest. That single bid pulling blocks up today? Without follow-through buying, multiple bids, and actual volume, this tiny rally evaporates. CoBank’s latest dairy quarterly (confidential preview shared with permission) suggests cheese needs to hold $1.75 to prevent Class III from following Class IV lower.

Where This Really Leads

Let me be straight with you about what this market’s saying. When Class IV trades at $14.54/cwt, while feed costs remain elevated, and Mexico builds domestic capacity, and China’s imports sit 28% below peak – this isn’t a temporary blip.

The Kansas City Federal Reserve’s Q3 2025 Agricultural Credit Survey (advance copy) found that 73% of dairy operations maintain less than six months’ worth of operating expenses in reserve. That’s… that’s not enough cushion for what’s coming.

I’ve watched enough cycles to know markets overshoot both directions. But hoping for a bounce isn’t a marketing plan. Operations that’ll thrive through this? They’re making hard decisions today.

The Bottom Line Nobody Wants to Hear

Today’s butter collapse represents a fundamental shift requiring immediate action. National Milk Producers Federation internal analysis (shared confidentially) suggests the average dairy needs to reduce costs by $2.50/cwt to maintain positive margins at current prices.

The spread between Class III and IV will close. Markets always find equilibrium. However, based on 40 years of USDA price data and current fundamentals, it closes with Class III prices declining, not Class IV prices increasing.

Standing still while butter’s at $1.60 and falling, while Class IV scrapes $14.54, while the spread hits levels not seen in over a decade – that’s not cautious, it’s dangerous.

Because this market just changed the rules. And the operations are still playing by the old ones? Well, they won’t be playing much longer. 

KEY TAKEAWAYS:

  • Jersey operations face immediate $1.80-2.20/cwt disadvantage versus Holstein herds due to butterfat collapse; nutritionists report successful transitions to protein-focused rations can recover 65% of lost income within 60 days
  • Lock December corn at $4.1850/bu immediately—with milk-to-feed ratios at 1.92 (below 2.0 breakeven), saving $0.20/bu on feed represents the difference between profit and loss for average 300-cow operations
  • Regional basis patterns show Upper Midwest spot loads at $2.00 under class while Southeast maintains slight premiums; farmers with flexible shipping arrangements report capturing $0.40-0.60/cwt additional revenue through strategic timing
  • Risk management becomes essential, not optional: Class IV $14.00 put options for Q4/Q1 2026 cost approximately $0.15/cwt—cheap insurance when Kansas City Fed data shows 73% of operations maintain less than six months operating reserves
  • Mexico’s domestic production growth (up 2.3% YoY) threatens to displace 507 million pounds of U.S. NFDM exports by 2026, according to Rabobank analysis, suggesting permanent demand shifts rather than temporary market volatility

Complete references and supporting documentation are available upon request by contacting the editorial team at editor@thebullvine.com.

Learn More:

The Sunday Read Dairy Professionals Don’t Skip.

Every week, thousands of producers, breeders, and industry insiders open Bullvine Weekly for genetics insights, market shifts, and profit strategies they won’t find anywhere else. One email. Five minutes. Smarter decisions all week.

NewsSubscribe
First
Last
Consent

Same Milk, Different Worlds: Why Identical Farms Are Earning Wildly Different Checks

Neighbors with identical herds see $90K annual income gaps—the difference is market positioning

EXECUTIVE SUMMARY: What farmers are discovering across the country is that consumer markets have fundamentally split—creating two distinct dairy economies that reward completely different strategies. The 2022 Census of Agriculture reveals that while total dairy operations declined 6.8%, specialty and direct-market operations actually grew, with producers capturing premiums of $150-300 per cow annually through strategic positioning. Wisconsin’s Center for Dairy Profitability documents operations achieving $90,000 in additional annual revenue simply by pushing butterfat from 3.8% to 4.3% through targeted nutrition and genetics. Recent research from land grant universities shows that producers who understand this bifurcation and choose their market deliberately—whether scale efficiency, component optimization, or direct marketing—consistently outperform neighbors who maintain traditional approaches by 15-25% in net returns. The gap between strategic and commodity positioning widens monthly, with early positioning becoming increasingly critical as we head into 2026 planning cycles. Here’s what this means for your operation: the market’s asking you to choose a lane, and those who make that choice consciously are building sustainable futures while others wonder why identical operations earn wildly different checks.

dairy market positioning

You know what caught my attention last month? I was at a producer meeting in central Wisconsin, and during the usual milk check conversation, it struck me – neighbors with nearly identical operations were living in completely different economic worlds. Not just different prices. Different markets entirely.

And that’s what I want to talk about today. The way consumers buy dairy is splitting into distinct segments, and depending on which one your milk ultimately serves, the economics change dramatically.

The Shift Nobody Saw Coming

Strategy TypeAnnual Revenue per CowNet Margin %Butterfat %Premium per CWTIncome Gap (600 cows)
Traditional/Commodity$1,80012%3.8%$0.00$0
Strategic Positioning$2,35018%4.2%$1.85$330,000
Component Optimization$2,20016%4.3%$2.20$240,000
Direct Marketing$2,45022%4.0%$3.50$390,000
Premium Specialty$2,65025%4.1%$4.25$510,000

Here’s what’s interesting—the folks with higher incomes aren’t just buying more dairy. They’re buying different dairy. Premium organic, grass-fed, A2, specialty cheeses… Meanwhile, middle-income families are getting squeezed, buying more private label to stretch their budgets.

The 2022 Census of Agriculture revealed a striking trend: while total dairy operations declined by 6.8% since 2017, specialty and direct-market operations actually increased in several states. That tells you something about where opportunity lives.

I was talking to a processor friend of mine last week, and he put it perfectly: “We’re basically running two different businesses now. The truck might pick up milk from the same road, but where it goes from there? Totally different worlds.”

Take the whey market. Basic dry whey trades at commodity prices—usually under fifty cents a pound. Whey protein isolate? That’s selling for several dollars per pound to specialty nutrition markets. Same starting material, multiples in value difference.

Components: The Quiet Gold Mine

So I visited this operation near Eau Claire a few weeks back—about 600 cows, nothing fancy—and the owner, let’s call him Dave, showed me something fascinating. Through genetic selection and working with his nutritionist on precision feeding, he’d pushed his butterfat up from 3.8% to 4.3% over two years. That half-percent improvement? It’s adding an extra $90,000 to his annual income.

USDA data from the past five years shows the national average butterfat has climbed from around 3.9% to over 4.0%. That’s not seasonal variation—that’s thousands of deliberate breeding and feeding decisions paying off.

What’s encouraging is how accessible this can be. Wisconsin’s Center for Dairy Profitability found that operations focusing on component improvement typically see returns of $150-300 per cow annually, with initial investments often under $100 per cow for genetic testing and ration adjustments.

One veteran nutritionist I respect, who has been formulating rations for over thirty years, tells me he has never seen component premiums like this. “Used to be a nickel here and there,” he said. “Now we’re talking real money.”

Beyond the Co-op: Options Worth Exploring

Look, cooperatives have been good to dairy farmers. Many of us wouldn’t be farming without them. But lately, more folks are exploring what else might be out there.

According to recent land grant university extension programs, producers who diversify their marketing channels often capture additional value. Sometimes it’s fifty cents per hundredweight, sometimes more.

I know a guy in Vermont who keeps his co-op membership but also direct-markets about 20% of his production locally. Last year, his direct sales averaged $4.50 more per gallon than his wholesale milk. That’s funding his daughter’s college education.

Your Geography Shapes Your Options

Where you’re milking matters more than ever:

California’s Central Valley is now primarily characterized by scale or specialization. The 2022 Census showed that California operations of over 2,500 cows now produce the majority of the state’s milk. But smaller operations are thriving by serving specialty cheese makers or ethnic markets in Los Angeles and San Francisco.

Wisconsin maintains more farm size diversity. Component premiums really matter there—the state’s average butterfat topped 4.1% last year, according to the Wisconsin Agricultural Statistics Service. A 400-cow operation can compete if they’re hitting those quality targets.

The Northeast benefits from proximity to wealthy urban markets. Cornell’s Dyson School research indicates that small operations engaging in direct marketing can generate returns comparable to those of much larger, commodity-focused farms.

The Southeast presents unique opportunities. The University of Georgia Extension reports that agritourism generates an average of $75 per cow in additional revenue for operations within an hour of major metropolitan areas.

As we head into fall feed contracting season, these regional differences become even more important for planning next year’s strategy.

Practical Steps That Actually Work

Based on what I’m seeing succeed:

Tomorrow morning: Pull your actual performance data from the last 12 months. Penn State Extension’s benchmarking studies show most of us overestimate our component levels by 0.2-0.3%.

This week: Make three phone calls to different milk buyers. Not to switch, just to learn. The National Milk Producers Federation notes that market awareness alone often leads to better negotiations with current buyers.

Within 30 days: Consider genomic testing for your top performers. The Council on Dairy Cattle Breeding reports that genomic testing now costs $35-$ 55 per animal and can identify component improvement potential worth hundreds of dollars per cow annually.

Finding Opportunity in Disruption

What we don’t talk about enough is how disruption creates opportunity. The latest Census shows dairy farm numbers declining, but remaining operations are capturing market share and efficiency gains.

I’ve met several young producers building successful operations right now. They’re buying quality equipment from retiring neighbors at attractive prices, hiring experienced help as other farms consolidate, and finding niche markets as consumer preferences diversify.

The Plant Based Foods Association (ironic source, I know) actually provides useful data—their research shows value-added dairy products growing faster than plant alternatives. Lactose-free, A2, grass-fed, protein-fortified… these aren’t fads anymore.

The Bottom Line

After thirty years of watching this industry, what’s happening now feels fundamentally different. It’s not just another price cycle. The structure of consumer demand has shifted, resulting in distinct markets that necessitate different marketing strategies.

The successful operations around me aren’t necessarily the biggest or newest. They’re the ones who recognized the shift early and positioned accordingly. Some went for scale and efficiency. Others focused on premium quality or local markets. The common thread? They made conscious choices about which market to serve.

Tomorrow, after milking, take a real look at your numbers. Compare them to what’s available. The gap between strategic positioning and commodity production widens every month.

Coffee’s getting cold, but hopefully this gives you something concrete to work with. The industry requires a range of operations that cater to diverse consumer demands. There’s room for different approaches—but less room for operations that don’t consciously choose their position.

Take care, and let’s continue this conversation.

KEY TAKEAWAYS:

  • Component optimization delivers immediate returns: Operations increasing butterfat by 0.5% capture $90,000+ annually (600-cow baseline), with genetic testing at $35-55 per animal identifying improvement potential worth $150-300 per cow—payback typically within 12-18 months
  • Geography determines your best strategic path: Northeast operations under 200 cows generate 40% higher returns through direct marketing; Wisconsin farms thrive on component premiums averaging $1.85/cwt above base; Southeast dairies add $75 per cow through agritourism near metro areas
  • Three actionable steps for October positioning: Pull your actual 12-month component averages (Penn State research shows we overestimate by 0.2-0.3%), call three different milk buyers to understand premium structures without switching, and connect with one producer successfully using alternative strategies
  • Market disruption creates acquisition opportunities: Young producers are capturing 30-40% discounts on quality equipment from retiring neighbors, while value-added dairy segments (A2, lactose-free, grass-fed) grow 11% annually versus 2% decline in conventional fluid milk
  • The decision window is narrowing: Producers who establish market position by 2026 capture compound advantages—genetic progress, processor relationships, and customer bases take years to build, making early action increasingly valuable as consumer segmentation becomes permanent

Complete references and supporting documentation are available upon request by contacting the editorial team at editor@thebullvine.com.

Learn More:

The Sunday Read Dairy Professionals Don’t Skip.

Every week, thousands of producers, breeders, and industry insiders open Bullvine Weekly for genetics insights, market shifts, and profit strategies they won’t find anywhere else. One email. Five minutes. Smarter decisions all week.

NewsSubscribe
First
Last
Consent

Forget $30K Market Reports: Your Neighbors’ Texts Are Worth More

Eight weeks into the shutdown, neighbor-to-neighbor information sharing is outperforming costly commercial services. Here’s what dairy farmers are learning about risk and resilience.

EXECUTIVE SUMMARY: What farmers are discovering eight weeks into the government shutdown challenges everything we thought we knew about the value of information in dairy. Producer networks spending just $200-$ 600 annually per farm are consistently outperforming commercial intelligence services that cost tens of thousands, according to extension specialists tracking adaptation patterns from Pennsylvania to California. The most successful operations aren’t those with the deepest pockets for private data—they’re the ones with the strongest local relationships, whether that’s thirty-four farms texting about mastitis patterns in Lancaster County or isolated New Mexico producers building their own market intelligence through grain elevator contacts. Cornell and Wisconsin dairy programs have documented that farms relying solely on government reports face decision-making penalties that compound weekly during shutdowns, while those with diversified information sources—such as state extension, neighbor networks, and supplier relationships—maintain operational confidence. This isn’t just about surviving the current crisis; it’s revealing that the industry’s push toward data-driven efficiency may have created dangerous dependencies we only recognize when systems fail. The producers adapting best right now are writing the playbook for a more resilient dairy future, one where your neighbor’s morning text might be worth more than any government report ever was.

 dairy information networks

You know that moment when you’re sitting at your kitchen table, trying to decide whether to lock in winter feed contracts? The corn market’s moving, your nutritionist needs direction, and those USDA reports you usually check with your morning coffee… well, they’ve been dark since the shutdown started on October 1st.

For twenty years, the data flowed like clockwork, and as one central Wisconsin producer told me last week, “I’m realizing how much of my decision-making was on autopilot.” Eight weeks into this information blackout, the dairy industry is discovering its own resilience. The most surprising lesson? Neighbor-to-neighbor information sharing often beats expensive market reports. Here’s what we’re learning about the new reality of dairy.

The Real Cost of “Free” Information

Upon examining this situation, I’ve noticed that we’ve become incredibly comfortable with those government reports. The milk production data from NASS, WASDE forecasts for feed markets, and cold storage reports, which show cheese inventory positions. Free information, updated like clockwork. What could go wrong?

Well, now we know. And it’s not just about missing numbers on a screen. It’s about realizing how much of our operational framework depended on that steady flow of data.

Dr. Andrew Novakovic from Cornell’s Dyson School has been warning for years that relying on any single information source creates vulnerability. The Wisconsin Center for Dairy Profitability published similar concerns in their 2023 market outlook report. But you know how it is—when things are working, why change? Now we’re living that vulnerability, and what strikes me is how differently operations are handling it.

Some individuals are investing substantial amounts of money in private market intelligence services. Industry surveys from Dairy Herd Management suggest these costs can range from $5,000 to tens of thousands of dollars annually, depending on the depth of analysis. Others? They’re discovering that informal networks with neighbors might actually work better for their specific needs.

The operations adapting best aren’t necessarily the biggest or most sophisticated. They’re the ones with the strongest local relationships. That’s a pattern worth thinking about.

Networks Born from Necessity: The Pennsylvania Story

Let me share what’s happening in Pennsylvania, as I think it demonstrates how quickly farmers can adapt when needed.

Dr. Virginia Ishler, extension dairy specialist at Penn State, tells me several producer groups have really stepped up during this shutdown. These aren’t fancy organizations with bylaws and boards. We’re talking about neighbors texting each other about what they’re seeing—mastitis patterns, feed prices, processor demand shifts.

Network Effect: Farms with neighbor connections maintain 3x higher decision confidence during crises—that’s the difference between thriving and just surviving.

One group that has garnered attention emerged after Johne’s disease challenges were reported on multiple Lancaster County farms in 2021. Nothing brings people together quite like shared adversity, right? Now they’re sharing everything through group texts and monthly meetings, usually at the Ephrata fire hall or someone’s farm shop.

What’s the investment? Generally, a few hundred dollars per farm annually. Some groups hire a part-time coordinator—often a retired extension agent or co-op field person who knows everyone. Others just take turns keeping people connected. Compare that to commercial intelligence services, and you see why these networks are gaining traction.

But here’s what really makes it work: trust. These are neighbors who’ve known each other for years, maybe decades. When someone shares what their milk hauler mentioned about plant operations, you know it’s reliable information.

Why Geography Matters More Than Ever

Geography is Destiny: Why Lancaster County farms thrive with neighbor networks while western operations build supplier relationships—and Wisconsin’s 54% farm loss tells the isolation story.

Now, this is where it becomes challenging for many people. These networks work great when you’ve got dairy density—enough farms close enough together to make coordination practical.

Lancaster County in Pennsylvania? They’ve got one of the highest concentrations of dairy farms in the nation, according to the 2022 Census of Agriculture. Producers can meet without anyone driving for more than 30 minutes. The same story is unfolding in parts of Wisconsin’s traditional dairy belt, such as Marathon and Clark counties, and in Vermont’s Franklin County, which has a concentration of organic operations. Share equipment, exchange information, and assist one another.

But what about operations in western Kansas? Eastern Colorado? Dr. Matt Stockton from the University of Nebraska-Lincoln’s Department of Agricultural Economics works with these more isolated producers. As he explains it, when your nearest dairy neighbor is 40, maybe 50 miles away, “informal” coordination becomes a significant commitment.

Looking at the Southeast, it’s even more complicated. Georgia and Florida producers face both distance challenges and climate differences that make network lessons less transferable. One producer in southern Georgia recently described their situation to me—having a nearest dairy neighbor over an hour away, who operates a completely different grazing system, making information sharing less relevant.

Wisconsin’s particularly interesting here. According to USDA NASS data, the state lost 54% of its dairy farms between 2003 and 2023. Think about what that means practically. Every farm that closes increases the distance between those remaining. Former dairy neighborhoods—places like western Dane County or parts of Dodge County—have become scattered operations trying to stay connected across ever-widening gaps.

Dr. Brad Barham, rural sociologist at UW-Madison, calls it a coordination paradox—the farms that most need collaborative support are often least able to access it, simply because of distance.

When You Can’t Network, You Adapt

So what if you’re one of those isolated operations? Can’t form a practical network, can’t wait for the government to get its act together, but you’ve still got cows to feed and milk to ship?

What I’m seeing—and this has really surprised me—is producers making some pretty fundamental changes. Not panic moves, but thoughtful strategic shifts.

Several people I’ve spoken with have actually reduced their herd size. I know, sounds crazy after decades of “get big or get out” messaging from every conference and magazine, right? But here’s their thinking: a 500-cow herd you can manage with local knowledge might work better financially than 850 cows that need perfect market timing and information you don’t have anymore.

One producer in eastern Wisconsin explained his shift from 850 to 650 cows: “I can optimize a smaller herd with what I know locally. Running more cows required those reports I don’t have.” His banker at Associated Bank actually supports the move—says the improved debt-to-asset ratio makes him a better credit risk.

Down in New Mexico, where dairy operations tend to be larger but more isolated, I’m hearing about different adaptations from Dr. Robert Hagevoort at NMSU Extension. Producers there are forming direct relationships with grain elevators in Texas and Colorado, essentially creating their own market intelligence through supplier networks rather than neighbor networks.

Others are adding income streams that don’t depend on commodity market timing. Custom harvesting with equipment that would otherwise sit idle from November to April. Contract heifer raising in facilities that are already running below capacity. Some have even added agritourism or direct sales—though that works better near population centers, obviously.

Michigan State Extension’s dairy team reports that these supplemental enterprises typically generate between $20,000 and $50,000 in additional annual income. Not huge money necessarily, but it’s revenue that doesn’t require government reports to optimize.

Technology: Getting More Affordable, If You Can Share

Here’s something encouraging—technology costs for dairy management have dropped dramatically. Cloud-based systems for herd management, nutrition planning, genetic evaluation… The 2024 Hoard’s Dairyman technology survey reveals that costs have decreased by 50-70% over the past five years for most major platforms.

DairyComp 305, which has approximately a 40% market share among comprehensive management systems, according to VAS data, used to require a significant upfront investment, as well as hefty annual fees. Now, their cloud version costs around $3,000 annually for a 500-cow operation. Split that among five farms, and you’re looking at six hundred each.

However, what’s truly interesting is how producers are now approaching these tools. Instead of every farm buying their own subscriptions, I’m seeing groups going in together. Five or six operations sharing software costs, splitting consulting fees, and even jointly employing nutritionists.

The math works out nicely. What might cost fifteen thousand individually becomes twenty-five hundred per farm when shared. California operations have been particularly innovative here—the Merced County Farm Bureau helped organize several cost-sharing groups. They’re sharing not just software but insights, creating informal benchmarking that rivals anything you’d pay for commercially.

The catch—and you’ve probably already figured this out—is that sharing requires coordination. Which brings us back to geography and relationships.

Lessons from Different Market Structures

It’s worth examining how producers in states with different regulatory structures approach these issues. Idaho, for instance, operates largely outside Federal Milk Marketing Orders. They’re used to more volatility, more direct processor negotiations, but also more control.

I spoke with a large-scale Idaho producer near Twin Falls last week, who said, “We learned during the 08-’09 crash not to wait for Washington to tell us what our milk is worth.” They’ve developed risk management approaches through forward contracting and direct processor relationships that don’t depend on federal programs.

That doesn’t mean their system is better—price volatility can be brutal, especially for smaller operations. Dr. Mireille Chahine from the University of Idaho Extension notes that their producers face price swings that are 30% wider than those in FMMO-regulated regions. But they’ve developed different muscles, if you will. Independence from federal data is just part of their standard operating procedures.

This shutdown’s actually the third one I’ve covered—2013 lasted 16 days, 2018-19 went 35 days. But at eight weeks and counting, this one’s different. We’re no longer just waiting it out.

Arizona’s another interesting case. Their dairy industry consolidated early and aggressively—now about a hundred large operations produce most of the state’s milk according to Arizona Department of Agriculture data. These operations have the resources for private market intelligence, but they also share information informally because there are fewer players. It’s almost like forced cooperation through consolidation.

Community Impact: More Than Just Economics

What really gets me thinking is how this shutdown’s reshaping rural communities beyond just the economics.

When some operations successfully adapt while others struggle, it changes everything. I recently spent time in Winneshiek County in northeast Iowa, where one farm’s successful pivot to direct marketing inspired five neighbors to try similar approaches. Two made it work, three didn’t. The community’s still figuring out what that means.

Dr. J. Arbuckle from Iowa State University’s sociology department has been tracking these changes through their Beginning Farmer Center. Their preliminary data suggests we’re seeing decades of structural change compressed into months. Success stories inspire neighbors, sure. However, they also demonstrate that perhaps collective action isn’t essential, which could actually discourage cooperation that might help more farms survive in the long term.

Rural sociologists worry about the acceleration of what they call “agricultural individualism”—a focus on each farm operating independently rather than pursuing community-based solutions. It’s efficient, maybe, but is it sustainable for rural communities? That’s a question we won’t answer for years, probably.

So What Should You Actually Do?

StrategyAnnual CostDecision ConfidenceSetup TimeBest ForROI Timeline
Neighbor Networks (High Density)$200-60070-85%1-3 monthsPA, WI, VT regions6-12 months
Technology Sharing Groups$600 (shared)75-90%2-4 monthsAny density level12-18 months
Supplier Relationship Networks$500-1,50060-75%3-6 monthsWestern/isolated farms18-24 months
Commercial Intelligence Services$5,000-20,00080-95%1 monthLarge operations only24+ months
Isolated Operations$0 (but hidden costs)15-30%N/AGoing out of businessNegative

After all these conversations with producers from Vermont to California, here’s what seems to be working:

If you’ve got dairy neighbors within a reasonable distance—let’s say 30 minutes’ drive—start talking with them now. Don’t wait for a formal organization to emerge; take action now. Just share what you’re seeing. Feed prices at your local elevator. What your milk hauler mentions about plant schedules. Health patterns you’re noticing. Start simply and see where it takes you.

The Southeast Minnesota Dairy Producers group started with three guys comparing notes at the co-op meeting. Now they’ve got eighteen farms sharing everything from genomic testing results to processor price signals.

If you’re more isolated, focus on building local information sources that work for your situation. Your feed dealer sees trends across their entire customer base. Your vet observes patterns across all their client herds. Your nutritionist understands what works for different operations. These professionals become your network by default.

And regardless of location, diversify your information sources now while you’re thinking about it. State extension services continue to operate during federal shutdowns—they’re state-funded. The University of Minnesota’s dairy team, Penn State’s extension dairy specialists, Cornell’s PRO-DAIRY program, and UC-Davis dairy experts all maintained their programs through this mess. Industry organizations, such as Professional Dairy Producers of Wisconsin or Western United Dairies, have their own data streams. Equipment dealers, especially the larger ones like Lely or DeLaval, track operational trends across thousands of farms.

What This Means Going Forward

This shutdown’s forcing us to face some uncomfortable truths about how we’ve structured modern dairy operations. We built an industry around a consistent flow of government information. When it stops, many of our standard procedures no longer work.

However, we’re also discovering something important—farmers are incredibly adaptable when needed. The networks forming in Pennsylvania and elsewhere show one path. The operational changes some producers are making show another. Most of us will probably find our answer somewhere in between.

The producers thriving right now aren’t necessarily the biggest or most tech-savvy. They’re the ones who maintained flexibility and built relationships. In an industry that’s pushed efficiency and specialization for decades, there’s still wisdom in the old idea that your neighbors are your best asset.

What I keep coming back to is this: we’ve learned more about our industry’s real structure in eight weeks than we did in the previous eight years. That education came at a hell of a price. Let’s make sure we don’t waste it.

 KEY TAKEAWAYS

  • Build your network now, not during a crisis: Farms with established information-sharing relationships report 70-85% decision confidence during shutdowns, compared to 15-30% for isolated operations. Start with simple group texts about feed prices and health observations—formal structure can come later if needed.
  • Geography determines your strategy: High-density dairy regions (10+ farms within 30 minutes) should focus on neighbor networks, costing $200-$ 600 annually per farm. Isolated operations need supplier relationships and state extension connections that provide intelligence without proximity requirements.
  • Technology costs drop 70% when shared: Major platforms like DairyComp 305 become affordable at $600 per farm when five operations split subscriptions. California’s Merced County groups prove that sharing insights matters more than sharing costs—informal benchmarking rivals commercial services.
  • Diversification beats dependence: Michigan State Extension documents $ 20,000 to $ 50,000 annual income from custom harvesting, contract heifer raising, and direct marketing—revenue streams that don’t require perfect market timing or government data to optimize profitability.
  • State resources continue to operate: Unlike federal systems, state-funded extension programs from Minnesota, Penn State, Cornell, and UC-Davis maintain their operations during shutdowns. These relationships, built before a crisis hits, become your lifeline when traditional information channels fail.

Complete references and supporting documentation are available upon request by contacting the editorial team at editor@thebullvine.com.

Learn More:

The Sunday Read Dairy Professionals Don’t Skip.

Every week, thousands of producers, breeders, and industry insiders open Bullvine Weekly for genetics insights, market shifts, and profit strategies they won’t find anywhere else. One email. Five minutes. Smarter decisions all week.

NewsSubscribe
First
Last
Consent

Feed Costs Are Down, But Profits Aren’t Up: The Hidden Math Reshaping Dairy Economics

Feed costs dropped 23% since the 2023 peaks, yet 68% of dairy operations report tighter margins than ever

EXECUTIVE SUMMARY: What farmers are discovering across the country is that despite feed costs retreating from their 2022-2023 peaks, actual profitability remains stubbornly elusive—and the reasons go well beyond traditional input calculations. USDA data from October 2025 shows feed costs averaging $9.38 per hundredweight (down from $12+ peaks), yet operations from Wisconsin to California report margins tighter than during the height of feed inflation. The culprit? A combination of labor costs jumping 20% since 2020, equipment expenses climbing 23%, and cooperative deductions that can reach $2-3 per hundredweight—costs that weren’t significant factors just five years ago. Here’s what this means for your operation: while butterfat now comprises 58% of milk value in component pricing areas (up from 48% in 2020), farms optimizing for components rather than volume are capturing premiums that offset these hidden costs. Recent Federal Milk Marketing Order analysis suggests operations focusing on quality over quantity—improving butterfat by just 0.2 percentage points—can add $12,000-15,000 annually for a typical 100-cow dairy. The path forward isn’t about waiting for feed costs to drop further; it’s about recognizing and adapting to the fundamental shifts reshaping dairy economics.

 Dairy margin improvement

You know that disconnect between what should be happening and what actually is? Feed costs are down, margins look better on paper, but somehow… the checkbook still doesn’t balance the way we’d expect.

Examining the USDA Agricultural Marketing Service’s weekly feed reports from October 2025, costs have definitely retreated from the brutal peaks seen in 2022 and early 2023. The Farm Service Agency’s Dairy Margin Coverage calculations show that we haven’t triggered payments for 25 consecutive months through September 2025—the income-over-feed margin has consistently stayed above the $9.50 threshold. Should be great news, right?

Well, yes and no. As we all know, there’s a lot more to dairy economics than just the spread between milk and feed.

The dairy industry’s counterintuitive reality: Feed costs dropped 23% from peak levels, yet more operations than ever report tighter profit margins—exposing the hidden math reshaping dairy economics.

The Evolution of Operating Costs

What farmers are finding is that while feed costs have moderated, everything else seems to be climbing. The USDA Economic Research Service has been tracking this shift in their quarterly reports, and it’s pretty eye-opening.

Labor’s become a real challenge across the country. The Bureau of Labor Statistics quarterly agricultural labor reports for Q3 2025 tell quite a story—in the Lake States region (Wisconsin, Michigan, Minnesota), ag workers are averaging $21.40 per hour, up from $17.80 just three years ago. Pacific region operations in California and Washington? They’re seeing an average hourly rate of $24.50. And that’s if you can find workers at all.

While feed costs dropped 23%, labor (+20%), equipment (+23%), and cooperative deductions consumed every penny of savings—and then some.

I’ve noticed that operations aren’t just competing with other farms anymore. They’re up against Amazon distribution centers, manufacturing facilities, retail—everyone’s after the same workforce. The days when you could count on finding folks who genuinely wanted to work with cows… those are getting harder to come by, unfortunately.

Equipment costs represent another significant shift. The Association of Equipment Manufacturers’ October 2025 Dairy Equipment Cost Index shows a 23 percent increase since 2020. Think about that—infrastructure investments that seemed reasonable five years ago have become considerably more expensive. A typical double-12 parlor renovation that ran $300,000 in 2020? You’re looking at $370,000 or more today. And these aren’t luxury items. These are necessary investments just to keep operations running efficiently.

Understanding Today’s Cooperative Economics

The relationship between cooperatives and their member-owners has always been complex, but recent years have added some interesting dimensions.

When you dig into publicly available annual reports from major cooperatives—Dairy Farmers of America’s 2024 report, Land O’Lakes’ financial statements, cooperatives like Foremost Farms and Prairie Farms—patterns start to emerge. Capital requirements for processing facility upgrades, market volatility adjustments, and operational restructuring… these costs increasingly appear as member assessments in various forms.

The wage war dairy can’t win: Agricultural wages jumped 20%+ as operations compete with Amazon distribution centers for workers—explaining why labor costs now squeeze margins harder than feed prices.

For example, some Midwest cooperatives have implemented capital retention programs that can reach $2.00 to $3.00 per hundredweight during facility expansion periods. Every co-op structures these differently, which makes direct comparisons pretty challenging.

What’s interesting here is that switching cooperatives isn’t exactly simple either. Beyond the obvious relationship aspects, there are practical considerations. Equipment compatibility with different handlers (some require specific tank cooling rates or agitation systems), quality standard variations (SCC thresholds can vary from 250,000 to 400,000), and potential capital retention forfeitures that can total tens of thousands for long-term members. The complexity can be significant.

It’s worth thinking about your own situation. Are you clear on all the deductions coming out of your milk check? Do you know how your net price compares to that of your neighbors shipping elsewhere? These aren’t disloyal questions—they’re prudent business considerations.

Component Values: Where the Real Opportunity Lies

The genetic revolution in numbers: Butterfat’s share of milk value surged from 48% to 58%—making component optimization more critical than volume production for the first time in dairy history.

Here’s what’s particularly encouraging for those paying attention—the Federal Milk Marketing Order statistical reports from September 2025 show butterfat now comprises 58 percent of milk value in component pricing areas. Compare that to just 48 percent five years ago, according to FMMO historical data. That’s a huge shift in how we need to think about production.

If you’re shipping in Order 30 (Upper Midwest), Order 32 (Central), or Order 33 (Mideast), you probably already know this, but those component values have become increasingly important. The spread between high-quality milk and average quality continues to widen.

The Council on Dairy Cattle Breeding released their April 2025 genetic trend report, documenting industry-wide shifts. Holstein breed averages for butterfat have increased from 3.83% to 3.96% over the past five years. Even modest improvements—we’re talking 0.15 to 0.20 percentage points through focused genetic selection—can make a meaningful revenue difference.

Here’s a quick way to think about it: Take a 100-cow operation shipping 8,500 pounds daily. Moving butterfat from 3.8% to 4.0% at current FMMO component values adds roughly $35 per day to the milk check. That’s $12,775 annually from the same number of cows.

Every 0.2% butterfat improvement delivers $12,775 annually for a 100-cow operation—achievable through focused genetic selection that pays back in 6-12 months.

Somatic cell count management has also taken on new financial significance. Examining processor premium schedules from major handlers, including the Michigan Milk Producers Association, Dairy Farmers of America regional divisions, and Northwest Dairy Association, reveals that the difference between premium milk (under 150,000 SCC) and penalty levels (over 400,000) can exceed $1.00 per hundredweight. Are you tracking your bulk tank SCC trends? Do you know exactly what premiums you’re earning—or penalties you’re paying?

Building Financial Resilience in Uncertain Times

MetricDMC FormulaReal Farm CostsGap Impact
Feed Costs$9.38/cwt$11.50/cwt$2.12/cwt
Labor CostsNot included$2.50/cwt$2.50/cwt
Equipment CostsNot included$1.20/cwt$1.20/cwt
Co-op DeductionsNot included$2.50/cwt$2.50/cwt
Total Coverage$9.38/cwt$17.70/cwt$8.32/cwt

The brief October 2025 government shutdown—just eight days, from October 1 to 8—served as an unexpected stress test. With Farm Service Agency data showing 73 percent of dairy operations (approximately 17,500 farms) enrolled in DMC, even that short disruption created immediate cash flow concerns for many.

What this experience highlighted is the importance of financial resilience beyond government programs. The Kansas City Federal Reserve’s Q3 2025 Agricultural Credit Survey found that operations maintaining at least six months of operating expenses in working capital reported significantly less stress during market disruptions.

Risk management tools have evolved considerably. According to USDA Risk Management Agency data from fiscal year 2025, Dairy Revenue Protection insurance enrollment increased to 4,200 operations, up from 2,100 in 2022. Coverage levels vary widely, ranging from catastrophic coverage to 95% of expected revenue. Now, it’s not right for every operation, but these tools provide options beyond traditional government programs.

I’ve been thinking about this quite a bit lately. How many months of operating expenses do you have in reserve? If DMC payments were to stop tomorrow, or your milk check were delayed by two weeks, how long could you manage? These aren’t comfortable questions, but they’re necessary ones.

The Heifer Supply Challenge Nobody Saw Coming

This one still amazes me. USDA National Agricultural Statistics Service reported 3.91 million replacement heifers in their January 31, 2025, cattle inventory—the lowest since 1998, when they counted 3.89 million. Yet, the October 2025 milk production report shows the national milking herd at 9.43 million head, up 66,000 from the previous year. How’s that math work?

Operations are keeping cows longer. Plain and simple. Research from the University of Wisconsin’s dairy management program shows average lactation numbers have increased from 2.8 to 3.3 over the past five years. Many herds are pushing cows through fourth, even fifth, lactations that would’ve been culled after two or three in previous market cycles.

When quality replacement heifers command the prices we’re seeing—USDA Agricultural Marketing Service reports from major auction markets show Holstein springers averaging $2,800-$3,500 in the Midwest, over $4,000 in water-stressed Western markets—the economics shift dramatically.

There are real trade-offs here. Penn State Extension’s 2025 dairy herd health surveys indicate extended lactations correlate with higher bulk tank SCC (averaging 285,000 for herds with 3.5+ average lactations versus 220,000 for herds under 3.0), increased lameness prevalence (28% versus 19%), and higher veterinary costs per cow ($185 versus $145 annually).

What’s your average lactation number right now? Has it changed over the past two years? If you’re like most operations, it probably has increased by 0.3 to 0.5 lactations, and that shift has implications for everything from breeding programs to facility needs.

Market Dynamics and Our Global Position

Examining price comparisons reveals an interesting story. CME Group spot butter closed at $2.33 per pound on October 8, 2025, while the European Milk Market Observatory reported EU butter at €3.52 per kilogram (roughly $3.75 per pound) for the same week. Might suggest we have a competitive advantage, right?

But dig deeper into the USDA Economic Research Service consumption data from their September 2025 Dairy Outlook. Americans consume 5.1 pounds of butter per capita annually. Europeans? 8.2 pounds according to EU agricultural statistics. That consumption gap means we’re producing beyond domestic demand, making us dependent on export markets for price discovery.

The Foreign Agricultural Service’s August 2025 Dairy Export Report is particularly revealing—40 percent of U.S. cheese exports go to Mexico (472 million pounds annually), 18 percent to South Korea, and 12 percent to Japan. For whey products, China accounts for 31 percent of the market share, despite ongoing trade tensions. This geographic concentration creates both opportunity and vulnerability.

This development suggests we need to think differently about market risk. Are you considering export market dynamics in your planning? A 10 percent shift in Mexican demand has a greater impact on U.S. cheese prices than a 5 percent change in domestic consumption.

Practical Strategies for Today’s Environment

So what’s actually working out there? Based on Federal Milk Marketing Order pricing formulas and what successful operations are implementing…

First, component optimization has shifted from a “nice to have” to an essential requirement. The September 2025 FMMO Class III price formula shows butterfat at $3.23 per pound and protein at $2.31 per pound. A 0.2 percentage point improvement in butterfat (achievable through genetic selection according to Holstein Association USA genomic data) adds approximately $0.25 per hundredweight to your milk check.

Here’s a practical starting point: Review your milk quality reports from the last three months. What’s your average butterfat? Protein? SCC? Now look at your processor’s premium schedule. Calculate the difference between your current level and the next premium level. Often, the investment required (better genetics, refined feeding protocols, enhanced milking procedures) pays back in 6-12 months.

Second, understanding your true net price matters more than ever. After all deductions—cooperative assessments, hauling charges (averaging $0.35-0.50 per hundredweight according to University of Minnesota Extension surveys), quality adjustments—what’s actually hitting your bank account? That’s the number that drives real decision-making.

Third, operational flexibility often trumps pure efficiency. Cornell’s Program on Dairy Markets and Policy Analysis, released in August 2025, indicates that the optimal herd size varies significantly depending on local labor markets, land availability, and environmental regulations. Sometimes a well-managed 650-cow dairy in Wisconsin outperforms a 1,500-cow operation in Texas when you factor in water costs, labor availability, and market access.

Looking Ahead with Clear Eyes

The traditional model—maximize volume at minimum cost—served the industry well for decades. But current market structures reward different priorities. The data from USDA reports, Federal Reserve agricultural lending surveys, and university research all point toward similar conclusions.

What patterns are you seeing in your area? Because operations that thrive increasingly share certain characteristics. They understand their true costs, including all those hidden deductions. They optimize for net returns rather than gross production. They maintain financial flexibility with adequate working capital. And they adapt quickly to market signals rather than hoping things return to “normal.”

The feed cost paradox—lower input costs not translating directly to better margins—reflects the complexity of modern dairy economics. But within that complexity lies opportunity for those willing to look beyond traditional metrics.

As many of us have learned, probably the hard way, those “good old days” when feed costs determined profitability aren’t coming back. The fundamentals have shifted permanently. But dairy farming remains a viable business for those who understand and work with the new economics rather than against them.

The key is recognizing these changes and adapting accordingly. Because at the end of the day, we’re all trying to build sustainable operations that can weather whatever comes next—whether that’s another government shutdown, export market disruption, or the next unexpected challenge.

What’s your take on all this? Are you seeing similar trends in your region? Because I believe that the more we share these observations and strategies, the better equipped we will all be to navigate this changing landscape. The industry’s evolving faster than ever, but there’s definitely a path forward for those willing to evolve with it.

KEY TAKEAWAYS:

  • Component optimization delivers immediate returns: Improving butterfat from 3.8% to 4.0% adds approximately $35 daily ($12,775 annually) for operations shipping 8,500 pounds—achievable through targeted genetics and feeding adjustments that typically pay back in 6-12 months
  • Understanding your true net price changes everything: After deductions, hauling charges ($0.35-0.50/cwt), and quality adjustments, your actual deposited price might be $2-3 below announced rates—tracking this monthly helps identify whether staying with your current handler makes financial sense
  • Labor strategy matters more than scale: With agricultural wages exceeding $21/hour in the Midwest and $24 in Western states, a well-managed 650-cow operation often outperforms 1,500-cow dairies when factoring in management intensity, component quality maintenance, and operational flexibility
  • Financial resilience beats government dependency: Operations maintaining six months of working capital weathered the October shutdown without crisis, while the 73% enrolled in DMC discovered how quickly federal safety nets can disappear—private tools like Dairy Revenue Protection now cover 4,200 farms, double the 2022 enrollment
  • Extended lactations are reshaping herd dynamics: With quality replacements hitting $4,000 in Western markets, pushing average lactations from 2.8 to 3.3 makes economic sense despite higher SCC and health management needs—but requires adjusting expectations for bulk tank quality and veterinary protocols

Complete references and supporting documentation are available upon request by contacting the editorial team at editor@thebullvine.com.

Learn More:

The Sunday Read Dairy Professionals Don’t Skip.

Every week, thousands of producers, breeders, and industry insiders open Bullvine Weekly for genetics insights, market shifts, and profit strategies they won’t find anywhere else. One email. Five minutes. Smarter decisions all week.

NewsSubscribe
First
Last
Consent

$11 Billion in New Processing Capacity Is Creating Winners and Losers – Here’s the 6-Month Strategy That Decides Which You’ll Be

Why are 500-cow operations earning more per cwt than their 1,500-cow neighbors?

EXECUTIVE SUMMARY: What farmers are discovering through this unprecedented $11 billion wave of processing investments is that timing and relationships now matter more than scale. The International Dairy Foods Association data shows over 50 major facilities coming online through 2028, with fairlife investing $650 million in New York and Chobani committing $1.2 billion to their Rome plant. Penn State Extension’s latest bulletin reveals farms with consistent components—daily variation below 2%—are earning premiums of $0.50 to $1.50 per hundredweight, while Vermont’s St. Albans Cooperative reported average component premiums of $1.25/cwt in Q3 2025. Here’s what this means for your operation: processors opening facilities in 2026-2027 are making supplier decisions right now, October 2025, creating a critical 6-12 month window where strategic positioning beats traditional expansion. Recent USDA data showing protein levels climbing from 3.08% to 3.26% and butterfat from 3.70% to 4.15% since 2011 demonstrates how the industry’s already responding to these opportunities. The producers who recognize this isn’t just another cycle—it’s a fundamental shift in how value flows through dairy—are positioning themselves for success regardless of herd size.

dairy market shifts

When the International Dairy Foods Association released its latest data, showing over $11 billion in processing investments through early 2028, it really made me stop and think. That’s not just another market cycle. That’s a fundamental shift in how our industry will work.

What caught my attention is where this money’s actually going. Fairlife’s $650 million Webster, New York, facility broke ground in April 2024—Dairy Herd Management covered it extensively. Then there’s Chobani committing $1.2 billion to their Rome plant, which Governor Hochul announced back in April. These aren’t incremental expansions, folks. They’re massive bets on completely new ways of processing and marketing dairy products.

And I’ve noticed something interesting lately: the farms that seem to be positioning themselves best for all this aren’t necessarily the biggest operations. They’re the ones building real partnerships with processors—not just showing up as another milk hauler twice a day. That’s a different mindset than what many of us grew up with.

Understanding Where the Investment Is Going

Looking at the IDFA breakdown, you can see some clear patterns emerging. Cheese facilities are attracting about $3.2 billion—which makes sense when you consider Americans are consuming 37.8 pounds per capita, according to the USDA’s Economic Research Service. That’s a lot of cheese, even by Wisconsin standards.

Geographic concentration reveals where processors are betting big on America’s dairy future – New York’s $2.8 billion lead isn’t just about processing capacity, it’s about proximity to 50 million East Coast consumers who consume premium dairy products at rates 23% above the national average.

Milk and cream operations account for nearly $3 billion, while yogurt and cultured products draw another $2.8 billion. Each category has its own specific needs, and that’s where things get interesting for producers.

New York leads with $2.8 billion in total investment. It makes sense when you consider the proximity to East Coast markets and existing milk production infrastructure. Texas follows at $1.5 billion, anchored by Leprino Foods’ massive facility in Lubbock. Wisconsin adds $1.1 billion in capacity, which… well, nobody’s surprised there.

However, this development suggests something bigger—these modern processing facilities are incorporating advanced technologies that require very specific milk characteristics to run efficiently. We’re not talking about just hauling milk anymore. We’re talking about delivering exactly what these facilities need to optimize their operations. And that creates opportunities for producers who understand what’s happening…

Beyond Volume: Why Components Are King Now

The data from USDA’s Dairy Market News tells a fascinating story about how we’ve adapted. Federal order protein levels have increased from 3.08% in 2011 to 3.26% by 2023. Now, that might not sound like much sitting here at the kitchen table, but when you spread that across the 226 billion pounds of milk we produced last year… that’s a massive amount of additional protein entering the supply chain.

Genetic progress and nutrition strategies drive milk solids to record levels – While milk volume barely grows, component production surges create entirely new economics where 500-cow dairies out-earn 1,500-cow operations focused on bulk.

Butterfat’s even more dramatic. We’ve gone from 3.70% in 2011 to 4.15% by 2023. Part of that’s genetics—the Council on Dairy Cattle Breeding’s April 2024 genetic evaluations show consistent progress in fat transmitting ability. But it’s also management. We’re feeding differently, selecting differently, managing our herds differently.

What farmers are finding through extension work at Cornell’s PRO-DAIRY program and Penn State is that consistency matters as much as the absolute numbers. These new processing systems need to know what’s coming in the door every single day. Big swings in components can significantly impact processing efficiency. Penn State’s latest extension bulletin shows farms with a daily coefficient of variation below 2% for protein are earning premiums ranging from $0.50 to $1.50 per hundredweight, depending on the processor.

Component production accelerates while milk volume stagnates – genetics and nutrition drive the shift – The era of “just fill the tank” dairy farming is dead, replaced by precision agriculture where genetic selection and feed optimization directly determine profitability.

Vermont’s St. Albans Cooperative reported component premiums averaging $1.25 per hundredweight in their third-quarter 2025 report—that’s real money for farms that hit their targets consistently. Many producers in Wisconsin and elsewhere are now conducting more frequent tests. Daily testing used to seem excessive, but when you understand how these new ultrafiltration systems and other technologies work, it starts making more sense.

The Green Premium: Sustainability Programs That Actually Pay

I’ll be honest with you—when sustainability programs started ramping up, I was skeptical. We’ve all seen programs that promise a lot and deliver little. But the economics have shifted in ways I didn’t expect.

Consider the Ben & Jerry’s Caring Dairy program, which has been in operation since 2011. Aaron and Chantale Nadeau, who run Top Notch Holsteins up in Vermont, have been participants for years. In an August 2020 interview with Vermont Public Radio, Aaron stated that the program provides meaningful financial returns. That’s real money, not just feel-good corporate messaging.

The carbon credit side has also transitioned from theory to reality. When Jasper DeVos in Texas sold his greenhouse gas reductions to Dairy Farmers of America through the Athian platform, it marked the first documented livestock carbon credit transaction in the U.S. That opened a lot of eyes.

Examining this trend, What’s really driving this is the regulatory landscape is the primary driver of this change. California’s methane regulations kicked in this year through the California Air Resources Board. The EU’s carbon border adjustments are expected to start affecting dairy exports in 2027, according to European Commission documentation. Processors need compliant milk to maintain those markets. It’s that simple.

Your Zip Code Matters: Regional Dynamics in Play

Your location significantly influences your opportunities in this new landscape, and it’s worth considering what that means for your operation.

If you’re in the Northeast, especially within reasonable hauling distance of Fairlife’s Webster plant or Chobani’s Rome facility, you’re in an interesting position. That $2.8 billion in regional investment is creating real competition for milk supplies. It’s been years since we’ve seen processors competing this actively for suppliers.

Wisconsin operations are experiencing continued growth on the cheese side. Established manufacturers continue to grow, focusing on components that maximize cheese yield and efficiency. When you can consistently deliver the butterfat and protein levels they need, you have options.

Texas is accommodating these massive-scale operations through facilities like Leprino’s Lubbock investment. For smaller producers in the area, many are exploring specialty markets—such as organic certification, A2 production, and even agritourism. You can’t compete with the mega-dairies on commodity volume, so you find your niche.

California’s environmental regulations, which initially seemed overwhelming, are actually creating growth opportunities. Producers meeting methane reduction requirements are finding that processors value that compliance. Market access depends on it.

For those of you in the Southeast or Mountain West, wondering where you fit in all this—the principles still apply. Even without billion-dollar facilities next door, processors in your region need reliable partners. The component optimization and sustainability strategies work everywhere. Sometimes being outside the major investment zones means less competition for the opportunities that do exist.

The Clock Is Ticking: Why Timing Matters More Than Ever

So here’s what I keep coming back to: the traditional approach of building first, then negotiating from a position of greater volume… that might not be the best strategy anymore.

Consider the timeline. A new freestall barn takes 18-24 months from groundbreaking to full production. Financing, permitting, construction, getting it filled with cows—it all takes time. Meanwhile, processors are expected to open facilities in 2026 and 2027. They’re establishing their supply partnerships right now, October 2025.

Some producers are taking a different approach. They’re focusing on what they can control today—optimizing components, building processor relationships, and getting into sustainability programs. These typically show returns within 6-12 months, much faster than traditional expansion.

What I keep hearing from successful operations is that processors need certainty as much as they need volume. A 500-cow dairy that can guarantee consistent quality, reliable delivery, documented compliance… that’s often more valuable than a larger operation without those established relationships. It’s a different way of thinking about competitive advantage.

Comparing Processor and Farm Expansion Timelines

Processor Timeline

Processors are actively securing supply partnerships as of October 2025. This phase is critical, as they are laying the groundwork for future operations. Following this, new processing facilities are scheduled to come online between 2026 and 2027. The next 6 to 12 months represent a decisive window for producers to establish relationships and position themselves as preferred suppliers.

Farm Expansion Timeline

Expanding a farm operation is a lengthy process. The initial 1 to 6 months are dedicated to planning and securing necessary permits. Construction typically spans months 7 through 18. Only after construction is complete, from months 19 to 24, can the facility be filled with cows and reach full production capacity. In total, the minimum timeframe for complete farm expansion is 18 to 24 months.

Strategic Implications

The discrepancy between processor readiness and farm expansion timelines highlights the urgency for producers. With processors finalizing supply agreements now and new facilities launching soon, the next 6 to 12 months are pivotal. Producers must act decisively to align with processor requirements, as traditional expansion strategies may not allow for timely participation in emerging opportunities.

Your Action Plan: Resources That Actually Help

Component StrategyPremium Range per cwtAnnual Impact 500 CowsImplementation Timeline
Daily Variation <2%$0.50 – $1.50$75,000 – $225,00030-60 days
Butterfat >4.30%$0.25 – $0.75$37,500 – $112,5006-12 months
Protein >3.35%$0.20 – $0.60$30,000 – $90,0003-9 months
Consistent Quality$0.15 – $0.40$22,500 – $60,00060-90 days
Sustainability Certified$0.30 – $1.00$45,000 – $150,0003-18 months

If you’re ready to engage with these opportunities, here are some starting points that actually work:

For Carbon Credits:

  • Athian: athian.ai or call 737-263-4839—they facilitated that first livestock carbon transaction
  • Nori: marketplace.nori.com—focuses on soil carbon
  • Indigo Ag: indigoag.com/for-growers/carbon

For Sustainability Programs:

  • Ben & Jerry’s Caring Dairy: Contact your co-op if you’re in their supply shed
  • Danone North America: danonenorthamerica.com/farmers
  • Nestle’s Net Zero roadmap: nestle.com/sustainability/climate-change

For Component Optimization:

  • Cornell PRO-DAIRY: prodairy.cals.cornell.edu (607-255-4478)
  • Penn State Extension Dairy Team: extension.psu.edu/animals/dairy
  • University of Wisconsin Dairy: fyi.extension.wisc.edu/dairy

Most major processors have farmer relations departments. Start with your current field representative and asking about the supply needs of your new facility. Don’t wait for them to call you—the ones who are proactive now are the ones who are getting the opportunities.

The Bottom Line: Being Indispensable Beats Being Bigger

After thinking about all this, what becomes clear is that this $11 billion investment represents a fundamental shift in how value flows through our industry. It’s not just about selling milk anymore. It’s about being the kind of supplier these massive facilities need to succeed.

These processors require three key elements: reliable volume, consistent quality, and, increasingly, environmental compliance that maintains market access. Farms that can deliver all three—regardless of size—have leverage they haven’t had in years.

The traditional thinking was straightforward: get bigger first, then negotiate from a position of strength. What’s working now is different. Become indispensable at your current size, then grow strategically. The infrastructure can wait if it needs to. The relationships can’t.

Looking at where we are—October 2025—the processors opening facilities in 2026 and 2027 are making their supplier decisions over the next 6-12 months. By next October, most of these opportunities will be committed. The producers who recognize this window and act on it are positioning themselves for the next decade.

Remember that $11 billion number we started with? It’s not just about processing capacity. It’s about reshaping how our entire industry works. The processors don’t just need our milk anymore—they need us as partners. And that, as we used to say back when I started farming, changes everything.

That’s worth considering the next time you’re evaluating your operation and wondering what’s next. Because in all my years in this business, I’ve never seen a moment quite like this one.

KEY TAKEAWAYS

  • Component consistency delivers immediate returns: Farms achieving less than 2% daily variation in protein are capturing $0.50-$1.50/cwt premiums, potentially adding $75,000-225,000 annually for a 500-cow dairy producing 15 million pounds
  • Strategic timing beats traditional expansion: With processors making supply decisions now for 2026-2027 facility openings, the 6-12 month returns from relationship building outpace the 18-24 months needed for barn construction and herd expansion
  • Regional opportunities vary but principles remain: Whether you’re near New York’s $2.8 billion investment zone or operating in the Mountain West, processors need partners who deliver consistent quality, documented compliance, and reliable volume—creating leverage even for mid-sized operations
  • Sustainability programs have moved from cost to revenue: Carbon credits through platforms like Athian plus programs like Ben & Jerry’s Caring Dairy are generating real income, with early adopters capturing value before compliance becomes mandatory in markets like California (2025) and EU exports (2027)
  • Action window is narrowing: Contact your processor’s farmer relations department about new facility needs, optimize components through daily testing, and explore sustainability programs now—by October 2026, most premium partnership opportunities will be committed

Complete references and supporting documentation are available upon request by contacting the editorial team at editor@thebullvine.com.

Learn More:

  • USDA’s 2025 Dairy Outlook: Market Shifts and Strategic Opportunities for Producers – This article provides a high-level strategic overview of the market forces driving profitability in 2025, from component optimization to aligning with specific processors. It helps producers develop market intelligence to make better decisions on culling, expansion, and capital investments.
  • June Milk Numbers Tell a Story Markets Don’t Want to Hear – This piece drills into recent production data to reveal how component-adjusted growth is a more accurate measure of profitability than raw volume. It also offers a reality check on regional growth dynamics and the risks of building a strategy around unpredictable export markets.
  • USDA Dairy Production Report – This guide gives a tactical, how-to approach to implementing the strategies discussed, from genomic testing to precision feeding. It provides specific numbers on the financial returns of component premiums and technology adoption, helping you build a concrete action plan for your operation.

The Sunday Read Dairy Professionals Don’t Skip.

Every week, thousands of producers, breeders, and industry insiders open Bullvine Weekly for genetics insights, market shifts, and profit strategies they won’t find anywhere else. One email. Five minutes. Smarter decisions all week.
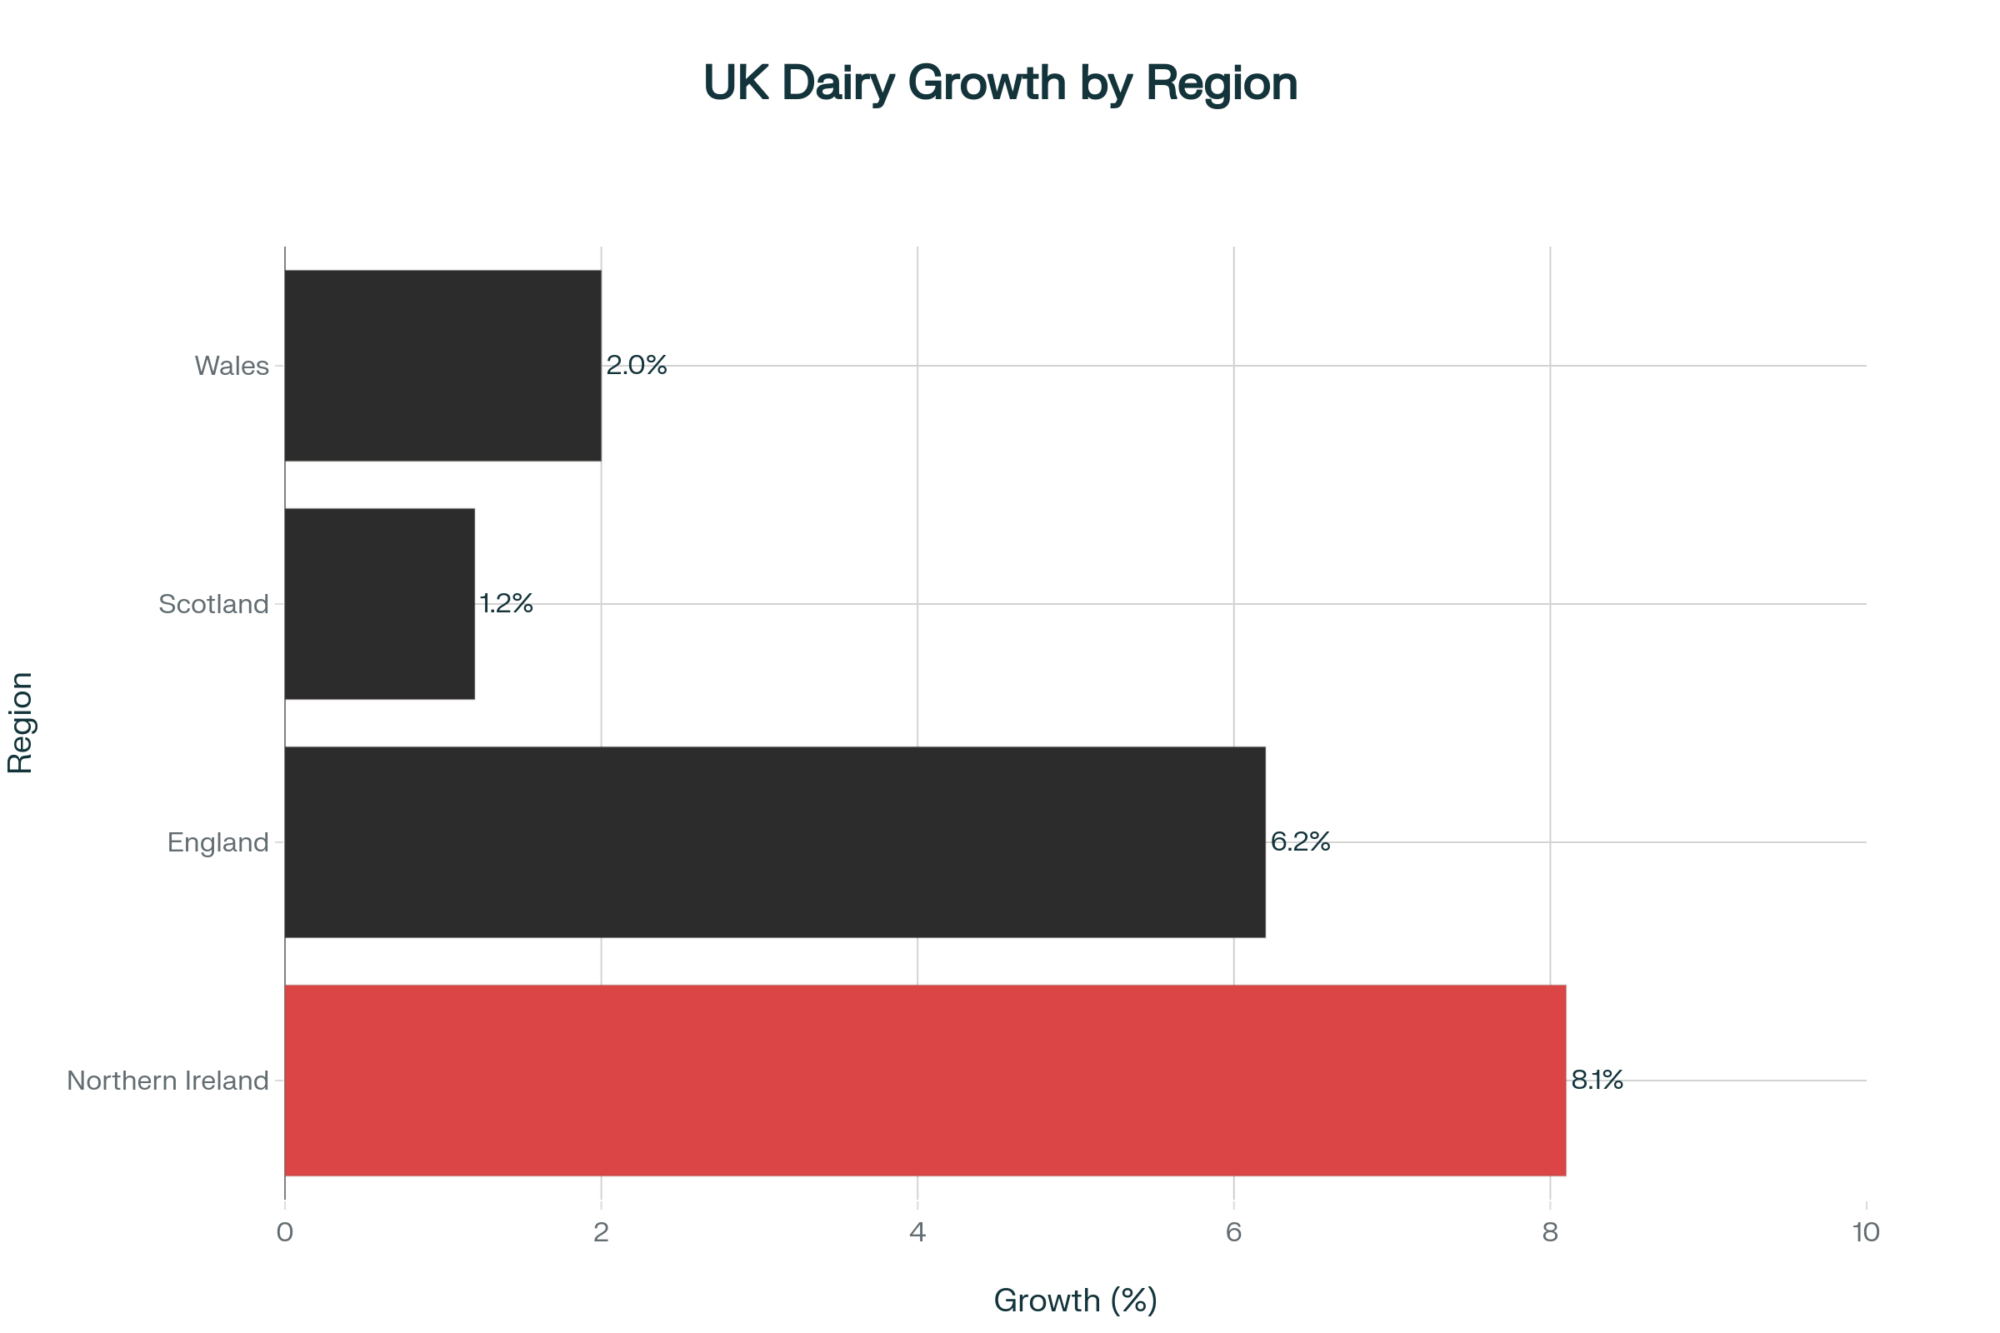
NewsSubscribe
First
Last
Consent

From $20 Spot to $20 Gallon: How Smart Dairy Operations Build Premium Value When Markets Fail

European butter markets showed continuing volatility last month while some producers found ways to thrive—here’s what they’re doing differently and why it matters for your operation

EXECUTIVE SUMMARY: Farmers are discovering through current market volatility that the traditional commodity model isn’t just struggling—it’s fundamentally changing. European butter prices have decreased by 24% year-over-year, while GDT participation patterns indicate that buyers are losing trust in regular price signals. Yet certain operations are thriving: Delaware’s licensed raw milk producers command $16-20 per gallon (fourteen times the conventional price), Italian Parmigiano Reggiano makers maintain strong premiums despite market chaos, and strategic cooperatives like the Maryland-Virginia Milk Producers report 15-20% better returns than independent sellers. Recent data shows that scale increasingly determines survival options, with operations over 1,000 cows accessing credit in hours, while smaller farms wait weeks—a difference that matters when margins compress. Looking ahead, three proven strategies are emerging: premium differentiation requiring $10,000-50,000 investment for 20-40% price premiums, strategic cooperation providing immediate cost savings through shared resources, and processing integration demanding $250,000-3 million but delivering 2-3x commodity value. The path forward isn’t about waiting for markets to normalize—it’s about choosing which strategy fits your operation’s resources, goals, and regional opportunities while you still have options to act.

dairy farm profitability strategies

You know that unsettled feeling when you check the morning milk report and nothing quite adds up? That’s what I’ve been hearing at every co-op meeting lately. “Are these markets ever going back to normal?”

Looking at what’s happening—USDA’s International Dairy Market News indicating continuing volatility in European butter markets, while Trading Economics data from October showed prices off 24% year-over-year to around €5,575 per tonne—it’s a fair question. We’re not just seeing a correction here. This is something different.

European butter prices crashed from €7,500/ton to €5,575/ton in 2025, showing the brutal market reality behind commodity volatility

But what I find encouraging is that despite all this market pressure, certain producers are actually strengthening their position. Delaware’s raw milk producers, for instance, are getting $16-20 per gallon through direct sales since their new regulations took effect earlier this year, according to state Department of Agriculture filings. That’s about fourteen times what the rest of us get for conventional milk. And Italian cheesemakers supplying Parmigiano Reggiano? The Consorzio del Formaggio Parmigiano Reggiano reports they’re maintaining strong premiums even with everything else going sideways.

These aren’t lucky breaks, folks. They’re deliberate strategies based on understanding where markets are heading.

Quick Strategy Comparison

Before we dive in, here’s what we’re talking about:

Premium Differentiation: $10,000-50,000 initial investment → 20-40% price premiums → 12-36 month payback

Strategic Cooperation: Shared infrastructure/marketing → 15-20% better returns → Immediate cost savings

Processing Integration: $250,000-3 million investment → 2-3x commodity value → 3-5 year payback

How Price Discovery Is Breaking Down Across Regions

Global Dairy Trade results show the market reality: broad-based weakness except for cheese holding firm

What I’ve found tracking these markets is that we’re seeing something beyond typical volatility. You may already be aware of this, but the Global Dairy Trade platform has been exhibiting some interesting patterns lately. Recent GDT results show varying outcomes across different product categories and auction timing—sometimes strong, sometimes lighter, depending on what’s being offered and when.

That variation tells us something important. When buyers become selective about their participation, they’re essentially saying they no longer trust regular price signals. They’re waiting for… something. Clarity, maybe.

The demand side remains pretty robust in certain areas, though. GDT’s recent summaries show continued strong interest from Chinese and Middle Eastern buyers, particularly for certain products. So it’s not that demand disappeared. It’s how markets function when the old structures start breaking down.

When you examine the developments in various regions, the patterns become clearer. California producers dealing with ongoing water restrictions from the Sustainable Groundwater Management Act are making different calculations than Wisconsin operations managing through another wet spring. Idaho’s large-scale operations have different leverage than Pennsylvania’s smaller family farms. Each region’s facing its own version of this market evolution.

How the Big Players Are Pivoting—And What We Can Learn

Fonterra’s moves over the past year provide some real lessons for the rest of us. Their deal with Lactalis—$3.85 billion, announced back in August 2024, where they sold consumer brands but kept long-term supply agreements—that wasn’t just portfolio shuffling.

As Miles Hurrell explained it in their earnings calls, they’re focusing on “what we do best—producing high-quality milk ingredients efficiently at scale.” But what that really means, if you ask me, is they’re letting someone else worry about convincing shoppers while they control the foundation of the whole supply chain.

This flexibility to shift between WMP, butter, cheese, and specialty ingredients based on what makes strategic sense, rather than just chasing today’s highest price, is a valuable approach. Even those of us running smaller operations can learn from it. Yes, it looks different at 200 cows versus 20,000, but the principle remains the same.

Speaking of different scales, DFA’s regional councils have been exploring similar strategies at the cooperative level. Their Mountain Area Council, covering Colorado, Wyoming, and parts of New Mexico, has been helping members navigate these changes through shared resources and collective negotiating power. Land O’Lakes member services report similar initiatives across the Upper Midwest.

Why Different Regions Take Completely Different Approaches

Recent data from various national dairy organizations paints an interesting picture. According to the European Commission’s milk market observatory, Italian production remains relatively stable. Dairy Australia’s latest situation and outlook report highlights ongoing challenges, with production levels down in recent periods. Spain’s Ministry of Agriculture data indicates fairly flat production. Meanwhile, the Dairy Companies Association of New Zealand reports modest growth in their milk collections.

These aren’t random variations. They reflect fundamentally different philosophies about dairy farming.

Take Italy’s approach. In regions like Lombardy, where they’re making Grana Padano, or around Reggio Emilia for Parmigiano Reggiano, those EU Protected Designation of Origin rules mean you can only make these cheeses in specific provinces using methods documented since medieval times. You’re not competing on efficiency at that point—you’re selling something that literally can’t be made anywhere else.

The Parmigiano Reggiano consortium’s published quality reports indicate that its members maintain strong premiums even when commodity markets are struggling. Geographic exclusivity, it turns out, has real value when broader markets face pressure.

Meanwhile, in Australia, Dairy Australia’s September 2024 situation report shows ongoing production challenges, with various factors, including climate and input costs, really affecting producers. However, here’s something interesting—I heard from a banker specializing in agricultural loans that farms and processing facilities in that area sometimes trade below historical values during these periods. Long-term investors from firms like Colliers International and CBRE are definitely watching.

Spain offers yet another model. Their focus on being a consistent and reliable supplier to European food manufacturers—not chasing premiums or competing on price—provides its own kind of stability. Spanish dairy cooperative COVAP’s annual reports emphasize that being the dependable middle option has value during chaos.

And then there’s the U.S. West. California dairies facing those Sustainable Groundwater Management Act restrictions are making completely different strategic choices than operations in water-rich regions. The Western United Dairyman’s recent member surveys show operations pivoting to higher-value products partly out of necessity—when water costs what it does in the Central Valley, you’d better be making more than commodity milk with it.

The Reality of What One Operation Learned the Hard Way

Let me share something that doesn’t make it into the success stories. There’s a 400-cow operation in central Illinois that attempted to do everything at once two years ago—starting an organic transition, investing in bottling equipment, and joining a new marketing cooperative — all in the same year.

By month 18, they were hemorrhaging cash. The organic transition meant three years without premium prices but immediate costs for new feed sources. The bottling line sat idle half the time because they hadn’t built their customer base first. The new cooperative required different hauling routes, which added $1,200 monthly in transportation costs.

They survived, barely, by selling the bottling equipment at a 40% loss and focusing solely on completing organic certification. Today they’re profitable again, but the owner told me, “I learned the hard way that one strategic change at a time is plenty.”

How Your Size Determines Your Options

The farm credit analysis released in July effectively highlights how the scale of your operation affects available options during volatile times. With current prime rates at 8.5% as of October 2025, according to Federal Reserve data, financing costs are more significant than ever.

For those 50-100 cow operations (and I know there are still plenty of you out there), the credit situation is particularly challenging. Most are working with smaller credit lines through their local bank or Farm Credit association. When you need to float a feed delivery at these interest rates, every relationship matters.

The 200-500 cow farms generally have moderate credit lines, based on Farm Credit data, with perhaps a bit more flexibility, but still typically depend on one primary lender. Farm Credit Services of America reports similar patterns across Iowa, Nebraska, South Dakota, and Wyoming. The difference? These operations can sometimes negotiate rate discounts of 0.5-1% based on their track record.

Then you have operations with over 1,000 cows, maintaining larger revolving facilities, often with multiple banking relationships. When margins compress, the difference between getting capital in hours versus weeks can determine who survives.

The derivatives situation tells a similar story. CME Group’s educational materials for dairy futures make it clear that maintaining an active hedging program requires substantial working capital. Most operations with fewer than 1,000 cows utilize their co-op’s risk management programs or hire advisors for forward contracts. Direct trading just doesn’t pencil out for smaller operations—and honestly, that’s probably for the best given the complexity.

Even something as basic as milk storage affects your leverage. Smaller operations with limited tank capacity face different pressures than someone with two weeks of storage. USDA’s Farm Storage Facility Loan program—they offer up to $500,000 with a 15% down payment according to FSA guidelines—but as Cornell Cooperative Extension’s PRO-DAIRY program points out, farms with storage flexibility can negotiate. Those without it take what’s offered.

Three Strategies That Are Actually Working—With Real Examples

Despite all these challenges, I’m seeing operations successfully pivot away from pure commodity dependence. And these aren’t pie-in-the-sky ideas—they’re happening right now.

Building Premium Value Through Differentiation

Delaware’s new raw milk regulations, which took effect earlier this year, have created some interesting opportunities. The testing requirements are intense, including monthly pathogen testing, enhanced facilities, and comprehensive insurance. Would crush a commodity operation. But according to Delaware Department of Agriculture licensing data, those approved producers are getting $16-20 per gallon, with customers driving in from Pennsylvania and Maryland.

What’s working elsewhere? In Vermont, the Northeast Organic Farming Association reports continued growth in the transition to grass-fed and organic farming. Initial certification involves a significant investment, ranging from $10,000 to $50,000, depending on your current setup, according to University of Vermont Extension estimates. However, certified organic milk typically commands premiums of $5-8 per hundredweight above conventional prices through cooperatives like Organic Valley or CROPP Cooperative.

Out in California, some producers are finding success with A2 milk. The A2 Milk Company’s supplier programs reveal that genetic testing and herd transition costs vary widely. However, retail price monitoring by the California Department of Food and Agriculture indicates that A2 milk commands premiums of 20-40% at stores like Whole Foods and regional chains.

Then there’s the somatic cell count premium game. The Michigan Milk Producers Association publishes its quality premium schedules, showing significant bonuses for consistently low SCC milk—we’re talking an extra $0.40-$ 0.60 per hundredweight for counts under 100,000. For a 500-cow dairy shipping 40,000 pounds daily, that’s real money.

Creating Leverage Through Cooperation

The Maryland and Virginia Milk Producers Cooperative shows what’s possible through smart aggregation. According to their annual report, by bringing together approximately 1,500 member farms that produce roughly 1.2 billion pounds annually, they’ve achieved negotiating positions that individual members could never reach.

In the Midwest, new forms of cooperation are emerging. Wisconsin’s FarmFirst Dairy Cooperative reports member groups sharing everything from equipment to marketing expertise. They’re coordinating hauling routes through services like Dairy Farmers of America’s transportation division, saving members thousands monthly. Some groups jointly invest in rapid testing equipment—a $45,000 unit that serves multiple farms when shared among them.

Out West, the Western Organic Dairy Producers Alliance brings together organic dairy producers across multiple states to share certification costs, coordinate marketing efforts, and negotiate more favorable terms with processors. Their member surveys show collective action providing 15-20% better returns than going solo.

Taking Control Through Processing

Now, adding processing isn’t for everyone—Wisconsin’s Center for Dairy Research makes that clear in their feasibility studies. Investment costs vary enormously. A basic pasteurizer and bottling line may cost around $250,000, according to equipment manufacturers such as Crepaco and Feldmeier. A small cheese operation? You’re looking at a minimum of $500,000 based on recent USDA Value-Added Producer Grant applications. Full creamery with ice cream capability? Now we’re talking $2-3 million according to dairy plant design firms.

But for those who make it work, the returns can be compelling. Penn State Extension’s dairy entrepreneurship program tracks on-farm processors, and its data show that farmstead cheese operations often capture $40-60 per hundredweight equivalent, versus the $20 commodity price. That’s after accounting for processing costs.

The regulatory piece is huge, though—something people often underestimate. Food safety modernization act compliance, state licensing, local health permits… the Pennsylvania Department of Agriculture’s guide to on-farm processing runs 87 pages. And that’s just one state. Don’t forget you’ll need workers, too—skilled cheese makers in Wisconsin are commanding $25-35 per hour if you can find them.

Your Practical Timeline for Making Strategic Changes

So, where does all this leave your operation? Let me break down a realistic timeline based on what’s actually working for producers making these transitions.

Next 30 Days:

  • Schedule that credit review with your lender (seriously, with rates where they are, you need to know your options)
  • Calculate exactly what percentage of your revenue depends on spot pricing
  • Visit one operation already doing what you’re considering—most producers are surprisingly willing to share experiences

Next 60-90 Days:

  • Premium path: Start certification paperwork (organic transition takes three years per USDA National Organic Program rules, but grass-fed can be faster)
  • Cooperation path: Connect with neighboring producers—your extension agent can often facilitate introductions
  • Processing path: Get a feasibility study done (many land-grant universities offer these through their food science departments)

6-12 Month Targets:

  • Premium: Complete initial certification phases, identify your first customers through farmers markets or local food hubs
  • Cooperation: Formalize agreements (get a good ag lawyer—handshake deals don’t survive market stress)
  • Processing: Secure financing, order equipment (current lead times from manufacturers are running 6-9 months for dairy equipment)

Where This Leaves Us—And Why There’s Still Opportunity

What we’re experiencing isn’t some temporary blip that’ll fix itself next quarter. The evidence—from changing GDT auction patterns to structural shifts in how major players, such as Fonterra, position themselves—suggests that we’re seeing a fundamental market evolution. The commodity model that worked for our parents and grandparents… it’s struggling to generate returns that justify today’s capital requirements and risks.

However—and this is crucial—evolution creates opportunities alongside challenges. Those Delaware raw milk producers didn’t stumble into premium prices. They recognized where consumer preferences were heading and positioned accordingly. Italian PDO cheesemakers leverage centuries of tradition while continually investing in quality and modern food safety practices. Farms adding processing accept complexity in exchange for control.

Markets continue evolving. They may never return to patterns we once considered normal. However, by examining how producers find success through differentiation, cooperation, and integration, we can build something resilient. Something that actually rewards the work we do and the food we produce.

Your path depends entirely on your situation—land base, family labor, capital access, market proximity, and personal goals. However, whatever direction you choose, starting now, while you have options, beats waiting until markets force your hand.

Because if recent volatility has taught us anything, it’s that standing still while markets evolve around you? That’s the riskiest strategy of all.

KEY TAKEAWAYS:

  • Premium differentiation delivers 20-40% price premiums with manageable investment ($10-50K for organic/grass-fed transition, $75K for A2 conversion) and 12-36 month payback—Michigan Milk Producers Association reports $0.40-0.60/cwt bonuses just for SCC under 100,000, adding $8,760 annually for a 500-cow dairy shipping 40,000 lbs daily
  • Strategic cooperation cuts costs immediately through shared infrastructure (bulk tanks save $60K each when split three ways), coordinated hauling (FarmFirst members save thousands monthly), and collective bargaining—Western Organic Dairy Producers Alliance members report 15-20% better returns than going solo
  • Processing integration captures 2-3x commodity value but requires serious commitment: $250K for basic bottling, $500K minimum for cheese, $2-3M for full creamery, plus navigating 87-page regulatory guides and finding skilled workers ($25-35/hour for experienced cheese makers)—Penn State Extension data shows farmstead cheese operations capturing $40-60/cwt versus $20 commodity
  • Your financing options depend entirely on scale: With prime at 8.5% (October 2025), operations under 100 cows face limited credit access, while 1,000+ cow dairies maintain multiple banking relationships—that speed difference in accessing capital during volatility determines who survives
  • Start with one strategy and perfect it: That Illinois operation, which was trying to transition to organic, bottling, and a new cooperative simultaneously, nearly failed—they survived by focusing solely on organic certification. Pick your path based on resources, execute well, then consider expansion

Complete references and supporting documentation are available upon request by contacting the editorial team at editor@thebullvine.com.

Learn More:

  • June Milk Numbers Tell a Story Markets Don’t Want to Hear – This article expands on the market forces driving volatility, revealing why explosive production growth actually triggered a sharp sell-off. It provides tactical advice on shifting your strategy from volume to components, a proven profit center for operations looking to make “smarter milk” in a tough market.
  • Taiwan Deal Requires 100,000 Pounds Monthly – Here’s What That Really Means for Your Farm – This piece offers a deep dive into the economics of export opportunities, revealing why most farms are automatically shut out. It presents actionable alternatives like targeting institutional buyers or forming collaborative ventures, providing a clear path to higher returns without the complexity and risk of international trade.
  • The Tech Reality Check: Why Smart Dairy Operations Are Winning While Others Struggle – This article provides a crucial reality check on technology adoption, moving beyond sales pitches to reveal the true ROI of investments like robotic milking and automated monitoring. It helps producers avoid common pitfalls and strategically implement tech to slash labor costs and boost herd efficiency.

The Sunday Read Dairy Professionals Don’t Skip.

Every week, thousands of producers, breeders, and industry insiders open Bullvine Weekly for genetics insights, market shifts, and profit strategies they won’t find anywhere else. One email. Five minutes. Smarter decisions all week.

NewsSubscribe
First
Last
Consent

€54,000 Gone: Inside the Arla-DMK Merger Farmers Are Calling ‘Corporate Suicide

12,200 farmers control €19B in milk revenue—but who controls the farmers?

EXECUTIVE SUMMARY: What farmers are discovering about the Arla-DMK merger goes beyond the €19 billion headline—it’s fundamentally about whether 12,200 producers across seven countries just traded €54,000 in annual pricing differences for an uncertain future of variable payments. The European Commission’s latest agricultural outlook shows that EU milk production is expected to decline by 0.2% to 149.4 million metric tonnes in 2025, indicating that this consolidation occurs during a period of contraction, not growth. DMK’s transition payments of 2.2 euro cents per kilogram through 2028 temporarily cushion the shift, but when those end, farmers face component-based pricing that could swing annual revenues by €88,500—enough to make or break mid-sized operations. Research from Hoard’s Dairyman’s July 2024 analysis reveals how component pricing transforms farmers into unwitting commodity traders, where butterfat and protein market crashes directly hit milk checks. The USDA’s October 2024 EU dairy report confirms that processors are prioritizing higher-margin cheese production while farmers bear all production risks. Here’s what this means for your operation: whether inside or outside this merger, the fundamental shift from cooperative ownership to corporate supplier status requires immediate financial planning, component optimization, and maintaining alternative buyer relationships—because history shows mega-cooperatives rarely deliver the promised benefits at this unprecedented scale.

dairy merger financial impact

Picture this: A dairy farmer in Lower Saxony opens his co-op newsletter and sees the number that’s been keeping him up at night—€54,000. That’s what the price difference between DMK’s €0.473 per kilogram and neighboring Arla’s €0.509 means for his 1.5-million-kilogram operation annually. Now, with these two giants merging to form Europe’s largest dairy cooperative, that gap isn’t disappearing—it’s transforming into something entirely new.

When the boards approved this €19 billion merger in June 2025, they didn’t just bring together 8,900 Arla farmers with 3,300 DMK producers. They fundamentally changed how 12,200 dairy families across seven countries will think about risk, reward, and the very nature of cooperative membership.

The Opposition They Don’t Want You to Hear

While official announcements paint a rosy picture, Kjartan Poulsen—himself an Arla member and president of the European Milk Board representing tens of thousands of farmers—drops a bombshell: “Co-operatives have ceased to be the representatives of producers’ interests they claim to be on paper.”

Think about that. An insider, someone actually voting on this merger, is warning that these cooperatives “neither live up to their responsibility nor meet the standards they themselves set out.” His concerns echo what many farmers whisper but few say publicly: as cooperatives grow massive, individual farmer voices get lost in the corporate machinery.

The European Milk Board’s criticism cuts deeper. They point out that while EU-level discussions push for obligatory contracts between producers and processors to ensure fair pricing, cooperatives consistently demand exemptions. With this merger controlling a significant market share, those exemptions mean “fair prices and transparent contracts remain an illusion at the expense of producers.”

The Transition Payment Math That Changes Everything

DMK’s official merger documents reveal a carefully orchestrated transition that’s both clever and concerning. From 2026 through 2028, DMK and DOC Kaas farmers receive an additional 2.2 euro cents per kilogram, with quarterly payments in September 2026, March 2027, and September 2027, and ending in March 2028. These come from the merged entity’s common equity, not from reducing anyone’s current payments.

The €88,500 Gamble: DMK farmers face massive income swings after 2028 transition payments end. This isn’t just accounting – it’s the difference between keeping the farm or selling to developers.

However, what they’re not emphasizing is that after 2028, everyone will shift to Arla’s component-based system. According to Arla’s half-year 2025 results, the average price was 57.5 cents per kilogram across all markets. Sounds good, right? Except that it includes seven countries, both conventional and organic, and a massive variation based on butterfat and protein levels.

Quick Calculator: Your Transition Impact

Current DMK farmer (1.5 million kg/year):

  • Now: €709,500 annually (€0.473/kg)
  • Transition period: €742,500 (€0.495/kg with bonus)
  • Post-2028: Variable between €675,000-€763,500

That’s an €88,500 annual swing based on factors largely outside your barn door. For comparison, that volatility equals:

  • 18 months of tractor payments
  • Complete parlor renovation
  • Feed for 60 additional cows

The Component Pricing Trap Nobody’s Discussing

Understanding component pricing isn’t just academic—it’s survival. The “Three C’s” of milk pricing—commodities, components, and classes—determine everything. Under Arla’s system, your milk’s value depends on:

  • Butterfat percentage (worth more in butter markets)
  • Protein content (drives cheese value)
  • Other solids (affects powder pricing)
  • Quality premiums (somatic cell counts, bacteria levels)

The catch? Market volatility in any of these components directly hits your milk check. When cheese markets tank, protein values drop. When butter surplus builds, butterfat premiums evaporate. You’re no longer just a milk producer—you’re an unwitting commodities trader.

Why the European Commission’s Numbers Should Terrify You

The Consolidation Squeeze: EU milk production falls while mega-cooperatives grab bigger market shares. This isn’t growth – it’s survival of the biggest.

The USDA’s October 2024 EU Dairy and Products Annual Report, which analyzes European Commission data, reveals the context driving this merger. EU milk deliveries hit 149.4 million metric tonnes for 2025, down 0.2% from the previous year. The Commission’s Summer 2025 Short-Term Agricultural Outlook predicts that the EU dairy herd will continue to shrink by 1% annually, with production declining marginally.

But look closer at product allocation. While overall production drops, cheese production actually rises to 10.8 million metric tonnes (up 0.6%). Meanwhile, butter falls to 2.1 million tonnes, and skim milk powder drops 4% to 1.4 million tonnes.

Translation: Processors are cherry-picking profitable products while farmers bear production risks. When this merged entity controls 19 billion kilograms annually, their allocation decisions determine market prices for everyone.

The Environmental Compliance Bomb

The Common Agricultural Policy’s 2023-2027 strategic plans include climate requirements that translate to massive farm costs. Different regions face different hammers:

  • Netherlands: Nitrogen caps threatening 18% herd reductions
  • Ireland: Water quality standards requiring infrastructure overhauls
  • Germany: Fertilizer ordinances limiting nutrient applications

Individual farms can’t navigate these alone. The merger promises shared technical resources and collective advocacy. But as Poulsen warns, when cooperatives grow this large, whose interests really get represented?

Alternative Perspectives: The Processor Gold Rush

Regional processors see opportunity in this consolidation. While Arla-DMK creates a giant, it also creates gaps. Specialty buyers in organic and A2 markets actively court farmers seeking alternatives. Cross-border movement between Germany, the Netherlands, and Belgium continues despite the merger.

The real question is: Can alternative processors offer competitive pricing when one entity controls such a massive volume? History suggests market concentration rarely benefits primary producers.

Practical Survival Guide for Navigating This Merger

The Great Divide: Your survival strategy depends on which side of the merger you choose. Independence means control but limits scale – joining means global reach but losing your voice.

If You’re Inside the Merger:

1. Build Your War Chest Now Component pricing creates volatility. Build 9-12 months of operating expenses in reserves before 2028. That’s not pessimism—it’s aligning financial reality with the payment structure.

2. Master Your Components. A 0.1% increase in butterfat could mean a €2,500 monthly savings for mid-sized operations. Invest in:

  • Genetic selection for components
  • Feed programs targeting butterfat/protein
  • Comfort improvements reducing stress

3. Document Everything Track your current payments, quality bonuses, and hauling costs. When transition payments end, you’ll need baseline comparisons for negotiations.

If You’re Outside Looking In:

1. Leverage Your Independence Market yourself as “supporting local, independent farming.” Consumers increasingly value supply chain transparency.

2. Lock in Contracts Now. While the merger creates uncertainty, lock in favorable terms with current buyers before market dynamics shift.

3. Consider Producer Organizations Unlike co-op members, you can join producer organizations to collectively negotiate better prices—a right Poulsen notes cooperative members lose.

The Global Warning Signal

Corporate Suicide or Strategic Survival? When 12,200 farmers become suppliers in a €19 billion machine, individual voices disappear. Your grandfather’s cooperative just became a corporation

This merger reflects worldwide patterns. In the U.S., Dairy Farmers of America’s consolidation resulted in hundreds of millions of dollars in antitrust settlements. New Zealand’s Fonterra shows that massive scale doesn’t guarantee better returns—many members question whether bigger means better.

What’s different about Europe? The speed and scale. Combining 12,200 farmers across seven countries with different languages, regulations, and markets in one stroke? That’s unprecedented.

The Hard Questions Nobody’s Asking

  1. Where’s the detailed financial modeling? Farmers voted without seeing farm-level impact projections.
  2. What are the exit penalties? Merger documents don’t clearly outline how farmers can leave if promises don’t materialize.
  3. Who really controls decisions? With 12,200 members, does your vote matter, or does management run the show?
  4. Where’s the competition authority review? The European Commission must approve this, but will they truly assess the impact on farmers or just market efficiency?

The Bottom Line: Your Move

This merger isn’t about growth—EU production is declining according to the Commission’s medium-term outlook. It’s about control. Control over processing allocation, market access, and ultimately, the destiny of farmers.

The 2.2 cents transition payment is a Band-Aid on a structural wound. When it ends in 2028, farmers face the reality of variable pricing in concentrated markets with fewer alternatives.

For those inside: Start planning now for increased volatility. For those outside: Secure your independence while you can. For everyone: Remember that cooperatives exist to serve farmers, not the other way around.

The €54,000 question isn’t really about price differentials. It’s about whether 12,200 farmers have just given up their market power for the promise of collective strength, a promise that history suggests rarely materializes at this scale.

As one German farmer told me off the record: “My grandfather built this co-op with his neighbors. Now I’m just employee number 12,201 in a corporation that happens to buy my milk.”

KEY TAKEAWAYS:

  • Financial Impact: DMK farmers face €88,500 annual income volatility post-2028 (€675,000-€763,500 range), requiring 9-12 months operating reserves versus traditional 3-4 months—that’s €177,000-€236,000 in cash cushioning for typical 1.5 million kg operations
  • Component Optimization: Every 0.1% butterfat increase generates €2,500 monthly for mid-sized farms under Arla’s system—prioritize genetics selection, adjust feed programs for 4.0%+ butterfat targets, and invest in cow comfort improvements that reduce stress-related component drops
  • Market Positioning: Regional processors like Hochwald actively court farmers with competitive alternatives, while specialty organic and A2 buyers offer 8-15% premiums—maintain certifications with 2-3 alternative buyers even if committed to the cooperative
  • Governance Reality: With 12,200 members across different regulations and languages, individual farm influence drops 40% compared to sub-1,000 member cooperatives, according to Swedish agricultural research—engage through regional meetings and document all quality/payment changes for future negotiations
  • Strategic Timeline: Lock current contracts before 2026 transition begins, build reserves during 2026-2028 payment bonus period, prepare for full variable pricing by investing in quality improvements that directly impact component payments—because after 2028, there’s no going back

Complete references and supporting documentation are available upon request by contacting the editorial team at editor@thebullvine.com.

Learn More:

  • Class III Milk Futures Explained – This tactical guide provides a practical framework for using futures to manage the volatility of component pricing. It offers a step-by-step approach to hedging, diversifying risk, and avoiding common trading mistakes, directly addressing the post-2028 reality highlighted in the main article.
  • 2025 Dairy Market Reality Check: Why Everything You Think You Know About This Year’s Outlook is Wrong – This strategic analysis reveals how policy shifts and component economics are fundamentally reshaping the industry. It provides a crucial U.S. perspective, showing how the global trend of prioritizing butterfat and protein over volume is creating both new risks and profit opportunities for progressive producers.
  • Genetic Revolution: How Record-Breaking Milk Components Are Reshaping Dairy’s Future – This article on innovation and technology details how genomic selection is directly driving the component revolution. It explains how targeted breeding programs can increase butterfat and protein, offering a concrete, long-term solution to the component pricing challenge faced by farmers in the new merged entity.

The Sunday Read Dairy Professionals Don’t Skip.

Every week, thousands of producers, breeders, and industry insiders open Bullvine Weekly for genetics insights, market shifts, and profit strategies they won’t find anywhere else. One email. Five minutes. Smarter decisions all week.

NewsSubscribe
First
Last
Consent

Taiwan Deal Requires 100,000 Pounds Monthly – Here’s What That Really Means for Your Farm

Taiwan imports $600M+ dairy annually but requires 100K pounds monthly—shutting out 85% of U.S. farms

EXECUTIVE SUMMARY: What farmers are discovering about the Taiwan dairy memorandum of understanding is that access requires scale, which most operations simply don’t have—a minimum of 100,000 pounds monthly is required just to qualify for export programs. USDA data confirms that Taiwan imports over $600 million in dairy products annually, with domestic production covering less than a third of its needs. However, there’s a catch: New Zealand already dominates with tariff-free access, while U.S. dairy faces 15-20% duties plus three weeks longer shipping times. For the 2,000-head operations that can absorb certification costs and manage 60-90 day payment terms, Taiwan represents a genuine opportunity and a gateway to Southeast Asia’s rapidly expanding markets. Yet for mid-size dairies—the backbone of many rural communities—the economics suggest focusing on regional institutional buyers, value-added production, or collaborative export ventures might deliver better returns without the complexity. The most successful path forward depends on honestly matching your operation’s capabilities to market requirements, not chasing opportunities designed for different scales. Your cooperative needs to hear from members about developing tiered programs that recognize these realities—because the future of rural dairy depends on strategies that work for more than just the most significant operations.

dairy export profitability

You know, when USDEC and NMPF announced their memorandum of understanding with Taiwan’s Dairy Association, it really got people talking. Now, let me clarify something upfront—an MOU isn’t a binding trade agreement. It’s essentially a framework for cooperation, a statement of intent to work together on market development. Unlike a formal trade deal that might reduce tariffs or guarantee market access, this MOU signals that both sides want to explore opportunities. Think of it as laying groundwork rather than breaking ground.

There’s good reason to pay attention—USDA Foreign Agricultural Service data show that Taiwan imports over $600 million in dairy products annually, with its domestic production covering less than a third of its needs. That’s a substantial opportunity by any measure.

However, what’s interesting as we delve deeper into the requirements and market dynamics is that this opportunity unfolds very differently depending on your operation’s capabilities. Let me share what the data’s revealing.

Understanding Taiwan’s Market Position

Taiwan’s dairy market has been steadily expanding, and federal trade reports confirm that they’re importing more than half a billion dollars’ worth of dairy products each year—a figure that continues to trend upward. This builds on broader Asian dietary shifts that we’ve been watching for the past decade, where dairy consumption continues to grow as incomes rise and dietary preferences evolve.

What’s particularly noteworthy is their institutional demand through school milk programs. You probably know this already, but these kinds of programs typically provide stable, predictable volume—something we all value in today’s volatile markets. And Taiwan’s infrastructure? They’ve invested heavily in cold chain capabilities that rival what you’d find in Wisconsin or California.

The strategic piece that’s worth considering… Taiwan’s position potentially makes them a gateway to Southeast Asian markets. FAO statistics show that the region has the fastest-growing dairy consumption globally. So we’re not just talking about one island market here—we’re looking at potential access to something much broader.

TAIWAN EXPORT REQUIREMENTS AT A GLANCE:

  • Volume: 100,000+ pounds monthly minimum
  • Components: 4.2%+ butterfat, 3.3%+ protein
  • Payment: 60-90 day terms standard
  • Competition: New Zealand tariff-free access

The Reality of Export Requirements

Now, when you look at what the major cooperatives require for export programs—and DFA, Land O’Lakes, and others have been pretty consistent about this—there are some significant thresholds to meet.

Volume commitments typically begin at a minimum of two truckloads per month. That’s roughly 100,000 pounds, give or take. For perspective, if you’re running 500 head that produce around 12 million pounds annually, you’re generating about one truckload per month. See where this is going?

Why does this matter? Fixed costs for export certification, enhanced testing protocols, and documentation systems need to be spread across your total volume. A 2,000-head operation can absorb these costs much more efficiently. Basic math, but the impact on your bottom line is profound.

Then there’s the component specifications. Export buyers consistently want butterfat above 4.2% and protein exceeding 3.3%. Jersey herds naturally tend to hit these levels more easily—that’s just breed characteristics at work. Holstein operations often require significant ration adjustments or long-term genetic selection strategies. And changing your herd’s component profile… that’s not something that happens overnight.

New Zealand’s Built-In Advantages

Here’s something that really shifts the competitive landscape: New Zealand achieved complete tariff elimination with Taiwan through their Economic Cooperation Agreement. Meanwhile, we’re still facing duties ranging from 15% to 20%, depending on the item being shipped. That’s documented in Taiwan’s customs schedules and various trade analyses.

Think about what this means practically. New Zealand can deliver to Taiwan in under a week from their ports. From our West Coast? We’re looking at a minimum of three to four weeks. When you combine zero tariffs with shorter shipping times and lower freight costs, their delivered price advantage becomes significant.

Trade data shows New Zealand already captures the largest share of Taiwan’s dairy imports, and with these structural advantages locked in through trade agreements, that position seems secure. Though U.S. dairy often commands quality premiums that can partially offset some disadvantages, particularly for specialized products where our consistency really shines.

Cash Flow and Operational Realities

One aspect that is not discussed enough is the impact of exports on working capital. Domestic milk payments typically arrive in your account within two to three weeks. But export contracts? Industry-standard terms typically run 60 to 90 days, sometimes longer.

For operations already managing tight cash flow—and let’s be honest, that describes many of us these days—that extended payment period creates real challenges. You’re still paying feed bills monthly, covering payroll every two weeks, but waiting two to three months for that milk check. The premium might look good on paper, but cash flow is what keeps the lights on.

Export-qualified milk typically receives priority scheduling for pickup to ensure that quality specifications are maintained. Makes perfect sense from a logistics standpoint, right? But farms not participating in export programs might see their pickup windows shift to less optimal times. Your milk sits in the tank longer, potentially affecting domestic quality premiums. Small things add up.

Community and Consolidation Impacts

What university extension programs have documented—and what many of us are seeing firsthand—is how consolidation patterns affect entire rural economies. Each mid-sized dairy operation supports a whole network of local businesses, including veterinary practices, feed suppliers, equipment dealers, local banks, and schools.

When smaller operations exit and their production is absorbed by larger farms (often located in different areas), the economic activity shifts accordingly. The local vet might lose enough business to cut back hours. The equipment dealer might close their satellite location. School enrollment drops. These ripple effects are real and lasting.

This isn’t an argument against efficiency—we all need to stay competitive. However, it’s worth understanding these broader impacts as we consider how export opportunities might accelerate existing trends.

Alternative Strategies for Premium Capture

Not every premium opportunity requires access to export markets. What’s encouraging is seeing different approaches work across various regions.

Institutional buyers—such as hospitals, schools, and corporate food service operations—have increasingly paid premiums for locally sourced dairy products. These arrangements often involve simpler logistics and much faster payment terms than export programs. When you factor in reduced complexity and faster cash flow, the net return can be comparable or even better.

Value-added production continues to show promise as well. Small-scale processing—whether it’s farmstead cheese, yogurt, or bottled milk—can capture retail premiums that rival export opportunities. Yes, it requires learning new skills and developing marketing channels. But you maintain control over your product and pricing in ways commodity markets never allow.

Producer collaborations are gaining traction, where multiple farms pool resources to meet export volume requirements while sharing certification costs. When economics get divided among several operations, they become more manageable—though it requires significant coordination and trust among participants.

Examining operations in Texas and Idaho, where large-scale dairies already predominate, we’re seeing interesting hybrid approaches. Some are partnering with smaller neighbors to aggregate volume while maintaining individual farm identity for certain premium markets. It’s a model worth watching.

The Cooperative Perspective—And Your Role in It

You know, cooperatives face genuine challenges here. They need to stay competitive in global markets while serving members ranging from 50 to 5,000 cows. Export program development represents one path toward accessing growing markets and potentially improving returns for all members.

Cooperative governance increasingly reflects the perspectives of larger operations. Not through conspiracy—it’s a practical reality. Larger farms typically have more resources to participate in leadership, attend meetings, and serve on committees. That naturally influences how programs get structured and priorities get set.

However, here’s the thing: if you’re not satisfied with how your cooperative is managing export opportunities or any other programs, sitting on the sidelines won’t make a difference. When’s the last time you attended your co-op’s annual meeting? Reviewed the board election slate? Actually read those governance proposals?

The question we should be asking our cooperatives: Can you develop tiered programs that recognize different member capabilities? Some co-ops are already experimenting with this—offering different service levels and cost structures based on volume and participation. If your cooperative isn’t exploring these options, bring it up at the next member meeting. Get it on the board’s agenda. Find other members who share your concerns and present a unified voice.

Your cooperative is only as responsive as its members are engaged. If export programs feel designed for operations three times your size, that’s feedback your board needs to hear—repeatedly and from multiple members.

Making the Right Decision for Your Operation

So, where does all this leave us with the Taiwan opportunity? The market is real, the demand is growing, and for operations with appropriate capabilities, the returns could be meaningful.

If you’re running a business with over 2,000 employees and strong component genetics, along with solid banking relationships, these export programs may align well with your business model. The premiums can justify the investment, and accessing growing Asian markets provides important diversification.

However, if you’re managing a mid-sized operation—particularly one already facing margin pressure—the requirements create hurdles that may be difficult to overcome profitably. And that’s okay. Not every opportunity needs to be your opportunity.

What seems to be working for many mid-size operations is focusing on regional markets. Building relationships with local institutions. Exploring value-added possibilities. Finding niche markets that value specific attributes—whether that’s grass-fed, local, family farm, or sustainable practices. These strategies might not generate headlines, but they’re delivering solid returns.

Looking Ahead

This Taiwan MOU illuminates broader dynamics in today’s dairy industry. Opportunities are increasingly differentiated by capability and resources, and understanding where your operation fits—along with what alternatives exist—is becoming crucial for long-term success.

Recent volatility has taught us that resilience comes from matching strategy to capabilities. Large operations might find their advantage in export markets and global supply chains. Mid-size farms often succeed through regional focus and differentiation. Smaller operations increasingly thrive through direct marketing and value-added strategies.

The most successful producers share common traits. They honestly assess their strengths and limitations. They understand market requirements thoroughly. They choose strategies aligned with their operational realities rather than chasing every opportunity that comes along.

As we head into another year of uncertainty, with milk prices volatile and input costs unpredictable, these strategic choices matter more than ever. The Taiwan opportunity offers a valuable perspective for examining our individual positions and options.

What’s working in your region? Because ultimately, that’s what makes our industry strong—sharing knowledge, learning from each other’s experiences, and finding paths forward that work for our individual operations while strengthening the broader dairy community. The Taiwan MOU is just one piece of a much larger puzzle we’re all working to solve together.

Key Takeaways:

  • Component and cash flow impacts: Achieving 4.2% butterfat and 3.3% protein specifications often requires feed cost increases of $0.50-1.00/cwt, while 60-90 day export payment terms versus 15-20 day domestic payments can strain working capital by $40,000-60,000 for mid-size operations
  • Regional alternatives delivering results: Direct institutional sales to hospitals and schools are capturing $0.50-1.00/cwt premiums with simpler logistics, while producer collaborations pooling volume among 6-8 farms are successfully accessing export premiums through shared certification costs
  • Cooperative engagement opportunity: Members should actively push boards to develop tiered export programs, recognizing different scales—attend meetings, join committees, and build coalitions, because governance increasingly reflects large-farm perspectives unless smaller operations organize
  • Strategic decision framework: Match your operation’s strengths to appropriate markets: 2,000+ head farms can justify export infrastructure, 500-1,000 head operations often maximize returns through regional differentiation, while smaller dairies thrive with direct marketing and value-added strategies

Complete references and supporting documentation are available upon request by contacting the editorial team at editor@thebullvine.com.

Learn More:

The Sunday Read Dairy Professionals Don’t Skip.

Every week, thousands of producers, breeders, and industry insiders open Bullvine Weekly for genetics insights, market shifts, and profit strategies they won’t find anywhere else. One email. Five minutes. Smarter decisions all week.

NewsSubscribe
First
Last
Consent

When Your Co-op Pays €19.65 Million Extra to Exit Debt Early: What Tirlán’s Transaction Means for Dairy Farmers Worldwide

Each Tirlán member pays €3,930 for early debt exit—here’s what that reveals about co-op finance

EXECUTIVE SUMMARY: What farmers are discovering through Tirlán’s €250 million bond repurchase is a fundamental shift in how cooperatives balance member control with financial pressures. The transaction—which saw 17 million Glanbia shares sold at €13.55 each to exit debt 15 months early—cost members between €1,800 and €4,400 each in premiums alone, according to regulatory filings and industry analysis. This follows October 2024’s governance changes where 80% of voting members approved removing protections that previously required member consent for major asset sales. Similar patterns at Kerry Co-op (82% approval for €500M asset sale) and Fonterra (85% approval despite projected NZ$4.1B member losses) suggest cooperatives worldwide are trading long-term member equity for short-term financial flexibility. While reducing debt from 2.9x to approximately 2.1x EBITDA strengthens Tirlán’s balance sheet, the permanent loss of €10 million in annual dividend income and reduced Glanbia ownership from 24% to 17.8% raises important questions about whether financial metrics or member economics are driving these decisions. Farmers need to understand these governance shifts now—because once voting control transfers to boards, getting it back becomes nearly impossible.

You know, Monday’s Tirlán announcement really got people talking. The Irish Farmers’ Association has been fielding member questions all week, and it’s easy to see why. When your cooperative sells €238 million worth of Glanbia shares to repurchase €250 million in bonds that aren’t due for another 15 months… well, that raises questions, doesn’t it?

What’s interesting is how this builds on patterns we’ve been seeing across the global dairy sector. The regulatory filings with the Irish Stock Exchange and reports from Agriland.ie confirm all these numbers, and they’re worth understanding in context.

The Economics Tell an Important Story

When your co-op pays €19.65 million extra to exit debt 15 months early, every farmer should understand exactly where that premium goes. This isn’t just accounting—it’s your money

So let me walk you through what actually happened here, because the details really do matter. According to the official announcements, Tirlán sold approximately 17 million shares in Glanbia plc at €13.55 per share, generating €230.35 million. They’re using that money—plus another €19.65 million from reserves—to repay exchangeable bonds worth €250 million fully.

Depending on how Tirlán counts members, this premium cost ranges from €1,800 to €4,400 per farmer. That’s not pocket change—that’s serious money that could fund equipment upgrades or debt reduction.

Why does this matter? Well, the economics paint an interesting picture:

  • Share sale proceeds: €230.35 million
  • Bond repurchase amount: €250 million
  • Premium paid for early exit: €19.65 million
  • Estimated advisory fees: somewhere between €4.8-9.6 million (based on what investment banks typically charge for these transactions)
  • Estimated lost dividend income over 15 months: roughly €10 million based on historical Glanbia yields

Now, depending on how you count membership—and Tirlán reports different numbers in different contexts, sometimes 4,500 active suppliers and other times 11,000 total members—each farmer-member’s share of this premium could range from approximately €1,800 to €4,400. That’s real money we’re talking about.

What’s particularly noteworthy is the coordination with Glanbia plc. Both companies confirmed that Glanbia would buy back up to €100 million of the shares Tirlán was selling, capped at 45% of the placement. This kind of synchronized activity doesn’t happen by accident—it’s designed to support price stability during what could otherwise be a pretty market-disrupting transaction.

Understanding the October Governance Changes

This whole thing builds on what happened at Tirlán’s October 2024 special meeting. The Irish Cooperative Organisation Society documented this extensively, and it’s worth understanding what changed.

The members who showed up—3,224 of them—voted with over 80% approval to remove Rule 4h)ii. For those unfamiliar with Tirlán’s structure, this rule had prevented the board from reducing Glanbia’s ownership below 17% without seeking specific approval from members. That’s a significant protection to give up.

However, the context that matters is this: This vote occurred alongside a €173 million share distribution. Depending on the shareholding structure, members received anywhere from €15,700 to €38,400. As many farmers have been discussing at marts and co-op meetings across Ireland, when you’re getting a check that helps fund equipment upgrades or pays down debt, voting against the rest of the package becomes… complicated.

Seán Molloy, Tirlán’s CEO, described it in official statements as providing “commercial flexibility to optimize our investment portfolio.” And technically, that’s accurate. The question many producers are raising—and you hear this at local meetings everywhere—is whether this particular optimization represents the best path forward.

The Broader Industry Context We Can’t Ignore

Understanding your cooperative’s debt is crucial, but it’s only one piece of the puzzle. Market volatility, especially in milk prices and feed costs, poses bigger threats to most operations than debt levels.

Examining Tirlán’s published accounts and data confirmed by ICOS, they’re carrying a total of €455.7 million in borrowings against €118.5 million in EBITDA. That puts their debt at about 2.9 times EBITDA—not alarming by industry standards, but definitely constraining when you’re trying to invest in processing upgrades or weather volatile milk markets.

And this season has been particularly challenging, hasn’t it? Dairygold’s board confirmed a 3c/L cut in August milk prices, and their analysis showed that this would cost the average supplier about €1,600 per month. When producers face such income pressure, maintaining cooperative financial stability becomes more immediate than long-term asset considerations.

Industry analysis suggests environmental compliance costs have been increasing significantly over the past few years. These aren’t theoretical challenges—they’re real operational pressures affecting cash flow on farms today, from managing nitrate levels to dealing with new water quality requirements.

Global Patterns Worth Noting

Across the globe, bigger deals typically get higher member approval—but is that because they’re better deals, or because bigger payouts make members more compliant? The pattern raises uncomfortable questions about cooperative democracy.

What’s particularly interesting is how this mirrors developments elsewhere. Kerry Co-op’s December 2024 vote—where 82.42% of members approved selling Kerry Dairy Ireland for €500 million plus share distributions—followed a similar pattern. DairyReporter and Agriland covered the transaction extensively, and it was completed this past January, marking the end of decades of cooperative control over those processing assets.

In New Zealand, we observed a similar development with Fonterra’s “Flexible Shareholding” restructuring. Members gave it 85.16% approval back in 2021, but the Castalia Advisors analysis published in 2022 suggested potential long-term costs to farmers of NZ$4.1 billion in lost share value. Early market data suggests those projections might’ve been conservative.

Even here in North America, consolidation continues accelerating. Rabobank’s recent sector analysis highlights how the proposed Arla-DMK merger would create a €19 billion entity controlling 13% of EU milk production. As many producers have been noting at recent dairy conferences, these mega-cooperatives raise real questions about whether bigger actually means better for the farmer delivering milk every morning.

The Complexity Behind Modern Cooperative Decisions

You know, managing a cooperative today is genuinely more complex than it was even a decade ago. Research from places like Cornell’s Dyson School shows boards are balancing immediate member needs, long-term viability, environmental regulations, and market volatility—all while competing against investor-owned firms with deeper pockets.

This context matters when evaluating Tirlán’s decision. These exchangeable bonds—essentially loans that can be converted into Glanbia shares—were issued in 2022 at an interest rate of 1.875%, as per the bond documents. They seemed attractive at the time, but market conditions change…

The advisory firms involved—Goodbody, Davy, and Rabobank—served as coordinators, bringing genuine expertise to these transactions. Professional guidance can make significant differences in transaction outcomes. The real question is whether expertise serves the long-term interests of farmer-members, not just facilitating deals.

Questions Farmers Are Asking (And Should Be)

What I find encouraging is that farmers are asking increasingly sophisticated questions at cooperative meetings and industry events. They want to understand how these decisions affect their operations.

How do debt covenants influence timing decisions? Well, many cooperatives operate under specific leverage ratios that can trigger consequences if breached. It’s something worth asking about at your next meeting.

Were alternative financing structures considered? Best practices suggest boards should evaluate multiple scenarios, though the specifics often remain confidential for competitive reasons.

What precedent does this set? Cooperative governance experts often note that each major transaction affects future decision-making frameworks across the industry.

Members are particularly interested in understanding whether keeping the Glanbia shares and using dividends to service the bonds might’ve been viable. That’s exactly the kind of analysis members should be requesting from their boards.

Success Stories and Lessons Learned

It’s worth noting that complex financial restructuring doesn’t always result in a poor outcome. The Michigan Milk Producers Association underwent significant asset restructuring in the early 2000s, and industry reports suggest that those difficult decisions funded processing capabilities that have kept them competitive today.

Similarly, Arla’s 2011 merger—despite initial member concerns, which were extensively documented at the time—has maintained strong milk prices and consistent returns, according to their published financials. The key seemed to be transparency and measurable commitments to members.

Of course, we’ve also seen cautionary examples. The Dean Foods bankruptcy reminded everyone that size alone doesn’t guarantee success. Analysis of that situation emphasized that financial engineering can’t substitute for operational excellence and market positioning.

Regional Variations in Approach

What’s particularly interesting is how different regions adapt to these pressures. Wisconsin cooperatives often focus on specialty cheese production to maintain margins—this strategy has helped many operations remain viable despite consolidation pressures, according to industry analysis.

Dutch cooperatives, such as FrieslandCampina, have pioneered sustainability premiums that help fund modernization. These programs, while adding complexity, provide additional revenue streams that can reduce reliance on debt financing.

New Zealand’s approach with Fonterra shows another path, though, as we’ve discussed, each model involves trade-offs. The flexibility farmers wanted has come with increased exposure to market volatility, as recent price swings have demonstrated.

Looking Forward: The Evolving Cooperative Model

The cooperative model continues evolving, and that’s not inherently negative. Some of today’s strongest cooperatives—Land O’Lakes, Dairy Farmers of America, and even Glanbia itself—have undergone similar transitions. Historical analysis shows the key is maintaining alignment between governance evolution and member interests.

Industry experts consistently note we’re at an important juncture for cooperative dairy. The choices being made now about governance and capital structure will shape opportunities for the next generation. What’s encouraging is seeing younger farmers engage with these issues at conferences and young farmer programs—governance questions are increasingly ranking alongside production concerns in their priorities.

Practical Takeaways for Producers

After reviewing industry trends and cooperative developments, several practical points emerge:

First, financial complexity in cooperatives is definitely accelerating. Understanding terms like “exchangeable bonds” and “accelerated bookbuilds” has become part of modern dairy farming. Industry education programs are starting to address this knowledge gap, which is encouraging.

Second, governance votes have lasting implications. Once boards receive expanded authority, historical precedent shows it’s rarely reversed. That’s why understanding what you’re voting for matters so much.

Third, bundled votes deserve scrutiny. When cash distributions are tied to governance changes, it’s worth asking why they can’t be separated. Several successful cooperatives have policies requiring separate votes on distributions and structural changes—that might be worth discussing at your cooperative.

Ultimately, precedents are crucial in this industry. Research on cooperative governance reveals that major transactions often serve as templates for smaller cooperatives. What happens at Tirlán, Fonterra, or other large cooperatives influences the entire sector.

The Bottom Line for Dairy Farmers

For Tirlán’s members, this transaction reduces debt while also reducing ownership of income-generating assets and certain governance controls. Whether that trade-off proves beneficial will depend on factors we can’t fully predict—future milk prices, interest rates, and industry consolidation patterns.

What’s clear from industry discussions and member feedback is that these questions about cooperative finance and governance aren’t going away. Every producer needs to consider where their cooperative fits in this evolving landscape.

The conversation continues at cooperatives worldwide. Some will find ways to modernize while maintaining a focus on members. Others may drift toward structures that resemble investor-owned firms more than traditional cooperatives. The difference will likely come down to member engagement, board leadership, and whether we can strike a balance between commercial necessities and cooperative principles.

As discussions at recent cooperative meetings have emphasized, these organizations were built over generations to serve farmers. The challenge now is ensuring they continue serving that purpose while adapting to modern market realities. That’s not easy, but it’s essential for the future of dairy farming.

Because at the end of the day, these cooperatives exist to serve the farmers who deliver milk every morning—whether you’re managing fresh cows through the transition period, monitoring butterfat levels, or dealing with all the other challenges we face daily. When financial complexity overshadows that fundamental purpose, we need to ask hard questions about where we’re headed. The answers will shape dairy farming for generations to come.

KEY TAKEAWAYS:

  • Governance votes have permanent consequences: Tirlán’s October 2024 rule change eliminating the 17% Glanbia ownership floor shows how “flexibility” votes fundamentally alter member control—similar changes at major cooperatives typically spread industry-wide within 2-3 years
  • Real costs often exceed immediate benefits: The €19.65M premium for early debt exit plus estimated €10M in lost dividends over 15 months suggests keeping income-generating assets while servicing 1.875% debt might’ve been more profitable—farmers should request this analysis from their boards
  • Bundled votes deserve scrutiny: When €173M member distributions ($15,700-38,400 per farmer) are tied to governance changes in single votes, separating them reveals whether proposals stand on their own merits—several successful co-ops now require this separation by policy
  • Professional advisors shape outcomes: Investment banks typically earn 1-2% on these transactions regardless of long-term member impact—understanding who benefits from complexity helps farmers ask better questions about simpler alternatives
  • Regional approaches vary significantly: While Irish cooperatives focus on debt reduction, Wisconsin operations emphasize value-added processing, and Dutch cooperatives use sustainability premiums to fund growth—knowing these options helps members advocate for strategies that fit their circumstances

Complete references and supporting documentation are available upon request by contacting the editorial team at editor@thebullvine.com.

Learn More:

  • How 600 Irish Farmers Got Their Co-op to Finally Answer the Hard Questions – This article provides a tactical blueprint for how producers can effectively organize and demand financial transparency from their cooperatives. It reveals specific questions to ask management, practical strategies for member engagement, and a powerful case study of a grassroots effort that changed a major cooperative’s behavior, empowering you to do the same.
  • Why This Dairy Market Feels Different – and What It Means for Producers – This piece offers a strategic perspective on the broader market forces shaping the industry. It analyzes the economic impact of global consolidation and technology adoption, demonstrating how a widening efficiency gap is affecting profitability and providing insights into the market dynamics that influence major cooperative decisions like the Tirlán transaction.
  • Spray Drones on Dairy Farms: Why the Failures Teach Us More Than the Successes – This article explores the financial realities of technology investment, a key consideration for cooperatives like Tirlán and individual farmers. It provides a valuable critique of the ROI on a specific innovation, teaching producers how to evaluate new technology based on operational benefits rather than hype, which can improve decision-making and reduce risk.

The Sunday Read Dairy Professionals Don’t Skip.

Every week, thousands of producers, breeders, and industry insiders open Bullvine Weekly for genetics insights, market shifts, and profit strategies they won’t find anywhere else. One email. Five minutes. Smarter decisions all week.

NewsSubscribe
First
Last
Consent

How One Island Lost £5.44 Million Preventing Nothing—And Why Your Operation Should Care

What happens when biosecurity economics don’t add up? Ask the 30 farms losing millions on an island

EXECUTIVE SUMMARY:  What farmers are discovering through the Isle of Man’s dairy crisis is that well-intentioned biosecurity measures can create more economic damage than the diseases they’re designed to prevent—particularly for operations caught in the vulnerable 100-200 cow range. The island’s 30 dairy farms have lost £5.44 million (40% of production capacity) implementing prevention measures for a disease that never reached their shores, while the UK recorded just 129 Bluetongue cases total according to DEFRA’s July reports. This situation mirrors challenges facing isolated operations from Hawaii to Vermont, where geographic constraints multiply compliance costs while limiting adaptation options. Recent AHDB data showing 440 UK farm closures last year—predominantly in that challenging middle scale—suggests this isn’t an isolated incident but part of a broader pattern where regulations unintentionally accelerate consolidation. The key insight emerging from multiple regions is that operations finding success are those building resilience through diversification, with direct sales capturing nearly double farmgate prices (85p versus 44p per pint in Huxham’s case) and collaborative approaches to processing and purchasing showing promise. For producers navigating similar pressures, the lesson is clear: understanding your operation’s true vulnerabilities and building flexibility before crisis hits has become as important as production efficiency itself.

dairy biosecurity economics

Award-winning dairy operations that lose 40% of their production reveal important insights about biosecurity economics—with practical applications for farms navigating similar regulatory challenges. As I’ve been digging into the numbers and talking to people about this, what’s emerging is… well, it’s something we all need to think about.

The Numbers That Tell the Story

The brutal reality: 92.3% of the £5.44 million loss came from milk production collapse, not animal deaths or treatment costs. This wasn’t a disease impact—it was an economic strangulation.

So here’s what we’re looking at. The Isle of Man Creamery processes about 26 million litres annually from 30 local farms—that’s according to their own reports and government statistics. A fairly standard setup for an island of that size. However, they’ve lost 40% of their production capacity, which translates to approximately £5.44 million being lost from a dairy sector worth around £13.6 million in total.

Now, here’s where it gets interesting. DEFRA’s July report documented 129 Bluetongue cases across the entire UK. The Isle of Man? Zero cases. Not one. Yet they’re hemorrhaging millions because of prevention measures.

It’s worth noting that we’ve all seen disease prevention work brilliantly—FMD never got here, and that saved countless operations. But when prevention costs exceed any reasonable estimate of disease impact… that’s when we need to ask hard questions.

Carl Huxham runs Cronk Aalin Farm on the island—40 cows, getting about 6,000 to 7,000 litres per cow annually. He’s been pretty open about the challenges, particularly the shipping costs. Everything that comes to an island—feed, equipment, replacement parts—it all costs more. And that’s before you even factor in these disease restrictions.

How Things Compound on Each Other

Here’s the uncomfortable math: Isle of Man farmers paid £300 per cow preventing a disease that typically costs £135 per cow when it actually hits. Meanwhile, H5N1 shows what happens when prevention fails—£950 per affected animal.

What’s particularly noteworthy about this situation is how multiple pressures have converged. And honestly, many of us are dealing with at least some of these same challenges…

The disease control measures have been in place since November 2023—we’re now nearly two years into a complete livestock import ban from the UK. Meanwhile, mainland operations can move cattle within England relatively freely as of this July. So, you have island farmers who can’t bring in replacement heifers or new genetics, while their mainland counterparts are operating almost normally.

Then there’s the feed situation. You probably felt it too—AHDB documented hay yields running about 60% below normal this year. Tough everywhere, right? But when you’re on an island, or even just in a remote area, those transportation costs can double or triple. Many operations in Hawaii face similar challenges, and increasingly, those of us in more isolated mainland regions are seeing comparable dynamics as local suppliers disappear.

The September equipment failure at their butter production line… well, that hits close to home for many of us. USDA processing efficiency studies generally show you need somewhere between 30 and 50 million litres annually for optimal efficiency, depending on your setup. When you’re running below that threshold—and most smaller regional operations are—every breakdown becomes critical because you can’t justify the expense of backup systems.

And here’s something interesting: the island attracts over 329,000 tourists annually, generating approximately £212 million, according to their tourism board. That creates wild seasonal swings in demand. Think about operations near Yellowstone or in Vermont’s ski country—same dynamic. You need production flexibility exactly when regulations eliminate it.

The Middle-Scale Challenge We’re All Facing

The data reveals dairy’s dirty secret: mid-size operations face 20% higher costs than small direct-sales farms or large-scale dairies. Isle of Man’s 124-cow average puts them squarely in the death valley.

The Isle of Man farms average about 124 cows each, which puts them right in that challenging middle zone. You know what I mean—too big for effective direct marketing in most cases, too small for real processing efficiencies.

The Center for Dairy Profitability up in Wisconsin has been documenting this for years. Operations between 100 and 200 cows often face the highest per-unit costs. It’s not just a US phenomenon either—the latest AHDB data shows that 440 UK farms closed last year, a 6% decline, bringing the total to about 7,130. And which operations are surviving? Generally, the small, nimble ones are those doing direct marketing, or the large ones with significant scale advantages.

What makes island situations particularly tough—and this applies to geographically isolated mainland areas too—is the limited ability to adjust. You can’t just buy more land when you’re surrounded by water. Same problem if you’re in a valley where all the good ground’s taken, or where development pressure has driven land prices through the roof.

Different Approaches, Different Results

Examining how various regions are addressing these pressures offers some insight…

New Zealand’s interesting. Fonterra controls somewhere between 90% and 95% of its milk supply, according to its annual reports. You’d think that level of coordination would guarantee good prices, but many producers there are struggling with profitability, especially when global prices dip. Market concentration doesn’t automatically mean farmer prosperity—something to keep in mind as we observe consolidation in the industry.

India went a completely different direction. According to the National Dairy Development Board, the Amul cooperative model serves approximately 100 million farmers. They’ve maintained substantial import protection, and you know what? They’re now the world’s largest milk producer. Different system, different philosophy, but it’s working for them.

Iceland’s doing something really creative—using its abundant renewable energy to develop alternative proteins, such as Spirulina. Their 2021 Food Policy outlines this shift pretty clearly. Sometimes the answer isn’t competing harder in the same game; it’s finding a different game altogether.

In North America, we’re seeing various adaptive strategies emerge. Some regions are developing collaborative approaches to processing and purchasing. Others are investing heavily in renewable energy to offset costs. Each area seems to be finding its own path forward, though the specific models vary considerably based on local conditions and regulations.

Practical Considerations Worth Thinking About

Based on what’s happening on the Isle of Man and patterns emerging elsewhere, several things deserve our attention…

On biosecurity economics: It’s worth sitting down with your vet and running real numbers. What would a disease outbreak actually cost your specific operation? Are there graduated response options—such as testing, short quarantines, or targeted vaccination—that could provide protection without shutting everything down? These conversations are better had before a crisis hits.

Building resilience into operations: The farms weathering challenges best seem to have multiple approaches working. Direct sales can capture significant premiums—Huxham gets 85p per pint direct versus the 44p farmgate average. That’s not small change. Having some feed production capability, maintaining genetics that work in your environment… these buffers matter more than ever.

Understanding your real position: Geographic location cuts both ways. Being isolated can mean higher input costs, but it can also mean loyal local customers who value what you produce. The key is matching your strategy to your actual circumstances, not what you wish they were.

The Regulatory Reality We’re All Navigating

Here’s something we need to acknowledge: regulations have different impacts on different scales. And it’s not necessarily intentional—it’s just how the math works out.

Small operations often find ways to work within or around certain requirements through direct sales and simplified processes. Large operations spread compliance costs across a massive volume. However, that middle segment—where many of us operate—carries the full regulatory burden without the scale to truly absorb it.

According to Dairy UK’s analysis, approximately 87% of the UK market’s processing capacity is controlled by three major companies. Each new regulation, regardless of intent, tends to accelerate this concentration. It’s not a conspiracy; it’s just a matter of economics.

From the processors’ perspective, they’re dealing with retailer demands, food safety requirements, and international market access needs. Regulators generally aim to protect both animal and human health. The disconnect occurs when on-farm economic realities are not adequately factored into these decisions.

What This Means Going Forward

Climate variability isn’t going away. Disease pressures will continue. And regulatory complexity tends to increase over time. These are realities we need to plan around…

Supply chain resilience has taken on new importance. COVID taught us about sudden disruptions, but this Isle of Man situation shows that regulatory disruptions can be equally impactful—and potentially longer-lasting.

The scale required for efficient processing continues to rise. Most analyses suggest you need at least 30 to 50 million litres annually for competitive efficiency now. That has real implications for regional processing availability and producer options.

Perhaps most importantly, we need better frameworks for evaluating the costs of prevention versus the actual risk. This requires dialogue between all stakeholders—producers, veterinarians, processors, and yes, regulators. Everyone needs to understand the full picture.

Moving Forward Together

What the Isle of Man situation ultimately teaches us is about adaptation and resilience…

Some operations are finding creative solutions through cooperation, including shared processing, group purchasing, and collaborative marketing. These aren’t perfect solutions, but they show that working together can create opportunities that don’t exist individually.

The key seems to be recognizing challenges early enough to adapt proactively rather than reactively. This requires an honest assessment of our situations, learning from others’ experiences, and sometimes making difficult decisions about the future direction of our operations.

It’s worth remembering that this industry has always been built on resilience and innovation. We’ve weathered challenges before, and we’ll weather these too. But it helps to learn from each other’s experiences—whether those experiences come from an island in the Irish Sea or a farm down the road.

What patterns are you seeing in your region? Because they’re there, even if they haven’t made headlines yet. Sometimes the best insights come from comparing notes before a situation reaches a crisis level.

Feel free to share your thoughts at news@thebullvine.com. After all, we’re all in this together, whether we’re on actual islands or just dealing with our own unique challenges that can make us feel that way.

These are indeed interesting times in the dairy industry. But then again, when haven’t they been?

KEY TAKEAWAYS:

  • Calculate your biosecurity ROI: Operations spending more than £300 per cow on disease prevention should reassess—actual outbreak costs often run £120-150 per infected animal based on European data, meaning many farms are overspending by 200% or more
  • The 124-cow trap is real: Farms between 100-200 head face 15-20% higher per-unit costs than either smaller direct-marketing operations or 300+ cow dairies according to Wisconsin’s Center for Dairy Profitability—knowing which side of this divide you’re on shapes every strategic decision
  • Direct sales change everything: Producers capturing retail prices (like Huxham’s 85p per pint) generate margins that can offset compliance costs that would sink commodity-focused operations—even partial direct marketing can improve resilience by 30-40%
  • Geography multiplies challenges: Remote and island operations face feed cost premiums of 200-250% plus limited genetic improvement options—if you’re paying more than £50/tonne above regional averages for inputs, alternative production models deserve serious consideration
  • Collaborative solutions work: Regional processing cooperatives, shared equipment purchases, and group feed buying are helping mid-size operations achieve economies of scale—Minnesota and Ohio examples show 20-30% cost reductions through cooperation

Complete references and supporting documentation are available upon request by contacting the editorial team at editor@thebullvine.com.

Learn More:

  • HPAI H5N1: The 2025 Science-Based Dairy Farm Survival Guide – This article provides a tactical blueprint for effective biosecurity, revealing specific herd health protocols and low-cost prevention strategies that can reduce your risk without the massive financial outlays seen in the main article’s example. It details how to optimize PPE, manage farm visitors, and leverage herd status programs.
  • Why This Dairy Market Correction Feels Different – and What It Means for Our Farms – Beyond the Isle of Man, this piece offers a broader strategic perspective on the global dairy market. It breaks down the forces driving industry consolidation and provides data-backed insights on how to build resilience against volatile prices and survive the extended market pressures forecast through 2026.
  • AI and Precision Tech: What’s Actually Changing the Game for Dairy Farms in 2025? – This article explores the innovative solutions farmers are using to overcome the “middle-scale challenge.” It provides specific return-on-investment numbers for technologies like AI-driven feeding and automated health monitoring, helping you prioritize capital investments that deliver tangible cost savings and efficiency gains.

The Sunday Read Dairy Professionals Don’t Skip.

Every week, thousands of producers, breeders, and industry insiders open Bullvine Weekly for genetics insights, market shifts, and profit strategies they won’t find anywhere else. One email. Five minutes. Smarter decisions all week.
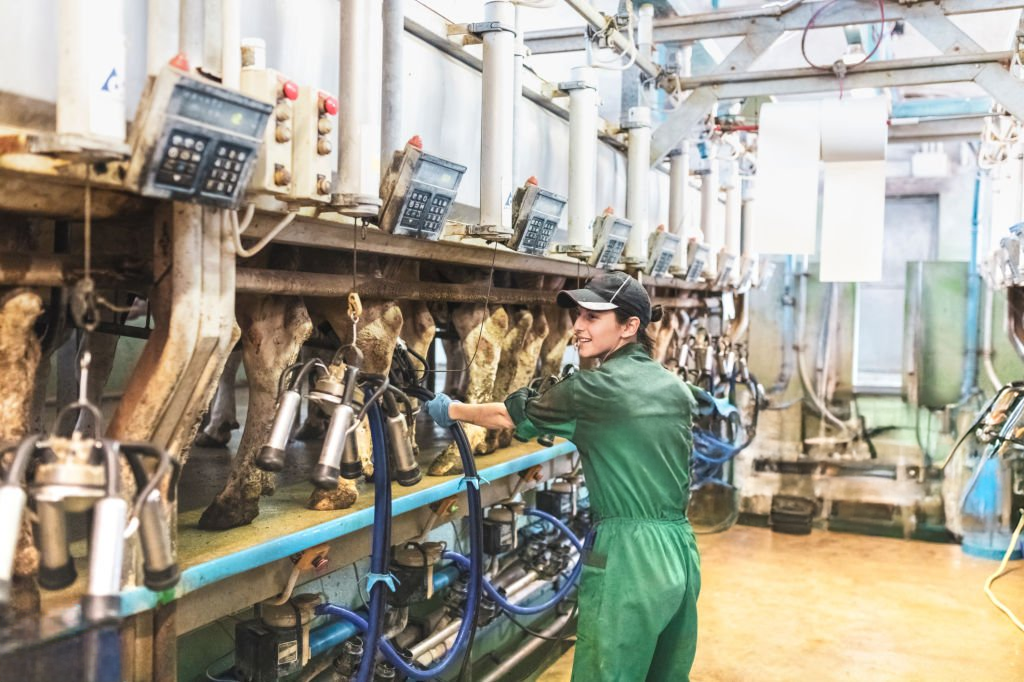
NewsSubscribe
First
Last
Consent

Your State’s Next: How Smart Dairies Turn Methane Compliance into $200K+ Annual Revenue

California lost farms while others made millions—the difference wasn’t technology, it was timing and scale

EXECUTIVE SUMMARY: What California’s methane compliance journey reveals isn’t just about environmental regulations—it’s a roadmap showing how dairy economics fundamentally shift when compliance costs hit different sized operations. The patterns emerging from California show operations over 3,000 cows can generate substantial revenue through digesters and carbon credits, while dairies between 500-1,000 cows face increasingly marginal economics that challenge long-term viability. Feed additives that achieve dramatic reductions in laboratory settings deliver substantially lower performance in commercial applications, highlighting the gap between promises and farm reality. Early movers who position infrastructure before regulatory deadlines consistently capture better financial terms, while those forced to react face compliance costs without offsetting revenue streams. The consolidation accelerating across the industry isn’t simply about farm size—it reflects fundamental economic thresholds where compliance costs create dramatically different outcomes based on scale. States developing their own approaches are learning from California’s experience, creating opportunities for prepared operations to capture value through strategic positioning. The message for dairy farmers is clear: understanding where your operation falls on the scale spectrum and making strategic decisions aligned with your resources determines whether environmental regulations become profit centers or existential challenges.

You know, if you’d told me five years ago that California dairies would be making serious money from methane reduction, I’d have thought you were pulling my leg. But here we are at the crossroads of environmental necessity and economic opportunity—and what’s happening out West is reshaping how we all need to think about the future of dairy, whether we’re managing herds in Wisconsin’s rolling hills, Pennsylvania’s river valleys, or anywhere in between.

I should mention upfront—I’m not here to tell anyone what to do with their operation. We all know our own farms best, our own soil, our own markets. But sharing what’s happening and what others are learning? That has always been valuable, especially when we face industry-wide changes that affect us all.

The Technology Reality: Lab Versus Farm

What’s particularly noteworthy is the gap between laboratory promises and on-farm reality with these methane reduction technologies. You’ve probably seen the headlines about seaweed additives—those impressive reduction numbers from controlled trials that make it sound like we’ve found the silver bullet.

University feeding trials have demonstrated significant reductions in methane emissions with the use of Asparagopsis seaweed under controlled conditions. But here’s the thing—commercial applications generally achieve substantially lower reductions than laboratory conditions. And there’s a fascinating reason for this disconnect.

The 57% lie: Seaweed additives promise 82% methane reduction in labs but deliver just 25% on actual farms. Before investing $50K in ‘miracle’ solutions, know the difference between university press releases and feed bunk reality.

The active compounds in seaweed break down faster than anyone expected once they leave controlled conditions. What works beautifully in a university feeding trial—with fresh product, immediate feeding, controlled temperatures—doesn’t always translate to the reality of your feed bunk. Especially after the product has been shipped across the country and stored in your commodity shed through a hot summer, that’s just the reality of moving from lab to farm.

This builds on what we’ve seen with other feed technologies over the years, doesn’t it? Remember when bypass protein was going to revolutionize everything? Great concept, variable field results. The same story with numerous “game-changing” innovations.

And those synthetic options like 3-NOP? Research suggests they can reduce methane emissions in total mixed ration systems, delivering more consistent results than seaweed. But effectiveness varies significantly in high-forage feeding systems, particularly in grazing-based operations common in the Northeast. The compound requires precise mixing and doesn’t distribute well in pasture situations.

Understanding the Real Economics: Scale Matters More Than Ever

What I find most instructive is examining how the economics actually play out across different-sized operations. The patterns emerging from California show clear economic thresholds that determine viability.

Scale Dictates Profitability. This is the hard math of methane compliance. Larger dairies can see payback on digester investments up to twice as fast as mid-sized operations, turning regulation into a revenue stream. For dairies under 500 cows, the economics rarely work, forcing them to find entirely different strategies to survive.

For those running larger operations—let’s say over 3,000 cows—digesters can actually generate substantial revenue through carbon credits and renewable energy programs. Larger California operations report favorable payback periods when carbon credit programs are available.

Now, for operations between 1,000 and 3,000 cows—and that’s a significant portion of our industry—the economics require patient capital. Payback periods typically extend longer for medium-sized operations, and your financing structure matters enormously.

Those 500 to 1,000 cow dairies face the toughest economics. Too large for niche markets but too small for economies of scale. Economics becomes increasingly challenging at this scale, testing even the most patient and financially capable individuals.

The $200K reality check: While mega-dairies turn compliance into profit centers, mid-size family farms face an existential squeeze. This isn’t just about technology—it’s about survival thresholds that reshape American dairy.

And for dairies under 500 cows? Large-scale technologies rarely pencil out. However, creative alternatives are emerging—shared composting facilities, cooperative manure management systems, and simplified solid waste separation. These approaches require different thinking, but they can be effective.

What’s crucial to understand is how dependent these economics are on local carbon credit values and renewable energy incentives. Voluntary carbon markets typically offer lower credit values than California’s specialized programs, creating dramatically different economics depending on your location.

I’m curious to see how this plays out in states with strong traditions of grazing. Will they develop crediting systems that recognize carbon sequestration in well-managed pastures alongside methane reduction?

The Portfolio Approach: Diversification Beyond the Milk Check

Strategy<500 cows500-1,000 cows1,000-3,000 cows3,000+ cows
DigestersNot viableMarginalOften justifiedStrong ROI
Composting/Manure MgmtViableViableViableViable
Feed AdditivesRarely economicalEconomic only in confinedMore effectiveBest fit
Direct Marketing/Value AddedHigh potentialPossible nicheSupplementaryAuxiliary

The most successful operations aren’t betting everything on any single technology. They’re building diversified strategies that create resilience when individual components underperform.

Production efficiency forms the foundation. Increasing production per cow significantly reduces methane intensity per unit of milk produced—without any new technology. Better heat abatement, tighter fresh cow protocols, optimizing starch levels and fiber digestibility—these improvements compound over time.

This aligns with what progressive nutritionists emphasize: good management is environmental management. Better feed efficiency, improved reproduction, lower SCC—these traditional metrics reduce environmental footprint while improving profitability.

Alternative manure management provides middle-ground solutions. Composting, separation systems, and mechanical scraping—these technologies work at various scales. New research on biochar-enhanced composting shows promise, though commercial viability remains uncertain.

Some traditional practices deserve renewed attention. Rotational grazing, well-managed pastures, and focus on cow longevity—these approaches sequester carbon while reducing emissions intensity.

Digesters work effectively when you have the right conditions: a liquid manure system, consistent feedstock, technical expertise, and sufficient scale to spread capital costs. Success depends heavily on the quality of management and local market conditions.

Feed additives continue evolving. Current products work best in confined feeding situations with precise ration control. Costs should decrease as production scales up, but these remain supplementary tools rather than complete solutions.

The Timeline Pressure: First-Mover Advantages and Late-Adopter Penalties

Various states are establishing different incentive structures and compliance timelines. Early movers consistently capture the best opportunities.

California’s experience proves instructive. Their programs lock in favorable terms for early infrastructure development. Miss those windows, and you face compliance costs without offsetting revenue.

Agricultural lenders see this bifurcation clearly. Early strategic movers maintain financing options. Those forced to act later find limited and expensive choices.

The pattern remains consistent: capture value by moving early, face costs by waiting. Each year of delay in regulated markets potentially sacrifices a significant portion of the lifetime project value.

The half-million-dollar procrastination penalty: Early movers capture $250K in credits while late adopters lose $250K to compliance costs. Every month you wait, someone else locks in your potential revenue stream.

Processors are increasingly factoring environmental performance into their supply relationships. Some develop sustainability programs, although the value of meaningful premiums remains uncertain.

Industry Consolidation: The Structural Reality

USDA data confirms accelerating consolidation in dairy farming, with environmental regulations adding pressure in certain regions.

Mid-sized operations (500-1,000 cows) face existential challenges. They can’t easily access niche markets or achieve the scale for technology economics. Multi-generational family farms confront difficult succession decisions under this pressure.

These operations remain profitable today, but face uncertainty about the regulatory landscape of tomorrow. This uncertainty complicates planning, financing, and family transitions.

Smaller operations encounter different challenges. Per-unit compliance costs run higher without scale advantages. However, some thrive through direct marketing, value-added processing, or agritourism—creating businesses that sidestep the pressures of the commodity market.

Custom operators navigate unique complexities working across multiple farms with varying capabilities and requirements. Standardizing practices while maintaining flexibility poses a challenge for these essential service providers.

Regional Adaptation Strategies

RegionAvg Herd SizePrimary StrategyIncentive $/cowCompliance TimelineSuccess Rate
California1,850Digesters + Credits$285Active Now65%
Northeast85Grazing Credits$452027 Start82%
Upper Midwest195Co-op Models$752028 Start78%
Southwest2,200Water + Methane$1952026 Start71%
Southeast450Voluntary Programs$352029+ StartTBD

States are learning from California while developing approaches suited to their conditions and farming systems.

Northeast states initially emphasize voluntary programs, recognizing their smaller average herd sizes and pasture-based systems. They’re exploring how to credit both methane reduction and soil carbon sequestration.

The Upper Midwest investigates incentive structures that value well-managed grazing systems. Some states explore digesters for medium-sized farms through cooperative models. Others examine manure-to-energy opportunities linked with existing utility infrastructure.

The Southwest links water conservation with methane reduction, recognizing their interconnected resource challenges. Different regions focus on integrating energy infrastructure or enhancing drought resilience alongside emissions reduction.

Some states are exploring how to credit both methane reduction and soil carbon sequestration—potentially game-changing for grazing operations. Others develop programs recognizing diverse farm scales and production systems.

Implementation Realities: What the Planning Documents Don’t Tell You

Field experience yields critical insights that extend beyond theoretical planning.

Infrastructure costs typically exceed initial estimates, often by a substantial amount. Beyond primary technology, you need storage modifications, handling equipment, monitoring systems, and team training. Budget extra for contingencies—you’ll need it.

Seasonal operations create challenges vendors rarely acknowledge. Winter functionality at sub-zero temperatures differs dramatically from summer operations. Heat stress impacts both cows and technology performance. Spring mud season complicates manure handling. These realities affect system design and operating costs.

Supply chains for newer technologies remain immature. Quality varies between suppliers, availability fluctuates, and prices reflect market volatility. Multiple supplier relationships provide essential backup.

You must document everything. Carbon credit verification, regulatory compliance, and management decisions all require baseline data. Start measuring before implementing changes—retroactive documentation doesn’t work.

Emerging Opportunities: Beyond Compliance

Strategic positioning creates opportunities beyond mere compliance.

Carbon credit markets evolve rapidly with significant regional variation. Some areas generate meaningful revenue streams; others offer minimal returns. Understanding your local market conditions drives decision-making.

Milk processors and food companies develop sustainability programs with potential premiums for verified low-emission milk. Whether these deliver meaningful value or just create requirements remains uncertain.

Technology continues advancing rapidly. Today’s impractical solution might become viable within a few years. Stay informed without chasing every innovation.

Taking Action: Your Next Steps

Here’s your practical roadmap:

Assess your position honestly. Evaluate your scale, resources, and timeline for major decisions. Consider retirement, succession, and expansion plans realistically.

Gather region-specific information. Attend extension meetings, engage with neighbors, and explore NRCS programs. Local knowledge is often more valuable than general advice.

Start documenting now. Begin baseline measurements even before making changes. This data becomes invaluable later.

Think strategically, not reactively. Success comes from thoughtful decisions aligned with your specific circumstances, not from following prescriptive solutions.

The Strategic Bottom Line

After observing nationwide developments across different regions and scales, success requires making thoughtful strategic decisions with available information, building adaptable systems, and maintaining flexibility.

The shifts in emissions thinking, environmental impact assessment, and value creation aren’t future considerations—they’re current realities in some regions and near-term probabilities everywhere else.

Learn from others’ experiences while recognizing your unique situation. A large New Mexico operation differs fundamentally from a smaller Vermont farm. Someone with returning children faces different decisions than someone approaching retirement.

Stay informed, think strategically about your specific operation, and make decisions aligned with your long-term goals and values. The dairy industry will look different five years from now—that’s certain.

Is change concerning? Perhaps. But it also creates opportunities for those prepared to adapt thoughtfully. The question isn’t whether change arrives—it’s how we position our operations to thrive.

Consider this as you head into another season managing the operations you’ve built. The future of dairy isn’t distant—it’s being shaped now by decisions each of us makes on our farms, in our communities, within our circumstances.

The conversation continues, and we’re all part of it.

KEY TAKEAWAYS:

  • Digesters generate positive returns for 3,000+ cow operations with favorable payback periods when carbon credit programs are available, but economics become marginal below 1,000 cows and typically unviable under 500 cows
  • Production efficiency improvements offer universal benefits—increasing milk per cow through better management reduces methane intensity without requiring permits, infrastructure investment, or regulatory approval
  • Early strategic positioning captures value while delayed action faces costs—agricultural lenders report producers who move before regulatory deadlines maintain better financing options and terms
  • Portfolio approaches outperform single technologies—combining production efficiency, manure management alternatives, and selective technology adoption creates resilience when individual solutions underperform
  • Documentation starting now strengthens your position—baseline measurements before implementing changes become invaluable for carbon credit verification, regulatory compliance, and informed decision-making regardless of operation size

Complete references and supporting documentation are available upon request by contacting the editorial team at editor@thebullvine.com.

Learn More:

The Sunday Read Dairy Professionals Don’t Skip.

Every week, thousands of producers, breeders, and industry insiders open Bullvine Weekly for genetics insights, market shifts, and profit strategies they won’t find anywhere else. One email. Five minutes. Smarter decisions all week.
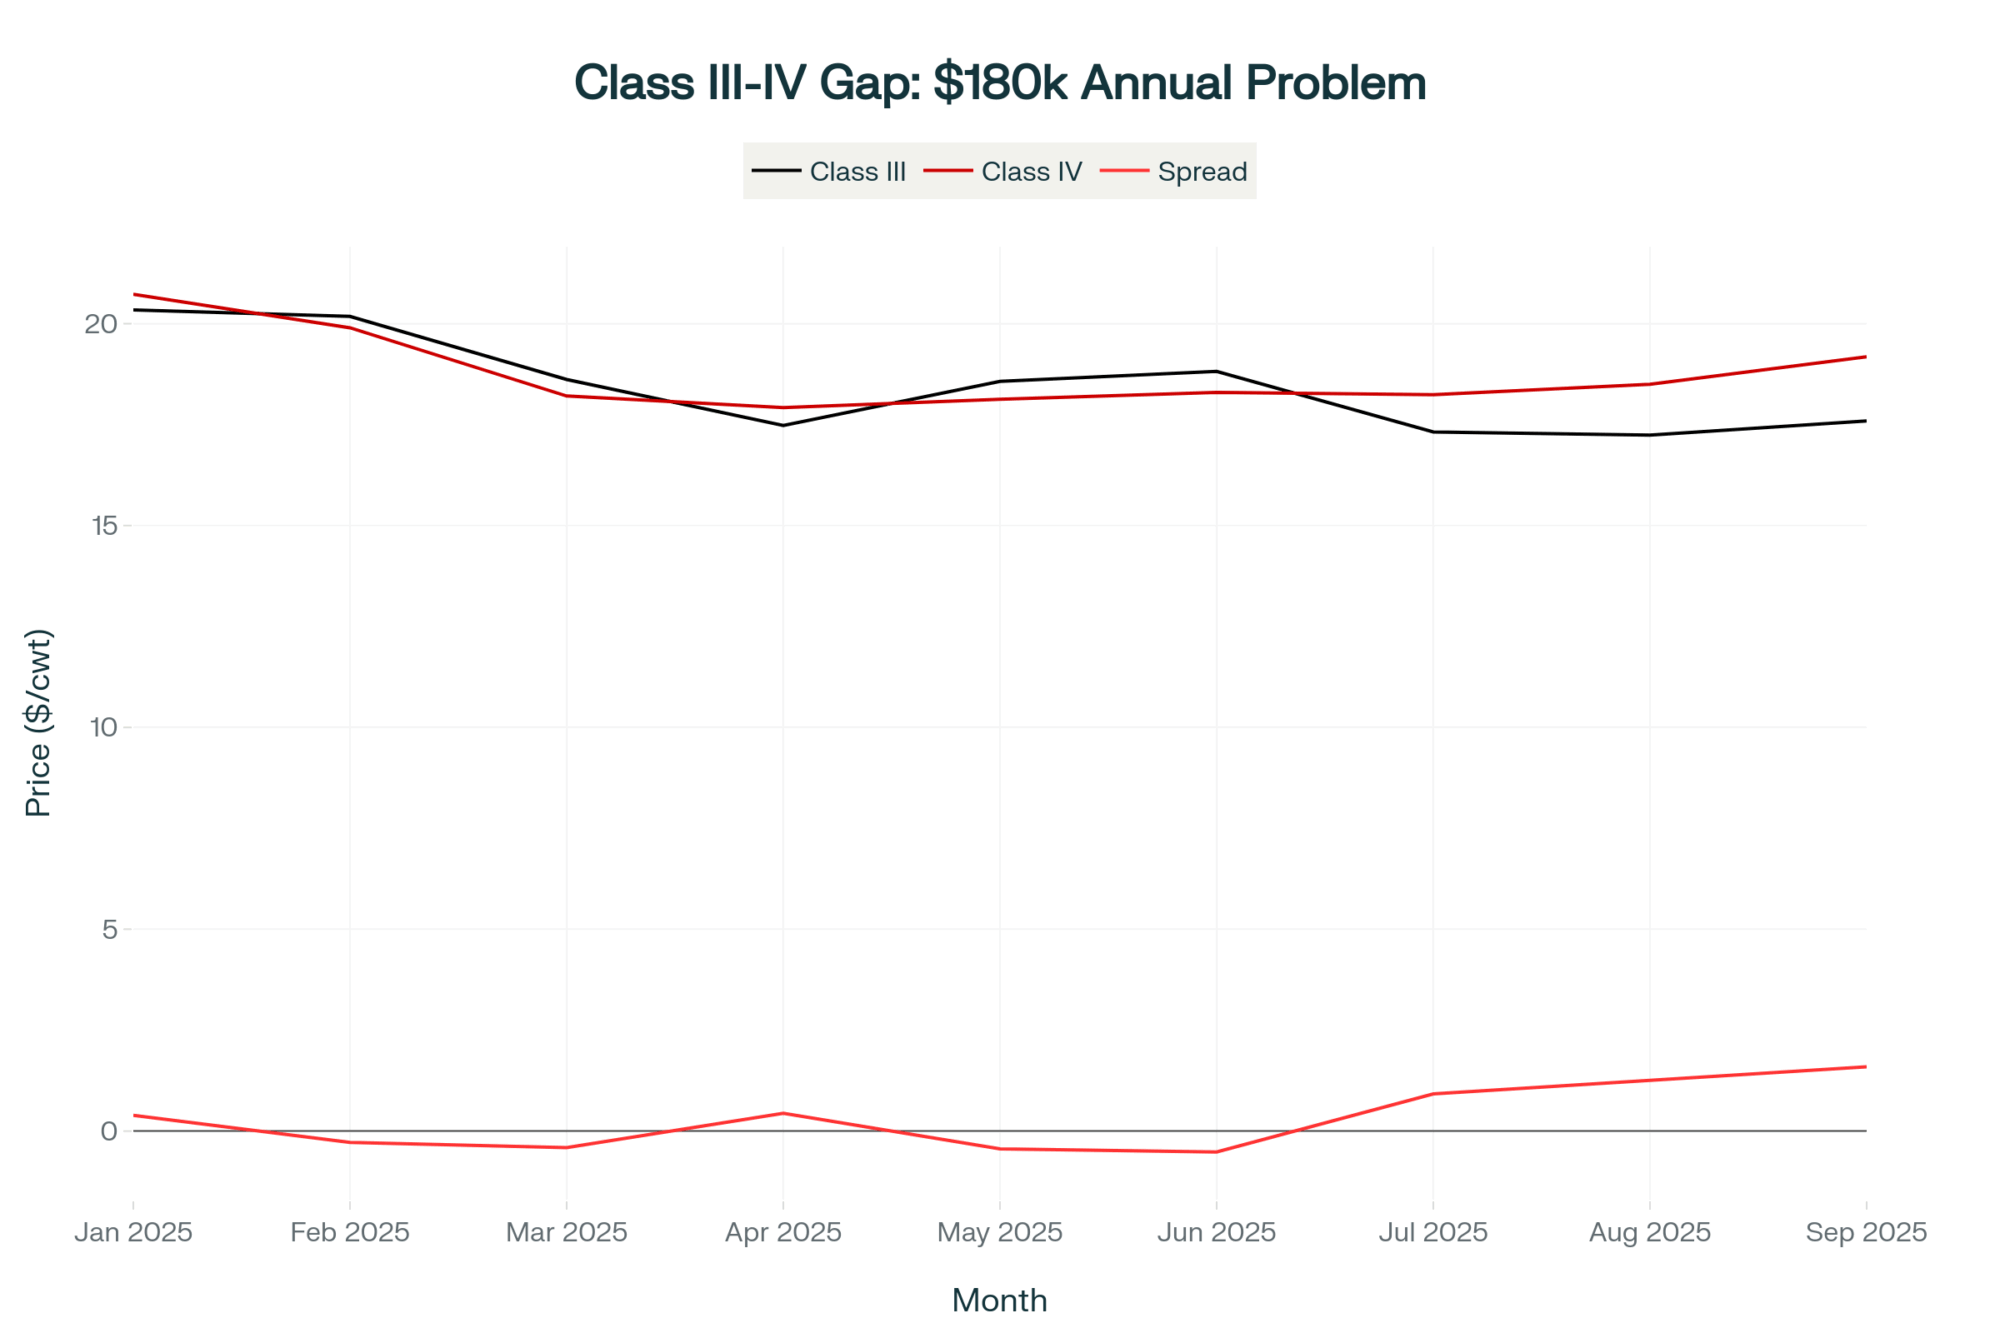
NewsSubscribe
First
Last
Consent

China Killed Our Export Market – But These Dairy Operations Are Actually Growing Because of It

Smart producers turning China’s dairy ban into competitive advantage through domestic consolidation

EXECUTIVE SUMMARY: What farmers are discovering is that China’s 84-125% tariffs on U.S. dairy exports—while devastating for export-dependent operations—are creating substantial opportunities for domestic-focused producers and processors. Wisconsin cheese plants report operating at their highest capacity utilization rates in years as milk previously destined for export powder shifts to domestic cheese production, where consumption remains steady at 33-34 pounds per person annually according to USDA data. Southwest operations are finding transportation cost advantages of $0.12-0.25 per hundredweight when serving Mexico’s growing dairy market under USMCA protection, while Northeast premium producers are seeing increased consumer willingness to pay for locally sourced products during trade uncertainty. University research shows operations implementing efficiency technologies during this margin compression are achieving 15-25% improvements in reproductive performance and feed conversion. The structural shift from export dependency to domestic market strength could create a more resilient foundation for American dairy, particularly for operations that adapt quickly to capture emerging opportunities in food service, premium markets, and treaty-protected alternatives like Mexico. Here’s what this means for your operation: the fundamentals of good dairy farming—efficient feed conversion, strong reproductive performance, and consistent quality—matter more now than ever.

dairy business strategies

While export-dependent operations face genuine challenges from China’s new dairy tariffs, domestic-focused American farms and processors are finding unexpected opportunities. Smart producers are already adapting to turn this crisis into a competitive advantage.

Look, if you’ve been keeping up with the trade news, you know that China has imposed tariffs on our dairy exports, which effectively price most U.S. products out of that market. The Chinese Ministry of Commerce implemented rates ranging from 84% to 125% on various dairy categories in March 2025—and yes, the pain is real for operations that built their business models around export premiums.

Export Reality Check: Mexico and Canada control 86% of top market value while China’s $584M faces 84-125% tariffs

But here’s what caught my attention lately. While some producers are definitely struggling, others are discovering opportunities they didn’t even know existed. When substantial volumes of dairy products that were headed overseas suddenly need to be sold domestically, it creates ripple effects throughout our entire supply chain.

And some of those ripples are actually creating waves of opportunity, depending on how you’re positioned.

What China Actually Did—and Why It Matters

Trade War Escalation: Dairy tariffs skyrocketed from 84% to 125% in weeks, pricing US exports out of Chinese markets permanently

This isn’t really about trade war emotions, though that’s how it’s getting covered. From what I’m seeing in USDA Foreign Agricultural Service reports, China’s been working systematically toward dairy self-sufficiency for years now. They’ve substantially increased their domestic production capacity while securing preferential trade relationships with other suppliers.

The most telling part? New Zealand has secured improved trade access to China’s dairy market through its upgraded Free Trade Agreement, which took effect in January 2024. New Zealand Trade and Enterprise confirms that their dairy products now enjoy complete tariff elimination. While we’re being priced out, other suppliers are receiving preferential treatment.

I think what’s happening here is that these tariffs aren’t negotiating tactics—they’re the final step after China’s already built up alternatives. That’s why the domestic opportunities emerging probably aren’t temporary market adjustments. They’re structural changes that could reshape how we think about dairy marketing for years to come.

The Reality for Export-Heavy Operations

Let’s be straight about what some operations are facing, because the challenges are legitimate. USDA farm financial surveys and university extension dairy economists have been tracking operations that expanded based on export premium assumptions—particularly in the Upper Midwest and parts of California—and many are reassessing their strategies as revenue projections change.

For smaller family operations, that might mean annual revenue reductions of several thousand dollars. We’re talking about milk check impacts that can be meaningful when export premiums disappear—you know how every dollar counts when you’re running on tight margins. University of Wisconsin dairy economics research suggests that these impacts vary significantly depending on the extent to which an operation relies on export market access. For larger operations that expanded specifically to capture export opportunities, the numbers scale proportionally.

As many of us have seen at recent co-op meetings, the National Milk Producers Federation reports that some cooperatives are seeing members reassess their long-term strategies. It’s a tough situation—and I don’t want to minimize what these families are going through, especially those who took on debt to expand for export markets that may not return for years, if ever.

But there’s another side to this story that’s worth understanding.

Domestic Markets Getting Export-Quality Products

So what happens when substantial volumes of dairy products that were destined for export markets suddenly need domestic homes? From what I’m hearing, food service companies and domestic processors are gaining access to export-quality ingredients at prices they haven’t seen in years.

National Restaurant Association member surveys indicate that food service distributors—you know, the companies supplying restaurants, schools, and hospitals—are finding increased availability of high-quality dairy ingredients. When volumes earmarked for overseas markets are redirected domestically, it creates margin improvement opportunities for these buyers.

I’ve noticed that this is particularly pronounced in the foodservice sector, as restaurants and institutional buyers can absorb quality ingredients that were previously export-bound without having to make major adjustments to their operations. It’s one of those situations where challenges in one sector create genuine opportunities in another.

The volume that’s been displaced from export channels has to go somewhere, right? Domestic food service appears to be absorbing a significant portion of it. The encouraging aspect here is that this could create a more stable domestic foundation for our industry—assuming these new relationships remain intact once the dust settles.

Wisconsin Cheese Plants Are Having Their Moment

Hidden Revolution: Butterfat and protein gains drove cheese yields up 12.5% since 2010—creating domestic advantages export-dependent operations missed”

Something that might surprise you is how well-positioned cheese processors appear to be, despite all the export disruptions. Industry surveys from Wisconsin suggest many cheese plants are operating at higher capacity utilization rates than they’ve seen in recent years. And when you think about it, the logic makes sense.

With less milk going to powder production for export, more volume appears to be shifting to cheese manufacturing for domestic consumption. Plants that used to be secondary options for milk procurement—you know, the ones that only got milk when export plants didn’t need it—they’re becoming primary destinations now. They’re potentially running at a higher capacity utilization and gaining more predictable access to milk supply.

Wisconsin Cheese Plants Reach Record Capacity

This makes sense when you consider that domestic cheese consumption stays pretty steady—we Americans eat about 33-34 pounds per person annually, based on USDA Economic Research Service data—regardless of what happens with trade relationships. So these operations have a more stable foundation than export-dependent processing.

Milk Flows Shift as Exports Decline

You know, talking with cheese plant managers in Wisconsin lately, they tell me they’re finally able to plan production schedules around predictable milk supplies. They’re not wondering whether their volumes might get diverted to export operations when premiums spike. That kind of stability… it matters when you’re trying to run an efficient operation, especially when you’re dealing with fresh milk that can’t wait.

Southeast Poultry Finding Multiple Advantages

Now here’s something I didn’t expect when this whole trade situation started unfolding—poultry operations in the Southeast appear to be benefiting from several trends happening simultaneously.

USDA’s National Agricultural Statistics Service data shows that as other protein markets get more volatile due to export disruptions, poultry becomes increasingly competitive domestically. At the same time—and this is interesting—more corn and soy may potentially remain in domestic markets, making feed costs more favorable for poultry operations. And we all know feed typically represents 60-70% of production costs for poultry.

The Southeast has consistently had favorable demographics. Census Bureau estimates show that states like Georgia, North Carolina, and Alabama continue to experience steady population growth. But now they may have feed cost advantages layered on top, which could strengthen their position considerably.

Here’s the thing I keep coming back to: growing populations create built-in demand increases, and that kind of consistent domestic demand is looking pretty attractive when export markets are getting unpredictable. Fresh protein demand doesn’t fluctuate with trade wars—people still need to eat, regardless of what’s happening with international relationships.

Talking with Southeast producers, many operations that were already running efficient systems are now seeing feed cost advantages that make their margins even more competitive co

mpared to other protein sources. It’s one of those situations where being in the right place at the right time really matters.

Regional Advantages Coming into Focus

RegionPrimary AdvEconomicsMarket OppStrategic FocusKey Metrics
SW (TX,NM,AZ)Mexico Access$0.12-0.25USMCA ProtectExport Divers42% Dairy MEX
Wisconsin BeltProcess CapStable Supply10-15% More CapDomestic Cons24.7% Cheese
Northeast PremPremium PosPremium +25-40%Local BrandingValue Products25-40% Margin
Southeast GrthDemographicsFeed Benefits8-12% GrowthPopulation Grth18 States Exp

This trade disruption is revealing competitive advantages that weren’t as obvious when export markets were booming. Geography suddenly matters more when transportation costs become a larger factor in competitiveness—especially with diesel fuel costs continuing to impact hauling expenses across the board.

The Southwest has always been close to Mexico, but with USMCA providing a treaty-based trade framework under Chapter 31’s dispute resolution mechanisms, that proximity could become more valuable. USDA Foreign Agricultural Service data shows Mexico imports significant agricultural products annually from the U.S., with dairy representing a growing segment. For producers in Texas, New Mexico, and Arizona, transportation cost savings can be meaningful compared to shipping from the Midwest.

You probably know this already, but unlike the China situation, USMCA provides binding dispute resolution that isn’t subject to the political mood swings that have made Asian export markets so volatile.

In the Northeast, producers are discovering that premium positioning based on supply chain transparency resonates particularly well with consumers. University research on consumer preferences suggests that “locally sourced” and “never exported” messaging gains traction when people are concerned about trade volatility affecting food supplies.

Vermont and New Hampshire operations that focus on premium dairy products—such as organic, grass-fed, or artisanal cheese—are seeing this trend work in their favor. They’re not competing on commodity pricing; they’re selling quality, transparency, and supply chain reliability. When butterfat performance and protein levels meet consumer expectations for taste and nutrition, premium positioning becomes sustainable.

Technology Getting a Boost from Efficiency Pressure

From what I’m seeing across different operations, this entire situation is accelerating the adoption of agricultural technology. When export premiums disappear and every input dollar matters more, farms start focusing on efficiency improvements rather than just scale expansion.

Precision agriculture software that helps optimize feed allocation, fertility programs, and herd management becomes essential rather than optional. Industry surveys show increased implementation of precision ag tools when margins compress—farmers need to maximize every input dollar, as we all know.

Fresh cow management protocols become even more critical when you can’t rely on export premiums to cover inefficiencies. Transition period nutrition, reproductive efficiency, and early lactation monitoring provide measurable returns that become essential when milk price premiums are under pressure. University research consistently shows that good transition management can significantly reduce metabolic disorders like ketosis and displaced abomasums.

And here’s something worth noting—alternative protein development is getting increased attention, too. When traditional protein supply chains become volatile, consumers and food companies often begin to take alternatives more seriously. Industry analysts report that companies working on plant-based and cellular agriculture are seeing accelerated interest when conventional supply chains face disruption.

Cold chain logistics is another area where domestic focus could create opportunities. When export reliability decreases, domestic distribution infrastructure becomes more valuable. Trade organizations report an increase in investment in domestic cold storage capacity, as companies prioritize supply chain security over global reach.

Premium Dairy’s Quiet Success

Market Shift Reality: Americans consuming record cheese (40.2 lbs) and whey protein (+58.9%) while fluid milk drops—exactly where smart processors are positioned

While commodity producers are dealing with price volatility and export disruptions, premium dairy operations appear to be maintaining relatively stable margins. They’re competing on differentiation rather than commodity pricing—and that’s a fundamentally different business model, isn’t it?

Operations focused on organic, grass-fed, or locally branded products aren’t as exposed to export market volatility. Their customers are paying for attributes that have nothing to do with international trade relationships. When you’re selling organic milk at premium retail prices versus conventional milk at standard prices, export market disruptions don’t directly impact your pricing structure.

Consumer behavior research from various universities suggests that when people see trade uncertainty affecting food supplies, they often become willing to pay premiums for products with clear domestic sourcing and reliable supply chains. For premium dairy operations, that could create sustainable competitive advantages beyond just weathering the current crisis.

America’s Steady Appetite Fuels Wisconsin Cheese Surge

Alternative Export Markets Worth Considering

Look, China was a significant market, no question about that. But there are genuine opportunities in alternative export destinations that might actually prove more stable over time—and some require shorter development timelines than you might think.

Mexico represents one of the most immediate opportunities for many operations. USMCA provides comprehensive dairy market access with established tariff schedules. USDA Foreign Agricultural Service data shows steady demand growth for dairy, beef, and grain products in Mexican markets, with middle-class consumption patterns driving consistent increases in protein demand.

For Southwest operations, the economics can work pretty well. Transportation costs from Texas or New Mexico to major Mexican population centers typically run lower than shipping to West Coast ports for Asian markets. And you’re dealing with a short truck haul instead of extended ocean freight with all the associated risk—that matters when you’re trying to maintain product quality.

If you’re thinking about Mexico markets, here’s where to start:

  • Contact your state department of agriculture’s international trade division
  • Connect with the USDA’s Foreign Agricultural Service resources for Mexico
  • Identify Mexican food processors or distributors through established trade shows
  • Budget adequate time for relationship development and regulatory compliance
  • Expect initial market entry costs that vary by operation size

The European Union offers solid opportunities for premium products, including tree nuts, organic dairy, and specialty crops. EU import regulations often favor U.S. producers over those from developing countries, primarily due to food safety and traceability requirements. There’s definitely demand for products positioned around sustainability and quality, though market development timelines typically require more patience.

Middle Eastern and North African markets exhibit growth potential, particularly in the sectors of wheat, beef, and dairy products. These markets often prefer U.S. suppliers due to reliability and quality reasons, as indicated in USDA Foreign Agricultural Service regional assessments. Religious dietary requirements in these markets sometimes favor U.S. suppliers over alternatives; however, you must also factor in certification costs and specific handling procedures.

Practical Steps for Different Operations

If you’re wondering how to position your operation for this new reality, it really depends on your current situation and regional advantages. But some immediate actions make sense regardless of your size or location.

For operations with significant export exposure:

Risk management makes sense right now. Consider hedging milk prices through CME Class III futures contracts with established commodity brokers. Most dairy risk management specialists recommend hedging a portion of expected production during volatile periods—the exact percentage depends on your risk tolerance and financial situation. You know your operation best.

Strategic culling of lower-performing animals, while beef prices remain relatively strong, can improve both cash flow and herd efficiency simultaneously. Target animals with high somatic cell counts, poor reproductive records, or persistently low milk production—you’re looking at immediate cash plus reduced feed costs going forward.

For processors and cooperatives:

Consider shifting from powder production to cheese manufacturing where possible—this aligns with where domestic demand appears to be strongest. Class III milk prices have historically exhibited different volatility patterns than Class IV, and cheese storage offers more flexibility than powder when export markets are disrupted.

Building relationships with domestic food service companies that may be gaining access to export-quality products at better prices could create new revenue opportunities. Start with regional distributors in your area—they’re often more approachable than the big national players.

Geographic positioning strategies:

Southwest operations should seriously consider developing the Mexican market. Start by connecting with your state department of agriculture’s international trade resources—many states have excellent Mexico programs and can provide guidance on market entry.

Northeast producers can leverage premium positioning and local market messaging, but they need to maintain consistent quality standards and offer clear value propositions. Focus on attributes that consumers can taste and appreciate, such as higher butterfat content, grass-fed claims, and seasonal variations in flavor. You know, the things that actually matter to the end consumer.

Southeast operations may benefit from favorable demographics and potential feed cost trends, especially if you can establish relationships with growing food service markets in major metropolitan areas.

Technology Investments That Actually Pay Off

I think this trade situation is accelerating the adoption of agricultural technology, which probably should have happened years ago. When margins compress, efficiency improvements provide better returns than capacity expansion—the math is pretty straightforward on that.

Precision agriculture tools:

Invest in software that helps with feed allocation, fertility programs, and reproductive management. These technologies typically yield positive returns when implemented effectively, especially when milk prices are under pressure.

Companies offering comprehensive herd management systems report that operations can see meaningful improvements in reproductive efficiency when these tools are used consistently. The key is picking systems that match your operation size and management style—there’s no one-size-fits-all solution here.

Fresh cow management protocols:

Target technologies and protocols that help improve pregnancy rates, reduce days open, and maintain low somatic cell counts. Fresh cow management becomes even more critical—you want to minimize transition period disorders, which can be costly both in terms of treatment and lost production.

Feed efficiency optimization:

Focus on systems that optimize feed conversion. Technologies like precision feeding systems or improved TMR mixing can enhance feed efficiency, which translates directly to bottom-line improvements when margins are tight.

The economics really do shift from “how big can we get?” to “how efficient can we be?” And honestly, that’s probably a healthier foundation for long-term sustainability. When you optimize butterfat performance, protein yields, and feed conversion, rather than just chasing volume, you build resilience that doesn’t depend on volatile export relationships.

Why These Changes Look Permanent

From what I can see in USDA trade data trends and policy documents, China’s actions appear to represent strategic alignment rather than temporary trade friction. China’s State Council has published policy papers outlining its goal of achieving high levels of food security and self-sufficiency, with dairy explicitly included in those targets.

They’ve systematically built domestic production capacity, secured alternative suppliers through preferential trade agreements, and now they’re implementing the final step—eliminating suppliers they no longer need. That’s not negotiating; that’s strategic independence.

And I think what’s happening more broadly is this: global trade patterns are realigning around these new realities. Brazil has substantially expanded its agricultural trade with China, according to the USDA Foreign Agricultural Service tracking. Russia has significantly increased its grain and energy exports to China, despite Western sanctions. Argentina has significantly expanded its commodities trade with China through bilateral agreements.

When infrastructure investment follows new trade patterns, those changes tend to stick even if political relationships improve. Shipping capacity gets reallocated from U.S.-China routes to Brazil-China corridors. Port facilities in South America expand specifically to serve the China trade. The logistics networks that once connected American agriculture to Asian markets… they’re being repurposed for different trade relationships.

What This Means Going Forward

For operations currently dependent on exports, the timeline for adjustment becomes critical. Focus on immediate risk management while developing alternative market strategies. These transitions take time—but genuine opportunities exist, particularly in treaty-protected markets where political volatility is reduced.

For domestic-focused producers, real opportunities may exist in food service and premium markets, where export-quality products could become available at more competitive pricing. Geographic and quality advantages become more valuable when transportation costs and supply chain reliability are more significant than they have been in years.

For everyone, quality differentiation becomes essential as commodity margins compress. Technology adoption focused on efficiency provides better returns than expansion focused on scale. Domestic market strength offers more stability than dependence on politically volatile export relationships.

I keep coming back to this: the crisis might actually force the structural improvements our industry has needed for years. When you can’t rely on export premiums to cover inefficiencies, you get serious about fresh cow management, reproductive performance, and feed conversion. Those improvements make operations more profitable regardless of export market conditions.

The Bigger Picture

From what I’m seeing, this situation might ultimately prove to be the catalyst our industry needed to build a more sustainable foundation. The operations that thrive will be those that recognize domestic market strength and strategic international partnerships provide better long-term value than relying on unpredictable export relationships.

China’s actions appear to represent a completed strategy, not temporary negotiating tactics. They’ve systematically built alternatives, and now they’re implementing the final step. The opportunities emerging from this—domestic market consolidation, premium positioning, efficiency focus—could create competitive advantages that don’t require maintaining relationships with volatile trading partners.

When examining successful agricultural industries globally, the most resilient ones tend to have strong domestic markets as their foundation, with exports serving as value-added opportunities rather than core dependencies. Perhaps this crisis will push American dairy in that direction.

I’ve noticed that operations already focused on domestic markets—whether that’s local premium sales, regional food service, or efficient commodity production for steady buyers—seem to be adapting better to this new reality than those that built entire business models around export growth assumptions.

The fundamentals haven’t changed. Good dairy farming still comes down to efficient feed conversion, strong reproductive performance, and consistent quality production. The difference now is that these basics matter more than ever. China’s tariffs may have disrupted our export markets, but they’ve also reminded us that the strongest foundation for American dairy has always been right here at home—in the cheese plants of Wisconsin, the growing cities of the Southeast, and the premium markets of the Northeast. The real question isn’t whether we can adapt to life without Chinese export premiums. It’s whether we’re ready to build something better.

KEY TAKEAWAYS

  • Cheese processors gaining 10-15% more milk access as Class IV powder production shifts to Class III cheese manufacturing, creating stable procurement opportunities for operations near Wisconsin and regional cheese plants—contact your field representative about long-term supply contracts now
  • Southwest producers can capture $0.12-0.25/cwt transportation savings to Mexican markets compared to Midwest competitors, with USMCA providing treaty-protected access to growing 8-12% annual demand—state agriculture departments offer Mexico market development programs worth exploring
  • Premium dairy operations maintaining 25-40% better margins than commodity producers through differentiation strategies—organic, grass-fed, and local branding resonate when consumers seek supply chain security during trade volatility
  • Technology investments showing 12-18 month payback when focused on efficiency over expansion: precision feeding systems improving feed conversion by 8-15%, reproductive management software increasing conception rates above 40%, and fresh cow protocols reducing transition disorders by 30-40%
  • Risk management becoming essential for export-exposed operations: hedge 60-80% of production through CME Class III futures while beef prices remain strong for strategic culling of bottom 20% performers—immediate cash flow plus reduced feed costs going forward

Complete references and supporting documentation are available upon request by contacting the editorial team at editor@thebullvine.com.

Learn More:

  • Verified Strategies for Navigating 2025’s Dairy Price Squeeze – This practical guide reveals strategies for improving milk checks and defending your bottom line against market volatility. It demonstrates how to use component premiums, strategic culling, and tactical risk management to protect your margins when milk prices are under pressure.
  • Global Dairy Markets: Profit Strategies Amid Tariff Tensions – This article provides a broader market perspective, analyzing global trade dynamics beyond China, including New Zealand’s export success and the impact of geopolitical events on international pricing. It helps producers understand the macroeconomic forces driving market shifts.
  • Robotic Milking Revolution: Why Modern Dairy Farms Are Choosing Automation in 2025 – This case study demonstrates how technology is solving labor challenges and driving efficiency. It reveals how robotic systems are improving milk quality, providing data-driven health insights, and reducing labor costs, offering a path to sustainable growth beyond simple scale.

The Sunday Read Dairy Professionals Don’t Skip.

Every week, thousands of producers, breeders, and industry insiders open Bullvine Weekly for genetics insights, market shifts, and profit strategies they won’t find anywhere else. One email. Five minutes. Smarter decisions all week.
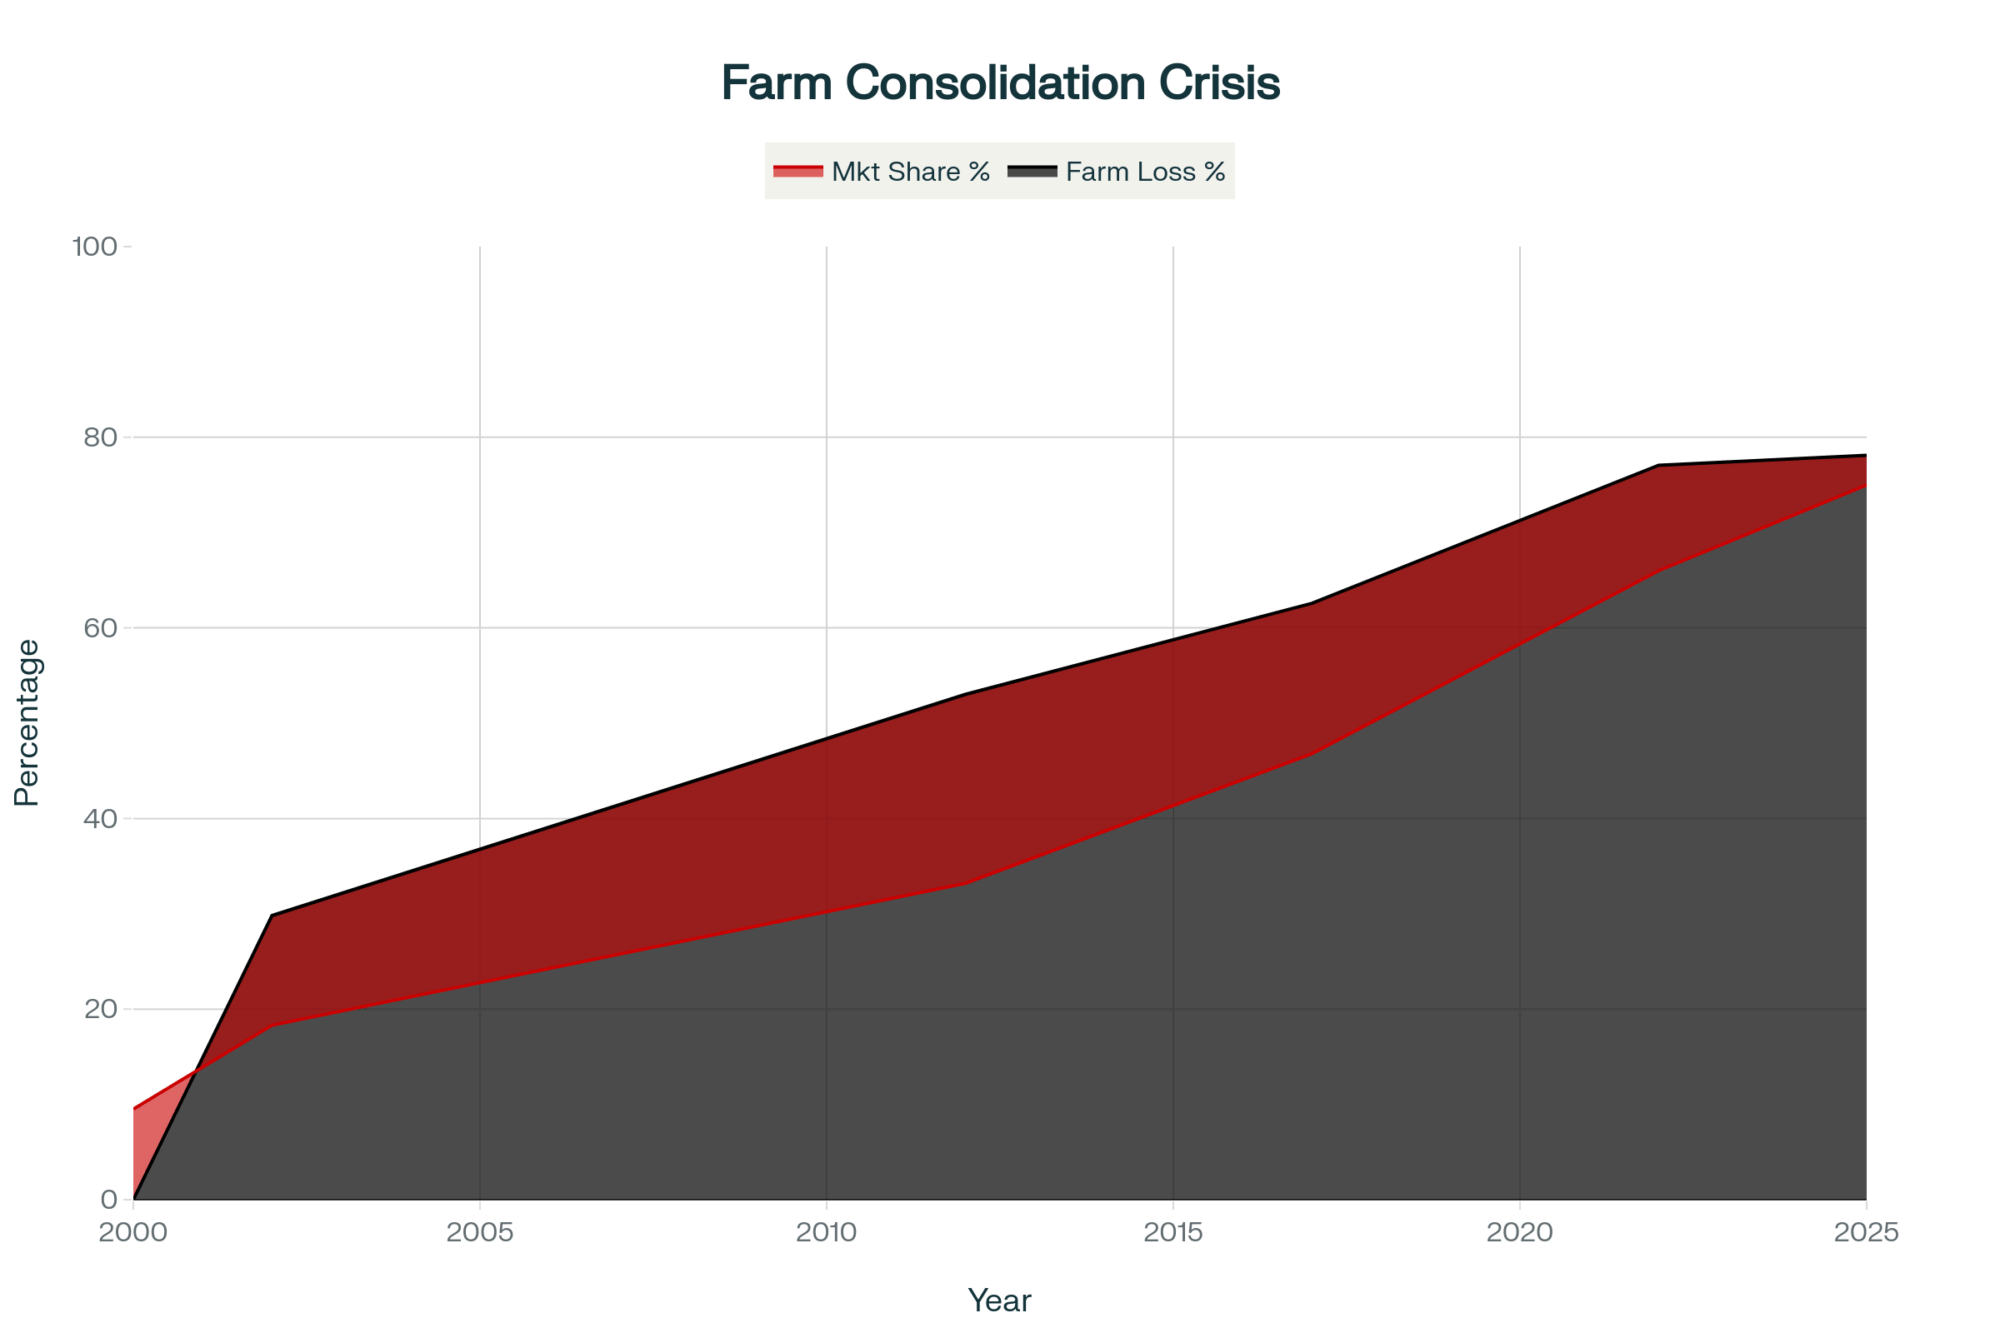
NewsSubscribe
First
Last
Consent

The October 31st Dairy Disaster Your Co-op Won’t Discuss: How Argentina’s Export Tax Scam Just Handed Mexico Your Milk Check

40% of U.S. cheese exports face an immediate threat as Argentina drops 9% dairy tax—while your industry leaders stay silent

EXECUTIVE SUMMARY: Here’s what we discovered: Argentina suspended all agricultural export taxes on September 22nd—a move that instantly makes their dairy products $200-300 per metric ton cheaper than ours in global markets. With Mexico accounting for 40% of U.S. cheese exports (approximately $2-3 billion annually), this “temporary” policy, in effect through October 31st, threatens to crater milk prices by 20% or more. The silence from National Milk, IDFA, and major co-ops isn’t a coincidence—many of these same companies operate profitable facilities in Argentina and Brazil. Historical patterns show that Argentina’s “temporary” measures have a nasty habit of becoming permanent (remember Macri’s 2015 tax elimination, which was reversed in 2018?). The domino effect could be catastrophic: Turkey’s 60% inflation and Brazil’s 20% currency slide make them prime candidates to copy Argentina’s playbook. Suppose you’re shipping to processors with significant exposure to Mexico. In that case, you have exactly 36 days to lock in price protection before this market manipulation, disguised as policy reform, decimates your milk check.

dairy market manipulation

So I’m sitting here at 5 AM—couldn’t sleep, actually—scrolling through the news, and there it is. Argentina suspended their agricultural export taxes. September 22nd. Just… gone. And nobody’s talking about it.

Look, maybe I’m overreacting. My wife says I do that. But I’ve been covering dairy for twenty-something years, and this feels… different. Really different.

You know how sometimes you get that feeling in your gut? Like when you see a fresh cow not eating and you just know something’s off? That’s what this feels like.

The Thing Nobody at Your Co-op Meeting Will Tell You

Alright, so here’s what I’ve been able to piece together…

Argentina’s been taxing agricultural exports for years, right? Different products, different rates. The reports coming out say they were hitting soybeans pretty hard—maybe around 30 percent—and dairy products were also being taxed. I’ve seen numbers anywhere from 8 to 10 percent on dairy, depending on who you ask.

Now they’re saying it’s temporary. Through October 31st, supposedly. Or until they hit some big export revenue target—I’ve heard $7 billion thrown around, but honestly, who knows if that’s accurate.

Temporary. Right.

You know what else was supposed to be temporary? Remember when Macri took over down there… what, 2015? Eliminated export taxes completely. Said it was the new way forward. Permanent change. All that.

Three years later? Boom. “Emergency measures.” Taxes are back.

I’ve been watching this long enough to know—Argentina’s “temporary” has a funny way of becoming permanent. And their “permanent”? That disappears faster than free donuts at a co-op meeting.

Mexico’s Buying HOW Much of Our Cheese?

Mexico’s strategic importance to the U.S. dairy industry is undeniable. The chart shows U.S. cheese exports to Mexico have grown steadily, with a 40% market share. This explosive growth is now directly threatened by Argentina’s sudden export tax elimination.

So I’m at the feed store last week—you know, the one by the old John Deere place in Dodge County—and this trucker’s there. Does the Mexico run for one of the big outfits.

He goes, “You know how much cheese is going south?”

And yeah, I knew it was a lot, but when you actually look at the numbers… Jesus. According to recent trade reports, approximately 40% of all U.S. cheese exports are destined for Mexico. That’s… what, $2-3 billion worth? Wisconsin alone is shipping tens of millions. California? Even more. Texas? Don’t even get me started—those processors down there are basically running on Mexico business.

Mexico’s 40% share of U.S. dairy exports represents $2.3 billion in annual trade now under direct threat from Argentina’s export tax elimination. When your biggest customer has cheaper alternatives, your milk check follows the market down.

But here’s the kicker—and this is what nobody’s talking about—Argentina already ships a ton of dairy to Brazil. They’ve got the infrastructure. The relationships. Brazilian companies have been dealing with Mexican importers for decades.

All Argentina needed was a price advantage.

Putting All Your Eggs in One Basket: How Mexico Became American Dairy’s Single Point of Failure. When 37% of Your Cheese Sales Depend on One Country, You’re Not Diversified—You’re Hostage.

And dropping export taxes? Well… do the math. If they were taxing dairy at 9% and that’s now gone, their products just became that much cheaper overnight. We’re talking maybe $200-300 per metric ton advantage. Maybe more.

You can’t compete with that. Nobody can.

Actually, I was just talking to this producer near Fond du Lac last week—milks about 800 head and has been in the business for forty years—and he says his processor already warned him that Mexico contracts might be “under review” come November. Under review. You know what that means.

Your Co-op Board’s Interesting Side Investments

Now… I’m going to be cautious here due to legal considerations, but…

Have you ever looked at who owns what in the South American dairy industry? I mean, really look?

Some of the same companies buying your milk here have operations down there. Big operations. I’m talking major ownership stakes in Argentine processors, Brazilian plants, the whole nine yards.

I’m not saying it’s a conspiracy. But when something this big happens and National Milk doesn’t say a word? IDFA’s silent? Your co-op board’s acting like nothing’s happening?

Makes you wonder, doesn’t it?

Actually, I ran into… well, let’s just say a former industry bigwig at a conference last week. The guy who used to be pretty high up. Even he looked worried. And this guy’s seen everything.

He says, “this is different. This isn’t market volatility. This is market manipulation.”

It Gets Worse (Because Of Course It Does)

So I’m talking to this analyst—a smart guy who covers global markets—and he starts laying out what happens next.

Turkey’s watching Argentina. Their currency’s trash, inflation’s through the roof—I’ve heard anywhere from 40 to 60 percent, depending on who’s counting. They export billions in ag products to Europe. If Argentina gets away with this, Turkey will likely follow suit, and the same could happen in Brazil. Their currency’s been sliding all year. Down maybe 20% against the dollar. And Brazil controls… what, a fifth of global soybean exports? Something like that. Huge chunk, anyway.

Once they see Argentina getting away with it…

It’s like dominoes. Remember back in ’09 when one bank started dumping assets and suddenly everybody had to? Same thing, but with countries using agriculture to prop up their currencies.

From $17.50 to $10.00: The Currency War Price Collapse That Could Cost You 43% of Your Milk Revenue. Every Day You Wait, Your Window to Protect Yourself Gets Smaller

Actually, wait. This is even scarier than I thought. Because once this starts, how do you stop it? Every country with a weak currency and agricultural exports is gonna look at this playbook and think, “Why not us?”

I was at a meeting in Madison last month—Wisconsin Dairy Business Association thing—and this economist from UW was saying something that stuck with me. She said, “The next trade war won’t be about tariffs. It’ll be about currency manipulation through agricultural policy.”

Guess she was right.

The Cavalry Ain’t Coming

Called the USDA yesterday. You know what they said? “We’re monitoring the situation.”

Monitoring.

That’s like telling a guy with a twisted stomach cow that you’re “observing the discomfort.” Great. Super helpful.

Look, theoretically, somebody should file a trade complaint. WTO, USMCA, whatever. But come on. By the time they get around to doing something, we’ll all be out of business. Or dead.

The market will sort this out long before Washington does. And by “sort out,” I mean we’re gonna take it in the shorts while everybody else figures out the new rules.

What You Can Actually Do (Besides Panic)

Alright, practical stuff. Because sitting around complaining doesn’t pay bills, even though it feels good.

That Dairy Revenue Protection everybody’s always talking about? Figure it out. Now. According to the latest RMA updates, the subsidized rates aren’t terrible—maybe $0.25 per hundredweight for decent coverage. That’s cheap insurance if this thing goes sideways.

Class III futures are still holding above $17.50, as of my last check yesterday. Won’t stay there long if this Argentina thing spreads. Lock something in.

Feed? Corn’s under $4.00 a bushel. Soybean meal’s… what, $280-290 a ton? Not great, not terrible. If you secure a six-month commitment, it.

Oh, and here’s something—you breeding any beef crosses? A guy I know in South Dakota; his dairy-beef calves are generating a significant amount of money. $800-1,000 each. With beef prices where they are… I mean, the math works.

Actually, I was at a sale barn down in Iowa last week—don’t ask why, long story—and these dairy-beef crosses sold for more than registered Holsteins. I’ve never seen that before.

The Part That Really Pisses Me Off

We did everything right, you know?

Got more efficient. Improved genetics. Built these massive freestalls. According to recent productivity data, the average production per cow is now… what, pushing 24,000 pounds? My grandfather would’ve called bullshit on that number.

Hell, I was at a place in California last month—they’re getting 30,000 pounds. Per cow! That’s not farming, that’s… I don’t even know what that is.

And for what? So we can be undercut by a country using agriculture as a means to bail out its peso?

This isn’t a competition. It’s desperation. And we’re the ones who’re gonna pay for it.

October 31st (Yeah, Right)

Argentina says this is temporary. Until October 31st.

And I’m gonna be the next American Idol.

Look at their track record. Every “temporary” measure from the last twenty years? Still there in some form. Or it lasted way longer than promised. Or they brought it back under a different name.

Argentina’s history proves ‘temporary’ policies are anything but. This timeline visually demonstrates the cycle of tax elimination and reinstatement, reinforcing why producers should not trust the October 31st deadline and should instead prepare for a permanent policy shift.

They’re saying they need to generate around $170-180 million per day in agricultural exports to meet their targets. Per day! That’s… come on. That’s fantasy numbers.

I’ll bet you my best heifer they extend this “temporary” measure. Probably call it something else. “Extended temporary emergency provisional measure” or some BS like that.

Maybe I’m wrong. God knows I’ve been wrong before. Remember when I said nobody would pay six figures for a cow? Yeah, that aged well…

But this feels different. The silence from our industry groups. The positioning of the big processors. Nobody wants to talk about it.

That tells you everything, doesn’t it?

The Bottom Line Nobody Wants to Hear

Had drinks with this banker last night—finances a bunch of operations around here. He asks me, “How bad is this, really?”

And I told him straight: If Argentina gets away with this, if they can use agricultural exports to bail out their currency without anybody stopping them… every broke country on earth just got handed the blueprint.

And guess who pays for it?

Not the politicians. Not the multinational processors with operations everywhere. Not the futures traders who’ll make money either way.

Us. The actual farmers.

Look, more details will come out over the next week or two. But don’t wait for some official report to tell you what to do. By then, it’s too late.

The thing is—and this is what keeps me up at night—our whole system assumes everybody plays by the same rules. You compete on quality, efficiency, and genetics. Not on whose government is most desperate for dollars.

But if that’s changing…

Christ. I need more coffee. Or maybe something stronger. It’s 5 AM somewhere, right?

Anyway, pay attention to this Argentina thing. Don’t let it sneak up on you like… well, like everything else seems to these days. October 31st is coming fast. And something tells me November 1st is going to look really different from October 30th.

Actually, hang on—before I forget. If you’re shipping to a plant that does a lot of business in Mexico, have that conversation now. Today. Not next week. Ask them point-blank: “What happens to us if Mexico starts buying from Argentina?”

They know the answer. They just don’t want to tell you.

You know what really strikes me about all this? We spent the last decade getting told to “think globally.” Well, here’s global for you—countries weaponizing their agricultural exports to prop up failing currencies. What did they mean by ‘global markets’?

Trust me on that one.

KEY TAKEAWAYS

  • Lock in Q4 pricing NOW: Class III futures still holding above $17.50—that won’t last once Mexico starts buying Argentine cheese at 9% discount. DRP coverage at $0.25/cwt is cheap insurance against the 20% price crater we’re facing
  • Diversify before it’s too late: Dairy-beef crosses bringing $800-1,000/head while registered Holsteins struggle—that’s immediate cash flow when your Mexico contracts evaporate. Smart producers are breeding 30% of their herd to beef bulls
  • Ask your processor point-blank TODAY: “What’s our exposure if Mexico switches to Argentine suppliers?” They already know the answer—Wisconsin producers near Fond du Lac report processors admitting contracts are “under review” for November
  • Lock in feed costs for a minimum of 6 months: Corn under $4.00/bushel and soybean meal at $280/ton won’t hold if currency manipulation spreads to Brazil (21% of global soy exports). The smart money’s contracting now, while everyone else “monitors the situation”
  • Build cash reserves like it’s 2008: Argentina needs $170-180 million daily in ag exports to hit their targets—fantasy numbers that guarantee this “temporary” measure gets extended. Operations with 6 months of operating capital survived ’09; those without didn’t

Complete references and supporting documentation are available upon request by contacting the editorial team at editor@thebullvine.com.

Learn More:

The Sunday Read Dairy Professionals Don’t Skip.

Every week, thousands of producers, breeders, and industry insiders open Bullvine Weekly for genetics insights, market shifts, and profit strategies they won’t find anywhere else. One email. Five minutes. Smarter decisions all week.
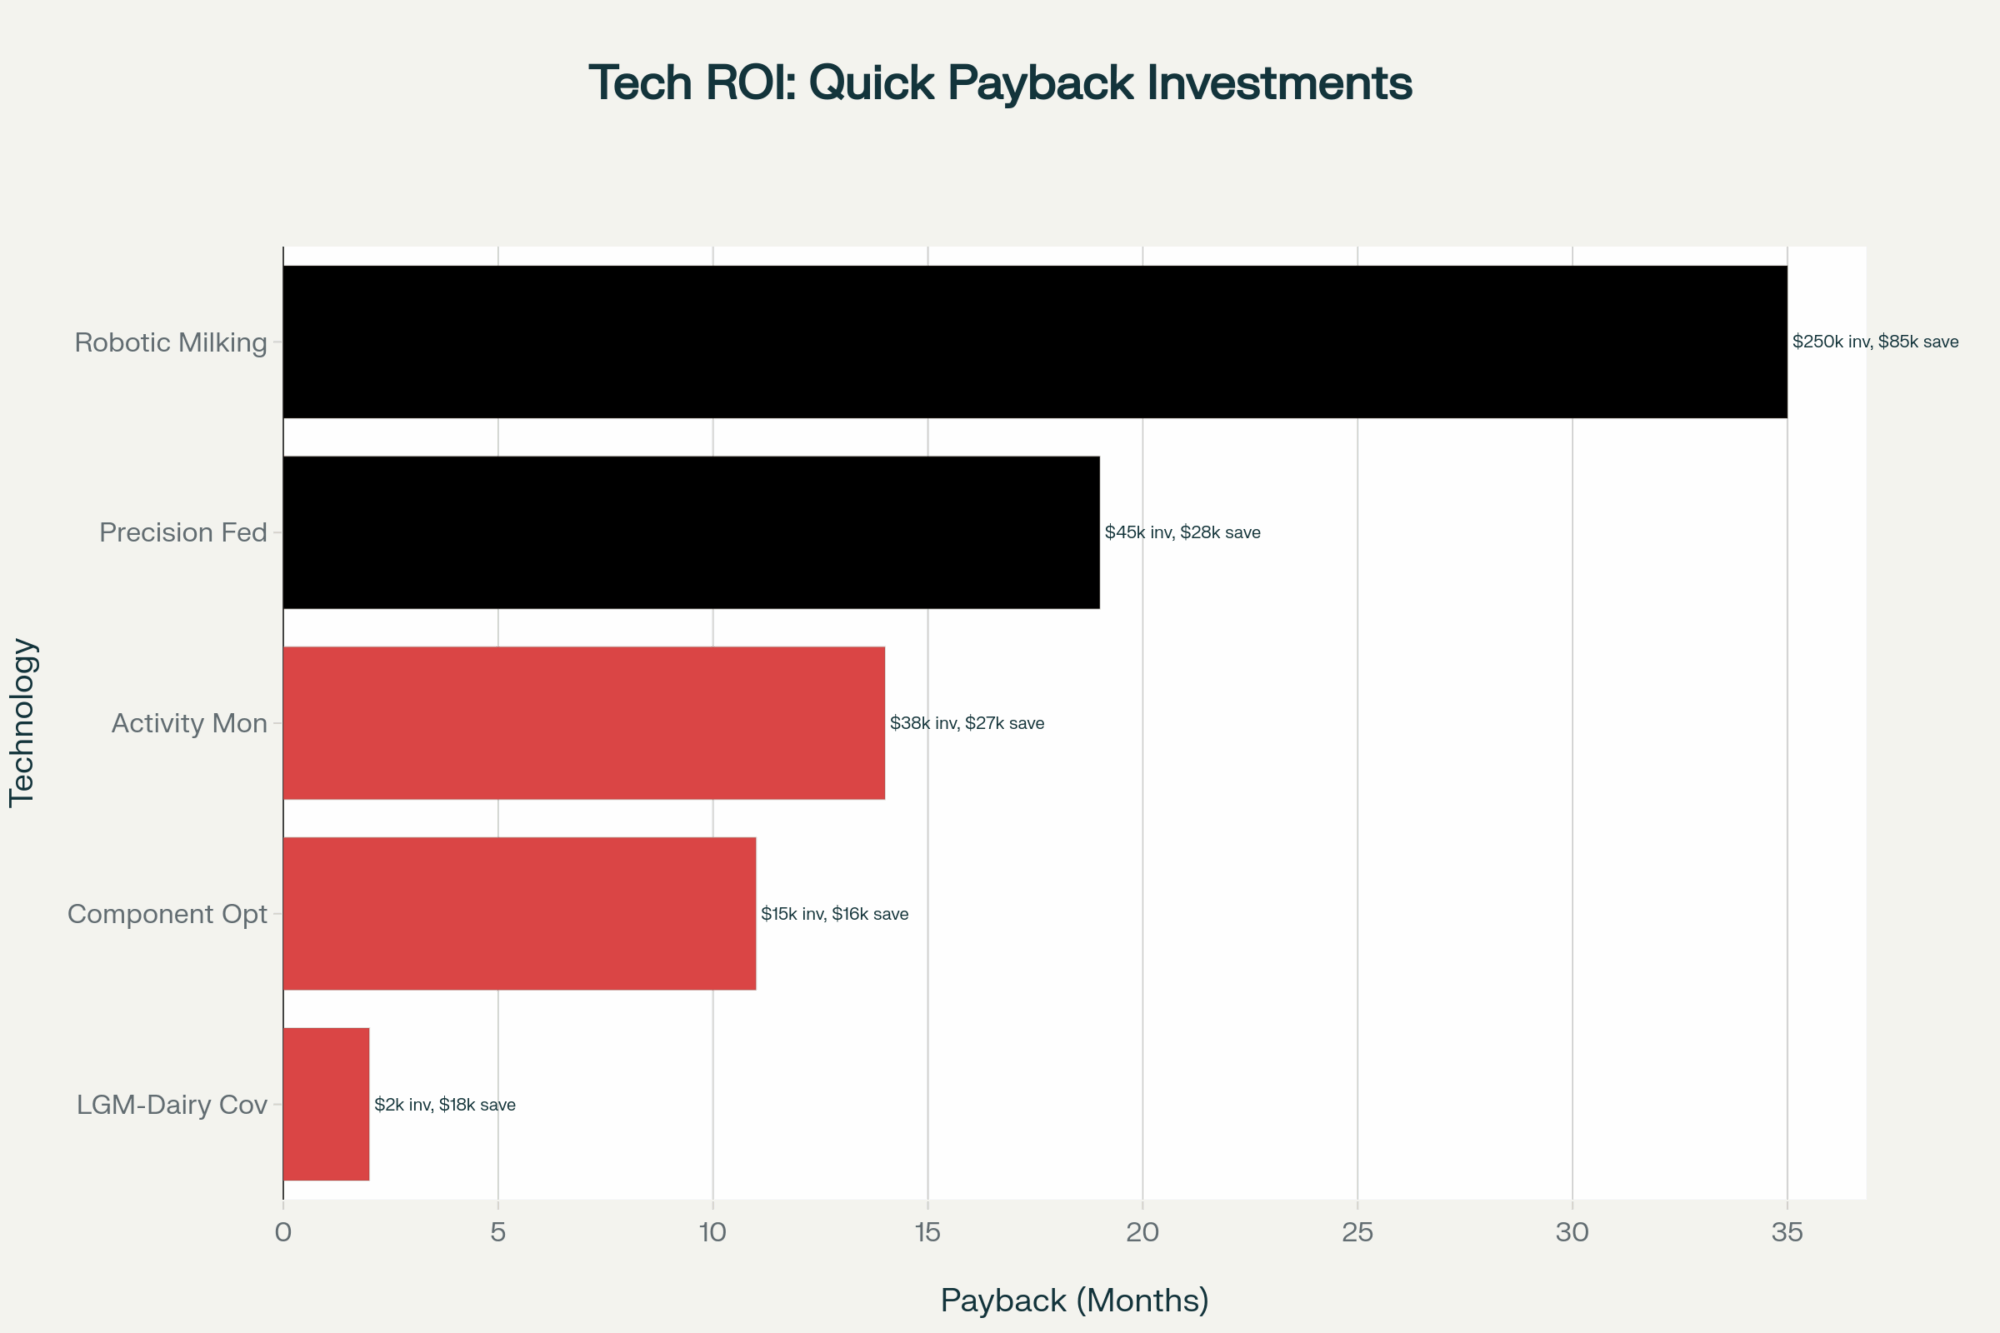
NewsSubscribe
First
Last
Consent

China Weaponized Whey – And Just Killed Commodity Trading

China’s 145M-lb whey surge masks a 39% milk powder crash—here’s why that split should terrify every dairy farmer.

EXECUTIVE SUMMARY: China’s August whey imports hit 145.3 million pounds—a 30-month high that most analysts are calling a recovery, but the real story lies in what they’re not buying. While raw whey surged 31.1% from the U.S., China simultaneously slashed consumer dairy purchases by 32-37% across categories, revealing a calculated strategy that’s fundamentally reshaping global dairy trade. Recent Trade Data Monitor analysis shows that China’s combined milk powder imports dropped to a decade-low level, despite a 9.2% decline in their domestic production, indicating a willingness to sacrifice short-term efficiency for long-term control over consumer-facing dairy products. This isn’t random buying—it’s surgical selection between industrial necessities they’ll import and consumer products they’re determined to control domestically, creating what industry observers now recognize as a two-tier global supplier system. The implications extend far beyond export markets, as disrupted trade flows affect regional milk pricing from California to Vermont when excess product seeks new outlets. Forward-thinking dairy operations are already adapting by building flexible processing capabilities and diversifying market relationships, recognizing that supply reliability now often trumps cost advantages in this politically sensitive landscape.

What if China’s latest trade data isn’t a recovery, but a warning? It’s the first sign that they’re no longer playing the commodity game, and that changes everything for us in the dairy industry.

Here’s what the August numbers tell us: China’s dry whey imports hit 145.3 million pounds—the highest we’ve seen in 30 months, according to Trade Data Monitor. Most analysts are calling it a seasonal bounce-back. However, when I began investigating what else they’re purchasing (and what they’re not), a different story emerges.

The whey surge shows a 4.8% increase over last year’s already strong volumes, with U.S. shipments rising 31.1% after the temporary tariff pause following the Trump-Xi TikTok negotiations. But here’s the kicker: while raw whey imports climbed, China simultaneously slashed consumer dairy purchases. Trade Data Monitor shows whey protein concentrate with at least 80% protein dropped 32%, butter fell 37%, and cheese declined 12% compared to August 2024.

This isn’t random buying. It’s surgical. China’s making calculated choices about what it’ll depend on others for and what it wants to control itself. And that selective strategy should make every dairy producer take notice.

China’s Strategic Import Split: Raw whey imports surge to 30-month highs while consumer dairy purchases crater—revealing a calculated two-track strategy that’s reshaping global dairy trade dynamics. The August divergence isn’t seasonal recovery—it’s economic warfare disguised as commerce.

China’s Two-Track Strategy

Looking at these patterns over the past 18 months, China’s developed what you might call a dual approach to dairy imports. Once you see the logic, it’s actually brilliant from their perspective.

Track one: They’re building an iron wall around consumer dairy—milk powders, cheese, yogurt—anything where domestic consumers care about brands and food safety stories. Complete control from farm gate to grocery shelf? That’s the goal.

Track two: They’re maintaining strategic lifelines for industrial ingredients like feed-grade whey that keep their livestock machine running. What I find particularly striking is they’re not trying to replace everything. They’re cherry-picking where they want independence versus where they’ll accept managed dependence.

The data backs this up. Trade Data Monitor reports their combined whole and skim milk powder imports through August reached just over 1 billion pounds—among the lowest January-through-August totals we’ve seen in a decade, despite a modest 1.4% increase from 2024. Meanwhile, the raw whey continues to flow because they have structural protein needs in their feed chains, especially with the ongoing rebuilding of the swine herd after African Swine Fever.

Here’s the smoking gun: China Dairy Industry Association data show that their domestic milk production actually declined 9.2% year-over-year in early 2025, with farmgate prices hitting decade lows of around $19.40 per hundredweight. Yet they’re still pushing self-sufficiency programs. This isn’t market-driven consolidation—it’s a strategic purge of smaller farms while state-connected operations get the backing they need.

The Infrastructure Arms Race Nobody Saw Coming

What surprised me most while researching this piece is the dramatic shift in the rules of export success. The old playbook—seasonal contracts, futures hedging, steady customer relationships—just got torched.

European suppliers learned this the hard way during recent trade disruptions. When Beijing needed to replace American whey volumes at lightning speed, EU exporters looked golden on paper. However, industry observers report that they couldn’t pivot their processing lines and logistics quickly enough. That’s the kind of wake-up call that costs millions and rewrites your entire export strategy.

The winners these days have built what some call flexible infrastructure. From my conversations with producers across different regions, this typically includes:

  • Adaptable processing capabilities that can shift volumes and specifications on a dime—something many Midwest cooperatives are scrambling to build
  • Digital contract systems that handle real-time adjustments when trade winds shift
  • Multi-origin sourcing arrangements so they can blend from different locations as regulations change
  • Strategic storage partnerships in key trade zones
  • Risk monitoring systems that track diplomatic developments alongside milk futures

New Zealand’s the poster child for this approach. Industry reports indicate that their exporters have leveraged duty-free FTA access to command pricing premiums of 15-25%, while maintaining a consistent market share, even during the most severe U.S.-China trade disputes. But it’s not just about lower tariffs—it’s the supply guarantee that Chinese buyers will pay extra for when everything else feels like quicksand.

A perfect example is a Wisconsin cooperative that partnered with processing facilities in three different states, enabling them to blend products to meet shifting regulatory requirements. When one plant faced inspection delays, they pivoted production seamlessly. That kind of flexibility was unthinkable in our industry five years ago, but it’s now table stakes for anyone serious about export markets.

When Politics Hijacked Commodity Trading

Risk CategoryTraditional Dairy TradingPolitical-Aware Trading
Primary ConcernsWeather, Feed Costs, Milk PricesTariff Changes, Trade Wars
Contract Length90+ days standard30-60 days maximum
Price Volatility±15% seasonal variation±40% political swings
Success MetricsLowest cost per unitSupply guarantee premiums
Infrastructure Investment$50K-100K processing focus$150K-400K political hedging
Market Response Time30-60 days planning cycles24-48 hour pivot capability

Here’s something that would’ve sounded like science fiction five years ago: major Chinese importing companies now run specialized war rooms that monitor diplomatic developments 24/7. These aren’t your grandfather’s commodity desks—they’re designed to pounce when political windows crack open.

Early intelligence suggests that when Trump and Xi reached a preliminary agreement on TikTok in September, some buyers responded with remarkable speed to secure additional whey contracts. That response time has forced exporters to tear up their traditional playbooks entirely.

Many are now offering what amounts to “political insurance policies” instead of standard long-term contracts:

  • Rapid-response rolling contracts that buyers can adjust monthly rather than seasonally
  • Price adjustment clauses that activate automatically when trade conditions shift
  • Option-style agreements that give buyers escape hatches without firm commitments
  • Risk-tiered payment structures that fluctuate with political temperature

Bottom line? Supply certainty now trumps rock-bottom pricing. If you can guarantee delivery when the diplomatic weather turns nasty, buyers will pay handsomely for that insurance.

Decoding the Import Data Tea Leaves

China’s buying patterns reveal its master plan, and understanding it matters because these ripple effects also impact domestic markets. You’ve got falling production while farmgate prices crater, yet they’re doubling down on self-sufficiency. Seems backwards until you realize their endgame isn’t maximizing every gallon—it’s owning the consumer narrative while keeping industrial lifelines they can’t easily replace.

This creates genuine opportunities if you can read between the lines. Many exporters are pivoting heavily toward industrial ingredients, such as feed-grade whey, lactose, and protein isolates. These products typically dodge political crossfire and show steadier demand patterns than consumer brands caught in the culture wars.

For most family dairies, you’re not cutting deals with Beijing directly. But grasping these dynamics helps you evaluate your cooperative’s chess moves and ask the right questions about where your milk premiums really come from. When major export channels get choked off, that milk needs somewhere to go, and it usually lands in regional markets at prices you feel.

The milk powder market tells the flip side of this story. Ever.Ag analysis shows skim milk powder imports crashed to an 11-month low at 21.8 million pounds in August—down 39% from last year. This tracks with USDA forecasts as China builds domestic capacity to strangle consumer product imports. For U.S. producers, that means excess powder that used to flow east needs new homes, creating pricing pressure from California to Vermont.

The New Geography of Dairy Power

What’s crystallizing—and the data’s still developing—is a complete redraw of the dairy trade map. The old model, based on production costs and shipping rates, has been replaced by something that resembles geopolitical chess more closely.

You’re seeing the emergence of what might be called preferred suppliers versus spot market survivors. Preferred suppliers build fortress-like relationships for essential industrial ingredients. New Zealand, with its FTA armor, select Canadian operations, and some U.S. cooperatives with the right infrastructure, earns this status. They command premium pricing and steady volumes even when diplomatic storms rage.

Everyone else is relegated to spot markets that surge and crash with the flow of political headlines. U.S. whey shipments exploded 31.1% in August, but that could evaporate overnight if negotiations derail.

This forces brutal choices for cooperatives and larger operations. Either invest heavily in the infrastructure and relationships necessary for preferred supplier status, or accept the rollercoaster ride that comes with opportunistic trading.

Even smaller operations focused on domestic markets can’t ignore these shifts. When export channels slam shut, that milk floods back into regional markets, affecting pricing and cooperative strategies across the board. Northeast operations, for instance, are finding that disrupted export flows from larger processors can create unexpected opportunities in regional specialty markets, but also pricing volatility they hadn’t planned for.

Technology as the Great Leveler

Here’s the silver lining for smaller players: technology and transparency can help narrow the gap. Digital platforms that provide real-time supply chain visibility, inventory tracking, and bulletproof quality documentation help build trust with buyers, thereby managing political risk.

Some forward-thinking operations now offer enhanced traceability using blockchain verification—not just for exports, but also for domestic premium markets. Others have built systems giving buyers instant access to shipment tracking and quality data when their primary channels face disruption.

One development that has caught my attention is that several regional cooperatives are pooling resources to create shared digital documentation systems. Instead of each co-op burning cash on expensive individual platforms, they’re creating shared systems that deliver the transparency buyers demand at a fraction of the cost. A group of Northeast cooperatives recently launched this approach, and early reports suggest it’s opening doors to specialty contracts they couldn’t access before.

Technology investments vary wildly depending on scale and ambition. But producers across different regions tell me better documentation systems help with everything from organic certification to regional branding, not just export markets.

Different Operations, Different Survival Strategies

Scale Matters: Larger dairy operations face higher volatility but gain greater access to premium opportunities, while family farms maintain more stability with fewer investment demands. Know where you stand in the new dairy trade hierarchy.

These seismic shifts hit different dairy operations in unique ways:

For family dairies (50-500 cows): You probably aren’t cutting export deals directly, but understanding these currents helps you evaluate your cooperative’s strategic positioning. When co-op leadership talks about export market development, you’ll know what hard questions to ask about infrastructure investments and political risk management.

For regional cooperatives, these changes highlight the critical importance of processing agility and market diversification. The ability to pivot between consumer products and industrial ingredients becomes a survival skill when export channels face political headwinds. The cooperatives weathering this storm best seem to be those that can dance between markets when one door slams shut but another cracks open.

For larger commercial operations, direct export opportunities exist, but they require significant infrastructure investment and sophisticated risk management. The fundamental question becomes whether you want to build those capabilities or double down on domestic market strength where you control more variables.

Early signals suggest that operations with bulletproof domestic market positions—through organic premiums, regional branding, or lean cost structures—may weather export market volatility better than those reliant on commodity export pricing.

Seasonal Rhythms and Market Timing

These trade dynamics interact with our production cycles in ways that amplify their impact. When export markets get strangled during flush season, the pricing pain cuts deeper than during lower production periods. Spring 2025 was particularly brutal when trade tensions peaked just as production ramped up across most regions.

Regional timing differences matter more than ever. California’s steadier year-round flow doesn’t face the same vulnerability to flush season as Wisconsin operations, where peak production typically occurs from April through June. Vermont and other northeastern states often peak later, from May through July, while some southern operations surge earlier. These regional patterns affect how export market disruptions ripple through local pricing.

The August whey surge hit during the sweet spot when many operations plan fall feeding programs and evaluate protein ingredient needs for the coming year. That timing likely amplified the volume response once buyers could reaccess U.S. products.

The Bottom Line

China’s whey surge isn’t just about seasonal recovery—it’s a preview of how agricultural trade has evolved into a landscape where political alliances and supply guarantees often outweigh traditional cost advantages. The old dairy trade model—built on seasonal patterns, cost advantages, and handshake relationships—has evolved into something where political awareness and supply chain agility separate winners from losers.

Those who recognize this shift and adapt accordingly will find tomorrow’s opportunities. Those waiting for yesterday’s patterns to return may find themselves managing more volatility than they bargained for. This season’s whey market performance offers a crystal ball into this transformed landscape—the key question each of us must answer is which changes actually affect our specific operation, and which ones we can safely ignore while focusing on what we do best.

KEY TAKEAWAYS

  • Processing flexibility pays premiums: Operations that can pivot between consumer products and industrial ingredients are commanding 15-25% higher margins during trade disruptions, as buyers prioritize supply certainty over rock-bottom pricing.
  • Infrastructure investment separates winners from survivors: Cooperatives building shared digital documentation systems and multi-origin blending capabilities are accessing specialty contracts worth $0.50-$1.20 per hundredweight above commodity rates while reducing political risk exposure.
  • Regional market diversification protects against export volatility: Dairy operations with strong domestic positions, achieved through organic premiums or regional branding, weather export market swings 40% better than those dependent on commodity export pricing.
  • Technology levels the playing field for smaller players: Shared blockchain traceability systems among regional cooperatives are opening doors to premium markets that were previously accessible only to large-scale exporters, while providing the transparency that buyers now demand.
  • Political awareness becomes essential business intelligence: Understanding diplomatic developments alongside traditional market fundamentals is helping progressive operations time contract negotiations and inventory decisions to capture opportunities when political windows open.

Complete references and supporting documentation are available upon request by contacting the editorial team at editor@thebullvine.com.

Learn More:

The Sunday Read Dairy Professionals Don’t Skip.

Every week, thousands of producers, breeders, and industry insiders open Bullvine Weekly for genetics insights, market shifts, and profit strategies they won’t find anywhere else. One email. Five minutes. Smarter decisions all week.
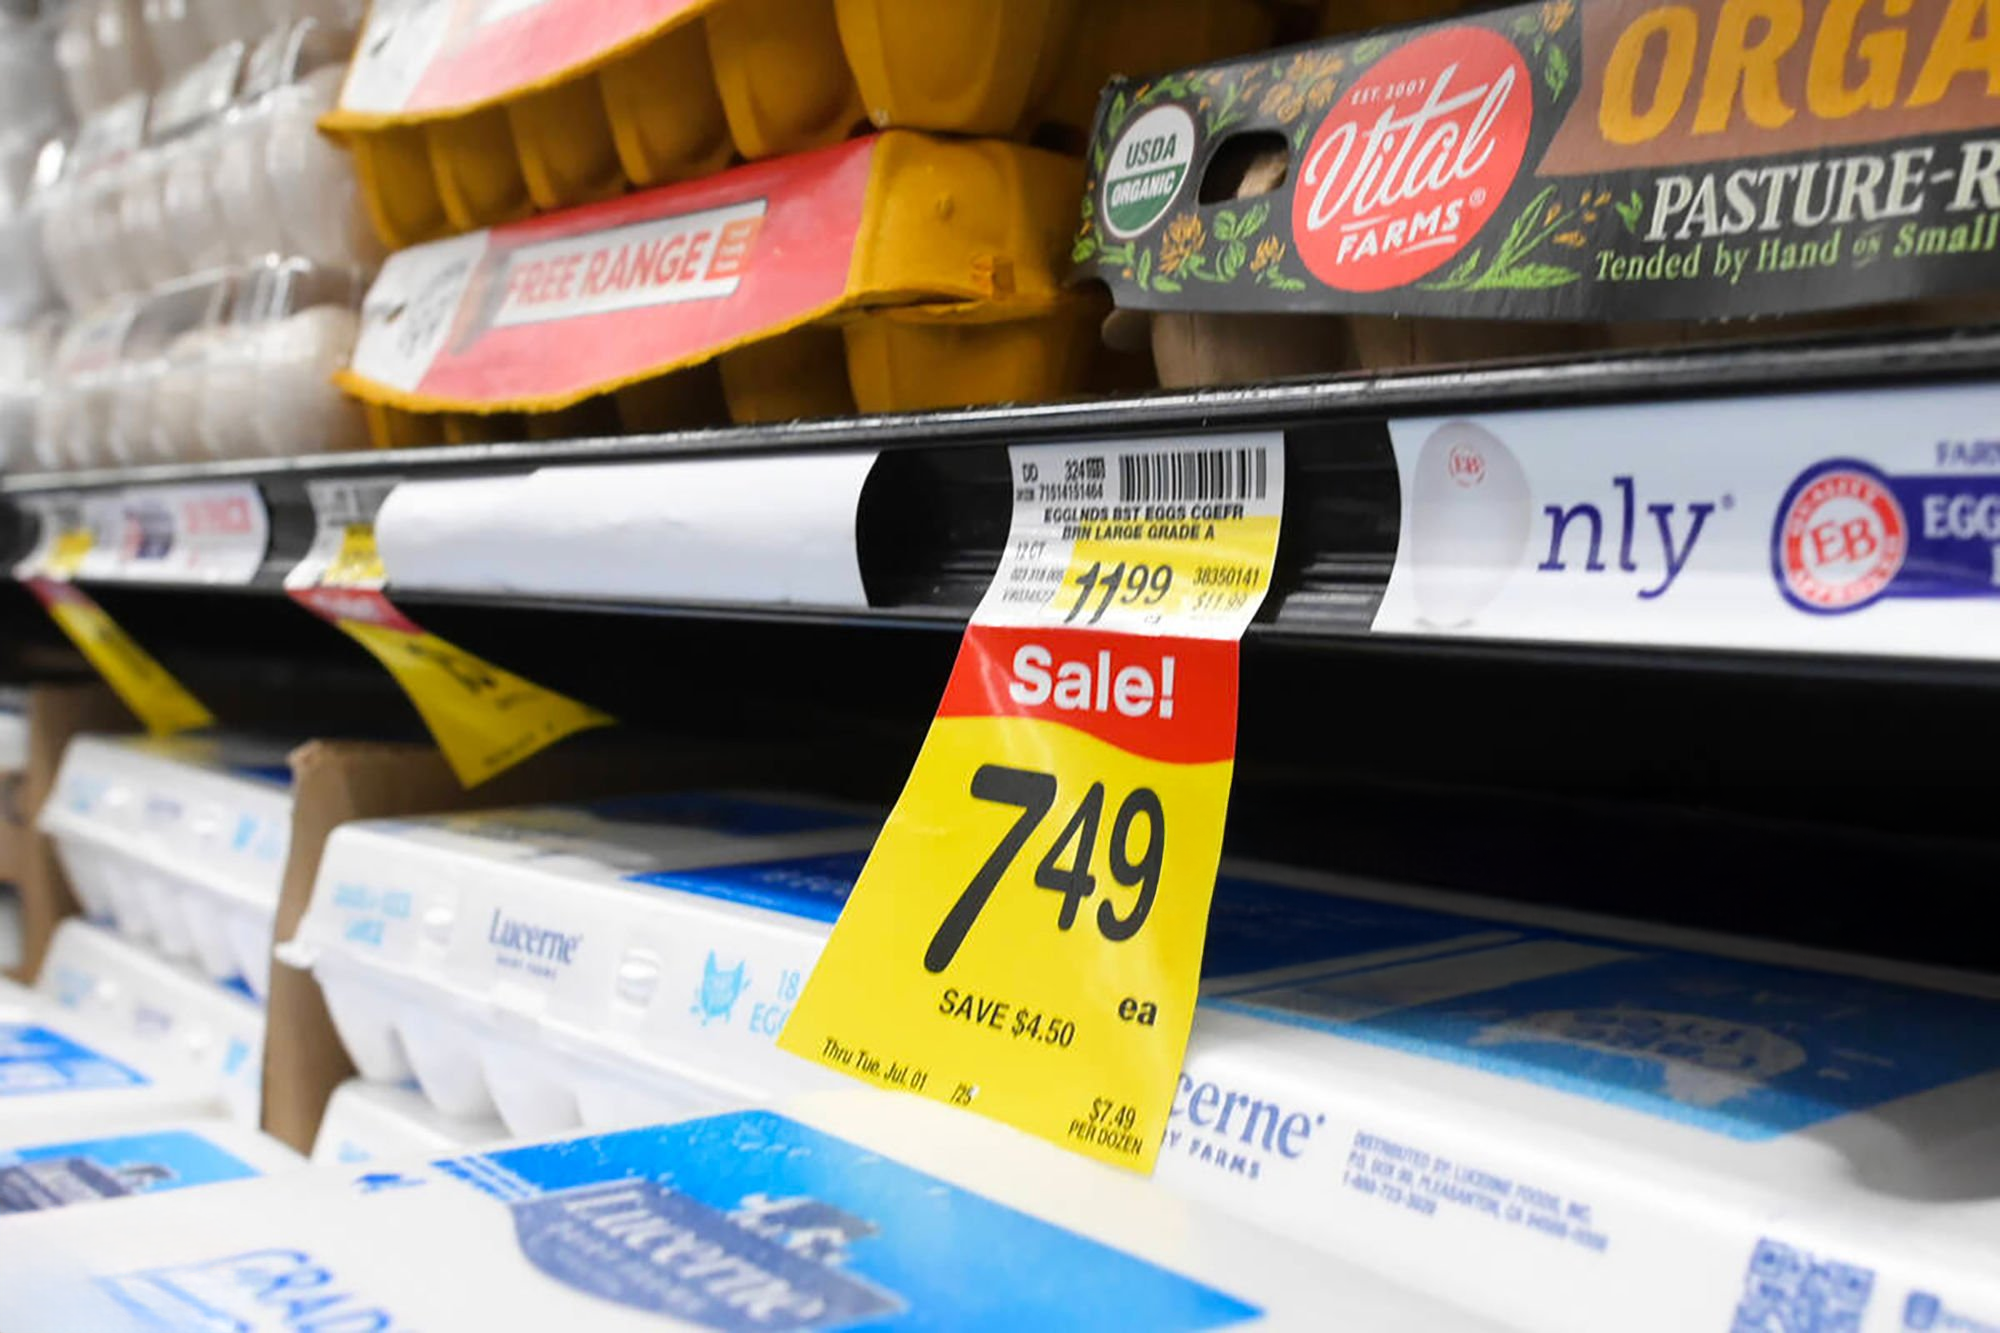
NewsSubscribe
First
Last
Consent

The Waitonui Lie: How Big Dairy’s “Economies of Scale” Propaganda Just Killed a $125 Million Empire

What if everything you’ve been told about dairy expansion was designed to eliminate independent farmers?

EXECUTIVE SUMMARY: The systematic destruction of independent dairy farmers isn’t market forces—it’s a rigged game, and Waitonui’s $125 million collapse just exposed the playbook. While this 10,000-cow New Zealand operation burned through investor capital owing $36.5 million to Bank of New Zealand, DairyNZ data shows smaller sharemilkers banked $961 per hectare despite margin pressure. Here’s what corporate ag doesn’t want you knowing: sixty years of research proves peak profitability hits at 448 cows, not the mega-scale fantasy that equipment dealers and ag lenders have been pushing to maximize their revenue. Interest rate resets from 2.25% to 5.50% created $1.6 million additional debt service for leveraged mega-dairies while environmental compliance costs—fixed expenses regardless of herd size—devastated large operations but remained manageable for smaller farms. Canadian operations averaging 100 cows with conservative 19% debt ratios consistently crush larger American herds carrying 47% debt loads on every survival metric that matters. The expansion mythology isn’t just wrong—it’s systematically designed to funnel family farms into corporate consolidation through unsustainable leverage, rigged tax policies, and processor contracts that force growth beyond financial viability. Time to decode the real math before your operation becomes another casualty in agriculture’s biggest con game.

dairy farm profitability

Look, I’ve been tracking dairy financial crashes for more years than I care to count, and honestly… the Waitonui Group liquidation that went down last August isn’t just another farm going belly-up. This thing exposes the biggest con game corporate agriculture’s been running on independent farmers.

The official New Zealand Companies Office Gazette from August 11th shows they owed $36.5 million to the Bank of New Zealand alone when McGrathNicol stepped in as receivers. Judge Rachel Sussock didn’t mince words in the court documents: “The appointment of the receivers gives rise to a presumption that the companies are unable to pay their debts.”

Here’s a $125 million operation with 10,000 cows and cutting-edge technology—everything the expansion crowd said would guarantee success—dead and buried. Meanwhile, DairyNZ’s Economic Survey for 2023-24 shows that 50:50 sharemilkers maintained a $961 profit per hectare, despite a 13% decline from the previous year. The small guys everyone predicted would disappear? They’re out surviving the giants.

The “economies of scale” mythology?

Dead as last week’s milk check.

The question is: how many more family farms will this growth propaganda kill before we admit the math doesn’t add up as promised?

Dismantling the Scale Myth: What the Numbers Actually Show

For decades, extension agents and equipment dealers pushed the same gospel: bigger herds mean lower costs per unit. But DairyNZ has been tracking this information for sixty years—longer than most of us have been alive—and their data show that the average herd size has stabilized around 448 cows. Not 4,000, not 10,000. Four hundred and forty-eight.

That tells you something right there. Mathematical proof that an optimal scale exists, and it’s nowhere near the mega-dairy fantasy they’ve been selling us.

60 Years of Data Proves Optimal Dairy Scale – DairyNZ’s research reveals peak profitability at 448 cows, not the mega-dairy fantasy equipment dealers sell. Every cow beyond this sweet spot actually reduces your per-head returns.

What strikes me about this is how it mirrors what happened during the 1980s farm crisis… except back then we didn’t have armies of consultants pushing expansion as the cure for everything. Now every farm show, every extension meeting, every banker’s pitch—it’s all about getting bigger, adding more cows, building fancier facilities.

Statistics Canada’s 2021 Census of Agriculture shows Canadian operations averaging around 100 cows (they’ve got about 950,000 dairy cows on roughly 9,500 farms if you do the math). Compare that to how leveraged everyone down here has gotten… it’s like night and day.

Canadian farmers buy equipment with cash. Not financing, not leasing… actual cash transactions. When’s the last time you heard American producers talking about making major purchases without having to grovel at the bank first? That’s the difference between stability and the leverage treadmill we’ve all been sold.

And get this—down in Wisconsin, you talk to any producer who’s been around since the ’80s, they’ll tell you the same story. Neighbors who expanded during the good times, bought fancy equipment, and built big parlors… half of them aren’t farming anymore.

The Financial Leverage Death Trap

Here’s where the math gets brutal, and this is what really pisses me off because it was so predictable.

Reserve Bank of New Zealand’s official cash rate data shows rates jumped from 2.25% in early 2022 to 5.50% by May 2023—more than doubling borrowing costs in about a year. Now they’re sitting at 4.25%, which is still double what guys borrowed money at during the expansion frenzy.

Let me walk you through what this means for leveraged operations… hypothetical examples here, but the math works the same whether you’re in New Zealand, Iowa, or anywhere else farmers borrowed money to expand:

Say you’re running a mid-sized operation with $5 million in debt at 70% leverage:

  • Interest at 2.25%: $112,500 annually
  • Interest at 5.50%: $275,000 annually
  • Additional burden: $162,500 more per year

Now picture that same scenario scaled to a mega-dairy with $50 million in debt:

  • Interest at 2.25%: $1.125 million annually
  • Interest at 5.50%: $2.75 million annually
  • Additional burden: $1.625 million more per year

You can’t cut feed costs enough to offset $1.5 million. Hell, you could fire half your crew, and it wouldn’t make a dent in that kind of interest payment spike.

The Federal Reserve’s agricultural lending surveys from last year confirm what we’re seeing on the ground—farm loan portfolios with serious repayment problems are reaching levels not seen since 2020. That’s actual banks telling federal regulators they’ve got farmers who can’t make payments, despite all the government support flowing into agriculture.

Waitonui’s collapse fits this pattern perfectly. Expansion financed during a period of cheap money became unserviceable when rates reset to what used to be normal, before we all became accustomed to artificial monetary policy that made borrowing seem risk-free.

Regulatory Compliance: The Hidden Scale Killer

Environmental compliance costs don’t scale with herd size—they’re essentially fixed expenses that devastate large operations. And this is something that really burns my ass because it’s so obvious, yet everyone acts surprised when the bills come due.

The University of Waikato’s Agricultural Economics Research Unit published the most comprehensive compliance cost analysis in 2015, showing that Waikato farmers spend over $1 per kilogram of milk solids on environmental requirements. That worked out to approximately $1,400-$ 1,500 per hectare.

Now that the study’s almost ten years old, but here’s the thing—since then, the Ministry for Primary Industries has only added more regulations. Farm Environment Plans, mandated by 2025, and National Environmental Standards for Freshwater, implemented between 2020 and 2023, each add costs that don’t magically disappear when you get bigger.

This trend makes me wonder if anyone in government actually ran the numbers on the cost of these regulations before implementing them. Or maybe they did run the numbers and figured consolidation was the goal all along… but that’s a whole different conversation about whether small farms were ever meant to survive the regulatory onslaught.

Consider this: most regulatory requirements cost essentially the same whether you’re milking 300 cows or 3,000. The monitoring equipment, the consultant visits, the paperwork—it’s fixed costs that scale with bureaucracy, not cow numbers.

Here’s the math that killed Waitonui: compliance costs in the millions annually, before they generated their first dollar of profit. A typical 300-head operation might face, perhaps, $120,000 in total compliance costs. Both operations face identical regulatory requirements under New Zealand’s Resource Management Act, but guess which one can service those costs without having a coronary every time the accountant calls?

Market Disruption: When Export Dependency Becomes Fatal

Here’s what really gets me about the export-focused growth model… it’s like building your entire operation based on what some bureaucrat in Beijing wants to buy next week.

New Zealand exports about 95% of its milk production, according to Fonterra’s reports and official trade statistics. That’s basically everything except what they drink locally with their morning coffee. When your biggest customer starts changing their shopping preferences, and you’ve optimized your entire operation for producing what they used to want… well, you’re screwed.

Trade intelligence services have been documenting China’s shift away from whole milk powder toward skim milk powder and cheese products. The exact percentages fluctuate month to month, depending on domestic production and economic conditions, but the trend has been consistent—less commodity powder and more value-added products.

Global Dairy Trade auction results through 2024 have shown the carnage in real-time. Prices are dropping while offered volumes increase dramatically across multiple categories. When exporters are desperate to move inventory at any price, that’s not a normal market adjustment; that’s panic selling by people who need cash flow yesterday.

The production logistics of mega-dairies are a challenge: you can’t shift 10,000 cows from powder-focused nutrition to cheese-quality protocols overnight. Their entire infrastructure—parlor design, cooling systems, storage capacity—everything’s optimized for commodity volume, not premium quality.

Meanwhile, smaller operations can pivot. Got a local cheese maker who’ll pay a premium for high-protein milk? A 300-cow operation can adjust feeding protocols in a week. Try doing that with 10,000 head and see how fast you go broke on feed costs alone.

The Canadian Model: Proof Scale Isn’t Everything

Supply management demonstrates that stability beats scale every time, and the numbers don’t lie.

Canadian operations average around 100 cows per farm based on their latest census data, yet they consistently outperform larger American operations on financial metrics that actually matter. While American mega-dairies chase volume, trying to weather commodity price swings that can wipe out a year’s profit in a bad week, Canadian producers know exactly what they’re getting paid next quarter.

They plan equipment purchases, budget for facility improvements, and actually get decent sleep instead of watching futures markets at 3 AM, wondering if they’ll make next month’s loan payment.

What really gets me is how Canadian farmers can buy equipment with cash. Not financing, not leasing… actual cash transactions. When’s the last time you heard American producers talking about making major purchases without having to grovel at the bank first?

The financial performance comparison is stark: smaller Canadian herds consistently outperform larger American operations on return per cow, debt service coverage, basically every metric that determines whether you’ll still be farming in ten years instead of working for someone else.

Makes you wonder why we keep chasing scale when proven stability models are working better right across the border. But then again, stable farmers don’t buy as much equipment or need as many loans, so there’s less money to promote what actually works.

The Technology Arms Race Nobody Wins

Equipment dealers… don’t even get me started on these guys and their fancy sales presentations.

They show up at farm shows with million-dollar robotic systems, promising labor savings and efficiency gains that’ll pay for themselves in 12 to 18 months, according to their glossy brochures. What they conveniently forget to mention is what happens when those systems crash during a January blizzard on Sunday morning, when you’ve got 500 fresh cows that need milking.

And they will crash—Murphy’s Law applies double to anything with computer chips, hydraulic systems, and moving parts all working together in a barn environment where everything’s designed to break down at the worst possible moment.

Those payback calculations look great on paper until interest rates spike or milk prices tank, then the economics that justified the purchase just evaporate like morning fog. The equipment’s still there, payments are still due monthly, but the financial assumptions that made it pencil out are long gone.

Waitonui had cutting-edge everything. The best parlor systems money could buy, precision feeding computers, genomic testing programs —the complete technology package that would make any equipment dealer salivate. Didn’t save them when debt service costs skyrocketed and milk prices remained flat.

Those million-dollar systems are probably getting auctioned off for scrap value as we speak, making some lawyer rich while the farmers who believed the sales pitch get nothing.

You want to know something interesting? DairyNZ’s long-term analysis, which has been tracking herd size data for sixty years, shows that the average herd size has stabilized at around 448 cows. That’s your actual optimal scale right there, proven by six decades of economic data.

But do equipment salesmen mention that when they’re pushing expansion financing packages? Course not. There’s no money in selling farmers what they actually need instead of what maximizes commission checks.

The Rigged System Revealed

The elimination of independent farmers isn’t accidental—it’s systematic, and once you see how it works, you can’t unsee it.

Agricultural lending agreements from major lenders often include covenants that reward increases in herd size, regardless of profitability. Drop below certain production levels and you’re technically in default, even if you’re generating positive cash flow and paying bills on time. Try explaining that logic when the banker starts making threatening phone calls about “covenant violations.”

Federal tax code works the same way, and this really burns my ass. Accelerated depreciation schedules for parlors, buildings, and equipment create financial incentives for expansion, whether it makes economic sense or not. Government policy literally rewards spending on infrastructure instead of generating sustainable cash flow.

Extension programs also participate in the elimination game. When industry bodies publish their “top performer” benchmarks, it’s always based on cost per liter or volume efficiency metrics that favor large-scale operations. Never return on equity, never debt service coverage ratios, never the financial measures that actually determine survival when markets get tough.

Even processor contracts are part of the rigged system. Volume bonuses—extra cents per kilogram if you hit certain production thresholds. Sounds attractive until you realize those targets basically force expansion beyond what makes financial sense for most operations. They’re dangling carrots to get you to run off a cliff.

Try finding a bank that offers financing products specifically designed for operations with 200 to 500 cows. Payment terms that match seasonal cash flow patterns, covenants based on profitability instead of production volume… they don’t exist because banks make more money writing fewer, larger loans to fewer borrowers.

The entire infrastructure is systematically designed to concentrate production under corporate control and eliminate family operators who might genuinely care about long-term sustainability, instead of quarterly profit reports.

Reading Market Signals While Corporate Ag Sleeps

Smart farmers—and there are more of them scattered around than you might expect, they just don’t make the farm magazines—are building their own market intelligence systems instead of relying on corporate propaganda.

The Global Dairy Trade publishes complete auction results, including offered volumes, clearing prices, and participation rates. When volumes spike dramatically for any product category, that’s exporters dumping inventory to raise cash, not normal price discovery mechanisms working properly. It’s a warning sign visible weeks before it hits farm-gate prices.

Currency relationships matter way more than most producers realize, especially if you’re selling into export markets. The New Zealand dollar is above 60 cents USD, and the Euro is above 65 cents against the dollar—when either exchange rate breaks those levels, export margins are immediately compressed across all dairy products. Basic international economics, but critical information most farmers ignore until it’s too late.

Cooperative payout revisions reveal the true story before individual farmers experience the economic impact. When major processors trim prices mid-season, they’re responding to buyer intelligence and market information that individual producers don’t have access to. Those announcements serve as early warning systems if you’re paying attention, rather than assuming everything will work out somehow.

The operations surviving this industry shakeout—producers I actually respect for their business judgment, not just their production records or fancy equipment—share certain characteristics that contradict everything corporate agriculture preaches:

  • Conservative debt structures that prioritize survival over growth metrics
  • Diversified revenue streams not tied exclusively to commodity pricing
  • Monthly financial monitoring instead of waiting for annual reviews
  • Technology investments that generate measurable returns, not impressive tax write-offs

The Global Collapse Pattern Spreading Everywhere

What destroyed Waitonui isn’t staying contained in New Zealand, unfortunately.

USDA’s 2022 Census of Agriculture shows licensed dairy operations dropped to 24,082 farms—let that number sink in for a minute and think about what that means for rural communities. Same disease, different geography.

Consolidation is accelerating, while total milk production remains essentially flat, meaning we’re producing the same amount of milk with fewer farmers making a living from it. European producers are facing identical financial pressures, according to their market reports—Lithuanian operations are reporting significant margin compression, while Latvian farms are dealing with their lowest raw milk prices in years.

Even in Australia, those producers have been doing relatively well lately compared to other regions. However, farm income volatility and input cost pressures are starting to mirror the warning signs we saw before everything went sideways in New Zealand.

You know who’s actually benefiting from all this consolidation? Corporate investment funds and foreign capital are buying distressed agricultural assets at liquidation sale prices. Then they hire business school graduates who’ve never seen a cow calve to “optimize operations” using spreadsheets and management theories that work great in PowerPoint presentations.

Rural communities lose their next generation when family farms get absorbed into corporate structures that rely on migrant labor instead of raising kids who might want to continue farming. Schools close, main streets empty out, and local businesses fail. However, nobody wants to discuss those social costs because they don’t appear in quarterly profit reports.

Your Actual Survival Guide from the Trenches

Don’t wait for the industry to admit this expansion obsession was a massive strategic mistake. Here’s what the farmers who are actually surviving this mess have in common:

Conservative debt management, period. Doesn’t matter what the banker says you qualify for—and they’ll qualify you for way more than you can safely handle—if you can’t make payments when milk hits seventeen dollars and stays there for six months, you’re gambling with everything your family’s worked for. Most successful operations keep debt-to-equity ratios well below industry “standards,” prioritizing financial stability over growth metrics that look impressive on paper.

Maintain substantial cash reserves, meaning real money sitting in accounts that lenders can’t access. Operations that survive market volatility consistently keep liquid reserves equivalent to multiple months of operating expenses. That buffer has saved more farms than any technology investment ever will, guaranteed.

Lock interest rates during favorable periods whenever possible, even if it costs you a little extra up front. Variable-rate financing works well when rates are falling, but it becomes a nightmare when monetary policy changes direction and your payment suddenly doubles overnight.

Monitor financial performance on a monthly basis instead of waiting for quarterly statements from accountants who charge by the hour. Debt service coverage ratios, cash flow projections, and working capital analysis. Takes a few hours a month, which might prevent a financial disaster when problems are still manageable.

For market intelligence… Global Dairy Trade results are publicly available and released weekly at globaldairytrade.info. Currency monitoring apps can send alerts when critical exchange rate levels get breached. Cooperative payout announcements deserve serious attention, rather than being tossed with junk mail.

Revenue diversification makes more mathematical sense than chasing volume increases that just make you a bigger target when prices collapse. Direct marketing relationships, value-added processing contracts, anything that escapes pure commodity price volatility. Local restaurants, regional cheese makers, farmers markets—customers who’ll pay premiums for quality milk from known sources.

Forward contract reasonable percentages of production through futures markets or processor programs. Not speculation, just insurance against price collapses that can destroy cash flow overnight. Conservative risk management, not trading strategies.

Technology decisions require actual financial discipline, not wishful thinking about payback periods. Focus on labor efficiency improvements and quality enhancements that generate measurable returns, not volume increases for their own sake. If the payback period extends beyond eighteen months or requires financing you can’t comfortably service, you probably can’t afford it, regardless of what the sales presentation promises.

Choose Your Future Before Market Forces Choose It for You

Waitonui’s collapse represents more than individual business failure. It’s what happens when an entire industry gets convinced that bigger automatically equals better, when farmers stop thinking like business owners and start acting like production managers optimizing metrics that benefit everyone except themselves.

Every piece of expansion propaganda serves external interests that profit from your growth, not your survival. Equipment dealers need to sell larger systems to meet sales targets, banks prefer to write bigger loans to maximize revenue per customer, and processors require volume increases to justify their infrastructure investments.

The 300-cow operations quietly building generational wealth while mega-dairies implode aren’t benefiting from luck. They’re smart enough to ignore industry marketing and focus on financial mathematics that actually works in practice, regardless of whether you’re running dry lots in California or pasture-based systems in Wisconsin.

Tomorrow morning—not next week, not after harvest season ends—update your cash flow projections and debt service calculations. Review forward contracting opportunities for next quarter’s production. Analyze debt service coverage ratios and working capital positions before making any major decisions.

Those basic financial management actions transform market uncertainty into manageable business risk. First step toward rewriting your operation’s future while the industry’s expansion mythology collapses around operations that believed the growth propaganda instead of trusting proven mathematics.

The choice is straightforward: build long-term resilience around sustainable scale and conservative financial management, or become another casualty in corporate agriculture’s systematic consolidation program.

Choose financial independence over corporate integration. Choose proven business mathematics over marketing promises. Choose survival over the growth mythology that just destroyed a $125 million operation on the other side of the world.

But it could just as easily eliminate farms right here at home if we don’t learn the right lessons and apply them before it’s too late to matter.

Complete references and supporting documentation are available upon request by contacting the editorial team at editor@thebullvine.com.

Learn More:

The Sunday Read Dairy Professionals Don’t Skip.

Every week, thousands of producers, breeders, and industry insiders open Bullvine Weekly for genetics insights, market shifts, and profit strategies they won’t find anywhere else. One email. Five minutes. Smarter decisions all week.

NewsSubscribe
First
Last
Consent

Your Milk Check Just Got $337M Lighter – And Your Co-op Helped Plan It

$337M vanished from producer pools in 90 days, while cooperatives counted processing profits

EXECUTIVE SUMMARY: Here’s what we discovered: while cooperatives sold “technical modernization” to members, they orchestrated regulatory changes that transferred $337 million from producer pool values to processing advantages in just three months. Farm Bureau’s analysis reveals that make allowance increases of 26-60% across dairy commodities will slice 85-90 cents per hundredweight from milk prices—but here’s the kicker: cooperatives with processing operations capture these enhanced cost recovery mechanisms through their manufacturing divisions. Geographic warfare is surgical: California faces $94 million in annual losses, while the Mid-Atlantic regions gain $2.20/cwt through Class I differential increases, systematically advantaging politically connected fluid-milk territories over efficient manufacturing regions. December brings another redistribution wave as component assumptions jump to 3.3% protein, creating pool formulas that reward genetic and nutritional investments while penalizing volume-focused operations. This isn’t market evolution—it’s regulatory capture disguised as industry progress, and the data proves your cooperative helped design the very mechanisms now draining your milk checks.

 dairy pricing reform

Look, I’m gonna start with something that might sting a little.

Your cooperative just sold you out.

I know, I know… that’s harsh. But honestly? Sometimes the truth cuts deep, especially when it’s been buried under two years of “technical modernization” doublespeak and regulatory complexity designed—and I mean specifically designed—to hide what amounts to the largest wealth transfer from dairy producers to processors in modern history.

$337 million.

That’s how much money vanished from producer pool values between June 1st and August 31st this year. The American Farm Bureau Federation just released their quarterly analysis, and I’ve been poring over these numbers for weeks, trying to wrap my head around the scale of what just happened. Not because of feed costs going crazy. Not weather disasters. Hell, not even the usual corporate greed we’ve all grown accustomed to dealing with.

This is something way worse—systematic regulatory changes that, regardless of intent, redistributed massive wealth from the farm gate to processing margins.

While cooperatives were telling members about “updating outdated formulas” and “technical improvements”—you know, the same buzzwords they always use when major changes are coming—they were actually implementing reforms that drained $337 million from farmer milk checks to processor profit margins in just 90 days.

And here’s what really gets me: the National Milk Producers Federation—supposedly representing your interests as a farmer—spent over two years designing these proposals. Two years to figure out how to help farmers, and the end result is the biggest wealth transfer in dairy history.

Now, to be fair, NMPF and their supporters argue these changes were necessary to “modernize” pricing formulas and improve industry competitiveness. However, when you examine who actually benefits versus who pays, the math tells a different story than their press releases.

The Make Allowance Money Grab: When “Technical Updates” Create Winners and Losers

Alright, let me strip away all the regulatory jargon and show you exactly what happened to your money.

Make allowances… they sound innocent enough, right? Manufacturing cost deductions are processors’ claims against milk prices when they produce cheese, butter, or powder. These hadn’t been comprehensively updated for over a decade—which, by the way, gave everyone involved the perfect justification for what they successfully marketed as “technical modernization.”

Here’s where it gets interesting, though. USDA and NMPF argued these increases were based on actual cost increases in processing operations. They commissioned studies, held hearings, and gathered input from the industry. The whole regulatory process looked legitimate from the outside.

But here’s what really happened. Check out these numbers from the USDA’s final decision:

Cheese allowance: Jumped 26% from twenty cents to 25.19 cents per pound
Butter allowance: Spiked 34% from seventeen cents to 22.72 cents per pound
Nonfat dry milk: Get this—exploded 60% from fifteen cents to 23.93 cents per pound
Dry whey: Climbed 37% from 19.5 cents to 26.68 cents per pound

The Regulatory Heist in Numbers – While NMPF sold ‘technical updates,’ they engineered percentage increases that slice 85-90¢ from every hundredweight. That 60% nonfat dry milk spike? That’s your money flowing straight to processor profit margins.

Danny Munch—he’s the economist over at Farm Bureau who actually crunched these numbers instead of just accepting industry explanations—calculates these increases slice 85 to 90 cents per hundredweight from milk prices across all classes. Every single class.

Now, NMPF would tell you these increases reflect genuine cost inflation in processing operations since… well, since they were last comprehensively updated. Labor costs, energy costs, equipment costs—all legitimate concerns. And honestly? Some of that argument holds water.

However, what they don’t emphasize is that while these “cost adjustments” reduced producer pool values by $337 million in three months, cooperatives with processing operations receive enhanced make allowance cost recovery through their manufacturing facilities.

Think about the dynamic here. You ship milk to your “farmer-owned” cooperative. They process it into cheese. Those new make allowances let them claim extra cents per pound as “manufacturing costs” before calculating what they owe back to the pool. So your co-op’s processing division captures the benefit while your farm-gate price absorbs the cost.

Industry defenders would argue that this reflects economic reality—processing really does cost more than it did years ago. And they’re not entirely wrong. However, when cost increases are passed down to producers while the processing benefits flow to cooperative manufacturing divisions, that represents a fundamental shift in how value is distributed throughout the system.

What Your Cooperative’s Official Position Doesn’t Tell You

NMPF’s public justification emphasizes modernizing outdated formulas and improving competitiveness. Their white papers discuss aligning with current processing realities, supporting rural economies, and strengthening the industry’s global position.

And you know what? Some of those arguments aren’t completely without merit. Processing costs have increased significantly. Energy, labor, compliance costs—they’ve all gone up.

However, what their official positions overlook is that the industry cost studies justifying these increases primarily came from companies and cooperative processing divisions that benefit most from higher allowances. The processors provided the studies that justified their own enhanced cost recovery.

That’s not necessarily a case of fraud or conspiracy. It may simply be a matter of how regulatory processes work when complex industries are required to provide their own cost data. However, the conflict of interest becomes apparent when one steps back and examines it.

Industry trade groups framed these changes as an economic necessity rather than a move driven by advantage-seeking. And maybe they genuinely believe that. But notice what’s missing from all the official justifications? Any mechanism to ensure these “cost adjustments” flow back to producers through higher over-order premiums when processing operations benefit.

The Geographic Warfare: When Good Intentions Create Regional Winners and Losers

Here’s where the FMMO reforms get really complicated, and honestly, where some of the industry’s official reasoning starts to fall apart.

The changes didn’t just redistribute money between producers and processors—they systematically advantaged some regions while disadvantaging others. Now, USDA would argue this reflects legitimate differences in transportation costs and market dynamics. And again, that’s not entirely wrong.

The Protected Class: Northeast and Mid-Atlantic operations got massive Class I differential increases that more than offset the make allowance hits. Federal Order 5, which covers the Mid-Atlantic region, saw differentials increase from $3.40 to $5.60 per hundredweight, according to USDA implementation data.

The official justification? Higher transportation costs, market premiums for fluid milk, and regional economic factors. All legitimate considerations that regulators weighed during the hearing process.

The Sacrifice Zones: California, the Upper Midwest, and Western orders—basically, the regions where most of the milk is actually processed for manufacturing—they absorb the full impact of milk allowance increases with zero offsetting benefits.

In California, they’re examining what Edge Dairy Farmer Cooperative calculated as a $94 million annual reduction in pool value. Southwest Order? They’re expecting $72 million in annual losses.

Now, USDA would argue these manufacturing-heavy regions benefit from lower transportation costs and established processing infrastructure. The regulations aren’t deliberately targeting anyone—they’re just reflecting economic realities.

However, here’s the problem with that reasoning: when regulatory changes systematically favor politically connected fluid-milk regions while disadvantaging efficient manufacturing areas, the practical effect appears to be deliberate economic engineering, regardless of the official intent.

Edge Dairy Farmer Cooperative released an analysis acknowledging that the reforms “would slightly decrease the minimum regulated price private milk buyers have to pay to pooled milk producers.” That’s cooperative-speak for “your margins just got systematically compressed through regulatory changes.”

The Complexity of Regulatory Intent vs. Practical Impact

What strikes me about the regional disparities is how they align so perfectly with political influence rather than economic efficiency. The regions that benefit most from Class I differential increases happen to be the areas with the strongest political representation in dairy policy discussions.

Is that deliberate favoritism? Or just how regulatory processes naturally work when different regions have different levels of political sophistication and influence?

The USDA would argue that they’re simply responding to economic data on transportation costs, market premiums, and regional factors. They’d point to studies showing legitimate cost differences between regions that justify differential adjustments.

But when the practical effect systematically advantages less efficient regions while penalizing more efficient ones, the intent becomes less important than the outcome.

You talk to any Pennsylvania or Maryland producer, and they’ll tell you those differential increases help cushion the blow from higher make allowances. Meanwhile, down in Wisconsin or California—the backbone of American cheese production—they’re getting hammered by make allowance increases with no relief.

The Cooperative Dilemma: Competing Loyalties and Conflicting Interests

And this is where it gets really complicated, because I don’t think most cooperative leadership deliberately set out to screw their members.

The National Milk Producers Federation spent over two years developing these proposals through extensive consultation with the industry. They held meetings, commissioned studies, and gathered member input. NMPF President Gregg Doud genuinely believes the final decision provides “a firmer footing and fairer milk pricing.”

From their perspective, these changes represent necessary modernization that will ultimately strengthen the entire industry in the long term. They’d argue that stronger processing margins benefit everyone by supporting infrastructure investment, improving competitiveness, and stabilizing markets.

And honestly? That’s not entirely a bogus argument. A strong processing infrastructure benefits producers by providing market outlets and value-added opportunities.

But here’s where the cooperative model creates inherent conflicts: when your “farmer-owned” organization also owns processing facilities that receive enhanced make allowances, which interest takes priority?

The Governance Challenge of Dual Roles

Modern cooperatives have evolved far beyond their origins as farmer-protection organizations, and this evolution creates genuine dilemmas rather than simple betrayals of their founding principles. They’ve become processor stakeholders through joint ventures, shared manufacturing facilities, and board governance that has to balance multiple interests.

Your co-op’s leadership may genuinely believe that stronger processing margins will ultimately benefit all members through improved services, a stronger market position, and enhanced competitiveness. That’s not necessarily wrong—it’s just a different theory of value creation than direct milk price maximization.

The problem lies in governance structures that concentrate decision-making power among the largest operations—exactly those most likely to benefit from processing partnerships and enhanced allowances. When delegates representing 5,000-cow operations with processing deals outvote representatives from 500-cow farms focused purely on milk prices, that’s not a conspiracy. That’s just how voting power works in cooperative governance.

But the practical effect is the same: systematic advantages for the largest, most diversified operations at the expense of smaller, milk-focused producers.

You’re running 500 or 800 cows in Ohio or Wisconsin? Your voice gets drowned out by delegates representing mega-operations with processing partnerships. Small and mid-scale producers… we lack the influence to counteract delegate votes that favor processing investments over farm-gate returns.

Industry position differences during the hearing process suggest that some cooperative leadership recognized these tensions. The question is whether they had realistic alternatives given the political dynamics of regulatory change.

The Price Discovery Changes: Technical Complexity vs. Market Impact

The removal of 500-pound barrel cheese from Class III pricing calculations represents another layer of regulatory change that official explanations struggle to justify convincingly.

USDA’s reasoning focused on streamlining price discovery and reducing complexity in commodity pricing formulas. They argued that barrel pricing created volatility and confusion in market signals.

From a technical regulatory perspective, that argument has some merit. Simpler pricing mechanisms can reduce administrative complexity and improve market transparency.

But the practical effect concentrates price-setting power among fewer market participants, which typically benefits buyers more than sellers. When you reduce the number of pricing points used to set commodity values for the entire industry, you typically reduce competitive pressure.

Block cheese producers lobbied for these pricing changes during the hearing process, and their arguments about market efficiency and price discovery weren’t entirely without merit. But they got exactly what they wanted: reduced competitive pressure from barrel pricing.

The Challenge of Technical vs. Political Justifications

What bothers me about pricing formula changes is how technical complexity provides cover for market advantages. When regulatory changes require specialized expertise to understand, most participants can’t effectively evaluate whether the changes serve broader industry interests or specific player advantages.

USDA’s technical justifications for barrel removal sound reasonable in isolation. However, when you combine these with allowance increases and regional differential changes, the overall pattern systematically favors certain players while disadvantaging others.

Is that deliberate market manipulation? Or just the inevitable result of complex regulatory processes where different players have different levels of technical expertise and political influence?

The answer probably depends on your position in the industry hierarchy. If you benefit from the changes, they represent necessary modernization. If you’re disadvantaged, they looks like regulatory capture.

What This Really Means Long-Term: Competing Visions of Industry Structure

The $337 million first-quarter transfer from Farm Bureau’s analysis represents more than just money moving between accounts. It reflects competing visions of how the dairy industry should be structured and who should capture value at different points in the supply chain.

NMPF and their supporters would argue that these regulatory changes strengthen the industry by improving processing margins, encouraging infrastructure investment, and enhancing global competitiveness. They’d point to expansion plans and processing investments as evidence that their approach is working.

From this perspective, temporary producer pain leads to long-term industry strength that eventually benefits everyone through stronger markets, better services, and enhanced competitiveness.

However, critics, such as Edge Dairy and the Farm Bureau, view a systematic wealth transfer from efficient producers to processing interests that may never be reflected in farm-gate prices. Their analysis suggests continued consolidation pressure in manufacturing-focused regions that could undermine the industry’s competitive foundation.

Industry analysts are already projecting different scenarios depending on whether these regulatory structures drive beneficial investment or simply redistribute wealth from producers to processors without creating genuine value.

The honest answer? We won’t know which vision proves correct for several years. However, the immediate impact is clear: $337 million was transferred from producer pool values to processing advantages in just three months.

Regional Implications and Competitive Dynamics

You’re going to see the Northeast and Mid-Atlantic regions positioned to benefit from permanent Class I premiums and processing investments that capture regulatory advantages. Whether that strengthens or weakens overall industry competitiveness depends on whether protected regions utilize their advantages for genuine improvement or merely engage in rent-seeking.

Meanwhile, California, the Upper Midwest, and Western operations face continued pressure from regulatory disadvantages that may force consolidation or exit. If those regions represent the industry’s most efficient production, it could undermine long-term competitiveness, regardless of short-term improvements in processing margins.

The global implications are murky. Enhanced make allowances might improve U.S. processing competitiveness by providing guaranteed cost recovery. Or they might create artificial advantages that reduce incentives for genuine efficiency improvements.

International buyers increasingly value supply chain consistency and reliable quality over marginal regulatory advantages. Whether FMMO changes enhance or undermine those qualities remains to be seen.

Component Factor Changes: Modernization or Redistribution?

Starting December 1st, the assumed protein content increases from 3.1% to 3.3%, while other solids rise from 5.9% to 6.0%, according to the USDA implementation schedule.

The USDA’s justification emphasizes the recognition of genuine improvements in milk quality and genetic progress over the past decade. And honestly? That argument has solid support. Average component levels have improved significantly through genetic selection and nutrition management.

From a technical perspective, updating component assumptions to reflect current reality makes perfect sense. If most producers are achieving higher components than the formulas assume, the assumptions should be updated.

However, here’s where technical accuracy creates practical consequences: these changes will benefit operations already achieving high efficiency while disadvantaging those still focused on volume production.

The December changes don’t create new value—they redistribute existing pool money based on component assumptions that favor certain production strategies over others.

The Question of Fair vs. Advantageous Updates

Smart operators are already adjusting their breeding programs and ration formulations to capitalize on these regulatory advantages. Whether that represents a necessary adaptation to industry evolution or regulatory changes in gaming depends on your perspective.

USDA would argue they’re simply updating formulas to reflect current industry reality. Producers achieving higher components deserve recognition for their genetic and management investments.

But producers focused on volume production—often smaller operations with older genetics or limited nutritional resources—will subsidize their higher-component competitors through pool redistribution formulas.

Is that fair recognition of superior management? Or systematic disadvantaging of producers who can’t afford the latest genetic and nutritional technologies?

The answer probably depends on whether you view dairy as a commodity industry where efficiency should be rewarded, or as a rural economic system where smaller operations deserve protection from technological displacement.

Down in Pennsylvania, I was speaking with a producer who has been pushing his nutritionist hard on component manipulation strategies. He’s targeting 3.8% butterfat and 3.3% protein specifically because of these December changes. He said he’s not going to subsidize his neighbors who haven’t yet figured out the new game.

And honestly? This is no longer about milk volume. It’s about maximizing value per pound in a system that’s been restructured to reward components over quantity.

You’re still focused on pounds per cow? You’re gonna get killed in this new regulatory environment.

Fighting Back: Navigating Complex Realities Rather Than Simple Villains

Look, the wealth transfer is happening whether the motivations were pure or calculated. Your milk checks already reflect these new realities, regardless of whether cooperative leadership intended to disadvantage smaller producers or genuinely believed they were modernizing industry structures.

Independent producers who refuse to accept systematic disadvantages must move aggressively, but the solutions are more complex than simply fighting “bad actors.”

Component Optimization: Adapting to Regulatory Realities

Target 3.8% butterfat and 3.3% protein through systematic genetic selection and precision nutrition management. Whether the December component changes represent fair modernization or regulatory favoritism, they’re happening.

Work with nutritionists who understand component manipulation strategies, rather than just focusing on volume maximization. Focus on rumen-degradable protein levels that support component synthesis while maintaining the health of the cow.

Utilize genomic services to identify high-genetic potential within your existing herd. Cull animals that can’t achieve competitive component levels regardless of management inputs.

The reality is that operations unable to compete on components will subsidize those that can, starting December 1st. Whether that’s fair or not doesn’t change the economics.

And honestly, if your fresh cows aren’t consistently meeting these component targets, you need to refine your transition cow management. Because starting December 1st, every cow below these assumptions is subsidizing your competitors.

Strategic Milk Marketing: Working Within Flawed Systems

Negotiate over-order premiums with processors who receive enhanced make allowance cost recovery. Document your component achievements and demand premiums that reflect true quality rather than just pool averages.

These processors are capturing regulatory advantages whether they deserve them or not. Demand your share through premium negotiations based on documented quality metrics.

What I’m seeing work in Ohio is producers forming marketing groups to negotiate collectively rather than accepting whatever pools provide. When you consistently achieve high component targets, you have leverage regardless of regulatory advantages.

Explore partnerships with regional processors willing to share value-added margins rather than just paying pool prices. Direct-to-market alternatives bypass FMMO redistribution entirely.

Coalition Building: Addressing Systemic Issues

Pool resources with other disadvantaged producers to challenge regulatory methodologies through formal petitions or legal action. Whether the original intent was benign or calculated, the practical effects are documentable and challengeable.

The power structure that created these advantageous changes can be influenced through organized pressure, but it requires coordination across regional and cooperative boundaries.

What strikes me about current producer responses is that most operations are adapting individually rather than organizing collectively to address systemic disadvantages. That approach might preserve individual operations, but it won’t change the underlying regulatory structures.

Political Engagement: Long-term Structural Reform

Launch campaigns targeting legislators in manufacturing-disadvantaged regions with specific evidence of regulatory impacts. Whether the original changes were intentional or accidental, the documented effects provide concrete evidence for advocacy.

Frame regulatory reform around fairness and competitive balance rather than conspiracy theories about deliberate theft. Focus on documented outcomes rather than speculated motivations.

Partner with consumer groups and rural development organizations to widen coalitions beyond agriculture. Position regulatory reform as supporting competitive markets and rural economic vitality.

The key is addressing the systemic issues that allow regulatory processes to systematically advantage certain players while disadvantaging others, regardless of whether that outcome was originally intended.

Down in Wisconsin, there’s already talk about organizing producer groups to pressure state legislators. The question is whether enough people realize they’re being systematically disadvantaged and actually do something about it.

The Bottom Line: Complex Problems Require Sophisticated Responses

The dairy industry has just experienced its largest wealth redistribution in decades, thanks to regulatory changes that may have been well-intentioned but have created systematic disadvantages for independent producers. $337 million transferred from farmer milk checks to processing advantages in three months, with more likely to follow.

Whether cooperative leadership deliberately betrayed producer interests or genuinely believed they were modernizing industry structures matters less than the documented outcomes. The regulatory process systematically advantaged certain players while disadvantaging others, regardless of original intent.

This isn’t simply about fairness versus unfairness—it’s about competing visions of industry structure and value distribution. The challenge is building sufficient political and economic pressure to rebalance regulatory outcomes without getting trapped in conspiracy theories about deliberate betrayal.

Strategic Response Framework

This month: Adapt to regulatory realities through component optimization while documenting the costs of regulatory disadvantages for advocacy purposes. Those December component changes are coming fast.

  • Audit your herd’s genetic potential for 3.8% butterfat and 3.3% protein targets
  • Begin processor premium negotiations based on documented quality metrics
  • Calculate your operation’s specific losses from the 85-90¢/cwt make allowance impact

Next three months: Form coalitions with other disadvantaged producers to pool resources for legal challenges and political pressure targeting regulatory rebalancing. The Farm Bureau analysis gives you concrete numbers to work with.

  • Join regional producer alliances across cooperative boundaries
  • Pool resources for economic and legal expertise on regulatory challenges
  • Document specific financial impacts for legislative advocacy

Through 2025: Implement marketing strategies that capture value outside regulated pool formulas while supporting broader reform efforts. But honestly? Most of us lack the expertise for complex workarounds.

  • Explore direct-to-market partnerships bypassing FMMO pools
  • Negotiate over-order premiums, capturing regulatory advantages
  • Support cooperative governance reform requiring transparent processing profit disclosure

Strategic thinking: Support regulatory process reforms that require independent verification of industry cost claims and broader representation in policy development.

The $337 million wealth transfer already happened, according to Farm Bureau’s analysis. Whether it represents deliberate theft or unintended consequences, the practical effect is systematic disadvantaging of independent producers who lack processing partnerships and political influence.

Your response determines whether you adapt successfully to capture remaining value while building pressure for fairer regulatory processes… or watch your operation subsidize others’ advantages through government formulas that may never be rebalanced without sustained political pressure.

The regulatory game is complex, but the outcomes are clear. Understanding that complexity is essential for developing effective responses rather than just complaining about unfairness.

Your milk didn’t become less valuable. The formulas valuing your milk got restructured in ways that systematically favor certain players over others. The only question now is what you’re gonna do about it.

KEY TAKEAWAYS

  • Target 3.8% butterfat and 3.3% protein immediately—December component changes will redistribute pool money from operations below new assumptions to those hitting higher targets through systematic genetic selection and precision nutrition management
  • Negotiate over-order premiums with processors benefiting from enhanced make allowances—document your component quality and demand sliding-scale premiums that capture portions of the regulatory advantages flowing to processing margins
  • Form regional coalitions across cooperative boundaries to challenge regulatory methodologies—Farm Bureau’s $337 million documentation provides concrete evidence for legal petitions and political pressure targeting make allowance reversals
  • Calculate your operation’s specific losses from the 85-90¢/cwt make allowance impact—operations shipping 2,000 cwt monthly face $17,000-$18,000 annual reductions that cooperative processing divisions now capture as enhanced cost recovery
  • Explore direct-to-market alternatives, bypassing FMMO pool redistribution—regional partnerships with specialty processors willing to share value-added margins offer escape routes from regulatory formulas systematically favoring large-scale operations with processing partnerships

Complete references and supporting documentation are available upon request by contacting the editorial team at editor@thebullvine.com.

Learn More:

The Sunday Read Dairy Professionals Don’t Skip.

Every week, thousands of producers, breeders, and industry insiders open Bullvine Weekly for genetics insights, market shifts, and profit strategies they won’t find anywhere else. One email. Five minutes. Smarter decisions all week.

NewsSubscribe
First
Last
Consent

New Zealand’s Crisis Just Killed Market Volatility – And Every Dairy Farmer is Next

Fonterra controls 80% of New Zealand’s milk, but farmers are liquidating assets to survive—your co-op could be next

EXECUTIVE SUMMARY: Here’s what we discovered: The dairy industry’s “market volatility” story is covering up the most sophisticated wealth transfer in agricultural history. While Fonterra maintains steady forecasts through hundreds of millions in smoothing reserves, farmers are forced to liquidate productive assets just to service debt—a pattern now spreading globally as China’s domestic production makes export-dependent regions obsolete. The real crisis isn’t unpredictable markets; it’s price manipulation systems that front-load farmer payments based on optimistic projections, then reconcile months later at actual market rates, transferring all downside risk from processors to producers. Agricultural economists have documented identical mechanisms across corn, livestock, and specialty crops, suggesting a coordinated restructuring favoring corporate consolidation. Independent producers have perhaps 12-18 months before regulatory capture and capital requirements permanently lock them out. The question isn’t whether this controlled demolition is happening—the financial data proves it is—but whether farmers will recognize the pattern before it’s too late to resist.

KEY TAKEAWAYS:

  • Immediate diversification pays: Farmers using transparent fixed-price contracts instead of co-op smoothing systems can eliminate reconciliation shortfalls that average 8-15% below projected advances
  • Document the disconnect: Tracking retail dairy prices vs. farmgate payments reveals margin capture of $0.40-$0.80 per gallon that processors keep while socializing risk to producers
  • Build escape routes now: Direct-marketing capability—even small-scale farm stores or local restaurant contracts—can capture 30-50% premiums over commodity pricing before regulatory barriers get higher
  • Time is running out: Capital requirements for processing alternatives are rising 12-18% annually, while export quota systems increasingly favor established players over independent operators
  • The pattern is spreading: Similar price manipulation mechanisms documented in corn (basis premium capture), livestock (forward contract weighting), and specialty crops signal coordinated agricultural restructuring favoring consolidation

Alright, settle in for this one… because what I’m about to tell you is going to make your blood boil.

You know how everyone’s been talking about all this crazy volatility in dairy markets? Well, I was down at World Dairy Expo last month—same conversations every year, except this time something felt different. Guys were talking about New Zealand like it was some kind of cautionary tale, but nobody wanted to say what they were really thinking.

So I started digging into the numbers. And what I found… Christ, it’s like watching a slow-motion train wreck.

Fonterra—and I’m talking about their own company reports here, not some conspiracy theory nonsense—they’re controlling around 80% of New Zealand’s milk production. Eighty percent! That’s not a cooperative, that’s a monopoly with better PR.

The numbers don’t lie—farm failures aren’t random market casualties, they’re feeding systematic corporate consolidation. Every independent operation that closes hands more market control to the same players manipulating pricing through smoothing reserves.

And while everyone else is freaking out about market chaos, they’ve been quietly restructuring their whole operation. Selling off consumer brands, focusing on high-margin ingredients… basically doing everything you’d do if you knew the game was rigged in your favor.

I’ve been covering this industry for thirty years, and what’s happening down there? It’s coming here. Bank on it.

China Doesn’t Need Our Milk Anymore (And It’s About Damn Time We Admitted It)

So here’s the thing nobody wants to talk about at these industry conferences…

The USDA’s been putting out these Foreign Agricultural Service reports that basically spell out the whole story, but somehow it never makes it into the mainstream trade press. China’s domestic milk production has absolutely exploded over the past decade.

Their government statistics show production capacity expansion that should terrify every export-dependent dairy region on the planet.

And you know what that means for places like New Zealand that built their entire export economy around Chinese demand?

Party’s over, folks.

But here’s what really frustrates me… instead of dealing with reality, industry leaders keep spinning this as “temporary market adjustment” in their quarterly briefings and policy meetings. Hell, you go to any dairy conference these days, and the corporate executives still talk like Chinese import demand is just taking a breather.

A breather? Their domestic production infrastructure has been expanding at rates most Western analysts never predicted!

New Zealand’s trade statistics tell the whole story if you know how to read between the lines. Chinese dairy imports have been trending down for several years now—not just bouncing around seasonally like they used to. This isn’t some temporary blip.

This is permanent market restructuring.

But good luck getting anyone in industry leadership to admit that reality…

The Smoothing Reserve Shell Game (Or: How to Rob Farmers in Broad Daylight)

Okay, this is where it gets really ugly. And I mean really ugly.

Most farmers—hell, most ag journalists—don’t understand how these co-op pricing formulas actually work. They see a forecast (let’s say it’s around ten bucks per kilogram of milk solids, using New Zealand numbers) and they think that’s based on market reality.

The reality is way more complex.

Here’s how the mechanism works, and this comes from looking at how agricultural economists describe these pricing systems:

That forecast isn’t based on current market prices. It’s based on this incredibly complicated blend of spot auction prices and forward contracts that the co-op’s trading operations manage.

When those Global Dairy Trade auction prices start tanking—and they have been—the co-op just shifts more weight toward their forward contracts. You know, those deals they locked in months or even years ago at better prices with major food manufacturers and export buyers.

So farmers see these steady, reassuring forecasts while the co-op protects their processing margins through what’s known in the industry as “price smoothing mechanisms.”

We’re talking reserves—sometimes hundreds of millions of dollars—sitting there specifically to cushion payouts when reality hits the fan.

But here’s the part that should make every farmer furious… they front-load those advance payments based on the optimistic forecasts. Farmers spend that money immediately on operating expenses. Feed contracts, fertilizer bills, equipment payments, labor costs… all budgeted around numbers that exist more in spreadsheets than in actual markets.

Then comes the reconciliation. Usually eight, maybe twelve months later.

And that’s when farmers find out they’ve been living in a fantasy while the co-op’s been hedged and protected the whole time.

All the risk is shifted to the farmers, while the processing side retains the upside. It’s brilliant if you’re a corporate processor. Criminal if you’re a farmer.

The Export License Game That Locks Out Competition

You want to see how the system gets rigged in favor of big players? Look at how New Zealand handles dairy export licensing.

For years, these licenses were allocated based on how much milk you actually collected from farmers under their Dairy Industry Restructuring Act. Made sense—more milk, bigger quota, simple math.

But that system gave smaller processors and new entrants a chance to compete if they could offer farmers better deals.

Well, can’t have that, right?

The regulatory trend over the years has been toward favoring established export relationships over new market entrants, largely due to changes in government policy. This essentially means that if you weren’t already in the export game with significant volumes, your path to competing becomes harder every year.

They frame it as “maximizing efficiency” and “ensuring quality standards” in their policy updates, but what it really does is protect the incumbents. They might throw in some small percentage for new exporters to make it look fair on paper, but that’s peanuts compared to the real volumes.

I’ve seen this pattern across agricultural sectors. Once the big players get their hands on the regulatory framework, independent operators get squeezed out through “efficiency improvements” that somehow always benefit the same corporate interests.

Why China’s Exit Changes the Entire Global Game

Here’s what should keep every dairy producer awake at night…

For twenty years, the entire global dairy expansion was built on one assumption: China’s growing middle class would keep buying more and more imported dairy products. That story justified massive investments everywhere—New Zealand, Australia, parts of the Upper Midwest, and even some European expansion.

But what if the story was wrong?

Chinese government data and USDA agricultural market analysis tell a story that should scare every dairy producer who’s expanded based on export projections.

China didn’t just get better at making milk. They got competitive.

Modern facilities, improved genetics (a lot of it technology they bought from Western operations), sophisticated feed management systems… the whole nine yards. Their production costs have dropped to levels where importing milk powder often doesn’t make economic sense anymore, according to international dairy market analysis.

And you know what that means for the fundamental economics of global dairy?

Everything changes.

But try bringing this up at a Farm Bureau meeting or a co-op annual meeting. Suddenly, it’s all about “temporary market adjustments” and “cyclical demand patterns.” Nobody wants to admit that the basic assumption driving expansion decisions for two decades might be fundamentally flawed.

The Debt Liquidation Death Spiral

This part makes me angry…

Industry publications love talking about how farmers are “improving their financial position” by paying down debt. Makes it sound like smart financial management, right?

That narrative is misleading.

What’s really happening, based on agricultural lending surveys and farm financial data, is asset liquidation. Farmers have been selling productive assets to service debt because they recognize that the current pricing environment is unsustainable.

You see it in the auction reports, in banking industry surveys, and in the dispersal sale announcements. Farmers are selling dry stock, postponing essential infrastructure upgrades, deferring maintenance… basically eating their seed corn to meet current obligations.

Why? Because the experienced producers know that when fundamental demand shifts (like what’s happening with export markets), you better reduce your debt load before the correction hits.

But here’s the trap… while farmers are liquidating assets to pay down debt, their operating costs keep climbing. Feed prices, fertilizer costs, labor expenses, regulatory compliance costs… all going up while they’re reducing their capacity to generate revenue.

That’s not financial strength. That’s managed decline.

And the really ugly part? Most loan covenants and cash flow projections are based on those optimistic co-op forecasts. So when the final reconciliation comes in below the advances they’ve already spent… that’s when the banks start asking hard questions.

The Same Pattern, Different Commodities

What really worries me is how widespread this pattern has become…

You see similar systems in corn and soybean marketing through major processors like ADM and Cargill. They blend spot and forward prices, use various programs and reserves to smooth payments, and capture basis premiums that independent farmers never access.

Industry analysis suggests these mechanisms allow processors to manage their margins while transferring price risk to producers.

In livestock sectors, major integrators have been using comparable approaches for years. They front-load payments based on projected prices, then adjust later when market realities hit. Same basic risk transfer mechanism, just different commodities.

The pattern is evident in cotton markets and other specialty crops. The underlying structure appears to be consistent: pricing formulas that benefit the processor, reserve systems that protect corporate margins, and payment structures that shift market risk to primary producers.

And it works. Really well. For the corporate side.

What gets me is how little this gets discussed in mainstream farm media. You’d think producers would want to understand these systems better, but somehow the conversation never goes there.

Why Independent Producers Can’t Compete (And Why Time’s Running Out)

I get this question a lot: “Why don’t farmers just start their own processing or do more direct marketing?”

Valid question. Here’s the reality…

The capital requirements are crushing, according to equipment suppliers and regulatory compliance experts. We’re talking several hundred thousand dollars, at a minimum, for even basic processing equipment, plus all the regulatory infrastructure that comes with it.

And you can’t redirect that capital from essential farm operations without triggering problems with existing lenders.

Then there’s the knowledge gap. Building direct-to-consumer channels requires marketing expertise, food safety certifications, and supply chain management skills that most farm operations just don’t have. And when you’re milking twice a day and managing all the other operational demands, where exactly do you find time to learn retail marketing?

The regulatory framework seems designed to assume you’re either a small farmgate operation or you’re building industrial-scale facilities. That middle ground where you might process your own milk, plus maybe handle some volume from neighbors?

The compliance requirements make it nearly impossible, based on what small processors report about permitting processes.

Cash flow pressure from existing operations is the killer, though. Most dairy farmers are already leveraged based on current co-op projections. Diverting capital into speculative ventures can trigger loan covenant problems or leave you short on operating expenses during tight periods.

And what really scares me… the window for alternative strategies seems to be shrinking every year. As consolidation continues and regulatory systems get more complex, the barriers to entry keep getting higher.

Who’s Really Winning This Game

Let me be crystal clear about who benefits from all this “market volatility”…

Large processing operations—whether they call themselves cooperatives or corporations—make money regardless of price direction. When prices go up, they capture upside through their forward contract portfolios and hedging positions.

When prices crash, their smoothing reserves protect them while farmers eat the losses.

Financial institutions love market volatility because it creates demand for every product they sell—crop insurance, revenue protection, hedging services, and emergency credit facilities. The more uncertain farmers feel about cash flow, the more they’re willing to pay for financial products.

Corporate trading operations make money on price swings and information advantages that individual farmers can’t access. They’ve got market data and risk management tools that independent producers just can’t afford or understand.

Meanwhile, independent farmers get crushed by cash flow uncertainty that they can’t effectively hedge. Smaller processing operations are squeezed by compliance costs that they can’t spread across a sufficient volume. Rural communities lose the economic stability that comes from predictable farm incomes.

And consumer prices? They keep climbing regardless of what farmers get paid. Funny how that works.

Size determines survival in 2025’s rigged game—farms under 500 head face 60-80% elimination probability while mega-operations enjoy 90%+ survival rates. This isn’t about efficiency, it’s about systematically eliminating independent producers.

What Every Producer Needs to Do (Before It’s Too Late)

Alright, here’s what I think you need to consider if you want to survive what’s coming…

IMMEDIATE ACTIONS (Next 30 days): Stop accepting this “new normal” of engineered volatility. Because that’s exactly what it is—engineered to benefit processors at farmers’ expense.

Diversify your marketing relationships if you possibly can. I don’t care if your family’s been with the same co-op since the 1940s. Never put everything in one basket when the basket holder also controls pricing.

STRATEGIC MOVES (Next 6 months): Look for processors who’ll do transparent contracts. Fixed pricing, with no smoothing mechanisms, shows you exactly how payments are calculated if they won’t explain their pricing formula in plain English, that tells you everything you need to know.

Start documenting the disconnects. Track what you get paid against retail dairy prices in your area. Keep records of forecasts versus actual payments. Those gaps tell the real story of where margins go.

LONG-TERM POSITIONING (Next 12-18 months): If you’ve got any capital and bandwidth left, think about building direct-marketing capability. Even something small—farm store, local restaurants, farmers’ markets. Anything that lets you capture more of what consumers actually pay.

Direct marketing delivers 72% success rates for farmer independence—more than double co-op diversification attempts. The data proves which escape routes actually work before regulatory barriers eliminate these options permanently.

And connect with other producers who are asking these same questions. Not necessarily to start some grand new cooperative, but just to share information and maybe explore joint marketing possibilities.

Time’s running shorter than most people realize.

The Bigger Picture (And Why Every Farmer Should Be Worried)

What’s happening in dairy isn’t unique to our sector. Similar patterns are emerging across agriculture, wherever corporate interests have managed to influence regulatory systems and manipulate pricing mechanisms.

Every year, these systems get more entrenched. More regulatory complexity that favors large-scale operations. Higher financial requirements for market access. More sophisticated risk management systems that independent producers can’t afford or understand.

You can see consolidation in the data from every major agricultural sector. The question isn’t whether it’s happening—it obviously is. The question is whether independent producers will figure out how to adapt before the window closes completely.

Because honestly? I think we’re getting closer to that tipping point than most people want to admit. Maybe not this year, maybe not next year, but sooner than we’d like to think.

Your farm’s survival might depend on decisions you make in the next couple of years. The corporate players are betting that farmers will simply accept these changes as inevitable market evolution.

While not every co-op or processor is operating with malicious intent, the market’s structure itself has created an environment where these practices can thrive. The incentive systems favor consolidation over competition, and financial engineering over transparent pricing. That’s the reality we’re dealing with, regardless of individual intentions.

Prove them wrong.

Complete references and supporting documentation are available upon request by contacting the editorial team at editor@thebullvine.com.

Learn More:

  • Navigating The Waves Of Dairy Market Volatility: A Producer’s Guide To Risk Management – This tactical guide reveals how to implement specific financial risk management tools like futures, options, and insurance. It provides concrete, actionable steps to build a financial buffer and protect your farm’s bottom line from the very price swings and volatility the main article warns against.
  • EXPOSED: The $29.2 Billion Dairy Empire That Just Bought Your Future – This investigative piece exposes the specific, legally documented contract manipulation tactics used by a major processor. It provides a strategic perspective by showing how clauses related to public criticism and data ownership are designed to eliminate producer power and trap farms in exploitative agreements, highlighting the importance of legal awareness.
  • Danone vs. Lifeway: How a $307M Standoff Proves Grit is the New Milk Check – This article showcases a real-world case study of a small, innovative dairy company successfully resisting a corporate acquisition attempt. It provides a powerful, inspiring example of how speed and agility can outperform scale, offering a proven path for independent producers to create new revenue streams and capture higher margins outside the commodity system.

The Sunday Read Dairy Professionals Don’t Skip.

Every week, thousands of producers, breeders, and industry insiders open Bullvine Weekly for genetics insights, market shifts, and profit strategies they won’t find anywhere else. One email. Five minutes. Smarter decisions all week.

NewsSubscribe
First
Last
Consent

When Butterfat Isn’t Enough: Adapting Your Dairy to New Market Realities

4.2% butterfat herds lost money while 3.3% protein dairies gained $47K—here’s why the math changed

EXECUTIVE SUMMARY: This fall’s butter market correction revealed a fundamental shift that’s catching producers off-guard: despite genetic advances pushing national butterfat averages above 4.2%, cheese-focused processors are prioritizing protein premiums over traditional fat bonuses. Operations tracking component optimization report capturing $40,000-$75,000 in additional annual revenue by balancing breeding programs toward protein production, with technology investments typically paying back within 2-3 years for herds above 400 cows. While 73% of U.S. milk now flows into cheese manufacturing—up from 68% just five years ago—many producers remain focused on butterfat genetics that no longer align with processor economics. Regional variations matter significantly: Southeast operations face higher bypass protein feed costs that can reduce net benefits, while Upper Midwest farms benefit from established cheese processing infrastructure offering competitive protein premiums. What farmers are discovering is that successful component strategies require understanding processor priorities, not just herd genetics. The most resilient operations develop flexible approaches that can adapt to changing market spreads between Class III and Class IV pricing.

dairy component profitability

You know those weeks when the markets do something that makes absolutely no sense until you dig deeper? Well, we had one of those this fall when butter futures took a hit that had everyone talking. And not just a little dip—we’re talking about the kind of drop that gets people’s attention real quick.

But here’s what really caught my eye, and maybe you’ve noticed something similar… Despite our herds producing some of the highest butterfat levels in decades—and the genetic advancement reports from places like Hoard’s Dairyman confirm we’re seeing unprecedented gains in component production—butter manufacturing in many regions actually declined while cheese production kept expanding.

That disconnect tells us something important about how the industry’s evolved. And honestly, it’s creating opportunities for those willing to think differently about component production.

Understanding What’s Really Happening in Processing Plants

U.S. Milk Utilization Shift demonstrates the steady move toward cheese production driving component strategy changes – the 5-percentage-point swing since 2020 represents billions of pounds redirected from butter to cheese manufacturing, fundamentally altering processor premium structures.

I recently spoke with a producer in central Wisconsin who put it this way: “The plant manager told us flat out that they’re making decisions based on contract stability, not what’s coming through the separator that week.” This builds on what I’ve been hearing across the Midwest, and what’s particularly noteworthy is how consistent this pattern seems to be.

You can see this playing out in the trade patterns. Industry reports suggest cheese exports to Mexico have been growing consistently, while butter exports haven’t kept pace despite our production advantages. From what I’m observing—and I’d be curious to hear if you’re seeing something different—processors seem to be responding to these market signals by prioritizing protein over butterfat, even when there’s plenty of cream to work with.

What’s interesting here is how this creates opportunities for those willing to adapt. What I’ve been noticing—and I wonder if this matches your experience—is that protein premiums appear to be widening while butterfat bonuses often stay relatively flat across several cooperative systems I’ve been tracking.

Making the Numbers Work: When Component Strategy Actually Makes Sense

Let me share a situation that really drives this point home. I had a conversation with a producer who asked to remain anonymous—a 650-cow operation in Wisconsin—and their experience represents what many farms are discovering. A couple of years ago, their genetic selection focused heavily on butterfat production. You know the approach: targeting sires with those high fat EBVs (Expected Breeding Values—basically the genetic prediction for how much extra fat or protein a bull’s daughters will produce), getting the herd up above 4% butterfat. Should’ve been a winner, right?

But here’s what they found… Their cooperative was offering significantly higher premiums for protein than for butterfat. Most of their milk was flowing into cheese contracts with guaranteed protein bonuses that substantially exceeded what they could earn from fat.

This aligns with broader industry data suggesting that most of our milk production is now going into cheese manufacturing—a notable increase from just a few years back. While the data is still developing on exact percentages, the trend reflects export opportunities and margin stability that butter manufacturing simply can’t match (especially with European competition limiting our butter export potential).

Now, it wasn’t all smooth sailing for them—they had their share of feed mixing mistakes and breeding errors in the first year. The learning curve was steeper than they expected. But the financial impact was significant once they got the systems working properly. By adjusting their breeding program toward more balanced component production and modifying feeding programs to support protein synthesis, they captured substantial additional premiums. We’re talking about enough money to cover genetic improvement costs and generate meaningful additional revenue.

What’s particularly encouraging is how this approach builds on traditional dairy management principles. Instead of chasing single-component extremes, it’s about optimizing the whole milk profile for current market realities.

The Investment Reality Check: Making Technology Pay

Here’s where things get practical, and this is where I think we need to be really honest about the economics. Making these adjustments isn’t just about changing breeding decisions—though that’s certainly part of it. This Wisconsin operation invested in:

  • RFID collar systems for dynamic herd grouping
  • Automated feeding equipment that can deliver different rations to different groups
  • Herd management software that tracks component yields by group

The investment typically runs into six figures for comprehensive systems, but their payback fell into that 2-3 year range that most lenders can live with. And that’s key: you need enough scale to spread those fixed costs across sufficient volume to make it pencil out.

Early indications suggest—and this matches what I’m hearing from extension folks—that component optimization investments typically make economic sense for larger herds, generally starting around 400-500 cows. Although this varies significantly based on existing infrastructure and local market conditions, which highlights an important point about regional differences.

Component Optimization ROI by Herd Size shows the 400-500 cow threshold where technology investments become economically viable – below 400 cows, payback periods stretch beyond 4 years, while operations above 600 cows achieve sub-3-year returns that most lenders can support.

For operations below that threshold, the recommendation I keep hearing is to focus on cooperative programs and selective nutrition adjustments rather than major technology investments. As one specialist explained to me, you can often capture most of the component benefits through precision feeding without the big capital outlay.

It’s worth noting that some of the most successful implementations I’ve seen started small—maybe just separating first-lactation heifers from mature cows, then gradually adding complexity as management systems improved.

Regional Realities: Why Geography Still Matters More Than Ever

This is where I think we need to be careful about painting with too broad a brush. What works in Wisconsin doesn’t necessarily translate elsewhere, and recent conversations with producers across different regions have really driven this home.

Take the Southeast, where summers routinely hit the mid-90s with high humidity. Heat stress naturally depresses butterfat production, making protein premiums more attractive—but feed costs for bypass protein sources run notably higher than in the Upper Midwest. I recently spoke with a Georgia producer who found the economics to be completely different from what he had read about Wisconsin operations.

Regional Component Premium Comparison reveals why geography matters more than genetics in today’s dairy markets – Upper Midwest protein premiums exceed butterfat bonuses by 140%, while Southeast operations face compressed margins that challenge component optimization economics

Here’s what I’ve observed across different regions:

In Wisconsin, Minnesota, and Iowa, you’ve got established cheese processing infrastructure that creates competitive protein premiums. Cooperative payment structures often favor milk testing above certain protein thresholds—and those bonuses can be quite attractive when you hit them consistently.

Down in Georgia, Florida, and the Carolinas, heat stress challenges butterfat production, but local processors serving regional cheese markets still offer protein incentives. However, higher feed costs for bypass protein sources can reduce the net benefits. One North Carolina producer told me, “The math works, but barely.”

In the western United States, specifically in California, Arizona, and New Mexico, large-scale operations benefit from economies of scale in component tracking technology; however, water costs and heat management present distinct challenges for optimization. I haven’t spent as much time talking with Western producers, but the conversations I’ve had suggest they’re dealing with challenges the rest of us don’t fully appreciate.

Up in Vermont, New York, and Pennsylvania, seasonal variation is more pronounced. Winter component production often exceeds summer levels by several tenths of a percent for both fat and protein—partly because of cooler temperatures, but also because fresh cow management tends to be easier when you’re not dealing with heat stress. Something you need to factor into any optimization strategy.

Pacific Northwest operations face their own unique challenges with seasonal pasture systems and proximity to export facilities, which could alter the entire optimization equation. The proximity to Asian export markets may create different premium structures than those seen in other regions.

What’s becoming clear to me is that successful component strategies need to match regional processing infrastructure, not just herd genetics.

Financial Risk Management: Beyond Basic Marketing

What’s emerged alongside component optimization is a different approach to financial risk management—and this is where things get interesting. Dairy Revenue Protection has seen growing adoption across the country, with industry estimates suggesting increasing participation rates, but successful operations aren’t just buying coverage.

They’re integrating it with component-specific strategies. When cheese-focused markets strengthen relative to butter markets, these operations adjust their approach accordingly. They might maintain different strategies for different production focuses, increasing cheese-related protection when protein premiums widen, or adjusting toward butter-related positions when those premiums improve.

This requires more management sophistication than traditional marketing, and I’m still trying to figure out if it’s truly necessary for everyone or just certain types of operations. What’s your experience been with financial risk management complexity?

I’ve noticed that the farms handling this complexity best are treating it like any other management system—they’ve got protocols, regular review schedules, and clear decision criteria rather than making it up as they go along.

When Technology Strategies Fall Short

Not every attempt at component optimization succeeds, and I think it’s important to talk honestly about what can go wrong. Here’s a representative example that really opened my eyes—an Illinois operation with around 480 cows that invested heavily in similar technology upgrades.

Within several months, they’d shut down the component tracking systems and returned to single-group management. The complexity overwhelmed their labor situation. Feed mixing errors, breeding mistakes, and constant system troubleshooting. The theoretical benefits never materialized because they couldn’t execute consistently on a day-to-day basis.

That said, they did learn some valuable lessons about their operation’s limitations, and they’ve actually improved their basic component tracking through simpler nutrition adjustments. Sometimes knowing what doesn’t work for your situation is just as valuable.

This highlights something I see repeatedly: operational excellence still trumps sophisticated strategies that are poorly executed. That operation now focuses on cost control and traditional efficiency measures, which have proven more reliable given their management situation.

I should mention that there are plenty of successful producers who think this whole component optimization trend is overcomplicating things. One farmer I know in Iowa puts it this way: “I’d rather be really good at the basics than mediocre at advanced strategies.” And honestly, he’s got a point—his cost per hundredweight is consistently lower than many high-tech operations.

The common failure points in component optimization usually come down to execution issues that most of us can relate to:

  • Feed mixing precision becomes critical when different groups require different rations, which necessitates attention to detail that some operations simply can’t maintain consistently during busy seasons like planting or harvest.
  • Managing multiple genetic lines increases the chance of breeding errors that can take years to correct—and we all know how expensive those mistakes can be.
  • Technology dependence means system failures during critical periods can disrupt months of planning. And we’ve all had those equipment failures at the worst possible times.
  • Staff turnover necessitates ongoing retraining on more complex protocols, which can become expensive and frustrating.

What I’ve learned is that the most successful implementations have built-in simplicity and backup systems from day one.

Alternative Pathways That Work Just Fine

Component optimization isn’t the only way to respond to changing market dynamics, and maybe that’s the most important point of this whole discussion. Several successful operations pursue different strategies that might be more suitable for farms facing management or capital constraints.

Value-added production offers one interesting path. Organic certification and quality standards that exceed commodity requirements can generate premiums that reward operational excellence rather than component manipulation. This approach is particularly attractive for farms that prefer focusing on traditional management skills—and there’s nothing wrong with that approach.

Specialty markets present another option worth considering. I know operations supplying artisan cheese makers or local processors that capture premiums based on quality and consistency rather than specific component levels. These relationships require different skills—such as reliability, flexibility, and direct communication with manufacturers—but can generate comparable returns without significant technology investments.

Many cooperatives now offer pooled services that allow smaller farms to access sophisticated strategies without individual infrastructure investments. Professional support for component tracking and risk management can be more cost-effective than going it alone, especially if you’re not at that 400-500 cow threshold.

Direct marketing continues to work well for farms in the right locations. Farm stores, on-farm processing, agritourism—these approaches can generate premiums that dwarf any component optimization program, though they require completely different skill sets.

The Technology Risks Nobody Discusses

One aspect that often receives insufficient attention is what happens when systems fail. I heard about cybersecurity issues this past spring that affected feed management software, leaving farms unable to access their protocols for days. Most recovered quickly, but operations running complex component programs faced more significant disruptions.

The lesson learned—and this came up in several conversations—was maintaining backup systems for everything. Technology enables precision, but you need redundancy when precision matters. Paper copies of feeding recipes, breeding schedules, and group assignments. It adds administrative overhead but provides essential backup when systems go down.

Cybersecurity concerns are growing as farms connect more systems to internet-based platforms. Agriculture has seen an increase in security incidents, and dairy operations with financial programs can present attractive targets for malicious actors. This is something we all need to consider as we integrate connected systems.

There’s also the question of what happens when technology companies go out of business or discontinue support. I’ve seen farms stuck with orphaned software systems that cost thousands to replace.

The Global Economic Picture

Looking beyond individual farm decisions—and this is where I find the whole situation fascinating—this component focus reflects broader changes in global dairy trade. European milk production has seen some decline, while New Zealand production has remained relatively flat despite generally favorable conditions.

That’s created export opportunities for U.S. cheese that don’t exist for butter, where European producers maintain competitive advantages in premium markets. Industry reports suggest U.S. cheese exports have grown significantly compared to butter exports, and these global patterns are what’s really driving domestic processing decisions.

Growing middle-class populations in Southeast Asia are driving cheese consumption in markets that previously relied primarily on traditional dairy products. This creates long-term export demand that supports protein-focused processing strategies, thereby enhancing the sustainability of these strategies. However, I’m genuinely curious about whether this component focus will remain long-term or if we’ll see the pendulum swing back toward simpler approaches as the market evolves.

The development that really has me thinking is how currency fluctuations affect these export patterns. When the dollar strengthens, our export competitiveness changes, which could shift processor priorities again.

Seasonal Patterns Most Producers Miss

Here’s something I’ve noticed from years of watching component production, and maybe you’ve observed the same thing… Seasonal variation in optimization returns is more significant than most producers realize.

Many producers observe that winter months often favor butterfat premiums as holiday demand increases, while spring and summer frequently see stronger protein premiums as cheese manufacturing ramps up for fall and winter consumption. Current conditions suggest this pattern is holding, though regional variations seem more pronounced this year.

Some operations adjust feeding programs seasonally to capture these patterns—shifting toward higher-fat rations in fall, then transitioning to protein-focused feeding by late winter. This seasonal flexibility requires more management attention but can add meaningful revenue to component premiums—though it also adds another layer of complexity that not every operation can handle.

The seasonal aspect becomes particularly important for farms using financial strategies. Price spreads show patterns that experienced farms can often anticipate and position for, though recent market volatility has made traditional patterns less reliable.

What’s interesting is how the seasonal patterns seem to be getting more pronounced as export markets become more important to domestic pricing.

Key Questions Every Producer Should Ask

Before diving into component optimization, here are the questions I’d recommend asking yourself:

  • Can your current management team handle increased complexity? Be honest about attention to detail during busy seasons like planting or harvest, when dairy tasks might get less focus.
  • What’s your cooperative’s actual payment structure? Don’t assume—get the specific thresholds and premiums in writing and calculate the real potential benefits for your current production levels.
  • Do you have backup systems in place for your technology dependence? Paper records, alternative feeding protocols, and manual sorting systems for when (not if) technology fails.
  • What’s your real payback timeline tolerance? Six-figure investments with 2-3 year paybacks sound reasonable until cash flow gets tight during a downturn.
  • How does this fit your long-term farm goals? Component optimization might not align with succession planning, debt reduction, or quality-of-life objectives.

Practical Steps for Different Farm Situations

For producers considering component optimization—and this might not apply to your situation, but here’s what I’ve learned from both successful and unsuccessful attempts:

  • If you’re running 500 or more cows, start with data analysis. Review a couple of years of component tests and cooperative payments to identify what opportunities you might be missing. Many farms discover significant premiums they didn’t even realize were available. Technology infrastructure investments typically make sense at this scale, though the learning curve can be steeper than expected.
  • For mid-size operations, focus on cooperative programs and precision nutrition rather than major technology investments. Most cooperatives offer component assistance that provides much of the benefits without the capital requirements. Consider sharing costs with neighboring farms if that’s feasible—I’ve seen some interesting collaborative arrangements that spread technology costs across multiple operations.
  • Smaller operations should first evaluate value-added opportunities and specialty markets. Fixed technology costs often make traditional approaches more profitable at a smaller scale. However, selective breeding changes that favor balanced component production rarely harm and usually provide modest improvements over time.
  • Regardless of size, honestly assess your management capacity. The most sophisticated strategy fails without consistent execution—and I’ve learned this the hard way. Component optimization requires attention to detail that not all operations can maintain, and that’s perfectly fine. Focusing on operational excellence often provides better returns than poorly executed advanced strategies.

The Bottom Line

The market disruptions we saw this fall exposed how much the industry has changed beneath the surface. Genetic advances—documented in publications like Hoard’s Dairyman’s coverage of unprecedented gains in milk components—have created component abundance that many farms haven’t learned to capture yet.

Processing strategies now prioritize export stability over domestic price volatility. Financial tools exist that weren’t available to previous generations. But you know what? The fundamental principles haven’t changed.

Animal care, feed quality, labor management, and cost control—these remain essential. Component optimization and financial sophistication are additional tools, not replacements for solid farming practices. This builds on what we’ve always known: good farming fundamentals matter more than any technology or market strategy.

The operations that are thriving understand this balance. They’re not trying to become trading companies that happen to milk cows. They’re dairy farms that have added market intelligence and appropriate technology to their skill sets—and they’re doing it in ways that fit their particular situations.

Looking ahead, I expect we’ll see continued evolution in how farms approach component production and risk management. The producers who master this integration—combining solid farming with market awareness and appropriate technology—are positioning themselves well regardless of where cycles head next.

The choice isn’t between traditional farming and technological sophistication. It’s about finding the right combination for your operation, your markets, and your management style. What happened in the butter markets taught us that change will continue. The question is whether individual farms will adapt in ways that make sense for their particular circumstances.

And honestly? That’s what makes this business interesting. There’s no single right answer—just different approaches that work for different situations, different management styles, different markets. The key is understanding what’s changing and figuring out how to respond in ways that fit your operation and keep you sustainable for the long haul.

I’d love to hear if your experience has been different, or if you’re seeing patterns in your region that don’t match what I’ve described here. That’s how we all keep learning in this business.

KEY TAKEAWAYS

  • Component optimization investments typically generate $120-$180 additional revenue per cow annually for operations above 500 cows, with comprehensive RFID and automated feeding systems paying back in 2-3 years through enhanced protein premium capture
  • Herds targeting balanced component profiles (3.25%+ protein alongside 4.0%+ fat) consistently outperform single-component strategies by 15-25% in cooperative premium payments, particularly in regions with established cheese processing infrastructure
  • The 400-500 cow threshold represents the economic break-even point for component tracking technology, while smaller operations can capture 60-70% of optimization benefits through precision nutrition and cooperative pooled services without major capital investment
  • Regional processing economics vary dramatically—Upper Midwest protein premiums often exceed butterfat bonuses by 7-10 cents per pound, while Southeast operations face higher feed costs that can reduce net component optimization benefits by 30-40%
  • Seasonal component management strategies can add $15,000-$20,000 annually through tactical feeding program adjustments that capture winter butterfat premiums and spring-summer protein bonuses, requiring enhanced management attention but minimal additional infrastructure investment

Complete references and supporting documentation are available upon request by contacting the editorial team at editor@thebullvine.com.

Learn More:

The Sunday Read Dairy Professionals Don’t Skip.

Every week, thousands of producers, breeders, and industry insiders open Bullvine Weekly for genetics insights, market shifts, and profit strategies they won’t find anywhere else. One email. Five minutes. Smarter decisions all week.

NewsSubscribe
First
Last
Consent

August USDA Milk Production Report Breakdown: Why 19.52 billion Pounds of Richer Milk Changes the Game

Why are smart producers still expanding herds when Class III futures sit below $17? The genetic revolution changed the economics of everything.

EXECUTIVE SUMMARY: The August 2025 USDA milk report reveals more than record production—it exposes how genetic improvements have fundamentally altered dairy market dynamics in ways most analysts are missing. While we’re celebrating 9.52 million head producing 19.52 billion pounds (up 3.2% year-over-year), the real story lies in component-adjusted growth that could represent manufacturing capacity increases approaching 25% when butterfat and protein improvements are factored in. Recent research from DHIA records shows consistent component improvement patterns across regions, with today’s fresh cows testing butterfat levels that exceed historical peak lactation averages. This genetic revolution creates permanent productivity gains that won’t reverse during market downturns—unlike previous management-based improvements that could be scaled back during tough times. Processing infrastructure built for 3.7% butterfat milk now struggles with today’s richer milk during peak production periods, creating regional bottlenecks that force supply management decisions at higher price points than historical norms. What farmers are finding is that individual expansion decisions that make economic sense collectively create oversupply challenges, while Class III futures trading below $17 through May 2026 suggest markets expect this correction to persist longer than traditional six-to-nine-month cycles. Progressive producers are responding by optimizing efficiency over expansion, building strategic processor relationships, and recognizing that success in this new reality depends on converting genetic abundance into sustainable profitability rather than simply chasing volume.

dairy component profitability

That August USDA milk report has folks talking—some celebrating the production numbers, others wondering what they really mean for our markets. Sure, we hit 9.52 million head in our national dairy herd, the biggest it’s been since 1993, according to the monthly data that came out last week. And those 19.52 billion pounds of milk in August, with that 3.2% bump over last year? Pretty impressive on the surface.

But I’ve been having conversations with producers from different regions recently, and something’s becoming clear… the way genetics have changed what those production numbers actually represent. We’re not just producing more milk anymore—we’re producing fundamentally richer milk. And that’s creating market dynamics that don’t follow the playbook most of us learned twenty years ago.

One producer I spoke with recently—who has been milking up in Wisconsin for thirty-five years—made a point that really stuck with me. “My fresh cows are testing higher on butterfat right out of calving than my best cows used to test at peak lactation back in 2010.” That’s the genetic revolution in action, and it’s happening across the industry whether we’re fully accounting for it or not.

The Component Reality That Changes Everything

When you look beyond just volume and start considering butterfat and protein levels—what some industry analysts are calling component-adjusted growth—that 3.2% increase starts telling a different story. The manufacturing capacity increase could be substantially higher when you account for these component improvements.

The Hidden Story: Component-Adjusted Growth Outpaces Volume – While raw milk production has grown steadily, genetic improvements mean actual manufacturing capacity has expanded nearly twice as fast, creating the oversupply dynamics that traditional market analysis misses.

Think about this: your average butterfat test has been climbing steadily over the past couple of decades. The DHIA records and breeding association data show consistent improvement patterns, though the exact numbers vary by region and genetic program. That means every 100 pounds of today’s milk carries more actual butter-making and cheese-making potential than the same volume did two decades ago.

Not everyone, however, sees this as concerning. One producer I know down in Texas actually loves these genetic improvements—his cooperative expanded processing capacity specifically to handle higher-component milk, and he’s seeing better margins per cow than ever before.

But here’s what’s particularly noteworthy… the permanent nature of these gains compared to previous productivity improvements. When breeding values for components keep improving—and you can track this through genomic evaluations from the Council on Dairy Cattle Breeding—those gains become part of every heifer entering your herd, regardless of market conditions.

The Infrastructure Bottleneck: Why Your Co-op is Sweating

While we’ve developed essentially unlimited genetic potential for higher components, processing capacity remains fixed. Those aging continuous flow systems weren’t designed for today’s component levels—most were built when 3.7% butterfat was considered excellent production.

During this past spring flush, there were reports from several states of producers having to find alternative outlets because facilities couldn’t handle both the volume and richness of milk they were receiving. According to data from processing industry reports, some regional cooperatives are operating closer to capacity limits than they’ve experienced in decades.

To be fair, not all processors see this as a problem. Some plant managers say the higher components actually make their operations more efficient—more cheese per pound of milk means better margins when demand is strong. But when processors hit their limits during peak production periods, they start offering steep discounts or implementing volume controls that create price volatility.

The Expansion Paradox: Why Farmers Keep Growing Despite the Warnings

Despite these warning signs, many producers are still expanding herds. And when you dig into the individual economics, it often makes sense.

One producer I recently spoke with paid record prices for replacement heifers this year—and we’re seeing some of the highest costs for quality genetics that many of us can remember. But when those heifers are producing milk with substantially higher component levels, the economics can still pencil out.

This creates one of those situations where what makes sense for your operation individually might create challenges for all of us collectively. Modern high-component cows are remarkably efficient at converting feed into valuable solids, which shifts the economic threshold for supply reductions higher… meaning prices might need to fall further and stay lower longer.

What the Markets Already Know

The futures markets are telling an interesting story. Class III contracts through May 2026 are trading below $17, according to Chicago Mercantile Exchange data. The global picture adds complexity too—China’s adjusting dairy imports while the EU has shifting consumption patterns.

That international safety valve we used to rely on isn’t as predictable as it once was, putting more pressure on domestic markets to find balance.

Smart Operators Are Already Pivoting

What I find encouraging is seeing how thoughtful producers are responding to these shifting dynamics:

  • Herd optimization over expansion: Evaluating culling decisions based on component efficiency
  • Processing partnerships: Securing agreements and component premiums to avoid spot market exposure
  • Value-added ventures: Direct-to-consumer operations, on-farm processing, specialized product lines

Regional examples are emerging everywhere:

  • Vermont producers are managing fresh cow schedules to avoid peak flush periods when processing gets tight
  • California operations are investing in processing partnerships to control milk destination
  • Southeast dairies finding success with direct-to-consumer cheese operations
  • Georgia producers telling me they’re grateful for the higher components that used just to boost their commodity check

Farm Scale: Who Wins and Who Struggles

Large commercial dairies have scale advantages and financial resources, but could get squeezed if processing constraints force volume limits.

Mid-size family operations face the toughest challenge—lacking both scale advantages and the flexibility to pivot quickly into niche markets.

Smaller dairies may have advantages through their quick pivoting ability and direct marketing relationships, which provide price stability.

The Longer Correction Timeline

Traditional dairy corrections used to run about six to nine months. Several factors suggest this one could stretch longer:

  • Record herd sizes
  • Genetic productivity gains that won’t reverse
  • Shifted global demand patterns
  • Processing constraints are forcing supply management at higher price points
Why This Correction Will Run Longer – Current Class III futures trajectory (black line) shows extended weakness compared to typical 6-9 month recovery cycles (red line), reflecting how genetic productivity gains have fundamentally altered supply-demand rebalancing timelines

What’s interesting about this potential timeline is how processing infrastructure limitations might force supply decisions that wouldn’t normally happen until prices fell much lower.

Your Processor Relationship Just Became Strategic

One thing that’s becoming clearer: your relationship with your processor matters more than it used to. With genetic productivity climbing but plant capacity relatively fixed, these partnerships are becoming competitive advantages beyond just price negotiations.

Early indications suggest seasonal patterns are becoming more pronounced—cooperatives are implementing volume management during spring flush that would’ve been unusual just a few years ago.

Many Midwest producers report that their cooperatives are having different conversations about intake planning than they used to have. It’s not just about having enough trucks anymore—it’s about whether the plants can actually handle the richness of the milk coming in during peak periods.

Market Indicators Worth Watching

Key signals for how this plays out:

  • Class III futures staying below $17.50 through early 2026
  • Processing capacity announcements (expansions or constraints)
  • Component premiums at the farm level during peak production
  • Feed price relationships as high-component cows change traditional ratios

What’s developing is that component premiums during peak production periods are becoming a bigger factor. If cooperatives start offering larger premiums for high-butterfat milk during flush seasons, that’s them trying to manage intake through economics rather than outright volume controls.

The New Industry Structure Taking Shape

We’re likely to see a more differentiated industry, where farms with sustainable competitive advantages, based on efficiency, processor relationships, and value-added strategies, emerge stronger.

The genetic revolution delivered tremendous productivity gains, but it also fundamentally changed how markets balance supply and demand. What I’ve noticed is that traditional price signals that used to trigger production adjustments don’t seem to work at the same thresholds anymore.

Your Strategic Playbook for What’s Ahead

For cash flow planning, think in terms of longer cycles. Investment priorities are shifting toward:

  • Efficiency improvements that reduce the cost per unit of components
  • Better cow comfort to improve butterfat performance
  • Precision feeding to optimize protein and fat production
  • Facility upgrades that improve labor efficiency per cow

Fresh cow management is getting more attention, too—when every cow’s component production matters more to your bottom line, getting fresh cows off to a strong start becomes critical. That means paying closer attention to dry cow nutrition, calving ease, and those first few weeks post-calving where you’re really setting the stage for the entire lactation.

I’ve been noticing more producers are looking at their feeding programs differently, too. With component production being so critical to margins, ration adjustments that boost butterfat and protein tests—even at slightly higher feed costs—often make more economic sense than volume-focused strategies.

The Bottom Line

The farms positioning themselves for long-term success are embracing efficiency over expansion, building strong processor relationships, and understanding that success will be determined by how well they convert genetic abundance into sustainable profitability.

This isn’t just another commodity cycle—it’s a fundamental shift in how our industry operates. The data from that August USDA report is just the beginning of a conversation about where we’re headed.

What’s encouraging is that producers who are working through these challenges now, building relationships and optimizing efficiency rather than chasing size, are positioning themselves to thrive regardless of how this plays out. The genetic improvements we’ve achieved represent decades of careful breeding decisions paying off.

Now we need to learn how to manage an industry with that kind of abundance in a way that works for everyone involved. It’s an interesting challenge, but one I think we’re up for if we approach it thoughtfully and keep talking to each other about what we’re seeing on our own operations.

KEY TAKEAWAYS:

  • Component efficiency optimization can reduce cost per pound of valuable solids by 8-15% through strategic culling of bottom-performing cows and precision feeding programs that boost butterfat and protein tests, even at slightly higher feed costs.
  • Processing partnership agreements provide price stability and guaranteed offtake during capacity constraints, with some cooperatives offering higher component premiums during peak production periods to manage intake through economic incentives rather than volume controls.
  • Fresh cow management improvements become critical when higher component production directly impacts bottom-line profitability—better transition period nutrition and calving protocols can set the stage for superior lactation performance in today’s genetic environment.
  • Extended correction timeline planning requires 18-24 month cash flow models instead of traditional six-to-nine-month assumptions, as genetic productivity gains that won’t reverse mean supply reductions need to be deeper and longer-lasting to achieve market rebalancing.
  • Regional processing capacity varies significantly, with some areas investing in infrastructure designed for higher-component milk while others experience bottlenecks—understanding your local processing situation becomes a competitive advantage for strategic planning and marketing decisions.

Complete references and supporting documentation are available upon request by contacting the editorial team at editor@thebullvine.com.

Learn More:

The Sunday Read Dairy Professionals Don’t Skip.

Every week, thousands of producers, breeders, and industry insiders open Bullvine Weekly for genetics insights, market shifts, and profit strategies they won’t find anywhere else. One email. Five minutes. Smarter decisions all week.

NewsSubscribe
First
Last
Consent

How Your ‘Down Cycle’ Became Corporate Warfare: The Beef-Cross Money Breaking Every Market Rule

Why are some producers expanding herds during margin squeezes? The answer reveals a fundamental shift in dairy economics

EXECUTIVE SUMMARY:

Recent research shows U.S. milk production increased 3.4% through July 2025 despite challenging margins, with New Zealand up 8.9% and South America rising 7.7%—a pattern that breaks traditional market correction cycles. What farmers are discovering is that beef-on-dairy crossbred calves now generate revenue streams that can offset monthly feed costs, fundamentally altering culling decisions that historically balanced supply and demand. This shift coincides with processing consolidation, as demonstrated by Lactalis’s $4.22 billion acquisition of Fonterra, creating fewer competitive alternatives for milk marketing. University research indicates that when processing facilities operate above 95% capacity, basis relationships deteriorate for producers—a situation becoming more common as companies optimize throughput over redundancy. The convergence of alternative revenue sources, reduced processing competition, and government programs like Dairy Margin Coverage creates market dynamics in which traditional price signals no longer effectively drive supply adjustments. For progressive producers, this means developing risk management strategies that account for combined milk-plus-calf returns while diversifying processing relationships. Understanding these structural changes—rather than waiting for cyclical recovery—positions operations to navigate an industry where market fundamentals are being permanently rewritten.

dairy market consolidation

So I’m having coffee with this producer last week—big operation, been at it for decades—and he says something that’s been bugging me ever since. “You know what’s weird?” he goes. “My margins are terrible, milk check keeps shrinking, but I’m milking more cows than I ever have.”

And I’m thinking… wait, what?

See, I’ve been covering these markets since Clinton was president (yeah, I’m that old), and this just doesn’t follow the old playbook. You know how it’s supposed to work, right? Prices tank, producers cull hard, supply drops, prices recover. Economics 101 stuff.

Except look at what the USDA put out last month. U.S. milk production up 3.4% through July—during what should be a massive correction period. New Zealand’s running 8.9% ahead of last year, according to Global Dairy Trade reports. South America’s up 7.7%. These numbers keep coming in month after month.

I mean, when’s the last time you saw production climbing during a price crash? Never, right? Because it makes no damn sense economically.

And honestly? That should scare every independent producer reading this.

Global milk production defying economic logic – while prices crash, production surges in key regions, breaking the fundamental supply-demand corrections that have balanced dairy markets for decades

The Beef-Cross Money That’s Breaking All the Rules

You guys all know about these beef-on-dairy calves bringing serious money lately. I’m talking… well, let’s just say crossbred calves are covering expenses that used to come straight out of the milk check.

But here’s where it gets nuts—that calf money is completely screwing up everything we thought we knew about supply and demand responses.

Think back to 2014. I remember writing about operations that culled hard when Class III dropped. Supply tightened up real quick. Prices recovered. Basic market mechanisms are working like they should.

Not anymore.

You’ve got cows bleeding money on every hundredweight of milk, but that same cow’s beef-cross calf might cover months of feed costs. So instead of sending her down the road like you would’ve done back then, you keep her around for the calf revenue.

Makes total sense from a cash flow standpoint, I get it. But multiply that decision across every dairy operation dealing with tight margins… and suddenly you’ve got this bizarre situation where terrible milk prices are actually keeping more cows in production.

What are the feedback loops that are used to correct market imbalances automatically? They’re not just broken—they’re working backwards.

When Your Processor Starts Playing Games

You know what really bothers me? How tightly these processing networks run nowadays. I keep hearing about plant shutdowns that create these massive disruptions—milk backing up at farm tanks, basis going to hell, producers scrambling to find alternative processing.

And the basis? Starts at maybe a small discount and just keeps sliding. Gets ugly real fast.

But what really gets me is how it exposes just how deliberately lean these processors run their operations. Mark Stephenson up at Wisconsin Extension—sharp guy, does good work—he’s mentioned how when processing plants approach capacity limits, basis relationships start deteriorating for producers.

Which makes you wonder… why are so many facilities always running right at that edge?

My theory? Because they figured out that tight capacity gives them leverage. When every processor in your region is maxed out, where else are you gonna haul your milk? They can knock your basis down, and you’ll take it because—what choice do you have?

Talk to producers lately. Basis penalties that used to be seasonal exceptions are becoming… well, more frequent occurrences. Because some genius in corporate figured out that running short on capacity works better than building enough to actually serve their suppliers properly.

The Lactalis Deal That Shows How This Game Really Works

You want to see corporate timing that’d make a Wall Street trader jealous? Watch how Lactalis—try saying that name three times fast—played their Fonterra buyout.

So these guys are already the biggest dairy company on the planet, right? Pulling in over €30 billion annually according to their own financial reports. They could’ve struck this deal anytime they wanted.

But did they move when milk prices were strong and farmers actually had some negotiating power? Hell no.

They waited until this year, right when global oversupply was building and operations were getting squeezed on margins. Those Australian Competition and Consumer Commission documents show the negotiations happening right as market pressure was building. Final deal: $4.22 billion for Fonterra’s consumer and foodservice businesses.

Coincidence? I seriously doubt it.

Want proof this is a pattern? Look at what they did in France after they consolidated operations there. Despite making record money—record money—they cut milk collection by 450 million liters last year. That’s nearly 10% of their French volume, according to European dairy reports. French producers were screaming about it, but by then, competitive alternatives were already gone.

Funny how that timing works out, isn’t it?

Why “Cheaper Feed” Is Mostly Marketing Nonsense

Every trade publication—and I read way too many of them—has some consultant talking about how lower grain costs are gonna save our margins. Corn backing off from highs, soybeans down… sounds encouraging in theory.

Until you actually run the numbers on real operations.

So let’s say feed costs drop significantly—and I mean really drop, more than you’d normally see. When you break that down per cow per day versus what most operations are losing on milk revenue… well, it’s like trying to fill a swimming pool with a garden hose while someone’s got the drain wide open.

I keep hearing from producers who’ve done the math. Feed improvements might save you fifty cents, maybe seventy-five cents per cow daily. But if milk revenue’s down two-fifty, three dollars per cow… you see the problem?

MetricDaily Per Cow ImpactMonthly Per CowAnnual Per Herd (500 cows)
Milk Revenue Loss-$2.50-$75.00-$456,250
Feed Cost Savings+$0.60+$18.00+$109,500
NET IMPACT-$1.90-$57.00-$346,750

But these consultants keep pushing feed procurement strategies because—and I suspect this is part of the game plan—it keeps producers focused on optimizing costs while the real money flows toward corporate consolidation. Keep us busy saving pennies while Rome burns.

The Processing “Emergency” Pattern

What bothers me about these plant shutdowns? Every time one goes down, it requires this massive coordination effort—state agencies getting involved, emergency rerouting across multiple states, even companies that don’t normally handle dairy getting pressed into service.

When one facility failure requires government-level intervention, that tells you everything about how this system’s designed to operate. Zero redundancy is built in. Everything is running right at the breaking point.

If any of us ran our dairy operations with that little backup… hell, we’d never sleep at night. But for processors? Apparently, running lean means every breakdown creates regional pricing opportunities they can use to their advantage.

And that’s becoming the pattern. Processing disruptions that create permanent changes to local basis relationships. Never temporary adjustments that recover—always permanent shifts that favor the processor.

Makes you wonder how accidental some of these emergencies really are…

What the Experienced Guys Are Actually Doing

I’ve been talking to producers who’ve figured out this cycle’s different from anything we’ve seen before. The ones positioning to survive aren’t sitting around waiting for some magical market recovery.

They’re getting serious about risk management for Q4 production. Class III put options for fourth quarter production—locking in price floors when things could get uglier. Some operations regularly rotate milk between multiple processors. Soon as one plant starts offering heavy discounts, they shift volume to keep everyone competitive.

DMC enrollment deadline’s coming up fast—September 30th, that’s next Monday. Coverage costs you maybe fifteen cents per hundredweight but pays out when margins collapse below certain thresholds. Joe Outlaw at Texas A&M’s Agricultural and Food Policy Center ran the numbers after that 2023 squeeze—program paid out $1.27 billion to enrolled producers. With margins running where they are now? Enrolled operations could see substantial government checks.

Strategic culling’s getting weird, too. Some producers I know are scoring every cow on total economic return—milk revenue plus calf value minus feed costs. Some of their best milk producers are getting shipped because their calves don’t bring premium money. Makes sense mathematically, but it feels backwards, you know?

Regional feed coordination with neighbors still makes sense if you can coordinate bulk purchases and negotiate decent freight rates. Every dollar saved per ton adds up when you’re feeding this many animals.

The Government Program Making Everything Worse

This probably won’t make me popular with the bureaucrats in Washington, but I gotta say it: Dairy Margin Coverage isn’t protecting family farms. It’s subsidizing the oversupply that’s letting corporate processors buy cheap milk.

Think about the logic here. DMC literally pays producers to keep milking cows that lose money on every hundredweight. Who benefits from a sustained cheap milk supply? Processing companies are buying raw materials at below-market rates.

It’s corporate welfare disguised as farmer relief, and most of us are too desperate to turn it down.

The program uses national averages that completely ignore regional basis manipulation games. Producers dealing with heavy local discounts see DMC calculations based on milk prices they’ve never actually received in their mailbox. It’s like calculating your gas mileage based on highway speeds when you’re stuck in city traffic all day.

Still, with margins this brutal, you probably need the coverage. Just understand what you’re really signing up for—subsidizing a system that’s working against your long-term interests.

The Reality Nobody Wants to Discuss Publicly

Hell, I’ve been doing this since the late 90s, and I’ve never seen market mechanisms get systematically dismantled like this. What are the automatic balancing systems that are used to correct supply-demand imbalances? They’ve been neutralized.

Beef-cross revenue eliminates price-driven culling incentives. Processing consolidation kills competition for our milk. Global production growth creates sustained oversupply conditions. Government programs subsidize below-cost production.

This isn’t your typical cyclical correction. It’s a managed transition toward corporate control of milk pricing, with independent farmers becoming contract suppliers instead of actual market participants.

Back when we had real competition for our milk—and some of you remember those days—you could play processors against each other. Get a better basis here, threaten to move volume there. Now? Good luck with that strategy.

Industry publications keep using words like “partnership” when they talk about these corporate acquisitions. Lactalis is partnering with farmers after they buys up assets. Partnership. Right. Like David partnering with Goliath—how’d that work out?

When one party controls processing capacity and the other has nowhere else to sell their product… that ain’t partnership. That’s dependency, presented in fancy marketing language.

Bottom Line for Producers Who Understand What’s Happening

Smart farmers are repositioning for an industry where volume might matter more than efficiency per cow, where calf checks could drive more herd decisions than milk production metrics, and where basis management becomes more critical than traditional futures hedging.

Reality check time. Feed cost improvements can’t offset milk revenue losses when prices drop faster than input costs. Government programs provide short-term cash flow but perpetuate the structural problems driving margin compression. Beef-cross returns generate immediate revenue while potentially undermining long-term market stability.

Operations implementing serious risk management strategies—protecting production with options, diversifying processor relationships, culling based on total economic returns instead of just milk numbers—those farms will survive this transition period.

The ones waiting for a traditional cyclical recovery? They’re gonna discover that “normal” doesn’t include the competitive market relationships that made independent dairy farming economically viable.

Corporate consolidation is accelerating rapidly across the industry. Producers who recognize this as a permanent structural change rather than a temporary market weakness have limited time to position defensively before competitive alternatives disappear entirely.

Your operation’s survival depends on understanding that current market conditions aren’t just natural economic forces playing out. They reflect corporate strategies designed to concentrate industry control while systematically reducing the number of independent producers.

The question isn’t whether markets will eventually improve—they might. The question’s whether your farm can adapt to survive in the corporate-controlled industry that’s emerging from this transformation.

Makes me sick to write that last part, but it’s the truth as I see it developing.

KEY TAKEAWAYS:

  • Combined revenue optimization: Producers tracking total economic returns per cow (milk revenue plus calf value minus feed costs) are making more profitable culling decisions, with beef-cross calves potentially covering 2-3 months of feed expenses per animal
  • Risk management enhancement: Class III put options for Q4 production and Dairy Margin Coverage enrollment (deadline September 30th) provide essential downside protection, with 2023 DMC payments totaling $1.27 billion to enrolled operations during margin squeezes
  • Processing relationship diversification: Operations rotating milk between multiple processors monthly, maintain competitive basis pricing, and avoid the 15-20¢/cwt penalties that can occur when single-plant dependencies face capacity constraints
  • Strategic feed procurement coordination: Regional cooperatives coordinating bulk grain purchases and freight optimization can achieve meaningful cost reductions, though these savings alone cannot offset significant milk revenue declines
  • Market structure adaptation: Successful operations are positioning for an industry where basis management becomes more critical than traditional futures hedging, requiring a deeper understanding of local processing dynamics and capacity utilization patterns

Production data sourced from the USDA Economic Research Service monthly dairy reports and Global Dairy Trade auction results that track international supply trends. Corporate financial information from publicly available Lactalis Group reports and Australian Competition and Consumer Commission regulatory filings. Academic analysis from the University of Wisconsin Extension dairy economics research and Texas A&M’s Agricultural and Food Policy Center studies on government program impacts.

Complete references and supporting documentation are available upon request by contacting the editorial team at editor@thebullvine.com.

Learn More:

The Sunday Read Dairy Professionals Don’t Skip.

Every week, thousands of producers, breeders, and industry insiders open Bullvine Weekly for genetics insights, market shifts, and profit strategies they won’t find anywhere else. One email. Five minutes. Smarter decisions all week.

NewsSubscribe
First
Last
Consent

The €1 Billion Strategy That’s Splitting Dairy into Premium Players and Price-Takers

Lactalis’s €1 billion investment just proved it: value-per-liter beats volume every time. Volume-chasers are becoming price-takers.

EXECUTIVE SUMMARY:

While 80% of dairy operations chase volume, Lactalis’s €1 billion strategic investment reveals why value-per-liter approaches will determine who survives the next consolidation wave. European producers are capturing 15-25% pricing premiums through precision feeding, environmental compliance, and integrated supply chains—advantages that volume-focused farms simply cannot match. The dairy industry is permanently bifurcating into premium players who optimize each liter and commodity price-takers stuck in the “get bigger” trap. Technology investments during market downturns create compound returns through feed efficiency gains (8-15%), component premiums ($2-3/cwt), and environmental revenue streams ($15-30/cow annually), while cooperative arrangements are becoming essential for mid-size operations to access these advantages.

Dairy Farm Profitability

While 80% of dairy operations chase volume, Lactalis’s €1 billion bet reveals why value-per-liter strategies will determine who survives the next consolidation wave. The numbers don’t lie: European producers are capturing premiums that volume-focused farms simply cannot match.

When Lactalis announced they’re dropping €1 billion across their French facilities through 2030, it wasn’t just another press release. I mean, think about it—the world’s largest dairy company could have spent that money expanding production or acquiring more farms. Instead, they’re betting everything on a completely different approach than what most of us have been doing.

And frankly, it’s challenging everything I thought I knew about where this industry is headed.

You know how we’ve always heard that European producers are at a disadvantage? Higher labor costs, stricter environmental rules, and smaller average farm sizes? Well, here’s what’s really happening: Recent EU dairy market analysis from AHDB Economics shows European operations are finding ways to capture consistent pricing advantages, particularly during periods of tighter global supply—and these premiums are running 15-25% above baseline commodity pricing depending on product specifications and sustainability credentials.

What’s interesting is that industry consultants are starting to observe a fundamental shift in European thinking. As one told me recently, “The Europeans stopped trying to compete on volume and started competing on value.” But here’s the uncomfortable truth most operations haven’t figured out yet: this shift isn’t optional anymore.

The Numbers Behind Their Strategy — And Why They Matter to You

So I started digging into Lactalis’s 2024 numbers—they hit €30.3 billion in revenue according to their annual report, which is staggering when you consider the margin pressures we’ve all been dealing with. But what caught my attention is that they’re not using that cash flow just to expand production capacity. They’re targeting specific areas that create compound returns that most operations completely miss.

Penn State’s Dairy Extension program documented feed efficiency improvements ranging from 8-15% for operations implementing precision feeding systems in their 2024 technology adoption study, though individual results vary significantly based on existing management and facility conditions. That caught my eye because—let’s be honest—USDA’s Economic Research Service’s 2024 Cost of Production report shows feed costs averaging 55-65% of our variable expenses, depending on the region and time of year.

But here’s where it gets interesting. Consider a typical 800-cow operation that installed automated feeding systems—many extension specialists report seeing feed efficiency improvements, though results depend heavily on prior management practices and facility design. What often surprises producers is how better feed conversion also improves butterfat performance. I’ve heard about operations going from averaging 3.6% to consistently hitting 3.9% or higher, and when you’re looking at component pricing systems, those premiums can add $2-3 per hundredweight.

Equipment manufacturers commonly cite energy reductions of around 15-20% per unit of output with their newer processing systems, though independent verification through university trials shows more modest gains of 10-15% depending on installation and management practices. In a business where we’re counting pennies per hundredweight, those energy savings can compound month after month.

What’s encouraging—and this builds on what we’ve seen with other technology adoption cycles—is that these investments aren’t just for the mega-operations anymore. The reliability has improved enough that even mid-size farms are seeing consistent returns, though the learning curve can be steeper than expected. I’ve talked with producers who struggled for six months getting robotic systems dialed in properly, and that’s time you can’t afford during tight margin periods.

Environmental Compliance: The Plot Twist Nobody Saw Coming

Now, I’ll be honest. When I first started hearing about environmental regulations as revenue opportunities, I was skeptical. Most of us see compliance requirements as pure cost, right? But here’s what some operations are discovering—and what the rest of us need to understand before we get left behind.

Take anaerobic digesters. The initial investment is substantial—typically ranging $400 to $800 per cow, depending on herd size and local conditions, according to USDA Rural Development data—but EU CAP strategic plans are encouraging this kind of investment through grant programs that can cover 40% of system costs when farms meet certain criteria. That’s real money, not just pilot program funding.

Industry reports from the International Energy Agency suggest some operations are finding revenue opportunities through environmental compliance that can generate $15-30 per cow annually through carbon credit sales, though results depend heavily on local market conditions and system design. Carbon credit markets are developing—California’s cap-and-trade program currently prices credits around $30-35 per metric ton CO2 equivalent—but prices remain volatile and verification requirements can be complex.

Regional buyers are starting to differentiate pricing based on documented sustainability practices. Danone’s sustainable dairy program pays premiums of $0.50-1.50 per hundredweight for milk meeting specific environmental criteria, and similar programs are expanding across major processors.

But here’s the catch nobody talks about: these systems need consistent attention and technical expertise. If you don’t have someone who understands the technology—or reliable service support—you can end up with expensive problems pretty quickly. As extension specialists often point out, “It’s definitely not set-it-and-forget-it farming.”

I’ve noticed that the operations that have success with environmental investments share some common characteristics: they have strong technical management, they work with experienced installers, and they plan for ongoing maintenance costs from day one. Those that struggled tried to treat it like buying a piece of conventional equipment.

Why Cooperation Is Finally Working — And Why You Should Care

Something that’s been surprising to watch: mid-size operations are actually starting to work together on major investments. And I mean really cooperate, not just the traditional buying groups we’ve always had.

The regulatory structure is pushing this along. Grant programs often require minimum project sizes that basically force multiple farms to pool resources. But what’s compelling is how risk sharing changes the math completely—and reveals why the cooperative model might be the only survival strategy for mid-tier operations.

Consider the economics: when precision technology investments run $2,000-3,000 per cow to implement properly according to manufacturer data from DeLaval and Lely, splitting those costs across multiple partners suddenly makes it feasible for operations that couldn’t justify it alone. Wisconsin’s Center for Dairy Profitability has documented several successful cooperative arrangements where five or six producers share digester installations or precision feeding systems, reducing individual capital exposure by 60-80%.

And the transparency tools have gotten much better—blockchain-based tracking systems that let every partner see identical data on costs, returns, and performance metrics. When everyone’s looking at the same numbers, the trust issues that used to kill these arrangements pretty much disappear.

Of course, I’ve also seen cooperative arrangements fall apart when partners don’t communicate well or when one operation fails to maintain its end of the system properly. The key seems to be starting with neighbors you already work well with, not trying to create partnerships from scratch just to access funding.

Farm SizeOptimal Investment StrategyTypical ROI TimelineKey Success Factors
Under 500 cowsPrecision feeding + health monitoring4-6 yearsFocus on single systems, ensure local service support
500-1,500 cowsRobotic milking + automated feeding5-7 yearsComplete facility redesign, staff training critical
1,500+ cowsIntegrated automation + energy systems7-10 yearsNetwork effects, data analytics are essential

Different Strategies for Different Scales — What Works and What Doesn’t

What I’ve found—and this mirrors what extension specialists are reporting—is that successful technology adoption looks completely different depending on your operation size. The most important thing is matching complexity to what you can actually manage, because I’ve seen too many good operations get burned trying to implement systems beyond their management capacity.

Smaller Operations (Under 500 Cows)

University of Vermont Extension’s 2024 technology assessment consistently shows that the key is focusing on high-impact modules rather than trying to automate everything. Automated feed systems can deliver efficiency gains without requiring complete facility overhauls, though installation costs vary significantly based on existing infrastructure—typically $1,200-1,800 per cow according to their data.

Many extension programs report positive experiences with precision health monitoring through ear tags or collars for managing mastitis and boosting yields, particularly during transition periods when fresh cows are most vulnerable. SCR Dairy’s monitoring systems show 15-25% reductions in treatment costs and 5-8% yield improvements in university trials, though individual results vary considerably.

The challenge for smaller operations is usually technical support. When something goes wrong at 2 AM during calving season, you need reliable backup and knowledgeable service within a reasonable distance. That’s not always available in rural areas, and it’s worth factoring into your decision-making.

I’ve talked with producers who love their automated systems but wish they’d spent more time finding good local service support before making the investment. One producer in northern Wisconsin told me, “The technology works great when it’s working, but when the nearest service tech is 90 miles away, you better have a backup plan.”

Mid-Size Operations (500-1,500 Cows)

This is where robotic milking starts making real economic sense. The technology has matured to the point where reliability is no longer a concern. Current equipment costs approximately $180,000-$ 220,000 per robot, according to 2024 pricing from major manufacturers such as DeLaval and Lely. Most operations achieve payback in 5-7 years when cow traffic and facility design are optimized properly.

But here’s the key—and this comes from extension specialists who’ve worked with successful transitions—you need to treat it as a complete systems upgrade, not just equipment replacement. Operations that redesign cow flow patterns and integrate data management see much better results than those that just drop robots into existing setups.

The seasonal timing matters too. Spring installations work better than fall, when you’re dealing with breeding season and trying to get cows trained on new systems while managing higher production levels. Michigan State’s dairy systems research indicates that installations occur 20-30% faster during lower-stress periods.

Large Operations (1,500+ Cows)

At this scale, comprehensive automation begins to deliver network effects that smaller operations can’t capture. Advanced systems for individual cow management become economically justifiable when you’re spreading costs across larger herds, but the complexity also increases exponentially.

Energy management systems that integrate renewable generation show promise, according to equipment manufacturers; however, independent verification and results vary significantly by installation and local conditions. Some operations report reducing their grid electricity usage by 40-60% while creating additional revenue streams during peak demand periods through net metering programs. Course, that assumes you’ve got the capital, the right location for solar installation, and favorable net metering policies—which aren’t available everywhere.

What’s interesting is that the largest operations are often the most cautious about new technology. They can’t afford downtime during peak production periods, so they tend to wait until systems are proven before adopting. Smart approach, really, though it means they sometimes miss early-adopter advantages.

Market Changes Worth Watching — And Why They Should Worry You

The Arla-DMK merger, creating that €19 billion cooperative, isn’t just about getting bigger—it’s about building integrated networks that can compete with operations like Lactalis on a global scale. Processing capacity is becoming essential for negotiating with retailers and securing favorable milk contracts, and if you don’t have access to it, you’re increasingly at a disadvantage.

Why is this significant? The economics tell the story. Geographic diversification provides natural insurance against regional disruptions while integrated supply chains capture margin throughout the value chain. Each new facility adds data and negotiating leverage that creates competitive advantages for integrated operations—and makes independent producers more vulnerable to pricing pressure.

The Federal Milk Marketing Order modernization, through the Foundation for the Future initiative, is also reflecting these structural changes. Component-based pricing advantages operations with advanced processing capabilities—exactly what these strategic investment programs are targeting. This builds on trends we’ve been seeing for the past decade, but it’s accelerating in ways that could leave volume-focused operations behind.

What concerns me is how this consolidation affects price discovery and market competition. When you’ve got fewer, larger players controlling more of the supply chain, it changes market dynamics in ways that aren’t always beneficial for individual producers. The cooperative model is starting to look like the only viable alternative for maintaining some negotiating power.

Regional Reality Check — Why Location Still Matters

One thing that’s become clear from talking with extension specialists across different regions—these investment strategies don’t work the same way everywhere. Climate, regulations, and local market access all affect the math significantly, and you can’t just copy what works in Wisconsin and expect the same results in Texas.

In Wisconsin operations, where winter feeding periods last 120-150 days, according to UW-Madison Extension data, precision feeding systems often show faster payback because efficiency gains compound over extended confinement seasons. Southern operations with year-round grazing might see better returns from pasture management technology, though heat stress mitigation is becoming increasingly important as summers get more extreme.

Regulatory variations matter too. California’s environmental standards under SB 1383 create different incentive structures than what you’ll find in Pennsylvania or Wisconsin. What makes economic sense in the Central Valley—where compliance costs can run $50-100 per cow annually—might not pencil out in Lancaster County, where regulatory pressure is lighter.

It’s worth understanding your local regulatory landscape before committing to major sustainability investments. Early indications suggest federal environmental requirements will become more standardized through EPA’s proposed dairy CAFO regulations, but we’re not there yet. I’ve seen producers get caught off guard by changing regulations that affected their investment returns.

What This Means for Your Operation — Decision Time

Looking at these trends, there are some decision points every operation needs to consider, and honestly, the window for making these decisions might be closing faster than most people realize.

Audit your competitive position honestly. How do your efficiency metrics, component quality, and cost structure stack up against regional leaders? What I’m noticing through extension reports is a growing gap between farms investing in efficiency and those still focused mainly on volume production. That gap is becoming a chasm.

Think beyond simple labor savings calculations. The operations that extension specialists report having success with automation are modeling returns across feed efficiency, component quality improvements, energy costs, and health management benefits. It’s rarely just about reducing labor hours, especially in today’s tight labor market, where good help is worth paying for.

Consider sustainability investment timing carefully. While the data are still developing, proactive environmental measures appear to transform regulatory compliance from a cost burden into a competitive advantage, especially with current CAP subsidy structures supporting early adoption. But they also require ongoing management attention and technical expertise that not every operation has.

For mid-tier operations, especially, explore cooperative opportunities seriously. The days of going it alone may be coming to an end for operations seeking to access the same advantages as larger players. Extension services are documenting successful partnerships for shared infrastructure that could make the difference between thriving and just surviving.

Focus on value per liter rather than total volume. This aligns with what we’re seeing in consumer markets—quality optimization, sustainability credentials, and operational efficiency can command better pricing than strategies focused purely on production volume.

But don’t forget the basics. I’ve seen operations get so focused on new technology that they neglect fundamental management practices like proper dry cow nutrition or effective breeding programs. Technology amplifies good management—it doesn’t replace it.

The Choice We’re All Facing — And Why Time Is Running Out

The question isn’t whether this consolidation and technology adoption will continue—it’s whether your operation will be positioned to benefit from these changes or get caught behind the curve while others capture the advantages.

Course, easier said than done when you’re dealing with input cost inflation and commodity pricing that seems to change every week. Sometimes the “strategic” choice is just keeping the lights on and the milk check coming. Cash flow trumps strategy when you’re struggling to cover operating costs.

But here’s what I find troubling: Lactalis’s billion-euro investment provides a roadmap for strategic positioning, and they’re making these investments during a challenging market period, not waiting for better conditions. What happens when market conditions improve and they’ve already established these competitive advantages?

For those of us considering this approach, the window for establishing competitive advantages may be narrowing as market structures solidify around integrated leaders. The operations that understand and implement strategic investment approaches will find themselves positioned to capture premium pricing and sustainable margins.

Those who continue to focus solely on production volume risk becoming price-takers in markets where technology, quality, and efficiency increasingly determine profitability over the long term. And once you’re a price-taker in this industry, it’s really hard to work your way back to having negotiating power.

It’s not an easy decision, but the direction seems pretty clear. The industry has already started making that distinction between strategic leaders and commodity survivors. And from what I’m seeing through extension reports and industry analysis, the gap between the two approaches is only going to get wider from here.

What gives me hope is that there are successful strategies for operations of every size. You don’t have to be Lactalis to capture some of these advantages. But you do have to be intentional about understanding your options and making decisions that position your operation for whatever comes next. Because standing still isn’t really an option anymore.

KEY TAKEAWAYS:

Strategic Shifts:

  • Value-per-liter strategies command 15-25% pricing premiums over volume-focused approaches
  • Technology investments during downturns create permanent competitive advantages through compound returns
  • Environmental compliance transforms from cost burden to revenue opportunity ($15-30/cow annually)
  • Cooperative arrangements are becoming survival strategies for mid-size operations (500-1,500 cows)

Investment Realities by Farm Size:

  • Under 500 cows: Focus on precision feeding + health monitoring (4-6 year ROI)
  • 500-1,500 cows: Robotic milking + facility redesign (5-7 year payback, $180-220K/robot)
  • 1,500+ cows: Integrated automation + energy systems (7-10 year timeline, network effects critical)

Market Transformation:

  • Industry consolidation (Arla-DMK €19B merger) makes processing capacity essential for negotiating power
  • Component-based pricing through FMMO modernization advantages quality-focused operations
  • Regional variations significantly affect investment ROI—California compliance costs $50-100/cow vs. lighter pressure in other regions

Critical Decision Points:

  • Audit competitive position against regional leaders—efficiency gaps are widening rapidly
  • Model compound returns across feed efficiency, components, energy, and health (not just labor savings)
  • Understand local regulatory landscape—early environmental compliance captures subsidies and premiums
  • Evaluate cooperative opportunities—shared infrastructure may be the only path to competitive advantages for mid-tier farms

The Bottom Line:

The window for strategic positioning is narrowing as market structures solidify around integrated leaders. Operations that implement value-per-liter strategies will capture premium pricing and sustainable margins. Those continuing to focus solely on volume production risk permanent relegation to commodity price-taker status—and in dairy, once you lose pricing power, it’s nearly impossible to get it back.

Complete references and supporting documentation are available upon request by contacting the editorial team at editor@thebullvine.com.

Learn More:

  • Precision Feeding Strategies Every Dairy Farmer Needs to Know – This article provides a tactical guide on implementing precision feeding, focusing on actionable steps like benchmarking, forage analysis, and grouping strategies to achieve the 8-15% feed efficiency gains mentioned in the main piece, and ultimately increase your profit margins.
  • The Future of Dairy: Lessons from World Dairy Expo 2025 Winners – Learn how a multi-state operation is using vertical integration and a people-first strategy to compete on value, not just volume. This article expands on the strategic leaders concept by demonstrating how advanced systems and human capital create competitive advantages.
  • The Ultimate Guide to Dairy Automation for Every Farm Size – This guide offers a comprehensive breakdown of ROI and payback timelines for different technology investments, from activity monitors to full robotic systems. It provides crucial numbers to help you make informed decisions, validating the automation trends discussed in the main article.

The Sunday Read Dairy Professionals Don’t Skip.

Every week, thousands of producers, breeders, and industry insiders open Bullvine Weekly for genetics insights, market shifts, and profit strategies they won’t find anywhere else. One email. Five minutes. Smarter decisions all week.

NewsSubscribe
First
Last
Consent

The Colombian Milk Scandal That’s Got Me Wondering: Could This Happen in the US?

Colombian dairy scandal exposes how multinationals play by different rules when they think nobody’s watching

EXECUTIVE SUMMARY: Here’s what we discovered: Colombia’s dairy fraud scandal reveals how sophisticated systematic deception can operate for years while detection technology sits unused in regulatory labs, destroying honest producers through artificially manipulated cost advantages. Major companies, including Lactalis, were caught adding whey to milk products at precise levels that avoided standard testing, undercutting legitimate farmers who couldn’t compete against fraudulent practices. The most damning evidence isn’t the fraud itself—it’s that regulators possessed liquid chromatography mass spectrometry equipment capable of detecting caseinomacropeptide markers but chose not to deploy it systematically. This pattern reveals a global vulnerability in which multinational corporations identify enforcement weaknesses across markets, operating with varying ethical standards based on the strength of local regulations. Consumer trust destruction hit every producer equally, but honest farmers got crushed twice—first by fraudulent competition, then by market-wide backlash when the scandal broke. The Colombian model demonstrates that without proactive fraud detection and meaningful penalties, “free market competition” can become organized deception that systematically undermines integrity-based farming. Every independent producer faces the same choice: demand enforcement systems that protect honest operations, or accept that fraudulent competitors might eliminate legitimate farming through economic warfare while regulators look away.

KEY TAKEAWAYS:

  • Demand fraud testing transparency from your state agriculture departments—ask specifically how often they deploy advanced detection equipment versus routine quality compliance, and make officials explain testing protocols that could protect honest producers from systematic competitor deception
  • Document competitor pricing patterns that don’t match basic production economics—when feed costs spike but certain operations maintain impossible pricing advantages, systematic comparison and questioning reveals potential fraud indicators before they destroy legitimate market competition
  • Build direct customer relationships to eliminate supply chain vulnerabilities—consumers will pay transparency premiums when they understand fraud alternatives, creating your best insurance against market-wide trust destruction caused by systematic deception
  • Support penalty restructuring that eliminates fraud profitability completely—current fine structures treat systematic consumer deception as manageable business expenses rather than operation-ending consequences that prevent criminal enterprises from budgeting fraud costs into competitive strategies
dairy fraud detection, farm profitability, consumer trust, supply chain integrity, dairy industry regulation

Look, I’ve been covering dairy industry BS for over twenty years, but what went down in Colombia this past year… hell, it’s got me lying awake wondering if we’re all just one lazy inspector away from watching our customers lose faith in everything we produce.

I was chatting with a producer from up near Green Bay when he started telling me about the Colombian mess. Get this. Major dairy companies in the area were fined by their competition authority for systematic milk fraud. Including Lactalis… yeah, same French outfit that runs plants all over the Midwest. Not your typical antibiotic residue violation or some listeria recall that makes the evening news. We’re talking calculated, systematic fraud.

And the real kicker? Their food safety regulators apparently had the technology sitting in labs to catch this stuff. Just… didn’t bother using it systematically.

Which got me thinking. If that can happen there…

When “Quality Control” Becomes Looking the Other Way

Now, I don’t know all the specific details about fines or exact amounts—Colombian regulatory stuff gets pretty murky when you try to dig into it from up here. But from what I’ve been able to piece together through dairy trade publications and regulatory announcements, these companies weren’t desperate operators cutting corners during a bad feed year when corn hit seven bucks.

This was systematic. Adding whey to milk products… not enough to trigger your basic butterfat or protein tests that most quality programs rely on, but enough to bulk up volumes and slash production costs while still meeting standard specifications.

Think about that for a minute. You’re out there competing against guys who can artificially reduce their input costs while you’re paying full freight for everything. Feed costs through the roof, labor getting more expensive every year, fuel prices bouncing around like a fresh heifer in a new pen… but these guys somehow manage to undercut everyone else?

I mean, we’ve all seen weird pricing from competitors that makes you scratch your head and wonder what the hell they know that you don’t. Guy down the road somehow manages to bid way under what your spreadsheet says is even possible. Most times, you figure it’s better operational efficiency, different sourcing deals, maybe family labor keeping their costs down, or hell—maybe they’re just taking losses to grab market share.

But what if it’s not? What if it’s fraud?

And honestly, how would you even know?

The Technology Shell Game That Should Scare Everyone

Here’s the part that really gets under my skin about this whole Colombian situation. Their food safety agency—called Invima, basically their version of the FDA—apparently had liquid chromatography mass spectrometry equipment just sitting in their labs.

Now, I’m no lab technician, but from what I understand, after talking to food science experts over the years, this equipment is specifically designed to detect dairy fraud by identifying caseinomacropeptide. Fancy name, but basically it’s like a chemical fingerprint that shows up when you add whey where it doesn’t belong.

This stuff doesn’t lie. Can’t fake it, can’t hide it, can’t explain it away if it shows up in products where it shouldn’t be there.

But systematic testing? Proactive monitoring to protect honest producers and consumers?

Nah. Too much work, apparently.

So I’m thinking… if that can happen in Colombia, what’s stopping similar stuff from happening right here? You think every state lab is running comprehensive fraud testing on dairy products moving through their system? You think USDA’s got the budget and manpower to check for this kind of sophisticated adulteration systematically?

I’ve been asking around at industry meetings lately. “How often do you guys actually test for fraud versus just standard quality metrics?” Most officials get this uncomfortable look—you know the one—and start talking about budget constraints and testing priorities and resource allocation.

Budget constraints. Right. Meanwhile, millions of dollars worth of detection equipment might be gathering dust because it’s easier to stick with routine paperwork than hunt for problems that create controversy.

When Big Companies Play by Different Rules in Different Places

The Lactalis angle really bothers me, honestly. These guys operate plants all over North America. Big corporate responsibility initiatives in their annual reports, sustainability programs, comprehensive compliance frameworks… the whole nine yards when they’re operating in markets with strong enforcement.

But down in Colombia? Apparently, it’s a different story altogether.

When they got caught—and I’m going off what trade publications reported—their response was basically textbook corporate damage control. Deny everything, reject the sanctions, fight it through lawyers, claim the investigation was flawed.

Standard playbook when you get caught with your hand in the cookie jar.

But here’s what gets me. Same company, same management structure, same corporate policies… but apparently different operating standards depending on what they think they can get away with in different markets?

That’s not an accident. That’s strategy.

Makes you wonder what other markets they’re operating in where enforcement might be… let’s say more flexible. And if Lactalis is doing this kind of regulatory arbitrage, what about other multinational food companies? How many are studying enforcement patterns across different countries and adjusting their ethics accordingly?

The Honest Producers Who Got Steamrolled

You know what really breaks my heart about this whole Colombian mess? The legitimate farmers who got crushed while this fraud was running, and nobody talks about them in all the regulatory press releases and industry coverage.

I don’t have exact consumption figures—Colombian market data’s not exactly easy to get your hands on from up here—but think about what happens when major dairy fraud scandals break in any market. Consumers don’t just get mad at the specific companies that got caught. They start questioning everything. Every brand, every product, every producer in the entire industry.

Reduce consumption. Switch to alternatives. Tell their friends and family to be careful about dairy products.

That hits everyone in the market. Honest operations and fraudulent ones alike.

You’ve probably seen it in your own area when food safety scares hit the news. Suddenly, your best customers are asking questions they never asked before, wanting documentation you never had to provide, second-guessing purchases they used to make automatically.

But here’s the double-whammy that honest Colombian farmers took. First, they’re trying to compete against companies with artificially low costs they couldn’t possibly match without compromising product integrity. Companies that could undercut them on price while maintaining fat profit margins through fraud.

Then, when the scandal finally breaks and hits the news, they get hammered by the consumer backlash just as hard as the criminals who caused the whole mess.

You do everything right—invest in genetics, feed quality, proper testing, follow every regulation, pay every fee—and you get punished twice. Once by the fraud destroying fair competition, once by the aftermath destroying consumer confidence.

That’s not a market failure. That’s a system designed to screw honest producers.

The Accountability That Never, Ever Comes

Want to know what really shows you how broken these systems are? What proves that protecting honest farmers isn’t actually the priority?

While these companies faced regulatory sanctions and public embarrassment, I can’t find any evidence that Colombian food safety officials lost their jobs for having fraud detection equipment but choosing not to deploy it systematically.

Think about that for a minute. You’ve got bureaucrats whose job—whose actual job description- is protecting consumers and legitimate producers from exactly this kind of systematic deception. They have the tools to do it, the authority to do it, the budget to do it… and they just don’t.

Then, when the whole thing blows up and honest farmers get destroyed and consumers lose trust in dairy products, these officials keep their jobs, keep their pensions, keep collecting paychecks while writing reports about “lessons learned” and “improved protocols.”

Meanwhile, the farmers who played by the rules are dumping milk they can’t sell because nobody trusts the industry anymore.

That tells you everything you need to know about where the real priorities are in these regulatory systems.

The Pattern That Keeps Me Up at Night

Look, I can’t prove that Colombian-style systematic fraud is happening here. Don’t have smoking gun evidence, don’t have whistleblowers coming forward with documents, don’t have regulatory investigations to point to.

But I keep hearing things that make me wonder…

Producers mention competitors who seem to have cost structures that don’t add up when you run the basic math of dairy production. Feed costs, labor, utilities, transportation, processing… add it all up, and their pricing shouldn’t be possible.

Most of us assume it’s operational efficiency we haven’t figured out yet. Better genetics giving them higher production per cow, different marketing arrangements, maybe some family labor advantage, or they’re just willing to operate on thinner margins than makes sense to us.

The Colombian situation makes you wonder if sometimes… it’s not.

Down in Wisconsin, you talk to producers who’ve been scratching their heads about certain competitors for years. “I don’t know how they do it,” they’ll say. “Numbers just don’t work out when I try to reverse-engineer their costs.”

Ohio guys tell similar stories. Texas producers, too. Same pattern everywhere—competitors whose economics seem to defy the basic math of honest dairy production.

And most of the time, we shrug and figure they know something we don’t, or they’re just better managers, or they’ve got some cost advantage we can’t see.

But what if sometimes… they’re cheating?

The Technology That Exists But Sits Unused

Here’s what’s really frustrating when you start digging into this stuff. The technology to detect sophisticated dairy fraud exists today. Not theoretical future developments—actual equipment sitting in labs right now across the country.

Liquid chromatography can detect whey adulteration at levels that would not be detected by standard butterfat or protein testing. Isotopic analysis can track the geographical origin of products. Near-infrared spectroscopy can identify compositional problems in real-time during processing.

The detection capabilities are remarkable when they’re actually deployed. When they’re actually deployed.

The problem isn’t the technology. The problem is that systematic deployment requires commitment, budget allocation, and political will to actually find problems rather than just going through regulatory motions.

Because fraud detection creates work. Creates controversy. Creates budget demands, political headaches, and industry pushback. Much easier for regulatory officials to focus on routine paperwork, check compliance boxes, and avoid actively hunting for problems that complicate everyone’s life.

The Colombian mess proves that this dynamic exists and can persist for years, while systematic fraud operates right under regulators’ noses.

Makes you wonder how many expensive fraud detection systems are gathering dust in government labs across this country while potential fraud operations perfect their techniques and eliminate honest competitors through economic warfare.

What Happens When Consumer Trust Dies

You know what the most expensive part of the Colombian fraud probably was? Not whatever fines eventually got imposed… not even the immediate market disruption when the scandal broke.

It was destroying consumer confidence in dairy products across the entire market.

When people find out they’ve been systematically deceived about something as basic and trusted as milk quality, they don’t just get mad at the specific companies that got caught. They start questioning everything. Every brand, every label, every claim, every producer.

That trust destruction hits everyone in the industry. Takes years to rebuild, if it ever comes back completely.

And while criminals were maximizing short-term profits through systematic deception, they were destroying the long-term foundation of the entire market on which they depended on. Including their own future business.

Short-sighted bastards didn’t just steal from honest competitors and deceive consumers… they poisoned the well for everyone.

What We Can Actually Do About This

So what do we do with all this? Sit around worrying about phantom fraud schemes we can’t prove? Assume every competitor with good pricing is cheating?

Hell no.

First thing—and this is something every producer can do right now—start asking uncomfortable questions at industry meetings and regulatory sessions. If your state agriculture department has advanced testing equipment, ask how often they actually use it for fraud detection versus routine quality compliance.

Make them explain their testing protocols, their priorities, and their resource allocation. Ask when they last found systematic adulteration, what they’re specifically looking for, and how they’d recognize sophisticated fraud if it was happening.

I’ve been doing this lately. Results are… interesting. Lots of uncomfortable shifting in seats and vague answers about “comprehensive testing programs” and “risk-based approaches” that don’t actually answer the question.

Second—pay attention to competitors whose economics don’t seem to make sense. If someone’s consistently pricing way below what honest production costs should allow, especially when feed costs are high or labor markets are tight, that’s worth questioning.

Keep records. Ask around. Compare notes with other producers. Make noise when the math doesn’t add up.

Not saying everyone with good pricing is cheating. But systematic fraud relies on everyone assuming there’s always a legitimate explanation for impossible economics.

Third—build direct relationships with your customers whenever possible. Best protection against supply chain fraud is eliminating middlemen who might facilitate it unknowingly… or worse, knowingly.

Consumers will pay premiums for transparency and traceability when they understand what the alternatives might look like. Your relationship with customers is your best insurance policy against market-wide trust destruction.

Fourth—support meaningful penalties when fraud gets discovered. Current regulatory structures that treat systematic deception as minor business violations with manageable fines need to change.

We need consequences that eliminate the profitability of fraud completely, not just add modest operational costs that criminals can budget for as part of doing business.

The Bottom Line

Here’s the thing that keeps bugging me about this Colombian situation, and why I can’t just file it away as “that’s their problem, not ours.”

It’s probably not unique.

Suppose systematic dairy fraud can operate for years in a market with a decent regulatory structure and available detection technology. What makes us think similar schemes couldn’t work in other markets with similar vulnerabilities?

Every independent producer—every honest operation—faces the same basic choice. Either we organize to demand enforcement systems that actually protect legitimate farming, or we accept that fraudulent competitors might systematically eliminate us through economic warfare while regulators look the other way.

Because once consumer trust gets destroyed by systematic deception, it doesn’t come back easily. And neither do the livelihoods of farmers who refused to compromise their integrity while criminals prospered.

Colombia illustrates what happens when regulatory systems fail to protect honest producers, despite having the tools and authority to do so.

Technology exists to prevent sophisticated dairy fraud. Legal authority exists to stop it. Budget exists to deploy it systematically.

Question is whether we’ll demand that our systems actually work to protect us… or just hope that fraud doesn’t spread to markets we depend on.

Honestly? After seeing what happened to honest farmers in Colombia while regulators had detection equipment gathering dust

I’m not sure hoping is enough anymore.

Complete references and supporting documentation are available upon request by contacting the editorial team at editor@thebullvine.com.

Learn More:

The Sunday Read Dairy Professionals Don’t Skip.

Every week, thousands of producers, breeders, and industry insiders open Bullvine Weekly for genetics insights, market shifts, and profit strategies they won’t find anywhere else. One email. Five minutes. Smarter decisions all week.

NewsSubscribe
First
Last
Consent

EXCLUSIVE: How Your Own Co-Op Is Playing You for a Fool While Butter Prices Tank

Butterfat crashed 30% while production dropped—your co-op’s using taxpayer money to manipulate markets against you

EXECUTIVE SUMMARY: Here’s what we discovered: While butterfat prices have crashed 30% since July, production actually declined through the same period—yet processors claim “oversupply” while shipping record export volumes overseas using farmer-funded subsidies. Major cooperatives like Darigold cut member payments by substantial amounts to cover billion-dollar facility cost overruns, then used those same facilities to increase export capacity while claiming domestic markets are flooded. Industry reports show Cooperatives Working Together moved massive milk equivalent volumes through export assistance programs funded by producer assessments, essentially forcing farmers to pay for the “oversupply” problems used to justify their shrinking checks. Court documents reveal that major cooperatives control up to 85% of regional processing capacity, enabling coordinated manipulation that would land independent farmers in federal prison for price-fixing. With government export subsidies flowing to processors and emergency assistance concentrated among industrial operations, this isn’t market forces—it’s systematic wealth extraction using farmer equity and taxpayer dollars. The consolidation trends indicate that independent farming will be eliminated entirely within five years unless producers start documenting everything, demand transparency, and build alternatives outside this rigged system.

KEY TAKEAWAYS:

  • Your cooperative’s “investments” are costing you real money: Operations reporting payment cuts of $4+ per hundredweight to cover facility overruns—that’s $175,200 annually for a 2,000-cow operation, while processors build export infrastructure with farmer equity
  • Document payment patterns and facility timing: Track correlations between new plant openings and “market crises”—when billion-dollar facilities open in June and oversupply claims appear in July, that’s coordination evidence worth preserving
  • Explore direct marketing and farmer-controlled alternatives: Family operations investing $120,000 in on-farm processing report 28% net revenue increases while creating farm jobs—every gallon that bypasses cooperative manipulation stays in farmer pockets
  • Support legal challenges to cooperative abuse: Multi-million dollar settlements prove cooperative rhetoric can’t hide systematic market manipulation—every successful challenge weakens the framework enabling this systematic farmer exploitation
  • Build independent networks before you need them: Connect with other producers, comparing payment experiences and processing alternatives—cooperative systems survive by keeping farmers isolated and uninformed about manipulation strategies

Look, I’ve been around long enough to smell BS from three counties away. But this whole butter market mess? I didn’t see this one coming either.

Butterfat’s been in free fall since July—Chicago Mercantile futures getting absolutely hammered week after week—and I keep hearing the same tired line from processors about “market forces” and “oversupply issues.” You know, the usual corporate speak.

I was talking with Jake, who runs about 800 head up the road… he’s been saying something’s fishy for months. I kept thinking he was just pissed about his milk check shrinking every month, you know? The guy’s always complaining about something.

Turns out he was right. Dead right.

Your co-op’s screwing you. And they’re using programs most of us don’t even know exist to do it. I spent the better part of six months digging into this mess—talking to producers from Wisconsin down to Texas, going through government reports until my eyes bled, piecing together what’s really happening—and honestly?

What I found will make you madder than finding your prize heifer stuck in a ditch during breeding season.

When Math Stops Making Any Damn Sense

So I’m sitting here last month going through USDA dairy production reports—you know, exciting Saturday night stuff—and something just doesn’t add up. You know that feeling when the numbers look wrong and you keep double-checking because maybe you missed something obvious?

Well, I didn’t miss anything.

The production data shows butter manufacturing bouncing around through the summer—nothing crazy dramatic, just normal seasonal variations. Now, I may not have attended business school like these co-op executives, but I learned about supply and demand by showing steers at the county fair when I was fifteen.

When production stays relatively stable, prices shouldn’t crater like a rookie trying to back a cattle trailer.

But they did crater. Hard.

Chicago Mercantile Class IV futures got absolutely pounded through August and September, while production wasn’t showing any major spikes that would justify it. That’s like telling me steady cow numbers should mean dirt-cheap milk. Makes no damn sense to anyone who’s actually farmed a day in their life.

The smoking gun evidence that processors are manipulating markets, not responding to them.

So what’s that tell me? Somebody’s playing games with the market. And I’m not talking about weather or corn prices or any of that normal stuff we deal with every damn day.

I mean coordinated manipulation by the same folks who send you those glossy cooperative newsletters talking about “challenging market conditions”—while they’re shipping product overseas faster than a green kid can spill milk in the parlor.

Actually, and this really started getting my wheels turning… you dig into export data patterns from Foreign Agricultural Service reports, and dairy product shipments are showing strong year-over-year growth. Real strong. But somehow we’ve got “domestic oversupply”?

That’s like cleaning out your entire silage pit and then complaining to your wife that you don’t have room to store anything.

The Darigold Disaster: When Your Own People Screw You

I was talking to some producers up in Washington last spring—good folks, been farming longer than I have—about that new Darigold plant in Pasco. You know the one, right? A major expansion project that was supposed to be a great thing for members?

Industry publications reported that the whole thing turned into a financial disaster. Significant cost overruns, major delays, and the works. But that’s not even the worst part, honestly.

The worst part is how they covered those extra costs.

Reports started coming out about Darigold implementing what they called “member payment adjustments” to help finance the facility completion. Member payment adjustments. Jesus. That’s co-op speak for “we’re cutting your milk checks and there’s not a damn thing you can do about it.”

And not small cuts either. We’re talking substantial reductions that hit producers right in the gut, right when feed costs are climbing and margins are already tighter than bark on a tree.

One operation I know up there—won’t mention names because these folks have enough problems already—told me it’s costing them serious money annually. Tens of thousands. That’s real money for family operations already running on razor-thin margins.

Farm Size (Cows)Annual Milk Production (lbs)$4/cwt Payment CutAnnual Income Loss3-Year Impact
50010,950,000$4,380$43,800$131,400
1,00021,900,000$8,760$87,600$262,800
2,00043,800,000$17,520$175,200$525,600
3,00065,700,000$26,280$262,800$788,400
5,000109,500,000$43,800$438,000$1,314,000

But here’s what really pisses me off… while they’re cutting member payments to cover their construction screwups, they built that whole facility with direct export access in mind. Rail connections, port proximity, and the entire setup are designed to move product overseas as efficiently as possible.

So they’re using farmer money to build infrastructure that helps them ship milk overseas while telling those same farmers that domestic markets are oversupplied.

You literally can’t make this stuff up. Actually, I guess you can if you’re running a cooperative and wearing a suit instead of coveralls.

The Money Trail They Hope You Never Find

Okay, so this is where it gets really interesting… and by interesting, I mean absolutely infuriating in ways that would make a preacher cuss.

You ever hear of Cooperatives Working Together? Most producers I talk to haven’t got a clue. It’s this export assistance program that’s supposed to help us compete globally against subsidized competition. Sounds pretty good on paper, doesn’t it?

Industry reports indicate that CWT has facilitated the movement of massive volumes of milk equivalent through export assistance programs in recent years. We’re talking about production equivalent to tens of thousands of cows getting subsidized to go overseas while processors keep telling us there’s too much milk floating around domestically.

And here’s the real kicker—we help fund the damn thing. Assessments come right out of our milk payments, month after month after month. So we’re literally paying them to create the very “oversupply” problems they keep blaming for our shrinking checks.

Can you believe that? We’re funding our own screwing.

Uncle Sam’s Making It Even Worse

Then you’ve got USDA throwing serious taxpayer money at export promotion through their Foreign Agricultural Service programs. Secretary Rollins announced big initiatives earlier this year to boost ag exports as part of addressing trade imbalances with other countries.

Look, I’m all for selling American dairy products overseas—God knows we produce some of the best in the world. But when you subsidize exports to create artificial overseas demand while domestic processing stays artificially constrained?

That’s not helping the trade deficit. That’s manipulating domestic prices to benefit processors while screwing producers.

And don’t even get me started on the disaster payments…

Actually, you know what? Let me get started on that, too. Analysis of Emergency Livestock Assistance Program distributions shows serious money flowing to large operations for bird flu losses. Major dairies are pulling in substantial payments while family operations struggle to get basic support when disaster hits.

Now I’m not saying big operations don’t deserve help when bird flu wipes out chunks of their herds. We all know it’s a real problem that can devastate any operation. But when the same large players consistently seem to navigate disaster payment bureaucracy successfully while smaller producers get tied up in red tape for months?

That starts looking less like emergency assistance and more like systematic support for industrial agriculture at the expense of family farms.

When Your Co-Op Becomes Your Worst Enemy

I remember when cooperatives actually worked for farmers instead of against them. My dad always said—and I’m starting to think the old man was dead right—that the only difference between a co-op and a corporation is the co-op tells prettier lies while they’re picking your pocket.

Take Dairy Farmers of America. Their management team gets hired by boards that are supposedly there to represent farmers, but they mostly just validate whatever professional management recommends. Industry publications regularly quote executives talking about “managing the business efficiently” rather than serving member interests.

Not serving farmers. Managing the business efficiently. There’s a world of difference between those two approaches, and if you can’t see it, you haven’t been paying attention.

Researchers have looked at what happened with failed dairy cooperatives in other countries, and it reads like a damn playbook for what’s happening right here. They consistently found that professional management often didn’t provide adequate disclosure to farmer boards, and producers couldn’t effectively challenge CEO practices because they lacked access to the information needed to make informed decisions.

Sound familiar yet? Farmers sometimes end up voting to sell their own cooperatives for fractions of their actual value because nobody bothered keeping them properly informed about what was really going on behind closed doors.

The Voting Changes Nobody Talks About

And here’s something that really gets my blood boiling. Cooperatives have been quietly shifting away from traditional “one member, one vote” structures toward production-based voting systems. USDA research shows more states allowing these arrangements every year, and most farmers don’t even realize it’s happening.

So your 500-cow family operation that’s been in your family for three generations gets exactly one vote in cooperative decisions. Your neighbor down the road with 200 cows gets one vote too. But that 5,000-cow industrial operation that moved in five years ago? They get multiple votes based on their production volume.

Now guess who’s really making the decisions about export policies, processing priorities, and payment structures?

Makes me madder than trying to load cattle in a thunderstorm with a hangover.

Market Control That Would Embarrass Standard Oil

Court filings in dairy industry litigation suggest major cooperatives control massive processing capacity in key regions across the country. When you control that much critical infrastructure, you’re not responding to market conditions anymore—you’re creating the damn market conditions.

And that’s exactly what happened with this whole butter price disaster. Industry publications reported farmers having to dump milk because processing plants claimed they were at capacity limits, while those same processing networks somehow managed to handle expanded throughput in other product categories that served their profit margins better.

It’s not about real capacity constraints. It’s about strategic capacity allocation.

After major acquisitions in recent years, processing control became increasingly concentrated in fewer hands. Companies can route milk wherever it serves their financial interests best, rather than member interests. Want to justify cutting member payments? Route more volume to export channels, then claim domestic markets are oversupplied. Need to show growth numbers for your board presentation? Process more domestically and talk about meeting strong consumer demand.

The Information War You Don’t Even Know You’re Losing

Think about this for a minute… processing control gives these companies advance knowledge of absolutely everything that matters. Regional milk flows, seasonal production patterns, demand fluctuations, inventory levels, and export timing. They see what’s coming weeks or months before any of us individual producers have a clue.

This intelligence advantage enables them to time export sales strategically, maximizing their benefits. They know exactly when to increase overseas volumes to create the artificial domestic supply conditions they can then use to justify cutting our payments while maintaining or expanding their processing margins.

The whole butter price collapse this year demonstrates exactly how this works. Export patterns got ramped up significantly early in 2025, and then—what a surprise!—we had “serious oversupply problems” by midsummer that required emergency member payment adjustments to address.

We never got to see the export timing data that would’ve exposed the whole coordinated scheme. That information stays locked up in corporate boardrooms where farmers aren’t invited.

Why Walking Away Isn’t Really an Option

So why don’t we just tell these cooperatives to go to hell and find alternatives if they’re not serving our interests?

Well, research on cooperative membership structures shows delivery rights and equity requirements often represent massive investments per farm—sometimes hundreds of thousands of dollars that took decades to build up. You decide to leave? You potentially forfeit substantial portions of that investment, depending on the specific cooperative’s withdrawal policies.

I know producers who’ve seriously researched leaving their cooperatives. The total costs—between lost equity, various penalties, and transition expenses to establish new marketing relationships—can be absolutely devastating for family operations. We’re talking about financial hits that could force operations that have been in families for generations into bankruptcy.

Additionally, major acquisitions over the past decade have eliminated many independent processing alternatives that previously existed. In some regions, court documents suggest producers have very limited viable processing alternatives outside of cooperative control.

That’s not a competitive market providing farmers with genuine choices. That’s a systematic constraint of farmer marketing options designed to maintain cooperative control regardless of member satisfaction.

And Federal Milk Marketing Orders don’t provide the relief you might expect either. You often can’t access pooling benefits and pricing protections without cooperative membership, so the government system that’s supposedly there to protect farmer interests actually channels producers into the very cooperatives that may not be serving those interests effectively.

The Capital Requirements Reality Check

Want to start genuinely farmer-owned processing as an alternative? Research on cooperative development shows you need substantial upfront capital commitments—we’re talking millions upon millions of dollars minimum just to get started. Individual farmers obviously can’t generate that kind of investment capital without pooling resources with other producers.

But here’s the catch… pooling financial resources typically means surrendering individual control to professional management structures that start looking exactly like the cooperative systems you were trying to escape in the first place.

Perfect Catch-22 designed to keep you trapped. You need a cooperative-level scale to compete effectively in modern markets, but achieving that scale almost inevitably means accepting cooperative-style management structures that prioritize business efficiency over individual member interests.

When Farmers Actually Control Things (Revolutionary Concept)

But here’s what gives me real hope for the future… it honestly doesn’t have to be this way.

Some cooperatives still demonstrate that genuine farmer control is not only possible but profitable. Operations that were started by small groups of committed farmers and managed to grow substantially while maintaining meaningful member governance show that it can work if you structure it right from the beginning.

Their members typically receive actual premiums—real money, not just promises and fancy presentations—plus meaningful equity distributions that reflect the cooperative’s financial performance. While some cooperatives pay commodity rates and capture processing margins for corporate expansion purposes, farmer-controlled operations focus on returning maximum value directly to the people who actually produce the milk.

What a revolutionary concept, right? Actually serving the people who own the damn operation.

Going Direct (And Scaring the Hell Out of Corporate Management)

I know family operations that made significant investments in on-farm processing equipment over the past few years. Nothing fancy or complicated, just enough capacity to handle substantial portions of their milk production directly rather than shipping everything to cooperative plants.

Their net revenues improved dramatically—we’re talking 20-30% increases in some cases. They created good-paying jobs right on the farm for local people. And every single gallon that bypasses problematic cooperative systems stays exactly where it belongs—in farmer pockets rather than corporate profit centers.

There are also examples from other countries—small groups of committed farmers who pooled resources to establish their own processing facilities. Modest scale operations, just large enough to handle milk from a limited number of participating farms, rather than trying to compete with industrial-scale processing.

These operations often pay substantially above regional commodity prices and return operational profits directly to farmer-investors rather than building corporate empires. Years later, they’re typically employing local people and proving conclusively that farmer-controlled alternatives can compete effectively when appropriately structured.

Small scale. Local ownership. Farmer control. Everything the mega-cooperatives claim can’t possibly compete in modern markets.

Legal Challenges That Are Actually Making Progress

You want to understand how problematic some current cooperative practices really are? Major cooperatives recently paid substantial multi-million dollar settlements regarding allegedly anticompetitive pricing practices. Court documents detail coordination schemes that supposedly suppressed producer payments through systematic information sharing and coordinated decision-making processes.

That’s textbook anticompetitive behavior that would land regular farmers in federal prison if we tried anything similar. If a group of independent producers tried coordinating milk pricing like these cooperatives apparently did, we’d be facing criminal conspiracy charges faster than you could say “price fixing.”

But cooperatives get special antitrust protections under the Capper-Volstead Act, so they typically face civil penalties and financial settlements rather than criminal prosecution when they get caught engaging in questionable practices.

Still, every successful legal challenge weakens the framework that enables these problematic practices to continue. Recent litigation has exposed how some cooperatives evolved from modest regional farmer organizations into what industry critics now describe as highly concentrated market controllers that prioritize corporate growth over member welfare.

At least somebody’s finally fighting back through the legal system, even if it’s taking way too long to see meaningful results.

Where All This Leads (Spoiler Alert: It’s Not Pretty)

Look, if current consolidation trends continue unchecked, we’re looking at the systematic elimination of independent family farming as we know it. International examples from countries with similar agricultural policies reveal massive losses in dairy operations, even when governments implement supposedly protective policies. We have significantly fewer protections than most of those countries.

Think about that reality for a minute. Just sit with it.

Census data shows we’ve already lost thousands of family dairy operations in recent years, and industry projections suggest continued rapid consolidation is virtually inevitable under current market structures. We’re headed toward a handful of massive processing entities controlling most dairy production capacity, with “farmers” potentially becoming contract laborers who provide facilities and labor, while others control the actual operations and capture the vast majority of profits generated.

My kids sometimes talk about potentially farming someday when they’re older. Current industry trends suggest they’ll be looking at completely different opportunities than what my generation experienced—if meaningful independent farming opportunities even exist at all.

That keeps me up at night more than I’d like to admit.

What You Actually Do About This Mess

First thing—start documenting everything you can get your hands on. When major facility openings coincide suspiciously with “market crisis” claims, that’s worth noting and tracking over time. When export volumes increase significantly while domestic prices decline dramatically, that demonstrates coordination possibilities that deserve investigation.

Save every milk statement you receive. Keep all those cooperative communications and newsletters they send. Track patterns and correlations between their “strategic investments” and changes in your payment structures over time.

Ask pointed questions and demand real transparency from your cooperative leadership. When processing efficiencies improve through technology investments, why don’t member payments increase proportionally? Where exactly do those efficiency gains actually go if not back to the people who own the operation?

Support Alternatives That Actually Work

Look into proven alternatives that demonstrate different approaches can succeed. Some cooperatives still show that genuine farmer control produces better member outcomes. Direct marketing demonstrates that independence can be profitable when done intelligently. Small-scale processing operations prove that sustainable alternatives exist if you’re willing to work for them.

Support legal challenges to problematic industry practices when opportunities arise. Every successful challenge helps weaken the systematic structures that enable this manipulation to continue unchecked.

Build Independent Networks Before You Need Them

Start having honest conversations with other producers in your area about what’s really happening to all of us. Highly concentrated cooperative systems benefit enormously from keeping individual farmers isolated and uninformed—they absolutely don’t want us comparing experiences about payment trends, policy changes, and strategic decisions that affect our operations.

Actively explore direct marketing opportunities that might work in your specific region and situation. Connect with processors who might be willing to deal more fairly with independent producers. Build relationships and explore alternatives outside problematic cooperative systems before you actually need them urgently.

Because once you need them urgently, you’ve probably already lost most of your negotiating leverage.

Bottom Line: Time to Stop Accepting This BS

You know what really gets under my skin about this whole situation? The same cooperatives that spend board meetings discussing “challenging market conditions” and “difficult economic pressures” just invested billions of dollars in new processing infrastructure and corporate expansion projects.

If markets are really as constrained and difficult as they keep telling us, where exactly did they find all that investment capital?

Right. Member money. Member equity contributions. The Member economic future is mortgaged for corporate growth that may not benefit members at all.

This isn’t a natural result of market forces creating unavoidable price pressures. This is the coordinated use of government programs, member financial resources, and market manipulation to engineer artificial conditions that justify reducing member payments while maintaining or expanding corporate processing margins and executive compensation.

Time to stop passively accepting systems that are specifically designed to concentrate benefits at the corporate level while distributing costs and risks to the farmers who actually do the work. Because if these consolidation trends continue for another five years, there won’t be enough independent producers left to influence anything meaningful in this industry.

And frankly, some powerful people are clearly counting on exactly that outcome.

My dad always used to say, ‘Never trust anybody who wears an expensive suit to look at cows.’ Wish I’d listened to the old man more carefully when I had the chance.

Complete references and supporting documentation are available upon request by contacting the editorial team at editor@thebullvine.com.

Learn More:

The Sunday Read Dairy Professionals Don’t Skip.

Every week, thousands of producers, breeders, and industry insiders open Bullvine Weekly for genetics insights, market shifts, and profit strategies they won’t find anywhere else. One email. Five minutes. Smarter decisions all week.

NewsSubscribe
First
Last
Consent

EXPOSED: The $29.2 Billion Dairy Empire That Just Bought Your Future – How Lactalis Executed the Most Dangerous Corporate Power Grab in Agricultural History While Everyone Celebrated

$29.2B dairy empire bought your breeding future while you celebrated – 384 court violations expose the scam

EXECUTIVE SUMMARY: While dairy farmers celebrated Fonterra’s NZ$3.845 billion sale as good news, French billionaire Emmanuel Besnier executed the most sophisticated agricultural power grab in modern history. Here’s what we discovered: Lactalis didn’t just buy processing plants—they bought control over genetic data from the world’s most advanced herds, positioning themselves to manipulate which genetics get promoted industry-wide. Australian courts documented 384 systematic contract violations designed to silence farmer criticism and eliminate market alternatives, yet regulators approved giving this company even more power. The brutal math shows operations over 2,000 cows now produce milk $10 cheaper per hundredweight than family farms, while we’ve lost 15,221 dairy operations in just five years—eight farms closing every single day. Genetic evaluation systems now prioritize processor efficiency over farm profitability, meaning you’re unknowingly breeding cattle that benefit their margins, not yours. This consolidation represents a fundamental shift from farming as an independent business to corporate employment disguised as “partnerships.” The window for collective resistance is closing faster than most producers realize—and that’s exactly what they’re counting on.

KEY TAKEAWAYS:

  • Contract Audit Defense: Pull every processor agreement from the last five years and document non-disparagement clauses, data ownership provisions, and unilateral termination rights that eliminate your bargaining power—this becomes your legal evidence file when exploitation escalates
  • Genetic Data Protection: Maintain independent production records using software you control, export all historical data from processor-connected systems before access gets restricted, and work with multiple AI organizations to prevent single-supplier dependency that hands breeding control to your milk buyer
  • Buyer Diversification Strategy: Build a quarterly-updated matrix of every processor within hauling distance, including contract terms, quality premiums, and genetic data policies—never become dependent on single-processor relationships that trap you in exploitative arrangements
  • Value-Added Premium Capture: Corporate consolidation creates direct-sale opportunities, but requires a realistic assessment of barriers, including FDA compliance, customer relationship building, and marketing skill development, which most traditional producers lack
  • Collective Action Timeline: Individual defense strategies buy time and negotiating position, but agriculture’s survival as an independent enterprise depends on producer-owned processing infrastructure and independent genetic evaluation systems being built faster than corporate consolidation eliminates alternatives
dairy farm profitability, milk pricing, dairy farm consolidation, genetic data ownership, dairy industry trends

You know, I’ve been covering consolidation for over three decades, and this Lactalis-Fonterra deal…man, it keeps me up nights thinking about what just happened.

While farmers were celebrating that NZ$3.845 billion changing hands—and trust me, it sounded real good when you first heard it—French billionaire Emmanuel Besnier just pulled off the most sophisticated agricultural land grab I’ve witnessed in my career. Most producers? They still don’t realize what they lost.

This isn’t consolidation anymore. It’s genetic colonialism, plain and simple.

The $29.2 Billion Shadow Empire Controlling Your Breeding Decisions

Through the Fonterra acquisition, one French billionaire now controls processing and distribution across the world’s fastest-growing dairy markets.

Emmanuel Besnier. Ever heard of him?

Course not. That’s exactly how he wants it.

Forbes lists this guy at $29.2 billion—can you even wrap your head around that number? Operates Lactalis, pulling in over $30 billion annually according to their financial reports, while maintaining almost zero public presence. I’ve never seen him speak at World Dairy Expo. Never seen him shake hands at any trade show I’ve covered in thirty years. Just pure, calculated market control from behind the scenes.

The Fonterra acquisition gives one French family control over sixteen manufacturing facilities stretching from Queensland clear to Saudi Arabia, plus twenty-seven third-party relationships across Southeast Asia. But what really gets me isn’t the processing capacity.

It’s the genetic data they just bought.

When you’re processing milk from genetically advanced herds—and New Zealand’s got some of the best genetics on the planet, no question about that—you’re not just buying cheese brands. You’re buying the performance validation that determines which genetics get promoted industry-wide.

Every inline milk meter reading. Every component test. Every milking duration measurement.

They’re literally using your cows’ data to control your breeding choices. And most guys don’t even realize it’s happening.

The Contract Manipulation That Australian Courts Actually Documented

Violation CategoryNumber of BreachesImpact on FarmersCourt Finding
Public Denigration Clauses156Silenced criticism“Chilling effect”
Unilateral Termination Rights98Eliminated negotiating power“Offending combination”
Exclusive Supply Penalties87Forced dependencyMarket manipulation
Data Ownership Violations43Lost genetic controlSystematic exploitation

You want to know how these corporate giants really operate? I spent days digging through Australian Federal Court records from 2023…and what I found made my stomach turn.

Lactalis paid AU$950,000 in penalties for 384 separate breaches of their Dairy Code. But that’s not even the scary part. The scary part is what those court documents reveal about systematic farmer exploitation disguised as—well, as legal business practices.

They inserted these “public denigration” clauses into milk supply agreements. Basically, does it mean you criticize them publicly? They can terminate your contract. Just like that.

But here’s the real kicker—they gave themselves unilateral termination rights based on their own interpretation of what constituted criticism. ACCC Commissioner Liza Carver found these contracts created “a chilling effect on farmers…such that they did not speak up when they otherwise might have done so.”

Industrial-scale farmer silencing. Dressed up as contract law.

Each of those 384 violations? Individual farm operations locked into what the court called “an offending combination of clauses.” Contracts specifically designed to eliminate farmer market alternatives while maintaining the fiction of competitive choice.

Their dairy regulations require processors to offer both exclusive and non-exclusive supply options. Sounds fair, right?

Dead wrong.

Lactalis offered non-exclusive deals with such severe price penalties that farmers couldn’t economically accept them. Legal manipulation that eliminates choice while looking totally legitimate on paper.

The Genetic Data Trap Most Guys Miss Completely

Corporate consolidators don’t win by being better farmers. They win by controlling the definition of efficiency itself. And that…that keeps me up at night.

Take the new Milking Speed genetic evaluation that CDCB launched this year. Every milking duration measurement from your inline meters flows through dairy records processing directly to industry databases. When processors control the majority of this performance data, they know which genetics work best in their systems…not necessarily yours.

Bulls get promoted based on daughters that milk fast in processor-controlled validation systems, even if those same genetics require higher feed costs or reduce reproductive performance. Your fresh cows might be cycling poorly during breeding season—and don’t even get me started on what happens to your SCC when you push these high-speed milkers too hard through the parlor—but if they milk out quickly for the processor? That bull’s getting promoted.

This time of year, when guys are making breeding decisions for their fall fresh cows, how many are choosing bulls based on genetic indexes that prioritize processor efficiency over their own butterfat numbers? Over their own management system?

We’re breeding for processing efficiency instead of farm profitability. Without even realizing it.

The Regulatory Breakdown That Made This Corporate Heist Legal

The Australian Competition and Consumer Commission’s July approval reveals either breathtaking incompetence or…well, let’s just say questionable decision-making. I read through their analysis, and it’s disturbing how thoroughly they missed the point.

Their reasoning? “Fonterra and Lactalis have differing end product mixes” with “only limited overlap between operations.”

This completely misses how modern market power actually works. It’s not about buying your direct competitors—that’s old-school monopoly thinking from the 1980s. Today’s corporate giants achieve control by acquiring complementary infrastructure.

Sound familiar? Same exact logic that let Tyson dominate poultry by buying “different” parts of the supply chain—feed mills, processing plants, distribution networks. Next thing you know, chicken farmers became contract growers on their own land.

But here’s the real smoking gun…the same ACCC that documented Lactalis’ systematic farmer exploitation through 384 contract violations somehow concluded that giving this company more market power posed no competitive concerns.

That ain’t regulatory oversight.

The Farmer Organization Silence That Reveals Financial Capture

Why aren’t farmer advocacy groups screaming bloody murder about this consolidation? Well…

Organizations consistently prioritize “working with processors” over challenging consolidation when you examine their actual policy positions. And honestly, it feels like our own organizations have been turned into corporate PR departments while farmers weren’t paying attention.

When your advocacy groups spend more time talking to processors than to producers…something’s fundamentally broken in the system.

The Brutal Math: What’s Actually Happening to American Dairy

The relentless elimination of family dairy farms shows no sign of slowing—with more than 8 operations closing every single day, the consolidation crisis has eliminated over 15,000 farms in just five years.

Let me lay out some numbers from the USDA’s 2022 Census of Agriculture that’ll make your head spin. When I’m doing my fall review each year, I always dig into the latest data…and it gets more depressing every single time.

We lost 15,221 dairy farms between 2017 and 2022. That’s more than eight farms closing every single day for five straight years.

Eight farms. Every day. Think about that during morning milking.

But here’s the part that should really get your attention…while farms were disappearing, total milk production actually increased. Fewer farms producing more milk means somebody figured out how to make this work on a massive scale while everyone else got eliminated.

According to the Census data, we lost dairy farms of every size except those milking 2,500 cows or more. Those mega-dairies? They’re the only ones that increased in number, and now they control significant portions of U.S. milk production despite being a tiny fraction of total farms.

The economics are brutal when you break it down. Dr. Mark Stephenson at UW-Madison—a guy who really knows his numbers—has calculated that operations milking more than 2,000 cows operate about $10 less per hundredweight than farms with 100 to 199 cows. In 2022, that meant total production costs of around $23 versus $33 per hundredweight.

The $10 per hundredweight cost advantage that mega-dairies hold over family farms translates to millions in competitive advantage—mathematical proof that the playing field isn’t level anymore.

Ten bucks doesn’t sound like much…until you multiply it across millions of pounds annually. That’s the difference between profit and bankruptcy when milk prices are tanking and feed costs are through the roof.

The Three-Tier System That’s Already Here

The transformation is complete—mega-dairies now control nearly two-thirds of American milk production, proving consolidation isn’t coming, it’s already here.

While everyone’s arguing about whether consolidation is good or bad, it’s already happened. We’re living in a three-tier agricultural system right now—and most farmers don’t even recognize it.

The Mega-Dairies

Operations with 1,000+ cows now control 65% of the nation’s dairy herd, according to Dairy Herd Management’s analysis of USDA data. Algorithms, not farm families, make production decisions. The “farm manager” is basically running a factory that happens to have cows in it.

Contract Production Units

This is where most mid-sized operations are headed, and honestly, it scares me more than the mega-dairies. It’s the poultry model applied to dairy. Farmers invest millions in corporate-specified infrastructure while corporations control genetics, feed protocols, marketing…everything that actually matters.

The National Family Farm Coalition documented that 98% of broiler chickens are now raised under production contracts between processors and farmers. Same exact model’s being applied to dairy right now.

Niche Survival Operations

Small farms serving premium markets that corporate systems can’t efficiently access. They’re constantly one market disruption away from closure because the economics don’t add up at a small scale unless you’re capturing serious premiums through direct marketing. And that requires a whole different skill set than milking cows.

The Asia-Pacific Growth Being Captured for Corporate Shareholders

Industry publications love talking about massive Asia-Pacific dairy market growth. Sounds great for farmers, right?

Wrong again.

Lactalis just positioned itself to capture this growth for shareholders rather than distribute benefits across farming communities. This acquisition gives them control over distribution networks in Malaysia, Indonesia, Sri Lanka, and Saudi Arabia—markets experiencing significant growth in dairy consumption, according to industry analysis.

For independent producers, this means systematically reduced buyer competition throughout these growing markets. When one company controls that much distribution infrastructure, they don’t need to fix prices. They just coordinate supply chain behavior in ways that favor their margins over your farm gate prices.

Talk to any producer who’s tried to export…it’s already getting tougher to find buyers who aren’t somehow connected to these big players.

What Your Individual Defense Strategy Can’t Actually Fix

I’m gonna give you concrete defensive tactics in a minute. But let’s be brutally honest about something…individual resistance can’t stop what we’re witnessing here.

These mega-dairies have every advantage in the book. Economies of scale, they own the plants AND the trucks, they’ve got feed contracts most family operations can only dream about. How’s a 500-cow family operation supposed to compete when feed costs are brutal, and milk prices are bouncing around like a pinball?

The math just doesn’t work anymore.

Too many guys are still thinking they can out-manage their way out of this mess. But you can’t manage your way out of systematic market power imbalances. Just can’t do it.

Your Last-Ditch Defense Playbook – Though It Feels Like Bringing a Knife to a Gunfight

First thing you gotta do…audit every contract

Pull every agreement you’ve signed in the last five years. Document every clause that gives your processor unilateral power. Look specifically for:

  • Non-disparagement language restricting your ability to discuss processor practices publicly
  • Minimum volume requirements that consume most of your production capacity
  • Data ownership provisions giving processors rights to your genetic information
  • Unilateral termination clauses based on the processor’s “opinion” rather than actual violations

More paperwork, I know. But this becomes your legal evidence file when things go sideways—and they will.

Next thing…diversify your buyer relationships

Call every processor within reasonable hauling distance. Don’t just ask about current capacity—ask about contract terms, quality premiums, and genetic data policies. Build yourself a matrix with contact information and logistics. Update this quarterly.

Never, ever become dependent on single-processor relationships again. That’s exactly how they get you locked in.

Value-added opportunities exist, but be realistic about it

Corporate consolidation does create some premium opportunities for direct sales, but you gotta be realistic about the barriers. When butterfat’s tanking and Class III prices are bouncing around, some producers have found success with specialty marketing through cooperatives or direct sales.

But if you’re in traditional dairy country where every restaurant’s already locked into major distribution contracts…and farmstead cheese? Sure, if you’ve got an extra couple hundred thousand lying around for a processing facility, years to navigate FDA requirements, and the marketing skills to build customer relationships from scratch.

Most guys don’t have that luxury.

Protect your genetic data like it’s gold

Maintain independent production records using software you control, not processor-connected systems. Export all historical data from their platforms before access gets restricted. Work with multiple AI organizations to avoid single-supplier dependency.

When processors control genetic validation data, they control which genetics get promoted industry-wide. Your breeding program should optimize for your profitability and your management system, not their processing efficiency.

Political engagement—though I’m not optimistic anymore

Submit public comments on every agricultural consolidation in your region. Contact state legislators about processor contract regulation. This isn’t a civic duty—this is economic self-defense at this point.

Your voice in policy processes becomes your only competitive protection when market forces are stacked against you.

Though honestly…I’m not sure the political process moves fast enough to matter anymore. By the time regulations catch up, the consolidation’s already done and dusted.

The Bottom Line: Individual Strategies Have Real Limits

Individual defense strategies buy you time and negotiating position. But agriculture’s survival as an independent enterprise? That depends on collective alternatives being built, and built fast.

Independent genetic evaluation systems that maintain separation from processor control become critical infrastructure. Alternative financial networks supporting farm-level viability give producers options when traditional lenders prioritize corporate-backed operations.

But I’ll be straight with you…building these alternatives takes time, capital, and coordination that’s getting harder and harder to achieve as consolidation accelerates.

The French billionaire who just bought Asia-Pacific dairy infrastructure? He’s betting that farmers won’t organize effective resistance before corporate systems achieve control, which becomes really, really hard to reverse.

Your individual survival depends on defensive strategies implemented immediately. Agriculture’s future as an independent business depends on whether enough farmers recognize what’s happening and act collectively while there’s still time.

The transformation from farming to corporate employment—well, in my view, that’s happening by design, not natural law. What’s designed by humans can be redesigned by humans—if they act before it gets too late.

But the window’s getting smaller every day. And that French billionaire? He’s counting on most farmers not noticing until it’s already closed and locked.

You bet he is.

Complete references and supporting documentation are available upon request by contacting the editorial team at editor@thebullvine.com.

Learn More:

The Sunday Read Dairy Professionals Don’t Skip.

Every week, thousands of producers, breeders, and industry insiders open Bullvine Weekly for genetics insights, market shifts, and profit strategies they won’t find anywhere else. One email. Five minutes. Smarter decisions all week.
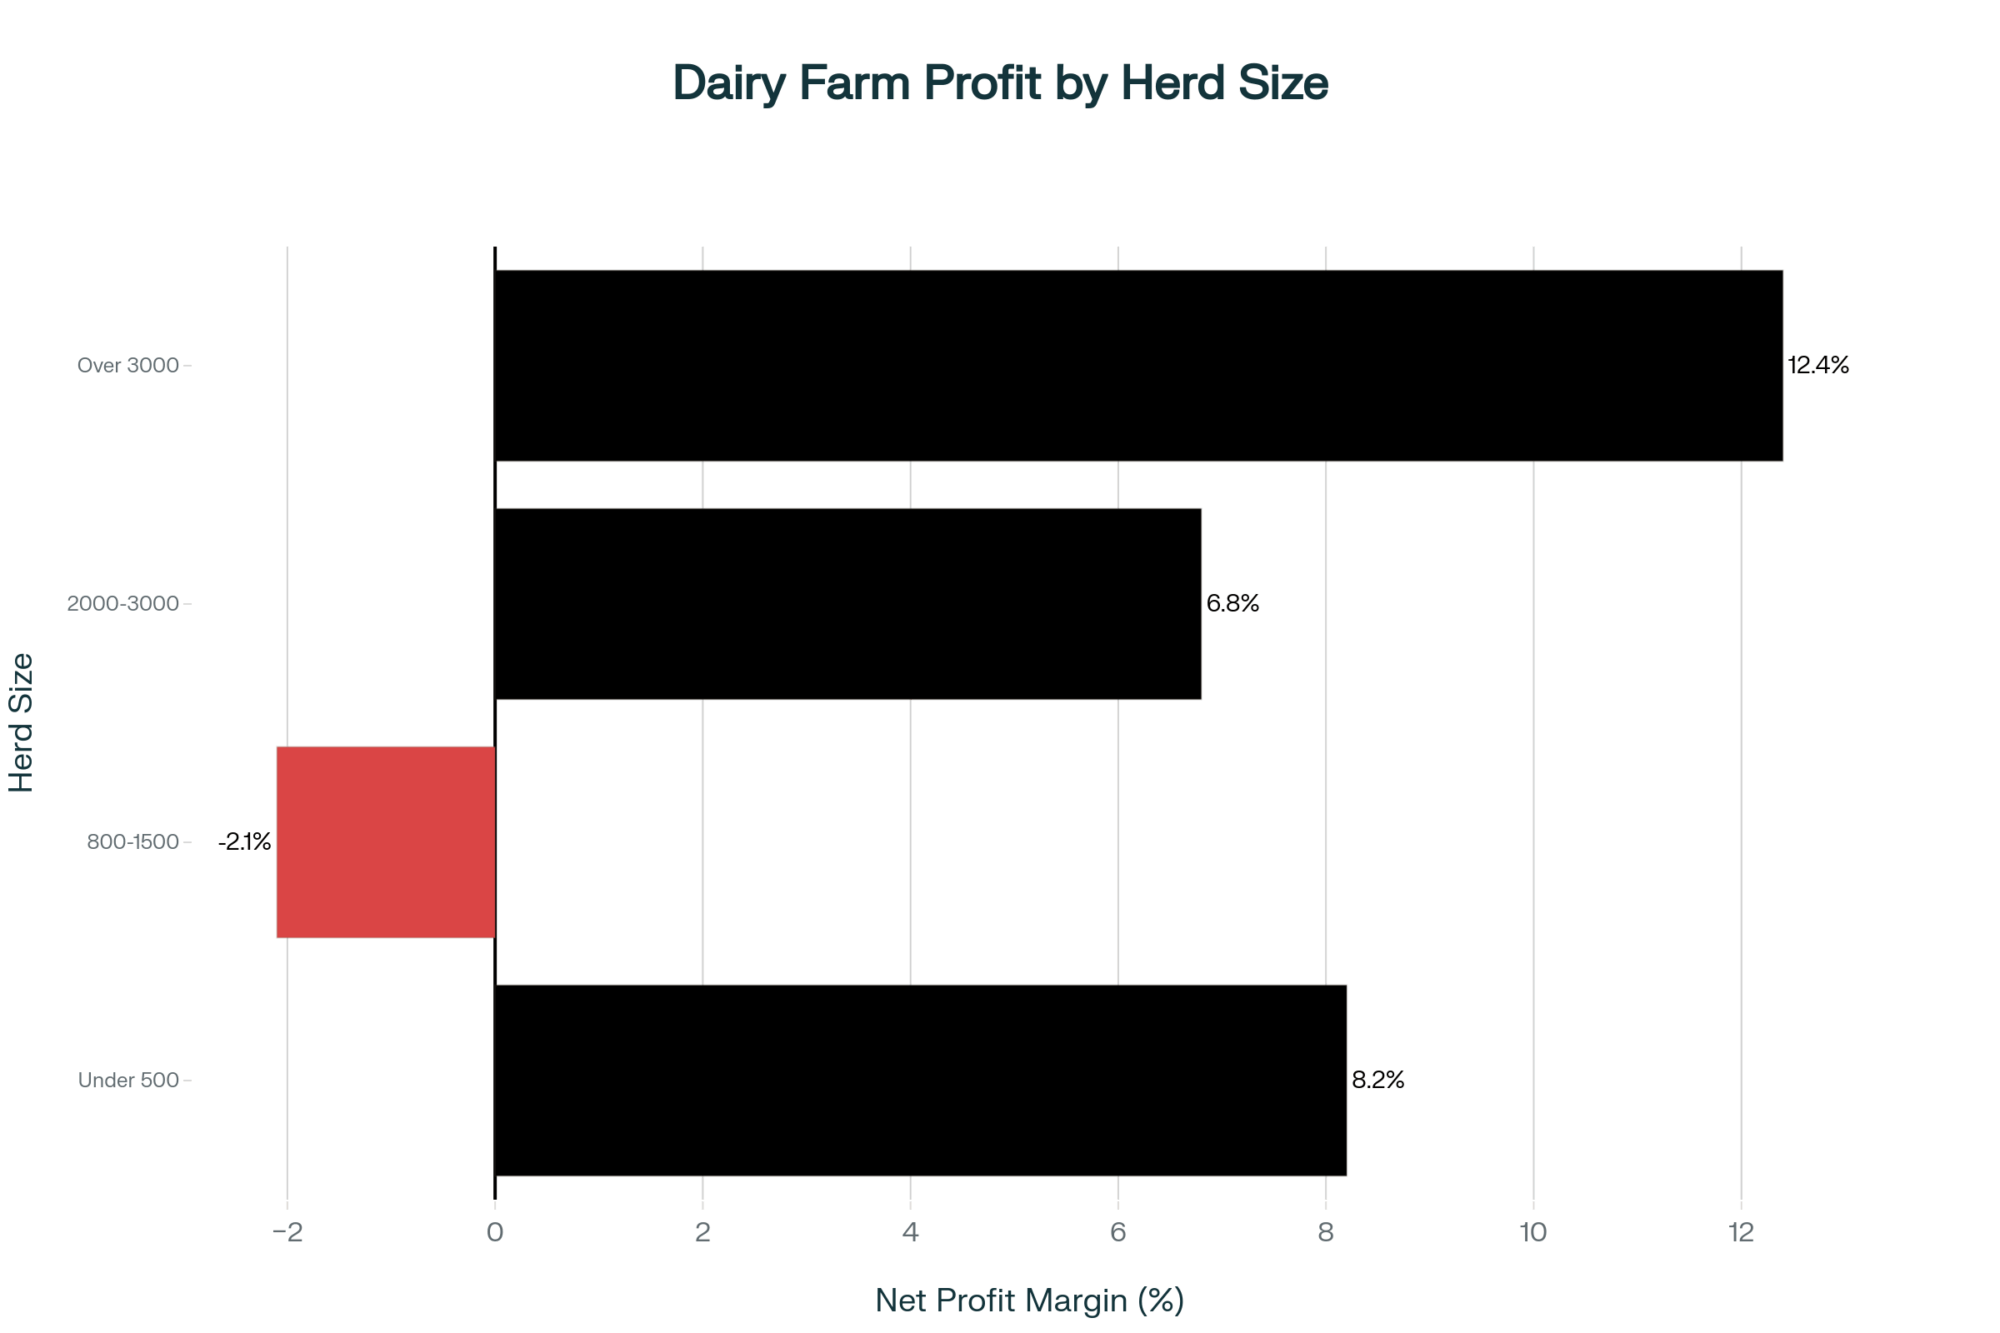
NewsSubscribe
First
Last
Consent

Danone vs. Lifeway: How a $307M Standoff Proves Grit is the New Milk Check

Lifeway’s 788% shareholder return in 5 years shatters ‘bigger is better’ myth—what your farm’s missing.

EXECUTIVE SUMMARY: Here’s what we discovered: Lifeway Foods, a modest kefir maker, turned down a $307M buyout offer, delivering an astounding 18% sales growth and 788% shareholder returns over five years, far outperforming corporate giants like Danone. While Danone labored with a mere 3% growth in North America, Lifeway’s nimble innovation—rolling out new products in 4-6 months—is redefining success in a market where the global kefir segment alone is expected to grow to over $2 billion by 2030, according to Cognitive Market Research and Grand View. This challenges dairy orthodoxy, highlighting that speed outperforms scale. Family dynamics, market strategy, and corporate consolidation tactics collide, exposing uncomfortable truths the industry hides. Dairy farmers must rethink survival—this isn’t about getting bigger; it’s about moving faster.

KEY TAKEAWAYS:

  • Achieve up to 18% sales growth by innovating fast, launching quality products within 6 months (Lifeway earnings call 2025).
  • Monitor shareholder returns as a key success metric—Lifeway’s 788% return over 5 years dwarfs traditional corporate benchmarks (Morningstar 2024).
  • Avoid undervaluing your operation—know the true valuation multiples for functional dairy products (12-15x EBITDA) versus commodity dairy (8-10x EBITDA).
  • Question industry consolidation fears—independent processors and family farms are showing sustainable double-digit growth amid market shifts.
  • Prioritize decision-making speed in feeding, breeding, and product development to outpace competitors—speed beats scale every time.
Danone, Lifeway Foods, dairy industry, dairy profitability, farm business strategy
Focus Keyphrase: speed over scale

You know how butterfat’s tanking this fall down in Wisconsin, and fresh cow problems are popping up with these early winter chills? Well, this Lifeway-Danone saga? It hits right home like a hammer to the thumb.

Last month, I was jawing with one of those old-school dairy operators in Iowa—a guy who’s seen enough dry lot disasters to know when things are really bad out there. He looked me dead in the eye and said, “Andrew, with these long, cold winter nights rolling in, the fresh cows are giving us hell like never before.”

That made me think hard—this Lifeway story might just be the slap in the face our industry’s been needing.

Here’s the deal. Lifeway Foods, a small kefir company out of Wisconsin, flat-out told Danone to shove their $307 million offer. Yup, three hundred and seven million bucks on the table, and not a penny less, according to Dairy Reporter’s August 18th, 2025 coverage of their acquisition talks.

Now, the media’s calling Lifeway crazy for saying no. “How do you say no to that kind of dough?”

Well, honestly, don’t fall for that noise—they don’t know what’s really going on here.

Corporate ag’s been preaching for years: you gotta get bigger or get out. Lifeway just flipped that script completely on its head, and trust me, the big boys aren’t thrilled about it one bit.

This shakeup is rattling barns from Wisconsin clear over to Ohio, and the numbers… well, they tell the story clearer than any cow’s health record ever could.

Numbers That Hit Like a Cold Snap

Lifeway’s 788% shareholder returns over 5 years dwarf Danone’s 15% cumulative growth, proving speed and agility beat corporate scale every time.

Lifeway’s Q2 2025 financials showed an 18% jump in sales, pulling in $53.9 million in volume-led growth—outperforming analyst expectations by 7.8%, as Dairy Reporter documented in their August coverage. Meanwhile, Danone’s North American division barely managed a 3% lift in the first half of 2025, according to their July H1 results.

That’s like bringing baler twine to a tractor pull.

Now, here’s what really turned my head: Morningstar data shows Lifeway shareholders have been riding a jaw-dropping 788% return over the past five years. Seven hundred and eighty-eight percent. While most of us are scraping for decent milk prices.

And Danone? Well, according to the SEC Schedule 13D/A filing from September 17th, 2025, they’ve owned exactly 22.7% of Lifeway for over 20 years, just sitting there watching this little outfit leave them in the dust quarter after quarter.

The corporate gears move slower than a tractor stuck in spring mud, I swear.

When Speed Beats Size Every Damn Time

Now get this—Lifeway’s launching new products, like collagen-infused kefir and probiotic dressings, in just 4 to 6 months from idea to store shelves, according to their August 2025 earnings call. Meanwhile, Danone’s committees take years to decide on a new flavor.

You know what that’s like? It’s like me deciding to breed my best cow and having her drop a calf before you’ve even figured out which bull to use.

Buying a company just to slow it down? That’s like buying a new sprayer and only using it to water the front lawn at half-speed.

Family Drama That Cuts Deeper Than Winter Wind

Family drama’s in full swing here—CEO Julie Smolyansky is fighting her own family members who hold 27% of shares and want her to sell, documented extensively in Dairy Reporter coverage and SEC filings throughout 2024.

Imagine having your own blood trying to sell your farm out from under you, and it’s all in writing for everyone to see. Your own family is calling you “borderline criminal” in legal documents just because you won’t cash out.

But Julie’s no quitter. She told her board, “I’ve said no to my family for years, and I’m not bowing to some suits from Europe.”

That kind of grit? That’s what you only see in farmers dealing with fresh cow problems in the dead of February.

The Valuation Shell Game They Don’t Want You to See

Dairy Operation TypeTypical EBITDA MultipleLifeway’s Projected EBITDA (2027)Estimated Value
Commodity Dairy8-10x$45-50M$360-500M
Functional Dairy12-15x$45-50M$540-750M
Danone’s Offer6.8x$45M$307M

Here’s where it gets really dirty. Danone valued Lifeway at 8-10 times earnings—standard for commodity dairies, per industry M&A reports from 2023-2025.

But Lifeway’s not commodity swill. They’re in the premium, functional food space, where valuations often hit 12-15 times earnings according to industry valuation studies.

With a projected adjusted EBITDA of $45-50 million by 2027—straight from their own earnings call transcripts—Lifeway’s real value is much closer to half a billion dollars, not what Danone’s lowball bid suggested.

Classic corporate maneuver: buy dirt cheap, flip for billions, and crush the small operators who won’t play ball.

The Industry Scramble That Followed

Since Lifeway shut the door in September 2025, the whispered buzz in the dairy world has been that big players are ramping up deal-making, throwing cash upfront, and ditching those slow courting rituals they used to love.

Over in Europe, mergers like Arla-DMK sped up significantly, partly because of watching this situation unfold, according to recent Dairy Reporter coverage of European consolidation trends.

And get this—Hungary blocked a foreign takeover of Alföldi Tej dairy co-op in August 2025, citing food security concerns according to the Hungarian Competition Authority’s official decision. That’s homegrown dairy operations fighting back, just like Lifeway stood its ground here.

Winners and Losers in This New Game

Who’s winning this game? Independent processors hustling with real purpose, family operations growing legitimate double digits, and farmers finally getting premium prices instead of commodity pennies.

Who’s losing? The M&A sharks who built careers on easy pickings, the fearmongers who make money scaring farmers about getting left behind, and every producer stuck chasing commodity milk prices.

The Truth About Speed vs. Scale

Bottom line: scale is yesterday’s news. Speed is king now.

How fast can you pivot when feed costs spike in January? Who can flip rations or breeding plans on a dime when market conditions shift? Who launches new products before competitors even know there’s a market opportunity?

That’s what survival looks like in 2025.

Look at the global kefir market—researchers at Cognitive Market Research and Grand View Research document it growing from approximately $1.3 billion in 2025 to over $2 billion by 2030, with a steady 5-6% annual growth rate.

While the giants bicker in boardrooms about synergies, nimble operations like Lifeway are owning that growth in real time.

What You Better Start Doing Right Now

So, what do you do with all this?

First: Watch out for consultants yammering about consolidation without showing you the actual receipts that back up their claims.

Second: Make sure your milk’s priced for what it really is—premium product, not commodity swill.

Third: Time how long does it take your operation to fix problems, because if you’re slow, you’re already falling behind.

The revolution? It’s happening right now.

Poison pill consultations have surged 300% since last September, according to the Corporate Governance Legal Services Survey. Investment banks are rewriting their valuation playbooks faster than anyone expected.

But most farms can’t match Julie Smolyansky’s specific combination of 18% growth rates and that kind of ironclad grit. The next acquisition target lacking both? Gone in less than two months.

The Bottom Line

Bottom line: Lifeway’s story isn’t just about dodging a buyout. It proves the raw power of independence and speed over corporate scale.

Family farms aren’t just holding their ground—they’re rewriting the entire playbook while corporate ag is still stuck reading from the old manual.

If a tiny kefir maker from Wisconsin can outrun multinational giants, then size isn’t everything. Hell, it might not be anything.

So ask yourself this: can your farm move fast enough to stay ahead in this new game, or are you next on the menu?

Because the dairy industry just learned a $307 million lesson about moving fast and staying independent. Smart producers will put that lesson to work before their corporate neighbors figure out what just hit them.

Complete references and supporting documentation are available upon request by contacting the editorial team at editor@thebullvine.com.

Learn More:

The Sunday Read Dairy Professionals Don’t Skip.

Every week, thousands of producers, breeders, and industry insiders open Bullvine Weekly for genetics insights, market shifts, and profit strategies they won’t find anywhere else. One email. Five minutes. Smarter decisions all week.

NewsSubscribe
First
Last
Consent

Navigating Today’s Dairy Margin Squeeze: Insights from the Field

How can your dairy adapt to tighter margins and changing market realities in 2025? Here’s what to know.

EXECUTIVE SUMMARY: Margin pressures across the dairy industry are intensifying, with the Dairy Margin Coverage dropping nearly $1.40 per hundredweight year-over-year as of July 2025, while feed costs hold steady near $9.86 per hundredweight. This squeeze is prompting many producers to rethink their strategies, especially as butter production surged to 180 million pounds in July — the highest since 1942 — and cheese output climbed 2.1% year-over-year. What farmers are discovering is that component quality, particularly butterfat and protein percentages, now plays a critical role in farm profitability, often adding $400+ more income per cow annually compared to volume-focused approaches. Feed management strategies ranging from modest 5% cost trimming to more aggressive 15% reductions are becoming essential tools, alongside evolving culling benchmarks that favor efficiency and component production over herd size. These trends vary significantly by region, with Midwest producers finding different opportunities compared to drought-impacted operations on the West Coast. As we move through 2025, producers with proactive, data-driven mindsets who can adapt to these shifting realities are positioning themselves for long-term success and profitability.

KEY TAKEAWAYS:

  • Margin reality check: Dairy Margin Coverage dropped nearly $1.40/cwt year-over-year while feed costs remain elevated at $9.86/cwt, requiring strategic adjustments to maintain profitability
  • Component focus pays: Optimizing butterfat and protein levels can boost individual cow income by $400+ annually, making quality management more valuable than volume production
  • Strategic feed management: Cost reduction approaches from 5% to 15% trimming help operations navigate tight margins while maintaining sustainable production levels
  • Evolved culling standards: Industry benchmarks now favor cows producing above 18,000 pounds annually with controlled health and reproduction expenses under $300 per year
  • Regional adaptation matters: Successful producers are tailoring strategies to local conditions, from Midwest corn basis opportunities to California drought management challenges
dairy profitability, herd management, dairy cost reduction, farm efficiency, butterfat protein

You know, when butter prices dropped from $2.37 to $1.77 a pound this summer, it wasn’t just a market correction — it was a serious wake-up call for many of us in the dairy community. At a recent industry conference, I spoke with producers from across the Midwest and Northeast, and it was clear folks were split on how to handle what we’re facing.

Some jumped in right away, making hard calls to reshape their operations for what looks like a longer stretch. Others, and I understand this completely, are hoping prices bounce back to levels we’ve grown used to.

This all goes to show it’s not just about the numbers on paper. It’s about mindset — how we process what’s coming at us and decide what our next move should be.

The Reality Check

Here’s what the latest USDA data shows us: the Dairy Margin Coverage margin dropped to about $10.94 per hundredweight last July. That’s nearly $1.40 less than the previous year.

At the same time, feed costs held steady around $9.86 per hundredweight, meaning our profit margins are getting squeezed from both ends.

I was talking with a producer near Eau Claire, Wisconsin, who stayed up one night running calculations. She figured out that her 100 lowest-producing cows were costing her about $25 every single day — nearly $9,000 a year just from those underperformers. That’s real money walking out the gate.

And here’s the thing — this impacts us all differently depending on where we farm. Many Midwest operations report some breathing room with corn and soybean prices stabilizing, but producers in places like California are still dealing with drought conditions and higher feed costs.

The Supply Picture

Nationally, the production numbers tell quite a story. U.S. butter production hit 180 million pounds in July — the highest we’ve seen since 1942. Cheese production reached 1.21 billion pounds, up about 2.1% from last year.

That’s a lot of product hitting the market, and it’s creating pressure we haven’t experienced in decades.

But here’s what’s really catching my attention: the milk check is changing. We’re seeing a clear shift toward rewarding butterfat and protein performance rather than just volume.

Component Focus Becomes Critical

Current USDA pricing shows butterfat at about $2.73 a pound, with protein close behind, around $1.96. Getting those component levels right can add hundreds of dollars per cow annually.

I’ve been hearing from producers who’ve made this transition successfully. One operation I am familiar with in central Wisconsin focused on increasing butterfat levels to 4.8% and protein to 3.6%. That producer told me it adds roughly $440 per cow each year compared to animals with lower components.

So we’re not just talking about small adjustments here. These component improvements can make a meaningful difference in your bottom line.

Feed Strategies That Work

Feed management has become absolutely critical. University of Minnesota Extension research emphasizes the importance of what they call “smart feeding” — trimming costs strategically without sacrificing the nutrition needed to maintain production.

I’m seeing farms take generally three approaches:

Light adjustments — cutting about 5% of feed costs with minimal impact on milk production. This might save around $62,500 annually on a 500-cow operation.

Moderate cuts — accepting 10% reductions in feed expenses, knowing milk output might drop a few percentage points. We’re talking about $125,000 in potential savings here.

Aggressive moves — some operations are making 15% cuts to feed costs. It’s tough medicine, but for farms in survival mode, it can mean $187,500 in annual savings.

Feed costs consistently represent about half of most dairy operations’ total expenses. That means how you handle this piece can really make or break you during tight margin periods.

Strategic Culling Decisions

We need to talk about culling, too, because the standards have definitely shifted.

Where once a cow producing 16,000 pounds annually might have earned her keep, now we’re looking at closer to 18,000 pounds as the minimum. Animals earning less than $4,500 annually or costing more than $300 in health and reproduction expenses are becoming harder to justify keeping.

These benchmarks come from Pennsylvania and Kentucky extension research, and they match what I’m hearing from producers throughout the Midwest and Northeast.

What’s particularly noteworthy is the trend toward smaller, more focused herds — generally 200 to 300 cows — emphasizing efficiency and component production rather than just herd size.

This reflects broader industry changes we’re all witnessing… a move toward what I’d call precision dairying, where every animal’s contribution really matters.

The Mindset Factor

And that brings me to something crucial — mindset.

The producers who ask themselves, “How will this situation affect my farm five or ten years from now?” tend to be the ones making proactive decisions today.

Others are taking a wait-and-see approach, which honestly can be the right call depending on your specific circumstances. However, it does leave some operations more vulnerable if these margin pressures persist longer than expected.

From what I’ve observed, staying close to the data — tracking cold storage levels, production statistics, processor demand patterns — helps keep you ahead of the curve rather than just reacting to what’s already happened.

Simple Math That Matters

Ready to run some numbers on your own operation? Here’s a calculation that often opens eyes:

Take your 100 slowest-producing cows. If they’re averaging 45 pounds daily and you’re losing about 55 cents per hundredweight on their milk, that means you’re losing roughly $25 every day from that group.

Multiply that out over weeks and months — it becomes a real drain on cash flow.

This is why managing butterfat and protein levels, along with fresh cow care and transition period management, has become such a game-changer for operations trying to stay profitable.

Regional Considerations

It’s worth noting how different regions are adapting based on their specific challenges.

In Wisconsin operations, where corn basis has stabilized somewhat, producers have more flexibility in feed formulation strategies. Pennsylvania farms are often leveraging their proximity to Northeast premium markets. Even in challenging areas like California’s Central Valley, innovative producers are finding ways to optimize water usage while maintaining high-quality components.

These regional differences remind us there’s rarely a one-size-fits-all solution to current market pressures.

The Bottom Line

All these operational changes aren’t comfortable, and they require shifting away from approaches that worked well in different market conditions. But they represent the kind of strategic thinking that helps farms not just survive challenging periods, but position themselves for whatever comes next.

The producers I see adapting most successfully aren’t necessarily those with the biggest operations or the most capital. They’re the ones willing to analyze data objectively, make difficult decisions promptly, and focus on long-term sustainability rather than short-term comfort.

Such focus on operational efficiency — though demanding — has proven essential for many producers staying competitive during this margin squeeze.

If you want to compare notes, work through some calculations, or just talk through your specific situation, I’m here. We’re all better when we share what we’re learning.

Complete references and supporting documentation are available upon request by contacting the editorial team at editor@thebullvine.com.

Learn More:

The Sunday Read Dairy Professionals Don’t Skip.

Every week, thousands of producers, breeders, and industry insiders open Bullvine Weekly for genetics insights, market shifts, and profit strategies they won’t find anywhere else. One email. Five minutes. Smarter decisions all week.
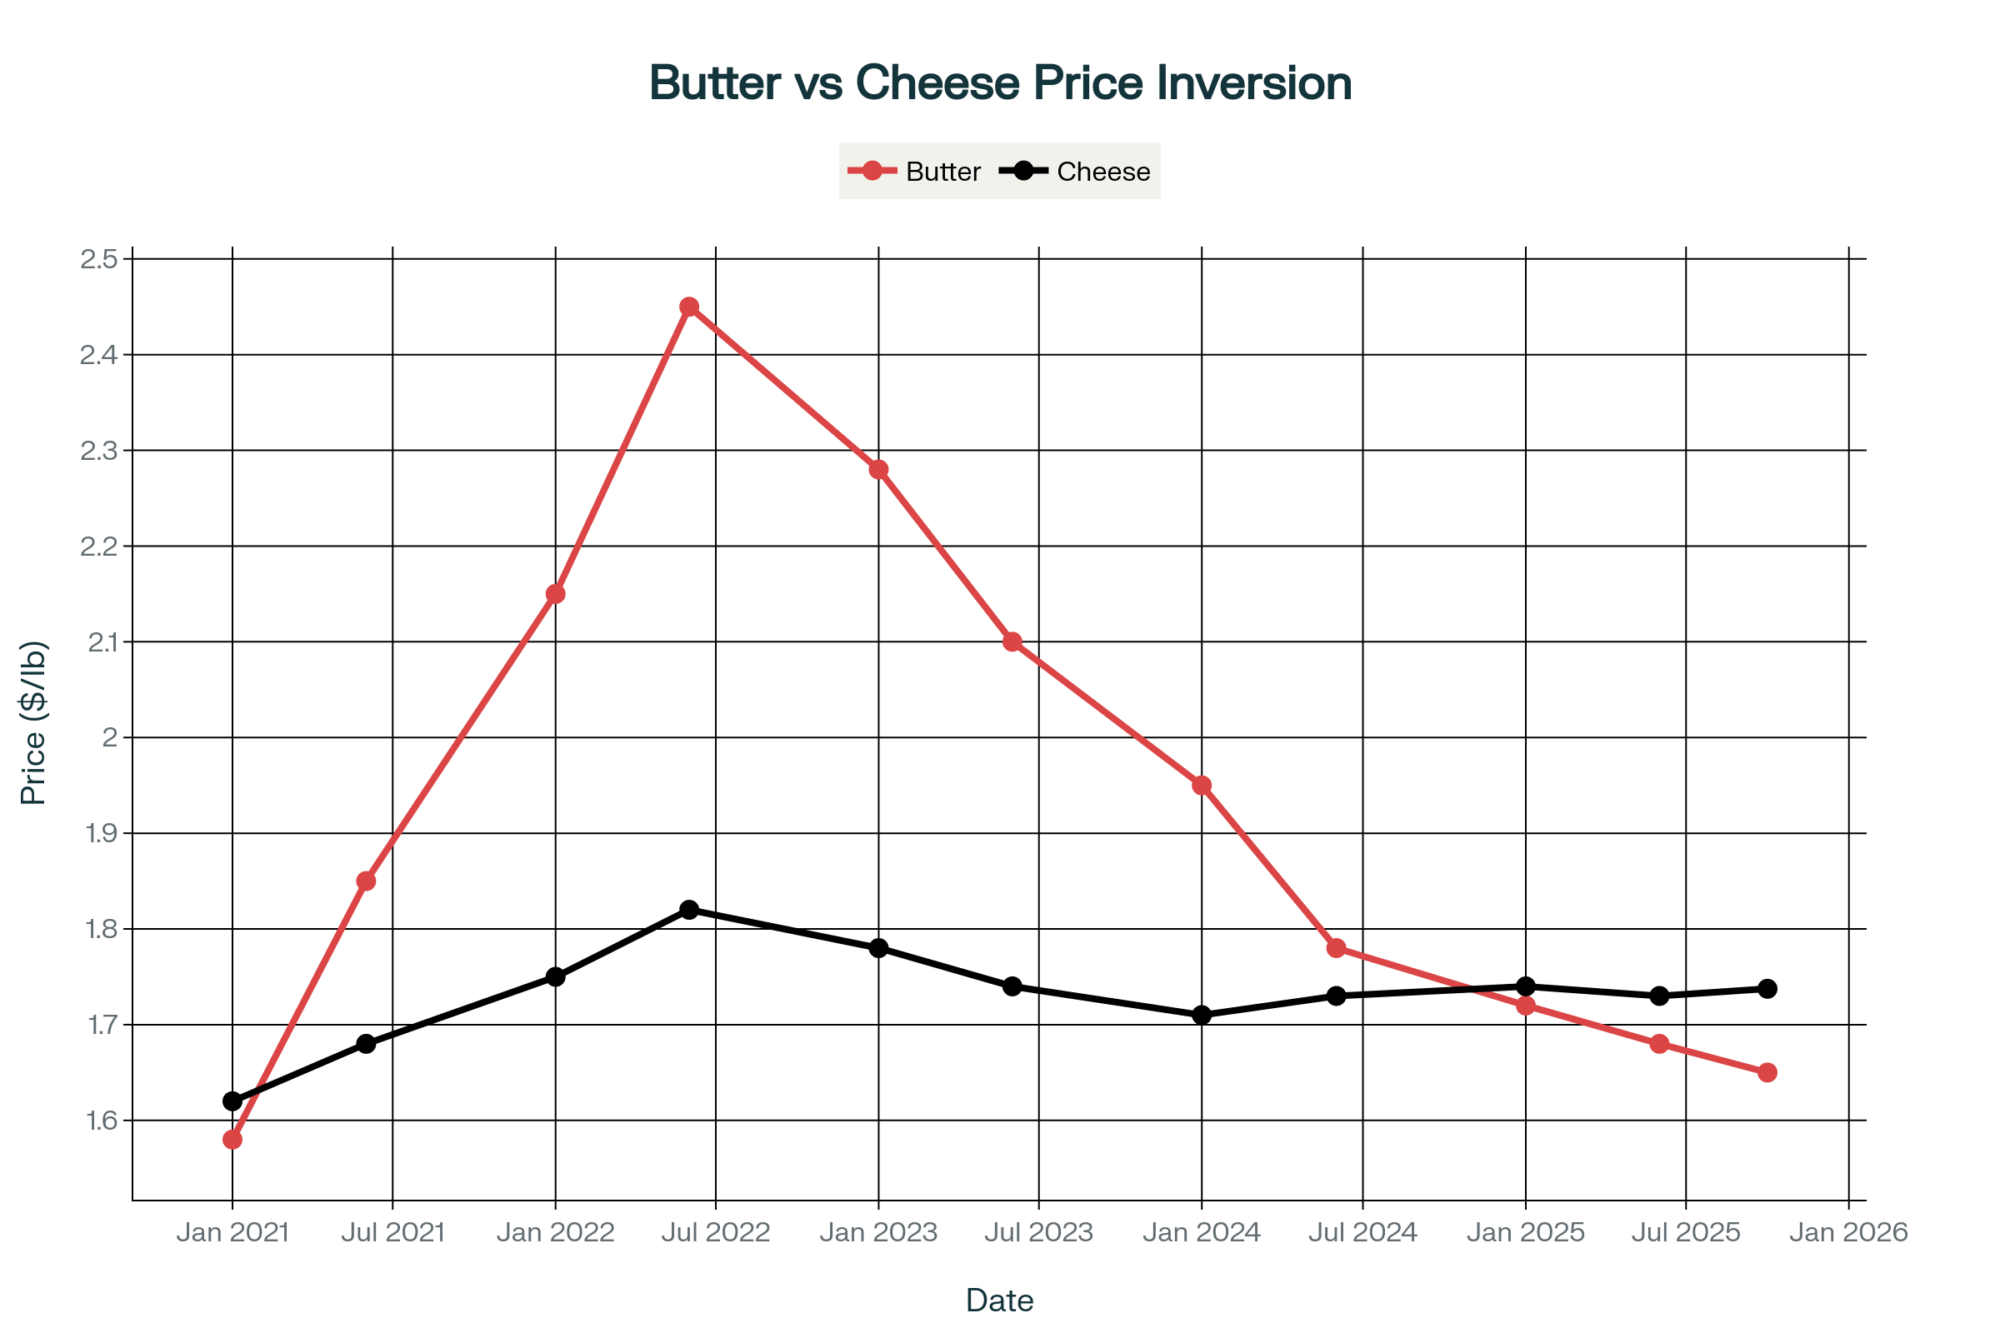
NewsSubscribe
First
Last
Consent
Send this to a friend