



Archive for protein premium

Tracing Coca-Cola’s fairlife Acquisition Payouts

Coca-Cola’s last fairlife check: $6.173B in March 2025. The SEC filings stop at the payment. Members need co-op records; suppliers need the clause that prices the next pound of protein.
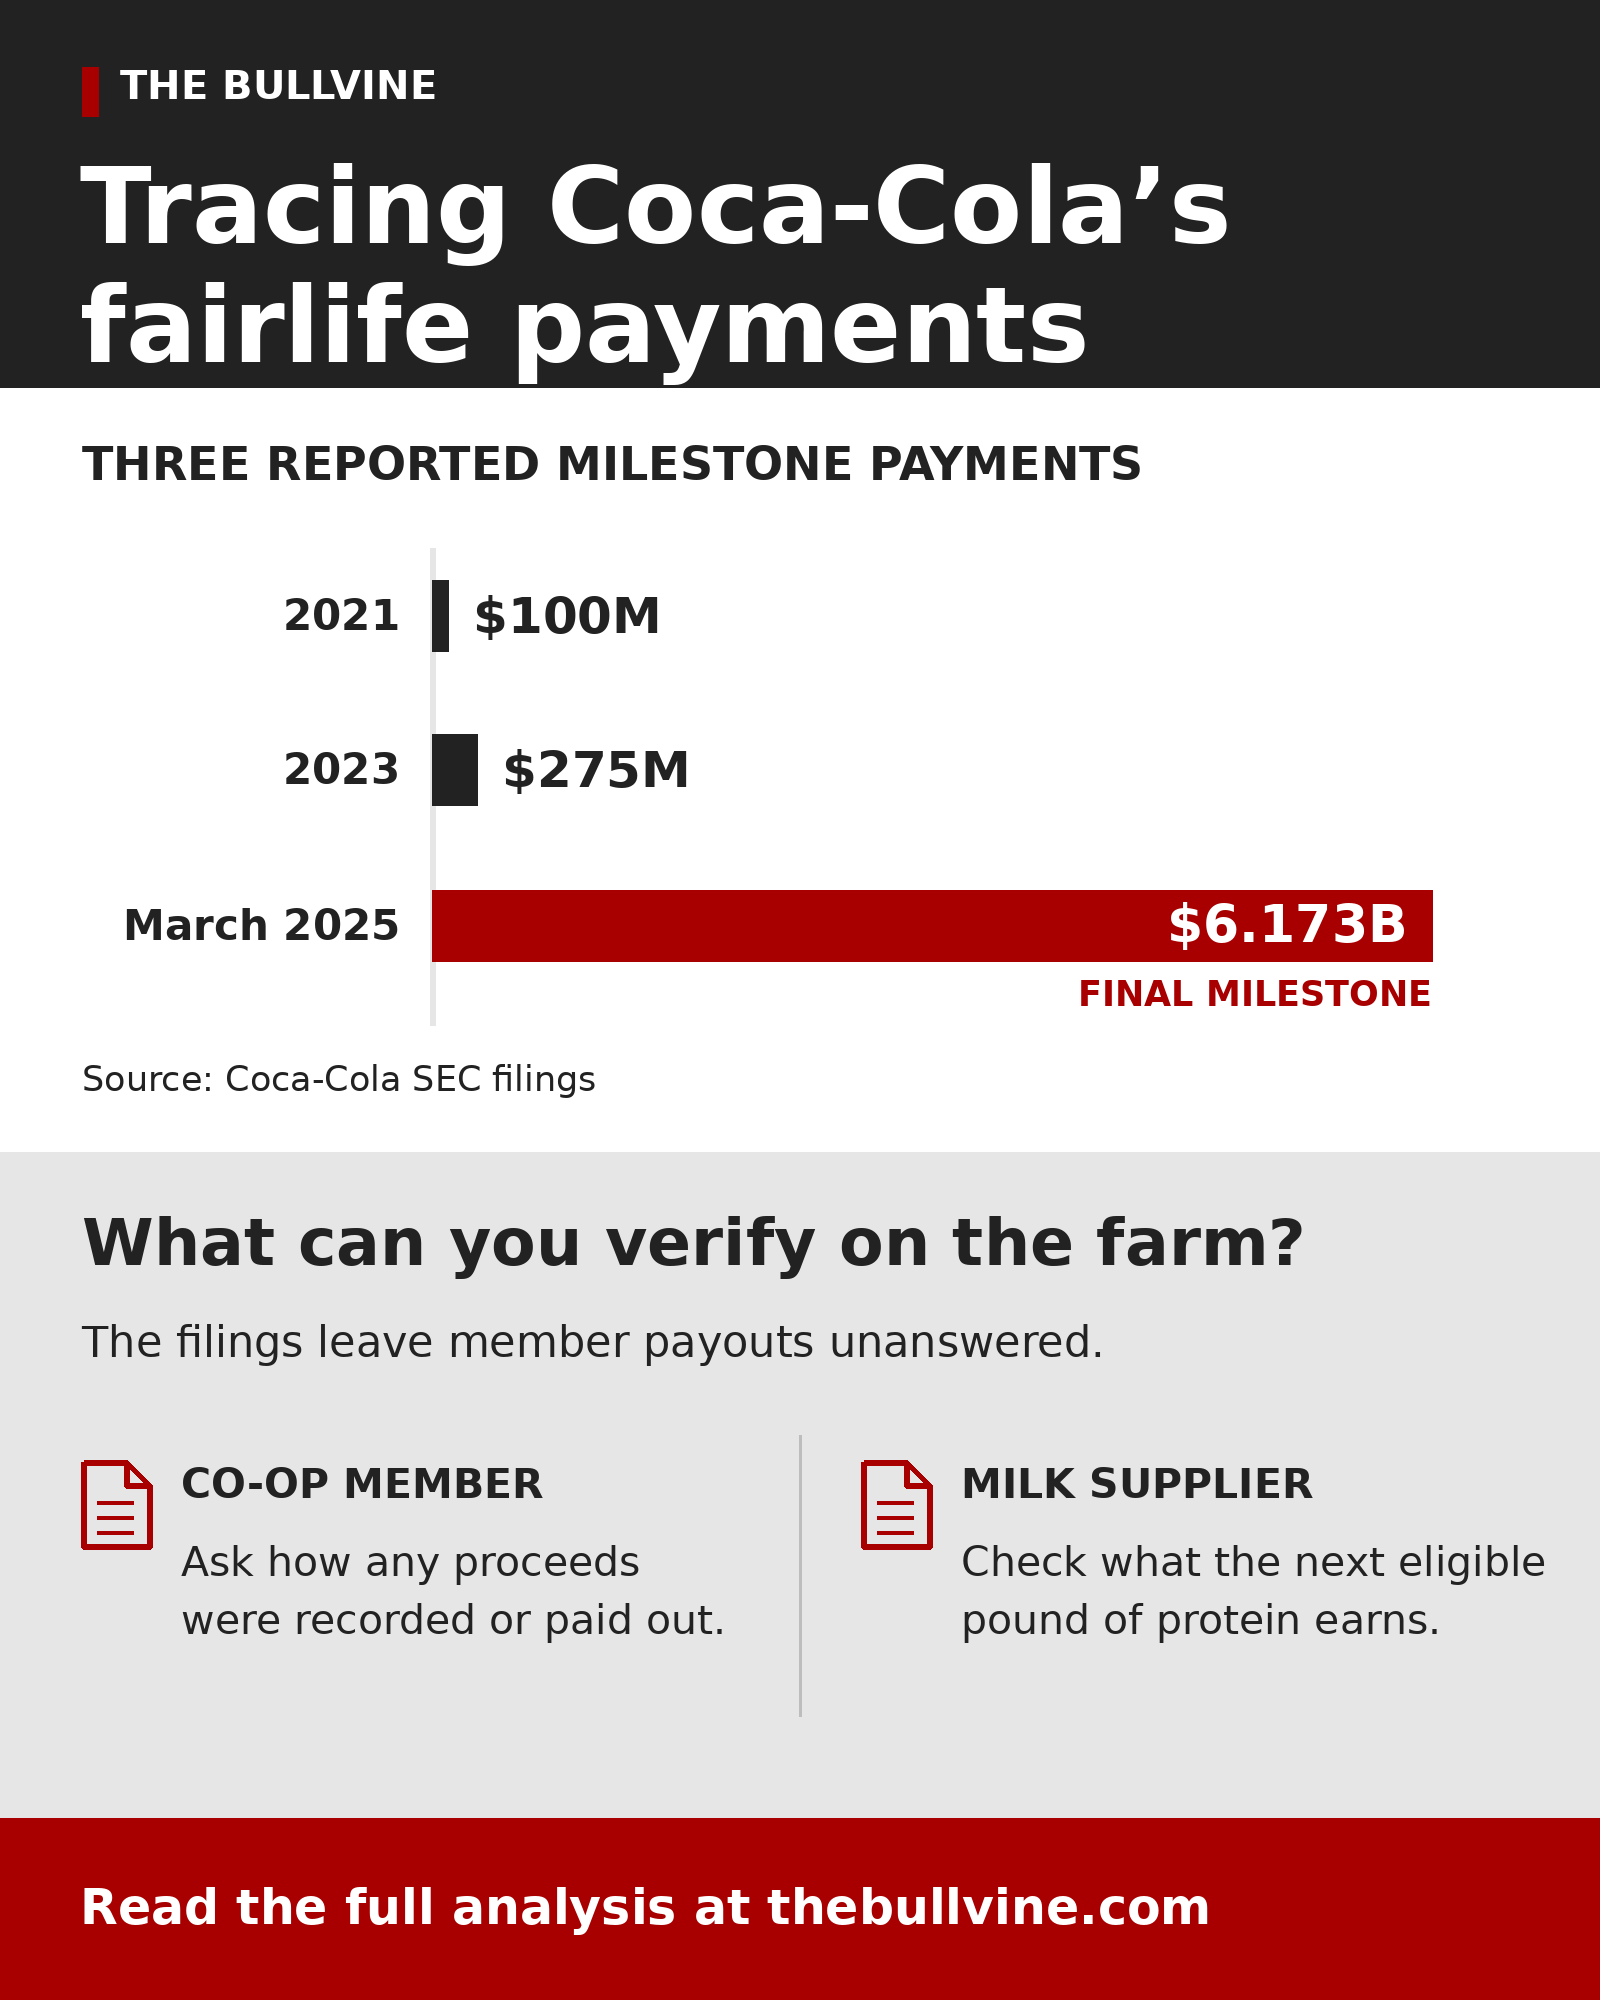
In March 2025, The Coca-Cola Company made the final milestone payment on its fairlife acquisition: $6.173 billion. For a dairy farmer, the natural question is whether any of that money reached the people who produce the milk.

The filings we reviewed establish the acquisition payment. They don’t disclose how the proceeds were allocated or distributed to Select Milk Producers members. That leaves two questions: what a co-op member received as an owner, and what a milk supplier is paid for components. One farmer can hold both roles, and each question needs different records.

New York and fairlife marked the production ramp-up at the $650 million Webster, N.Y. plant in August 2026. For Northeast shippers, the document that matters is the buyer’s written payment terms, and the rate it sets for the next eligible pound of protein.

What Coca-Cola actually paid for

In January 2020, Coca-Cola bought the 57.5% of fairlife it didn’t already own. fairlife identified Select Milk Producers as the seller, the dairy cooperative that had been Coca-Cola’s joint-venture partner.

Coca-Cola paid $979 million in cash, net of cash acquired. It also agreed to milestone payments, payable in 2021, 2023 and 2025 if fairlife met financial targets through 2024, each based on agreed formulas tied to fairlife’s operating results and with no ceiling.

Coca-Cola reported milestone payments of $100 million in 2021, $275 million in 2023 and $6.173 billion in March 2025. By Bullvine’s math, the three totaled $6.548 billion.
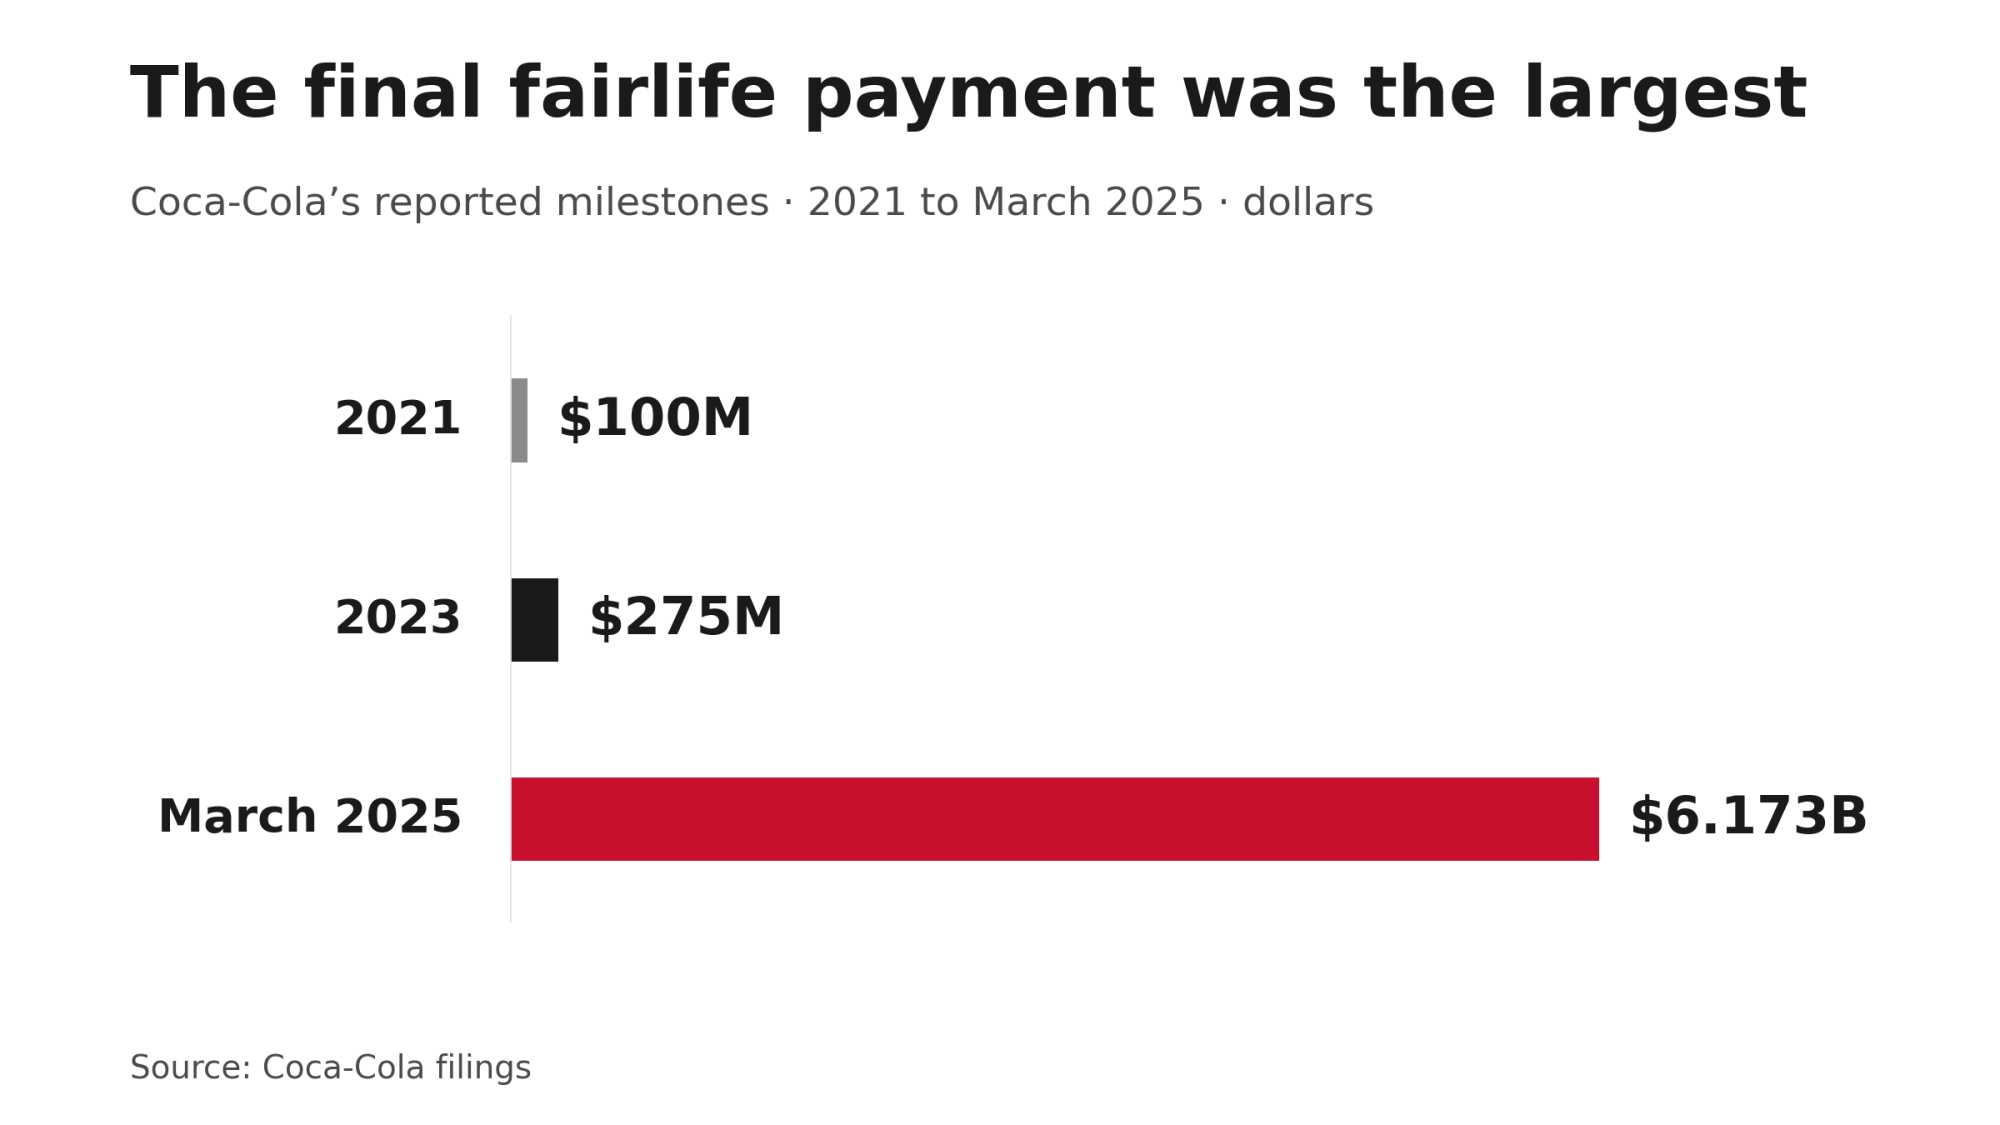
Coca-Cola reported $100M in 2021, $275M in 2023 and a final $6.173B in March 2025, the largest payment.

At acquisition, Coca-Cola booked $270 million as the estimated fair value of those contingent payments. The filings give the amounts paid but leave out the formula details, so they can’t show how much of the final payment came from volume, price or margin.

What the filings don’t tell Select members

Select sold the stake and its members are dairy farms, so it’s easy to assume the earnout reached those farms. Identifying the seller doesn’t establish what any member received, and the filings we reviewed don’t settle who received each milestone payment or whether any of it went to members.

For a co-op member, the question is what the co-op received from the sale and any milestone payments, and whether it allocated, retained, credited or distributed that money. The board can show how it recorded them. The records that answer it are:

  • co-op financial statements and annual reports to members
  • equity or patronage allocation notices
  • board resolutions on the proceeds
  • bylaws on allocation

For a milk supplier, the question is what the payment schedule pays for additional components, and under what conditions. That answer sits in a different set of documents:

  • the payment schedule or supply agreement
  • 12 months of milk statements
  • any written premium terms

Bylaws may explain allocation rules without showing how these particular proceeds were treated. A milk statement can’t resolve the ownership question, and co-op equity records can’t price the next pound of protein.
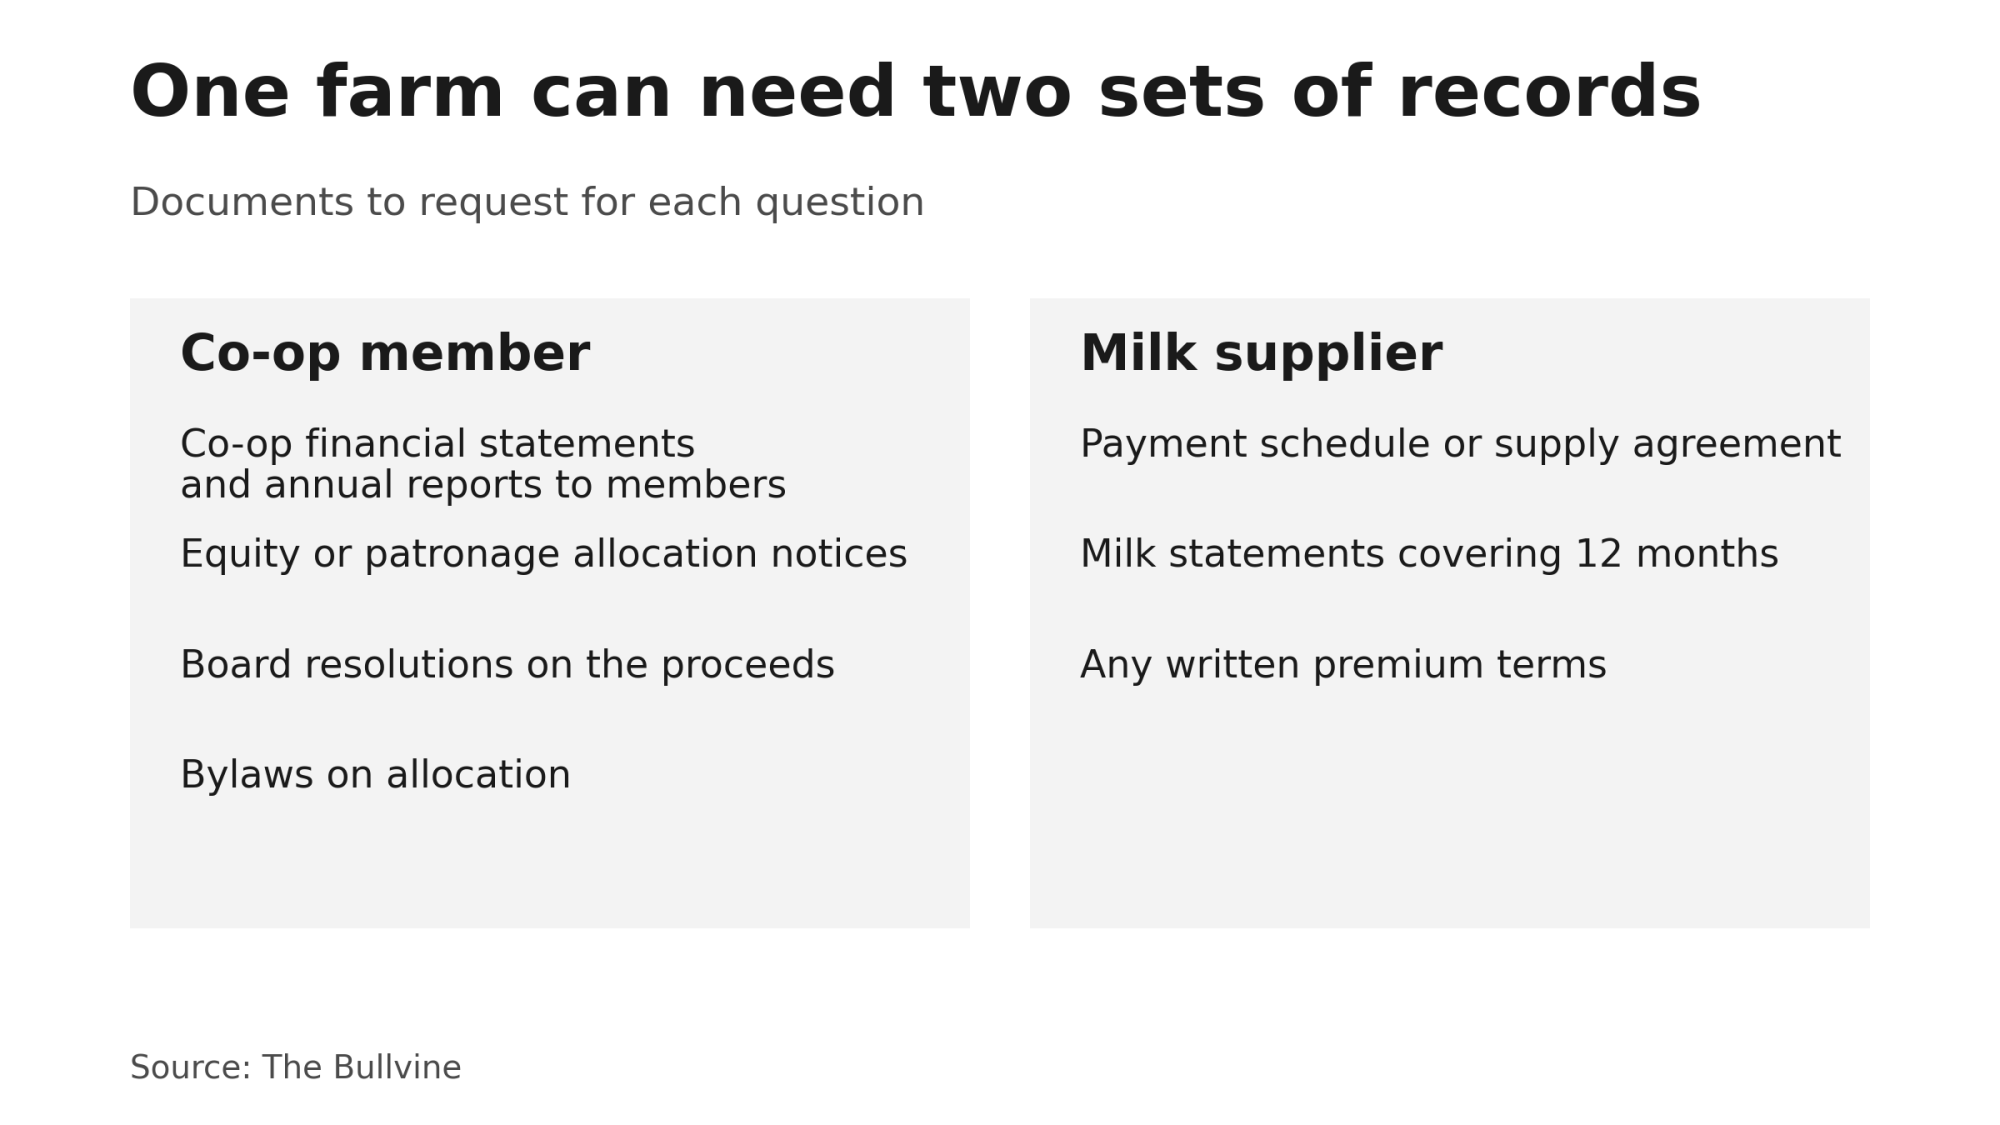
Co-op members need ownership records. Suppliers need payment terms and 12 months of milk statements.

Two roles, two sets of records

Co-op member (owner)Milk supplier
The questionWhat did the co-op receive from the sale and any milestone payments, and did it allocate, retain, credit or distribute that money?What does the payment schedule pay for additional components, and under what conditions?
Who can answerThe board can show how it recorded themThe buyer, through written payment terms
Records to requestCo-op financial statements and annual reports to members; equity or patronage allocation notices; board resolutions on the proceeds; bylaws on allocationThe payment schedule or supply agreement; 12 months of milk statements; any written premium terms

How big is Webster’s milk draw at design capacity?

At the low end of announced capacity, 5 million lb a day × 365 days comes to 1.825 billion lb a year. By Bullvine’s math, that’s about 11% of New York’s 16.568 billion lb of milk production in 2025.
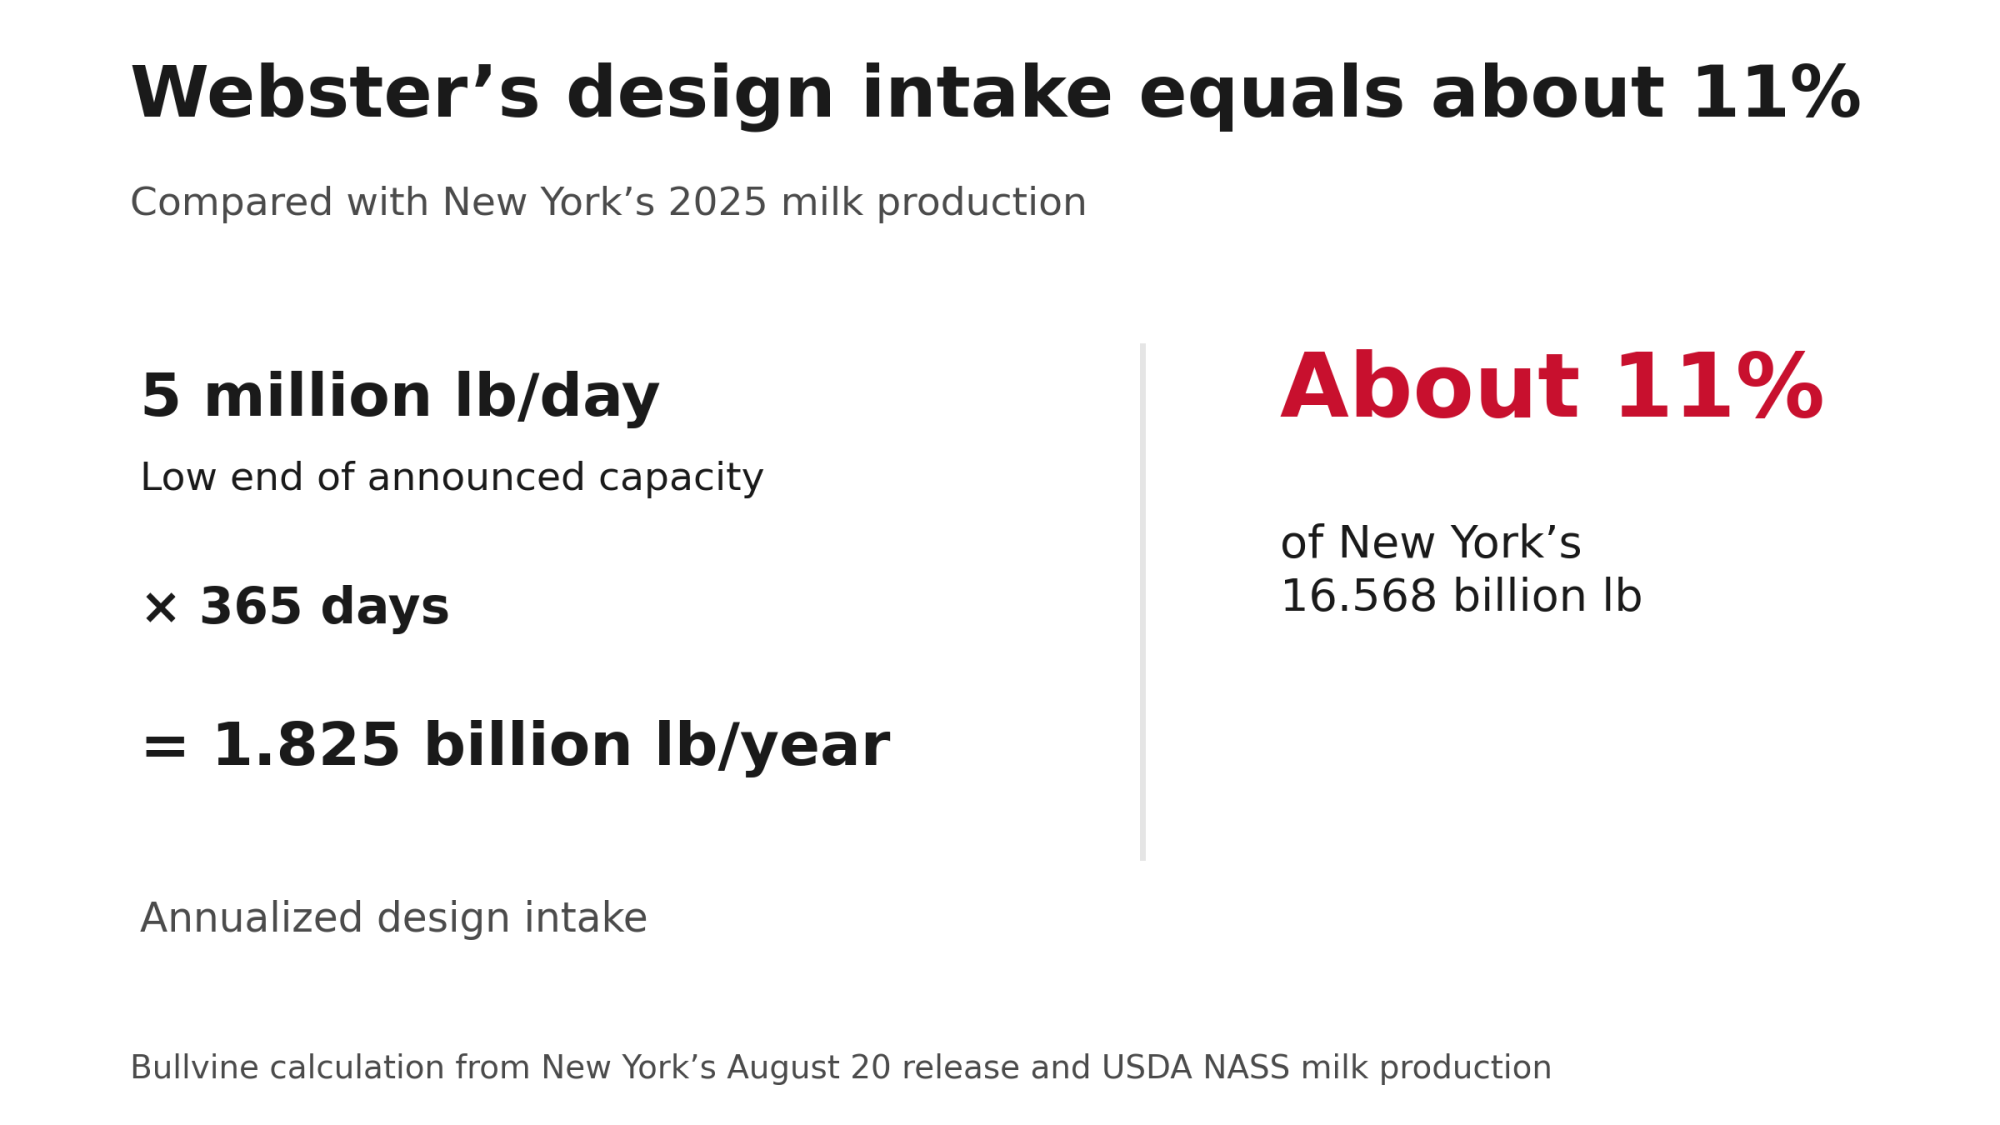
At 5 million lb/day, Webster’s design intake annualizes to 1.825 billion lb, about 11% of New York’s 2025 milk output.

New York’s August 20 release describes a 745,000-square-foot facility designed to take 5 to 6 million lb of milk a day. In its Aug. 20 release, fairlife said the plant was already sourcing milk daily from more than 40 local dairy farms. Reports showed that commercial shipments of fairlife ultra-filtered milk, Core Power protein shakes and Nutrition Plan shakes began there in January 2026. As of late August the plant was still ramping toward full capacity, and fairlife expected full operation later in 2026.

Webster: on the record vs. not disclosed

On the public recordNot disclosed in sources reviewed
$650 million, 745,000 sq ft plantActual milk intake
Designed for 5–6 million lb of milk a daySupplier openings
Sourcing daily from 40+ local farms (Aug. 2026)What suppliers are paid
Commercial shipments began January 2026Any effect on Northeast premiums
Full operation expected later in 2026Supplier agreements

We didn’t locate public supplier agreements. The sources reviewed don’t disclose actual intake, supplier openings, what suppliers are paid or any effect on Northeast premiums.

What the next pound of protein earns

Under a U.S. component-pay schedule, one clause sets the rate for the next eligible pound of protein. Where a statement has no protein line, the buyer can say whether protein enters the payment formula at all. Canadian producers are paid under a different system, so the USDA figures below don’t apply to them.

USDA’s federal order protein price uses wholesale cheddar and the butterfat price calculated from wholesale butter. In 2025, the average of USDA’s 12 monthly announced component prices was $2.4495/lb for protein and $2.4416/lb for butterfat. Those are announced federal order prices, not proof of what any particular supplier was paid.

Before a ration or contract change

1. Audit 12 months of statements before renewal or a feeding change

Three numbers from 12 months of statements

CalculationFormulaWhat it tells you
Historical protein revenue per cwtTotal protein dollars ÷ total shipped cwtHow much protein contributed to each cwt
Historical average realized price per lbTotal protein dollars ÷ total paid protein lbThe average price paid per pound in the past
Marginal payment per added lbPayment at current protein lb, then again with one extra lb, holding milk volume and other components constantWhat the next pound earns under the farm’s terms

A year of statements supports three separate calculations:

  • Historical protein revenue per cwt: total protein dollars ÷ total shipped cwt
  • Historical average realized price per lb: total protein dollars ÷ total paid protein lb
  • Marginal payment per added lb: the payment at current protein pounds, then again with one extra pound, holding milk volume and other components constant. The difference is what that pound earns under the farm’s terms.

The second number is useful, but it isn’t the third. An average only works as a marginal value once three things are confirmed: the extra pound is eligible, no threshold or cap blocks it, and the deduction changes are known. Where the statement doesn’t break out protein revenue, the buyer should be able to explain how protein enters the calculation. The Bullvine’s $28,614 tenth works through an Upper Midwest example.

Question for the buyer: Which line on the statement pays for the next pound of protein, and at what rate?

2. Get premium terms in writing

When a buyer offers a protein premium or a UF/high-protein line, these terms belong in writing:

  • eligible pounds and test method
  • thresholds and caps
  • deductions
  • duration, notice and exit terms

Question for the buyer: What happens to this premium at renewal?

3. Change the ration only when total margin holds

This protein-only screen holds only when other revenue and cost changes are negligible or counted separately:
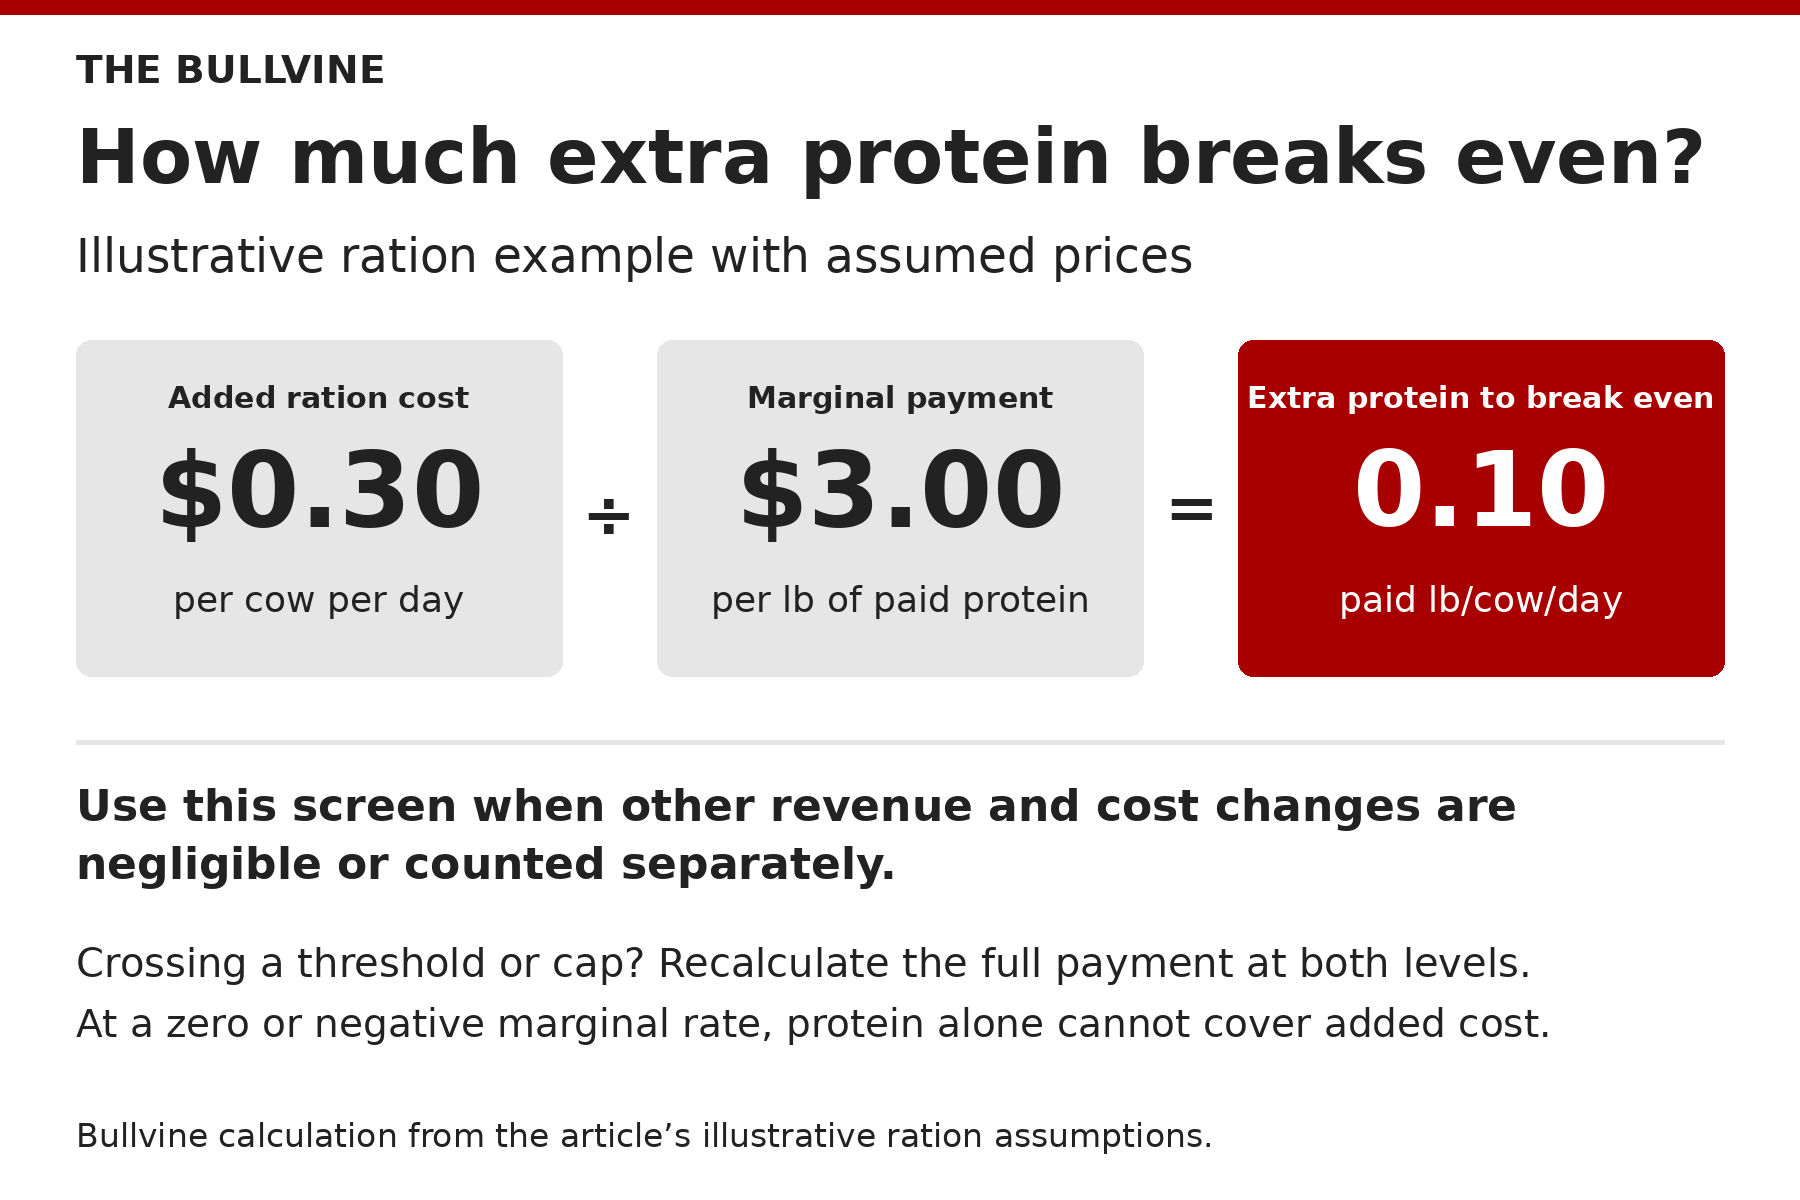
An added $0.30 per cow per day at $3.00 per paid pound requires 0.10 extra paid lb of protein per cow per day.

Break-even extra paid protein (lb/cow/day) = added cost per cow per day ÷ marginal protein payment per lb

As an illustration with assumed prices, not a market quote or forecast: a ration adding $0.30/cow/day, against an assumed marginal payment of $3.00/lb of eligible protein, breaks even at 0.10 additional paid lb/cow/day. If the projected increase crosses a threshold or cap, run the full payment formula at both production levels. At a zero or negative marginal rate, extra protein alone can’t cover the added cost.

A ration change can also move milk volume, butterfat, other solids and costs. The full test compares the change in total milk revenue with the change in feed and other relevant costs.

Question for the nutritionist: Does the change in the total milk check beat the change in total cost?

4. Keep sire selection balanced

Genetic emphasis should match how the farm is actually paid, inside a balanced breeding objective built on current CDCB and Holstein USA evaluations rather than protein compensation alone. The Bullvine’s analysis of TPI 2026’s protein trap covers how the 2026 revision treats protein.

Question for the breeding plan: Would this mating still make economic sense if the special premium ended before the resulting daughters entered the milking herd?

If payment depends on processor performance, require a way to verify it

A payment tied to a product, plant or margin is only as good as the records that come with it. A farm’s delivery records prove what it shipped. They can’t prove how big a performance pool was or how it was split among suppliers.

The terms to request and weigh are:

  • defined inputs and calculation periods
  • a statement the supplier can reconcile
  • independent review provisions
  • a correction process with deadlines

Not every supplier will get these terms. A buyer that won’t provide them has told the supplier something about the payment.

Question for the buyer: If the payment depends on the buyer’s results, how can the supplier check the calculation?

Coca-Cola’s filings account for the $6.173 billion on Coca-Cola’s side of the deal. The farm side still runs through two other documents: the co-op’s books and the buyer’s protein clause.

Methodology note: Bullvine calculations

  • Milestone payments: $100M (2021) + $275M (2023) + $6.173B (March 2025) = $6.548B.
  • Webster capacity vs. New York production: 5M lb/day × 365 = 1,825M lb. Dividing by 16,568M lb of New York milk production in 2025 gives 11.0%.
  • Ration example inputs: the $3.00/lb and $0.30/cow/day figures are illustrative assumptions.

Learn More

The Sunday Read Dairy Professionals Don’t Skip.

Every week, thousands of producers, breeders, and industry insiders open Bullvine Weekly for genetics insights, market shifts, and profit strategies they won’t find anywhere else. One email. Five minutes. Smarter decisions all week.

NewsSubscribe
First
Last
Consent

When Butter Sinks Below Cheese: The Market That Refused to Trade

Butter just crashed below cheese, CME froze up, and the global dairy market is rewriting every play farmers thought they knew. Is your operation ready for the new normal?

Executive Summary: Butter just sank below cheese, CME trades froze, and global dairy pricing rules are being rewritten in real time. What’s fascinating is how quickly protein has stolen butterfat’s thunder—today’s mailbox check is won or lost on what your cows put in the vat, not just how many pounds fill the tank. The flood of new U.S. processing plants won’t rescue margins if exports stall, especially with Europe and New Zealand cranking out more milk to chase slow demand. Input costs might be finally easing, but so are milk prices—so efficiency, not expansion, is the edge that matters most right now. It’s a moment that rewards the bold: managing risk, tweaking diets, and staying lean on labor can make all the difference. Everyone’s watching and waiting, but real leaders will act before they’re forced. The bottom line? In the 2025 milk market, the fastest to adapt will stand to gain, while those standing still will already be behind.

Dairy profitability, component feeding, Class III hedging, dairy market volatility, farm efficiency, protein premium, North American dairy

Let’s be honest: what happened last week on the CME was unlike anything we’ve seen since the pandemic. On October 8, not a single contract changed hands—no spot cheese, no butter, no nonfat dry milk, nothing at all. That’s more than a rare occurrence; it’s a signal that uncertainty and risk are now running the show in dairy’s major pricing arena.

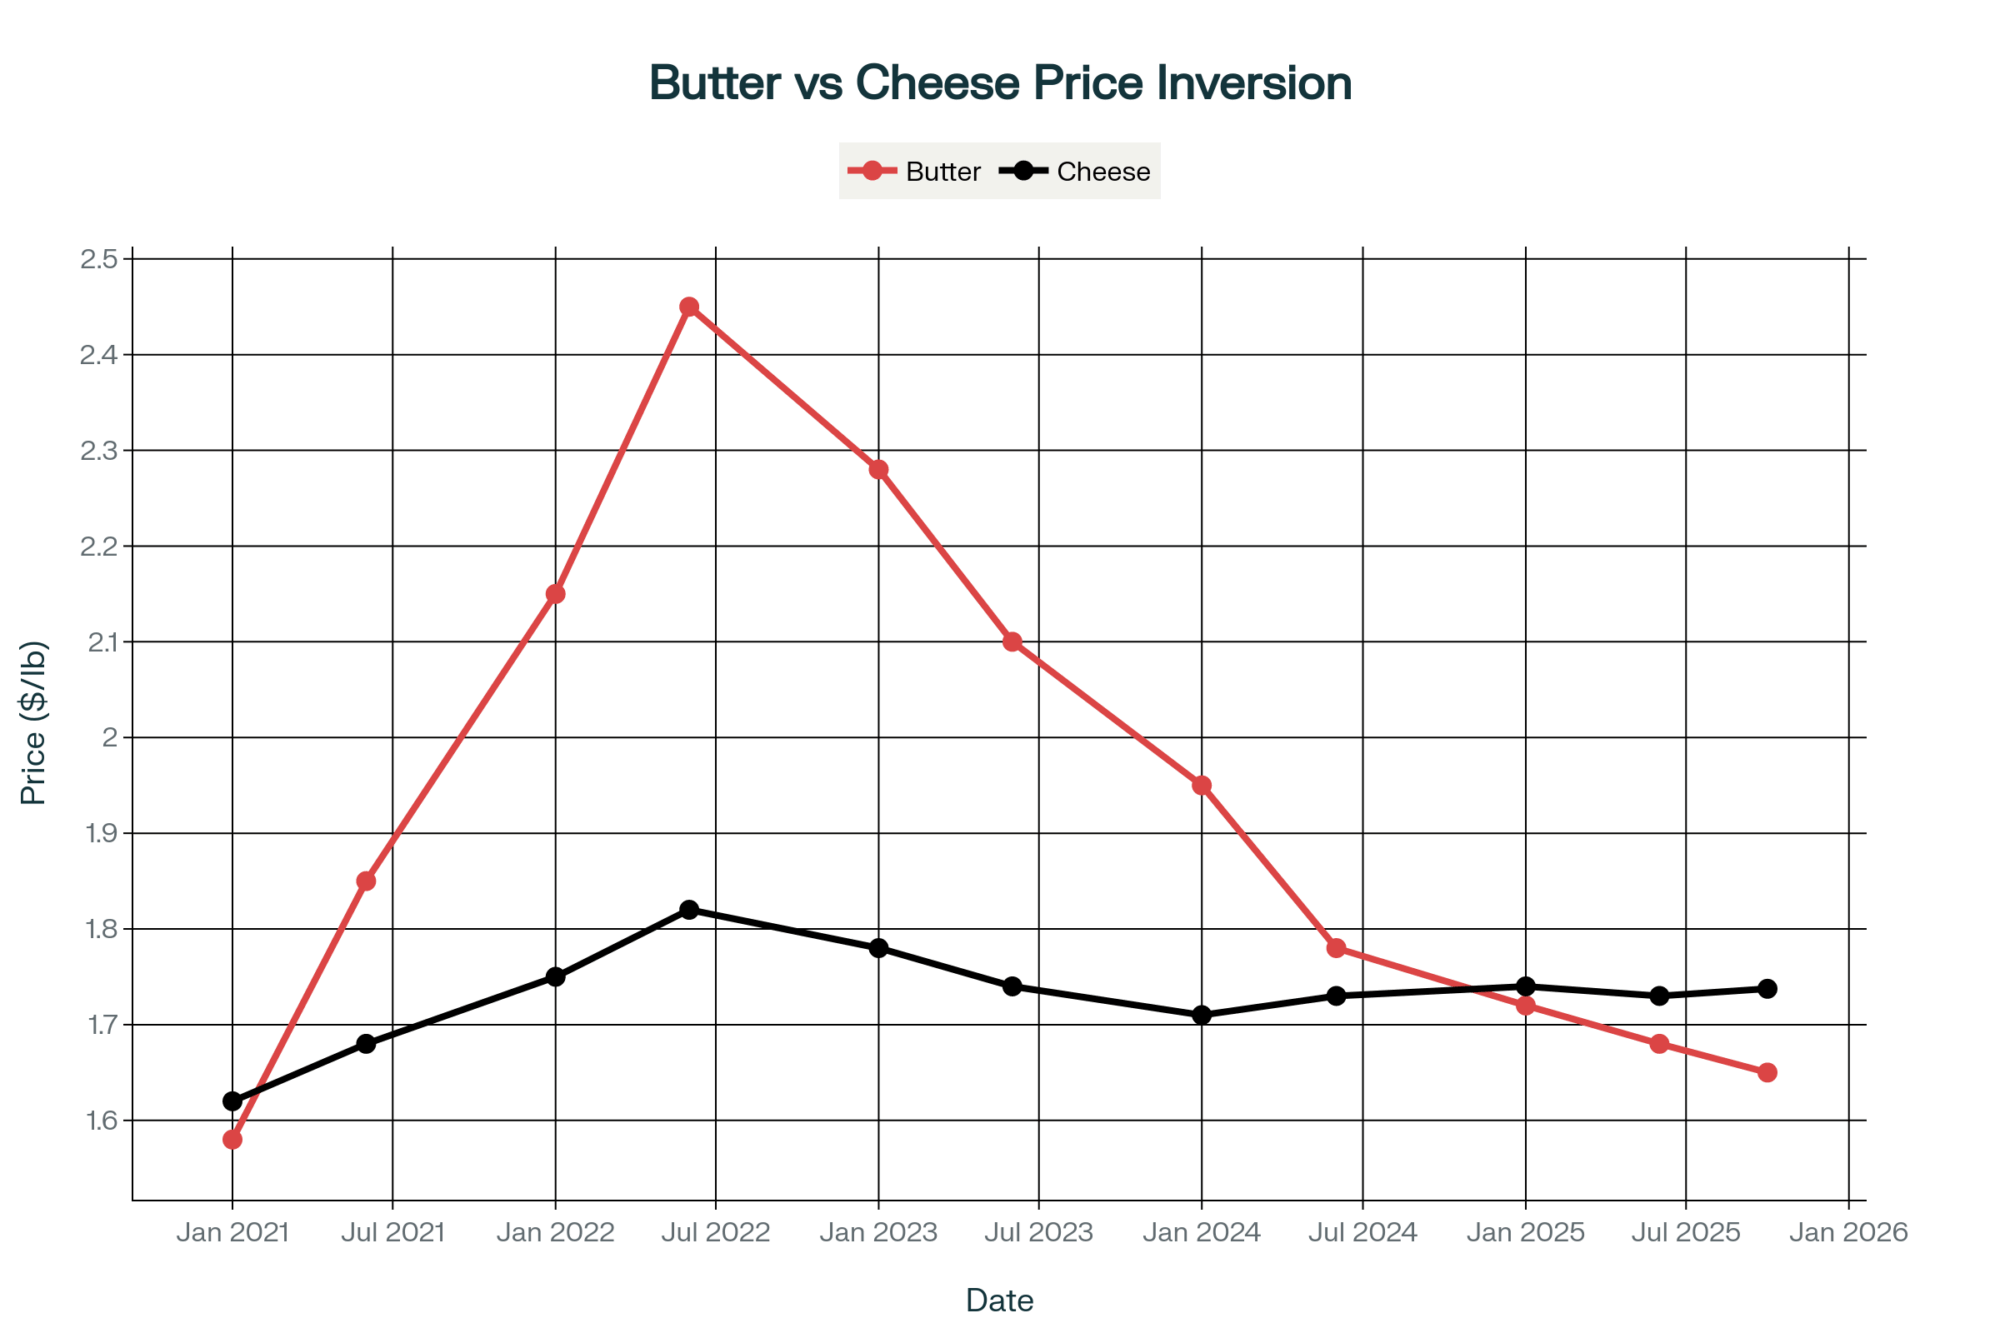
What’s interesting here is that when the market goes silent, it’s usually not confidence—it’s confusion. Butter actually dipped to $1.65/lb, while cheese held at $1.7375/lb. When’s the last time butter traded below cheese? You’d have to dig back to 2021 or early 2022 to find that particular inversion, and the implications for milk pricing—especially for anyone playing the class and component game—are immediate and sweeping.

The Great Inversion: For the first time since 2021, butter has crashed below cheese prices—a seismic shift that’s rewriting every dairy farmer’s component strategy overnight

The GDT Auction: Reading the Global Thermometer

Looking at the numbers from Global Dairy Trade’s TE389 auction (October 7), you get a sense of just how widespread the turbulence is. Here’s a breakdown, with direct source attribution to the GDT/USDA for verification:

ProductPrice Change (%)Winning Price (US$/tonne)
Whole Milk Powder (WMP)-2.3%$3,696
Skim Milk Powder (SMP)-0.5%$2,599
Anhydrous Milk Fat (AMF)+1.2%$6,916
Butter-3.0%$6,712
Cheddar+0.8%$4,858
Mozzarella-11.8%$3,393
Buttermilk Powder (BMP)-2.3%$2,768

The standout? Mozzarella got hammered, losing 11.8%, while AMF eked out a rare gain. What’s worth pausing on here is that Fonterra’s SMP maintains a premium of $105/tonne over the top European competitors—a spread that’s both unusual and unsustainable long-term. Buyers and sellers alike are weighing whether New Zealand is overpriced or if Europe’s downward spiral is a bigger issue.

Europe in the Red: Pressure on Every Front

European Dairy Collapse: The devastating numbers reveal an industry in crisis, with Young Gouda down 36% year-over-year and butter hemorrhaging nearly 30%

European dairy prices have been bleeding for months, but the latest quotes make that trend painfully clear. Citing data verified via the EEX and the EU’s weekly surveys:

CommodityWeekly Change (%)Current Spot (€ per tonne)Year-over-Year (%)
Butter-1.5%€5,533-29.6%
SMP-0.5%€2,159-14.9%
WMP-1.8%€3,740-13.8%
Whey+0.6%€890+0.6%
Young Gouda-2.4%€3,115-36.1%

What I’ve noticed over the years is that when European butter prices move this sharply, they tend to drag global fat values along with them. The decrease of €2,329 per tonne on butter this year is severe even for volatile markets, and SMP’s year-on-year losses are hardly better. For producers exporting into—or competing with—the EU, these are tough numbers.

The U.S. Spotlight: Processing Boom Meets Margin Squeeze

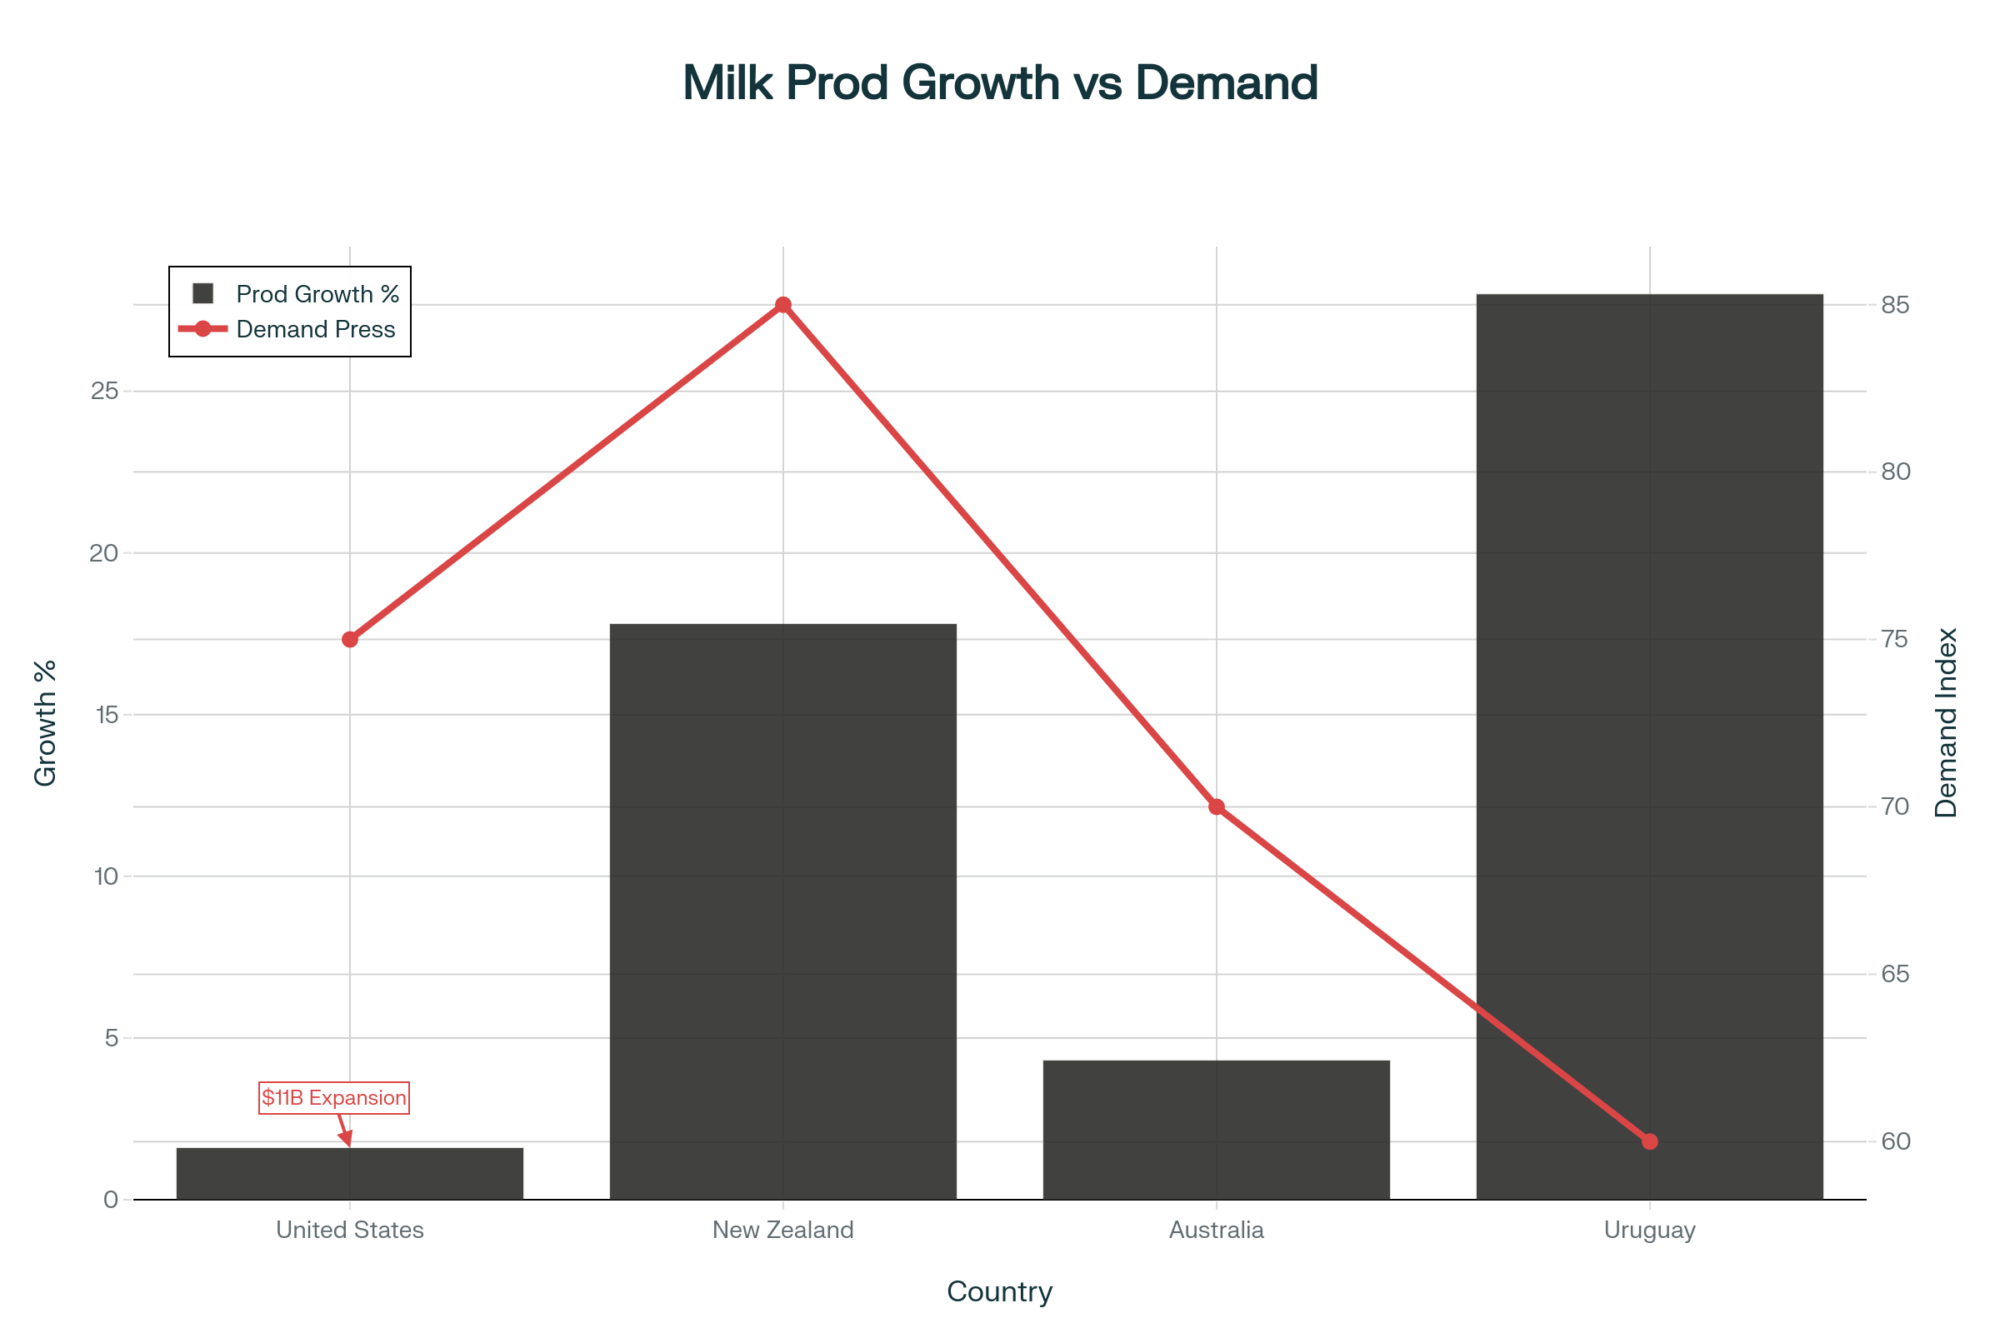
You want to talk about structural shifts? U.S. dairy is investing $11 billion in processing expansion across 50 new and expanded plants in 19 states through 2028, as verified by IDFA and federal development filings. This is happening due to two factors: persistent bottlenecks in cheese and powder production, and a rush to capture more global value as domestic consumption levels off.

But here’s the catch: bigger processing doesn’t necessarily mean bigger margins. As hundreds of millions of new pounds of milk are processed through cheesemakers in states like Texas, South Dakota, and New York, pricing pressure grows—not just due to feed, labor, or weather, but also from global market fluctuations and export volatility. I’ve had processors tell me flat out: “Volume can cannibalize value unless exports hold up.” They’re not wrong.

Component Pricing Clarity: Where’s the Money Now?

Here’s where the new component math really bites. With butter spot at $1.65 and cheese at $1.7375, current theoretical values work out as follows using the USDA Federal Milk Marketing Order Class III and Class IV formula calculations for the week ending October 10, 2025:

  • Butterfat: Approx. $2.19/lb
  • Protein: Approx. $2.71/lb

For years, protein was the underdog, and butterfat was king. Now? We’re in a market where protein drives the milk check and butterfat takes a back seat. What’s remarkable is how quickly this change came about—a swing like this would have looked improbable just last fall.

What does this mean practically? If you’re near the break-even point, even a small shift in herd average protein—from, say, 3.05% up to 3.12%—could change your bank balance more than anything you do on butterfat. That’s especially true with Class III at $17.19/cwt and Class IV at $14.60/cwt; protein premiums are back in charge, at least for now.

Feed Costs, Herds and Margins: The Reality on the Ground

Now, feed costs are down this fall—corn’s at about $4.13 and soy meal around $275. However, here’s the paradox: margins didn’t exactly return to their original levels. I’ve spoken to several producers who saw input costs ease by 10-15%, but lost even more due to falling milk prices. In this kind of margin environment, efficiency beats expansion. Producers rocking 15–25% better feed efficiency—usually those leveraging precision diets and sharp dry lot management—are far outperforming neighbors still running by last year’s playbook.

It’s also worth noting that with replacement heifer numbers at a multi-decade low, aggressive culling isn’t just a cost control—it’s a competitive advantage. Keep your best cows fresh, don’t hang on to underperformers, and watch the butterfat-protein balance in your breeding goals.

Global Forces: More Milk, More Competition

Global Production Surge Meets Demand Reality: While milk output explodes worldwide, processing capacity can’t save margins when export markets stall.

Let’s talk about the milk waves. The U.S. added another 114,000 cows year-over-year, now at 9.45 million, and lifted production 1.6% in May. Irish and Belgian farmers both reported strong late-summer surges, with Ireland’s August total increasing by 6.8% and Belgium’s by 3.6%.

But what’s striking is the pressure coming from Oceania. New Zealand kicked off its new season with a 17.8% production bump, and Australia pumped up August exports by 4.3% despite back-to-back years of drought. All this is happening while China’s local output and cow numbers are stabilizing or even declining slightly, which complicates demand-side optimism.

Even in South America, Uruguay’s dairy exports are capturing new market share, increasing by 28% in September alone. The takeaway? The competition for export slots—especially for cheese and powders—is intensifying by the month. The world doesn’t need surplus milk from every region at once, especially when consumer demand in places like China remains tepid.

If You’re Milking Cows, Three Moves You Should Consider

Looking at these numbers, what stands out is that there’s no single “right” answer for every farm. But the directional signals are clear:

  1. Actively Manage Risk: If you can lock in Class III or IV futures at a profit, don’t wait. The market could tighten, but it’s far more likely we stay volatile, and margin squeezes hurt more than missing a few cents.
  2. Feed for Components, Not Just Volume: It’s a fresh-cow-to-dry-cow world now. Precision feeding, component-oriented breeding, and tighter culling have real paybacks.
  3. Watch the Processing and Export Play: Growth in U.S. processing capacity is a double-edged sword—great for local demand, tough for global price stability. Farms able to pivot into value-added or more reliable regional supply chains (think specialty cheeses, A2 products, grass-fed claims) may find less risk, more reward.

So, Where Are We Headed?

This past week’s trading freeze isn’t just a blip. It’s a signal that nobody at the big end of the market is sure what’s next. Butter’s below cheese. Protein is paying. The U.S. is betting big on processing, but the world’s awash in milk, and margins are one bad export report from falling through the floor.

However, here’s my perspective, after decades in this space: challenge breeds innovation. The producers who stay nimble, watch the fundamentals, and act decisively on both feed and marketing will come out ahead. It’s not about surviving the tidal wave, it’s about learning how to surf it.

Suppose you’re looking for further reading and validation. In that case, I encourage you to dig into the latest weekly USDA Dairy Market News, spot market details at the CME, EEX, and GDT auction reports, IDFA and federal investment data, and regional herd and feed guidance from your local extension or university resource.

After decades in dairy, I’ve learned: hope can’t milk cows or balance the books. The market’s rewrite is a chance to step up. Those who adapt—fast—will turn volatility into advantage. Those who wait will watch margins vanish.

Key Takeaways:

  • Butter dropped below cheese—for the first time in years. Big warning for milk pricing ahead.​
  • Not a single dairy futures trade at CME; uncertainty just went off the charts.​
  • Protein now rules the milk check—if you haven’t shifted your herd’s diet, you’re losing dollars.​
  • U.S. plants are expanding, but global competition and weak demand are causing margins to shrink rapidly.​
  • Feed your best cows smarter; efficiency now beats herd size every time when profits are tight.​

Complete references and supporting documentation are available upon request by contacting the editorial team at editor@thebullvine.com.

Learn More:

  • Spring Pasture Powerplay: Balancing Grazing Efficiency with Milk Component Goals – This tactical guide reveals immediate, on-farm methods like using Rumen-Protected Amino Acids (RPAAs) and strategic buffer feeding to optimize milk protein and butterfat. It provides actionable component feeding adjustments and rotational grazing strategies to capture efficiency gains and stabilize rumen health, ensuring your herd can meet the new protein demand.
  • Global Dairy Market Dynamics: Navigating Volatility and Strategic Opportunities in 2025 – Extend your strategic understanding beyond the CME freeze with a deep dive into global market drivers. This analysis identifies major trends—from European oversupply and shifting policy to logistics normalization—and emphasizes the data-driven KPIs (like Feed Conversion Ratio) producers must track to maintain competitiveness amid sustained international volatility.
  • Your Feed Room’s Hidden $58400 Leak – And How Smart Dairy Farms Are Plugging It – To directly achieve the 15-25% efficiency gains discussed in the main article, this report quantifies the financial risk of feed shrink. It demonstrates how precision feeding technology and real-time tracking can plug losses worth up to $58,400 annually for a 100-cow dairy, turning input cost control into a major profit center.

The Sunday Read Dairy Professionals Don’t Skip.

Every week, thousands of producers, breeders, and industry insiders open Bullvine Weekly for genetics insights, market shifts, and profit strategies they won’t find anywhere else. One email. Five minutes. Smarter decisions all week.

NewsSubscribe
First
Last
Consent
Send this to a friend