Archive for dairy genomics

Zoetis–Neogen’s $160M Genomics Deal: The Hidden Cost of Letting One Company Own Your Pipeline

When the same logo sits on your genomic test, your wellness index, and now the lab behind a big slice of the industry’s DNA cards, the number that matters isn’t just $160 million — it’s the $86,000 you quietly push through that pipeline over five years.

Executive Summary: Zoetis’ just-announced $160 million purchase of Neogen’s animal genomics business is a bet on owning the global DNA pipeline, not just another test brand. Neogen’s unit brings in $90 million in genomics revenue, operates five labs across the U.S., Brazil, Australia, China, and the U.K., and serves customers in 120+ countries, dropping a ready‑made lab network into Zoetis’ Precision Animal Health machine. For a 750‑cow Holstein herd using CLARIFIDE Plus at roughly $43/head, that means around $17,200 a year — about $86,000 over five years — flowing through one company’s genomic loop that now influences breeding, wellness traits, and health protocols. The article shows how that integration can genuinely help (sharper predictions, smoother software, simpler decisions) while also raising switching costs and shifting leverage away from herds, breed associations, and AI programs toward a handful of platforms. It then gives a concrete 30/90/365‑day playbook: audit genomics contracts for data ownership and use, secure export rights, pilot a non‑Zoetis lab as Plan B, and stop letting any single index be the only lens on your genetics and health risk. The core message: you can stay in the Zoetis ecosystem, but before this deal closes in the second half of 2026, you need to decide — and document — who owns your genotypes, how portable they are, and how hard it would really be to change course later.

Zoetis Neogen genomics deal

On March 2, 2026, Zoetis announced it would pay 0 million to acquire Neogen’s animal genomics business, including its GeneSeek laboratories and livestock/companion animal genomics portfolio. Neogen says the net proceeds will primarily go toward debt reduction and a tighter focus on its food safety and animal safety markets, and both companies expect the deal to close in the second half of calendar year 2026, subject to regulatory approvals.

If you’re running 300–1,500 cows or sit on a breed association genetics committee, this isn’t abstract M&A. It means the lab work that used to sit quietly in the background — where your DNA cards went before proofs came back — is on track to sit under the same corporate roof as CLARIFIDE Plus, DWP$, vaccines, mastitis tubes, and digital herd‑software integrations.

The real question for 2026 is blunt: How much control over your genomics and data are you handing to one company — and on what terms — when this closes?

What $160 Million Actually Buys — and What It Doesn’t

Here’s what’s actually changing.

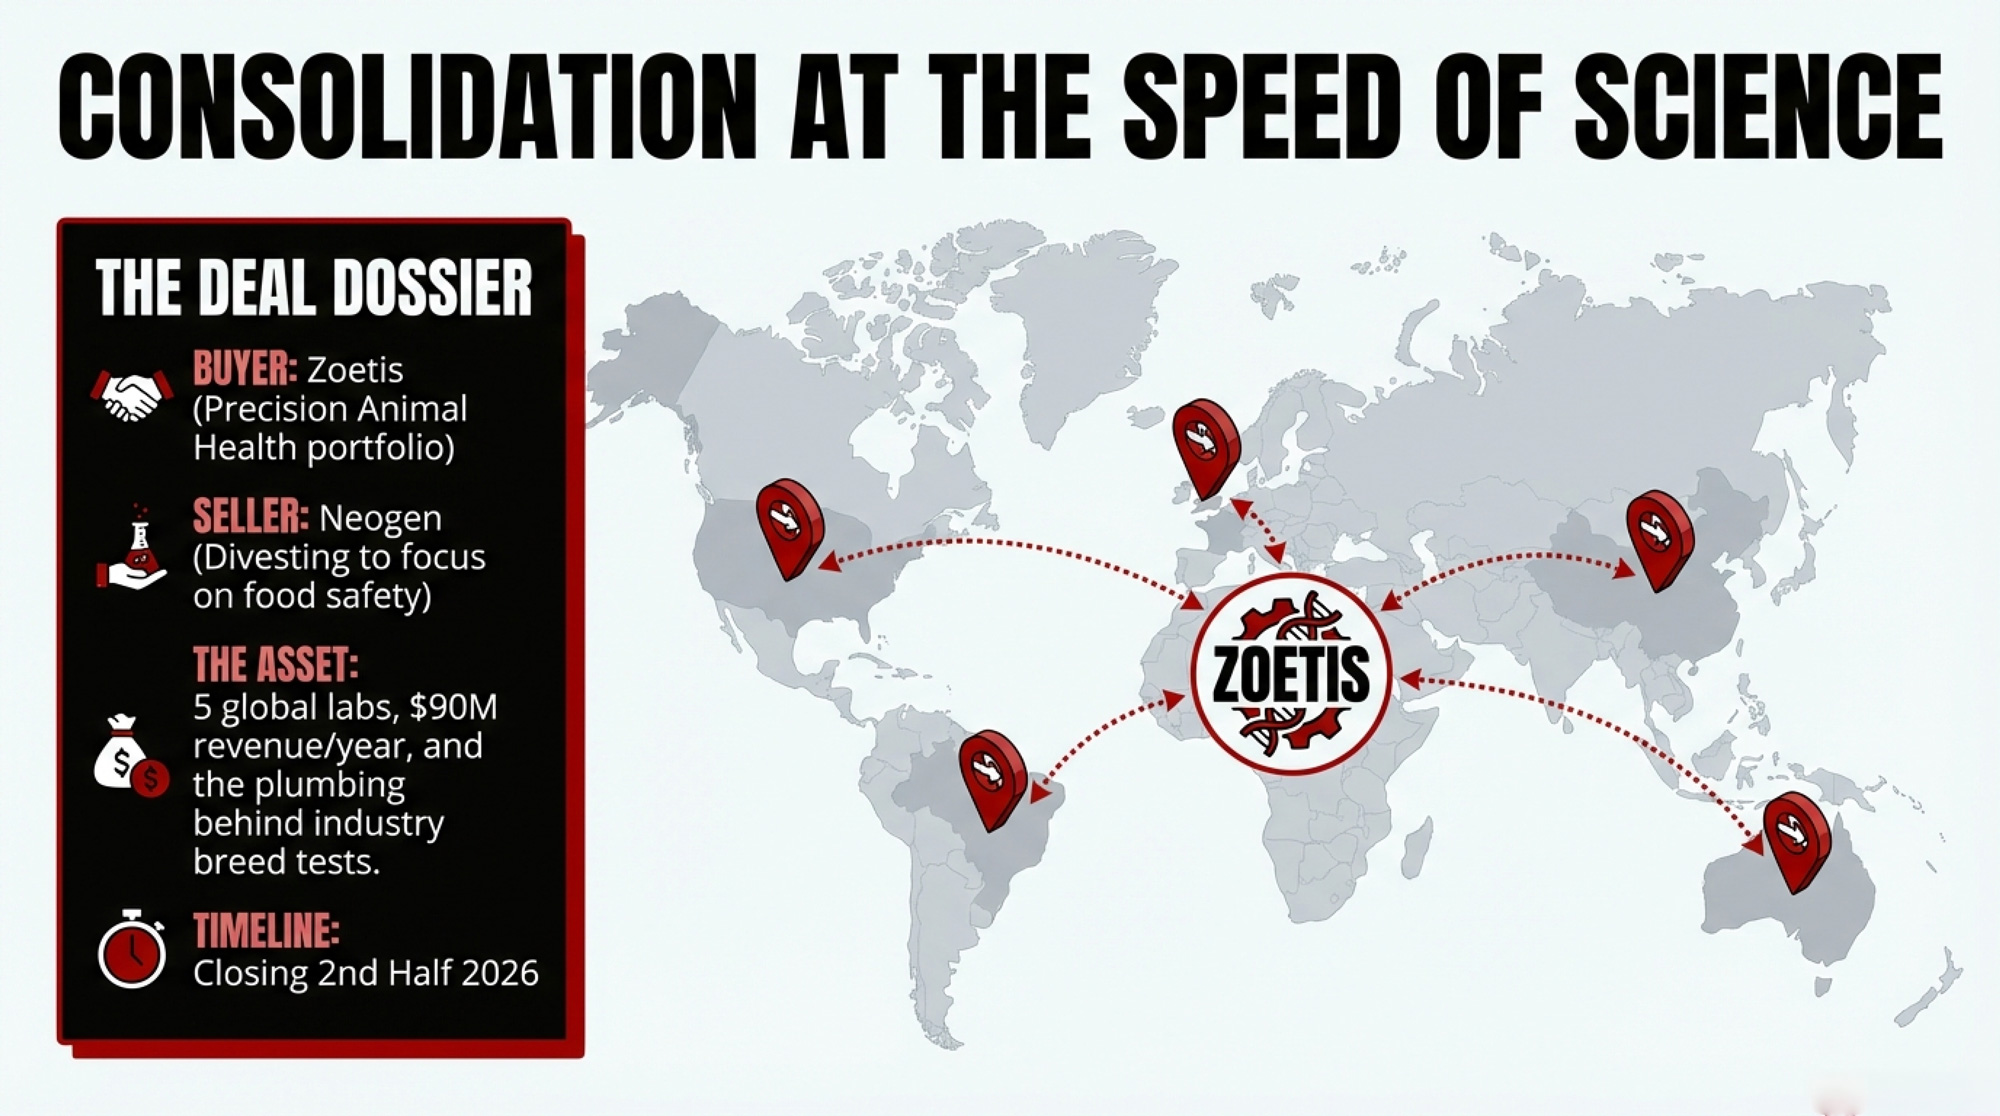
  • Buyer: Zoetis Inc. (NYSE: ZTS), “the world’s leading animal health company,” positioning the deal as strengthening its Precision Animal Health portfolio. Jamie Brannan, Zoetis’ Chief Commercial Officer, says the acquisition “brings complementary capabilities that expand predictive insights and individualized care, enabling us to deliver added value to customers.” 
  • Seller: Neogen Corporation (NASDAQ: NEOG), calling this a “planned divestiture” of its animal genomics business, so it can simplify operations, focus on core food and animal safety markets, and reduce debt. CEO and President Mike Nassif says the sale “allows the company to accelerate de‑leveraging and improve profitability.” 
  • Asset: Neogen’s animal genomics business, which:
    • Generates about $90 million in annual sales as of Neogen’s fiscal 2025. 
    • Operates five laboratories in the United States, Brazil, Australia, China, and the United Kingdom, plus an office in Canada. 
    • Serves customers in more than 120 countries, using fixed‑array and sequencing technologies with associated software to support genetic testing. 
    • Zoetis describes it as a leader in U.S. beef and dairy genomics. 
  • Price: $160 million, a clean ~1.8× revenue multiple on that $90 million sales base. 
  • Timeline: Zoetis expects to complete the acquisition in the second half of 2026, and Neogen expects to close by the first half of its 2027 fiscal year, pending regulatory approvals. 

That 1.8× revenue multiple tells you how each side sees this. For Neogen, it signals that genomics is a scale‑dependent service line — valuable, but not its primary growth engine, compared with food and animal safety. For Zoetis, rolling a ~$90‑million genomics business into a much larger animal health portfolio is easy to justify if it deepens their Precision Animal Health strategy and tightens the link between genetics, medicines, vaccines, diagnostics, and digital tools.

Zoetis isn’t starting from zero on genomics. They already had:

  • CLARIFIDE and CLARIFIDE Plus for dairy, built around genomic predictions and the Dairy Wellness Profit Index (DWP$), with wellness traits aimed at mastitis, metritis, displaced abomasum, ketosis, lameness, twinning, abortion, and more. 
  • INHERIT Select for beef, positioned as a genomic tool for commercial herds. 
  • A genetics lab in Kalamazoo, Michigan, is part of their existing Precision Animal Health infrastructure. 

What they’re buying now is plumbing and reach: a global lab footprint, thousands of customers who’ve used GeneSeek as their processor, and a large base of Igenity and GGP genotypes feeding evaluations and management tools across species.

AssetZoetis Holdings (Before Deal)After $160M Neogen Acquisition
Genomic ProductsCLARIFIDE Plus (dairy), INHERIT Select (beef), DWP$ wellness indexAll existing products + Neogen’s Igenity, GGP platforms, sequencing technologies
Lab Footprint1 genetics lab (Kalamazoo, Michigan)6 total labs: U.S., Brazil, Australia, China, U.K., Canada
Customer ReachNorth America focus via existing distribution120+ countries served through acquired lab network
Annual Genomics RevenueEst. $400M+ (within Precision Animal Health segment)Adds $90M from Neogen genomics business
Strategic ControlOwned genomic testing pipeline for proprietary indexesAlso processes DNA for competitors, associations, AI companies
Competitive PositionLeading dairy genomics brandOwns both the test brand AND much of the third-party lab infrastructure

The 750‑Cow Herd Caught in the New Loop.

Now pull this into a barn you recognize.

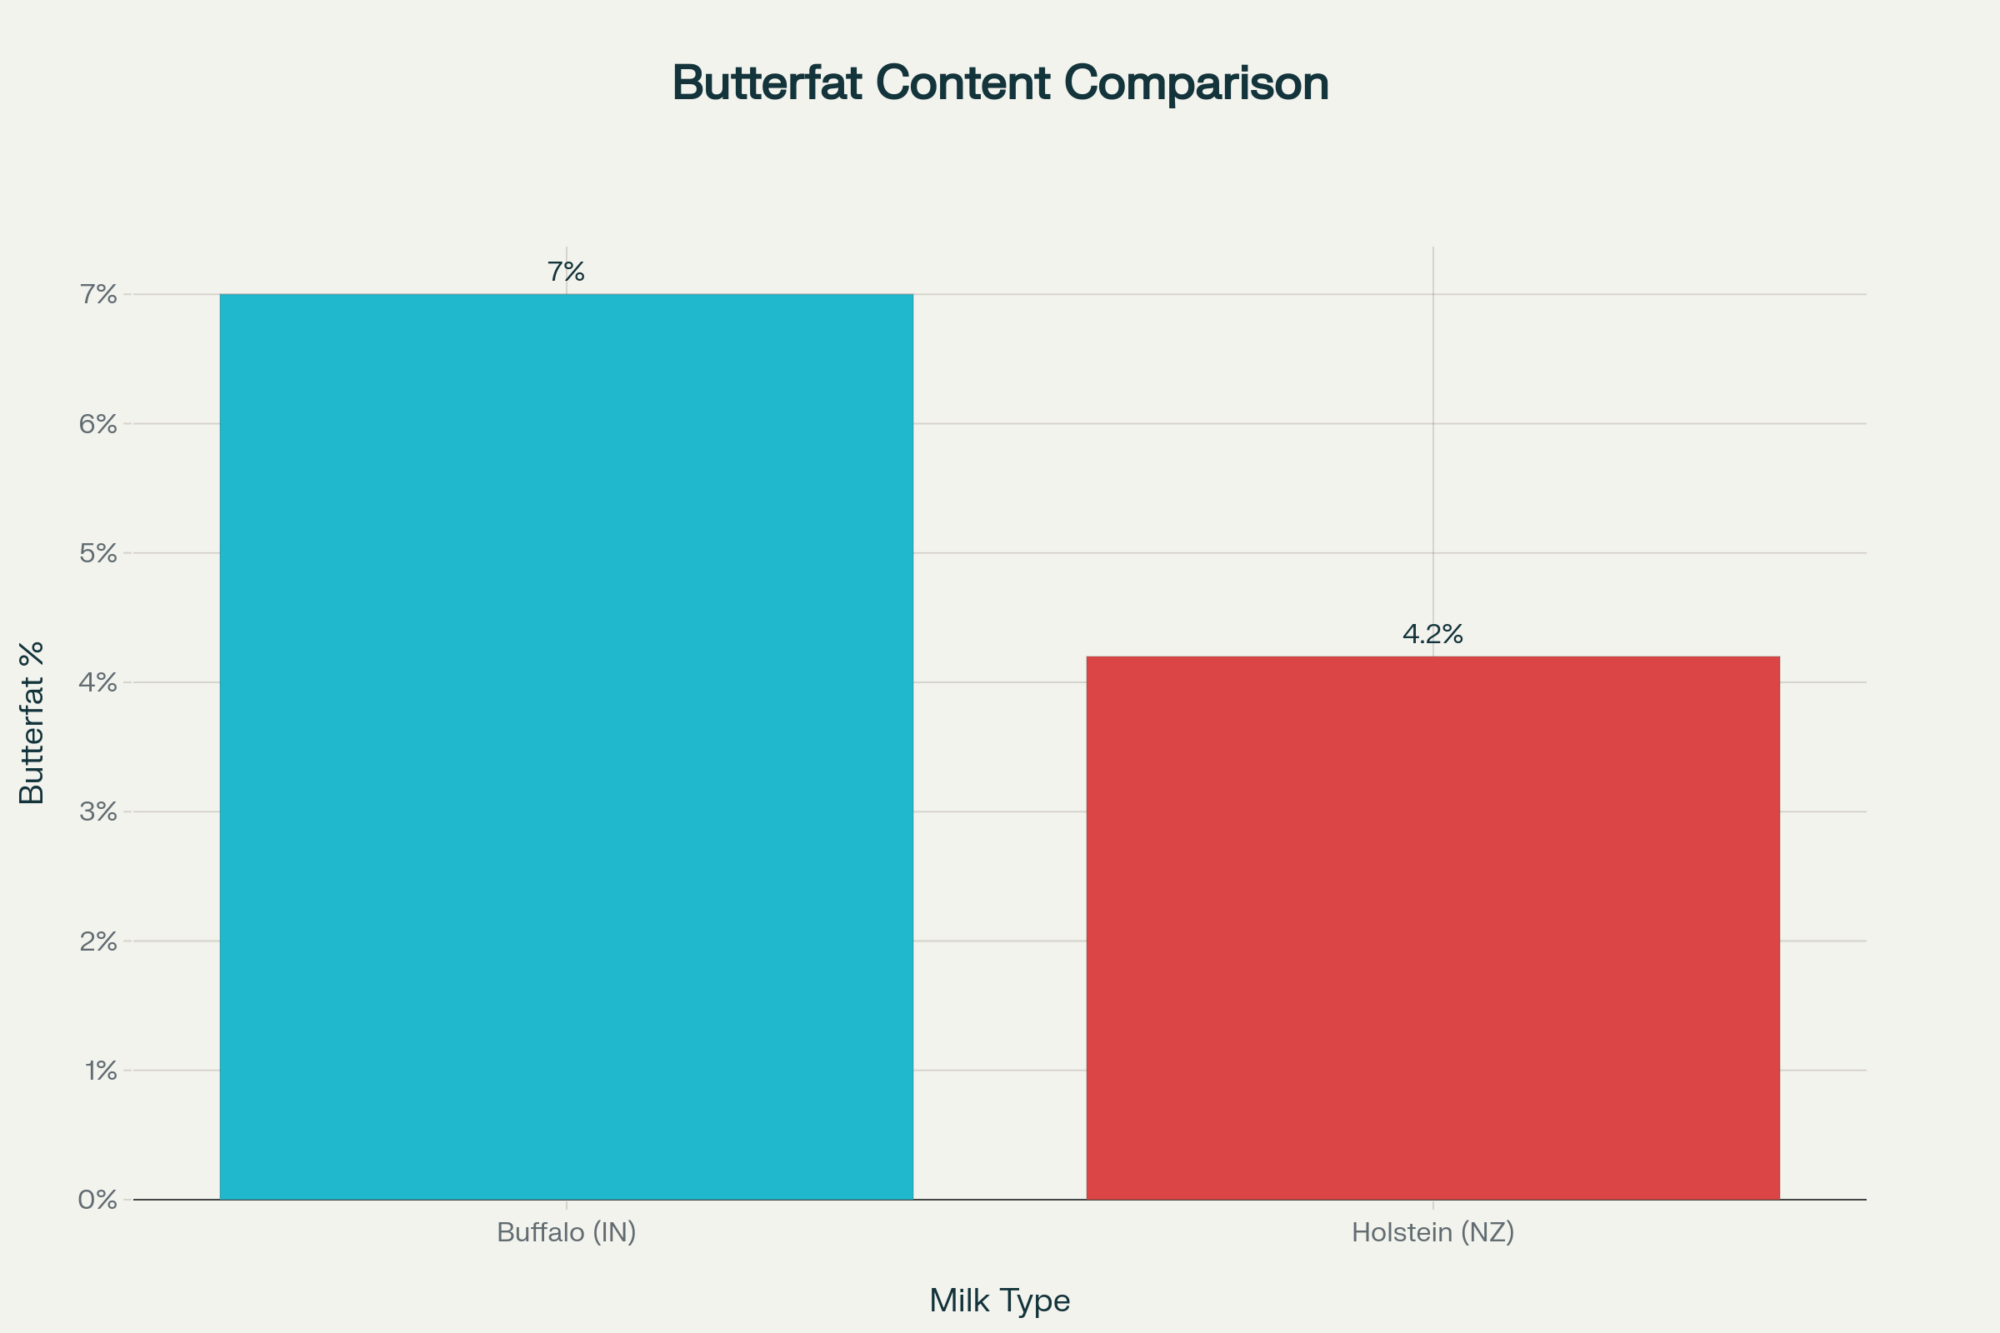
Picture a family‑run 750‑cow Holstein herd that’s all‑in on CLARIFIDE Plus:

  • Every heifer gets genotyped through CLARIFIDE Plus.
  • The breeding program leans heavily on DWP$ and wellness traits that Zoetis positions as predictors of health and profitability. 
  • The herd‑management software — through Zoetis or partner integrations — pulls genomics directly into the cow card, so DWP$ and wellness scores sit alongside repro, health, and production records. 

Meanwhile, another herd in the same region runs Igenity or GGP tests through a breed or AI program that sends DNA cards to Neogen’s GeneSeek labs.

As of March 2, 2026, those routes are set to converge:

  • Neogen’s animal genomics business — including its five labs and software — is under a definitive agreement to be sold to Zoetis. 
  • Zoetis says integrating Neogen’s genomic technologies and data solutions will expand “predictive insights, individualized care, and greater value” across major livestock and companion species. 

From the 750‑cow herd’s side of the fence, that means:

  • The lab processing a significant share of breed/AI genomics — Neogen’s business — is on track to have the same corporate parent as CLARIFIDE Plus and other Zoetis genomics offerings. 
  • The company that runs your genomic test, defines your wellness index, integrates with your herd software, and sells you disease‑prevention products will also own a big chunk of the lab capacity behind your neighbors’ tests and some association pipelines you rely on. 

That might pencil out just fine. But it’s no longer the same arm’s‑length relationship you started with.

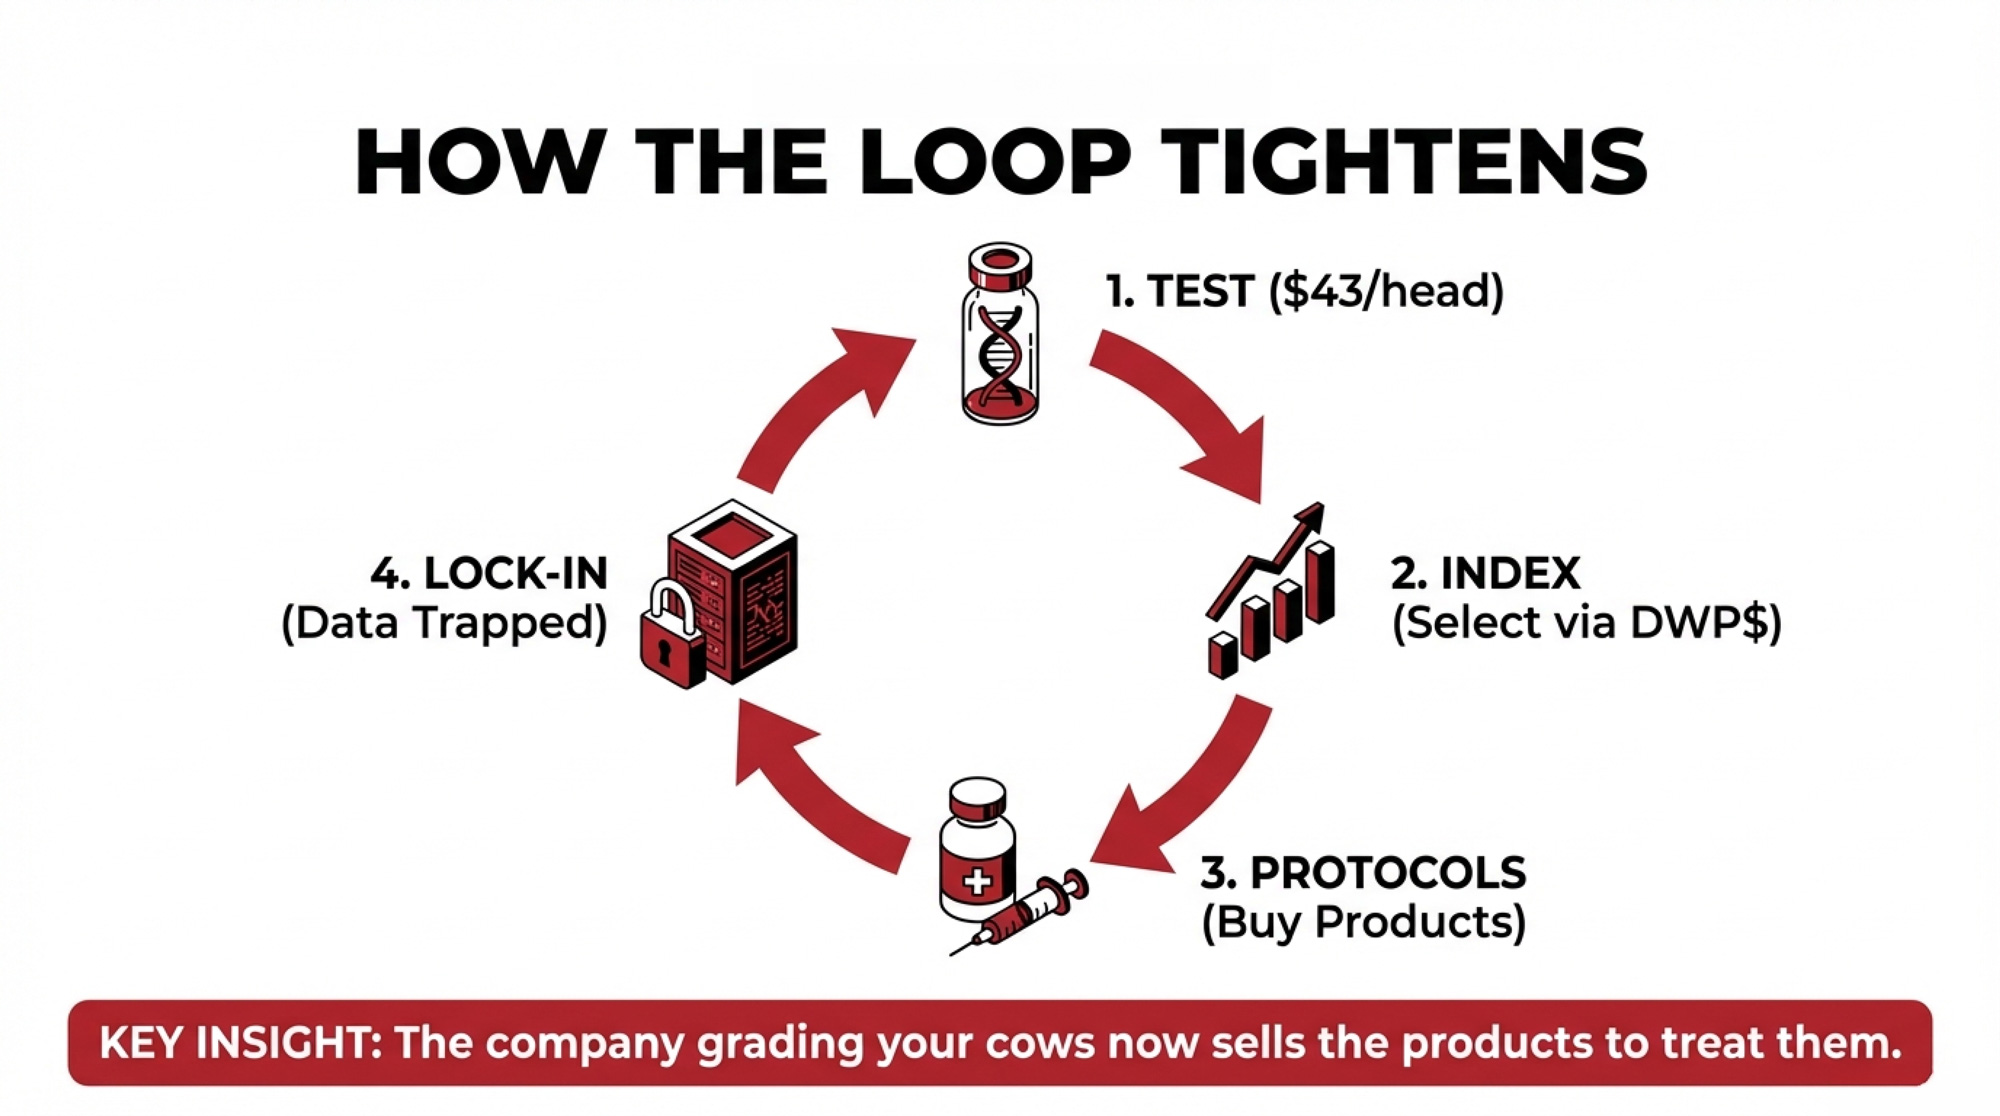
The Genomics Loop: $43 Per Head, 2,000 Animals, One Company

CLARIFIDE Plus isn’t a mystery line item. Holstein Association USA lists CLARIFIDE Plus at around $43 per Holstein animal, with practical costs for many herds in the $40–$50 per head band depending on volume and program.

StepAnnual Activity5-Year TotalWho Benefits
Direct Testing400 tests × $43 = $17,200/year$86,000Zoetis (lab revenue)
Genetic DirectionSelection/culling decisions based on DWP$ index2,000 animals shaped by one platform’s trait prioritiesZoetis (proves index “works”)
Protocol AdjustmentsEst. $10/cow/year targeted health spend (750 cows)$37,500Zoetis (wellness-linked product sales)
Switching FrictionStaff retraining, advisor realignment, dual-index periodOpportunity cost: $15,000–$25,000Zoetis (customer retention)
Total Economic Exposure$24,700/year$123,500+Platform lock-in achieved

Now run realistic barn math for that 750‑cow herd:

  • You test 400 head per year — heifers plus some key cows.
  • You keep that up for 5 years.
  • You use one platform’s genomic test and index to steer breeding and culling.

Step 1: Direct testing spend

Using $43 per head as a concrete, sourced test price:

  • 400 tests/year × $43 = $17,200 in genomics fees per year.
  • 5 years × 400 tests/year = 2,000 animals genotyped.
  • 2,000 tests × $43 = $86,000 in direct testing spend over five years.

Your invoices might come in a little lower or higher with discounts and bundling, but you’re still in that neighborhood.

Step 2: Genetic direction

Each year, you and your advisors use those scores to:

  • Push sexed semen on the top DWP$ heifers.
  • Push beef semen or early culling on low‑index animals.
  • Make earlier do‑not‑breed calls when low‑index animals also underperform in the parlor or maternity pen.

After five years, a large share of your milking herd has been shaped by one company’s definition of “profitable genetics” — the way DWP$ weights milk, fat, protein, fertility, and wellness traits.

That’s powerful if DWP$ lines up with your economics. It’s limiting if you ever decide you want different trade‑offs.

Step 3: Downstream product spend

Those wellness traits don’t just sit in a report. They steer protocols.

Zoetis describes its Precision Animal Health vision as predicting, preventing, detecting, and treating disease using integrated tools across medicines, vaccines, diagnostics, and digital solutions. On a CLARIFIDE Plus herd, that often turns into:

  • High mastitis‑risk genetics? More aggressive mastitis prevention and treatment programs.
  • High lameness risk? Tighter hoof‑health schedules, trims, and monitoring.
  • Transition disease risk? Higher‑touch dry‑cow and fresh‑cow protocols backed by specific products.

Nobody’s forcing these choices, but when the same company provides the risk scores and sells the tools, it’s easy for more of your per‑cow health spend to gravitate there over time.

Even modest shifts add up. If wellness‑driven protocols increase targeted health spend by:

  • $10 per cow per year across 750 cows, that’s $7,500/year.
  • Over 5 years, it’s $37,500 in additional health spending guided by the same platform.

You may get every dollar of that back in avoided disease. The point is that your genomics, protocols, and product choices are now tightly coupled to one ecosystem.

Step 4: Switching cost

Fast‑forward to 2031.

You decide you’d like to:

  • Move some or all genotyping to a non‑Zoetis, CDCB‑approved service lab, or
  • Shift your primary emphasis from DWP$ to a national index like NM$, TPI, or PRO$, alongside your own KPIs.

You’re not just changing who prints your reports.

You’re:

  • Re‑training staff who’ve lived in DWP$ bands and wellness trait lists.
  • Re‑aligning conversations with genetics advisors, vets, and lenders.
  • Managing a period where different indexes don’t always agree on which cows are “top” and which are “bottom.”

Each turn of the loop made the system easier. It also raised the friction if you ever want to step partly outside it.

What Does This Deal Change for a 750‑Cow Herd?

StepWhat You Do/SpendWhat Zoetis Gains
1. Testing400 tests/year$17,200/year$86,000over 5 yearsLab revenue and a larger genomic dataset
2. SelectionHerd bred and culled to a single platform indexEvidence their index “works” + genetic direction aligned to their trait priorities
3. ProtocolsWellness traits steer more targeted health programsProduct sales linked to genomic risk and integrated Precision Animal Health offerings
4. SwitchingHigher friction if you try to move labs or indexes after 5+ yearsStickier customers and more leverage in commercial negotiations

That’s the decision pipeline Zoetis is paying $160 million to tighten.

Why Many Producers Will Choose the Loop Anyway

There are plenty of good reasons herds will lean into this ecosystem on purpose.

Zoetis and Neogen both emphasize that combining their genomics businesses will expand “predictive insights,” “individualized care,” and “highly accurate, scalable genetic testing,” giving customers deeper views on animal health, productivity, and sustainability across species.

For a 700‑cow operation juggling labor, data overload, and disease pressure, that upside looks like:

  • Sharper predictions. A larger combined genomics business — more samples, traits, and species — can support more robust trait predictions, especially for wellness and health.
  • Less friction. Results that feed directly into herd software and decision tools cut the time you spend moving files and reconciling systems.
  • Cleaner conversations. When your genomics, wellness traits, and protocols use the same language, it’s easier for your team to pull in the same direction.

So it’s perfectly rational for a herd to say: “We’ll accept more dependence if the tools keep improving and the economics hold up.”

The risk isn’t using the loop. It’s using the loop without knowing how to exit it or what happens to your data if you ever need to.

When “Neutral” Labs Aren’t Neutral Anymore

For breed associations, AI companies, and public genomics projects, the immediate tension isn’t about convenience. It’s about governance.

From Zoetis and Neogen’s own descriptions, Neogen’s genomics business has been:

  • Serving customers in more than 120 countries,
  • Operating five laboratories in the U.S., Brazil, Australia, China, and the U.K., plus an office in Canada, and
  • Acting as a leader in U.S. beef and dairy genomics. 

For years, much of that work sat under Neogen as a third‑party service:

  • Associations sent member DNA for genotyping under genomic‑enhanced evaluations.
  • AI companies used Neogen’s platforms (Igenity, GGP) to genotype bulls and commercial heifers. 
  • Government and research projects used its lab network for large‑scale testing. 

Neogen’s incentive was straightforward: provide accurate, timely testing and invest in genomics technology as a service line.

Once those labs move under Zoetis’ roof, the questions change:

  • What do the firewalls really look like? Zoetis says it’ll integrate Neogen’s genomic technologies and data solutions into its Precision Animal Health offering while “supporting continuity for colleagues and customers” and building on Neogen’s genomics legacy. Partners will want clarity on how individual customer data is segregated and protected. 
  • What visibility does a lab owner get, even without individual IDs? Aggregate volume, array choice, and project timing can reveal a lot about what breeds, studs, and associations are doing.
  • Who benefits most from data aggregation? Associations may own members’ genotypes, but Zoetis’ ownership of the lab business gives it more visibility into patterns than a standalone, service‑only lab would.

Zoetis is open about using this acquisition to “advance animal health through innovation, data, and technology,” and to empower customers with tools for healthier animals and sustainable production. That’s legitimate. The flip side is that it also concentrates influence — as both lab vendor and product competitor — in fewer hands.

If Consolidation Keeps Rolling, Where Does It End?

The Zoetis–Neogen deal fits a familiar pattern from seeds, crop protection, and precision ag:

  • Products evolve into platforms.
  • Platforms build data moats.
  • Data moats raise switching costs — and leverage shifts toward the platform owners.

In animal genetics, current signals already point to:

  • A global market where animal genetics and genomics continue to grow as producers chase productivity, health, and sustainability gains. 
  • A small top tier of players — Zoetis, major genetics companies, and large animal health providers — controlling most of the genomics and evaluation stack.

If current consolidation trends continue, it’s easy to picture a world where:

  • Four to six dominant platforms effectively steer most genetics and health decisions on commercial herds.
  • Genomics becomes a feature inside integrated solutions (software + products + advisory) rather than a standalone service you can easily shop for.
  • Independent labs focus on niche work or act as backup routes for organizations that deliberately keep a second lane open. 

For mid‑size dairies, the risk creeps in quietly:

  • Platform indexes and wellness scores become the default language for your team and advisors.
  • The easiest tools — usually the ones tied to your main platform — get used by default.
  • By the time you question the relationship, your replacement strategy, cull logic, and protocols may all be tuned to a single system.

The myth is: “If this stops working, we’ll just switch.”

The reality, if you don’t plan, is: “We’d like to switch, but the friction is too high, and the whole farm thinks in one platform’s numbers.”

The Turn: It’s Not “Stay or Go” — It’s “On What Terms?”

You’re not going to stop Zoetis and Neogen from closing this deal. Regulatory reviews may tweak conditions, but the labs will likely sit under Zoetis by late 2026.

What you do control is how boxed in you are when that happens.

The real decision over the next 12–18 months is:

  • Do you keep using Zoetis‑linked genomics on default terms, or
  • Do you keep using them while locking in better data and exit terms to maintain leverage?

Most producers and associations will stay in the ecosystem because:

  • The tools are strong and already integrated.
  • The workflows are familiar.
  • Evaluating alternatives takes time and focus.

That’s fine — as long as you treat lab and data contracts like infrastructure decisions, closer to choosing a milk buyer or lender than picking a glove supplier.

That means pushing for:

  • Clear language that your farm or organization owns your raw genotypes.
  • Guaranteed data portability — the right to export complete genotype files with IDs in standard formats if you move some or all volumes.
  • Tight data‑use provisions — especially around using your genotypes, even de‑identified, to train proprietary tools.
  • transition clause that obligates cooperation if you shift business elsewhere.

You don’t have to leave. You don’t want to discover your options are gone the day you actually need them.

The Playbook Before This Deal Closes

Here’s a practical, time‑bound framework.

In the Next 30 Days: Read the Fine Print Like It’s a Milk Contract

Before the announcement fades:

  • Pull your genomics agreement or program terms.
    That might be with Zoetis directly, a stud, a breed association, or a vet/genetics service that bundles testing.
  • Circle language on:
    • Data ownership
    • Data use (especially “de‑identified,” “aggregated,” “research,” “product development”)
    • Term, automatic renewal, and termination
  • Ask your contact three blunt questions:
    • Who legally owns my raw genotype files — me, the association, the vendor, or some combination?
    • Can I get a full export, with animal IDs, in a standard format if I move labs?
    • Will my herd’s genotypes be used to train proprietary tools without a separate, explicit data‑sharing agreement?

If the answers are fuzzy and the contract doesn’t match them, that’s not a problem for tomorrow. That’s a now problem.

In the Next 90 Days: Build a Real Plan B Lab

You may never use it. You’ll still sleep better knowing it exists.

  • Identify at least one non‑Zoetis, cattle‑focused genotyping lab that’s compatible with CDCB or your national evaluation system. holsteinusa Get specifics: pricing, turnaround time, data formats, and how they deliver results back to you or your association.
  • Run a pilot batch.
    • Choose a defined group (e.g., a heifer cohort).
    • Send samples through both your current program and the alternative lab.
    • Confirm that:
      • Results from the alternative lab plug into your existing evaluation system.
      • Service and communication are solid.
      • You can easily map data back into your farm or association records.

Spending roughly the cost of 50 tests to learn how hard it is to move volume is cheap insurance compared to discovering you’re stuck mid‑dispute.

In the Next 365 Days: Rebalance Who Really Steers Your Decisions

As the Zoetis–Neogen integration moves from press release to day‑to‑day reality:

For 300–1,500‑cow herds:

  • Split your steering wheel.
    • Keep using CLARIFIDE Plus, DWP$, and wellness traits if they’re working; Zoetis and its partners built those tools for a reason. 
    • But cross‑check big moves with at least one independent lens:
      • National indexes (NM$, TPI, LPI, PRO$, etc.).
      • Your own data on culls, mastitis, lameness, stillbirths, and reproduction.
  • Get your advisory team aligned.
    Sit down with your genetics advisor, vet, nutritionist, and lender and ask:
    • “Whose index are we effectively breeding to?”
    • “How much of our herd strategy assumes this one platform’s view of genetic value and health risk is the truth?”

For breed associations and genetics committees:

  • Write a lab and data policy on purpose, not by default.
    • Define expectations: independence, firewall standards, audit rights.
    • Decide how often you’ll review lab partnerships and under what conditions you’ll diversify volume.
  • Keep a non‑Zoetis lane open.
    • Even if most samples continue flowing through Zoetis‑owned labs for cost and performance reasons, maintain a meaningful stream through at least one other approved lab. 
    • That stream is your insurance policy; you don’t want to build it from scratch under pressure.

What This Means for Your Operation

Turn this from news into checks you actually run.

  • In the next 30 days, read your genomics contract line by line.
    If it doesn’t clearly say who owns your genotypes and how you can export them, that’s your first negotiation target.
  • Ask for written data‑use boundaries.
    Push for language that says your genotypes won’t be used to train proprietary tools without a separate, explicit agreement you sign.
  • Know at least one backup lab by name and price.
    Make a call, get a quote, and ask exactly what it would take to send 50 heifers through their system.
  • Test the switching friction with a small pilot.
    Don’t wait until you’re unhappy with pricing or terms to find out your data is badly stuck in one ecosystem.
  • Stop letting any single index be the only truth.
    On your next breeding or cull list, compare your platform index with at least one national index and your own health and cull data before you finalize.
  • If you’re on a genetics committee, get this on the agenda.
    Ask staff to map where member DNA goes, who has access, and what it would take to move 10–20% of volume elsewhere over the next 1–3 years.
  • Treat genomics and lab choice like a processor or lender decision, not a glove order.
    The wrong glove order is annoying. The wrong lab contract can shape your herd’s genetics and negotiating power for a decade.

Key Takeaways

  • Zoetis isn’t just buying five labs and $90 million in sales. It’s buying a global genomics business that plugs into its Precision Animal Health strategy and tightens the loop between your DNA, your herd software, and its products. 
  • At roughly 1.8× revenue, Neogen is signaling genomics is a scale‑driven service line for them, not their main growth engine. For Zoetis, that same business is another gear in a much larger machine for animal health and diagnostics. 
  • A typical 750‑cow herd testing 400 head a year at around $43/head is putting roughly $17,200/year — about $86,000 over five years — through one genomic loop. That loop shapes genetics, protocols, and, eventually, your flexibility. 
  • Mid‑size dairies (roughly 300–1,500 cows) are often the most exposed to platform lock‑in. You’re big enough that the loop meaningfully affects your economics, but not always big enough to dictate terms.
  • There are real upsides — sharper predictions and cleaner workflows — that many herds will choose on purpose. The smart play is to enjoy those benefits while making sure your data ownership, portability, and Plan B lab are nailed down in writing before the labs change hands. 

The Bottom Line

When you sit down at the desk tonight, don’t just skim the $160 million headline.

Pull your latest genotyping invoice, find the program terms it points to, and circle every line that spells out who owns your data, who can use it, and what it takes to walk away.

Then ask yourself, honestly: Is that language strong enough for the $17,200 a year you’re putting through this pipeline?

Complete references and supporting documentation are available upon request by contacting the editorial team at editor@thebullvine.com.

Learn More

The Sunday Read Dairy Professionals Don’t Skip.

Every week, thousands of producers, breeders, and industry insiders open Bullvine Weekly for genetics insights, market shifts, and profit strategies they won’t find anywhere else. One email. Five minutes. Smarter decisions all week.

NewsSubscribe
First
Last
Consent

Why Your Milk Check Makes No Sense Anymore (And How Smart Farms Are Adapting)

Butter inventories: lowest since 2016. Butter prices: falling fast. Your milk check: shrinking. We connect the dots.

Executive Summary: Something broke in dairy markets this October: butter crashed to $1.60 despite the tightest inventories since 2016. Just 15 CME trades triggered the drop, opening a massive $2.47 gap between Class III and Class IV milk prices—the widest since 2011. Jersey farms shipping to butter plants now lose up to $500,000 annually, while Holstein neighbors shipping to cheese plants gain from the exact same market. Why? Algorithmic trading dominates these thin markets, punishing the high butterfat we spent decades breeding for. Smart farms are adapting fast: switching processors (6-month payback), negotiating collectively ($0.35/cwt gains), and even reducing butterfat through nutrition. The message is clear—understand these new market dynamics or get left behind.

I was chatting with a Jersey producer near Mondovi, Wisconsin—been in the business 28 years—and he told me something that’s really stuck with me. “For the first time,” he said, “I genuinely don’t understand what’s driving my milk check.”

That’s a powerful statement coming from someone who’s weathered every market cycle since the mid-90s. And he’s not alone. I’ve been hearing similar frustrations from producers all across the dairy belt lately, from the Great Lakes down through Texas.

October 2025 just matched the worst Class spread since 2011—and this time, it’s not a temporary spike. The fundamentals driving this gap are structural, not cyclical. When pricing signals stay broken this long, farms that wait for ‘normal’ to return are making a dangerous bet.

Why Are Butter Prices Falling When Inventories Are Tight?

So here’s what happened this October that’s got everyone talking. According to CME Group’s daily reports, spot butter prices fell from $1.6950 in mid-September to $1.6025 on October 9th. Pretty significant drop.

But what makes this genuinely puzzling is what else was happening. USDA’s Cold Storage report, released September 24th, showed butter inventories at 305.858 million pounds for August. That’s the tightest August inventory we’ve seen since 2016.

Tight inventories should support prices, shouldn’t they? That’s how it’s always worked. But not this time.

Here’s what’s keeping me up at night. August 2025 butter inventories sit at 305.9 million pounds—the tightest since 2016. Basic economics says tight supplies mean higher prices. Instead, butter crashed to $1.60. That’s not a market signal. That’s market failure. And your breeding decisions for the last decade just became a liability because algorithms don’t care about supply and demand.

And the timing… October is traditionally when we see butter prices strengthen. Retailers start building holiday inventory, and demand picks up through Thanksgiving. We’ve all seen that pattern. This October? Complete opposite.

What’s particularly interesting is the global picture. While our butter was trading around $1.60 in early October, industry reports suggest European prices were holding near $2.60 per pound. New Zealand’s Global Dairy Trade auction from October 1st showed butter equivalent prices in the $3.40 to $3.50 range after conversion.

That’s a massive disconnect. And according to USDA Foreign Agricultural Service data through August, it’s been driving butterfat exports way above last year’s levels—increases of over 200% in some months. You’d think that kind of export demand would support domestic prices, but apparently not in this market.

The recent trade agreements, particularly USMCA provisions, have actually made cross-border dairy movement easier, which you’d expect would help price discovery. But even with those improvements, we’re seeing these wild disconnects.

How Can 15 Trades Set Prices for an Entire Industry?

At a recent University of Wisconsin Extension meeting, several producers raised good questions about how these price movements could occur with such thin trading volume. Let me walk you through what I’ve been observing.

On October 9th, CME’s daily report showed selling pressure that drove prices down 4.75 cents in just one session. We’re talking about spot loads of 40,000 pounds each, and on a busy day, maybe 15 loads change hands. That’s 600,000 pounds of butter, setting the tone for an industry producing 1.8 billion pounds of milk daily, according to USDA production statistics.

Academic research increasingly suggests electronic trading has fundamentally changed these markets. A good chunk of trading volume in futures markets now comes from algorithmic systems rather than traditional commercial hedging. It’s not farmers hedging production or cheese plants covering forward needs anymore—it’s computers trading momentum patterns.

You can actually see it in the data. Days when butter prices drop sharply often show heavier volume—maybe 12 to 15 loads trading. But when prices try to recover? Volume frequently drops to just 5 or 6 loads. That’s not normal commercial hedging, where you’d expect consistent volume regardless of price direction.

The Class III/IV spread really tells the story. USDA’s Agricultural Marketing Service data showed that spread widening to $2.47 per hundredweight on October 9th—the largest gap since 2011. Class III milk for cheese was $17.01, while Class IV milk for butter-powder was $14.54.

In a market where butter supplies are supposedly tight, that kind of spread doesn’t make fundamental sense. I’ve been in this industry long enough to remember when a 50-cent spread was considered wide. Now we’re looking at nearly $2.50.

Who’s Getting Hit Hardest—And Who’s Finding Solutions?

What I’ve found eye-opening is how differently this affects farms depending on location and milk destination.

There’s a Wisconsin Jersey producer I work with—let’s call him Tom—who runs about 480 cows, averaging 4.8% butterfat. Beautiful production numbers. Based on Federal Order 30 component pricing, his milk should be worth significantly more than the Holstein operation down the road, which is testing at 3.8% fat.

Let’s talk real numbers. That 1,000-cow Jersey operation your family built over three generations? You’re bleeding $600,000 annually at today’s Class spread—that’s $50,000 monthly straight off the top. Meanwhile, your Holstein neighbor with the same 500 cows loses only $75,000. For the first time in dairy history, the genetics we told you to breed for are costing you a quarter-million dollars a year. And it’s not temporary

But when he’s shipping to a butter-powder plant and that Class III/IV spread hits $2.47 per hundredweight, that advantage completely reverses.

Using calculation tools from UW-Madison’s Center for Dairy Profitability (excellent resources at cdp.wisc.edu), we can quantify this. A 100-cow Jersey operation faces nearly $60,000 less income annually under these conditions. Mid-size farms with 300 cows could be down about $175,000. That 500-cow operation? Close to $300,000 annually. And if you’re running 1,000 head? Over half a million dollars in lost revenue.

These are real losses affecting real families. We’re not talking about missed opportunities here—we’re talking about actual cash flow gaps that affect everything from feed purchases to equipment payments.

But here’s what’s encouraging—creative solutions are emerging all over. A producer group in Pennsylvania negotiated a shift from shipping to a butter-powder plant to accessing a cheese cooperative. They invested in equipment upgrades to meet new specs, but told me the investment paid for itself within six months once they escaped that Class IV pricing penalty.

In California, more operations are exploring value-added opportunities. Farmstead cheese, on-farm processing, direct sales. It requires significant capital and a different business model, but those making it work see premiums of $3 to $5 more per hundredweight over commodity pricing.

And in the upper Midwest, I recently visited a 650-cow operation near La Crosse that’s taking a different approach. They’ve partnered with two neighboring farms to collectively negotiate milk marketing, giving them leverage they wouldn’t have individually. “We’re still shipping Class IV,” the owner told me, “but we negotiated quality premiums that offset about 40% of the spread disadvantage.”

Down in Texas, where I was last month, producers face different challenges. The heat stress on butterfat production actually works in their favor when these spreads widen—their naturally lower butterfat levels mean less exposure to the Class IV penalty. One producer near Stephenville told me, “We used to curse our 3.5% fat tests in summer. Now it’s actually protecting us from worse losses.”

I’ve also been talking with Holstein producers who are navigating this differently. A 1,200-cow operation in Michigan shared its strategy—they’ve actually benefited from maintaining moderate butterfat levels around 3.7% while focusing on volume. “Everyone was chasing components,” the owner explained, “but we stuck with balanced production. Now that’s paying off.”

And it’s not just Jerseys and Holsteins feeling this. A Brown Swiss producer in Vermont mentioned their breed’s protein-to-fat ratio has actually become an advantage in this market. “We naturally produce closer to what processors want,” she said. Even some Guernsey operations with their golden milk are finding niche markets that value their unique component profile beyond commodity pricing.

Why Did Everyone Breed for Butterfat If This Was Coming?

Looking at USDA National Agricultural Statistics Service data from 2014 forward, butterfat prices beat protein prices in eight of ten years through 2024. The whole industry was singing the same tune—breed for components, maximize butterfat.

I remember reading CoBank’s November 2023 report titled “The Butterfat Boom Has Just Begun.” They documented that butter consumption grew 43% over 25 years, and that cheese was up 46%; according to USDA Economic Research Service data, Americans now eat about 42 pounds of cheese per person annually. Double what we ate in 1975.

But by September 2024, CoBank published a follow-up with a different tone, warning that butterfat production might be growing too fast. According to analysis from CoBank and other industry sources, the protein-to-fat ratio in U.S. milk has shifted. It held steady around 0.82-0.84 for nearly two decades, but recent data suggests we’re now closer to 0.77.


Metric
JerseyHolstein
Milk Production18,000 lbs/yr25,000 lbs/yr
Butterfat4.8%3.8%
Feed Efficiency1.75 ECM/lb1.67 ECM/lb
Feed Cost per lb Fat$1.82$1.97
Normal Market-$456/yr$0
At $2.47 Spread-$956/yr$0

​I recently spoke with a cheese plant manager in Central Wisconsin who explained their perspective. “We’re not trying to penalize high-butterfat milk,” he said, “but our process is optimized for certain ratios. When milk comes in with too much fat relative to protein, we’ve either got to add milk protein concentrate—which isn’t cheap—or skim off cream. Either way, it’s an added cost.”

This seasonal component shift matters too. Spring flush typically brings lower components as cows transition to pasture—you know how it goes, that first lush grass drops butterfat like a rock. We’d normally see fat tests drop from 4.0% to 3.6% or lower in grazing herds. Then, fall milk traditionally shows higher butterfat as cows return to TMR and corn silage.

But with year-round confinement becoming standard in larger operations, these seasonal patterns are flattening. A nutritionist I work with in Idaho told me that their 5,000-cow clients now maintain 3.8% butterfat year-round, plus or minus 0.1%. That consistency sounds good, but processors built their systems around predictable seasonal variation. Now they’re scrambling to adjust.

What Can You Actually Do About This Right Now?

Risk management has become essential. Looking at CME quotes in late October, Class IV put options at the $14.00 strike were trading around $0.15 per hundredweight. That’s affordable insurance—maybe 6% of what you’d lose if prices really tank. Worth discussing with your milk marketing cooperative.

On the feed side, December corn futures were trading near $4.19 per bushel in early November. Given where feed markets have been, locking in at least some costs makes sense. When milk pricing is this volatile, having one side of your margin equation fixed helps you sleep at night.

Stop waiting for the market to fix itself—here are five strategies working right now on real farms. The Pennsylvania group switching to cheese plants? Six-month payback and they’re adding $2/cwt every month since. The Ohio farm reducing butterfat through nutrition? Four months to breakeven. And locking December corn at $4.19? That’s protecting your margin TODAY. These aren’t theory—these are survival tools farms are using while others are still wondering what happened.

Marketing flexibility is crucial, though limited for many. But it’s worth exploring whether you could shift even a portion of milk to different processors. Some regions have more options than folks realize—cooperatives and plants not considered because they’ve been shipping to the same place for decades.

A Northeast producer recently shared something interesting—they partnered with neighboring farms to collectively negotiate better terms with processors. Not feasible everywhere, but where geographic concentration allows, collaborative approaches deserve consideration. They told me payback on legal and consulting fees took eight months, but they’re now seeing $0.35 more per hundredweight.

I’ve also been seeing increased interest in adjusting components through nutrition. A farm in Ohio began working with its nutritionist to moderate butterfat production, reducing it from 4.1% to 3.85% through ration adjustments. Sounds counterintuitive after years of pushing components higher, but when that Class IV spread is wide, it can actually improve their milk check.

For those with Dairy Margin Coverage through FSA, it’s worth revisiting your coverage levels. The program calculations don’t fully capture these Class III/IV spread impacts, but higher coverage levels might provide some cushion when markets get this disconnected. With crop insurance interactions, some producers are finding ways to layer their risk protection more effectively.

Is This How Dairy Pricing Works Now?

October’s butter price action reveals fundamental questions about how dairy prices get discovered in modern markets.

When CME spot markets with thin daily volume—sometimes just a dozen trades—determine pricing for over 90% of U.S. milk production, the traditional relationship between supply and demand can become distorted.

Other commodities have addressed similar issues. The beef and pork industries implemented mandatory price reporting years ago, where packers report transactions to the USDA, creating broader datasets for price discovery. Some in dairy are asking whether we need something similar. Organizations like the National Milk Producers Federation have begun discussing potential reforms, and there’s growing support from state organizations as well.

The Canadian system offers an interesting contrast. They operate under supply management with administered pricing through the Canadian Dairy Commission. Their system has its own challenges—less export opportunity, higher consumer prices—but price volatility isn’t one of them. Canadian producers maintained stable component premiums throughout October while we dealt with wild swings.

Where Do We Go from Here?

Based on everything I’m seeing and hearing across the industry, here’s what we need to keep in mind:

Traditional price signals might not mean what they used to. When butter prices fall despite the USDA showing the tightest inventories in years, market structure issues go beyond normal supply and demand.

Component strategies need evolution. The protein-to-fat ratio processors want has shifted, and breeding programs might need adjustment. That feels like abandoning years of genetic progress, but markets change. The Jersey breeders I know are already talking about selecting for more moderate butterfat—targeting 4.5% instead of pushing toward 5%. Holstein operations that maintained balanced components are suddenly looking smart. Brown Swiss and Guernsey breeders are reassessing their component targets in response to processor feedback.

Risk management isn’t optional anymore. Even basic strategies like put options provide crucial downside protection. If you’re not working with someone on this, it’s time to start.

Mid-size commodity operations face the most pressure. You need either scale advantages of large operations or premium markets that reward quality differently than commodity channels.

I know this is challenging to process. Many built operations based on signals the market sent for over a decade—maximize components, breed for butterfat, invest in genetics. Now the market’s sending different signals, and adapting isn’t easy.

But dairy farmers are incredibly resilient. We’ve weathered droughts, surpluses, price crashes, and policy changes. This market structure challenge? It’s serious, but not insurmountable.

What encourages me is the innovative responses nationwide. Producers exploring new marketing arrangements, investigating value-added opportunities, and approaching risk management with fresh perspectives. A young producer in Minnesota recently told me, “My grandfather adapted when bulk tanks replaced milk cans. My father adapted when computers changed breeding programs. Now it’s my turn to figure out these new market dynamics.”

That perspective—acknowledging change while maintaining confidence—that’s exactly right.

October’s butter price action, with spot prices at $1.60 while inventories sit at six-year lows according to USDA data, shows the old rules might not apply. Understanding these new dynamics—electronic trading’s role, thin-market impacts, and the importance of component ratios—that’s crucial for smart decisions going forward.

The question isn’t whether markets return to the old ways. They probably won’t. It’s how quickly we adapt strategies to thrive where market structure matters as much as production efficiency.

We’ll figure it out. We always do. That’s what dairy farmers do—adapt, persevere, find a way forward. This time won’t be different.

For those interested in risk management tools, reach out to your cooperative or check CME Group’s educational resources. The University of Wisconsin’s Center for Dairy Profitability has excellent free tools for analyzing component pricing impacts at cdp.wisc.edu. Regional extension services provide valuable market analysis and decision-support resources tailored to local conditions. Organizations like the National Milk Producers Federation (nmpf.org) and your state dairy associations are actively working on market reform proposals worth following.

KEY TAKEAWAYS

  • Your milk check isn’t broken—the market is: 15 CME trades (600,000 lbs) now set prices for 1.8 billion lbs daily production
  • High butterfat became a liability overnight: Jersey farms lose $500K/year at current Class III/IV spreads ($2.47/cwt) while moderate-component Holsteins gain
  • Three farms found solutions that work: Pennsylvania group switched processors (6-month payback), Wisconsin neighbors negotiated together (+$0.35/cwt), Ohio farm reduced fat through nutrition (4.1% to 3.85%)
  • Risk protection costs less than you think: Class IV puts at $14 strike cost $0.15/cwt—that’s $450/month for a 500-cow dairy
  • This isn’t temporary: Algorithmic trading owns these markets now—farms still breeding for maximum butterfat are planning for yesterday’s market

Complete references and supporting documentation are available upon request by contacting the editorial team at editor@thebullvine.com.

Learn More:

The Sunday Read Dairy Professionals Don’t Skip.

Every week, thousands of producers, breeders, and industry insiders open Bullvine Weekly for genetics insights, market shifts, and profit strategies they won’t find anywhere else. One email. Five minutes. Smarter decisions all week.

NewsSubscribe
First
Last
Consent

When 80 million Indian Farmers Meet New Zealand’s Dairy Machine: The Trade Talks That Could Change Everything

80 million Buffalo Herders Are About to Teach New Zealand’s Dairy Giants a Lesson—Here’s What It Means for Your Farm

EXECUTIVE SUMMARY: Here’s what we’ve uncovered that nobody’s talking about: India’s 80 million dairy families aren’t your typical producers—they’re mostly buffalo herders milking 40-50 liters daily with 7% butterfat content. Meanwhile, NZ’s massive Holstein operations eye this protected market hungrily, but here’s the kicker—buffalo milk dominates 65% of key Indian states, meaning direct substitution won’t happen overnight. We’re looking at potential tech partnerships worth billions, cold chain investments that could cut India’s staggering 50% spoilage rates, and market shifts that could redirect NZ’s export flows as China cools off by 15%. The smart money isn’t betting on trade war—it’s positioning for the innovation partnerships that’ll reshape how two billion consumers get their dairy. Bottom line: those who understand these nuances and act now will capture the opportunities while others scramble to catch up.

KEY TAKEAWAYS

  • Respect the species difference—buffalo milk isn’t cow milk: With 65% market share in Punjab and UP, buffalo’s 7% butterfat creates natural market protection. Your move: Assess your herd’s unique strengths (fat content, seasonal patterns) and find your competitive niche before imports shift the landscape (NDDB 2024; ICAR 2024)
  • Cold chain upgrades pay massive dividends: India loses 40-50% of milk to spoilage while NZ protects 95% for export—that’s millions in lost revenue daily. Your move: Start with basic chilling improvements at collection points and transport protocols; the ROI is immediate (CIPHET 2024; NZ Food Safety Authority 2024)
  • Genomics adoption separates leaders from followers: NZ’s 50% genomic bull usage contrasts sharply with India’s 115 million traditional AI doses annually. Your move: Attend genomic selection workshops now and explore heat-tolerant crossbreeding programs before the competition catches up (DairyNZ 2024; ICAR 2023)
  • Market volatility is the new normal—prepare accordingly: China’s 15% drop in NZ imports signals major shifts, while India’s cautious 0.5-2% market opening creates new opportunities. Your move: Review Dairy Revenue Protection options and diversify your market risk exposure before the next disruption hits (China Customs 2025; USDA RMA 2025)
  • Policy changes happen faster than you think: India’s never opened dairy in any FTA, but urban consumers spending 18-22% of income on high-priced dairy are demanding change. Your move: Engage with producer associations and stay plugged into policy discussions—regulatory shifts create winners and losers overnight (MEA India 2025; NSSO 2024)
Generate SEO elements for this The Bullvine article targeting dairy industry professionals:
ANALYSIS REQUIREMENTS:
Identify the article's primary topic and target audience (dairy farmers, industry professionals, agricultural specialists)
Focus on practical, implementation-oriented keywords that dairy professionals would search for
Consider both technical dairy terminology and business/profitability terms
DELIVERABLES:
1. SEO Keywords (5 keywords):
Create a comma-separated list of relevant keywords mixing:
Primary dairy industry terms (dairy farming, milk production, herd management, etc.)
Technology/innovation terms if applicable (precision agriculture, automated milking, genomic testing, etc.)
Business/economic terms (dairy profitability, farm efficiency, ROI, cost reduction, etc.)
Geographic terms if relevant (dairy industry trends, global dairy, etc.)
2. Focus Keyphrase:
Develop a 2-4 word primary keyphrase that captures the article's core topic and would be commonly searched by dairy professionals seeking this information.
3. Meta Description (under 160 characters):
Write a compelling meta description that:
Summarizes the article's main value proposition
Naturally incorporates the focus keyphrase and 1-2 keywords
Appeals to dairy industry professionals
Includes a benefit or outcome (cost savings, efficiency gains, profit increases, etc.)
Uses action-oriented language that encourages clicks
4. Category Recommendation:
Suggest the most fitting category from The Bullvine website (e.g., Dairy Industry, Genetics, Management, Technology, A.I. Industry, Dairy Markets, Nutrition, Robotic Milking, etc.) where this article should be published for maximum relevance and engagement.
FORMAT REQUIREMENTS: Present results in this exact format:
SEO Keywords: [keyword1, keyword2, keyword3, keyword4, keyword5]
Focus Keyphrase: [primary keyphrase]
Meta Description: [compelling description under 160 characters with natural keyword integration]
Category Recommendation: [Best-fit category from The Bullvine’s options]
DAIRY INDUSTRY CONTEXT: Ensure all elements appeal to dairy farmers, agricultural specialists, and industry professionals seeking practical, profitable solutions for their operations.

You know what’s wild about the India-New Zealand dairy trade talks underway this September? While everyone’s been glued to what’s happening with China, a negotiation’s brewing that could flip the global dairy scene on its head. We’re talking 80 million Indian smallholders, mostly buffalo herders, facing off against New Zealand’s highly efficient Holstein operations.

Buffalo Milk vs. Cow Milk: More Different Than You Think

Picture a typical dairy family in Karnal, Haryana. They’re milking around 40-50 liters daily. The actual take-home varies with local milk prices, but regions like Haryana show steady income streams from that milk (NDDB, 2024).

It’s not just any milk—these are buffalo giving you nearly 7% butterfat, perfect for the ghee and paneer everyone craves on the subcontinent (NDDB, 2024; ICAR, 2024).

Now compare that to New Zealand’s Holsteins, optimized to produce milk around 4.2% fat (DairyNZ, 2024). And buffalo milk makes up a massive 60-65% of the total in places like Punjab and UP (NDDB, 2024). So, what seems like a simple quota or tariff issue quickly gets complicated once you realize these milks aren’t one-to-one substitutes.

Scale’s a Whole Different Ballgame

New Zealand’s average Canterbury farm runs about 375 cows—a chunk of land, a solid rotation, mostly seasonal calving (DairyNZ, 2024). Meanwhile, Indian smallholders juggle just under three animals, aiming for year-round calving to keep cash flowing (NDDB, 2023; India Livestock Census, 2019).

Breeding is another story. Kiwi farmers have genomic bulls covering half their inseminations, while Indian farmers depend on about 115 million AI doses annually, mostly in traditional setups (NZ Animal Evaluation, 2024; ICAR, 2023). That’s a real game of cat and mouse between tech and tradition.

The Cold Chain: A Challenge and a Massive Chance

India’s cold storage game? Rough. Roughly 6,300 facilities handling what some estimates suggest is about 11% of perishables (NCCD, 2024). And spoilage rates? Could be 40-50% across villages, transport, and retail points (CIPHET, 2024). That’s a lot of lost milk and money.

Contrast that with New Zealand, where 95% of milk for export passes through integrated cold chains monitored by IoT and smart tech (NZ Food Safety Authority, 2024). Fix that cold chain gap in India, and you’re talking a transformative opportunity that punches above most tariff conversations.

China’s Cooling Thirst, India’s Growing Appetite

New Zealand used to lean on China for close to a third of its dairy exports. Whole milk powder shipments fell by 15% through August 2025, driven by China’s expanding domestic capacity (China Customs, 2025).

Canterbury farmers are feeling the squeeze. Thankfully, India’s urban markets are picking up the slack, especially for cheese and butter—products where buffalo milk doesn’t hold sway. However, breaking into India’s complex market is not as straightforward as it appears.

Politics and Milk: The Ultimate Balancing Act

India has never opened dairy in a trade deal—not Australia, not the UK, not the EU—and that’s not just a coincidence (MEA India, 2025). Those 80 million dairy families voted hard in 2024, keen to protect their livelihoods (Election Commission India, 2024).

Yet, urban Indians pay 18-22% of their income on dairy products, which are priced significantly above global averages (NSSO India, 2024). The government is under pressure to juggle consumer relief with rural protection.

On the Kiwi side, Fonterra sold off consumer brands for NZ$3.845 billion to refocus on growth markets (Fonterra, 2025). The challenge: how to boost productivity without breaking the backbone of rural economies.

What This Means for Your Farm or Operation

For producers in the U.S. or Europe, keep in mind—if New Zealand cracks India, expect similar trade demands elsewhere. It’s time to revisit risk management plans. This Dairy Revenue Protection stuff? It’s not optional anymore (USDA RMA, 2025).

If you’re in ag tech or processing, grab your opportunity. India’s supply chains are hungry for investment, imports or no imports (India Dairy Infrastructure Report, 2025).

The Big Divide: Fresh Buffalo vs. Processed Cow Milk

Indian consumers love fresh buffalo milk—the kind you buy fresh down the street. New Zealand’s strength is in processed products: powders, cheeses, and infant formulas.

Even if the market opens fully, foreign milk flooding Indian village economies is unlikely. Market penetration will probably start at a cautious 0.5-2% of demand and grow slowly (Trade Modelling Reports, 2025).

The Bottom Line: Time to Watch and Get Ready

What’s happening in Delhi will ripple through every dairy heartland—from Wisconsin to Canterbury to Punjab. Watch the Global Dairy Trade index for swings. Watch for new technology tie-ups in India. Reassess your supply chain risks.

This isn’t just a trade story—it’s a turning point. For dairy producers worldwide, readiness for this new chapter isn’t a question, but a prerequisite for future success.

Complete references and supporting documentation are available upon request by contacting the editorial team at editor@thebullvine.com.

Learn More:

The Sunday Read Dairy Professionals Don’t Skip.

Every week, thousands of producers, breeders, and industry insiders open Bullvine Weekly for genetics insights, market shifts, and profit strategies they won’t find anywhere else. One email. Five minutes. Smarter decisions all week.

NewsSubscribe
First
Last
Consent

The Genomic Kick in the Pants: Why NZ Dairy is Facing a Sink-or-Swim Moment

NZ’s at 50% genomic bull usage while global leaders race ahead. Your farm can’t afford to wait much longer.

EXECUTIVE SUMMARY: Look, here’s what’s really happening out there. New Zealand’s genetic evaluation system got officially slammed as “not fit for purpose” by the 2024 DairyNZ report — and that should wake everyone up. We’re sitting at 50% genomic bull usage while our competitors are way ahead, and frankly, that gap’s costing us. Lincoln University crunched numbers on 127 Canterbury farms and found something interesting: spend $8,000 on a 300-cow operation, you could see $14,000 to $19,000 back annually. The tech behind this — LIC’s Single Step Animal Model — bumps up accuracy by 8%, which is massive when 60% of our cows are crossbreds. With global markets hungry for resilient genetics that can handle tough conditions, this isn’t just about keeping up anymore. It’s about getting ahead while there’s still time.

KEY TAKEAWAYS:

  • Milk production jumps 8-15% with genomic selection — start by getting your replacement heifers genotyped early and watch the data guide your breeding decisions
  • Fertility rates improve 10-20% when you use genomic data — integrate LIC’s Single Step Model results into your mating plans this season for measurable gains
  • Somatic cell counts drop up to 40% with smart genetics — less mastitis means lower vet bills and higher milk quality bonuses hitting your bottom line
  • Global crossbred demand is exploding in 2025 — source bulls with proven multi-breed genomic evaluations now, especially for tropical export markets
  • Feed costs eating your margins? Genomic efficiency pays back fast — better converting cows stretch every feed dollar further in today’s tough input cost environment
dairy genomics, New Zealand dairy industry, dairy farm profitability, genetic progress in cattle, crossbred dairy genetics

The bottom line? Your neighbors are already doing this. Don’t be the last one to figure out that your phone really can pick better cows than your gut.

Pull up a chair, mate. The other day, I was chatting with an old-school Canterbury dairy farmer. This bloke’s been walking the paddocks long enough to spot a good cow with his own eyes. “I don’t need some fancy computer to tell me who to breed,” he said.

But these days? He’s swiping genomic breeding values on his phone right between milking sessions. What flipped the script? His neighbour’s genomics-selected heifers jumped ahead by a whopping 150 kilos of milk solids. That kind of leap wakes you up.

This ain’t just chatter over the fence – the 2024 DairyNZ Industry Working Group officially called our genetic evaluation system “not fit for purpose.” We’re standing still while others chase the future.

Late 2024 LIC data drops another bomb: only about half the AI straws in NZ are from genomic bulls. That’s lagging far behind other top dairy nations.

And the kicker? We’re genotyping around 40,000 cows. To compete at the highest level, we need over 400,000 in the game. It’s like trying to fill a paddock with a bucket when you need a tank.

The Economics: What’s Actually in Your Pocket?

Lincoln University’s 2024 study on 127 Canterbury farms shows the potential, though results vary by operation.

Herd SizeAnnual Investment (Approx.)Potential Annual Return
300 Cows$8,000$14,000 – $19,000
600 Cows$15,000$28,000 – $38,000
1,000+ Cows$25,000$47,000 – $63,000

Data based on 2024 Lincoln University analysis of 127 farms. Individual results will vary.

Farmers involved in DairyNZ studies say the predictions generally match what the vat delivers. That’s coming from people who’ve heard plenty of promises before.

Tech Talk: SSAM — the Game-Changer

LIC’s Single Step Animal Model, SSAM, if you want to sound tech-savvy, is a leap forward.

Instead of separating pedigree, phenotype, and genome analysis, it handles it all at once — bumping up accuracy by around 8%. That’s massive, especially with NZ’s 60% crossbred herd.

Professor Ben Hayes from Queensland said it best: “If you nail multi-breed genomic evaluation, the future’s yours.”

The Pasture Problem: Why NZ’s Farm Setup is Different

Unlike our overseas mates with year-round calving herds, we pack all our calves into a tight spring window.

Mud, rain, and paddocks make sampling a logistical headache. Canterbury trials found pushing compliance from 60% to nearly 90% is doable — if you nail timing, weather, and team coordination. Mess that up, and you’re off the pace.

Ask any farmer who’s dealt with a wet spring and late contractors how that goes.

Aussies Nailed It First

Australia hit their stride when genomic reliability topped 70%. Farmers got on board fast because they trusted the data.

Their focused Holstein and Jersey reference herds nailed precision. No theoretical stuff — just results they could see in the milk vat.

From Rivals to Teammates: The Data-Sharing Revolution

Old rivalries? History. LIC, CRV, DairyNZ, and others are sharing data to get ahead.

Wayne McNee from LIC sums it up: “Genomic success requires population scale that exceeds any single company’s capacity. We’re either working together or we’re all falling behind.”

That’s a complete shift from the days when breeding companies treated genetic data like classified intel.

Who Crunches These Numbers?

Here’s the quiet powerhouse — NeSI and Genomics Aotearoa. Without their computing grunt, processing millions of genetic markers across hundreds of thousands of animals with complex family relationships just wouldn’t be possible.

The Global Angle: Crossbreds Rule

Most of the world’s dairy cows aren’t purebreds — they’re crossbreds. Pure Holsteins and Jerseys really only dominate in North America and northern Europe.

That means NZ’s expertise gives us an edge in tropical and emerging markets where crossbreeding is standard practice. They’re hungry for genetics that can handle environmental stress, disease pressure, and variable feed quality.

Africa’s even rolling out genomic tools made just for crossbreds. The demand is real and it’s growing.

The Skeptics’ Corner

Got doubts? Consider these results from NZ trials:

  • Better Milk Production: 8-15%
  • Improved Fertility Rates: 10-20%
  • Lower Somatic Cell Counts: 25-40%

This isn’t marketing fluff — it’s real results from real farms showing up in milk vats and vet records right across both islands. However, remember that performance improvements vary significantly by operation and management system.

The $86 Million Question

NZ’s planning to invest $58 to $86 million over five years — serious money for building reference populations, computing infrastructure, and farmer education programs.

Countries that master crossbred genomic evaluation in the next five years will dominate global dairy genetics for the next fifty. Our 60% crossbred population — once seen as complicating genomic evaluation — is actually our competitive ace in the hole.

Time’s tight and the stakes are high.

Bottom Line

  • For Farmers: Ring your breeding company about genomic testing today. Sitting still means watching your competitors bank the gains while you explain to your banker why your neighbors are consistently outproducing you.
  • For Industry Leaders: Collaborate, share data, and grow reference populations. Success demands scale; no single company can achieve it alone.

The genomic revolution rewards early adopters and punishes those who hesitate. Simple as that.

Miss this and you’ll be on the wrong side of history.

Complete references and supporting documentation are available upon request by contacting the editorial team at editor@thebullvine.com.

Learn More:

  • Genomic Testing: Are You Just Collecting Data or Actually Using It? – This piece provides practical strategies for turning raw genomic data into profitable on-farm decisions. It bridges the gap between testing and implementation, revealing how to leverage your results for better mating choices, culling strategies, and overall herd improvement.
  • The Great Debate: ProCROSS vs CROSSBREEDING vs PUREBRED – This article breaks down the economics and long-term implications of different breeding strategies. It provides a strategic framework for evaluating which system best aligns with your operation’s goals for profitability, health, and resilience in a competitive market.
  • Stop The Guessing Game: Using Genomics to Select for Health & Wellness – Explore the future of dairy breeding with this look at health-focused genomics. It reveals methods for selecting animals with genetic resistance to common diseases, helping you proactively manage herd health, reduce treatment costs, and improve animal welfare.

The Sunday Read Dairy Professionals Don’t Skip.

Every week, thousands of producers, breeders, and industry insiders open Bullvine Weekly for genetics insights, market shifts, and profit strategies they won’t find anywhere else. One email. Five minutes. Smarter decisions all week.

NewsSubscribe
First
Last
Consent
Send this to a friend