


$3.75/cow/day. That’s the IOFC gap between Ishler and Ferreira — and it adds up to $547,500 on 400 cows. The question isn’t if it’s real. It’s where it’s hiding.
Executive Summary: A $3.75/cow/day gap in income over feed cost between Penn State’s Ishler benchmark and Virginia Tech’s Ferreira example adds up to $547,500/year on a 400‑cow herd. The article shows how 2026 feed and milk outlooks — corn around $4.10, soymeal near $300/ton, and milk in the high‑$19s — can swing IOFC from roughly $9.15 to $3.75/cow/day depending on whether you’re in a “soft feed,” “margin squeeze,” or “forage short” scenario. You’ll see the full barn math on a $0.75/cwt feed‑cost move (about $98,550/year at 400 cows) and how it interacts with Penn State’s $7.41/cow/day IOFC breakeven. The piece then walks through three research‑backed levers — trimming excess protein, grouping by IOFC instead of just volume, and chasing NDFD instead of tons — with per‑cow and per‑herd IOFC impacts. Finally, it gives you a 30‑minute IOFC calculation you can run with your own milk check and feed bills, plus thresholds to decide when a ration change or feed contract is actually worth at least $0.50/cow/day in IOFC.
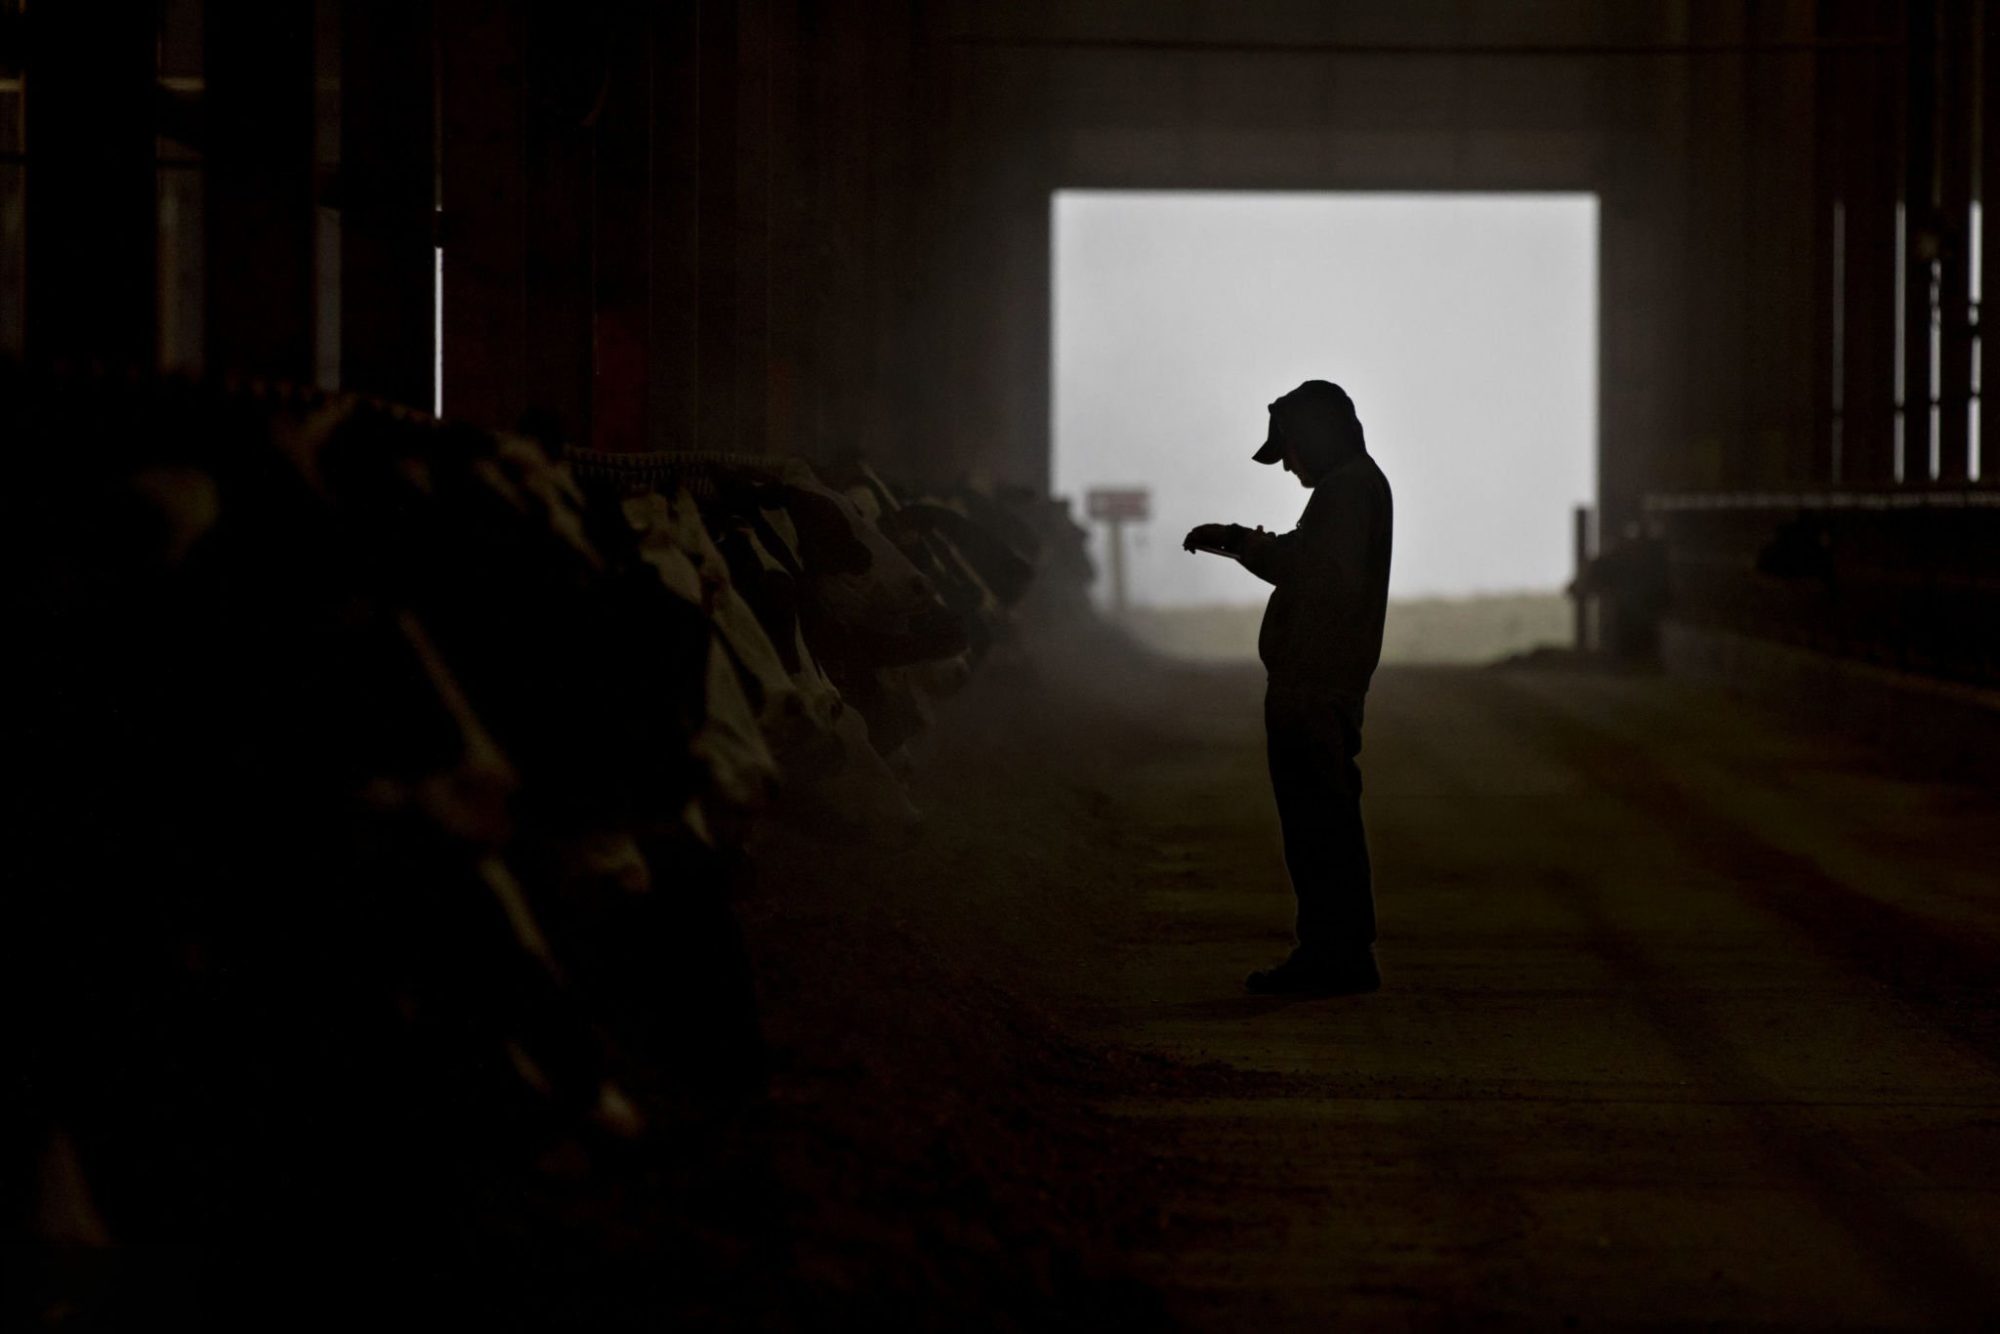
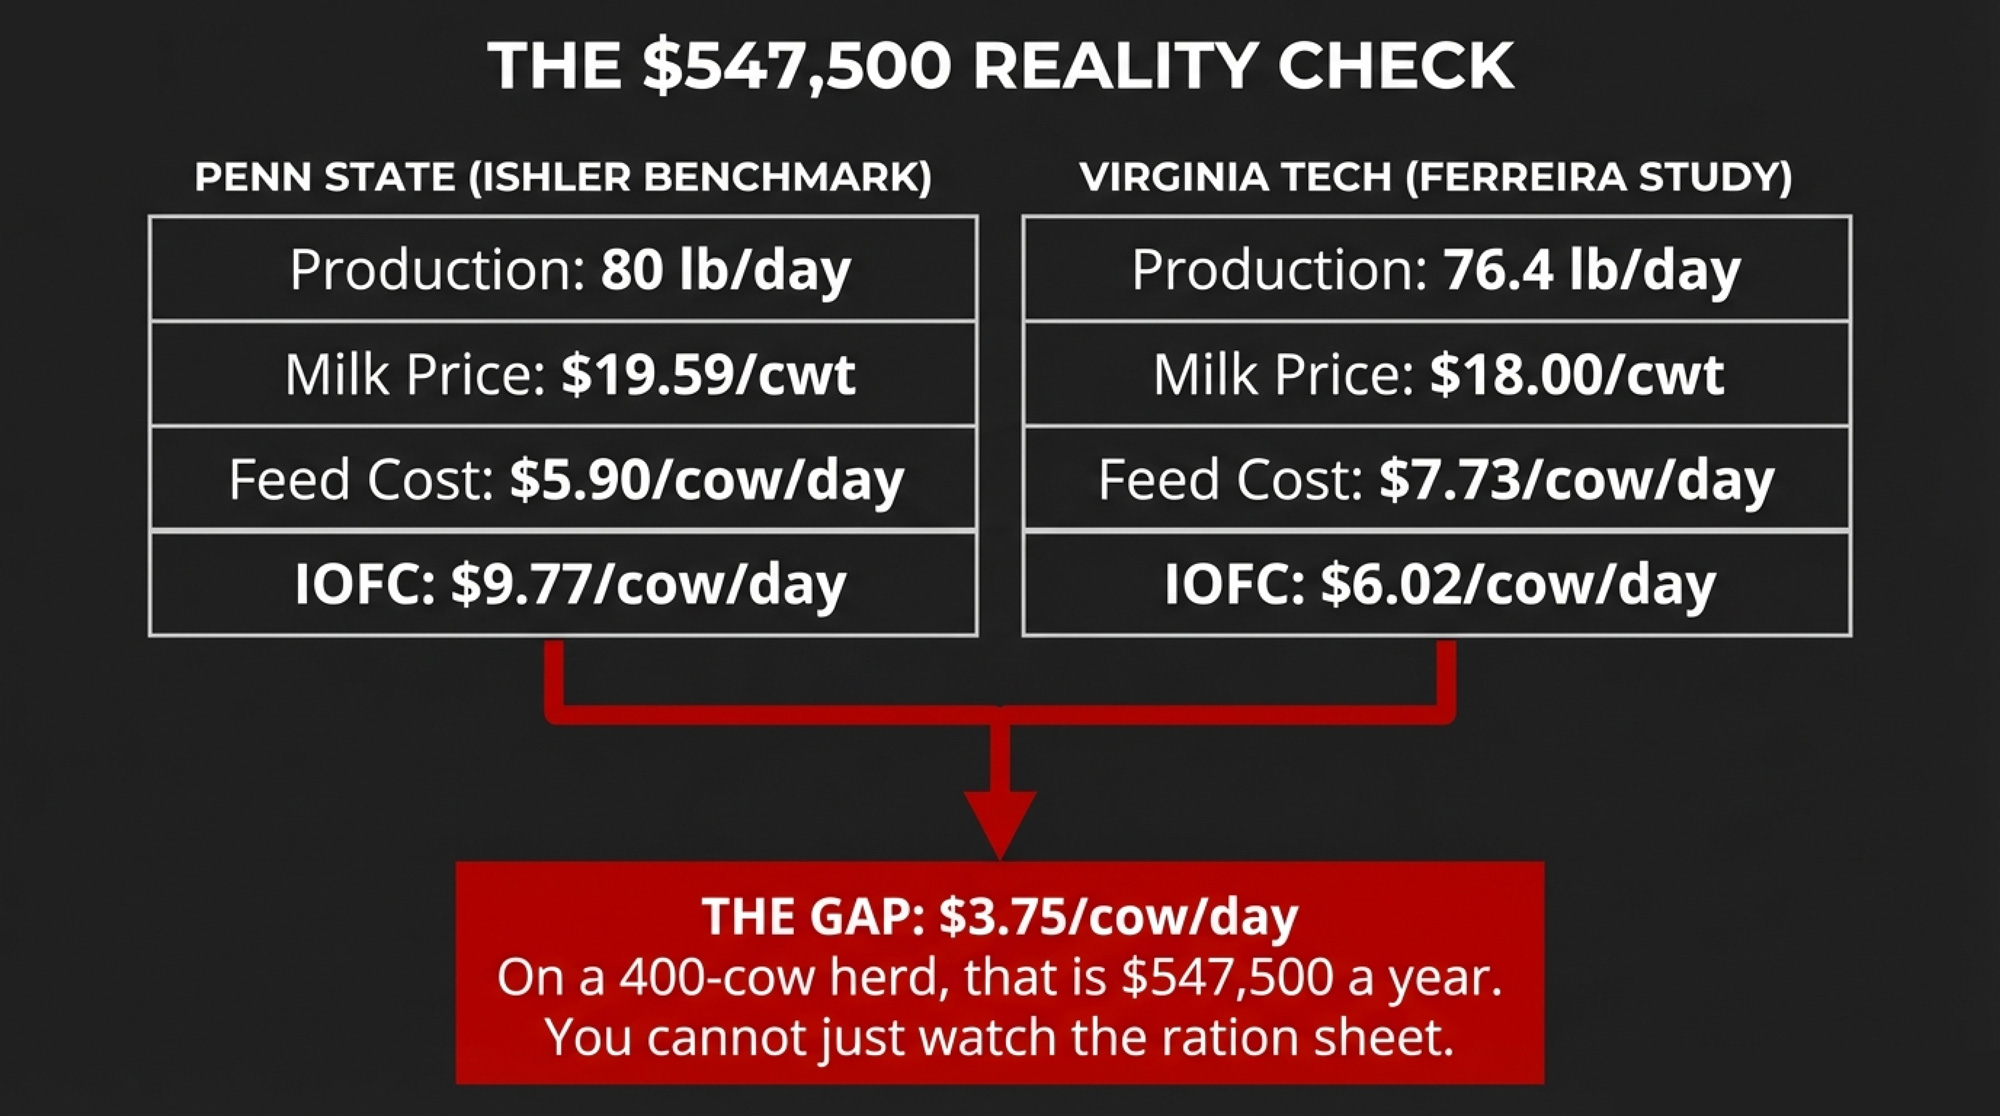
Virginia Ishler’s team at Penn State Extension runs one of the cleanest income‑over‑feed‑cost benchmarks in dairy economics: a herd averaging 80 lb/day, milk at $19.59/cwt, and feed cost at $5.90/cow/day. IOFC: $9.77 per cow per day. Down in Blacksburg, Virginia Tech’s Gonzalo Ferreira published a very different reality: 76.4 lb/day, milk at .00/cwt, and feed cost at .73/cow/day in a controlled feeding study — IOFC: .02.
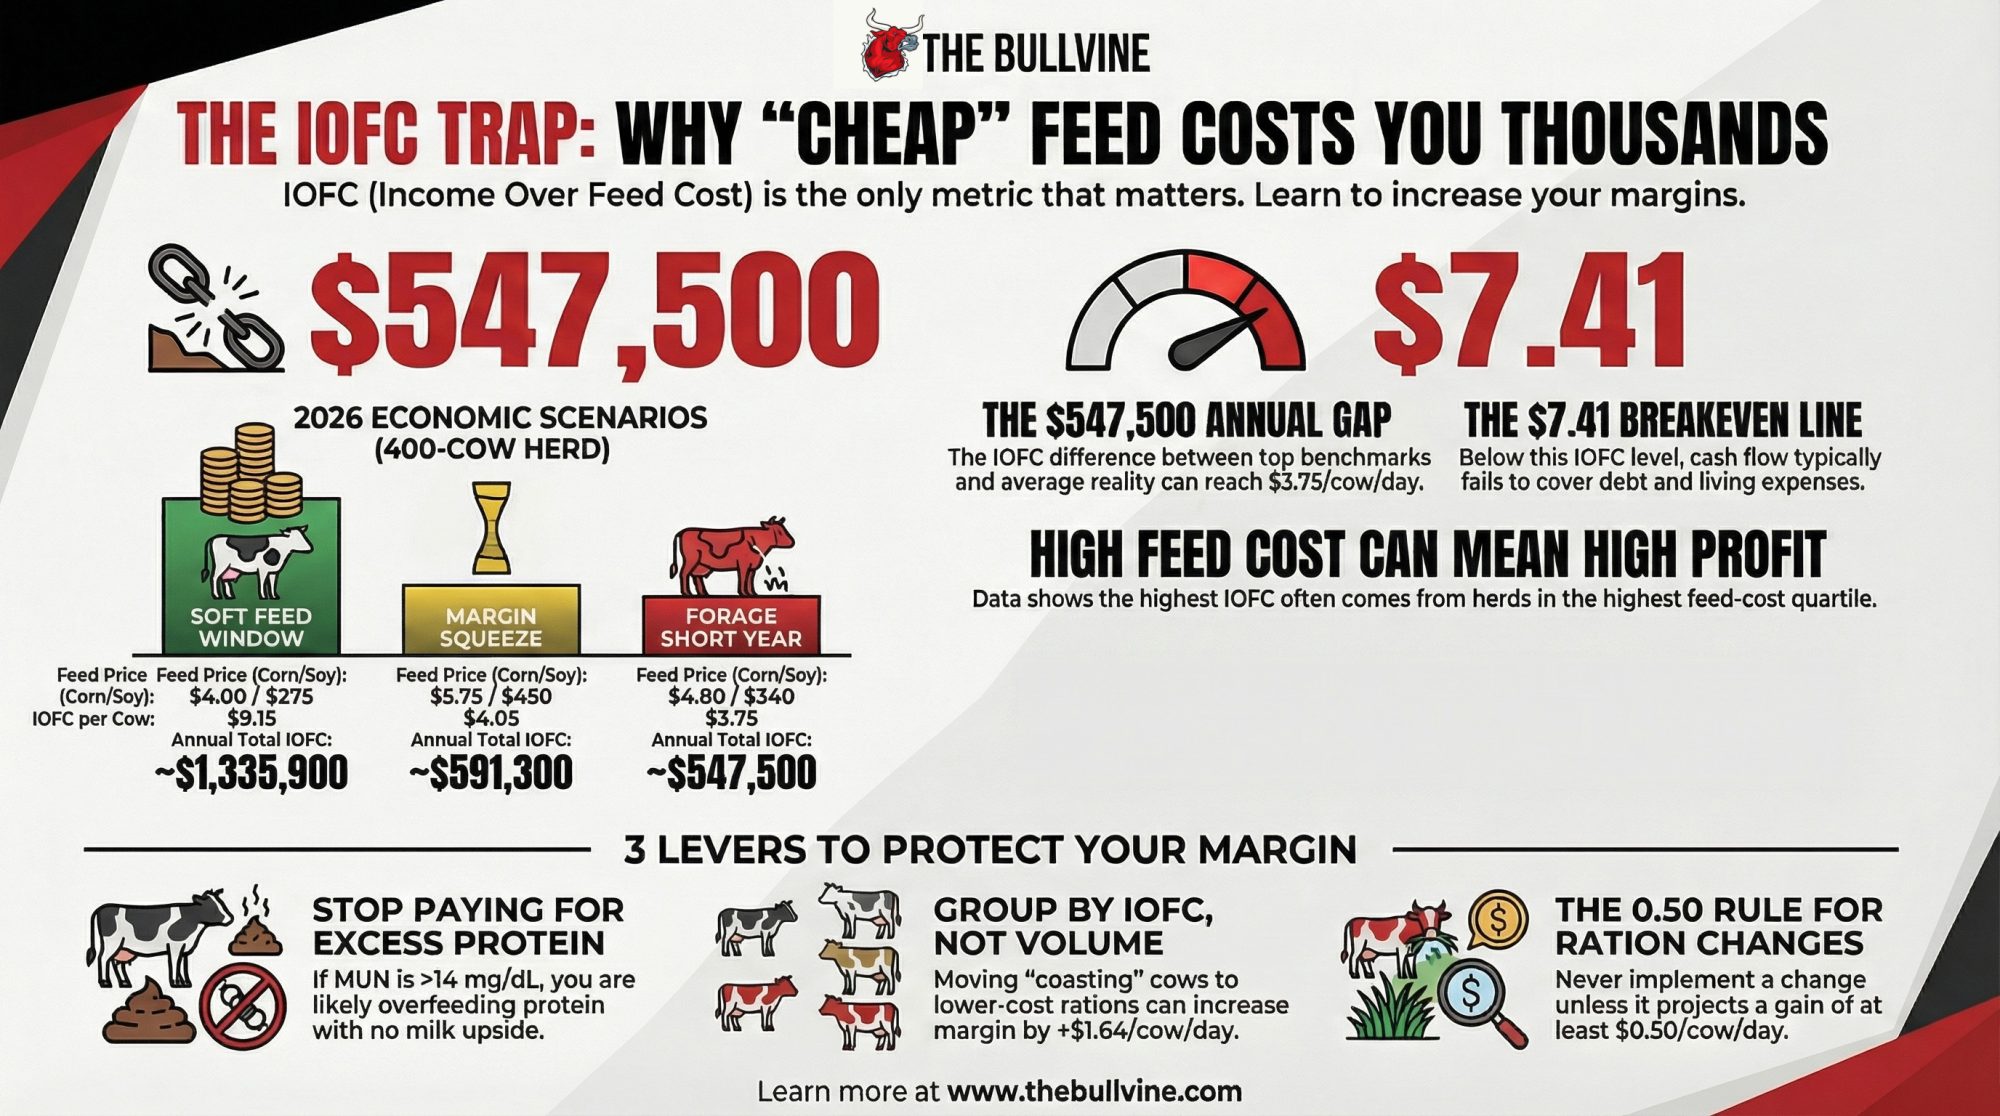
That .75/cow/day gap is what a lot of mid‑size herds are actually living with — they just haven’t run the math. On a 400‑cow herd, it’s roughly $547,500/year (3.75 × 400 × 365). This isn’t about a 10¢ tweak in the corn market. It’s three variables — milk price, production, and feed cost — compounding in opposite directions while most operations only watch one number on the ration sheet.
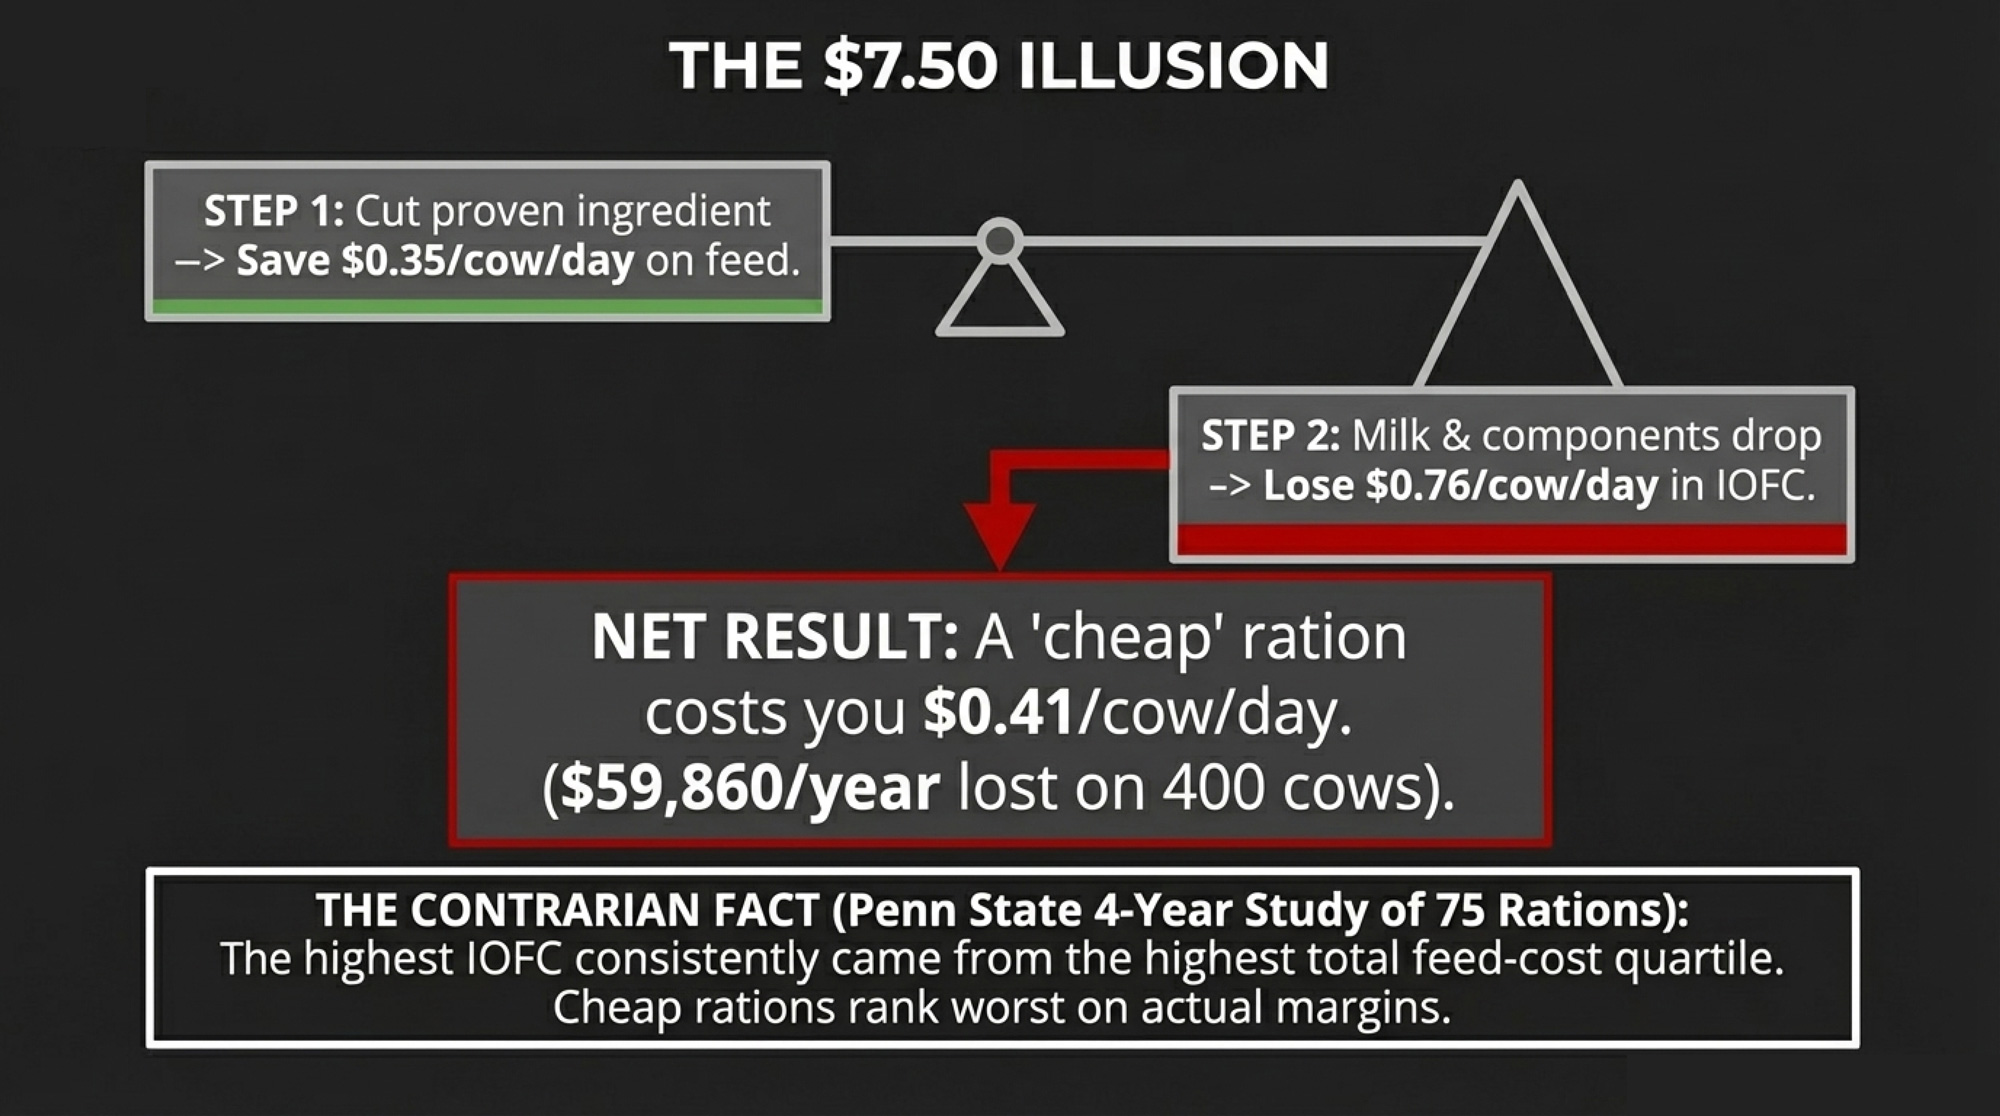
The $7.50 Illusion
Your ration sheet says $7.50/cow/day. Maybe $7.75. Looks disciplined.
Run the full IOFC, not just the feed line. A 78‑lb cow at $18.00/cwt generates $14.04 in milk income per day (78 ÷ 100 × 18). Subtract $7.50 feed cost, and IOFC is $6.54/cow/day. Not the $8–$9 a lot of people carry around in their heads. A miss of .50–.50/cow/day is 9–5/cow/year — five‑figure money for a 400‑cow herd hiding in the gap between “what it feels like” and “what the math says.”
Ishler, Goodling, and Beck hammered on this in a 2014 Journal of Dairy Science paper built from 75 Pennsylvania dairy rations over four years. The contrarian result: the highest IOFC came from the highest total feed‑cost quartile— herds spending $6.27 or more/cow/day. Cheap rations ranked worst on IOFC.
But it wasn’t a simple “spend more” story. Milk yield and IOFC didn’t correlate with purchased feed cost alone. The herds that won on IOFC lived in the intermediate forage‑cost band — about $1.45–$1.97/cow/day for forage. Not the absolute cheapest, not the most expensive. The money came from where they spent feed dollars, not just how many dollars they spent.
| Milk Price ($/cwt) | Production (lb/day) | Feed Cost ($/cow/day) | Actual IOFC ($/cow/day) | Annualized on 400 Cows |
|---|---|---|---|---|
| $19.59 | 80 | $5.90 | $9.77 | $1,424,620 |
| $18.00 | 78 | $7.50 | $6.54 | $955,260 |
| $18.00 | 76.4 | $7.73 | $6.02 | $878,920 |
| $17.00 | 78 | $9.50 | $3.76 | $549,040 |
| $17.00 | 78 | $11.25 | $2.01 | $293,460 |
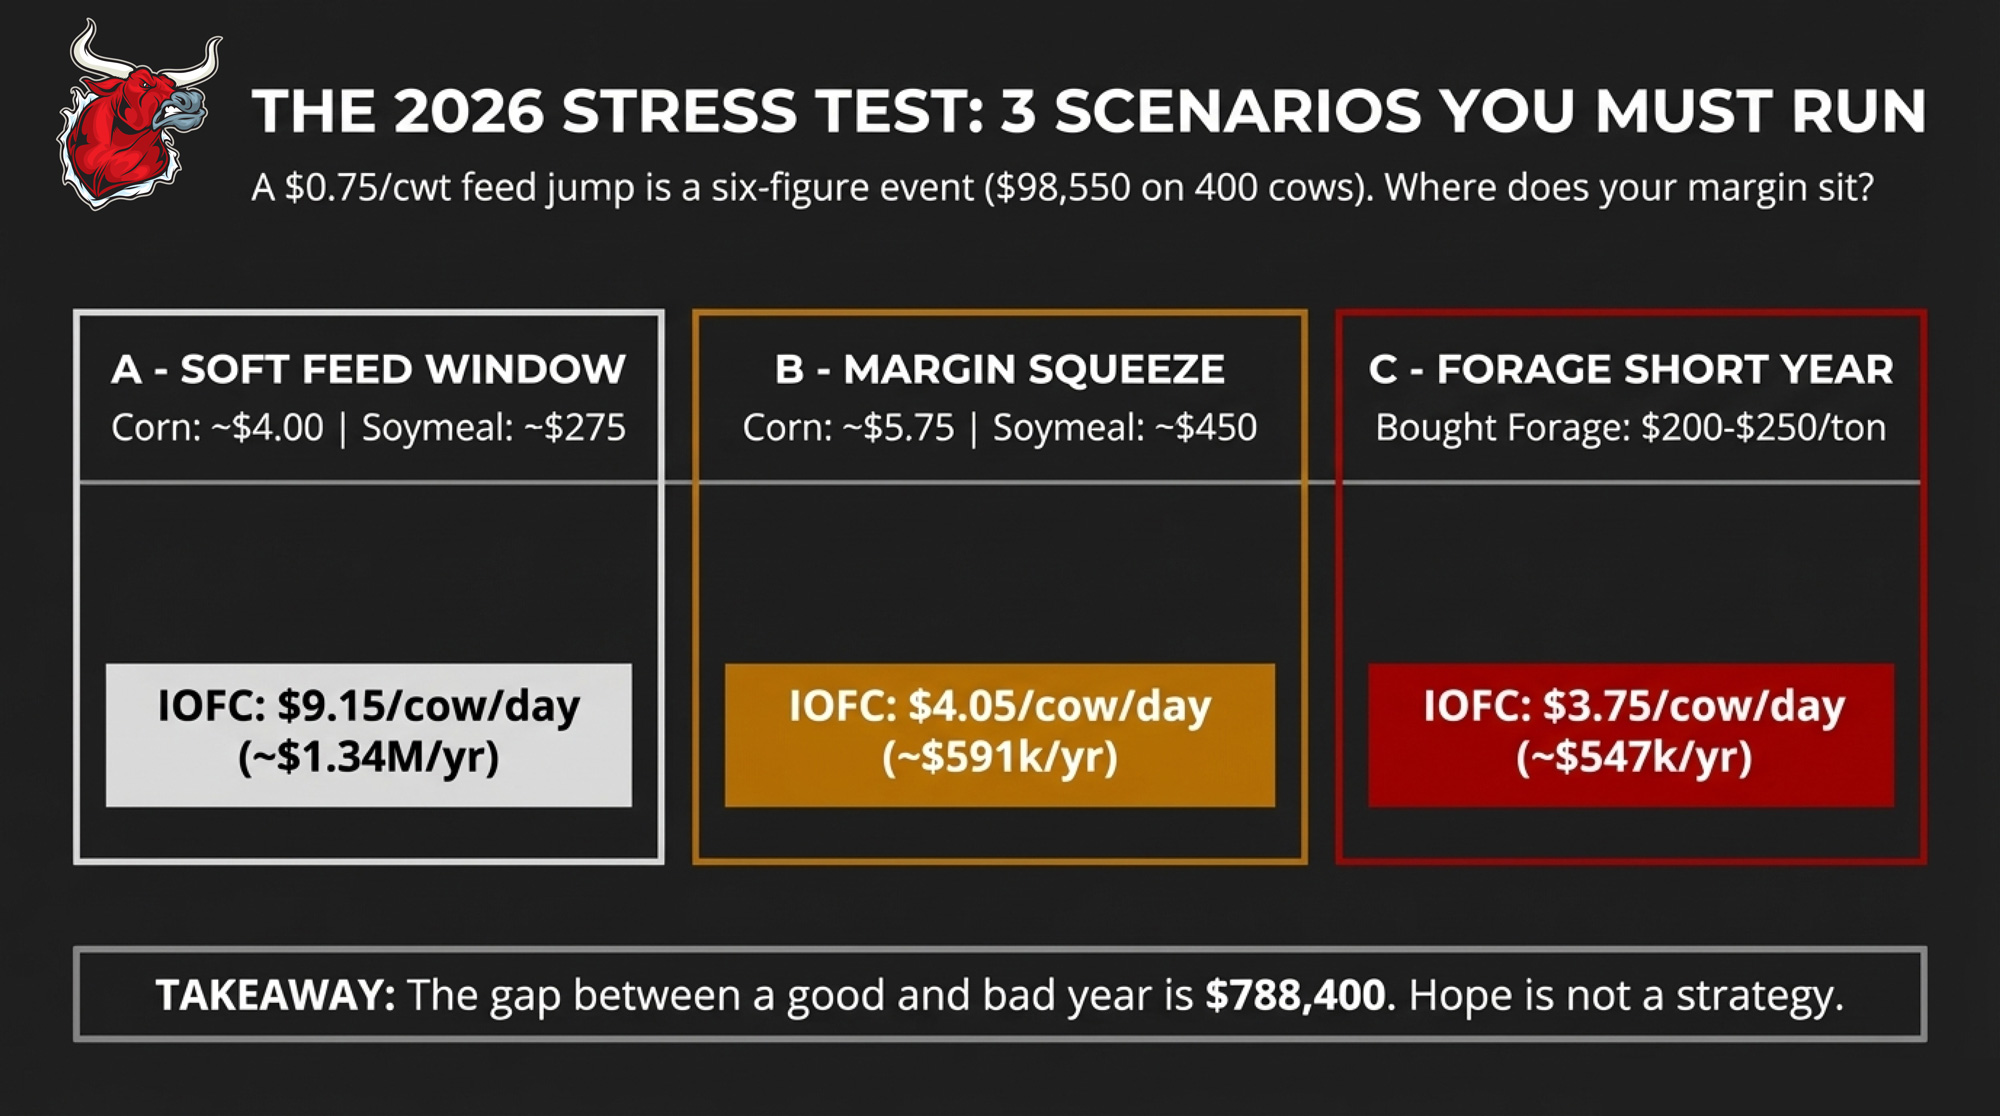
What Does a $0.75/cwt Feed Jump Do to a 400‑Cow Herd?
The February 2026 WASDE pegs 2025/26 U.S. corn ending stocks at 2.127 billion bushels and the season‑average corn price at .10/bu. USDA’s soymeal forecast for 2025/26 sits around $295/short ton, with subsequent March commentary and market coverage pointing toward a $300/ton season‑average as futures firm. Nearby soybean meal futures have been trading in the low-$320/ton range on the CME in late March. On the milk side, USDA’s 2026 outlook has the all‑milk price in the high‑$19s, roughly $0.75/cwt higher than earlier 2025 projections, depending on region and class mix.
On a spreadsheet, $0.75/cwt doesn’t look dramatic. On your cash flow, it’s a capital decision. A 400‑cow herd averaging 90 lb/day ships about 131,400 cwt/year (90 ÷ 100 × 400 × 365). A $0.75/cwt change in feed cost is roughly $98,550/year. That’s your robot payment. That’s the difference between building equity and explaining to your lender why principal just got tight.
Penn State’s IOFC guidance (updated 2023) frames it plainly: lactating‑cow feed cost often runs 30–70% of milk income, and IOFC is what’s left to pay heifers, dry cows, overhead, debt, and family living. When IOFC compresses $1/cow/day, your whole plan for the year shifts.
So the real question isn’t “Is $7.50/cow/day reasonable?” It’s: “Where does my IOFC sit now — and what happens if feed jumps $0.75/cwt?”
Three IOFC Scenarios You Should Run Before Summer
Let’s stay with a very normal profile: 400 cows, Holstein, 90 lb/day, U.S. basis. The TMR costs below are modeled off WASDE corn and soymeal projections applied to a standard 55%‑forage ration. Your numbers will float ±$0.50–$1.50/cow/day depending on basis, forage program, and shrink. The point is the magnitude, not arguing over pennies.
| Scenario | Corn ($/bu) | Soymeal ($/ton) | Milk ($/cwt) | Est. TMR $/cow/day | IOFC $/cow/day | Annual IOFC (400 cows) |
| A – “Soft feed” window | ~4.00 | ~275 | 18.50 | ~7.50 | 9.15 | ≈$1,335,900 |
| B – “Margin squeeze” | ~5.75 | ~450 | 17.00 | ~11.25 | 4.05 | ≈$591,300 |
| C – “Forage short” year | ~4.80 | ~340 | 17.50 | ~12.00 | 3.75 | ≈$547,500 |
Scenario A — “Soft feed” window. Corn near $4.00, soymeal around $275, and milk at $18.50. IOFC is $9.15/cow/day, or about $1.34 million/year for 400 cows. This is when grouping, forage upgrades, and IOFC‑positive ration tweaks pay for themselves fastest. You’ve got room to move.
Scenario B — “Margin squeeze.” Corn pushes toward $5.75, soymeal into the mid‑$400s/ton range, similar to 2023 levels when Argentina’s worst drought in decades crimped soybean output and kept meal values elevated above prior‑year averages. Milk is stuck at $17.00. IOFC drops to $4.05/cow/day, or about $591,300/year on 400 cows. The gap between Scenario A and B is roughly $744,600/year.
That’s not “a tighter year.” That’s a different business model.
Scenario C — “Forage short” year. A local weather hit takes out a chunk of your corn silage. Forage that usually pencils at $80–$100/ton on‑farm now has to be bought at $200–$250/ton. TMR lands closer to $12.00/cow/day. At $17.50 milk, IOFC is about $3.75/cow/day — roughly $547,500/year on 400 cows. The difference between Scenario A and C is about $788,400.
How many herds have actually run all three scenarios on their own IOFC and feed contracts, instead of just asking “What’s corn today?” and hoping for a soft year?
It Looks Like a Feed Problem. It’s Actually a Measurement Problem.
Look at those scenario gaps — $744,600–$788,400 between good and bad years. It feels like a feed‑cost problem.
It’s mostly a measurement problem. And a pricing problem.
The Ishler vs. Ferreira contrast isn’t “Penn State feeds cheap, and Virginia Tech doesn’t.” Ishler’s benchmark herd has higher production (80 vs. 76.4 lb/day), a higher milk price ($19.59 vs. $18.00), and lower feed cost ($5.90 vs. $7.73). Any one of those variables can swing six figures at 400 cows. Most herds are watching just one.
Elliot Block, writing in Progressive Dairy, walked through a ration change where a herd pulled a proven ingredient and shaved $0.35/cow/day off feed cost. Milk and components dropped. IOFC fell $0.76/cow/day. Net, the “savings” cost $0.41/cow/day in lost margin — about $59,860/year on 400 cows. Cheaper ration. Worse economics.
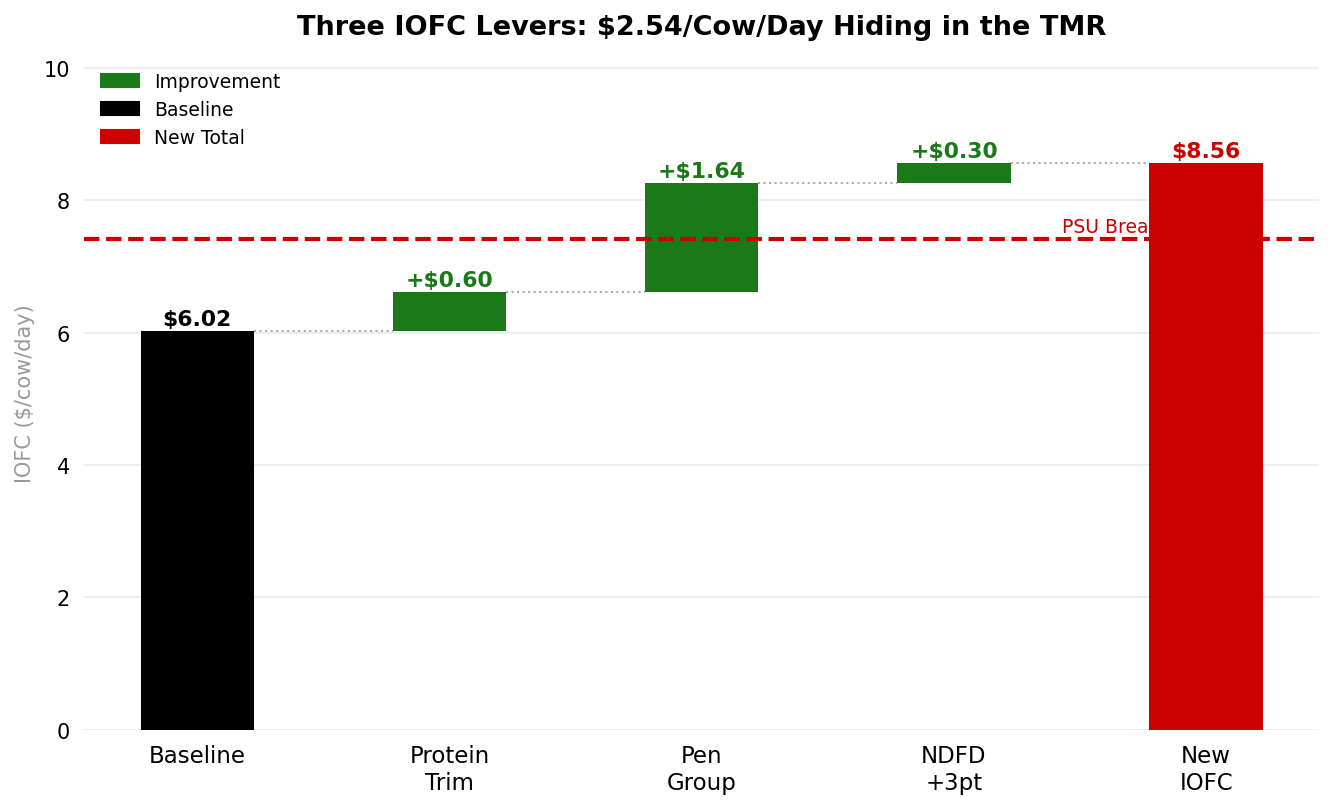
Penn State’s case‑farm breakeven IOFC is about $7.41/cow/day. Below that line, the cash‑flow plan stops working without more debt or less family living. That’s the number worth taping above the feed desk.
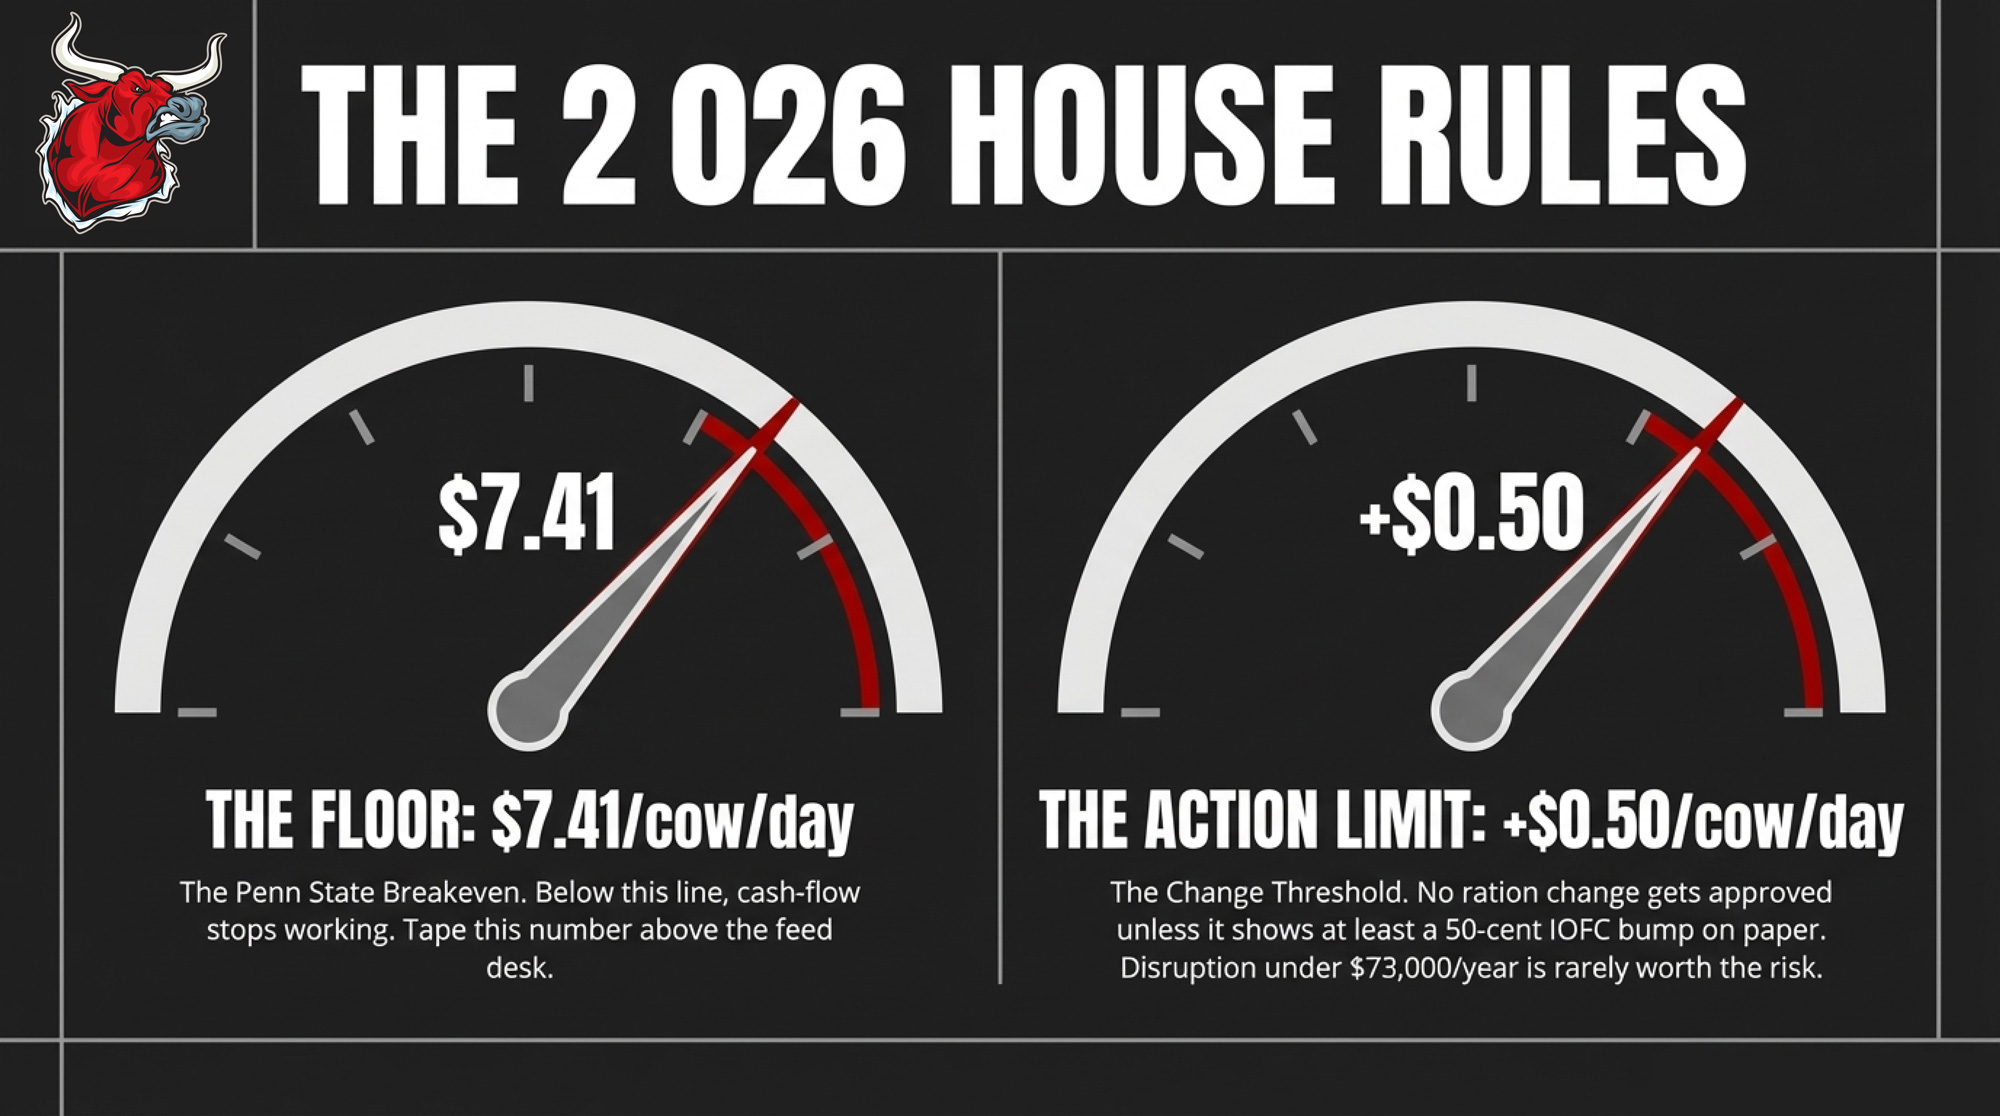
A practical house rule in 2026: no ration change gets implemented unless it shows at least +$0.50/cow/day in IOFC on paper. On 400 cows, $0.50/cow/day is roughly $73,000/year. Below that threshold, the disruption is rarely worth it.
Move 1: Stop Paying Cows to Excrete Protein
Jonker and Kohn looked at 1,156 dairy farms in the Chesapeake Bay watershed for a 2001 paper in The Scientific World Journal and found the average farm fed 6.6% more nitrogen than NRC recommendations, boosting urinary N excretion 16%. That’s protein you’re buying, not getting paid for, and hauling out in the spreader.
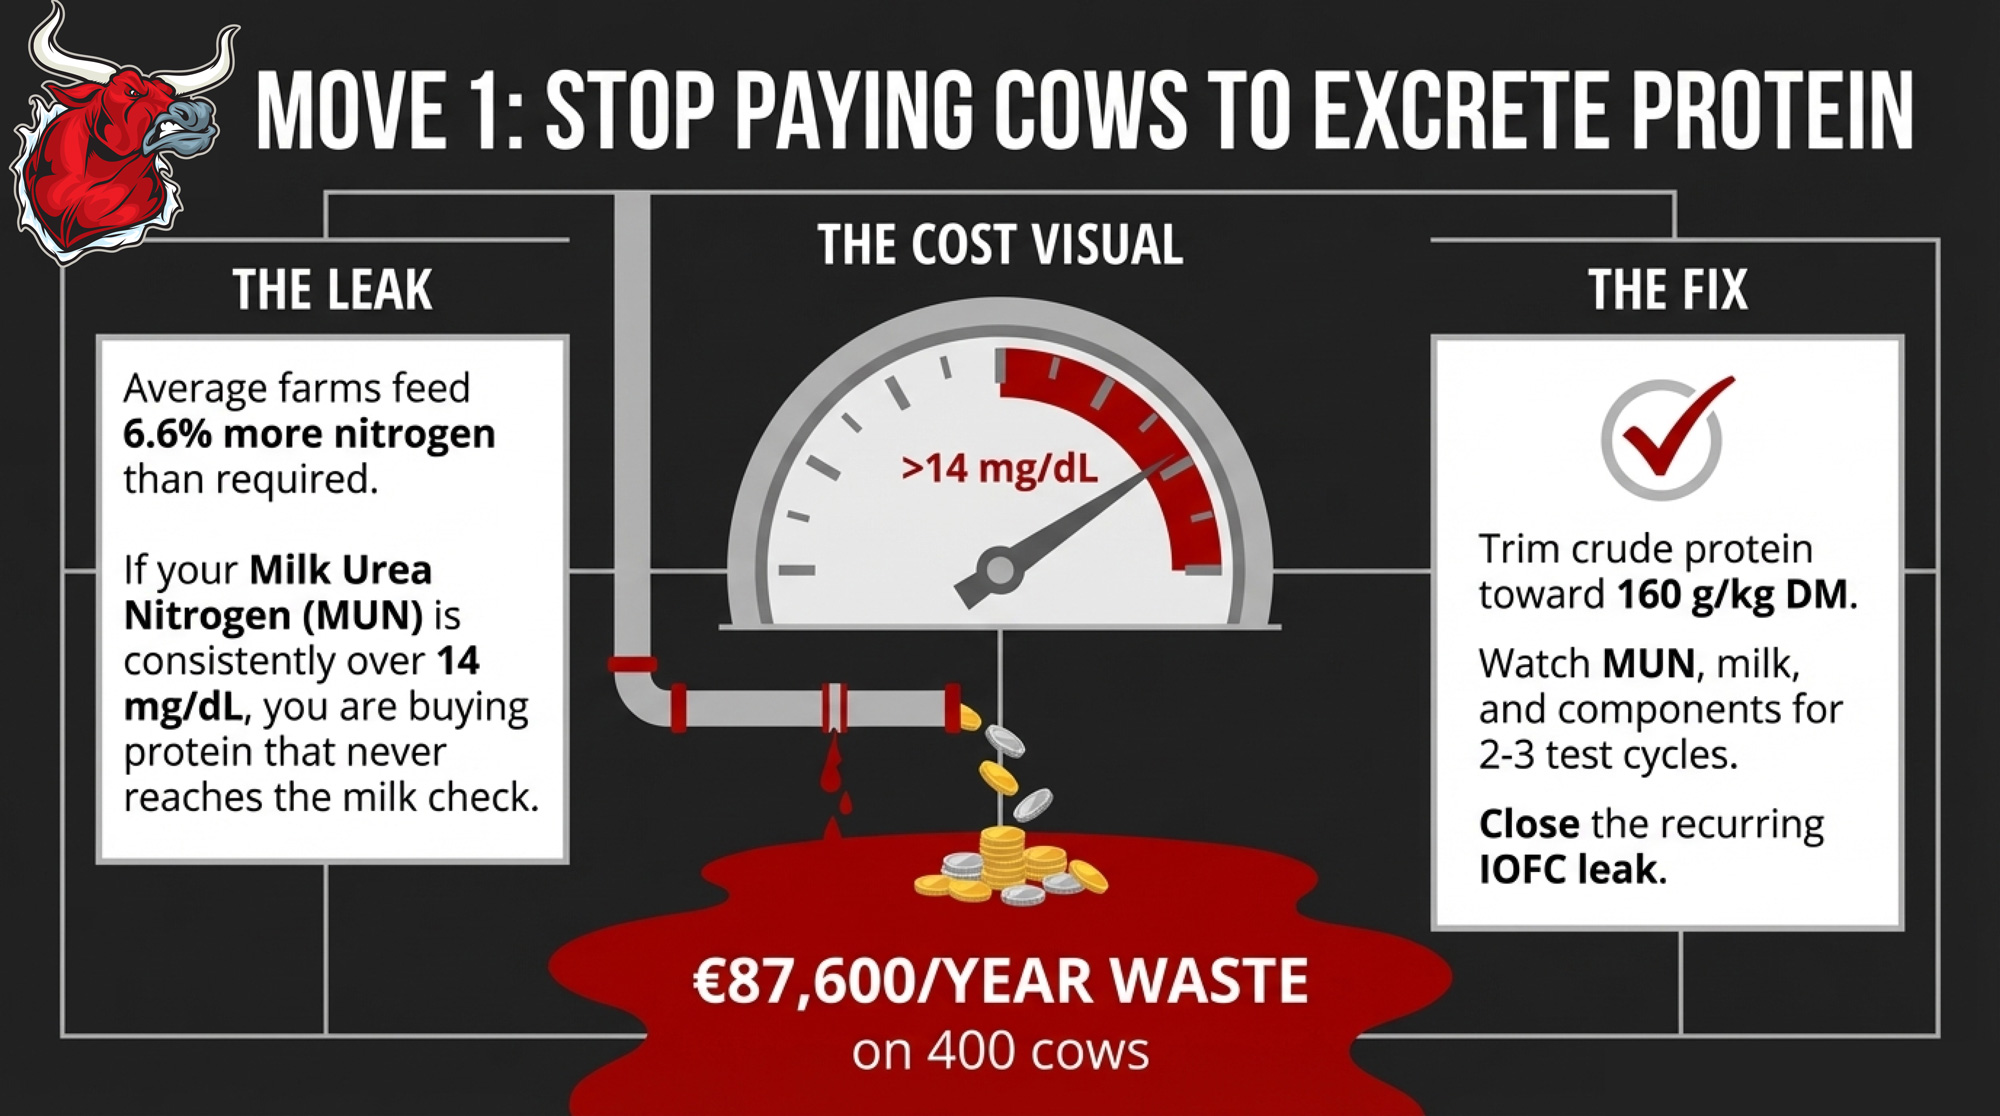
Dutch agricultural accounting firm Countus benchmarked herds at 160 g vs. 180 g crude protein per kg dry matterand reported about €0.60/cow/day in extra feed cost at the higher protein level. That’s roughly €219/cow/year. On 400 cows, you’re looking at around €87,600/year in protein cost with no milk check upside if those grams never show up as higher components.
Five‑figure money sitting in the manure pit. Literally.
Here’s the simple, data‑backed check:
- Pull your last three DHI milk urea nitrogen (MUN) reports.
- If a group is consistently over about 14 mg/dL for 2–3 tests, you’re most likely feeding more protein than the rumen — and the milk check — need.
The first move isn’t an additive. It’s a call to your nutritionist about trimming crude protein toward roughly 160 g/kg DM while watching MUN, milk, and components for 2–3 test cycles. Cutting protein too hard without watching data, and you’ll give back what you saved. Cut with a MUN target, and you start closing a recurring IOFC leak.
Move 2: Let IOFC — Not Volume — Decide Who Eats What
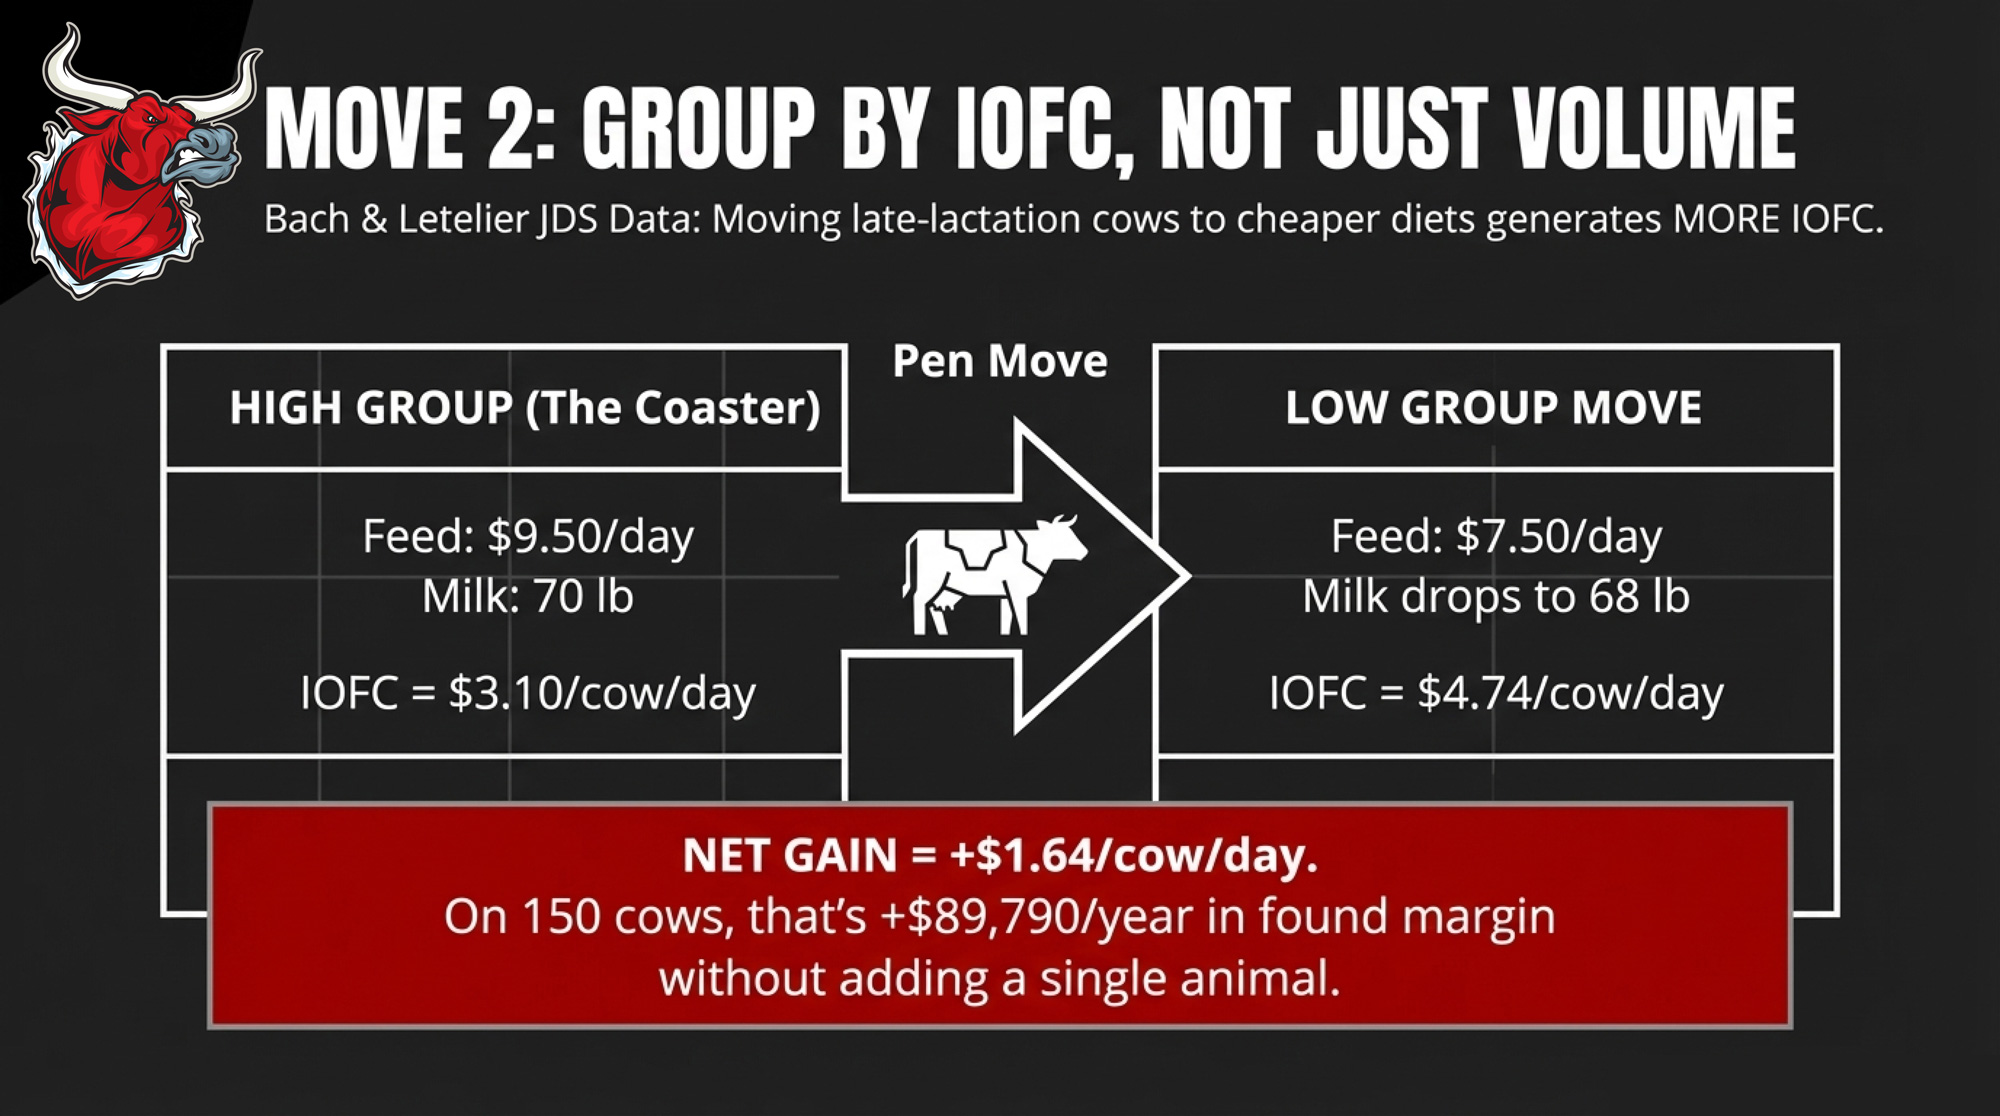
Alex Bach’s 2023 Journal of Dairy Science study tracked 1,960 cows across three herds and 2,142 pen moves. Cows moved from high‑nutrient to lower‑nutrient diets and lost some milk. The economics flipped it: IOFC was positive in every case except two pen moves on two farms when diet cost savings were included.
Vita Plus dairy specialist Paulina Letelier, Ph.D., took that work into a 750‑cow dairy, reporting in Hoard’s Dairymanin August 2024. Cows moved to a low‑production diet dropped 12.2 lb/day, but ration cost dropped more, and IOFC improved when feed prices were high relative to milk.
Run that math on a slice of your herd:
- High group: 150 late‑lactation cows on a ration costing $9.50/cow/day, averaging 70 lb/day at $18 milk.
IOFC = 70 ÷ 100 × 18 − 9.50 = $3.10/cow/day. - Low group: move them to a ration at $7.50/cow/day that supports 68 lb/day.
IOFC = 68 ÷ 100 × 18 − 7.50 = $4.74/cow/day.
That’s +$1.64/cow/day from a pen move. Across 150 cows for a full year, it’s about $89,790/year.
You gain margin. You give up some flexibility, and you have to manage pen dynamics. Push timid cows into a bad group or move cows too often, and you’ll pay in lameness and reproduction. This isn’t a “just group more” slogan. It’s a reminder that, with 2026 feed prices, IOFC should be deciding who eats what — not just “we’ve always had one high group.”
Move 3: Turn NDF Digestibility into IOFC, Not Just Tons
Three points of NDF digestibility are a harvest‑timing choice, not a product.
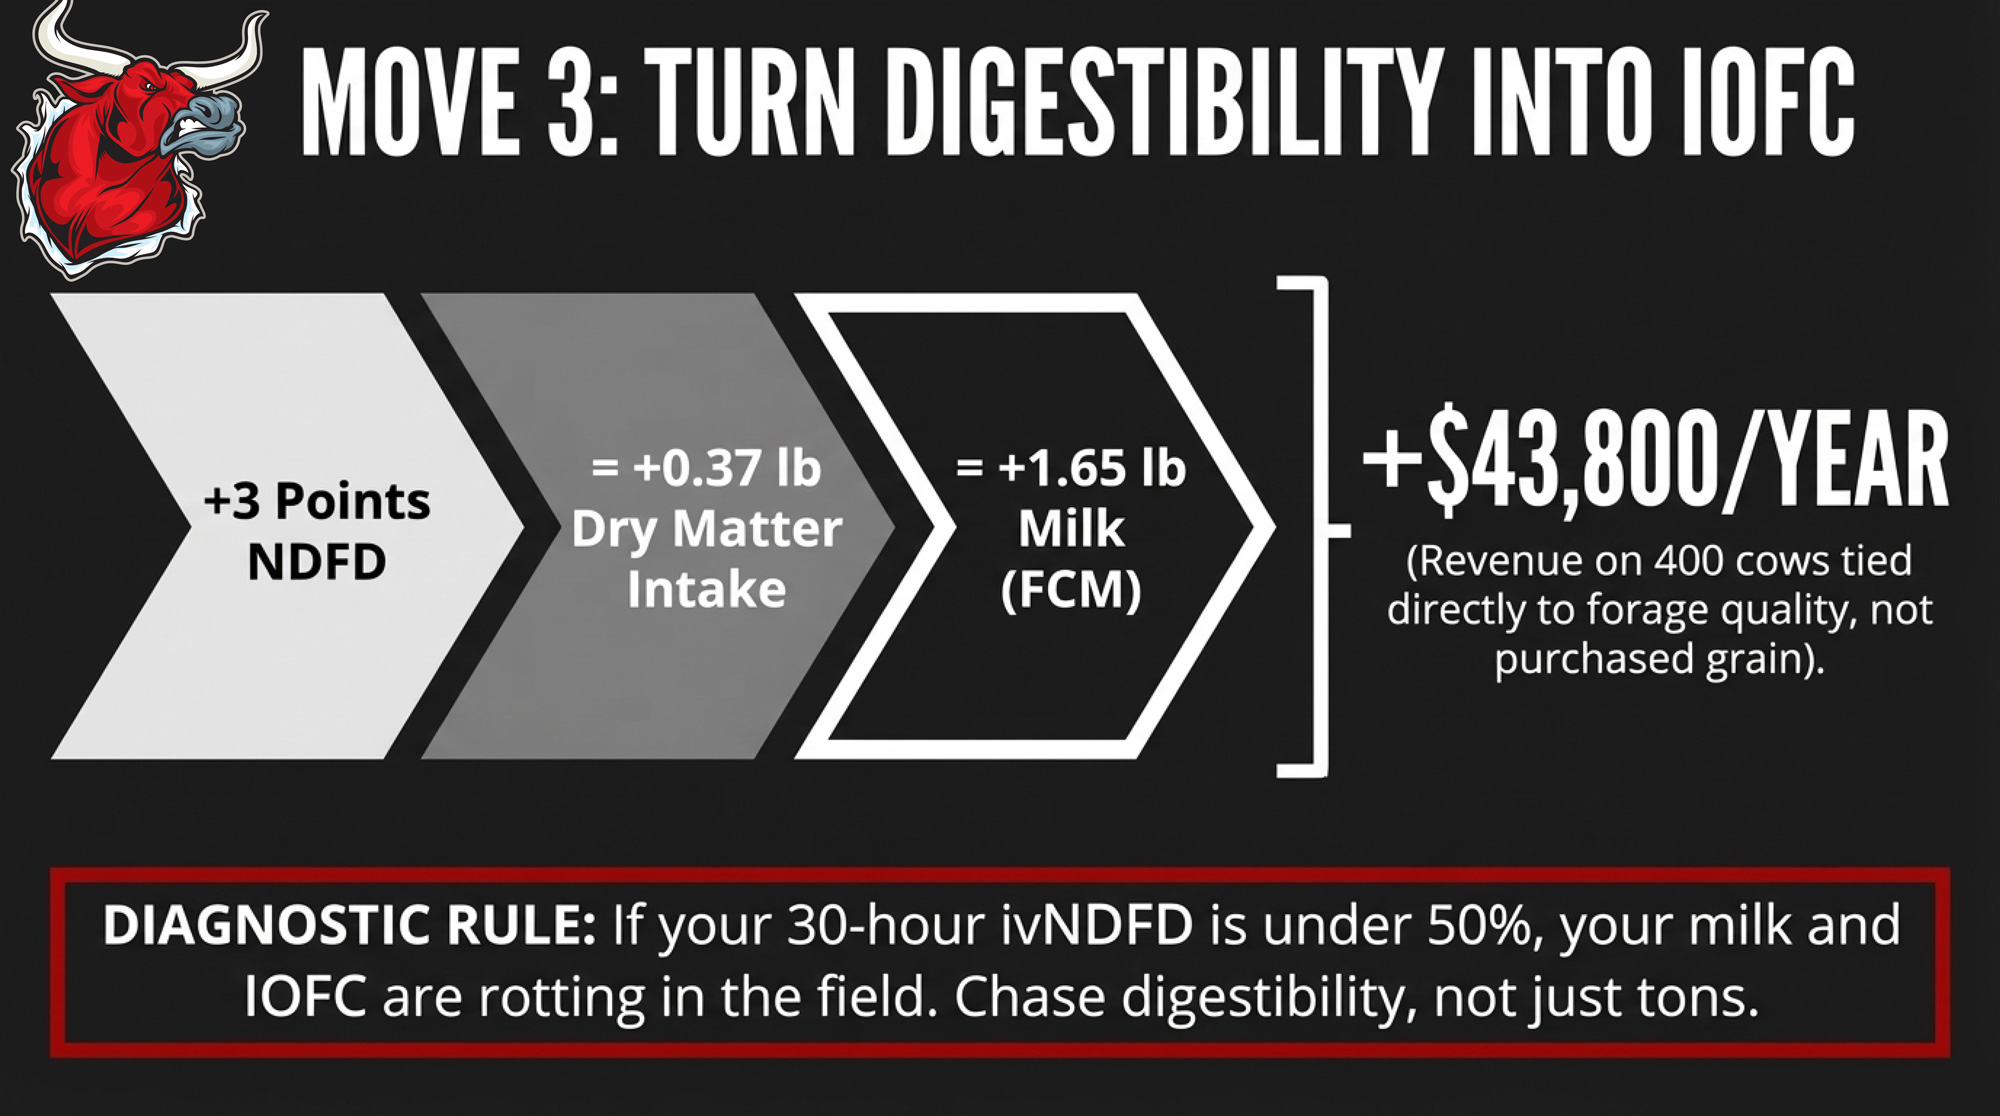
Oba and Allen’s 1999 meta‑analysis in Journal of Dairy Science pulled together in vitro NDF digestibility (NDFD) work on corn silage and found that for each 1‑point increase in NDFD, cows ate about 0.37 lb more dry matter and produced roughly 0.55 lb more 4% fat‑corrected milk. Michigan State University Extension built that into forage recommendations in 2018–2022 as climate pressure forced more attention to forage quality.
Take a 3‑point NDFD bump:
- Extra milk: 3 × 0.55 ≈ 1.65 lb FCM/cow/day.
- At $18/cwt, that’s 1.65 ÷ 100 × 18 ≈ $0.30/cow/day in revenue.
On 400 cows over 365 days, that’s about $43,800/year in milk income tied directly to forage quality — not more purchased grain.
If your 30‑hour ivNDFD numbers are under about 50%, milk and IOFC are sitting in the field. But chasing tonnage by letting corn get too mature can cost you those digestibility points. You gain tons. You give up IOFC. That trade‑off gets made with hybrid selection, kernel processing, and chop timing — long before you argue about $0.10/bu corn.
How to Calculate Your Own Income Over Feed Cost This Weekend
Before you change anything, you need one number: your current IOFC per cow per day.
Grab three pieces of paper from last month:
- Your milk is shipped, and the number of milking cows, so that you can get lb/cow/day.
- Your milk check to get your actual blend price in $/cwt (or producer blend price under Canadian supply management).
- Your feeding records or invoices to get lactating‑cow feed cost per cow per day, including a realistic value for homegrown forage.
Then run the formula:
IOFC = (milk price × lb milk ÷ 100) − feed cost/cow/day
Penn State’s DairyCents tool is one way to cross‑check your IOFC against market‑based numbers in your region; Penn State Extension has used it for years to monitor IOFC against their own herd and benchmark herds. It’s not a substitute for your invoices, but it’ll tell you whether your numbers move with the broader market.
Now shock it. Add $0.75/cwt to your feed cost.
At 85 lb/day, a $0.75/cwt feed increase is about $0.64/cow/day more in feed cost (0.75 × 0.85). Subtract that from your IOFC.
- If your current IOFC is under about $8.00/cow/day and the $0.75 shock pushes you below $7.00, you’re operating close to or under the $7.41 Penn State case‑farm breakeven. That’s thin ice heading into any feed shock.
- If your IOFC holds above $9.00 after the shock, you’ve got room. That’s the window where grouping, protein cuts, and forage work pay back quickest — before feed risk moves you toward Scenario B or C.
This is half an hour at the kitchen table with a calculator. Then you walk into your next nutritionist meeting, and your next lender review with a number more honest than “feed is about $7.50.”
Forward Signals: What to Watch in the Next 90 Days
You can’t control South American weather. You can control when you re‑run IOFC and how you react to changing risk.
Three signal sets matter most in 2026:
- Acreage and yield expectations. USDA’s Prospective Plantings (late March) and June Acreage reports are the first clear reads on intended corn and soybean area. If corn acres come in light or soy acres tighten, you’re moving toward Scenario B. If 2026/27 corn ending‑stock projections in WASDE trend toward or below 1.5 billion bushels, your long‑feed view gets tighter.
- Your own forage inventory and quality. A local drought or wet fall that trims silage tonnage or knocks NDFD down is how Scenario C shows up first — in your bunk, not on CME. Watch ivNDFD and inventory spreadsheets with the same discipline you watch futures.
Component pricing and premiums. CoBank’s Corey Geiger has noted that well over 90% of U.S. farm milk is now marketed on multiple components. DFA and other co‑ops report component values, adding roughly $1–$3/cwt to checks for some producers. If you’re still feeding for volume under a component system, you’re working against your milk check — and your IOFC.
What This Means for Your Operation
| Change Type | Typical $/cow/day Shift | Projected IOFC Impact | Annual Impact (400 cows) | Threshold Met? |
|---|---|---|---|---|
| Protein trim to ~160 g/kg DM (from >180 g) | -$0.60 feed cost | +$0.60 IOFC | +$87,600 | ✅ Yes |
| Pen regroup — move coasting late-lact. cows | -$2.00 ration cost | +$1.64 IOFC | +$89,790 | ✅ Yes |
| Forage NDFD +3 pts (harvest timing) | $0 direct cost | +$0.30 IOFC | +$43,800 | ⚠️ Borderline |
| Single ingredient swap, 10¢ cheaper | -$0.10 feed cost | -$0.06 IOFC net* | -$8,760 | ❌ No |
| Add-on supplement, no ration restructure | +$0.20–$0.40/day | Needs verification | Varies | ❓ Needs IOFC proof |
| Lock forward feed contract at $4.10 corn | Stable vs. scenario B | Defends vs. -$7.10/day | +$744k vs. Scenario B | ✅ Strategic |
- This weekend: Calculate your IOFC per cow per day with current milk and feed prices. Write the number down. Then run the $0.75/cwt feed shock. If the shock drops you under $7.00, you’re operating below the Penn State breakeven band; you need to tighten that IOFC conversation before your banker does it for you.
- At your next nutritionist visit: Take your IOFC and shock numbers and make them the first agenda item. Any ration change that doesn’t show at least +$0.50/cow/day projected IOFC — about $73,000/year on 400 cows — doesn’t get implemented.
- On protein: If MUN is consistently >14 mg/dL in a group, treat that as a specific IOFC leak. Use the 160 g/kg DM crude‑protein target and Countus’s €0.60/cow/day overfeed cost as the guardrails for your next formulation round.
- On grouping: If you’re feeding one high group where a third of cows are coasting, run the Bach/Letelier math on those coasters. If a pen change can add $1–$1.50/cow/day in IOFC for 100–150 cows, that’s a cleaner lever than chasing more cows or more steel.
- On forage: If your 30‑hour ivNDFD is under 50%, mark this year’s harvest window in red. Hybrid choice, kernel processing, chop height, and timing will show up as IOFC next year. Treat that NDFD report like a second milk check.
- Within 90 days: Before you lock in major feed or forage contracts for the 2026–27 season, re‑run IOFC under your own version of Scenarios A, B, and C with your contracts and your forage numbers. Print those three IOFC outcomes and take them to your lender. It changes the conversation from “we hope feed stays reasonable” to “here’s how we’ve stress‑tested our cash flow.”
Key Takeaways
- If you don’t have your IOFC per cow per day written down with 2026 numbers, you don’t actually know whether your ration is earning its keep. The Penn State vs. Virginia Tech benchmarks show that what feels like “reasonable feed cost” can be a $3.75/cow/day gap — about $547,500/year at 400 cows.
- A $0.75/cwt change in feed cost is a six‑figure event, not background noise. On a 400‑cow, 90‑lb herd, it’s about $98,550/year. Treat feed‑price moves like capital decisions.
- Most of the margin you’re hunting is already in your TMR and pen map. Overfeeding protein, keeping coasting cows on high‑octane rations, and ignoring NDFD are all documented IOFC leaks with fixable barn‑math behind them — not mysteries that require new tech or more cows.
- A house rule that fits 2026: No ration change gets implemented without a written IOFC projection, and anything under +$0.50/cow/day doesn’t make the cut. That’s roughly $73,000/year on 400 cows; below that, the churn probably isn’t worth it.
The Bottom Line
Pull your milk check. Pull your feed invoice. Run the IOFC math with a pen. Then look at your next feed contract and ask one blunt question before you sign: Does this deal defend your income over feed cost when feed jumps $0.75/cwt — or does it just make your $/cow/day ration line look cheaper on paper?
Complete references and supporting documentation are available upon request by contacting the editorial team at editor@thebullvine.com.
Learn More
- The $200K Dairy Margin Trap: What Cheap Feed Won’t Tell You About 2026 – Exposes the dangerous illusion of low corn prices that mask a looming $1.75/cwt margin squeeze. It arms you with immediate NIR testing and component tactics to protect six figures of cash flow before the 2026 price dip hits.
- USDA’s $109 Billion Warning: $18.95 Milk, $19.14 Costs, and 29% of Farm Income from Government Checks– Delivers a brutal three-year strategic forecast for mid-size operations starting 2026 structurally in the red. It reveals how to stress-test your equity and provides a “Strategic Exit” versus “Forced Liquidation” timeline to preserve family wealth.
- Robotic Milking Pays 13% More – After 7 Years of Red Ink – Breaks down the latest 2026 USDA findings on automation profitability versus the harsh reality of a seven-year cash flow valley. It reveals the unvarnished ROI of robots, helping you decide if the long-term gain justifies the short-term risk.
 The Sunday Read Dairy Professionals Don’t Skip.
 The Sunday Read Dairy Professionals Don’t Skip.
Every week, thousands of producers, breeders, and industry insiders open Bullvine Weekly for genetics insights, market shifts, and profit strategies they won’t find anywhere else. One email. Five minutes. Smarter decisions all week.

 Join the Revolution!


