Archive for heifer raising costs

How a $286 Milk Replacer Shortcut Cost One 600‑Cow Herd $30,000 in Future Milk

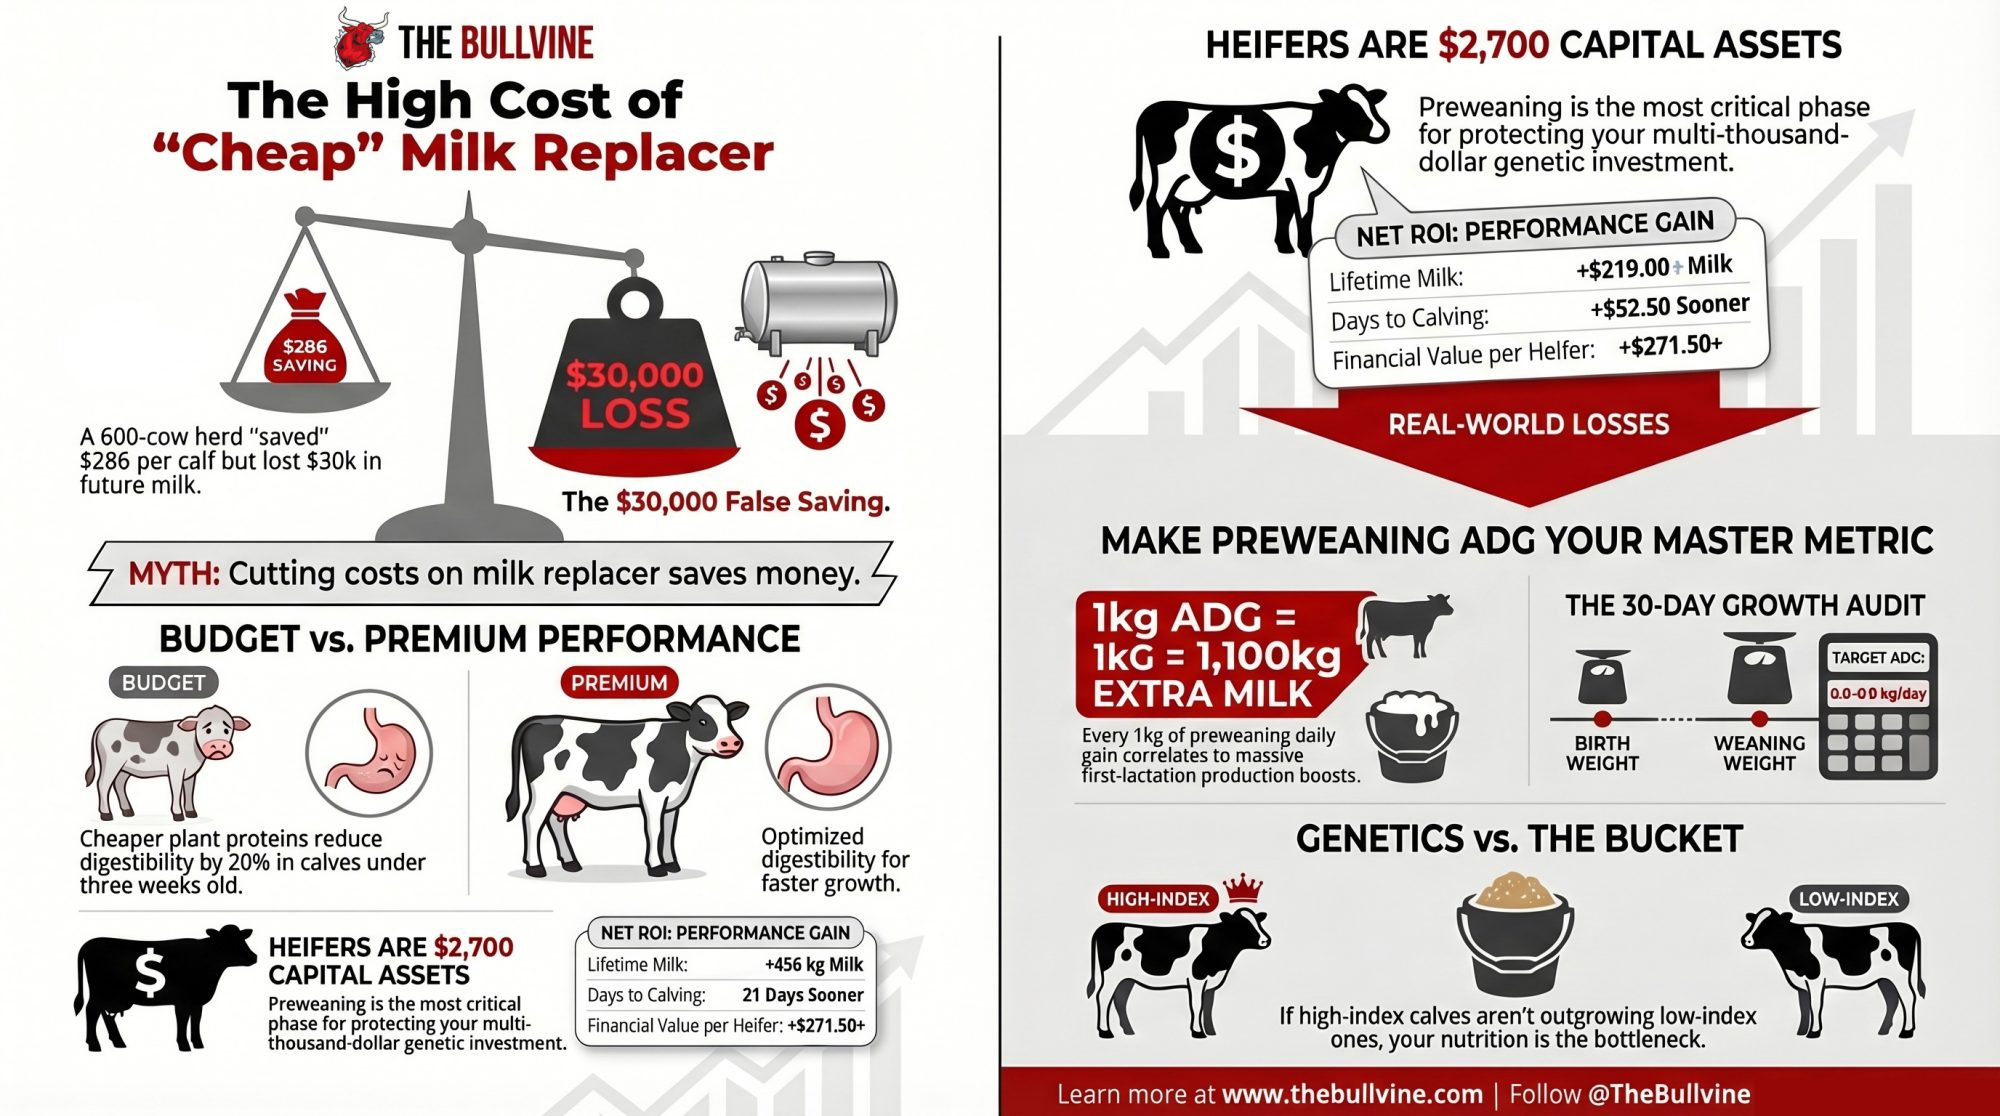
When a 600‑cow Wisconsin herd tried to save $286 per calf on milk replacer, it looked like smart cost‑cutting. Three years later, the heifer records told a different story.

In early 2023, the team at a 600‑cow Holstein herd in central Wisconsin sat down with their nutritionist and lender to “trim the fat” out of their youngstock program. Feed and labor had pushed their heifer‑raising cost toward the $2,300–$2,600 per head range Iowa State budgets were warning about for herds of their size. They moved from a premium all‑milk replacer to a cheaper 20/20 blend, cutting about $286 per heifer out of the total preweaning milk program when you include both bag price and the way they fed it — roughly $30,000 – $35,000 ‘saved’ over four heifer crops on 120 replacements a year.
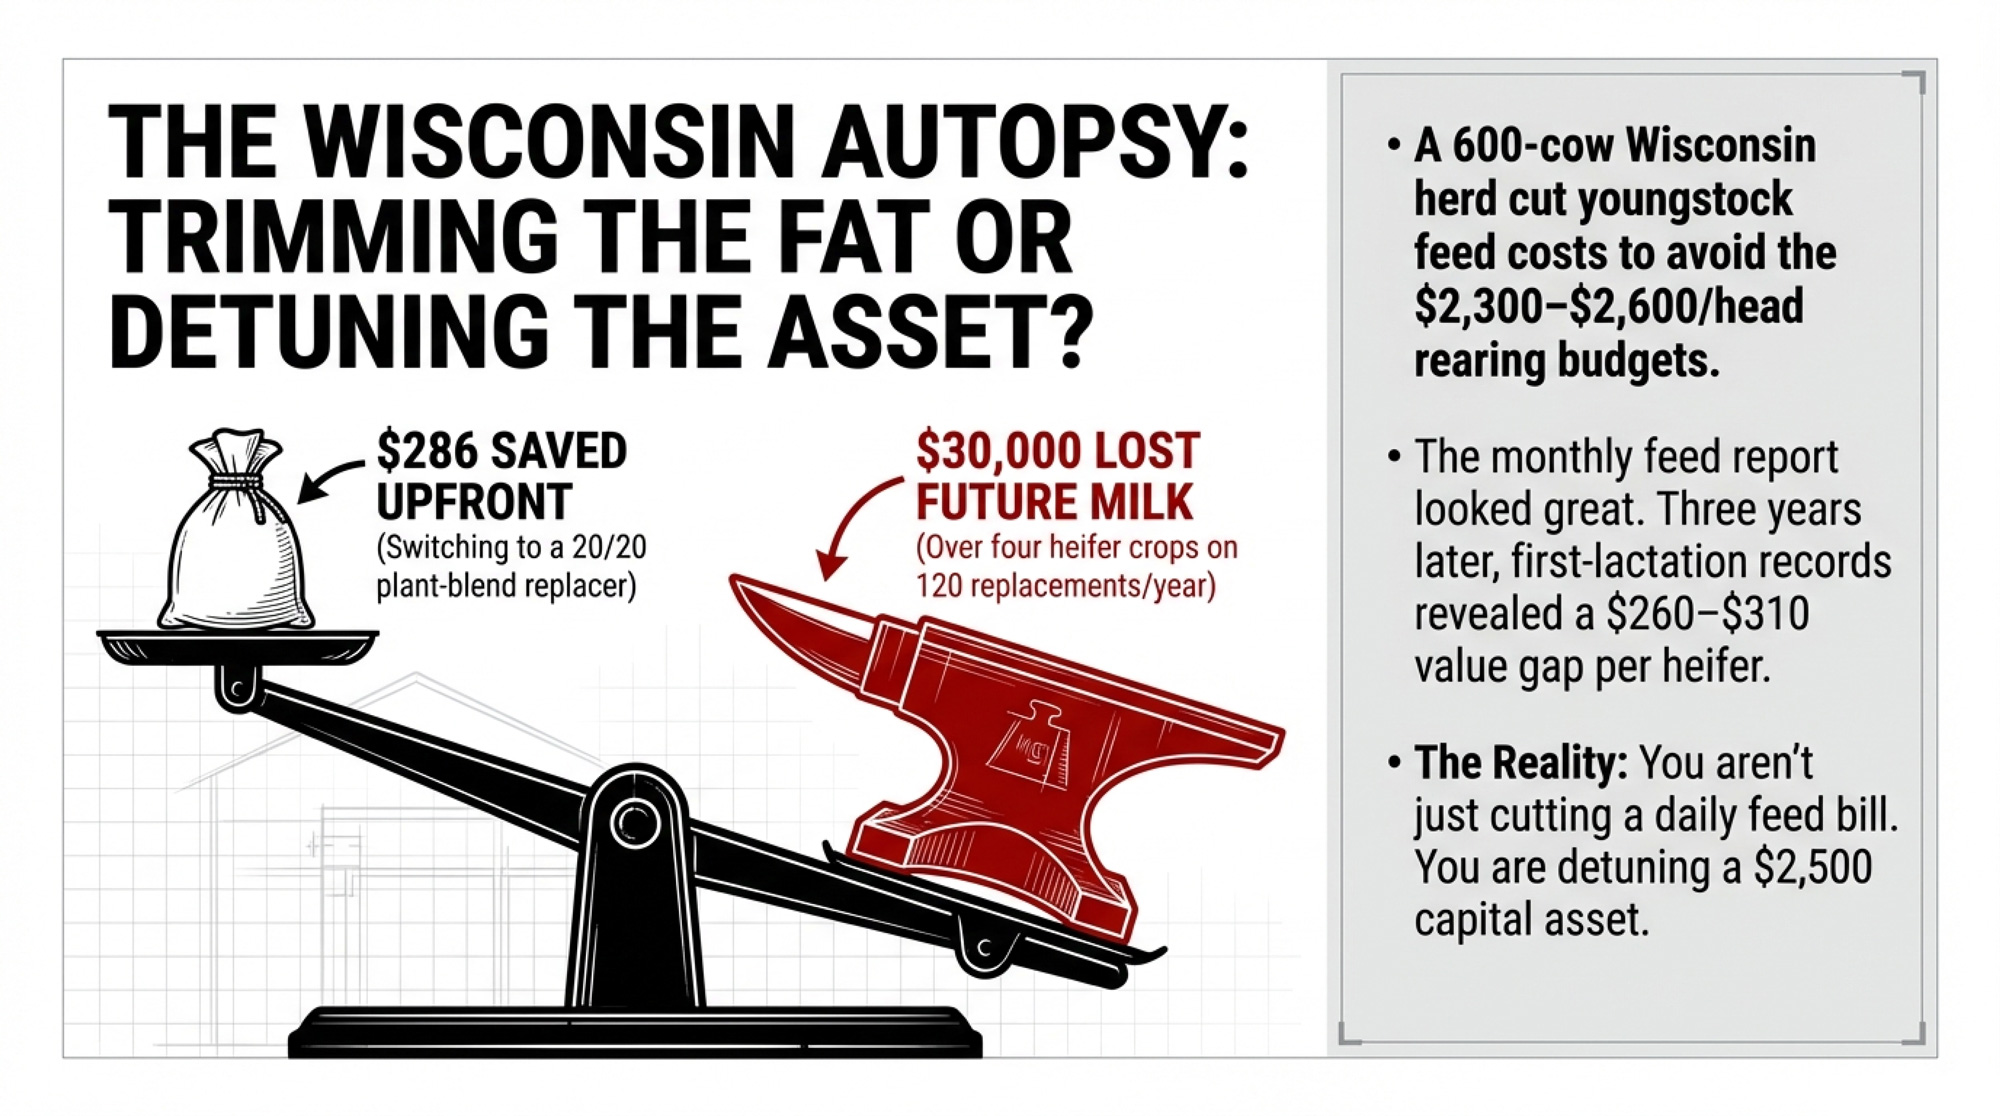
At the time, that felt like a win. When they ran first‑lactation records three years later and lined those heifers up against their previous all‑milk program, the pattern — exactly what Cornell’s calf data has been screaming for a decade — was hard to ignore. The calves raised on the cheaper program were behind on first‑lactation milk, behind on age at first calving, and more likely to leave early. When you added it up, the realistic value gap sat around $260–$310 per heifer, stacked against that $286 “saving” on replacer. You weren’t just cutting a feed bill. You were detuning a $2,500 capital asset.

MetricBudget 20/20 (plant protein)Premium all‑milk program
Preweaning ADG (kg/day)0.650.85
Replacer cost per heifer (USD)Base – 286Base
Lifetime milk value per heifer (3 lactations, USD)Base+ 218.88
Days to first calvingBase–21 days (~52.50 saved)
Net impact per heifer (before survival, USD)+ 286 “saved” feed–14.62 vs budget

What’s Really Changing in Those First 56 Days

If you’ve followed calf work over the last 10–15 years, you’ve watched the question flip. We used to ask, “How little milk can we get away with?” Now the serious conversation is, “What does early growth really do to lifetime production?”
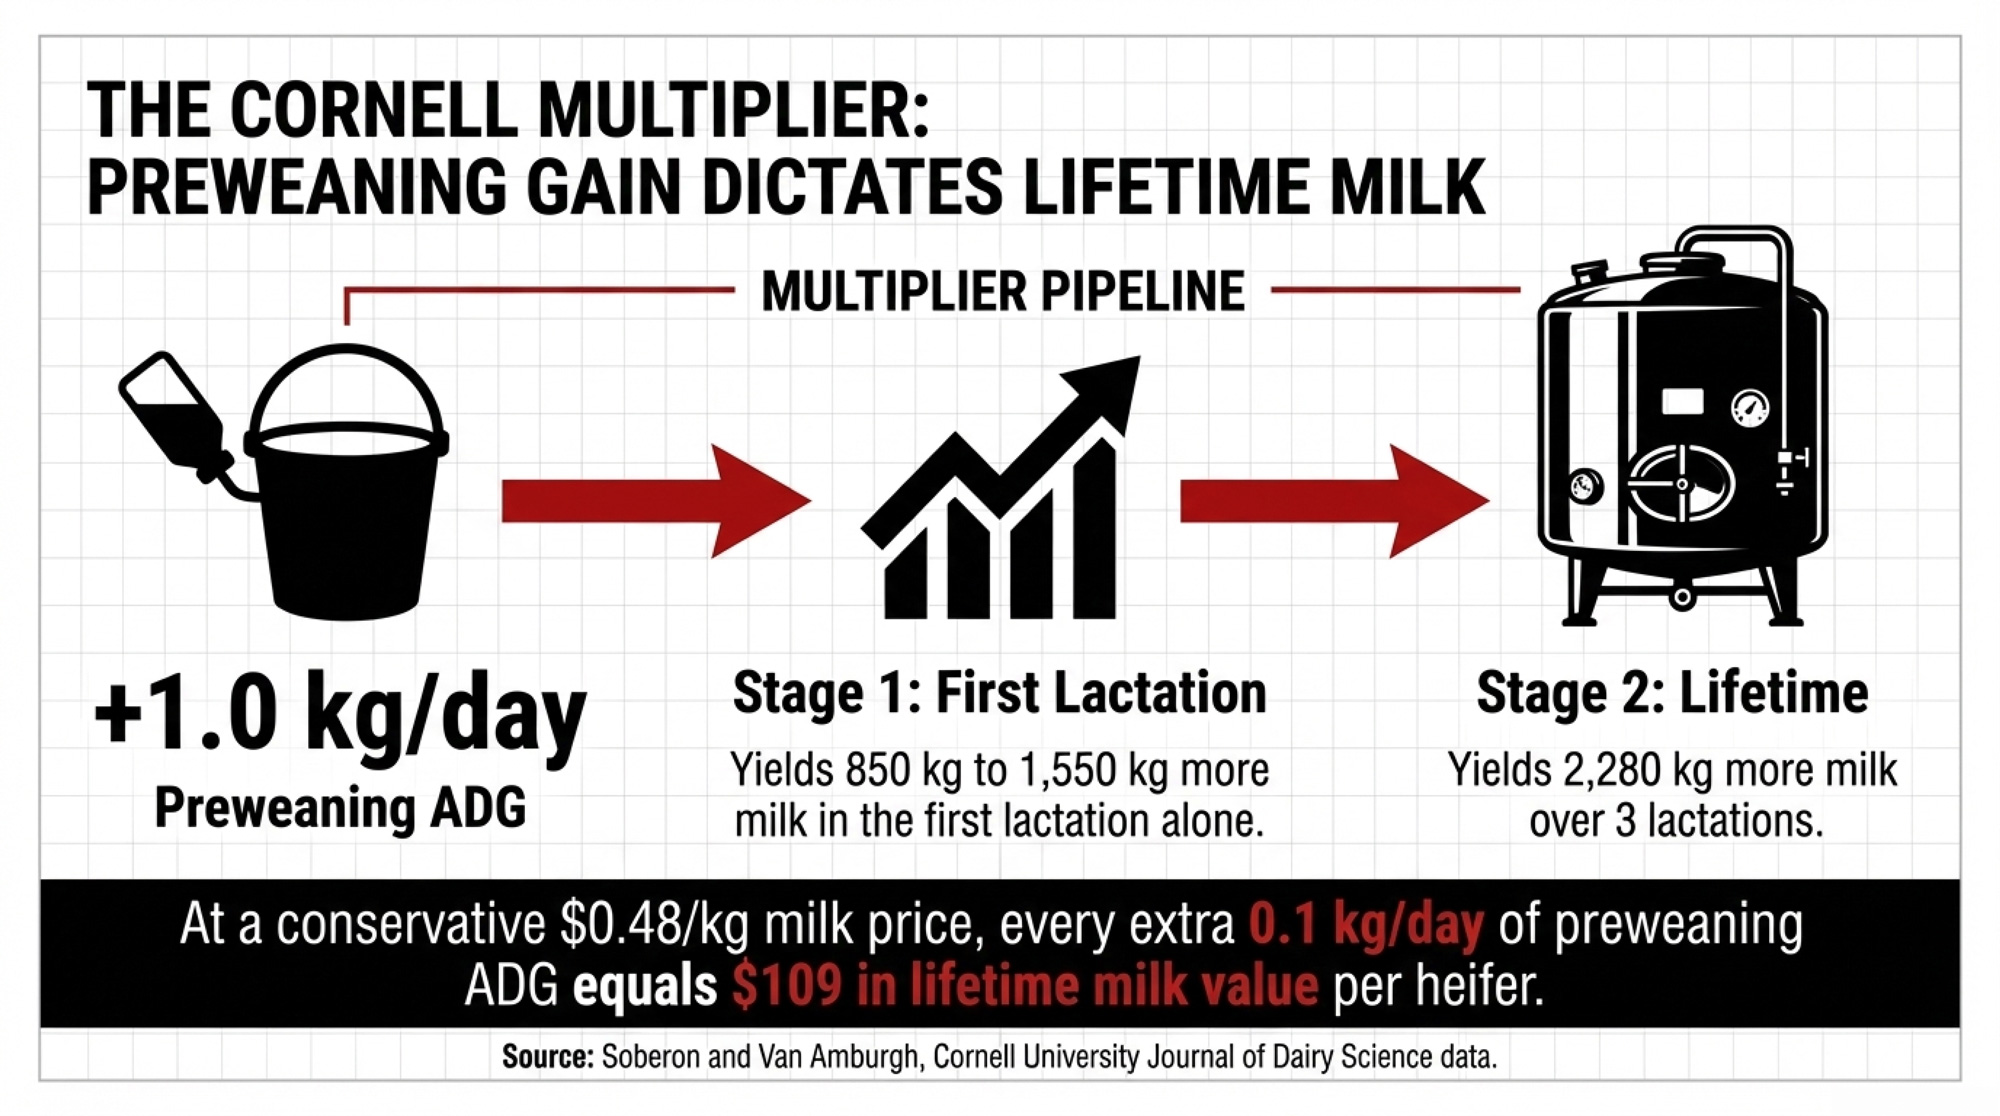
Felipe Soberon and Mike Van Amburgh at Cornell pushed that shift hard in their 2012 Journal of Dairy Science study. They tracked 1,244 heifers in the Cornell research herd and 624 heifers on a commercial dairy, tying their preweaning average daily gain (ADG) back to first‑lactation milk. For every 1.0 kg/day of preweaning ADG, they saw about 850 kg more milk in first lactation at Cornell and 1,113 kg more in the commercial herd. Later datasets pushed that first‑lactation response up to around 1,550 kg per 1 kg/day of preweaning ADG in some datasets.

Even if you stick with the conservative end of that range, you’re looking at roughly 1,100 kg of milk tied to how a calf grew while she was on replacer. At the 2024 All Federal Order mailbox average of about $21.80/cwt — roughly $0.48/kg — that’s around $528 per heifer in first‑lactation milk value that lives or dies on those preweaning gains. Cornell’s longer‑term modeling says that in cows that make it through three lactations, each extra 1 kg/day of preweaning ADG can be worth about 2,280 kg more milk over three lactations — another $1,090 or so per heifer at that same milk price.

ADG bump (kg/day)Extra milk 3 lactations (kg)Lifetime value (USD, $0.48/kg)
0.0000
0.10228109
0.15342164
0.20456219
0.25570274
0.30684329

Meanwhile, the cost to get a heifer from the hutch to the parlor keeps climbing. Iowa State’s 2024 budgets put the total cost to raise a heifer to calving between about $2,258 (pasture‑based, 18,000‑lb herd) and $2,651 (confinement, 26,000‑lb herd). Back that into a per‑head, per‑day cost, and you’re looking at roughly $2.50–$3.00 once you include feed, bedding, facilities, and labor. You already treat each replacement like a $2,300–$2,700 capital asset before she ever hits the parlor.

Preweaning is the most expensive phase per day in the heifer program. It’s also the one with the cleanest, most measured link between what you feed and what that genetic investment actually does in the tank.

How This Math Shows Up in a Real Herd

Back to that 600‑cow Wisconsin herd. On paper, the change looked harmless. The monthly feed report even looked better.

On the budget replacer program, they switched into:

  • 20/20 milk replacer with plant protein listed in the top half of the tag.
  • Feeding rate around 0.7 kg of powder per day.
  • Preweaning ADG averaged about 0.65 kg/day across Holstein heifers in hutches.

On their earlier all‑milk program:

  • Higher‑cost replacer using only milk‑derived proteins.
  • Feeding rate closer to 0.9 kg/day, split into two or three feedings.
  • Preweaning ADG averaged about 0.85 kg/day under similar genetics and housing conditions.

That’s a 0.20 kg/day ADG advantage for the all‑milk program across a roughly 56‑day preweaning window. Here’s the barn math — the same math they walked through when they finally put numbers to it.

0.20 kg/day × 56 days = 11.2 kg more gain to weaning. Call it about 24–25 lb of extra bodyweight when you pull the nipples. Now plug that into the Cornell relationships:

  • 0.20 × 850 = 170 kg more milk in first lactation (Cornell herd).
  • 0.20 × 1,113 = 223 kg more milk in first lactation (commercial herd).

Split the difference, and you’re looking at roughly 180–200 kg extra milk in first lactation from that 0.20 kg/day ADG gap. At $0.48/kg, that’s about $86–$96 more milk per heifer in her first trip through the parlor.

Over the longer run, Cornell reported that cows reaching three lactations could produce about 2,280 kg more milk per 1 kg/day increase in preweaning ADG. On that same 0.20 kg/day bump:

  • 0.20 × 2,280 = 456 kg more milk over three lactations.
  • 456 × $0.48 ≈ $219 lifetime milk value per heifer.

Here’s how that stacks up for this herd, using the conservative Cornell numbers and Iowa State’s cost ranges:

MetricBudget Program (Plant)Premium Program (All‑Milk)Difference (All‑Milk vs Budget)
Preweaning ADG0.65 kg/day0.85 kg/day+0.20 kg/day
Lifetime Milk (3 lactations)Base+456 kg+$218.88
Approx. AFC (days to calving)Base−21 days+$52.50 (at $2.50/day)
Direct Replacer Cost−$286Base−$286.00
Net (milk + AFC, before survival) −$14.62 per heifer

So before you even talk about survival, the higher‑nutrition, all‑milk program is essentially breaking even on this conservative model, down roughly $15 per heifer once you net lifetime milk, earlier calving, and replacer cost. That’s not exciting on its own. The story changes when you look at which heifers actually stick around to use that extra capacity.

On this herd, the calves from the all‑milk program reached breeding weight sooner and freshened several weeks earlier on average, resulting in fewer non‑productive days and burning $2.50–$3.00/day in feed and yardage. Stack that across 120 heifers a year and add in even modest improvements in early survival, and the decision to “save” $286 per calf added up to more than $30,000 in lost potential over a few heifer crops — right in line with the research linking rough starts to higher culling and lower lifetime performance.

What Is That $286 “Saving” Really Doing to Your Herd?

If you’re trying to decide whether your “cheap” replacer is actually saving you money, you have to stack three pieces together:

LeverKey stat (red in design)Take‑home message
Lifetime milk~$219 per heifer from 0.20 kg/day ADG bumpExtra early gain keeps paying for three lactations.
Days to first calving~$40–$90 saved per heifer15–30 fewer non‑productive days at $2.50–$3.00/day.
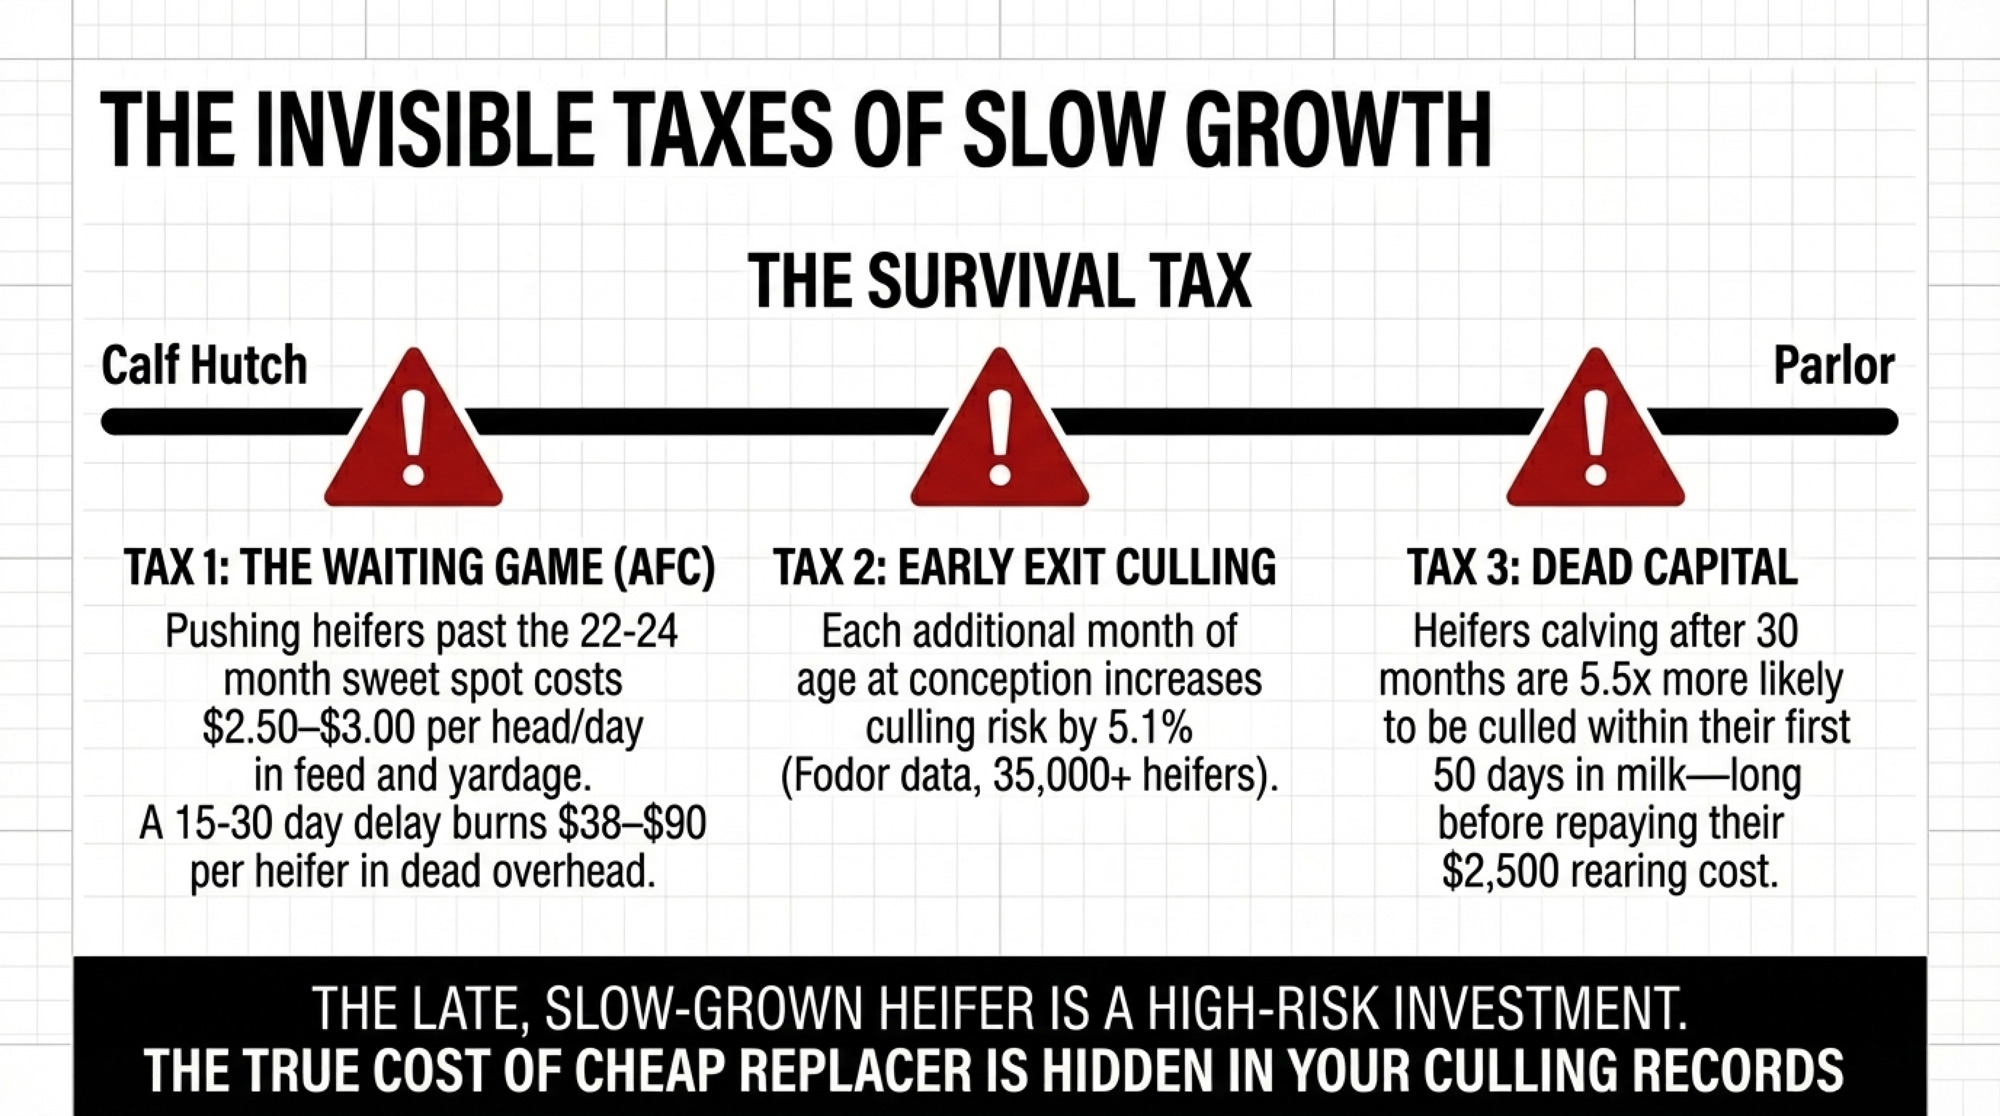
Survival risk+5.1% culling risk per extra month; 5.52× risk after 30 mo calvingLate, slow‑grown heifers are the riskiest “investments”.

1. Lifetime Milk: Around $200–$220 per Heifer

A 0.20 kg/day ADG difference across preweaning realistically buys you about 456 kg more milk over three lactationsin the cows that stay in the herd. At $0.48/kg, that’s right around $219 per heifer in lifetime milk value.

Even if your herd only captures half of that response because of other bottlenecks, you’re still in the $100+ per heiferrange tied directly to preweaning gain.

2. Days to First Calving: Roughly $40–$90 per Heifer

Better‑grown calves hit breeding weight sooner and freshen earlier. They don’t spend extra months standing around eating your money while you wait for the scale to catch up.

On‑farm work in the UK, looking at 11 herds, found restricted‑milk calves running well under 0.6 kg/day, while higher‑intake calves in the same systems were closer to 0.7 kg/day or better in the first month. Those early gaps don’t just disappear; they follow heifers right up to breeding targets.

Research on age at first calving (AFC) and survival shows that the sweet spot for first‑lactation milk and lifetime performance is around 22–24 months, with performance dropping off when you push heifers much later than the mid‑20s. When you feed calves so they reach breeding size sooner instead of dragging them through extra months on low gain, you’re realistically shaving a couple of weeks to a month off the calendar for a lot of heifers.

Even a 15–30 day shift at a daily maintenance cost of $2.50–$3.00 per head — in line with recent heifer‑raising and housing cost work — is worth roughly $38–$90 per heifer in feed, bedding, and overhead you don’t have to burn.

3. Survival and Longevity: Real Money, Even if the Exact Number Varies

The third piece is messier but important. Slow‑grown, disease‑hit heifers are more likely to leave early and less likely ever to pay back what you put into them.

Fodor and colleagues followed 35,128 Holstein heifers across 33 herds and found that each additional month of age at conception increased culling risk by 5.1%, and heifers calving after 30 months were 5.52 times more likely to be culled within the first 50 days in milk compared with heifers calving before 22 months. In plain language: the later and rougher you bring her in, the more likely she is to leave before she’s repaid her replacement cost.

Putting a single dollar figure on “improved survival” across all herds isn’t honest. The value depends on your replacement cost, culling patterns, and the number of cows that actually reach second and third lactation. What the Fodor data do say clearly is that the late, slow‑grown heifer is a much higher‑risk investment than the one that grew well and calved on time. For most herds, even a slight drop in early culling tied to better early growth adds real money on top of the 9 in milk and – in earlier calving.

So even if you ignore survival completely and stack the ~$219 in lifetime milk with a conservative $40–$90 from shaving non‑productive days, you’re looking at roughly $260–$310 of value per heifer against a $286 replacer gap. Add any survival benefit on top, and the “cheap” program stops looking cheap.

On a 600‑cow herd raising 120 heifers a year, that per‑head swing quickly adds up to tens of thousands of dollars in capital performance — one way or the other.

Why Protein Source in Week 1–3 Matters So Much

If those 1,100–1,550 kg of milk per 1 kg/day of preweaning ADG still feel too large, it helps to look under the hood. In those first weeks, you’re not just putting on frame. You’re building the factory, wiring the control system, and deciding how often it breaks.
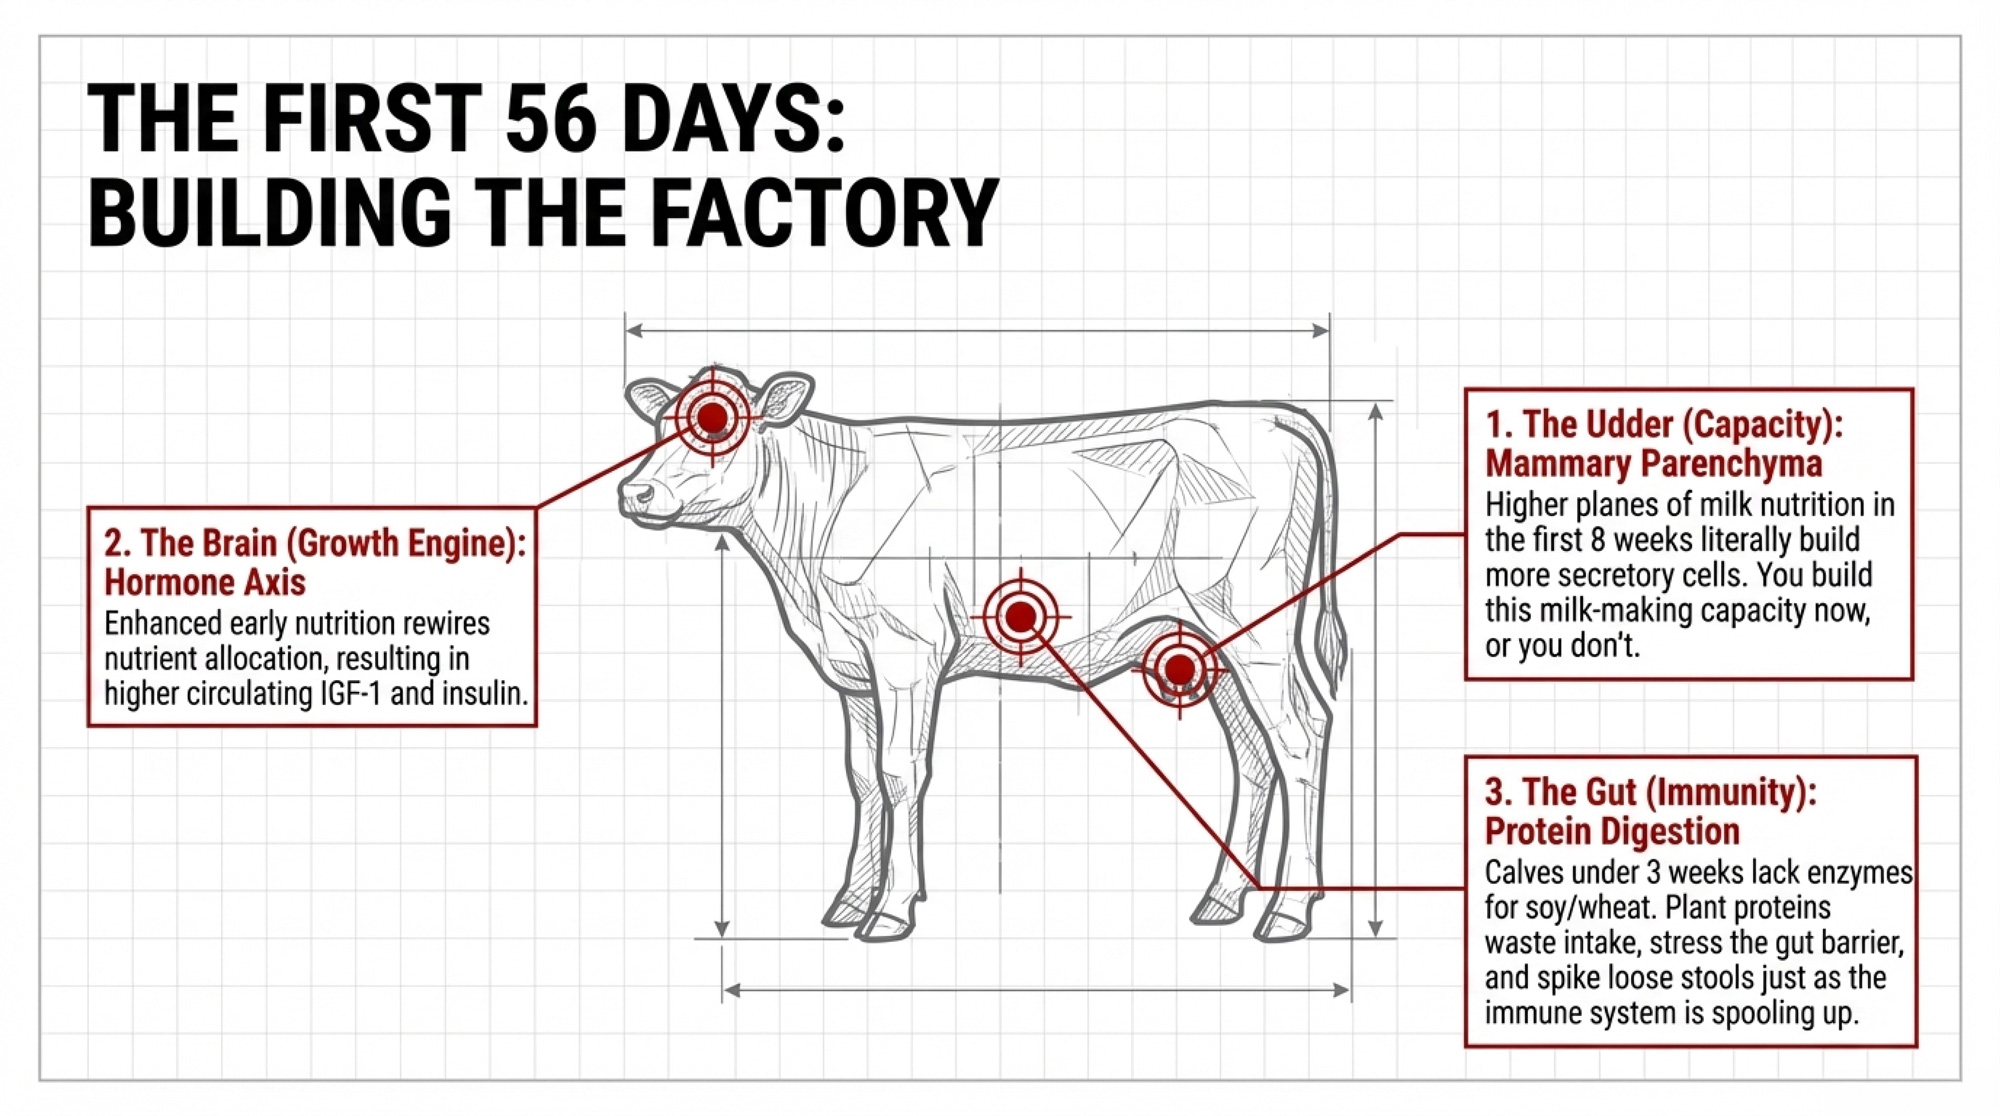
You’re building a mammary factory. Trials comparing restricted and enhanced preweaning feeding show calves on higher planes of nutrition develop substantially more mammary parenchyma — the secretory tissue — by eight weeks of age. More parenchyma now means more secretory cells later. That’s literal milk‑making capacity you either build or you don’t.

You’re resetting the growth hormone axis. Calves fed higher planes of milk nutrition show higher circulating IGF‑1 and insulin, and mammary gene expression patterns that favor development. One regression, Soberon and Van Amburgh reported — roughly milk yield = −106 + 1,551 × ADG in one model — isn’t magic; it’s what happens when better early nutrition rewires how that calf allocates nutrients and grows.

You’re wiring immunity and gut health — and protein source is a big part of it. Back in the late 1980s, researchers showed that replacing milk protein with isolated soy protein reduces the ileal digestibility of indispensable amino acids from about 82% to around 62% in neonatal calves. CalfCare.ca and similar extension programs are blunt: calves under three weeks of age should be on an all‑milk protein milk replacer, because their abomasal enzymes aren’t built to handle soy or wheat proteins efficiently yet.

When you push plant protein too early, you’re not just wasting protein. You’re buying more loose stools, depressed intake, and a gut barrier under stress right when the immune system is still spooling up. Add in research tying preweaning disease events to poorer fertility and lower first‑lactation milk later on, and it’s not surprising that preweaning ADG explained about 20–22% of the variation in first‑lactation milk yield in the Cornell models.

How Much Is Your Calf Milk Replacer Really Costing You?

Here’s the Cornell‑style math in a version you can actually drop your own numbers into.

Say your calves are averaging 0.7 kg/day preweaning ADG right now. You’re looking at a move to an all‑milk, higher‑plane program that you expect will push that to 0.8–0.9 kg/day. Trials and field data put a 0.1–0.2 kg/day improvement well within reach when you upgrade both protein quality and feeding rate and keep housing and health decent.

Take the conservative end: a 0.1 kg/day bump in ADG.

Using Soberon’s 850–1,113 kg/kg ADG range:

  • 0.1 × 850 = 85 kg more milk in the first lactation.
  • 0.1 × 1,113 = 111 kg more milk in the first lactation.

At $0.48/kg, that’s around $41–$53 extra milk per heifer in first lactation. Over three lactations, that same 0.1 kg/day bump scales to:

  • 0.1 × 2,280 = 228 kg more milk over three lactations.
  • 228 × $0.48 ≈ $109 lifetime milk value per heifer.

Now compare that to your replacer cost. If your all‑milk program runs roughly $200–$286 more per calf than a budget plant‑protein 20/20 replacer, and even that conservative 0.1 kg/day improvement is worth roughly $41–$53 in first‑lactation milk and around $109 over three lactations, you’re at $150–$162 of milk value before you even think about days to first calving or survival.

In herds where a full 0.2 kg/day improvement is realistic, the lifetime milk advantage roughly doubles. That’s how you land in the ~$219 milk value range you saw in the Wisconsin herd’s model. So if your replacer choice is “saving” $286up front, but even a cautious reading of the data says you’re giving up $219–$300 in lifetime value before you add survival, that bag isn’t cheap. It’s a capital trade‑off.
Sponsored Post

Is Your Calf Barn Measuring the Right Number?

Most calf barns can answer two questions without opening a laptop: “Did she live?” and “What did she weigh at weaning?” Helpful, but not enough.

If you want to know whether your replacer program is building the cows your genetic plan paid for, the number you need to start treating as non‑negotiable is preweaning ADG.

Here’s a 30‑day action that doesn’t require a new feeder or building:

  1. Weigh or tape every heifer calf at birth and at weaning. Use a platform scale if you have it, or a consistent heart‑girth tape on dry calves if you don’t.
  2. Calculate ADG for each calf and each birth month. (Weaning weight − birth weight) ÷ days on milk. Write it somewhere you’ll actually look — a whiteboard in the calf barn beats a forgotten tab in the herd software.
  3. Write the replacer product and lot number at the top of each month’s record. When a group suddenly averages 0.6 kg/day and treatments spike, you’re not guessing whether a formulation change or batch issue was involved.
  4. Cross‑check ADG against your genomic rankings. Are your highest‑index calves actually outgrowing the lower‑index calves preweaning? If not, the bottleneck isn’t genetics. It’s what’s in the bucket.
MetricSolid target (black text)Red‑flag zone (red text in design)
Preweaning ADG (kg/day)0.8–0.9 kg/day when housing and health are decent. <0.7 kg/day = nutrition/housing bottleneck.
Cost per kg of gain (preweaning)Lower on all‑milk, higher‑plane programs because calves grow faster and stay healthier. “Cheap” program shows higher cost per kg of gain than premium.
Age at first calving22–24 months sweet spot for milk and lifetime performance. Regularly calving >26–27 months.
Heifer investment lensView each heifer as a $2,300–$2,700 capital asset.Decisions driven only by bag price, not lifetime ROI.

Holstein herds using higher‑plane milk programs in trials and field reports commonly hit 0.8–0.9 kg/day preweaning when housing and health are decent. If your 30‑day snapshot says you’re living under about 0.7 kg/day, something in your replacer, feeding rate, housing, or health is capping the genetic engine you paid for.

Options and Trade-Offs for Farmers

How Much Is Your $286 “Saving” Really Costing?

When it makes sense: Any time your feed supplier or spreadsheet says, “We can save you $X per calf on milk replacer.”

What it requires:

  • A realistic estimate of preweaning ADG on your current program and on the program you’re considering — even a month of tape weights is better than guessing.
  • A simple ADG‑to‑milk conversion using the Cornell ranges: 850–1,113 kg per 1 kg/day ADG in first lactation, about 2,280 kg over three lactations for survivors.
  • One milk‑price assumption used consistently across your math (for now, $0.48/kg based on 2024 mailbox).

Risks/limits: Your first pass won’t be perfect. But it’s better than letting the bag price decide for you.

Make Preweaning ADG a Non‑Negotiable KPI (30‑Day Action)

When it makes sense: Any herd raising replacements — whether you’re milking 80 cows or 1,800.

What it requires:

  • Birth and weaning weights (or tape equivalents) for every heifer calf over the next month.
  • One simple tracking sheet: calf ID, birth date, birth weight, weaning date, weaning weight, replacer, lot.
  • A starting target: work toward 0.8–0.9 kg/day preweaning. Treat anything consistently under 0.7 kg/day as a red flag, not a detail.

Risks/limits: It’s one more habit to build. Once it’s in place, it becomes one of the most useful numbers in your heifer program.

Why it matters: Once ADG is on your dashboard, replacer changes, seasonality, housing tweaks, and staff shifts all show up in hard numbers. You stop arguing “calves look good” and start asking “Are they growing fast enough to justify the genetics we paid for?”

Shift From Least‑Cost to Fixed‑Formulation, All‑Milk Protein Replacer
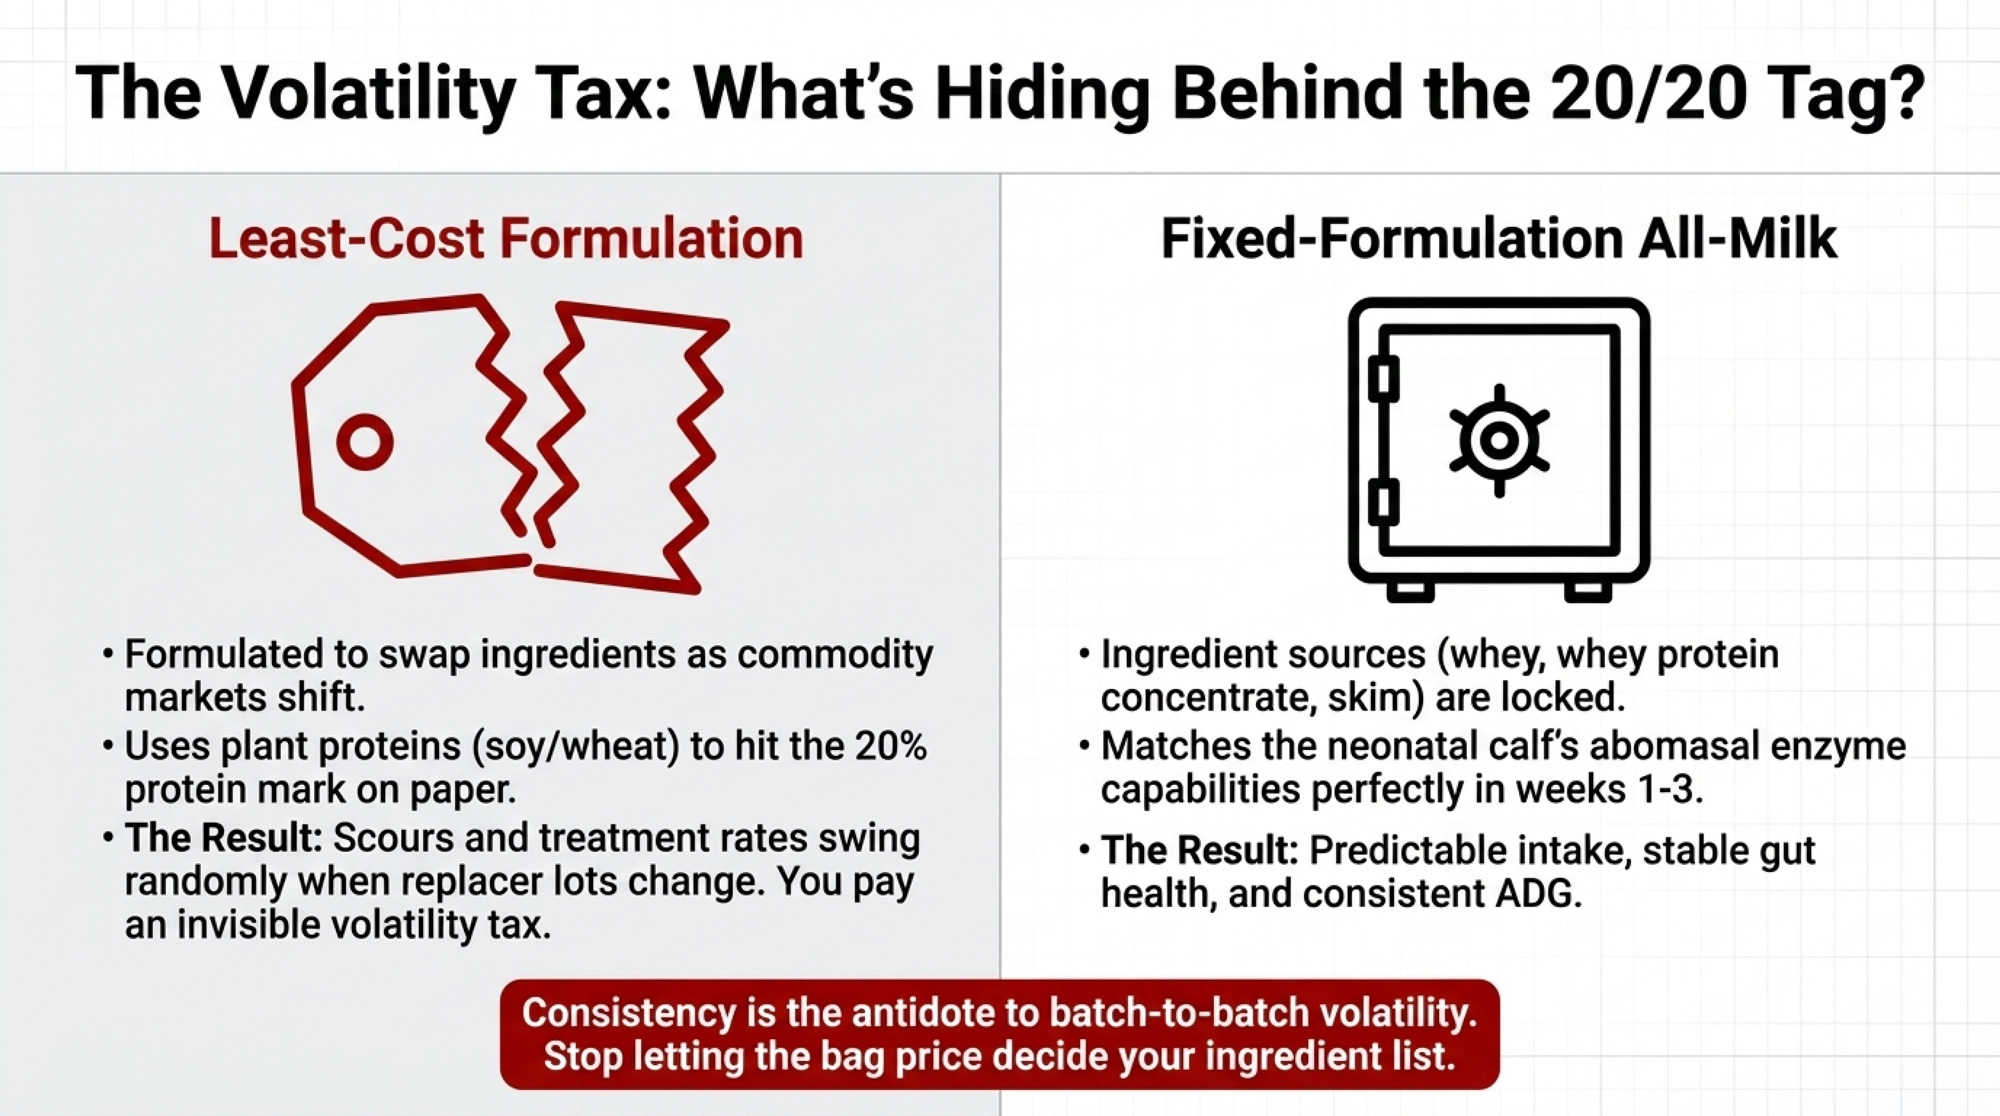
When it makes sense: When you’ve seen calf performance bounce around with no obvious changes in housing, staff, or weather — or when you’re pretty sure your replacer is being sold on price first and formulation second.

What it requires:

  • A direct question to your supplier: “Is this replacer least‑cost formulated, or are the ingredient sources fixed?”
  • Confirmation that protein sources are all milk‑derived — whey, whey protein concentrate, skim — especially in the first three weeks.
  • A habit of tying replacer lot numbers to calf ADG and health in your own records.

Risks/limits: Bag price will almost always go up compared with aggressive, least‑cost options. And some mills aren’t eager to talk about how often they swap ingredient sources under a least‑cost model.

Why it matters: Least‑cost formulation is built to swap ingredients as commodity markets move while keeping the 20/20 tag on paper. On some herds, those quiet shifts show up as an invisible “volatility tax” on calf performance when ingredient changes affect how calves respond. Fixed‑formulation, all‑milk replacers don’t make calves bulletproof, but they remove one of the biggest hidden variables in your heifer program.

Compare Programs by Cost per Pound of Gain, Not Cost per Bag

When it makes sense: Anytime you’re comparing a “cheap” replacer against a higher‑priced option — especially if someone is trying to sell you on bag price alone.
What it requires:

For at least two recent calf groups:

  • Total preweaning cost per calf: replacer, starter, meds, plus a realistic estimate for labor and bedding.
  • Total gain: weaning weight − birth weight.
  • The simple metric:
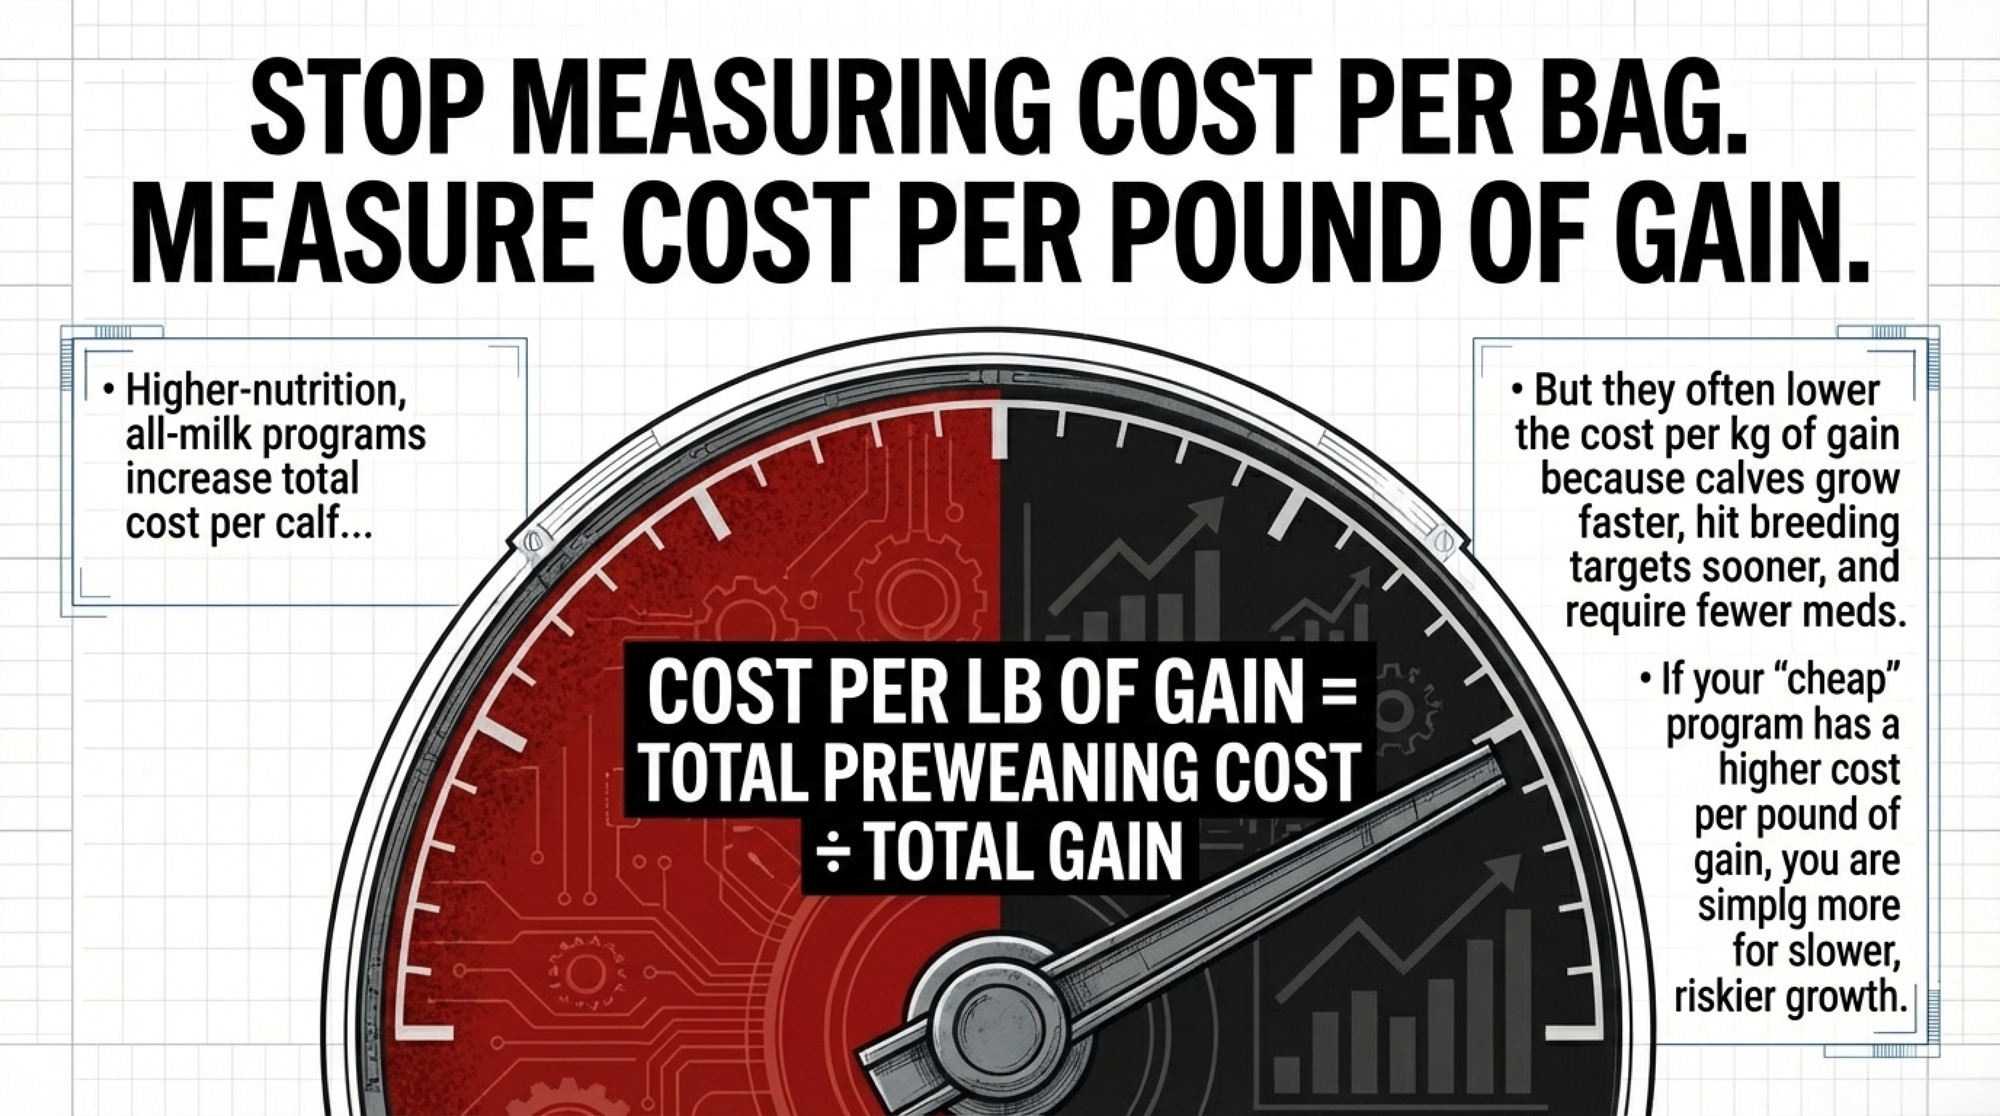
  • Cost per lb (or kg) of gain = Total preweaning cost per calf ÷ Total gain.

Economic modeling of preweaning programs shows that while higher‑nutrition, all‑milk programs increase total preweaning cost per calf, they often lower cost per kg of gain because calves grow faster and stay healthier. In one 2019 analysis, preweaning costs ranged from about $258.56 to $582.98 per calf across different feeding strategies, but the higher‑milk programs produced more gain per dollar invested.

Risks/limits: You need enough calves in each group to avoid chasing noise. And pulling real cost numbers takes a bit of time.

Why it matters: If your cost per pound of gain is higher on the “cheap” program, that saving isn’t real. You’re paying more for slower, riskier gain.

Reframe the Lender Conversation as Heifer ROI
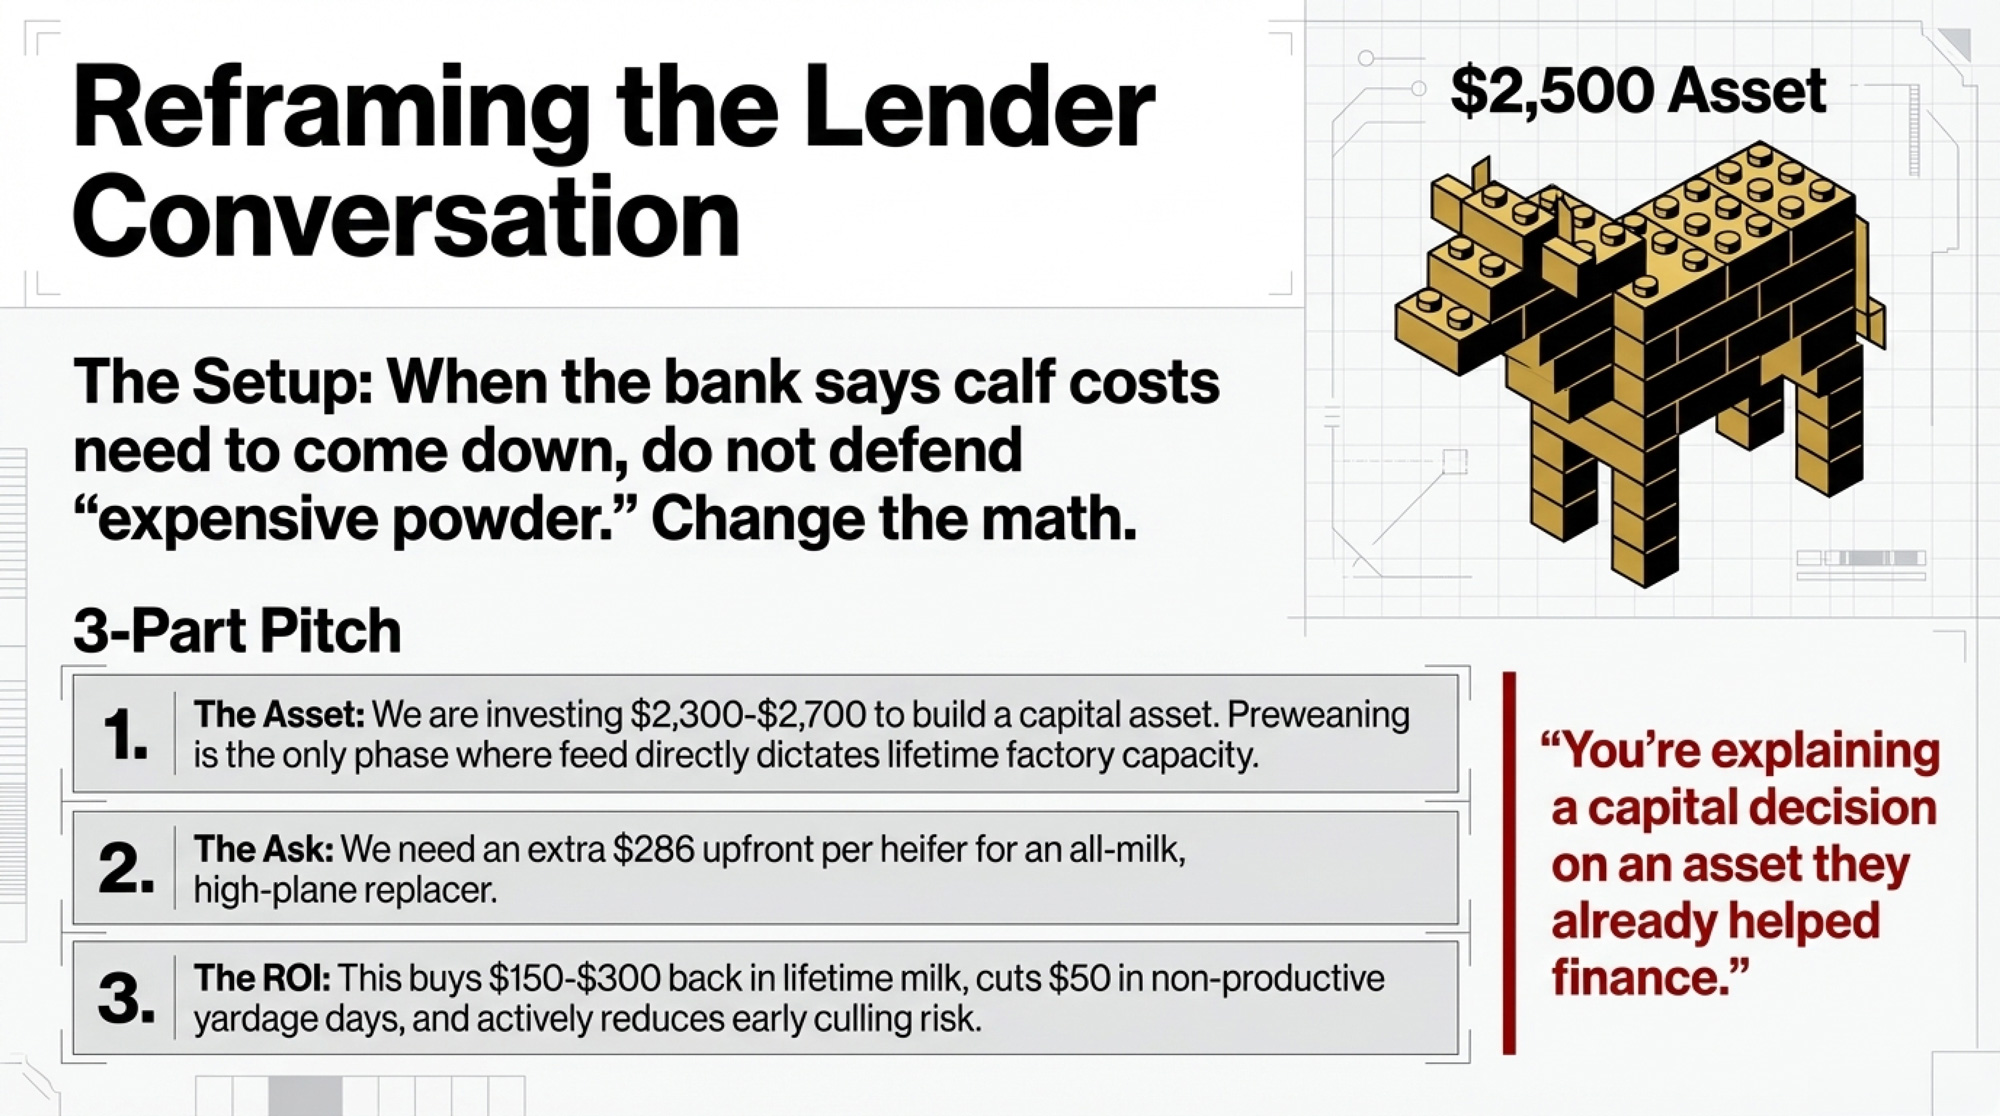
When it makes sense: When your lender or business partner tells you calf costs need to come down this year.

What it requires:

  • A one‑page summary that shows, for your herd:
    • Current preweaning cost per heifer (from your cost‑per‑gain work).
    • Projected extra spend per heifer on an improved replacer program (for example, around +$200–$286).
    • A conservative payback story, grounded in the research: roughly $150–$300 in lifetime milk and fewer non‑productive days per heifer from even a 0.1–0.2 kg/day ADG bump, plus the survival risk differences Fodor documented for late‑calving heifers.

Risks/limits: Some lenders think in 12‑month cycles, not three‑lactation ROI. You may have to walk them through replacements as capital assets, not just an expense line.

Why it matters: When you can say, “We’re asking to invest an extra $286 in each heifer to realistically capture more than that in lifetime value and reduce early culling risk,” it changes the tone of the meeting. You’re not defending “expensive powder.” You’re explaining a capital decision on an asset your lender already helped finance.

Partner Perspective: Consistency as the Antidote to Volatility

Consistency is the antidote to the batch‑to‑batch volatility problem you’ve probably felt in your calf barn. Industry partners like Kalmbach Feeds have leaned into that with their Generations™ All Milk 20/20 and 22/20 Milk Replacers, using milk‑derived proteins in a fixed formulation and including LifeGuard® immune support, as described in Kalmbach’s product literature. The idea is simple: keep ingredient sources consistent from batch to batch so you’re not chasing unexplained intake or performance dips tied to formulation changes when you’re making a capital decision on a $2,300–$2,700 animal. Knowing what’s actually in the bag matters.
Key Takeaways

  • If your preweaning ADG is consistently under about 0.7 kg/day, don’t start by chasing a cheaper bag. Start by asking why your calf barn is putting a governor on the genetics you’re paying for.
  • If your highest‑index calves aren’t outgrowing your lower‑index calves preweaning, genetics aren’t the weak link — your nutrition program is. That’s a bottleneck you can actually fix.
  • If your “cheap” replacer program has a higher cost per pound of gain than an all‑milk or higher‑plane program, that saving isn’t real. You’re paying more for slower, riskier gain.
  • If scours and treatment rates swing when replacer lots change, treat that as a sign that the least‑cost formulation is adding volatility you never agreed to pay for.
  • If you’re walking into a lender meeting under pressure to cut calf costs, go in with a three‑part story — milk, days to first calving, and survival risk — instead of a single bag price. Let the math make the case for you.

You don’t need to turn your calf barn into a research station. You do need to know whether the milk replacer in your mixer is building the cows your genetic plan is paying for — or quietly turning that investment into scrap value.

So here’s the challenge. Over the next 30 days, weigh a run of calves at birth and weaning. Calculate ADG. Tie it to replacer lots and genomic rankings. Then ask yourself, with your own numbers in front of you: is that 6 “saving” actually putting money in your pocket — or is it the most expensive cut you make all year?

Run Your Own Milk Replacer Math

Learn More

The Sunday Read Dairy Professionals Don’t Skip.

Every week, thousands of producers, breeders, and industry insiders open Bullvine Weekly for genetics insights, market shifts, and profit strategies they won’t find anywhere else. One email. Five minutes. Smarter decisions all week.

NewsSubscribe
First
Last
Consent

The Six-Figure Execution Leak Happening on Most Dairies: Broken Protocols, Heifer Costs, and Dairy‑Beef Checks

If your best employee can’t hit the protocol, your farm has a six‑figure problem — not a training issue.

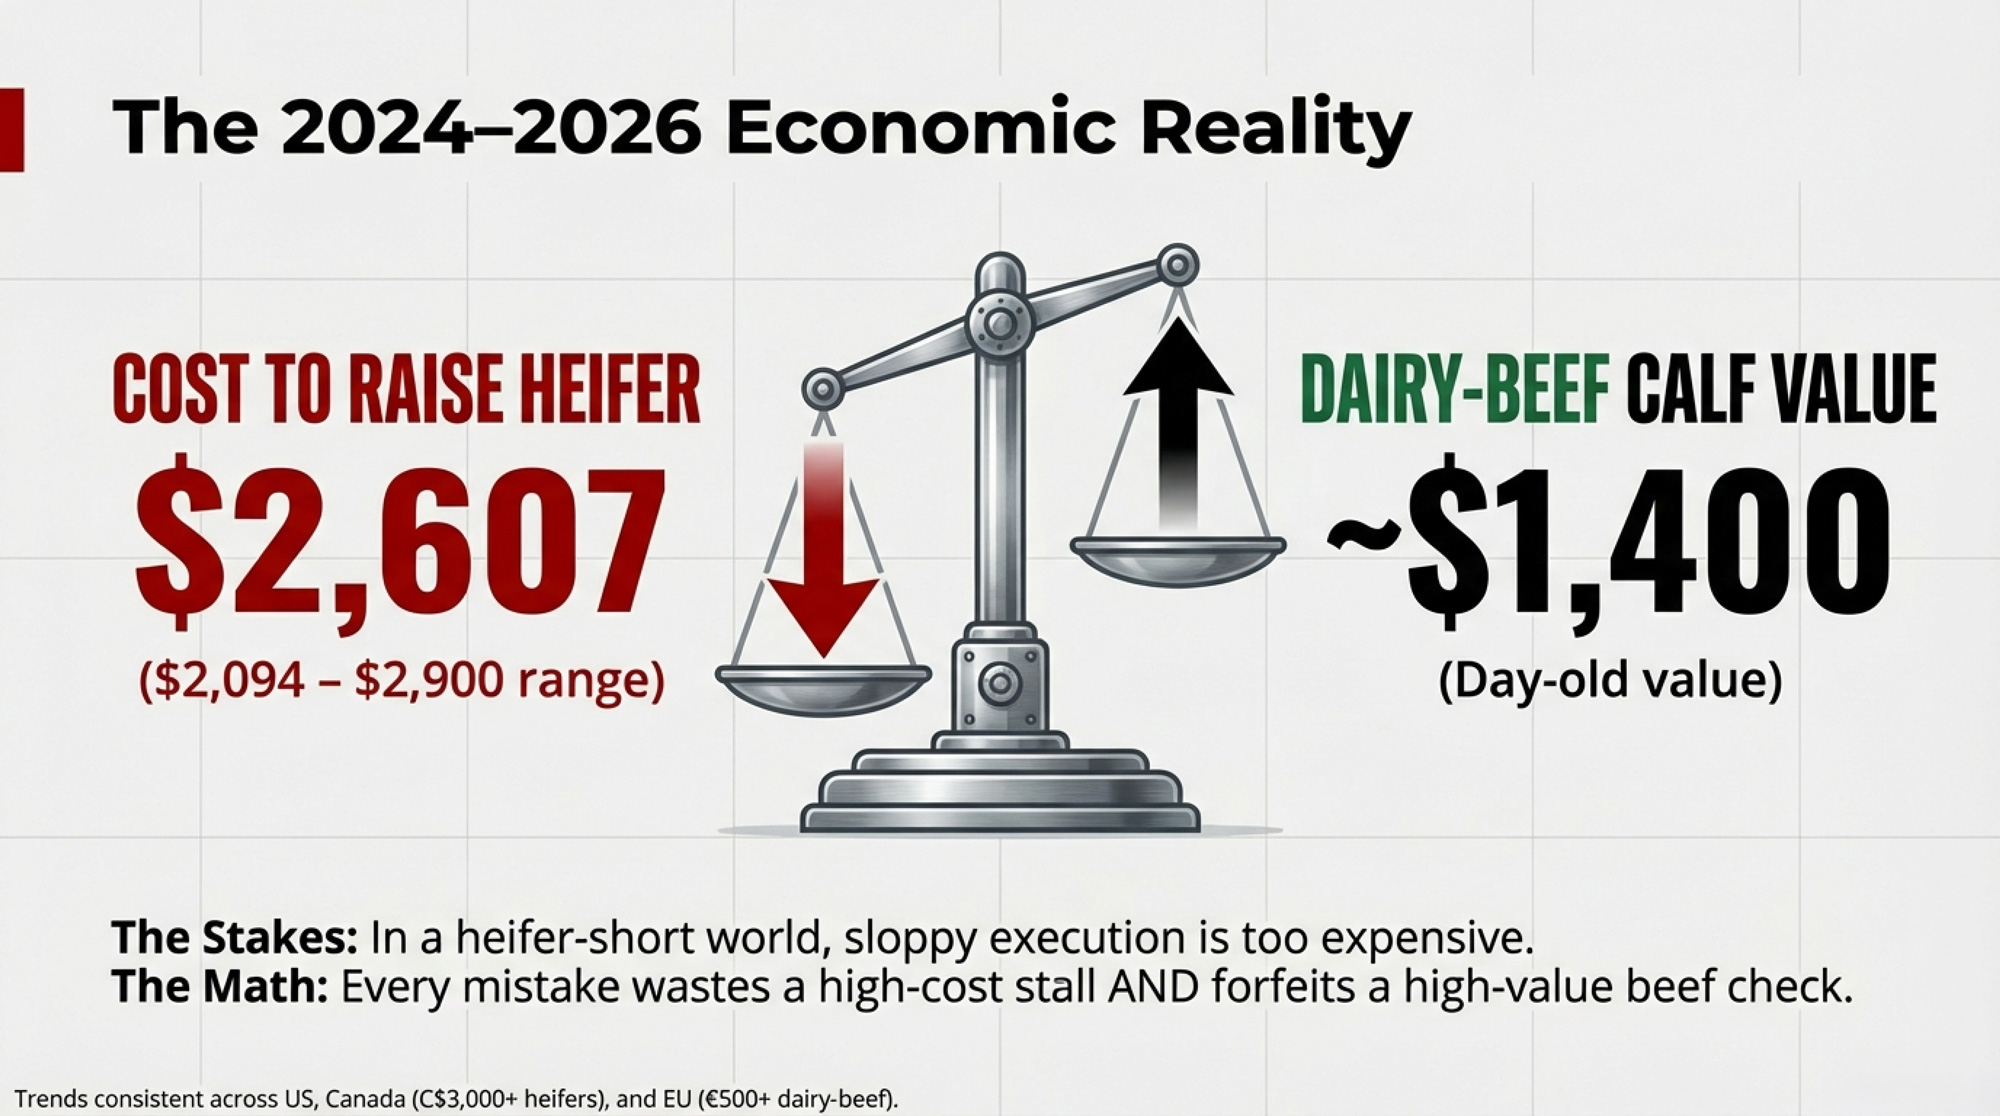
Executive Summary: In a heifer‑short, dairy‑beef market where it costs US$2,094–2,607 to raise a replacement, and day‑old beef‑on‑dairy calves can bring about US$1,400, sloppy execution has turned into a six‑figure problem for many dairies. This article uses McCarty Family Farm’s “top half only” genomic rule to show what happens when breeding, colostrum, and culling decisions actually match the math instead of the emotion. Data from MSU, Taiwanese sire‑checks, and large‑herd audits make the leak obvious: only 36% of farms hit FTPI targets, 27.78% of recorded sires are wrong, and even small timing errors in Double‑Ovsynch leave roughly a quarter of cows off‑protocol. From there, you get four concrete paths — harder genomic cutoffs with heifer‑inventory guardrails, redesigning impossible protocols instead of retraining, tracking results by person, and treating consistency as infrastructure — plus the trade‑offs on each. The summary farm‑level math on RPO, stall value, STP, and calf checks gives you simple “run your own numbers” thresholds so you can decide when to breed dairy, breed beef, or ship a cow based on what that stall can really earn over the next 12–24 months.

dairy herd management protocols

The most expensive execution gap on your dairy isn’t your semen bill, your ration, or even the latest heifer price spike. It’s the distance between what your protocols say and what actually happens when someone is standing in front of a cow with the wrong straw in his hand. In a heifer‑short, dairy‑beef world where total raising cost runs US$2,094–US$2,607 per heifer on many U.S. farms and can approach US$2,900 in higher‑cost systems, while top dairy‑beef calves in strong programs are bringing around US$1,400 per head, that gap adds up fast. 

McCarty Family Farm in Kansas reports, based on its own records, that it has genomically tested more than 75,000 females since 2018. Their rule is brutally simple: the top half of the breeding herd creates the next generation, the bottom half goes to beef — regardless of age or stage. Applied consistently across breeding, colostrum, and culling, that kind of discipline can drive a six‑figure annual swing in profitability for larger herds compared to “raise every heifer” systems once you factor in stall value, heifer cost, and dairy‑beef calf prices. 

If you’re running genomics, dairy‑beef, or both, this isn’t theory. This is your milk cheque, your replacement pipeline, and your risk exposure for 2024–2026. 

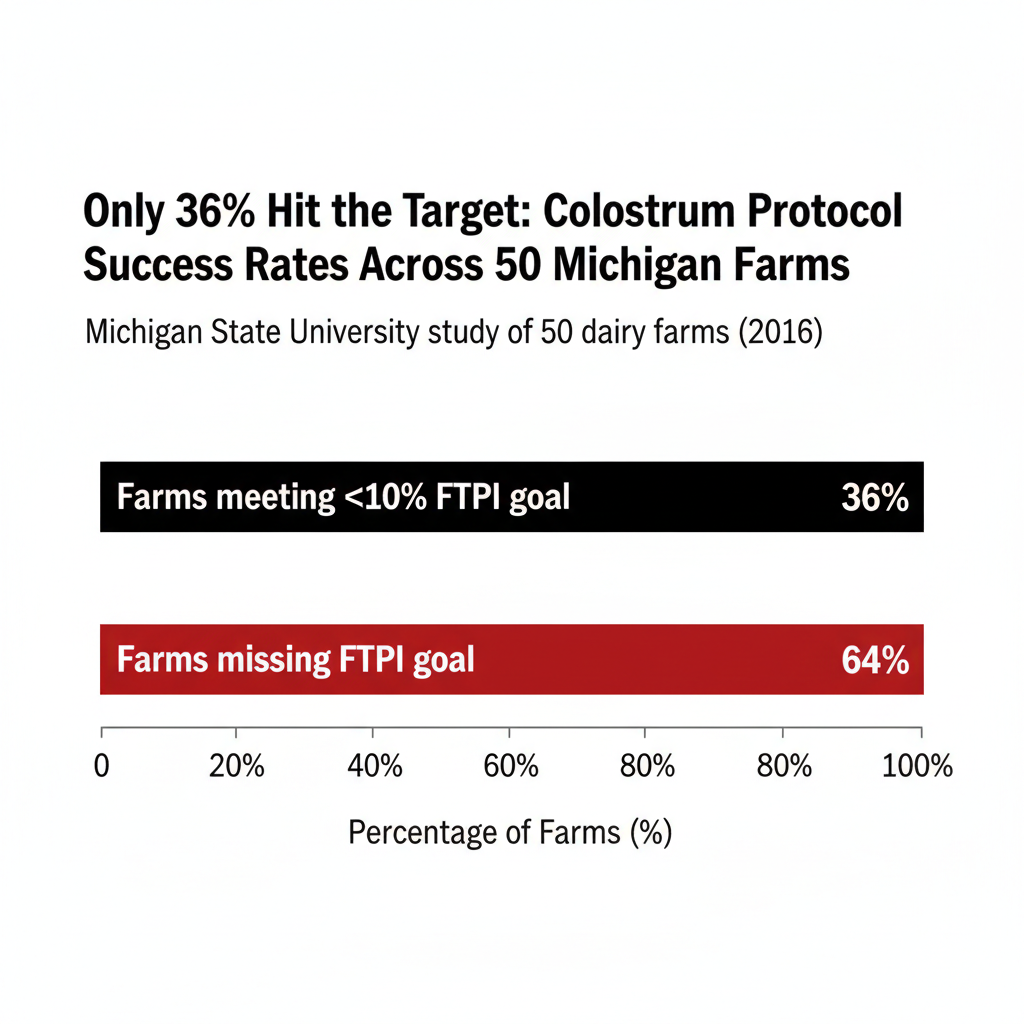
Only 36% of Farms Hit Their Colostrum Targets

Back in 2016, Michigan State University Extension and collaborators looked at the failure of passive transfer (FTPI) and colostrum management on 50 Michigan dairy farms. Only 18 of those 50 farms (36%) hit the industry goal of less than 10% FTPI, meaning at least 90% of calves achieved successful passive transfer. That left 32 farms missing the target, and on six of those herds, half or more of the calves failed. These weren’t wrecks. They were farms that thought their colostrum program worked. 

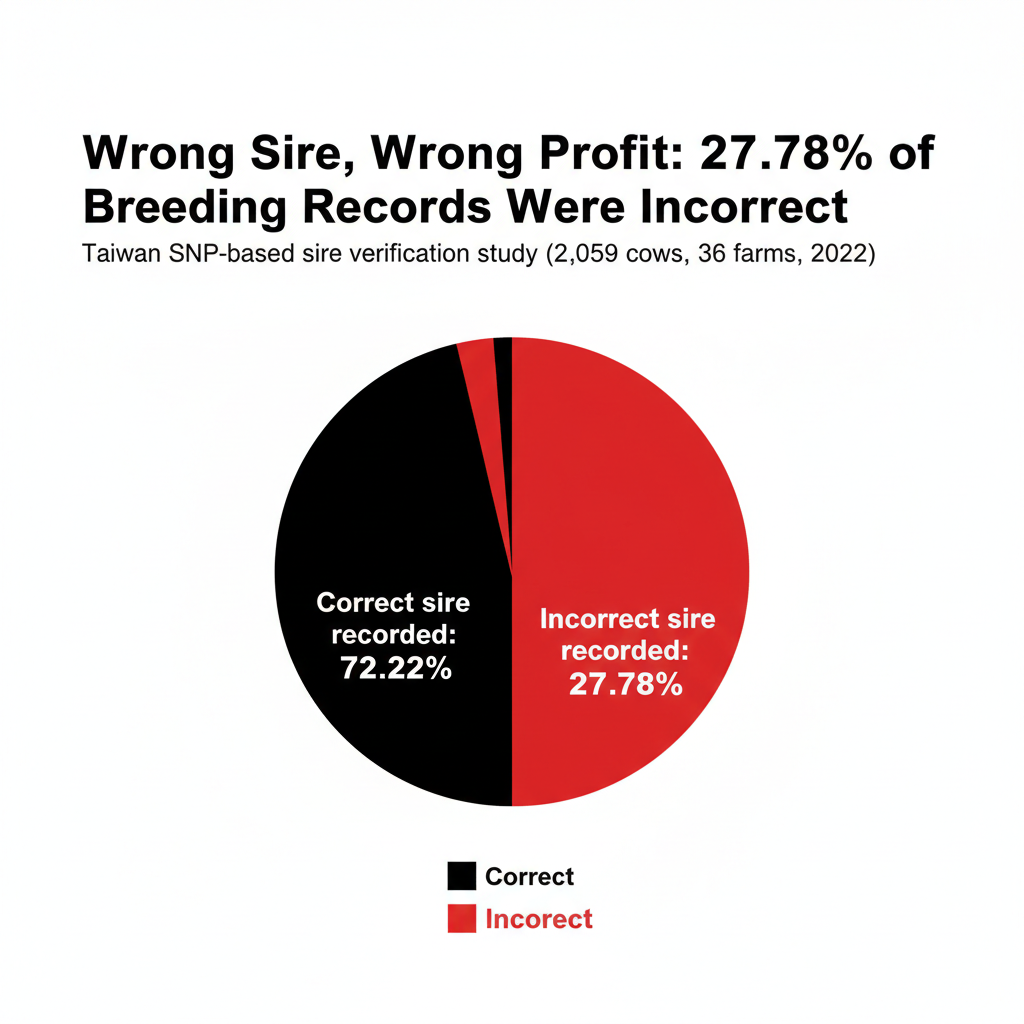
You see the same pattern in breeding records. A 2022 SNP‑based sire‑verification study from Taiwan checked 2,059 cows on 36 dairy farms and found that 27.78% of recorded sires were incorrect — wrong bull codes, wrong storage location, or recording errors. In other words, more than one in four matings went to a different bull than the records claimed. 

Semen handling has its own quiet leak. Extension and A.I. handling guidelines generally recommend that sexed semen be deposited within about 10 minutes of thawing to protect fertility. On a busy timed‑AI morning with 40–80 cows, that window gets stretched more often than anyone likes to admit. 

Feed isn’t immune. Nutritionists will tell you there are three rations on every dairy: the ration on paper, the ration delivered, and the ration cows actually consume. Forage dry matter swings, over‑mixing that chews up effective fiber, and real intakes drifting several percentage points from the estimate are common. A lot of the math you use on feed cost and income over feed cost still assumes a ration that your cows never really eat. 

This isn’t a “people don’t care” problem. It’s a “protocols don’t fit reality” problem. 

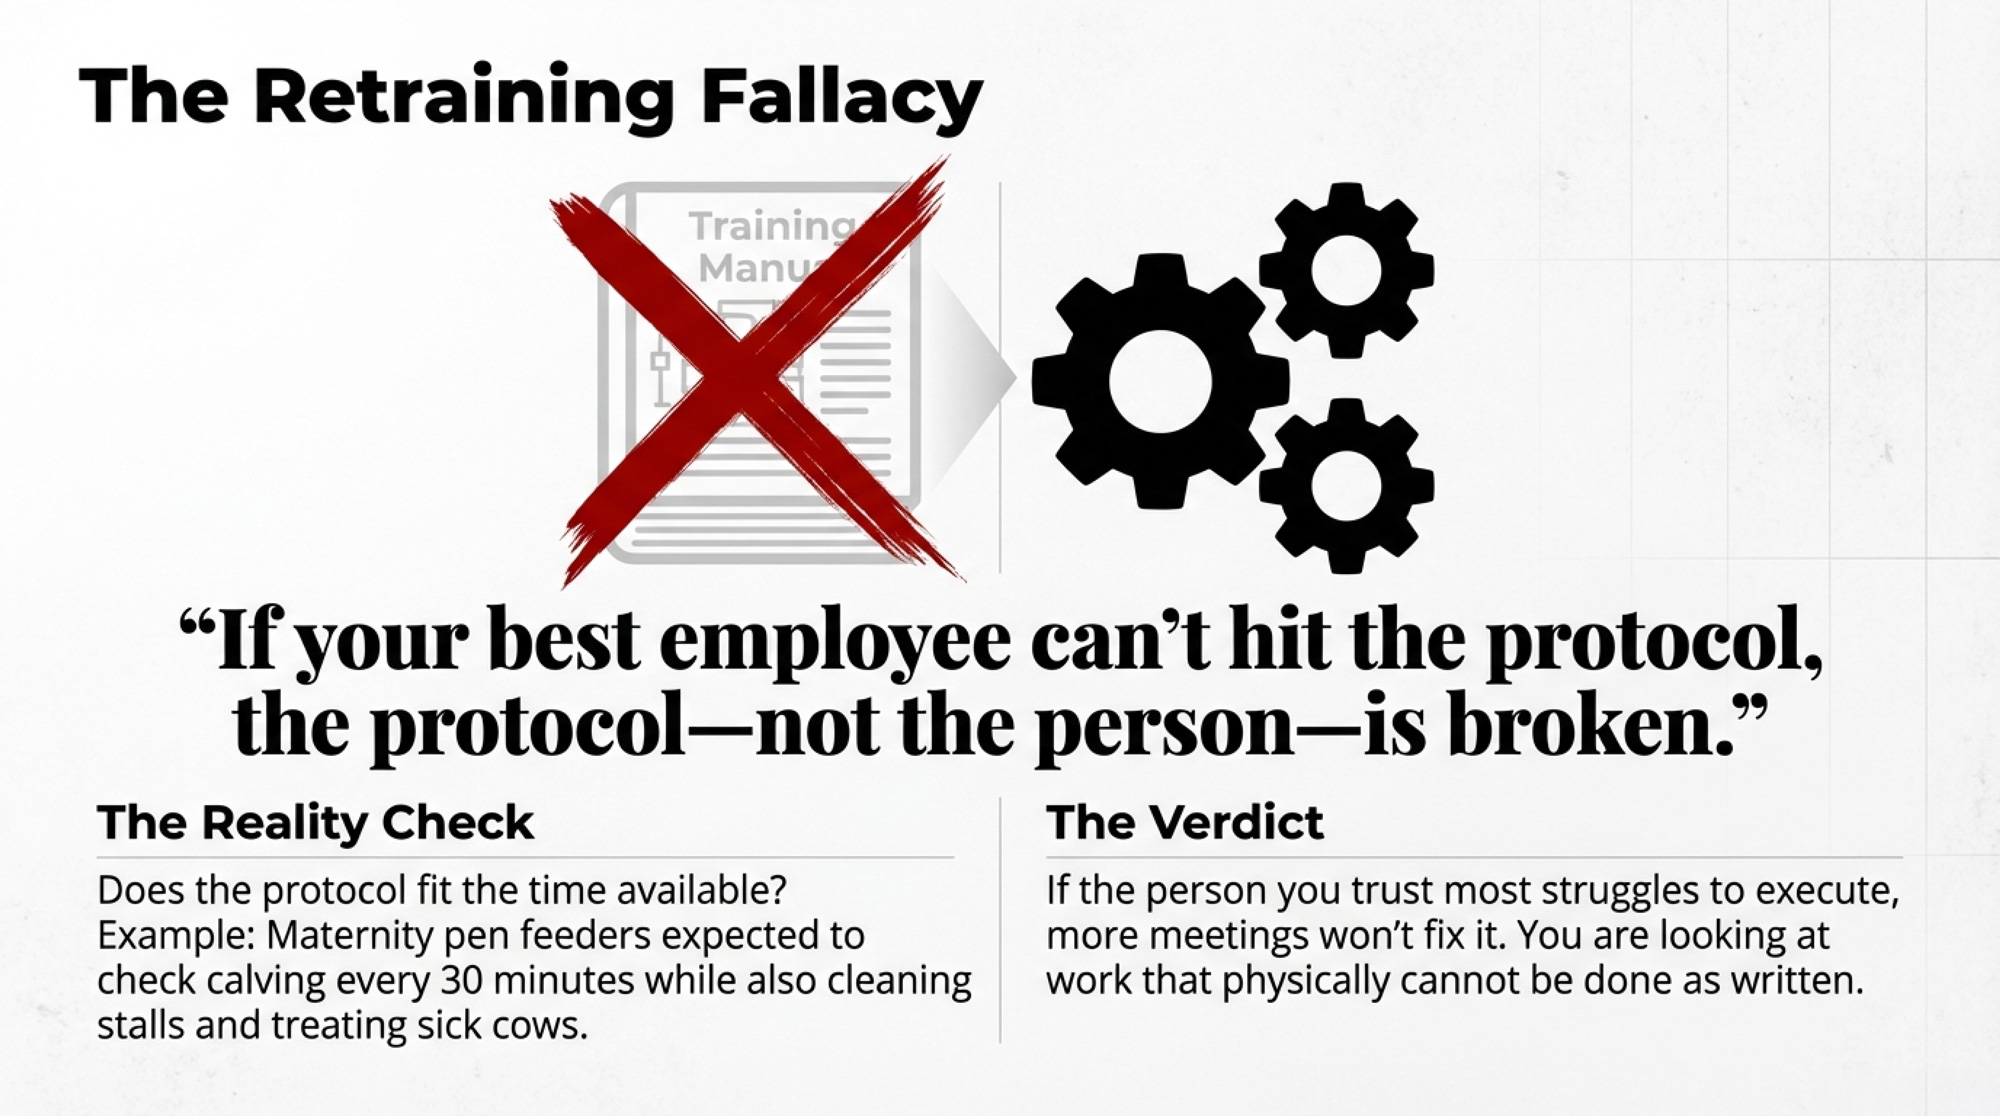
The Retraining Fallacy

Here’s the default move that quietly costs you: a protocol misses its target, so you schedule more training. Another meeting. Another sign. 

But when the same protocol keeps failing after you’ve retrained more than twice, you’re almost never looking at a knowledge problem. You’re looking at work that simply can’t be done the way it’s written. 

MSU’s colostrum work shares a good example from the maternity pen. Feeders in one herd were expected to check calving progress every 30 minutes, in addition to cleaning stalls, processing newborns, and treating sick cows. On paper, that looks like “best practice.” On a rough day, it’s physically impossible. 

There’s a sharper question than “Who screwed up?” Ask this instead: Does your best employee also struggle with this protocol? If the person you trust most can’t hit it consistently, the protocol is broken—not them. At that point, more training isn’t a solution. It’s self‑deception. 

And if you’ve watched a good A.I. tech or feeder drowning in a pile of “must‑do” tasks, you’ve seen exactly how that plays out. 

“If your best employee can’t hit the protocol, the protocol — not the person — is broken.” 

The 13% Colostrum Gap You Don’t See Until You Measure It

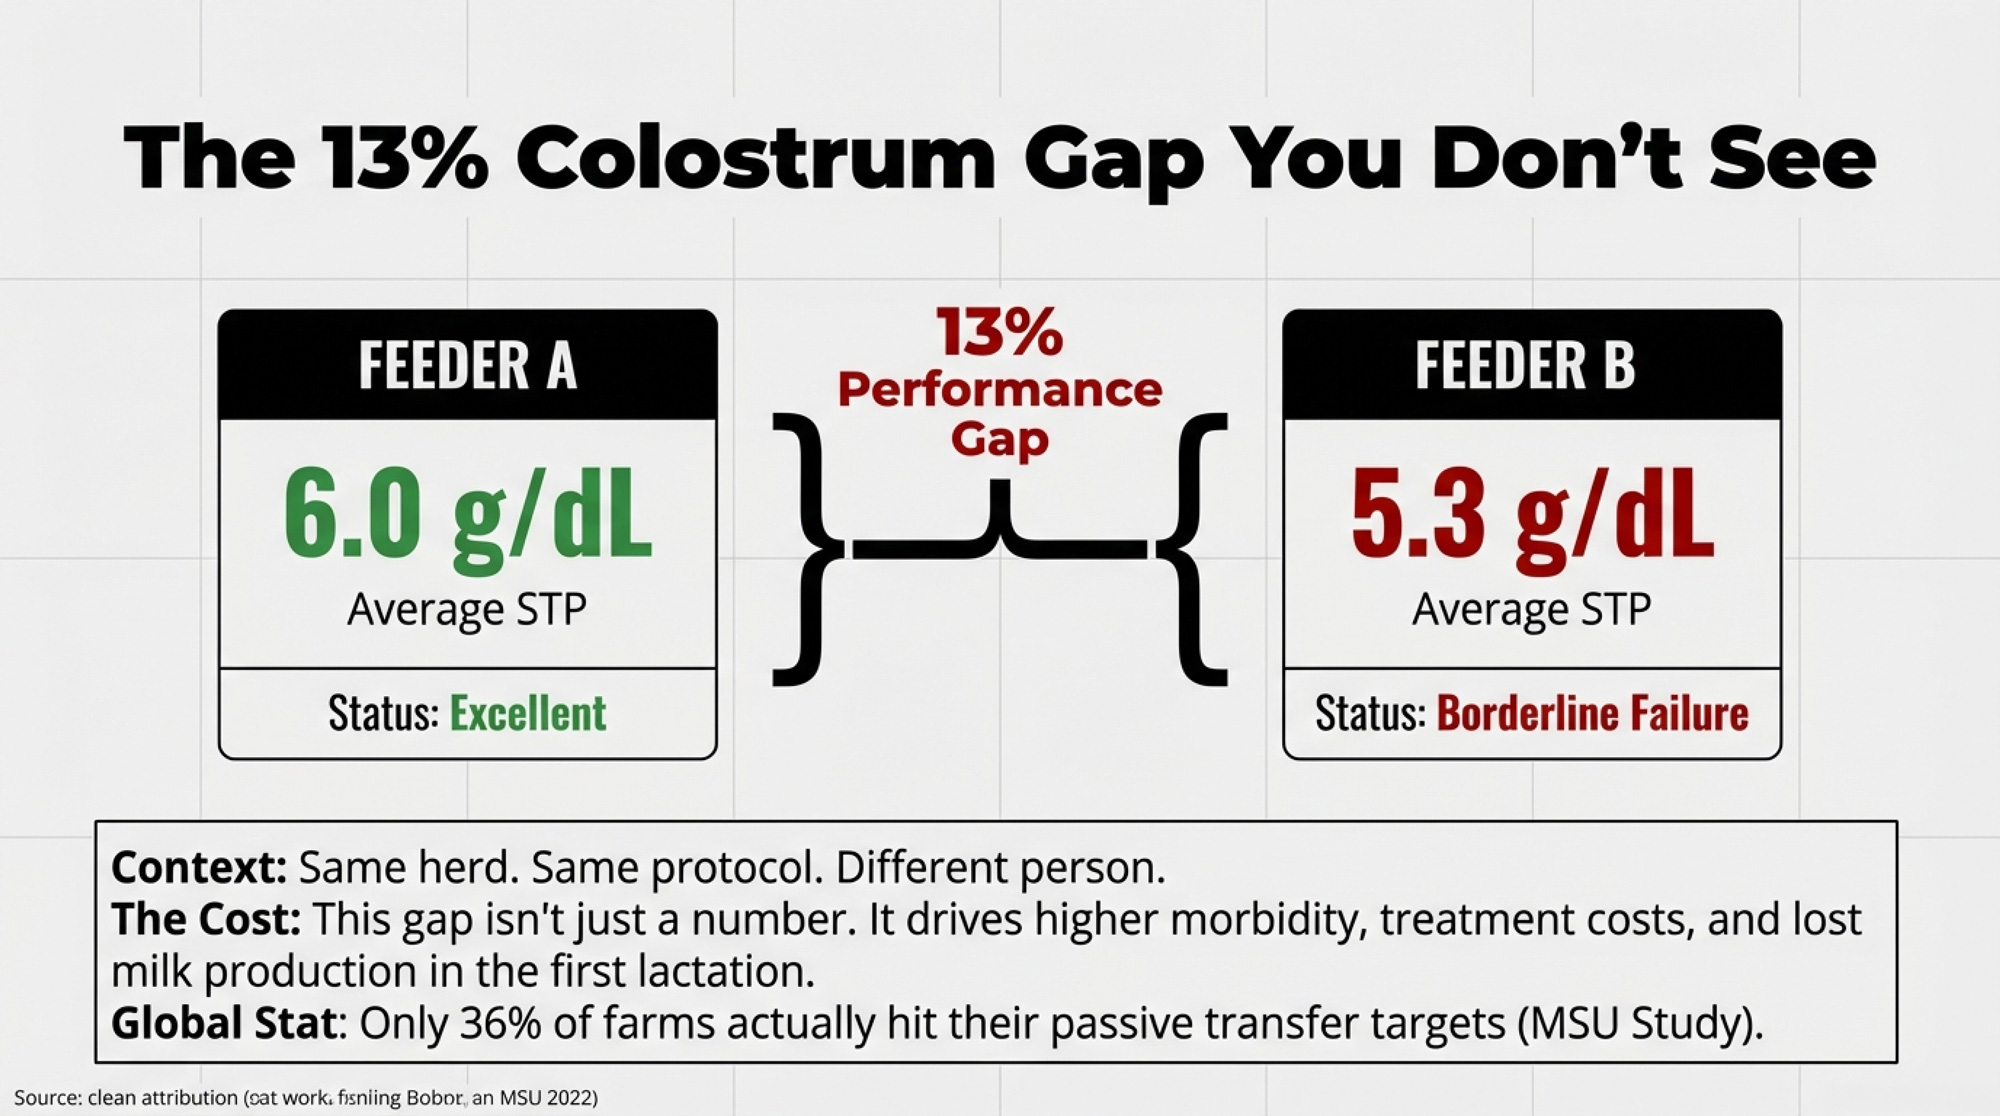
At one large U.S. dairy, a retrospective review of colostrum results showed that an employee measured serum total protein (STP) using a simple refractometer. Same herd, same colostrum, same written protocol — just different people doing the work. 

  • One feeder averaged 6.0 g/dL STP.
  • Another averaged 5.3 g/dL STP. 

On that farm, that’s roughly a 13% performance gap between 6.0 g/dL “excellent” results and 5.3 g/dL borderline passive transfer. The only real difference was who mixed and fed the colostrum.

Economically, FTPI is a slow bleed. Calves with FTPI have higher morbidity and mortality, weaker pre‑weaning growth, and higher treatment costs. Some never reach first calving. Others enter the milking string and never deliver the production their genetics suggest they can. Spread that 13% gap over a few hundred calves, and you’re looking at a five‑figure cost that never shows up as a separate line on the milk cheque. 

Now layer in dairy‑beef. A 2025 Purina/CattleFax analysis put average day‑old dairy‑beef calves around US$1,400, up from roughly US$650 three years earlier — more than double in a short window. Hoard’s Dairyman has been blunt that dairy‑beef calf prices are “breaking records” at many U.S. sales. A calf that ships at three days old with poor passive transfer is more likely to get sick, die, or need heavy treatment, and those problems pull down the prices buyers are willing to pay. 

Colostrum research from MSU, Wisconsin, and others all point the same way: what you did with colostrum this morning is one of the main predictors of that heifer’s health and productivity down the road. If you haven’t pulled STP by employee lately, you’re relying on a farm average that might be hiding your weakest link. 

Where Good Breeding Programs Quietly Go Sideways

On paper, your breeding plan might be elite. Genomics. Customized matings. Sexed semen on your best heifers. Beef semen on the bottom half. 

But if the wrong semen ends up in the cow, or the right straw gets mishandled, the whole thing quietly falls apart. 

The Taiwanese SNP‑based sire‑verification study puts hard numbers to that risk: 27.78% of recorded sires were wrong across 36 herds and 2,059 cows. That’s not a rounding error. That’s more than one in four cows with a different sire than your records say. 

Here’s where the leaks show up on‑farm:

  • Tank chaos. Straws from multiple bulls share a goblet. The breeder fishes for the right code with the canister too high in the neck, exposing every straw they aren’t using to warm air. Semen‑handling guides warn that when liquid nitrogen depth drops below about 6 inches, the temperature in the neck can rise sharply; straws left above the frost line quickly take damage. Late nights, cramped spaces, and tanks tucked into corners all make it easier to stay above the frost line longer than you should. 
  • Service‑number blind spots. Your plan says: sexed dairy for first and second service, beef from third service on. But if service numbers aren’t updated promptly, the person with the gun can’t follow the plan, no matter how good the spreadsheet looks. 
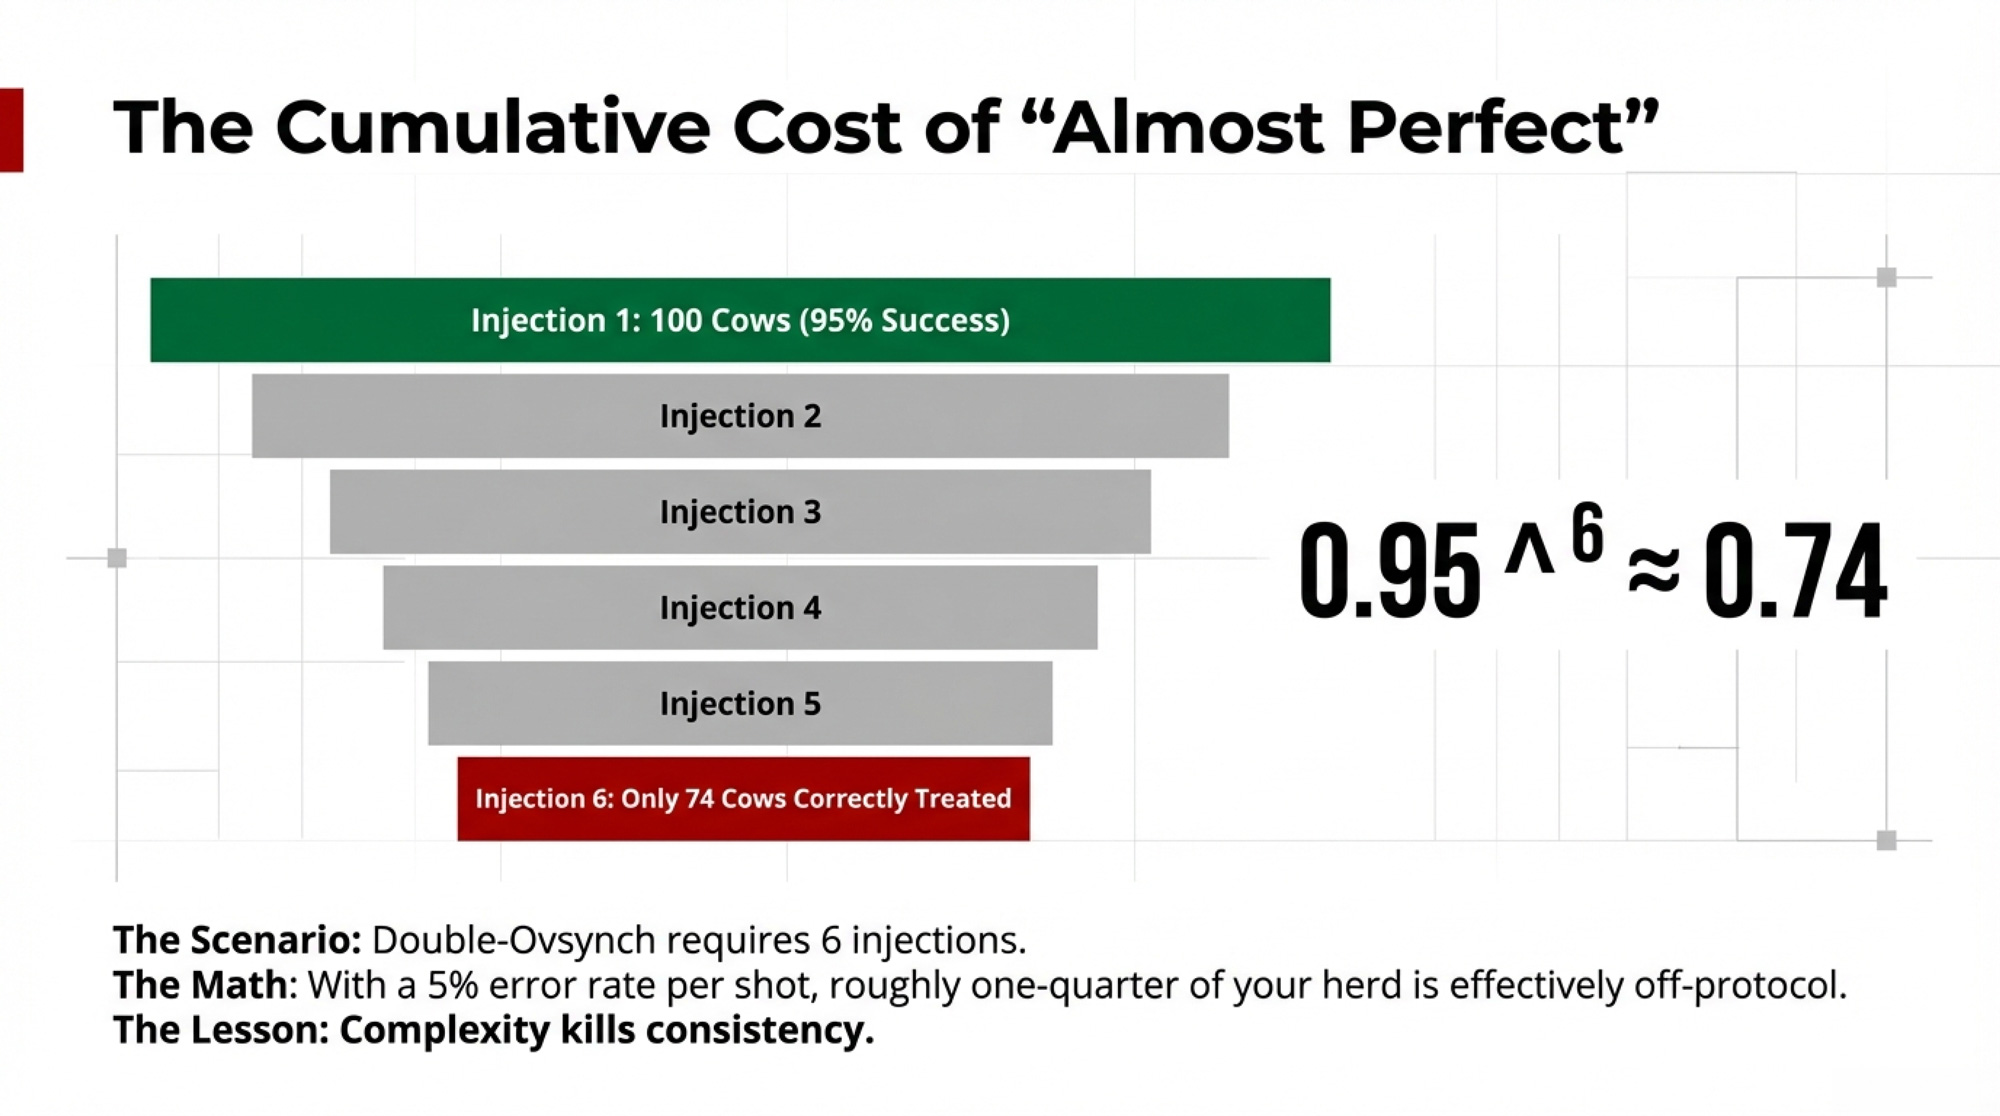
  • Synchronization drift. Double‑Ovsynch is powerful — six injections, tight timing, strong conception when done right. Do the math: at just a 5% error rate per shot, the chance of a cow receiving all six injections correctly is about 74%, because 0.95 6 ≈ 0.735. That means roughly a quarter of your herd is on some other version of the protocol than you think. 

The herds that consistently post top‑end reproduction numbers almost always share one habit: the same person both breeds and records, backed by a setup that makes the right straw easy and the wrong straw hard. Every handoff — between people, between shifts, between paper and software — is another leak you have to pay for. 

Why That 95‑Pound Cow Is Still Standing in Your Barn

McCarty’s “top half only” rule sounds ruthless until you stand in front of a cow who’s right on the bubble. 

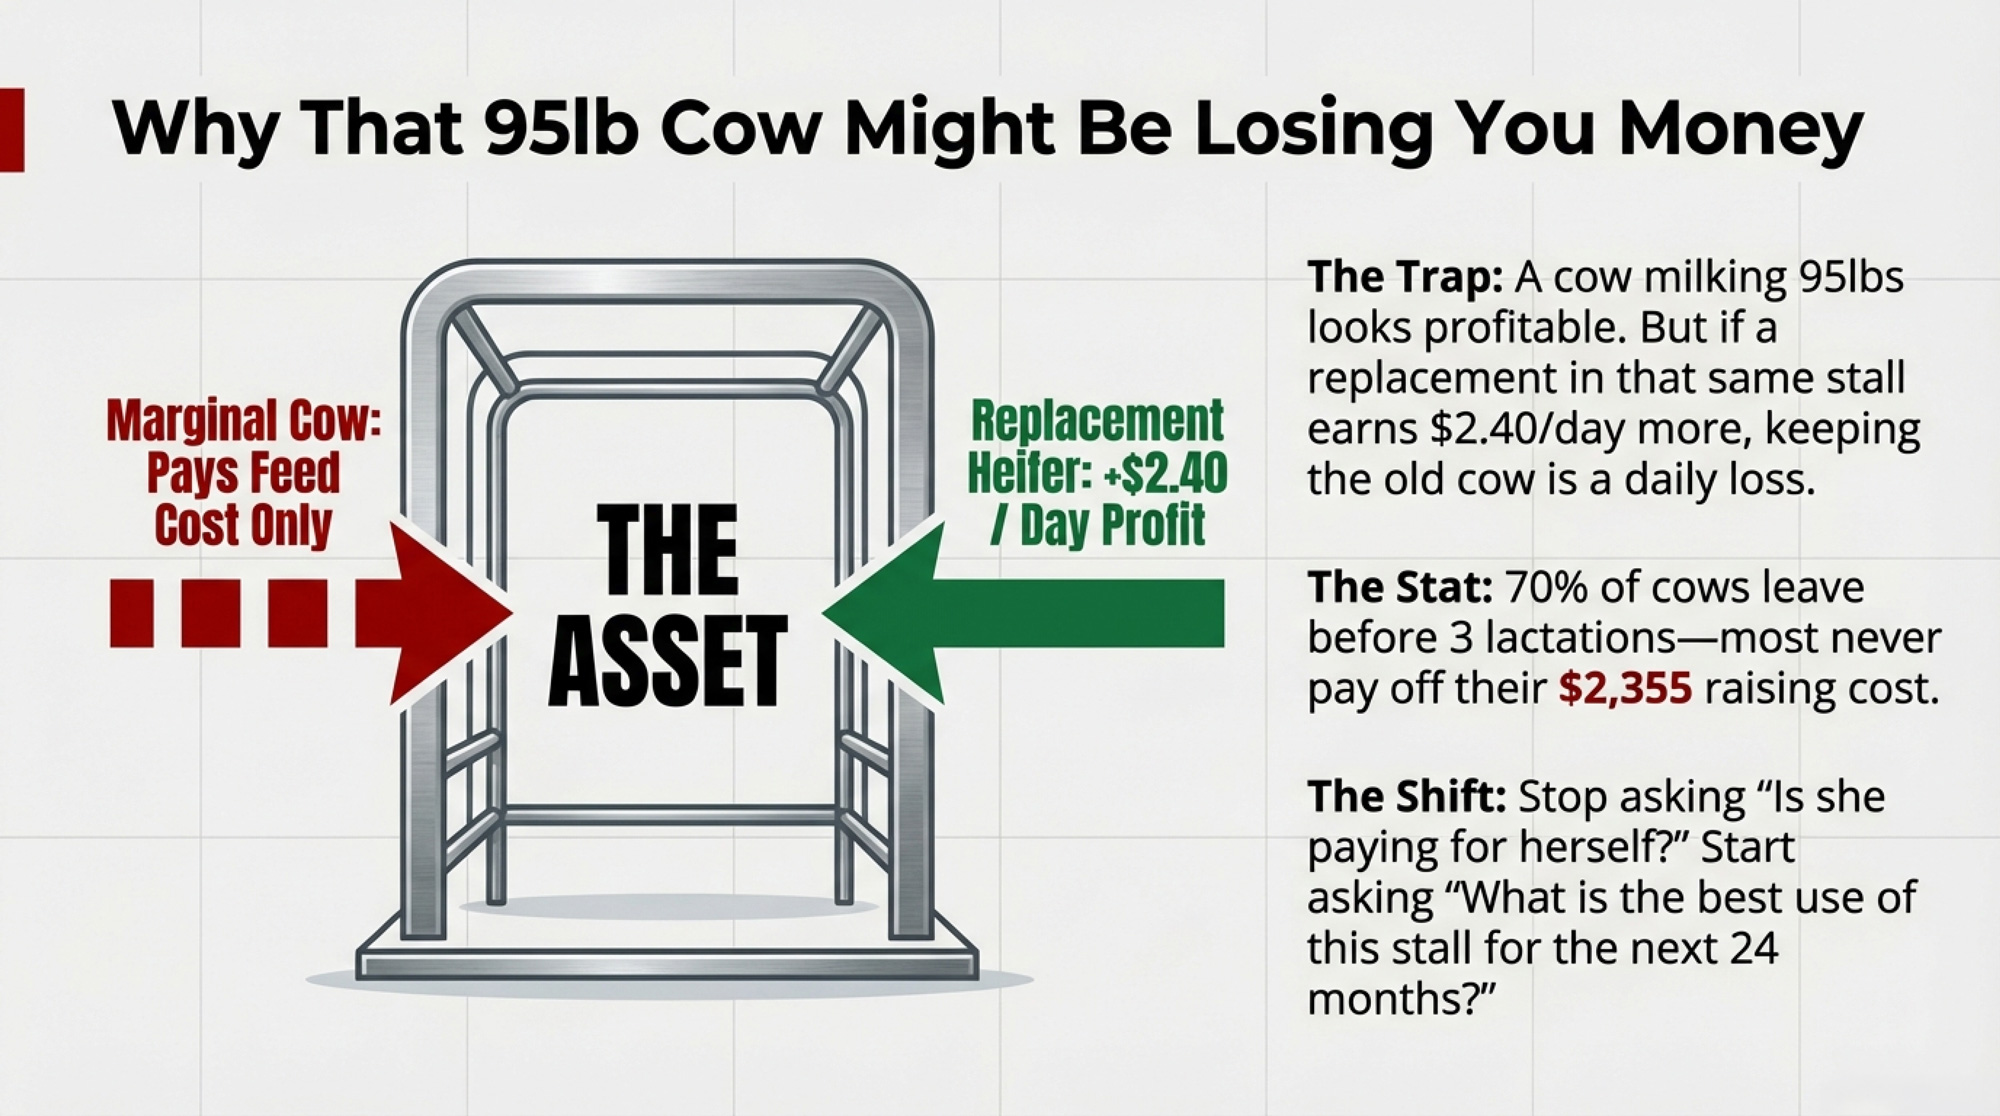
Picture a second‑lactation cow giving 95 pounds, sitting in your bottom‑third genomically. On your genetic ranking, she’s an easy cull. In the parlor, she looks like money. Human brains are wired to value today’s visible rewards — that full unit of milk — more than abstract, future gains like a higher‑merit daughter calving in three years. 

Culling work backs this up. Dairy Herd Management’s 2024 review of USDA/NAHMS data shows that about 70% of cows leave the herd within their first three lactations, and the average productive life is just 2.7 lactations. That same piece notes it takes more than three lactations to recoup roughly US$2,000 in raising cost. In other words, the “she hasn’t paid herself off yet” argument doesn’t hold up for most cows — they’re likely to leave before that point anyway. 

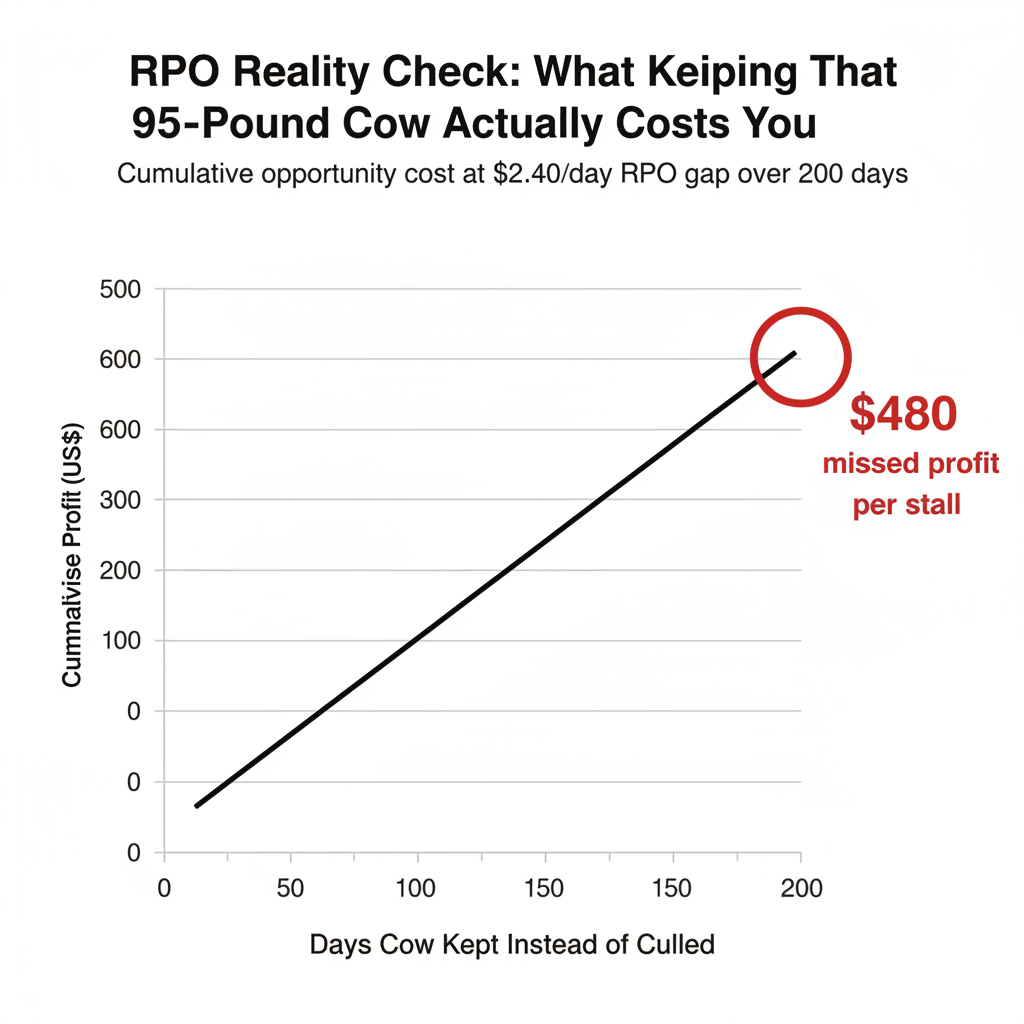
This is where Retention Pay‑Off (RPO) earns its keep. RPO is the expected profit difference between keeping a cow versus replacing her in that stall. That 95‑pound cow might be cash‑positive day to day. But if a replacement would generate US$2.40/day more in the same stall, you’re effectively giving up US$2.40/day by keeping her. Over 200 days, that’s US$480 in missed profit per stall. The cow isn’t necessarily losing money — she’s just blocking a more profitable animal from using that space. 

Recent reports show that average U.S. raising cost at US$2,355 per head, with most farms between US$2,094 and US$2,607. Other cost‑of‑raising work shows some systems pushing near US$2,900 per heifer. With those numbers and a 2.7‑lactation average productive life, hanging onto every decent cow just because she’s milking OK is usually the more expensive choice, not the safer one. 

So the real money question isn’t “Is she still paying for herself?” It’s: “What’s the best use of this stall over the next 12–24 months?”

Four Practical Paths to Close the Execution Gap — and Protect Profit

You don’t close this gap with a nicer poster or one more meeting. You close it by picking an approach that fits your people and facilities, then building systems that still hold together on the worst days. 

Path 1: Genomic Ranking With Hard Cutoffs

When it fits.
You’re already genomic‑testing, you’ve got more heifers than you absolutely need, and you’re willing to let numbers overrule emotion when it comes to who gets dairy semen versus beef. 

What it takes.

  • Genomic tests running roughly US$40–US$50 per head in many programs. 
  • Software and discipline to rank animals, keep that list current, and get it in front of whoever is breeding. 
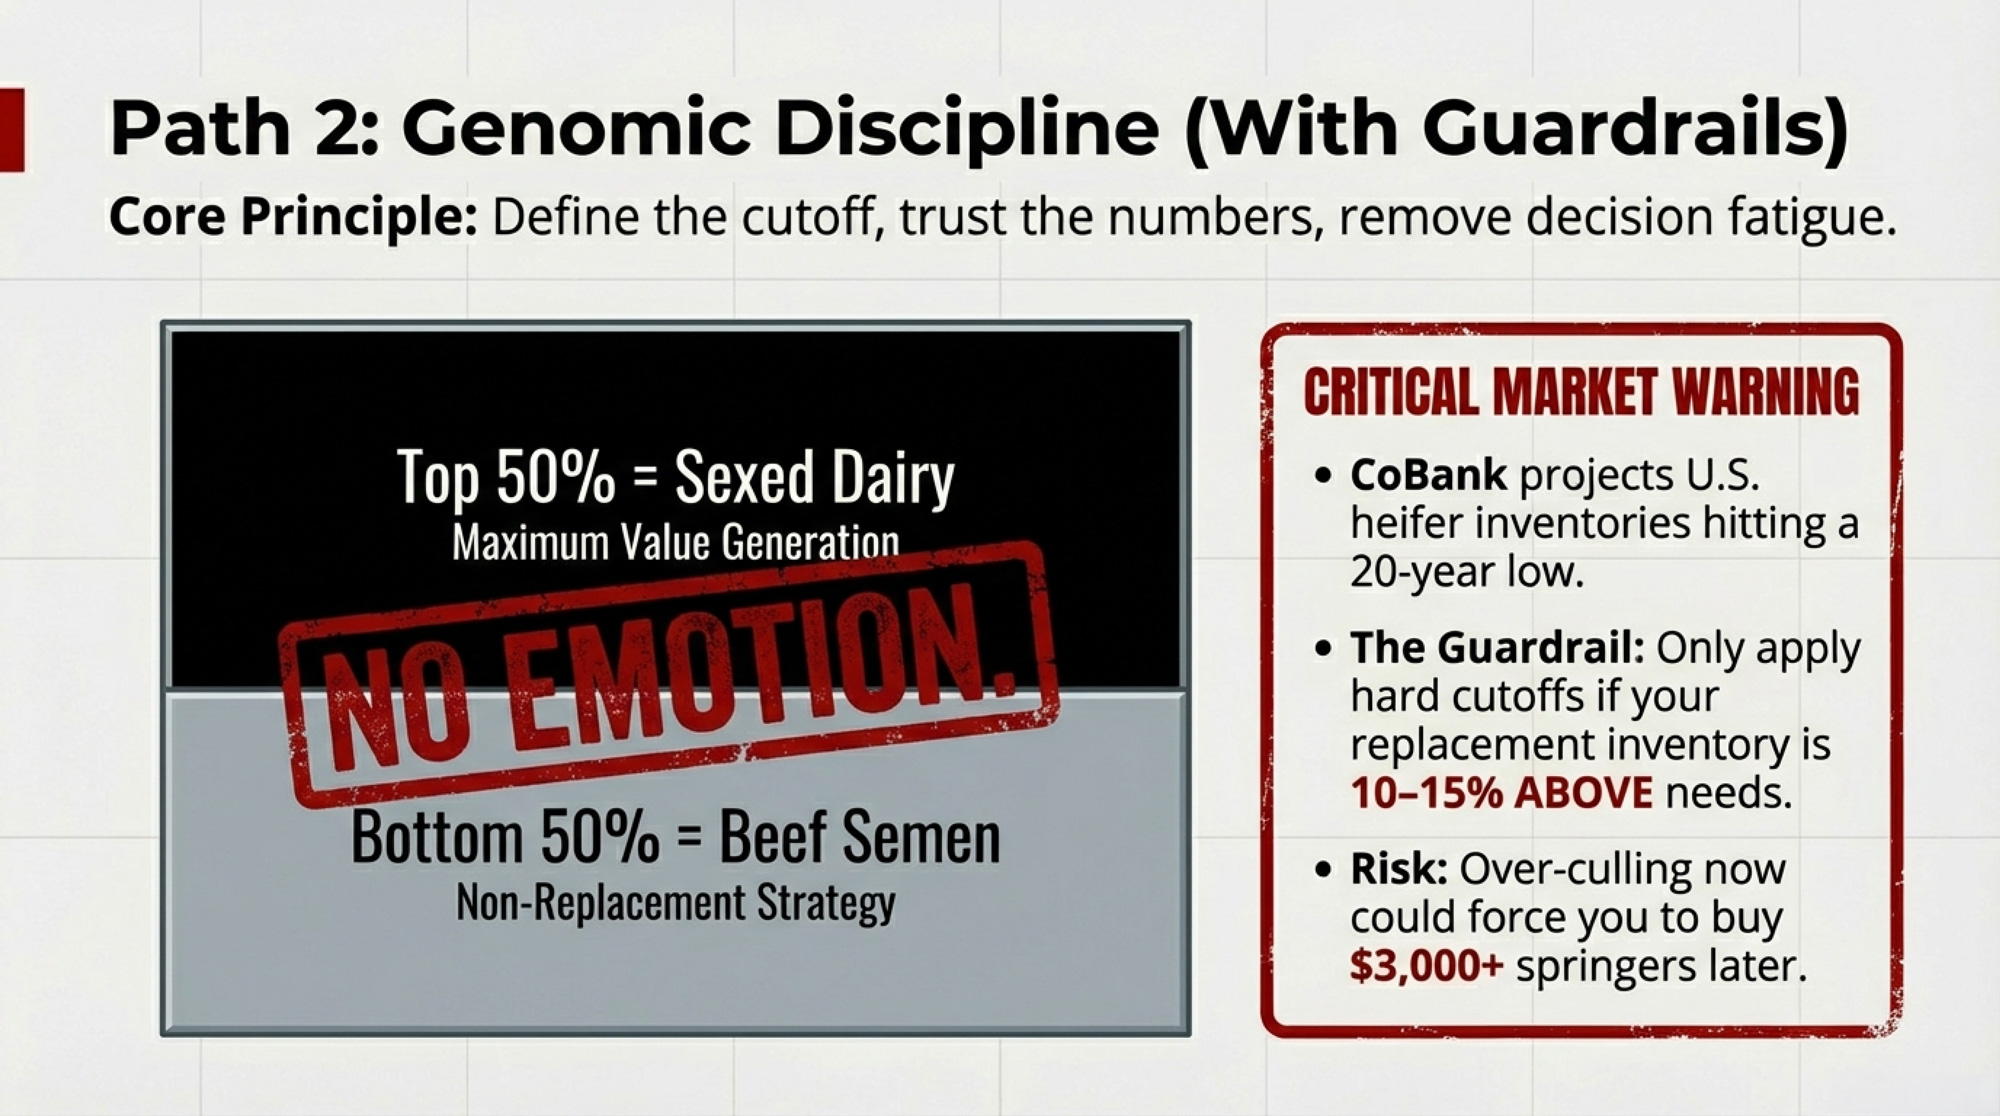
  • A clear rule: top 40–60% by index get dairy semen, the rest get beef. No exceptions. 

Where it bites back.
CoBank’s August 2025 analysis — echoed by Hoard’s Dairyman and other outlets — projects U.S. replacement heifer inventories hitting a 20‑year low, dropping by roughly 800,000 head before they start rebounding in 2027. Fresh heifer prices “vaulted far into record territory” in spring 2025, with baseline pregnant heifers averaging about US$2,870 and premium groups fetching “upward of US$4,000” per head. Over‑culling in that environment can easily push you into US$3,000–US$4,000 heifer purchases just to refill stalls. If your replacement inventory isn’t at least 10–15% aboveminimum needs, going full “top half only” overnight is asking for trouble. 

Phone‑friendly takeaway: Use genomics to steer dairy vs. beef, but only go harsh on the bottom half if you’ve clearly got a 10–15% replacement surplus and you’re truly comfortable buying heifers at US$3,000+ if you mis‑judge it. 

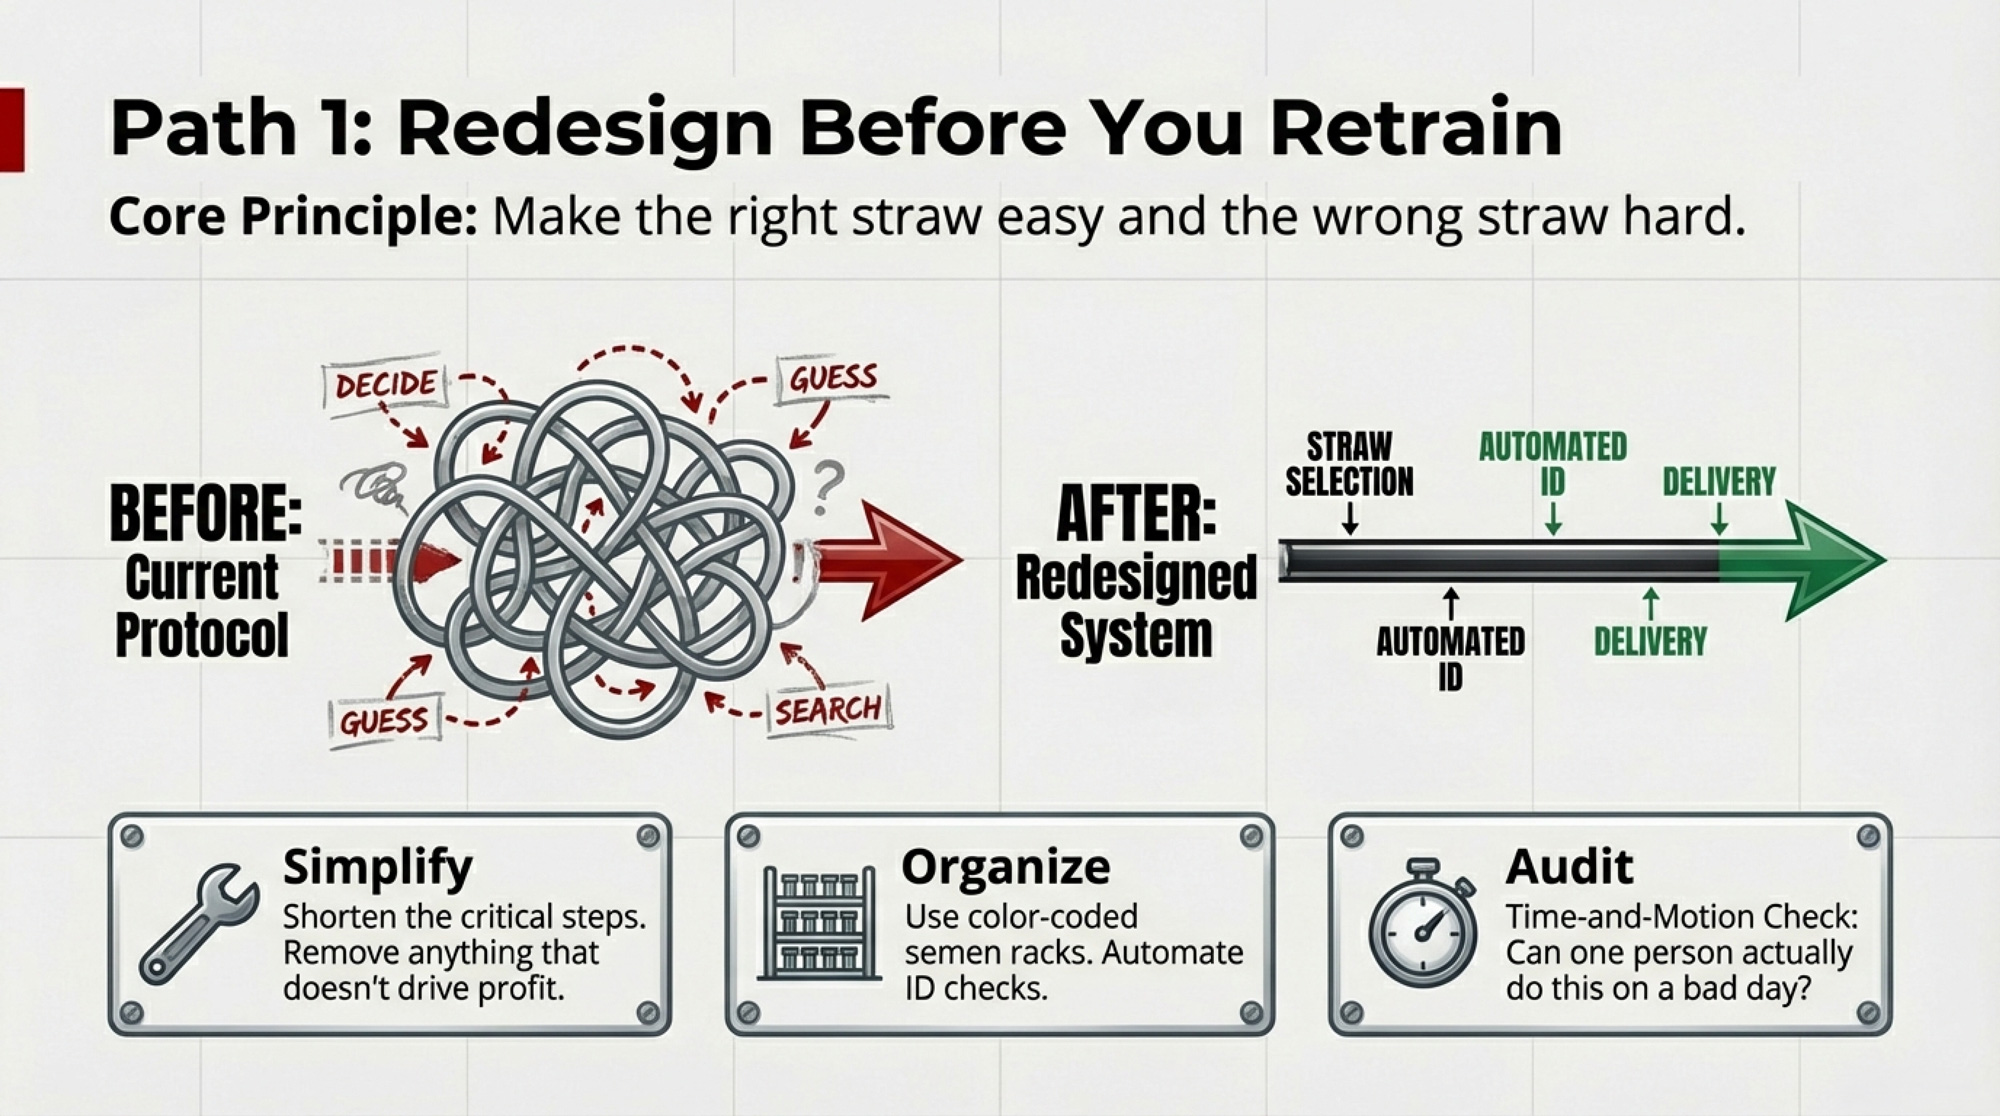
Path 2: Redesign the System Before You Rewrite the Protocol

When it fits.
You’ve already retrained a protocol two or three times, and you’re still not seeing the results move. Your best employees are missing steps or improvising on the fly. 

What it takes.

  • A blunt look at time and motion: can one person actually do what you’re asking on a bad day?
  • A shorter list of critical steps that really move the needle (for colostrum, that usually means timing, volume, and quality at the first and second feeds). 
  • Tools that remove choices: organized semen racks, simple color‑coding, auto‑ID checks, and checklists that must be signed off. 

Where it bites back.
You can absolutely overcorrect and strip out tasks that genuinely pay — like a documented second colostrum feeding — in the name of simplicity. The sweet spot is the simplest protocol that still pays, given your milk price, calf value, and labor cost. 

Phone‑friendly takeaway: If your best person can’t hit the protocol, shorten it until they can. Then, only add back steps that clearly improve profit. 

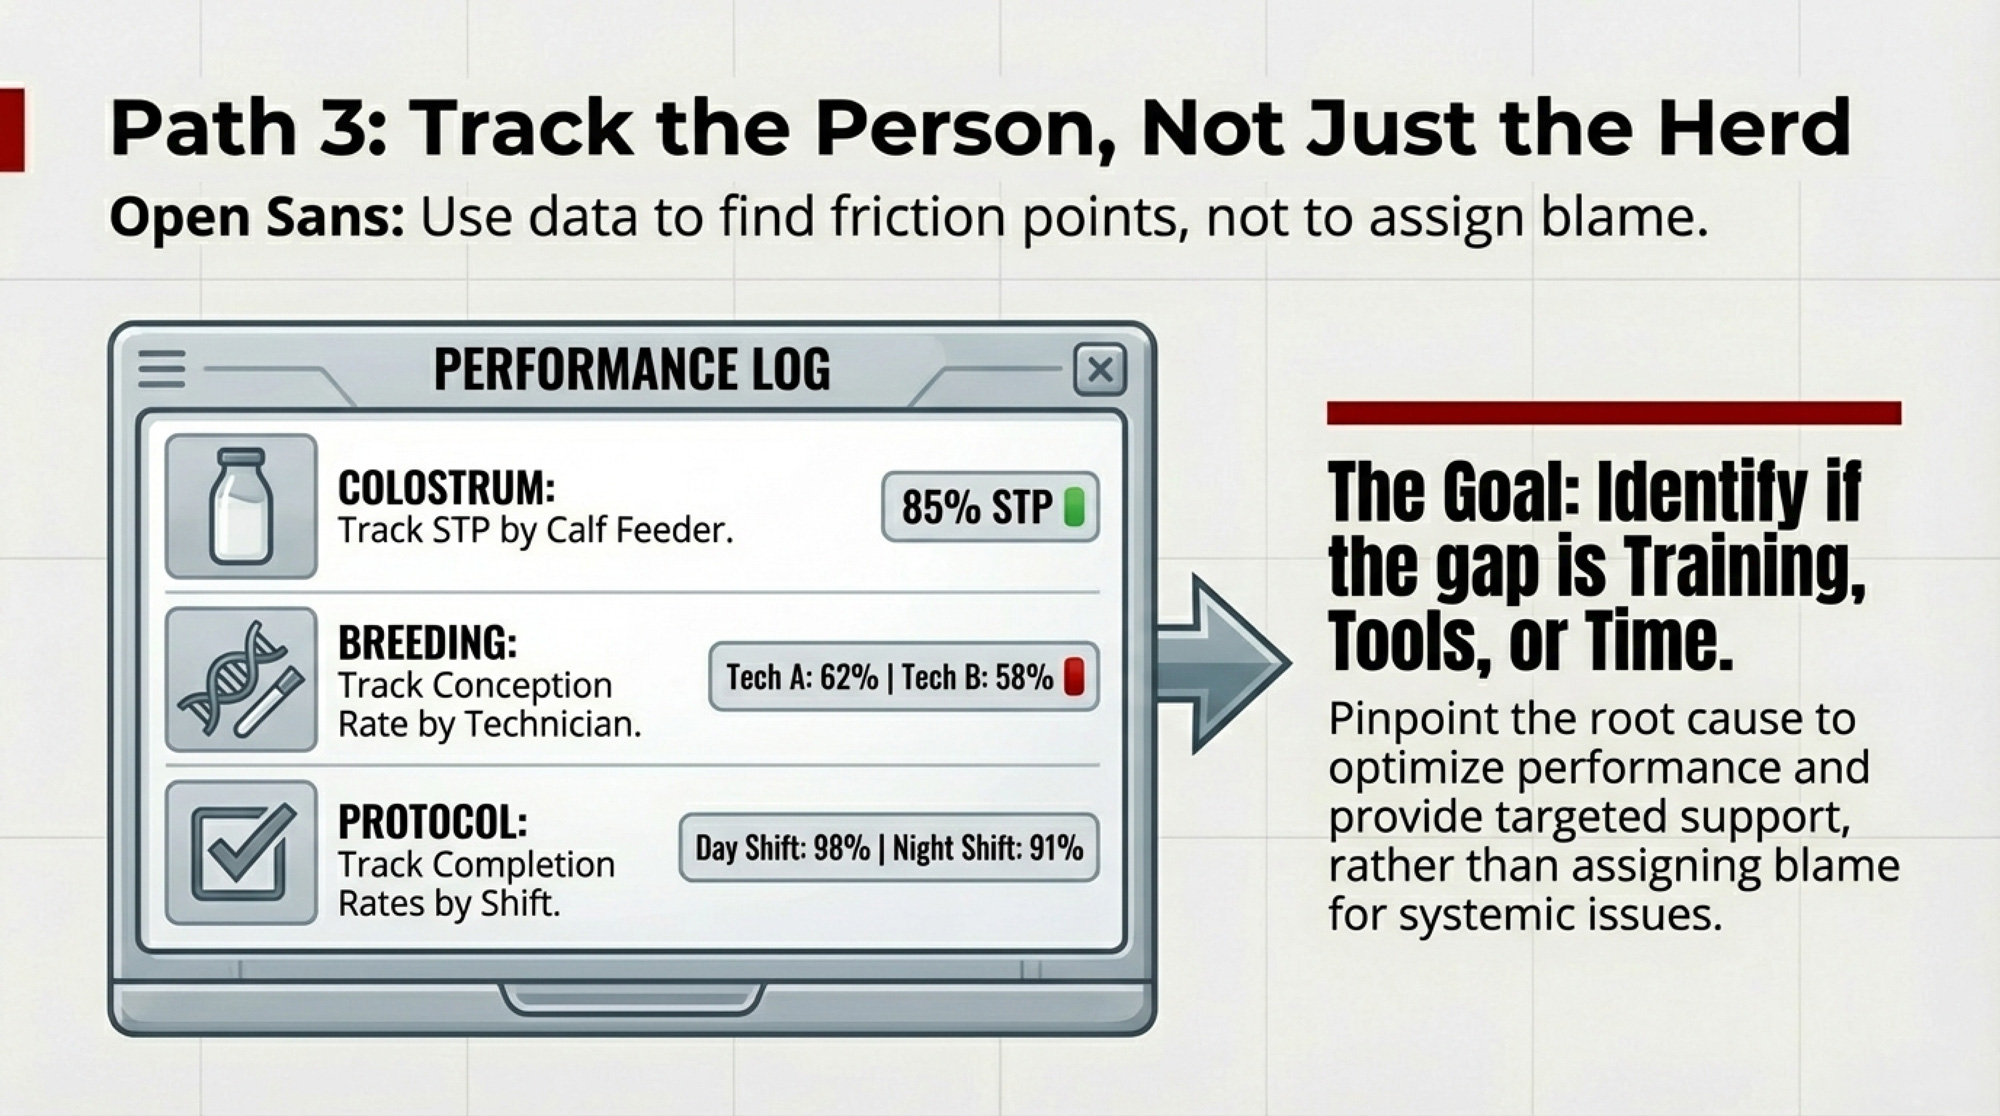
Path 3: Track Results by Person, Not Just Herd

When it fits.
You know there are good days and bad days, but you’re not sure where the swings are coming from. 

What it takes.

  • STP by calf feeder for the next 30–60 days. 
  • Conception rate and pregnancy risk by A.I. technician and by protocol (e.g., Double‑Ovsynch vs. natural heats). 
  • Protocol completion rates by shift for things like second colostrum feeds, vaccines, and synchronization shots. 

The Michigan colostrum work and that large‑herd STP example both show it: the gap between “excellent” and “fair” passive transfer can sit almost entirely in who mixes and feeds colostrum. 

Where it bites back.
If you jump straight from data to blame, you’ll destroy trust. The order has to be:

  1. Check whether they had the time, tools, and information.
  2. Fix those gaps.
  3. Then, coach, reassign, or change staffing if you still see the same pattern. 

Phone‑friendly takeaway: Use the numbers to identify friction points and training needs—not to pin everything on one person. 

Path 4: Treat Consistency as Infrastructure

When it fits.
Every operation, regardless of size or system. 

What it takes.

  • Written, non‑negotiable checklists for key jobs (colostrum, transition cows, breeding, semen tank handling). 
  • Documented second colostrum feeding where your disease risk and calf value justify the extra pass. 
  • Scheduled mixer‑wagon calibrations and forage dry‑matter checks so your ration on paper stays close to the ration in the bunk. 
  • Feeding times that stay within a tight window day after day to smooth out intakes. 

Where it bites back.
Consistency without review can lock you into executing a plan that no longer fits 2024–2026 economics. Feed prices, calf values, and heifer costs have all moved since 2020. Consistency has to be paired with regular “does this still make money?” checks. 

Phone‑friendly takeaway: Lock in consistency for the handful of jobs that really drive calf health, conception, and stall value — then put a date on the calendar to re‑run the math. 

Running the Numbers: Dairy‑Beef Calves vs. Raising Replacements

ScenarioRaise as Dairy ReplacementSell as Dairy‑Beef Calf
Raising costUS$2,094–US$2,607 per heifer on typical U.S. farms; some systems near US$2,900≈US$50–US$75 in first‑week costs
Forgone dairy‑beef sale≈US$1,400/calf (recent U.S. average in strong programs)N/A
Total exposure per headRoughly US$3,250–US$4,350 (raising cost + forgone calf sale)≈US$75
ReturnDepends on genetics, health, and reaching 3+ lactations; average life ≈2.7 lactations≈US$1,400 day‑old income in active programs
Break‑even requiresMore than 3 lactations to recoup the raising costEssentially week one

Exact numbers depend on your region and marketing channel. Recent U.S. commentary shows day‑old dairy‑beef calves averaging around US$1,400, with some lots higher and some lower, while straight Holstein bull calves still trail by several hundred dollars. 

This isn’t a blanket order to stop raising heifers. It’s a reminder that every “just in case” heifer carries a real opportunity cost in a heifer‑short, dairy‑beef world. 

Regional Sidebar: Calf and Heifer Prices Outside the U.S.

If you’re reading this from outside the U.S., the exact dollar or euro values look different. But the pattern is starting to feel very familiar. 

  • Canada.
    Manitoba and national beef‑market reviews for 2024–2025 point to stronger calf prices lifted by tighter beef cow inventories. At the dairy end, Ontario auction reports show fresh milk cows and bred heifers trading in the C$3,000–C$4,400 range at selected sales, with individual top cows over C$5,000 and quality springers frequently around C$3,000–C$3,800, while open heifers often fall in the C$1,500–C$2,250 band. That’s not a national average, but it’s a clear signal that replacements aren’t cheap. 
  • European Union (example: Ireland and Denmark).
    In June 2025, the Irish Farmers Journal reported that Friesian bull calf averages jumped to €209, nearly three times the roughly €67 average a year earlier, while Angus and Hereford dairy‑beef calves were regularly trading in the mid‑€200s to mid‑€300s. Teagasc’s mid‑2025 update noted that €500–€700 for very strong dairy‑beef calves had become “the new normal” for the top of the trade in some rings. In Denmark, there is a national calf‑pricing scheme where a 60 kg Holstein x beef calf earns about €100, plus bonuses that can add another €100 for the best male calves. 

The exact dollar or euro values are different, but the pattern is similar: stronger beef prices and constrained replacement supplies are lifting both dairy‑beef calf values and in‑calf heifer prices in Canada and parts of Europe. The stall‑value and opportunity‑cost questions in this article still apply — you just need to plug in your local calf and heifer prices. 

The Execution Cost in One Table

Leak PointStatistical FrequencyEconomic Impact (per event)
Incorrect sire recording27.78% of cows had a wrong recorded sire in one Taiwanese datasetLoss of expected genetic gain; weaker matings; less reliable proofs 
Colostrum execution (STP)13% performance gap between 6.0 g/dL and 5.3 g/dL by an employee on one large herdHigher morbidity and mortality, more treatments, and lost milk in the first lactation 
Timed‑AI protocol errors5% error per shot ≈ , 26% of cows missing at least one of six Double‑Ovsynch injectionsMore open cows, longer calving intervals, fewer high‑value dairy pregnancies 
Culling delay (RPO)N/A (herd‑specific)Example: ≈US$480 missed profit per stall over 200 days at US$2.40/day lost opportunity 

Signals to Watch Over the Next 24–36 Months

Your own execution data.

If you want to know where your biggest leaks are:

  • Pull STP distributions by feeder for the next 30–60 days. 
  • Track conception and pregnancy risk by technician and by protocol type. 
  • Audit how many cows actually complete full synchronization protocols and second colostrum feeds. 

Until you see those numbers by person and protocol, you’re guessing where your execution gap really sits. 

Replacement pipeline stress.

CoBank’s August 2025 report predicts that: U.S. replacement heifers are expected to hit a 20‑year low, with an ~800,000‑head reduction before inventories start to rebuild in 2027. Heifer prices have already “vaulted far into record territory,” with baseline bred heifers near US$2,870 and premium groups “upward of US$4,000.” Any aggressive culling or dairy‑beef plan has to start with an honest count of how many replacements you have and how many you really need. 

Dairy‑beef premium durability.

Dairy‑beef calves are benefiting from tight beef supplies and expanded fed‑beef capacity. CoBank’s outlook suggests 2027 as a likely turning point in the heifer cycle, and broader beef‑market work points to eventual easing of the tightest supply conditions. That doesn’t mean the bottom falls out, but it does mean the easiest premiums can narrow. Herds with consistently low FTPI and strong calf health should stay at the top of the dairy‑beef market even when everyone else starts catching up. 

What This Means for Your Operation

  • If your best person can’t hit a protocol, stop retraining and start redesigning. Before the next “training session,” audit the time, tools, and information they actually have. If the protocol doesn’t fit reality, fix the protocol—not the person. 
  • Audit colostrum by person, not just herd average. If STP by employee shows a spread of 0.5–1.0 g/dL, you’ve got an execution gap that will come back at you in treatment costs, death loss, and weak first‑lactation cows. 
  • Run RPO, not emotions, on your bottom third. When a cow’s projected daily profit is clearly below what a replacement could do in that stall — and your heifer inventory is solid — it’s time to let her go, even if her current milk looks good. 
  • Use genomic ranks to control who gets dairy semen, but only as aggressive as your replacement math allows. If your replacement count isn’t at least 10–15% above minimum needs, phase in hard cutoffs instead of flipping the switch to “top half only” overnight. 
  • Treat dairy‑beef as a serious margin tool, not a fad. It only really pays if your colostrum and calf care are strong enough to deliver high‑value calves consistently. If FTPI is shaky, fix that first before you chase top‑tier calf checks. 
  • Spend time in the parlor and by the tank. Watch how IDs are read, how long the canister stays in the neck, and how often people hunt for the right straw above the frost line. The cheapest fixes usually hide in daily habits, not in new technology. 

Key Takeaways

  • Execution gaps — not genetics or feed alone — may be one of the biggest hidden costs on modern dairies, once you line up the FTPI data, sire‑error rates, and heifer economics against what you thought your protocols were delivering. 
  • Only 36% of the 50 Michigan farms in a major colostrum project actually met passive transfer goals, even though most believed their routines were solid. Until you track STP by person, you honestly don’t know where your farm sits. 
  • When you’ve retrained a protocol twice, and results haven’t moved, the problem is almost always the system — not the people. Redesign the work, remove failure points, and then retrain with a protocol that fits real‑world conditions. 
  • Retention Pay‑Off and stall opportunity cost matter more than whether a cow is “still paying for herself” on paper, especially when 70% of cows leave before three lactations and the average heifer raising cost sits around US$2,355 per head. 
  • Tight heifer inventories and record dairy‑beef calf values make poor execution more expensive than ever.In 2024–2026, every protocol miss has the potential to waste a historically valuable calf and a historically valuable stall. 

The Bottom Line

The herds that win over the next few years won’t be the ones with the fanciest protocols in a binder. They’ll be the ones that build simple, durable systems their people can hit on the worst days, not just the best. 

If you pulled your numbers tomorrow, which protocol would look the worst — and what’s your plan to rebuild it before it costs you another year? 

Complete references and supporting documentation are available upon request by contacting the editorial team at editor@thebullvine.com.

Learn More

The Sunday Read Dairy Professionals Don’t Skip.

Every week, thousands of producers, breeders, and industry insiders open Bullvine Weekly for genetics insights, market shifts, and profit strategies they won’t find anywhere else. One email. Five minutes. Smarter decisions all week.
NewsSubscribe
First
Last
Consent

When Your Calves Outearn Your Cows: The 357,000-Heifer Shortage and the $200K Math Reshaping Dairy Survival

Hope is not a strategy. Nostalgia is not a business plan. Three hundred fifty-seven thousand heifers short and $200K on the line—here’s the math dairies need now.

Beef-on-dairy math

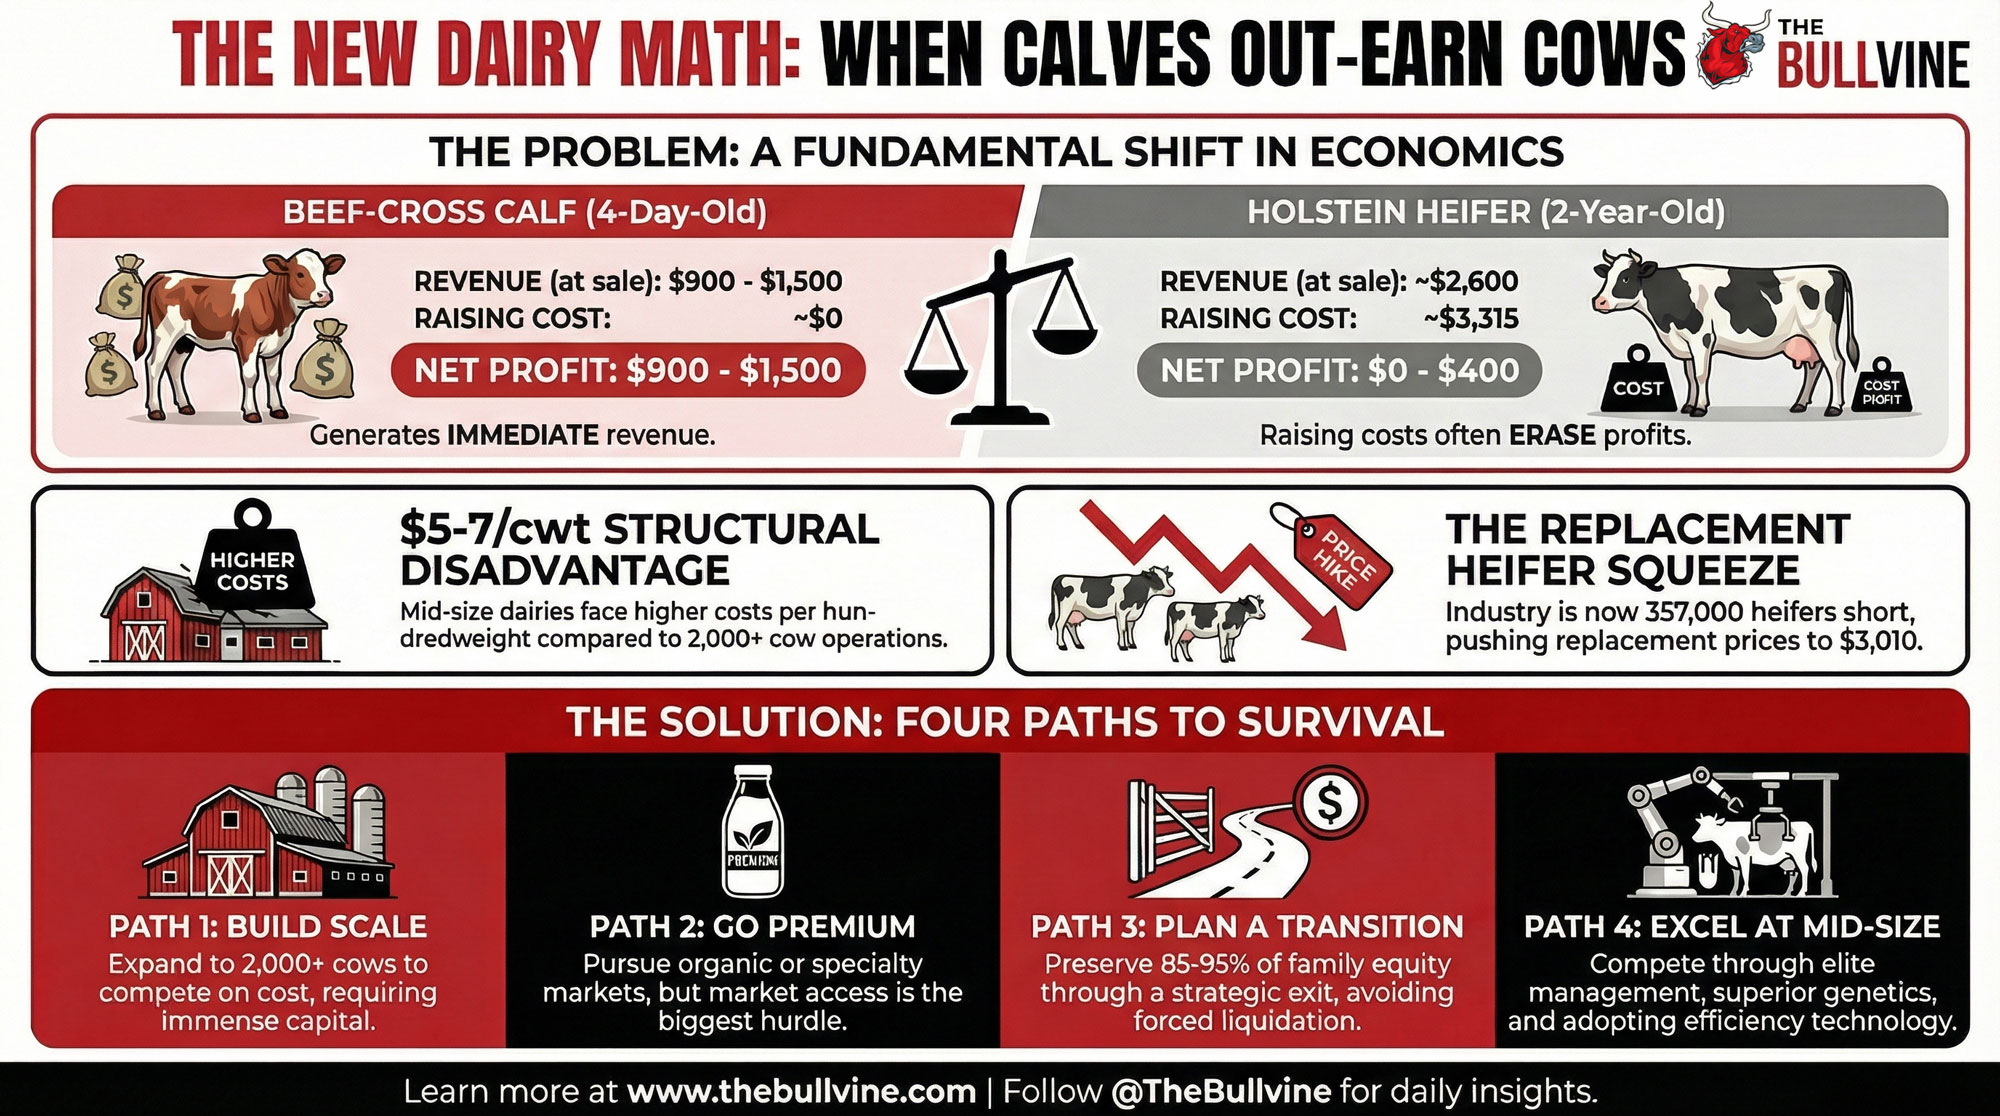
EXECUTIVE SUMMARY: A beef-cross calf at four days old now generates more profit than a Holstein heifer does after two years—and for mid-size dairies, that shift represents $200,000-$300,000 in annual revenue sitting on breeding decisions. Beef-cross calves fetch $900-$1,500 while heifer-raising nets $0-400 after $3,315 in average costs. Three structural forces have converged: butterfat oversupply from genetic progress, China’s 75-85% self-sufficiency killing export recovery hopes, and processor consolidation creating $5-7/cwt disadvantages for mid-size suppliers. The industry is now 357,000 heifers short with replacements at $3,010 nationally, per CoBank’s August 2025 analysis. Four paths remain for mid-size operations—scale aggressively, pursue premium markets, execute planned transitions that preserve 85-95% of equity, or achieve the operational excellence that makes mid-size sustainable. Hope is not a strategy; families preserving wealth are deciding in months 6-10, during margin pressure, not in month 18, when options have narrowed, and equity has eroded.

Something worth paying attention to is happening on dairy operations across North America, and honestly, I don’t think it’s getting the discussion it deserves. A beef-cross calf sold at four days old now generates somewhere between $900 and $1,500 in revenue, depending on your market and genetics. Meanwhile, a Holstein heifer calf—after 24 months of feeding, housing, breeding, and veterinary care—often produces milk worth roughly the same in annual margin contribution.

I know. It sounds backwards. But the numbers are real.

Here’s the uncomfortable question nobody wants to ask at the coffee shop: Why are so many operations still raising every heifer calf like it’s 2015? The answer usually has more to do with tradition than spreadsheets—and that’s a problem when margins are this tight.

What we’re looking at is a meaningful shift in how successful operations are thinking about revenue streams, genetic decisions, and the fundamental question of where their margins actually come from. For mid-size operations—those running 300 to 1,000 cows—understanding this shift matters a great deal for long-term planning.

The Revenue Picture Has Changed

Here’s what’s interesting about the current market. Premium beef-cross calves from Angus, Limousin, or Belgian Blue sires bred to dairy cows are commanding prices that would have raised eyebrows five years ago. USDA Agricultural Marketing Service data from late 2025 shows auction prices for quality dairy-beef crosses consistently exceeding $1,200 at major livestock markets in the East, with premium genetics pushing above $1,400 in strong markets.

Now, those numbers vary quite a bit by region—and that matters for your planning. The Bullvine’s market tracking shows beef-cross calves in the 60-100 pound range fetching $931-$1,075 per head at New Holland in Pennsylvania, while Wisconsin markets run $690-$945, and Minnesota comes in around $700-$985. California operations often see stronger prices due to proximity to feedlot demand, while Canadian producers face different dynamics under supply management. So your results will depend significantly on where you’re selling and what genetics you’re putting into those calves.

Meanwhile, the traditional replacement heifer model—which made solid economic sense when Holstein heifers sold for $2,800 and milk margins were healthier—now requires some careful penciling. And by “careful penciling,” I mean actually doing the math rather than assuming heifer-raising still works because your dad did it.

Here’s the practical math many operations are working through:

  • Beef-cross calf at 4 days: $900-$1,300 average revenue, depending on market and genetics
  • Holstein heifer at 24 months: $2,600 sale value minus roughly $2,500-$3,000 raising cost = $0-$400 net in many cases
  • Difference: Often $700+ per animal favoring beef-on-dairy

That heifer raising cost deserves a moment here. Canfax’s 2024 analysis of 64 benchmark farms found average costs of about $3,315 per heifer, and Beef Research Canada’s 2023 work showed a range of $2,904 to $3,806, depending on the operation. Your costs might be lower if you’ve got cheap home-raised feed and efficient facilities—but they might also be higher than you think when you pencil in everything honestly.

And that’s the thing. In my experience, many operations haven’t honestly factored heifer-raising costs into their budgets in years, if ever. They keep doing it because they’ve always done it. That’s not a strategy—it’s a habit.

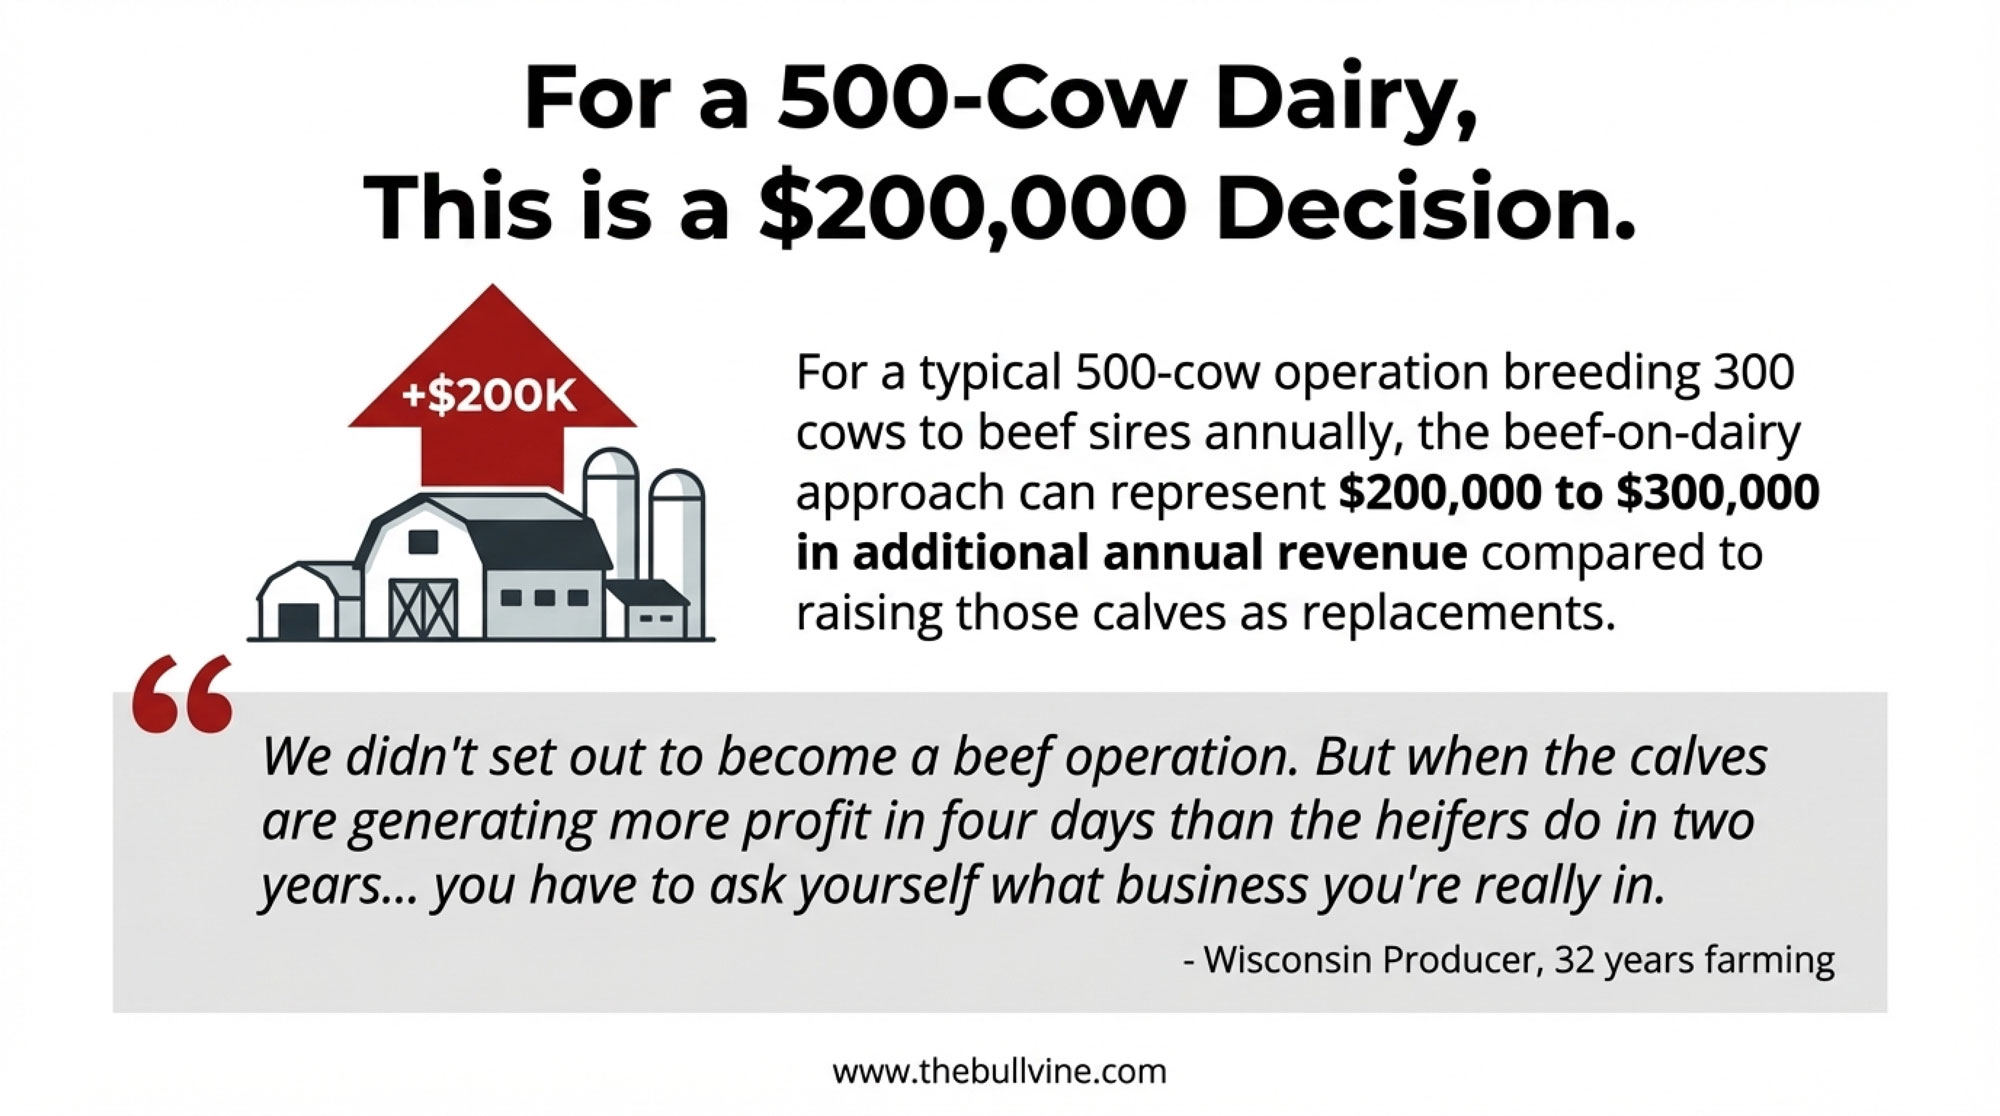
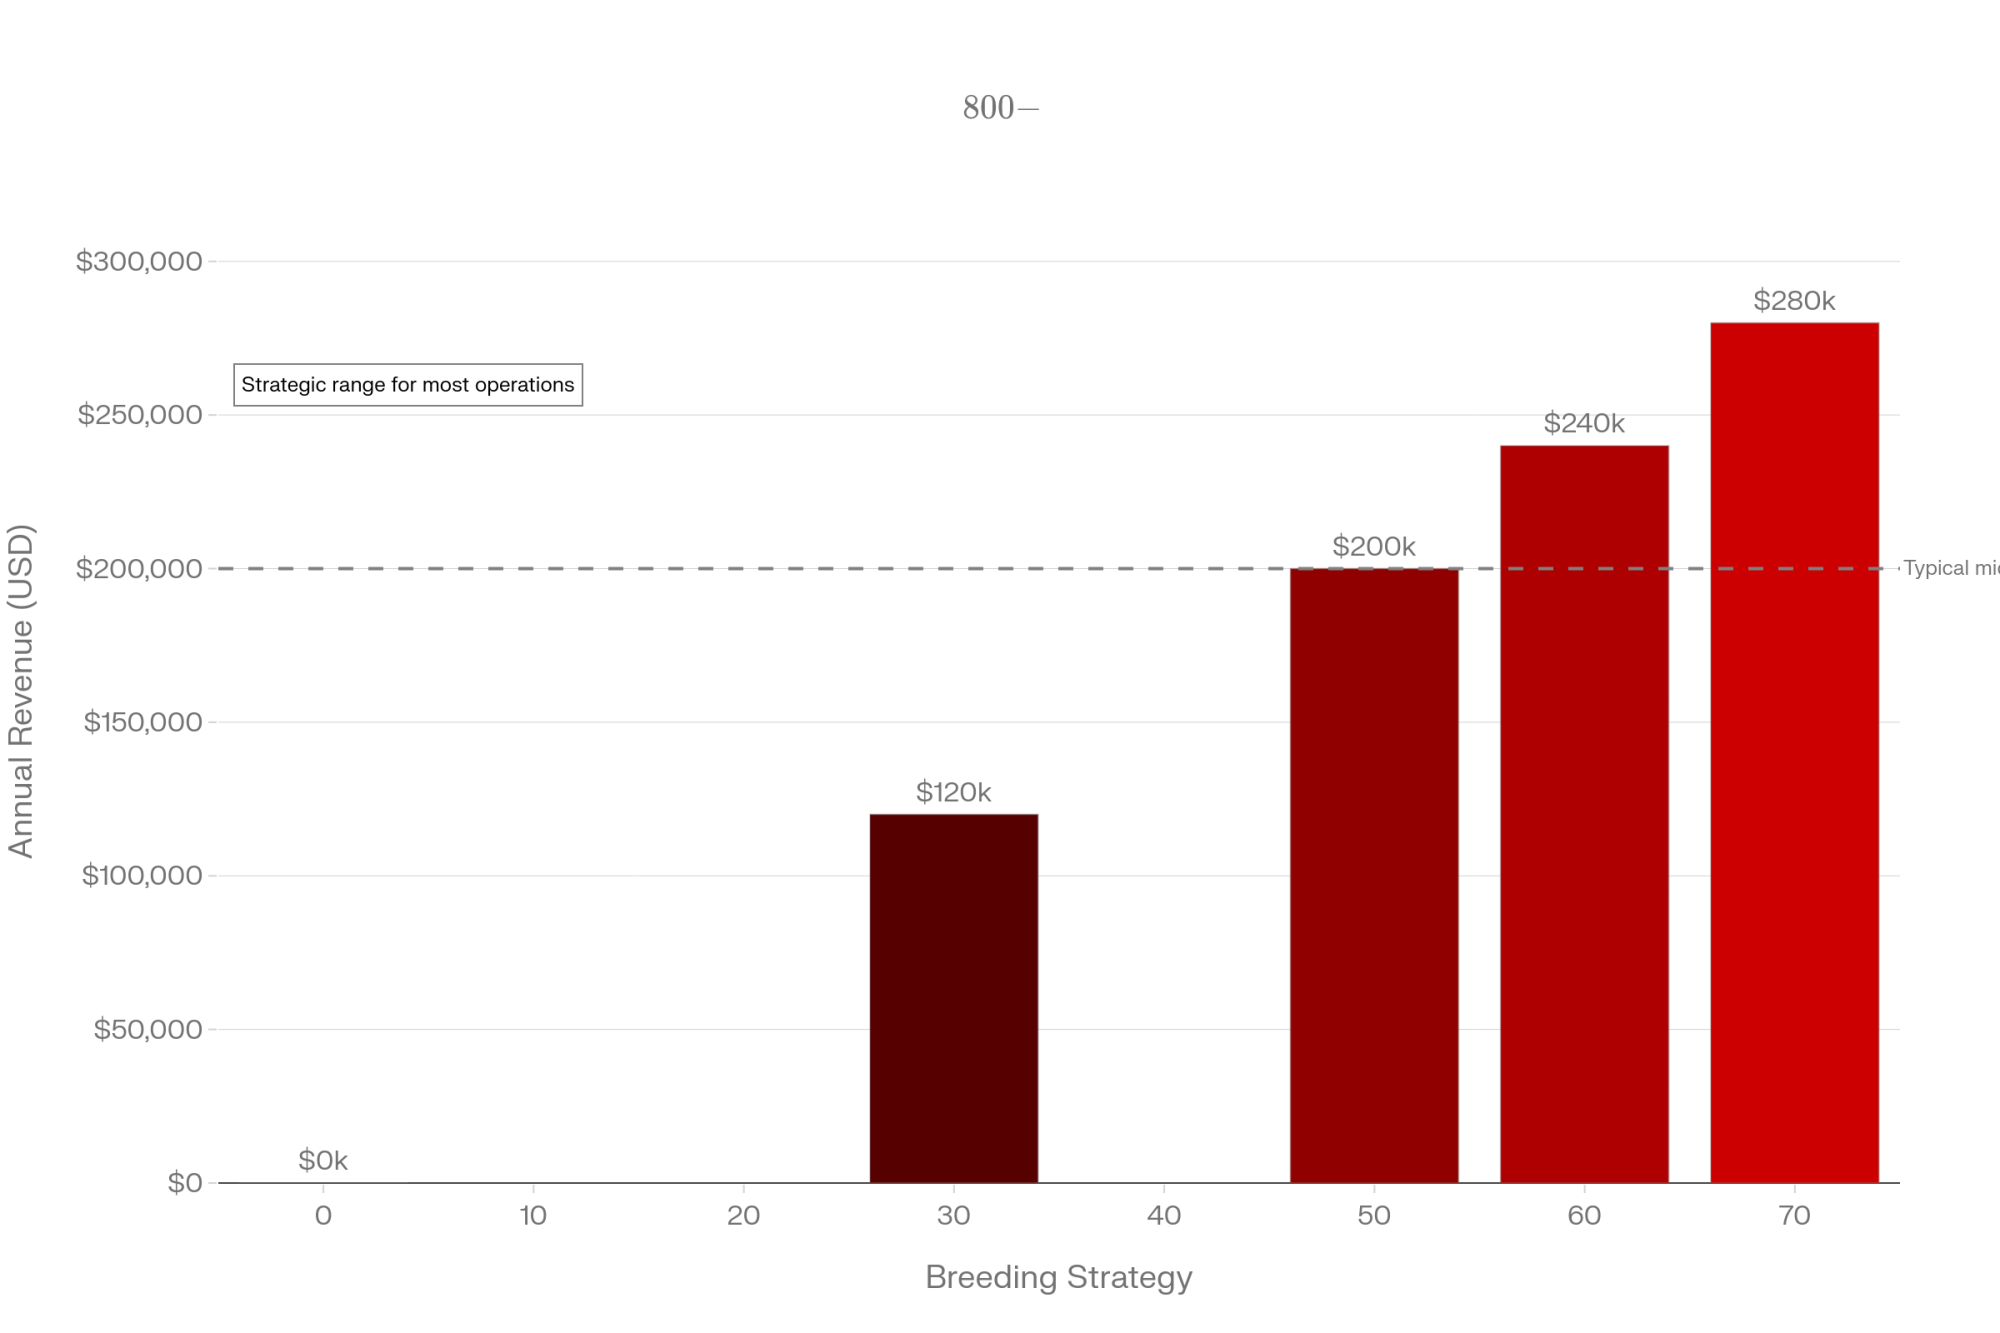
For a 500-cow operation breeding 300 cows to beef annually, the beef-on-dairy approach can represent $200,000 to $300,000 in additional revenue compared to raising all those calves as replacements. That’s meaningful money for operations working on tight margins.

For a 500-cow operation, shifting 60-70% of breeding to beef genetics generates $240,000-$280,000 in annual revenue—enough to offset much of the structural cost disadvantage mid-size dairies face. This isn’t a sideline business; it’s the difference between survival and slow equity erosion 

I spoke with a Wisconsin producer recently who’s been farming for 32 years about this shift. “We didn’t set out to become a beef operation,” he told me. “But when the calves are generating more profit in four days than the heifers do in two years of work, you have to ask yourself what business you’re really in.”

Now, I want to be clear—beef-on-dairy isn’t right for every operation. Farms with genuinely superior heifer genetics, established replacement programs that actually pencil out, or specific breeding objectives may find the traditional model still makes sense for their situation. The key word there is “genuinely.” Too many operations claim their heifer program is profitable without ever running the real numbers. The key is running the actual math for your specific circumstances rather than assuming what worked in 2015 still pencils today.

Understanding What’s Driving These Changes

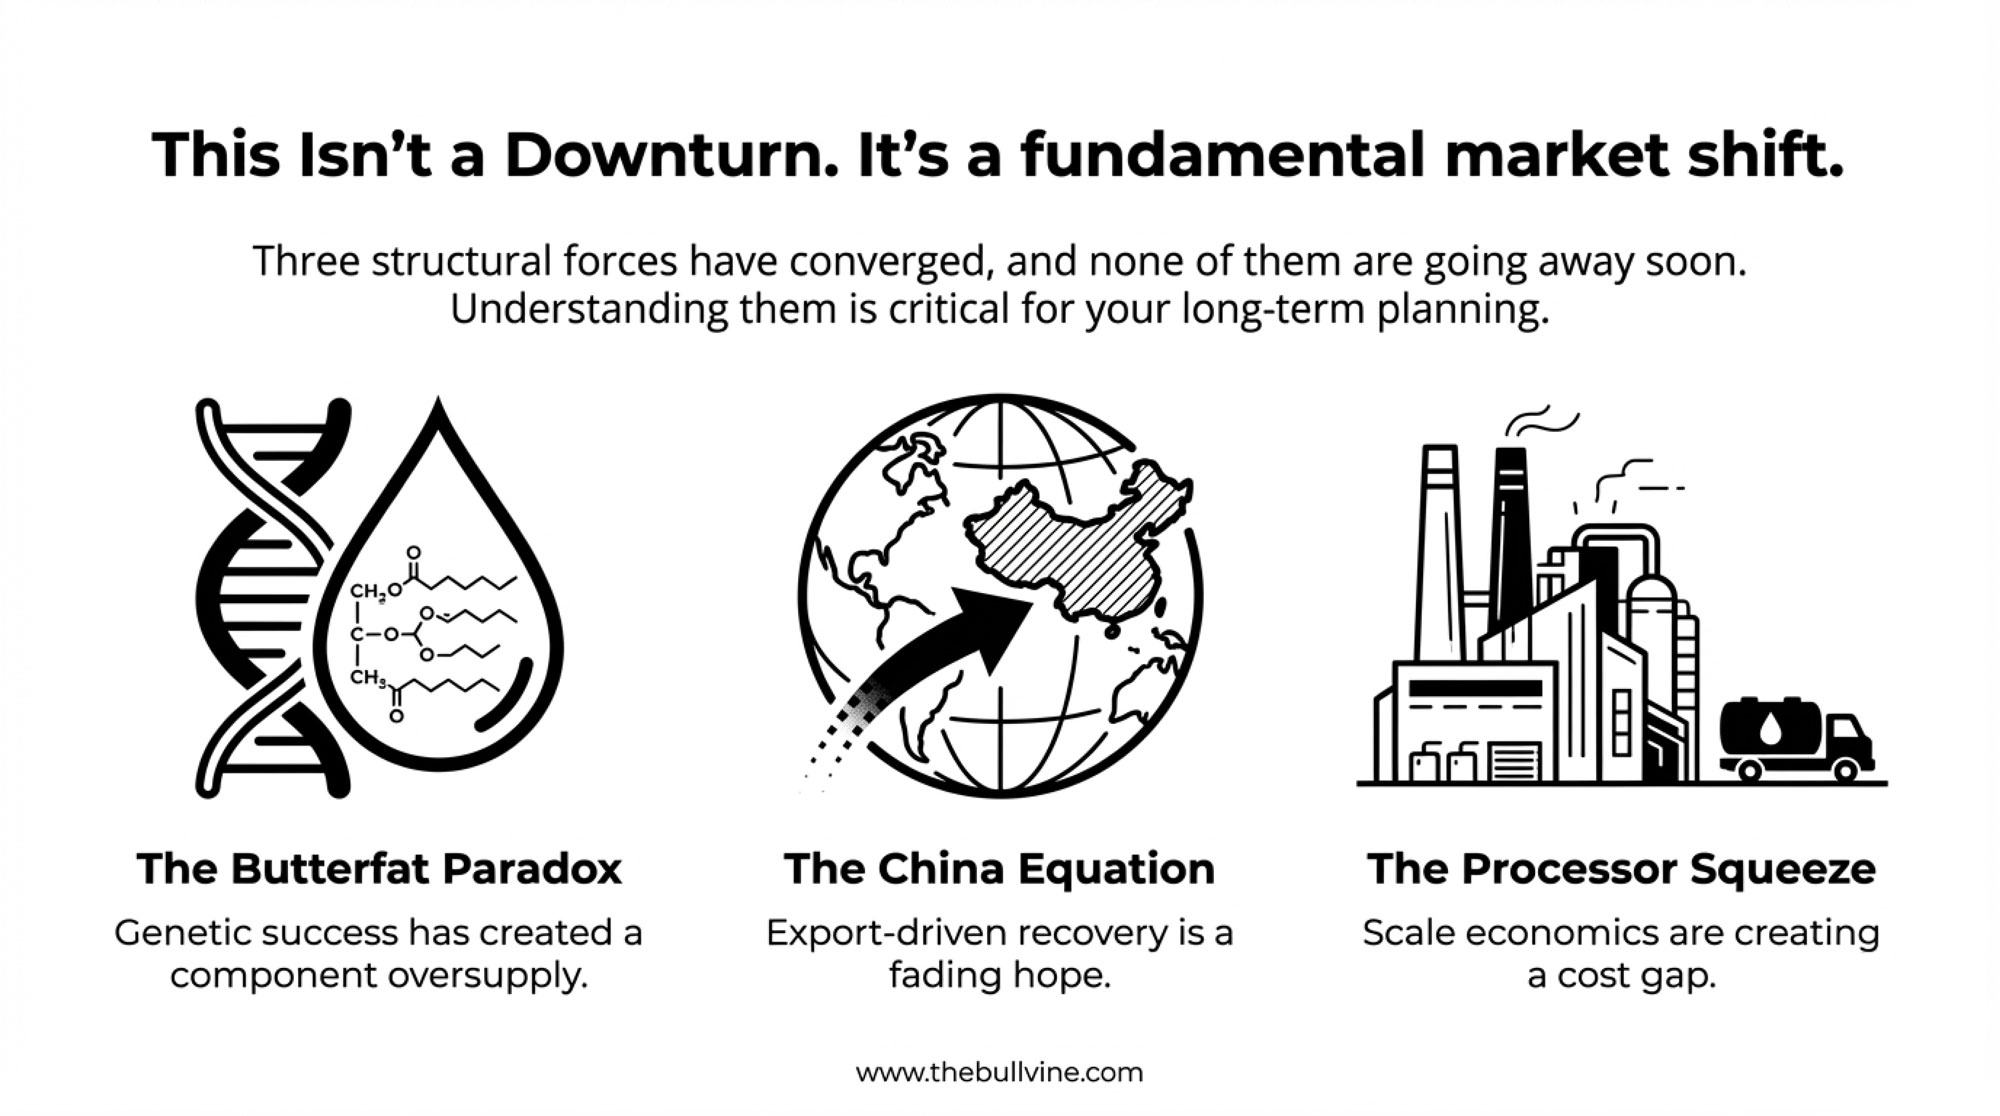
Three factors have converged to create the current environment. And what’s notable is that each one looks more structural than cyclical, which matters for planning purposes. This isn’t a two-year downturn you can wait out.

The Butterfat Genetics Story

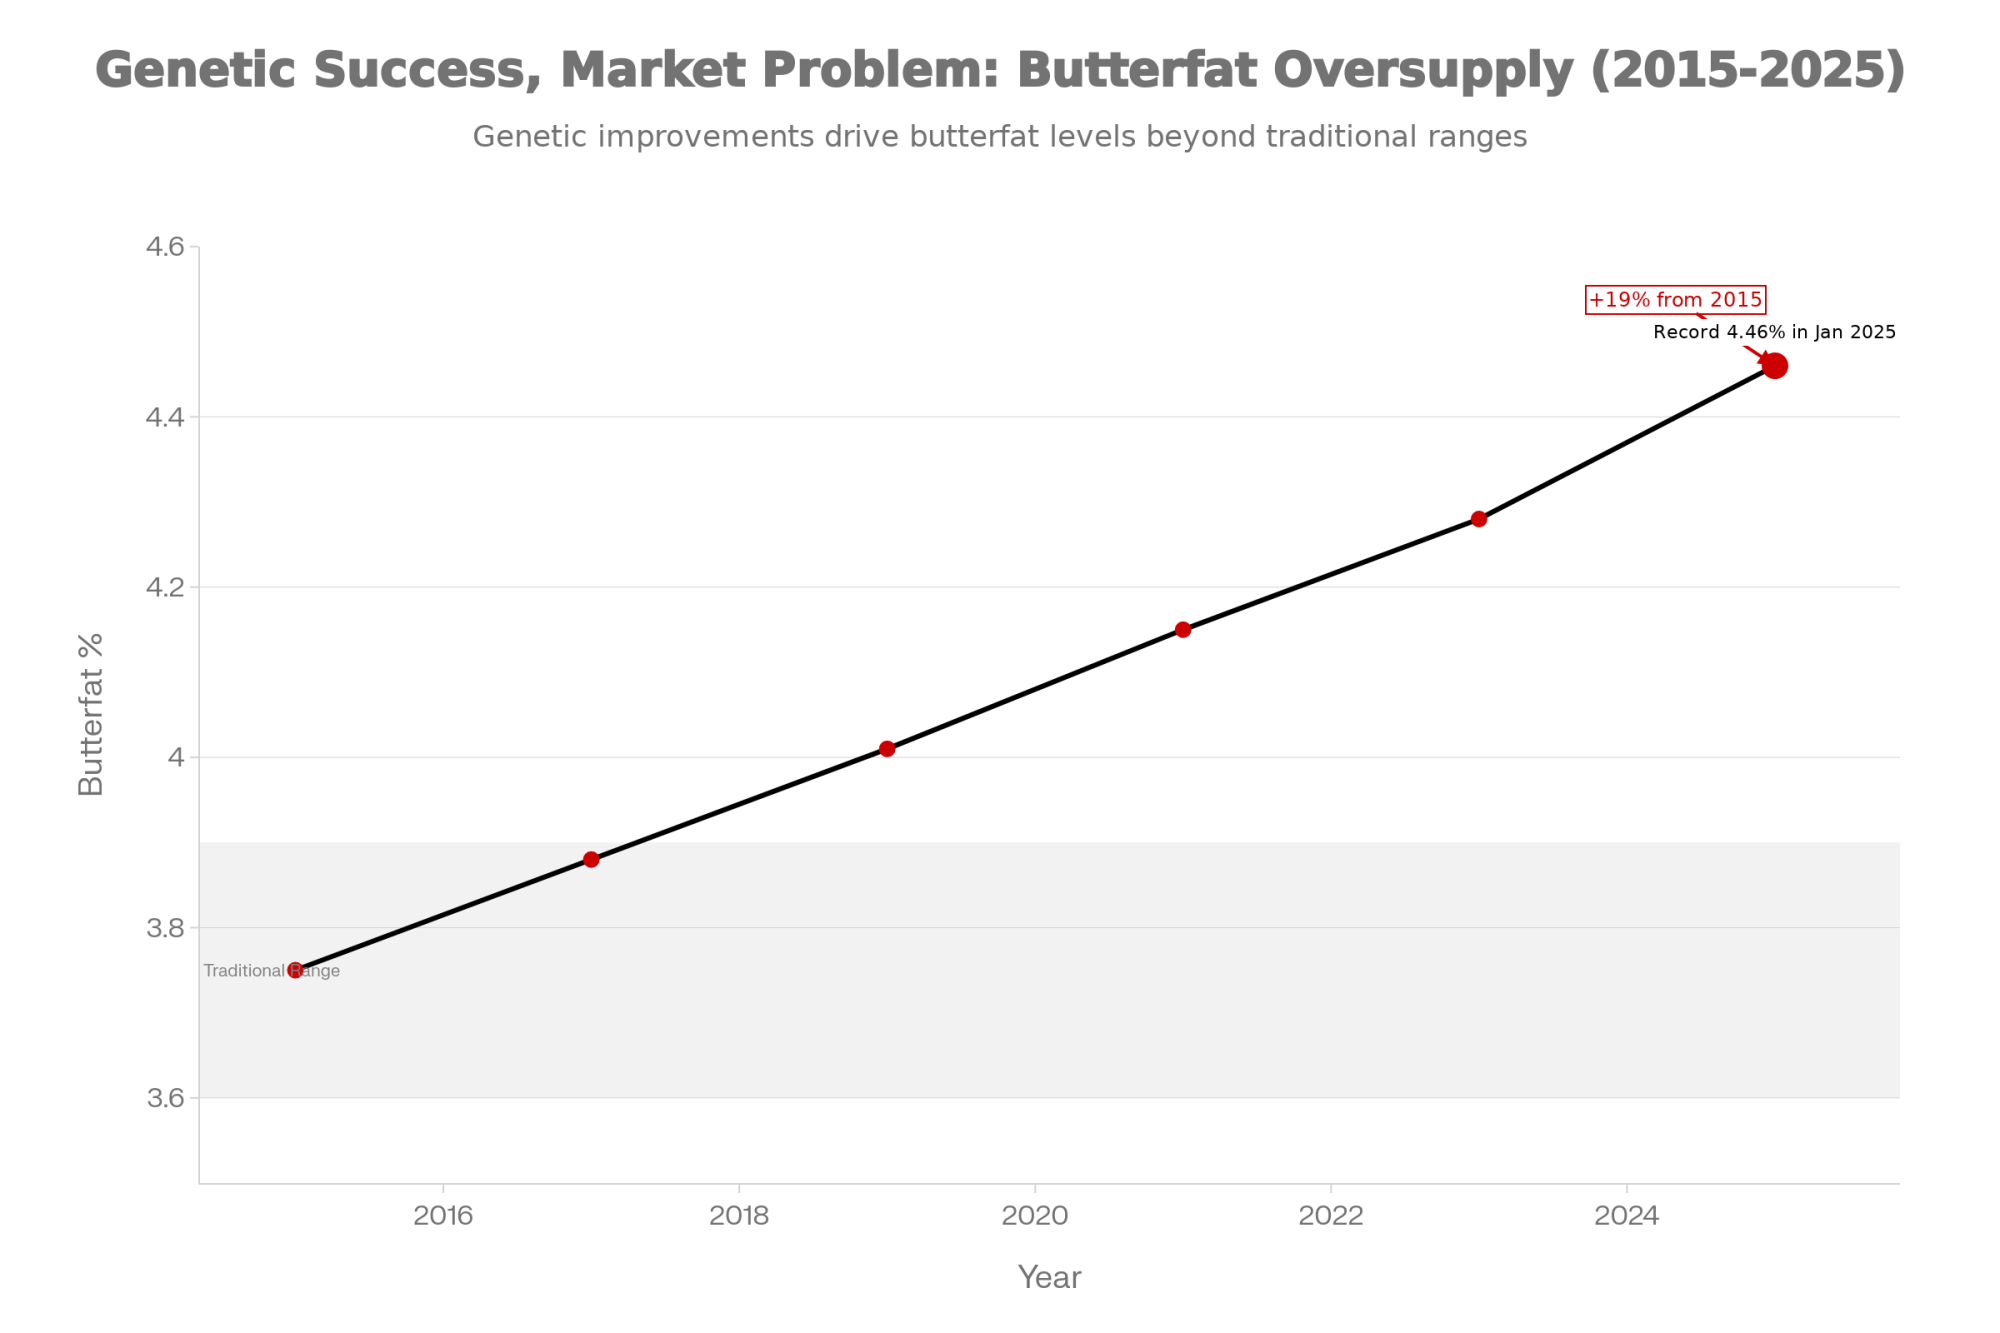
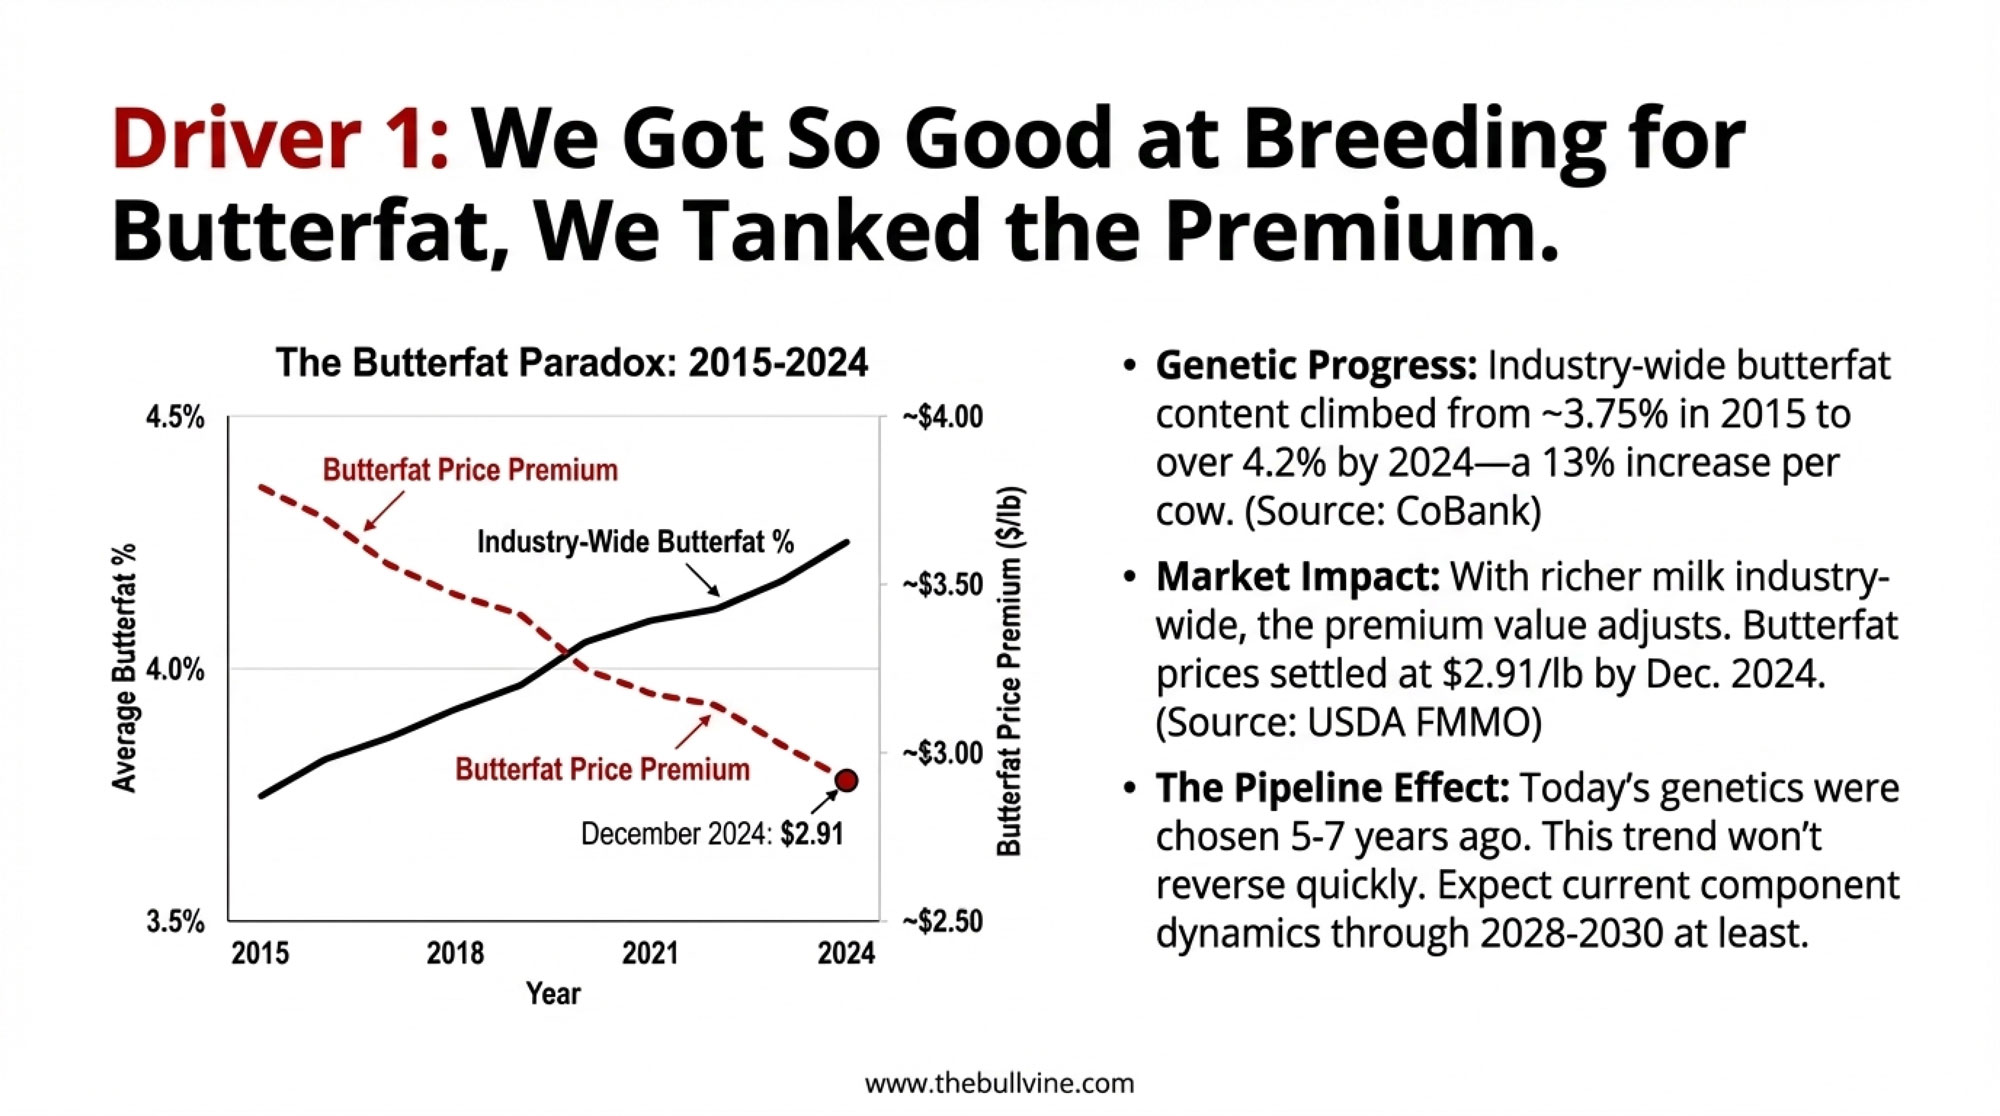
North American dairy genetics programs spent 15 years successfully breeding for higher butterfat content. By most measures, they achieved exactly what they set out to do. CoBank’s analysis shows butterfat percentages climbed from around 3.75% in 2015 to over 4.2% by 2024—a 13% increase in component production per cow. Butterfat levels in January 2025 hit a record 4.46% in some markets.

North American dairy genetics achieved exactly what they set out to do—boosting butterfat from 3.75% to 4.46%, a 19% increase in a decade. The unintended consequence: when everyone’s milk is richer, component premiums collapse, and the genetic pipeline means this won’t reverse until 2028-2030 at the earliest

That’s genuinely impressive genetic progress. Here’s where it gets complicated from a market perspective, though.

These genetic improvements are now hitting markets simultaneously across much of the industry. When a large portion of cows produce richer milk, the premium value of those components naturally adjusts. We saw butterfat prices decline significantly through 2024, with USDA Federal Milk Marketing Order data showing butterfat settling at $2.91 per pound by December 2024—down from stronger premiums earlier in the year.

The genetic pipeline creates a timing consideration that I don’t think gets enough attention in these conversations. Bulls used today were evaluated 5-7 years ago, when butterfat premiums were steadily climbing. The market environment has evolved, but genetic decisions made years ago are still working through the system. Operations probably won’t see meaningful adjustment in their milking strings until 2028-2030 at the earliest.

This isn’t anyone’s fault—it’s simply how long-term genetic selection interacts with shorter-term market cycles. But it does mean the component dynamics we’re seeing won’t reverse quickly.

Global Demand Patterns Have Shifted

For two decades, China’s growing middle class drove global dairy demand projections. You know the story—expansion plans, processor investments, and price forecasts often included Chinese import growth as a key assumption. Many of us built business plans around that expectation.

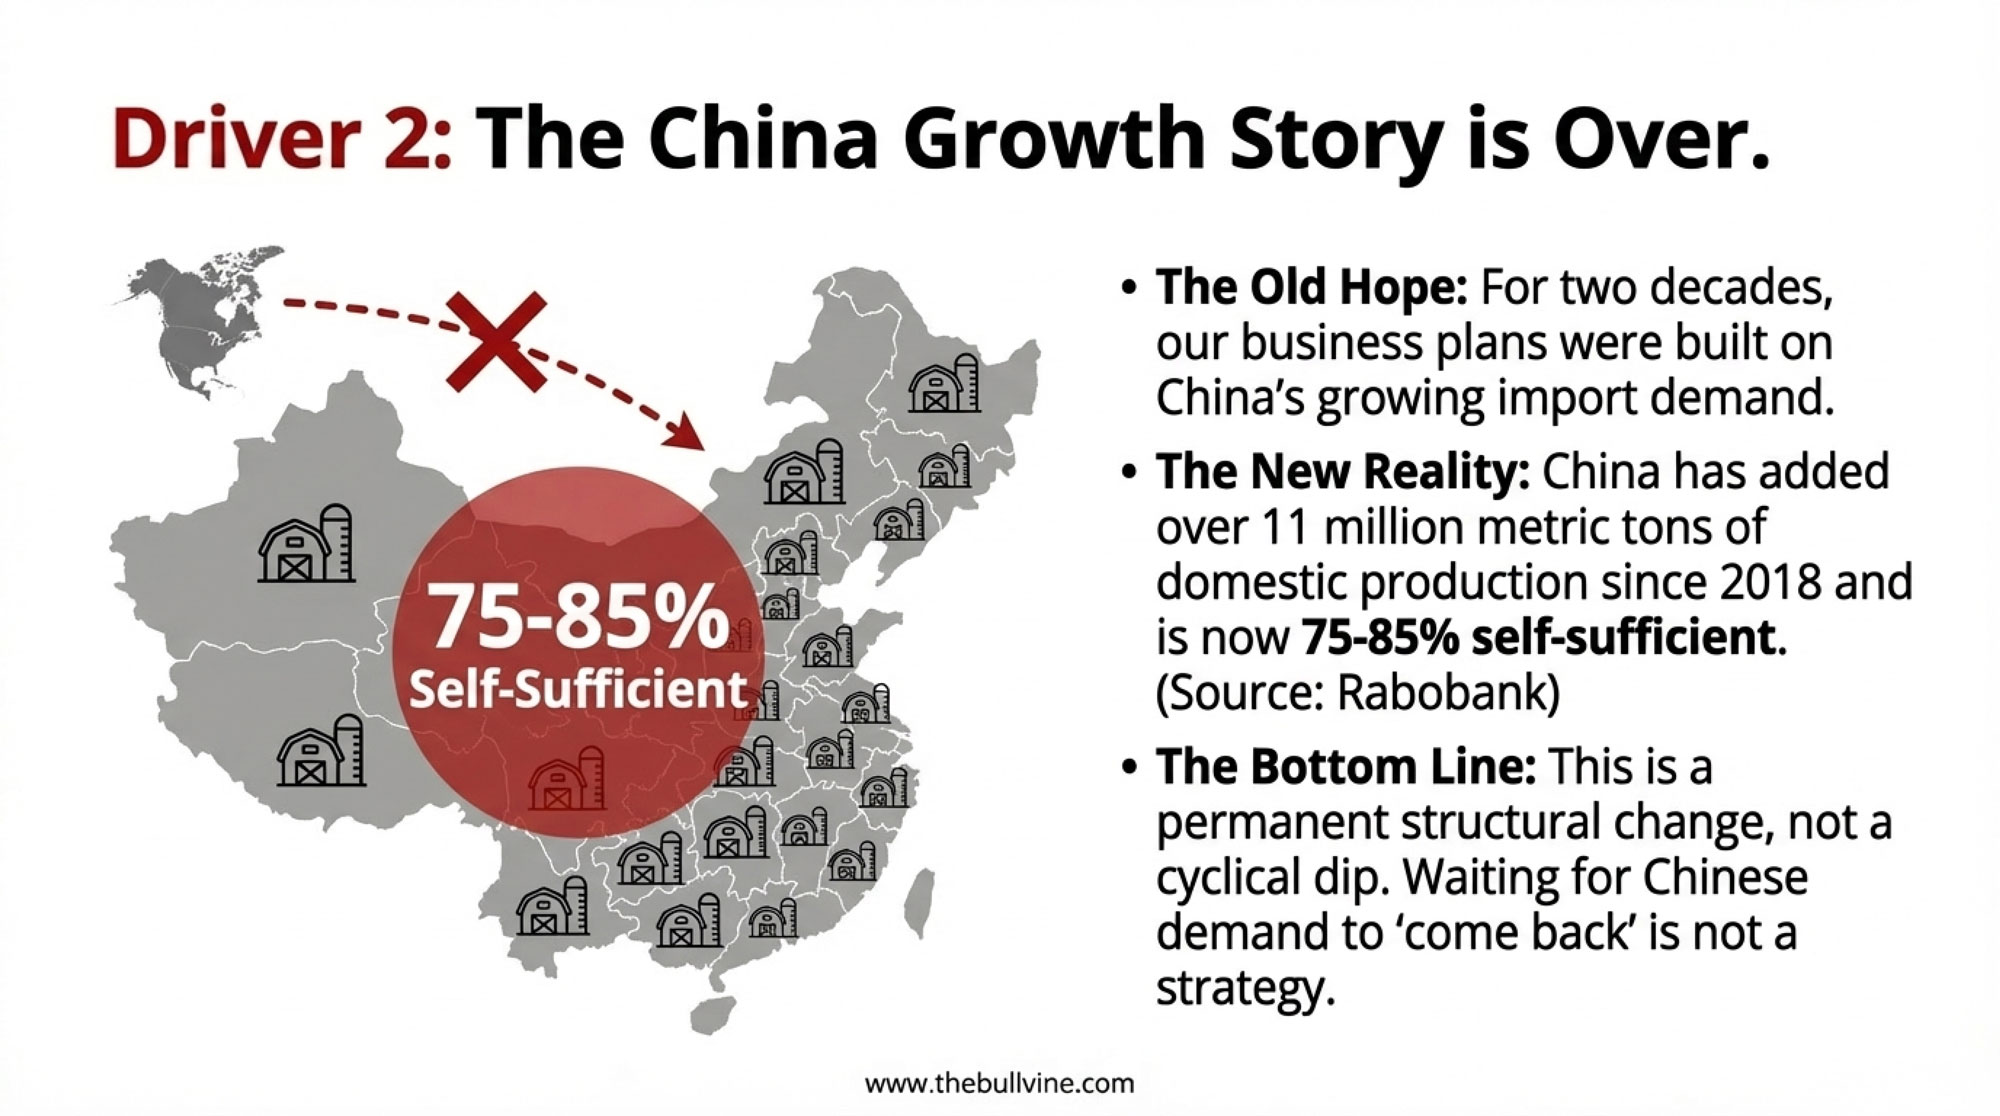
That picture has evolved considerably. According to Rabobank’s Global Dairy Quarterly analysis, China has added over 11 million metric tons of domestic production capacity since 2018 and has moved toward approximately 75-85% self-sufficiency in dairy. That’s a dramatic shift from where they were a decade ago.

Rabobank’s analysts suggest this represents a more permanent structural change rather than a cyclical dip. The infrastructure investments China has made in domestic production indicate that it’s building for long-term self-sufficiency, not for temporary import substitution.

For North American producers, this means export-driven price recovery depends on developing other markets, which is certainly possible, but represents a different timeline and strategy than waiting for Chinese demand to return to previous growth patterns. Mexico has become an increasingly important market, as CoBank has noted, but it’s a different dynamic than the rapid growth we saw from China in the 2010s.

If your business plan depends on “prices have to come back eventually,” it might be time for a new business plan.

Processor Economics Are Evolving

Modern dairy processing plants need substantial daily volume to operate efficiently—we’re talking several million pounds daily for competitive economics. This reality naturally favors fewer, larger suppliers from an operational standpoint.

A 500-cow operation producing 33,000 pounds daily represents a relatively small portion of a major processor’s intake needs. And when processors are investing billions in new capacity—industry reports show over $10 billion in dairy processing infrastructure investment through 2028—they’re designing facilities around large-volume supplier relationships.

Transportation economics factor in as well. Consolidated pickup routes to larger operations create real cost savings for processors, savings that either flow to large farms through better contract pricing or improve processor margins. Either way, that dynamic doesn’t particularly benefit mid-size suppliers trying to maintain competitive market access.

For cooperative members, these dynamics create additional considerations. Voting power in many cooperatives correlates with volume, which can affect how mid-size operations see their interests represented in cooperative decision-making. A 500-cow operation and a 5,000-cow operation technically have equal membership status, but their influence on cooperative strategy often differs considerably. I’ve watched cooperative boards approve hauling route consolidations and component pricing structures that made sense for their largest members while quietly disadvantaging the mid-size operations that historically formed their base.

That’s not a blanket criticism of cooperatives—some have adopted modified voting structures or regional representation models that give individual producers more proportional voice, and the cooperative model still provides genuine value for many operations. But the governance dynamics are worth understanding as you think about your market position and long-term relationships.

The Mid-Size Cost Picture

USDA Economic Research Service cost-of-production data reveals patterns worth understanding for operations in the 300-1,000 cow range. And I’ll be honest—these numbers can be sobering, but they’re important to face clearly.

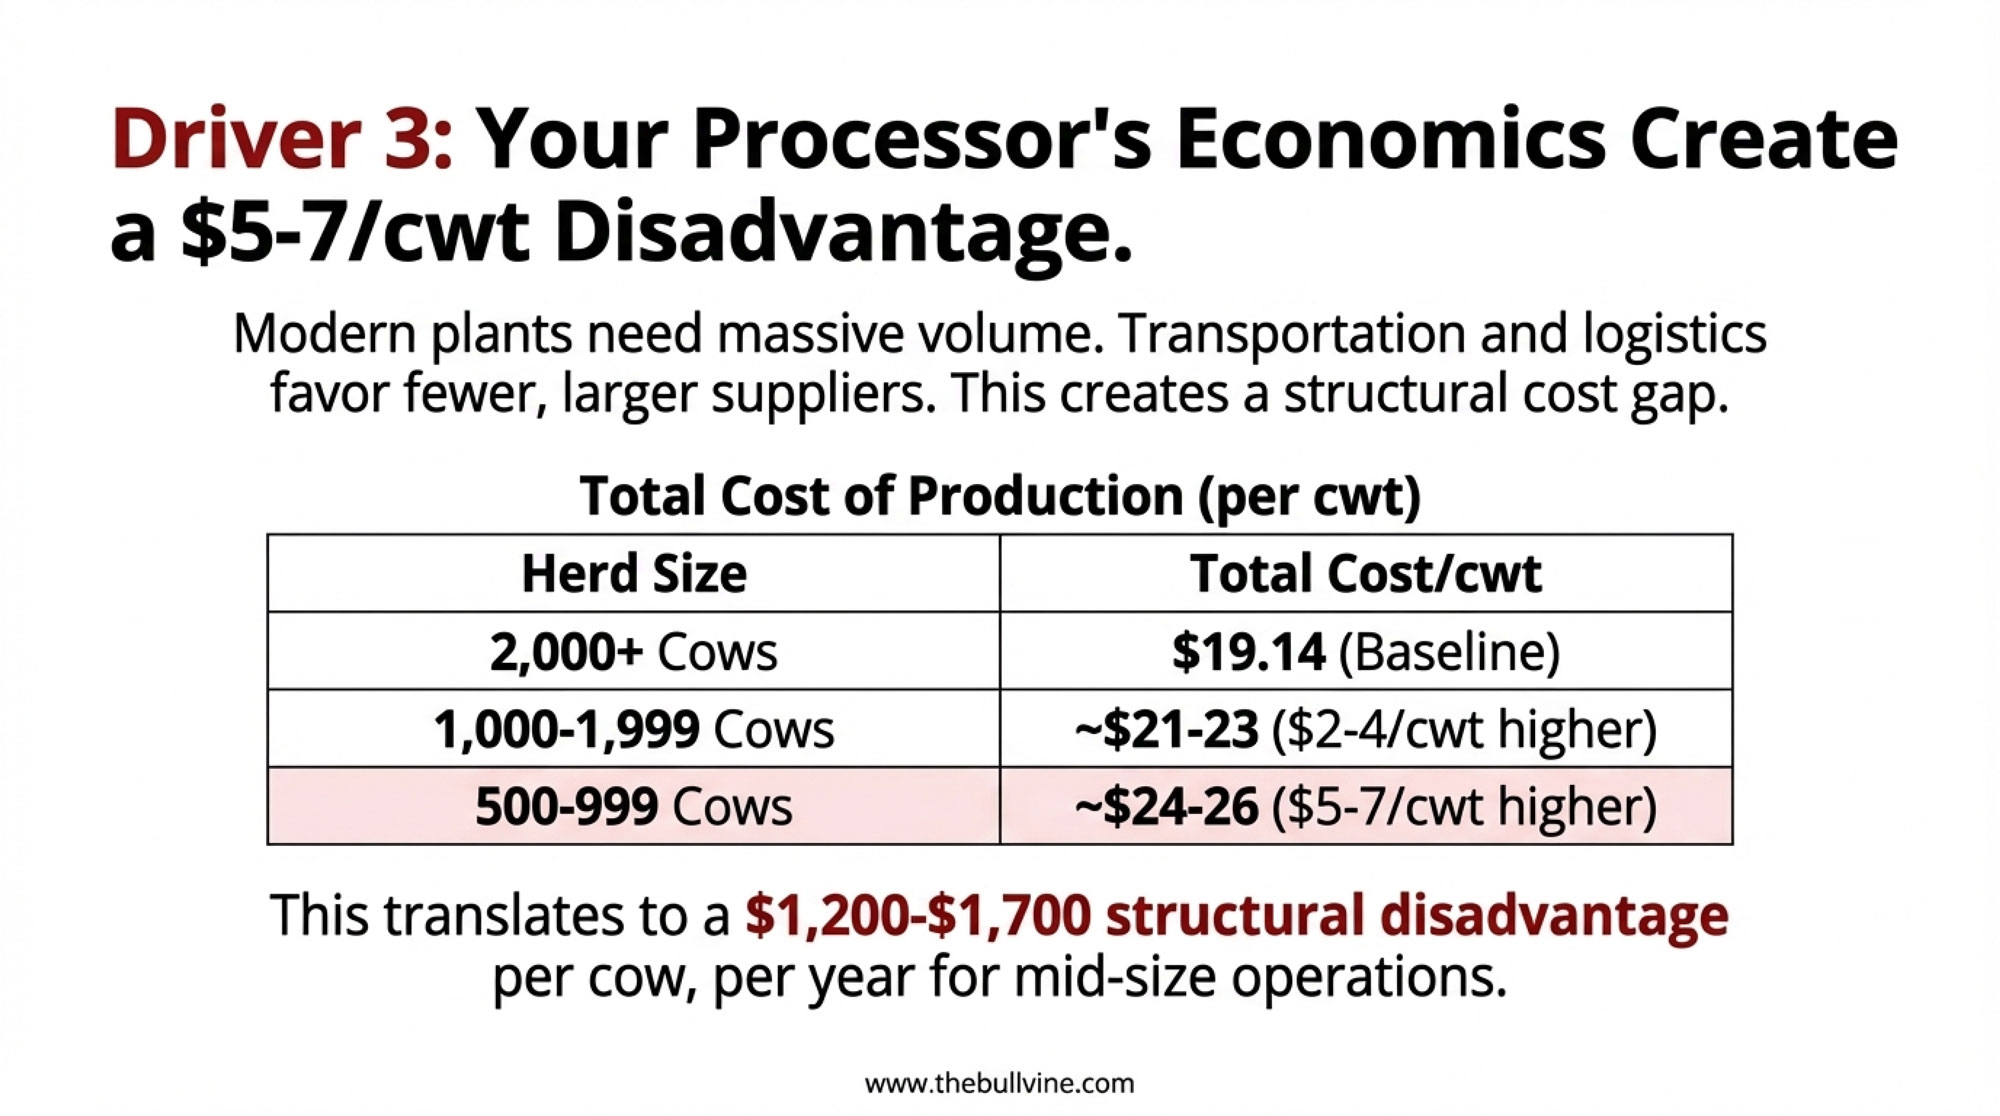
Mid-size operations face a structural disadvantage of $5-7 per hundredweight—translating to $1,200-$1,700 in higher costs per cow annually compared to operations with 2,000+ cows. This cost gap persists regardless of management quality and explains why scale has become survival in commodity dairy
Herd SizeTotal Cost/CWTDifference vs. 2,000+ Cows
500-999 cows~$24-26$5-7/cwt higher
1,000-1,999~$21-23$2-4/cwt higher
2,000+ cows$19.14Baseline

Based on USDA ERS Milk Cost of Production Estimates, 2021 data—the most recent comprehensive survey available

That cost gap of roughly $5-7 per hundredweight translates to approximately $1,200-$1,700 in structural disadvantage per cow annually. Those are significant numbers that affect long-term competitiveness regardless of how well you manage day-to-day operations.

Where does this cost difference come from? It’s distributed across several areas that you probably recognize intuitively:

  • Labor efficiency: Larger operations typically spread management and specialized labor across more production, achieving better output per worker
  • Feed procurement: Volume buyers often negotiate 10-15% lower prices on concentrates through direct mill contracts
  • Capital costs: Facility and equipment depreciation spreads across more production units
  • Professional services: Veterinary, nutrition, and accounting fees get divided by more cows

Now, these figures represent national averages, and your situation may differ significantly. Regional variations matter quite a bit. California operations face environmental compliance costs that Midwest farms largely don’t carry. Wisconsin and Pennsylvania operations deal with different land costs and climate considerations than Texas dairies. Your specific costs depend on your specific circumstances—which is why it’s worth penciling your actual numbers rather than assuming you match the averages.

Beef-on-dairy revenue helps offset these structural differences. Based on current calf prices, it might cover roughly 40-50% of that gap for many operations. That’s meaningful, though it doesn’t eliminate the underlying economics entirely.

The Replacement Heifer Squeeze

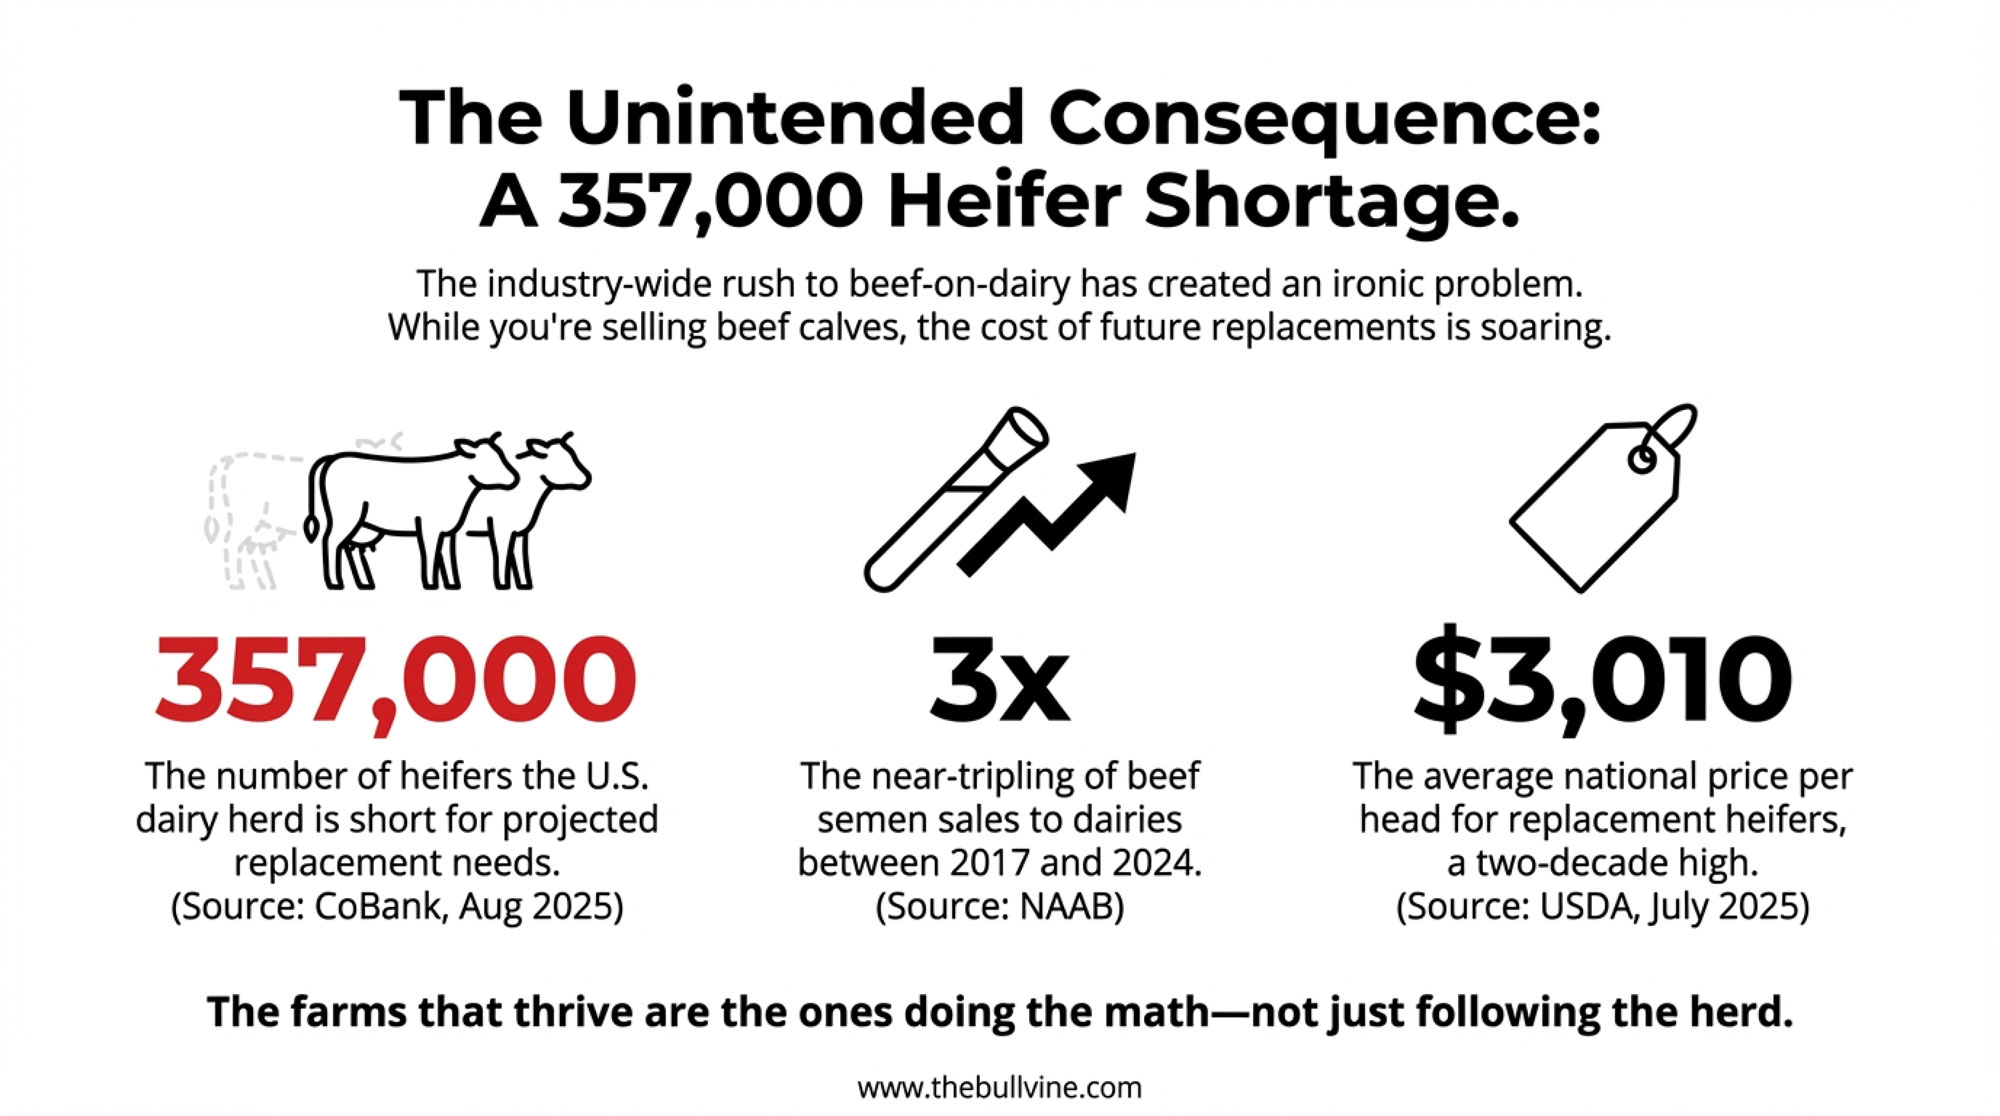
There’s another dimension to this that complicates the picture—and frankly, reveals the consequences of industry-wide groupthink. The widespread adoption of beef-on-dairy breeding has created something of a heifer shortage across the industry. CoBank’s August 2025 dairy analysis indicates the U.S. dairy herd is running approximately 357,000 heifers short of projected replacement needs—a direct consequence of so many operations shifting breeding priorities toward beef genetics.

This shortage has pushed replacement heifer prices to levels we haven’t seen in two decades. USDA’s July 2025 Agricultural Prices report showed replacement heifers averaging $3,010 per head nationally, with top genetics commanding $4,000 or more at California and Minnesota auction barns.

The irony isn’t lost on me: an industry that spent decades telling farmers to “raise your own replacements no matter what” has now swung to an equally thoughtless extreme of “breed everything to beef.” Beef semen sales to dairies nearly tripled between 2017 and 2020, reaching 7.9 million units by 2024, according to NAAB data. Neither the old approach nor the new one involves actually analyzing what makes sense for your specific operation. The farms that will thrive are the ones doing the math—not following the herd in either direction.

But here’s the catch—and it’s worth thinking about carefully. If you’re planning to exit the industry in 3-5 years, the beef-on-dairy math works fine. If you’re planning to operate for another 20 years, you’re eventually going to need those replacements—and they may be harder and more expensive to find.

Four Paths Worth Considering

Producers working through margin challenges generally have four strategic directions available. The key—and I can’t emphasize this enough—is to assess which path fits your specific situation honestly, rather than pursuing the one that sounds best, feels most comfortable, or lets you avoid difficult conversations with family.

Path 1: Building Scale

This tends to work for: Operations with strong debt service coverage—generally above 2.0-2.5—manageable debt-to-asset ratios below 40-45%, clear succession plans, and confident processor relationships.

Scaling from 500 to 2,000+ cows represents a significant undertaking. We’re talking substantial capital—often $10-15 million or more, depending on your starting point and approach—plus considerable additional land to meet nutrient management compliance requirements. The financial and management prerequisites are demanding.

Based on what I’ve observed over the years, a relatively small percentage of mid-size operations are genuinely positioned to pursue this path successfully. That’s not a criticism—it’s just an acknowledgment of the financial realities involved. The problem is that too many operations pursue expansion because it feels like “doing something” rather than because the fundamentals actually support it. Expanding into a cost structure you still can’t compete in just means losing money faster.

What successful scaling typically involves:

  • Multi-year timeline from decision to full operation—often 5-7 years
  • Major milking infrastructure investment for robotics or rotary systems
  • Management systems that can function without daily owner involvement in routine decisions
  • Strong processor relationships with confirmed market access at expanded volume

Penn State Extension has noted that operations seeking expansion financing typically need to demonstrate sustained positive cash flow history and strong management capacity before lenders will seriously consider major facility loans. That generally means having your current operation running well before taking on expansion debt.

I should mention that scaling does work for some operations. A central Indiana dairy I’ve followed grew from 600 to 2,400 cows over eight years by acquiring a neighboring operation, investing heavily in robotics, and securing a long-term processor contract before breaking ground. But they started with a debt-to-asset ratio under 30% and two generations actively involved in management. The prerequisites were there before the expansion began. They didn’t expand, hoping to fix their problems—they expanded because they’d already solved them.

Path 2: Premium Market Positioning

This tends to work for: Smaller operations—often under 200-250 cows—with strong balance sheets, secured processor contracts for specialty milk, and a willingness to fundamentally change their operational approach.

The challenge for mid-size operations pursuing this path is significant. Organic certification requires extensive pasture access—typically several hundred acres of quality grazing land for a larger herd. Feed costs increase 30-80% with organic inputs, and production often dips 10-15% during the transition period.

Perhaps most critically, organic processors in several major dairy regions report adequate or surplus supply and aren’t actively seeking new large-volume suppliers. The premium is attractive on paper, but market access is often the limiting factor in practice. You can get certified, but that doesn’t guarantee someone wants to buy your organic milk at organic prices. I’ve watched operations spend 18 months and significant capital to achieve organic certification, only to discover there’s no market for their milk at organic premiums. That’s an expensive lesson in checking market access before making production changes.

A2 milk and other specialty designations present similar market access considerations. These segments remain relatively small portions of total fluid milk sales, and most specialty processors have established supplier relationships they’re not looking to expand significantly.

One exception worth noting: Direct-to-consumer models with on-farm processing can work quite well at 50-150 cow scale, potentially capturing 60-80% of retail margin rather than commodity pricing. This does require significant processing infrastructure investment—$250,000-$600,000 isn’t unusual—and fundamentally different business skills. You’re essentially building a retail and marketing business that happens to have cows. Different game entirely, but it works for some folks with the right location, skills, and appetite for that kind of venture.

Path 3: Planned Transition

This may make sense for Operations where the primary operator is approaching retirement age without a clear succession plan, where debt service is consuming too much cash flow, where breakeven costs significantly exceed market prices, or where the operation has experienced extended periods of negative cash flow.

And here’s something I want to say directly: suggesting that some operations should consider transition isn’t a criticism of those farms or their management. Markets change. Cost structures evolve. Making a thoughtful decision to preserve family wealth is good business management, not failure.

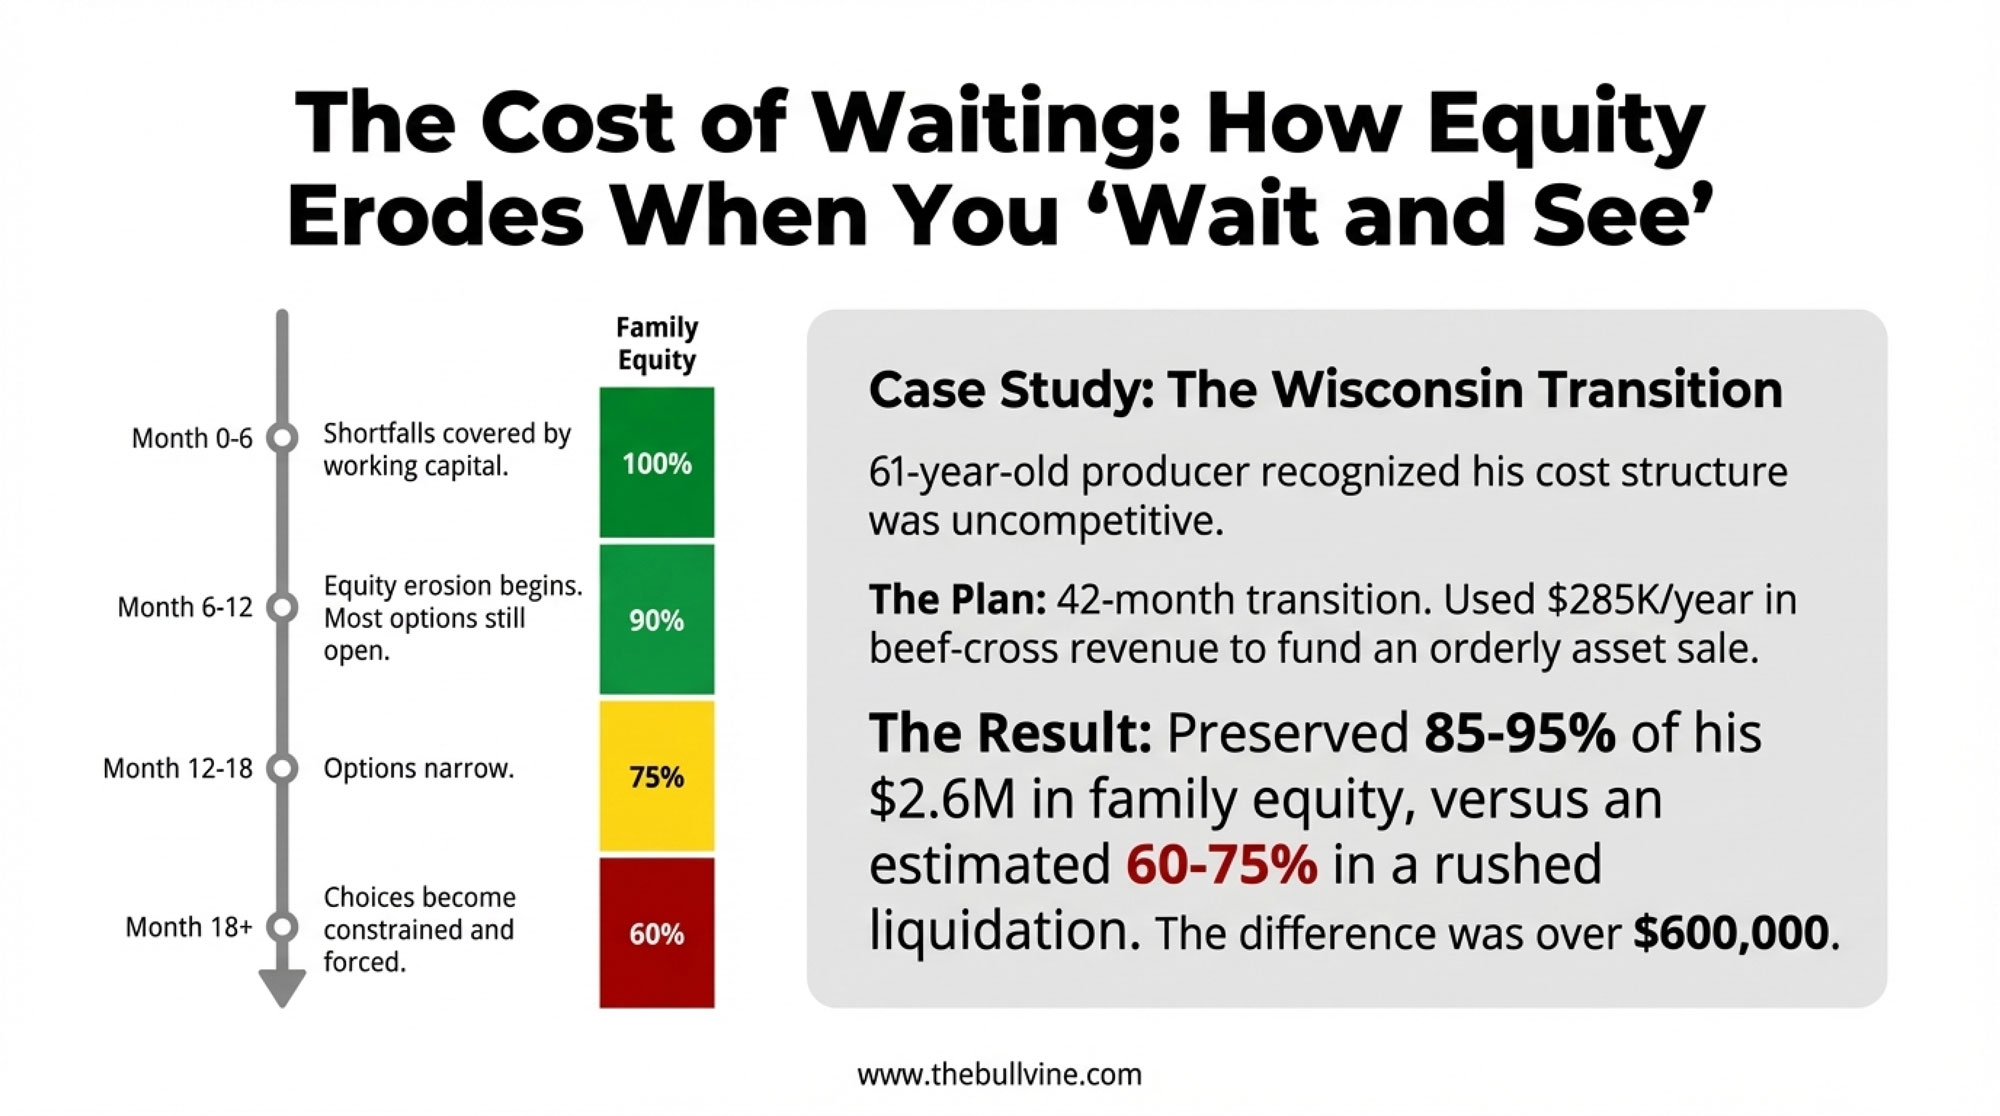
What I will criticize is the stubborn refusal to consider transition when the numbers clearly indicate it’s time. I’ve seen too many families lose $500,000 or more in equity by waiting too long, hoping things would turn around, and being unwilling to have honest conversations about the future. That’s not perseverance—it’s denial dressed up as virtue. And it devastates families financially.

What makes planned transition more viable today than in previous challenging periods is that beef-on-dairy revenue can maintain positive cash flow during a drawdown. That $200,000-$300,000 in annual beef-cross revenue provides working capital for orderly asset sales at reasonable market value rather than distressed pricing.

The equity preservation difference can be substantial:

  • Planned transition over 36-48 months: Families typically preserve 85-95% of asset value
  • Rushed liquidation after extended losses: Families often preserve 60-75% of asset value

For an operation with $3 million in net worth, that difference can exceed $600,000 in actual preserved family equity. That represents real money for retirement, for the next generation’s opportunities, or for whatever comes next.

Path 4: Making Mid-Size Work

I’d be doing you a disservice if I didn’t mention that some mid-size operations are genuinely finding ways to compete—and the research backs this up. University of Vermont Extension’s 2024 dairy economics analysis found that operations in the 400-600 cow range implementing robotic milking systems achieved labor cost reductions averaging 15-18%, which began to close the efficiency gap with larger operations meaningfully.

A 650-cow Vermont operation I’ve followed has carved out a sustainable position by combining aggressive robotic milking efficiency with a local processor relationship that values consistent quality and year-round supply stability over raw volume—and they’ve kept heifer-raising in-house because their genetics actually command premium replacement prices that make the math work. Their fresh cow protocols and transition period management have pushed their rolling herd average well above regional benchmarks, which gives them leverage in processor negotiations that most mid-size operations don’t have.

It’s not easy, and it requires exceptional management in multiple dimensions simultaneously. But it’s worth noting that “mid-size is doomed” isn’t universally true. It’s just that this path requires you to be genuinely excellent at several things at once, not just average at everything. If you’ve got superior genetics, strong local processor relationships, and the management capacity to optimize every efficiency lever available—robotics, feed management, reproduction, cow comfort—mid-size can still work. You just can’t afford to be mediocre at any of it.

A Framework for Decision-Making

When producers work through these decisions with their CPA and agricultural lender, several metrics typically guide the conversation. Understanding these ahead of time can make those discussions more productive.

Debt Service Coverage Ratio (DSCR)

This ratio measures the cushion between income and debt payments. Lenders watch this number closely—it’s often the first thing they calculate.

  • Formula: Net operating income ÷ Total annual debt service
  • Above 2.0: Generally solid position for considering strategic investments
  • 1.5-2.0: Optimization makes sense; expansion capacity may be limited
  • Below 1.25: Transition planning deserves serious consideration

True Cost Analysis

One pattern I’ve noticed over the years: producers often underestimate their actual breakeven by not accounting for costs that don’t show up as monthly payments but are economically real:

  • Operator labor at what you’d pay a hired manager—$65,000-$95,000 annually isn’t unreasonable in many markets
  • Return on your equity could earn in alternative investments—typically 4-6%
  • Deferred maintenance is accumulating on facilities

When these factors are honestly included, some operations discover that their true economic breakeven point significantly exceeds current milk prices. That’s uncomfortable to realize, but better to know it than not. And frankly, if you’re not willing to calculate your true breakeven because you’re afraid of what you’ll find, that tells you something important right there.

Stress Testing

Experienced lenders evaluate what happens to your DSCR if milk drops $2 per hundredweight while feed costs rise 10%. It’s worth doing that calculation yourself before you’re sitting in the loan officer’s office. Operations that look marginal under that scenario typically face limited options for expansion financing.

Five Questions for Your Next Lender Meeting

Before you sit down with your agricultural lender or CPA, work through these honestly:

  1. What’s your true all-in breakeven? Include operator labor at replacement cost, opportunity cost on equity, and deferred maintenance. If this number scares you, that’s information.
  2. What happens to your DSCR if milk drops $2/cwt and feed rises 10%? If you go below 1.25 under that scenario, your strategic options are already narrowing.
  3. Are you strategic to your processor, or easily replaced? If your milk disappeared tomorrow, would they notice—or just shift a route?
  4. What’s your succession plan—documented, not assumed? Verbal family interest isn’t the same as committed next-generation involvement with financial analysis.
  5. If you’re considering expansion, are you doing so because the fundamentals support it, or because it feels better than the alternatives? Be honest with yourself here.

Timing Considerations

What I’ve observed over the years is a fairly consistent pattern once operations enter challenging cash flow territory:

  • Months 0-6: Operating shortfalls often get covered by savings and working capital
  • Months 6-12: Equity erosion becomes more noticeable; most strategic options remain available
  • Months 12-18: The situation typically demands more immediate attention; options narrow
  • Month 18+: Choices become more constrained

The practical insight here is that decisions made earlier in this timeline—during months 6-10, say—tend to preserve more options and more equity than decisions made later. Waiting and hoping for market improvement is completely understandable… but it has real costs. Every month of delay is a decision—it’s just a decision not to decide, which is often the most expensive choice of all.

Beef-on-dairy revenue can extend these timelines somewhat, providing breathing room that previous generations of struggling dairy farms didn’t have. But it doesn’t change the underlying economics. An operation generating $300,000 in beef-cross revenue while facing $500,000 in other losses is still experiencing $200,000 in annual equity erosion. The beef revenue buys time for better decisions—not infinite time.

What Successful Transitions Look Like

A Wisconsin Example

A 61-year-old producer I’ve followed over the past few years recognized, around month 7, that his cost structure wouldn’t allow him to compete effectively long-term at his current scale. Rather than waiting indefinitely—or worse, doubling down on a strategy that wasn’t working—he implemented a 42-month planned transition:

  • Increased beef breeding to 70% of the herd for revenue optimization
  • Generated approximately $285,000 annually in beef-cross calf sales
  • Reduced herd size gradually while maintaining processor relationships and milk quality
  • Marketed real estate with an 18-month timeline, allowing proper buyer qualification rather than a rushed 60-day distressed sale

Result: Preserved $2.6 million in family equity—substantially more than a rushed liquidation would have yielded.

He now manages cropland for neighboring operations at around $55,000 annually while drawing income from invested assets. His total annual income actually increased, and his working hours dropped considerably. Not the outcome he’d imagined when he started farming, but a genuinely good outcome for his family.

“The hardest part wasn’t seeing the numbers—those were clear enough. The hardest part was accepting that the market had changed in ways I couldn’t control or wait out. Once I made peace with that, the decisions got a lot simpler.”

— Wisconsin dairy producer, 32 years in operation

His son, who had considered returning to the family operation, used his share of the preserved assets to start a successful trucking business. Different path, but solid financial foundation—which was really the goal all along.

Practical Takeaways

Assessing your current position:

  • Calculate the true all-in breakeven, including the opportunity costs that are easy to overlook
  • Run stress-test scenarios—milk down $2, feed up 10%—before your lender does
  • Evaluate succession plans honestly. Verbal family interest isn’t the same as documented commitment with financial analysis
  • Assess your processor relationship realistically. Are you strategic to them, or easily replaced?

If considering growth:

  • Verify you meet financial thresholds before investing in detailed planning
  • Secure processor commitment for expanded volume before major capital decisions
  • Document succession planning with realistic financial projections
  • Plan for multi-year implementation with regular evaluation points
  • Be honest: Are you expanding because the fundamentals support it, or because it feels better than the alternatives?

If considering premium markets:

  • Confirm market access before beginning any conversion—certification without a buyer isn’t worth much
  • Recognize that finding a processor often matters more than achieving certification
  • Evaluate direct-to-consumer models if scale and location support them
  • Budget realistically for transition periods with uncertain cash flow

If pursuing mid-size excellence:

  • Identify your genuine competitive advantages—don’t assume you have them
  • Invest in efficiency technology where ROI is demonstrable
  • Build processor relationships based on quality, consistency, and reliability
  • Evaluate whether your genetics actually justify keeping heifer-raising in-house
  • Accept that this path requires excellence across multiple dimensions simultaneously

If considering transition:

  • Make decisions while meaningful options remain available
  • Use beef-on-dairy revenue to maintain positive cash flow during the process
  • Engage qualified professionals—CPA, agricultural attorney—early rather than late
  • Explore all available tools, including Chapter 12 provisions where applicable. Section 1232 can provide meaningful tax advantages in farm bankruptcy situations

For all operations:

  • Beef-on-dairy provides valuable revenue flexibility, though it’s one tool among several
  • Cost differences between herd sizes reflect structural economics that tend to persist
  • Earlier decisions typically preserve more options than later ones
  • Thoughtful wealth preservation honors what previous generations built—more than stubbornly running losses ever will

The Bottom Line

The North American dairy industry continues to evolve toward two primary models: larger-scale commodity production, where cost structures provide a competitive advantage, and smaller-scale operations, where premium positioning or direct consumer relationships create different economics.

Operations in the 300-1,000 cow range face a challenging middle position. Beef-on-dairy revenue helps considerably, but doesn’t fully resolve the underlying cost dynamics. Some operations will find ways to make mid-size work through exceptional execution on multiple fronts simultaneously—but that’s a narrow path that requires genuine excellence, not just determination.

That observation isn’t a criticism of mid-size operations or the people who run them. Many excellent managers operate in this range. But market structures have evolved in ways that create real challenges regardless of management quality. Pretending otherwise—or blaming the challenges on things you can’t control while ignoring the decisions you can make—doesn’t help anyone.

The producers who will be well-positioned in 2030 are the ones making clear-eyed assessments today: pursuing growth where the prerequisites genuinely exist, pivoting toward premium markets where access is available, finding the operational excellence to make mid-size sustainable where the skills and circumstances align, and transitioning thoughtfully where the underlying economics have shifted.

Each of these paths can lead to good outcomes for families. The path that tends to work poorly is waiting indefinitely for conditions to change while equity gradually erodes. Hope is not a strategy. Nostalgia is not a business plan.

Previous generations built these operations by adapting to market realities, not by ignoring them. That same practical wisdom—applied to today’s circumstances—will preserve these operations for the families who depend on them.

For operations working through these decisions, conversations with your agricultural lender and CPA provide a good starting point. The numbers for your specific situation may look quite different from industry averages—and understanding your actual position is the first step toward making good decisions.

Complete references and supporting documentation are available upon request by contacting the editorial team at editor@thebullvine.com.

Learn More

The Sunday Read Dairy Professionals Don’t Skip.

Every week, thousands of producers, breeders, and industry insiders open Bullvine Weekly for genetics insights, market shifts, and profit strategies they won’t find anywhere else. One email. Five minutes. Smarter decisions all week.
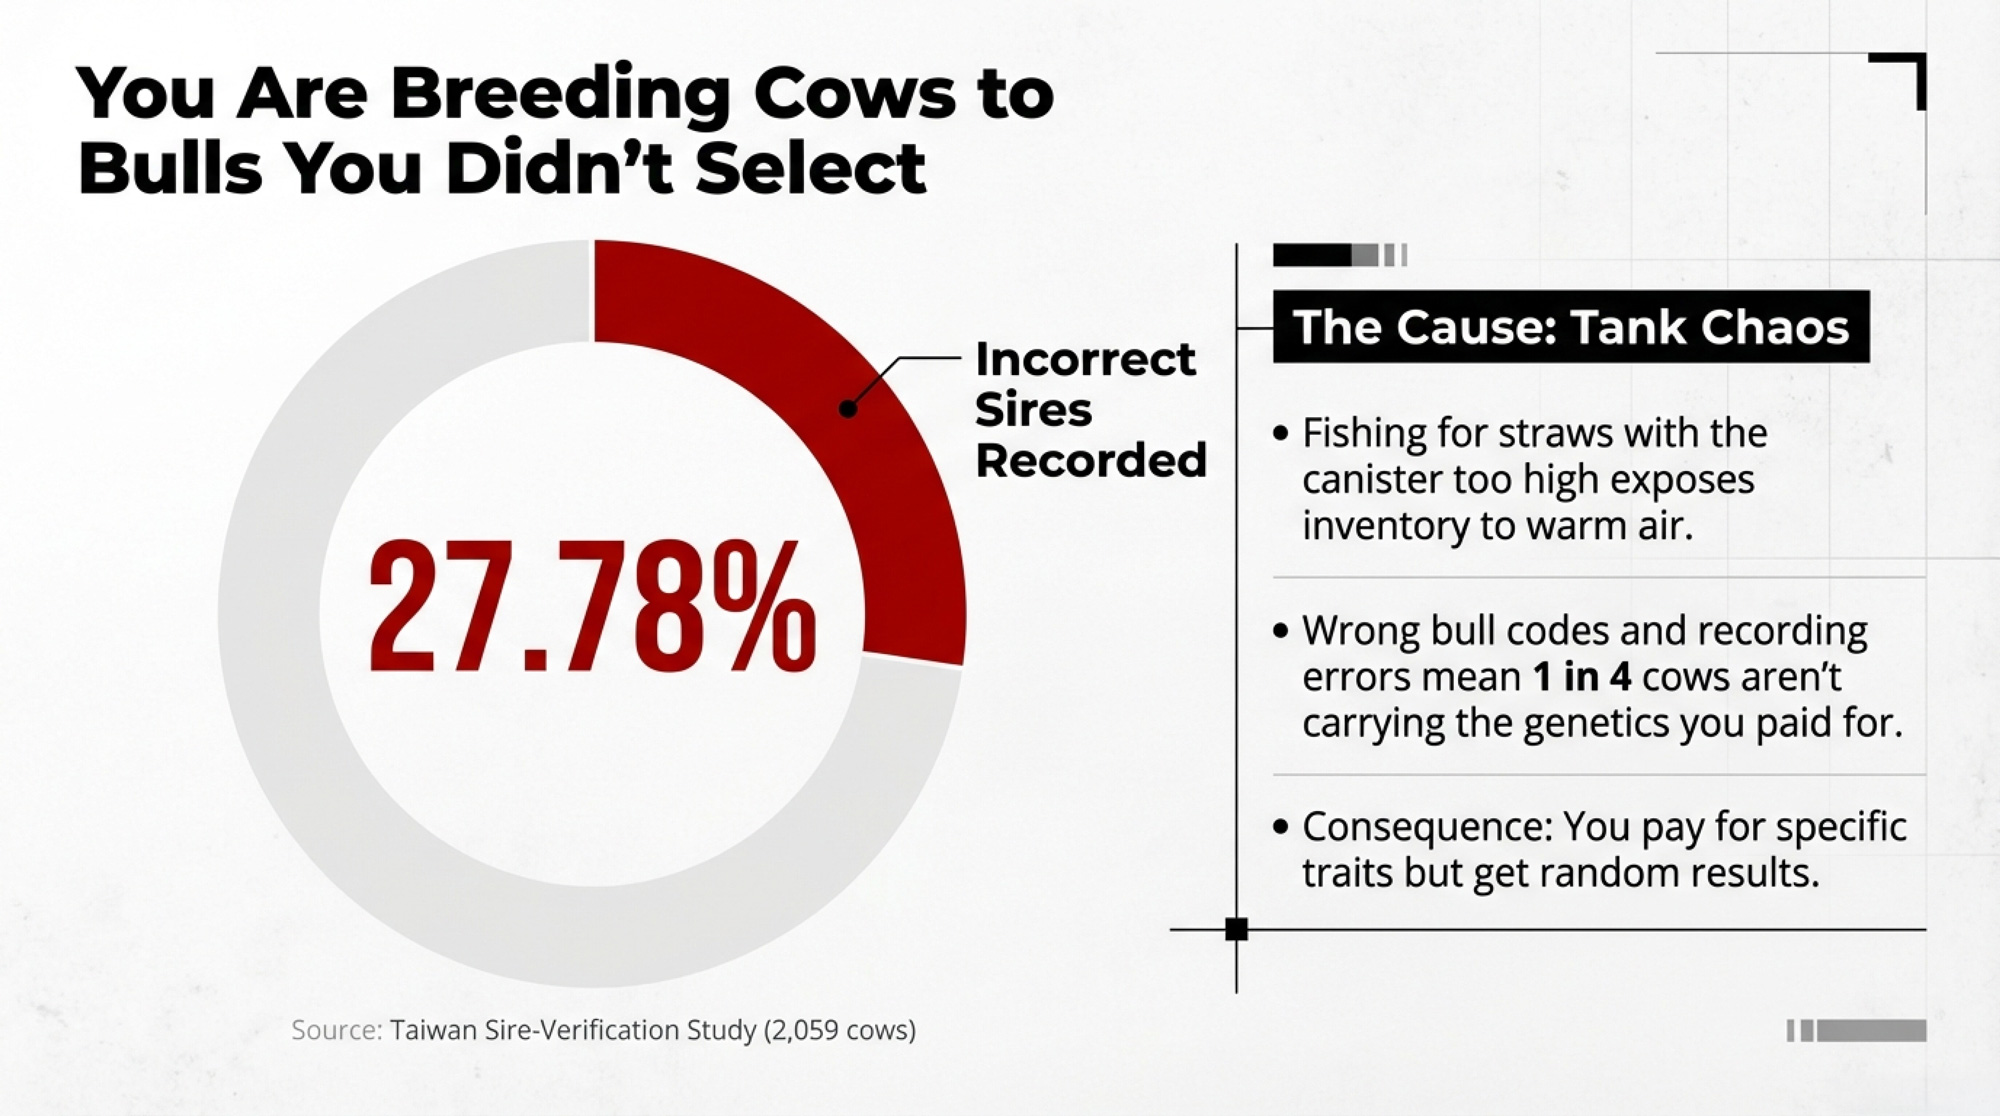
NewsSubscribe
First
Last
Consent
Send this to a friend