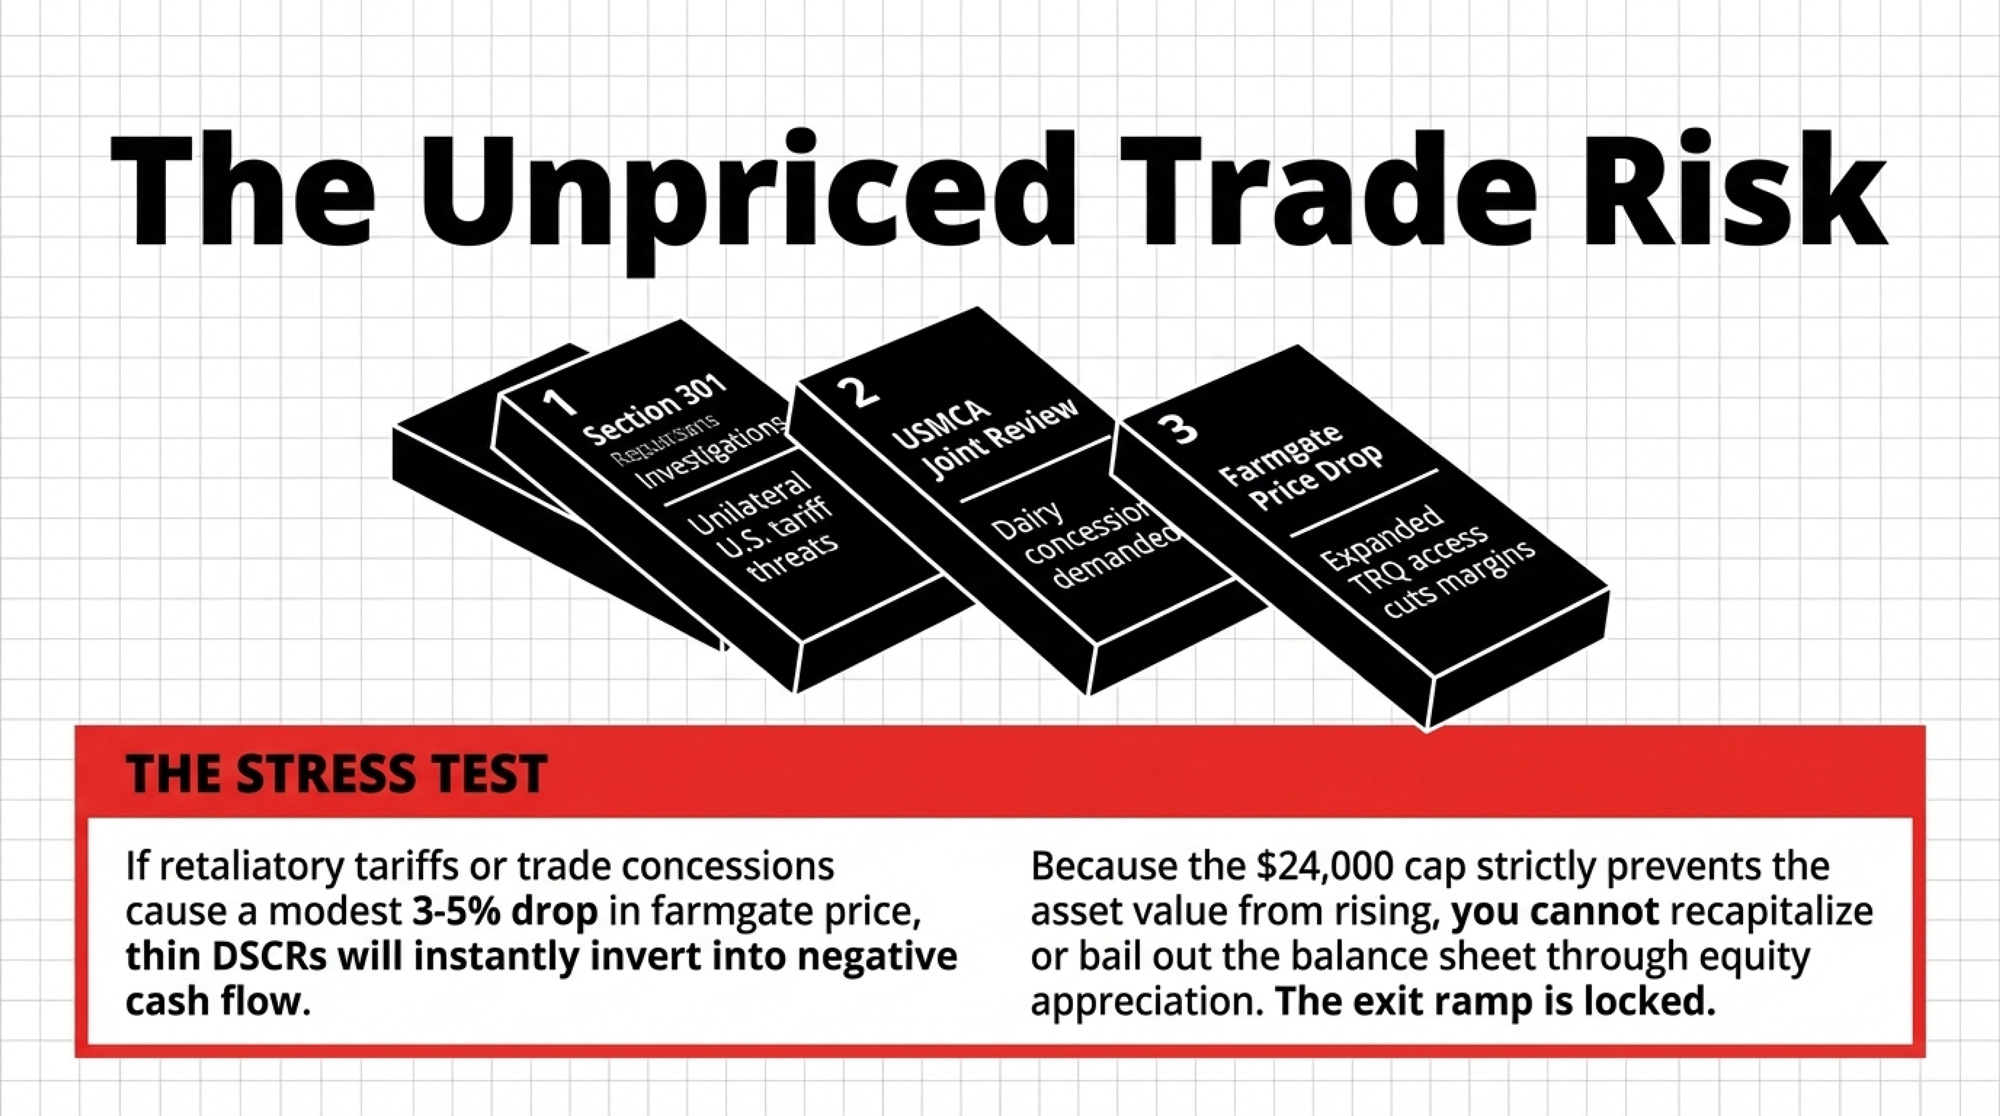
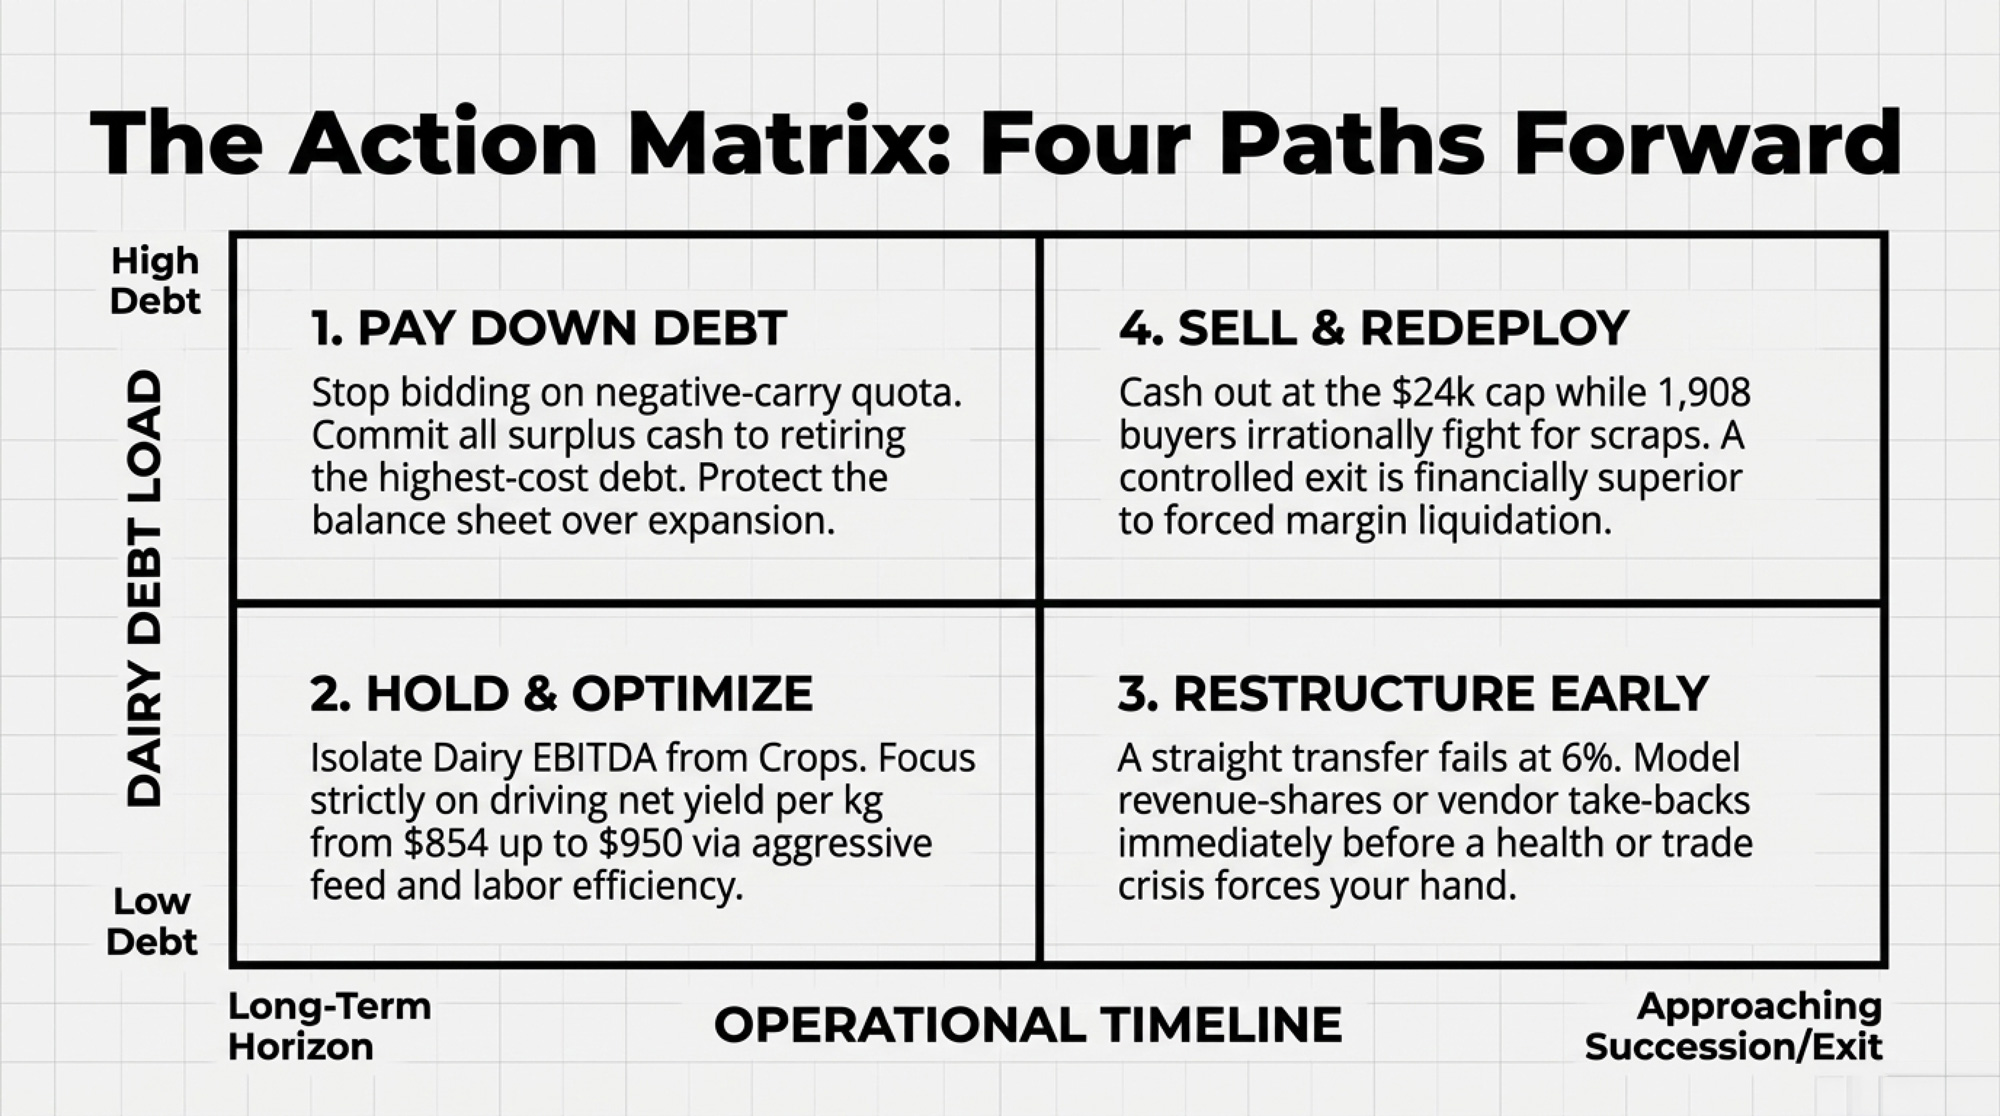
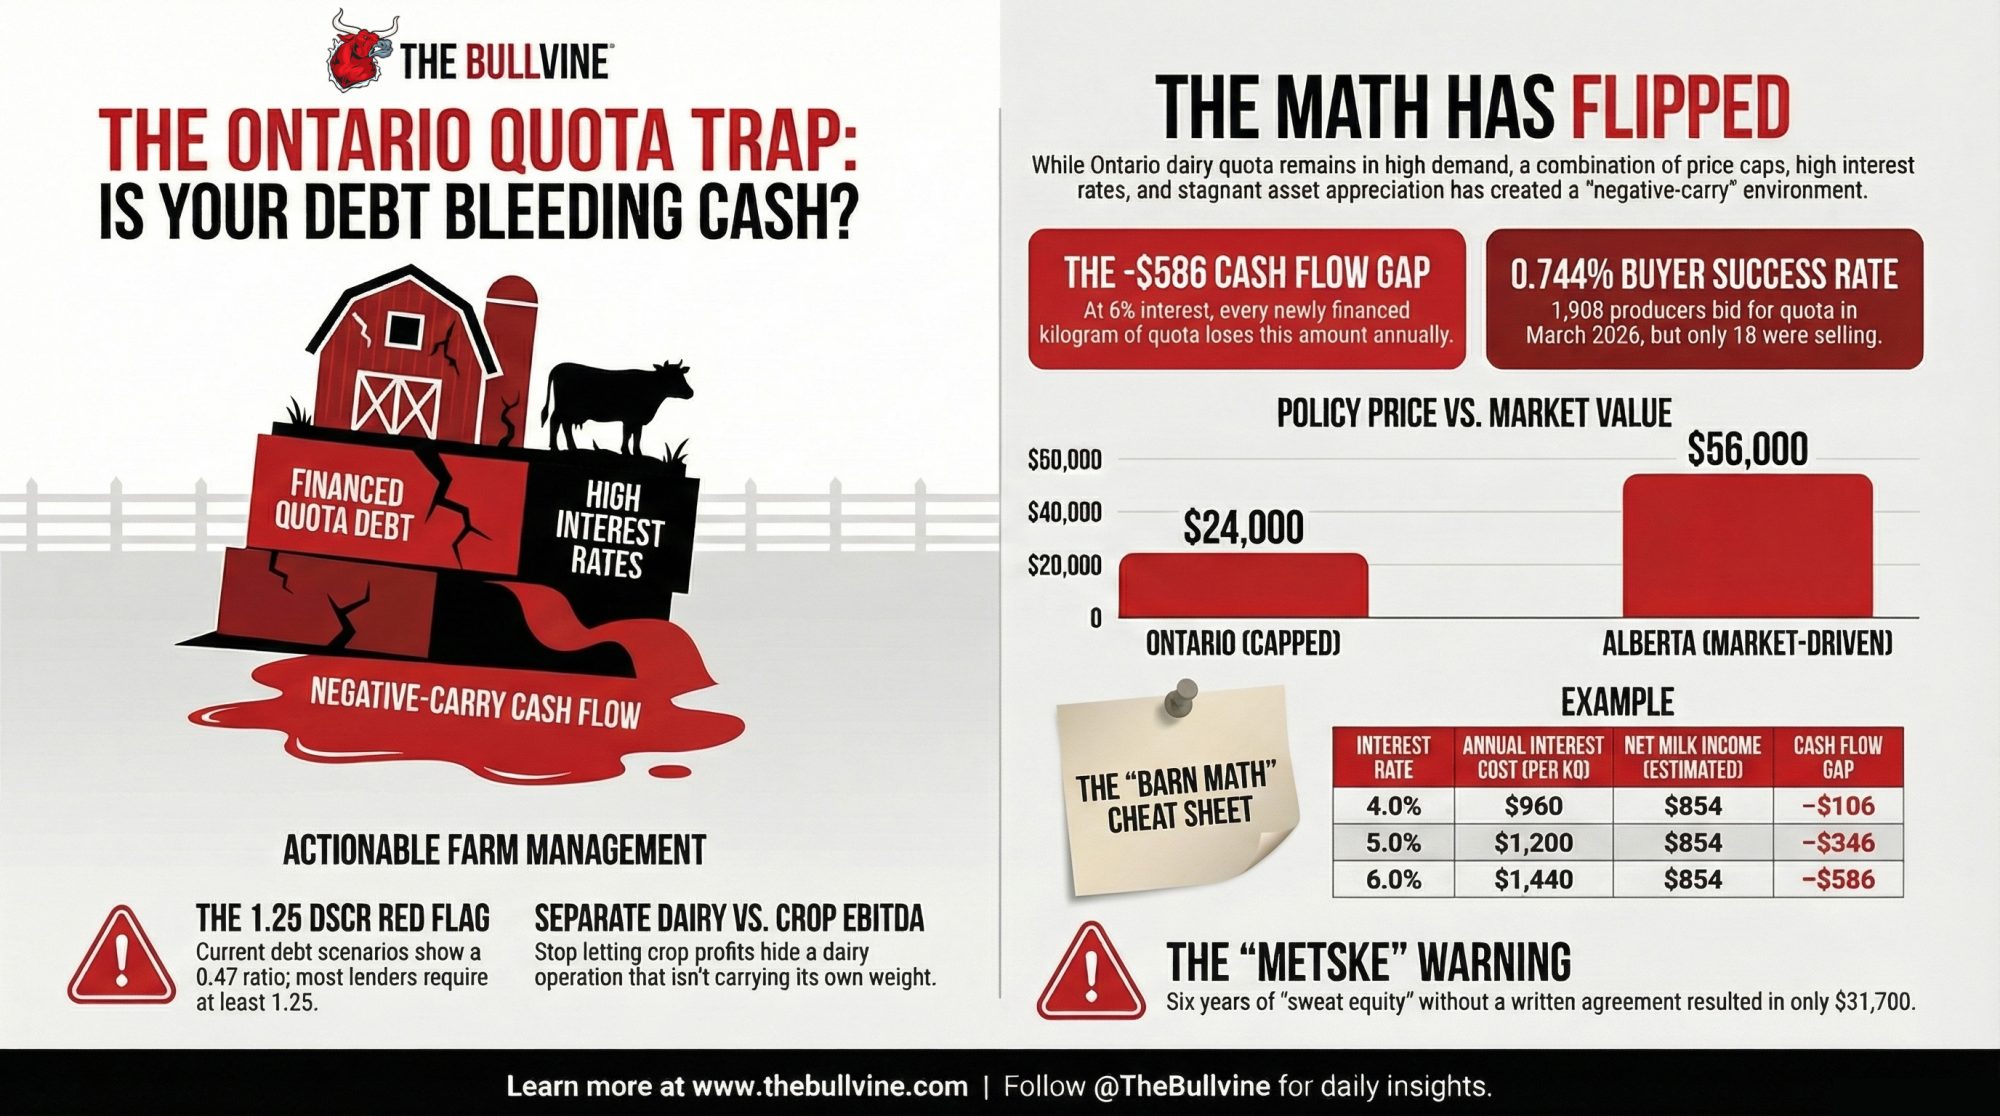
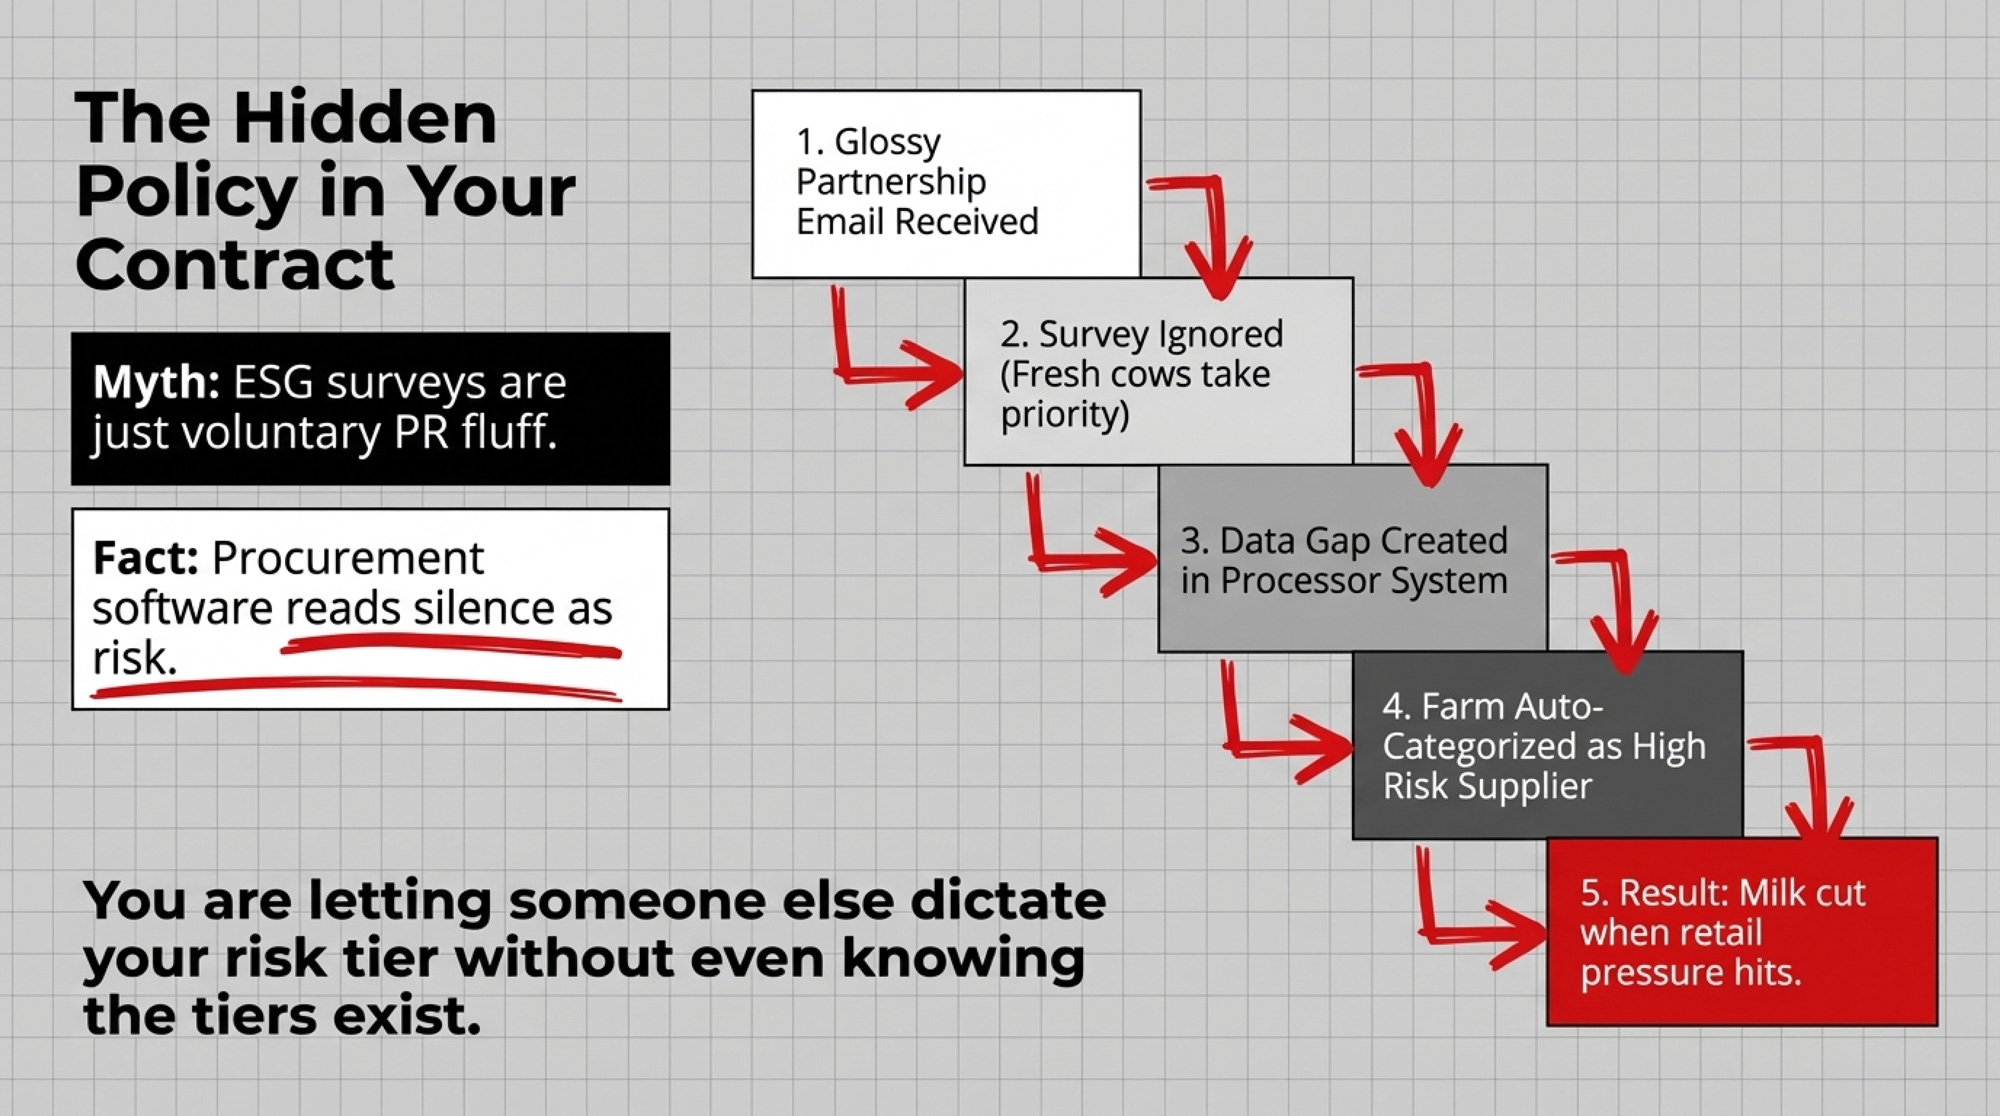
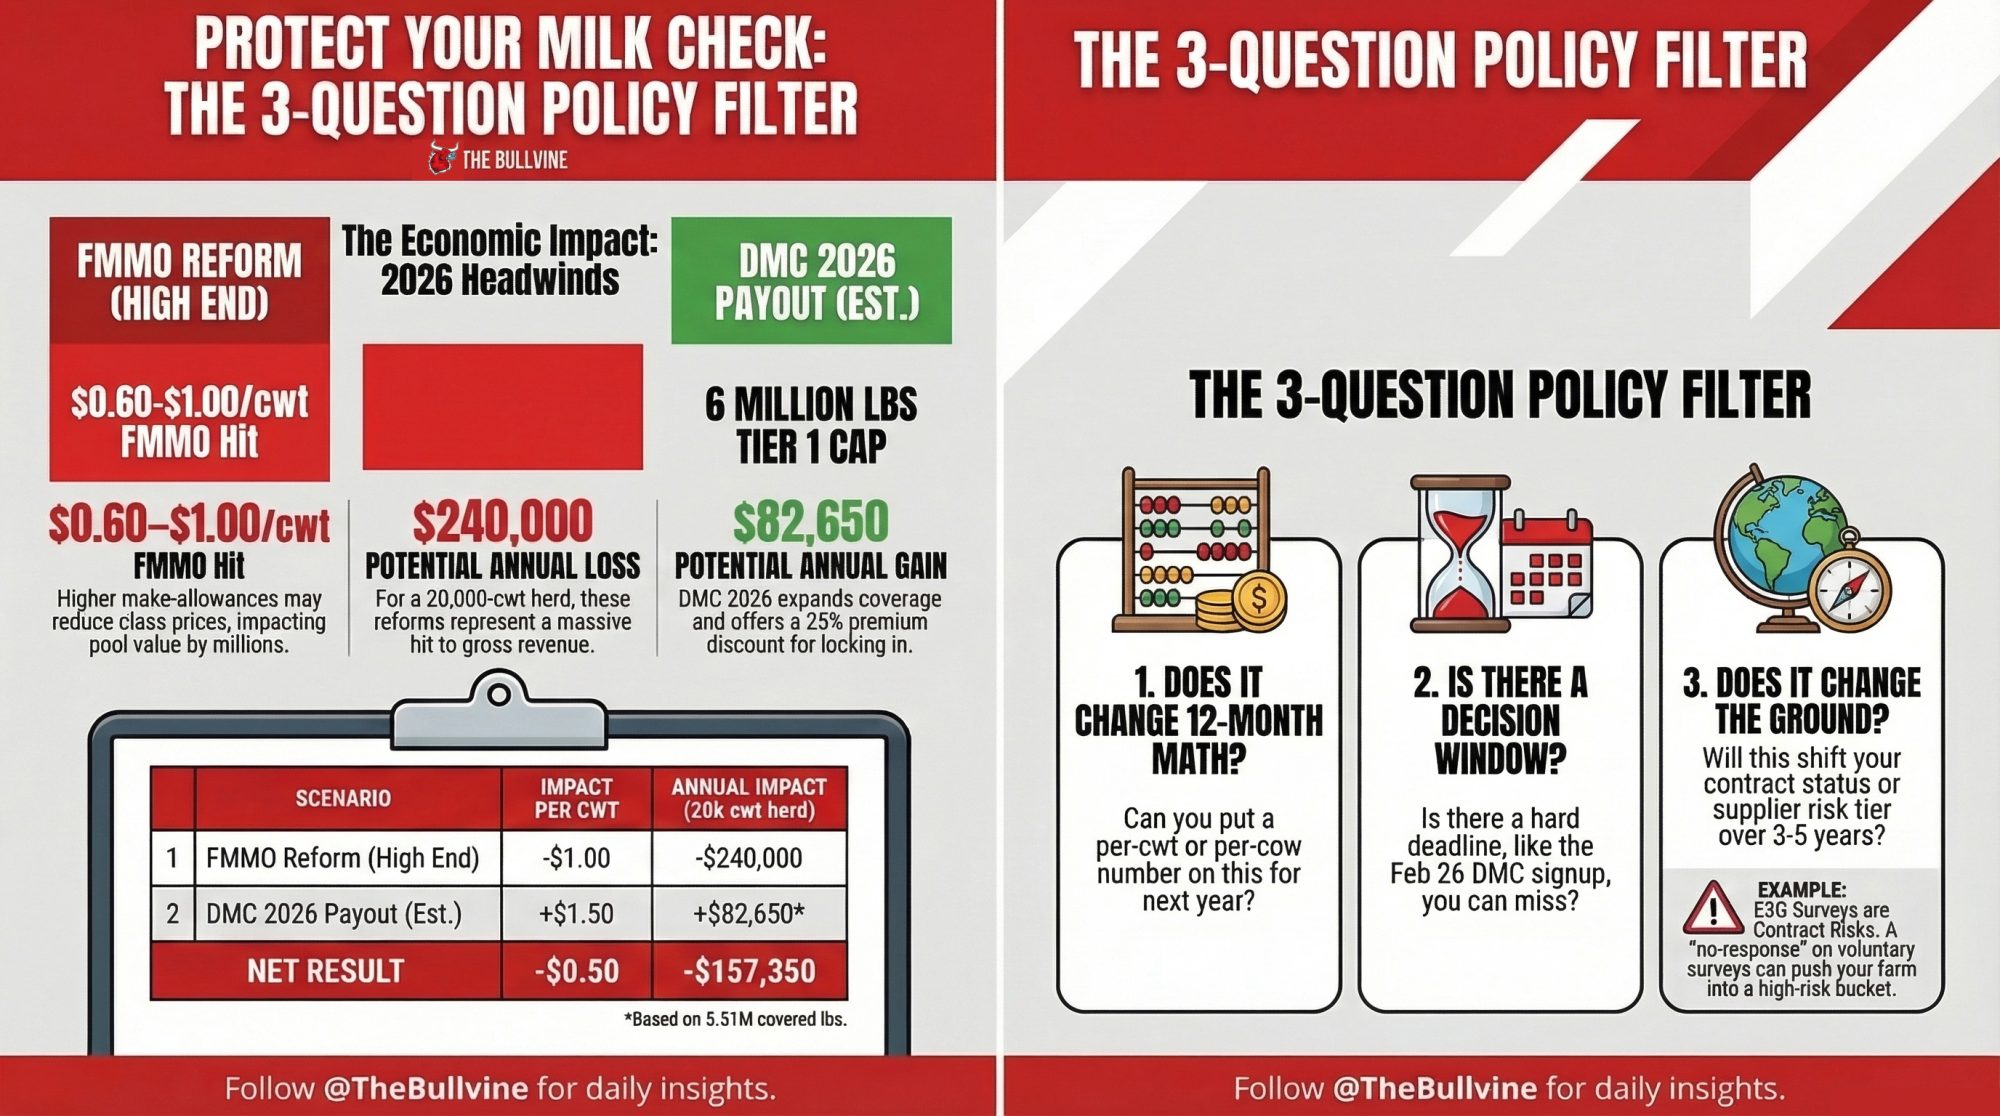
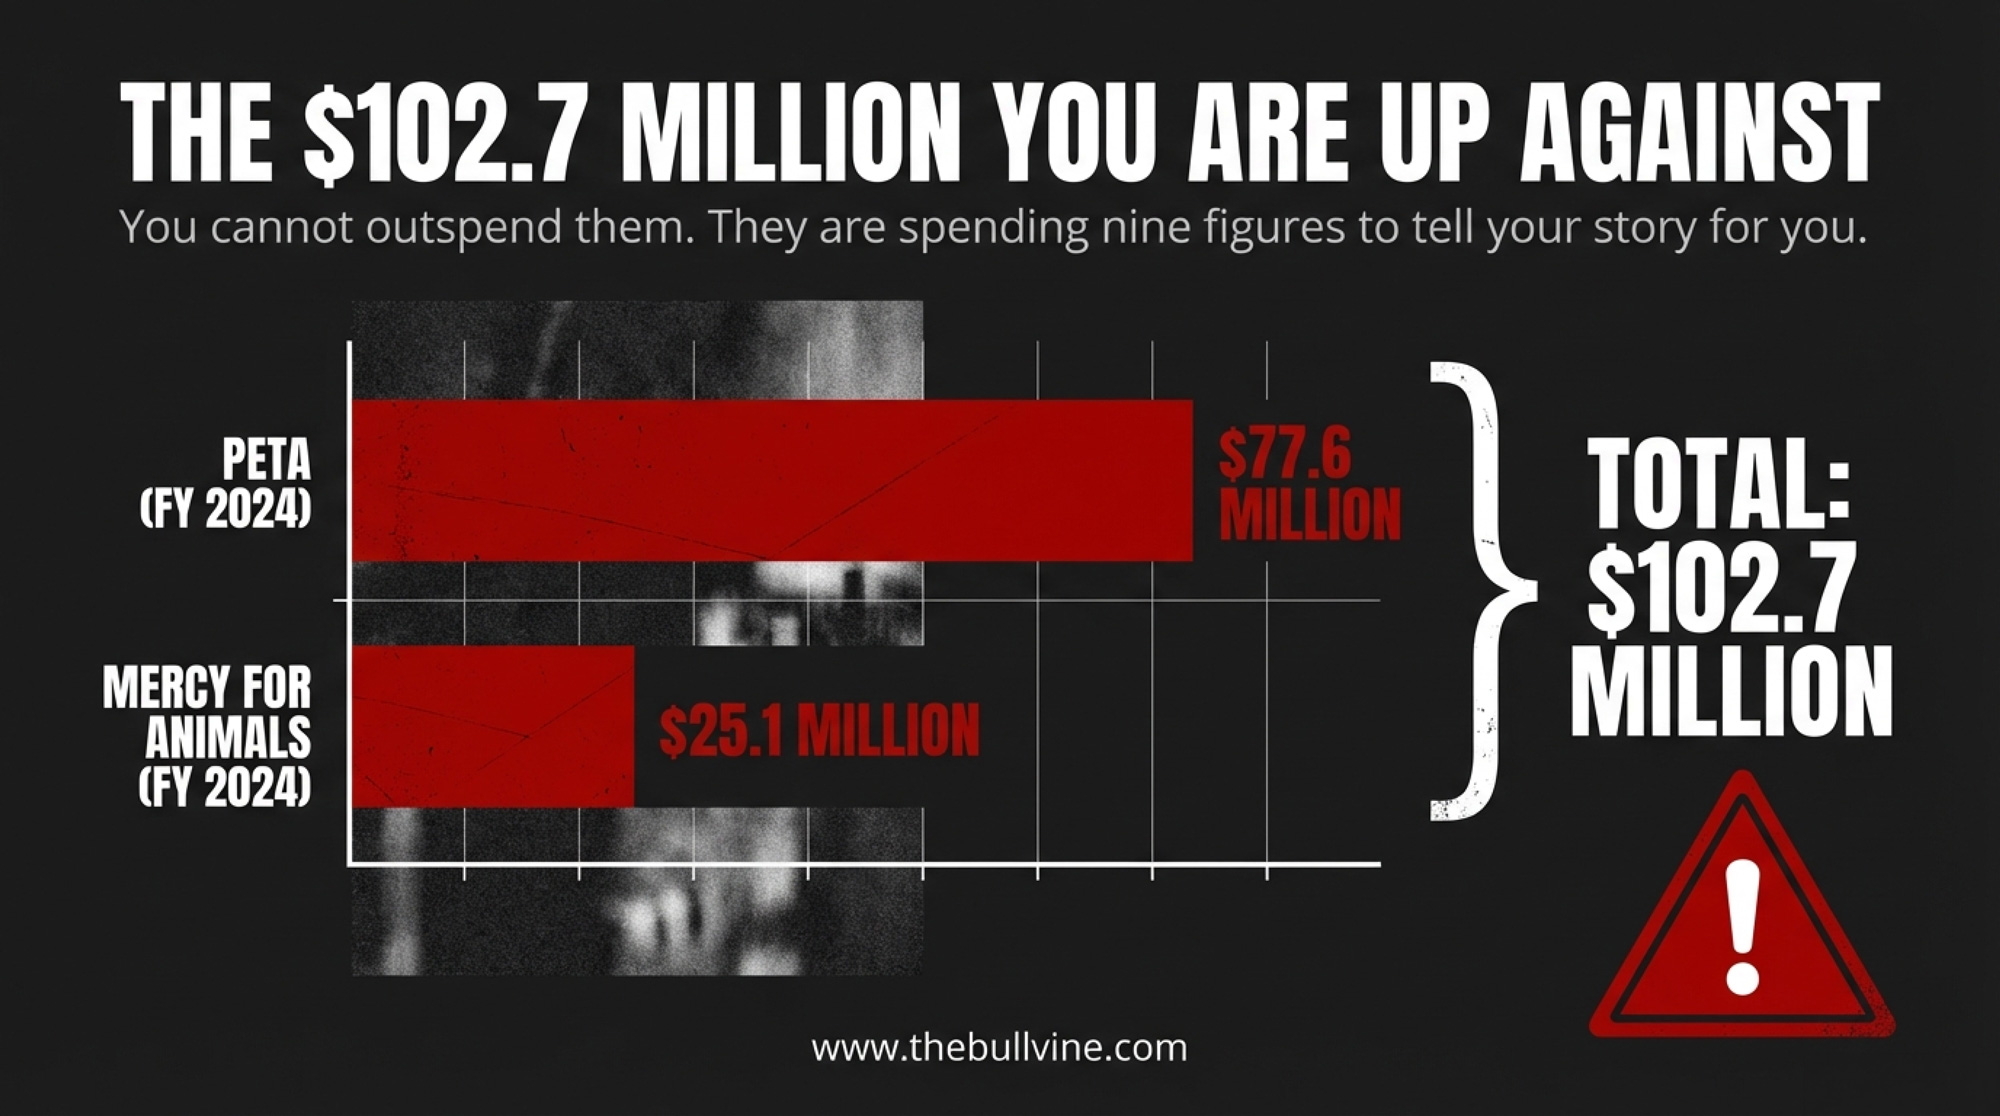
Processor consolidation has cut U.S. milk handlers by 28% in two decades. The gap between competitive and captive markets now runs $3–4/cwt — and your address determines which side of that line you’re milking on.
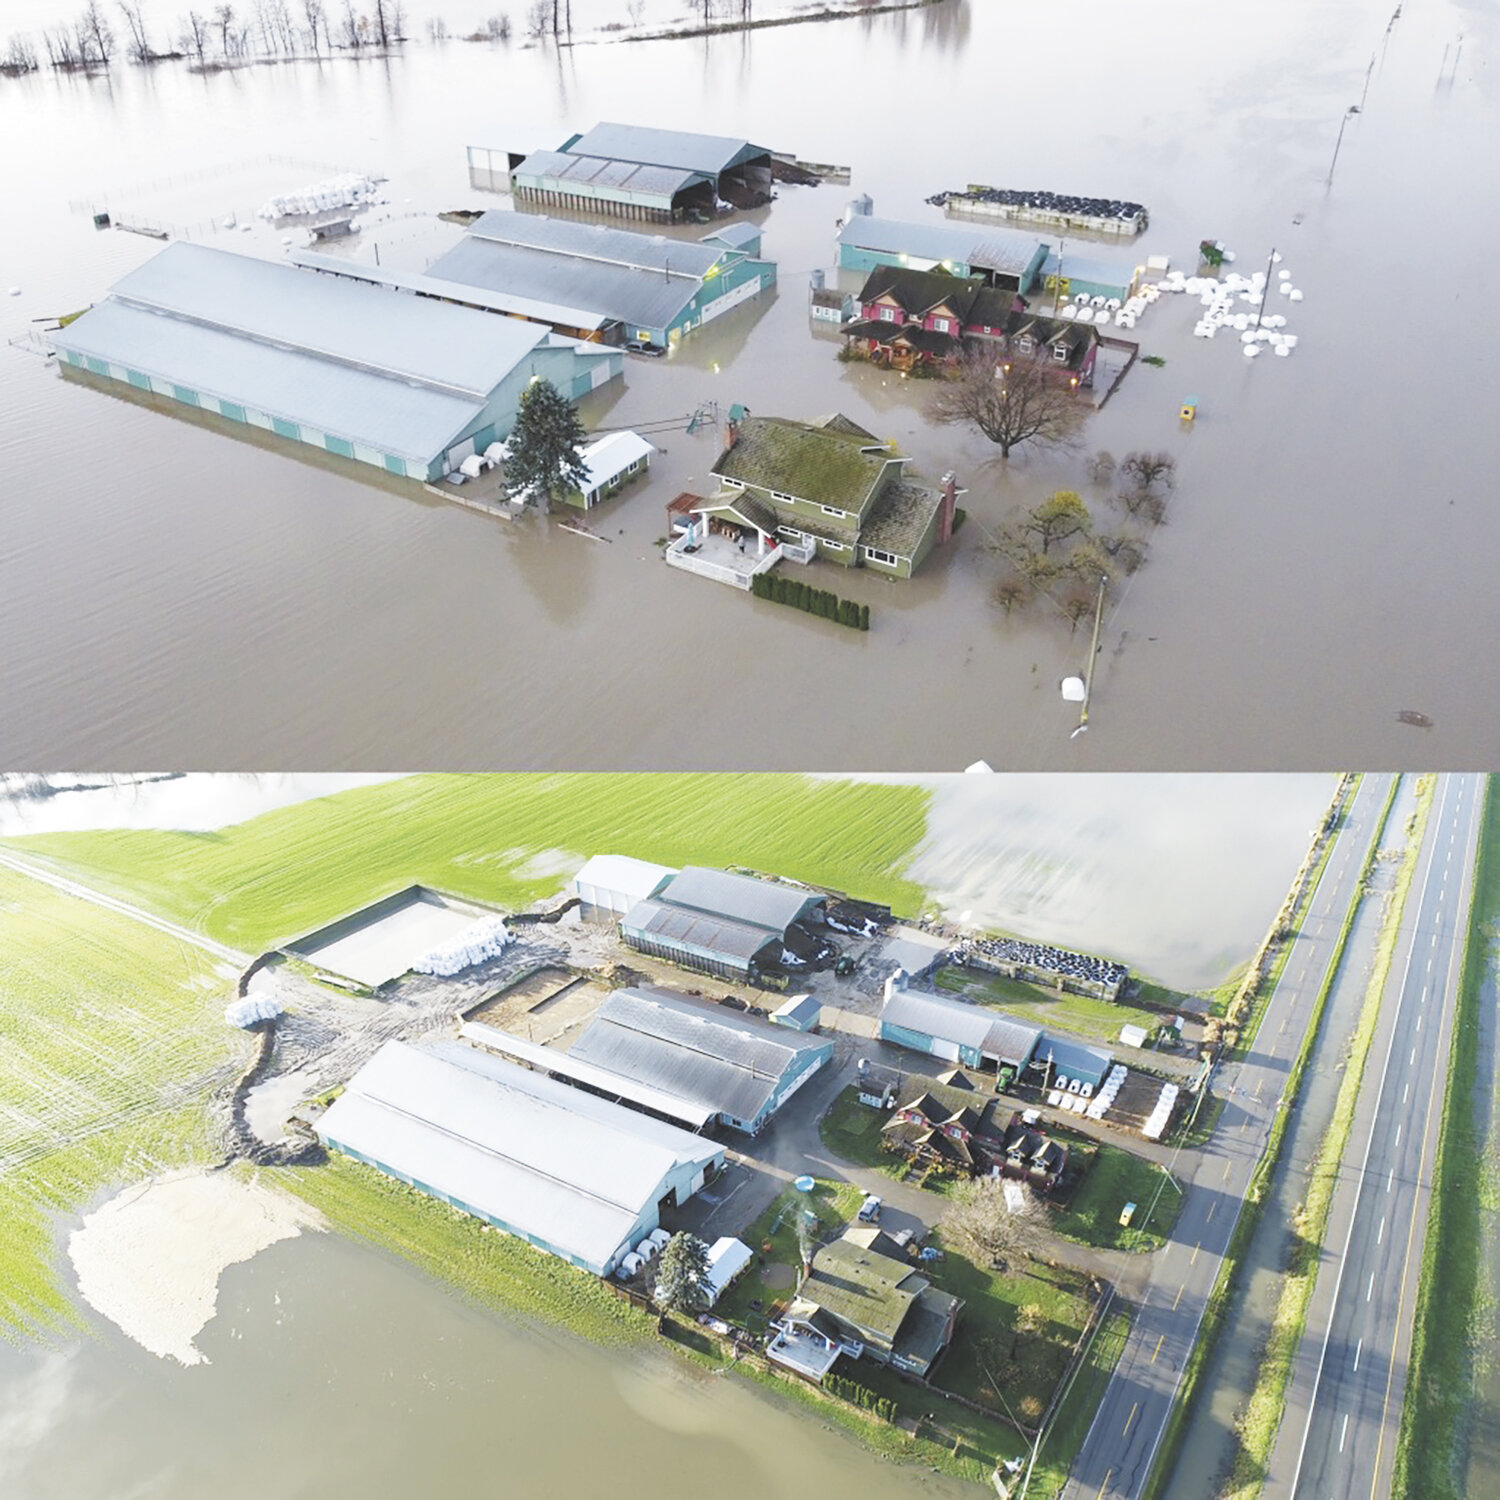
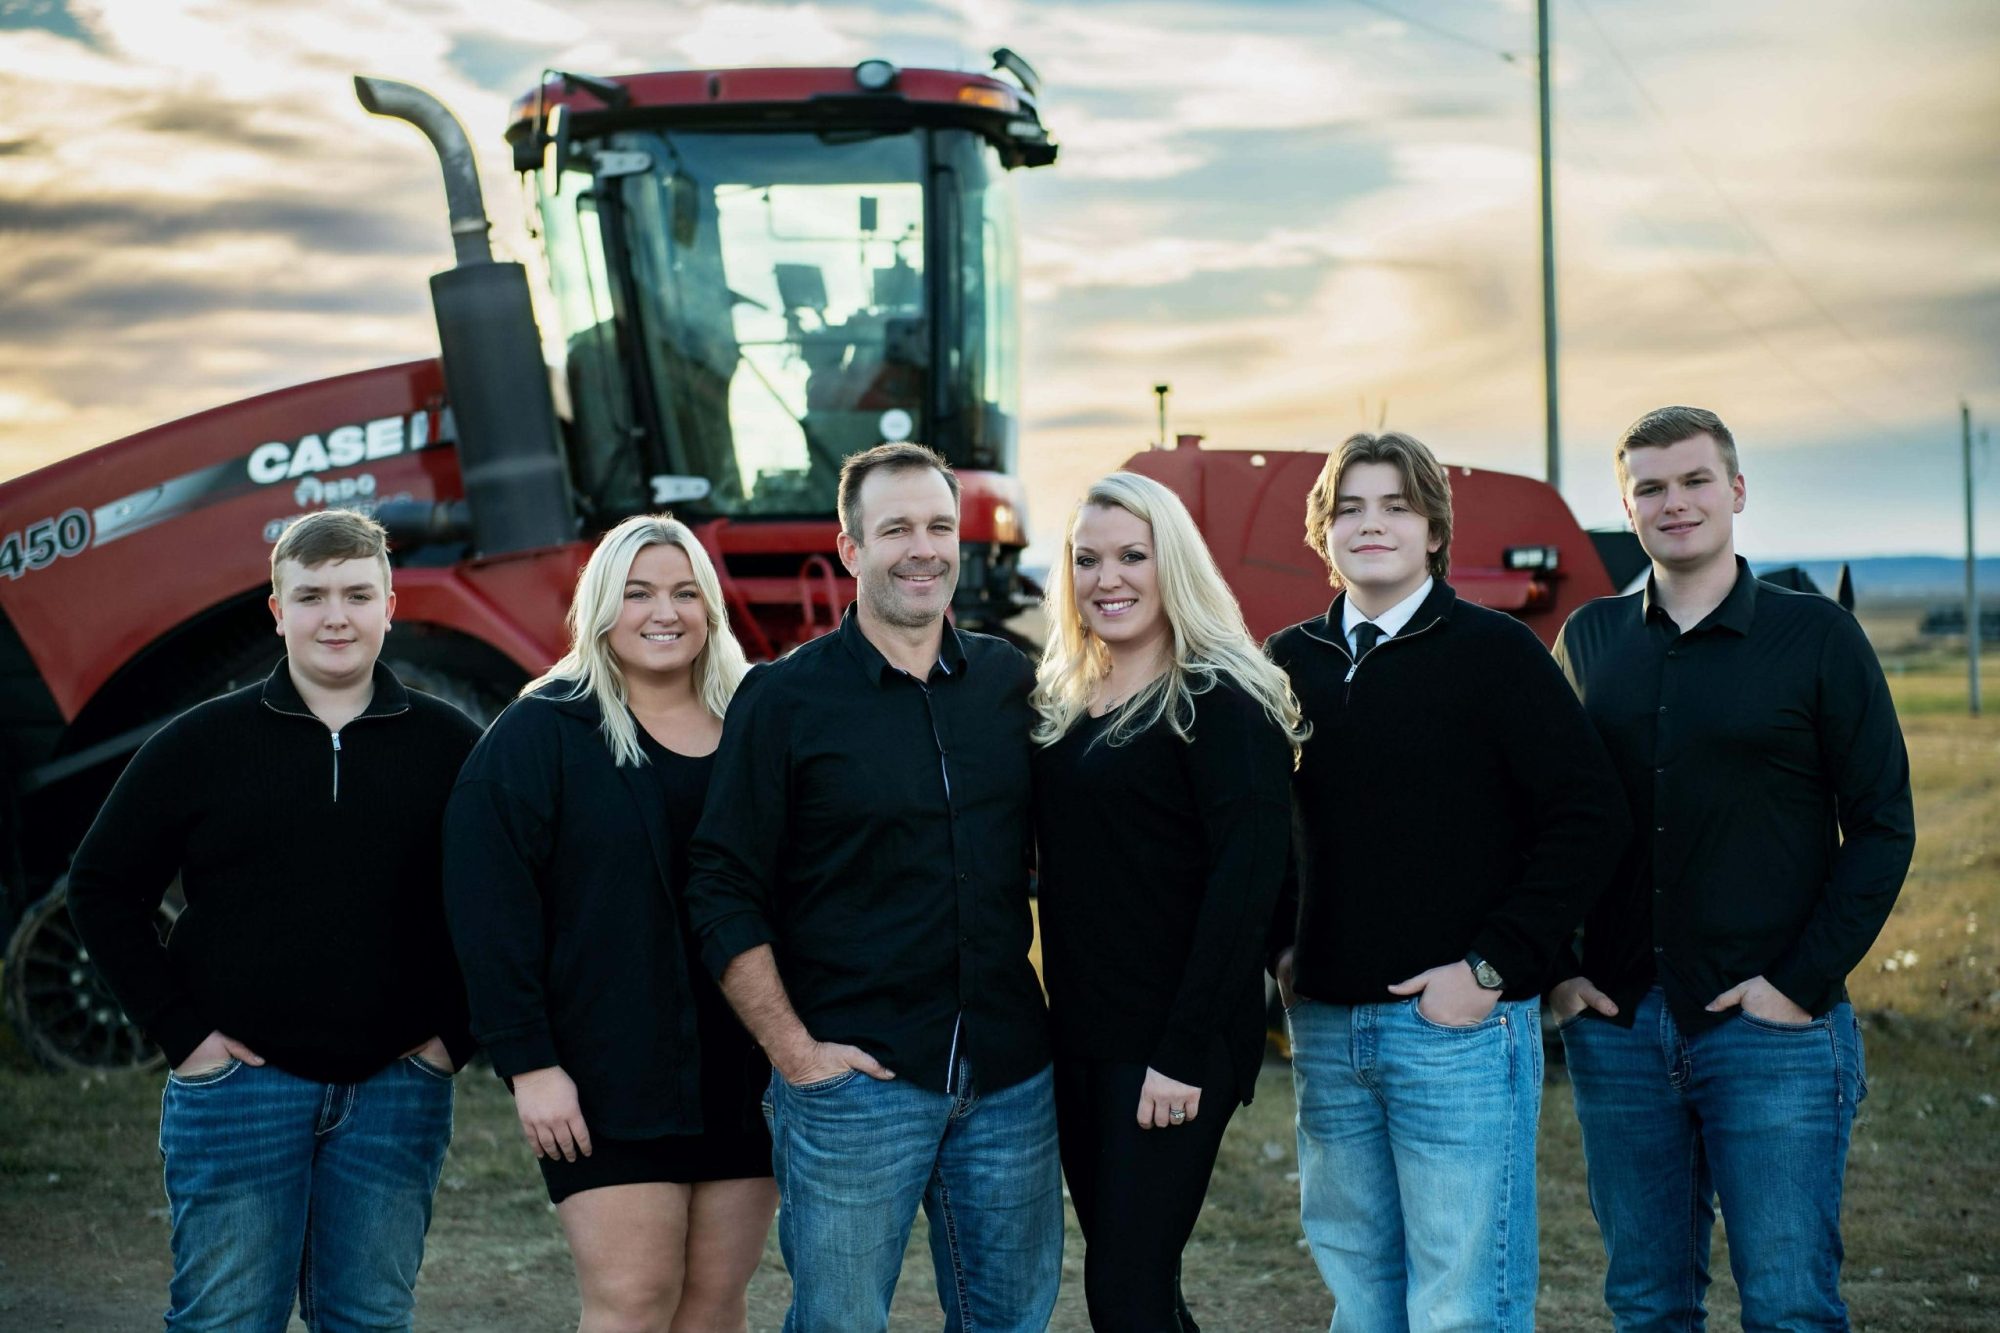
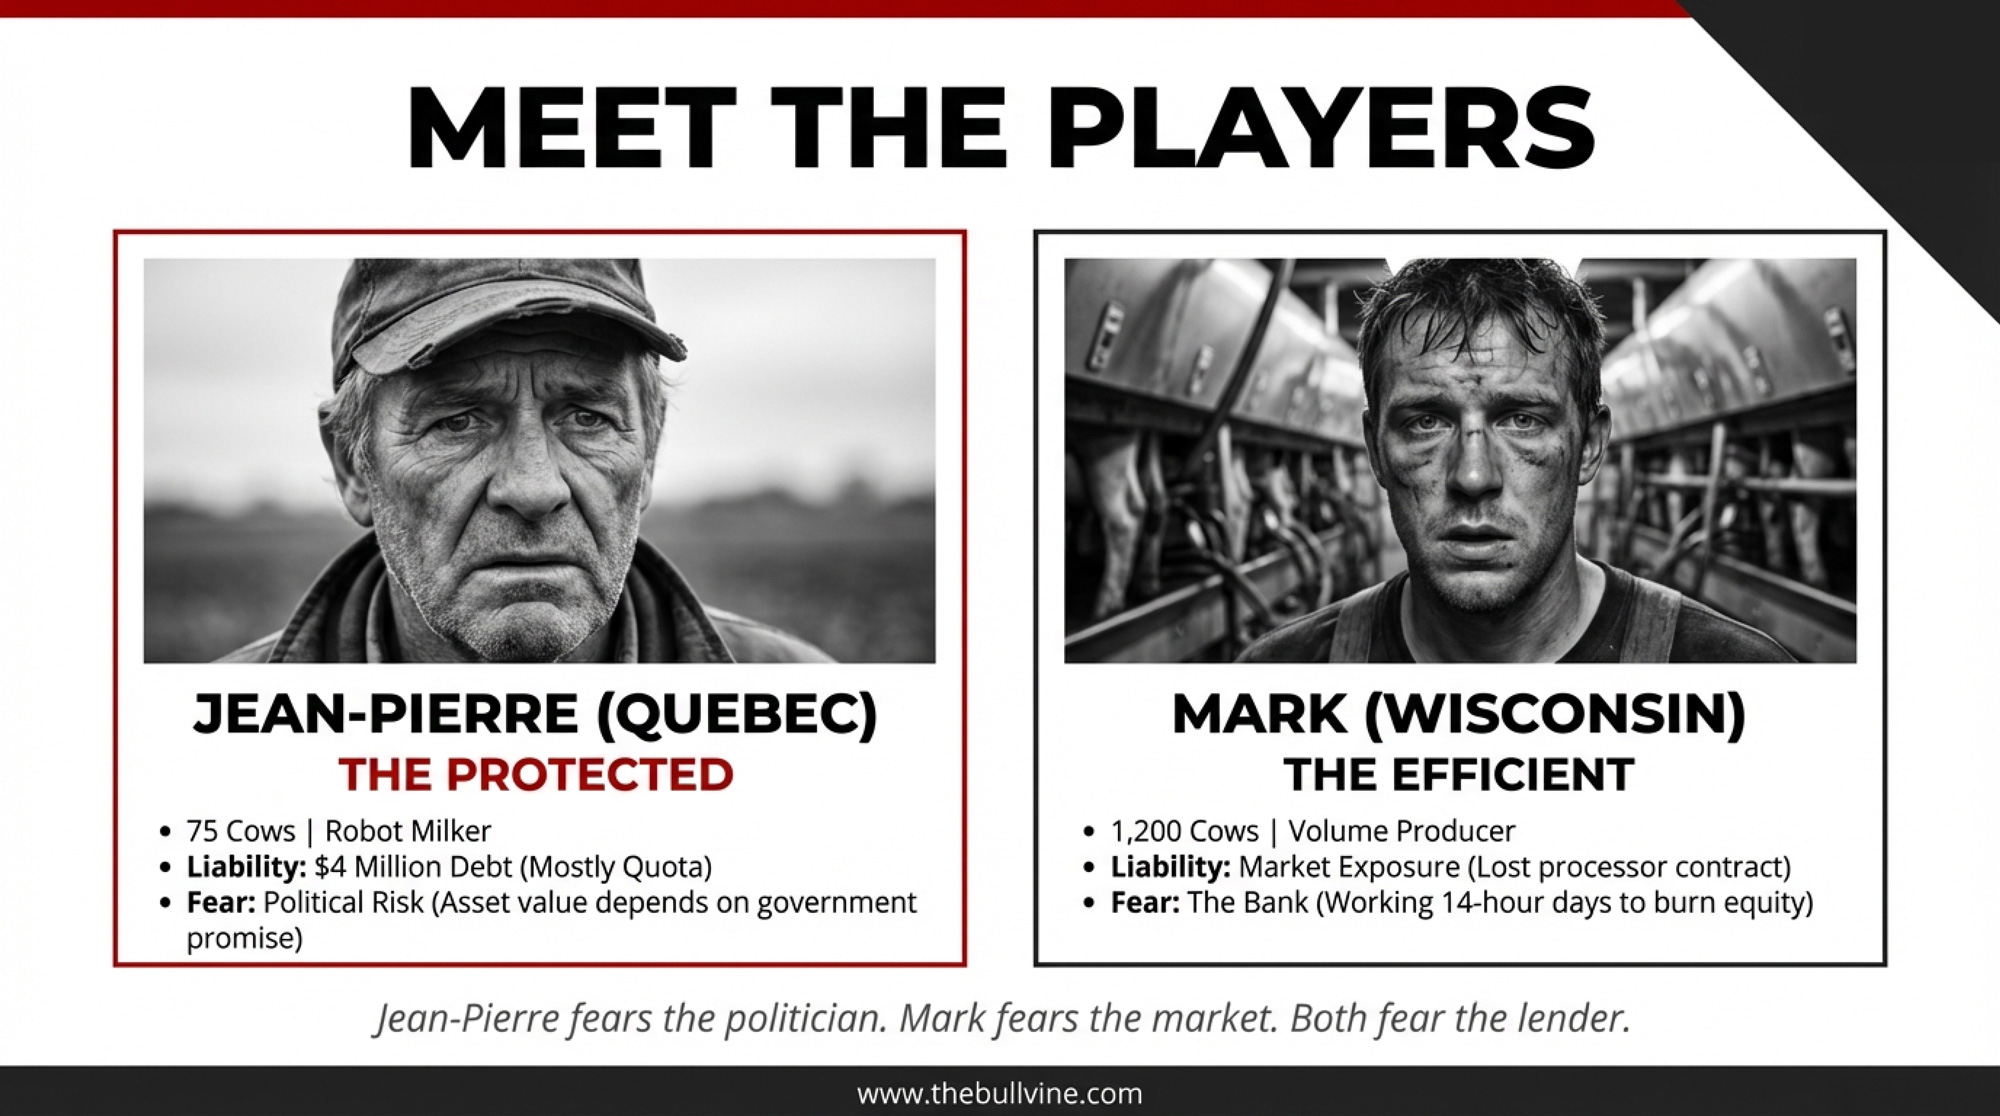
Krista Stauffer’s family has shipped milk to Darigold for years, building equity in the cooperative, as generations of Pacific Northwest dairy families have. She shared that they now have “quite a bit of equity sitting there” — with a real chance that only her kids ever see it come back. Her situation isn’t a one-off grievance. It’s what happens when processor consolidation narrows your options to one real buyer. And the financial distance between farming where processors compete for your milk and farming where a single handler calls the shots is wider than most people think.
When you stack documented premium differences, structural hauling costs, and the 2025 make-allowance hit together, the gap between the best and worst regions runs roughly $3.00–$4.25/cwt on your milk check. On a 500-cow herd, that’s $390,000–$552,500 a year, driven by your zip code, not your TMR.
From 306 Buyers to 220
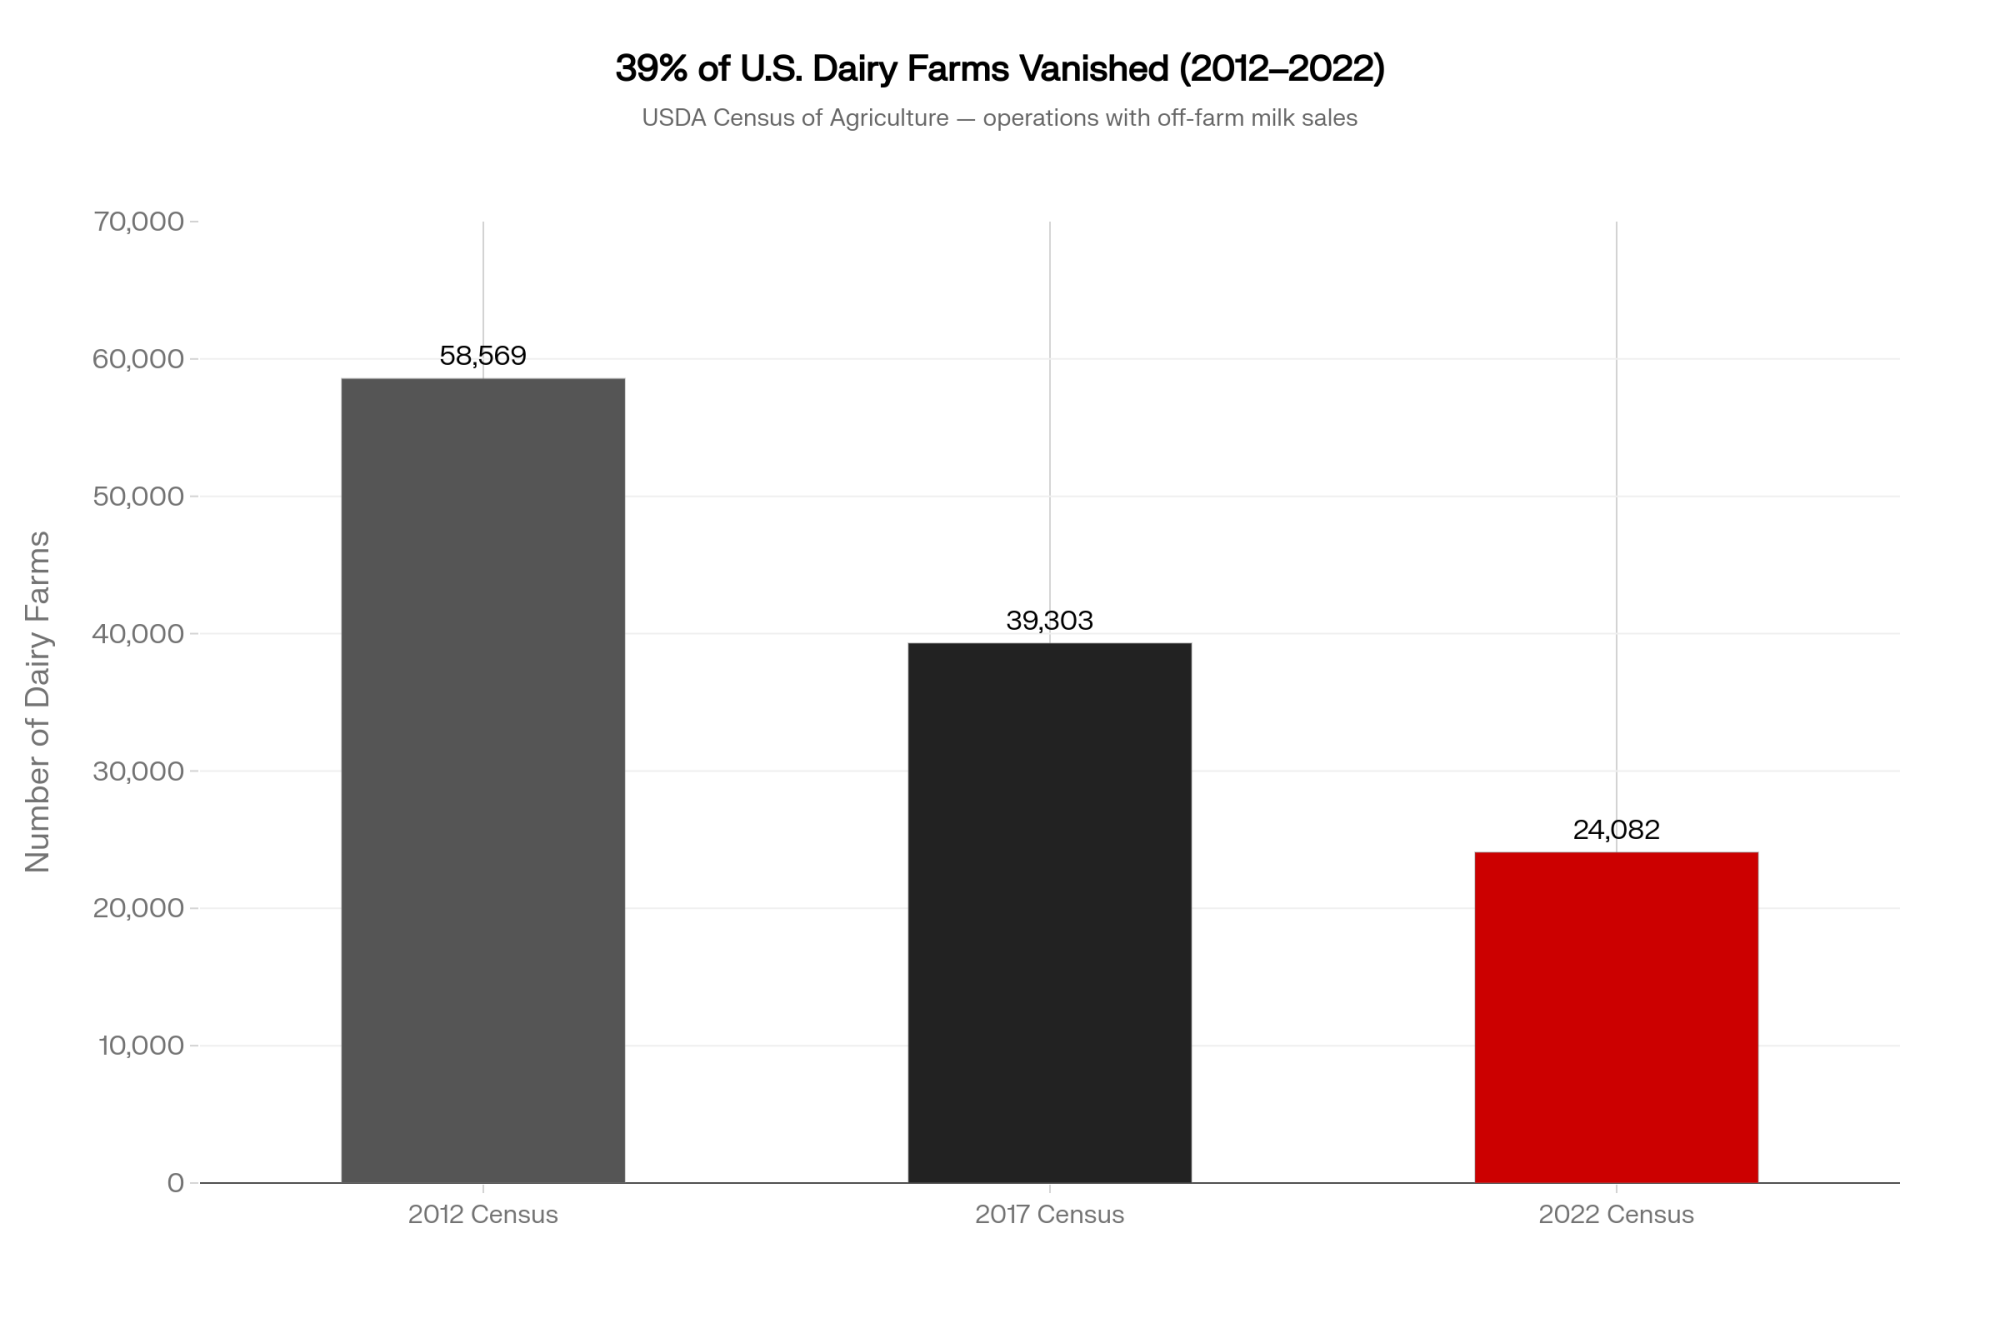
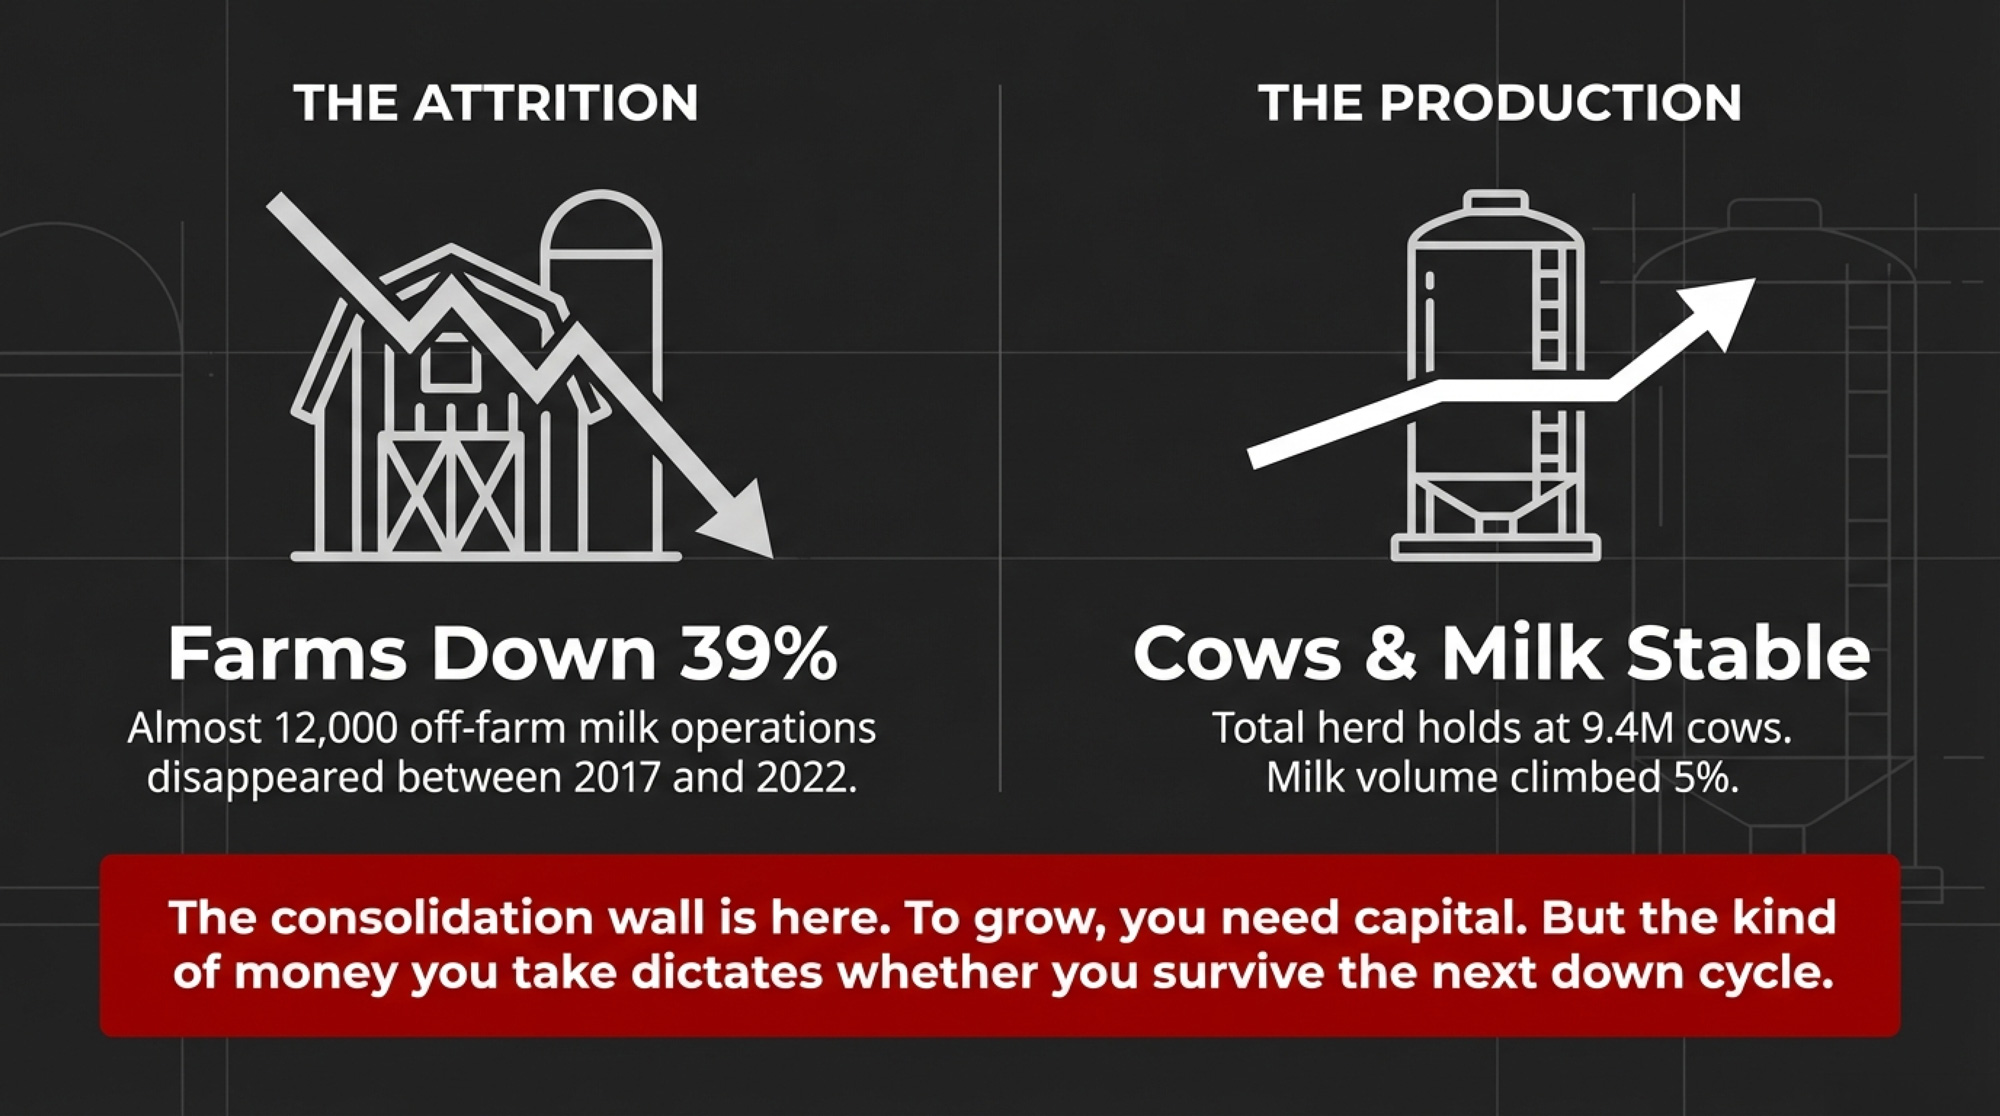
Twenty years ago, the USDA counted 306 handlers pooling milk across the federal orders. By 2024, that number had dropped to 220 — a 28% decline (USDA AMS, 2024). Pooled producers fell from 52,853 to 20,168 over the same stretch. Fewer farms are shipping to fewer buyers. That’s the whole structural picture in one sentence.
But it doesn’t look the same everywhere. In Wisconsin’s Upper Midwest order, multiple cooperatives and proprietary processors still overlap routes and counties, so they’re forced to bid for milk. In the Pacific Northwest, Darigold operates 11 production facilities and handles the vast majority of pooled milk in the order — processing up to 8 million pounds per day at its new Pasco plant alone (Northwest Dairy Association annual report; FMMO-124 data). In the Southeast, DFA and its affiliates manage supply for essentially every regulated fluid plant in the Florida order. All three regions are “orderly markets” on paper. On your milk check, they’re completely different worlds.
The $11 Billion Build-Out — and Who It Actually Helps
Processors are in the middle of an $11 billion processing build-out — more than 50 new or expanded plants announced between 2025 and 2028 (Dairy Foods, 2025). Texas, Idaho, New York, and South Dakota are picking up the lion’s share. Pennsylvania, parts of the Northeast, and Washington are losing plants as older facilities shutter or consolidate.
That looks like capital investment on a press release. On the farm, it means some regions are getting more bidders for your milk — and others are getting fewer. The question isn’t whether new capacity is coming. It’s whether any of it lands within your hauling radius.
Same Time Zone, Different Reality: Idaho vs. Washington
The sharpest contrast in American dairying right now sits inside the Pacific time zone. Same climate band. Very different leverage.
Idaho just reclaimed the No. 3 spot in U.S. milk production. According to USDA data released in February 2026, the state’s roughly 350 dairy operations produced 18.26 billion pounds of milk in 2025 — narrowly edging Texas at 18.21 billion (USDA NASS, Feb. 2026). In the Magic Valley, at least four independent processors are actively adding capacity. Chobani broke ground on a $500 million expansion in Twin Falls — its largest capital investment ever — bumping milk usage from about 4 million pounds per day to over 10 million (Chobani, 2025; Twin Falls Times-News). Idaho Milk Products is building in Jerome. High Desert Milk has invested tens of millions in its own operation. Newer players like Suntado have come online. Every one of those plants needs milk. Everyone competes for it. Idaho Dairymen’s Association CEO Rick Naerebout told Dairy Herd Management: “Idaho dairymen, for the most part, are fairly well situated financially right now.”
Drive west, and the story flips. Darigold’s Pasco, Washington, plant — originally budgeted at around $600 million — exceeded $900 million by the time it opened in June 2025 (Capital Press; Reuters, 2025). The cooperative approved the project back in 2021. CEO Stan Ryan pointed to labor shortages and equipment procurement as the main cost drivers. To cover the gap, the cooperative pulled a $4/cwt deduction from member checks (eDairyNews, May 2025). Yakima County producer Dan DeRuyter, milking about 4,800 cows, told reporters the hit amounted to nearly $5 million taken from his operation over two years. He didn’t sign the construction contract. He didn’t pick the procurement strategy. He had no practical alternative buyer for his milk. He just absorbed the deduction.
That’s the governance structure on paper. Here’s how it played out on the milk check: one buyer, one deduction, limited alternatives.
The Leverage Gap at a Glance
“Captive” Market (WA / PNW)
“Competitive” Market (ID / Magic Valley)
Dominant Player
Darigold (~85–90% of pooled milk)
Diverse: Chobani, Idaho Milk Products, High Desert Milk, Suntado, Glanbia
Farmer Leverage
Low — limited exit options, retained equity as anchor
High — multiple independent bidders for milk
Recent Trend
$4/cwt capital deduction from member checks
$500M+ in private processor expansions
Risk Profile
High “address risk” — geography controls your basis
Dynamic growth — processors competing for supply
2025 Milk Production
~10 billion lbs (NDA members, WA/OR/ID/MT)
18.26 billion lbs (Idaho alone, USDA NASS)
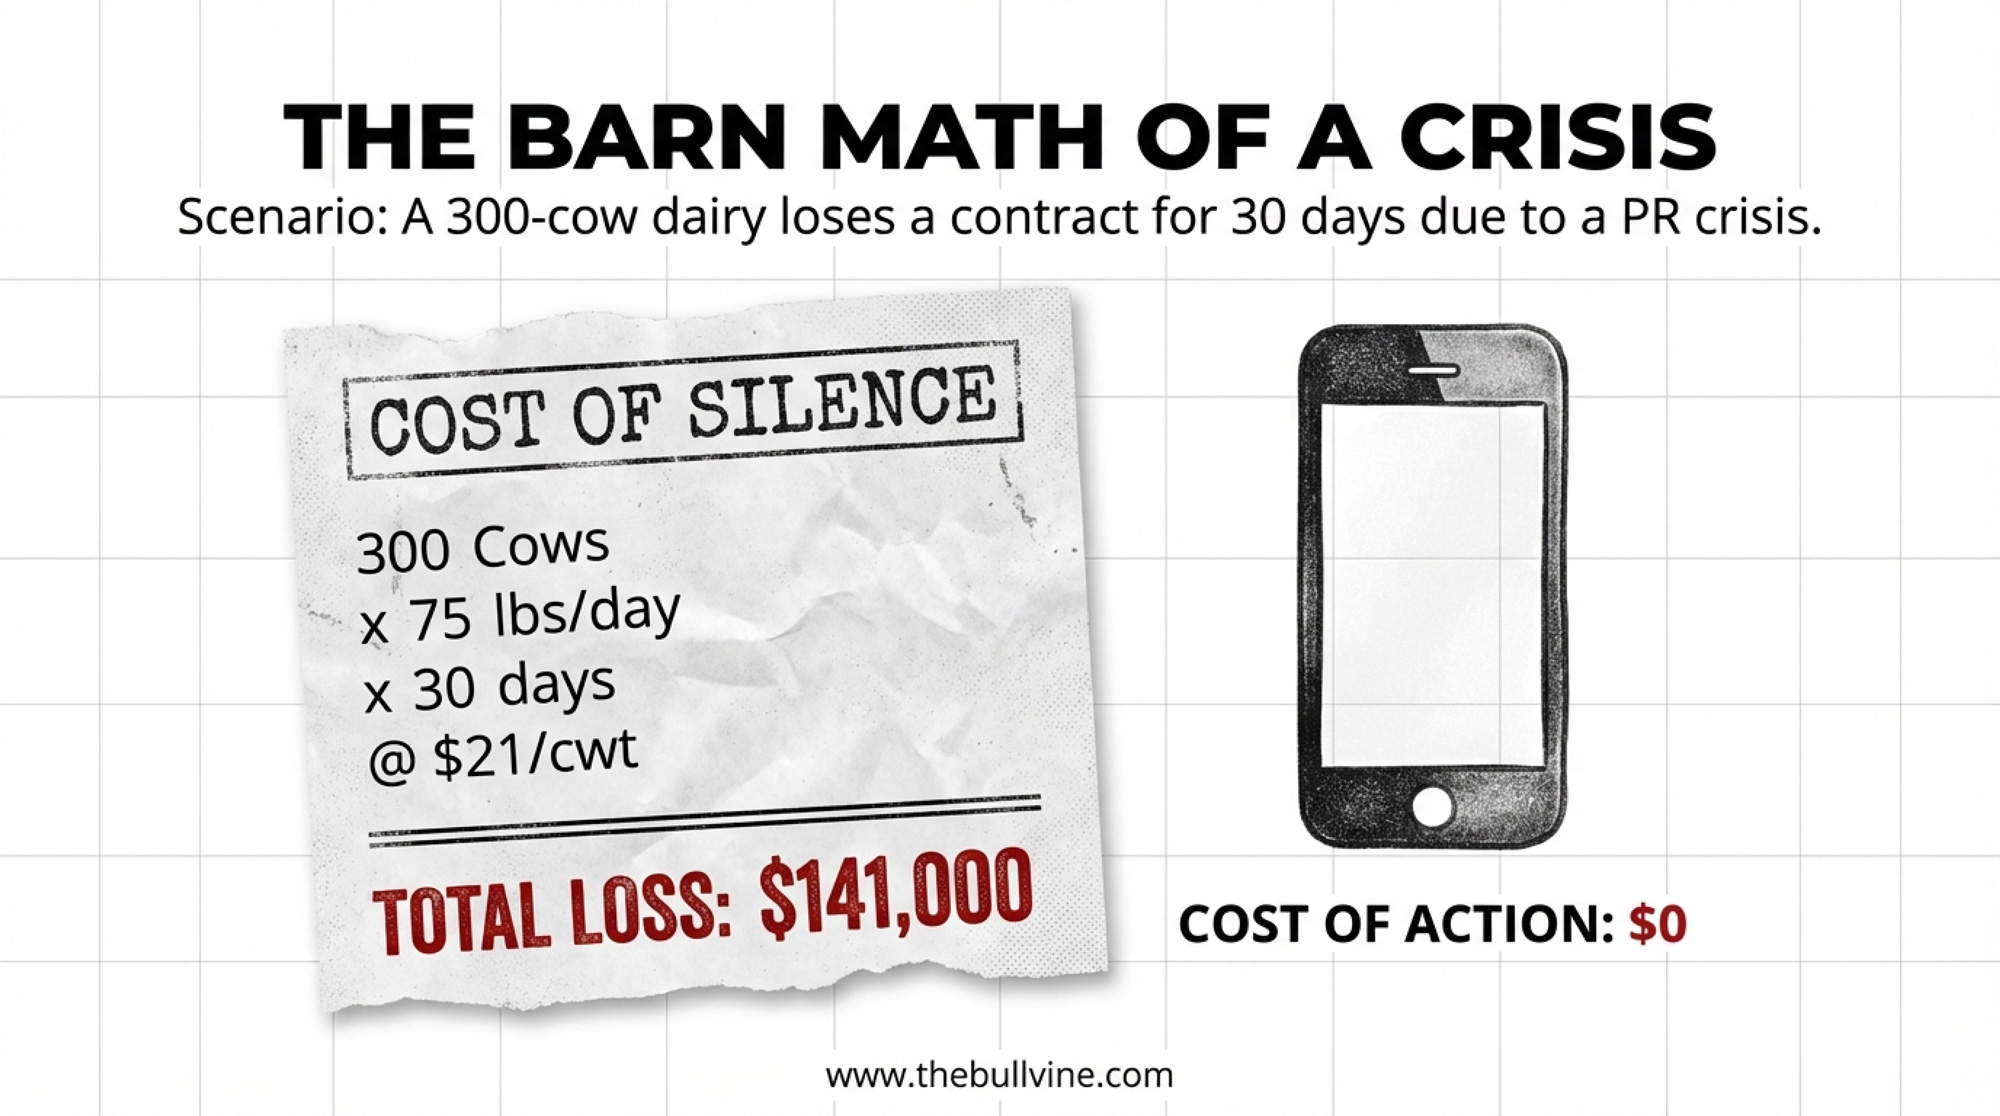
Here’s the barn math that connects those two columns. Take a 300-cow herd shipping about 78,000 cwt a year. In a region with multiple handlers fighting for milk — over-order premiums, quality bonuses, and hauling competition all working in your favor — it’s reasonable to see at least 50-100¢/cwt more in total value than the same herd in a single-buyer region. That’s $58,500 a year. Or roughly $195/cow — pushed or pulled entirely by how many processors are in range, not how well you bed stalls.
How Many Buyers Can Actually Bid on Your Milk Right Now?
This is the question that invisibly sets your basis.
Pull up a map. Draw a circle with your maximum economic hauling distance — for most outfits, that’s 100–150 miles, depending on roads and fuel. Count the plants inside that circle. Then ask the harder follow-up: how many of those plants are controlled by different companies?
Two DFA plants don’t equal two buyers. A DFA plant and a Leprino plant do.
If you count four or more independent buyers, you’re in rare air. Much of Wisconsin, eastern Minnesota, and chunks of Idaho’s Magic Valley still look like this — multiple co-ops, proprietary cheese plants, and specialty processors overlapping territories. Charles Krause, chair of Midwest Dairy’s board and a sixth-generation dairy producer running a 350-cow operation in Buffalo, Minnesota, told Progressive Dairy: “In the central states, we are finally seeing processors out procuring more milk. It has been several years since farmers had options.”
If the count is one, you’re in a captive market. CME settlements or national mailbox averages don’t drive your real price. It’s set by whatever your lone buyer decides is sustainable — for them.
Where Does the Money Go Before It Reaches Your Statement?
Two pieces of plumbing turn consolidation into smaller milk checks. Neither one shows up as a tidy line item.
Make allowances move money upstream before your check is even printed.
When USDA raised the cheese make allowance to 25.19¢/lb in June 2025 — up from 20.03¢ where it had sat since 2008 — nobody added a “make allowance” deduction to your statement (USDA AMS, Final Decision on FMMO Amendments, 2025). The money vanishes earlier than that. USDA subtracts the allowance from the wholesale commodity price before calculating protein and butterfat values for Class III. The processor keeps the allowance as an operating margin. What’s left becomes your component price.
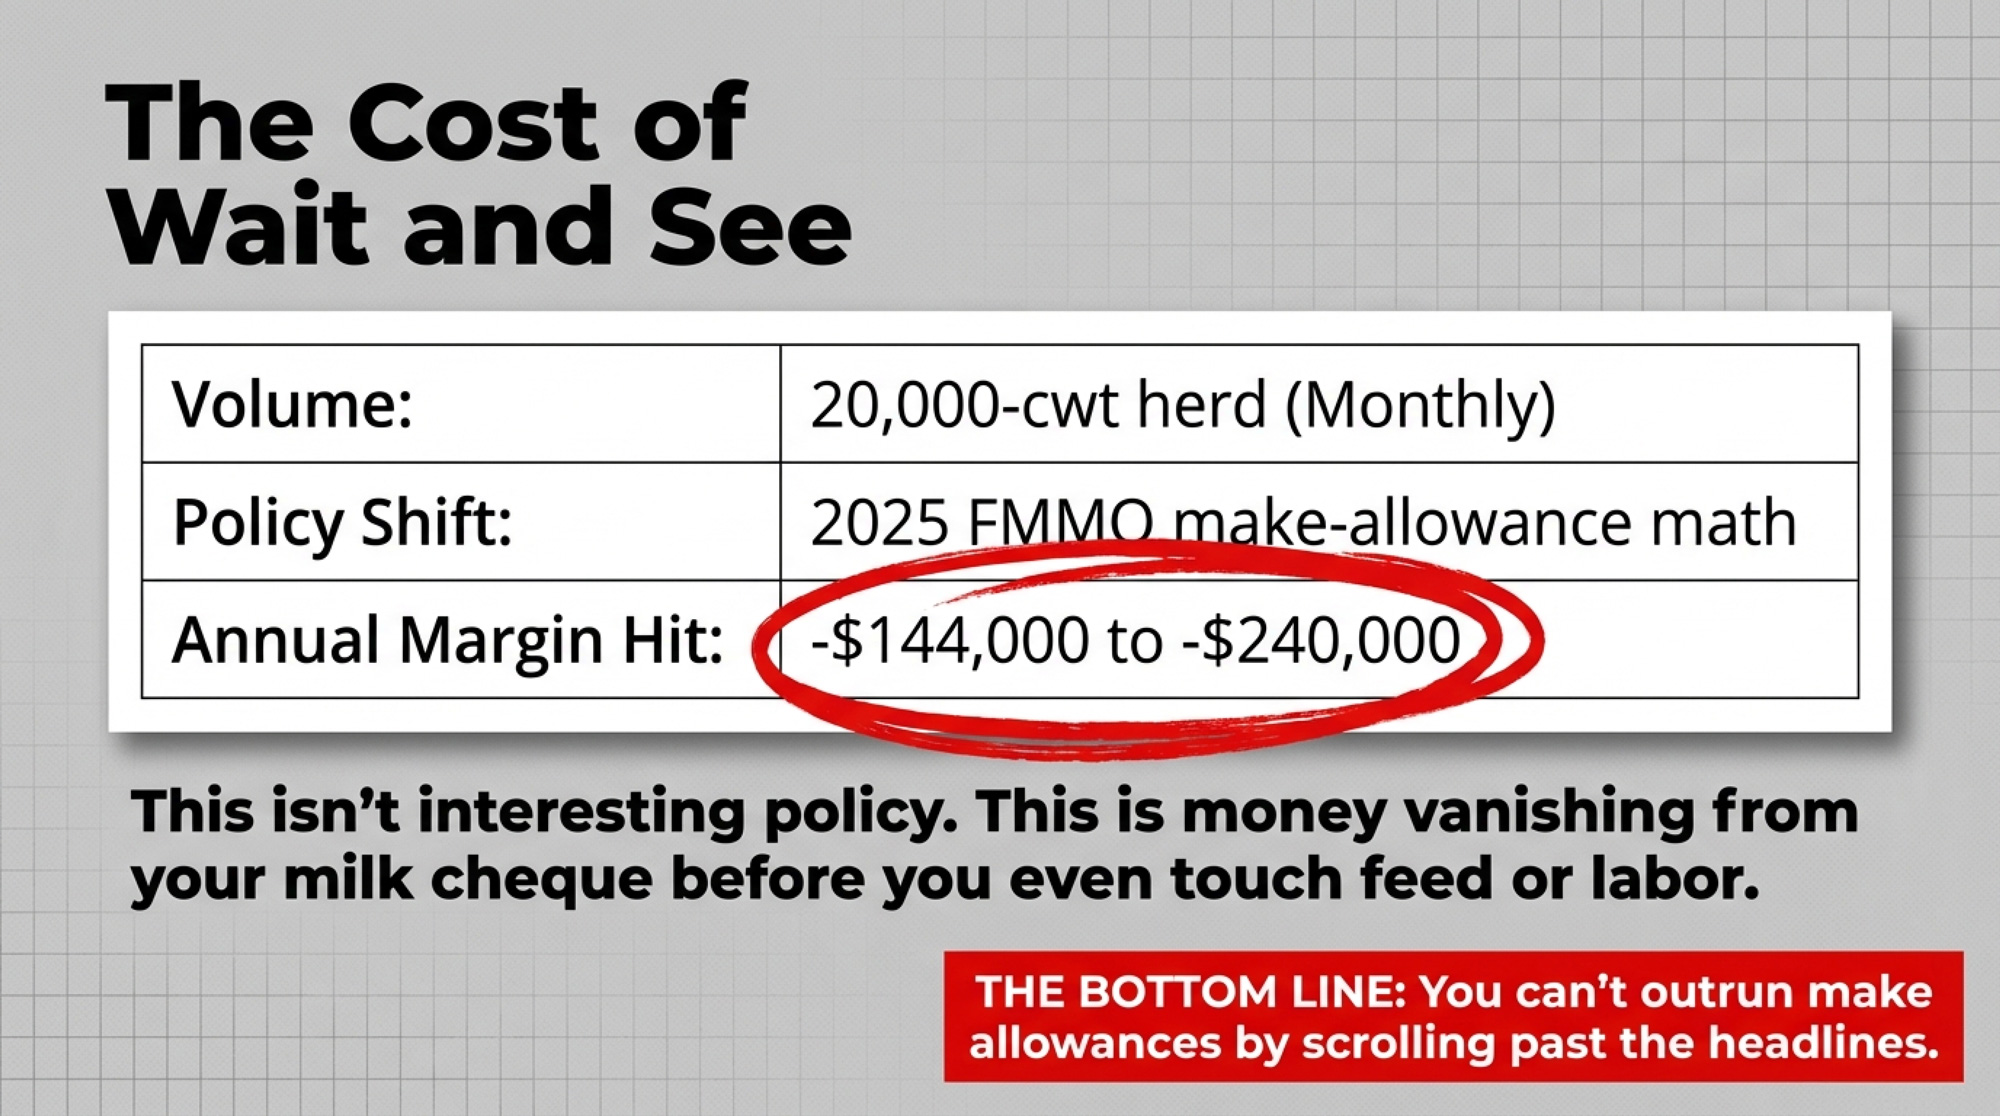
Danny Munch at AFBF did the math. The new make allowances stripped $337 million from producer pools in just 90 days — June through August 2025 (AFBF Market Intel, 2025). That included about $64 million from the Upper Midwest and $62 million from the Northeast. Class price reductions ranged from 85 to 93 cents per hundredweight. Terrain Ag’s analysis was blunt: “Increased make allowances will have the most clear-cut negative effect on component values and milk prices.”
Run that through the barn. A 300-cow herd shipping 78,000 cwt a year sees about $70,000 in annual gross revenue shift from farm accounts to processor margins because of a single rule change. You can’t negotiate it back in a premium. It’s baked into the formula — based on a voluntary cost survey that, according to the hearing record, only about 17% of eligible plants bothered to respond to.
Co-op governance wasn’t built for nine-figure construction risks.
On paper, farmer-directors run cooperatives. Members often report that management holds significantly more information than individual directors — and in a complex construction project, that asymmetry can matter enormously. When Darigold says “farmer-owners approved the Pasco project,” that’s technically true. The board voted in 2021. But members did not vote on which contractors to use, whether the job was fixed-price or cost-plus, or who would absorb cost overruns. Those three decisions are exactly what turned a $600M project into a $900M one — and a $4/cwt deduction.
Co-op law gives you formal authority. Consolidation takes away your exit threat. When retained equity builds up over decades, notice periods stretch out, and there’s no other buyer within economic hauling distance, “you can always leave” becomes an expensive theory. That’s how Krista Stauffer ends up with equity sitting in a co-op she may never meaningfully cash out of.
The transparency metric worth demanding: Before your co-op board approves any capital project over $100 million, it’s worth asking in writing whether the construction contract is fixed-price or cost-plus — and what the member-approved cost cap is. If there’s no cap, your future milk checks are the cap. A simple resolution — “No cost-plus contracts above a set threshold without a member-wide vote on overrun allocation” — would have changed the math for DeRuyter and Stauffer.
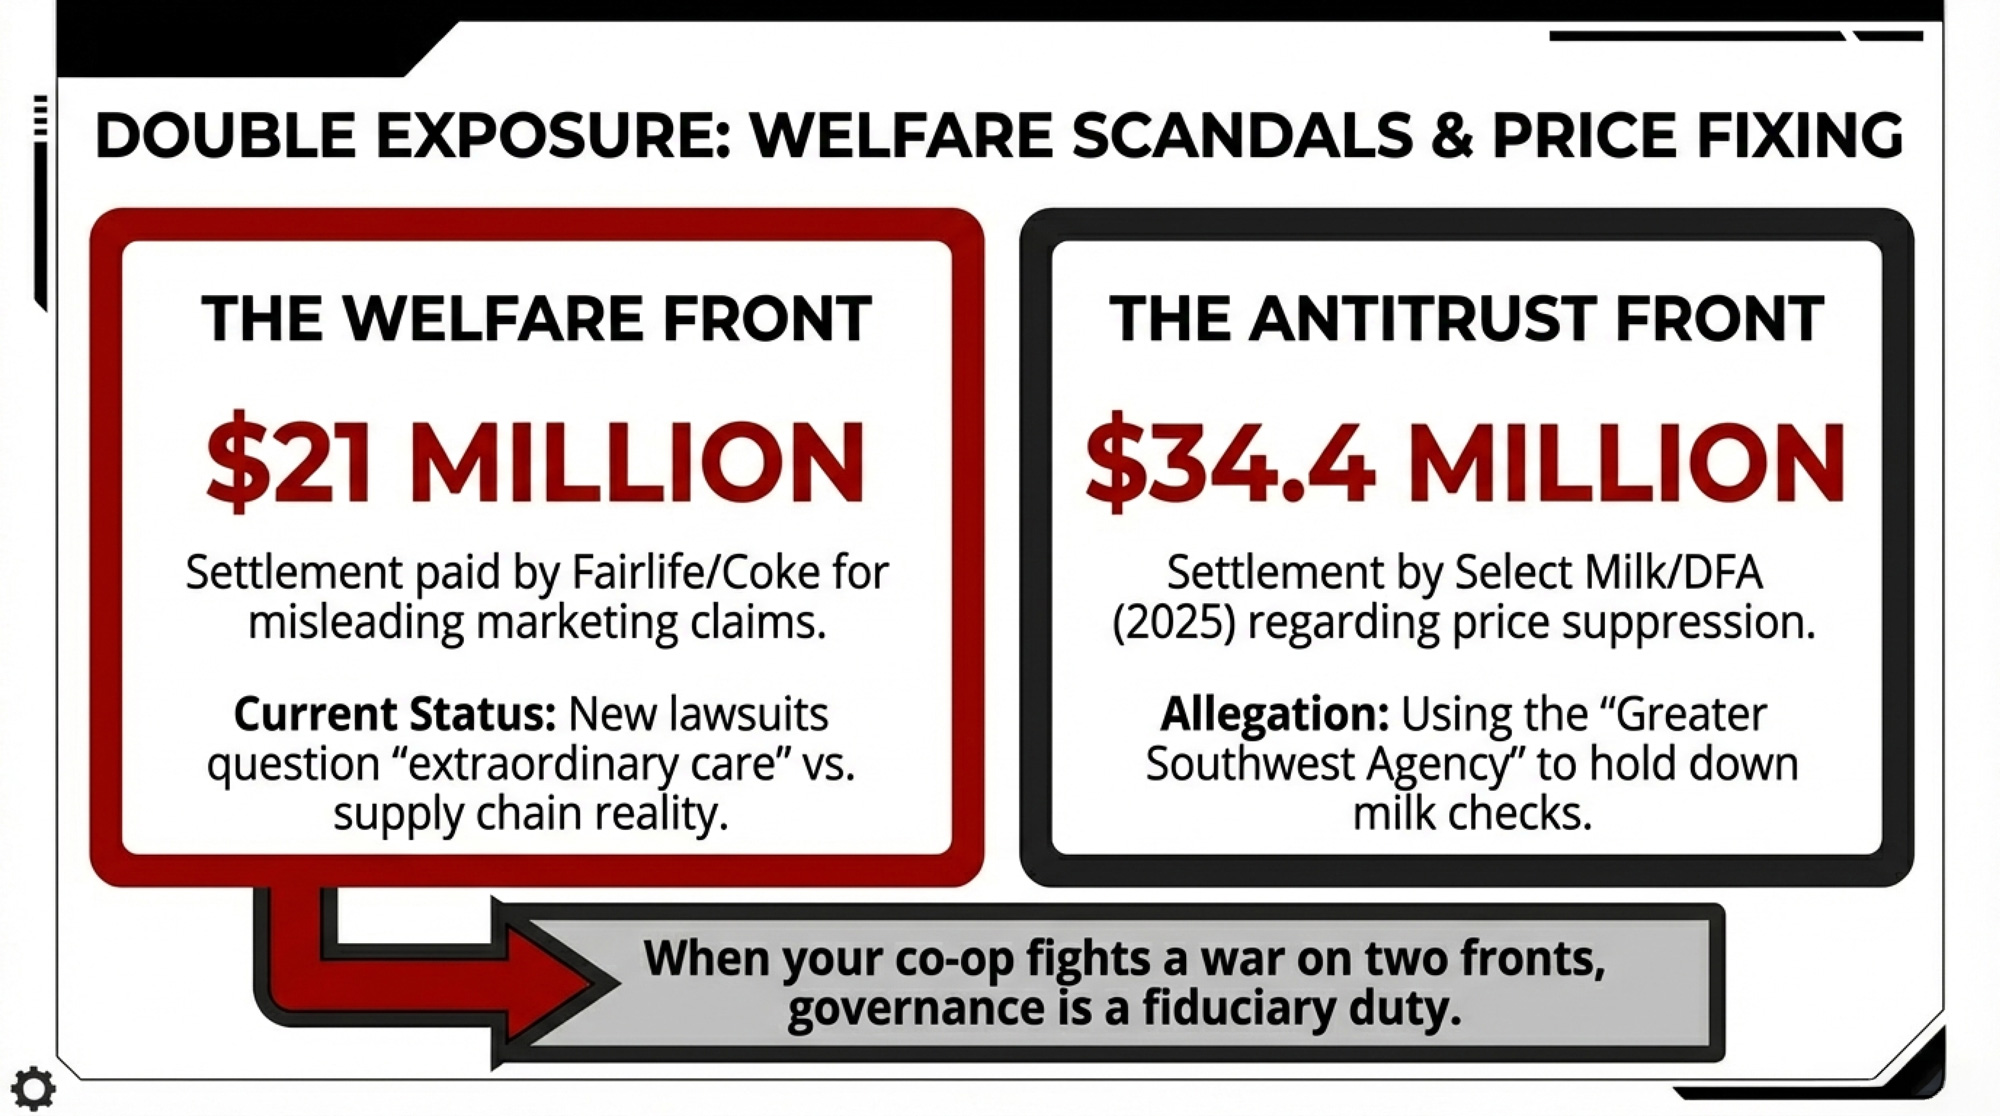
And the pattern isn’t limited to the Pacific Northwest. DFA has settled antitrust lawsuits in three separate regions: $50 million in the Northeast, $140 million in the Southeast, and $34.4 million in the Southwest — a combined $186+ million since 2013 (court records; Cheese Reporter, multiple years). Settling litigation is standard practice and doesn’t constitute an admission of wrongdoing — DFA has made that point explicitly in each case, stating it “steadfastly denied liability and mounted a vigorous defense.” But somebody still wrote a check.
Should You Lock Your Supply Agreement Before or After Your Construction Loan?
Before. Always before.
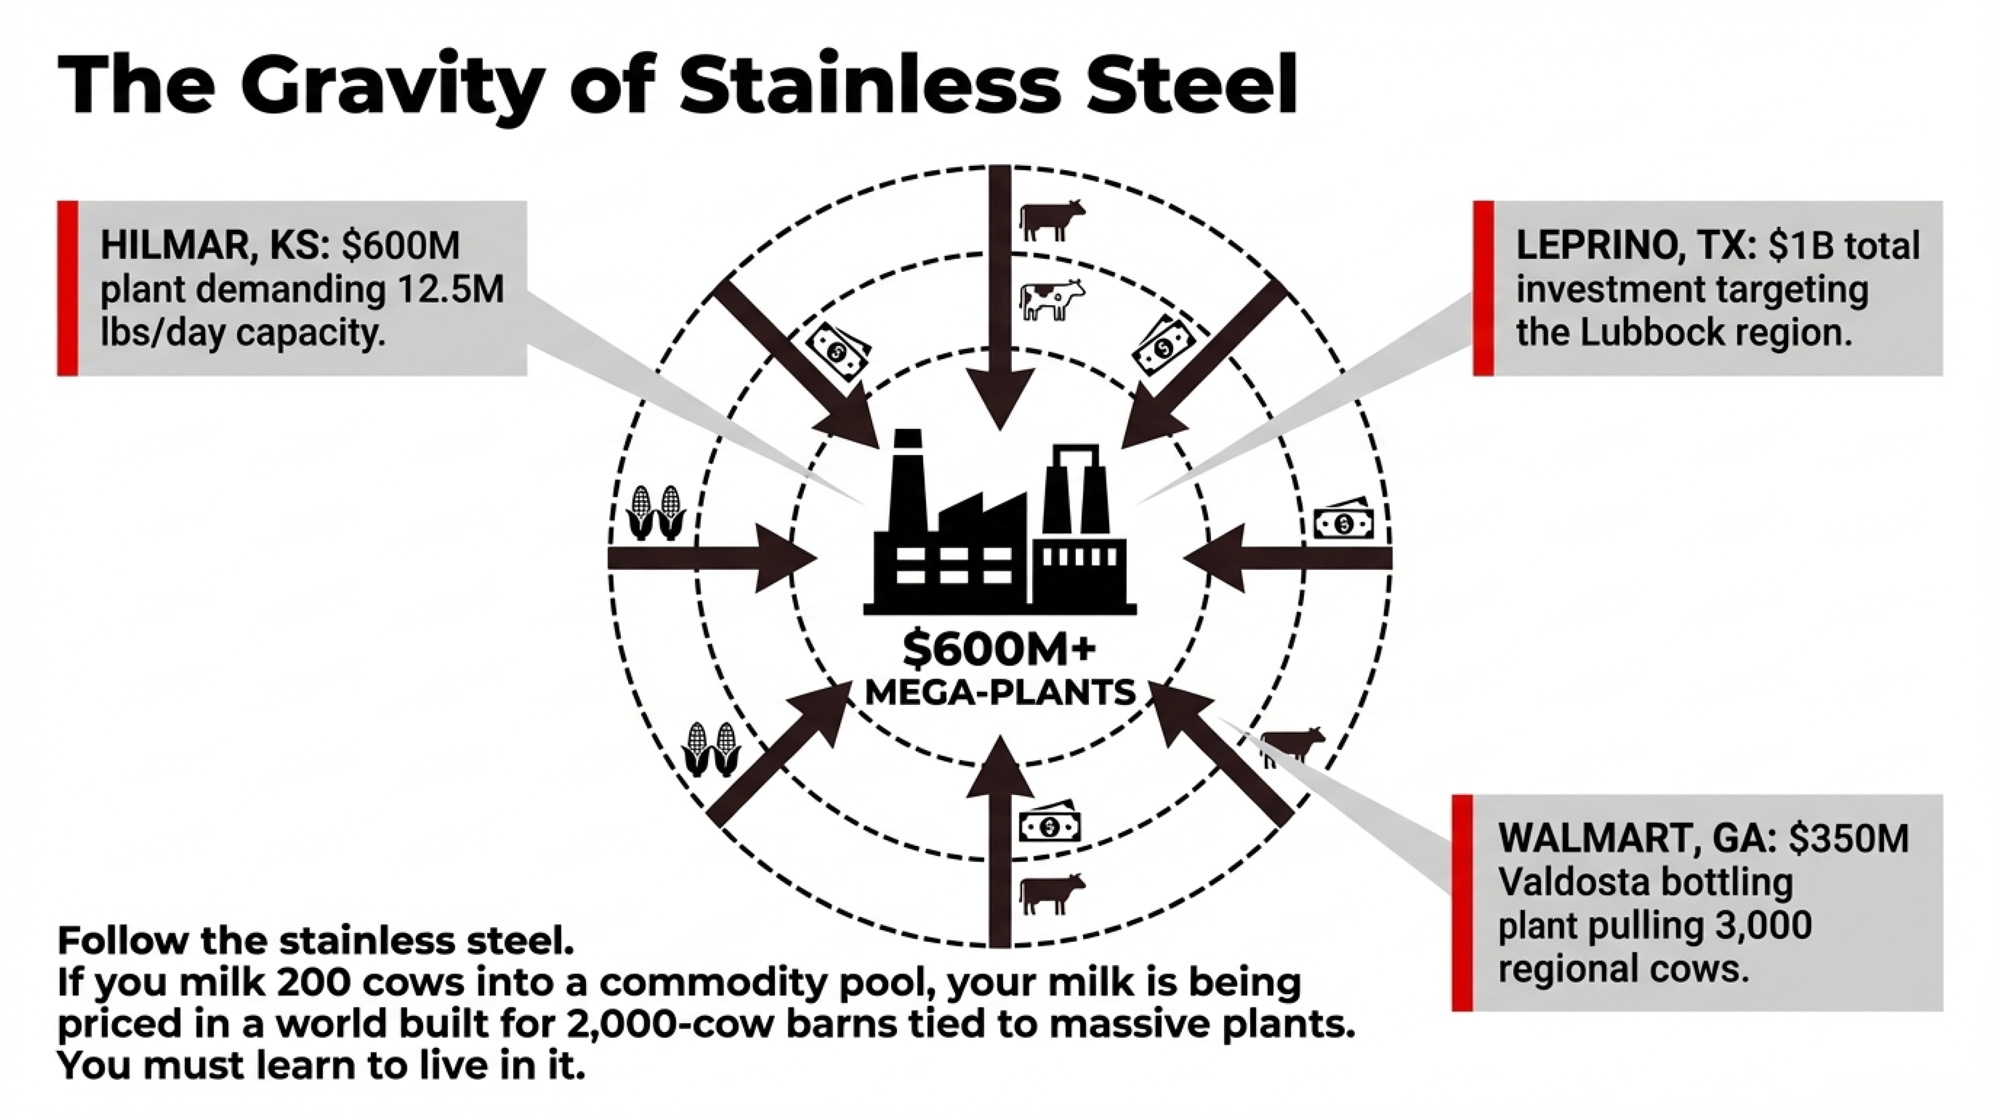
A 300-cow dairy looking at 1,000 cows has something processors need: roughly 18 million pounds of additional annual supply. Right now, that’s the story around places like Leprino’s new Lubbock cheese plant in Texas, Hilmar’s Dodge City facility in Kansas, and Chobani’s Twin Falls expansion — which alone will need an additional 6 million pounds of milk per day once it’s fully running.
But two clocks are running against you.
Plant utilization. Once those new plants reach roughly 85% capacity, the tone changes. CoBank has warned that as new cheese capacity in the Southern Plains fills by around 2027, competition for milk will cool and product prices will come under pressure. The first herd to sign has more leverage than the last.
Your loan closing. The day your construction loan funds, your lender expects a signed supply agreement. At that point, your processor knows you must have a buyer. Your negotiating position shifts from “we’re one of several attractive options” to “we can’t close this loan without you.”
The contract you’ll live under for five years — base period, over-base penalties, premiums, termination rules — should be negotiated while both clocks are still in your favor. Not as a rushed afterthought once the concrete trucks have come and gone.
What You Can Actually Do About This
Here’s where the data stops and your decisions start. Not every move fits every operation, but each one has a clear trigger, a trade-off, and a timeline.
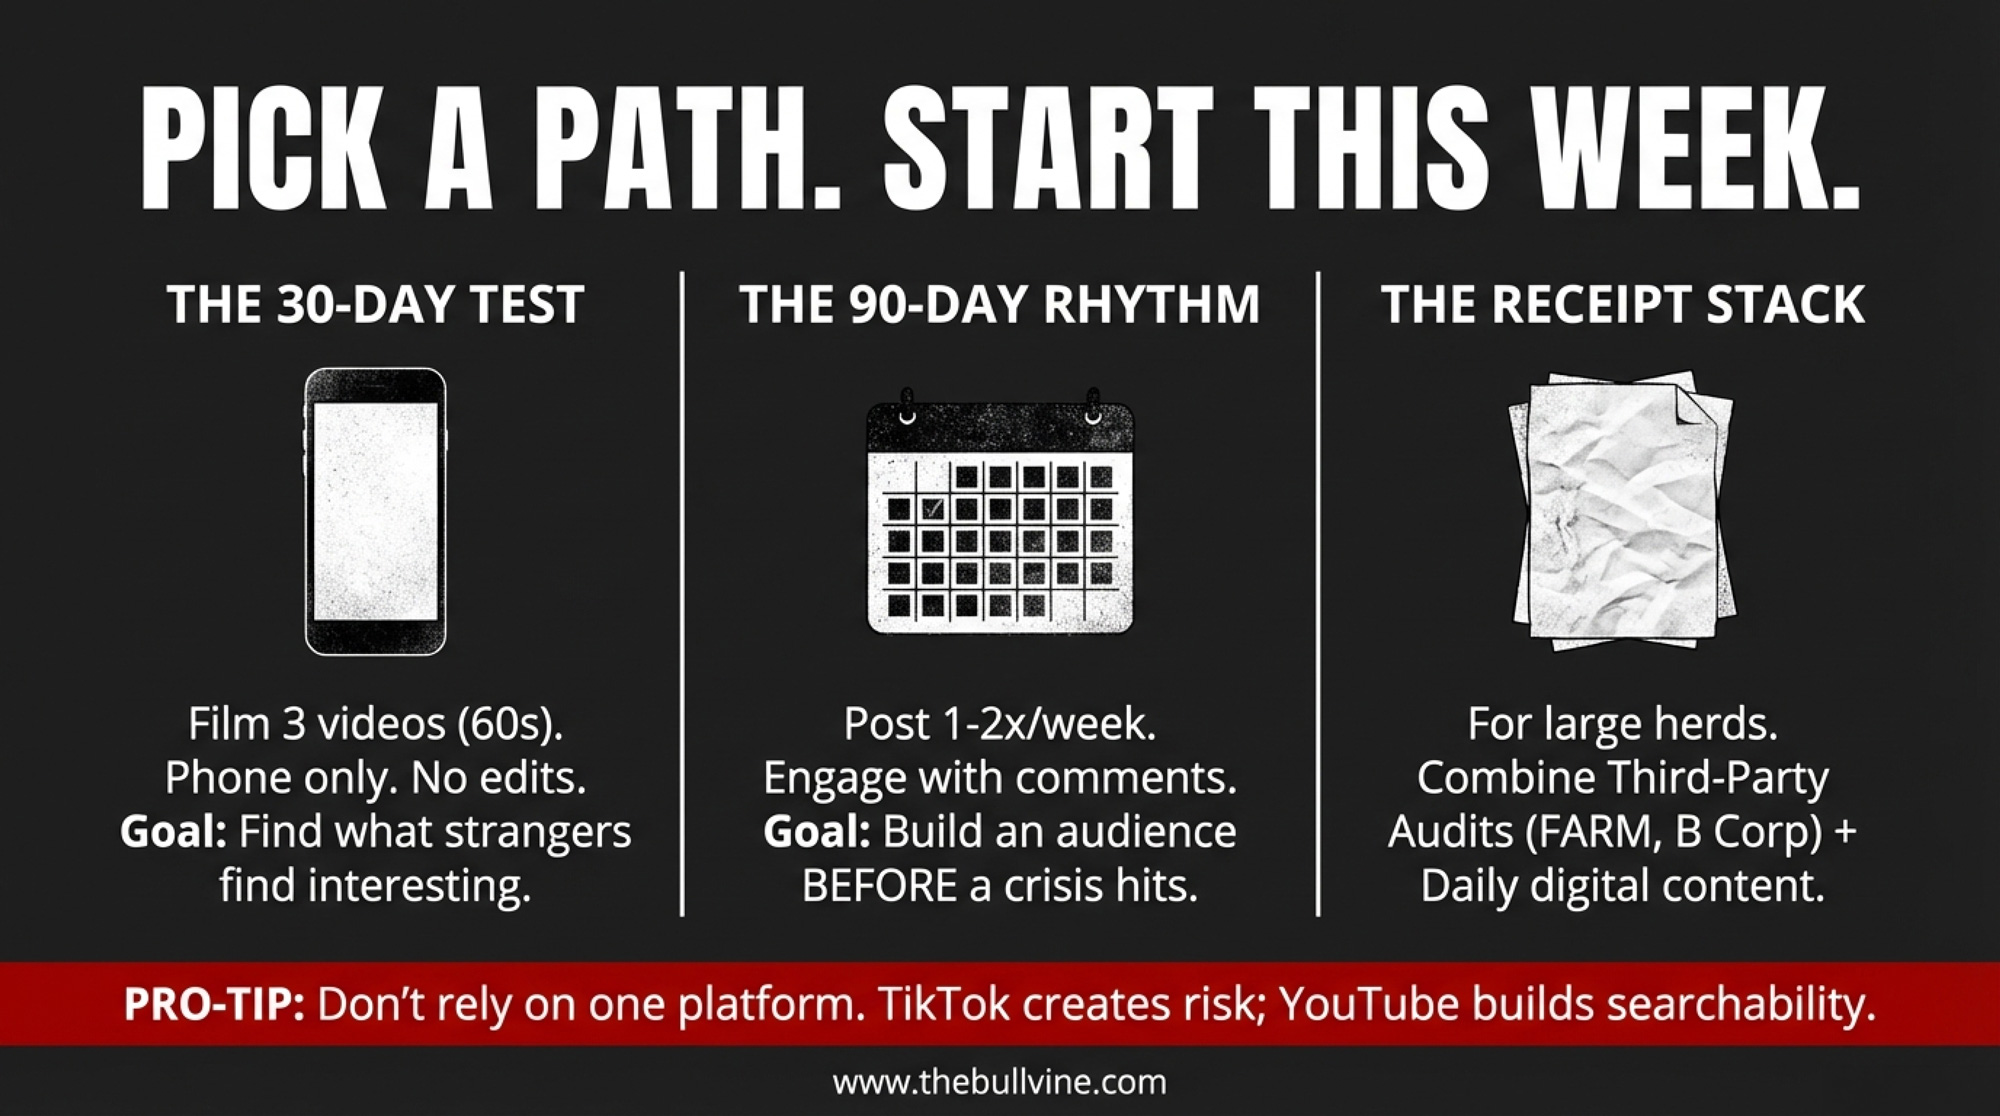
Next 30 Days: Map your processor options and take the map to your lender.
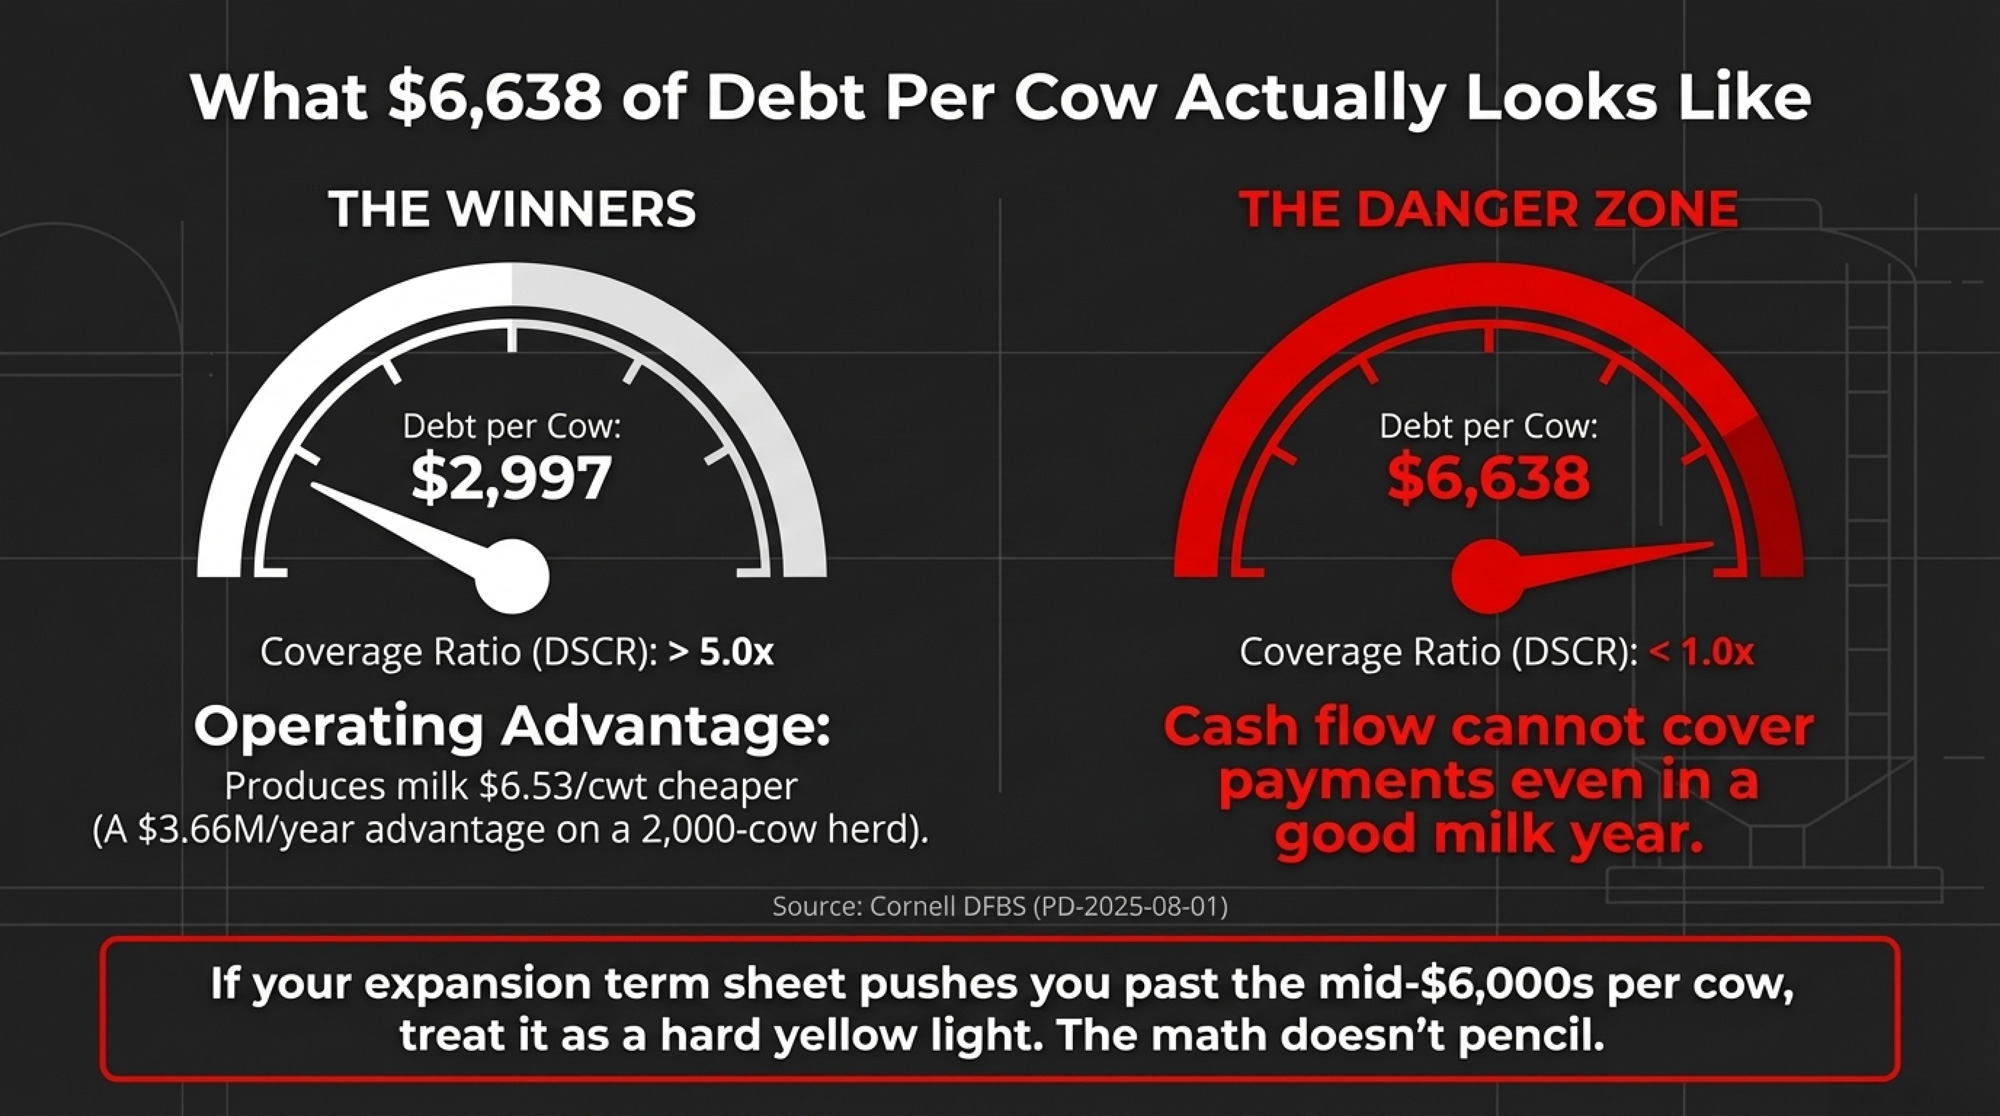
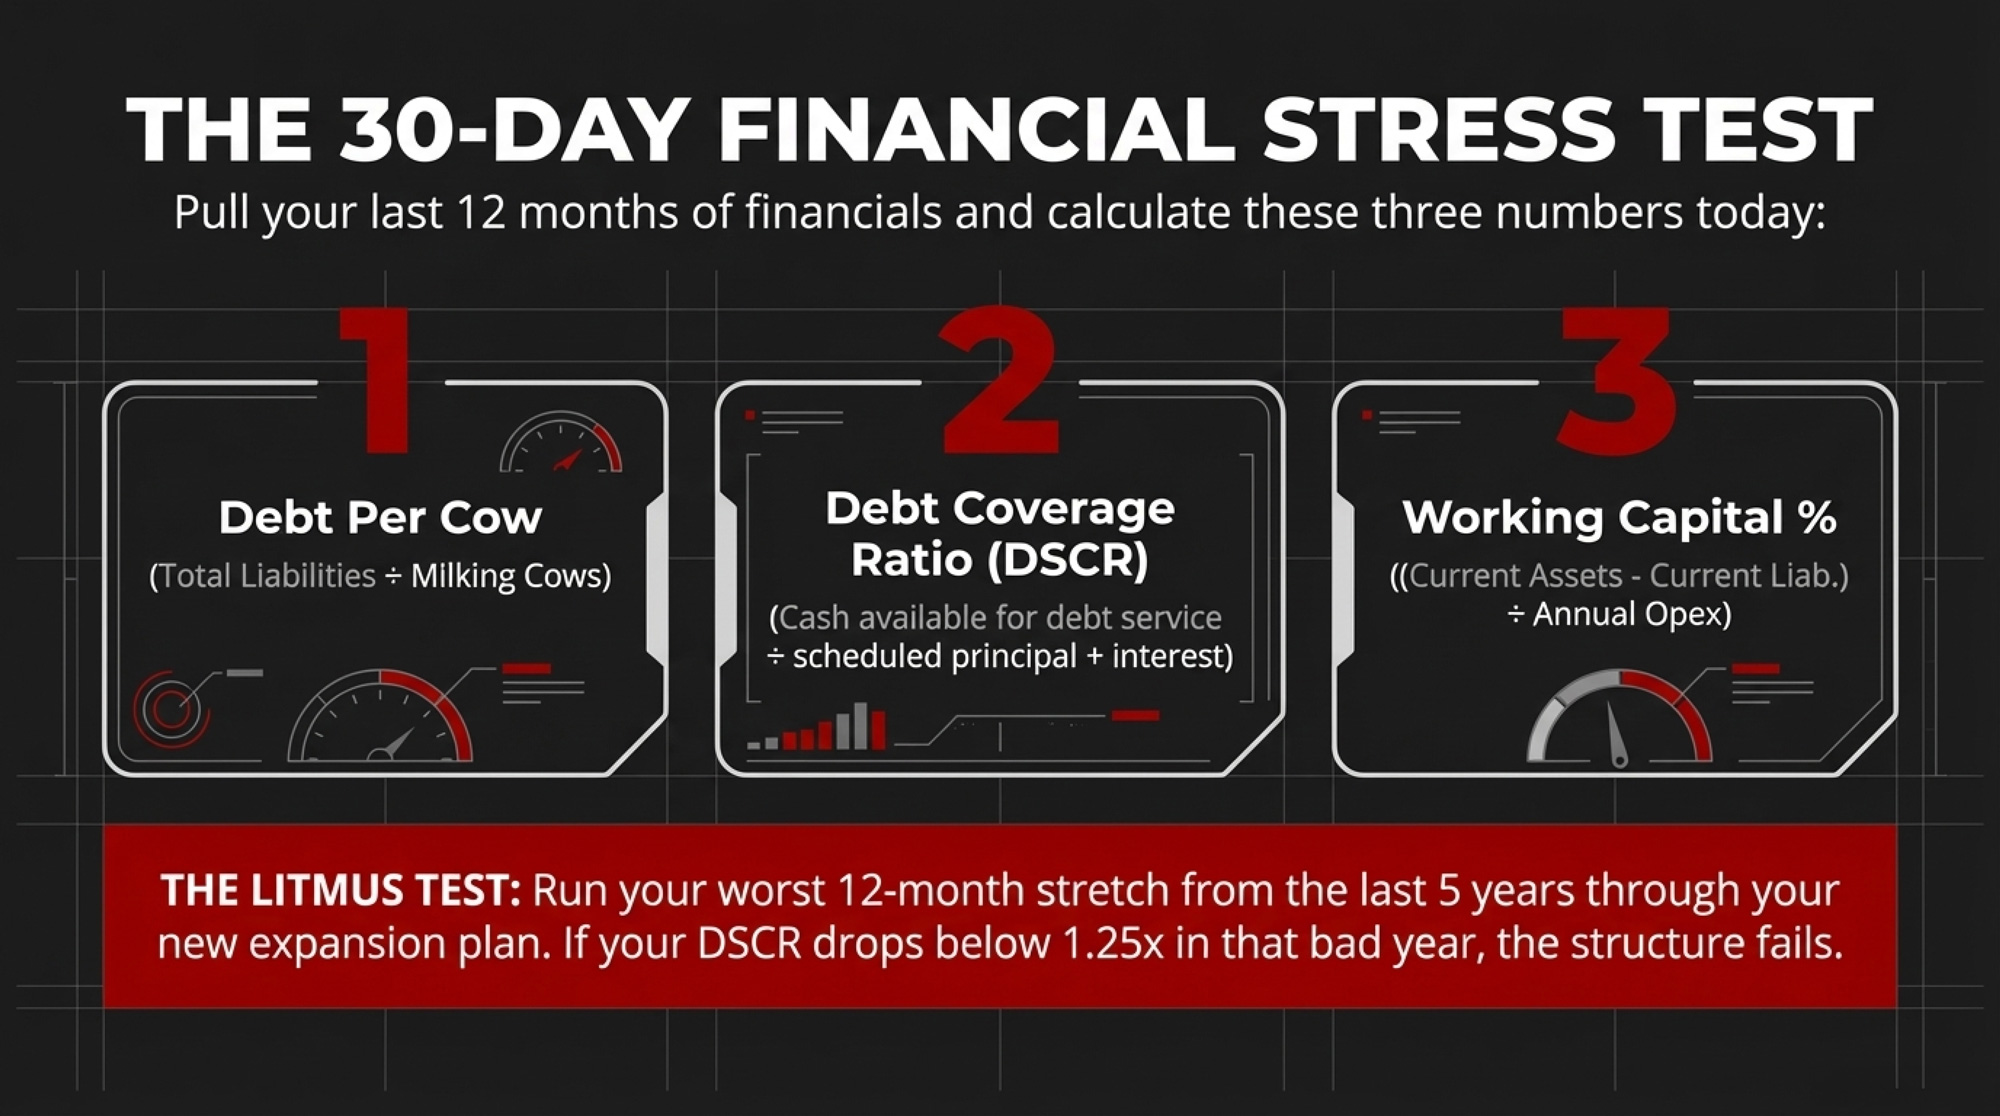
Set aside an afternoon. Pull a map and mark every plant within your realistic hauling radius: who owns it, what it makes, whether it’s expanding or shrinking. Count independent buyers, not just plant dots. If it’s one, that’s your biggest business risk — bigger than any single feed line. Lenders are starting to stress-test processor dependency alongside debt coverage, especially after 2025’s make-allowance shock and the Darigold overrun.
Walking into a loan review with a processor map signals that you understand your exposure. Suppose you’ve got two or three real options, which gives you room to negotiate. If you don’t, it justifies tighter risk management and more conservative debt.
The Lender Stress-Test Cheat Sheet
Bring these four questions to your next lender meeting:
“How much of our debt coverage depends on over-order premiums that could vanish if our buyer consolidates or restructures?”
“What is our Plan B if our primary plant issues a 12-month termination notice?”
“Based on the 2025 make-allowance shifts, what is our new break-even cost per hundredweight?”
“If our co-op levies a $2–4/cwt capital assessment — like Darigold did — for how many months can we service debt at that reduced pay price?”
Next 90 Days: If you’re expanding, lock your supply agreement before your construction loan closes.
Your leverage window is the 60–120-day period when new plants are still filling capacity, and you haven’t yet signed the building loan. Use it. Ask for a base period that moves with herd size, a clear over-base penalty cap, a symmetric termination notice, and a quality premium schedule fixed for at least 24–36 months. Farms that treat this like a formality end up signing whatever’s in front of them. Farms that treat it like a one-time leverage point can carve out terms that matter the next time prices roll over.
This Year: In single-buyer regions, treat DRP as a core defense.
If you can’t change your processor, you can still change your exposure. HighGround Dairy’s quarterly analysis shows DRP (Dairy Revenue Protection) covered about 32–33% of the U.S. milk supply in Q3–Q4 2024 (HighGround Dairy, 2024). In a competitive market, DRP is one more tool. In a captive market, it might be the only way to put a price floor under part of your check that doesn’t depend on your buyer’s goodwill. The key is to run DRP against your actual butterfat and protein, not a generic blend. A 20-minute meeting with a good agent can show you what 10–20% of protected revenue looks like compared to rolling the dice entirely on your local basis.
You gain a price floor, but you give up premium dollars and take on basis risk between the futures price and the DRP you cover. In a one-buyer region, that trade-off usually pencils. In a region with three competitive buyers already bidding up your premiums, it’s less clear-cut.
Ongoing: Push components that keep paying even when formulas shift.
Make allowances hit everyone, but high-component herds still come out ahead. Herds consistently above about 4.2% butterfat and 3.3% protein are seeing 50¢–$1.50/cwt in premiums that help offset structural hits they can’t control. That doesn’t fix consolidation. But your breeding and feeding decisions can either leave money on the table or claw some of it back.
Key Takeaways
If your processor map shows only one independent buyer within 100–150 miles, treat that as your top business risk. Everything else in your plan should assume that the buyer controls your basis.
If new deductions — hauling surcharges, co-op assessments, base-excess penalties — add up to more than $1/cwt compared to your 2023 statements, that’s a structural change, not a bad month. Revisit expansion plans and debt levels accordingly.
If you’re expanding and your supply agreement is being negotiated after your construction loan closes, you’ve already given up your best leverage. Flip the order.
If you’re in a single-buyer region and not using DRP on at least part of your volume, you’re carrying all the downside your buyer doesn’t want. Run the numbers on one or two coverage levels before your next quarterly enrollment.
If your co-op can approve nine-figure plant projects without a member vote on cost-control terms, assume your future milk checks are potential collateral. Ask for fixed-price contract disclosure and a written cost cap before the next build — not after the overrun.
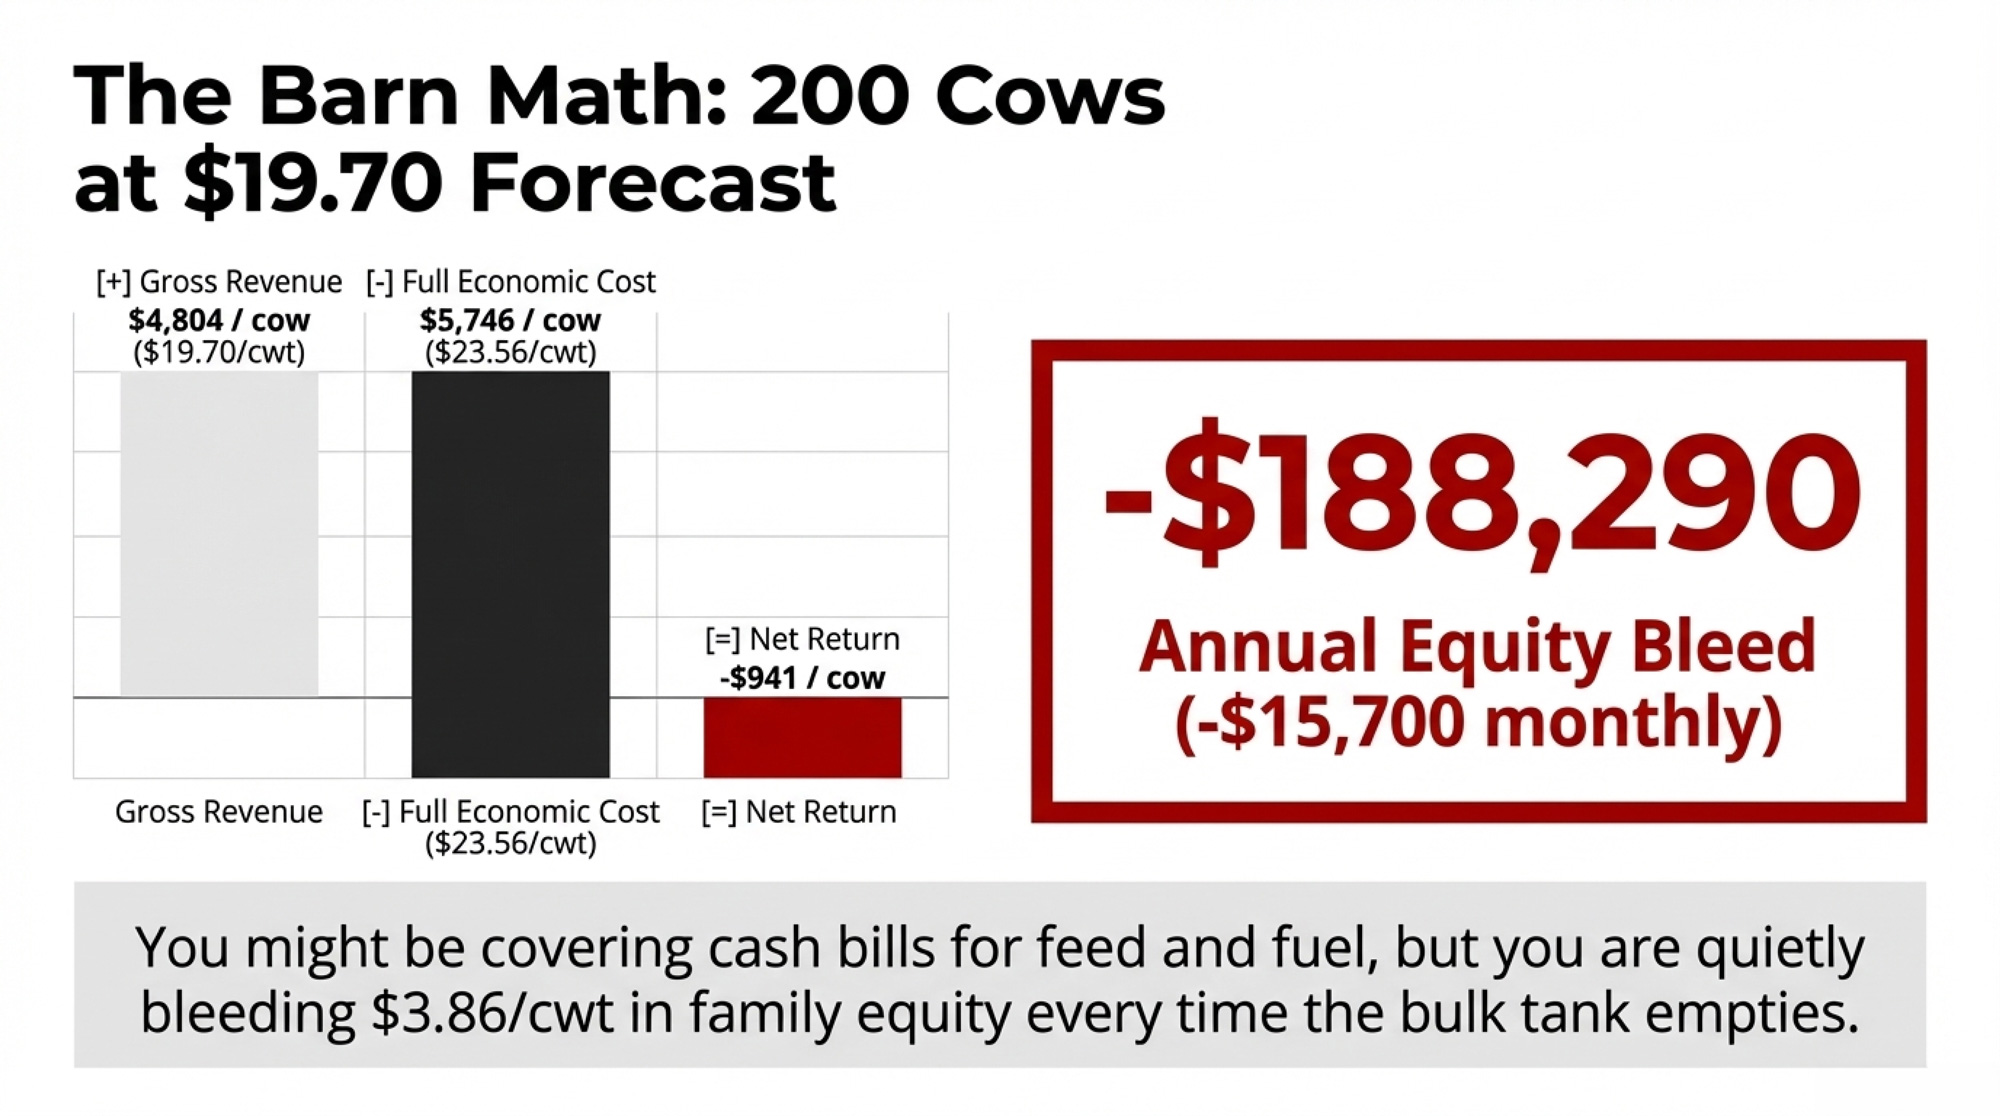
If your 3-to-5-year plan only works at $22–23/cwt with healthy premiums, it’s not a plan. Model your numbers at $18–21/cwt with no over-order premiums and see if the pencils still sharpen.
Where does your farm sit on this leverage map — competitive, moderate, or captive? That’s not an abstract policy question. It’s whether your next expansion, your next loan renewal, and your next contract negotiation assume you have options or admit you don’t.
The make-allowance drag, the co-op capital calls, and the processor build-out aren’t going away. The real question is whether your numbers, contracts, and risk tools align with the reality of who can actually bid on your milk.
Complete references and supporting documentation are available upon request by contacting the editorial team at editor@thebullvine.com.
More Milk, Fewer Farms, $250K at Risk: The 2026 Numbers Every Dairy Needs to Run – Secure a long-term competitive advantage by mastering the “more milk, fewer farms” era. This strategic breakdown delivers essential margin-protection tactics, helping you choose a profitable path before market consolidation decides your future for you.
The Robot Revolution: Transforming Organic Dairy Farms with Smart Tech in 2025 – Gain a disruptive edge by integrating robotic milking and AI-driven feeding systems into your operation. This analysis exposes how smart technology can reduce waste by 30%, driving efficiency gains that offset narrowing processor margins.
The Sunday Read Dairy Professionals Don’t Skip.
Every week, thousands of producers, breeders, and industry insiders open Bullvine Weekly for genetics insights, market shifts, and profit strategies they won’t find anywhere else. One email. Five minutes. Smarter decisions all week.
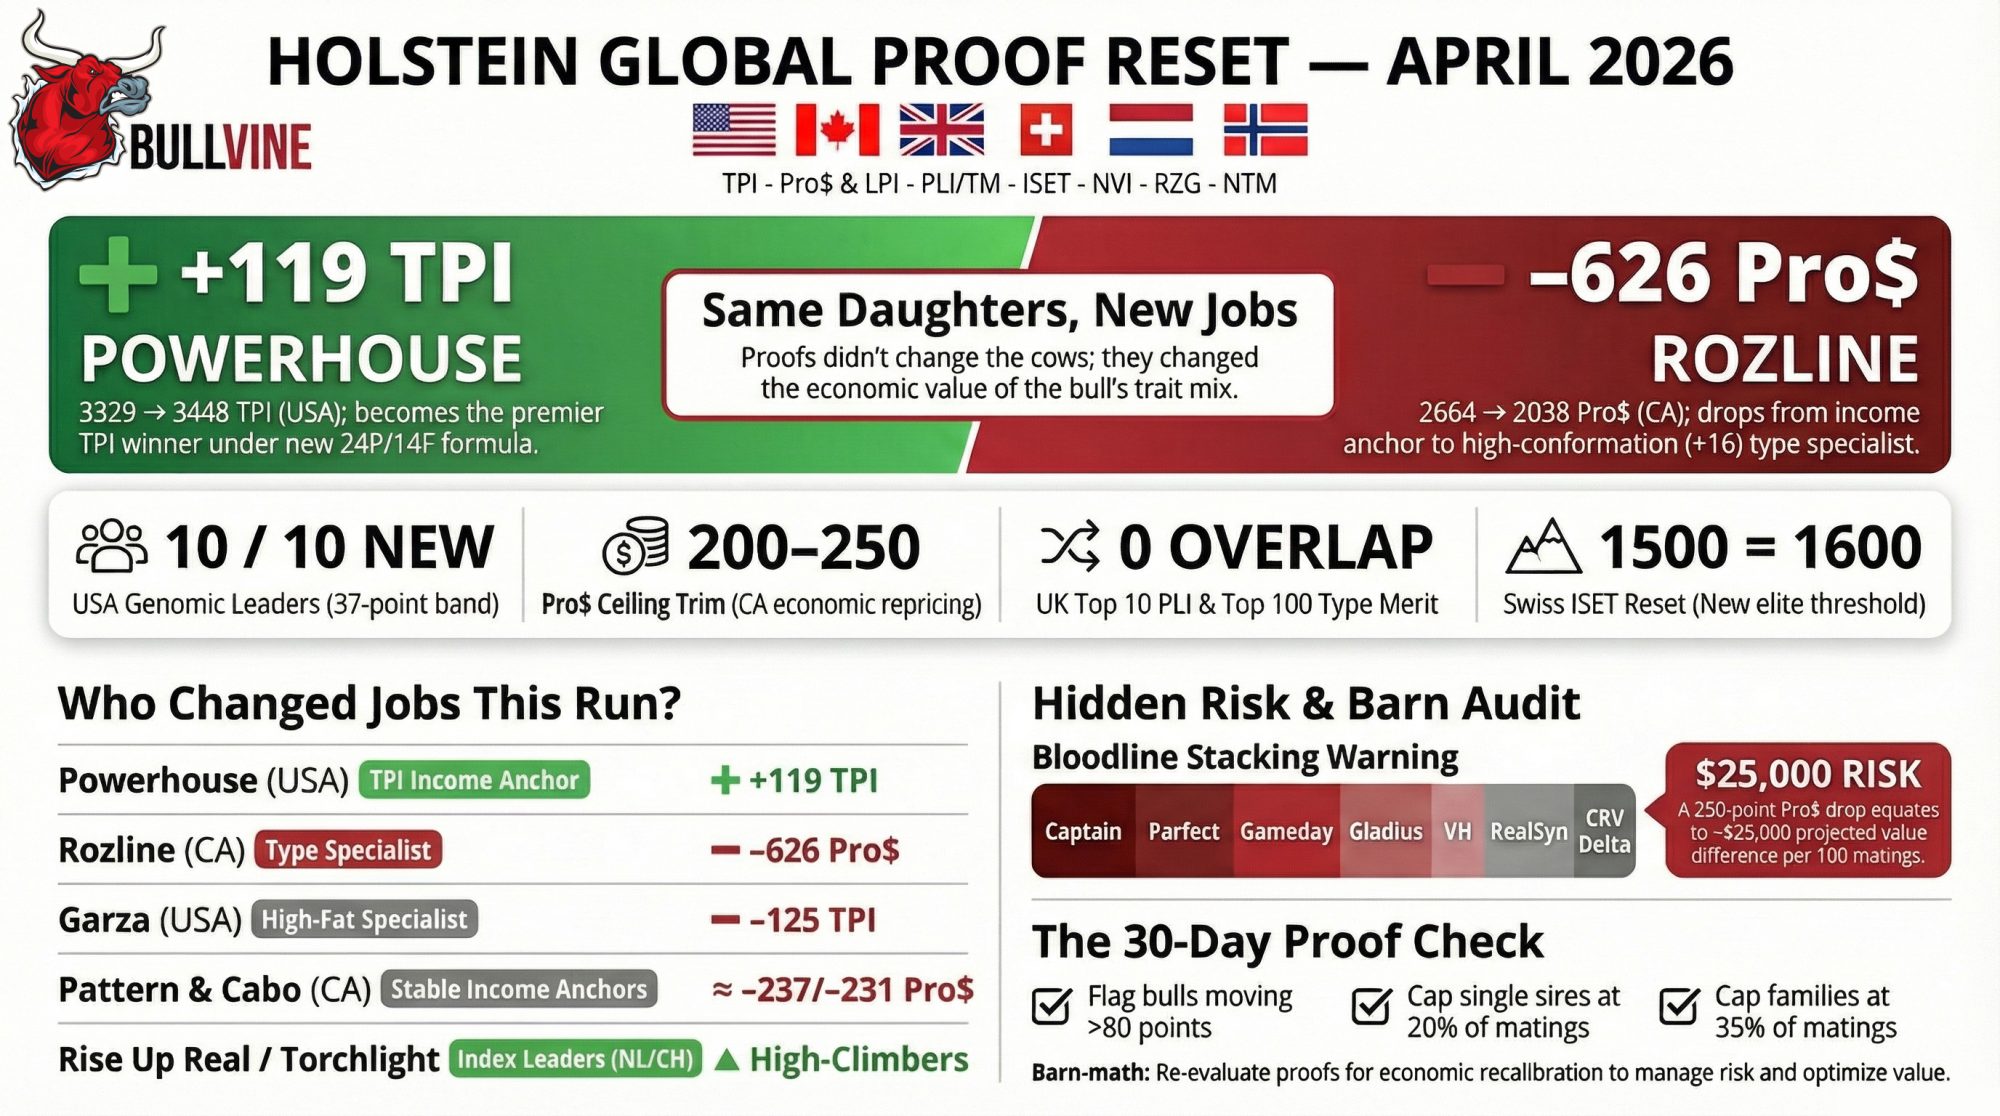
One bull climbed 119 TPI, another lost 626 Pro$, and a few “safe” favorites quietly slid out of the money.
The proofs landed on a cold April morning, and by the time the printer stopped spitting out pages, one thing was obvious at a 450‑cow Wisconsin freestall herd we chatted with: the semen in their tank no longer matched the numbers on the sheets. Powerhouse had just picked up 119 TPI under the new US protein formula, while Rozline had shed 626 Pro$ in Canada.
Same bulls. Same daughters milking in their barns. But in one proof run, their jobs changed. This is the story of how that happened — and what you can realistically do in the next 30 days so you’re not breeding April 2026 calves with December 2025 math.
“Did We Just Spend Our Semen Budget on Yesterday’s Bulls?”
That Wisconsin herd had done what a lot of us do. The winter order leaned into bulls that felt like “safe bets”: Peak Powerhouse‑ET on the US side for TPI and Siemers Renegade Rozline‑ET for Canadian Pro$ and LPI with type.
On paper, in December, that plan made sense. Powerhouse sat at 3329 TPI, Rozline at 2664 Pro$ and 3947 LPI, and both were plastered all over catalog covers.
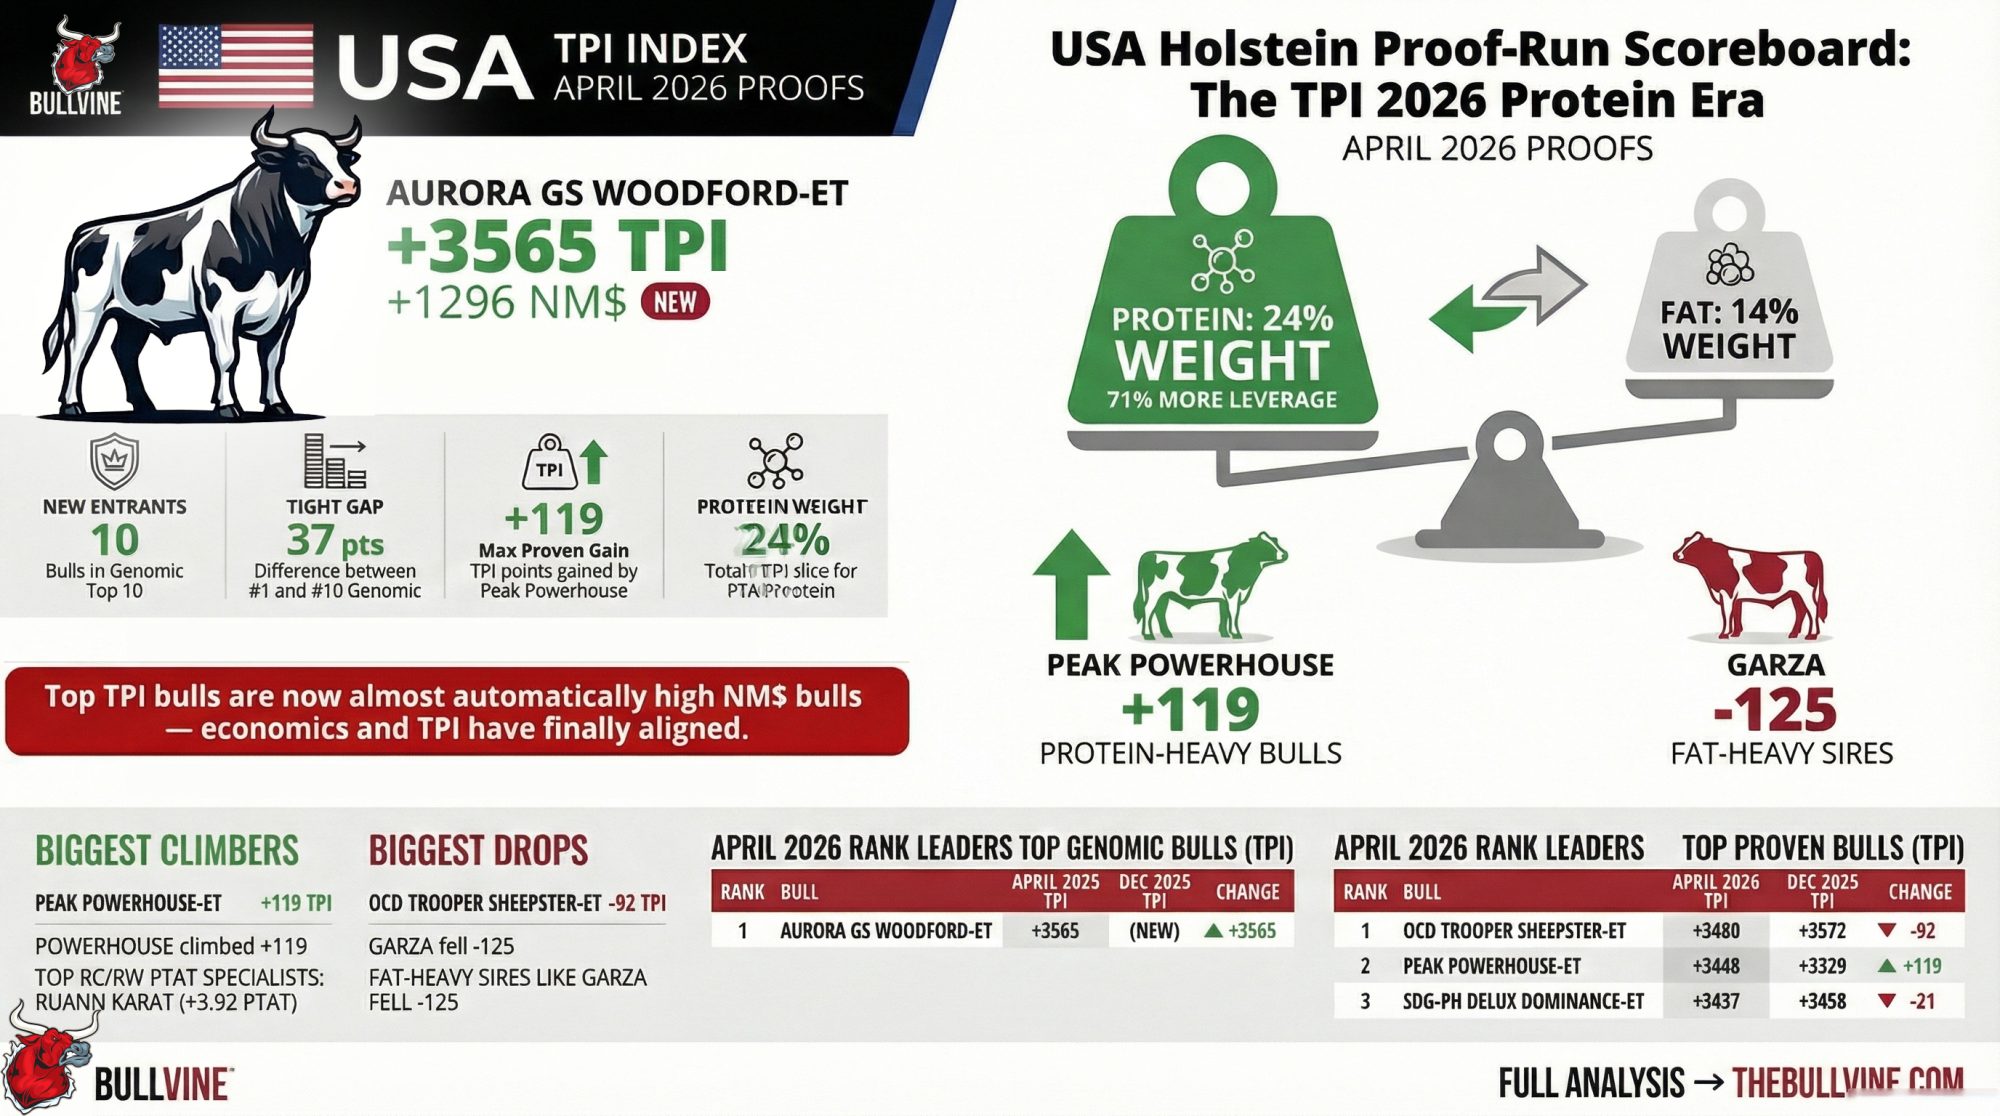
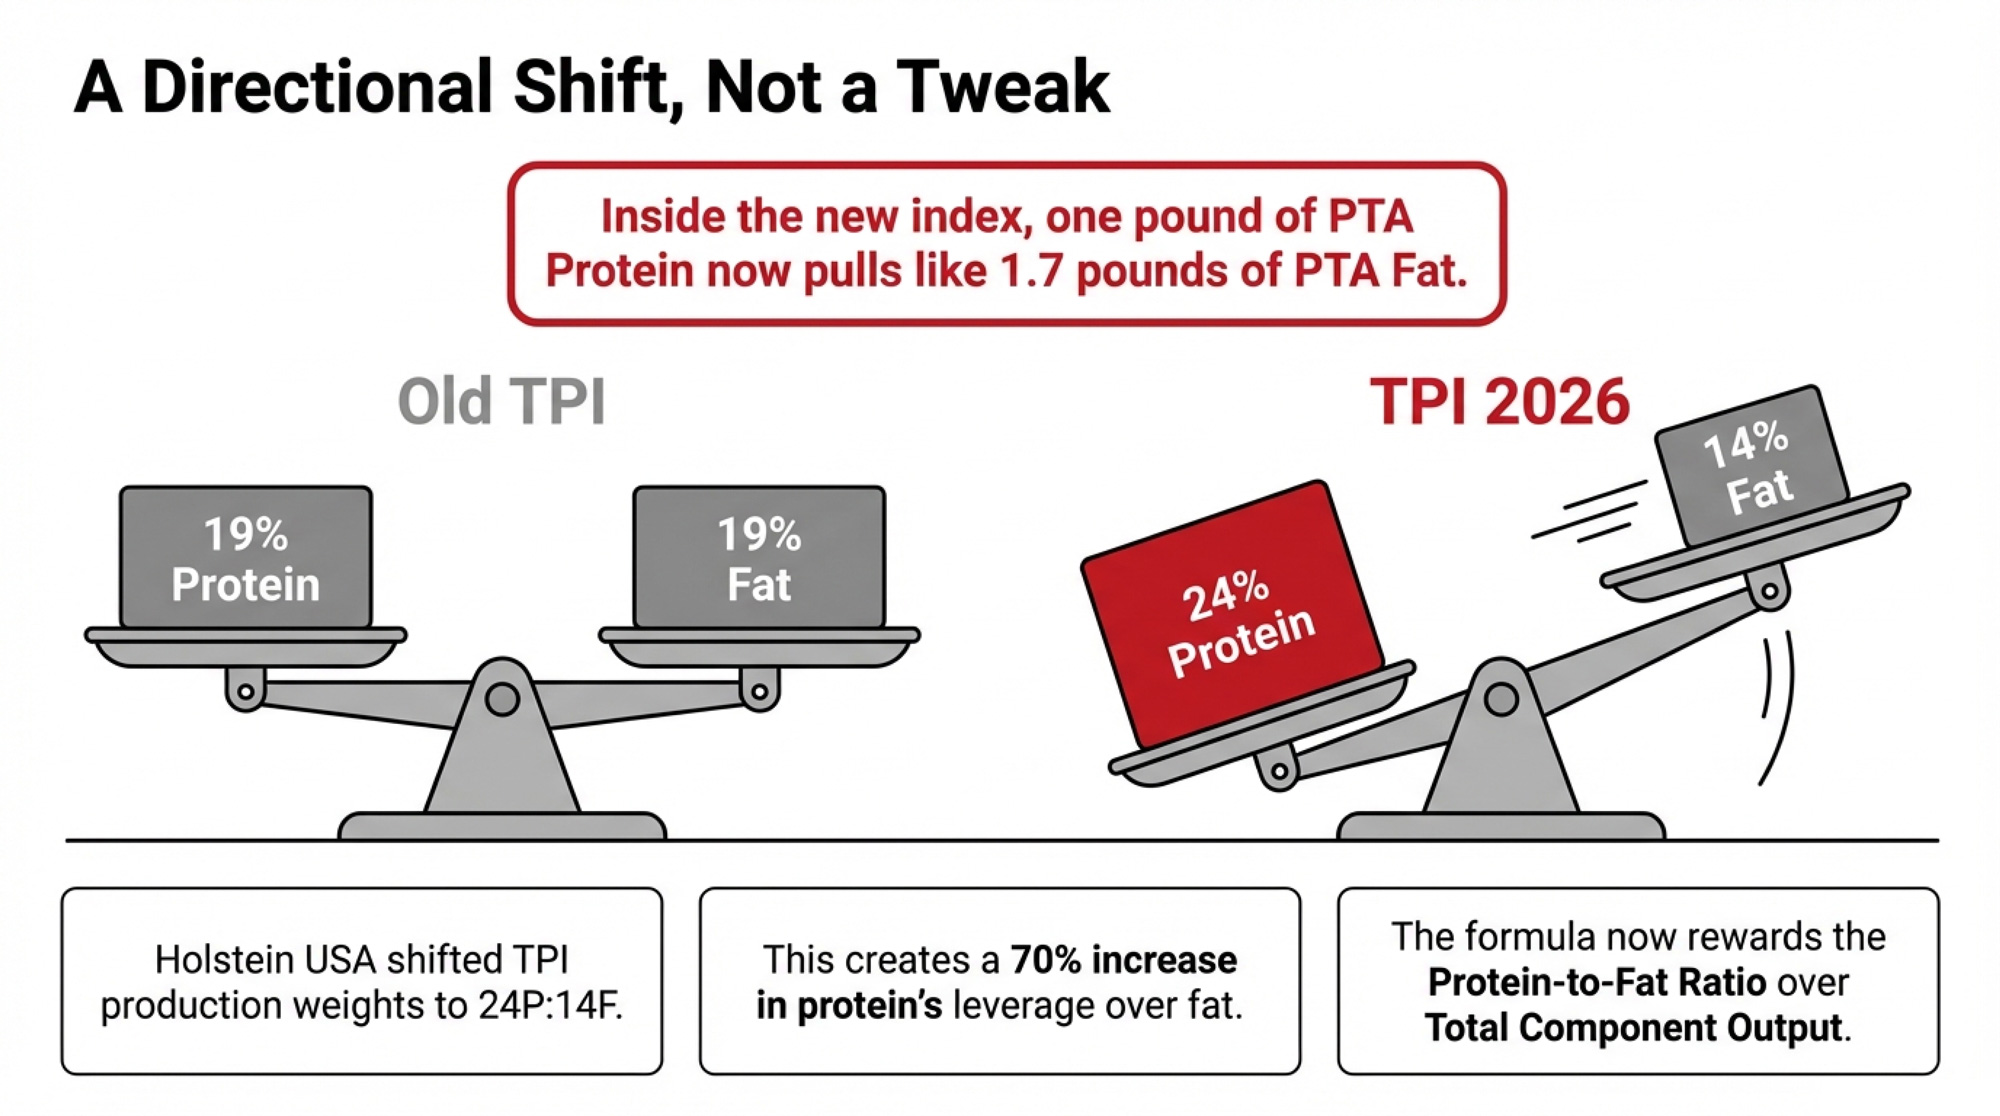
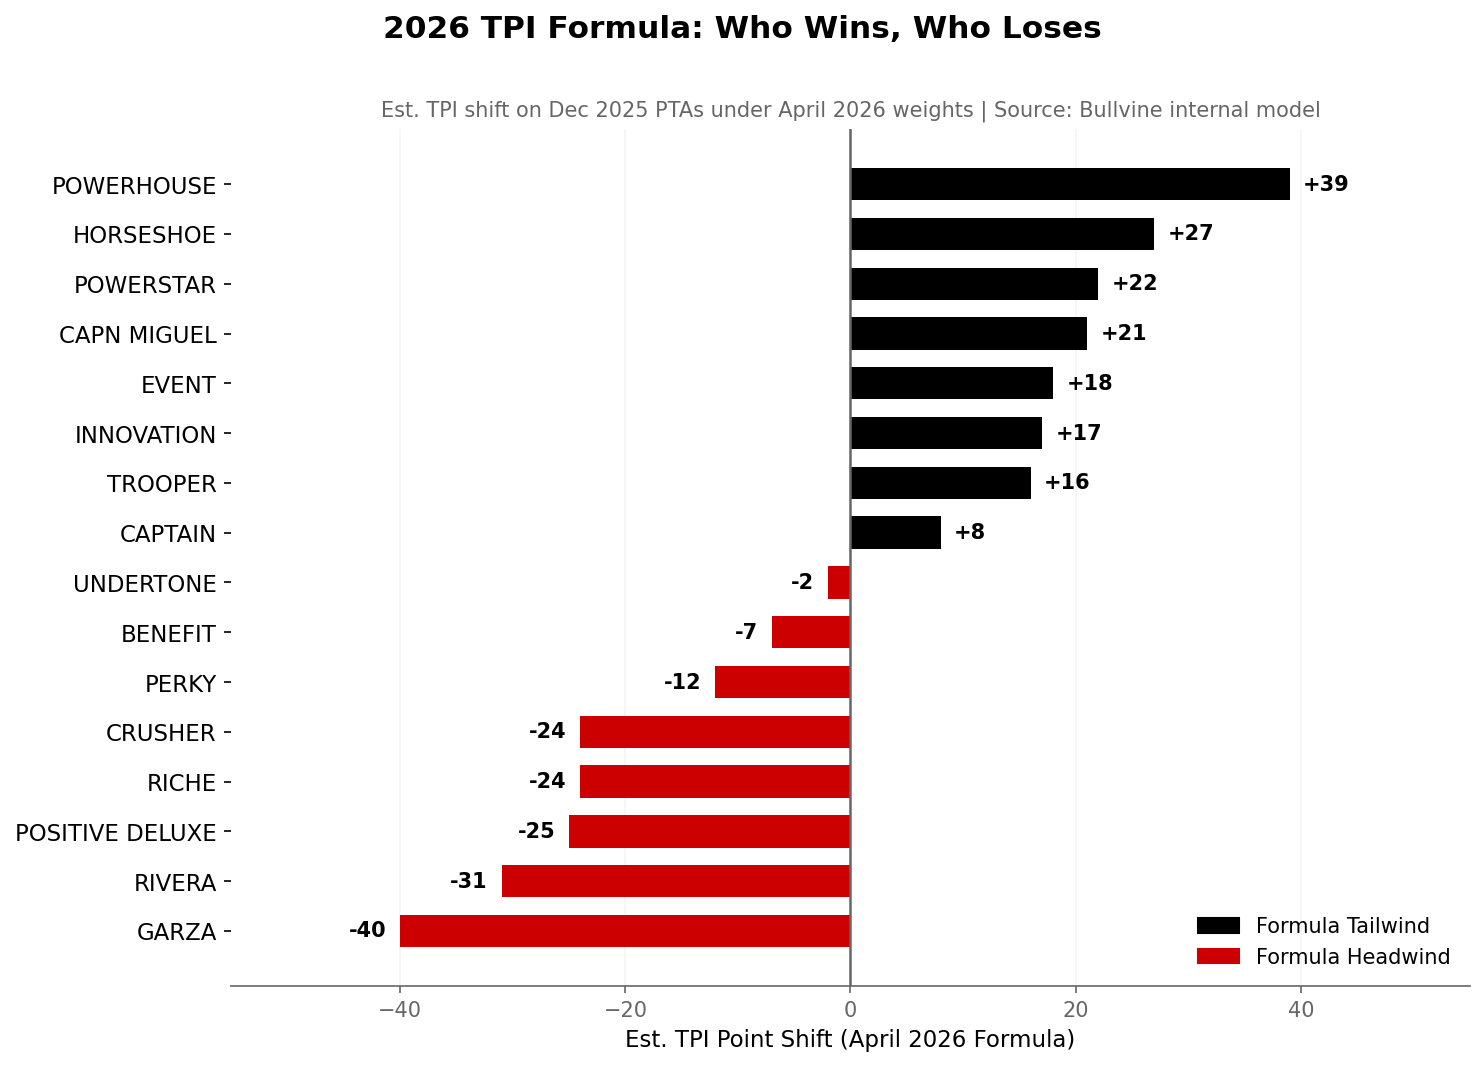
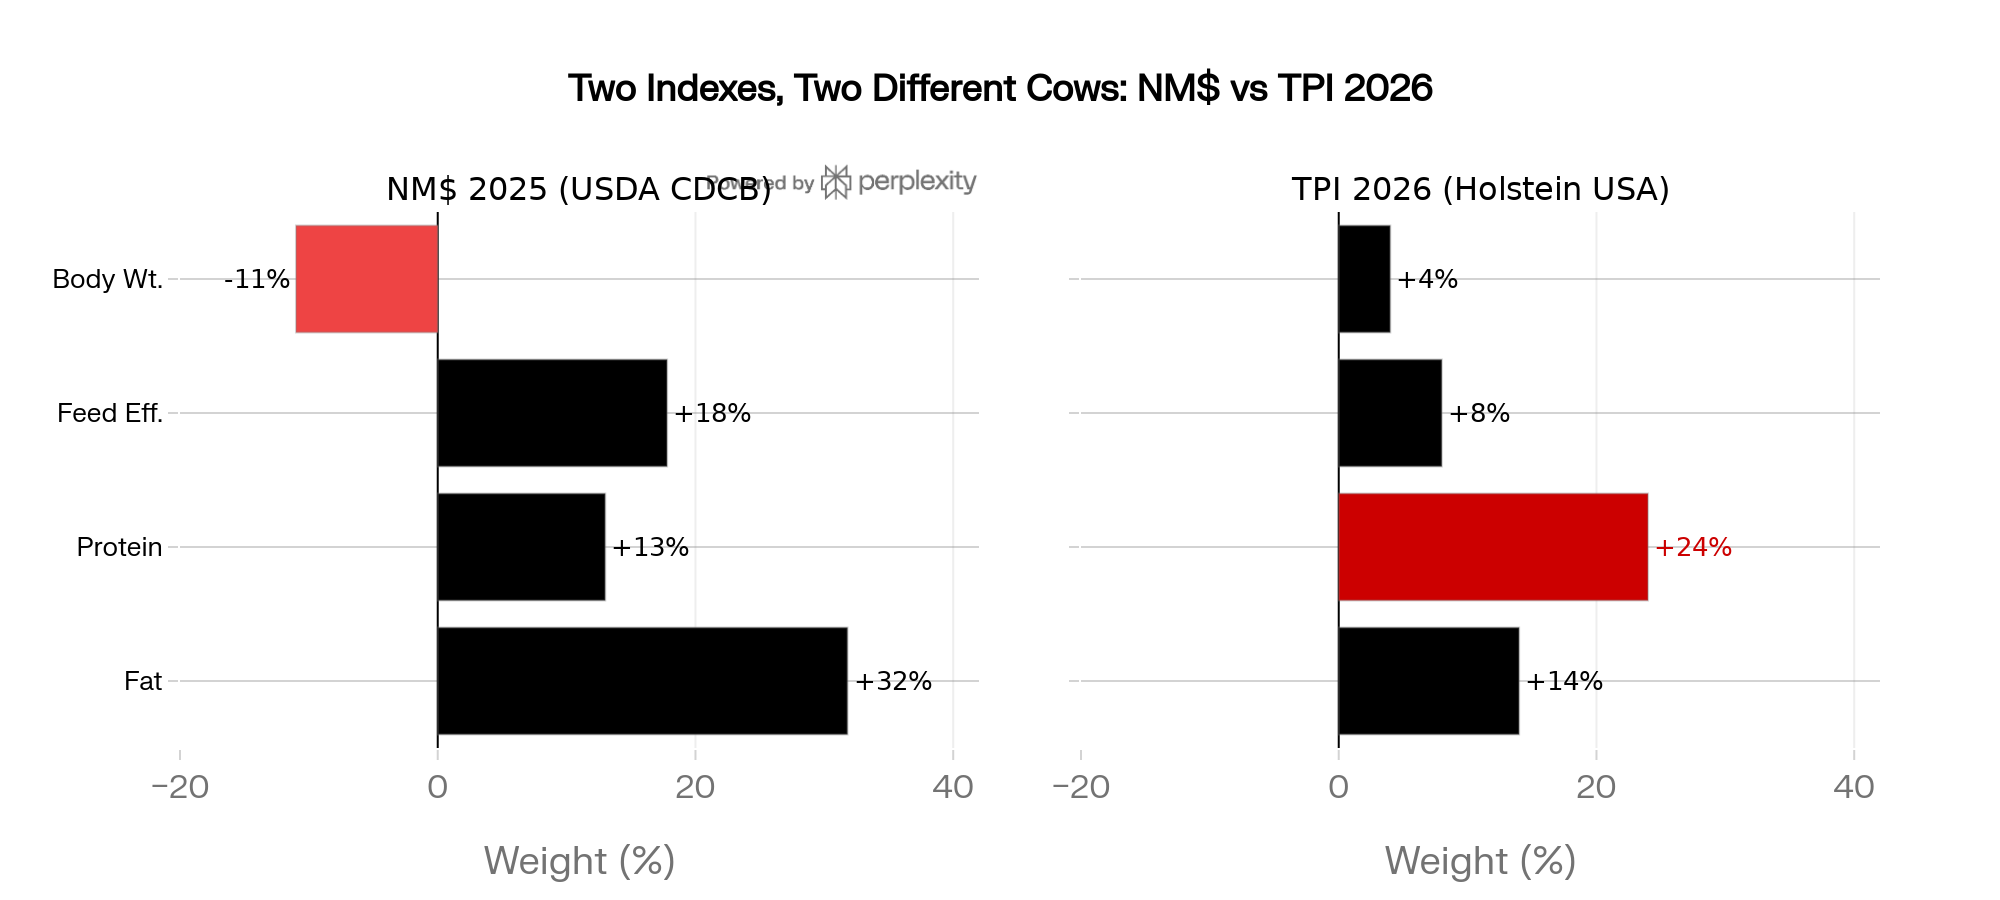
Then April hit. Holstein USA rolled out the TPI 2026 formula with 24% weight on PTA Protein and 14% on PTA Fat, shifting five percentage points of production weight from fat to protein. That single change lifted Powerhouse from 3329 to 3448 TPI (+119) and knocked fat‑heavy bulls like SDG Cap Garza‑ET down –125 TPI (3464 → 3339).
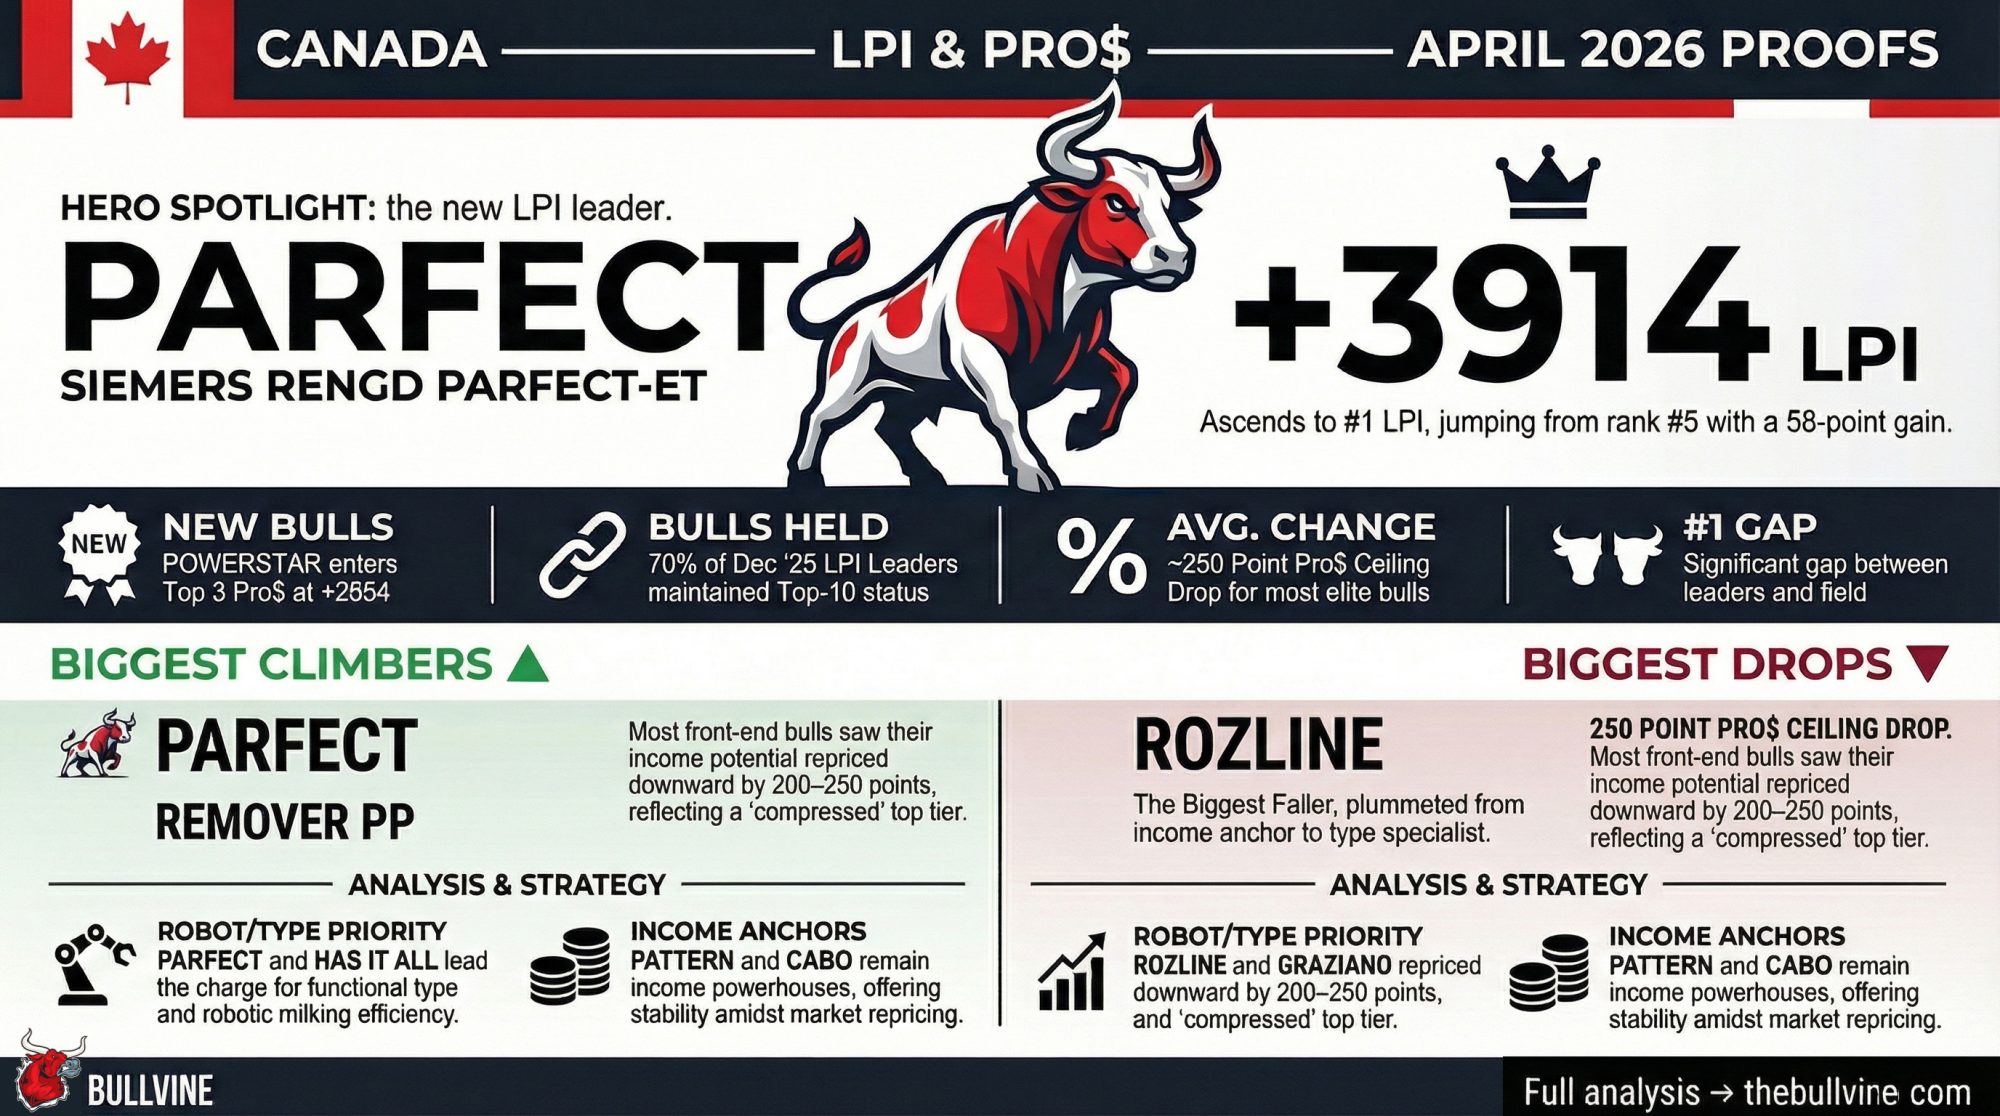
North of the border, Canada’s April 2026 run trimmed the Pro$ ceiling by roughly 200–250 points for most front‑end bulls — and a lot more for Rozline. Progenesis Pattern‑ET held #1 Pro$ at 2974, but still dropped –237 Pro$; Denovo 16034 Cabo‑ET fell –231 Pro$ to 2877. Rozline took the biggest hit, sliding from 2664 to 2038 Pro$ (–626) and from 3947 to 3810 LPI (–137), dropping from #1 to #9 LPI.
The proofs didn’t change how that breeder felt about the daughters. They did change how comfortable he was betting big semen checks on those bulls for the next calf crop.
One Global Run, Eight Different Messages
The April 2026 Holstein proof run isn’t one neat headline. It’s eight different proof systems pulling on the same straw box in their own way. Here’s the short tour before we get into what you do about it in your herd or ET program.
Bull
Country / Index
Dec 2025 Value
Apr 2026 Value
Change (Dec 2025 → Apr 2026)
Formula Verdict
!WINNER Peak Powerhouse-ET
USA / TPI
3329 TPI
3448 TPI
+119 TPI
Protein flip winner — 92 Pro vs 113 Fat rewarded
!LOSER SDG Cap Garza-ET
USA / TPI
3464 TPI
3339 TPI
−125 TPI
!RISK Extreme fat bias; demoted from anchor
!LOSER Siemers Renegade Rozline-ET
Canada / Pro$
2664 Pro$
2038 Pro$
−626 Pro$
Repriced; type specialist only
!LOSER Siemers Renegade Rozline-ET
Canada / LPI
3947 LPI
3810 LPI
−137 LPI
Dropped #1 → #9 LPI
!LOSER Winstar Graziano-ET
Canada / Pro$
3099 Pro$
2655 Pro$
−444 Pro$
Dropped #3 → #81 Pro$
!WINNER Siemers Rengd Parfect-ET
Canada / LPI
3856 LPI
3914 LPI
+58 LPI
Took #1 LPI from Rozline
!LOSER Peak AltaSeverus
UK / PLI
764 PLI
596 PLI
−168 PLI
Daughter data correction; demoted
!WINNER Peak Powerhouse-ET
UK / PLI
746 PLI
768 PLI
+22 PLI
Climbed to proven #1 PLI
!LOSER TGD-Holstein Beautyman
CH / ISET
1586 ISET
1427 ISET
−159 ISET
Fell out of top 20; niche type tool only
!WINNER Progenesis Torchlight
CH / ISET
1584 ISET
1519 ISET
— raw pts (new scale)
Recalibrated #1; production-fit formula winner
!WINNER Rise Up Real
NL / NVI
410 NVI
468 NVI
+58 NVI
Longevity-driven surge to genomic #1
!WINNER Genosource Captain
NL / NVI (proven)
289 NVI
363 NVI
+74 NVI
Daughters confirmed; jumped #9 → #2 proven
!WINNER Crisalis RF
Italy / gPFT
5180 gPFT
5247 gPFT
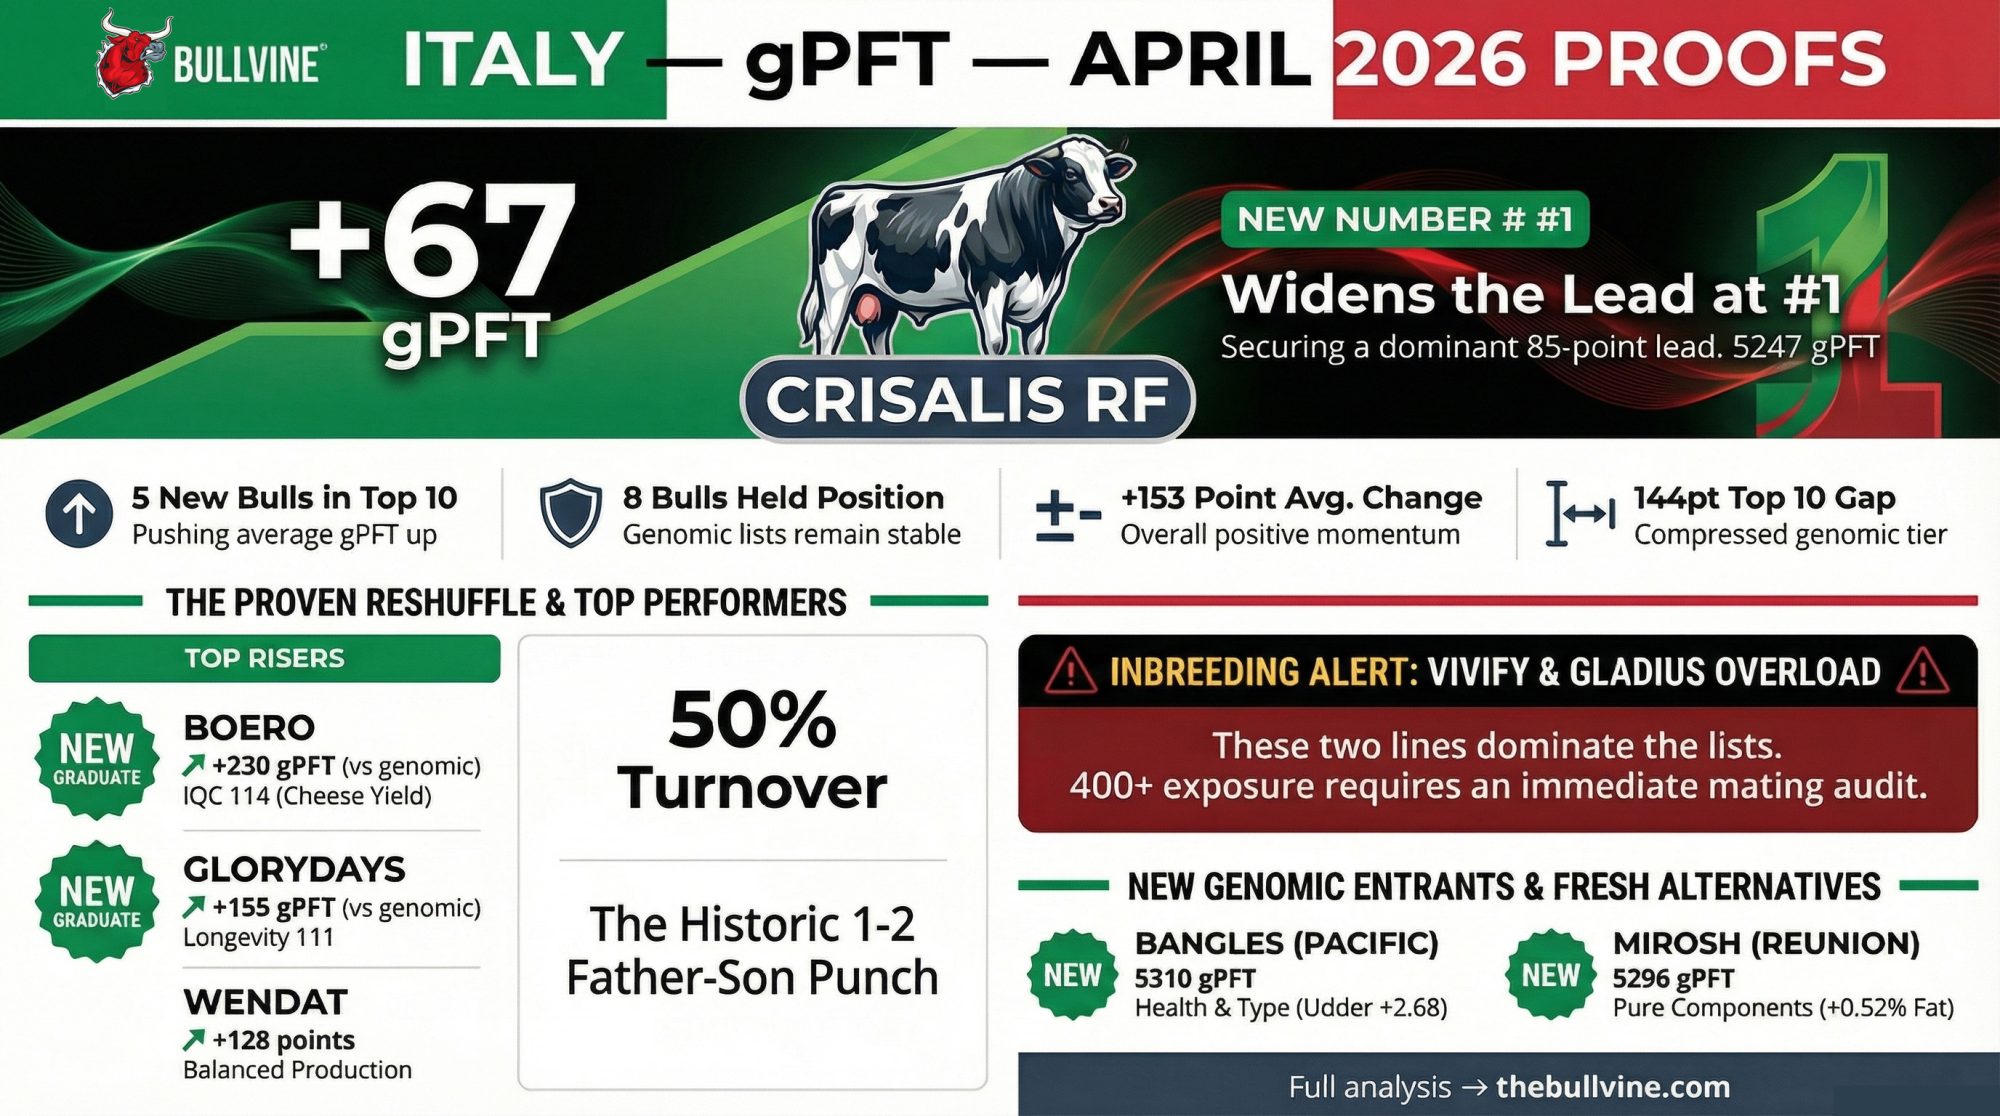
+67 gPFT
Extended domestic proven #1 lead
!WINNER Fugleman
Scandinavia / NTM
35 NTM
38 NTM
+3 NTM
Largest proven NTM gain; within 2 pts of #1
!LOSER Peak Rainow-ET
Scandinavia / NTM
42 NTM
40 NTM
−2 NTM
Still #1 proven; lead over Fugleman shrinking
USA: Protein Wins, Fat Pays Less
Bull
Dec 2025 TPI Rank
Apr 2026 Rank
TPI Dec 2025
TPI Apr 2026
Change
PTA Pro / PTA Fat
Formula Verdict
!WINNER Peak Powerhouse-ET
#3
#2
3329 TPI
3448 TPI
+119 TPI
92 Pro / 113 Fat
Protein-winner; push semen share
!LOSER OCD Trooper Sheepster-ET
#1
#1
3572 TPI
3480 TPI
−92 TPI
67 Pro / 133 Fat
Moderate loser; still #1 proven
!ANCHOR SDG-PH Delux Dominance-ET
#4
#3
3458 TPI
3437 TPI
−21 TPI
64 Pro / 135 Fat
Slight loser; reliable anchor
La-Ca-De-Le T Isaac 8731-ET
#5
#4
3390 TPI
3396 TPI
+6 TPI
62 Pro / 111 Fat
Neutral; stable anchor
!WINNER Peak Momento-ET
#6
#5
3334 TPI
3360 TPI
+26 TPI
53 Pro / 113 Fat
Mild protein-winner
!LOSER Genosource Captain-ET
#7
#6
3428 TPI
3356 TPI
−72 TPI
64 Pro / 117 Fat
Fat-leaning loser; still elite anchor
Terra-Calroy Zuri-ET
#8
#7
3375 TPI
3355 TPI
−20 TPI
52 Pro / 104 Fat
Slight loser; neutral role
!LOSER !RISK SDG Cap Garza-ET
#4 (≈)
#8
3464 TPI
3339 TPI
−125 TPI
50 Pro / 140 Fat
Biggest loser; fat specialist only
!NEW Denovo 3946 Elgin-ET
Outside top 10
#9
—
3337 TPI
New entry
68 Pro / 100 Fat
Formula winner; protein-balanced
!NEW Welcome Sensei-ET
Outside top 10
#10
—
3333 TPI
New entry
73 Pro / 97 Fat
Formula winner; highest Pro/Fat ratio in top 10
Holstein USA’s TPI 2026 production slice — 24P / 14F — quietly moved real money.
Powerhouse: +119 TPI (3329 → 3448) on the same daughters, thanks to 92 Pro vs 113 Fat and big milk.
Garza: –125 TPI (3464 → 3339) as his extreme fat profile became less valuable inside the index, even though his cows still fill the fat tank.
On the genomic side, the signal is just how tight and volatile the very top has become:
All 10 bulls in the April 2026 genomic TPI top 10 are new names compared with December.
The band from Aurora Gs Woodford‑ET at 3565 TPI down to Welcome Gustavsson‑ET at 3528 is only 37 points wide.
The “shape” of a winning genomic TPI bull is clear — high milk, strong protein, good health, functional type — but the exact names at the top are going to churn.
!ANCHOR Polled anchor; trimmed but holds both lists
!ANCHOR Progenesis Pattern-ET
3829 LPI (≈#10)
3766 LPI
−63 LPI
#15 LPI
3211 Pro$
2974 Pro$
−237 Pro$
#1 Pro$
!ANCHOR Pro$ reference anchor; slightly lower LPI
!ANCHOR Denovo 16034 Cabo-ET
3707 LPI
3611 LPI
−96 LPI
#32 LPI
3108 Pro$
2877 Pro$
−231 Pro$
#2 Pro$
!SPECIALIST Components/fat Pro$ specialist
!NEW Peak Powerstar-ET
Not in Pro$ top 100
3406 LPI
—
—
Not in Pro$ top 100
2854 Pro$
New entry
#3 Pro$
!NEW Proven newcomer; income anchor candidate
!LOSER Siemers Renegade Rozline-ET
3947 LPI
3810 LPI
−137 LPI
#9 LPI
2664 Pro$
2038 Pro$
−626 Pro$
Outside top 10
!SPECIALIST Type/component specialist only; not an income anchor
!LOSER Winstar Graziano-ET
3707 LPI
3564 LPI
−143 LPI
#56 LPI
3099 Pro$
2655 Pro$
−444 Pro$
#81 Pro$
!SPECIALIST High-fat niche only; removed from income role
In Canada, April 2026 was less about formula changes and more about level resets and the re-pricing of some favorites.
Pattern: 3211 → 2974 Pro$ (–237), still #1 Pro$.
Cabo: 3108 → 2877 Pro$ (–231), still #2 Pro$.
Winstar Graziano‑ET: 3099 → 2655 Pro$ (–444), sliding from #3 to #81.
Rozline: 2664 → 2038 Pro$ (–626) and 3947 → 3810 LPI (–137), dropping to #9 LPI.
Rozline’s April profile — 852 Milk, 85 Fat, 52 Protein, 0.47F, 0.18P, 16 Conf, MS 9, FL 9, DS 13 — reads like a type and component bull now, not a Pro$ anchor. Pattern and Cabo still carry the income banner, but the gap between them and the next tier is smaller.
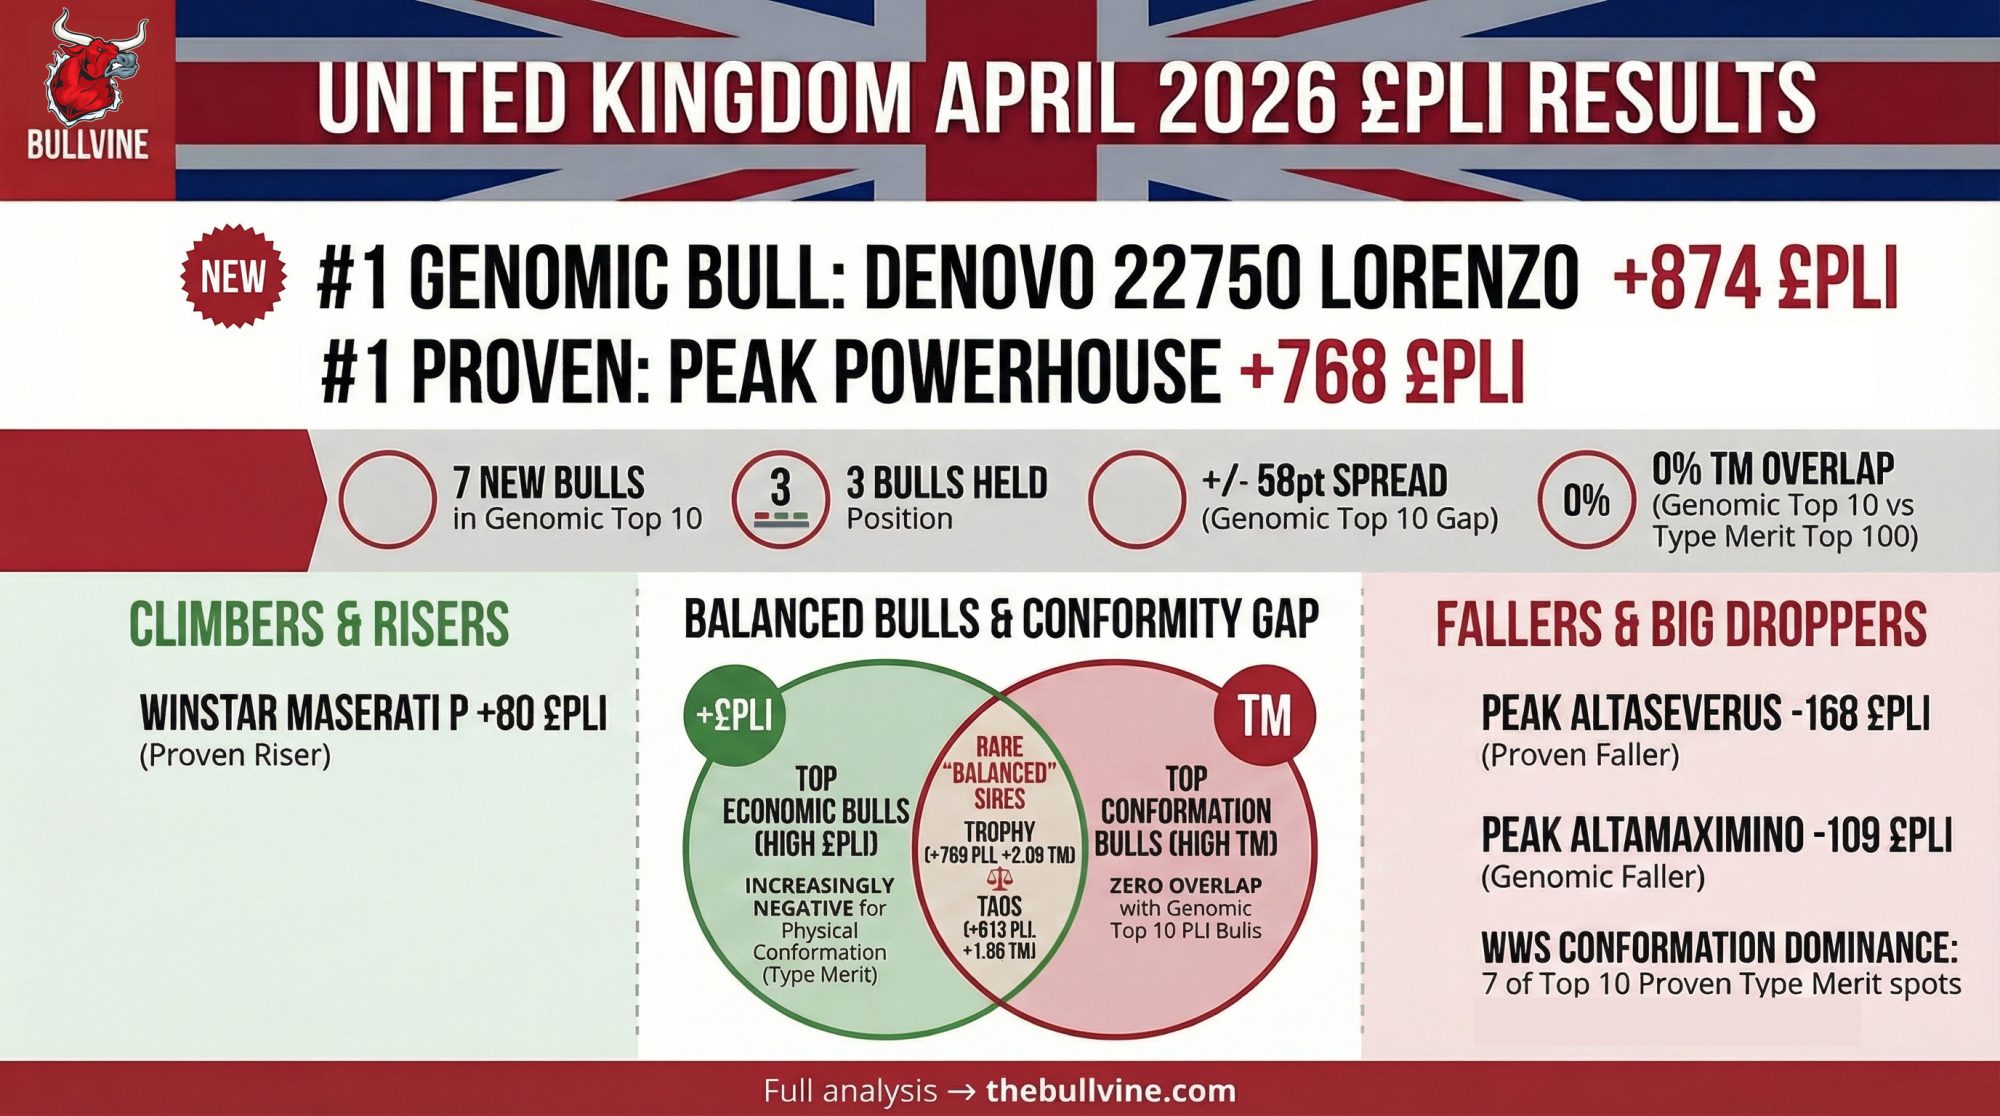
The UK’s April 2026 proof run draws a hard line between profit index and type.
Denovo 22750 Lorenzo is #1 genomic PLI at 874, but carries –0.21 Type Merit with negatives on mammary and legs.
0 bulls are both top‑10 for PLI and top‑100 for TM.
That doesn’t mean you can’t have reasonable type and profit at the same time. It just means the bulls that manage it are rarer:
Trophy: 769 PLI, 2.09 TM.
Leaninghouse Taos: 613 PLI, 1.98 TM, 2.42 LF — PLI plus legs and feet that classifiers actually like.
If you’re breeding UK‑aligned, April spells out a simple trade‑off: pure PLI rockets vs. those handful of bulls that keep both the milk cheque and the classifier roughly happy.
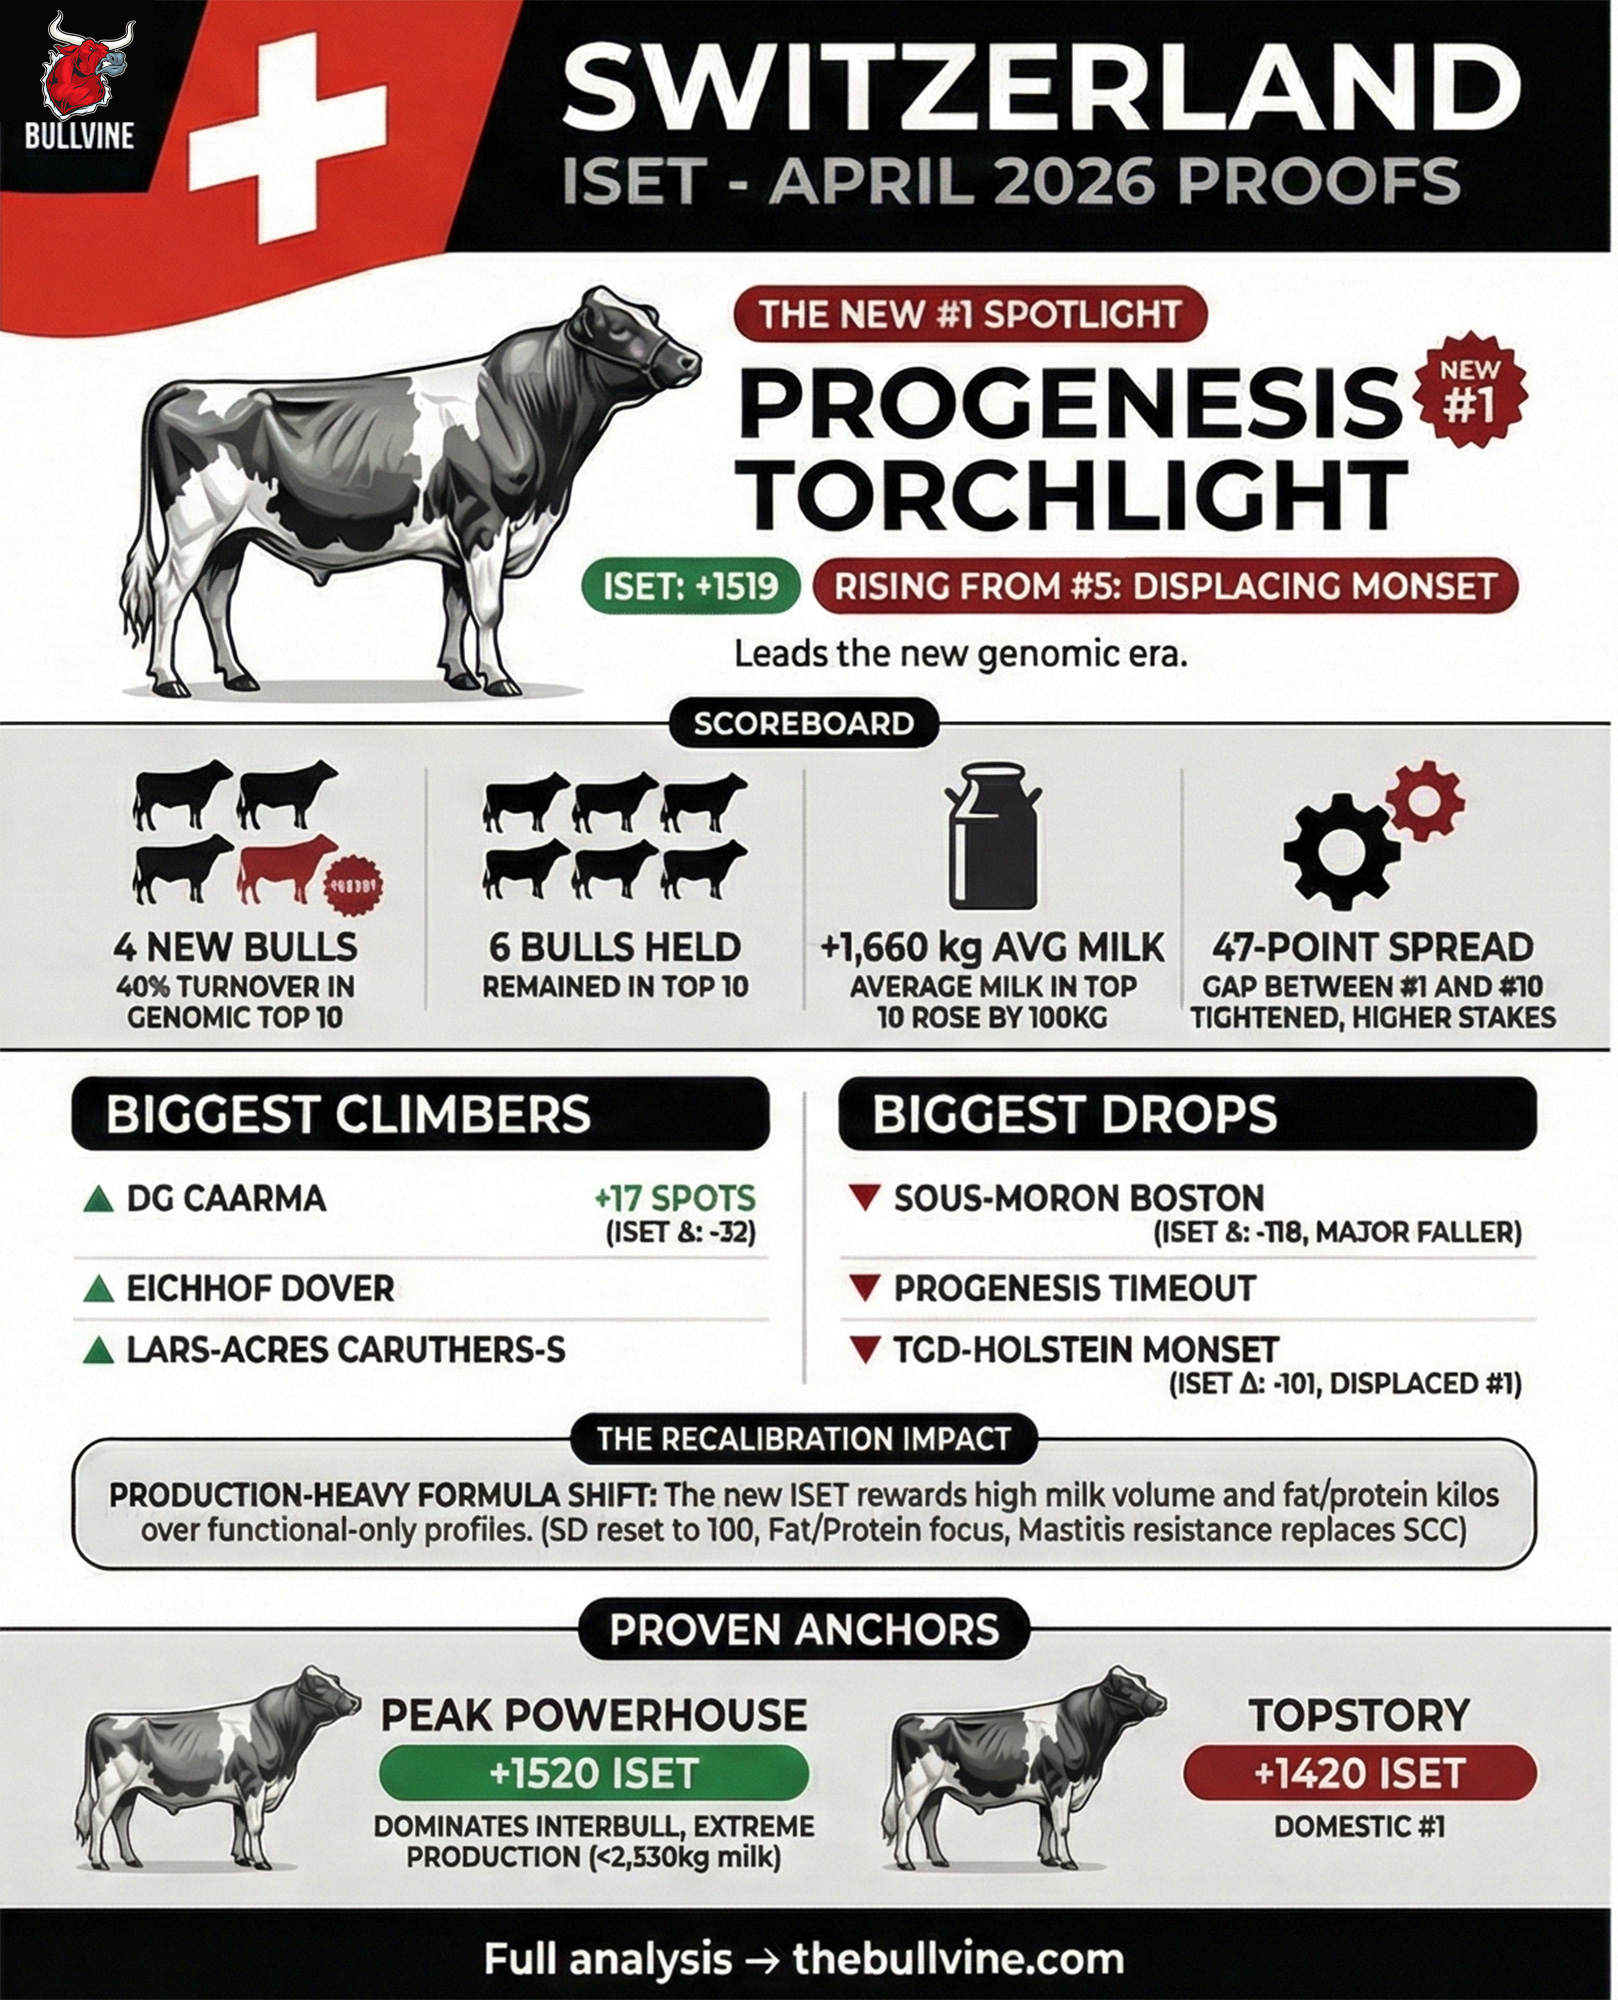
Switzerland’s April 2026 Holstein ISET reset is a big story in a small country. The standard deviation change and swap from SCC to Mastitis Resistance mean 1500 ISET is more like the old 1600.
Progenesis Torchlight: 1519 ISET, 1954 kg Milk, 130 kg Fat, 88 kg Protein, plus strong Mastitis Resistance and good health — a classic high‑ISET production bull.
DG Caarma: 1482 ISET, 2212 kg Milk, 153 kg IPL, but fertility 98 and temperament 92 — he’ll put a lot of milk in the tank if your management can handle the extra temperament and fertility work.
Beautyman took one of the bigger hits, dropping –159 ISET and sliding out of the top 20.
The Swiss signal is clear: ISET now pays even more attention to cow health and mastitis, and you need to read bulls like Caarma through that lens before you chase their ISET number.
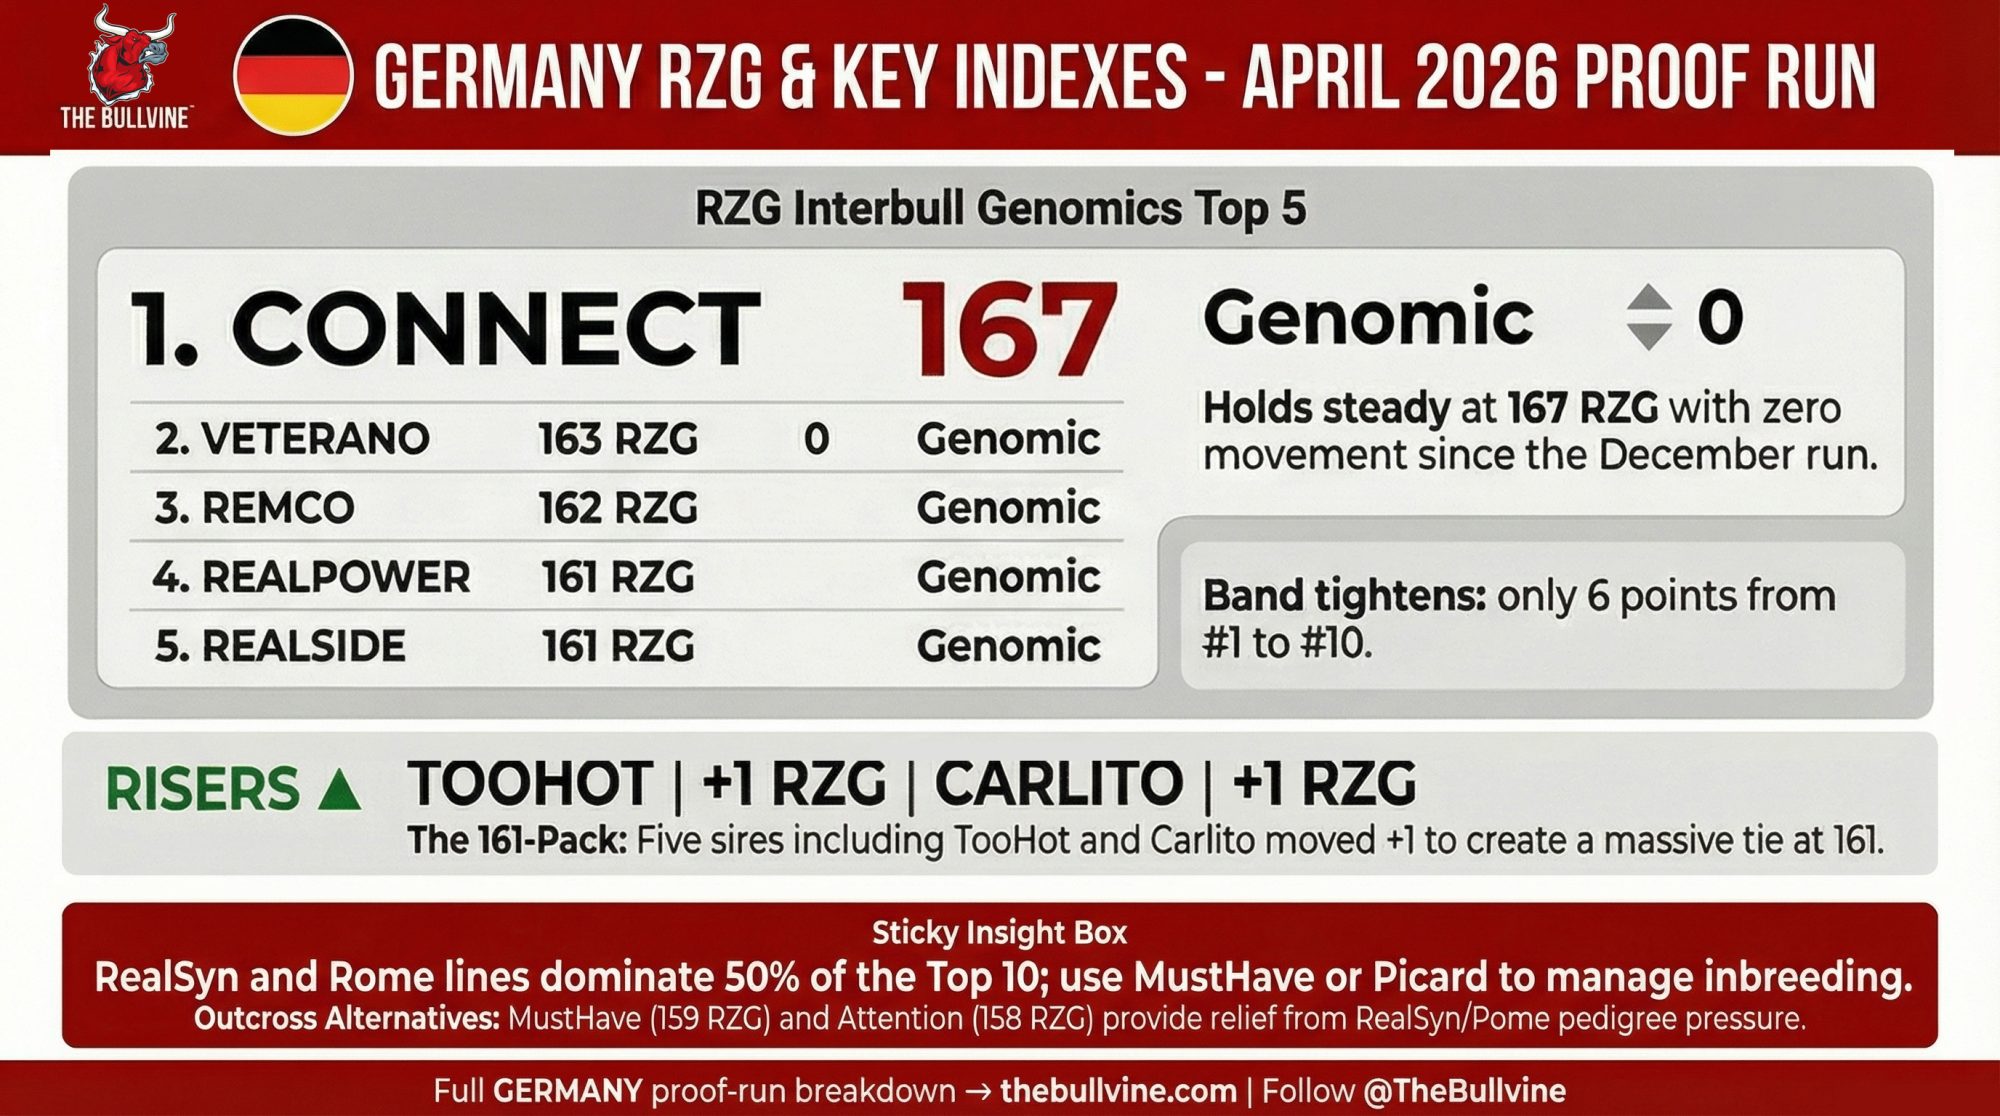
In Germany, the Interbull BW RZG genomic top 10 is almost too calm.
Connect stays at 167 RZG, unchanged from December.
The next nine bulls all sit between 161 and 163 RZG, and all ten are returning genomic bulls.
Under the hood, pedigrees are heavily saturated with RealSyn and Rome; at least half of the pack traces through those sires.
If you’re leaning on German RZG genomics, the risk isn’t that your bull drops 10 RZG. It’s that you wake up in three years and realize half your best heifers are RealSyn/Rome granddaughters, no matter which catalog you bought from.
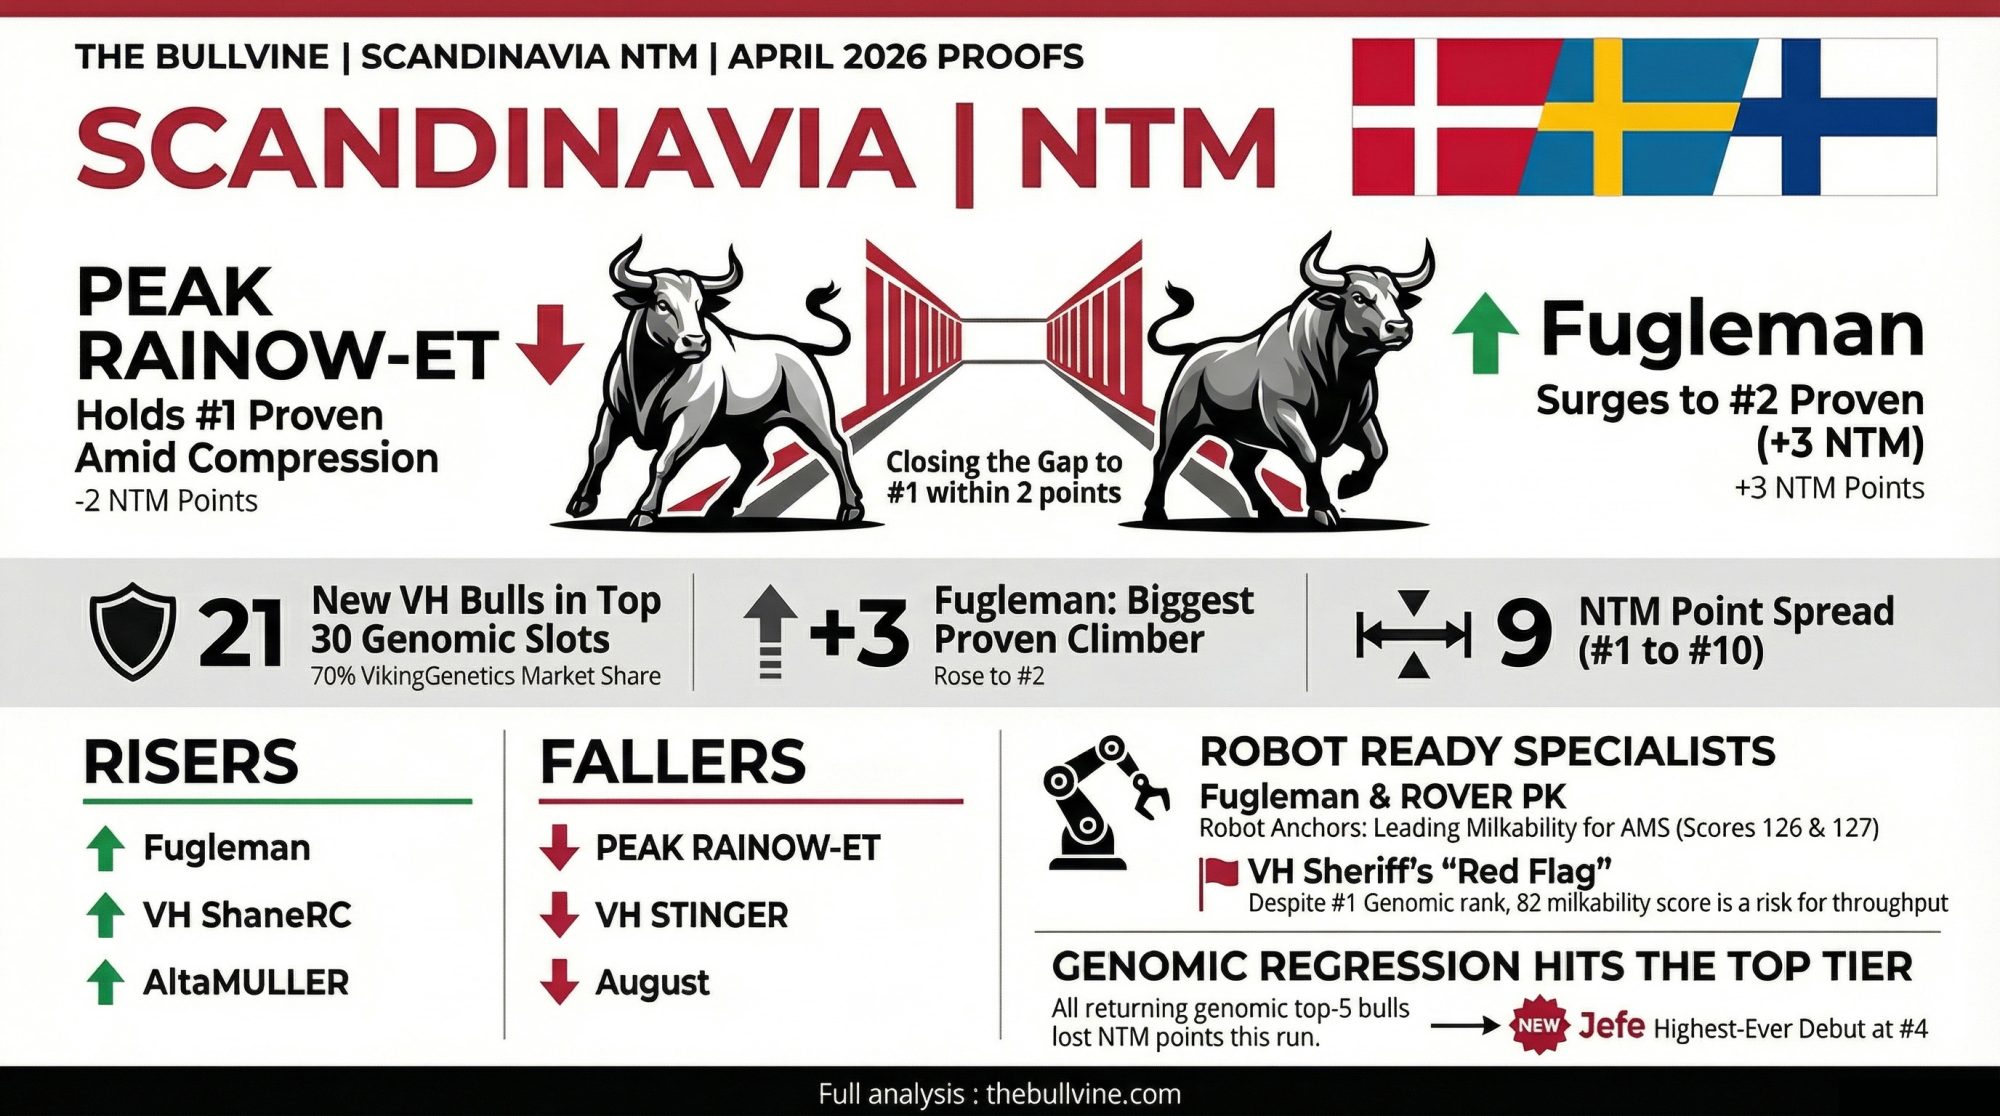
In Scandinavia, NTM is where the robots and the Viking genetics program shake hands.
Peak Rainow‑ET slipped from 42 to 40 NTM but still holds proven #1.
Fugleman climbed from 35 to 38 NTM, with better yield, udder health, claw health, and confirmed milkability at 126.
On the genomic side, VH now owns 21 of the top 30 NTM slots.
For a robot herd in Denmark or Sweden, that’s good news and a warning in the same sentence: plenty of high‑NTM options, but you can’t just buy “the top” and expect to stay out of a VH wall.
How Noisy Is “#1” This Run — and Should You Still Pay for It?
When you line all these lists up, the most important thing isn’t who’s #1. It’s how tight the bands are and how fast the names change.
USA genomic TPI: 10/10 new bulls, 37‑point band (3565–3528).
UK genomic PLI: roughly 70% turnover in the PLI top 10, 58‑point band from Lorenzo at 874 to the #10 bull at 816.
Swiss ISET: 40% new bulls in the top 10 and only 47 points from Torchlight at 1519 down to the #10 bull at 1472.
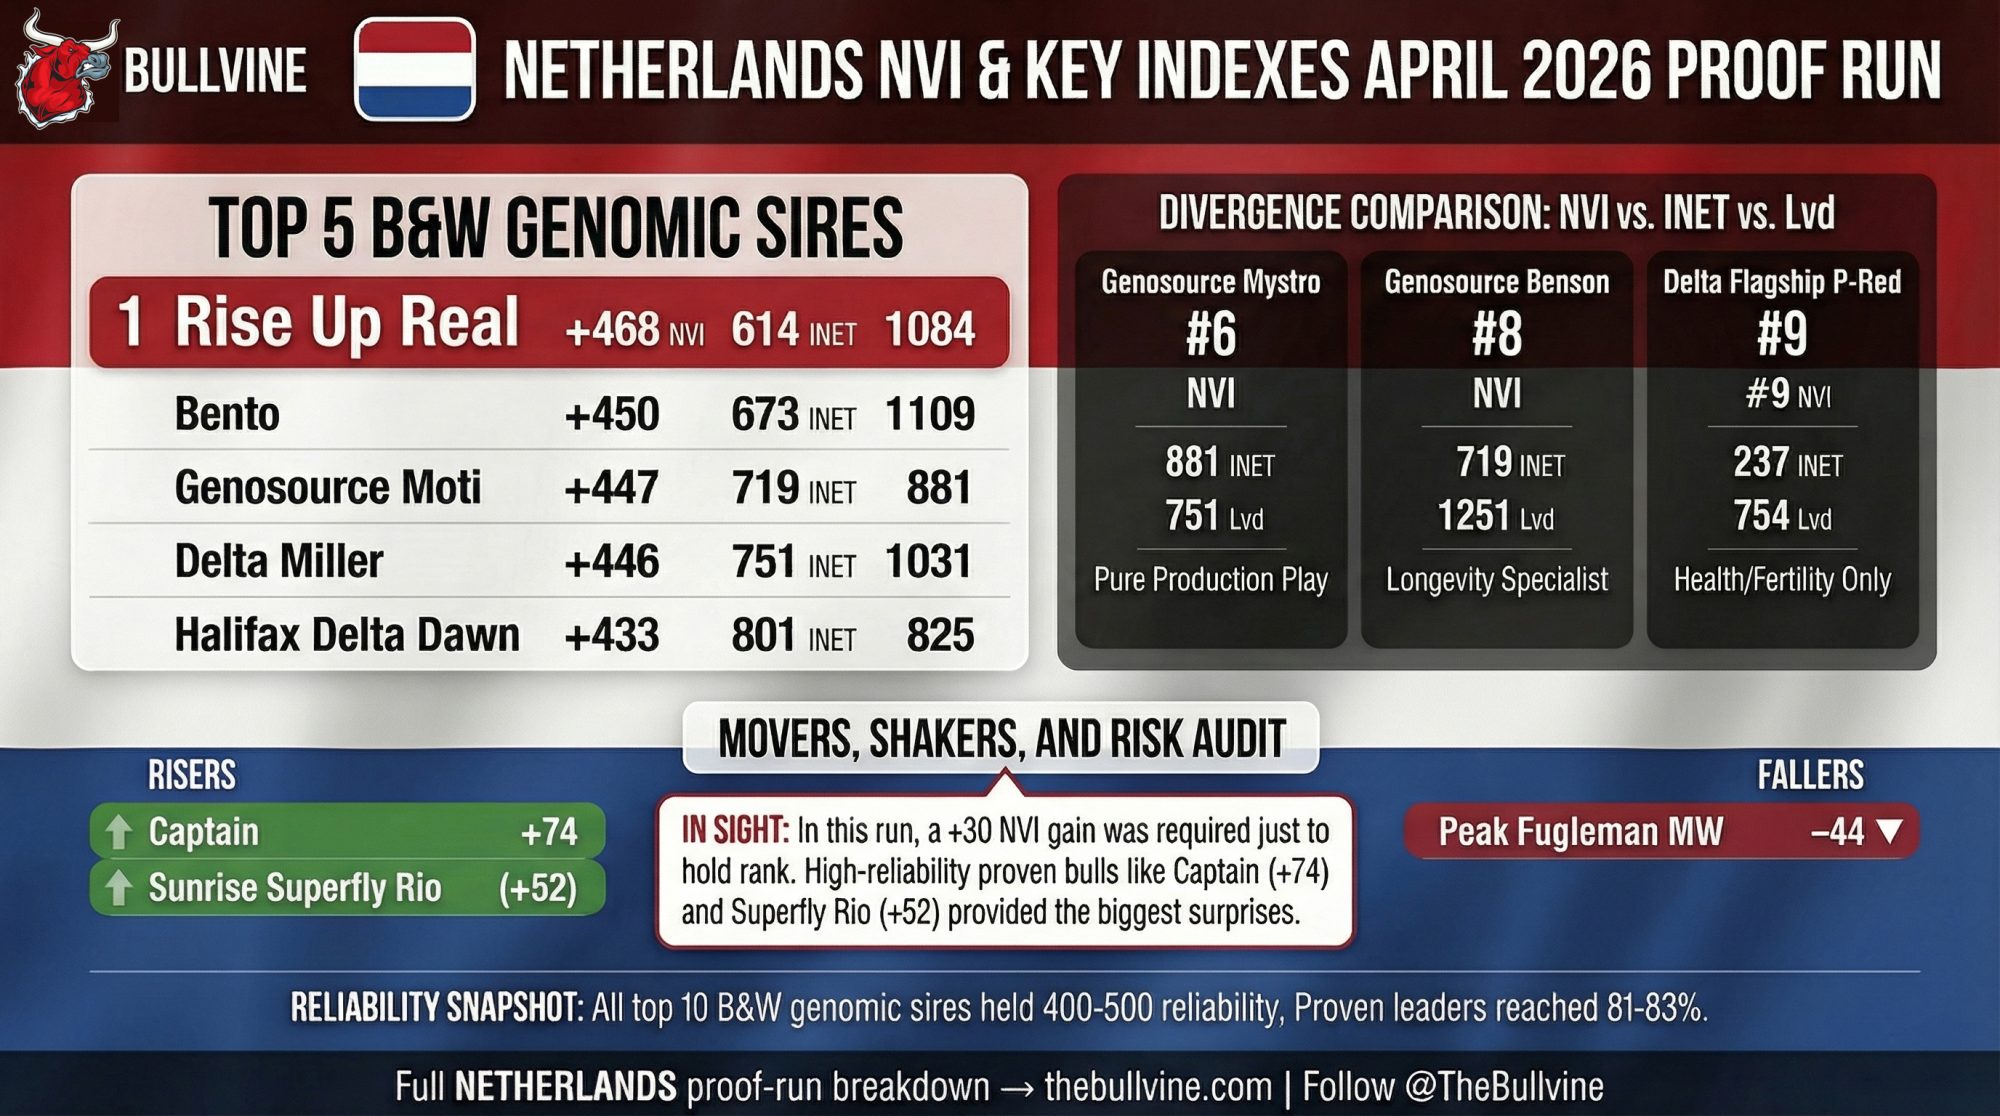
Dutch genomic NVI BW: only 1 new entrant, but the band still lifted and compressed to 468–424 NVI.
German RZG: 0 turnover and a 6‑point band (167–161 RZG).
At that point, paying a premium just because a bull is “#1” is more about marketing than genetics. It can still be fun. It just shouldn’t be the backbone of your breeding plan.
For practical breeding decisions, the takeaway is simple:
Treat that whole top genomic band as one group of bulls with a similar job description — high milk and protein, or high NVI longevity, or high ISET — not as ten different universes.
Use “#1” as a tie‑breaker only after you’re happy with trait shape, health, and pedigree.
If the only reason a bull is on your short list is “He’s #1 this run,” this is the year to rethink that.
Country / Index
Genomic #1 (Apr 2026)
Genomic #1 Value
Genomic #10 Value
Band Width (#1 → #10)
New Bulls in Top 10
Turnover Rate
Key Churn Signal
USA / TPI
Aurora Gs Woodford-ET
3565 TPI
3528 TPI (Welcome Gustavsson-ET)
37 TPI pts
10 of 10
100%
All-new top 10; 100% turnover from Dec 2025
UK / PLI (genomic)
Denovo 22750 Lorenzo
874 PLI
816 PLI
58 PLI pts
7 of 10
70%
All 7 new entrants carry ≤66 reliability; zero overlap with TM top 100
CH / ISET (genomic)
Progenesis Torchlight
1519 ISET
1472 ISET (Eichhof Dover)
47 ISET pts
4 of 10
40%
Scale recalibrated (SD reset to 100); 1500 = old 1600
NL / NVI (BW genomic)
Rise Up Real
468 NVI
424 NVI (Delta Standout RF)
44 NVI pts
1 of 10
10%
Most stable genomic list globally; entire top 10 inflated +19 to +58 NVI
Germany / RZG (genomic)
Connect
167 RZG
161 RZG (7 bulls tied)
6 RZG pts
0 of 10
0%
Zero turnover; 7 bulls at exactly 161 RZG; bloodline risk is the real issue
Italy / gPFT (domestic genomic)
Ecbert Gladius Dateline
5371 gPFT
5227 gPFT (Jegolo)
144 gPFT pts
2 of 10
20%
Low churn; proven list far more volatile (50% turnover same run)
Scandinavia / NTM (genomic)
VH Sheriff
50 NTM
41 NTM (Bravo)
9 NTM pts
3 of 10
30%
Every returning top-5 bull lost NTM; universal regression in progress
The Quiet Risk in Your Straw Box: Bloodline Stacking Across Borders
As the Wisconsin breeder flipped through the April results, another pattern popped up: the same sire families showed up over and over again, even though he was buying semen from three studs and four countries.
Captain and his sons anchor US proven TPI lists, appear in Dutch NVI pedigrees, and show up behind Swiss and Italian bulls.
Parfect/Renegade lines are written all over Canadian LPI and Pro$, and they feed into UK PLI/TM pedigrees.
Gameday/Hadley/Troy show up repeatedly in Switzerland: five of the ISET top 15 have Gameday as maternal grandsire, with Hadley and Troy siring multiple leaders.
Gladius/Vivify lines dominate Italy’s domestic and foreign gPFT lists, with Gladius responsible for four of the top‑10 positions across those lists.
CRV Delta holds 5 of 10 black‑and‑white and 6 of 10 red‑and‑white genomic NVI spots in the Netherlands.
VH sires (Viking Holstein) own 21 of the top 30 genomic NTM bulls.
RealSyn/Rome pedigrees sit under at least half of Germany’s BW RZG genomic top 10.
On the farm’s scribbled sire list, that looked like this: about 15% Captain sons, another 10–15% Parfect/Renegade line, and a big chunk of Swiss and Dutch bulls that quietly had Gameday, RealSyn, or Gladius as sire or grandsire.
Technically, he was “diversified.” Practically, he was a couple of sire families away from painting himself into a corner. The daughters won’t care which logo was on the straw. They’ll know who their grandsires are.
Sire Family
Markets Dominant In
Example Top Bulls (Apr 2026)
Concentration Metric
Risk Level
Article-Recommended Cap
Captain
USA proven TPI; NL NVI proven; UK PLI proven; CH (pedigree depth)
Genosource Captain-ET (USA TPI #6; NL NVI proven #2; UK PLI proven #2); Garza, Capn Miguel (USA)
≥50% of Germany BW RZG genomic top 10 trace RealSyn/Rome sire lines
!RISK HIGH
Add MustHave, Attention, or SaturnRDC; cap RealSyn/Rome cluster at ≤35% matings
A Simple Micro Barn‑Math Check: When Does a 200‑Point Drop Actually Hurt?
One question that keeps coming up as breeders read about Rozline’s –626 Pro$ and Pattern’s –237 Pro$ is, “Okay, but what does that actually mean for my milk cheque?”
Here’s a simple, illustrative way to think about it using Canadian Pro$:
Bull A: 3000 Pro$ in December, 2750 Pro$ in April — a 250 Pro$ move.
Bull B: 3000 Pro$ in both runs — steady.
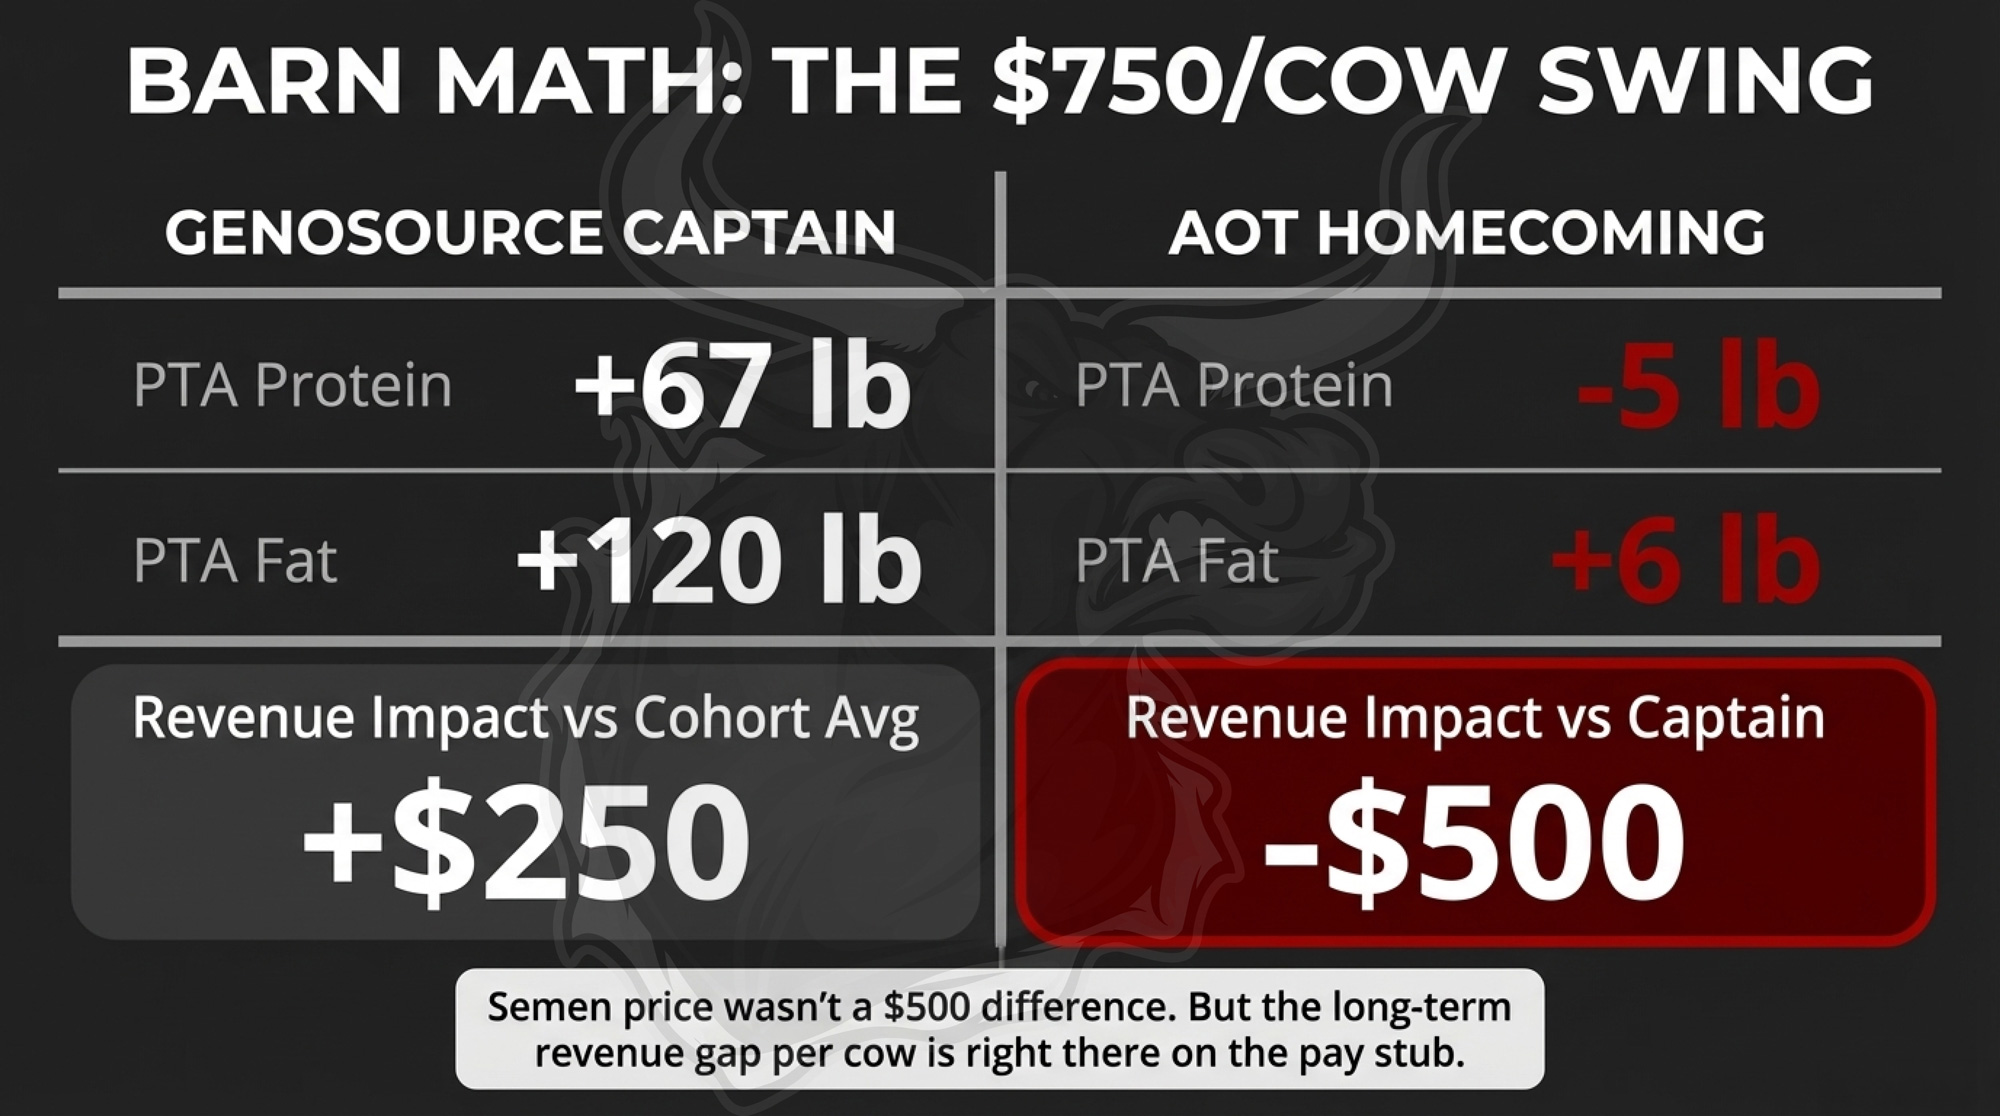
If you use each bull on 100 cows this year, that 250‑point difference represents about $250 per daughter in expected lifetime net profit on the Pro$ scale, based on Canadian assumptions for components, culling, and longevity. Over roughly three lactations, you’re looking at about $25,000 of projected value difference per 100 matings between those two bulls.
It’s not a cheque you cash in one year, and your herd’s actual numbers will run a little higher or lower. But it’s enough that you shouldn’t keep calling a bull your “Pro$ anchor” if his index just moved 250 points in the wrong direction.
The same logic applies in other systems — whether it’s NM$, INET, gPFT, or NTM — even if the dollars and assumptions are different. A one‑run swing of 200–250 index points is not background noise.
Where Do the Bulls Actually Sit Now?
If we strip the marketing off and look at how their jobs changed, a few bulls land in pretty clear buckets after April 2026.
Formula winners — bulls the system likes more now than it did in December, without them adding a single daughter:
Powerhouse (USA)
+119 TPI to 3448 TPI under TPI 2026, with big milk and a protein‑leaning CFP profile.
Woodford, Jitters, Sabotage (USA genomics)
Woodford: 3565 TPI, 1296 NM with roughly 1498 Milk, 142 Fat, 120 Protein, and strong health.
Jitters: 3552 TPI, 1127 NM with high CFP and survival.
Sabotage: 3551 TPI, 1076 NM with high production and solid type.
Rise Up Real (NL)
+58 NVI to 468, with a strong longevity profile and good CFP.
Torchlight (CH)
1519 ISET with big, balanced production and health — a bull that fits the new ISET formula well.
Formula losers — bulls that didn’t suddenly get “bad,” but whose index jobs changed:
Garza (USA)
–125 TPI under the new 24P/14F slice, despite being a very strong fat bull.
Rozline (CA)
–626 Pro$ and –137 LPI, shifting him from income anchor to high‑type, strong‑component specialist.
Beautyman (CH)
–159 ISET and out of the top 20, making him a more niche choice for specific traits than a front‑end ISET sire.
Quiet anchors — bulls that got trimmed but still do exactly what you hired them to do:
Pattern and Cabo (CA)
Both lose about 200–250 Pro$ but stay #1 and #2 Pro$, with strong CFP and workable type.
Rainow and Fugleman (Nordic)
Rainow slides 42 → 40 NTM, Fugleman climbs 35 → 38 NTM with better yield, udder health, claws, and milkability 126 — a classic pair of high‑reliability anchors for robot herds.
Captain (NL proven)
+74 NVI to 363, now proven #2 NVI, confirming his status as a long‑haul bull, not a flash.
Once you look at them through those lenses, “What’s this bull’s job now?” becomes a better question than “What rank did he hit on one list?”
What This Means for Your Operation
Here’s where this turns into a 30‑day job, not just an interesting April reading.
1. In the next 30 days, pull your sire list and highlight any bull who moved more than about 80 index points this run.
In the US, that’s bulls like Powerhouse (+119 TPI) and Garza (–125 TPI).
In Canada, it’s Rozline (–626 Pro$), Graziano (–444 Pro$), and even the –237/–231 Pro$ trims on Pattern and Cabo.
In Switzerland, bulls like Torchlight (+65 ISET) and Beautyman (–159 ISET) deserve a second look.
If a bull shifted more than ~80 points on the main index you’re using (TPI, Pro$, NVI, gPFT, NTM, etc.), you should consciously re‑decide whether he’s an anchor, a specialist, or a bull you park for now.
2. Cap any single bull at roughly 15–20% of your matings and any single sire line at roughly 30–35%.
Look at how many matings trace back to Captain, Parfect/Renegade, Gameday/Hadley/Troy, Gladius/Vivify, CRV Delta, VH, RealSyn/Rome when you follow pedigrees one or two generations back.
If any one of those clusters is more than about a third of your planned matings in the next year, deliberately add two or three strong outcross bulls — for example, Swiss sires like Caruthers‑S or Race, Red and polled options like Drouner KL Augustus P Red and Koepon OH Robin Red, or non‑VH genomic NTM bulls such as DG Brujito or AltaMULLER, depending on your market.
You’re not trying to avoid every trace of Captain or Parfect. You’re just making sure you still have options in three years when your best heifers are ready to flush.
3. Match your main index to how you actually get paid and where you’re bleeding money.
If you’re quota‑limited or selling into cheese and component‑heavy markets, give more weight to Pro$, NM$, INET, and gPFT than to pure TPI/PLI height.
If your biggest headaches are cull cows, feet, and fertility, you may be better off stacking NVI, NTM, ISET, or health‑tilted bulls within TPI/PLI, even if they don’t carry the very highest overall index number.
The bull that fits your milk cheque best may not be the one that looks prettiest on a global list.
4. Treat “formula winners” and “formula losers” differently — without either panicking or ignoring them.
Bulls like Powerhouse, Woodford, Rise Up Real, Torchlight, and Parfect are now better aligned with their main index; if they already fit your herd’s needs, they probably deserve more semen share.
Bulls like Garza, Rozline, Beautyman become specialists: fat bulls, type bulls, or outcross tools used on cows where those specific strengths really matter, not on every fresh heifer.
You don’t have to throw your favorite bull out of the tank. You have to stop pretending the index says the same thing it did last December.
Bull
Country / Index
Previous Role (Dec 2025)
New Role (Apr 2026)
Key Index Highlights
When to Use Now
When to Avoid
!WINNER Peak Powerhouse-ET
USA TPI / UK PLI / CH ISET / Italy gPFT
Proven TPI #3 anchor
!WINNER Multi-market #1 proven anchor
3448 TPI (+119); 768 PLI (#1 UK proven); 1520 ISET (CH Interbull #1); 5394 gPFT (Italy foreign proven #1)
High-input housed herds across all systems; protein-heavy production goal
Herds needing extreme type or structural improvement (0.09 PTAT; 0.17 TM)
Income-driven Canadian herds needing Pro$ depth after Pattern/Cabo
Programs needing high milk volume or extreme type
5. Make proof‑run review a habit instead of an emergency.
Build a simple April habit: every time the proof run lands, spend an evening doing exactly what that Wisconsin herd did — mark big movers, check sire lines, and re‑tier bulls into anchors, specialists, and parked.
Keep a short, hand‑written or digital note for your key sires: “movement this run” + “role now”. Over two or three runs, you’ll see which bulls hold steady and which ones re‑rank every time.
If you only do one thing from this article, do that 30‑day audit before you breed another cow as if nothing changed.
Key Takeaways
If a bull moved more than about 80 points on his main index this run, don’t assume he’s still doing the same job in your program. Big upward movers may deserve more matings; big downward movers probably belong in narrower, trait‑specific lanes instead of carrying your whole herd.
If anyone’s family accounts for more than roughly a third of your planned matings, you’re not diversified — you’re boxed in. With Captain, Parfect/Renegade, Gameday/Hadley/Troy, Gladius/Vivify, CRV Delta, VH, and RealSyn/Rome showing up on lists from Wisconsin to Switzerland, capping them is the only way to keep mating options open in three years.
Genomic #1 is a marketing label; the real breeding decisions live in the band behind it. With tight top‑10 spreads and high turnover, you’re better off picking three or four bulls with the right shape than paying extra for one name at the very top.
Matching your index to your actual payment and bottlenecks is worth more than chasing a global rank. If components, robots, feet, or fertility are what really make or break your cheque, choose bulls and systems that pay on those traits, even if they aren’t “#1” anywhere.
The Bottom Line
At the end of a long day in the barn, the proofs are still just paper. The daughters in your pens are the real scorecard. So next time you open the semen fridge, which of those bulls are you still using like it’s December — and which ones are finally ready to move up or down a tier in your own program?
Every week, thousands of producers, breeders, and industry insiders open Bullvine Weekly for genetics insights, market shifts, and profit strategies they won’t find anywhere else. One email. Five minutes. Smarter decisions all week.
World Dairy Expo just announced three honorees who, between them, have shaped how North America breeds, benchmarks, and builds dairy herds. Here’s why each one earned it.
World Dairy Expo doesn’t hand out its Recognition Awards for showing up. The three names on the 2026 list — Oakfield Corners Dairy, Corey Geiger, and Robert Chicoine — represent six decades of genetics infrastructure, a media and economics career that changed how producers think about their milk cheque, and a family operation that went from 65 cows in 1965 to more than 10,000 across two states without losing its grip on cow care or the show ring.
The honorees will be celebrated at the Recognition Awards Banquet on Tuesday, September 29, during WDE’s return to Madison, Wisconsin, September 27 through October 2, 2026. Banquet tickets go live at worlddairyexpo.com on July 1.
Oakfield Corners Dairy: 2026 Dairy Producers of the Year
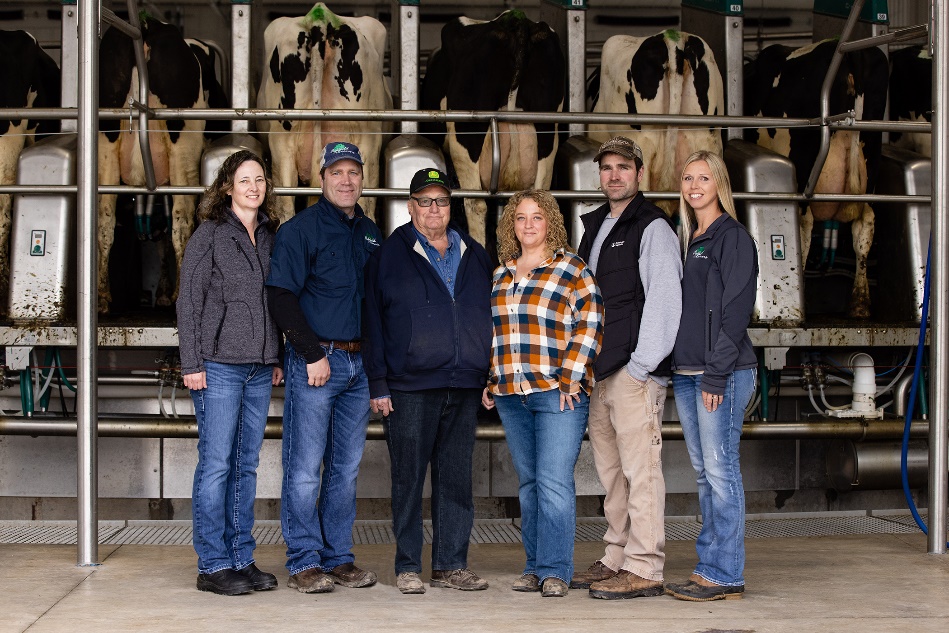
Sixty‑one years from 65 cows to more than 10,000. The Lamb and Veazey families — the ownership team behind Oakfield Corners Dairy — in front of the 72‑stall GEA DairyProQ robotic rotary that milks 1,800 of their herd daily in Oakfield, New York. Just named World Dairy Expo’s 2026 Dairy Producers of the Year. (Photo: Oakfield Corners Dairy)
Sixty‑one years ago, the Lamb family started milking about 65 cows in Oakfield, New York. Today, 12th‑generation farmers Jonathan and Alicia Lamb, Matthew and Kendra Lamb, and long‑time partners Jim Veazey and Janette Veazey‑Post oversee more than 10,000 milking and dry cows, a similar number of youngstock, and over 15,000 acresacross New York and Ohio. The name on the award is Oakfield Corners Dairy. Still, the scope behind it is Lamb Farms Inc. — a multi‑site, multi‑generation partnership in which the Lamb family drives cows, genetics, and facilities, In contrast, the Veazey family leads cropping, nutrient management, and the business office.
The production numbers back the reputation. Oakfield’s energy‑corrected milk average now tops110 pounds per cow per day, and the herd has an 18‑year streak of milk‑quality awards — the kind of consistency you don’t get by accident at any scale, let alone with 10,000 cows and 150 employees spread across multiple sites. A 60‑cow rotary, double‑herringbone parlors, and a 72‑stall GEA DairyProQ robotic rotary — that last one milking about 1,800 cows on its own — keep the system running, with a labor model built for reality, not brochures.
Two Tracks, Both Running
What sets Oakfield apart from a lot of large‑herd operations is that the genetics program didn’t get swallowed by the commercial side. About 75% of their embryo program drives a high‑index, genomics‑focused commercial engine. The other 25% feeds a deliberately small, intense show‑type nucleus — roughly 28 cows managed separately so the tanbark doesn’t bend the 10,000‑cow system.
On the commercial side, the Soy cow family tells the story. In a 2026 proof run, the Trooper son 7HO16276 OCD TROOPER SHEEPSTER‑ET — out of OCD Acura Soy 60075‑ET EX‑90 — posted GTPI 3572, NM$ 1,111, +203 lbcombined fat and protein, PL +5.5, SCS 2.90, and type +0.69. Wide chests, strong udders, robot‑ready, and pushing components. That’s the commercial blueprint, scaled through the implantation of over 4,500 embryos annually, using their own herd as the recipient pool.
On the show side? The results speak for themselves. Oakfield Solom Footloose‑ET EX‑96, bred and developed at Oakfield, was Supreme Champion at World Dairy Expo in 2022 and came back as Grand Champion Holstein in 2024. Lovhill Sidekick Kandy Cane EX‑96, owned and exhibited by Oakfield Corners, won Grand Champion of the 2025 International Holstein Show and Reserve Supreme Champion at WDE — all while carrying more than 125,000 lb of lifetime milk. Hurcroft Awe Lillyann‑Red EX‑97 has anchored their Red & White program. Premier Breeder banners in the Red & White Show (2018) and the International Holstein Show (2022), plus a Best Three Females title in 2024, round out the hardware.
And they’ve done it while building Oakfield Artisanal, a value‑added cheese line developed with input from Hispanic employees who couldn’t find familiar cheeses locally. Queso fresco, Oaxaca, Chihuahua — small in scale, big in what it says about how this operation thinks about its people. Read more: Oakfield Corners Dairy (OCD) – Dairy Breeder Video Interview
Robert Chicoine: 2026 International Person of the Year
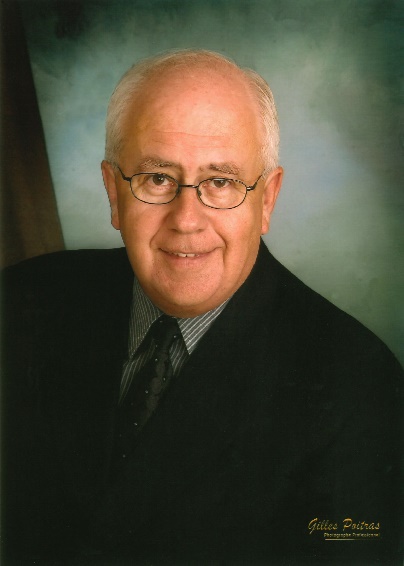
He walked into CIAQ in 1966 and backed a bull the entire industry rejected. Six decades later, Robert Chicoine’s fingerprints are on the genetic evaluation systems, progeny testing programs, and the Semex Alliance that delivers Canadian genetics to more than 80 countries. World Dairy Expo’s 2026 International Person of the Year. (Photo: Gilles Poitras)
Robert Chicoine’s career is one of those stories where you keep peeling layers and finding more infrastructure underneath. He grew up in Saint‑Pie‑de‑Bagot, Quebec, on a small mixed farm milking 15–20 cows. He read The Holstein‑Friesian Journal cover to cover, memorized performance tables, and earned his B.Sc. Agr. and Master’s Degree in Animal Breeding at Université Laval, and walked into the Centre d’insémination artificielle du Québec (CIAQ) as a dairy sire analyst in 1966. From there, he essentially helped build the plumbing that modern Canadian genetics runs on.
At a time when AI decisions in Quebec were driven mostly by pedigree, reputation, and show‑ring appearance, Chicoine championed genetic indexes. He launched progeny testing built on breeder herds, becoming the first analyst in Canada to insist that every sire decision run through data. That push forced CIAQ to overhaul its data collection and evaluation methods — laying groundwork for what became the Canadian Dairy Network.
The Bull Nobody Wanted
The Senator story is the one that sticks. The bull — 73HO101 Senator — had a dam picture breeders didn’t like and markings that made registration drawings a headache. Field staff steered clear, and CIAQ reportedly told inseminators to use Senator only when a farmer just wanted “any” test bull. Chicoine backed the data. He kept Senator in the sampling stream, watched his daughters performance prove him out, and the rest is pedigree history — Senator’s genetics eventually spread through a huge share of Canadian Holsteins and show up in the pedigrees of Madison champions.
He went on to serve about 14 years as general manager of CIAQ, founded Boviteq to bring embryo transfer into the AI business model in the 1980s, and launched a national progeny testing program for coloured dairy breeds in 1987. He was a driving force behind CDN and DairyGen, centralizing genetic evaluation nationally. And when it came time to unify Canada’s genetics export strategy, Chicoine became the first general manager of The Semex Alliance — bringing CIAQ, WestGen, and other partners together in a collaborative model that now delivers Canadian genetics to more than 80 countries.
Laval awarded him a Ph.D. honoris causa. The Ordre national du Québec named him a Knight in 2010. The Canadian Agricultural Hall of Fame inducted him in 2023. And at 60 years into this career, he still shows up in roles around genetic resource conservation. The International Person of the Year award feels less like a capstone and more like a long‑overdue public acknowledgment of how much of the modern breeding system one person helped wire together.
From the editor’s desk to the economist’s chair — without ever leaving the barn. Corey Geiger spent nearly 30 years at Hoard’s Dairyman, including 14 as managing editor, still co-owns his family’s sixth-generation Wisconsin dairy, and now shapes industry economics as CoBank’s Lead Dairy Economist. World Dairy Expo’s 2026 Industry Person of the Year.
If you’ve read a sharp breakdown of dairy economics in the last three decades, there’s a good chance Corey Geiger’s fingerprints are on it. The Wisconsin native grew up on his family’s sixth‑generation dairy near Reedsville, studied dairy science and agricultural economics at the University of Wisconsin–Madison, and spent nearly 30 years at Hoard’s Dairyman — including about 14 as managing editor — turning that publication into one of the industry’s most trusted voices on cost of production, policy, and market dynamics. Along the way, he helped launch Hoard’s Dairyman China and Spanish‑language editions, expanding the brand’s reach well beyond the Midwest.
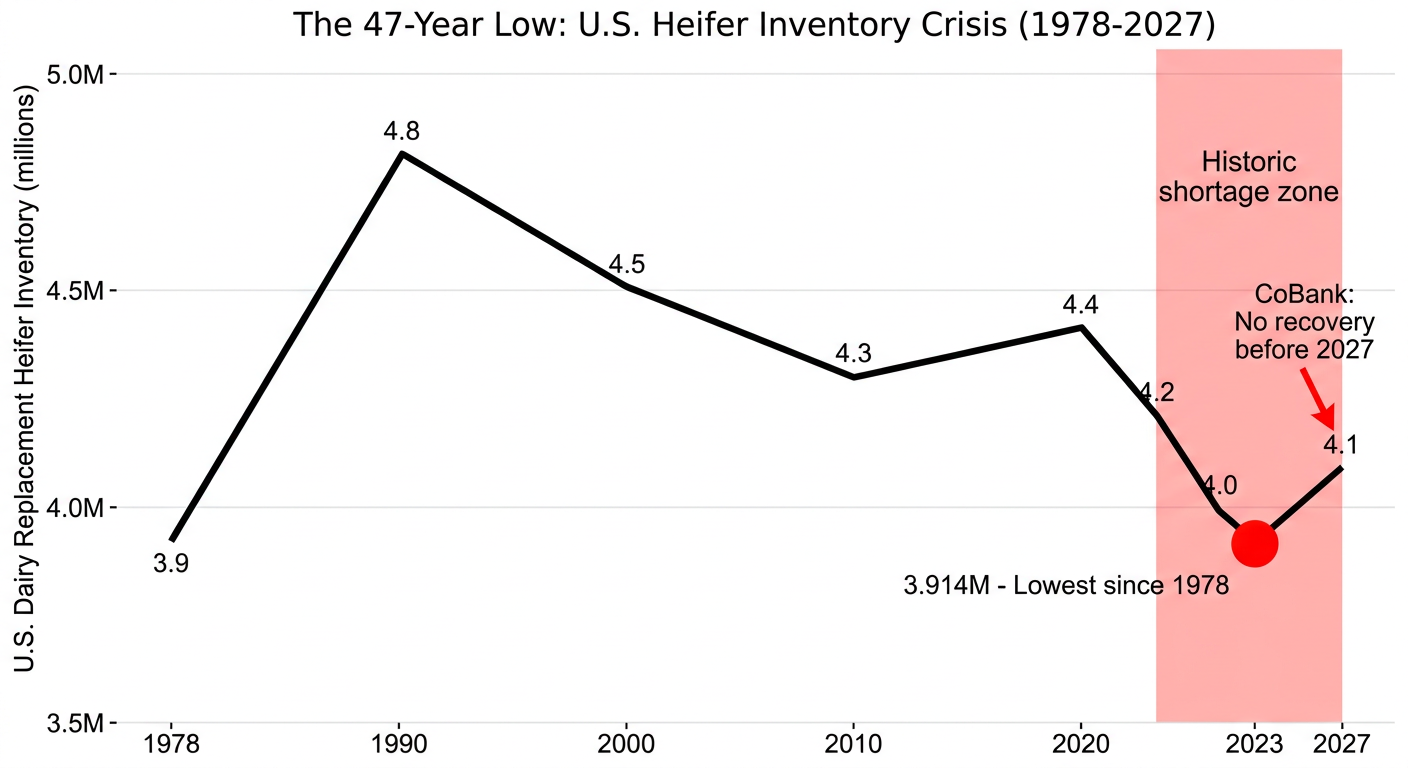
Today, as Lead Dairy Economist at CoBank’s Knowledge Exchange division, Geiger sits where capital meets cows. CoBank is a cornerstone of the Farm Credit System, and Geiger’s analysis shapes how lenders, co‑ops, and policymakers think about where dairy is headed. His recent work has highlighted a 4.23% national milkfat average in 2024 — record territory — and the implications of an 800,000‑head hole in the U.S. replacement heifer inventory after the 2022–24 beef‑on‑dairy wave. When the April 2025 genetic base change rolled butterfat back by 45 lb and protein by 30 lb, Geiger was one of the first voices to connect that magnitude directly to what it means for milk cheque math on real farms.
What makes him different from a lot of industry economists is that he still co‑owns part of the family dairy. He’s not just modeling the margins — he’s living them. That blend of farm boots, editorial credibility, and lending‑sector analysis is exactly the kind of career WDE’s Industry Person of the Year award was built to recognize.
Three Winners, One Clear Signal
What ties these three together isn’t just résumé length. It’s that each one built something — a herd system, an analytical platform, a national genetics infrastructure — that other people now rely on without always knowing it.
Oakfield Corners proved you can run a 10,000‑cow operation and still chase Grand Champions, quality awards, and employee culture without one track undermining the other. Geiger made economic analysis accessible and honest enough that producers actually use it instead of filing it. Chicoine built the evaluation architecture that Canadian breeders — and breeders in 80‑plus countries — now take for granted every time they pull up a proof sheet.
Madison is going to feel a little different when these three take the stage on September 29. If you’re planning to attend World Dairy Expo this fall, the Recognition Awards Banquet is one evening you’ll want to block out. Tickets open July 1 at worlddairyexpo.com.
Key Takeaways
Oakfield Corners Dairy went from 65 cows in 1965 to more than 10,000 across New York and Ohio — earning WDE’s 2026 Dairy Producers of the Year while stacking 18 straight years of milk‑quality awards and Grand Champion banners on the coloured shavings.
Robert Chicoine built much of the evaluation and AI infrastructure that Canadian and international breeding programs run on today — from genetic indexes and progeny testing at CIAQ to the Semex Alliance’s reach into 80+ countries.
Corey Geiger brought farm experience, editorial reach, and lending‑sector analysis together in a career that’s shaped how producers and policymakers think about dairy economics — from milkfat records to the 800,000‑head heifer gap.
The Recognition Awards Banquet takes place Tuesday, September 29 during World Dairy Expo in Madison (September 27 – October 2, 2026). Tickets go live July 1 at worlddairyexpo.com.
Continue the Story
Jon-De Farm: The Wisconsin Dairy That Proved Bigger Isn’t Always Better– This breeder profile walks a similar path to the Lambs, exploring a multi-generational family that wrestled with the same question of scale. It proves the point that cow care remains the heart of success, regardless of herd size.
Every week, thousands of producers, breeders, and industry insiders open Bullvine Weekly for genetics insights, market shifts, and profit strategies they won’t find anywhere else. One email. Five minutes. Smarter decisions all week.
Trace Elevation back twenty dams and you land on a cow imported from North Holland in 1879. Starbuck goes back to the same farm. So does half your herd.
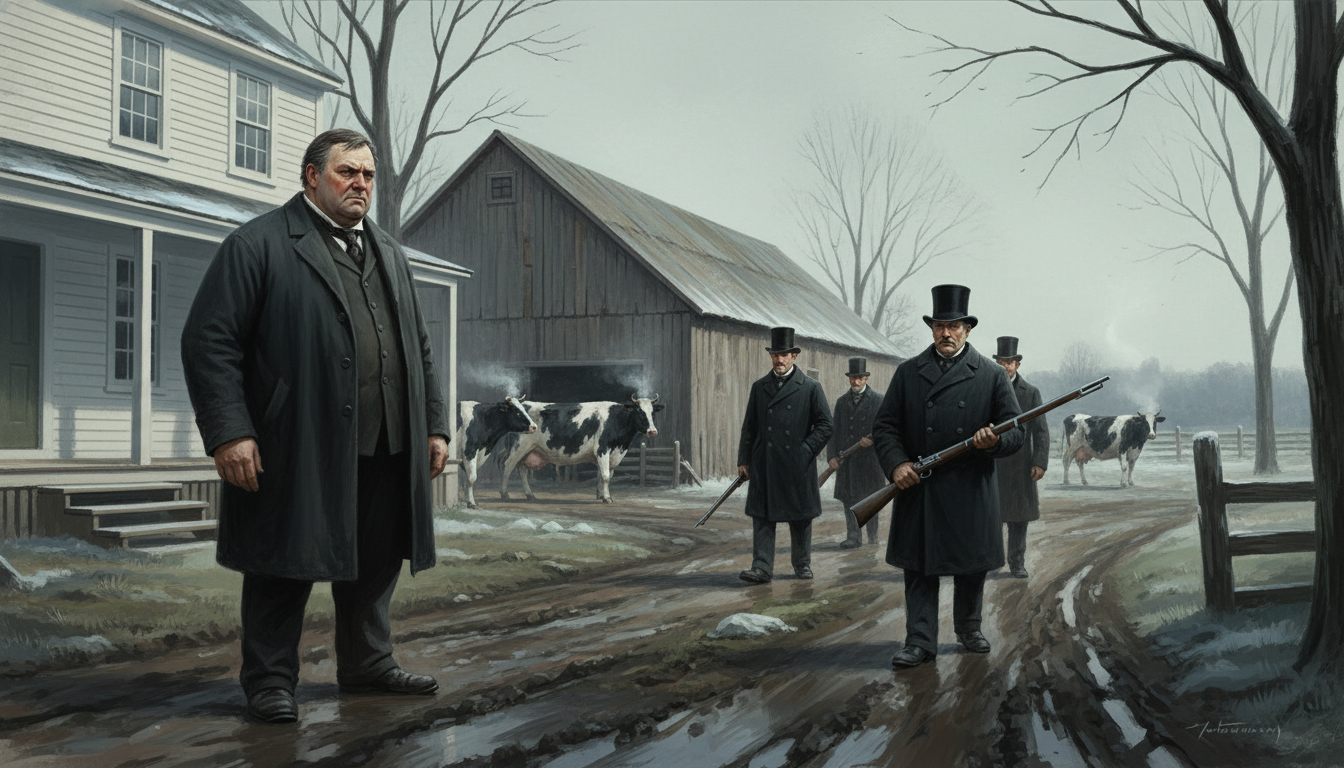
On a cold Massachusetts morning in the late 1850s, a small group of state men rode up the lane to Winthrop Chenery’s Belmont farm and walked straight past the house toward the barn. They weren’t there for coffee. They were there to shoot his cows.
Rinderpest—cattle plague—had slipped into his little group of Dutch black‑and‑whites, and the Commonwealth had ordered the whole lot destroyed, sparing only one young bull in a last attempt to salvage something from the wreck. By all accounts, Chenery was a big man—six‑foot‑four, three hundred pounds—and he’d already seen enough of these cattle to know they weren’t like the native stock he’d been dealing in. One of the cows from his later shipment, Texelaar 51 H.H.B., would go on to put up a 76 lb 5 oz day and 744 lbs 12 oz in ten days in 1865, but on that rinderpest morning he was watching an earlier group of Dutch cows hit the ground one by one.
Nobody wrote down what he said while the rifles cracked. The records just tell us that, the very day the cattle were condemned, he sent word back to Holland for another lot. That’s all we really need to know about what was going through his mind.
They rode past the farmhouse with rifles, came for his Dutch cows, and still, before the day was over, Winthrop Chenery had already ordered another load from Holland.
Now, the thing about that era is that the American dairy cow was still a compromise. The typical “dairy” animal was a dual‑purpose Shorthorn or local native—good enough to pull the wagon and fill a pail, but not built for specialized commercial dairying. The Erie Canal had already turned New York into a grain corridor. After the Civil War, when grain prices sagged, you suddenly had a whole region where dairying looked like the next way to make a living. A big, true dairy cow with a stomach like a cement mixer and an udder to match made a lot more sense than a do‑everything ox.
The Dutch had already built that cow. She was big and black‑and‑white, from Friesland and North Holland, and she could outmilk almost anything in America at the time, both in pounds of milk and in butter when you put her on a seven‑ or thirty‑day test. Chenery saw that early. When the state shot his first imports, he didn’t go back to Shorthorns. He doubled down.
That stubbornness, plus one quirky error in a government report, set the stage for everything that came next.
Act I – A New Kind of Cow in a New Kind of Country
After the 1861 shipment landed—a bull and four more cows that escaped disease—Chenery finally had a little nucleus of Dutch cattle anchored by that surviving bull, Dutchman 37. He called them “Dutch cattle” in his own catalogs and letters, but in 1864 he sent an article to the U.S. Department of Agriculture in which he quoted Professor T. Low about the “Dutch or Holstein” breed. Somewhere in the editing room, “Holstein” drifted out of the quotation and into the heading.
When the first Holstein herdbook was printed in 1872, the name had stuck. A Dutch scientist, G.H. Hengeveld, fired off a letter pointing out that Holstein cattle were a different type and that these cows were actually Friesland and North Holland animals. Chenery later said he’d used “Dutch” in his original manuscript and blamed the change on officials in Washington, but he never went to war over it. The name “Holstein” rolled forward anyway, and three casual words in a government document ended up on millions of ear tags.
Chenery’s own cattle didn’t become the dominant cow families themselves—the historical record is blunt about that. His real contribution was scattering those Dutch genes into the countryside. By 1870, herds based on his cattle were operating in Vermont, Rhode Island, Connecticut, New York, Pennsylvania, Ohio, Iowa, Oregon, California, and at home in Massachusetts. His farm proved the type. Other men would prove what the type could do.
And that brings us to New York State.
If Chenery lit the match, New York was the tinderbox. New York City was the port where European cattle came ashore. The Erie Canal funneled those cattle, and everything they stood for, straight into the heart of a farm economy that was already shifting from grain to milk. Some families went west and helped build the dairy industries of Michigan and Wisconsin. Others drifted to the cities. A lot stayed put and turned to cows.
The men who started importing Holsteins into that setting weren’t fly‑by‑night speculators. They were orchardists, nurserymen, landed families, storekeepers turned breeders. The principals of Smiths & Powell already ran big nursery and fruit operations along Onondaga Lake near Syracuse. T.G. Yeomans in Walworth had 150 acres of orchards knit together with sixty miles of tile drains, with a line running within five feet of every pear tree. Gerrit S. Miller farmed land his grandfather had carved out of Oneida territory and grew up in a world where people like John Brown turned up at the house to talk about ending slavery.
Most of them had enough money—or enough nerve—to take a real risk. It cost around $300 a head to bring cattle from Holland at a time when the average man was making about $1 a day. That’s not dabbling. That’s pushing chips to the middle of the table.
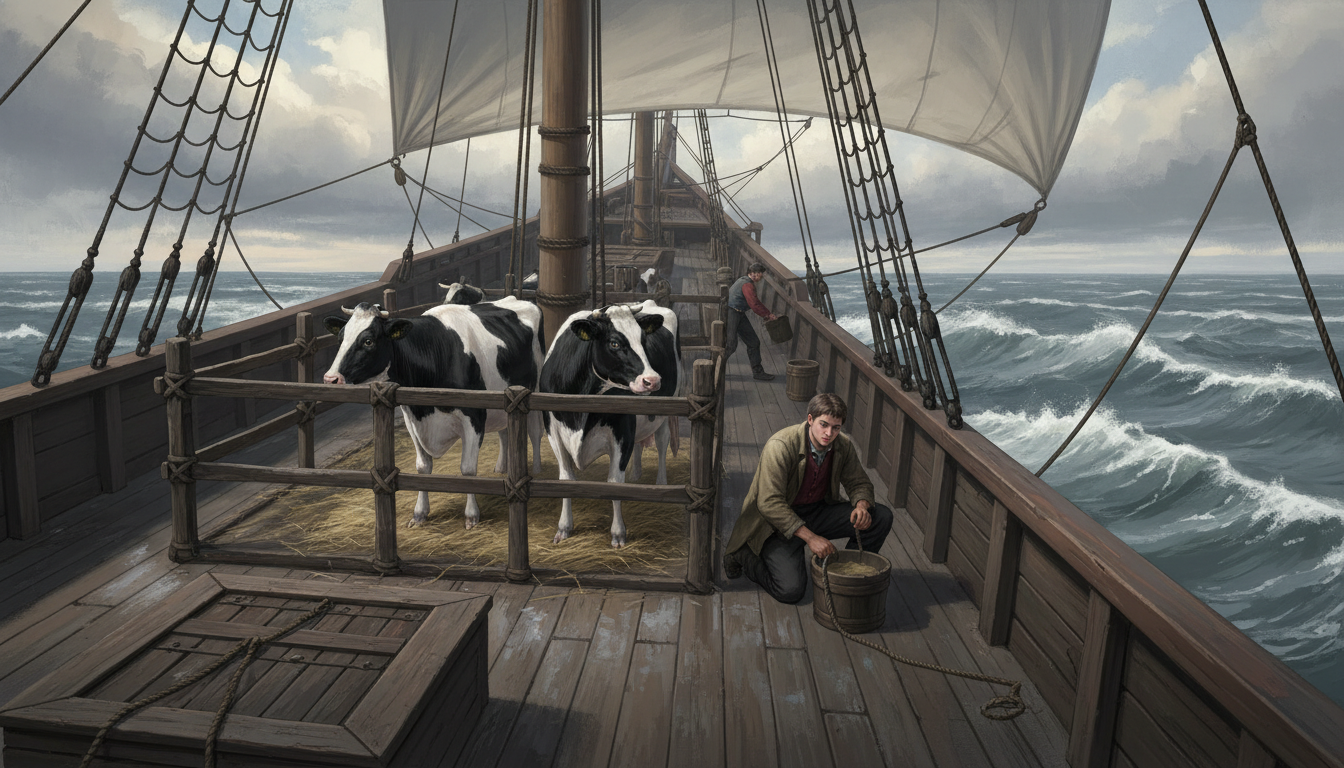
Before they filled herd books and proof sheets, the first Holsteins to matter here were seasick Dutch cows on wooden decks, gambling their way across the Atlantic in rough weather.
Gerrit S. Miller – Three Great Cows and a Herd Called Kriemhild
If Chenery proved the Dutch cow could make it in America, Gerrit S. Miller showed just how far she could go.
In the late 1860s, Miller was at Harvard, studying science and the liberal arts and captaining what’s credited as the first organized football team in the country. When he walked out from Cambridge for exercise, he kept noticing a herd of black‑and‑white cows near Belmont—Chenery’s cows—and they made enough of an impression that when he went home to Peterboro he asked his father to let his brother, Charles Dudley, bring some over from Holland.
Dudley found his way to a cattle market at Weiner in West Friesland, way up at the northern tip of the Netherlands, and bought four head: the bull Hollander and the cows Crown Princess, Dowager, and Fraulein. He rode the ship back with them, took them by train to Canastota, then drove them along an old plank road to the Miller farm. That 1869 load was only the third pure Dutch shipment to the U.S., after Chenery’s 1857 and 1859 importations.
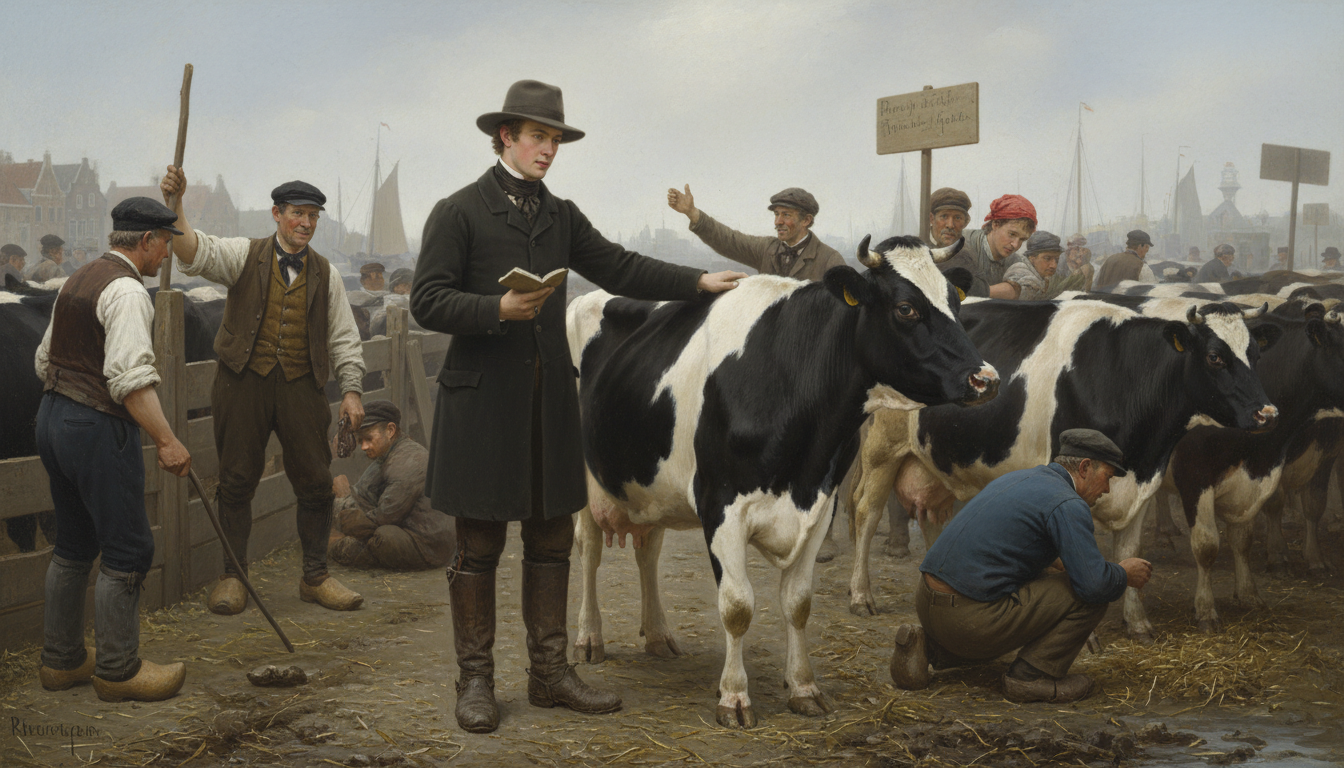
A young Charles Dudley Miller walked into a West Friesland cattle market in 1869 and walked out with four black‑and‑whites that would change North American dairying.
Dowager completed the first full annual milk record in the United States—12,681 lbs 8 oz on a record closing March 10, 1871. In a letter to Holstein pioneer Frank N. Decker, Miller explained that in 1868 a cow that did 6,000 lbs a year and 12 lbs butter in seven days was still considered exceptional. Dowager did that and then some, on two‑a‑day milking, with no grain at all in June, July, and August and grain made half of wheat bran the rest of the year. Fifty pounds of milk was her biggest day on that early record, and she hit it twice in one lactation.
Miller kept importing and selecting. In 1878 he went to Holland “with the express purpose” of buying the best milk cow he could find. He found Johanna in the herd of K.J. Akkerman in North Holland, brought her over, and in 1880 she stood first as milk cow over all breeds and ages at the New York State Fair. She wasn’t perfect on paper—a sloping rump, lots of white with specks—but she had extreme dairy quality and a big engine. Miller used her hard in his breeding program.
Two years later, while she was still in full flight at Peterboro, he turned Johanna out with another star, Empress, in the lush pasture by the Mansion House. Both old cows pushed up to 88 lbs in a day. Over a thirty‑one‑day stretch, Johanna averaged 80 lbs a day and made 2,407 lbs of milk. While she was at that height, Wisconsin breeder W.J. Gillett stopped in to buy a cow. On August 24, 1881—Miller’s diary spells it out—he wrote, “sold Johanna to Gillett & More of Wis. for $500.00.” In Gillett’s herd at Rosendale, Johanna really left her mark.
If Johanna was the workhorse, Empress was the model. Imported in 1879, she became Miller’s ideal of Holstein type. He said flat‑out that she was “the type I have been trying ever since to reproduce.” Compared with his big bull Billy Boelyn—weighing around 2,300 lbs—Empress measured twelve inches longer in body, an inch taller, and larger in every measurement except around the neck and front legs. She carried a one‑day milk record of 109 lbs and a yearly record of 19,714.5 lbs, world‑class in that time.
Then there was Ondine. Imported in 1879, she had already taken first prize as a three‑year‑old at Rotterdam in 1878. Under Miller’s ownership, she walked into the ring at the 1880 New York State Fair and beat Smiths & Powell’s previously unbeaten Netherland Queen for the championship. She then became the first Holstein cow in America to give over 90 lbs in a day, with individual records of 90½ lbs in one day and 2,545½ lbs in 31 days.
Looking back, those three cows—Johanna, Empress, and Ondine—were Miller’s Triple Crown. Everything else he bred over the next sixty years, he built around them.
Miller’s sire battery matched the quality of his cows. The foundation bull, Billy Boelyn, was chosen by a Dutch dealer with twenty years’ experience, who called him the best young bull in the country. He had the classic Dutch markings—black head, white mark on the forehead—and became the backbone of Kriemhild linebreeding. Empress and Billy Boelyn combined to produce Empire, the bull Miller rated as his best sire.
There’s a little farmyard story from Holland that tells you as much about Miller as any statistic. One day, a Dutch farmer waved him and his brother over. He said he had nothing for sale, but he’d like to show them his cows. Miller watched the herd, listened to the man talk about the cheese he was making, and one heifer caught his eye. He bought her. Only when the bill of sale was signed did the farmer put his name to it: Gerrit Smit. He suggested naming the heifer after his little daughter, Annitje. At that point Miller told him his own name—Gerrit Smith Miller—and that his grandmother and sister were both named Anne. Registered here as Nannie Smit, that heifer later headed the two‑year‑old class at the 1880 State Fair and became a key piece of the Johanna Rue branch of the family.
From these cows and sires Miller stacked generations. Johanna’s granddaughter Ononis, out of Onyx and by Empire, was sold in calf to Frederick C. Stevens. The calf, Sir Henry of Maplewood, grew into the leading show sire of the 1890s and one of the great ancestors of the breed. Sir Henry’s grandson Colanthus Abbekerk became Canada’s premier early foundation sire.
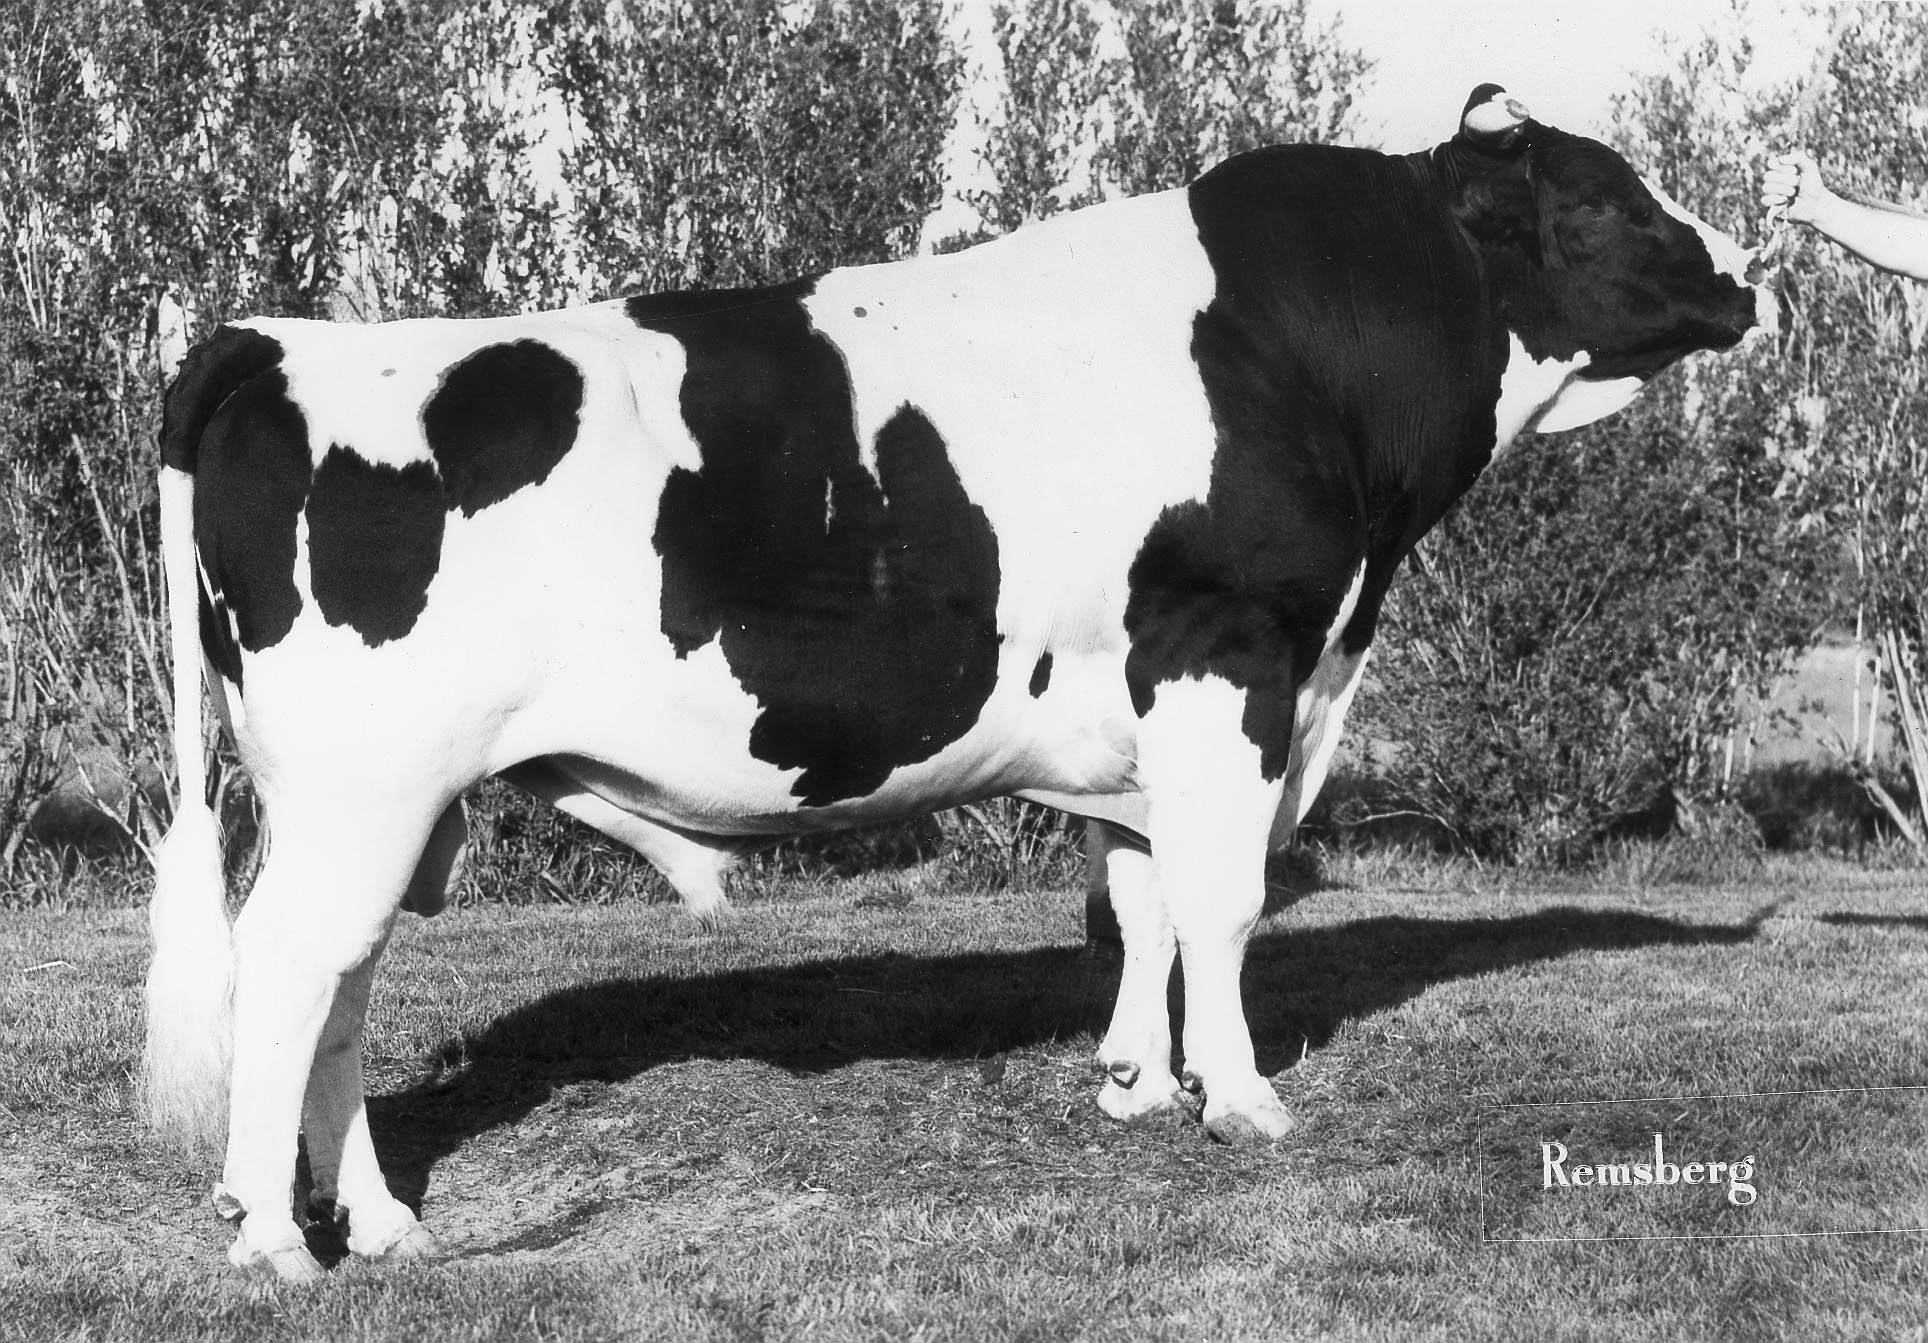
And Ondine? Her female line kept right on transmitting. About eighty years later, a bull named Round Oak Rag Apple Elevation was born. Ondine is his twentieth dam on the bottom side of his pedigree. Elevation sits at the absolute top tier of Holstein history, and his blood runs through bulls like Hanoverhill Starbuck. Starbuck, in turn, traces back not just to Ondine through Elevation, but directly to Johanna on his maternal line.
Think about that for a second. You could walk through a Canadian barn in the 1980s, look at Elevation and Starbuck daughters, and not realize you were looking at Kriemhild cows talking across a century.
Smiths & Powell – Turning Great Cows into a Population
While Miller was working away at Peterboro, a pair of nurserymen down by Onondaga Lake were paying close attention.
Wing and Judson Smith had started in cattle a year or two earlier, looking mostly for manure for their orchards and nurseries. They’d heard about a man in Madison County with a shipment of “Dutch‑Friesians” that were beating their Milking Shorthorns and brindle crosses. So they drove over to Peterboro to see for themselves.
They bought the bull Uncle Tom and the cows Aegis, Iris, Juniata, and Sappho from Miller and took them back to their operation at Lakeside Stock Farm. Those cows did exactly what the rumors said they’d do in the milk pail. The Smiths saw two things immediately: this breed was special, and Miller was making very good money. They decided to cut out the middleman and go straight to Holland.
They teamed up with William Brown Smith and son‑in‑law Edward Powell as Smiths & Powell and, starting in 1878, began importing Holsteins on a scale nobody matched. Over the years they brought in 1,293 head—about one‑sixth of all pure Dutch Holsteins imported to North America.
But here’s what really set them apart: it isn’t the number that matters as much as the names.
Their first Holland trip brought thirteen females, including Netherland Queen, who stood first as a yearling and as a two‑year‑old at the New York State Fair in 1878 and 1879 and made a 2‑year‑old yearly record of 15,614 lbs of milk. A year later they brought in her dam Lady Netherland and Lady’s calf Netherland Prince, who had been born after purchase and before shipment. They already had Netherland Princess and Netherland Duchess in the barn and later added Netherland Dowager, the paternal granddam of Prince.
From that group they built the Netherland family, known for size, strong type, and big milk with good butterfat. The bull Netherland Prince took his place alongside Neptune (from Aaggie) and Miller’s Billy Boelyn as one of the three great imported foundation sires. Prince’s sons—Netherland Monk, Prince Imperial, Netherland Carl, Netherland Statesman, Netherland Alban, and others—spread his genetics all over.
Their second major family came from a cow whose name Holstein people still say with respect: Aaggie.
Imported in 1879 as a five‑year‑old, Aaggie went on yearly test in 1880 with Aegis (one of Miller’s cows now at Lakeside). Early in lactation Aegis hit 82 lbs in a day; Aaggie topped her at 84. Over 365 days, Aegis made 16,823 lbs. Aaggie finished at 18,004 lbs, the first cow in the United States to cross the 18,000‑lb mark on a yearly record.
Her daughter Aaggie 2d, imported as a calf by their kinsmen T.G. Yeomans & Sons, produced 17,746 lbs of milk as a two‑year‑old, beating all previous records except her dam’s. Aaggie and Aaggie 2d both traced to the Dutch bull Rooker, whose blood had also yielded the record cowLady Clifden. The Smiths & Powell crew scoured Holland for daughters and granddaughters of Rooker’s sons, naming them all with the Aaggie prefix. They ended up with about 100 “Aaggie” animals.
The third pillar at Lakeside was Clothilde. Born in 1879 and imported in 1880, she produced 26,021 lbs of milk in 1885, setting a world record and proving that Holsteins could compete with Jerseys for butter production when put on proper tests. She was large, strong, and transmitted those traits. Seven of her daughters were by Netherland Prince, and their sons spread Clothilde’s blood across North America.
You can see their reach today if you open an old herdbook and walk the pedigrees forward:
Gerster 1917 H.H.B., imported by Smiths & Powell in 1881 and sold to Chapman Bros. in Ohio, stands behind bulls like Cook‑Farm Starbuck Flip, Canyon‑Breeze Allen, and Whittier‑Farms Apollo Rocket.
Aaggie Ida 2600 H.H.B., imported in 1882, shows up behind cows like Donnandale Skychief Jemima, Riverside Boast Ormsby Dad, and Southwind Bell of Bar‑Lee.
La Polka 2d 2774 H.H.B., from their 1882 imports, is back in Homestead Susie Colantha and Marshline Ormsby Blossom.
It wasn’t just that they imported a lot of cows. They imported the right cows, tested them hard on milk and butter, and then sold their sons and daughters across the country.
What most people don’t realize is that many red‑and‑white Holsteins today trace their red genes back to these same herds. After Miller brought in outcross bulls like Clothilde Monk and later used Aaggie Cornelia 4th’s Clothilde, red and white calves started appearing. Those patterns increased when Smiths & Powell leaned into the Clothilde and Aaggie bloodlines. That history is still lurking in the pedigrees of today’s roan and red Holsteins.
Henry Stevens – Reading Cows by Feel
If Miller was the master cow man and Smiths & Powell were the big engine builders, Henry Stevens of Brookside Farm was the bull man.
Brookside sat just south of Lacona, New York, on land granted to Henry’s great‑grandfather for Revolutionary War service. Henry’s first Holsteins—cows May and Juno—were bought straight out of Miller’s herd for $300 apiece. From there he built his program around four foundation cows: DeKol 2d, Netherland Hengerveld, Belle Korndyke, and Helena Burke.
On paper, each of those cows made solid official records for their day—mid‑20‑lb butter tests, strong yearly numbers. Their real magic came through their sons:
DeKol 2d’s son DeKol 2d’s Butter Boy and grandson DeKol 2d’s Paul DeKol built the DeKol line.
Belle Korndyke produced Pontiac Korndyke, a key figure in the long Pontiac bull family.
Netherland Hengerveld’s line ran through Hengerveld DeKol, linking those families together.
Helena Burke’s son DeKol Burke led to the Burke family, which eventually produced bulls like Wisconsin Admiral Burke Lad.
The twist in Stevens’ story is that he did some of his best work after he lost his sight.
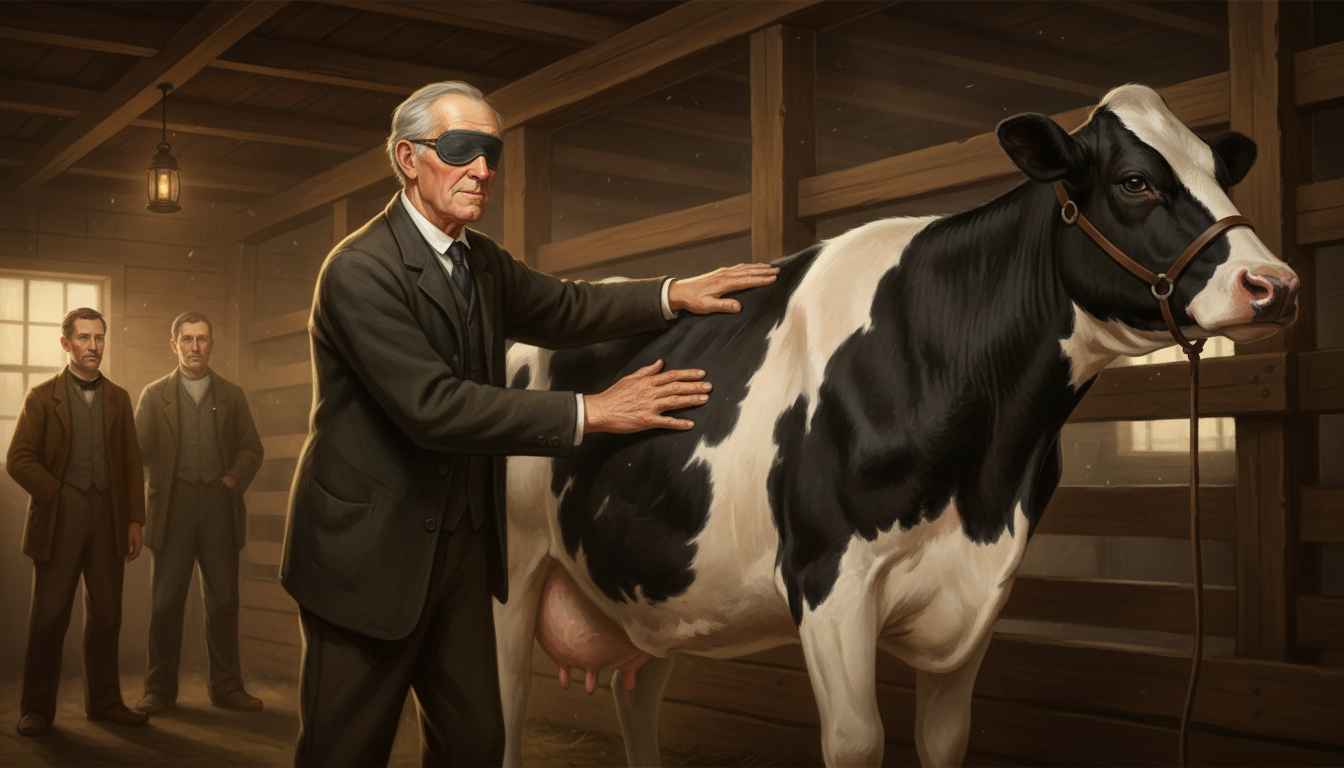
An illness in middle life left him blind, but he didn’t quit. People remembered him walking down the cow alley at Brookside with a hand on the halter rope, then turning loose and letting his fingers do the judging. He’d follow the curve of a rib, feel the spring in the barrel, test the pliability of an udder, even trace hair to tell where black gave way to white. His sons trusted his hands more than their own eyes when it came time to decide which heifers stayed and which bulls went out. The records back that faith up.
Blind before his best years as a breeder, Henry Stevens still “saw” cows better than most men with sight—reading frame, rib and udder with nothing but his hands.
DeKol 2d herself was imported by B.B. Lord & Son in 1885, sold to J.B. Dutcher & Son, and later bought by Henry Stevens & Sons, Lacona. From there, her descendants spread everywhere. Holstein historians calculate that her blood is shared in common with roughly 7.2% of the modern general herd—an astonishing saturation for one cow.
By the 1920s, Henry’s sons, trading as Stevens Bros.–Hastings Company at Liverpool, New York, were running what the Importers history calls “the most influential Holstein farm of the 1920s,” anchored by the bull King of the Pontiacs. The bull power that started with those four Brookside cows and a blind man’s hands helped carry Holsteins into the machinery era.
You see “DeKol” or “Pontiac” stacked three or four times in an older pedigree, and you’re looking straight back at Brookside and a breeder who literally felt his way into the future.
B.B. Lord & Son – A Bridge North
Head west across New York and you come to Sinclairville in Chautauqua County. Just south of the little bridge over Mill Creek lies what used to be Sinclairville Stock Farm, 110 acres owned and worked by Bela B. Lord and his son Clarence.
From 1882 to 1889, B.B. Lord & Son shipped 178 head of Holsteins to Canada—about 12.5% of all Canadian imports—and many of those animals ended up as foundation cows. Working in partnership with Michael Cook & Son of Aultsville, Ontario, they put together almost all the main building blocks of the Posch‑Abbekerk strain:
Tidy of Downie, dam of Tidy Abbekerk, one of the cornerstone cows.
Aaltje Posch 4th, foundation female of the Posch family.
Hiemke 3d, dam of Abbekerk Prince 2d.
Mercena, whose female line produced Pauline Colantha Posch and ultimately King Toitilla Acme.
From those cows came the Mount Victoria Farms herd at Hudson Heights, Quebec, and sires like Prince Colanthus Abbekerk Extra, Canada’s first Class Extra bull and a worldwide influence. Another Lord cow, Disone 6268 H.H.B., went to H.M. Williams and then to A.B. Mallory. Her descendants include May Echo Sylvia (seven world records in 1916), Re‑Echo May Burke EX (world champion in 1950 at 35,314 lbs milk and 1,261 lbs fat in an 11‑year‑old 3X record), and A.B.C. Reflection Sovereign EX‑Extra, sire of multiple All‑American get‑of‑sire groups.
Even Lord cows that stayed in the States made noise. Milly 5153 H.H.B., imported in 1883, shows up as sixth dam of May Walker Ollie Homestead, dam of Sir Inka May. That ties in Shadeland Daisy and other Shadeland blood further back.
Lord’s operation gradually drifted toward horses—French Coach, Percherons, Standardbred trotters—and Holsteins slid out of focus. But by then the cattle they’d picked and shipped were already planted all over Canada and the northern U.S. If you work with Posch‑Abbekerk descendants, Pauline Colantha Posch blood, or some of the old King Toitilla Acme lines, you’ve got a little bit of Sinclairville running in your herd.
Regional Pioneers – The Web Tightens
Once the big New York pipelines were flowing, a second wave of importers stepped in. Their names might not be as famous on the surface, but if you spend any time chasing deep pedigrees, you bump into them constantly.
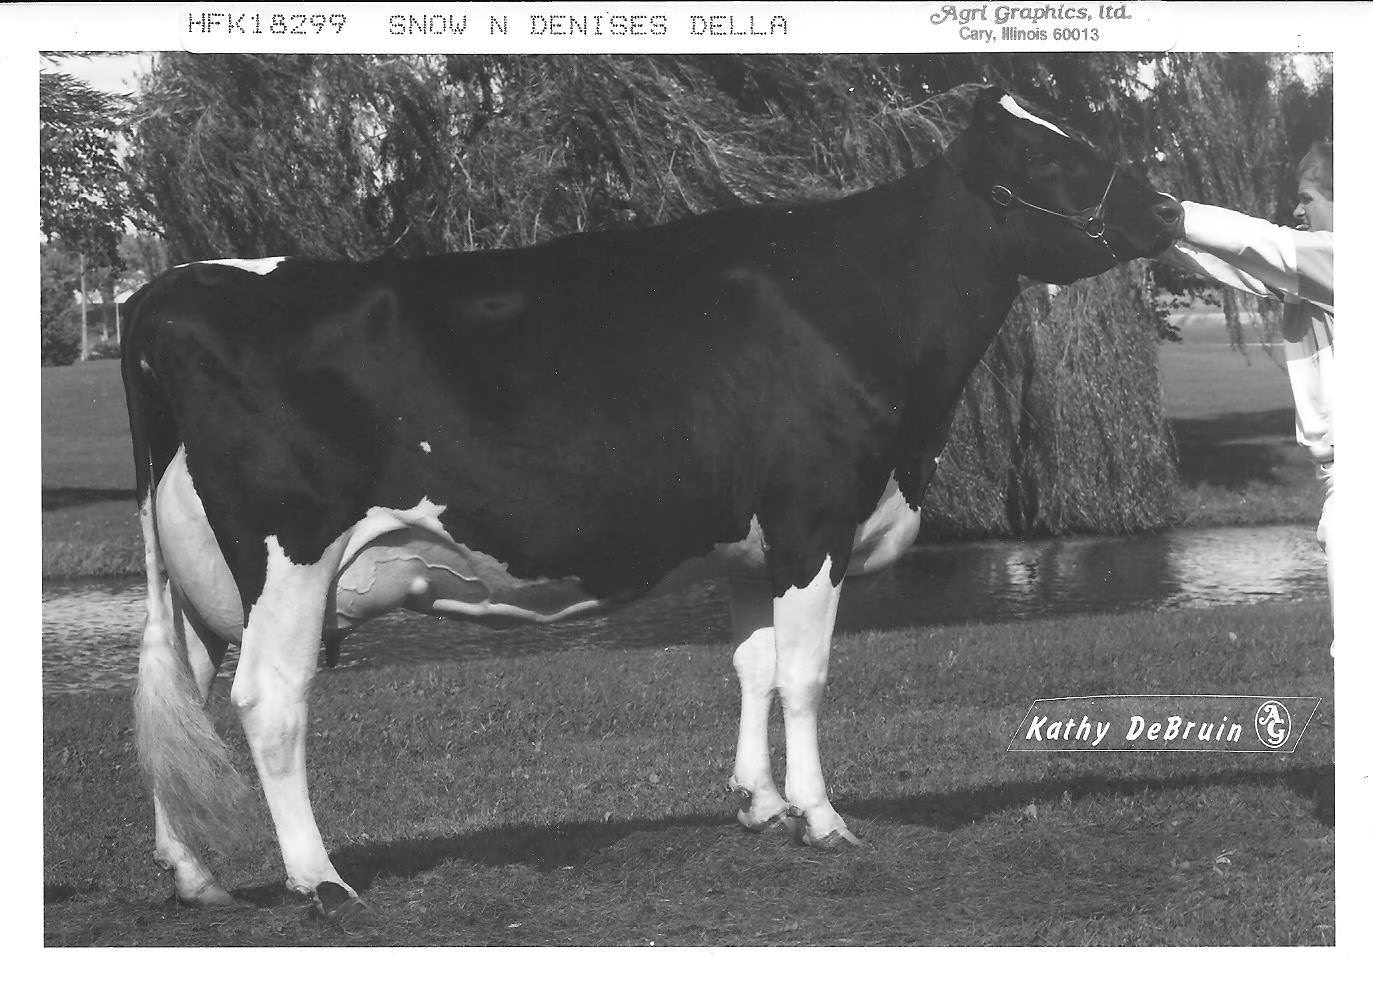
Take Alonzo Bradley of Lee, Massachusetts. He was a lumberman before he turned to farming and made six trips to Holland between 1879 and 1884, picking cattle off the ground himself. Among his imports were Segis 5765 H.H.B.,Pietertje 2d 3273 H.F.H.B., and Aaltje Salo 5868 H.H.B. Those cows became the headwaters of the Segis, Pietertje, Rag Apple, and Ormsby families—names that echo later in bulls like King Segis and Johanna Rag Apple Pabst. Bradley sold just twelve young females to H. Rust & Bros. in Wisconsin. From that small group came, generations later, cattle like Hanover‑Hill Triple Threat and Snow‑N Denises Dellia and the cow families they started.
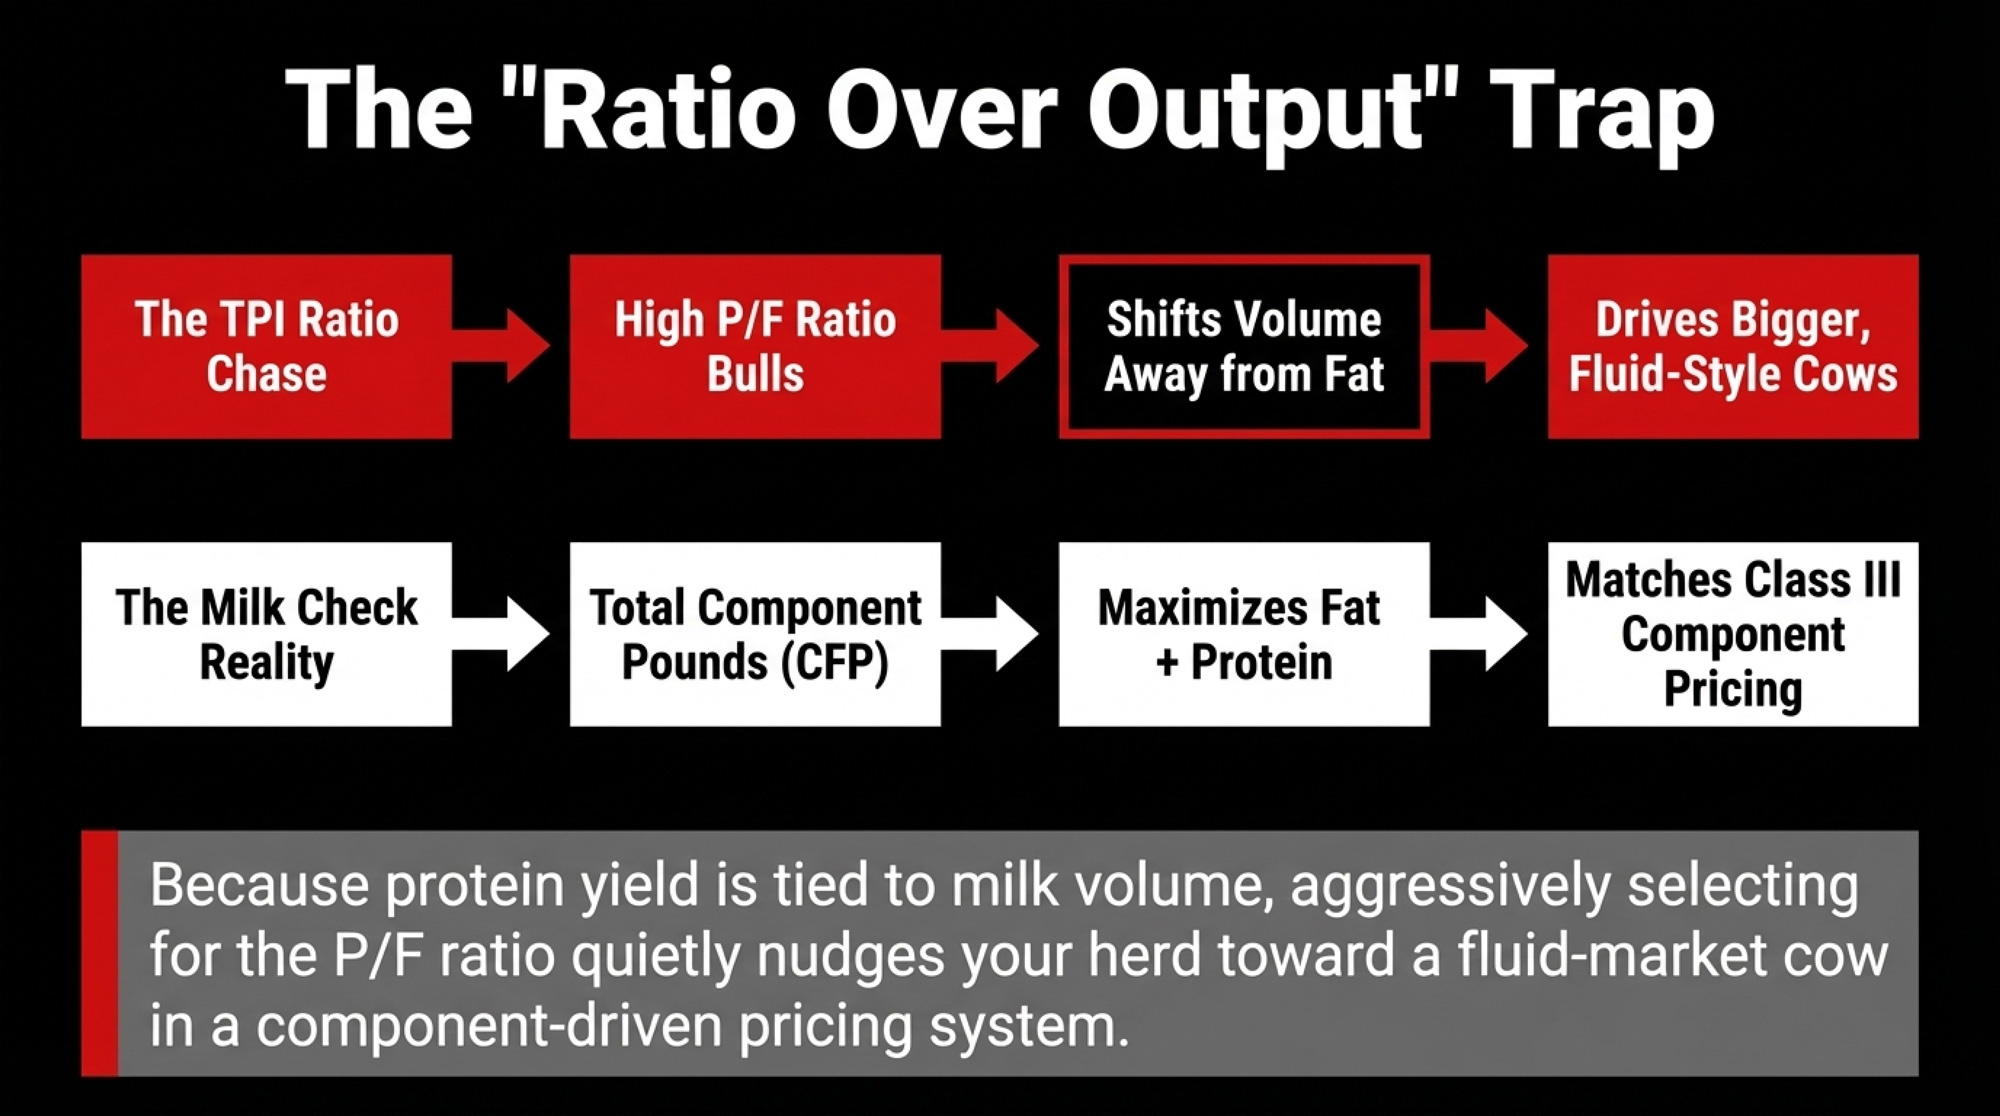
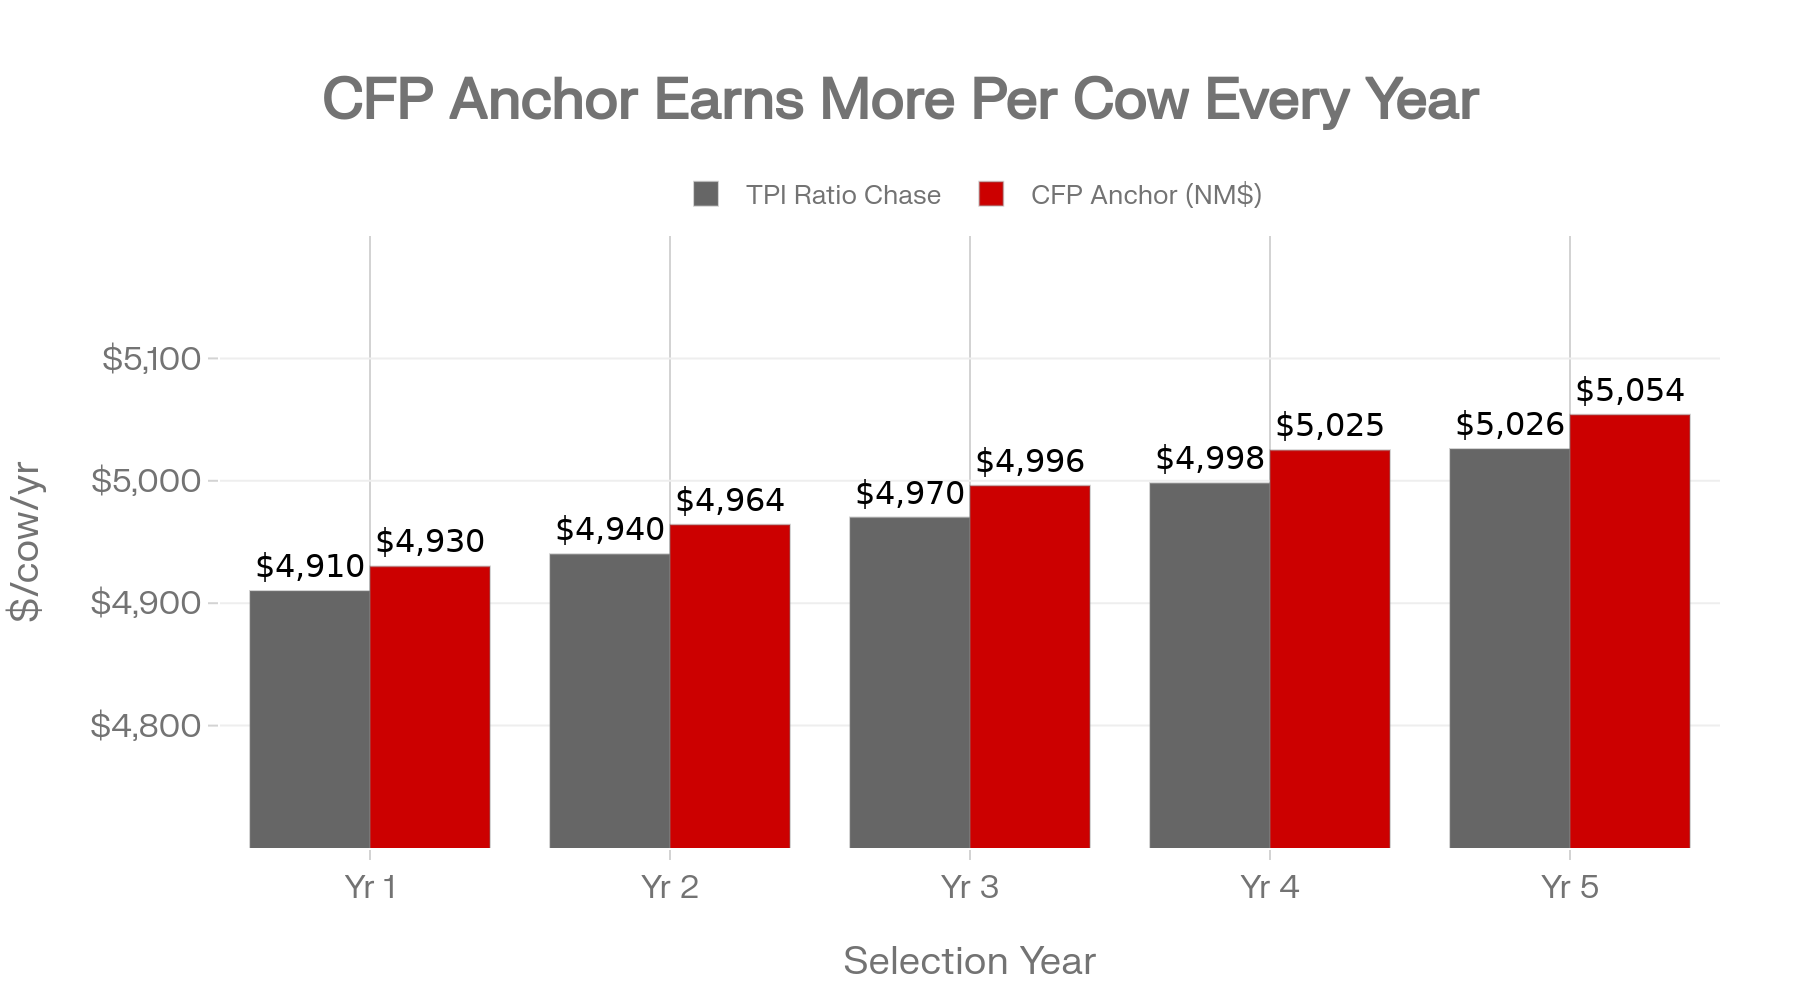
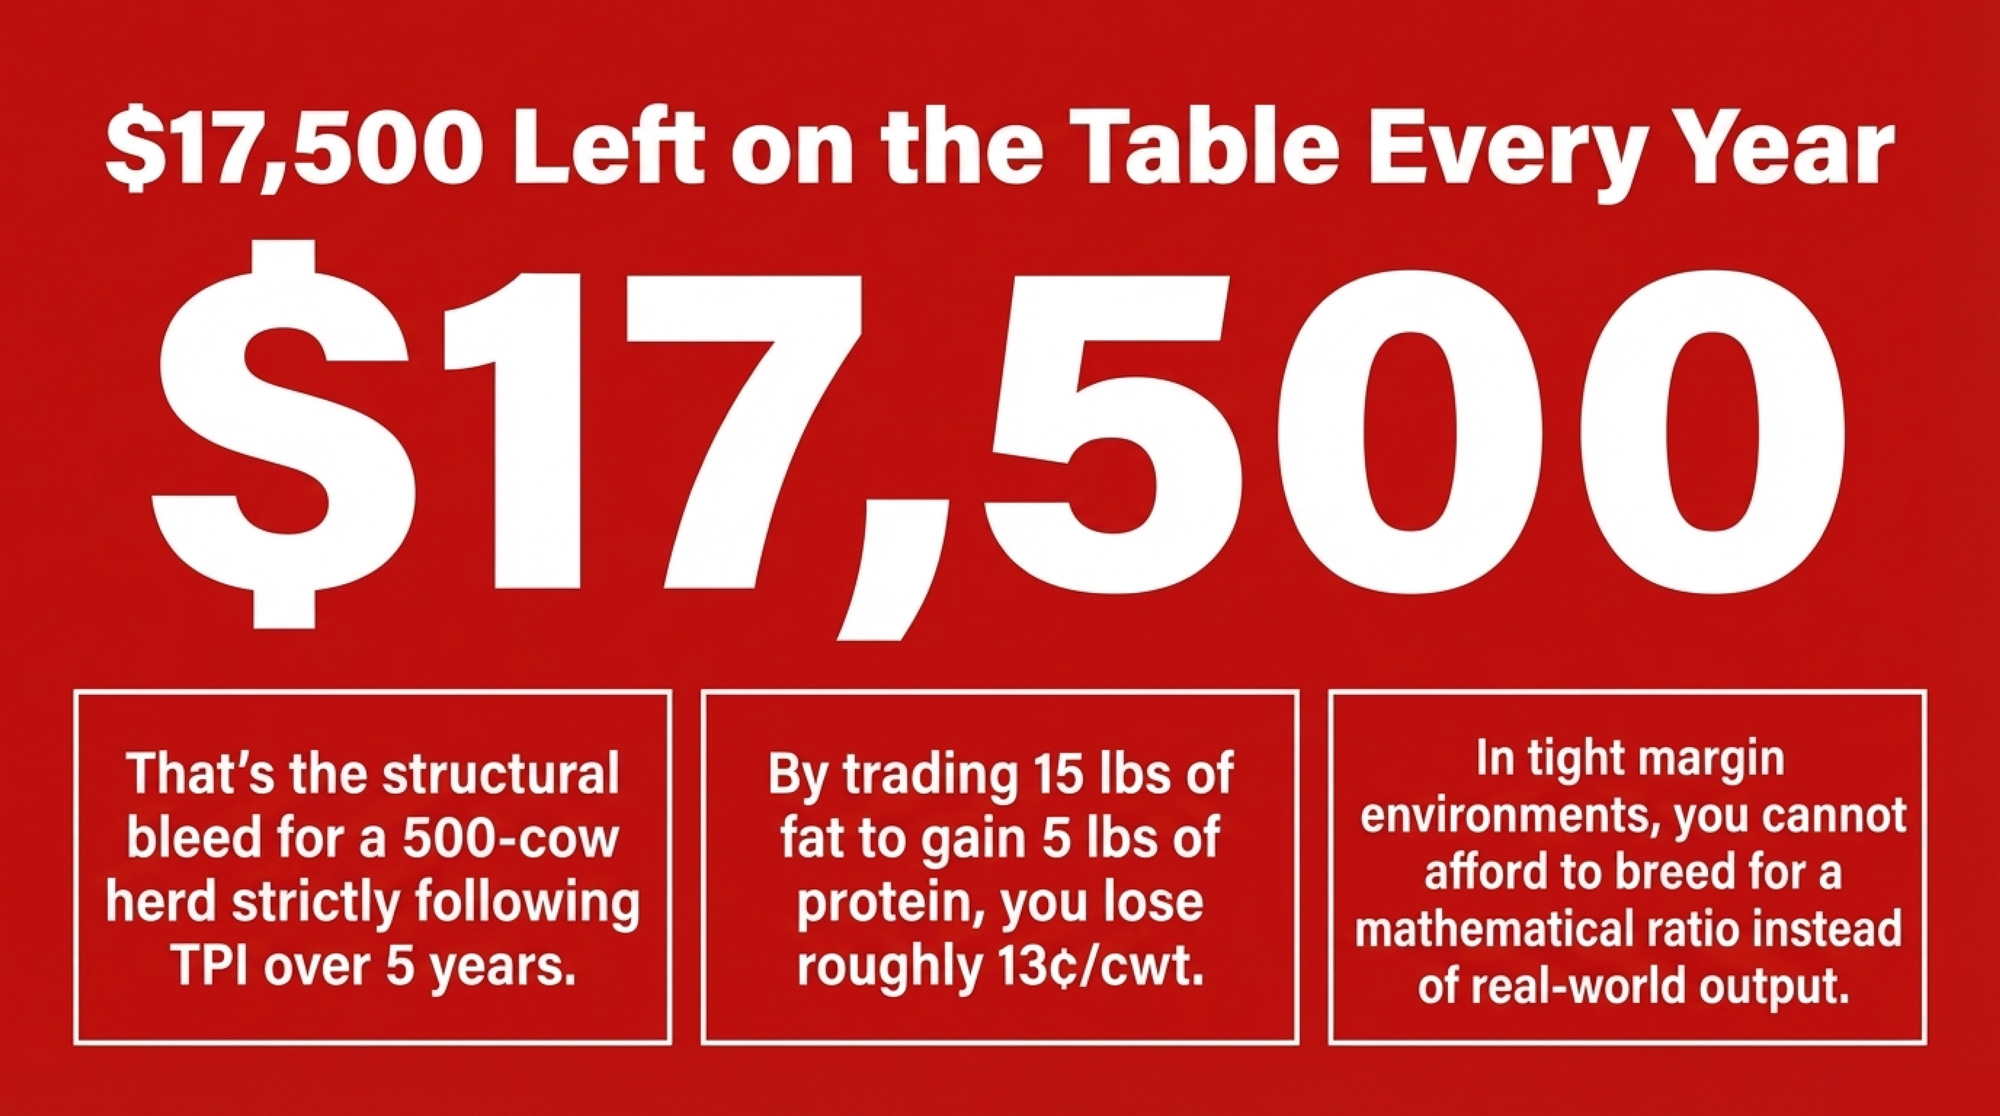
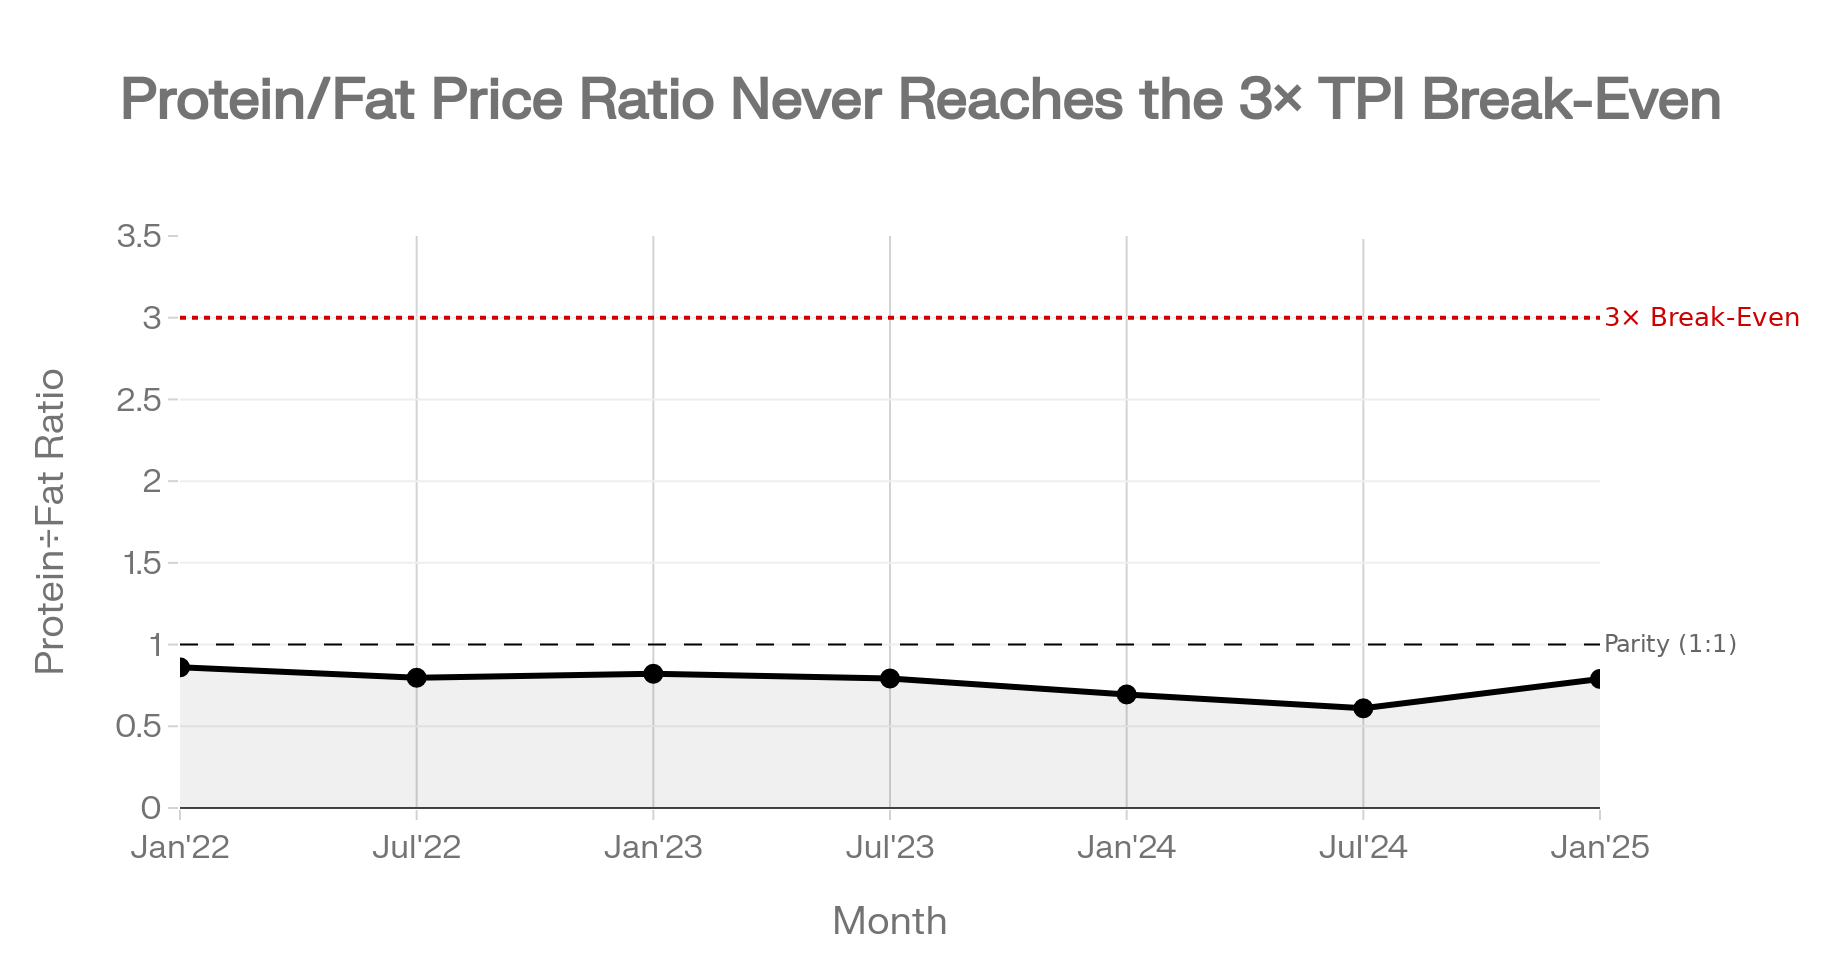
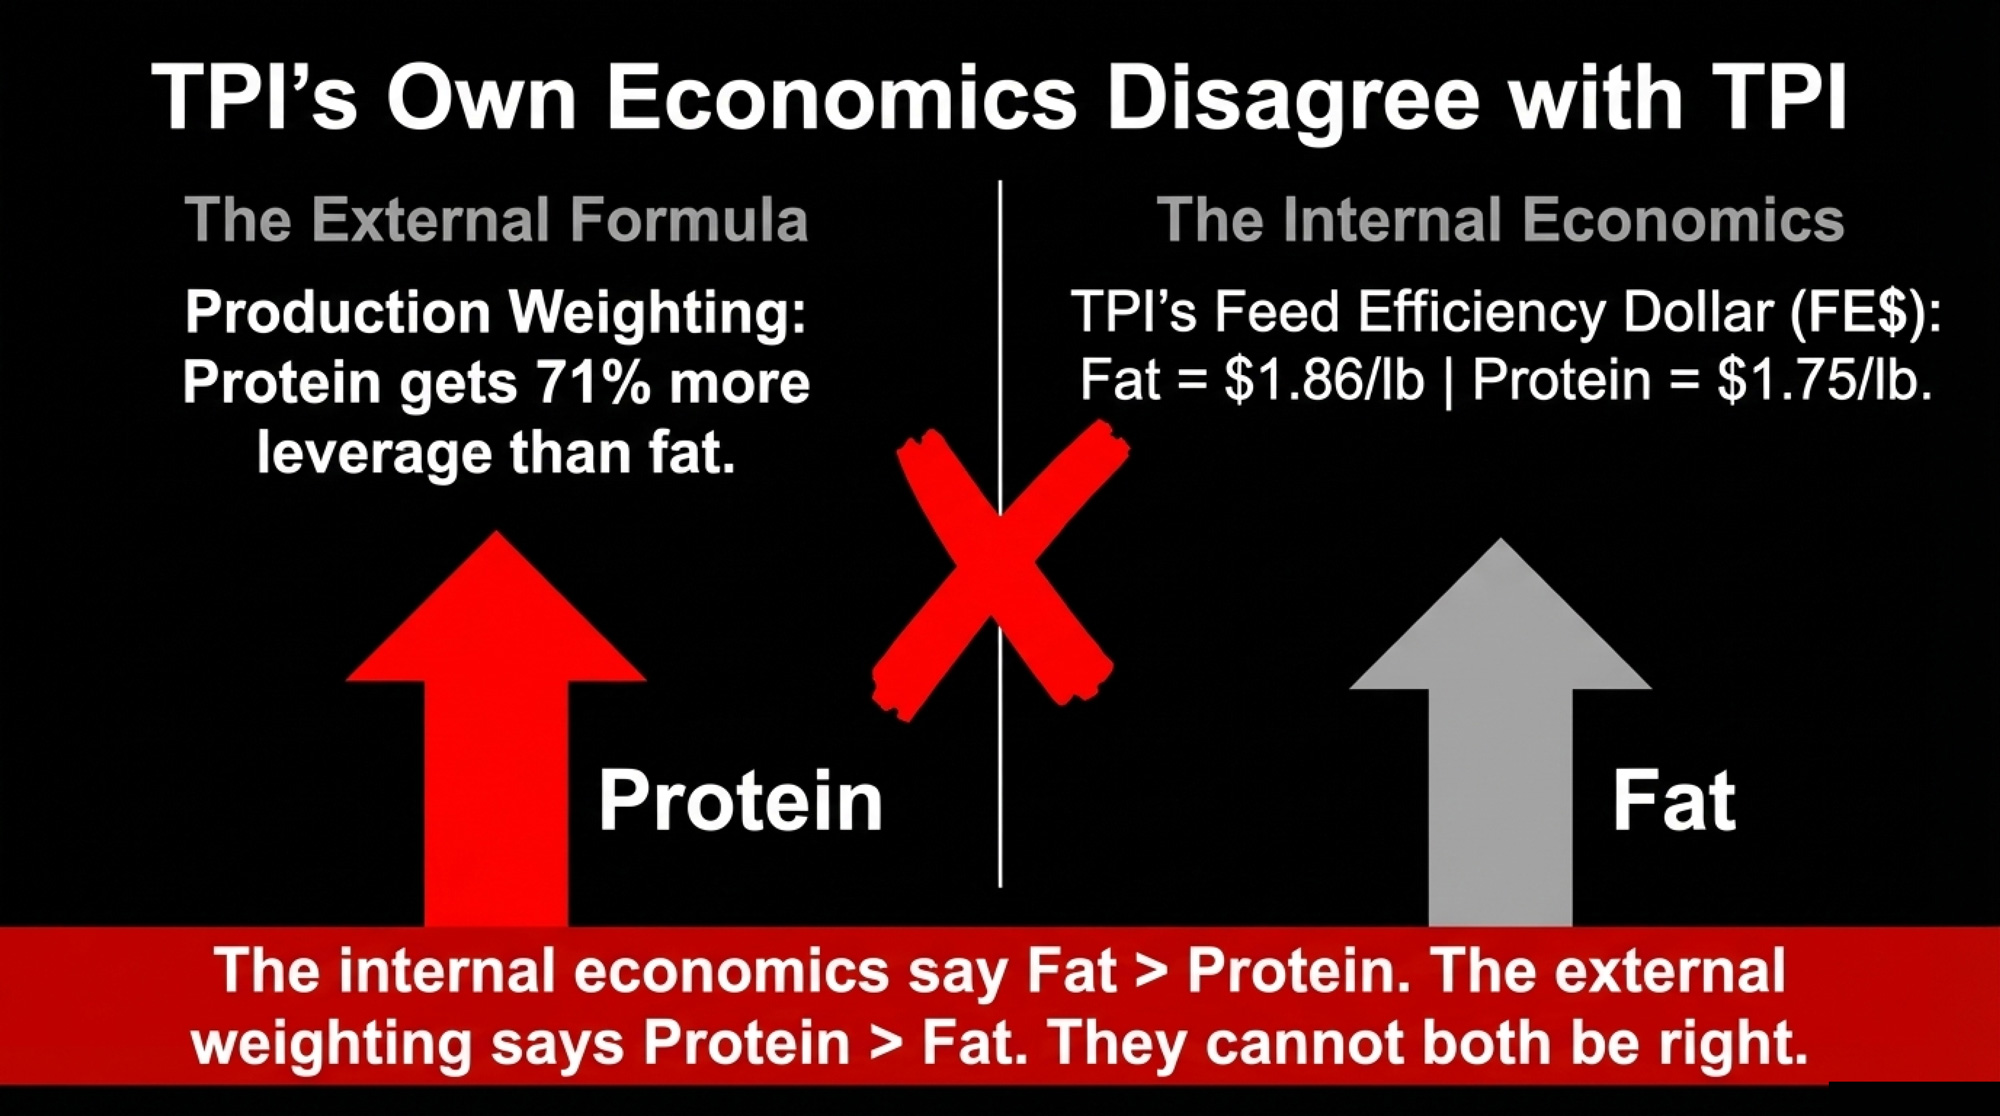
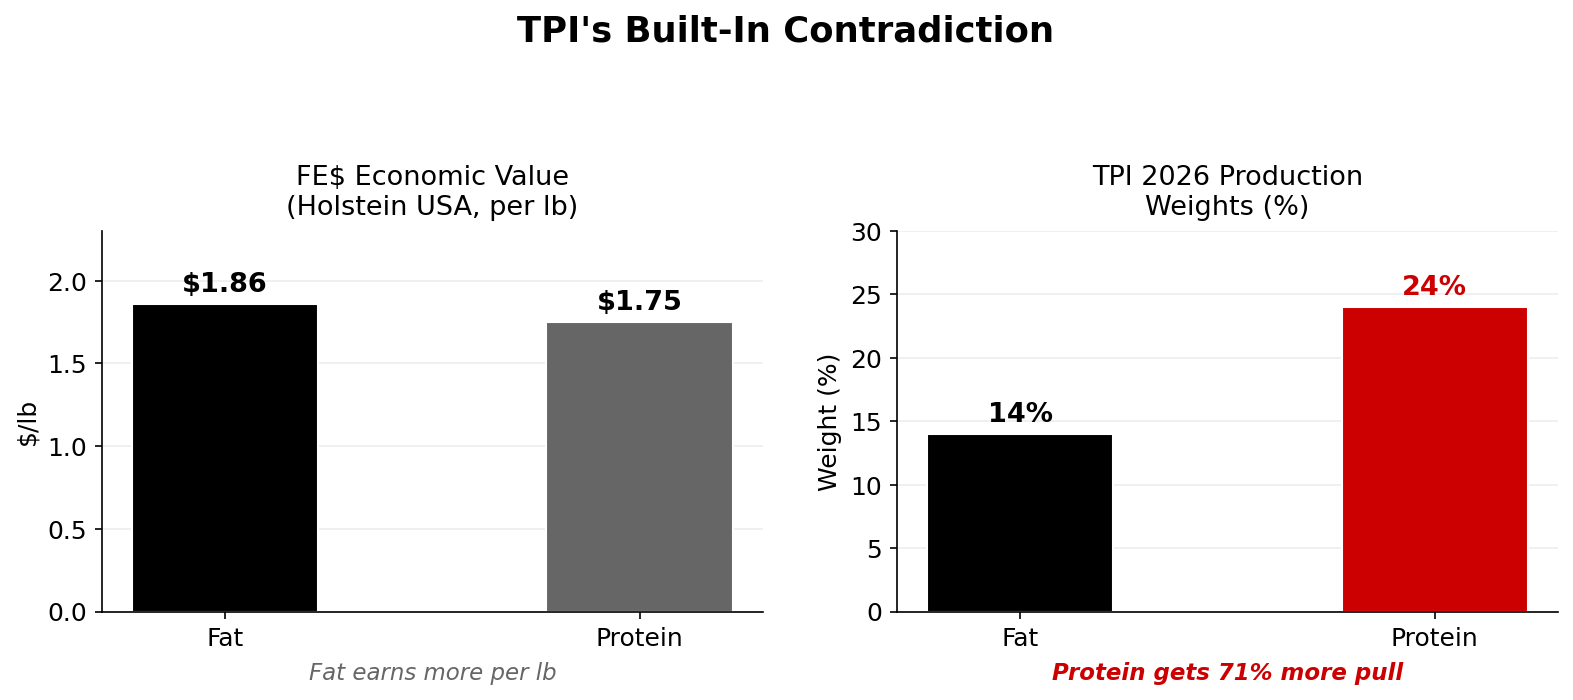
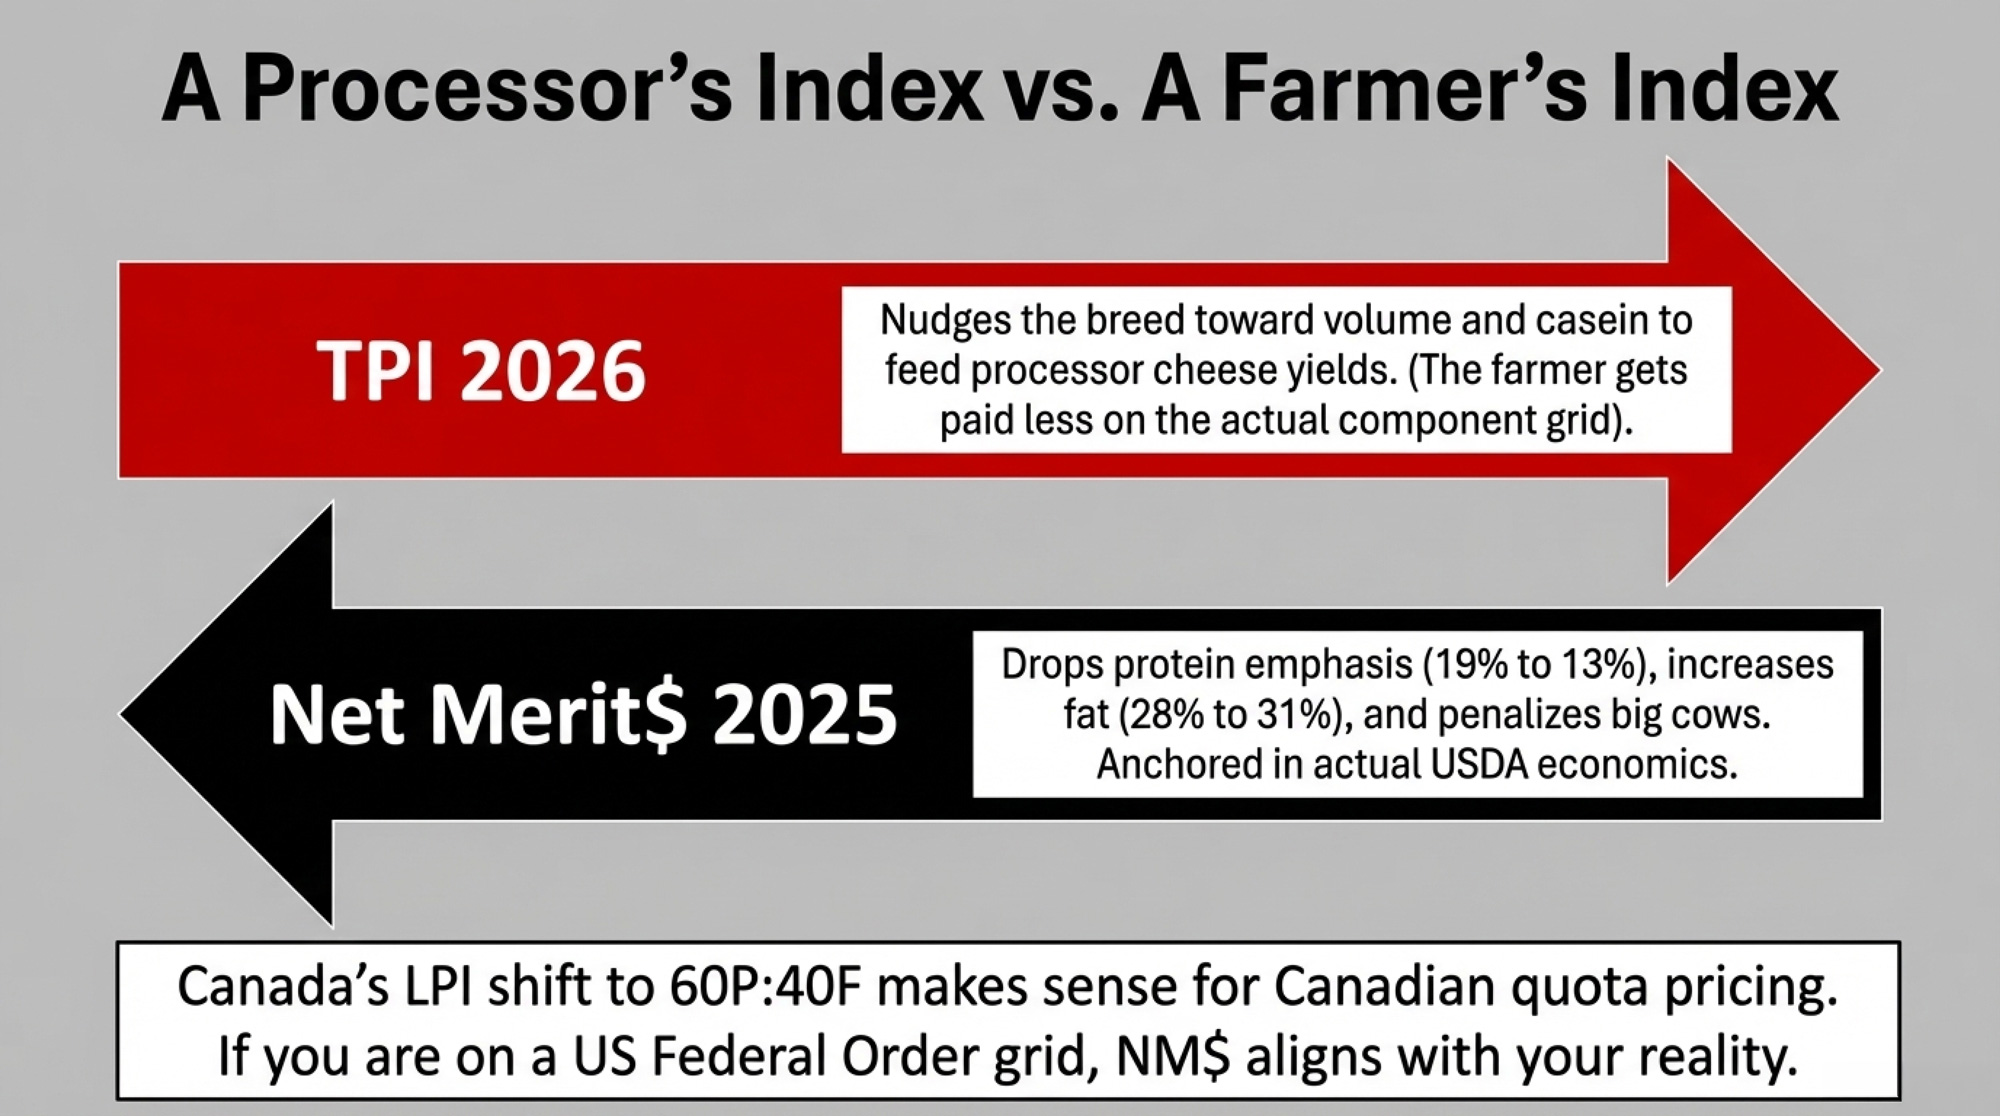
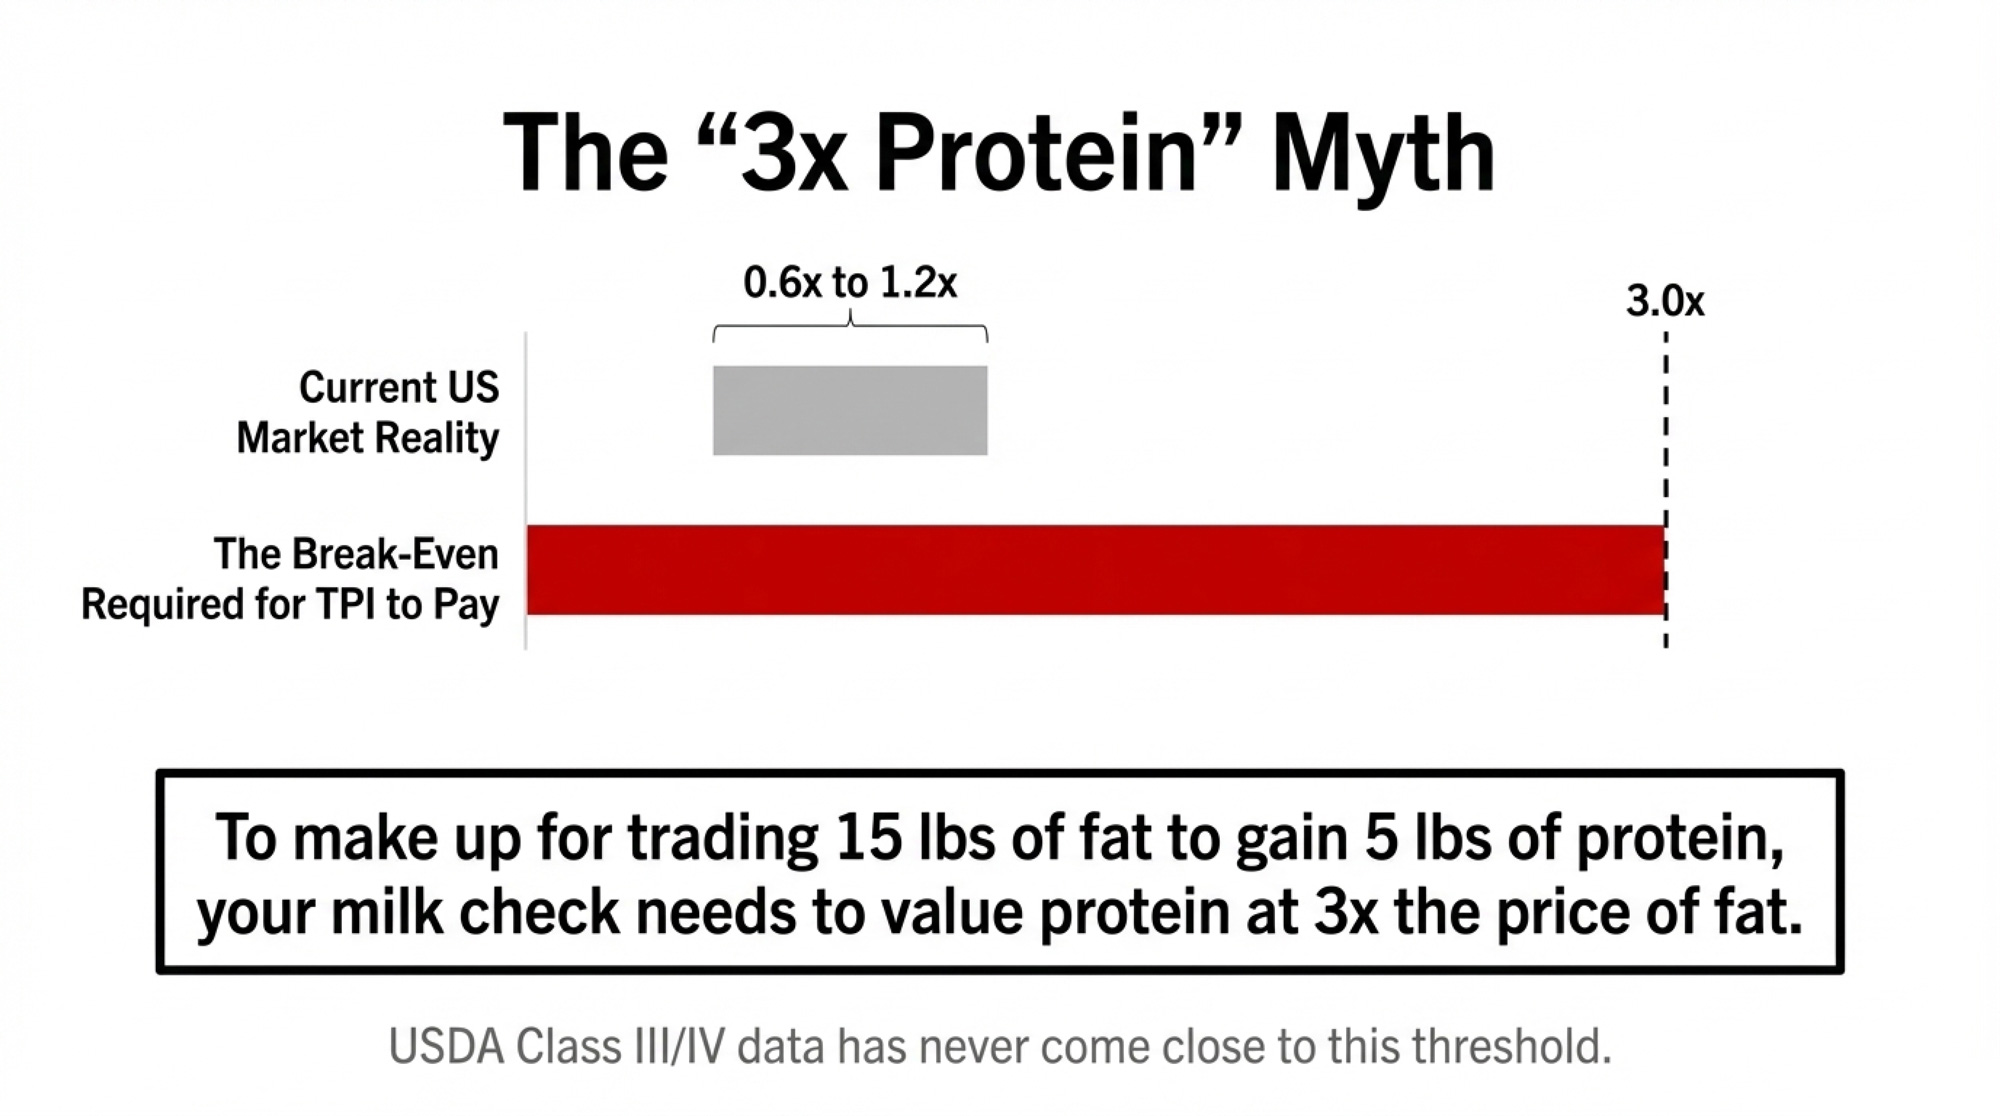
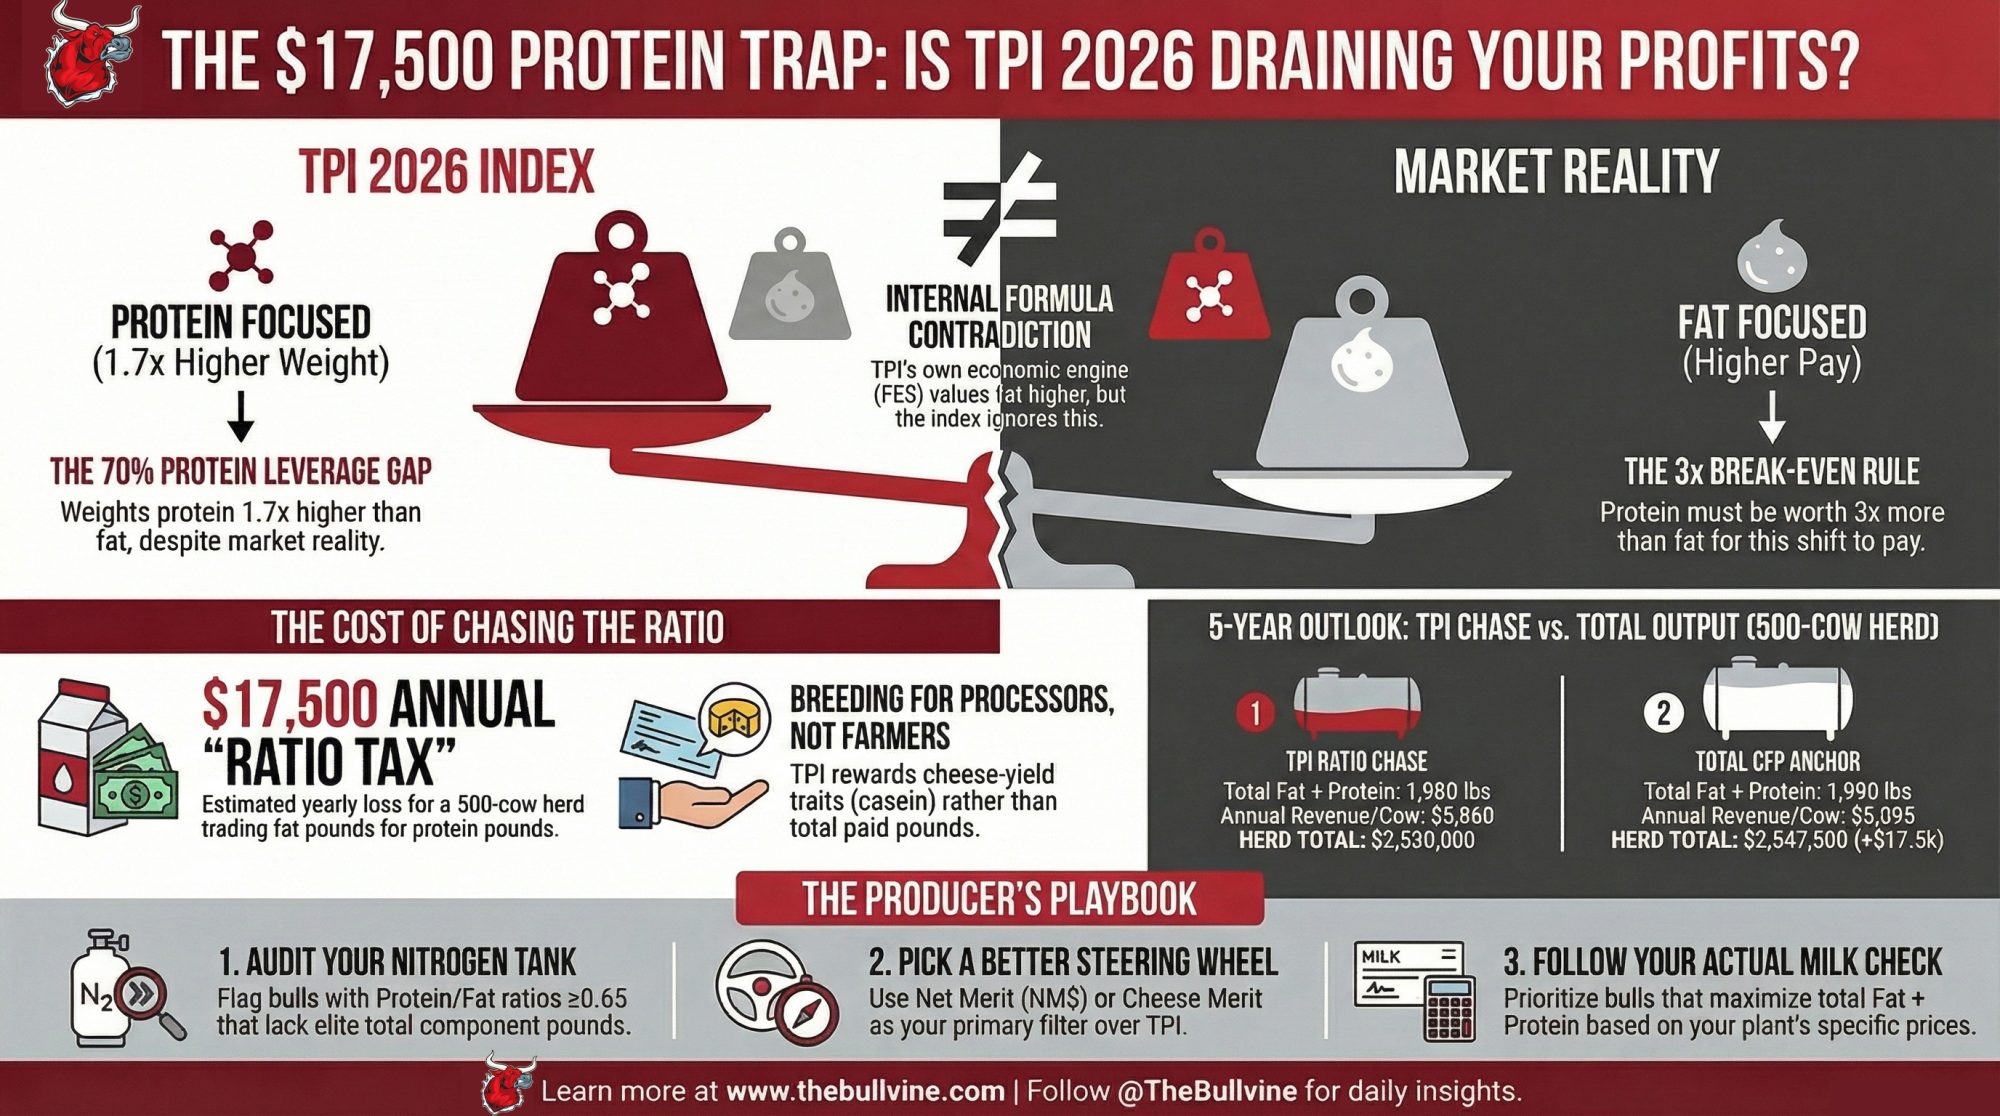
Protein would have to be worth 3× fat for this TPI shift to pay. Your milk check says it isn’t. Where does that leave the bulls you’ve been loading into your tank?
[Editor note: “Mark H.” and “Sara L.” in this article are composite characters built from real barn math and industry context to illustrate decisions many 500‑cow dairies face in 2026.]
The new TPI weights don’t just tweak your sire list. They push the Holstein breed in a new direction for the next 10–15 years. This isn’t a milk check issue alone; it quietly changes the fundamental type of cow the industry breeds for over the next decade.
Holstein USA’s April 2026 TPI formula doesn’t just nudge protein; it rewards the protein‑to‑fat ratio over total output. That’s a fundamentally different breeding goal from previous iterations that treated fat and protein more evenly in the production slice. If you follow that signal unthinkingly in a US Class III component grid, a 500‑cow herd can easily leave about $17,500 a year on the table.
Mark H., who milks 500 Holsteins in New York, only saw “five‑point tweaks” when Holstein USA shifted TPI production weights to 24% protein and 14% fat, and Lactanet moved Holstein LPI production to 40% fat, 60% protein. Under pressure from reps and neighbors, he leaned into the new high‑TPI, protein‑heavy bulls — and that’s where the barn math started to disagree with his milk check.
2026 TPI Formula Changes: A Directional Shift, Not a Tweak
Holstein USA’s 2026 TPI formula update increased the weighting on PTA Protein from 19 to 24 and decreased the weighting on PTA Fat from 19 to 14. That’s the headline change in the production slice.
By early 2025, Mark’s Federal Order milk check looked like most US Class III/IV component checks. USDA Class III and IV component reports through 2023 and into 2025 often show butterfat prices near the high‑$2.80s to low‑$3.00s per lb, with protein commonly in roughly the $1.80–$2.50 per lb range, depending on the month and year. In several recent months, that’s meant fat is worth more per pound than protein on his component line.
At the same time, the TPI formula did something very different inside the index. It moved the production weights from:
19% protein, 19% fat → to → 24% protein, 14% fat.
On the surface, you see a five‑point bump to protein and a five‑point cut to fat. Simple enough.
When Mark’s nutritionist and genetics advisor, Sara L., put a pen to it at his kitchen table, she wrote one line that changed the whole conversation:
Old protein:fat leverage = 19:19 = 1.0
New protein: fat leverage = 24:14 ≈ 1.71
Inside the production slice of TPI, one pound of PTA Protein now pulls like roughly 1.7 pounds of PTA Fat. That’s roughly a 70% increase in protein’s leverage over fat, even though Holstein USA’s own description says the formula is designed to yield “additional pounds of fat and protein, with slightly more emphasis on protein.”
Because protein yield is closely tied to milk volume in most Holstein evaluations, loading selection on the P/F ratio nudges herds — and over time the breed — toward higher‑volume, more fluid‑style cows, even while most plants continue to pay based on total fat + protein sold.
The formula isn’t creating more total components — it is redistributing emphasis. A hard P/F chase moves components away from fat instead of maximizing total pounds of fat + protein you sell. TPI is now quietly rewarding the ratio more than the total output. That’s a different breeding goal than the one that built the modern high‑component Holstein.
Lactanet did something similar but more transparent. Its April 2026 bulletin spells out that shifting Holstein LPI production from 60F:40P to 40F:60P is meant to “better reflect anticipated changes in milk pricing and processor demand, particularly the growing emphasis on protein,” and that it should cause only minor reranking among top animals. Canada’s move is explicitly anchored in its quota‑based pricing math and processor demand; it’s internally consistent with that market.
Holstein USA’s change, by contrast, is big enough to push fat‑heavy bulls down the list and protein‑heavy bulls up, even when no new daughters are added. The 24P:14F production weighting behaves more like a new rulebook for which cow wins — especially in how it reshuffles bulls with very different fat vs protein profiles. Mark saw that on the spring lists. He just hadn’t tied it back to dollars or to the kind of cow he was breeding for 2036.
2026 TPI vs Total CFP: Two Paths for the Same 500‑Cow Herd
To get past the rhetoric and the rankings, Sara asked Mark to walk through two very different five‑year futures off the same starting herd. Same cows today, different sire lists from 2026 through 2030.
They agreed on a realistic starting point for his 500‑cow Holstein herd:
Fat: 1,070 lb/cow/year
Protein: 840 lb/cow/year
Total components (CFP): 1,910 lb/cow/year
That’s roughly a 26,700‑lb Holstein at ~4.0% fat and 3.1% protein — very normal for a well‑managed commercial herd.
These gains are illustrative — built to show directional outcomes, not to predict any specific bull’s future proof. Actual genetic trends will vary by herd, sire choice, and whatever comes out of the April evaluations.
Path 1: Follow the 2026 TPI Formula — Chase the Ratio
If Mark listens to the new 24P:14F signal and leans into bulls that look fantastic on updated Holstein TPI 2026 lists, he’s going to pick a lot of sires that:
Carry high PTA Protein
Have only moderate PTA Fat
Sit at P/F ratios ≥0.60
Those are the profiles that jumped when TPI changed — protein‑strong, fat‑lighter bulls that TPI now likes roughly 1.7× more per pound of protein than per pound of fat.
Looking at typical genomic bull PTAs and recent trends, Sara used conservative, scenario‑level genetic gains for a herd that picks sires that way:
+6 lb PTA Fat per year
+8 lb PTA Protein per year
Over five years of bull selection, that’s +30 PTA Fat and +40 PTA Protein at the sire level. With a realistic ~2.5‑year lag from bull usage to milking cows, about half of that gain has flowed into the cow herd by Year 5:
+15 PTA Fat, +20 PTA Protein in the herd.
Translate PTAs to actual production (roughly 2 lb actual per lb PTA on mature daughters):
+30 lb fat, +40 lb protein per cow per year by Year 5.
So if Mark “follows TPI,” his Year‑5 average cow looks like this:
Fat: 1,070 + 30 = 1,100 lb
Protein: 840 + 40 = 880 lb
Total CFP: 1,980 lb
P/F ratio (by lb): 880 ÷ 1,100 ≈ 0.80
He’s now got a prettier P/F ratio and more protein. That’s what the formula rewards.
Path 2: Follow Total Output — Anchor on Combined Fat + Protein
The alternative is boring but powerful. Ignore the TPI noise and:
Filter bulls first on a profit index that actually starts from dollars — Net Merit (NM$), Cheese Merit, or a similar economic index.
Within that filtered list, sort bulls by Fat PTA + Protein PTA (total CFP).
Keep bulls with P/F in a sane band, roughly 0.50–0.60, so you’re not accidentally tanking protein.
That’s very similar to how Lactanet positions Pro$ and LPI: as profit‑oriented tools tuned to Canada’s component pricing and costs, with the production subindex explicitly anchored to fat and protein yields.
For a herd following that logic, Sara assumed slightly different gains:
+9 lb PTA Fat per year
+7 lb PTA Protein per year
Over five years, that’s +45 PTA Fat and +35 PTA Protein among the sires, or about half in the cow herd by Year 5:
+22.5 PTA Fat, +17.5 PTA Protein.
Translate to actual:
+45 lb fat, +35 lb protein per cow per year by Year 5.
Now Mark’s “CFP‑anchored” herd is at:
Fat: 1,070 + 45 = 1,115 lb
Protein: 840 + 35 = 875 lb
Total CFP: 1,990 lb
P/F ratio: 875 ÷ 1,115 ≈ 0.79
Notice what happened: the TPI‑driven path didn’t grow total CFP faster; it just redistributed pounds from fat to protein to achieve a prettier ratio. That is the “ratio over output” trap.
Because protein yield is closely tied to milk volume in most Holstein evaluations, selecting aggressively for the P/F ratio doesn’t just shift your component ratio — it tends to nudge herds toward higher‑volume, more fluid‑style cows. You’re nudging both your herd and, if enough herds follow, the breed toward a fluid‑market cow in a component‑driven system.
2026 Selection Paths for a 500‑Cow Herd (Year‑5 Scenario)
Metric (per cow/year)
Path 1: TPI Ratio Chase
Path 2: CFP Anchor
Difference
Fat yield (lb)
1,100
1,115
–15 lb
Protein yield (lb)
880
875
+5 lb
Total CFP (lb)
1,980
1,990
–10 lb
Fat revenue @ $3.00/lb
$3,300
$3,345
–$45
Protein revenue @ $2.00/lb
$1,760
$1,750
+$10
Total components revenue
$5,060
$5,095
–$35/cow
500-cow herd annual loss
—
—
–$17,500
The $17,500 Gap: Paper Cows vs Real Cows
To keep the math honest, Sara anchored everything to real US component prices.
USDA Class III and Class IV component reports through 2023 and into 2025 often show butterfat prices near the high‑$2.80s to low‑$3.00s per lb, with protein commonly in roughly the $1.80–$2.50 per lb range. In several recent months, that’s meant fat worth more per pound than protein on a Federal Order check.
For barn‑table math, she used simple, conservative averages:
$3.00/lb fat
$2.00/lb protein
She wasn’t trying to pick a magic month. She wanted Mark to see the difference.
Using the Year‑5 cows they just built:
Ratio herd (TPI‑driven)
Fat dollars: 1,100 lb × $3.00 = $3,300
Protein dollars: 880 lb × $2.00 = $1,760
Total components revenue: $5,060/cow/year
CFP herd (milk‑check‑driven)
Fat dollars: 1,115 lb × $3.00 = $3,345
Protein dollars: 875 lb × $2.00 = $1,750
Total components revenue: $5,095/cow/year
The difference:
$35/cow/year — in favor of the boring CFP herd.
At 500 cows:
$35 × 500 = $17,500/year.
On paper, the ratio‑focused herd “improved” faster. In the tank and on the check, the CFP herd won. That’s the danger of breeding for a mathematical ratio instead of real‑world output.
If your operation is already navigating tight margins under current milk prices, that $17,500 is serious money — the kind of structural bleed the Bullvine explored in “2025’s $21 Milk Reality: The 18‑Month Window to Transform Your Dairy Before Consolidation Decides for You,” which showed how a $21.60/cwt milk price could wipe out about $125,000 a year from a typical 500‑cow dairy’s profits if nothing changes.
Using the same 26,700 lb/cow:
26,700 lb ÷ 100 = 267 cwt/cow/year
Then:
Ratio herd: $5,060 ÷ 267 ≈ $18.95/cwt
CFP herd: $5,095 ÷ 267 ≈ $19.08/cwt
While 13¢/cwt may not feel like a crisis in year one, over a decade, it represents a meaningful directional bleed — and it points the herd toward a more fluid‑style cow while your plant still pays you on components sold.
What Does the 3× Protein Break‑Even Really Mean for Your Milk Check?
Mark’s next question is probably the same one you’re thinking: “Sure, that’s with today’s pricing. What if protein really outpaces fat?”
So they stacked the deck for protein. Lactanet’s April 2026 article is explicit that they expect more emphasis on protein in Canadian milk pricing because of processor demand and SNF‑heavy products, and that LPI’s tilt is intended to reflect those anticipated pricing changes. Some specialty protein markets and niche contracts already pay a heavier protein premium than the standard Federal Order grid. The question is whether your check looks like that.
To mirror a “protein‑friendly” future, Sara tried:
$2.80/lb fat
$3.50/lb protein
That’s a world where protein is worth ~25% more per lb than fat — much more protein‑heavy than many recent US Federal Order months, but not fantasy.
Run the Year‑5 cows again:
Ratio herd
Fat: 1,100 × 2.80 = $3,080
Protein: 880 × 3.50 = $3,080
Total: $6,160/cow/year
CFP herd
Fat: 1,115 × 2.80 = $3,122
Protein: 875 × 3.50 = $3,062.50
Total: $6,184.50/cow/year
Even in that protein‑leaning grid:
The CFP herd is still $24.50/cow/year ahead.
On 500 cows, that’s about $12,250/year.
The trade behind that number:
Fat lost vs CFP herd: 15 lb × $2.80 = $42
Protein gained vs CFP herd: 5 lb × $3.50 = $17.50
Net: $24.50 worse for the ratio herd.
The milk check still doesn’t care that TPI loves Mark’s higher P/F ratio.
Sara wrote the trade on the board:
Ratio herd vs CFP herd Year 5: –15 lb fat, +5 lb protein.
For the ratio herd to make more money on components, you’d need:
5 × protein price > 15 × fat price
So the break‑even is:
protein price ÷ fat price > 3.0
Unless your component grid effectively values protein at 3× the price of fat, you’re being paid to maximize total output, not to reshuffle the ratio.
Scenario
Fat Price ($/lb)
Protein Price ($/lb)
Protein÷Fat Ratio
TPI Path Winner?
Current US avg (2024–25)
$2.95
$2.33
0.79
❌ CFP wins by $35/cow
Protein-lean month
$3.00
$1.80
0.60
❌ CFP wins by $45+/cow
Protein-heavy scenario
$2.80
$3.50
1.25
❌ CFP still wins by $24.50/cow
Break-even threshold
$2.00
$6.00
3.0
= Tie
TPI math finally pays
$2.00
$6.50+
>3.0
✅ TPI path wins
USDA Federal Order Class III/IV component data through 2024 and early 2025 doesn’t show anything remotely like that. Protein moves around. Some months it’s close to fat. For many months, it’s been cheaper. But nowhere does it sustainably hit 3× fat per lb.
Who Benefits When TPI Chases Protein?
After the 3× math sank in, Mark asked the question every producer should be asking: “If this doesn’t make sense for my milk check, who decided to do it — and who does it make sense for?”
It’s a fair question. And Holstein USA’s own numbers make it sharper than you’d expect.
TPI’s Own Economics Say Fat Is Worth More
Holstein USA’s Feed Efficiency Dollar (FE$) formula — the economic engine inside TPI — uses these component values:
Fat: $1.86/lb
Protein: $1.75/lb
Milk: –$0.0025/lb
That’s straight from Holstein USA’s published TPI formula page. Protein ÷ fat = $1.75 ÷ $1.86 = 0.94. In their own economic model, fat is slightly more valuable than protein.
But in the TPI production weighting, protein gets 24% vs fat’s 14% — a ratio of 1.71 favoring protein.
Read that again. The economics inside the formula say fat ≥ protein. The weighting applied on top of those economics values protein at 71% more than fat. Those two things can’t both be right at the same time.
And those FE$ component prices? Holstein USA’s own TPI materials show FE$ component values of $1.86 for fat and $1.75 for protein, tied to updated cheese‑market economic assumptions released since 2021. Whatever exact update cycle you use, the current published FE$ values still favor fat over protein — $1.86 vs $1.75. And compared to the April 2021 FE$ values ($1.55 fat, $1.73 protein), fat’s advantage has actually grown: fat jumped 20% while protein barely moved. The formula’s own economics are drifting toward fat even as the production weighting lurches toward protein. The FE$ values are net of feed cost, so they’re not directly comparable to AMS spot prices — but the direction is the same. In January 2025, USDA reported butterfat at $2.9460/lb and protein at $2.3267/lb, a protein/fat ratio of just 0.79. Whether you look inside the formula or outside it, fat keeps winning. The 24P:14F weighting doesn’t reflect that.
By contrast, USDA’s Net Merit 2025 update used current AGIL data and moved toward fat and away from protein. Same data agency, different conclusion.
Is This a Processor’s Index or a Farmer’s Index?
Holstein USA’s stated rationale includes alignment with processor demand for casein and the observation that genetic gains for protein have lagged behind fat in recent years. That’s a processor‑supply argument — cheese plants absolutely want more casein per vat because it drives cheese yield.
But here’s where it gets uncomfortable: a farmer doesn’t get paid on cheese yield per vat. You get paid on the total pounds of fat and protein sold, at whatever the Federal Order grid says those pounds are worth. If TPI steers the breed toward protein at fat’s expense, processors get more of the component they want for cheese yield — while farmers may end up with fewer total component dollars per cow under the actual Class III grid.
The Bullvine’s own analysis of the component revolution showed that processors are already capturing a 12.5% cheese yield windfall from higher components, and asked the pointed question: Are farmers getting their fair share of that value?
That doesn’t mean there’s a conspiracy. It means TPI may be optimizing for a processor’s view of what the breed should look like, not necessarily for the farmer’s milk check. If you’re making breeding decisions based on TPI, you should know whose economics the formula is actually serving.
Why Such a Big Swing?
If the goal was to keep protein gains from falling too far behind fat genetically, a modest adjustment might make sense. Go from 19:19 to maybe 21:17. Nudge it.
The question Holstein USA hasn’t clearly answered: if your own FE$ economics say fat ≥ protein, and AMS prices have only reinforced that since 2021, why did the production weighting move this far in the other direction?
Net Merit vs TPI 2026: Two Models, Two Directions
Mark’s not operating in a vacuum. While TPI’s production slice is shifting toward protein, Net Merit 2025 explicitly moved the other way, increasing the emphasis on fat and reducing the emphasis on protein to match observed component price trends.
Bullvine’s Net Merit 2025 analysis in “Net Merit’s $57 ‘Weight Tax’: How to Pick Holstein Bulls That Still Pay”shows:
Protein’s share of NM$ dropping from 19.6% to 13.0%.
Fat’s share is increasing from 28.6% to 31.8%.
Feed Saved rising to a combined 17.8% of NM$ when you add Residual Feed Intake and the negative Body Weight Composite (a ‑11% emphasis that acts as a $57 “weight tax” per BWC point, per daughter).
In plain language:
NM$ 2025: rewards fat strongly and penalizes big cows, aiming for smaller, efficient, high‑component animals that fit real feed and component markets.
TPI 2026: increases protein leverage over fat within the production slice and continues to favor higher body weight more than NM$, nudging toward bigger, more fluid‑type cows.
Lactanet’s LPI shift for Holsteins back to 40F:60P is explicitly anchored to “evolving industry directions and milk pricing changes” in Canada and is expected to cause only “minor reranking” of top bulls. The Canadian system is internally consistent with its own pricing math.
The bottom line: the Canadian system is internally consistent with its market. NM$ 2025 is internally consistent with current USDA economics. TPI 2026’s production slice is inconsistent with its own FE$ values or recent AMS pricing data. That’s not a small discrepancy. It’s a question the industry should be asking out loud.
If thousands of herds follow this TPI signal, we don’t just change individual milk checks; we start re‑steering the Holstein breed toward more volume and less fat density over the next 10–15 years. That’s a directional shift for the whole breed, not just a personal quirk for one 500‑cow dairy.
Index
Fat Weight
Protein Weight
Body Size Emphasis
Market Anchor
NM$ 2025 (USDA)
+31.8%
+13.0%
–11% penalty
AGIL/Federal Order economics
TPI 2026 (Holstein USA)
+14%
+24%
+4% (slight favor)
Processor casein demand
LPI 2026 (Lactanet CA)
40%
60%
Neutral/moderate
Canadian quota pricing
Cheese Merit (USDA)
Higher than NM$
Lower than TPI
Negative (like NM$)
Class III cheese yield value
The Turn: When Mark Stopped Letting TPI Drive
By the end of that kitchen‑table session, Sara hadn’t told Mark to throw TPI in the garbage. She just forced a role change.
Before this spring, Mark treated TPI as the main definition of “good bull.” If a bull climbed the list, he needed him in the tank. If a bull slid, he wondered if he’d made a mistake.
The hardest part wasn’t the math. It was the social pressure.
When a bull is all over social media and climbing the TPI list, it feels like a mistake not to use him. That pressure is real. But a bull rising because a formula changed — not because his daughters produce more total components or more dollars under your grid — isn’t a signal. It’s noise.
After walking through the 70% protein leverage inside 24P:14F, the Year‑5 scenario math, the $35/cow/year gap at realistic component prices, the 3× protein/fat break‑even that the market’s never touched, the contradiction between TPI’s own FE$ economics and its production weighting, and the biological reality that high‑protein selection leans toward more volume, Mark could see one thing clearly:
“If I let TPI steer my breeding program, I’m not actually breeding for the cow my milk check pays best. I’m breeding for the cow the index designer likes.”
So he made three quiet decisions for 2026:
Pick his steering wheel. NM$ (or Cheese Merit for his Class III plant) now decides which bulls make it to the short list; TPI is a filter, not the boss. If you want to understand how NM$, Cheese Merit, and the other CDCB indexes actually work — and why the April 2025 NM$ update already shifted weight toward fat and away from protein — the Bullvine’s “Net Merit’s $57 ‘Weight Tax’: How to Pick Holstein Bulls That Still Pay” walks through the new weights and practical filters in detail.
Stay obsessed with total CFP. Every bull on his “heavy‑use” list has to be elite for fat + protein pounds, with P/F in the 0.50–0.60 band. The ratio‑pretty but mid‑pack CFP bulls get used carefully, not across the whole herd.
Let his milk check, not the buzz, define success. If a bull looks great on high‑TPI slide decks but doesn’t add more dollars per cow under Mark’s own fat and protein prices, he’s a luxury, not a core sire.
He didn’t burn down his program. He just stopped confusing a breed index with a cheque.
The Playbook: 30/90/365 Days to Get Out of the TPI Protein Ratio Trap
You don’t have to change everything overnight. You have to stop reinforcing the bias that’s quietly bleeding your components and reshaping your herd type.
In the Next 30 Days: Stop Digging
1. Audit your top bulls for P/F bias
Pull the 5–10 sires you’ve used the most in the last 12 months.
For each, jot down PTA Fat, PTA Protein, total CFP (fat+protein), and P/F (protein ÷ fat).
Count how many of your heavy‑use bulls are P/F ≥0.65 and not in the very top tier for total CFP.
If that’s more than a couple, you’re already leaning into the ratio side of the trap.
2. Freeze new orders on extreme ratio bulls
Any bull that’s P/F ≥0.65 and only average for CFP goes on a “no reorder” list until you’ve rebalanced.
Use remaining straws on lower‑value cows or recips if you like; don’t keep filling the tank.
3. Build a CFP‑first short list from a profit index
Tell your rep exactly what you want:
Filter bulls first on NM$, Cheese Merit, or your co‑op’s profit index, not TPI.
Within that filtered list, sort bulls by Fat PTA + Protein PTA.
Keep bulls with P/F roughly 0.50–0.60 and decent PL/DPR (or Herd Life/Fertility in Canada).
If a bull is high TPI and top‑end CFP under your grid, great. If he’s only high TPI because the formula loves his P/F, be cautious.
4. Check your actual fat and protein prices
Grab your last milk check and write down:
Fat price ($/lb)
Protein price ($/lb)
Then do one quick ratio: Protein ÷ Fat.
If that number is nowhere near 3.0, a pure P/F chase isn’t justified by your pay structure. In the most recent US Federal Order Class III/IV data from 2023–early 2025, it sits well under 2.0 and often between about 0.6 and 1.2.
In the Next 90 Days: Rebalance Without Blowing Up Your Program
5. Watch the cow type you’re breeding
Look at your last group of fresh heifers:
Are your best “new genetics” cows the ones with the highest components per cwt, or the highest volume?
Are you seeing more long, big‑framed, fluid‑type heifers in the pipeline than you expected?
If you’re on a component grid, your index choices shouldn’t slowly turn your herd into cows that fit a fluid market you don’t sell into.
6. Re‑tier your sires by role
Split your bull battery into:
Core sires (60–70% of matings): High profit index, high CFP, P/F in the 0.50–0.60 range, solid fitness.
Specialty sires (10–20%): Extreme type or high‑TPI ratio bulls you still want a little of — used intentionally, not across the board.
Clean‑out sires: Ratio‑heavy or weak‑CFP bulls; finish their straws on lower‑value cows or phase them out.
This keeps your main genetic direction pointed at components and cow style that actually pay, while still letting you play with a few favorites.
7. Re‑score your genomic heifers with a custom index
Ask your genetic provider to compute a simple custom score:
Use that score for replacement vs beef decisions and prioritizing heifers for sexed semen. If two heifers are similar, the one whose parents are genuine component earners under your grid wins over the one whose parents look good on P/F.
In the Next 365 Days: Let Your Own Data Judge the Indexes
8. Tag daughters by sire group and track components
Pick a few bulls as “test cases”:
Group R (ratio): 2–3 bulls with high P/F that gained TPI spots in April 2026.
Group C (CFP): 2–3 bulls with strong total fat + protein and balanced P/F.
For daughters freshening over the next year, tag them by sire group in your records and track fat lb, protein lb, and CFP over 305 days (or good projections). You’re not trying to do a PhD. You want enough signal to see whether your ratio group or your CFP group is doing more work for your cheque.
9. Do a simple “by‑sire” milk check sanity check
Once you’ve got at least a dozen daughters per group, use your actual component prices from the past 12 months:
Calculate $/cow/year from fat + protein for Group R vs Group C.
If Group C cows are clearly ahead by more than $20–30/cow/year on components and aren’t worse on fertility/survival, that’s your own proof that CFP bulls beat P/F bulls under your grid.
If Group R genuinely beats Group C under your grid and costs, you might be one of the rare operations where a strong protein tilt actually pays. Either way, you’re making decisions off your own data, not somebody else’s formula.
10. Build your own index — and stick to it
Sit down with your advisor or rep and formalize your own weights for fat, protein, fertility, longevity, and maybe feed efficiency. Have them build a custom index in their software that matches your milk check and cull costs rather than TPI’s 24P:14F weights. Commit: new bulls get chosen on that index first, then filtered by TPI, type, or show traits as needed.
At that point, you’re not arguing with Holstein USA or Lactanet. You’re just letting them have their opinion while you follow your money.
What This Means for Your Operation
Run the P/F sanity check on your lineup. This week, pull the main bulls you’re using and calculate P/F and CFP. If most of your semen is going to P/F ≥0.65 bulls who aren’t top‑end CFP, you’re not maximizing output — you’re redistributing it away from fat instead of maximizing total fat + protein sold.
Watch the cow type you’re breeding. Your sire choices today decide whether your 2036 herd is built for a fluid market or a component market. If your plant still pays more per pound for fat than protein, you don’t want your index pushing you toward big, fluid‑style cows.
Your milk check decides your index — not the other way around. A breed index can move toward protein without your grid ever justifying the shift. If your cheque still pays more per pound for fat than for protein, you’re being paid to maximize total components, not to chase a ratio.
Use the 3× rule as a hard brake. If protein on your check isn’t worth anywhere near three times fat per lb — and in most US Federal Order markets it won’t be — a strong P/F chase won’t pay under the kind of “15 fat for 5 protein” genetic trade the 24P:14F world incentivizes.
Ask whose economics the index is actually serving. Holstein USA’s own FE$ values put fat at $1.86 and protein at $1.75 — fat wins. But the production weights say protein is 71% more important. If the formula’s own economics don’t justify the weighting, ask who benefits from the direction the breed is being steered.
Don’t assume Canada’s direction validates the US move. Canada’s formula makes sense for Canadian quota‑based component pricing. Copying the protein pivot without copying the pricing logic is how you end up selecting for the wrong cow in the wrong market.
Do one contract‑check in the next 30 days. Before you order your next semen, pull your last 12 months of checks and write down average fat and protein prices. Divide protein by fat. If that ratio doesn’t look anything like the weights inside the index you’re following, adjust how you use that index.
Key Takeaways
Directional shift, not a tweak. If a 500‑cow herd follows the 24P:14F TPI signal hard for five years, scenario math shows it can give up around 15 lb fat per cow per year to gain only about 5 lb protein — and end up roughly $35/cow/year behind a CFP‑anchored strategy under realistic US Federal Order component prices.
Market vs formula mismatch. Protein would have to be worth more than 3× fat per pound for that kind of trade to win on components alone. Recent Class III/IV data from 2022–2024 haven’t come close.
The formula contradicts its own economics. TPI’s FE$ engine values fat at $1.86/lb and protein at $1.75/lb — fat wins. But the production weighting gives protein 71% more leverage than fat. The internal economics and the external weighting point in opposite directions.
Follow the incentives. TPI’s stated rationale includes processor demand for casein. That’s a cheese‑yield argument, not a farmer‑profitability argument. Your milk check pays on total fat + protein sold, not on cheese yield per vat.
Paper vs tank. It’s now possible for a herd to look better on paper without actually selling more total pounds of components. That’s exactly what happens when a formula rewards a ratio instead of total output.
The Bottom Line
One question matters more than any list or formula: What did your plant actually pay per pound for fat and per pound for protein over the last 12 months — and do the bulls you’re buying make more money under those numbers, or under someone else’s?
Complete references and supporting documentation are available upon request by contacting the editorial team at editor@thebullvine.com.
Learn More
The Holstein Bulls Bleed Pregnancies in Arizona Heat – Gain an immediate edge in your summer reproduction program. This breakdown delivers the specific DC305 filters needed to expose the high-NM$ bulls failing your herd in the heat, arming you with a $360-per-daughter reproductive rescue plan.
Gene Editing: The Next Frontier in Dairy Cattle Breeding – Prepare for the most significant disruption in a generation. This technical roadmap reveals how gene editing for heat tolerance and disease resistance could bypass decades of traditional breeding, delivering an unfair advantage to those ready to embrace the next frontier.
The Sunday Read Dairy Professionals Don’t Skip.
Every week, thousands of producers, breeders, and industry insiders open Bullvine Weekly for genetics insights, market shifts, and profit strategies they won’t find anywhere else. One email. Five minutes. Smarter decisions all week.
Lady Crush Reigns Supreme: Inside the 2026 Northeast Spring National Holstein Show
Lo-Pine-VA Lady Crush (Maverick Crush x Aftershock Lilac) — EX-96, 4th lactation — claims Grand Champion at the 2026 Northeast Spring National. Judge Brian Carscadden called her one of the best he’s placed since Licorice and Goldwyn Lotto graced this same ring in 2011. Exhibited by Butlerview; bred by Terry Perotti, Virginia.
190 head. Four championship-caliber mature cows. One judge who compared them to the icons of 2011. The Northeast Spring National Holstein Show delivered a statement at the Erie County Fairgrounds in late March — and Butlerview’s operation walked away with hardware that’ll take a while to polish.
Brian Carscadden, with five years at Blondin Sires under his belt and longtime friend Adam Hodgins at his side, presided over what the broadcast team of Brad Ainsley, Chris Hill, and Russell Gammon repeatedly called one of the strongest spring shows in recent memory. And Carscadden himself left no room for debate: standing before his Senior Champion lineup, he invoked the several iconic cows he’d placed at this same show in Syracuse back in 2011 — Licorice, Stormatic Hazel, and Goldwyn Lotto — and said these four cows in today’s final pull for senior champion belonged in that company.
That’s not a throwaway compliment. That’s a judge planting a flag.
The Queen: Lo-Pine-VA Lady Crush
Grand Champion | Senior Champion | 1st Aged Cow Lo-Pine-VA Lady Crush (Maverick Crush x Lo-Pine-VA Aftershock Lilac) — EX-96 — Butlerview, Chebanse, IL | Bred by Terry Perotti | 4th Lactation
“Today is this gal’s day,” Carscadden said. “She’s bagged perfectly. She looks incredible. When you analyze her from head to tail, there are very few faults”.
Fresh since July 2025 and scored 96 points, Lady Crush is the reigning Reserve All-American and Reserve All-Canadian Aged Cow. She carried more fullness up front, more chest width, more frame length, and slightly more correct rump structure than everything behind her. In the Aged Cow class, Carscadden called the placing between her and Jeffrey-Way Hard Rock Twigs “splitting straws” — rare praise at a spring show, where cows are seldom this dialed in.
Bred by Terry Perotti in Virginia, Lady Crush was lead by Roger Turner for Butlerview. The broadcast crew noted her maternal line and the fact that she’s become an embryo machine — every flush selling briskly.
The Udder That Stole the Show: Oby-Crest Victor Aria
Real-In-Lant Bella (Summerfest x Reality-Ave L Beauty) — Reserve Intermediate Champion. “She came out of nowhere for me,” Carscadden said. “I didn’t know she existed, which is great.” Exhibited by Eaton, Doebriner & Lantland.
Reserve Grand Champion | Reserve Senior Champion | 1st 5-Year-Old Oby-Crest Victor Aria (Our-Favorite Victor-ET x Oby-Crest Atwood Avia) — EX-94 — Butlerview, Chebanse, IL | Bred by Darryl Oberholtzer | 3rd Lactation
Carscadden split the mature cows to slot this five-year-old into Reserve Grand over the 96-point Twigs. His reasoning was blunt: “I’m a sucker for a great udder. And there’s not a lot of points you can’t put into this udder”.
“How would you like to wake up to that udder to milk every day?” he asked in the five-year-old class. “Incredible mammary system — the width, the capacity, the correctness, the symmetry. She’s an easy winner”.
The backstory on Aria is pure Holstein lore. She was bred in Lebanon, Pennsylvania, by Darryl Oberholtzer — a Mennonite family operation. Aaron Eaton, with help from Adam Liddle, found her as a three-year-old, bought her, and she later moved to Butlerview’s program. The broadcast team compared her mammary to Footloose — and nobody pushed back on it. Our-Favorite Victor, her sire, may never have a more famous daughter.
Honorable Mention Grand: Jeffrey-Way Hard Rock Twigs
Jeffrey-Way Hard Rock Twigs (Hardrock x Doorman Twiggy) — EX-96 — Honorable Mention Grand Champion. A Royal Winter Fair champion and perennial contender, Twigs was edged on rear udder symmetry in a placing Carscadden called “splitting straws.” Exhibited by Doebriner & Bowen, Conroy Walker Dairy and R&F Livestock.
Jeffrey-Way Hard Rock Twigs (Cookiecutter MD Hardrock x Jeffrey-Way Doorman Twiggy) — EX-96 — Doebriner & Bowen, Conroy Walker Dairy, R&F Livestock, West Salem, OH | Bred by Jeffrey-Way Holsteins
At 96 points and a Royal Winter Fair champion, Twigs is no stranger to the big stage. Carscadden openly admired her total frame, depth, and silkiness. Aria edged her on hind-leg movement and rear udder symmetry — but this was a cow the judge admitted could’ve gone higher on a different day. Three great, great cows. That was the refrain.
Three cows, 288 combined classification points. The 2026 Northeast Spring National Senior Champion lineup: Lady Crush (Grand), Victor Aria (Reserve), and Hard Rock Twigs (HM). Carscadden compared this trio to the iconic Syracuse championship of 2011.
The Young Cow Show: Lambda Dominate Takes Intermediate
Goldenflo Lambda Dominate (Lambda x Fitz Rice Krispies) — Intermediate Champion and Best Udder of the Senior 3-Year-Old class. Bred on Prince Edward Island by Macbeath Farms; campaigned by Butlerview. A Canadian-bred, American-championed success story.
Intermediate Champion: Goldenflo Lambda Dominate (Farnear Delta-Lambda x Goldenflo Fitz Rice Krispies) — Butlerview, Chebanse, IL | Bred by Macbeath Farms Ltd., PEI | 2nd Lactation
The Senior Three-Year-Old class produced a tremendous pair at the top. Dominate earned Best Udder in the class and won on her length of frame, ring presence, and the way her neck blended out of her shoulder. Carscadden awarded her over the “extremely wide rear uddered” Raypien Alpha Milly from Currie Holsteins and the beautiful, angular Sweet-Peas Archer Daisy-Red from Oakfield Corners Dairy.
Bred on Prince Edward Island by the Macbeath family at Golden Flow — a herd the broadcast crew praised as one of the highest totals on the island — Dominate represents a Canadian-bred, American-campaigned success story.
Reserve Intermediate Champion: Real-In-Lant Bella (Avant-Garde-I KD Summerfest x Reality-Ave L Beauty) — Reality Holsteins & Lantland, LLC.
Bella came out of nowhere for the judge. “The reserve intermediate champion came out of nowhere for me,” Carscadden said. “I didn’t know she existed, which is great”. This Fall Senior Two-Year-Old combined well with Dominate — Carscadden actually separated the two three-year-olds to slot Bella between them, citing her more level udder floor and the way she carried her head and neck.
A Heifer for the Ages: Butlerview Glitter Girl
Butlerview Glitter Girl (Bruins x Rosemary Unix Goldie EX-95) — Junior Champion. Carscadden called her “one of the nicest heifers I’ve had the privilege to make Junior Champion in my career.” She chewed her cud while the ring buzzed around her. Bred and exhibited by Butlerview, with Pat Conroy, Kevin Doebriner, and Clark Valley.
Junior Champion Butlerview Glitter Girl (Jacobs Bruins x Rosemary Unix Goldie EX-95) — Butlerview, Pat Conroy, Kevin Doebriner, Clark Valley | Bred by Butlerview Farm (B&O)
“One of the nicest heifers I’ve had the privilege to make Junior Champion in my career. This heifer is just stunning”.
That’s Carscadden — a man who’s judged internationally — talking about a winter yearling. Glitter Girl dominated from the moment she walked in. The broadcast crew noticed her chewing her cud calmly while every other heifer around her fussed. Spring to her barrel, precision in movement, dairiness and quality throughout.
Her dam, Rosemary Unix Goldie (EX-95), was an All-American herself and used to battle Sally as contemporaries. Butlerview bought Goldie from Pierre Boulet, and her daughters are now selling like hotcakes. One of the commentators called Glitter Girl “lights out” when she came around the corner.
Reyncrest Dundee Affable — Reserve Junior Champion. The “last of the Dundees” traces to the Sky-Buck Lucy family and sold at auction before landing with Glamourview, Iager & Walton. Bred by Reyncrest Farm, Corfu, NY.
Reserve Junior Champion: Reyncrest Dundee Affable (Regancrest Dundee x Reyncrest Tatoo Automatic) — Glamourview, Iager & Walton. The “last of the Dundees” — this heifer sold at auction recently and traces to the Sky-Buck Lucy family.
Alexis Schultz leads her bred-and-owned Ranway Handsome Spade to Honorable Mention Junior Champion and a Fall Yearling class win. The UW-Madison student flew in to show her, herself — with grandparents DeWitt and Diane of Headline Farm fame watching ringside.
Honorable Mention Junior Champion: Ranway Handsome Spade — Alexis Schultz, bred and owned. The University of Wisconsin-Madison student flew in and handled her own heifer to a top-three finish. Her family’s Headline Farm bloodlines run as deep as the pedigrees she’s leading.
The Four-Year-Olds: McGarr’s Grace-Leigh Beautiful Earns Best Udder
The 20-entry four-year-old class was anyone’s game. The broadcast team said five cows could justifiably win, and they weren’t wrong.
Grace-Leigh Beautiful (Moovin x Endco Diamond Beauty) — EX-92 — tops a 20-head four-year-old class and earns Best Udder honors. Fresh just months, she showed more quality of bone and body depth than anything behind her. Owned by Eoghan McGarr; bred by Grace-Leigh Holsteins.
Eoghan McGarr’s Grace-Leigh Beautiful (Moovin x Endco Diamond Beauty) took the top spot — fresh a couple of months and carrying what Carscadden called the best udder in the class. She showed more quality throughout, cleaner bone, and slightly more body depth than the long-framed Top-View BRB Cheerio in second.
Cheerio, owned by Genetics Link (Steve Linkowski) and shown by Sam McWilliams, is an EX-92 Ron Burgundy daughter who won the Ohio Futurity in 2025. She’s bred by Phil Topp and descends from the Cheers Avalanche family. Nate King’s Kings-Ransom Hanans Crazy Bee slotted third, with Elmvue Farm’s Benrise Master Bette Midler fourth and Butlerview’s Desperle Monia Sidekick fifth.
150,000-Pound Club: Baracuda Still Swimming
Jericho-Dairy Baracuda-ET (Corvette x AD Barley-Red) — EX-96, 193,000 pounds lifetime, 11 years old, seven calvings. Purchased at the Jericho Dairy dispersal for $30,000, she now generates $700–$900 per flush regardless of the bull. Owned by Currie Holsteins, Tully, NY.
Jericho-Dairy Baracuda-ET (Corvette x Jericho-Dairy AD Barley-Red) — EX-96, 193,000 pounds lifetime — took the production class for Currie Holsteins. At 11 years old with seven calvings, she’s a walking return on investment — purchased at the Jericho Dairy dispersal for $30,000, she now generates $700–$900 per embryo flush after flush, regardless of the bull.
Wil-O-Mar Diamondback Rose-Red (EX-95, 160,000 lbs lifetime) placed second for Elmvue Farm. Together, the top three cows in the class represented over half a million pounds of lifetime milk and an average age north of eight years.
The Butlerview Dominance
The numbers tell the story. Butlerview’s operation captured:
Grand Champion (Lady Crush)
Reserve Grand Champion (Victor Aria)
Intermediate Champion (Lambda Dominate)
Junior Champion (Glitter Girl)
Premier Exhibitor — Heifer Show
Multiple class wins across the heifer and milking divisions
Grand and Reserve Grand from the same string. Intermediate Champion from PEI genetics campaigned through their barn. Junior Champion from their own breeding program. That’s not a good day — that’s a statement.
The Supporting Cast Deserves Headlines Too
Currie Holsteins (Tully, NY) showed consistently strong across the show — Reserve Intermediate with Raypien Alpha Milly, third in the five-year-olds with Benbie Bridgestone Coco, and the lifetime production winner with Baracuda.
Elmvue Farm (Johnstown, NY) campaigned Wildweed Warrior Maui-Red (EX-94) — the Grand Champion of the Red & White show the day prior — to second in the five-year-olds and had Wargo-Acres Doc 3707 Iris and Bette Midler placed in the four- and five-year-old classes.
Reyncrest Farm (Corfu, NY) earned Reserve Junior Champion with Dundee Affable, placed consistently through the heifer classes, and earned Premier Breeder of the heifer show.
Alexis Schultz — a UW-Madison student who flew in to show her own bred-and-owned Ranway Handsome Spade — took the fall yearling class and Honorable Mention Junior Champion. Her grandfather DeWitt and grandmother Diane, of the old Headline Farm program, were ringside.
The Booth Crew and the Broadcast
Judge Brian Carscadden picking the winners at the 2026 Northeast Spring National. From Syracuse in 2011 to Erie County in 2026, Carscadden set the bar — then told the crowd these cows cleared it.
Viewers from around the world tuned in online to hear Ainsley, Hill, and Gammon call the action. Hill’s encyclopedic pedigree knowledge, Gammon’s judging eye (he nailed the junior champion pick before the finger pointed), and Ainsley’s connections-driven color commentary made for a broadcast that felt like sitting in the bleachers with your sharpest friends.
Bottom Line
The 2026 Northeast Spring National Holstein Show proved — again — that the spring show circuit isn’t just a tune-up. It’s where reputations are built and confirmed. Lady Crush arrived bagged to perfection and left as the cow Carscadden compared to Licorice and Goldwyn Lotto. Victor Aria’s udder may be the best in the breed right now. And a Bruins daughter out of Goldie named Glitter Girl just announced herself to the Holstein world.
After a long winter, it sure was nice to see everybody out. And it sure was nice to see cows like this.
The Northeast Spring National Holstein Show was held in conjunction with the New York Spring Dairy Carousel. Results via the Showman App. Livestream commentary by Brad Ainsley, Chris Hill, and Russell Gammon via Ringside Live.
Winter Calf
1. Blacklilly Direct Lala-ET (Direct), Eaton Holsteins, Glamourview Farms, Zeh & Cates Morrill, Marietta, NY 2. Curr-Vale-AE Majr Belvedere (Major), Makayla Osinga, Hico, TX 3. WOCC Tatoo V-Card (Tatoo), Avery Best, Ephrata, PA 4. Kennebec Jerry Lewis Amazon (Jerry Lewis), Ford & Handley Kids, Richmond, UT 5. McWilliams Alpha D (Alpha), Sam McWilliams, Somerset, PA 6. Winright Moovin Envision (Moovin), Winright Holsteins, Winchester, ON 7. Monoak Master Precious (Master), Howe Holsteins & Certified Holsteins, Aylmer, ON 8. McWilliams Impress Momore (Impression), Sam McWilliams, Somerset, PA 9. Reyncrest BDing Grouchy (Bullding), Reyncrest Farm, Corfu, NY 10.K-Ace Hand Me A Ruby-Red (Handy), Bret & Shelby Keister, Cochranton, PA
Judge Carscadden called it a tremendous way to open the show — and the top pair made it look easy. First-place Lala stood apart with her rare blend of dairyness and strength, carrying more width and depth through the chest and rib than anyone behind her, plus superior spring of rib and pin width. The stylish Belvedere in second drew praise for quality and frame length but couldn’t match Lala’s body. Second over third came down to hind-leg correctness and frame length. Third edged fourth on overall strength and cleaner front-end travel, while fourth topped fifth with a deeper, more open midsection and greater femininity through the head and neck.
Fall Calf
1. Petitclerc Harris Alaska (Harris), Nate King and Larsen & Keaton Phoenix, Schuylerville, NY 2. Siemers Lambda Honeymoon-ET (Delta Lambda), Maple Downs Farm II & Duane Tillapaugh, Middleburgh, NY 3. Mar-Del-View AC Apollo-ET (Aircraft), John Brown, Gretna, VA 4. Butlerview Major Celine-ET (Major), Butlerview Farm, Chebanse, IL 5. Blacklillys Limelite-ET (Epiphany), Kings-Ransom Farm, Schuylerville, NY 6. Ms Curr-Vale Pazz Done Deal (Pazzle), Adelyn, Eva, Elle & Easton Ford, Richmond, UT 7. Reykug Resilient-Red (Acetylene), Reyncrest Farm & Fly Higher Holsteins, Corfu, NY 8. SR Architect Bangalore (Architect), Butlerview Farm, Chebanse, IL 9. Ms Hailey ECandy Honesty-ET (Eye Candy), Ferme Petitclerc, St-Basile, QC 10. Curr-Vale-AE LMB Babybel-ET (Delta Lambda), Hill, Pascaretla & Barton, Tully, NY
In a massive 40-head class, Judge Carscadden found his winner fast. Alaska moved out perfectly on her hind legs with outstanding rump structure, a striking silhouette, and impressive length of frame and neck. Honeymoon in second flashed tremendous rib but gave up ground on foot correctness and rump angle — Alaska also carried more femininity through the head and neck. Second over third came down to hind-leg accuracy and quality. Apollo in third held a clear depth-of-body edge over Celine — deeper at fore rib and rear rib with more spring to her barrel. Fourth topped fifth on dairyness and a cleaner profile through neck and thigh, though Limelite earned admiration for her end-to-end correctness and width throughout.
Summer Yearling
1. Butlerview Master Shock-ET (Master), Addison Lortie, Albion, IN 2. Curr-Vale Enrgy Armcandy-ET (Energy), Kenlee & Kel Phillips, Stephenville, TX 3. Curr-Vale Detectiv Adeen-ET (Detective), Alphie Stoltzfus, Somerset, PA 4. Elmvue Bruins Siracha (Bruins), Matthew Richenberg, Marion, NY 5. Blacklillys MJ Liability (Major), Butlerview Farm, Chebanse, IL 6. Reyncrest Major Premium (Major), Reyncrest Farm, Corfu, NY 7. AOT Hulu Silky-ET (Hulu), Everett, Jacob & Marion Brayman, Skaneateles, NY 8. Klinedell DMan Daydream-ET (Doorman), Jackson Kline, Myerstown, PA 9. Winright Loyal Lollipop (Loyal), Jaquemet & Winright, Winchester, ON 10. Milk & Honey Detect Ysabel-ET (Detective), Cedar Lane Farm CLF, LLC, Oldwick, NJ
No heifer jumped out and demanded the win — so Carscadden sorted a sharp black pair to the top on type and balance. Both showed beautiful silhouettes, width, and seamless blending of parts. Shock earned first traveling more correctly from behind with more openness and depth of body over the straight-lined, wide-rumped Armcandy. Second over third came down to femininity — cleaner bone and more loin strength over the deep-bodied Adeen. Third topped fourth on mass: wider chest, more spring of rib, and more accurate front-end travel. Siracha in fourth earned admiration for her angularity, dairyness, and mobility — carrying her over Liability with more pin and thurl width and a better flex of hock.
Spring Yearling
1. Go-Sho Detect Revenge (Detective), Butlerview Farm, Chebanse, IL 2. Reyncrest Mstr Go4Da Win (Master), Reyncrest Farmm, Corfu, NY 3. Loa-De-Mede Eye Candy Lulu (Eye Candy), John Werry, Oshawa, ON 4. Armcrest Lmtd Budget (Limited-P), Butlerview Farm, Chebanse, IL 5. Kozy-Kountry Loyal Chrissy (Loyall), Celeste Clark, Springville, PA 6. Braxco Alpha Velour (Alpha), Katie Darnell, Salvisa, KY 7. Reyncrest Master Go4It (Master), Reyncrest Farm, Corfu, NY 8. Diamond-VL Master Pineapple (Master), Dice Partners, Myerstown, PA 9. M-Divine Arc Luxury (Architect), Cooper Merrill, Seneca Falls, NY 10. Rivercross Tango Ragtime (Tango), Rivercross Holsteins, Edmeston, NY
A tremendous group top to bottom, but the leading pair separated themselves handily — both traveling beautifully with that ideal balance of dairyness and strength. Revenge earned first with precise movement coming and going, superior blending of parts, and more quality and cleanliness through bone and thigh. Go4da Win in second topped Lulu on rump carriage, carrying her pins more correctly throughout with a cleaner thigh. Lulu in third earned admiration for her overall correctness — more accurate on all four legs than Budget in fourth. Budget countered with beautiful symmetry, profile, and frame length, then edged Chrissy with a stronger loin, more accurate thurl placement, and more length of neck.
Winter Yearling
1. Butlerview Glitter Girl-ET (Bruins), Clarkvalley, Butlerview, Doeberiener & Conroy, Chebanse, IL 2. Reyncrest Dundee Affable (Dundee), Glamourview, Walkersville, MD 3. Rogue Hulu Riptide-ET (Hulu), A, W, M Reynolds, Elmlo Holsteins & Fly Higher, Corfu, NY 4. Peace&Plenty Dlam Jub124-ET (Delta-Lambda), Cassie Menendez & Andrew Post, Edmeston, NY 5. Duhibou Lambda Running (Delta-Lambda), Butlerview Farm, Chebanse, IL 6. Valley-Folts Janalee-Red (Jordy), Glamourview, Walkersville, MD 7. Loa-De-Mede Master 4 Bells (Master), Issac Folts, North Collins, NY 8. McWilliams Ms Shaboozy-ET (Master), Clyde & Charlene McWilliams, Somerset, PA 9. Ovaltop Crushabull Molly (Crushabull), Deanna Wolfe, Richfield Springs, NY 10. Budjon Bud Seltzer-ET (Dropbox), Reyncrest Farm, Corfu, NY
Glitter Girl wowed from the moment she walked in — precise on all four legs with outstanding dairyness, quality, and spring of barrel. A heifer with very few faults. Affable in second is the kind that wins most spring shows, but Glitter Girl showed more barrel spring, a cleaner inner thigh, and more refinement through the neck. Second over third came down to rump — Affable carrying her pins more correctly with more depth of body. Riptide edged Jub124 with easier hind-leg movement, more frame length, and a cleaner head and neck. Fourth topped fifth on depth, deeper at both fore and rear rib over the stylish, long-framed Running.
Fall Yearling
1. Ranway Handsome Spade-ETS (Handsome), Alexis Shultz, Marion, NY 2. Our-Favorite Endzone-ET (Lombardi), Butlerview Farm, Chebanse, IL 3. Ms Cabos Cocodril (Alligator), K&B Ziemba, A&J Hippen and Retso Holsteins, Durhamville, NY 4. Loa-De-Mede Master 2 Bells (Master), John Werry, Oshawa, ON 5. Appalachian An Amaretto-ET (Analyst), Landen Copenhaver, Ephrata, PA 6. Curr-Vale-AE Be Breezy-ET (Bullseye), Michael Iager, Frederick, MD 7. Reyncrest Master Chant (Master), Reyncrest Farm, Corfu, NY 8. Winright Sidekick Maddox (Sidekick), Winright, Borba & Jaquemet, Winchester, ON 9. Red-Violet Sidekick Flora (Sidekick), Jacob Smithgall, Corfu, NY 10. MB-Luckylady-I Catcharide-ET (Alligator), Reyncrest Farm, Corfu, NY
A razor-thin placing at the top in a class full of heifers nearing freshening. Spade earned first with more width throughout, a silkier hide, and better pin and rump structure. Endzone countered with more frame and neck length, but that rump advantage tipped the decision. Endzone’s ring presence, loin strength, and more accurate movement on all four legs carried her over the deep-bodied Cocodril in third. Third over fourth came down to cleaner hock bone and a more dairy look over the well-made 2 Bells. Fourth topped Amaretto with more depth at both fore and rear rib, plus superior femininity and bone quality throughout.
Milking Yearling
1. Jacobs Tarmac Constance (Tarmac), Butlerview Farm, Chebanse, IL 2. Oakfield Hancock Ava-ETS (Hancock), Alicia & Jonathan Lamb/Oakfield Corners Dairy, Oakfield, NY 3. Woodmansees Algtr Haalah-ET (Alligator), Alicia & Jonathan Lamb/Oakfield Corners Dairy, Oakfield, NY 4. Curr-Vale Algtr Adella-ET (Alligator), Currie Holsteins, Tully, NY 5. Sashill-PA Master Liddy (Master), Paul & Abby Pavolko, Albion, PA
Many of these heifers calved under 24 months — and Constance, fresh just four weeks, impressed immediately with femininity, balance, and blending of parts. She paired that with the best udder in the class, plus more barrel spring, body depth, and mammary width over Ava in second. Ava earned high praise as a cow with a great future — her mammary advantage carried her over Haalah with a more balanced rear quarter and higher rear udder. Third over fourth came down to smoother fore udder attachment and cleaner hock bone. Adella topped Liddy with more depth and spring of rib and a higher, wider rear attachment.
Spring Two Year Old
1. Famipage Detective Jazz-ET (Detective), Butlerview Farm, Chebanse, IL 2. Famipage Dtctiv Jalapeno-ET (Detective), Elmvue Farm, Johnstown, NY 3. Elmvue Lambda Telluride-ET (Delta-Lambda), Vierra Dairy, Hilmar, CA 4. Kings-Random Dover Devine (Dover), Lauren, Nate & Hannah King, Schuylersville, NY 5. Liddleholme Heydude-ET (Pazzle), Butlerview Farm, Chebanse, IL 6. Ms Archtct Risky Business (Architect), Beth Roberts & Bill Taylor, Oldwick, NJ 7. McWilliams Ec Adrenaline-ET (Eye Candy), Sam McWilliams, Somerset, PA 8. Diamond-VL Energy Pursuit (Energy), Dice Partners, Myerstown, PA 9. Kings-Ransom Al Caramel-ET (Alligator), Dice Partners, Myerstown, PA
A Famipage Detective one-two punch — full siblings, no less. Jazz led with tremendous dairy character, the best udder in the class, outstanding frame length, and effortless hind-leg movement. She topped Jalapeno with more correct front-leg travel, a higher and wider rear udder, and cleaner hock bone. Second over third was razor-close: Jalapeno carried more body depth and moved more comfortably behind, though Telluride countered with more chest width and better front-leg structure. Devine in fourth showed an admirably shallow, tight mammary with more frame length, neck, and overall scale over Heydude. Fourth over fifth on a more level udder floor plus better foot and rump structure.
Fall Two Year Old
1. Real-In-Lant Bella (Summerfest), Reality Holsteins & Lantland, LLC., Horseheads, NY 2. Blondin Detective Bacardi (Detective), Butlerview Farm, Chebanse, IL 3. Maifield Crushabull Mushroom (Crushabull), Glamourview, Walkersville, MD 4. Dice-Pts All Mine-ET (Alligator), Dice Partners, Myerstown, PA 5. J-Folts Al Homegirl (Alligator), Genetics Link, Somerset, PA 6. Ladys Haniko Lucee (Haniko), K&B Ziemba, A&J Hippen, M Hockett & Genosource, Durhamville, NY 7. Central-Park DL Markessa (Delta-Lambda), A & M Hirt, New Woodstock, NY 8. McWilliams Alpha Shania (Alpha), Sam McWilliams, Somerset, PA 9. AGB-KVM Alt Shirley Temple (Altitude), Averie & Kirt Menzi Jr., Horseheads, NY 10. Mt-Glen Master Lulu (Master), Dean Jackson, Columbia Crossroads, PA
Some days the top of the class sorts itself. Bella, the youngest cow here and fresh just four months, wowed with youthfulness, femininity, and ring presence paired with the best udder in the class. She topped Bacardi with more rear udder symmetry, a more level floor, and more dairyness throughout — though Bacardi, in milk considerably longer, countered with admirable loin strength and mammary width. Bacardi’s superior leg structure and hind-leg movement carried her over Mushroom in third. Third over fourth on more fore udder length plus more drop and openness through the midsection. All Mine edged Homegirl on foot structure and a fore udder blending more smoothly into the body wall.
Junior Three Year Old
1. Melboro Etesian Roxstar (Etesian), Chloe & Claire Lamb, Oakfield, NY 2. Woodmansees Dlb Stunner-ET (Delta-Lambda), Luncrest Farm LLC, Granville, NY 3. Ovaltop Master Emoji (Master), Deanna Wolfe, Richfield Springs, NY
Fresh since January in her second lactation, Roxstar had the advantage of time to strip down and organize — and she used it. Carscadden praised her quality throughout, particularly through the mammary system, with more balance through the rear quarters than the powerful Stunner in second. Stunner, fresh just three weeks, showed impressive power and strength — a cow the judge noted will only look better in a month‘s time. Second over third came down to more overall correctness, more body depth, and more spring of rib over the long-framed Emoji.
Senior Three Year Old
1. Goldenflo Lambda Dominate-ET (Delta-Lambda), Butlerview Farm, Chebanse, IL 2. Raypien Alpha Milly (Alpha), Currie Holsteins, Tully, NY 3. Sweet-Peas Archer Daisy-Red (Archer), Oakfield Corners Dairy, Oakfield, NY 4. Harvue Doc Ladybug-TW (King Doc), Makayla, Kaleb, Jaclyn, Kylie, Katie Osinga, Hico, TX 5. Eastside Hanley Lennon (Hanley), Isaac Folts, Janalee Coleman & Cameron Garcia, North Collins, NY 6. KBSM Cadillac America (Cadillac), Sam McWilliams & Katie Kutscher, Somerset, PA 7. Ms Milksource Tijuana-ET (Delta-Lambda), Justine Kelsey, Canastota, NY 8. Show-Mar Evelyn (Bucks), Mark Bratner, Seagertown, PA 9. Woodmansees Sdk Haelisa (Sidekick), CLF LLC & Clarke Woodmansee, Oldwick, NJ 10. Diamond-VL Party Girl (Chief), Dice Partners, Myerstown, PA
A tremendous pair of second-calvers headlined this class. Dominate commanded the ring with presence, the best udder in the class, outstanding frame length, and seamless blending of parts. She topped Milly with a smoother neck-into-shoulder transition and a more level udder floor, though Milly’s extremely wide rear udder made it close. Milly’s silky dairy quality carried her over Daisy-Red — wider rear attachment and more correct pin setting over a beautiful, angular red cow. Third over fourth came down to hind-leg movement: Daisy-Red showing more freedom and ease than the powerful Ladybug. Fourth edged Lennon through the mammary — slightly higher rear udder and a nicer fore udder over an open-framed, strong-loined competitor.
Four Year Old
1. Grace-Leigh Beautiful-ET (Moovin), Eoghan McGarr, King Ferry, NY 2. Topp-View B RB Cheerio-ET (Aristocrat), Genetics Link, Somerset, PA 3. Kings-Ransom Hanans CrazyB (Hanans), Nate King, Schuylersville, NY 4. Benrise Master Bette Midler (Master), Elmvue Farm, Johnstown, NY 5. Desperle Monia Sidekick (Sidekick), Butlerview Farm, Chebanse, IL 6. Lovhill Believe Hottie (Believe-P), Elmvue Farm, Johnstown, NY 7. Arolene Sidekick Gisele (Sidekick), Michael Leclerc, St-Isidore, QC 8. Ovaltop Select Ellen (Select), Owen & Lucy Kimball, Groveland, NY 9. Amerada DCT Black Eyed Suzy (Tatoo), Owen & Lucy Kimball, Groveland, NY 10. La-Ca-De-Le Hancock 9706 (Hancock), Owen Kimball, Groveland, NY
Third-calvers swept the top four in a deep 20-head class. Beautiful led fresh a couple of months, combining dairy quality throughout with the best udder in the class. She topped Cheerio with cleaner bone, more quality, and slightly more body depth over a long-framed competitor. Second over third came down to femininity — Cheerio longer and more refined through the head and neck with more median suspensory and rear udder quality. CrazyB countered with a tremendous fore udder that carried her over Bette Midler — more level udder floor and more precise fore attachment. Fourth edged the second-calver Sidekick in fifth on rear udder quality and a more ideal leg set.
Five Year Old
1. Oby-Crest Victor Aria (Victor), Butlerview Farm, Chebanse, IL 2. Wildweed Warrior Maui-Red (Warrior), Elmvue Farm, Johnstown, NY 3. Benbie Bridgestone Coco (Bridgestone), Currie Holsteins, Tully, NY 4. Retso-Ridge Mstr Sherry-ET (Master), Averie & Kirt Menzi Jr., Horseheads, NY 5. Wargo-Acres Doc 3707 Iris (King Doc), Elmvue Farm, Johnstown, NY 6. Whiteleather Solo 4626 (Solo), Sam McWilliams, Somerset, PA 7. La-Ca-De-Le Warrior 8796 (Warrior), Owen Kimball, Groveland, NY 8. Hike-Em-Up Twix (Radio), Brooke King, Belleville, PA
“How would you like to wake up to that udder every day?” — Carscadden left no doubt. Aria’s mammary was the story: width, capacity, correctness, and symmetry that made her an easy winner, paired with comfortable hind-leg movement. She topped Maui-Red with a wider, higher-quality rear attachment and smoother travel behind. Second over third was razor-close: Maui-Red showed more overall mass and slightly more rear udder width over the silky, dairy Coco — a cow the judge said he loved. Coco’s modern dairy type and more accurate mammary carried her over the massive, deep-ribbed Sherry in fourth. Fourth edged Iris on body depth, more correct rump, and more height and width at the rear udder.
Aged Cow
1. Lo-Pine-Va Lady Crush (Crush), Butlerview Farm, Chebanse, IL 2. Jeffrey-Way Hard Rock Twigs (Hardrock), Doeberiener & Bowen, Conroy, Walker Dairy and R&F Livestock, West Salem, OH 3. Shedd-C Bailey Bliss (Bailey), Cedar Lane Farm CLF, LLC, Oldwick, NJ
Only three entries — but what a pair at the top. Carscadden called it rare to see this quality of cows at a spring show and said he was splitting straws. Lady Crush earned the nod on mammary symmetry, balance, blending of parts, and youthfulness — her udder carried tighter to the body than the stunning Twigs in second. But make no mistake: Twigs’ total frame, depth, and silkiness made this as close as it gets. Second over third came down to more mammary symmetry and quality throughout over Bliss, a veteran with five calvings under her belt who deserved more attention than the top pair allowed.
Production Cow
1. Jericho-Dairy Baracuda-ET (Corvette), Currie Holsteins, Tully, NY 2. Wil-O-Mar Diamndbk Rose-Red (Diamondback), Elmvue Farm, Johnstown, NY 3. Ms Jrdy Temptation (Jordy), Beth Roberts & Bill Taylor, Oldwic, NJ
A round of applause for cows that have stood the test of time. Two veteran seven-calvers — 11-year-old Baracuda and 10-year-old Rose-Red — made this a razor-close placing at the top. Rose-Red showed slightly more correct rump and loin structure, but Baracuda answered with significantly more mammary width from behind, more ideal teat shape and size, and a definite advantage in hock quality, bone, and the way she stands on those hind legs. Tremendous foot and leg on this first-place cow. Rose-Red countered with a great side profile and strong fore udder, then carried over Temptation in third with more body depth at both fore and rear rib, more rear udder quality, and more definition of median suspensory.
The Sunday Read Dairy Professionals Don’t Skip.
Every week, thousands of producers, breeders, and industry insiders open Bullvine Weekly for genetics insights, market shifts, and profit strategies they won’t find anywhere else. One email. Five minutes. Smarter decisions all week.
Pacheco Sweeps Grand and Reserve at 2026 NY Spring Brown Swiss Show
Grand Champion Iroquois Acres Total Candy, the nine-year-old Sunnyisle Total daughter shown by Brian Pacheco. Housed at Callum McKinven’s Look Out Farms in Canton de Hatley, Quebec, she topped the 100,000-lb Lifetime Production class before claiming the supreme banner at the 2026 NY Spring Dairy Carousel.
Brian Pacheco made the trip to Syracuse count. His Iroquois Acres Total Candy — a nine-year-old daughter of Sunnyisle Total out of Iroquois Acres Jong Cali — walked away as Grand Champion Brown Swiss at the 2026 New York Spring Dairy Carousel, held March 30. Then Pacheco doubled down: his Jer-Lene Im A Cali Girl, a Superbrown Kiba Superstar daughter, claimed Reserve Grand Champion, giving one exhibitor both banners in the breed’s senior division.
Reserve Grand Champion Jer-Lene I’m A Cali Girl, a Superbrown Kiba Superstar daughter bred and owned by Brian Pacheco. She won the 4-Year-Old class over stablemate Lookout Super Ginta — giving Pacheco both senior banners from a single sire.
Pacheco’s show string is housed at Callum McKinven’s Look Out Farms in Canton de Hatley, Quebec — a cross-border partnership that clearly works. It was a show that rewarded longevity, homebred programs, and the kind of quiet consistency that defines the best Brown Swiss herds.
Total Candy: A Lifetime Cow Earns Her Crown
Iroquois Acres Total Candy isn’t a stranger to the ring. Born in July 2017 and bred by Iroquois Acres, she topped the 100,000-lb Lifetime Production class before marching through the championship drive. At nearly nine years old, she represents exactly the kind of functional longevity the Brown Swiss breed hangs its hat on — a cow who keeps showing up, keeps milking, and keeps winning.
Pacheco also showed Lookout Super Ginta — bred by Look Out Farms — who placed second in the 4-Year-Old class behind his own Jer-Lene Im A Cali Girl. Both cows are sired by Superbrown Kiba Superstar, and when one exhibitor fills first and second in a cow class with two daughters of the same sire, that’s not luck. That’s a breeding program, with McKinven’s Look Out Farms playing a key role in developing and fitting these cattle.
Balthaser Dominates the Junior Division
If Pacheco owned the senior end, Hannah Balthaser of Bernville, Pennsylvania, owned everything else. The junior exhibitor collected banners like most people collect show ribbons:
Junior Champion — CIE Northkill Creek Tessa (Hilltop Acres P Prince OCS × IE Northkill Creek 786), first-place Spring Yearling
Intermediate Champion — Northkill Creek Groove ET (Hilltop Acres B Daredevil ET × Northkill Creek Groovy), first-place Senior 2-Year-Old
Grand Champion Junior Show — Northkill Creek Groove ET
Junior Champion CIE Northkill Creek Tessa, sired by Hilltop Acres P Prince OCS, topped a 12-entry Spring Yearling class — the deepest heifer class of the day. Another bred-and-owned Balthaser entry from the Northkill Creek program.
That’s three champion banners from one exhibitor, all bred and owned, all tracing back to the Northkill Creek prefix. Balthaser also placed first and third in the Fall Yearling class with Northkill Creek Groove Time ET and Northkill Creek Get The Groove ET — both First Choice and Design daughters out of the same Northkill Creek Groovy cow family. When your donor cow keeps throwing class winners by different sires, you’ve found something.
Senior Show Breakdown
Class
First Place
Exhibitor
Sire
Jr. 2-Year-Old
Miley Foremost Patina
Peter Vail, Middleburgh, NY
Cutting Edge T Foremost
Sr. 2-Year-Old
Northkill Creek Groove ET
Hannah Balthaser, Bernville, PA
Hilltop Acres B Daredevil ET
Jr. 3-Year-Old
Way Lyn Daredevil Prize
Brandon Deeter, Cochranton, PA
Hilltop Acres B Daredevil ET
Sr. 3-Year-Old
Heilinger Design Luxury
Brody Jackson/Blake & Garrett Hill, Cattaraugus, NY
HF Design
4-Year-Old
Jer-Lene Im A Cali Girl
Brian Pacheco
Superbrown Kiba Superstar
5-Year-Old
Hills Valley Dairystar Riki
Hills Valley Farm, Cattaraugus, NY
Hilltop Acres Dairystar
Aged Cow
Greystone Kingpin Gitana
Amelia Somers, Walton, NY
Jo-Dee Trooper Kingpin TM
100K Lifetime
Iroquois Acres Total Candy
Brian Pacheco
Sunnyisle Total
Heifer Classes: Design, Double Take, and Cadence Lead the Way
Three sires kept surfacing across the younger classes: HF Design, Edge View Cal Double Take ETV, and Shiloh Brookings Cadence.
Reserve Junior Champion Dare2Dream DT Shag Me Baby, an Edge View Cal Double Take ETV daughter bred, owned, and shown by Dylan Klossner of Owego, New York. She won the Summer Yearling class over six competitors.
Dylan Klossner of Owego, New York, earned Reserve Junior Champion with Dare2Dream DT Shag Me Baby, an Edge View Cal Double Take ETV daughter he bred and owns. At the young end, Hallie Steck of Atwater, Ohio, won Winter Heifer Calf with Patchohevn Wapi Sapi OCS, a Cadence daughter, and Cassandra Sophia Wilbur of Durhamville, New York, topped the Fall Heifer Calf class with Neidervale Sas Witchcraft, a La Rainbow Sweet Sasuke daughter.
The Bred-and-Owned Story
What jumps off the page in this show book is how many winners were bred and owned. Balthaser’s entire championship string. Klossner’s heifer. Steck’s calves. Mase’s yearlings. The Kaufmans’ All-Glo Carter Popular ET, who took second in Spring Yearlings behind Balthaser’s Tessa.
In a dairy world where flush-and-flip consignment cattle dominate some breed shows, the NY Spring Brown Swiss ring rewarded breeders who develop their own genetics — families building cow families over years, not flipping embryos between sales.
Junior Show Champions
Title
Animal
Exhibitor
Junior Champion
CIE Northkill Creek Tessa
Hannah Balthaser
Reserve Junior Champion
Dare2Dream DT Shag Me Baby
Dylan Klossner
Intermediate Champion
Northkill Creek Groove ET
Hannah Balthaser
Reserve Intermediate Champion
Way Lyn Daredevil Prize
Brandon Deeter
Senior Champion
Giesy Manor Tenascious Moonbeam
Liliana Marie Williams
Reserve Senior Champion
Greystone Kingpin Gitana
Amelia Somers
Grand Champion Junior Show
Northkill Creek Groove ET
Hannah Balthaser
Reserve Grand Champion Junior Show
Giesy Manor Tenascious Moonbeam
Liliana Marie Williams
What This Show Tells Us
The 2026 NY Spring Dairy Carousel Brown Swiss show wasn’t the biggest ring in the country. It didn’t need to be. What it showed is that the breed’s strength in the Northeast and mid-Atlantic runs deep — rooted in junior programs, family breeding operations, and cows that work for a living. Pacheco’s partnership with McKinven’s Look Out Farms adds a cross-border dimension that reminds us Brown Swiss genetics don’t stop at customs.
Grand Champion Brown Swiss (Junior Show): Northkill Creek Groove ET — Hannah Balthaser Reserve Grand Champion Brown Swiss (Junior Show): Giesy Manor Tenascious Moonbeam — Liliana Marie Williams
Senior Champion: Iroquois Acres Total Candy — Brian Pacheco Reserve Senior Champion: Jer-Lene I’m A Cali Girl — Brian Pacheco
Grand Champion Brown Swiss: Iroquois Acres Total Candy — Brian Pacheco Reserve Grand Champion Brown Swiss: Jer-Lene I’m A Cali Girl — Brian Pacheco
A Junior 2-Year-Old Stole the Show: Chaluka Reynolda Bella Named Grand Champion at the 2026 NY Spring Ayrshire Show
McKayla Spencer’s junior 2-year-old Chaluka Reynolda Bella (Palmyra Lochinvar Reynolds-ET) stood alone in her class — then stood above them all. Grand Champion Ayrshire, 2026 NY Spring Dairy Carousel.
McKayla Spencer walked into the Showplex in Hamburg, NY on Sunday afternoon with one cow — and walked out with the Grand Championship banner. Her junior 2-year-old, Chaluka Reynolda Bella, a Palmyra Lochinvar Reynolds daughter bred by Ferme Charest 2001 Inc., was the only entry in her class, yet Judge Jean-Philippe Charest had zero hesitation pulling her to the top of a competitive senior division and handing her both the Senior and Grand Champion Ayrshire titles.
That’s a bold statement from a 2-year-old — especially one standing alone in Class 7. But when the cow is right, the cow is right.
The Judge’s Picks
JP Charest sorted through roughly 49 head across 13 classes on Sunday afternoon, running simultaneously with the Brown Swiss show in the Cause Building. The cow show side was thin — single entries in three milking classes and no entries at all in both the Winter Heifer Calf and Senior 2-Year-Old classes. But what showed up in the heifer classes brought genuine depth and quality.
The 4-year-old Palmyra Blackjack R Rosalyn gave Steve Linkowski the Reserve Grand Champion banner — the most mature cow in a senior division that leaned young.
Reserve Grand Champion went to Palmyra Blackjack R Rosalyn, the first-place 4-year-old exhibited by Steve Linkowski of New Enterprise, PA. A Palmyra Calimero Blackjack ET daughter out of Palmyra Roush A Rosalyn, she carried the maturity and frame to earn Reserve Senior Champion honors as well.
Heifer Classes Delivered the Numbers
The real action was in the dry stock. The Summer Yearling class was the show’s deepest ring with 10 entries, followed closely by the Spring Yearlings at 9.
Shocking Genetics’ Ms Cinderella’s Crown ET (Heineman Melios Rage) topped the show’s deepest class — 10 Summer Yearlings — and earned Reserve Junior Champion for her trouble.
Class 3 – Summer Yearling (10 entries): Shocking Genetics’ Ms Cinderella’s Crown ET, a Heineman Melios Rage daughter, topped a loaded class. Russell Isley’s Kozy Kountry GB Pretty In Pink slotted second, with Karlie Supplee’s bred-and-owned Shultz Oops She Did It Again (by Mardel Stanley) earning third.
Class 4 – Spring Yearling (9 entries): Ashton and Levi Wilcox’s bred-and-owned On-The-Map Rage Journey — another Rage daughter — took command here. Winright and Madison Fisher crossed the border from Winchester, ON with Cedar Hall Climax Nala (by Marbrae Climax) for second, while Jeff Atherton’s Jackson-Hill Auto Teagan (by Marilie Autograph) grabbed third.
Junior Champion True-Blessings Dante Renatte, a Bear-Ayr Dreamer Dante daughter, crossed the border from Quebec and topped six Winter Yearlings for Cindy Bowen and Wyatt Johnston.
Class 5 – Winter Yearling (6 entries): This is where the Junior Champion emerged. True-Blessings Dante Renatte, exhibited by Cindy Bowen and Wyatt Johnston from Canton de Hatley, QC, topped the class. A Bear-Ayr Dreamer Dante daughter, she had the style and correctness Charest was looking for.
Class 6 – Fall Yearling (4 entries): Matthew Sweeney’s bred-and-owned Maple View’s A Carmenere (AMC), by Marilie Autograph, took the top spot here.
No Intermediate Champion was named in either the open or junior show divisions, with only single entries in the Junior and Senior 3-Year-Old classes.
Sire Trends Worth Watching
Heineman Melios Rage was arguably the sire of the show. Four daughters paraded through the heifer classes, including the Summer Yearling class winner (Ms Cinderella’s Crown ET) and the Spring Yearling class winner (On-The-Map Rage Journey). That’s the kind of consistency that turns a bull from “interesting” to “proven.”
Marilie Autograph placed daughters in multiple classes — Jackson-Hill Auto Teagan (3rd Spring Yearling), Jackson-Hill AG Coke Zero (Class 3), and the Fall Yearling winner Maple View’s A Carmenere. Palmyra Lochinvar Reynoldssired both the Grand Champion and placed daughters elsewhere in the show. And Grand-View Gentle Beast continued to produce show-ring calves, with daughters from Russell Isley and Matthew Sweeney in the lineup.
The Junior Exhibitor Story
Karlie Supplee bred her, owns her, and showed her to Junior Show Junior Champion. Shultz Oops She Did It Again (Mardel Stanley) — the name says it all.
This show was loaded with junior entries, and that might be the most important takeaway from Hamburg. McKayla Spencer — a junior exhibitor — owns the Grand Champion. Ashton and Levi Wilcox showed multiple bred-and-owned entries across several classes. Karlie Supplee earned Junior Show Junior Champion with a bred-and-owned heifer. Claire and Cara Stoltzfus, Mulligan Palmerton, Tyler March, Natalie Stuart — the next generation of Ayrshire breeders showed up and showed well.
The Wilcox family’s On-The-Map prefix appeared in three classes, all bred-and-owned junior entries. That’s not just participation — that’s a breeding program in the making.
Small Show, Big Signals
Let’s be honest: a show with single-entry milking classes and no entries in two divisions isn’t going to be confused with a national. But the NY Spring Ayrshire Show has never been about massive numbers — it’s about kicking off the season and getting a read on who’s bringing what.
The signals from Hamburg are clear. The heifer classes are strong, the junior exhibitors are engaged, and Rage daughters are everywhere. The cow side needs more depth, but the pipeline looks healthy. When a junior exhibitor’s 2-year-old is good enough to beat everything else in the building, the breed’s got something to build on.
Class 2 – Fall Heifer Calf (Born 09/01/25–11/30/25) — 5 Entries
Place
Animal
Sire
Exhibitor
City/State
1st
Kozy Kountry Gentle Rayne
Gentle Beast
Russell Isley
Clear Spring, MD
2nd
Toppglen Champ Whit-ET
Cedarcut Colata’s Champion
Christopher & Melanie Hackett & Claire Stoltzfus
Manheim, PA
3rd
SML PV Auto Blithe-ET
Marilie Autograph
Peter Vail & Rosie Trowbridge
Middleburgh, NY
4th
Houghton Farms Dynamic Melody
Good-Vue-KP Dynamic
Morgan Houghton
Paxton, MA
5th
On-The-Map Rage Bellaroz
Heineman Melios Rage
Ashton and Levi Wilcox
Freedom, NY
Class 3 – Summer Yearling Heifer (Born 06/01/25–08/31/25) — 10 Entries
Place
Animal
Sire
Exhibitor
City/State
1st
Ms Cinderella’s Crown ET
Heineman Melios Rage
Shocking Genetics
Chambersburg, PA
2nd
Kozy Kountry GB Pretty In Pink
Gentle Beast
Russell Isley
Clear Spring, MD
3rd
Shultz Oops She Did It Again
Mardel Stanley
Karlie Supplee
Chambersburg, PA
4th
Jackson-Hill Rage Bender
Heineman Melios Rage
Jeff Atherton
Greenwood, NY
5th
Pennwood O’Reilly Gem
Palmyra O’Reilly
Claire & Cara Stoltzfus
Manheim, PA
6th
Hardy-Farms Reynolds Ava
Reynolds
Robert Nagel
Ephrata, PA
7th
Grand-View PV Tux Draven (AMC)-ET
Ruisseau Clair Tuxedo (AMC)-ET
Tyler March
Walton, NY
8th
Grand-View PV T Drama-ET
Ruisseau Claire Tuxedo
Ashton and Levi Wilcox
Freedom, NY
9th
Jackson-Hill AG Coke Zero
Marilie Autograph
Jeff Atherton
Greenwood, NY
10th
Maple View’s Beast Reba
Grand-View Gentle Beast
Matthew Sweeney
Appleton, NY
Class 4 – Spring Yearling Heifer (Born 03/01/25–05/31/25) — 9 Entries
Place
Animal
Sire
Exhibitor
City/State
1st
On-The-Map Rage Journey
Heineman Melios Rage
Ashton and Levi Wilcox
Freedom, NY
2nd
Cedar Hall Climax Nala
Marbrae Climax
Winright & Madison Fisher
Winchester, ON
3rd
Jackson-Hill Auto Teagan
Marilie Autograph
Jeff Atherton
Greenwood, NY
4th
Spencer Farms Rage X-Layla
Heineman Melios Rage
McKayla Spencer
Attica, NY
5th
Glamourview PV KS Beyonce-ET
Bear-Ayr Distinct Kingsire
Lily Trowbridge & Peter Vail
Middleburgh, NY
6th
Mile High C Mercedes
Kler-Vu Charisma-ET
Tyler March
Walton, NY
7th
Hillacres Kiwi’s Koachella
Ridale Most Wanted-ET
Maple Downs Farms II / Peter Vail
Peach Bottom, PA
8th
On-The-Map Stanley Beyonce
Mardel Stanley
Ashton and Levi Wilcox
Freedom, NY
9th
Maple View’s Dynamic Kiwi
Good-Vue-KP Dynamic
Matthew Sweeney
Appleton, NY
Class 5 – Winter Yearling Heifer (Born 12/01/24–02/29/25) — 6 Entries
Place
Animal
Sire
Exhibitor
City/State
1st
True-Blessings Dante Renatte
Bear-Ayr Dreamer Dante
Cindy Bowen & Wyatt Johnston
Canton de Hatley, QC
2nd
Mile High Shockwave Icelyn
Mont Comi Shockwave-ET
Lily Trowbridge & Peter Vail
Middleburgh, NY
3rd
Woodman-Farm GB Gertrude
Grand-View Gentle Beast
Peter Vail
Middleburgh, NY
4th
Lace Acres Boond Galaxy
Good-Vue Boondock
Natalie Stuart
Quarryville, PA
5th
River Valley GB Rum
Gentle Beast
Kassi Bailey
Fillmore, NY
6th
Myline-RC Get Chills-ET
Duo Star Gentleman ET
Hallie Steck & Justin Fox
Atwater, OH
Class 6 – Fall Yearling Heifer (Born 09/01/24–11/30/24) — 4 Entries
Place
Animal
Sire
Exhibitor
City/State
1st
Maple View’s A Carmenere (AMC)
Marilie Autograph-ET
Matthew Sweeney
Appleton, NY
2nd
MM-T Pockets Sharp Criminal-ET
Deer-Hill Sharp Dressed Man
Maple Downs Farms II / Peter Vail
Middleburgh, NY
3rd
Jackson-Hill Reynolds Fever
Palmyra Lochinvar Reynolds-ET
Jeff Atherton
Greenwood, NY
4th
Sliver-Lane Most Bootylicious
Ridale Most Wanted-ET
Lexi Findley
Quarryville, PA
Junior Champion
True-Blessings Dante Renatte — Cindy Bowen & Wyatt Johnston, Canton de Hatley, QC
Reserve Junior Champion
Ms Cinderella’s Crown ET — Shocking Genetics, Chambersburg, PA
Junior Champion (Junior Show)
Shultz Oops She Did It Again — Karlie Supplee, Chambersburg, PA
Reserve Junior Champion (Junior Show)
Toppglen Champ Whit-ET — Christopher & Melanie Hackett & Claire Stoltzfus, Manheim, PA
Class 7 – Junior 2-Year-Old (Born 03/01/24–08/31/24) — 1 Entry
Place
Animal
Sire
Exhibitor
City/State
1st
Chaluka Reynolda Bella
Palmyra Lochinvar Reynolds-ET
McKayla Spencer
Attica, NY
Class 8 – Senior 2-Year-Old (Born 09/01/23–02/28/24)
No Entries
Class 9 – Junior 3-Year-Old (Born 03/01/23–08/31/23) — 1 Entry
Place
Animal
Sire
Exhibitor
City/State
1st
Maple View’s Rushmore Katrina
Palmyra Ruth’s Rushmore-ET
Timothy Stead
Appleton, NY
Class 10 – Senior 3-Year-Old (Born 09/01/22–02/28/23) — 1 Entry
Place
Animal
Sire
Exhibitor
City/State
1st
Family-AF-Ayr Vicking Anna
De La Plaine Vicking-ET
Chase Eller, Jared Helsley & Daniel Fyock
Roaring Spring, PA
Class 11 – 4-Year-Old (Born 09/01/21–08/31/22) — 4 Entries
Place
Animal
Sire
Exhibitor
City/State
1st
Palmyra Blackjack R Rosalyn
Palmyra Calimero Blackjack ET
Steve Linkowski
New Enterprise, PA
2nd
True-Blessings KS Cherry Candy
Bear-Ayr Distinct Kingsire
Jared Fishman, Fiona Malauley & Jarvis Idowu
Canton de Hatley, QC
3rd
True-Blessings PK Rollthedice
Palmyra Lochinvar Reynolds
Preston Peabody
Buskirk, NY
4th
All-Glo Reagan Minnie
Palmyra Berkley Reagan
Avery Kaufman
Berlin, PA
Class 12 – 5-Year-Old (Born 09/01/20–08/31/21) — 2 Entries
Place
Animal
Sire
Exhibitor
City/State
1st
Jackson-Hill Beguiled Curry
Destiny Bethanys Beguiled-ET
Mulligan Palmerton
Delevan, NY
2nd
Scapeland K Sunday
Bear-Ayr Distinct Kingsire
Maple Downs Farms II / Peter Vail
Middleburgh, NY
Class 13 – Aged Cow (Born Prior to 08/31/20) — 1 Entry
Place
Animal
Sire
Exhibitor
City/State
1st
Rock-View Perfecta Brandy
Locust-Springs Gibbs Perfecta
Maple Downs Farms II / Peter Vail
Middleburgh, NY
Class 14 – 100,000 Lifetime Production (Colored Breeds)
No Entries
Senior Champion
Chaluka Reynolda Bella — McKayla Spencer, Attica, NY
Reserve Senior Champion
Palmyra Blackjack R Rosalyn — Steve Linkowski, New Enterprise, PA
Senior Champion (Junior Show)
Chaluka Reynolda Bella — McKayla Spencer, Attica, NY
Reserve Senior Champion (Junior Show)
True-Blessings PK Rollthedice — Preston Peabody, Buskirk, NY
Grand Champion Ayrshire
Chaluka Reynolda Bella — McKayla Spencer, Attica, NY
Reserve Grand Champion Ayrshire
Palmyra Blackjack R Rosalyn — Steve Linkowski, New Enterprise, PA
Grand Champion Ayrshire (Junior Show)
Chaluka Reynolda Bella — McKayla Spencer, Attica, NY
Reserve Grand Champion Ayrshire (Junior Show)
True-Blessings PK Rollthedice — Preston Peabody, Buskirk, NY
Kira and Griffin Lamb’s aged cow sensation caps a dominant day in Hamburg as JP Charest rewards dairy quality, open ribs, and mammary systems that stop you in your tracks.
Grand Champion Kevetta Colton Delilah, the 94-point Colton daughter owned by Kira and Griffin Lamb, adds the 2026 NY Spring International Jersey Show grand champion banner to a resume that already includes Grand Champion of the 2025 World Dairy Expo Junior Show.
The 2026 International Jersey Show at the New York Spring Dairy Carousel delivered one of the deepest, most competitive lineups Hamburg has seen in years. Judge JP Charest of Quebec sorted through massive classes — 27 entries in the fall heifer calf class alone — inside the Showplex at the Erie County Fairgrounds on March 29, running simultaneously alongside the Northeast Spring National Red & White Show in the adjacent ring.
And when the dust settled, there was no debate. Kevetta Colton Delilah, the 94-point aged cow exhibited by Kira and Griffin Lamb, walked away as both Junior Show Grand Champion and Open Show Grand Champion. She’s the reigning Grand Champion of the 2025 World Dairy Expo Junior Show and Reserve All American Aged Cow — and she looked every bit that caliber in Hamburg.
Delilah Was Never in Doubt
JP Charest didn’t mince words. When it came time for the grand champion drive, he acknowledged the obvious: the senior champions were going to be grand and reserve, and the intermediate champion would slot into honorable mention. “No surprise,” he said. “Quality cows”.
Delilah’s combination of tremendous openness, dairy quality, feet and legs, and ring presence made her untouchable. The commentators had called it well before the tap — “the presence of that cow is astounding,” one noted, while the other quipped about whether it was presence or if “she’s just crazy… she’s got her head up, and she’s always on, so alert”.
Reserve Grand Champion Waymar Viral Noel, a 93-point five-year-old tracing to the legendary Waymar Patrick Nadine, made back to the show ring in over a year at the 2026 Hamburg for Isaac Fultz, Forex Ford, and Cache Valley Genetics — and walked straight into the reserve banner.
Reserve Grand Champion went to Waymar Viral Noel, the 93-point five-year-old exhibited by Isaac Fultz, Forex Ford, and Cache Valley Genetics. Here’s the kicker: this cow hasn’t been in a show ring since the Royal in 2024. She traces back to the legendary Waymar Patrick Nadine — a cow one commentator recalled parking “a truck in that cow’s rib cage” when he saw her in 1996. Viral Noel’s mammary system, forequarter attachment, and venetion earned her a handy win in the five-year-old class and a well-deserved reserve banner.
Honorable Mention Grand Champion went to McWilliams CC Double, the intermediate champion exhibited by Valerie and Jim Sprang and Ackley. JP kept six cows in his intermediate pull instead of the usual five — a testament to the depth in the two-year-old and three-year-old ranks.
The grand champion drive at the 2026 NY Spring International Jersey Show. Left to right: Honorable Mention McWilliams CC Double, Reserve Grand Champion Waymar Viral Noel, and Grand Champion Kevetta Colton Delilah.
The Heifer Show: Spats VIP Sorrell Tops a Loaded Field
Junior Champion MPH Spats VIP Sorrell delivers the style, rib, and width that made her an “easy winner” for judge JP Charest. Exhibited by Matt Seneca, Kutu, and T & K Reynolds, she topped a spring yearling class of 19.
The open show junior championship went to MPH Spats VIP Sorrell, the winning spring yearling exhibited by Matt Seneca, Kutu, and T & K Reynolds. Charest called her an “easy winner” — a heifer that combined beautiful style, open rib, width in all her parts, and a gorgeous set of feet and legs. Her pedigree stacks up too, with a 95-point next dam and 94-point third dam.
Rory Cornell’s Holly Lane BL Video Dolce Vita earned Junior Champion of the Junior Show and Reserve Junior Champion of the Open — a fall yearling with correctness, length, and ring presence that Charest said “owns the ring right now.”
Reserve Junior Champion of the open show was Holly Lane BL Video Dolce Vita, exhibited by Rory Cornell. This fall yearling owned her class and then flipped to Junior Champion of the Junior Show, where Charest praised her correctness, ring presence, and length from hooks to pins. She’s bred by a partnership spanning South America and Canada — a Holly Lane-bred Video daughter tracing into the Cross Brooks family.
Honorable Mention Junior Champion of the open division was South Mountain & Co Rock Rebellion, the winning summer yearling for Rodney and Kate Hetz and Renee Pieric, a Rascal daughter out of a 93-94 point dam.
McWilliams CC Double earned intermediate champion honors with what Charest described as a cow that “puts it all together” — a high, wide rear udder and beautiful forequarter that edged out a strong group. Reserve intermediate went to Underground Milkshakes Margo for Cameron and Macy Crothers, while Nicole Arrowsmith’s Hillacres Video Abba picked up honorable mention.
The senior three-year-old class produced a notable entry in Robin Hood MPH Tequila Rose, who was Junior Supreme Champion at the Pennsylvania Farm Show just two months earlier. She placed second behind Isaac Fultz’s excellent Casino daughter from Newark Valley — a herd the commentators praised for “extraordinary herd averages for a long time”.
The lifetime production class featured two warriors within 5,000 pounds of each other. Elm View Farm’s Willabar Diamondback Rose, an excellent-95 cow with roughly 160,000 pounds lifetime, topped Lantland’s 94-point entry carrying approximately 163,000 pounds. Charest noted that the first cow “overpowers” on frame and spring of rib, though both 10-year-olds with seven lactations “stood the test of time”.
Mason Zimba: The Quiet Dominator
Mason Ziemba collected premier breeder and premier exhibitor honors at Hamburg — backed by winning junior best three, best three females, and produce of dam, plus the intermediate reserve champion and multiple class wins across Z Class and Sunnyside Farms entries.
If there was a premier exhibitor story at this show, it’s Mason Zimba and Z Class/Sunnyside Farms. Zimba’s fingerprints were everywhere:
Junior 3-year-old class winner with ZC & SS Laspada Constance
Reserve Intermediate Champion of the Junior Show
Winning Junior Best Three in both the Junior and Open shows
Winning Produce of Dam
Best Three Females winner
Multiple entries placing consistently across heifer and cow classes
His Z Class program is breeding them and showing them at a level that’s hard to ignore. The Laspada daughters, the Garland Crown two-year-old, the Cash Recognition winter yearling — Zimba brought depth, not just a single headliner.
The Crothers Sisters Keep Climbing
Cameron and Macy Crothers had a banner day that included the winning four-year-old (Jaybird SSF Reckless Jola at 91 points), reserve intermediate champion (Underground Milkshakes Margo), and honorable mention grand champion of the Junior Show. They also placed in the produce of dam. The Silver Springs Farm and SSF genetics connection is paying dividends, and these two are building a show string that demands attention at every level.
Sale Night Heifer Makes Immediate Impact
One of the more compelling storylines: Big Guns Joyride Valhalla, consigned by Glamourview/Yeager & Walton, sold as Lot 2 at the NY Spring Select Sale on Saturday night and walked into the winter yearling class the next morning to place second behind Maker Farms’ Side Show Ruby Red. Her dam is a 93-point cow tracing to the Vanilla family. Gene Yeager picked her up, and she immediately proved her worth in one of the show’s toughest heifer classes.
A Judge Who Knew What He Wanted
JP Charest was consistent all day: open ribs, dairy character, width through the chest and rump, high and wide rear udders with venetion and texture. He rewarded correctness on the move and wasn’t afraid to separate close placings on mammary quality alone. His enthusiasm was infectious — the commentators noted he was “clutch on the mic” and described him as “an enthusiastic, positive judge” who was “looking for people to talk to” between classes.
Running a Jersey show simultaneously with a Red & White show in the same building is logistically chaotic. Credit to show committee chairperson Ginny Folts and the crew — including the tireless ring-runner Deb Crothers, who corrected class placings “five times, no joke” as JP shuffled his winter yearling order repeatedly in a class of 18.
Kevetta Colton Delilah is the cow to beat in 2026. At every angle, she’s operating at a level that separates her from the pack. The Lambs have a legitimate national contender.
The Video daughters are showing up everywhere — from Rory Cornell’s junior champion to Nicole Arrowsmith’s entries to Caroline Arrowsmith’s string. That sire is stamping quality mammary systems and dairy character into the breed.
The next generation of exhibitors — Zimba, the Crothers sisters, Rory Cornell, the Arrowsmiths — aren’t just showing up. They’re winning classes, collecting banners, and building programs that rival established operations.
Hamburg delivered. The water was deep, the quality was real, and the Jersey breed walks out of the Showplex with a clear message: the 2026 show season is going to be a fight from top to bottom.
HEIFER CLASSES
Fall Heifer Calf
Labels Out Dexter — Evan Westerfield
Dream Valley Tour de France — Michael Bosley
Winter Heifer Calf(27 entries)
Pacific Edge (dam was Supreme Champion WDE Junior Show 2024) — Daniel Hosking, New Berlin, NY
Rock and Roll Serenity (Hidalgo x EX-91 dam) — Christy Ellsworth & Sara Reed
Summer Yearling
South Mountain & Co Rock Rebellion (Rascal x 93-94 pt dam) — Rodney & Kate Hetz and Renee Pieric
MPH Spats VIP Sorrell — Matt Seneca, Kutu, T & K Reynolds
Spades Gigawatt Spice — Ford & Handley Kids
Ravenside Hidalgo Genesis — Sara Reed, Columbia Cross Roads, PA
Jeff Van Patten entry
Beth Roberts entry (Kid Rock x EX-93 dam)
(entry 1086) 7–10. (additional placings announced on Showman; 1st Junior: Jacob Smith Gall with Bar KG entry; 2nd Junior: JKB Maverick Lena — Jersey Newland, Kirby Nichols & Bryce Warner)
Winter Yearling(18 entries)
Maker Side Show Ruby Red — Maker Farms (Carrie Alexander), Rockwood, ON
Big Guns Joyride Valhalla — Glamourview/Yeager & Walton (sold at NY Spring Select Sale the night before)
Cash Out Kid Rock Vice — Sailor Reynolds, Ren Crest Farm
Z Class Cash Recognition — Mason Ziemba (1st Junior)
South Mountain & Co Chocolate Chip Cherish — Kira & Griffin Lamb (2nd Junior)
Fall Yearling
Holly Lane BL Video Dolce Vita — Rory Cornell
Maker Reckless Shivers — Maker Farms
Rock and Roll entry — Christy Ellsworth & Sara Reed (Hidalgo x EX-91 dam)
Katie Carpenter entry (Coco Chip daughter)
Elizabeth Bosley entry (Canadian Club x VG-86 dam, 4th dam Veronica)
COW CLASSES
Summer Junior Two-Year-Old(1 entry)
Locus Air Victorious Maddie — Riley Hanes, Maryland
Spring Junior Two-Year-Old(8 entries)
Z Class Garland Crown — Mason Ziemba, Sunnyside Farms (Sexing Garland daughter)
River Valley Chief daughter — Grace Klein
Flat Rock Savage Little Missy (VG-88) — Nicole Arrowsmith
Klein entry (Kid Rock x EX-94 Hired Gun dam)
Maker Farms Lala daughter (EX Tequila dam, 3-4 dams EX) — Carrie Alexander
Star Rock Victorious Ellie (VG-85, dam of Rivendale VIP Eloise) — Cooper Merrill
Joel daughter (VG-88 dam, 2nd dam EX-94 All Canadian Mature Cow) — Tyler Spencer
Milo Vindication daughter
Fall Senior Two-Year-Old
Palmerton Frank Shiloh — Crothers
Winter Senior Two-Year-Old
McWilliams CC Double — Valerie & Jim Sprang & Ackley (bred by Doe Brainer, Bowen & Carters Corners)
Z Class Vale Canadian Winter — Mason Ziemba & Peter Vail
Junior Champion: MPH Spats VIP Sorrell — Matt Seneca, Kutu, T & K Reynolds Reserve Junior Champion: Holly Lane BL Video Dolce Vita — Rory Cornell HM Junior Champion: South Mountain & Co Rock Rebellion — Rodney & Kate Hetz, Renee Pieric
Senior Champion: Kevetta Colton Delilah — Kira & Griffin Lamb Reserve Senior Champion: Waymar Viral Noel — Isaac Fultz, Forex Ford & Cache Valley Genetics HM Senior Champion: Jaybird SSF Reckless Jola — Cameron & Macy Crothers
Grand Champion: Kevetta Colton Delilah — Kira & Griffin Lamb Reserve Grand Champion: Waymar Viral Noel — Isaac Fultz, Forex Ford & Cache Valley Genetics HM Grand Champion: McWilliams CC Double — Valerie & Jim Sprang & Ackley
CHAMPIONS — JUNIOR SHOW
Junior Champion: Holly Lane BL Video Dolce Vita — Rory Cornell Reserve Junior Champion: Z Class Cash Recognition — Mason Ziemba HM Junior Champion: HRC Manhattans Moneymaker — Cameron & Macy Crothers
Intermediate Champion: Palmerton Frank Shiloh — Crothers Reserve Intermediate Champion: ZC & SS Laspada Constance — Mason Ziemba HM Intermediate Champion: ZC & SS Garland Crown — Mason Ziemba
Senior Champion: Kevetta Colton Delilah — Kira & Griffin Lamb Reserve Senior Champion: Waymar Viral Noel — Isaac Fultz, Forex Ford & Cache Valley Genetics HM Senior Champion: Jaybird SSF Reckless Jola — Cameron & Macy Crothers
Grand Champion: Kevetta Colton Delilah — Kira & Griffin Lamb Reserve Grand Champion: Waymar Viral Noel — Isaac Fultz, Forex Ford & Cache Valley Genetics HM Grand Champion: Underground Milkshakes Margo — Cameron & Macy Crothers
Ford & Handley Kids & Cache Valley Genetics — Richmond, UT (scratched)
Krissa Brewer — Bangor, PA (scratched)
Michael Bosley — Glen Rock, PA (scratched)
Dam & Daughter(2 entries)
Caroline Arrowsmith — Peach Bottom, PA
Mason Ziemba — Durhamville, NY (scratched)
Best Three Females(5 entries)
Mason Ziemba — Durhamville, NY
Thomas & Amanda Arrowsmith — Peach Bottom, PA
Ryan Lawton — Newark Valley, NY
Camryn & Maci Crothers — Pitcher, NY (scratched)
Lookout/Brooke McKinven — Canton de Hatley, QC (scratched)
SPECIAL AWARDS
Premier Breeder: Mason Ziemba / Z Class Jerseys Premier Exhibitor: Mason Ziemba 1st Junior Exhibitor (Spring Jr. 2-Year-Old): Mason Ziemba 1st Junior Exhibitor (Junior 3-Year-Old): Mason Ziemba Best Bred & Owned (4-Year-Old): Plumb Line V Sunflower — Olivia Carey Herdsmanship: Nickerson, Hills, Atherton families
Wildweed Warrior Maui Tops Deep Red & White Field in Hamburg
Wildweed Warrior Maui-RED (Warrior), 1st 5-Year-Old, is named Grand & Senior Champion of the Northeast Spring National Red & White Show 2026 for Elmvue Farm, Johnstown, NY.
Judge: Chip Savage
When the dust settled in Hamburg, it was the mature cows that owned the ring. Wildweed Warrior Maui-RED (Warrior), the massive, power-packed 5-year-old from Elmvue Farm, Johnstown, NY, was tapped Grand & Senior Champion after what Judge Chip Savage called an almost impossible split between the top two in the class. Maui brought the full package – width, depth of heart and barrel, tremendous udder bloom and the kind of strength on the move that “hits you like a truck coming at you” – to edge another standout five-year-old, Lucky Atomic Castaway-RED (Atomic), exhibited by Tyler Carter, Pat DeGroot & Pat Conroy, Greenville, IL, who settled for Reserve Grand & Senior Champion.
Lucky Atomic Castaway-RED (Atomic), exhibited by Tyler Carter, Pat DeGroot & Pat Conroy, Greenville, IL, earns Reserve Grand & Senior Champion after a razor-close battle in the 5-Year-Old class.
Honorable Mention Grand went to a cow that’s already proved everything she needs to: Wil-O-Mar Diamndbk Rose-RED (Diamondback), the Lifetime Production winner for Elmvue Farm. Around 10 years old with seven lactations, Rose impressed Savage with her longevity, fuller and stronger front end, extreme width and a balanced udder floor that still holds up against cows half her age.
Wil-O-Mar Diamndbk Rose-RED (Diamondback), Elmvue Farm, Johnstown, NY, wins the Lifetime Production class and is tapped Honorable Mention Grand after seven lactations and 10 years of work in the parlor.
Junior, Intermediate and Champions-in-the-Making
On the junior side, Mer-James Unstop Ava-RED (Unstopabull), the 3rd-place 5-year-old shown by Kyra & Griffin Lamb, Tully, NY, stormed through the lineup to be named Grand Champion of the Junior Show on the strength of her maturity, multiple calves and high-quality mammary system. Reserve Junior Grand went to Middlebush Jordy Jenny-RED (Jordy), the balanced, high-uddered Winter Senior 2-year-old for Cait O’Sullivan, Hillsborough, NJ, with Ovaltop Warrior Span-RED-ET (Warrior), Deanna Wolfe, Richfield, NY, taking Honorable Mention for her style and dairyness as a Senior 3-year-old.
Mer-James Unstop Ava-RED (Unstopabull), 3rd 5-Year-Old, powers to Grand Champion of the Junior Show for Kyra & Griffin Lamb, Tully, NY, on maturity and an outstanding udder.
In the intermediate division, Sweet-Peas Archer Daisy-RED (Archer), the ultra-dairy Senior 3-year-old from Oakfield Corners Dairy, Oakfield, NY, was a “runaway winner” for Intermediate Champion thanks to her tremendous udder, width, openness and balanced frame. Merrillea St Charish-RED (Showtime), the correct, high-uddered Winter Senior 2-year-old for Russ-Jan Holsteins, Somerset, PA, claimed Reserve, while Landland Sasha’s Showtime-RED (Dalton), the stylish Junior 3-year-old for Averi & Kirt Menzi Jr, Horseheads, NY, earned Honorable Mention.
Sweet-Peas Archer Daisy-RED (Archer), 1st Senior 3-Year-Old from Oakfield Corners Dairy, Oakfield, NY, is a runaway choice for Intermediate Champion with her ultra-dairy frame and tremendous udder.
The Intermediate Champion of the Junior Show followed a similar script: Middlebush Jordy Jenny-RED stood at the top for her extra balance, heart and chest, sweeping rib and high, tight udder on strong legs. Reserve went to Ovaltop Warrior Span-RED-ET on her two-calf maturity, defined udder cleft and angular dairyness, with B&L Ocean Analyst-RED (Analyst), Kaylee Byma, Ilion, NY, rounding out the trio as Honorable Mention.
Heifers Set the Stage
At the front end of the day, the heifers gave the crowd plenty to talk about. Durkacres Schnaps-RED-ET (Unstopabull), exhibited by Rierdan Ryan, Friendsville, PA, topped a deep Fall Calf class with her ring presence, balance, depth of rib and strength over the loin, using a more correct track and neater tail head to place over the stylish M-Divine When I Win-RED (Architect) for Merillea Holsteins and the big-growth Reykug Resilient-RED (Acetylene) from Reyncrest Farm & Fly Higher Holsteins. Kampy Hulu Abolish-RED (Hulu), Clarkvalley Holsteins, Beaverton, ON, dominated the Winter Yearling class as a “handy winner” on mass, balance, hard top and ring presence, beating Valley-Folts Janalee-RED (Jordy) and Mcgarr-Farms E Raia-RED-ET (Alpha) on width, length and a more correct stride.
Fall Yearlings were “quality, quality, quality” from top to bottom, with Kress Hill Sky-RED-ET (Altitude), Fastlane Genetics, Tipton, CA, getting the easy nod for her blend of strength, style, open rib and wide rump on perfect feet and legs. She led a sharp group that included Mcgarr-Farms E Racy-RED-ET (Awesome) for Eoghan Mcgarr and Oakfield Ace Regalia-RED-ET (Acetylene) for Chloe & Claire Lamb in the top three.
Among the yearling milking prospects, Hilrose Moovn Around-RED-ET (Moovin), shown by Michael Iager, Frederick, OH, headed the Summer Yearling class with more depth and openness of fore rib, strength over the loin and overall “more heifer” look than Blondin Alpha Whippet-RED (Alpha) and S-Creek Acres Acetylene Daisy-RED. The Spring Yearling class was another runaway, with Winright Altitude Turpentine-RED for Bridgerland Holsteins & Emily Shear taking the red banner on sheer mass, openness of rib, balance and ring presence over the dairy, angular Eshlane Dice Verna-RED-ET for Kaylee Byma.
In the Junior Champion of the Junior Show, Savage rewarded those heifer profiles. Eshlane Dice Verna-RED-ET, the ultra-dairy, long-framed Spring Yearling for Byma, stretched just a bit more through her frame and held herself together a touch nicer in line to earn Junior Champion of the Junior Show ahead of Oakfield Rompen Apollo-RED (Rompen), the correct, wide Summer Yearling for Chloe & Claire Lamb, and Tiger-Lily HND Fanta-RED-ET (Hindsight), the stylish Fall Calf for Addison Dickey.
Young Cows With Big Futures
Down the milking line, the two-year-olds brought plenty of depth for a March show. In the Winter 2-Year-Olds, Merrillea St Charish-RED stood out as “the most correct cow in the class” with big open rib, clean head and neck, breed character, a long hooks-to-pins and a beautiful leg set, placing over Middlebush Jordy Jenny-RED on height at withers, stretch and overall balance.
The Fall 2-Year-Olds were led by (B&O) Milk & Honey T Bombshell-RED (Tango), Cedar Lane Farm CLF, Oldwick, NJ, on openness and angularity, depth of rib and chest width. Savage did name Shoresbrook W Pamela-RED-ET (Warrior), Randall & Meredith Shores, Horseheads, NY, Best Udder of the class for her higher, wider rear udder and stronger cleft, but Bombshell’s total-frame advantage kept her on top. Pamela in turn used her snug, higher and wider attachments to place over B&L Ocean Analyst-RED and Ovaltop Aristcr Talia-RED.
In the Junior 3-Year-Olds, Landland Sasha’s Showtime-RED (Dalton), Averi & Kirt Menzi Jr, took a small but high-quality class on the strength of an “exceptional mammary system” – higher, wider rear udder, snug fore udder, lots of bloom and more width of chest and frame – over Ovaltop Warrior Lesley-RED (Warrior) for Douglas Wolfe. The Senior 3-Year-Olds saw Sweet-Peas Archer Daisy-RED shine as an “ultra-dairy runaway winner,” with magnificent udder bloom, clean lines and a balanced frame placing her over (B&O) Ovaltop Warrior Span-RED-ET and S-CreekAcres Pmkn Spice-RED on frame length, locomotion and superior udder quality. Ovaltop Unst Tago-RED slotted into fourth on a strong udder of her own.
Mature Cows and Longevity
Behind the five-year-old headliners, the Four-Year-Old class was “stacked with power.” Ms Danielles Dayanna-RED-ET (Unstopabull), exhibited by A & J Lamb and Oakfield Corners Dairy, floated to the top as the most dairy, angular cow with added openness of rib, sweep and clean head and neck over the powerful Siemers Tequila 033-RED-ET (Altitude). Her snug fore udder, higher, wider rear attachment and stronger overall frame also carried her over (B&O) Ovaltop Warrior Revive-RED-ET and Tiger Lily Romp River-RED, with Gold-Bros Warri Maddie-RED rounding out the top five.
The Five-Year-Old class, where Maui and Castaway first locked horns, was as stout as it gets. Maui’s extreme mass, width and depth of heart and barrel set the tone, while both she and Castaway brought “tremendous mammary systems” to the party. Castaway earned her Reserve on udder floor and fore-udder length over Mer-James Unstop Ava-RED, who in turn used additional chest width, frame balance and better tracking to place ahead of the tall Ms Darkhose M Fergy-RED-ET and the snug-uddered Kuperus Altitud Ruby-RED-ET.
In the Aged Cow class, Miss Pretty Playful-RED-ET (Avalanche), Maple Downs Farms II & Peter Vail, overpowered Laspada Awesome Allie-RED (Awesome), Brandon Nickerson, on frame, mass and substance and then sealed the deal with a higher, wider and more blooming rear udder with better balanced quarters.
From calf classes to lifetime cows, Chip Savage had quality in front of him all day – and he rewarded those that combined dairyness, mammary quality, structural correctness and ring presence with banners to match. Congrats to all exhibitors and junior showmen who loaded the trailers and put the Red & Whites on full display in Hamburg.
In Mason County, up to $60,000 an acre was on the table for working farmland — and at least four families still walked away, forcing every serious producer in a growth corridor to ask what their own ground is really worth.
Ida Huddleston is 82 and owns 71 acres of farmland outside Maysville, Kentucky. Her daughter, Delsia Bare, holds another 463 acres nearby. Together, according to local coverage, the family operates roughly 1,200 acres of ground that has supported them since the 1860s— through wheat in the Depression and working farmland still today.
Last year, a group representing an unnamed Fortune 100 company — described as Fortune 50 in more recent reporting — came looking to buy a big piece of that ridge for an AI data center. WLEX reporting cited by People magazine says the group offered Huddleston $60,000 per acre for her 71 acres and Bare $48,000 per acre for her 463 acres — more than $26 million combined for 534 acres.
“My grandfather and great-grandfather and a whole bunch of family have all lived here for years, paid taxes on it, fed a nation off of it,” Bare told CBS affiliate WKRC. “Even raised wheat through the Depression and kept bread lines up in the United States of America when people didn’t have anything else.”
They said no.
The offers that came with a five-day clock
The Huddleston family’s story hit regional news in mid-March 2026 and went national within days. But the land chase started much earlier — and their neighbors felt the same pressure.
Down the road, cattleman Dr. Timothy Grosser and his son Andy raise cattle on their place along KY 3056. In March 2025, a group representing the same data-center development offered them $35,000 per acre, according to LEX18 — nearly $8 million for their farm.
“They stressed that time was of the essence and they wanted responses really fast, like within the next five days,” Andy told LEX18. Despite the money and the rush, he was blunt: “We do not want to sell. The farm is my dad’s, and it means everything to him.”
Local 12’s segment on the Grossers emphasized the same theme: that kind of money “can buy a lot,” one line went, but Dr. Grosser made it clear it couldn’t buy what the place means to him.
Local 12 also reported in late March 2026 that the company’s representatives now have contracts “ready to go” on 28 properties as part of the proposed data-center complex. The company itself hasn’t been publicly identified “because of nondisclosure agreements,” the station said.
So you’ve got a Fortune 50–caliber tech client that no one is allowed to name yet, dozens of farms under contract, and a handful of families — like the Huddlestons and the Grossers — who’ve decided they won’t cash out, even at numbers that would make most advisors choke on their coffee.
“It’s not a business deal, it’s mind harassment.”
Huddleston didn’t sugarcoat how the process felt. In an interview with NBC affiliate WLEX, she described months of pressure in plain language: “What they’ve proposed and carried on, it’s not a business deal, it’s a mind harassment.”
She also told WKRC she doubted the data center would deliver the kind of jobs and growth its boosters promised. “It’s a scam,” she said in that interview, according to TechCrunch and WKRC’s original report. These are Huddleston’s characterizations of the proposals she received, reflecting her experience as a landowner who’s been repeatedly approached. The Bullvine hasn’t independently investigated the company’s economic claims, and the company itself hasn’t been publicly identified.
Bare talked less about the meetings and more about what the land means. “There’s nothing that can destroy me if I’ve got this land,” she told WKRC.
Huddleston has been just as blunt about how she thinks farmers are being treated in the process. “They call us old stupid farmers, you know, but we’re not,” she told WKRC in a separate segment. “We know whenever our food is disappearing, our lands are disappearing, and we don’t have any water — and that poison. Well, we know we’ve had it.”
Whatever you make of their language, there’s no question they’re speaking from long experience, not from a tweet. When a family that fed people through the Depression and kept bread on other tables says the money doesn’t move them, that hits differently than a talking point in a planning meeting.
The 2,080-acre plan: what’s actually coming to Mason County?
On the power side, the outlines are more concrete than the company name. East Kentucky Power Cooperative owns the Spurlock Station power plant in Mason County, a four-unit coal facility capable of generating about 1,608 megawatts— a little over 40 percent of EKPC’s total capacity. Planning documents from regional grid operator PJM show EKPC studying new transmission and substation options near Maysville, including a new Mason County substation tied into a 345-kV line to serve a potential large industrial load.
In a March 19, 2026 opinion piece in Kentucky Living and Building Kentucky, EKPC president and CEO Don Mosierwrote that the co-op has been in talks “for more than a year” with a Fortune 100 company evaluating a data-center site near Maysville and Spurlock Station. Mosier said any such customer would be responsible for paying the costs of required transmission upgrades under EKPC’s tariff.
At a special meeting at Maysville Community and Technical College, attorney Tanner Nichols of FBT Gibbons outlined a plan for a six-building “hyperscale” data-center complex on more than 2,080 acres, with about 2,000 construction jobs and 400 permanent positions, at a cost of more than 5 million — costs he told the commission the company would cover 100 percent. Coverage from WEKU described the company as a “Fortune 50 tech firm,” while WCPO summarized it as “Fortune 500” in a separate report from the same hearing. For consistency, this article follows WEKU’s “Fortune 50” phrasing and flags the discrepancy for readers.
Opponents, including We Are Mason County treasurer Janet Garrison, argue the permanent job number could be far lower. “We are not anti–data center or anti–progress at all,” she told Realtor.com. “But we want this thing to go in an industrial park. They want farmland, and that’s just not a very efficient use of 2,000 acres when they might only hire 50 people.”
Attorney Hank Graddy, representing residents, pressed Nichols on why the public had to address questions to an attorney for the industrial development authority and not directly to the company itself. A grassroots citizens’ group called We Are Mason County filed suit on March 27 against the Mason County Fiscal Court and Planning Commission, arguing the rezoning that enables the data center violates the county’s comprehensive plan and that “zoning without planning is illegal.”
For any dairy or mixed-livestock producer, this isn’t just a tech story in Kentucky. It’s about whether land that grows your forages — or your neighbor’s corn silage and hay — ends up under barns and pivots, or server halls and parking lots. When 534 acres of mostly working ground disappear into an industrial site, you’re not just losing asset value. You’re punching a hole in the local forage base that might be impossible to patch later.
What Does $26 Million Buy That 534 Acres of Kentucky Farmland Can’t?
Here’s where the barn-math gets real, and it starts with the fact that the offers were not one flat number.
Based on WLEX reporting cited by People magazine:
Huddleston’s 71 acres at $60,000/acre ≈ , $4,260,000.
Bare’s 463 acres at $48,000/acre ≈ , $22,224,000.
Together, those two offers total roughly $26.5 million for 534 acres.
Now, stack that against what farmland is usually worth. USDA’s 2024 Land Values Summary puts average U.S. farm real estate at $4,170 per acre, with cropland at about $5,570 and pasture at $1,830. Kentucky-specific data puts average farm real estate around $5,300/acre and cropland near $6,220/acre. Bare herself told WKRC that land in Mason County is valued at “about $6,000 an acre,” and that the offer she received was roughly ten times that amount.
If you use a ballpark $6,000 per acre as a benchmark for good Kentucky cropland — consistent with both USDA data and Bare’s own description of local values — the math looks like this:
At that ag value, 534 acres ≈ $3.2 million.
The AI offer of ≈ $26.5 million is roughly 8.3× that number.
Or, said differently: the company compressed the land value of more than 4,400 acres of average U.S. farmland into one family’s 534-acre footprint.
Now switch from asset values to income, because that’s the part you live on.
If the family took the .5M and invested it at a conservative 5% annual return, that portfolio could throw off about .325 million a year before tax. No drought risk. No $4 diesel. No 4 a.m. milking unless somebody wants to get up anyway.
There’s no single “standard” net-income-per-acre figure for Kentucky, but extension budgets and Census-level data suggest a lot of mixed grain/forage acres end up in the low hundreds after expenses in an average year. To keep this useful, not hypothetical, treat $150–$400 per acre as a rough net range you can swap your own numbers into.
At $250 net/acre, 534 acres × $250 = $133,500/year net farm income.
At $400 net/acre, 534 acres × $400 = $213,600/year.
Compare that to the $1.325M passive return. You’re talking about turning down something like six to ten times your likely annual net, every single year, for as long as you’d hold the investments.
Over 30 years, without even compounding that 5%, the simple math is:
Passive: $1.325M × 30 = $39.75M.
Farm net: $133,500–$213,600 × 30 = $4.0–$6.4M.
Here it is side-by-side:
Ag Value vs. AI Tech Offer (Huddleston–Bare, 534 Acres)
Metric
Working Farm (Ag Value)
AI Data Center Offer
Price Per Acre
$6,000 (ballpark benchmark, in 2024 KY cropland range)
$48,000–$60,000 (Bare at $48k, Huddleston at $60k)
Total Asset Value (534 acres)
~$3.2 million
~$26.5 million
Annual Income
~$134k–$214k (net farm income at $250–$400/acre, illustrative)
~$1.325 million (5% return on $26.5M)
30-Year Total (no compounding)
~$4.0–$6.4 million
~$39.75 million
The Multiplier
1×
~8.3× (offer vs. farm-use value)
On a yellow pad, that looks like a once-in-a-lifetime chance to cash out, erase debt, fund retirement, and maybe even restart somewhere cheaper if you wanted to. For a lot of operations, it would be.
But you’d also be permanently trading control over this dirt — this ridge, these fence lines, that water — for a brokerage balance somewhere else.
If you’ve just poured serious money into new barns, parlors, robots, or a creamery, that math gets even more brutal. High per-acre offers can blow up the amortization schedule you built for that infrastructure. Suddenly, you’re wondering whether to walk away from a system that hasn’t had time to earn its keep, just because the ground underneath it is now worth more to servers than to cows.
From what Bare and Huddleston have told reporters, keeping their family’s ground in production still matters more to them than what any spreadsheet says those acres could generate in passive income. You don’t have to land on the same answer. But you do need to know what your own numbers say before a truck pulls into your lane.
Is Your Estate Plan Ready for a $60,000-Per-Acre Offer You Didn’t Ask For?
Most farm estate plans quietly assume your land will be valued somewhere near its agricultural use value. They weren’t built for a world where one project takes land from $6,000/acre to $48,000–$60,000/acre a couple of miles away.
Kentucky has an agricultural use-value system for property tax, where cropland assessments are based on capitalized rental income and typically work out to a few hundred dollars per acre, not full market value. That helps keep annual tax bills in line with what the ground earns. It doesn’t stop eye-popping industrial sales from influencing how your lender, your non-farming heirs, or a future buyer thinks about what the place is “worth.”
Even with use-value on the tax rolls, assessors and boards still see those comps, and over time that can change how they think about “updating” values.
On paper, the book value of your estate can jump far beyond what your operation’s cash flow supports.
If only one heir wants to farm and the others want a buyout, that farming heir could be staring at buyout numbers pegged to data-center comps, even though the ground still only earns like farmland.
When families like the Huddlestons and the Grossers refuse these offers, the ripple goes beyond their own payouts — it also shapes whether their kids or grandkids inherit land that’s still valued as farmland, or land priced at data-center comps that could force a sale on someone else’s terms.
The result, whether they’d frame it this way or not, is that they’re preserving a future where farming stays on the table for the next generation — even though it means walking away from a number that would solve a lot of short-term problems.
If you’ve got land in any kind of growth or transmission corridor — the I‑29 and I‑35 corridors, California’s Tulare and Kings counties, the Snake River plain, the I‑5/99 belt, or the outer rings of major Canadian cities — you’re in the same structural game. The names and logos change. The math doesn’t.
In California, dairies in what some now call the “Lost Dairy Valley” have already had to weigh roughly 0‑per‑cowSGMA water costs against 30‑year solar leases — and some concluded the land was worth more as someone else’s energy platform than as their own forage base.
In Wisconsin and the Upper Midwest, processors like Hilmar, Leprino, and Valley Queen have committed about $1.6 billion in new cheese capacity across Texas, Kansas, and the I‑29 corridor since 2020, according to prior Bullvine analysis and company announcements. Over the same stretch, Wisconsin’s dairy farm count fell from more than 15,900operations to fewer than 6,000, a drop of roughly 76% driven by consolidation, labor, and processing pull.
If you’re milking in the northern edge of the GTA — places like Vaughan, Caledon, or Bradford — you’ve watched good dirt along the 400‑series corridors disappear under warehouses and subdivisions. You don’t need an AI logo to know how fast the math can flip under your boots.
The Kentucky story adds AI data centers to that list. The real question isn’t “Would I sell?” It’s “Have we done enough math and paperwork that, if an offer comes, our answer doesn’t blow up the family?”
What Does $26 Million Really Change for Your Operation?
At one level, it’s obvious. A check in the eight figures:
Clears debt.
Funds retirement with room to spare.
Lets you help kids buy houses, go to school, or start their own businesses.
But it also:
Removes your operating base and, in many cases, your collateral.
Changes how your family thinks about fairness, inheritance, and obligation.
Might take you away from a region where your network, processors, and help are.
That’s why the barn-math in the last section matters. If your place looks anything like the Huddleston/Bare situation, an AI-style offer doesn’t just tilt the scales. It flips them.
The harder part is deciding whether you want to live in the world on the other side of that decision — and whether your current estate plan gives the next generation any chance to answer that question on their own terms.
What Are Your Real Options If a Developer Shows Up?
You don’t get to pick whether a data center, warehouse, or solar farm wants your neighborhood. You do get to decide how prepared you are when their rep calls. Practically, you’ve got three real paths.
Decision Path
Best Fit For
Key Requirement
Financial Signal
Biggest Risk
Hold — Keep Producing
At least one heir wants to farm; manageable debt load
Written family agreement + updated estate plan using ag-use valuation
Farm net: ~4k–4k/yr on 534 ac
Creeping tax pressure as industrial comps arrive nearby
Full Exit — Cash Out
No farming heirs; already near a planned exit window
Concrete reinvestment plan + tax/legal advice before signing
Passive: ~.325M/yr at 5% on .5M
Loss of operating identity; starting over in a new region at 50+
Map-level analysis of feed, manure, expansion impact + lender review
Hybrid: debt cleared + partial passive income stream
Boxed in between non-ag neighbours; manure/silage haul complaints
Do Nothing / Ignore
—
—
—
Hands all decisions to someone else, usually on a bad day
1. Hold the line and keep producing
When it makes sense:
At least one heir genuinely wants to farm.
Your debt is manageable at current margins.
No per‑acre number anyone can write feels worth trading away the place.
What it requires:
A blunt family meeting where everyone agrees that below a certain number, you’re staying, and understands what that means for future buyouts, lifestyle, and retirement timing.
An estate plan that uses current‑use or ag‑use valuation tools where they exist and doesn’t leave heirs scrambling if nearby land sells high.
Risks and limits:
Property taxes and political pressure can still creep up as industrial projects arrive in the county.
You may end up farming next to an industrial site with heavier traffic and neighbors who don’t share farm‑country expectations about noise, manure, or late‑night lights.
2. Take a full exit and restart on your own terms
When it makes sense:
None of your kids or key family members want to milk or farm full‑time.
Your own numbers already have you eyeing an exit in the next decade.
The offer clearly exceeds what you’d reasonably earn from operating another 20–30 years on the same acres.
What it requires:
A concrete plan for where the money goes — debt settlement, retirement, a smaller place, off‑farm business, investments — not just “we’ll figure it out.”
Tax and legal advice before signing; long‑held land comes with capital‑gains and estate questions you don’t want to discover after closing.
Risks and limits:
Once you sell, you’re not a producer anymore. For people who built their identity around the farm, that’s a bigger shock than any interest‑rate change.
Moving to cheaper land in a new region means new markets, weather, rules, and community. Starting over at 50+ isn’t simple.
3. Partial sale or conversion — keep farming on fewer acres
When it makes sense:
The proposed site can be carved off one side without gutting your forage base or your core facilities.
The proceeds can fund debt retirement, facility modernization, or the purchase of replacement ground that has better cash flows.
What it requires:
A map‑level view of how losing those acres affects feed supply, manure management, and any long‑term expansion you were planning.
Hard conversations with your lender about how they view a farm that’s now part dirt, part liquid assets, and what that does to covenants and collateral.
Risks and limits:
You could end up boxed in between non‑ag neighbors and an industrial load, where hauling manure or silage turns into complaint calls to the county.
Replacement land that’s further out adds trucking time, fuel, and weather risk into a system that might already be running tight.
Not picking a path — not looking at fair‑market and ag‑use values, not updating your estate plan, not talking to your heirs — is still a choice. It just hands the toughest decisions to somebody else, usually on a bad day.
As you watch your own area, pay attention to forward‑looking signals:
New transmission lines or substation plans are hitting county maps.
Utility filings talking about a “large industrial load” or “data center.”
Land signs on neighboring farms with unfamiliar LLC names instead of local families or operations.
Each one is someone else already doing the math on your neighborhood.
Options and Trade-Offs for Farmers
Do this within 30 days.
Pull your county’s planning and zoning agendas, plus your power co‑op or utility filings. Search specifically for “data center,” “technology park,” or “solar” within about 10 miles of your home.
Call your accountant or estate attorney and ask one simple question: “If land around me sold for $50,000 an acre next year, what would that do to my taxes and my estate plan?”
Within 90 days
Get both a fair‑market appraisal and an agricultural‑use appraisal on your ground. The gap between those two numbers is the same pressure the Huddlestons and the Grossers are staring at — and you need that gap on paper.
Sit down with your advisor and update your estate documents so they match today’s land reality, not the values you were carrying 15 years ago.
Within 365 days
If you’re in any growth or transmission corridor, put a written family agreement in place about if, when, and at what per‑acre number you’d even consider a non‑ag sale. It doesn’t lock anyone in. It just keeps your kids from having their first real conversation about it at the lawyer’s office.
Key Takeaways
If any serious offer on your land comes in at several times recent farm‑land sales in your county, treat it as a strategic decision that affects your heirs — not a side conversation — and run the barn‑math both ways before you say a word.
If you’ve got more than one heir and only one wants to farm, assume high‑value industrial comps will make future buyouts far more expensive, and bake that into your estate plan now with written agreements — not just good intentions.
If you decide you’ll “never sell,” back that conviction with paperwork: a current appraisal, a use‑value tax strategy where available, and an updated will or trust so your kids aren’t trying to manage big‑number assessments on a farm‑income business model.
If you’re already seeing power‑line upgrades, rezoning, or new tech projects within 10 miles, treat that as your 30‑day clock to check local filings, talk to your advisor, and start a family conversation — before someone else writes a number on your kitchen table for you.
The Bottom Line
Based on what Bare and Huddleston have told reporters, their answer, for now, is simple: land’s real value sits in what it grows and what it means, not just what someone’s willing to pay to pave it. They’ve chosen to keep producing food on Kentucky soil instead of trading their ridge for eight‑figure passive income backed by server halls and cooling ponds.
You don’t have to make the same call. But you should know your own numbers well enough that if a Fortune 50 company offered you eight times your current land value tomorrow, you wouldn’t be trying to do 30‑year math in a 30‑minute meeting. If you want the deeper economics — the full SGMA water‑vs‑solar math in California or the structural Dairy Curve that’s shrinking U.S. operations toward 10,000 by 2035 — dive into our Tier 2 and Tier 3 follow‑ups and make sure you’re getting the Bullvine Weekly so those playbooks land in your inbox, not just your feed.
Then ask one more question at your own kitchen table: what’s the real “make‑me‑move” number for your home farm — and have you actually told your heirs, or are you leaving them to guess when the offer shows up?
Complete references and supporting documentation are available upon request by contacting the editorial team at editor@thebullvine.com.
When Land Is Worth More Than Milk in California’s Lost Dairy Valley – Navigate land-value wake-up calls with a kitchen-table framework used by families who watched 17,000 acres vanish into logistics. This case study delivers the courage to protect your legacy, whether in the barn or elsewhere.
The Sunday Read Dairy Professionals Don’t Skip.
Every week, thousands of producers, breeders, and industry insiders open Bullvine Weekly for genetics insights, market shifts, and profit strategies they won’t find anywhere else. One email. Five minutes. Smarter decisions all week.
Greg Bethard told a roomful of dairy operators he doesn’t want investors — he wants partners who know what a bad milk year smells like.
“We are looking for partners, not investors.”
That’s how Greg Bethard opened his talk at the 2025 MILK Business Conference. He’s the CEO and managing partner of High Plains Ponderosa Dairy near Plains, Kansas — a rotary‑parlor operation that ships milk to the Hilmar Cheese Co. plant in Dodge City and earned the 2025 Kansas Distinguished Dairy Award. Bethard has expanded without private equity, choosing people who already understand cows and volatility over funds that want out in five to seven years. Sitting beside him on the panel were TJ Tuls, a fourth‑generation Nebraska dairy farmer, and Hank Hafliger of Cedar Ridge Dairy in Filer, Idaho. Different herds, different structures, same basic bet: keep the timeline with the cows and the family, not the fund clock.
Nearly 4 in 10 U.S. dairy farms with off‑farm milk sales disappeared between 2017 and 2022. Cow numbers barely moved — still around 9.3–9.4 million head — but milk shifted hard into fewer, bigger herds. Those herds now face a blunt question: do you take fast capital and more leverage, or do you find slower money that lets you sleep at night?
The Fork Every Growing Dairy Hits
Any serious expansion now runs into the same wall: your own balance sheet.
USDA’s 2022 Census of Agriculture shows the number of dairy operations with off‑farm milk sales fell from 39,303 in 2017 to 24,082 in 2022 — almost 12,000 farms gone, roughly a 39% decline. Over that stretch, total cow numbers held near 9.3–9.4 million while milk volume climbed about 5%. Just over 2,000 herds with 1,000‑plus cows now produce about two‑thirds of the country’s milk by value, according to Census analysis and Rabobank estimates. PE funds look at that curve and see a defensive thesis. People still buy food in a downturn.
You know the other side of it. A heifer you raise this year won’t really pay back until her second or third lactation. You invest for years before you know whether genetics and cow‑care decisions actually worked. When you finance that biology with a five‑ to seven‑year buy‑grow‑flip model, something gives — either the cows, the capital, or your control.
Three Families, Three Very Different Paths
What made the MILK Business panel worth paying attention to wasn’t just that Bethard, Tuls, and Hafliger all said no to PE. It’s that each built a completely different alternative — and accepted the trade‑offs that came with it.
Operator
Capital Model
Structure
Geographic Anchor
Core Trade-Off
Exit Timeline
Greg Bethard— High Plains Ponderosa Dairy, KS
Patient ag-industry partners; no PE
Private partnership
Plains, KS → Hilmar Cheese, Dodge City
Slower growth; full cow-level decision control
None — family timeline
TJ Tuls — Nebraska, DARI Processing
Bank + infrastructure lenders for $165M greenfield plant
Family equity + bank debt; no outside shareholders
Multi-site family unified business
Filer, ID (moved from CA)
High people/alignment demands across kids and in-laws
None — family-controlled
PE-Backed Generic Model
Private equity fund; limited partners
Fund-controlled; DSCR covenants
Processor clusters; “packageable” geography
5–7 yr hold period; drag-along exit rights; covenant restrictions
5–7 years (fund clock)
TJ Tuls went vertical. His family is building DARI Processing at Nebraska’s Seward Rail Campus — reported in mid‑2025 coverage as the state’s first major greenfield dairy plant in more than six decades. Trade and state sources peg the project at about $165 million, designed to handle roughly 1.8 million pounds of milk per day, with groundbreaking in 2025 and start‑up targeted around 2027. When asked where he’d build a new dairy, Tuls didn’t hesitate: “Close to a milk plant.” His family decided to be the milk plant. Their capital partners are lenders and infrastructure‑focused entities, not limited partners, grading them on quarterly IRR.
The trade‑off is concentration. If DARI hits a rough patch — construction overruns, a slower ramp‑up, margin squeeze — every part of the family’s operation feels it. You swap processor dependency for execution risk. Not every family wants that exposure.
Hank Hafliger went structural. Cedar Ridge Dairy started in California before the family moved the operation to Filer, Idaho. Today, Hank owns it with three of his children and their spouses, running multiple dairy sites as a single unified business. No PE fund. No outside equity. Bank debt, retained earnings, and a family agreement that everything lands in one bucket. “By running them as one, we don’t have that ‘my dairy is doing better than yours’ conflict,” Hafliger told the crowd. “It’s about maturity, learning to relax and let things happen rather than trying to force them.”
That model asks a lot of people, not just paper. Not every family can operate three sites as one business without it fracturing. When it works, you get alignment across kids, in‑laws, and locations. When it doesn’t, the damage runs deeper than dollars.
Bethard went for patient partners with ag scars. High Plains Ponderosa has grown by bringing in people who already know what a bad milk year feels like — not financial sponsors planning a sale before the heifers from this year ever calve. He’s honest about the early expansion learning curve. “We have our 10,000 hours of experience now,” he said, borrowing Malcolm Gladwell’s mastery concept. “We’re going to screw stuff up. There are going to be bad days… But we keep going at it, and we’ll get it figured out.”
You don’t get to 10,000 hours if the business plan has a Year 6 expiration date.
What Does $6,638 of Debt Per Cow Actually Look Like?
Here’s where this stops being theoretical and starts hitting your spreadsheet.
Cornell’s July 2025 bulletin “Comparing New York dairy farm characteristics, costs, and returns by profitability, 2024” (PD‑2025‑08‑01) sorted 129 New York dairy farms into earnings quartiles. The patterns are stark. More profitable herds consistently carried less debt per cow, held stronger debt coverage ratios, and produced milk at a substantially lower cost per cwt than the least profitable group. In that dataset, the highest‑earning quartile averaged about $2,997 of debt per cow with a debt coverage ratio north of 5× — roughly five dollars of cash flow for every dollar of scheduled principal and interest. The lowest‑earning quartile? About $6,638 per cow, with coverage under 1×. Cash flow couldn’t cover the payments. And this was during a year when average net farm income per cow jumped sharply.
Even in one of the best income years in recent memory, the most leveraged herds couldn’t comfortably service their debt.
The cost‑of‑production gap runs parallel. Cornell’s public DFBS tables show top‑quartile farms producing milk several dollars per cwt cheaper than the bottom group — a function of better feed efficiency, labor productivity, and fixed‑cost absorption. Using a spread of roughly $6.53/cwt between the top and bottom quartiles, run that through a real herd: 2,000 cows shipping 280 cwt per cow per year gives you 560,000 cwt. Multiply by $6.53, and you’re looking at approximately $3.66 million per year in operating‑cost difference. Same milk prices. Same feed markets. Very different bank statements.
That’s New York data, not a national average — your region’s numbers will look different. But the pattern between top and bottom tends to hold across state farm‑business summaries. When any capital source — PE or otherwise — pushes you toward that $6,600‑per‑cow neighborhood before your earnings and cost structure say you belong there, the term sheet isn’t your biggest problem. The math is.
Is the Deal Built to Pencil — or Built to Sell?
This is the economic question you actually live with: can you still hit your numbers when things go sideways?
Highly leveraged structures — PE‑backed or just aggressive debt — usually come with tighter covenants than a traditional bank expansion. DSCR floors, restrictions on new borrowing, caps on capex, and sometimes approval requirements on major operational changes. None of that bites when milk is good, and feed is reasonable. It bites when you need breathing room.
You’ve probably had that year already. Health wreck, feed quality issue you chase for months, or a long run of heat that drags component tests. Your instinct says: slow expansion, keep youngstock, invest in a dry‑cow barn or fans, buy time to reset. Tight covenants can push in the opposite direction: freeze spending, delay maintenance, and more milk per stall. That’s the structural conflict Bethard described on the panel — not that PE is evil, but that the contract can force you to make the opposite call from what your gut and cows are telling you.
Then there’s drag‑along language. Many PE shareholder agreements give the fund the right to force a sale of the whole business when they exit. In corporate settings, that’s standard. On a family place, depending on how it’s written, it can short‑circuit a slow‑build succession plan. Cross‑industry family‑business research consistently reports that only about 30% of family businesses transition to the second generation, and fewer than 12–13% make it to the third. Contract provisions that accelerate a sale timeline don’t improve those odds.
Before you stare at the check size, it’s fair to ask: Is this structure built to pencil through your worst 12‑month stretch, or is it built to be easy to sell?
Can You Still Make Cow‑Level Decisions When Covenants Control the Budget?
This is the operational version of the same question.
Ask anyone who’s lived under tight covenants. The day‑to‑day pressure doesn’t feel like “capital structure.” It feels like arguing with your own spreadsheet about things you’d normally just do..
Do you need a lender sign‑off to build that fresh‑pen addition you know would take stress off transition cows? Does a board have to agree before you hang more fans, add a hoof‑trimming visit, or keep more heifers this year instead of selling? On paper, those are capital‑allocation decisions. In the barn, they’re cow‑care decisions that directly change milk, longevity, and cull rates.
Bethard was blunt on this point. When you pick partners, you’re also picking who sits at the table when there’s a tough quarter. He wants people who understand that holding onto extra heifers in a bad year can be the best long‑term move, even if it drags DSCR in the short run.
If a deal puts you in a position where every down‑cycle adjustment needs outside permission, you haven’t just sold equity. You’ve sold a chunk of how you manage cows.
Is Your Expansion Built to Stay — or Built to Flip?
Location exposes what you really believe about your time horizon.
Bethard told the audience that if he were siting a new dairy today, he’d look for “low environmental risk and a place without a lot of people.” Fewer neighbors, less legal risk, more room to run. Tuls’ answer was short: “Close to a milk plant.” For him, that means DARI — because that’s the anchor his family is building generations around.
Investors running a shorter‑term play often think about geography differently. They like production clusters that can be packaged with processing capacity and sold together: multiple herds within hauling distance of a plant, good roads, a neat story for the next buyer. That doesn’t automatically make a site wrong for a 40‑year plan. But it means you need to double‑check the long‑term water, permitting, and community story — not just the current land price.
Bethard noted you need a contract before you can even build now. That reality has pushed new capacity toward regions like western Kansas and the I‑29 corridor, where processors like Hilmar and Valley Queen are pulling milk into existence rather than chasing existing herds. If you’re choosing a spot for your grandkids to renew contracts in 2045, that’s a completely different filter than picking the easiest site to sell in 2032.
Options and Trade‑Offs for Farmers
You don’t need a PE term sheet on your desk for this to matter. Any expansion that stretches your balance sheet forces you to pick a path.
Expansion beyond bank capacity; multigenerational family
🟡 Yellow if partners want short-term return hurdles
3. Private Equity / PE-Style Equity
$4,500–$6,638+
May drop below 1.0× under covenants
Reduced — capex/hiring may require board approval
High — 5–7 yr hold, drag-along rights
Rapid roll-up, processing integration, very large facilities
🔴 Red if DSCR <1.0× in bad-year scenario
4. Slow-Build / Do Less, Better
<$3,500
Typically >1.5×
Full — sole-prop or tight family
None
Operations with sub-optimal cost structure needing reset
🟡 Yellow if facility is fundamentally inefficient
Path 1: Traditional Debt + Patient Partners
When it makes sense: You’ve got solid profitability, reasonable leverage, and a lender who understands your history. Your debt per cow sits closer to that top‑quartile DFBS band than the most leveraged group, and your coverage ratio stays above roughly 1.25× even when you run a bad‑year scenario.
What it requires: Clean financials, believable projections, and genuine working capital. In Cornell’s 2024 DFBS, the most profitable quartile held substantially more working capital relative to operating expenses than the least profitable group. You don’t need to match any specific benchmark exactly, but you need real cushion — not wishful thinking.
Risks and limits: You’re still exposed to milk price and interest‑rate swings. Size the project too aggressively relative to your earnings, and the “traditional” deal lands you in bottom‑quartile debt territory without a PE fund anywhere in the picture.
30‑day action: Pull your last 12 months of financials this month and calculate three numbers:
Debt per cow (total liabilities ÷ milking cows)
Debt coverage ratio (cash available for debt service ÷ scheduled principal + interest)
Working capital % ((current assets − current liabilities) ÷ annual operating expenses)
Then run your worst 12‑month stretch from the last five years through your next‑step plan. If this structure keeps DSCR above ~1.25× in that bad year, it stays on the table. If it drops below 1.0×, the red flag goes up.
Path 2: Strategic Partners Without a Fund Clock
When it makes sense: You need more capital than your bank will supply alone, but you want partners who’ll stay through cycles — family members, neighbors, or agribusiness investors who aren’t running a 5‑ to 7‑year fund. This is the space Bethard lives in, and it’s what Hafliger built with his kids and spouses across multiple Idaho sites.
What it requires: Hard conversations about control. Operating agreements that spell out who decides what: capex thresholds, hiring and firing senior managers, land purchases, and dividend policy. A common understanding that you’re building for 20–40 years, not dressing the place up for a sale.
Risks and limits: People risk. These deals fall apart when expectations around distributions, lifestyle, or succession were never put on paper. Even without PE, your partners may still want tighter covenants than a simple family sole‑prop structure.
Signals to watch: If a potential partner insists on sale or IPO timelines, short‑term return hurdles, or aggressive drag‑along rights, you’re drifting back into fund‑clock land. That’s not automatically wrong — but call it what it is.
Path 3: Private Equity or PE‑Style Outside Equity
When it makes sense: You’re chasing a very specific play: rapid multi‑site roll‑up, vertical integration into processing, or a large‑scale facility where the check size isn’t realistic any other way. Teams like Tuls’ on the processing side live near this territory, even if their specific capital stack isn’t classic PE.
What it requires: Exceptional cost of production, real management depth, and a story that sells in a boardroom as well as it does in the parlor. You need a cold‑eyed lawyer walking you through every clause: covenants, drag‑along, tag‑along, non‑competes, and reserved matters.
Risks and limits: The fund’s holding period is usually 5–7 years. That’s a heifer and a half. If milk prices and interest rates don’t cooperate, pressure to hit IRR targets can show up as stalled maintenance, pushed cows, or delayed people investments. At the family level, drag‑along language can force a sale on a timeline that doesn’t match the next generation’s readiness.
Forward‑looking signals: Where are interest rates headed over the next 3–5 years? How tight are current milk‑supply contracts in your region, and how long are they written for? Are lenders and investors pricing in environmental and labor risk — or assuming they’ll be gone by the time it matters?
What it requires: Patience. Relentless work on cost per cwt instead of headline herd size — feed efficiency, cow longevity, reproduction, labor efficiency. In DFBS data, the most profitable, lower‑debt farms didn’t just borrow less; they also produced milk several dollars per cwt cheaper. That combination is what gives them room to breathe.
Risks and limits: You may age out of opportunities if processors shift or neighbors move faster. And if your current facility is fundamentally inefficient, no amount of small tweaks fully fixes that.
Forward‑looking signals: Watch how processors tweak premiums in your area, what they say about components, and whether they start writing water‑ or sustainability‑linked clauses into contracts. That tells you how far a “do less, better” strategy can carry you where you sit.
Key Takeaways
If your expansion plan pushes debt past the mid‑$6,000s per cow, treat that as a hard yellow light.Cornell’s 2024 DFBS shows the lowest‑earning New York quartile at about $6,638 per cow with debt coverage under 1×, even in a strong income year. Top earners sat near $2,997 with coverage above 5×.
If one capital structure survives your worst recent 12‑month stretch and another fails the DSCR test, believe the math. Run both through your ugliest year. The structure that keeps coverage above roughly 1.25× when everything goes wrong is the one you can build on.
If you can’t approve cow‑comfort or youngstock spending in a down year without outside sign‑off, someone else is making your cow‑level calls. Any deal that pulls basic barn decisions into board or lender approval changes how you manage stress years.
If there’s drag‑along language, understand what it can force — and when. Cross‑industry benchmarks say only about 30% of family businesses survive to the second generation and fewer than 13% reach the third. You don’t want contract terms cutting those odds even further.
The Bottom Line
Hafliger’s grandkids are already counting cows. Bethard talks about 10,000 hours of expansion scars. Tuls is backing a $165 million plant with no exit date in the plan.
None of them got there quickly. All of them got there on terms they chose.
So here’s the question worth sitting with: five years from now, do you want to be explaining your decisions to a board — or to your kids?
We’re building the full debt‑per‑cow stress‑test model now — covenant math, leverage thresholds by herd size, and a PE‑vs‑partner calculator you can drop your own numbers into. Watch for it in The Bullvine Weekly and our follow‑up economics deep dive.
Source note: Quotes and panel insights are drawn from MILK Business Conference coverage in Dairy Herd Management. Financial patterns are based on Cornell’s 2024 Dairy Farm Business Summary bulletin, “Comparing New York dairy farm characteristics, costs, and returns by profitability, 2024” (PD‑2025‑08‑01).
Learn More
Squeezed Out? A 12-Month Decision Guide for 300-1,000 Cow Dairies – Secure your farm’s immediate future with this ruthless 12-month survival checklist. This guide breaks down labor costs by herd size and delivers specific “Action This Week” steps to protect your equity before the market decides for you.
Every week, thousands of producers, breeders, and industry insiders open Bullvine Weekly for genetics insights, market shifts, and profit strategies they won’t find anywhere else. One email. Five minutes. Smarter decisions all week.
The Henschel family milked through 5‑to‑15‑foot drifts near Manawa — then dumped a full day’s milk because the truck couldn’t come, and no federal program covers the milk you lose.
Chris Henschel told US Farm Report that they were dealing with “whiteout conditions with snow drifts anywhere from 5 to 15 feet high” around the farm, and that the roads were “impassable for about 36 hours.” Keeping feed in front of cows and milk moving out of the parlor didn’t change one hard fact: the tank only holds so much. In the end, Henschel said they dumped “basically almost a day’s worth of milk because nobody could get to the farm.”
They did the work. They hit every milking. They had no way to ship it. Lay the program rules and the barn math beside that picture, and it’s hard not to see your own risk sitting there too.
When the crew couldn’t reach the barn and the backup was plowing snow, the backup to the backup crew rolled in — the Henschel boys muscling a cart of milk for calves on that blizzard day.
What the March 14–16 Blizzard Really Did to Dairy Roads
This wasn’t a normal March snow that blows through overnight and melts by the weekend. The National Weather Service called it a “historic, record-setting winter storm” — a potent Colorado low that deepened as it tracked from the central Plains toward Chicago and Lake Huron, pulling Gulf moisture into cold air and hammering the Upper Midwest for more than 48 hours.
NWS Green Bay reported a widespread 1 to 2 feet across northeast Wisconsin, with localized amounts exceeding 30 inches from Wausau to Marinette and Door County. Green Bay itself recorded 26.6 inches — its second-largest snowstorm on record. Waupaca County, where the Henschel dairy sits near Manawa, saw 25 to 30.5 inches, with nearby Shawano County reporting up to 33 inches. Snowfall rates hit 4 inches per hour at times, with thundersnow and lightning.
To the west, NWS La Crosse confirmed 25 inches at Kellogg, Minnesota, with similar totals across Trempealeau and Clark Counties in Wisconsin — Independence and Strum both hit 25 inches, Granton 25 inches, and Mondovi 26.6 inches. Peak wind gusts reached 59 mph at Green Bay Airport and 60 mph in De Pere, with 40–55 mph gusts common across the region. NWS La Crosse noted reports of 3‑to‑5‑foot drifts were common; NWS Green Bay documented a 10‑foot drift in Ephraim.
The timing was brutal. Storm onset hit Saturday evening, March 14. Peak winds and whiteouts ran late Saturday into Sunday. Interstates 35, 80, and 94 were all closed for a period on Sunday and Sunday night. NWS Twin Cities confirmed that vehicles became stranded on I‑94 between Eau Claire and Osseo during blizzard conditions, and WisDOT posted “No Travel Advised” across the northern half of the state for an extended period. The worst transport window lasted roughly 24–36 hours, during which rural routes were effectively shut down. If your usual truck hits the yard Saturday night or Sunday morning, a 36‑hour shutdown doesn’t just mean “late pickup.” Depending on your tank size and flow, it can mean “no pickup” before you run out of storage.
US Farm Report and Dairy Herd both described the Henschels’ situation as a “rare milk dump” triggered by this storm, noting that towering drifts blocked every path to the farm. On farms across the region, that translated into township and county plows leaving some dairy roads for last, haulers making the call to stay parked rather than risk drivers in whiteouts, and milk plants adjusting schedules or pausing loads until they knew trucks could actually move.
You can’t change the weather. You can be honest about what it costs — and why all the programs that show up after storms like this barely touch the milk itself.
“Milk Can’t Wait”: The Aid That Showed Up — and What It Missed
Within days, USDA’s Farm Service Agency in both Wisconsin and Minnesota was pushing reminders about disaster programs. Sandy Chalmers, FSA State Executive Director in Wisconsin, put it bluntly: “Milk can’t wait. When trucks can’t reach farms or processors on time, producers face costly delays and, in some cases, must dispose of milk that can’t be stored.” She urged producers to report “crop, livestock, and infrastructure-related losses” and to contact their county offices.
Here’s what was actually on the table for a storm like this:
Livestock Indemnity Program (LIP) — Authorized under the 2014 Farm Bill and administered by FSA, LIP pays 75% of the fair market value for livestock deaths above normal mortality due to eligible adverse weather events like blizzards and extreme cold. It can also cover animals sold at a discount after storm-related injuries. Notice of Loss must be filed within 30 calendar days of when the loss becomes apparent.
Emergency Assistance for Livestock, Honeybees, and Farm‑raised Fish (ELAP) — Provides emergency relief for above‑normal feed costs, feed and water hauling, and equipment rental for snow removal when adverse weather makes normal operations impossible. ELAP does not cover milk loss directly, though USDA expanded ELAP in July 2024 to cover milk production losses from H5N1‑infected herds — a different mechanism. Notice of Loss: 30 calendar days from when the loss first became apparent.
Noninsured Crop Disaster Assistance Program (NAP) — Covers non‑insured crops and forage in eligible situations. NAP does not cover milk. A Notice of Loss must be filed within 15 days of the loss becoming apparent — that 15‑day window is shorter than LIP and ELAP, so hay and forage losses from this storm need to be reported fast.
Farm Storage Facility Loan Program (FSFL) — Provides low‑interest financing on 3–12 year terms to build, repair, or upgrade on‑farm storage facilities. USDA’s eligible commodity list explicitly includes milk, and eligible facility types include bulk tanks, so this can apply directly to expanding your on‑farm milk storage capacity. It doesn’t pay for losses, but it can help you build more buffer for the next storm.
On the margin side, the farm bill politicians in Washington have been celebrating as a “big, beautiful” win for producers, reauthorizing and improving Dairy Margin Coverage (DMC) through 2031. DMC is margin insurance, not a disaster program, but it’s the main federal backstop on dairy revenue. By late 2023, DMC had paid out about $1.27 billion nationally, with Wisconsin topping the list at roughly $272.2 million — around $63,633 per enrolled operation— according to USDA and prior Bullvine analysis.
Bullvine’s DMC work shows margins slipping below /cwt by late 2025 and into the mid‑s for early 2026, triggering some of the bigger checks in a few years for farms that stayed fully enrolled. Those payouts helped on paper margins. They didn’t do a thing for milk forced down the drain because the road and plant system around you blinked.
On paper, it can look like you’re covered. In the parlor, once you read the fine print, it’s a different story.
Does Any Federal Program Actually Cover Dumped Milk?
Line up USDA’s current tools, and the gap jumps off the page:
Program
What It Covers
Trigger Mechanism
Covers Dumped Milk?
2026 Status
LIP
Livestock deaths above normal mortality; injured animals sold at discount
Low-interest loans for on-farm storage construction/upgrades
N/A — financing, not indemnity
NO
Active — 3–12 yr terms
MLP
Milk dumped due to qualifying weather — impassable roads, power outages
Physical milk dumped without compensation
YES — BUT 2020–2024 ONLY
EXPIRED — signup closed Jan 23, 2026
There is one program specifically designed to pay for dumped milk: the Milk Loss Program. Congress has authorized it twice. The first round, under the Consolidated Appropriations Act of 2023, covered eligible losses in 2020, 2021, and 2022 — including extreme weather, supply chain snarls, and COVID‑era processing shutdowns. MLP paid 75% of the milk value for most producers and 90% for underserved producers, including beginning, limited‑resource, and veteran farmers.
The second round, authorized under the American Relief Act of 2025 as part of USDA’s Supplemental Disaster Relief Program, extended MLP to cover qualifying weather events in 2023 and 2024. That signup window opened in late November 2025 and closed in late January 2026 — less than two months before the Henschels’ blizzard.
The March 14–16, 2026, blizzard lands outside both windows. No current MLP authority covers losses for 2025 or 2026. Congress knew about the problem, funded it retroactively twice, and still hasn’t built a permanent program.
So when the Henschels opened that valve, here’s what the safety net really did:
Any calves or cows lost to storm stress or injuries? LIP might cover 75% of their value — but you need to file a Notice of Loss within 30 days, which for this storm means roughly by mid‑April 2026. The application for payment deadline extends to approximately March 1, 2027.
Extra feed, fuel, and snow removal to dig out? ELAP might help — same 30‑day Notice of Loss requirement, with an application deadline of approximately January 30, 2027. fsa. usda
Margins squeezed this winter? DMC sends a check if the national margin falls far enough below your coverage level.
The actual milk they dumped — roughly a full day’s output — sat entirely outside federal coverage in 2026.
That’s not a clerical error. That’s how the net has been structured so far.
How Much Does 72 Hours Without a Milk Truck Actually Cost Your Operation?
Now put some numbers to what a storm like this means in dollars.
March 2026 Class III futures were trading around $16.11/cwt on the CME. Take a realistic daily production number: 80 pounds of saleable milk per cow per day — 0.8 cwt per cow. Daily revenue per cow at that price: 0.8 cwt × $16.11 = $12.89 per cow per day.
Scale that across a herd and across three days of no pickup:
200 cows: 48,000 lb = 480 cwt. At $16.11 ≈ $7,733 down the drain.
For the Henschels, coverage described them dumping “basically almost a day’s worth of milk” when roads kept trucks out. If you assume a mid‑size herd shipping around 32,000 lb per day — 320 cwt — one dumped day at $16.11/cwt is about $5,155. That’s explicitly example math, not their disclosed volume, but it’s the right scale for a lot of upper‑Midwest family dairies.
Herd Size
Avg Daily Pickup (lbs)
3-Day Pickup (cwt)
At $14.59/cwt (Jan 2026 low)
At $16.11/cwt (March futures)
At $18.00/cwt (strong market)
200 cows
16,000
480
$7,003
$7,733
$8,640
500 cows
40,000
1,200
$17,508
$19,332
$21,600
1,000 cows
80,000
2,400
$35,016
$38,664
$43,200
2,500 cows
200,000
6,000
$87,540
$96,660
$108,000
5,000 cows
400,000
12,000
$175,080
$193,320
$216,000
Here’s the quick version for your own barn:
Grab your last hauler or co‑op statement and find your average daily pickup volume in pounds.
Multiply that number by 3.
Divide by 100 to turn pounds into cwt.
Multiply by today’s Class III or your mailbox price.
That final number is your current three‑day “dump exposure.” Whether you’ve thought about it or not, you’re self‑insuring it.
Does Your Disaster Plan Survive Three Days Without a Pickup?
Most of us say we have a “plan” for storms. What we really have are habits and luck:
The township usually plows us early.
The hauler always finds a way.
The generator has “never let us down.”
Henschel dairy had habits, too. Then they watched the system around them break — drifts higher than the skid steer, I‑94 closed, WisDOT posting “No Travel Advised” across the northern half of the state.
If you want an honest 72‑hour plan, start by knowing your own limits:
How many hours to a full tank? Take your tank size in gallons. Multiply by 8.6 (the weight of a gallon of milk in pounds). Divide by your average hourly milk flow. If your 6,000‑gallon tank fills in 30 hours at peak, you don’t have a 72‑hour problem — you’ve got a 30‑hour one.
What backup storage do you really have? A clean nurse tank you actually trust? Access to a neighbour’s bulk tank under a mutual‑aid agreement? A rented tanker or portable tank you could bring in ahead of a forecast blizzard? USDA’s FSFL program will finance bulk milk storage tanks at low interest rates, so if you’ve been thinking about adding capacity, the loan structure already exists.
What are your hauler’s hard limits? Do they have written rules for when they pull trucks? Will they combine routes, run nights, or send smaller trucks? Who actually decides when routes are suspended, and how do they let you know?
Power and access matter too. If a storm like this takes down the grid, can your generator actually run the parlor, vacuum, compressors, and essential lights for three days, or just enough to limp along for a few hours? If you don’t know the answer, that’s worth a conversation with your electrician before fall.
You don’t control the plows or the wind. You do control whether you know your own numbers and weak spots before the next tank alarm reminds you how tight your margin for error really is.
Options and Trade‑Offs for Farmers
Option
Upfront Cost / Effort
Ongoing Cost
Time to Implement
Covers Which Risk?
Key Limitation
Add on-farm storage (extra tank, nurse tanker)
High — stainless steel, plumbing, wiring; FSFL loans available at low interest
Low — maintenance & cleaning
6–18 months
Buys 12–24 hrs extra buffer
Hauler still won’t come in whiteout; storage has limits
Tighten hauler/processor agreement
Low — phone calls, written plan
None
30 days
Reduces likelihood of no-show
Can’t override DOT road closures; hauler serves many farms
Neighbor/mutual-aid milk pact
Low — a conversation now, co-op paperwork
None
30–60 days
Routes milk to farm with access/storage
Co-op food-safety rules; requires pre-approval before crisis
Push for permanent MLP
Political capital + time
None
1–3 years (Congress)
Creates federal backstop on dumped milk
Program has expired twice; 2026 dumps currently uninsured
You’ve basically got four paths when you think about the “truck can’t come” problem. None are perfect. Each has trade‑offs.
1. Build more on‑farm or shared storage
When it makes sense: you’re milking enough cows that even one dumped day is a five‑figure event, you have physical space, and your lender understands risk management. A 500‑cow herd with 80 lb/cow/day has about $19,332 at risk in a three‑day storm at $16.11/cwt.
What it requires: capital for a larger bulk tank, a second tank, or a nurse tanker. USDA’s Farm Storage Facility Loan Program offers low‑interest financing on 3–12 year terms, and its eligible commodity list specifically includes milk, with bulk tanks listed as eligible facility types.
Risks and limits: you tie up cash in stainless that mostly sits there until the rare bad week. If your hauler and processor can’t or won’t add emergency routes, you may still end up dumping.
2. Tighten hauler and processor agreements
When it makes sense: you’ve got relationship leverage as a long‑term patron with solid quality.
What it requires: honest conversations before the next storm. During this event, WisDOT posted “No Travel Advised” across the entire northern half of Wisconsin – at that point, nobody was running. But for storms short of that, some co‑ops and haulers have emergency pickup or route‑consolidation protocols. If yours doesn’t, that conversation is worth having now.
Your 30‑day move: write a one‑page “storm plan” with hauler and processor contacts, who calls first, and what you’ve agreed to. Tape a copy on the bulk tank, one in the office, and one at home.
3. Build neighbour and community mutual‑aid pacts
When it makes sense: you’ve got another dairy or two within a few miles, and at least one has different exposure — better road, more storage, different hauler.
What it requires: sitting down now and asking, “If your truck can reach you but not us, could you take one load?” Then work with your co‑op on how that milk is ticketed and paid. Some processors are open to cross‑farm loads if quality can be tracked; others need approvals in place.
We’ve seen this kind of neighbour network in real crises. When Ohio dairyman Reed Hostetler died in a manure pit accident, neighbours stepped in to run chores, haul feed, and keep the dairy going. That same instinct — organized ahead of time — can keep a blizzard from turning into a five‑figure milk loss.
4. Push for policy change
What it requires: calling your members of Congress and being specific: “Congress funded the Milk Loss Program twice — first for 2020–2022 under the Consolidated Appropriations Act of 2023, then for 2023–2024 under the American Relief Act of 2025. Why does the program keep expiring?”
You can also press your co‑op or processor board. During the 2020 milk‑dump crisis, USDA relief dollars flowed through co‑ops to help cover losses. Ask your buyer, bluntly: “If we’re forced to dump because the road or plant is shut, do you share any of that hit, or are we on our own?”
Bullvine Perspective: The Bill That Brags About DMC and Leaves the Drain Uninsured
The latest farm bill made a big deal out of reauthorizing DMC through 2031 and tweaking margins and coverage levels. They lined up for photo‑ops, telling dairy producers they’d “protected family farms.”
Look at the blizzard math again:
You do the work.
You feed and milk through 5‑ to 15‑foot drifts.
The truck can’t get to you.
You open the valve and dump thousands to tens of thousands of dollars of milk.
DMC pays based on a national margin. It doesn’t care whether your milk is left in a tanker or runs across the floor. LIP and ELAP pay for dead cows, extra feed, and some snow removal. The only program USDA has built to pay for dumped milk — the Milk Loss Program — has been funded twice, retroactively, for events in 2020–2024, and the last signup closed in late January 2026. Less than seven weeks before the Henschels’ tank overflowed.
Congress knew this was a problem. They funded it. Twice. And still left a gap you could drive a snowplow through.
What This Means for Your Operation
If you had any livestock deaths, discounted livestock sales, or major feed disruptions in this storm, your Notice of Loss deadline is roughly 30 days from the event — mid‑April 2026 for March 14–16 losses. Don’t wait. File with your county FSA office now. The application‑for‑payment deadline extends to early 2027, but the Notice of Loss window is the one that catches people off guard.
If your three‑day milk exposure number makes you flinch when you multiply daily pickup × 3 × current Class III, then it’s not a freak event — it’s a business risk you’re actively self‑insuring, and it belongs in the same conversation as debt service and feed contracts.
If you can’t afford more storage, your 30‑day move is to get your paperwork and people in order:document any milk dumps even if they’re not covered yet (you’ll want that record if Congress funds MLP retroactively again), and write down a simple storm plan with hauler and neighbour contacts where everyone can find it.
If you’ve been treating DMC as disaster coverage, remind yourself it’s margin insurance, not milk‑dump insurance. Congress has funded the Milk Loss Program twice for past events and let it expire both times. If you want dumping covered going forward, someone from your area is going to have to say that out loud — using real numbers from storms like this one.
The Bottom Line
Sandy Chalmers was right: milk can’t wait. The Henschels kept cows milking and fed through 5‑ to 15‑foot drifts, and the federal system around them offered help with feed costs and animal losses — but not with the milk they had to dump.
So here’s your kitchen‑table homework: grab your last hauler statement. Multiply your average daily pickup by three days and by today’s price. Are you actually comfortable self‑insuring that number the next time your road disappears under three feet of snow?
If you want the deeper math on how DMC, processor contracts, and USDA dairy disaster assistance actually fit together — and what happens when it’s not the weather but a plant shutdown that stops the truck — keep an eye out for the next “When the Truck Can’t Come” instalments. We’ll be looking at what the AMPI Paynesville strike and shutdown just taught us about stranded milk, and at whether the $17,500 DMC gamble was really the right bet for a storm year like this.
And one more question to chew on while you’re staring at that bulk tank: Do you know where your co‑op actually stands on renewing a permanent Milk Loss Program — and whether they’re truly pushing for it, or just offering sympathy when you’re the one opening the drain valve?
Complete references and supporting documentation are available upon request by contacting the editorial team at editor@thebullvine.com.
DMC: The Six-Year Lock-In Gamble or a Big Beautiful Safety Net? – This strategic analysis exposes the hidden costs of the 2026-2031 lock-in, revealing how the “One Big Beautiful Bill Act” actually impacts your long-term liquidity. It provides the high-stakes perspective you need to position your operation against five years of margin volatility.
Your Top Heifers All Trace to Three Cow Families. That’s a $93,300-A-Year Trap. – This guide reveals how over-concentrating maternal lines creates a massive capital drain through inbreeding-driven frailty. It delivers a new genetic filter for your genomic sorting, reclaiming diversity and protecting your herd’s physical resilience against the next regional crisis.
The Sunday Read Dairy Professionals Don’t Skip.
Every week, thousands of producers, breeders, and industry insiders open Bullvine Weekly for genetics insights, market shifts, and profit strategies they won’t find anywhere else. One email. Five minutes. Smarter decisions all week.
In March, 1,908 Ontario producers bid on quota. Only 190.60 kg traded. Every financed kilogram lost $586 at 6%. The math has flipped — and most farms haven’t noticed yet.
When it fell apart, the Ontario Court of Appeal — in Metske v. Metske, 2025 ONCA 418 — awarded $33,700 for tangible improvements, then subtracted a $2,000 counterclaim. Net recovery: $31,700. Six years on a 152‑acre operation carrying millions in Ontario dairy quota, and the court valued the tangible result at less than one kilogram of Alberta quota is worth today.
That number matters well beyond one family. It shows how fast sweat equity evaporates on a farm where the P5 quota cap fixes the single largest asset at ,000 per kilogram of butterfat per day — a policy number, not a market number. And right now, the math on buying that asset has quietly turned against anyone carrying debt on it.
1,908 Buyers. 18 Sellers. Zero Upside.
On March 19, 2026, Dairy Farmers of Ontario released the monthly quota exchange results. The numbers are stark: 1,908 producers placed bids to buy. Just 18 offered quota for sale. All kilograms cleared at the $24,000 cap. Of the 25,628 kg bid by buyers, only 190.60 kg actually traded — what DFO’s own summary calls a “0.744% average buyer success rate.”
A month earlier, it was worse. On the February exchange, 1,915 producers tried to buy. DFO needed 191.40 kg to run even the first allotment round, but only 129.27 kg was offered. The exchange was cancelled outright. Not a single kilogram changed hands.
At roughly 106‑to‑1 by producer count, Ontario farmers are bidding into a market where each newly financed kilogram loses about $586 a year at current rates. That’s not building equity. It’s transferring cash flow from the farm to the lender.
Why Ontario Quota Stopped Growing Your Wealth
Before the P5 provinces imposed quota price ceilings, values rose steadily. Ontario prices ranged from roughly $17,000 to $22,000/kg around the 1999/2000 dairy year, according to University of Guelph research, and climbed past $40,000/kg in the 2000s before the caps took hold. That capital gain, layered on top of milk income, made quota one of the best‑performing agricultural assets in the country.
The cap shut off that tailwind. At $24,000/kg, Ontario quota is frozen. It doesn’t climb in a good year, track inflation, or compound. With CPI at 1.8% in February 2026, the real value of each kilogram drops by roughly $432 per year in purchasing power — money you won’t recover as long as the cap holds.
Metric
Ontario
Alberta
Current Quota Price (Jan–Feb 2025)
$24,000/kg(policy cap)
$56,648/kg(market price)
Gap vs. Ontario
—
+$32,648/kg
Appreciation Potential
None(hard cap)
Uncapped; market-driven*
Real Value Loss at 1.8% CPI/yr
–$432/kg/yr
Partially offset by price appreciation
Supply Management System
P5 / National
P5 / National
Annual Cash Flow at 6% Financing
–$586/kg
Negative at same rate; higher income potential
Exit Price for Seller Today
$24,000/kg (capped)
~$56,648/kg (market)
Asset Class Behaviour
Fixed liability
Appreciating asset
Look west for proof that $24,000 is a policy number, not a market number. According to AAFC’s monthly quota trade data, Alberta’s exchange averaged $56,495/kg in January 2025 and $56,800/kg in February. British Columbia — which caps at $35,500/kg — traded at that ceiling in January and at $36,500/kg in February. Saskatchewan and Manitoba traded in the $40,000–$44,000/kg range over the same two months. Ontario sits more than $32,000/kg below Alberta. Same supply management system. Same national milk pool. Radically different asset values.
Is Every Financed Kilogram of Ontario Quota Now Underwater?
Here’s the barn math. Stick it on a sticky note beside your desk.
Take one kilogram of Ontario quota at the $24,000 cap. The Canadian Dairy Commission calculated the 2024 cost of production — indexed to the three months ending August 2025 — at $92.82 per standard hectolitre, up 2.72% from $90.36 the previous year. That iCOP result is what feeds the 2.3255% farmgate price increase effective February 1, 2026.
Using current P5 farmgate pricing with that increase baked in, and subtracting cost of production for feed, labour, overhead, and cow depreciation, you land in the ballpark of 4 in net annual milk income per kilogram of quotaon many Ontario herds. That’s The Bullvine’s modeled estimate using current farmgate pricing and recent P5 cost‑of‑production benchmarks — not a DFO or CDC published constant. Your own number will shift with components, feed costs, and overhead. But it’s a defensible mid‑range figure for this math.
The Bank of Canada cut its overnight rate to 2.25% on October 29, 2025, and has held it there through four consecutive decisions — December, January, March — with the next call on April 29. But commercial lenders price quota loans 200–350 basis points above that floor. A rate of 5.5–6% on a quota loan is realistic right now. Nesto’s March 2026 forecast projects no further easing, with bond markets assigning a slight probability of a 0.25% rate hike by October.
Loan Rate
Annual Interest Cost/kg
Est. Net Milk Income/kg
Cash Flow Gap/kg/yr
Rate Needed to Break Even
4.0%
$960
$854
–$106
~3.56%
5.0%
$1,200
$854
–$346
~3.56%
5.5%
$1,320
$854
–$466
~3.56%
6.0%
$1,440
$854
–$586 🔴
~3.56%
If $1,000/kg net
$1,200 (5%)
$1,000
–$200
~4.17%
At $854/kg net income, there isn’t any commercial dairy loan rate on offer today that makes newly financed Ontario quota cash‑flow positive. Even if you’re running tighter than most and clearing $1,000/kg net, your breakeven is only 4.17%. Where’s your rate sitting right now?
Scale it up. Say you’ve picked up 35 kilograms on the exchange in the past few years, all financed at 6%:
35 × $586 = $20,510 of cash leaving your operation every year
That’s interest only. No principal repayment. No new calf barn. Just debt service.
What Did Kyle Horst Find When He Ran His Own Numbers?
Kyle Horst dairy farms with his wife, Jen, and his brother Craig, a school teacher, near Formosa, Ontario. The farm has about 88 kg of butterfat quota, purchased as part of an ongoing operation in 2019.
When Horst enrolled in Chris Church’s Central Dairy Solutions course, he came in carrying the assumption most dairy farmers hold: more milk means more money. Church’s data challenged that head‑on.
“When I started the course, I always thought another litre of milk is obviously more profitable, but he brought that into question with good data,” Horst told Farmtario in August 2025. “I still think high performance through better management is a winner at the end of the day. But simply doing it through added cost is not necessarily financially sustainable.”
Church — DVM, MBA, University of Guelph, and founder of Central Dairy Solutions — spent years as a dairy vet before shifting his focus to farm finance. “I always just figured, as long as we could make more milk, we could make the farm more money,” he told Farmtario. “And that’s about as deep as we’d usually go. And unfortunately, that’s as deep as most of the producers go.” His courses walk Ontario dairies through their quota ranges, from 40 kg to 1,200 kg, using metrics such as operating expense ratio, EBITDA per kilogram of quota, and debt‑service coverage.
Are You Running a Dairy, a Crop Farm — or Both Without Knowing It?
The Terpstra family milks about 420 cows near Brussels, Ontario. Joe farms with his wife Barb, daughter Emily, and son Cole. Joe and Emily both took Church’s course as part of their succession planning. According to Farmtario, the family has moved to monthly financial reviews, with Emily now managing the books.
“Maybe you’re a really excellent cash cropper and not a great dairy farmer.” — Chris Church, Central Dairy Solutions, Farmtario, August 2025
A lot of farms have never actually separated the financial performance of their dairy from that of their cropping operation. Milk and corn live in the same line on the spreadsheet. As long as the overall farm makes the payment, nobody digs deeper.
But when grain prices drop or weather punches your yields, that cross‑subsidy disappears. The dairy suddenly has to stand on its own. If it can’t, that’s when the bank meeting gets tense. And if your dairy numbers and your crop numbers live in the same line — while you’ve also got leveraged quota in the mix — you might be using crop profits to service a dairy business that, on its own, is financing a negative‑carry asset.
The Succession Collision
This is where the Metske ruling, the quota cap, and the interest rate environment crash into each other.
Most Ontario successions assume the next generation will take over quota — structured as a sale, a gradual buy‑in, or a gift with a vendor take‑back. However you paper it, the incoming operator still has to cash‑flow the debt tied to that quota on their own balance sheet.
Run a DSCR on a mid‑size scenario:
Quota position: 140 kg of butterfat per day
Quota value at $24,000/kg: $3.36 million
Financing: 75% at 6%, amortized over 15 years
Loan amount: $2.52 million
Annual debt service (P+I): ~$255,000
Net milk income: 140 kg × $854 = $119,560
DSCR: $119,560 ÷ $255,000 = 0.47
Most lenders want at least 1.25. In this scenario, quota income covers less than half the payment. The rest has to come from crops, off‑farm income, parents deferring payments, or more borrowing.
In Metske, the Court of Appeal found the family’s discussions were an “agreement to agree” — too vague to create ownership rights. The parents’ decision to sell their dairy quota separately was held to be a legitimate exercise of autonomy. That’s how six years of contributed labour ended up valued at $31,700.
The P5 boards agreed to increase the saleable quota by 1% as of December 1, 2025, which will slightly dilute your share of the national milk pool. The February 2026 farmgate price bump helps offset that erosion, but doesn’t fix the structural problem: you’re trying to service 5.5–6% money with an asset that isn’t allowed to appreciate.
The Trade Risk Nobody’s Priced In
The CUSMA joint review is underway, and it’s not happening in a vacuum. In March 2026, the Trump administration launched Section 301 trade investigations covering Canada and 59 other economies — focused on forced labour and manufacturing overcapacity — after the Supreme Court struck down IEEPA‑based tariffs, according to CBC. USTR fact sheets and the 2026 Trade Policy Agenda make it clear these investigations will feed into the broader USMCA review.
CBC’s coverage notes that U.S. officials have repeatedly flagged Canadian dairy policies as part of a “non‑exhaustive” list of trade irritants. Dairy isn’t the only target, but it’s very much on the table.
Wiens has repeatedly warned that Canada has already conceded roughly 18% of its dairy market access in past trade deals, and that further access would cut directly into domestic production.
Carney has repeatedly said in public that supply management isn’t up for negotiation.
But a Section 301 investigation is different from a negotiation. It’s a unilateral tool the U.S. can use to justify tariffs without Canadian consent. And here’s the link between trade and succession that deserves attention: if a wider TRQ, retaliatory tariffs, or a forced restructuring devalues the exit ramp, the next generation isn’t just fighting to make the numbers work. They’re fighting over a shrinking pie — sale prices might fall at the same time debt loads stay fixed.
Here’s the stress test you can run on your own numbers: assume a modest 3–5% drop in farmgate price if TRQ access expands or tariffs bite. On a farm already running a negative‑carry quota, that price hit drops directly onto your already‑thin DSCR. If a 3–5% decline pushes you below 1.0, you’re into negative cash flow unless something else gives. The quota can’t bail you out by appreciating. The cap keeps that door shut.
Options and Trade‑Offs for Farmers
Path 1: Pay Down Debt First — Your 30‑Day Action
When it makes sense: You’re carrying quota debt at 5% or higher, and your DSCR is hovering near or below 1.25.
What it requires: One meeting with your lender in the next month. Bring your current loan schedule and ask for a simple ranking: highest to lowest effective interest rate. Then commit your next 12 months of surplus cash to retiring the highest‑cost debt instead of bidding on new quota.
Risk/limits: You won’t grow your quota position while your neighbours might. But right now, negative‑carry quota growth is eating equity. You give up bragging rights to keep your balance sheet intact.
Signals to watch: The BoC has held at 2.25% since October 29. Bond markets currently price a small probability of a rate hike by fall. Even if they cut, commercial quota loan rates would need to drop below roughly 3.6% before newly financed quota stops bleeding cash at $854/kg net income, and below 4.17% even at $1,000/kg. Plug your own numbers into the cheat sheet above.
Path 2: Hold and Optimize What You’ve Got
When it makes sense: Your quota is mostly or entirely paid off, and your net yield per kilogram sits comfortably above your personal opportunity cost.
What it requires: Doing the Church‑style split — separate dairy EBITDA from crop EBITDA and calculate net profit per kilogram of quota. Then tighten the screws on the cost of production: feed efficiency, labour per cow, components, and cull strategy. If you’re earning around $854/kg but could push to $950 through better management, that’s the cheapest “quota purchase” you’ll ever make.
Risk/limits: Inflation quietly erodes your real equity every year the cap holds. At 1.8% CPI, that’s $432/year in real purchasing power per kilogram. You’re not building asset value. You’re milking income from a flat line.
Path 3: Restructure the Succession Before the Bank Does
When it makes sense: You’re within 5–10 years of wanting to step back, and a straight transfer at today’s values and rates produces a DSCR under 1.25 for the next generation.
What it requires: Getting uncomfortable now, not desperate later. Sit down with an ag‑focused accountant and your lender to model alternatives: longer amortizations, revenue‑share structures, vendor take‑backs with interest‑only periods, or partial transfers that let the next generation build equity gradually instead of swallowing a $3‑million loan on day one.
Risk/limits: These structures take time and trust. If you wait until a health scare, a marital split, or a CUSMA/301 shock, you’ll be negotiating with fewer options and less leverage. And here’s the trade risk tied back to your succession: if a 301 finding or wider TRQ devalues quota even 10–15%, the exit ramp the parents are counting on to fund retirement gets shorter — while the next generation faces the same debt load on a less valuable asset.
Path 4: Sell and Redeploy
When it makes sense: Your dairy only cash‑flows when crop income props it up, your debt‑to‑asset ratio keeps climbing, and your kids are lukewarm about taking over.
What it requires: Facing the hardest question in farming: is your equity better deployed in quota, cows, and concrete — or somewhere else? Selling quota into a market where 1,908 buyers are chasing 18 sellers at $24,000/kg turns paper into cash fast. That cash can fund debt elimination, retirement, or a pivot into a different enterprise entirely.
Risk/limits: The risk here is almost entirely emotional. You lose the barn, the routine, the identity. Financially, a controlled exit at the cap is far better than a slow slide into forced liquidation if rates stay stubborn and margins tighten. Right now, 1,900+ buyers are competing for scraps. Last month, the exchange was cancelled because not enough quota even made it to the table. That level of demand won’t last forever.
Key Takeaways
If your blended borrowing rate on quota is above ~3.6%, every new kilogram is cash‑flow negative. At 6%, the gap is –$586/kg/year. Even at a net income of $1,000/kg, breakeven is only 4.17%. Plug your own numbers into the cheat sheet before your next exchange bid.
If the next generation’s DSCR on quota debt alone falls under 1.25, the succession structure needs to change — not your kid’s work ethic. The Metske ruling shows where “we’ll figure it out later” ends: $31,700 for six years of contributed labour.
If you haven’t separated dairy EBITDA from crop EBITDA, you don’t actually know which side of your business is profitable. Church’s Central Dairy Solutions courses are working with Ontario farms from 40 to 1,200 kg — and the answers aren’t always what people expect.
If trade pressure devalues the quota even modestly, the exit and entry ramps both get steeper at the same time. Get the succession on paper now, while the exchange is still massively in the sellers’ favour.
What This Means for Your Farm Right Now
Before the next DFO exchange deadline, ask yourself two questions. When was the last time you ran a real DSCR on your quota loans at today’s rates? And what happens to that ratio if the farmgate price slips 3–5% for a year?
Complete references and supporting documentation are available upon request by contacting the editorial team at editor@thebullvine.com.
Learn More
The Metskes’ $31,700 Wake‑Up Call: What ‘Not Yet’ Costs a $4 Million Dairy – Exposes the brutal financial consequences of delaying your transition plan. It arms you with a 365-day succession playbook to protect millions in equity from the “agreement to agree” legal trap that sank the Metske family.
Beyond Efficiency: Three Dairy Models Built to Survive $14 Milk in 2026 – Reveals strategic positioning for the next five years by moving past simple volume. It delivers a blueprint for mid-tier stability through enterprise diversification, ensuring your operation remains cash-flow positive even during the harshest market downturns.
Every week, thousands of producers, breeders, and industry insiders open Bullvine Weekly for genetics insights, market shifts, and profit strategies they won’t find anywhere else. One email. Five minutes. Smarter decisions all week.
$144,000–$240,000. That’s what a 20,000‑cwt herd can lose in a year from the new FMMO make‑allowance math. Before you shrug, run it through three hard questions.
You really see it when you look at how two neighbours handle the same noise. Let’s look at Mark. He’s a composite — built from the kinds of situations central Wisconsin producers are describing this year — but his numbers are real. Mark doesn’t read Federal Register notices. He runs a commercial dairy and measures time in milkings, not hearings. When the new FMMO rules kicked in around June 1, 2025, his co‑op’s economist didn’t send him a white paper. She sent him a number: AFBF economist Daniel Munch’s September 2025 Market Intel showed roughly 85–93¢/cwt in class‑price reductions from higher make allowances — and more than $337 million pulled from producer pool value in the first three months alone.
For his order and plant mix, she translated that into a working range: expect somewhere around $0.60–$1.00/cwt less on each cheque over the next year. Mark ships about 20,000 cwt a month. At the low end, that’s $12,000 gone every month — roughly $144,000 over 12 months. At the high end, closer to $240,000. That’s not “interesting policy.” That’s whether you keep the loan officer relaxed and the feed mill paid on time.
Now picture the producer down the road — call her Sarah. She’s a composite, too, built from the ESG experiences multiple farms have described to us. Sarah tossed a new “Supplier Code of Conduct” email from her processor into the pile on the kitchen table. It linked to a glossy brochure about sustainability, asked her to complete an online questionnaire about manure, energy, and welfare, and used words like “partnership” and “journey.” Fresh cows in the pen and a scraper that wouldn’t start. The survey could wait.
A year later, the tone from procurement on these programs was different at some plants. Supplier codes and ESG surveys were feeding internal risk‑sorting tools that grouped farms by perceived risk level, tied to “time‑bound corrective action” language and, on paper, potential termination if issues weren’t addressed. ESG and procurement teams were using that data to show management which suppliers looked lower‑ or higher‑risk.
Mark and Sarah faced the same wall of noise: FMMO modernization, Dairy Margin Coverage 2026 changes, USMCA review chatter, ESG pressure from retailers and banks. The difference wasn’t that Mark cared more about policy. He just ran every headline through three questions before he gave it his time. Sarah didn’t have a filter at all.
Here’s how you steal those three questions for your own operation — and stop letting policy eat hours of your week without giving anything back to your margin.
Policy Headline
Changes 12-Mo Math?
Decision Deadline
3–5 Year Ground Shift
Bucket
FMMO make-allowance changes (Jun 2025)
YES — $0.60–$1.00/cwt
Already in effect
Class I formula, pool dilution
🔴 Act Now
DMC 2026 Tier 1 expansion to 6M lbs
YES — up to $0.15/cwt savings
Feb 26, 2026
6-year lock-in at 25% discount
🔴 Act Now
USMCA 2026 joint review
Indirect — TRQ fill rates avg 42%
2026 review milestones
Market access, import competition
🟡 Watch
ESG supplier survey (processor)
Not directly — risk tier risk
Varies by contract
Audit/termination clause risk
🟡 Watch
Canada NPF 2028 consultations
No — 2028+
Jan 2026 input window
Safety net depth (AgriStability)
⚫ Ignore for Now
Carbon tax adjustments
Marginal — varies by province/state
Ongoing
Input cost creep
⚫ Ignore for Now
What’s Actually Changed — FMMO Reform 2026 and the Rest of the Noise
On the U.S. side, USDA’s final FMMO decision raised make allowances, butter, nonfat dry milk, and whey, updated product composition factors, adjusted some Class I differentials, and returned the Class I mover to the higher of Class III or IV starting June 1, 2025. In that first look‑back, Munch’s AFBF Market Intel analysis calculated that higher make allowances alone trimmed 85–93¢/cwt off class prices and removed more than $337 million from combined producer pool value in the first three months. Composition factor updates add back around $110 million over the first half‑year — real money, but it doesn’t erase the hit.
Dairy Margin Coverage shifted under your feet, too. For 2026, USDA’s Farm Service Agency reset each farm’s production history to the highest annual marketings from 2021, 2022, or 2023 and expanded Tier 1 coverage from 5 million to 6 million pounds. The 2026 sign‑up window is also your one shot to lock in a coverage level and percentage for 2026–2031 in exchange for a 25% discount on Tier 1 premiums. Enrollment opened mid‑January and closes February 26, 2026, according to FSA national and state office reminders. Miss that, and you’re self‑insuring Tier 1 for the year.
Zoom out further, and trade is humming in the background. The 2026 joint review of the USMCA will reopen questions about dairy access among the U.S., Canada, and Mexico. USMCA promised U.S. dairy roughly $200 million in new annual access to the Canadian market — about 3.6% of Canada’s dairy consumption — but tariff‑rate quota data show average fill rates of only about 42%, with 9 of 14 quotas below 50% in 2022/23. That under‑use has already fuelled formal USMCA disputes and plenty of frustration among U.S. dairy groups and negotiators.
Then there’s “policy by contract.” Supplier codes from global processors say it plainly: they only partner with suppliers who comply with environmental, welfare, and labour requirements, they reserve audit rights, and they can terminate relationships if high‑risk issues aren’t corrected. ESG supply‑chain planning guidance tells those processors to score suppliers on risk, audit the flagged ones, and prioritise low‑risk milk when retailers and banks squeeze.
Meanwhile, North of the Border
If you’re shipping under quota, your stress looks different — but you’re not off the hook.
In Canada, the Sustainable Canadian Agricultural Partnership (Sustainable CAP) runs from 2023 through March 31, 2028, as the main framework behind AgriStability, AgriInvest, AgriInsurance, AgriRecovery, and cost‑shared sustainability and innovation programs. Ottawa launched consultations in January 2026 on the Next Policy Framework (NPF) that will replace it for 2028–2033. Federal and provincial governments are now gathering input on priorities like competitiveness, climate resilience, and risk management as they shape the next five‑year agreement.
For Canadian producers, that framework plays a role similar to that of DMC and other federal tools in the U.S. It doesn’t set your mailbox price, but it shapes how AgriStability, AgriInvest, and other supports respond when margins squeeze. You may not see “NPF 2028” printed on your milk cheque — but it quietly decides how deep the safety net is when weather and markets turn.
Every one of those pieces lands in your feed as “news.” The reality: only a few change your numbers, your deadlines, or your ground in a way that deserves more than a skim.
The Barn Math — DMC 2026 Lock‑In Versus the FMMO Headwind
Back to Mark and that FMMO reality check.
Using that 85–93¢/cwt class‑price impact range and a realistic view of his order’s utilization and plant mix, his co‑op’s economist told him to plan for something in the neighbourhood of $0.60–$1.00/cwt less on his cheque over the next year. Not a perfect model. A band you can work with.
Instead of burying that in prose, here’s how it looks on paper — with a DMC year that lines up with what you’ve already seen when margins got ugly.
Scenario
Impact per cwt
Monthly (20,000 cwt)
Annual Impact
FMMO (Low End)
−$0.60
−$12,000
−$144,000
FMMO (High End)
−$1.00
−$20,000
−$240,000
DMC 2026 Payout*
+$1.50
+$30,000
≈+$82,650 (5.51M lbs covered)
*Example uses a 5.8M‑lb production history at 95% coverage (55,100 cwt) and a hypothetical .50/cwt average annual DMC payment — similar to some of the worst 2019–2020 margin months when modelled over a full year; used here as a stress‑test scenario, not a forecast.
For that 5.8M‑pound herd:
Covered pounds = 5.8M × 0.95 = 5.51M lbs.
Covered cwt = 5.51M ÷ 100 = 55,100 cwt.
Tier 1 premium at $0.15/cwt for $9.50 coverage — the 2026 Tier 1 rate listed by Penn State Extension with the 25% lock‑in discount baked in — comes to 55,100 × 0.15 ≈ = $8,265.
Margin history from 2019–2025 includes several years where DMC payments at higher coverage levels more than covered annual premiums for many herds. It doesn’t take many bad months with average payments around $1.50/cwt to repay an $8,265 premium on that volume.
The ESG Side of the Cheque
Now look again at Sarah’s composite.
Her processor’s supplier code spelled out that they partner only with suppliers who comply with environmental, labour, and animal‑welfare requirements — and that they can audit farms, request documentation on emissions, energy, manure, and welfare, and require action plans if they find problems or data gaps. High‑risk suppliers get corrective action plans with deadlines. Failure to address issues can end the relationship.
That first survey email sounded optional. But in 2026, a no‑response on an ESG survey usually isn’t neutral — in many supplier‑risk systems, it’s treated as a data gap that pushes your farm toward the “higher‑risk” bucket, right alongside weak paperwork or unresolved issues. ESG and procurement teams are already using that data to rank suppliers for audits and, when things get tight, decide whose milk is simplest to keep.
ESG Response Status
How Processor Software Reads You
Typical Consequence
Timeline Risk
Survey completed, no flags
Low-risk supplier
Priority in milk volume allocation
Stable
Survey completed, gaps noted
Medium-risk
Corrective action plan requested
30–90 day window
Survey ignored / no response
High-risk (data gap = red flag)
Audit triggered; at bottom of volume-cut list
Immediate
Repeated non-response
Unacceptable supplier risk
Potential relationship termination
Contract cycle
Survey completed + audit passed
Verified low-risk
Retailer/bank ESG credit for processor
Positive long-term
Good or bad, that’s how their software reads you.
You can’t outrun make allowances by scrolling your phone. The lesson is simpler: you need a fast way to decide whether a headline belongs in your barn math, your calendar, or your trash folder.
The Three‑Question Filter That Keeps Policy in Its Place
You don’t need to enjoy politics to protect your milk cheque. You need three questions you can ask about any policy headline, email, or rumour in under two minutes.
“Does this change my math within 12 months?”
“Does this create a decision window I can actually miss?”
“If this keeps marching for 3–5 years, does it change the ground my operation stands on?”
Here’s what each one is really asking.
How Much Does This Change Your 12‑Month Math?
This is your first cut. Any change that touches your milk price formula (FMMO changes, premiums, hauling adjustments), your safety‑net math (DMC rules, AgriStability margins), or known costs (carbon taxes, labour rules, feed subsidies) deserves a quick “can I put a believable per‑cwt or per‑cow number on this for the next year?”
For FMMO, you’ve already got a starting point: AFBF’s 85–93¢/cwt class‑price hit from higher make allowances. Once you run that through your order’s utilization and your plant’s product mix, it becomes a $0.60–$1.00/cwt working range for your cheque. For DMC, FSA and Extension have already laid out how the new 6M Tier 1 cap and production‑history reset change which part of your volume gets covered cheaply.
If you can’t get to a range for your own operation with help from one or two trusted sources, you either need better sources — or that headline probably doesn’t belong in your “urgent” pile.
How Much Does Waiting 30 Days on FMMO or Dairy Margin Coverage 2026 Actually Cost?
“Wait and see” feels reasonable when you’re tired, and the numbers are fuzzy. Sometimes it is. The trick is stopping it from becoming your default answer to everything that makes your head hurt.
Take that 5.8M‑pound DMC farm. If you shrug and let February 26 slide, you’ve decided to self‑insure Tier 1 for the year — even though margin history from 2019–2025 shows several years where DMC payments at high coverage more than covered premiums for many herds. That decision might be fine if your cost of production is low and you’re comfortable riding the margin. It’s not fine if you just never sat down with a pencil because somebody forwarded a scary link about something else that failed all three questions.
FMMO is the same story. If AFBF’s analysis and your plant’s product mix suggest a realistic $0.60–$1.00/cwt headwind on average mailbox prices once everything bakes in, “wait 30 days” doesn’t improve the forecast. It just pushes back when you revisit risk coverage, tighten cost targets, or re‑evaluate expansion projects that only work at pre‑reform prices.
The real question isn’t “Could this analysis be off?” It’s this: if that range is right and you do nothing, can your operation carry it for a year at current feed, interest, and labour? If your gut says no, waiting isn’t neutral anymore.
Is Your Contract Language Already Writing Policy for You?
On the operational side, a lot of the policy that will matter most to your farm over the next five years isn’t hiding in Parliament or Congress. It’s in contracts.
Supplier codes from global dairy companies are clear on three points. They expect compliance with specific environmental, animal‑welfare, and labour standards — often referencing local law and sometimes going beyond it. They reserve the right to audit your operation, request documentation, and require action plans if they identify problems or data gaps. And they give themselves the option to end relationships with suppliers who don’t correct high‑risk issues within set timelines.
ESG planning guidance tells these companies to categorise suppliers as low, medium, or high risk, then prioritise lower‑risk suppliers when squeezed by retailers, banks, or emission‑reduction commitments. Data you send — or don’t send — in that first “voluntary” survey directly feeds those scores.
If you haven’t read the ESG, audit, and termination sections of your own supplier code or milk contract in the last year, you’re letting someone else decide what risk tier your farm occupies without even knowing the tiers exist. You might be perfectly comfortable where you are. Or you might find out you’re at the bottom of the list only when volume cuts land on your desk.
Options and Trade‑Offs for Farmers
You can’t turn the policy tap off. You can decide how much gets past your gate. Here’s how producers are using the three‑question filter — and what each path demands.
Barn Math First, Politics Later
When it makes sense: You’re already using at least one risk tool (DMC, DRP, crop insurance) and you’re comfortable with a pencil and a calculator.
What it requires: Any time a big headline shows up — FMMO tweaks, DMC changes, USMCA review drama, ESG survey — ask yourself: “Can I get a credible per‑cwt range for this on my farm in the next 12 months?” If yes, what does that look like on your monthly cwt? Lean on one or two trusted sources for the heavy lifting — your co‑op economist, Extension, or a piece that translates policy into cheque math.
Risks/limits: If you don’t have those sources, you risk either underplaying real hits (like making allowances) or overreacting to noise. And barn math is only as honest as your breakeven — if the base numbers are fiction, the filter won’t save you.
The Calendar and Contract Gate
When it makes sense: You’re not spending evenings reading market intel, but you’ll respect hard dates and signatures.
What it requires: Put a single sheet or whiteboard in the office with three columns: “Act Before,” “Ask Before,” and “Ignore For Now.” “Act Before” gets DMC sign‑ups, crop insurance deadlines, DRP windows, and any AgriStability/AgriInvest enrollment dates on your side of the border. “Ask Before” applies to the USMCA 2026 review, co‑op meetings, and any session where your buyer explains their plan. “Ignore For Now” gets headlines that don’t pass any question and carry no date.
Risks/limits: If nobody owns updating that sheet weekly, it becomes wallpaper. Someone — you, a partner, the family member who actually reads this stuff — has to be the designated filter and move items between columns as things develop.
Treat ESG as Contract Risk, Not PR
When it makes sense: Your milk goes to a processor selling into big retail or export markets, and their website is full of “net‑zero,” “scope‑3,” and “responsible sourcing” language.
What it requires: Read every supplier code, sustainability annex, and contract update your buyer sends. Highlight anything about ESG data, audits, “continuous improvement,” or termination. Ask blunt questions: “If I don’t fill out this survey, what happens to my status?” and “Are you scoring suppliers? If so, how?” You don’t have to like the answers. But you’re making decisions with eyes open instead of assuming good farming speaks for itself.
Risks/limits: This won’t stop ESG from coming. It keeps you from being blindsided when procurement starts treating ESG like quality or SCC. If you strongly disagree with the direction, the bigger decision is whether to stay in that buyer’s system at all.
Install a Designated Filter in 30 Days
When it makes sense: You’re running 200–500 cows, you don’t have a “policy person,” and every week someone different is forwarding “urgent” links into the family group chat.
What it requires (within 30 days): Choose one person — the owner, a partner, or a family member who actually reads — and make it their explicit job to filter the policy. Give them 20–30 minutes once a week to run every headline, email, or rumour through the three questions and sort them: “Act Now,” “Watch,” or “Noise.” Only “Act Now” items go on the weekly meeting agenda. “Watch” items get a look at the end of the month. “Noise” dies on their notepad.
Risks/limits: Only works if everyone agrees to respect the filter. If you still treat every Facebook thread like an emergency, you’re back to chaos. But if you back the filter, you trade random panic for a predictable, small time cost that protects a very large cheque.
Key Takeaways
If you can’t get to a realistic 12‑month per‑cwt impact for your own volume, a policy headline doesn’t outrank chores. Ask your co‑op, Extension, or a trusted source to turn it into barn math first.
If there’s a date on it — DMC signup, a USMCA review milestone, a supplier‑code acknowledgment, a contract auto‑renewal — treat it as a decision window, not background noise. Saying nothing before the deadline is still a decision; it might not be the one you’d pick on purpose.
If your main buyer talks about ESG, net‑zero, or “responsible sourcing,” treat supplier codes and sustainability surveys like policy notices, not marketing fluff. Read the audit, data, and termination clauses and decide whether you’re willing to live in the tier they assign you.
If your production history sits between 5 and 6 million pounds, the 2026 DMC upgrade to a 6M Tier 1 cap and six‑year lock‑in changed your numbers enough that “same as last year” isn’t a safe default. Run the new math or call your FSA office now.
If your order’s best estimates point to a $0.60–$1.00/cwt headwind from FMMO changes once make allowances and utilization settle, ignoring it isn’t neutral. Either your balance sheet carries that for a year, or you adjust risk coverage, costs, or capital plans now.
The Bottom Line
The three questions didn’t make the noise go away for producers like Mark. They made it obvious which pieces belonged in barn math, which belonged on a calendar, and which belonged in the trash icon. Farms like Sarah’s didn’t have that filter. By the time they realised their “voluntary” ESG survey had been feeding into a risk-tiering system, their buyer already had a list of farms flagged as harder to keep when things got tight.
So, does your operation look more like Mark’s — pencil to cheque, questions before panic — or more like Sarah’s, finding out about the tiers a year late?
The question isn’t whether policy is getting louder. It’s whether, if FMMO tweaks, a missed DMC cycle, or an ESG‑driven contract change knocks $0.75/cwt off your cheque next year, you’d catch it early enough to move — or hear about it from a neighbour in the parlour after the fact.
Complete references and supporting documentation are available upon request by contacting the editorial team at editor@thebullvine.com.
The Hidden Contract Clause That Could Cost Your Dairy $55,000 in 2026 – This report uncovers high-stakes liability shifts in 2026 milk contracts that could erase 44% of your net profit. It delivers an immediate 30-day survival checklist to dodge these disruptive costs and protect your family equity.
The Sunday Read Dairy Professionals Don’t Skip.
Every week, thousands of producers, breeders, and industry insiders open Bullvine Weekly for genetics insights, market shifts, and profit strategies they won’t find anywhere else. One email. Five minutes. Smarter decisions all week.
They started with grade cows and manure on their trousers. They built every genomic proof you chase today.
The year was somewhere in the mid‑2000s, and if you were lucky enough to lean on the rail at World Dairy Expo with a coffee in your hand, you felt it. The big banners and spotlights still belonged to the cow show—the Goldwyns, the Durhams, the glossy strings from famous prefixes—but when the sire lists went up on the bulletin boards outside the Coliseum, a different set of names rose to the top in black and white: Durham. Goldwyn. O‑Man. Rudolph. Shottle. Marshall. Mountain.
Now, the thing about that era is this: if you judged the future by those glossy ads and center‑spread photos, you’d have sworn the next great sires would all come out of investor barns with brass nameplates and full‑time fitters. But what a lot of people didn’t realize was that the real engine of change was turning miles away—in grade‑started herds where the breeder’s trousers were more likely streaked with manure than show sheen, and where the biggest “promotion” was a good proof and a paid‑off feed bill. Between roughly 1991 and 2010, a handful of farmer‑bred bulls, show‑ring architects, and fitness warriors quietly built the cow population that genomics would later “discover.”
Most of those bulls and cows are long gone now, except in the pedigrees. This is the story of how they earned their place there.
Act I – Hillsides, Sale Rings, and the Bulls Nobody Expected
If you want to understand how this Golden Age began, you don’t start in Madison or Toronto. You start on a Vermont hillside in 1946.
Everett’s Hills and the Mathematics of Manure
Bis‑May Farm sat in the rolling hills around Moretown, Vermont, about 17 miles west of Montpelier. It wasn’t a show palace. Everett and his father, Ralph, started with a grade herd; a few cows had papers, but most just had to earn their keep in a tie‑stall barn where every empty stanchion hurt. In 1950, they bought Kearsarge Governor Jean from C. Leland Slayton in New Hampshire, and a few years later, Everett’s fascination with the old Mount Victoria Rag Apple cattle pushed him to buy nine Canadian cows rich in Rag Apple blood, including Marie Pabst Lochinvar.
Through his college years, Everett had pored over Holstein‑Friesian World, thumbing through pictures of Montvic Rag Apple Gladiator and the rest of Thomas Macaulay’s great cattle. The Mount Victoria dispersal had already happened in 1942. The sale was over. But in his mind, those cows still had something to say.
Here’s the thing—Everett believed the math. There are thousands of farmer‑breeder herds. There are only a handful of Pabsts, Skokies, and Carnations. If great sires come from good cows, and there are vastly more good cows in ordinary barns than in famous ones, where do you think most of the real genetic power is hiding?
When he became chairman of the little Central Vermont Breeding Association, whose entire A.I. battery was Jersey bulls, he pushed the group to buy a Holstein: Walker Homestead Dawn, proven at Howacres in Vermont for high butterfat test and “exceptionally good type.” They did. Everett used him so heavily that when Dawn died, he bought 100 extra doses and kept right on breeding Dawn daughters.
Out of that web of grade cows, Rag Apple immigrants, and Dawn blood came three bulls no one would have picked out of a show catalog: Bis‑May Astro Jupiter, Bis‑May Tradition Cleitus, and Bis‑May S‑E‑L Mountain.
Mathematical probability, with manure on its boots.
Jupiter: Astronaut’s “Second Son” and the Brood Cow Maker
In the Paclamar Astronaut era, the headlines went to Bridon Astro Jet, and rightly so. But at Eastern A.I. in Ithaca, New York, there was another Astronaut son quietly doing the heavy lifting: Bis‑May Astro Jupiter, born in 1972. He was out of Bis‑May P Admiral Jana VG‑88‑GMD, a high‑lifetime Irvington Pride Admiral daughter backed by Bis‑May Homestead June, one of Everett’s precious Walker Homestead Dawn cows.
Jupiter’s daughters had that farmer’s wish‑list look—usually only medium for stature, but wide in the muzzle and chest, deep in the rib, and carrying big, capacious rear udders that could hold up to full meters of milk. The New York cow Welcome Jupiter Gala VG‑GMD‑DOM put up 31,360 pounds of milk at 4.1 fat as a 2‑11 365‑day record—a state record when she made it. When you asked her breeder, Bill Peck of Welcome Stock Farm, what kind of cow he wanted to breed, he’d tell you: “wide in the muzzle, wide in the chest, and wide in the udder.” When you asked which family did that best, he pointed straight at the Jupiter Galas.
Gala’s daughter, Welcome Valiant Gingersnap VG‑GMD‑DOM, produced Mark CJ Gilbrook Grand VG‑GM by Walkway Chief Mark, and Grand, in turn, became the double grandsire in the pedigree of Braedale Goldwyn—siring both Shoremar James (Goldwyn’s sire) and Braedale Gypsy Grand (Goldwyn’s maternal granddam).
So every time you see a Goldwyn daughter step into the ring at Madison, there’s a little strand of Bis‑May Astro Jupiter and Walker Homestead Dawn hiding in the fine print of that pedigree.
On the home farm, another Jupiter daughter, Bis‑May Jupiter Mabel VG, made a top record of 31,159 milk, 3.6 fat, and 3.3 protein—but she only classified Good Plus for udder. Her dam line, back through Zion‑View Amys Prince and U.N.H. Burke Ideal Graduate, was all about body capacity and power. The Maynards bred Mabel to the udder specialist Cal‑Clark Board Chairman, and the resulting daughter, Bis‑May Chairman Merri VG‑87‑DOM, made two heifer records, both over 28,600 pounds, with 3.3 protein.
Midway through Merri’s second lactation, they flushed her to Lekker Valiant Royalty. When they consigned Merri and her five Royalty pregnancies to the North‑East Kingdom Sale, Steve Smith and Chet Crosby of Shade‑E‑Lane bought the package for $14,500. One of those Royalty calves would make the whole thing look cheap.
Mountain: The “Poor‑50” Bull Whose Daughters Didn’t Read His Proof
To‑Mar Mountain Helen VG — a stylish Bis‑May S‑E‑L Mountain daughter whose frame, udder, and balance give breeders a rare visual glimpse of what the famous 50‑point “homely anti‑hero” was actually capable of siring.
Under the Shade‑E‑Lane roof, one of those Royalty calves grew into Bis‑May S‑E‑L Mountain. He was proven at Sire Power in Pennsylvania. He had two flush brothers. When Sire Power analyst Steve Neeley had to choose between them, he did what sire analysts do: he looked at type, frame, legs, and testicles—because bigger testicles meant earlier and heavier semen production. Mountain got the nod.
Then the classifier came.
The classification report on Mountain is one of those documents you’d frame if you like irony: “Poor. Fifty points. Straight legs and almost no middle.” That’s almost comical in an era when Good still meant something—back when a 50‑point score really meant “don’t bother taking his picture.” For a moment, you can imagine folks at the stud wondering if they’d backed the wrong brother.
But the classification sheet didn’t tell the whole story. As Mountain daughters freshened, their proofs started rolling in, and they were “pumping out the protein like nobody’s business,” as one contemporary account put it. They weren’t all pretty, but they were resilient producers with better‑than‑average type and solid milk.
When A.I. centers started using Mountain sons because of those daughters, the people rose in protest. Holstein‑Friesian World and the Holstein Association were flooded with cranky letters about a 50‑point bull being used as a sire of sons. The cows didn’t care. They just milked.
From that “homely anti‑hero” came an elite trio of 100% U.S. blood bulls scattered around the globe: Jesther CV in France, Etazon Addison in the Netherlands, and Elite Mountain Donor in Australia. Another daughter, Emerald‑Acr‑SA Tannice VG, produced Emerald‑Acr‑SA Dawson, a popular protein sire in the early 2000s.
Think about that for a second. In a time when breeders still slapped bull pictures on the fridge, one of the defining protein sires of his era was a 50‑point bull whose best “photo” might have been his proof sheet.
Cleitus: The Milk Bull That Slipped in the Side Door
If Mountain taught the industry not to judge a bull by his picture, his herdmate Bis‑May Tradition Cleitus EX‑GM taught it not to judge a bull by his dam’s index.
When Bis‑May Conductor Coral VG‑88‑GMD‑DOM, a tall, deep‑bodied Wapa Arlinda Conductor daughter out of Bis‑May Bold C Coconut VG‑87 (by Nicolk Sunshine Bold Chief), dropped an early Sweet‑Haven Tradition son in 1987, his numbers were low enough that the first A.I. stud the Maynards approached turned him down. Tradition semen was hard to get, and Coral’s index didn’t look like bull‑mother material on paper.
Eastern A.I. remembered what Jupiter had done for them and decided to roll the dice. The young bull they took was named Bis‑May Tradition Cleitus.
Cleitus grew into one of the key production sires of his time and one of the best Elevation grandsons in the books. His best son, Norrielake Cleitus Luke EX‑GM, stood at Alta Genetics in Alberta and sired Dixie‑Lee Aaron EX‑GM and Lexvold Luke Hershel GM, both out of Mascot daughters. Aaron daughters clicked beautifully with O‑Bee Manfred Justice to produce bulls like Long‑Langs Oman Oman VG‑GM, while Hershel’s sons included Sandy‑Valley Bolton EX‑GM, a big milk and protein bull that earned a reputation as a serious freestall sire.
Norrielake Cleitus Luke EX‑GM — the powerful Alta Cleitus son whose Aaron and Hershel lines carried Bis‑May blood straight into Oman Oman, Bolton, Snowman, and the protein‑driven pedigrees of the genomic age.
Another Cleitus son, Paradise‑R Cleitus Mathie EX‑GM, was selected by Charlie Will for Select Sires and sold upwards of two million doses, making him the highest semen seller in Holstein history at the time.
By the late 1990s and early 2000s, you could hardly scan a top TPI or Net Merit list without bumping into Cleitus, Luke, Aaron, or Hershel in the pedigree. Everett’s Hill Farm in Vermont had done exactly what his probability instincts predicted: stock the A.I. shelves from farmer‑bred cows.
Act II – Madison Architects and Fitness Warriors
All that milk, type, and protein needed a frame to live on—and a body that would last long enough to pay for itself. That’s where the second act of this Golden Age really takes hold.
Dellia, Durham, and Five Years at the Top of Madison
Snow‑N Denises Dellia EX‑95‑2E‑GMD‑DOM wasn’t bred as a glamour cow. She was a Bell x Mark granddaughter developed by Bob Snow and young herdsman John Steinhoff out of a hard‑doing family that had to travel down a pasture, cross a creek, and walk back up to the barn every day. By all accounts, there were nights when she walked into the parlor carrying three gallons of sand in her udder.
Frank Regan saw Dellia and couldn’t shake her from his mind. He came back. Looked again. Eventually, he bought her, on the condition that she show one more time at the Wisconsin Spring Show in 1991 before heading to Regancrest in Iowa.
The night before the show, Dellia looked a little drawn. So the crew did what cow people do: they fed her four bales of hay, warmed up her beet pulp—Dellia liked it that way—and let her settle down. The next day, judge Niles Wendorf walked her out first in the four‑year‑old class, gave her the best udder, and slapped her grand champion of the show. That creek‑bottom cow had just crossed a completely different kind of river.
Back at Regancrest, Frank called Select Sires’ Charlie Will. “What should I use on her?” he asked. The answer came back: Emprise Bell Elton, a Bell son whose daughters were building a reputation for udders, feet, and legs, and longevity. The Dellia x Elton flush produced four sons. First choice went to Japanese buyers for $20,000. The second choice went to Alta Genetics for similar money. Select Sires took the third bull, Regancrest Elton Durham. The Regans used the fourth.
Nobody in that semen office knew they’d just picked up the bull who’d become Premier Sire at World Dairy Expo five years in a row, 2003 through 2007—a run that, as the Durham profile notes, may stand for a very long time.
Sheeknoll Durham Arrow EX — a signature Regancrest Elton Durham daughter, captured in her World Dairy Expo moment, showing exactly the kind of balanced frame and welded‑on udder that kept her sire on the Premier Sire podium for five straight years.
The thing about Durham daughters is that you could pick them out from the stands: long bodies, flat and wide rumps, and udders that looked like they’d been hung with a level—high rear udders, smooth fore udders, clean teat placement. More than one dairyman has said his Durhams weren’t always the highest milk cows on the test sheet—but they were some of the most trouble‑free cows he ever milked. They bred back, they walked well, and they often looked their best at four and five—exactly when the milk check really starts to count.
Durham sons—Mr. Sam, Duplex, Damion, Modest, Drake, D‑Fortune, Primetime—filled type lists from Canada to Europe. His daughters—Kamps‑Hollow Altitude, Lylehaven Lila Z, MD‑Delight Durham Atlee, Regancrest‑PR Barbie, Scientific Debutante Rae—founded families that still show up behind modern genomic stars.
Looking back, the signs were there: Durham gave the breed a blueprint for “classic” dairy cow architecture exactly when the industry was learning to care about cell counts, fertility, and productive life as much as it cared about banners.
If Durham was the architect of style, Braedale Goldwyn GP‑Extra was the finisher who wouldn’t leave a seam out of place.
Goldwyn was born January 3, 2000, a Semex young sire out of Braedale Baler Twine VG‑86, the Maughlin Storm daughter of Braedale Gypsy Grand VG‑88, both cows deeply rooted in Sunnylodge breeding. His sire was Shoremar James GP‑Extra, a Mark CJ Gilbrook grandson out of an Aerostar daughter.
His pedigree is a masterclass in line breeding. Goldwyn carries three close crosses to Madawaska Aerostar (through James, Storm, and Moonriver), and three to Walkway Chief Mark (through James, Gypsy Grand, and Sunnylodge Chief Vick). There’s also a tight knot in the ninth, tenth, and eleventh dams involving Hays Inspiration and Ajax Sovereign B, both tied to Montvic Rag Apple Sovereign and the anchor Dutch cow Vrouka 9198 H.H.B.—the same foundation that produced Osborndale Ivanhoe.
Put simply, Goldwyn didn’t just pop out of nowhere. Canadian breeders deliberately stacked old Sovereign and Rag Apple blood, via Aerostar and Chief Mark, because they believed those cows still had something to say—if you lined them up just right.
On diets and bedding that looked a lot more modern than Dellia’s creek‑bottom pasture, Goldwyn daughters made people rethink what “mammary perfection” meant. Their udders were high, silky, and veiny, with square teat placement and rear udders that looked welded onto the pelvis. They carried long, stylish dairy frames and near‑perfect feet and legs.
RF Goldwyn Hailey EX-97—the next dynastic champion who captured Supreme Champion at World Dairy Expo in 2012 and 2014, ensuring Goldwyn daughters wore the ultimate crown for four consecutive years.
In 2008, Goldwyn ended Durham’s run and became Premier Sire at World Dairy Expo—the youngest sire in 25 years to win it and the first bull at the top of Canada’s LPI list to do so. You could feel the shift in the Coliseum that night. The banners still said “Madison,” but the cow families and sire stacks behind those udders were starting to look a lot like the pedigrees that would soon feed into genomic flush programs.
When Eastside Lewisdale Gold Missy EX‑95 sold for roughly $1.2 million in 2009 and then went on to be grand at Madison and the Royal, it wasn’t just a big number. It was proof that deep Canadian cow families, carefully line‑bred back to Vrouka and Sovereign, could still ring the cash register in an era about to be dominated by SNP chips.
Eastside Lewisdale Gold Missy EX‑95 — the $1.2‑million Goldwyn daughter who turned mammary perfection into both Madison and Royal banners, proving just how valuable those deep Canadian cow families still were in the genomic age.
And if you trace a Goldwyn pedigree far enough, you still find Welcome Jupiter Gala, Mark CJ Gilbrook Grand, Walker Homestead Dawn tucked into the background—the same farmer‑bred math that was quietly powering Mountain cows in commercial parlors.
If there’s a single moment where you can say “everything changed,” it’s probably that 2008 Premier Sire banner. Durham had ruled Madison for five straight years. Goldwyn took his place while sitting at or near the top of LPI for conformation, and the genomic era was just around the corner. The old show‑ring order had just shaken hands with the future.
O‑Man and Formation: The Fitness Wars
Now, while all that was happening under the Madison lights, another battle was raging in the proofs—a battle over fitness. Cows were getting taller and fancier, but fertility was slipping, and cows weren’t lasting like they used to. The industry needed bulls that could keep daughters in the herd.
O‑Bee Manfred Justice (O‑Man): The Fitness Turning Point
The fitness story starts with a cow called Rynd‑Home Valiant Cutie EX‑91, who earned the “Mama Protein” nickname by producing two sons, Cubby and Curious, who topped protein lists in 1992. Her son Osdel‑Endeavor Bova Cubby EX‑94‑GM sired Ha‑Ho Cubby Manfred GP‑GM, bred by the Grose family in North Carolina.
Manfred’s proof at Accelerated Genetics was a strange mix: high production, deep udders, plain type—but with outstanding fertility and longevity numbers. As Net Merit shifted to reward health traits, Manfred suddenly looked like “America’s answer” to the longevity and fertility concerns of the early 2000s.
His best son was O‑Bee Manfred Justice, EX‑GM, known everywhere as O‑Man. Bred by Obert Bros. of Illinois, O‑Man was a Manfred son out of Meier‑Meadows El Jezebel EX‑92‑GMD, an Emprise Bell Elton from an Arlinda Melwood daughter, backed by Chief Mark and Rockalli Son of Bova.
When O‑Man’s proof hit in 2002, it landed like a rock in a pond. At a time when the whole world was suddenly worried about fertility, he scored positive for all the major health traits—productive life, daughter fertility, somatic cell score—with enough milk and type to keep most programs comfortable. Holstein International even called his appearance a “turning point in global Holstein breeding.”
By August 2009, O‑Man sons held five of the top ten spots in high‑ranking sire reports. Long‑Langs Oman Oman VG‑GM (from a Dixie‑Lee Aaron dam) and Schillview Garrett GM (from a Carol Prelude Mtoto dam) were near the very top. Schillview Oman Gerard EX‑GM, out of Schillview Marsh Glash VG‑89‑DOM, tied Marshall’s production to O‑Man’s health.
And then came Flevo Genetics Snowman 388965513, O‑Man’s high‑type son from Broeks MBM Elsa EX‑90, the Mara‑Thon BW Marshall daughter named Global Cow of the Year 2009, and later recognized again in 2010 by World Wide Sires Germany. Snowman’s genomic numbers were so strong that he became a worldwide sensation before his daughter’s proofs were even in; he died during the waiting period, but not before his genetics were widely used.
Looking back, it’s hard not to see O‑Man as the hinge where health traits stopped being an afterthought and started driving breeding decisions.
Formation: Burke Lad 33 Times Over
Shen‑Val NV LM Formation EX — the white Leadman son loaded with 33 crosses to Admiral Burke Lad, whose balanced udders and stay‑in‑the‑herd daughters made him the quiet longevity specialist of the fitness revolution.
Running alongside the O‑Man wave was a quieter bull: Shen‑Val NV LM Formation, a Leadman son whose pedigree carried 33 crosses to Wisconsin Admiral Burke Lad.
Formation daughters weren’t extreme—they were correct. Good udders, strong ligaments, enough strength, and cows that just kept coming back through the parlor doors. His biggest contribution to this era came through Lylehaven Form Laura EX, who produced Lylehaven Lila Z EX‑94, the million‑dollar Durham daughter that anchored a host of Goldwyn and genomic descendants.
Lylehaven Lila Z EX‑94 — the million‑dollar Formation granddaughter whose sweeping rib and welded‑on udder turned a quiet longevity sire into one of the most respected brood‑cow makers of his time.
At the time, most folks saw Formation as “one of those good Leadman sons.” Decades later, breeders would recognize that he’d helped pipe Burke Lad’s balanced, long‑lasting daughters straight into some of the most intensively used cow families in the world.
Act III – Shottle, Rudolph, Marshall, and the Hand‑Off to Genomics
By the early 2000s, A.I. had truly gone global. British cows were shaping American proofs, Canadian cow families were being flushed to Italian and German bulls, and American fitness sires were showing up in Dutch programs. As the genomic era dawned, three bulls sat right at the intersection of all those threads: Picston Shottle, Startmore Rudolph, and Mara‑Thon BW Marshall.
Picston Shottle: Sharon’s Son and the Bull No One Could Knock Off
The Shottle story starts at Don McLean’s Condon dispersal in Ontario.
At that 1991 sale, Condon Inspiration Sally VG‑87, a Hanover‑Hill Inspiration daughter from the Cranford Sovereign Marjorie family, walked through the ring with a nine‑month‑old Madawaska Aerostar heifer at her side named Condon Aero Sharon. Sharon sold for $4,400 to an English buyer who eventually moved her to joint ownership between John and Helen Pickford (Picston) and Anthony Brough (Tallent).
Under their care, Sharon became a force. By the time the smoke cleared, Condon Aero Sharon EX‑91‑60* had earned 60 brood cow points based on 37 daughters averaging 87 points and seven sons with a median score of 91. She was, as the Shottle profile says outright, one of the most powerful brood cows in U.K. history.
When the Pickfords and Brough sat down to pick a mating, they chose Carol Prelude Mtoto EX‑SP, a bull known for strong, functional type and low somatic cells whose sire stack—Prelude, Blackstar, Chief Mark, Bell, Elevation, Bootmaker—and maternal Holtex Peggy line were full of respected Canadian and U.S. names.
The calf from that mating, born July 23, 1999, was registered as Picston Shottle. According to pedigree expert Douglas Blair, Shottle had “the best proof in the world” at the time, and Blair noted he’d never seen a modern pedigree with so many respected Canadian bulls and prefixes lined up in a row. Helen Pickford later admitted they still had to “pinch themselves” when they thought about the impact he’d made—the kind of remark that tells you how surreal it felt even to the people who bred him.
On the ground, Shottle’s daughters weren’t prima donnas. You could park a Shottle daughter in a 400‑cow freestall or in a county fair front row, and she’d look like she belonged in both places—quiet, correct, with an udder that didn’t need excuses. They milked, they bred back, they walked well, and they did it in barns from Staffordshire to Wisconsin to northern Italy.
Huntsdale Shottle Crusade EX‑95‑3E — Nasco International Type and Production Award winner at World Dairy Expo, living proof that Picston Shottle’s daughters didn’t just win banners but milked their way through multiple lactations with the kind of trouble‑free udder that changed what breeders expected from a type sire.
For a stretch in the mid‑2000s, Shottle sat at or near the top of type and production lists in the U.S., Canada, and Italy at the same time. In late 2010, ABS sire summaries still showed him at +1334 milk, +63 fat, +36 protein, and +2.95 on overall type, on 30,049 daughters in 7,276 herds, with semen at $100 a dose. Round after round, new proofs came and went, but breeders kept finding one constant at the top of the page: Old Shottle, still sitting there.
If Durham gave the blueprint and Goldwyn fine‑tuned the udder, Shottle was the bull you used when you wanted a cow that would work anywhere on the planet.
Startmore Rudolph: The Brood Cow Fountain
Startmore Rudolph VG‑Extra — the Aerostar son from Jim‑Mar‑D Astronaut Gail’s family whose daughters became the most prolific source of brood cows in modern Holstein history, with eleven lines still running through Genosource Captain alone.
Then there’s Startmore Rudolph VG‑Extra, born July 17, 1991, on Earl Start’s farm near Woodstock, Ontario.
Rudolph’s story really begins at the Reflections of Milly Sale in May 1976 in Henrietta, New York. Earl had been a Guernsey man all his life—official judge, major shows, the whole bit. But by the mid‑’70s, he’d decided to move into Holsteins. That wasn’t easy emotionally; his family had gotten their first Guernsey for doing a neighbor’s fall plowing back in 1931, one of the worst years of the Depression.
He and his neighbor, Gerry Row, drove down to the sale with their wives. As they walked up to the Monroe County Fairgrounds sheds, they saw a big black cow being led to water. That was it. They could hardly think of anything else. The cow was Jim‑Mar‑D Astronaut Gail EX‑11, Honorable Mention All‑American 3‑year‑old the year before, an Astronaut from a 30,000‑pound Rosafe Shamrock Perseus granddaughter.
Jim‑Mar‑D Astronaut Gail EX‑11 — the Honorable Mention All‑American 3‑year‑old whose combination of Astronaut power and Perseus production made her the sale‑ring purchase that ultimately put Startmore Rudolph and his brood‑cow dynasty on the map.
“The more we looked at her, the more we liked her,” Earl recalled some 35 years later, although he didn’t think they could touch the price. Gerry finally said, “Well, Earl, I’d like to buy half,” even though either man could have bought her alone. They bought them together for $15,500.
Back home, when an investor group came sniffing around, Earl did some mental math on ten flushes and quoted what he figured she was worth. “I didn’t say I’d sell her for that,” he told them. “I’m just giving you an idea of what she’s worth.” He and Row started flushing her, taking turns picking bulls. Earl leaned on S‑W‑D Valiant, Row favored Nelacres Johanna Senator, and later Earl added Butlerview Mattador after seeing a group of Mattador daughters at an Eastern Breeders display.
Gail’s daughters and granddaughters—Startmore Chanel (by Valiant), Startmore Rachelle (by Mattador), and others—built a family of cows that were, as one account put it, “virtually royal,” packed with brood cow power. Out of Rachelle by Madawaska Aerostar came Rudolph.
As a young proven bull, Rudolph debuted at the top of Canada’s LPI list in August 1996 and sat there for four consecutive years. His young sire semen allotment sold out so quickly in 1992 that Canadian breeders nearly cleaned him out before any daughters calved. By the end of his career, he’d sold 1,495,000 doses, just shy of the “super‑millionaire” status (1M+ units) only nine bulls in the breed had ever achieved.
At first, he was used for high type and production. Later, as fitness traits entered the indexes, people realized his real gift was late maturity, longevity, and low cell count—a gift traced back through his maternal grandsire, Butlerview Mattador EX‑ST, one of the top longevity and fertility bulls of his day.
Wesswood‑HC Rudy Missy EX‑92‑3E‑GMD‑DOM — the deep‑ribbed Rudolph daughter whose production, fertility, and bull‑making consistency turned a good cow family into the genomic powerhouse behind Mogul, Supersire, and an entire generation of TPI leaders. (Read more: The Phone Call That Built a Genetic Empire: The Wesswood-HC Rudy Missy Story)
Rudolph’s daughters turned into a who ’s-who of brood cows. By the mid‑2000s, sale catalogs read like a roll call of Rudolph daughters—Wesswood‑HC Rudy Missy, Windsor‑Manor Rud Zip, Ladys‑Manor Ruby Jen, Gloryland Lana Rae—anchoring the footnotes on bulls that would dominate the TPI lists for a decade. Rudy Missy sits behind Mogul, Supersire, Silver, Balisto; Rudy Zip behind Miss OCD Robst Delicious and sons like Delta and Denver; Ruby Jen behind Ruby D and Ladys‑Manor PL Shamrock; Lana Rae behind a string of Excellent daughters, including Gloryland Liberty Rae EX‑95.
The 2025 Rudolph feature spells out just how deep that influence goes: modern superstar Genosource Captain carries Rudolph 11 times in his pedigree, and Global Cow winner Siemers Lambda Paris traces to Rudolph nine times. Permanently and intensely interwoven, as the article put it.
If you want one bull story that sums up the quiet side of this Golden Age, Rudolph is it: a bull whose sons did fine, but whose daughters changed the breed.
Mara‑Thon BW Marshall: The Needle in a Haystack from Hemingway Country
Mara‑Thon BW Marshall VG‑GM — Charlie Will’s “needle in a haystack,” the Upper Peninsula Bellwood son whose protein daughters and Rudolph‑cross sons now thread through nearly every modern TPI pedigree.
Finally, we come to Mara‑Thon BW Marshall VG‑GM, a bull from a place almost no one associates with global Holstein influence: the Upper Peninsula of Michigan, the same country where Ernest Hemingway wrote “Big Two‑Hearted River.”
Marshall was bred by Mara‑Thon Associates—a partnership of Brad Morgan of Sears, Michigan, and the Brunink family of McBain. His sire was Maizefield Bellwood, and his dam, Morgan‑Valley Elton Mara VG‑87‑GMD‑DOM, was an Emprise Bell Elton daughter out of a tall, strong, wide Mel‑Est Valiant Irose Melvin EX‑GM cow whose structure clearly stamped Marshall’s daughters.
Marshall’s sire stack reads like a who ’s-who of high‑production sires: Pawnee Farm Arlinda Chief, Glendell Arlinda Chief, Arlinda Rotate, Arlinda Melwood, Maizefield Bellwood. Many of his best sons came from Brabant Star Patron and Startmore Rudolph daughters: Jenny‑Lou Mrshl Toystory GM and his full brother Jenny‑Lou Marshall P149 VG‑Extra out of Jenny‑Lou Patron Toyane VG‑89‑GMD; Regancrest‑HHF Mac EX‑GM and Regancrest‑HHF Marcus EX‑GM out of Rudolph daughter Regancrest Rudolph Dena VG‑89; England‑Ammon Million EX‑GM out of Regancrest‑HHF Maya VG.
Jenny‑Lou Mrshl Toystory — the Marshall son from Mystic Valley Dairy who sold over two million units of semen worldwide, turning Mitch Breunig’s quiet, balance‑and‑longevity breeding philosophy into one of the most commercially successful Holstein stories ever written. (Read more: Mystic Valley Dairy: The Secret Behind Their Jaw-Dropping 125-Pound ECM Average)
His daughter, Broeks MBM Elsa EX‑90‑5Y, out of Ever‑Green‑View Elsa VG‑89 (by Dixie‑Lee Aaron), was named Global Cow of the Year 2009 and later recognized again in 2010 by World Wide Sires Germany. Elsa became the dam of Flevo Genetics Snowman, O‑Man’s high‑type son. Elsa’s own maternal line, bred at Tom and Gin Kestell’s Ever‑Green‑View herd in Wisconsin, stacked Ever‑Green‑View Elsie EX‑92 by Emprise Bell Elton, then Excellent daughters by Drendel Melvin Grant and Stardell Valiant Winken.
In 2009, another family member, Ever‑Green‑View My 1326 EX‑92, set a world milk record at 72,036 pounds of milk in 365 days, sharing the same granddam, Elsie, with Broeks MBM Elsa. That’s the kind of tribe Marshall walked into.
Charlie Will, who bought Marshall for Select Sires, later called him proof that not all good sires come from elite cow families. “Just like in the days of Blackstar,” he said, “I view Marshall as a needle that was found in a haystack.”
By the time Shottle and Rudolph proved out, and Marshall’s daughters hit the big lists, it was clear the Golden Age had done its job. The genomics era was putting numbers to what cow people had already built.
Key Takeaways
The Holstein’s Golden Age was driven by farmer‑breeders, not investor show strings—people like the Maynards, Starts, and Kestells quietly breeding great cows in everyday barns.
Durham and Goldwyn defined a new “classic” cow: Madison‑winning style on udders, feet, and legs that still hold up in big freestall herds.
O‑Man, Formation, and their kin dragged fertility, longevity, and low SCC onto the front page of breeding goals and baked fitness into modern Holsteins.
Shottle and Rudolph knit North American and European cow families together, flooding proofs with daughters that became brood‑cow factories.
Today’s genomic headliners—Captain, Paris, Snowman, Oman Oman, Bolton, and more—stack multiple lines to these sires, so every “hot” proof still sits on Golden Age foundations.
The Bottom Line – Names in the Small Print, Foundations Under Genomics
Today, when you pull up a proof sheet for a hot young bull, your eyes go straight to the genomic numbers. That’s just how the business works now. But scroll down into the pedigree, and those same old names keep peeking out of the fine print: Jupiter. Cleitus. Mountain. Durham. Goldwyn. O‑Man. Formation. Shottle. Rudolph. Marshall.
Every time you admire a Goldwyn udder, you’re seeing the echo of Walker Homestead Dawn and a New York cow family that Bill Peck insisted be “wide in the muzzle, wide in the chest, and wide in the udder.” Every trouble‑free Durham daughter in your freestall pen carries a little bit of Dellia’s creek‑bottom toughness and the Elton flush that almost went somewhere else.
Every time your herd’s somatic cell count runs lower, and cows stick around for one more lactation because of O‑Man, Rudolph, or Marshall blood, that’s the fitness revolution those bulls kicked off in the early 2000s, finally paying out in your own bulk tank. And when you see a modern sire like Genosource Captain with eleven lines back to Rudolph stacked on top of O‑Man, Goldwyn, Marshall, and Shottle, you’re not just looking at a clever genomic mating—you’re looking at three decades’ worth of cow people betting on the right kind of cows long before a computer told them they were right.
Genosource Captain and his breeding team — a barn‑aisle snapshot of the genomic era, where coverall‑clad farmer‑breeders quietly distilled Rudolph, Marshall, O‑Man, Shottle, and Goldwyn into the TPI‑topping kind of bull the old show herds could only dream about. (Read more: CAPTAIN: The Bull That Rewrote the Rules for Modern Breeding)
If there’s one equation that sums up this Golden Age, it might be the one borrowed from the Durham story: Classic = Quality + Time. Durham and Goldwyn gave the breed quality you could see from the stands at Madison. O‑Man, Formation, Rudolph, Marshall, and the Bis‑May bulls made sure that quality would still be there in ten years by hard‑wiring fitness, protein, and durability into the bones of the cow population.
So the next time you lean on the rail at Expo or flip through a proof list in the pickup with the radio low and the windows fogged, pause when you see those names in the small print. Remember the Vermont hills and the creek in Wisconsin, the Milly sale ring in New York, the Upper Peninsula snow, the British sale barns, and all those kitchen tables spread with bull pictures. These aren’t just sires. They’re the architects of the most quietly revolutionary era our breed has ever seen—and the foundation under every genomic number we chase today.
Continue the Story
From Depression-Era Auction to Global Dominance: The Picston Shottle Legacy – Explore another parallel journey of a farmer-bred legend built in the same era. This narrative honors the patient builders at Condon Farm who developed the maternal line that eventually produced the global icon, Picston Shottle.
Sire Spotlight: The Backup Bulls Who Created Holstein History – Deepen your understanding of the historical world these bulls were navigating. This retrospective examines the industry forces and “backup” status of legends like O-Man and Elevation, proving that the foundation held even when the experts looked elsewhere.
When Lightning Strikes: The Braedale Goldwyn Story That Changed Everything – Connect the line from then to now by tracing how Goldwyn carried forward the genetic engine of his predecessors. This piece highlights his lasting influence on conformation and how his impact is still visible in today’s genomic headliners.
The Sunday Read Dairy Professionals Don’t Skip.
Every week, thousands of producers, breeders, and industry insiders open Bullvine Weekly for genetics insights, market shifts, and profit strategies they won’t find anywhere else. One email. Five minutes. Smarter decisions all week.
Before you hook up the trailer this show season, ask one question: will this show budget build your herd, or someone else’s brand?
In March 2025, the Purebred Dairy Cattle Association rolled out its toughest show ring ethics overhaul in a decade — new rules on over-bagging and misrepresentation that put exhibitors on notice with real penalties. Four months later, Olortine Avenger Design hammered at $1,000,000 at the International Intrigue Sale at Butlerview Farm in Chebanse, Illinois, proving exactly how much money now rides on a single banner.
Olortine Avenger Design soaks in the moment as the judge Blair Weeks lifts her David Dyment’s arm — a million‑dollar cow proving exactly how much is now riding on one walk around the ring.
Here’s the disconnect. PDCA tightened the screws on the people holding the halter. But across most of North America, the person in the middle of the ring — the judge — still operates under rules you could fit on a napkin. When a Grand Champion title can realistically swing high six to low seven figures in lifetime genetics revenue, that gap between exhibitor accountability and judge accountability isn’t just an ethics conversation. It’s a financial one.
The Money That Changed Everything
For years, talk about politics in the show ring sounded like barn chatter. Same names. Same judges. Same faces in the backdrop. You shrugged and told your kids it was just part of showing.
The money has changed. The written standards around judging really haven’t kept pace.
To understand the stakes, start with one number: $1,000,000. That’s what GenoSource paid for Avenger Design — the VG-89 (max score) Mystique Avenger daughter who’d already earned Grand Champion at Western Dairy Expo 2025 and a major win at The Royal Winter Fair. She’ll now call Budjon home as a donor for one of the world‘s most aggressive genetics programs. By the end of that July sale, 173 live lots had crossed the ring for a total of $4,298,525, averaging $24,846.97 per head.
Design earned her price tag on merit. But her sale is the clearest proof that show ring decisions now carry business consequences that would’ve been unthinkable a generation ago.
A few months before Intrigue, World Dairy Expo’s World Classic Holstein Sale averaged $30,245 across 55 lots, including an IVF session on OCD Sheepster 23614, then the #1 GTPI female in the breed, that brought $205,000 to Oakfield Corners from Semex. That’s one donor, one lot, and it’s a bigger cheque than many parlor upgrades.
On the IVF side, the multiplication keeps stacking. When you’re talking about a donor that can produce dozens of embryos per flush and hundreds over her productive life, every extra notch of perceived “elite” status matters. Put a legitimate banner on a female like that, and every IVF session, embryo package, and daughter that walks through a sale picks up an extra shine.
Oakfield Corners Dairy has seen that effect first-hand. When Oakfield Solomon Footloose went Supreme Champion at World Dairy Expo in 2022 and returned as Grand Champion of the International Holstein Show in 2024, demand for that cow family’s genetics didn’t just rise — it spiked. A banner doesn’t create quality where there isn’t any, but it does drive more eyes, calls, and bids toward the cattle that already have it.
Meanwhile, the rule books have been rewritten — but mostly for the people on the halter, not the person in the middle.
What Changed in the Rulebook — and What Didn’t
The PDCA changes were the first major update in a decade, following a unanimous Board vote in December 2024. They covered the Show Ring Code of Ethics, Showmanship Guidelines, and the Dairy Cow Unified Scorecard,which underpin most North American dairy shows.
The revised Code of Ethics doesn’t dance around specifics. It explicitly calls out over-bagging and misrepresenting an animal’s lactation status as violations — the kind of “finesse” everyone has seen, and too many have ignored. Topline hair allowance moves from 1 inch to 1.5 inches, while the Unified Scorecard now gives fore and rear udder attachment equal 7-point weight in the mammary system section. Showmanship guidelines tighten expectations for how exhibitors lead, set up, and present animals in the ring.
World Dairy Expo followed with its own overhaul. WDE updated its Code of Ethics and Showring Policy for 2025, with changes beginning on page 24 of the Premium Book. Board President Bill Hageman said the revisions emphasize clearer rule definitions, a more efficient violation process, and a more structured approach to assessing responsibilities and penalties.
Expo’s update sits inside a broader framework. Exhibitors must agree to WDE’s Rules, Regulations, Showring Policy, and Code of Ethics as a condition of entry, and violations can lead to forfeiture of premiums, disqualification, and suspension from future shows. At the national level, the IAFE National Code of Show Ring Ethics and language, adopted by events like the Calgary Stampede, calls for violators to be barred from future competition.
For exhibitors, that’s real enforcement power on paper. For judges, there’s still a big hole.
World Dairy Expo is the exception, not the rule. Judges at Madison are nominated and voted on by exhibitors, vetted by a Judge Selection Committee, and covered under a published ethics and showring policy. Most county, regional, and even some state-level shows don’t come close to that level of structure. In those rings, judge conflicts sit in a gray zone that everybody knows is there and nobody wants to write down.
How Much Is a Grand Champion Banner Actually Worth?
This is where you stop arguing about “politics” in theory and start looking at numbers you’d actually write on a barn-sheet.
Here’s a conservative scenario. Say show-ring exposure on a cow family helps push a related sire from “good bull” to “headline” status and supports an extra per dose on 50,000 additional units over his career. That’s $500,000 in incremental semen revenue tied, at least in part, to one story that started in a show ring.
Embryos and IVF
At the World Classic, that IVF session on OCD Sheepster 23614 brought $205,000 to OCD. Embryos and pregnancies of banner cows and their close relatives routinely sell in the four- and five-figure range, especially when they combine show-ring success and high genomic rankings.
If a Grand Champion cow with a national-level resume sells even a couple of IVF sessions with a ,000–0,000premium each over what she’d have brought untitled, and moves 80–120 embryos over a few years at an extra 0–0 per embryo because of her show record, you’re easily in the 0,000–0,000 ballpark of extra revenue linked to that banner.
Auction hammer prices
The sale ring is where all of this gets cashed in at once. Avenger Design brought $1,000,000 at Intrigue on a day when the overall average was $24,846.97. That’s not just a premium; it’s a different category. Other banner-backed lots at elite sales regularly sell for well over six figures, even when the sale average is well under that.
Those cows and heifers aren’t just “pretty faces.” They come from deep cow families and strong genomic profiles. Without the banners, though, those same genetics likely don’t touch those numbers. It’s impossible to say exactly how much of each hammer price comes from the show ring versus the pedigree. It’s not a stretch to say the show record adds tens to hundreds of thousands to the value of some of these lots.
What it adds up to
On one page:
Semen premiums: a realistic scenario of $500,000 extra over a bull’s career.
IVF and embryo premiums: roughly $130,000–$300,000 in added revenue for a banner cow.
Sale-ring uplift: $50,000–$250,000+ compared with what a similar non-champion from the same family might bring.
Not every Supreme or Grand Champion reaches those numbers. Some will fall short. A few will blow past them. The point is the order of magnitude. A true national-level banner can realistically move high six to low seven figures in lifetime genetics revenue.
At that scale, a judge’s decision isn’t only about who walks first out of the ring. It’s about who gets to sell that story for the next decade.
What Does This Cost the Families Standing at the Rail?
You rarely see a family storm out of the barn and announce they’re done showing. That’s not how this industry moves.
You do see it quietly. A kid who used to live for show season suddenly has “other priorities.” A breeder who hauled a full string every year decides to stay closer to home. A trailer that used to be parked on the rail at Madison is no longer showing up.
The research backs what you hear in the aisles. A Purdue University livestock ethics study found that youth who completed an ethics curriculum improved their understanding of ethical decisions and consequences in show programs. A separate survey of 4-H and FFA youth and parents in Pennsylvania and West Virginia documented how kids view twenty-three common livestock practices; they could clearly label what’s ethical and what isn’t, and reported seeing unethical behaviour in the barn more often than adults might admit.
On your own balance sheet, the tipping point is simple barn math plus your gut.
If you’re hauling a serious multi-animal string, once you count calves, feed, entries, fuel, hotels, fitting, and a few repairs, you can easily land in the $15,000–$30,000 a year range. Over a five-year junior window, that’s roughly $75,000–$150,000. Stretch into the open divisions over a longer career, and that total can push north of $200,000.
Here’s what that looks like in your notebook:
Rough annual show-string spend for a serious family: about $20,000.
Five-year junior window: around $100,000 total.
Alternative use: that same $100,000 could be a serious chunk of a robot payment, a parlor remodel, stall upgrades, or IVF on your top 1–2% cows.
Payback: those investments work for every cow, every day — whether your kid wins the class or not.
The moment a family decides the system isn’t as fair as it should be, that $100,000 starts to feel more like tuition in someone else’s marketing program than an investment in their own herd.
If you still believe a particular show gives your cattle a fair shot and helps build your herd’s story, then spending might make sense. The night you decide the balance of fairness isn’t there, those cheques start to feel like donations.
What Would Real Accountability in the Show Ring Look Like?
A fair ring doesn’t mean you agree with every placement. That’s never going to happen. Good judges see cows differently.
A fair ring means judges walk in with clean, declared hands — no undisclosed semen contracts, consulting deals, or co-ownership ties with the cattle they’re about to sort. It means exhibitors know what will get them tossed and have seen rules enforced even when it hurts important names. It means show management can point to a real process for handling complaints, not just “we’ll look into it.”
Other industries already solved this. The American Kennel Club runs formal conflict‑of‑interest rules for judges, enforces look‑back periods of six months to a year for ownership or handling ties with exhibitors, and backs it all with an enforcement ladder that runs from formal observation to lifetime suspension of judging privileges and fines up to $5,000. A dog show. For the full AKC framework and how a dairy version could work for your show committee, watch for our upcoming accountability playbook.
For most dairy shows — especially smaller fairs and regional events — real accountability isn’t complicated on paper:
A judge conflict-of-interest disclosure form filed before the show, where judges list recent consulting, ownership, and semen/IVF relationships with exhibitors, plus clear recusal rules when conflicts show up.
An ethics committee with at least one independent voice — someone who isn’t deeply financially tied to the main exhibitors or sponsors, empowered to review both exhibitor and judge issues.
Basic exhibitor-retention tracking: how many families come once and never return, which juniors stop, which longtime exhibitors quietly scale back.
Major events like World Dairy Expo already have pieces of this in place; the real gap is at the local and regional level, where there often isn’t any written structure at all. None of this guarantees your cow wins. But it does change who takes the hit when someone crosses a line.
Is Your Show Budget Really Paying You Back?
You don’t owe anybody a trailer spot at a ring you don’t trust. But you do owe your farm an honest look at what that show budget has actually done for your herd.
If your annual show spend is creeping into the $15,000–$20,000+ bracket and you can’t point to specific semen orders, embryo deals, or sale-ring interest that came out of those appearances, it’s worth asking a tough question: Is this level of spend building your balance sheet or someone else’s brand?
The barn-sheet test is simple. Take last year’s total show spend — every dollar: fuel, entries, hotels, clipping, calves, truck repairs. Then run one scenario: if you redirected even 25–50% of that into facilities, robotic or monitoring systems, or IVF on your best cows, what does the five-year payback look like? You gain more predictable returns. You give up some backdrop photos and maybe a run at a banner. Only you can decide whether that trade still pencils out.
How Do You Pick a Ring You Can Still Trust?
You can’t fix every show. You can pick where you send your cattle.
Start with what you can see on paper. Shows that post a current Show Ring Code of Ethics, outline how complaints get handled, and explain at least the basics of how judges are selected are already ahead of the pack. World Dairy Expo, for example, posts its ethics policy, requires exhibitors to agree to its Showring Policy and Code of Ethics as a condition of entry, and explains in its materials how judges are nominated and approved. That doesn’t make Madison perfect. It does say they’re willing to be held to something.
Then look at what happens when there’s trouble. When an over-bagged udder or questionable prep job becomes the talk of the aisle, does the committee investigate and respond — or smooth it over? When a judge with a visible financial tie keeps landing the same herd on top, does anyone in a position of authority ask questions, or do they shrug?
You can’t control those meetings. You can decide whether your entries and sponsorship dollars are a vote for that culture.
Options and Trade-Offs for Farmers
You don’t have to torch your show program. But you do need to be straight with yourself about what you’re buying.
1. Keep showing — but only where the rules are real
When it makes sense: You can point to banners that translated into genetics or marketing payback — embryo sales, semen deals, or sale-ring premiums — and your kids are learning real stockmanship, marketing, and life skills. There are rings where you still feel your cattle are judged on merit.
What it requires: Getting pickier. Less “every show we can reach,” more “a few shows with real structure.” Focus on rings that follow PDCA-style ethics codes, show you an enforcement process, and publish their policies.
30-day action: Pick your top one or two target shows for the upcoming season. Call or email and ask for three things: their current Show Ring Code of Ethics, their complaint/enforcement process, and any written judge conflict-of-interest policy. If you can’t get those in writing after asking twice, treat that as a no-confidence signal and consider moving your cattle — and your cheque — somewhere else.
2. Scale back the string and put the saved dollars to work at home
When it makes sense: You like the ring, but the real engine on your farm is milk, components, and genetics — and you know most of your show spend is more passion than profit.
What it requires: Cutting back on the number of shows or animals and deliberately moving a slice of that budget into things that lift the whole herd, not just the ones that clip up well.
90-day action: Add up last year’s show costs: entries, fuel, hotels, fitting, calves, repairs, everything. Take 25–50% of that total and earmark it for one of three buckets: facility upgrades, a robot fund, or IVF on your top 1–2% cows. If a realistic five-year projection says those investments will pay back at 2:1 or better compared with what banners have done for you, you’ve got a clear direction.
3. Use your weight locally to push for judge accountability
When it makes sense: You sit on a committee, sponsor a show, or you’re a breeder whose name carries weight in the barn. People listen when you speak up.
What it requires: Being willing to push for structure in rooms where people are used to doing things by handshake.
365-day action: Pick one reform to champion at the show where you’ve got the most leverage. Three realistic starting points:
A written judge conflict-of-interest disclosure form filed before the show and kept on record.
An annual enforcement summary (even anonymized) shared with exhibitors, so they see when rules are actually applied.
One independent seat on the ethics or show committee for someone without deep financial ties to the main exhibitors or sponsors.
You may not get everything in one year. You’ll quickly find out which shows want real integrity and which want clean-looking rules.
Key Takeaways
If your annual show spend is pushing past $15,000–$20,000 and you can’t point to specific genetics or marketing payback, treat that as your trigger to run the “2:1 redeployment” test. If facilities or IVF would realistically give you twice the return that banners have, it’s time to rethink how many miles you put on the trailer.
If you ask a show twice for their ethics code, complaint process, and judge conflict policy and still get vague answers, believe what that silence tells you. That’s your clearest early signal that integrity sits below convenience in their priorities.
If your juniors come home talking more about who knows who than about clipping, fitting, and cow care, it’s time to reassess what the ring is actually teaching them. At that point, the perception of politics may be shaping your kids more than the cattle are.
If you sit on a show committee, track who doesn’t come back — not just who wins. Every time a committee chooses not to address a clear ethics concern, you may be losing families who still wanted to believe the ring was fair. The committee that counts both banners and exits is the one that can actually fix the problem.
The Bottom Line
When your kids look back on this stretch of their showing years, how do you want them to remember it — as proof that good cattle and honest work still counted, or as the moment they decided the odds were stacked in favour of someone else’s brand?
You can’t take the money out of the ring. A $1,000,000 cow makes that crystal clear. But you can decide which rings deserve your cattle, your time, and your money — and whether you’re building your own herd’s future or underwriting somebody else’s marketing plan.
If you want the deeper barn-sheet numbers on what a banner is actually worth at different herd sizes and breeding strategies, watch for the upcoming Tier 3 economics breakdown here at The Bullvine — it’ll walk the semen, IVF, and sale-ring math line by line. And if you’re on a show committee and want a concrete accountability checklist you can plug into your Premium Book this year, we’re building that playbook too, with PDCA, WDE, and other models as starting points.
So, here’s the straight-up question: Is the million-dollar banner good for the breed, or just the brand — and are you scaling back your string this year?
Judge With Confidence: The Ultimate Playbook for Dairy Cattle Judging – Arms you with the ethical framework and evaluation patterns used by elite international officials to maintain ring integrity. You’ll gain the tools to identify—and demand—the transparency and decisiveness that protect your investment’s credibility.
The Sunday Read Dairy Professionals Don’t Skip.
Every week, thousands of producers, breeders, and industry insiders open Bullvine Weekly for genetics insights, market shifts, and profit strategies they won’t find anywhere else. One email. Five minutes. Smarter decisions all week.
The plant-protein lobby pushed for a rule change that would’ve cut billions from milk payments worldwide. Jeremy Hill stopped it. Most producers have never heard his name.
For decades, the global protein scorecard was rigged — capping dairy’s score at the same level as soy and pea. One New Zealand scientist spent 15 years fixing it, and the data now proves what your bulk tank already knew. Here’s why Dr. Jeremy Hill’s work is behind the component premiums hitting your milk check right now — and why those premiums aren’t going anywhere.
Here’s something that should bother every dairy producer reading this.
For years — decades, really — the standard system for measuring protein quality capped every score at 1.0. Didn’t matter how good your protein actually was. Dairy casein, which is genuinely one of the most complete, most digestible protein sources on the planet, got the exact same grade as soy protein isolate. Same number. Same ranking. Like judging a VG-89 fourth-lactation cow on the same scorecard as a crossbred heifer and telling the market they’re identical.
Nobody questioned it. For years, the industry just… accepted this.
The man who finally said that’s not good enough — who spent 15 years championing the development of the scientific frameworks that rewrote protein quality standards and also define how protein content in your milk is measured — never actually planned on working in dairy. He was supposed to go back to medical research. He was studying liver enzymes, for crying out loud.
His name is Jeremy Hill. And what he built is now the science behind the component premiums on your milk check — and the single most powerful piece of evidence the dairy sector has ever had against plant-based alternatives.
Every producer shipping milk today should know this story.
The Guy Who Turned Right Instead of Left
There’s a road in Palmerston North, New Zealand — flat, windswept, surrounded by the kind of relentless green pasture that feeds both cows and the scientists who study them — that splits in two directions. Left takes you to Massey University. Postdocs, academic grants, the quiet hum of biochemistry labs. Right takes you into what became the Fonterra Research and Development Center — the scientific engine behind the world’s largest dairy exporter.
Sometime in the late 1980s, a young British biochemist named Jeremy Hill stood at that fork. PhD in medical research. Specialty in liver enzymes. The plan was always medical research.
But here’s how dairy gets its hooks in you.
Hill had done an undergraduate project years earlier — modifying yeast to produce cocoa butter-like fats using whey as a feedstock. “Stone age techniques compared to today,” he says now with a laugh. But that project was essentially precision fermentation before the venture capitalists gave it a fancy name. When his PhD wrapped up, his department head offered a postdoc based on that earlier dairy work. Hill took it — not because he saw a future in dairy, but because he needed a paycheck between medical gigs.
“To be quite frank,” Hill tells me, “I saw that as just a temporary gig before I would move back into medical research.”
That temporary gig deposited him in New Zealand. His wife picked up a teaching job. They liked the lifestyle. Hill started crossing the road to Fonterra’s facility — their gear was better than Massey’s, and the coffee was decent — got to know the protein chemistry team, and one day the department head said, “Hey, we’ve got a scientist role. Interested?”
You’d think a guy studying liver enzymes would have nothing to say about your milk check. Stick with me.
That was 1989. He’s still there. Talking to Hill via video from the Palmerston North campus — you can practically hear the New Zealand rain against the windows — you’d never guess this was supposed to be temporary. Thirty-five years, 100-plus patents, a Queen’s Birthday Honour, and the distinction of being the only New Zealander ever to lead the International Dairy Federation later, Jeremy Hill has, as he puts it, “probably become a dairy person.”
Yeah. Probably.
The Protein Scorecard Nobody Questioned — Until He Did
Alright, here’s where this gets directly relevant to anyone watching their component numbers.
For decades, the global standard for measuring protein quality has been PDCAAS — Protein Digestibility-Corrected Amino Acid Score. Sounds rigorous, right? Here’s the problem: PDCAAS had an artificial ceiling. It capped at 1.0. So dairy protein — which is demonstrably, measurably superior in essential amino acid profile and digestibility — scored the exact same as several plant proteins that weren’t remotely in the same league.
The industry had been playing on a rigged scoreboard. But nobody in industry or regulatory bodies was pushing for change.
Hill pushed. And then he spent 15-20 years championing the development of a replacement.
It wasn’t easy. And it wasn’t cheap. The thing that gets me about this story is how long it took the broader industry to get behind the investment. Hill championed this through a partnership with the Riddet Institute at Massey University, drove it into a public-private partnership with the New Zealand government, and then sponsored it into the Global Dairy Platform to globalize it. Every step required convincing people that spending money on long-term nutrition science — with returns 10 or 15 years out — was worth it. There were skeptics. There were always skeptics. Processors who didn’t want to fund research with a decade-long horizon. Co-ops that figured the old system was “good enough.”
“For it to be credible,” Hill explains, “it can’t just be about how it works with milk. You have to do it across different sources of food. You have to move from animal models into confirming that it works from a human nutrition perspective. That takes a lot of time. It’s also expensive.”
The result was DIAAS — the Digestible Indispensable Amino Acid Score. It removed the cap. It measured individual amino acids rather than total protein. And critically, it assessed digestibility at the ileal level — meaning it tracked how much of each essential amino acid your body could actually absorb and use, not just how much appeared on a nutrition label.
I don’t normally get worked up about nutrition tables. This one’s different. Here’s what the scoreboard looks like when the system isn’t rigged — all values on the same scale, FAO 2011 reference pattern (ages 0.5–3 years), from peer-reviewed research published in the British Journal of Nutrition (Mathai et al., 2017) and Nutrients (Hertzler et al., 2020):
Protein Source
DIAAS (%)
FAO Quality Classification
Whey protein isolate
109
Excellent
Whole milk
108
Excellent
Whey protein concentrate
107
Excellent
Milk protein concentrate
101
Excellent
Skimmed milk powder
92
Good
Soy protein isolate
84
Good
Soy flour
79
Good
Pea protein concentrate
62
No quality claim
Wheat
45
No quality claim
Oat
44
No quality claim
Look at that spread. Whey protein isolate — 109. Pea protein concentrate — 62. Oat protein — 44. Under the old PDCAAS system, soy scored a perfect 1.0, right alongside milk. Under DIAAS, the truth comes out: soy isolate scores 84, which is “good” but not “excellent.” Pea can’t even make a quality claim.
Some people have credited DIAAS as the greatest tool the dairy industry has ever possessed against plant-based competitors. Hill’s been told he “didn’t win the nutrition war — he changed the battlefield.”
And here’s the part that should make every producer angry: if the broader dairy sector had funded this work faster — if the industry had gotten behind nutrition science with the same urgency it brings to trade negotiations or quota disputes — this tool could have been ready years earlier. Instead, it arrived just in time for the plant-based wave because one scientist and a handful of collaborators had the stubbornness to keep pushing while everyone else figured the old system was fine.
The Protein Quantity Fight You’ve Never Heard About
So that was the protein quality side of Hill’s work. But here’s the thing — there’s a second front in this battle that hits your milk check even more directly, and most producers have never heard a word about it.
Standard-setting agencies have been under constant pressure from the vegetable and plant protein industry to change how protein quantity is measured. The push has been for a “convenient” one-size-fits-all method that would see a 2% downward change to how milk protein content is determined — and up to a 10% upward change in how some plant protein content is determined.
Think about what that means for your payment. A 2% downward shift in how your milk protein is measured, applied across the entire global dairy sector, would wipe billions off milk payments. Billions. Not hypothetically — that was the trajectory if the plant protein lobby had gotten its way.
They didn’t. By bringing the best available evidence to bear, undertaking and publishing new research, the dairy sector under Hill’s leadership has been able to prevent that unjustified change.
So when we talk about Hill’s legacy, it’s not just that he proved dairy protein is better than the alternatives. He also fought to make sure the way your protein is counted wasn’t quietly rigged against you. Quality and quantity. Both battles. Both won — for now. And most of the industry doesn’t even know it happened.
Why This Protein Science Is Hitting Your Milk Check Right Now
The thing is, Hill’s protein quality work didn’t land in a vacuum. It landed right in the middle of the biggest protein demand surge the food industry has ever seen.
The numbers coming out of early 2026 are staggering. CoBank’s January report shows 70% of American consumers now actively seek more protein in their diets — up from 59% in 2022. Ready-to-drink dairy protein shake sales have climbed 71% in four years, from $4.7 billion to $8.1 billion. Cottage cheese — which, let’s be honest, was a punchline five years ago — posted over 51% year-on-year growth in some markets, with demand so intense producers couldn’t keep up. TikTok, of all things, drove cottage cheese into a supply shortage in 2025.
IDFA called 2025 “one of American dairy’s strongest years,” with consumption growth led by value-added products such as milk, yogurt, cottage cheese, and butter.
And right here at home? Farm Credit Canada’s 2026 outlook flagged that Ontario is now staring down a protein deficit— demand for high-protein dairy products grew so significantly through 2025 that production couldn’t keep pace. Agropur just reported improved profitability in fiscal 2025, driven by the strength of its enriched dairy products.
Then there’s what dropped on January 7, when the USDA and HHS released the new 2025–2030 Dietary Guidelines for Americans. The recommended daily protein intake for adults jumped from 0.8 g/kg body weight to 1.2–1.6 g/kg — a 50–100% increase in what the U.S. government says you should be eating. The guidelines also specifically call for three daily servings of full-fat dairy with no added sugars. For dairy processors and the producers supplying them, that’s a massive tailwind.
And the GLP-1 effect. If you haven’t been tracking this, you should be — as we reported in our GLP-1 deep dive last year. Twelve percent of U.S. adults are now on appetite-suppressing drugs like Ozempic, with cheaper pill versions hitting the market this year that could push adoption significantly higher. If that sounds like bad news for food demand, it’s not. Research shows that GLP-1 users increased their spending on yogurt, protein bars, and other nutrient-dense foods. When you eat less overall, nutrient density matters more. You can’t afford empty calories when your appetite is chemically suppressed. You need the most nutritional bang per bite.
If that feels like the goalposts moving again just when you figured out the last shift… you’re right. But this time, the movement favors exactly what you’re already producing.
Hill saw this coming. “If we’re going to eat less, then nutrient density and richness and quality of diets becomes really important,” he says. “I think there is a right for dairy in that space, and a big one.”
60 Million Years of R&D — and the Cow Still Wins
Hill’s perspective on why dairy protein is so extraordinary gets at something deeper than amino acid tables. And this is where his medical research background — that left turn he almost took — actually pays off.
“Sixty million years of evolution has evolved this food to be the sole source of nutrition when we’re at our most vulnerable from a developmental perspective — body, mind, and everything,” he says, and Hill leans into this point like a man who’s made this argument in government offices and boardrooms for a decade. “So it shouldn’t be surprising that it’s full of these great nutrients and bioactivities.”
Think about that. Milk didn’t come out of a laboratory or a venture capital pitch meeting. It was refined over geological time by the most ruthless quality-control system in existence: survival. If milk failed to deliver complete nutrition to the most vulnerable members of a mammalian species, that species went extinct. Full stop. Every load you ship is the product of 60 million years of evolutionary R&D.
Dairy is the number one source of at least half a dozen essential nutrients in the human diet. In modeling work Hill’s been involved in — covering dozens of nutrients — dairy ranks in the top five sources for 20 to 30 of them. It contains bioactive compounds, such as lactoferrin, with antiviral, antibacterial, and immune-stimulatory properties.
And here’s the line that deserves to be painted on the wall of every dairy boardroom and co-op office on the continent:
“It’s naive to look at nutrition with just the protein paradigm,” Hill argues. “The value of dairy is the great protein and what comes with it.”
Protein plus calcium plus B vitamins plus zinc plus iodine plus phosphorus plus a constellation of bioactives working in concert. That’s not a commodity. That’s a nutritional ecosystem.
As Hill dryly observes, dairy was produced as food. Meat, by contrast, “is actually produced as a muscle and only becomes food when it doesn’t move fast enough.”
He gets a laugh with that one. But the distinction matters—and it brings us to the question of precision fermentation.
A Bullvine Reality Check on Precision Fermentation
Hill was literally doing precision fermentation before it had a name — his undergraduate yeast project in the UK was the same concept. His assessment after decades on both sides? “I do not believe, and I haven’t seen the evidence, that this technology will disrupt the dairy industry. Even though we’re heavily involved in it. We see it playing a nice complementary role.”
His reasoning is compelling: the mammary epithelial cells in a cow’s udder produce their own weight in protein every single day, while simultaneously generating fats, sugars, minerals, bioactives — the whole nutritional ecosystem — in a self-sustaining biological system powered largely by grass and sunlight. Replicating that in a bioreactor remains, frankly, a fantasy at commercial scale.
And the market data backs him up — at least partially. The plant-based alternatives that were supposed to revolutionize the food system have been on shelves for 10, 15, or even 20 years. They’ve found a niche and plateaued.
But here’s the Bullvine’s editorial note on this: We’re less sanguine than Hill on the precision fermentation timeline. Our own reporting suggests that commodity dairy faces real disruption risk over the next decade, particularly for ingredient-grade proteins, where PF firms are approaching cost parity. Hill’s argument that the cow remains the most efficient protein ecosystem on earth? That’s hard to argue with. But if you’re a commodity producer shipping bulk powder to a co-op with no value-added strategy, the PF threat warrants more caution than “complementary” suggests. Keep your eyes open.
The Methane Vaccine: Dairy’s Environmental Game-Changer
Let’s talk about the methane in the rumen.
Hill has publicly called a methane vaccine a potential game-changer for our industry. Not as wishful thinking — as a strategic assessment rooted in one word: ubiquity.
Most other methane-reduction tools are context-specific. Feed additives like 3-NOP work great in a TMR system — precise dosing, consistent delivery, specialized supply chains. Perfectly viable for a 2,000-cow operation in Wisconsin or a 500-cow barn in Oxford County. Completely impractical for a smallholder milking three cows outside Rajasthan.
A vaccine? Administer it once or twice a year. Works across dairy, beef, and sheep. Works in pasture systems, confinement operations, and the approximately one billion livelihoods that depend on dairy globally — a figure from the 2016 FAO Dairy Declaration of Rotterdam, which Hill himself co-signed with the United Nations.
Imagine walking into a policy meeting where the first question isn’t about your carbon footprint. When environmental regulators come knocking — and they will — that declaration is the reason dairy has scientific standing in the room.
The science is moving fast. ArkeaBio — backed by over million in total funding and now running second-generation formulations with Texas A&M — has confirmed that its vaccine successfully reduces methane by targeting methanogen microbes in the rumen. Full field trials are targeted for 2026–2027. New Zealand’s AgriZeroNZ has committed $73.4 million across its emissions portfolio as of December 2025, with the methane vaccine as a centerpiece. And India’s National Dairy Development Board is sponsoring parallel development — because this is a global race.
“Probably not the only tool,” Hill says carefully. “We may need a number of tools to stack them, and of course, in concert with practice improvements.”
But his larger point — and this is where producers need to lean in — is that the environmental conversation can’t be separated from the nutritional one. If dairy provides irreplaceable nutrition to billions of people, then the imperative isn’t to eliminate dairy production. It’s to make it cleaner. And the data on that front is better than most people realize.
The 72% Surge You’re Not Hearing About
Here’s a number that should reshape how you think about your herd’s future.
72% — the increase in U.S. milk solids per cow between 1990 and 2020 (USDA/NASS). New Zealand achieved gains above 60% over the same period. That’s your best productivity AND sustainability argument in a single number.
In a single generation, the North American dairy cow became nearly three-quarters more productive on a components basis. Not through some radical disruption. Through the compounding, relentless application of better genetics, better nutrition, better management — the blocking and tackling of good dairy science applied consistently over decades.
“A good way of looking forward at what might happen from a productivity point of view is to look back 30 years,” Hill says.
And here’s the correlation that doesn’t get nearly enough attention: a high-component cow is also a high-efficiency cow from a methane-per-unit-of-production standpoint. The goals sync up. Every 1% increase in components per cow is effectively a 1% decrease in methane per unit of nutrition produced. Producing more nutritionally dense milk from fewer inputs isn’t just good economics — it’s your best sustainability story right now.
This is hitting the payment system hard. Canada’s component pricing — where protein commands $9.70/kg in Class 3(d) — is already incentivizing exactly the kind of production Hill’s research validates. Hill acknowledges New Zealand is ahead on this: “I think you guys are a little ahead of us there… but that is where the biggest change is coming.” The U.S. is catching up.
So here’s the uncomfortable question the dairy industry needs to ask itself: if we’ve known about the component value story for this long, why did it take this long for payment systems to reflect it? And how much milk check money did producers leave on the table in the meantime?
So what do you do with all of this? Here’s how Hill’s global insights translate to decisions at your farm gate — and honestly, some of this is stuff the industry should have been shouting from the rooftops years ago.
Stop measuring the wrong thing. If you’re still evaluating your herd on litres of fluid milk rather than kilos of components, you’re farming in 2005. With Canadian protein premiums at $9.70/kg and U.S. processors scrambling for high-protein ingredients, the cows in your herd that test high on protein and fat are your most valuable assets — period. If your breeding decisions aren’t prioritizing component yield in 2026, you’re not leaving money on the table. You’re writing your own exit notice.
Understand the GLP-1 demand shift. This isn’t a fad. Twelve percent of U.S. adults are already on these drugs, with cheaper pill versions launching this year. Users eat less but spend more on protein-dense dairy. The market is shifting from volume to value — and your high-component milk is the raw material processors need to meet it.
Play offense on sustainability, not defense. Hill’s central argument is that dairy’s nutritional irreplaceability is the basis for the sustainability argument. A methane vaccine could be commercially available within five years. In the meantime, your productivity gains are already your best environmental story. Document them. Talk about them.
Know the protein quality numbers. DIAAS is increasingly referenced in dietary guidelines and trade policy — and now the 2025–2030 U.S. Dietary Guidelines are explicitly calling for higher protein intake and three daily servings of full-fat dairy. When someone at the dinner table or in a policy meeting says oat milk is “just as good,” the peer-reviewed data says otherwise. Whole milk DIAAS: 108. Oat: 44. That’s not a competitive gap. That’s a canyon. Know these numbers. Make your MP, your congressman, your county councillor see them.
Don’t ignore precision fermentation. We covered our concerns above—if you skimmed that section, go back and read it. The short version: Hill’s optimistic, we’re more cautious, and either way, the best defense is moving up the value chain.
The Legacy That Actually Matters
Ask Jeremy Hill about his proudest achievement, and he doesn’t mention the DIAAS standard, the Rotterdam Declaration, his cheese technology patents, or even the Queen’s Birthday Honour. He talks about people.
“The real legacy is the impact that you’ve had on the people and perhaps the way they’re thinking in the future,” he says.
Then he tells you a story about his son. As a teenager, the kid was an elite swimmer — setting New Zealand records, stacking national titles. One day, he looked at his dad and said: “Dad, all the sports people are forgotten. But those scientists that have something named after them — they’re remembered.”
Hill still marvels at it. That son went on to earn dual degrees in biotechnology and chemical engineering. Hill jokes that he’ll leave it to the next generation to establish “a unit called a Hill”—and if it exists, it should measure “the level of perspiration associated with innovating.”
It’s a funny line. But underneath it is a truth every dairy producer understands instinctively: the things worth building take decades, not quarters. The DIAAS standard took 15 years. The Rotterdam Declaration required a career’s worth of credibility. The methane vaccine has been in development for over a decade. None of it was fast. All of it mattered.
Hill finishes his book Legendairy with a line that should be painted on the wall of every dairy boardroom, every farm office, every ag policy department on the continent:
“If dairy was invented today by some agritech startup, it would be seen as the greatest blockbuster in the history of food.”
We live in an era that worships disruption and pours billions into lab-grown alternatives to foods that already exist. And the most nutritionally dense, most versatile, most evolutionarily perfected food source on earth — supporting a billion livelihoods, anchoring the world’s most valuable agricultural sector, now riding the biggest protein demand wave in history — is sitting right there. In your parlor. In your bulk tank. On pastures from the Waikato to Wisconsin to Woodstock, Ontario.
The industry doesn’t need to invent its blockbuster. It needs to stop being so damn quiet about the one it already has.
Sometimes the right move isn’t the new move. Sometimes it’s just turning right instead of left—and spending 35 years making sure the world can’t look away.
Is the dairy industry doing enough to tell its own protein quality story? Or are we still letting oat milk and pea protein control the narrative with inferior science? We want to hear from producers on the ground—drop your take in the comments.
KEY TAKEAWAYS
For decades, the global protein scorecard hid how far ahead milk really is — DIAAS puts whole milk at 108 vs oat at 44 and pea at 62.
Jeremy Hill spent 15+ years driving DIAAS and fighting plant protein lobby moves to change how milk protein is measured, protecting billions in potential milk payments.
Higher protein targets in the 2025–2030 Dietary Guidelines, 70% of consumers chasing more protein, and 12% of adults on GLP-1 drugs all point the same direction: high-component dairy is in demand.
A 72% jump in milk solids per cow since 1990, plus a methane vaccine on the horizon, gives dairy a powerful sustainability story when you talk emissions per kilo of nutrition, not per cow.
The producers best positioned for the next decade will breed and feed for components, get their milk into value-added protein products, and know the DIAAS numbers when they’re up against plant-based and precision-fermentation claims.
Dr. Jeremy Hill has spent 35+ years at Fonterra turning dairy science into dairy ammunition — from protein quality and quantity standards that rewrote global nutrition policy to cheese technology patents that transformed how the QSR industry sources its products. He’s the only New Zealander to serve as IDF President (2012–2016), an adjunct professor at Massey University’s Riddet Institute, a Member of the New Zealand Order of Merit, and author ofLegendairy. His work shapes how the entire sector talks about protein, sustainability, and the future of food.
Continue the Story
Frank Mitloehner: Clearing the Air on Cattle and Climate – He wrestled with the same vital question: how do we defend an industry being buried by bad data? This profile follows another scientist who stepped out of the lab to become a fierce, data-driven champion for producers worldwide.
Precision Fermentation: The $100 Billion Threat to the Dairy Industry? – Carrying forward the debate on Hill’s “evolutionary R&D,” this deep dive examines the next chapter of the Cow vs. Lab battle. It’s essential reading for every producer wondering if the bioreactor will ever truly outrun the rumen.
The Sunday Read Dairy Professionals Don’t Skip.
Every week, thousands of producers, breeders, and industry insiders open Bullvine Weekly for genetics insights, market shifts, and profit strategies they won’t find anywhere else. One email. Five minutes. Smarter decisions all week.
At $3,500 a head, every unnecessary cull hurts. A 1,700-cow operation cut udder-health culls from 1-in-3 to 1-in-7 — saving ~$189K/year on replacements.
Your most profitable cow probably isn’t the one producing the most milk right now. She’s the one who sticks around long enough to pay back what she cost you — and then some. At $3,500 per replacement heifer, dairy cow longevity isn’t a soft welfare talking point. It’s a financial strategy.
That’s a hard sell in an industry that’s spent two decades optimizing for peak lactation production. Push for genetic gain, cull aggressively, slot in a superior replacement, repeat. The logic held when a springer heifer ran you $1,200. It holds a lot less at $3,500.
A peer-reviewed study published in the Journal of Veterinary Health Science (Herrema et al., Vol. 4, Issue 3, 2023) analyzed 162,057 milk production records across 1,208 Dutch farms and 213,047 animals. Farms using a biofilm-disruption protocol — quorum sensing inhibition, which we’ll unpack — averaged €1,578 more profit per cow over her lifetime (roughly ~$1,700 USD at near-parity exchange rates; the study was conducted in the Netherlands, and all financial figures are in euros) and saw a 23% reduction in culling probability. The statistical confidence in that culling number? A P-value of 1e-46. The odds of it being a fluke are effectively zero.
Full disclosure: the longevity study was conducted using AHV International’s proprietary protocols, and AHV co-authored the research. We’ll flag where the data comes from, AHV’s own analysis versus independent sources throughout. The dataset is large enough — and the supporting evidence broad enough — that the economics deserve a serious look regardless.
The Replacement Math That Changed
USDA’s January 2025 cattle inventory report put dairy replacement heifer inventory at 3.914 million head — the lowest since 1978. CoBank’s August 2025 Knowledge Exchange report tracked heifer prices climbing from $1,720 per head in April 2023 to $3,010 per head by mid-2025, with quality animals in California and the Upper Midwest clearing $4,000. This isn’t a blip. CoBank projects the shortage won’t meaningfully ease before 2027.
So you’re spending ,000–,000 to replace a cow that — if she’d stayed healthy through her 4th and 5th lactation — had already paid back her rearing costs and was producing at or near her lifetime peak. Studies estimate that 50% to 70% of dairy cows are forcibly culled at 4 to 5 years of age (Gosselink et al., 2008, V-focus). The average U.S. dairy cow lasts roughly 2 to 3 lactations (Pinedo et al., 2014, Journal of Dairy Science, 97(5)). The Dutch average, as tracked by CRV, is closer to 6 years (CRV, 2022). Research on the economically optimal replacement age varies — some analyses suggest 5 to 6 parities, while others put it as high as 8 to 9 lactations depending on genetics and carcass values (Evers & de Haan, 2017).
As Dr. Albert DeVries at the University of Florida has noted, U.S. dairy cows in the 1930s often had productive lives of 5 to 10 years after first calving — now that number is under 3 years. Replacement prices reaching record levels make that shortened productive life more expensive than at any point in the industry’s history.
Either way, the gap between optimal and actual productive life is where the €1,578 lives. And at $3,500+ per heifer, that gap got a lot more expensive.
What 162,000 Records Actually Showed
The Herrema et al. (2023) study is worth slowing down on. It’s unusually large for a longevity study, and the methodology is more rigorous than most.
Researchers compared 64,467 cows from 3,171 farms using AHV’s quorum-sensing inhibition protocol against Dutch national averages from CRV, the country’s official herd recording organization. They built separate XGBoost machine learning models for treated and non-treated groups—a counterfactual approach that adjusts for confounding factors like age at first treatment. One caveat: farms self-selected into the AHV protocol, so the dataset may partly reflect operations already focused on herd health. The counterfactual modeling addresses some of that, but observational studies can’t fully control for management quality. That said, 64,467 animals benchmarked against CRV national records is a scale that smooths out much of the individual-farm variation. The differences were statistically significant at levels orders of magnitude below p ≤ 0.001.
Metric
QSI Protocol Farms
Dutch National Avg (CRV)
Average cow age
6.59 years
5.74 years
Average lactations completed
4.1
3.3
Culling probability reduction
23% lower
Baseline
Additional profit/cow (lifetime)
+€1,578 (~$1,700 USD)
—
Longevity improvement
+0.7 years (8.5 months)
—
The paper’s ROI section used FrieslandCampina milk pricing (Milk Fat: €300/100 kg; Milk Protein: €595/100 kg) to calculate lifetime revenue. AHV-treated cows produced 43,881 kg of milk over their lifetimes, versus 35,228 kg for non-treated cows — a difference of 8,653 kg. That translated to €0.50 more revenue per day of life (€6.37 vs. €5.87), totaling €1,578 in additional lifetime profit from milk revenue alone.
A Benelux subset of 2,161 cows in AHV’s Trial Information Sheet (TIS, 2024) analysis further extended the picture: a 19.8% lower replacement rate on top of the production gains. Factoring in replacement savings, AHV’s own analysis pegs total lifetime ROI at 11.1:1 — approximately €310 (~$335 USD) invested per cow returning €3,447 (~$3,720 USD) through additional milk revenue, reduced replacement spend, fewer hospital pen days, and lower treatment costs. That broader ROI comes from AHV’s TIS marketing analysis, not the peer-reviewed paper. The paper supports the milk-revenue component; the replacement cost savings are AHV’s calculation.
A companion study published in Smart Agricultural Technology (Streefland, Herrema & Martini, 2023, Vol. 6, p.100302) — Elsevier-indexed — validated the milk-yield findings using a Gradient Boosting model with prediction errors under 2.5%, confirming improved yield across all three dairy companies in the trial.
One more journal note: the Journal of Veterinary Health Science (OPAST Publishers) isn’t top-tier—it’s not indexed in PubMed or Scopus. But the Elsevier-published companion validation and the sheer size of the CRV-benchmarked dataset give the production findings more weight than the journal alone would suggest. The direction aligns with independent, peer-reviewed research consistently showing that involuntary culling before optimal age is one of dairying’s largest unmanaged cost centers. The Bullvine’s own deep dive into the hidden costs of shortened productive life mapped this same tension between genetic progress and longevity economics — and that was before heifer prices hit $3,500.
Why Your Best Cows Keep Leaving Before Their 4th Lactation
You know the cow. She freshened well, bred back, and hit her stride in 2nd lactation. By her 3rd, she’s putting serious milk in the tank. Then she picks up clinical mastitis. You treat it. She clears. Two months later, it’s back. Treat again. By the time she’s chronic, she’s on the cull list — not because she can’t produce, but because you can’t keep her healthy.
That treat-clear-relapse-cull cycle is the single biggest driver of premature exit from the milking herd. USDA/NAHMS 2018 data pegs total U.S. removal rates at 37.6% for Northeastern herds — 31.4% live culls plus 6.2% death loss. Only about 26.8% of those removals are voluntary. The rest are forced. Udder health, fertility, and lameness lead the involuntary list.
Here’s what’s actually happening inside those chronic mastitis cases: biofilms. Structured communities of bacteria coating tissue surfaces — think of the slime layer inside an old water pipe, except it’s growing in udder tissue. Biofilms contribute to roughly 80% of chronic and recurrent microbial infections. And bacteria sheltered inside a biofilm show 10 to 1,000 times greater antibiotic resistance than the same bacteria floating freely.
That’s why your antibiotic treatment clears the clinical flare-up but never fixes the underlying problem. You’re killing the bacteria that ventured outside the biofilm. The colony inside it barely notices. The cow clears clinically and returns to the string. Six weeks later, she’s in the hospital pen again. Eventually, she’s on the truck.
What Changed on a 1,700-Cow Dairy
As Dr. Gertjan Streefland, a veterinary microbiologist and AHV’s founder, puts it: “Imagine a group of troublemakers. Blindfold them and make them deaf — they can’t coordinate, and they’re immediately harmless. That’s what we do to the bacteria. We don’t kill them. We cut their communication so they can’t organize.”
That’s quorum sensing inhibition — QSI — in one sentence. Instead of killing bacteria (which hasn’t worked against biofilms for decades), QSI disrupts the chemical signaling bacteria use to coordinate biofilm formation. Block the signal, and bacteria can’t build their protective shield. The cow’s own immune system handles the rest.
AHV’s patented approach uses an allium-derived (onion plant) extract, screened and concentrated in their own BSL-2 lab for the specific fraction with the highest impact on quorum sensing. It’s delivered orally — no injections, no intramammary tubes, no withdrawal periods. RTI Laboratories tested the compounds on field bacteria from cows with active udder health issues — both gram-positive and gram-negative strains — and confirmed biofilm inhibition without the development of antimicrobial resistance.
That last point matters. A lot.
One producer started at dry-off. Another focused on fresh cows. Both saw the same downstream effect.”
On a 1,700-cow dairy, the full udder health turnaround took two years, with fresh cow protocols running for 14 months. That timeline is honest — this isn’t a 30-day fix. But within that window, udder health culling dropped from 1 in 3 to 1 in 7. The result: 10 to 12 additional cows in his daily milking string that would’ve been on the cull truck. Today, 17% of his herd exceeds 5 lactations.
“Come back in 5 years, and I’m extremely confident that we will be using AHV protocols. It just makes sense from a herd health and financial standpoint.” — Large-herd dairy operator.
These results aren’t the only North American data. A 2024 multi-farm trial (AHV TIS, 2024) across 8 U.S. operations— ranging from 1,000 to 20,000 cows, totaling 4,495 trial animals — showed a 34% reduction in metritis incidence, 3.2 kg/day (~7 lbs/hd/day) more milk in the first 100 DIM, and a positive ROI of €160.76 (~$174 USD) per cow(5.04:1 return) using a transition protocol built on the same QSI platform. A separate 2024 trial (AHV TIS, 2024) across farms in California, Idaho, and Wisconsin — 2,703 cows — showed a 14% reduction in udder health issues and a 70% reduction in mortality rate in the first 60 DIM.
How Much Does Involuntary Culling Cost a 500-Cow Dairy at $3,500 Heifers?
Let’s walk the barn math. Plug in your own numbers where yours differ.
Starting assumptions:
Current cull rate: 35% (USDA/NAHMS 2018 pegs total removal at 37.6% for NE herds; 35% is conservative)
Replacement heifer cost: $3,500
Annual replacements: 500 × 0.35 = 175 cows
Annual replacement spend: 175 × $3,500 = $612,500
With a 23% reduction in culling probability (matching the Herrema et al. study average):
New effective cull rate: 35% × 0.77 = ~27%
Replacements needed: 500 × 0.27 = 135 cows
New annual spend: 135 × $3,500 = $472,500
Saved: $140,000 per year on replacement costs alone
That’s 40 cows that stayed in the string instead of hitting the truck. At 4th- and 5th-lactation production levels, those cows are converting feed more efficiently than any first-calf heifer in the replacement pen.
Now the numbers from that 1,700-cow dairy. His improvement was specifically in udder health culling — from 1-in-3 to 1-in-7 as a share of total removals. That’s a different calculation than the 23% total-cull reduction from the study, and it’s important to keep the two separate. USDA/NAHMS data shows udder health issues account for roughly 18–19% of all culling decisions. On a 1,700-cow herd running ~33% overall cull rate, that’s approximately 104 udder-health culls per year. Cut that roughly in half — which is what moving from 1-in-3 to 1-in-7 approximates — and they eliminated about 54 udder-related replacements annually. At $3,500 per heifer, roughly $189,000 in avoided replacement cost per year. And that’s just the udder piece.
With each additional lactation you keep a cow, there are fewer slots for a genomically superior replacement. If you’re running an aggressive genetic improvement program, extending cow life slows the rate of genetic gain. That trade-off is real.
But at what heifer price does it flip? At $1,200 heifers, rapid turnover for genetic gain penciled out for most herds. At $3,500, with a shortage projected through at least 2027, the breakeven has shifted. A 2025 analysis in Animals (MDPI) found that many early replacement decisions remain economically justified when accounting for genomic values and beef-on-dairy carcass premiums. So this isn’t a blanket “never cull early” argument. It’s a targeted one: if a cow is leaving your herd involuntarily for a chronic health issue that’s treatable, and she had two or more profitable lactations ahead of her, the math at today’s heifer prices says you’re almost certainly losing money on that transaction.
For many operations, the crossover point may now sit closer to lactation 3.5 or 4 than the industry has assumed — though your number depends on your genetics program, your replacement costs, and what a cull cow brings at auction.
What This Means for Your Operation
Day 1: Calculate your current average productive life in lactations. If it’s under 2.8, you’re below even the U.S. average, and this analysis applies directly to your herd. This takes five minutes in your herd management software.
In the next 30 days: Pull your involuntary cull rate for the last 12 months, separated by reason code. If udder health culls represent more than 25% of your total removals, you’ve found your single biggest margin leak. Two hours in DairyComp or PCDART. Cost: zero.
In the next 90 days: Run the replacement-cost math against your actual cull reasons. Rank them by economic cost per cull, not by frequency. One udder health cull that removes a 3rd-lactation cow producing 90 lbs/day costs more than three voluntary culls of open heifers. Multiply your involuntary udder culls by your current heifer price. That’s the number you’re managing against.
Over the next 365 days, evaluate a biofilm-aware protocol for your chronic and recurrent clinical cases. Start with a defined cohort — your hospital pen repeat offenders or your 2nd+ lactation cows entering dry-off. At ~€310 (~$335 USD) per cow invested, per the study’s protocol, the costs for a 100-cow pilot cohort run ~$33,500. Budget that against your projected replacement savings. The two-year timeline from that dairy timeline is realistic for a full udder-health turnaround at the herd level. They started at dry-off. They started with fresh cows. Both approaches built evidence before scaling. Benchmark against your own 12-month baseline before deciding on a herd-wide rollout.
Two thresholds to know: If your involuntary cull rate is already below 20% and your bulk tank SCC sits under 150,000, the marginal return from a biofilm-focused protocol is smaller — this math hits hardest for operations where chronic, recurrent cases are driving the cull truck. Conversely, if your average productive life already exceeds 3.5 lactations and your replacement rate sits below 28%, you’ve captured much of the low-hanging fruit. The biggest gains land on herds stuck between high involuntary culling, sound genetics, and cows leaving before they should.
Key Takeaways
If your udder health culls exceed 25% of total removals, run your replacement-cost exposure before your next management meeting. At $3,500 per heifer, that’s your single largest controllable cost center — and it’s probably bigger than you think.
Before adopting a biofilm-disruption protocol, ask two questions: Does your chronic/recurrent mastitis pattern match the biofilm profile these protocols target? And can you commit to two-year evaluation timeline? This isn’t a 30-day fix. Budget ~$335/cow for the pilot, benchmark your own baseline, and let the data accumulate.
The €1,578 (~$1,700 USD) lifetime profit figure is based solely on milk revenue, calculated using FrieslandCampina pricing for 64,467 cows. Factor in replacement savings from a 19.8% lower replacement rate, and AHV’s own analysis puts total lifetime ROI at €3,447 (~,720 USD) per cow. The dataset is large, and the direction is consistent with independent research—but AHV co-authored the study. Weigh accordingly.
Run your own breakeven: At what heifer price does keeping a healthy 3rd-lactation cow beat replacing her with a genomically superior heifer? If you don’t know that number for your operation, that’s the first calculation worth doing.
The Bottom Line
The dairy industry spent 20 years optimizing for peak milk per lactation. The economics of 2025 and 2026 may be forcing a different optimization: peak lifetime value per stall. With heifer inventory at a 47-year low and replacement prices that CoBank doesn’t expect to ease before 2027, every involuntary cull carries a price tag that would’ve seemed absurd a decade ago.
A 1,700-cow operation answered the longevity question two years ago. Others came in through dry-off protocols. Your answer might differ, but the replacement math stays the same. What’s your involuntary cull rate, and what would a 5-point drop be worth at your current heifer price?
Complete references and supporting documentation are available upon request by contacting the editorial team at editor@thebullvine.com.
Learn More
Beef-on-Dairy’s $6,215 Secret: Why 72% of Herds Are Playing It Wrong – Capture an extra $4,200 in monthly revenue with this precision blueprint that stops the breeding guesswork, arming you with the specific reproductive “guard rails” needed to turn your Monday-morning breeding list into a high-margin profit center.
Beef-on-Dairy’s $3,000 Trap: 800,000 Missing Heifers and Who Pays the Bill – Protect your equity against a structural 800,000-head replacement deficit as this analysis exposes the upcoming supply collision, delivering the market intelligence you need to navigate $4,100 price tags and secure elusive processor partnerships before the window slams shut.
Every week, thousands of producers, breeders, and industry insiders open Bullvine Weekly for genetics insights, market shifts, and profit strategies they won’t find anywhere else. One email. Five minutes. Smarter decisions all week.
We tracked 401 genomic Holstein bulls from April 2020 to their December 2025 daughter-proven proofs. Most never showed up. The ones that did reshuffled everything.
In April 2020, a lot of breeders logged into that proof run feeling like it was draft day. Lists of sky-high GTPI young bulls, reps pushing “can’t-miss” sires, and mating programs swinging hard toward genomics overnight. Five years later, the December 2025 CDCB/HAUSA proofs told a very different story in the U.S. Holstein system: 59% of those “elite” genomic Holstein bulls never made it to a daughter-proven proof at all, while a small group of outliers like Genosource CAPTAIN didn’t just hold — they gained hundreds of TPI points.
This is the reality check on that April 2020 class: who vanished, who climbed, what changed under the hood of TPI, and what it should do to the way you build your sire stack going into 2026.
How We Tracked the 2020 Class
Before we get into winners and wrecks, here’s where these numbers come from.
The Bullvine pulled an “elite” group of 401 genomic Holstein bulls from the April 2020 U.S. CDCB/HAUSA evaluations, based on their GTPI at that time. We then followed those same bulls forward to their December 2025 U.S. proofs, recording who made it to a daughter-proven evaluation, how their TPI changed, and which AI stud carried their semen.
Every cohort-level average and stud-level number you’ll see here describes this 401-bull slice over that five-year window. It’s not claiming to represent every bull each stud owns.
By December 2025, only 165 of those bulls — 41% — had an official daughter-proven proof in the U.S. system. The other 236 bulls — 59% — never showed up with a CDCB/HAUSA daughter proof at all. No proof. No official daughters in the data.
If you bred heavily to April 2020 genomics, a big slice of the “genetic potential” you were sold never even got the chance to prove itself in your bulk tank — or anyone else’s.
How Accurate Were the April 2020 Rankings?
The 59% failure rate isn’t the whole story. Among the bulls that did survive to a December 2025 proof, the ranking shuffle was just as important.
Of the Top-10 genomic bulls in April 2020, 8 eventually got a proof, but only 4 were still in the proven Top-25 by December 2025.
Of the Top-25 genomic bulls, 21 got a proof; just 9 held a Top-25 spot.
Of the Top-100 genomic bulls, 74 got a proof; only 14 were still Top-25.
That means only 36% of the Top-25 bulls from April 2020 were still Top-25 five years later. Genomics clearly did a solid job flagging an “elite” pool. The fine sort between #1 and #25 turned out to be noisy once real daughters, base changes, and formula rewrites landed.
Underneath that index whiplash, the biology held up better than the rankings suggest. Correlations between 2020 genomic predictions and 2025 proven proofs stayed strong for core biological traits: 0.814 for PTAT, 0.762 for fat yield, 0.709 for protein yield.
Genomics did a pretty good job on pounds of fat and protein and general type. The volatility came from what the formula decided those traits were worth over time — not from the underlying DNA suddenly changing its mind.
Why Your Bull’s TPI Dropped Even if His Genetics Didn’t
You can’t stack a 2020 GTPI beside a 2025 proven TPI and read it straight. The ground moved under every bull in three big ways.
The 2025 Base Change: The Big Rollback
In April 2025, CDCB reset the Holstein genetic base from cows born in 2015 to cows born in 2020. The breed made serious progress in that window, so every bull’s PTA got pulled back:
Milk: −650 lb
Fat: −38 lb
Protein: −26 lb
Productive Life: −2.31 months
Somatic Cell Score: +0.10
For bulls in this 401-bull cohort that made it to December 2025, the average TPI drop was about 42.5 points, just from living through that base reset and the other formula changes. Expected Future Inbreeding (EFI) climbed from 7.5% to 9.4%, which added extra pressure on certain pedigrees.
So if you saw a favorite bull lose a chunk of TPI over those five years, part of that was simply the yardstick moving.
Feed Efficiency and Feed Saved: Penalties for Big, Hungry Cows
In April 2021, Holstein Association USA rewrote the TPI formula to pull Feed Saved into the mix. The revised feed efficiency term leaned hard into solids and efficiency, not just raw volume:
Bulls that made big, heavy daughters with high body weight composite (BWC) — and big maintenance bills — started paying a TPI penalty, even if their milk PTAs looked flashy. That was bad news for “bigger is better” pedigrees whose value had been built on sheer volume. And very good news for moderate-framed cows that quietly pounded out components without eating the farm out of house and home.
DPR Couldn’t Carry the Fertility Load Alone Anymore
By August 2024, the Fertility Index was also rebalanced. DPR had been 70% of that index. After the change, DPR and Cow Conception Rate (CCR) each carried 40%, with Heifer Conception Rate (HCR) and Early First Calving (EFC) at 10% each.
Any 2020 bull whose genomic TPI leaned heavily on extreme DPR, but didn’t have the CCR to back it up, took a hit. The new math rewarded bulls that actually got cows bred on first service, not just bulls whose daughters came back into heat quickly after a miss.
Put those three shifts together, and you get the pattern: genomics did a decent job on biology; the index moved underneath them.
One sire didn’t just ride out those hits. He used them.
Born on New Year’s Day 2019 in Iowa, the Charl × Sabre calf spent his first six months at Farnear Holsteins. “With his very promising gTPI, everyone doted on him,” recalled Tom Simon from Farnear. Genosource’s Tim Rauen had flagged Captain early, calling him “a long-term deal” during a conversation in Madison in October 2019 — months before the bull would debut at 3059 GTPI in April 2020.
Most of his peers dropped from their genomic starting point once the base changed and the formula shifted. Captain went the other way.
By December 2025, Captain was sitting at 3428 TPI, a gain of 369 points from his 2020 genomic estimate. His proof at that time pulled from over 12,000 daughters in nearly 800 herds under U.S. CDCB/HAUSA evaluations. His daughters averaged 32,542 lb milk with +123 lb fat and +64 lb protein, and his milk reliability sat at 99%.
That’s not an opinion. That’s a bull whose daughters out-delivered the genomic math while the formula got tougher. “He is without a doubt, the best bull that the breed has ever seen,” STgenetics CEO Juan Moreno has stated publicly — and in this case, the proof file backs up the claim.
Captain’s profile — heavy on components, efficient frames, and enough fertility to hold value under the 2024 FI rewrite — was effectively built for the TPI of the future, not the one we were using in 2020. He’s not faultless. Rauen himself has noted Captain needs to be “protected for somatic cell” and watched on overall conformation, strength, foot angle, and teat length. But the production engine underneath is something the breed hasn’t seen before at this reliability level.
Barn Math: Captain vs. Homecoming in Your Milk Cheque
“Captain over-performed” sounds nice. Let’s put a dollar figure on it.
On the December 2025 U.S. proof run, Captain’s PTA stands at +67 lb protein and +120 lb fat per lactation. The average bull in this April 2020 proven cohort sits at +29 lb protein and +64.9 lb fat. That gives Captain an edge of roughly:
+38 lb protein
+55.1 lb fat
per daughter per lactation versus the class average.
Using January 2025 U.S. FMMO Class III component prices — $2.33/lb protein and $2.95/lb butterfat (per USDA/AMS) — that component gap works out to roughly $250 per cow per year in extra component revenue compared with the average bull in this group.
Put that in your own barn. If Captain sires half the replacements in a 300-cow herd, once those daughters are in full production, you’re looking at around $37,500 more in component revenue per year than if you’d used the cohort average instead. On a 1,000-cow operation, that gap jumps to roughly $125,000 per year. That’s not a rounding error — for a lot of upper Midwest freestall herds, it’s the difference between making the principal payment comfortably and sweating every month.
Now flip it with AOT HOMECOMING. His proven PTAs landed at −5 lb protein and +6 lb fat. Versus Captain, that’s about:
72 lb less protein
114 lb less fat
per daughter per lactation. At the same component prices, that’s in the ballpark of $500 less per cow per year in component revenue for a Homecoming daughter than for a Captain daughter.
Bull
Protein PTA (lb)
Fat PTA (lb)
Component Revenue/Cow/Year (USD)
CAPTAIN
+67
+120
~$510
Cohort Average
+29
+64.9
~$260
HOMECOMING
-5
+6
~$0
Captain vs. Homecoming Gap
+72 lb
+114 lb
~$500
Both bulls were available to you in essentially the same era. The semen price gap wasn’t $500 a straw. But the long-term revenue gap per cow per year is right there on the pay stub. Run the same math with your own component prices and herd size — the method is the same even if your numbers differ.
The Siemers Renegad Parfect Surprise
If Captain is the headline, Siemers Renegad Parfect is the bull a lot of people skimmed past in 2020 — and shouldn’t have.
In April 2020, Parfect sat at #150 on the genomic TPI list with 2980 gTPI. Solid, but a long way from the Top-10. By December 2025, he had 19,079 daughters in 2,627 herds — the highest daughter count of any bull in this 401-bull dataset — and his TPI climbed to 3124, a gain of 144 points. He’s also the only bull in the 165-head proven group whose PTAT went up: from +1.80 genomic to +1.88 proven.
A Renegade × Delta-Lambda × Denver from the Siemers Lmda Paris family, Parfect has sold approximately 450,000 units of semen worldwide with 24% sexed and 35% sold outside the U.S., and he remains an allocated bull because demand keeps outrunning production, according to Select Sires. Paris herself was a Global Cow winner with GMD and DOM designations and more than 20 sons to AI — and there are already 76 bulls released from Parfect dams.
At Trent-Way Holsteins in Wisconsin, Trent Hendrickson calls Parfect a “generational talent” for their black and whites, describing daughters that are well-balanced, with positive milk, strong components, and consistent udders and rumps.
None of that makes Parfect bulletproof — it just shows that in this cohort, he’s one of the rare bulls whose proof climbed with massive daughter numbers behind him. When 19,000+ daughters tell the same story, you’re past the “small sample” excuse and into something real.
When the “Can’t-Miss” Genomic Bulls Missed Hard
On the other side of the ledger sit the crashes.
Bull
April 2020 gTPI
Dec 2025 TPI
Change
Daughters
Sire Stack
CAPTAIN
3059
3428
+369
12,170
Charl x Sabre x Ahead
ENVY
3038
3231
+193
1,168
Entity x Achiever x Bayonet
PARFECT
2980
3124
+144
19,079
Renegade x Delta-Lambda x Denver
HOLDON
2980
3091
+111
2,937
Charl x Draco x Numero Uno
DUFFY
3025
3152
+127
1,979
Acura x Rio x Modesty
The bulls that fell more than 300 TPI points between April 2020 genomics and December 2025 proofs share a familiar pattern:
SUPERCHARGE (Legacy × Rubicon × Morgan): −396 TPI points, including a 2.32-point collapse in PTAT (from +1.18 to −1.14).
TYCOON: −352 TPI points, mainly from yield under-performance.
SHINE: −327 TPI points, driven by fertility and health erosion.
In the worst of these crashes, the structure is the same: over-predicted type stacked on weak or shallow functional traits. Sire lines heavy on Legacy and Heroic on the top side, with Delta on the maternal side, were over-represented.
Supercharge is the clearest example. His genomic PTAT was built on a stack of fashionable type sires and early pedigree data. Once his daughters hit real commercial parlors, the structure didn’t hold up — and the index followed.
For breeders who leaned hard into those pedigrees, the disappointment wasn’t a chart. It was cows that didn’t do the job they were supposed to do.
Does More Semen in More Herds Really Make Proofs Worse?
You’ve heard it at the coffee shop: “Once a bull goes everywhere, his proof will just get worse.” This class gives you a cleaner answer.
Group the 165 proven bulls by how many daughters they had in December 2025, and the pattern is pretty clear:
Proven daughters
Bulls
Avg TPI change
% that gained TPI
Under 500
52
−81.8
28.8%
500–1,000
29
−65.5
24.1%
1,000–2,000
27
−23.4
33.3%
2,000–5,000
42
−27.9
40.5%
5,000+
15
+62.3
66.7%
Bulls with 5,000+ daughters actually gained TPI on average, and two-thirds of them went up, not down. Bulls with fewer than 500 daughters lost an average of almost 82 points, with fewer than a third improving.
Mr. Farnear Helix Twitch: 12,480 daughters, −246 TPI.
Sandy-Valley R Conway: 12,411 daughters, +22 TPI.
Genosource Captain: 12,170 daughters, +369 TPI.
Once you’re past around 5,000 daughters in a few hundred herds, what you see is basically what you get — good or bad.
For your own herd, this dataset says one thing: treat daughter and herd counts as filters, not afterthoughts. A bull with 300 daughters in 20 herds is still on trial. A bull with 2,000 or 5,000 daughters spread over hundreds of herds is telling you who he really is.
Which Studs Got It Right — and Which Got Burned?
This five-year window didn’t just sort bulls. It showed which AI programs were actually breeding for the new economics and which ones were still built around the old index.
All stud-level averages and retention rates here come from The Bullvine’s analysis of that 401-bull April 2020 cohort through the December 2025 U.S. proofs — not every bull each stud owns.
AI Stud
Bulls in April 2020 Elite Group
Bulls with Dec 2025 Proof
Retention Rate (%)
Avg TPI Change (Retained Bulls)
STgenetics
36
14
38.9%
+21.8
PEAK
36
19
52.8%
-36.0
Select Sires
106
43
40.6%
-32.9
ABS Global
196
77
39.3%
-70.6
Cohort Average
401
165
41.2%
-42.5
STgenetics: Building for the Index of the Future
In this look-back, STgenetics came out on top.
They were the only major stud whose retained bulls gained TPI points on average, at about +21.8 TPI per bull across the group. That lift was anchored by Captain and his clone brothers Jack and John, but it went deeper — bulls like HOLDON (+111) and JARVIS (+76) also posted gains.
That pattern lines up with ST’s long-running focus on Chromosomal Mating and their EcoFeed program — both targeting feed conversion and solids years before those traits were fully rewarded in the TPI formula. For a commercial herd, that meant ST-sired daughters were better positioned than most when the formula turned on big, hungry cows and rewarded efficient ones.
Select Sires landed in the middle of the pack, but with a wide spread.
They retained 43 bulls (40.6%), a better survival rate than the group as a whole, and those bulls dropped an average of −32.9 TPI points, beating the overall cohort decline. They also owned 16 bulls that gained points, including PAYLOAD, CRUSHER, and GAMEDAY.
But Select also held four of the six worst crashes in this analysis, including HOMECOMING and SUPERCHARGE. If you spread your matings across their lineup, you probably did fine. If you concentrated on a couple of high-PTAT pedigrees that later deflated, December 2025 may have been a painful read.
PEAK: The Safe Center
PEAK showed up as the most stable of the majors.
They had the highest retention rate, successfully proving 19 of 36 bulls (52.8%), and their retained bulls dropped an average of −36.0 TPI points. No moonshot 300-point gainers. No catastrophic 300-point crashes.
PEAK’s strategy leaned into balanced, predictable genetics that mostly held their rank even as the base and formula moved. Sires like ZILLION and ALTAZAZZLE became quiet anchors in that approach. If your breeding philosophy values predictability over fireworks, this is the sort of stud profile that lets you sleep at night.
ABS Global: Exposed to the Old Index
In this particular 2020 look-back, ABS Global had the roughest ride.
They started with the most bulls on the 2020 elite list, but recorded the lowest retention rate — 39.3% (77 bulls) — and their retained bulls dropped an average of −70.6 TPI points, the steepest decline among the major studs in this dataset.
Many of their high-profile young sires at that time were built on extreme DPR and high-milk, larger-framed daughters. Once feed efficiency and CCR were given more weight in TPI, those profiles were more exposed than some competitors’ lineups. There were bright spots — bulls like ENVY (+193) — but the volume of Heroic and Prince sons that fell off pulled their stud average down.
ABS has been adjusting. They introduced 36 new Holstein graduates following later sire summaries, a sign they’re working to realign with updated TPI standards and market demands.
Genomics Got the Biology Right. The Index Is What Moved.
The biggest takeaway from this April 2020 class is simple: don’t confuse index volatility with genomic failure.
The average retained bull dropped 42.5 TPI points over five years, driven largely by base changes and formula shifts, not by failed biology.
The correlations between 2020 genomic predictions and 2025 proofs stayed strong for core traits: PTAT around 0.81, fat around 0.76, protein around 0.71.
The core question for your breeding program isn’t “Does genomics work?” It’s “Am I breeding for the index and milk cheque of the next five years — or the one that just got retired?”
You don’t control base changes or formula tweaks. You do control how much risk you take, which studs you trust, and how you weight solids, fertility, and efficiency when you pick bulls.
Audit your reliability stack within 30 days. Print your current sire list and match it against the December 2025 U.S. CDCB/HAUSA proofs. Any bull under 70% reliability on TPI? Treat him as a genomic young sire in practice, even if he technically has some daughters. Any bull above 90% reliability with daughters across multiple herds is your stability layer — the Captain/Gameday-type bulls that absorb shocks when formulas move. Any sire list where three young bulls cover more than half your matings should be a red flag, given the 59% attrition this class showed.
Balance proven vs. genomic on purpose, not by accident. For a commercial Holstein herd, a pragmatic split looks like 50–70% of matings on a small group of high-reliability proven sires whose daughters do exactly what the current TPI and milk cheque care about — solids, fertility, efficiency — and 30–50% of matings on genomic sires spread across at least 4–6 different lines.
Run a type-fragility check before you chase the next PTAT rocket. The bulls that crashed hardest here — Homecoming, Supercharge, Shine — weren’t derailed by milk. They were derailed by over-predicted type and weak functional traits, especially once base and formula changes hit. Before you lean into the next big PTAT bull, look at his sire and MGS proof history and his health/fertility stack. If the pedigree is all type and no ballast, keep that semen for donors and show projects — not across the whole freestall herd.
Respect daughter and herd counts as filters, not fine print. A bull with 300 daughters in 20 herds is still on trial. A bull with thousands of daughters in hundreds of herds is telling you who he really is, for better or worse. Make that filter part of your mating program, not a footnote you glance at after you’ve picked the bull.
Align with solids and efficiency economics. U.S. component pricing and export data are pointing the same direction: fat and protein drive the cheque, and global demand is solids-hungry. Pick sires that put more fat and protein in the tank at realistic feed costs — the new FE$ and Net Merit formulas are already paying those cows differently. For the economics that now reward solids and efficiency over sheer volume, see our analysis of the $1.6B dairy shift.
Key Takeaways
If you build your sire list only from the very top of a genomic ranking, you’re accepting that roughly 6 out of 10 “elite” bulls may never even see a daughter-proven proof; to manage that risk, blend proven stability with genomic upside.
If you see a bull drop 100–150 TPI points between 2020 and 2025, don’t panic; check how much of that is base change and formula moves versus real trait erosion before you write him off.
If a high-PTAT young sire’s pedigree leans hard on Legacy/Heroic/Delta lines and doesn’t bring matching health and fertility, treat him as a specialist tool for donors and show cows — not as a herd-wide solution.
If you’re choosing between two bulls available at the same time, and one puts an extra 90–100 lb of combined fat and protein into each daughter’s tank at current component prices, assume that’s worth several hundred dollars per cow per year and make your semen budget reflect it.
The Bottom Line
Genomics is still the sharpest tool in the shed. But if you love speed and are willing to absorb some crashes, you’ll keep leaning into young sires. If you’d rather sleep at night, let bulls like Captain and Parfect carry most of the weight while genomics scouts the next generation. The difference between a well-diversified strategy and a concentrated one is the difference between Captain and Supercharge.
Pull up your semen invoices from 2020–2021 and your December 2025 proof file. How many of those bulls are still earning their keep under today’s rules — and how many were gone before their daughters hit a parlor?
Complete references and supporting documentation are available upon request by contacting the editorial team at editor@thebullvine.com.
The Next Frontier: What’s Really Coming for Dairy Cattle Breeding (2025-2030) – Harness the disruptor’s edge with a roadmap to 2030’s most aggressive genetic breakthroughs. From methane indexes to rumen microbiome PTAs, this guide delivers the early-adoption strategies that slash feed costs and unlock massive environmental premiums.
The Sunday Read Dairy Professionals Don’t Skip.
Every week, thousands of producers, breeders, and industry insiders open Bullvine Weekly for genetics insights, market shifts, and profit strategies they won’t find anywhere else. One email. Five minutes. Smarter decisions all week.
Harrisburg dark Oct 6. 11 farms stranded, unpaid milk piling up. 19.70 $/cwt? $188k yearly bleed for 200‑cow herds. State scorecard + 30‑day paths inside.
When Harrisburg Dairies shut down for good on October 6, 2025, the trucks just stopped coming. At least 11 or 12 family farms and their haulers were suddenly sitting on weeks of shipped milk with no check and no clear backup buyer. That was one regional bottler, one weekend — and a preview of what 19–20 $/cwt milk looks like when the math and the processor power both turn against you.
When the National Numbers Say “We’re Fine” — But Your Milk Check Doesn’t
In Canadian research led by the University of Guelph’s Dr. Andria Jones‑Bitton, roughly one in four farmers said they’d had thoughts of suicide in the previous 12 months, often during winter when stress, debt, and dark days all pile up. Now look at the U.S. scoreboard. USDA NASS says total farm numbers fell from 1,880,000 in 2024 to 1,865,000 in 2025 — that’s 15,000 farms gone in a single year across all sectors. At the same time, January 2026 milk production in the 24 major dairy states hit about 19.1 billion lb, up 3.4 % from a year earlier.
USDA ERS estimates 2025 U.S. milk production at around 231.5 billion lb, roughly 2.5% higher than 2024. WASDE‑669 then calls for a 2026 all‑milk price of 19.70 $/cwt, down from 21.17 $/cwt in 2025. On a 300‑cow herd shipping about 69,000 cwt/year, that 1.47 $/cwt drop alone carves roughly 101,000 $ out of your annual milk check before you do anything wrong. You feel that in every feed‑mill statement, every delayed repair, every time you tell yourself you’ll talk to the bank “after planting.”
Meanwhile, the cows keep coming. In January 2026, the 24 major milk states reported about 9.15 million cows, roughly 200,000 head more than a year earlier. Average output hit 2,082 lb/cow for the month, 24 lb higher than January 2025. NASS licensed‑herd time series show dairy operations have fallen by well over half in two decades, yet national milk production is still climbing. The cows aren’t disappearing — they’re moving into big barns that can afford to live on 19‑dollar milk by spreading fixed costs and risk over thousands of stalls.
Add to the balance sheet. USDA ERS projects farm sector debt of around $ 624.7 billion for 2026, with interest expenses of $33 billion . Every tiny rate bump siphons a few more cents per cwt off your milk check and hands it to the bank before you pay feed, fuel, or yourself. That’s the backdrop to Harrisburg Dairies going dark — and the bigger question hanging over your yard: are you already in the kill zone at 19.70 $/cwt?
The Q1 2026 Dairy Consolidation Scorecard
The USDA’s 2025 “Farms and Land in Farms” summary provides total farm numbers by state. NASS Milk Production supplies state cow inventories and volumes. Put those together, and you can see where consolidation is running hot versus just simmering. Color codes here are based on annual dairy farm loss: RED = >4 %/year, YELLOW= 2–4 %/year, GREEN = <2 %/year. Farm counts are estimated from total farms and dairy cow numbers — directionally right, but not the same as the USDA’s licensed‑herd census.
Color
State
Est. Farms (2025)
YoY Farm Change
Milk Prod (B lb)
YoY Prod Change
Avg Herd Size
Consolidation Velocity
🟢
California
1,175
-1.8%
41.8
+0.4%
1,850
STABLE
🔴
Wisconsin
5,580
-4.3%
31.8
+1.1%
245
ACCELERATING
🟢
Idaho
345
-1.4%
18.2
+5.5%
1,680
STABLE
🔴
Texas
310
-4.6%
18.2
+6.9%
4,000
ACCELERATING
🟡
New York
2,390
-3.9%
15.8
+1.2%
260
STABLE
🔴
Michigan
970
-4.5%
12.4
+3.4%
550
ACCELERATING
🔴
Minnesota
1,810
-5.2%
11.2
+1.0%
240
ACCELERATING
🔴
Pennsylvania
~3,700
-11.7%(41% of U.S. exits)
10.1
-0.8%
~115
ACCELERATING
🟢
New Mexico
110
-2.2%
7.7
-1.0%
2,100
DECELERATING
🟡
Washington
275
-2.6%
6.8
+1.1%
920
STABLE
🟡
Ohio
1,320
-3.4%
5.8
+2.1%
195
STABLE
🟡
Iowa
790
-2.5%
5.7
+0.7%
275
STABLE
🟡
Kansas
180
-3.8%
4.8
+17.2%
1,250
ACCELERATING
🟡
South Dakota
140
-2.9%
4.5
+9.5%
1,300
ACCELERATING
🟢
Colorado
105
-1.9%
5.4
+3.9%
1,550
STABLE
Analysis of USDA’s licensed herd counts says the quiet part out loud: using USDA’s original 2024 baseline, the U.S. lost about 1,202 dairies in 2025, and 490 of them were in Pennsylvania — an 11.7 % drop that accounts for 41 % of all U.S. dairy exits. When four out of every ten closures are in one state and state milk still sits at near 10.1 billion lb, you’re not watching a gentle reshuffle. You’re watching cows stay while barns and families disappear.
Where Is the Processing Money Going — And What Does It Do to Your Milk Check?
If you want to know where your future mailbox price is set, follow the stainless steel, not just the blend price.
Kansas is the clearest example right now. NASS and ERS report Kansas milk output jumped roughly 17.2% in a single year, driven largely by Hilmar Cheese’s new plant in Dodge City. Hilmar has about $600 millionsunk into that site, with a capacity of around 12.5 million lb/day when fully ramped, a level it essentially reached in early 2025. A plant like that doesn’t just “add capacity.” It creates gravity. Cows, corn silage, employees, and bankers all start orbiting Dodge City.
Texas and Idaho are locked in a fight for third place nationally. In 2025, Idaho’s roughly 350 dairies shipped about 18.26 billion lb, just ahead of Texas at 18.21 billion lb. But Texas has the bigger forward pipeline: Leprino’s Lubbock cheese complex — targeting roughly 1 billion $ in total investment — is phasing in through 2026, and Walmart’s fluid plant in Robinson, TX, is sourcing directly from regional farms for Great Value and Member’s Mark bottling. Those facilities want big, steady loads. That shapes what your co‑op can pay, even if your milk never hits their silos.
Up the I‑29 corridor, South Dakota shows how a single expansion can remake a region. State milk production is up around 9.5 %, tied heavily to Valley Queen’s expansion at Milbank, which doubled capacity to roughly 8 million lb/day and is expected to pull in another 25,000–30,000 cows over 2025–2026. Across the High Plains and mountain states, average herd sizes run from roughly 1,700 to more than 2,000 cows, with plenty of outfits milking 4,000 head in the Texas Panhandle.
If you’re milking 150–400 cows into a commodity pool, your milk is being priced in a world built for 2,000‑cow barns tied to 600‑million‑dollar plants. You may hate that. You still have to decide how you’re going to live in it.
Where Are Farms Bleeding Out Fastest — And Can Sub‑500‑Cow Herds Survive This Math?
While stainless steel moves west and south, the traditional milksheds are losing barns first and fastest.
NASS data for the Northeast/Mid‑Atlantic corridor (Maine through Maryland) show hundreds of dairy exits in 2025, and Farmshine’s breakdown of USDA-licensed herd numbers says that, using the original 2024 baseline, 41 % of all U.S. dairy exits were in Pennsylvania alone. That’s 490 dairies gone and an 11.7 % hit to the state’s dairy farm count in one year. State milk output only slipped about 0.8 % to roughly 10.1 billion lb, which tells you exactly what’s happening: cows are staying, they’re just changing barns and addresses.
ERS’s February 2026 cost‑of‑production work (ERR‑334) explains why this is hitting smaller herds first. For herds under 50 cows, full economic cost — cash expenses plus depreciation, unpaid labor, and opportunity cost — sits above 42.70 $/cwt. In the 100–499‑cow bracket, total economic costs cluster roughly between 19 and 21 $/cwt once you count everything, not just the checks you write. At a 19.70 $/cwt all‑milk forecast, any mid‑size herd with a true breakeven near 21.00 is losing about 1.30 $/cwt, even if there’s still something left after paying feed and fuel.
That pressure is showing up in the courts. According to U.S. Courts data summarized by the American Farm Bureau Federation and university analysts, 315 Chapter 12 farm bankruptcies were filed in 2025, up 46 % from 216 in 2024. The Midwest region logged 121 cases, while the Southeast recorded 105, and filings in both regions rose roughly 70 %year‑over‑year. When you hear neighbors say, “We just need one good year,” this is the backdrop — a lot of farms tried to wait that year out and met their lender and their lawyer instead.
Region
2024 Filings
2025 Filings
Midwest
71
121
Southeast
62
105
Other Regions
83
89
Total
216
315
The Hidden Story: Georgia’s Rise and New Mexico’s Floor
Not every growth story comes with sand and center‑pivots.
Georgia quietly led the Southeast in 2025. NASS numbers and extension analysis show the state adding around 3,000 cows and boosting milk output by about 7.8% to roughly 2.09 billion lb, while losing only five dairies. The anchor is Walmart’s 350‑million‑dollar bottling plant in Valdosta, which opened in December 2025 and now supplies more than 650 Walmart and Sam’s Club stores across the Southeast with private‑label milk sourced from regional farms. If you’re milking in Alabama or the Florida panhandle and telling yourself, “This region’s done for dairy,” Georgia is the counter‑example — the plant showed up, and the cows followed.
On the other side, New Mexico looks “stable” in the scorecard — small further farm loss, flat‑to‑slightly‑negative milk — but only because the hard part already happened. Years of contraction stripped out almost every sub‑1,000‑cow operation and left a landscape dominated by 2,000‑plus‑cow barns shipping into a handful of plants. If you’re a 200‑cow operator in Wisconsin or Pennsylvania, New Mexico isn’t an oddity. It’s a possible future — after your region has already done a lot of painful shrinking.
What Does 19.70 Milk Actually Look Like on Your Farm?
Let’s get out of the abstract and into numbers you can map onto your own herd.
Say you’re milking 200 cows in Wisconsin or Pennsylvania. USDA’s 2025 numbers say the average U.S. cow shipped about 24,390 lb — that’s 243.9 cwt per cow per year.
Barn Math: 200 Cows at 19.70 Milk
Revenue side (all‑milk forecast 19.70 $/cwt):
Milk per cow: 243.9 cwt
Gross revenue per cow: 243.9 × 19.70 = 4,804.83 $/cow
Total herd revenue (200 cows): 960,966 $
Cost side (full economic cost, ERS/Illinois FBFM example):
Total economic cost per cwt: 23.56 $/cwt
Total cost per cow: 23.56 × 243.9 = 5,746.28 $/cow
Total herd cost (200 cows): 1,149,257 $
Bottom line:
Net return per cow: 4,804.83 − 5,746.28 = –941.45 $/cow
Annual net loss: –188,290 $
Monthly equity bleed: about –15,700 $/month
That’s at 19.70 $/cwt. You’re probably covering cash bills for feed, fuel, and vet — ERS benchmarks often put cash operating costs in the mid‑to‑high teens per cwt. The grain mill gets paid. The TMR still runs. Maybe you chip away at some old payables.
Year
All-Milk Price ($/cwt)
Full Economic Cost ($/cwt)
2019
18.53
19.85
2020
18.18
20.12
2021
18.64
21.35
2022
25.16
24.89
2023
20.66
22.47
2024
20.82
22.94
2025
21.17
23.12
2026
19.70
23.56
But you’re not paying yourself a fair wage. You’re not truly replacing equipment. You’re not paying for the capital already sunk into cows and concrete. And you’re quietly moving about 3.86 $/cwt of value — the gap between full economic cost (23.56) and forecast price (19.70) — out of your equity column every time you ship a hundredweight.
Line Item
Per Cow ($/cow/year)
200-Cow Herd ($/year)
REVENUE
Milk production (cwt/cow/year)
243.9 cwt
48,780 cwt
All-milk price ($/cwt)
$19.70
$19.70
Gross milk revenue
$4,804.83
$960,966
Cull cow & calf revenue
$285
$57,000
Total Revenue
$5,089.83
$1,017,966
COSTS (Full Economic)
Feed (purchased + homegrown)
$2,850
$570,000
Labor (paid + unpaid family)
$1,125
$225,000
Replacement heifers
$620
$124,000
Fuel, utilities, repairs
$485
$97,000
Vet, breeding, supplies
$310
$62,000
Interest & debt service
$245
$49,000
Depreciation (facilities, equipment)
$385
$77,000
Opportunity cost (equity, land)
$526
$105,200
Total Economic Cost
$6,546.28
$1,309,257
NET RETURN
-$1,456.45
-$291,290
Monthly equity bleed
-$121/cow/month
-$24,274/month
If your basis is weak or your SCC premiums are off by 0.25–0.50 $/cwt, the hole gets deeper. That “one good heifer every 23 days” image isn’t an exaggeration — this example is roughly burning that value, whether you see it on a statement or not.
Where Does Your Real Breakeven Sit — and How Long Can You Live Below It?
This is the question everything else hangs on. You can’t decide whether to scale, specialize, or exit until you know what a hundredweight actually costs you.
Pull the last 12 months of real numbers: feed (including home‑grown at market value), fuel, repairs, vet, breeding, interest, insurance, taxes, family living, and a realistic wage for your time. Divide by shipped cwt, not “produced” milk. If that all‑in number is:
Under 19.70 $/cwt — you have margin and choices.
Around 19–21 $/cwt — you’re in the gray zone where small changes in milk price or feed cost swing you from black to red.
Above 21 $/cwt — you’re already in kill‑zone territory. The longer you run like this, the more equity quietly disappears.
Then stress‑test at 18.00 $/cwt for six months. That’s not a fantasy — January 2026 Class III printed at 14.59 $/cwt, February only improved to 14.94, before basis, hauling, and deductions. At an 18‑dollar average for half a year, can your operation stay under about 60 % debt‑to‑asset and avoid burning more than 15 % of your equity? If the honest answer is “no,” you’ve got a timeline problem, not just a margin problem.
What Can You Realistically Change in the Next 30 Days?
You don’t rebuild a cost structure overnight. You can absolutely change its trajectory in a month.
In the next 30 days, you can:
Sit down at the kitchen table for two hours with last year’s numbers and build your real cost per cwt on paper or with your advisor. That one session changes how you look at every other decision.
Re‑draw your breeding plan so beef semen only hits cows you don’t want daughters out of, and your highest‑merit cows only see high‑profit dairy sires.
Mark cull candidates using both production and genetics — cows sitting in the bottom slice of NM$ who are also lagging in components or fertility.
Call your co‑op or plant rep and ask bluntly what basis, premiums, or volume commitments are likely to look like over the next 12–24 months in your exact area.
You don’t have to decide in 30 days whether to build a 500‑stall barn. You do have to decide whether you’re going to keep feeding cows that don’t pencil at 19‑dollar milk.
How Do You Use Beef‑on‑Dairy as a Tool, Not a Trap?
Beef‑on‑Dairy has been the hottest “extra margin” lever in a lot of parlors and robot rows. Trade and extension reports still talk about beef‑cross calves bringing up to around 1,400 $ a head in some programs when the genetics and weights are right. Spread across your total shipped cwt, that can effectively add 2–3 $/cwt worth of value if you’re consistent and disciplined.
But there’s a hidden tax: replacements. USDA’s price series and industry coverage show dairy replacement heifers averaging around 3,010 $/head by mid‑2025, up from roughly 1,140 $ in 2019 — about a 160 % jump in six years. So every time you chase a high‑priced beef‑cross calf instead of a heifer, you’re betting that Future‑You can afford to buy back the genetics you’re not making today.
The smart way to play Beef‑on‑Dairy in a 19‑dollar world is as a lever, not a life raft:
Aim beef semen at your low‑merit cows first, not your best.
Keep beef to roughly a quarter to a third of your breedings so you don’t starve your replacement pipeline.
Pair it with a genetics plan, not just a cash‑flow band‑aid.
The calf checks feel great. The real test is whether your replacement math still works 18–24 months from now when those heifers should be freshening.
Can Genetics Keep You Off the Auction Block?
Feed, bedding, and power hit every cow the same. Genetics is where you decide which cows deserve a spot on your TMR.
USDA‑ARS is blunt about Net Merit: NM$ is a measure of lifetime profit. It’s built to rank animals by net dollars they’re expected to return, not just yield. When you genomic test and line your cows and heifers up by NM$ or your co‑op’s profit index, you’re looking at who’s likely to pay their way — and who’s just eating.
At 19–20 $/cwt milk, you can’t afford to carry a long tail of passengers. Practical steps:
Sort your cows and heifers by NM$ or your chosen index and print the list.
Circle the bottom slice — whatever percentage your gut can handle — and ask, cow by cow, “Does she justify another lactation, another breeding, or another year’s feed?”
Get especially honest about the heifers stuck in the bottom half of your genomic ranking. In this environment, raising a low‑merit heifer to calving is often worse than selling her and keeping the cash.
You don’t have to chase sky‑high GTPI or build a show string. You do have to stop feeding genetics that have no realistic shot at paying their way under the margins USDA is telling you to expect.
How Do You Use DMC and Risk Tools Without Fooling Yourself?
The 2026 Dairy Margin Coverage enrollment window ran from January 12 to February 26, 2026, so by now, you either locked it in or you didn’t. Under the updated rules, Tier I coverage now extends up to 6 million lb of production history per year — plenty to blanket a 200–500‑cow herd at realistic production levels.
ERS’s LDP‑M‑380 shows how quickly the DMC margin can move when feed and milk don’t play nice together. In late 2025, margins slid close to trigger levels as milk softened while feed costs remained stubbornly high. If you enrolled, those Tier I checks won’t magically turn a structurally unprofitable herd into a winner, but they can plug real holes when margins squeeze hard.
If you didn’t enroll, now’s the time to sit down with your lender and risk‑management advisor and talk about Dairy‑RP, forward contracts, or co‑op tools — not when your Class III mailbox price is already starting with a “1,” and your equity chart is pointed straight down.
What DMC and risk tools cannot do is change the basic fact that if your full cost sits above the price line, you’re selling equity every time the tank empties.
Options and Trade-Offs for Farmers
Here’s where the rubber meets the lane. There are only a few real paths. The math above is what each path is working against.
Path
When It Makes Sense
Key Actions (Next 30–90 Days)
What You Gain
What You Give Up / Risk
1. Fix Cost Structure
Full cost within 1–2 $/cwt of forecast price; solid facility; debt manageable; willing to cut ruthlessly
– Run true cost/cwt with advisor- List specific cuts (rent, machinery, low-merit cows)- Hunt SCC/component premiums- Stress-test at $18/cwt for 6 months
Survival without major capital; preserve equity; keep optionality for next move
Can cut into burnout if you don’t know when to stop; only works if gap is ≤2 $/cwt
2. Scale or Align
In growth corridor (TX, KS, SD, ID, Southeast); processor adding capacity; willing to leverage up or commit volume long-term
– Contact plant/co-op for volume contracts- Model expansion to 500–1,000+ cows- Secure basis guarantees or premiums- Line up financing with lender
Lose flexibility; high leverage = faster pain if Class III tanks; stuck in contract even if milk crashes
3. Specialize & Strip Overhead
Region won’t support mega-scale; real niche demand (A2A2, grazing, on-farm bottling, local brand); you like marketing
– Match genetics/cow type to niche- Cut anything not serving the premium- Build direct customer pipeline- Get comfortable with people, not just cows
Swap FMMO risk for niche margin; can feel like 22–23 $/cwt effective price; differentiation protects you
Customer risk replaces market risk; lose a key buyer = scramble; requires marketing skills most don’t have
4. Plan Strategic Exit
Full cost clearly >21 $/cwt; worn out; no clear successor; equity preservation matters more than legacy
– Price cows & heifers NOW (3,010 $ heifers, 1,800–2,000 $ cows vs. 1,400 $ distressed)- Model liquidation value vs. forced sale- Talk to family, lender, lawyer- Set timeline before bank sets it for you
Preserve 30–40% more equity than distressed sale; protect family balance sheet; exit with dignity
Emotional cost is brutal; end of generational identity; no second chance if you wait too long and values crash
Path 1: Fix the Cost Structure (Start in the Next 30 Days)
When it makes sense You’ve got a solid facility, decent cow flow, and debt that isn’t already crushing you. You’re willing to cut pet expenses and sacred cows — literal and figurative — if the numbers say they should go.
What it takes You do a full, honest cost‑of‑production run — no “back of the napkin,” no ignoring family living. You list specific cuts or changes: maybe it’s dropping one rented parcel that never pays, changing TMR ingredients, or burning down non‑productive machinery. You hunt for easy nickels: better components, SCC premiums, co‑op quality bonuses.
The limits You can cut your way into survival. You can also cut your way into burnout if you don’t know where to stop. This path works best when your full cost is within 1–2 $/cwt of the forecast price and the barn math says you can close that gap.
Path 2: Scale or Align — If Your Region Wants More Milk
When it makes sense You’re in a growth corridor — Texas Panhandle, I‑29, Idaho, parts of the Southeast — where processors are actively adding capacity and courting new milk.
The play You either add cows significantly or tie your existing string into a long‑term supply relationship. That might be a direct contract with a cheese plant, a guaranteed‑volume arrangement through your co‑op, or a barn expansion that moves your average cost per cwt down as you fill stalls.
The catch You gain a better basis and potentially more stable premiums. You give up flexibility and take on more fixed costs. If Class III spends another year flirting with the mid‑teens, highly leveraged big herds feel that pain faster and harder than smaller, lightly leveraged ones.
Path 3: Specialize and Strip Overhead
When it makes sense You’re in a region where you’ll never out‑scale the 4,000‑cow outfits, but there’s real demand for something different — higher components, grazing‑based milk, A2A2, on‑farm processing, or a branded local product.
What it requires You match your genetics, cow type, and farm layout to that niche. You cut anything in your cost stack that doesn’t feed the niche premium. You get comfortable with marketing and people, not just cows.
The trade‑off You swap FMMO risk for customer risk. Lose a key buyer, and you’re scrambling. But if the niche is real — and if you execute — you can turn a 19‑dollar commodity environment into something that feels more like 22–23 $/cwt on your milk check.
Path 4: Plan an Exit While Cows and Heifers Are Still Worth Real Money
When it makes sense Your full‑cost number is clearly above 20 $/cwt, you’re worn out, and the successor plan is blurry or non‑existent.
What it looks like You look straight at the current replacement and cull values. In 2025, replacement heifers averaged around 3,010 $, and many good cows would bring 1,800–2,000 $; in a forced or distressed liquidation, those numbers can slide toward 1,400 $ for cows. That’s a 450 $/head swing. Across 300 cows, that’s roughly 135,000 $ that either lands in your bank account or disappears if you wait too long.
The hard part Emotionally, this is the toughest path. Practically, it can be the one that protects the most family equity and gives the next generation the best footing — whether they farm or not.
Key Takeaways
If your full‑cost breakeven is above 21 $/cwt, 19.70 milk isn’t a rough patch — it’s a slow equity bleed. Either fix the cost, add a margin, or set a clear exit timeline before the bank or your health sets it for you.
If you’re in a processing growth zone and your true cost per cwt is competitive, scaling or aligning with a plant can turn 19‑dollar milk into a workable long‑term play — but only if you respect the leverage and build a genetics pipeline that keeps replacements affordable.
If your proof sheets show a long tail of low‑NM$ or low‑index cows and heifers, feeding them is a choice — culling the bottom slice and only raising replacements from the top half of your ranking is one of the cleanest ways to lift dollars per cwt without adding a single stall.
If you can’t run your own barn math in the next 30 days, you’re flying blind — the biggest risk to your operation isn’t the market, it’s not knowing exactly where your kill zone starts in dollars per cwt.
The Bottom Line
The farm is what you do; it isn’t who you are. The numbers in this scorecard are brutal, but they’re about a system — debt, policy, processors, and markets — not your worth as a producer, a parent, or a neighbor. If walking through this math makes your chest tight or your stomach knot up, that’s not weakness. That’s your body saying the load is heavy. Talk with someone you trust — spouse, vet, lender, neighbor. And if it feels like too much, you can call or text 988 in the U.S., or reach out to farm‑focused supports like Farm Aid or Do More Ag, and talk to someone who understands what you’re carrying.
Then, with your own cost per cwt and best‑guess 12‑month milk price written down in front of you, decide: are you going to fix, scale, specialize, or exit? And before six more milk checks hit the mailbox, what single move — cull list, genetics plan, risk‑management conversation, or succession step — are you willing to make so your herd doesn’t quietly slide deeper into the kill zone?
Complete references and supporting documentation are available upon request by contacting the editorial team at editor@thebullvine.com.
Learn More
Maximizing Your Milk Check: The 2025 Guide to Component Pricing – Stop leaving money in the parlor. This guide exposes the specific component thresholds required to outrun rising input costs and delivers a tactical roadmap for adjusting rations to capture every possible premium on your next check.
The Year of the Great Divide: Navigating Dairy Consolidation – Secure your operation’s future against aggressive structural shifts. This analysis breaks down the economic forces hollowing out the middle market, arming you with the long-term positioning strategies needed to survive the next five years.
Precision Breeding: Using NM$ to Outrun the Commodity Trap – Outrun the commodity trap with data-driven selection. This deep dive reveals how leveraging Net Merit (NM$) and genomic testing creates a high-efficiency herd, giving you a decisive competitive advantage in a low-margin environment.
The Sunday Read Dairy Professionals Don’t Skip.
Every week, thousands of producers, breeders, and industry insiders open Bullvine Weekly for genetics insights, market shifts, and profit strategies they won’t find anywhere else. One email. Five minutes. Smarter decisions all week.
From bachelor farmers to world-class photographers, meet the visionaries who trusted the maternal line when nobody else did — and reshaped the breed one daughter at a time. This is the story of seven of them. And of the breeders who recognized what they had before anyone else did.
One shot. That’s all they took that day.
It was sometime in the mid-1970s at Mil-R-Mor Farm in Dundee, Illinois, and the cow standing in front of that camera was Glenridge Citation Roxy — clipped, washed, full of milk after a visit from a group of Japanese buyers. Miller’s son held the halter. His wife worked the trunk. And in that single frame, Miller captured what many consider the finest Holstein photograph ever taken.
Glenridge Citation Roxy EX‑97‑4E — Queen of the Breed I & II, International Cow of the Century (1999), first cow in the breed with 10 Excellent daughters and more than 300 Excellent descendants, foundation of the only 4‑generation direct line with 11+ Excellents and the family behind 30* brood cow Mil‑R‑Mor Roxette, EX‑96 Tony Rae, EX‑97 Rustler‑Red and countless high‑production Roxy daughters worldwide.
But here’s the thing about that picture. It didn’t make Roxy famous. Roxy made the picture famous. Because behind that perfect broadside image stood a cow who would produce 16 Excellent daughters, generate 50 direct maternal lines of four-plus generations of Excellents, and earn more popular-vote titles — Queen of the Breed I, Queen of the Breed II, Top Cow of the Top Ten Cows of the Century, International Cow of the Century — than any Holstein before or since.
She wasn’t the only one. In the three decades between 1968 and 2001, a handful of Holstein cows emerged whose genetic impact was so profound and commercially transformative that calling them “great cows” doesn’t begin to do them justice. They were franchise cows — biological engines that didn’t just win shows or set records but built entire empires of daughters and sons that reshaped the breed worldwide. Good luck finding a sale catalogue without a Roxy on page three.
This is the story of seven of them. And of the three breeders — a bachelor farmer, a livestock photographer, a bankruptcy trustee’s unlikely partner — who recognized what they had before anyone else did.
I. The Photograph and the Cow Behind It
Glenridge Citation Roxy was born on April 15, 1968, on Lorne Loveridge’s farm at Grenfell, Saskatchewan — about as far from the corridors of North American Holstein power as you could get. Loveridge’s grandfather had milked Ayrshires. His father, Gordon, switched to Holsteins in the 1920s. When Lorne took over management in 1957, he changed the prefix from Norton Court to Glenridge and set about his life’s work.
Roxy’s sire was Rosafe Citation R. Her dam, Norton Court Model Vee (EX-6*), was a Star Brood cow whose own dam, Norton Court Reflection Vale (VG-4*), was a Roeland Reflection Sovereign daughter. That gave Roxy two close A.B.C. Reflection Sovereign crosses — and, possibly, the red factor that would surface generations later in one of her most celebrated descendants.
What the pedigree doesn’t tell you is what Roxy looked like in person. Andy Clawson, the classifier who scored her 96 points in 1976, said she was closer to perfection than any cow he’d ever scored. Avery Stafford, who gave her 97 two years later when she was ten, said the same thing. Between them, Clawson and Stafford had classified half a million cows.
R.F. Brown — Bob Brown, who owned Green Elms Echo Christina, a cow who ranked right up there with the best in any era — called Roxy the best he’d laid eyes on. Brown was known for fair assessments, not flattery.
And then there were Doug Blair and Lowell Lindsay. Blair owned Alta Genetics; Lindsay was the sire procurement officer for United Breeders. They’d visited the Loveridge farm a few months before Miller, seen Roxy, and been overwhelmed. They discussed buying her on a 50-50 basis. At the end of the day, they couldn’t come up with the kind of money Loveridge was asking. One has to wonder how long that decision haunted them.
The Move to Illinois
Miller, a transplanted Canadian from Brome, Quebec, worked part-time as a livestock photographer. In 1973, he was summoned to Grenfell to photograph Roxy and her dam. He’d been searching for a cow family for some time, and he had very specific requirements: type, production, and longevity. Roxy and her family met all three.
Loveridge, for his part, was beginning to realize that his farm’s remote location precluded visitors from seeing the cow. Miller’s Illinois base was better suited for promotion and merchandising. Within a year, Miller had bought Roxy and a half-interest in Vee and moved the pair to Dundee.
Even though embryo transfer was still in its infancy — this was the early 1970s, when flushing a cow was more gamble than science — Miller put Roxy on an ET program. Over the years, she produced 30 ET offspring and three natural calves. Twenty daughters. And she became the first cow in the world to have ten of those daughters classify Excellent. By the time the final tally came in, 16 daughters had earned the Excellent designation.
Bob and Kaye Miller at Mil‑R‑Mor’s Golden Anniversary Sale, standing beneath the iconic one‑shot photograph of Glenridge Citation Roxy that helped turn their quiet Illinois herd into one of the most influential cow families in Holstein history.
In Miller’s hands, Roxy made four records over 1,000 pounds of fat, reaching 26,470 pounds of 4.4% milk and 1,166 pounds of fat in her best year. Career total: 209,784 pounds of milk at 4.5% butterfat and 9,471 pounds of fat. She rounded out three generations of 200,000-pound producers — her dam and granddam had both hit that mark. At 12 years of age, she earned a 4E rating, and her show record included All-Illinois honors from 1976 through 1979, a win in the dry-aged class at the 1979 Central National Show, and membership in eight All-American, All-Canadian, or Reserve All-Canadian groups.
The Empire She Built
But the real story wasn’t what Roxy did. It was what her daughters did. And her granddaughters. And their daughters after them.
Seven of Roxy’s daughters earned Gold Medals. By 2004, according to Holstein World, 50 direct maternal lines of at least four generations of Excellents descended from Roxy, with Roxy appearing as the second Excellent dam in each. Her 16 Excellent daughters produced 34 Excellent daughters. Those 34 had 52. Those 52 had 48. That’s the kind of cow family that just keeps writing cheques your herd can cash.
Until 1977, Miller had never sold a Roxy daughter. He relented that year when he consigned Roxy’s Elevation daughter, Mil-R-Mor Roxette, born on Valentine’s Day the year before, to the National Convention Sale at Columbus, Ohio. Peter Heffering bought her for $25,000, the third-highest price of the sale, and took her to Hanover Hill Farms at Port Perry, Ontario.
The transaction nearly collapsed. Miller hadn’t understood his heifer would be sold on investor terms — one-third down and the balance over two years. But years later, Miller acknowledged he was glad Roxette ended up at Hanover Hill. She eventually became an Excellent Gold Medal Dam who lived into her late teens, produced over 100 pregnancies, left 13 Excellent daughters and eight Excellent sons, and added upwards of two million dollars to Hanover Hill coffers.
The Roxette daughters branched in every direction. There was Hanoverhill Star Roxy (EX-92-3E-GMD-DOM), a Starbuck daughter developed by the Conard family at Ridgedale Farm in Sharon Springs, New York, whose Leadman daughter produced a Milestone-Red granddaughter, who in turn produced Sir Ridgedal Rustler-Red (EX-95) at Trans-World Genetics. Rustler became enormously popular in Germany — so popular that grateful German breeders arranged an all-expense-paid trip for Wayne Conard and his wife in 2006.
There was Mil-R-Mor Toprox (EX-94-3E-GMD), Roxy’s highest-record daughter and one of the breed’s first 2,000-pound fat cows, who became the fountainhead of the Brigeen herd’s Roxy family. Mary Briggs of Brigeen Farms described the Roxys this way: “Healthy and fertile — the indexes around the world for somatic cell count, fertility and longevity highlight the family’s real strengths. They just go along doing their business,”
Liddlehome Beemer Rockstar ET EX‑92 — a modern, high‑type show cow whose pedigree runs Beemer × Durham Rhonda EX‑95 × Miss Ridgedale Rhonda EX‑92 × Hanover‑Hill‑R Rhonda EX‑94 × Hanover‑Hill Star Roxy ET EX‑92 × Mil‑R‑Mor Roxette EX‑90 × Glenridge Citation Roxy EX‑97, proof that Roxy’s maternal line is still throwing frame, udders, and banners generations later.
If you’ve ever bought into a cow family and watched it perform under your management the same way it did under theirs — no drama, no fuss, just daughters that score Excellent and milk like freight trains — you know exactly what that consistency feels like.
That’s the kind of cow Roxy was. And her daughters were the same. Wide through the rear end, correct in the rump, sound on their feet, and absolutely relentless at the milk pail. No drama. Just production and reproduction, generation after generation.
On July 8, 1984, Glenridge Citation Roxy died at 16 years of age. A stone monument on the Mil-R-Mor farm reads:
Glenridge Citation Roxy 4E-97-GMD. April 15, 1968 – July 8, 1984. Lifetime 209,784M-4.5%-9,471F. First cow in the world to have ten daughters classified Excellent. First cow in the world to accomplish 4E-97-GMD plus be a 3rd generation 200,000-lb. milk producer.
II. The Bachelor, the Sale Bill, and the Black Cow at Bob Snow’s
Snow‑N Denises Dellia EX‑95 — the quietly powerful brood cow behind Durham, Dundee and Derry, pictured here doing what she did best at Bob Snow’s farm: looking like “just another cow” while building one of the most profitable maternal lines the Holstein breed has ever seen.
Here’s how different the Dellia story is from Roxy’s. No livestock photographer. No Illinois showplace. No Japanese buyers. Just a bachelor farmer sitting in a kitchen corner while his mother made lunch, thumbing through the Holstein-Friesian World.
Robert Snow — “a sober man of direct gaze and resolute jaw; not a man who moves on a whim; reflective; prudent,” as one neighbor described him; “never a man to be anybody’s fool” — started farming in 1951 on a grade herd inherited from his father in Monroe County near Sparta, Wisconsin. The county extension workers pushed him toward purebreds, and Snow liked the idea. There was more to life, he felt, than milking a bunch of grades.
He chose his prefix early. “I wanted to use my last name,” Snow explained, “but I thought just plain ‘Snow’ was too simple. So I added an ‘N’. I can’t tell you why I chose the letter ‘N’. It doesn’t stand for anything. I could just as well have chosen X, Y, or Z. I just thought it sounded nice — ‘Snow-N’.”
That last week of July 1970, what caught Snow’s eye in the magazine was a sale advertisement for the Adolph Buergi dispersal, one of Barron County’s finest groups of registered Holsteins. Buergi had been at the game for 32 years. On the first page of the ad, below a banner headline touting “A Foundation Daughter of Creator Fobes Governor,” were four photographs of the same cow: Ce-Buerg Homestead Governor Jo. Broadside view. Three udder shots — left, right, and rear.
Rice Lake was 125 miles away, and Snow was of no mind to waste time and gasoline. “I wasn’t interested in the middle or the bottom,” he confided 35 years later. “If I was going to the sale, I would buy off the top.”
He picked up an old uncle who lived near Rice Lake and took him out for the day. They bought a sandwich and coffee at the sale, sat down, and watched the cattle come through. Snow bid only on the top animals, as promised. The high seller was the “Jo” cow at $2,800 — Snow was the runner-up bidder. By day’s end, he’d bought three head: an open two-year-old at $1,500, a yearling at $800, and Ce-Buerg Creator Hartog Fobes, an inbred three-year-old right up to calving who looked like a million dollars. Snow paid $2,500 for her.
Almost three decades later, Snow wasn’t entirely sure which of those three cattle was Dellia’s direct ancestor. Turned out he’d bought both dam and daughter — Hartog Fobes and her St. Croixco Pioneer daughter, Ce-Buerg Creator Fobes Garnet — and they became the seventh and sixth dams, respectively, in the maternal line of Snow-N Denises Dellia.
A Breeding Strategy Built on Balance
Now, the thing about Snow’s approach — and this is what made Dellia possible — was his alternating-sire philosophy. He’d follow a strength bull with a dairy one, then back to strength, always maintaining balance and striving for a functional dairy type. Garnet got Cedardale Corporal, a calving-ease sire. That daughter, Edith, got Harborcrest Happy Crusader — strength, substance, square rumps, particularly good udders. Crusader’s daughter, Ellen, inherited Arlinda Commander’s stature and clean bone. Commander’s daughter Ella got MD-Sunset-View R A Wonder — an Elevation son who sired large frames, wide chests, and ample bone.
Snow-N Denises Dellia, the legendary Holstein matriarch, sired by Walkway Chief Mark and out of Snow-N Dorys Denise, with maternal grand sire Carlin-M Ivanhoe Bell. This EX-95 cow revolutionized dairy genetics with her exceptional balance of production and type, leaving an indelible mark on the industry. Her legacy continues to shape modern Holsteins worldwide
Then, in the winter of 1983, Snow won two units of Carlin-M Ivanhoe Bell semen at a barn meeting. He used them on his two best animals. One was Snow-N Ellas Dory, a virgin. From that mating came Snow-N Dorys Denise — a typey cow with considerably more strength than the average Bell daughter, a shapely udder, and correct feet and legs.
Peter Blodgett later explained why the combination worked so well: “There have been thousands of Marks out of Bells, but I think the thing that makes Dellia different is MD-Sunset-View R A Wonder, her granddam’s sire. Wonder was one of those extreme bulls that sired a lot of bone. It’s rare that you combine a bull like Wonder with Bell. The fact that those two bulls were combined is the work of a ‘master breeder’ for sure.”
When it came time to breed Denise, Snow’s hired man, John Steinhoff — a young man just out of high school from the Tomah area who was “up” on his bulls — picked Walkway Chief Mark. The Mark-Bell combination was already considered one of the “golden crosses,” with Mark joining width, capacity, and udders to the correct feet and legs of Bell daughters.
The resulting heifer calf, born December 20, 1986, was registered as Snow-N Denises Dellia.
“Who Is That Cow?”
At the Wisconsin Championship Show, judged by Loren Elsass, Dellia placed second in the senior two-year-old class behind Miklin Starbuck Beth in a class of 23, but won best udder. Frank Regan, one of the partners at Regancrest Farms in Waukon, Iowa, happened to be at the show. It had rained early that morning, and when Frank looked out at his recently cut hay, he decided there’d be no haying that day and bundled up his family for the drive.
They arrived about noon. As Regan walked into the arena, they were starting the two-year-old class. He saw a black cow coming through the gate and said to himself, “Wow! Who is that cow?”
That’s the moment that changed everything — for Regan, for Dellia, and, it’s no exaggeration to say, for the Holstein breed.
After the class, Regan followed her back to the barn. He approached Bob Snow and asked his price. The figure was high, so Regan thought, we’ll get a daughter instead. Snow was flushing Dellia to Blackstar and agreed to sell a Blackstar daughter.
But Regan couldn’t let go. The truth was, he was looking for a herd-building kind of cow — a franchise dam he could flush and make some money on — and he’d looked at other Chief Marks. Dixie-Lee Chief Liza, others. It kept coming back to the black cow at Bob Snow’s. The farm was only a hundred miles away, so Regan made it his business to stop often.
“I started at $10,000,” Snow said. “And every so often, I boosted it by $5,000. I got up past $50,000 pretty quick.”
A couple of weeks before the Wisconsin Spring Show of 1991, Regan paid Snow another visit. Dellia was entered and looked like she might win. They settled on a price. Regan would lead her at the show; Snow would own the cow until after, then Regan would take her home.
The day before the show, Orville Kemmink came up to Regan. “Are you the kid who bought this cow?” Regan said he was. “Don’t you think you paid too much?” Kemmink asked. Dellia had been flushed several times, and a lot of embryos had been sold. “You won’t get your money back,” he warned.
That night, over supper, Regan asked Snow to guarantee a number of embryos. “How many do you want?” Snow replied.
But that night, Dellia looked empty. She had a perfect udder but was a little shallow in the body, and they needed to fill her out. So Regan bought four bales of hay — three grassy and one alfalfa — and a bag of calf feed to mix with her grain. “She likes warm water with her beet pulp,” Snow told him.
Regan started feeding her, and by the next morning, she began to straighten out. By ten o’clock, people were filing into the barn to see her. The word had spread. Instead of looking like a racehorse, Dellia had started to look like a winner.
With Niles Wendorf judging, Dellia topped the four-year-old class, won best udder, and was named grand champion of the Wisconsin Spring Show of 1991. After the show, Bob Snow had to back his car into the arena to load all the trophies.
“There were a lot of disgruntled people,” Snow recalls. “They were upset that a ‘nobody’ could come in and clean up.”
The Dellia Dynasty
What Regan and his partners built from that one cow defies easy summary. According to Regancrest records, Snow-N Denises Dellia produced 76 registered daughters by 21 different sires. Forty-four sons were A.I.-sampled. Three earned Gold Medals: Regancrest Elton Durham, Regancrest Dundee, and Regancrest Emory Derry. Official figures show 34 Excellent and 49 Very Good offspring. Dellia was very fertile, averaging 15 embryos per flush — she once produced 25 Melwood embryos in a single collection.
Sheeknoll Durham Arrow EX‑96, Grand Champion of the 2016 World Dairy Expo, celebrating on the colored shavings and showing exactly what Snow‑N Denises Dellia bred true for through Durham — balance, power, and the kind of udder that still wins when the announcer calls for champions.
Durham, by Emprise Bell Elton, went to Select Sires. Dundee, by Mar-Crest Encore, was proven by A.B.S./St. Jacobs in Canada and eventually scored EX-95. Derry, by MJR Blackstar Emory, landed at Select Sires as well. These three bulls, alongside grandsons like Erbacres Damion (EX-94-GM) and Regancrest-HHF Mac (EX-92-GM), flooded A.I. barns across North America and beyond.
Tim Abbott while at A.B.S. Global put it this way: “Dellia and her family are all about type — just everyday nice-uddered cows that people are happy with. People consistently say their Durham daughters are trouble-free cows. They’re good-uddered young cows that don’t cause any problems and just kind of blend with the herd.”
Scott Culbertson while at Select Sires went further: “Dellia’s impact through her daughters has sent more dollars back into farmers’ pockets across the world than any other cow.”
DH Gold Chip Darling EX‑96‑CH, Swiss Expo Champion and Dellia descendant, lighting up the ring and reminding everyone that Snow‑N Denises Dellia didn’t just make bull mothers — she bred the kind of balance, udder and ring presence that still wins under the brightest lights.
Two months after the Regans took Dellia home from the Wisconsin Spring Show, she took a crampy spell and started kicking at her belly. The vet recommended surgery, cut her open, and removed three gallons of sand from her stomach. Snow had a sandy farm with a creek behind the barn; cows sometimes stirred up the water and drank sand. After the operation, Dellia bounced right back. She was that kind of cow.
S‑S‑I Doc Have Not 8783‑ET EX‑92 — a modern proof that Snow‑N Denises Dellia still stamps cows the same way decades later: tall, sharp, snug‑uddered and built to work, carrying Dellia’s genetics into today’s high‑index, high‑production Holstein era.
She lived until December 8, 2001, with a lifetime record of 180,240 pounds of milk at 3.9% butterfat, 7,108 pounds of fat at 3.2% butterfat, and 5,723 pounds of protein. Even near 15 years old, she walked on a perfect set of legs and feet. The Regans’ tribute in Holstein World read: “She has influenced our lives in ways we never would have imagined. Her legacy will live on not only through her offspring but in the lesson she taught to many — that the demand for high type plus production never goes away.”
Now here’s a story that couldn’t have been invented.
Nandette TT Speckle‑Red EX‑93 — the red‑and‑white Triple Threat daughter whom judge David Houck called “a happy combination of strength, breed character, and sufficient angularity.” When the investor empire around her collapsed, Louis Prange saw what the bankruptcy trustees couldn’t: the cow who would become Blackrose’s dam.
Nandette TT Speckle-Red was bred by Burdette Holt of Delavan, Wisconsin, born November 11, 1978, sired by Hanover-Hill Triple Threat. She first showed up in the magazines in November 1981 when she placed sixth in the two-year-old class at Madison. Her owner at the time was Elm Park Farms Limited, Sheboygan Falls, Wisconsin — Louis Prange’s outfit.
A month later, Prange took Speckle to the Royal Winter Fair in Toronto. His string was tied beside the Browndale and Cher-Own herds of R.F. Brown and his son, David. Dave Brown took a shine to the heifer and helped get her ready. On show day, Prange got the bad news: Speckle was eight days too old for the two-year-old class. She had to show as a three-year-old and placed third.
Two months later, Dave Brown went down to Wisconsin and bought her. Prange’s price was $60,000, and Brown paid it. Title transferred to Browndale Farm.
Speckle aborted her calf and wasn’t shown in 1982, came back in 1983, placing sixth as a four-year-old at Madison, then was second at the Royal that fall behind Brookview Tony Charity, whom judge Doug Wingrove later made grand champion.
Then Jack Stookey showed up.
The Investor Era’s Wild Ride
Flush with investor money, Stookey bought Speckle from the Browns on investor terms: $275,000, one-third down and the balance in two annual payments. He paid the deposit and took her home.
What followed was textbook investor-era madness. Stookey went on a buying rampage, picking up top cows on similar contracts. Before long, he was taking home Premier Exhibitor banners at major shows, including Madison. Under Stookey’s ownership, Speckle showed as a five-year-old at the 1984 Wisconsin Spring Show, where judge David Houck made her grand champion, calling this red-and-white cow “a happy combination of strength, breed character, and sufficient angularity with plenty of chest and heart.”
But the stories were already starting. Some had truth; many were fiction. People whispered that an angry investor had dynamited the porch off Stookey’s house. That the Mafia was involved. That he was a smooth talker who couldn’t follow through.
The reality was messier but more mundane. Stookey’s books were a disaster — piles of paper two feet deep covered the office floor. He’d charge investors $750,000 for cows he’d bought for $250,000. When the returns didn’t materialize, investors stopped paying. Stookey couldn’t honor his own contracts with the breeders who’d sold him the cattle. By the late 1980s, it all collapsed. Bankruptcy. Creditors — including the Browns, who’d only ever seen the initial down payment on Speckle — received legal notices listing large debts and meager assets.
Most took one look and decided there was no point chasing it.
Prange’s Rescue
And this is where the story takes its most improbable turn. Louis Prange — the same man who’d originally owned Speckle before selling her to Brown — received an order for embryos from a Brazilian buyer who wanted the best. Prange knew Stookey’s cattle were now under the control of a bankruptcy trustee. So he went to Leesburg, Indiana, to talk.
He leased a dozen of the Stookey cows, took them home, and flushed them. After filling the Brazil order, he realized what a nucleus he had. He negotiated a longer-term arrangement: Prange would pay all expenses and take full ownership of male calves; all females had to be sold before age two, with sale proceeds divided half to Prange, a quarter to the bank, and a quarter to Stookey.
Stookey insisted on one thing: all calves had to carry the Stookey prefix. He still dreamed of someday returning and winning Premier Breeder banners.
He got his way.
Nandette TT Speckle was one of the cows in the Prange-Stookey ET program. Prange had visited To-Mar Farm in Iowa and been impressed with To-Mar Wayne Hay, dam of To-Mar Blackstar. He thought Blackstar would suit Speckle perfectly. Stookey’s preferred sires were Rosafe Citation R and Browndale Commissioner, and he pushed hard for them. Prange told him to send the semen.
A day or two later, Stookey called back: “Can’t send you the semen, Louie. My semen tank ran dry.”
So Speckle was flushed to Blackstar instead.
Stookey Elm Park Blackrose was born on March 24, 1990 — a cow who never would have existed if Jack Stookey had managed to keep his semen tank topped up.
From $5,400 to Show Ring Royalty
In December 1991, fitter and breeder Mark Rueth of Oxford, Wisconsin, was working the Elm Park Red Futures Sale. His friend Mark VanMersbergen of Lynden, Washington — a Guernsey man switching to Holsteins — was looking for brood cows. Rueth pointed him to an 18-month-old Blackstar heifer: deep-ribbed, wide-rumped, the kind that catches a cattleman’s eye.
They bought her for $5,400 — Rueth, VanMersbergen, and later Bob and Karyn Schauf of Indianhead Holsteins in Barron, Wisconsin, who took a one-third interest in exchange for housing her. The Schaufs were known for big-framed, deep-pedigreed cows and a low opinion of pure index breeding.
What happened next was extraordinary. Blackrose was voted All-American and All-Canadian junior two-year-old in 1992. All-American and All-Canadian junior three-year-old in 1993. In 1995, she became one of the few U.S.-bred cows to win grand champion at the Royal Winter Fair — and was named Reserve All-American and Reserve All-Canadian five-year-old. She came back in 1997 as a Reserve All-American and Reserve All-Canadian aged cow.
Even though she was a Blackstar daughter with two records over 40,000 pounds of milk, Blackrose was never really treated as an “index cow.” Her type credentials told a different story: +3.77 PTAT with udder and feet-and-leg composites of +2.78 and +2.87, making her the No. 1 type cow in the breed at that time.
Stookey Elm Park Blackrose EX — the $5,400 Blackstar daughter born from a bankrupt semen tank, whose massive frame, textbook udder, and +3.77 PTAT made her the No. 1 type cow in the breed and the foundation behind Talent, Advent‑Red, and the EX‑95 Supreme Champion Lavender Ruby Redrose‑Red.
A Brood Cow Without Equal
By 2004, Blackrose had 30 Excellent sons and daughters. Her sons included Markwell Kite (Skychief), marketed by St. Jacobs and A.B.S., who sired KHW Kite Advent-Red; Indianhead Red-Marker (Stardust), a former No. 1 type sire; Rosedale Reflection (Starbuck) at Foundation Sires; and Rosedale Big Sky (Skychief) at Semex. They were promoted under a line that summed it up: “At a time when our breed most needed an infusion of substance and strength, Blackrose and her sons were there.”
The culmination of a dynasty: Lavender Ruby Redrose-Red (EX-96). In 2005, she achieved the impossible, becoming the first and only Red & White cow ever named Supreme Champion at World Dairy Expo, proving the enduring magic of the Blackrose line.
The most remarkable branch came through Kinglea Leader, a red-factor son of Ca-Lill Standout Cavalier from a Conductor dam. Leader to Blackrose produced five Excellent daughters, two of whom — Rosedale Lea-Ann and Markwell Leader Rose — founded the family’s strongest branches. Leader Rose produced the Storm son Ladino Park Talent (EX-ST), a rump and udder specialist at Semex Australia who became one of the most popular red-factor sires of his era. And from Lea-Ann, through a Rudolph daughter named Northrose-I Lavender, came Lavender Ruby Redrose-Red (EX-95) — All-Breed Supreme Champion at World Dairy Expo in 2006.
Ladyrose Caught Your Eye EX‑96 — three consecutive World Dairy Expo Senior Champion titles, dam of champions and high‑demand A.I. sires — showing the rear‑udder width, substance, and sheer presence that trace straight back through the Blackrose dynasty born from a $5,400 bankruptcy‑sale heifer and an empty semen tank.
Speckle herself lived to 18, dying at TransOva in 1996. All nine of her daughters owned by Prange were eventually classified as Excellent. Stookey Elm Park Blackrose died at Alta Genetics in 2004, with seven Excellent daughters, 17 Very Good daughters, and offspring registered in Holland, England, Germany, and Japan.
Jack Stookey never did come back to win those Premier Breeder banners. After leaving the cattle business, he worked as a hospital administrator. His wife, Darla, studied for the ministry at Oral Roberts University and later served as a minister. Jack Stookey died in 2007. But those calves still carry his prefix — and the greatest of them was born because his semen tank ran dry.
IV. The Supporting Cast: Faith, Kaye, Pala, and the Hiawathas
Roxy, Dellia, and Blackrose were the headliners. But they weren’t the only franchise cows rewriting the Holstein playbook in those years. A handful of others — less celebrated, perhaps, but no less consequential — were building their own dynasties in their own quiet corners of the dairy world.
The Cow Charlie Plushanski Wouldn’t Sell
Plushanski Chief Faith EX‑94‑4E — the deep‑bodied, wide‑fronted brood cow Charlie Plushanski refused to sell in 1973, built on heavy‑duty production sires and an udder that defied Chief’s reputation, and whose four main branches would later dominate Locator Lists, fuel Japanese bull sales, and put cows like Quality B C Frantisco in the centre of the Royal ring.
Charlie Backus tried to get her consigned to the National Convention Sale. Pete Heffering, assembling the first cows for Hanover Hill, tried to buy her outright. Neither man could get it done.
When it came to Plushanski Chief Faith, Charlie Plushanski wouldn’t budge. It wasn’t about money. It went deeper.
Plushanski had come home from World War II — where he’d been a Marine Corps boxer who once had a ringside match stopped by none other than Jack Dempsey, who put on the gloves himself and knocked out the winner — and settled on a farm in Berks County, Pennsylvania, at a place called Kutztown. In the fall of 1965, his brother Henry, who worked for what would become Sire Power, told him about a dozen Kingpin daughters on Allen Yoder’s farm in Selinsgrove. Charlie bought the lot. One of them — Ady Whirlhill Frona, exactly one year old that day — became Faith’s dam.
Faith, born in November 1968, scored EX-94 with a 4E rating and piled up lifetime totals of 242,863 pounds of milk and 11,353 pounds of fat. Her early adulthood came just ahead of widespread ET use, so her first calves were natural — and that was fitting, because the Plushanski philosophy was never about show ring flash. The sires they used were heavy-duty production bulls. None of them would ever be accused of siring a show ring champion. They fathered solid type — dairy character, deep barrels, functional legs, and mammary systems — but they weren’t bulls who’d ever threaten to win Premier Sire at Madison.
The four main branches — through Astronaut Frolic (EX-DOM), Valiant Fran (EX-35*), Nugget Fobes (VG-88-GMD), and Job Fancy (VG-87-GMD) — spread across North America. When Plushanski sold Valiant Fran to Paul Ekstein of Quality Holsteins in Woodbridge, Ontario, it was to acquaint Canadians with what this family could do. Fran’s 35 Star Brood Cow points made her the highest-numbered Canadian brood cow, and her descendant Quality B C Frantisco was twice grand champion at the Royal Winter Fair, five times All-Canadian, and International Cow of the Year in 2005.
Quality B C Frantisco‑ET EX‑96‑3E 18* — the twice Royal Winter Fair grand champion and 2005 International Cow of the Year — carrying Plushanski Valiant Fran’s blood and proving just how far Plushanski Chief Faith’s family could climb when given a bigger stage.
By 1996, four of the top 20 animals on the national Locator List were from the Chief Faith family. When Charles Plushanski died in 1991, his obituary noted that more Plushanski-bred bulls had gone to Japan between 1985 and 1991 than from any other herd.
Fred Rice found the source of his family’s future contentment the old-fashioned way: he offered to do chores for an ailing neighbor.
Jay Knepper, down the road, called his place Terracelane. While Knepper recovered from surgery, Fred milked his cows. The first day, he noticed something. One bunch of cows, about five head, seemed to milk way better than the others. Milked their heads off, in fact. Fred checked them out. They were all related.
When Knepper later sold off his heifers, Fred and his brother Dale bought one: Terracelane Ideal Star. She scored 76 points as a two-year-old — nothing to write home about — but climbed to VG-88 at eight and piled up 207,000 pounds of milk lifetime. She was creating a family.
Several generations later, through Ricecrest Elevation Ella and Ricecrest Ned Boy Noreen, came Ricecrest Southwind Kaye — and the protein floodgates opened. Three dozen Kaye sons entered A.I. service. In September 1999, three of them — Ricecrest Lantz, Ricecrest Brett, and Ricecrest Marshall — all placed on the Top 100 TPI list simultaneously, with Lantz at number one. No other Holstein cow had ever accomplished that.
Ricecrest Southwind Kaye EX‑90 — the modest‑looking brood cow who quietly rewrote the TPI lists, dam of three Top 100 TPI sons that all hit No. 1 and the protein powerhouse behind the Ricecrest phenomenon.
Holstein International dubbed it “The Ricecrest Phenomenon.” The herd had placed 10 bulls on the TPI list. Detractors pointed to the family’s modest type scores. Elite sale selectors often walked right past them. “Just good milk bulls, that’s all,” said several anonymous insiders. But through Kaye’s full sister Ricecrest Southwind Amy’s descendants, and through Ricecrest Bwood Brianne at the Bauer brothers’ Sandy-Valley herd, came Sandy-Valley Bolton (EX-GM) — the Luke Hershel son who ranked No. 1 on TPI lists in 2006 and 2007, standing alongside Shottle and Goldwyn as one of the defining bulls of the 2000s.
Next time someone tells you type doesn’t matter, ask them who Bolton’s great-granddam was.
Kaye’s critics don’t have much to say about Bolton.
Jim and Nina Burdette started dairy farming in 1974 on a rented farm with 19 Ayrshires and four Holsteins. They bought cows other men didn’t want — animals with minor defects, maybe slow milking — as long as they had compensating features: strong frames, broad rumps, chest width. Burdette’s quick fix for subpar udders was Round Oak Rag Apple Elevation. On this type of animal, Elevation worked particularly well.
When Quality Ultimate’s daughters swept the four-year-old class at World Dairy Expo in 1983, Burdette rushed home and used Ultimate on two of his cows. One was Windy-Knoll-View Creek Pauline (VG-88). On March 14, 1985, she produced Windy-Knoll-View Ultimate Pala.
It dawned on Burdette how powerful Pala was when she produced Melvin twins, one of whom — Windy-Knoll-View Priss-Twin — was All-American summer yearling of 1990 and later scored EX-93. At the 1991 Pennsylvania Spring Show at Harrisburg, Pala accomplished something that had never been done before: she furnished four class-winning daughters by four different bulls. The five females — Pala and her daughters — won the produce of dam, dam-daughter, and best three females classes.
Three generations in one frame: Windy‑Knoll‑View Pledge‑ET EX‑95‑3E leads the way, followed by her dam Windy‑Knoll‑View Promis‑ET and the matriarch herself, Windy‑Knoll‑View Ultimate Pala EX‑94‑3E‑DOM — the cow who furnished four class winners by four different sires at Harrisburg and whose maternal line stretches 21 generations back to an 1884 Dutch import.
Over time, Pala produced 18 Excellent offspring and 33 Very Good. By 2007, she was dam, granddam, or great-granddam of 23 All-American or Junior All-American nominations. But the A.I. industry, deep in an index binge, wanted nothing to do with her sons because of Quality Ultimate so close in the pedigree.
It took Jim Burdette’s friend Jeff Resner and a marketing pitch called “My Three Grandsons” — brought to Dick Witter at Taurus Service in Mehoopany, Pennsylvania — to break through. Witter, who’d known the Burdettes for years and shared their conviction that the industry put too much emphasis on production indexes, liked the idea. Popular, Promote, and Powerhouse — all Outside grandsons — entered the Taurus lineup.
“The sire analysts focus on the sire stack,” Witter said, “which resulted in the overlooking of the Palas because of the presence of Quality Ultimate. At Taurus Service, we have always selected from a complementary mating sire standpoint and put extra weight on the maternal side of the pedigree.”
Pala’s maternal line goes back 21 generations to Xanthe 8793 H.H.B., imported from Holland in 1884. Sometimes the long view is the only view that matters.
The Hiawathas: A Half-Million-Dollar Heifer and the Kitchen-Table Breeder Who Made Her Possible
The Hiawatha family didn’t begin in the investor-era frenzy that made it famous. It began at a kitchen table in Hoosick Falls, New York, where Sherman Herrington sat with Bill Weeks, the developer of the aAa system, and hammered out a breeding philosophy. Herrington liked Weeks’ way of thinking, but he pushed it further. “I focused on longevity,” he explained. “In my view, a cow was at her best when she was 10 years of age.”
From Herrington’s Sher-Mar Farm came Sher-Mar Lee Mitzi (EX), top Honor List cow for 1979, and her daughter by the Marquis son Puget-Sound Highmark: Sher-Mar Highmark Hiawatha (EX-94-2E), the cow who gave the family its name. In 1981, Hiawatha claimed second position on the Honor List by producing 34,970 pounds of milk, 5.0% fat, and 1,763 pounds of fat as a six-year-old. The June 25, 1980, Holstein World even put a four-generation Hiawatha group on its cover — “these cows had everything,” one observer wrote, “production and pulchritude, both.”
Tyrbach Valiant Hiawatha EX‑94‑DOM — a powerful S‑W‑D Valiant daughter from Dreamstreet Rorae Hesper and Sher‑Mar Highmark Hiawatha, carrying the Sher‑Mar Hiawatha family from Sherman Herrington’s kitchen‑table breeding program into the big‑money investor era without losing the frame, udders, and longevity that made the line famous.
That was when George Morgan of Dreamstreet Holsteins in Walton, New York, stepped in. When news broke that Morgan was buying into the Hiawathas, people were strangely relieved. “This is good for the industry!” they said. “They’re bringing together some great cattle!” — the same people who, not long before, had muttered darkly about the whole investor craze.
Later in 1981, Dreamstreet sold Sher-Mar Highmark Hiawatha privately to Mansion-Valley Farm in South Kortright, New York, for $280,000, where Dave Rama was manager. At Mansion-Valley, Hiawatha produced Mansion-Valley Niagara, a daughter of Ocean-View Sexation born in September 1982. Niagara went through the Designer Fashion Sale of 1983 at the exact same $280,000 price her mother had brought. Hilltop-Hanover Farms, Yorktown Heights, New York, signed the cheque. At 95 points, Niagara became the highest-classified Sexation daughter in the breed and, later in life, completed an eleven-year-old record of 48,910 pounds of 4.0%, 3.0% milk — the highest record for age in North Carolina history under her then-owner Edgar Miller of Winston-Salem.
Back at Sher-Mar, Hiawatha had left more than one mark. She birthed six Excellent daughters, among them Mansion-Valley Precious (EX-94) by Mars Tony. Precious, in turn, was dam of the Blackstar daughter Clover-Mist Black Peach (EX-92), who left Excellent daughters in Ireland and the Netherlands. But it was Precious’s Elevation daughter, Dreamstreet Rorae Pocohontis (EX-93), who lit the biggest fire.
Pocohontis first went through the Designer Fashion Sale in 1981, selling at ten months of age for $225,000 to the Pocohontis Syndicate of Turner, Maine. Two years later, in the 1983 Designer Fashion Sale, she came back as a milking two-year-old and hammered down for $530,000. The buyer was William Ogden, a banker from Stamford, Connecticut. At the time, that price put her in the same rarefied air as the highest-valued cattle in Holstein history.
Ogden boarded Pocohontis at Golden Oaks Farm in Wauconda, Illinois. Golden Oaks’ owner, John Crown, was so impressed by the cow that he wanted a piece of the action himself. Rather than trying to buy her outright, he concentrated on her daughters. He bought Sexation and Valiant daughters from Pocohontis, and each one he took home eventually made an Excellent daughter for him.
One of those branches ran straight into Japan. Ogden Hanover Sexy Prudence (EX), a Sexation daughter from Pocohontis, was sold young to Japanese buyers. Before she left, though, Sexy Prudence dropped a Chief Mark daughter: Golden-Oaks Mark Prudence. As her dam was being exported, Prudence stood in the Golden Oaks heifer pen looking every inch the brood cow. They decided to flush Sexy Prudence to Chief Mark one more time. The flush resulted in four full sisters, among them Golden-Oaks Mark Marion (EX-92) and Golden-Oaks Mark Merle (EX), both of whom found their way to Don Mayer’s Mayerlane Farm in Bloomer, Wisconsin, while another sister went to California and became the dam of four Excellent Prelude daughters.
Mayer later bought Golden-Oaks Mark Prudence herself in the Golden Oaks Top 10 Sale. She’d already been flushed to Prelude and had left two daughters: Golden-Oaks Prelude Pru (EX), who went to Rolling Lawns Farms in Illinois, and Golden-Oaks Prelude Pie (EX), who stayed at Mayerlane. Then, under Mayer’s ownership, Mark Prudence set the world’s highest 3X milk record in December 1996: 62,981 pounds of milk in 365 days — just shy of the 2X record but a world record for three-times-a-day milking.
Ms Crushable Carolina, Reserve Intermediate Champion at World Dairy Expo 2022, carrying a stacked Golden-Oaks Rae family pedigree (Crushabull × Golden-Oaks By Charlotte EX‑90 × Golden-Oaks MCC Charlina EX‑90 × Golden-Oaks ATWD Charla EX‑93 × Golden-Oaks Champ Rae EX‑93) that proves the Roxy–Rae maternal line is still writing banners in the modern show ring.
By the late 2000s, Don Mayer was working with members of several famous maternal lines — Roxy, Dellia’s tribe, and the Hiawathas, among them. Asked to compare them, he didn’t hesitate. “We work with cows from several top families,” he said, “but the Hiawatha family is my absolute favorite. They have a lot in common with the Roxys, and we have a few of those in production here. Both families consistently produce cows with lots of frame and lots of milk.”
It was a neat kind of symmetry: a kitchen-table breeder obsessed with ten-year-old cows, an investor-era banker willing to write a half-million-dollar cheque, a Midwestern dairyman pushing cows to world records — all of them orbiting a family that, like Roxy’s, turned frame and longevity into a global brand.
V. The Long Shadow
What ties all these cows together isn’t just Excellent scores or Gold Medal dams or A.I. contracts worth hundreds of thousands of dollars — though there’s plenty of all that. Here’s the thing nobody wants to say out loud: the conviction, held by a handful of breeders against the prevailing wisdom of their eras, that the maternal line matters.
Bob Snow spent 35 years building toward Dellia — alternating strength sires with dairy sires, generation after generation, never rushing. Bob Miller searched for years before he found a cow family that met his requirements for type, production, and longevity. The Plushanskis used heavy-duty production bulls that would never win a show, but built a family that dominated TPI lists and shipped bulls to Japan. Fred Rice noticed five head that milked their heads off in a neighbor’s barn and had the sense to buy their relative. Jim and Nina Burdette bought cows that other men didn’t want and saw past Quality Ultimate when the rest of the industry couldn’t. Sherman Herrington bred ten-year-old cows while the world chased short-term numbers.
These weren’t accidents. These were philosophies, held with patience and executed over decades.
The Bottom Line
Today, you can’t pick up a sale catalogue without finding a Roxy descendant tracing back to her in the direct maternal line. You can’t look at a TPI list without seeing Dellia’s influence through Durham and Dundee and their sons. Blackrose’s type credentials echo in every Talent or Advent-Red daughter walking into a show ring. Bolton — Kaye’s great-grandson — helped define what a modern sire proof looks like. In Pennsylvania, Pala’s grandsons and great-grandsons are still siring the kind of udders that make a dairyman stop and stare in the milking parlor. And scattered from Illinois to Japan, the Hiawatha daughters and granddaughters carry forward that big-frame, big-milk profile that made them investor darlings in the first place.
Bob Miller took one photograph that afternoon at Mil-R-Mor. One shot, one cow, one moment caught in silver gelatin. But the cows in this story — Roxy, Dellia, Blackrose, Faith, Kaye, Pala, the Hiawathas — they weren’t one-shot wonders. They were the biological engines of a breed, the franchise mothers whose influence would outlast every index revision, every genomic recalculation, every shift in breeding fashion.
They go along doing their business. And the breed is better for it.
So the next time a sire analyst tells you a cow family doesn’t matter because the genomic index says otherwise, ask them one question: where do they think those indexes came from?”
KEY TAKEAWAYS
The maternal line is the most overlooked profit center in your herd. Every franchise cow here was built by breeders who invested decades in dam lines while the industry chased sire stacks. Roxy’s family is still producing Excellents 40 years after her death. Your current genomic rankings won’t be.
The best brood cows don’t announce themselves. Terracelane Ideal Star scored GP-76 as a two-year-old. Blackrose cost $5,400 from a bankruptcy sale. Bolton’s great-granddam was a cow elite sale selectors walked right past. Look harder at what’s already in your barn.
Bob Snow bred strength-dairy-strength-dairy for 35 years. The result was Dellia. One cow. Three Gold Medal A.I. sons. Seventy-six registered daughters. A family that, according to Select Sires’ Scott Culbertson, “sent more dollars back into farmers’ pockets across the world than any other cow.”
The type-vs.-production debate was settled by the cows themselves. Roxy: 97 points, 209,784 lbs lifetime milk. Dellia: EX-95, three Gold Medal sons. Kaye: modest type, three sons on Top 100 TPI at once. The answer was never either/or — it was knowing what your cow family does best and breeding to it.
When the hot sire of 2024 is forgotten by 2027, the brood cow who throws Excellents regardless of the bull she’s mated to is the one asset that holds its value. These seven families prove it. Cow families aren’t nostalgia. They’re the genetic insurance policy genomics can’t replace.
Continue the Story
The 10 Greatest North American Holstein Breeders of All Time – While Miller and Snow were carving out legacies with Roxy and Dellia, these masters were operating in that same high-stakes world. Discover the other visionaries who defined the golden age of pedigree breeding alongside them.
The 10 Most Influential Holstein Sires of All-Time – These franchise mothers didn’t work in a vacuum; they were mated to the giants. Deepen your understanding of the sire side of the era, exploring the genetic forces like Elevation and Starbuck that shaped these dynasties.
Snow-N Denises Dellia – The Empress of the Breed – Follow the thread from a single barn-meeting semen prize to the global dominance of Durham and Dundee. This feature traces how one cow’s influence carried forward to build the very foundation modern Holstein breeders stand upon today.
The Sunday Read Dairy Professionals Don’t Skip.
Every week, thousands of producers, breeders, and industry insiders open Bullvine Weekly for genetics insights, market shifts, and profit strategies they won’t find anywhere else. One email. Five minutes. Smarter decisions all week.
Holstein USA widened the stature scale. Most barns didn’t. Here’s the milk you’re leaving on the lunge box.
Kip Law didn’t have a genetics problem. He had a concrete problem.
The stalls in his 70‑cow tiestall in Sherburne, New York, were — in his words — “too small for Holsteins.” More cows than stall spaces, six hours to milk, and a steady stream of animals scrambling in and out of beds that didn’t fit them. Nothing on a proof sheet would’ve told you that.
That disconnect — between what genetics are building and what concrete can carry — is quietly bleeding milk and culling cows from progressive Holstein herds across North America. In late 2024, Holstein Association USA revised its stature linear scale from 51–61 inches to 55–65 inches because the breed had physically outgrown the old range. It was Dr. Jeffrey Bewley’s 2023 cow measurement project that exposed the discrepancy — Holsteins had become too tall for the existing scale. Many freestall barns poured during the expansion years of the late 1990s and 2000s are still sitting at roughly 45–46 inches of stall width. The cows standing in them pay for that gap every time they try to rest.
How Big Is the Stall Gap, Really?
Start with the frame. Holstein USA’s Body Size Composite and Stature PTA have trended toward larger cows for years. Stack a couple of points of stature over multiple generations, and you end up milking daughters that carry hundreds of pounds more live weight than the cows your barn was designed around.
Nigel Cook and the University of Wisconsin’s Dairyland Initiative turned that reality into barn specs. Their current freestall design table sizes stalls by cow body weight for adult Holsteins:
Around 1,200 lb: recommended stall width (divider spacing) is 45 inches.
Around 1,400 lb: 48 inches.
Around 1,600 lb: 50 inches.
Around 1,800 lb: 54 inches.
A lot of older barns were built on 45‑inch centres because they were designed around smaller cows or heifers. When your cows grow, and your concrete doesn’t, you create a mechanical penalty every time a big cow tries to lie down or get up.
Visualizing the Stall Fit Gap
Based on the Dairyland Initiative’s freestall dimension table for adult Holsteins:
Cow size (approx. weight)
Recommended stall width
Common 2000s stall width
The “gap”
~1,200–1,400 lb
45–48 in (45 in @ 1,200 lb; 48 in @ 1,400 lb)
45–46 in
0–3 in depending on actual cow weight
~1,600 lb
50 in
45–46 in
4–5 in
~1,800 lb
54 in
45–46 in
8–9 in
Imprint width defines minimum stall space—the lateral distance from hock to abdomen when resting narrow. For mature Holsteins, that’s about 132 cm (52 in.). Your 45-inch stalls? They’re forcing cows to compress into a space 7 inches narrower than their resting posture. That’s not comfort—that’s forced perching.” (Source: Ontario Ministry of Agriculture, Food and Rural Affairs
Cook’s team notes that, in most situations, a 48‑inch‑wide stall is already an improvement over a 45‑inch stall for mature Holstein cows. For a lot of modern +stature cows in older barns, that missing 3–9 inches is exactly what your time‑budget and lameness numbers are screaming about.
Cook’s analysis of AgSource DHIA data from April 2008 puts production numbers on top of that picture. In herds with more than 500 cows — mostly freestall operations — the mature‑equivalent milk (ME) gap between first‑lactation and third‑or‑greater‑lactation cows averaged 1,046 kg. In herds under 100 cows — predominantly tiestalls — the same gap was just 475 kg. The freestall environment was disproportionately punishing older, bigger cows, not genetics, suddenly “quitting.” In remodels where stalls were widened and surfaces improved, that gap shrank dramatically — in some herds, it essentially disappeared.
That’s not “bad feet and legs genetics.” That’s the barn punishing the frame those genetics created.
Why Did Holsteins Outgrow Their Stalls?
At the 130th National Holstein Convention in 2015, Nate Zwald, with Alta at the time, put numbers on something a lot of breeders already felt. He reported a genetic correlation of about 0.50 between stature and the udder composite, and highlighted how strongly PTAT is associated with stature in the U.S. Holstein population. In plain language: when you chase UDC and FLC through type, you drag stature along for the ride.
“We think we are selecting for better UDC and FLC, but the unintended effect is that we are also making bigger cows,” Zwald told the crowd.
He built the case with three hypothetical bulls. Same production, same health traits — the only difference was about one point each on type, feet and legs, and udders. The tallest bull landed around 4th on TPI. The moderate bull sat near 100th. The smallest slid toward 1,000th. That type inflation, driven heavily by stature, was worth roughly 115 TPI points for the tall bull compared to the moderate one — enough to earn elite flushes and heavy semen demand, even though the mid‑ranked bull had more than enough type for commercial freestalls.
Bull Profile
Production
Health Traits
Type/UDC/FLC
Approx. TPI Rank
Tall Bull (+Stature, +PTAT)
Same
Same
High
~4th
Moderate Bull (0.0 Stature)
Same
Same
Moderate
~100th
Small Bull (−Stature)
Same
Same
Lower Type
~1,000th
TPI Gap (Tall vs. Moderate)
—
—
—
~115 TPI points
Breeders often keep chasing those bulls for a simple economic reason: high‑TPI and high‑PTAT animals can command higher sale prices for cattle and embryos, even when they’re harder to keep efficient in a crowded commercial stall. That’s the conflict a lot of herds live with — proofs that look great on paper but quietly work against the barn you already own.
Holstein USA lists stature as one of the more heritable linear traits, with heritability estimates commonly in the low‑to‑mid 0.4 range in U.S. Holstein evaluations. When you select for tall, you reliably get tall. Research and breeding work have shown that larger body size and higher stature are unfavorably associated with longevity and fertility — cows bred for size tend to have shorter productive lives and poorer reproductive performance.
Work from Ontario, Guelph, and the USDA has established a clear economic relationship between body size and feed efficiency: genetically larger cows consume more energy for maintenance and tend to produce milk less efficiently once you account for that overhead. That’s why the 2021 Net Merit revision put stronger negative economic weight on Body Weight Composite and added a new Feed Saved component, explicitly rewarding breeders who select for more efficient, moderate‑sized cows. By the 2025 NM$ update, BWC emphasis had reached −11%, and total Feed Saved emphasis hit 17.8% — the index actively penalizes every extra pound of body weight at roughly 5.5 lbs of DMI per lactation.
The Indexes Caught On. Did Your Mating Plan?
AHDB geneticist Marco Winters has seen the same paradox in UK data. “Everywhere I go, farmers tell me they don’t want bigger cows,” he’s said, “but all the genetic trends tell us that’s what they’re breeding.” AHDB figures show average Holstein body weight is climbing, and UK indexes have responded with more emphasis on maintenance and efficiency.
Holstein USA’s stature scale change in 2024 and classification’s tighter eye on extreme size are another signal. The math in the national indexes has already turned against huge frames. The question is whether your mating plan has followed — or whether you’re still penciling in +stature sires into a barn that was poured around smaller Holsteins.
The genetics drifted. The concrete stayed put.
When Stall Width and Holstein Size Collide
Cassandra Tucker’s group at the University of British Columbia has spent years watching what big Holstein cows actually do in undersized stalls. In one set of studies, cows averaging roughly 1,600 pounds were housed in stalls 44, 48, and 52 inches wide. Lying time increased when the stall width increased from 44 to 48 inches, with smaller gains between 48 and 52 inches. In the narrow stalls, cows spent more time perching — front feet on the bed, rear feet in the alley — exactly the posture you see in mature pens that are too tight for the cows living there.
“Proper neck rail placement and adequate stall width let cows stand straight with all four feet on the bed—the posture that protects claws and suspensory apparatus. When stalls are too narrow or neck rails are too far forward, cows perch (front feet on bed, rear feet in alley), loading the claw’s suspensory structures and driving sole ulcers. Tucker’s UBC work showed lying time dropped and perching spiked in 44-inch stalls vs. 48-inch stalls. Your barn tells you which side of that line you’re on.” (Source: Ontario Ministry of Agriculture, Food and Rural Affairs)
Perching isn’t just ugly. It’s the first step in a cascade. Longer standing bouts overload the claw’s suspensory apparatus, driving more sole hemorrhage and ulcers. Once those structural changes happen inside the hoof, you don’t “fix” them; you manage around them until the cow leaves.
Rick Grant at the Miner Institute translated that behavior into milk. His work suggests each lost hour of lying time is associated with roughly 2–3.5 lb less milk. Cook’s freestall time‑budget data from 17 Wisconsin barns found that cows averaged about 11.3 hours, with a range of 2.8 to 17.6 hours. The worst‑off cows weren’t just a bit behind. They were living in a completely different reality.
Stall Width Is Only Half the Story: The Lunge Box
As cows get taller, they don’t just need a wider bed. They need somewhere to put their head when they get up.
The Dairyland Initiative’s adult freestall dimensions specify that a mature Holstein needs about 10 feet of stall length against a wall to allow a full forward lunge, and about 17 feet on a head‑to‑head platform so cows can lunge without colliding with the cow across from them. They treat 16 feet as a minimum platform length; going shorter forces cows to lunge to the side and lie diagonally, which drives perching and bed contamination.
Rising cows need 61 cm (24 in.) of forward lunge space, with the nose arcing 10–30 cm above the bed. Short platforms (<16 ft head-to-head) or obstructions force side-lunging and diagonal lying—the perching behavior you see in pens where big cows outgrew the concrete. That missing foot of platform length isn’t a rounding error—it’s a daily lying-time penalty.” (Source: Ontario Ministry of Agriculture, Food and Rural Affairs)
In many older barns, head‑to‑head platforms were built around that minimum 16‑foot length from earlier design recommendations, rather than the 17 feet now preferred for mature Holsteins. That might have been acceptable for smaller 1,200–1,400‑lb cows. Push stature toward the top end of Holstein’s new 65‑inch scale, and the nose‑to‑tail length and lunge arc increase — but the concrete doesn’t. The result: more side‑lunging, more diagonal lying, and more stall‑use frustration you can see in any overgrown pen.
Head-to-head platforms need 5.5 m (18 ft) for mature Holsteins to lunge forward without hitting the cow across from them. Older barns built to 16 ft minimums force cows to lunge sideways through loops or lie diagonally, driving bed contamination and perching. That missing 1–2 feet isn’t a comfort upgrade—it’s the difference between cows using stalls normally vs. fighting the barn every time they lie down.” (Source: Ontario Ministry of Agriculture, Food and Rural Affairs)
Kip Law’s herd was living that reality before he built his new barn.
Kip Law’s 8‑lb‑a‑Day Concrete Fix
Law’s old setup was a classic Northeast tiestall: a 70‑cow pipeline arrangement with more cows than stalls, Holsteins that had outgrown their beds, and milking that took roughly six hours because cows had to be rotated in and out. “It was taking us about six hours to milk,” he told Progressive Dairy. Stalls were “too small for Holsteins,” and the facility no longer fit the herd.
He didn’t start by rewriting a mating program. He started by changing the barn.
Law built a new freestall with a double‑eight parlor, deep sand bedding, proper lunge space, and stalls sized for mature Holsteins. Within three weeks, milk jumped about 8 lb per cow per day. Over roughly two years, his average daily production climbed from about 55 lb to 70 lb per cow — a 27% increase. The milking herd grew from about 80 to 130 cows, and overall milk production doubled. Somatic cell count dropped to about 100,000.
“The overall herd health is a lot better. Our cows are a lot calmer than they used to be,” Law said. “In two years, it’s a completely different herd.”
Same cows. Same genetics. New concrete.
The Barn Math on Missing Milk
To get a feel for what’s at stake, take a simple example. Say 50 of the biggest cows in a 200‑cow freestall herd — mostly third‑lactation and older — lose just 1.5 hours of lying time per day because stalls are too narrow. Using Grant’s mid‑range estimate of 3 lb per lost hour, that’s:
1.5 hours × 3 lb = 4.5 lb per cow per day.
4.5 lb × 50 cows = 225 lb per day.
225 lb × 305 days = 68,625 lb of milk in a lactation.
That’s barn math, not Law’s actual numbers — but it lives in the same neighbourhood as what he saw when he fixed stall fit and watched milk move.
Cook’s freestall remodels show the same pattern: widen stalls and improve surfaces, and the 1,046 kg ME gap between first‑calvers and older cows starts to shrink. In some herds, it disappears.
In Florida, Don Bennink took the opposite route and ended up in a similar place — cows that fit their environment.
In a 2017 profile, North Florida Holsteins in Bell, Florida, was milking about 4,200 cows at any one time, with roughly 4,800 cows on the farm and around 10,000 head on site. They were shipping approximately 140 million pounds of milk per year with a rolling herd average of 29,357 lb at 3.6% fat and 3.0% protein on 3× milking, all through about 4,000 sand‑bedded freestalls in a mix of tunnel‑ventilated and naturally ventilated barns. Bennink moved his herd from western New York to Florida in 1980 and built the operation from there — figuring out quickly that hot, humid conditions and a Northern European breed demanded relentless attention to comfort, cooling, and housing. (Read more: NORTH FLORIDA HOLSTEINS. Aggressive, Progressive, and Profitable!!)
“High production, strong health traits and feed efficiency,” Bennink said in that profile. “They are the bywords for breeding profitable cows.” He doesn’t mince words about what profitable doesn’t look like. The taller, more angular cow favoured in the show ring, the classification system, or the current PTAT formula is “so far removed from what most milk producers want that it is irrelevant to the majority of dairy operations,” he argued.
The results back up the philosophy. Between 1981 and 2021, more than 200 bulls carrying the NO‑FLA prefix were enrolled with the National Association of Animal Breeders. Bennink bred the dam of Mr. T‑Spruce Frazz LIONEL‑ET — NO‑FLA Montross 42446‑ET — who topped the TPI list in April 2022, tracing back at least five generations of North Florida breeding. NO‑FLA MATRIARCH sits in the top 20 all‑time among proven bulls with a PTA Productive Life of 7.3. The farm has produced 55 dams of merit awardees, 11 gold-medal dams, 9 94‑point animals, and 15 93‑point animals. In 2024, the National Dairy Shrine honored Bennink as Distinguished Dairy Cattle Breeder — recognition built squarely on functional trait selection and profitability, not show‑ring aesthetics.
He built his own North Florida Index around pounds of protein shipped, health traits, daughter fertility, and calving ease. Stature and sharpness don’t enter the equation. He actively selects bulls that are negative for stature, even as many breeders still chase high PTAT and lofty frames.
If you’re breeding for Madison or the Royal, you’re playing a different game with different priorities. If your milk cheque comes from a 46‑inch freestall, Bennink’s math may be closer to what your barn needs than the TPI top‑ten list.
He didn’t widen stalls to keep up with ever‑taller cows. He bred cows that work in the freestalls he already had. The trade‑off is real: go too far shrinking stature without watching udder and locomotion traits, and you can sacrifice udder height or rear‑leg structure, which is why Bennink leans hard on individual udder and leg traits instead of chasing overall type composites.
Two herds, two different levers. Both stopped letting body size run the show.
The “Stop the Growth” Breeding Manifesto (Month 0–3)
You can stop making the mismatch worse this week without spending a dollar on concrete.
Hard cap: Stature PTA ≤ 0.0. Net Merit 2021 and subsequent updates have already placed a negative economic weight on the larger Body Weight Composite due to higher maintenance costs — by 2025, BWC emphasis in NM$ hit −11%. There’s no financial case for adding more frame in a tight barn.
Weight tax: Body Weight Composite ≤ 0.0. Larger‑bodied cows eat more just to maintain themselves. USDA research behind the NM$ formula estimates that each extra unit of BWC costs roughly 5.5 lbs of DMI per lactation.
The real “type”: Prioritize Productive Life (PL), Daughter Pregnancy Rate, and the individual locomotion traits (rear legs rear view, locomotion, foot angle) instead of chasing PTAT points that are heavily tied to stature.
The goal: A moderate, efficient cow that fits the stall and lasts — not a frame race. The exact weight and production numbers vary by region and system; the point is to stop rewarding size for its own sake in a barn that can’t carry it.
Write it down as a farm rule: “No sires over 0.0 Stature or positive BWC until mature‑cow stalls are at least at Dairyland’s recommendation for our cow size.” That one line keeps you honest the next time a glossy proof sheet lands on the desk.
Concrete and Comfort: Sequencing the Physical Fix (Month 0–24)
Chase the Cheap Cow Comfort Wins (Month 0–6)
Concrete can wait a year. Behavior and time budgets can’t.
Drop effective stocking density in the fresh and high‑cow groups below about 110% of stalls where you can.
Tighten bedding management: more bedding, more often, with level, well‑groomed beds — especially if you’re on mats or mattresses.
Walk pens with a simple anemometer. If air speed at cow level runs under about 1 m/s in high‑risk pens, you’re leaving heat‑stress risk on the table.
Score locomotion monthly in the fresh and high groups. Treat and block score‑3+ cows quickly and give them the best stalls you have — because a 2022 University of Wisconsin study pegged lameness cases at about $337each in lost milk, treatment, and culling.
These moves cost time and operating money, not six figures. They can still deliver a few pounds per cow per day and peel points off your lameness rate inside the first six to nine months.
Pilot Stall Widening Where It Pays Fastest (Month 6–18)
Instead of waiting until you can redo the entire barn, fix one pen.
Pick the highest‑value group — fresh cows or your top production string. Widen those stalls by moving or replacing divider loops. Using Dairyland’s table, if your average mature cow weighs around 1,600 lb, you should aim for about 50‑inch centres, not 45–46. Get as close as your building will let you, even if it temporarily reduces stall count in that pen.
Then track milk, lying behavior, and lameness scores in that pen against unchanged pens. Cook’s Western Canadian Dairy Seminar work was blunt: after stall-surface changes, increasing stall width for large, mature Holstein cows was the second most important improvement in both sand and mattress facilities. Your pilot pen becomes proof of that in your own herd — and evidence for your lender.
Use the Extra Milk to Fund the Concrete (Month 12–24)
If the combination of a genetic freeze and comfort fixes adds even 4 lb/cow/day across 200 cows, that’s 800 lb/day. Over a full lactation, you’re looking at roughly 244,000 lb of additional milk. The exact margin depends on your component price and feed cost, but that kind of volume moves the needle in a loan conversation.
Instead of walking into the bank saying, “I read I should widen stalls,” you walk in with a year’s worth of herd data showing that better stall fit in one pen produced real milk. That’s a fundamentally different conversation.
What rarely works: still using high‑stature bulls because they rank on the elite lists, and relying on more frequent hoof trimming to outrun the concrete.
Your 5‑Minute Barn Audit
Use this as a quick pass before you ask your breeding rep to bring another batch of +stature proofs.
Stall width vs cow size. Tape‑measure at least five stalls in your mature‑cow pen. Check your average mature cow weight from Lactanet or your nutritionist’s records. If you’re milking roughly 1,600‑lb cows in 45‑inch stalls, Dairyland says you’re 4–5 inches short.
Platform length and lunge. Measure your head‑to‑head platform. Anything under 16 feet is below Dairyland’s minimum recommendation for forward lunge for mature Holsteins. Short plus wide forces side‑lunging and diagonal lying.
Lameness and locomotion check. Score 20 mature cows on a 1–5 locomotion scale. If more than about 20% land has a score of 2 or worse, you likely have more lameness than you think — and stall design is almost always part of that story.
Stall Comfort Index proxy. Walk your high group two hours before milking. If more than 20% of cows touching a stall are standing idle instead of lying, your SCI is giving you a clear warning sign — regardless of what your Feet & Legs composites say.
Genetic pressure. Pull the last three years of sire BWC and Stature values. If your average is positive on BWC and above zero on Stature, you’re still breeding cows that are bigger than the ones that built your barn.
Breeding rep reality check. Ask, “Given my stall width and cow size, what’s the maximum Stature PTA you’d be comfortable using here?” If that number is lower than what’s on your current sire list — or they can’t answer — you’ve just found the DNA of your facilities‑genetics mismatch.
30‑day action. In the next 30 days, pull the BWC and Stature values on every active sire in your lineup and cross‑check them against your stall tape. Any bull that doesn’t fit both your index and your concrete comes off the mating list first.
What This Means for Your Operation
If your three‑year average sire BWC is positive and your mature‑cow stalls are under 48 inches, your mating program and your barn are pulling in opposite directions. You don’t fix that with more hoof‑trimming visits.
Cook’s Wisconsin data showed a 1,046 kg ME gap between first‑lactation and third‑or‑greater‑lactation cows in large freestall herds — more than double the 475 kg gap in tie-stall herds. That’s the environment punishing bigger, older cows, not genetics suddenly “quitting.”
Law’s herd gained 8 lb/cow/day in three weeks — not by changing sires, but by giving them stalls that actually fit. Over two years, daily milk increased by 27%, and SCC fell to about 100,000, despite the same genetics.
Bennink ships about 140 million pounds a year (as of 2017) by selecting smaller, tougher cows and ignoring stature‑heavy PTAT — running them through sand‑bedded freestalls he already had. That’s breeding for the barn you have, not the one on the semen catalogue cover.
The 2021 Net Merit revision began the turn against body size; by 2025, BWC emphasis in NM$ hit −11%, and total Feed Saved emphasis reached 17.8%. Holstein USA’s updated stature scale and classification changes reinforce that same direction. The math in the indexes has already turned against huge frames.
Replacement heifers are expensive — and getting more so. USDA Ag Prices data show U.S. dairy replacement values climbing from about $2,140 per head in April 2024 to around $2,660 by early 2025, reaching a record$3,110 in October 2025 before easing to $2,860 in January 2026, with top lots in California and Minnesota still clearing north of $4,000. Every cow you cull early because she can’t stay sound in an undersized stall is a capital loss, not just a hoof‑trimmer bill.
Key Takeaways
If your average sire BWC is positive and your stalls are built for smaller cows, cap Stature and BWC at 0.0 on your mating list until your concrete catches up. That alone stops the facilities‑genetics mismatch from getting worse.
If your mature‑cow stalls measure 45–46 inches and your average cow is in the 1,600‑lb range, you’re 4–5 inches short of Dairyland’s recommendation. Expect more perching, more lameness, and a bigger ME gap in older cows until that changes.
If more than 20% of cows touching stalls are standing instead of lying two hours before milking, treat it as a red‑alert comfort problem, not a personality flaw in your cows. That’s barn design talking, not “weak feet.”
If your herd is already built on big, sharp cows, you don’t have to choose between genetics and concrete.Freeze height and body size now, chase cheap comfort and ventilation wins, then use the extra milk to justify stall and platform upgrades.
The Bottom Line
If you walked your barn this afternoon with a tape measure in one hand and your last proof run in the other, would they tell the same story — or would they argue with each other all the way down the alley?
Complete references and supporting documentation are available upon request by contacting the editorial team at editor@thebullvine.com.
Learn More
Net Merit 2025 | The Bullvine – This implementation guide reveals how to stop Net Merit 2025’s new $57-per-point “weight tax” from working against you. It arms you with non-negotiable filters for Feed Saved, ensuring your sire stack generates margin rather than just frame.
$3,010 Per Heifer. 800,000 Short. Your Beef-on-Dairy Bill Is Due. – This strategic deep dive exposes the massive capital risk hiding in today’s record-high $3,000+ replacement market. It delivers a 90-day blueprint to rebalance your breeding and secure your 2028 pipeline against inventory fragility.
Robotic Milking Revolution: Why These Money Machines Are Crushing Traditional Parlors – This innovation brief breaks down how automated systems recover the “hidden hours” lost to parlor routines. You’ll gain a 13% average net return advantage by leveraging precision data to finally match milking frequency with each cow’s biological potential.
The Sunday Read Dairy Professionals Don’t Skip.
Every week, thousands of producers, breeders, and industry insiders open Bullvine Weekly for genetics insights, market shifts, and profit strategies they won’t find anywhere else. One email. Five minutes. Smarter decisions all week.
Before you clip another sale animal, four breeders from Pennsylvania’s marketing panel want you to think hard about which cow you’re leading on the truck — and how she looks when she gets off.
Chris Hill asked a room full of Holstein breeders in Mars, Pennsylvania, how many had ever consigned their best animal to a sale. Not their second-best. Their best. A few hands went up. Not many.
That moment set the tone for the Pennsylvania Holstein Association‘s “Market Like a Pro” panel at the 2026 convention on February 7 — a session that brought together four operations spanning 35 registered cows to about 11,000 milking head, five states, and nearly every marketing channel in the registered dairy cattle business. Between them, the panelists own the reigning WDE Grand Champion Holstein, today’s #1 Holstein sire Sheepster, over 200 All-American and All-Canadian nominations, and a cow family that’s been farming since 1777. The message was consistent and uncomfortable: if you won’t let your best one go, your registration papers are just expensive wallpaper.
The Panel: From a $3,000 Auction Barn to 8,500 Embryos a Year
Chris Hill — Klussendorf-MacKenzie winner, WDE judge, MD-Hillbrook sales manager — moderating the “Market Like a Pro” panel.
Hill — a Klussendorf-MacKenzie Award winner (WDE 2002) who has judged five different breed shows at World Dairy Expo and manages roughly 35 sales a year across the United States and Canada through MD-Hillbrook — moderated the discussion. Over 90 minutes, the panelists kept coming back to the same themes: the quality of the cattle you offer, the courage to sell your best, and how both the consignor and the sale manager present those cattle. Here’s who was at the table.
Nathan and Jenny Thomas — WDE/Royal judges, 180+ All-American nominators — at the PHA convention.
Jenny Thomas, Triple-T Holsteins & Jerseys, North Lewisburg, Ohio. Jenny and her husband, Nathan — a WDE and Royal Winter Fair judge — milk about 35 head from a registered inventory of over 100 Holsteins and Jerseys, and board the Vierra Dairy Jersey show string. The farm started roughly 20 years ago as what Jenny calls “a 4‑H project gone astray”: Nathan bought a standing building at auction for $3,000, tore it down, and reassembled it as a cow barn. The family purchased the dam that produced T-Triple-T Dundee Paige (3E-EX-96), and Paige became the cornerstone — producing three 95-point offspring, including MS Beautys Black Velvet-ET (EX-96), best bred-and-owned at World Dairy Expo two years running. Triple-T has now been behind over 180–200 All-American and All-Canadian nominations, a three-time WDE Grand Champion Jersey and 2025 Royal Winter Fair Supreme Champion in Stoney Point Joel Bailey (EX-97), and countless Excellent descendants. That track record built Thomas Marketing and Consulting, which manages sales like the Amplify Sale and the Spring Select Sale with Aaron Eaton.
Betsy Bullard — Brigeen Farms’ 10th generation, 530–600 cow manager, Top 10 BAA 108.4 herd — at the PHA convention.
Betsy Bullard, Brigeen Farms, Turner, Maine. Brigeen has been in continuous operation since 1777. Betsy and her husband, Bill, are the 10th generation, and the farm has been a member of Holstein Association USA for 83 years. When the couple joined the farm in 2000, they were milking about 60 cows. Today, Brigeen commonly milks around 530–600 registered Holsteins, with 530 reported as the milking herd in a 2024 profile and over 500 cited in Holstein USA’s 2025 BAA lists. Their current BAA is 108.4, ranking in the Top 10 for herds with 250 or more cows on Holstein USA’s 2025 lists. Deep cow families anchor the program, including the “G” family from Royland Leadman Glory (GMD DOM) and the Roxy’s.
Jonathan and Alicia Lamb — 12th‑generation Oakfield Corners owners turning 11,000 Holsteins and 8,500 embryos a year into a genetics-and-cheese business.
Alicia Lamb, Oakfield Corners Dairy, Oakfield, New York. Jonathan and Alicia Lamb — 12th-generation farmers — run Oakfield Corners as a division of Lamb Farms, Inc., milking about 11,000 cows between three farms in western New York and a fourth in western Ohio, with about 99% of the herd being Holstein. Their genetics program produces and implants about 8,500 embryos a year through Trans Ova and Bova Tech: about 95% index cattle (high GTPI, Net Merit, polled, Red Carrier), a small percentage show-type, and the remainder specialty beef.
The numbers back it up. As of October 2025, Oakfield bred OCD Ripcord R2D2, then the #1 GTPI female at 3628 GTPI, and 7HO16276 Sheepster, then the #2 TPI bull at 3458 GTPI. Since then, Sheepster has moved up and is now ranked #1 Holstein sire on TPI, with Holstein International’s March 2026 Sires Report describing him as the current TPI leader at 3572 TPI, with more than 100 AI sons. They also own the reigning WDE Grand Champion Holstein, Lovhill Sidekick KandyCane (EX-96-2E).
Peter Dueppengiesser — former 1,200‑cow New York dairyman turned STgenetics Eastern U.S. sales manager and registered-cow partner.
Peter Dueppengiesser, Ransom-Rail Holsteins, Pavilion, New York. A two-term Holstein Association USA board member, Peter operated a 1,200-cow dairy and 2,100-acre crop farm near Perry, New York, for 35 years before accepting a position with STgenetics in 2019. He now serves as the Eastern U.S. dairy sales manager and maintains six to eight partnerships, keeping him working with more registered cattle than he ever had on his own farm. His wife, Roxanne, saw the partnership spreadsheet once. “I thought we were downsizing,” she said during the panel. Peter’s answer: “It’s sexed semen and embryo transfer. I’m working on it.”
Co‑Vale Dempsey Dina 4270‑ET (EX‑95), co‑owned by Peter’s Ransom‑Rail partnerships — proof that his “sell your best, not your sick calf” philosophy is backed by cows that can top the ring and the sale sheet.
“They Don’t Want Your Sick Calf. They Want Your Best One.”
That line came from Peter, recalling a moment when his son Jared was eight or nine. They had four sisters to a Robert Cameron daughter, and a buyer was coming to pick one. Jared said, “They’re going to pick the best one.” Peter’s reply stuck: “But they don’t want your sick calf. They want your best one, right?”
Every panelist landed on this principle from a different angle. Jenny pointed out that plenty of strong breeders won’t sell — afraid the animal won’t bring enough, or afraid they can’t make another one. She flipped that fear: “Your prefix stays on that animal forever. Dundee Paige put us on the map.” Those cows — out working for other people — built the Triple-T brand more than anything else could.
T-Triple-T Dundee Paige (3E-EX-96) — the brood cow Jenny’s talking about, whose daughters, show wins, and sale consignments turned the Triple-T prefix into a brand buyers recognize.
Betsy brought a classifier’s honesty to it. “They’re worth what the market says they’re worth. We can imagine they’re all 89‑point two‑year‑olds, but until somebody unbiased comes in and tells us where they fit — that’s eye-opening.” Maybe your best is an 86‑point heifer. Still fantastic. But you have to know that and act on it.
The trade-off is real. When you sell your best, you lose her future production and flush potential. When you keep her invisible, your prefix fades, and your buyer relationships go stale. Both sides of that equation need math and marketing, not just emotion.
What Do Sale Managers Actually Want — And What Do They Remember?
The commission question came up fast — and Hill didn’t duck it. “Commission’s the same as it was in 1984,” he said, “and animals bring the same price they did, or less.” Sale managers aren’t getting rich. But the relationship has to go both ways.
What consignors should expect: a well-promoted event with an established buyer base, accurate catalog information, and honest guidance on which animal fits which sale. Peter was direct — “Help us decide what’s the right fit. They understand the sale, how it’s going to flow, what the customer base is going to be.”
What sale managers remember about you: whether your cattle showed up halter broke, whether they had decent feet, and whether you did any work before sale day. “If they come in there with skis for feet, nobody’s going to see the good parts,” Hill said. “Everybody’s going to turn to the negative, because it’s human intuition.”
Presentation is your job too. Alicia added a pressure test every consignor should use: before you commit an animal, ask the sale manager what it’s worth. “If he says $2,500 and you’re expecting $5,000, there’s a significant difference. I’d much rather be the bad guy up front than after the animal’s gone.”
And then there’s your own responsibility. Sale managers juggle dozens of lots. If you’re not sharing posts, shooting phone photos, and telling the cow-family story on your own social media, you’re leaving money on the table.
Hybrid Sales Aren’t the Future — They’re the Floor
Hill told the story of having 80 head tied up at Frederick Fairgrounds when COVID hit. That crisis pushed him to create the Bright Futures Elite Embryo Online Sale — a low-overhead, Cowbuyer-powered format now in its 15th edition.
The ripple effect matters most. Alicia estimates that when Oakfield sells five embryos from a specific cow on a Bright Futures night, nine times out of ten, another interested party calls within days — sometimes resulting in 15 or 20 additional embryo sales outside the commission structure. That kind of pipeline effect is easier to generate when your prefix carries the weight of a WDE Grand Champion and the breed’s top sire. For a smaller herd, the multiplier will be more modest — but the format still creates visibility you wouldn’t get otherwise.
Oakfield Solomon Footloose (EX‑96), 2024 WDE Grand Champion Holstein — the kind of banner that makes one Bright Futures embryo lot turn into 15 or 20 quiet follow‑up sales.
Oakfield has pushed hybrid further with their Spring Sensation series. Cattle stay on-farm. Buyers walk through in a low-pressure setting. Bidding goes live on Cowbuyer, and a qualified crew evaluates lots on-site for absentee bidders. “We don’t have to worry about the wind blowing the tent down or storms frightening animals going through the ring,” Alicia said. The format cuts expense, keeps cows comfortable, and hasn’t produced unhappy buyers because “most of them, if they’re not there, are represented by somebody qualified.”
Peter added the buyer’s angle: “I’ll be sitting behind my computer screen, potentially making some bids, and I’m still able to work on-farm and do my own thing.” Technology amplifies trust. It doesn’t replace it.
The 68‑Inch Frail Two‑Year‑Old Is Dead.
One of the sharpest exchanges happened around the convergence of show and functional cattle. As one panelist put it: “The days of having 68‑inch two‑year‑olds whose front legs cross have slowly, luckily, started to drift away.”
Triple-T’s recent run proves the point. Stoney Point Joel Bailey (EX‑97) won Grand Champion Jersey at World Dairy Expo for the third consecutive year in 2025 — and then took Supreme at the Royal. Black Velvet (EX‑96) claimed best bred-and-owned at Expo two years running. These are cows that didn’t sacrifice function for frame. The modern show winner increasingly comes out of a freestall herd: medium-framed, sound-footed, able to handle concrete.
Stoney Point Joel Bailey (EX‑97), Triple‑T’s three‑time WDE Grand Champion Jersey and 2025 Royal Supreme — a freestall cow with enough strength and rear udder to sell both banners and embryos.
For breeders of high-type cattle, this convergence is good news for marketing. A cow that wins and milks is easier to sell than one that only does one or the other. But it means you can’t coast on frame and dairy character alone. “Show and function should be two words that go together,” one panelist said. “We want that show animal to be medium size, functional, able to survive in a freestall, slatted-floor environment.”
Can Great Barn Cows Generate Real Embryo Revenue?
A question texted in from the audience hit a nerve: “If you don’t have a show herd, what avenues are there to market those great barn cows?”
Alicia’s answer was concrete. She described a cow in the Oakfield herd — not high enough on the index for the stud cut, almost four years old. But a rear udder that “would pop you in the head” when she’s full of milk. Alicia photographed her, posted her, and started selling embryos. According to Alicia, pairing the cow with a popular sire created interest in the $5,000 to $10,000 range per resulting calf — but those numbers aren’t typical for most registered herds. They reflect the Oakfield brand, the buyer network behind Sheepster and KandyCane, and decades of building a reputation that commands premiums. A 60-cow registered herd should calibrate expectations down, but the strategy still works: IVF to hot bulls, photograph the rear udder, tell the cow-family story, match the sale to the cow.
Lovhill Sidekick KandyCane (EX‑96‑2E), Oakfield’s reigning WDE Grand Champion Holstein — the kind of cow whose ring presence and rear udder help make those $5,000–$10,000 embryo calves believable.
Hill mentioned sending five or six solid milk cows to a regional sale where, by his account, they brought $4,000 to $6,000 each. After two or three lactations and daughters on the ground, that’s real money off cows that were never destined for Harrisburg.
Genomic Contracts: One Piece of a Bigger Marketing Puzzle
With Class III prices averaging $18.01 in 2025 — down from $18.89 in 2024 — and the USDA’s February 2026 WASDE now projecting just $16.65/cwt for 2026 (while January’s actual Class III posted at only $14.59), the pressure to maximize every revenue stream off your registered cattle isn’t going away.
Contracts came up briefly during the panel as one more factor breeders should watch. According to Alicia, Oakfield’s index marketing is now primarily limited to bulls going to studs. IVF sessions can be sold occasionally — a few privately, a few on sales — but contract restrictions have tightened the window. “It’s not so easy anymore,” she said. “It’s still financially successful. It’s just different than it used to be — maybe not quite as fun.”
Some studs now write contracts so restrictive that not only the resulting calf but the next generation can be encumbered. Other studs remain “free and open,” which creates real incentive to use their bulls when performance is comparable. On the type side, most cattle are effectively unencumbered. On the genomic side, those truly free animals are increasingly rare and increasingly valuable.
For most breeders, the practical takeaway was simple: if you’re playing in the index game, read every line and ask questions before you sign. But for the bulk of the room in Pennsylvania that day, the emphasis landed squarely on the quality of cattle offered and the way they’re presented. Contracts were a piece of the discussion, not the headline.
Your Prefix Follows the Truck
Contracts can determine what you can sell. Reputation determines whether anyone wants to buy from you again.
Oakfield Corners has bought cows back when buyers couldn’t get them pregnant — brought them home, got them settled, confirmed the pregnancy, and shipped them back. Brigeen operates the same way. “If we don’t stand behind the animals we sell, then why are we selling?” Betsy said. A bad experience travels faster than a good one. That’s exactly why the follow-up matters.
Hill recounted a deal in which the seller guaranteed $750 per IVF embryo from a high-priced cow. By Hill’s account — he didn’t name the buyer or seller — the cow went to the chute regularly and eventually generated around $22,000 in embryo revenue on top of show wins and a calf. Not every deal ends that way. But backing your sale with action is what separates breeders who sell once from breeders who sell for decades.
Jenny framed follow-up: help buyers with breeding decisions, feeding questions, whatever they need. If a kid buys their first 4‑H calf and wants to know what kind of pen she needs, take the call.
What This Means for Your Operation
If you’ve never consigned: Start with one animal — your genuinely best available — and call a sale manager for a candid price estimate before you commit. Hill said it himself: “Call us, text us, email us. We’ve got to know you’re interested.” Do it this month. One phone call.
If you’re consigning but not promoting: Shoot three phone photos this week — side, rear udder full of milk, head — and post them with the pedigree and one sentence of cow-family story. Share every post the sale manager puts out. Algorithms bury what people don’t engage with.
If you’re running index cattle, pull every active genetics contract and confirm what’s restricted—daughters, granddaughters, flush rights, export. The answer may change which bulls you use next month, but remember it’s only one piece of the marketing puzzle.
If you have great barn cows with no show future, they’re still pedigree builders. IVF them to a popular sire, photograph the udder, tell the story. Results will scale with your brand — Oakfield commands premiums most herds can’t — but even a $3,000–$5,000 calf sale is real revenue off a cow you were milking anyway.
If you’re a young breeder without cows: Buy embryos. Partner with a herd that has recipient space. Start building your prefix one flush at a time — and don’t be shy about asking established breeders how they got sale managers into their driveway.
The Bottom Line
All four panelists represent Northeast and Midwest U.S. operations — Ohio, Maine, New York, and Maryland. If you’re running a western U.S. or Canadian program, some sale channels and buyer dynamics may differ. But the fundamentals hold.
Every year your best genetics stay invisible is a year your prefix means nothing to the next buyer flipping through a sale catalog. Your registration papers are either a marketing asset or wallpaper. Which one are they this month?
Business Ethics in Marketing Dairy Cattle Genetics – Extending the panel’s blunt warnings about reputation, this piece dives into the ethical forces that underpin every handshake and sale truck, proving that an honest prefix is a breeder’s most valuable asset.
Every week, thousands of producers, breeders, and industry insiders open Bullvine Weekly for genetics insights, market shifts, and profit strategies they won’t find anywhere else. One email. Five minutes. Smarter decisions all week.
You say you love five‑lactation cows. Your numbers say three. Is your beef‑on‑dairy program and pen crowding killing your “old ladies” before they ever get there?
Metric
3-Lactation System
5-Lactation System
Impact
Rearing cost per heifer
$3,010
$3,010
Same upfront investment
Amortized cost per lactation
$1,003
$602
$401 less per lactation
Annual heifer needs (700 cows)
245 heifers/year
175 heifers/year
70 fewer heifers
Total annual rearing cost
$737,450
$526,750
$210,700 savings
Beef semen usage (typical)
70% of breedings
~35% of breedings
More internal replacements
At Glacier Edge Dairy in Wisconsin, Kristen Metaf will tell you her favorite cows are the “old ladies” on their fifth or sixth lactation — the ones that don’t panic in the parlor and turn feed into milk, day after day. She says those fifth‑lactation cows are her moneymakers because they know the routine and don’t waste energy. She runs a herd that, like a lot of progressive dairies, breeds heavily to beef, lung‑scans calves at three to five weeks, and trims hooves three times a year to keep cows on their feet.
On that same World Dairy Expo panel, Pennsylvania herd manager Eric Grodigette shared that cameras over his pens showed fresh cows were spending more time out of the pen than he realized — a few “extra” minutes in the holding area, three times a day, added up to hours of lost rest and more third‑calvers heading to the cull string. Both of them say they want five‑ and six‑lactation cows. But like a lot of U.S. herds, they’re having to make those decisions in an industry where USDA’s January 2026 cattle report counted just 3.914 million dairy replacement heifers over 500 pounds — the lowest since 1978 — and CoBank projects roughly 800,000 fewer heifers over 2025–26 before numbers start to rebound closer to 2027. By mid‑2025, the national average replacement heifer price sat around $3,010 per head, up sharply from about $1,140 in 2019, with top springers in some Western and Upper Midwest auctions topping $4,000.
Bullvine’s analysis of NAAB’s 2024 semen report estimates that about 7.9 million units of beef semen were used in U.S. dairy herds, while NAAB’s own summary shows 9.9 million units of gender‑selected dairy semen, up 17.9% from 2023. Beef‑on‑dairy now supplies an estimated 2.6 million calves to U.S. feedlots, up from roughly 410,000 in 2018. Put bluntly: a lot of barns are managed for three‑lactation cows, even as producers talk about five‑lactation cows and cash beef checks.
What’s Changed — And Why It Hits You Now
For years, the default answer was simple: raise more heifers, milk more cows, keep the parlor full. Heifers were relatively cheap, custom‑grower slots were open, and processors wanted volume.
That world’s gone. USDA’s January 1, 2026, inventory pegged dairy replacements over 500 pounds at 3.914 million, down from 3.951 million the year before and the lowest since USDA reported 3.886 million in 1978. CoBank’s August 2025 outlook says those heifer numbers will shrink by roughly 800,000 head over 2025 and 2026, even as about $10 billion in new U.S. dairy processing capacity comes online through 2027 — all of it needing more milk and components.
Heifer values tell the same story. Hoard’s Dairyman and other market summaries show quarterly U.S. replacement prices around $1,140 per head in 2019, then climbing to the $2,800–3,010 range by mid‑2025. In Wisconsin, USDA and regional reports indicate replacement costs climbed about 69% from late 2023 to late 2024, landing in the mid‑$2,000s, while top springers in some California and Minnesota sales cleared $4,000.
On the calf side, beef‑on‑dairy keeps roaring. NAAB’s 2024 summary recorded 9.9 million units of gender‑selected dairy semen, up 17.9% from 2023, alongside very strong beef‑semen sales. Ever.Ag’s Mike North told Brownfield that newborn beef‑cross calves in early 2025 were “bringing as much as $1,000” in some markets, while Holstein bull calves often traded in the $500–1,000 band — a few‑hundred‑dollar per‑head premium for beef‑cross in many barns.
Now add cow time to the mix. Freestall work across North America and summaries from Wisconsin’s Dairyland Initiative show that when cows have roughly one usable stall per head and spend no more than about 3–3.5 hours per day out of the pen for milking and lock‑ups, they typically lie down 12–14 hours/day. Push stocking density into the 120–140% range and let time out of pen creep past 4 hours/day, and lying time commonly drops by 45–120 minutes/day, with more lameness, lower milk yield, softer components, and higher somatic cell counts. Miner Institute and related field work boil this into a simple rule: each lost hour of lying time is associated with roughly 2–3.5 pounds less milk per cow per day.
When herds run replacement rates in the mid‑30s, breed 60–70% of cows to beef, and crowd pens until cows only get 9–10 hours of rest — and a chunk of that is drowsy standing, not real lying — they’re effectively betting more of their future on expensive purchased heifers and very optimistic IVF performance. That’s the 3‑lactation trap.
What Happens When a 700‑Cow Herd Chases Beef and Longevity at the Same Time?
Busy producers think in pictures and quick comparisons. So let’s put the 700‑cow scenario you’re probably already running in your head into a simple table.
Rearing Payback: 3‑Lactation vs 5‑Lactation System (700‑Cow Herd)
Metric
3‑Lactation System
5‑Lactation System
Impact
Rearing cost (est.)
$3,010/heifer
$3,010/heifer
Same base investment
Amortized cost per lactation
~$1,003 ($3,010 ÷ 3)
~$602 ($3,010 ÷ 5)
About $401 less rearing cost per lactation
Heifer needs (700 cows)
700 × 0.35 = 245/year
700 × 0.25 = 175/year
70 fewer heifers to raise or buy
Beef semen usage (typical)
High (70% beef matings)
Moderate (~40% beef)
More beef cash vs more internal replacements
Heifer inventory work from Michael Overton and others suggests many U.S. herds still sit in the low‑to‑mid 30% replacement band, even when owners say “about 30%.” At 35%, a 700‑cow herd needs 245 cows entering the parlor each year to hold head count. Factor in a realistic 15% loss from abortions, stillbirths, and pre‑fresh culls, and you actually need 245 ÷ 0.85 ≈ 288 dairy heifer calves born annually to stand still.
Now plug in a breeding pattern that’s become very common:
70% of breedings to beef semen.
30% to dairy semen (mix of sexed and conventional).
About a 50:50 bull‑to‑heifer ratio on dairy conceptions.
On roughly 700 conceptions per year:
700 × 0.70 = 490 beef‑cross calves.
700 × 0.30 = 210 dairy calves, about 105 heifers, and 105 bulls.
You need 288 dairy heifer calves; you’re only making about 105 from conventional dairy breedings. IVF embryos and sexed semen on your top end have to supply the other 180‑plus, or you have to buy heifers at $3,000–4,000 a head. And if IVF comes up short, conception dips, or a respiratory bug hits your “elite” heifer group, you’re forced into the market or into keeping cows and heifers you’d normally ship.
If a herd’s replacement rate slides toward 25% and average lactations move toward five, the math flips. You now need around 175 new cows a year, so 175 ÷ 0.85 ≈ 206 dairy heifer calves born — that’s roughly 82 fewer heifer calves per year compared to the 35% scenario. You can still run some beef, maybe 30–40% of matings, but you’re not mathematically forced into the heifer market or heavy IVF to replace early exits. Longevity and internal growth are finally pulling in the same direction.
That’s why the beef cap matters. In many replacement‑rate scenarios, holding beef semen usage in roughly the 20–35% band is a practical range for internal growth when your replacement rate is coming down, and your calf program is solid. At 70% beef, you’re essentially stating that you will buy heifers or lean heavily on expensive IVF to maintain herd size. There’s no way around the numbers.
The Mechanics Behind the Trap
When you strip the buzzwords away, three choices set the ceiling on average lactations: who you raise, how hard you push beef semen, and what you ask stalls and time budgets to carry.
Calves, Lungs, and the “Ollivett Effect”
Terri Ollivett at the University of Wisconsin–Madison has helped turn lung ultrasonography into a practical on‑farm tool and popularized the #WeanClean mindset — calves should arrive at weaning with healthy lungs, not just acceptable weight gains. Her extrapolation from USDA’s 2014 NAHMS survey is blunt: about 9.5% of U.S. dairy calves show clinical pneumonia, and for every clinical case, there are roughly two to four subclinical cases you only see on ultrasound. That puts preweaning BRD — clinical and subclinical — in the 30–50% range for many herds. North American studies report subclinical BRD prevalence between 23% and 67%, depending on farm and timing.
A 2021 systematic review and meta‑analysis found that heifers diagnosed with calfhood BRD had 2.85 times higher odds of dying and 2.3 times higher odds of herd removal before first calving, plus about 0.067 kg/day lower average daily gain and 121 kg less milk in their first lactation. Progressive Dairy and veterinary summaries add that chronic BRD cases often lead to heifers with limited lung capacity and decreased longevity. That’s the biological core of the longevity story: scar the lungs, and you shrink the “engine.” Those animals can still freshen and produce, but the data show they’re more likely to leave early and produce less, which makes it nearly impossible for them to reach the kind of fourth‑ or fifth‑lactation peaks you bred them for.
Outcome
Healthy Heifers (Baseline)
BRD-Diagnosed Heifers
Odds of death before first calving
1.0× (baseline)
2.85× higher
Odds of herd removal before first calving
1.0× (baseline)
2.3× higher
Average daily gain (kg/day)
Baseline
-0.067 kg/day slower
First-lactation milk production
Baseline
-121 kg (approx. -267 lb)
At Glacier Edge, every calf gets a 0–5 lung score at 3–5 weeks; larger or repeated lesions get aggressive treatment. That’s smart. But scanning without changing who you raise is just adding cost. The BRD meta‑analysis and Ollivett’s field work point in the same direction — calves with significant BRD damage are much more likely to die, to be culled before first calving, and to give less milk when they do freshen. The only way lung ultrasound really supports longevity is if you’re willing to say, “A calf with a score of 4 and two BRD treatments is never a replacement in this herd,” even when her pedigree looks great.
Genomics belongs in that same “decide who never gets a ticket” bucket. DWP, mastitis PTAs, lameness, and fertility traits give you a durability preview years before a cow hits the parlor. Glenn Klene has 13 years of genomic data at Yun Farms behind him and has seen high‑health‑index home‑breds outlast bought‑ins. But if low‑health‑index heifers with poor calf records still get raised as replacements, you’re paying for information you won’t act on.
What Happens to Your Numbers If You Actually Change?
You can rewrite a protocol in a week. You can’t rewrite your herd’s age structure in one turn of the calendar.
On a 700‑cow herd that truly commits — culling harder on weak young stock, dialing beef usage into that 20–35% range, and protecting rest time — you’re realistically signing up for a multi‑year project.
Year 1 — You change a lot, the numbers don’t
You:
Start lung‑scoring calves and mark some as “never replacements.”
Cap beef semen in the 20–35% range, aim sexed dairy only at truly top cows and heifers.
Pull your worst overstocked pen back toward 105–110% of stalls and keep time out of the pen under 3.5 hours/day.
Move from two to three hoof trims a year on higher‑risk pens.
You feel:
Short on heifers.
Like pens and heifer barns are “too empty.”
Pressure from partners or lenders who only see fewer cows in the parlor.
On paper, replacement rate and average lactations barely budge. You’re still milking cows bred and raised under the old rules.
Years 2–3 — The first “new rules” heifers hit second and third lactation
Replacement rate drifting from, say, 36% toward 30–32%, because fewer young cows fall out.
Average lactations might move from 3.0 to 3.3–3.5. That’s progress, but it still doesn’t “look” like a five‑lactation herd. And this is exactly where many herds quietly increase beef use again, cram pens back to 130%, or ease up on calf culls.
Years 4–5 — The herd actually looks different
Herds that stay the course usually report more 4th‑ and 5th‑lactation cows, fewer first‑lactation culls, and replacement rates in the 25–30% range. Average lactation at cull inches into the 3.8–4.2 area, with a meaningful tail of fifth and sixth-lactation cows. The payoff is both biological and financial: your “engines” are bigger because you protected lungs and legs early, and your rearing cost per lactation is hundreds of dollars lower because you spread that $3,010 over five lactations instead of three.
The question isn’t whether cows can get there. It’s whether you’ll still be running the hard rules when those years finally show up on your DHIA printout.
Is One Pen Stealing All Your Lactations?
You don’t need a five‑year plan to learn something useful this month. Start with one group.
Field work on time budgets and cow comfort suggests that when cows average around 12–14 hours of lying time per day and spend only about 3–3.5 hours out of the pen for milking and lock‑ups, they produce more milk and stay sound longer. Miner Institute research, echoed in multiple comfort case studies, puts a number on it: each lost hour of lying time is associated with roughly 2–3.5 pounds less milk per cow per day.
At Grodigette’s farm, cameras showed that fresh cows were being pulled to the holding area just a little too early for each milking — that “little” added up to 30 minutes or more of lost lying time a day and more standing on concrete. When they moved that group’s slot 10 minutes later three times a day and retrained movers, the lying time recovered. Using the Miner Institute rule, that kind of rest recovery represents roughly 3–5 pounds of previously “hidden” milk per cow per day that had been sacrificed to standing fatigue. They also saw fewer lame, open third‑calvers coming out of that pen.
Overstocking adds another layer. Work from the Dairyland Initiative, Michigan State, and others shows that stocking freestall pens much above 100–110% leads to more competition, less lying time, higher lameness, lower rumination, and reduced milk yield. When bunk space gets tight in an overstocked pen, cows tend to eat fewer, larger meals — classic slug feeding — which increases the risk of SARA, lower fat test, and laminitis‑type lameness. Those cows might still hit half‑decent first‑lactation numbers, but repeated bouts of SARA and sore feet keep chipping away at longevity. That’s the management face of the 3‑lactation trap.
30‑Day Pen Test: Is This Group Built for Three Lactations or Five?
Within the next 30 days, pick one pen — fresh, high, or the one you complain about the most. For 30–60 days, track:
Average lying time per cow per day (collars, cameras, or structured spot checks).
Total hours per day that the group spends out of the pen (walk, holding, lock‑ups).
Cows per usable stall.
If you see:
Lying time under 11.5 hours/day, or
Time out of pen over 3.5 hours/day, or
Stocking density over 110% of stalls,
treat it like a mastitis outbreak. Within 14 days:
Adjust milking order and lock‑up schedules until time out of the pen is ≤3.5 hours/day.
Move or ship enough cows to get that pen to about 100–110% of stalls.
Then run those conditions for 60 days and watch: lameness treatments from that pen, “low and open” culls, and milk per stall — not just per cow. If nothing changes, your bottleneck is probably stall design, bedding, or nutrition. If things improve, you’ve just proven with your own cows that overstocking and time budgets were quietly stealing cow years and milk checks.
Options and Trade‑Offs for Farmers
You don’t have to pick the “perfect” path. You do need to admit which game you’re actually playing.
Decision Factor
Longevity-First
Beef-Led Cash Flow
Hybrid with Guardrails
Beef semen usage
20–35% of breedings
60–70% of breedings
30–50% (data-driven)
Replacement rate target
25–28%
33–36%
28–32%
Average lactations (expected)
4.2–5.0
3.0–3.3
3.5–4.2
Primary risk
Empty pens, partner pressure
Heifer market squeeze, price spikes
IVF/sexed semen underperformance
Heifer source
Internal + selective purchase
Heavy purchase or contract growers
Internal + IVF + selective purchase
What you’re betting on
BRD control, rest time, genomics
Beef calf premiums, available heifers
Genomic accuracy, IVF success
Discomfort you accept
Fewer cows, slower growth
High heifer costs, market volatility
Complex breeding rules, constant monitoring
Longevity First: Fewer Replacements, More Lactations
When it makes sense: You feel the heifer squeeze, you’re not keen on bidding $3,000–4,000 for replacements, and you’d rather cut replacement risk than chase every last beef‑calf premium.
What it requires:
Hold beef semen usage in that 20–35% band until your replacement math says you can push higher. At current prices and heifer inventories, 70% beef is basically a commitment to buying heifers or leaning heavily on IVF.
Use genomic health indexes and Ollivett‑style lung scores as disqualifiers: repeated BRD or high lung scores mean “never a replacement,” not “we’ll see how she does.”
Hard‑wire rest: “No lactating pen stays under 11.5 hours lying time for more than a week; if it does, we get stocking to ≤110% and time out of the pen to ≤3.5 hours/day within 14 days.”
Accept a 2–3 year lag before average lactations really move.
Risks and limits: The heifer barn and some pens will look “too empty” for a while. You may have some hard conversations with your banker about why you’re chasing fewer, older cows instead of more, younger cows.
Beef‑Led Cash Flow: Volume and Calf Checks First
When it makes sense: You’re expanding or heavily leveraged, beef‑cross calves in your area reliably bring strong checks, and you’ve got solid access to custom growers or purchased replacements.
What it requires:
A clear‑eyed acceptance that your herd will probably sit near 3.0–3.3 average lactations and mid‑30% replacement for the foreseeable future.
Firm relationships or contracts that secure enough replacement capacity before you need it, because both heifers and grower space are tight, and CoBank doesn’t see inventories rebounding before 2027.
A budget that can handle heifer price spikes beyond $3,010; that number isn’t guaranteed to hold.
Risks and limits: You’re exposed in two markets — beef calf and heifer — so policy, trade, or health hits can double up on you. Longevity stays mostly a story, not a driver of profit. This path isn’t automatically wrong. It just carries different risks than the longevity‑first play.
Hybrid With Guardrails: Beef and Longevity Under One Roof
When it makes sense: You want those beef checks, but you’re willing to let data — not habit — decide who gets beef versus dairy.
What it requires:
Broad genomic testing plus good calf and heifer records.
A written breeding rule; for example, top 30–40% on DWP + production + health get sexed dairy and IVF consideration; bottom 60–70% get beef semen every time.
A simple monthly replacement calculator: heifer calves needed = milking cows × target replacement rate ÷ 0.85. If projected dairy heifer calves (sexed + conventional) fall short, the next breeding round’s beef percentage comes down.
Risks and limits: It depends on IVF and sexed semen performing close to conservative conception assumptions, not the best‑case number in a brochure. And if calf health isn’t tight, even “elite” heifers can carry scarred lungs and fragile legs; your rules must let you bump them to the beef side without blowing up your replacement pipeline.
The 30‑Day Pen Test: A No‑Regrets Start
If you do nothing else in the next month, run that 30‑day pen test. It costs time and honesty, not capital.
When it makes sense: Pretty much always, any herd can learn something from it, whether you’re a 100‑cow tie‑stall or a 2,000‑cow freestall.
What it requires (within 30 days): Pick one pen: fresh, high, or the obvious lameness hot spot. Measure lying time, time‑out‑of‑pen, and stocking density for 30 days. If lying time <11.5 hours/day, time‑out‑of‑pen >3.5 hours/day, or stocking >110%, adjust stocking and schedules inside 14 days and hold that line for at least 60 days.
Risks and limits: You’ll likely move or ship a small group sooner than planned, and it might look “inefficient” on a whiteboard. If results don’t improve, your next step is to look at stalls, bedding, or ration — not to shrug and go back to 130% stocking.
What you gain: Hard numbers from your own barn about whether overstocking, lock‑up, and slug feeding are quietly stealing cow years and 3–5 lb of milk per cow per day. And a story you can tell to partners and lenders when you argue that fewer, better‑rested cows beat more, exhausted cows.
Key Takeaways
If your true replacement rate is well above 30%, pull 12 months of cull data and count how many cows are left in first or second lactation for lameness, mastitis, or reproduction. That’s where your “we love old cows” story leaks — and those early exits are exactly the animals BRD and SARA hit hardest.
If any lactation pen averages less than 11.5 hours of lying time for a week, treat it like any other health problem: within 14 days, get stocking down toward 100–110% of stalls and total time out of the pen under 3.5 hours/day, then watch lameness, SARA signs, and “low and open” culls from that group.
If you’re breeding more than about 35% of cows to beef semen without clear health and genomic cut‑offs,sit down and run the replacement math on paper. With CoBank projecting about 800,000 fewer heifers over 2025–26 and average heifers already at $3,010, heavy beef usage basically commits you to buying heifers or leaning hard on IVF.
If you’re lung‑scanning calves but still raising almost all heifers as replacements, add one written rule: lung score ≥4 or two BRD treatments = never a replacement here. The data suggest those heifers are much poorer candidates for five‑lactation careers.
If your average lactations haven’t moved in two years despite new tech, stop buying tools and change one structural decision instead — stocking density in one pen, beef percentage, or young‑stock cull thresholds — and give it long enough to show up on your DHIA printout.
If you’re serious about five‑lactation cows, pick one number — average lactations, replacement rate, or lying time — and agree that when it looks bad, you’ll change rules, not just stories.
Which Discomfort Are You Willing to Live With?
In the next 30 days, you can pick one pen and find out whether your barn is built for three‑lactation cows or five. In the next 90 days, you can write one non‑negotiable rule — about calves, beef usage, or rest time — and stick with it even when the heifer barn looks too empty. Over the next few years, you’ll see whether you’ve actually built a five‑lactation herd or just told yourself you had one.
Because the cows can do it, the question is whether you’d rather feel the discomfort of culling a few more weak calves and over‑conditioned third‑calvers now, or keep writing checks for an extra 40‑plus heifers a year at roughly $3,010 a head while overstocked, slug‑fed, BRD‑scarred cows quietly age out at three lactations.
Complete references and supporting documentation are available upon request by contacting the editorial team at editor@thebullvine.com.
Learn More
$3,010 Per Heifer. 800,000 Short. Your Beef-on-Dairy Bill Is Due. – You’ll gain concrete decision rules for rebalancing your breeding sheet before the next semen order. It delivers the specific pregnancy rate and culling thresholds required to stop your beef-on-dairy program from cannibalizing your future herd size.
Every week, thousands of producers, breeders, and industry insiders open Bullvine Weekly for genetics insights, market shifts, and profit strategies they won’t find anywhere else. One email. Five minutes. Smarter decisions all week.
Five “backup” bulls nobody wanted now shape most Holstein pedigrees. At 9.99% inbreeding, your next 15–20% sire choice will decide how your herd survives.
Monroe was supposed to be the bull.
Select Sires had contracted the young sire — a Chief son out of Walkway Matt Mamie (EX-90 GMD DOM) — for collection in 1978. When Monroe died during test services before a single straw was frozen, Charlie Will, a young sire analyst on his first acquisition, bought Monroe’s full brother instead. Registration HOUSA000001773417. Walkway Chief Mark (Bullvine Podcast E484, Feb 2026).
That backup bull’s DNA now sits in roughly seven percent of every Holstein on the continent (2020 Holstein Pedigree Analysis). His name appears twenty-five times in the pedigree of Farnear Delta-Lambda, whose daughter, West-Adub Lambda Sadie, won Intermediate Champion at World Dairy Expo in 2025. And Mark is just one of five bulls who reshaped the breed precisely because they started as Plan B — the overlooked outcross genetics nobody was chasing. With Canadian Holstein heifers born in 2024 averaging 9.99% inbreeding (Lactanet Canada), backup bulls aren’t just good history. They’re survival gear.
Walkway Chief Mark (VG-87-GM), bred by Foster Walk, Neoga, Illinois. Monroe was supposed to be the bull — Mark was Plan B. His 57,654 daughters delivered the best udders of their generation and the worst feet. His DNA now accounts for 7% of every North American Holstein. Photo: Remsberg (Read more: Walkway Chief Mark: The Backup Bull Behind Seven Percent of Every Holstein Cow)
The Backup Bull Pattern at a Glance
Bull
The “Plan A”
Why He Was Plan B
Key Legacy Stat
Walkway Chief Mark
Monroe (full brother)
Sibling replacement after Monroe died
7% of North American Holstein genome
Carol Prelude Mtoto
Bell-line “rockets”
Italian import; £40/straw
Sire of Shottle (1.17M doses)
O-Bee Manfred Justice
Durham (type king)
UDC of -3.22; too plain for show barns
~13% genetic relationship to breed
Fustead Emory Blitz
Blackstar A-list sons
Small-farm prefix; unremarkable pedigree
1.52 million straws sold
Round Oak Rag Apple Elevation
None — low-priority mating
Known fertility limitations
15.28% of Holstein genome
The Heifer Pen Where Mark Was Born
Foster Walk farmed outside Neoga, Illinois. The Bullvine’s podcast profile described him as having “an eye for diamonds in the rough” — a farmer who purchased groups of heifers at 21 cents a pound and built quality through cow sense rather than catalog pedigrees. His herd wasn’t the kind that generated buzz in Holstein World classifieds. But it produced Mark’s dam, and that turned out to matter more than every splashy sale catalog of the decade.
By the late 1970s, breeders were deep in the first great wave of Pawnee Farm Arlinda Chief genetics — Chief’s contribution eventually measured at 14.95% of the entire Holstein genome (2020 Holstein Pedigree Analysis). Every AI organization wanted more of his sons. Will had come looking for one. He left with a different one.
One backup bull is an accident. Keep reading.
Udders That Won, Feet That Lost
When Mark’s first daughters freshened, coded 7HO980 in every AI catalog in the country, the udder results were hard to argue with. Fore attachments, rear attachments, teat placement, udder depth — all trending well above the competition.
But a structural curse traveled with the package. Shallow heels. Weak pasterns. The problem traced back through Mark’s maternal line, through No-Na-Me Fond Matt. As one breeder recalled in the Bullvine’s profile: “When they come into the show, you love them. However, when they turned sideways, you see the legs and high pins.”
Breeders who treated Mark as a specialist tool — using him exclusively on cow families with strong feet and legs — built the best udders of their generation. The ones who spread him indiscriminately spent a decade managing foot problems. He eventually recorded 57,654 production-tested daughters, more than most AI studs produce from their entire lineup in a decade.
Can a Backup Bull Really Appear 42 Times in 10 Elite Pedigrees?
When analysts traced the pedigrees of the breed’s top 10 GTPI females circa 2015, Mark appeared forty-two times — thirty-three as sire of a female in the lineage, nine as sire of a male. Only Starbuck, at thirty-five, came close.
His most consequential genetic path ran through a son named Mark CJ Gilbrook Grand, connecting eventually to Seagull-Bay Supersire — who debuted at +2530 gTPI as a genomic young sire in December 2012 and graduated as the breed’s No. 1 proven GTPI sire in April 2015 at +2613 GTPI with NM$ of +$834 (Bullvine, April 8, 2015; Select Sires). Supersire sold over one million units of semen. Three separate Mark crosses sit in Braedale Goldwyn’s pedigree.
The Bullvine’s Mark profile also documented a hidden cost in his legacy: the APAF1 mutation, traced back through his sire Chief, caused the loss of more than 500,000 calves worldwide over 30 years — more than 100,000 in the United States alone — before Harris Lewin’s team at UC Davis identified it (Adams et al., 2016, UC Davis College of Biological Sciences; also covered by the Bullvine, October 2016). The economic toll: an estimated $420 million.Greatness and genetic risk travel in the same pedigree. That’s the trade-off every backup bull forces you to confront.
Carol Prelude Mtoto: The £40 “Failure” From Italy
Two backup bulls are a coincidence. But the pattern was just getting started.
By the late 1990s, the industry was hooked on first-lactation records. Bell daughters and their descendants were flooding barns with milk at volumes nobody had seen before. But those daughters were falling apart structurally by the second lactation. Small frames, weak substance, udders that couldn’t sustain the metabolic load.
“It was like a battlefield,” producers from that era told the Bullvine in our 2025 Mtoto profile. “Cows are down with milk fever everywhere. Others were standing with their legs all splayed out, trying to hold up udders that had completely broken down. We were getting maybe two, two and a half lactations before they were done.”
What Does a £40 Outcross Buy You?
Mtoto was born July 13, 1993, in Italy’s Parmigiano-Reggiano region. Average size. Production genetics that looked mediocre next to the Bell-line rockets everyone else was marketing. When Avoncroft brought him to Britain in 1998, his straws cost £40 each — roughly four times the going rate for standard proven bulls.
Carol Prelude Mtoto, photographed in Italy’s Parmigiano-Reggiano region where he was born in 1993. That deep body and rugged frame were everything the Bell-line pipeline wasn’t selecting for. At £40 a straw — four times the going rate — he looked like an expensive gamble on unfashionable genetics. The payoff: Picston Shottle and 1.17 million doses. (Read more: Carol Prelude Mtoto: The £40 ‘Failure’ That Saved the Holstein Breed)
But Mtoto had been deliberately bred to fix what Bell broke. His sire, Ronnybrook Prelude — a Starbuck son — brought good frame and dairy character. His dam, a Blackstar daughter, brought constitution. And Chief Mark was back there for the udders. The pedigree read like a correction formula.
Mtoto’s daughters weren’t production champions. They were survivors — lasting six profitable lactations while Bell-line contemporaries washed out after two. His mature proof (UK, August 2025 run) shows somatic cell scores of -13, a HealthyCow index of +17, and a lameness advantage of +0.7. Thirty years on, those health advantages haven’t eroded.
An Eight-Year-Old Cow, a £40 Sire, and a Bull Worth 1.17 Million Doses
The real payoff came one generation later. The Pickford family at Picston Farm (Spot Acre Grange, Staffordshire), along with Anthony Brough of Tallent Farm in Cumbria, had purchased Condon Aero Sharon (EX-91) at the Great Yorkshire Show in 1991. By 1999, Sharon was eight years old — an age when most breeding programs have long since moved on.
Helen Pickford recalled the pushback in our 2025 profile: “The reps kept showing us data on first-lactation heifers. Dad just kept saying, ‘But Sharon’s still here, still producing well. These heifers you’re pushing — will their daughters still be milking in eight years? “
The Pickfords bred Sharon to Mtoto through ABS’s progeny testing program. Louise Pickford, then a Genus ABS sire analyst, identified the resulting bull calf for the company’s Cornerstone program (ABS Global, July 2014). That calf was Picston Shottle, born July 23, 1999.
Shottle hit No. 1 TPI (2060) in the US in January 2008 and dominated rankings on both sides of the Atlantic — including seven consecutive evaluations atop the UK’s Profitable Lifetime Index (ABS Global; Bullvine Shottle Legacy, June 2025). He achieved 9,674 Excellent daughters worldwide through 2014, and ABS documentation confirms the sale of over 1.17 million doses. Sharon herself was voted Global Cow of the Year in 2007.
When feed costs spiked and milk prices crashed in 2008, herds heavy with Shottle daughters weathered it better than operations that had chased peak first-lactation yields. “Shottle daughters saved farms,” producers told the Bullvine. “When feed doubled, and milk crashed, operations with higher-producing herds went under. Those moderate-production cows that lasted six lactations? They kept us alive.”
O-Bee Manfred Justice: The Anti-Type Bull
Three backup bulls. Same pattern emerging. And the next one would make the show crowd furious.
The early 2000s belonged to Regancrest Elton Durham — five consecutive Premier Sire banners at World Dairy Expo from 2003 to 2007. Long bodies, broad and flat rumps, outstanding dairyness. Goldwyn succeeded him in 2008 and claimed ten Premier Sire banners at World Dairy Expo — seven consecutive from 2008 through 2014 (Semex, October 2014), interrupted by Pine-Tree Sid in 2015, then recaptured in subsequent years for a total of ten through 2018 (Farmers Forum, October 2018; Bullvine, February 2026).
Too Plain for the Ring, Too Profitable to Ignore
O-Bee Manfred Justice — born March 8, 1998, sired by Manfred with Elton as maternal grandsire — didn’t fit that mold. His NAAB linear profile tells the story: UDC of -3.22, Dairy Form at -3.45, Feet & Legs score of -1.07 (NAAB Sire Evaluation Database). Commercial farmers saw a cow that would stay in the herd. Show breeders saw a cow they’d never lead into the ring.
O-Bee Manfred Justice, born March 8, 1998. A UDC of -3.22 and Dairy Form of -3.45 — numbers that guaranteed he’d never see a show ring. Commercial herds kept reordering anyway. Over one million units sold worldwide. Photo: Frank Robinson
A landmark PNAS study (Dechow & Cole, 2016) noted that “O-Man was notable as an outlier for Net Merit, the primary economic index promoted by the USDA, in part because he was also an extreme bull for longevity.” When the A-list was Durham for type and high-index production bulls for the commercial crowd, O-Man occupied an awkward middle ground that turned out to be exactly where the money was.
He received his first official proof in May 2003, and the commercial dairy world noticed immediately. Calving ease. Productive life. Daughter pregnancy rate. The traits commercial dairymen had been quietly prioritizing for years.
O-Man eventually sold over one million units of semen worldwide (NAAB records; Select Sires documentation per Charlie Will’s 2025 NAAB Pioneer Award). Will had now acquired three of the five bulls on this list — Mark, Blitz, and O-Man — all from farms outside the industry’s inner circle.
How Does a -3.22 UDC Bull End Up in 13% of the Breed?
O-Man’s genetic relationship to the breed sits at roughly 13% (USDA Animal Genomics and Improvement Laboratory) — not far below Chief at 14.8% or Elevation at 15.2%. Fragomeni et al. (2023, JDS Communications) ranked him 12th in genetic importance among all US Holstein sires. His influence ran almost entirely through his sons.
Every proof run still produces bulls with outstanding economic indexes and mediocre type scores. The temptation is always to skip them. O-Man is the permanent rebuttal.
Fustead Emory Blitz: 1.52 Million Straws From a Farm Nobody Knew
Four backup bulls. Nobody designs this. The pattern keeps showing up.
By the mid-1990s, the Blackstar pipeline was flowing at full capacity through Select Sires, with the emphasis on bulls that combined Blackstar’s power frame with the emerging Durham-style type. Fustead Emory Blitz — born March 2, 1996, bred by Brian and Wendy Fust — didn’t fit that bill. His sire was MJR Blackstar Emory (EX-97-GM), his dam was Fustead Tesk Bev (EX-90). Solid breeding, but not the kind of pedigree that commanded premium sale prices.
A Bullvine profile described him as “a rough diamond nobody wanted” (Bullvine, October 2025). Charlie Will acquired Blitz for Select Sires — the same analyst who’d bought Mark two decades earlier and O-Man three years later.
Fustead Emory Blitz, born March 2, 1996 — bred by Brian and Wendy Fust. The Bullvine called him “a rough diamond nobody wanted.” Daughters weren’t the prettiest in the barn, but farmers who milked them kept coming back. 1.52 million straws sold. The reorder rate doesn’t lie. Photo: Frank Robinson
The Reorder Signal That Couldn’t Be Ignored
Then came the daughters. Holstein International dubbed Blitz “the comeback bull.” When dairy farmers milked his daughters, they wanted more. Not the prettiest cows in the barn, but they showed up, produced consistently, and stayed healthy.
The numbers tell it. Blitz eventually sold over 1.52 million units of semen, as confirmed by Hoard’s Dairyman’s “Super Millionaires Club,” among the highest totals in breed history. With 42,268 daughters in 11,499 herds (per Alta Genetics data), that reorder rate represents the most honest form of breeder validation: commercial farmers used him, liked what they milked, and came back for more.
His genetic legacy flows through some of the breed’s most consequential modern sires. He sired Velvet-View KJ Socrates (EX-94-GM), and Socrates produced Roylane Socra Robust (VG-88), who debuted at +2230 GTPI and led Select Sires’ proven lineup for NM$ (+782), CM$ (+834), and FM$ (+742) upon graduation. From Robust came Supersire. The sire stack powering genomic breeding today traces back to a bull the industry initially overlooked.
Round Oak Rag Apple Elevation: The Mating Nobody Prioritized
Five backup bulls. Five decades. The same pattern every time.
In 1965, first cousins Ronald Hope Sr. and George Miller had spent a quarter-century layering Burke and Ivanhoe bloodlines into their herd at Round Oak Farm in Virginia. They bred Tidy Burke Elevation — a bull with known fertility limitations — to Round Oak Ivanhoe Eve, a cow that had matured more slowly than some of her contemporaries. As the Bullvine documented in our Elevation profile (March 2025), neither parent was anyone’s top choice for a high-impact mating.
Elevation was just a young, unproven sire when the Virginia Animal Breeders Association joined Select Sires. His semen costs member organizations under $1.50 per unit. No premium. No expectations. [Read more: Round Oak Rag Apple Elevation: The Bull That Changed Everything]
Round Oak Rag Apple Elevation, photographed at Round Oak Farm, Virginia. Semen at $1.50 a unit. Known fertility limitations. Neither parent was anyone’s top mating choice. Holstein International named him Bull of the Century — 15.28% of the genome, 8.8 million descendants, semen shipped to 45 countries. Photo: Remsberg
When the First Daughters Freshened
The results spoke for themselves. Elevation was the first proven Holstein bull in the modern era to combine a high production proof with the ability to sire show-winning type. Daughters averaged 29,500 pounds of milk in their first lactation — 15% above contemporaries in the 1970s — while maintaining exceptional udder structure and extended productive lives.
George Miller put it plainly in the Bullvine’s Elevation profile: “It’s been said that Elevation built the barns at Sire Power and Select Sires.” Revenue from one backup mating funded the infrastructure of what became the world’s largest AI cooperative.
Holstein International named Elevation “Bull of the Century” — and the data backs it up. His genetic contribution measured at 15.28% of the Holstein genome (2020 Holstein Pedigree Analysis), the highest of any individual sire at the time. Over 10,000 registered sons. An estimated 8.8 million descendants worldwide (Bullvine Elevation profile, March 2025). Semen is shipped to 45 countries.
While the industry average hovered at 2.8 lactations per cow in the 1970s, Elevation daughters averaged 4.2 lactations— a 50% increase in productive life. Up to 99% of AI bulls born after 2010 trace back to either Elevation or Chief. That single stat tells you everything about why the breed’s genetic base is where it is today.
The Holstein Squeeze: Why Backup Bulls Are Survival Gear
Every bull on this list came from outside the breeding establishment’s centre. Mark’s dam was purchased at commodity heifer prices. Mtoto was an Italian import in a North American-dominated market. O-Man’s type proofs would disqualify him from any show-oriented program. Blitz came from a farm without a marquee prefix.
Elevation’s dam wasn’t a priority in her own herd. This isn’t a coincidence — when the entire industry chases the same fashionable genetics, the bulls that offer something genuinely different almost always emerge from breeders working outside the mainstream.
The commercial reorder signal flagged every one of these bulls before the industry consensus caught up. Blitz’s 1.52 million units. O-Man’s million-plus. Shottle’s 1.17 million doses. Commercial farmers who milk daughters every day knew what they had. The rankings took years to agree.
Today’s Backup Candidates: Who Fits the Profile Right Now?
Here’s the practical question: if these five bulls changed the breed by being undervalued outsiders, who fits that profile today?
Dr. Chad Dechow at Penn State reports US Holstein inbreeding around 8%, with young bulls running 9–10%. Lactanet Canada’s figure for 2024-born heifers: 9.99%. The damage isn’t theoretical.
Ablondi et al. (2023, Journal of Animal Science) showed inbreeding across 27,735 Italian Holstein cows severe enough to cost over half a wheel of Parmigiano-Reggiano per cow per lactation in lost production — roughly 310 to 600 eurosdepending on the inbreeding measure.
The Europeans saw this coming decades ago. CRV in the Netherlands deliberately draws from 40 different black-and-white sires of sons to maintain population diversity. Their bull Delta Boyan (Warren P RF × Endless RF) scores +19% CRV Efficiency and +6% CRV Health, with breeding values of 112 udder health and 111 hoof health (CRV, August 2025).
VikingHolstein’s VH Sandro (VH Skills × Youngster) carries a gNTM of +38, projects daughters with 12,289 kg milk, 4.24% fat, and 3.54% protein, and averages 963 days in production (VikingGenetics, August 2025 official proofs). Neither bull will ever appear on your TPI top-100 list. Both fit the Mtoto profile: health-heavy, functionally bred, invisible to anyone filtering by North American indexes alone.
On this side of the Atlantic, the Bullvine’s four-slot sire roster framework identified FB 8084 Adebayo-P-ET as a longevity/fertility fixer — PL +5.3, LIV +4.5, FI +2.5, SCS 2.78, polled, confirmed on the Holstein Association August 2025 TPI list and the NAAB December 2025 Top 200 TPI Proven Bulls report. His production proofs (56M, 54F, 33P) would get scrolled past by anyone chasing leaderboard rankings. That’s exactly the point.
The 2026 Mtoto is probably in your catalog right now. Nobody’s using him because we all filter for top-50 and never scroll further.
All proof data is current as of December 2025. Rankings may shift at the April 2026 evaluation.
What This Means for Your Operation
☐ In the next 30 days: Pull your EFI report. Check your herd’s average Expected Future Inbreeding from your mating software. If it’s above 7%, you need a backup bull in the rotation today — not next proof run. Any bull that pushes a mating above your ceiling, regardless of index ranking, moves to the beef-on-dairy list for that cow.
☐ In the next 90 days: Audit sire usage against the plan. Most operations aim for a diversified lineup but end up putting 60% of matings through one or two bulls. Pull breeding records from the last two proof cycles: intended allocation vs. actual. If your franchise bull consumed more than 40% of matings, your roster isn’t doing its job.
☐ Run the math on genomic testing. For 200 replacement heifers, genomic testing costs roughly $7,000–$10,000 (at $35–50/head). Virginia Tech research found each 1% increase in inbreeding costs approximately $40–43 per cow in lifetime profit (inflation-adjusted from 1999 data, per the Bullvine’s February 2026 analysis). On a 200-cow herd averaging 10% inbreeding, the accumulated lifetime drag runs somewhere around $80,000–$86,000. Dropping the average EFI by 1% across those 200 heifers avoids roughly $8,000–$8,600 in lifetime production drag. The test pays for itself before the first calf hits the ground.
☐ Structure a four-slot sire roster. One franchise profit bull (your NM$/CM$ leader), one high-component hammer, one durability/fertility fixer, and one genuine outcross. The Bullvine’s December 2025 sire roster framework assigns roughly 35/25/25/15% allocation across those four slots.
☐ Over the next 12 months: Track reorder rates, not first-use popularity. When commercial herds keep coming back for more of the same bull, pay attention. That signal predicted Blitz’s 1.52 million units years before the industry caught on. Ask your AI rep which bulls are generating the strongest repeat-order rates among herds milking 100+ daughters. That’s where the next backup bull is hiding.
Key Takeaways
If your proof filters stop at top-50 TPI, you’re missing the next Mtoto. The bull ranked 200th–400th for elite health traits and an outcross pedigree; it is this generation’s backup candidate. Or look outside TPI entirely — CRV and Viking bulls won’t appear on that list at all, which is part of the point.
Specialist sires require specialist use. Mark built the best udders of his generation for breeders who protected every mating against his feet-and-leg weakness. Used indiscriminately, he created a decade of foot problems. Know your bull’s hole and mate accordingly.
The reorder rate is the most honest proof. Blitz sold 1.52 million units, not because of marketing, but because farmers milked his daughters and wanted more. That commercial signal beats any catalog ranking.
Premium-priced outcross genetics look expensive today and cheap in retrospect. Farms that paid £40 for Mtoto in 1998 are still making a profit. More than a few farms that bought cheaply are gone.
The Bottom Line
The bulls you quietly add at 15–20% of matings over the next year will do more to shape your herd’s long-term resilience than whatever sits atop the TPI list today. That’s been true for five decades running.
Your catalog’s open. Your EFI report is one click away. What’s your backup plan?
Carol Prelude Mtoto: The £40 ‘Failure’ That Saved the Holstein Breed – Understand the world they were both navigating by diving into the metabolic battlefield that necessitated a genetic revolution. This feature uncovers the high-production era’s hidden costs and why the industry was crying for a correction.
From Depression-Era Auction to Global Dominance: The Picston Shottle Legacy – Discover how they carried forward what they started by tracing the extraordinary genetic throughline from a 1941 Depression-era auction to global dominance. This story proves that the foundation held and continues to pay dividends today.
The Sunday Read Dairy Professionals Don’t Skip.
Every week, thousands of producers, breeders, and industry insiders open Bullvine Weekly for genetics insights, market shifts, and profit strategies they won’t find anywhere else. One email. Five minutes. Smarter decisions all week.
Mexico just proved it can park 38,000 trucks and almost run out of milk. Has your co‑op ever shown you that risk map?
Farmers and truckers block a commercial highway in Chihuahua during Mexico’s November 2025 “megablockade.” At the Ciudad Juárez–El Paso crossing, roughly 38,000 trucks stalled — and dairy was the first product to nearly run out.
December Class III settled at $15.86/cwt. January dropped to $14.59 — the lowest since July 2023, according to Dairy Star. Those are price moves your hedge is built to handle. But if your co‑op sells heavily into Mexico, your mailbox came in shorter than even those numbers explain. And nothing on the futures screen told you why.
The answer was 1,500 miles south, stuck in traffic at Ciudad Juárez.
In late November 2025, farmer and trucker groups across Mexico launched what they called a “megablockade” — shutting highways and occupying customs facilities in at least 17 states. The National Front for the Rescue of Mexican Farmland (FNRCM), the National Association of Carriers (ANTAC), and the Movimiento Agrícola Campesino (MAC) targeted corridors in Chihuahua, Sinaloa, and Zacatecas, as well as routes radiating from Mexico City. At the Ciudad Juárez–El Paso crossing — Mexico’s busiest commercial border zone — FreightWaves reported roughly 38,000 trucks stranded, delaying about US.45 billion in exports and causing industry losses of around US.8 million per hour.
Dairy was the first product to run short. Iván Pérez Ruiz, president of the Juárez Chamber of Commerce, told news reporters that previous blockades “nearly resulted in a complete shortage of dairy products, with milk and cheese being the most impacted.” María Teresa Delgado Zárate of Index Juárez estimated daily export losses at $250 million. Manuel Sotelo Suárez of CANACAR warned the city was “very close to running out of supplies.”
That’s the heart of this story. You hedge prices like an adult. But the Mexico border isn’t a permanent green light — it’s a high‑beta pipeline that can slam shut with one national protest call. The risk hiding in your milk check isn’t about what Class III settles at. It’s about what happens between that settlement and your mailbox when the road closes.
CoBank Called Mexico “Reliable.” Three Weeks Later, Juárez Froze.
In December 2024, CoBank published a report called “Mexico Has Become America’s Most Reliable Dairy Customer.” Lead dairy economist Corey Geiger laid out the numbers: Mexico accounts for more than one‑fourth of total U.S. dairy export value and buys roughly 4.5% of U.S. milk production. In 2023, U.S. dairy exports to Mexico hit 1.38 billion pounds on a milk‑solids basis — a 42% increase over the prior decade. Mexico’s per-capita dairy consumption has grown about 50 pounds since 2011, and U.S. exports now cover more than 80% of Mexico’s dairy deficit. CoBank estimates one in six tanker loads of U.S. milk ends up overseas, and processors have committed around US$8 billion in new capacity coming online soon.
From a demand standpoint, Mexico really has behaved like an anchor customer. The pipes getting product there are another story.
On November 23–24, 2025, ANTAC, FNRCM, and MAC rolled out coordinated blockades before dawn. Mexico News Daily reported on November 27 that “mega-blockades” were in their fourth day, choking truck access to U.S. ports of entry. Maquiladora plants went into technical stoppages. Around 30,000 workers sat on downtime. Shippers were told to expect 10 or more days of delays even after protesters cleared the roads. News outlets reported the dairy sector faced “operational paralysis,” and by the time a third blockade was announced in December, the backlog from earlier rounds still hadn’t cleared.
Interior Minister Rosa Icela Rodríguez announced a deal on November 27 — working groups in exchange for suspending the blockades. FNRCM and ANTAC called it a truce, not a surrender. They’ve already circled the next date.
On March 3, 2026, UnoTV reported that FNRCM and ANTAC called a national mobilization for March 20 — two weeks from today — including highway blockades and actions in Mexico City. The CNTE teachers’ union announced a national strike for March 18–20, which will overlap with other strikes. MexicoBusiness.news confirmed the call on February 27. Mexico Solidarity described it as a mobilization for “food sovereignty and agricultural transformation,” with farmers demanding that basic grains be removed from the USMCA.
That’s a planned action, not a historical event. But it tells you blockades are a deliberate political tool now — not a one‑off tantrum. And the people who really control your milk check aren’t all sitting at your co‑op’s head office.
How Does This Actually Hit Your Milk Check?
The broader numbers were already ugly before the blockades started. October 2025’s U.S. average mailbox dropped 85¢ in a single month to $18.70/cwt — $5.58 below the same month a year earlier, according to USDA NASS data. Upper Midwest producers on FMMO 30 held up better, averaging $19.74 in September and roughly $19.25 in October. But reports already documented a $1.30/cwt gap nationally between the statistical all‑milk price and what farmers actually received, driven by depooling, component math, and co‑op deductions.
For co‑ops whose Mexico-bound product was stuck at Juárez, that gap had one more driver the data didn’t itemize.
Here’s the sequence: bridges close or crawl for days. Even after protesters leave, backlogs add another 10 days of friction. Plants scramble — rerouting loads through Nogales or Nuevo Laredo, shoving product into lower‑value domestic channels, piling inventory, and hoping buyers wait. Class III still settles where it settles. Your hedge does what it’s supposed to on that screen. But the gap opens in the co‑op’s margin. And when that margin gets squeezed, the co‑op pulls the levers it controls: export premiums, quality incentives, over‑base pricing, intake policies.
The basis risk lands on you.
Here’s the barn math. A 1,200‑cow herd at 80 lb/day ships 960 cwt/day. If the co‑op’s effective pay price runs 40¢/cwtbelow your hedge‑implied price for 30 days, that’s 960 × $0.40 × 30 = US$11,520. A 700‑cow herd shipping 560 cwt/day at the same gap: US$6,720. At 2,400 cows, closer to US$23,000. Plug in your own daily cwt and see where you land.
Those aren’t predictions. They’re scenarios built off the scale you just watched at Juárez — where Delgado Zárate estimated $250 million a day in export losses and Pérez Ruiz said dairy nearly ran out. The kind of surprises that show up in the mailbox, not on the futures app. With dairy economist Bill Brooks of Stoneheart Consulting estimating 2026 income over feed costs at $10.14/cwt — down $2.30 from 2025, per Dairy Star — there’s not much cushion between a rough month and the 2026 margin math that makes every basis surprise harder to absorb.
Why Can’t Your Price Hedge See a Blockade Coming?
Hedging tools handle price risk. There’s no ticker for “pipe” risk — no DRP endorsement that covers Juárez running at half capacity or 8,000 cargo robberies a year on Mexican highways.
Three forces are driving the border risk your hedge account can’t touch.
Cargo theft and highway violence. El País reported in December 2025 that cargo trucks in Mexico suffer at least 8,000 robberies per year — 21 a day — and more than 80% involve violence against the driver. ANTAC says the real figure is 54 to 70 thefts daily because most go unreported. Concamin estimates cargo theft costs around 15 million pesos per day.
Water, grain, and food sovereignty politics. In October 2025, FNRCM paralyzed highways and rail lines in 17 states, demanding higher grain prices and opposing changes to Mexico’s General Water Law. FNRCM leader Marco Antonio Ortiz Salas publicly alleged that the CME and transnational grain companies were “manipulating markets.” No evidence supported that specific claim — but the grievances are real enough to park tractors on bridges, and they’re at the core of the March 20 call.
The 2026 USMCA review. Under Article 34.7, the USMCA must undergo a joint review by July 1, 2026. On January 5, the National Milk Producers Federation said it and the U.S. Dairy Export Council are “advancing a coordinated strategy to ensure the agreement delivers on its promises to U.S. dairy producers.” More than 120 U.S. agricultural groups want an extension with minimal changes. Mexican farm movements want the opposite — basic grains removed from the agreement entirely.
Your hedge locks in a price. The fact that Mexico is both your co‑op’s most “reliable” customer and one of its riskiest corridors — that’s what you have to decide what to do with.
What Should You Ask Your Co‑op Before March 20?
You can’t control FNRCM or ANTAC. You can control how blindly you’re exposed to them.
Start with the exposure question. Ask for a simple 12‑month breakdown: what percent of total solids are exported, what percent goes to Mexico, and how much of that moves through Pharr, Laredo, Ciudad Juárez, or Nogales. CoBank’s data show that Mexico buys more than a quarter of the U.S. dairy export value. If your co‑op can’t ballpark which bridges carry your milk, that’s worth raising at the next member meeting.
Then make them walk through a scenario. Say Juárez runs at half capacity for 30 days, including backlog time. Which plants pull back intake first? Which products get priority for limited export slots? In what order do they adjust premiums, quality incentives, and over‑base pricing? You’re not asking them to predict the future. You’re asking whether they’ve done the same “what if?” work you do before locking in feed.
The USMCA review adds a harder edge. NMPF confirmed in January that it’s pushing for stronger enforcement of market‑access commitments. Mexican farm movements are treating July 1 as a pressure point. Ask your board what assumptions they’re making about Mexico volumes through 2027 — and how those interact with the $8 billion in new processing capacity CoBank flagged.
If the only chart they show you is “exports up and to the right,” ask what happens when the road under that chart closes for a few weeks. For the families who’ve already decided the farm is worth fighting for, the answer matters.
How Does This Change What You Do on the Farm?
Macro risk is interesting. The bank and the feed mill still want their money on time.
Cash flow isn’t just about price anymore. With 2026 income over feed at $10.14/cwt, a surprise basis hit is the difference between a month you ride out, and a month you’re juggling which bill to delay. Within the next 30 days, pull your last 12 months of milk checks, calculate your average daily cwt shipped, and model what happens if your mailbox comes in 30¢/cwt worse than your hedge implied for 30 days. Then do the same at 50¢/cwt. Turn each into a dollar number and ask: could we ride this without breaking covenants?
If the answer makes your stomach tighten, sit down with your lender before March 20. Say: “Here’s what these scenarios look like for us. If something like this happens because of a border event, what would you want to see from us?” That’s not panic. That’s the conversation a lender expects to have before trouble arrives, not after.
Your hedge strategy may need one more trigger. You probably adjust coverage when futures move sharply, or big USDA reports drop. Consider adding one more: the gap between your hedge‑implied price and the actual mailbox. If that gap widens beyond 30–50¢/cwt for two consecutive checks, it doesn’t automatically mean “Mexico.” But it’s a red flag to ask your co‑op whether pipeline issues are in the mix and to re‑check your cash‑flow plan for the next 60–90 days.
Expansion decisions carry new questions. If you’re adding cows or signing a longer‑term supply deal, ask how those decisions tie into Mexico exposure. “How dependent is this plant on exports through Juárez?” and “What exactly did you do on premiums during the November 2025 blockades?” won’t make every marketer smile. But they’re the questions a lender would ask if they were sitting where you are.
Options and Trade‑Offs for Farmers
You don’t get to vote on Mexico’s water law or who parks a tractor on a bridge. You do get to choose how much of that volatility you carry.
Path 1: Treat Mexico as a high‑beta outlet — and price it in. This makes sense if your co‑op is genuinely good at export business and you have enough financial cushion for occasional rough patches. It requires knowing how much of your co‑op’s volume goes to Mexico and building a realistic risk haircut into long‑range margin expectations. You still get stung in bad years. If blockades become seasonal, the “occasional rough patch” becomes a pattern.
Path 2: Run a 30‑day border stress test — this month, before March 20. This is the move if you’re mid-size, have real debt, and have limited shock absorbers. Use your actual daily cwt and run two scenarios — basis 30¢/cwt and 50¢/cwt worse for 30 days. Put those dollar numbers next to your cash‑flow plan and covenants. Book a conversation with your lender this week.
Path 3: Push for a written co‑op border playbook. If you’re committed to your co‑op and want fewer surprises, ask the exposure questions in member meetings, where they’re recorded. Push for a border‑risk section in the annual business update: exposure by crossing, disruption scenarios, and the order in which premiums change. If Pérez Ruiz can tell the media that dairy nearly ran out at his city’s crossing, your co‑op can tell you how much of your milk was heading there. The USMCA review deadline — July 1, 2026 — makes this more urgent, not less.
Path 4: Align your risk advisors around pipes, not just prices. In your next risk call, say: “Let’s talk specifically about basis moves when pipelines jam — blockades, plant outages — and what that looks like in our numbers.” In your next lender meeting: “Are you factoring Mexico corridor risk into how you look at our credit?”
Key Takeaways
If your co‑op sells a meaningful share of solids into Mexico through one or two crossings, treat border risk as its own line on your 2027 plan — not just “export.”
If your mailbox comes in 30–50¢/cwt below what your hedge implied for two consecutive checks, call your co‑op and ask whether pipeline issues are in the mix.
If your co‑op can’t tell you what share of its Mexico volume flows through Pharr, Laredo, Juárez, or Nogales, push for that exposure map before you sign a major expansion or supply contract.
If a 30‑day stress test at 40¢/cwt basis hit would strain your cash flow or covenants, talk to your lender now — not after March 20.
The Bottom Line
Your hedge account sees the price side of your risk. The Mexico border has quietly become one of the most important pipe risks in North American dairy, concentrated in a handful of crossings where organized groups have already proved they can park 38,000 trucks and push dairy to the brink of shortage in days.
The question isn’t whether somebody will line up on those crossings again. They’ve already circled March 20. Whether you find out how exposed you are from a slide at a co‑op meeting, a conversation with your lender, or the next milk check that doesn’t match what you modeled — that part is up to you.
Complete references and supporting documentation are available upon request by contacting the editorial team at editor@thebullvine.com.
Learn More
The $4/cwt Your Milk Check Is Missing – And What’s Actually Working to Get It Back – Stop the bleeding in your mailbox price by identifying the structural make-allowance hits and regional deductions currently scalping your margin. It delivers a hard-nosed checklist to recover value through component gold-rushes and smarter beef-sire selection.
The Texas ESL Boom: How Smart Producers Are Turning Consistency into Contract Power – Reveals how the ESL boom is weaponizing milk quality data into contract leverage, shifting the profit center from bulk volume to 90-day shelf-life predictability. It identifies the high-tech supply chains that will dominate the landscape through 2030.
The Sunday Read Dairy Professionals Don’t Skip.
Every week, thousands of producers, breeders, and industry insiders open Bullvine Weekly for genetics insights, market shifts, and profit strategies they won’t find anywhere else. One email. Five minutes. Smarter decisions all week.
She ditched physics for dairy calves. Emily Miller-Cushon’s PECASE-winning research: pair housing saves $9,900/year in heifer losses. Ready to test it on your farm?
Emily Miller-Cushon observes a Holstein heifer calf at the University of Florida Dairy Unit, part of her five-year longitudinal study proving pair housing builds resilient feeding behavior worth $9,900/year in replacements.
On a February morning in Gainesville, Florida, Emily Miller-Cushon walked through the calf barn at the University of Florida Dairy Unit and checked on animals she’d been tracking since the day they were born — some for nearly five years. Not somatic cells. Not feed conversion. She was watching how they behaved, whether they approached unfamiliar pen-mates or hung back. How confidently they ate at the bunk when competition showed up.
Those aren’t the measurements most dairy scientists build careers on. But Miller-Cushon isn’t most dairy scientists — she started in physics. And that background, plus the unconventional path that followed, is reshaping how the industry understands how a calf’s lifetime performance is affected by decisions you make in her first two weeks of life.
From Quantum Mechanics to Calf Pens
Miller-Cushon grew up in rural Ontario, surrounded by small farms and animals, but headed straight into a physics and mathematical physics program at the University of Waterloo — one of Canada’s most rigorous STEM schools. The work was intense, and she was good at it. By her senior year, though, she had a problem: she couldn’t see where it connected to anything she actually cared about.
“I wanted to make a tangible difference in areas that personally interested me,” she’s said. The summer before her final year, she assisted with animal science research. A mentor recognized something in her excitement that Miller-Cushon hadn’t fully seen herself — and encouraged her to pivot.
So she did. Walked away from physics entirely. Entered a doctoral program in animal science at the University of Guelph, working under Trevor DeVries at the Campbell Centre for the Study of Animal Welfare. Finished her PhD in 2014, joined the University of Florida faculty, and now runs one of the most closely watched calf welfare research programs in North America.
The pivot cost years of career momentum. Physics colleagues didn’t always get it. But what she brought from that training — a comfort with long data sets, statistical rigor, the habit of questioning assumptions — turned out to be exactly what calf welfare research needed.
What Does a Physicist See in a Calf Barn?
Here’s what makes Miller-Cushon’s work different from most calf welfare research you’ve read: she doesn’t just measure what happens during the preweaning period. She has followed animals for years.
One USDA-NIFA-funded project tracked calves from birth through their second lactation — a five-year study that ran from 2020 through 2025, straight through a pandemic. “Tracking animals into adulthood was hard work that took a team of dedicated students,” Miller-Cushon told UF/IFAS. “It has been worth it, though, to see the long-term impact of early life experiences for dairy calves on welfare into adulthood.”
Most calf housing studies end at weaning. Hers didn’t. And the results challenge some comfortable assumptions about what “good enough” looks like in a calf program.
A 2024 JDS paper from her lab tracked Holstein heifers raised in pairs versus individually, then observed their behavior during a social regrouping and a housing transition as pregnant heifers. The pair-housed animals spent 4.2 more minutes per hour feeding and visited the feed bunk nearly twice as often — 1.5 visits per hour versus 0.8 for individually raised heifers. The difference was most dramatic under competitive pressure, exactly the conditions your fresh heifers face when they enter the milking string.
“These results suggest that preweaning social housing had long-term effects on behavior and ability to adapt to a novel environment, which became most apparent under heightened competitive pressure,” the study concluded.
Translation: the housing decision you make in week one shows up in the bunk two years later.
Metric
Individually Housed
Pair-Housed (Birth)
Feed bunk visits/hour under competitive pressure
0.8
1.5
Additional feeding time (min/hour)
Baseline
+4.2
Preweaning ADG advantage
Baseline
+130 g/day
BRD risk increase (7 studies reviewed)
—
0% increase
Can a Simple Housing Change Actually Move the Needle on Performance?
The short answer: yes, if you look past weaning.
Research from Miller-Cushon’s lab and collaborating institutions has consistently shown that pair-housed calves eat more solid feed earlier — a finding she attributes to social learning. “We underestimate the role of the social environment in determining when and how much animals eat,” she’s told The Dairy Podcast Show. Calves develop preferences for feeds that others in the group are eating. They learn where to go and what to eat from pen-mates, before they ever see a feed bunk in a freestall.
A 2025 scoping review in Frontiers in Veterinary Science, examining pair-housing studies published since 2016, confirmed that pair-housed calves often exhibit better growth performance than individually housed peers. And the health concern that has kept many producers in individual hutches? Seven out of seven BRD studies in that review found no association between pair housing and increased respiratory disease.
That’s not a cherry-picked number. That’s every BRD study they examined.
Research from the University of British Columbia, published in 2023, found pair-housed calves averaged 130 grams per day more weight gain than individually housed calves — a finding consistent across multiple Canadian studies. At UF, Miller-Cushon’s own 2025 study (n=100 pens, 50 individual vs. 50 paired) showed clear performance benefits from pair housing from birth, with advantages particularly strong during cooler months.
The performance edge compounds over time. Pair-housed heifers adapted faster to freestall environments after weaning, ate more aggressively when stocking density climbed, and showed lower displacement rates at the feed bunk. On a commercial dairy where fresh heifers compete with mature cows for bunk space, that behavioral resilience translates directly to dry matter intake — and intake drives milk.
Laura Whalin, a UBC graduate researcher, put it: “Pair housing sets the heifer up for easier transitions such as moving to new pens, changing diets, or learning to cope with an automatic milking system.”
What’s This Worth to a 300-Cow Operation?
You’re not going to change your calf housing because a scientist says it’s “better for welfare.” You’ll change it when the math works. So let’s run it.
Start with replacement economics. Holstein springer heifers are currently trading between $2,500 and $4,000+ per head, depending on region, genetics, and health records, with national averages around $3,300 as of late 2025, according to Ever.Ag and ISU Extension data. Premium strings with sexed semen confirmation have cleared $4,000 in Northwestern and Upper Midwest markets. Meanwhile, heifer inventory sits at 3.914 million head — the lowest since 1978, per USDA’s January 2025 cattle report. CoBank projects the number will fall further before any recovery begins around 2027. Every heifer you raise is worth more today than at any point in the last two decades.
Now consider calf mortality. The most recent USDA NAHMS data (2014, with the next study currently in the field) put preweaned calf mortality at 5.0% nationally. Many operations run higher. If you’re calving 300 cows annually and losing 6% of heifer calves preweaning, that’s 9 dead heifer calves per year. At today’s replacement value, you’re looking at $25,000 to $36,000 in lost inventory — before you count the feed, labor, and vet costs already invested.
Pair housing alone doesn’t eliminate mortality. But the behavioral and health data from Miller-Cushon’s research and the broader literature suggest lower disease incidence, stronger development of feed intake, and better transition outcomes. If pair housing helps you move from 6% preweaned mortality to 4% — a conservative improvement consistent with the published literature — that’s 3 fewer dead heifer calves per year.
At $3,300 per replacement heifer (near the national average), that’s roughly $9,900 in annual saved inventory value on a 300-cow dairy.
Add the downstream performance benefits. Heifers that visit the feed bunk 1.5 times per hour instead of 0.8, that eat 4.2 more minutes every hour under competitive conditions — those are heifers that peak higher and stay healthier in early lactation. You can’t quantify the exact first-lactation milk premium yet (that data is still coming from Miller-Cushon’s five-year study), but the mechanism is clear: more resilient animals produce more consistently.
Is Pair Housing Actually Practical — or Just a Research Ideal?
This is the honest friction point. Miller-Cushon’s research is rigorous. The welfare benefits are real. But your calf barn wasn’t built for pairs, and you’ve got real concerns about cross-sucking, disease transmission, and labor.
Here’s what the evidence actually says:
Cross-sucking. It happens. Miller-Cushon’s own research shows that providing hay from starter grain significantly reduces cross-sucking behavior. “Pretty much universally, we’ve seen benefits to giving calves hay earlier in life,” she’s stated. Hay provision around weaning — when the motivation to cross-suck peaks — is low-cost and effective.
Disease. The scoping review data are unambiguous: across multiple university studies (UC Davis, UW-Madison, University of Florida, UBC, and others), pair housing did not increase BRD or scours incidence. Miller-Cushon’s own 2021 JDS work found “a tendency for reduced scours in pair-housed calves, providing evidence that social housing does not negatively affect, and may benefit, early-life calf health.” The caveat: group size matters. Risk climbs above 8 calves per pen, particularly in continuous-flow systems. Pair housing — two calves — keeps the biosecurity math manageable.
Facility conversion. You don’t need a new barn. Laura Whalin’s UBC commercial farm study used a straightforward approach: two standard hutches with a shared outdoor space. Many operations convert existing individual setups by removing a shared wall or placing hutches end-to-end. The capital cost is minimal compared to the value of the heifer at stake. UW-Madison’s dairy welfare program has published a step-by-step pair housing introduction guide specifically designed for commercial operations already using hutches.
The regulatory trajectory. Canada’s draft Code of Practice for the Care and Handling of Dairy Cattle requires healthy calves be housed in pairs or groups by two to four weeks of age, effective 2031. The Netherlands has a similar timeline targeting 2030. If you’re shipping genetics or dairy products into those supply chains, the direction is clear. Staying ahead of mandates is cheaper than scrambling to comply.
Options and Trade-Offs for Your Calf Program
Path 1: Start pairing this calving season (30-day action). Pick your next 10 heifer calves and pair them at 3–5 days of age. Use existing hutches modified for shared space — Whalin’s UBC model works with standard commercial equipment. Offer hay from day one alongside the starter. Track feed intake, health events, and weaning weights against your individually housed calves from the same period. You’ll have your own data in 8 weeks — and your own data beats anyone’s published study when it comes time to decide whether to scale up.
Path 2: Full transition over 90 days. Convert your entire preweaned heifer program to pair housing. Requires modifying hutch layouts or pen configurations, adjusting milk feeding schedules (automated feeders simplify this considerably), and training staff to monitor pairs rather than individuals. Budget for modest facility modifications — the main cost is labor time for reconfiguration, not materials. The payoff: consistent behavioral development across your entire replacement pipeline, plus labor savings from feeding and monitoring paired calves rather than individuals.
Path 3: Wait and watch (risk-aware hold). If your current preweaned mortality is already below 3% and your heifer transition performance is strong, the incremental gain from pair housing may be smaller for your operation. But track your fresh heifer feed intake and first-lactation peak carefully — if heifers are slow to compete at the bunk post-calving, the early housing environment may be the variable you haven’t tested yet. As processor audits increasingly incorporate calf welfare metrics through the FARM Program, having a pair- or group-housing protocol in place positions you ahead of compliance timelines rather than behind them. Miller-Cushon now serves on the FARM Program’s animal care committee — the research-to-policy pipeline is short and getting shorter.
Key Takeaways
If your preweaned heifer mortality exceeds 5%, pair housing is one of the lowest-cost interventions available — the research shows equal or better health outcomes, and every percentage point of mortality reduction is worth roughly $4,950/year on a 300-cow dairy at the current national average heifer price.
If you’re concerned about cross-sucking, provide hay from the time you introduce starter grain — Miller-Cushon’s data and the broader literature consistently show it reduces abnormal oral behaviors.
If your fresh heifers are slow to eat in the milking string, investigate whether their preweaning social environment is part of the problem — pair-housed calves visited the feed bunk nearly twice as often (1.5 vs. 0.8 visits/h) under competitive pressure in Miller-Cushon’s 2024 JDS study.
If you sell genetics or products into Canadian or European markets, pair/group housing mandates are coming (Canada 2031, Netherlands 2030) — getting your protocol in place now costs less than retrofitting under a deadline.
The Outsider Advantage
Miller-Cushon has won the two biggest early-career honors available to a dairy scientist in the United States: the 2025 PECASE — the Presidential Early Career Award for Scientists and Engineers, the highest recognition the U.S. government gives early-career researchers — and the 2025 ADSA Foundation Scholar Award in Dairy Production.
“My enthusiasm for research is in part due to the opportunities to mentor amazing graduate students and network with the broader scientific community in animal behavior and welfare,” she’s said. “Good research is a team effort.”
The dairy industry has a history of breakthroughs that came from outside the usual channels. Robert Chicoine showed what one unconventional thinker could do with a bull nobody else wanted. Miller-Cushon is showing what a physicist’s training does when you point it at a calf barn — and the data says it changes outcomes your heifers carry for life.
What’s the most unconventional background on your farm team right now — and what are they seeing that the dairy lifers might miss? We’re building a deeper playbook for pair housing conversions and running the full replacement heifer lifecycle economics in upcoming Bullvine coverage. And keep an eye out for the next installment of “The Outsiders” — the software engineer who rewrote how we read bull proofs.
Executive Summary:
Emily Miller-Cushon traded her University of Waterloo physics degree for dairy calf research at the University of Florida—and just won the U.S. government’s top early-career science award (PECASE). Her five-year study shows that pair-housed calves develop more resilient feeding behavior: 1.5 bunk visits/hour vs. 0.8 for individually raised heifers under competitive pressure. That’s 130g/day more gain preweaning, carrying through to adulthood. Barn math: $9,900/year saved in heifer inventory on a 300-cow dairy at $3,300/head. No BRD risk increase (7/7 studies), hay from Day 1 cuts cross-sucking. 30-day test plan: pair your next 10 heifers this calving season.
Complete references and supporting documentation are available upon request by contacting the editorial team at editor@thebullvine.com.
$3,010 Per Heifer. 800,000 Short. Your Beef-on-Dairy Bill Is Due. – Exposes the structural heifer shortage that makes every retained calf worth $3,300+ in today’s market. This economic breakdown helps you position your replacement pipeline to survive the most expensive heifer squeeze in 47 years.
Dairy Tech ROI: The Questions That Separate $50K Wins from $200K Mistakes – Delivers the hard math on automated calf feeders and precision tech that slash labor while improving heifer performance. You’ll reveal whether a technology-led transition to group housing justifies the capital investment on your specific scale.
The Sunday Read Dairy Professionals Don’t Skip.
Every week, thousands of producers, breeders, and industry insiders open Bullvine Weekly for genetics insights, market shifts, and profit strategies they won’t find anywhere else. One email. Five minutes. Smarter decisions all week.
The heifer looked fine. She was eating her morning feed, moving normally, ready for the ring at Canada’s most prestigious dairy show in about 48 hours. Twenty years of experience told Maxime Petitclerc everything was on track. The rumen bolus sitting in her stomach told a different story.
It was November 2025, preparation week for the Royal Agricultural Winter Fair, and Ferme Petitclerc’s show string was bedded down in Quebec before the long haul to Toronto. Core body temperature on one heifer: trending upward. Rumination: starting to drop. The Farmfit monitoring system flagged what no one could see yet—this animal was probably 12 to 18 hours from showing obvious signs of illness.
“We saw her temperature rising, and we started treatments,” Petitclerc explained in a recent interview with STgenetics Canada. “We caught it much sooner. She wasn’t showing many symptoms yet, but the data showed things sooner than our eyes can see them.”
STgenetics Canada facilitated the interview and background access for this story; all research citations and ROI calculations in this article have been independently sourced and verified by The Bullvine editorial team.
Check out the interview with Max following the show
That early catch likely saved Petitclerc from a cascade that could have cost tens of thousands in lost sales, scratched entries, and the kind of reputation damage that Oklahoma State University research shows causes a quarter of cattle buyers to walk away entirely—regardless of an animal’s individual quality.
By evening feeding—the next time anyone would’ve given her a close look—she likely would’ve been obviously off. At that point, you’re looking at a potential scratch from competition, a vet call, and questions about whether she should even make the trip. Instead, early treatment kept her in sound and show-ready condition.
MILLEN LAMBDA ANNETTE HOCANF14907820, third in the Fall Yearling in Milk class at the Royal Winter Fair, exhibited by Ferme Jean‑Paul Petitclerc & Fils Inc., St‑Basile, QC—one of the fresh heifers Ferme Petitclerc wasn’t willing to leave to chance when they bolused their Royal string.
Here’s the part that actually changes your math: catching problems early doesn’t just save animals—it makes treatment more effective, reduces the risk of antimicrobial resistance building in your herd, and costs less than waiting until symptoms become obvious. With Farmfit, the temperature curve can be marked with treatment times, making it easy to see whether your intervention is working or needs adjustment.
Most farms do the opposite. This wasn’t some pilot project on commercial cattle. Petitclerc put the monitoring technology on his most valuable animals first—the ones headed to The Royal. And that decision runs against how most farms approach new technology.
The Reputation Tax Is Real—Here’s the Math
Before we dive into the technology itself, let’s talk about why this matters so much for exhibitors. Everyone in the industry understands that sick cattle cost money. But on the show circuit, the math works differently than it does in the commercial milking string—and the stakes are considerably higher.
Direct costs are straightforward enough: on-site veterinary work at a major show can easily run $200 to $500 per case. Anyone who’s made that call at World Dairy Expo or The Royal knows exactly what I’m talking about.
What gets expensive fast is everything else.
Research on cattle marketing shows that seller reputation significantly influences buyers’ willingness to pay. Oklahoma State University survey work found some striking numbers here. Certified cattle from positive reputation sellers commanded premiums averaging $10.42 per hundredweight, while uncertified cattle from positive reputation sellers still earned $2.86/cwt premiums over base prices. That’s real money.
But here’s the part that should make every exhibitor pause: according to the University of Wisconsin Livestock Extension’s summary of this research, roughly 25% of buyers indicated they wouldn’t bid at all on cattle from sellers with negative reputations, regardless of the animal’s individual quality. One in four potential buyers walks away if your reputation takes a hit.
The Show Circuit Risk Calculation
If a quarter of your buyer pool disappears after a public health incident, the cost of monitoring technology gets covered by a single saved sale. For a high-profile problem at The Royal or World Dairy Expo, the cascade includes immediate vet costs ($200-500), scratched competition entries ($500-2,000 in prep and fees), evaporated private sale discussions (potentially $10,000-50,000 depending on genetics), and long-term reputation damage that can follow a prefix for years. Run your own numbers—the math usually isn’t close.
For Ferme Petitclerc, with nearly two decades of Royal Winter Fair history behind them, one public health failure could undermine years of careful breeding decisions. That’s the context for understanding why Petitclerc was willing to try monitoring technology on his show cattle first—not as an experiment, but as protection for genetics that took generations to develop.
What Would a Health Miss Have Cost Petitclerc?
Let’s make this concrete. Petitclerc had 22 animals in his Royal string. At $99 CAD per bolus, plus one Internet Gateway ($700 CAD) and one Collector for the barn setup ($600 CAD), his total Farmfit investment came to approximately $3,478 CAD—about $158 per head.
Now consider what a missed fever on that heifer could have cost:
Entry fees, transport, and prep already spent: Easily $1,500-2,500 for a single animal headed to The Royal
Emergency vet care at the show: $300-500 minimum, potentially more for after-hours calls
Scratched from competition: The primary reason for making the trip—gone
Private sale conversations that evaporate: Hard to quantify, but if that heifer had serious buyer interest, we’re talking $8,000-25,000 in potential lost revenue.
Breeding season impact: Stress and illness during show prep can extend calving intervals by weeks, at roughly $5-6 per day in delayed production
Add it up, and a single serious health incident could easily exceed $15,000 to $ 30,000 in combined direct costs and lost opportunity costs. Against a monitoring investment of $3,478 CAD for the entire show string, the insurance math makes sense.
Cost Category
Low Estimate
High Estimate
Entry fees + transport + prep (sunk)
$1,500
$2,500
Emergency vet at show venue
$300
$500
Scratched competition entry
—
—
Private sale conversations lost
$8,000
$25,000
Breeding season delay (stress impact)
$150
$400
Reputation damage (hard to quantify)
—
—
Total potential loss per incident
$9,950
$28,400
And that’s before we factor in the reputation effects that compound over the years.
A Growing Industry Response
Petitclerc’s preventative save isn’t just a lucky break—it’s a microcosm of a broader shift in how we manage livestock. The precision livestock farming market has grown substantially, reaching roughly $7.5 billion in 2024 according to Grand View Research’s industry analysis, with projections suggesting it could approach $20 billion by 2033.
That kind of investment flooding into the sector means your neighbor is probably evaluating this technology too—and the farms that figure out the ROI math first will have an edge in both production efficiency and genetics marketing.
About 70% of large-scale farms now use at least one precision agriculture technology, based on the latest USDA data. But when you look specifically at livestock operations, the picture is more nuanced. Wearable technology adoption—such as activity collars and rumen boluses—currently sits at around 12% on large farms, while robotic milking systems are deployed in roughly one in five large dairy operations. So we’re still in relatively early days, at least compared to what’s happened in crop agriculture with GPS and variable-rate applications.
Canadian adoption figures are harder to pin down, though anecdotally, Ontario and Quebec appear to be leading in adoption among elite genetics programs. The combination of high-value registered cattle and a concentrated show season creates natural pilot conditions.
The typical adoption pathway makes sense from a risk management perspective: try new technology on your commercial animals first, work out the kinks, validate that it delivers value, then consider expanding to higher-value genetics. There’s nothing wrong with that approach.
Ferme Petitclerc took a different path.
When STgenetics Canada approached them about Farmfit—their rumen bolus monitoring system—Petitclerc decided to start with the 22 animals heading to The Royal. His show string. The cattle that carry his prefix onto the national stage.
“Right now, we have 22 on the bedding here, and all 22 have the bolus,” he explained. “We wanted that little bit of an edge, to be a step ahead—especially with the long hours of trucking.”
One detail that makes Farmfit particularly practical for show operations: the Collectors can be mobile. STgenetics had a farm whose cattle were continuously monitored from Washington state to World Dairy Expo using a Collector mounted in the trailer that traveled with the animals. For anyone who’s ever worried through a long haul, that kind of continuous data is a different level of peace of mind.
Petitclerc’s experience represents an early-adopter perspective—about 3 weeks of use at the time of the interview. That context matters when evaluating any new technology. But the technology’s performance is either verifiable or it isn’t—and third-party research supports the core claims about its early-detection capabilities.
Within three weeks, he was already planning to expand beyond show cattle. “Eventually, we’re going to have more boluses. We’ll invest more in it. It’s working well so far.”
Why the Show Circuit Stress-Tests Everything
Here’s what I find compelling about Petitclerc’s choice of testing ground: the show circuit effectively stress-tests every assumption about health-monitoring technology.
Think about what these cattle go through. You’re taking a genomically valuable heifer, putting her on a trailer for hours, changing her environment completely, disrupting her feeding routine, and then asking her to peak physically in a crowded arena. That’s a lot of variables working against her immune system.
Research on cattle transport consistently supports this. Even relatively short hauls trigger measurable stress responses—elevated cortisol, altered immune function, and shifts in energy metabolism—that can persist for days after arrival. There’s a solid body of peer-reviewed work documenting these effects, and they’re significant enough that the European Food Safety Authority conducted a comprehensive review in 2022. EFSA identified 11 distinct welfare consequences during cattle transport: group stress, handling stress, heat stress, injuries, motion stress, prolonged hunger, prolonged thirst, respiratory disorders, restricted movement, restlessness, and sensory overstimulation. That’s a lot of physiological challenges hitting animals simultaneously.
The fall show circuit adds another layer that anyone who’s hauled cattle in November understands. Temperature swings across the Northeast and into Ontario mean animals acclimated to outdoor conditions are suddenly housed in climate-controlled facilities, or vice versa. Many Quebec and Ontario producers I’ve talked with over the years mention this transition as particularly tricky—you’re managing animals through environmental stress at exactly the moment you need them looking their best.
In Canadian quota systems, there’s an additional wrinkle worth considering. Sick cattle don’t just cost treatment dollars—reduced production affects your ability to fill quota and can impact long-term quota holdings. The opportunity cost extends beyond the individual animal.
The Hidden Cost of Calfhood Disease
This is the piece most people miss about the economics of early detection—and why monitoring young stock matters more than most producers realize.
A 2021 meta-analysis published in the Journal of Dairy Science by Buczinski, Achard, and Timsit reviewed 27 studies on bovine respiratory disease (BRD) in calves. The numbers are pretty hard to ignore:
2.9 times higher odds of dying for heifers that had BRD as calves
2.3 times higher odds of being removed from the herd before first calving (dead, culled, or sold)
Average daily gain reduced by 0.067 kg/day
121 kg less milk during the first lactation
U.S. data suggest the average incidence of calfhood respiratory disease is around 37%, depending on the publication, with a total cost of roughly $237 per case when accounting for treatment, poorer growth, and lost future production.
What’s particularly striking is that this lung damage from calfhood respiratory disease is permanent. The research followed the animals throughout their productive lives. By the time those heifers enter the milking string, the damage is already done.
This is where Farmfit’s design becomes relevant. Unlike systems designed primarily for mature cows, Farmfit boluses can be administered as early as the first month of life. That means you can identify temperature spikes indicating respiratory challenges before they do permanent damage to lung tissue—damage that would otherwise follow that animal through every lactation she completes.
For operations raising heifers at a separate facility—which is increasingly common—this matters even more. Those animals often don’t get seen as frequently as the milking herd. Continuous temperature monitoring fills that gap and provides early warning for animals quietly drifting off track.
Comparing Your Monitoring Options
Whether you’re running a 100-cow operation in the Eastern Townships or a 3,000-head facility in California’s Central Valley, the monitoring options have expanded considerably. Each system has distinct strengths and tradeoffs.
Monitoring Technology Comparison
Technology
Primary Strength
Temperature Accuracy
Cost Range
Key Limitation
Rumen Bolus (ex. Farmfit)
Early illness/fever detection
High (core body, ±0.1°C)
$110–$125/head*
Low overall lameness sensitivity (~5%)
Activity Collar
Heat detection
High for activity; moderate for temp
$80–$150/unit
Environmental interference (wind, cold)
Ear Tag Sensors
Low entry cost
Moderate (skin surface)
$30–$80/unit
Weather variability affects readings
*Farmfit pricing based on typical 100-head installations with 1 Gateway + 2–3 Collectors; individual boluses are $99 CAD. Detection sensitivity data from Pfrombeck et al. 2025 SimHerd study, Journal of Dairy Science.
What I notice in talking with producers who’ve tried multiple systems is that each optimizes for different priorities. For Petitclerc’s specific situation—show cattle under transport stress where early fever detection mattered most—the bolus approach made sense. For a commercial dairy prioritizing heat detection in a large breeding pen, collars have proven their worth over decades.
Scanning a Farmfit bolus with the QR code assigns that $99 sensor to a specific cow in seconds—so every temperature spike and rumination dip is tied to the right animal from day one.
Rumen boluses remain in the reticulum throughout the animal’s lifetime, providing continuous core temperature readings unaffected by external conditions. They measure every 15 minutes, tracking temperature, rumination patterns through accelerometers, and activity levels. Temperature change is the early, leading indicator of disease—often moving 12 to 48 hours before visible signs or rumination drops—while rumination change tends to follow as a secondary indicator. Farmfit includes an integrated magnet for hardware disease protection, which explicitly captures wire fragments, nails, and staples that end up in TMR. Farmfit boluses have a 5-year battery life, and there are no subscription fees—you get a full dairy management software platform included. The significant limitation is that overall lameness detection sits around 5% in the modeling work. Most non-infectious hoof problems don’t create a strong temperature signal. That said, Farmfit users and STgenetics’ team have identified lameness cases linked to infectious causes, such as footrot, in which fever was the primary early symptom. So you will catch some lameness—but mainly those cases where systemic infection is driving a temperature spike, not every cow with sore feet.
Activity collars remain the gold standard for heat detection, having undergone years of refinement. They’re moderately effective for illness detection, with a typical battery life of 5 to 7 years. Research indicates that external sensors are susceptible to environmental conditions, so operations in Manitoba or Alberta that deal with extreme temperature swings should factor that into their evaluation.
Ear tag sensors offer the lowest barrier to entry, but they’re measuring skin surface temperature rather than core body temperature. In the variable conditions of a show barn—or most transitional housing situations—that accuracy gap matters.
What Ferme Petitclerc’s Implementation Looked Like
The practical details of the Petitclerc experience offer useful insights for anyone considering precision monitoring, particularly for show or elite genetics programs.
They started focused: 22 head in the Royal string, bolused before show preparation and the trip to Toronto. Daily monitoring happened through the Farmfit phone app—checking overnight temperature trends, rumination patterns, and activity data became part of the morning routine.
PETITCLERC LAMBDA SKY HOCANF121565497, second in the Winter Yearling class and Best Bred & Owned at the Royal Winter Fair, exhibited by Ferme Fortale Holstein Inc. and Ferme Jean‑Paul Petitclerc & Fils Inc., Saint‑Christophe‑d’Arthabaska, QC—exactly the kind of heifer Ferme Petitclerc trusted a $99 bolus to protect.
The key moment came early. That heifer whose temperature began to rise before she showed any visible symptoms.
What made early detection matter in this case was something every show exhibitor understands: the schedule. Show cattle typically get fed twice daily during events. If you miss a subtle sign at the morning feeding—maybe an animal that’s slow to get up or doesn’t clean up her grain quite as fast—you might not get another close look until evening. That’s a 10- to 12-hour window when problems can develop unnoticed, especially when you’re busy with fitting, washing, and ring preparation.
Checking overnight alerts on the Farmfit app turns every cow’s temperature and rumination curve into a morning to‑do list, instead of a surprise vet call.
Farmfit flagged the temperature trend while the heifer still looked essentially normal to experienced eyes. Dominique Petitclerc, who works with the heifers daily, used that data to trigger treatment. By the time visual symptoms would’ve been obvious, intervention was already underway.
“It’s an eye 24 hours a day, seven days a week for the well-being of your animals,” Maxime said. “You wake up in the morning, and you have the data from the night—you see activity levels, you see heats, you see what’s coming.”
I’ve heard similar observations from other early adopters. Nic Sauder of River Valley Farm, a Jersey operation in Tremont, Illinois, mentioned checking the app “first thing in the morning before I even get into the barn” to know what to expect. Brian Oster of Retso Holsteins, who runs about 150 milking cows near Schodack Landing, New York, and boards show cattle for several outside clients, called it “an extra set of eyes,” providing peace of mind for both his staff and the breeders whose cattle they manage.
The common thread is a reduction in uncertainty—knowing before you walk in the barn whether something needs attention.
For operations already using STgenetics genomics, the integration creates a single dashboard view of both genetic potential and real-time health status—useful for identifying whether high-genomic animals are actually expressing their potential or being held back by subclinical issues that traditional observation might miss.
The ROI Reality Check
Marketing materials for precision livestock technology often make impressive claims. The independent research paints a more nuanced picture—still generally positive in the right circumstances, but with important caveats.
On the cost side, Farmfit runs approximately $110-125 per head for typical installations (100 boluses at $99 CAD each, plus one Gateway at $700 CAD and 2–3 Collectors at $600 CAD each to cover barn areas). Smaller installations like Petitclerc’s show that string work costs roughly $158 per head due to fixed infrastructure costs spread across fewer animals.
What’s particularly noteworthy is how returns vary based on your starting point. A study published in the Journal of Dairy Science (Pfrombeck et al. 2025) used SimHerd modeling on 65 dairy cows with rumen bolus sensors and found annual net returns that ranged dramatically based on baseline herd health:
Economic Returns by Herd Health Status
Baseline Herd Health
Annual Return Per Cow (EUR)
Annual Return Per Cow (USD)*
Poor health (above-average disease incidence)
+€23 to +€119
+$25 to +$130
Average health
-€12 to +€84
-$13 to +$92
Excellent health (below-average disease)
-€33 to +€63
-$36 to +$69
*USD figures calculated at approximately $1.09/€1.00 exchange rate as of January 2026.
If you’re facing above-average disease rates, the research suggests you could see annual returns of $25 to $ 130 per cow. If your health protocols are already excellent, you might actually lose money on the investment.
Here’s the uncomfortable truth the technology vendors won’t tell you: if your transition program is already running at 90th-percentile health metrics, you might be better off spending that $15,000 on an extra part-time employee than on sensors. The math only works when there’s something to catch.
One important nuance here: those mature cow ROI numbers are already discounted by whatever lung damage and health losses happened back in calfhood, because those animals never had early intervention to reduce BRD impacts. In other words, the modeled returns don’t capture the extra upside of catching respiratory disease in calves before it permanently affects lifetime performance.
That said, Natalia at STgenetics confirms that this matches their field experience: herds with unresolved health issues make the biggest gains from adopting the technology. If you know you’ve got problems but can’t quite pin them down, that’s where monitoring shines.
That same study found detection rates that varied considerably by condition:
Detection Sensitivity by Condition
Health Condition
Detection Rate
Retained placenta
64%
Clinical milk fever (hypocalcemia)
61%
Mastitis
43%
Metritis
25%
Lameness
5%
The pattern reveals what the technology does well and where it struggles. Systemic and metabolic conditions—where core temperature changes early as a leading indicator—are more reliably caught. Reproductive tract issues show moderate detection. Locomotion problems largely escape notice because a bolus sitting in the reticulum can’t see what’s happening in the hooves unless infection is driving a systemic fever.
On disease prevention specifically, the numbers are encouraging where detection works. University of Wisconsin Dairy Extension shows that preventing a single case of clinical ketosis saves roughly $289 and boosts 305-day milk yield by about 3.5 percent—numbers that should get the attention of any producer managing fresh cows.
For show operations, the math shifts because animals have fundamentally different value profiles. A Royal-bound heifer isn’t comparable to a commercial fresh cow. The cost of monitoring a 20-animal show string is modest, whereas a serious health incident during a major show could cost several times that amount.
Canadian Availability and Considerations
For Canadian producers, some regional context is helpful.
STgenetics has been actively expanding Farmfit availability through its Canadian headquarters in Sainte-Marie-Madeleine, Quebec. The system operates in the 915 MHz frequency band, which is compatible with North American regulations—an important technical detail, since some European systems use different frequencies.
One practical advantage worth noting: Farmfit charges no subscription fees. Once you’ve purchased your boluses and infrastructure, you’ll have full access to their dairy management software platform with no ongoing monthly costs. For operations that closely monitor cash flow, a predictable cost structure matters.
Competing options include smaXtec (pricing varies by distributor, with producers reporting costs in the $250- $ 400/bolus range for full-featured systems) and collar-based systems from Allflex, SCR, and several others.
Five Questions to Ask Before You Invest
What’s actually costing you money? Pull your 12-month health records. Count your transition disease cases. That’s your baseline problem rate—and the ceiling on what monitoring can save you.
How does this integrate with your setup? Get a demonstration of your actual herd management software. Compatibility issues are the most common frustration I hear about.
What does support look like when something breaks? Ask for references from Canadian operations of similar size. Find out response times.
What’s your realistic learning curve? Factor in the time it takes your team to become comfortable checking data daily. A system nobody looks at is worthless.
Will you actually use it? Be honest. If it doesn’t become part of the morning coffee routine, you’re wasting money.
Who Should—and Shouldn’t—Consider This Technology
The Ferme Petitclerc experience suggests specific applications, though what makes sense varies considerably by operation.
For show exhibitors and elite genetics programs: If your show string insurance (entry fees, transport, prep costs) exceeds $3,000 per animal and your average private sale value exceeds $8,000, monitoring technology likely pays for itself with a single prevented incident. Transport stress, environmental changes, and compressed timelines create exactly the conditions where early detection matters most.
For commercial operations with fresh cow challenges: If your transition program is where problems concentrate—above-average rates of metritis, ketosis, or displaced abomasums—that’s where monitoring investment pays back fastest. The research consistently shows stronger returns in herds with higher baseline disease incidence.
For heifer-raising operations: This is an application that deserves more attention. Many farms raise heifers at a separate facility, where those animals aren’t observed as frequently as the milking herd. Given research showing that calfhood respiratory disease causes permanent lung damage that reduces lifetime productivity—121 kg less milk in the first lactation alone—catching respiratory issues early in young stock may be where monitoring delivers its biggest long-term payback.
For smaller herds with limited labor, the “always watching” aspect is particularly valuable when there aren’t enough people to conduct frequent visual observation. Being able to check overnight data before morning chores could catch issues that would otherwise wait until evening feeding. Producers running 80 to 150 cows often find real value here, particularly during busy seasons like planting or harvest.
For operations with excellent existing outcomes: This one requires honest self-assessment. If your protocols are already working well—low transition disease rates, strong reproduction, minimal fresh cow losses—monitoring technology might not meaningfully improve your numbers. That capital might be further invested in facilities, genetics, nutrition, or additional labor. Not every technology makes sense for every operation.
Dr. Robert Van Saun, Professor of Veterinary Science at Penn State University, has emphasized in his work on transition cow metabolic health that monitoring technology functions best as a supplement to skilled observation rather than a replacement for it. The goal is earlier detection and better-informed decisions—not hands-off management.
Petitclerc’s approach reflected this philosophy. His father, Réjean, still handles most breeding decisions on the farm. Farmfit didn’t change that dynamic—it just gave them better information to work from.
The precision livestock market’s projected growth—from $7.5 billion to nearly $20 billion over the next decade, according to Grand View Research—suggests the industry broadly agrees this technology category is here to stay.
The technology works. The question isn’t whether precision monitoring can catch problems earlier—the research confirms it can. The question is whether your specific operation has enough problems to catch.
What This Means for Your Operation
If this sounds like you, monitoring probably pays:
You haul high-value show cattle multiple times a year and a single scratch or health incident would blow a five‑figure hole in your genetics revenue.
Your calf BRD rate is north of ~25% and you’re seeing too many heifers culled or underperforming in first lactation.
Your fresh-cow pen is a mess—metritis, ketosis, DA—and you’re constantly reacting instead of catching problems a day early.
If this sounds like you, fix the basics before buying boluses:
Your herd health is already excellent, with low transition disease and BRD rates and no obvious weak spots in records.
You rarely ship cattle, most animals stay on‑farm, and visual observation is genuinely happening several times a day.
Most of your losses are hoof‑driven (lameness, cow comfort, flooring) rather than metabolic or respiratory disease.
Your 30/90/365-day checklist:
Next 30 days: Pull 12 months of vet and treatment records. Count your BRD, metritis, ketosis, and DA cases, and estimate a real cost-per-case (vet, drugs, lost milk, culls).
Next 90 days: Pilot monitoring on one high-risk group—your show string, fresh cows, or off‑site heifers—and track whether alerts actually move treatment timing earlier.
Next 365 days: Compare this year’s BRD and transition disease rates, cull rates, and treatment timing against your baseline. If the numbers and timing don’t change, cut the tech and put the money into facilities, feed, or labor.
Key Takeaways
A $3,478 bolus investment on 22 head at The Royal likely saved Ferme Petitclerc from a five‑figure hit in scratched entries, vet bills, and lost genetics sales.
Reputation is the hidden cost driver: once your health reputation tanks, roughly one in four potential buyers stops bidding, no matter how good the animal looks.
Calf BRD at “normal” levels (≈37%) quietly burns $26,000+/year in a 300‑cow herd before you count the lost 121 kg of first‑lactation milk per sick heifer.
Rumen boluses make financial sense when you haul cattle often or run BRD above ~25%; smaller, closed herds often get more ROI from fixing basics like ventilation and vaccine timing.
The article hands producers a 30/90/365‑day checklist to prove whether monitoring is insurance or just another expensive dashboard.
The Bottom Line
After nearly 20 years of showing cattle at The Royal, Maxime Petitclerc discovered that sometimes the best way to see your cattle clearly is to supplement what your eyes can catch.
“It’s an eye 24 hours a day, seven days a week for the well-being of your animals,” he said. “We always want to have that little edge—to be a step ahead.”
The trade-off is straightforward: monitoring technology costs $110-160 per head, depending on installation size, catches 60%+ of metabolic issues through early temperature changes, but misses most non-infectious lameness. For show cattle under transport stress, that’s a good bet. For a pasture-based operation where hoof health is your primary concern, it’s probably not.
Know your numbers. Know your gaps. Let the math make the decision.
Complete references and supporting documentation are available upon request by contacting the editorial team at editor@thebullvine.com.
Learn More
Tech Reality Check: The Farm Technologies That Delivered ROI in 2024 (And Those That Failed) – Stop guessing and start measuring with this brutal 90-day roadmap that separates high-performing tech from expensive barn ornaments. It arms you with verified ROI figures—like a 2.1-year payback on sensors—to protect your balance sheet from underperforming vendor promises.
Beyond Efficiency: Three Dairy Models Built to Survive $14 Milk in 2026 – Secure your operation’s future with three battle-tested business models designed to survive structural shifts in processing. This strategy reveals how to pivot from volume-chasing to risk-diversified stability, ensuring you’re positioned to capture premiums through 2028 and beyond.
Every week, thousands of producers, breeders, and industry insiders open Bullvine Weekly for genetics insights, market shifts, and profit strategies they won’t find anywhere else. One email. Five minutes. Smarter decisions all week.
OSHA priced six dead dairy workers at $246,609. Wayne County priced one dead dairyman at 75 tractors and weeks of unpaid chores.
Reed Hostetler was 31, co-owner of L&R Dairy in Marshallville, Ohio, and father of three kids under five. On March 5, 2025, he was killed in an accident involving the manure pit at the family farm.
Within days, the same barn where Reed and Abby Hostetler had been married was pressure-washed, scraped, and transformed into a funeral venue — by neighbours who showed up without being asked. An estimated 75 to 100 tractors, trucks, semis, and implements lined the road outside Grace Church in Wooster, organized by local farmers and custom harvesters, according to Farm and Dairy. Weeks later, people were still arriving before dawn to feed calves and clean pens, then leaving before anyone could thank them.
A mourner rests a hand on the Krone forage harvester bearing Reed Hostetler’s name outside the barn-turned-church at his March 12 funeral on the family dairy.
We tracked six dairy crises across five years and four structural threats — climate, immigration enforcement, workplace safety, and processing collapse. Different regions, different triggers, same lesson: operations with community infrastructure before the crisis recovered faster than those without.
When the River Turned a Dairy Region Into a Lake
On November 14, 2021, an atmospheric river dumped a month’s worth of rain on British Columbia’s Fraser Valley in 48 hours. The Nooksack River breached into Sumas Prairie — one of Canada’s most productive dairy regions — and the B.C. The Dairy Association reported more than 600 farms affected, with thousands of animals stranded.
Abbotsford Fire Chief Darren Lee told CBC News the flooding moved at a rate he’d never seen in 30 years of emergency services. B.C. Agriculture Minister Lana Popham said she’d been on video calls with farmers who had dead cattle visible behind them.
The community response started before the government’s. Sumas Prairie farm women Jimi Meier and Alison Arends launched a Facebook donation page that collected more than $470,000 in hay, feed, equipment, and cash — tracked through a 2022 Rotary Club accounting. Dairy families from the Fraser Valley, Chilliwack, and Vancouver Island drove in feed while roads were still partially impassable.
Dr. Lisa McCrea Hemphill, a veterinarian who documented the disaster for the Western Canadian Dairy Seminar in 2024, put it bluntly: the 2021 event “was not the first of its kind for Sumas Prairie and it will not be the last.”
In November 2021, the atmospheric river put 3.5 feet of water in U&D Meier Dairy #1’s parlour and sent 14 loads of milk down the drain (top). By December 2025, pumps, planning, and a neighbour network built from that loss kept stalls dry and cut the damage to a single missed pickup (bottom).
The people who showed up first knew which farm had a flatbed, which neighbour had generator power, and which operation kept extra feed on hand. That informal network — built over years of milk truck routes and co-op meetings — was the actual first responder. For the full story of how Sumas Prairie dairy families turned three floods into a rebuild blueprint, read “Three Floods, One Lifetime”.
What Happens When 35 Workers Disappear in One Morning?
June 4, 2025, at Outlook Dairy in Lovington, New Mexico. ICE officers detained 35 workers in what the Albuquerque Journal described as a targeted enforcement operation. Owner Isaak Bos told the Journal the workers had provided false documentation, and the dairy was cooperating fully with the investigation — the dairy itself was not accused of wrongdoing. But the operational hit was immediate: Bos said milking and feeding “effectively ceased” for a period after the detentions.
Replacing a 35-person crew in Lea County — one of the most remote dairy regions in the country — isn’t a phone call. It’s a months-long rebuild.
What the Outlook Dairy story exposed isn’t about one farm’s hiring practices — Bos made clear the dairy cooperated fully and wasn’t accused of wrongdoing. It’s about an industry-wide labour structure that everyone in dairy knows, and almost nobody talks about publicly. NMPF’s 2015 economic analysis with Texas A&M estimated immigrants account for 51% of all U.S. dairy labour, and dairies employing immigrant workers produce 79% of the nation’s milk supply. Dr. Robert Hagevoort of New Mexico State University, speaking at the Dairy Cattle Reproduction Council in late 2024, said he believes the true percentage is even higher — that study’s a decade old, and dairy’s reliance on immigrant labour has only deepened.
What happened next: family members, office staff, and local teenagers traded summer plans for scraping alleys and attaching milking units. Neighbours from surrounding operations covered shifts. Three days later, at a town hall in Hobbs, Governor Michelle Lujan Grisham heard about the impact firsthand. “It is a real issue, and I’m very worried about it,” she told the Albuquerque Journal.
Nobody had a playbook for “ICE raid response.” They built one in real time. The full account of how Lovington built a response from nothing goes deeper into the labour math and what happened in the months after.
The Three-Day Rule — and the Road That Broke It
Most tragedies in farm country follow a pattern: three days of intensity, three weeks of fading attention, then silence — while the family is still trying to figure out how to milk cows and raise three kids alone.
Wayne County broke that pattern after Reed Hostetler’s death.
Shuttle buses ran from Marshallville Park to the barn funeral. Local companies brought gravel to shore up the lane. A phrase circulated — “Lead Like Reed” — and it served as a decision rule, not a bumper sticker. If something needed doing — calves to feed, kids to watch, hay to chop — people didn’t wait to be asked. They just did it.
Green Elementary’s PTO, led by president Shelly Baumgardner, organized a “Dine to Donate” night at a local restaurant, using a student day-off incentive to bring in more families and raise money for the Hostetlers. Groceries, diapers, and hot meals kept arriving for weeks. As Abby told Farm and Dairy: ‘It has shown me that when our community needs help, help comes. And… the next time our community needs help, I will be there and I will show up.
What made Wayne County different wasn’t that people cared more than anywhere else. It’s that the support network was already there. People had been helping each other with harvest, calving, and equipment breakdowns for years. Reed’s reputation — the kind of guy who’d show up in someone else’s barn without being asked — was the deposit. The community’s response was the withdrawal.
Six Workers Dead in Minutes — and the Fines OSHA Proposed
Five months after Reed’s death, the same hazard — manure gas — killed six workers at Prospect Valley Dairy in Keenesburg, Colorado.
On August 20, 2025, according to OSHA’s investigation, a pipe connected to the manure management system disconnected, releasing hydrogen sulfide. One worker went down almost immediately. Then five more went in to save him. All six died. The Weld County coroner confirmed toxic gas exposure as the cause of death.
The victims: Alejandro Espinoza Cruz, 50, of Nunn, and two of his sons — Oscar Espinoza Leos, 17, and Carlos Espinoza Prado, 29. Jorge Sanchez Pena, 36, was related to the family by marriage. Ricardo Gomez Galvan, 40, and Noe Montanez Casanas, 32, rounded out the toll. A father, two sons, and three more men — gone in minutes.
“They were extremely hardworking and humble,” Tomi Rodriguez, an outreach worker for Project Protect Food System Workers, told CPR News. “They were a very united family.”
OSHA cited three businesses in February 2026, classifying the violations as “serious” — not “willful.” Total proposed fines across all three entities came to $246,609 — about $41,000 per life lost. The largest single penalty: $132,406 to Prospect Ranch LLC, the entity operating Prospect Valley Dairy. OSHA calculates fines per violation, not per fatality, but the math is hard to ignore either way.
All citations remain proposed and subject to employer contest. Prospect Ranch LLC has not publicly commented on the citations beyond the formal contest process.
Attorney Sam Cannon of Cannon Law in Fort Collins, representing four of the victims’ families, told KUNC: “We’re no nearer figuring out why this system malfunctioned.” He added: “Family members deserve to understand why this system was operating when it wasn’t safe.”
That impulse — I’m going in after him — is the rawest form of community response. Workers risking their lives for a friend, a father, a coworker. But this story doesn’t have Wayne County’s arc. In Keenesburg, the community showed up with condolences, a benefit dance, and organized services for the families, as the Colorado Sun reported.
Wayne County’s sustained, months-long operational support — the before-dawn chore crews that were still running weeks later — requires a pre-existing infrastructure that not every community has in place when a crisis hits. That gap isn’t about generosity. Every road has generosity. It’s about whether the relationships were already built. For the full OSHA citation breakdown and what the industry hasn’t done, that piece walks through every violation, every dollar, and the confined-space fix that costs less than two cows.
What Does Your Road Look Like When There’s Nobody Left to Call?
Not every crisis arrives with sirens. Some arrive as a letter from your processor.
North Dakota went from 1,810 dairy farms in 1987 to 18 by early 2026 — a 99% decline in less than four decades, per USDA Census data and the Holle family’s own count. That collapse left the state with almost no local processing infrastructure. The Holle family runs Northern Lights Dairy, a 1,000-cow operation about 12 miles south of Mandan — one of just 18 Grade A dairy farms left in the state. After Prairie Farms closed its Bismarck plant in 2023 and DFA ceased operations at Pollock in 2024, the Holles were forced to find a new market for their milk twice in 30 months. They now ship to a Bongards plant in Perham, Minnesota — a five-hour haul, one way.
The Holle family — Andrew, Jennifer, and their four children — at their fifth-generation Northern Lights Dairy south of Mandan, North Dakota. They milk 1,000 cows and haul every load five hours to Minnesota. When we asked what comes next, their answer was: “We don’t know what we are going to do.
But the Holles aren’t waiting for an answer to find them. The family is exploring adding on-farm processing — Dawson Holle, their son and a state representative who sits on the House Agriculture Committee, told the North Dakota Monitor the family has plans for a processing plant, though the timeline remains uncertain. And two new large-scale dairies announced for eastern North Dakota along the I-29 corridor are projected to bring $122–$227 million in annual gross revenue to the state, according to a December 2025 NDSU Extension analysis. The 18 farms still standing aren’t just surviving — they’re building the infrastructure that disappeared around them.
Agriculture Commissioner Doug Goehring has publicly noted that “with no other processors nearby, those dairies will likely pay for shipping longer distances that will be deducted from their milk checks.” Every extra mile eats into the milk check — and the further you haul, the harder it gets to pencil out staying in business.
And when a herd sells out in a region this thin, there’s nobody to absorb the loss — no neighbour to take on heifers, no local market for the genetics, no route density to keep the hauler coming.
From 1,810 farms to 18 is what community infrastructure looks like after it’s gone. For the full 1,810-to-18 diagnostic, including the Holle family’s testimony and the processing closures that cornered them, that piece is the warning label.
How Do You Spot the Farm That’s Quietly Going Under?
Not every crisis shows up as a manure pit or a flood. Some show up as yards that don’t look quite like they used to. Ration sheets that haven’t been updated in weeks. A kid who quietly steps back from 4-H. A familiar face missing from the co-op meeting — not once, but three meetings running.
University of Guelph researchers have documented what most producers already sense: farmers carry higher levels of stress, depression, anxiety, and burnout than the general population. Financial pressure and workload consistently top the list. CDC studies published in the agency’s Morbidity and Mortality Weekly Report — including Peterson et al. (2020) analyzing 32 states and Sussell et al. (2023) covering 49 states — have consistently found suicide rates among agricultural workers significantly elevated compared with the general working population. Earlier state-level studies found the disparity to be two-fold or higher when measured against the broader population.
The rescue in this story isn’t dramatic. It’s a vet walking back to the truck after a DA, leaning on the door instead of climbing in, and saying, “You look worn out. How are you really holding up?” It’s a retired dairyman feeding calves three mornings a week without being asked. It’s the neighbour who notices the late barn lights and calls — not texts, calls — to say, “I’ll swing over. Put the coffee on.”
Those interventions buy something that doesn’t show up on any milk statement: time to think clearly. When stress is driving your decisions, you’re more likely to make rushed calls on genetics, culling, expansion, or exit that feel necessary in the moment but leave you with fewer options six months out. The data behind why dairy farmers face a 3.5× higher suicide risk — and what the people closest to them can actually do — goes deeper than any headline.
What Does a Lost Herd Actually Cost Your Road?
Here’s a piece of math most people skip. When a 250-cow herd sells out, you don’t just lose one family’s income. You lose roughly 6.4–6.8 million lbs of annual milk volume on the truck route — that’s 250 cows at 70–75 lbs/day, every day of the year — and your processor starts thinking about rationalizing pickups and consolidating drop points.
That exit takes an estimated $8,000–$15,000/year in genetics purchases with it — semen, embryos, show heifers — money that supported your local AI tech and breed association. Gone, too, are an estimated 50–100 hours of informal labour and equipment sharing per year that nobody tracks but everybody depends on. And you lose one seat at the co-op board, one voice at herd improvement days, one barn where kids learned to fit calves for the ring.
On a 200-cow herd, a single missed milking costs roughly $1,100–$1,400 in lost milk alone — January 2026 Class III hit $14.59/cwt per USDA AMS, the January all-milk price came in at $17.50/cwt per USDA Agricultural Prices (Feb. 27, 2026), and USDA’s February WASDE forecasts $18.95/cwt all-milk for the full year. That’s before the SCC spike and mastitis risk that compounds for days afterward. If your neighbour’s crisis means your backup milker no longer exists, that math applies to your bulk tank too.
Community isn’t charity. It’s risk management you can’t buy from an insurance company.
What You Can Build in 30 Days
You can’t control floods, raids, pit gases, or processor closures. You can control whether anyone on your road faces one alone.
Build a phone tree this week.
Eight to ten names — neighbours, church, co-op, school. Who calls whom in the first 15 minutes after an accident, barn fire, or sudden death? Write it down in the milk house. Tape it next to the bulk tank. This costs nothing and takes one evening. If you can’t fill 8 names without thinking hard, that tells you something.
Check three farms this month.
Not by text. By call or visit. “How are you doing — really?” Be ready for the answer to take longer than you planned. If a yard on your road has been slipping — gates not closed, lane rough, a familiar face missing from meetings — that’s not “busy.” That’s a signal. The earlier you show up, the more steering room exists.
Know your backup processor before you need one.
If your only buyer closes or tightens terms, where does your milk go tomorrow? Contact your co-op or marketer to request a contingency routing plan. The Holle family at Northern Lights Dairy didn’t get a warning. Neither will you.
Put mental health on the agenda — out loud.
At your next discussion group, dairy association meeting, or men’s breakfast, share one real story. Be the person who goes first. In the U.S., Farm Aid’s hotline (1-800-FARM-AID) connects you with staff who understand agriculture. In Canada, the Do More Agriculture Foundation maintains a current directory of crisis lines and counselling by province. If a conversation turns serious and you’re worried about someone’s safety, the 988 Suicide & Crisis Lifeline (U.S.) and Crisis Services Canada (1-833-456-4566) are 24/7.
Give your kids a crisis role
4-H and FFA clubs can own comfort jobs — cards, freezer meals, calf chores. Clear roles mean kids grow up knowing how to show up. And the families that keep their kids connected to 4-H, shows, and herd improvement days through the rough years are quietly protecting the infrastructure that decides who’s still farming in a decade.
Not Every Road Has a Wayne County
This piece would be dishonest if it pretended that every road has that kind of response waiting to be activated.
Some barns are too far apart for quick drop-ins. In some regions, most families work full-time off-farm, and there aren’t extra hands available. Pride keeps good people from speaking up until they’re closer to the edge than anyone’s comfortable with. And sometimes the structural forces — processing deserts, debt loads, a market that doesn’t want your milk at any price — are bigger than anything a neighbour with a skid steer can fix.
Farmer suicide — rates significantly elevated compared with the general working population, per Sussell et al. in CDC’s MMWR (December 2023) — isn’t something you solve with casseroles. It requires professional support, funded infrastructure, and an industry culture that treats “I’m not okay” as maintenance, not weakness.
But here’s what six stories across five years and six provinces and states prove: operations with community infrastructure before the crisis recovered faster — financially and operationally — than those without it. That’s not soft thinking. That’s business continuity.
Key Takeaways
If you can’t name 8 people who’d be in your yard within 15 minutes of a crisis, you don’t have a phone tree. Build one this week — it’s the single cheapest piece of risk management on your operation.
If you don’t know your second processor option, call your co-op or marketer this month and ask for contingency routing. The Holles didn’t get a warning.
If a yard on your road has been slipping for a month, that’s not “busy.” Call — not text — and ask one honest question. Early is always cheaper than late.
If missing one milking costs you $1,100–$1,400 and you don’t own standby power, know whose generator you’d borrow and whether it’s wired to connect. Virginia Tech Extension’s standby generator guide walks through the sizing math.
Whose lane are you turning into tonight?
Randy Roecker is training milk haulers to spot the signs that a farmer is in trouble — because haulers are the last person on every road, every other day. That story is worth 10 minutes of your time. And if the deeper economics of processor loss, generator ROI, or what it really costs your road when another herd exits — that’s the kind of analysis we build out in The Bullvine Weekly and our Tier 2 management playbooks. North Dakota’s 1,810-to-18 collapse is the diagnostic tool.
Tonight, the only math that matters is the distance between your lane and the next one over.
The $11 Billion Reality Check: Why Dairy Processors Are Banking on Fewer, Bigger Farms – Reveals the structural shift in global processing that favors mega-dairies, helping you position your operation for the next three years. Breaks down why 80% of future supply is already pre-secured, allowing you to secure your contract before regional consolidation closes your window.
Six Colorado Dairy Workers Dead. OSHA’s Price: $41,101 a Life—and No Jail Time. – Exposes the deadly “rescue chain” math and the $450 technology fix that prevents confined-space fatalities. Delivers an immediate safety framework that integrates with herd management software, turning a catastrophic liability risk into a documented, insurance-ready competitive advantage.
The Sunday Read Dairy Professionals Don’t Skip.
Every week, thousands of producers, breeders, and industry insiders open Bullvine Weekly for genetics insights, market shifts, and profit strategies they won’t find anywhere else. One email. Five minutes. Smarter decisions all week.
One farm ET that barely penciled out. Four decades later, the bull from that flush shapes 60% of Select’s lineup — and your herd’s inbreeding curve.
To-Mar Blackstar EX-93-GM: the coal-black Chairman son from Marengo, Iowa, who topped the TPI list, sold 500,000 doses, and left a 15.8% relationship to every Holstein alive. Photo: Remsberg.
One pregnancy.
That’s what Randy Tompkins got from his first embryo transfer attempt in 1981. He flushed To-Mar Wayne Hay — a solid, unglamorous second-lactation cow producing 25,110 pounds, sired by Cal-Clark Board Chairman — and the vet packed up with a single viable embryo for the whole effort. Anyone who’s sweated through an ET flush knows what that arithmetic feels like: you’re standing in the barn doing the math before the vet’s boots are off, stacking the cost against what a bull calf might bring, wondering if you just torched money you didn’t have to spare.
For a working dairy in Marengo, Iowa — registered cattle alongside commercials, always watching corn prices, every decision measured against the milk check — that kind of return was a gut-punch.
That single embryo became a coal-black bull calf born May 17, 1983, and nothing about him said history. The Tompkins family named him To-Mar Blackstar, went back to milking, and didn’t think much more about it.
For about nine years.
The Cow Nobody Wrote Up
What keeps pulling me back to the Blackstar story is where it started. Not with a legendary dam, not with a calculated million-dollar mating — it started with a cow named Hanna.
Royal-Cedar Oak Hanna was Wayne Hay’s dam, and she was the kind of cow that experienced dairymen notice, but nobody puts on a cover. Tight udder. Sturdy frame. Deep through the heart girth in a way that told you she’d been converting feed into milk for years without drama, without a vet call, without anyone having to worry about her. She wasn’t winning banners. She was paying bills — quietly, reliably, lactation after lactation.
You know this cow. You’ve probably got three of her in your barn right now, and if you’re honest, she’s the one keeping your operation solvent while the flashy ones eat up your time and your treatment budget.
To-Mar Wayne Hay EX-90-USA — the cow nobody wrote up. She wasn’t winning banners; she was paying bills. One ET flush produced Blackstar. With five AI-sampled sons, she’d be a Holstein International Global Cow winner today. Photo: Pete’s Photo.
Wayne Hay inherited that durability. The Tompkins operation wasn’t Hanover Hill — this wasn’t a high-profile genetics program with deep pockets and a marketing department. This was an Iowa dairy where every decision had to pencil out, or it didn’t happen, and when Randy decided to try ET for the first time, flushing Wayne Hay to Board Chairman and coming away with exactly one pregnancy… that was real money on a real gamble that hadn’t paid off yet.
Why Did the Holstein Breed Need Blackstar in 1985?
To understand why this particular bull landed like a bomb, you need to remember what the Holstein breeding world looked like in the mid-1980s — because the show ring and the milk parlor had drifted dangerously far apart.
Bell daughters were flooding barns with milk nobody had seen before — +1,704 pounds predicted difference, over 30% of the cows on the Holstein Locator List by mid-decade — but they were falling apart structurally by second lactation. Small frames, weak substance, udders that couldn’t sustain the metabolic load they were built to carry. The Bullvine’s own analysis calls Bell “the worst best bull in Holstein history,” and that’s not hyperbole: producers who’d built their programs around Bell production were watching replacement rates climb, and herd life drop, and the smarter ones were getting nervous.
Meanwhile, up in Canada, Starbuck was emerging as the type answer — 70% of his daughters scored Good Plus or better, 200,000 daughters by the mid-’80s, and he’d collect 27 Premier Sire titles between ’86 and ’95. Beautiful cattle, showring dominance. But the production gap was real, and Starbuck was a type bull in an era when the milk check still decided who survived. (Read more: Hanoverhill Starbuck’s DNA Dynasty: The Holstein Legend Bridging 20th-Century Breeding to Genomic Futures)
Hanoverhill Starbuck with Carl Saucier at Mount Victoria Farm, Québec, 1994 — 15 years old and still in service at CIAQ. 685,000 doses. 27 Premier Sire titles. 200,000 daughters. He was everything the show ring wanted. Blackstar was what the milk check needed.
The breeders paying attention — and by the late ’80s, that was a growing number — knew the breed needed something else entirely. A bull that could improve conformation without sacrificing components; type married to production in the same proof sheet. Everyone wanted it, and nobody could find it.
The bull that delivered it was sitting in a barn in central Iowa, bred by a family that wasn’t trying to solve the industry’s identity crisis. They were trying to make a good cow a little better.
The Mystery of 7H1897
Blackstar’s first proof dropped in January 1989, and the numbers were unlike anything the industry had seen from one animal: +58 pounds fat, +63 pounds protein, and a +3.16 PTAT.
A PTAT above 3.0 from a bull who was also positive on components — in 1989, that combination was unicorn territory. You picked type bulls, or you picked production bulls, and that was the deal everyone had accepted. Getting both at this level from a first-time ET calf out of a cow nobody outside Iowa County had heard of wasn’t supposed to happen.
But the moment that really captures how Blackstar emerged isn’t about the proof sheet. It’s about Ron Long.
Long was at Select Sires, working through classification data from herds across the country — the way you tracked genetic quality before genomics made everything instant. He kept flagging one sire code, herd after herd, state after state, because daughters of this particular bull were classifying well above expectations, and the pattern was unmistakable. But the bull wasn’t on anybody’s radar.
“I do not know which bull is 7H1897,” Long told his colleagues, “but his daughters are actually classifying extremely well.”
7H1897 was Blackstar. Before the industry knew his name, before a single marketing dollar was spent, before anyone at Select Sires had built a campaign around him, his daughters were already proving him on concrete — in real barns, on real DHIA sheets, from the Midwest to the Southeast. The data was finding him, not the other way around.
How Blackstar Topped the TPI List in 1992
Then the phone started ringing.
Blackstar had just topped the TPI list at 1,256 points — at that point was the highest total performance index any Holstein sire had ever achieved — and in a pre-internet world where you secured semen by picking up the telephone and hoping the AI stud had inventory, that number set off something close to a stampede. At Select Sires, the switchboard was overwhelmed: international calls stacking up, wire transfers from Germany, the Netherlands, Australia, New Zealand, breeders on three continents competing for straws selling at hundreds of dollars each in 1992 money, when proven semen from a solid bull ran a fraction of that.
Jeff Ziegler, Select’s breeding manager, would later put the constraint in perspective: “From Blackstar, no more than 500,000 doses were sold, since our semen collection methods back then were very different.”
Half a million doses from one bull in an era when collection technology produced far fewer straws per session than modern methods allow. No bull before him had generated that kind of sustained, global demand.
The morning that the first proof sheet must have arrived at the Marengo farm — a Select Sires envelope, a page of numbers that looked like any other mailing — it’s hard to imagine Randy Tompkins understood he was holding the breeding industry’s next decade in his hands. By all accounts, he wasn’t a man who sought the spotlight. He’d bred one bull, and the bull was doing the rest. But by the summer of ’92, with international calls coming in before dawn and wire transfers landing from three continents, the distance between that single-embryo gamble in 1981 and what it had become must have felt impossible to bridge.
What His Daughters Proved on Concrete
You could spot a Blackstar daughter from across the free-stall alley, and not because she was flashy — it was the opposite. She looked right. Depth through the heart that meant genuine capacity, not the narrow, weedy frame, the show ring had been rewarding for a decade. Spring of rib that told you she could handle a heavy TMR load without burning through body condition in sixty days. And the udders — tight fore attachment, strong medial, teat placement that meant your milking crew wasn’t fighting her twice a day, and this was back when udder quality actually differentiated sires, before everyone’s proof sheet started looking the same.
The real proof, though, was in the bulk tank.
LA-Foster Blackstar Lucy 607, down in North Carolina, became world production champion in 1998: 75,275 pounds of milk with 1,738 pounds of fat and 2,164 pounds of protein in a single 365-day lactation. The Foster family described her the way any dairyman would understand: “She’s either at the feed bunk or at the water trough. She eats and eats and produces that milk!” Over 200 pounds a day, sustained for an entire year, without breaking down — and when corn’s at seven dollars, and your margins are measured in pennies per hundredweight, that kind of metabolic engine separates the operations making the payment from the ones having a difficult conversation with their lender.
Stookey Elm Park Blackrose EX-96-USA 3E GMD DOM — All-American at two and three. Grand Champion, 1995 Royal Winter Fair. 149,881 pounds lifetime. She wasn’t just a show cow or a production cow. She was a Blackstar daughter — and that was the whole point. Photo: Wolfhard Schulze.
Then there was Stookey Elm Park Blackrose — classified EX-96-USA 3E GMD DOM, one of the highest classification scores ever assigned to a Holstein female. Bred by Jack Stookey and purchased by Mark Rueth and the Schaufs from Indianhead Holsteins as a hiefer, they developed her into something genuinely rare: All-American Junior Two-Year-Old in 1992, All-American Junior Three-Year-Old in 1993, and then Grand Champion at the 1995 Royal Winter Fair, joining that exclusive club of American-bred cows to win Canada’s most prestigious show. At 5 years old, she posted 42,229 pounds of milk, with 1,940 pounds of fat and 1,433 pounds of protein, and her lifetime production reached 149,881 pounds over 1,609 days in milk. She wasn’t just a producer and a show cow — she became a foundation brood cow whose AI sons carried the Blackstar blueprint into herds across the continent, and whose descendants were still winning banners as recently as the 2016 Hokkaido Winter Fair in Japan. (Read more: When Financial Disaster Breeds Genetic Gold: The Blackrose Story That Changed Everything)
Lucy and Blackrose weren’t outliers — and that’s what mattered most to producers milking Blackstar daughters day after day. As a group, his daughters consistently showed above-average productivity and lower somatic cell counts, peaking in their fourth and fifth lactations rather than flaming out as two-year-olds. The kind of cow your milking crew mentions at year’s end because she never once showed up on the treatment list, the kind that lets you amortize rearing costs over six or seven years instead of two.
That profile — the one every sustainability conversation in this industry eventually circles back to — came from a cow named Hanna.
2,500 Sons and the Mistake Nobody Stopped
The AI industry sampled nearly 2,500 of Blackstar’s sons globally, representing roughly half the world’s total sampling capacity in any given year, poured into the offspring of a single sire. The results were spectacular, and the consequences were severe, but nobody hit the brakes.
MJR Blackstar Emory EX-97-GM — the crown jewel. Half his sons made proven sire. His son Blitz topped 1.52 million doses. The line from here runs straight into your semen tank. Photo: Remsberg.
MJR Blackstar Emory was the crown jewel — 50% of his sons achieved proven sire status, against an industry norm of about 10%. Among them, Fustead Emory Blitz became a super-millionaire at over 1.52 million doses sold, a record at Select Sires that still stands. Blitz sired Velvet-View KJ Socrates, and Socrates gave us Roylane Socra Robust — who died young, before anyone fully grasped what they had — and from Robust came Seagull-Bay Supersire, a massive milk transmitter whose son JoSuper carried that Blackstar blueprint into yet another generation of elite matings. If that lineage sounds familiar, it should — Walkway Chief Mark, the backup bull behind 7% of every Holstein cow alive today, sits in these same pedigree networks.
Through Etazon Lord Lily, a millionaire son in his own right, Blackstar genetics reached Vision-Gen Ozzie and eventually influenced Ransom-Rail Facebook Paris. Up in Quebec, the Comestar program took Blackstar’s impact in a different direction entirely: three daughters out of Comestar Laurie Sheik produced six AI sons, including Comestar Lee, Outside, and Lheros — all millionaire sires distributed worldwide through Semex. One cow family, one mating sire, and a genetic footprint that reshaped Canadian breeding for a decade.
Comestar Laura Black VG-87-CAN 24 — Blackstar × Laurie Sheik. Twenty-four brood cow stars. Her son Lee became a super-millionaire at 1.5 million doses; Lheros and Lartist went global through Semex. This is what happened when Blackstar met the right cow family. Photo: PAB.* (Read more: The Cow That Built an Empire: Comestar Laurie Sheik’s Unstoppable Genetic Legacy)
And then there’s the line that ties the whole modern breed together. Through Dixie-Lee Bstar Betsie — dam of Carol Prelude Mtoto, the Italian specialist whose improbable origin story we profiled last year — and then through Mtoto’s son Picston Shottle, Blackstar’s fingerprint reaches into virtually every elite Holstein pedigree walking the planet today. If you’ve used Shottle genetics in the last fifteen years, and you have, you’ve been using Blackstar genetics whether you knew it or not.
Carol Prelude Mtoto — the £40 “failure” out of Dixie-Lee Bstar Betsie, a Blackstar daughter. Born in Italy, 1993. His son Picston Shottle sold 1.17 million doses and sired 9,674 Excellent daughters. If you’ve used Shottle genetics in the last fifteen years — and you have — you’ve been using Blackstar genetics.
This global saturation wasn’t just a numbers game; it was a masterclass in pedigree dominance that reached into every major breeding powerhouse. While the Comestar family was cementing the line in Canada, the influence was echoing through the Netherlands and Italy via the Dutch-born Blackstar Betsy. A daughter of the foundation cow Prices Chiefs Bess, Betsy’s ET journey across the Atlantic eventually produced Carol Prelude Mtoto, the sire of Picston Shottle—widely considered one of the top ten most influential bulls in history. Meanwhile, the lineage was branching through “super-millionaire” Fustead Emory Blitz to Roylane Socra Robust, and eventually to Siemers Lambda, ensuring that whether a breeder was looking for high-type show winners or high-profit commercial producers, they were inevitably tapping back into the same Marengo, Iowa, source.
Jeff Ziegler estimates that more than 60% of Select Sires’ current bull lineup carries Blackstar in its pedigree.
Sixty percent. From one ET pregnancy on a farm cow in Iowa.
Now, somewhere in the late ’90s, a breeder whose promising young sire got buried under the Blackstar avalanche — sampled too late, overlooked because the sure thing was already proven and available — must have said exactly what plenty of us are thinking now. But nobody was listening. When you look at the four bulls who reshaped the entire breed, Blackstar’s concentration story fits a pattern the industry has repeated — and may be repeating.
15.8% of Every Holstein Alive
USDA Animal Genomics and Improvement Laboratory data, estimated with a 1960 base year, puts the cost of that concentration in numbers nobody can argue with: Blackstar has a 15.8% relationship to the current your herd, higher than Elevation at 15.2%, higher than Chief at 14.8%, higher than any individual sire in the breed’s documented history. A 1999 Journal of Dairy Science study by P.M. VanRaden found that Blackstar’s expected inbreeding of future progeny — the metric that captures how deeply a single animal is embedded in the breed — was 7.9%, the highest of any Holstein sire evaluated.
And the breed’s effective population size — the measure geneticists use for how much diversity actually exists, regardless of raw numbers? Multiple peer-reviewed studies using both pedigree and genomic methods have estimated it at somewhere between 40 and 70 animals for major Holstein populations, with a consistent downward trend accelerating since genomic selection began. For context, conservation biologists flag vertebrate species with an effective population size below 50 as at risk of inbreeding depression under IUCN guidelines. We’re talking about the most numerous dairy breed on earth, and its genetic base has collapsed to the equivalent of a small village.
We did this to ourselves.
AI companies would never again sample as many sons from one bull as they did from Blackstar — not because his genetics fell short, but because the wholesale use of his offspring meant other potentially great bulls never got their chance. Good genetics pushed to the margins, diversity sacrificed because the sure thing was right there, proven, in demand, and profitable to sell.
The rate of inbreeding per generation has increased since genomic selection was introduced — a 2022 Frontiers in Veterinary Science study of Italian Holsteins found an annual inbreeding rate at +0.27% by pedigree and +0.44% by genomic measures, corresponding to roughly +1.4% to +2.2% per generation. Better tools, faster concentration, different instrument, same mistake. We learned the lesson with Bell in the ’80s: the risk of concentration, lethal recessives, structural compromise. Then we learned it again with Blackstar in the ’90s. And the genomic era is running the same experiment a third time, at higher speed, with more data and less excuse for not knowing better.
The Lesson from Marengo
Blackstar was classified EX-93-GM — as good a specimen as he was a genetic force. During his long career at Select Sires, his semen was nearly continuously sold out, the demand outlasting trend after trend as the industry moved through the ’90s and into the 2000s.
The traits he stamped on the breed — components, functional type, udder quality, productive life — remain at the center of every modern selection index. Automated milking systems reward the kind of teat placement and udder depth his daughters were known for; feed efficiency research validates the metabolic capacity his genetics delivered. When processors push harder on environmental metrics, and they will, the ability to produce more from less across more lactations is exactly what survival looks like. Every time you walk through a robotic barn and see a cow whose udder sits perfectly for the machine, whose body condition holds through peak, whose SCC stays low without intervention — you’re looking at traits Blackstar helped build into the breed.
But the lesson of To-Mar Blackstar isn’t just “breed for function over fashion.” That part’s been obvious for thirty years. The deeper lesson — the one this industry learned through him and appears determined to learn a third time through genomics — is about what happens when you find something extraordinary and use it on everything.
Randy Tompkins flushed one cow and got one calf. He was trying to make a good bull from a good cow on a working dairy where every decision had to pencil out. The industry took that bull and built a genetic monopoly — 2,500 sons sampled, half a million doses sold, pedigrees saturated across six continents — and four decades later, the narrowed genetic base he helped create is one of the breed’s most pressing long-term vulnerabilities.
One pregnancy. One bull. A breed forever changed and permanently narrowed.
What Blackstar’s Legacy Means for Your 2026 Matings
The math on inbreeding depression isn’t abstract anymore. Research estimates the cost at approximately $22–$24 per cow per lifetime for every 1% increase in pedigree inbreeding, in 1999 dollars. Canadian Holstein data show 2024-born heifers averaging 9.99% genomic inbreeding, roughly triple that of 2014. At those levels, you’re looking at $200–$400 per cow in hidden lifetime losses: extra breedings, transition problems, productive cows culled too soon — costs that don’t appear on any single report but show up everywhere in your bottom line.
Here’s what you can do about it:
This month: Pull your herd’s average inbreeding coefficient from your genetic management software, breed association records, or CDCB query. Identify what percentage of your pedigree traces through Blackstar, Chief, and Bell lineages. If your average exceeds 8%, you’re already paying for it.
Before the April proof run: Build a sire portfolio using a minimum of 8–10 unrelated sires. No single bull should appear on more than 12–15% of your matings. Prioritize outcross lines on your bottom-third genomic females — that’s where concentration costs compound fastest.
Over the next year: Genomically test every replacement heifer and run mating programs that cap individual-sire inbreeding contribution. Track your herd’s F-coefficient quarterly rather than annually. Treat genetic diversity like feed inventory — monitor it before it runs out, not after.
Key Takeaways:
One ET calf on a commercial Iowa dairy became one of the most influential Holstein sires in history, with the USDA estimating that To-Mar Blackstar now has a 15.8% relationship to the US Holstein population.
His daughters combined high components, strong udders, and longer productive life, which drove roughly 500,000 doses sold and ~2,500 sons sampled worldwide, but also funneled a huge share of the breed’s genetics through a single sire line.
VanRaden’s 1999 work flagged Blackstar as the Holstein bull with the highest expected inbreeding of future progeny (7.9%), and more recent Italian Holstein data show that inbreeding is still climbing by about +0.27% to +0.44% per year in the genomic era.
Virginia Tech research pegs each 1% of inbreeding at $22–$24 in lost lifetime net income per cow (1999 dollars; roughly $43–$47 adjusted to 2026). At 2024-born Canadian heifer inbreeding levels of ~10%, that’s $430–$470 per cow in hidden lifetime drag.
For a working dairy, the punchline is simple: Blackstar genetics helped build the kind of cows you like to milk, but the article shows how to measure the inbreeding bill you’re paying and lays out a 30/90/365-day plan to diversify sires and protect profit.
The Bottom Line
The tension hasn’t changed since 1992: the best genetics concentrate the fastest, and managing that concentration is the cost of using them responsibly.
The next proof run is scheduled for April. Before you pick up the semen catalog, pull that inbreeding report and trace how much of it flows through a single bull from a farm where the family was trying to make the numbers work. Because somewhere in that catalog right now — ranking 300-something on TPI, priced at a premium nobody wants to pay, getting skipped for cheaper bulls with flashier numbers — is the next Blackstar. The next bull whose daughters show up every morning, breed back without complaint, and quietly outlast everything around them.
History says the cheap bulls with the big numbers don’t last.
Round Oak Rag Apple Elevation: The Bull of the Century – Explore the industry-shaping era of the “Bull of the Century,” whose balanced blueprint for production and type created the very world Blackstar was bred to improve, anchoring the pedigrees that define our modern breed.
Every week, thousands of producers, breeders, and industry insiders open Bullvine Weekly for genetics insights, market shifts, and profit strategies they won’t find anywhere else. One email. Five minutes. Smarter decisions all week.
The confined-space program that could’ve saved six men costs about two cows. This Colorado dairy never had it.
At approximately 6:30 p.m. on August 20, 2025, a pipe in the manure management system disconnected inside an enclosed pump room at Prospect Valley Dairy — operating as Prospect Ranch LLC — near Keenesburg, Colorado. Manure water and hydrogen sulfide gas filled the space. A Fiske Inc. employee and a Prospect Ranch employee entered to stop the flow and were overcome by the gas. Then four more workers went in after them.
By the time first responders arrived, six men were dead.
The entrance to Prospect Ranch at 32063 CR 18, Keenesburg, Colorado. On the evening of August 20, 2025, six men went to work behind this sign. None of them came home. (Photo: Jesse Kuncz/CPR News)
Name
Age
Hometown
Role
Family Connection
Alejandro Espinoza Cruz
50
Nunn, CO
Dairy service technician, High Plains Robotics
Father of Oscar and Carlos
Oscar Espinoza Leos
17
Nunn, CO
Intern, High Plains Robotics; senior at Highland High School
Son of Alejandro
Carlos Espinoza Prado
29
Evans, CO
Service technician, High Plains Robotics
Son of Alejandro
Jorge Sanchez Pena
36
Greeley, CO
(Role not specified)
Married into Espinoza family
Ricardo Gomez Galvan
40
Keenesburg, CO
(Role not specified)
—
Noe Montañez Casañas
32
Keenesburg, CO
Veterinarian (Hidalgo, Mexico; working in U.S. under visa)
Remains repatriated to Mexico
Alejandro Espinoza Cruz, 50, of Nunn — a dairy service technician for High Plains Robotics, a dairy equipment contractor and division of Fiske Inc. His son, Oscar Espinoza Leos, 17, of Nunn, was a senior at Highland High School in Ault and worked as an intern for his father’s company. His other son, Carlos Espinoza Prado, 29, of Evans, was also a High Plains Robotics service technician. Jorge Sanchez Pena, 36, of Greeley, was married into the Espinoza family. Ricardo Gomez Galvan, 40, of Keenesburg. Noe Montañez Casañas, 32, of Keenesburg — a veterinarian from the state of Hidalgo in central Mexico, working in the U.S. under a visa. His remains were later repatriated to Mexico, according to the Mexican consulate in Denver.
Four of the six came from the same extended family. All six were Hispanic males.
“They were extremely hardworking and humble,” said Tomi Rodriguez, an outreach worker for Project Protect Food System Workers, in an interview with CPR News. “They were a very united family.”
Six months later, OSHA’s response landed. On February 24, 2026, the agency announced proposed fines totaling $246,609 against three companies. Divide that across six deaths and the proposed penalties work out to $41,101.50 per worker killed. That’s not what the government says a life is worth — but it’s what the enforcement system produced. And it’s less than the cost of a single robotic milking unit.
Item
Cost
Replacement dairy cow (USDA NASS, Q4 2025)
$3,110
Bred heifer
$3,500–$4,200
Bulk tank replacement
$15,000–$25,000
Single robotic milking unit
$150,000–$200,000
Full confined-space safety program (Year 1)
$3,805–$6,520
OSHA proposed penalty per worker killed
$41,101.50
Average civil settlement, confined-space fatality
$10–$17 million
What OSHA Found — and What It Couldn’t Charge
OSHA cited all three companies with serious violations. Here’s how the proposed penalties break down:
Prospect Ranch LLC — the dairy operator, headquartered in Bakersfield, California, and a Dairy Farmers of America member farm — faces $132,406. OSHA cited serious violations for failure to protect workers from atmospheric hazards, failure to maintain a written hazard communication program, and failure to train workers on methods to detect hazardous gases. Prospect Ranch did not respond to the AP’s request for comment.
Fiske Inc. / High Plains Robotics — a dairy equipment contractor that employed four of the six workers who died — faces $99,306. OSHA cited serious violations for failing to protect employees from hazardous atmospheres and for failing to provide training on hydrogen sulfide detection. In a public statement, Fiske and owner Kevin Fiske said the company disagrees with the findings and is reviewing its options, while affirming its commitment to preventing future tragedies. In earlier reporting by Denver7, sources familiar with the operation said the contractor had been following proper protocols and that the manure storage had been mostly empty due to maintenance work. OSHA’s investigation reached different conclusions.
HD Builders LLC — a contractor whose employees were present but unharmed — faces $14,897 for failure to maintain a written hazard communication program and failure to train workers on hydrogen sulfide detection. HD Builders declined comment, according to the AP.
Every citation is classified as “serious.” Not one classified as “willful.” The investigation took six months.
That classification matters. Willful violations can result in a penalty of $165,514 per violation under the January 2025 penalty schedule. More importantly, willful citations are the only category that can trigger criminal referral — though even then, the maximum is a misdemeanor carrying up to six months in jail. But proving willfulness requires evidence that the employer already knew about a hazard or standard and chose to ignore it. Prior citations. Internal memos. Documented refusals.
The Enforcement Gap: Why Agriculture’s Missing Standard Limits OSHA’s Options
Here’s the structural problem: it isn’t unique to these three companies. It runs through the whole agricultural sector.
Agriculture doesn’t have a specific OSHA confined-space standard. General industry has 29 CFR 1910.146. Construction has 29 CFR 1926 Subpart AA. Farms get the General Duty Clause — Section 5(a)(1) of the OSH Act — which requires employers to keep workplaces “free of recognized hazards” but doesn’t mandate atmospheric testing, written entry permits, or rescue plans for manure pits.
OSHA’s own confined-space fact sheet for agriculture says it plainly: “OSHA’s confined spaces standard at 29 C.F.R. 1910.146 does not apply to agricultural operations, but serves as a guide”.
A guide. Not a requirement. The distinction between “standard” and “guide” matters more to lawyers than it does to the six families in Weld County. But without a specific standard to violate, the willful threshold becomes nearly impossible to clear on any agricultural operation — regardless of the circumstances.
A congressional appropriations rider in place since 1976 compounds the gap: OSHA can’t spend funds to inspect farms with 10 or fewer employees that don’t maintain temporary labor camps. Purdue University’s 2024 agricultural confined-space data shows that most known incidents happened on operations exempt from OSHA standards, in which facility exemption status was known, occurred primarily on operations exempt from OSHA standards.
For comparison: when OSHA cited Burnett Dairy Cooperative in Wisconsin after a 2014 grain bin death, investigators found two willful and eight serious violations totaling $193,200. Grain handling is subject to a specific federal standard. Manure pits don’t. The same structural vulnerability that squeezes mid-size dairy operations shows up here in its most lethal form.
All three companies have 15 business days to comply, request an informal conference with OSHA, or contest the findings before the independent Occupational Safety and Health Review Commission. OSHA’s own release notes state that “penalties and citations may be adjusted throughout the course of the case.”
“Do Not Go in After Them.”
OSHA determined that a Fiske employee and a Prospect Ranch employee entered first to address the disconnected pipe. The gas overcame them. Then three more Fiske employees and one more Prospect Ranch employee entered — almost certainly trying to save their co-workers. Their family.
Denver7 reported that an on-site supervisor was telling workers not to enter the pump room. They went in anyway.
This is the rescue cascade. It’s the pattern that keeps turning accidents into mass funerals.
Purdue’s Agricultural Confined Space Incident Database — 2,429 cases documented between 1962 and 2024 — has tracked this pattern for decades. Of 409 livestock waste incidents between 1975 and 2021, about 11% involved multiple victims. The victim’s average age was 37 years. Every time someone collapses, someone else rushes in, and the gas takes both of them.
It happened in Northern Ireland in 2012. Dairy farmer Noel Spence slipped into a slurry tank on his farm in County Tyrone. His sons Graham and Nevin went in after him. All three died. Their sister Emma tried too — she survived only because the rescuers pulled her out in time.
And it happened at Prospect Valley Dairy on an August evening when four members of the same family followed the first two workers in.
What stops the cascade is one piece of blunt, specific training: If someone collapses in a confined space, you do not go in after them. You call 911. You ventilate from outside if you can. You do not enter without a gas monitor, a rescue plan, and a team trained to execute it.
The supervisor at Prospect Valley Dairy apparently knew this. But the workers who rushed in hadn’t been trained to override the instinct that says save them. That’s the gap training is supposed to close — not information, but muscle-memory refusal to enter a space that will kill you too.
The Weld County Coroner’s Office confirmed through autopsy and toxicology that each victim died of “sudden death due to acute hydrogen sulfide exposure.” Thiosulfate levels in the victims’ blood ranged from 4.0 to 7.3 mcg/mL — highly elevated and consistent with lethal H₂S inhalation.
What the Industry Said After Six Workers Died
DFA — the nation’s largest dairy cooperative and the co-op Prospect Ranch belongs to — issued a single public statement in August 2025: “This incident deeply saddens us, and our thoughts and most sincere condolences go out to the friends and families of the deceased. At this early stage, we have no further details,” according to the Colorado Sun. As of late February 2026, no follow-up statement or confined-space safety initiative from DFA has appeared in public reporting.
NMPF’s October 2025 newsletter covered screwworm prevention, Taiwan trade missions, PFAS contamination, government shutdown monitoring, and eleven other items. None referenced Prospect Valley, dairy worker safety, or confined-space hazards. In December 2025, NMPF published detailed preparedness materials on foot-and-mouth disease, including biosecurity protocols, vaccination strategies, and supply chain contingencies. Biosecurity and worker safety involve different organizational mandates and regulatory structures. But the FMD response demonstrated the industry’s capacity for rapid, organized action on threats it prioritizes — and raised an obvious question about why confined-space reform hasn’t received similar urgency.
NMPF’s FARM Program does maintain a voluntary Safety Self-Assessment that includes a confined-space section — covering hazard assessment, engineering controls, training, and inspections. It existed before the deaths in Prospect Valley. What doesn’t exist, six months later, is a new industry-wide initiative in response to them.
The Idaho dairy industry is the exception. After manure pit deaths in 2016–2017 — including one worker who’d been on the job only two weeks — the Idaho Dairymen’s Association launched statewide safety training aimed at its predominantly Spanish-speaking workforce. “We won’t shy away from the fact that those fatalities provided a wake-up call . . . that we need to be more robust in safety training,” Rick Naerebout, then IDA’s director of operations and now its CEO, told the Washington Post.
IDA Consulting Services now provides on-farm training and safety programs to roughly 400 dairy operations across Idaho. National numbers are suggestive — Purdue’s 2024 summary found only three livestock waste incidents across the entire U.S. that year, down from 11 in 2020 and 13 in 2021. Researchers caution that up to 30% of incidents go unreported, and they can’t confirm whether training programs drive the decline. But Colorado, six months after losing six workers in a single evening, hasn’t produced an equivalent response.
Does Your Operation Have a Confined Space That Could Kill Someone This Week?
Most dairies do.
Hydrogen sulfide is heavier than air — specific gravity 1.19. It pools in every pit, pump room, and below-grade channel on your operation. At low concentrations, you smell rotten eggs. At 100 ppm, the gas deadens your sense of smell — and 100 ppm is the NIOSH “Immediately Dangerous to Life or Health” threshold. Between 500 and 700 ppm, you lose consciousness within minutes. Above 1,000 ppm, a single breath can paralyze your diaphragm.
For context, hydrogen sulfide in biogas from anaerobic digestion of manure typically ranges from 2,000 to 4,000 ppm. That’s not a gradual risk. That’s a light switch.
Since the early 1960s, nearly 150 people have died in the U.S. from manure-related gas incidents. Almost half occurred on dairy farms. The most common activity at the time of death: repairing manure-handling equipment or attempting to rescue another worker.
What It Costs to Prevent This — and What It Costs to Skip It
Now run those numbers against what’s at stake. A full confined-space entry program for a mid-size dairy — gas monitor, ventilation blower, annual training for an eight-person crew, rescue tripod and winch, signage, and written procedures runs roughly $3,800 to $6,500 in year one.
Your full confined-space program costs about what you’d pay for two replacement cows at today’s record prices.
William Field, the Purdue professor who maintains the agricultural confined-space database, told the AP that OSHA fines in these cases are often reduced upon appeal, or partially waived in exchange for safety investments. OSHA’s own release notes that penalties may be adjusted throughout the case. But Purdue’s database — 2,429 cases over six decades — shows wrongful death settlements in agricultural confined-space fatalities typically range from $10 million to $17 million.
The enforcement system produces penalties that can be absorbed as a line item. The civil system produces the number that changes behavior — but only after someone is already in the ground.
When a father, two sons, and a son-in-law die in the same pump room on the same evening, the ripple isn’t abstract.
The community around Keenesburg organized fundraising — a dance, haircuts, a car wash — to support the families. A GoFundMe page for funeral expenses raised over $63,000 toward its $70,000 goal, with individual donations ranging from $5 to $5,000. Local churches held a memorial service at the Weld County fairgrounds in early September. The Weld Re-9 School District made counseling available to students and staff at Highland High School — Oscar’s school.
On the GoFundMe page, a former classmate named Jaxson Robson left a $20 donation and a comment: “I knew Oscar in middle school; we shared a room at the YMCA. He was such a nice kid, I can’t wait to see him again in heaven.”
Nationally, more than half of the dairy industry’s roughly 150,000 workers are immigrants, according to industry estimates. In Idaho, approximately 90% of the state’s 8,100 dairy farmworkers were born outside the United States. Many come from tight-knit communities rooted in specific regions of Mexico and Central America, just like the Espinoza and Montañez families, who also came from tight‑knit communities in Mexico.
The industry’s failure to protect workers from physical hazards like is mirrored by its failure to protect the men at the top from the psychological hazards of the job. We’ve reported on dairy farmers facing a 3.5× higher suicide risk than the general population — drawing on CDC occupational mortality data and research in the Journal of Rural Health. Male farmers, ranchers, and agricultural managers die by suicide at a rate of 43.2 per 100,000, versus 27.4 for all other occupations.
Every one of these stories — the suicides, the manure pit deaths, the mental health crises — comes back to the same thing. Preventable loss on operations that didn’t have the systems to catch it. At Prospect Valley Dairy, the prevention system costs about two cows. The question nobody asked those six workers is the same question nobody asks the ones we lose to despair: Was anyone looking out for you?
The Honeywell BW Flex4 (left) and Flex5. A 4-gas monitor like this runs $700–$900 — less than a bred heifer. It alarms before hydrogen sulfide reaches lethal concentrations. Nobody at Prospect Valley Dairy was carrying one on August 20, 2025.
Buy a 4-gas monitor. The Honeywell BW Flex4 runs $700–$900. Clip it on before anyone enters a pit, pump room, or below-grade vault. If it alarms, back out. No exceptions. No heroics.
Walk the operation. Tag every confined space — every manure pit, pump room, under-floor channel, silo base, and mechanical chase — with “DANGER: NO ENTRY WITHOUT ATMOSPHERIC TESTING.”
Have one blunt conversation with your crew in their language. Three sentences: One breath can kill you. If someone goes down in a pit, nobody goes in after them. You call 911.
Within 90 days ($1,200–$2,400):
A FrenchCreek confined-space rescue tripod with self-retracting lifeline and winch — $1,455 to $2,025. This is what stops the rescue cascade. You pull a worker out from above instead of following them into the gas. At Prospect Valley, four people followed.
Complete confined-space entry training for all employees. HAZWOPER-OSHA offers online courses at $25–$50/person and virtual instructor-led sessions at roughly $200/person. State extension or safety council programs may run at a lower cost.
Write a buddy system and rescue plan. Post it at every tagged confined space. Pick up a ventilation blower — Major Safety’s RamFan UB20 line, $250–$895 — and a rescue tripod with winch — FrenchCreek systems, $1,455–$2,025.
365-day cycle:
Annual refresher training.
Equipment calibration.
Written confined-space entry permit program.
Key Takeaways
If you have a manure pit, pump room, or any below-grade enclosed space and no gas monitor, your operation is carrying a version of the same risk that killed six people at Prospect Valley Dairy. A Honeywell BW Flex4 costs less than a bred heifer.
If nobody on your crew has been specifically trained not to enter a confined space to rescue someone, you’re one disconnected pipe from a rescue cascade. Have that conversation this week — in every language your workers speak.
Don’t count on OSHA’s proposed penalties to deter anything. The Prospect Valley case produced $41,101.50 per life lost — and both OSHA’s release and Purdue’s research indicate that number often shrinks through the review process. The real financial consequence arrives in civil court at $10 to $17 million, after someone is already gone.
If you have 10 or fewer employees, the 1976 appropriations rider likely means OSHA can’t inspect your operation. The gas doesn’t check your headcount.
The Bottom Line
Alejandro Espinoza Cruz was 50, from Nunn. Oscar Espinoza Leos was 17, interning with his father’s company, a high school senior with a friend who remembered him from the YMCA. Carlos Espinoza Prado was 29. Jorge Sanchez Pena was 36. Ricardo Gomez Galvan was 40. Noe Montañez Casañas was 32, a veterinarian from Hidalgo, Mexico.
The confined-space program that could have sent all six home that night costs about two cows.
When’s the last time someone on your operation entered a pit without a monitor?
If you or someone on your operation is struggling: 988 Suicide & Crisis Lifeline (call or text 988), Farm Aid hotline (1-800-FARM-AID), Do More Ag Foundation (domore.ag).
Executive Summary:
Six Colorado dairy workers — including a father, his two sons, and a son‑in‑law — died when hydrogen sulfide gas filled a pump room at Prospect Valley Dairy in August 2025. OSHA has proposed $246,609 in fines against the dairy and two contractors, effectively valuing each death at about $41,101 — less than a bulk tank, far less than a robot, and nowhere near typical civil payouts for confined‑space fatalities. Investigators issued only “serious” violations, not “willful” ones, so no one is facing criminal charges or jail time despite six preventable deaths. The case exposes how agriculture’s OSHA exemptions and the lack of a specific confined‑space standard leave dairy workers protected mainly by a vague General Duty Clause rather than clear rules. While DFA and NMPF have offered condolences and point to existing voluntary FARM safety checklists, neither has launched a new confined‑space safety push even as the sector mobilizes quickly on issues like disease outbreaks. The article runs the barn math: a basic confined‑space program on a mid‑size dairy costs roughly the price of two cows, but skipping it invites $10–$17 million lawsuits and the kind of funerals Weld County just lived through. It closes with a blunt 30/90/365‑day checklist for producers who don’t want their own pump room to become the next scene like this.
Complete references and supporting documentation are available upon request by contacting the editorial team at editor@thebullvine.com.
The Triple Cushion Trap: Why 2025’s Strong Margins Won’t Save You in 2026 – Expose the three temporary market “cushions” currently masking structural dairy weaknesses. This analysis reveals the looming heifer shortage and margin compression threats, empowering you to reposition your herd strategy before the 2026 window slams shut.
Every week, thousands of producers, breeders, and industry insiders open Bullvine Weekly for genetics insights, market shifts, and profit strategies they won’t find anywhere else. One email. Five minutes. Smarter decisions all week.
New Mexico can track every cow that left Woodcrest Dairy. It can’t tell you which bottle their milk ended up in. That gap is your problem too.
Sometime in 2025, roughly 2,000 dairy cows left Woodcrest Dairy near Roswell, New Mexico — not to be confused with the New York breeding operation of the same name, known for Select Sires’ Woodcrest King DOC. Livestock records reviewed by KOB-TV show that those Roswell animals were sold to Harry Dewit of Westland Dairy in Clovis. KOB-TV reported that the sale occurred shortly before the release of an undercover video from the facility. There is no public evidence indicating Dewit was aware of the pending investigation at the time of the transaction. Federal business filings list Dewit — a past Innovative Dairy Farmer of the Year honoree who milks 4,400 cows at High Plains Dairy in Texas — as CEO of Blue Sky Farms and as a director and treasurer of Select Milk Producers, the cooperative that helped launch the Fairlife milk brand before Coca-Cola acquired full ownership in 2020. Dewit has not been named as a defendant in the federal welfare lawsuit, and no public allegations of wrongdoing have been made against him personally.
Here’s the problem that should keep every co-op member awake tonight: New Mexico has no system for tracking which dairy’s milk ends up in which branded bottle on which store shelf. That’s not a welfare story. That’s a supply chain story. And it has direct implications for every producer whose milk moves through a cooperative network.
The $21 Million Promise
In 2022, Fairlife and Coca-Cola paid $21 million to settle a class-action lawsuit accusing the company of misleading consumers with marketing that suggested cows received “extraordinary care and comfort.” The companies denied wrongdoing but agreed to implement animal welfare standards and third-party audits as part of the court-approved settlement.
Animal Recovery Mission says those reforms didn’t work. ARM alleges its operative — hired as a milker at Woodcrest and later promoted to the birthing and medical units — recorded footage from December 2024 through approximately March 2025 that ARM describes as showing workers striking cows with shovels and wrenches, forcing metal rods down animals’ throats, and dragging calves through dirt. These allegations, first reported publicly by ARM and subsequently by KOB-TV (February 22, 2026), are now part of a federal lawsuit proceeding in the Central District of California. The Bullvine has not independently verified them, and no criminal charges have been filed as of publication. ARM presented its findings to six agencies — the Chaves County Sheriff’s Department, the New Mexico Livestock Board, the FDA, the New Mexico Department of Agriculture, the USDA, and the FSIS — in May 2025, before going public. ARM says it has investigated other dairies linked to Fairlife in the past.
Fairlife says Woodcrest was not a supplier during 2024 or 2025. ARM’s investigation claims Woodcrest was “directly tied to Coca-Cola’s bottling operations in Dexter, NM, with frequent raw milk pickups by Ruan Trucking.” Those two claims are difficult to reconcile — and the federal lawsuit will likely examine exactly how Fairlife defines “supplier” and whether the cooperative pooling structure creates connections the company’s statement doesn’t acknowledge.
Where Did the Cows Go?
This is where the welfare story becomes a supply chain story — and where The Bullvine’s angle diverges from every other outlet covering this.
KOB-TV’s investigation traced the roughly 2,000 cows from Woodcrest to Westland Dairy, which operates within the Select Milk Producers network. NM Livestock Board investigative records show that by early summer 2025, Woodcrest’s pens were empty, and remaining animals were set to be sold within weeks. Cows from that redistribution remain within the broader Select Milk cooperative framework. But here’s the gap: New Mexico doesn’t track milk from individual dairies to retail brands. The state can trace cows — livestock records document the transfers. What it can’t trace is the milk those cows produce once it enters the cooperative pipeline.
Translation: if a Fairlife bottle tests clean for safety, nobody is required to know whose cows produced it. That’s a food safety system, not a brand integrity system.
The FDA’s FSMA Food Traceability Rule, which took effect January 20, 2026, addresses traceability for high-risk foods — but fluid milk isn’t on the Food Traceability List. Ultra-filtered products like Fairlife’s fall into a regulatory gap: the Pasteurized Milk Ordinance addresses safety, but farm-to-brand sourcing remains voluntary and processor-controlled. The industry’s Innovation Center for U.S. Dairy has built traceability infrastructure, but it’s designed for processor-lot tracking and recall response — not for answering the question “which farm’s milk is in this bottle?”
New Mexico runs roughly 95 dairy operations milking approximately 240,000 cows as of 2024, down from 150 farms a decade ago — a 37% decline even as the state’s cow numbers fell 26% from 323,000 (USDA 2025). Average herd size exceeds 2,500 — among the largest in the nation. These are big operations where co-op relationships and brand supply chains matter enormously to the bottom line. And New Mexico’s mailbox milk prices already run roughly $2.00/cwt below the national average — among the lowest in the country, according to USDA data. When your base price is already that thin, the brand premium isn’t a bonus. It’s your margin.
Metric
New Mexico
U.S. National Average
Mailbox Price Disadvantage
$2.00/cwt BELOW national avg
—
Operating Dairies (2014→2024)
150 → 95 farms (−37%)
−26% nationally
Cow Inventory (2014→2024)
323K → 240K (−26%)
Slight increase nationally
Average Herd Size
2,500+ cows (among largest in U.S.)
~350 cows
Can Your Co-op Prove Your Milk Is Clean?
That’s the question this story forces into the open. And the honest answer, for most co-op members, is probably not.
Select Milk Producers — a cooperative of 99 family dairy farm members based in Texas and New Mexico — said in a statement to KOB-TV: “Select Milk Producers is committed to the highest standards of animal care.” In court filings, Select argues that plaintiffs have not shown Woodcrest was supplying milk to Fairlife at the time of the alleged abuse. Fairlife has similarly stated that Woodcrest was not a supplier during 2024 or 2025 and said its supplying farms are subject to animal welfare standards and third-party audits.
The structural problem remains: when cows transfer between operations within the same cooperative network — as 2,000 did from Woodcrest — and when state regulators can’t trace milk to brands, the burden of proving supply chain integrity falls on the processor’s word. Not on verifiable records. Not on independent audit trails.
The owner of Woodcrest declined to comment on camera to KOB-TV and distanced himself from Fairlife, directing questions to his former co-op, Select Milk Producers. According to KOB-TV’s reporting, Select Milk did not respond to specific questions about Dewit’s business affiliations or the co-op’s role in the sale of the cows.
If you’re a co-op member — in New Mexico or anywhere — this matters to you even if your operation has never been within 1,000 miles of Roswell. The question isn’t whether you treat your cows right. The question is whether your co-op can prove, with documentation, that the milk carrying a premium brand label actually came from farms that met that brand’s welfare standards. The Woodcrest situation raises the question of whether most can.
Double Legal Exposure in the Same District
The welfare lawsuit isn’t the only legal problem facing Select Milk Producers in federal court in New Mexico.
In a separate case (Othart Dairy Farms LLC et al v. DFA Inc. et al, No. 2:22-cv-00251, filed April 2022), dairy farmers including Othart Dairy Farms of Veguita, New Mexico, along with Pareo Farm, Desertland Dairy of Vado, Del Oro Dairy of Mesquite, Bright Star Dairy, and Sunset Dairy alleged that DFA and Select Milk conspired through their Greater Southwest Agency to suppress milk prices paid to producers in New Mexico and portions of Texas, Arizona, Kansas, and Oklahoma from January 2015 through at least June 2025. Judge Margaret Strickland ruled the case could proceed in March 2024. A $34.4 million settlement — $24.5 million from DFA and $9.9 million from Select Milk — received preliminary judicial approval in the summer of 2025. Neither cooperative admitted liability. The complaint alleged that DFA and Select controlled at least 75% of all raw Grade A milk in the Southwest, and that more than 85% of the region’s milk moves through cooperatives.
Beyond the settlement payments, both co-ops agreed to dissolve Greater Southwest Agency — the joint marketing entity the lawsuit alleged was the main vehicle for the conspiracy — and to implement antitrust training for marketing staff and better pay transparency for members (August 2025). DFA has a history of antitrust litigation. The cooperative paid $140 million to settle a price-fixing suit in the Southeast in 2013 (without admitting liability) and $50 million in the Northeast in 2015 (also without admission). Combined with the Southwest settlement, DFA’s total antitrust settlement obligations across three regions now exceed $225 million.
Two federal lawsuits in the same district, involving the same cooperative network — one alleging welfare failures in the supply chain, the other alleging price suppression. Whether that’s a coincidence or something more structural is a question Select Milk’s members deserve to ask. The Bullvine explored the real math behind who controls your milk check in “The American Dairy Heist: Who Really Owns Your Milk Check.”
The Barn Math
Here’s where this gets personal for your operation. Brand-premium milk programs — Fairlife included — typically command $1.50 to $2.50/cwt above commodity pricing for qualifying farms (exact premiums vary by contract and aren’t publicly disclosed). On a 1,000-cow herd producing at New Mexico’s state average of 24,717 lbs/cow/year, a $2.00/cwt premium works out to roughly $494,000 per year.
That premium exists because consumers pay more for a brand that promises higher welfare standards. A welfare investigation — at your farm, your co-op partner’s farm, or anywhere in your cooperative’s supply chain — puts the brand at risk. And when that happens, the premium is what evaporates. Not the base milk price. The premium. In a state where mailbox prices already sit $2.00/cwt below the national average, that premium isn’t extra income — it’s the difference between positive margins and red ink. The question isn’t whether you can afford traceability — it’s whether you can afford not to have it. (For more on how management alone can’t close the gap when structural economics shift, read “Exposing Dairy’s Biggest Lie: Management Can’t Save You.”)
Herd Size
Annual Production (lbs)
Premium Value ($2.00/cwt)
Potential Loss
500 Cows
12,358,500
$247,170
A New Tractor
1,000 Cows
24,717,000
$494,340
A New Parlor Wing
2,500 Cows
61,792,500
$1,235,850
The Entire Margin
And here’s the other number worth sitting with: that $34.4 million price-fixing settlement — in which, again, neither cooperative admitted liability — covers roughly 8,000 producers who marketed milk during the affected timeframe (per the settlement class definition). That works out to approximately $4,300 per farm before legal fees. The potential brand-premium loss from a welfare scandal dwarfs that. Unlike a one-time settlement, premium erosion compounds every month the brand stays damaged.
What Corporate Statements Actually Tell You
Fairlife’s position, stated to KOB-TV and multiple other outlets: “Woodcrest Dairy in New Mexico is not a supplier to fairlife” during the period in question, and the company has “zero tolerance for animal abuse.” Select Milk Producers maintains it is “committed to the highest standards of animal care.”
These are the corporate statements as provided. But note what they don’t address: the structural traceability gap. Saying Woodcrest “is not a supplier” is a claim about a business relationship. And in an industry where “not a supplier” can have multiple contractual meanings — not a direct supplier, not during a specific period, not under a particular agreement — the precision of the language deserves closer scrutiny than the reassurance it may offer. That traceability gap isn’t Fairlife’s creation — it’s a structural feature of how cooperative milk marketing works in most states. But it does mean that corporate assurances about supply chain integrity rest on voluntary self-reporting rather than on independently verifiable records.
The judge overseeing the welfare case recently dismissed certain claims against Coca-Cola and Select Milk but allowed others tied to Fairlife’s branding and consumer assurances to proceed. Plaintiffs have been given time to amend their complaint. On the state level, KOB-TV confirmed the Livestock Board has an active investigation — spokesperson Belinda Garland told the station, “The Woodcrest Dairy is an ongoing investigation in this agency,” adding, “We’ll hold them accountable if we feel that we have probable cause and the evidence to support it.” Garland noted that proving extreme animal cruelty can be difficult, particularly when allegations surface after the fact. The Chaves County Sheriff’s Office referred the matter to the NM Livestock Board. Woodcrest Dairy itself has since shut down — pens empty, cows dispersed across the network.
Within 30 days: Audit your own audit. Call your cooperative and ask three questions: Who selects your third-party welfare auditor? How often are audits conducted? Can you get the most recent audit summary for every farm in your pool? Get the answers in writing. If your co-op can’t or won’t answer, that tells you something.
Audit Question
Why This Matters
Red Flag Answer
Who selects your third-party welfare auditor?
If the co-op picks its own auditor, independence is compromised. Best practice: member-elected oversight board selects auditor.
“Management handles that” or “We don’t know”
How often are member farms audited?
Annual audits are industry standard for premium brands. Less frequent = gaps where problems can develop undetected.
“Every 2-3 years” or “Only problem farms get audited”
Can you access audit summaries for every farm in your pool?
If you can’t see audit results, you can’t verify supply chain integrity. Transparency = accountability.
“That’s confidential” or “Only management sees those”
Does your marketing agreement address brand-contamination risk from other member farms?
Without explicit clauses, you carry exposure from other farms’ welfare failures but have no legal recourse for lost premiums.
“We don’t have specific language on that” or “Never thought about it”
Within 90 days: Review your marketing agreement. Look for brand-contamination clauses — language that addresses what happens to your premiums if another member farm in your supply chain gets investigated. If that language doesn’t exist, you’re carrying risk you haven’t priced. Talk to your ag attorney.
Within 12 months: Push for traceability infrastructure. This is the harder conversation, and it costs money. Canada’s DairyTrace program, launched in 2021, tracks individual animals from birth to disposal — it’s a livestock traceability system, not a milk-to-brand system — and it’s further than what most U.S. cooperatives have built. The real gap is at the processor level: can your co-op’s system document which farms’ milk went into which branded product on which date? The Woodcrest situation raises that question for every cooperative in the country. That gap is a business risk that will only grow as consumers, regulators, and plaintiffs’ attorneys get more sophisticated about dairy supply chain questions. If you’re rethinking your operation’s positioning in that environment, “Transform Your Dairy Before Consolidation Decides for You” maps out the decision framework.
The trade-off is real. Better traceability protects premiums but adds cost. Voluntary industry programs are cheaper to implement but harder to defend in court. And waiting for regulators to mandate traceability means you’re letting someone else set the terms.
Key Takeaways
If your co-op can’t tell you who audits its member farms or when, your premium is built on trust, not verification. That’s fine until it isn’t.
If your milk marketing agreement doesn’t address brand-contamination risk from other member farms, you’re exposed. The Woodcrest situation shows how one operation’s investigation can call into question the entire cooperative network’s brand relationships.
The traceability gap is real and unregulated. Most states — including New Mexico — can’t trace milk from individual farms to retail brands. That means the burden of proving “clean” supply chains rests entirely on processor self-reporting. Ask yourself: Is that enough?
Two federal lawsuits in the same cooperative network raise questions that Select Milk’s members deserve to ask. When your co-op is simultaneously settling antitrust claims and facing welfare allegations, governance isn’t optional — it’s fiduciary.
The Gap Nobody’s Closing
The dairy industry spent decades building a system optimized for food safety and efficient pooling. That system works — it moves milk safely from farm to shelf on an enormous scale. But it wasn’t built to answer the question premium branding now requires: whose milk is this, and can you prove the cows that produced it were treated as the label promises?
Woodcrest Dairy is shut down. The cows are dispersed across the Select Milk network. The lawsuits are proceeding in narrowed form after some claims were dismissed and others allowed to continue. And somewhere between Roswell and a Fairlife bottle on a grocery store shelf, there’s a traceability gap that no settlement check, no third-party audit, and no corporate press statement has closed.
Your operation might never make national news. But your co-op’s ability to prove where your milk went — and that it came from farms meeting the standards your brand premiums depend on — is now a question with a dollar sign attached. Can yours?
Executive Summary:
A New Mexico welfare investigation at Woodcrest Dairy has exposed a deeper problem: once 2,000 cows were sold out of that herd, nobody could clearly trace which branded products their milk now supplies. Fairlife and Coca-Cola previously paid $21 million to settle animal welfare marketing claims and now say Woodcrest wasn’t a supplier in 2024–25, while ARM’s undercover footage and new federal filings paint a murkier picture of what “supplier” actually means in this system. At the same time, Select Milk Producers is dealing with a separate $34.4 million price-fixing settlement it reached with DFA in the Southwest, without admitting liability, after farmers accused it of using a joint agency to hold down milk checks. For you, the real risk isn’t the courtroom drama — it’s what happens to brand premiums that can be worth around $494,000 a year on a 1,000-cow New Mexico herd if a welfare scandal hits your co-op’s supply chain. Because New Mexico can trace cattle movements but not milk from farm to brand, most co-op members still can’t independently prove where their milk went or whether every supplying farm actually met a premium label’s welfare standards. This piece breaks down that traceability gap and gives you concrete moves — from grilling your co-op on audit practices in the next 30 days to stress-testing your marketing agreement for brand-contamination clauses — so you’re not finding out about your exposure when the premium disappears.
Update, 25/02/2026: Fairlife responded to The Bullvine’s request for comment. A Fairlife spokesperson stated: “Woodcrest Dairy is not a supplier to fairlife, which means no milk from this dairy is received by fairlife for fairlife products.” Fairlife did not address questions regarding the transfer of approximately 2,000 Woodcrest cows to Westland Dairy, milk-to-brand traceability within cooperative pools, Harry Dewit’s role within Select Milk Producers, or the company’s welfare verification process.
This article is based on published reporting by KOB-TV (February 22, 2026), federal court filings, USDA data, and other public sources cited throughout. Fairlife’s and Select Milk Producers’ positions are presented as stated to KOB-TV and in court filings. Harry Dewit has not been named as a defendant in the federal welfare lawsuit.
Learn More
Exposing Dairy’s Biggest Lie: Management Can’t Save You – Stop chasing marginal efficiencies while your foundation crumbles. This breakdown reveals why “perfect” management fails when structural economics shift—and arms you with the strategy to pivot before the market forces the move for you.
The American Dairy Heist: Who Really Owns Your Milk Check? – How much of your check is lost to cooperative “pooling” and marketing fees you never approved? This deep dive exposes opacity in your payout and delivers the leverage needed to challenge your board’s status quo.
Every week, thousands of producers, breeders, and industry insiders open Bullvine Weekly for genetics insights, market shifts, and profit strategies they won’t find anywhere else. One email. Five minutes. Smarter decisions all week.
Six farms, four countries, zero marketing budget — and more reach than $102.7M in anti‑dairy campaigns. Are you letting strangers explain your barn?
Nathan Ranallo — Nate the Hoof Guy — in west-central Wisconsin. He’d never edited a piece of footage before 2020. The 880 million views came because he didn’t bother starting.
Nathan Ranallo had been trimming hooves in west-central Wisconsin for more than two decades when he started filming his work and posting it online in 2020. “Maybe a year prior to that, I was still using a flip phone,” he told Wisconsin Public Radio. “I had never edited a single piece of footage in my life.” His reasoning, as he later told Wisconsin Public Radio: push back on viral clips that made standard procedures look like torture, and show what proper hoof care actually looked like.
Here’s why this matters to you, even if you never plan to post a single video: these farmers are building something the dairy industry has struggled to buy for decades — real consumer trust. If you’re not shaping the public story of your operation, someone else is telling it for you. They probably won’t get it right.
He told Wisconsin Public Radio he figured other farmers might watch — he never anticipated the broader audience. Two of his most popular TikTok videos have since pulled more than 150 million views combined (Wisconsin Public Radio, July 2024). His YouTube channel — launched in February 2020 — has grown to more than 1.7 million subscribers and passed 880 million total views as of February 2026 (Social Blade; VidIQ).
On TikTok, he’s at roughly 2 million followers. Facebook has 1.6 million users (The Tilt, August 2024). Ranallo — now known to the internet as Nate the Hoof Guy — didn’t see it coming. “Little did I know that it wouldn’t be just farmers watching this, but it would be many more people,” he told Wisconsin Public Radio. “It kind of exploded on me.”
What a Cow Pedicure Teaches About Trust
Social license sounds like something a consultant made up for a PowerPoint. But the concept is dead simple: it’s the informal permission the public gives your industry to keep operating. Lose it, and you get ballot initiatives, regulatory crackdowns, and retail buyers who want to talk to somebody else.
Ranallo builds social license without ever using the phrase. His videos look intense — paring overgrown claw, draining abscesses, clearing stones. But he explains every step.
Hoof horn is dead tissue, he tells viewers, much like a fingernail. “The analogy I like to use is: The hard hoof part that they walk on is like a boot that we would wear. We wouldn’t ever feel it if we were taking a rock out of the sole of our boot,” he told Wisconsin Public Radio. The lesions inside the claw are painful, and he’s clear about that, but careful trimming relieves the pressure — you can see the cow walk easier right after treatment.
For millions of viewers who’ve never set foot on a dairy, that’s the moment the industry stops being scary. The psychology mirrors power-washing videos and pimple-popping compilations: a visible problem, methodical work, satisfying relief. Ranallo adds something those genres don’t have — context and education.
The content side isn’t a hobby anymore, either. VidIQ’s algorithmic estimates — based on public view counts, not confirmed earnings — placed Ranallo’s monthly YouTube revenue at $8,000–$24,000 as of fall 2025. Those aren’t guaranteed numbers, and your mileage will vary wildly — but they’re worth weighing against the 30 to 50 hours a week he puts into content production. He also runs a Facebook paid-subscriber tier at $1.99/month and sells merchandise (The Tilt, August 2024). He told WiscNews that he spends 45 to 50 hours a week on hoof trimming and another 30 to 50 hours on content — essentially two full-time jobs.
At the low end — $8,000 a month from YouTube, 30 hours a week producing content — that works out to about $62 an hour. At the high end — $24,000 a month, 50 hours a week — closer to $111. You won’t touch those numbers; he’s an extreme outlier with more than 1.7 million subscribers. But the real value for most farm creators isn’t ad revenue. It’s the consumer trust that already exists before a crisis hits your county. And if you want to understand the real cost of lameness — and why hoof health is your most underrated profit driver, the connection between what Ranallo shows on camera and what’s happening in your barn is tighter than you’d think.
When Polished Transparency Shatters
And crises do hit. In June 2019, undercover footage from Fair Oaks Farms in Indiana went viral overnight (CBS News, June 2019). This wasn’t some anonymous operation with no public face — Fair Oaks was the Midwest’s premier agritourism destination, drawing more than 600,000 visitors a year to guided dairy tours and a birthing barn where visitors watched calves being born (Guardian, June 2019; IndyStar, June 2019).
Fair Oaks Farms in Indiana — 600,000 visitors a year, guided tours, a calf birthing barn. The actual working barns weren’t on the route. That gap is what collapsed in June 2019.
Retailers pulled Fairlife products from shelves. Owner Mike McCloskey posted a widely circulated video apology. Fair Oaks had invested more in public engagement than almost any dairy in the country — but it was the polished, curated kind. Guided bus tours and gift shops sat along the visitor route while the actual working barns didn’t (Center for Land Use Interpretation, 2013; IndyStar, June 2019).
When undercover footage showed what happened where the tours didn’t go, the gap between the brand and the barn destroyed trust more thoroughly than if there’d been no public face at all. That’s the distinction Ranallo, Pemberton, and Payne demonstrate in their own content: showing the raw, sometimes ugly, daily reality weathers scrutiny. A visitor center shatters under it.
A New York dairy that faced a PETA campaign offers the flip side. The owner called an AP reporter who’d requested an interview and invited her to the farm. The reporter declined the visit — but dropped the story entirely.
In her research, she’d found a news release from the New York Animal Agriculture Coalition about the farm’s NYSCHAP certification and contacted Cornell’s PRO-DAIRY program, which confirmed the farm’s reputation (Bovine Veterinarian, May/June 2016). The difference wasn’t size or budget. It was whether authentic trust existed before the camera showed up. That story — and others like it — speak to why social license is the issue dairy can’t afford to ignore.
Can a 4,500-Cow Operation Feel Personal?
One of the most stubborn myths in the public dairy conversation — and one your consumers almost certainly believe — is that scale automatically equals cruelty. MVP Dairy in Celina, Ohio, is proving that assumption wrong one TikTok at a time.
MVP is owned and operated by two fourth-generation farming families: the McCartys of Colby, Kansas, and the VanTilburgs of Celina, Ohio. The operation milks 4,500 cows and supplies Danone North America (PR Newswire, June 2020). “As 4th generation farmers, we know the care we provide to our cows, land, and team members today can help create a more sustainable world tomorrow,” co-owner Ken McCarty told Dairy Reporter when MVP earned its B Corp Certification (Dairy Reporter, June 2020).
That certification carries weight. To become a B Corp, MVP completed B Lab’s Impact Assessment — covering governance, workforce, community, and environmental performance — scoring 106.3 at its initial 2020 certification, well above the 80-point minimum (PR Newswire, June 2020). B Lab’s current listing shows a score of 102.7 following recertification (bcorporation.net, accessed February 2026). The farm is also DairyCARE certified through Where Food Comes From and was named the 2020 Innovative Dairy Farm of the Year.
Those credentials sit behind the TikTok feed. On social media, MVP doesn’t look like a sustainability report — it looks like cow-comfort walkthroughs, parlor routines, and “pampering the girls” trends, shot by real people in the barn. An audit score north of 100, plus a person in coveralls talking to the camera? That combination makes a 4,500-cow dairy feel like a place you could walk through, not a place you’d protest outside.
MVP took that principle offline, too. The Dairy Learning Center, a nonprofit onsite, invites the public to explore interactive displays, view cows being milked on a carousel, and shuttle through the free-stall barns (dairylearningcenter.com; TripAdvisor, 2026). Unlike Fair Oaks, MVP pairs the physical experience with daily, unpolished social content and third-party verification. It’s the combination that builds durable trust.
Inside MVP Dairy’s Learning Center in Celina, Ohio — a 4,500-cow operation that invites the public through the barns, not around them. B Corp certified. DairyCARE audited. Hands-on, not hands-off.
Should Your Dairy Farm Be on Social Media?
That’s the real question this whole trend forces. And the honest answer is: it depends on what you’re trying to accomplish, how much time you can spare, and what you’re protecting against. But the farmers building a real farm social media presence share patterns worth studying.
Tom Pemberton runs a mixed dairy-and-beef operation at Birks Farm near Lytham in Lancashire, England (BBC, November 2019). His YouTube channel has grown to 591,000 subscribers and more than 228 million views across over 1,000 uploads as of early 2026 (Social Blade, January 2026). What makes Pemberton worth your attention is what he doesn’t hide — the slurry, the silage, the equipment breakdowns, the days when nothing works. His audience returns not for highlights but because the full picture, grim days included, feels real.
What Makes a Cow Go Viral?
Down in Ikamatua on New Zealand’s West Coast, herd manager Chloe Payne took a completely different route to the same destination. She manages 600 mixed-breed cows — mainly Fleckvieh — on a 240-hectare milking platform, and owns 26 personally, all with names (Guardian Online, May 2024). Her Instagram account, Cows of New Zealand (@cowsofnewzealand), reached 325,000 followers by mid-2024 after gaining 270,000 in a single year.
Chloe Payne and friend, Ikamatua, New Zealand. The tattoo on her arm is Brown Sugar — a Jersey she loved enough to ink permanently. 325,000 Instagram followers showed up for exactly this.
A cow named Popcorn was one of her first viral stars — Payne told the Guardian that people still follow her account years later because of Popcorn. Then came Barbie, a Fleckvieh-Friesian calf whose photo pulled 2.4 million likes on Instagram and wound up on Khloe Kardashian’s account (NZ Dairy Exporter, January 2024). And Brown Sugar, a Jersey so beloved that Payne had a tattoo of her inked on her thigh (NZ Dairy Exporter, January 2024).
When Gingerbread — Brown Sugar’s daughter died in the spring of 2023, Payne compiled a video tribute to her life and shared it with her followers, many of whom had watched the calf grow up on their feeds (NZ Dairy Exporter, January 2024). “They see what happens on the farm and get to see that cows here are not just a number,” she told the NZ Dairy Exporter.
“If We Don’t Show It, Someone Else Will”
Jan Kielstra — SaskDutch Kid on YouTube — rounds out the picture from Saskatchewan. His parents, Bruce and Vicki, started milking 42 cows in 1996; today, Kielstra Holsteins runs roughly 380 head (YouTube channel description, 2026). His YouTube has grown to 223,000 subscribers and 63 million views (VidIQ, January 2026). His take on why he does it is the simplest version of the argument: “If we don’t show how we do things on a farm, someone will” (Sweet Peas Evening Ag News, March 2020).
Real dirt, real names, real problems outperform polish. They always have. For a different kind of story about the family that chose dairy chores over the NHL draft, the theme is the same — showing that the real thing beats selling the shiny version.
What Does Farm Social Media Actually Cost?
Chloe Payne is honest about the money. She told the Guardian in May 2024 that her Instagram is still a hobby and doesn’t generate much income — though she’d love to earn enough to eventually retire her pet cows. Even with 325,000 followers, the direct revenue isn’t there yet.
Big Farmer Andy — a third-generation dairy farmer in Australia whose grandfather emigrated from Holland in 1936 — started on TikTok almost by accident (Australian Farmers podcast, September 2022). A nose operation in November 2020 left him stuck inside for two weeks, so he posted some old farm videos to kill time. They blew up. His TikTok following stood at 449,200, with 14.5 million likes, as of early 2026 (TikTok, January 2026).
Big Farmer Andy — “Full time farmer, part time washed up tiktoker” — surrounded by what are very clearly not dairy cows. His humour built a TikTok audience of 449,200. His honesty about three mates lost to suicide is why they stayed.
Andy’s hook is humour — his bio reads “Full time farmer, part-time washed-up TikToker.” But his most important content isn’t funny. He’s one of the few agricultural creators willing to talk openly about the mental health toll of farming. “I also know, in my life, three young men who have died from suicide,” he told the Australian Farmers podcast.
“I know there are a lot of people in the community who struggle and suffer in silence,” Andy said in the same interview. “I just want people to know how preventable suicide is.” He grew a fundraising mullet to raise money for Australia’s Black Dog Institute and directs followers to mental health resources (Australian Farmers podcast, September 2022; 4BC, March 2023).
That’s the trade-off nobody puts in the marketing deck. Social media gives dairy farmers a tool for consumer engagement, yes. But for isolated operators, it can also be a lifeline — a bridge to the outside world during stretches when the only conversations you’re having are with the herd. The flip side is real, too: visibility invites hate comments, trolls, and scrutiny you didn’t ask for. Payne told the Guardian she focuses on the followers who genuinely want to learn about the industry — that’s the right line. And if isolation is a factor on your operation, Andy’s experience points to something worth reading: the suicide risk dairy farmers face — and what your operation can do about it.
The $102.7 Million You’re Up Against
None of this replaces solid genetics, good nutrition, or profitable management. A TikTok account won’t fix your production costs. But consider what you’re up against.
PETA alone spent $77.6 million in its fiscal year ending July 2024 (PETA financial report). Mercy for Animals reported another $25.1 million in consolidated spending for its FY 2024 (MFA audited financial statements, year ending December 31, 2024). That’s $102.7 million from just two organizations — before counting Humane World for Animals (formerly the Humane Society of the United States, rebranded February 2025), which dwarfs both. When you look at who really owns your milk check, the money flowing against dairy’s public image is part of the same picture.
You’re not going to outspend them. You can out-trust them — but only if the trust is already built before the camera shows up. Fair Oaks showed how fast a curated public image can collapse when the reality behind it doesn’t match. Ranallo, Pemberton, and Payne are showing the raw, unfiltered version holds up to scrutiny.
Herd Size
Daily Production per Cow (lbs)
Milk Price ($/cwt)
Daily Revenue Loss
30-Day Total Loss
300 cows
75
$18
$4,050
$121,500
300 cows
75
$21
$4,725
$141,750
500 cows
75
$18
$6,750
$202,500
500 cows
75
$21
$7,875
$236,250
Think of it this way: if your 300-cow operation lost a processor contract for even 30 days over a consumer-trust crisis — at even $18/cwt on 75 lbs/day, and that’s conservative; USDA’s 2025 all-milk price ran around $21 (USDA WASDE, 2025) — that’s roughly $121,500 in milk revenue with nowhere to go. At $21/cwt, the hit climbs past $141,000. The cost of one phone and 20 minutes a week looks different against those numbers.
Creator / Operation
Platform(s)
Total Reach / Followers
Herd Size / Scale
Core Content Approach
Nate the Hoof Guy (Nathan Ranallo)
YouTube, TikTok, Facebook
880M+ YouTube views, 1.7M subscribers
Hoof-trimming service
Unedited hoof-care procedures with methodical explanations
Large operations supplying consumer-facing brands or in high-scrutiny regions
Turn scale into asset via third-party verification + raw content + public access
Don’t quit—this is crisis insurance, not an experiment
Path 1: The 30-day test — just start. Film three short videos (60–90 seconds) of daily operations. Phone only. No editing, no script. Post on whichever platform your local consumers use most. Ranallo went from a flip phone to 880 million YouTube views — his early videos were rough, and that didn’t matter.
Kielstra’s advice: “Just pick up your phone and start taking pictures and videos of what you do around the farm” (Sweet Peas Evening Ag News, March 2020). Your goal in the first month isn’t to build an audience — it’s to discover what about your operation people find interesting. It’s rarely what you’d guess. Cost: 20 minutes per video. Time to first post: this week.
Path 2: Build a weekly rhythm — the 90-day commitment. Pick one platform and post consistently once or twice a week. Engage with every comment — Kielstra has said the early comments on each upload make the effort feel worthwhile. Find your farm’s “oddly satisfying” moment: the one thing a non-farmer would watch twice.
This path takes 2–4 hours per week. The trade-off is real time diverted from operations. The payoff is a growing audience that trusts you before any controversy hits. If you’re getting zero engagement after 90 days, switch platforms before quitting.
Path 3: Stack the receipts—the 365-day strategy. If you’re a larger operation, pair third-party audits (DairyCARE, B Corp, FARM Program) with a consistent digital presence. MVP Dairy’s model — a B Corp score well above the 80-point threshold, plus daily human-scale content, plus a physical learning center — is the strongest shield available when consumer perception is a direct business risk.
If you sell fluid milk or supply a processor with a public brand, this is you. The investment is significant, but it turns your size into an asset rather than a liability. Pair it with unpolished digital content and independent verification, or you’re building a facade instead of a foundation.
One caution across all three paths: don’t build your entire presence on a single platform. TikTok faced a U.S. divestiture mandate for most of 2025 before a joint venture deal closed on January 22, 2026 (Axios, January 2026) — Pemberton’s strength is YouTube, a long-form, searchable platform that doesn’t depend on any one app’s survival. Whichever path you’re on, the broader forces reshaping dairy operations aren’t slowing down. It’s worth understanding what consolidation means for your operation’s next move.
Key Takeaways
If you supply a processor with a consumer-facing brand, your operation’s public visibility isn’t optional — it’s part of the trust chain. Ask your fieldman or co-op what their transparency expectations look like this month.
If your region has faced activist campaigns or ballot initiatives, an established digital presence is cheaper insurance than crisis PR after the fact. One New York dairy’s years of NYSCHAP participation killed a PETA-driven AP story before it ran (Bovine Veterinarian, May/June 2016). Start with Path 1 this week — three videos, twenty minutes each.
If you’re running a large operation with no authentic public face, study MVP Dairy’s model — then study what happened to Fair Oaks when curated transparency met undercover footage. The combination that holds is third-party audit, plus raw content, plus a willingness to let people see the real barn.
If isolation is a factor on your operation — and on a dairy, it almost always is — content creation can serve double duty. Andy’s experience isn’t unusual. The digital connection matters even when the audience is small.
The Bottom Line
A herd manager in Ikamatua has 325,000 followers who know her cows by name. A hoof trimmer in Wisconsin — a guy who told Wisconsin Public Radio he’d never edited a single piece of footage in his life — built an audience of 880 million views. So who’s telling your story right now?
Complete references and supporting documentation are available upon request by contacting the editorial team at editor@thebullvine.com.
Learn More
Zero Mastitis Tubes Since March: The Real Cost of Lameness – Delivers a brutal reality check on your bottom line. You’ll gain a high-precision method for calculating the hidden drain of lameness, transforming invisible losses into a targeted, actionable strategy for immediate profit recovery.
The American Dairy Heist: Who Really Owns Your Milk Check? – Exposes the financial machinery syphoning your margins. This analysis arms you with the hard data on processor consolidation and global shifts, revealing exactly how to position your equity for the next five years of volatility.
Social License: Why it is the biggest threat to the dairy industry – Reveals why “doing a good job” isn’t enough anymore. This deep dive breaks down how the industry’s boldest mavericks are weaponizing transparency to secure their social license and dominate the high-value consumer market.
The Sunday Read Dairy Professionals Don’t Skip.
Every week, thousands of producers, breeders, and industry insiders open Bullvine Weekly for genetics insights, market shifts, and profit strategies they won’t find anywhere else. One email. Five minutes. Smarter decisions all week.
While Canada and the U.S. fight for men’s hockey gold, 1,434 dairy herds are gone, and quotas are at $24,000/kg. Where does your balance sheet land in this faceoff?
The U.S. lost 1,434 licensed dairy herds in 2024 — a 5% annual decline that dragged the national total to 24,811 operations, with Wisconsin alone shedding 400. At this rate, the country falls below 10,000 dairy farms before 2044. Across the border, Dairy Farmers of Ontario cancelled its February 2026 quota exchange entirely: 1,915 buyers lined up, 12 sellers offered quota, but the system couldn’t clear a single allotment round at the CA$24,000-per-kilogram butterfat cap.
Year
5% Decline Scenario
7.5% Decline Scenario
2024
24,811
24,811
2027
21,000
19,800
2030
18,400
15,800
2035
13,200
9,200
2040
9,500
5,300
2044
7,800
3,100
Tomorrow morning, Canada and the U.S. face off for Olympic hockey gold at Milano Santagiulia — 8:10 a.m. ET on NBC. That game lasts sixty minutes. The dairy version of this rivalry has no final buzzer, and the July 1, 2026,USMCA sunset review could rewrite both rule books.
Five months from the most significant dairy trade reset in a generation, neither system is as healthy as its politicians claim. If you haven’t stress-tested your balance sheet against a 15% equity hit, you’re not being an optimist. You’re a spectator.
Two Rule Books, Same Rink
You know the basics, so we’ll keep this tight. Canada runs supply management: production quotas, cost-of-production pricing through the CDC, and import tariffs of 200% to 315%. Your milk cheque is predictable. Your growth is capped.
The U.S. runs an open market with federal safety nets. Dairy Margin Coverage catches you — partially — when margins collapse. But volume is uncapped. That’s freedom. Until DMC margins crash from $15.57/cwt in September 2024 to $10.04/cwt by November 2025. That’s how fast the floor moves.
Two operations will carry this story.
In Quebec, call him Jean-Pierre. Seventy-five cows, a modern robot, and CA$4 million in debt — most of it for the quota he bought to bring his son into the business. His milk cheque is high, but the bank takes most of it. One policy change could blow up his balance sheet, because his CA$3 million in quota value isn’t backed by concrete or genetics. A political promise backs it.
In Wisconsin, call him Mark. Twelve hundred cows. An efficiency machine who just lost a processor contract because the plant switched to “dedicated suppliers” from even larger farms. He’s selling milk on the spot market at a loss, hoping DMC payments and a friendly lender bridge the gap. He has freedom — including the freedom to go broke while working 14-hour days.
Jean-Pierre fears the politician. Mark fears the market. Both fear the bank.
Metric
Jean-Pierre (Quebec)
Mark (Wisconsin)
Herd Size
75 cows (robot)
1,200 cows
Total Debt
CA$4.0M (75% for quota)
$2.8M (land, equipment, cattle)
Quota Asset Value
CA$3.0M @ CA$24,000/kg
N/A
Milk Price Stability
High (cost-of-production formula)
Volatile ($16.50–$24/cwt swings)
Growth Constraint
Capped by quota availability
Uncapped (if capital/market allow)
Primary Risk
USMCA concessions erode quota value
Processor consolidation + spot market collapse
Breaking Point
15% quota drop → 60%+ debt-to-equity → bank review
USDA NASS data confirms 24,811 licensed U.S. dairy herds at the end of 2024, down 1,434 (about 5%) from the prior year. Eighty-six percent of those losses hit the Midwest and East — Wisconsin dropped 400 herds, Minnesota and New York combined for another 315, and Pennsylvania lost 90. Rabobank’s North American dairy outlook projected roughly 2,800 U.S. dairy closures for 2025 — a 7–9% annual exit rate through 2027. For context, Agriculture Secretary Brooke Rollins was talking about a “golden age” for dairy that same week.
The cows aren’t disappearing. They’re consolidating. The February 20, 2026, USDA Milk Production report shows the U.S. averaged 9.50 million head in 2025, up 153,000 from 2024, with average herd size nationally at 377 cows. More milk from fewer farms. The engine doesn’t have a brake pedal.
Canada’s exit rate runs slower. Agriculture and Agri-Food Canada’s Dairy Sector Profile puts the count at 12,007 farms in 2014 and 9,256 in 2024 — an average annual decline of approximately 2.6%. National average herd size has climbed to 150 cows. But Dalhousie University food economist Sylvain Charlebois co-authored a 2020 report with the University of Guelph’s Simon Somogyi warning that Canada could lose half its dairy farms by 2030 without fundamental supply management reform — a warning he reiterated in May 2025. The DFO exchange cancellation tells the same story from inside the system: when 1,915 producers want to buy quota, and 12 want to sell, the system isn’t just “protective.” It’s a capital trap with a waiting list
What Does a 15% Quota Drop Mean for Your Balance Sheet?
Here’s where the numbers get personal. Grab a pencil.
The Canadian stress test. Take Jean-Pierre’s 100-cow equivalent Ontario operation. At DFO’s CA$24,000/kg butterfat cap and approximately 1.25 kg BF daily allocation per cow, his quota represents roughly CA$3 million in asset value. That quota is collateral for the operating line, the land, the robot, and his parents’ retirement.
Model a USMCA concession that triggers a 15% decline in quota values:
Quota asset value drops: CA$3.0M → CA$2.55M (CA$450,000 paper loss)
Total farm assets: CA$5.0M → CA$4.55M
Total debt: CA$2.75M (unchanged)
Equity drops: CA$2.25M → CA$1.80M
Debt-to-equity ratio jumps: 55% → 60.4%
That crosses Farm Credit Canada’s comfort threshold for operating renewals
Nobody can assign a probability to this scenario. But if Jean-Pierre hasn’t run it, his lender already has. There’s no futures market for Canadian quota — the succession math just broke, and you can’t hedge against it.
The American stress test. Take Mark’s 300-cow equivalent herd. USDA puts Wisconsin’s average at roughly 25,493 lbs/cow annually — call it 2,125 lbs/cow per month, or 21.25 cwt. The University of Wisconsin–Madison Extension’s July 2025 dairy enterprise budget puts the cost of production in the range of $18.68 to $21.50/cwt. Midpoint: ~$20/cwt. Now stress at $16.50 milk:
DMC Tier I at 5M lbs covers ~4,167 cwt/month — 65% of Mark’s output
Remaining 2,208 cwt fully exposed: $7,728/month uncovered loss
Six months at the full rate burns $133,875 in equity
Month
Monthly Cash Drain
Cumulative Equity Loss
1
$22,313
$22,313
2
$22,313
$44,626
3
$22,313
$66,939
4
$22,313
$89,252
5
$22,313
$111,565
6
$22,313
$133,878
Mark’s lender is already running these numbers. If his DSCR falls below 1.0, the conversation shifts from “renewal” to “exit planning.”
Your turn: [your herd size] × [your cwt/cow/month] × [gap between your breakeven and stress price] = monthly cash exposure. If six months of it exceeds your liquid reserves, you’ve got a decision to make before the market makes it for you.
What Does USMCA 2026 Mean for Your Milk Cheque?
When Idaho dairyman Ted Vander Schaaf told the U.S. Senate Finance Committee on February 12 that the USMCA’s foundation depends on Canada following through on its dairy commitments, Jean-Pierre wasn’t watching C-SPAN. He was doing morning chores. But the testimony was about his CA$3 million.
Here’s what the trade data shows. U.S. dairy exports to Canada topped $1.2 billion through the first 11 months of 2025 — up 11% from 2024 and 64% higher than 2020. America is already selling plenty of dairy into Canada, despite the rhetoric. The central U.S. complaint: Canada allocates 85–100% of its tariff-rate quotas to Canadian processors—the companies with the least incentive to import American competition. Average TRQ fill rates: just 42% across key categories.
Congressional pressure is bipartisan and escalating. In December 2025, Rep. Jim Costa led 74 members of Congress in pushing USTR to hold Canada accountable. On February 5, USDEC and NMPF co-launched the Agricultural Coalition for USMCA.
Every percentage point of additional access erodes the structural guarantee that makes Jean-Pierre’s quota valuable. DFC president Pierre Lampron called the original USMCA signing “a dark day in the history of dairy farming in Canada” on November 30, 2018. Since then, Ottawa has committed CA$2.95 billion in direct compensation to dairy producers — CA$1.75 billion for concessions under CETA and CPTPP (disbursed between 2019–20 and 2022–23) and CA$1.2 billion for CUSMA (being disbursed from 2023–24 through 2028–29), according to Agriculture and Agri-Food Canada’s Dairy Direct Payment Program. That works out to roughly CA$320,000 per farm spread over a decade. It was an admission that concessions cause real financial damage. The question for 2026 isn’t whether more damage is coming. It’s how much, and whether the next round covers the gap between what Jean-Pierre’s quota was worth on June 30 and what it’s worth on July 2.
For Jean‑Pierre, a “successful” U.S. panel win looks like Ottawa trading away 3–4% more of his home market so Mark can ship more powder north — and his banker quietly repricing that CA$3 million quota.
For Mark, more Canadian access is a bonus, not a lifeline. Even if U.S. negotiators win everything they want, 3.6% of the Canadian market is a small number against 225.9 billion pounds of domestic production. Don’t build a business plan around it.
The Invisible Cost Neither System Budgets For
Dr. Andria Jones-Bitton’s survey of 1,132 Canadian farmers, conducted in 2015–16 and published in Social Psychiatry and Psychiatric Epidemiology in 2020, found 45% reported high stress, 57% met criteria for anxiety classification, and 35% for depression — all far above the general population. Her pandemic follow-up found every metric worsened. Jean-Pierre’s stress is capital-weighted — a multi-million-dollar asset controlled by politicians he can’t lobby. Mark’s is market-weighted — chronic price swings and the knowledge that 1,434 operations vanished last year. Neither system budgets for this, but both pay for it — in burnout, in broken families, in farms that go dark.
If you’re struggling: Farm Aid 1-800-FARM-AID | 988 Suicide & Crisis Lifeline | Do More Ag Foundation (Canada)
Canada vs USA Dairy Farming: Which System Wins?
If Jean-Pierre and Mark sat down with this table, here’s what each would circle first:
No quota to buy. But you’re entering a market, losing 5–9% of participants per year
Succession
Canada
98% of Canadian dairy farms are family-owned and operated, per DFC’s 2025 pre-budget submission. But 88% lack a formal written succession plan, and only about 16.5% of family farms make it to a third generation
Trade Policy Risk
U.S.(lower)
Mark’s operation isn’t collateralized on a political construct.
Mid-Size Survival
Neither
Canada caps you. The U.S. crushes you. Both bleed the middle.
The Canadian system is arguably superior for preserving a mid-sized family farm that already exists. It creates a stable, middle-class existence for 9,256 families. The U.S. system is superior for the entrepreneur who can stomach the casino.
But you can’t lose 5% of your farms every year and call it “healthy”. And you can’t charge CA$24,000 per kilogram for the right to milk a cow and call it “accessible”. Both systems are aging out — just at different speeds and for different reasons.
What This Means for Your Operation
If you milk in Canada (Jean-Pierre’s playbook):
30 days: Run three balance-sheet scenarios through FCC’s calculator — current quota value, minus 10%, minus 20%. If the minus-20% scenario pushes your debt-to-equity above 0.60, you need a contingency plan before Ottawa sits down at the table.
90 days: If the quota represents more than 50% of your total asset base, you’re overexposed to a single political construct. Start shifting equity toward land, equipment, or off-farm investments. The trade-off is real: diversification capital competes with quota debt service. But the concentration risk is worse.
365 days: Get involved in producer organizations ahead of the USMCA talks. Don’t let the November 2023 panel victory create complacency. The sunset clause is a reset button, not a renewal.
If you milk in the U.S. (Mark’s playbook):
30 days: Enroll in DMC by February 26. The production history reset and higher Tier I cap change the math for every herd under 350 cows. The trade-off: Tier II coverage gets expensive for larger herds, and the 5M-lb Tier I cap still leaves Mark’s remaining output exposed. Model it anyway.
90 days: If your all-in cost of production exceeds $20/cwt and your DSCR sits below 1.15, you’re one 90-day price dip from an exit conversation. Run the number now. Review processor contract renewal terms — if yours expires before December, negotiate before July 1, as leverage dynamics change.
Watch the ITC report on Canadian dairy protein — expected March 2026, four months before the USMCA decision. It sets the tone.
Talk to your lender. Now. Not when you’re in trouble. The farmer who walks in with a stress test gets a different conversation than the one who gets called in.
Timeframe
If You Milk in Canada 🇨🇦
If You Milk in USA 🇺🇸
Both Systems
30 Days
Run 3 balance-sheet scenarios (current, −10%, −20% quota value). If −20% pushes debt-to-equity >60%, you need a plan now
Enroll in DMC by Feb 26. Model Tier I production history reset vs cost
Stress-test your actual breakeven. Stop guessing.
90 Days
If quota = >50% of total assets, you’re overexposed to a political construct. Start shifting equity to land/equipment/off-farm
If cost of production >$20/cwt and DSCR <1.15, you’re one 90-day price dip from exit
Talk to your lender NOW—before you’re in trouble
90 Days
Get involved in producer orgs before USMCA talks. Panel victory ≠ complacency
Review processor contract terms if yours expires before Dec. Negotiate before July 1
Watch the March ITC report on Canadian dairy protein—it sets the tone
365 Days
Diversification capital competes with quota debt service, but concentration risk is worse
Treat Canadian access as bonus, not business plan. Invest in efficiency, quality, genetics
Neither government has your back. Plan accordingly.
365 Days
Don’t let July 1 sunset clause sneak up on you—USMCA is a reset button, not auto-renewal
Processors are chasing component premiums—breed for what they’ll pay for, not what they paid for
The rules change July 1. Your balance sheet needs to work on July 2.
Key Takeaways
If you’re in Canada, a 10–15% quota value hit in the 2026 USMCA review can push your debt‑to‑equity from the mid‑50s into the 60s fast — run those scenarios now.
If you’re in the U.S., six months of $16.50 milk on a $20/cwt breakeven can burn well over $100,000 in equity on a 300‑cow herd, even with DMC — your DSCR needs to be safely above 1.15.
When the quota is more than 50% of your total assets, or your lender already flags leverage, you’re overexposed to forces you don’t control on either side of the border.
Treat extra Canadian market access as found money, not a business plan, and treat current quota values as political, not permanent — both systems reward those who stress‑test and adjust early.
The men’s hockey gold medal game ends Sunday; the real Canada–USA faceoff is whether your balance sheet still works on July 2 if the rules or the milk price move against you.
The Real Gold Medal
The jerseys come off tomorrow. The medals get boxed. The hashtags fade.
But Jean-Pierre will still walk into his Quebec barn at 4:30 a.m. on Monday, servicing CA$4 million in debt on a political promise that expires in 131 days. And Mark will still be milking 1,200 cows in Wisconsin on the spot market, watching his equity burn at $22,313 a month while waiting for a rally that may not come before his lender’s patience runs out.
Both are betting entire family histories on systems that haven’t been tuned since the last time the border was this tense. The real win isn’t a gold medal. It’s making sure there are still farm families on both sides with enough skin in the game when the next generation drops the puck.
Start with your own balance sheet. What’s your actual debt-to-equity ratio today — and what does it look like on July 2 if quota drops 15% or milk hits $16.50 for six months?
Executive Summary:
The U.S. lost 1,434 dairy herds in 2024, while Ontario’s February 2026 quota exchange was cancelled after 1,915 buyers chased quota from just 12 sellers at CA$24,000/kg. This article uses the men’s hockey gold medal game as the backdrop to show the real Canada–USA faceoff: quota‑backed stability with capital risk versus open‑market upside with a 5–9% annual farm exit rate. For Canadian producers, it shows how a 10–15% quota value hit in the 2026 USMCA review could push debt‑to‑equity ratios past lender comfort levels. For U.S. herds, it shows what six months of $16.50 milk does to a 300‑cow balance sheet, even with DMC, and why more access to Canada is a bonus, not a business plan. You get step‑by‑step barn math to plug in your own herd size, breakeven, and equity, plus a 30/90/365‑day checklist for both systems. If you’re milking on either side of the border, this is your game tape before July 1 — because when the gold medals are boxed away, your balance sheet is still on the ice.
Complete references and supporting documentation are available upon request by contacting the editorial team at editor@thebullvine.com.
Learn More
Profitable but Drowning: The Interest Rate Crisis Reshaping Mid-Size Dairy – Arms you with a line-by-line breakdown of how 2025 loan repricing impacts your bottom line. It exposes the $1.30/cwt hidden cost of debt and delivers a 90-day survival checklist to keep your lender from calling the loan.
The Next Frontier: What’s Really Coming for Dairy Cattle Breeding (2025-2030) – Explores how CRISPR and AI are projected to deliver up to $5,000 in extra annual revenue per cow by 2030. It reveals a roadmap to transition from commodity volume to high-value “designer milk” components that outpace traditional markets.
The Sunday Read Dairy Professionals Don’t Skip.
Every week, thousands of producers, breeders, and industry insiders open Bullvine Weekly for genetics insights, market shifts, and profit strategies they won’t find anywhere else. One email. Five minutes. Smarter decisions all week.
One kilogram of preweaning gain. 1,113 kilograms more milk. The real question is what your calf starter is doing with that opportunity.
Here’s a number that stopped me cold when I first came across it: 1,113 kilograms of additional milk in first lactation for every single kilogram of preweaning average daily gain. And no, that’s not a typo. It comes from Cornell University work led by Fernando Soberon and Dr. Mike Van Amburgh, published in the Journal of Dairy Science back in 2012—and you know what? It’s held up remarkably well as more data have come in over the years.
I recently spoke with a Wisconsin producer who’d seen this research presented at a nutrition conference. His reaction was similar to mine: “I’ve been buying dairy calf starter feed the same way for twenty years. Maybe it’s time to ask some different questions.”
For most of my time covering this industry, dairy calf starter occupied that comfortable category of “necessary but unremarkable.” You bought it primarily for price, made sure it met the tag minimums, and moved on to the next item on your list. That thinking is starting to shift on a meaningful number of operations, and the reasons why are worth exploring.
A meta-analysis published this year in the Journal of Dairy Science combined 18 studies and confirmed what the Cornell team found over a decade ago—calves that grow faster before weaning consistently produce more milk in their first lactation. The exact response varies somewhat by study and herd, but the positive relationship appears again and again.
But here’s the question that’s really driving the current conversation: If early nutrition matters this much, does the consistency of that nutrition matter too?
Why Your Rumen Bugs Care About Consistency
Let me walk through the science here, because it’s genuinely fascinating once you dig into it—and it has real practical implications for how we think about calf feeding programs.
We’ve known for decades that the calf’s rumen microbiome undergoes rapid colonization during those first weeks of life. What’s newer, and what’s really caught my attention, is our understanding of just how diet-dependent that colonization process is.
The microbial foundation you establish in those hutches appears to influence how well these animals perform in the years ahead.
Think about what that means for your operation. The bugs establishing themselves in your calves’ rumens right now are being shaped by what those calves eat—and that foundation may well stick around through first calving and beyond.
It’s a bit like laying concrete: what you do in those early days sets up the structure for everything that follows.
Dr. Mike Van Amburgh over at Cornell—he’s a Professor of Animal Science there and leads the development of the Cornell Net Carbohydrate and Protein System (which, as many of you probably know, is used to formulate diets for roughly 70 percent of dairy cows in North America)—has been studying this connection for over two decades. Cornell’s calf nutrition program emphasizes a straightforward goal: double birth weight by weaning through adequate and consistent milk replacer and starter intake.
Why is this significant? The long-term numbers tell the story.
Industry technical summaries based on the Cornell data show just how much this matters over a cow’s productive life. In one commercial herd tracked by researchers, cows that made it to three lactations produced about 1,287 kilograms more milk across those lactations for every extra kilogram of preweaning gain. The Cornell research herd showed even larger responses.
Lactation
If Benefit Stopped After L1
Commercial Herd Actual
Research Herd (High Response)
L1
1,113
1,113
1,113
L2
1,113
1,200
1,350
L3
1,113
1,287
1,500
The early nutrition effect doesn’t just show up once and disappear—it builds on itself over time.
It’s worth noting that genetics also play a role here. Operations heavily focused on genomic selection for feed efficiency are seeing these early nutrition effects interact with genetic potential—calves with strong genetic merit for production seem to respond particularly well to optimized early nutrition. Nutrition and genetics work together rather than independently.
So what happens when feed formulations shift on your calves? The rumen microbiota need time to adapt to new feed ingredients. Research on rumen microbial dynamics, including work by Schären and colleagues published in Frontiers in Microbiology, shows that meaningful adaptation can take anywhere from a day or two to three weeks or more when diets change substantially.
During those adaptation periods, feed efficiency typically drops, and the risk of digestive upset increases. And when formulation changes occur frequently—as can happen with feeds optimized first for ingredient prices rather than consistency—the rumen may never fully stabilize.
That’s the biological argument. But biology, as we all know, is only part of the decision.
What the Treatment Data Actually Show
The USDA’s National Animal Health Monitoring System (NAHMS) provides solid benchmarks here. Their Dairy 2014 study collected data from 104 operations across 13 states, which is about as representative as you’re going to find for this kind of work.
Here’s what they found: about 33.8 percent of preweaned heifers experienced at least one bout of illness, with digestive problems accounting for just over half of those cases—50.9 percent to be exact. Mortality stood at 5.0 percent overall.
Now, context matters here. These numbers actually represent real improvement from earlier surveys. NAHMS reported mortality rates of 8.4 percent back in 1992 and 7.8 percent in 2007. So the industry has improved significantly in keeping calves alive and healthy over the past few decades. That’s encouraging, and it reflects genuine progress in housing, colostrum management, and overall calf care protocols.
But the current numbers also suggest room for continued progress. The NAHMS study compared those results to Dairy Calf and Heifer Association (DCHA) targets at the time—25 percent morbidity and 5 percent mortality. It’s worth noting that the current DCHA Gold Standards are actually more stringent: scours incidence below 10 percent preweaning, pneumonia below 15 percent preweaning, and survival rates of at least 97 percent from 24 hours through 60 days of age. High-performing operations across the country are hitting these numbers. Some are doing even better.
Health Metric
USDA NAHMS National Avg (2014)
DCHA Gold Standard Target
High-Performing Operations
Est. Cost Gap ($/calf)
Preweaning Scours Rate
17.2% ⚠️
<10%
6–8%
$8–12
Preweaning Pneumonia Rate
16.2% ⚠️
<15%
8–10%
$15–20
Preweaning Mortality
5.0% ⚠️
<3% (≥97% survival)
2–2.5%
$45–60
Overall Morbidity
33.8% ⚠️
<25%
15–18%
$25–35
I spoke with a calf manager at a large California operation last spring who’d brought her scours rate down to around 6 percent—well under that DCHA target. When I asked what changed, she walked me through several factors, but consistent nutrition was near the top of her list. “We stopped chasing the cheapest option every delivery,” she told me. “Once we did that, we could actually see what else was going on.”
What I found particularly telling was her approach to tracking the change. She started measuring weaning weight coefficient of variation alongside her treatment records—something she hadn’t done systematically before. Within about four months, her CV had dropped from around 14 percent to just under 9 percent. “That’s when I knew the consistency piece was real,” she said. “The calves weren’t just healthier on average—they were more uniform. And uniform is easier to manage.”
That observation—about finally being able to see the other variables—comes up repeatedly in conversations with producers who’ve improved their numbers. Eliminating feed variability actually allowed them to troubleshoot the other factors. When feed was no longer confounding their analysis, they could isolate issues with housing, or ventilation, or colostrum protocols.
I should be honest with you here, though: controlled comparisons in the published literature remain limited. The evidence connecting feed consistency specifically to improved outcomes is suggestive rather than definitive at this point. Much of what we know comes from producer experience and biological reasoning. That’s valuable information, but it’s different from randomized trial data.
Quick Reference: Key Benchmarks
1,113 kg additional first-lactation milk per 1 kg preweaning ADG (Soberon & Van Amburgh, Journal of Dairy Science, 2012)
~1,287 kg additional milk across three lactations per 1 kg preweaning ADG in one tracked commercial herd (Cornell research technical summaries)
33.8% average preweaned heifer morbidity (USDA NAHMS Dairy 2014)
Days to 3+ weeks, typical rumen microbiome adaptation period to diet changes (Schären et al., Frontiers in Microbiology, 2017)
Sponsored Post
The Economics: Running Your Own Numbers
The financial case for feed consistency depends heavily on individual operation parameters, which is why I get a little skeptical when I see generic ROI claims floating around. Your math isn’t my math, nor is it your neighbor’s math.
But the framework for calculating it is straightforward, and the research coefficients are reasonably solid at this point.
What the research tells us: the 2025 meta-analysis confirms that for meaningful increases in preweaning ADG, you’re looking at real gains in first-lactation milk yield—the positive relationship holds across diverse management systems and keeps showing up study after study. And as the Cornell data show, those effects appear to persist across multiple lactations, not just the first one.
The NAHMS data suggest that reducing morbidity from the 33.8 percent average toward those tighter DCHA Gold Standard targets would reduce treatment costs in ways that add up. When you factor in drugs, labor, and lost performance, the total cost of a treated calf can run into the tens of dollars per case—sometimes considerably more depending on your vet costs and how much growth gets set back. Across a calf crop, which accumulates quickly.
The Basic Math: A 400-Calf Operation
Factor
Estimate
Annual starter usage
~60 tons
Premium for fixed-formulation
$20–40/ton
Additional annual feed cost
$1,200–$2,400
Potential return per calf
Plausible weaning weight improvement
+5 kg average
First-lactation milk gain (using Cornell relationship as a guide)
typically on the order of ~100–200 kg/head, depending on how much of that 5 kg reflects true ADG improvement and your current baseline
Multi-lactation compounding effect
Additional gains in L2, L3 are likely when those early gains carry through
Reduced treatment costs
Variable by operation
The question isn’t whether the research is real—it is. The question is whether your specific operation’s baseline makes the investment worthwhile.
What this means for your operation depends explicitly on your current baseline. If you’re already achieving tight weaning weight distributions and low morbidity, the marginal benefit from changing feeds may be modest. If you’re seeing high variability and treatment rates above industry benchmarks, the potential benefits of a stronger nutrition and management program are considerably larger.
On the cost side: from conversations with nutritionists and producers across several regions, many report that fixed-formulation dairy calf starters often cost somewhere in the ballpark of $20–40 per ton more than strictly least-cost options. Some regions see higher premiums where supplier choices are limited. Because prices vary so much by company and freight, you’ll want to confirm this with your own quotes.
Run your own calculation. Pull your weaning weight data from the last three cohorts. Calculate your coefficient of variation—that’s your standard deviation divided by your mean, expressed as a percentage—as a measure of how much variability you’re seeing. Look at your treatment records. The math will tell you whether the potential upside justifies the definite cost increase—and that answer genuinely varies by operation.
Knowing When to Prioritize Other Investments First
I’d be doing you a disservice if I presented this as a simple “switch feeds immediately” recommendation. Every operation has competing priorities, and feed consistency is one variable among many affecting calf performance.
On some farms, the bigger wins might come first from tightening up colostrum delivery, improving housing and ventilation, or addressing transition-cow bottlenecks before focusing on feed formulation details for calves. On others, especially where calf programs are already fairly sound, but weaning weights and health records still look noisy, dialing in nutrition consistency can be the logical next move.
One nutritionist I spoke with—who asked me not to use his name because he consults for suppliers using different formulation approaches—put it this way: “The right feeding strategy depends on the operation’s specific goals, constraints, and current performance baseline. What works exceptionally well for one farm might not be the highest-priority investment for another.”
That strikes me as exactly right. The consistency question isn’t about whether variable-formulation feeds meet regulatory requirements—they do. It’s about whether feed consistency represents the best next investment for your operation, given where you are today and where you want to go.
Evaluating Supplier Approaches
If you decide feed consistency is worth investigating for your operation, how do you actually figure out whether a supplier delivers it? I’ve found that a few direct questions reveal a lot—and most suppliers will give you straight answers if you ask clearly.
Questions that tend to cut through the marketing:
“Can you provide batch records showing our specific product’s formulation over the past year?” A supplier with consistency systems will generally have this readily available—it’s just how they operate. A supplier using a more flexible formulation will show ingredient variation that tracks commodity prices. Neither response is inherently wrong. What matters is that it tells you what you’re actually buying.
“What percentage of your ingredient sourcing uses fixed-supplier relationships versus spot-market commodity purchasing?” This gets at their underlying business model. There’s no single “right” answer—but you should know what you’re getting.
“Do you conduct incoming ingredient testing beyond supplier certifications?” Operations with NIR spectroscopy or proximate analysis on incoming loads can verify what they’re receiving. Those relying solely on supplier certificates are trusting their ingredient sources. Reputable companies in the marketplace use both approaches.
Operations prioritizing low upfront cost, high risk tolerance
Depends on baseline performance and goals
What the responses typically reveal:
Detailed documentation with specific dates and formulations → you’re likely dealing with a consistency-focused supplier
General assurances about quality control without specific records → approach is unclear, and it’s worth following up
Acknowledgment that formulations adjust based on ingredient prices → that’s a more flexible formulation model, and there’s nothing inherently problematic about that if it fits your goals
The key is understanding which model you’re buying and whether it aligns with what you’re trying to accomplish.
The Transition Timeline: Setting Realistic Expectations
Operations that switch to a more consistent, fixed-formulation feeding program typically experience a transition period before realizing the anticipated benefits. Based on producer conversations and the biological literature on rumen adaptation, here’s roughly what to expect:
Weeks 1–3: Initial adjustment. Some producers report slight changes in fecal consistency as the rumen microbiome adapts to the new substrate—even though that substrate will now remain consistent. This is the period of highest uncertainty, and it’s easy to second-guess your decision. Stick with it unless you’re seeing serious problems.
Weeks 3–6: Early signals start to emerge. Starter intake patterns should smooth out. Fecal scores stabilize. Treatment incidence may begin declining in new calves entering the program—though calves already through the highest-risk period won’t show dramatic changes.
Weeks 6–8, around weaning: First measurable outcomes appear. Weaning weight distribution should tighten—look for your standard deviation narrowing—and cohort uniformity generally improves. This is when you can start to see whether the change is actually delivering for you.
Months 3–6: The pattern becomes clear. By this point, enough cohorts have moved through the system to distinguish signal from noise. If consistency delivers value on your operation, you should see it by now.
Phase
Duration
Key Milestones
Weeks 1-3: Initial Adjustment
Week 0-3
Rumen microbiome adapting; possible fecal consistency changes; highest uncertainty
Weeks 3-6: Early Signals
Week 3-6
Starter intake patterns smooth out; fecal scores stabilize; treatment incidence begins declining in new calves
Weeks 6-8: First Outcomes
Week 6-8
Weaning weight standard deviation narrows; cohort uniformity improves; first measurable confirmation
Months 3-6: Pattern Clear
Week 12-24
Multiple cohorts processed; signal distinguished from noise; definitive performance data available
The timeline matters for setting expectations. Feed changes don’t produce overnight results. Operations that switch, see some initial variability during the adaptation window, and immediately switch back may never realize any potential benefit. Give it time to work—or not work—before drawing conclusions.
A Practical Assessment Framework
For producers considering whether feed consistency deserves attention alongside other calf management priorities—colostrum protocols, housing ventilation, transition feeding, fresh cow management—here’s a straightforward framework:
Step 1: Benchmark your current performance
Calculate the weaning weight coefficient of variation for your last three cohorts. If you’re already below 10 percent, you’re doing well.
Document treatment incidence rates against the NAHMS benchmarks and DCHA Gold Standards.
Note any patterns in timing—do problems tend to cluster after feed deliveries or lot changes?
Step 2: Understand your current supplier’s model
Ask the questions outlined above.
Request documentation if they claim consistency.
Pay attention to whether the answers satisfy you or leave you with more questions.
Step 3: Calculate your specific economics
Use your operation’s numbers, not industry averages.
Include both direct costs (treatment, mortality) and opportunity costs (production potential).
Factor in realistic switching costs and the transition period.
Step 4: Prioritize against other investments
How does this compare to other calf program improvements you could make?
Where’s your biggest current gap—nutrition, housing, health protocols, colostrum management?
Would the money deliver better returns somewhere else in your operation?
Step 5: Make a data-informed decision
Current performance is strong, and your supplier can demonstrate consistency? You may be well-positioned already.
Unexplained variability in weaning weights or treatment rates? The consistency question is worth investigating.
Economics don’t pencil out clearly? A pilot approach—one cohort on a new feed while maintaining your current program—can give you operation-specific data.
What It All Adds Up To
The research connection is real. Preweaning nutrition has measurable, long-term effects on lifetime milk production. The work from Cornell and the 2025 meta-analysis show consistent associations between early growth and first-lactation performance. This isn’t speculation—it’s well-documented science that keeps getting confirmed.
The consistency question is more nuanced. While the biological case for nutritional consistency is plausible—stable rumen microbiome, reduced adaptation stress, better feed efficiency—the controlled research comparing consistent versus variable formulations remains limited. Much of the evidence comes from producer experience and biological reasoning rather than randomized trials. I think being honest about that is important.
The economics are genuinely operation-specific. A 400-calf operation with high current variability might find substantial opportunity here. A smaller operation with already strong performance might find limited benefit. Run your own numbers rather than relying on anyone else’s projections—mine included.
Supplier models vary legitimately. Different formulation strategies correspond to distinct business approaches with distinct trade-offs. Understanding which model your supplier uses—and whether it aligns with your priorities—matters more than assuming one approach is universally superior.
Context always matters. Feed consistency is one of many variables affecting calf performance. Operations with excellent colostrum programs, well-designed calf housing, and strong health protocols may see less marginal benefit from feed consistency improvements than operations with gaps in those areas. Consider where your biggest opportunities actually lie.
The conversation around feed consistency reflects a broader shift in how progressive operations are thinking about calf-raising these days: as a foundational investment in lifetime productivity rather than a cost center to minimize. Whether that perspective applies to your operation depends on your specific circumstances—but it’s a question worth asking.
Key Takeaways
Early-life growth pays: Cornell work links each extra kilogram of preweaning gain to roughly 1,113 kg more milk in the first lactation, with multi-lactation benefits on top.
Consistent calf starter helps the rumen microbiome settle, reduces stress when calves hit diet changes, and can make weaning weights and health records a lot less “noisy.”
National data (NAHMS, DCHA) show calf health has improved, but many herds still sit above target levels for scours, pneumonia, or death loss—leaving money on the table.
For a 400-calf operation, paying about $20–40/ton more for a fixed-formulation starter means roughly $1,200–$2,400 extra feed cost per year, which can pencil out if it boosts growth and trims treatments.
There’s no one-size-fits-all answer; the article gives a simple checklist and supplier questions so each farm can decide whether calf starter consistency is the right next lever to pull.
Executive Summary:
This article looks at a simple but powerful question: could the consistency of your dairy calf starter be quietly influencing lifetime milk production? Cornell research links each extra kilogram of preweaning gain to about 1,113 kilograms more milk in first lactation, with follow-up work and industry summaries showing those gains can carry into later lactations. It pairs that science with USDA NAHMS data and current DCHA Gold Standards to show where calf health has improved and where there’s still room to tighten things up. From there, the piece walks through how inconsistent formulations can disrupt rumen development and drive avoidable health bumps, while also being upfront that direct, controlled research on feed consistency itself is still limited. A practical “400-calf” example lays out the likely cost premium for more consistent starter versus the potential milk and health returns, then offers a step-by-step framework to run the numbers with your own data. Producers also get concrete questions to ask feed suppliers, a realistic transition timeline if they switch feeds, and guidance on when other investments—such as colostrum, housing, or fresh cow management—might warrant priority. The aim is to give dairy producers a clear, research-grounded context so they can decide whether dialing in calf starter consistency is the right next move for their own operation, not to sell a one-size-fits-all solution.
Complete references and supporting documentation are available upon request by contacting the editorial team at editor@thebullvine.com.
Learn More
17-26x ROI: Why Top Dairies Stopped Saving Calves and Started Preventing Loss – Arms you with a ruthless economic audit of your calf barn. This breakdown reveals how top-tier dairies generate a 26x return by pivoting to aggressive prevention, stopping the scours avalanche before it erodes your herd’s lifetime production potential.
$3,010 Per Heifer. 800,000 Short. Your Beef-on-Dairy Bill Is Due. – Exposes the brutal reality of the 800,000-heifer shortage and skyrocketing replacement costs. It delivers the decision framework you need to navigate the next 24 months, ensuring your breeding sheet keeps you a preferred partner for processors.
Every week, thousands of producers, breeders, and industry insiders open Bullvine Weekly for genetics insights, market shifts, and profit strategies they won’t find anywhere else. One email. Five minutes. Smarter decisions all week.
The catalogs are full of top‑10 sires from the same bloodlines. Dann Brady and ferme Blondin couldn’t find the pedigrees they wanted – so they built the stud they couldn’t buy from.
Dann Brady, co-founder of Blondin Sires, St. Placide, Quebec. When the big AI catalogs couldn’t deliver the cow families he wanted, Brady and his partners started their own stud under code 799.
Dann Brady had a specific problem. The General Manager and Co-Founder of Blondin Sires in St. Placide, Quebec, wanted bulls backed by deep, documented cow families — sires where you could trace maternal longevity and functional type back through generations of real milk records, not just index printouts. He went looking through the major AI catalogs. What he found were rank leaders from the same tight circle of bloodlines everyone else was already using. What he couldn’t find were the pedigrees behind them.
“Over the past few years, the rush of genetics has overshadowed the true art of breeding great cows,” Brady and his partners wrote when they launched Blondin Sires. “We decided it was time to put the emphasis back on great type and deep pedigrees combined with production, health & fertility”. And in an interview, Brady laid it out plainly: “We have a focus on type and pedigree combined with using genomics and the show ring to market and promote our breeding. Breeding for long lasting, high producing, deep pedigreed cows”.
So Brady and his partners — Simon Lalande and the team at ferme Blondin — started their own stud under code 799. It wasn’t a vanity project. Blondin began releasing young sires as early as 11 months of age, months ahead of the industry standard of 15–18 months, built a sales team of 25 across Canada, and grew its share of Canadian sire usage from 2.8% in 2022 to 4.9% in 2023, according to Lactanet market data. That’s a 75% jump in a single year, built without a global distribution network or a corporate parent.
Across Ontario, the Stanton Brothers made a parallel bet from their dairy operation, marketing genetics directly to producers. Their bull Remover PP reclaimed the #1 spot on Canada’s Proven Holstein LPI rankings in August 2025 at +3897 — backed by 234 daughters across 32 herds — the first homozygous polled bull to top a major national index based on daughter performance. No major study had bothered to build a whole program around that niche.
These operations aren’t outliers. They’re businesses growing into structural gaps the biggest genetics companies created—and largely can’t fill.
Dann Brady holds three Premier Sire banners at World Dairy Expo 2025 — Holstein Heifer Show, Ted Krueger Red & White, and Ayrshire Heifer Show. Three breeds, one independent stud, zero corporate backing.
Two Bulls and More Than 99% of the Gene Pool
A number that deserves to land differently than it usually does: more than 99% of North American Holstein AI sires trace their paternal lineage to just two bulls — Pawnee Farm Arlinda Chief and Round Oak Rag Apple Elevation, both born in the 1960s. Penn State geneticist Chad Dechow’s research documented this through Y-chromosome analysis: Chief accounts for roughly 49% and Elevation for 51% of active AI sire lines, with only a fraction of a percent from any other lineage (Yue et al., 2015). Every other Y-chromosome line that existed at the start of artificial insemination has effectively gone extinct in commercial use.
The consolidation behind that bottleneck accelerated fast. Three major entities — URUS (formed from the Alta/GENEX/Trans Ova mergers), Select Sires (in the process of merging with STgenetics’ production arm), and Genus PLC (parent of ABS Global, selling into around 80 countries) — control the vast majority of elite Holstein genetics moving through North American herds. The number of Holstein bulls actively sampled through AI dropped roughly 61% between 2010 and 2020, per Bullvine analysis.
Genomic selection drove real genetic progress during that same period — research estimates that gains increased by 50% to 100% for yield traits. But it also compressed generation intervals dramatically, from roughly five years to as little as two on the fastest pathways, through genomic testing and juvenile IVF technologies. The gains are genuine. So is the narrowing.
What Does Rising Inbreeding Actually Cost Per Cow?
Lactanet Canada’s August 2025 update puts the average inbreeding level for Holstein heifers born in 2024 at 9.99% — nearly double what it was fifteen years ago. John Cole, a USDA geneticist, walked through this acceleration in detail at the 2024 Beef Improvement Federation symposium, and the rate of change caught even some industry veterans off guard. Dr. Chad Dechow at Penn State reports that current Holstein inbreeding levels in the US average around 8%, with young bulls running somewhat higher at 9–10%. When researchers measure inbreeding genomically — through actual runs of homozygosity in the DNA — the numbers come in higher still. Italian Holstein data from Ablondi et al. (2023) at the University of Parma showed a mean genomic inbreeding (FROH) of 16% across 27,735 cows in 939 herds.
Year
Avg Inbreeding (%)
2009
5.1
2012
6.2
2015
7.4
2018
8.5
2021
9.2
2024
9.99
And here’s what it costs. Ablondi et al. found every 1% increase in genomic inbreeding cut 305-day milk yield by 61 kg. Using pedigree-based inbreeding, the loss was 44 kg per 1% increase in inbreeding. Doekes et al. (2019), working with Dutch Holstein–Friesians at Wageningen University, reported about 36 kg of milk per 1% increase in pedigree inbreeding, plus a half-day longer calving interval and higher somatic cell scores.
Run the math on your own herd. Research from Virginia Tech found that each 1% increase in inbreeding costs approximately $22–$24 per cow in lifetime profit — and that’s in 1999 dollars. Adjusted for inflation, that’s roughly $40–$43 today. On a herd averaging 10% inbreeding, the accumulated drag works out to $400–$430 per cow over a lifetime. Nobody sends you an invoice for that. It just… shows up. Slightly worse conception rates. A few extra mastitis treatments. Heifers that leave before the third lactation. Your records say “bad luck.” The math says otherwise.
Inbreeding Level
Milk Loss per Lactation (kg)
Calving Interval Increase (days)
Lifetime Profit Loss per Cow (CAD)
Total Herd Cost (200 cows, CAD)
6%
366 kg
3 days
$240–$260
$48,000–$52,000
8%
488 kg
4 days
$320–$344
$64,000–$68,800
10%
610 kg
5 days
$400–$430
$80,000–$86,000
12%
732 kg
6 days
$480–$516
$96,000–$103,200
Why the Big Catalogs Can’t Fix What They Created
Brady’s frustration pointed to something structural — not bad intentions, but gaps that stem from how consolidated AI companies make money.
Major studs routinely hold back their highest-ranking young sires for internal nucleus use before releasing semen broadly. Many companies have restricted access to young sires both because of limited semen production and to maintain competitive leadership. By the time a top genomic bull reaches your tank, his sons may already be entering the pipeline. Blondin and Stanton positioned against this directly: no restrictions, every bull available to every customer.
Corporate catalogs sell index numbers. The dam’s lifetime production, the granddam’s longevity record, the maternal line’s functional depth — that context has largely vanished from mainstream AI marketing. Brady and his partners founded Blondin specifically because they wanted that cow-family transparency and couldn’t buy it. And if a sire doesn’t project into the top tier for TPI or NM$, he rarely gets a catalog slot at a major stud. Rational for a company optimizing revenue per straw across a global network. But it means genuinely outcross bulls from distinct pedigree backgrounds get cut before producers ever see them.
The breeder economics shifted, too. The Bullvine documented in January 2026 that a well-run seedstock operation that generated $1.5 million in genetics revenue a decade ago might bring in $150,000 today — with objectively better cows. Corporate contracts now transfer semen rights, lock in female purchase options, and grant perpetual data licenses. Breeders like Brady looked at that landscape and saw a different kind of opportunity: own the bull, own the semen, control the marketing, and capture the upside yourself through facilities like DMV GenetiQ Services in Drummondville, Quebec. DMV’s model is straightforward — the breeder pays for boarding, health tests, and semen collection and freezing, but keeps 100% of the product and retains decision-making authority. The operation recently expanded to house 130 bulls and store 500,000 doses of semen, with four veterinarians on staff. Blondin bought a stake in DMV in 2022 to lock in that infrastructure for its growing bull lineup.
What the Europeans Figured Out Decades Ago
VikingGenetics and CRV didn’t stumble into genetic diversity. They engineered it.
Viking’s Nordic Total Merit index included mastitis resistance starting in the 1980s and general health traits by 1987, decades before North American indexes seriously weighted health. Today, health, reproduction, and longevity carry 45% of NTM’s total weight, per VikingGenetics — the highest ratio among major total merit indexes globally. NTM combines 90 different sub-indices into 15 main traits, drawing from a population in which Nordic cows are recorded for health traits through data from vets, hoof trimmers, and slaughter plants, all compiled into a single database. Their current top genomic VikingHolstein, VH Sandro (VH Skills × Youngster), carries a gNTM of +38 and projects daughters at 12,289 kg milk, 4.24% fat, and 3.54% protein — with an average 963 days in production. That’s the kind of profile that comes from selecting on functional longevity, not just peak yield.
CRV in the Netherlands runs a similarly deliberate funnel through its Delta breeding program. Starting from around 12,000 embryos produced each year, CRV genomically tests approximately 3,000 male calves and ultimately selects around 60 for semen production — drawing intentionally from 40 different black-and-white sires of sons and 20 red-and-white to maintain population diversity. “To maintain and ensure sufficient variation in the paternal bloodlines, we use around 40 different black-and-white bulls,” CRV’s head of product development, Jaap Veldhuisen, explained. On the health side, their bull Delta Boyan (Warren P RF × Endless RF) scores +19% CRV Efficiency and +6% CRV Health, with a 112 udder health and 111 hoof health breeding value — the kind of multi-trait health profile that North American rankings don’t yet fully capture. Both organizations are farmer cooperatives. Their shareholders milk the daughters. That makes it commercially viable to trade a few points of short-term index for long-term population health.
For North American producers, Viking and CRV bulls function as ready-made outcross tools with health-heavy proof profiles and genuine pedigree distance. But telling a real outcross from a Holstein with a European postal code takes homework. If you can read three generations of pedigree and recognize every sire name from your current AI catalog, it’s probably not the diversity you’re looking for. Screen instead for bulls with strong simultaneous scores across udder health, daughter fertility, and longevity — a CRV Health score above +5% or a NTM health sub-index well above breed average — combined with sire stacks you don’t already have in your tank.
Breeding Program / Index
Health/Fertility/Longevity Weight (% of Total Merit)
Key Traits Measured
Example Bull Profile
VikingGenetics (NTM)
45%
Mastitis resistance, general health, daughter fertility, herdlife, calving traits
VH Sandro: +38 gNTM, 12,289 kg milk, 963 days in production
Is Your Mating Plan Building an Asset — or Slowly Borrowing Against Your Daughters’ Future?
Research consistently shows that recent inbreeding — long runs of homozygosity in the genome — hits harder than older, more distant inbreeding. Ablondi et al. (2023) found that longer ROH segments (over 8 Mb, reflecting recent common ancestors) had a significantly negative effect on all production traits, while shorter segments were less consistent. Doekes et al. (2019) confirmed the pattern in Dutch Holsteins. Line-breeding on the latest popular bloodline does more damage per percentage point than having common ancestors five or six generations back.
And the University of Minnesota’s 10-year ProCROSS study shows what pushing back looks like in practice. Three-breed crossbred cows (Holstein × VikingRed × Montbéliarde) showed up to 15–20 fewer days open, first-service conception rates up to 9–10 percentage points higher in second and third lactations, and herdlife 147 days longer than purebred Holsteins. Daily fat-plus-protein production for lifetimes of those three-breed crossbreds was 1% lower than their Holstein herdmates, while two-breed crosses were actually 1% higher. Professor Les Hansen at the University of Minnesota led the research across herds averaging 13,587 kg of milk, 512 kg of fat, and 426 kg of protein. Daily profits for ProCROSS cows ran 9–13% greater than purebred Holsteins.
Performance Metric
Pure Holstein
Two-Breed Cross
Three-Breed ProCROSS
ProCROSS Advantage
Days Open
Baseline
15 fewer
15–20 fewer
Fertility recovery
First-Service Conception (2nd/3rd lactation)
Baseline
+7–8%
+9–10%
Heterosis payback
Herdlife (days)
Baseline
+85 days
+147 days
5 more months productive
Daily Fat + Protein (kg)
Baseline
+1%
-1%
Minimal production trade-off
Daily Profit per Cow
Baseline
+10–12%
+9–13%
$0.90–$1.30 per cow per day
That isn’t a theoretical model. It’s a decade of measured data from high-production herds. And while most operations won’t go full crossbred, the ProCROSS results quantify what happens when you deliberately invest in genetic diversity: the traits most damaged by inbreeding — fertility, health, survival — are exactly the ones that recover.
Four Ways to Hedge Your Genetics — and What Each One Costs
Keep 65–70% with your main AI supplier—but stop accepting the default. This is where most of your genetic gain, sexed semen supply, and technical support lives. Don’t unplug it. But ask your rep to show you the sire-of-sons diversity in your mating plan. If all roads trace back to the same three or four global sires, you’re stacking risk regardless of how the indexes look. Request lower-relationship sires specifically. Set hard inbreeding caps in your mating program — not just “avoid close relatives” but an explicit ceiling on expected future inbreeding per mating.
Allocate 15–20% to European cooperative genetics. VikingHolstein and CRV Holstein EU bulls offer genuine pedigree distance from the North American mainstream, bred under health-heavy total merit indexes. Target these matings at your most inbred cow families. Up to 5% of this allocation could go to a structured crossbreeding trial — VikingRed or Montbéliarde on your worst-performing, highest-inbreeding cows, where heterosis pays back fastest. The ProCROSS data shows that the fertility and survival payback is immediate, even though the daily component yield on three-breed crosses dips by about 1%. The trade-off beyond production: limited sexed-semen availability on some European sires, longer shipping lead times, and proof profiles that may not translate perfectly to your climate and management system.
What if you only have a budget for one outcross move this season? Direct 10–15% of matings to independent North American studs. Blondin, Stanton, and operations using DMV GenetiQ-style service centers offer unrestricted bull access, cow-family transparency, and niche trait programs the majors won’t prioritize. Per-straw costs will be higher than those in volume programs from the big studs — DMV GenetiQ charges breeders for boarding, health testing, collection, and freezing, with the breeder setting their own marketing and pricing. You’re paying more per unit for something the big catalog can’t deliver: pedigree distance with a story you can verify. But before writing any cheque, get clear answers: Who owns the semen and data? What health-testing standard do they follow — CSS-equivalent or not? Are the proofs from official national evaluations with published reliabilities? What’s the succession plan if the principal gets sick or sells the business? Can they actually ship sexed product to your region on a reliable schedule? Vague answers on any two of those should end the conversation.
Your 30-day action: Pull your herd’s inbreeding report from Lactanet or CDCB this week. Identify your most inbred cow families by average inbreeding coefficient. Those are the animals where your next mating decision matters most — and where a single outcross sire choice can do the most immediate good. Virginia Tech’s data gives you a baseline for that conversation with your AI rep: roughly $40–$43 per cow per 1% inbreeding in today’s dollars. On a 200-cow herd averaging 10% inbreeding, the accumulated lifetime drag is somewhere around $80,000–$86,000 across the whole herd. Even clawing back one or two percentage points on the next generation of replacements moves real money.
Key Takeaways
This month: Pull your herd’s inbreeding report. Canadian Holsteins are rising by 0.25% per year on a pedigree basis, according to Lactanet. If your heifer cohort is above the breed average of 9.99% for 2024-born animals and trending upward, the strategies in this article aren’t optional—they’re overdue.
Within 90 days: Ask your AI rep to walk you through the sire-of-sons diversity in your current mating plan — not just individual mating inbreeding, but the population-level picture. Request one catalog from an independent stud or European cooperative and compare pedigrees to what you’re currently using.
Within 12 months: Compare conception rate, mastitis incidence, and first-lactation survival by sire group on any outcross or crossbred matings you’ve started. Track the heifer-class inbreeding year over year. If the trend is flattening while genetic merit holds, you’ve found your balance.
Before buying from any independent stud: Demand clear answers on ownership and data rights, CSS-equivalent health testing, official genomic evaluations with published reliabilities, a written business continuity plan, and reliable distribution, including sexed semen capability. Vague answers on any two should end the conversation.
The Bottom Line
Dann Brady pulled up his own herd’s numbers years ago and didn’t like what he saw. He didn’t write a letter to the AI industry asking them to fix it. He started a company—and grew it 75% in a year by selling exactly what the big catalogs had stopped offering.
You don’t need to start a stud. But Brady’s question is the same one every Holstein producer should be sitting with right now: when you look at where your herd’s genetic diversity is headed over the next five to ten years, do you like what you see? And if you don’t — what changes this breeding season?
Genetic Gatekeepers: The High-Stakes Gamble of Dairy’s Elite Bloodlines – To understand the world Brady is navigating, you have to look at the forces tightening their grip on the gene pool. This piece exposes the hidden costs of consolidation and why independent voices are more critical than ever.
Every week, thousands of producers, breeders, and industry insiders open Bullvine Weekly for genetics insights, market shifts, and profit strategies they won’t find anywhere else. One email. Five minutes. Smarter decisions all week.
Teagasc and repro data show why the best herds work 19 fewer hours a week and still come out at least $24,000 ahead on a 200‑cow dairy.
Jim Kirk milks 606 Holsteins through a 60‑point GEA rotary parlour at Heanton Barton Farm near Okehampton in North Devon – and two people can run the whole thing in under two hours, according to an AHDB profile. Kirk and his herdsman Harrison handle all the AI, backed up by quarterly breeding reviews from Genus, weekly PD checks from the vet, and reports from VetIMPRESS after every visit. The team – three full‑time employees plus an apprentice, all living within five miles – meets every morning at a whiteboard, writes down the jobs, and ticks them off through the day. His pregnancy rate sits at about 25%, up from 20%, putting the herd in the top 5% of British operations on that metric.
Kirk took over from his dad and replaced an old herringbone – the kind of call you’d make if milking was eating your whole day, the AHDB profile noted. The hardware changed, sure. But the real shift was where Kirk put his own hours: breeding strategy, team development, ration management – the stuff that never happens when you’re stuck in the pit.
That’s the same shift Steve Jobs made on the original Macintosh – from “doer” to designer. Jobs never soldered a circuit board. He set the vision, picked the team, and killed anything that didn’t fit. The lone‑genius myth looks great on a magazine cover. It also shows up in too many barns as the lone‑wolf owner – and the gap between those two mindsets is about 19 hours a week, roughly 988 hours a year, and at least $24,000 on a 200‑cow herd before you even talk about family time.
The Steve Jobs Story We Think We Know
Most people picture Jobs in a black turtleneck, holed up in a garage, personally inventing the Macintosh by sheer force of will. Clean story. One guy. One vision. One machine.
The real story’s a lot more crowded. Jef Raskin pitched the Macintosh project inside Apple in 1979 as a cheap, easy‑to‑use computer for ordinary people. Burrell Smith – a self‑taught technician who started in Apple’s service department fixing Apple II boards – designed the first Mac prototype around Motorola’s 68000 processor. Andy Hertzfeld wrote much of the system software. Bill Atkinson built QuickDraw, the graphics engine. Jerry Manock shaped the case everyone remembers.
Jobs didn’t even join the project at the start. He spotted what the Mac team was doing, got hooked, and forced his way in around 1981. A BYTE magazine roundtable in February 1984 listed a dozen engineers and designers – Atkinson, Hertzfeld, Smith, Kenyon, Hoffman, Egner, Espinosa, Capps, Manock, Horn, Crowe – trading war stories about the machine they’d built together. Jobs sat there asking questions and drawing the line around what counted as “Mac‑like.”
What Jobs actually owned were the decisions nobody else wanted to make. He decided what the Mac would not be – not a hobbyist toy, not a business terminal, not a stripped‑down Lisa knock‑off. He picked the team, set the standard, killed features that didn’t fit the user experience, and pushed everyone to strip away anything that made the product harder to love. As quoted in that BYTE roundtable, Jobs said the team was driven by “building something really inexpensive so that everyone can afford it”.
The false lesson from that story is dangerous: if you’re the genius, you have to do everything yourself.
The real lesson is more useful on a dairy. The owner’s job is to design the system and say no ruthlessly. Everything else? That’s ego talking.
The 988‑Hour Gap Between Grinding and Growing
Teagasc Moorepark looked at labour time‑use on Irish pasture‑based dairy farms and split them into the top 25% most labour‑efficient and the bottom 25%. Herd sizes were almost identical – 112 cows in the top group, 113 in the bottom. The difference wasn’t cow numbers. It was hours.
On those farms, the top group worked about 51 hours a week. The least efficient worked 70. Same cows. Same grass‑based system. Nearly 19 extra hours a week for the bottom group – about 988 hours over a year.
On a seasonal‑calving Irish place, some of that gap piles up in spring when everything hits at once. But Teagasc’s case‑study work, published in the Irish Journal of Agricultural and Food Research in 2023, showed the same pattern on an individual herd: one 119‑cow spring‑calving operation ran on 2,986 total labour hours a year – about 54 hours a week – with the farmer doing 2,314 of those hours and the rest covered by family and outside help.
Those numbers are Irish, seasonal, and heavily grass‑based. Your hours will look different on year‑round calving in Quebec tie‑stalls or on robots in Minnesota. But the core finding keeps repeating whenever somebody actually measures it: the most profitable farms don’t always work more hours. They work different hours.
Cornell’s 2024 Dairy Farm Business Summary put teeth on that idea across 129 New York farms. Top‑earning quartile herds shipped about 1.7 million pounds of milk per worker equivalent and spent $3.17/cwt on hired labour. Bottom‑quartile farms shipped about 1.2 million pounds per worker and spent $3.82/cwt.
Here’s the kicker. Hired labour cost per worker was roughly the same across all four quartiles – between about $57,600 and $61,177 a year. Top farms didn’t find cheaper people. They got a lot more milk per person. That’s what systems do.
The Identity Problem Nobody Wants to Talk About
Jobs didn’t prove his worth by pulling every all‑nighter himself. He proved it by building a team that could ship a Mac without him standing over every keyboard.
If you’re honest, sleeping until 6:00 a.m. probably feels like failure. When you’ve been told since you were five that “real” dairy farmers are in the barn at 4:30, stepping back from a milking shift can feel like turning your back on your father’s work ethic, your cows, and half your identity.
In Teagasc focus groups, farmers themselves said “less than 55 hours per week” felt like an acceptable workload – anything above that was a grind they tolerated. Bottom‑quartile farms blew past that threshold by 15–20 hours every week. Nobody in those groups was lazy. Many had built herds from 60 cows to 200 by doing exactly what they were taught: show up first, leave last.
But the data doesn’t care how guilty you feel taking a morning off. It just measures outcomes.
The question isn’t whether the grind was necessary in 1998, when parlours were smaller and sensors didn’t exist. It’s whether the same grind is still the highest‑value use of your time when margins are tight, lenders are watching operating cost per cwt, and the technology to shift your role already sits on the market.
Every hour you spend holding a milker claw instead of managing reproduction, negotiating inputs, or reviewing cost of production is an hour you don’t get back. And once you put dollar values on those hours, the story changes fast.
What Does a Six‑Point Pregnancy Rate Gap Actually Cost?
Dr. John Fetrow at the University of Minnesota laid this out in a DCRC white paper, “The Dollar Value of a Pregnancy.” A one‑point improvement in 21‑day pregnancy rate is worth about US$15 to US$35 per cow per year, depending on milk price, replacement heifer cost, and cull value. One pregnancy was worth roughly US$200 to US$600, and every extra day open cost between US$2 and US$6.
Here’s what that looks like on a 200‑cow freestall. Say your 21‑day pregnancy rate is 19%. A neighbour with similar genetics and facilities sits at 25%. Six‑point gap.
Fetrow’s formula, simplified:
Annual cost = (PR target − PR actual) × value per point × herd size
Plug in the middle of his range:
(25 − 19) × US$20 × 200 cows = US$24,000 per year
Low end at US$15 per point: US$18,000. High end at US$35: US$42,000. Same cows, same facilities, just different repro management.
Your 21-Day Pregnancy Rate
Neighbour’s PR (Target)
Annual Cost at $20/Point
Range ($15–$35/Point)
15%
25%
$40,000
$30,000 – $70,000
17%
25%
$32,000
$24,000 – $56,000
19%
25%
$24,000
$18,000 – $42,000
22%
25%
$12,000
$9,000 – $21,000
The University of Wisconsin’s “Repro Money” program – developed by UW–Madison’s Department of Dairy Science with UW–Extension – tested this on real farms. Forty Wisconsin dairies completed the team‑based program. On average, they lifted 21‑day pregnancy rate by two points and saw an estimated economic gain of US$31 per cow per year. No new sheds. No shiny robots. Mostly structure: advisory teams, clearer repro protocols, regular review meetings.
On 200 cows, that Repro Money average is US$6,200 a year. On 300 cows, US$9,300. Run Fetrow’s six‑point example at US$20 and you’re back at US$24,000‑plus territory.
You don’t fix a pregnancy‑rate problem from inside the parlour. You fix it with better heat detection, cleaner data, tighter protocols, and a team that’s trained and trusted to execute. That’s owner work. Not milker work.
What Jobs Actually Did – and What Smart Dairy Owners Do
Jobs didn’t write code, machine cases, or design circuit boards. He surrounded himself with people who could, then obsessed over decisions, not tasks. On a dairy, the parallels are closer than most owners want to admit.
Product vision → herd vision. Jobs decided the Mac would be cheap, beautiful, and easy to use – not a Lisa clone and not a hobbyist box. On your farm, this is the one‑sentence answer to “What is this herd optimized for?” Cash flow? Components? Low‑labour lifestyle? If you can’t say it in a sentence, your team can’t execute it.
Team‑building → hiring and developing your people. Jobs poached Andy Hertzfeld from the Apple II team, pulled Bill Atkinson from the Lisa project, gave Burrell Smith freedom to build prototypes until something clicked. Kirk did his own version. According to the AHDB profile, he invested in Harrison – including sending him to the U.S. with Worldwide Sires for a week to visit American herds and breeders – then handed him real responsibility when he came back. That’s not “help.” That’s succession in slow motion.
System design → SOPs and data flows. Jobs killed features engineers loved if they made the Mac feel clunky. On your farm, that’s your milking routine, your fresh‑cow checks, your repro protocol, and how data moves from parlour or robot into decisions. CAFRE in Northern Ireland puts it bluntly: “It does not matter if a dairy producer has the best milking parlour feeding system and housing in the world, if employees do not perform their tasks consistently, herd health and performance will suffer.”
And the big one.
Saying “no” → culling tasks off the owner’s plate. Jobs killed the internal fan and a floppy port on the original Mac because he cared more about noise and simplicity than backward compatibility. On a dairy, saying “no” means dropping unprofitable side projects, stepping away from that one milking shift your ego says only you can run, or killing a tradition once the math proves it doesn’t work.
The owner’s “unit of work” has to shift from “hours in the parlour” to “decisions per week that move net margin.”
That single sentence is worth putting on your office wall.
Are You Designing the System – or Just Running Laps Inside It?
Great cows don’t help much if the person running the breeding list is too tired to see a cow in heat.
Grab a scrap of paper and be honest with yourself.
Where do you spend your first hour every morning? Looking at repro lists and yesterday’s data, or already halfway through a milking shift?
Who actually makes breeding decisions? You set a plan and trust someone to handle heat detection and AI – or you personally breed every cow and heifer because “nobody else will do it right”?
What happens if you’re gone for three days? Do metrics hold, or do SCC and repro numbers wobble the moment you leave the yard?
How often do you review cost of production and labour cost per cwt? Monthly at minimum, or “whenever the accountant sends something”?
If your answers land in the second column more than twice, you’ve probably found the real bottleneck on your operation. And it’s the name on the mailbox.
Do Robots and Sensors Fix the Lone‑Wolf Problem?
Jobs was obsessed with user experience – he wanted people to turn a Mac on and just know what to do. Today’s dairy tech sells a similar promise. Robots milking around the clock. Collars flagging heats and health events. Sort gates moving the right cows at the right time.
The uncomfortable truth: robots and sensors don’t fix the lone‑wolf problem if the owner still insists on personally watching every exception and making every micro‑decision.
Look at Wayside Dairy LLC near Green Bay, Wisconsin. Co‑owners Jeremy Natzke, his father Dan, sister Jenna Nonemacher, and partner Jesse Dvorchek milk about 2,000 cows with 1,850 replacements, rolling herd average around 32,171 lb with 4.3% butterfat and 3.3% protein . For years their pregnancy rate hovered around 18% . Over roughly 17 years they brought in a new vet, changed nutritionists, implemented a double Lutalyse shot program, and added a 4 mL dose of GnRH 10 days before first breeding . “We kept asking consultants how we can improve,” Natzke told Bovine Veterinarian Online .
Those management changes – not a piece of stainless steel – lifted Wayside’s pregnancy rate to about 33%. Then, in mid‑2020, they installed CowManager ear sensors across the herd. In a Select Sires case study published in September 2022, Natzke said, “The return on investment with CowManager is really very quick. What it does is allow us to spend more time with the animals that need more attention”. By then, their pregnancy rate had climbed to 38% – because the Fertility alerts catch more cows on natural heats, reducing how many need the synchronization program and saving on both drug costs and labour.
Seventeen years of decisions, protocols, and team development built the foundation. The sensors made it easier to catch that last five‑point gain because the system was already there to act on the data.
Task
The “Robot/Sensor” Job
The “Owner/Designer” Job
Heat Detection
24/7 Activity/Rumination Alerts
Setting the “Threshold” for Intervention
Milking
Unit Attachment & Milk Mapping
Reviewing Quarter-Level SCC Trends
Health
Flagging “Off-Feed” or High Temp
Consulting Vet on Treatment Protocols
Data
Recording the 1,000 Events
Deciding which 3 Events matter today
Succession / Lifestyle
Providing a functional asset
Ensuring the farm is a life the next generation wants, not just a job they have.
If you bought a robot and still insist on being the robot, you didn’t buy technology. You bought a guilt machine.
The right tech lets you work more like Jobs: set the rules, watch a dashboard, make a handful of big calls, step in only when the system throws a true red flag. The wrong mindset turns every robot alarm into another reason you can’t ever leave the yard.
Options and Trade‑Offs for Letting Go of the Milker Claw
There’s no single path out of the lone‑wolf trap. Herd size, labour market, and bank account all shape what’s realistic. But the data points to patterns that work – and each one carries real friction you should know about upfront.
Milestone
Action Item
Target Metric
Day 1
Write the “One-Page SOP” for the AM shift.
Zero ambiguity in prep/post-dip.
Day 15
Side-by-side training with “Shift Lead.”
100% protocol compliance.
Day 30
Owner Vacates Shift.
Track SCC & Bulk Tank Weight.
Day 90
Reallocate 15 hours/week to Repro Data.
+1.5 points in 21-day PR.
Path 1: The 30‑Day Milking Test (Any Herd Size – Start This Month)
Steve Jobs’ first move wasn’t to code faster – it was to get out of the weeds. On your farm, that starts with one milking shift per day you’re willing to be absent from within 30 days. Write how you want that shift to run on one page: cow flow, prep routine, unit attachment, post‑dip, wash‑up. If you can’t fit it on a page, you don’t have a standard. You have a wish.
Train one person to run that shift to that page. Pay them for the responsibility. Then for 30 days, track three numbers: milk shipped per cow, bulk tank SCC, and how many cows hit your mastitis treatment list. If numbers hold, that shift becomes “owner‑optional” permanently.
If they slip, that’s not proof delegation fails. It’s proof you’ve got training or clarity gaps to fix. Don’t run back into the parlour and tell yourself “nobody cares like I do.” Fix the gap.
That first owner‑free milking is the proof your system works, not just your back.
Path 2: Strategic Reallocation on 150–500‑Cow Herds
This is where Kirk lives. When he stepped out of one milking, he freed up 3–4 hours a day. According to the AHDB profile, he put those hours into consistent feed push‑ups to lift dry matter intake, a daily chalking routine for heat detection at the same time every day, and investing in Harrison’s skills.
Those changes helped move his pregnancy rate from 20% to 25%. Run Fetrow’s math on 300 cows at US$20 per point:
(25 − 20) × US$20 × 300 cows = US$30,000 per year
At the low end (US$15): US$22,500. High end (US$35): US$52,500. That’s the kind of margin movement that separates “covering the bank” from “actually getting ahead.”
The risk is real: for the first 60 days, it’ll feel like standards are slipping. You’ll see things you don’t like. Treat that as feedback on your system, not proof that stepping back was a mistake.
Path 3: The Team Build on 500+ Cow Herds
Above 500 cows, the question isn’t whether to delegate. It’s whether you’re doing it with structure.
Written SOPs, weekly team meetings, and outside advisors earn their keep here. The UW Repro Money program showed that when farms created farmer‑led repro teams – owner, vet, nutritionist, key staff – and actually met, average pregnancy rate improved by two points at about US$31 per cow per year. On a 700‑cow herd, that’s US$21,700 annually from repro alone.
Forty farms completed the program . They didn’t keep meeting out of politeness. They kept meeting because the numbers moved.
The risk? Meetings for the sake of meetings. Simple fix: every meeting ends with three things written down. One protocol tweak. One training commitment. One number to check before the next meeting. Without those, you had coffee, not a team.
Path 4: The Financial Reckoning When U.S. Margins Are Tight
If your all‑milk price hovers close to your cost of production, you can’t afford to spend 70 hours a week doing work you could hire a livestock worker to do. USDA’s Farm Labor report for January 2025 pegged the national average at US$18.15/hour for livestock workers. In the Great Lakes region – Wisconsin, Minnesota, Michigan – the 2024 annual average ran US$17.68/hour. That’s roughly US$37,750 in base wages for a full‑time position, or about US$47,000–$49,000 once you load in payroll taxes, workers’ comp, and basic benefits.
Meanwhile, US$50‑to‑US$100/hour decisions – breeding strategy, capital allocation, lender negotiations, ration‑level changes – keep getting pushed “to when it’s quieter.”
Cornell’s DFBS numbers are blunt. Bottom‑quartile farms spent about US$22.32/cwt in operating costs. Top‑quartile farms: US$15.79/cwt. Gap of US$6.53/cwt. On a 200‑cow herd shipping 75 lb/day, that’s roughly 5,475 cwt a year × US$6.53 = about US$35,750 per year.
Not all of that gap is labour. But your lender already knows which side you’re on – they see your cost per cwt long before you do.
As labour tightens and margins compress through 2026–2027, farms that already treat owner time as a strategic resource will flex – cut hours, keep performance, absorb shocks. Farms that keep using the owner as the cheapest milker in the barn will break first.
Path
Upfront Cost
Payback Timeline
Expected Annual Gain
Biggest Friction Point
30-Day Milking Test
$0–$2,000 (training time)
30–60 days
3–4 hrs/day freed
Feels like losing control first 2 weeks
Strategic Reallocation (150–500 cows)
$37,750–$49,000 (one FTE)
6–12 months
$22,500–$52,500 (5-pt PR gain)
Standards slip for 60 days during transition
Team Build (500+ cows)
$5,000–$15,000 (SOPs + advisor time)
4–6 months
$21,700+ (2-pt PR gain, 700 cows)
Meetings feel like busywork without strict 3-item close
Financial Reckoning
$0 (audit existing time use)
Immediate insight
$35,750 (closing Cornell cost gap)
Admitting you’re the bottleneck, not the hero
Tech Investment: What the Numbers Actually Look Like
If you’re weighing sensors against robots, the cost gap is worth spelling out. Ear‑tag monitoring systems like CowManager run about US$0.07 per head per day according to CowManager reps – roughly US$25.55 per cow per year. Activity monitoring platforms more broadly (collars and ear tags combined) range from US$80–$150 per cow in hardware, plus base station equipment (US$2,500–$5,000) and software licensing (US$1,800–$3,600 annually), putting a 200‑cow operation at roughly US$20,000–$38,600 all‑in for the first year.
A full robot string? US$400,000‑plus per unit once you count construction.
That doesn’t mean robots are wrong. It means the investment decision needs to match your actual bottleneck. If your bottleneck is information – catching heats, flagging health events, getting data into decisions faster – sensors at US$25/cow/year are a different conversation than robots at six figures.
Technology
Cost per Cow (Year 1)
200-Cow Herd All-In
Bottleneck It Solves
Ear-Tag Sensors (e.g., CowManager)
$25.55/year
$5,110/year (ongoing)
Information: catching heats, health alerts, getting data into decisions faster
Information + protocol consistency: 24/7 monitoring, automated alerts, team accountability
Single Robot Unit (incl. construction)
$2,000+
$400,000+
Labour replacement: physical milking task automation, BUT only if system/team already works
Full Robot String (3–4 units, 600+ cows)
$2,000–$2,500+
$1.2M–$1.5M+
Scale labour constraint: enabling herd growth when local labour market fails
Key Takeaways
If you can’t miss one milking a day without stressing out, your 30‑day goal is simple: pick a shift, write a one‑page SOP, train one person, track SCC and milk per cow for a month. Numbers hold? That shift is owner‑optional from now on.
If your 21‑day pregnancy rate sits below 22%, run Fetrow’s formula with your own herd size this week. If the number makes your stomach drop, book a repro team meeting with your vet and nutritionist and commit to one protocol change within 60 days.
If your name shows up more than three times on the “who handles exceptions” list for robots or sensors, you’ve found your bottleneck. Write down what the tech is responsible for and what humans handle. Pick one area to hand off within 90 days.
If you haven’t reviewed cost per cwt and labour cost per cwt with your lender in six months, that’s your next call. Within a year, you want your time usage mapped well enough to say, with a straight face, “Here’s what I earn per hour of owner work.”
If your job description still reads ‘chief milker,’ remember Jobs didn’t prove his worth by living in the lab. He proved it by building a lab that worked when he walked out the door.
The Bottom Line
Ten years from now, the herds still standing will be owned by people who stopped pretending they were the machine and started acting like the designer – more Steve Jobs than “hired milker in chief.”
So this year – when you look at your own time sheet, even if it’s just the back of an envelope – which job are you training for?
Complete references and supporting documentation are available upon request by contacting the editorial team at editor@thebullvine.com.
Decide or Decline: 2025 and the Future of Mid-Size Dairies – Exposes the hidden equity drain facing herds without a clear five-year strategy. It arms you with the financial stress-tests and regional benchmarks necessary to decide whether to scale up, optimize, or pivot before the 2026-2027 market reset.
Ditching Robot Pellets: How Smart Farms Save $36,000 and Improve Milk Components – Challenges the expensive “standard” of robotic feeding and reveals how elite producers are pocketing an extra $36,000 annually. This disruptor’s guide breaks down the forage-first systems that boost butterfat while simplifying your daily management load.
The Sunday Read Dairy Professionals Don’t Skip.
Every week, thousands of producers, breeders, and industry insiders open Bullvine Weekly for genetics insights, market shifts, and profit strategies they won’t find anywhere else. One email. Five minutes. Smarter decisions all week.
Every time you pull up a sire list, there’s one question you almost never ask: what am I not measuring that’s already costing me money?
February 2003. Snow coming down sideways in a drafty barn at the Wisconsin Holstein Convention Sweetheart Sale. Experienced breeders — guys who’d driven hours through a Wisconsin winter to be there — were heading for the exits. The auctioneer’s voice was getting that tired, frustrated edge as bidding stalled out on a five-year-old Holstein whose rump “wasn’t entirely balanced.”
Matt Steiner called in from Pine-Tree Dairy in Ohio. He’d never laid eyes on the cow in person. Her second lactation ran 31,880 pounds at 4.1% fat and 3.2% protein — respectable, not revolutionary. He bid $8,100 for what everybody else in the room saw as just another decent cow past her prime.
Wesswood-HC Rudy Missy-ET EX-92 — the “unbalanced” Wisconsin sale cow whose $8,100 phone bid quietly rewrote Holstein genetics for the next 20 years.
But here’s the part of that story nobody tells. The same breeding system that produced Missy — the same genomic toolkit that doubled annual genetic gain to 109 kg/year for milk in registered Holsteins (García-Ruiz et al., 2016, PNAS) — was simultaneously dragging 198 fertility genes and 67 immunity genes in the wrong direction. For 20 years. And the industry didn’t catch it.
The question that should bother you: what’s getting dragged sideways in your herd right now?
How Fast the Engine Actually Runs
Before 2009, you waited five to seven years for a bull’s daughters to start milking before you knew if he was any good. Genomic selection rewired that math completely. Paul VanRaden and colleagues at USDA helped architect a system that estimates merit at birth, and the speed gain was dramatic. Across all four selection pathways that drive Holstein genetics (sire-of-bulls, sire-of-cows, dam-of-bulls, dam-of-cows), the combined generation interval dropped from 21.4 years in 2009 to 13.5 years by 2015 — a 37% reduction in just six years (García-Ruiz et al., 2016, PNAS). The sire-of-bulls pathway collapsed the fastest, from about 7 years to under 2.5.
Financially, the results are hard to argue with. Annual Net Merit gains climbed from $13 during 2000–2004 to more than $85 after 2010 (nominal dollars). Fat yield accelerated 173%. Protein yield, 156%. And the daughter pregnancy rate — which had been flat or declining for decades — finally reversed direction, rising to +0.26% per year.
Here’s a way to feel that in your bulk tank. On a 200-cow herd averaging 85 lbs/day, the post-genomic milk yield acceleration alone (from ~50 kg/year to 109 kg/year for registered Holsteins) translates to roughly an extra 130 lbs of milk per cow per year in genetic potential over what the old system would have delivered. At a $19.50/cwt mailbox price, that’s about $5,070 in additional gross milk revenue across your herd annually — and it compounds every generation. Adjust that number for your regional mailbox price, but the scale holds. The record-breaking component shifts reshaping dairy’s economics are a direct product of this acceleration.
But the engine has a blind spot. And it’s biological, not mathematical.
What Happened When Nobody Was Measuring Fertility
The University of Minnesota’s research herd at the Southern Research and Outreach Center in Waseca did something nobody else bothered to do: they maintained an unselected Holstein control line alongside the commercially selected national population from 1964 onward. Same management. Same feed. Different genetics.
By 2004, the selected population had increased milk yield by 79%, from 6,309 kg to 11,324 kg. It had also lost roughly 30 additional days for successful conception compared to the control cows living right next door (Ma, Cole, Da & VanRaden, 2019, BMC Genomics 20:128).
That fertility decline wasn’t nutrition. Wasn’t repro protocols. Purely genetic. A breeding consequence nobody planned for.
The genome-level analysis revealed the mechanism. Within 234 chromosome regions shaped by four decades of milk selection, researchers found 198 genes involved in reproduction and 67 genes involved in immune function whose allele frequencies had shifted as collateral damage. The estrogen receptor gene ESR1 decreased from 0.45 to 0.13. The MHC region on chromosome 23 — the heart of immune diversity — showed significantly decreased heterozygosity.
Category
Count
Fertility genes negatively affected
198
Immunity genes negatively affected
67
Total chromosome regions under selection
234
Nobody selected against fertility or immunity. Those genes just happened to sit near milk-boosting alleles on the same chromosomes, and they got swept along for the ride. Geneticists call it hitchhiking. Producers who lived through the collapse in conception rates in the 1990s just called it expensive.
(This hitchhiking analysis comes from a single study using the unique Minnesota control line — the only unselected comparison herd of its kind. The broader fertility decline is independently confirmed across both the U.S. and Israeli dairy populations.)
Is the Same Thing Happening to Heat Tolerance Right Now?
The fertility crash is old news — the industry course-corrected, and genomic selection actually reversed the decline. The real question: where is the same pattern building today?
Heat tolerance is eroding, and almost nobody is selecting against it. Research led by Ignacy Misztal at the University of Georgia and Luiz Brito at Purdue found that the temperature-humidity index (THI) threshold where Holsteins start losing production has dropped from 72 to 69 over the past two decades (Misztal, Brito & Lourenco, 2024, JDS Communications 6(3):464–468). Your cows start suffering heat stress at lower temperatures than cows bred a generation ago.
And the grim part: cows that maintain production during heat stress peaks show an increased likelihood of death. They’re not tolerating the heat. They’re metabolically overriding their body’s protective shutdown. The authors note that better fans, sprinklers, and tunnel ventilation may actually be masking an even larger genetic deterioration underneath.
With the exception of Australia, dairy cows are not directly selected for improved heat tolerance anywhere in the world. In Alabama, Mississippi, and Louisiana, dairy has already become economically unviable — these states don’t even appear in the 24 major dairy states NASS tracks monthly (Misztal et al., 2024). A quiet testament to how completely the industry has retreated from the Deep South.
If your herd faces more than 60 days per year above THI 68, this isn’t an abstract research finding. It’s your next fertility crash in slow motion.
The Inbreeding Bill Coming Due
Genetic diversity is narrowing faster under genomics, not slower. A study of 74,485 Italian Holstein cows found the annual inbreeding rate based on runs of homozygosity (ROH) was +0.32% per year before genomic selection. After genomic selection took hold, it jumped to +0.70% per year (Ablondi et al., 2022, Frontiers in Veterinary Science8:773985). That’s above the 1% per generation threshold FAO considers critical for long-term sustainability.
Category
Value
Pre-Genomic Annual Rate (Italy)
0.32%
Post-Genomic Annual Rate (Italy)
0.70%
U.S. Cumulative Increase 2010–2020
168%
It isn’t just an Italian problem. U.S. Holstein inbreeding climbed from about 5.7% in 2010 to 15.2% by 2020 — a 168% jump — with CDCB analysis putting the cumulative cost to the national herd at an estimated $6.7 billion (The Bullvine, 2025 year-end review).
Metric
Annual Impact (200-cow herd)
What’s Driving It
Extra Milk Revenue (Genomic Gain)
+$5,070
109 kg/year genetic gain vs. 50 kg/year pre-genomic (registered Holsteins, $19.50/cwt)
Inbreeding Drag (4% increase)
−$4,800 to −$6,400
$23–25/cow lifetime NM$ loss per 1% inbreeding, annualized over 3–4 year turnover
Net Realized Gain (Conservative)
+$270 to +$1,070
On fast-turnover herds, inbreeding wipes out nearly all the genomic advantage
Net on Fast-Turnover Herds
−$1,330 (loss)
Herds replacing >35% annually can lose more than they gain
Here’s where the barn math gets uncomfortable. Each 1% increase in inbreeding costs roughly $23–25 off a cow’s lifetime Net Merit (USDA-ARS, 2025 NM$ revision). Go back to that 200-cow herd. If your average genomic inbreeding crept up 4 percentage points over the past decade — and given that the national average jumped 9.5 points in ten years, 4% is conservative — that’s about $96 per cow in lifetime profit quietly erased. Spread across a herd that turns over every three to four years, you’re looking at roughly $4,800 to $6,400 per year leaking out through health costs, fertility failures, and shortened productive life, depending on your actual turnover rate. Remember that $5,070 in extra annual milk revenue from faster genetic gain? At most turnover rates, inbreeding depression is clawing back nearly all of it — and on herds that turn over faster, the loss actually exceeds the gain. You’re running the genetic engine harder, and a big chunk of what it produces is leaking out the other side.
(Note: the $5,070 figure is gross milk revenue at $19.50/cwt; the $4,800–$6,400 range is annualized lifetime Net Merit loss, which captures health, fertility, and longevity effects beyond milk alone. They’re not identical units, but the scale of the offset is real — and the barn-math range depends on how quickly your herd turns over.)
Options and Trade-Offs for Your Next Breeding Decisions
The fertility crash lasted 20-plus years because nobody measured the trait being eroded. Heat tolerance, inbreeding, and resilience are in a similar position today. Here’s what you can actually do about it — with the honest trade-offs attached.
Action
When to Act
What You’re Hedging Against
Trade-Off
ROH Inbreeding Audit
If genomic inbreeding >7–8%
$23–25 lifetime NM$ loss per 1% increase; $4,800–$6,400/year drag on 200-cow herd
Restricting matings may slow genetic progress 5–15%
Weight Productive Life + Livability
If you face 60+ days above THI 68
Heat tolerance declining; THI threshold dropped from 72 to 69 over 20 years
May sacrifice 3–5% genetic gain on other traits
Diversify Across 3+ AI Programs
If top 5 bulls all trace to one program
Genomic inbreeding rising 0.7%/year; 22 of top 30 NM$ bulls from one program (Dec 2025)
Aggressively avoiding related matings costs ~5–15% progress
Contribute AMS/Activity Monitor Data
If you’re running precision dairy tech
Next hitchhiking problem: feeding the reference population so crashes get caught in 5 years, not 20
Consistent data entry discipline required
Confirm you’re using CDCB’s 2025 NM$ revision — and don’t override it. The updated index rolled out alongside the April 2025 base change. It now balances 17 traits for lifetime profitability, with feed efficiency (FSAV) carrying 17.8% of total emphasis — a substantial shift from prior weightings. If your genetics provider hasn’t updated to the 2025 revision, it’s worth a quick conversation; the trait emphasis shifted enough that older weightings are optimizing for a different market than the one you’re selling into. But even the right index can’t save you from yourself: if your top five bulls all rank in the top 20 for a single component while sitting below breed average for productive life, you’re running a single-trait program no matter what the index says. David Dyment at AG3 has built his program on exactly this principle — “consistency over unpredictability,” as he puts it — betting that balanced functional genetics outlast flavor-of-the-month rankings. The trade-off: you’ll pass on some high-component bulls that look great on paper. The fertility crash is what happened when the industry overrode balanced selection often enough.
Ask your genetics advisor for your herd’s ROH-based genomic inbreeding — this month. Pedigree coefficients underestimate actual homozygosity. In Italian Holsteins, pedigree inbreeding averaged 0.07 while genomic inbreeding was more than double at 0.17 (Ablondi et al., 2022). As a general rule of thumb, many geneticists start flagging concern when genomic inbreeding crosses 7–8% for Holsteins — there’s no official industry threshold, but herds above 9% should seriously consider a diversity audit. CDCB provides genomic inbreeding estimates — if your genetics provider isn’t using ROH-based calculations in mating plans, you’re flying partly blind. Diversify your sire lineup across at least three AI organizations. The trade-off: aggressively avoiding related matings can slow genetic progress — estimates vary, but the general range is somewhere around 5–15% depending on how restrictive you get. That’s a real cost. But inbreeding depression quietly eating your gains from the inside is worse — and that $4,800-to-$6,400-a-year leak on a 200-cow herd is real money.
If you’re in a heat-stress region, start weighting for it now. Increasing emphasis on productive life, livability, and fertility provides indirect selection pressure for thermotolerance — these traits correlate positively (Misztal et al., 2024). The trade-off: you may sacrifice 3–5% of genetic gain on other traits. In a warming climate, that’s a hedge worth paying for. If you’re south of the Mason-Dixon or running herds in the Central Valley, this isn’t optional — it’s self-defense.
Contribute the data you’re already collecting. If you’re running activity monitors, AMS systems, or feed intake tracking, those records can help build the reference populations for tomorrow’s evaluations. Contact CDCB or your breed association — in Canada, Lactanet already accepts health event and AMS data. The trade-off: consistent data entry takes discipline. But incomplete data contributed widely still beats perfect data that never leaves the farm. And it’s how the next hitchhiking problem gets caught in five years instead of twenty.
Key Takeaways
If your herd’s ROH-based genomic inbreeding is trending above 7–8%, schedule a diversity audit before your next mating run. Each 1% of inbreeding costs $23–25 off lifetime NM$ per cow, and on a 200-cow herd, a 4% accumulation translates to $4,800–$6,400 a year in hidden drag, depending on your turnover rate.
If you face 60+ days above THI 68, add productive life and livability emphasis to your sire selection now. Heat tolerance is declining genetically, even as heat abatement technology improves — the infrastructure is masking the problem.
If your genetics provider hasn’t updated to the 2025 NM$ revision, have that conversation this week. The updated index rebalanced 17 traits and added feed efficiency with an emphasis of 17.8%. Older weightings mean you’re optimizing for a market that’s already shifted.
If all your top sires trace to the same program, diversify across at least three AI organizations. Genetic gain means nothing if you’re narrowing the base that sustains it.
Before your next mating run, ask one question your genetics advisor probably won’t raise on their own: “Which traits am I not measuring that might be shifting in the wrong direction?” That’s the question the fertility crash should have taught us to ask in 1985.
The Bottom Line
Steiner’s $8,100 gamble in that drafty Wisconsin barn wasn’t a bet on a cow. It was a bet on seeing what the data couldn’t yet show him. Twenty-three years later, the tools are sharper than they’ve ever been — genomic testing at birth, AI-driven mating plans, embryo tech that was science fiction in 2003. The engine runs faster every year.
But the biology is still messier than the model. And the gap between what you’re optimizing and what you’re actually affecting is where unintended consequences compound. Silently. Generationally. The only question worth asking every time you pull up a sire list: What am I not measuring that I’m going to wish I had?
Editor’s Note: Genetic gain data from García-Ruiz et al. (2016, PNAS); the 37% generation interval reduction refers to the combined total across all four selection pathways (sire-of-bulls, sire-of-cows, dam-of-bulls, dam-of-cows), not any single pathway. Hitchhiking analysis from Ma, Cole, Da & VanRaden (2019, BMC Genomics 20:128), using the University of Minnesota unselected control line at Waseca, MN. Heat tolerance data from Misztal, Brito & Lourenco (2024, JDS Communications 6(3):464–468). Inbreeding data from Ablondi et al. (2022, Frontiers in Veterinary Science 8:773985), based on 74,485 Italian Holstein cows. U.S. inbreeding trends from CDCB analysis as reported in The Bullvine (December 2025). Barn-math calculations use $19.50/cwt mailbox price; inbreeding annualization assumes 3–4 year herd turnover and should be adjusted for your operation’s actual replacement rate. Per-trait figures are for registered Holsteins; all-cow population gains were approximately half this magnitude. NM$ figures are nominal. Missy auction details from The Bullvine’s Wesswood-HC Rudy Missy feature (July 2025), cross-referenced with the Wisconsin Holstein Association’s 2020 convention report.
Executive Summary:
Genomic selection has more than doubled Holstein genetic progress, but it also proved something you feel in your own breeding records: traits you don’t measure still move, and sometimes they move against you. The same engine that helped make Wesswood-HC Rudy Missy a global brood cow quietly dragged 198 fertility genes and 67 immunity genes the wrong way for about 20 years before anyone caught it. Over those same decades, the THI threshold at which cows start losing milk slipped from 72 to 69, yet almost no one outside Australia selects directly for heat tolerance, even as better fans and sprinklers mask how fragile the genetics underneath have become. On the inbreeding side, genomic homozygosity in Holsteins is rising around 0.7% per year in some populations, and each 1% costs roughly $23–25 in lifetime Net Merit per cow — enough for a 200-cow herd to quietly leak $4,800–$6,400 a year, which can wipe out almost all of the roughly $5,070 in extra milk revenue from faster gain. You’ll see how those blind spots developed. You’ll see how those blind spots developed, then get concrete next steps: stick with the 2025 NM$ revision instead of custom tweaking, ask your genetics provider for ROH-based genomic inbreeding for your herd, and spread risk across multiple AI programs instead of loading your list from just one. If you’re staring down 60+ days above THI 68, it also explains how to lean harder on productive life, livability, and fertility as indirect heat-tolerance filters while feeding good data back into the system so the next crash is spotted in years, not decades. Underneath it all is one question this article keeps pushing you to ask every time you open a sire catalog: what am I not measuring that I’m going to wish I had?
Complete references and supporting documentation are available upon request by contacting the editorial team at editor@thebullvine.com.
211,000 More Dairy Cows. Bleeding Margins. The 2026 Math That Won’t Wait. – Breaks down the structural reset facing the U.S. herd and reveals why current beef-calf premiums are masking a dangerous replacement shortage. It prepares you to navigate a $2.00–$4.00/cwt breakeven gap before the 2027 heifer crunch arrives.
Slick Genetics Revolution: How One Gene Could Save Dairy Farmers $5,000 Per Cow Lifetime – Reveals the internal “thermal management system” that infrastructure can’t match, delivering a permanent 50–70% reduction in heat stress. You’ll gain the competitive edge to trade expensive fans and sprinklers for heritable, internal resilience that protects your production year-round.
The Sunday Read Dairy Professionals Don’t Skip.
Every week, thousands of producers, breeders, and industry insiders open Bullvine Weekly for genetics insights, market shifts, and profit strategies they won’t find anywhere else. One email. Five minutes. Smarter decisions all week.
Think an “outsider” can’t build a serious dairy? An Oscar‑winner with Golden Guernseys proved otherwise — right up until the war took her help away.
The cover that started this story. LIFE Magazine, March 2, 1942: Ginger Rogers in angling gear on the banks of the Rogue River — a 15-hour drive from Hollywood, and she made the trip as often as her filming schedule allowed. Inside the issue, three photographs told the rest: Rogers feeding wildflowers to her cows, surveying 1,000 acres from the ranch-house roof, and watching the Guernseys come home at dinnertime with Lela at her side.
On March 2, 1942, LIFE Magazine hit newsstands with Ginger Rogers on the cover. Not in a sequined gown. Not mid-pirouette with Fred Astaire. She was in fishing gear — rod in hand, somewhere on the banks of her own river in southern Oregon.
Inside the magazine, the photographs told a deeper story. One showed Rogers on the roof of her ranch house, surveying more than 1,000 acres of the Rogue River Valley — the LIFE caption noted it took her 15 hours to drive here from Hollywood, but she went there often “for a taste of honest country life.” In another, she was feeding wildflowers to one of her 22 cows. And in a third, she leaned against a fence rail with her mother, Lela, and their farm manager, watching the cattle at dinnertime — with a Jersey and a Guernsey looking straight at the camera.
The fence-rail moment. From LIFE Magazine, March 2, 1942: Ginger (left), the farm manager, and Lela Rogers (right) watch the cattle come in at dinnertime on the Rogue River Ranch, Eagle Point, Oregon. In the foreground, looking straight at the camera — a Jersey and a Guernsey. Remember this scene. It comes back at the end.
This wasn’t a photo op. By the spring of 1942, Virginia Katherine McMath — the girl from Independence, Missouri, who’d tap-danced her way to an Academy Award — had sunk serious money into Guernsey dairy cattle, purebred Angus beef, and a milking parlor built to standards that meant business. Barely a year off her Oscar win for Kitty Foyleat the 13th Academy Awards on February 27, 1941 — she’d beaten Katharine Hepburn, no less — and still only 30 years old, she was RKO Studios’ hottest commodity.
The day job. Fred Astaire and Ginger Rogers in the iconic “Cheek to Cheek” number from Top Hat (1935). By 1942, the woman in the white gown was the highest-paid star in Hollywood — and spending every free hour driving 15 hours north to build a Guernsey dairy from scratch on the banks of the Rogue River.
And she was pouring it all into a dairy.
The Ranch That Wasn’t a Playground
The purchase happened in 1941, the same year as that Oscar. Rogers and her mother bought what would become Rogers’ Rogue River Ranch — locally known as the “4R” — near the hamlet of Eagle Point, about 17 miles north of Medford. Two parcels combined: 470 acres on the east side of the Rogue River, 380 on the west. Eight hundred fifty acres to start.
By 1942, additional purchases pushed the holding past 1,050 acres, with more than 2.5 miles of river frontage on both banks.
Now, the thing about Lela Rogers — she wasn’t some Hollywood stage mother content to ride her daughter’s fame. She’d been a newspaper reporter, a screenwriter, a Marine Corps publicist during World War I. The kind of woman who ran a household like a business long before there was a ranch to manage. When the Medford Mail Tribune came calling, Lela didn’t gush about views or country air. She gave them numbers.
“We will have possibly 50 dairy cows and as many blooded cattle as the ranch will accommodate,” she told the paper. The plan: purebred Angus east of the river, an ultra-modern dairy on the west side, and full stocking within two years.
Two women. A thousand acres. A river between the beef and the milk.
And every skeptic in Jackson County watching to see how fast the movie star would get bored.
The Joke About Bees
The skepticism came fast. When Dr. W. H. Lytle of the Oregon State Department of Agriculture needed to remind celebrity landowners about brand registration, he passed the word through fellow actor Eugene Pallette — a character actor who actually did ranch in eastern Oregon — and cracked that Rogers’ livestock would “probably consist of nothing but bees.”
If you’ve ever been the outsider at a breed association meeting — the one without three generations of family history in the barn — you know exactly the weight behind a joke like that. In rural Oregon in the early 1940s, the idea of a tap-dancing Academy Award winner running a real cattle operation ranked somewhere between unlikely and laughable.
Lela answered in writing. Her daughter had already purchased Golden Guernsey cattle. The brand was decided: “4R.” The letter was firm, factual, and entirely devoid of Hollywood charm.
Then Ginger shut the conversation down herself. When a reporter asked if she really expected the ranch to pay, she didn’t finesse it:
“You’re joking, aren’t you? Why, darn it, I am making it pay. That ranch is no hobby with me. I have enough hobbies. It’s my insurance, and when I’m through in films, I’m going up there to live. I spend all the time I can there now.”
The woman they thought was joking. Ginger Rogers in a studio publicity portrait, circa late 1930s — Hollywood’s highest-paid actress, diamonds on both wrists, with a gaze that dared you to underestimate her. While skeptics cracked that her livestock would “probably consist of nothing but bees,” she’d already applied for membership in the American Guernsey Cattle Club.
That word — insurance — tells you everything. She’d watched Hollywood careers flame out overnight. She’d seen what happened to stars when the box office turned cold. And somewhere in the back of her mind, the daughter of a woman who’d already reinvented herself half a dozen times decided that land and livestock were the only assets a studio couldn’t take back.
Why Golden Guernseys?
Here’s the breed question, and it’s the one most people skip right over in the “movie star buys a farm” version of this story.
Rogers didn’t fill her parlor with Holsteins. She could have. Holsteins were already the volume leaders by the early 1940s — the safe choice, the breed any co-op fieldman would’ve recommended without thinking twice. Instead, she went looking for Guernseys. And this was back when you could still find them everywhere, before the black-and-white tide swept the breed landscape clean.
The nucleus of her herd traces to breeders in Skagit County, Washington; local Shady Cove historians point to the Tillamook dairy country of northern Oregon. She may have bought from both — a woman stocking a thousand-acre ranch from scratch doesn’t always stop at one sale barn. What we know for certain: by 1942, she had applied for membership in the American Guernsey Cattle Club, formally tying the “4R” brand into the registered breed community.
That wasn’t a casual move. Joining the breed association meant committing to registration, to recordkeeping, to the long game of documented genetics.
What nobody standing in those Rogue River pastures could have known — what Rogers herself couldn’t possibly have predicted — was that the very traits pulling her toward Guernseys in 1942 would, eight decades later, become the foundation of a multibillion-dollar premium milk market. The rich golden color, caused by high beta-carotene that passes directly into the milk. The butterfat that routinely runs above 4.5%, with protein over 3.4%. And a trait nobody had a name for yet: the breed’s extraordinary proportion of A2 beta-casein protein — a genetic characteristic that would eventually reshape how consumers choose their milk.
She picked the golden milk breed before “golden milk” was a marketing phrase. She chose the A2 cow before A2 was a line item on a genomic test.
Twelve Cows, 150 Gallons, and a War
A 12-cow milking parlor with electric milkers — no hand milking, no romance about it. A 40-cow feeding barn adjacent to the parlor. An eight-stall hospital barn — and that’s the detail worth pausing on. She built dedicated space for fresh cows and sick cows, the kind of investment that says somebody on this ranch understood cow care isn’t optional. The woman who fed wildflowers to her cattle also built them a hospital. A 150-ton corn silage silo. A hay-keeper rated for about 100 tons of haylage.
The LIFE photographs show approximately 22 cows in early 1942, with the herd growing to 32 Guernseys at peak capacity. At least one Jersey appears in the LIFE photos alongside the Guernseys — so the dairy may not have been exclusively one breed, though Guernseys clearly dominated and carried the brand identity.
Between filming Roxie Hart — which premiered at the Craterian Theater in Medford in April 1942, the same stage she’d first danced on as a 14-year-old vaudeville performer on April 21, 1926 — Rogers commuted those 15 hours from Hollywood to work the ranch. After gas rationing kicked in later that year, that drive became even harder to justify. She kept making it. She admitted she kept the chores light: no plowing, no hoeing. The electric milkers and the hired crew handled the heavy fieldwork.
And then, in January 1942, the U.S. Army started building a city nine miles from her front gate.
Camp White rose from the Agate Desert in six months flat. A $27 million construction project — more than 1,300 buildings thrown up around the clock, designed to house and train tens of thousands of soldiers. By that August, the 91st “Fir Tree” Division reactivated at a camp that hadn’t existed eight months earlier. At its peak, more than 40,000 soldiers were stationed there, with a training pipeline that would process well over 100,000 during the war years.
Think about that for a second. A military installation the size of a small city, materializing overnight in the Rogue Valley. And a small city needs milk. A lot of it.
The 4R dairy stepped into that gap. Rogers’ Guernseys shipped approximately 150 gallons per day to Camp White, helping supply more than 2,000 soldiers. Run the math: 150 gallons is roughly 1,300 pounds of milk daily. Spread across 32 cows, you’re looking at about 40 pounds per cow per day — solid, honest Guernsey production for the 1940s, right in line with what the breed could deliver under competent management.
The milk had to be clean. Military contracts meant rigorous bacteria-count standards, and the parlor’s infrastructure — electric milkers, dedicated hospital barn, proper feeding facilities — suddenly makes even more sense as equipment designed for consistency and sanitation, not show.
For one brief, brilliant window, the 4R dairy had the best possible setup for a small Guernsey operation: a captive institutional customer with an enormous appetite, a product that stood apart — golden, rich, high in components — and a brand that no other farm in Jackson County could match.
Those embossed Duraglas quart bottles told the whole story. On the glass: “Golden Guernsey (Trade Mark), America’s Table Milk.”
Not bad for a “hobby farm.” This December 15, 1943 Jamesway ad in the Western Livestock Journal featured Ginger and Lela Rogers alongside the streamlined dairy complex at Rogers’ Rogue River Ranch, Eagle Point, Oregon. The ad copy confirms 150 gallons shipped daily to Camp White — with bacteria counts of just 900 to 1,200 on raw milk, numbers that would impress any inspector today. Bottom left: the Guernsey herd at the feeding corral. Bottom right: six Guernseys in the milking parlor. Image courtesy of the Western Livestock Journal.
When the War Took the Help Away
Here’s where the story hits the fencepost.
The same war that gave Rogers Camp White as a customer gutted her labor supply. Young men who might have run hay crews, cleaned the parlor, and managed irrigation were shipping out to the Pacific or building Liberty ships in Portland. Rural Oregon was emptying out, and a ranch that needed hands to function was competing for workers against a war economy that paid better and wrapped itself in patriotism besides.
Rogers sold animals from the herd. She entered a profit-sharing arrangement with a partner to keep the operation running. Every dairy farmer who’s ever had to let a hired man go because the margins couldn’t carry the payroll knows exactly what those decisions feel like. These aren’t hobby-farm problems. These are the desperate, 2 a.m. math problems of someone fighting to hold a real business together.
And then — around 1943, barely two years after those first Guernseys arrived — the dairy herd was sold.
Let that land for a moment.
The woman who’d stood in front of reporters and declared “darn it, I am making it pay” watched her Golden Guernseys leave the property. The parlor went quiet. The bulk tank went dry. The “4R” brand stayed on the Angus, but the dairy — the thing she’d joined the American Guernsey Cattle Club for, the thing she’d built a hospital barn and a silage silo for — was done.
She never said publicly how that felt. But remember what she’d told writer Jack Holland: the ranch was her “biggest thrill,” her “secret desire.” She’d confessed she never told anyone about wanting it — “Perhaps because I didn’t want to listen to a lot of idle talk and advice as to why I would be foolish to buy a ranch.”
Selling those Guernseys must have tasted like proving every skeptic right. Even though the real enemy wasn’t bad judgment. It was a world war.
Holding On
A lesser person walks away. Rogers held the land.
The Angus stayed. The river kept running. She fished steelhead on drift boats with Glen Wooldridge — the pioneer whitewater guide who later said she was one of the best guests he ever took on the Rogue. She took camping trips without leaving her own property. A thousand acres was enough wilderness to get lost in, if getting lost was what you needed. She climbed her own silo — a photograph that still circulates on the internet eight decades later, showing an Academy Award winner in work clothes scaling a concrete tower like she owned the place. reddit
Because she did.
No sequins required. Ginger Rogers grooms Prince Domino XVII — a Hereford bull from one of the most famous sire lines in beef cattle history — at the Blue Moon Ranch near her 4R property in Eagle Point, Oregon. She looks every bit as at ease with a curry brush and a feed bucket as she ever did under the studio lights. Photo by Earl Theisen for Look Magazine; image courtesy of the family of Earl Theisen.
In 1948, three years after the war ended, she started restocking the ranch with cattle, aiming for another run at the vision she and Lela had sketched in 1941.
But the dairy world she re-entered was shifting underneath her. Artificial insemination was gaining traction. Holstein dominance was accelerating. The breed landscape that had been a patchwork of Guernseys, Jerseys, Ayrshires, and Brown Swiss was beginning its long consolidation into the black-and-white monoculture that would define the next half-century. Decades later, a woman from Tillamook County who’d raised a Guernsey 4-H calf named Java Jive in 1962 would look around her community and mourn: “Those were the days when Jerseys and Guernseys were everywhere. Now, Tillamook is a black and white landscape of Holsteins.”
Rogers’ Guernseys had already become part of that disappearing world.
By 1959, a portion of the ranch went up for sale — the first crack in the thousand-acre footprint. She held the rest for three more decades, finally selling the remaining parcels in 1990. She kept a home in the area — a resident of nearby Shady Cove, according to local records. On November 21, 1993, just over a year before her death, the 82-year-old Rogers stood on the stage of the Craterian Theater, the same house where she’d danced as a teenager in 1926 and premiered Roxie Hart in April 1942, and urged the crowd to help save the aging building. She re-introduced what she called her favorite film and helped raise more than $100,000 for the theater’s restoration.
For half a century, the communities along the Upper Rogue knew her not as the woman who danced backwards in high heels, but as the neighbor who ran a ranch as a business, fished the river like she meant it, and never treated southern Oregon like a set that could be struck after the cameras stopped rolling.
On April 25, 1995, Ginger Rogers died at her home in Rancho Mirage, California. She was 83. She was cremated and interred at Oakwood Memorial Park in Chatsworth — next to Lela.
Mother and daughter, together at the end. The way they’d been together at that fence rail, watching cattle come in at dinnertime on the Rogue.
After her death, more than 3,000 locals signed a petition to rename the Craterian Theater in her honor. The Medford City Council agreed. It became the Craterian Ginger Rogers Theater — and the stage carries her name to this day.
The Milk Bottle That Outlasted the Parlor
You can still hold one of Ginger Rogers’ milk bottles in your hands.
1940s — cowboy hat logo, “Medford, Oregon,” and that unmistakable orange print. Flip it over and you’ll find the words: “Golden Guernsey (Trade Mark), America’s Table Milk.” These bottles, donated by Rogers’ longtime secretary Roberta Olden, are still available through the Owens-Rogers Museum in Independence, Missouri — the town where Ginger was born.
The Owens-Rogers Museum in Independence, Missouri — the town where she was born — has sold original 4R Dairy Duraglas quart bottles, donated by Rogers’ longtime secretary, Roberta Olden. Turn one over and you’ll find the words that mattered: “Golden Guernsey (Trade Mark), America’s Table Milk.”
That phrase — embossed in glass, surviving decades after the cows that filled those bottles were sold, after the parlor that processed their milk went silent, after the woman who built it all was laid to rest — carries more weight now than it did in 1942.
Because the bet Ginger Rogers placed on Golden Guernsey milk has turned out to be exactly right.
The Breed She Saw Before Anyone Else
Of all tested Guernseys in the American Guernsey Association database, over 80% carry the A2A2 genotype for beta-casein — and every Guernsey sire currently in AI service tests 100% A2A2. That’s not an accident. Decades of selection by breeders who understood that what makes Guernsey milk different is what makes it valuable produced a breed now sitting at the front of a consumer revolution.
The global A2 milk market — driven by buyers seeking milk they believe is easier to digest — is projected to grow from roughly $3 billion to over $7 billion by 2034. Guernseys, with their naturally dominant A2 genetics, own the inside lane.
Layer on butterfat above 4.5%, protein over 3.4%, and that unmistakable golden color — the same color that made Rogers’ bottles look different from every other quart in Jackson County in 1942 — and you’ve got a breed that seems purpose-built for the premium, direct-to-consumer, story-driven dairy model attracting a new generation of farmers.
Farms like Promise Valley Farm & Creamery on Vancouver Island are the living proof. Mark and Caroline Nagtegaal — both first-generation dairy farmers — tried conventional Holsteins first. Struggled financially. Dispersed the herd in 2015 and sold their quota. But they still had the dream. They connected with Leon Zweegman at Rozelyn Farm in Lynden, Washington, a passionate Guernsey breeder who sold them their foundation animals. Today, their 14-cow registered Guernsey herd is 100% A2A2 and certified organic — the only certified organic Guernsey herd in Canada. They process on-farm into yogurt, whole milk in branded glass bottles from a self-serve dispenser, and feta in traditional whey brine.
In Idaho, Paul Herndon at Pleasant Meadow Creamery runs a similar operation: all registered Guernseys, every animal A2A2, raw milk sold direct to consumers who drive to the farm specifically because they want what Guernseys produce.
Rogers didn’t have yogurt cups or self-serve dispensers or Instagram. But she made the same fundamental move these operations are built on: pick a breed that produces something visibly, measurably different. Find a customer who values that difference. Build the infrastructure to deliver it every single day.
What Ginger Rogers Left the Dairy Industry
She didn’t leave a prefix in the herdbook. The 4R Guernseys, dispersed around 1943, are too far back and too few in number to trace forward into modern pedigrees or sire catalogs. Her genetic footprint in the breed is, honestly, invisible.
But the legacy that matters here isn’t written in bloodlines. It’s written in conviction.
Rogers proved — in 1941, when the notion was laughable — that someone from entirely outside the industry could enter dairy farming with serious intent, build a real operation, join the breed community, and produce milk that met the standards of a wartime military contract. She didn’t succeed permanently. The dairy lasted barely two years before economics and labor broke it. But she tried with everything she had. And when the herd was gone, she held the land for five more decades because she believed in what it represented.
Every time a career-changer walks into a Guernsey breeder’s barn and says “I want to build something different,” they’re walking a path she helped beat through the skepticism. Every time a 14-cow Guernsey dairy stamps “A2A2” and “Golden Guernsey” on a glass bottle and sells it for three times the conventional price, they’re reaching for the same thing an Oscar-winning actress and her mother reached for on the banks of the Rogue River, 85 years ago.
Her Place in Dairy History
The bottles are still out there. Heavy Duraglas quart glass, embossed with the 4R logo and the words that told the whole story.
The woman who filled them is gone. The cows are gone. The parlor is gone. The ranch itself has been carved into pieces and sold to strangers. But the bet she placed — that golden milk from a breed most people overlooked could be worth more than a studio contract — has never looked smarter.
Somewhere in southern Oregon, the Rogue River still runs past the ground where an actress decided her real life wasn’t on a soundstage. It was in a barn, at dawn, with Golden Guernseys breathing steam into the morning air.
For a woman who spent her whole career proving she could do anything Fred Astaire did — backwards, and in high heels — this might have been the role she was proudest of.
Key Takeaways
Ginger Rogers didn’t play “hobby farm.” She poured Oscar money into 1,000 Rogue River acres, a 12-cow Guernsey parlor, and real, working-dairy infrastructure.
At its peak, her 4R Guernseys shipped about 150 gallons a day of Golden Guernsey milk to Camp White, helping fuel over 2,000 WWII soldiers on the Agate Desert.
The same war that created that market stripped her labor and forced a painful herd dispersal after just a few years — yet she held the land for roughly 50.
Today’s A2A2 Guernsey micro-dairies — from Promise Valley in Canada to Pleasant Meadow in Idaho — are finally monetizing the golden milk and components she chose.
For modern producers, her legacy isn’t in pedigrees but in mindset: premium milk, clear breed identity, and the guts to build a serious dairy as an “outsider” can still pay.
Why the A2 Boom Bypassed Heritage Breeds – And What’s Actually Working – This deep-dive into breed politics and market shifts explains the industry forces Rogers saw coming. It provides the essential context for understanding why her bet on Golden Guernseys was genetically sound but economically ahead of its time.
Waterloo dairy farm producing milk that’s easier to digest – Tracing the line from Rogers’ “Golden Guernsey” quart bottles to the modern success of operations like Eby Manor, this profile proves her foundation held. It shows how today’s breeders finally monetized the “insurance” she first identified on the Rogue.
The Sunday Read Dairy Professionals Don’t Skip.
Every week, thousands of producers, breeders, and industry insiders open Bullvine Weekly for genetics insights, market shifts, and profit strategies they won’t find anywhere else. One email. Five minutes. Smarter decisions all week.
To provide the best experiences, we use technologies like cookies to store and/or access device information. Consenting to these technologies will allow us to process data such as browsing behavior or unique IDs on this site. Not consenting or withdrawing consent, may adversely affect certain features and functions.
Functional
Always active
The technical storage or access is strictly necessary for the legitimate purpose of enabling the use of a specific service explicitly requested by the subscriber or user, or for the sole purpose of carrying out the transmission of a communication over an electronic communications network.
Preferences
The technical storage or access is necessary for the legitimate purpose of storing preferences that are not requested by the subscriber or user.
Statistics
The technical storage or access that is used exclusively for statistical purposes.The technical storage or access that is used exclusively for anonymous statistical purposes. Without a subpoena, voluntary compliance on the part of your Internet Service Provider, or additional records from a third party, information stored or retrieved for this purpose alone cannot usually be used to identify you.
Marketing
The technical storage or access is required to create user profiles to send advertising, or to track the user on a website or across several websites for similar marketing purposes.
To provide the best experiences, we and our partners use technologies like cookies to store and/or access device information. Consenting to these technologies will allow us and our partners to process personal data such as browsing behavior or unique IDs on this site and show (non-) personalized ads. Not consenting or withdrawing consent, may adversely affect certain features and functions.
Click below to consent to the above or make granular choices. Your choices will be applied to this site only. You can change your settings at any time, including withdrawing your consent, by using the toggles on the Cookie Policy, or by clicking on the manage consent button at the bottom of the screen.
Functional
Always active
The technical storage or access is strictly necessary for the legitimate purpose of enabling the use of a specific service explicitly requested by the subscriber or user, or for the sole purpose of carrying out the transmission of a communication over an electronic communications network.
Preferences
The technical storage or access is necessary for the legitimate purpose of storing preferences that are not requested by the subscriber or user.
Statistics
The technical storage or access that is used exclusively for statistical purposes.The technical storage or access that is used exclusively for anonymous statistical purposes. Without a subpoena, voluntary compliance on the part of your Internet Service Provider, or additional records from a third party, information stored or retrieved for this purpose alone cannot usually be used to identify you.
Marketing
The technical storage or access is required to create user profiles to send advertising, or to track the user on a website or across several websites for similar marketing purposes.











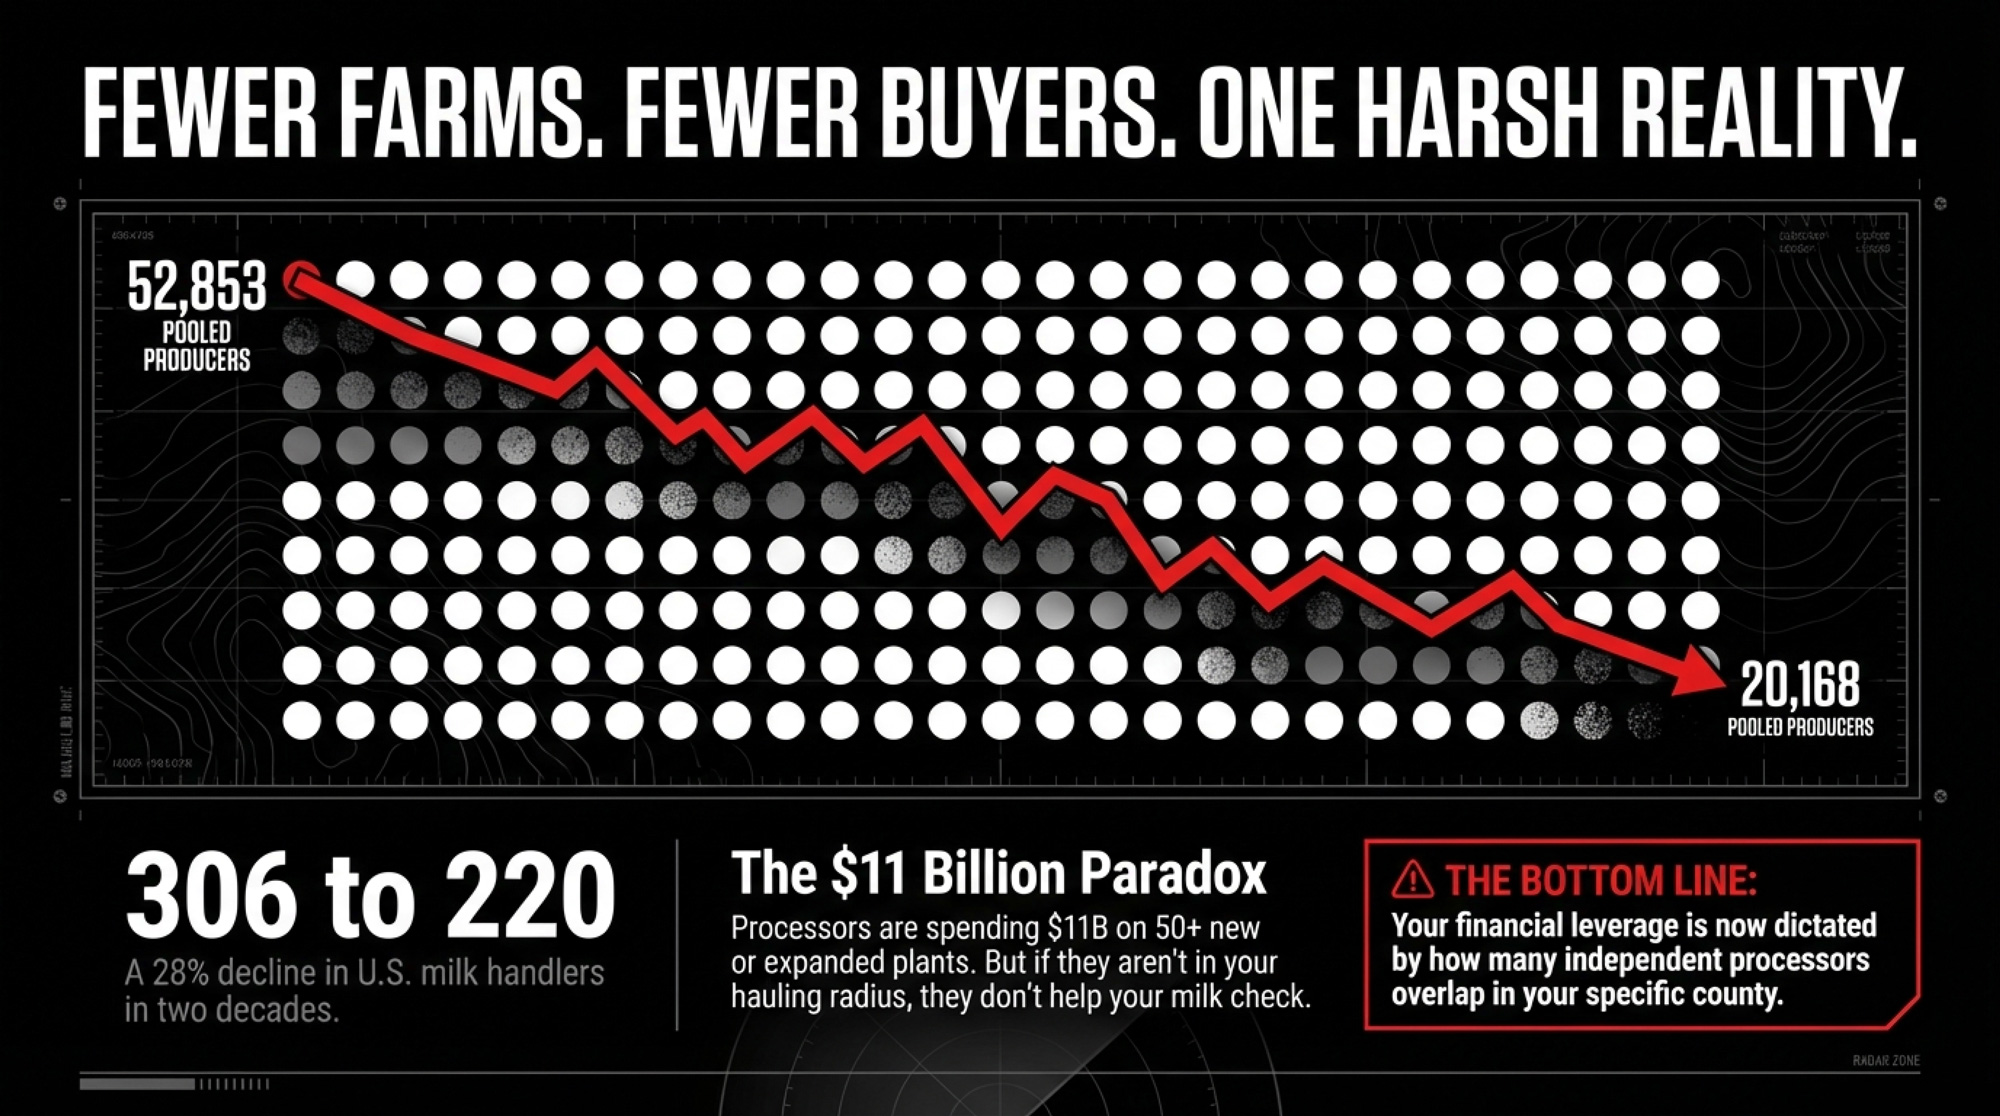
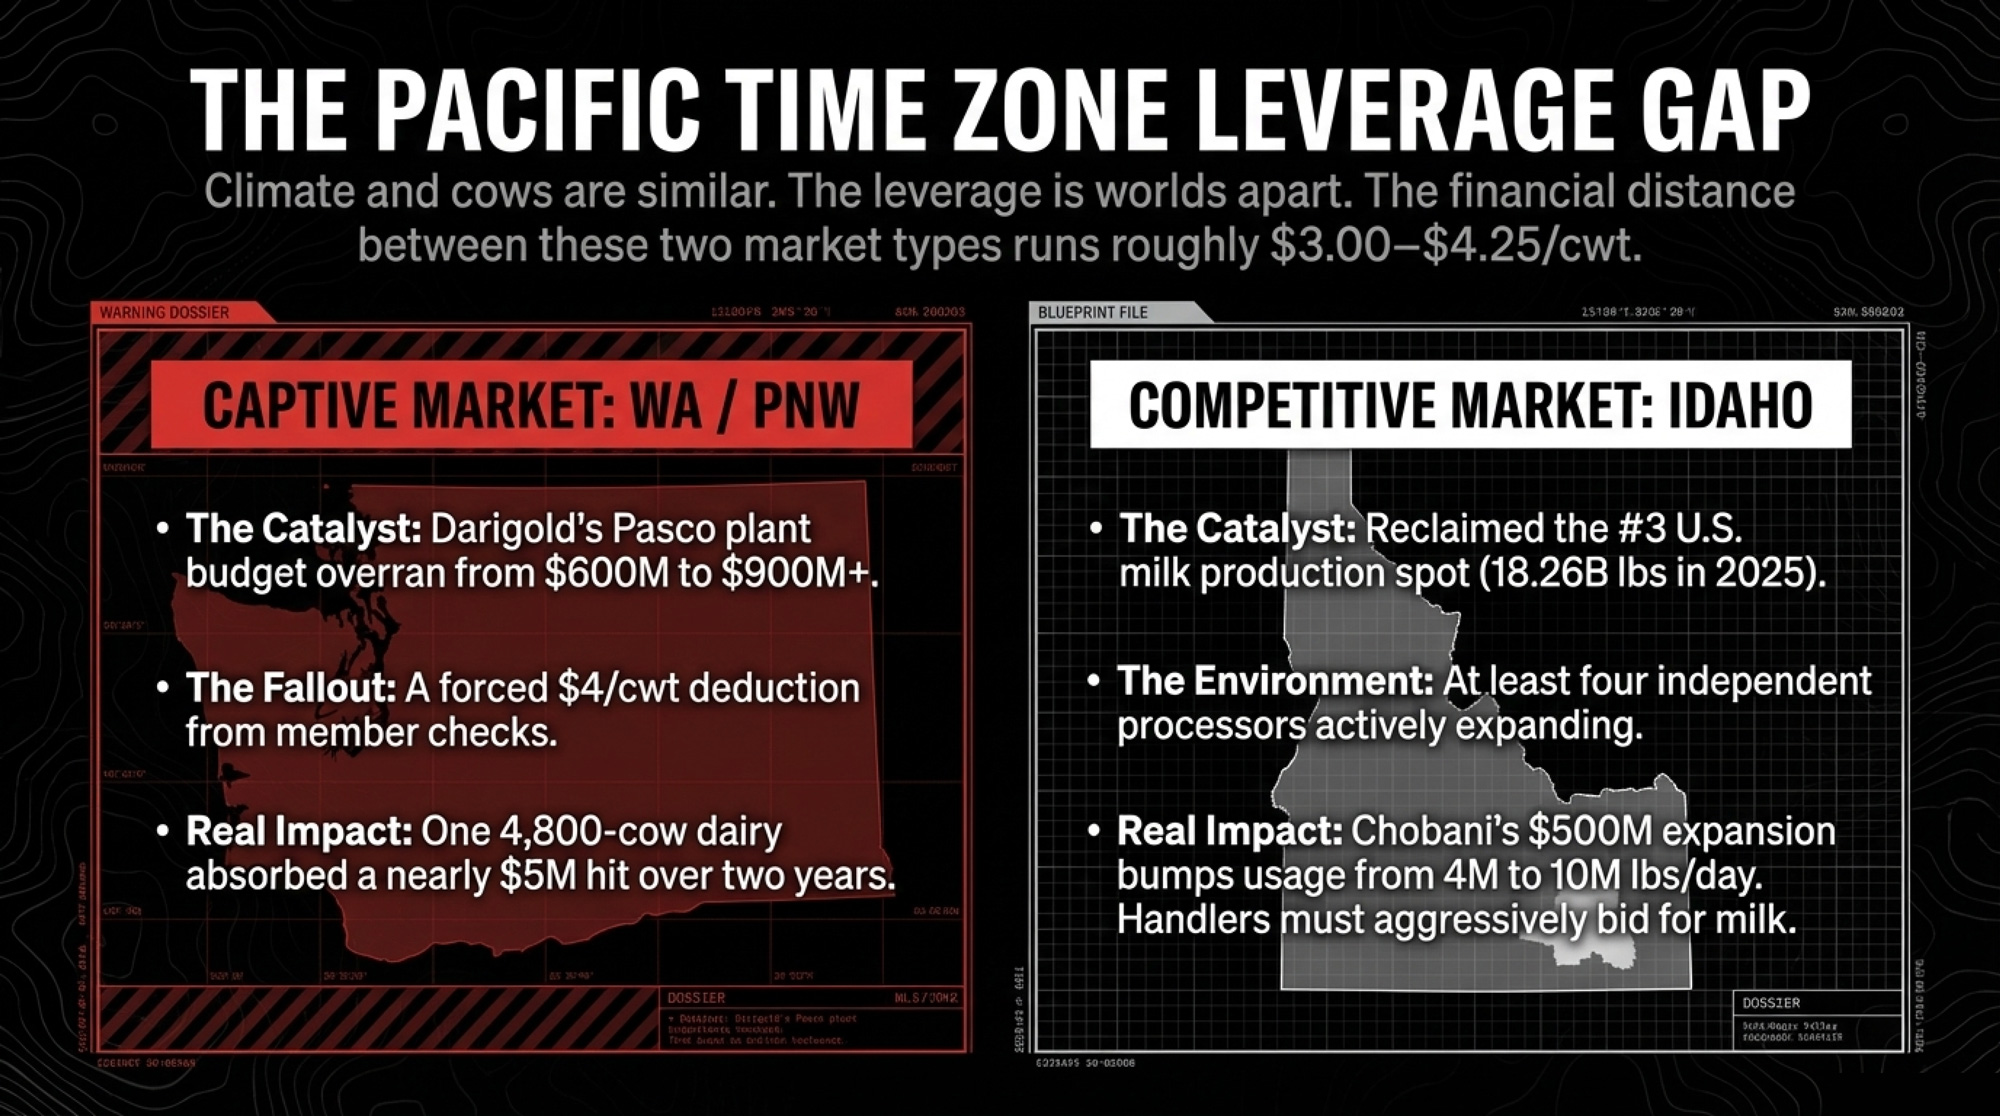
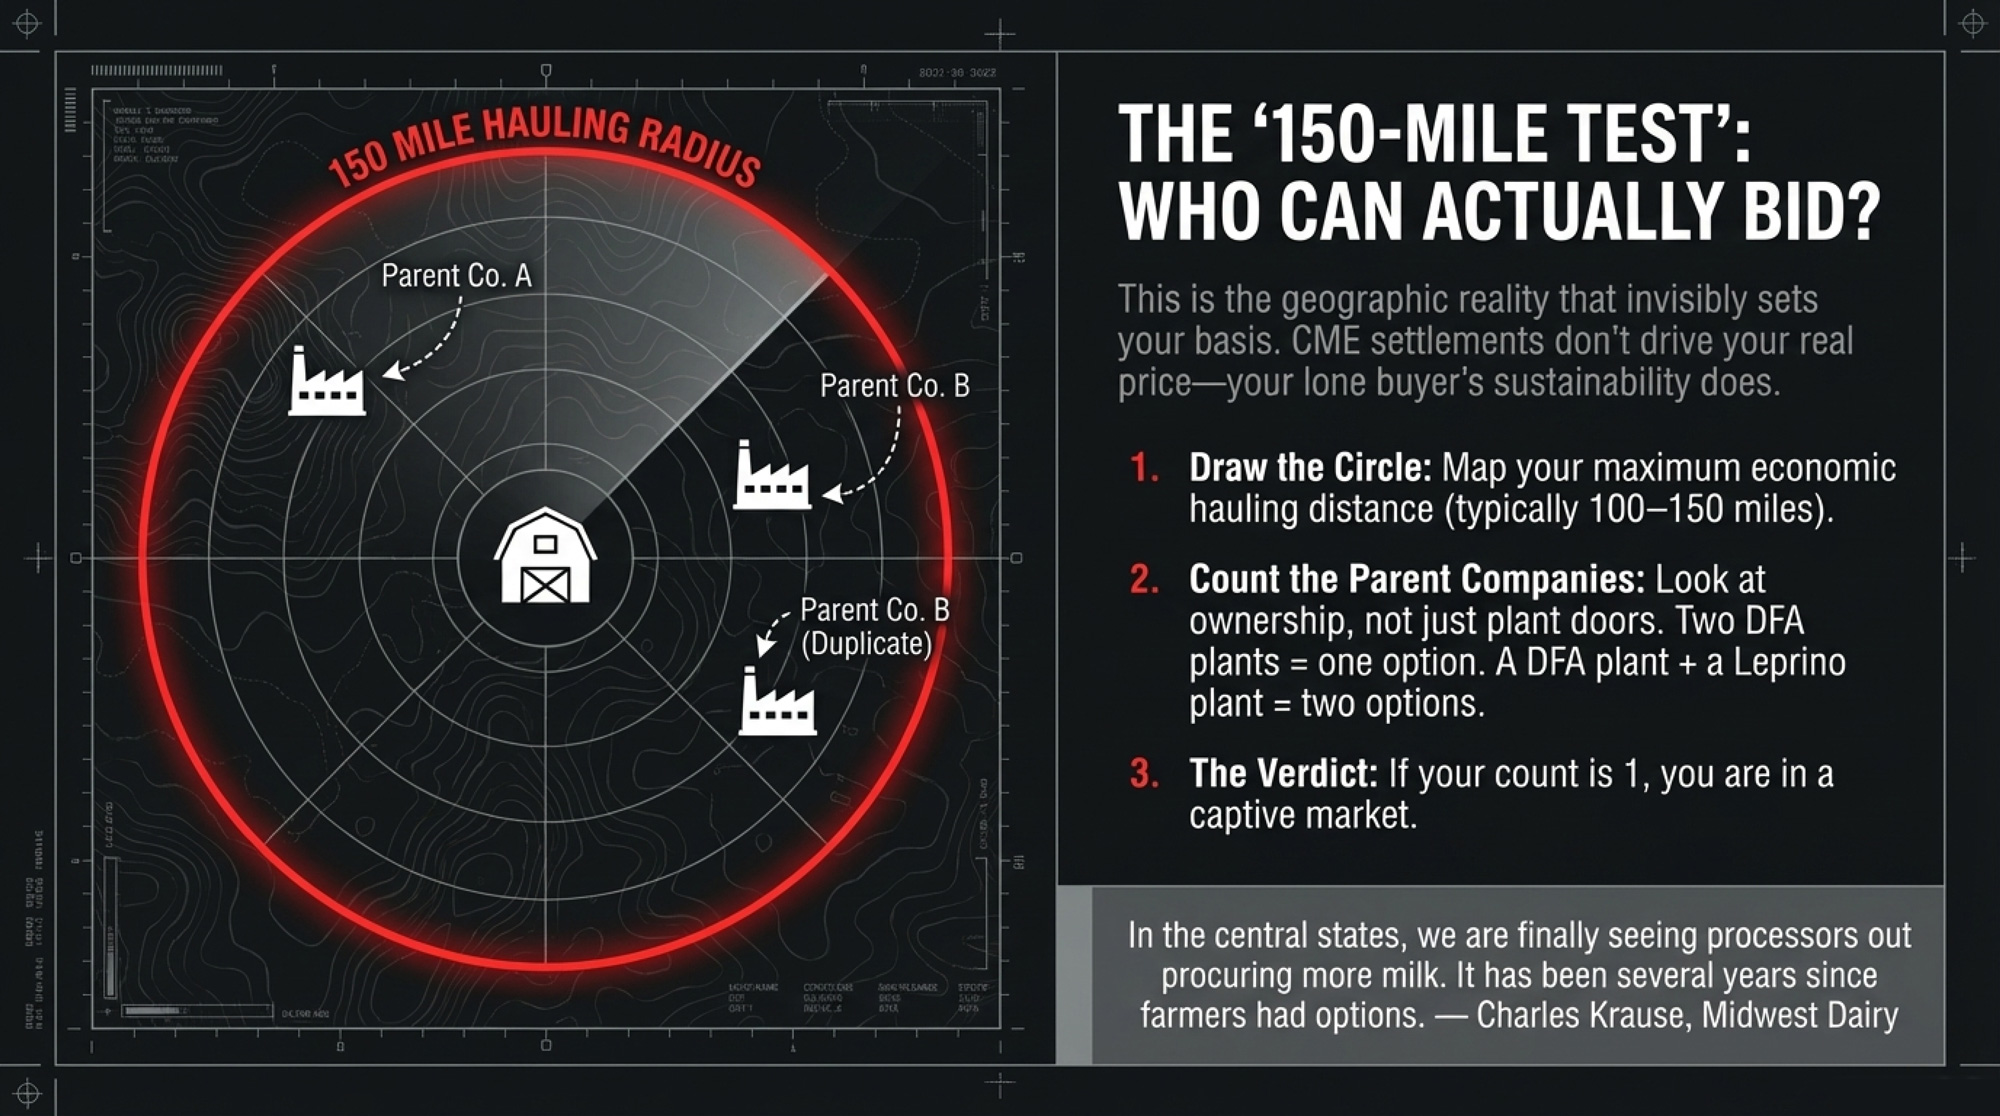
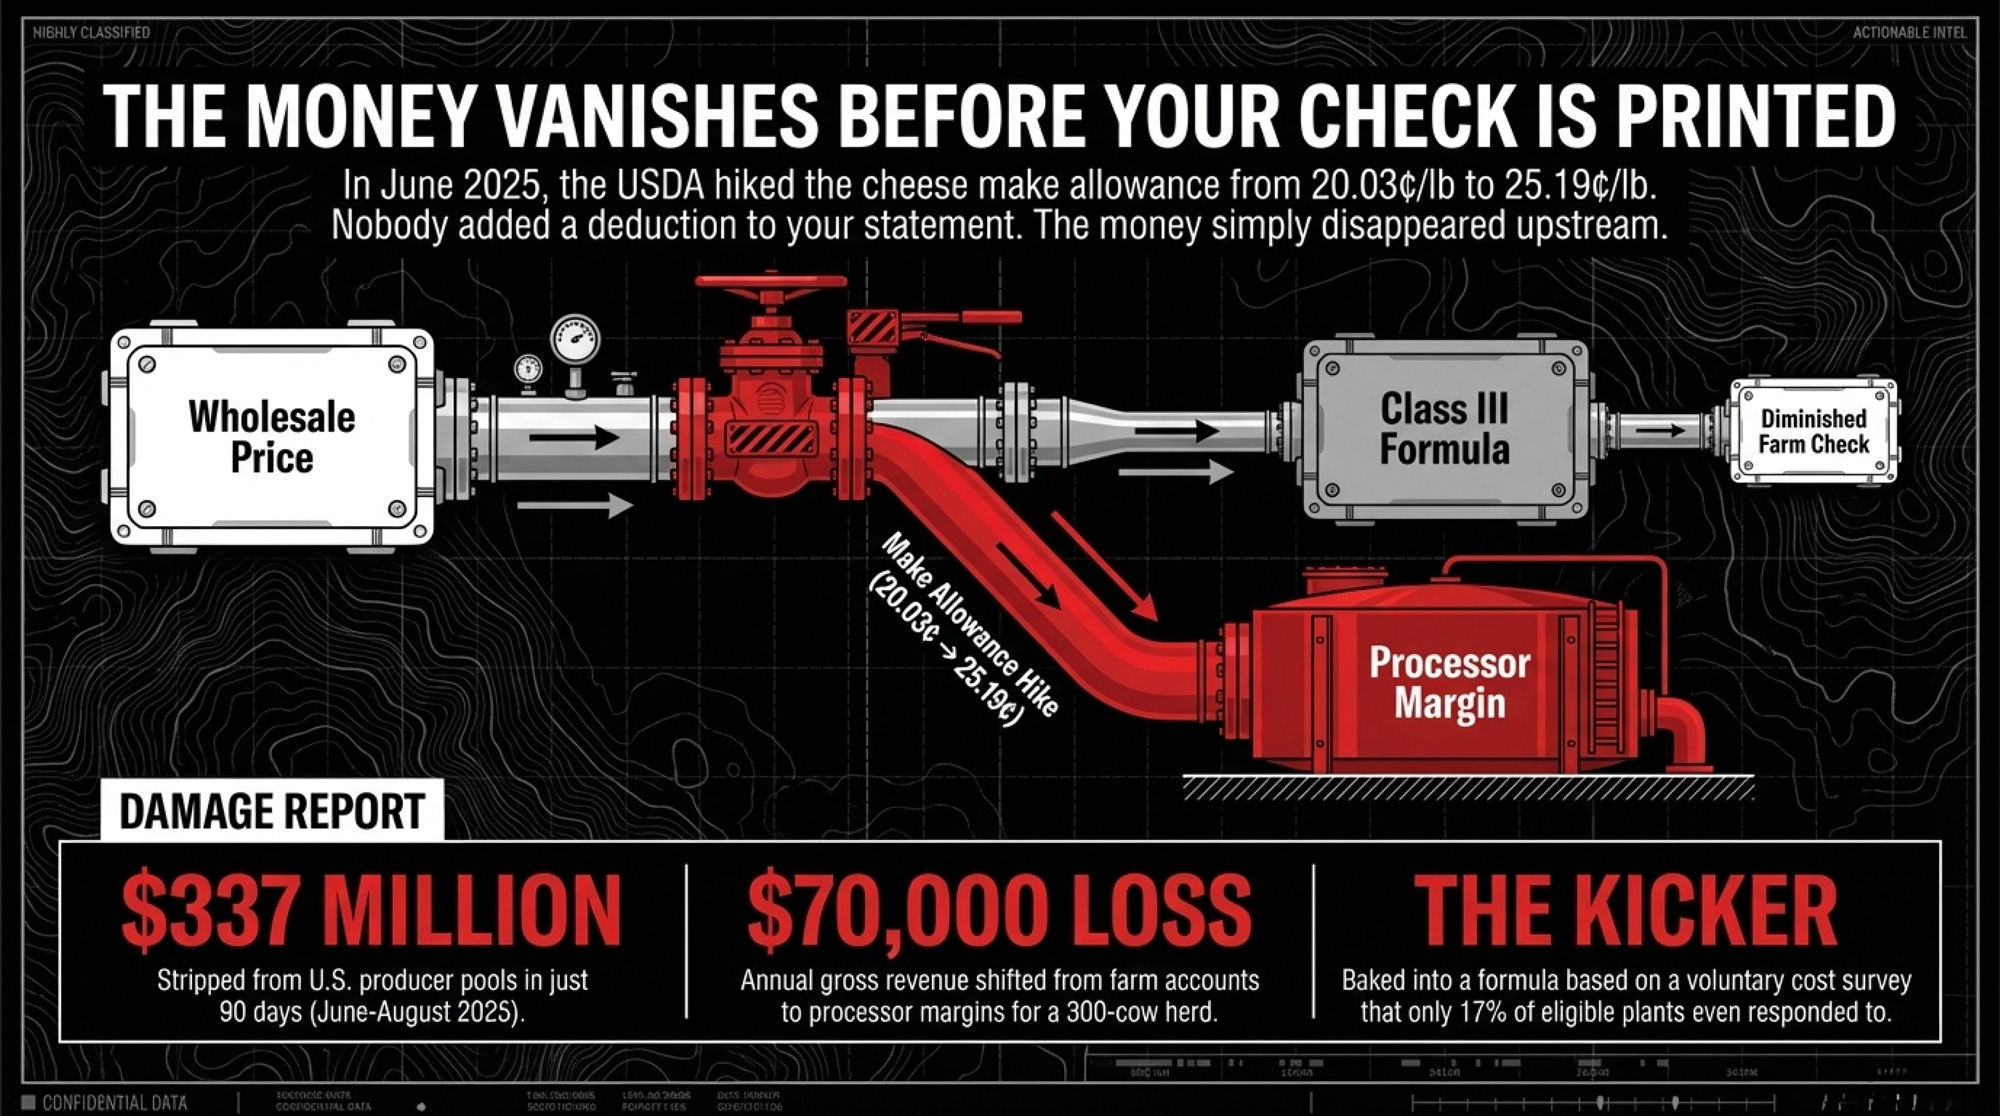
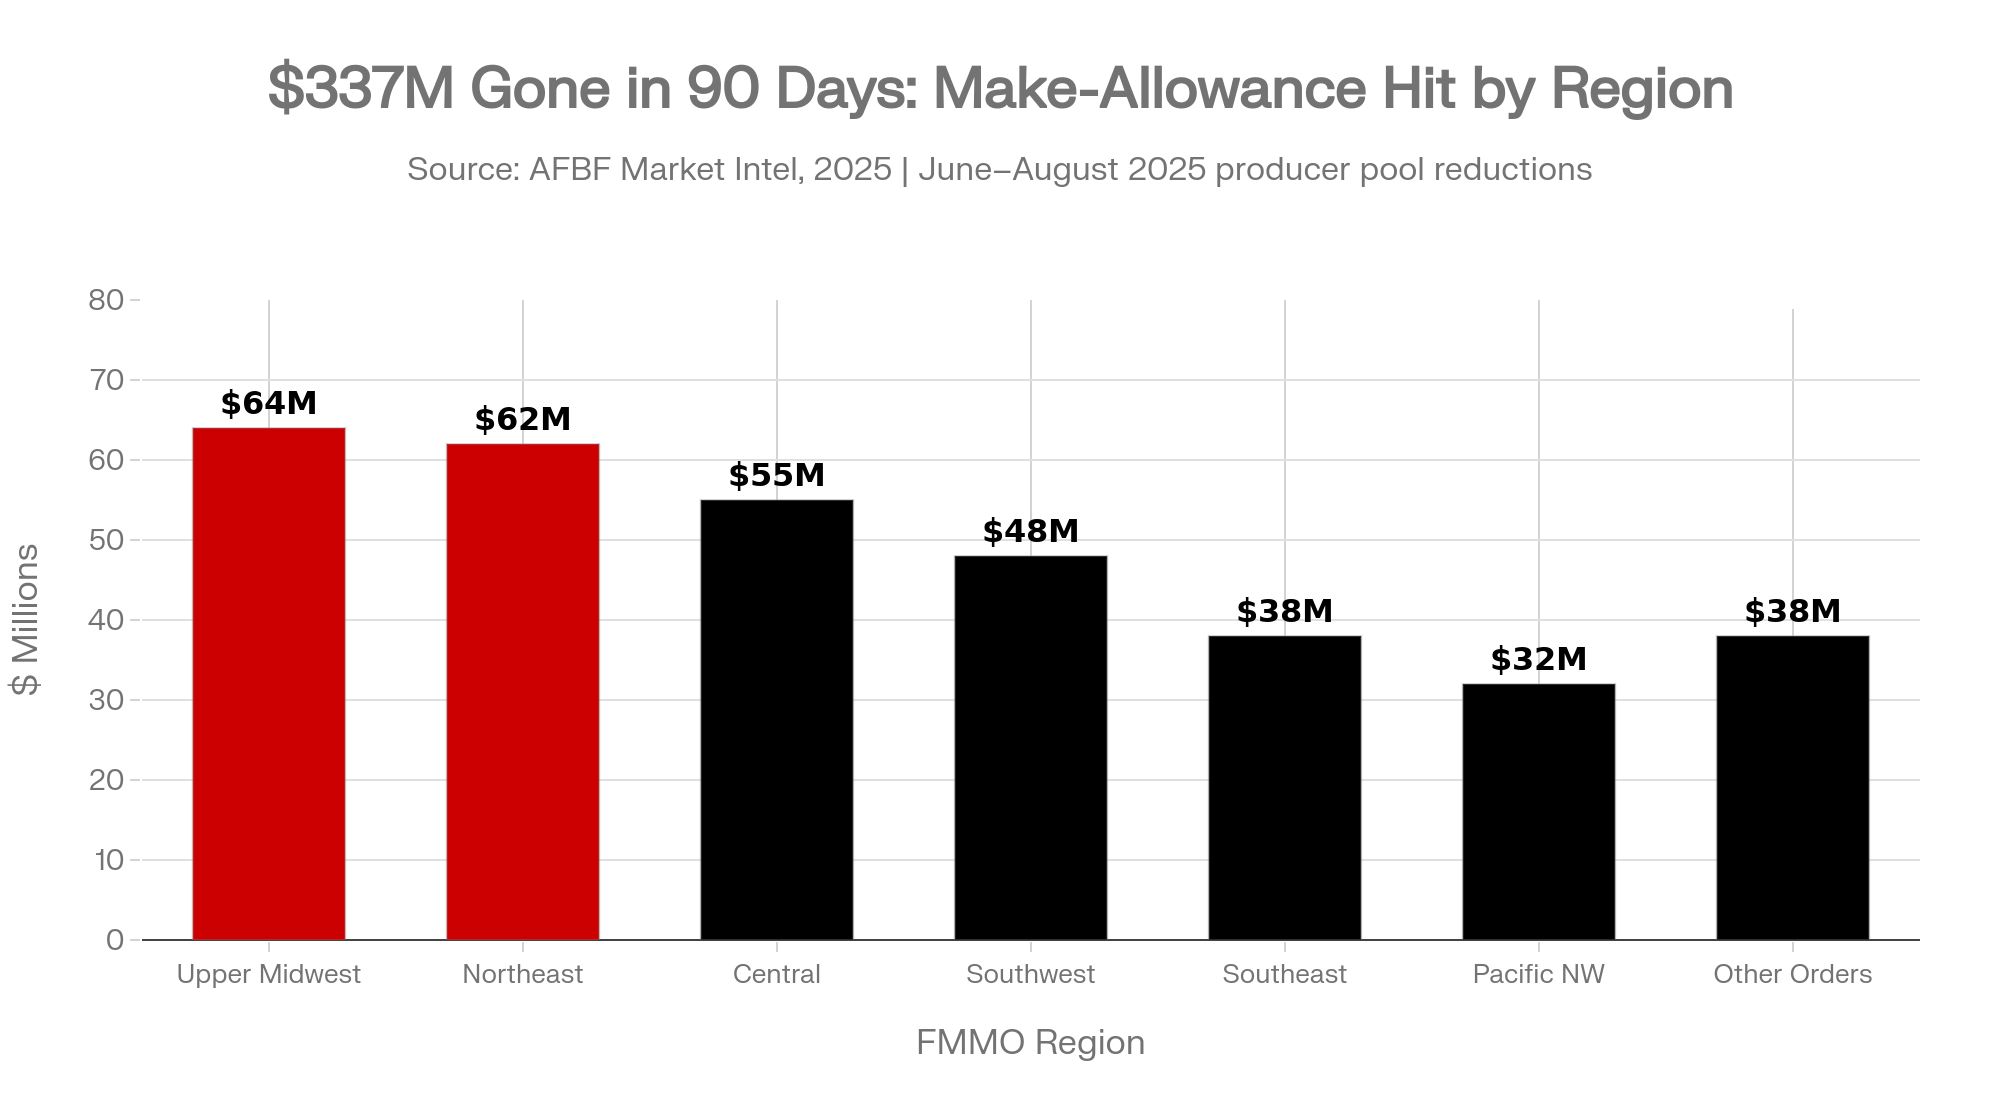


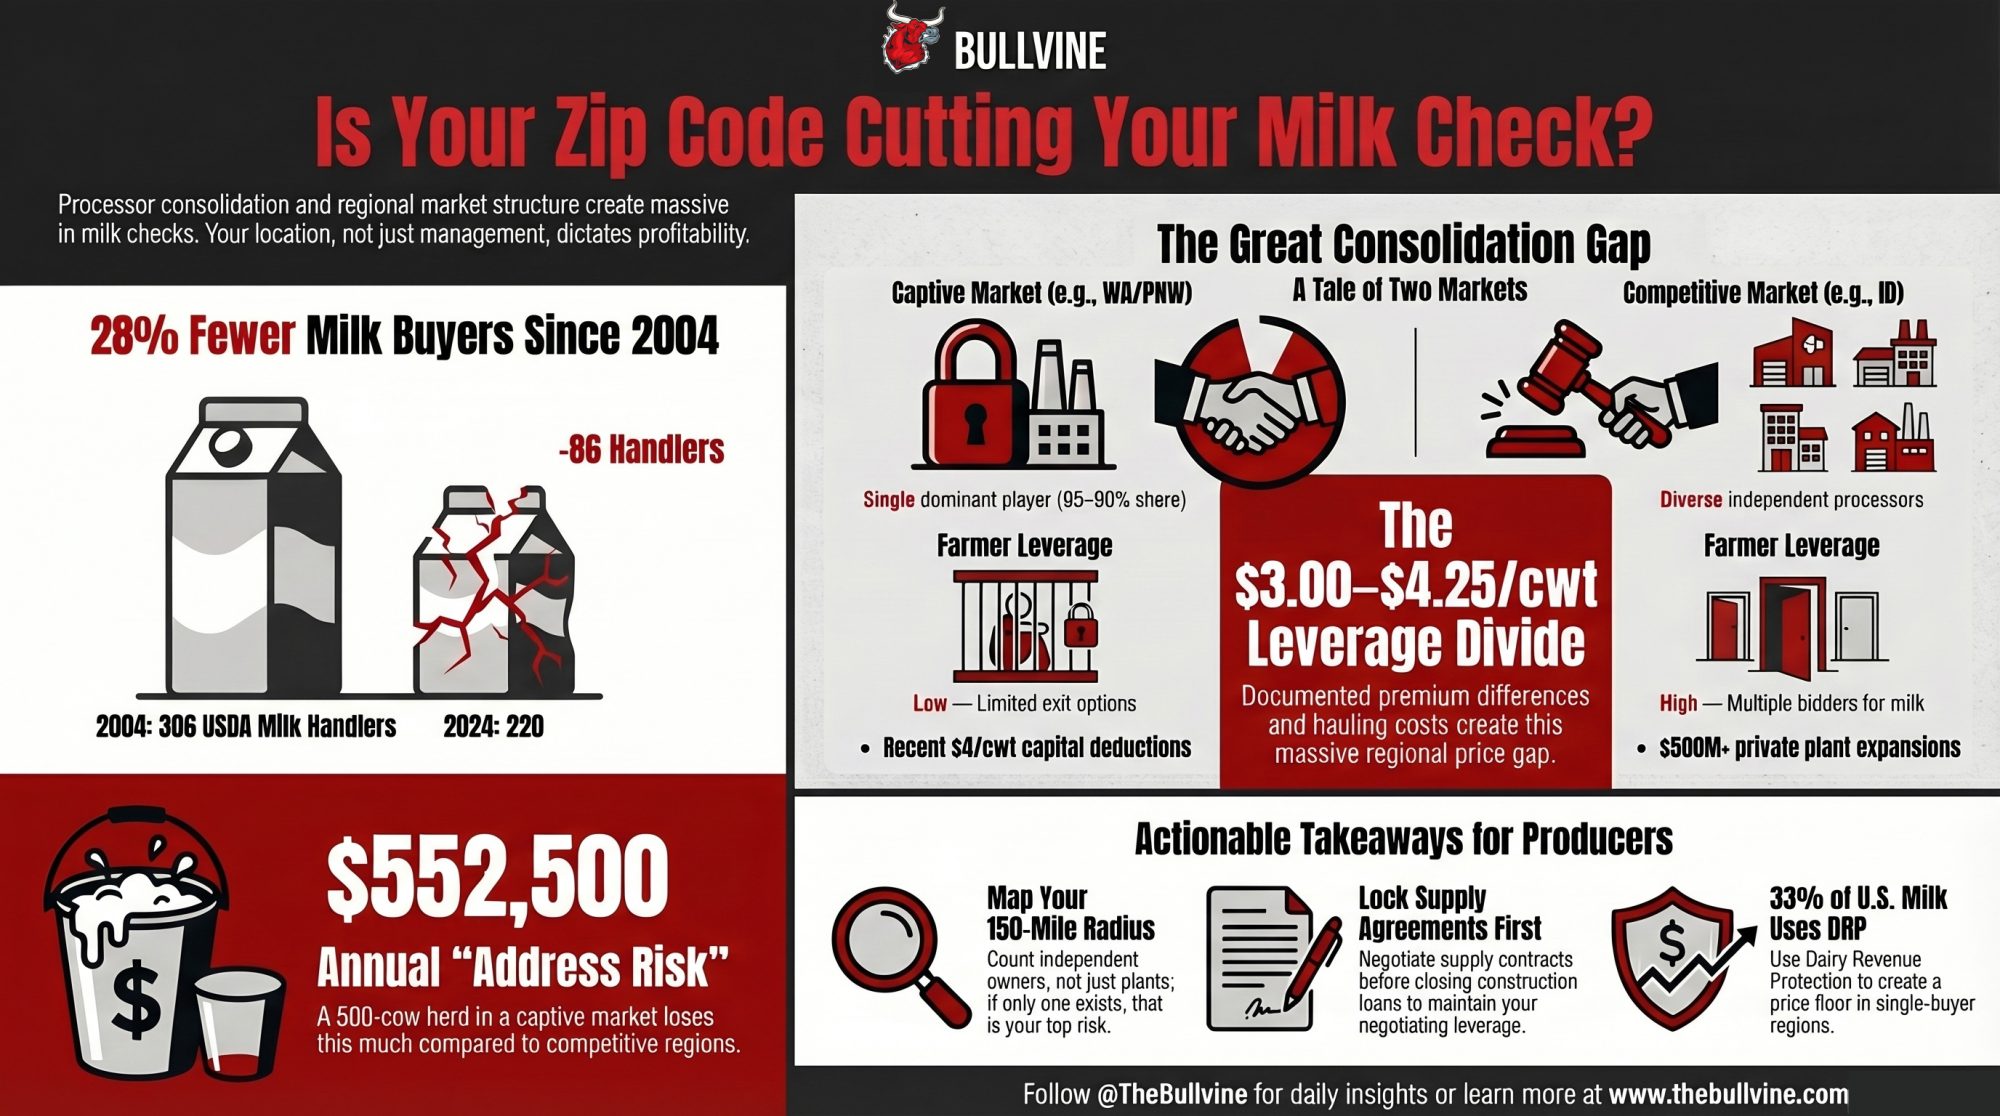
 The Sunday Read Dairy Professionals Don’t Skip.
 The Sunday Read Dairy Professionals Don’t Skip.